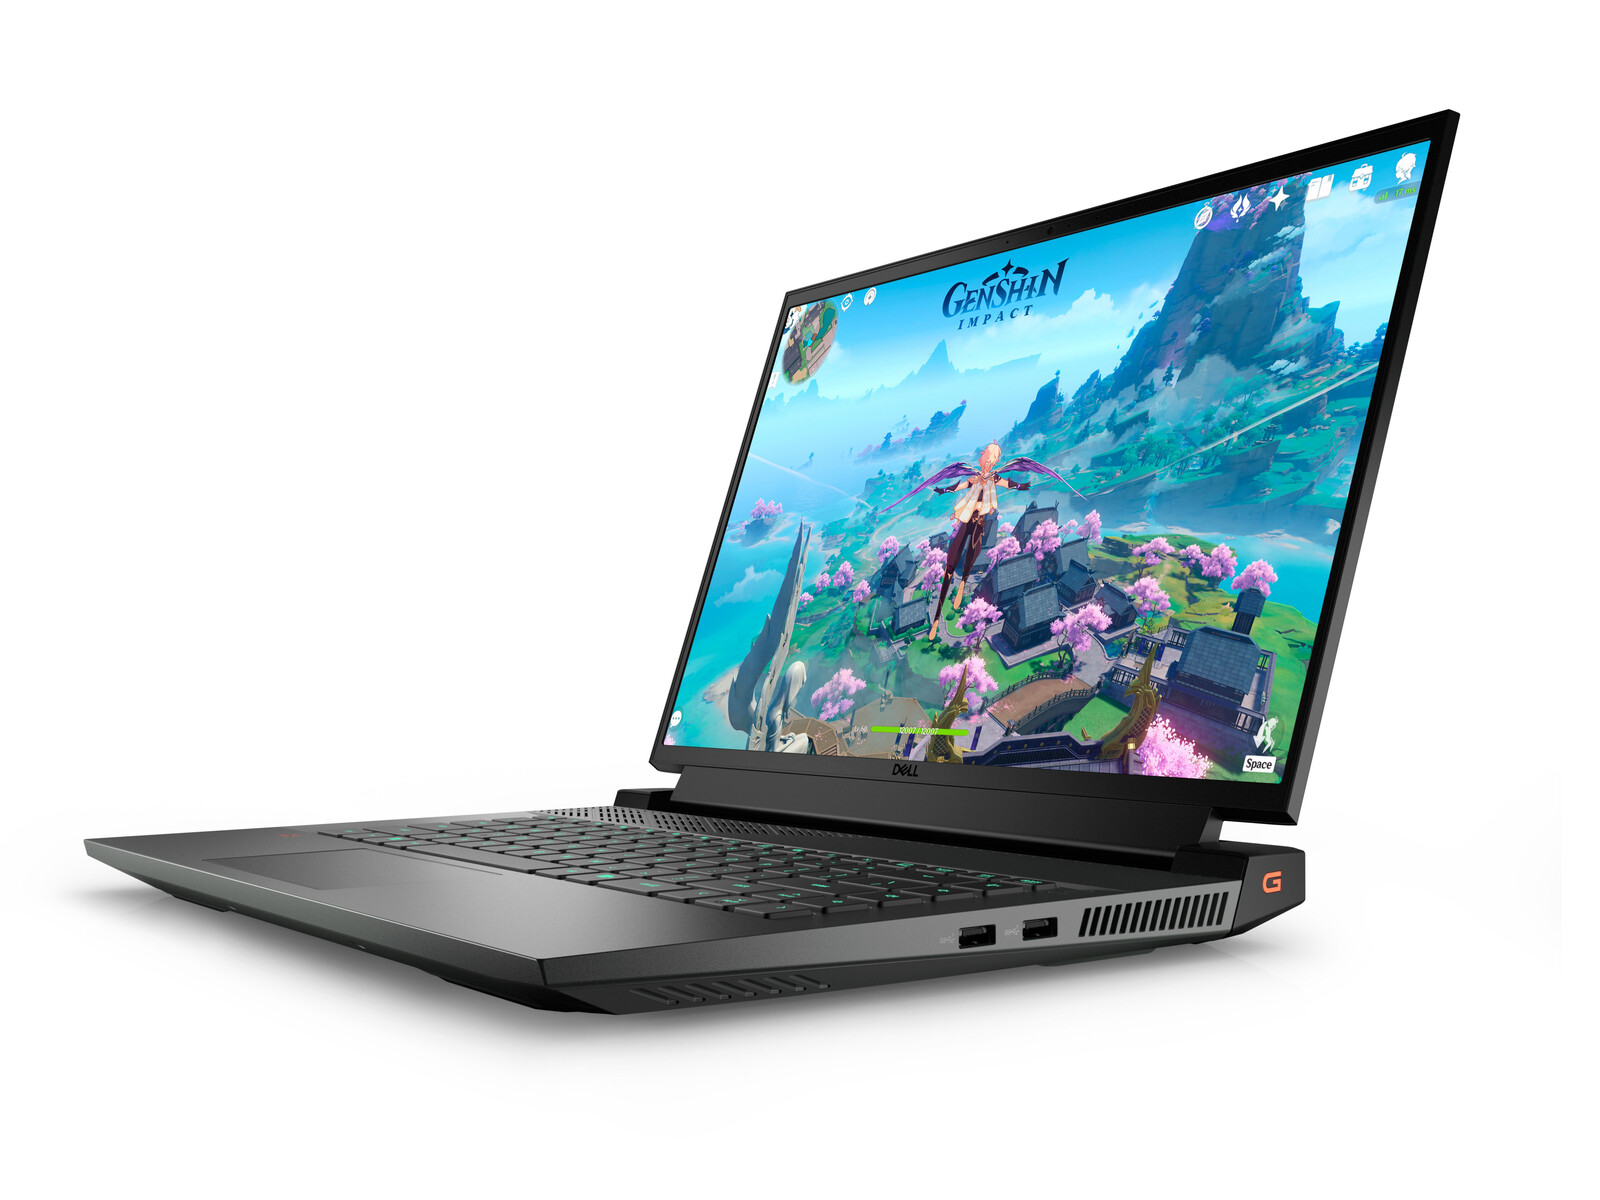
Dell G16 7620 laptop review: Thick build for fast performance
The Dell G series consists of budget to midrange gaming laptops in contrast to the higher-end Alienware series. The series is just a couple of years old with initial G15 and G17 models covering the 15.6-inch and 17.3-inch form factors, respectively. For 2022, Dell has introduced a 16-inch model called the G16 complete with the latest Intel 12th gen Core-H series CPUs and Nvidia RTX Ampere GPUs.
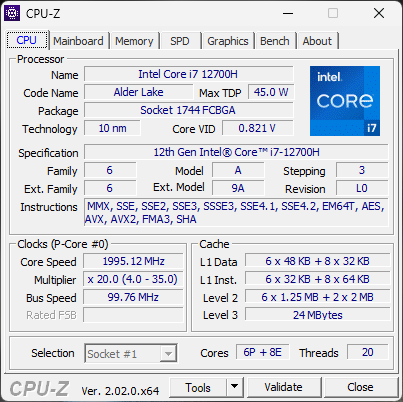
Our unit in review is a midrange configuration with the Core i7-12700H CPU and 130 W GeForce RTX 3060 GPU for approximately $1500 USD retail. Other SKUs are available with the slower RTX 3050 Ti, faster RTX 3070 Ti, or Core i9-12900H instead. All current configurations otherwise come with the same 16-inch 1600p 165 Hz display.
Competitors in this space include other 16-inch gaming laptops like the Lenovo Legion 7 16, HP Victus 16, Asus ROG Zephyrus M16, or Acer Swift X SFX16.
More Dell reviews:
Potential Competitors in Comparison
Rating | Date | Model | Weight | Height | Size | Resolution | Price |
|---|---|---|---|---|---|---|---|
| 86.1 % v7 (old) | 10 / 2022 | Dell G16 7620 i7-12700H, GeForce RTX 3060 Laptop GPU | 2.6 kg | 26.9 mm | 16.00" | 2560x1600 | |
| 90.8 % v7 (old) | 09 / 2022 | Lenovo Legion 7 16ARHA7 R9 6900HX, Radeon RX 6850M XT | 2.6 kg | 19.4 mm | 16.00" | 2560x1600 | |
| 82.3 % v7 (old) | 05 / 2022 | HP Victus 16-e0145ng R5 5600H, GeForce RTX 3050 Ti Laptop GPU | 2.4 kg | 23.5 mm | 16.10" | 1920x1080 | |
| 85.6 % v7 (old) | 07 / 2021 | Asus ROG Zephyrus M16 GU603H i9-11900H, GeForce RTX 3070 Laptop GPU | 2 kg | 20 mm | 16.00" | 2560x1600 | |
| 86.6 % v7 (old) | 07 / 2022 | Lenovo Legion 5 Pro 16IAH7H i7-12700H, GeForce RTX 3060 Laptop GPU | 2.6 kg | 27 mm | 16.00" | 2560x1600 | |
| 86.2 % v7 (old) | 07 / 2022 | Acer Swift X SFX16-51G-5388 i5-11320H, GeForce RTX 3050 4GB Laptop GPU | 1.8 kg | 18.9 mm | 16.10" | 1920x1080 |
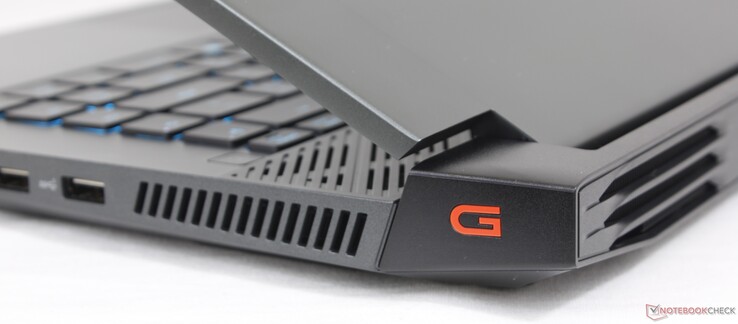
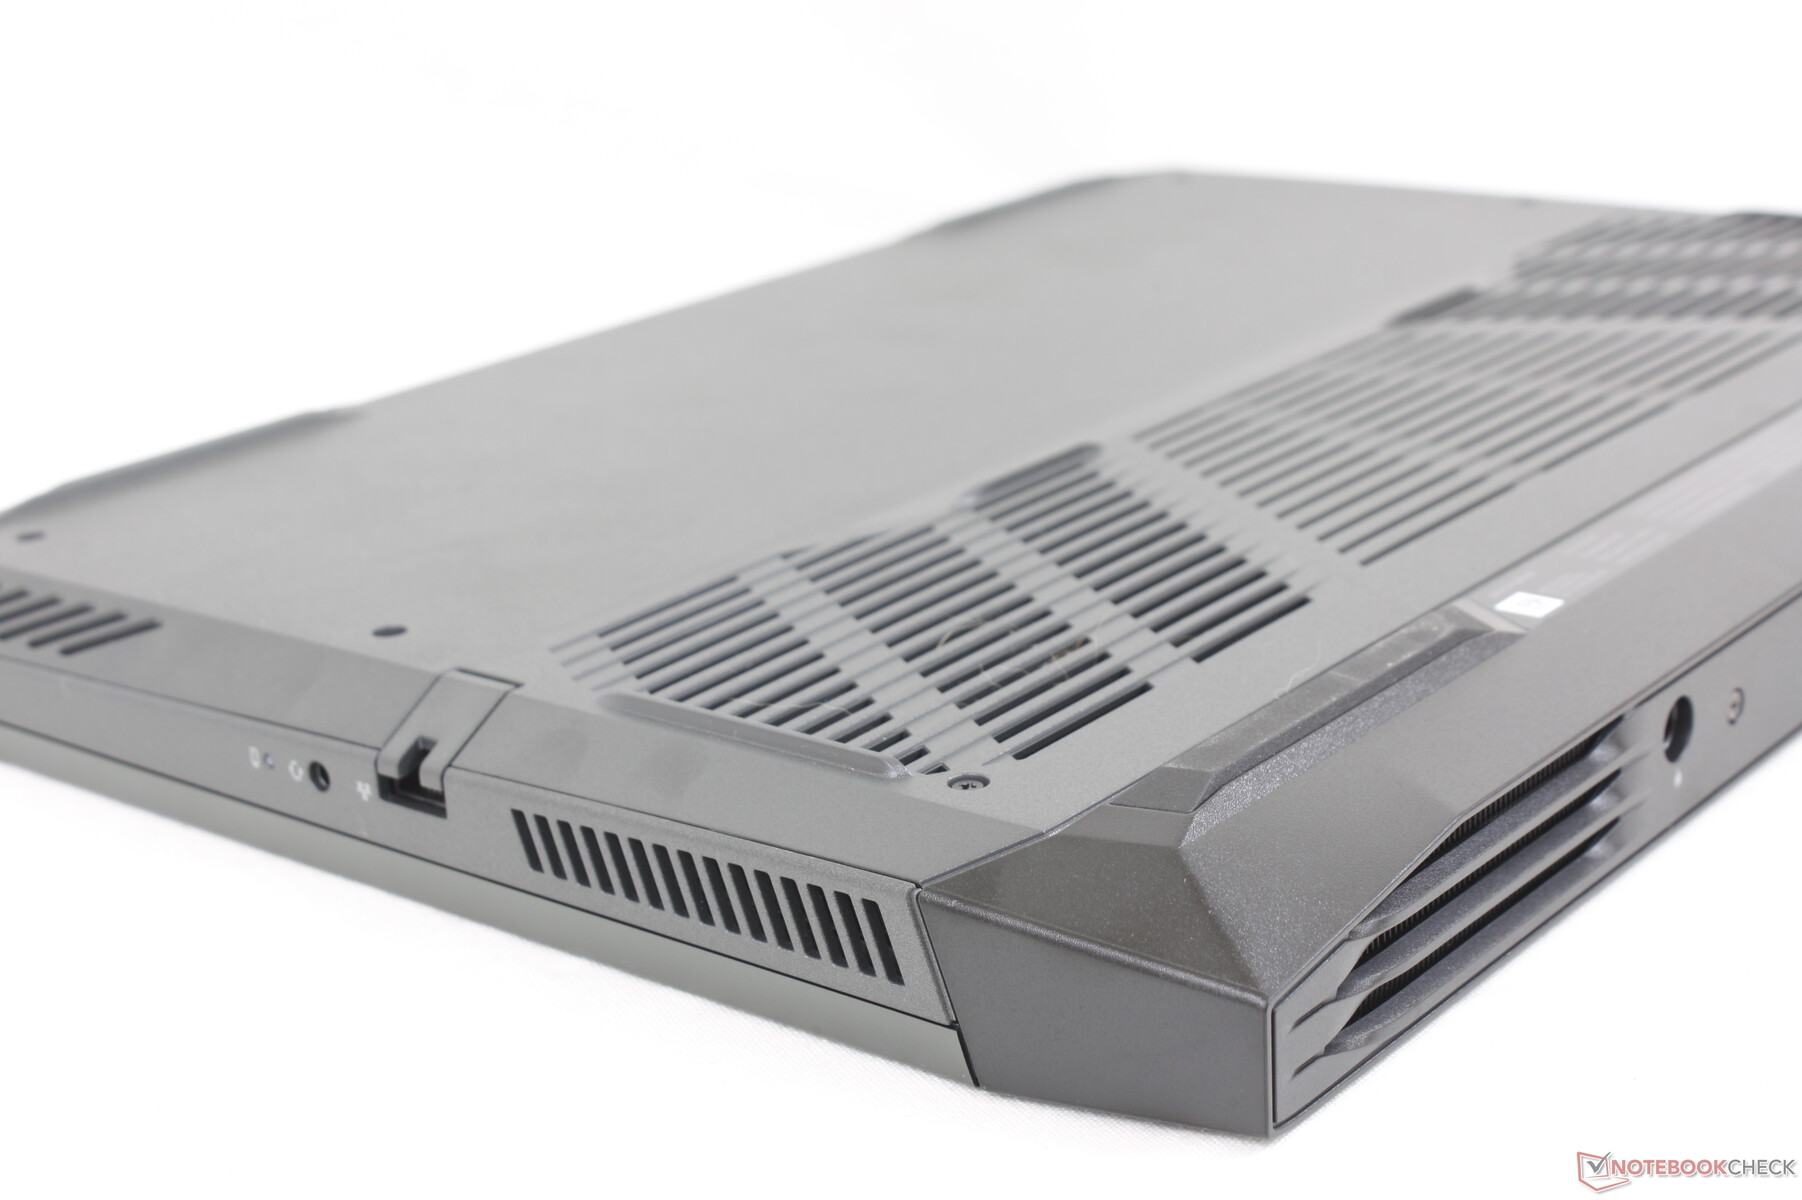
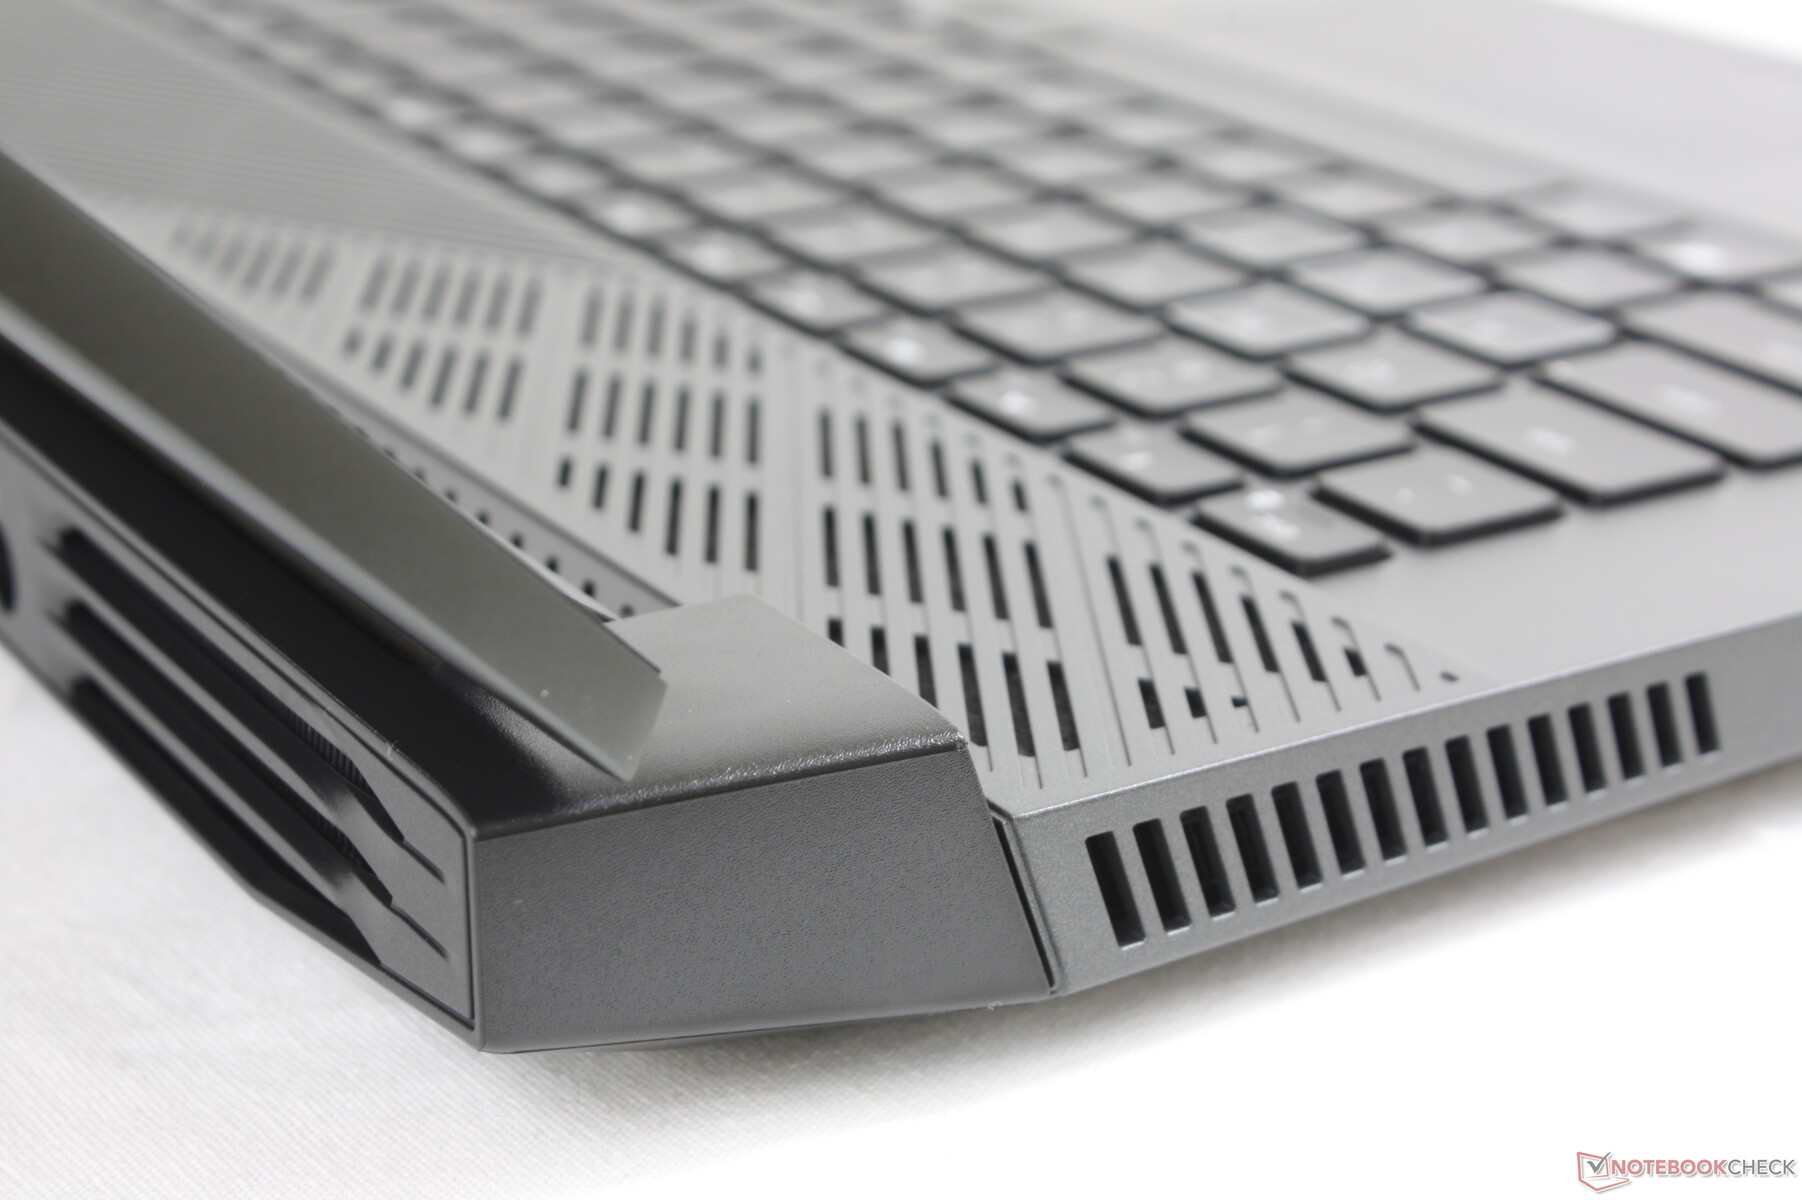
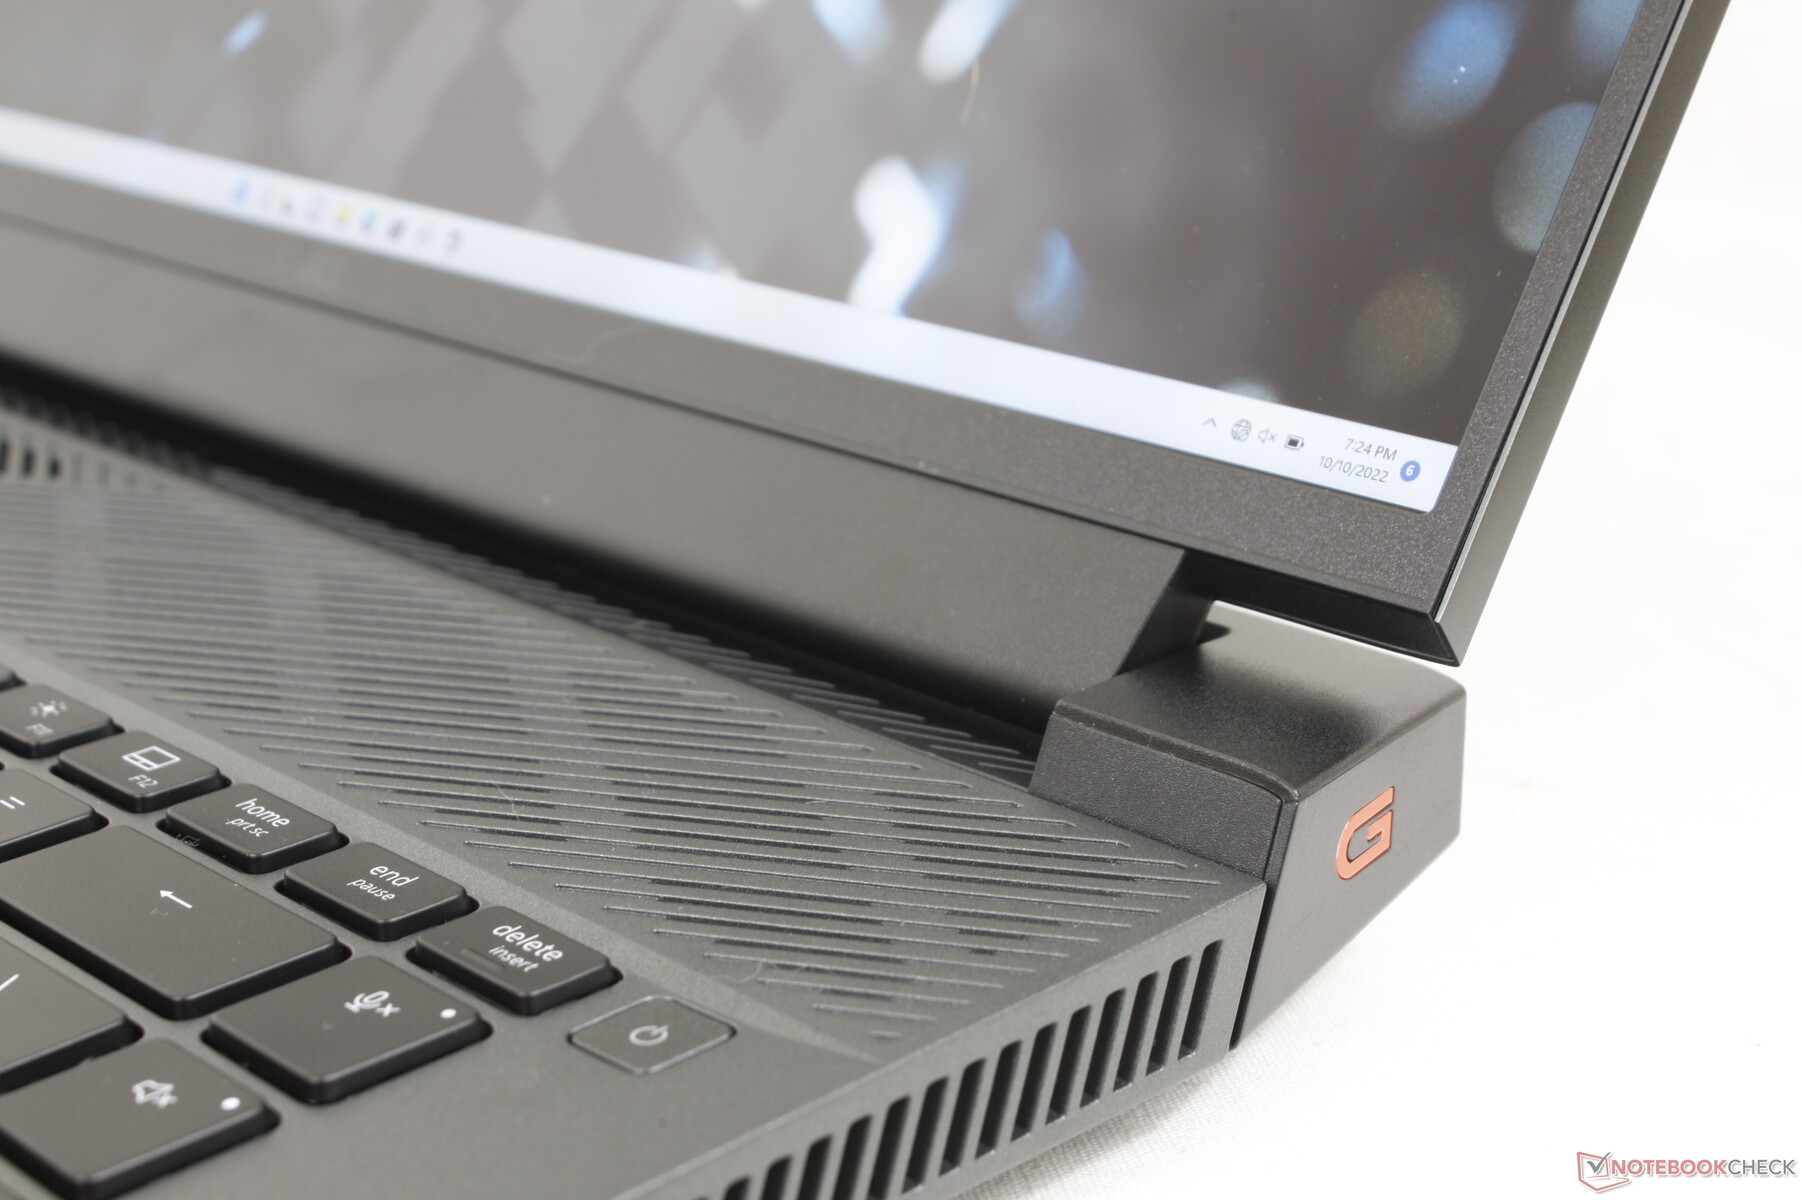
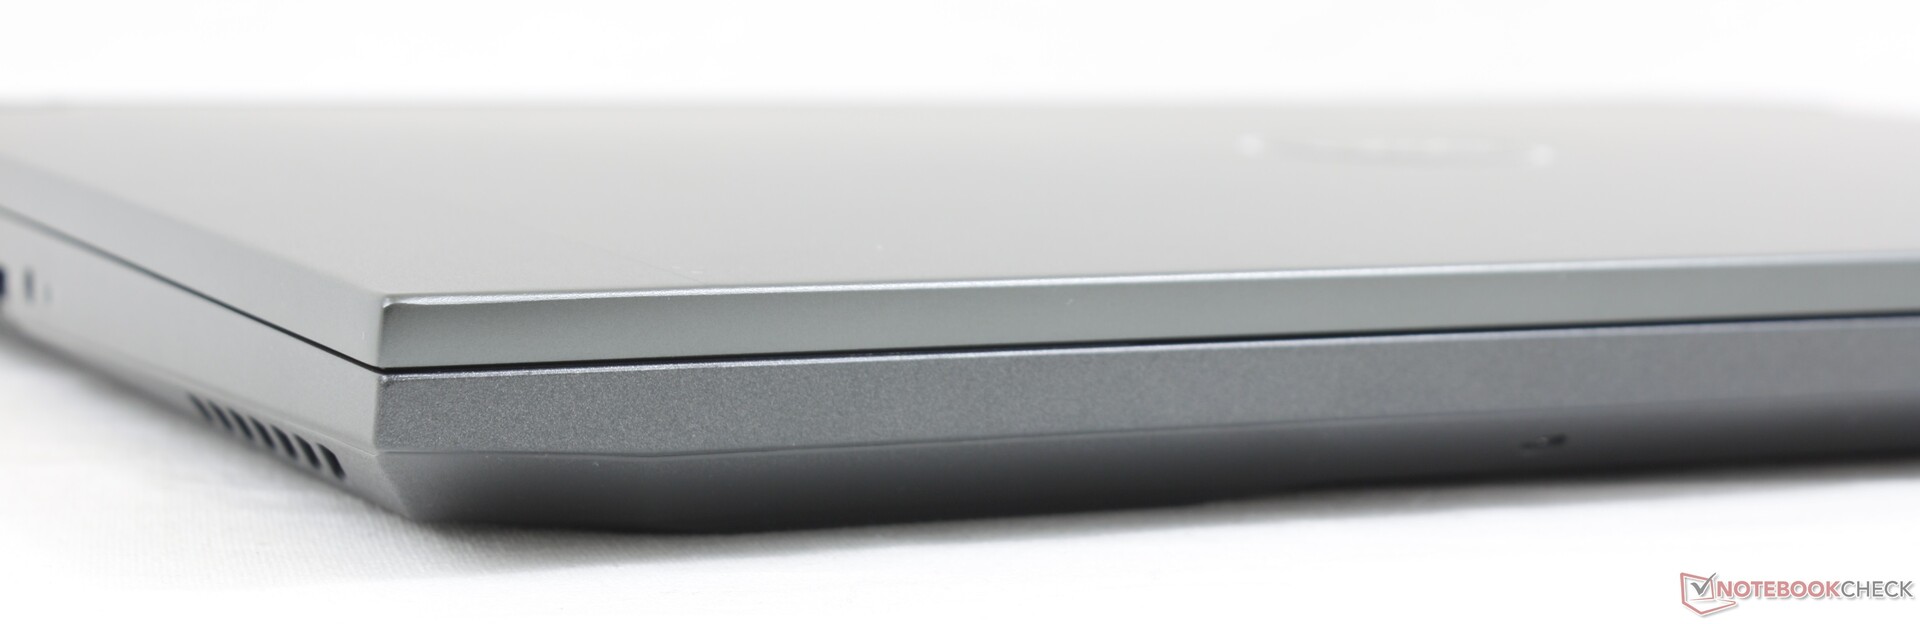
Case — A bigger G15
The overall design has many similarities to the existing 16:9 15.6-inch Dell G15 but revamped for the new 16:10 form factor. The obsidian plastic base and anodized aluminum lid materials remain the same for the familiar smooth texture and feel. "Gamer" aesthetics like the glossy inner display bezel or RGB ring of the Alienware laptops are not present on the G series.
Chassis rigidity is firm around the base and keyboard center where flexing and twisting are minimal. The lid exhibits relatively more flexing but not by significant margins to be of any concern.
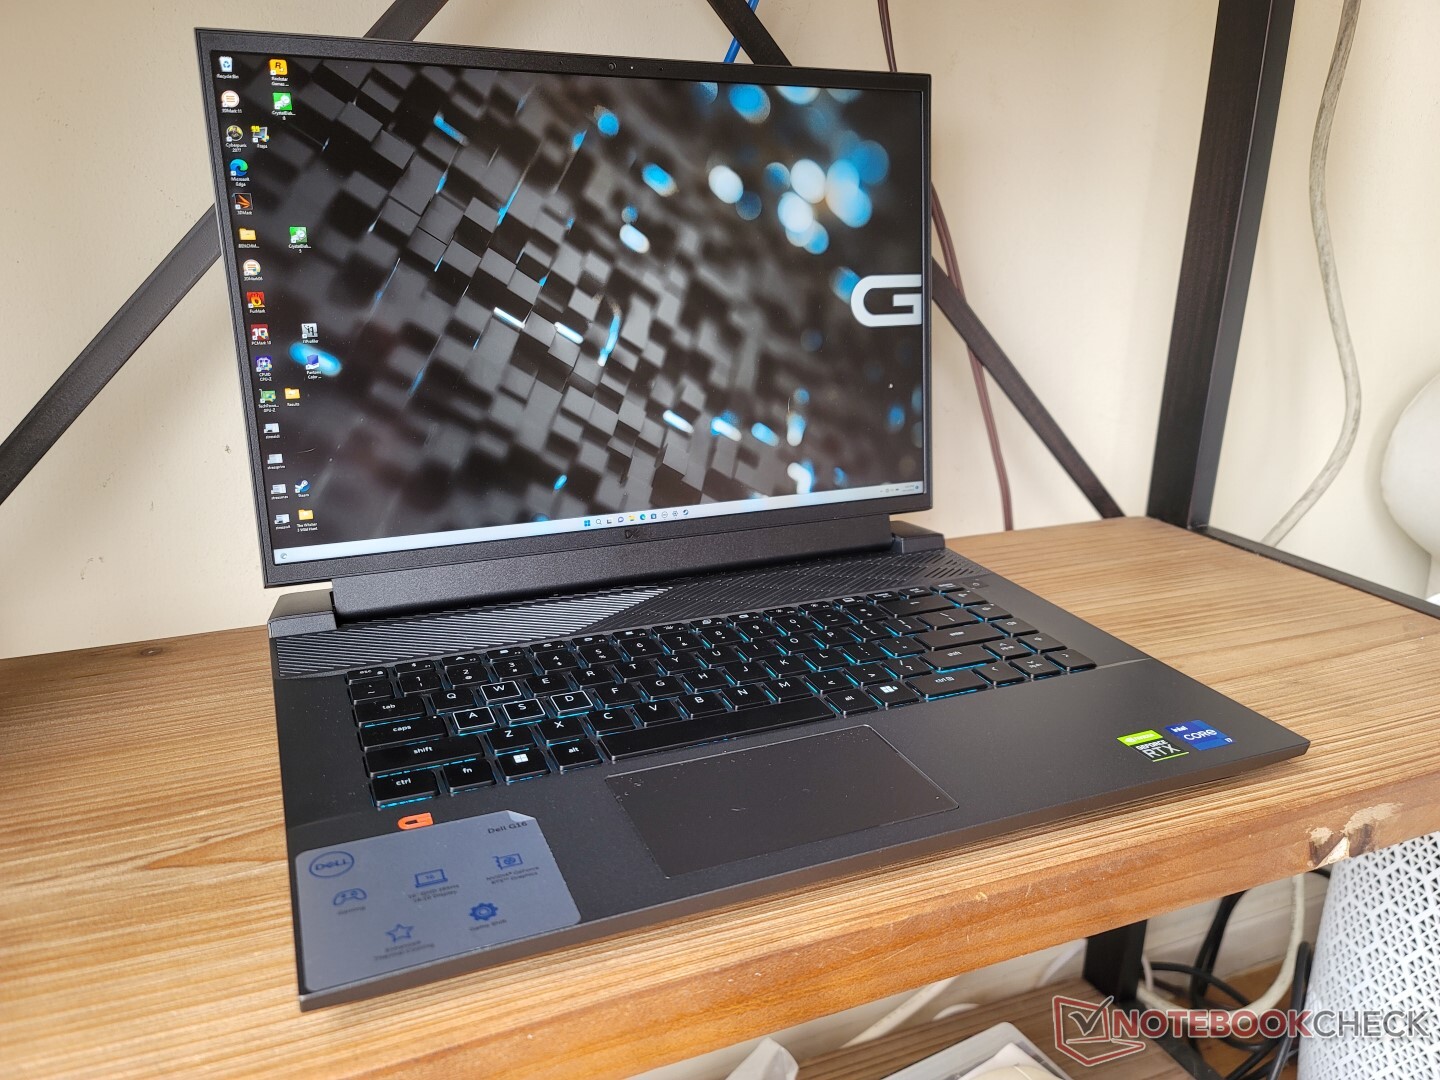
Dell gaming laptops are typically heavier than the competition and the G16 is no exception. At 2.6 kg, the model is heavier than the HP Victus 16, Acer Swift X, and Asus Zephyrus M16 by several hundred grams each. The G16 is consequently thicker than most other gaming laptops in its size category as well.
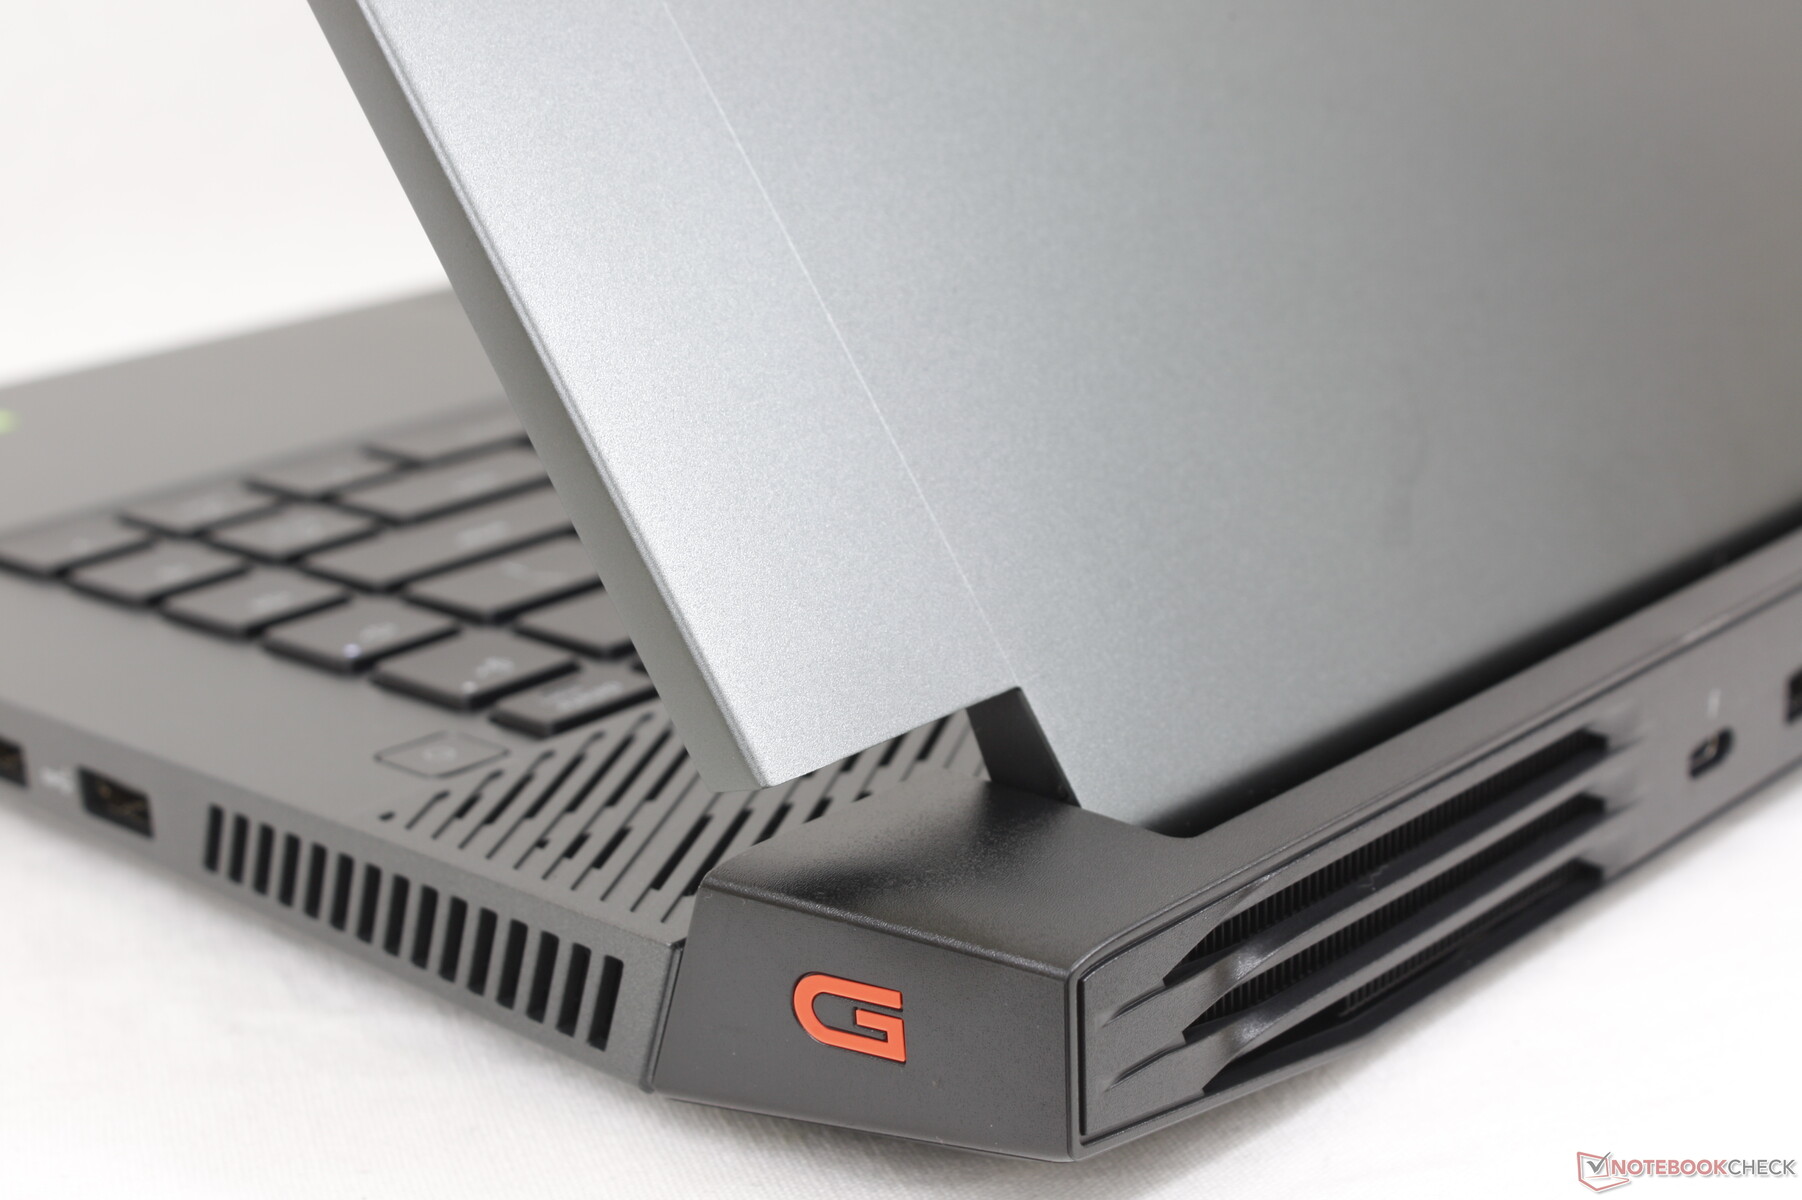
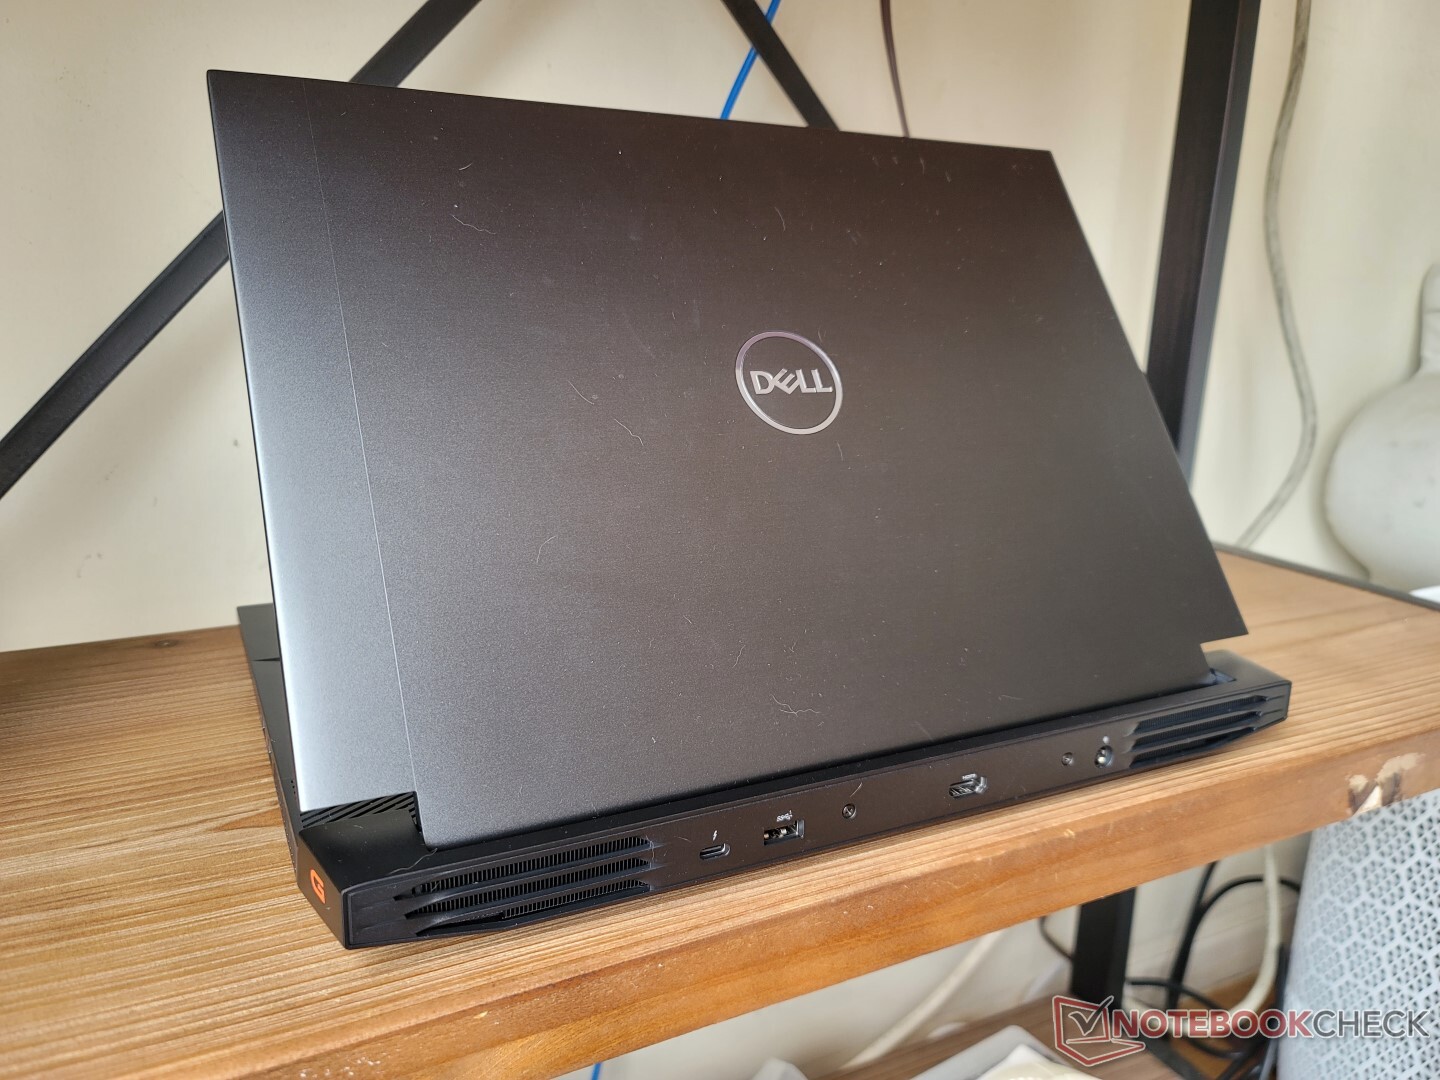
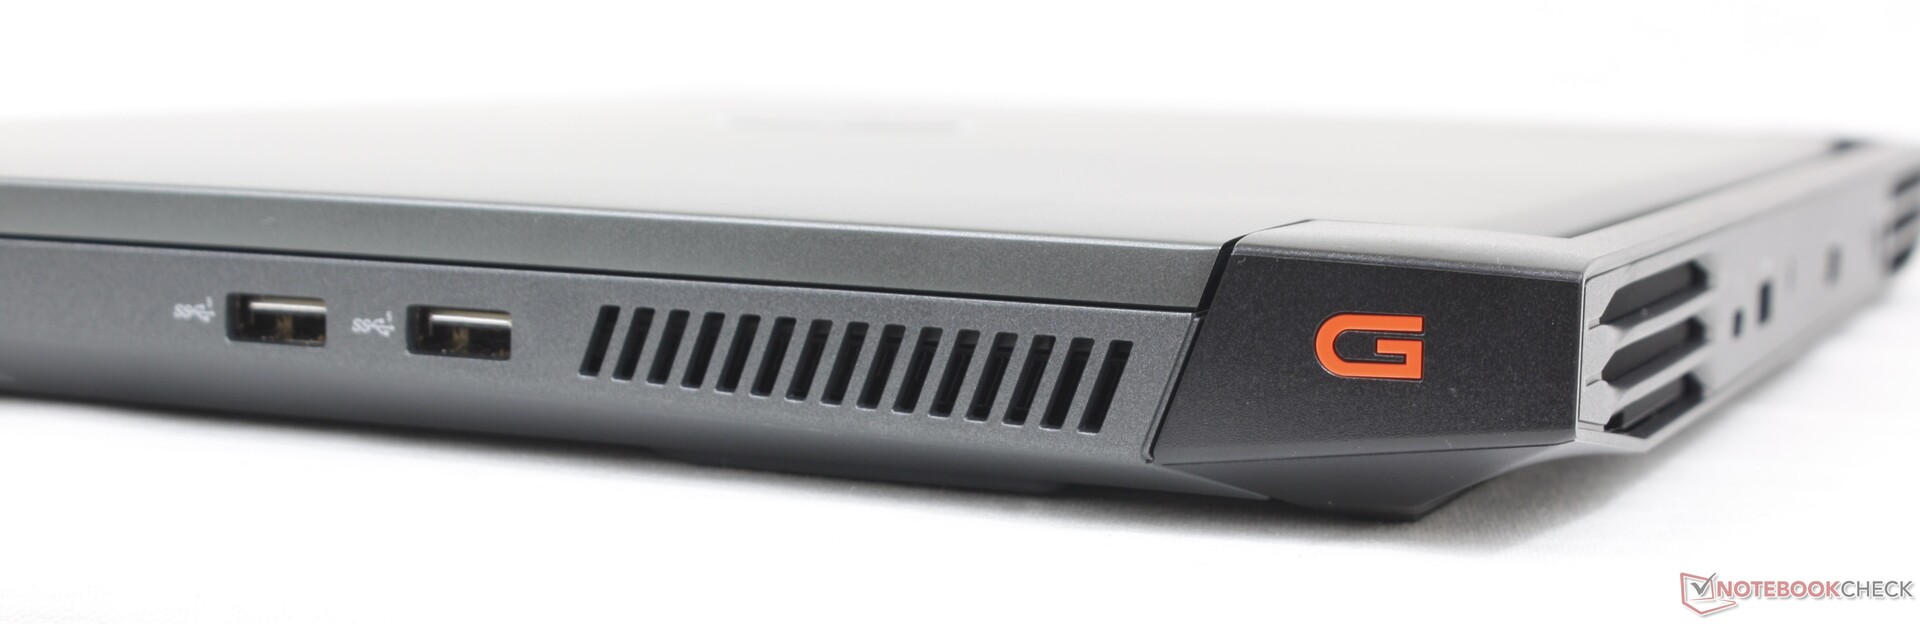
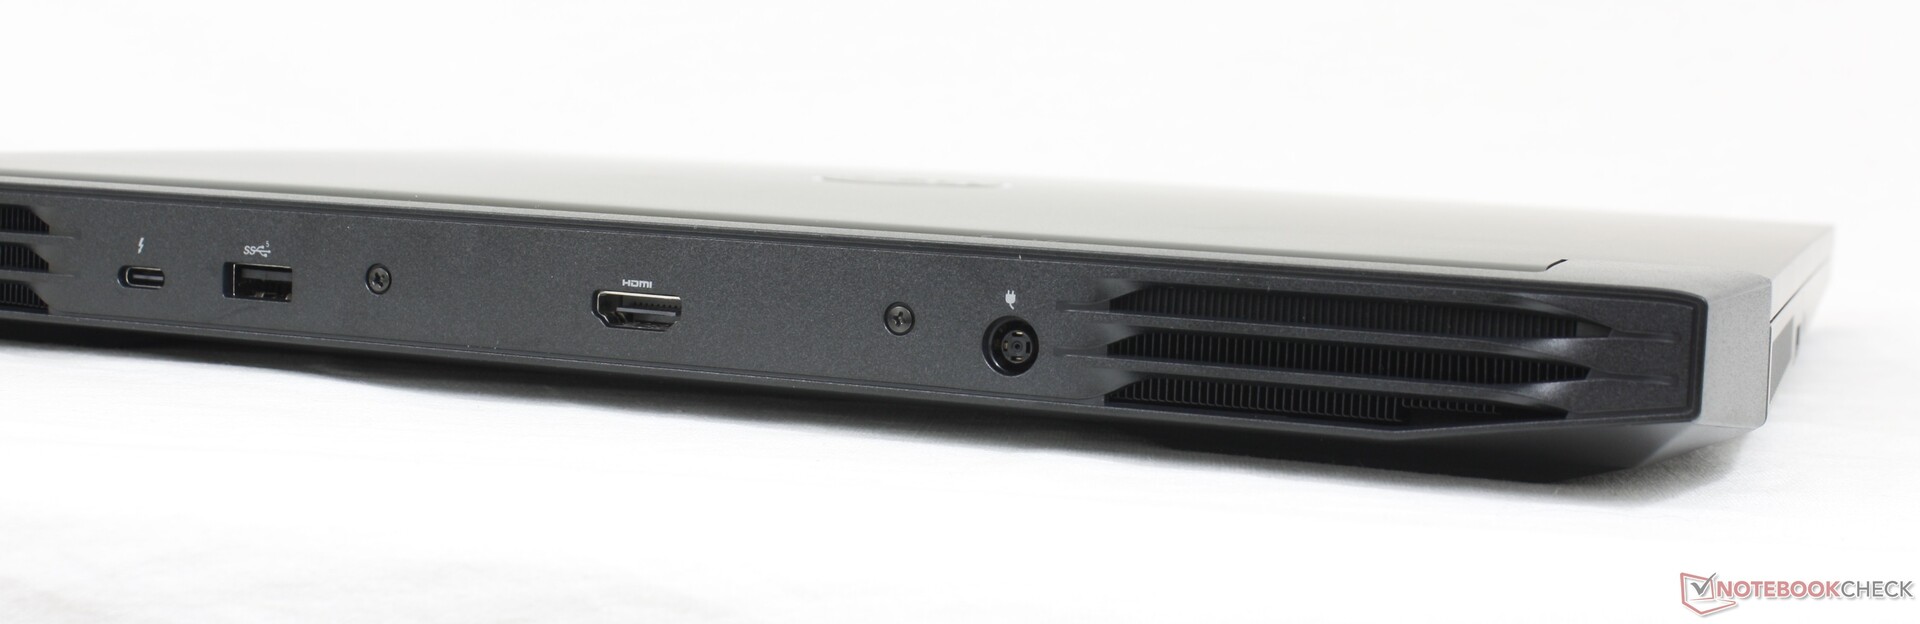
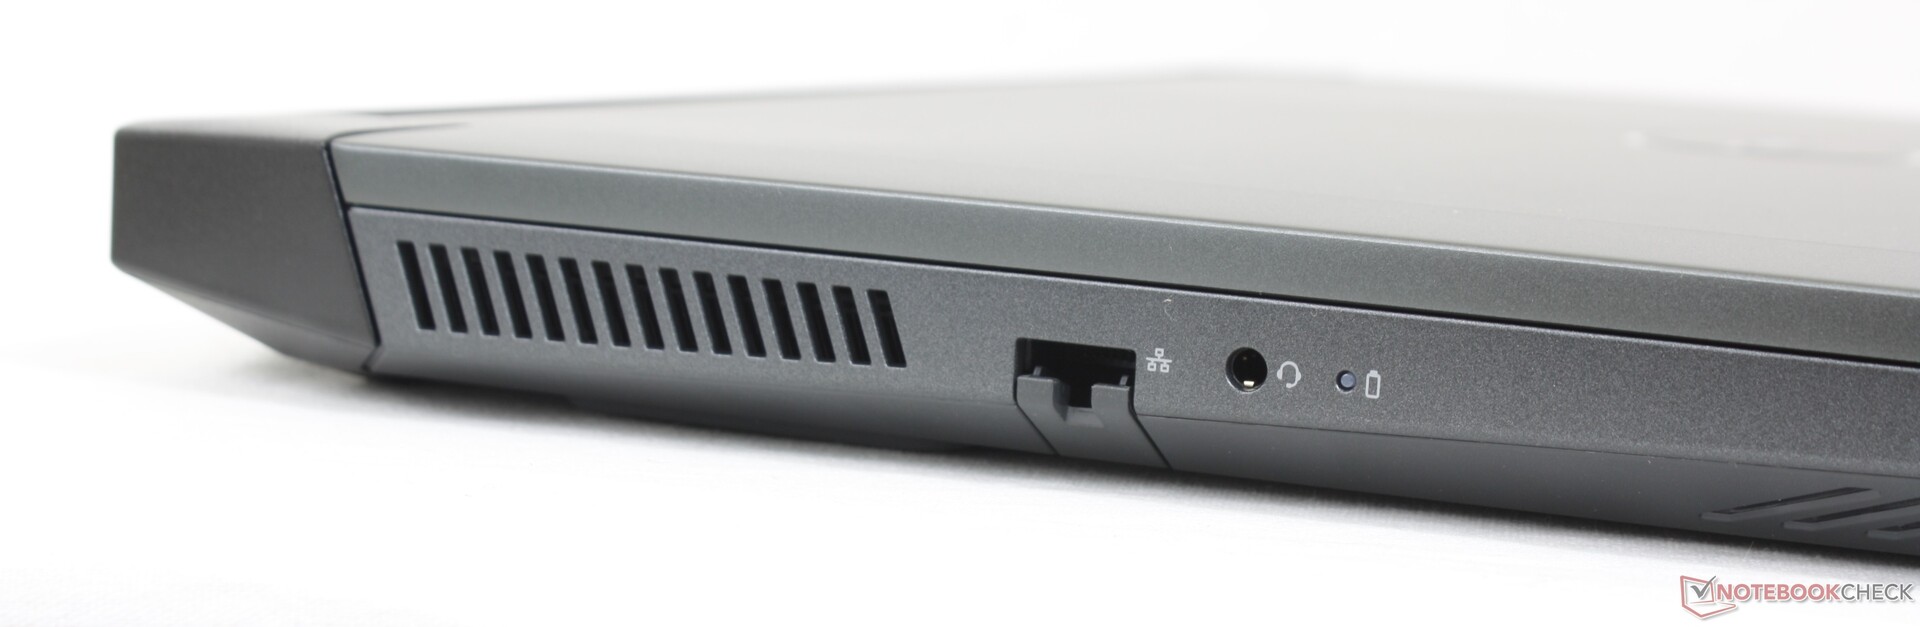
Connectivity — Thunderbolt 4 Support
Port options are most similar to the HP Victus 16 albeit rearranged. In fact, half the ports on the G16 are along the rear due to the large ventilation grilles on the left and right edges. We would like to see more USB-C ports in the future as there is only one compared to three on the competing Lenovo Legion 5 Pro.
Communication — 6 GHz Not Included
An Intel AX201 comes standard for Wi-Fi 6 and Bluetooth 5.2 connectivity. There are no Wi-Fi 6E options likely to save on costs. Transfer rates are otherwise steady if not unimpressive when paired to our AXE11000 router.
| Networking | |
| iperf3 transmit AX12 | |
| Acer Swift X SFX16-51G-5388 | |
| Asus ROG Zephyrus M16 GU603H | |
| iperf3 receive AX12 | |
| Acer Swift X SFX16-51G-5388 | |
| Asus ROG Zephyrus M16 GU603H | |
| iperf3 receive AXE11000 6GHz | |
| Lenovo Legion 5 Pro 16IAH7H | |
| Lenovo Legion 7 16ARHA7 | |
| iperf3 receive AXE11000 | |
| Dell G16 7620 | |
| HP Victus 16-e0145ng | |
| iperf3 transmit AXE11000 6GHz | |
| Lenovo Legion 7 16ARHA7 | |
| Lenovo Legion 5 Pro 16IAH7H | |
| iperf3 transmit AXE11000 | |
| Dell G16 7620 | |
| HP Victus 16-e0145ng | |
Webcam
The webcam is a disappointing 1 MP for a very muddy picture. There is no IR sensor or privacy shutter, either.


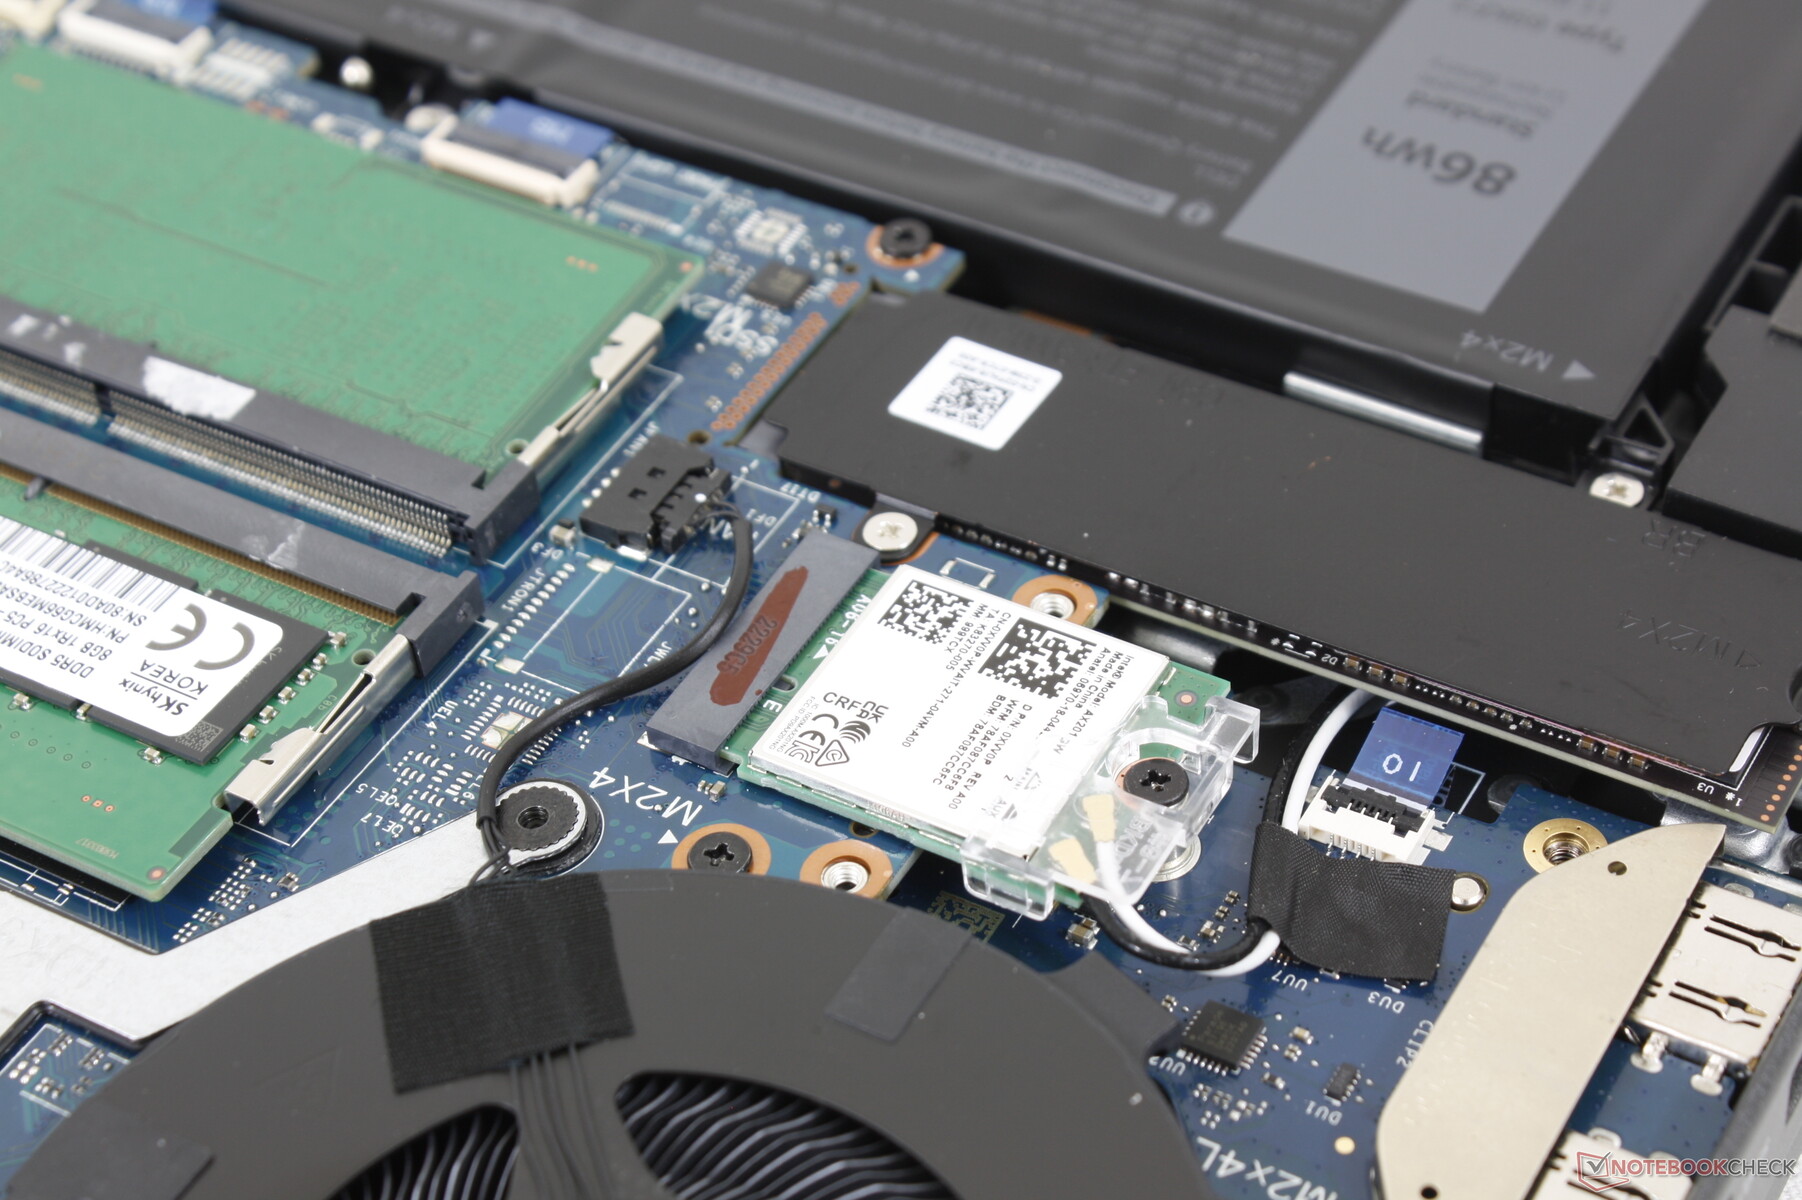
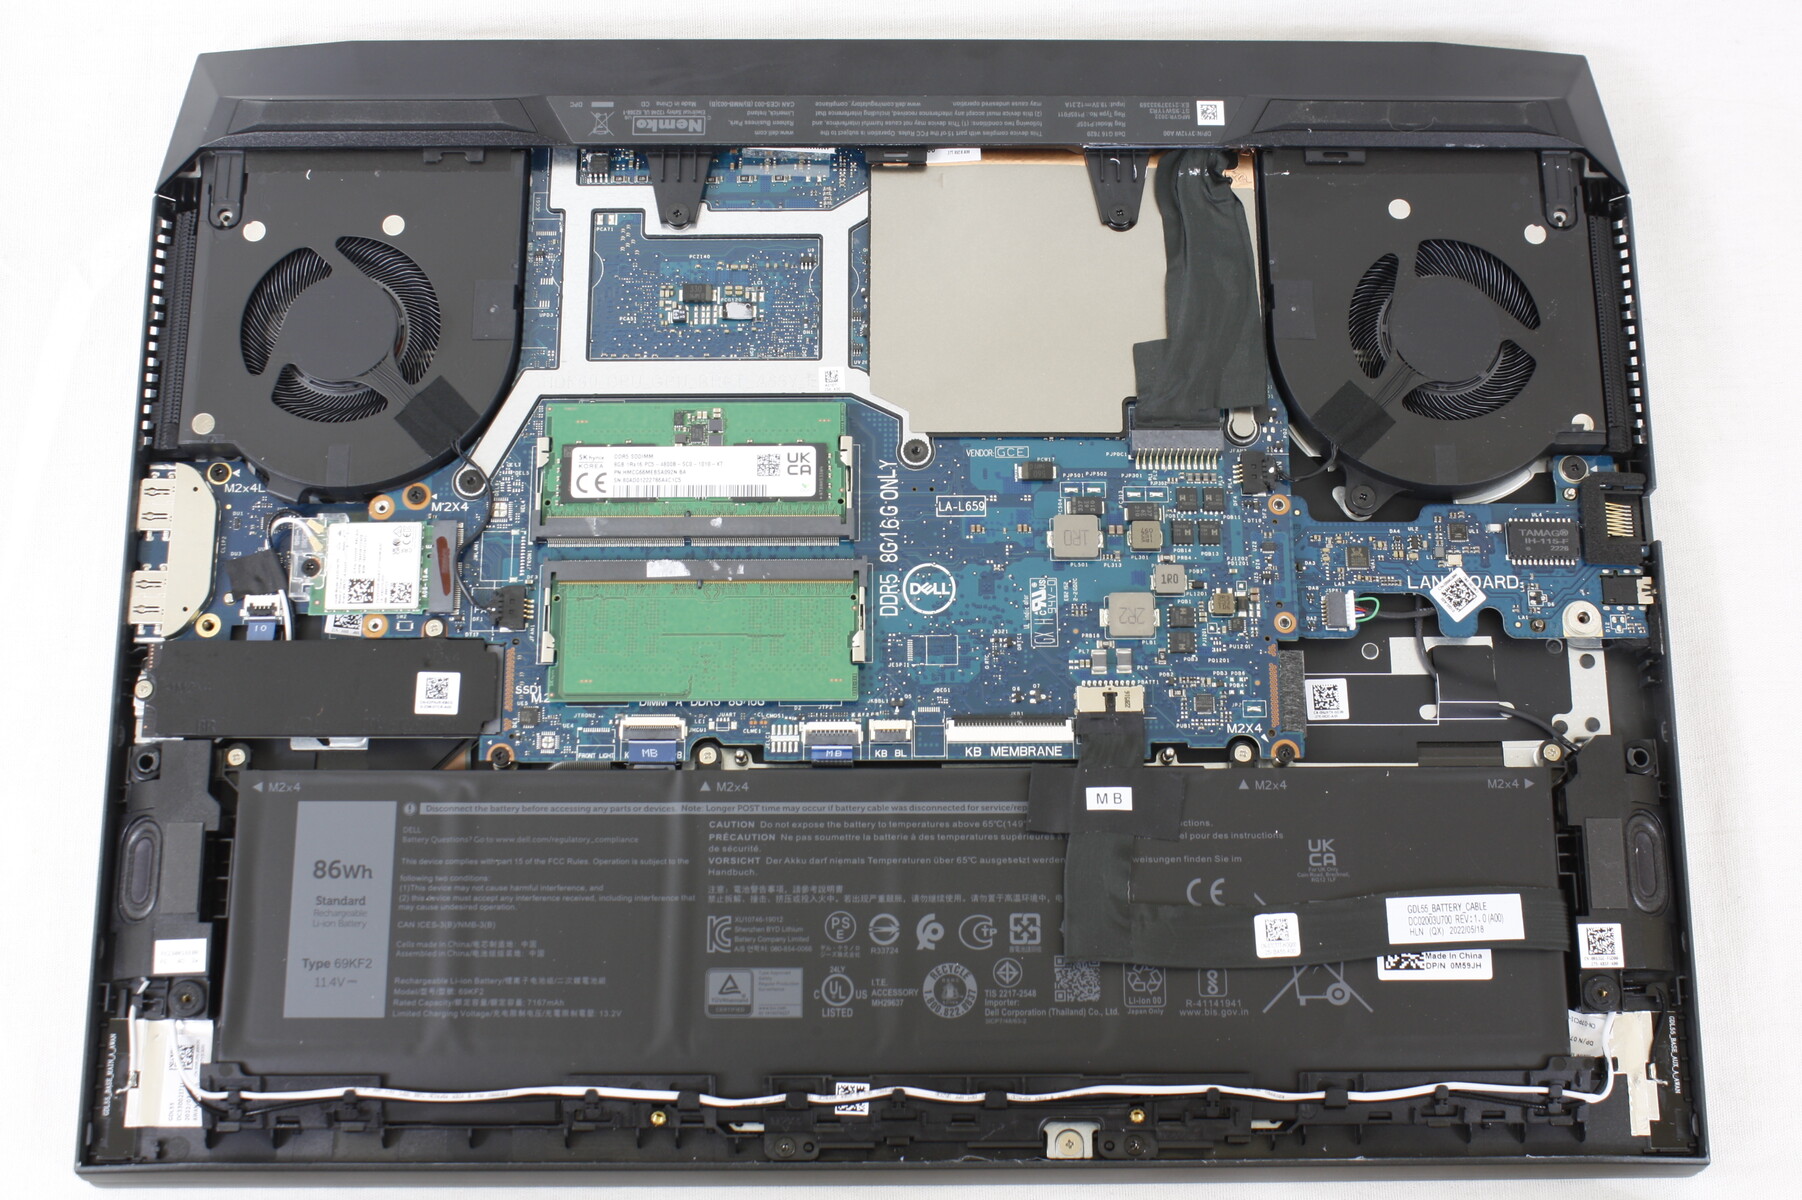
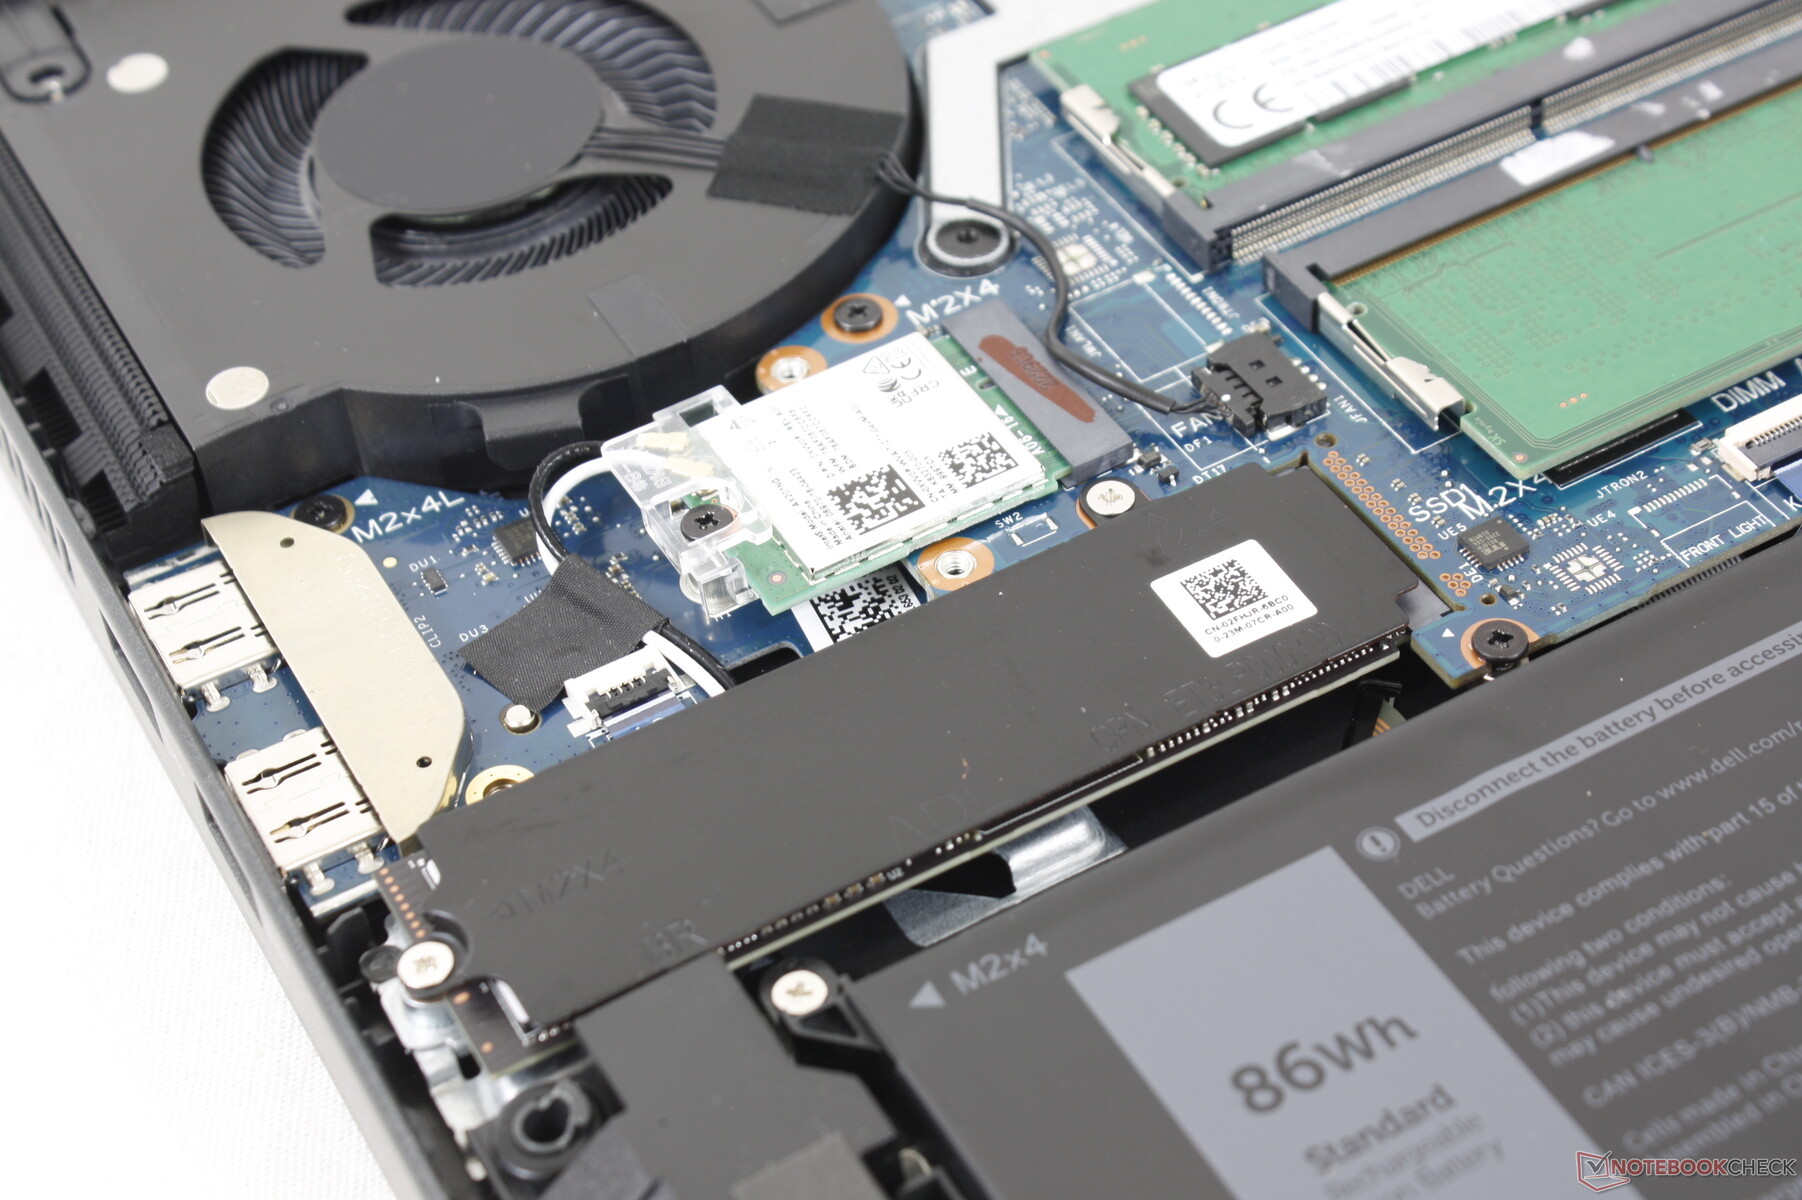
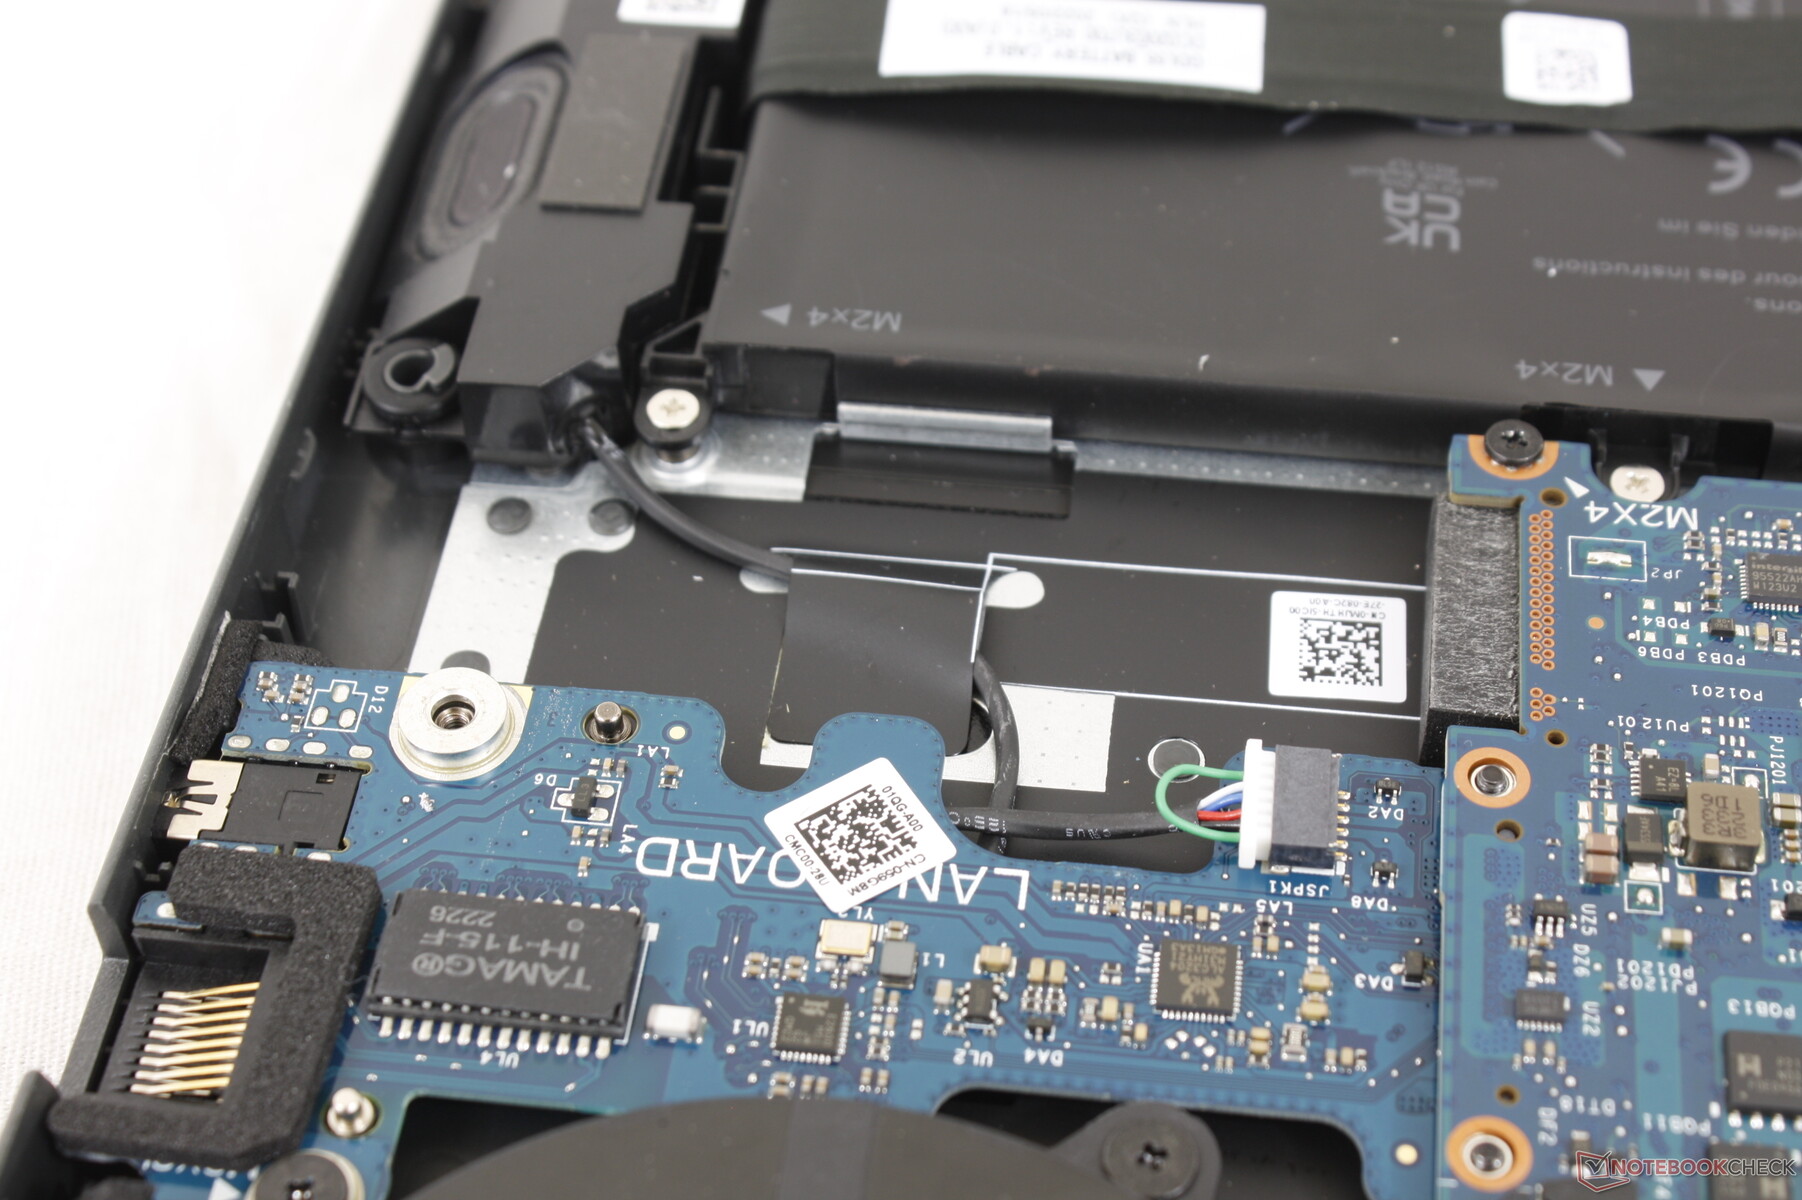
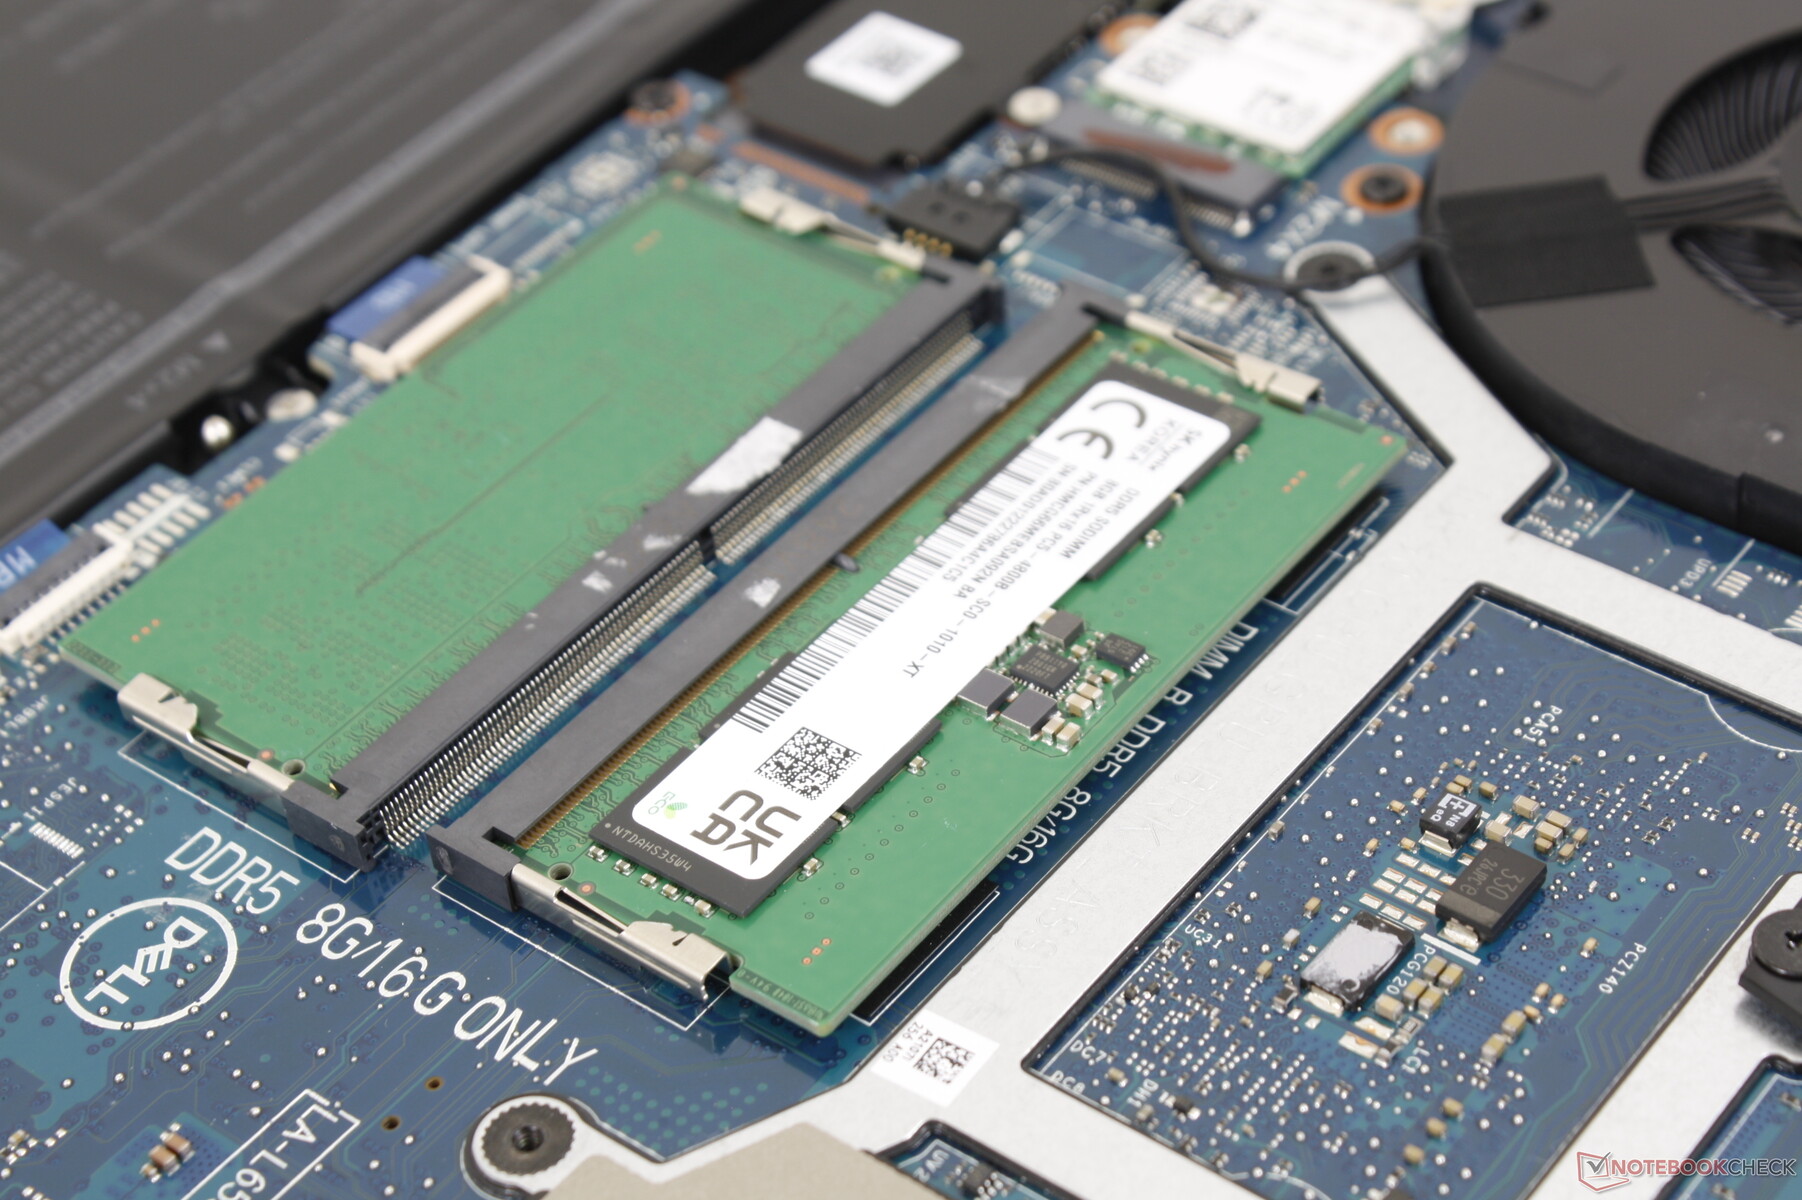
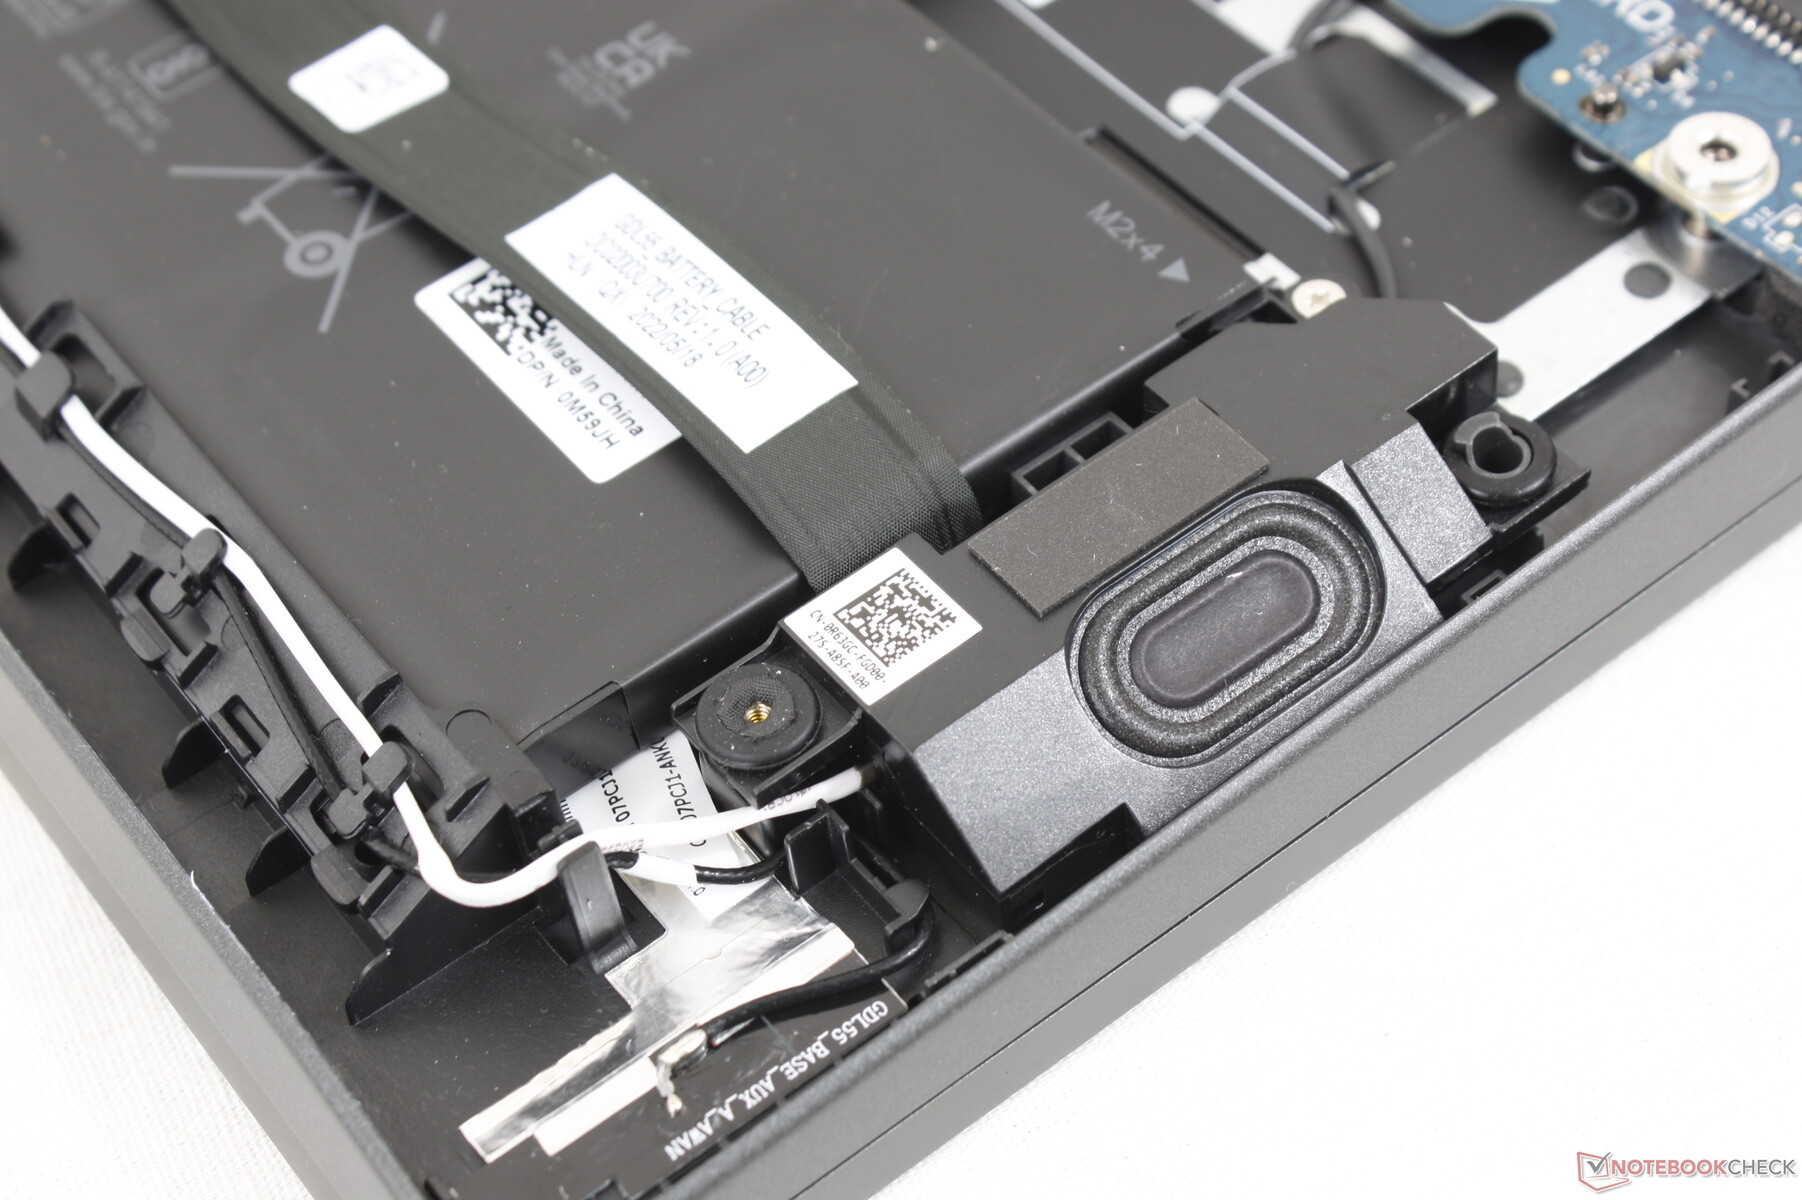
Maintenance
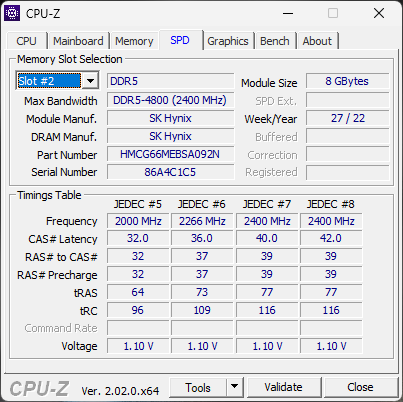
The bottom panel is secured by 8 Philips screws for easy servicing. Users have direct access to 2x DDR5 SODIMM slots, 1x M.2 2280 SSD slot, battery, and removable M.2 WLAN module. The heat pipes and processors are on the opposite side and require further disassembly to access.
Accessories and Warranty
There are no extras in the box other than the AC adapter and paperwork. The usual one-year limited manufacturer warranty applies if purchased in the US.
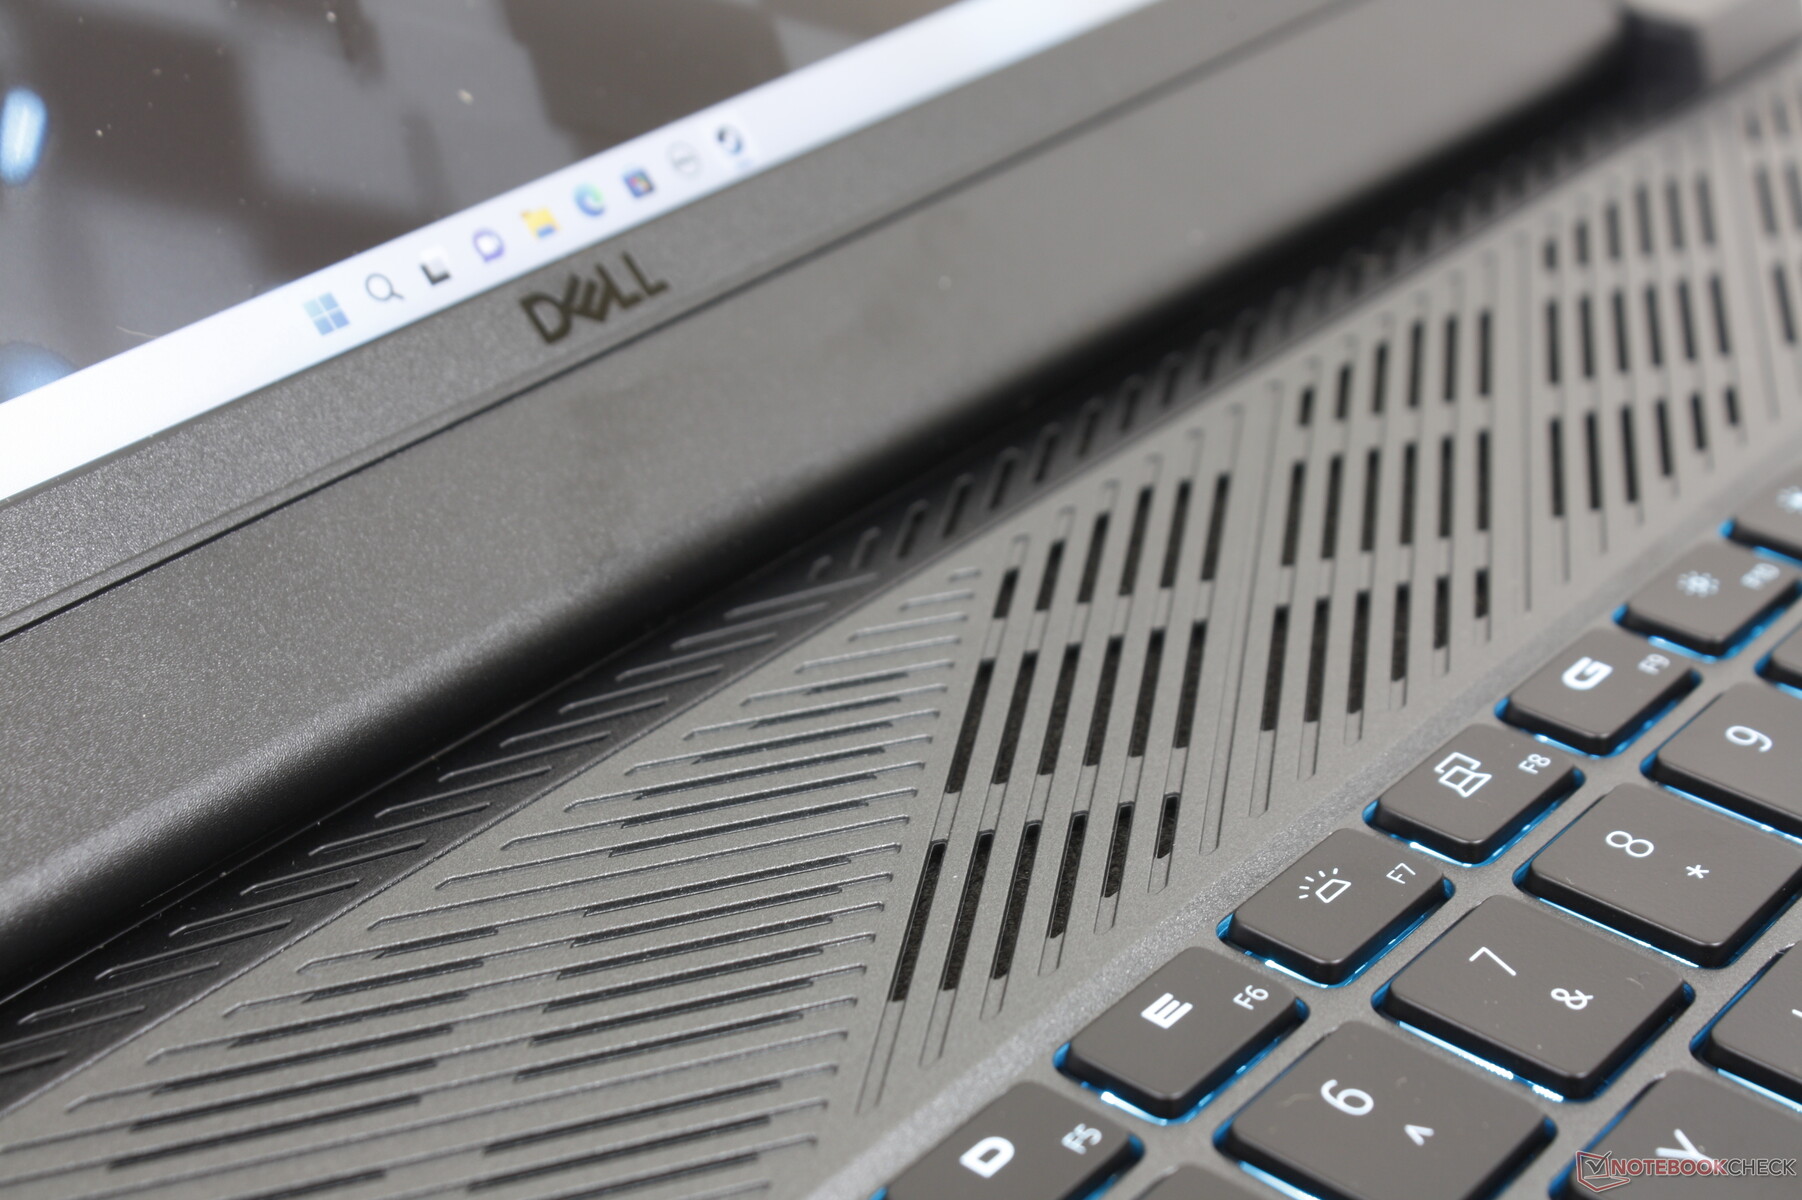
Input Devices — No More Numpad
Keyboard
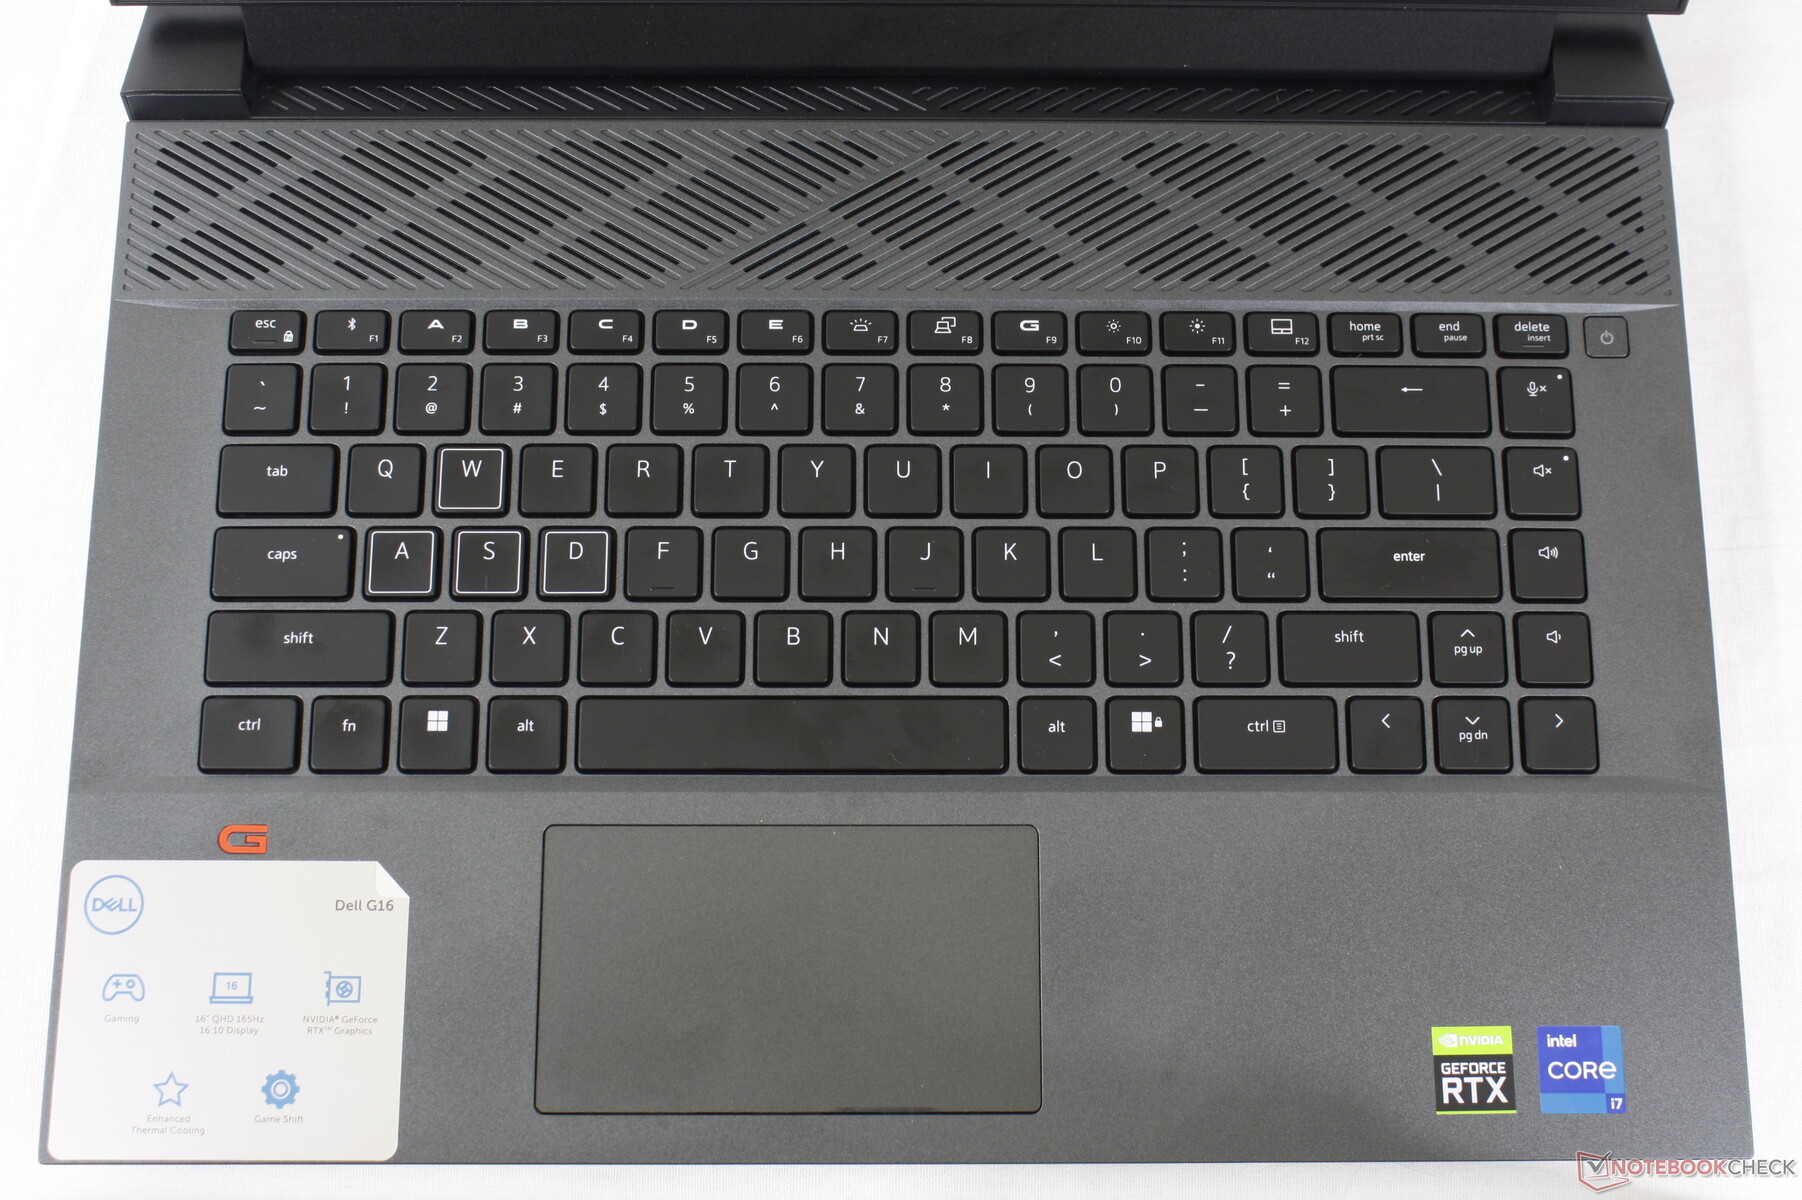
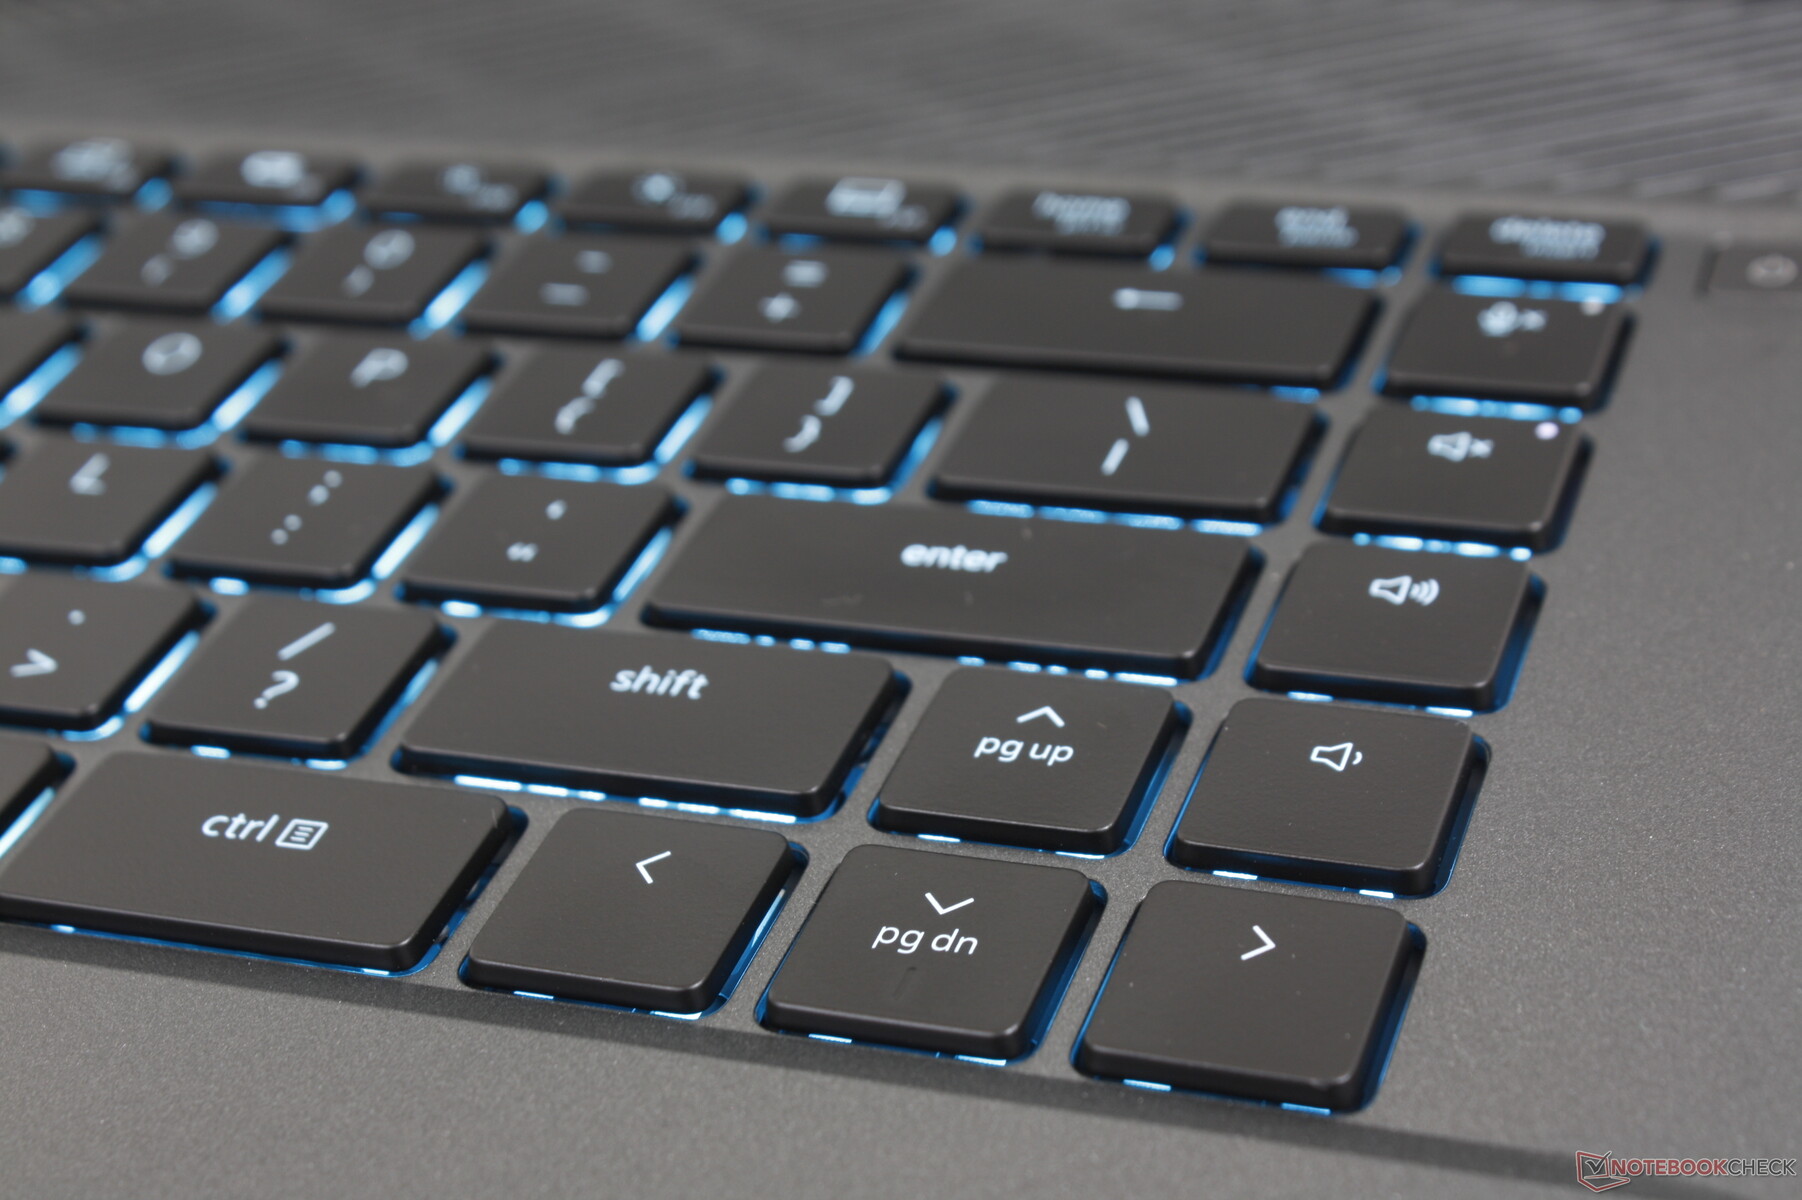
While Dell could have easily used the exact same G15 keyboard for its new G16 model, they have instead opted for a completely different one. The G16 keyboard has dropped the numpad for full-size arrow keys which is a mixed bag depending on the application or game. On the bright side, key feedback feels crisper and firmer than on the G15 for a more satisfying typing experience.
Annoyingly, users will have to pay more for the per-key RGB lighting feature on the G16. The model otherwise comes with a single-zone blue LED backlight as shown by our images below.
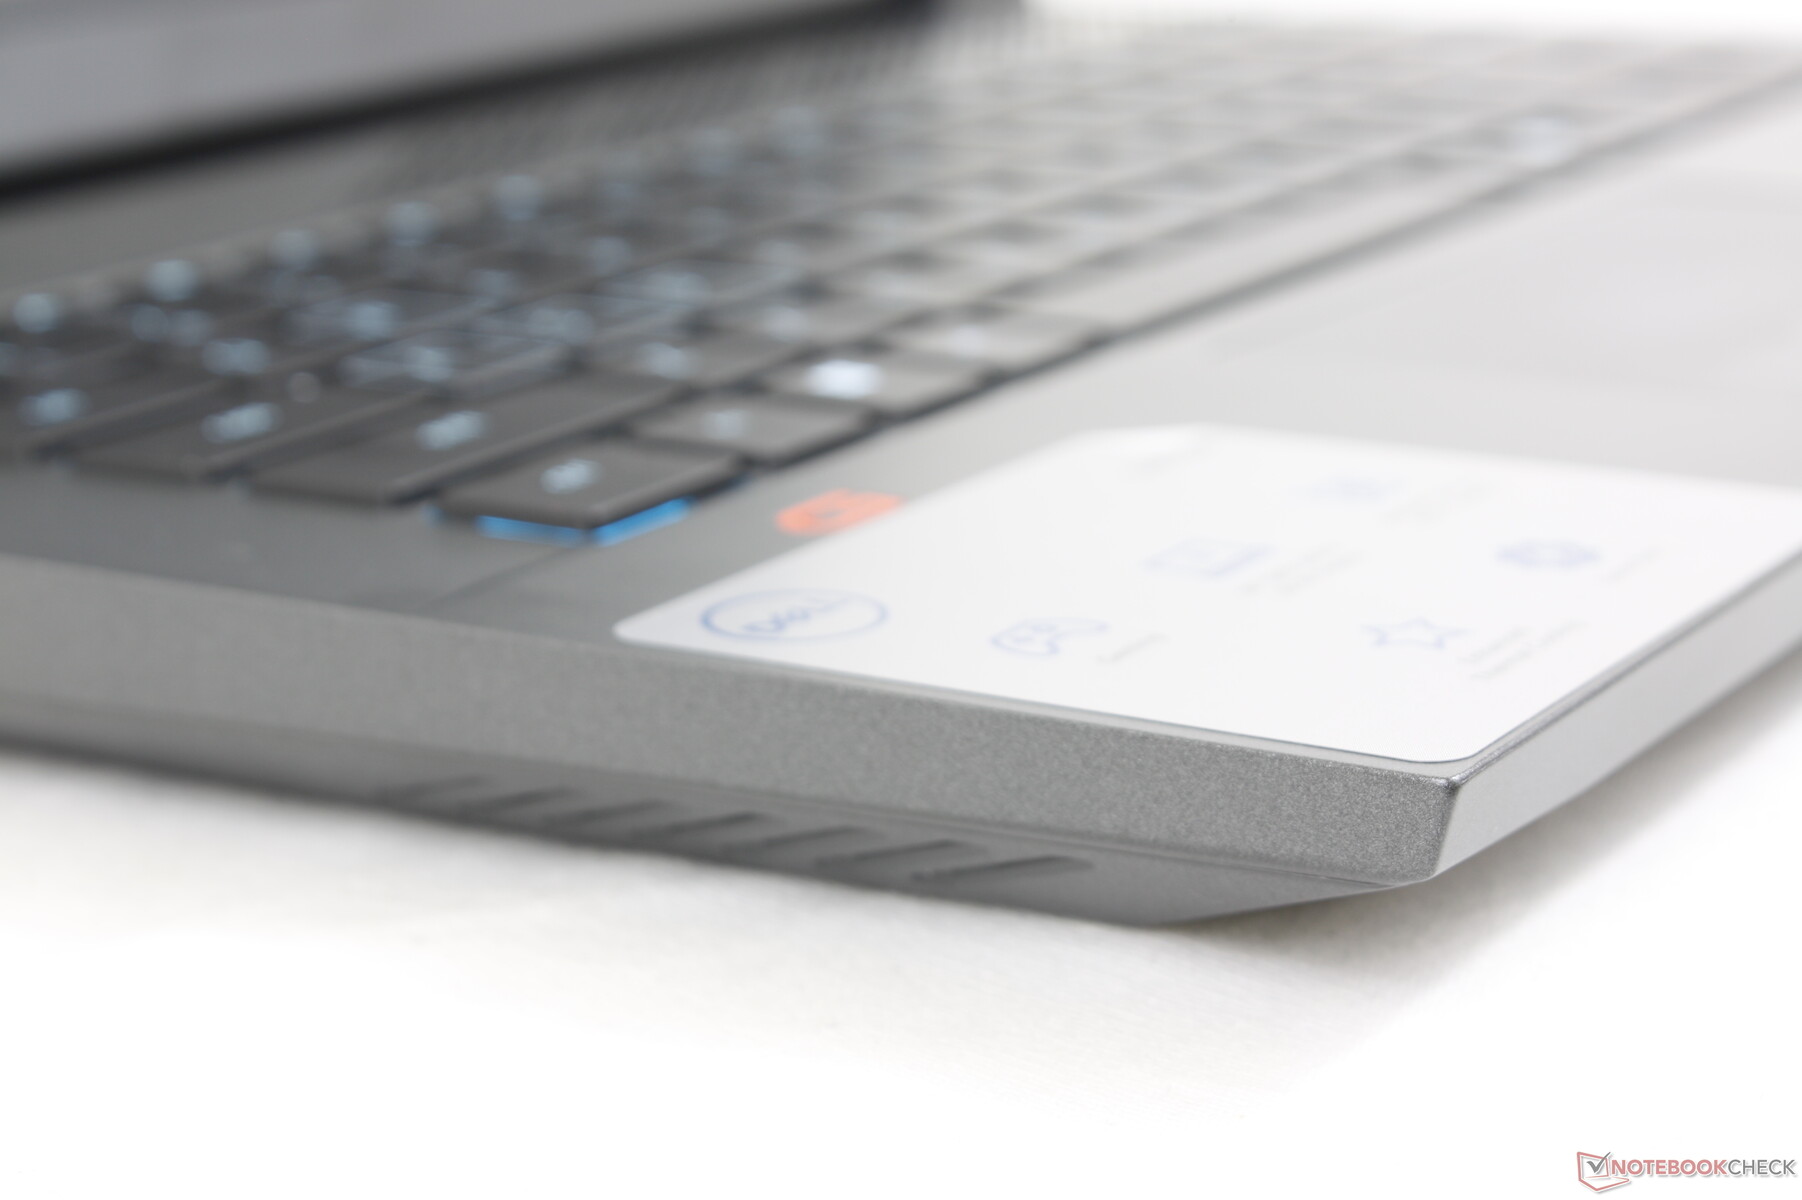
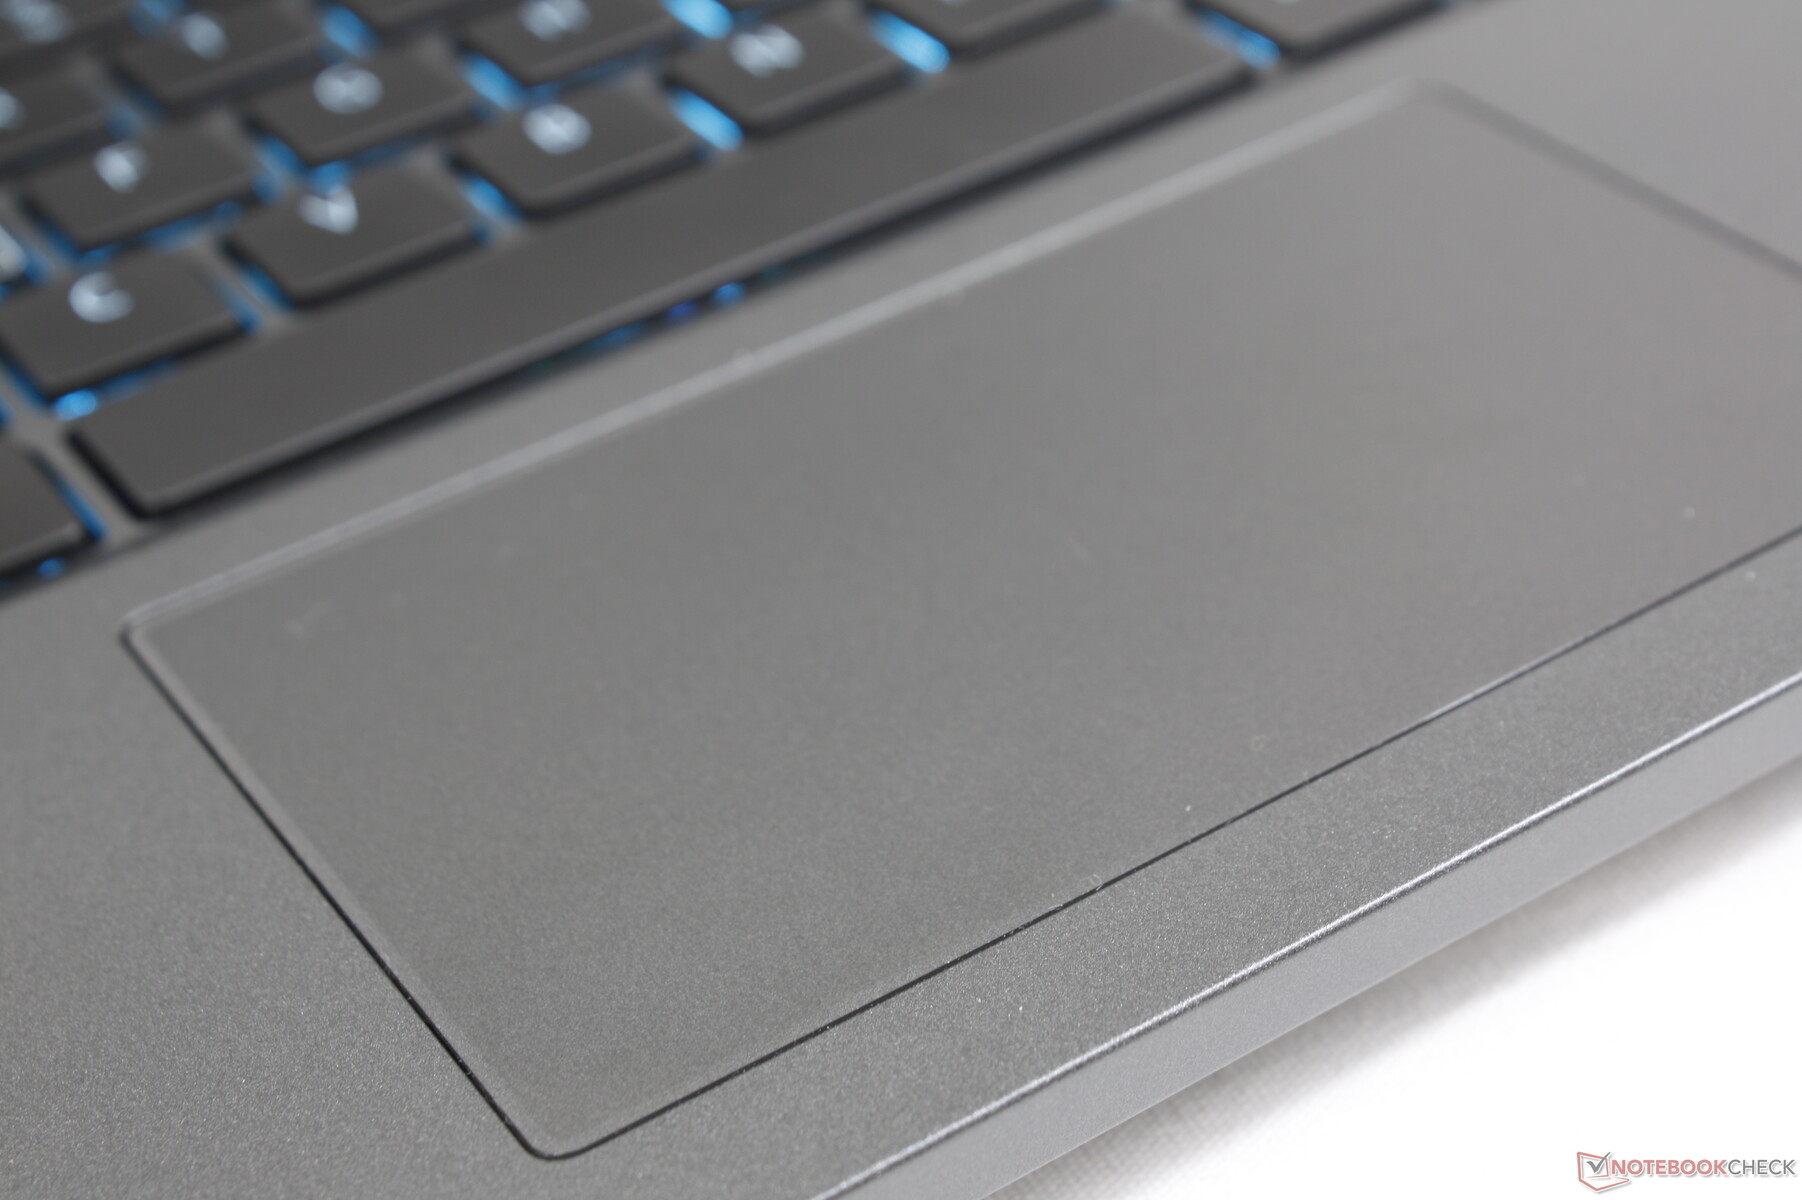
Touchpad
At just 10.5 x 6 cm, the G16 clickpad is one of the smallest clickpads we've seen on any laptop in this price range. The clickpad on the Inspiron 16 Plus 7620 is 11.5 x 8 cm in comparison. The small size isn't a deal breaker, however, as the target audience of gamers will likely have a mouse ready at all times, anyway.

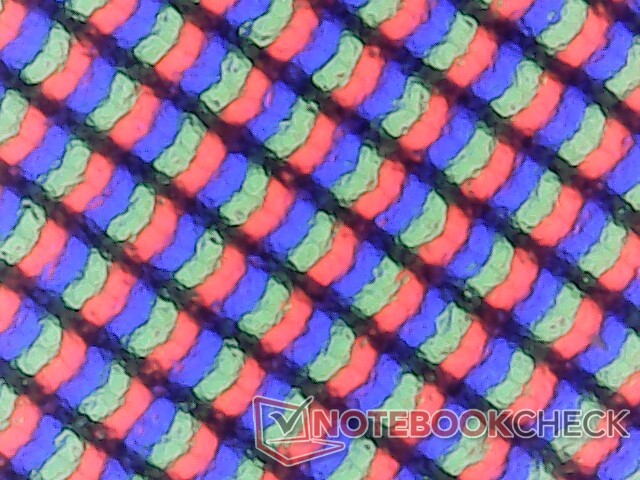
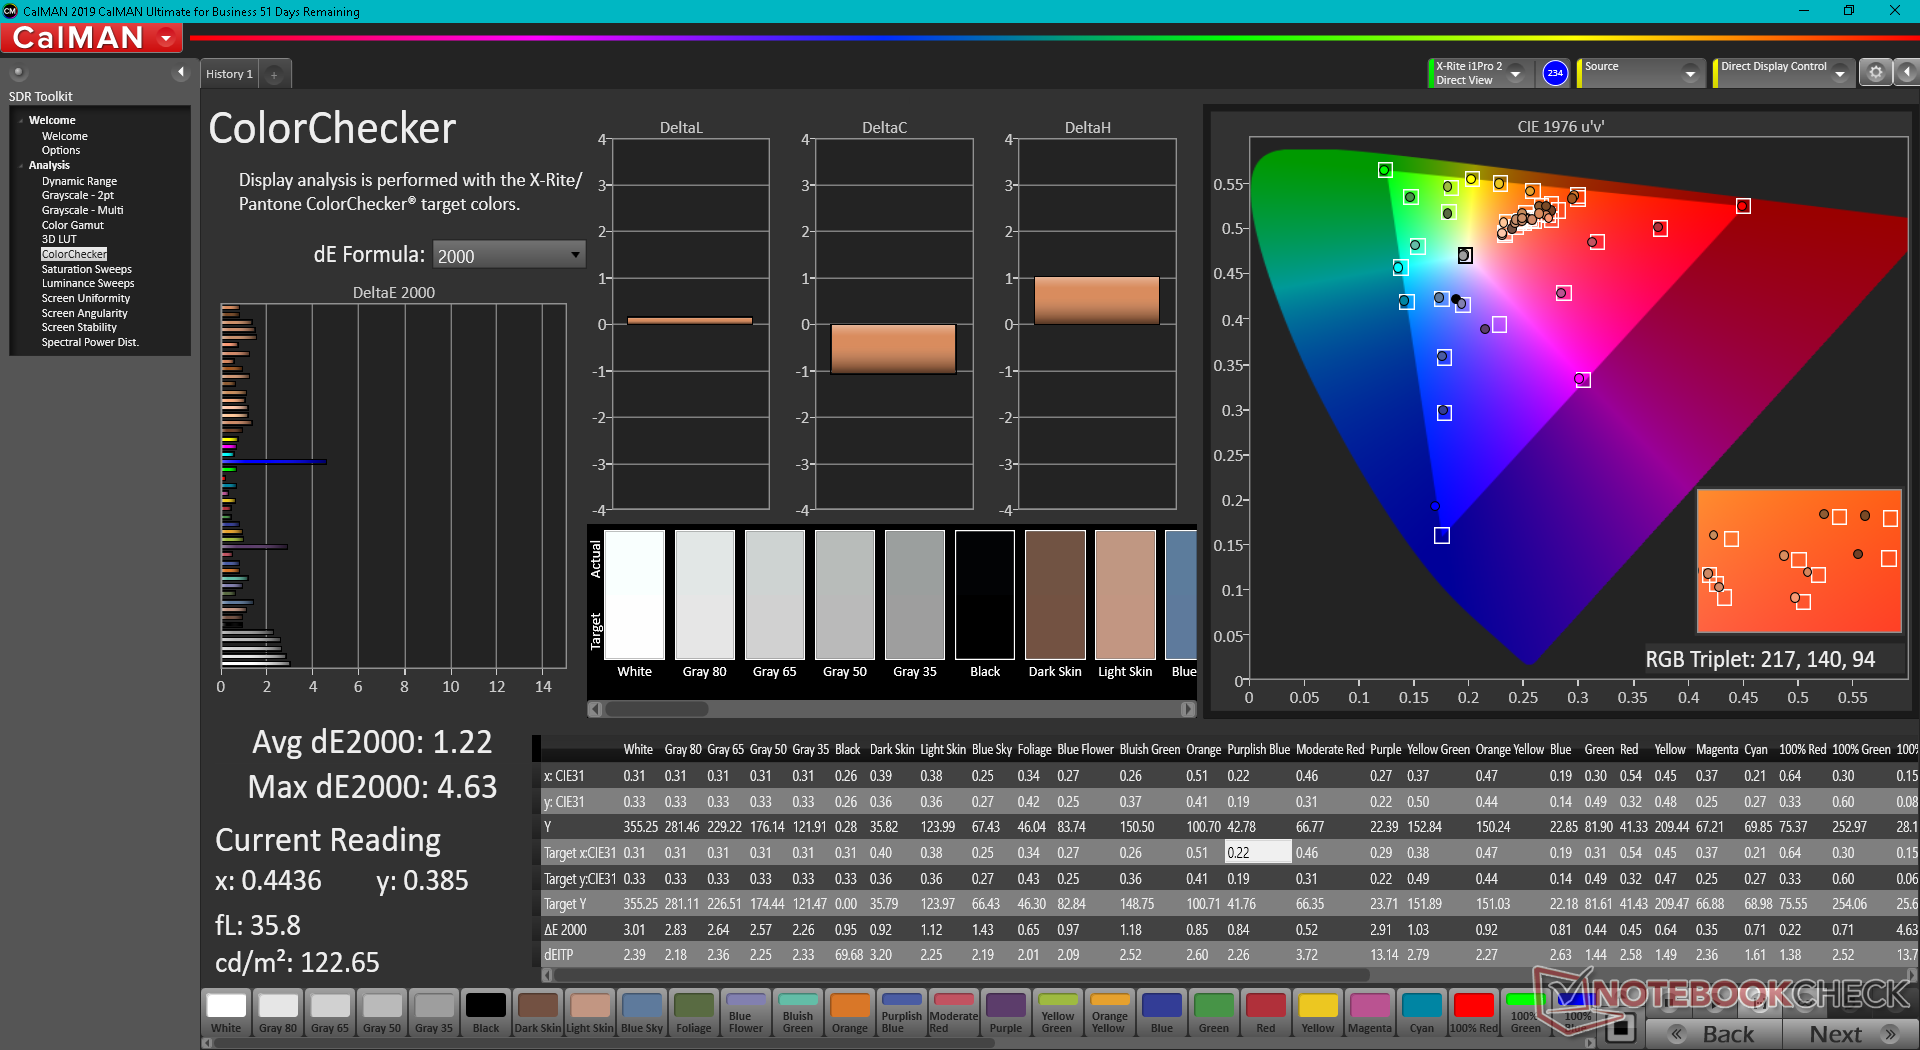
Display — IPS, Full sRGB, 165 Hz, And Fast Response Times
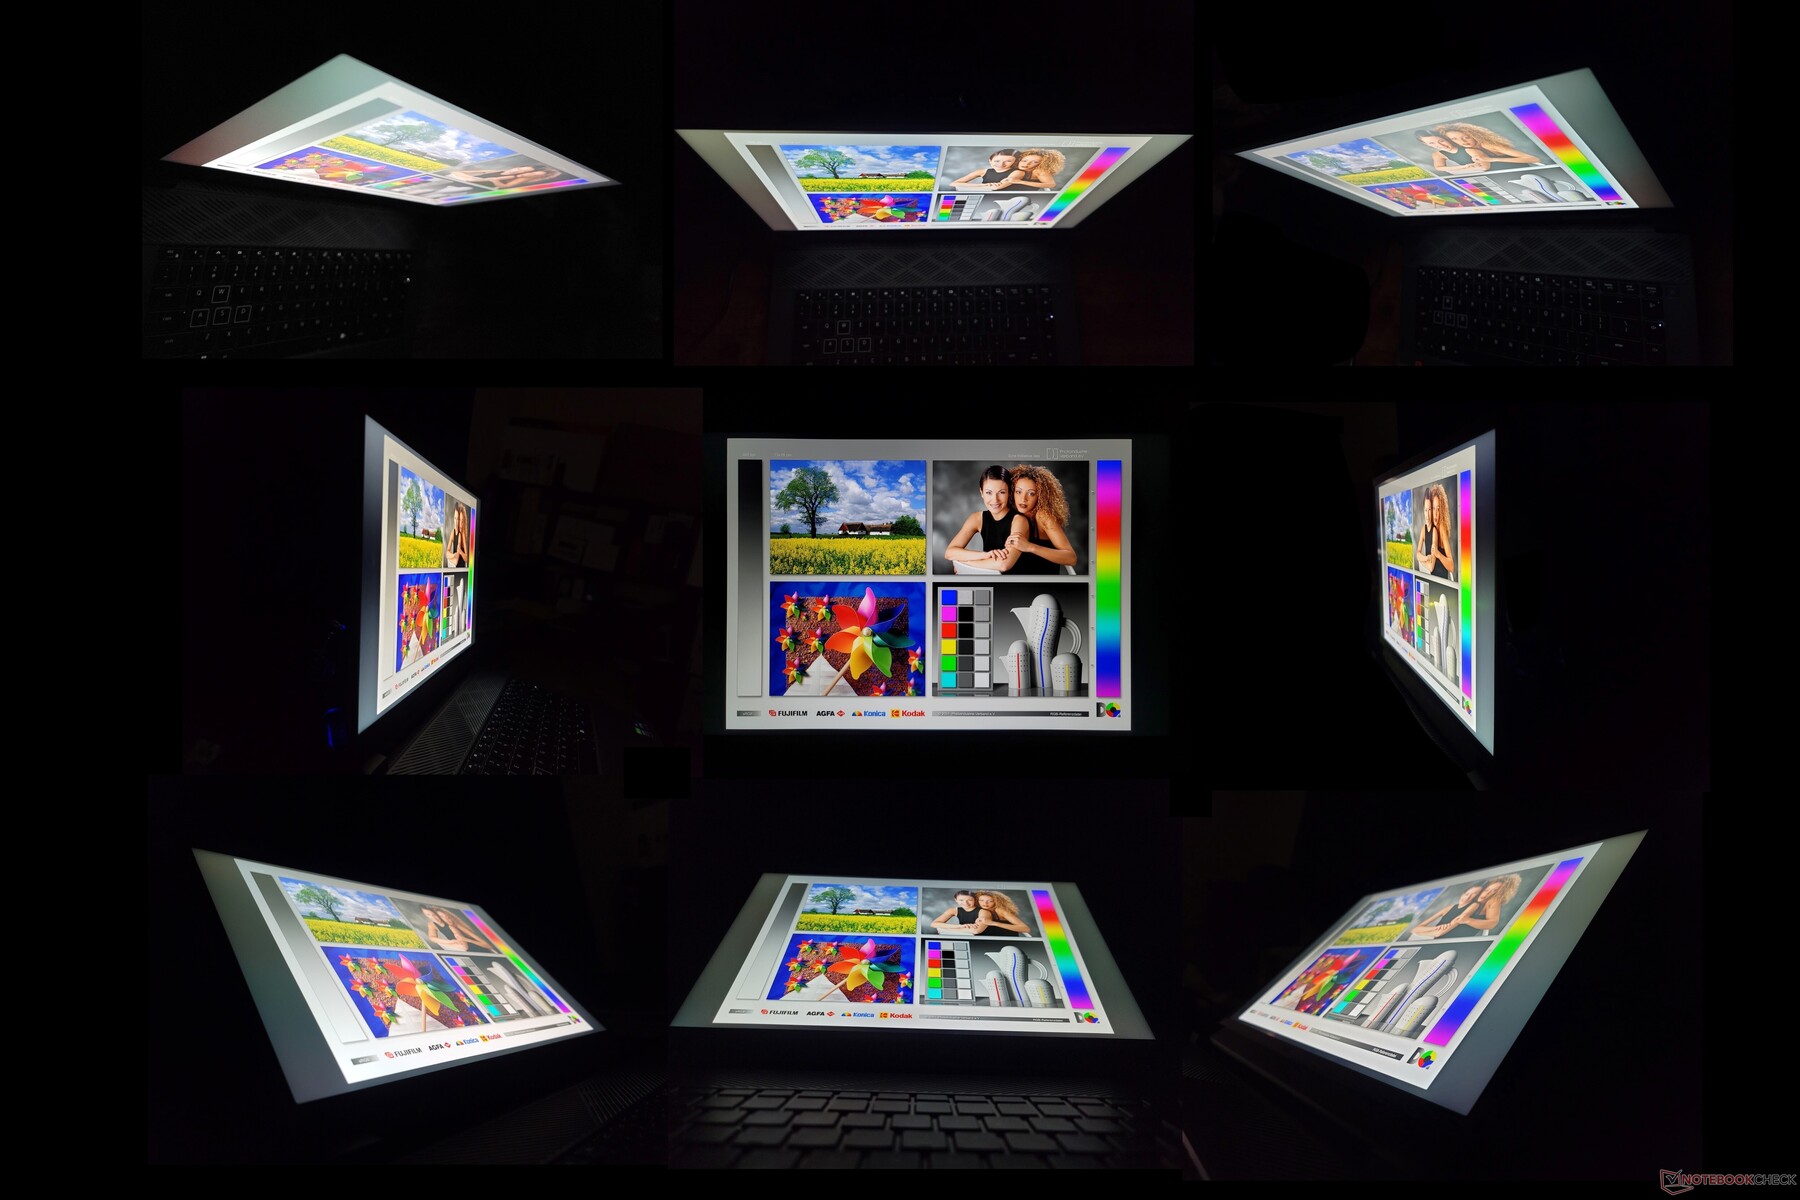
The panel here is similar to the one currently shipping with the Lenovo Legion 7 16ARHA7 as they share the same manufacturer, same high refresh rate, same resolution, same 100% sRGB target, and even nearly identical contrast ratios and black-white response times. Image quality is significantly better than the Chi Mei panel as found on the HP Victus 16. Though it's kind of a bummer that there are no other options to choose from, it at least means that all G16 owners should be getting the same excellent viewing experience with no unexpected low-end display configurations.

| |||||||||||||||||||||||||
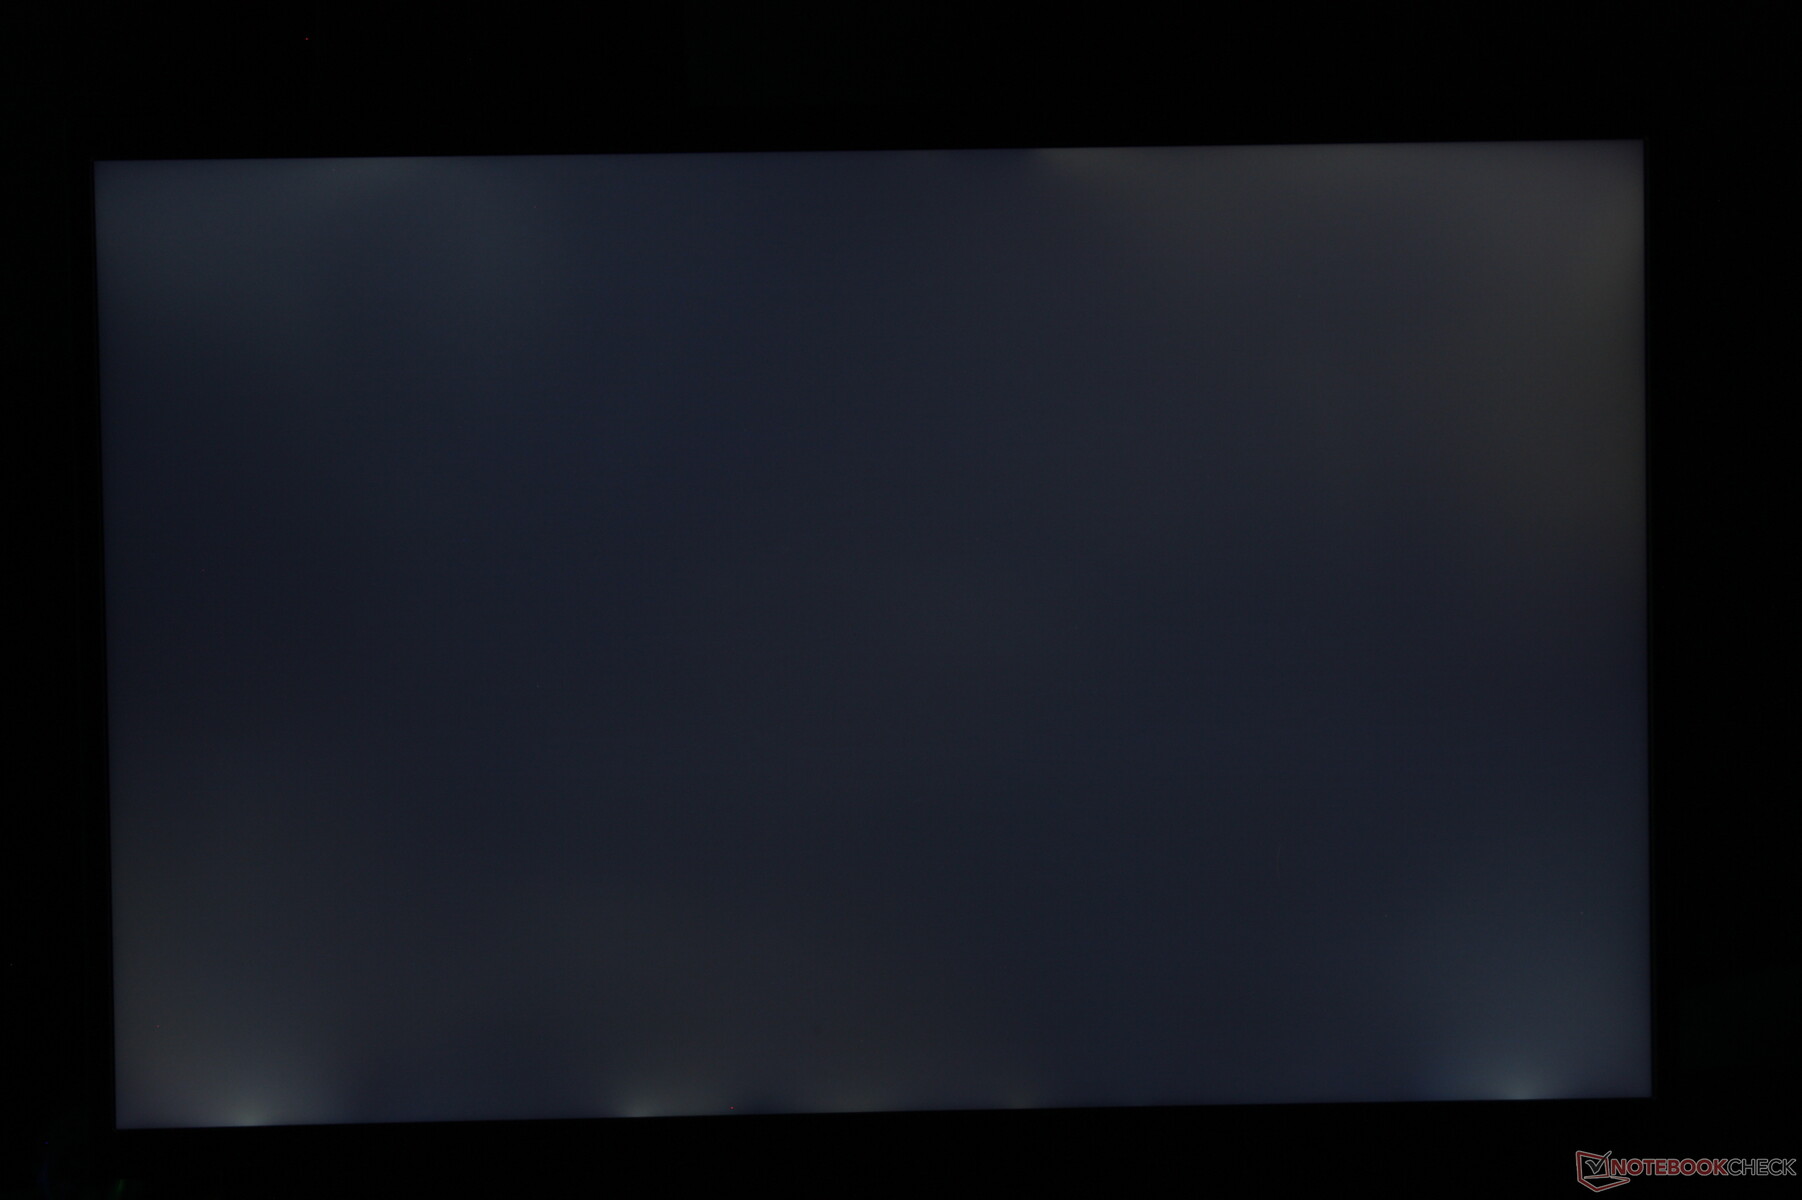
Brightness Distribution: 83 %
Center on Battery: 369.4 cd/m²
Contrast: 1154:1 (Black: 0.32 cd/m²)
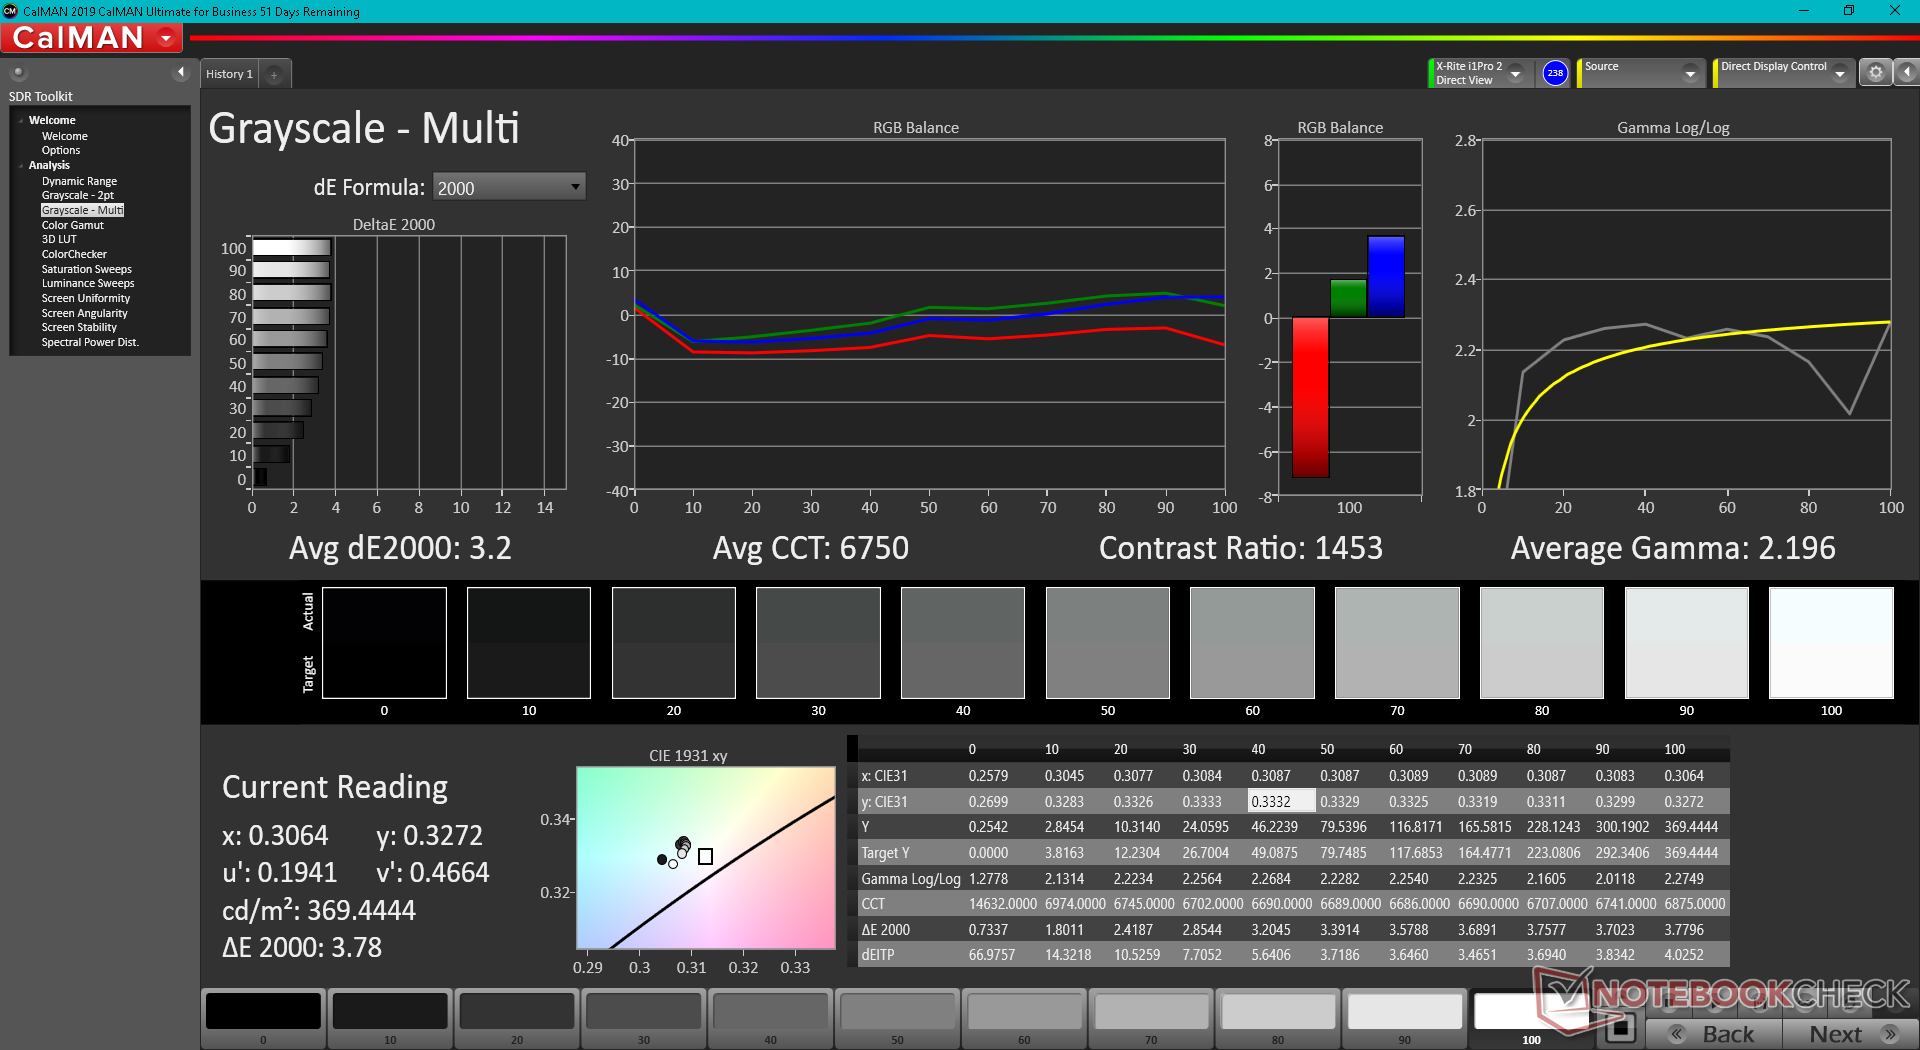
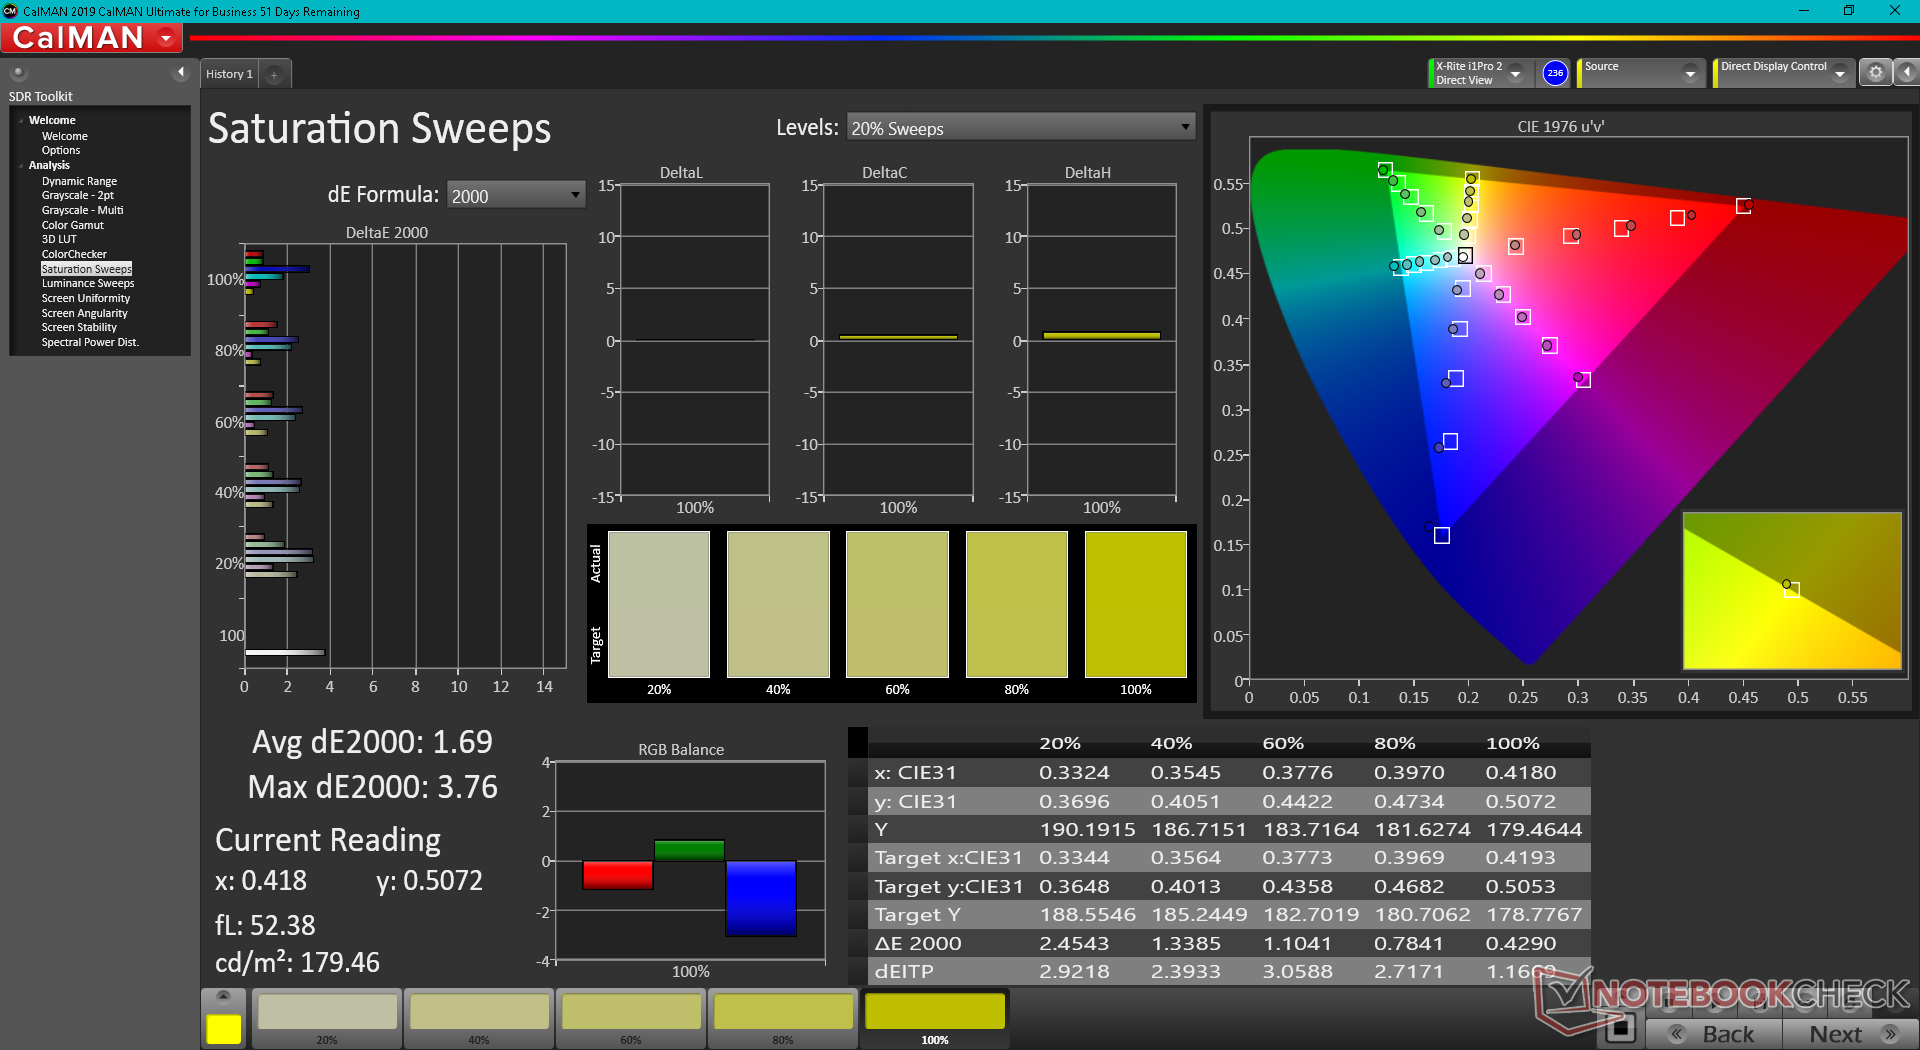
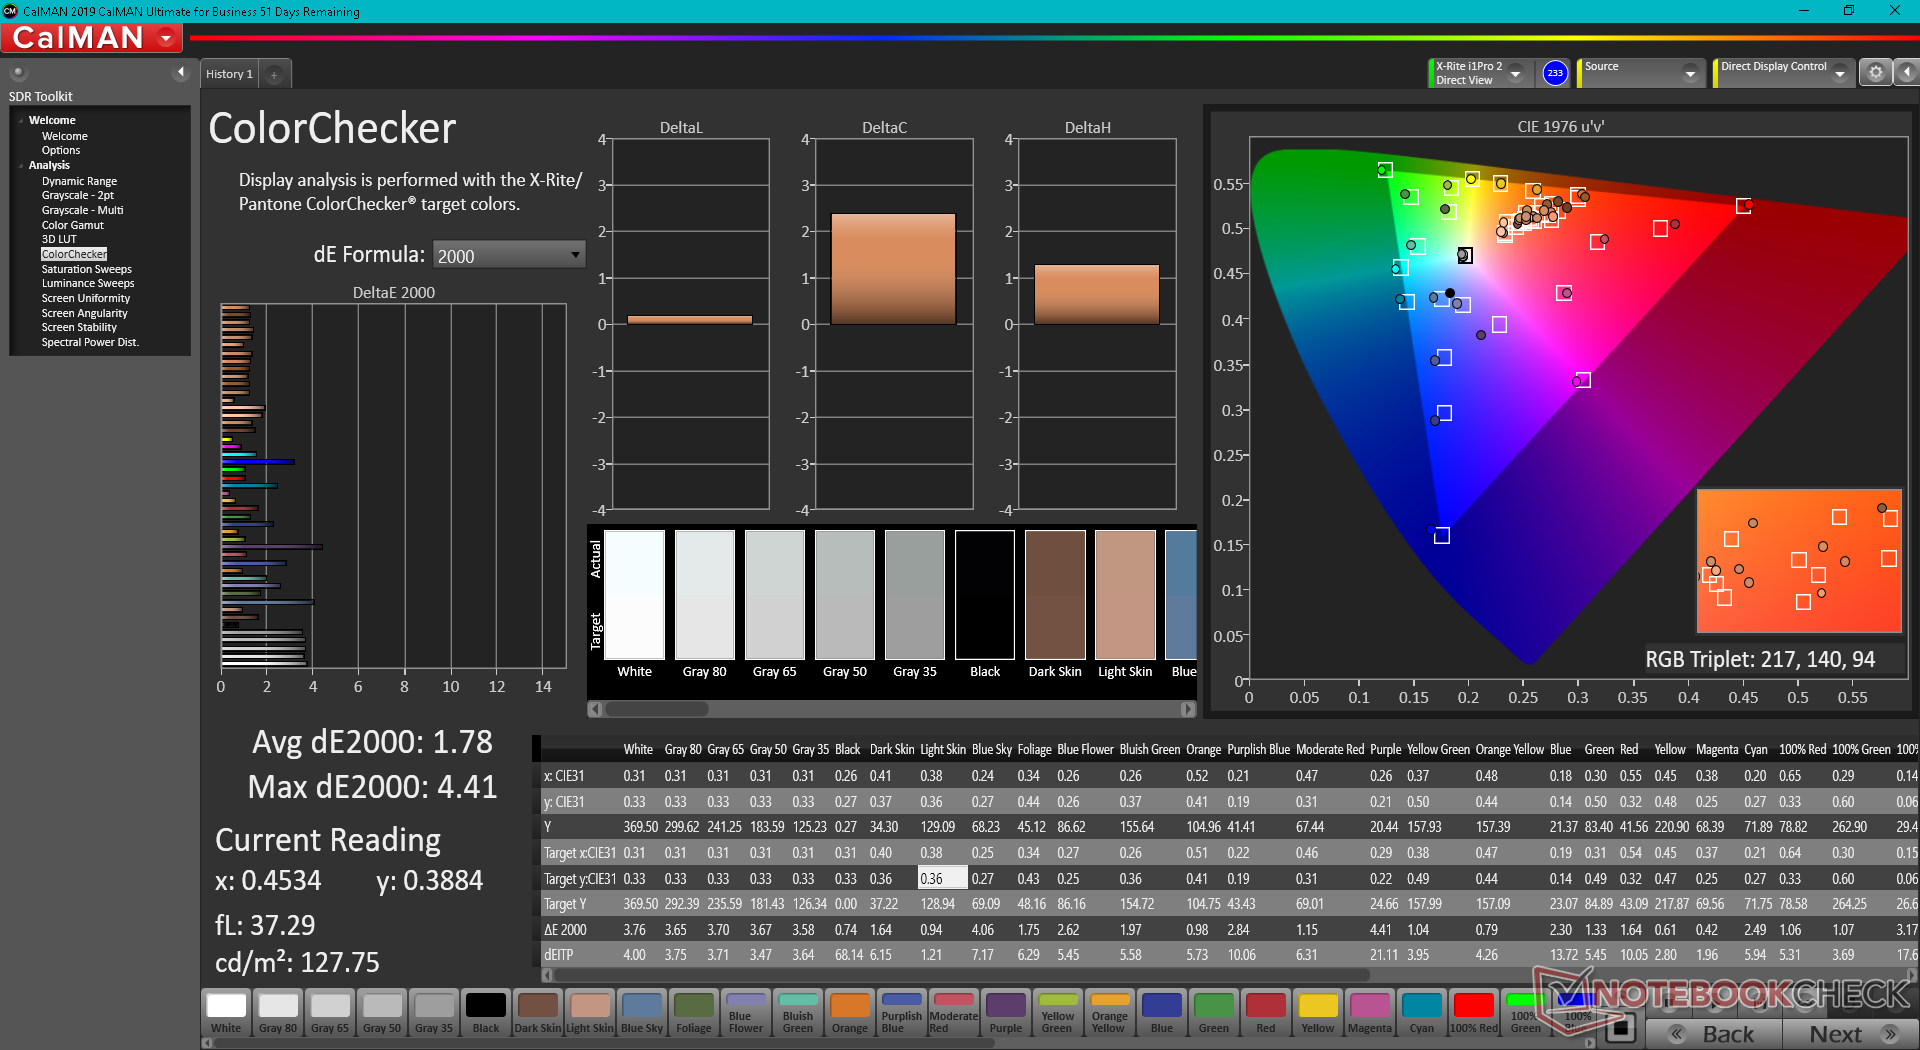
ΔE ColorChecker Calman: 1.78 | ∀{0.5-29.43 Ø4.71}
calibrated: 1.22
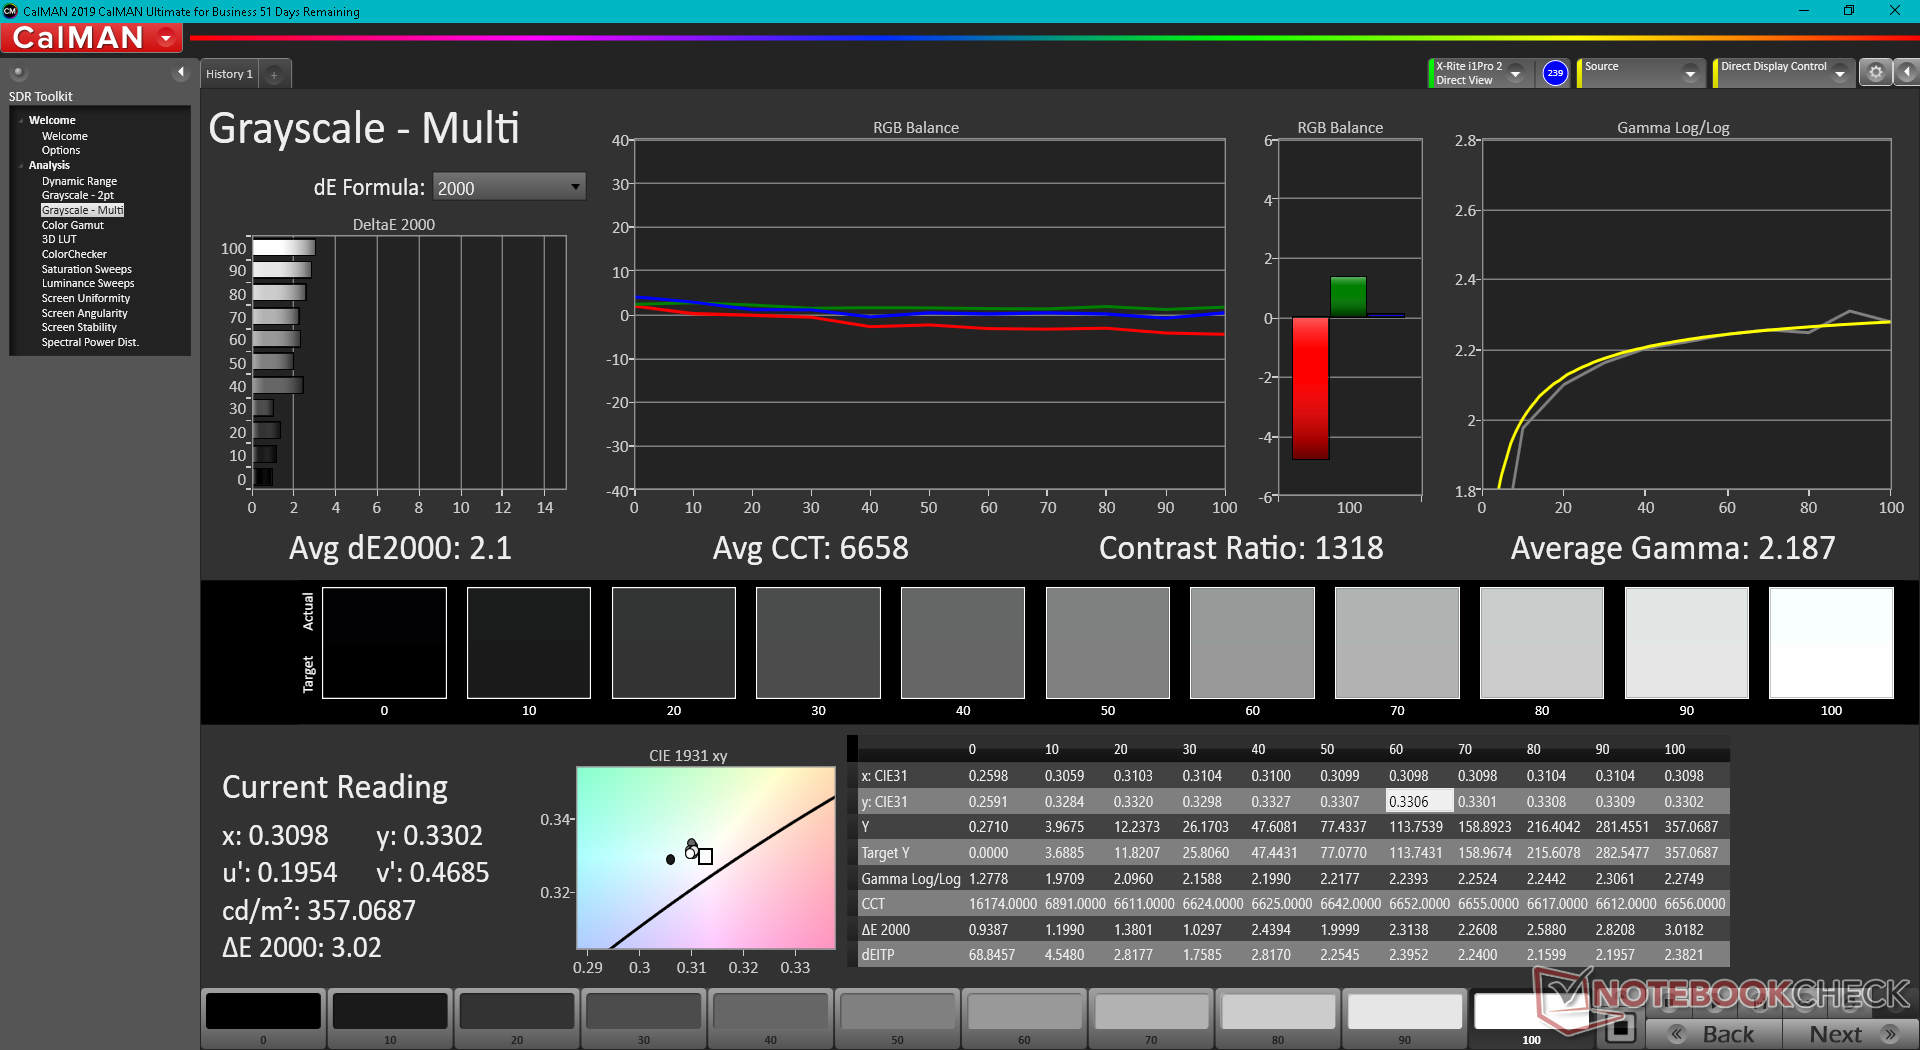
ΔE Greyscale Calman: 3.2 | ∀{0.09-98 Ø4.96}
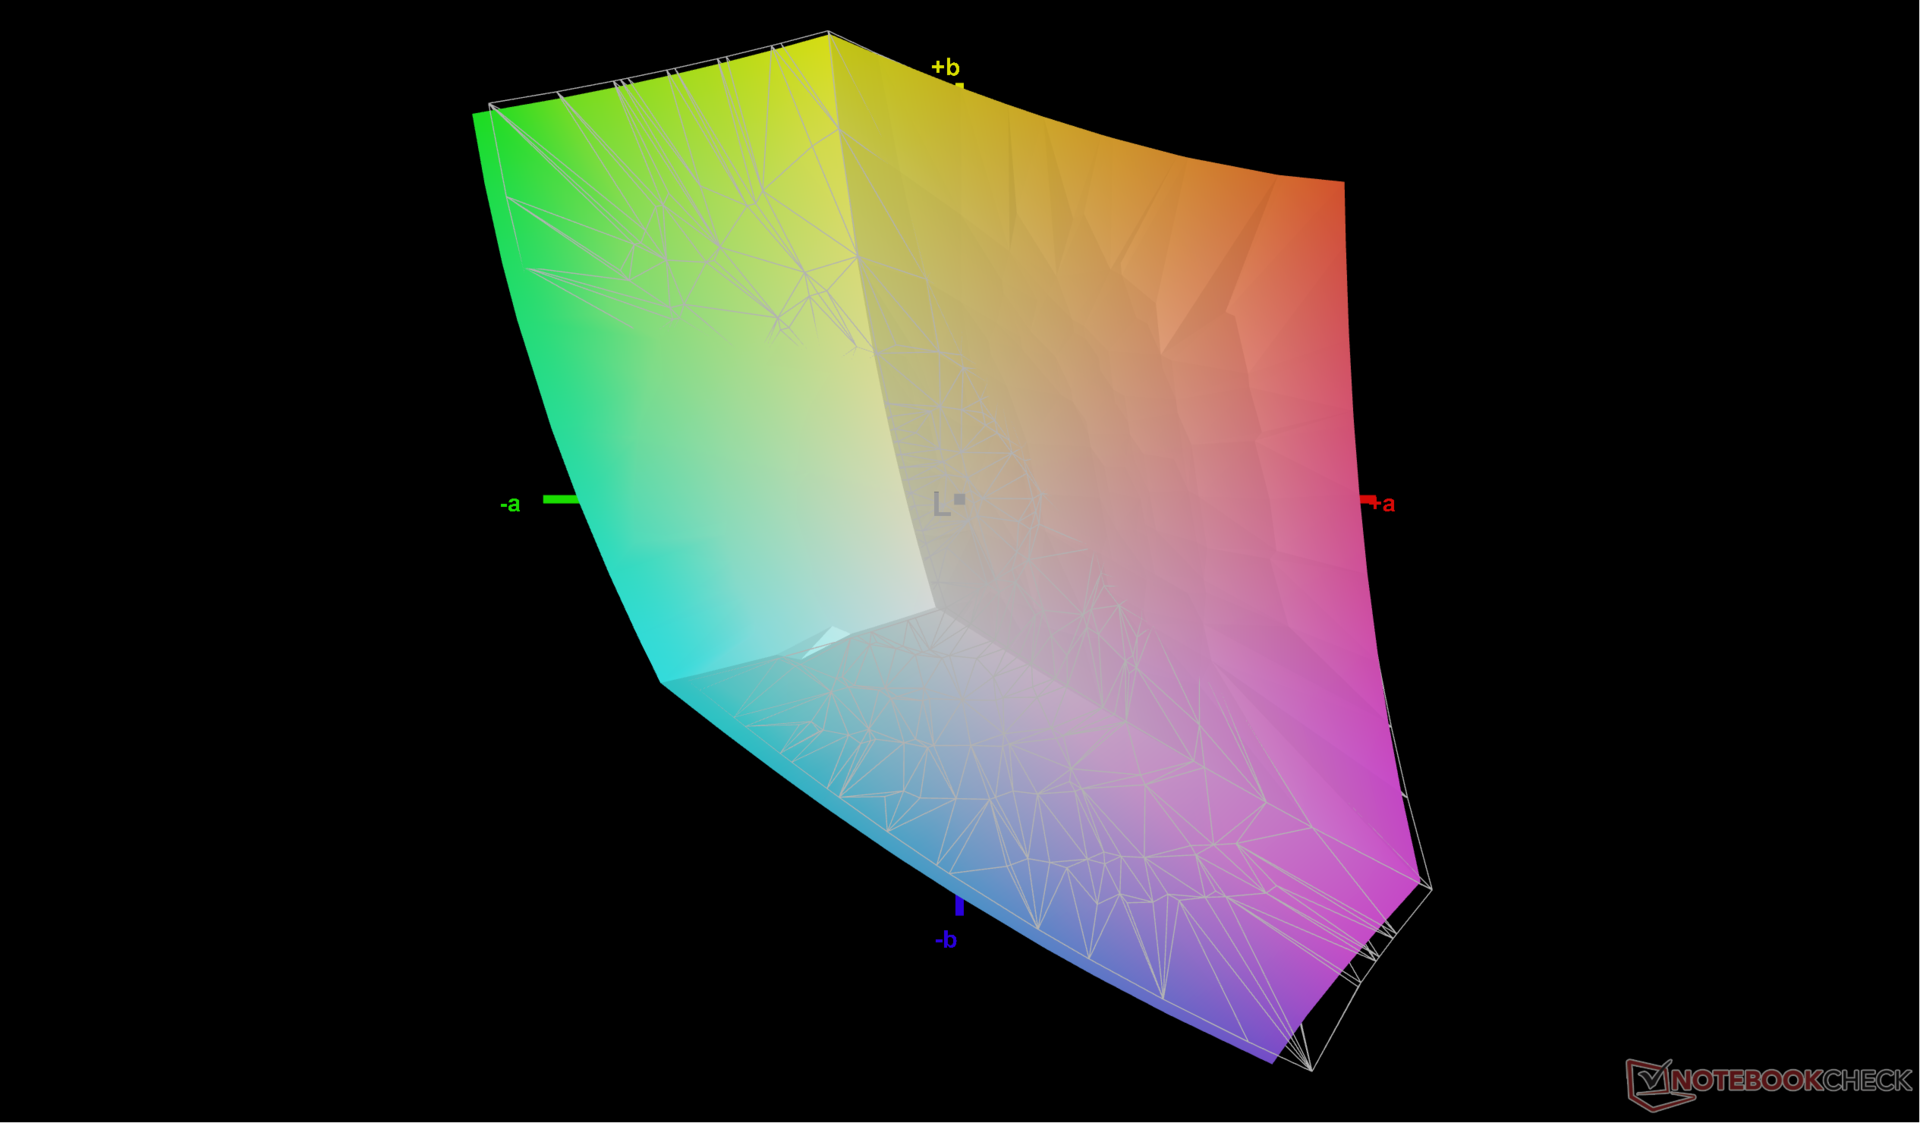
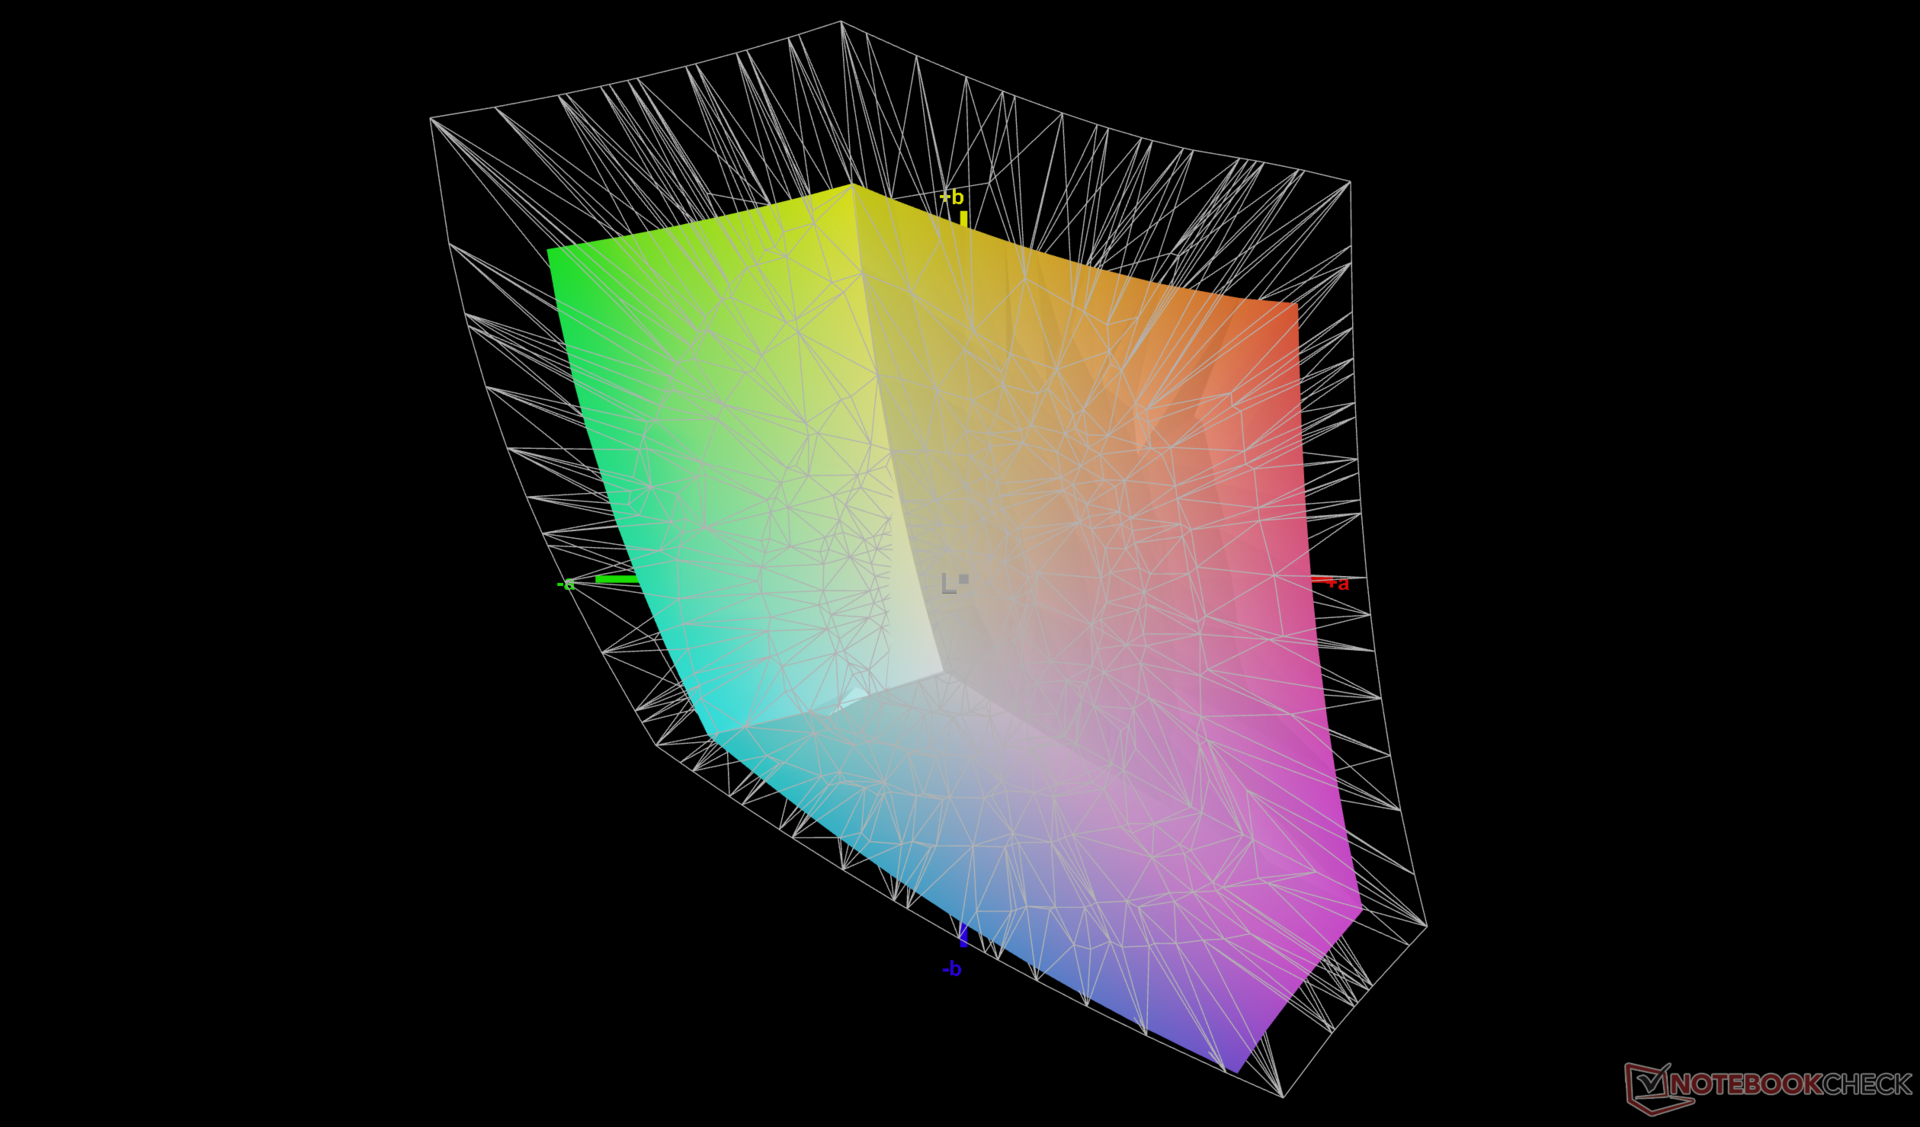
70.5% AdobeRGB 1998 (Argyll 3D)
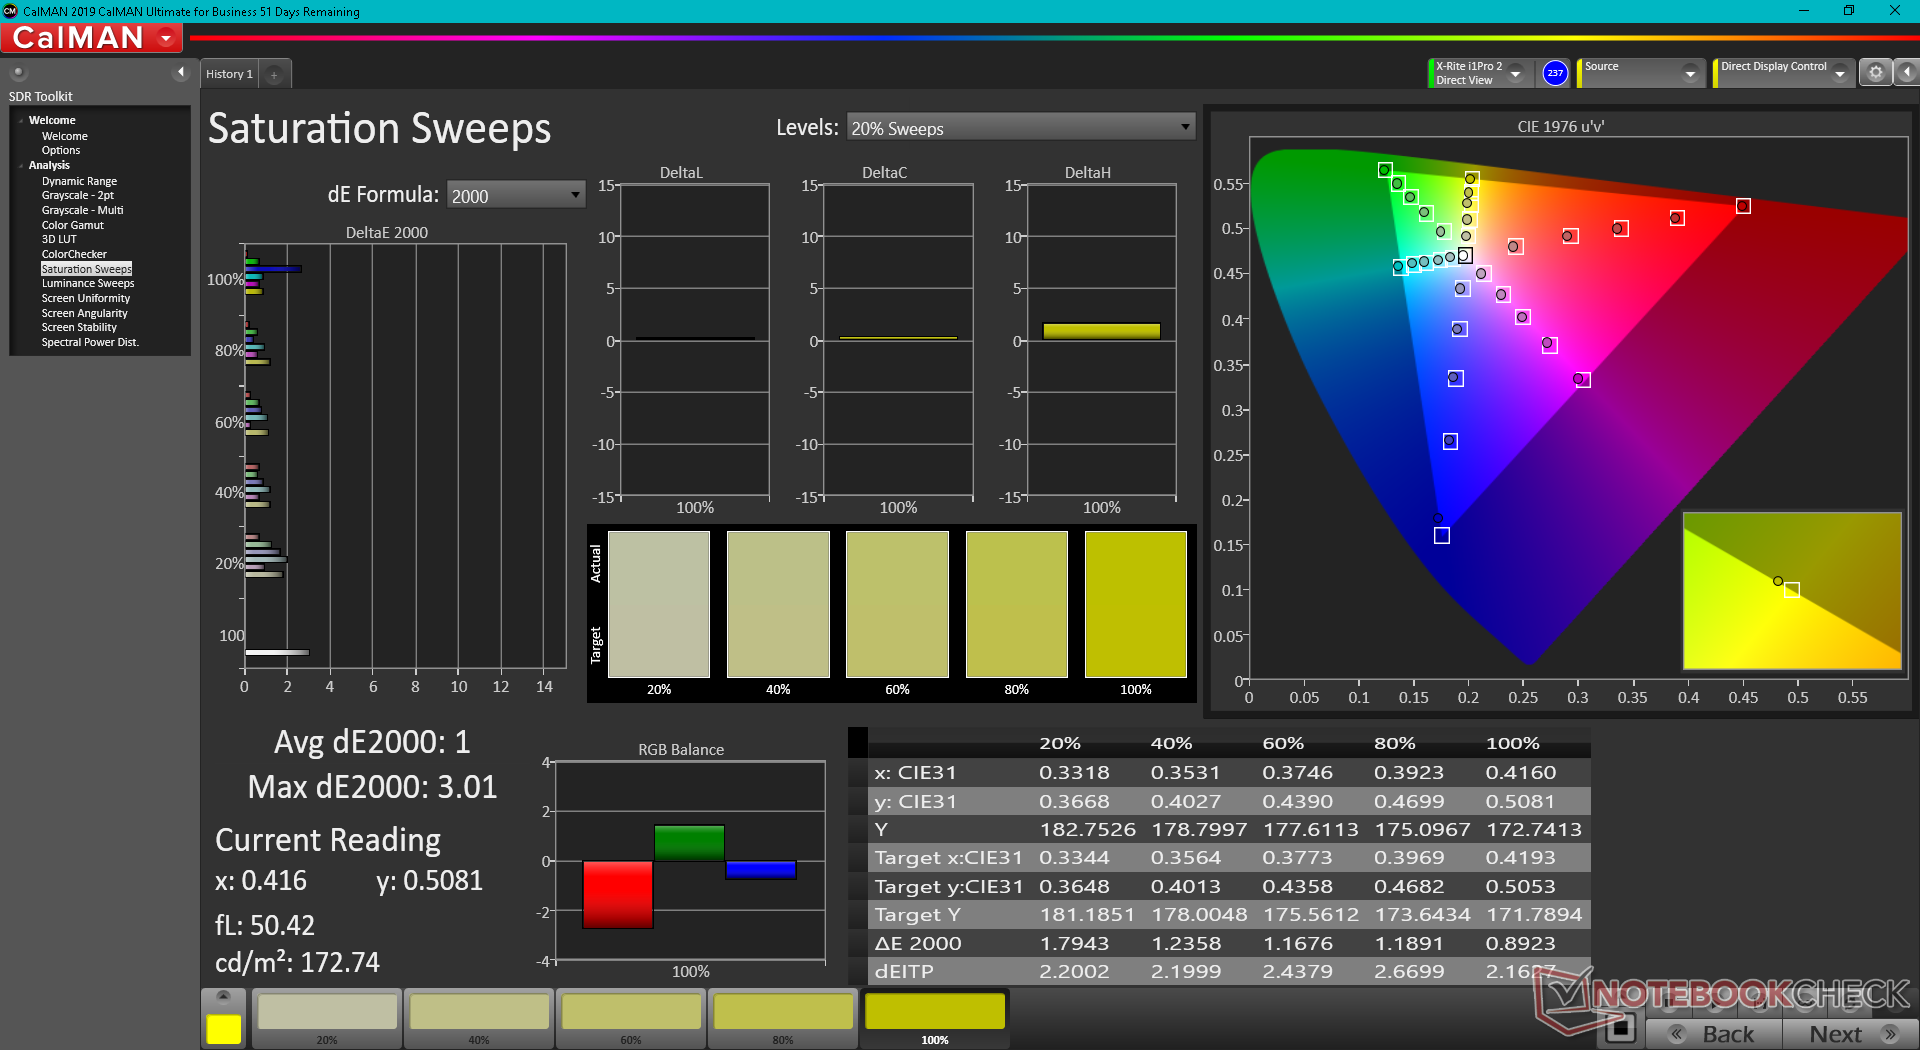
98% sRGB (Argyll 3D)
68.3% Display P3 (Argyll 3D)
Gamma: 2.2
CCT: 6750 K
| Dell G16 7620 BOE NE16QDM, IPS, 2560x1600, 16" | Lenovo Legion 7 16ARHA7 BOE CQ NE160QDM-NY1, IPS, 2560x1600, 16" | HP Victus 16-e0145ng CMN1609, IPS, 1920x1080, 16.1" | Asus ROG Zephyrus M16 GU603H AU Optronics AUOC199, IPS, 2560x1600, 16" | Lenovo Legion 5 Pro 16IAH7H BOE CCQ_NE160QDM_NY1, IPS, 2560x1600, 16" | Acer Swift X SFX16-51G-5388 Chi Mei N161HCA-EA3, , 1920x1080, 16.1" | |
|---|---|---|---|---|---|---|
| Display | -6% | -38% | 0% | -4% | ||
| Display P3 Coverage (%) | 68.3 | 63.7 -7% | 41.6 -39% | 68.53 0% | 65.1 -5% | |
| sRGB Coverage (%) | 98 | 95.3 -3% | 61.9 -37% | 98.38 0% | 95.65 -2% | |
| AdobeRGB 1998 Coverage (%) | 70.5 | 65.7 -7% | 43 -39% | 70.45 0% | 66.75 -5% | |
| Response Times | 1% | -166% | 43% | -11% | -171% | |
| Response Time Grey 50% / Grey 80% * (ms) | 8.6 ? | 9.2 ? -7% | 29.6 ? -244% | 4.8 ? 44% | 14 ? -63% | 30 ? -249% |
| Response Time Black / White * (ms) | 10.4 ? | 9.6 ? 8% | 19.4 ? -87% | 6 ? 42% | 6 ? 42% | 20 ? -92% |
| PWM Frequency (Hz) | ||||||
| Screen | -2% | -119% | -29% | 3% | 14% | |
| Brightness middle (cd/m²) | 369.4 | 478.8 30% | 257 -30% | 448 21% | 515 39% | 276 -25% |
| Brightness (cd/m²) | 348 | 477 37% | 239 -31% | 446 28% | 475 36% | 264 -24% |
| Brightness Distribution (%) | 83 | 90 8% | 88 6% | 86 4% | 85 2% | 85 2% |
| Black Level * (cd/m²) | 0.32 | 0.43 -34% | 0.25 22% | 0.48 -50% | 0.45 -41% | 0.16 50% |
| Contrast (:1) | 1154 | 1113 -4% | 1028 -11% | 933 -19% | 1144 -1% | 1725 49% |
| Colorchecker dE 2000 * | 1.78 | 2.24 -26% | 6.91 -288% | 2.76 -55% | 2.38 -34% | 1.8 -1% |
| Colorchecker dE 2000 max. * | 4.41 | 4.49 -2% | 22.27 -405% | 7.09 -61% | 4.37 1% | 3.77 15% |
| Colorchecker dE 2000 calibrated * | 1.22 | 1.89 -55% | 3.61 -196% | 2.86 -134% | 1.1 10% | 0.63 48% |
| Greyscale dE 2000 * | 3.2 | 2.3 28% | 7.5 -134% | 3.1 3% | 2.71 15% | 2.76 14% |
| Gamma | 2.2 100% | 2.25 98% | 2.125 104% | 2.153 102% | 2.49 88% | 2.37 93% |
| CCT | 6750 96% | 6955 93% | 6025 108% | 6826 95% | 6117 106% | 6564 99% |
| Color Space (Percent of AdobeRGB 1998) (%) | 87 | |||||
| Color Space (Percent of sRGB) (%) | 100 | |||||
| Total Average (Program / Settings) | -2% /
-2% | -108% /
-108% | 7% /
-16% | -3% /
0% | -54% /
-16% |
* ... smaller is better
Colors are decently calibrated out of the box even though Dell runs no pre-calibration procedures for the G16. Calibrating the panel ourselves with an X-Rite colorimeter would improve average grayscale and color DeltaE values just marginally from 3.2 and 1.78 to 2.1 and 1.22, respectively. An end-user calibration is therefore not necessary for most owners.
Users can apply our calibrated profile above for a more accurate display.
Display Response Times
| ↔ Response Time Black to White | ||
|---|---|---|
| 10.4 ms ... rise ↗ and fall ↘ combined | ↗ 5.2 ms rise | 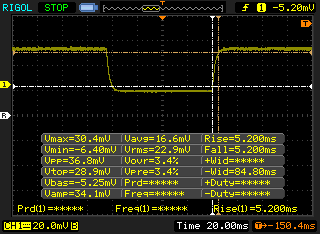 |
| ↘ 5.2 ms fall | ||
| The screen shows good response rates in our tests, but may be too slow for competitive gamers. In comparison, all tested devices range from 0.1 (minimum) to 240 (maximum) ms. » 28 % of all devices are better. This means that the measured response time is better than the average of all tested devices (19.8 ms). | ||
| ↔ Response Time 50% Grey to 80% Grey | ||
| 8.6 ms ... rise ↗ and fall ↘ combined | ↗ 3.4 ms rise | 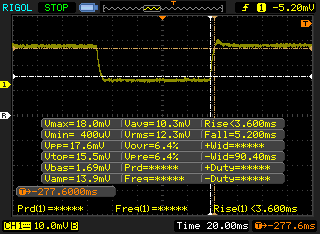 |
| ↘ 5.2 ms fall | ||
| The screen shows fast response rates in our tests and should be suited for gaming. In comparison, all tested devices range from 0.165 (minimum) to 636 (maximum) ms. » 22 % of all devices are better. This means that the measured response time is better than the average of all tested devices (30.9 ms). | ||
Screen Flickering / PWM (Pulse-Width Modulation)
| Screen flickering / PWM not detected | 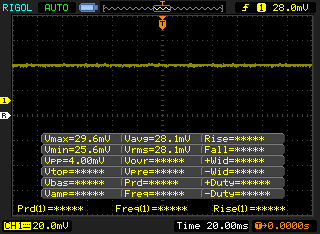 | ||
In comparison: 52 % of all tested devices do not use PWM to dim the display. If PWM was detected, an average of 7744 (minimum: 5 - maximum: 343500) Hz was measured. | |||
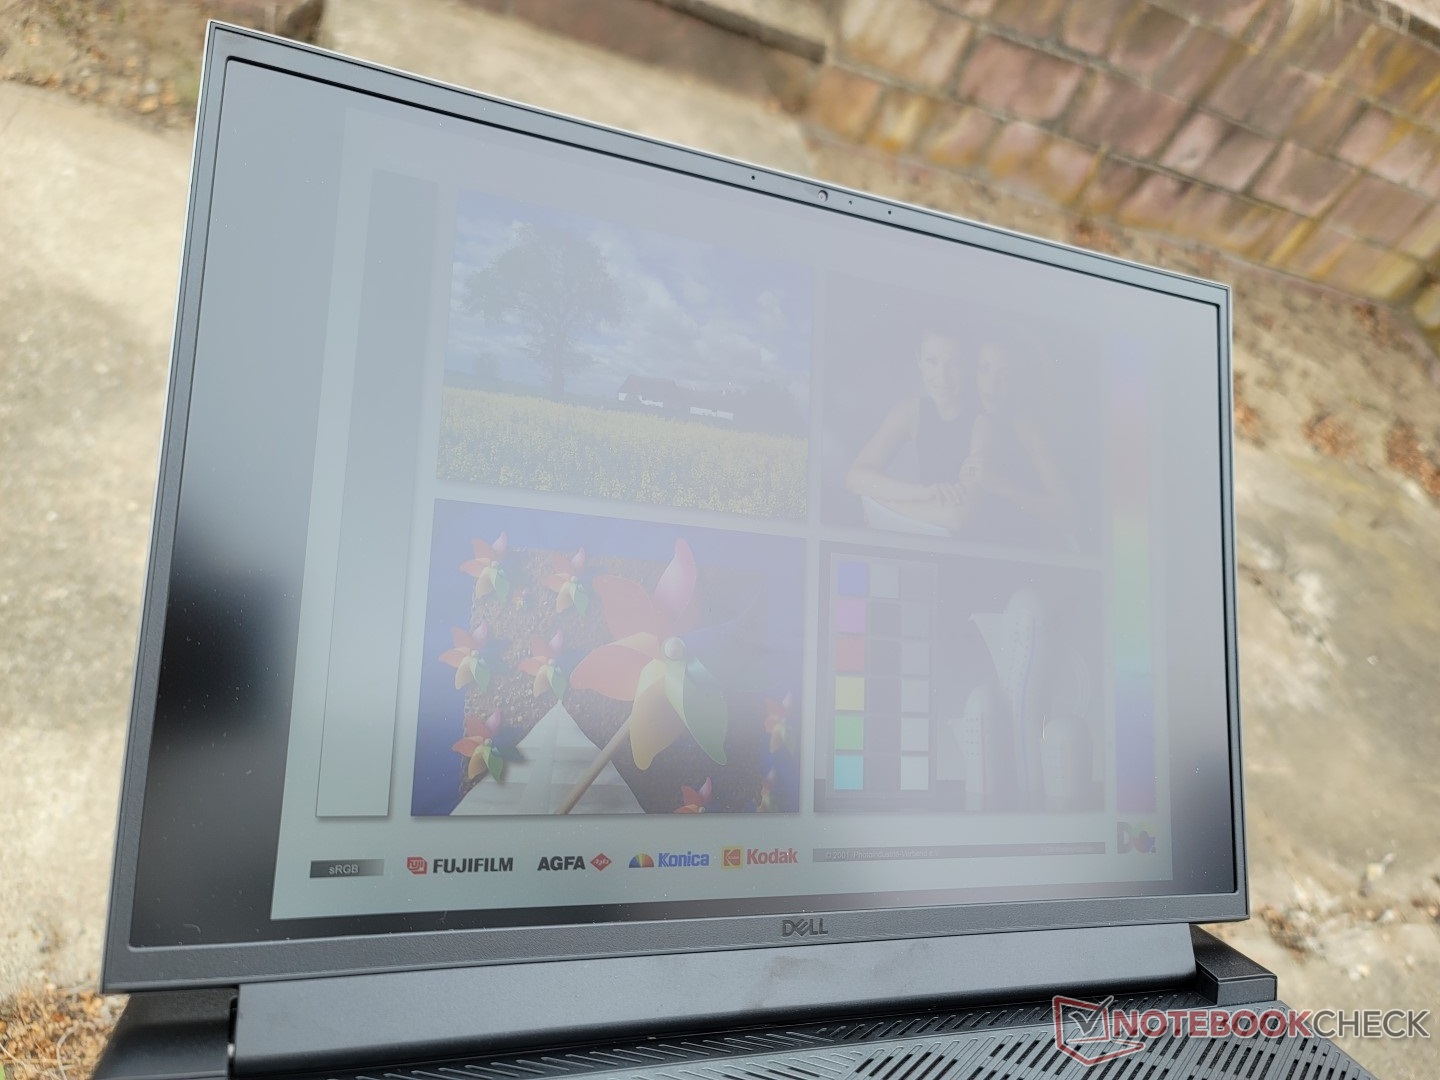
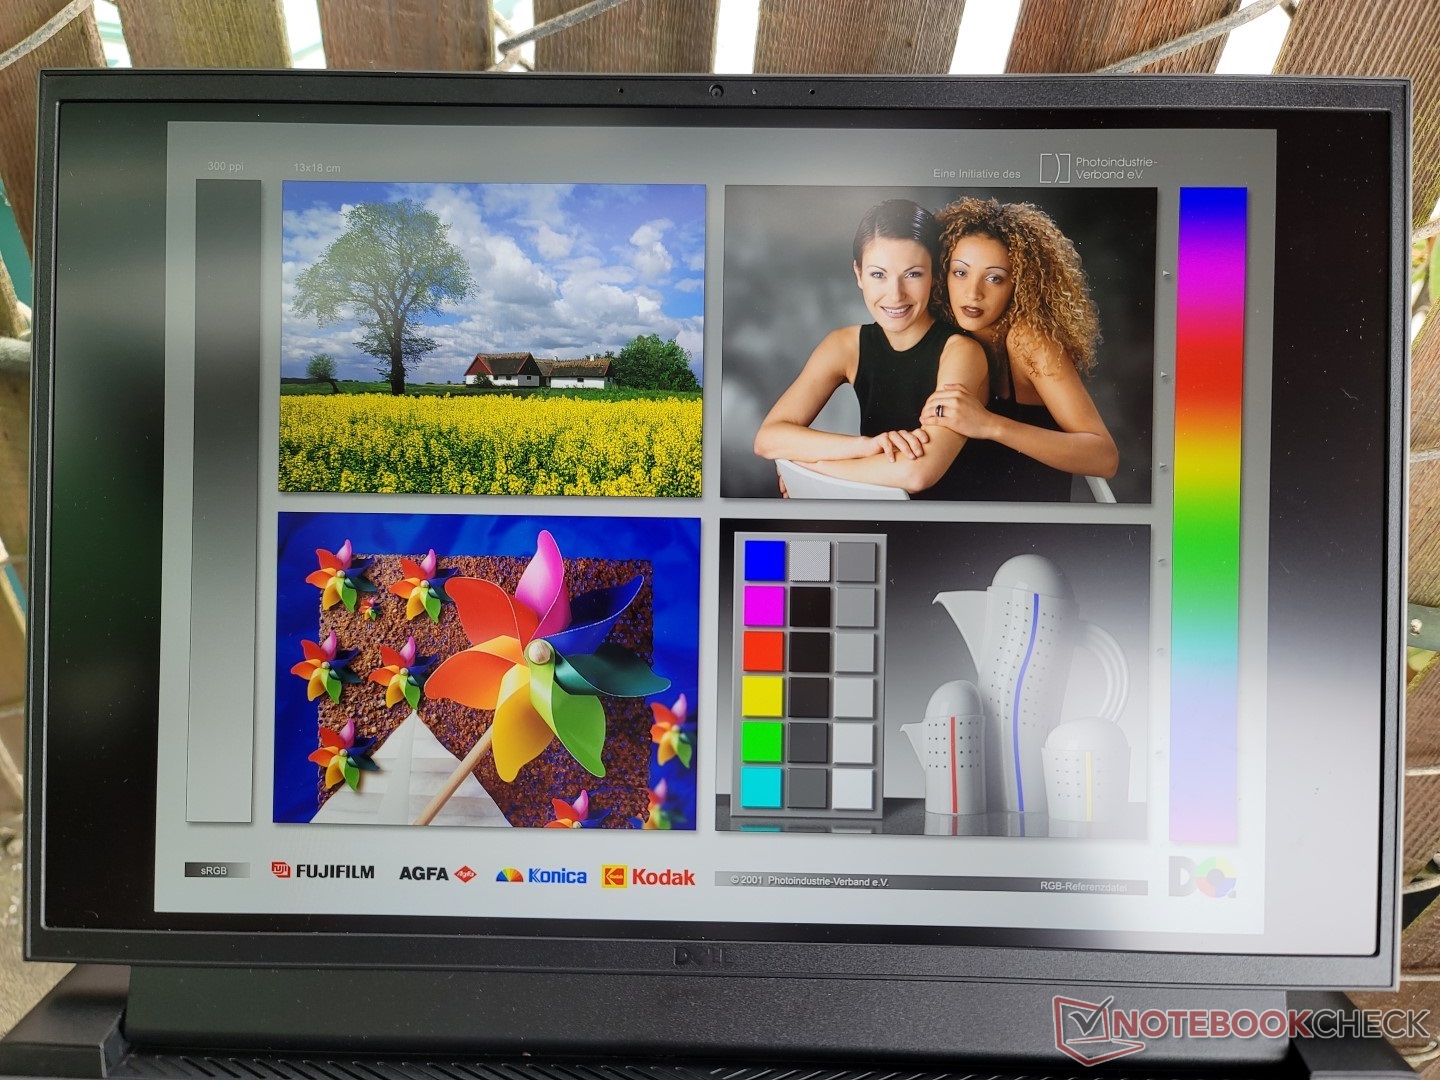
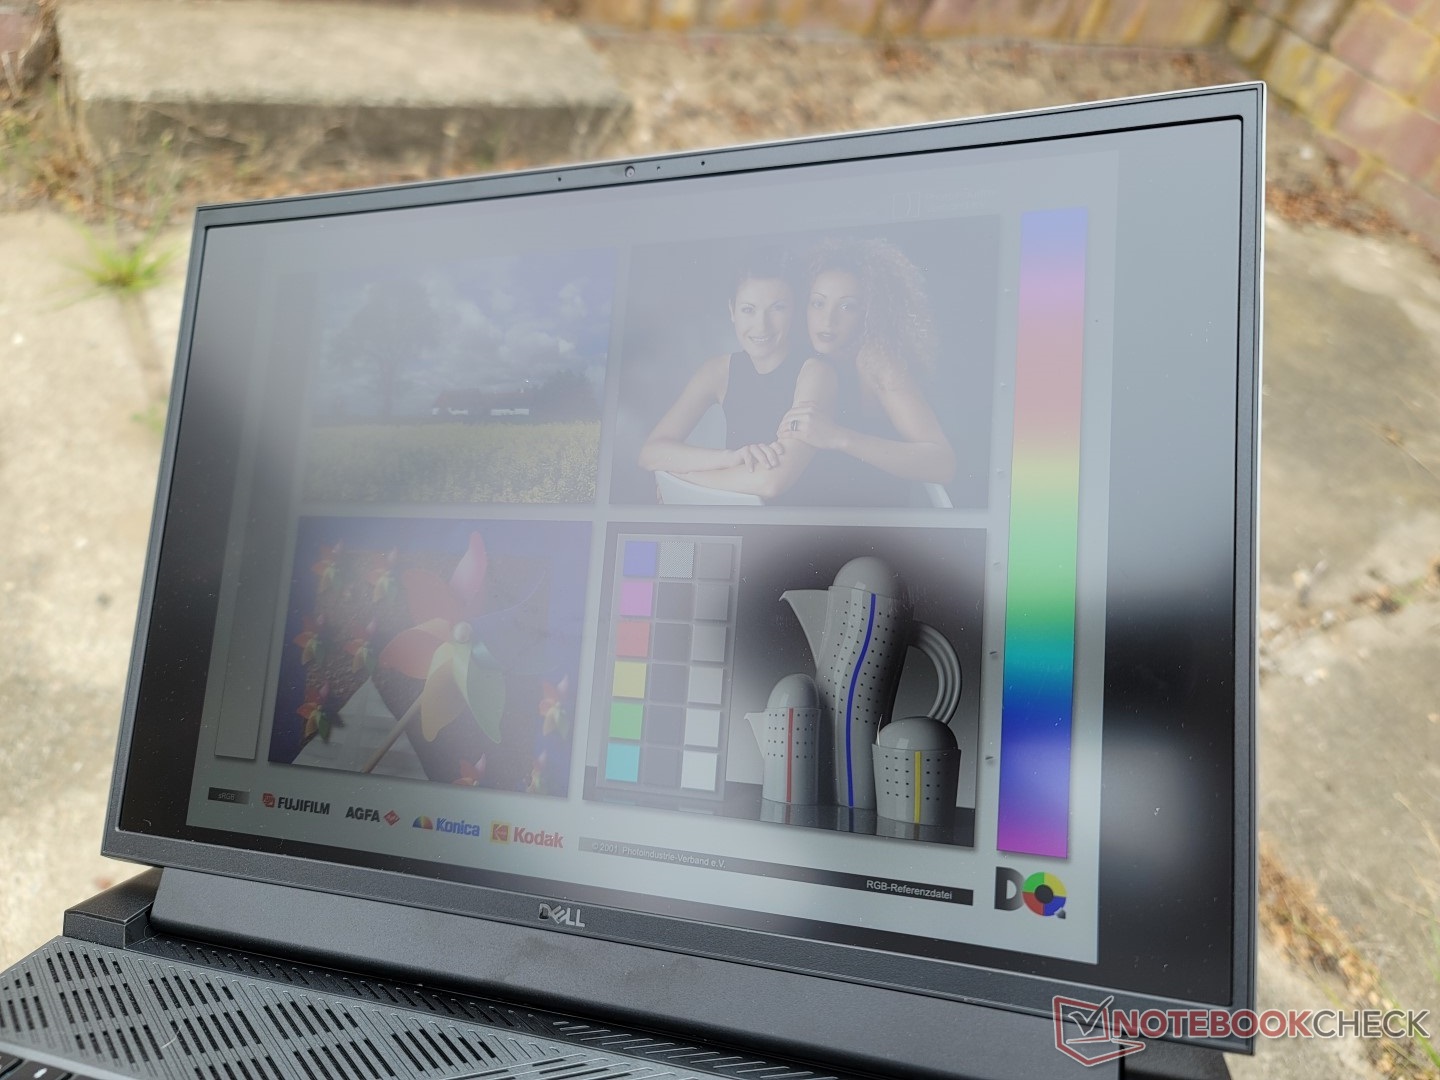
Outdoor visibility is decent if under shade, but glare becomes too heavy if under brighter ambient lighting. Alternatives like the Lenovo Legion 5 Pro 16 or Legion 7 16 have much brighter displays of around 500 nits each if outdoor visibility is a concern.
Performance — Faster Than Average
Testing Conditions
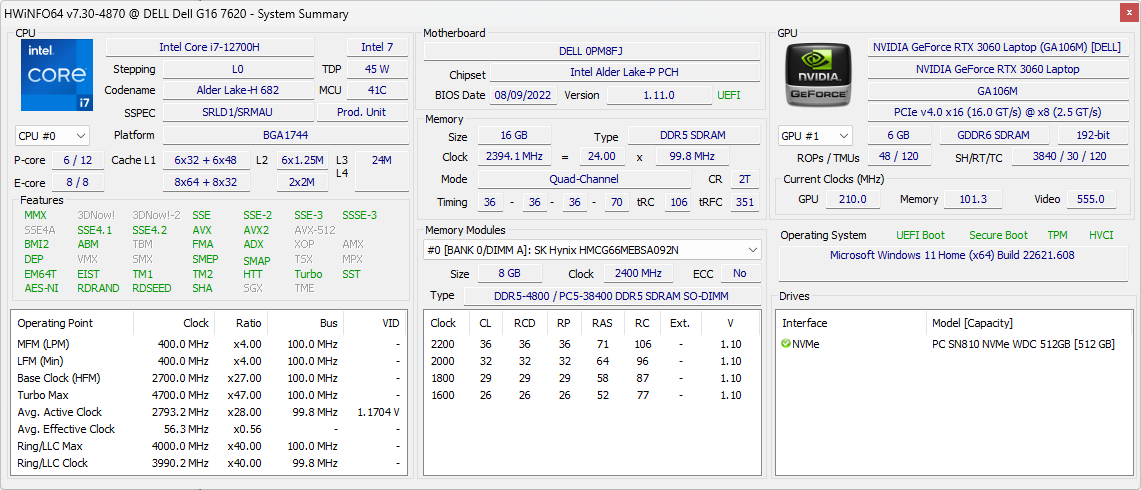
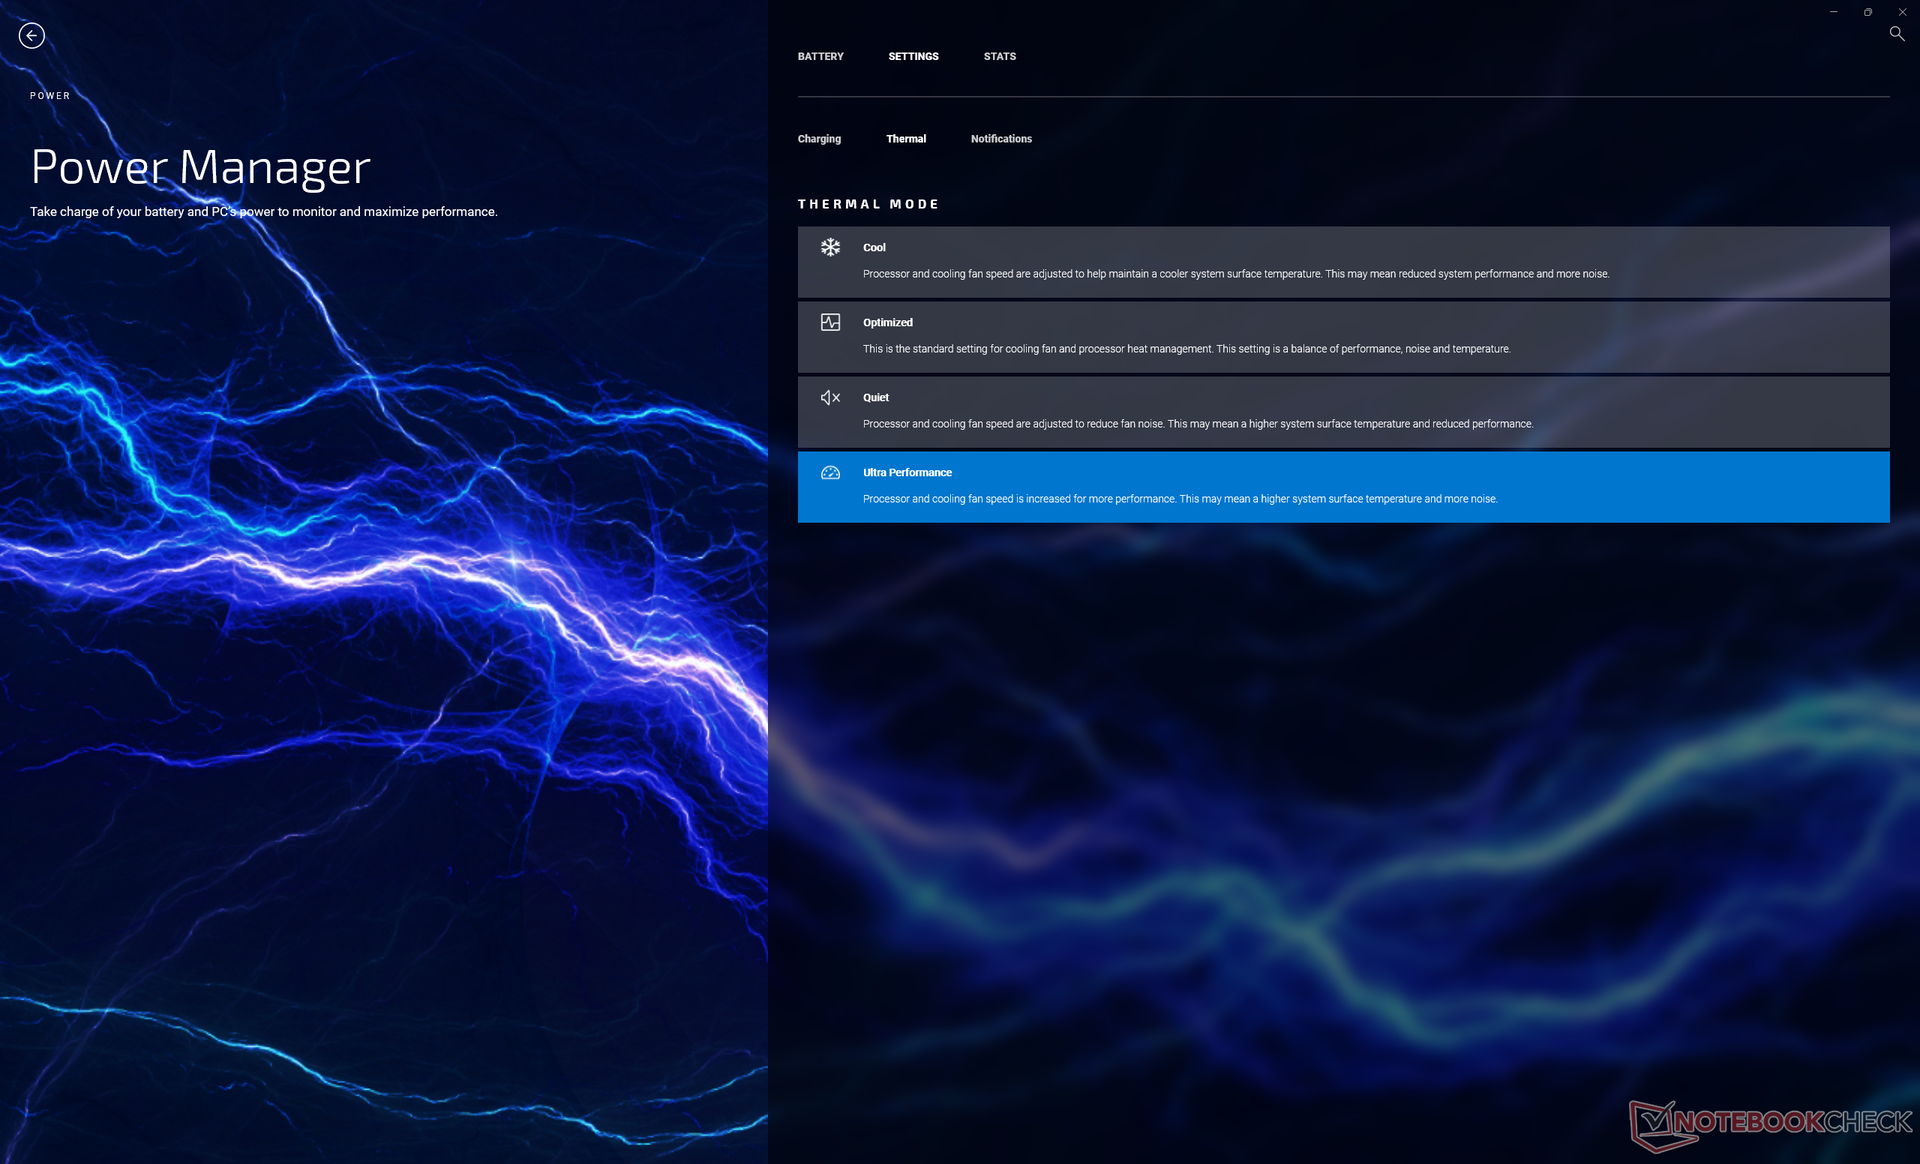
We set our unit to Performance mode via Windows and Ultra Performance mode via the My Dell software prior to running any benchmarks below. We also made sure to disable Optimus and set the system to discrete GPU mode via the Nvidia Control Panel. It's recommended that owners become familiar with My Dell and Dell Update as these two pre-installed applications are vital for adjusting the behavior of the system.
Processor
Multi-thread performance is excellent with results that are 5 to 10 percent faster than the average laptop in our database with the same Core i7-12700H CPU. The CPU is about 20 to 30 percent faster than even the last generation Core i9-11900H in multi-threaded workloads, but single-thread performance can be slower by up to 10 percent.
Upgrading to the Core i9-12900H is expected to boost performance only by about 5 percent based on our experience with the Alienware x15 R2. Thus, the Core i7-12700H is the much better option in terms of performance-per-dollar.
Performance sustainability is excellent and better than on the Dell Inspiron 16 Plus 7620 equipped with the same CPU as shown by our CineBench R15 xT loop test comparison graph below.
Cinebench R15 Multi Loop
Cinebench R23: Multi Core | Single Core
Cinebench R15: CPU Multi 64Bit | CPU Single 64Bit
Blender: v2.79 BMW27 CPU
7-Zip 18.03: 7z b 4 | 7z b 4 -mmt1
Geekbench 5.5: Multi-Core | Single-Core
HWBOT x265 Benchmark v2.2: 4k Preset
LibreOffice : 20 Documents To PDF
R Benchmark 2.5: Overall mean
| HWBOT x265 Benchmark v2.2 / 4k Preset | |
| Lenovo Legion 7 16IAX7-82TD004SGE | |
| Alienware x17 R2 P48E | |
| Lenovo Legion 5 Pro 16IAH7H | |
| Alienware x15 R2 P111F | |
| Dell G16 7620 | |
| Lenovo Legion 7 16ARHA7 | |
| Average Intel Core i7-12700H (4.67 - 21.8, n=64) | |
| Asus ROG Zephyrus M16 GU603H | |
| HP Victus 16-e0145ng | |
| Razer Blade 15 Advanced Model Early 2021 | |
| Acer Swift X SFX16-51G-5388 | |
* ... smaller is better
AIDA64: FP32 Ray-Trace | FPU Julia | CPU SHA3 | CPU Queen | FPU SinJulia | FPU Mandel | CPU AES | CPU ZLib | FP64 Ray-Trace | CPU PhotoWorxx
| Performance rating | |
| Lenovo Legion 7 16ARHA7 | |
| Dell G16 7620 | |
| Lenovo Legion 5 Pro 16IAH7H | |
| Average Intel Core i7-12700H | |
| HP Victus 16-e0145ng | |
| Acer Swift X SFX16-51G-5388 | |
| Asus ROG Zephyrus M16 GU603H -9! | |
| AIDA64 / FP32 Ray-Trace | |
| Lenovo Legion 7 16ARHA7 | |
| Dell G16 7620 | |
| Lenovo Legion 5 Pro 16IAH7H | |
| Lenovo Legion 5 Pro 16IAH7H | |
| HP Victus 16-e0145ng | |
| Average Intel Core i7-12700H (2585 - 17957, n=64) | |
| Acer Swift X SFX16-51G-5388 | |
| AIDA64 / FPU Julia | |
| Lenovo Legion 7 16ARHA7 | |
| Dell G16 7620 | |
| Lenovo Legion 5 Pro 16IAH7H | |
| Lenovo Legion 5 Pro 16IAH7H | |
| HP Victus 16-e0145ng | |
| Average Intel Core i7-12700H (12439 - 90760, n=64) | |
| Acer Swift X SFX16-51G-5388 | |
| AIDA64 / CPU SHA3 | |
| Dell G16 7620 | |
| Lenovo Legion 7 16ARHA7 | |
| Lenovo Legion 5 Pro 16IAH7H | |
| Lenovo Legion 5 Pro 16IAH7H | |
| Average Intel Core i7-12700H (833 - 4242, n=64) | |
| HP Victus 16-e0145ng | |
| Acer Swift X SFX16-51G-5388 | |
| AIDA64 / CPU Queen | |
| Lenovo Legion 7 16ARHA7 | |
| Dell G16 7620 | |
| Lenovo Legion 5 Pro 16IAH7H | |
| Average Intel Core i7-12700H (57923 - 103202, n=63) | |
| HP Victus 16-e0145ng | |
| Acer Swift X SFX16-51G-5388 | |
| AIDA64 / FPU SinJulia | |
| Lenovo Legion 7 16ARHA7 | |
| Lenovo Legion 5 Pro 16IAH7H | |
| Lenovo Legion 5 Pro 16IAH7H | |
| Dell G16 7620 | |
| Average Intel Core i7-12700H (3249 - 9939, n=64) | |
| HP Victus 16-e0145ng | |
| Acer Swift X SFX16-51G-5388 | |
| AIDA64 / FPU Mandel | |
| Lenovo Legion 7 16ARHA7 | |
| HP Victus 16-e0145ng | |
| Lenovo Legion 5 Pro 16IAH7H | |
| Lenovo Legion 5 Pro 16IAH7H | |
| Dell G16 7620 | |
| Average Intel Core i7-12700H (7135 - 44760, n=64) | |
| Acer Swift X SFX16-51G-5388 | |
| AIDA64 / CPU AES | |
| Lenovo Legion 7 16ARHA7 | |
| Lenovo Legion 5 Pro 16IAH7H | |
| Lenovo Legion 5 Pro 16IAH7H | |
| Average Intel Core i7-12700H (31839 - 144360, n=64) | |
| Dell G16 7620 | |
| Acer Swift X SFX16-51G-5388 | |
| HP Victus 16-e0145ng | |
| AIDA64 / CPU ZLib | |
| Lenovo Legion 5 Pro 16IAH7H | |
| Lenovo Legion 5 Pro 16IAH7H | |
| Dell G16 7620 | |
| Average Intel Core i7-12700H (305 - 1171, n=64) | |
| Lenovo Legion 7 16ARHA7 | |
| HP Victus 16-e0145ng | |
| Acer Swift X SFX16-51G-5388 | |
| Asus ROG Zephyrus M16 GU603H | |
| AIDA64 / FP64 Ray-Trace | |
| Lenovo Legion 7 16ARHA7 | |
| Dell G16 7620 | |
| Lenovo Legion 5 Pro 16IAH7H | |
| Lenovo Legion 5 Pro 16IAH7H | |
| HP Victus 16-e0145ng | |
| Average Intel Core i7-12700H (1437 - 9692, n=64) | |
| Acer Swift X SFX16-51G-5388 | |
| AIDA64 / CPU PhotoWorxx | |
| Acer Swift X SFX16-51G-5388 | |
| Dell G16 7620 | |
| Lenovo Legion 5 Pro 16IAH7H | |
| Lenovo Legion 5 Pro 16IAH7H | |
| Average Intel Core i7-12700H (12863 - 52207, n=64) | |
| Lenovo Legion 7 16ARHA7 | |
| HP Victus 16-e0145ng | |
System Performance
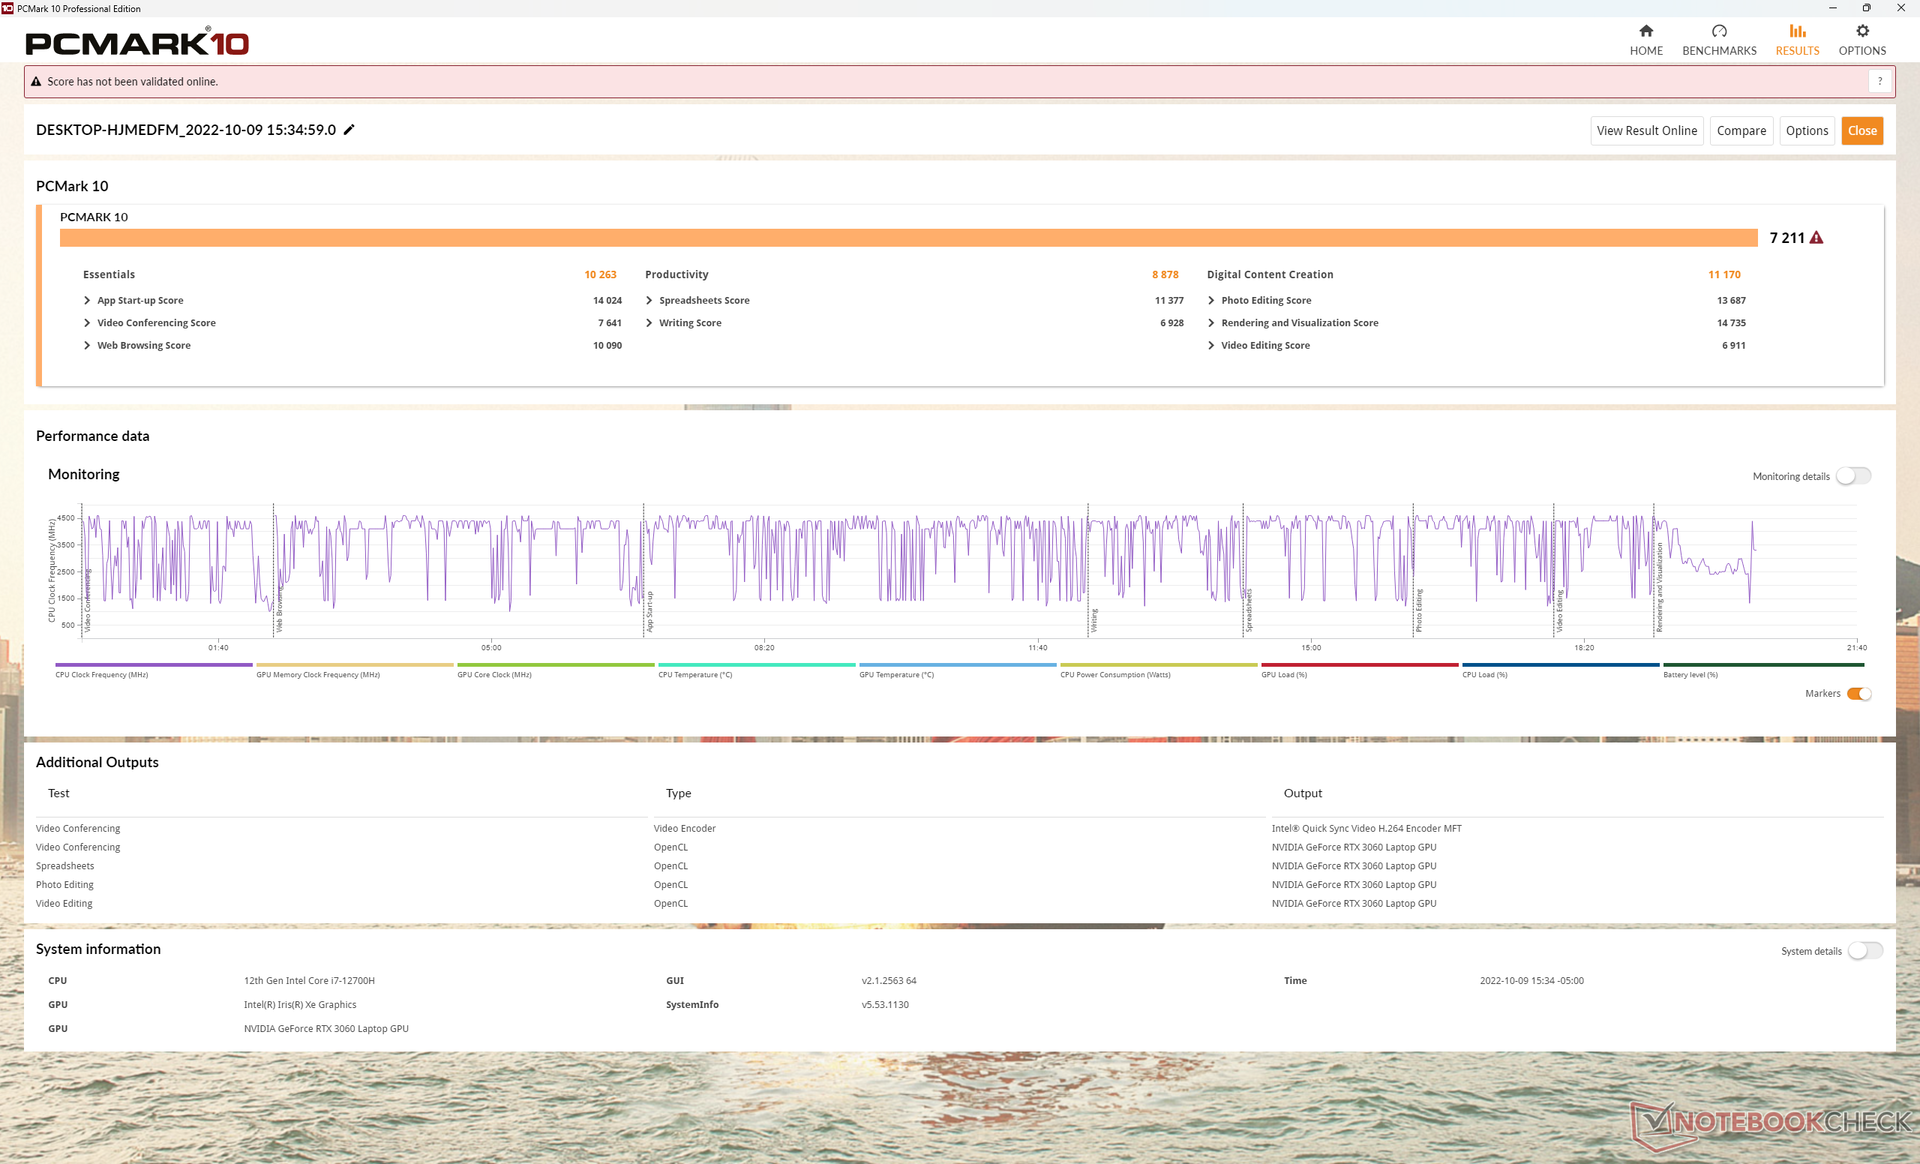
PCMark results are within a few percentage points of other laptops with the same Core i7-12700H CPU and RTX 3060 GPU. Scores are also higher on average than on last year's Alienware m15 R5 with the same GPU but slower AMD Ryzen 7 5800H.
CrossMark: Overall | Productivity | Creativity | Responsiveness
| PCMark 10 / Score | |
| Lenovo Legion 5 Pro 16IAH7H | |
| Lenovo Legion 7 16ARHA7 | |
| Average Intel Core i7-12700H, NVIDIA GeForce RTX 3060 Laptop GPU (5986 - 8156, n=12) | |
| Dell G16 7620 | |
| Asus ROG Zephyrus M16 GU603H | |
| HP Victus 16-e0145ng | |
| Acer Swift X SFX16-51G-5388 | |
| PCMark 10 / Essentials | |
| Lenovo Legion 5 Pro 16IAH7H | |
| Average Intel Core i7-12700H, NVIDIA GeForce RTX 3060 Laptop GPU (9289 - 12144, n=12) | |
| Asus ROG Zephyrus M16 GU603H | |
| Lenovo Legion 7 16ARHA7 | |
| Dell G16 7620 | |
| HP Victus 16-e0145ng | |
| Acer Swift X SFX16-51G-5388 | |
| PCMark 10 / Productivity | |
| Lenovo Legion 5 Pro 16IAH7H | |
| Average Intel Core i7-12700H, NVIDIA GeForce RTX 3060 Laptop GPU (6161 - 10362, n=12) | |
| Asus ROG Zephyrus M16 GU603H | |
| Lenovo Legion 7 16ARHA7 | |
| Dell G16 7620 | |
| Acer Swift X SFX16-51G-5388 | |
| HP Victus 16-e0145ng | |
| PCMark 10 / Digital Content Creation | |
| Lenovo Legion 7 16ARHA7 | |
| Lenovo Legion 5 Pro 16IAH7H | |
| Dell G16 7620 | |
| Average Intel Core i7-12700H, NVIDIA GeForce RTX 3060 Laptop GPU (8950 - 12554, n=12) | |
| Asus ROG Zephyrus M16 GU603H | |
| HP Victus 16-e0145ng | |
| Acer Swift X SFX16-51G-5388 | |
| CrossMark / Overall | |
| Average Intel Core i7-12700H, NVIDIA GeForce RTX 3060 Laptop GPU (1649 - 2017, n=11) | |
| Dell G16 7620 | |
| Lenovo Legion 5 Pro 16IAH7H | |
| Lenovo Legion 7 16ARHA7 | |
| Acer Swift X SFX16-51G-5388 | |
| CrossMark / Productivity | |
| Average Intel Core i7-12700H, NVIDIA GeForce RTX 3060 Laptop GPU (1536 - 1958, n=11) | |
| Lenovo Legion 5 Pro 16IAH7H | |
| Dell G16 7620 | |
| Lenovo Legion 7 16ARHA7 | |
| Acer Swift X SFX16-51G-5388 | |
| CrossMark / Creativity | |
| Average Intel Core i7-12700H, NVIDIA GeForce RTX 3060 Laptop GPU (1816 - 2084, n=11) | |
| Dell G16 7620 | |
| Lenovo Legion 5 Pro 16IAH7H | |
| Lenovo Legion 7 16ARHA7 | |
| Acer Swift X SFX16-51G-5388 | |
| CrossMark / Responsiveness | |
| Lenovo Legion 5 Pro 16IAH7H | |
| Average Intel Core i7-12700H, NVIDIA GeForce RTX 3060 Laptop GPU (1210 - 2207, n=11) | |
| Dell G16 7620 | |
| Lenovo Legion 7 16ARHA7 | |
| Acer Swift X SFX16-51G-5388 | |
| PCMark 10 Score | 7211 points | |
Help | ||
| AIDA64 / Memory Copy | |
| Acer Swift X SFX16-51G-5388 | |
| Lenovo Legion 5 Pro 16IAH7H | |
| Lenovo Legion 5 Pro 16IAH7H | |
| Dell G16 7620 | |
| Average Intel Core i7-12700H (25615 - 80511, n=64) | |
| Lenovo Legion 7 16ARHA7 | |
| HP Victus 16-e0145ng | |
| AIDA64 / Memory Read | |
| Dell G16 7620 | |
| Lenovo Legion 5 Pro 16IAH7H | |
| Lenovo Legion 5 Pro 16IAH7H | |
| Average Intel Core i7-12700H (25586 - 79442, n=64) | |
| Acer Swift X SFX16-51G-5388 | |
| Lenovo Legion 7 16ARHA7 | |
| HP Victus 16-e0145ng | |
| AIDA64 / Memory Write | |
| Acer Swift X SFX16-51G-5388 | |
| Lenovo Legion 5 Pro 16IAH7H | |
| Lenovo Legion 5 Pro 16IAH7H | |
| Dell G16 7620 | |
| Lenovo Legion 7 16ARHA7 | |
| Average Intel Core i7-12700H (23679 - 88660, n=64) | |
| HP Victus 16-e0145ng | |
| AIDA64 / Memory Latency | |
| Lenovo Legion 5 Pro 16IAH7H | |
| Lenovo Legion 5 Pro 16IAH7H | |
| Acer Swift X SFX16-51G-5388 | |
| Dell G16 7620 | |
| Lenovo Legion 7 16ARHA7 | |
| Average Intel Core i7-12700H (76.2 - 133.9, n=62) | |
| HP Victus 16-e0145ng | |
| Asus ROG Zephyrus M16 GU603H | |
* ... smaller is better
DPC Latency
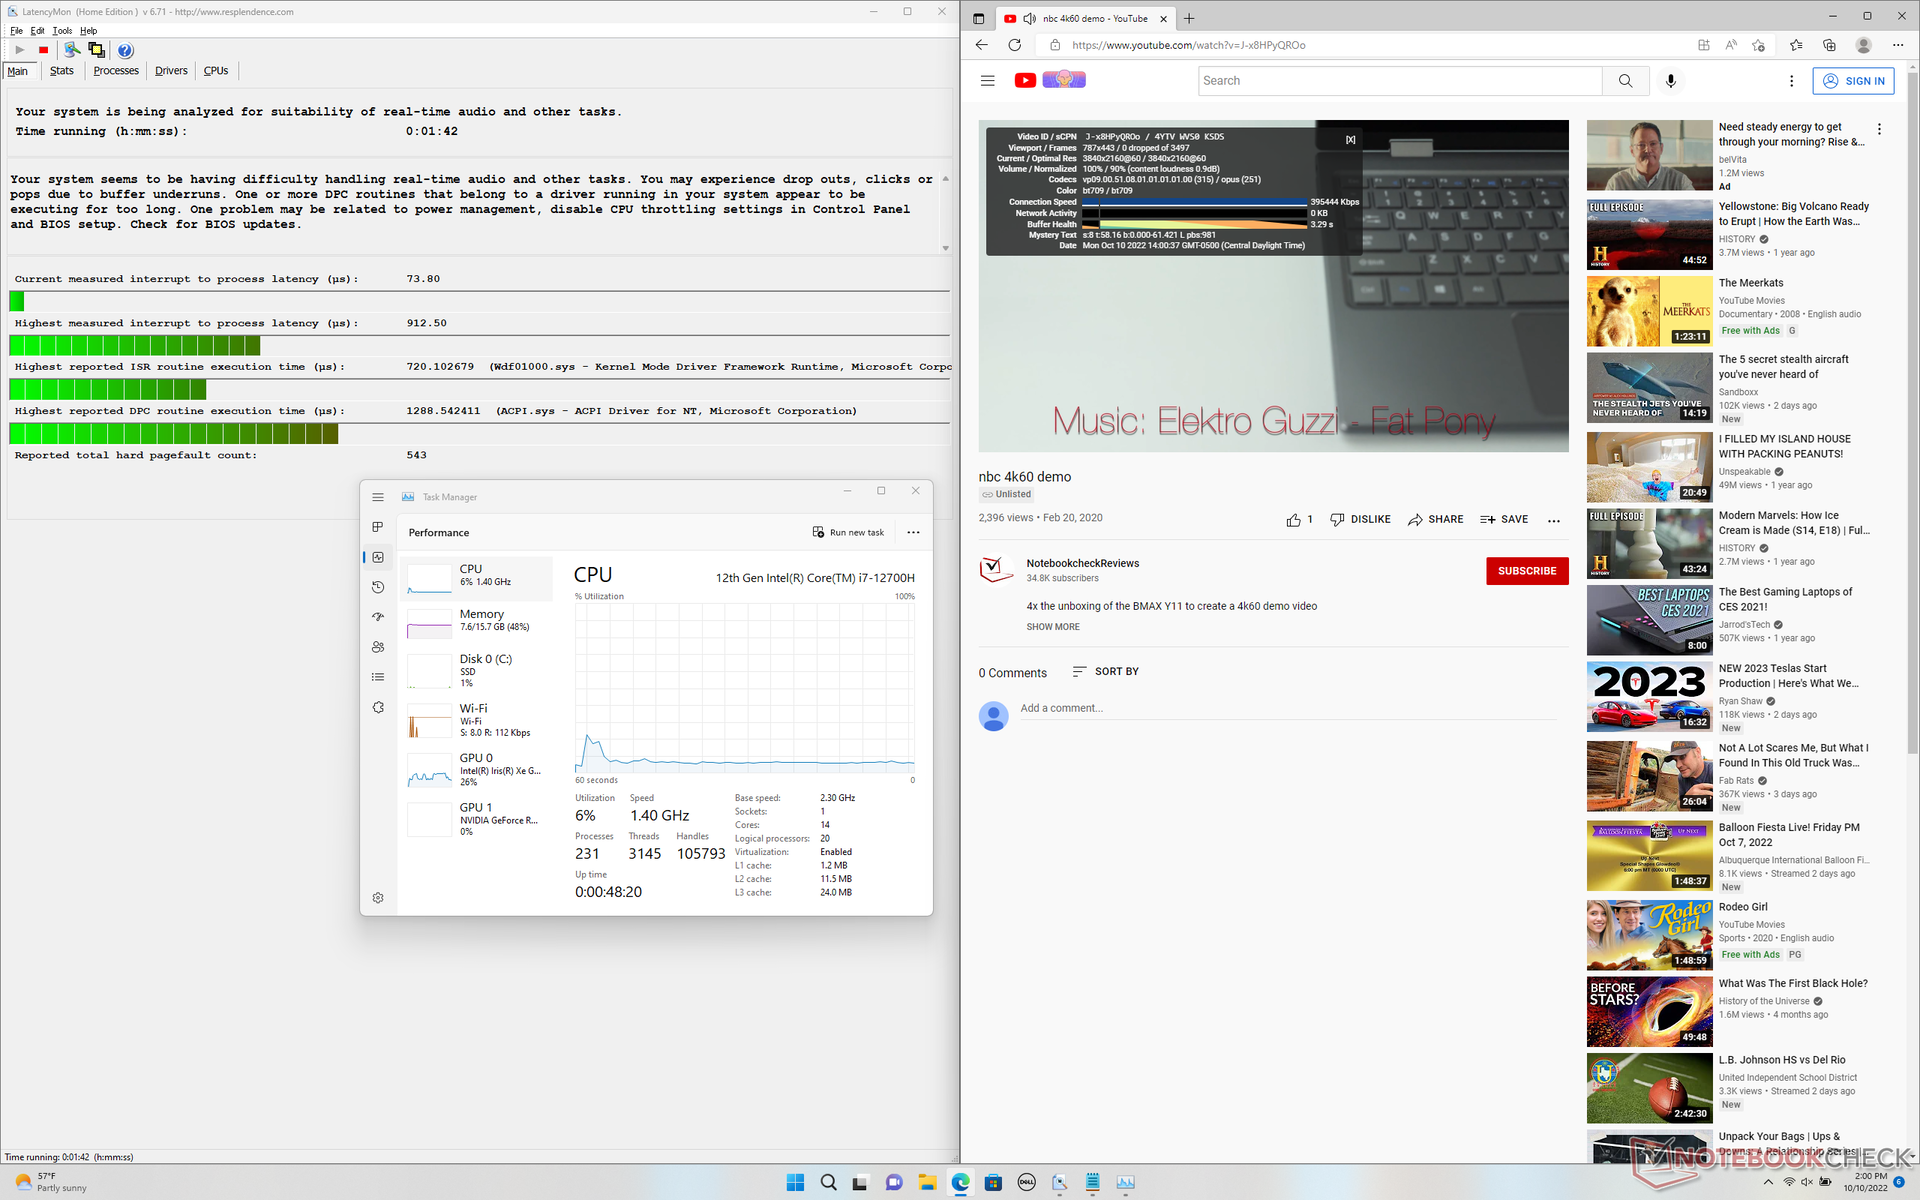
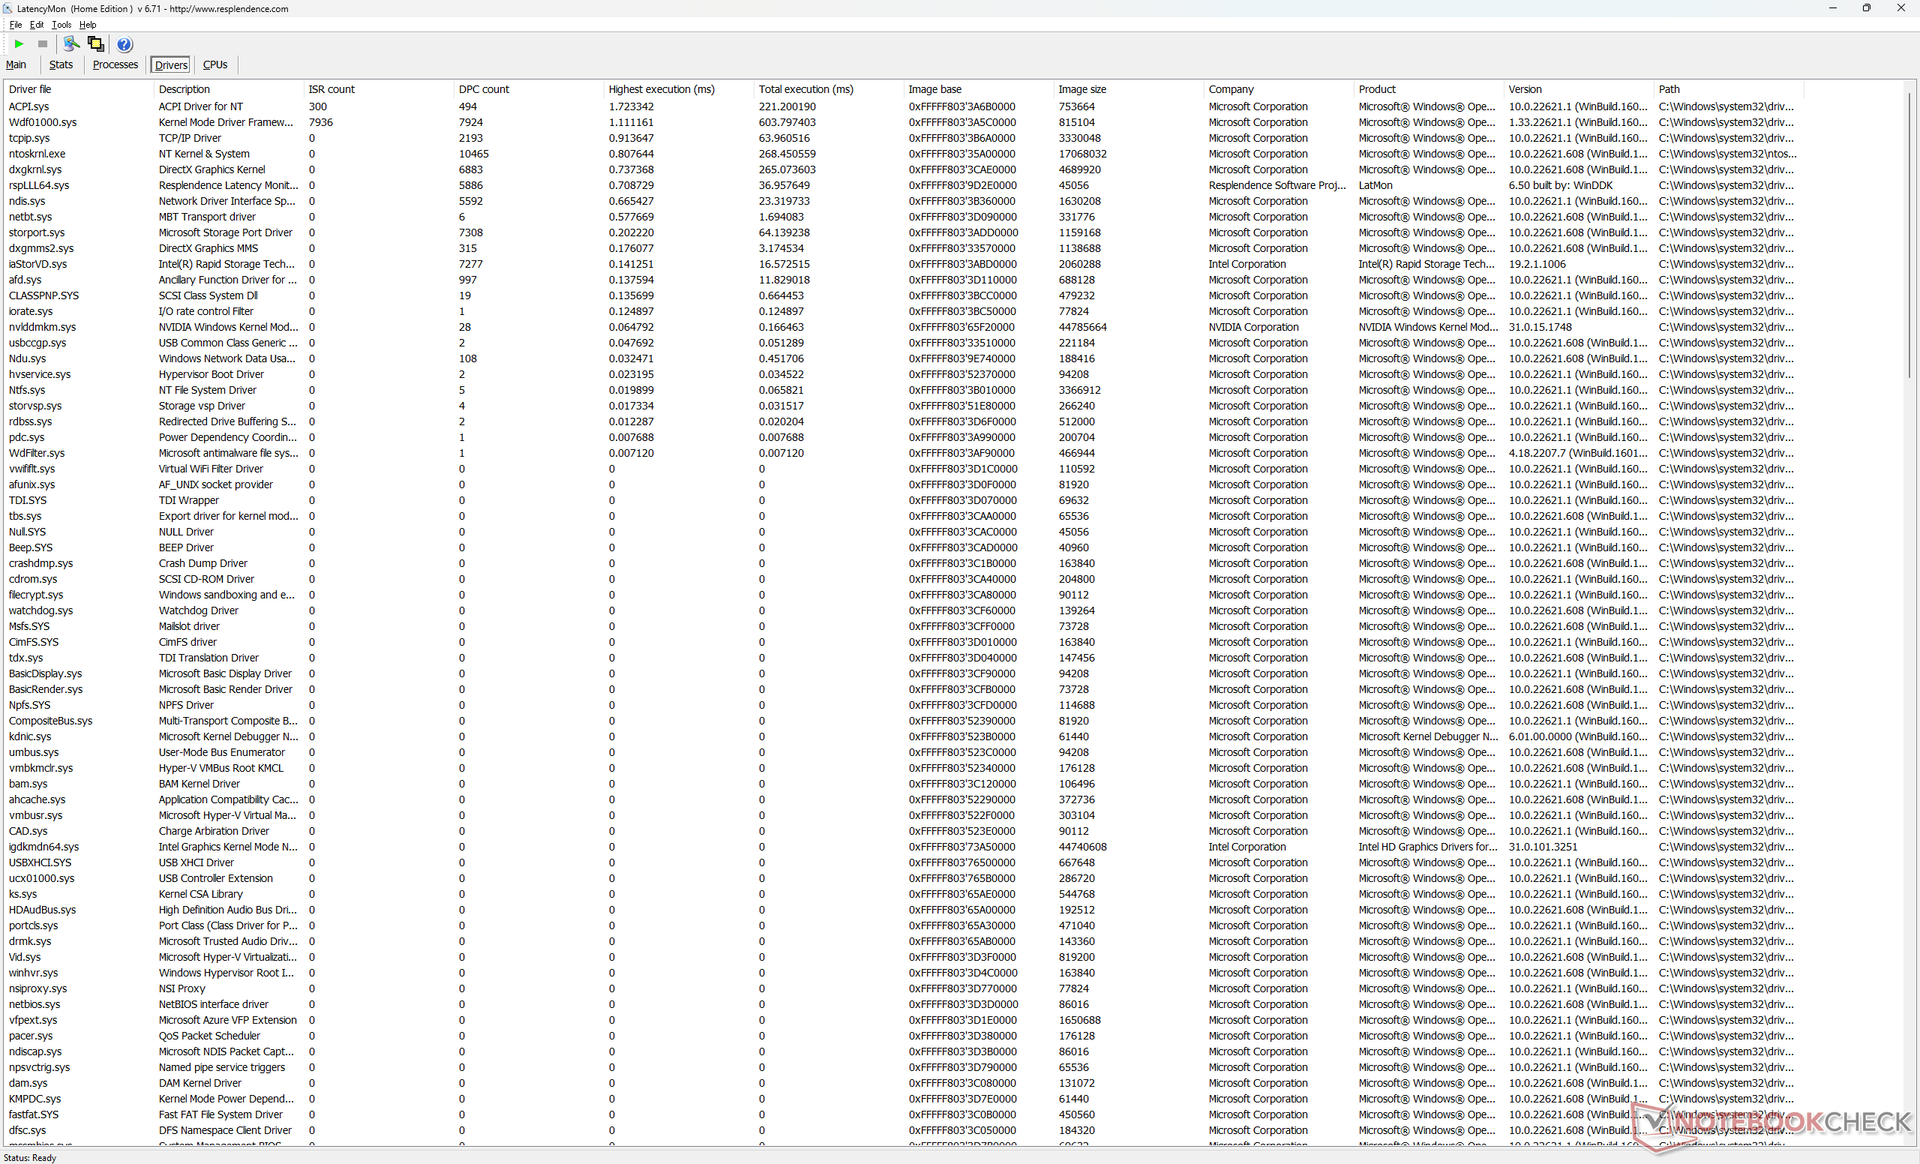
LatencyMon reveals slight DPC issues when opening multiple browser tabs on our homepage. 4K video playback at 60 FPS is otherwise perfect with no dropped frames.
| DPC Latencies / LatencyMon - interrupt to process latency (max), Web, Youtube, Prime95 | |
| Acer Swift X SFX16-51G-5388 | |
| Lenovo Legion 7 16ARHA7 | |
| Asus ROG Zephyrus M16 GU603H | |
| Dell G16 7620 | |
| HP Victus 16-e0145ng | |
| Lenovo Legion 5 Pro 16IAH7H | |
* ... smaller is better
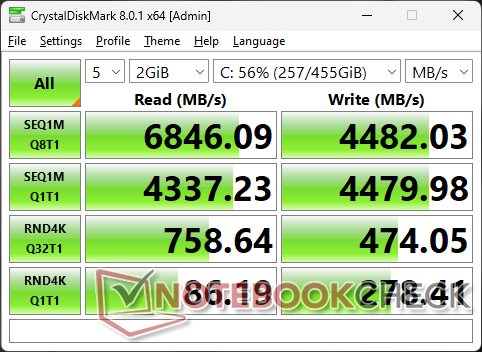
Storage Devices
The motherboard has space for up to two M.2 2280 SSDs as shown by our images below. However, all configurations at the moment are shipping with the second connector removed meaning the G16 can support up to one internal M.2 2280 SSD only.
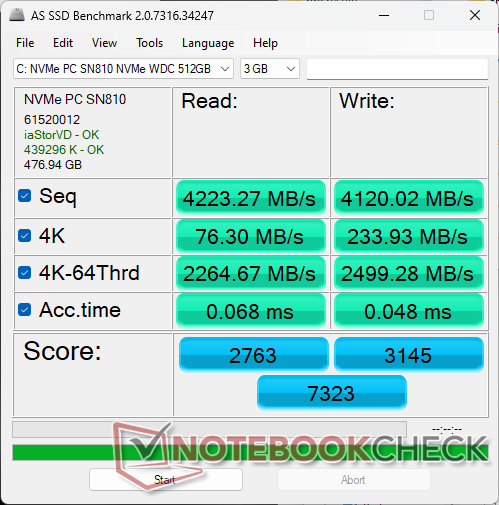
Our test unit ships with the upper midrange WDC PC SN810 PCIe4 x4 NVMe SSD for theoretical sequential read and write rates of up to 6000 MB/s and 4000 MB/s, respectively, according to the manufacturer. The drive in our unit is able to reach 6700 MB/s, but it is unable to sustain these fast speeds for extended periods. When running DiskSpd in a loop, for example, read rates would eventually throttle to as low as 3500 MB/s.

| Drive Performance rating - Percent | |
| Lenovo Legion 5 Pro 16IAH7H | |
| Asus ROG Zephyrus M16 GU603H | |
| Dell G16 7620 | |
| Lenovo Legion 7 16ARHA7 | |
| HP Victus 16-e0145ng | |
| Acer Swift X SFX16-51G-5388 | |
* ... smaller is better
Disk Throttling: DiskSpd Read Loop, Queue Depth 8
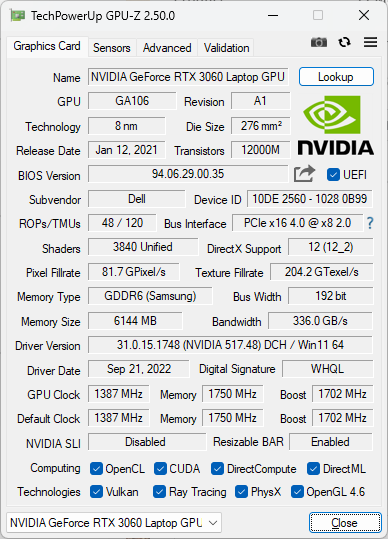
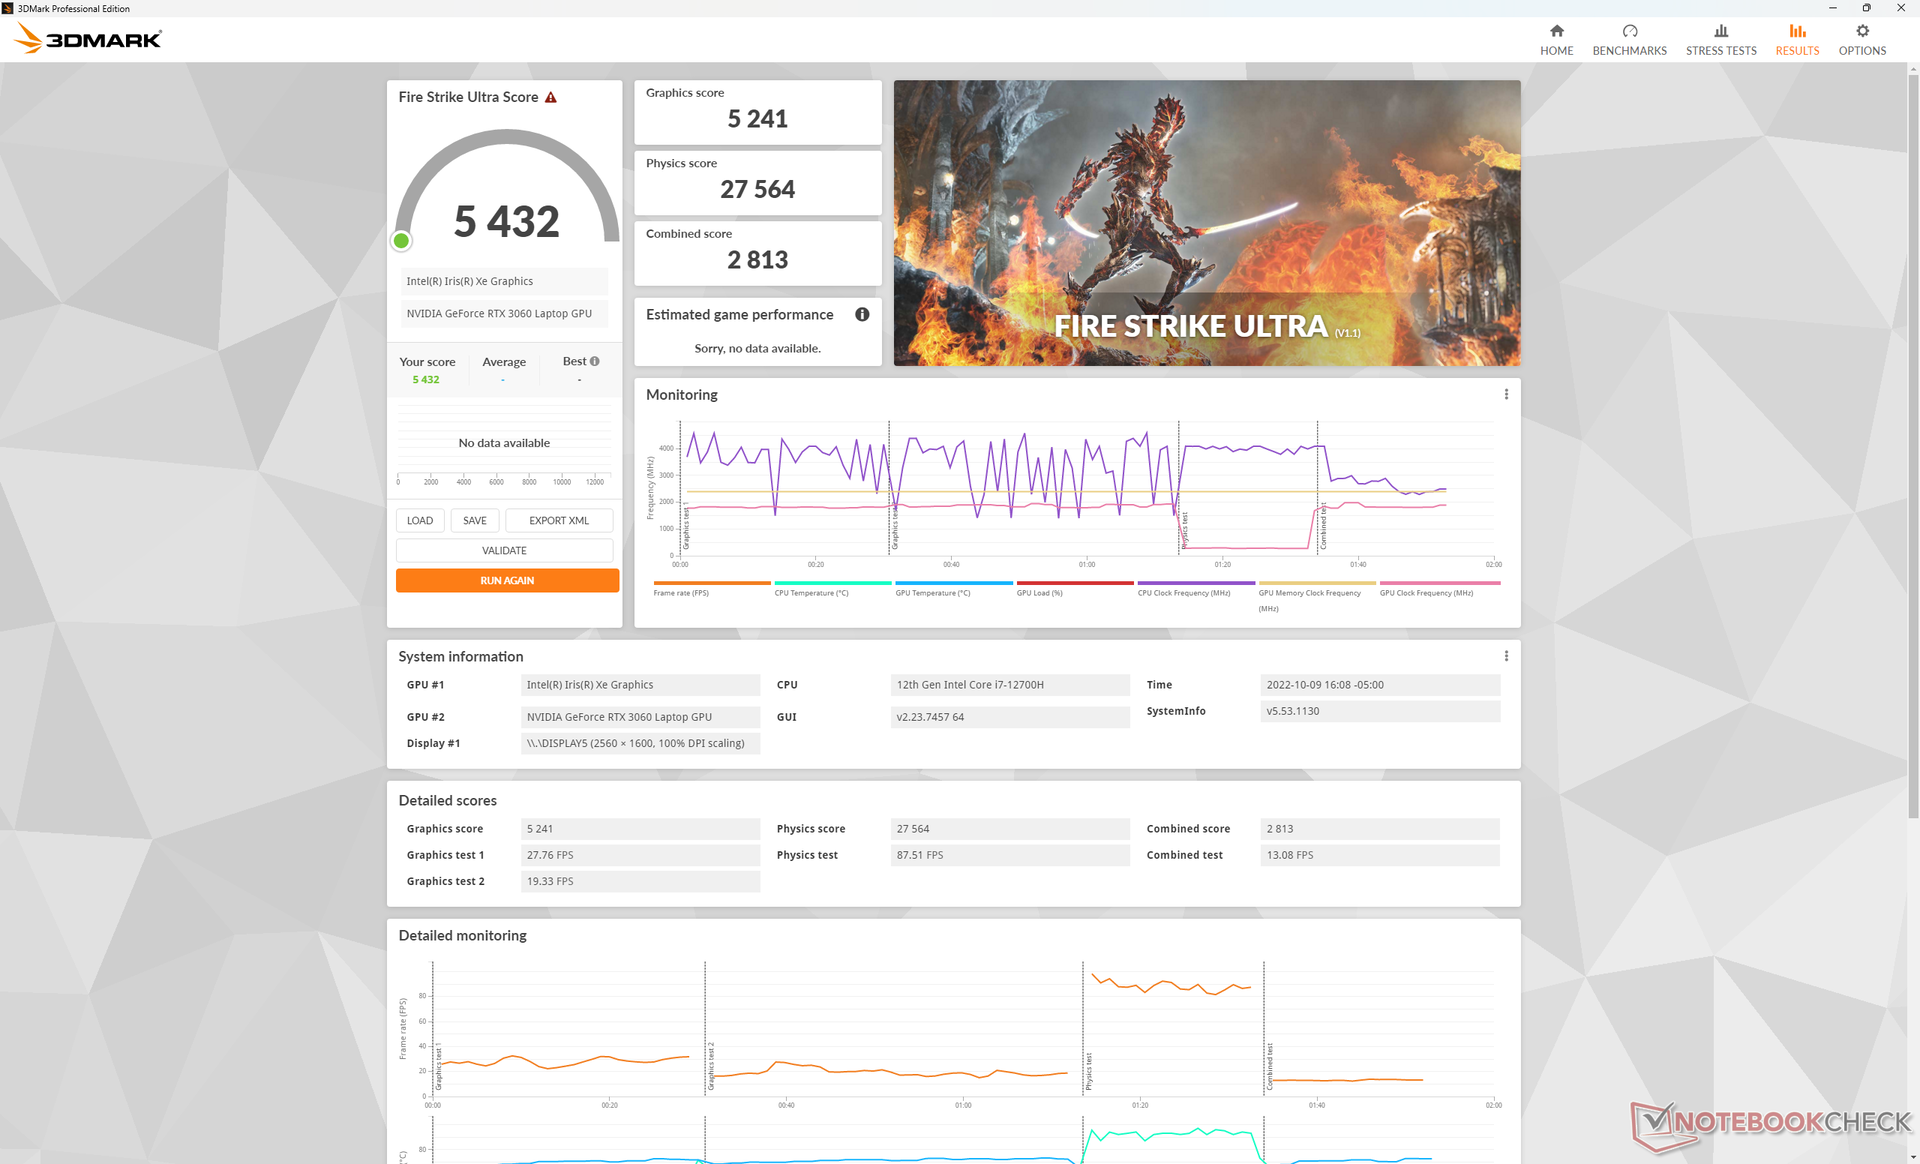
GPU Performance — 130 W TGP Graphics
Graphics performance is excellent with results that are 5 to 10 percent faster than the average laptop in our database equipped with the same GeForce RTX 3060 GPU. Overall performance is now within 10 percent of a proper desktop RTX 3060. This is partly due to the 130 W TGP target of the Dell G16 which is on the higher-end of the spectrum when it comes to gaming laptops.
Upgrading to the RTX 3070 Ti configuration is expected to boost graphics performance by about 20 to 30 percent while downgrading to the RTX 3050 Ti configuration will decrease performance by about 30 to 35 percent.
Running on Optimized mode instead of Ultra Performance mode impacts performance very slightly. A Fire Strike test on Optimized mode would return Physics and Graphics scores of 26289 and 21492 points, respectively, compared to 27735 and 21584 points when on Ultra Performance.
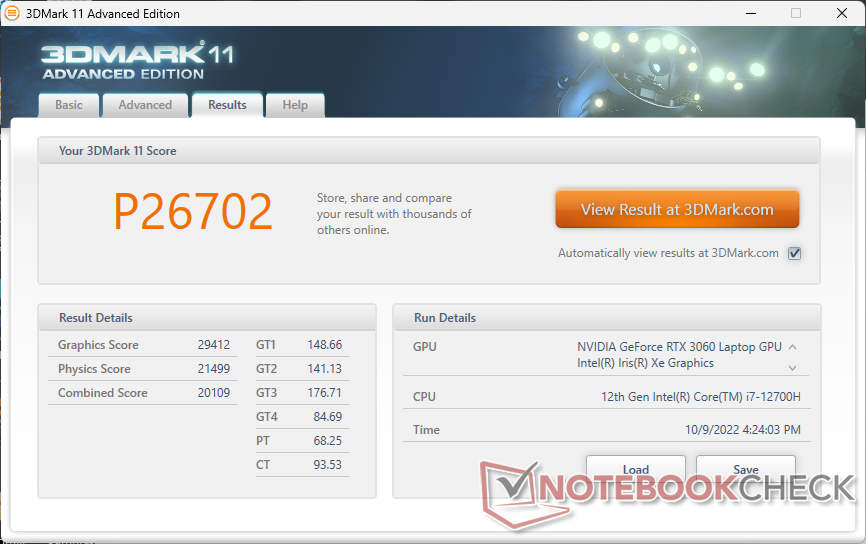
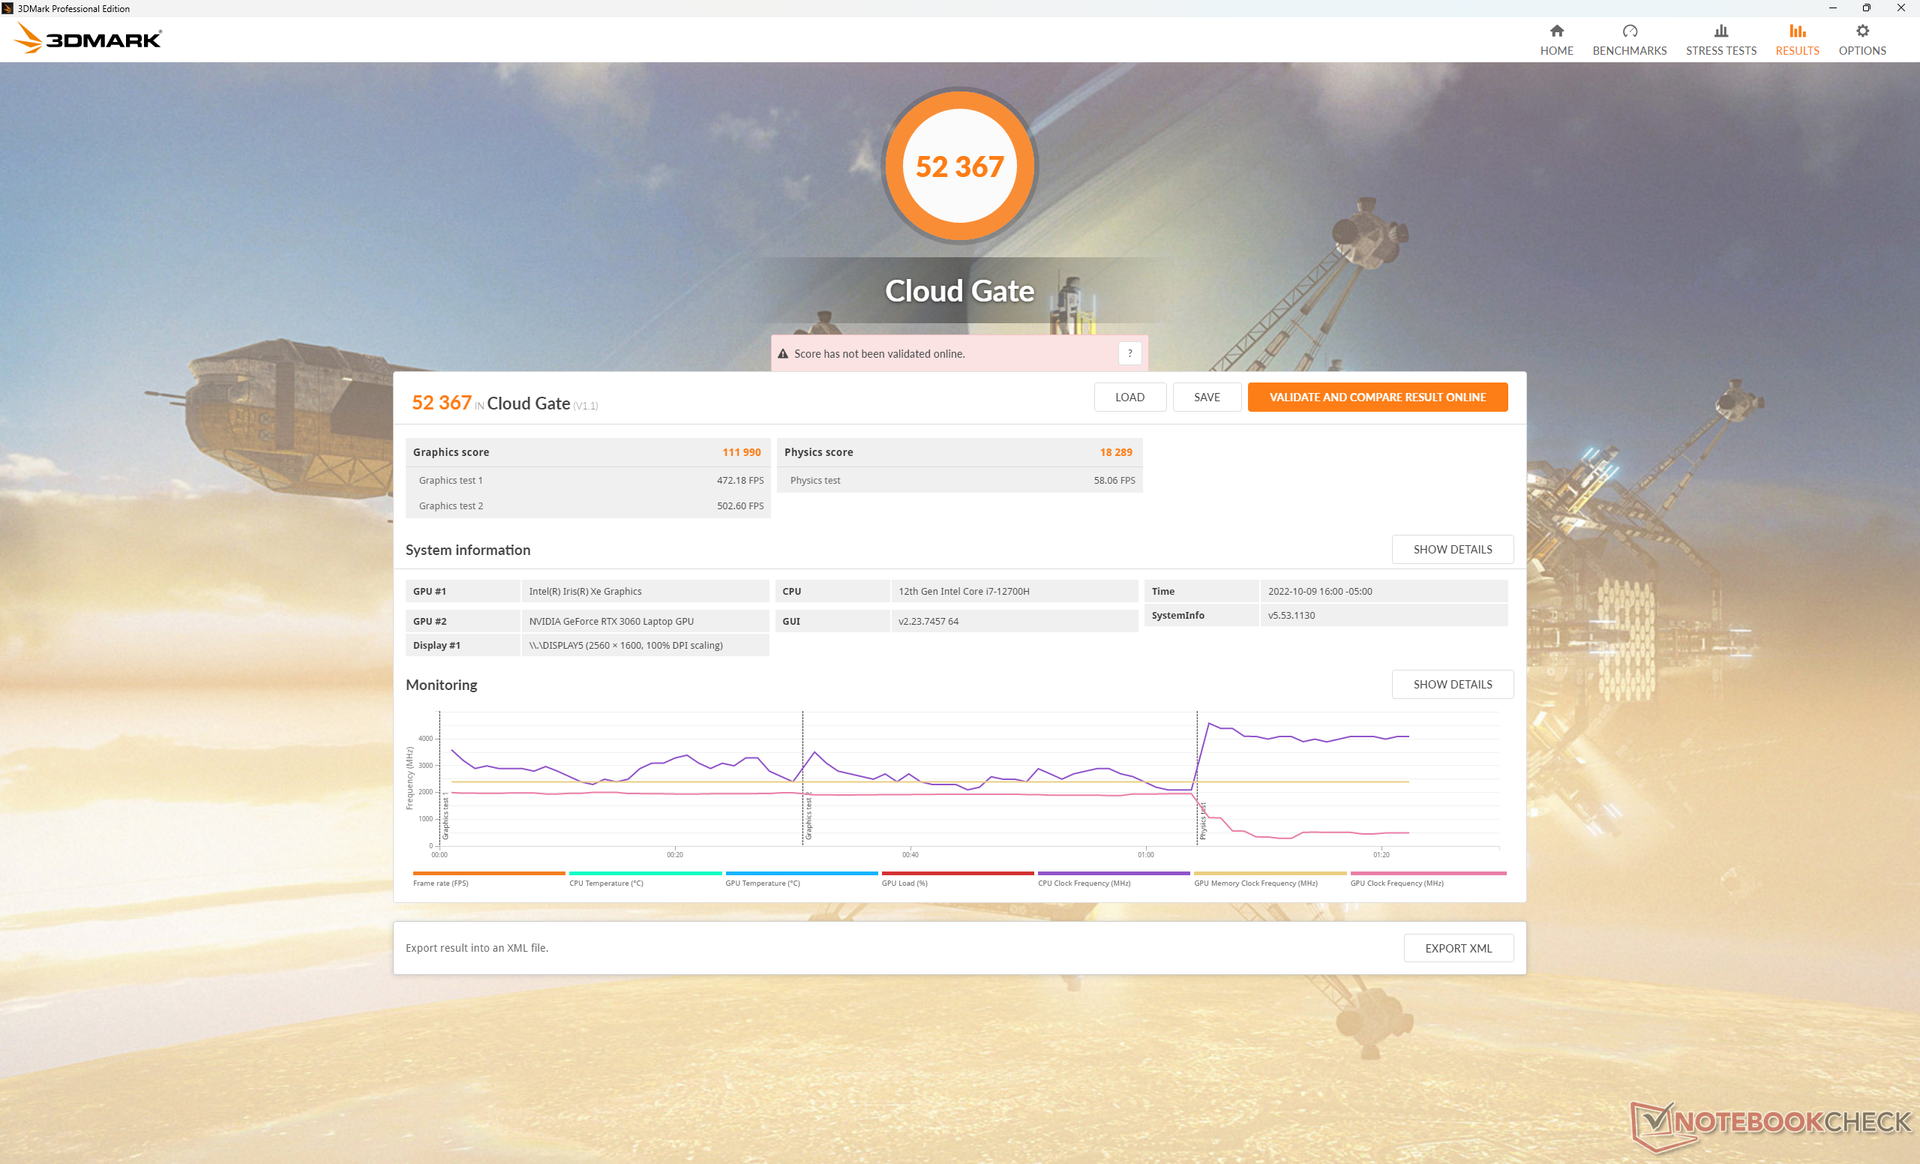
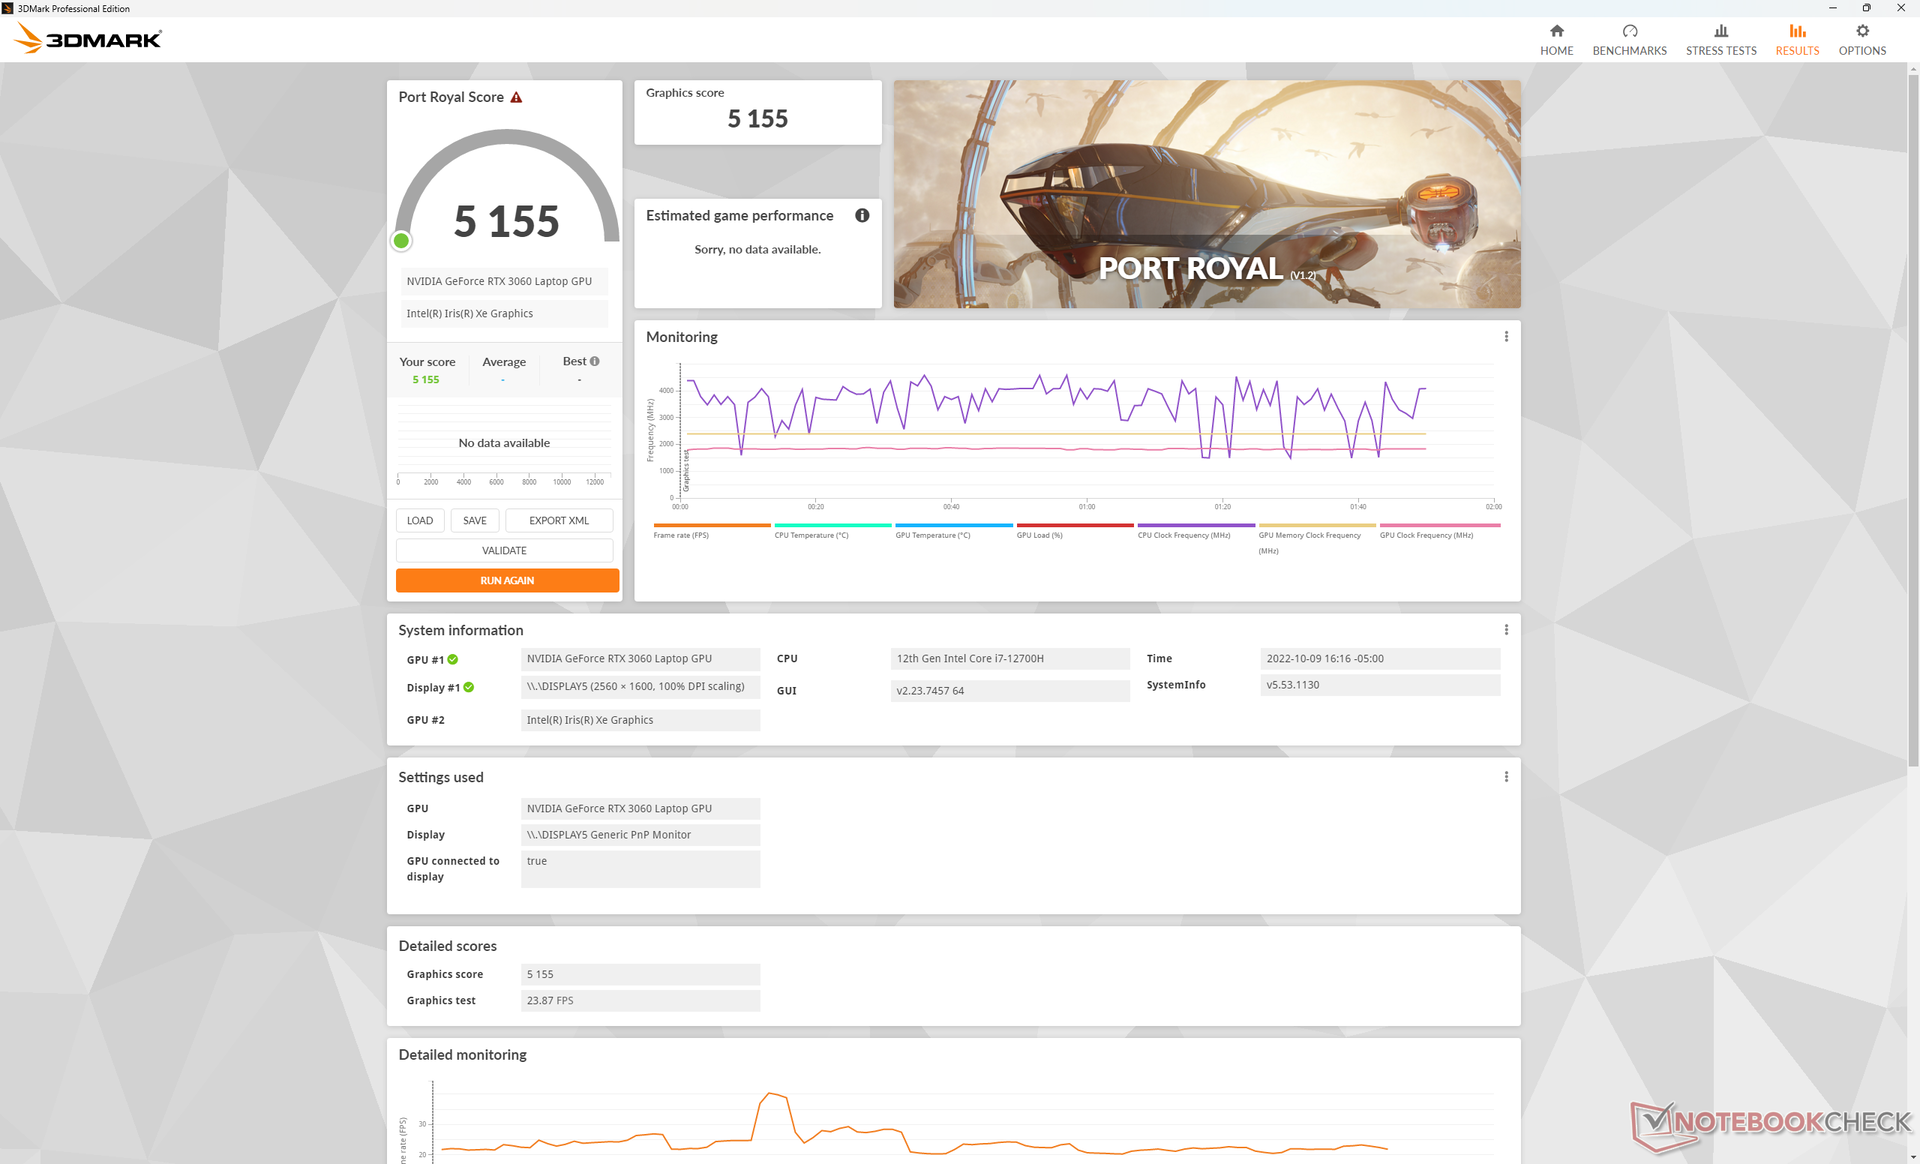
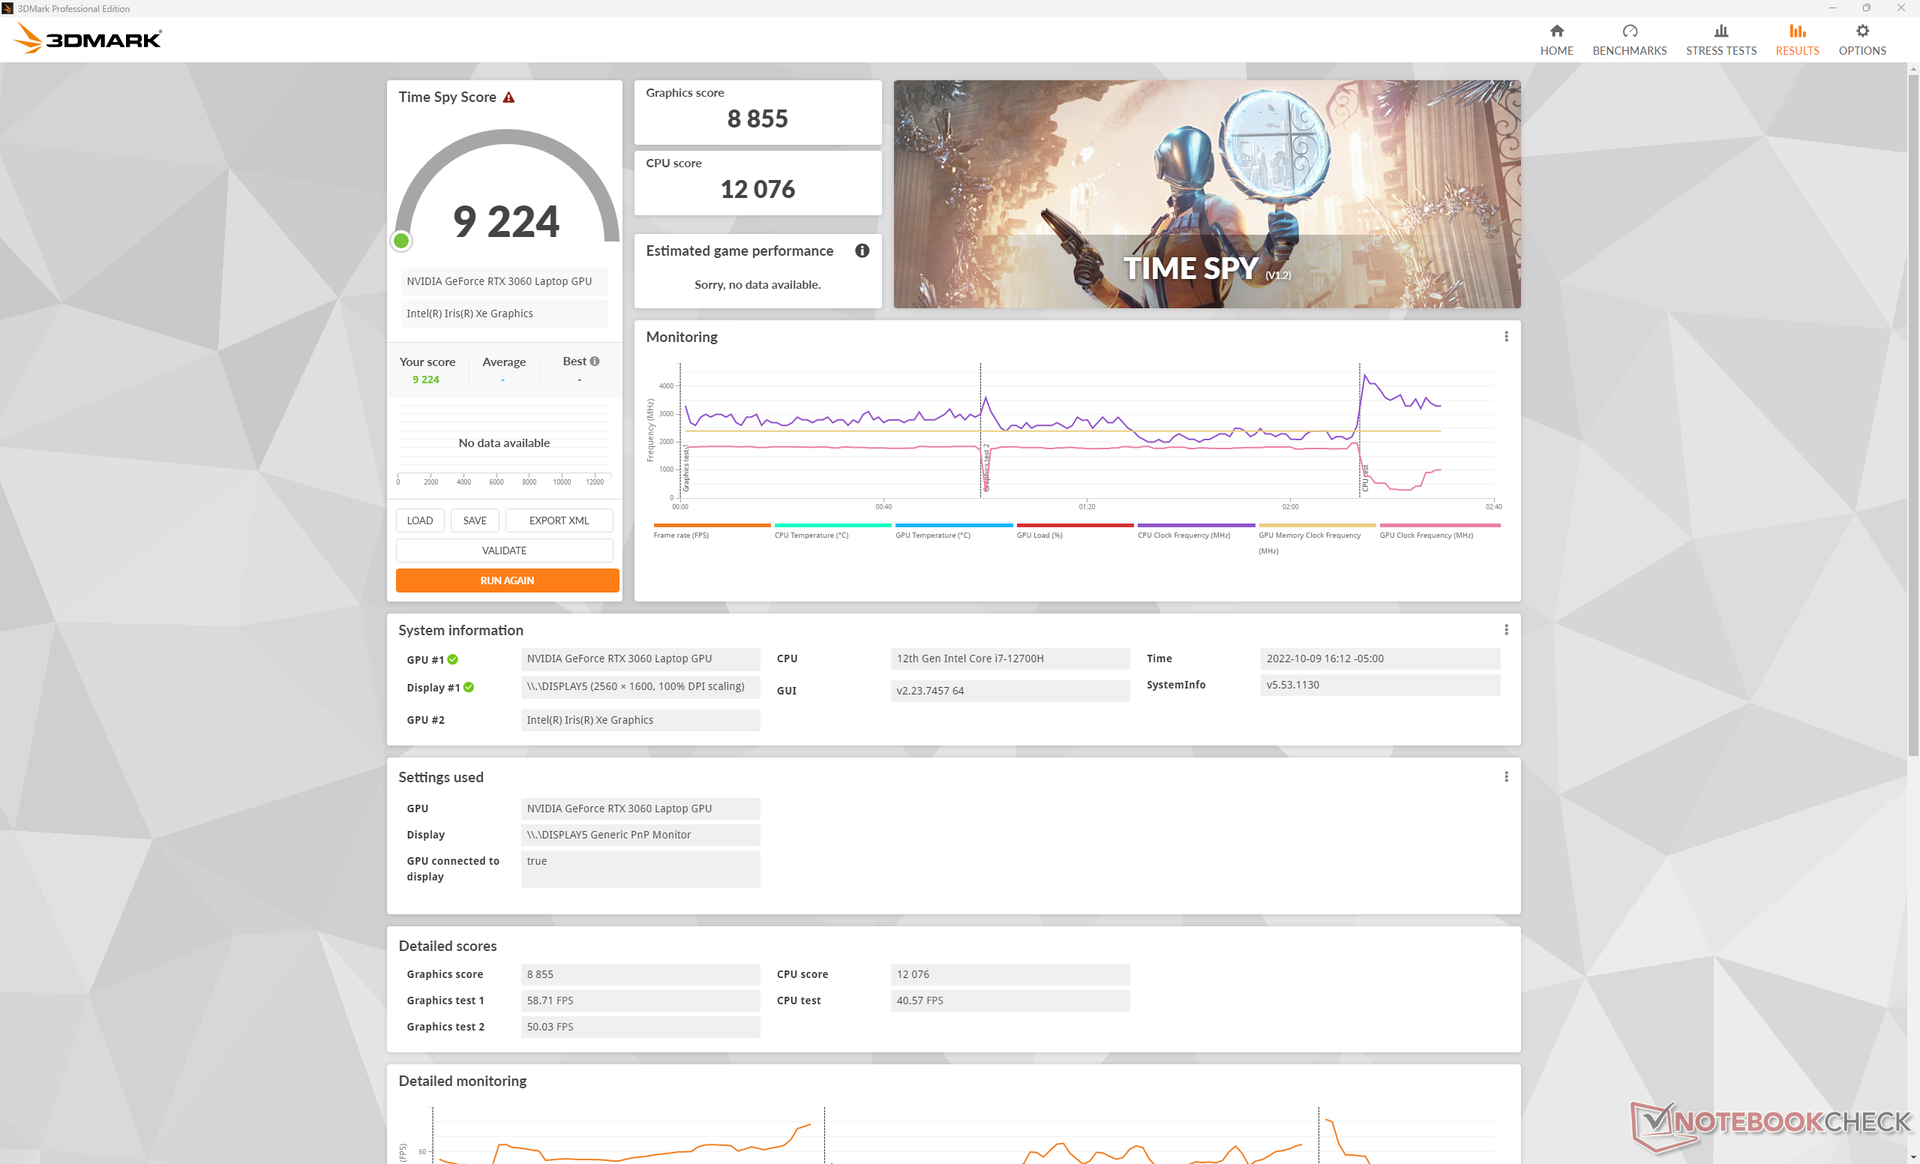
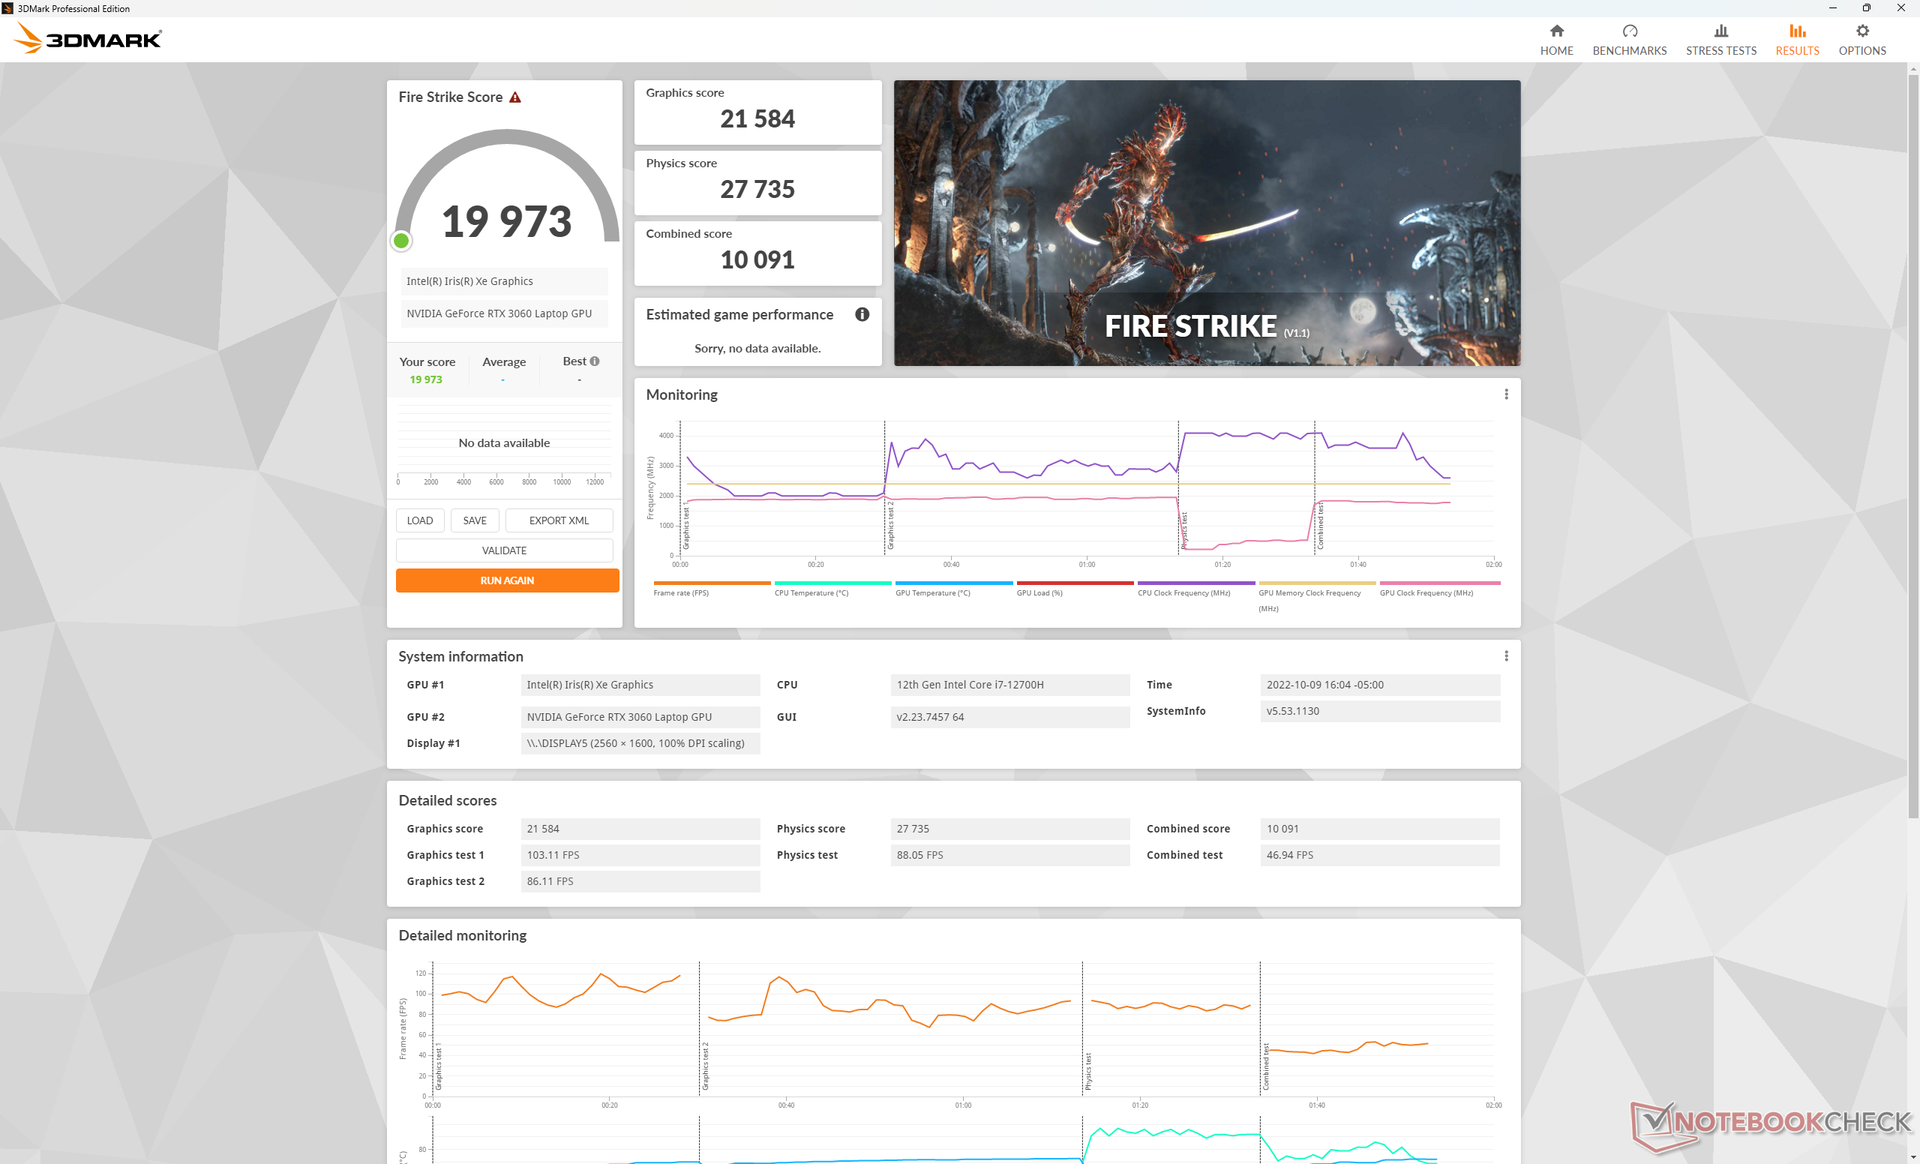
| 3DMark 11 Performance | 26702 points | |
| 3DMark Cloud Gate Standard Score | 52367 points | |
| 3DMark Fire Strike Score | 19973 points | |
| 3DMark Time Spy Score | 9224 points | |
Help | ||
* ... smaller is better
A temporary performance dip to as low as 43 FPS can be observed when running Witcher 3 as shown by our graph below. The sudden change is usually caused by poor resource management from certain background applications, such as any pre-installed software from the manufacturer, that interrupt the current application in focus.
Witcher 3 FPS Chart
| low | med. | high | ultra | QHD | |
|---|---|---|---|---|---|
| GTA V (2015) | 185.6 | 179.9 | 176.2 | 108.7 | 82.1 |
| The Witcher 3 (2015) | 415.2 | 260.5 | 167.2 | 86.6 | |
| Dota 2 Reborn (2015) | 171.8 | 159.3 | 159 | 147.2 | |
| Final Fantasy XV Benchmark (2018) | 176.7 | 123.3 | 89.4 | 67.1 | |
| X-Plane 11.11 (2018) | 147.8 | 130.5 | 102.6 | ||
| Strange Brigade (2018) | 395 | 228 | 180.2 | 155.5 | 113 |
| Cyberpunk 2077 1.6 (2022) | 125.1 | 105.4 | 80.4 | 66.8 | 41.6 |
Emissions
System Noise — Almost Never Silent
The internal fans in the G16 are almost never idle even when set to the lowest power profile. When on "Quiet" mode, for example, we're still able to record a fan noise of 28 dB(A) against a silent background of 23 dB(A). This is loud enough to be noticeable when video streaming and also louder than many other gaming laptops under similar conditions such as the Lenovo Legion 7 16 or HP Victus 16.
The good news at that the high floor noise means the fans will ramp up more slowly when higher loads are introduced. When running the first benchmark scene of 3DMark 06, for example, fan noise would top out at 32 dB(A) compared to 40 dB(A) or higher on the Acer Swift X SFX16 HP Victus 16.
Fan noise would stabilize at 45.7 dB(A) and 48.3 dB(A) when running Witcher 3 on Balanced mode and Performance mode, respectively.
Noise level
| Idle |
| 28.3 / 28.8 / 28.9 dB(A) |
| Load |
| 32.4 / 48.1 dB(A) |
 | ||
30 dB silent 40 dB(A) audible 50 dB(A) loud |
||
min: | ||
| Dell G16 7620 GeForce RTX 3060 Laptop GPU, i7-12700H, WDC PC SN810 512GB | Lenovo Legion 7 16ARHA7 Radeon RX 6850M XT, R9 6900HX, Samsung PM9A1 MZVL22T0HBLB | HP Victus 16-e0145ng GeForce RTX 3050 Ti Laptop GPU, R5 5600H, Samsung SSD PM981a MZVLB512HBJQ | Asus ROG Zephyrus M16 GU603H GeForce RTX 3070 Laptop GPU, i9-11900H, Samsung PM9A1 MZVL22T0HBLB | Lenovo Legion 5 Pro 16IAH7H GeForce RTX 3060 Laptop GPU, i7-12700H, 2x Samsung PM9A1 MZVL21T0HCLR (RAID 0) | Acer Swift X SFX16-51G-5388 GeForce RTX 3050 4GB Laptop GPU, i5-11320H, Samsung PM991 MZVLQ512HBLU | |
|---|---|---|---|---|---|---|
| Noise | 8% | -9% | -17% | -14% | -1% | |
| off / environment * (dB) | 23.2 | 22.8 2% | 26 -12% | 25 -8% | 24.6 -6% | 25.4 -9% |
| Idle Minimum * (dB) | 28.3 | 23 19% | 26 8% | 25 12% | 28.7 -1% | 25.4 10% |
| Idle Average * (dB) | 28.8 | 23 20% | 28 3% | 31 -8% | 32 -11% | 25.4 12% |
| Idle Maximum * (dB) | 28.9 | 23 20% | 34 -18% | 42 -45% | 32 -11% | 27.8 4% |
| Load Average * (dB) | 32.4 | 26.8 17% | 44 -36% | 48 -48% | 45.2 -40% | 41 -27% |
| Witcher 3 ultra * (dB) | 48.3 | 54.3 -12% | 48 1% | 52 -8% | ||
| Load Maximum * (dB) | 48.1 | 54.2 -13% | 53 -10% | 56 -16% | 54.4 -13% | 47 2% |
* ... smaller is better
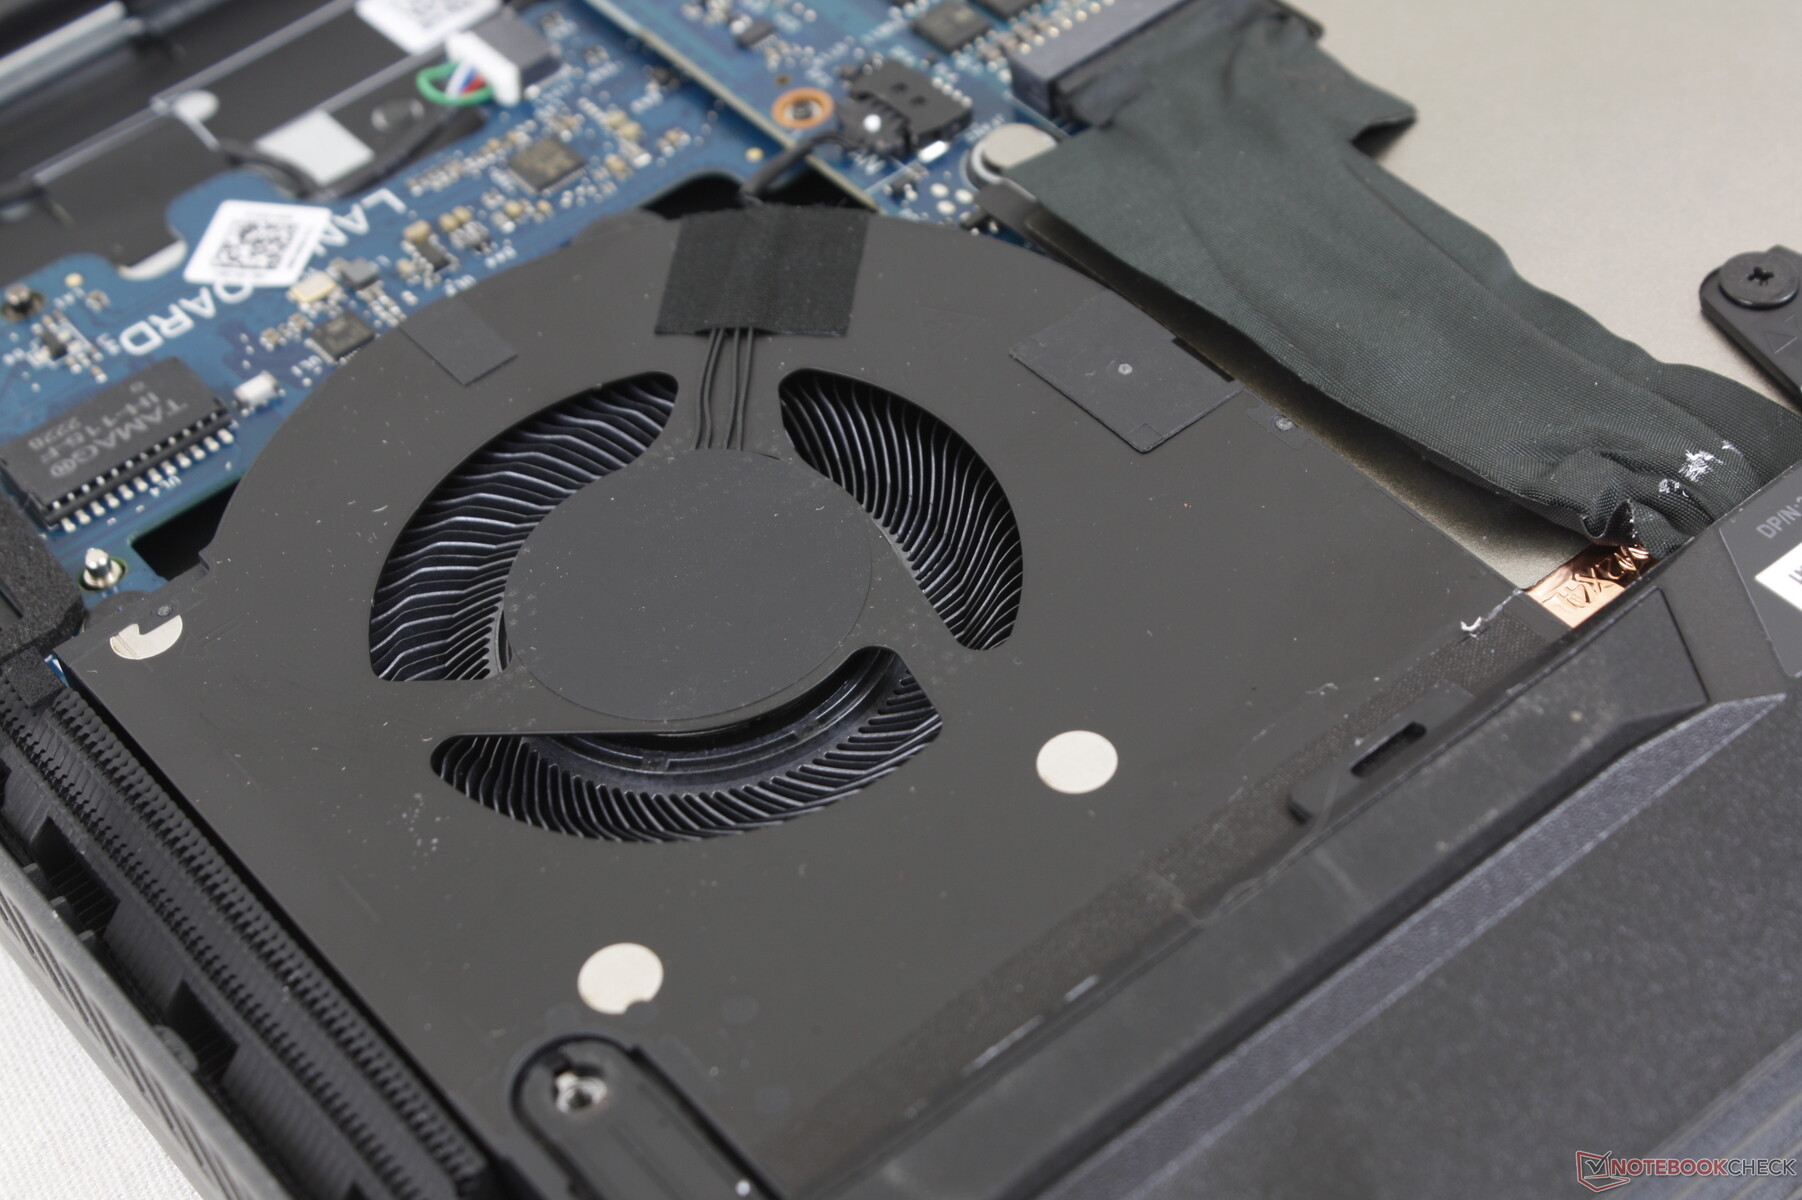
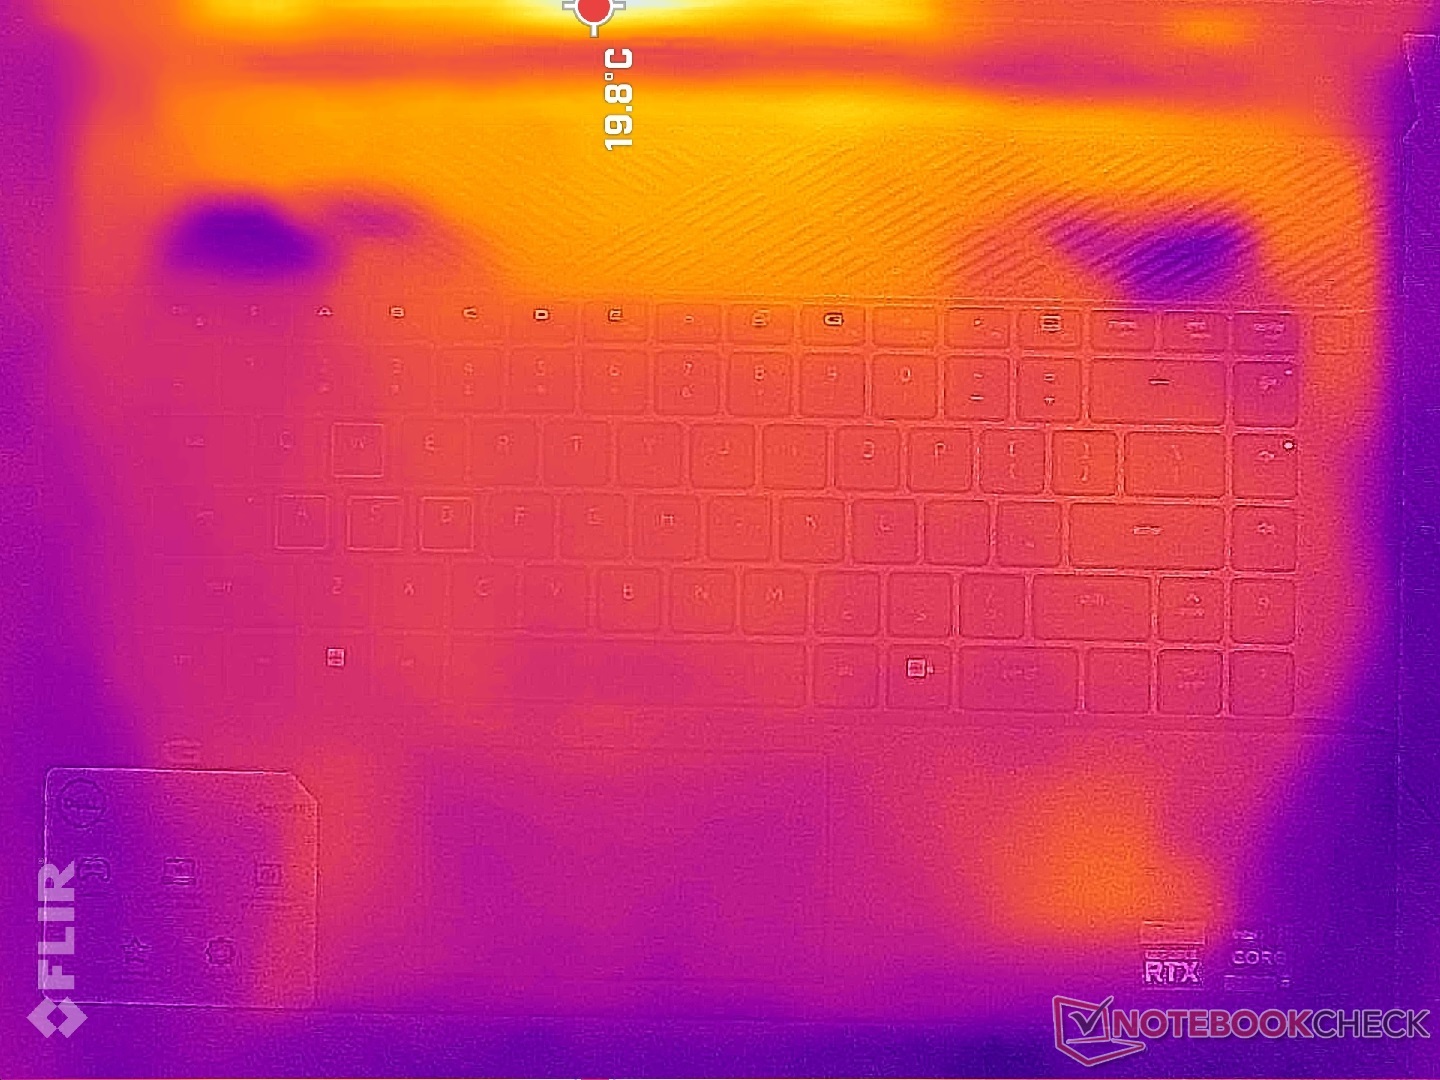
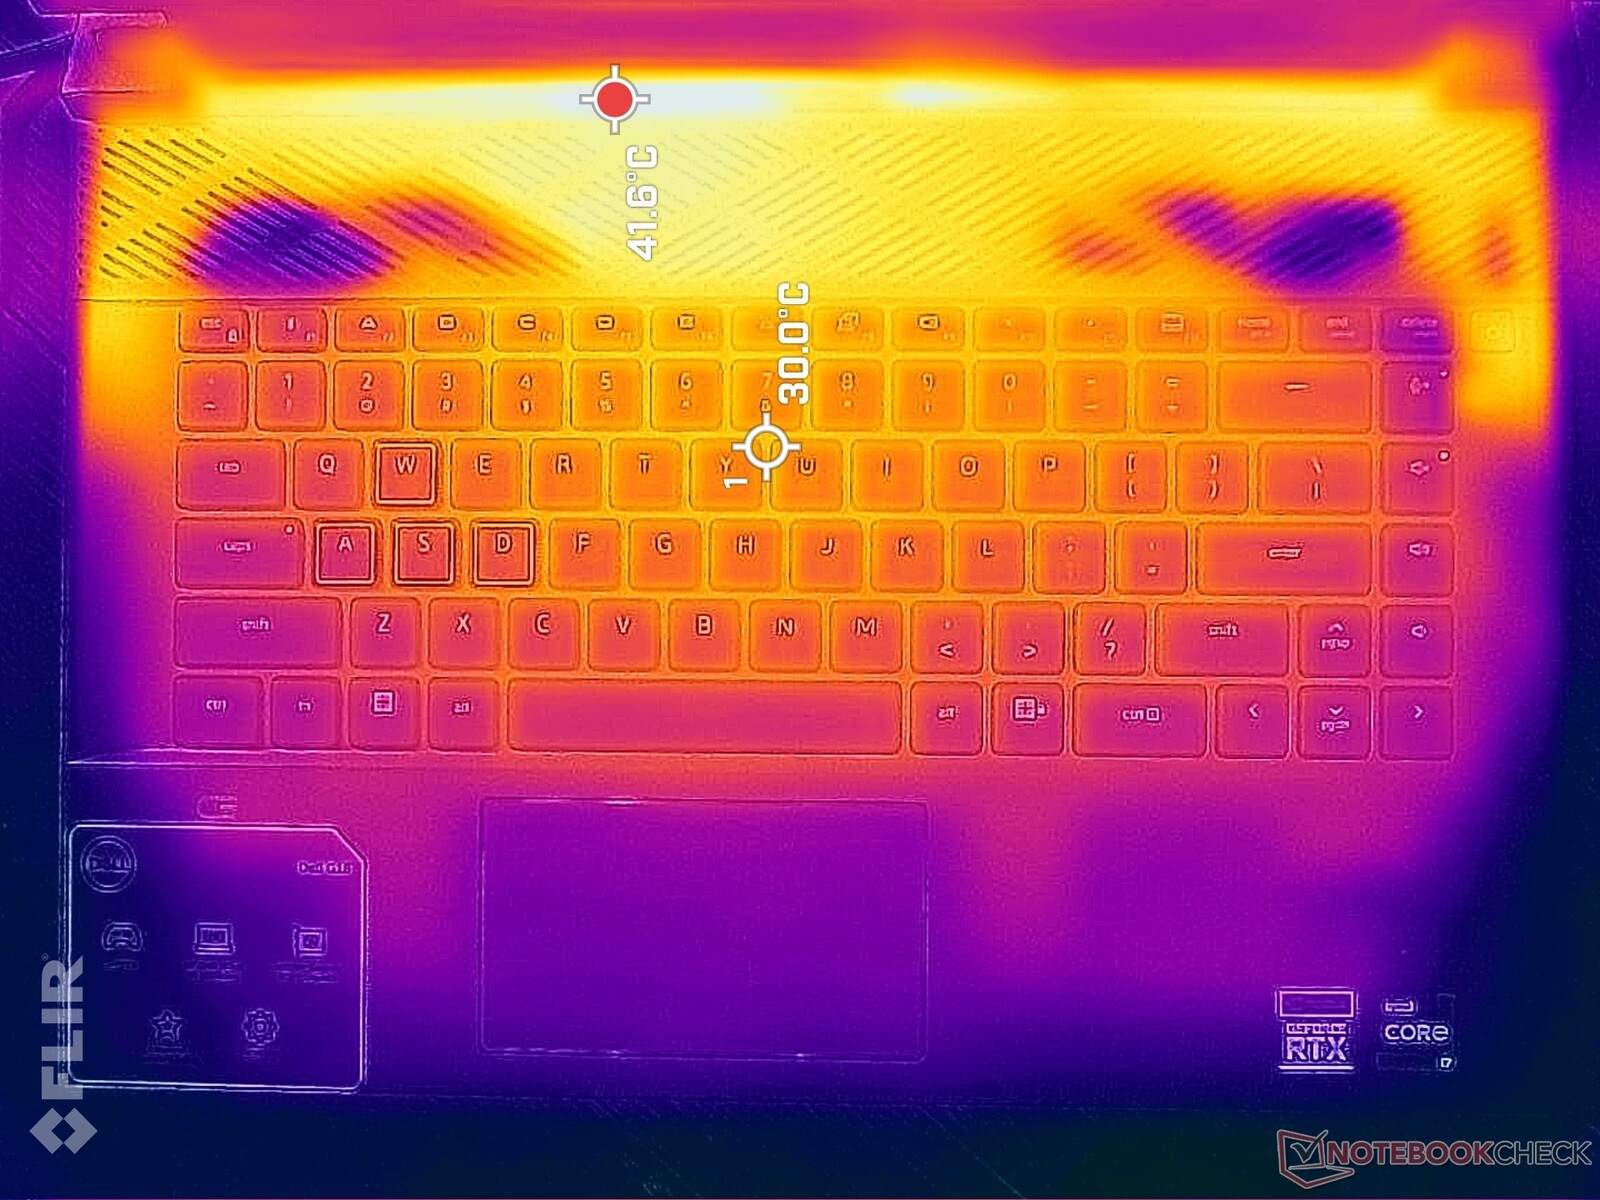
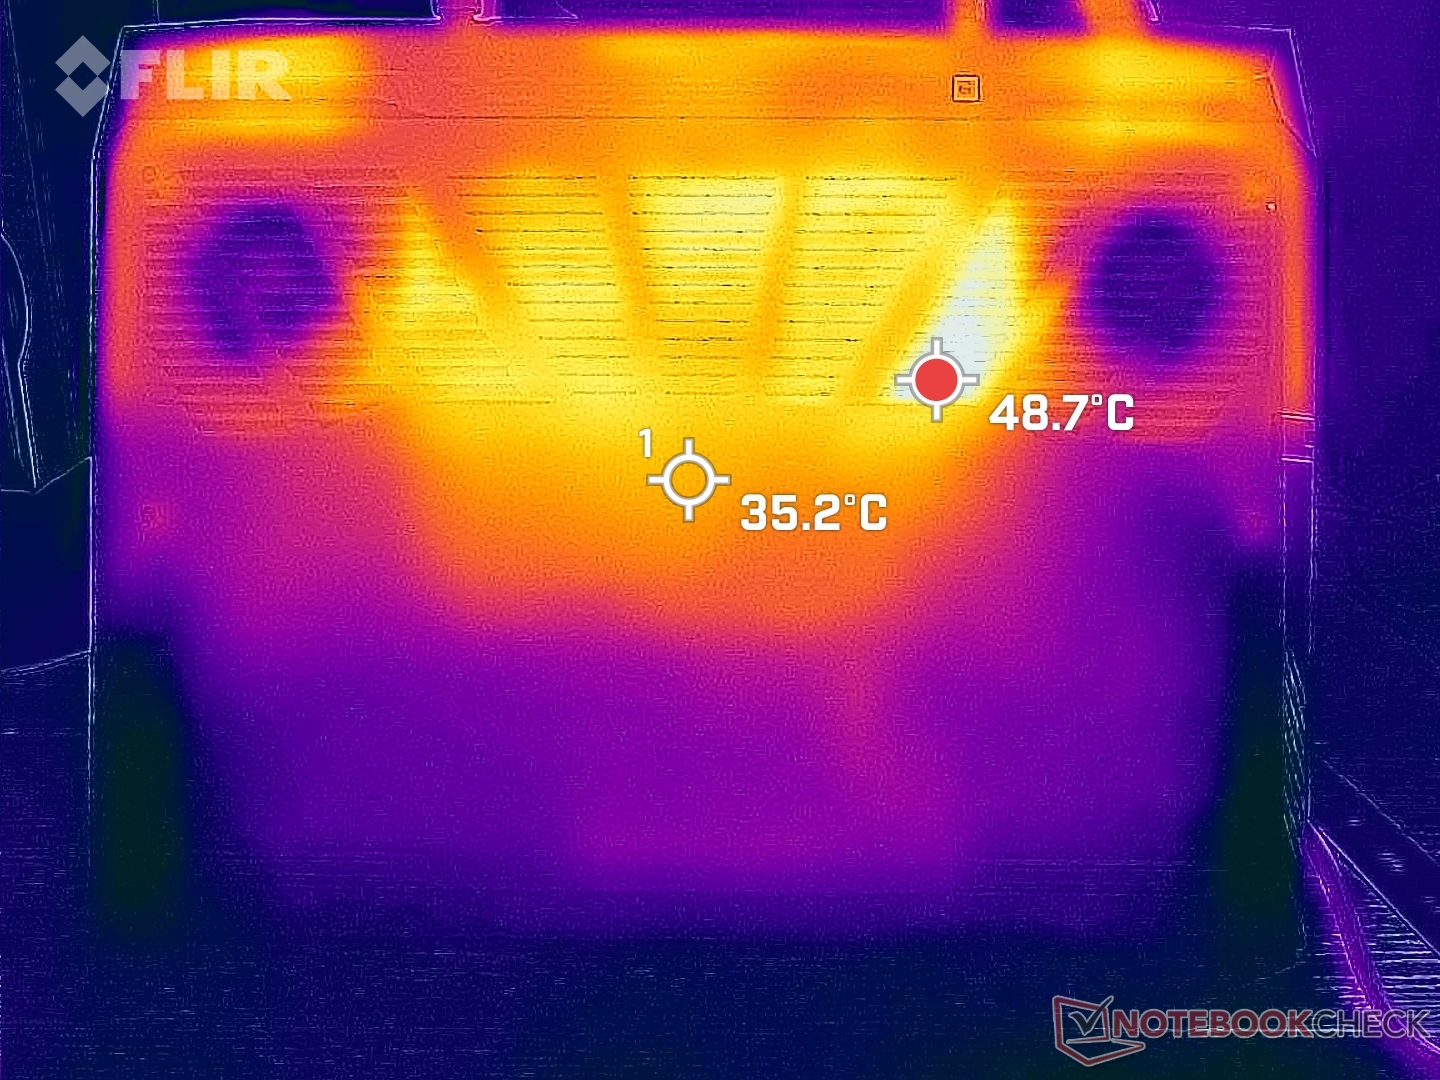
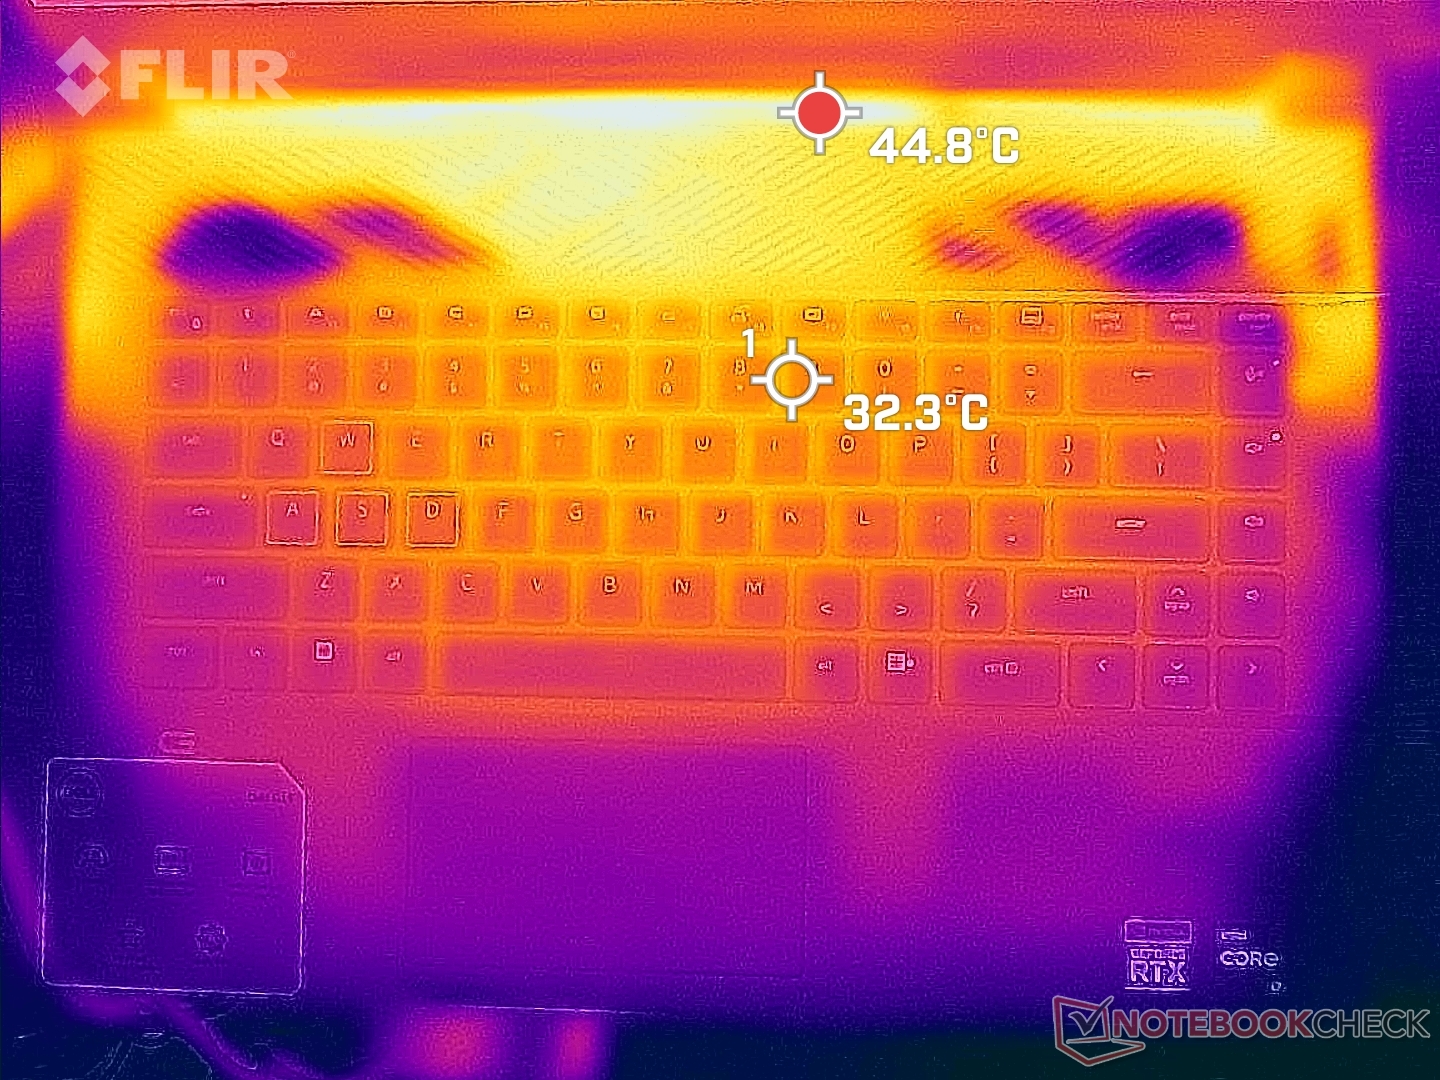
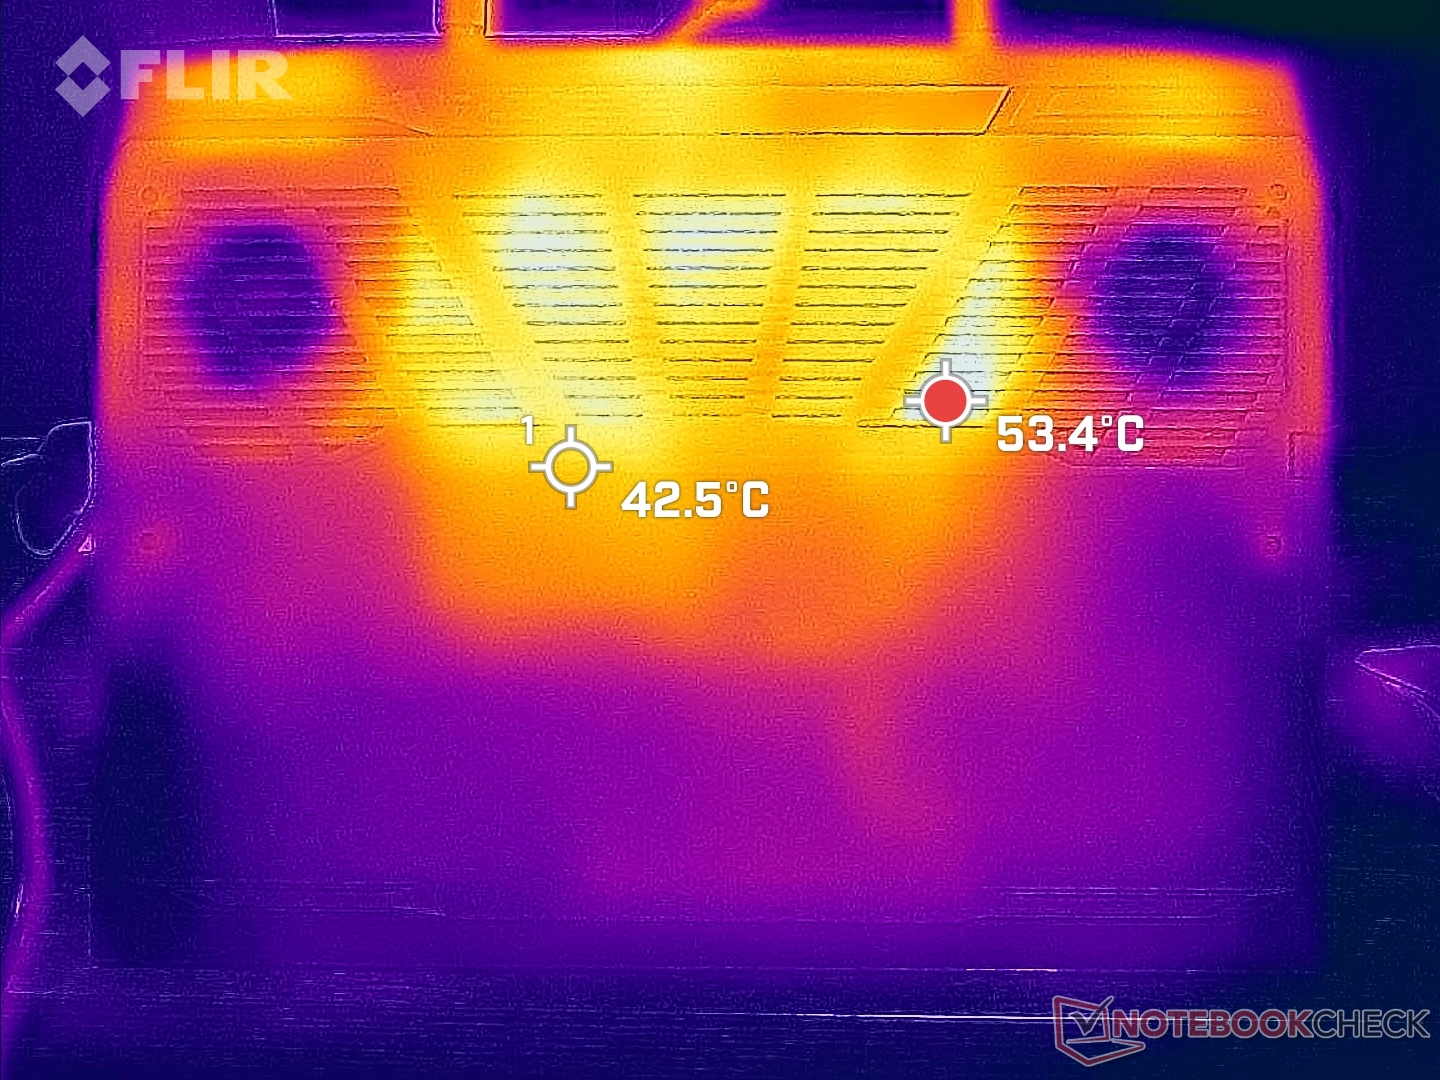
Temperature — Very Warm Towards The Back
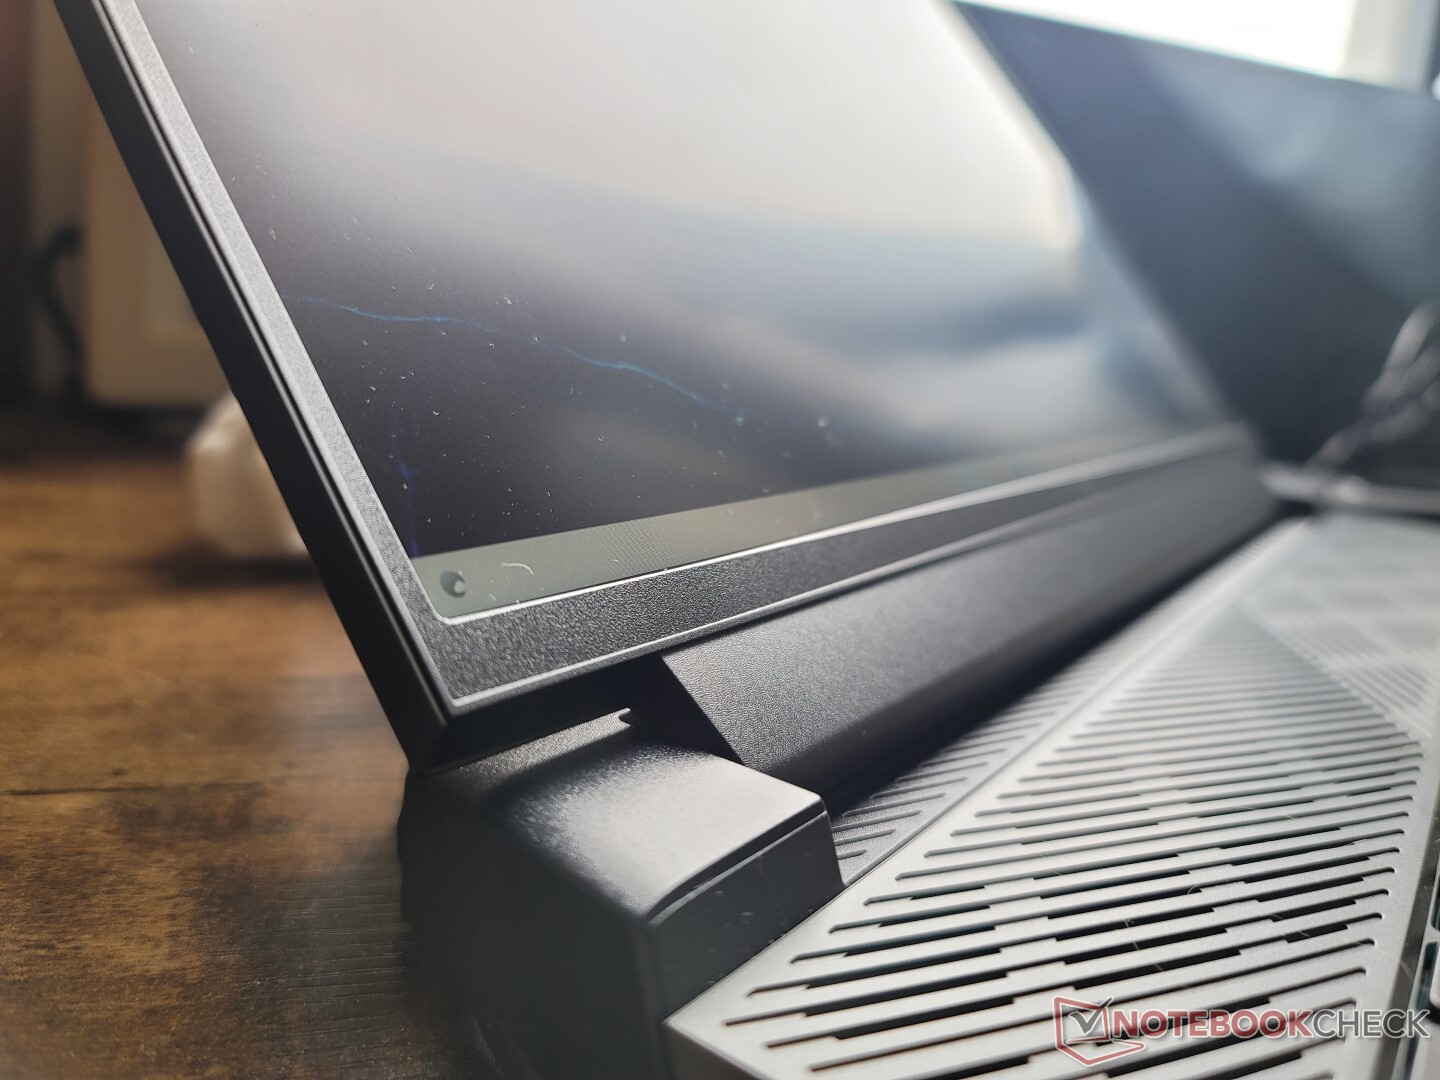
Surface temperatures when gaming can reach up to 48 C and 51 C on the top and bottom, respectively, compared to 54 C and 46 C on the HP Victus 16 when under similar conditions. The hot spots are thankfully toward the rear and away from the keyboard keys or frontal areas. Thus, the palm rests and keys never become uncomfortably warm when gaming.
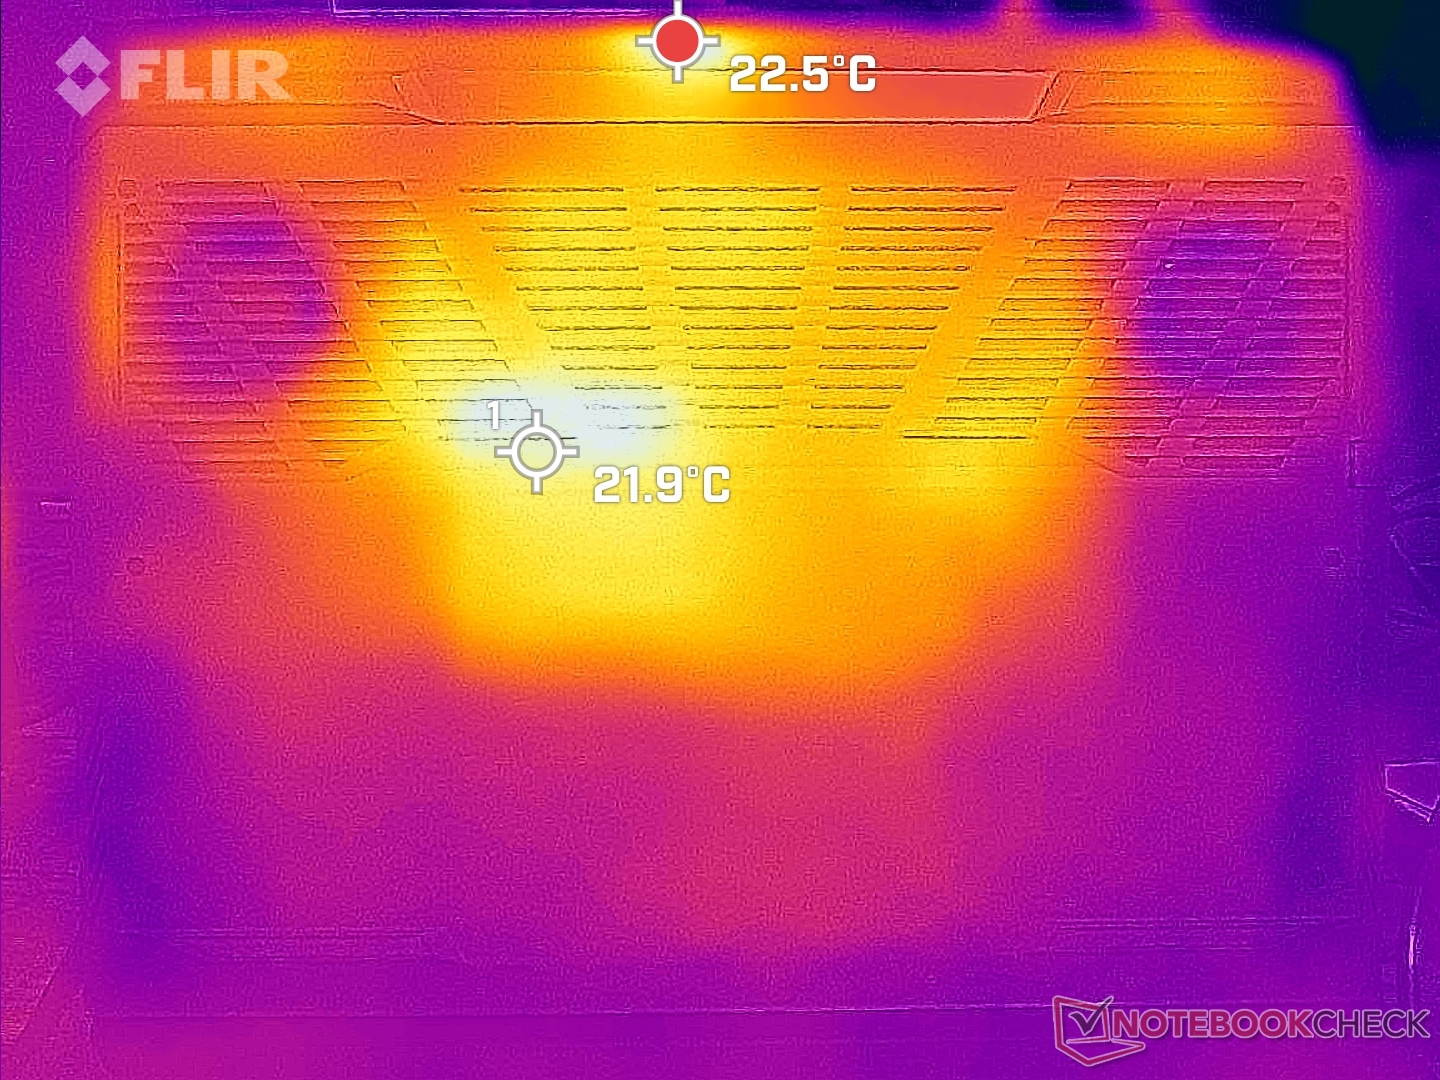
Much of the rear is dedicated to ventilation as evident by the many grilles on all sides of the base.
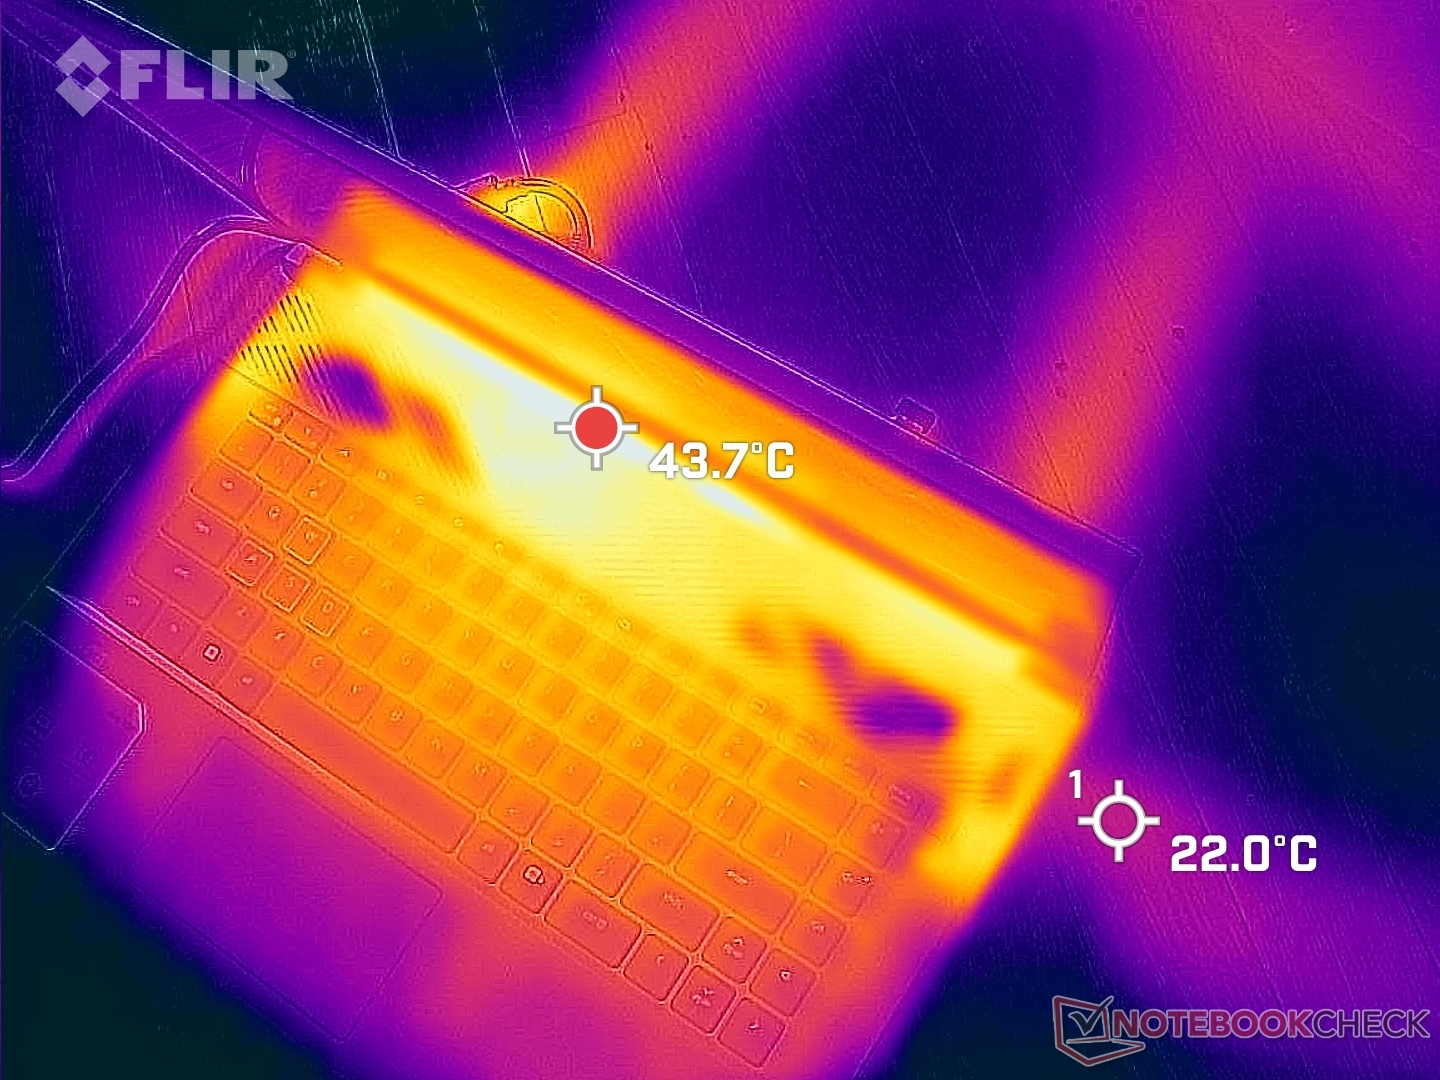
(-) The maximum temperature on the upper side is 47.6 °C / 118 F, compared to the average of 40.4 °C / 105 F, ranging from 21.2 to 68.8 °C for the class Gaming.
(-) The bottom heats up to a maximum of 54 °C / 129 F, compared to the average of 43.2 °C / 110 F
(+) In idle usage, the average temperature for the upper side is 21.8 °C / 71 F, compared to the device average of 33.9 °C / 93 F.
(±) Playing The Witcher 3, the average temperature for the upper side is 33.7 °C / 93 F, compared to the device average of 33.9 °C / 93 F.
(+) The palmrests and touchpad are cooler than skin temperature with a maximum of 30.2 °C / 86.4 F and are therefore cool to the touch.
(±) The average temperature of the palmrest area of similar devices was 28.8 °C / 83.8 F (-1.4 °C / -2.6 F).
| Dell G16 7620 Intel Core i7-12700H, NVIDIA GeForce RTX 3060 Laptop GPU | Lenovo Legion 7 16ARHA7 AMD Ryzen 9 6900HX, AMD Radeon RX 6850M XT | HP Victus 16-e0145ng AMD Ryzen 5 5600H, NVIDIA GeForce RTX 3050 Ti Laptop GPU | Asus ROG Zephyrus M16 GU603H Intel Core i9-11900H, NVIDIA GeForce RTX 3070 Laptop GPU | Lenovo Legion 5 Pro 16IAH7H Intel Core i7-12700H, NVIDIA GeForce RTX 3060 Laptop GPU | Acer Swift X SFX16-51G-5388 Intel Core i5-11320H, NVIDIA GeForce RTX 3050 4GB Laptop GPU | |
|---|---|---|---|---|---|---|
| Heat | -10% | -26% | -35% | -19% | -15% | |
| Maximum Upper Side * (°C) | 47.6 | 37.2 22% | 54 -13% | 52 -9% | 45.8 4% | 52.4 -10% |
| Maximum Bottom * (°C) | 54 | 43 20% | 47 13% | 53 2% | 66.3 -23% | 50 7% |
| Idle Upper Side * (°C) | 23 | 34 -48% | 41 -78% | 38 -65% | 30.4 -32% | 30.3 -32% |
| Idle Bottom * (°C) | 24.6 | 32.8 -33% | 31 -26% | 41 -67% | 30.4 -24% | 30.4 -24% |
* ... smaller is better
Stress Test
CPU temperatures become very warm when the system is stressed. When running Prime95, for example, clock rates and board power draw would boost to 4.1 GHz and 117 W, respectively, lasting for about a minute at up to 99 C. The CPU would then drop to the 3.1 to 3.5 GHz range and at a lower board power draw of 88 W in order to prevent core temperatures from reaching 100 C. In comparison, running this same test on the HP Envy 16 with the same Core i7-12700H CPU and GeForce GPU would result in a core temperature of just 66 C. The already high core temperature of the G16 suggests that the costlier Core i9-12900H SKU will likely bring just minor performance boosts at best.
Running Witcher 3 would result in a stable GPU core clock, temperature and board power draw of 1777 MHz, 86 C, and 114 W, respectively, against the 130 W TGP target. Repeating this same test on the aforementioned Envy 16 would result in slightly slower core clock rates and both lower temperatures and power demands. More concerning, however, is that the temperature of the CPU in the G16 is again over 90 C to be much warmer than on competing gaming laptops.
Running on battery power severely limits performance. A Fire Strike test on batteries would return Physics and graphics scores of 19465 and 4162 points, respectively, compared to 27735 and 21584 points when on mains.
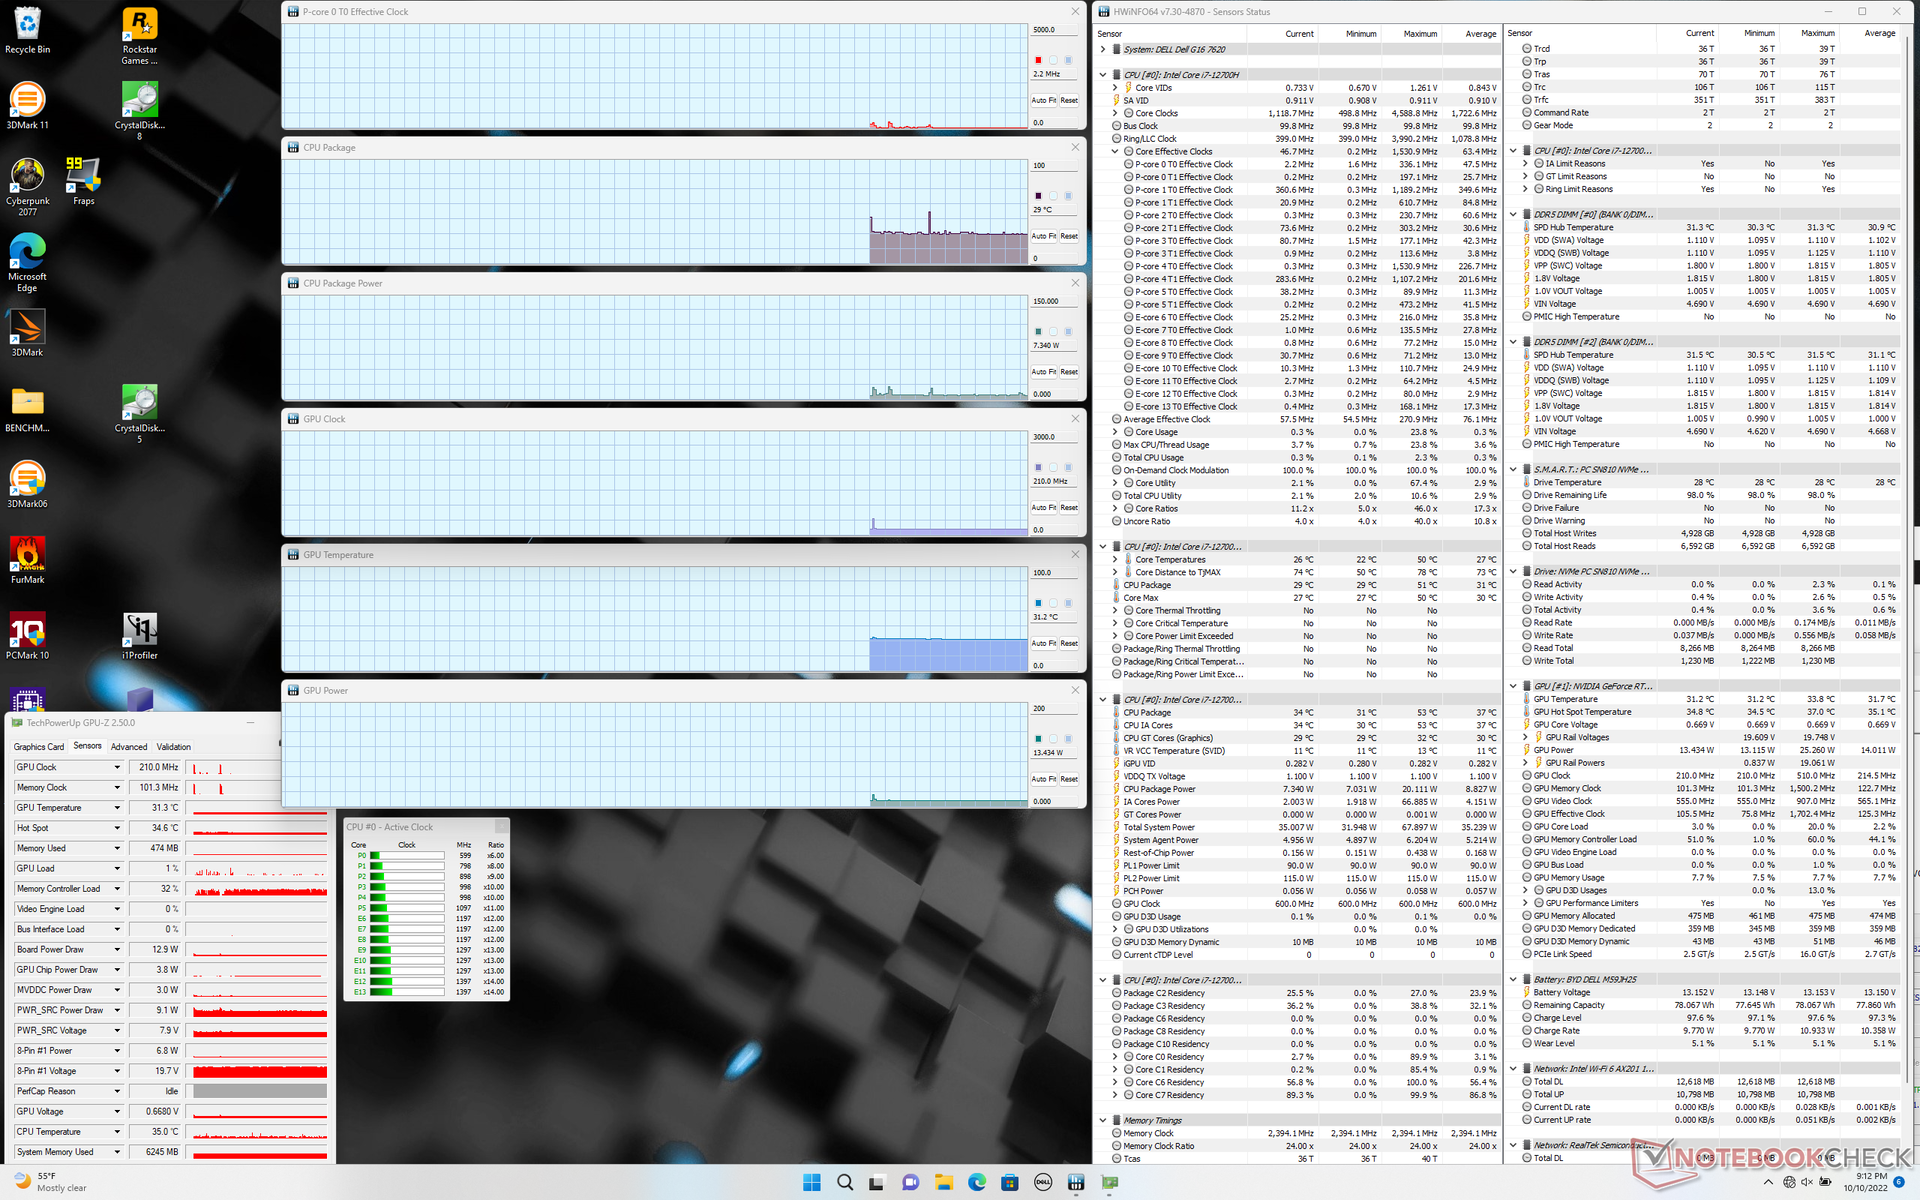
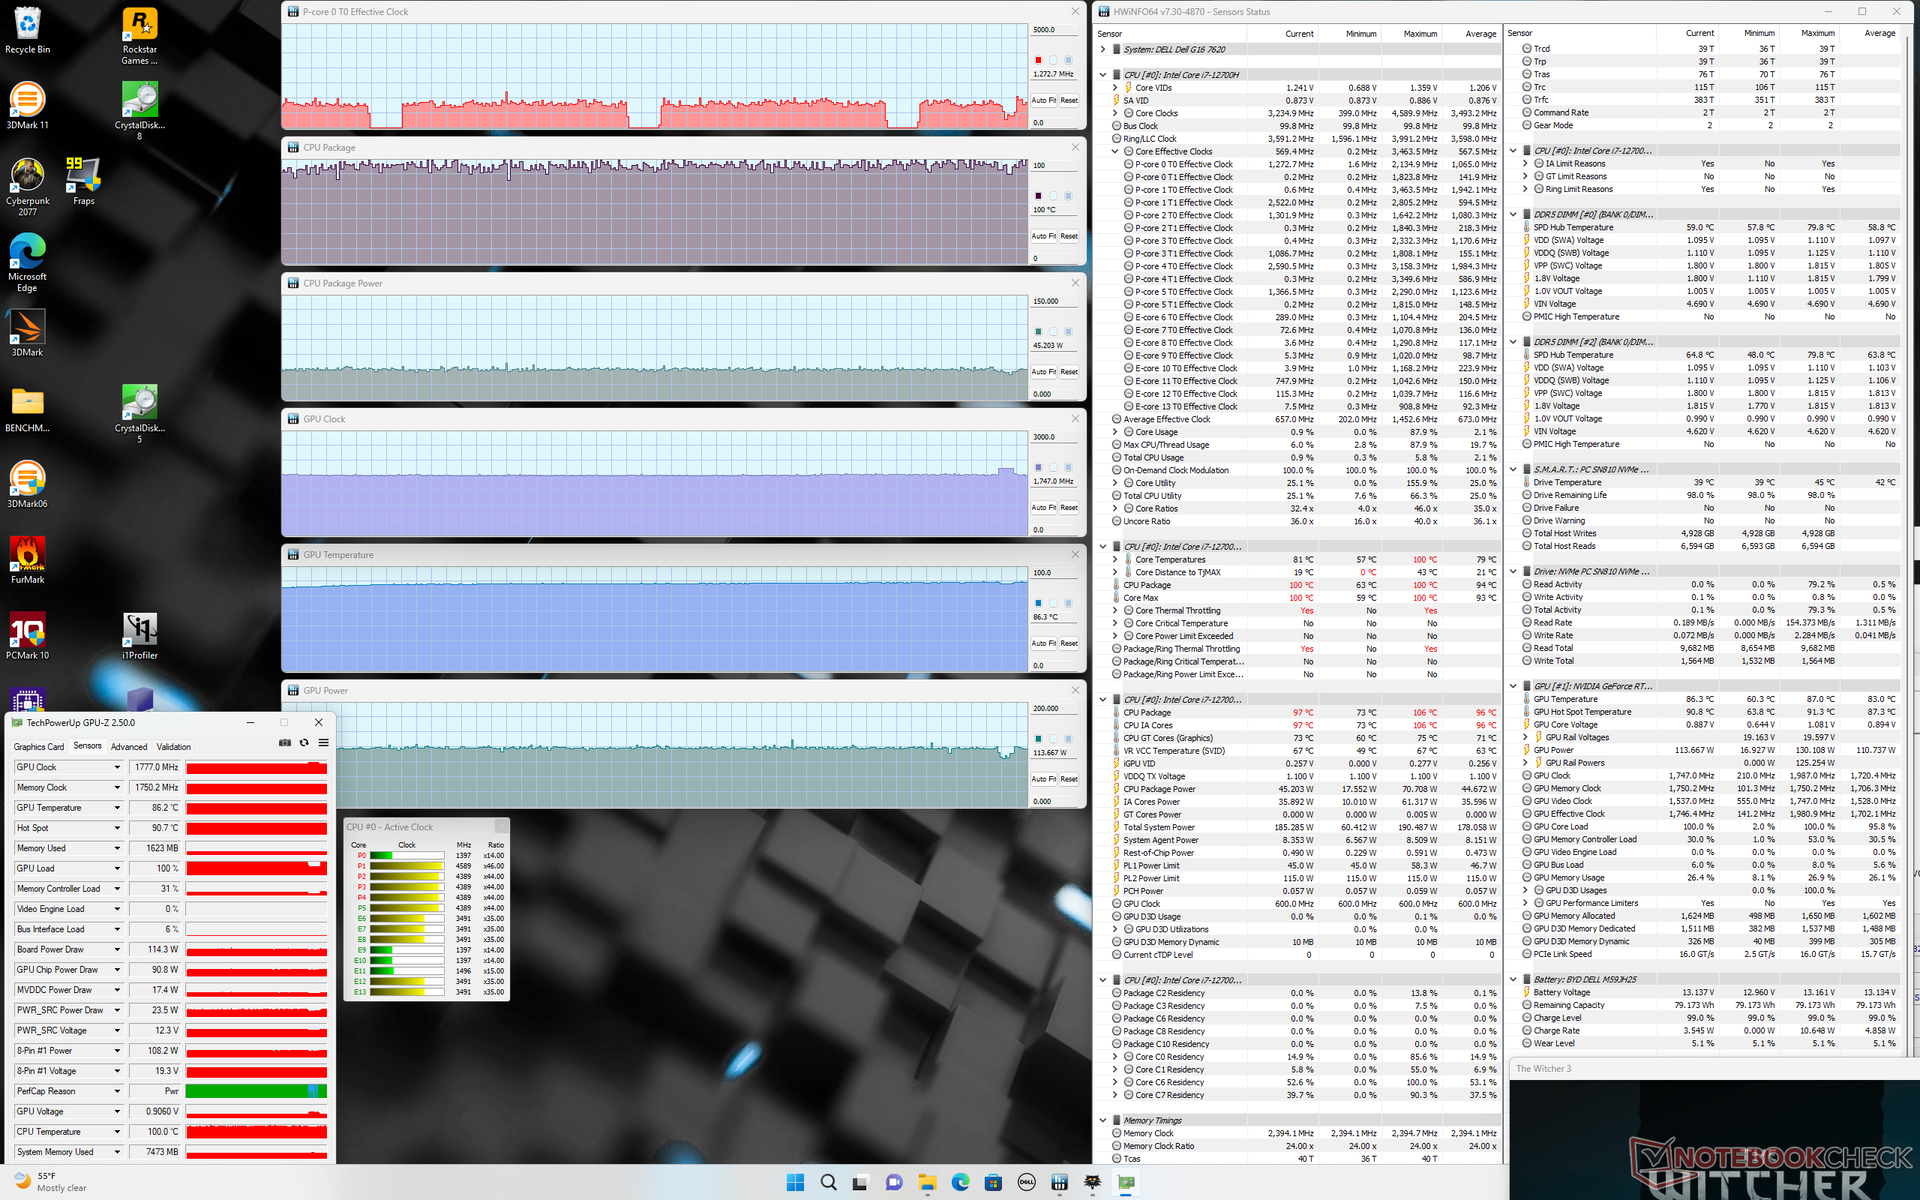
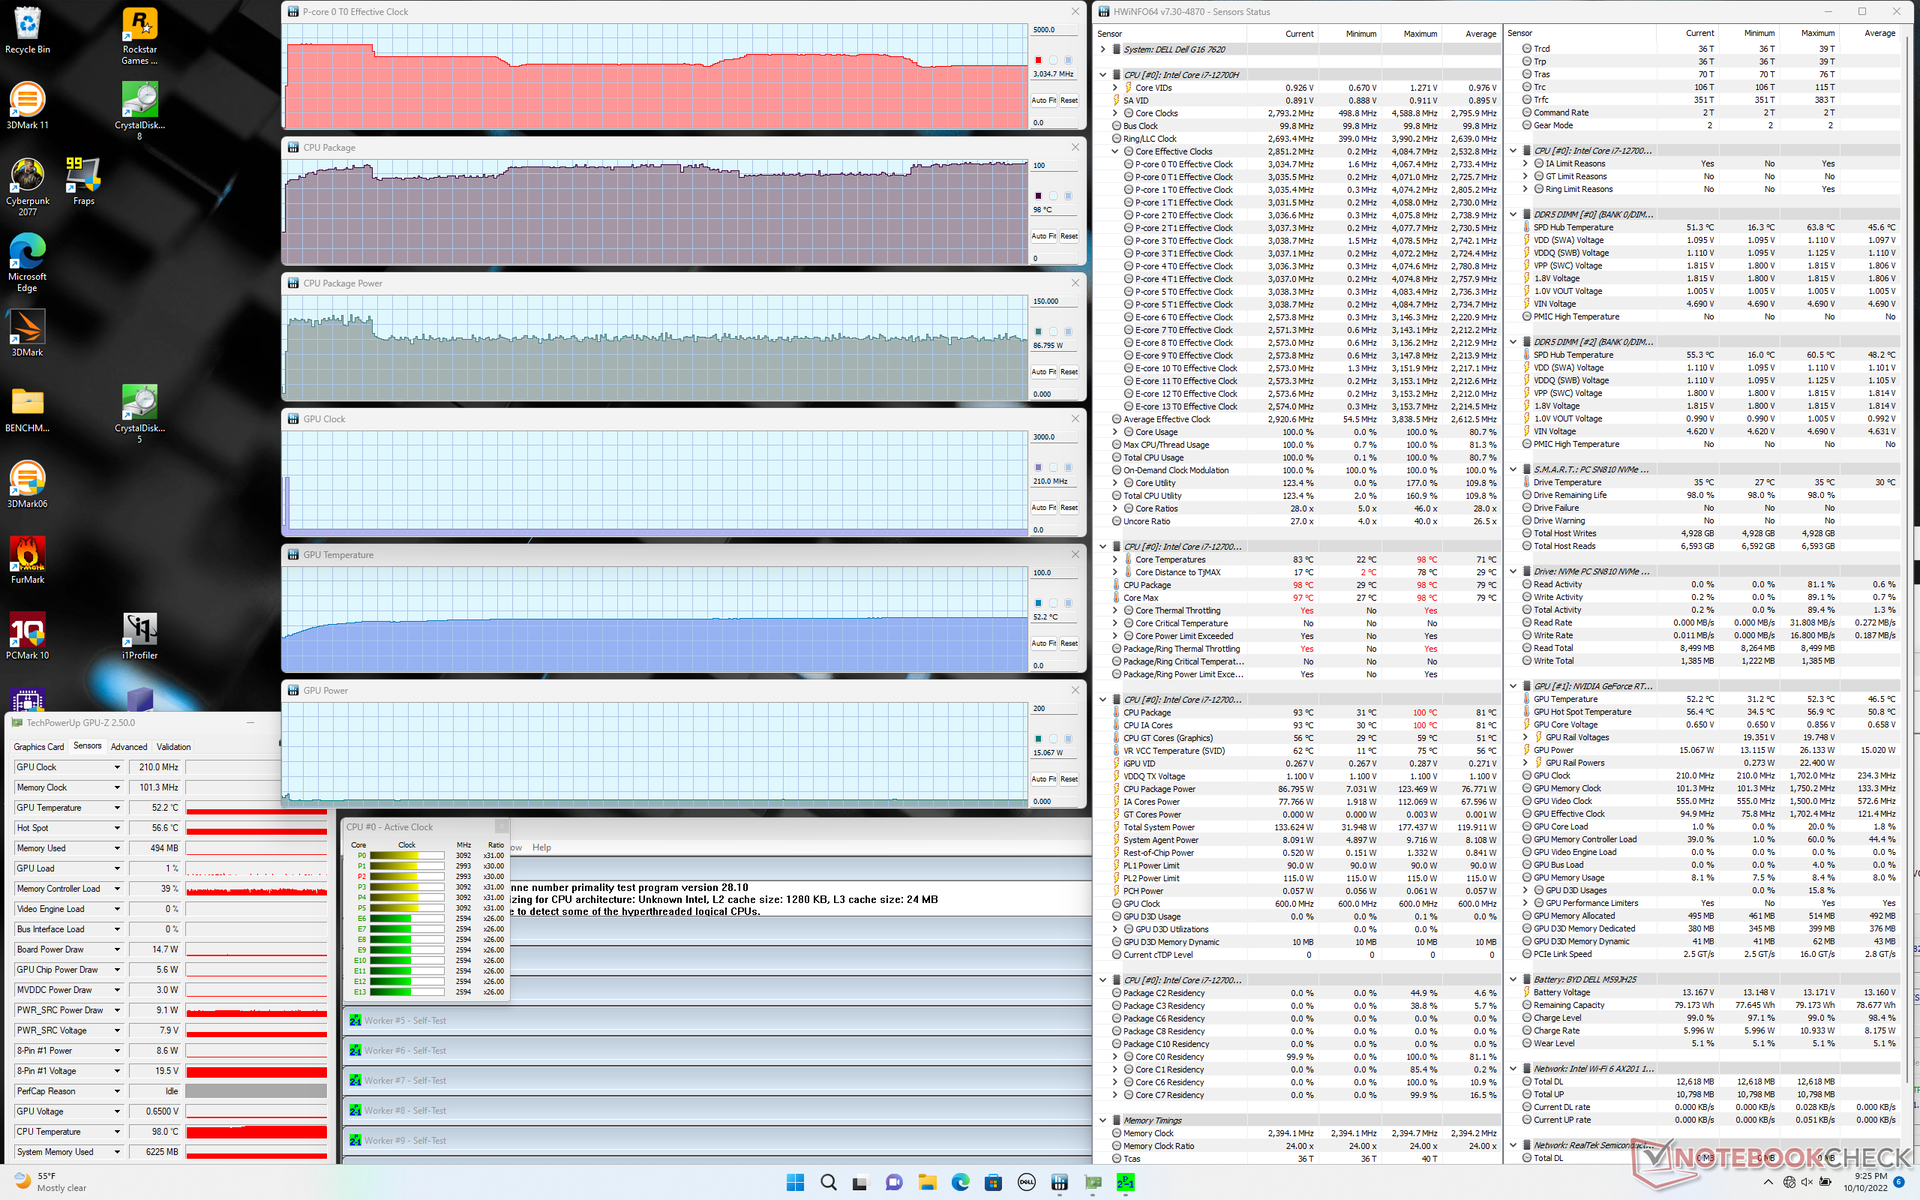
| CPU Clock (GHz) | GPU Clock (MHz) | Average CPU Temperature (°C) | Average GPU Temperature (°C) | |
| System Idle | -- | -- | 29 | 31 |
| Prime95 Stress | 3.1 - 3.6 | -- | 86 - 98 | 52 |
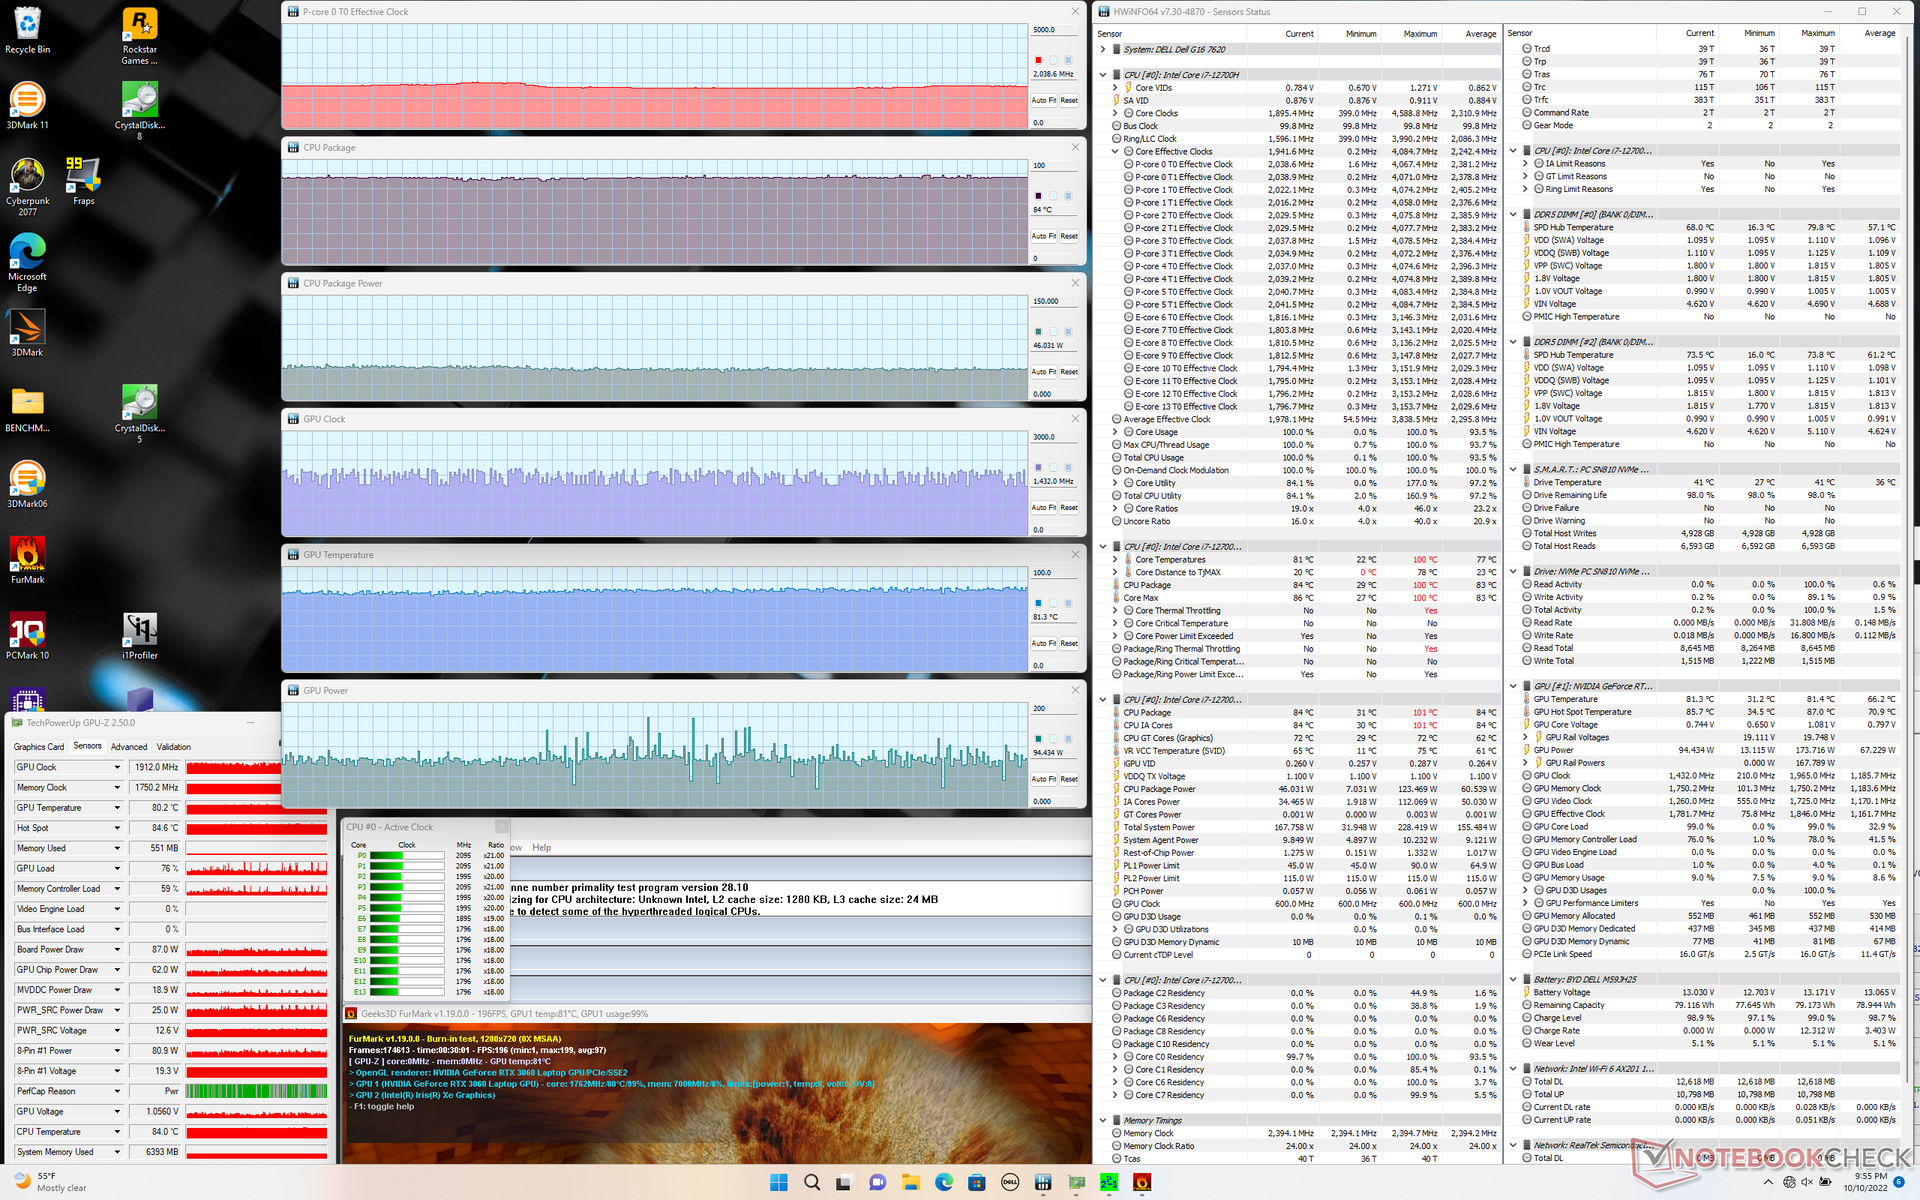
| Prime95 + FurMark Stress | 2.0 | ~1432 - ~1912 | 84 | 81 |
| Witcher 3 Stress | ~1.3 | 1777 | ~99 | 86 |
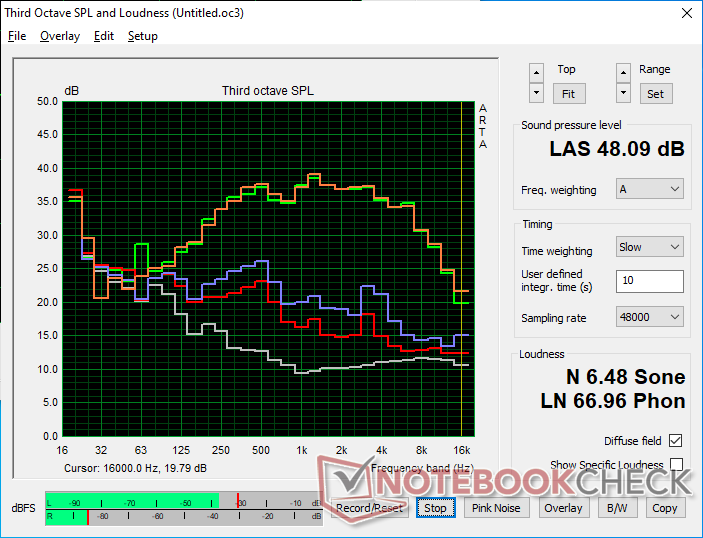
Speakers
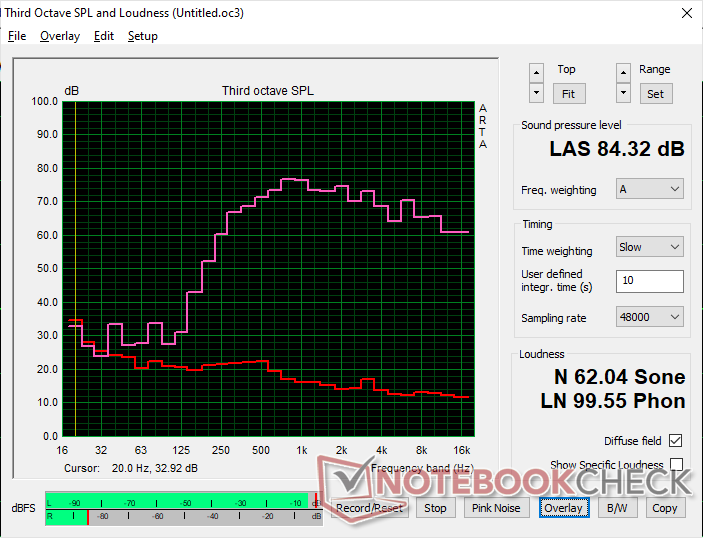
Dell G16 7620 audio analysis
(+) | speakers can play relatively loud (84.3 dB)
Bass 100 - 315 Hz
(-) | nearly no bass - on average 21.8% lower than median
(±) | linearity of bass is average (14.5% delta to prev. frequency)
Mids 400 - 2000 Hz
(+) | balanced mids - only 4.9% away from median
(+) | mids are linear (3.5% delta to prev. frequency)
Highs 2 - 16 kHz
(+) | balanced highs - only 2.6% away from median
(±) | linearity of highs is average (7.7% delta to prev. frequency)
Overall 100 - 16.000 Hz
(±) | linearity of overall sound is average (17.2% difference to median)
Compared to same class
» 47% of all tested devices in this class were better, 11% similar, 42% worse
» The best had a delta of 6%, average was 18%, worst was 132%
Compared to all devices tested
» 32% of all tested devices were better, 8% similar, 60% worse
» The best had a delta of 4%, average was 23%, worst was 134%
Apple MacBook Pro 16 2021 M1 Pro audio analysis
(+) | speakers can play relatively loud (84.7 dB)
Bass 100 - 315 Hz
(+) | good bass - only 3.8% away from median
(+) | bass is linear (5.2% delta to prev. frequency)
Mids 400 - 2000 Hz
(+) | balanced mids - only 1.3% away from median
(+) | mids are linear (2.1% delta to prev. frequency)
Highs 2 - 16 kHz
(+) | balanced highs - only 1.9% away from median
(+) | highs are linear (2.7% delta to prev. frequency)
Overall 100 - 16.000 Hz
(+) | overall sound is linear (4.6% difference to median)
Compared to same class
» 0% of all tested devices in this class were better, 0% similar, 100% worse
» The best had a delta of 5%, average was 17%, worst was 45%
Compared to all devices tested
» 0% of all tested devices were better, 0% similar, 100% worse
» The best had a delta of 4%, average was 23%, worst was 134%
Energy Management — Demanding Under Most Scenarios
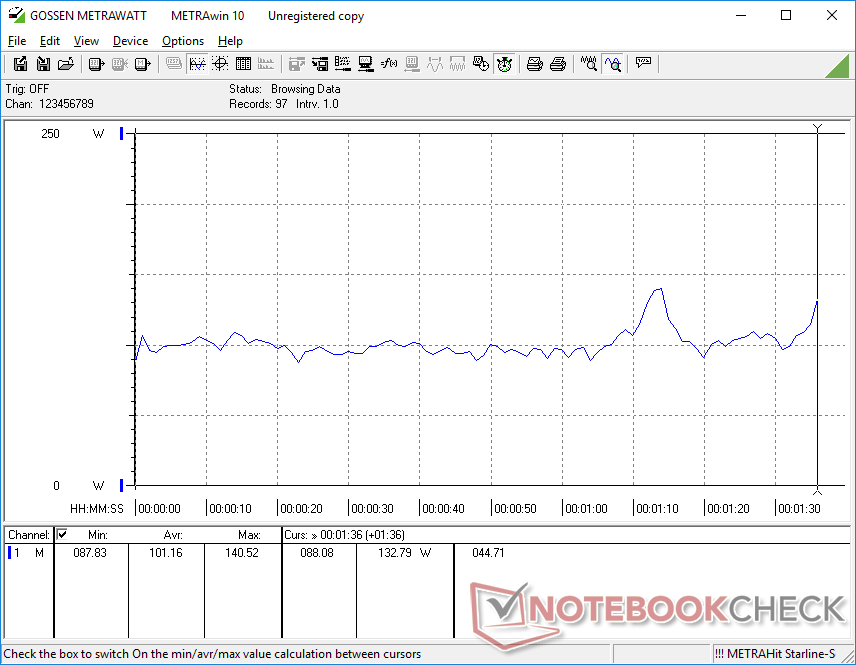
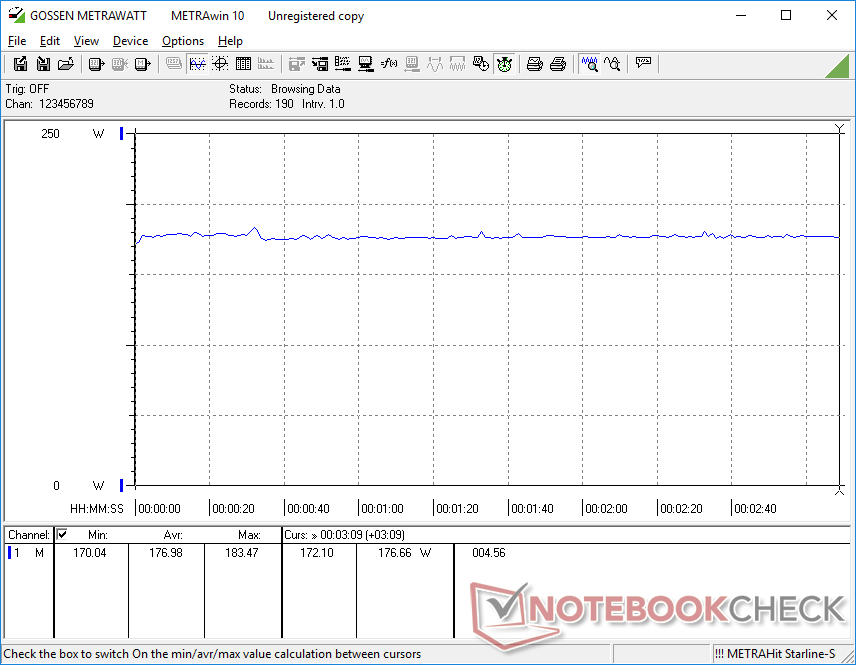
Power Consumption
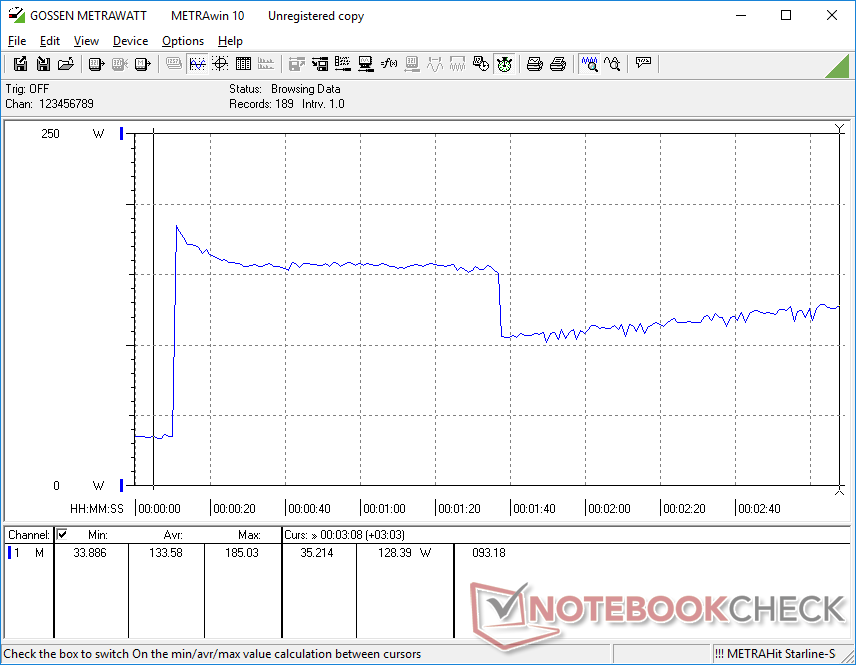
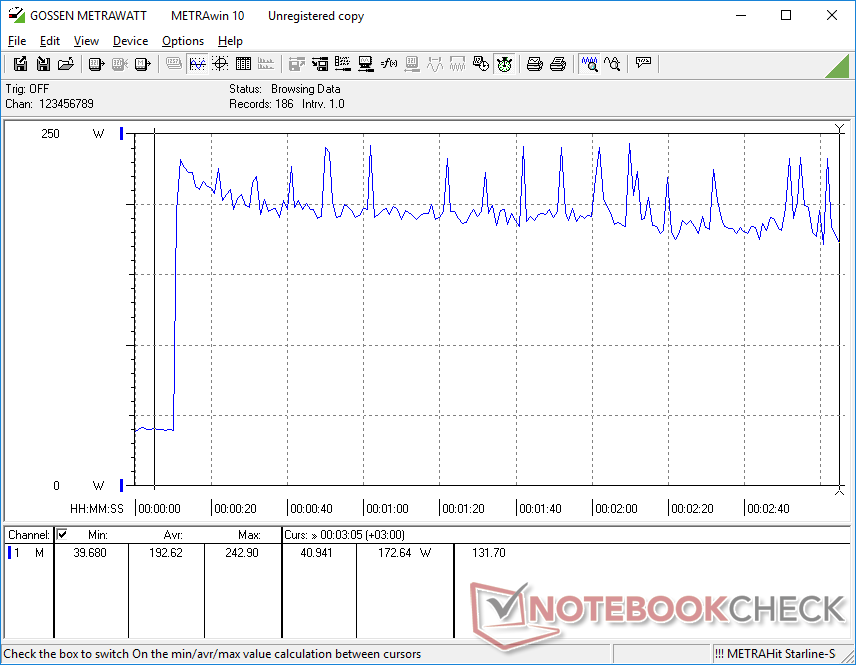
Power consumption is relatively high when idling on desktop at 14 to 32 W. Nonetheless, this range is only slightly higher than on the HP Envy 16 with the same CPU and GPU. Expect consumption to be as high as 177 W when running games or about 20 W less than on the Lenovo Legion 5 Pro or Asus ROG Strix Scar 15.
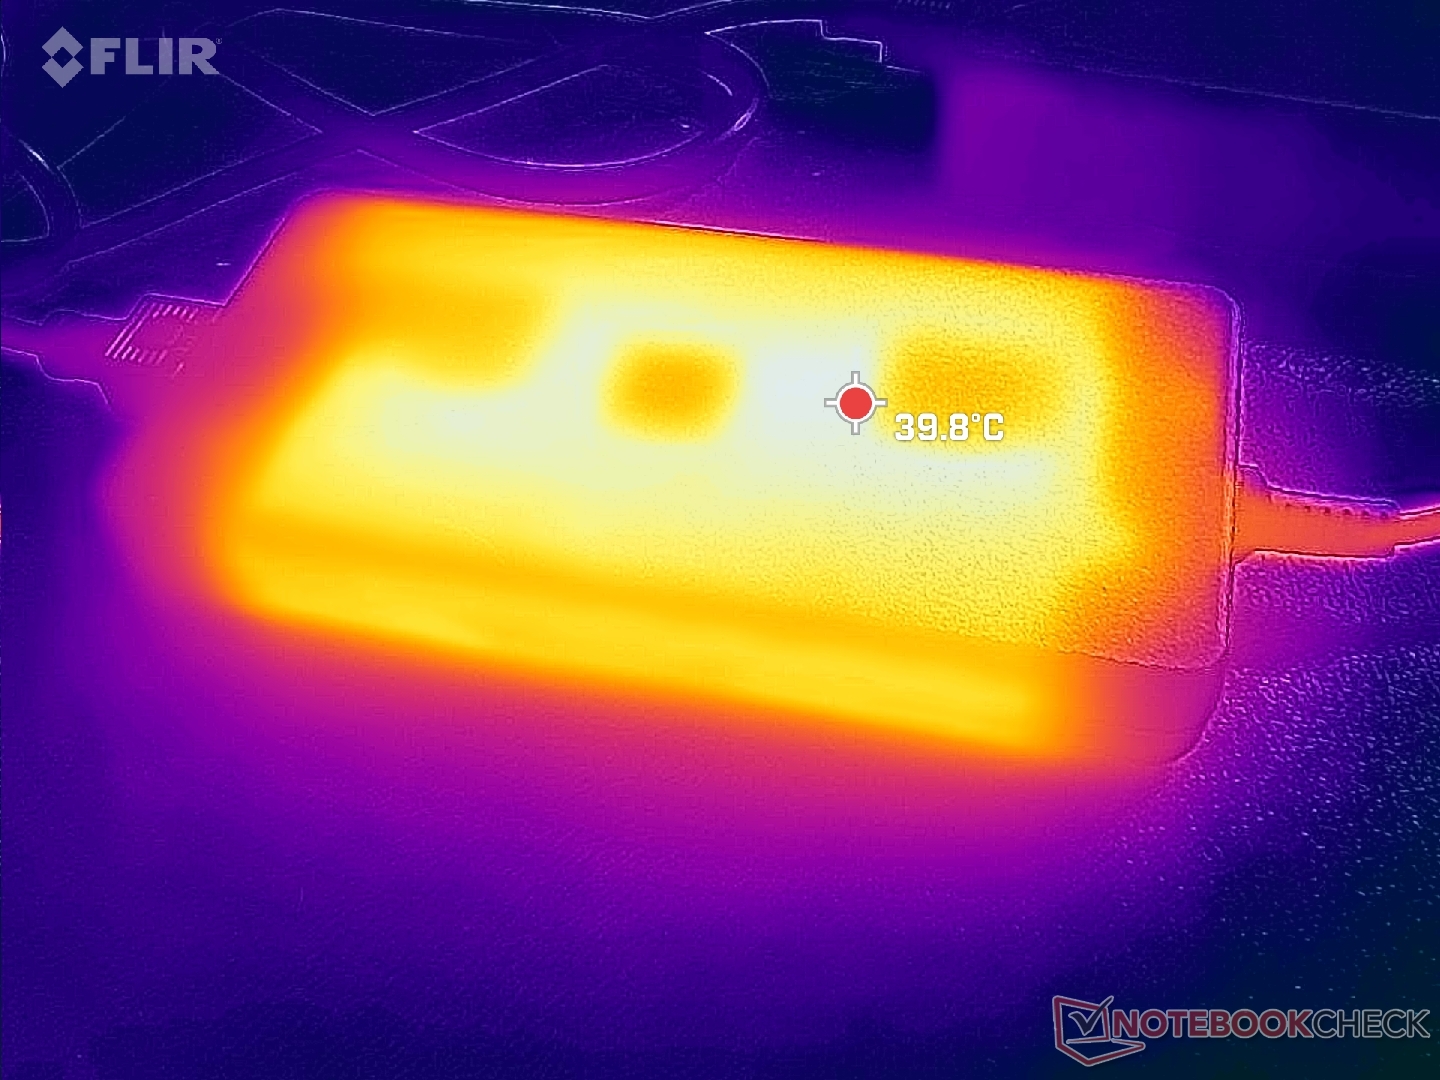
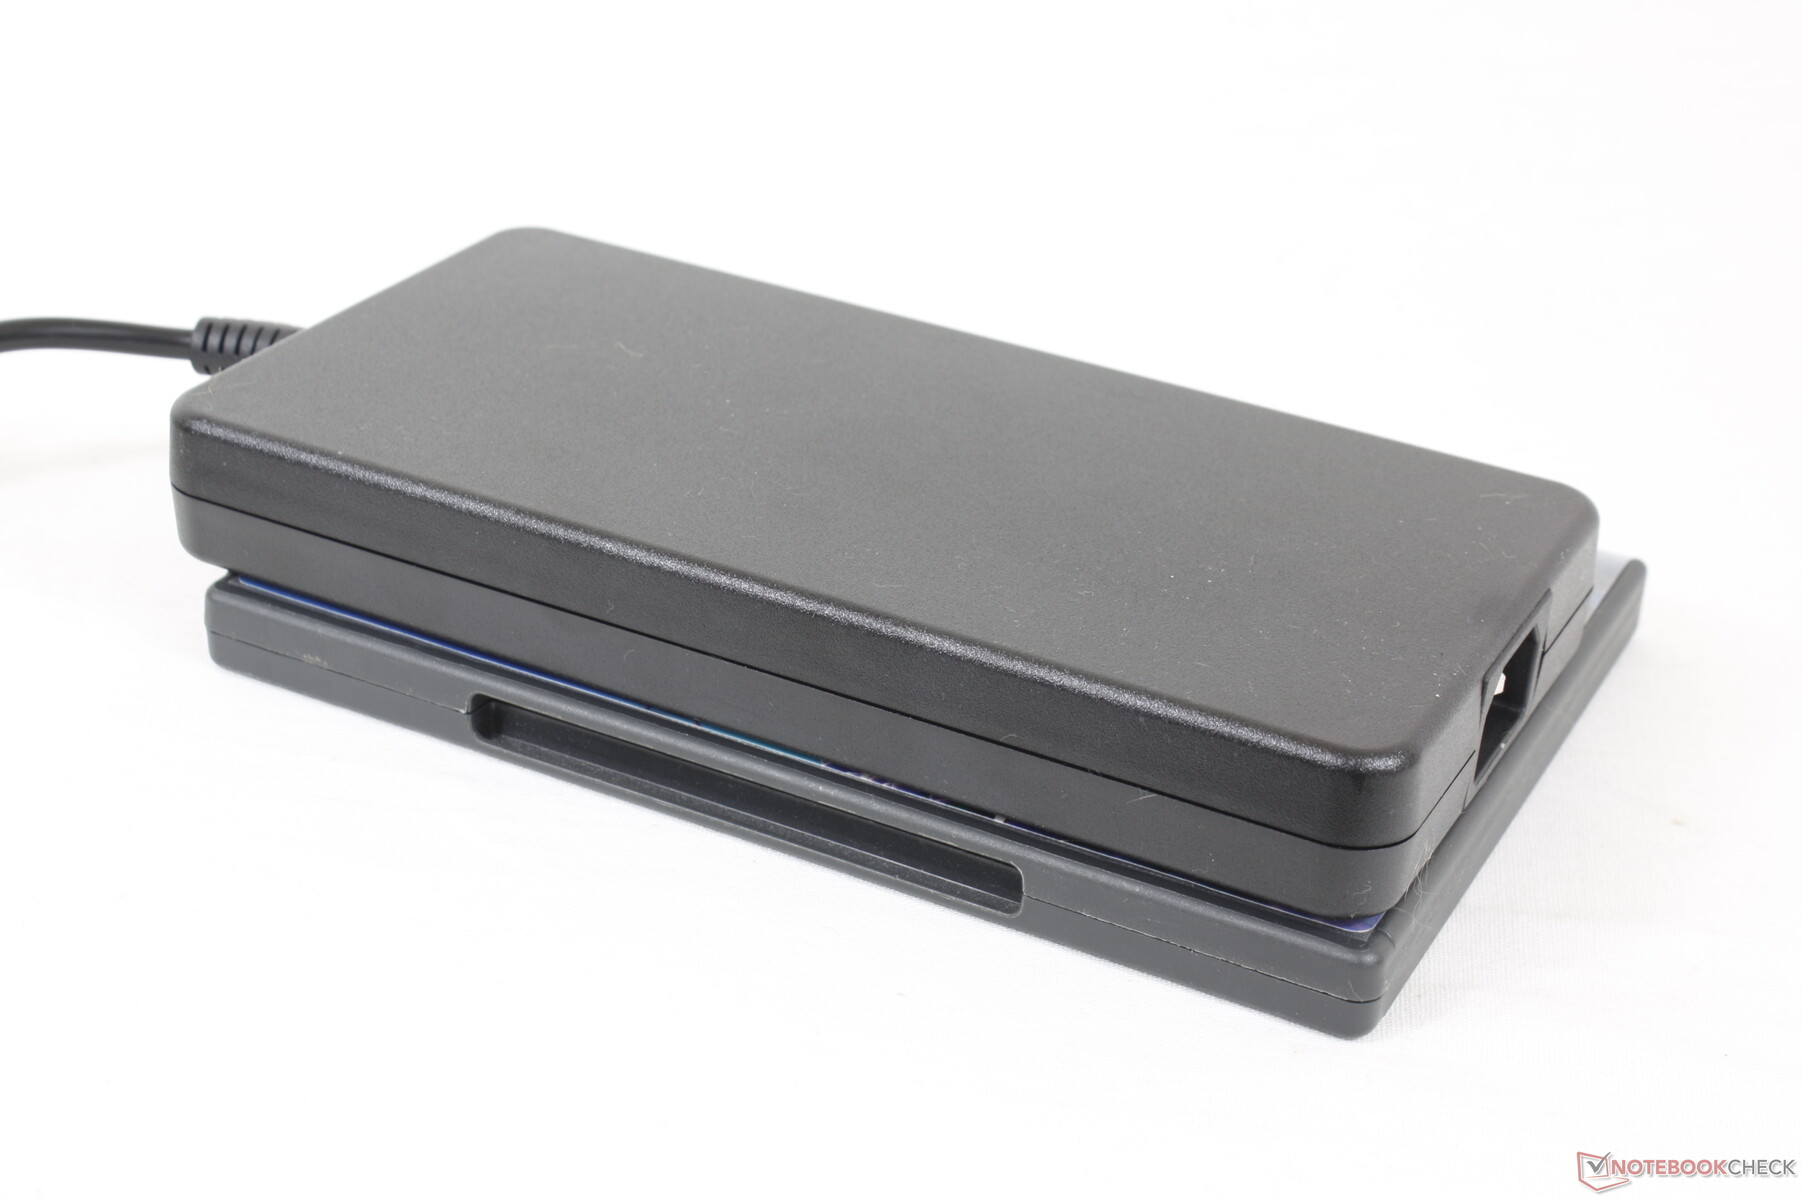
We're able to record a maximum draw of 243 W from the large (~19.9 x 10 x 2.5 cm) 240 W AC adapter when the CPU and GPU are each at 100 percent utilization. Consumption would cycle between 180 W and 240 W when under such conditions likely due to thermal limitations.
| Off / Standby | |
| Idle | |
| Load |
|
Key:
min: | |
| Dell G16 7620 i7-12700H, GeForce RTX 3060 Laptop GPU, WDC PC SN810 512GB, IPS, 2560x1600, 16" | Lenovo Legion 7 16ARHA7 R9 6900HX, Radeon RX 6850M XT, Samsung PM9A1 MZVL22T0HBLB, IPS, 2560x1600, 16" | HP Victus 16-e0145ng R5 5600H, GeForce RTX 3050 Ti Laptop GPU, Samsung SSD PM981a MZVLB512HBJQ, IPS, 1920x1080, 16.1" | Asus ROG Zephyrus M16 GU603H i9-11900H, GeForce RTX 3070 Laptop GPU, Samsung PM9A1 MZVL22T0HBLB, IPS, 2560x1600, 16" | Lenovo Legion 5 Pro 16IAH7H i7-12700H, GeForce RTX 3060 Laptop GPU, 2x Samsung PM9A1 MZVL21T0HCLR (RAID 0), IPS, 2560x1600, 16" | Acer Swift X SFX16-51G-5388 i5-11320H, GeForce RTX 3050 4GB Laptop GPU, Samsung PM991 MZVLQ512HBLU, , 1920x1080, 16.1" | |
|---|---|---|---|---|---|---|
| Power Consumption | -2% | 35% | 6% | -39% | 51% | |
| Idle Minimum * (Watt) | 14.4 | 9.9 31% | 7 51% | 11 24% | 22.8 -58% | 7 51% |
| Idle Average * (Watt) | 17.8 | 22 -24% | 9 49% | 20 -12% | 26.5 -49% | 10.1 43% |
| Idle Maximum * (Watt) | 31.5 | 23.1 27% | 15 52% | 30 5% | 41 -30% | 15 52% |
| Load Average * (Watt) | 101.2 | 94.4 7% | 93 8% | 111 -10% | 191 -89% | 63.3 37% |
| Witcher 3 ultra * (Watt) | 176.9 | 249 -41% | 134.5 24% | 156 12% | 194.7 -10% | 63.3 64% |
| Load Maximum * (Watt) | 242.9 | 276 -14% | 185 24% | 197 19% | 238 2% | 94 61% |
* ... smaller is better
Power Consumption Witcher 3 / Stresstest
Power Consumption external Monitor
Battery Life — Not That Great
Runtimes are only average even for a large gaming laptop. WLAN battery life lasts for just under 5 hours compared to 7 hours on the Lenovo Legion 7 16ARHA7 or HP Victus 16.
Charging from empty to full capacity takes about 2 hours. The model does not support USB-PD and so it cannot be recharged via USB-C.
| Dell G16 7620 i7-12700H, GeForce RTX 3060 Laptop GPU, 84 Wh | Lenovo Legion 7 16ARHA7 R9 6900HX, Radeon RX 6850M XT, 99 Wh | HP Victus 16-e0145ng R5 5600H, GeForce RTX 3050 Ti Laptop GPU, 70 Wh | Asus ROG Zephyrus M16 GU603H i9-11900H, GeForce RTX 3070 Laptop GPU, 90 Wh | Lenovo Legion 5 Pro 16IAH7H i7-12700H, GeForce RTX 3060 Laptop GPU, 80 Wh | Acer Swift X SFX16-51G-5388 i5-11320H, GeForce RTX 3050 4GB Laptop GPU, 58.7 Wh | |
|---|---|---|---|---|---|---|
| Battery runtime | 57% | 42% | 90% | -21% | 88% | |
| Reader / Idle (h) | 7.1 | 4.9 -31% | 13.3 87% | |||
| WiFi v1.3 (h) | 5 | 7.3 46% | 7.1 42% | 7.7 54% | 3.6 -28% | 8.1 62% |
| Load (h) | 0.7 | 1.8 157% | 1.6 129% | 0.6 -14% | 1.5 114% | |
| H.264 (h) | 4.1 | 8.4 | ||||
| Witcher 3 ultra (h) | 2.1 | |||||
| Gaming (h) | 1.1 |
Pros
Cons
Verdict — Big And Fast
The G16 has a lot of similarities to some of the latest Alienware laptops for better or worse. More specifically, the system is larger and heavier than many competitors and it even runs much warmer with core temperatures hovering around 90 C when gaming. The G16 is therefore not the best solution for users who want a thin-and-light gaming laptop experience. Alternatives such as the Lenovo Legion 7 16 or Asus ROG Zephyrus M16 are thinner, lighter, or even both while offering similar display and processor options.
The Dell G16 excels when it comes to performance at the cost of a larger footprint, heavier weight, and warmer core temperatures.
Where the Dell system struggles it makes up for in performance. The system is faster than most other laptops with the exact same CPU and GPU as a direct result of its thicker profile and warmer temperatures. Even so, the average battery life, lack of secondary SSD support, poor webcam, and inconveniently large power brick mean there's still a lot of room for improvement.
Price and Availability
The Dell G16 7620 is now shipping through Best Buy at our current configuration for $1600 USD. It is not yet on Amazon as of this writing. More SKUs can be ordered directly from Dell ranging from $1140 to $1935.
Dell G16 7620
- 10/18/2022 v7 (old)
Allen Ngo
Price comparison
