Radeon RX 6850M XT performance debut: Lenovo Legion 7 16ARHA7 laptop review
The 16-inch Legion 7 16 is a high-end gaming laptop from Lenovo to contrast the midrange Legion 5 series or budget IdeaPad Gaming series. This latest 2022 model is a complete refresh from the 2021 version with both revised internals and a new chassis design.
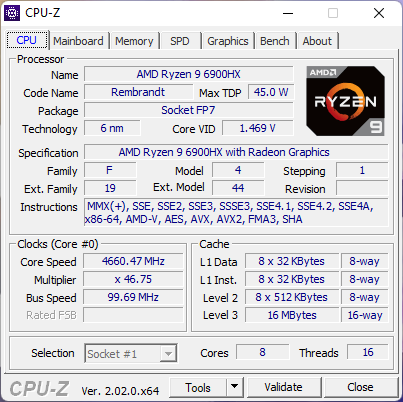
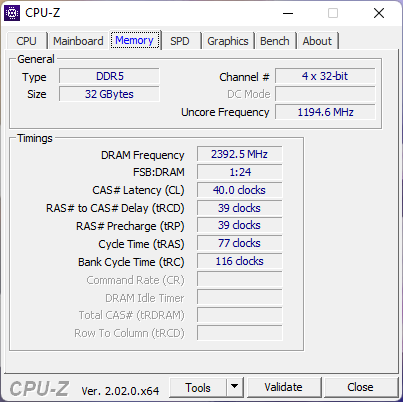
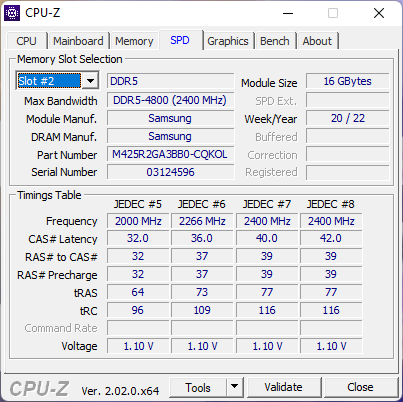
Our configuration in review comes with the AMD Zen 3+ Ryzen 9 6900HX CPU, 140 W Radeon RX 6850M XT GPU, 32 GB of DDR5-4800 RAM, and 1 TB PCIe4 x4 NVMe SSD for approximately $2600 USD retail. Lesser SKUs with the Ryzen 7 6800H or Radeon RX 6700M are also available, but all options otherwise come with the same matte 2560 x 1600 165 Hz IPS display only.
Alternatives to the Legion 7 16 include other high-end 16-inch gaming laptops like the Asus ROG Zephyrus Duo 16 or HP Omen 16. The 15.6-inch and 17.3-inch screen sizes are much more common, however, and so we will also be comparing the Lenovo to some high-end 15.6-inch models like the MSI GE66.
More Lenovo reviews:
Potential Competitors in Comparison
Rating | Date | Model | Weight | Height | Size | Resolution | Price |
|---|---|---|---|---|---|---|---|
| 90.8 % v7 (old) | 09 / 2022 | Lenovo Legion 7 16ARHA7 R9 6900HX, Radeon RX 6850M XT | 2.6 kg | 19.4 mm | 16.00" | 2560x1600 | |
| 87.4 % v7 (old) | 06 / 2022 | MSI Raider GE66 12UHS i9-12900HK, GeForce RTX 3080 Ti Laptop GPU | 2.4 kg | 23.4 mm | 15.60" | 3840x2160 | |
| 87.9 % v7 (old) | 11 / 2022 | Lenovo Legion Slim 7-16IAH 82TF004YGE i7-12700H, GeForce RTX 3060 Laptop GPU | 2.2 kg | 16.9 mm | 16.00" | 2560x1600 | |
| 88.2 % v7 (old) | 05 / 2022 | Asus ROG Zephyrus Duo 16 GX650RX R9 6900HX, GeForce RTX 3080 Ti Laptop GPU | 2.6 kg | 20.5 mm | 16.00" | 3840x2400 | |
| 86 % v7 (old) | 04 / 2022 | HP Omen 16-c0077ng R7 5800H, Radeon RX 6600M | 2.3 kg | 26 mm | 16.10" | 2560x1440 | |
| 87.4 % v7 (old) | 08 / 2021 | Lenovo Legion 5 Pro 16ACH6H (82JQ001PGE) R7 5800H, GeForce RTX 3070 Laptop GPU | 2.6 kg | 26.85 mm | 16.00" | 2560x1600 |
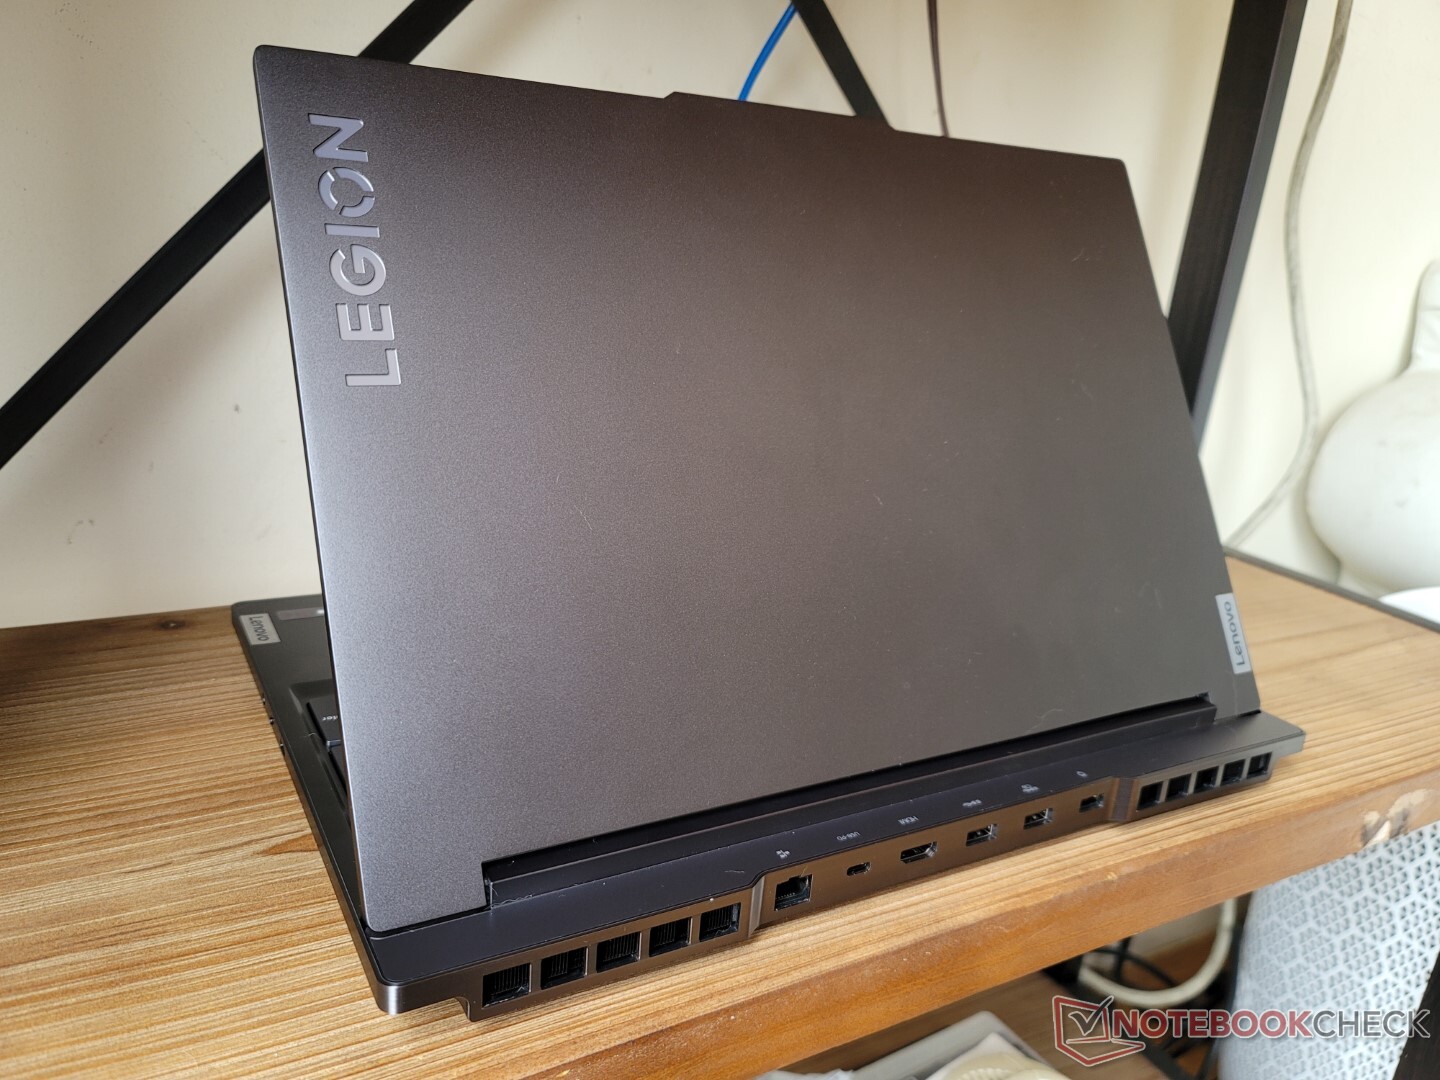
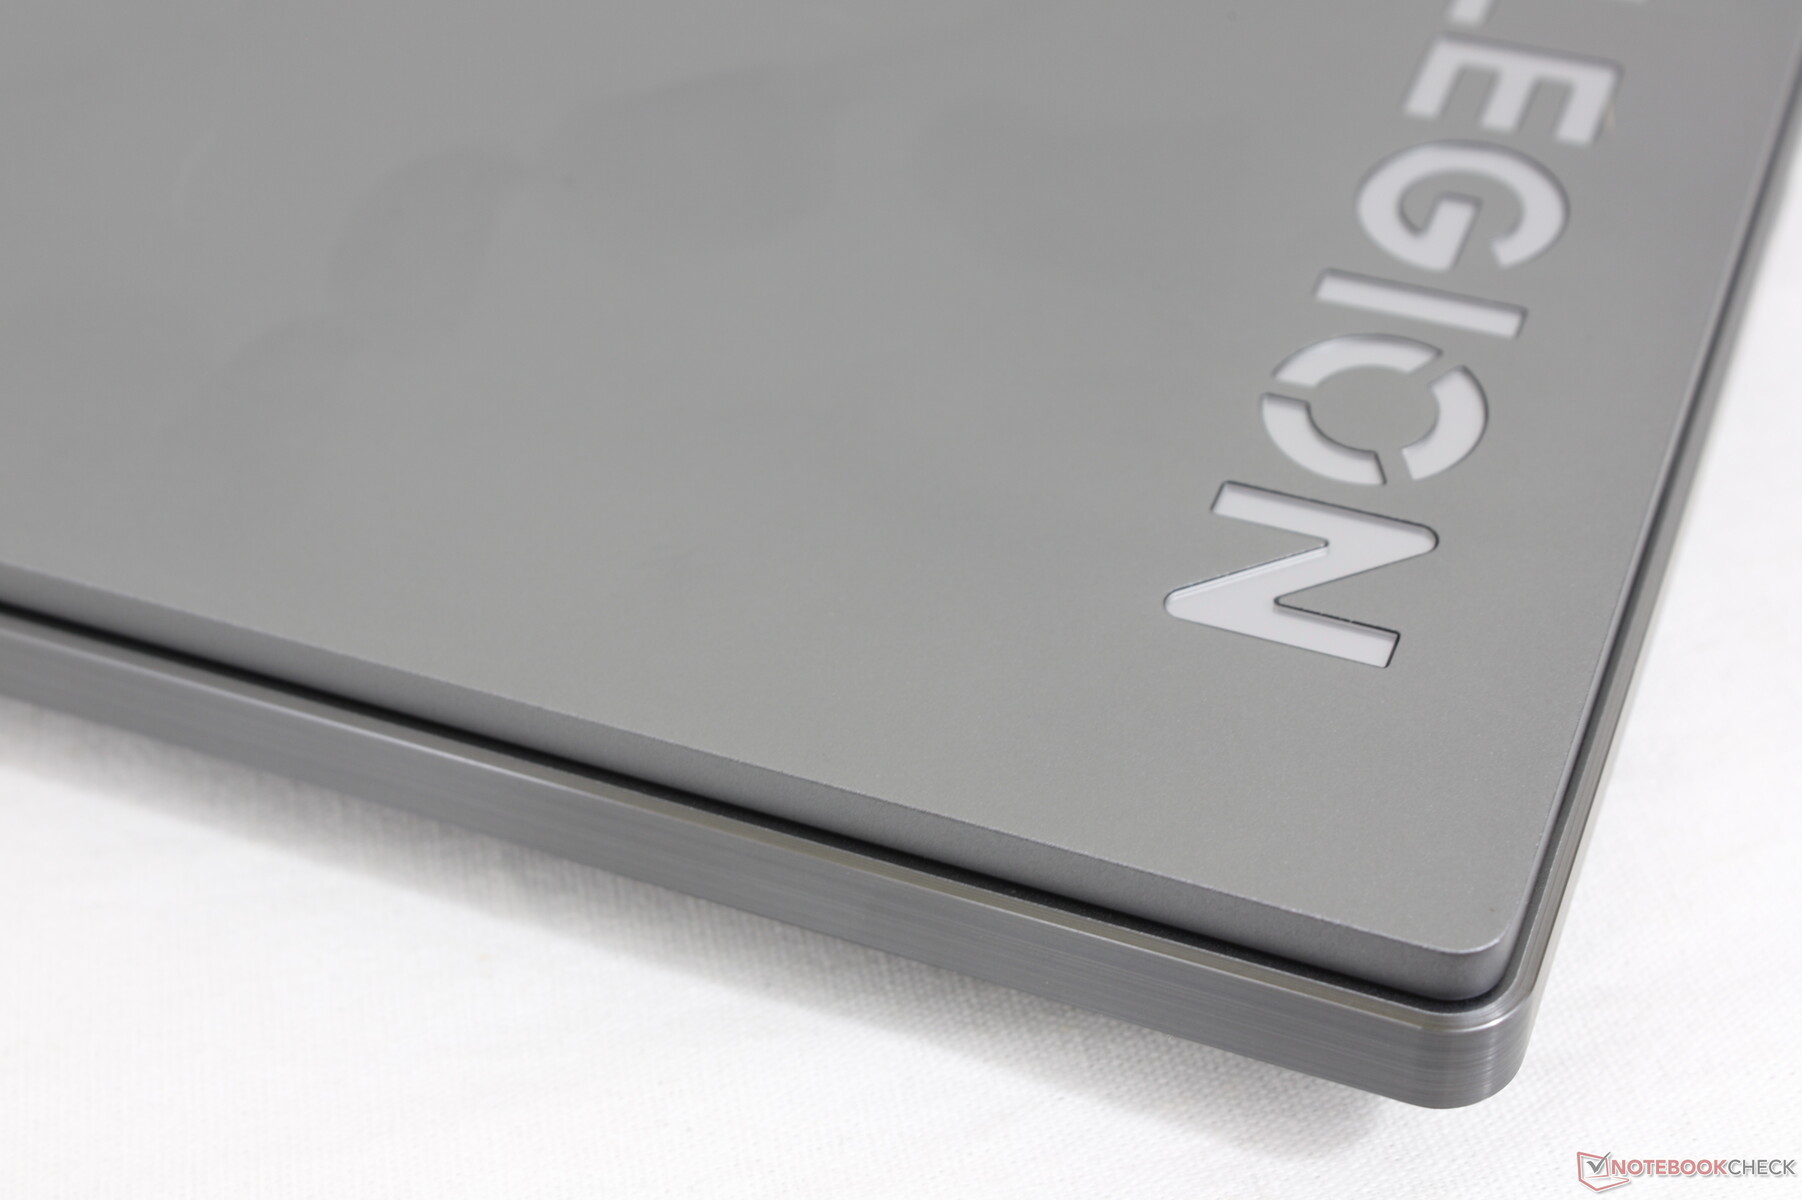
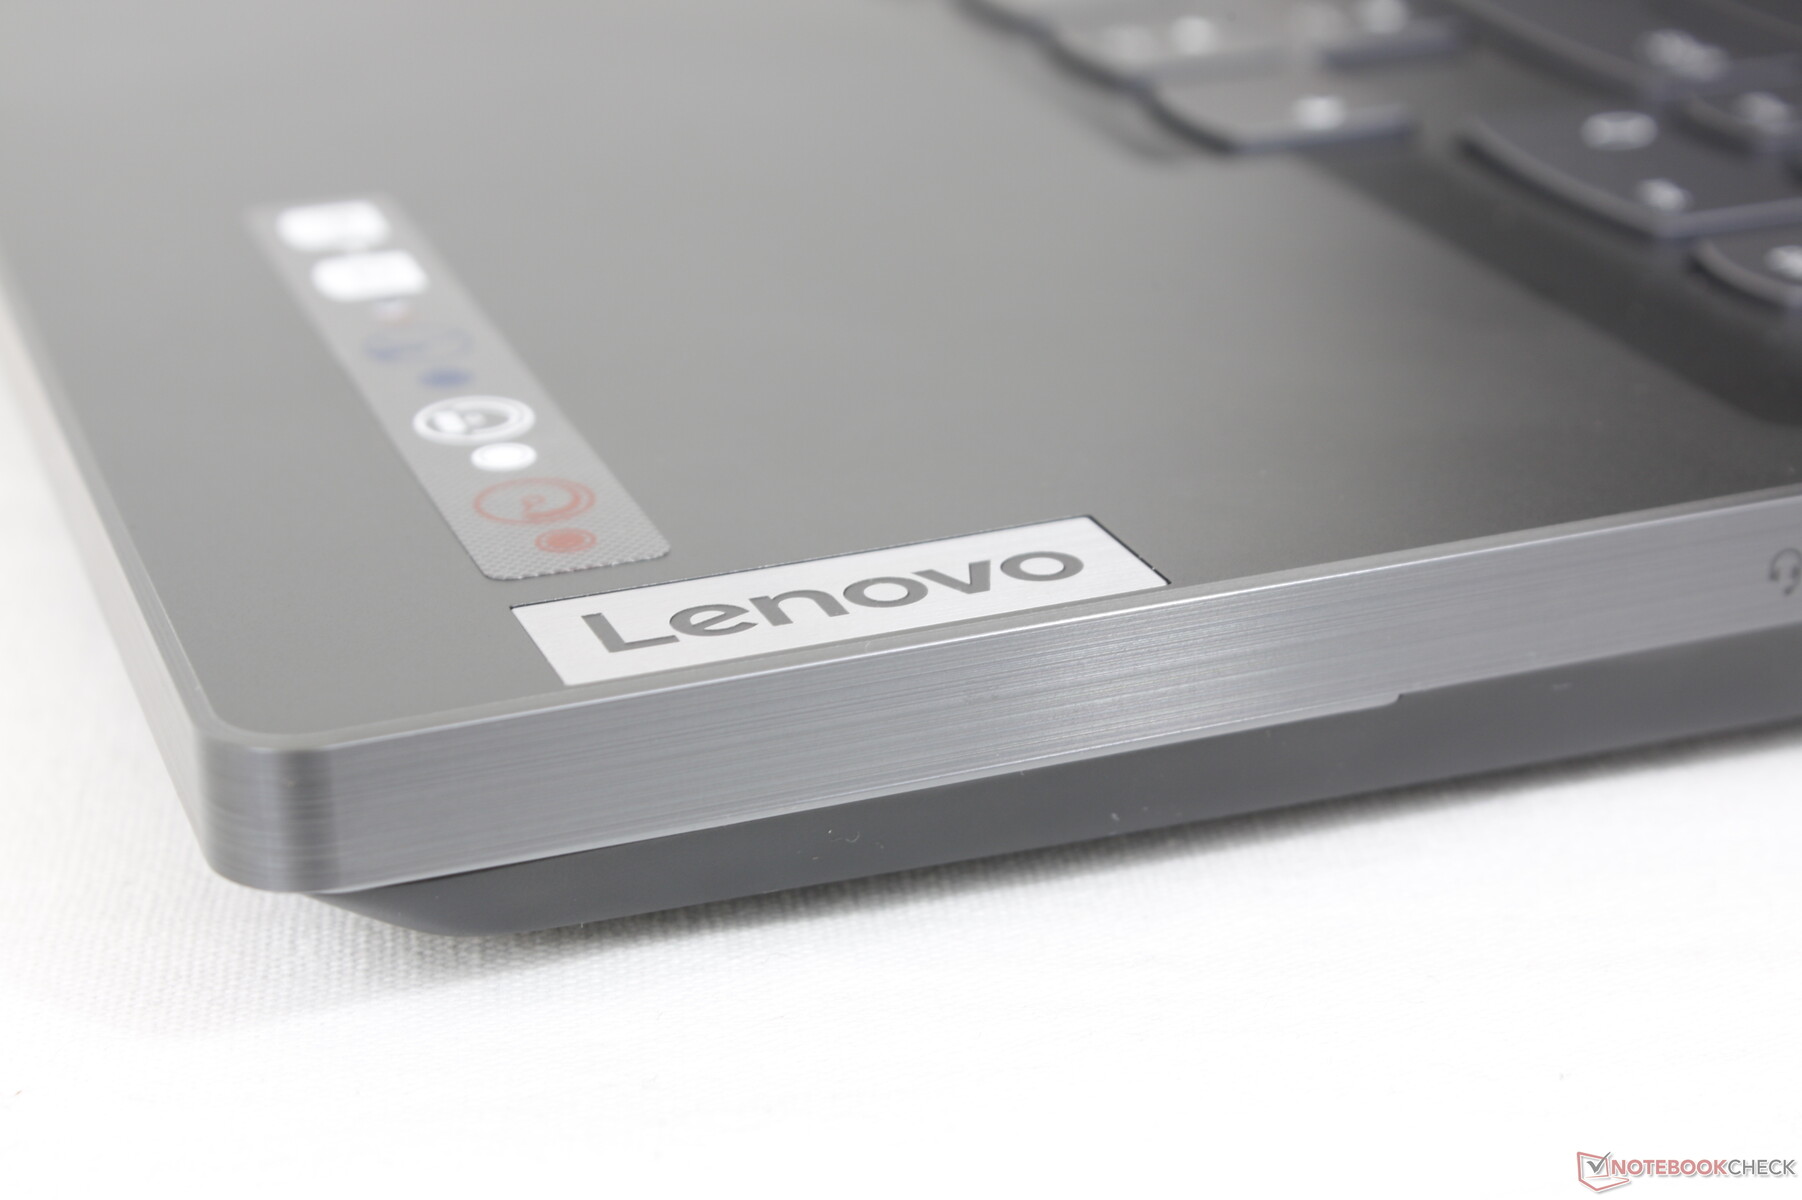
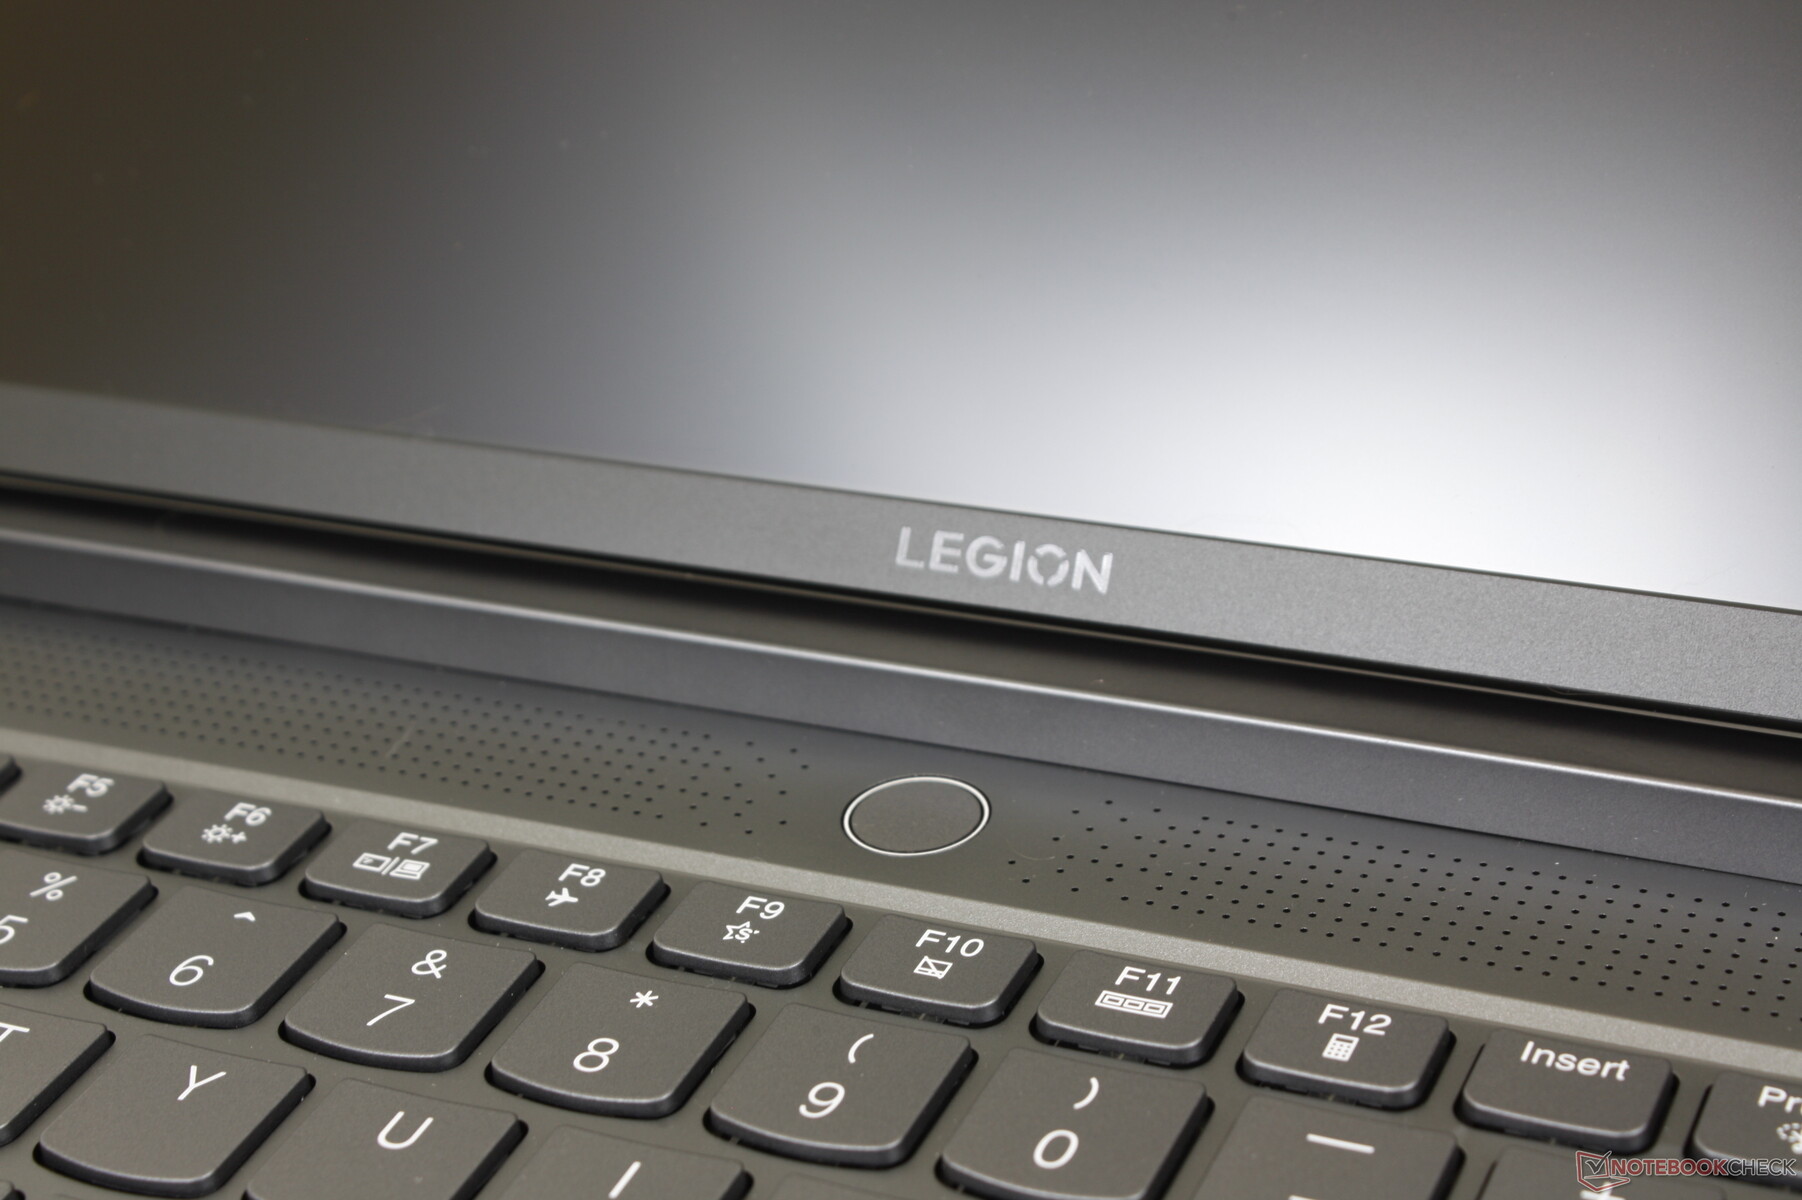
Case — Professional Look
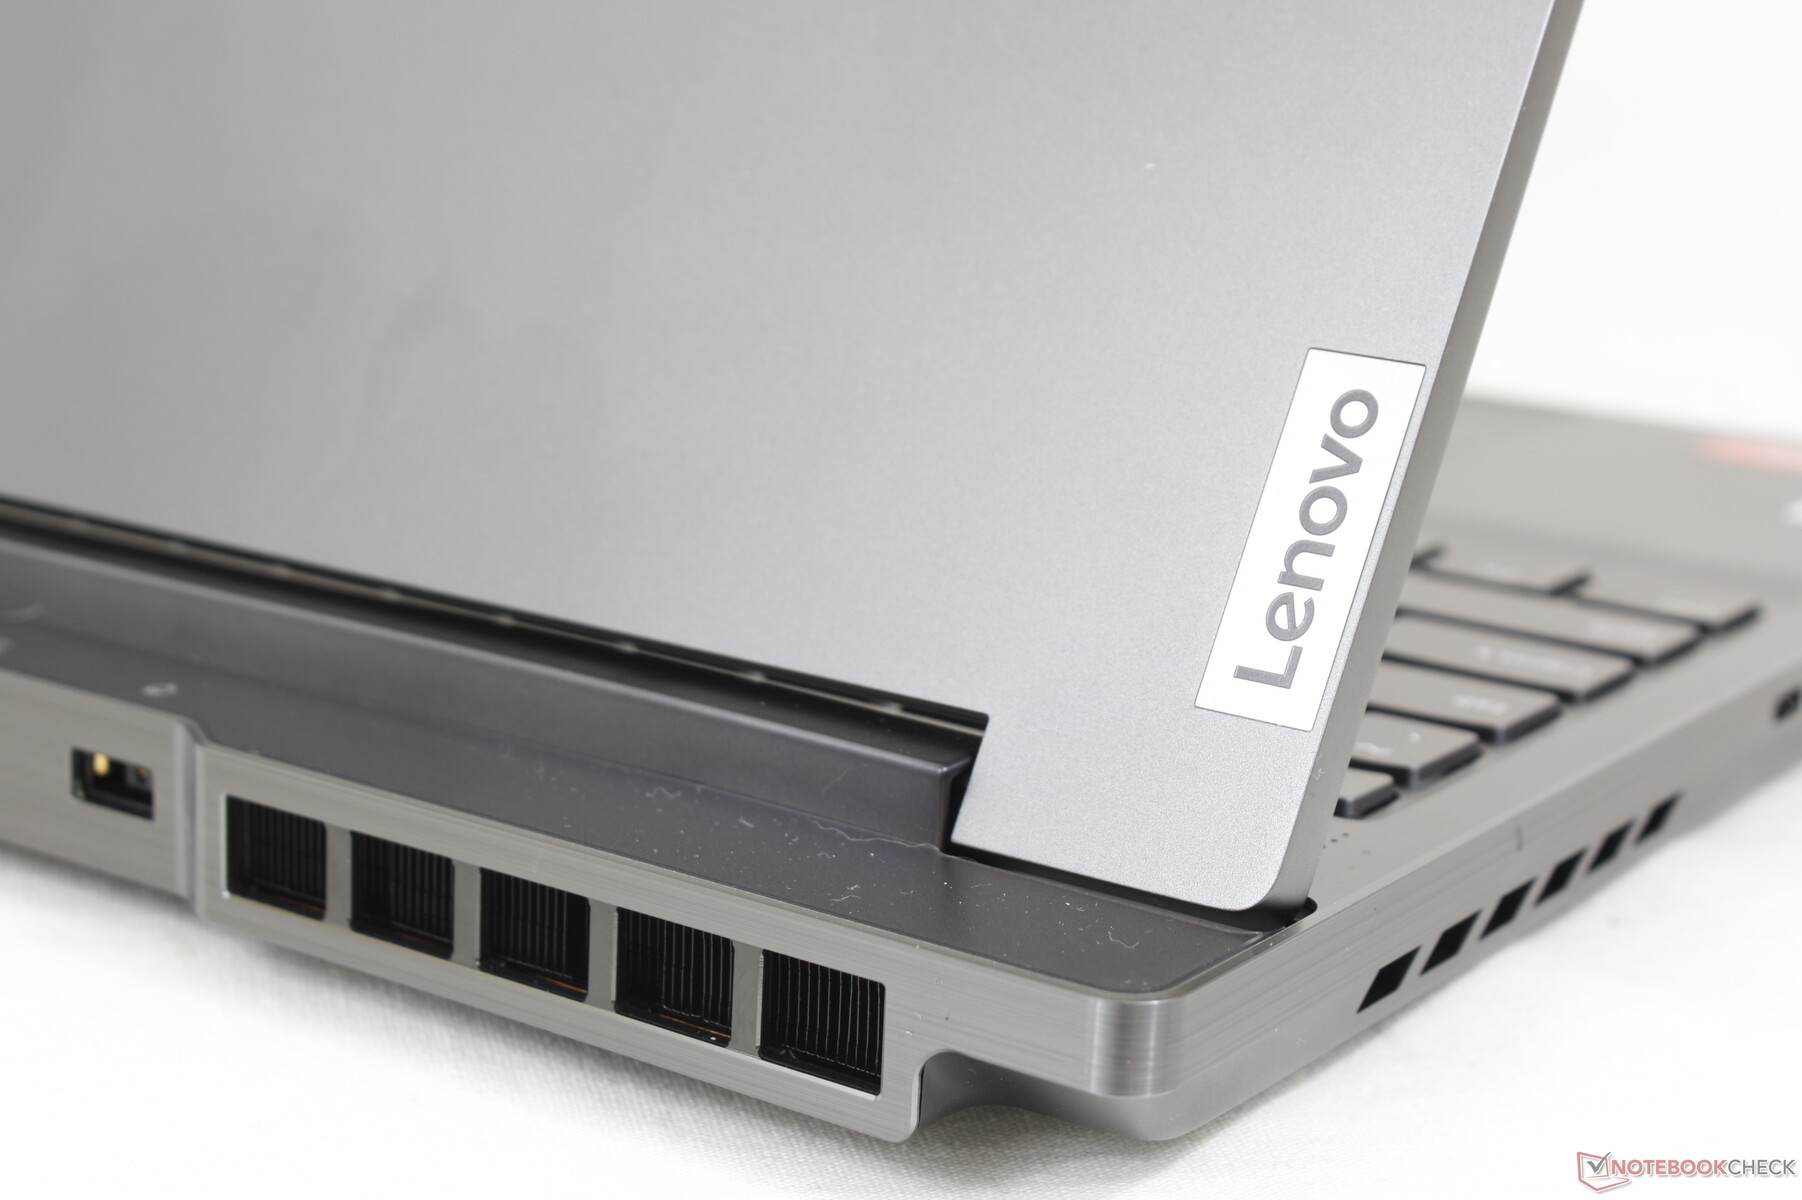
The 2022 model retains the anodized aluminum materials and metal trims of the 2021 model but with a few notable changes. The ventilation grilles along the sides, for example, are now flush instead of protruding from the edges for a cleaner look. Meanwhile, the rear has been completely redesigned with rounder corners and a smoother visual flow. The LED features of the 2021 model remain unchanged including the thin light bar along the front edge and sides. When the lights are turned off, the monotone dark gray look could easily pass as a potential mobile workstation or Nvidia Studio model.
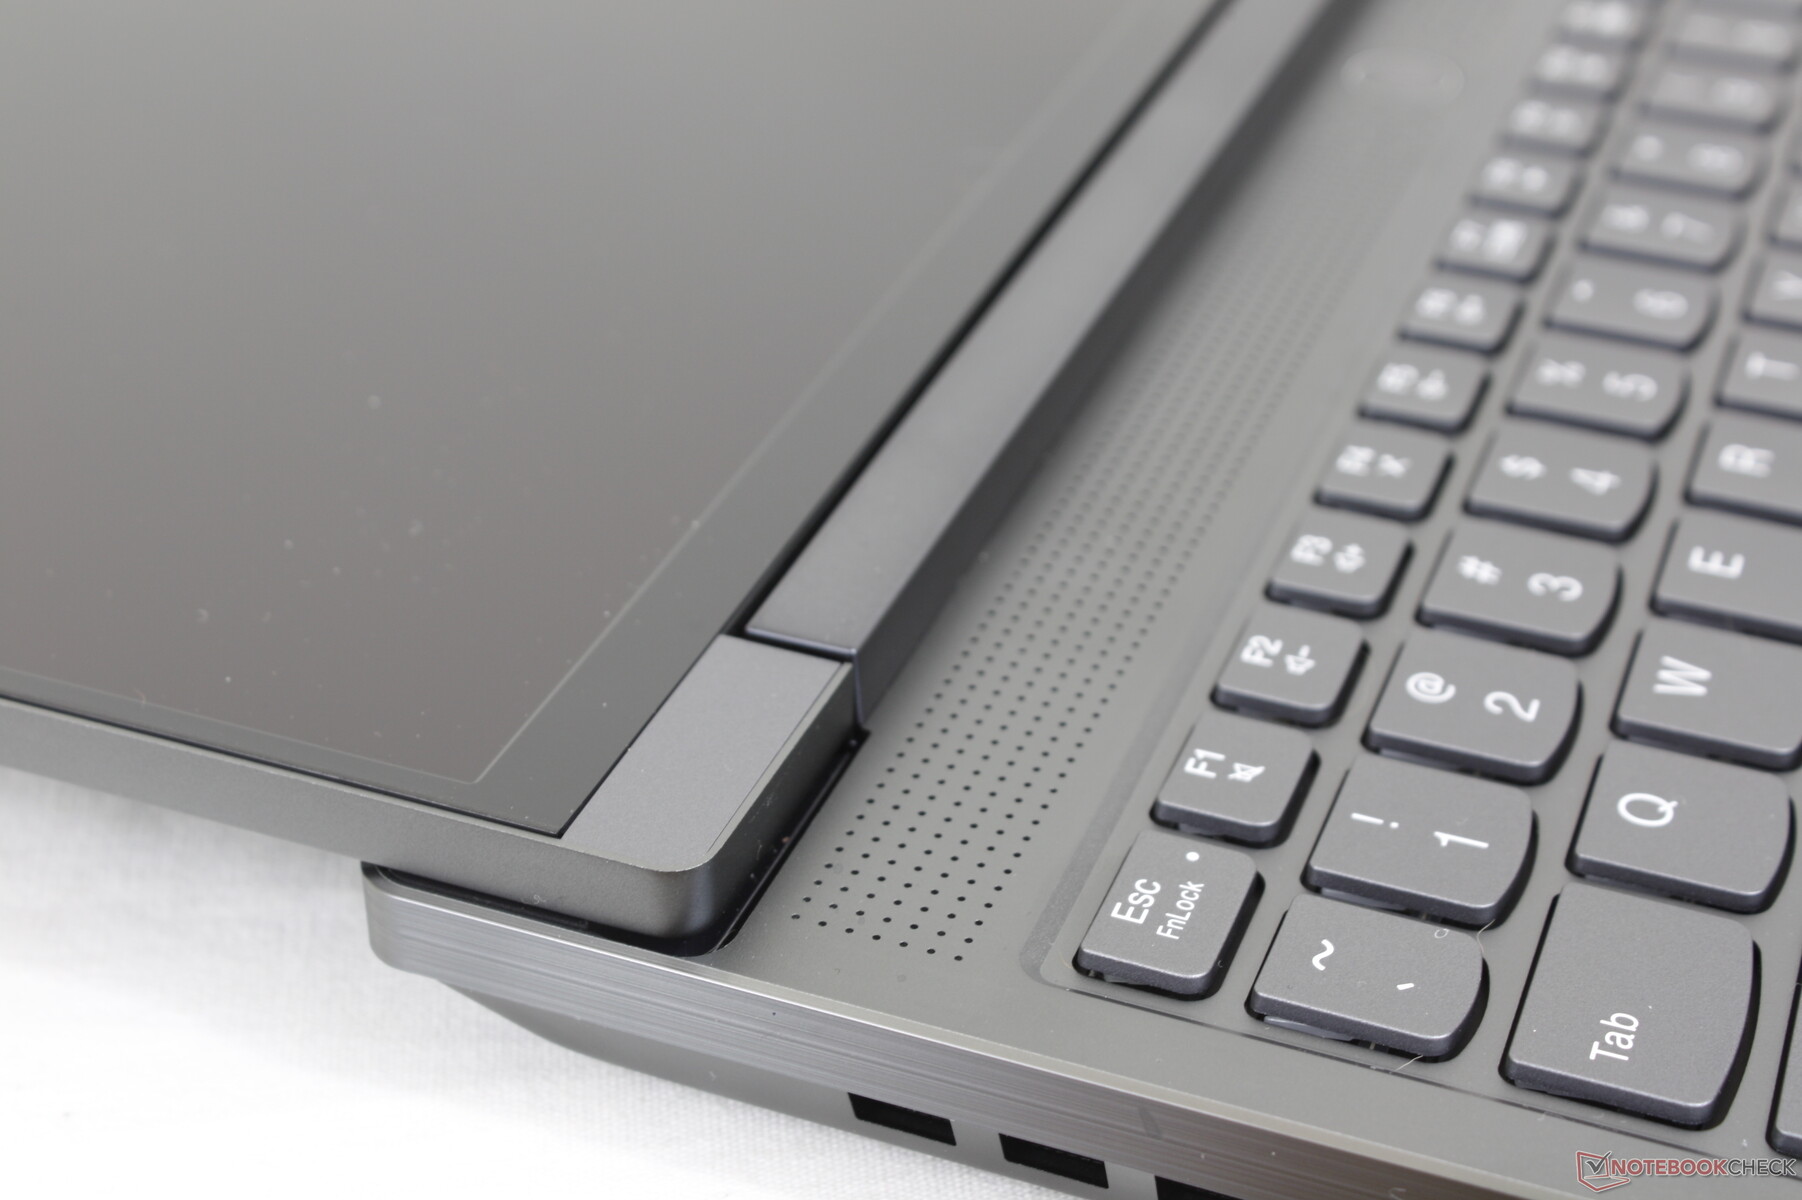
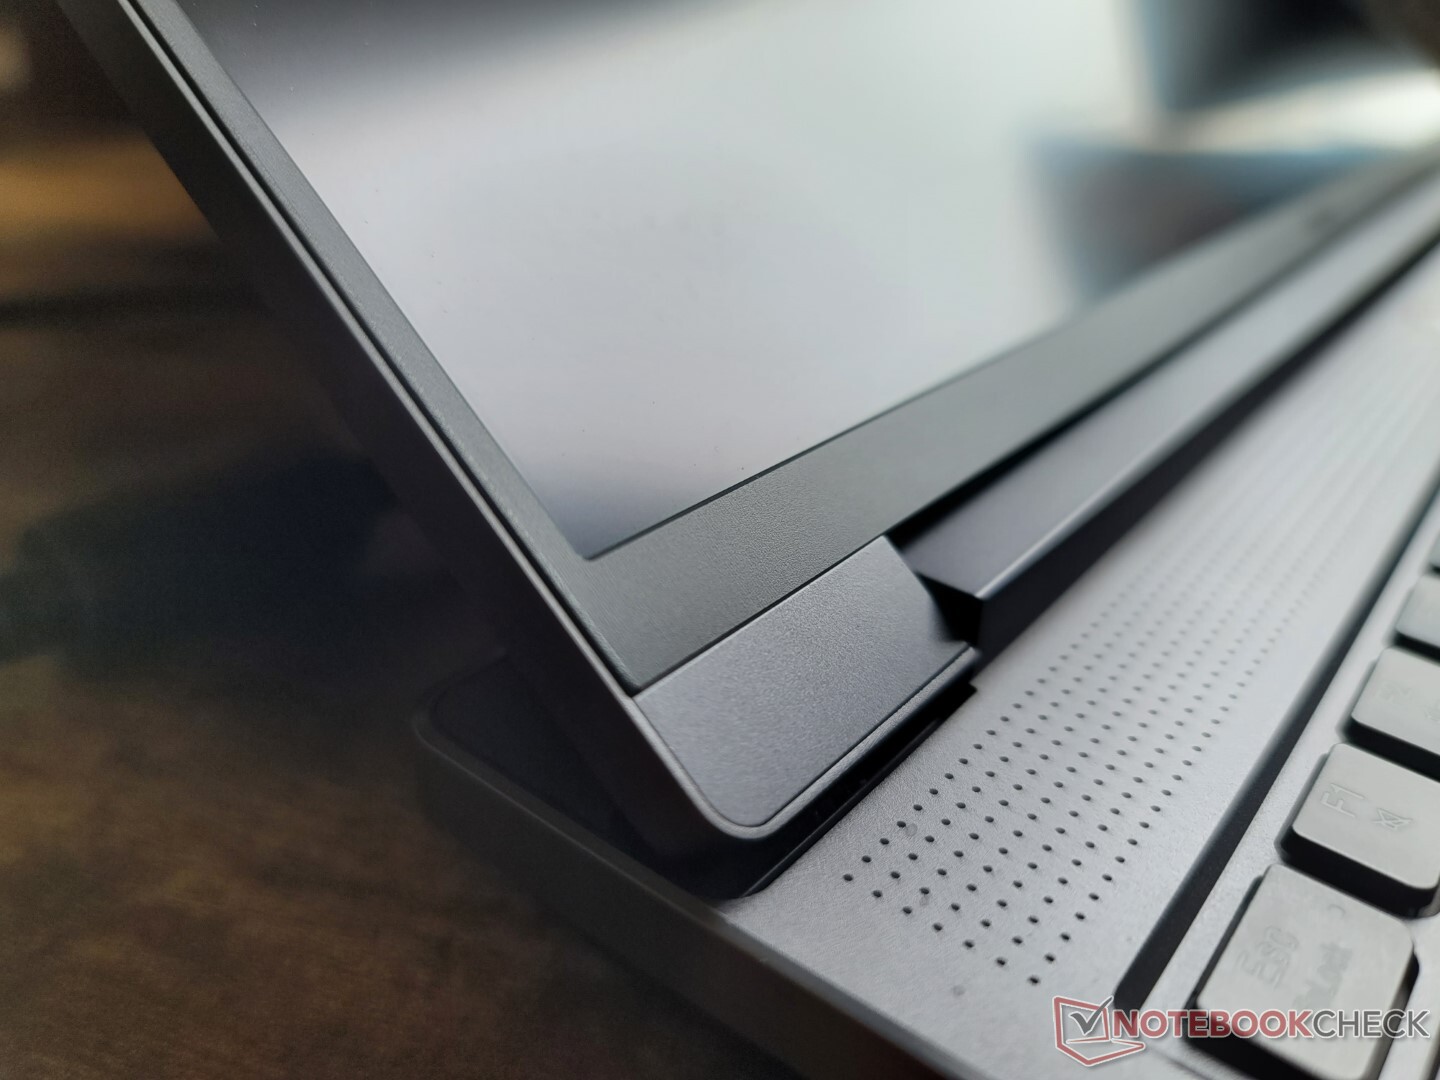
In terms of quality, the base is rigid and very resistant to any twists or depressions even when applying pressure on the keyboard center. The lid and hinges, however, are weaker and more susceptible to damage over time. The lid twists more readily than the lid on the Razer Blade 15 while the hinges tend to teeter when adjusting angles.
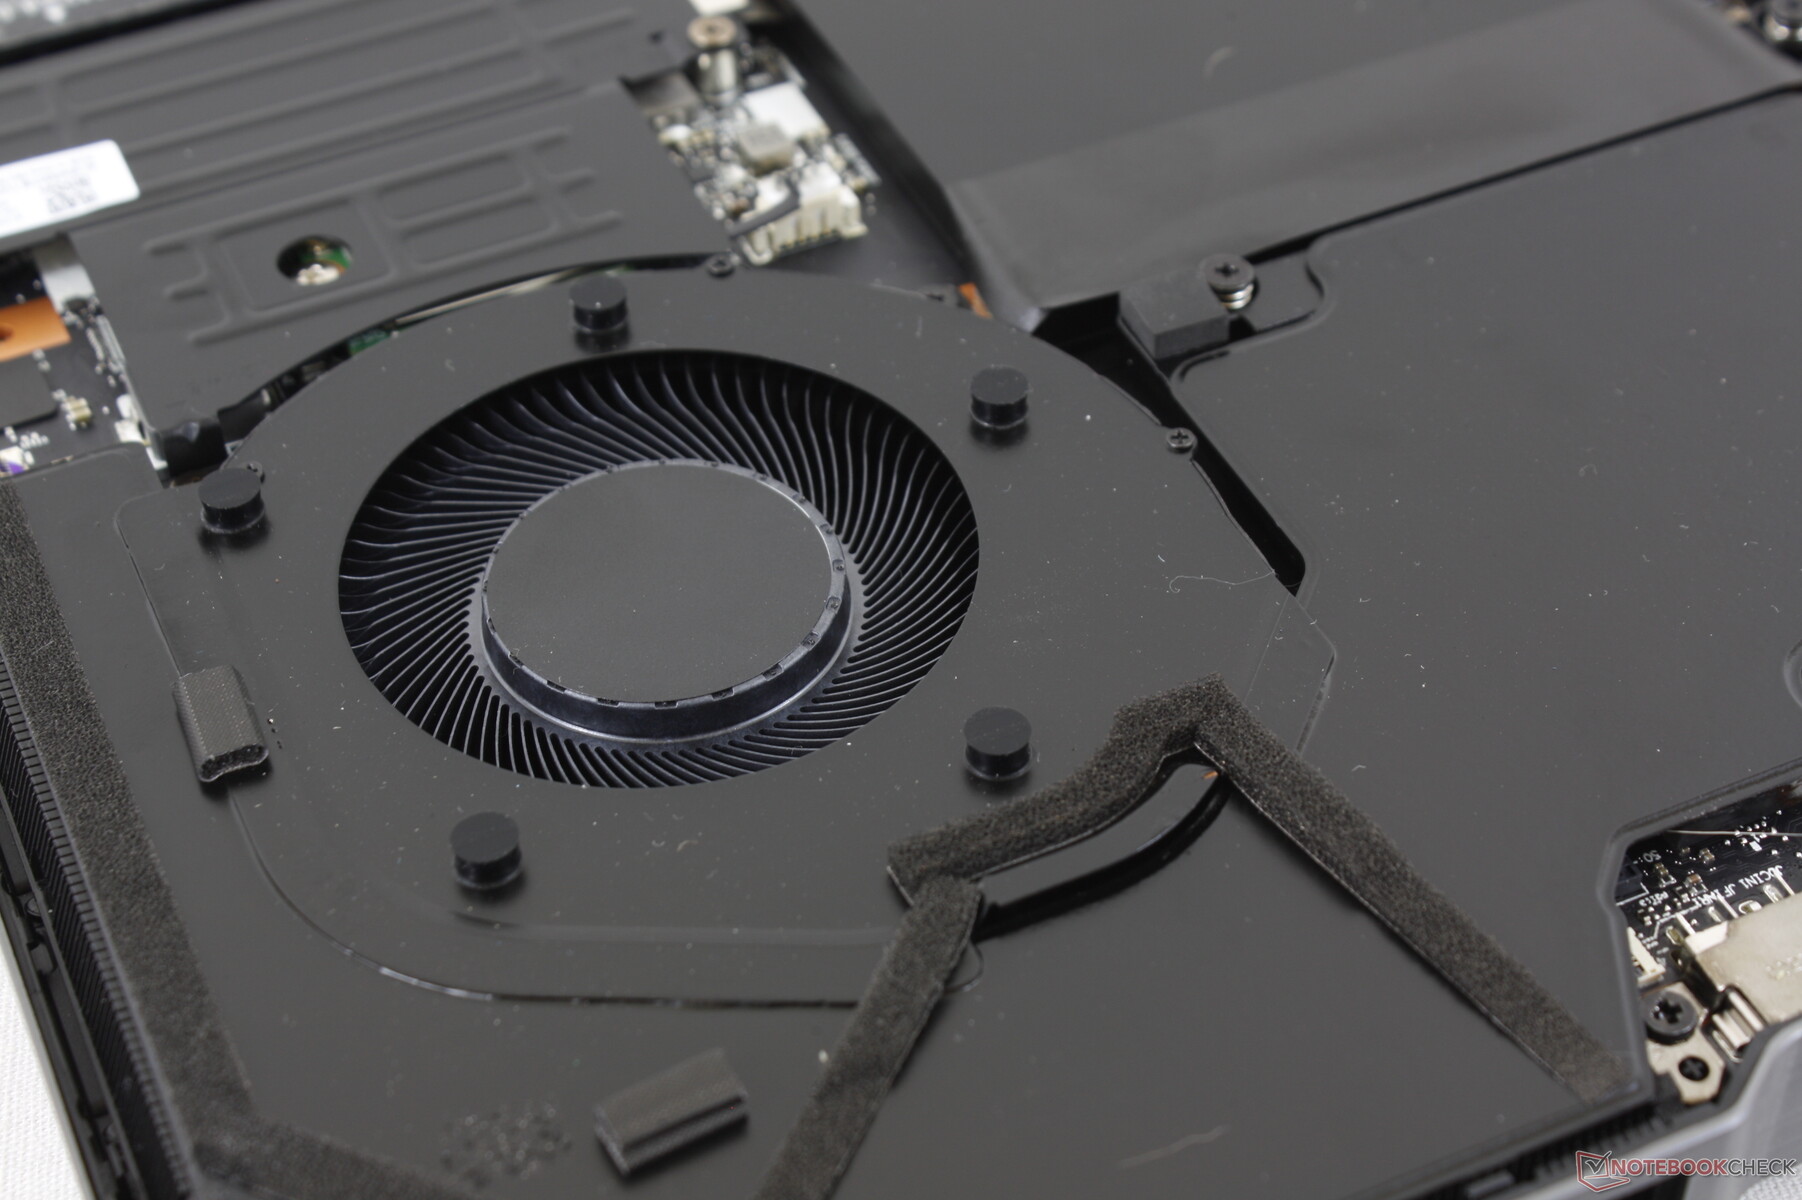
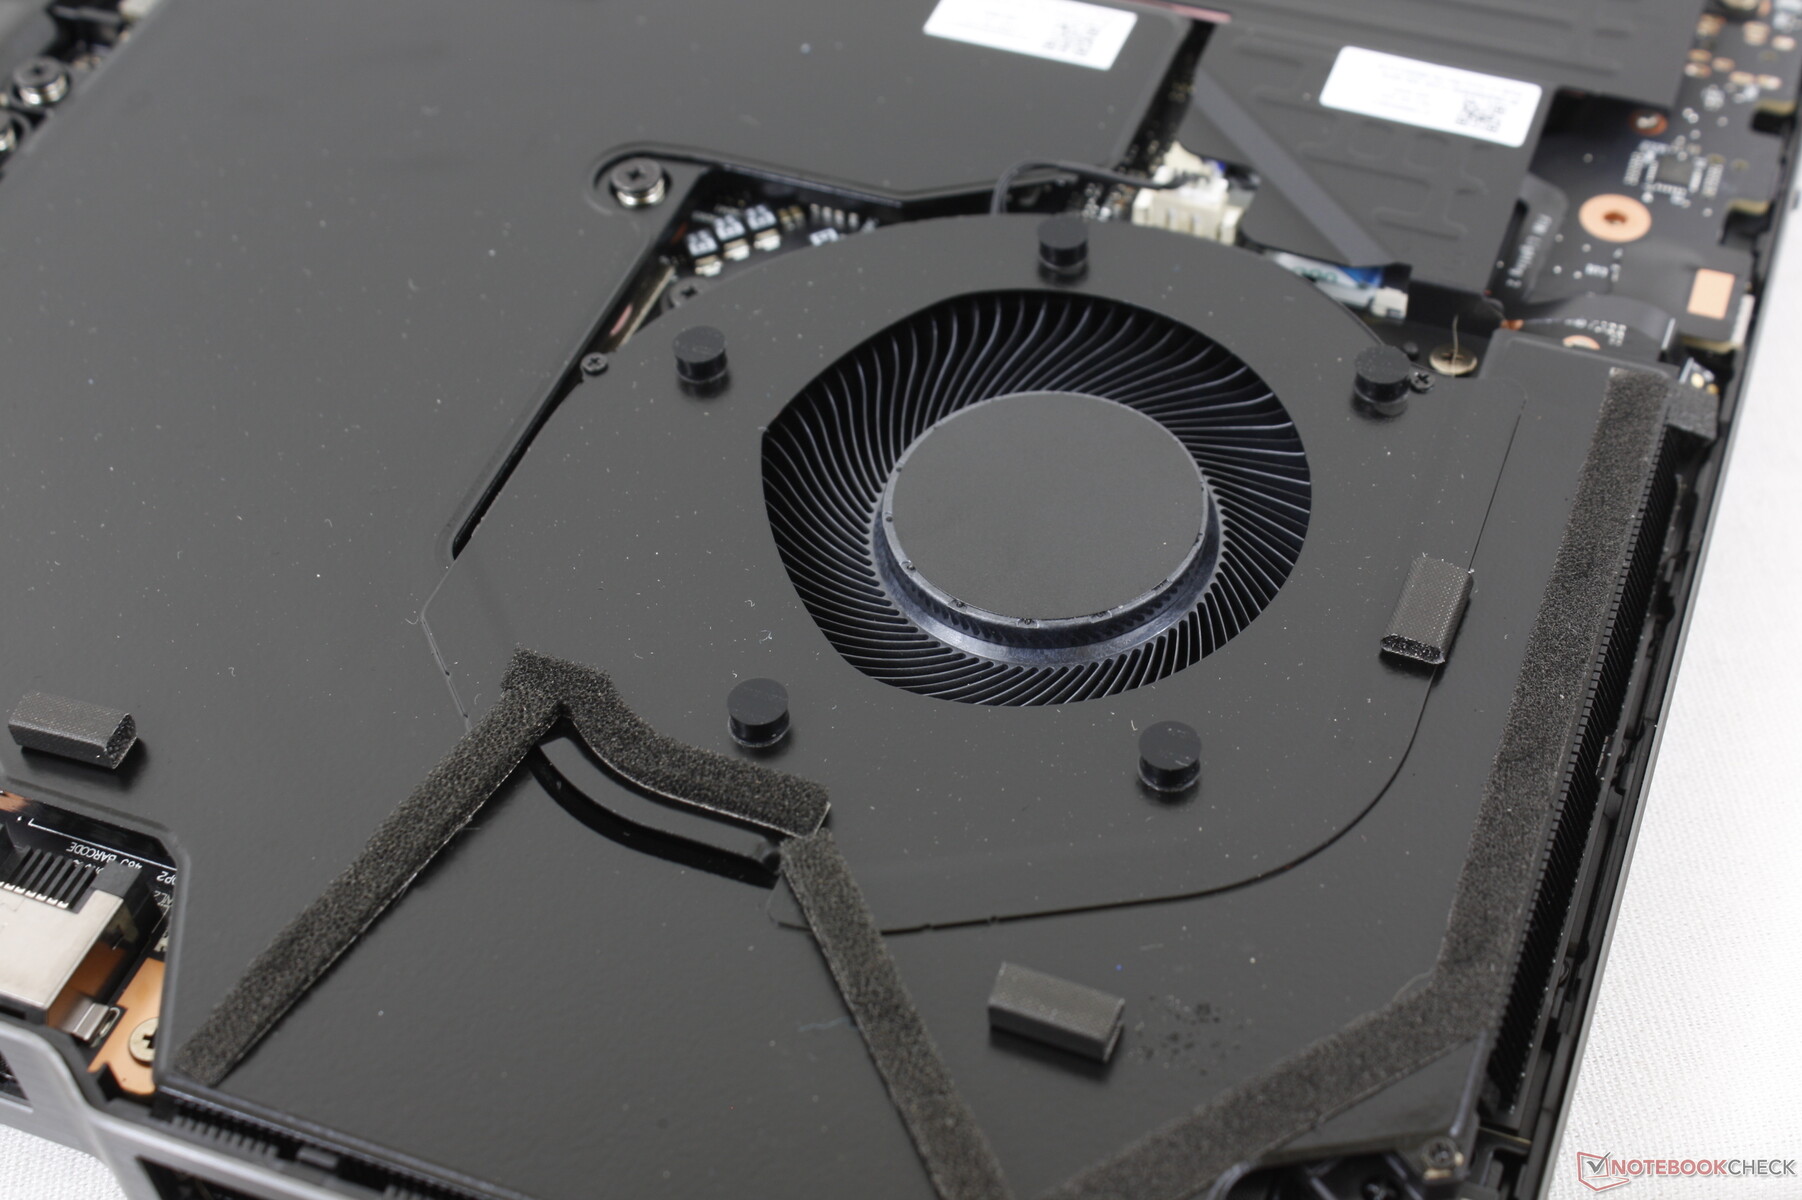
Overall dimensions and weight are very close to the Asus ROG Zephyrus Duo 16 to be one of the heavier gaming laptops in the market despite the thin <20 mm form factor. Perhaps most notably, the Asus system is able to integrate a second screen without needing to be any heavier or bigger than our Lenovo. The very dense feel of the legion can be attributed to its vapor chamber cooling solution which is traditionally heavier than the usual copper heat pipes.
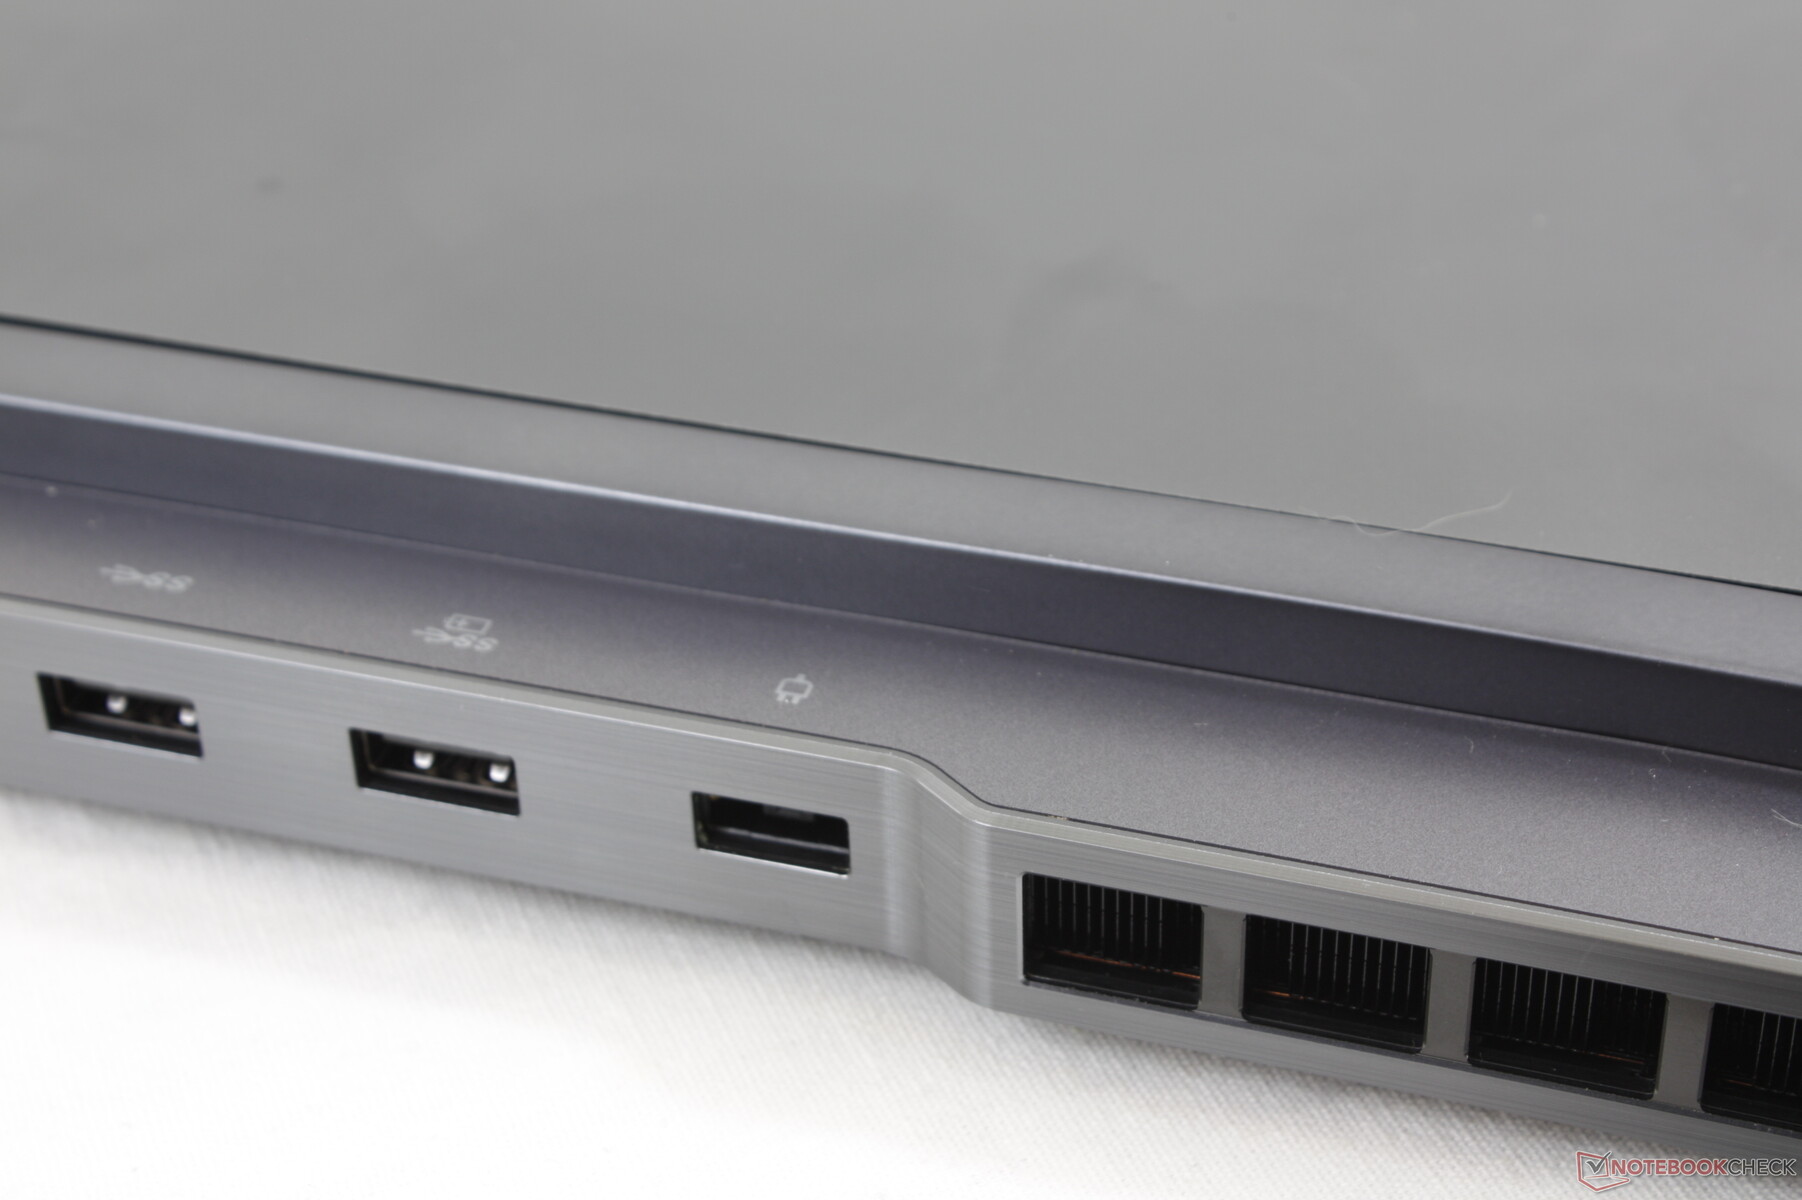
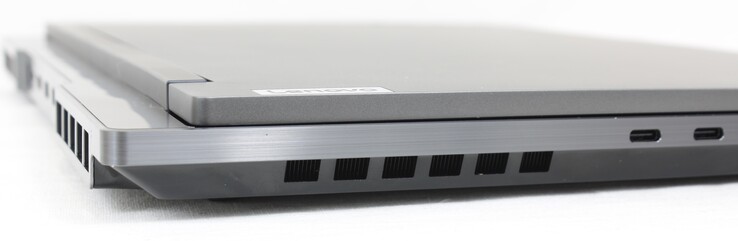
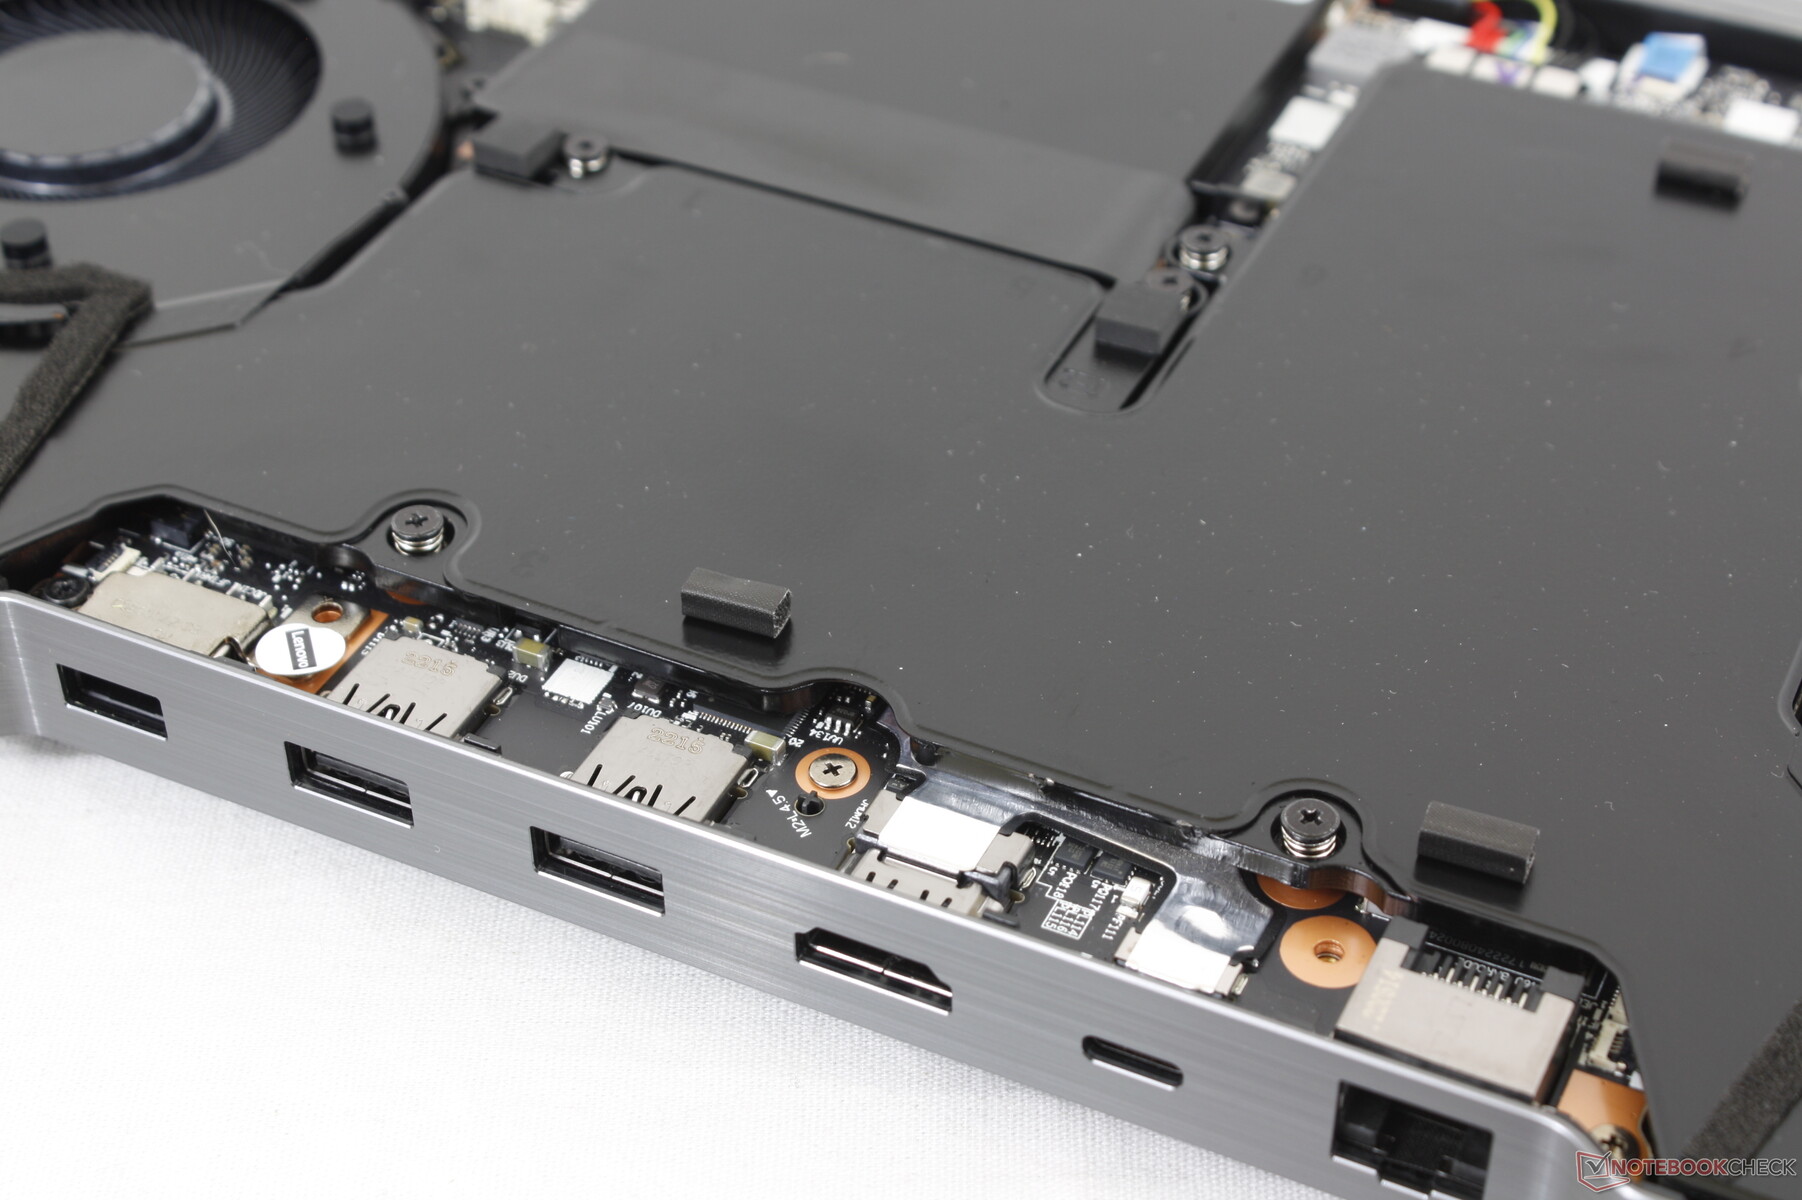
Connectivity — Lots Of USB-C Ports
Port options are varied and mostly along the rear edge of the chassis instead of the sides. There are four individual USB-C ports which is more than on most other gaming laptops. They are not created equal, however, as only certain USB-C ports support DisplayPort while another may support Power Delivery as shown by our pictures below.
There is no Thunderbolt support unlike on most Intel-powered gaming laptops.
Communication
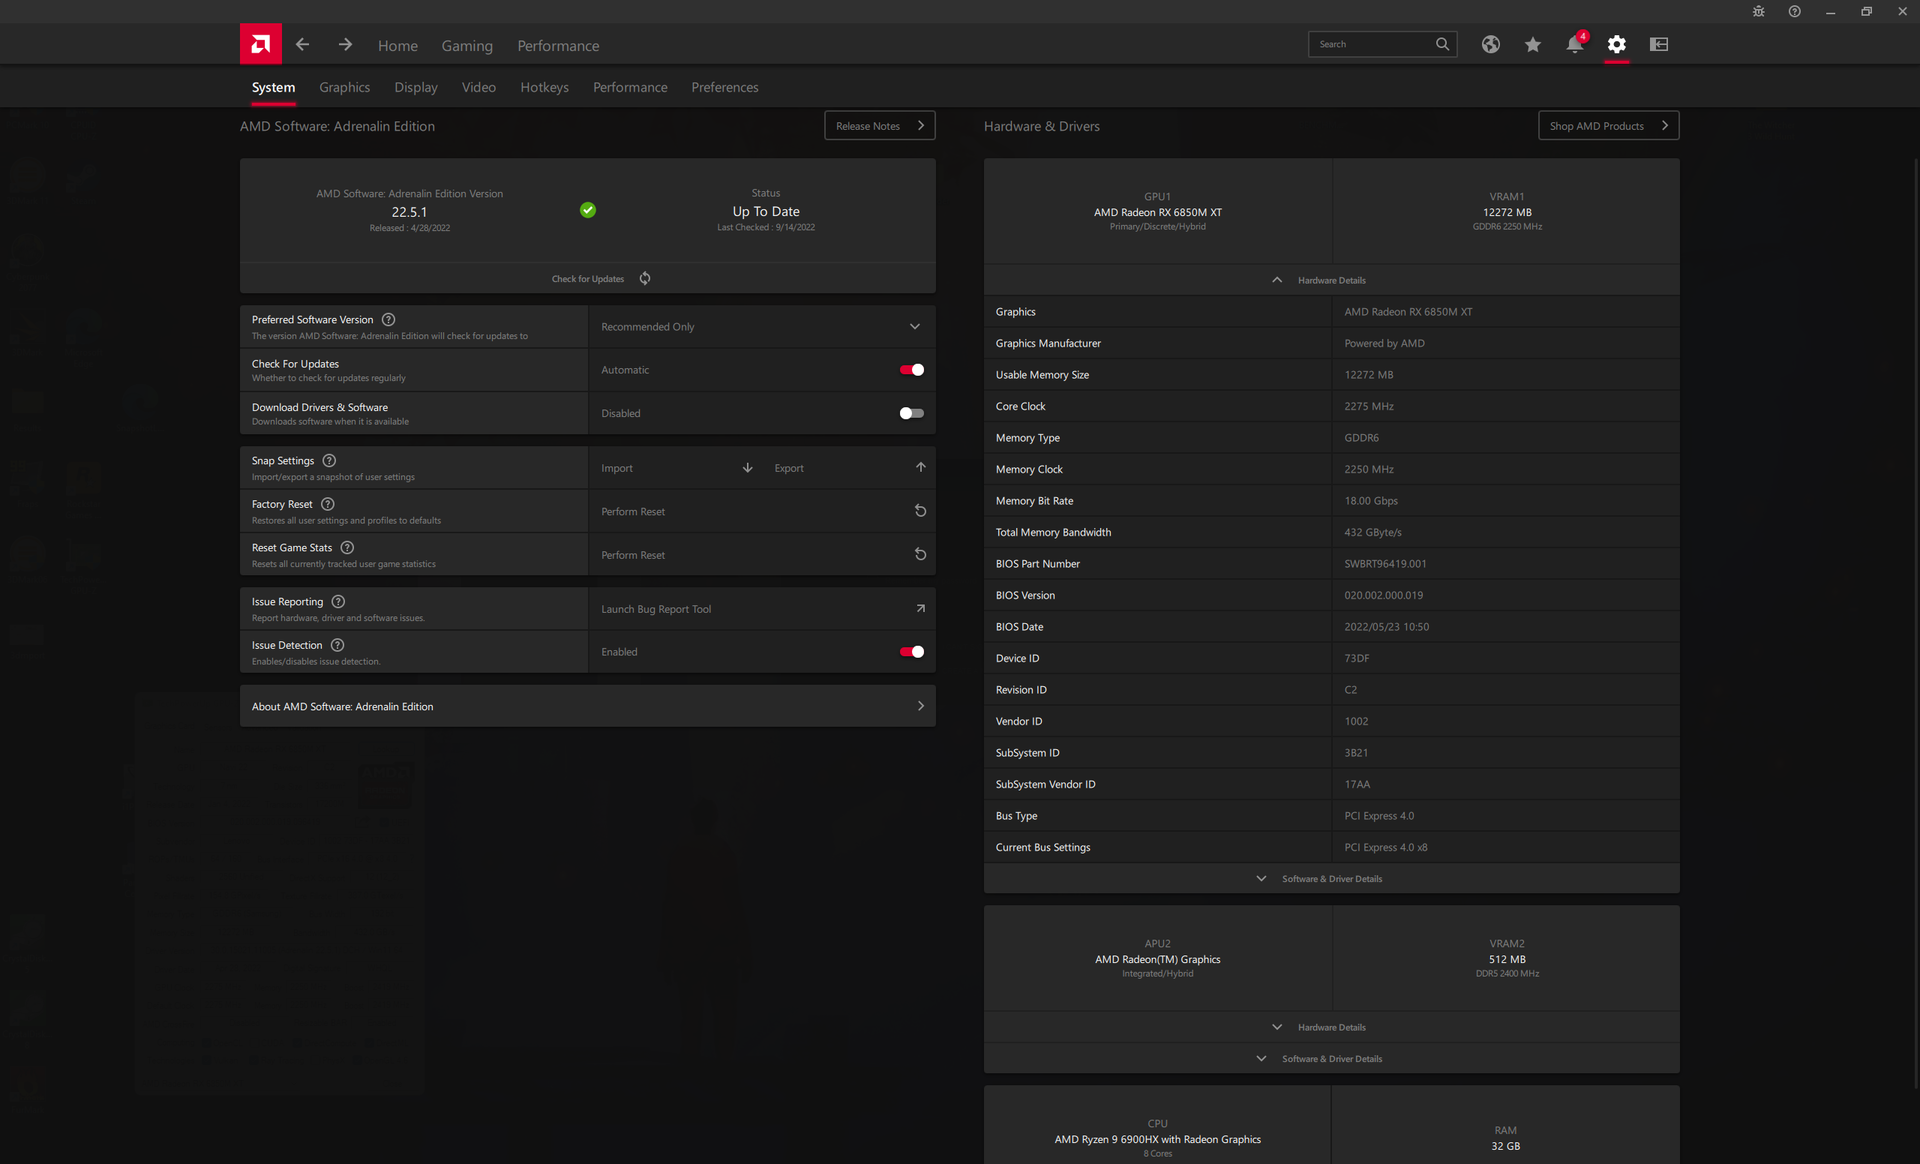
The system ships with the uncommon MediaTek RZ616 for Wi-Fi 6E and Bluetooth 5.2 connectivity instead of the usual Intel AX solution. Transfer rates are fast and steady when paired to our 6 GHz home network, but receive rates are slightly slower than expected.
| Networking | |
| iperf3 transmit AX12 | |
| Lenovo Legion 5 Pro 16ACH6H (82JQ001PGE) | |
| HP Omen 16-c0077ng | |
| iperf3 receive AX12 | |
| Lenovo Legion 5 Pro 16ACH6H (82JQ001PGE) | |
| HP Omen 16-c0077ng | |
| iperf3 receive AXE11000 6GHz | |
| Lenovo Legion 7 16ARHA7 | |
| iperf3 transmit AXE11000 | |
| Asus ROG Zephyrus Duo 16 GX650RX | |
| Lenovo Legion Slim 7-16IAH 82TF004YGE | |
| MSI Raider GE66 12UHS | |
| iperf3 receive AXE11000 | |
| MSI Raider GE66 12UHS | |
| Lenovo Legion Slim 7-16IAH 82TF004YGE | |
| Asus ROG Zephyrus Duo 16 GX650RX | |
| iperf3 transmit AXE11000 6GHz | |
| Lenovo Legion 7 16ARHA7 | |
Webcam
The 2 MP webcam offers a sharper picture than most other laptops where 720p is still common. A camera kill switch is along the right edge, but there is no visual indicator to show that the camera lens is blocked in any way.
There is no IR sensor for Hello support.


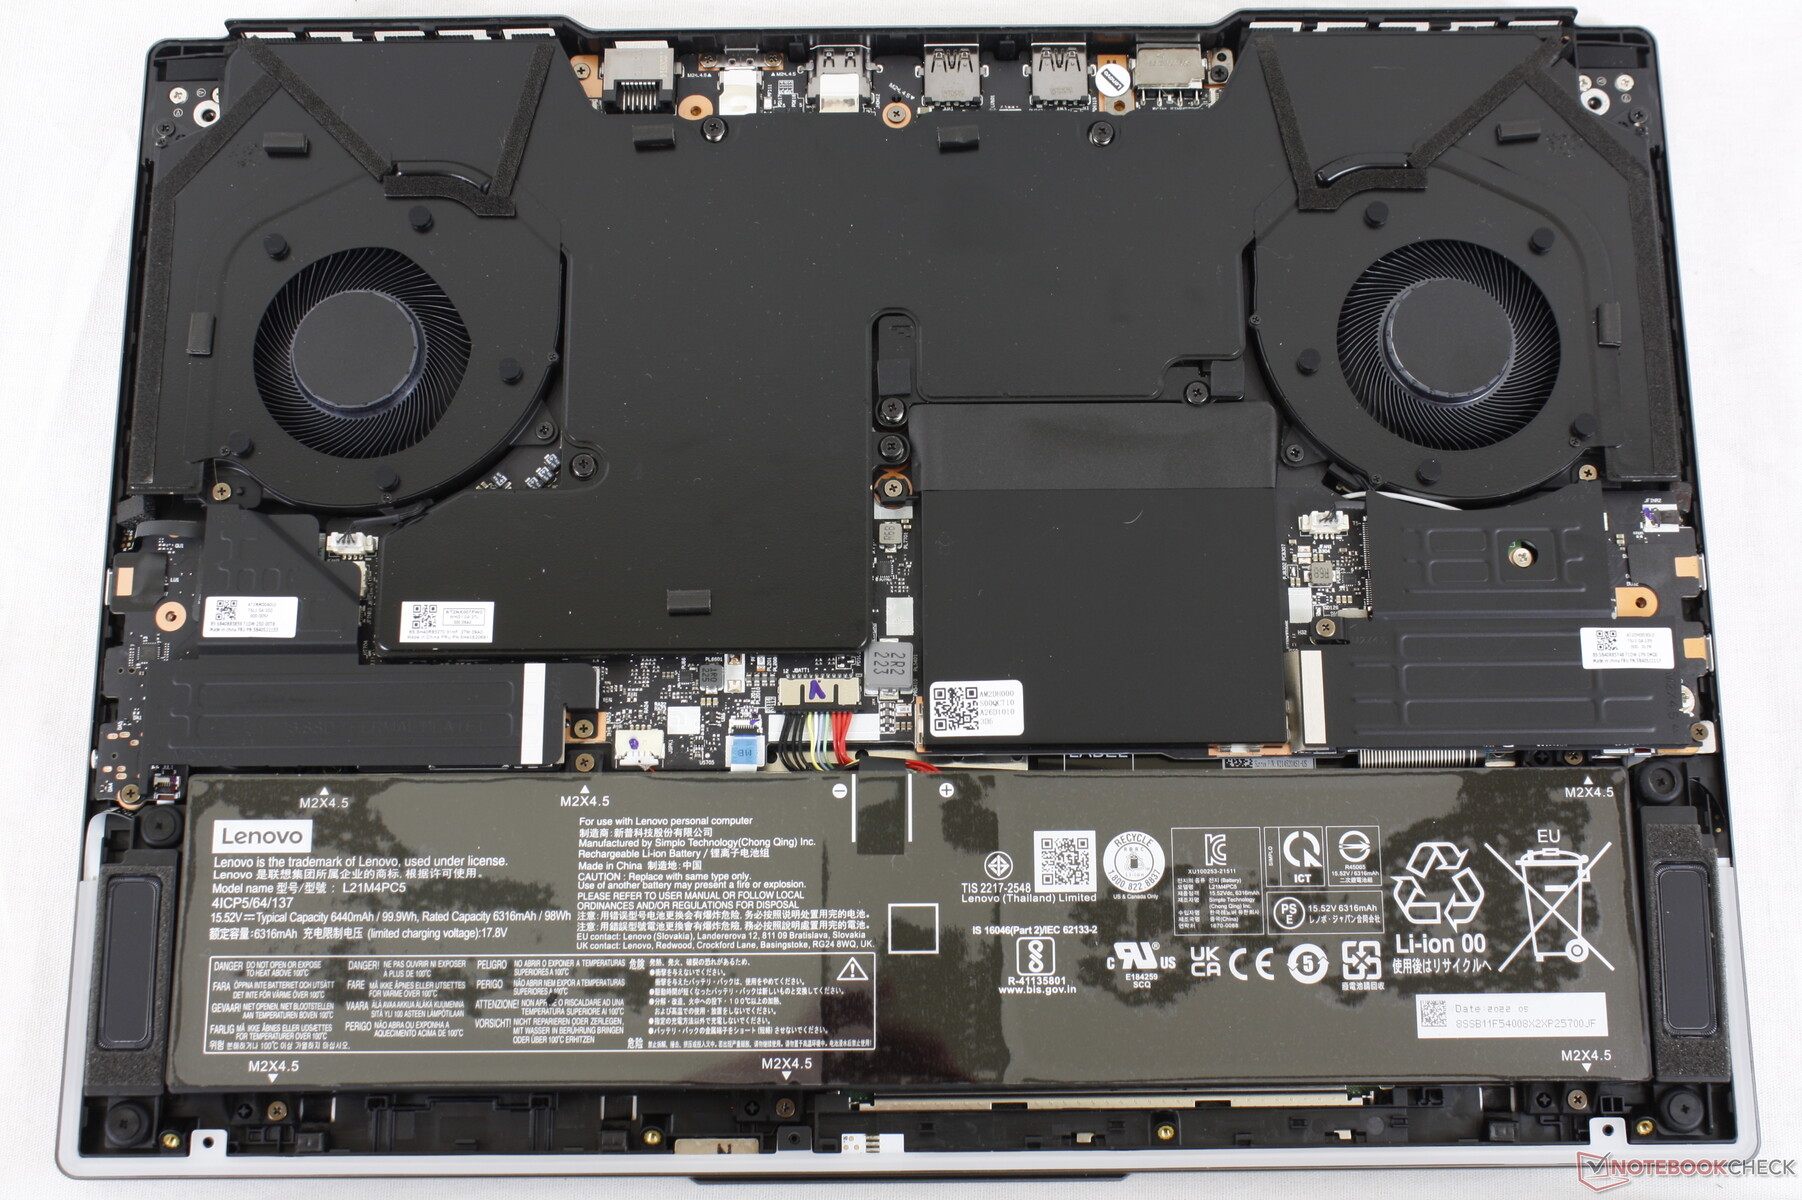
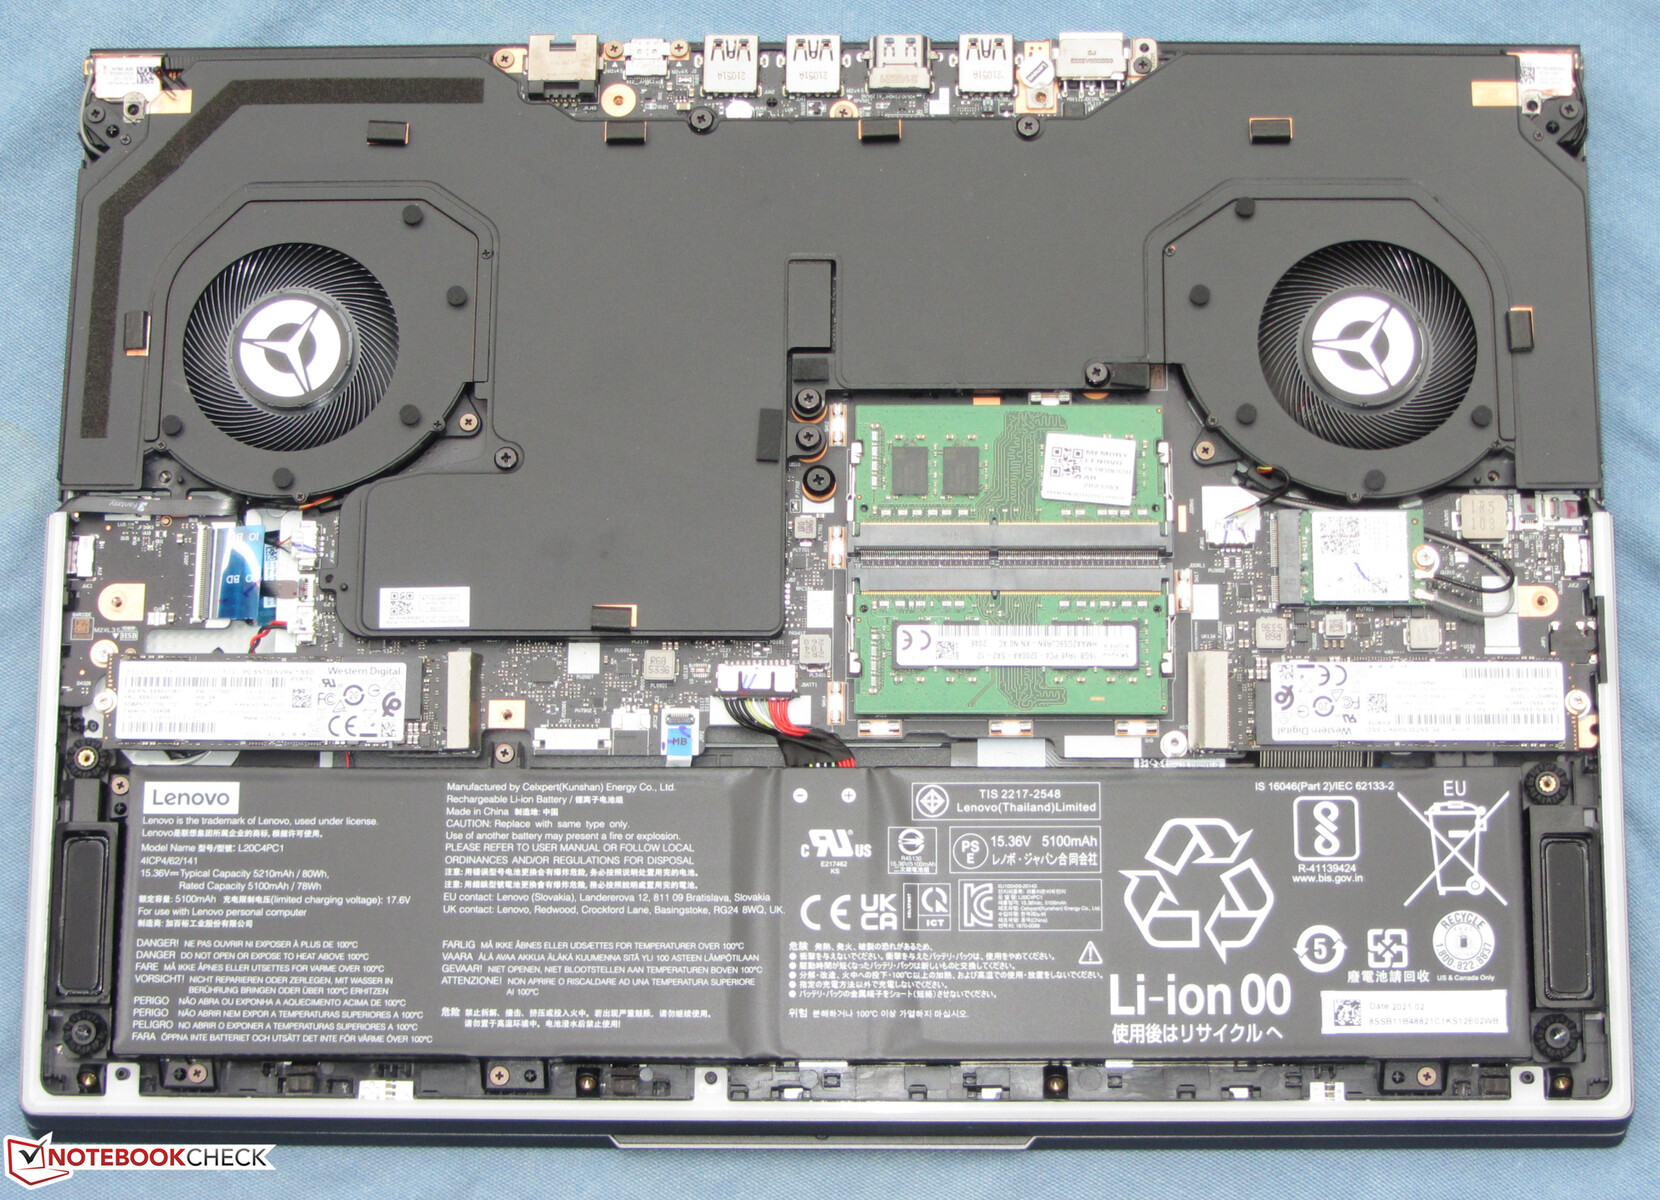
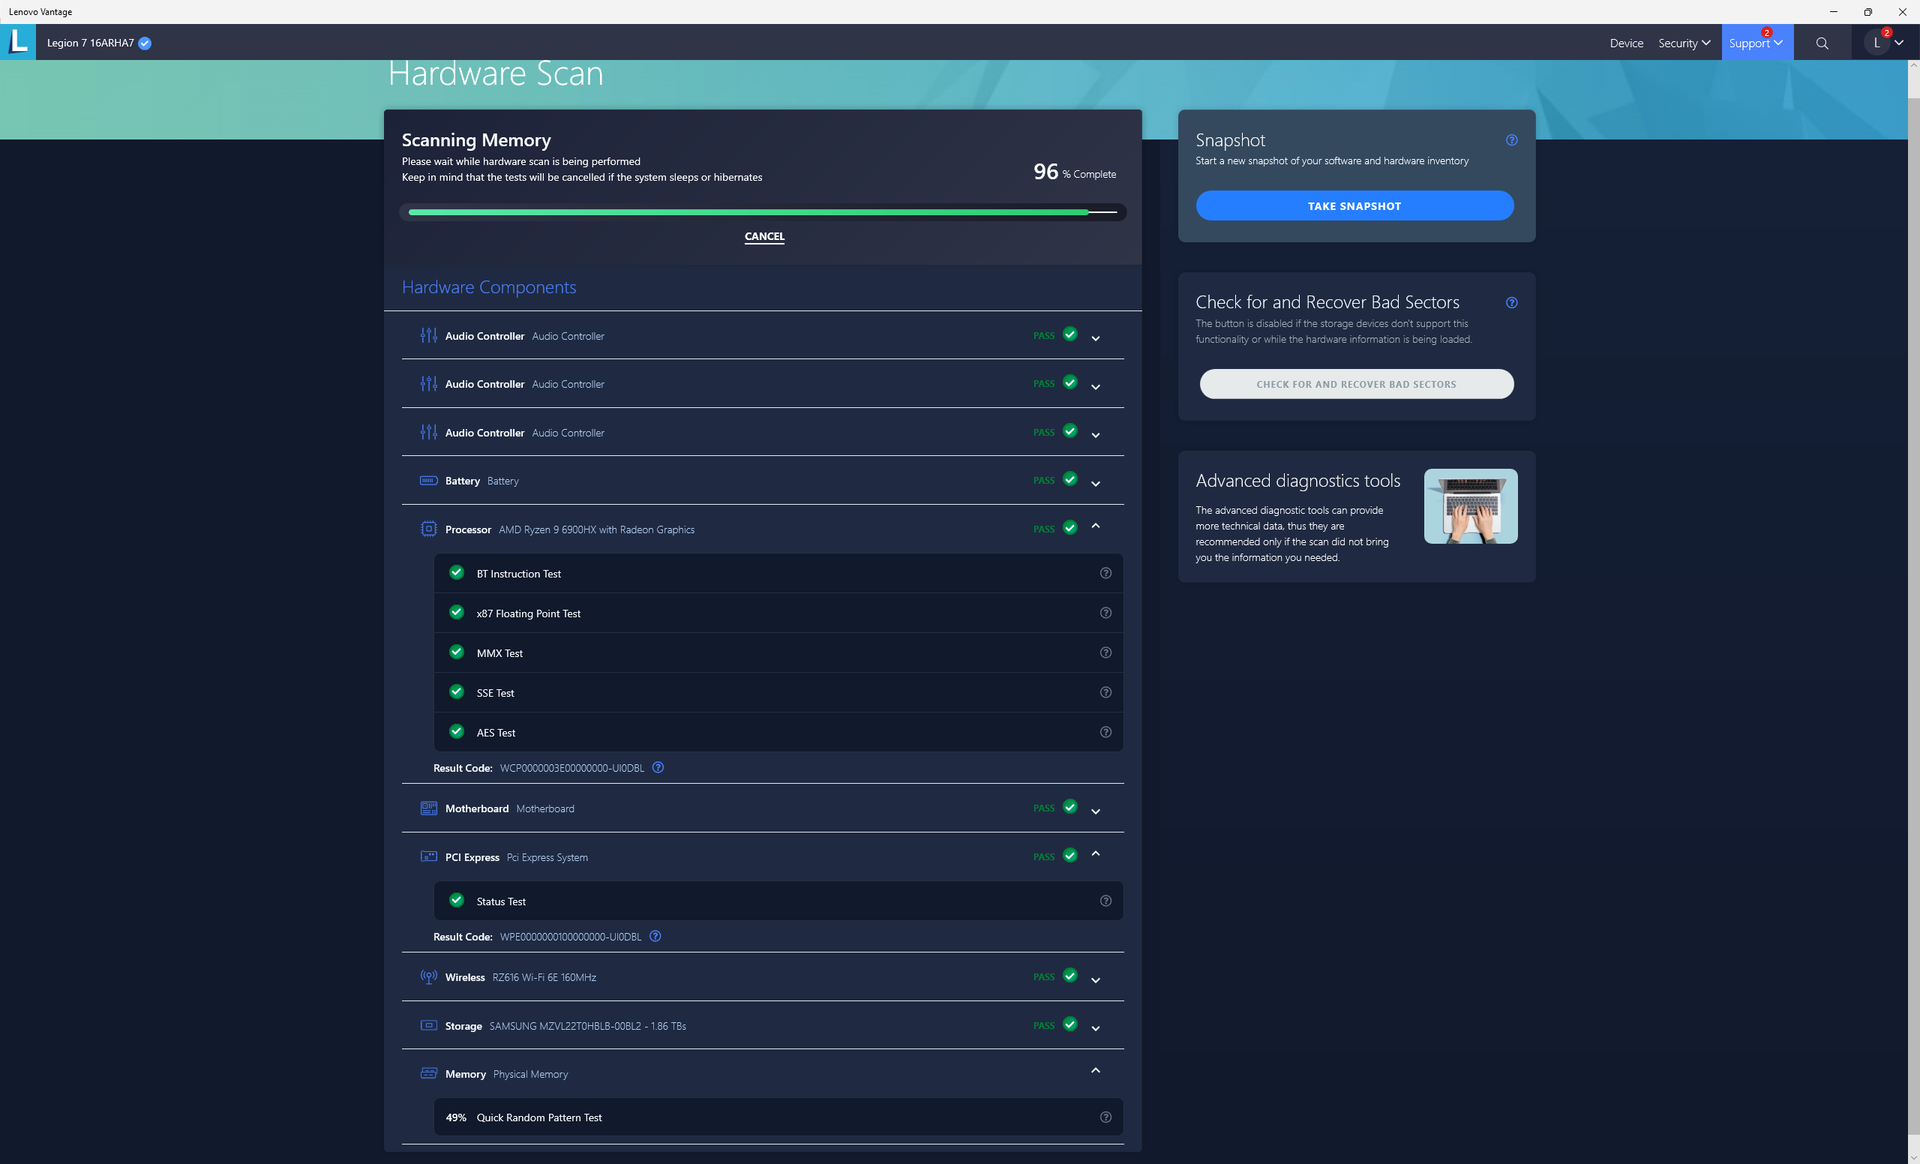
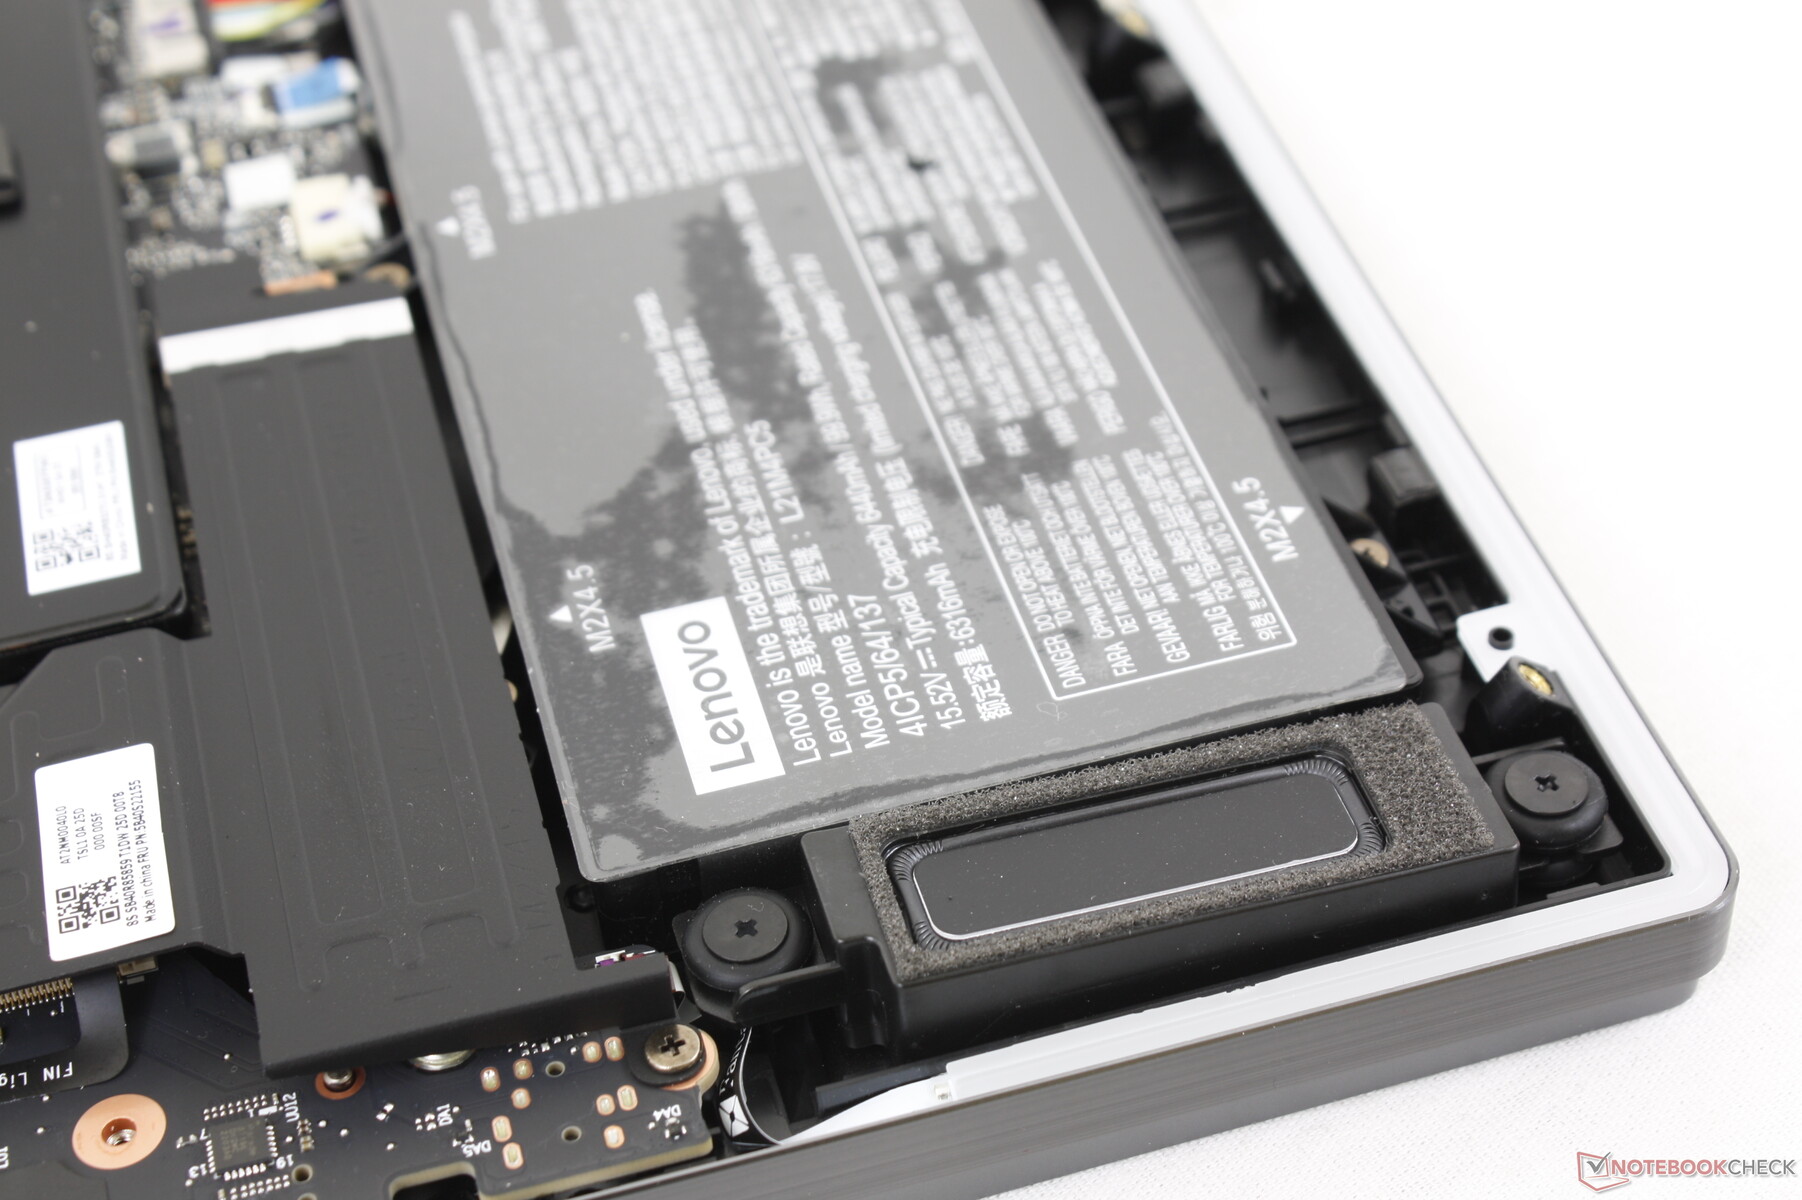
Maintenance
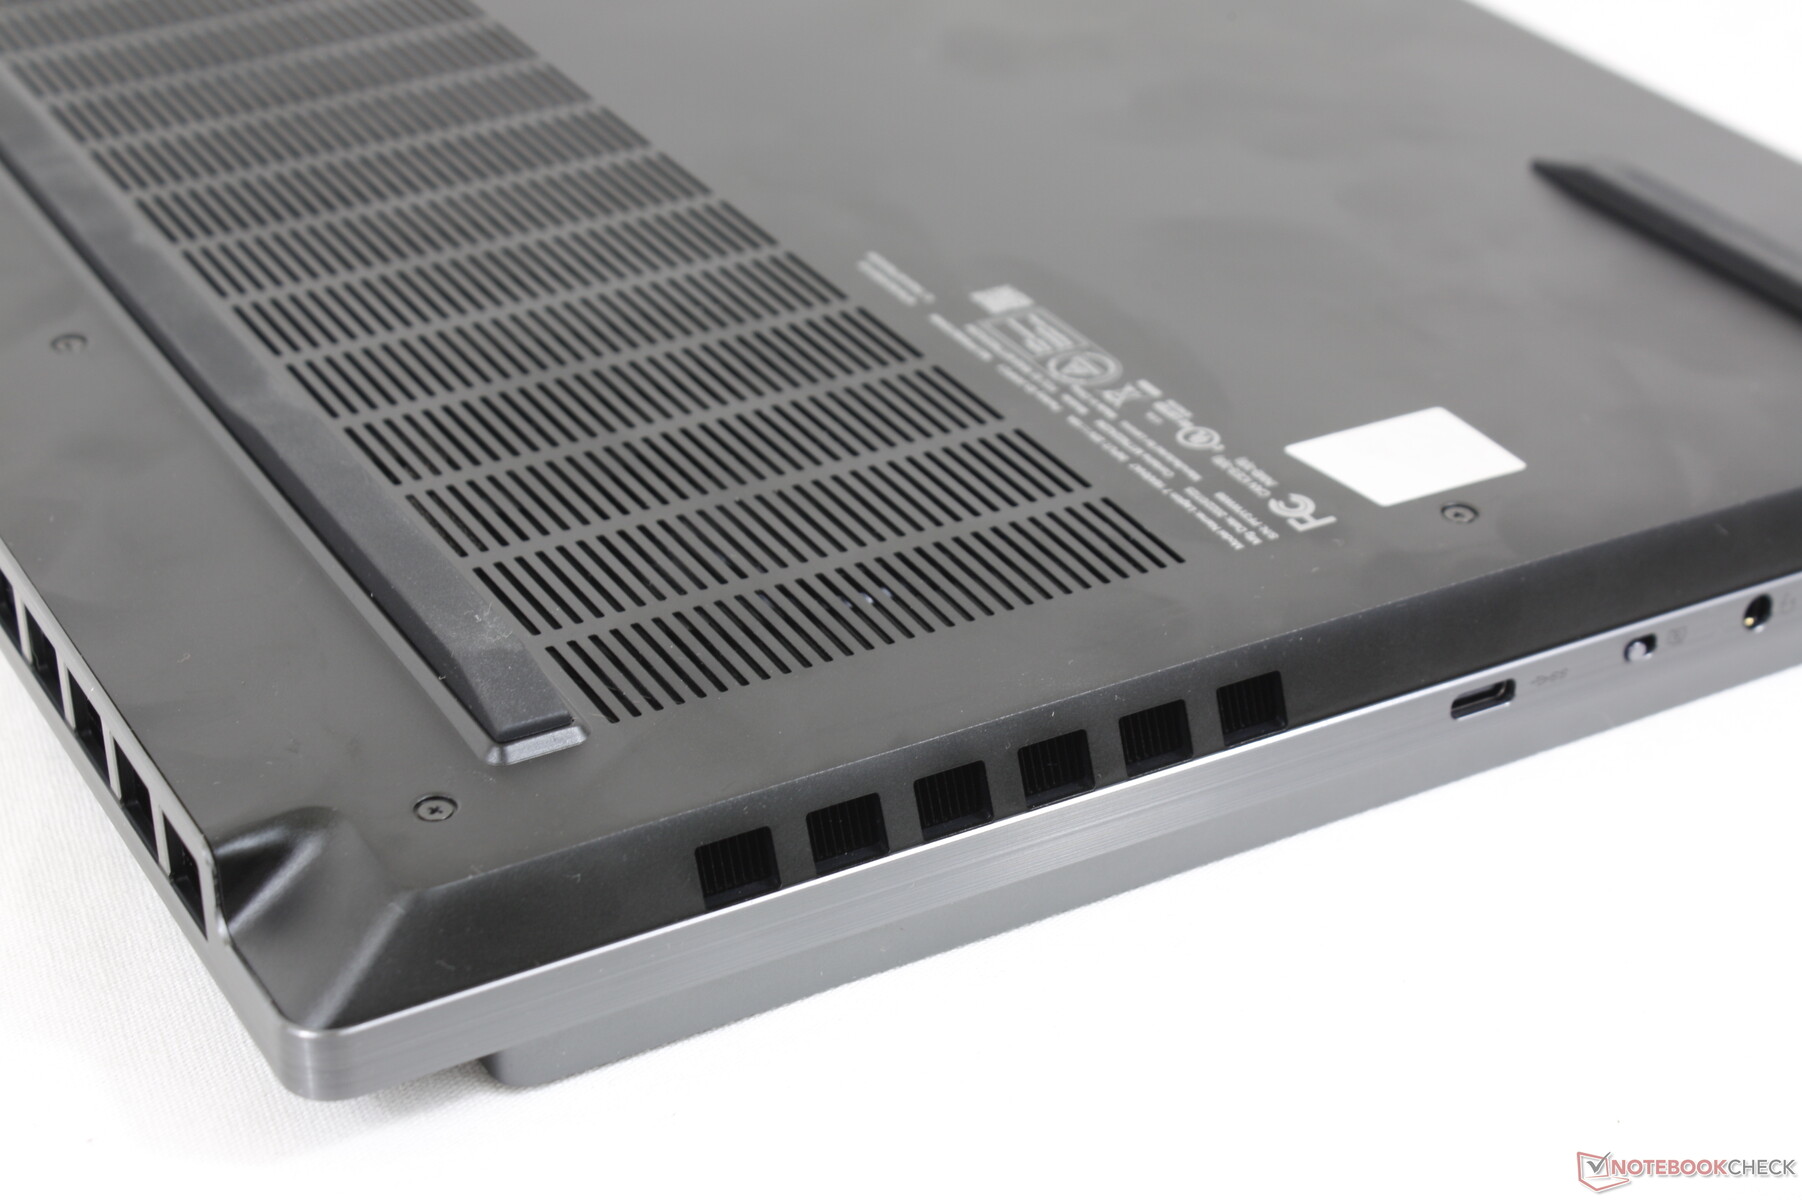
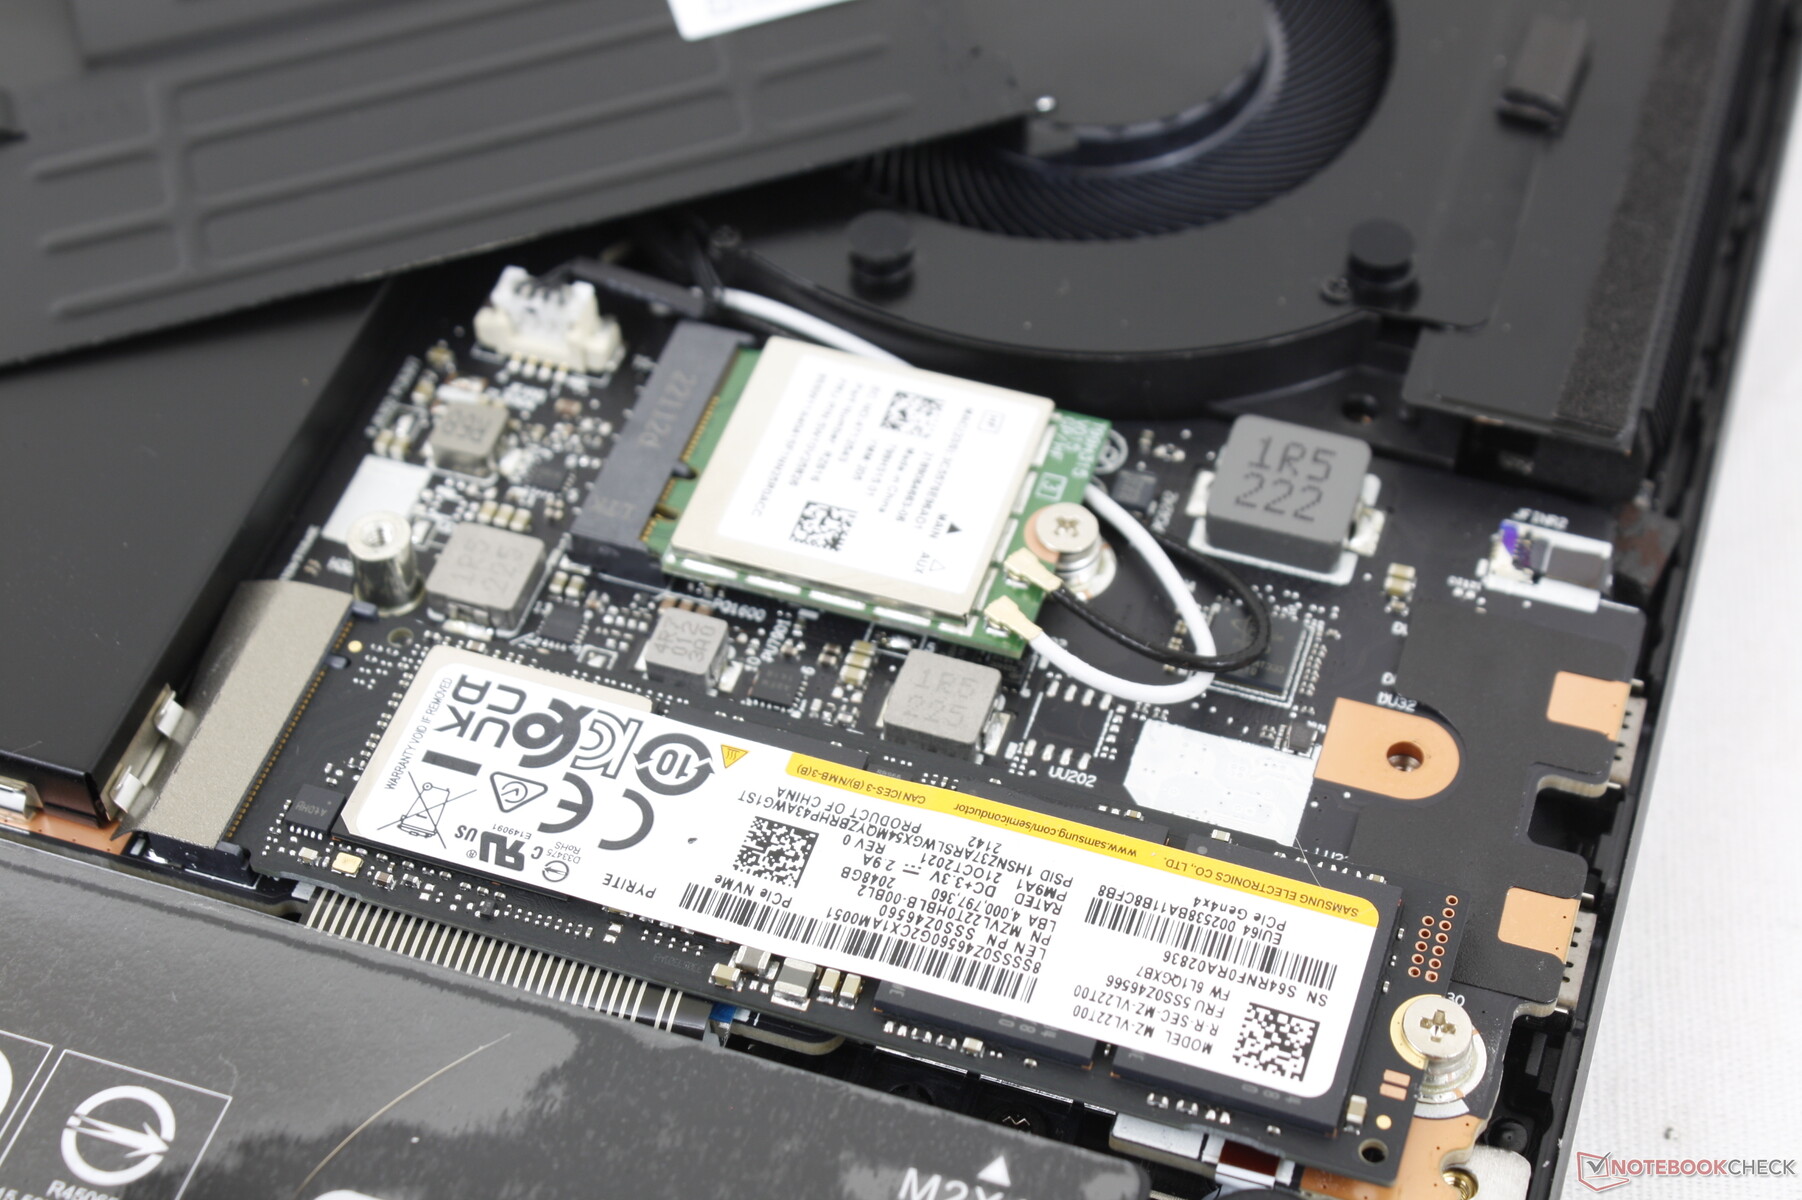
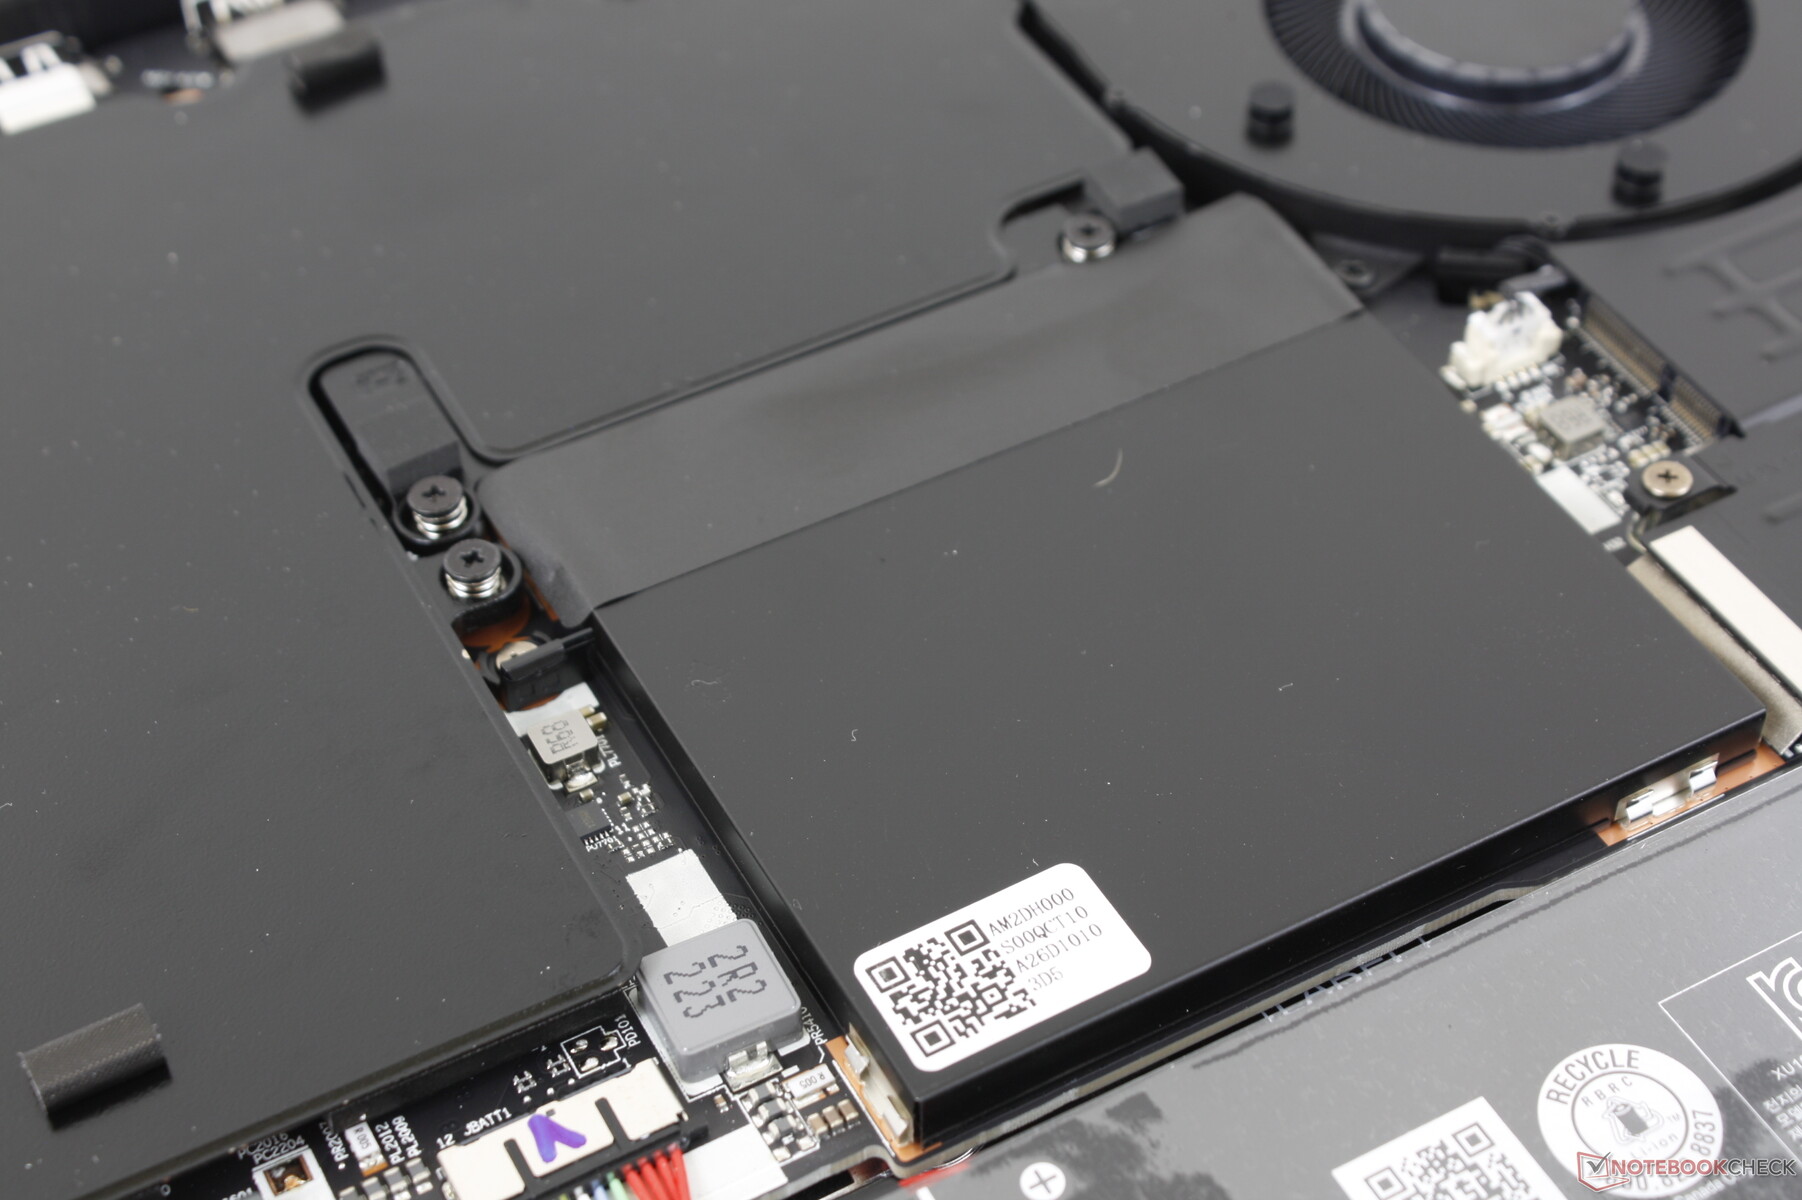
The bottom panel is secured by 10 Philips screws for relatively easy serviceability. Owners have access to two M.2 2280 storage slots and two SODIMM slots each with their own metal cover.
Accessories and Warranty
Lenovo includes a tool for removing the keycaps for cleaning or replacement purposes. The standard one-year limited warranty applies if purchased in the US.
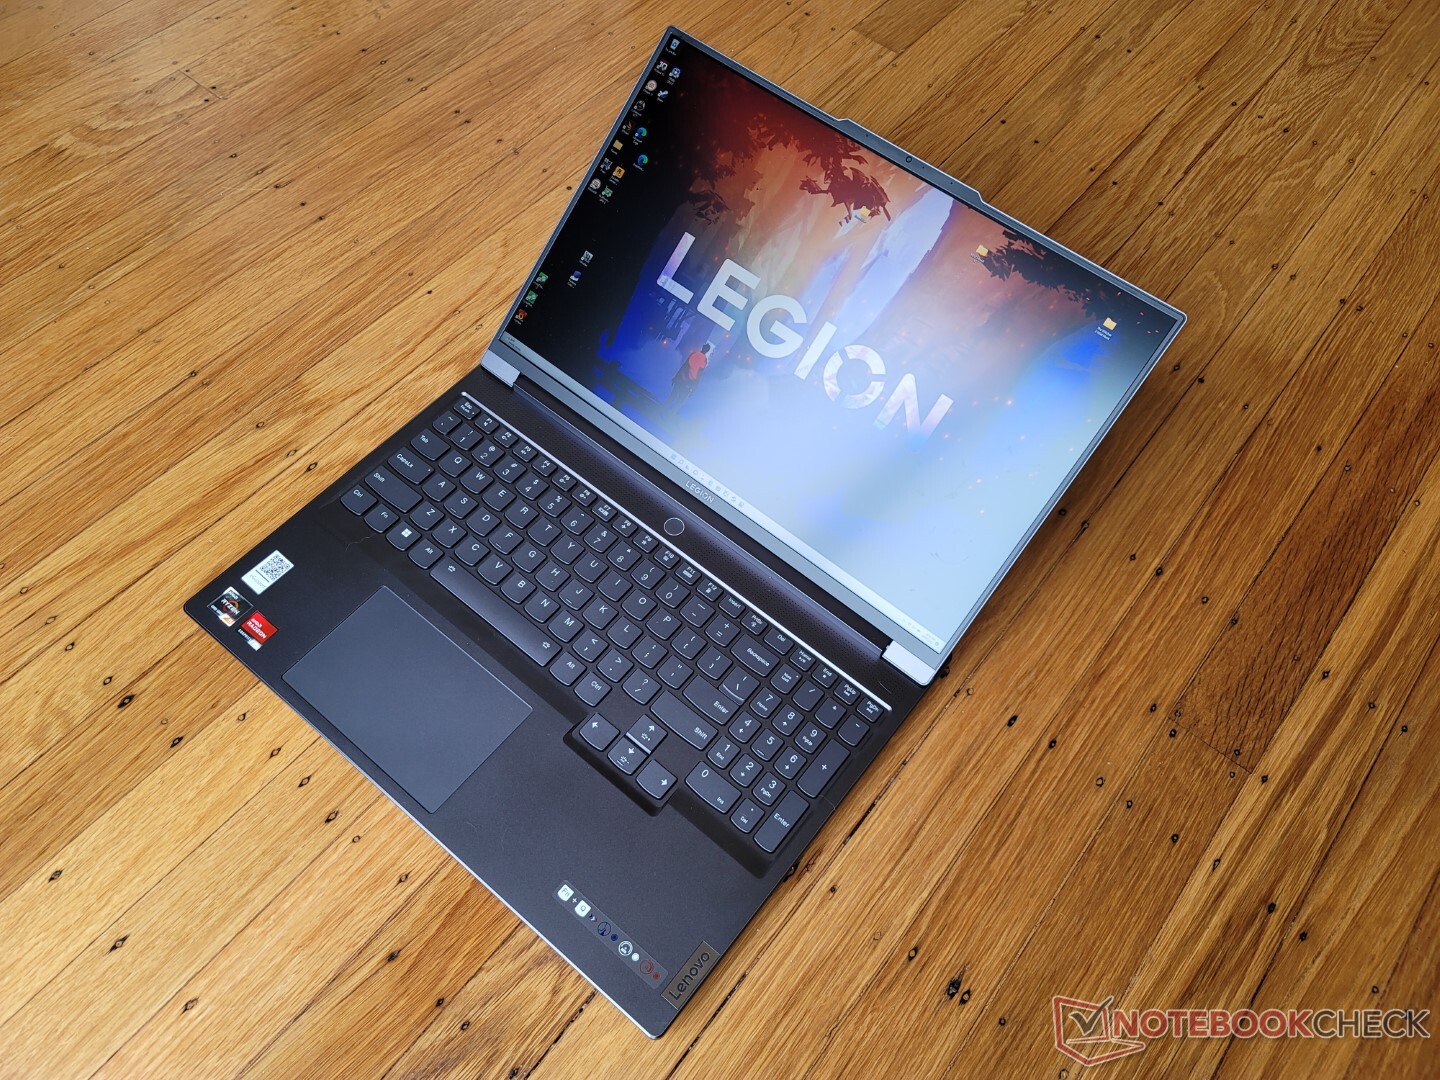
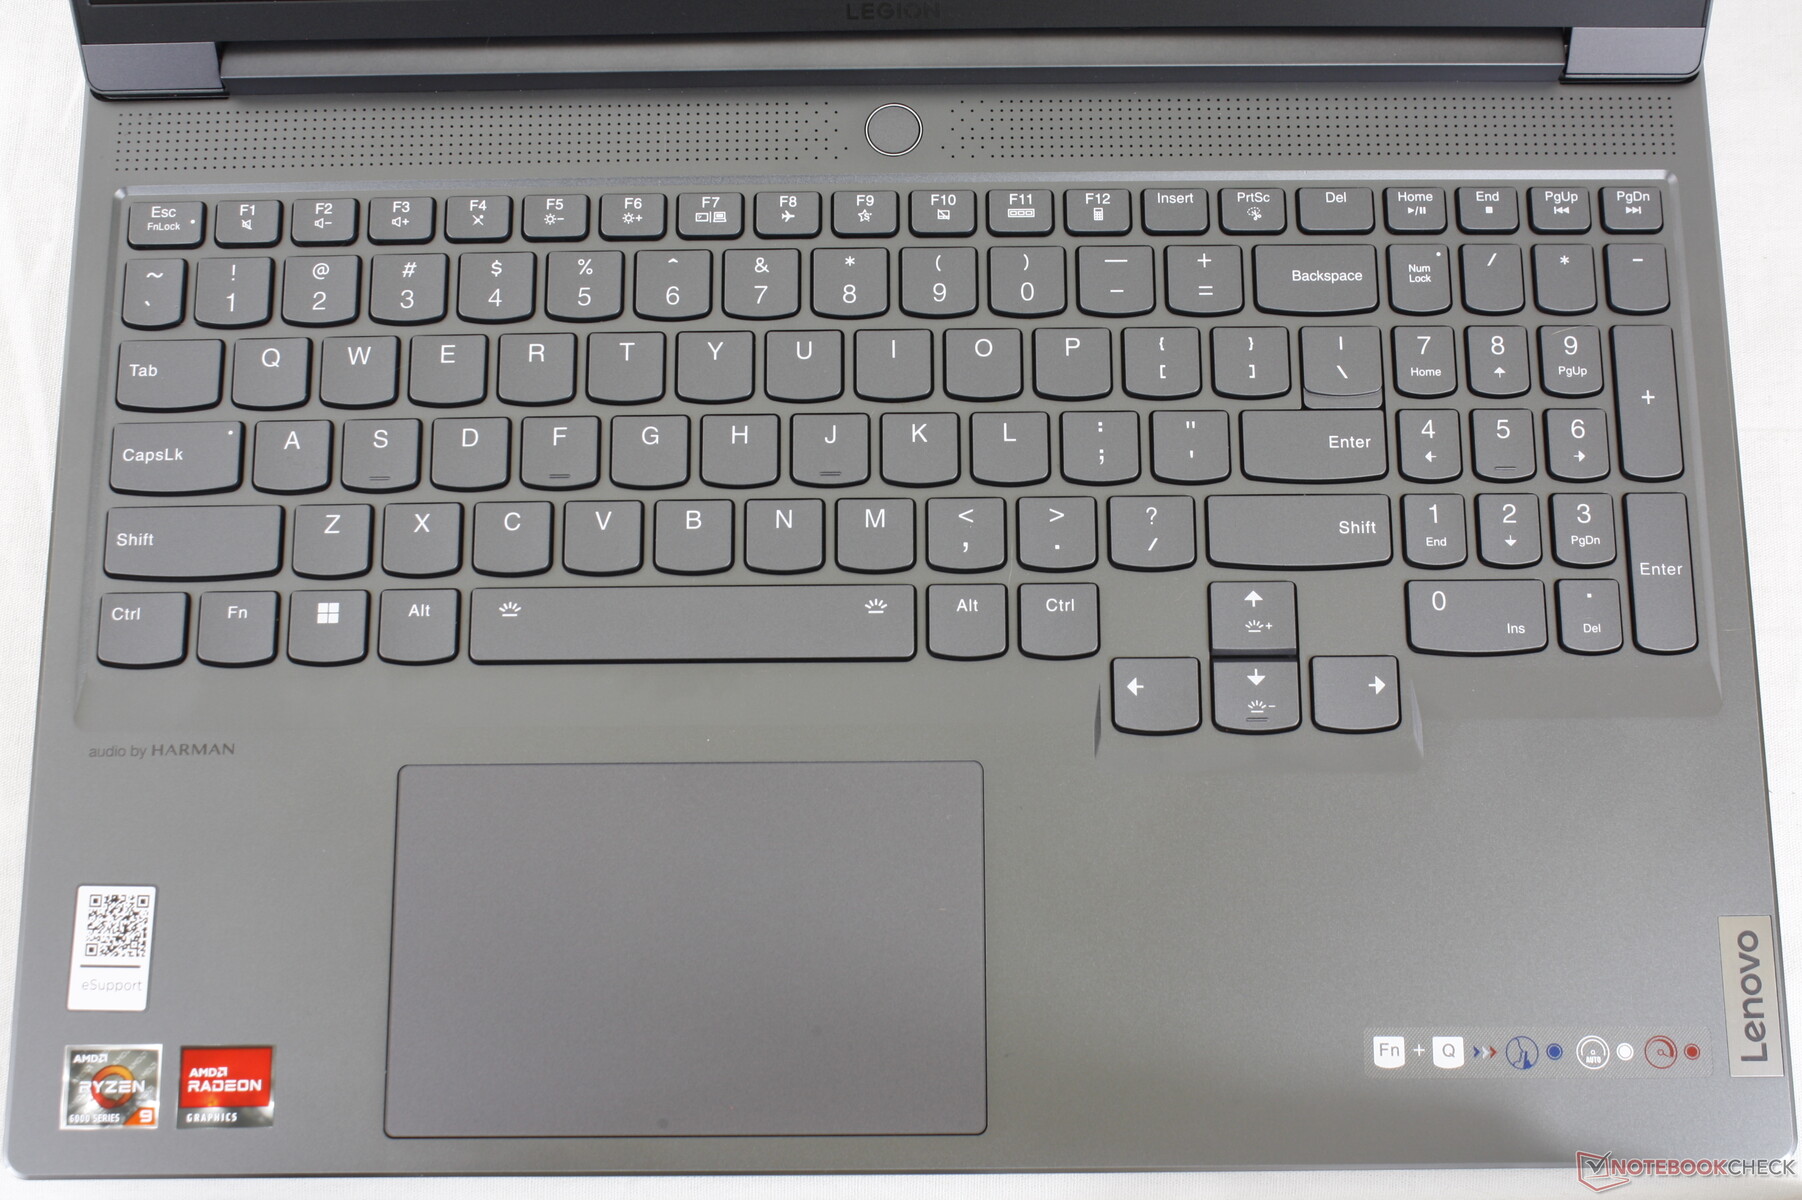
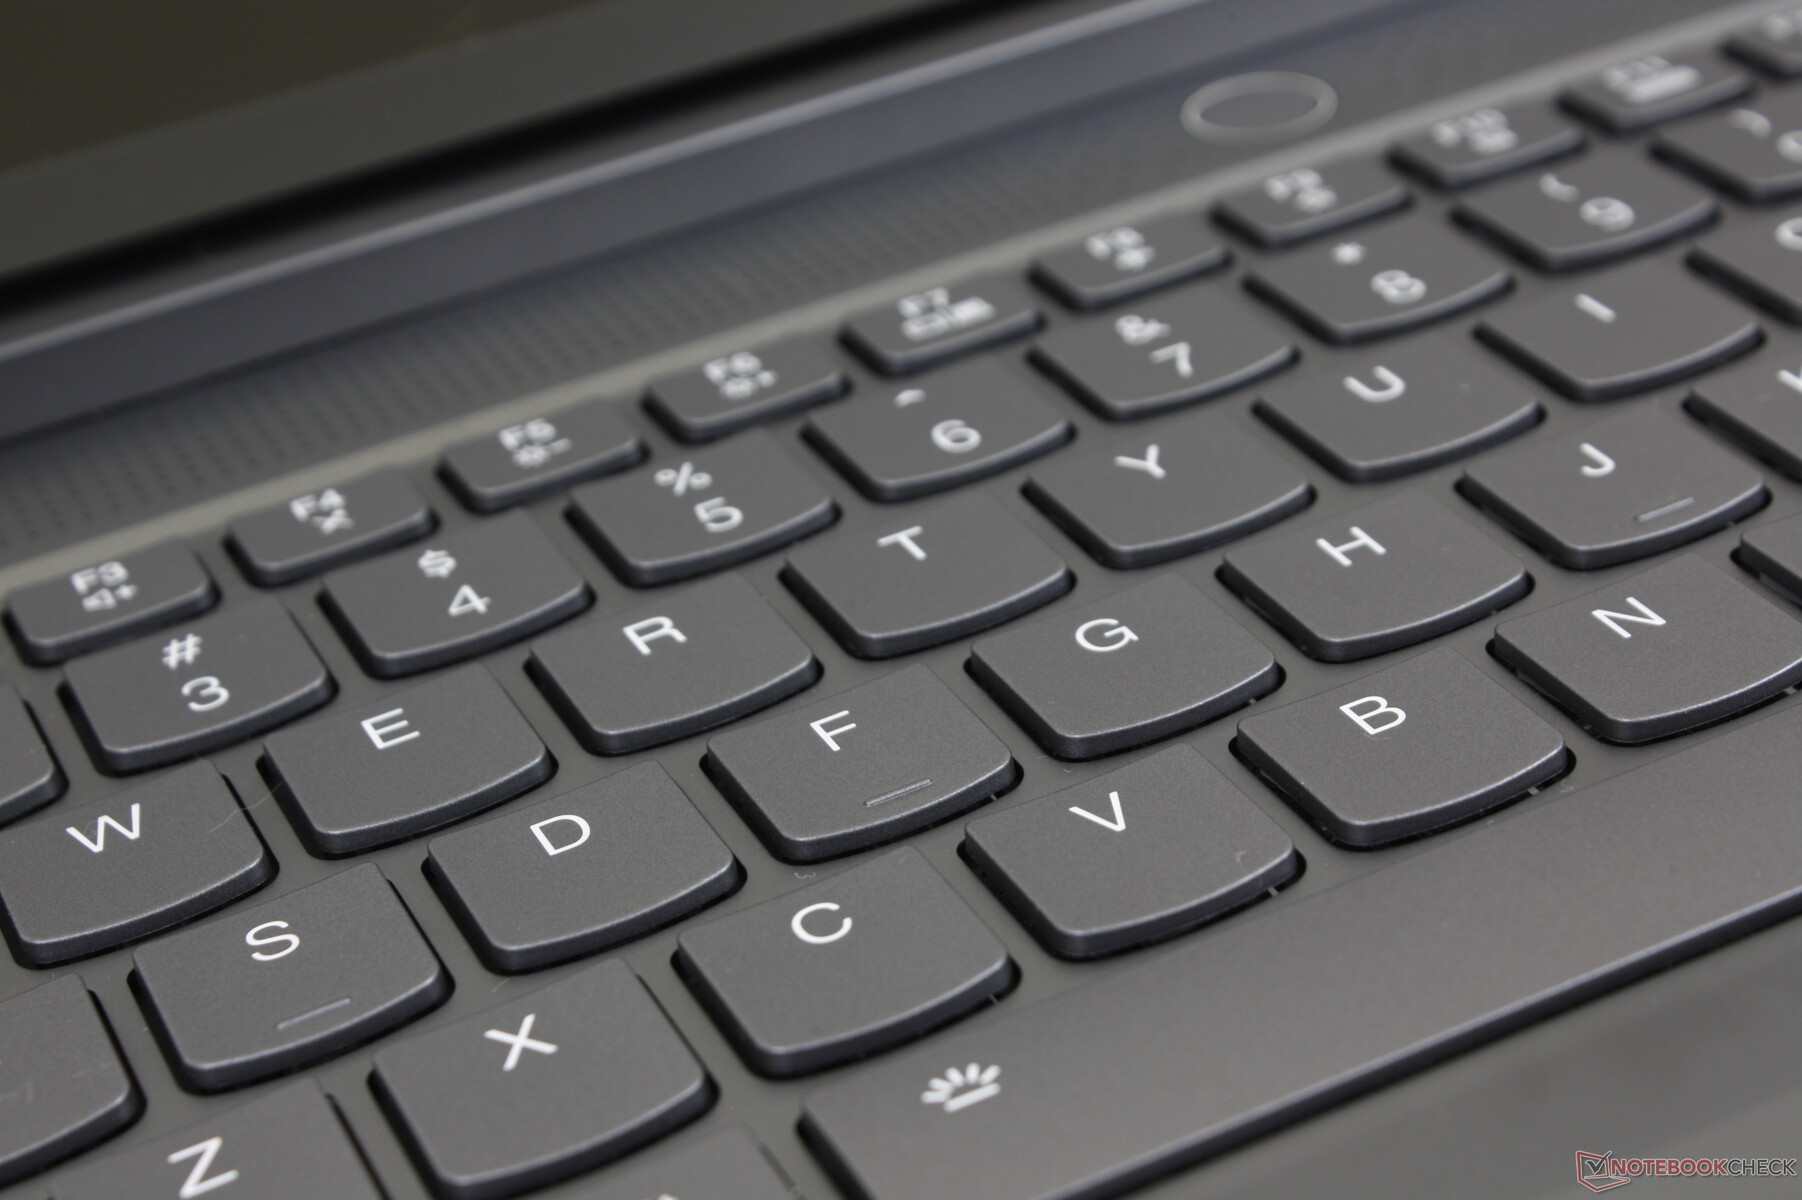
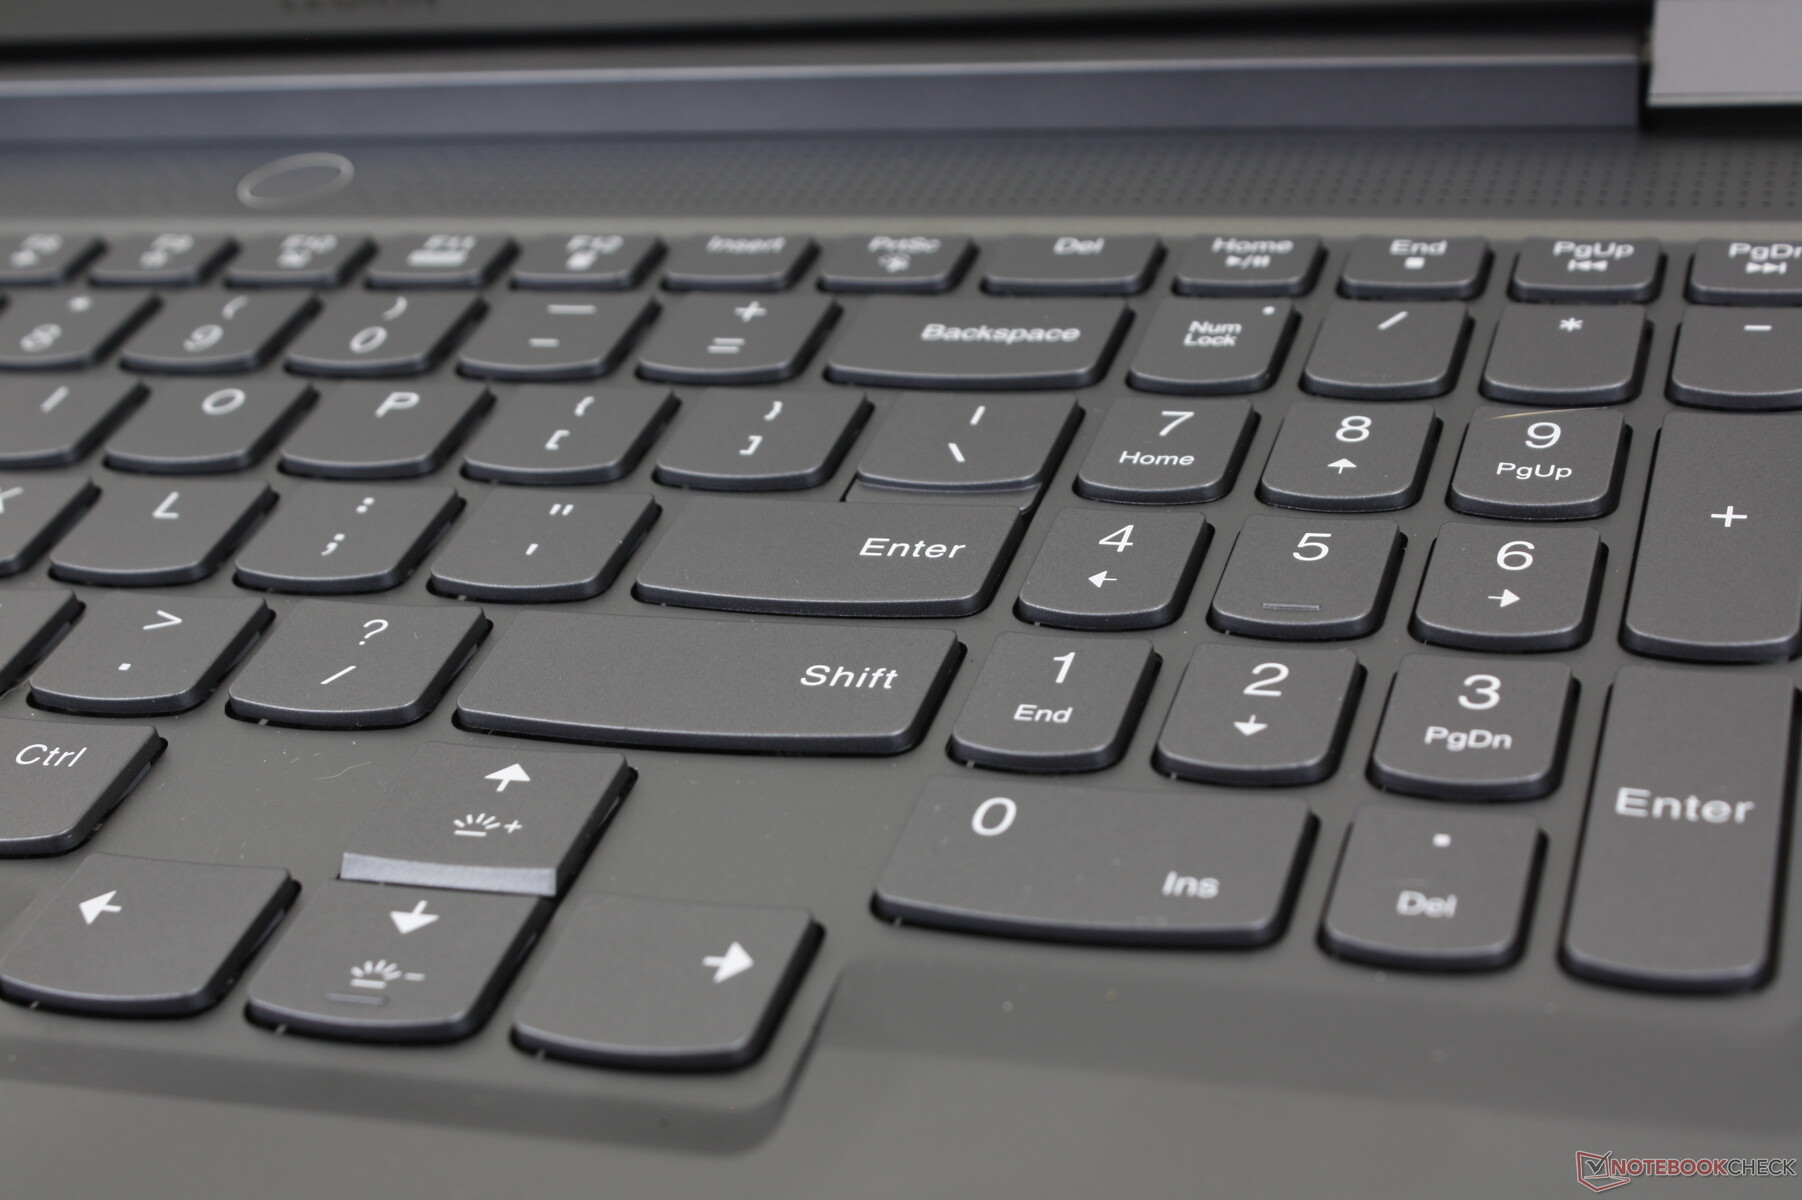
Input Devices — Better Than An IdeaPad or Yoga
Keyboard
We were initially afraid that the keyboard would be identical to a cheaper IdeaPad keyboard with shallow travel and soft feedback. Fortunately, the keyboard on the Legion 7 16 is of higher quality than the keyboards on IdeaPad and Yoga models. Key travel is noticeably deeper and with firmer feedback for a more satisfying typing experience especially in regard to the Space and Enter keys. It's not quite a ThinkPad, but the keyboard comes pretty close.
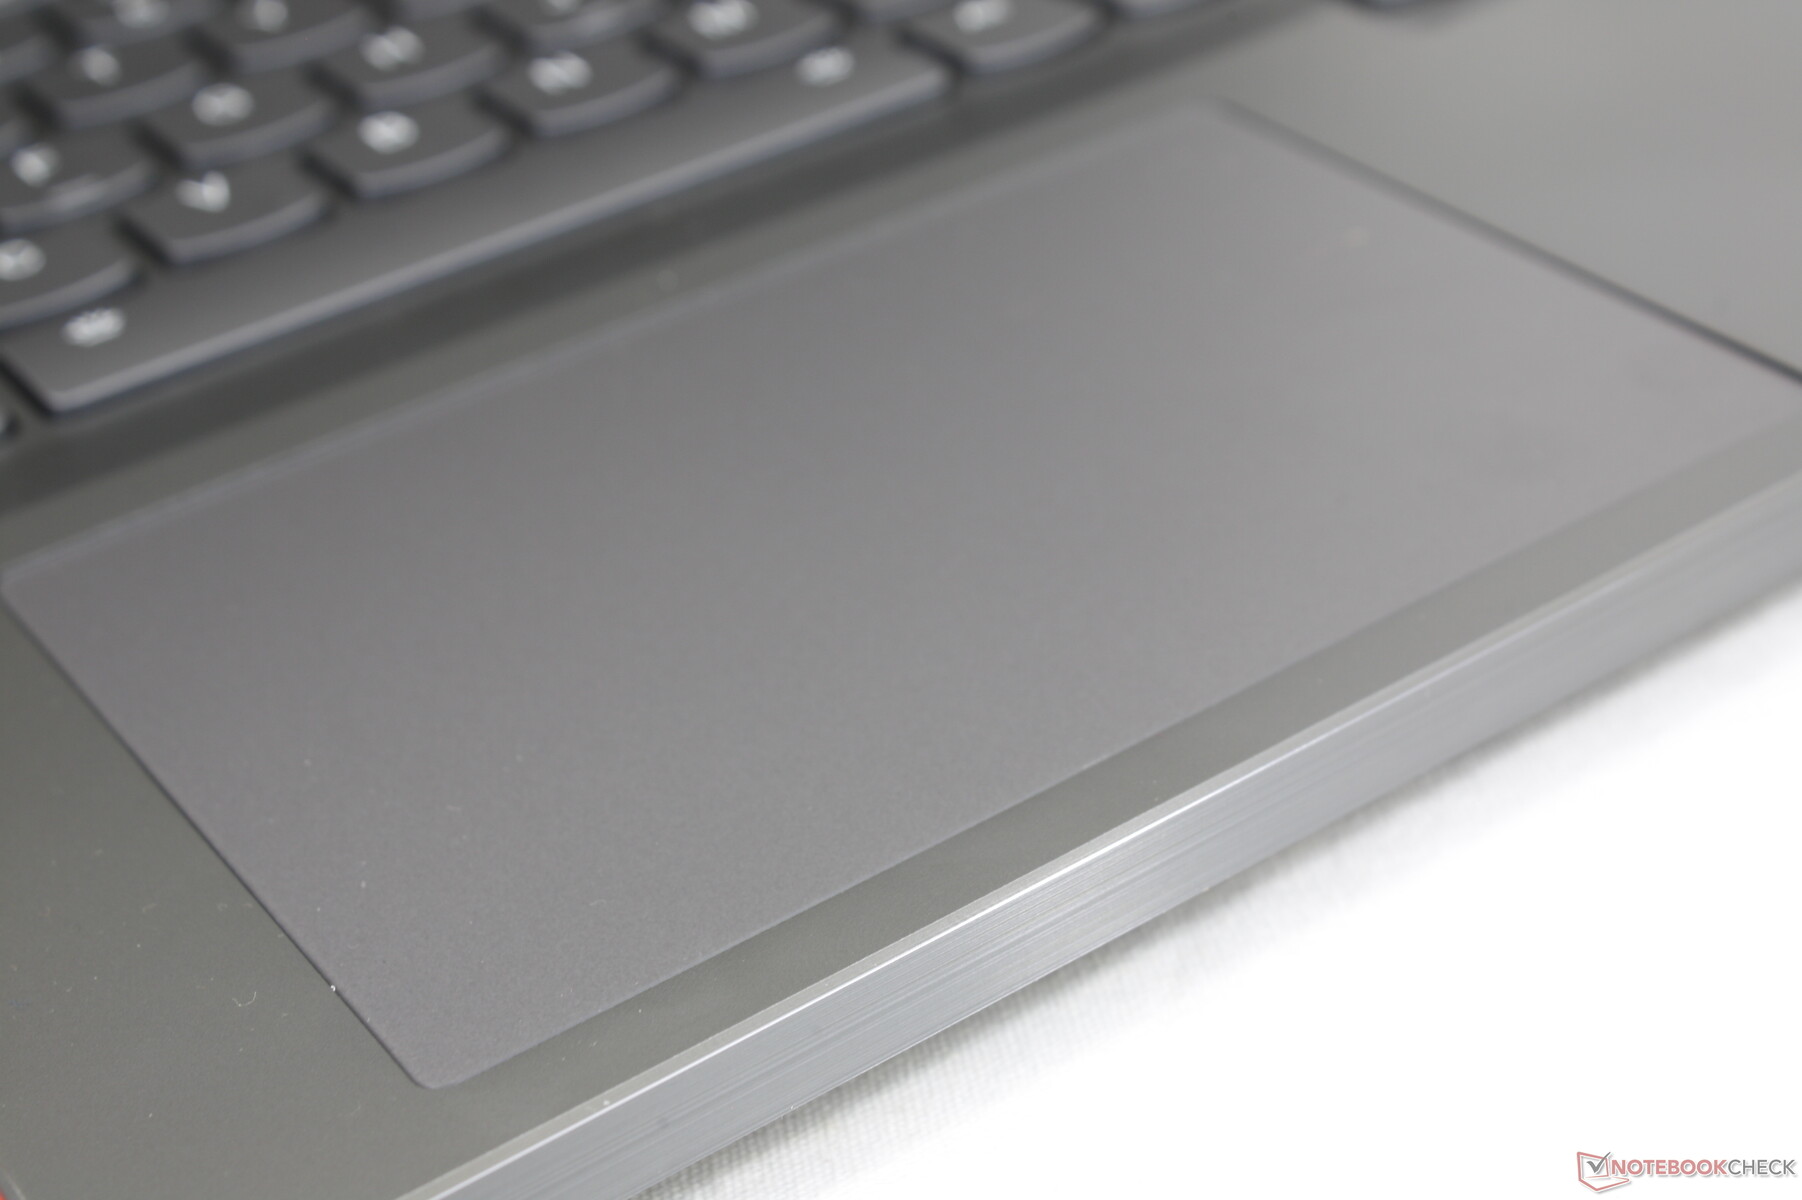
Touchpad
Clickpad size is almost identical to the clickpad on the Dell Inspiron 16 Plus 7620 Plus (12 x 7.5 cm vs. 11.5 x 8 cm). Traction is very smooth and only a tad bit sticky when gliding at slower speeds for easier dragging and dropping.
Clicking on the clickpad is shallow but with decent feedback. Though slightly on the softer side, feedback is at least firmer than on some other gaming laptops like the MSI Stealth GS77.
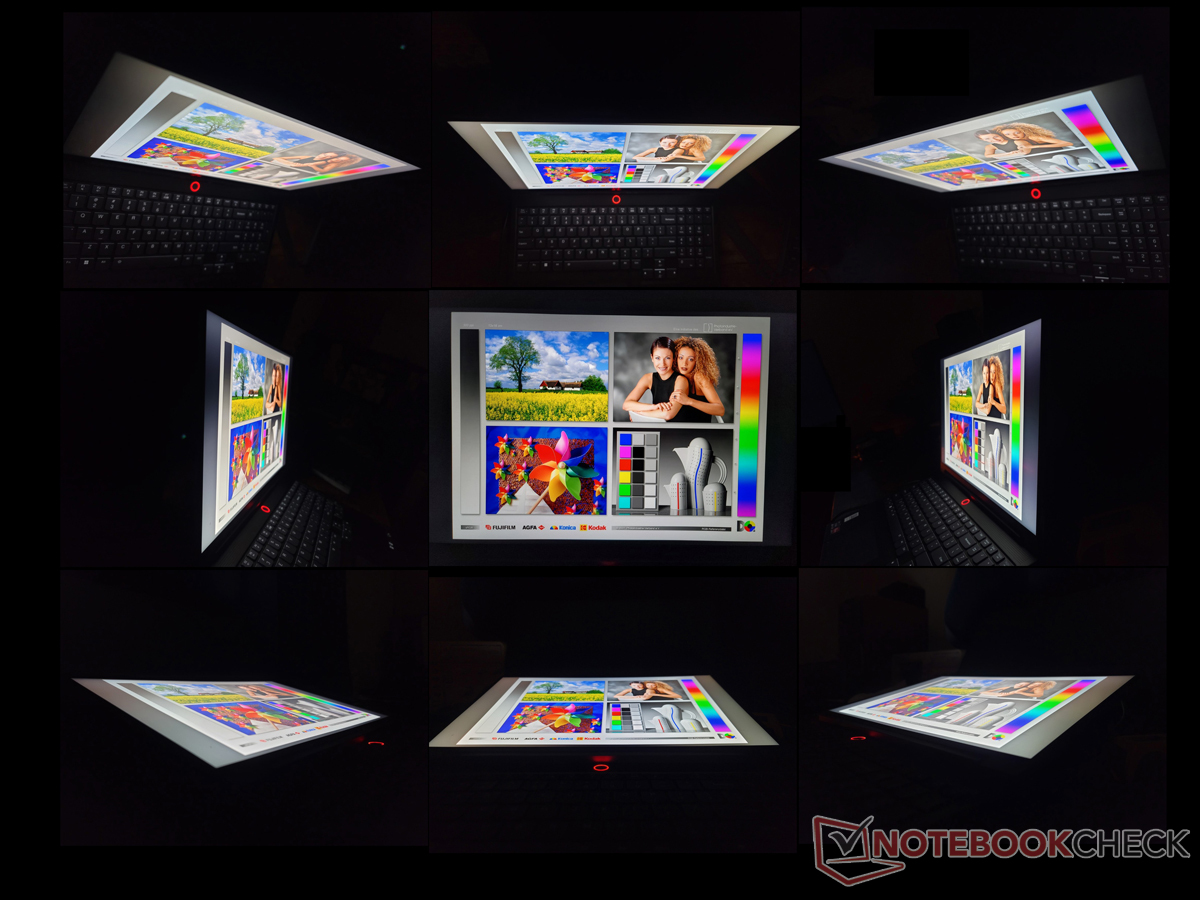
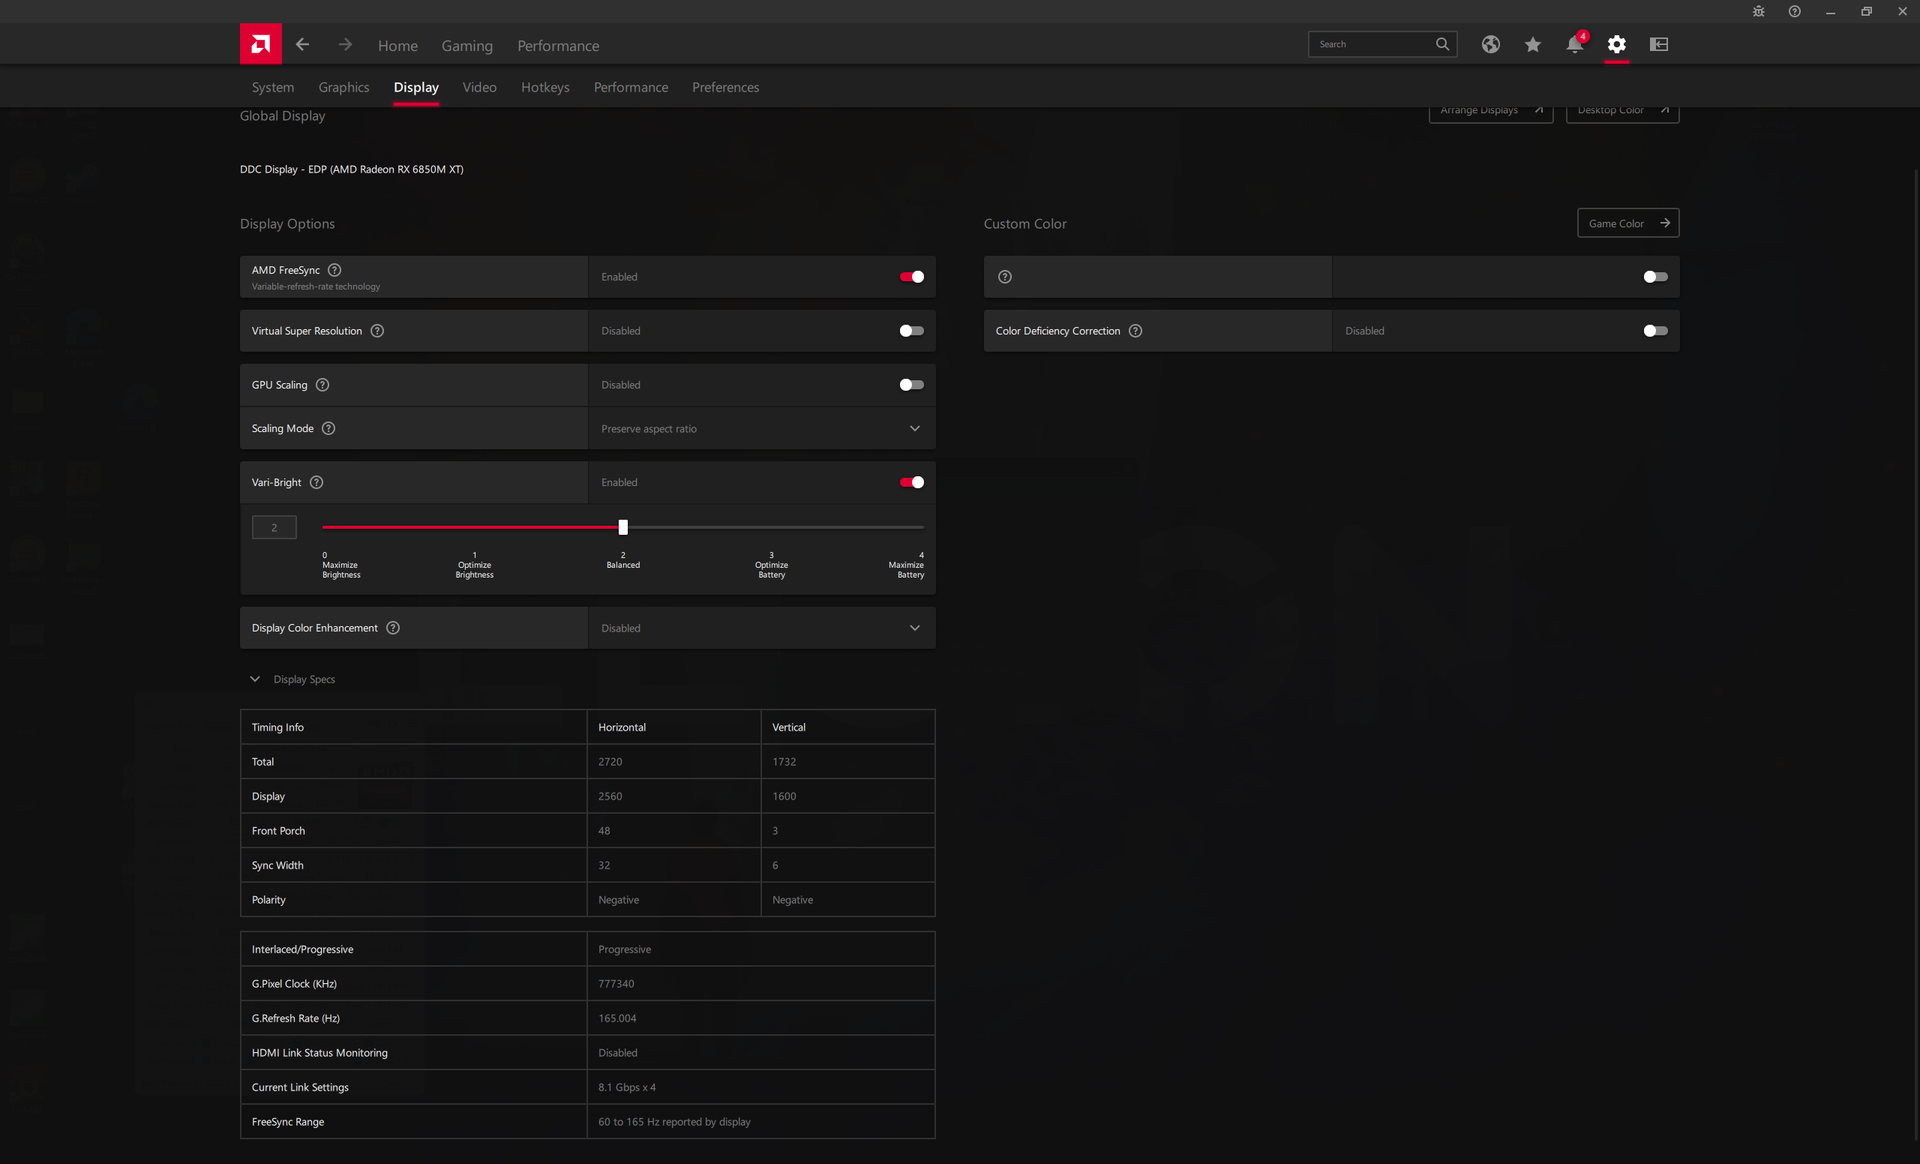
Display — 165 Hz, FreeSync, 100% sRGB Standard
The Legion 7 16 ships with a high quality BOE IPS panel that's almost analogous to the panel on the Asus ROG Zephyrus Duo 16 (NE160QDM-NY1 vs. NE160QDM-NX1). Both panels share very similar features including response times, brightness levels, and contrast ratio, but they differ in two key aspects: refresh rate and color coverage. The display on the Lenovo targets sRGB coverage with a faster 165 Hz native refresh rate compared to the wider P3 colors but slower 120 Hz refresh rate on the Asus. One panel is not necessarily better than the other depending on user preferences.
| |||||||||||||||||||||||||
Brightness Distribution: 90 %
Center on Battery: 478.8 cd/m²
Contrast: 1113:1 (Black: 0.43 cd/m²)
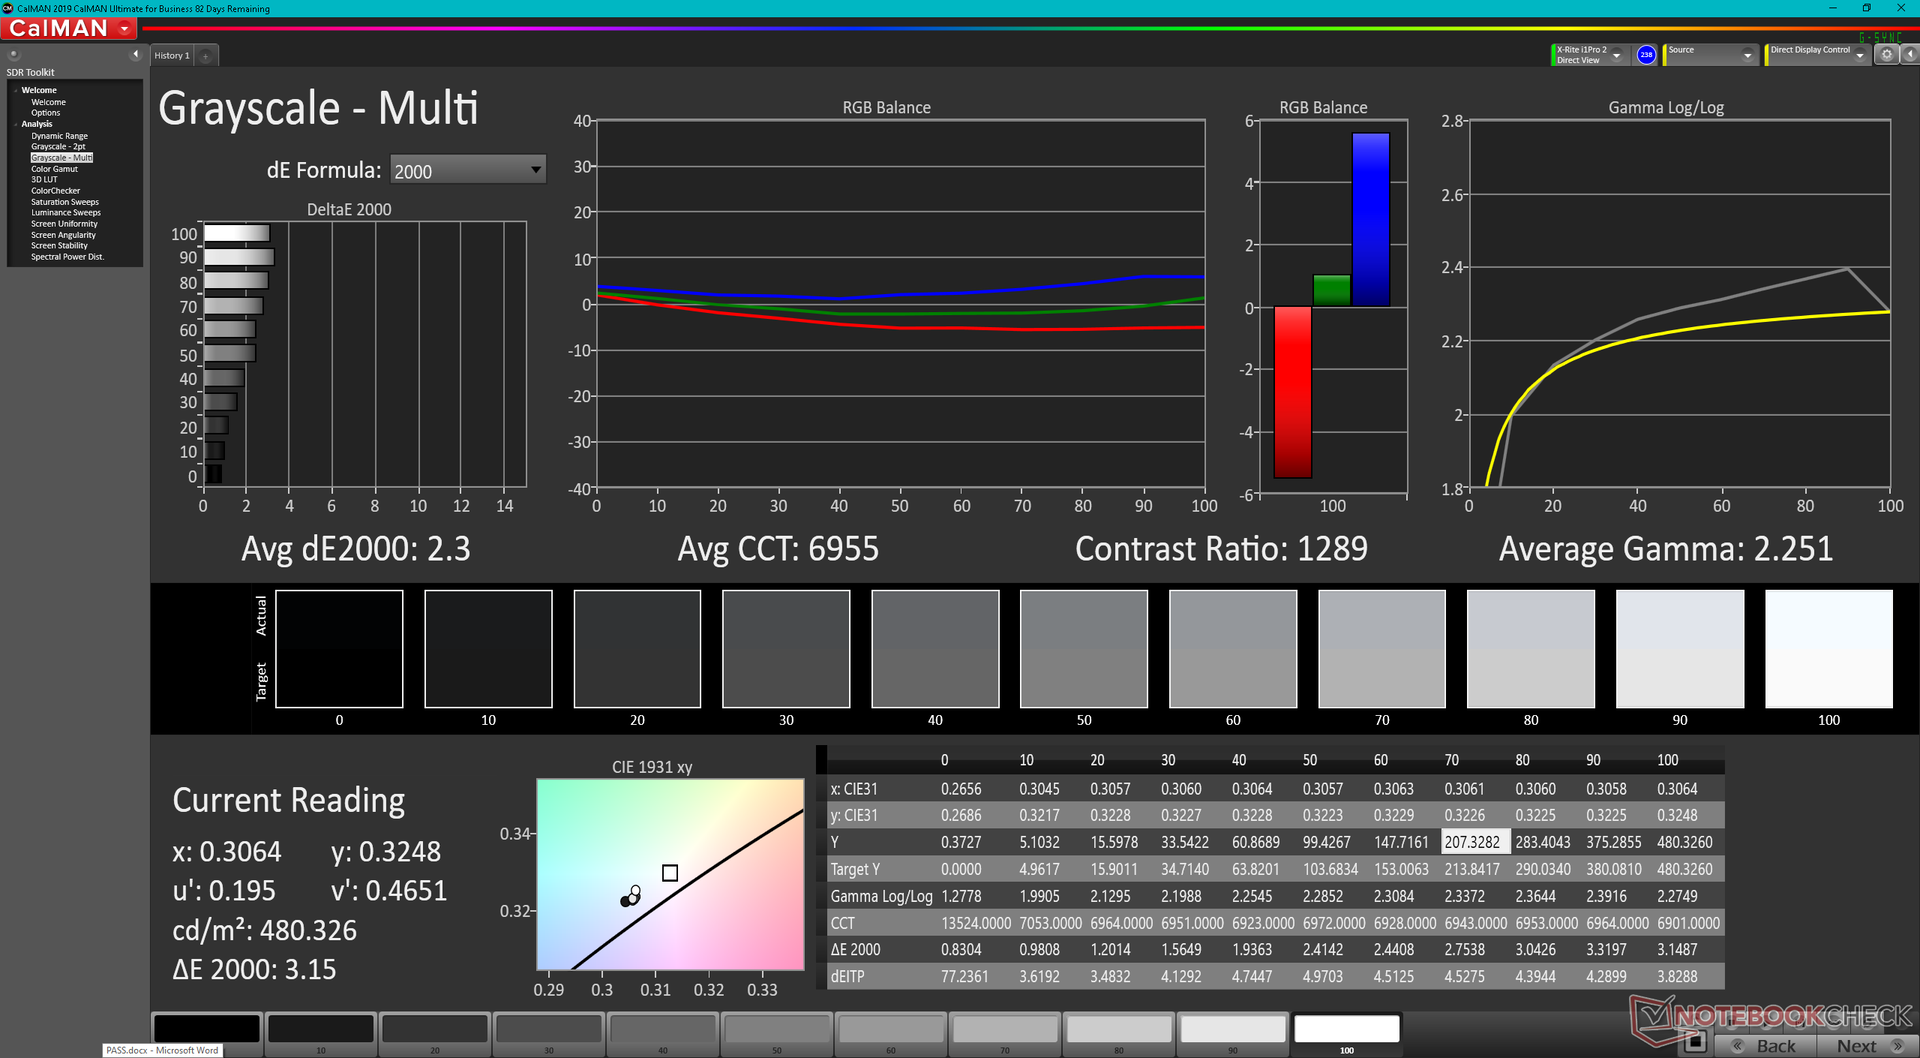
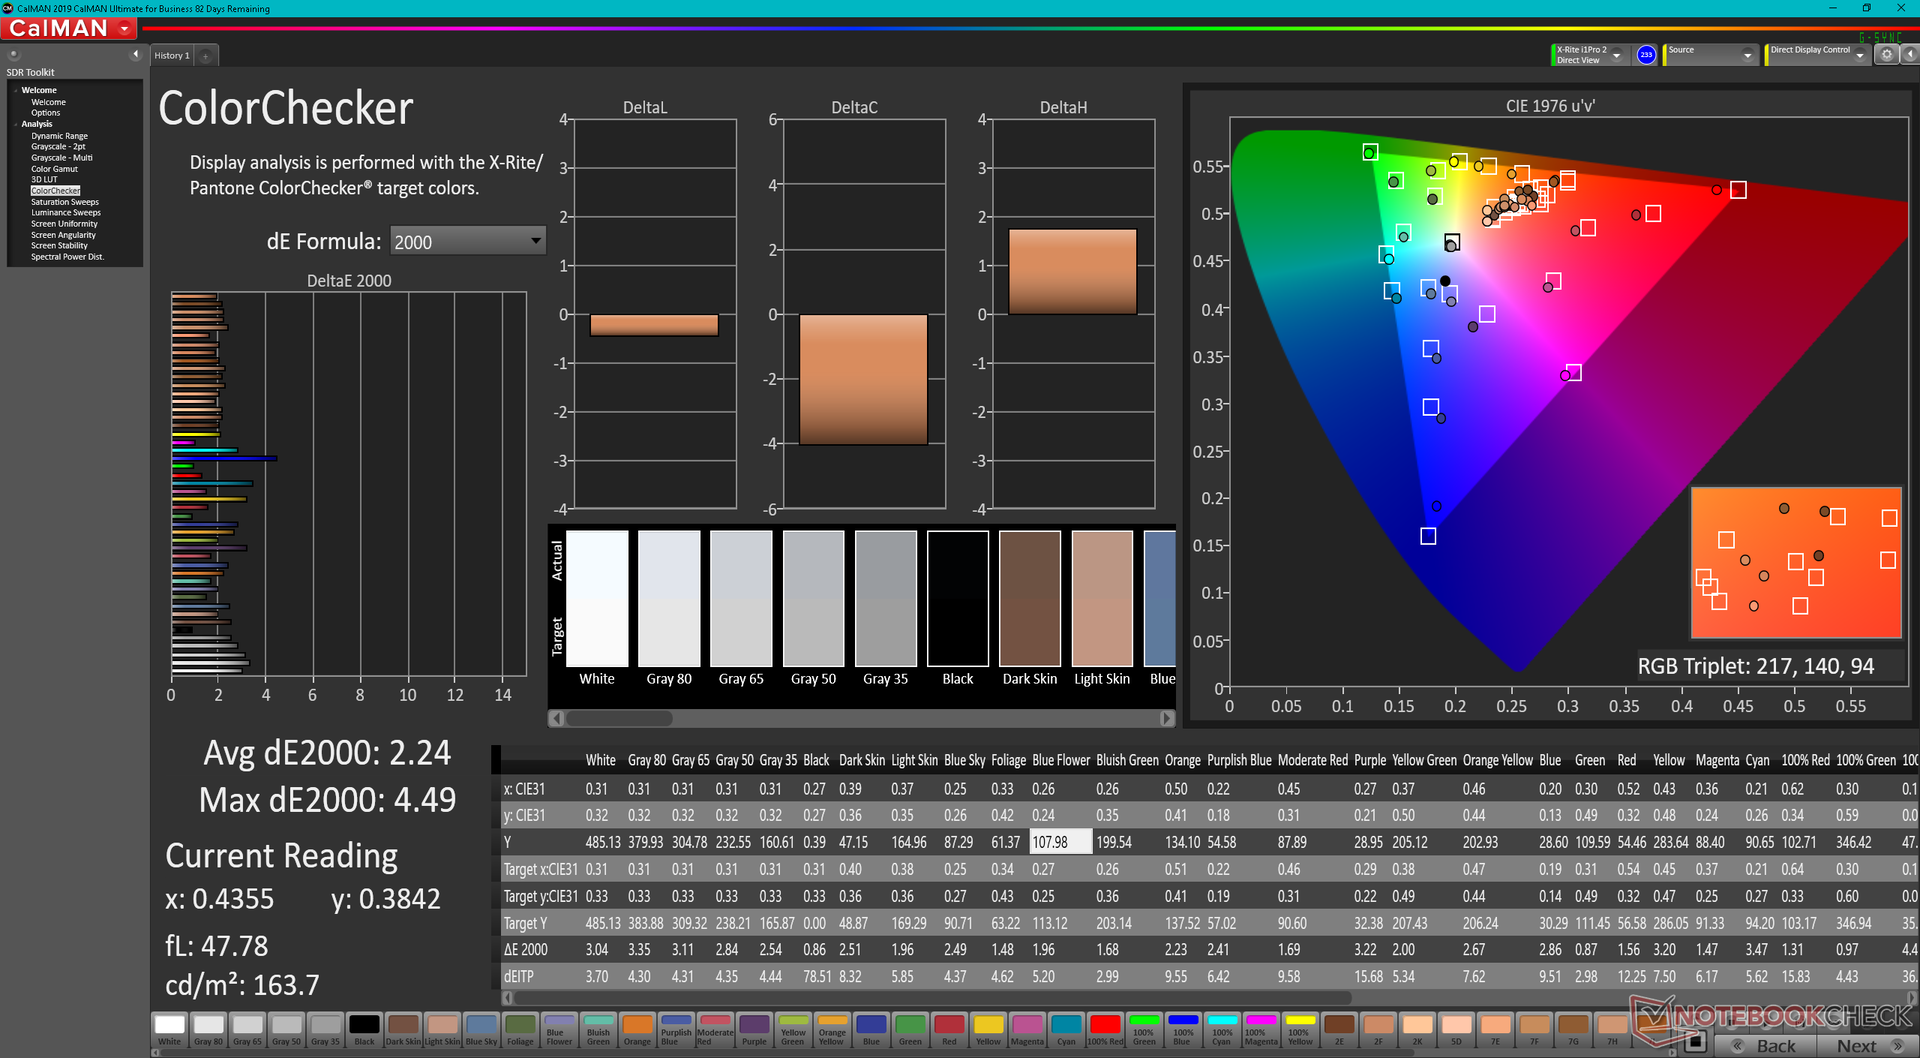
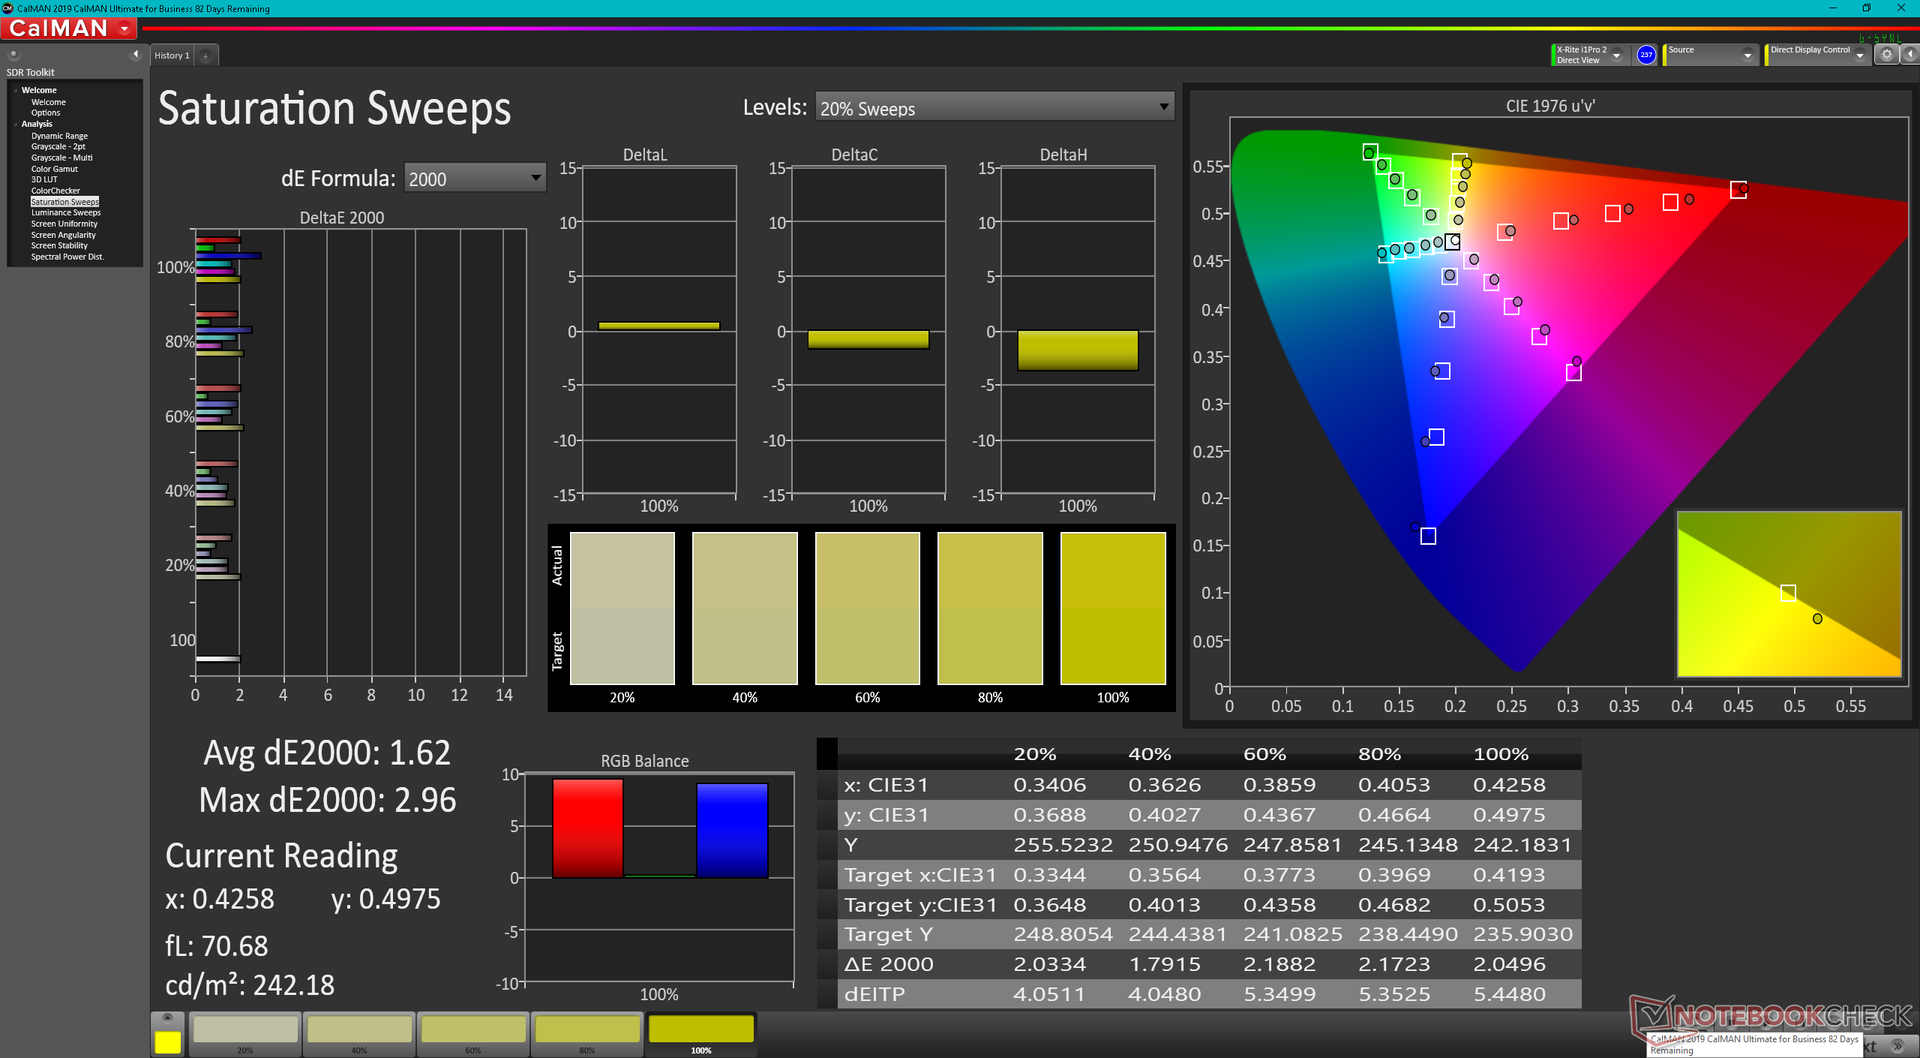
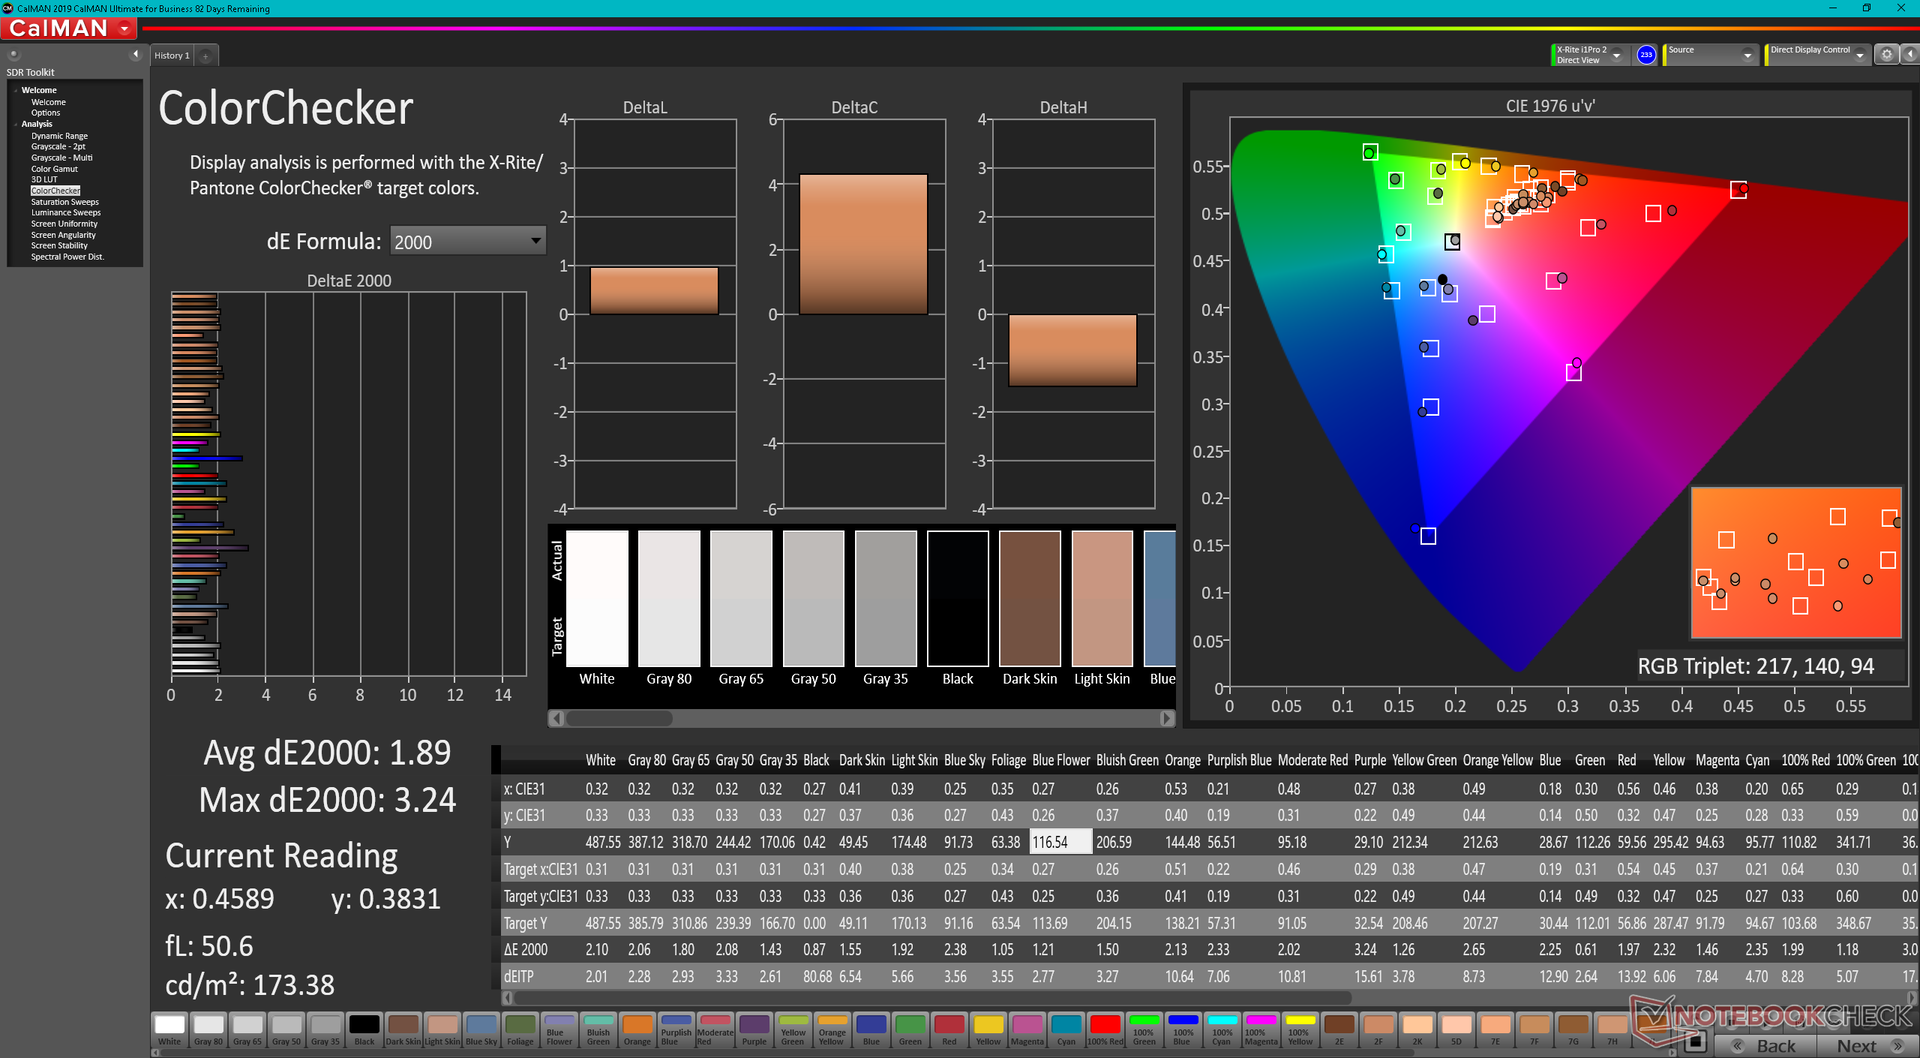
ΔE ColorChecker Calman: 2.24 | ∀{0.5-29.43 Ø4.71}
calibrated: 1.89
ΔE Greyscale Calman: 2.3 | ∀{0.09-98 Ø4.96}
65.7% AdobeRGB 1998 (Argyll 3D)
95.3% sRGB (Argyll 3D)
63.7% Display P3 (Argyll 3D)
Gamma: 2.25
CCT: 6955 K
| Lenovo Legion 7 16ARHA7 BOE CQ NE160QDM-NY1, IPS, 2560x1600, 16" | MSI Raider GE66 12UHS AUO51EB, IPS, 3840x2160, 15.6" | Lenovo Legion Slim 7-16IAH 82TF004YGE MNG007DA1-G , IPS LED, 2560x1600, 16" | Asus ROG Zephyrus Duo 16 GX650RX BOE NE160QAM-NX1, IPS-Level, 3840x2400, 16" | HP Omen 16-c0077ng BOE09E5, IPS, 2560x1440, 16.1" | Lenovo Legion 5 Pro 16ACH6H (82JQ001PGE) CSOT T3 MNG007DA1-1, IPS, 2560x1600, 16" | |
|---|---|---|---|---|---|---|
| Display | 24% | 9% | 30% | 6% | 8% | |
| Display P3 Coverage (%) | 63.7 | 80.4 26% | 70.5 11% | 98 54% | 68.8 8% | |
| sRGB Coverage (%) | 95.3 | 98.4 3% | 99.1 4% | 99.9 5% | 96.9 2% | 99 4% |
| AdobeRGB 1998 Coverage (%) | 65.7 | 94.7 44% | 72.8 11% | 86.3 31% | 71.1 8% | 73 11% |
| Response Times | -69% | -2% | -9% | -23% | 25% | |
| Response Time Grey 50% / Grey 80% * (ms) | 9.2 ? | 18.8 ? -104% | 12 ? -30% | 14.6 ? -59% | 13 ? -41% | 9.2 ? -0% |
| Response Time Black / White * (ms) | 9.6 ? | 12.8 ? -33% | 7 ? 27% | 5.6 ? 42% | 10 ? -4% | 4.8 50% |
| PWM Frequency (Hz) | ||||||
| Screen | -17% | 2% | -23% | -28% | 9% | |
| Brightness middle (cd/m²) | 478.8 | 351 -27% | 523 9% | 459 -4% | 297 -38% | 551 15% |
| Brightness (cd/m²) | 477 | 347 -27% | 494 4% | 434 -9% | 283 -41% | 523 10% |
| Brightness Distribution (%) | 90 | 90 0% | 90 0% | 88 -2% | 91 1% | 88 -2% |
| Black Level * (cd/m²) | 0.43 | 0.35 19% | 0.4 7% | 0.44 -2% | 0.22 49% | 0.54 -26% |
| Contrast (:1) | 1113 | 1003 -10% | 1308 18% | 1043 -6% | 1350 21% | 1020 -8% |
| Colorchecker dE 2000 * | 2.24 | 2.54 -13% | 2.6 -16% | 2.97 -33% | 3.25 -45% | 1.8 20% |
| Colorchecker dE 2000 max. * | 4.49 | 8.36 -86% | 5 -11% | 8.13 -81% | 6.33 -41% | 2.53 44% |
| Colorchecker dE 2000 calibrated * | 1.89 | 0.67 65% | 1 47% | 1.03 46% | 1.11 41% | 1.66 12% |
| Greyscale dE 2000 * | 2.3 | 4.1 -78% | 3.3 -43% | 4.9 -113% | 6.97 -203% | 1.85 20% |
| Gamma | 2.25 98% | 2.089 105% | 2.17 101% | 2.235 98% | 2.3 96% | 2.3 96% |
| CCT | 6955 93% | 7036 92% | 6013 108% | 6775 96% | 6050 107% | 6338 103% |
| Color Space (Percent of AdobeRGB 1998) (%) | 72.81 | |||||
| Color Space (Percent of sRGB) (%) | 99.41 | |||||
| Total Average (Program / Settings) | -21% /
-16% | 3% /
3% | -1% /
-9% | -15% /
-20% | 14% /
12% |
* ... smaller is better
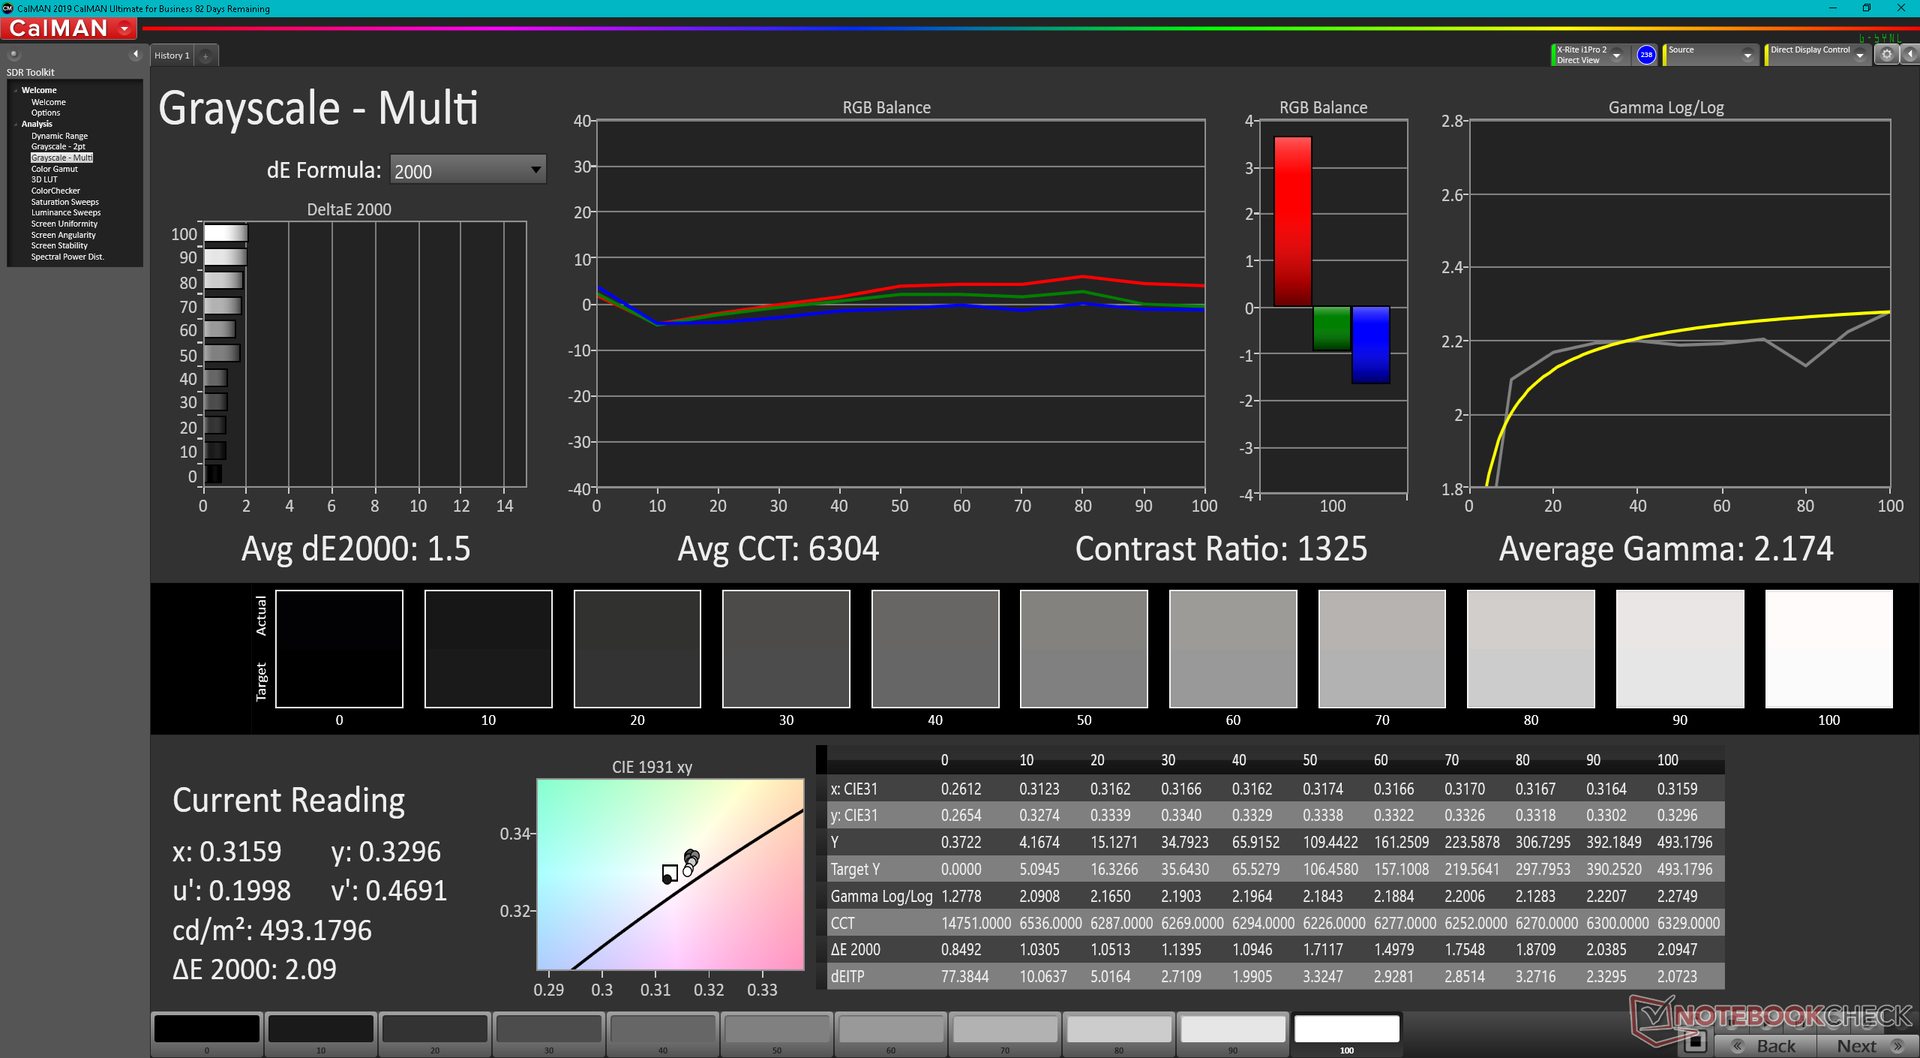
The display is well calibrated out of the box with average grayscale and ColorChecker DeltaE values of only 2.3 and 2.24, respectively. Calibrating the panel even further ourselves would improve DeltaE values to just 1.5 and 1.8 to better exploit the full sRGB coverage.
Display Response Times
| ↔ Response Time Black to White | ||
|---|---|---|
| 9.6 ms ... rise ↗ and fall ↘ combined | ↗ 4.8 ms rise | 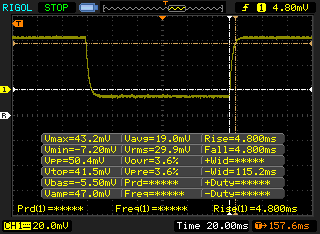 |
| ↘ 4.8 ms fall | ||
| The screen shows fast response rates in our tests and should be suited for gaming. In comparison, all tested devices range from 0.1 (minimum) to 240 (maximum) ms. » 26 % of all devices are better. This means that the measured response time is better than the average of all tested devices (19.8 ms). | ||
| ↔ Response Time 50% Grey to 80% Grey | ||
| 9.2 ms ... rise ↗ and fall ↘ combined | ↗ 4.8 ms rise | 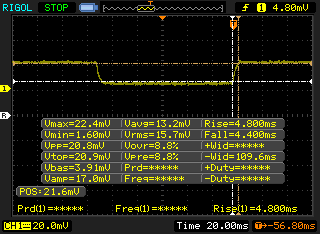 |
| ↘ 4.4 ms fall | ||
| The screen shows fast response rates in our tests and should be suited for gaming. In comparison, all tested devices range from 0.165 (minimum) to 636 (maximum) ms. » 23 % of all devices are better. This means that the measured response time is better than the average of all tested devices (30.9 ms). | ||
Screen Flickering / PWM (Pulse-Width Modulation)
| Screen flickering / PWM not detected | 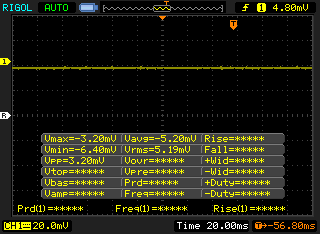 | ||
In comparison: 52 % of all tested devices do not use PWM to dim the display. If PWM was detected, an average of 7748 (minimum: 5 - maximum: 343500) Hz was measured. | |||
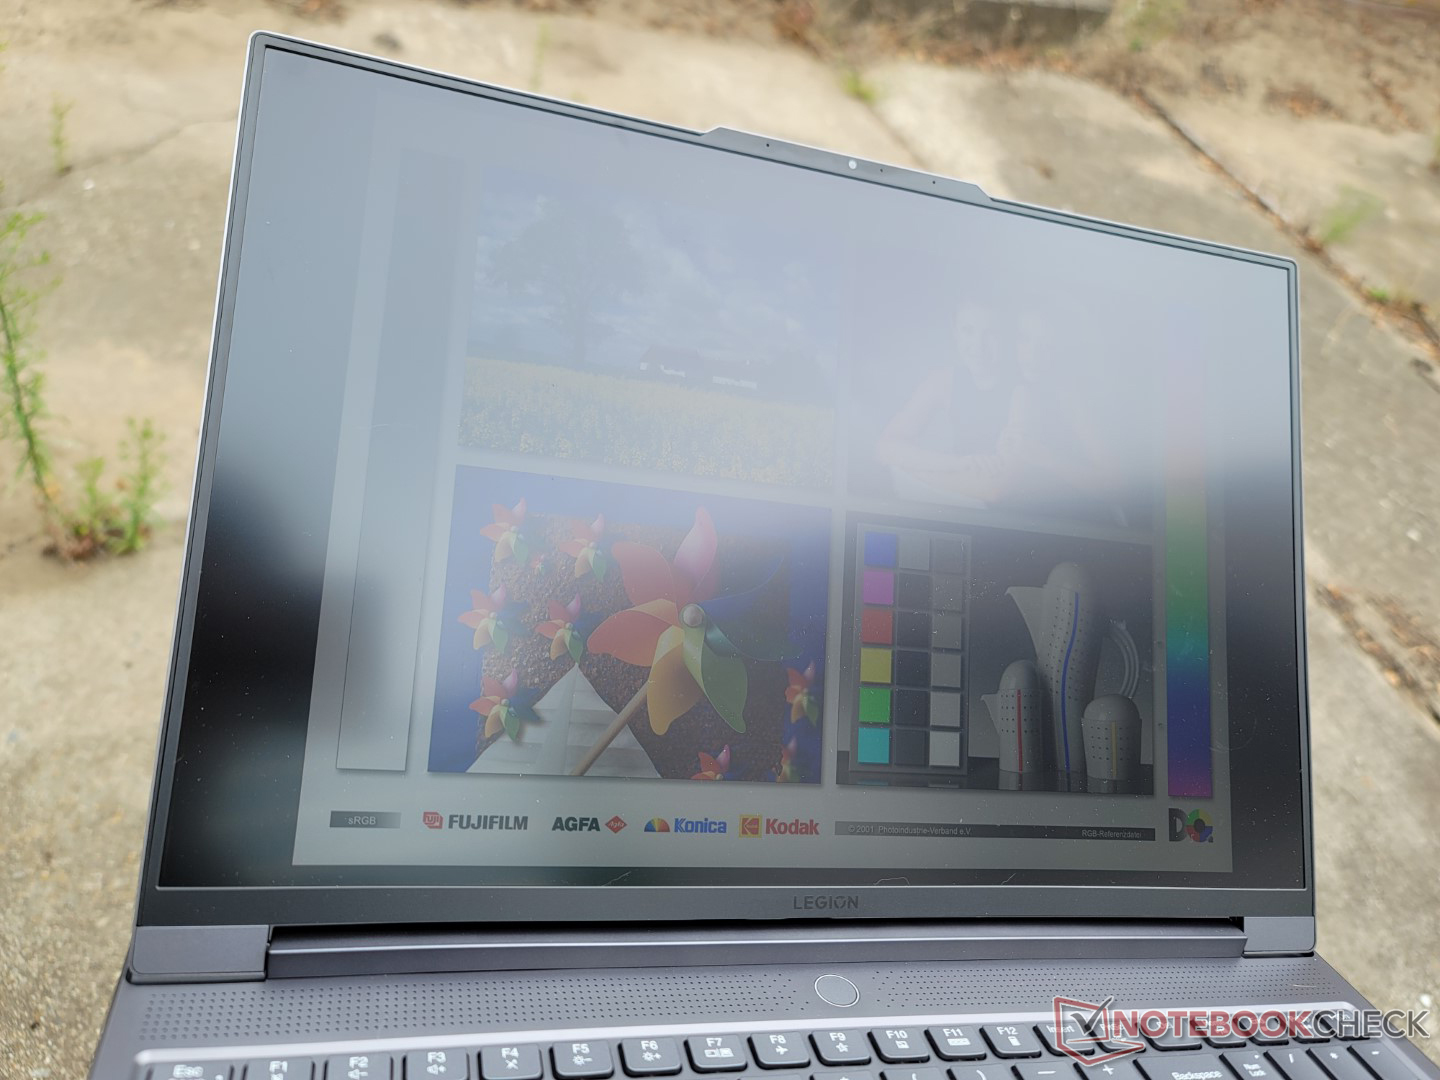
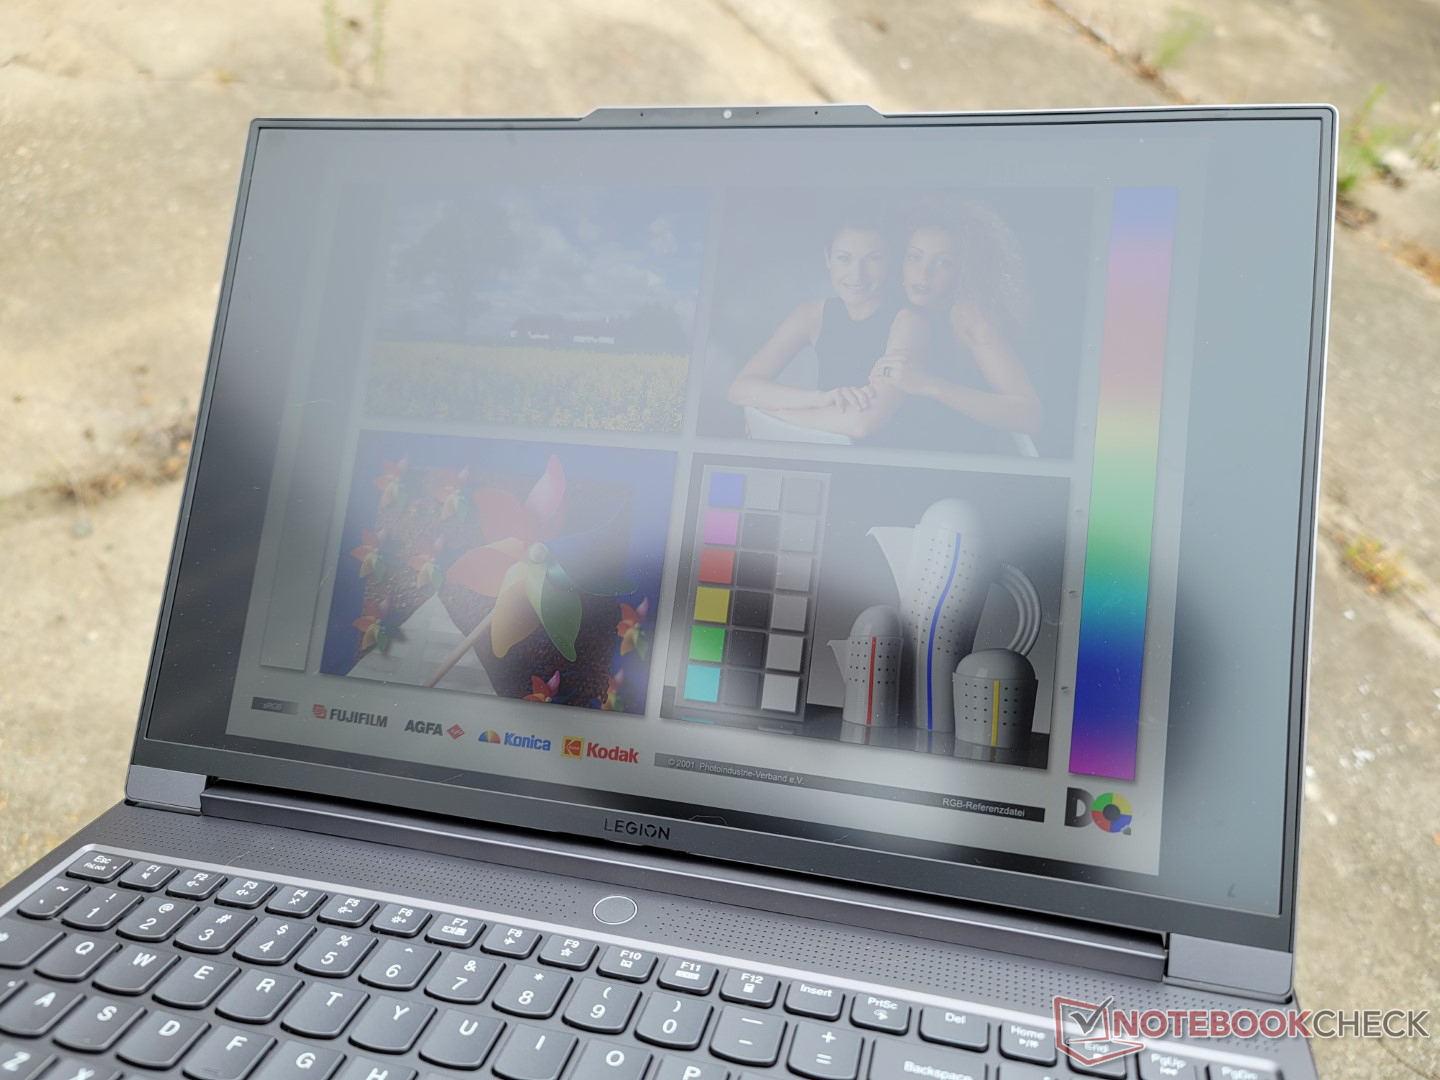
Outdoor visibility is better than most other gaming laptops due to the bright 500-nit display. However, you'll still want to avoid using the system under direct sunlight to maximize visibility. Glare becomes much more manageable if working under shade.

Performance
Testing Conditions
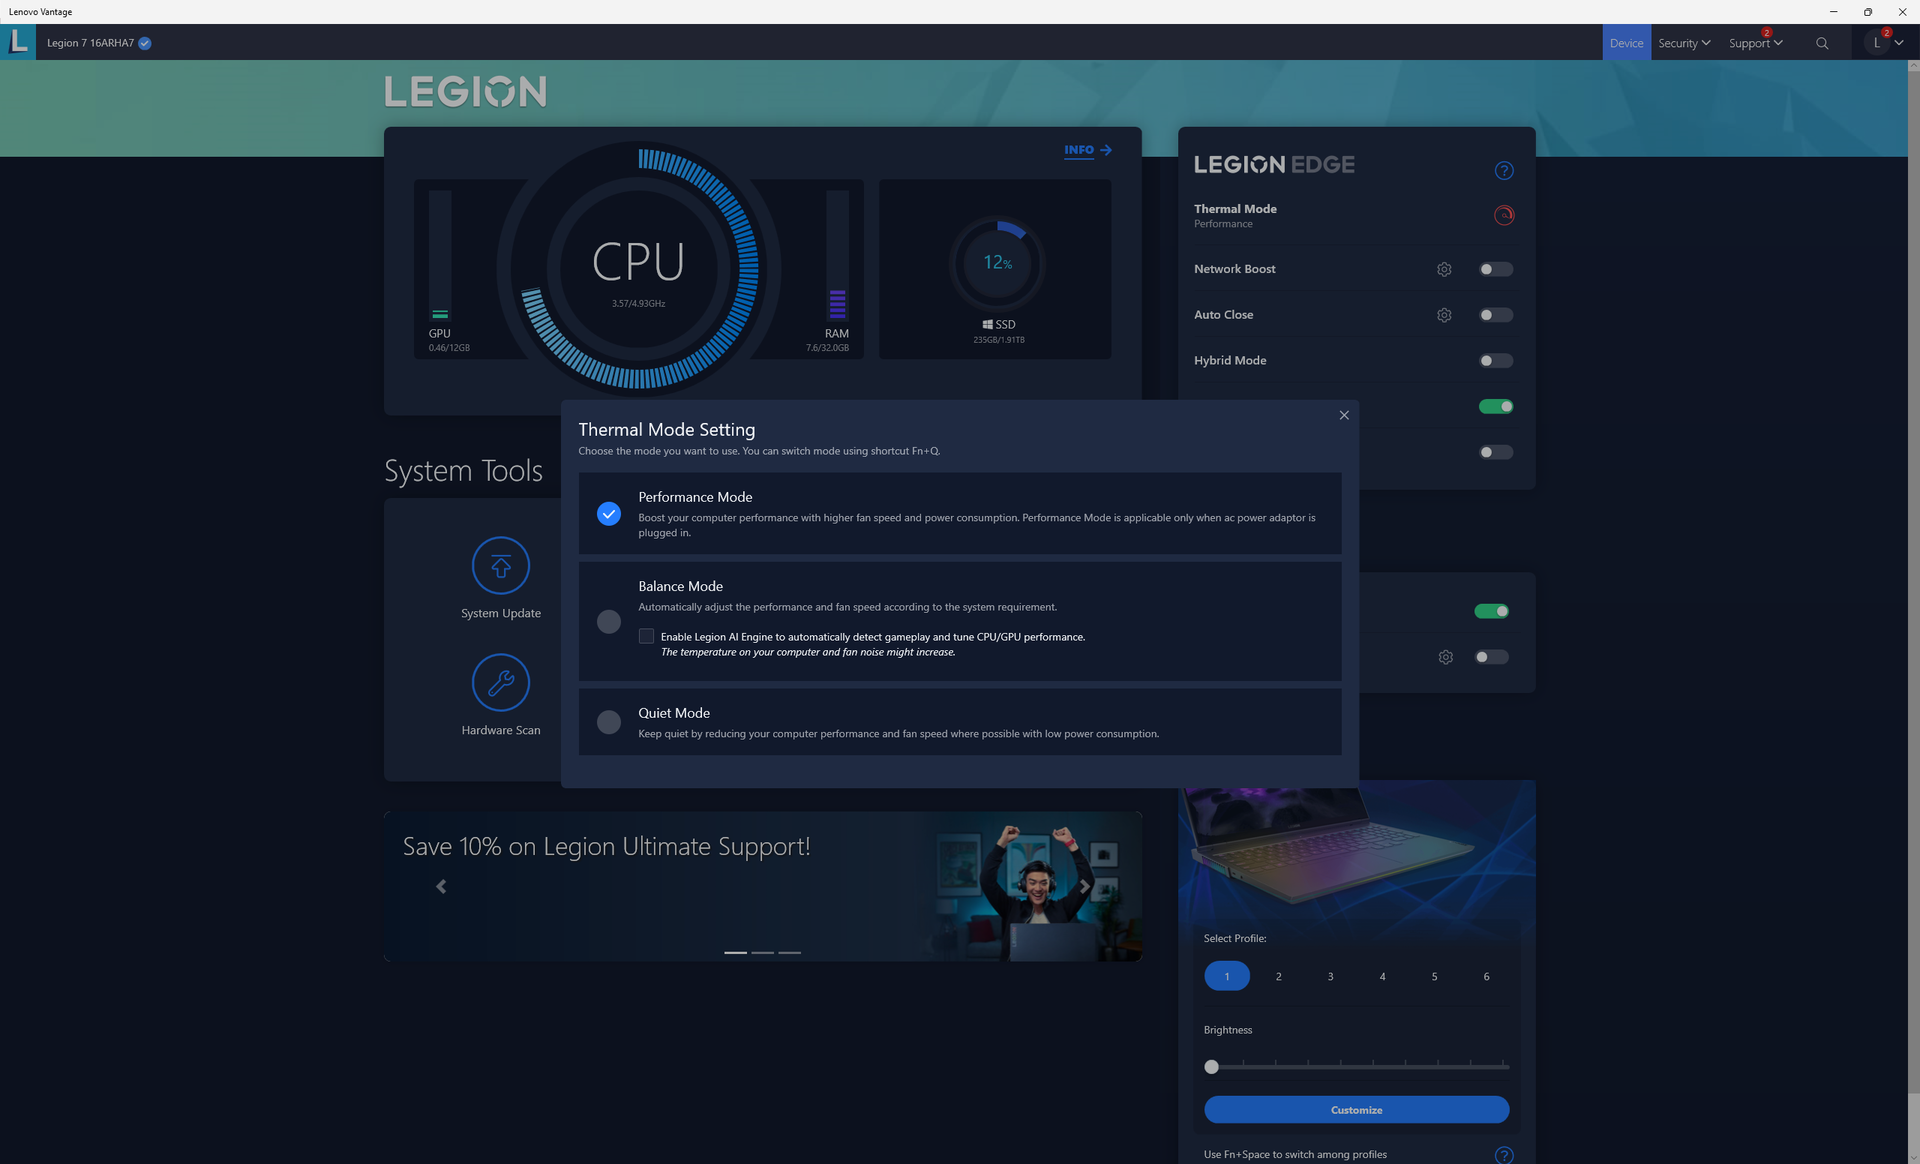
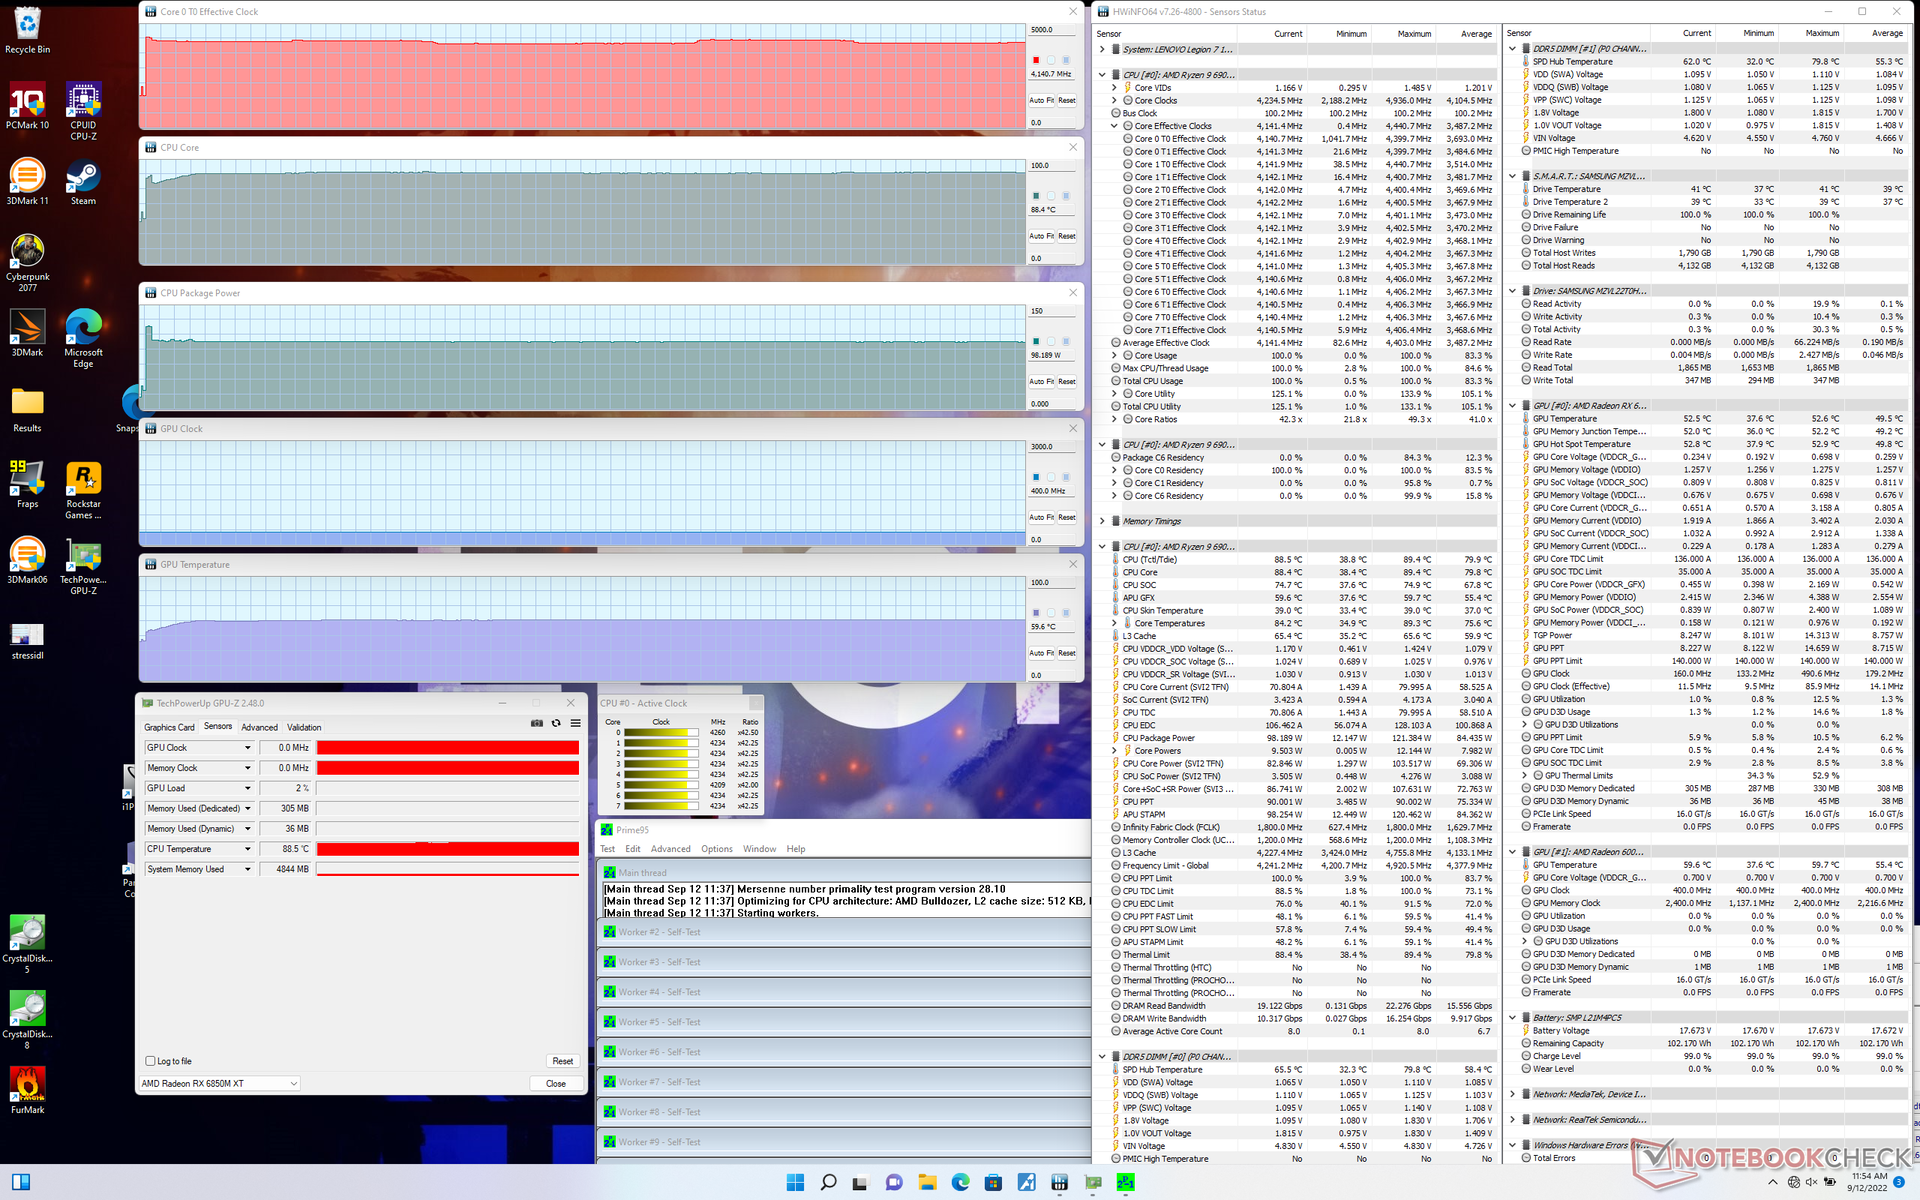
We set our unit to Performance mode via Lenovo Vantage and High Performance mode via Windows prior to running any benchmarks below. We also made sure that 'Hybrid Mode' was turned off on Vantage to better utilize the discrete Radeon GPU.
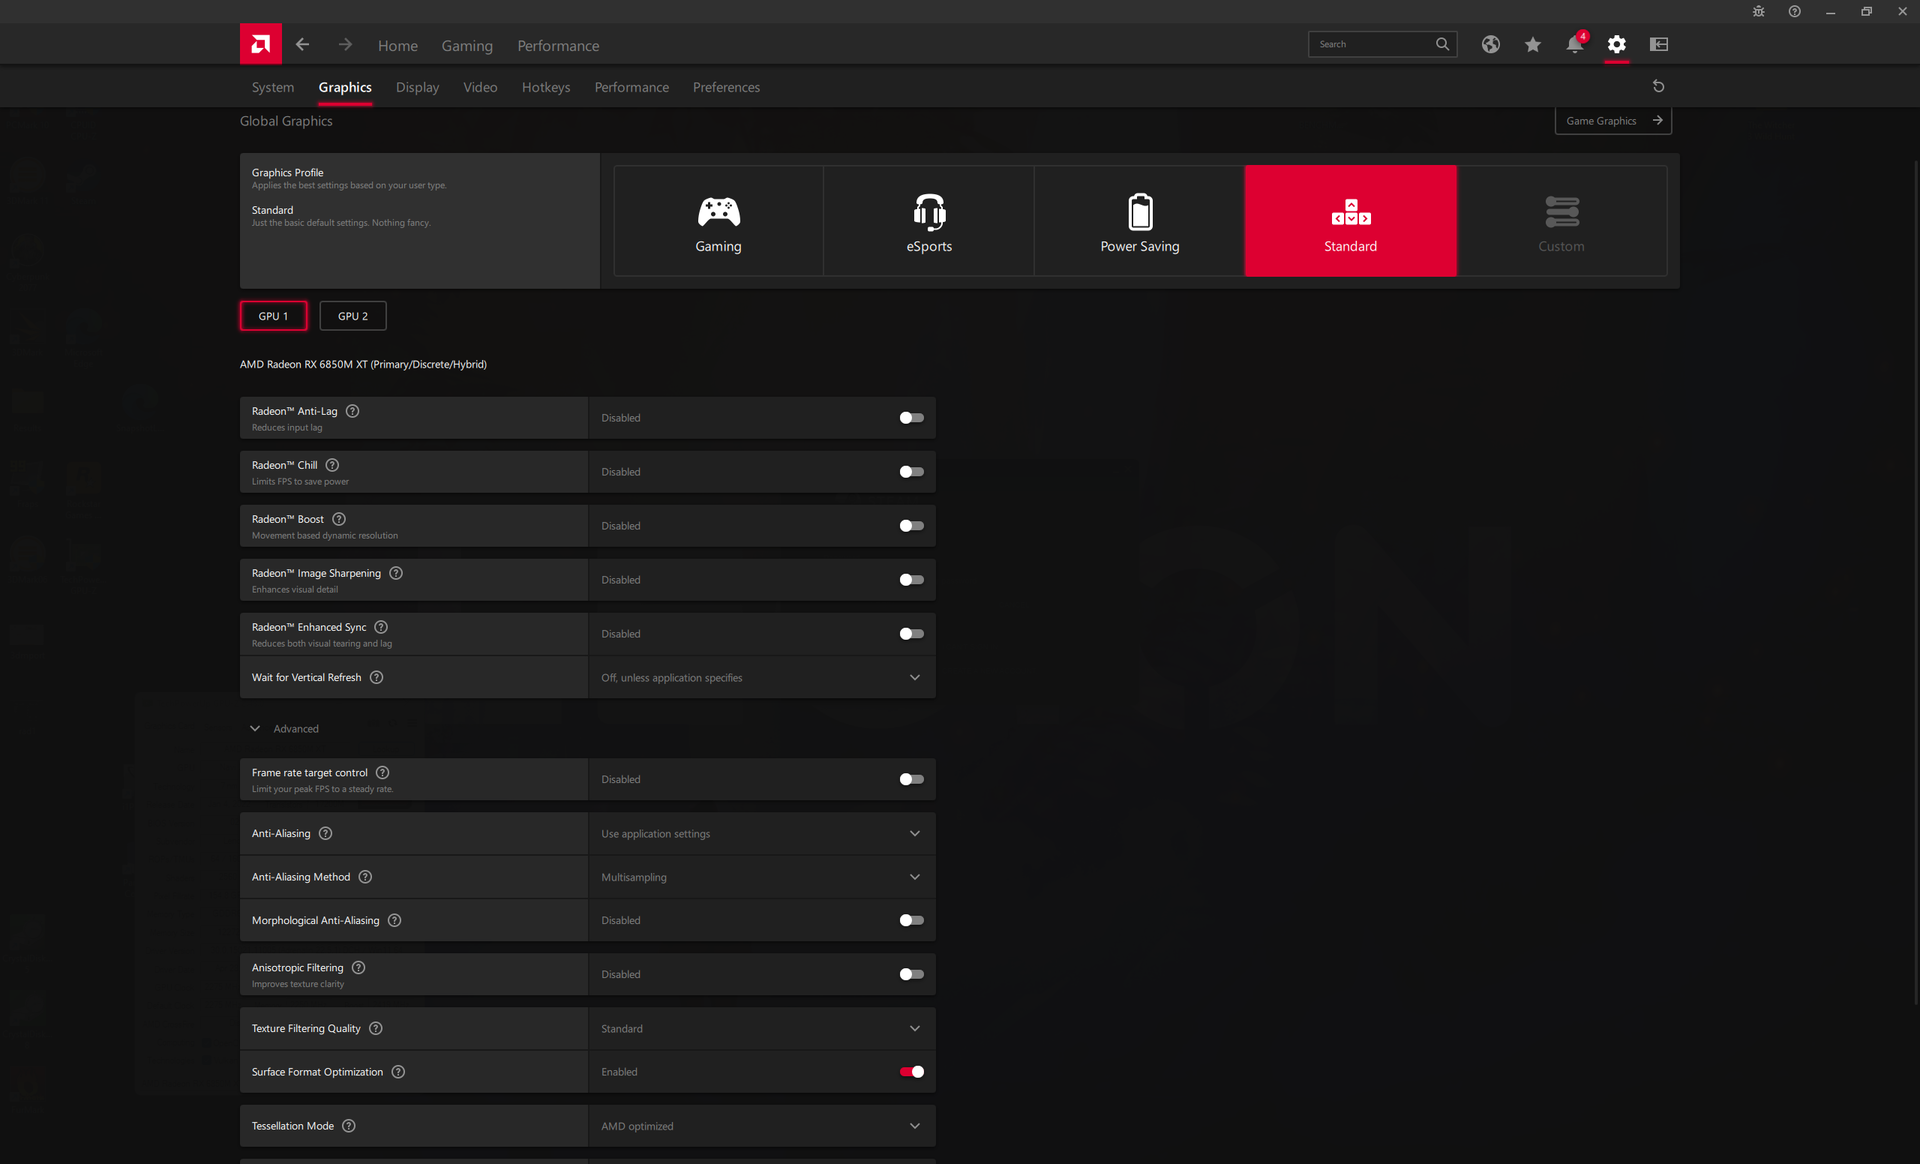
It's highly recommended that users become familiar with Lenovo Vantage and the Radeon software. System performance, LED effects, and vital updates are tied to these two specific applications. Our specific test unit had issues updating the graphics drivers where the display would remain black upon rebooting. We had to reinstall the drivers a second time before the Radeon software could launch without problems.

Processor — Marginal Zen 3+ Improvements
CPU performance is excellent and almost exactly where we expect it to be relative to other laptops equipped with the same Ryzen 9 6900HX processor. Nonetheless, don't expect significant gains over last year's Ryzen 9 5900HX as the 6900HX is only 5 to 25 percent faster at best depending on the 5900HX laptop. Overall performance falls behind the latest 12th gen Intel Alder Lake-H options like the Core i7-12700H or i9-12900HK by 15 to 20 percent.
Running CineBench R15 xT in a loop shows consistent results to suggest excellent performance sustainability when stressed.
Cinebench R15 Multi Loop
Cinebench R23: Multi Core | Single Core
Cinebench R15: CPU Multi 64Bit | CPU Single 64Bit
Blender: v2.79 BMW27 CPU
7-Zip 18.03: 7z b 4 | 7z b 4 -mmt1
Geekbench 5.5: Multi-Core | Single-Core
HWBOT x265 Benchmark v2.2: 4k Preset
LibreOffice : 20 Documents To PDF
R Benchmark 2.5: Overall mean
| Cinebench R20 / CPU (Multi Core) | |
| MSI GE67 HX 12UGS | |
| Lenovo Legion Slim 7-16IAH 82TF004YGE | |
| MSI Raider GE66 12UHS | |
| Lenovo Legion 7 16ARHA7 | |
| Average AMD Ryzen 9 6900HX (3742 - 5813, n=19) | |
| Asus ROG Strix G15 G513QY | |
| MSI GS76 Stealth 11UH | |
| Eurocom RX315 NH57AF1 | |
| HP Omen 16-c0077ng | |
| MSI Delta 15 A5EFK | |
| MSI GS66 Stealth 10UG | |
| Cinebench R20 / CPU (Single Core) | |
| MSI Raider GE66 12UHS | |
| MSI GE67 HX 12UGS | |
| Lenovo Legion Slim 7-16IAH 82TF004YGE | |
| Lenovo Legion 7 16ARHA7 | |
| MSI GS76 Stealth 11UH | |
| Average AMD Ryzen 9 6900HX (595 - 631, n=19) | |
| Asus ROG Strix G15 G513QY | |
| Eurocom RX315 NH57AF1 | |
| MSI Delta 15 A5EFK | |
| HP Omen 16-c0077ng | |
| MSI GS66 Stealth 10UG | |
| Cinebench R15 / CPU Multi 64Bit | |
| MSI GE67 HX 12UGS | |
| Lenovo Legion Slim 7-16IAH 82TF004YGE | |
| MSI Raider GE66 12UHS | |
| Lenovo Legion 7 16ARHA7 | |
| Asus ROG Strix G15 G513QY | |
| Average AMD Ryzen 9 6900HX (1588 - 2411, n=19) | |
| MSI GS76 Stealth 11UH | |
| MSI Delta 15 A5EFK | |
| HP Omen 16-c0077ng | |
| Eurocom RX315 NH57AF1 | |
| MSI GS66 Stealth 10UG | |
| Cinebench R15 / CPU Single 64Bit | |
| MSI Raider GE66 12UHS | |
| MSI GE67 HX 12UGS | |
| Lenovo Legion Slim 7-16IAH 82TF004YGE | |
| Lenovo Legion 7 16ARHA7 | |
| Average AMD Ryzen 9 6900HX (241 - 261, n=19) | |
| Asus ROG Strix G15 G513QY | |
| MSI Delta 15 A5EFK | |
| MSI GS76 Stealth 11UH | |
| HP Omen 16-c0077ng | |
| Eurocom RX315 NH57AF1 | |
| MSI GS66 Stealth 10UG | |
| HWBOT x265 Benchmark v2.2 / 4k Preset | |
| MSI GE67 HX 12UGS | |
| Lenovo Legion Slim 7-16IAH 82TF004YGE | |
| MSI Raider GE66 12UHS | |
| Lenovo Legion 7 16ARHA7 | |
| Average AMD Ryzen 9 6900HX (12.6 - 18.7, n=20) | |
| MSI Delta 15 A5EFK | |
| Asus ROG Strix G15 G513QY | |
| HP Omen 16-c0077ng | |
| MSI GS76 Stealth 11UH | |
| Eurocom RX315 NH57AF1 | |
| MSI GS66 Stealth 10UG | |
| LibreOffice / 20 Documents To PDF | |
| HP Omen 16-c0077ng | |
| Lenovo Legion 7 16ARHA7 | |
| Average AMD Ryzen 9 6900HX (44.8 - 81.7, n=20) | |
| MSI Delta 15 A5EFK | |
| Asus ROG Strix G15 G513QY | |
| MSI GS76 Stealth 11UH | |
| Eurocom RX315 NH57AF1 | |
| MSI GS66 Stealth 10UG | |
| MSI GE67 HX 12UGS | |
| Lenovo Legion Slim 7-16IAH 82TF004YGE | |
| MSI Raider GE66 12UHS | |
* ... smaller is better
AIDA64: FP32 Ray-Trace | FPU Julia | CPU SHA3 | CPU Queen | FPU SinJulia | FPU Mandel | CPU AES | CPU ZLib | FP64 Ray-Trace | CPU PhotoWorxx
| Performance rating | |
| Lenovo Legion 7 16ARHA7 | |
| Asus ROG Zephyrus Duo 16 GX650RX | |
| Lenovo Legion Slim 7-16IAH 82TF004YGE | |
| Average AMD Ryzen 9 6900HX | |
| HP Omen 16-c0077ng | |
| MSI Alpha 15 B5EEK-008 | |
| MSI Raider GE66 12UHS | |
| AIDA64 / FP32 Ray-Trace | |
| Lenovo Legion 7 16ARHA7 | |
| Asus ROG Zephyrus Duo 16 GX650RX | |
| Lenovo Legion Slim 7-16IAH 82TF004YGE | |
| Average AMD Ryzen 9 6900HX (10950 - 17963, n=20) | |
| HP Omen 16-c0077ng | |
| MSI Alpha 15 B5EEK-008 | |
| MSI Raider GE66 12UHS | |
| AIDA64 / FPU Julia | |
| Lenovo Legion 7 16ARHA7 | |
| Asus ROG Zephyrus Duo 16 GX650RX | |
| Average AMD Ryzen 9 6900HX (71414 - 110797, n=20) | |
| HP Omen 16-c0077ng | |
| MSI Alpha 15 B5EEK-008 | |
| Lenovo Legion Slim 7-16IAH 82TF004YGE | |
| MSI Raider GE66 12UHS | |
| AIDA64 / CPU SHA3 | |
| Lenovo Legion Slim 7-16IAH 82TF004YGE | |
| Lenovo Legion 7 16ARHA7 | |
| Asus ROG Zephyrus Duo 16 GX650RX | |
| Average AMD Ryzen 9 6900HX (2471 - 3804, n=20) | |
| HP Omen 16-c0077ng | |
| MSI Alpha 15 B5EEK-008 | |
| MSI Raider GE66 12UHS | |
| AIDA64 / CPU Queen | |
| Lenovo Legion 7 16ARHA7 | |
| MSI Raider GE66 12UHS | |
| Asus ROG Zephyrus Duo 16 GX650RX | |
| Lenovo Legion Slim 7-16IAH 82TF004YGE | |
| Average AMD Ryzen 9 6900HX (84185 - 107544, n=20) | |
| HP Omen 16-c0077ng | |
| MSI Alpha 15 B5EEK-008 | |
| AIDA64 / FPU SinJulia | |
| Lenovo Legion 7 16ARHA7 | |
| Asus ROG Zephyrus Duo 16 GX650RX | |
| Average AMD Ryzen 9 6900HX (10970 - 13205, n=20) | |
| HP Omen 16-c0077ng | |
| MSI Alpha 15 B5EEK-008 | |
| Lenovo Legion Slim 7-16IAH 82TF004YGE | |
| MSI Raider GE66 12UHS | |
| AIDA64 / FPU Mandel | |
| Lenovo Legion 7 16ARHA7 | |
| Asus ROG Zephyrus Duo 16 GX650RX | |
| Average AMD Ryzen 9 6900HX (39164 - 61370, n=20) | |
| HP Omen 16-c0077ng | |
| MSI Alpha 15 B5EEK-008 | |
| Lenovo Legion Slim 7-16IAH 82TF004YGE | |
| MSI Raider GE66 12UHS | |
| AIDA64 / CPU AES | |
| Lenovo Legion 7 16ARHA7 | |
| Asus ROG Zephyrus Duo 16 GX650RX | |
| Lenovo Legion Slim 7-16IAH 82TF004YGE | |
| HP Omen 16-c0077ng | |
| MSI Alpha 15 B5EEK-008 | |
| Average AMD Ryzen 9 6900HX (54613 - 142360, n=20) | |
| MSI Raider GE66 12UHS | |
| AIDA64 / CPU ZLib | |
| MSI Raider GE66 12UHS | |
| Lenovo Legion Slim 7-16IAH 82TF004YGE | |
| Lenovo Legion 7 16ARHA7 | |
| Asus ROG Zephyrus Duo 16 GX650RX | |
| HP Omen 16-c0077ng | |
| Average AMD Ryzen 9 6900HX (578 - 911, n=20) | |
| MSI Alpha 15 B5EEK-008 | |
| AIDA64 / FP64 Ray-Trace | |
| Lenovo Legion 7 16ARHA7 | |
| Asus ROG Zephyrus Duo 16 GX650RX | |
| Lenovo Legion Slim 7-16IAH 82TF004YGE | |
| Average AMD Ryzen 9 6900HX (5798 - 9540, n=20) | |
| HP Omen 16-c0077ng | |
| MSI Alpha 15 B5EEK-008 | |
| MSI Raider GE66 12UHS | |
| AIDA64 / CPU PhotoWorxx | |
| MSI Raider GE66 12UHS | |
| Lenovo Legion Slim 7-16IAH 82TF004YGE | |
| Lenovo Legion 7 16ARHA7 | |
| Asus ROG Zephyrus Duo 16 GX650RX | |
| Average AMD Ryzen 9 6900HX (26873 - 30604, n=20) | |
| MSI Alpha 15 B5EEK-008 | |
| HP Omen 16-c0077ng | |
System Performance
PCMark 10 results are excellent but still consistently behind the MSI GE66 powered by the faster Intel 12th gen Core i9 CPU and GeForce RTX 3080 Ti GPU.
We experienced wake-from-sleep issues at least once on our test unit. The system would be unable to wake when opening the lid which required a hard shut off and cold reboot.

CrossMark: Overall | Productivity | Creativity | Responsiveness
| PCMark 10 / Score | |
| MSI Raider GE66 12UHS | |
| Lenovo Legion Slim 7-16IAH 82TF004YGE | |
| Lenovo Legion 7 16ARHA7 | |
| Average AMD Ryzen 9 6900HX, AMD Radeon RX 6850M XT (7292 - 7377, n=2) | |
| HP Omen 16-c0077ng | |
| Lenovo Legion 5 Pro 16ACH6H (82JQ001PGE) | |
| Asus ROG Zephyrus Duo 16 GX650RX | |
| PCMark 10 / Essentials | |
| MSI Raider GE66 12UHS | |
| Lenovo Legion Slim 7-16IAH 82TF004YGE | |
| Lenovo Legion 7 16ARHA7 | |
| HP Omen 16-c0077ng | |
| Average AMD Ryzen 9 6900HX, AMD Radeon RX 6850M XT (10250 - 10521, n=2) | |
| Lenovo Legion 5 Pro 16ACH6H (82JQ001PGE) | |
| Asus ROG Zephyrus Duo 16 GX650RX | |
| PCMark 10 / Productivity | |
| MSI Raider GE66 12UHS | |
| Lenovo Legion Slim 7-16IAH 82TF004YGE | |
| HP Omen 16-c0077ng | |
| Lenovo Legion 7 16ARHA7 | |
| Average AMD Ryzen 9 6900HX, AMD Radeon RX 6850M XT (9090 - 9097, n=2) | |
| Lenovo Legion 5 Pro 16ACH6H (82JQ001PGE) | |
| Asus ROG Zephyrus Duo 16 GX650RX | |
| PCMark 10 / Digital Content Creation | |
| MSI Raider GE66 12UHS | |
| Lenovo Legion 7 16ARHA7 | |
| Average AMD Ryzen 9 6900HX, AMD Radeon RX 6850M XT (11296 - 11385, n=2) | |
| Lenovo Legion Slim 7-16IAH 82TF004YGE | |
| HP Omen 16-c0077ng | |
| Lenovo Legion 5 Pro 16ACH6H (82JQ001PGE) | |
| Asus ROG Zephyrus Duo 16 GX650RX | |
| CrossMark / Overall | |
| Lenovo Legion Slim 7-16IAH 82TF004YGE | |
| Asus ROG Zephyrus Duo 16 GX650RX | |
| Average AMD Ryzen 9 6900HX, AMD Radeon RX 6850M XT (1596 - 1597, n=2) | |
| Lenovo Legion 7 16ARHA7 | |
| CrossMark / Productivity | |
| Lenovo Legion Slim 7-16IAH 82TF004YGE | |
| Asus ROG Zephyrus Duo 16 GX650RX | |
| Average AMD Ryzen 9 6900HX, AMD Radeon RX 6850M XT (1551 - 1565, n=2) | |
| Lenovo Legion 7 16ARHA7 | |
| CrossMark / Creativity | |
| Lenovo Legion Slim 7-16IAH 82TF004YGE | |
| Lenovo Legion 7 16ARHA7 | |
| Average AMD Ryzen 9 6900HX, AMD Radeon RX 6850M XT (1738 - 1754, n=2) | |
| Asus ROG Zephyrus Duo 16 GX650RX | |
| CrossMark / Responsiveness | |
| Lenovo Legion Slim 7-16IAH 82TF004YGE | |
| Asus ROG Zephyrus Duo 16 GX650RX | |
| Average AMD Ryzen 9 6900HX, AMD Radeon RX 6850M XT (1310 - 1315, n=2) | |
| Lenovo Legion 7 16ARHA7 | |
| PCMark 10 Score | 7377 points | |
Help | ||
| AIDA64 / Memory Copy | |
| MSI Raider GE66 12UHS | |
| Asus ROG Zephyrus Duo 16 GX650RX | |
| Lenovo Legion 7 16ARHA7 | |
| Average AMD Ryzen 9 6900HX (47938 - 53345, n=20) | |
| Lenovo Legion Slim 7-16IAH 82TF004YGE | |
| Asus ROG Flow X16 GV601RW-M5082W | |
| HP Omen 16-c0077ng | |
| AIDA64 / Memory Read | |
| MSI Raider GE66 12UHS | |
| Lenovo Legion Slim 7-16IAH 82TF004YGE | |
| Asus ROG Zephyrus Duo 16 GX650RX | |
| Lenovo Legion 7 16ARHA7 | |
| Average AMD Ryzen 9 6900HX (43892 - 53321, n=20) | |
| Asus ROG Flow X16 GV601RW-M5082W | |
| HP Omen 16-c0077ng | |
| AIDA64 / Memory Write | |
| MSI Raider GE66 12UHS | |
| Lenovo Legion Slim 7-16IAH 82TF004YGE | |
| Asus ROG Zephyrus Duo 16 GX650RX | |
| Lenovo Legion 7 16ARHA7 | |
| Average AMD Ryzen 9 6900HX (51085 - 57202, n=20) | |
| Asus ROG Flow X16 GV601RW-M5082W | |
| HP Omen 16-c0077ng | |
| AIDA64 / Memory Latency | |
| Lenovo Legion Slim 7-16IAH 82TF004YGE | |
| Asus ROG Flow X16 GV601RW-M5082W | |
| MSI Raider GE66 12UHS | |
| Asus ROG Zephyrus Duo 16 GX650RX | |
| Average AMD Ryzen 9 6900HX (80.7 - 120.6, n=20) | |
| HP Omen 16-c0077ng | |
| Lenovo Legion 7 16ARHA7 | |
* ... smaller is better
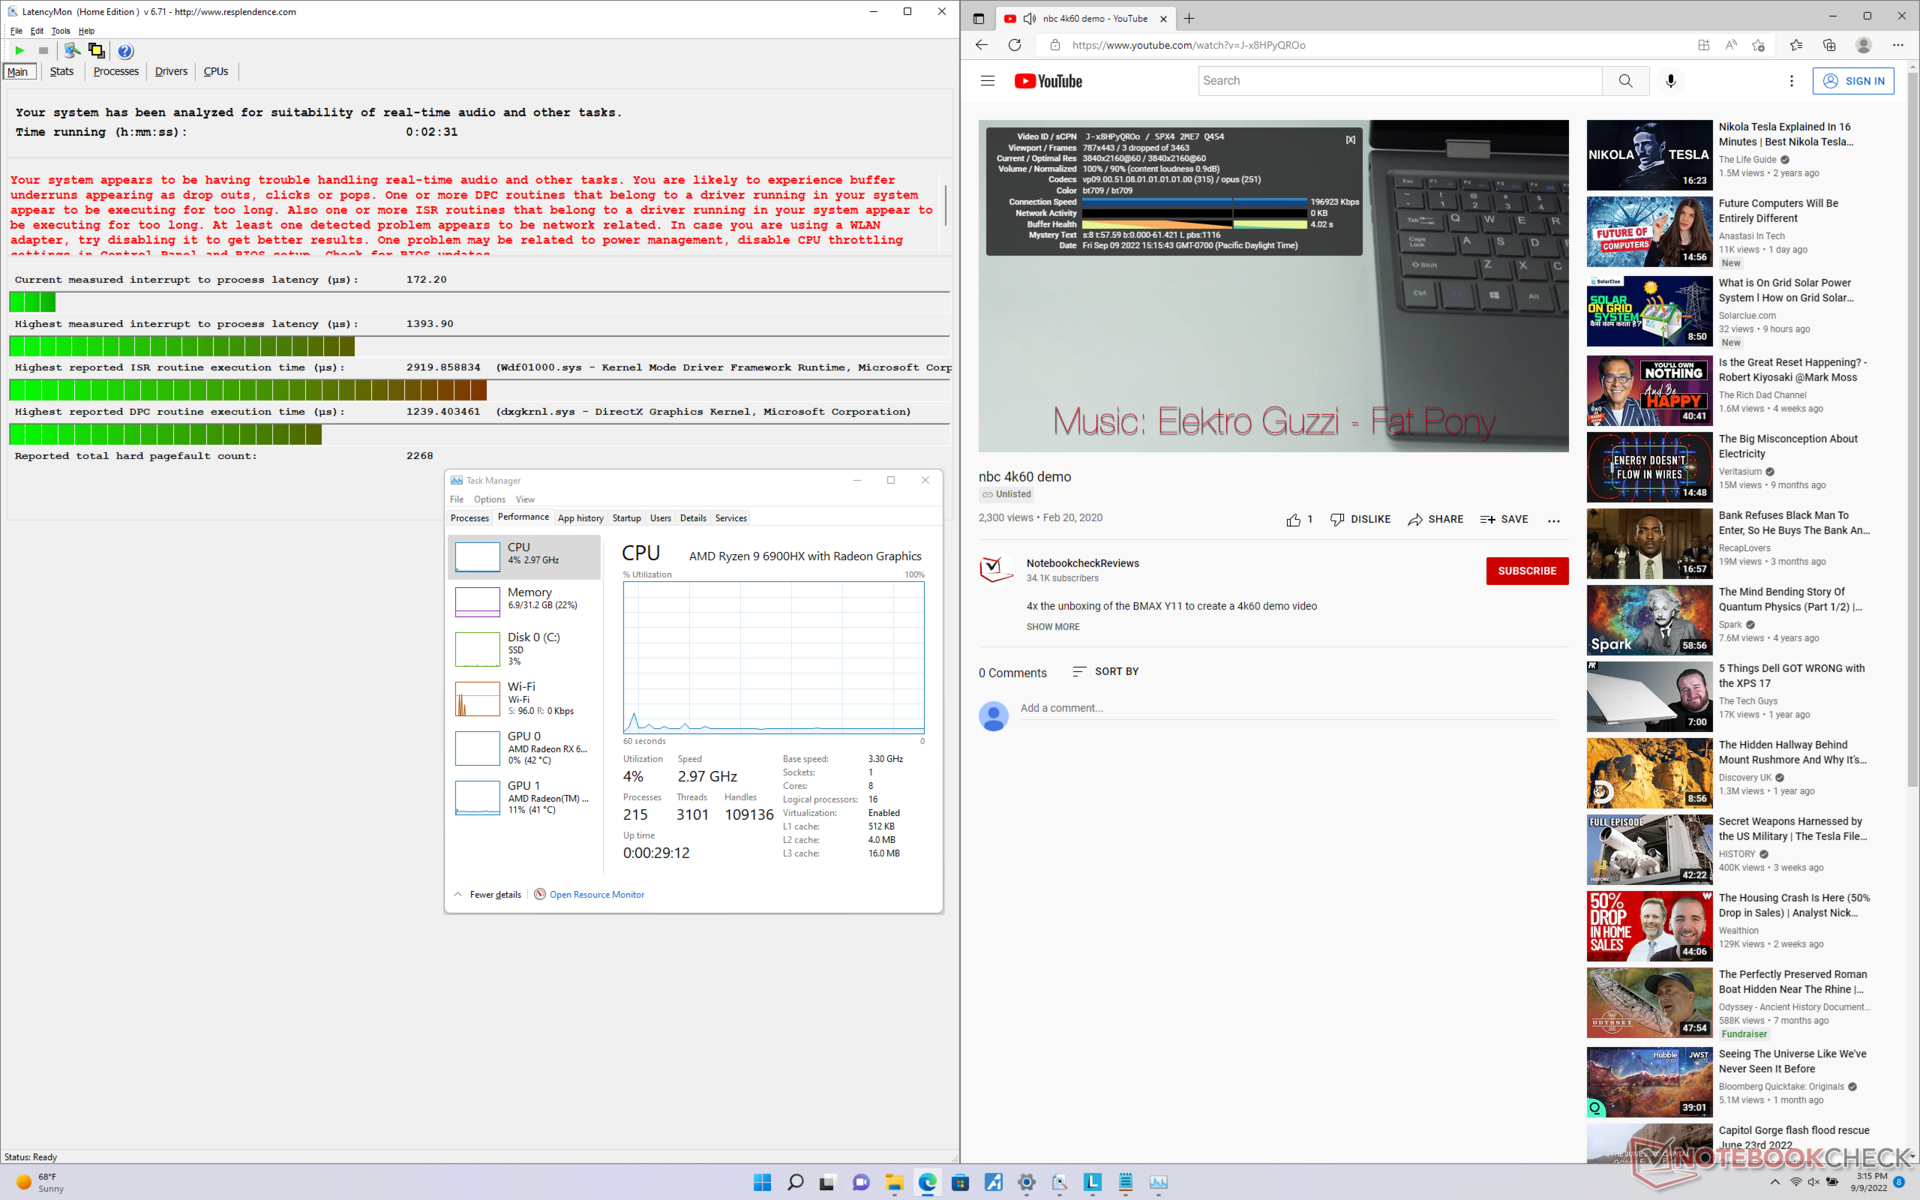
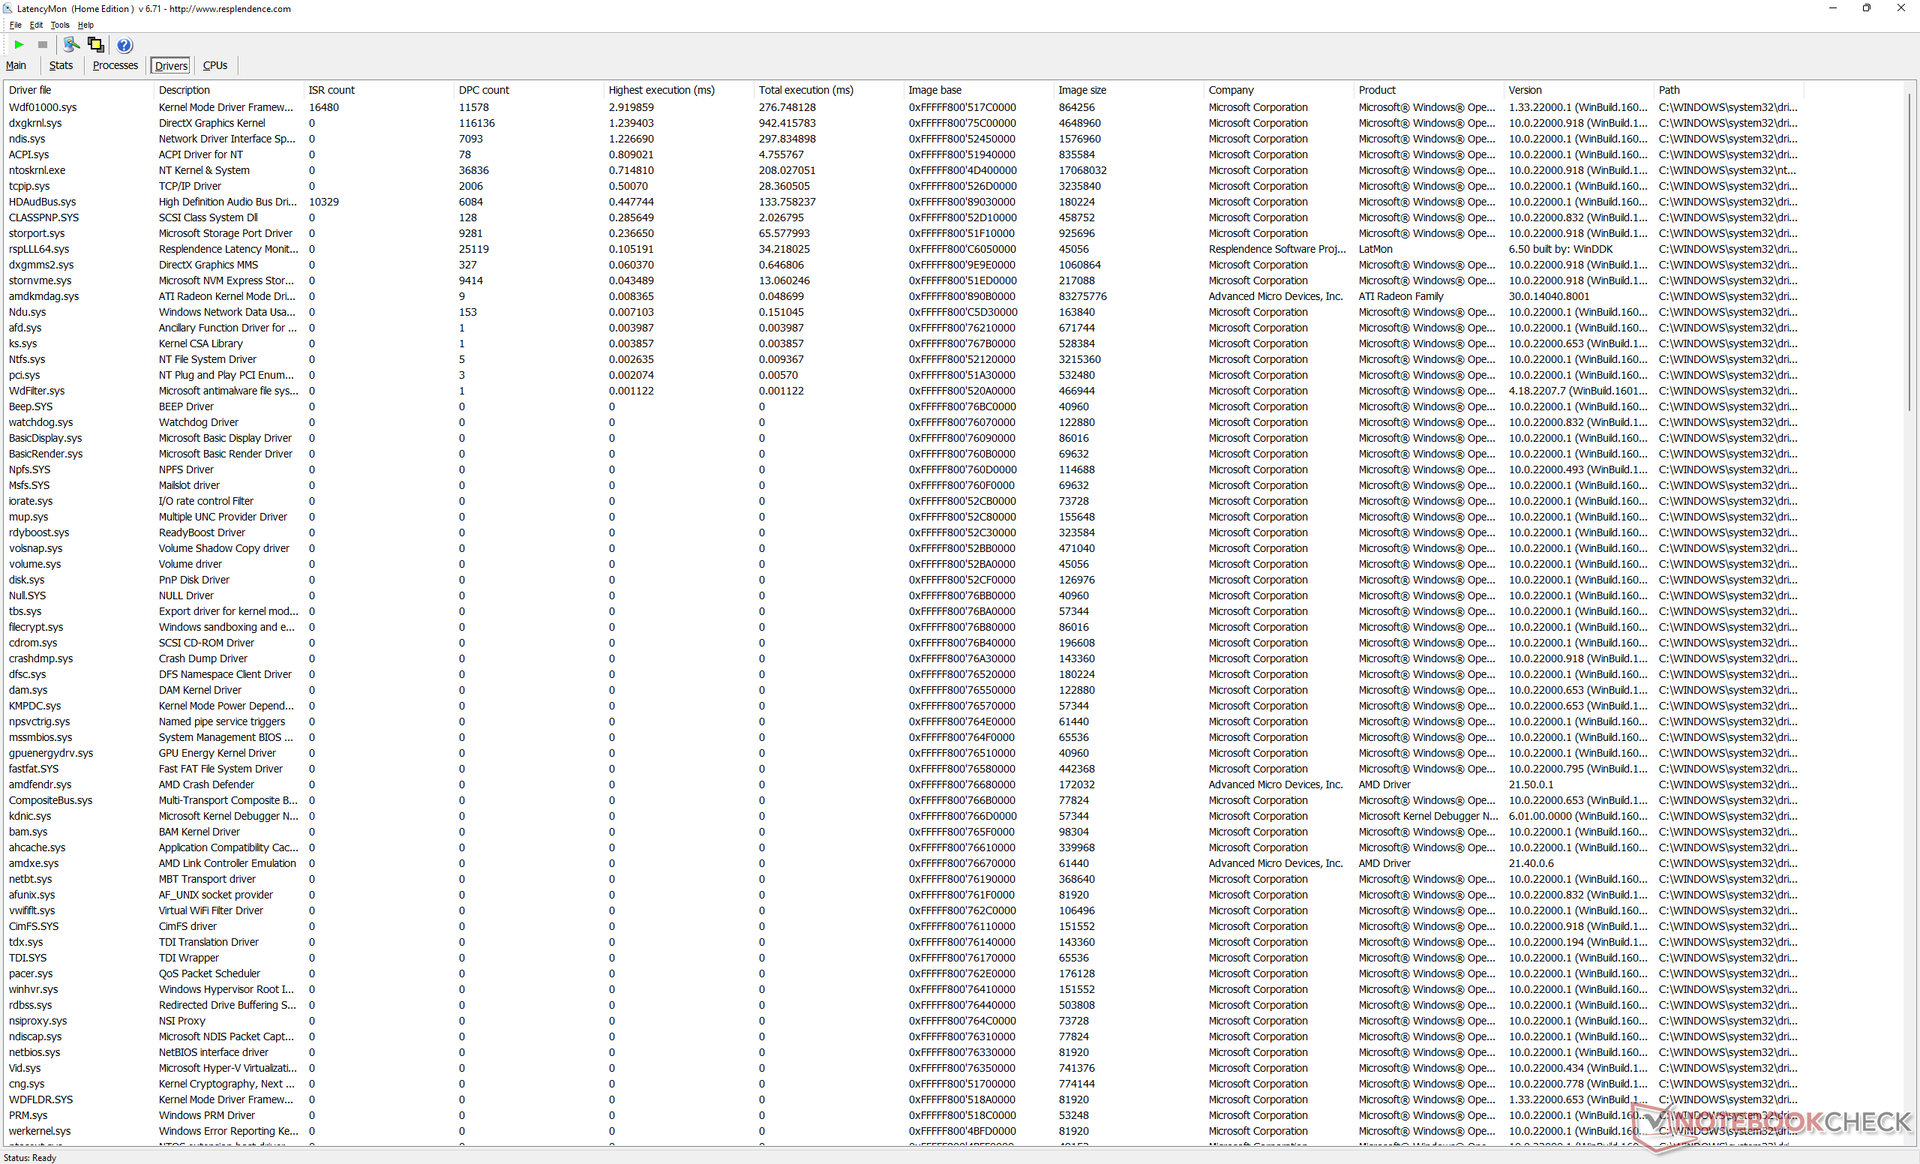
DPC Latency
LatencyMon reveals DPC issues when opening multiple browser tabs on homepage. 4K video playback at 60 FPS is mostly smooth with just 3 dropped frames during our minute-long video test.
| DPC Latencies / LatencyMon - interrupt to process latency (max), Web, Youtube, Prime95 | |
| MSI Raider GE66 12UHS | |
| HP Omen 16-c0077ng | |
| Lenovo Legion 7 16ARHA7 | |
| Lenovo Legion 5 Pro 16ACH6H (82JQ001PGE) | |
| Lenovo Legion Slim 7-16IAH 82TF004YGE | |
| Asus ROG Zephyrus Duo 16 GX650RX | |
* ... smaller is better
Storage Devices — Up To Two PCIe4 x4 SSDs
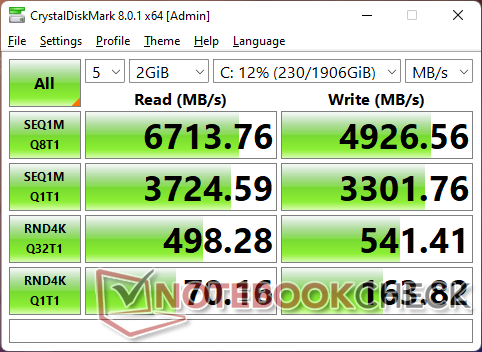
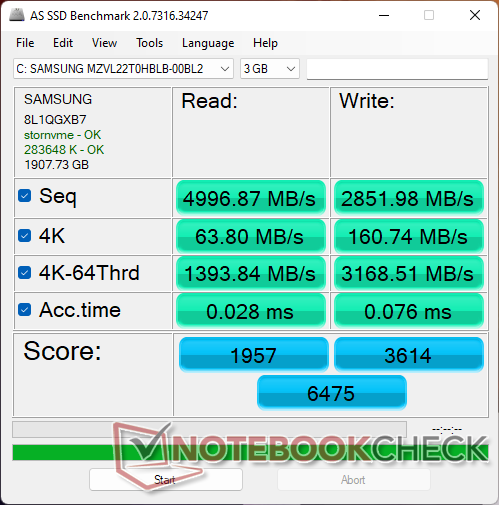
Our test unit ships with the same Samsung MZVL22T0HBLB PCIe4 x4 NVMe SSD as found on the MSI GE66 Raider. However, performance appears to be slower on the Legion than on the MSI in almost all cases according to multiple SSD benchmarks. When running DiskSpd in a loop, transfer rates would inexplicably drop to as low as 3300 MB/s before picking back up again whereas the same drive in the GE66 would exhibit no such behavior.

* ... smaller is better
Disk Throttling: DiskSpd Read Loop, Queue Depth 8
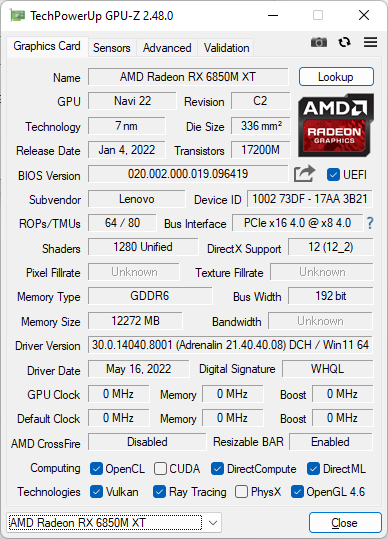
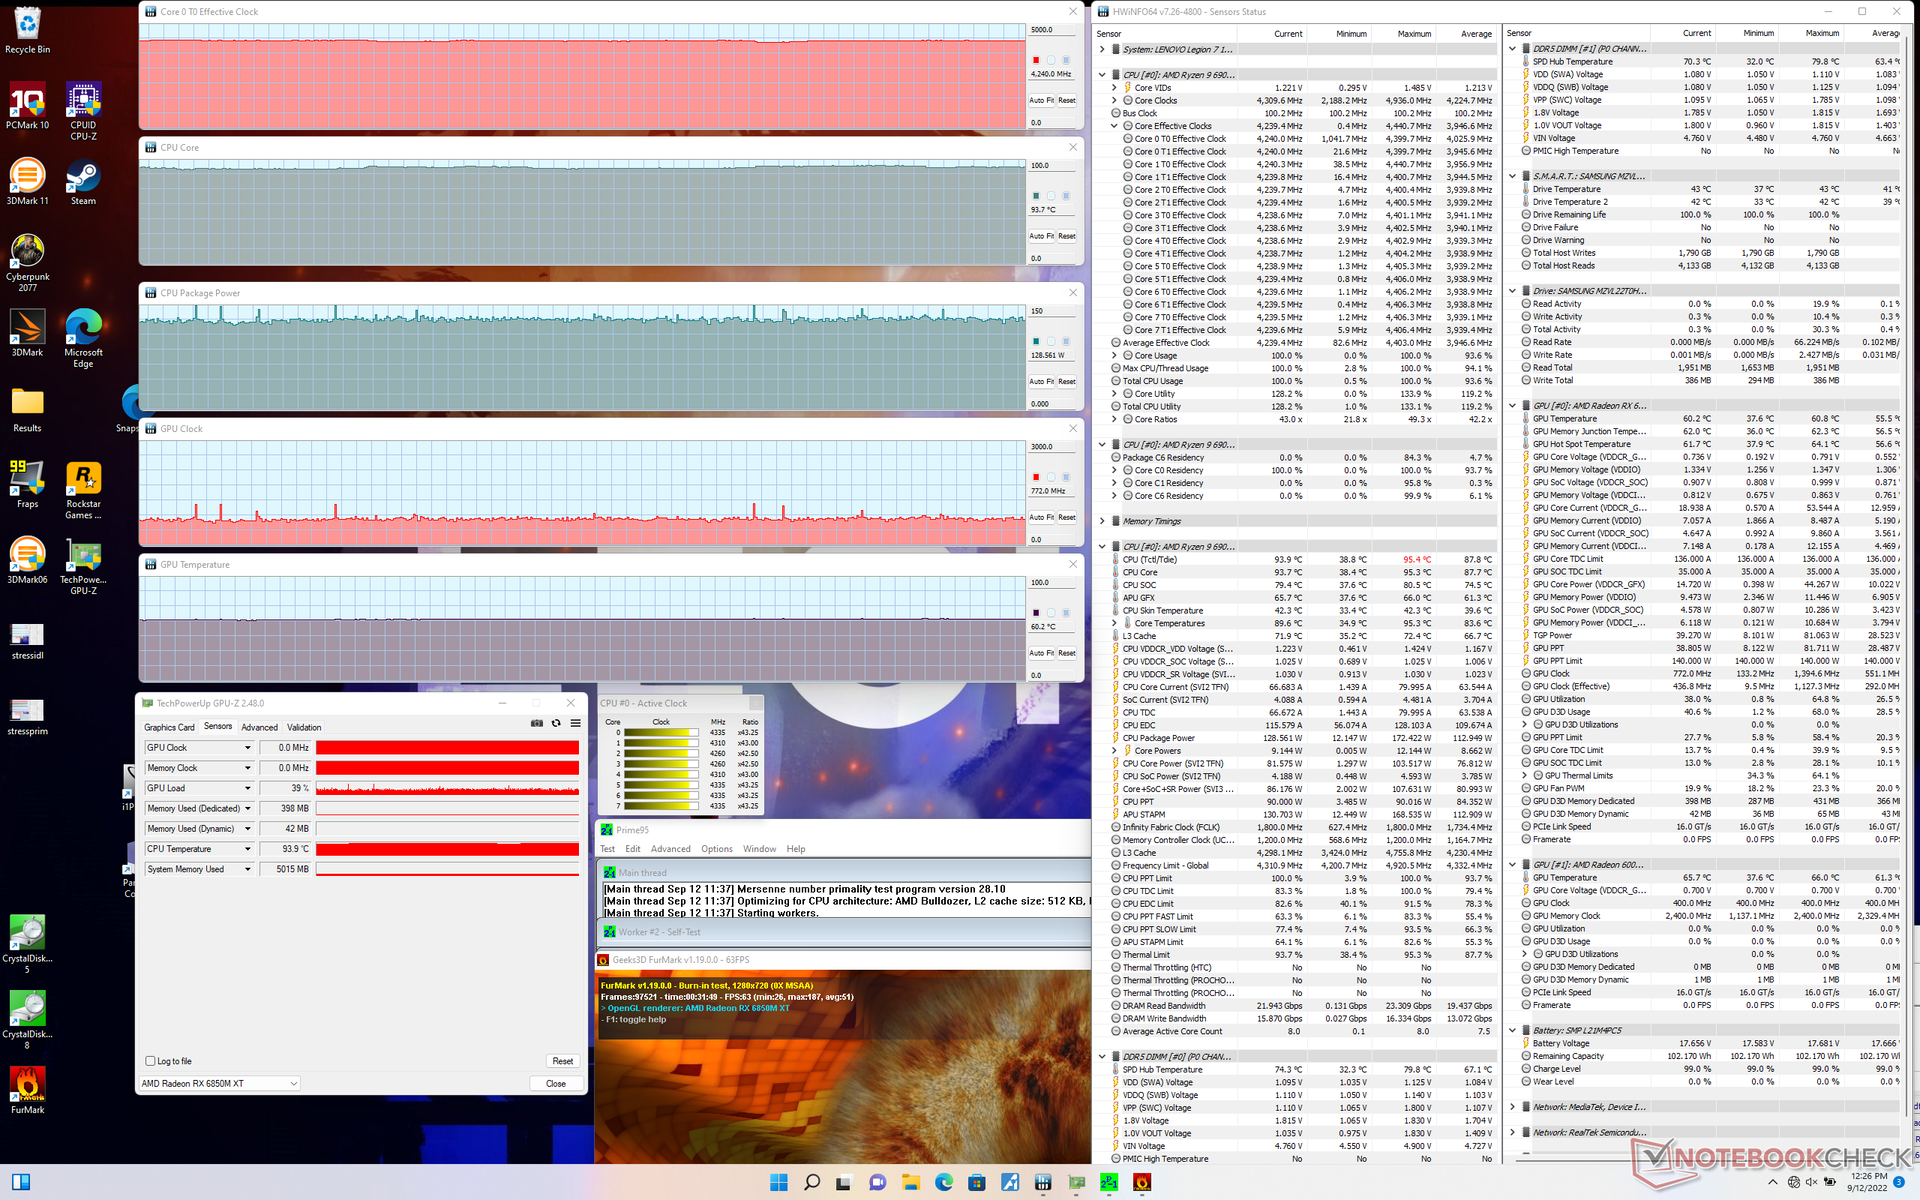
GPU Performance — Like A GeForce RTX 3080
3DMark benchmarks rank our 140 W Radeon RX 6850M XT within single-digit percentage points of the Radeon RX 6800M as found on the Asus ROG Strix G15. Thus, users shouldn't expect anything more than just minor performance differences between the two GPUs.
Certain SKUs come with the Radeon RX 6700M for roughly 15 to 20 percent slower graphics performance than our 6850M XT. Both options are most equivalent to the GeForce RTX 3070 Ti or 3080 as found in other ultrathin gaming laptops like the Maingear Vector Pro or Razer Blade 15. The MSI GS76 is a notable exception as its low TGP GPU is slower than expected even for its ultrathin size category.
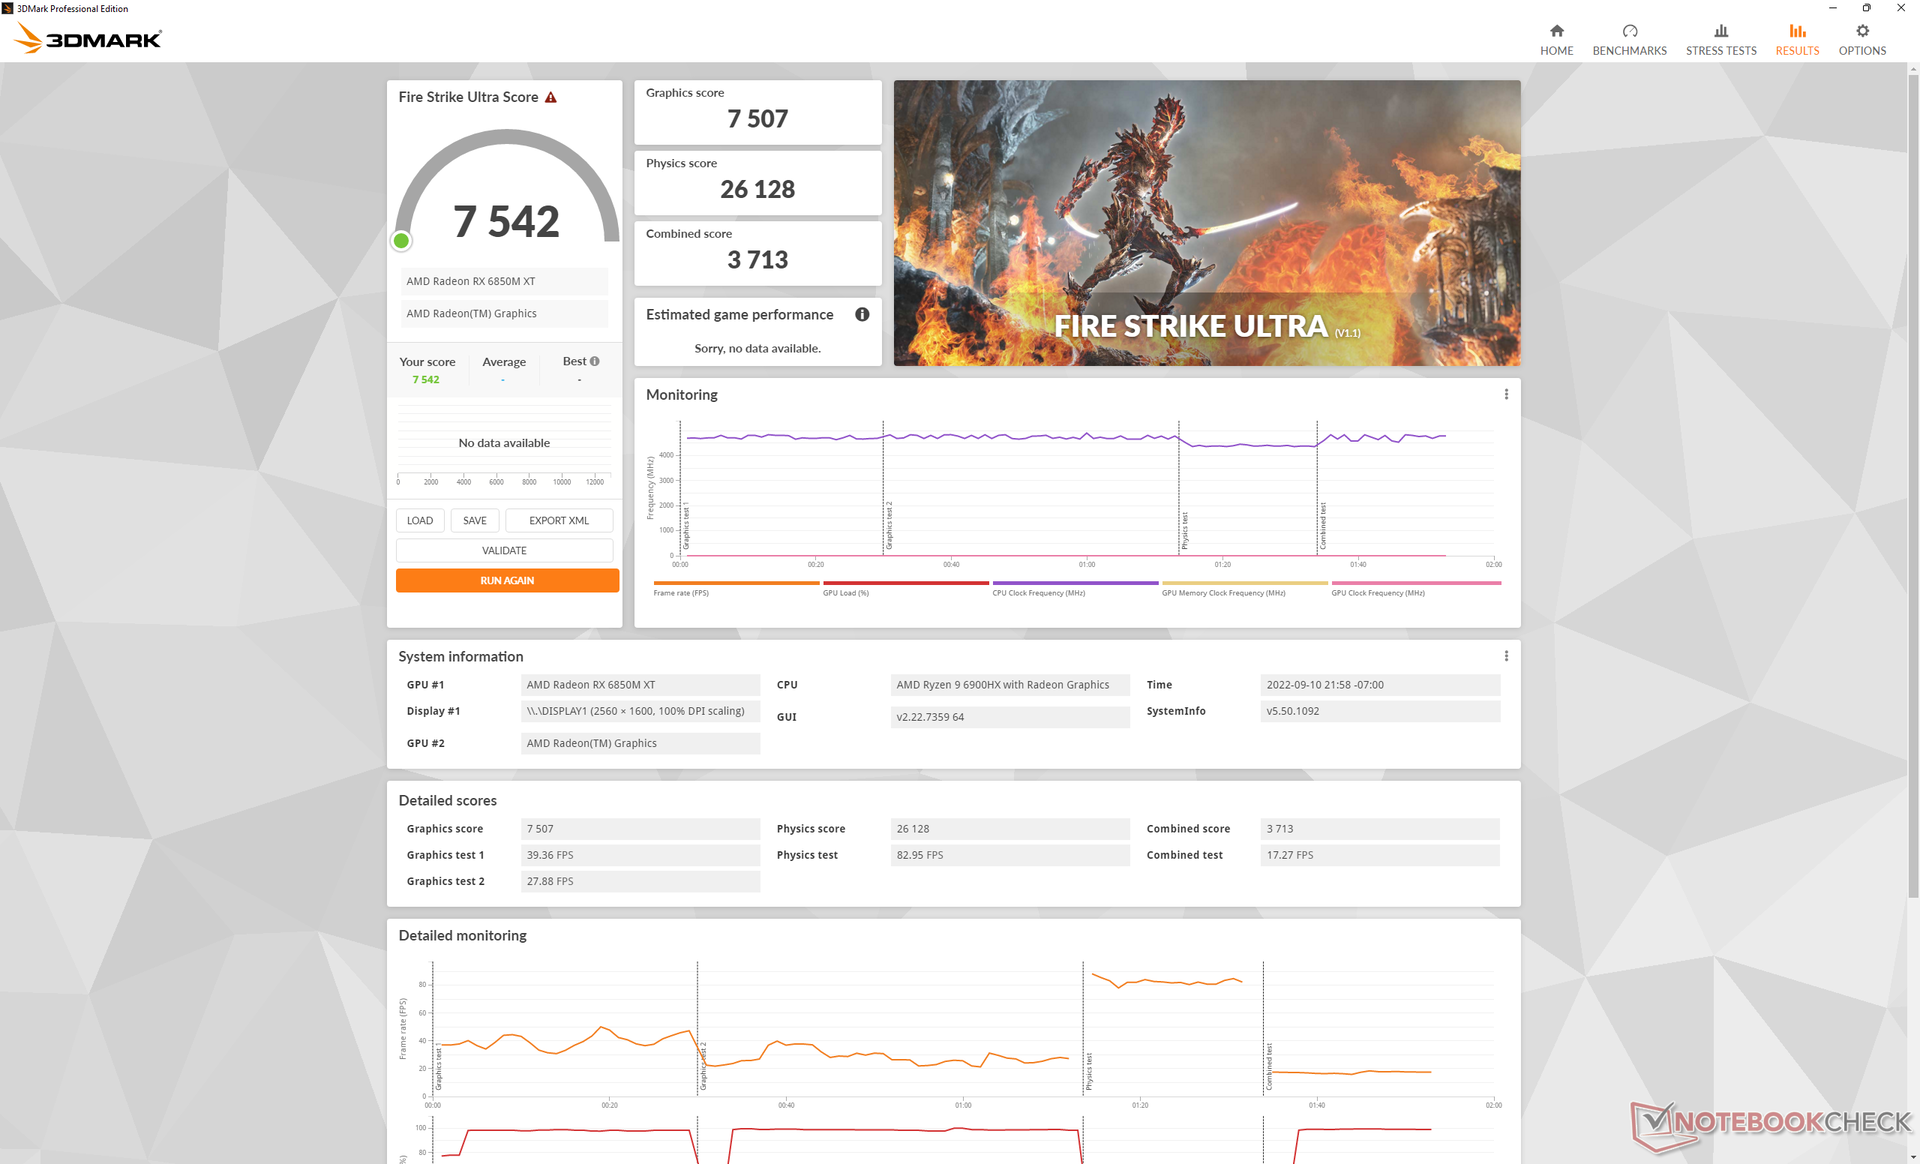
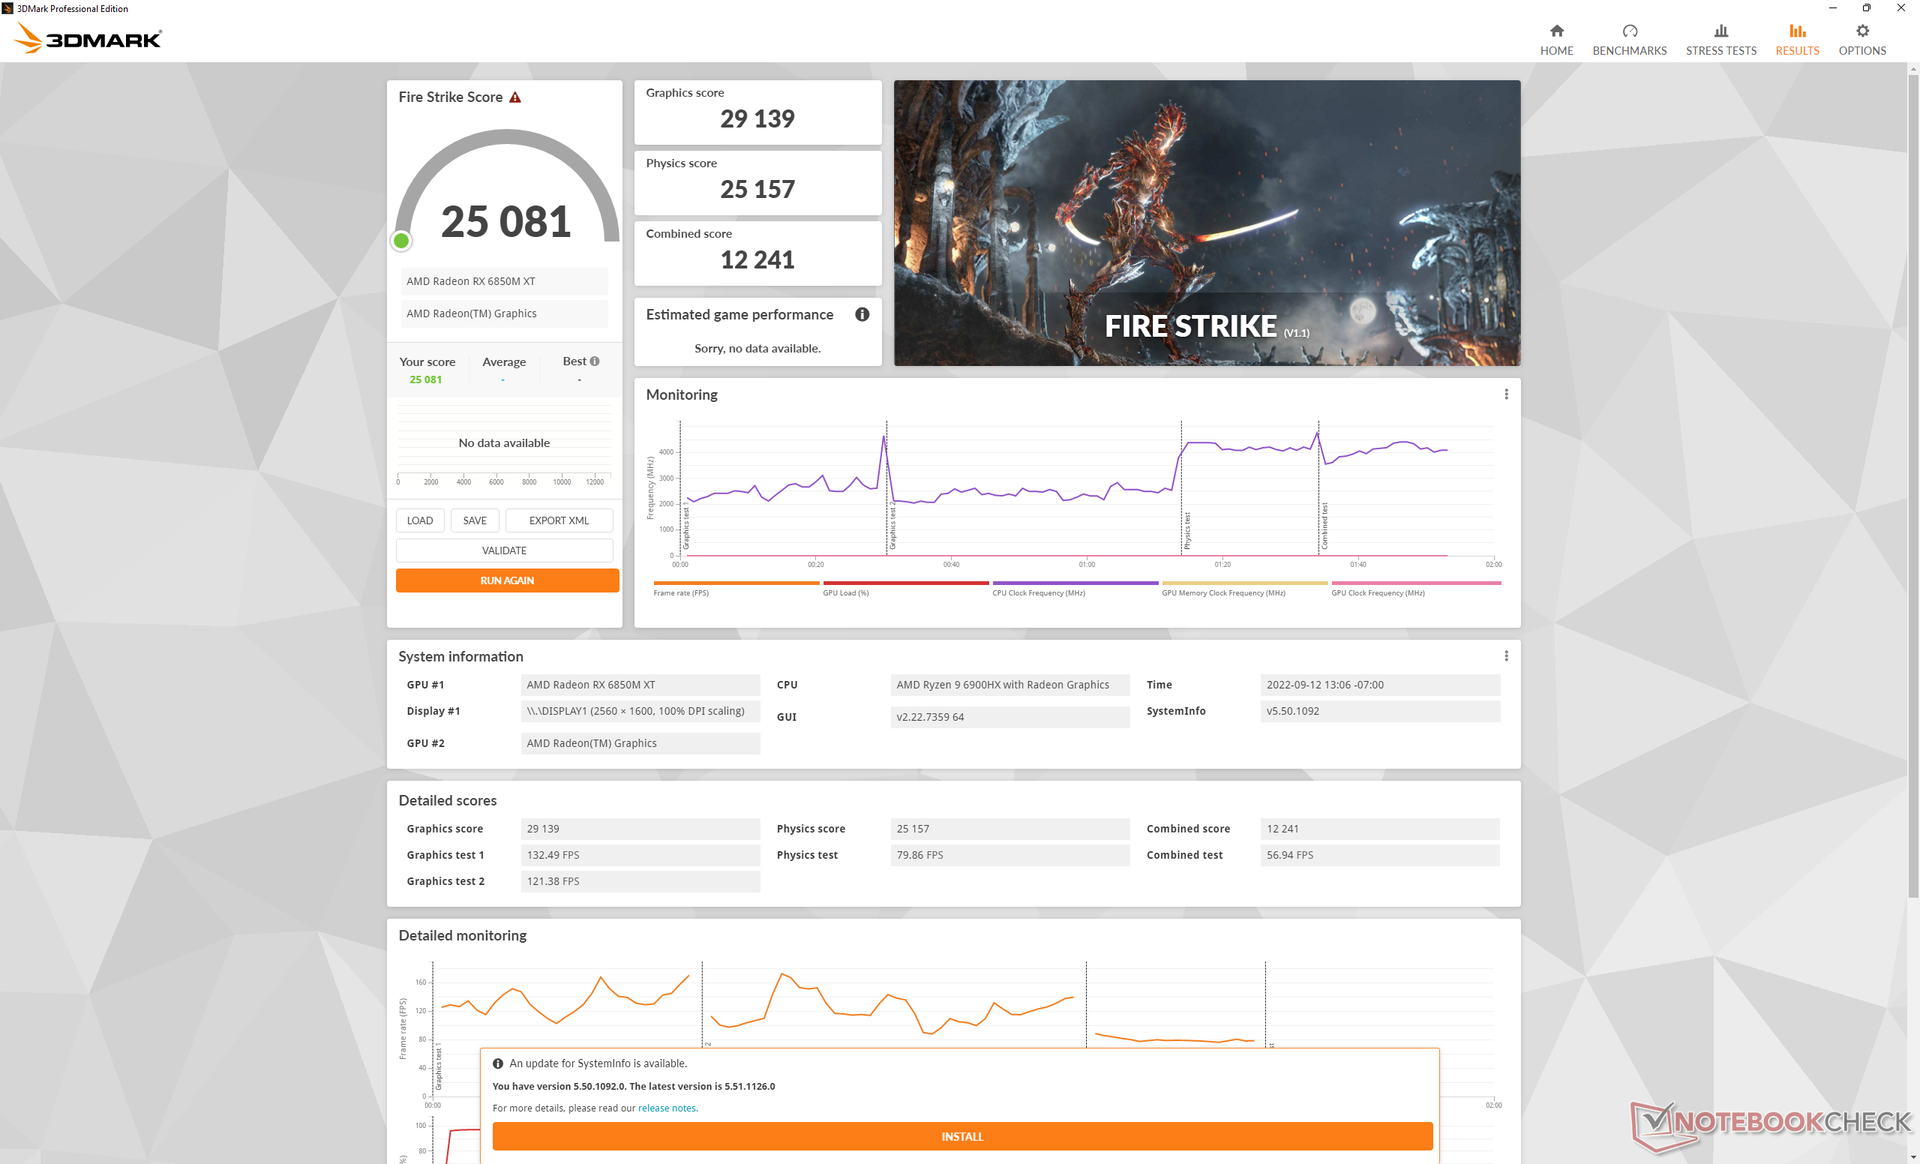
Running on Balanced mode instead of Performance mode reduces graphics performance by as much as 11 percent according to 3DMark Fire Strike.
Actual gaming performance is within 10 percent of the MSI GE66 and its RTX 3080 Ti GPU in most cases. MSI comes out ahead in most scenarios, but the frame rate advantages are slight for the most part. DOTA 2 is the unusual exception as the Lenovo system appears to be much slower than expected.
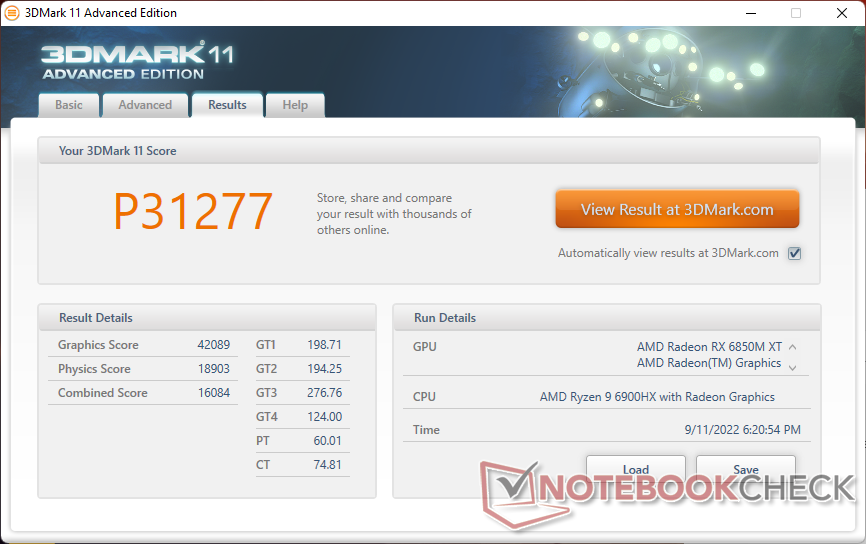
| 3DMark 11 Performance | 31277 points | |
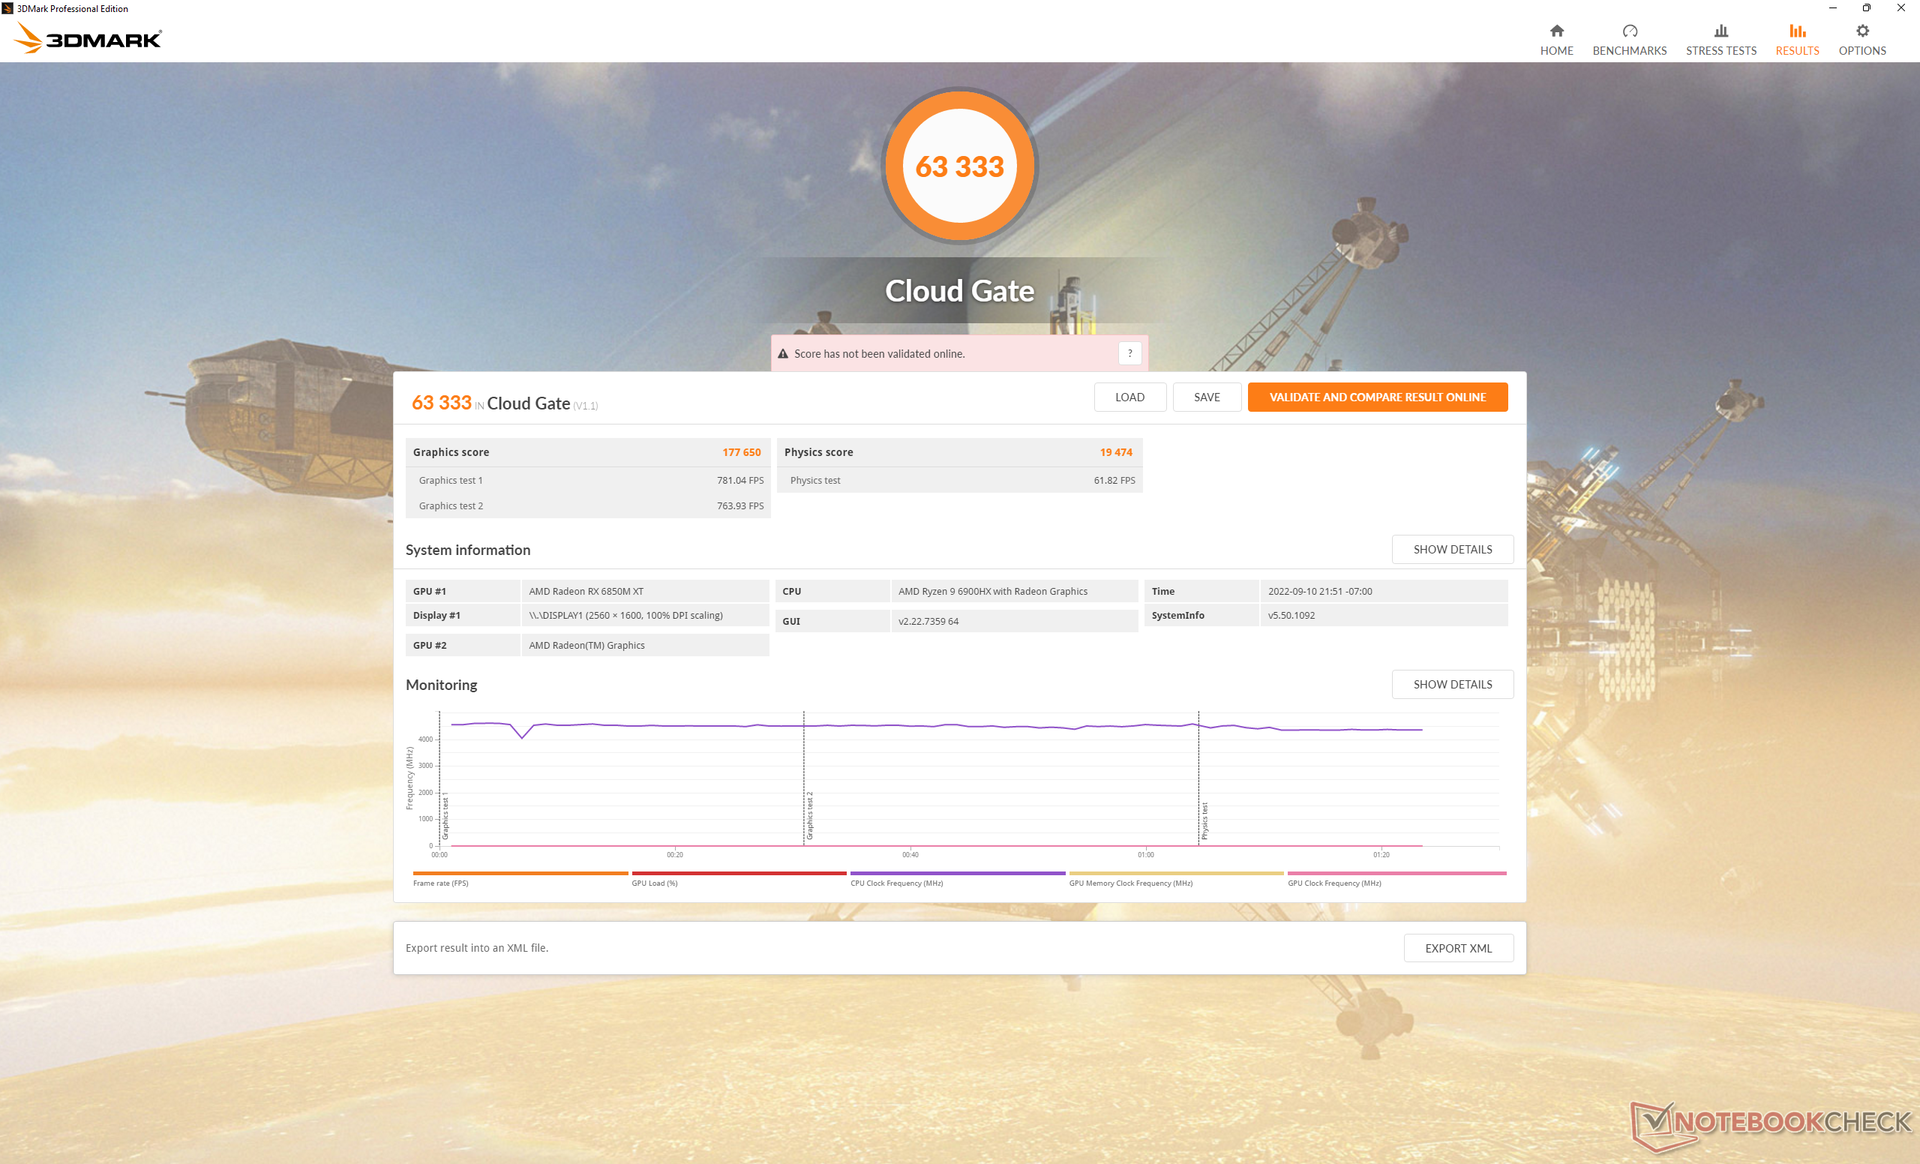
| 3DMark Cloud Gate Standard Score | 63333 points | |
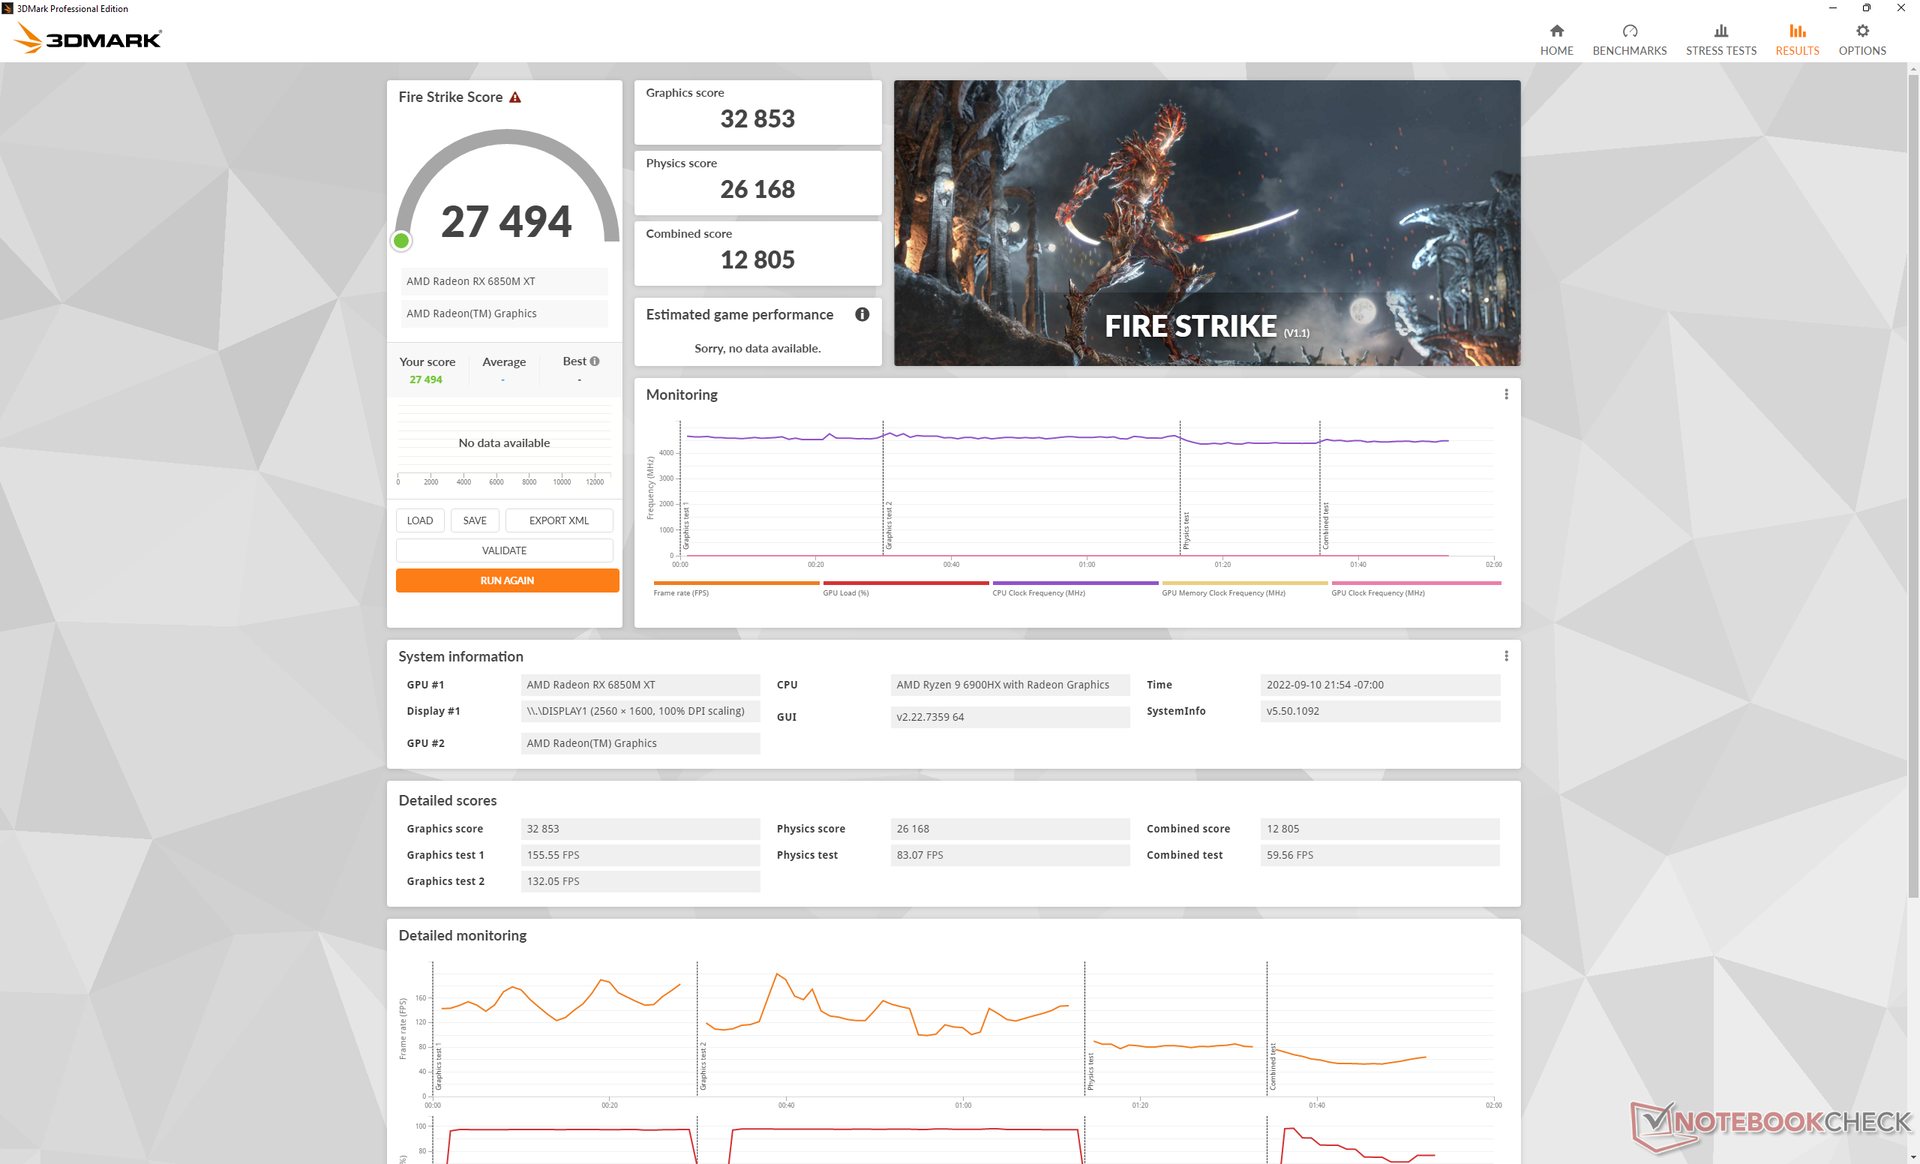
| 3DMark Fire Strike Score | 27494 points | |
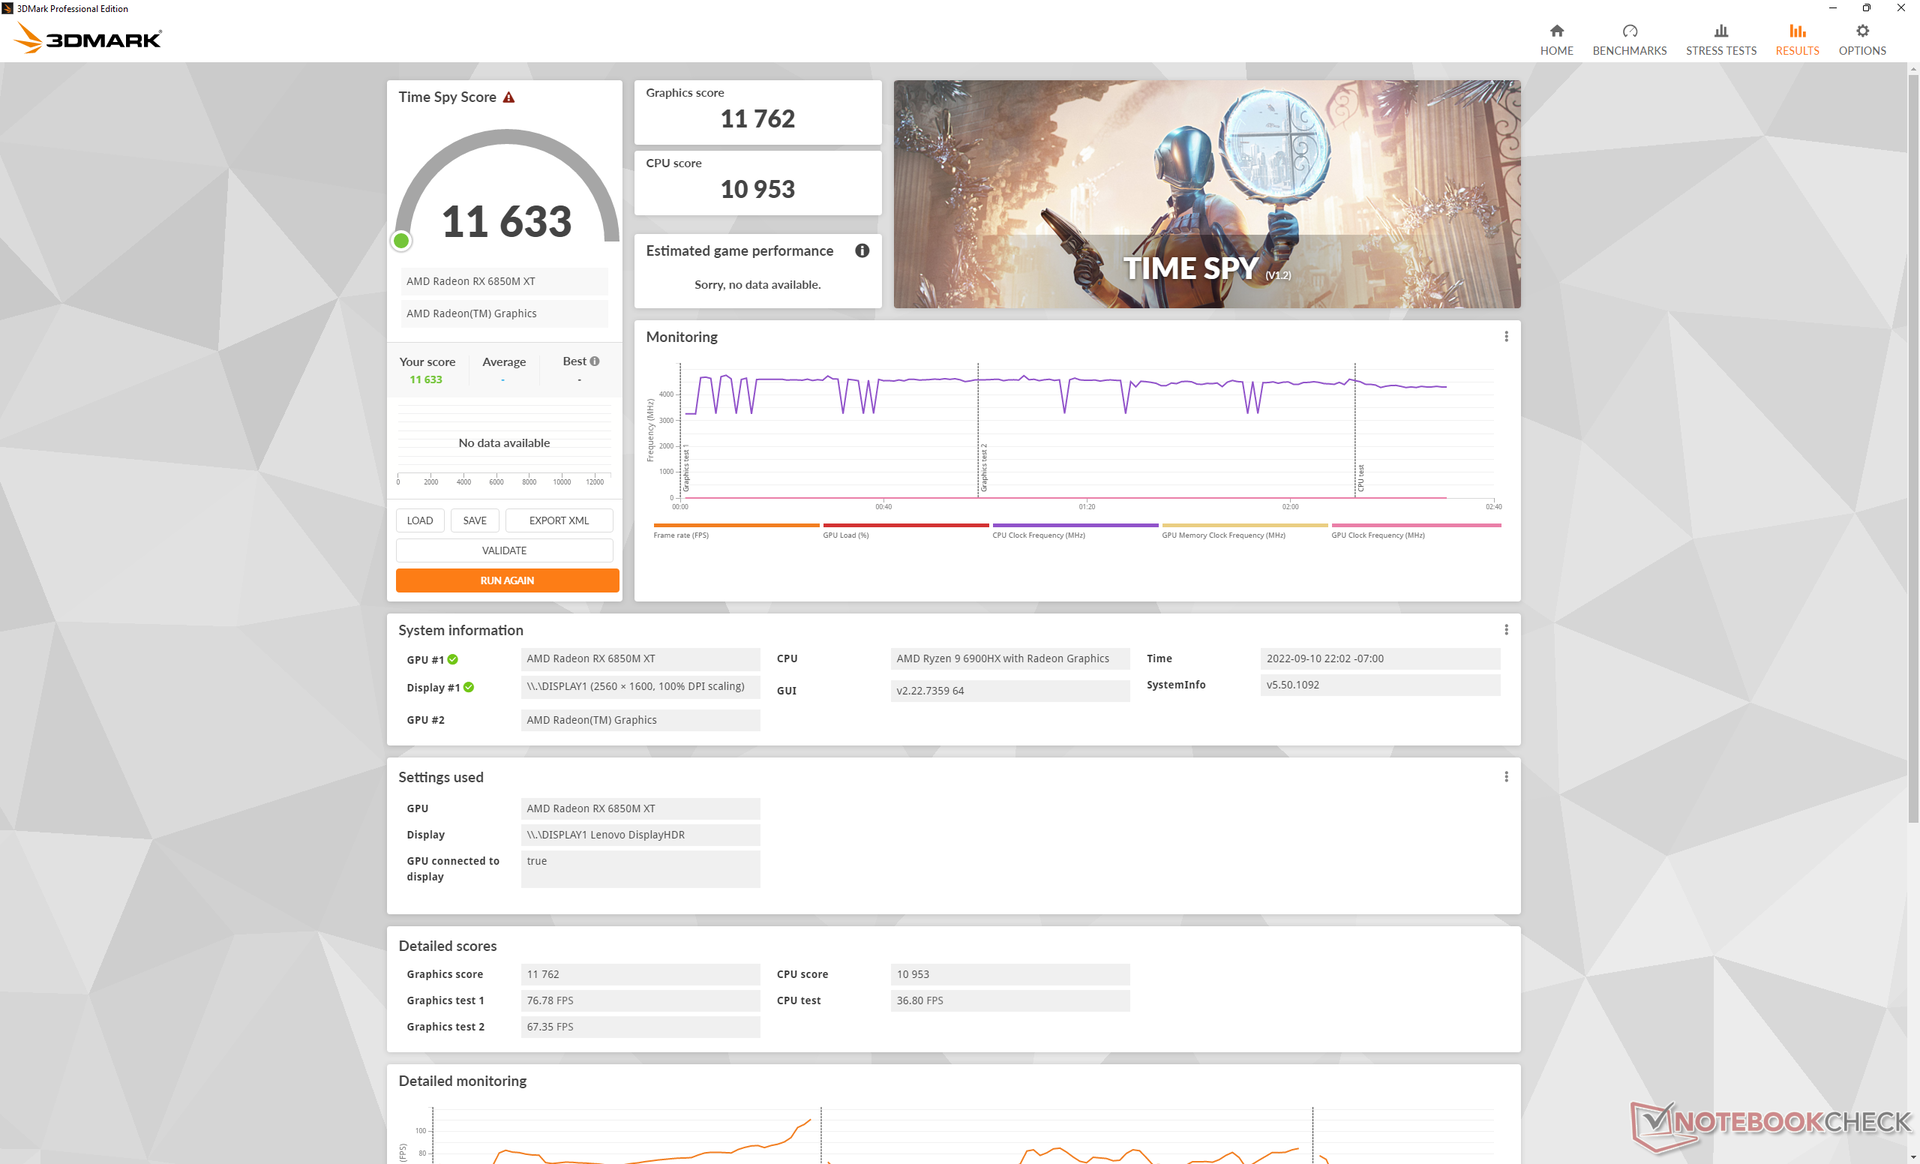
| 3DMark Time Spy Score | 11633 points | |
Help | ||
| Cyberpunk 2077 1.6 | |
| 1920x1080 Low Preset | |
| Lenovo Legion 7 16ARHA7 | |
| Average AMD Radeon RX 6850M XT (n=1) | |
| MSI Raider GE66 12UHS | |
| MSI GE67 HX 12UGS | |
| 1920x1080 Medium Preset | |
| MSI Raider GE66 12UHS | |
| Lenovo Legion 7 16ARHA7 | |
| Average AMD Radeon RX 6850M XT (n=1) | |
| MSI GE67 HX 12UGS | |
| 1920x1080 High Preset | |
| MSI Raider GE66 12UHS | |
| MSI GE67 HX 12UGS | |
| Lenovo Legion 7 16ARHA7 | |
| Average AMD Radeon RX 6850M XT (n=1) | |
| 1920x1080 Ultra Preset | |
| MSI Raider GE66 12UHS | |
| MSI GE67 HX 12UGS | |
| Lenovo Legion 7 16ARHA7 | |
| Average AMD Radeon RX 6850M XT (n=1) | |
| 2560x1440 Ultra Preset | |
| MSI Raider GE66 12UHS | |
| MSI GE67 HX 12UGS | |
| Average AMD Radeon RX 6850M XT (53.6 - 57, n=2) | |
| Lenovo Legion 7 16ARHA7 | |
Witcher 3 FPS Chart
| low | med. | high | ultra | QHD | |
|---|---|---|---|---|---|
| GTA V (2015) | 179.2 | 173.4 | 162.4 | 96.9 | 90 |
| The Witcher 3 (2015) | 384.5 | 251.6 | 208.1 | 118.1 | |
| Dota 2 Reborn (2015) | 147.3 | 110.9 | 113.7 | 95.2 | |
| Final Fantasy XV Benchmark (2018) | 180.6 | 148.5 | 111.9 | 83.8 | |
| X-Plane 11.11 (2018) | 63.3 | 51.2 | 44.1 | ||
| Strange Brigade (2018) | 445 | 303 | 261 | 224 | 161.7 |
| Metro Exodus (2019) | 157.4 | 150.7 | 109.6 | 86.9 | 68.4 |
| Borderlands 3 (2019) | 112.8 | 102.1 | 94.2 | 85.6 | 68.6 |
| Gears Tactics (2020) | 153 | 252.2 | 155.5 | 117.8 | 83.6 |
| Horizon Zero Dawn (2020) | 181 | 159 | 142 | 123 | 100 |
| Watch Dogs Legion (2020) | 120 | 119 | 108 | 83 | 60 |
| Dirt 5 (2020) | 270 | 169.5 | 131.7 | 110.5 | 89.3 |
| Assassin´s Creed Valhalla (2020) | 235 | 159 | 130 | 112 | 82 |
| Hitman 3 (2021) | 211.9 | 192.6 | 192.9 | 191.3 | 136.1 |
| F1 2021 (2021) | 351 | 308 | 297 | 146 | 95 |
| Far Cry 6 (2021) | 123 | 112 | 100 | 99 | 87 |
| Guardians of the Galaxy (2021) | 130 | 131 | 132 | 129 | 103 |
| God of War (2022) | 89 | 95.6 | 94.5 | 78.4 | 64.7 |
| Cyberpunk 2077 1.6 (2022) | 160 | 135.5 | 105.8 | 87.2 | 53.6 |
| F1 22 (2022) | 245 | 241 | 204 | 52 | 31 |
Emissions
System Noise — Loud Gamer
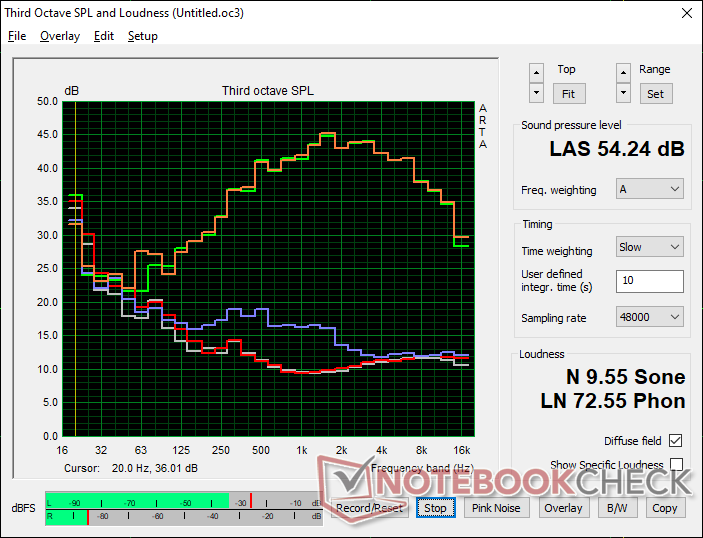
The internal fans are generally very quiet when under low to low-medium loads. When running 3DMark 06, for example, system noise would top out at just 26.8 dB(A) by the end of the first 90-second benchmark scene against a silent background of 22.8 dB(A). Repeating this same test on the MSI GE66 or Omen 16 would result in significantly louder fans in the 40 to 50+ dB(A) range.
Fan noise stabilizes at 47.2 dB(A) and 54.3 dB(A) when running Witcher 3 on Balanced and Performance modes, respectively. The system is therefore significantly quieter when gaming on Balanced mode and so users may want to consider sacrificing some graphics performance for quieter fans depending on the environment. The 50 dB(A) range is very loud and it is unfortunately common amongst most gaming laptops.
Noise level
| Idle |
| 23 / 23 / 23 dB(A) |
| Load |
| 26.8 / 54.2 dB(A) |
 | ||
30 dB silent 40 dB(A) audible 50 dB(A) loud |
||
min: | ||
| Lenovo Legion 7 16ARHA7 Radeon RX 6850M XT, R9 6900HX, Samsung PM9A1 MZVL22T0HBLB | MSI Raider GE66 12UHS GeForce RTX 3080 Ti Laptop GPU, i9-12900HK, Samsung PM9A1 MZVL22T0HBLB | Lenovo Legion Slim 7-16IAH 82TF004YGE GeForce RTX 3060 Laptop GPU, i7-12700H, SK Hynix HFS001TEJ9X115N | Asus ROG Zephyrus Duo 16 GX650RX GeForce RTX 3080 Ti Laptop GPU, R9 6900HX, 2x Samsung SSD 980 Pro 2TB MZ-V8P2T0 (RAID 0) | HP Omen 16-c0077ng Radeon RX 6600M, R7 5800H, Samsung PM981a MZVLB1T0HBLR | Lenovo Legion 5 Pro 16ACH6H (82JQ001PGE) GeForce RTX 3070 Laptop GPU, R7 5800H, WDC PC SN730 SDBPNTY-1T00 | |
|---|---|---|---|---|---|---|
| Noise | -24% | -8% | -15% | -35% | -6% | |
| off / environment * (dB) | 22.8 | 26 -14% | 23 -1% | 26 -14% | 25 -10% | 23 -1% |
| Idle Minimum * (dB) | 23 | 27 -17% | 23 -0% | 26 -13% | 25 -9% | 25 -9% |
| Idle Average * (dB) | 23 | 30 -30% | 23 -0% | 27 -17% | 31.2 -36% | 25 -9% |
| Idle Maximum * (dB) | 23 | 39 -70% | 23 -0% | 29 -26% | 33.8 -47% | 25 -9% |
| Load Average * (dB) | 26.8 | 45 -68% | 43.7 -63% | 41 -53% | 55.4 -107% | 35.5 -32% |
| Witcher 3 ultra * (dB) | 54.3 | 45 17% | 51.7 5% | 48 12% | 46.67 14% | |
| Load Maximum * (dB) | 54.2 | 47 13% | 52 4% | 50 8% | 56 -3% | 50.35 7% |
* ... smaller is better
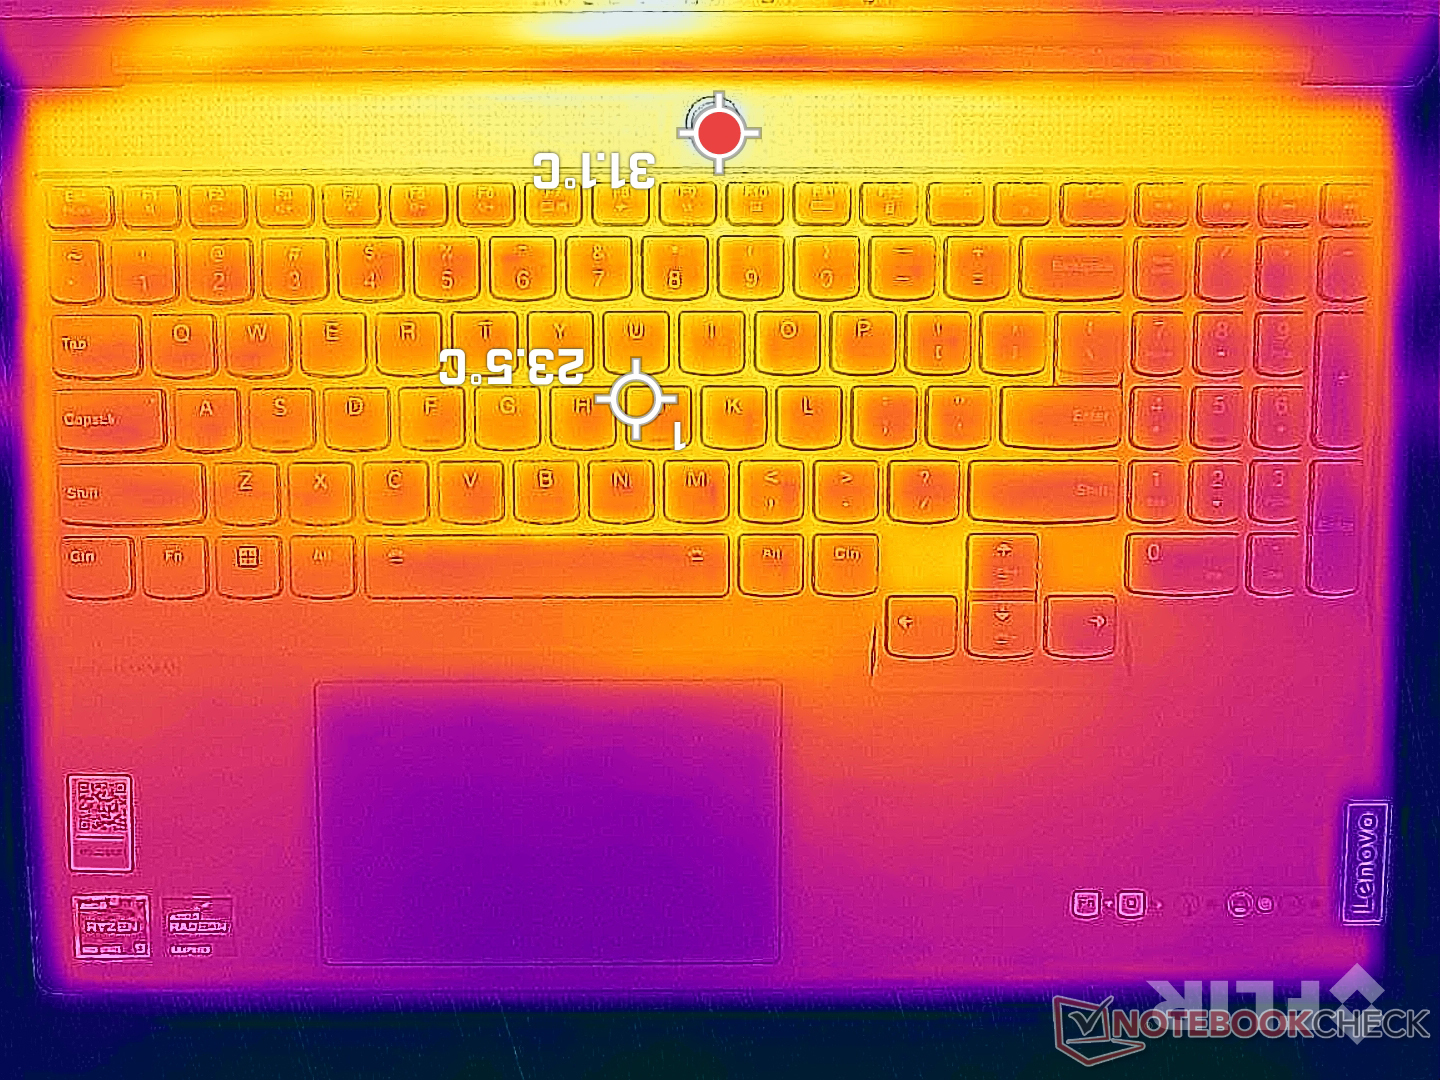
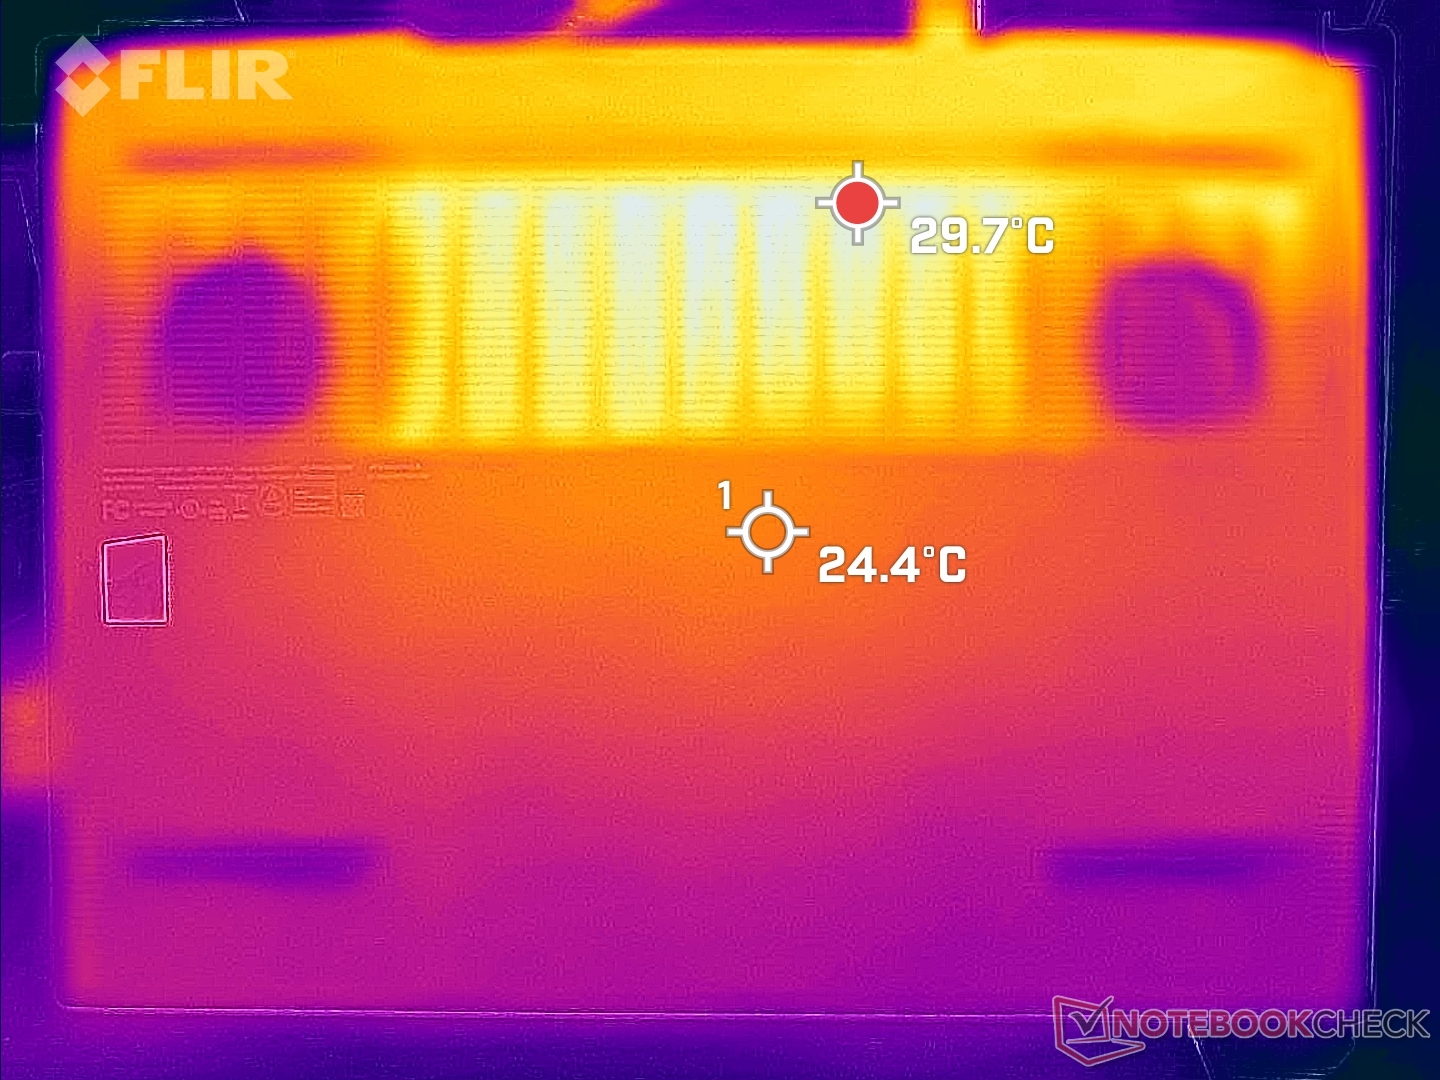
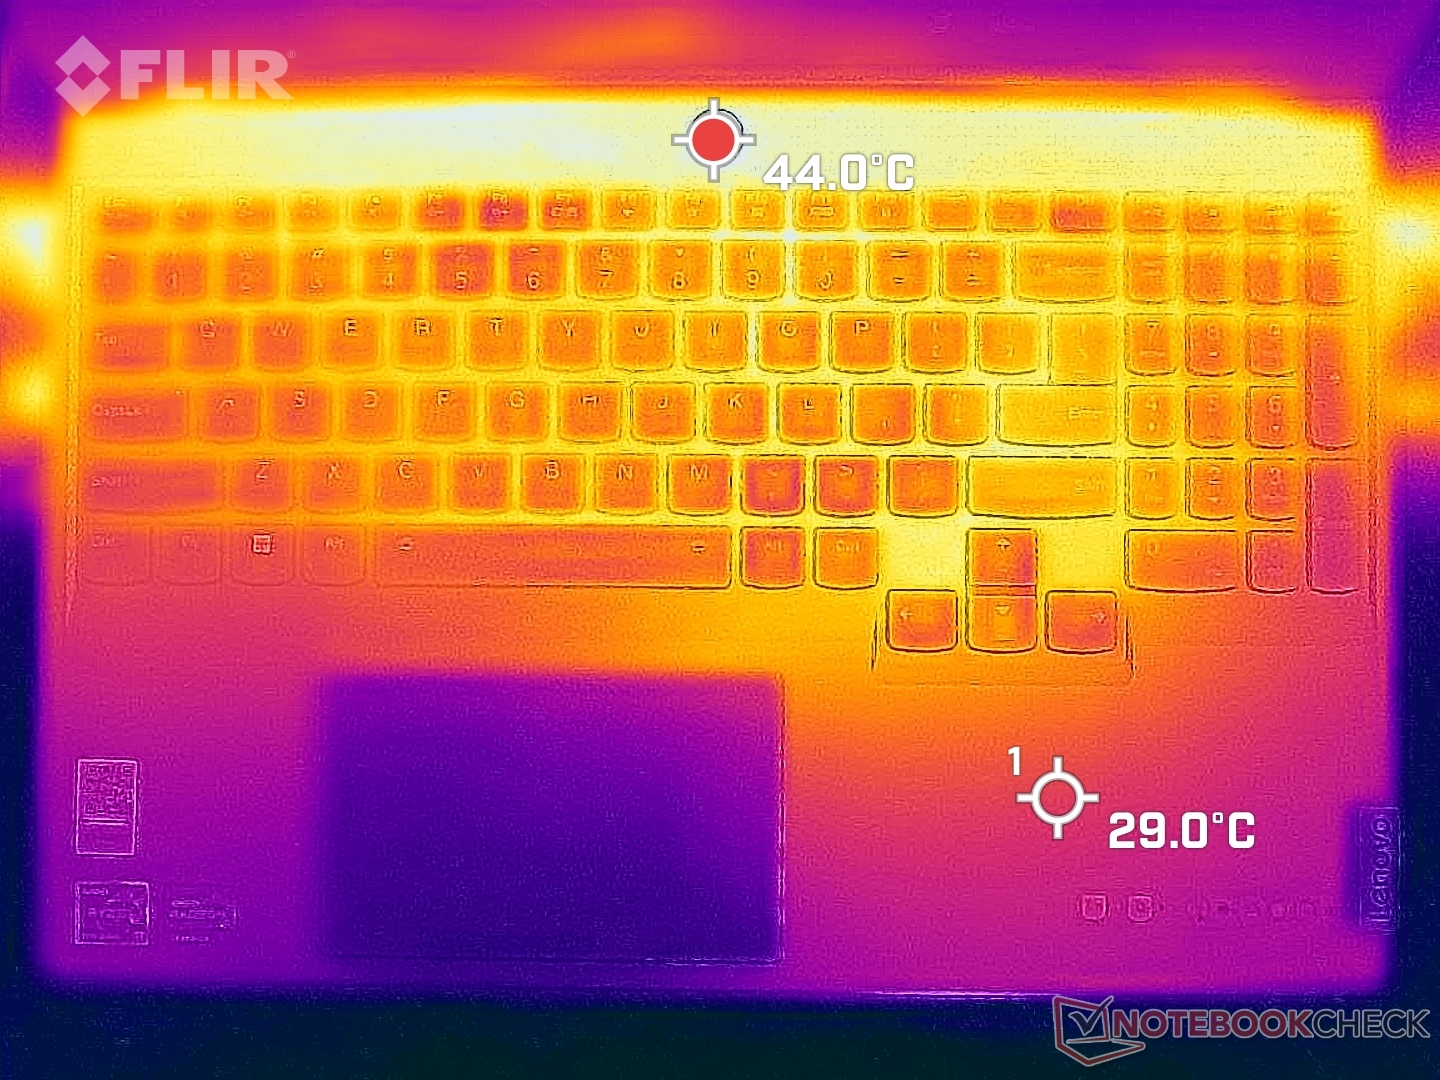
Temperature
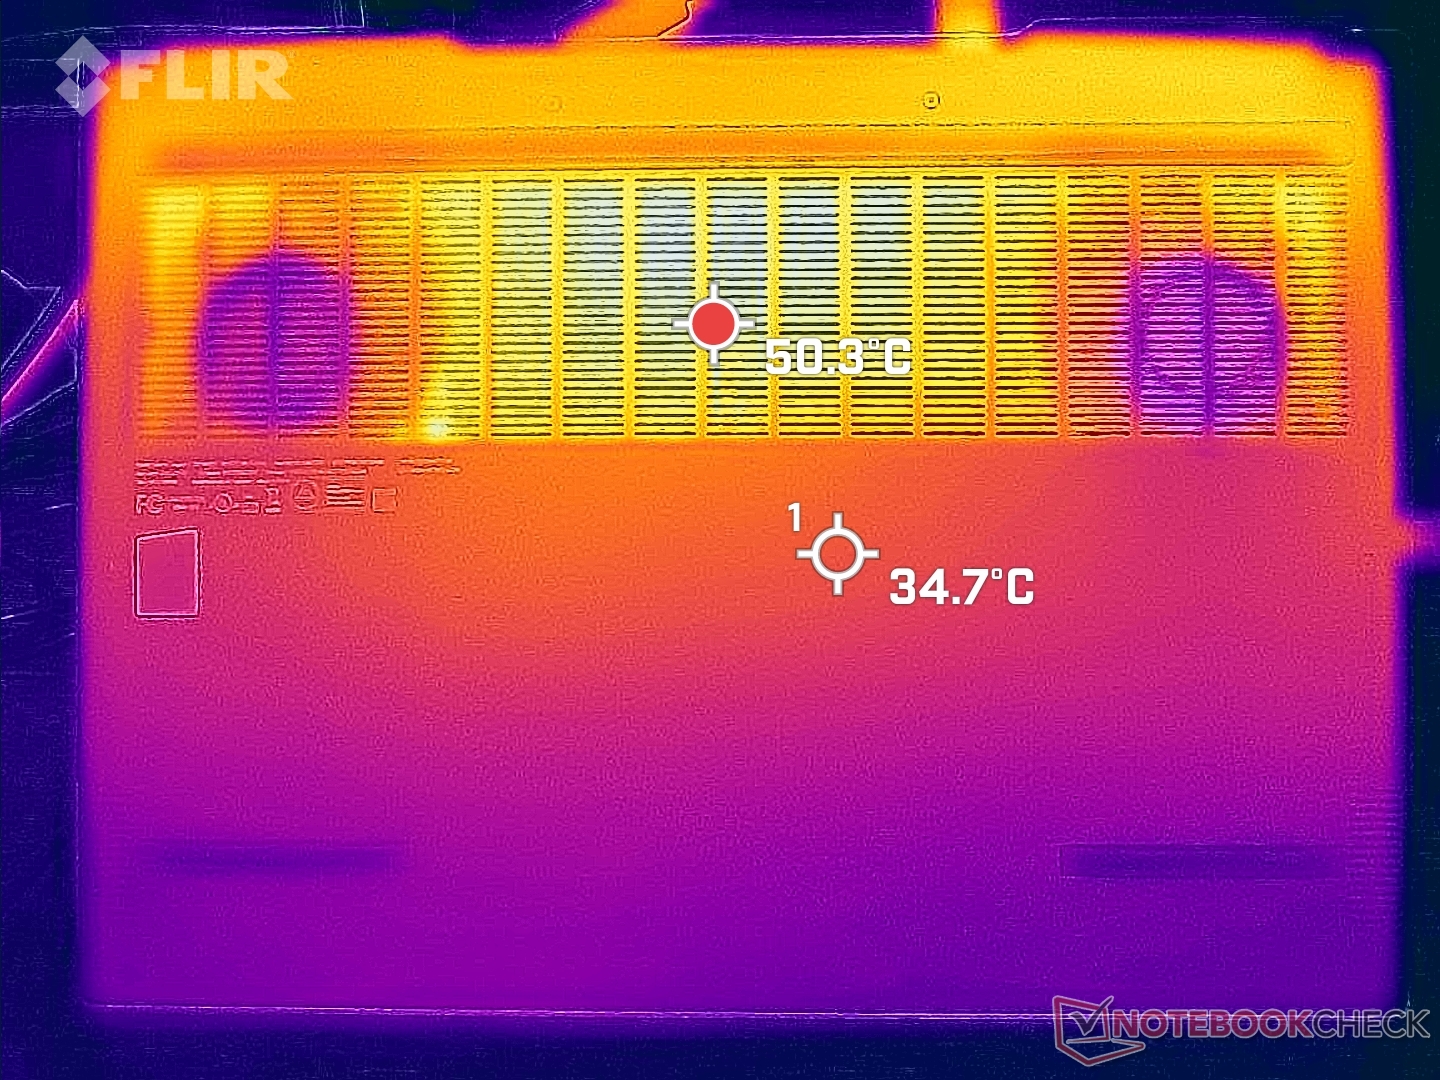
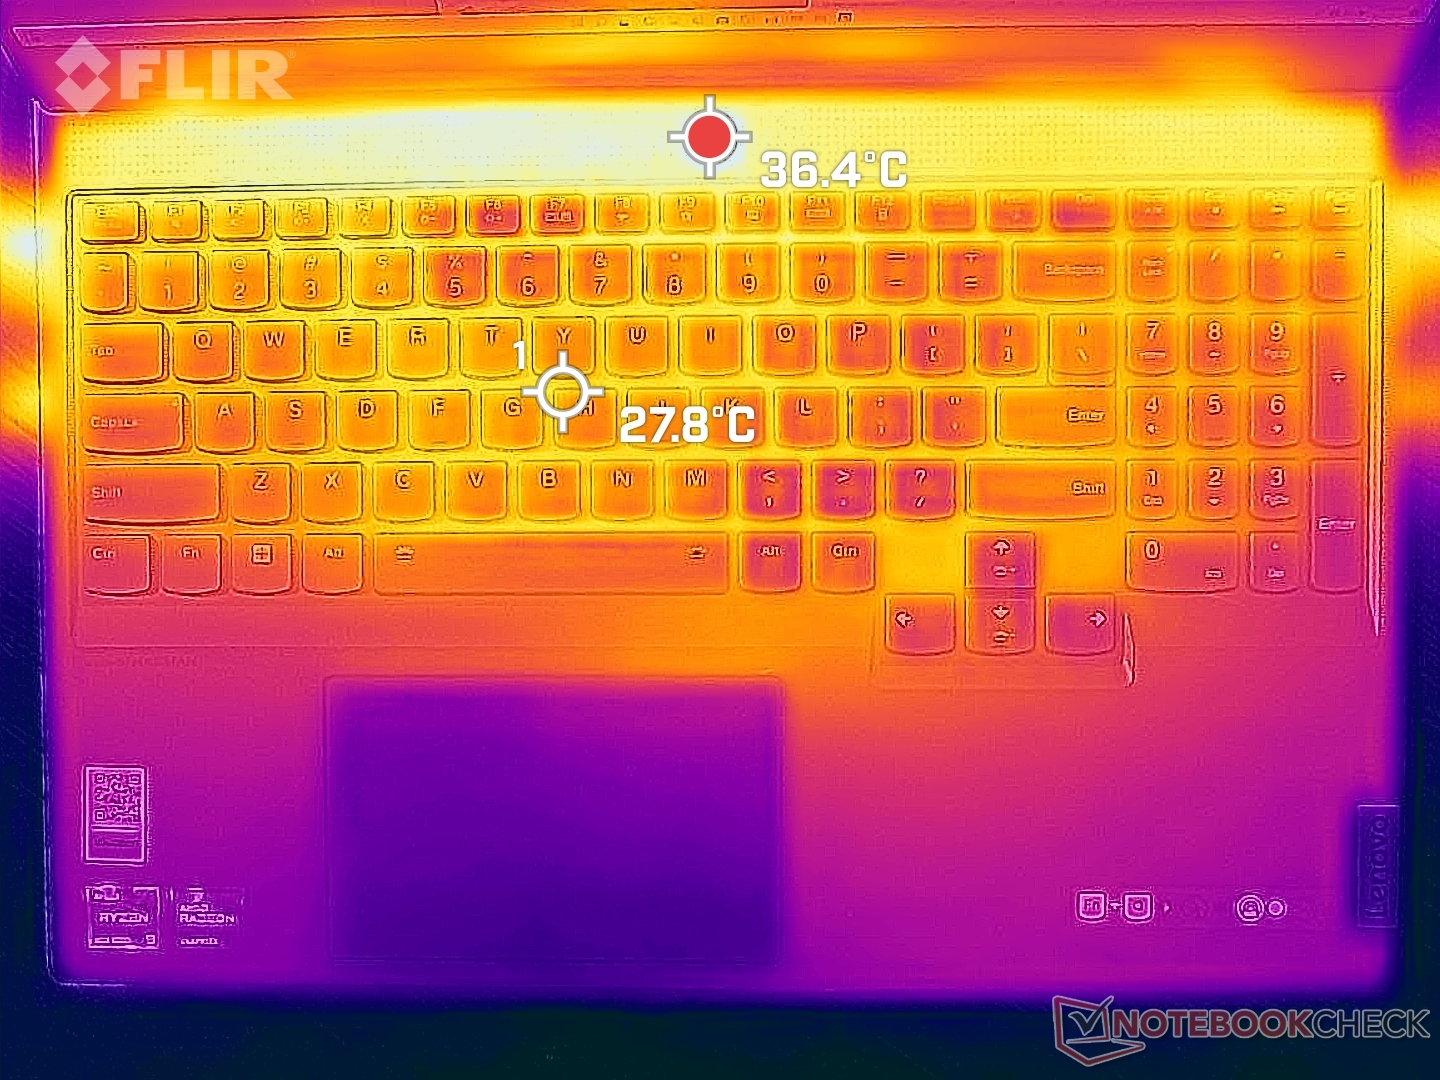
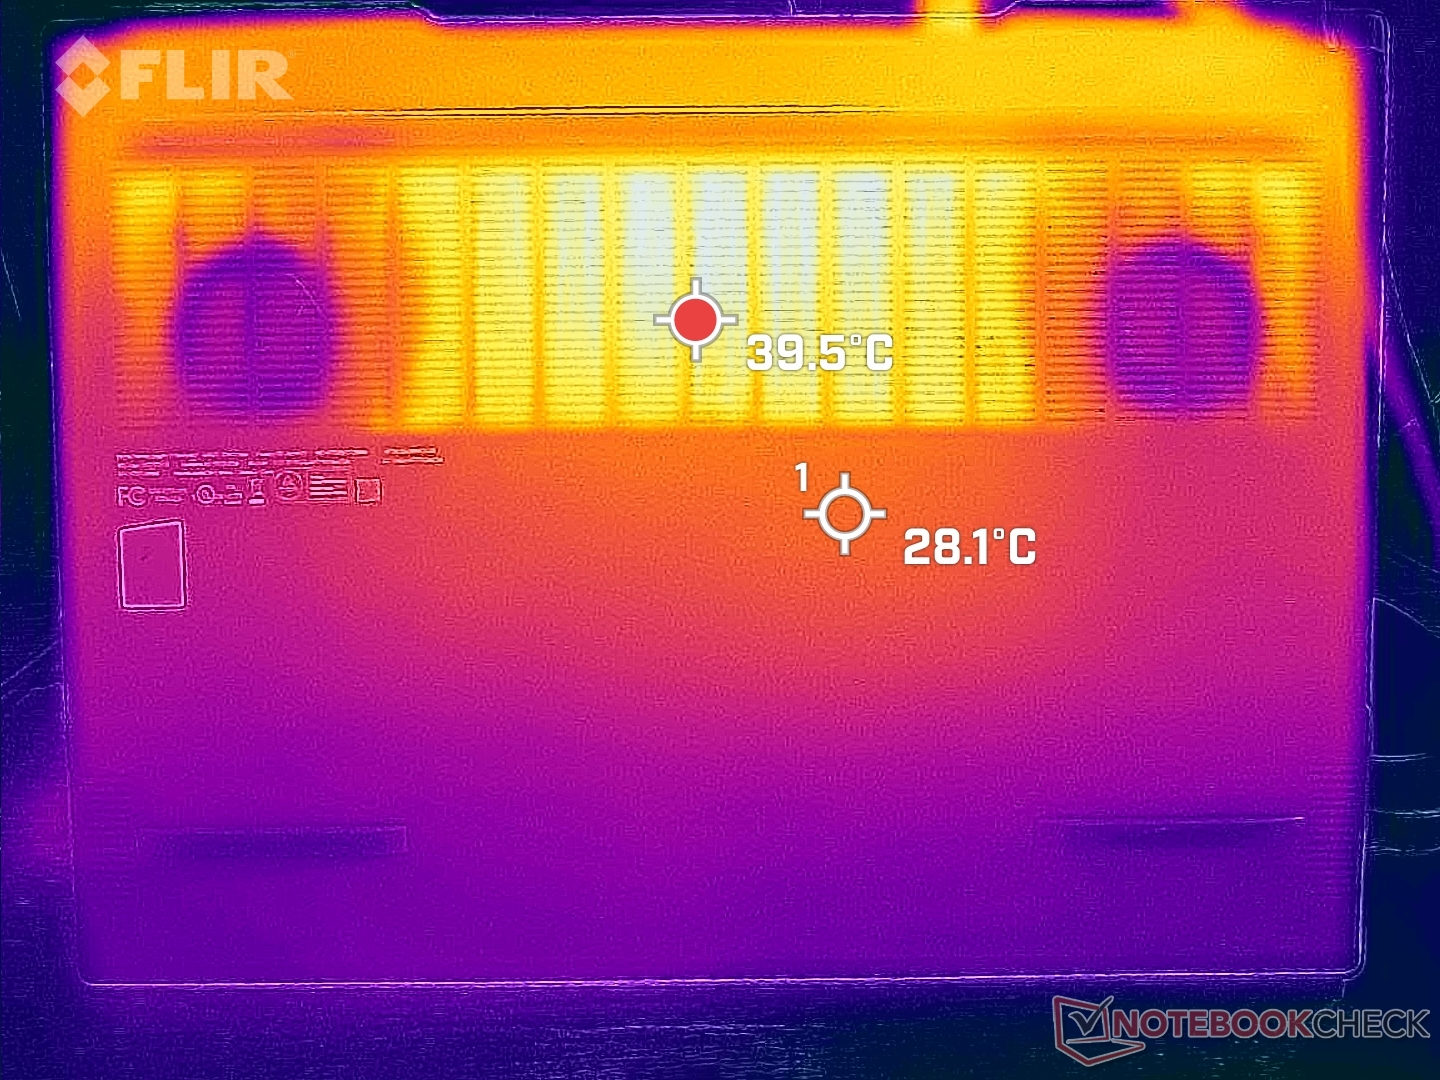
Surface temperature hot spots can reach up to 46 C and 49 C on the top and bottom, respectively, when gaming for long periods. These hot spots are thankfully toward the rear and away from the keyboard keys. In comparison, the MSI Raider GE66 can reach much warmer temperatures of up to 54 C to 62 C when under similar loads. The substantial amount of ventilation grilles do a good job at keeping the system relatively cool despite the thin form factor.
Note that the system is warmer when running Witcher 3 than when running both Prime95 and FurMark simultaneously. These results match our power consumption observations below where Witcher 3 would actually demand more power from mains than Prime95 and FurMark.
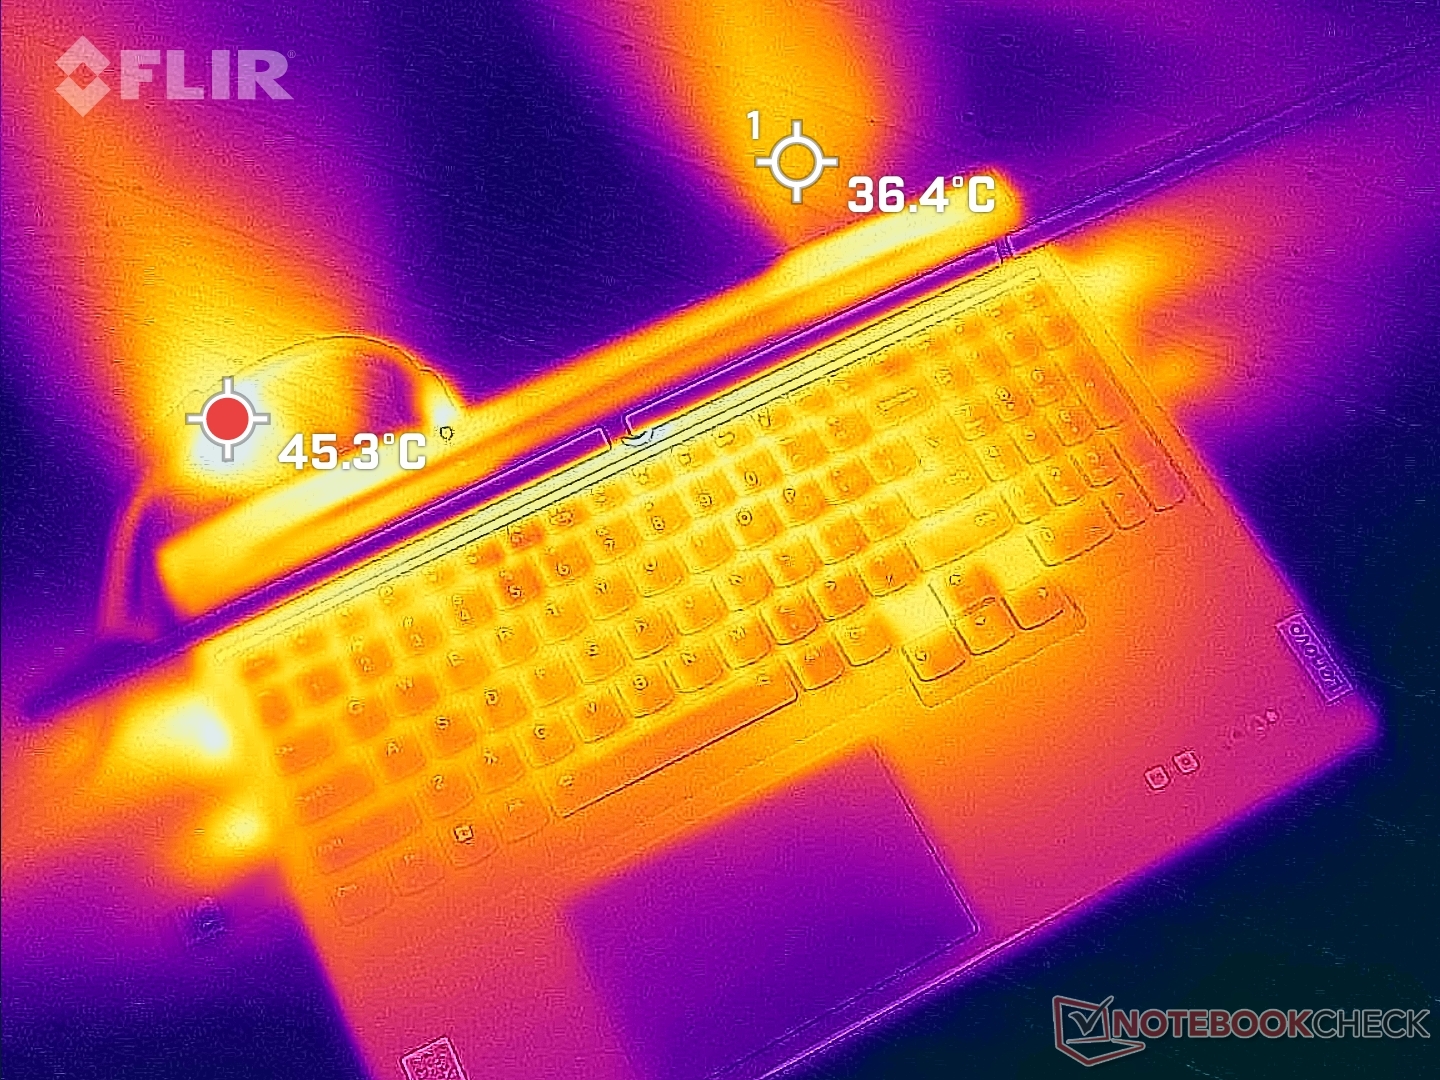
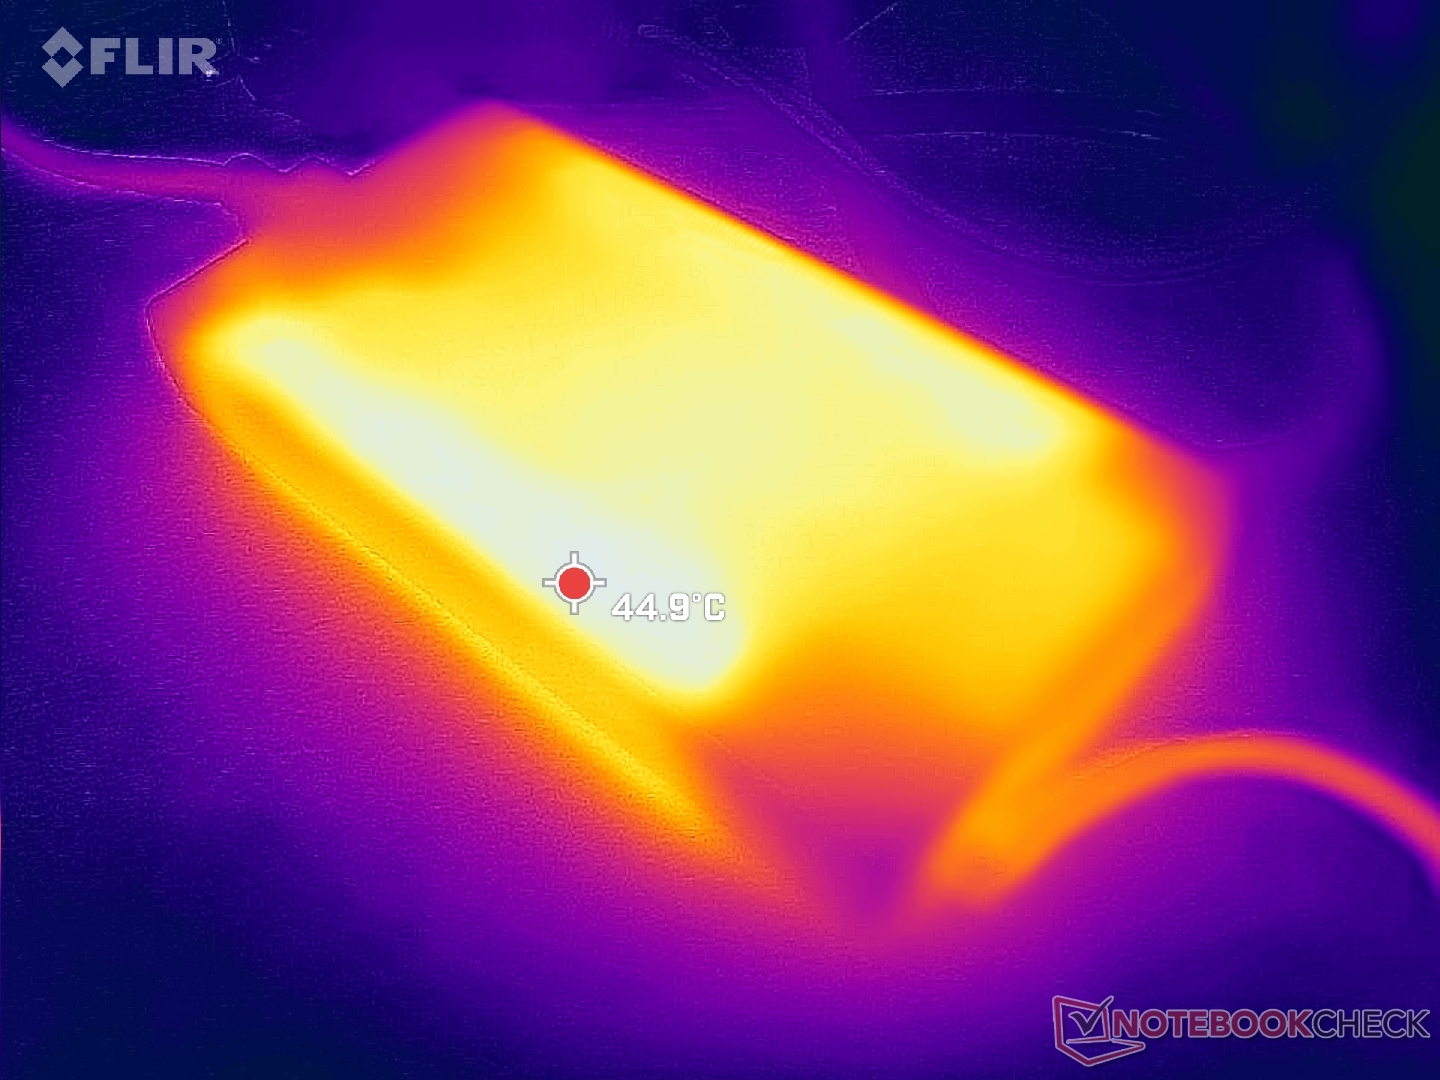
(+) The maximum temperature on the upper side is 37.2 °C / 99 F, compared to the average of 40.4 °C / 105 F, ranging from 21.2 to 68.8 °C for the class Gaming.
(±) The bottom heats up to a maximum of 43 °C / 109 F, compared to the average of 43.2 °C / 110 F
(+) In idle usage, the average temperature for the upper side is 29.7 °C / 85 F, compared to the device average of 33.9 °C / 93 F.
(-) Playing The Witcher 3, the average temperature for the upper side is 41 °C / 106 F, compared to the device average of 33.9 °C / 93 F.
(±) The palmrests and touchpad can get very hot to the touch with a maximum of 38 °C / 100.4 F.
(-) The average temperature of the palmrest area of similar devices was 28.8 °C / 83.8 F (-9.2 °C / -16.6 F).
| Lenovo Legion 7 16ARHA7 AMD Ryzen 9 6900HX, AMD Radeon RX 6850M XT | MSI Raider GE66 12UHS Intel Core i9-12900HK, NVIDIA GeForce RTX 3080 Ti Laptop GPU | Lenovo Legion Slim 7-16IAH 82TF004YGE Intel Core i7-12700H, NVIDIA GeForce RTX 3060 Laptop GPU | Asus ROG Zephyrus Duo 16 GX650RX AMD Ryzen 9 6900HX, NVIDIA GeForce RTX 3080 Ti Laptop GPU | HP Omen 16-c0077ng AMD Ryzen 7 5800H, AMD Radeon RX 6600M | Lenovo Legion 5 Pro 16ACH6H (82JQ001PGE) AMD Ryzen 7 5800H, NVIDIA GeForce RTX 3070 Laptop GPU | |
|---|---|---|---|---|---|---|
| Heat | -23% | -20% | -9% | 1% | -19% | |
| Maximum Upper Side * (°C) | 37.2 | 54 -45% | 48.3 -30% | 45 -21% | 40.6 -9% | 50 -34% |
| Maximum Bottom * (°C) | 43 | 65 -51% | 55.3 -29% | 50 -16% | 36 16% | 55 -28% |
| Idle Upper Side * (°C) | 34 | 30 12% | 35.7 -5% | 33 3% | 31.3 8% | 34 -0% |
| Idle Bottom * (°C) | 32.8 | 35 -7% | 37.6 -15% | 33 -1% | 36 -10% | 37 -13% |
* ... smaller is better
Stress Test — 140 W TGP GPU
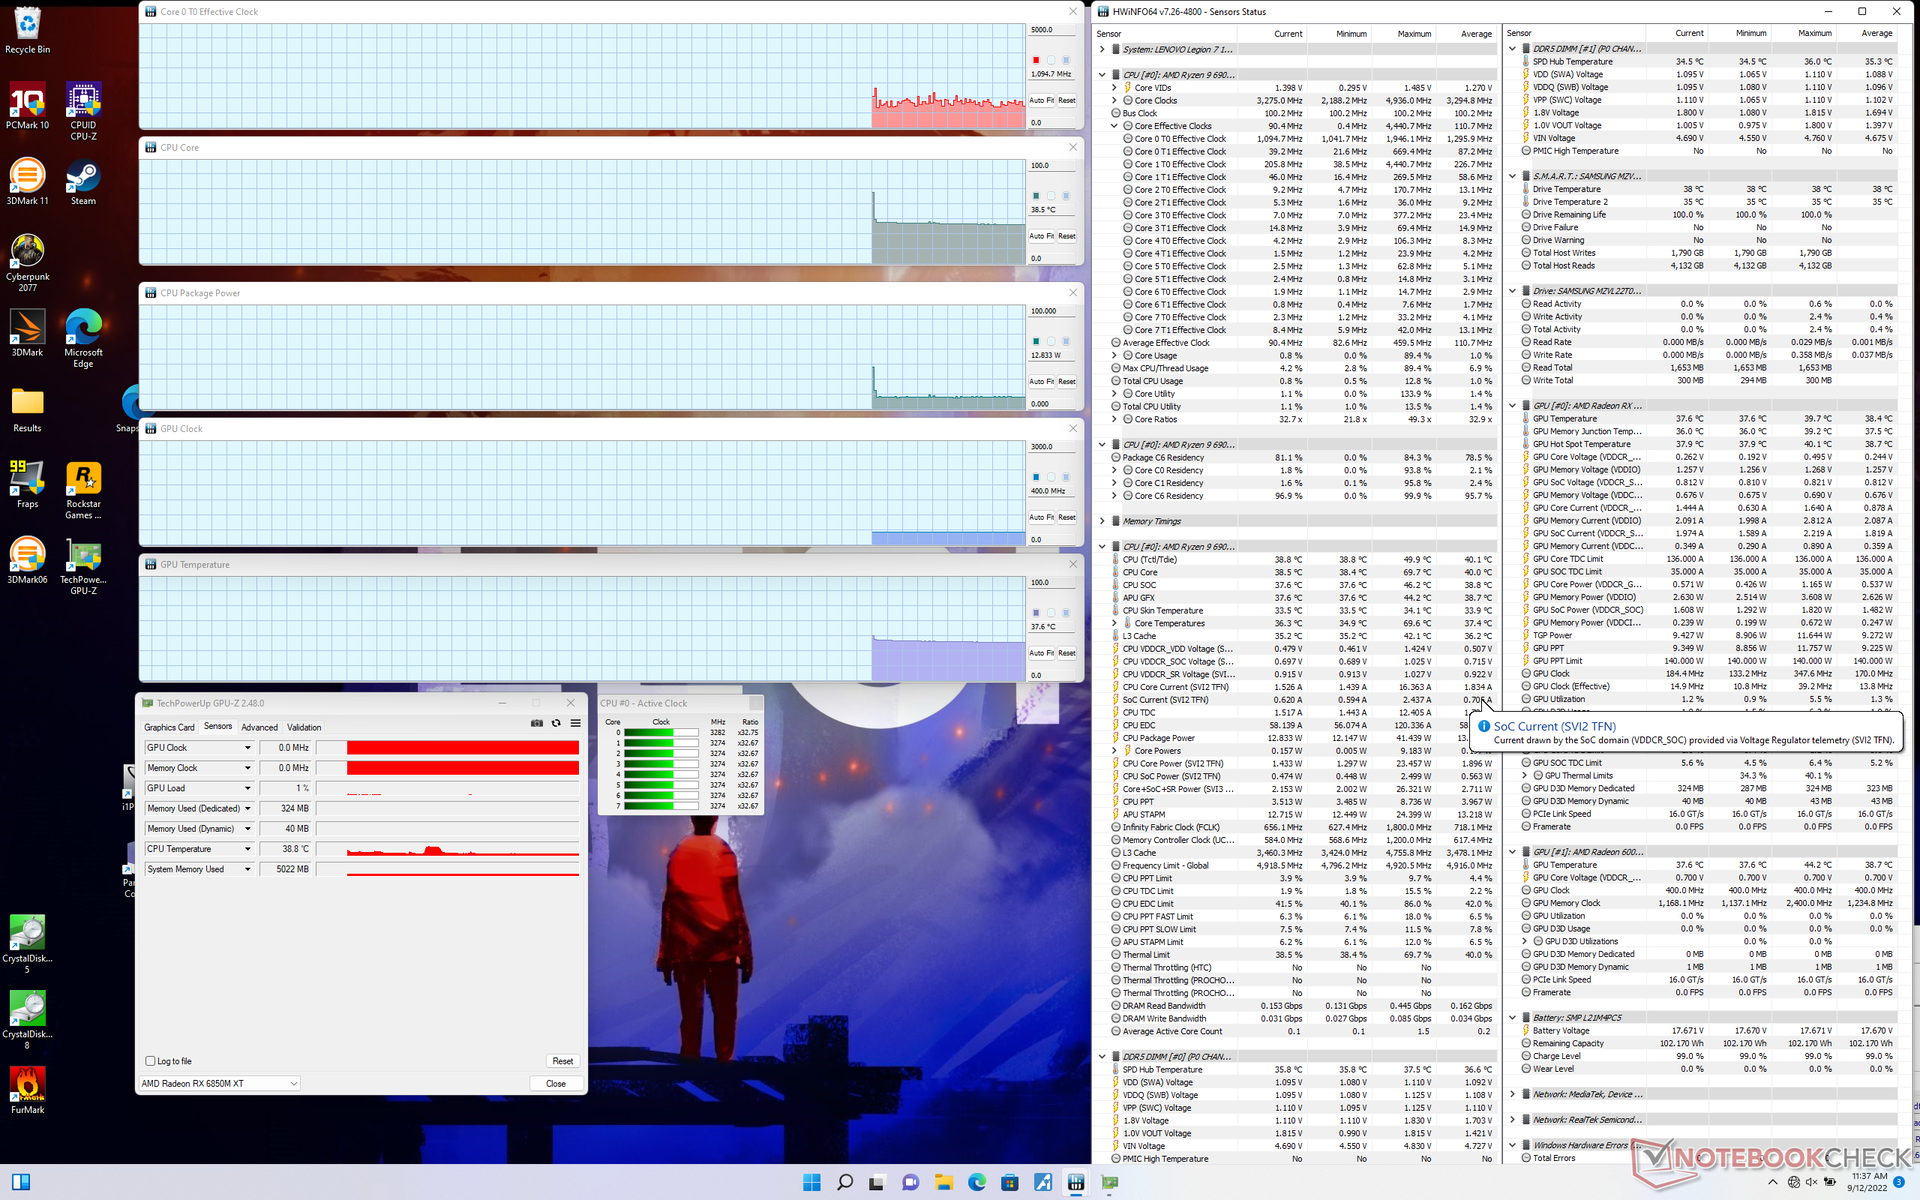
CPU clock rates, temperature, and board power draw would boost to 3.3 GHz, 86 C, and 120 W, respectively, when initiating Prime95. The processor would then quickly stabilize indefinitely at 4.2 GHz, 89 C, and 99 W after just a couple of seconds. In comparison, repeating this same test on last year's Asus ROG Zephyrus Duo 15 with the Ryzen 9 5900HX would see CPU clock rates in a similar 4.2 GHz range but a cooler 75 C core temperature.
If Priem95 and FurMark are running simultaneously, the system appears to throttle the GPU in favor of maintaining high CPU performance.
GPU clock rate, TGP power, and temperature when running Witcher 3 on Performance mode would stabilize at 2391 MHz, 140 W, and 77 C, respectively, compared to only 1982 MHz, 100 W, and 70 C when on Balanced mode. Thus, owners must endure the much louder fan noise of Performance mode if they wish to exploit the discrete GPU to its fullest potential.
Running on battery power limits performance especially since Performance mode is automatically disabled if not on mains. A Fire Strike run on batteries would return Physics and Graphics scores of 20389 and 12512 points, respectively, compared to 26168 and 32853 points when on mains.
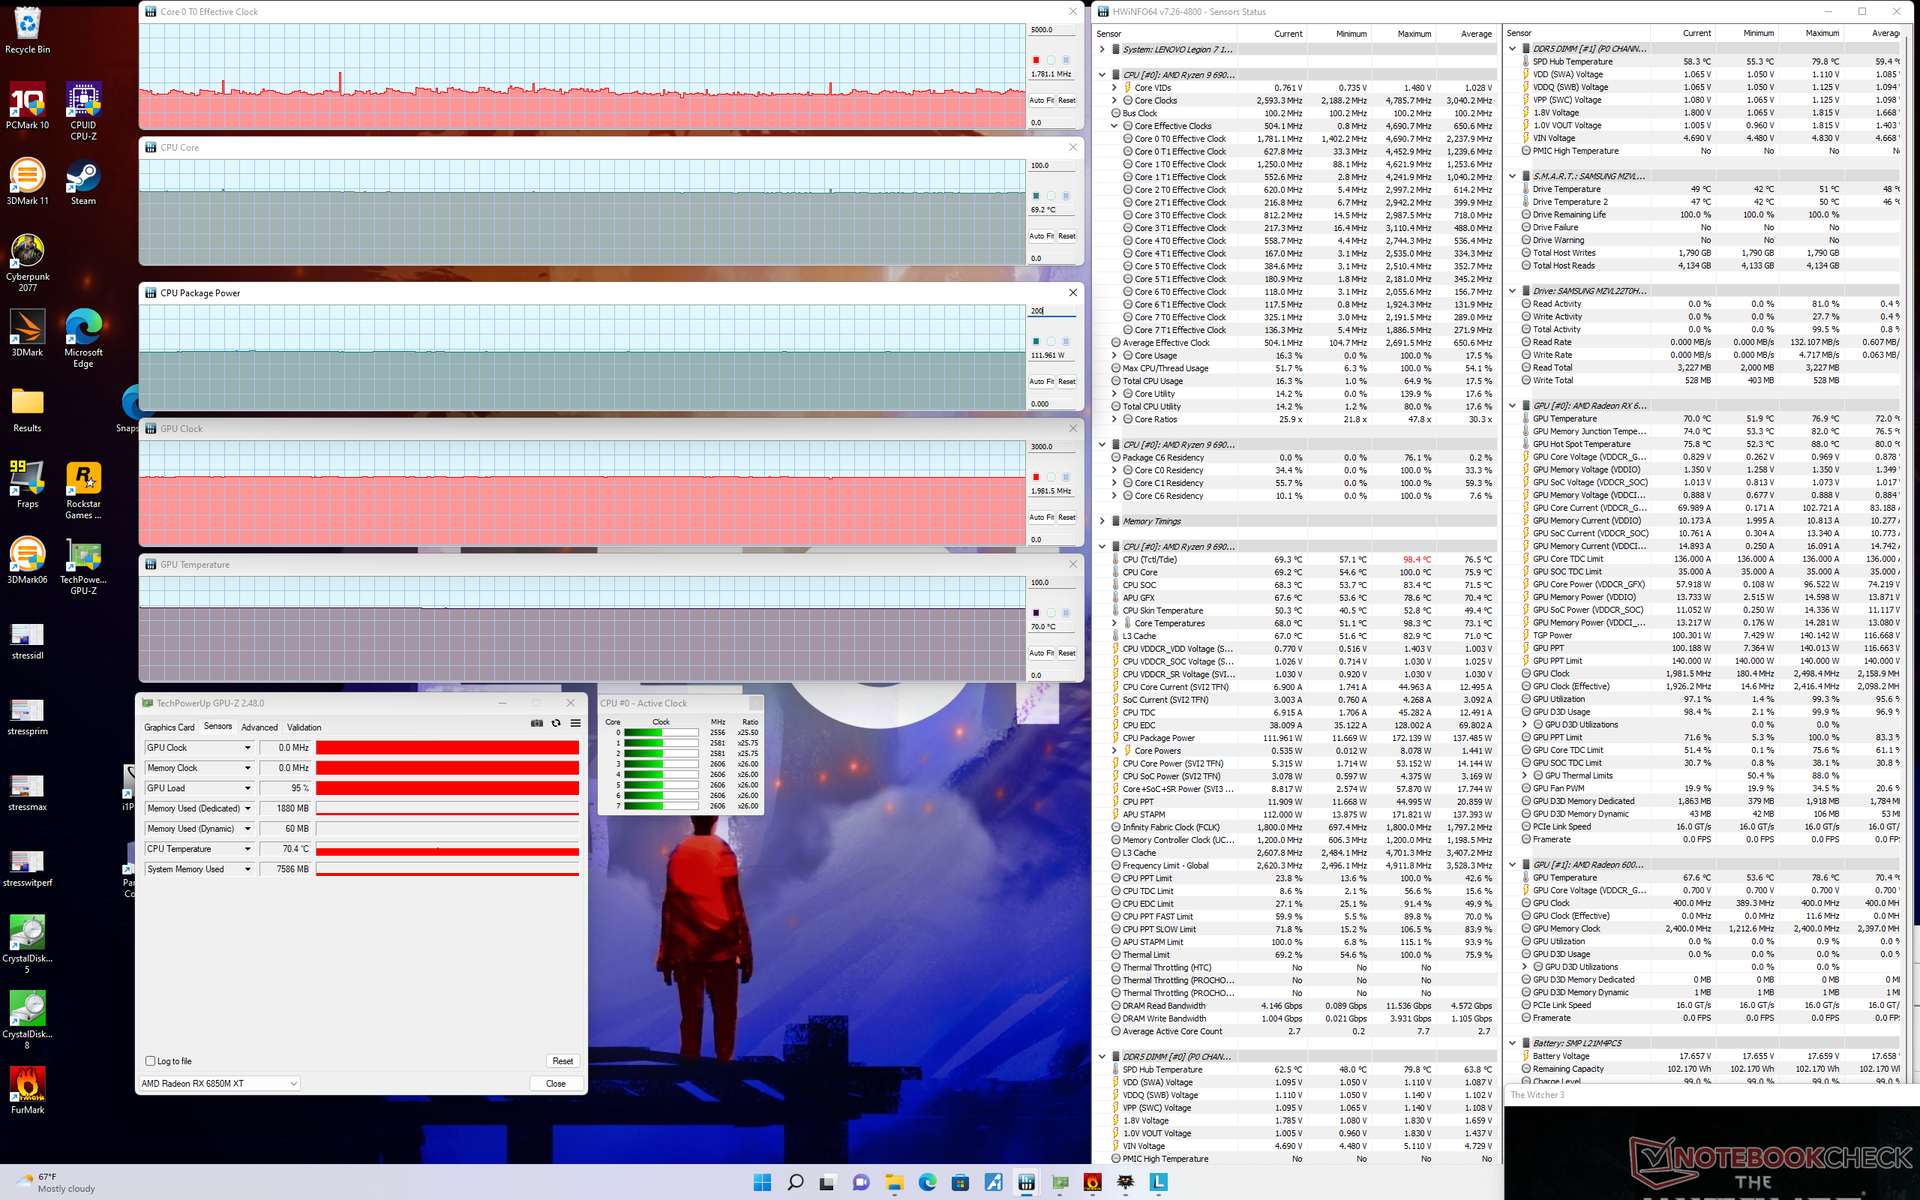
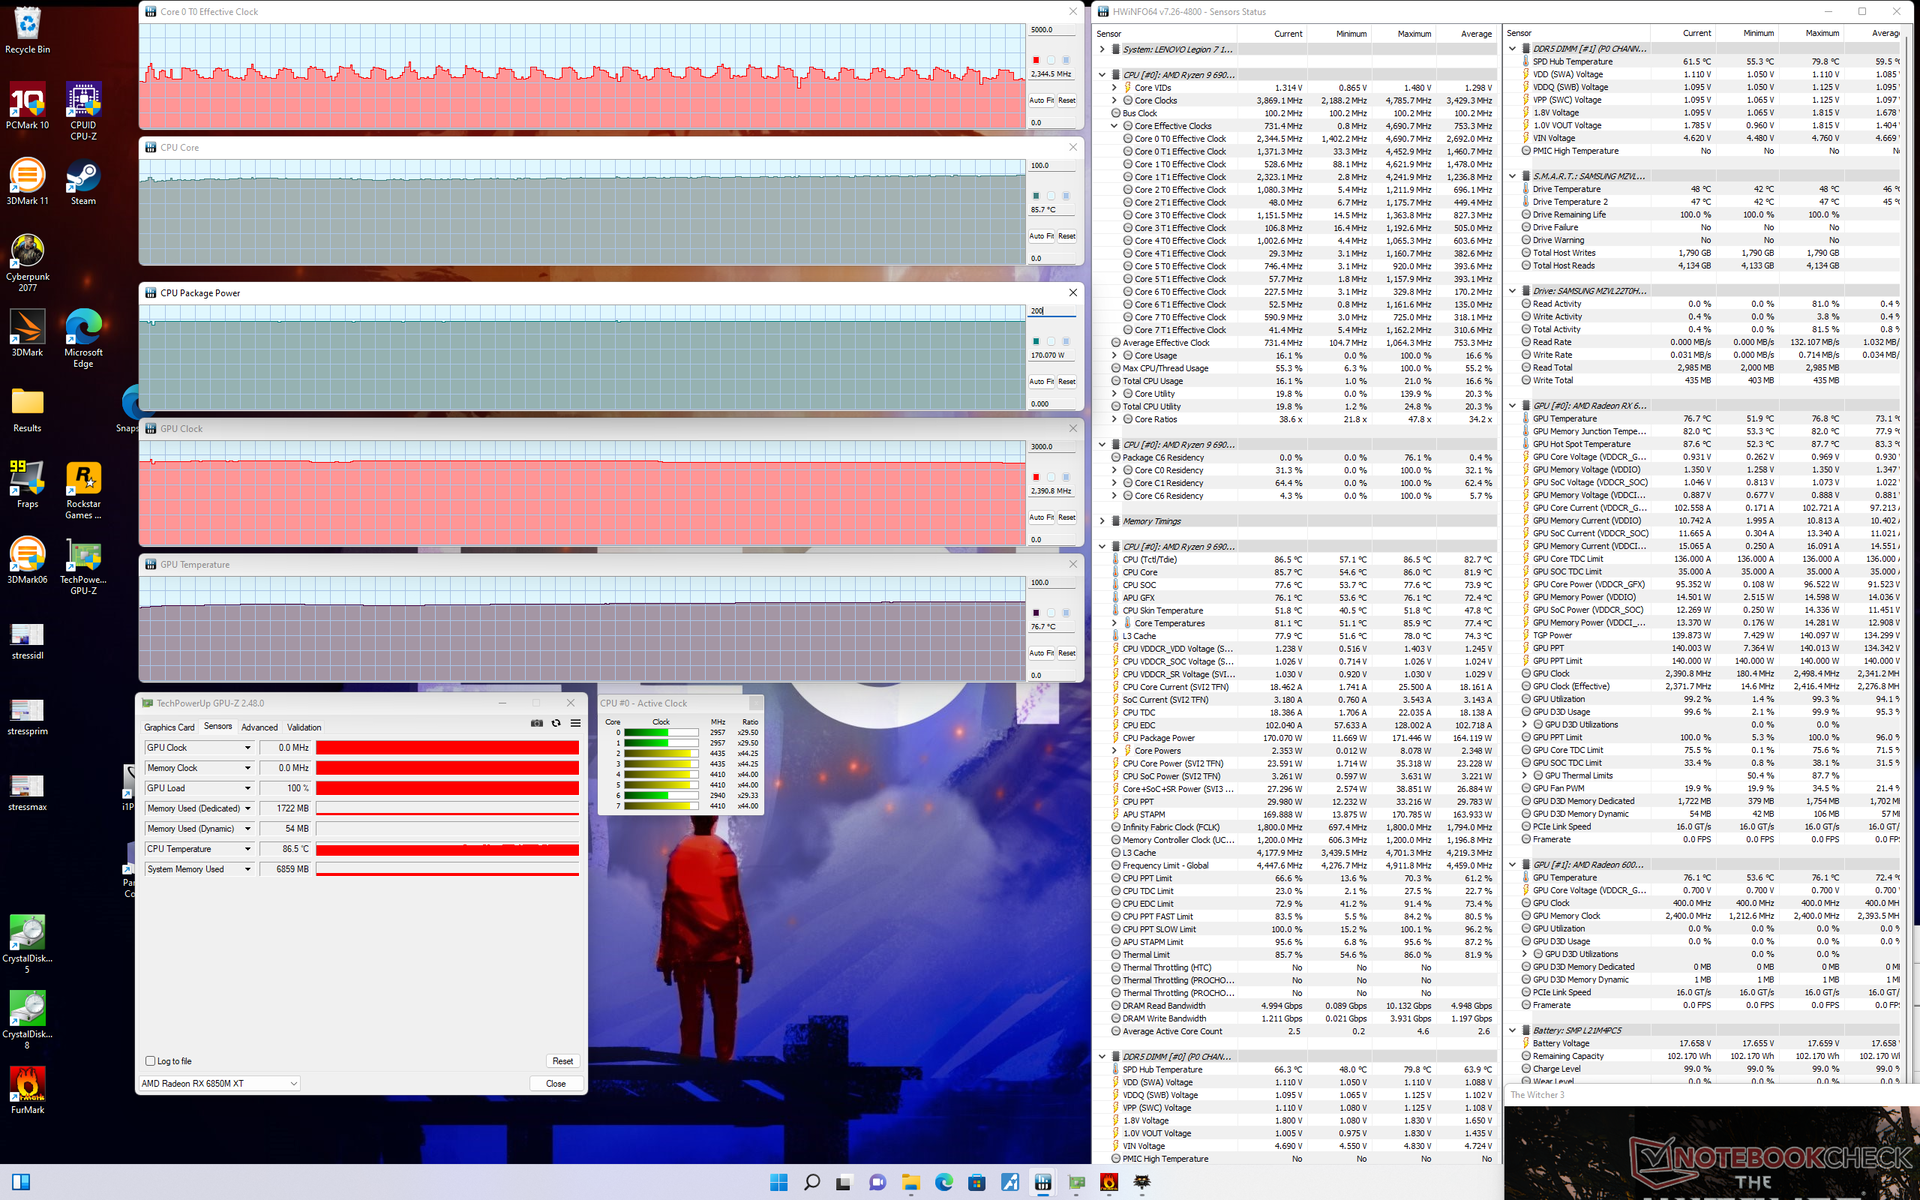
| CPU Clock (GHz) | GPU Clock (MHz) | Average CPU Temperature (°C) | Average GPU Temperature (°C) | |
| System Idle | -- | -- | 39 | 38 |
| Prime95 Stress | 4.1 - 4.2 | -- | 88 | 53 |
| Prime95 + FurMark Stress | 4.2 | 772 | 94 | 60 |
| Witcher 3 Stress (Balanced mode) | 1.8 | 1982 | 69 | 70 |
| Witcher 3 Stress (Performance mode) | 2.4 - 2.9 | 2391 | 86 | 77 |
Speakers
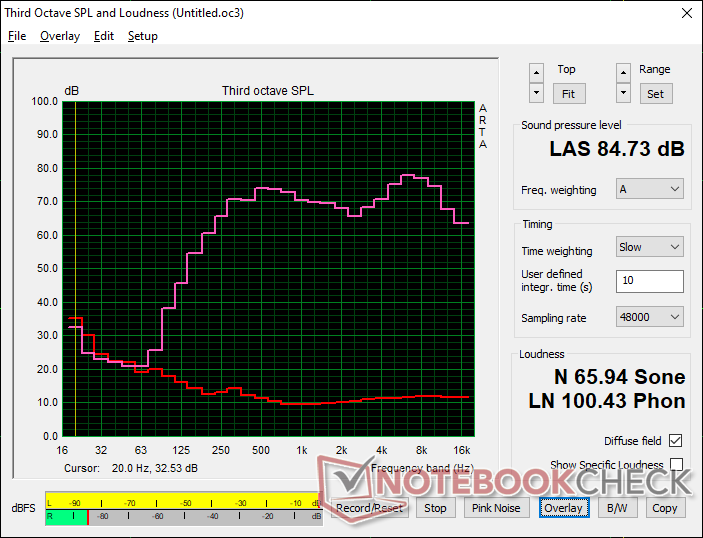
Lenovo Legion 7 16ARHA7 audio analysis
(+) | speakers can play relatively loud (84.7 dB)
Bass 100 - 315 Hz
(±) | reduced bass - on average 14.2% lower than median
(±) | linearity of bass is average (12.8% delta to prev. frequency)
Mids 400 - 2000 Hz
(+) | balanced mids - only 1.8% away from median
(+) | mids are linear (2.1% delta to prev. frequency)
Highs 2 - 16 kHz
(+) | balanced highs - only 4.6% away from median
(+) | highs are linear (4.4% delta to prev. frequency)
Overall 100 - 16.000 Hz
(+) | overall sound is linear (10.9% difference to median)
Compared to same class
» 7% of all tested devices in this class were better, 3% similar, 90% worse
» The best had a delta of 6%, average was 18%, worst was 132%
Compared to all devices tested
» 6% of all tested devices were better, 2% similar, 92% worse
» The best had a delta of 4%, average was 23%, worst was 134%
Apple MacBook Pro 16 2021 M1 Pro audio analysis
(+) | speakers can play relatively loud (84.7 dB)
Bass 100 - 315 Hz
(+) | good bass - only 3.8% away from median
(+) | bass is linear (5.2% delta to prev. frequency)
Mids 400 - 2000 Hz
(+) | balanced mids - only 1.3% away from median
(+) | mids are linear (2.1% delta to prev. frequency)
Highs 2 - 16 kHz
(+) | balanced highs - only 1.9% away from median
(+) | highs are linear (2.7% delta to prev. frequency)
Overall 100 - 16.000 Hz
(+) | overall sound is linear (4.6% difference to median)
Compared to same class
» 0% of all tested devices in this class were better, 0% similar, 100% worse
» The best had a delta of 5%, average was 17%, worst was 45%
Compared to all devices tested
» 0% of all tested devices were better, 0% similar, 100% worse
» The best had a delta of 4%, average was 23%, worst was 134%
Energy Management
Power Consumption — More Demanding Than Intel
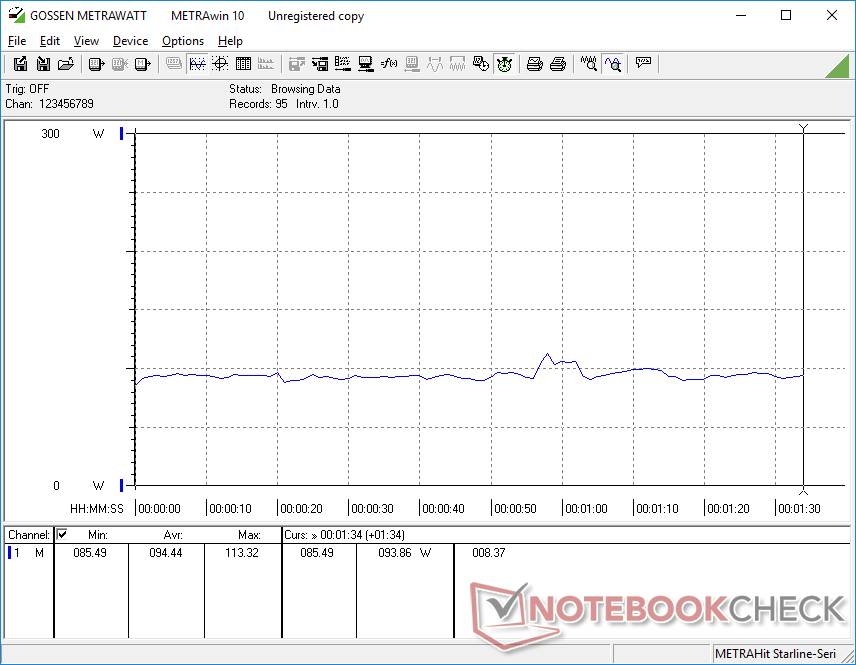
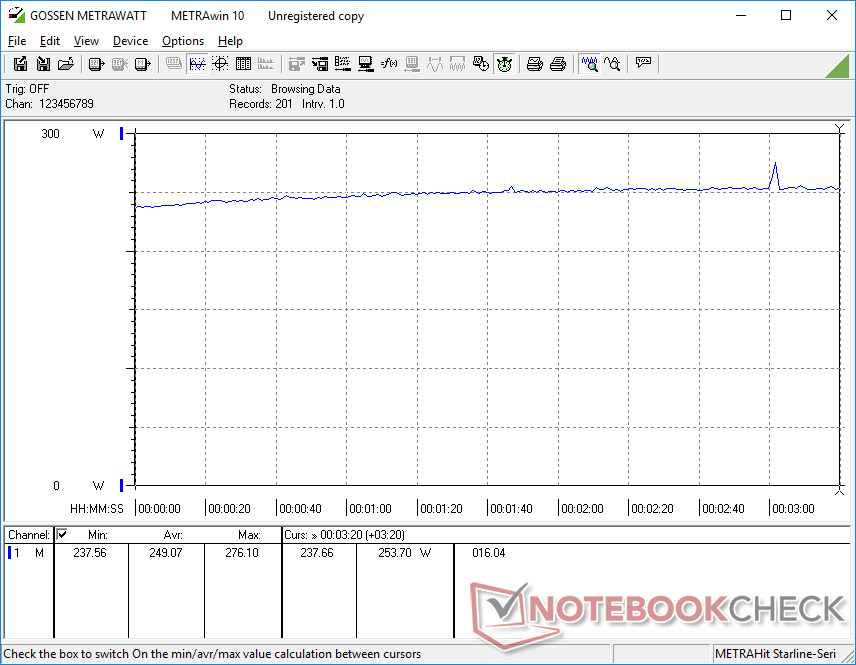
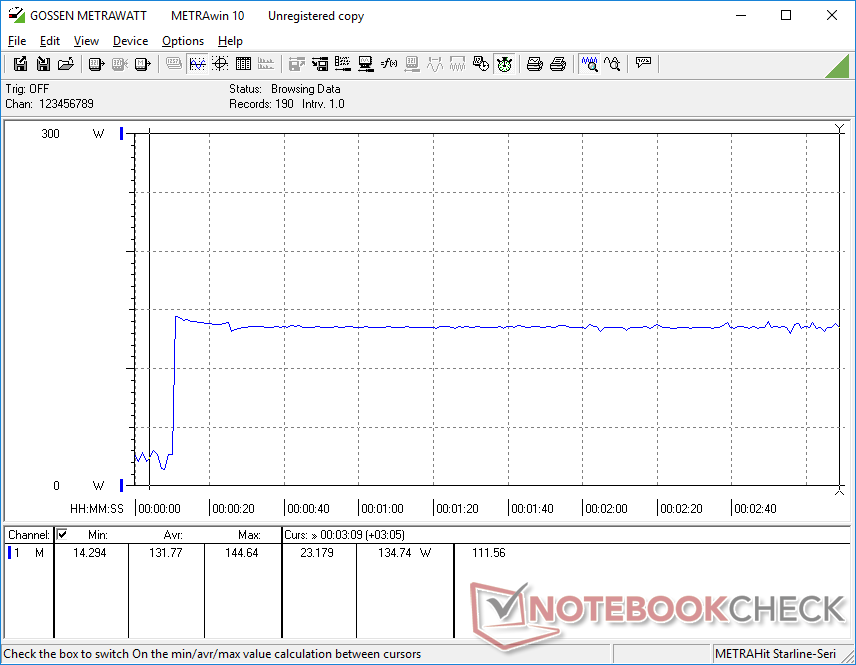
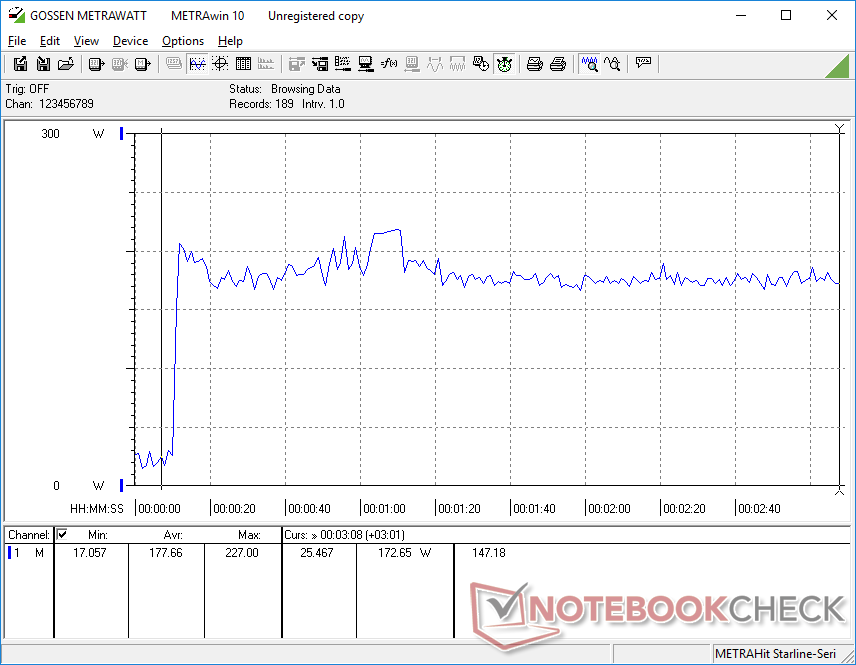
Power consumption is at the expected levels when simply idling on desktop or when running medium loads like 3DMark 06. When gaming, however, the system becomes much more demanding than most other laptops. Running Witcher 3 would draw 249 W on average compared to just 202 W or 187 W on the MSI Raider GE66 or Asus Zephyrus Duo 16, respectively, each with comparable RTX 3080 graphics and H-series processors.
The high power consumption carries over to the Ryzen 9 6900HX as well. When running Prime95 on an external monitor, our Lenovo would draw an average of 135 W compared to only 90 W on the Core i9-12900HK-powered MSI Raider. In other words, the Intel-powered MSI system demands less from the outlet while still providing 10 to 15 percent faster multi-thread performance than our Lenovo.
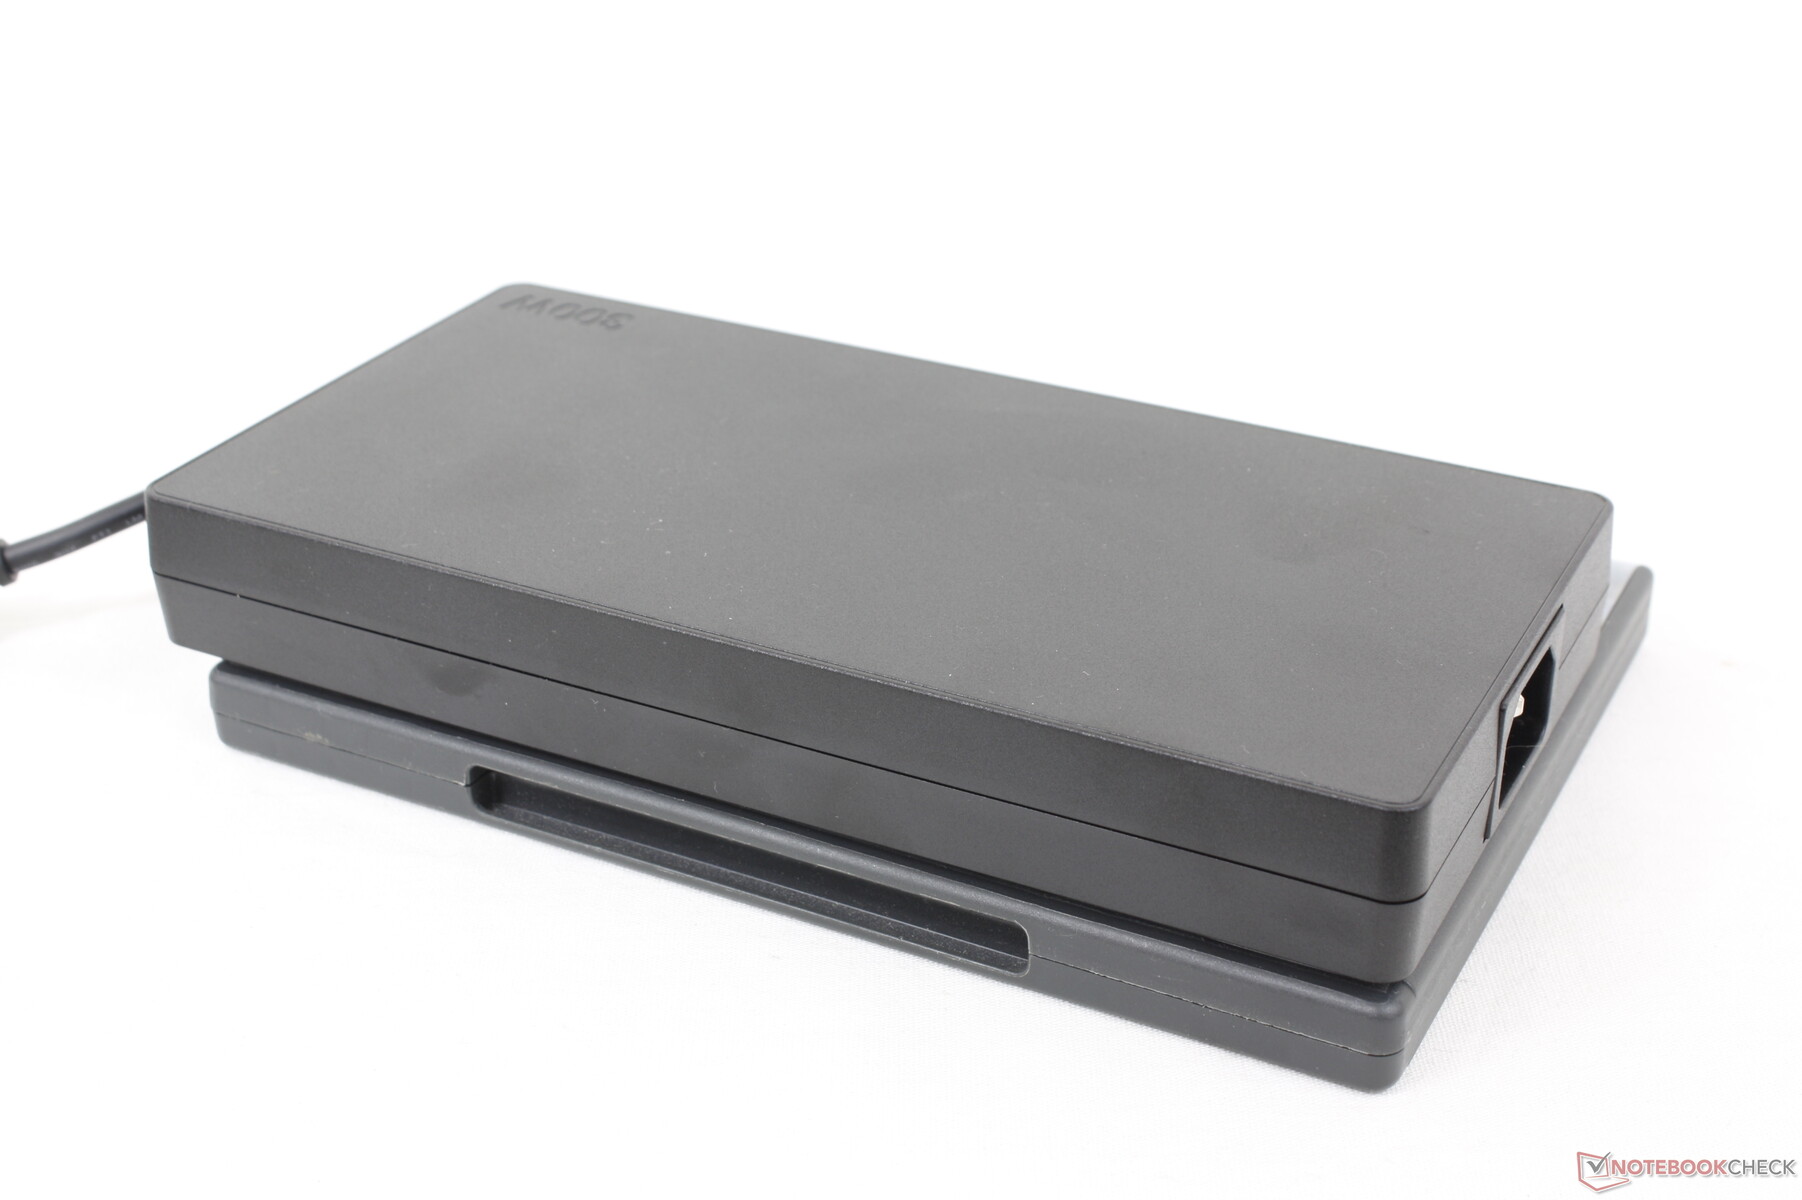
We're able to record a temporary maximum draw of 276 W from the medium-large (~20 x 10 x 2.6 cm) 300 W AC adapter when running Witcher 3 on Performance mode. Consumption is lower when running Prime95 and FurMark simultaneously as shown by the screenshots below due to throttling of the GPU if each are at 100 percent utilization.
| Off / Standby | |
| Idle | |
| Load |
|
Key:
min: | |
| Lenovo Legion 7 16ARHA7 R9 6900HX, Radeon RX 6850M XT, Samsung PM9A1 MZVL22T0HBLB, IPS, 2560x1600, 16" | MSI Raider GE66 12UHS i9-12900HK, GeForce RTX 3080 Ti Laptop GPU, Samsung PM9A1 MZVL22T0HBLB, IPS, 3840x2160, 15.6" | Asus ROG Zephyrus Duo 16 GX650RX R9 6900HX, GeForce RTX 3080 Ti Laptop GPU, 2x Samsung SSD 980 Pro 2TB MZ-V8P2T0 (RAID 0), IPS-Level, 3840x2400, 16" | HP Omen 16-c0077ng R7 5800H, Radeon RX 6600M, Samsung PM981a MZVLB1T0HBLR, IPS, 2560x1440, 16.1" | Lenovo Legion 5 Pro 16ACH6H (82JQ001PGE) R7 5800H, GeForce RTX 3070 Laptop GPU, WDC PC SN730 SDBPNTY-1T00, IPS, 2560x1600, 16" | Aorus 5 KB i7-10750H, GeForce RTX 2060 Mobile, ADATA XPG SX8200 Pro (ASX8200PNP-512GT), IPS, 1920x1080, 15.6" | |
|---|---|---|---|---|---|---|
| Power Consumption | -8% | -19% | -2% | 15% | 17% | |
| Idle Minimum * (Watt) | 9.9 | 16 -62% | 19 -92% | 12 -21% | 10.45 -6% | 8 19% |
| Idle Average * (Watt) | 22 | 19 14% | 24 -9% | 12.8 42% | 14.92 32% | 12 45% |
| Idle Maximum * (Watt) | 23.1 | 26 -13% | 31 -34% | 18.5 20% | 16.02 31% | 21 9% |
| Load Average * (Watt) | 94.4 | 110 -17% | 104 -10% | 190 -101% | 119.65 -27% | 128 -36% |
| Witcher 3 ultra * (Watt) | 249 | 202 19% | 186.5 25% | 194 22% | 174.9 30% | 138 45% |
| Load Maximum * (Watt) | 276 | 242 12% | 256 7% | 200 28% | 187.26 32% | 217 21% |
* ... smaller is better
Power Consumption Witcher 3 / Stresstest
Power Consumption external Monitor
Battery Life — Power Saver Issues
WLAN runtime on the Balanced power profile is decent and comparable to the Asus ROG Zephyrus Duo 16 at almost 7.5 hours. Battery life is abnormally shorter if on Power Saver mode which we believe could be a bug on some AMD-powered Legion laptops.
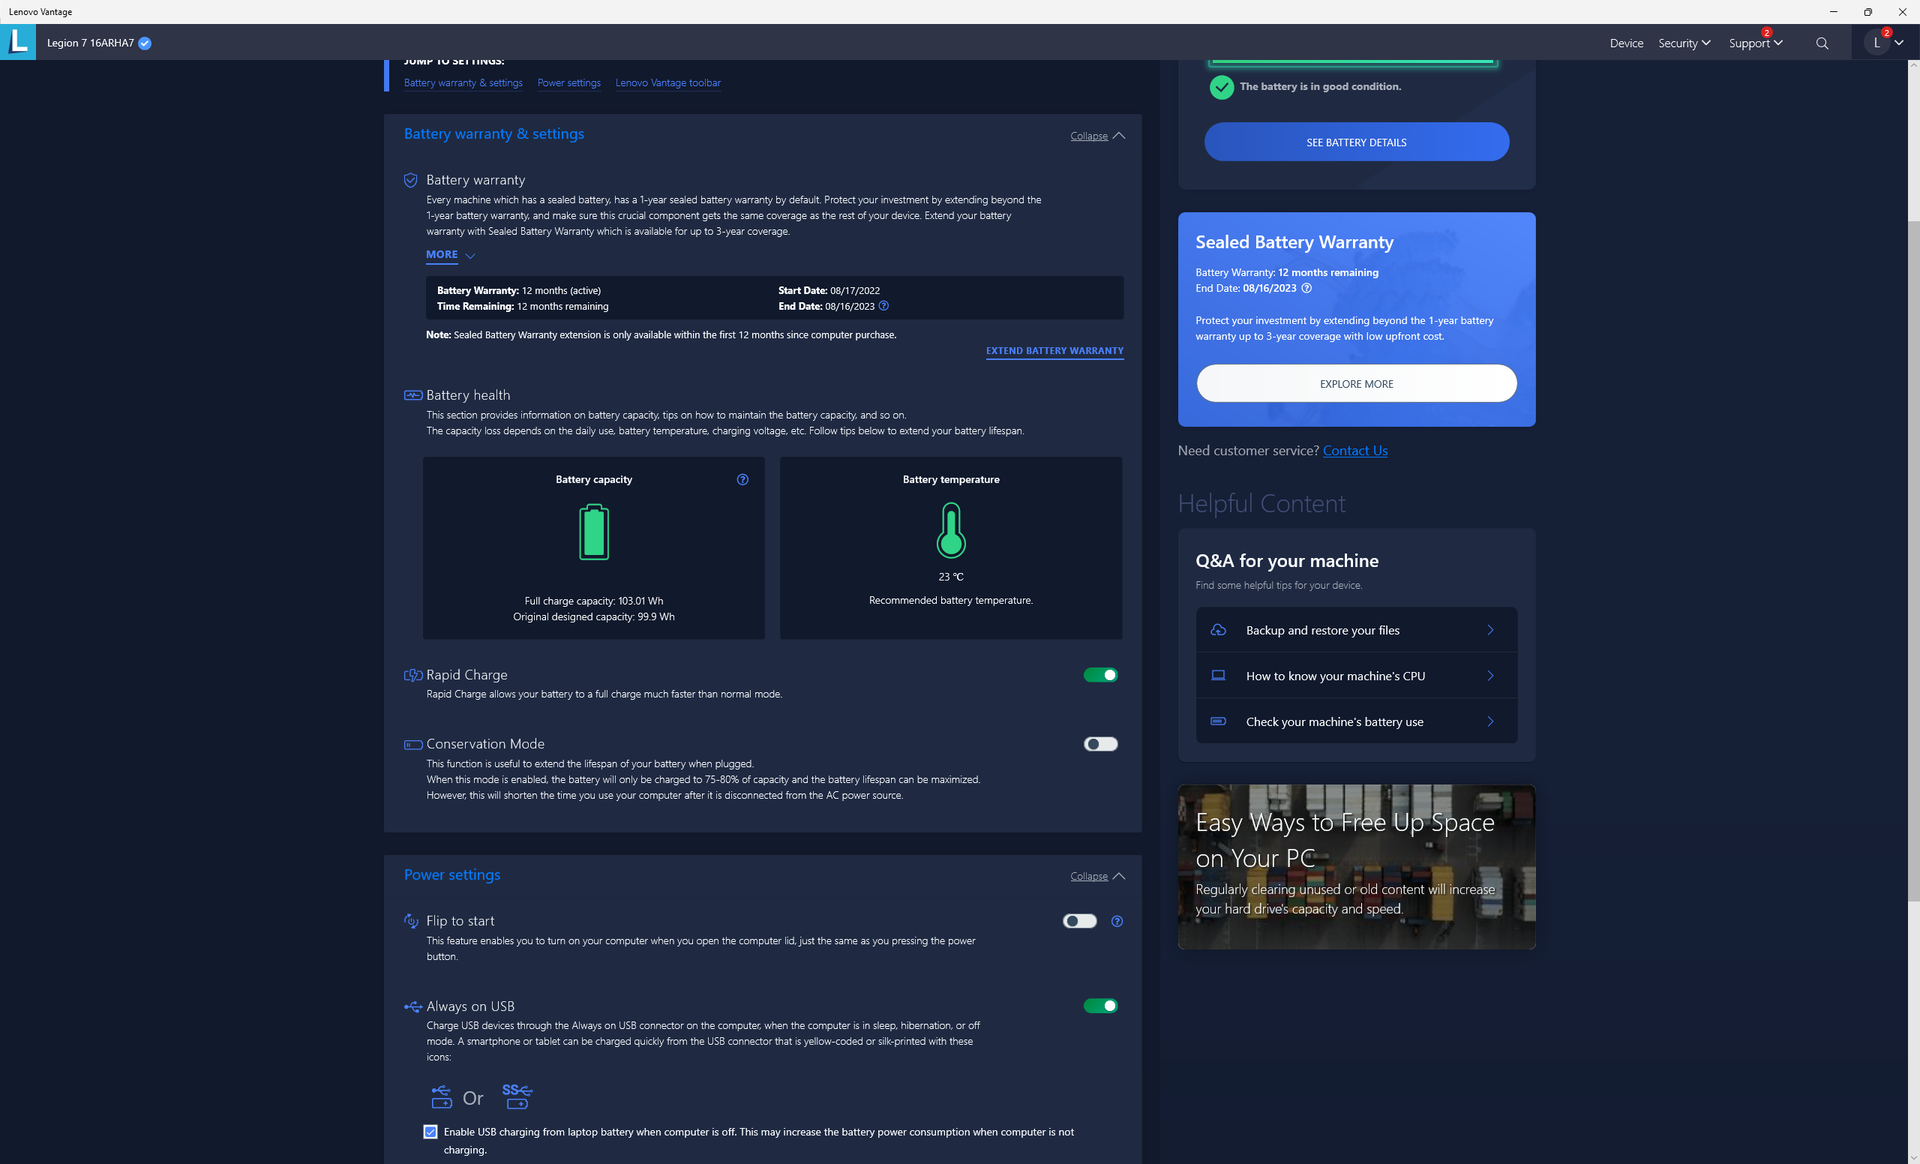
Charging from empty to full is relatively fast at 1 to 1.5 hours if Rapid Charge is enabled via the Lenovo Vantage software. The system can also be recharged with third-party USB-C adapters albeit at a much slower rate.
| Lenovo Legion 7 16ARHA7 R9 6900HX, Radeon RX 6850M XT, 99 Wh | MSI Raider GE66 12UHS i9-12900HK, GeForce RTX 3080 Ti Laptop GPU, 99 Wh | Asus ROG Zephyrus Duo 16 GX650RX R9 6900HX, GeForce RTX 3080 Ti Laptop GPU, 90 Wh | HP Omen 16-c0077ng R7 5800H, Radeon RX 6600M, 70 Wh | Lenovo Legion 5 Pro 16ACH6H (82JQ001PGE) R7 5800H, GeForce RTX 3070 Laptop GPU, 80 Wh | Asus ROG Flow X16 GV601RW-M5082W R9 6900HS, GeForce RTX 3070 Ti Laptop GPU, 90 Wh | |
|---|---|---|---|---|---|---|
| Battery runtime | -14% | 39% | -16% | 7% | -36% | |
| Reader / Idle (h) | 4.9 | 12.5 155% | 9.1 86% | |||
| WiFi v1.3 (h) | 7.3 | 5.7 -22% | 7.8 7% | 6.1 -16% | 7 -4% | 5.7 -22% |
| Load (h) | 1.8 | 1.7 -6% | 1 -44% | 0.7 -61% | 0.9 -50% | |
| H.264 (h) | 7.1 | 9.3 | 7 | |||
| Witcher 3 ultra (h) | 1.4 | 0.9 |
Pros
Cons
Verdict — Plays Like A Gamer, Looks Like A Workstation
It's taken a while to get there, but Lenovo has finally found its footing in the gaming laptop market with this latest 2022 Legion 7 model. The chassis design has been refined to the point where it can easily stand toe-to-toe with more seasoned ultrathin gaming alternatives like the MSI GS series, Asus Zephyrus S series, and even the Razer Blade series in many respects. The sleeker look doesn't sacrifice other equally important characteristics like port options, numpad, a comfortable keyboard, rigid metal skeleton, TDP and TGP performance, and easy serviceability. It's a bit heavier than it looks, but the dense feel may not necessarily deter gamers.
The 2022 Legion 7 16 is a homerun for Lenovo in terms of looks and design. The all AMD hardware also holds up well against some of the fastest Intel-Nvidia gaming laptops currently in the market.
As for the Ryzen 9 6900HX CPU and Radeon RX 6850M XT GPU, they're only a hair faster than the 5900HX and 6800M as found on much cheaper laptops like the Asus ROG Strix G15. Overall performance is only slightly behind most GeForce RTX 3080 Ti laptops and so this is still a powerful gaming machine nonetheless.
Power consumption when gaming is a key setback for the all-AMD Legion system as it is higher than many Intel-Nvidia alternatives currently in the market. It's not a good look for Lenovo or AMD when the system demands more power while running slower than the competition for poorer performance-per-watt. OLED display options and some OTA bug fixes down the line wouldn't hurt as well.
Price and Availability
The Legion 7 16ARHA7 is not yet widely available through third-party channels at the time of publishing. Our current configuration is not yet shipping to customers. We recommend checking the official Lenovo product page for updates. The only configuration currently available is the lesser Ryzen 7 and Radeon RX 6700M SKU for $2380 USD.
Lenovo Legion 7 16ARHA7
- 09/14/2022 v7 (old)
Allen Ngo
Price comparison
