Lenovo ThinkBook Plus Gen 3 laptop review: 21:10 ultrawide productivity booster
The Lenovo ThinkBook Plus Gen 3 directly succeeds last year's ThinkBook Plus Gen 2. Though you can't tell from the name alone, the Gen 3 model is a significant change from its predecessor in more ways than most other laptops. While the Gen 2 model is a 16:10 13.3-inch convertible with a secondary 12-inch E-Ink touchscreen, the Gen 3 model is a 21:10 17.3-inch clamshell with a secondary 8-inch IPS touchscreen. The two models are so different that arguments could be made about the naming of the Gen 3 model in relation to Gen 2 as they both serve very different purposes.
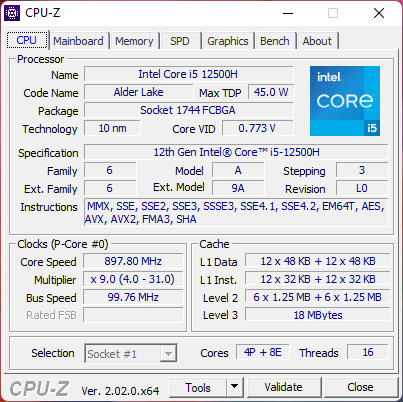
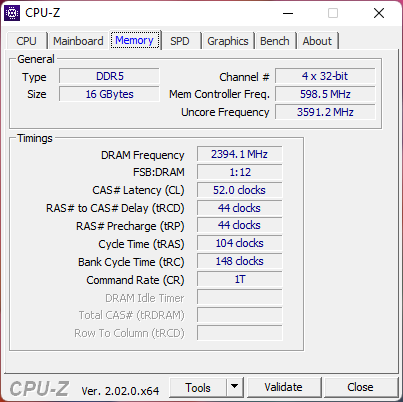
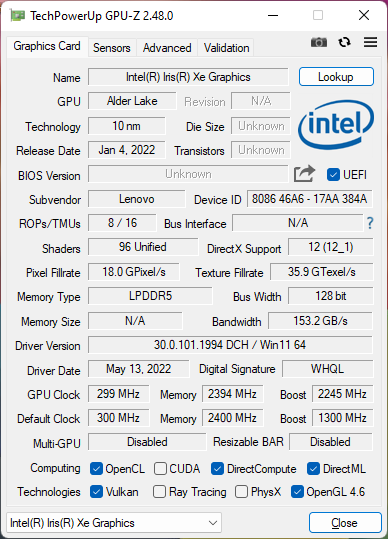
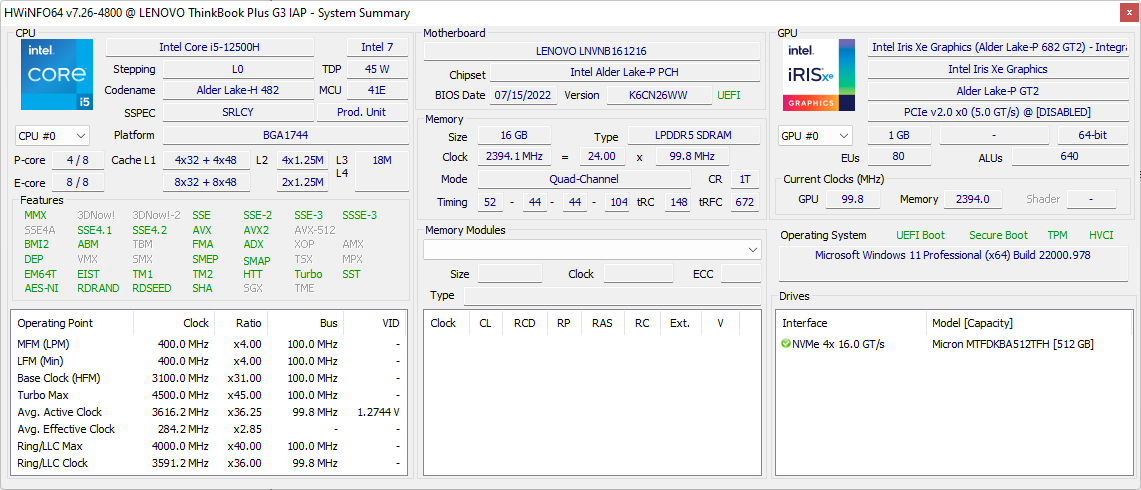
Our Gen 3 review configuration includes the 12th gen Core i7-12700H CPU with 16 GB of soldered RAM and 512 GB PCIe4 storage for approximately $1600 USD. A Core i5-12500H SKU is available, but all options come with the exact same primary 3072 x 1440 matte IPS touchscreen, secondary 8-inch 800 x 1280 IPS touchscreen, and integrated Iris Xe graphics.
Alternatives to the ThinkBook Plus Gen 3 include the 15-inch Asus ZenBook Pro Duo series and other 17-inch laptops designed for content creators or office productivity like the LG Gram 17 or Dell XPS 17.
More Lenovo reviews:
Potential Competitors in Comparison
Rating | Date | Model | Weight | Height | Size | Resolution | Price |
|---|---|---|---|---|---|---|---|
| 85.6 % v7 (old) | 09 / 2022 | Lenovo ThinkBook Plus Gen3 i7-12700H, Iris Xe G7 96EUs | 2 kg | 17.9 mm | 17.30" | 3072x1440 | |
| 86.1 % v7 (old) | 10 / 2021 | Lenovo ThinkBook Plus Gen2 Core i5 i5-1130G7, Iris Xe G7 80EUs | 1.2 kg | 13.9 mm | 13.30" | 2560x1600 | |
| 86.4 % v7 (old) | 05 / 2020 | Asus ProArt StudioBook Pro 17 W700G3T i7-9750H, Quadro RTX 3000 Max-Q | 2.5 kg | 18.4 mm | 17.00" | 1920x1200 | |
| 87.3 % v7 (old) | 08 / 2022 | LG Gram 17 (2022) i5-1240P, Iris Xe G7 80EUs | 1.4 kg | 17.7 mm | 17.00" | 2560x1600 | |
| 89.3 % v7 (old) | 06 / 2022 | Dell XPS 17 9720 i7-12700H, GeForce RTX 3050 4GB Laptop GPU | 2.5 kg | 19.5 mm | 17.00" | 3840x2400 | |
| 88 % v7 (old) | 05 / 2021 | Gigabyte Aero 17 HDR YD i9-11980HK, GeForce RTX 3080 Laptop GPU | 2.8 kg | 22 mm | 17.30" | 3840x2160 |
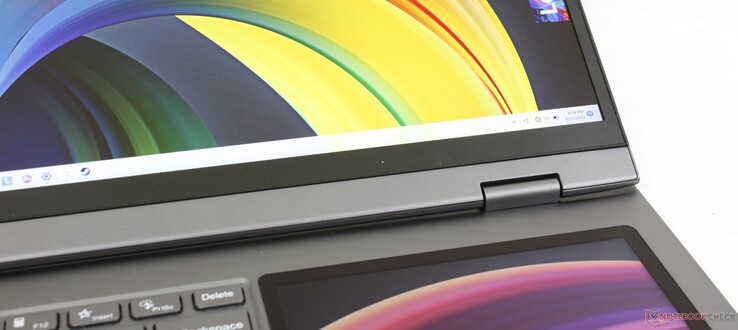
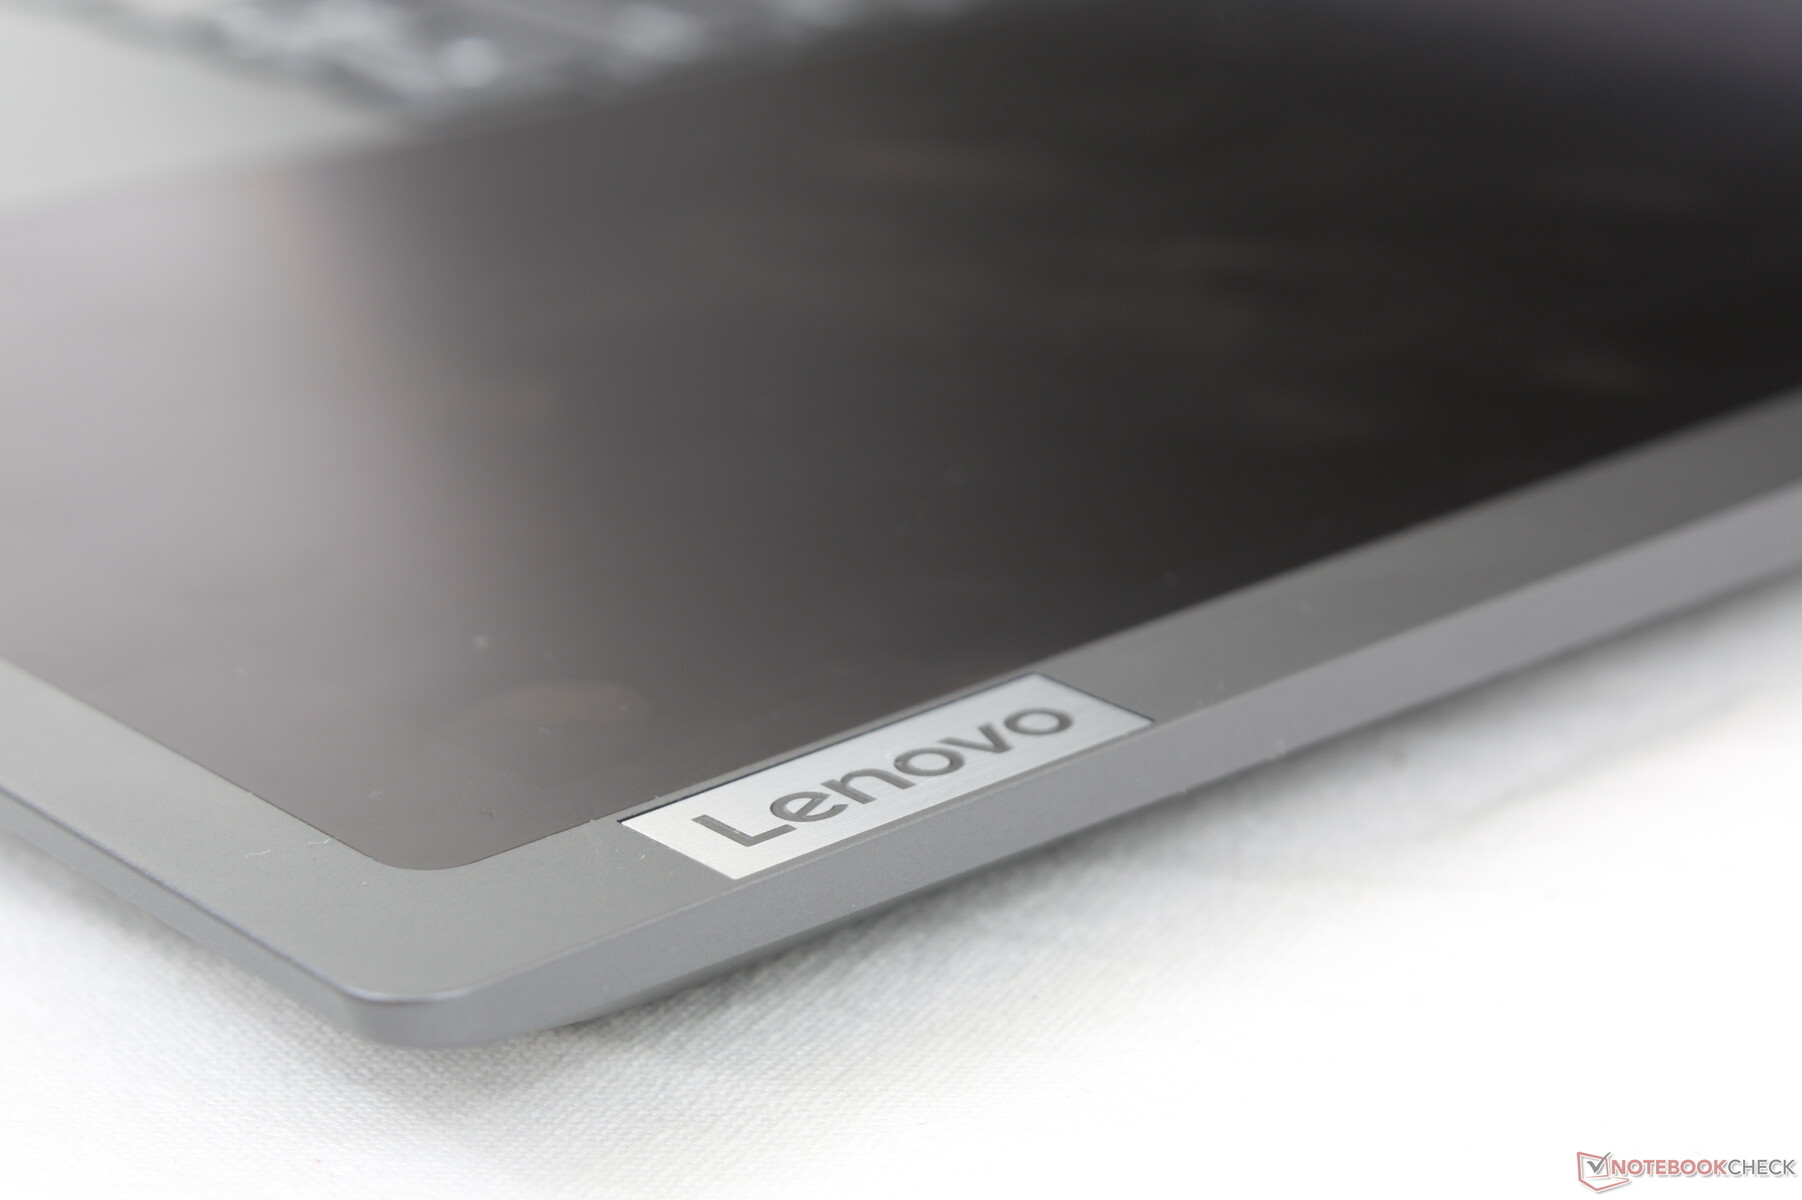
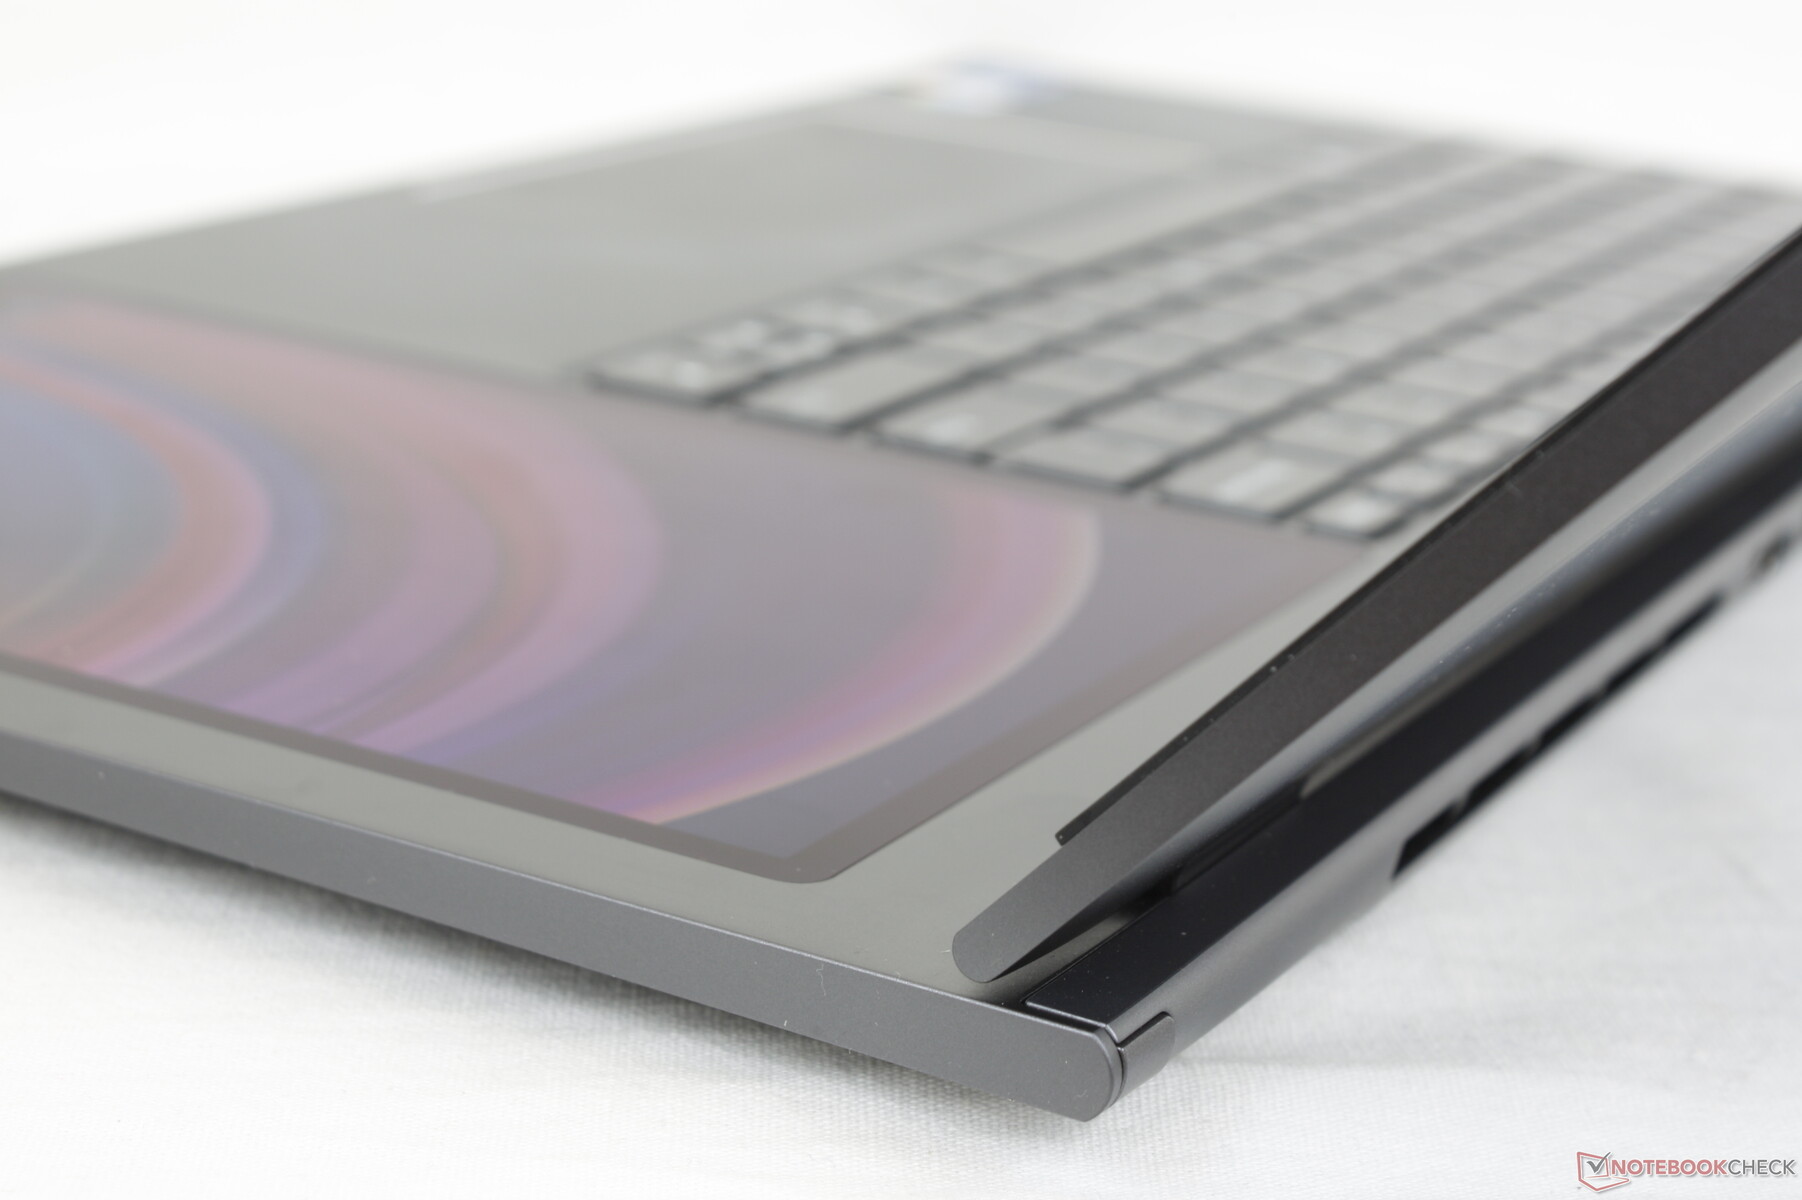
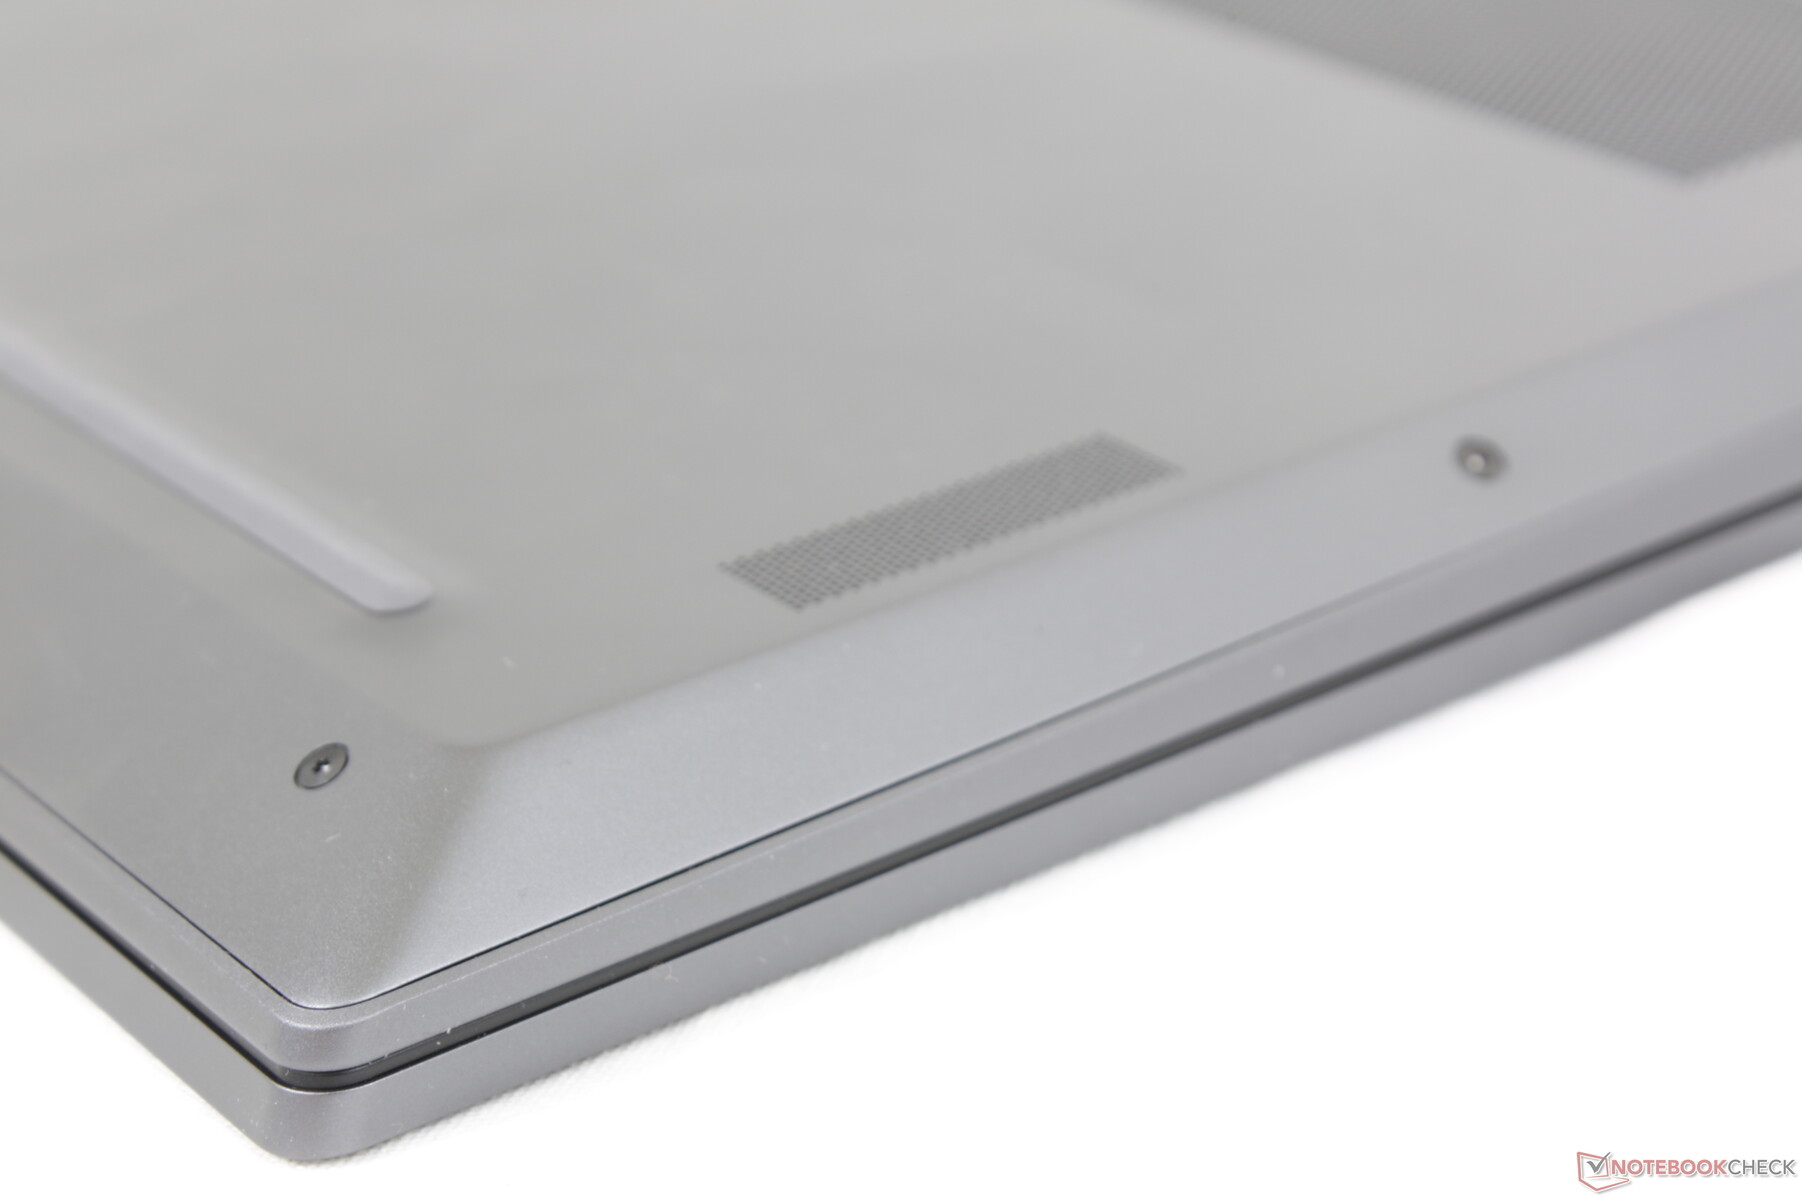
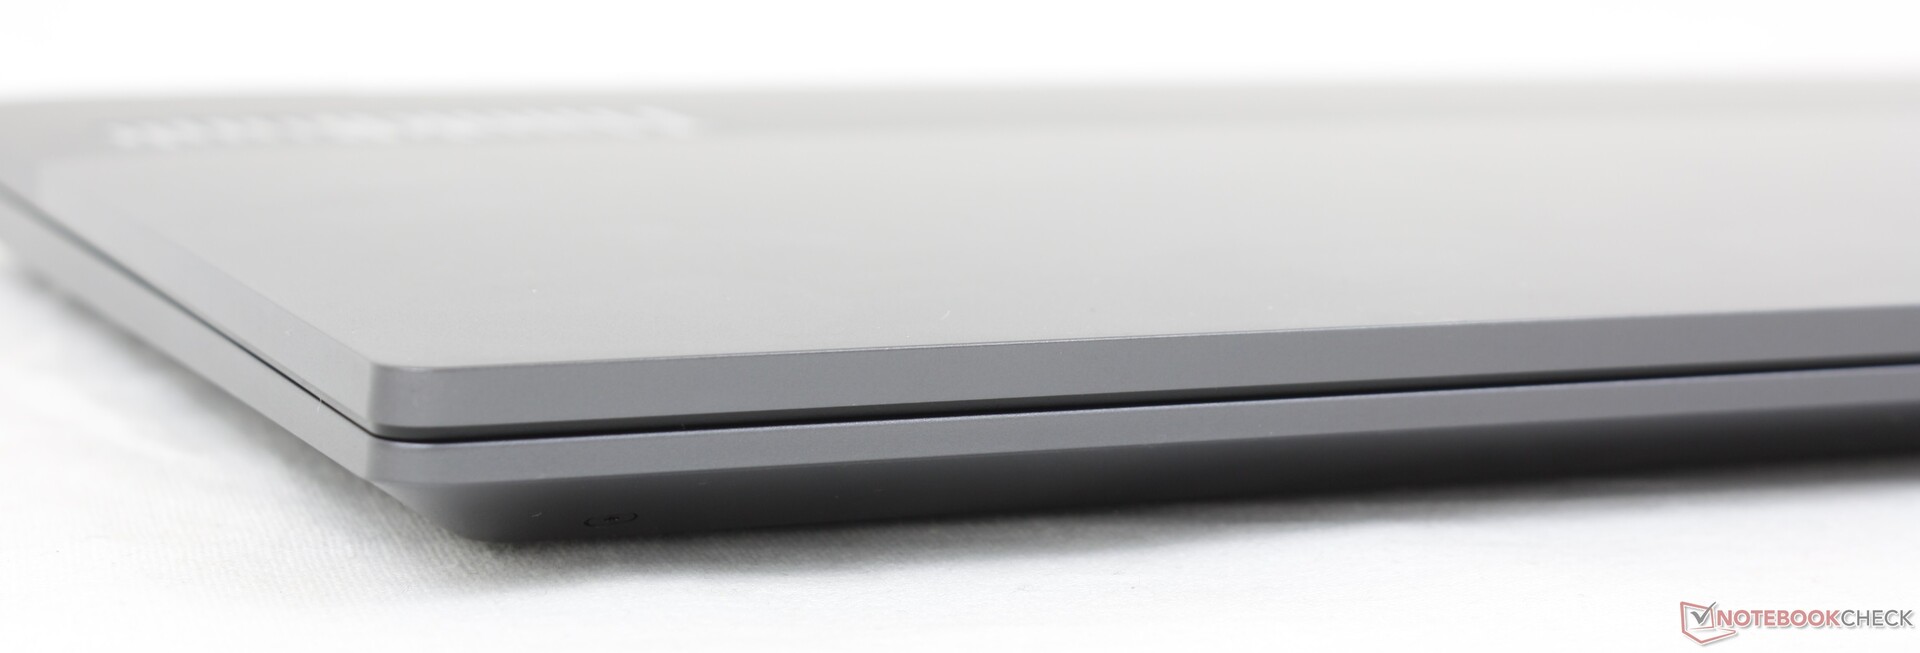
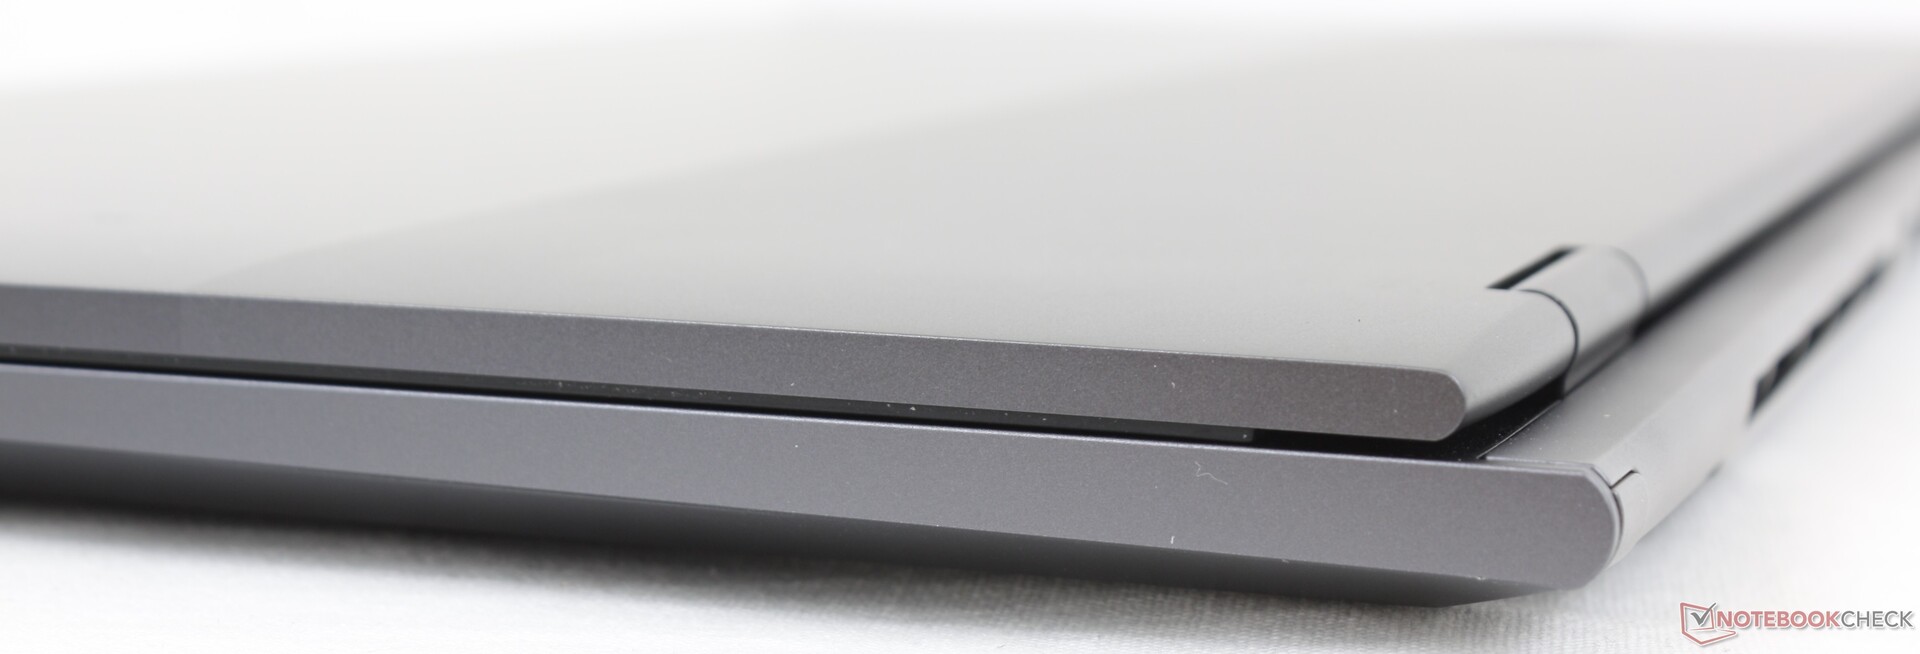
Case — Long And Thin
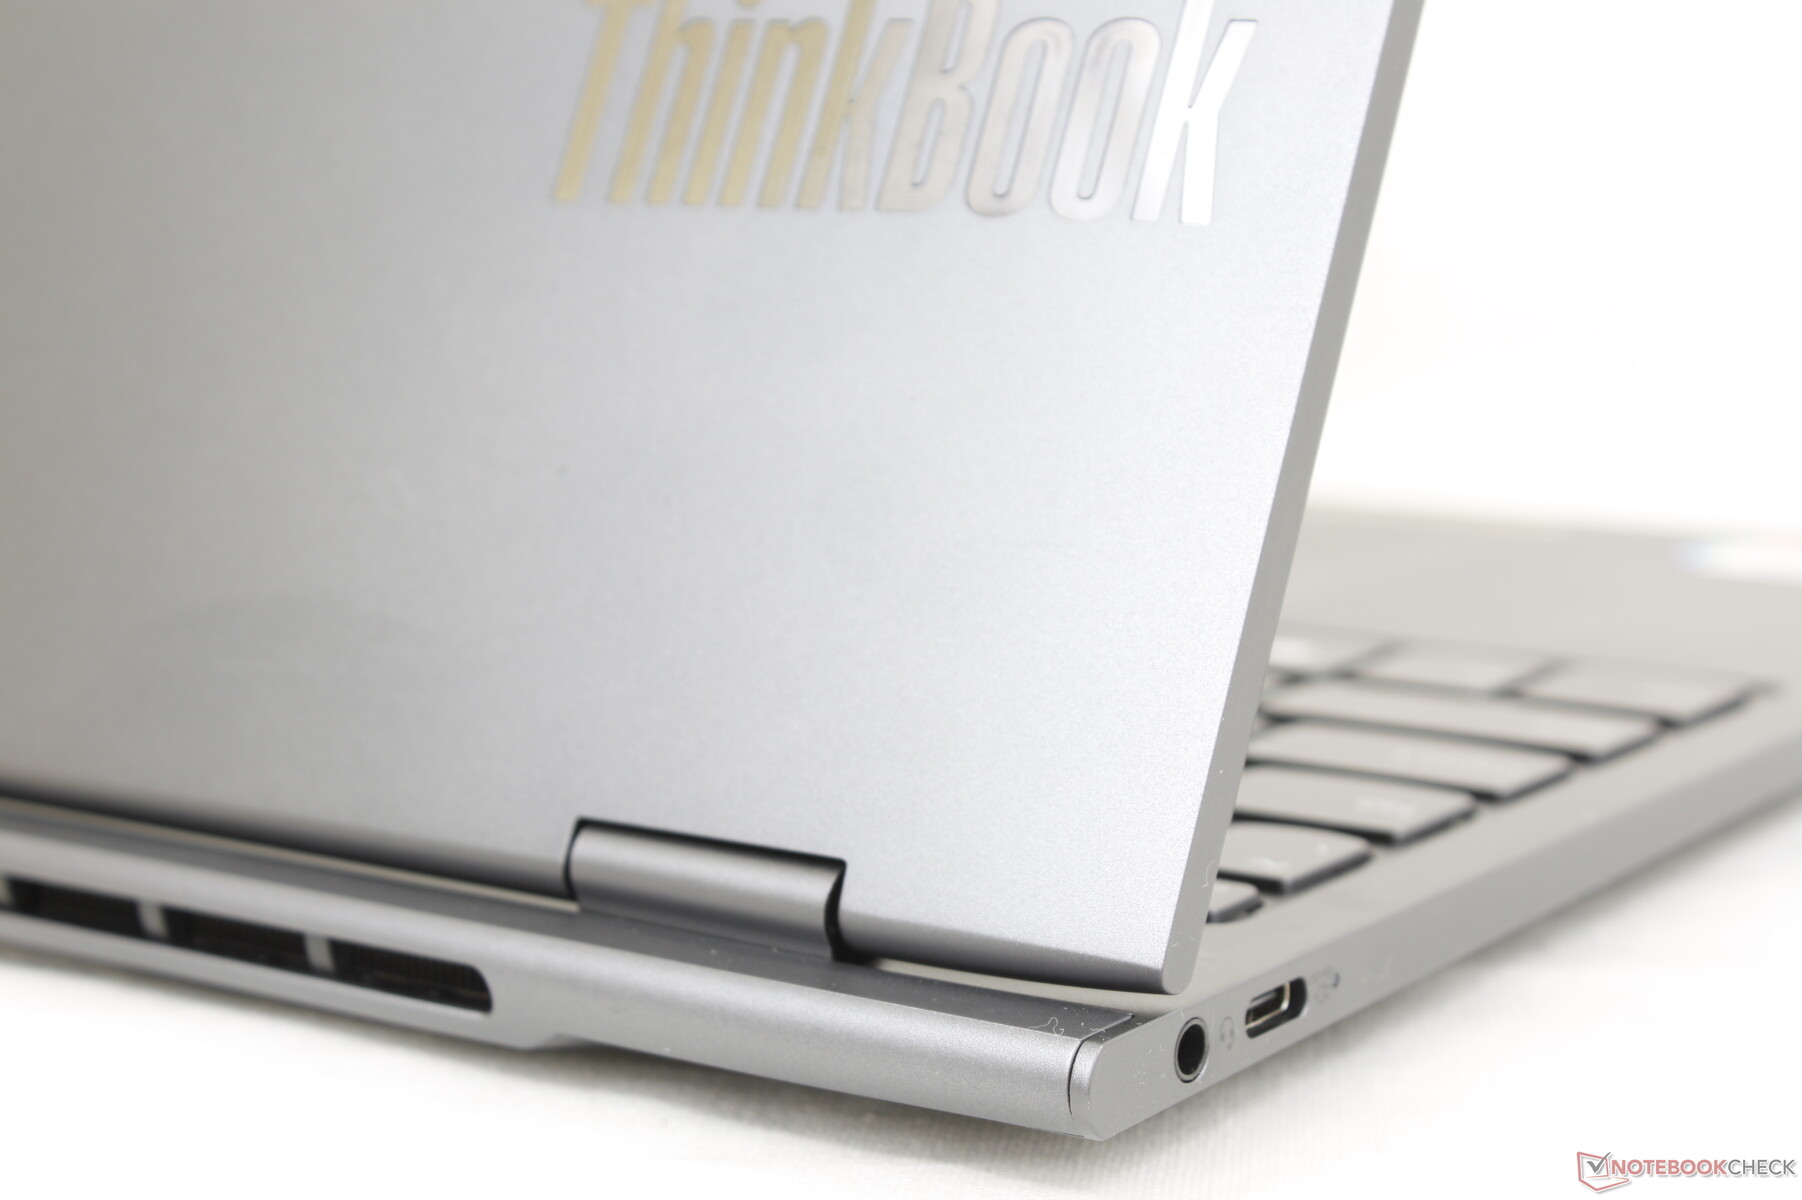
The chassis shares the same aluminum alloy materials as on other ThinkBook models like on the recent ThinkBook 16 G4 Plus. Thus, if you've held a ThinkBook model in the past, then the smooth dark gray surfaces of the ThinkBook Plus Gen 3 will feel instantly familiar. The design targets casual offices and SMB environments in between the consumer-centric Yoga and more traditional ThinkPad models.
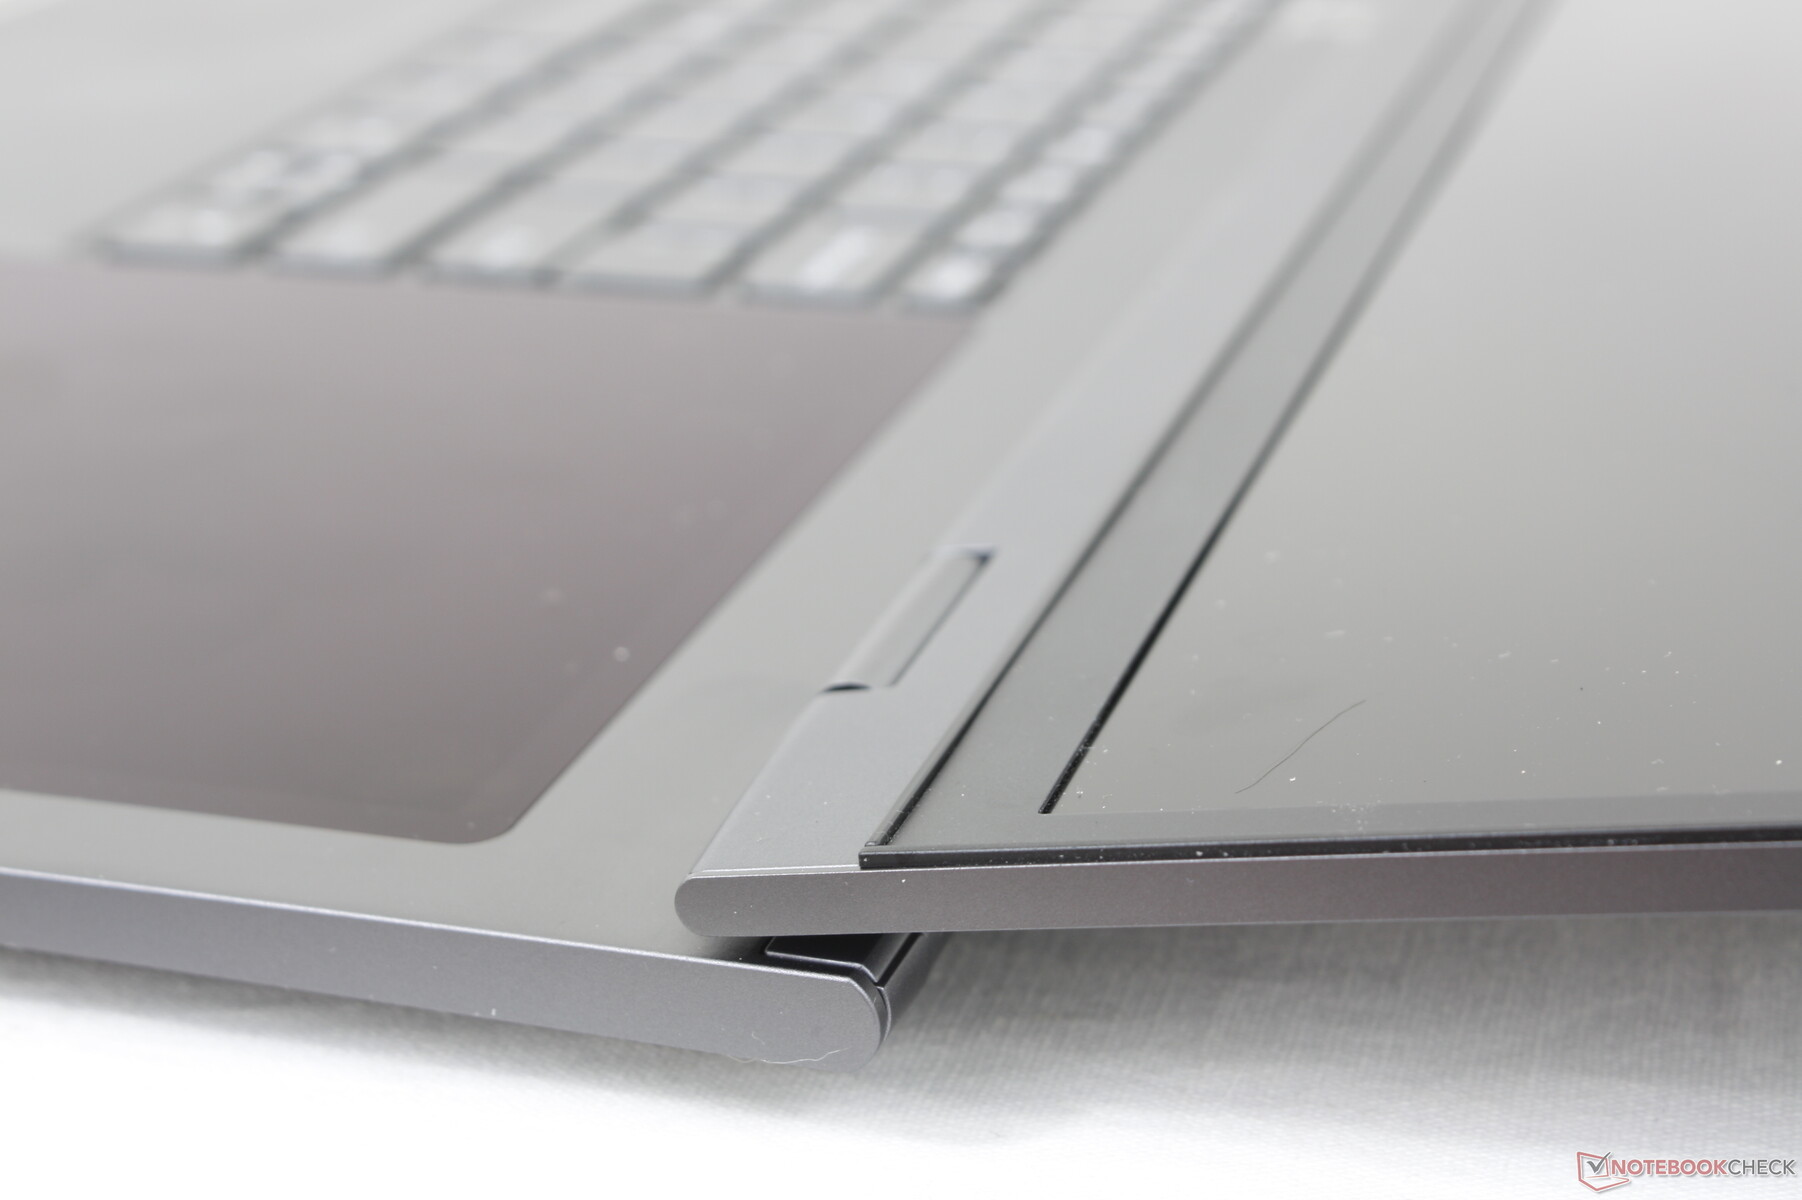
Build quality is slightly below that of a Yoga or ThinkPad X series model. The lid and base are a bit more susceptible to twisting and creaking likely due to the larger 17.3-inch form factor and relatively thin skeleton. Alternatives like the smaller ZenBook Duo or heavier XPS 17 feel firmer and with a more solid feel especially in regards to their hinges.

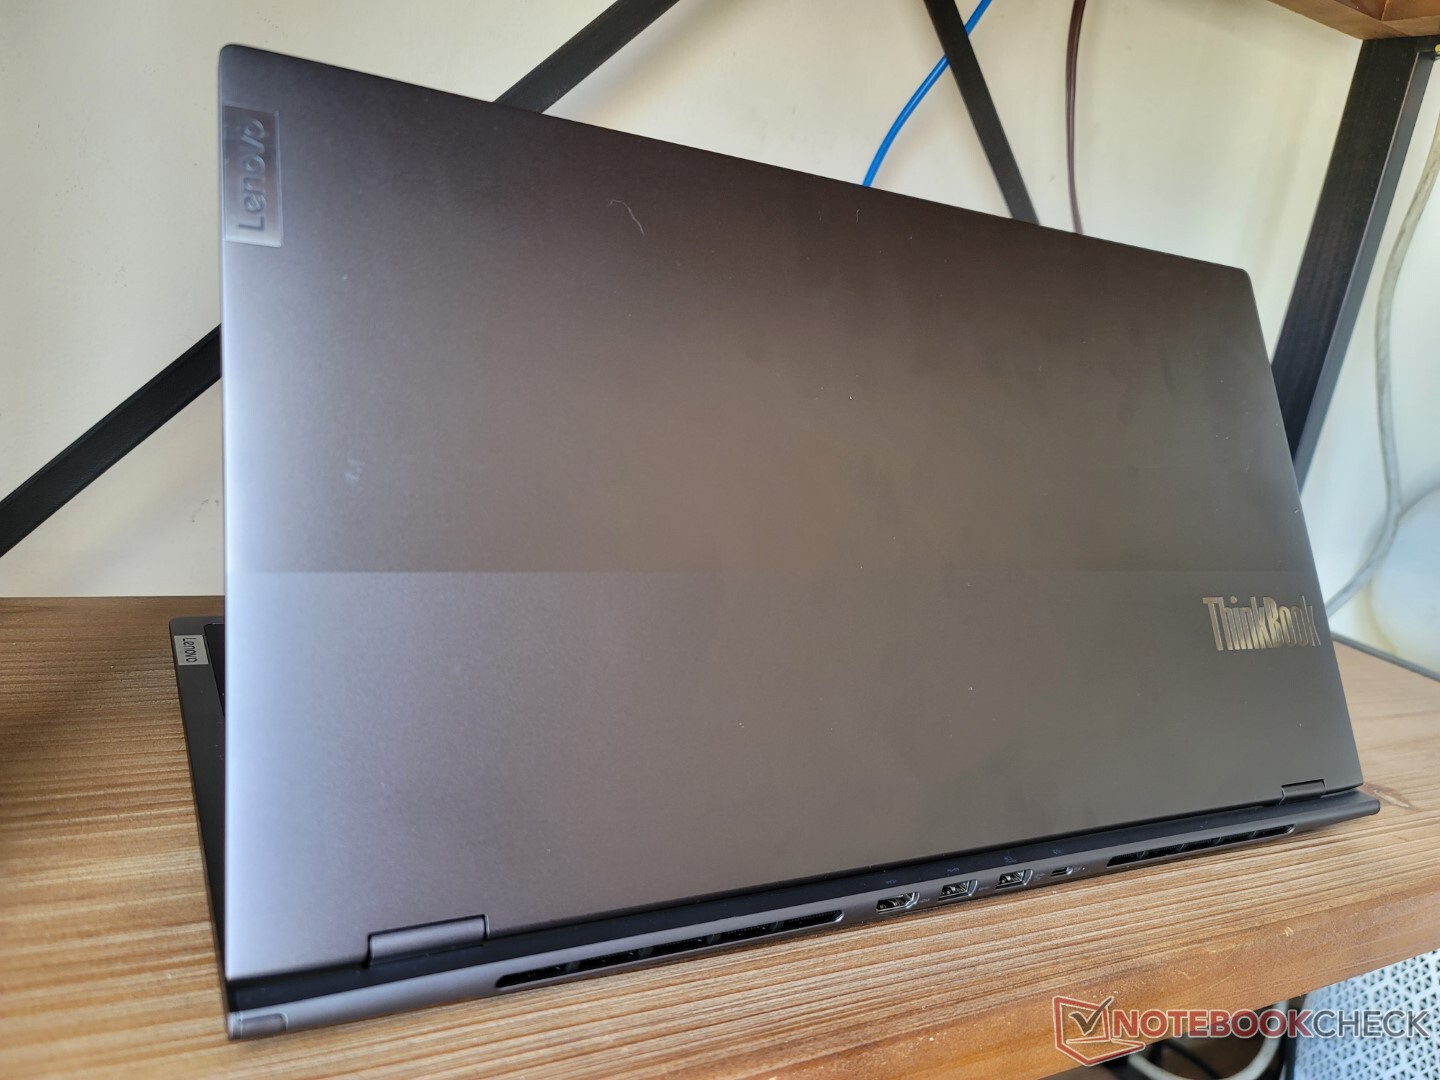
The elongated aspect ratio has resulted in a chassis that's both wider but shorter than other 17-inch laptops. It's thankfully still thin and lightweight when considering its size category. The XPS 17, for example, is half a kilogram heavier.
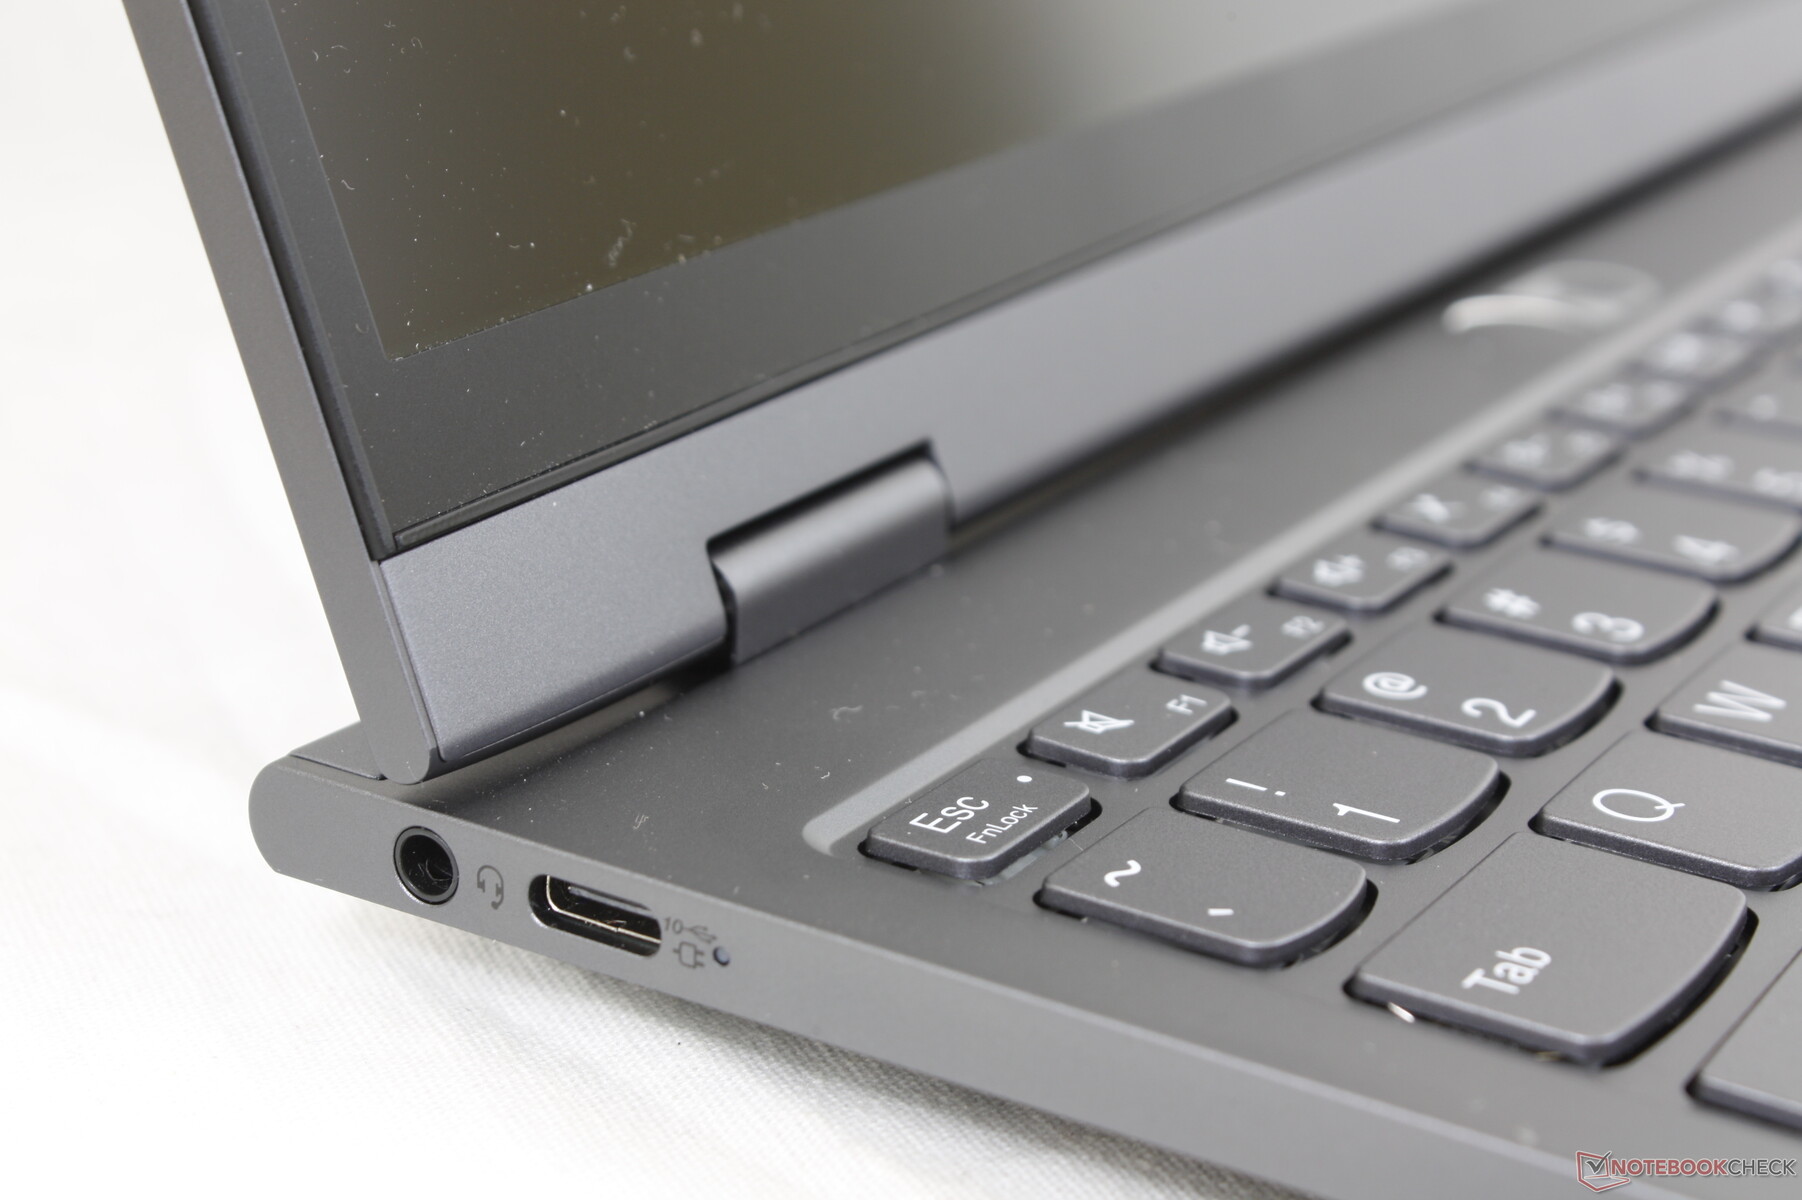
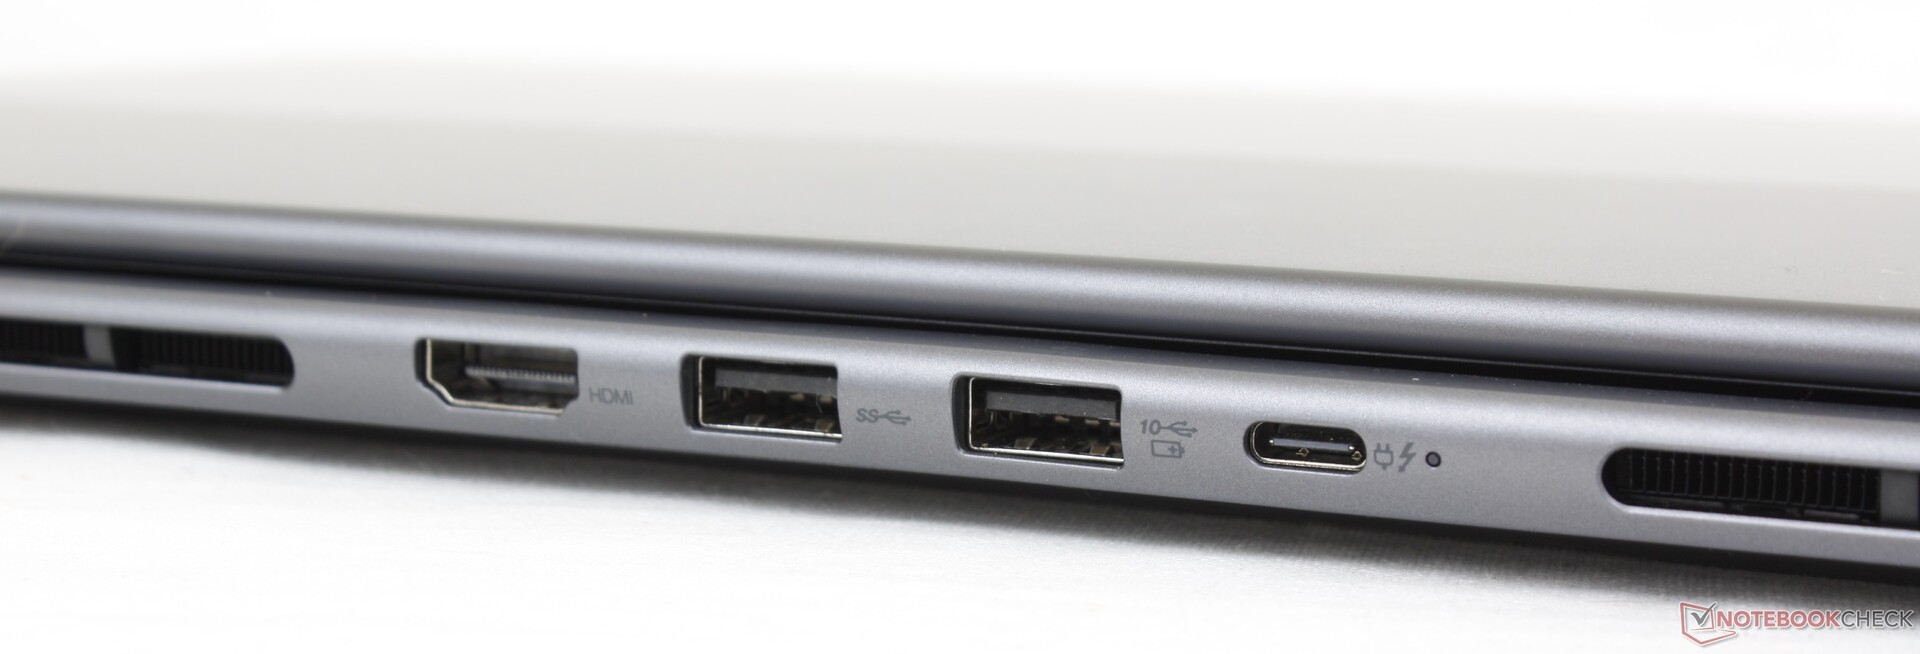
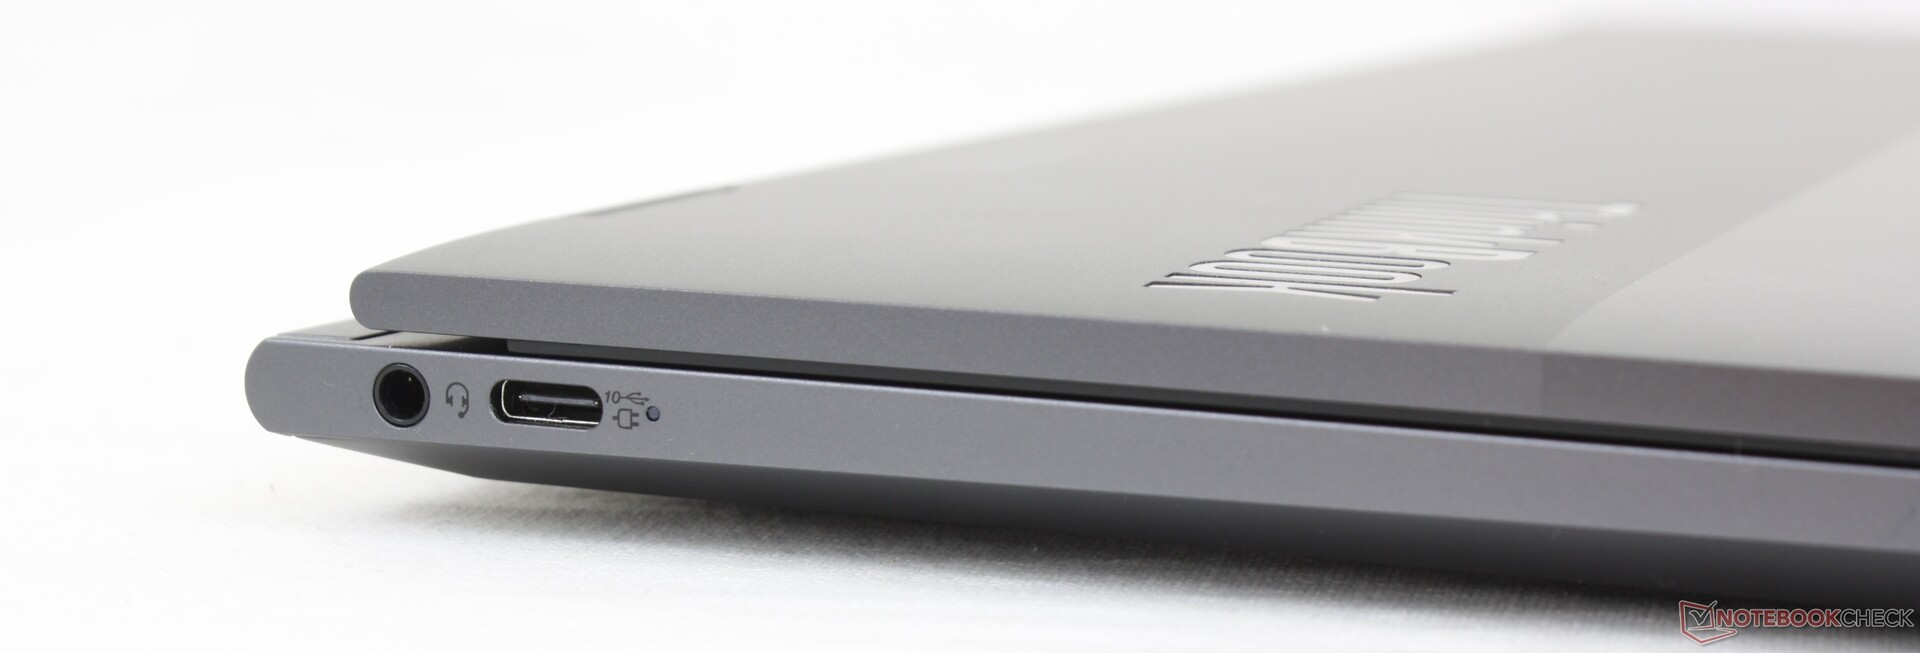
Connectivity — Thunderbolt 4 Support
It would be a crime if the Gen 3 model came with fewer ports than the much smaller last generation model. The system integrates two USB-C ports much like its predecessor plus new USB-A and HDMI ports along the rear for a wider variety of options. Note that only one of the two USB-C ports is compatible with Thunderbolt, but either can be used for charging or DisplayPort.
There is no SD card reader which is a little disappointing considering the large form factor and focus on office/editing tasks.
Communication
An Intel AX211 comes standard for Wi-Fi 6E and Bluetooth 5.2 connectivity. We experienced stable transfer rates when paired to our 6 GHz network.
| Networking | |
| iperf3 transmit AX12 | |
| Gigabyte Aero 17 HDR YD | |
| Asus ProArt StudioBook Pro 17 W700G3T | |
| Lenovo ThinkBook Plus Gen2 Core i5 | |
| iperf3 receive AX12 | |
| Asus ProArt StudioBook Pro 17 W700G3T | |
| Lenovo ThinkBook Plus Gen2 Core i5 | |
| Gigabyte Aero 17 HDR YD | |
| iperf3 receive AXE11000 6GHz | |
| Lenovo ThinkBook Plus Gen3 | |
| iperf3 receive AXE11000 | |
| LG Gram 17 (2022) | |
| Dell XPS 17 9720 | |
| iperf3 transmit AXE11000 6GHz | |
| Lenovo ThinkBook Plus Gen3 | |
| iperf3 transmit AXE11000 | |
| Dell XPS 17 9720 | |
| LG Gram 17 (2022) | |
Webcam
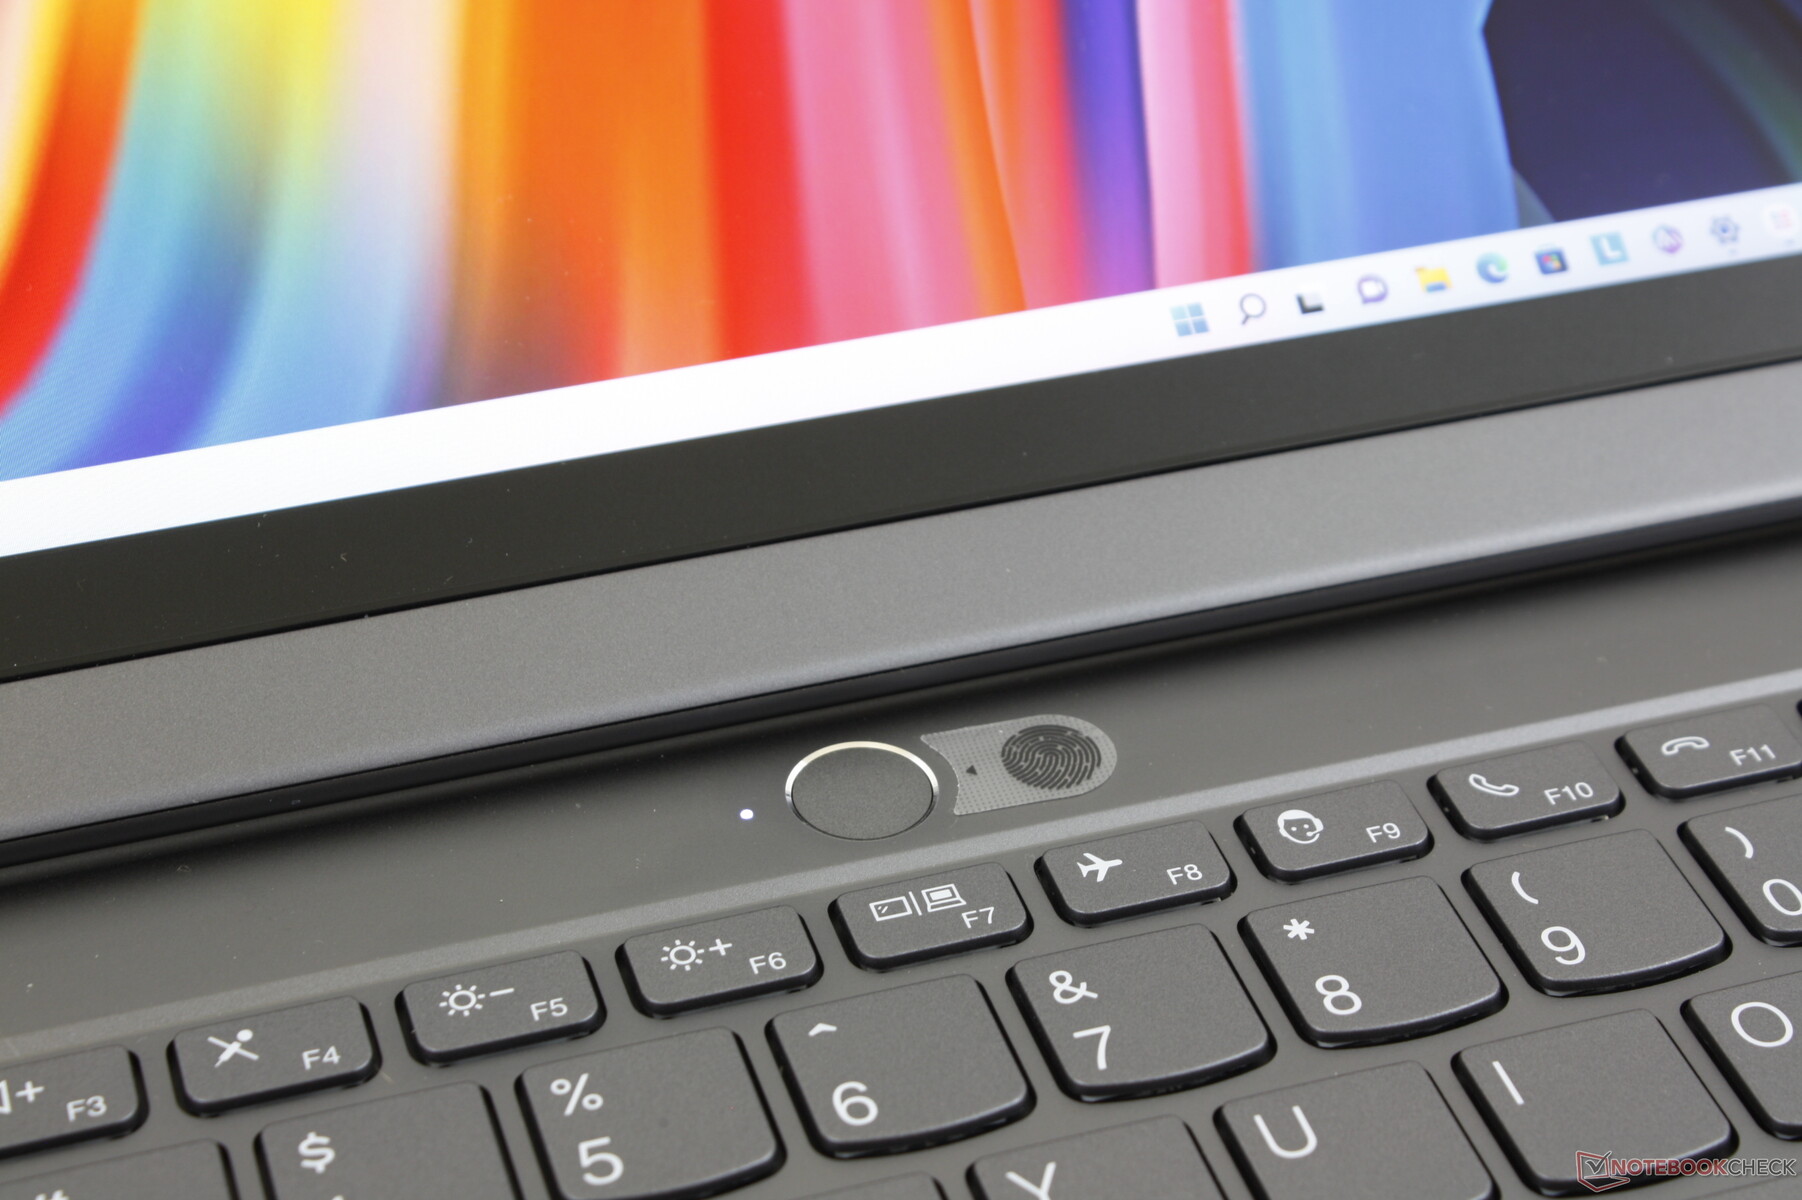
The 2 MP camera is sharper than the ones on the XPS series but still not as good as the 5 MP cameras on many newer HP models. Both an IR sensor and shutter are present for Hello support and privacy, respectively.


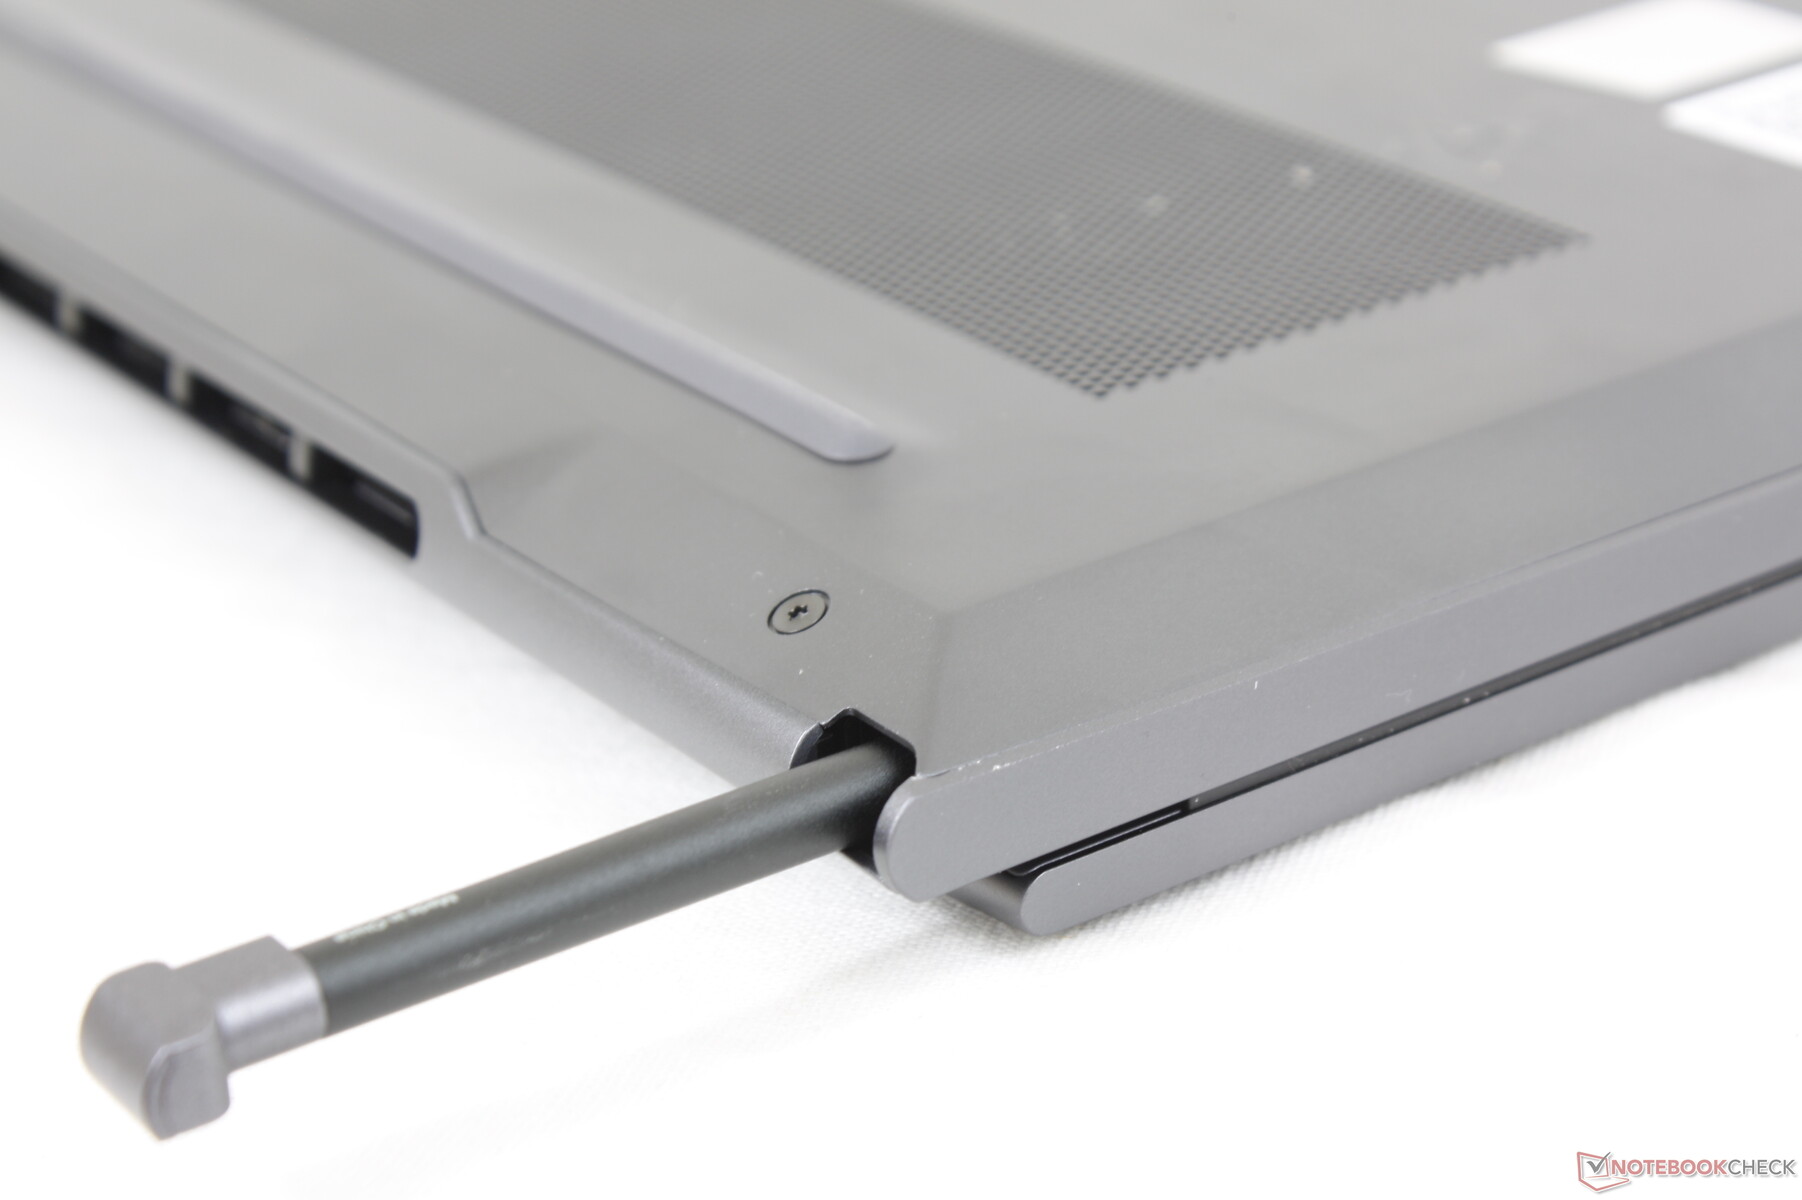
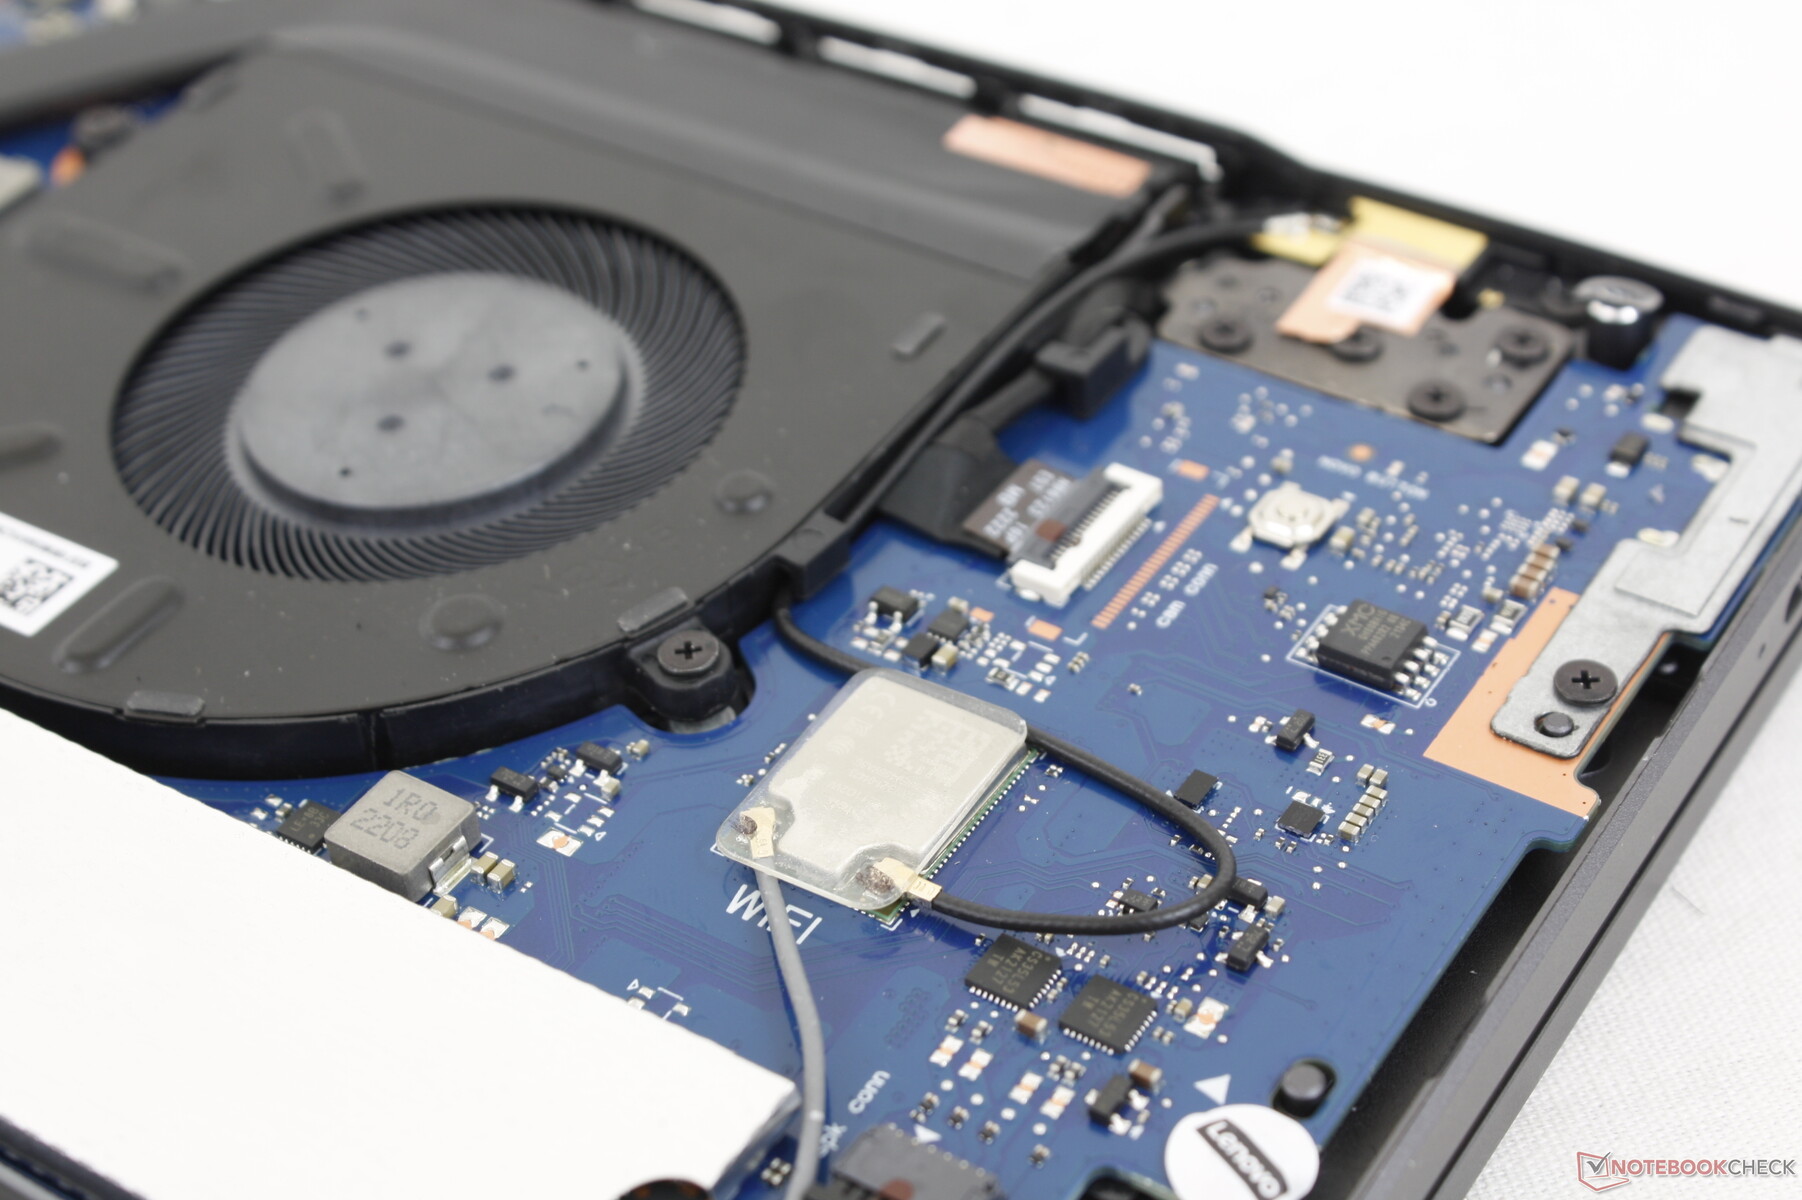
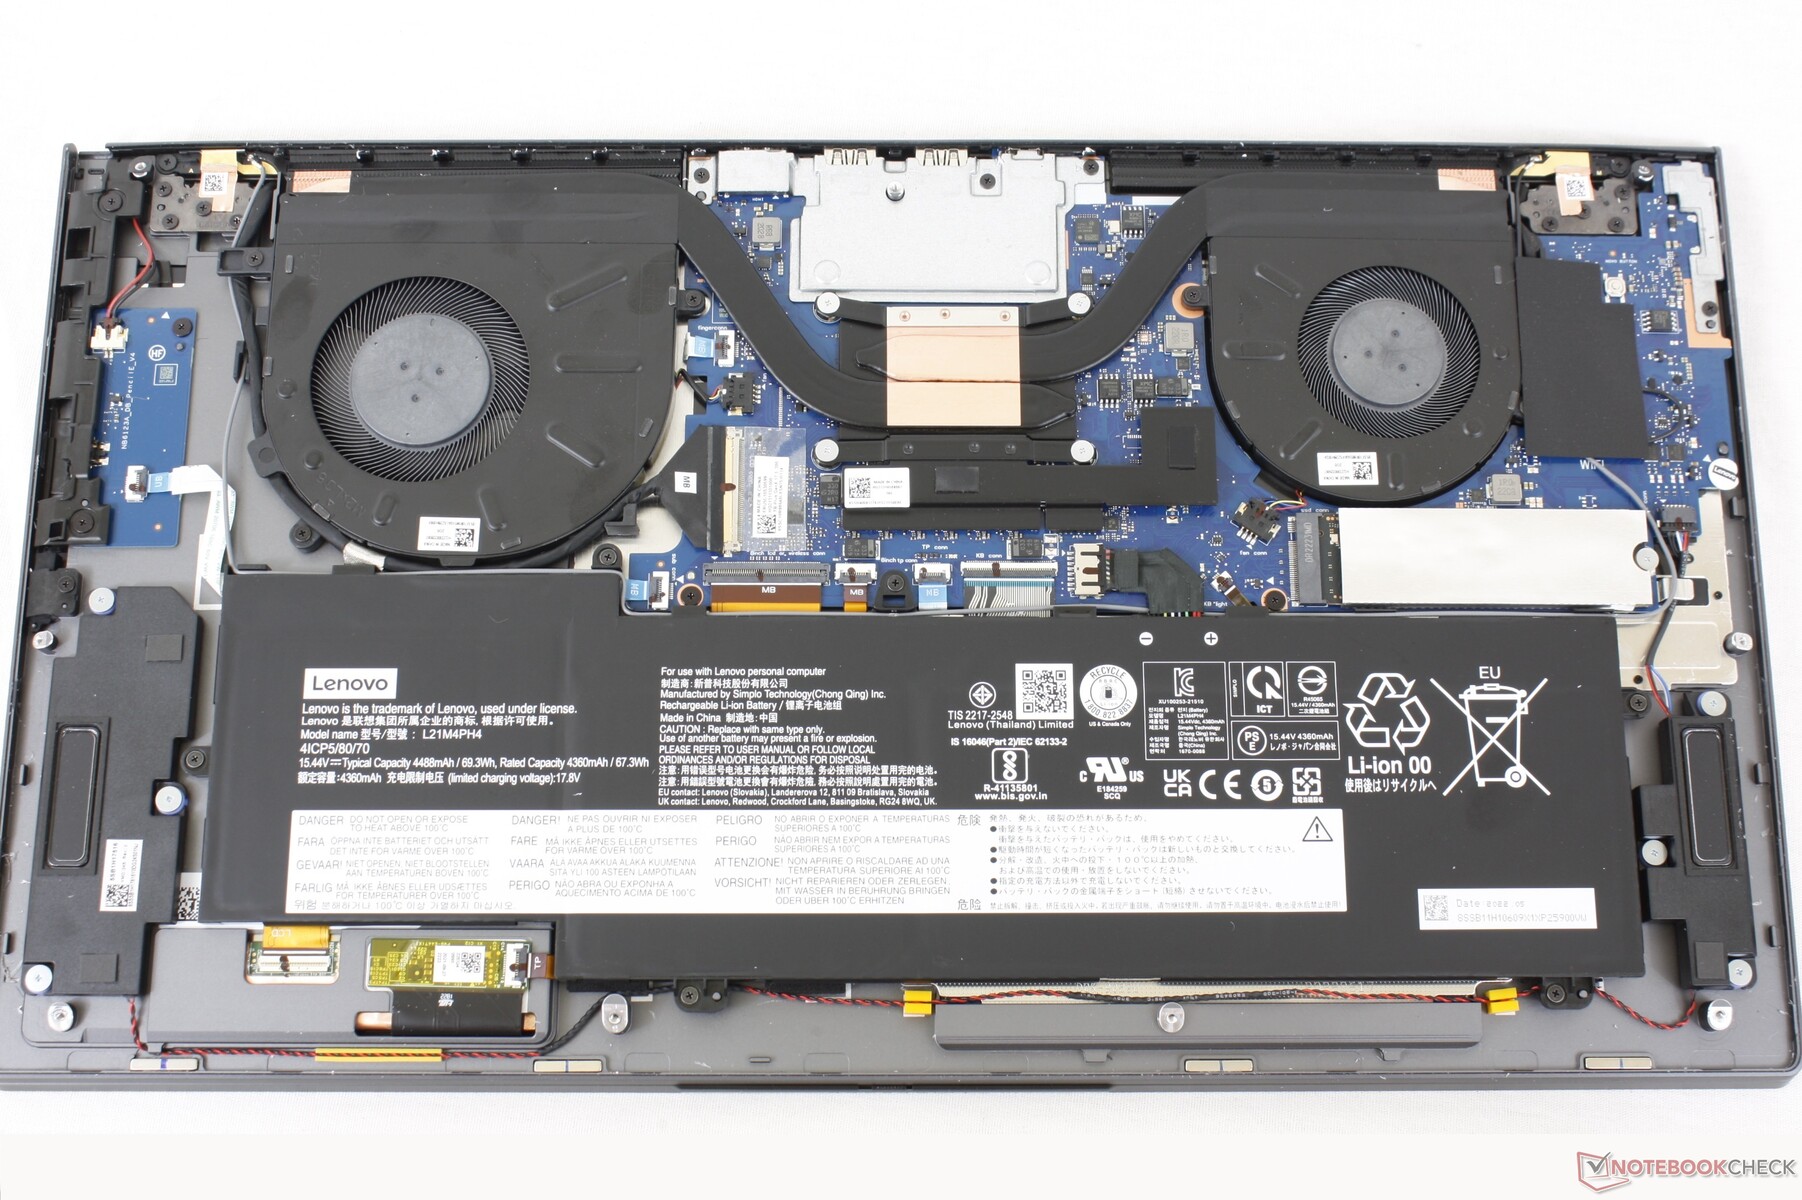
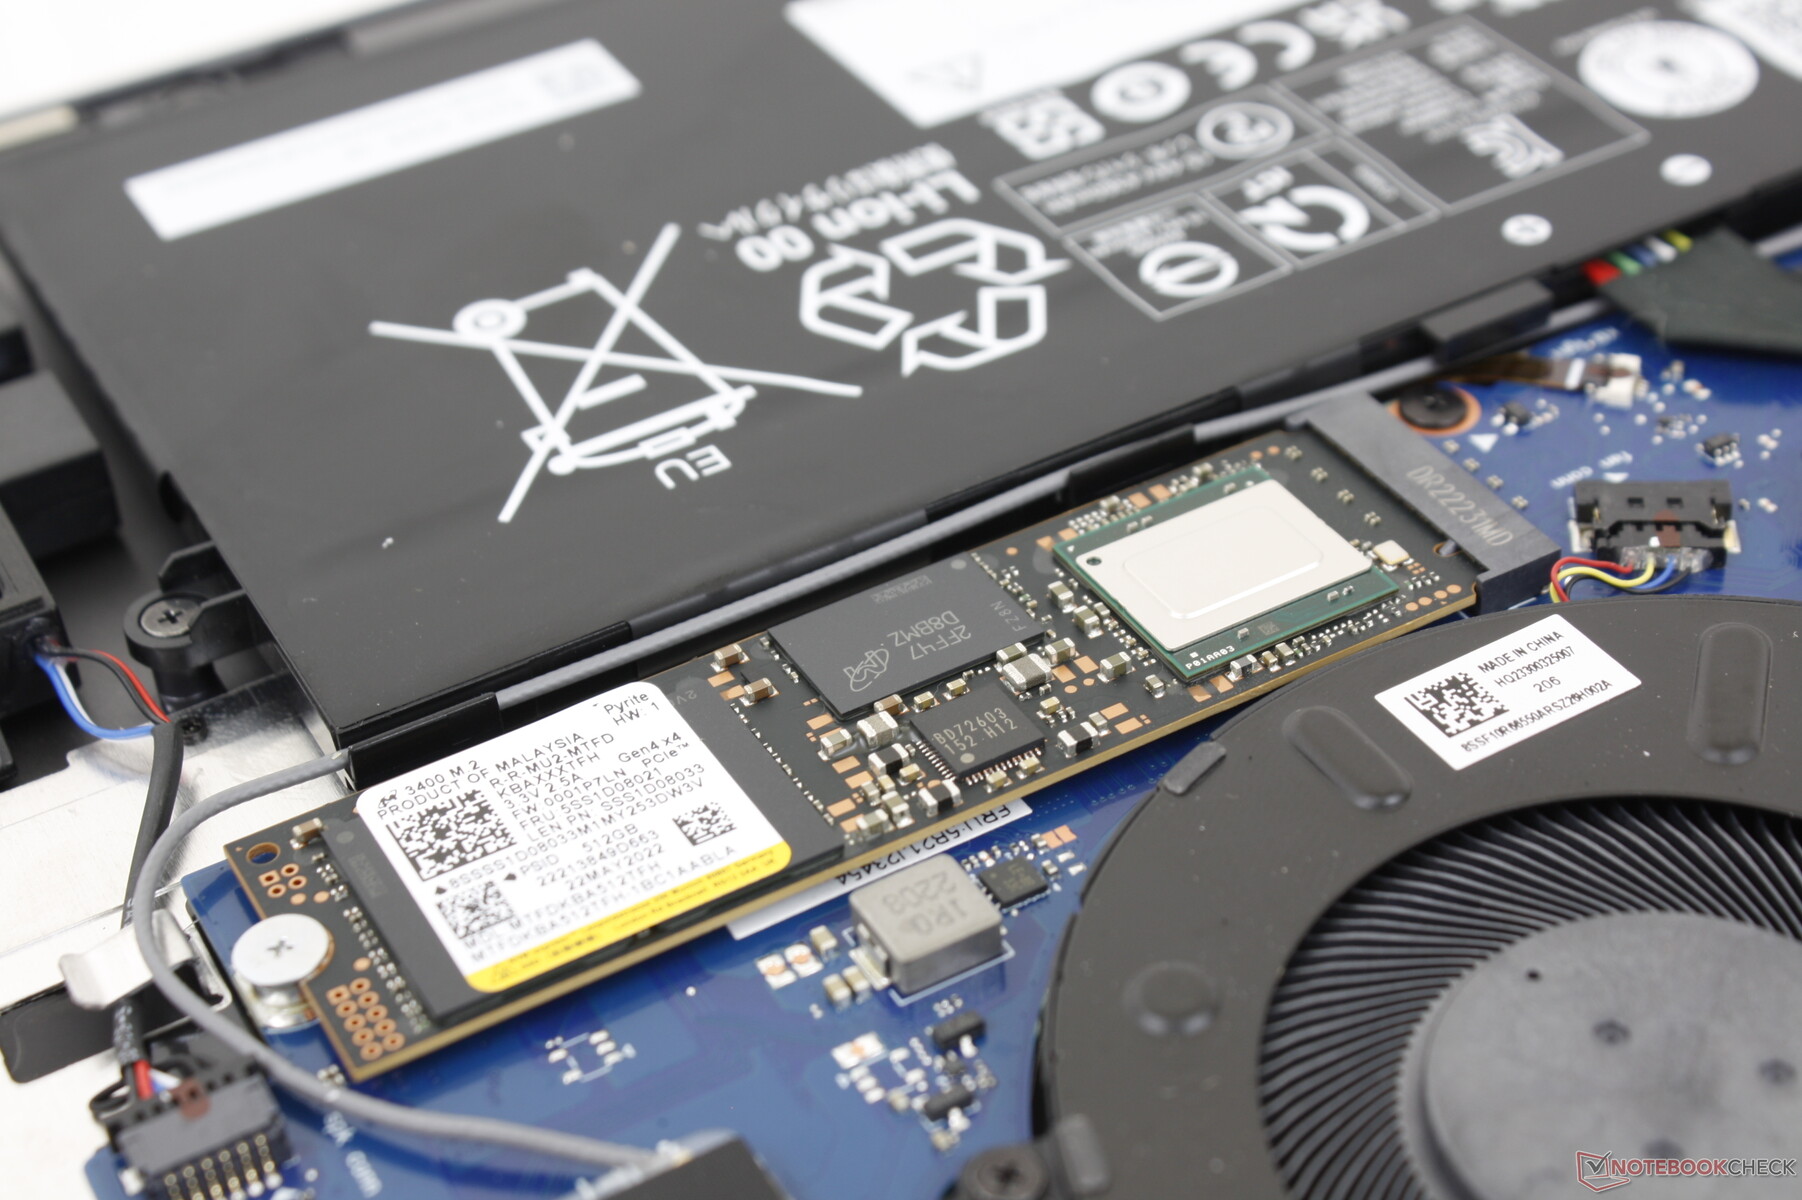
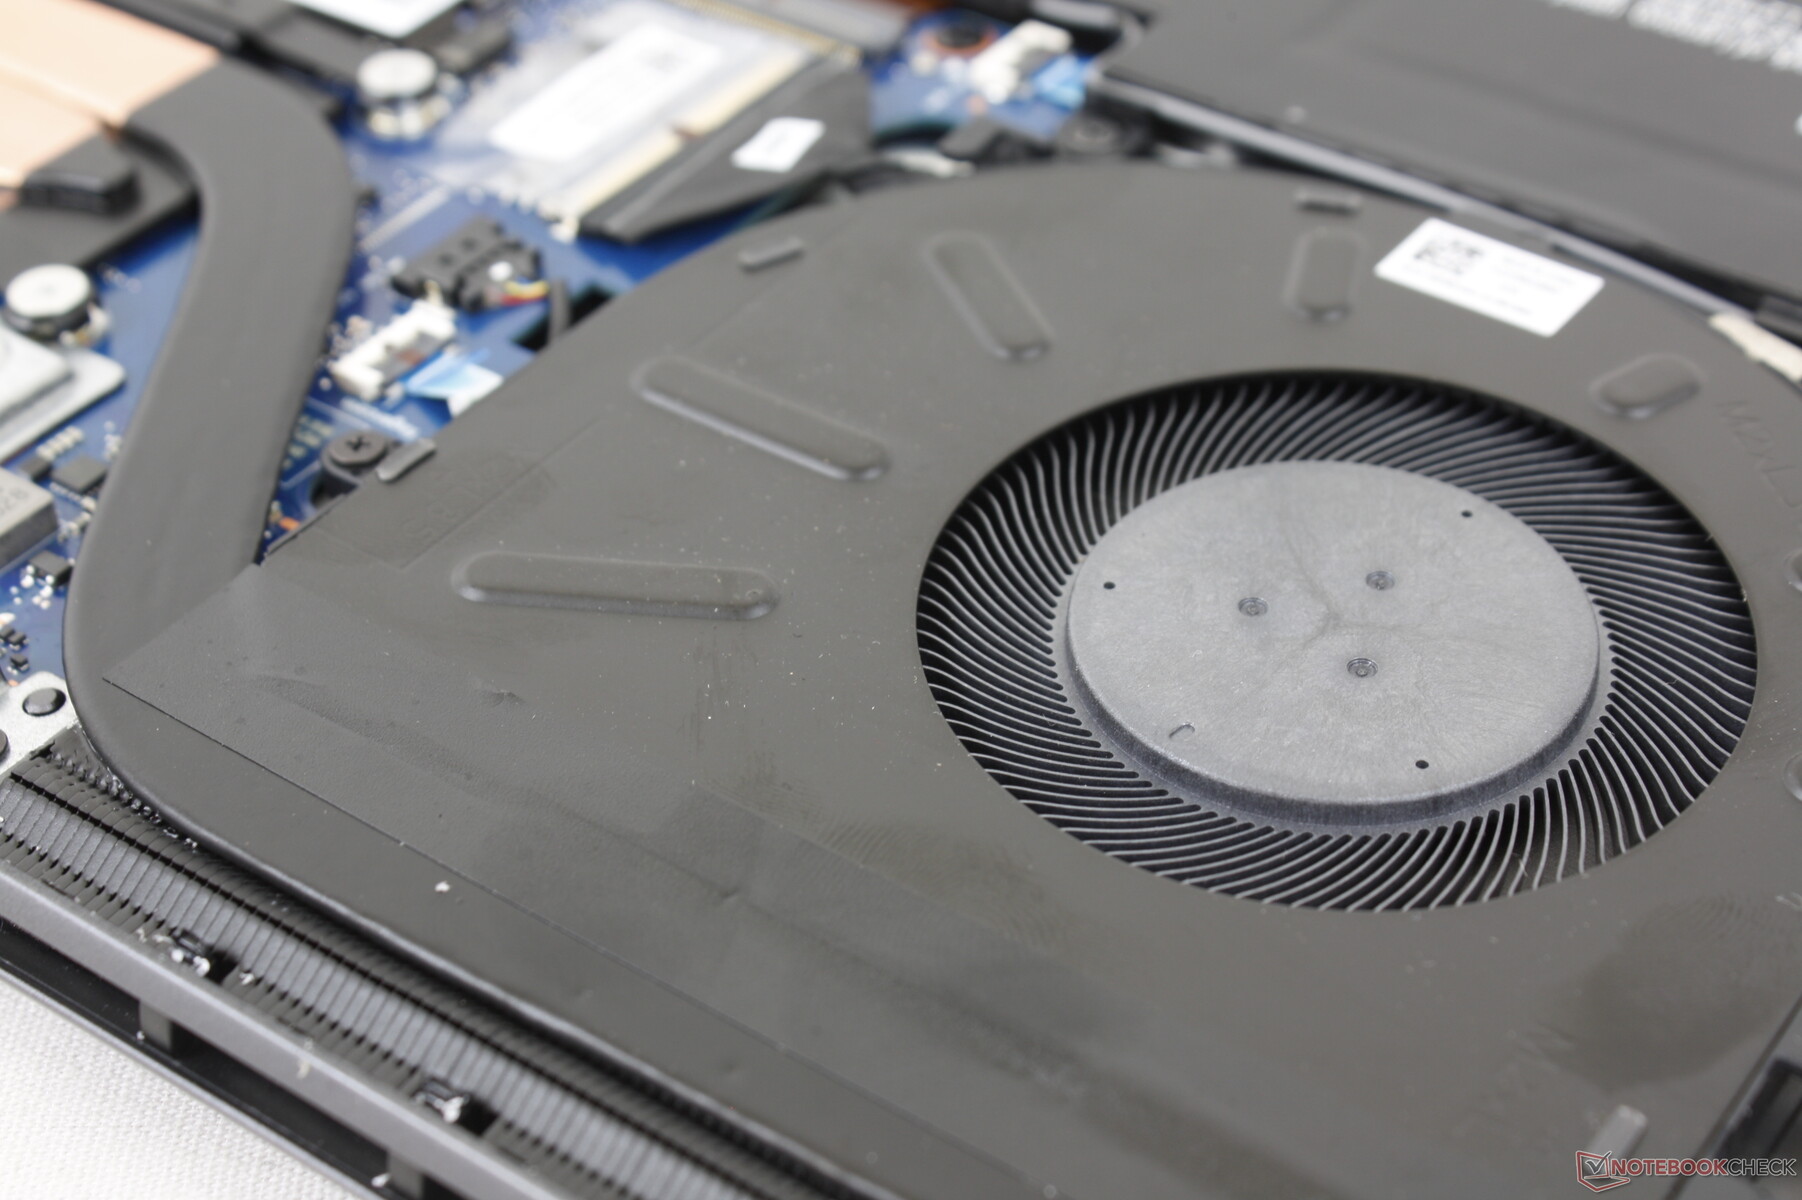
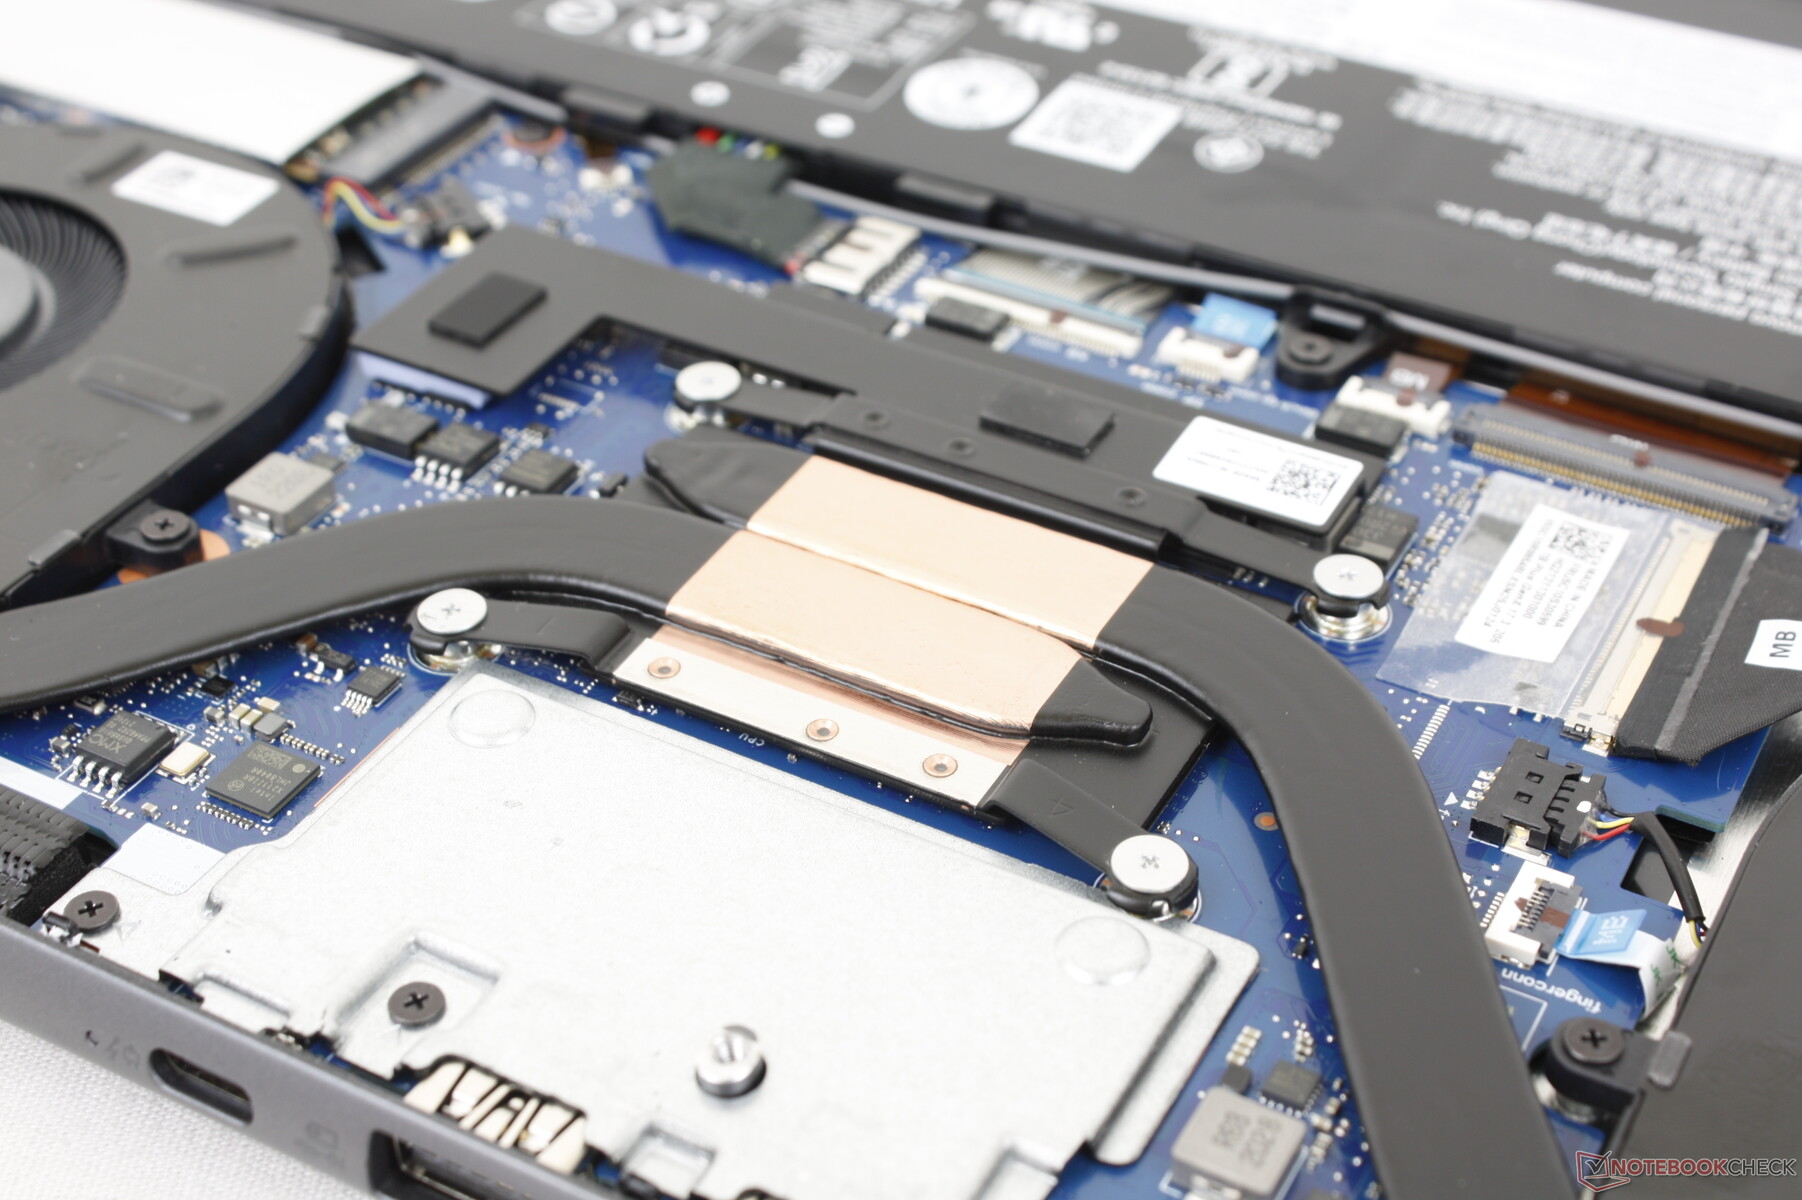
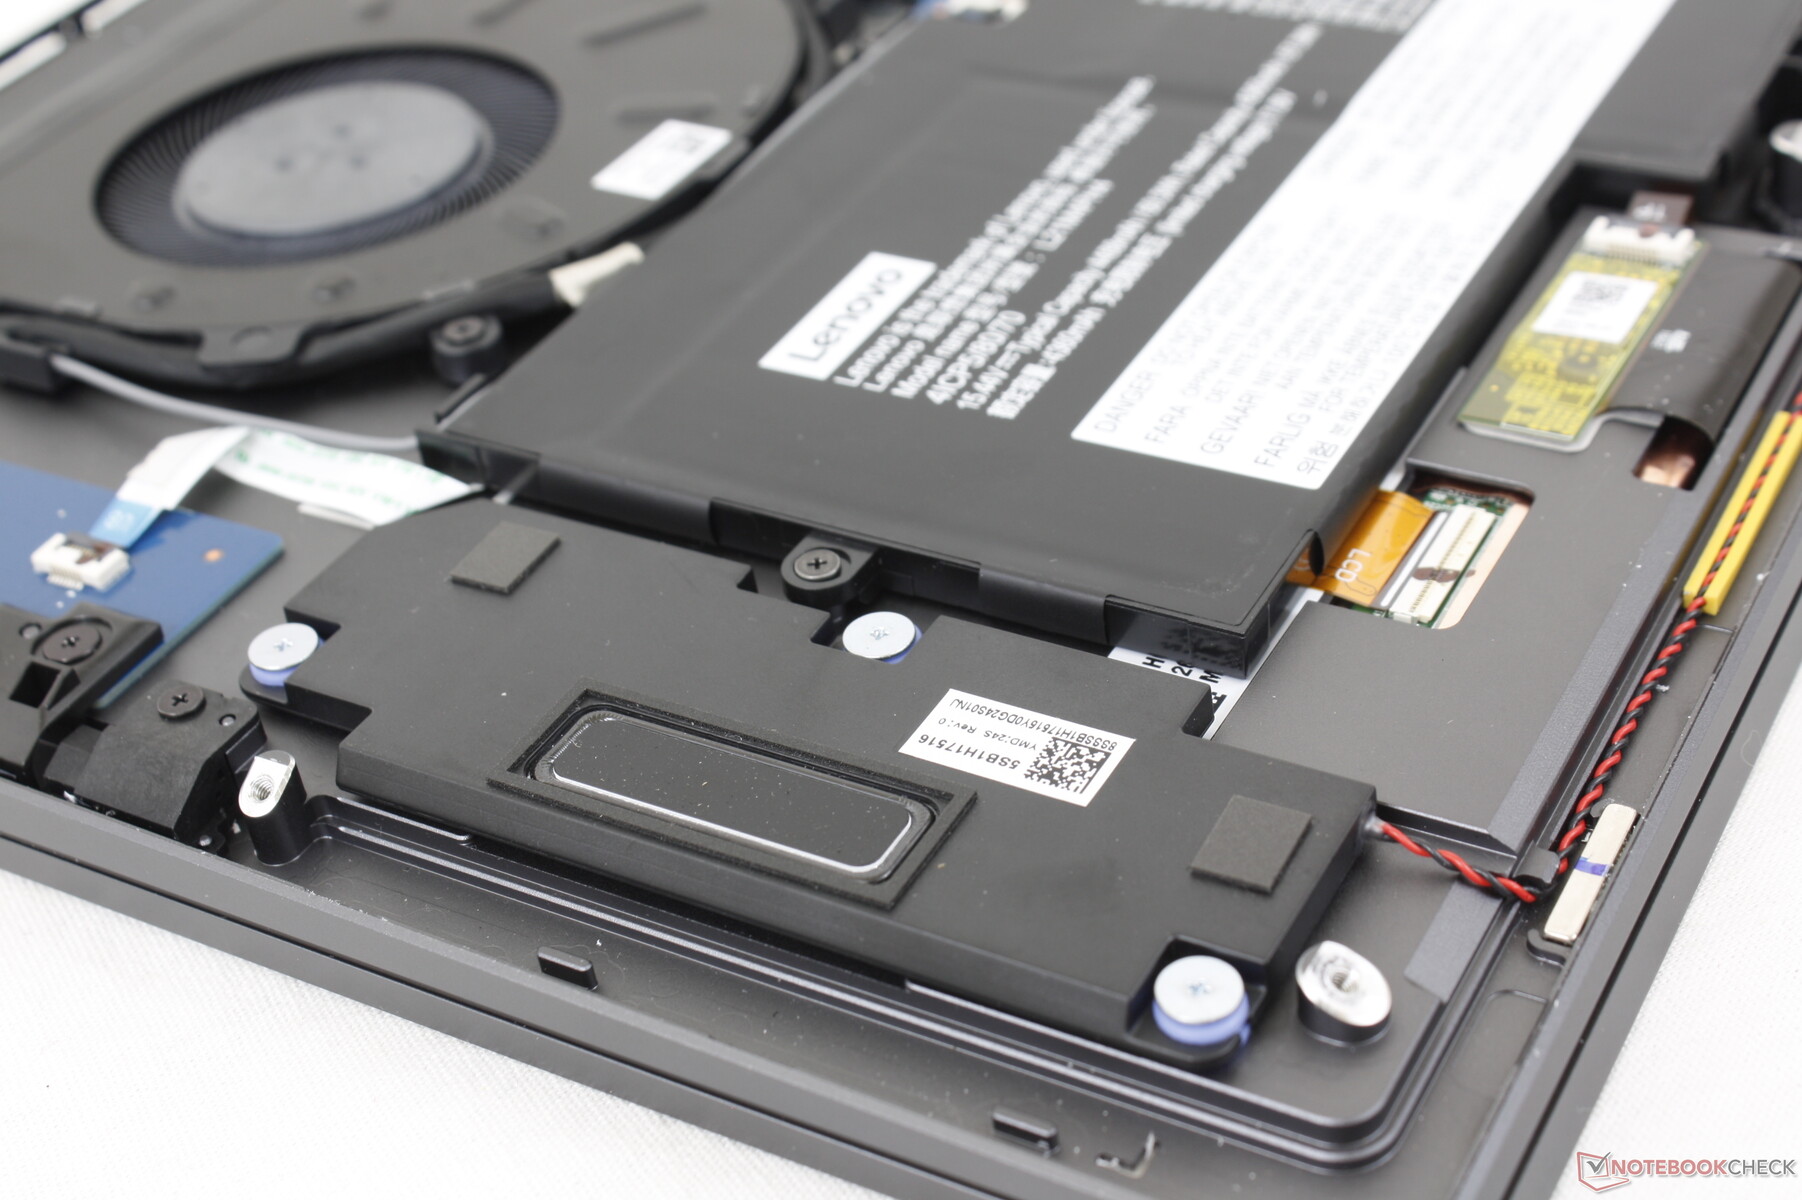
Maintenance
The bottom panel is secured by nine T5 Torx screws. We recommend removing the pen from the rear first and then using that opening to more easily detach the panel from the base.
There is not much to upgrade once inside as both the WLAN and RAM modules are soldered.
Accessories and Warranty
The system integrates an active stylus much like on last year's Gen 2 model. The standard one-year limited manufacturer warranty applies if purchased in the US.
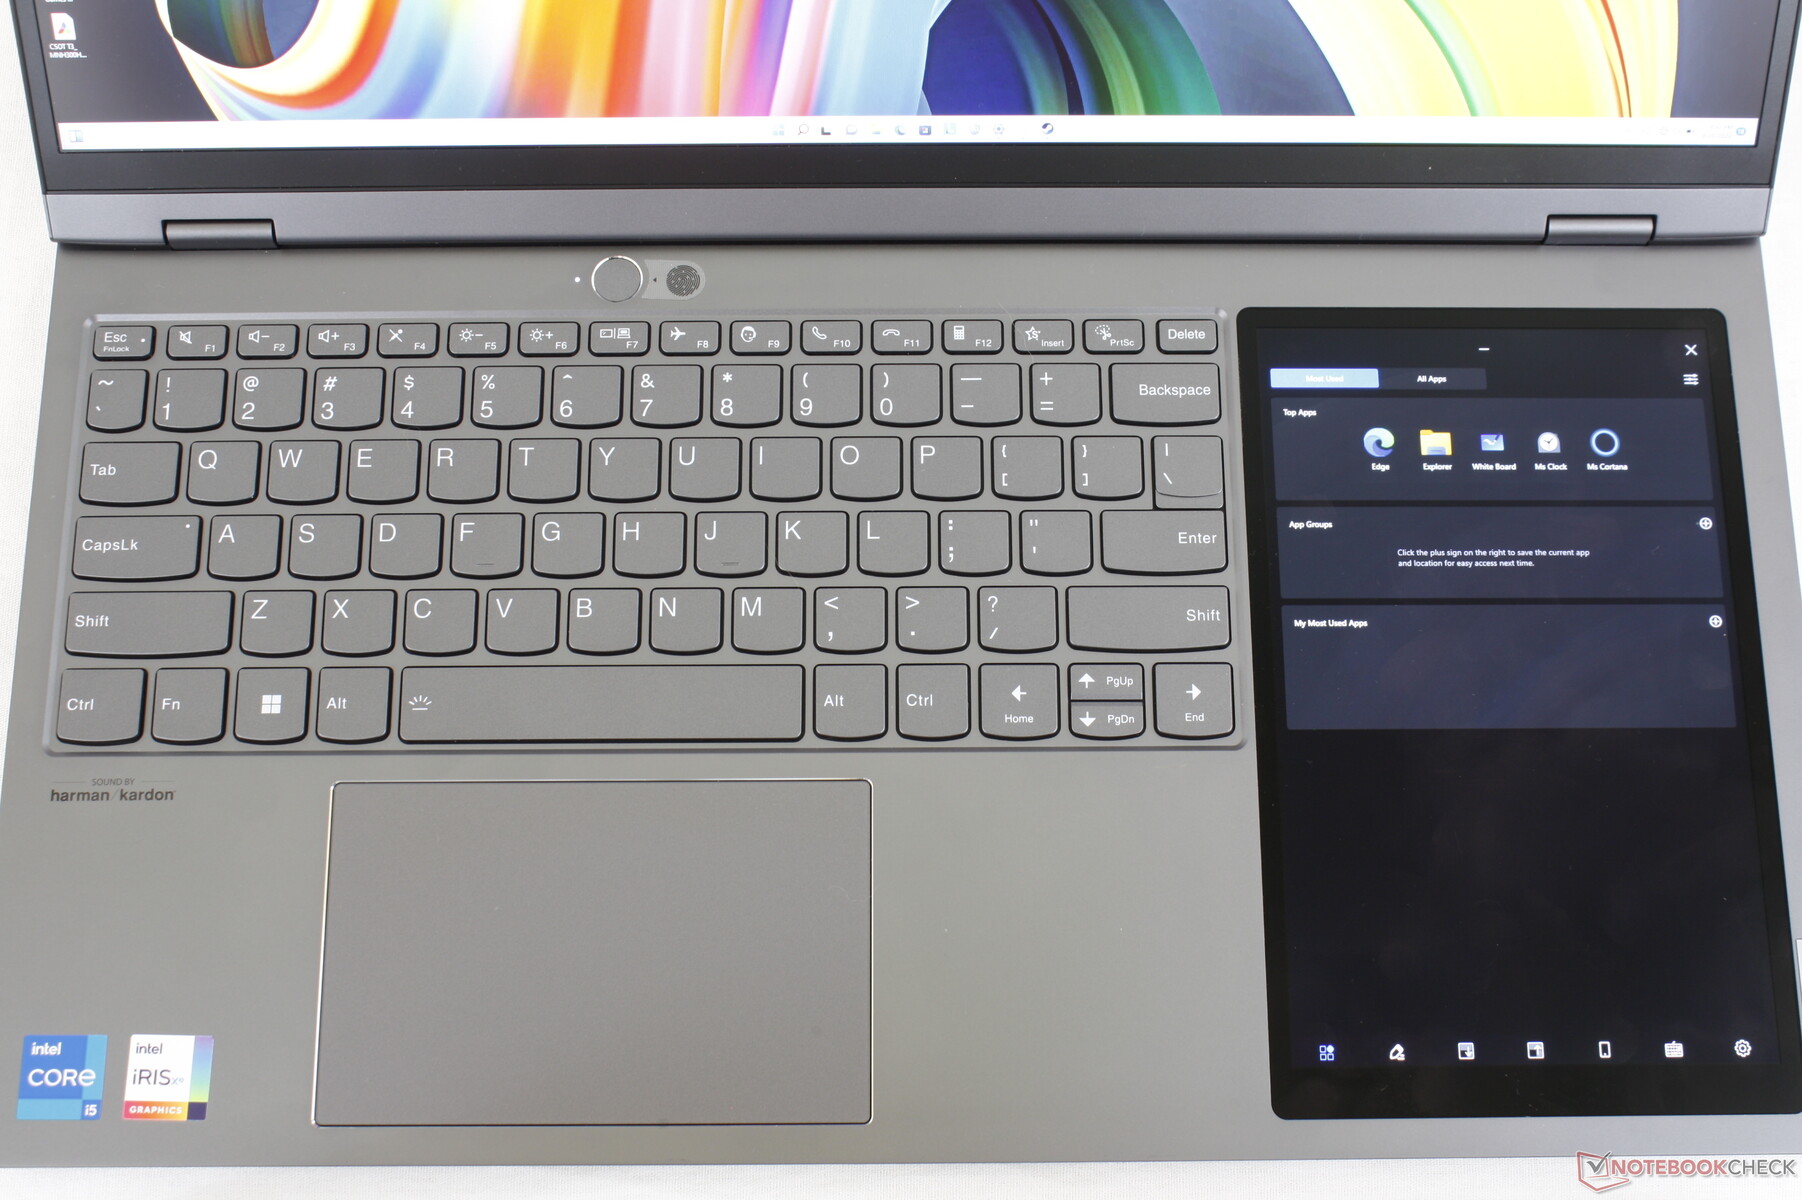
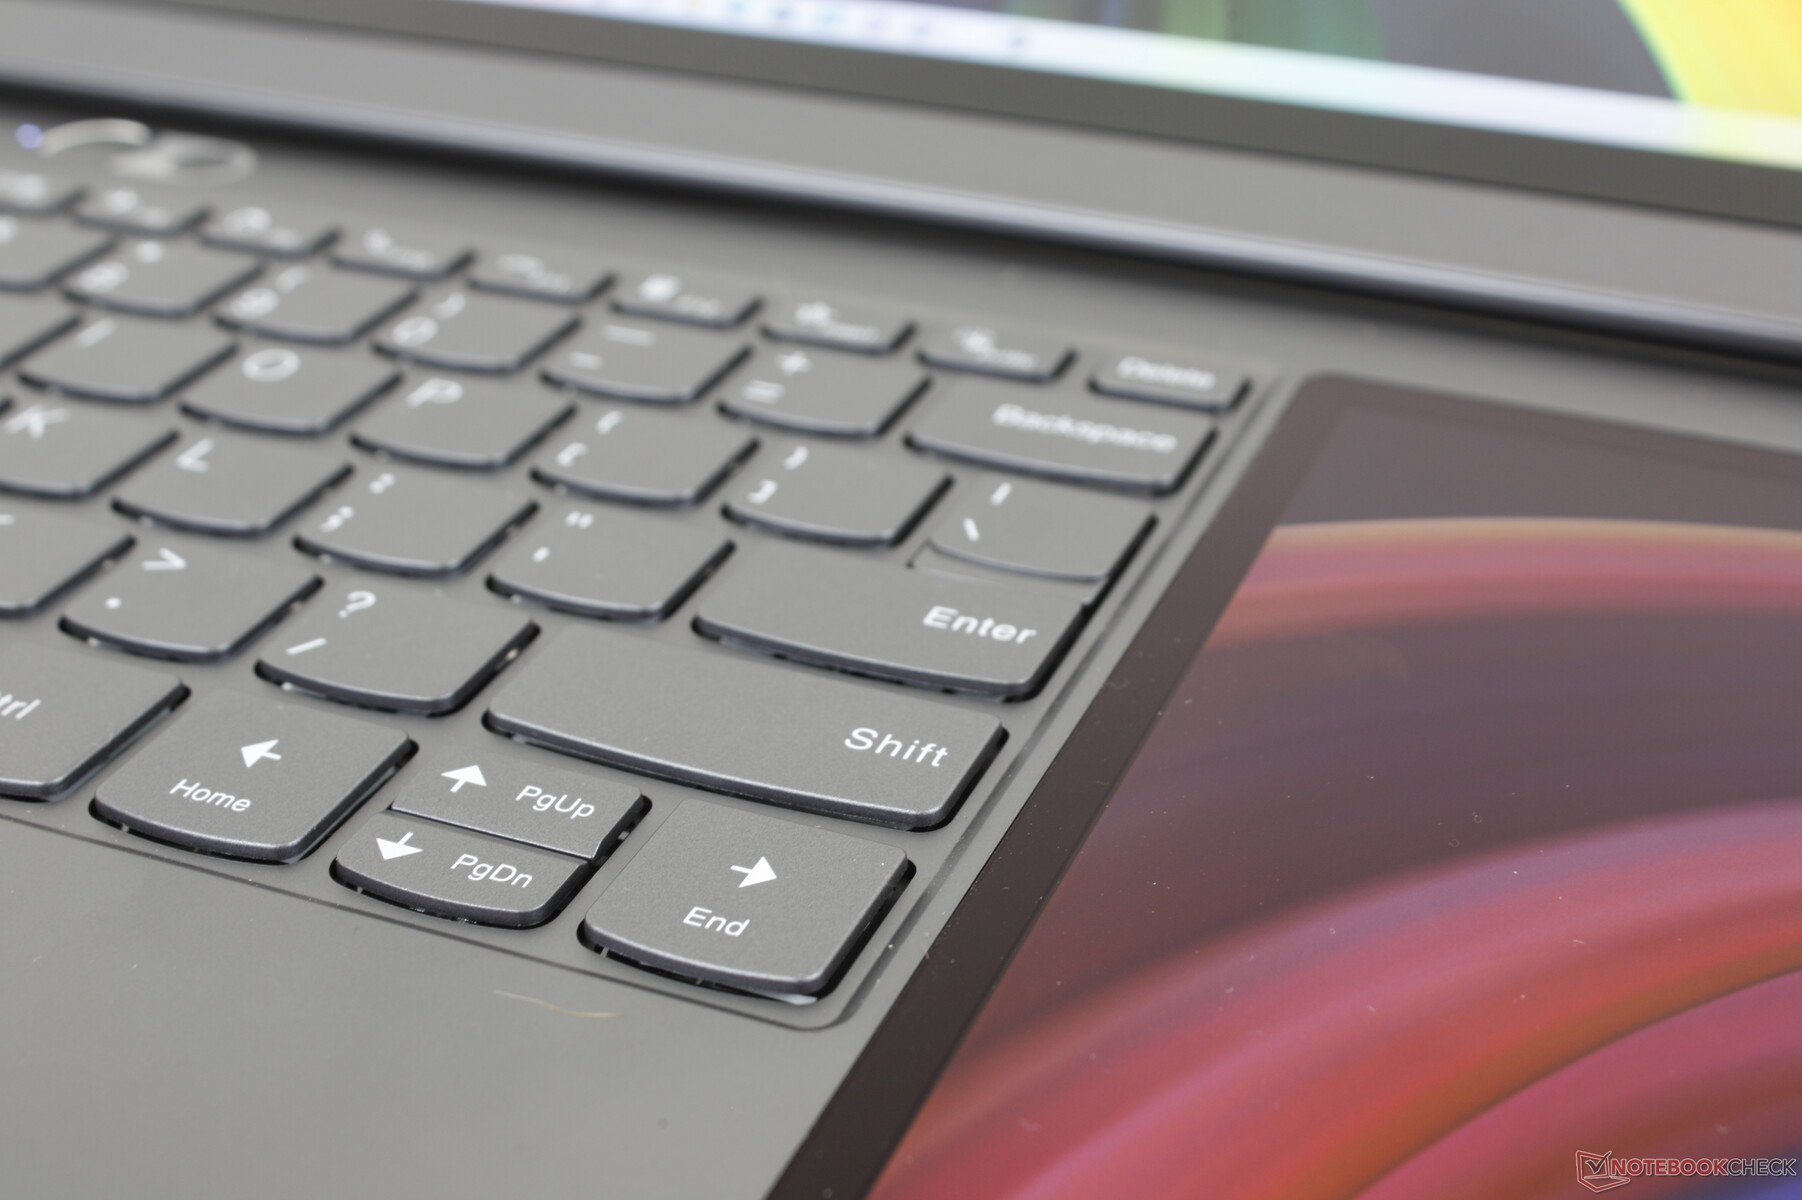
Input Devices — Spacious Keyboard Deck
Keyboard
The typing experience remains identical to other ThinkBook laptops including the ThinkBook 14 G4 despite the inclusion of the secondary touchscreen. The wider footprint allows for a relatively spacious clickpad, touchscreen, and keyboard all on one laptop whereas they can feel cramped on a smaller 14-inch or 15-inch ZenBook.
Key feedback is shallow and light not unlike the keyboards on many Yoga, IdeaPad, or midrange Ultrabook models. ThinkPad keyboards are generally firmer and with deeper travel in comparison.
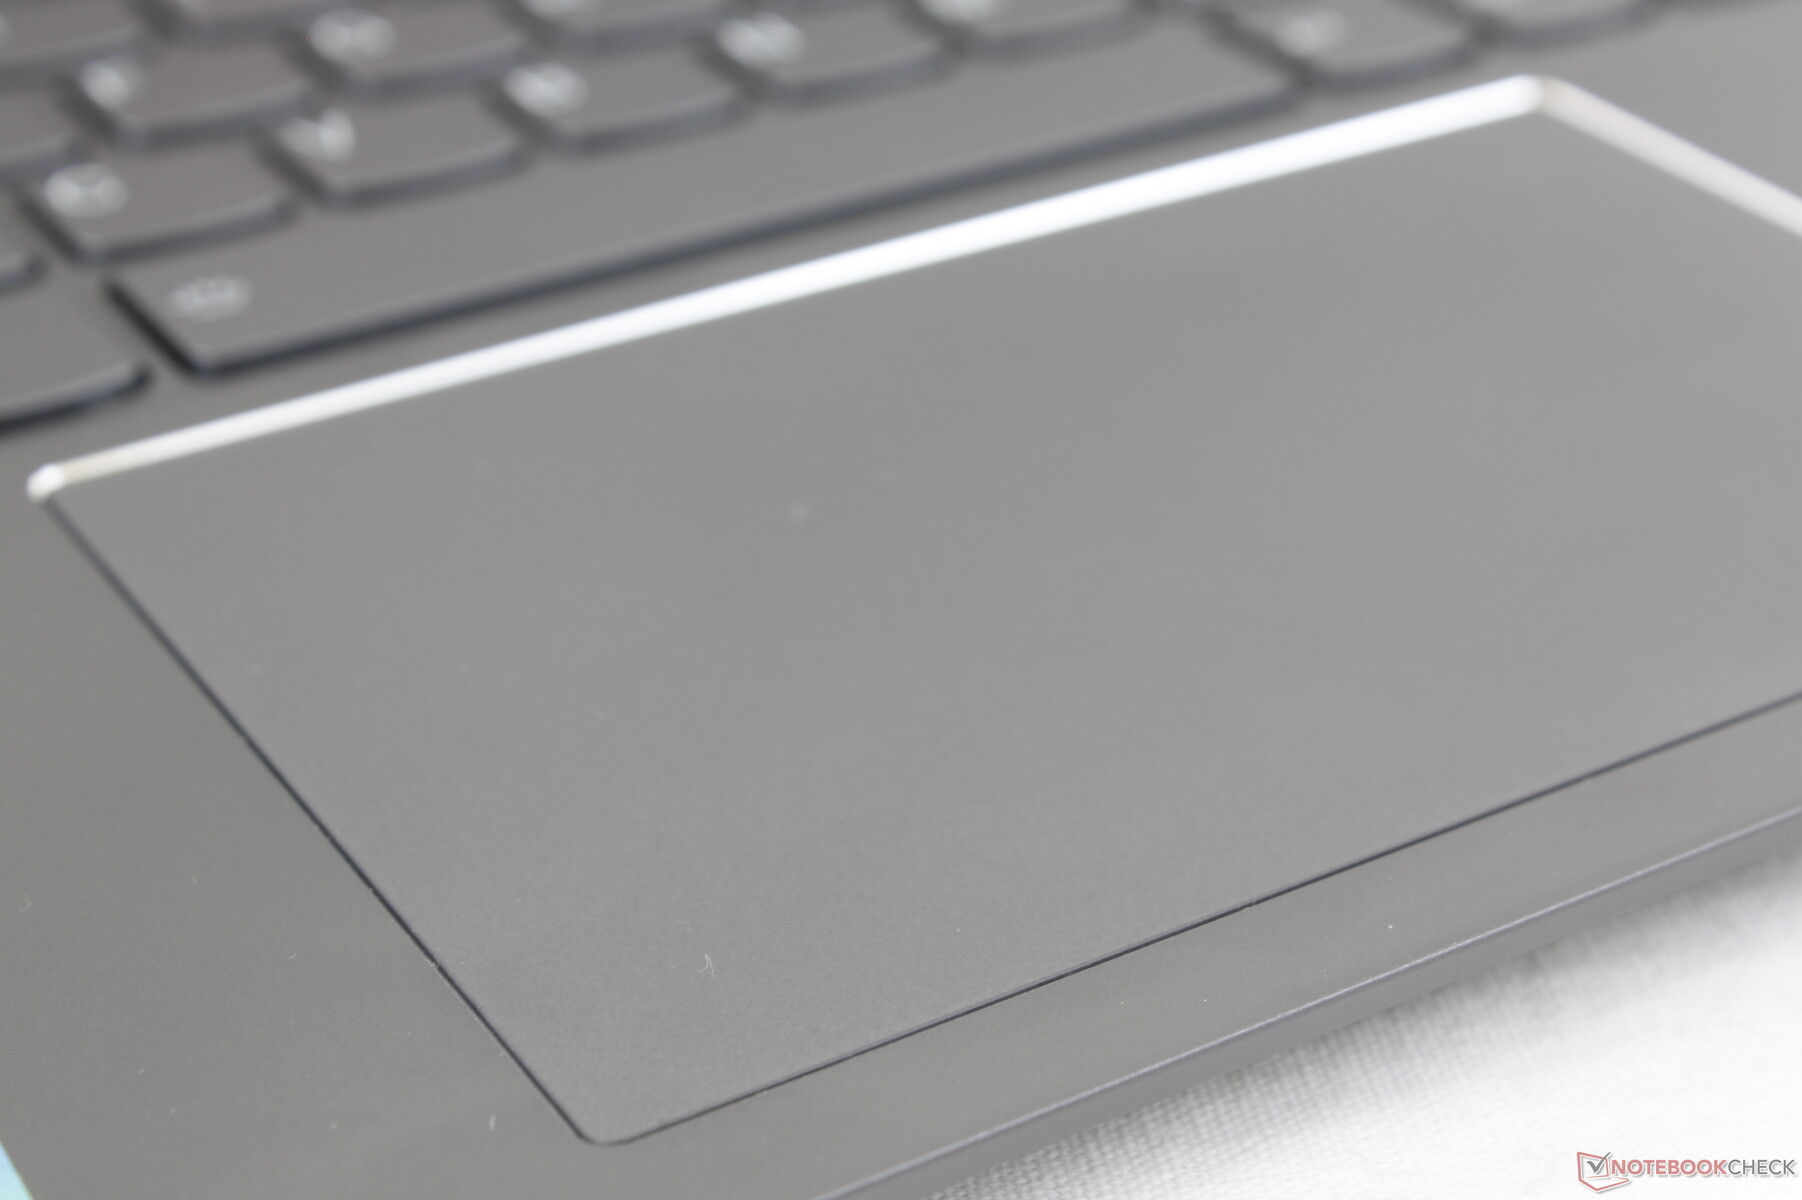
Touchpad
The clickpad is of a decent size unlike the tiny one on the ZenBook Duo UX481 (12 x 7.5 cm vs. 5.5 x 7 cm). Gliding is smooth and responsive due in part to the faster 120 Hz native refresh rate of the main display. Clicking on the clickpad is firm and with a loud auditory click for satisfying feedback.

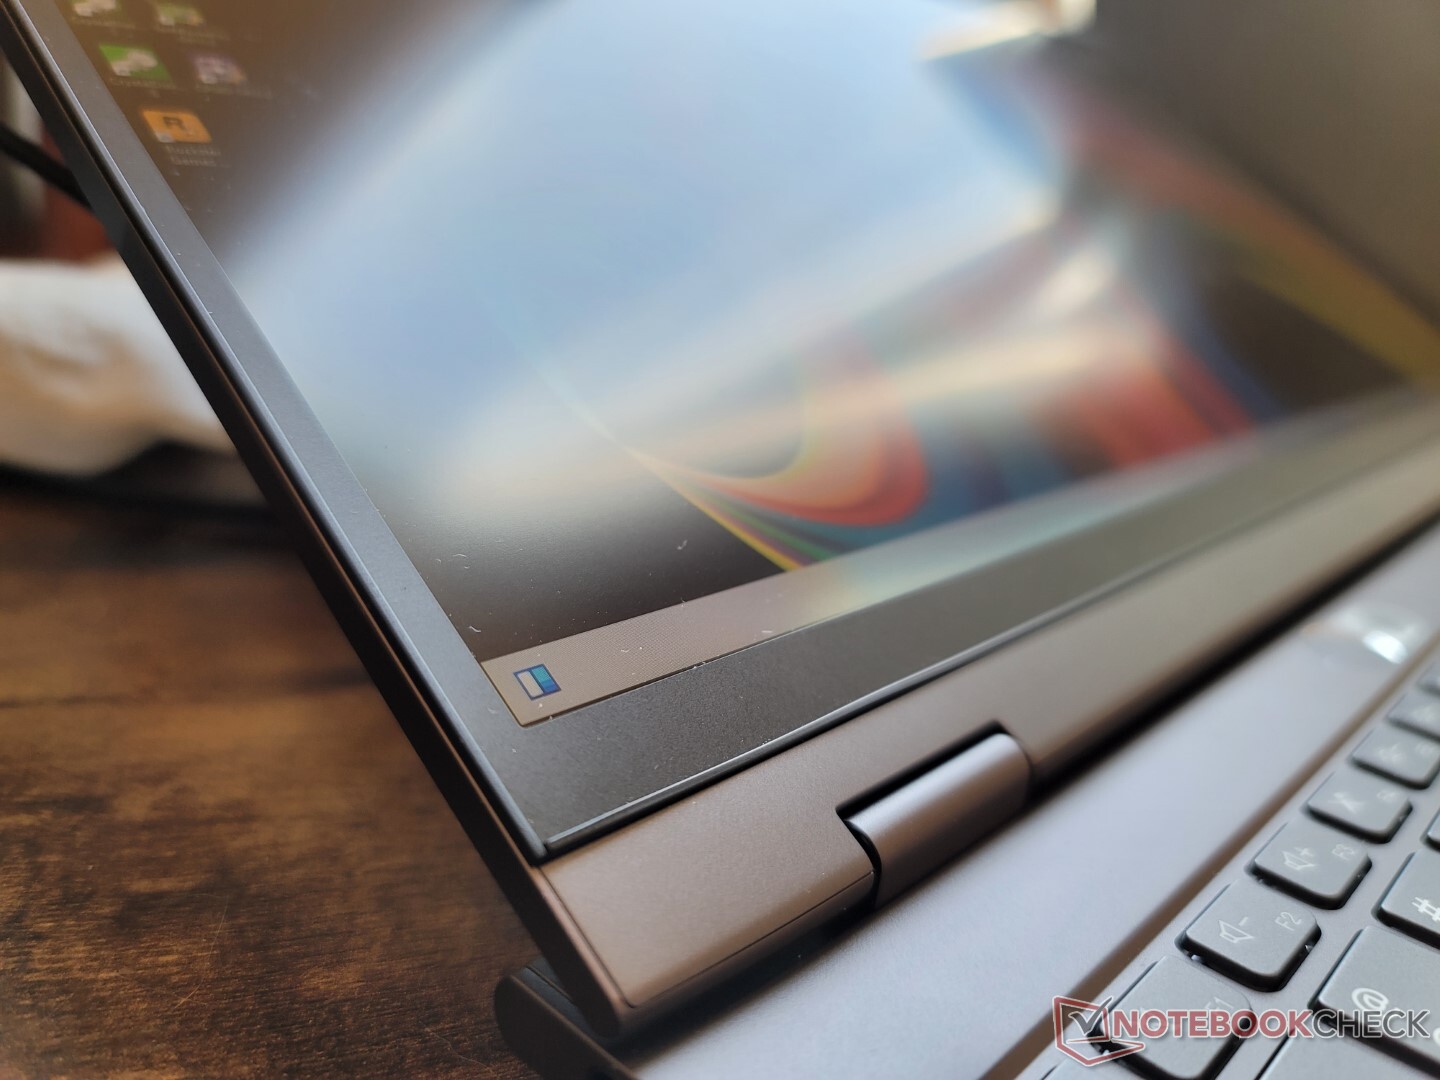
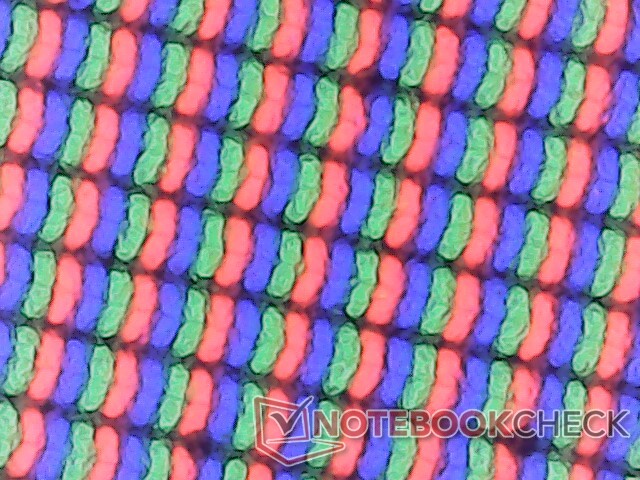
Primary Display — P3, 120 Hz, and IPS 21:10
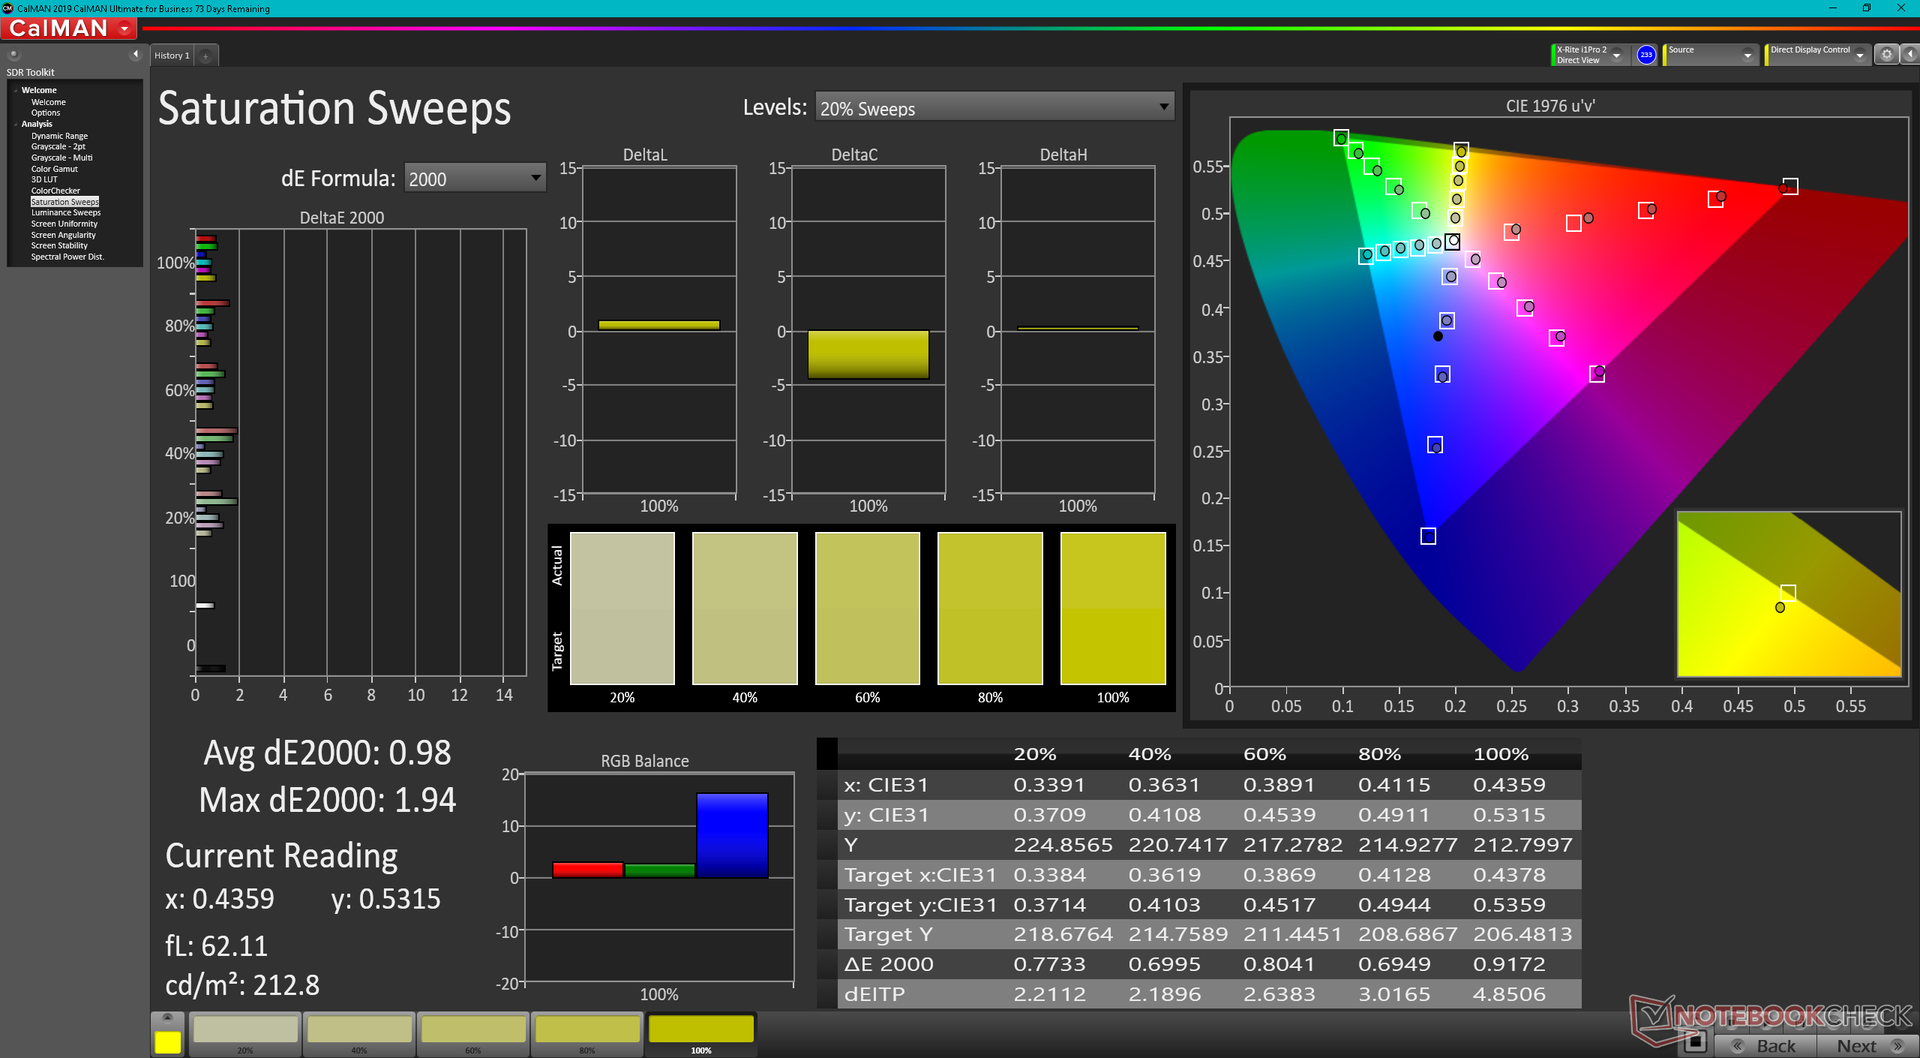
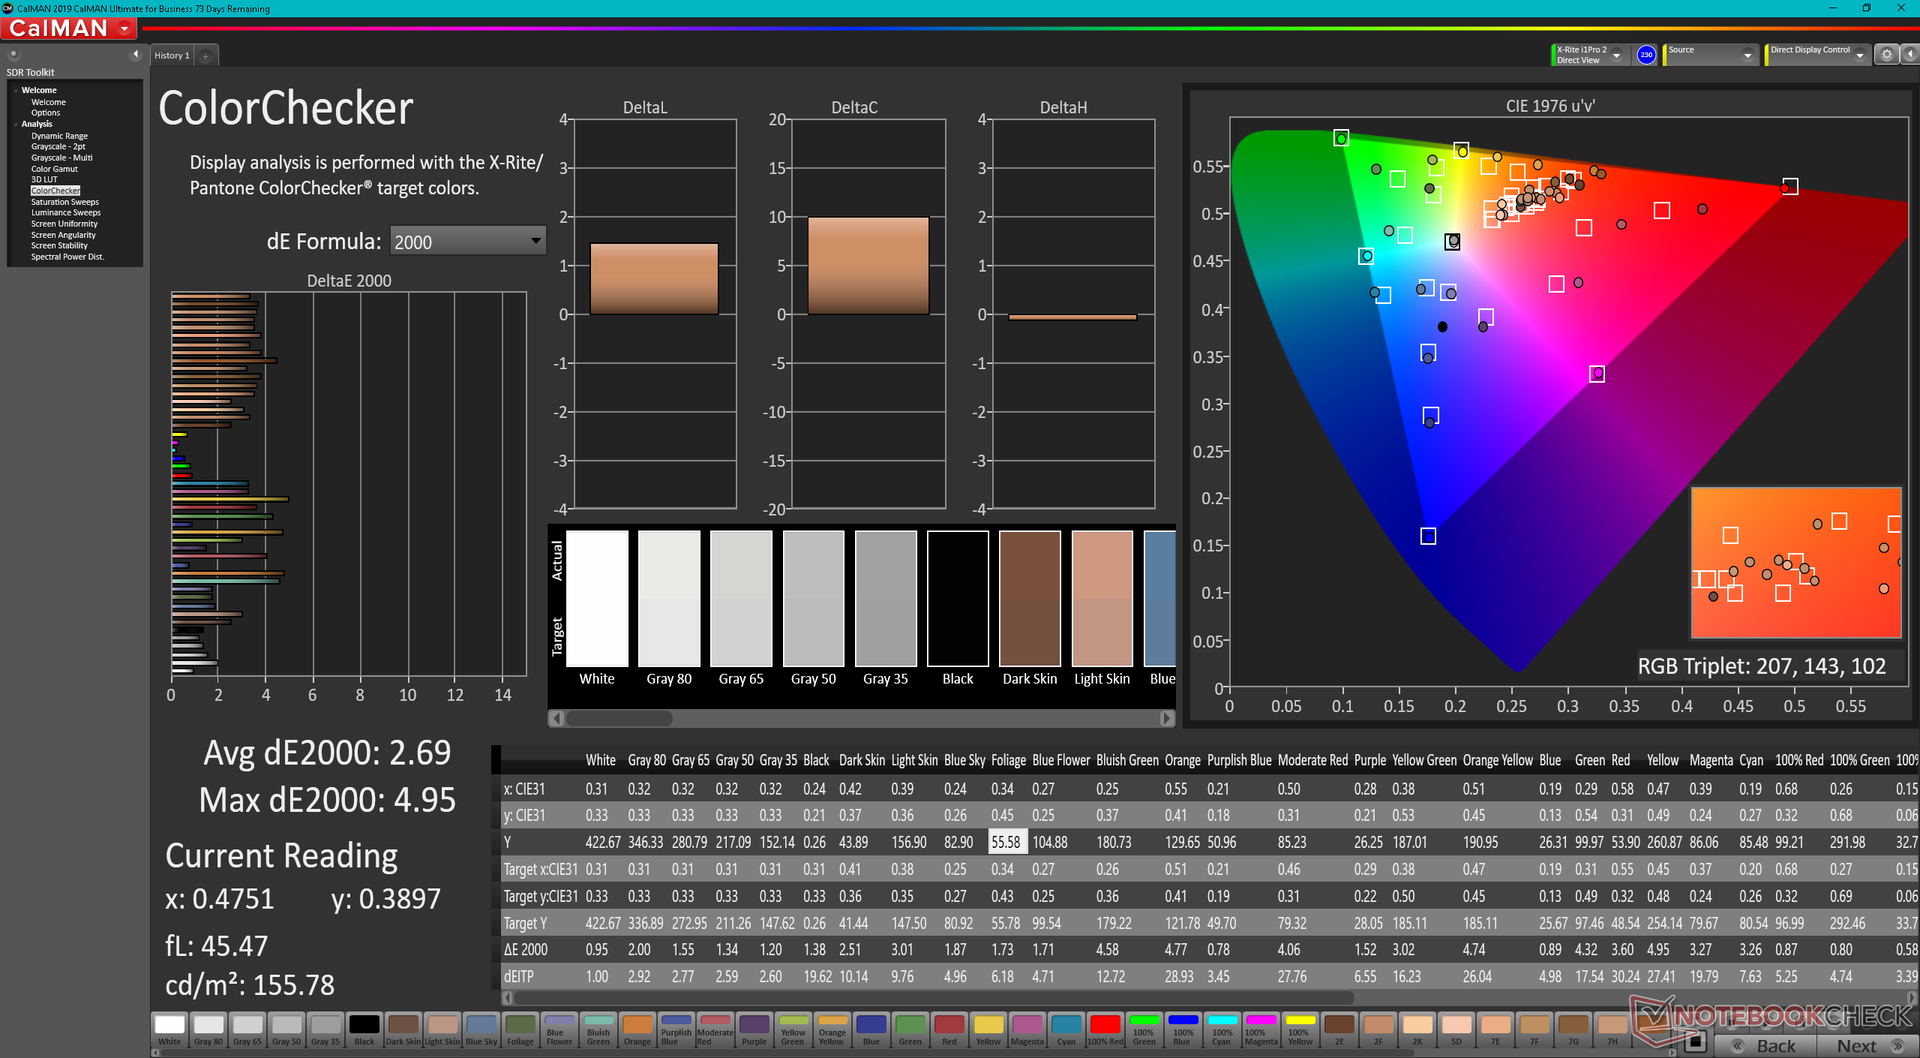
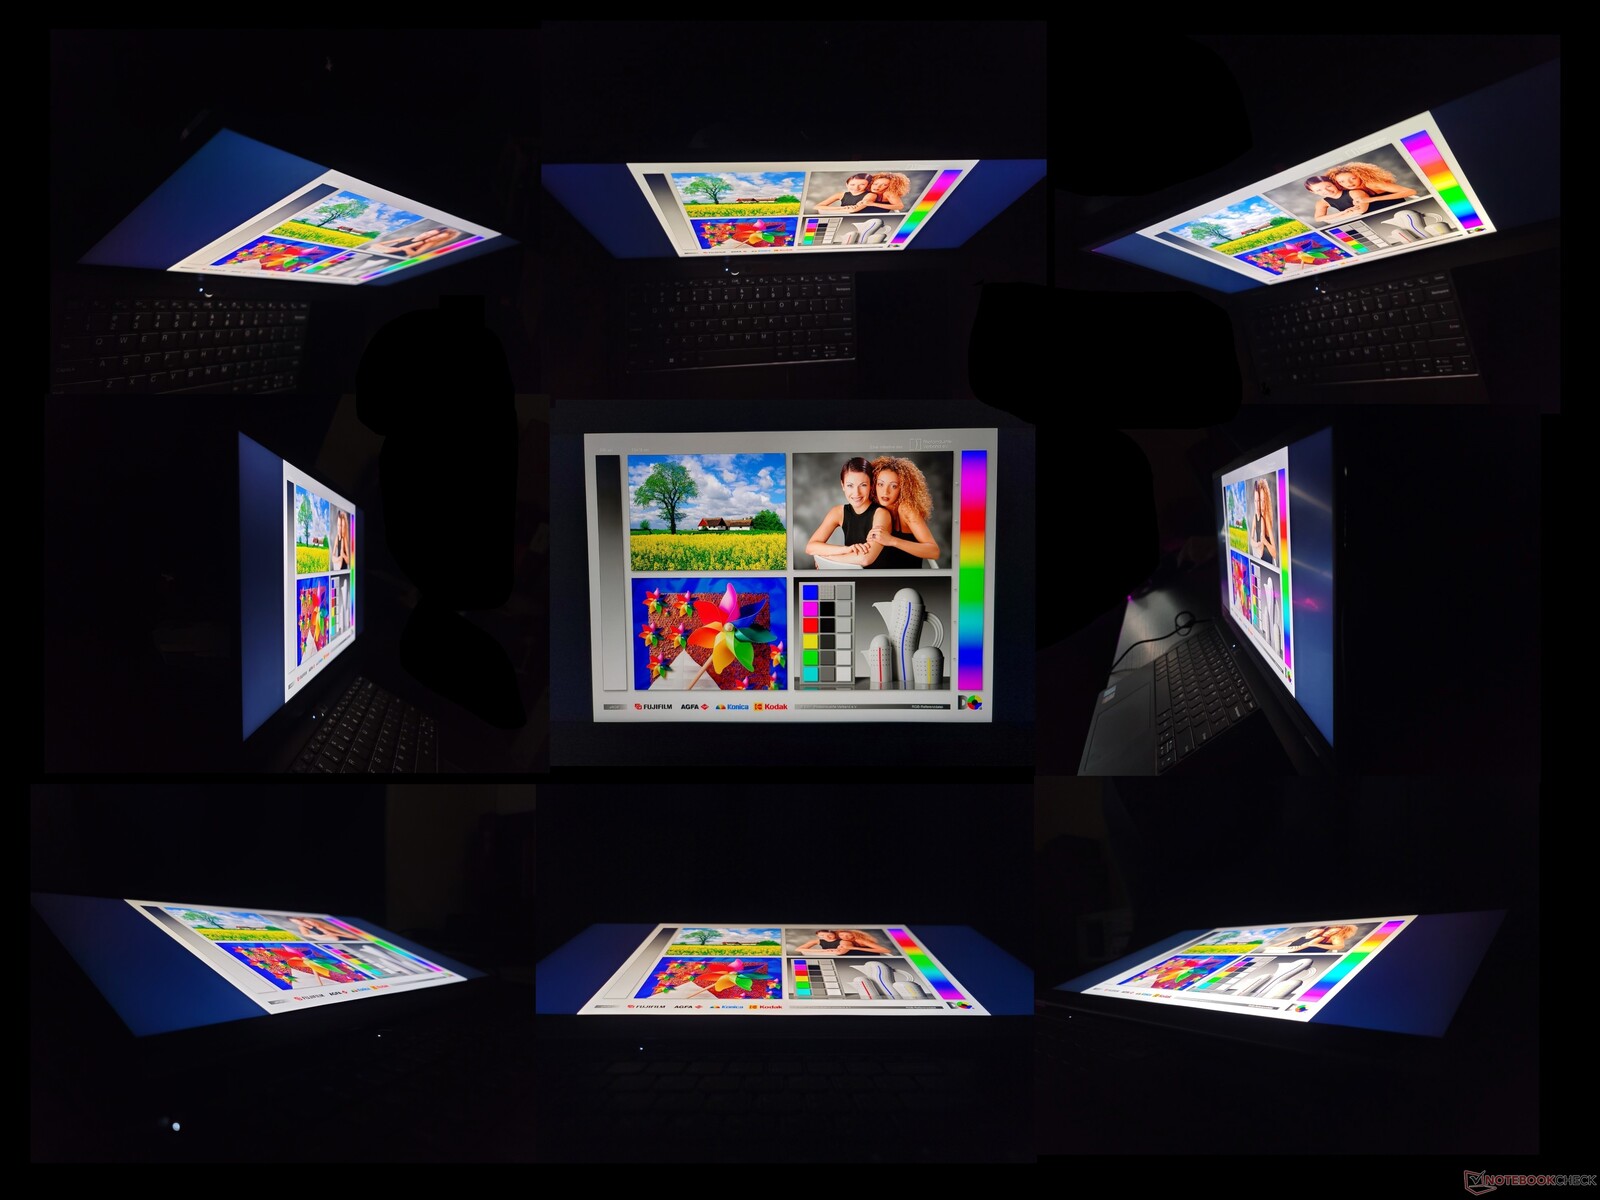
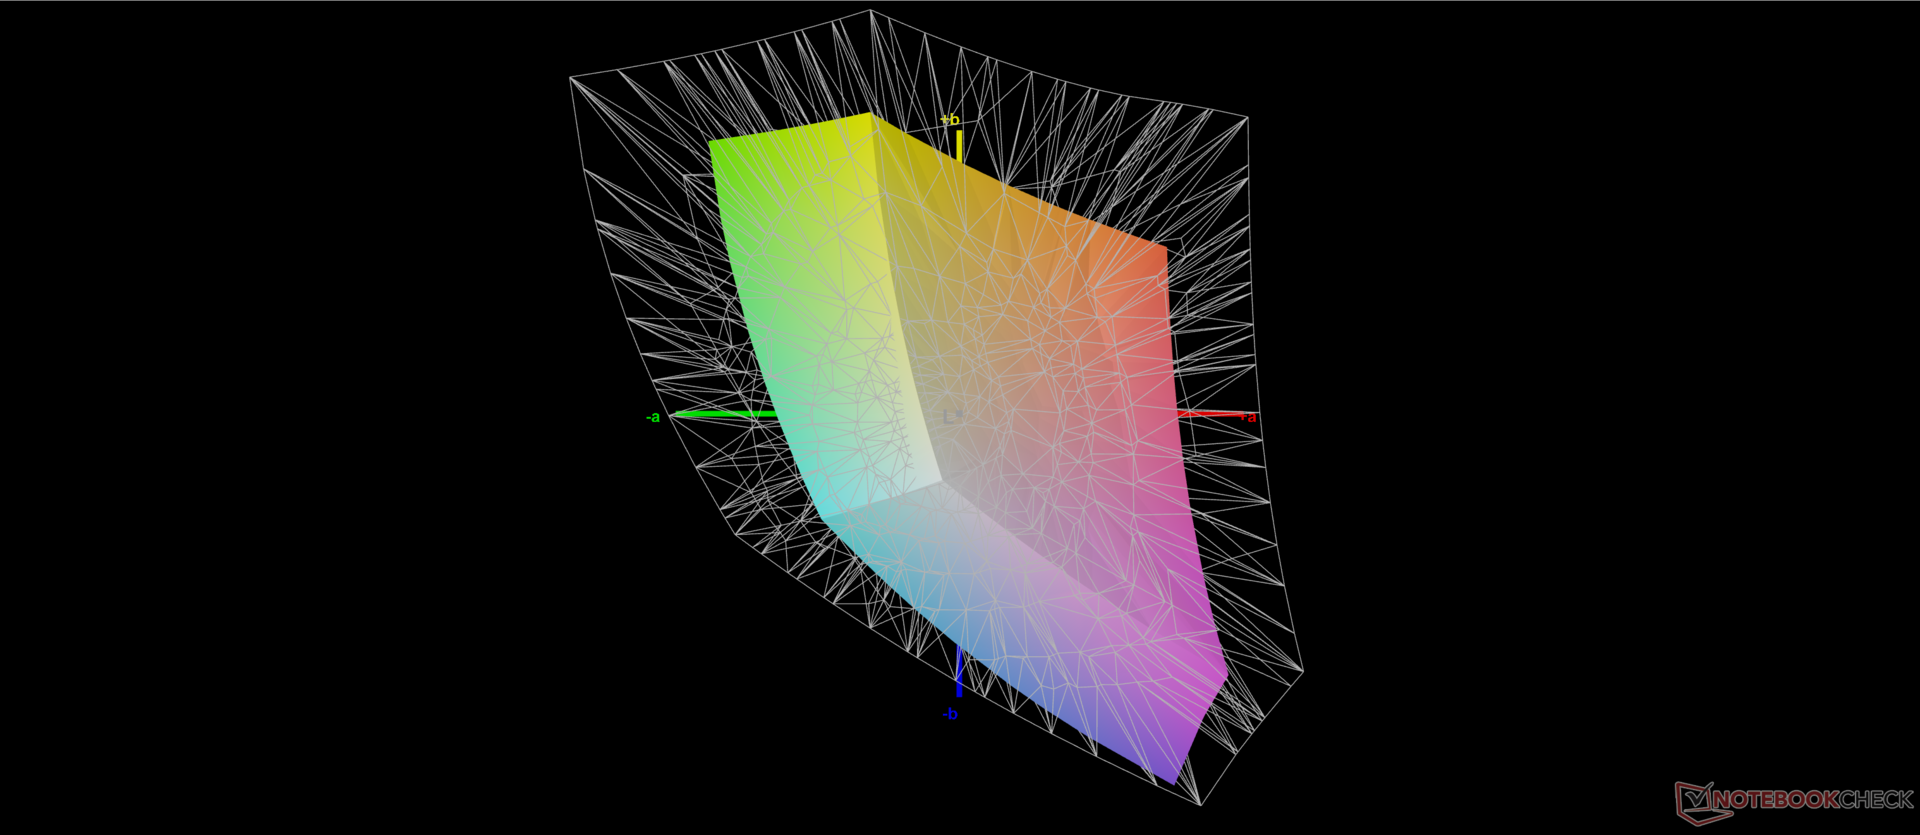
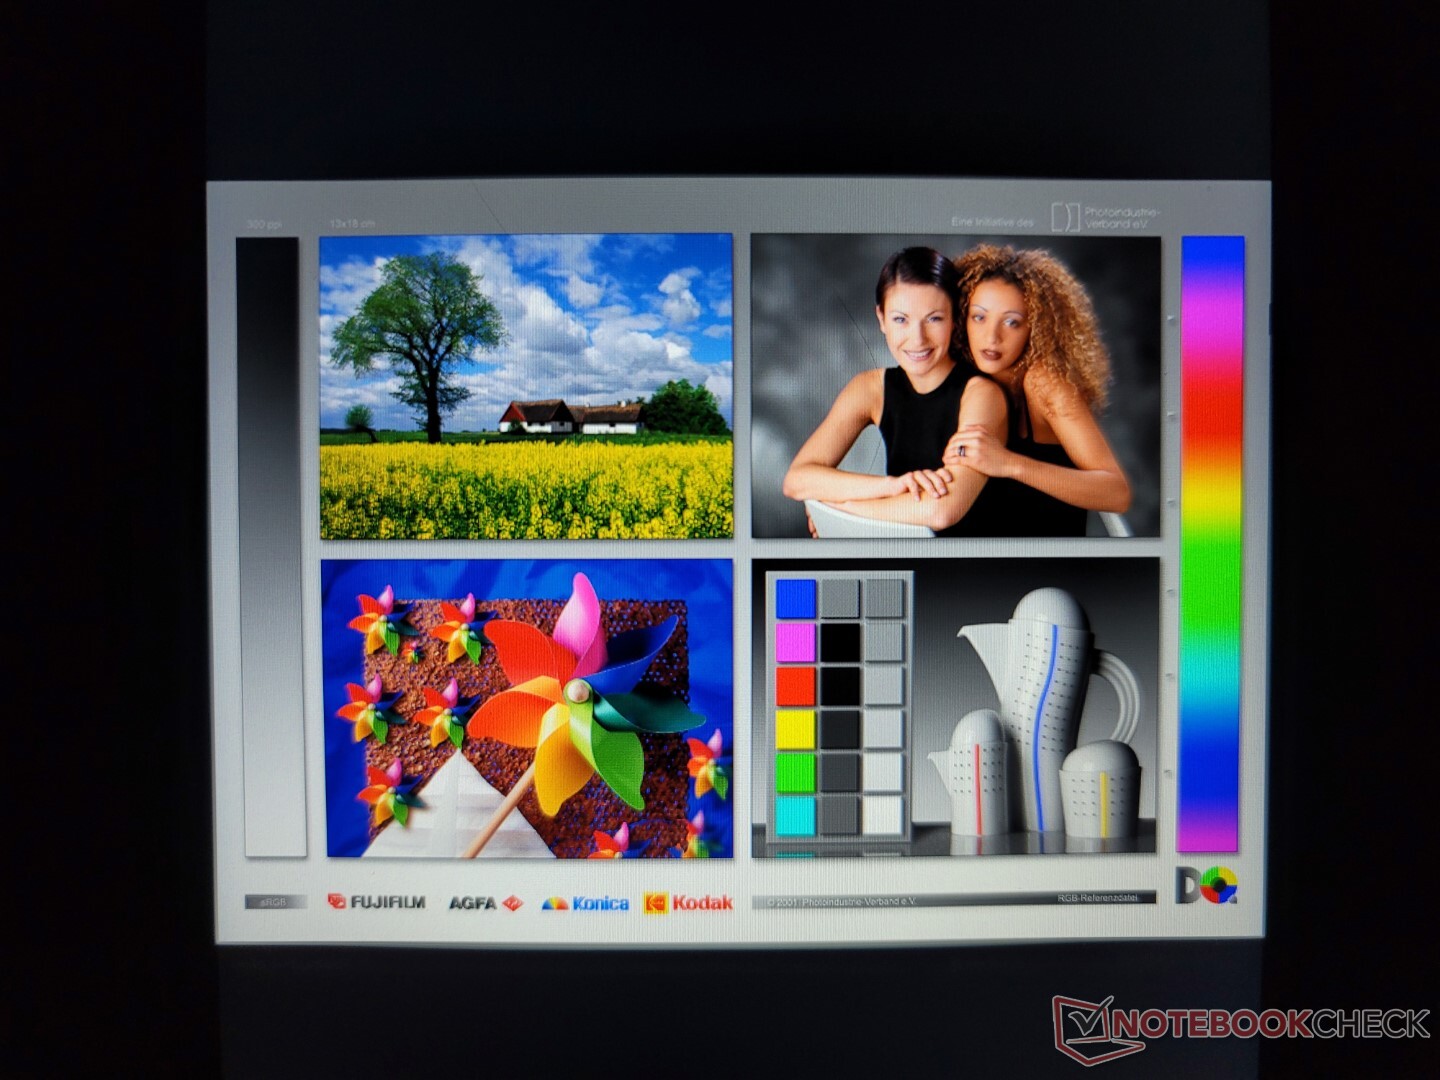
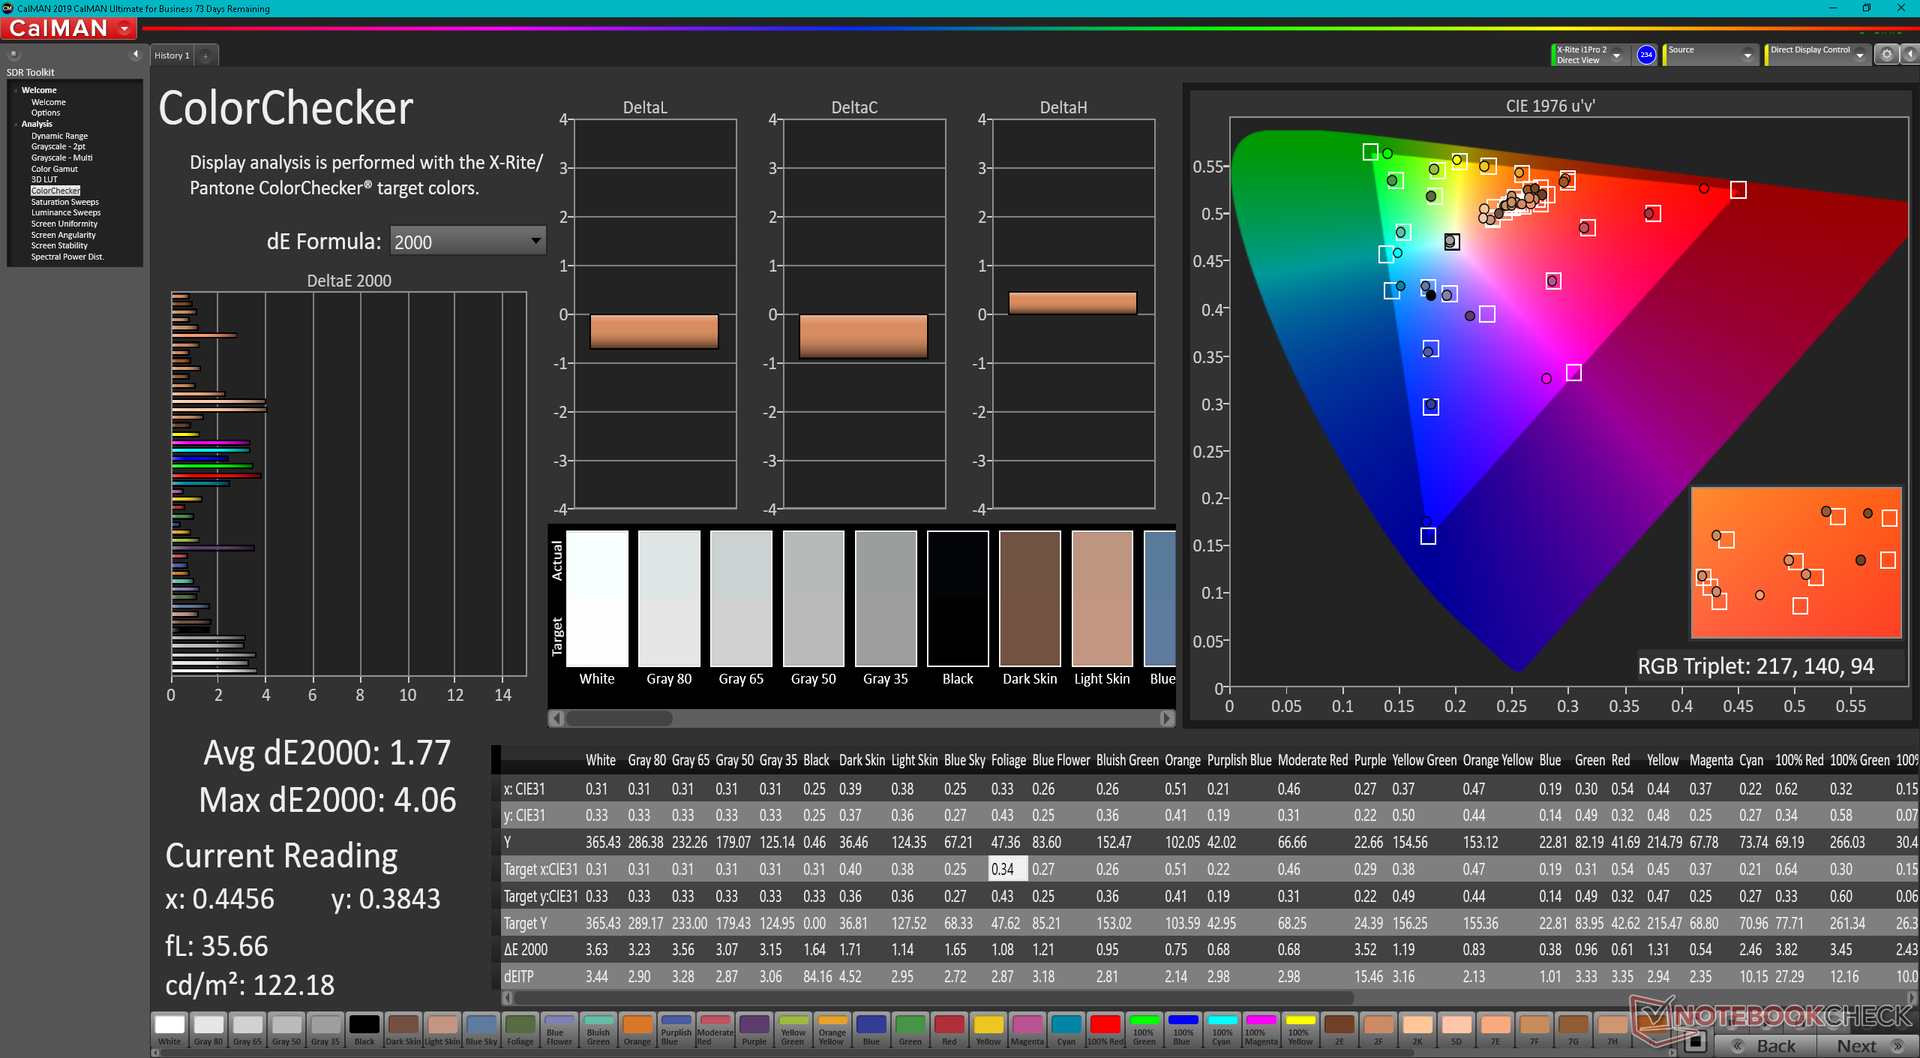
The main IPS display may be of an atypical aspect ratio, but it carries the same characteristics as most other high-end IPS panels. The ~1000:1 contrast ratio, reasonably fast black-white response times, fast 120 Hz native refresh rate, and >95 percent P3 color coverage all make the display surprisingly good for both graphics, editing, and everything in between. Both colors and response times in particular are deeper and faster, respectively, than the panel on the ThinkBook Plus Gen 2 while maximum brightness remains about the same.

| |||||||||||||||||||||||||
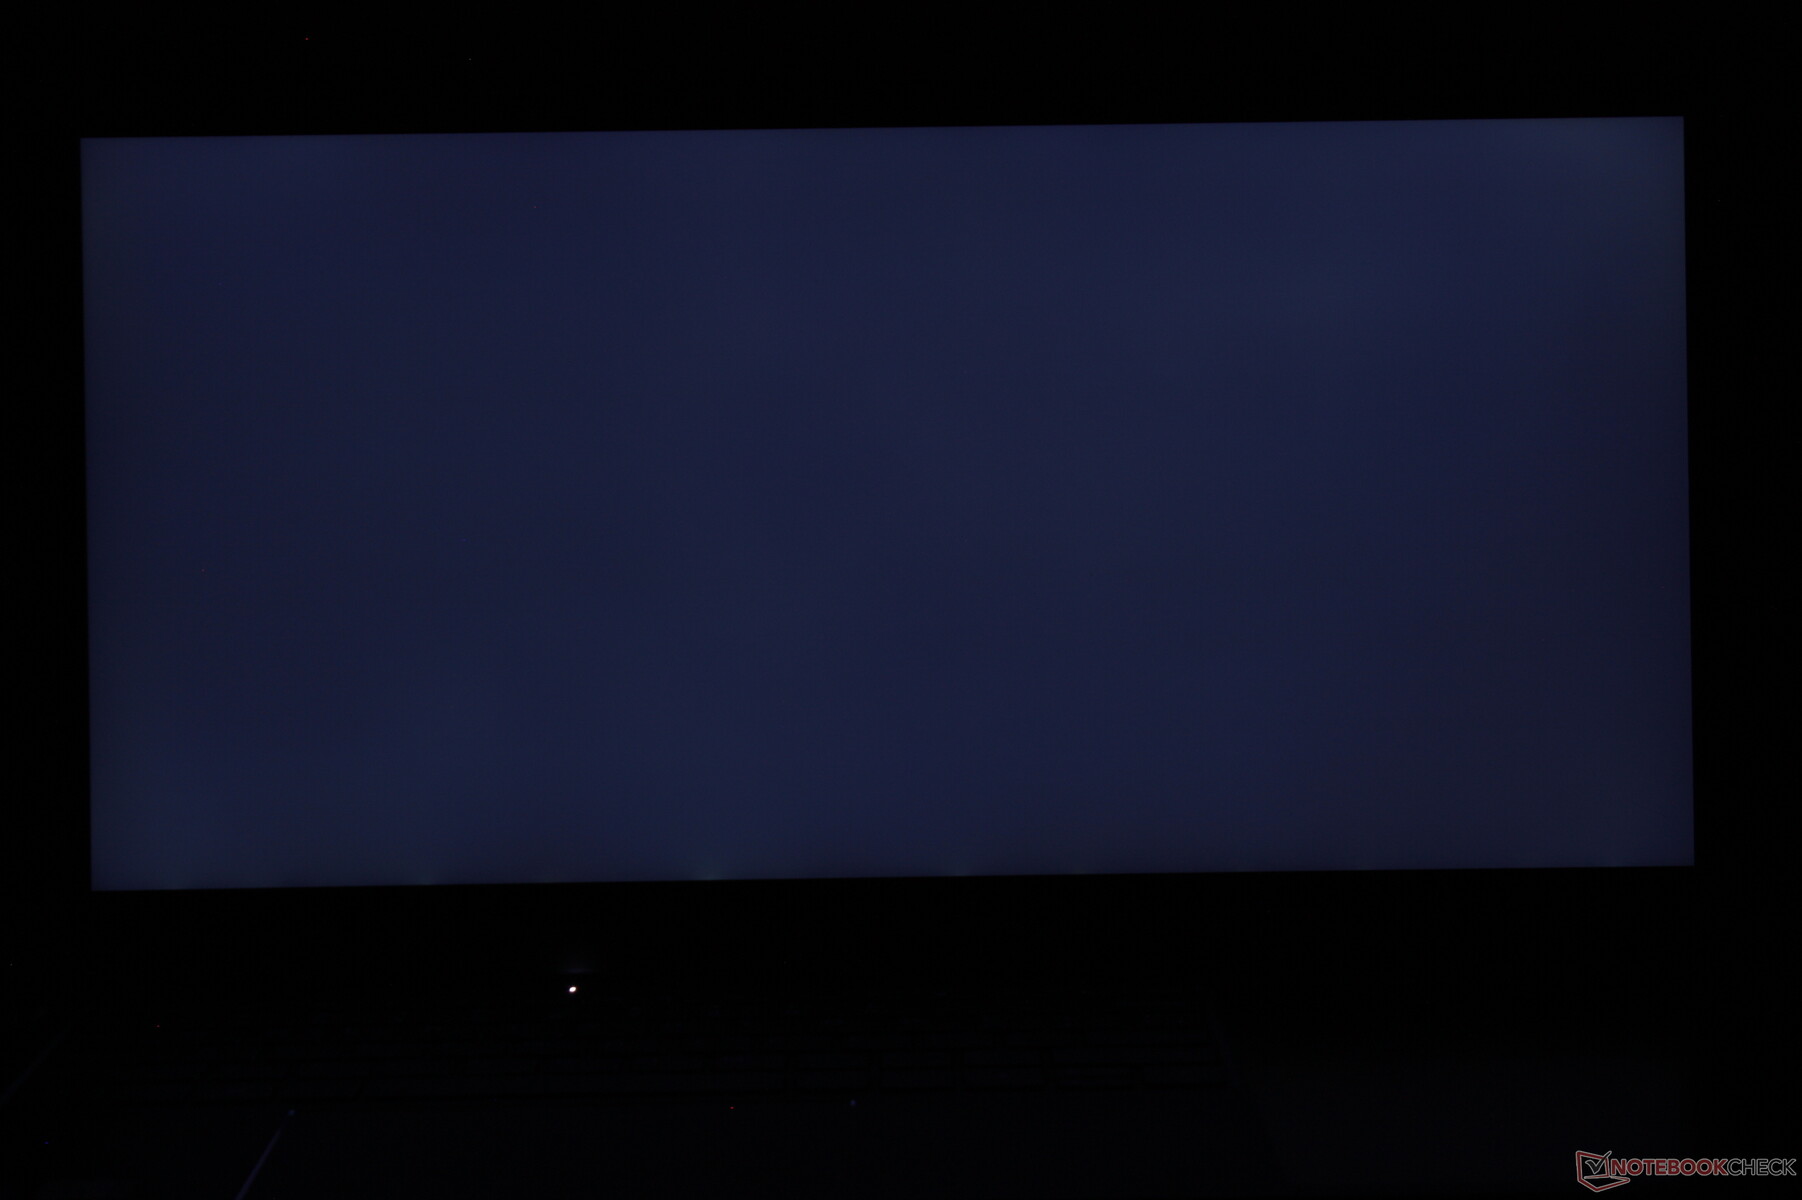
Brightness Distribution: 84 %
Center on Battery: 405 cd/m²
Contrast: 1191:1 (Black: 0.34 cd/m²)
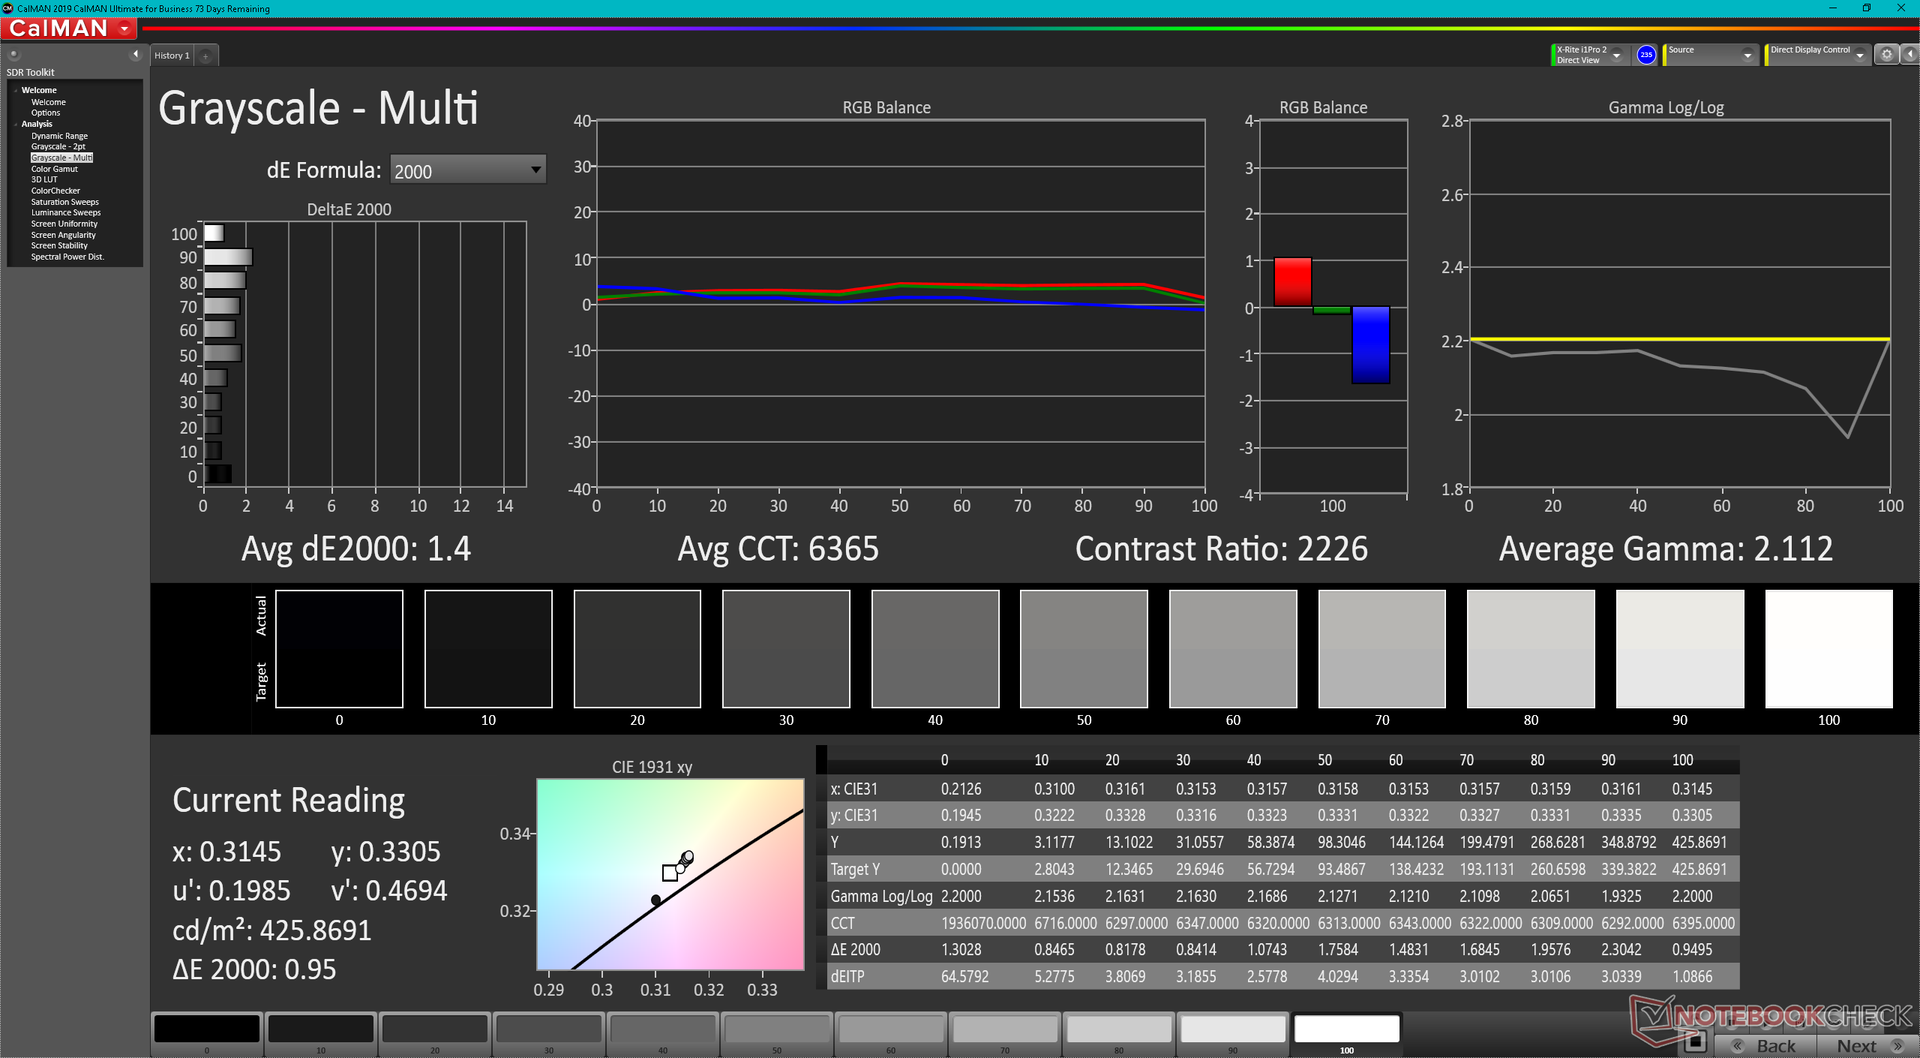
ΔE ColorChecker Calman: 2.69 | ∀{0.5-29.43 Ø4.72}
ΔE Greyscale Calman: 1.4 | ∀{0.09-98 Ø4.97}
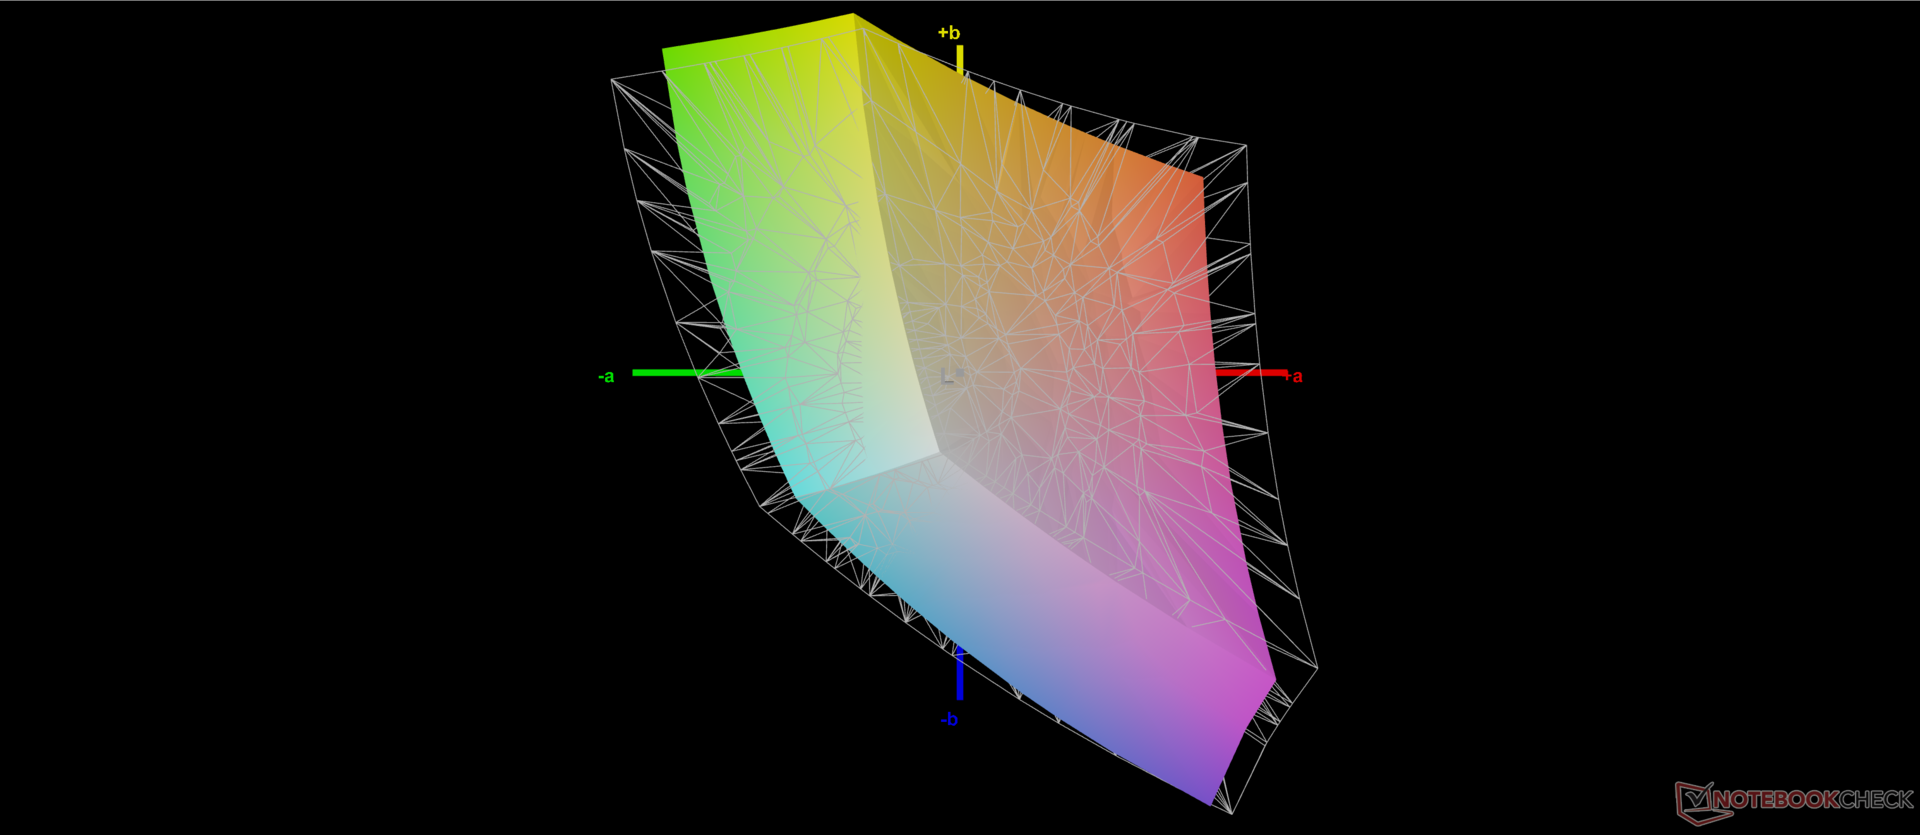
87.8% AdobeRGB 1998 (Argyll 3D)
100% sRGB (Argyll 3D)
96.8% Display P3 (Argyll 3D)
Gamma: 2.1
CCT: 6365 K
| Lenovo ThinkBook Plus Gen3 MNH300HB1-1 CSOT T3, IPS, 3072x1440, 17.3" | Lenovo ThinkBook Plus Gen2 Core i5 CSOT T3 MND307DA1-5 (LCD), IPS, E-Ink, 2560x1600, 13.3" | Asus ProArt StudioBook Pro 17 W700G3T 170PUW1-A00, IPS, 1920x1200, 17" | LG Gram 17 (2022) LG Philips LP170WQ1-SPF2, IPS, 2560x1600, 17" | Dell XPS 17 9720 Sharp LQ170R1, IPS, 3840x2400, 17" | Gigabyte Aero 17 HDR YD AU Optronics AUO329B, IPS, 3840x2160, 17.3" | |
|---|---|---|---|---|---|---|
| Display | -16% | -2% | -0% | 4% | 1% | |
| Display P3 Coverage (%) | 96.8 | 70.1 -28% | 96.2 -1% | 98.1 1% | 94.8 -2% | 86.9 -10% |
| sRGB Coverage (%) | 100 | 98 -2% | 99.8 0% | 99.9 0% | 100 0% | 100 0% |
| AdobeRGB 1998 Coverage (%) | 87.8 | 72.2 -18% | 84.7 -4% | 85.9 -2% | 100 14% | 99.6 13% |
| Response Times | -44% | -45% | -28% | -64% | -56% | |
| Response Time Grey 50% / Grey 80% * (ms) | 28 ? | 42.8 ? -53% | 41.2 ? -47% | 46 ? -64% | 53.2 ? -90% | 52 ? -86% |
| Response Time Black / White * (ms) | 20.8 ? | 28 ? -35% | 29.6 ? -42% | 19 ? 9% | 28.4 ? -37% | 26 ? -25% |
| PWM Frequency (Hz) | 17990 ? | |||||
| Screen | -17% | 9% | -28% | -18% | 20% | |
| Brightness middle (cd/m²) | 405 | 404 0% | 323 -20% | 400 -1% | 438 8% | 488 20% |
| Brightness (cd/m²) | 389 | 388 0% | 308 -21% | 353 -9% | 411 6% | 467 20% |
| Brightness Distribution (%) | 84 | 94 12% | 88 5% | 81 -4% | 86 2% | 86 2% |
| Black Level * (cd/m²) | 0.34 | 0.24 29% | 0.36 -6% | 0.3 12% | 0.27 21% | 0.33 3% |
| Contrast (:1) | 1191 | 1683 41% | 897 -25% | 1333 12% | 1622 36% | 1479 24% |
| Colorchecker dE 2000 * | 2.69 | 3.1 -15% | 1.1 59% | 3.15 -17% | 2.5 7% | 1.23 54% |
| Colorchecker dE 2000 max. * | 4.95 | 6.9 -39% | 3.3 33% | 6.54 -32% | 6.3 -27% | 2.94 41% |
| Greyscale dE 2000 * | 1.4 | 3.7 -164% | 0.8 43% | 4 -186% | 4.2 -200% | 1.5 -7% |
| Gamma | 2.1 105% | 2.26 97% | 2.23 99% | 2.14 103% | 2.22 99% | 2.169 101% |
| CCT | 6365 102% | 5936 110% | 6479 100% | 7278 89% | 7034 92% | 6614 98% |
| Colorchecker dE 2000 calibrated * | 1.3 | 0.8 | 1.44 | 0.8 | 0.77 | |
| Color Space (Percent of AdobeRGB 1998) (%) | 75.7 | 99 | ||||
| Color Space (Percent of sRGB) (%) | 99.8 | 99 | ||||
| Total Average (Program / Settings) | -26% /
-21% | -13% /
-2% | -19% /
-22% | -26% /
-20% | -12% /
4% |
* ... smaller is better

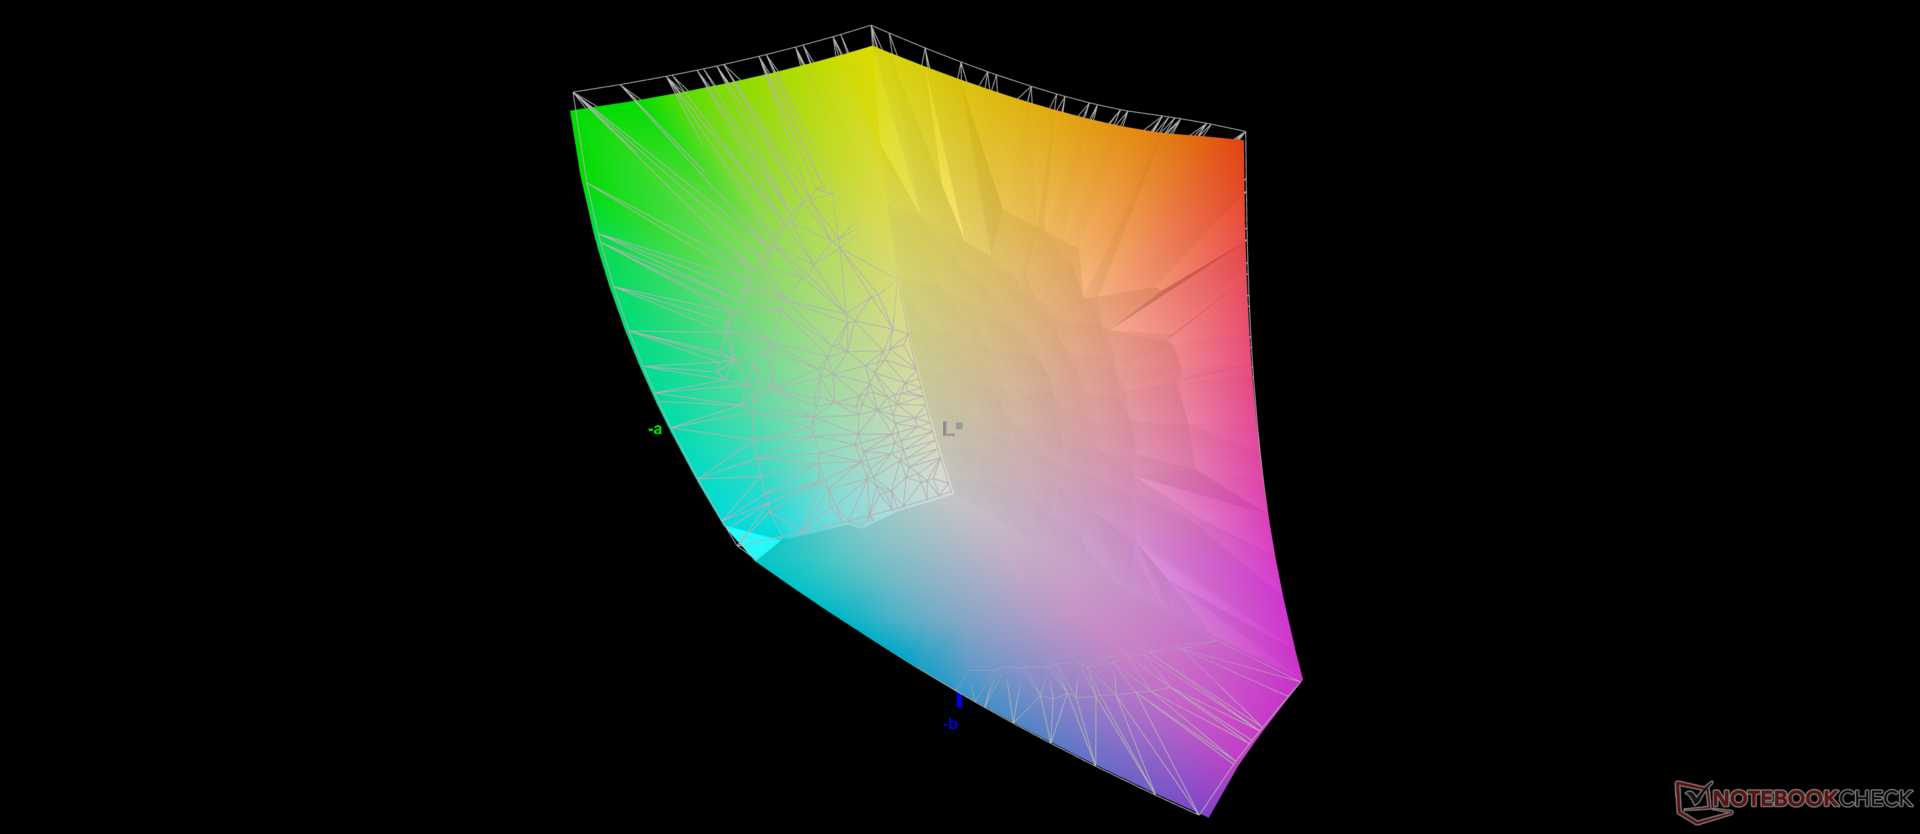
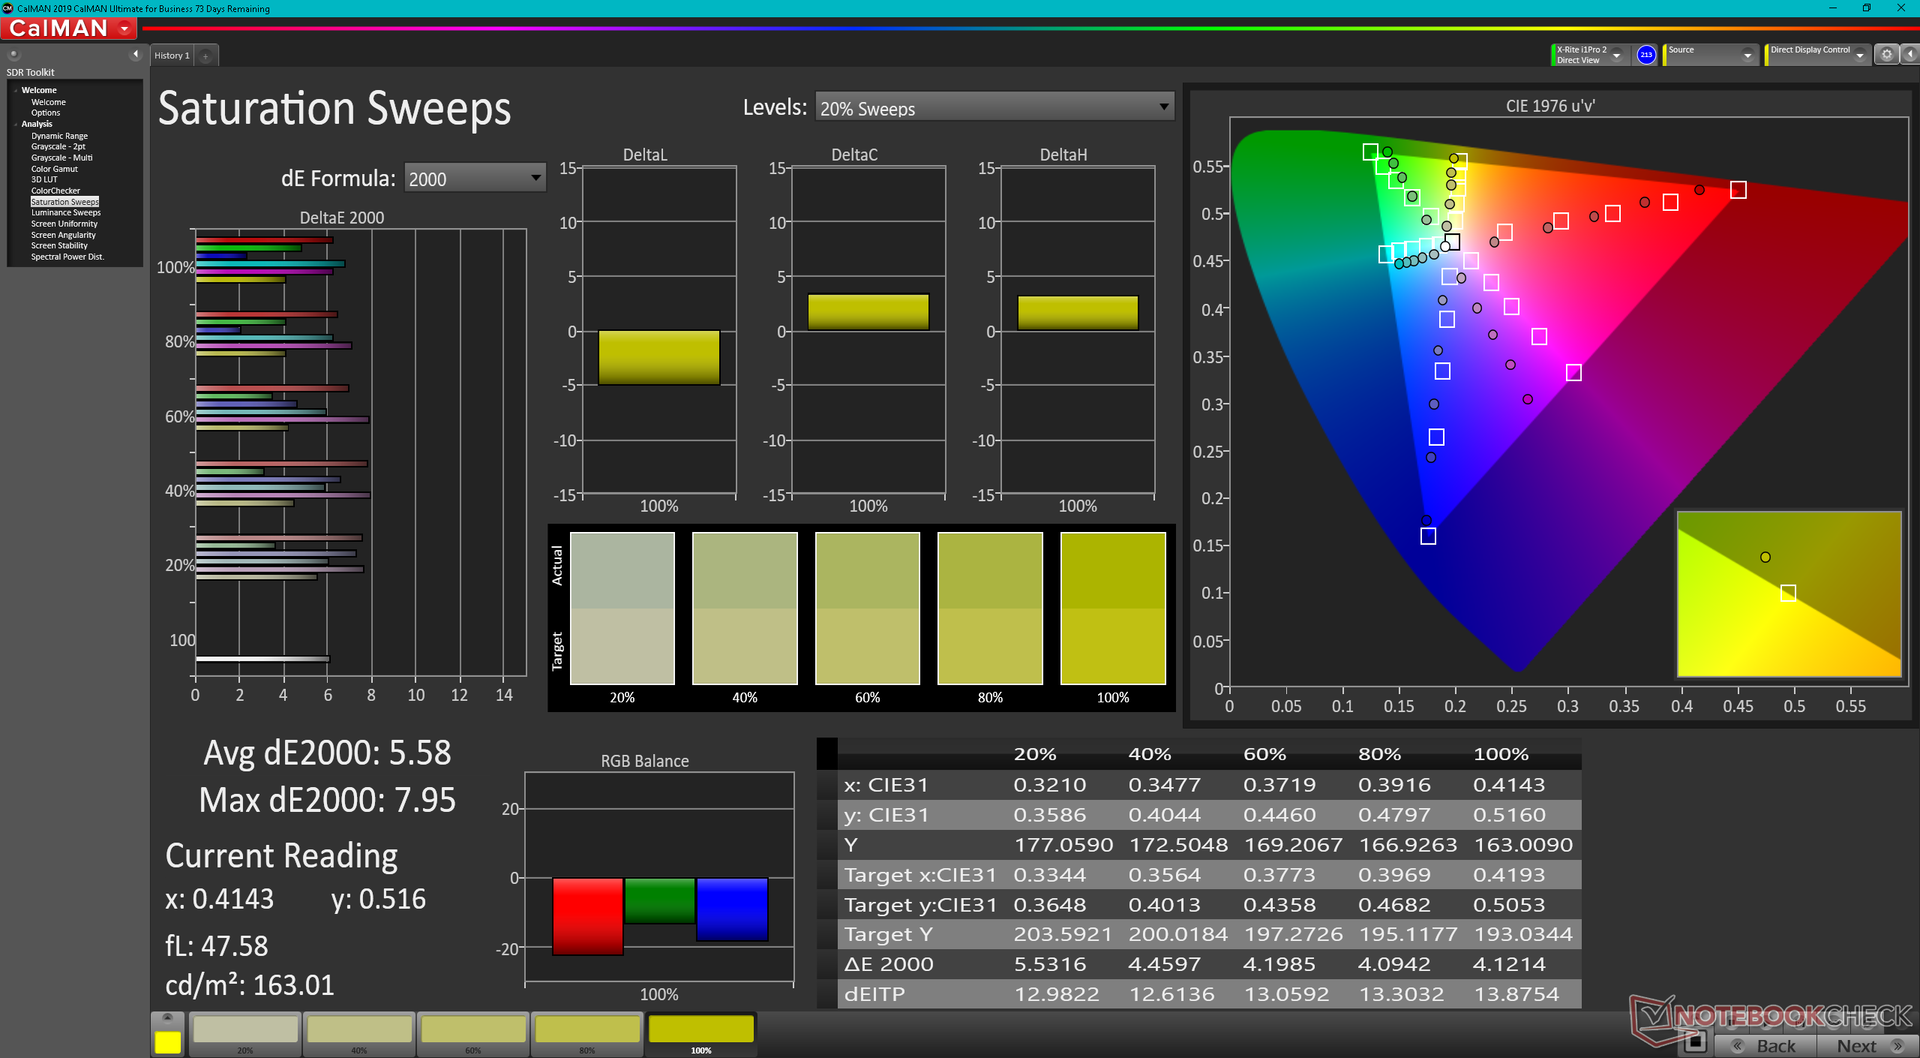
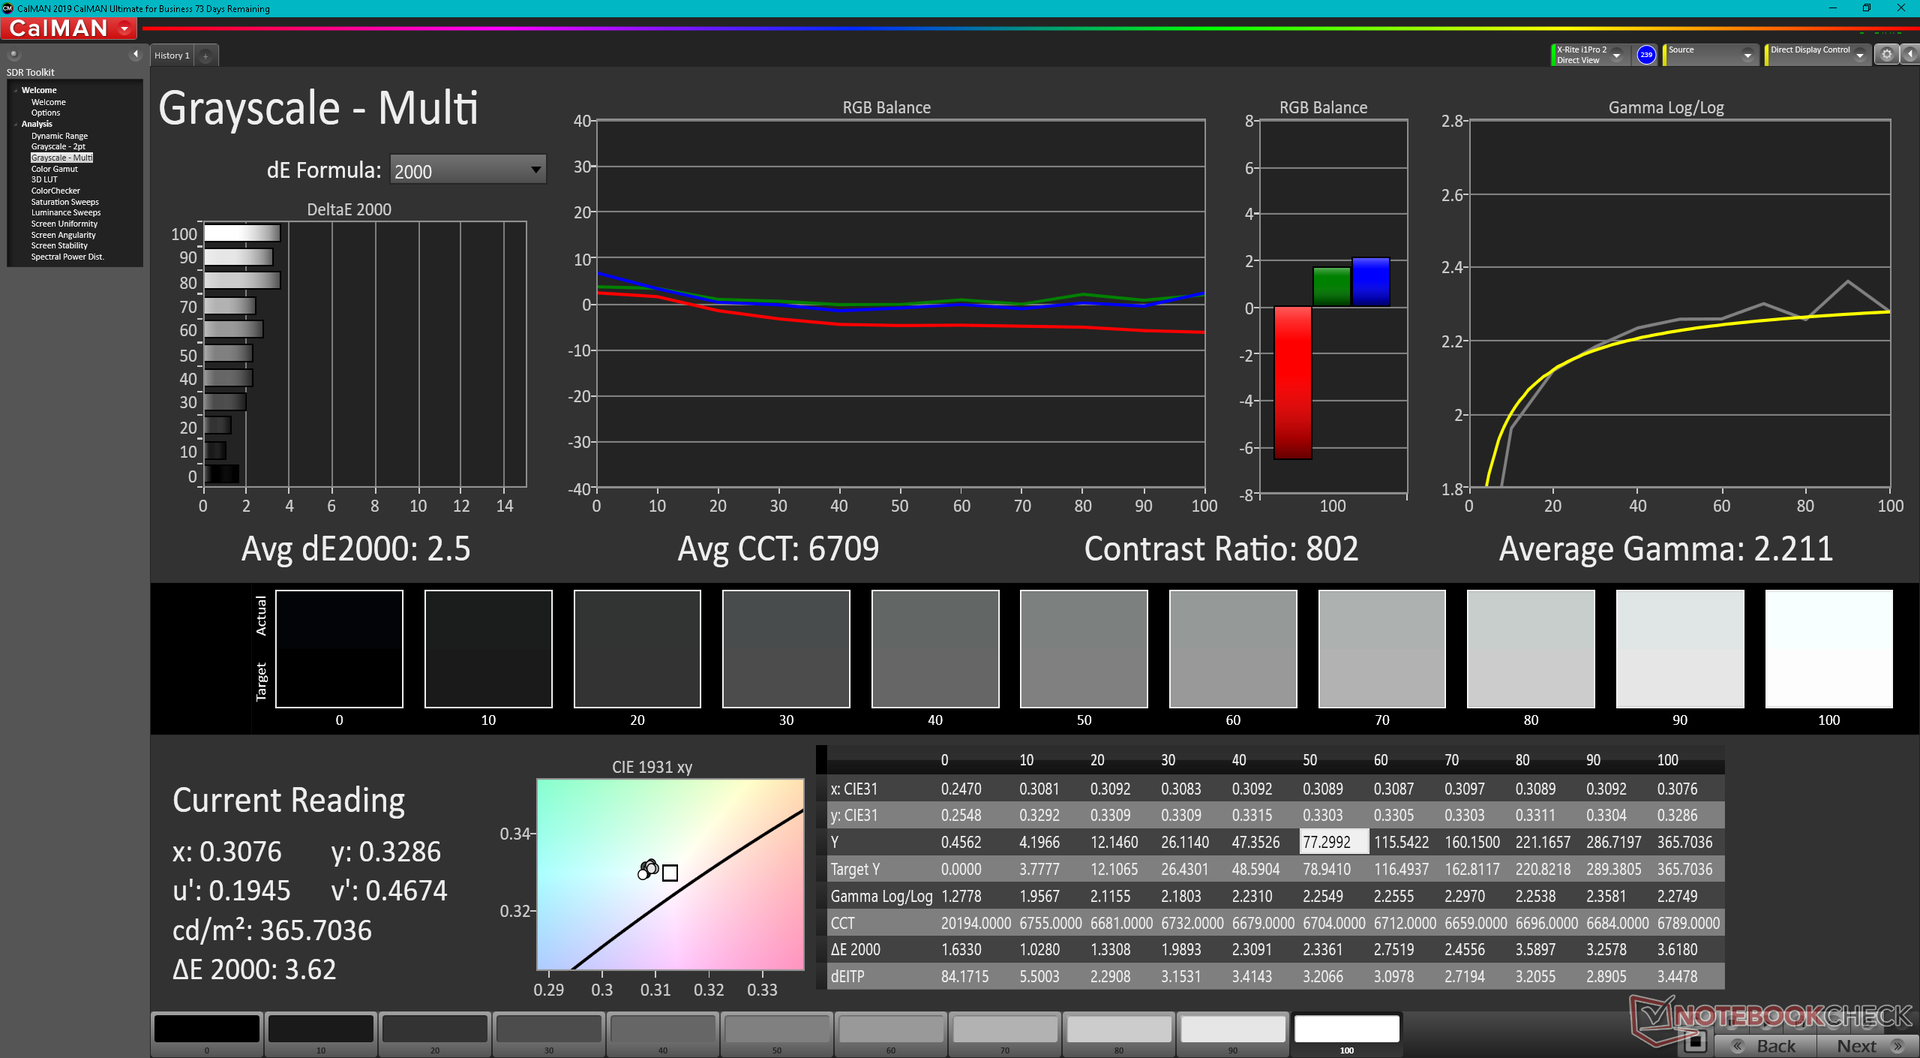
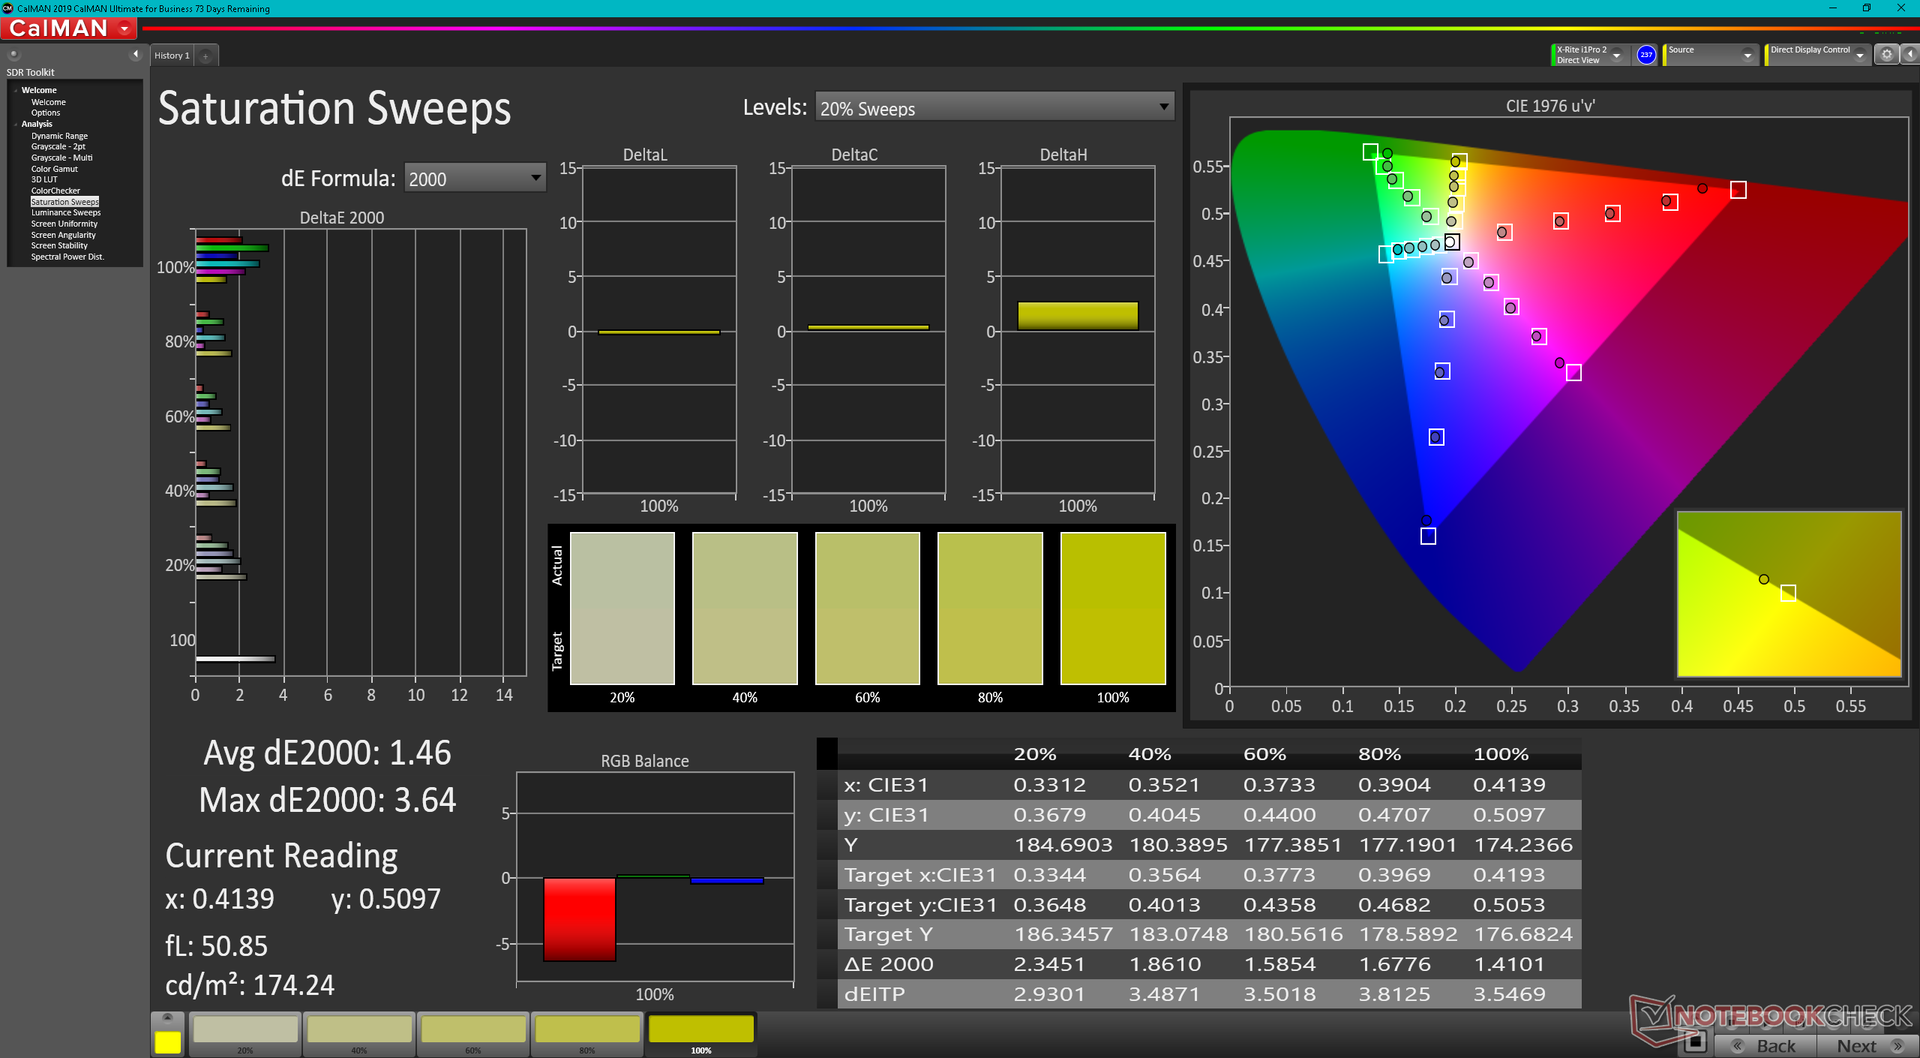
The display is well-calibrated out of the box against the P3 standard with average grayscale and color DeltaE values of just 1.4 and 2.69, respectively. An end-user calibration isn't necessary.
Display Response Times
| ↔ Response Time Black to White | ||
|---|---|---|
| 20.8 ms ... rise ↗ and fall ↘ combined | ↗ 10.8 ms rise | 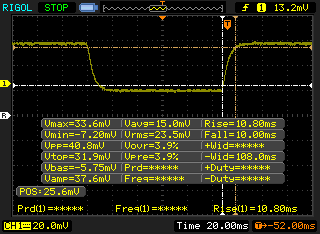 |
| ↘ 10 ms fall | ||
| The screen shows good response rates in our tests, but may be too slow for competitive gamers. In comparison, all tested devices range from 0.1 (minimum) to 240 (maximum) ms. » 46 % of all devices are better. This means that the measured response time is similar to the average of all tested devices (19.8 ms). | ||
| ↔ Response Time 50% Grey to 80% Grey | ||
| 28 ms ... rise ↗ and fall ↘ combined | ↗ 13.2 ms rise | 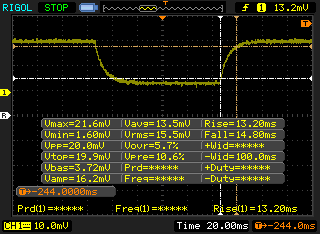 |
| ↘ 14.8 ms fall | ||
| The screen shows relatively slow response rates in our tests and may be too slow for gamers. In comparison, all tested devices range from 0.165 (minimum) to 636 (maximum) ms. » 38 % of all devices are better. This means that the measured response time is similar to the average of all tested devices (31 ms). | ||
Screen Flickering / PWM (Pulse-Width Modulation)
| Screen flickering / PWM not detected |  | ||
In comparison: 52 % of all tested devices do not use PWM to dim the display. If PWM was detected, an average of 7769 (minimum: 5 - maximum: 343500) Hz was measured. | |||
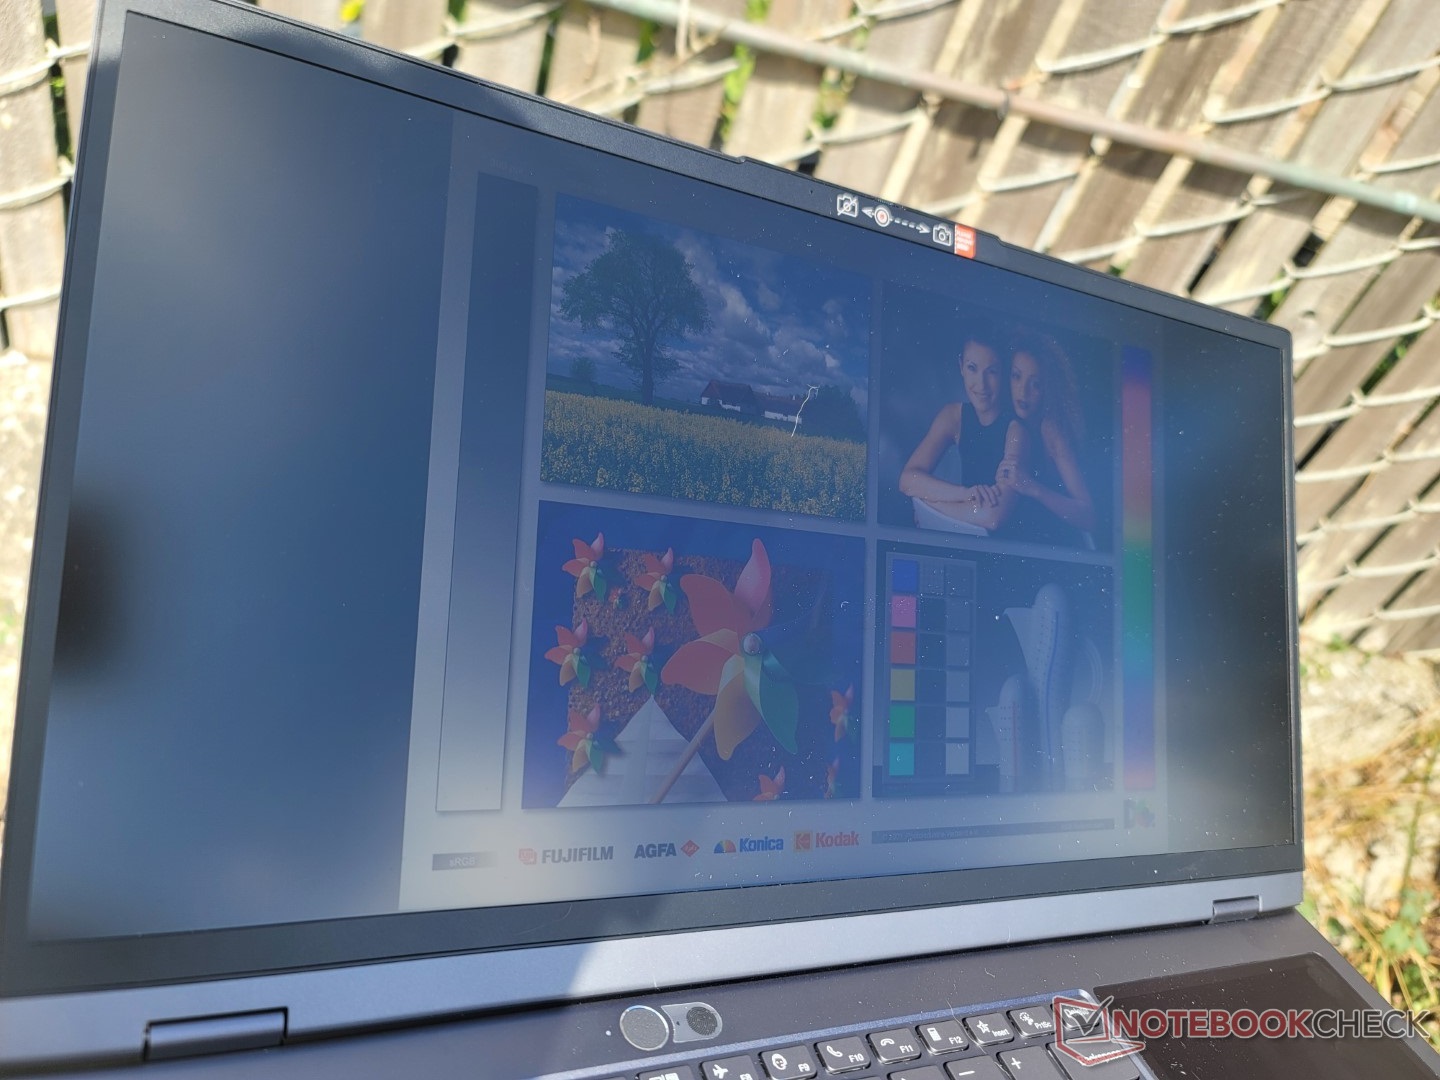
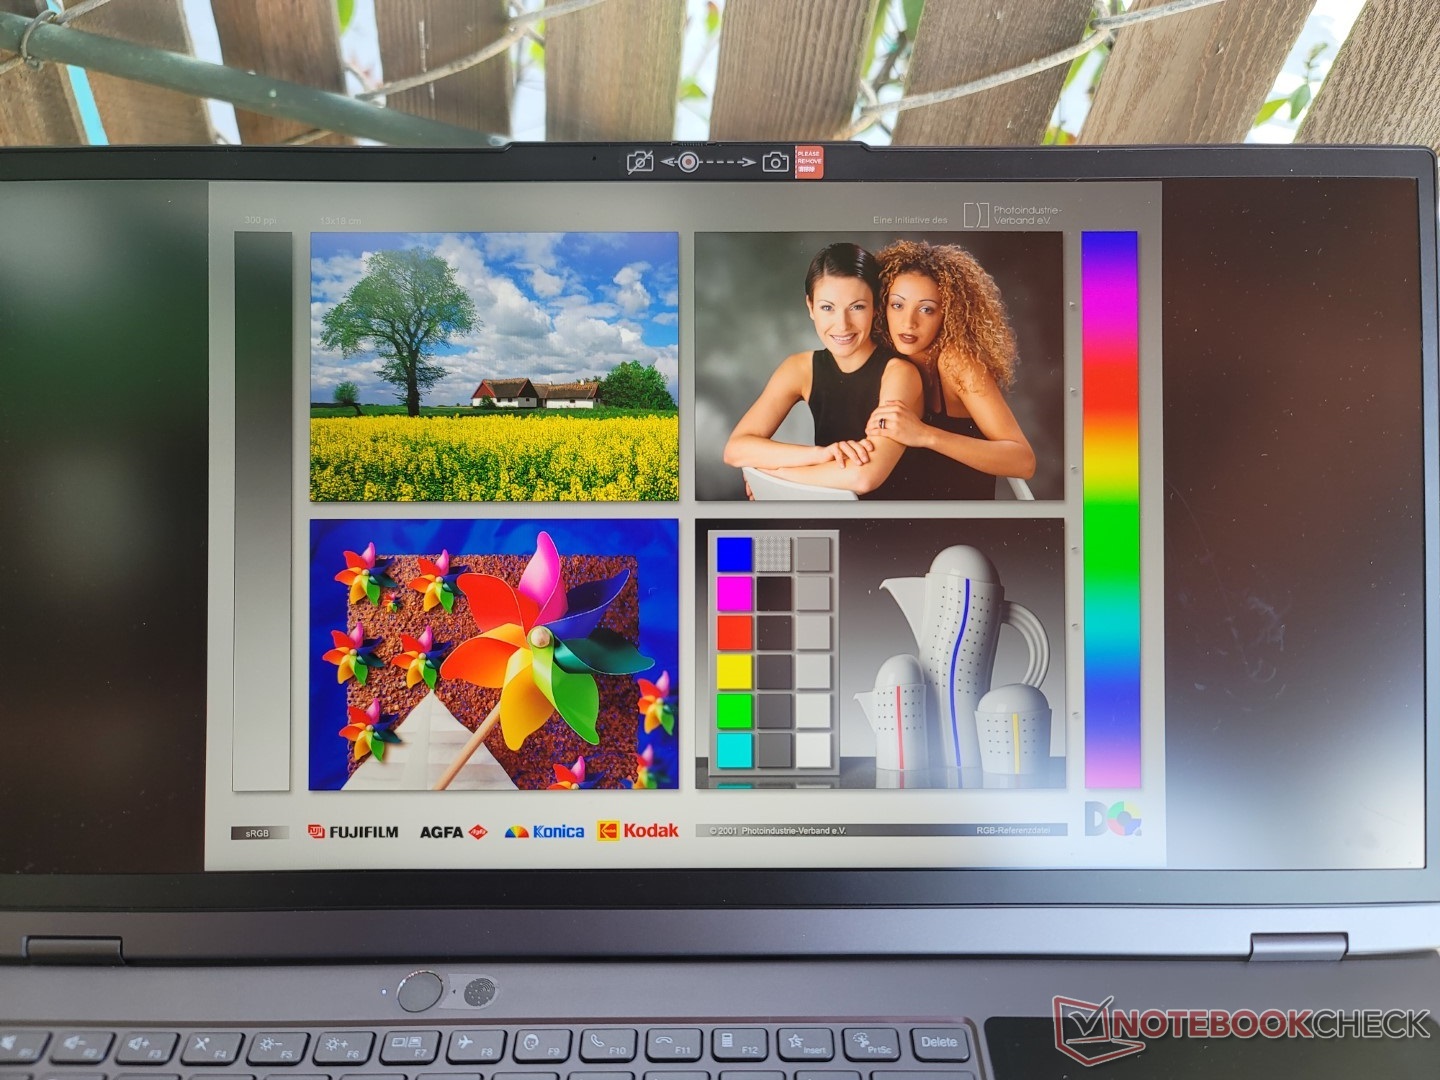
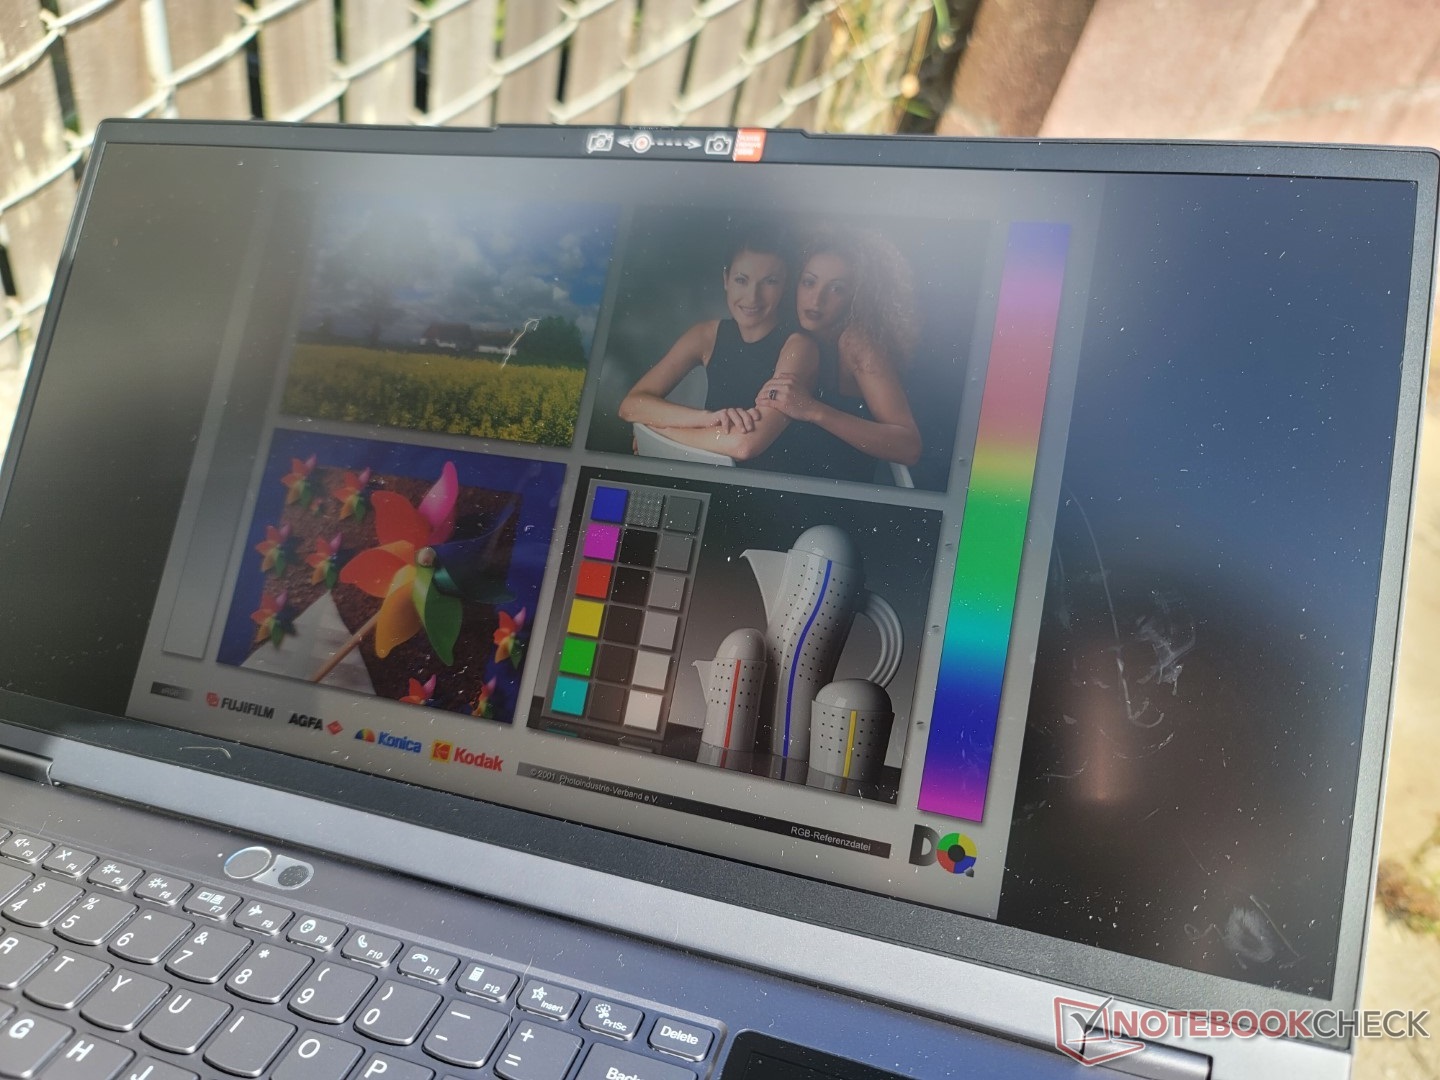
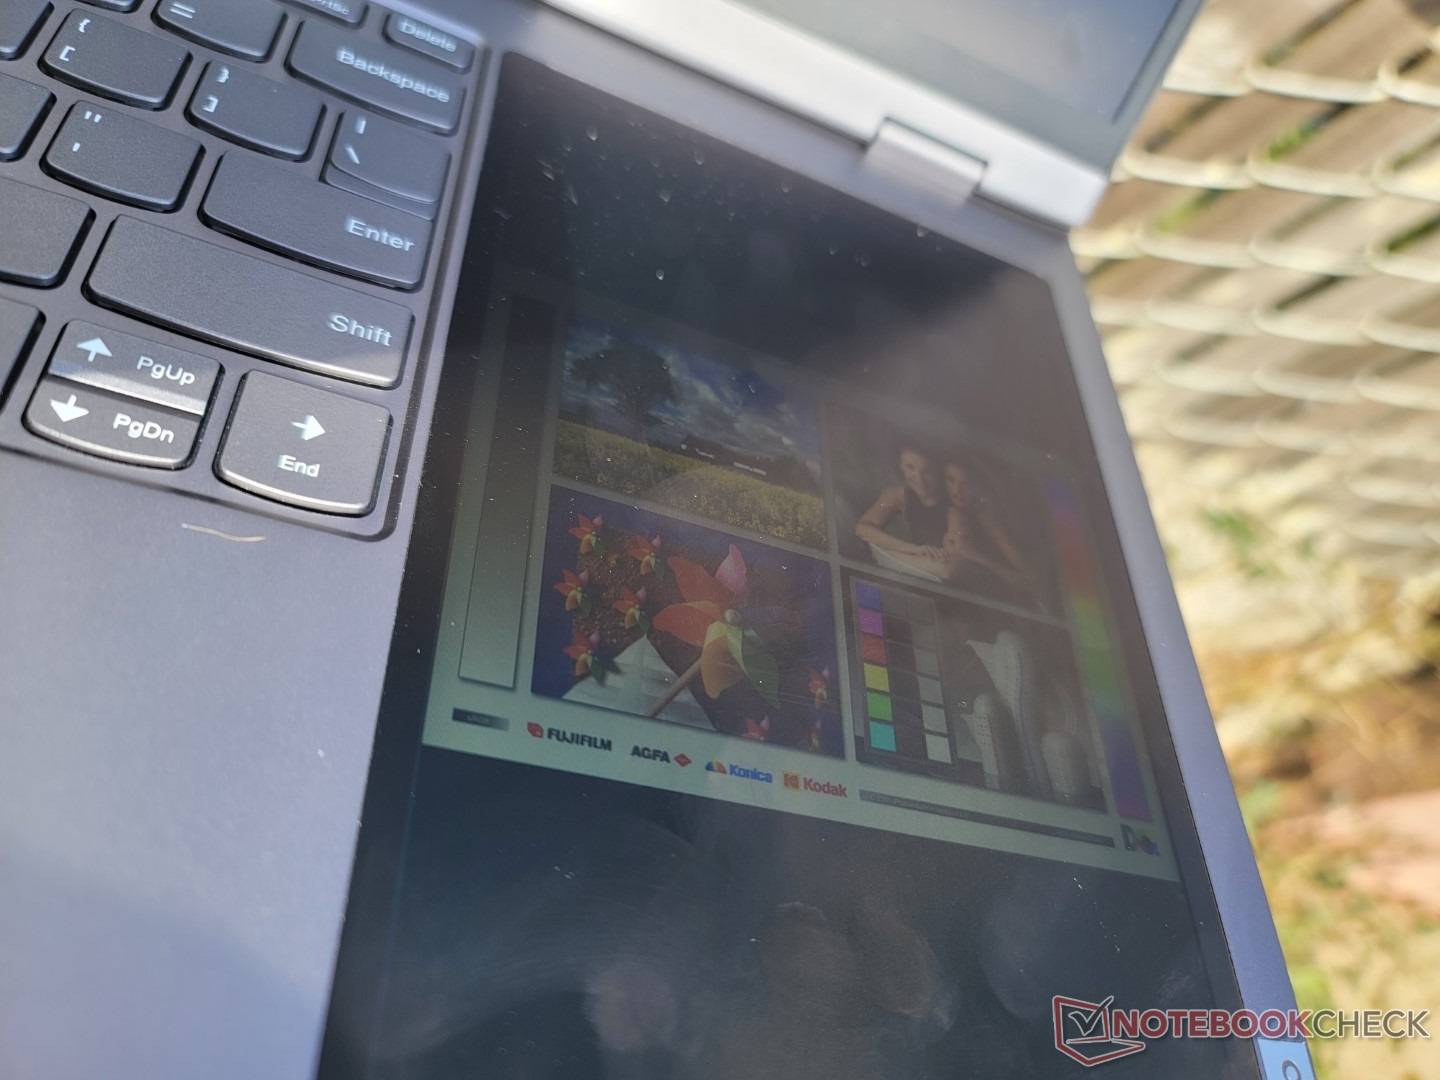
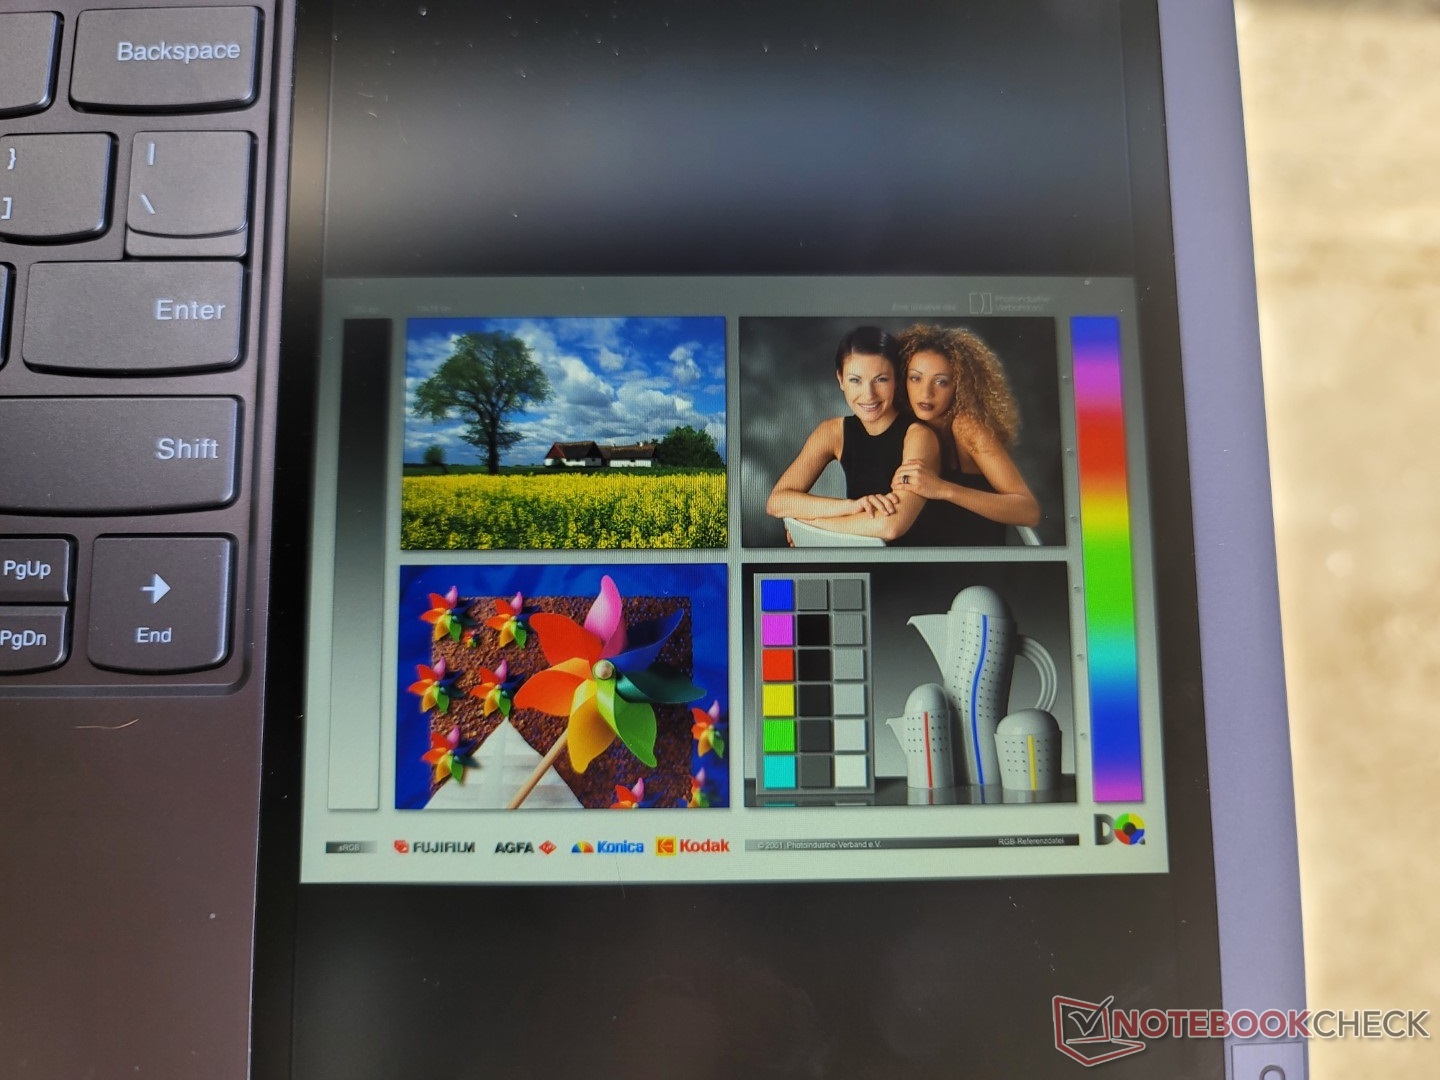
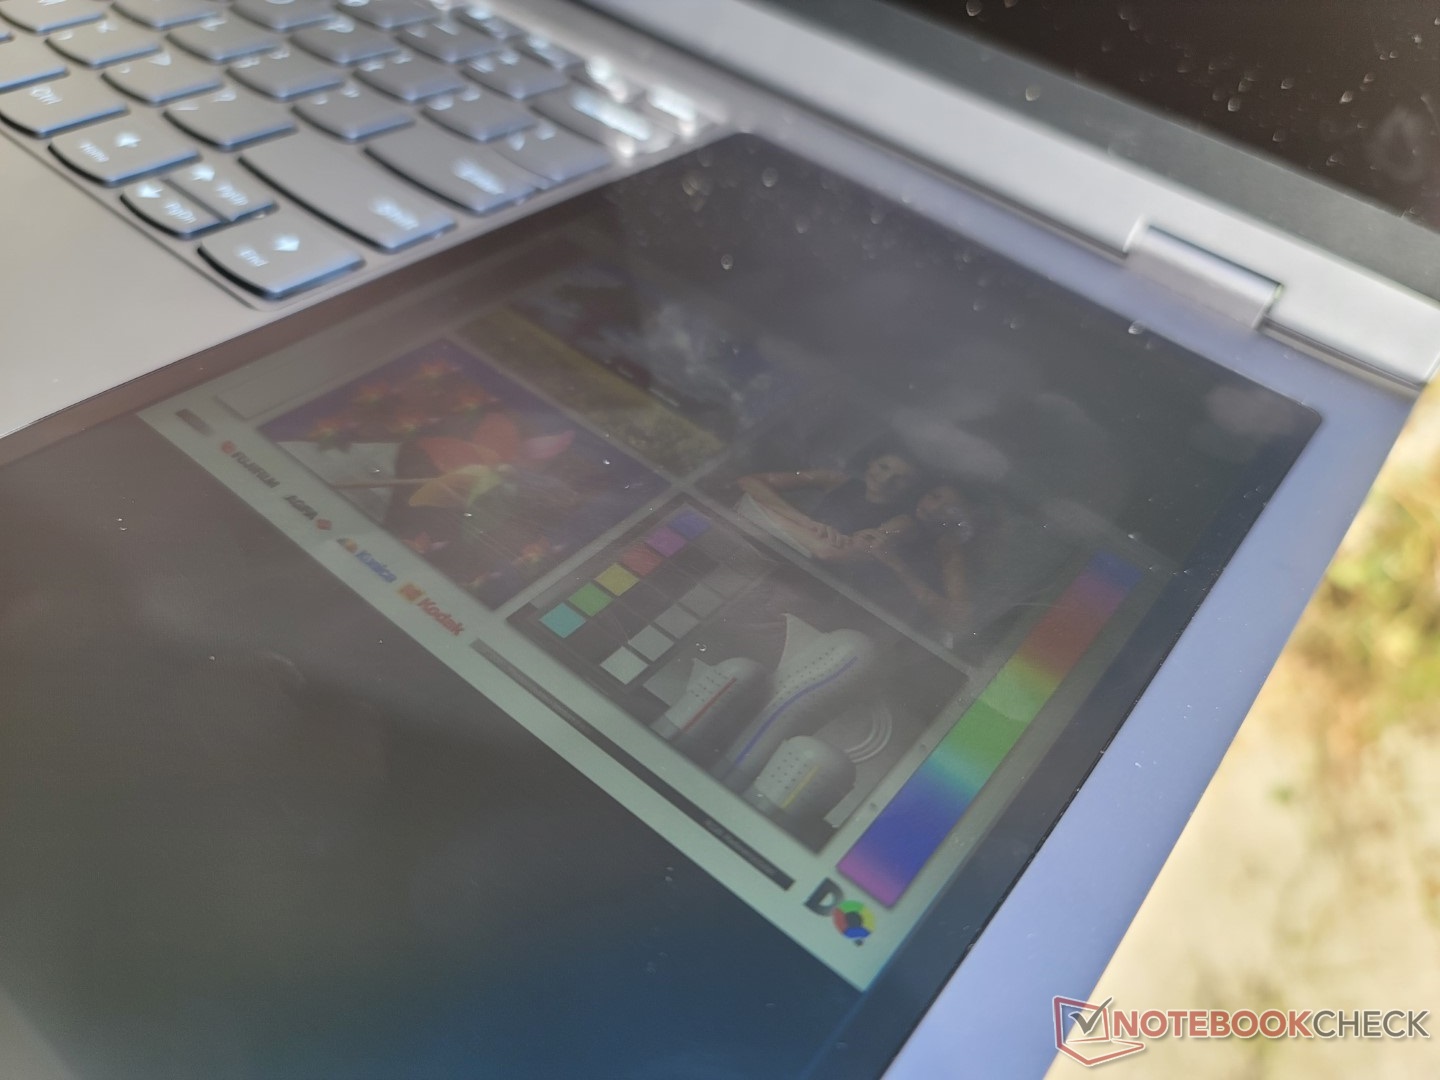
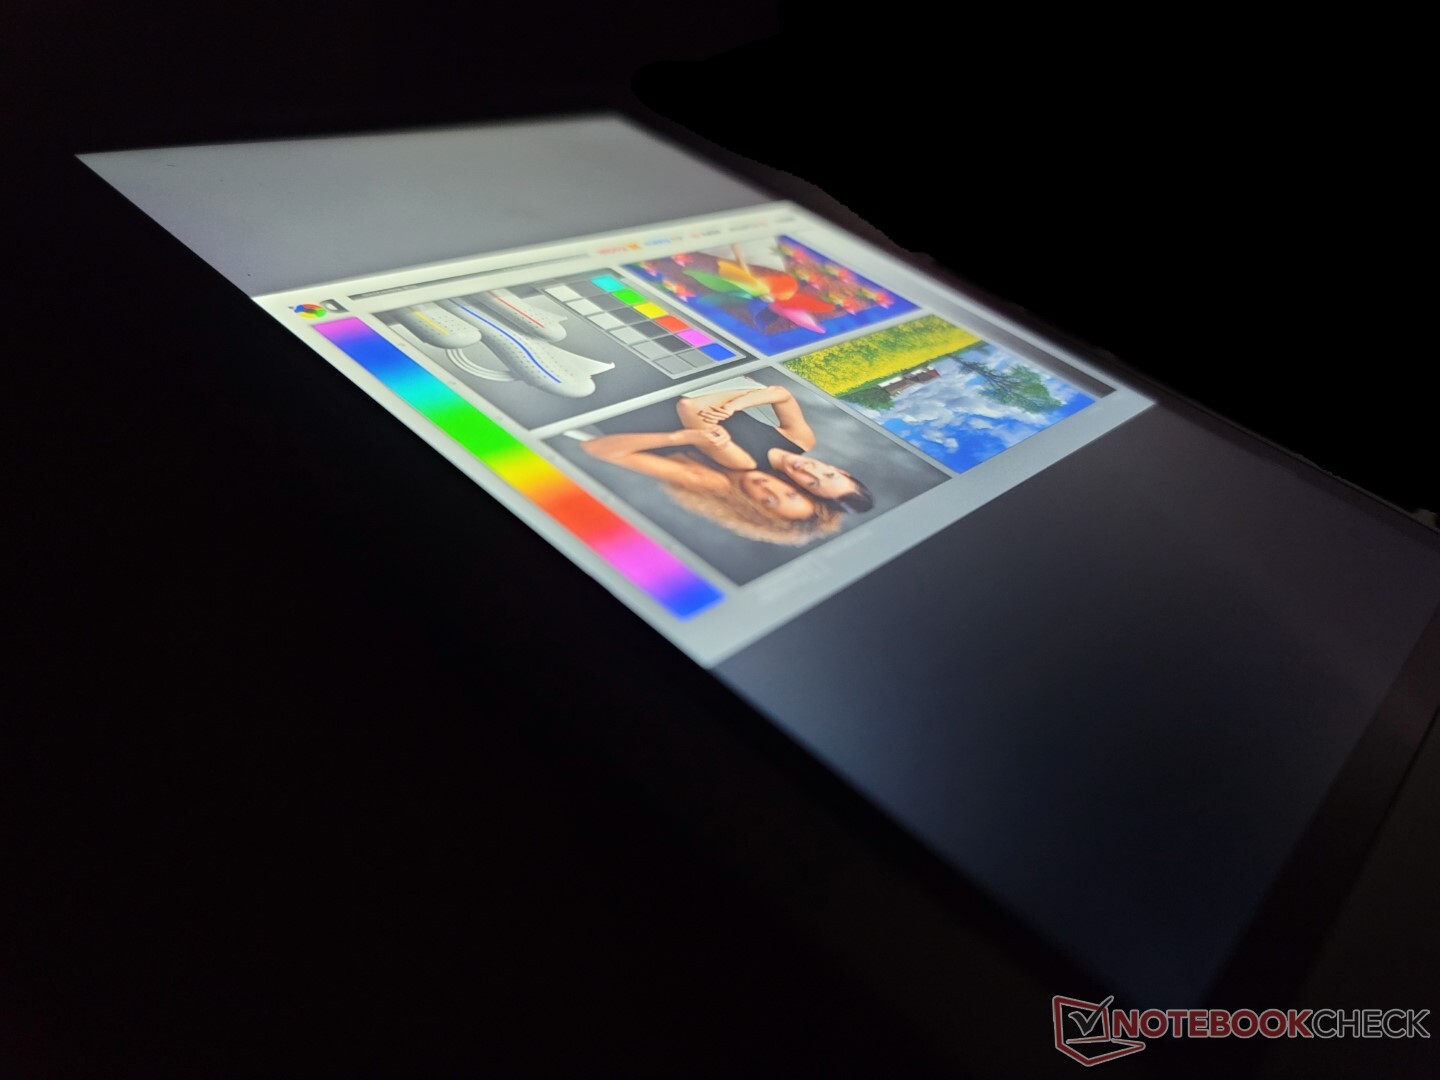
Outdoor visibility is similar to the LG Gram 17 or XPS 17 as they all have similar maximum brightness levels. On the Lenovo, however, glare is more noticeable along the sides of the screen due to its larger-than-normal aspect ratio. You'll still want to work under shade whenever possible to maximize visibility.
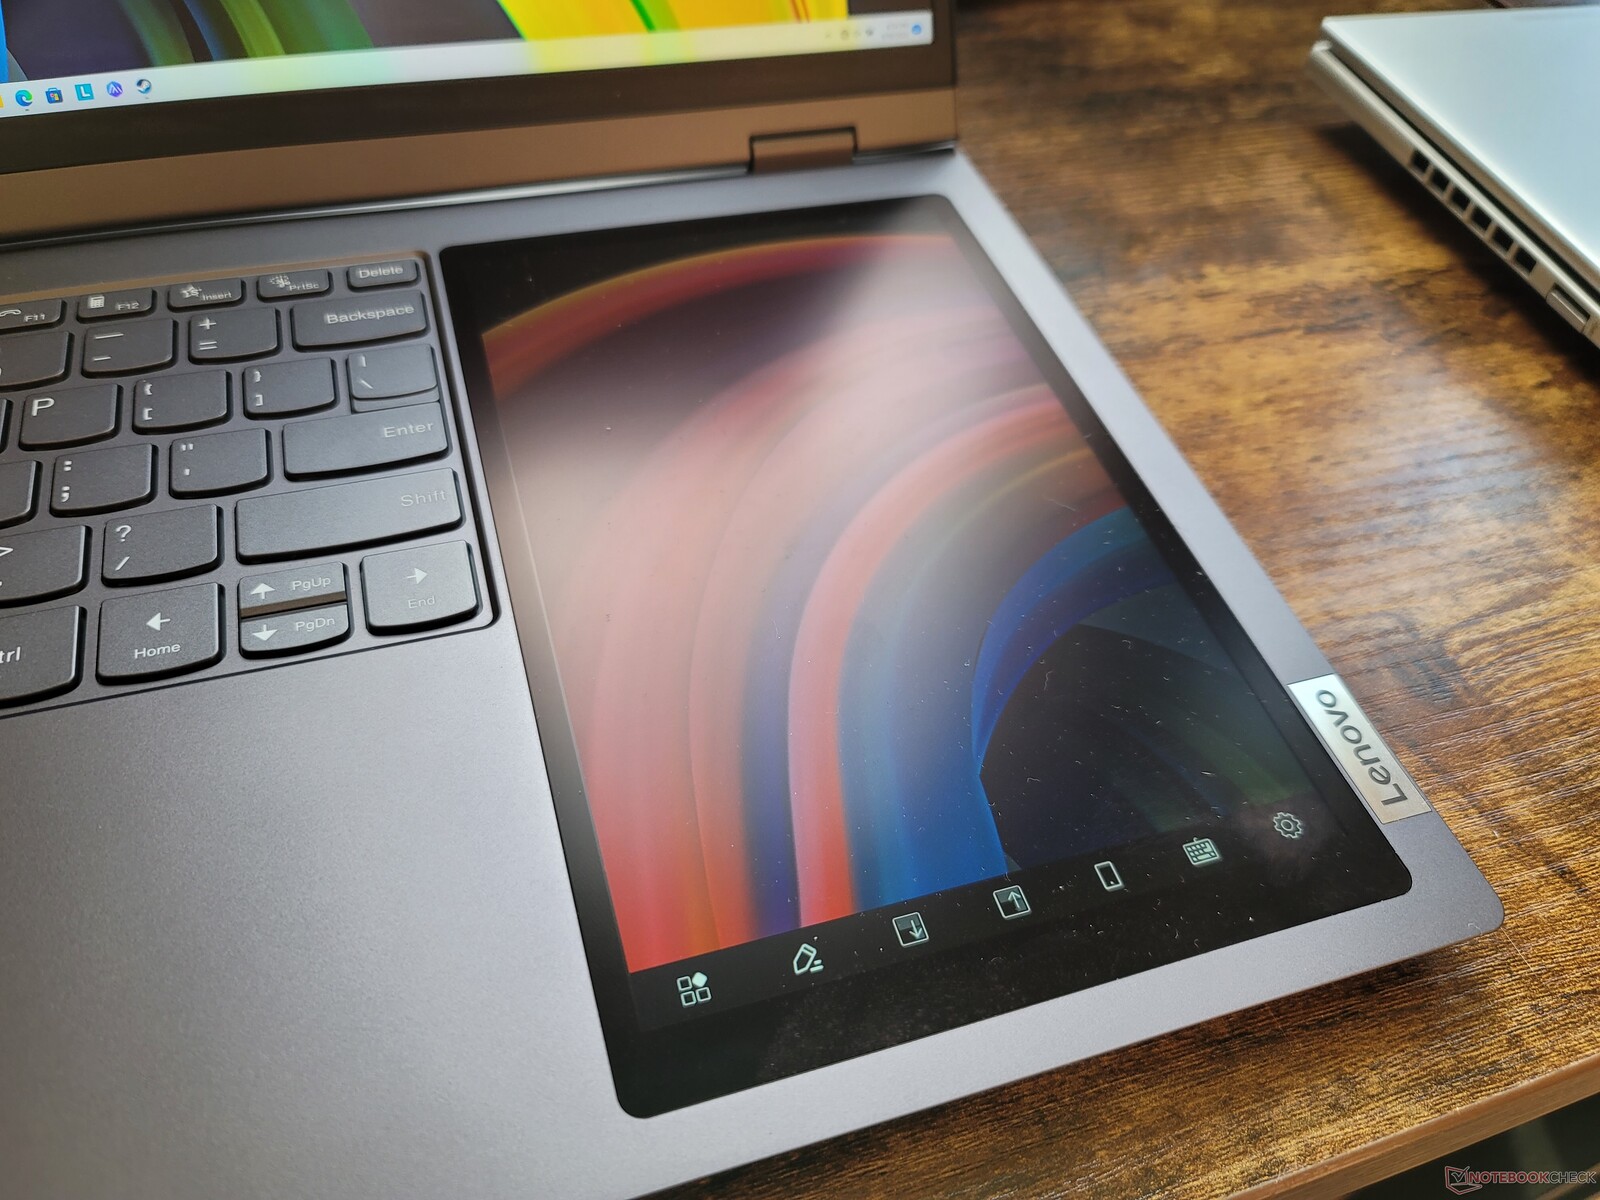
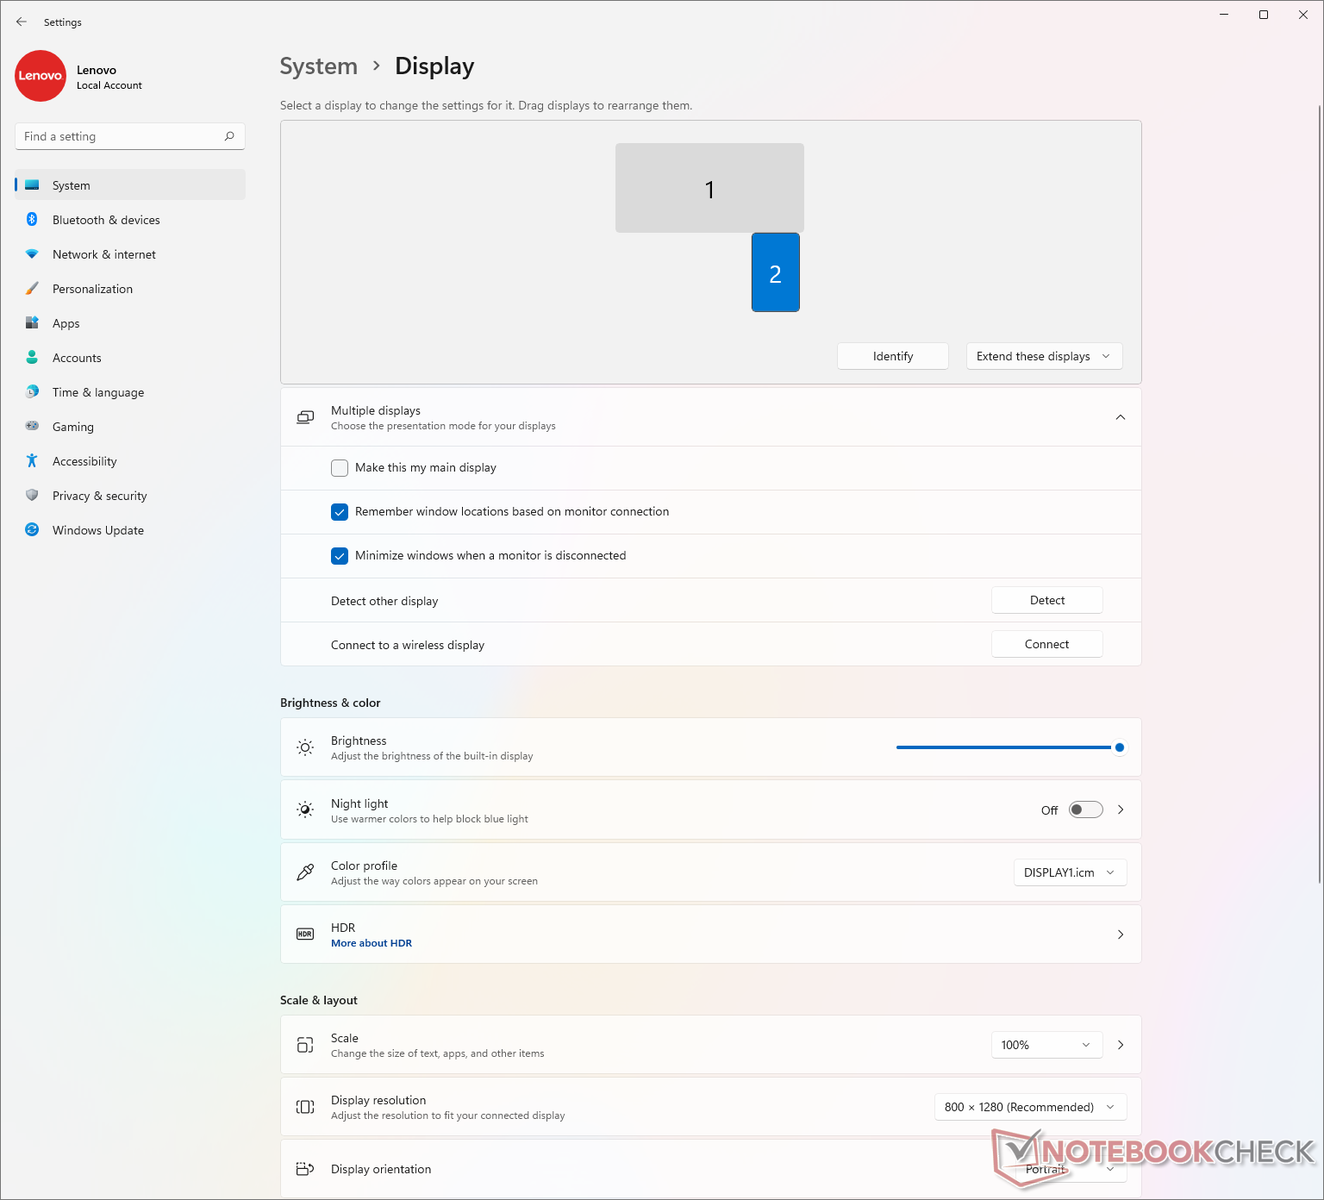
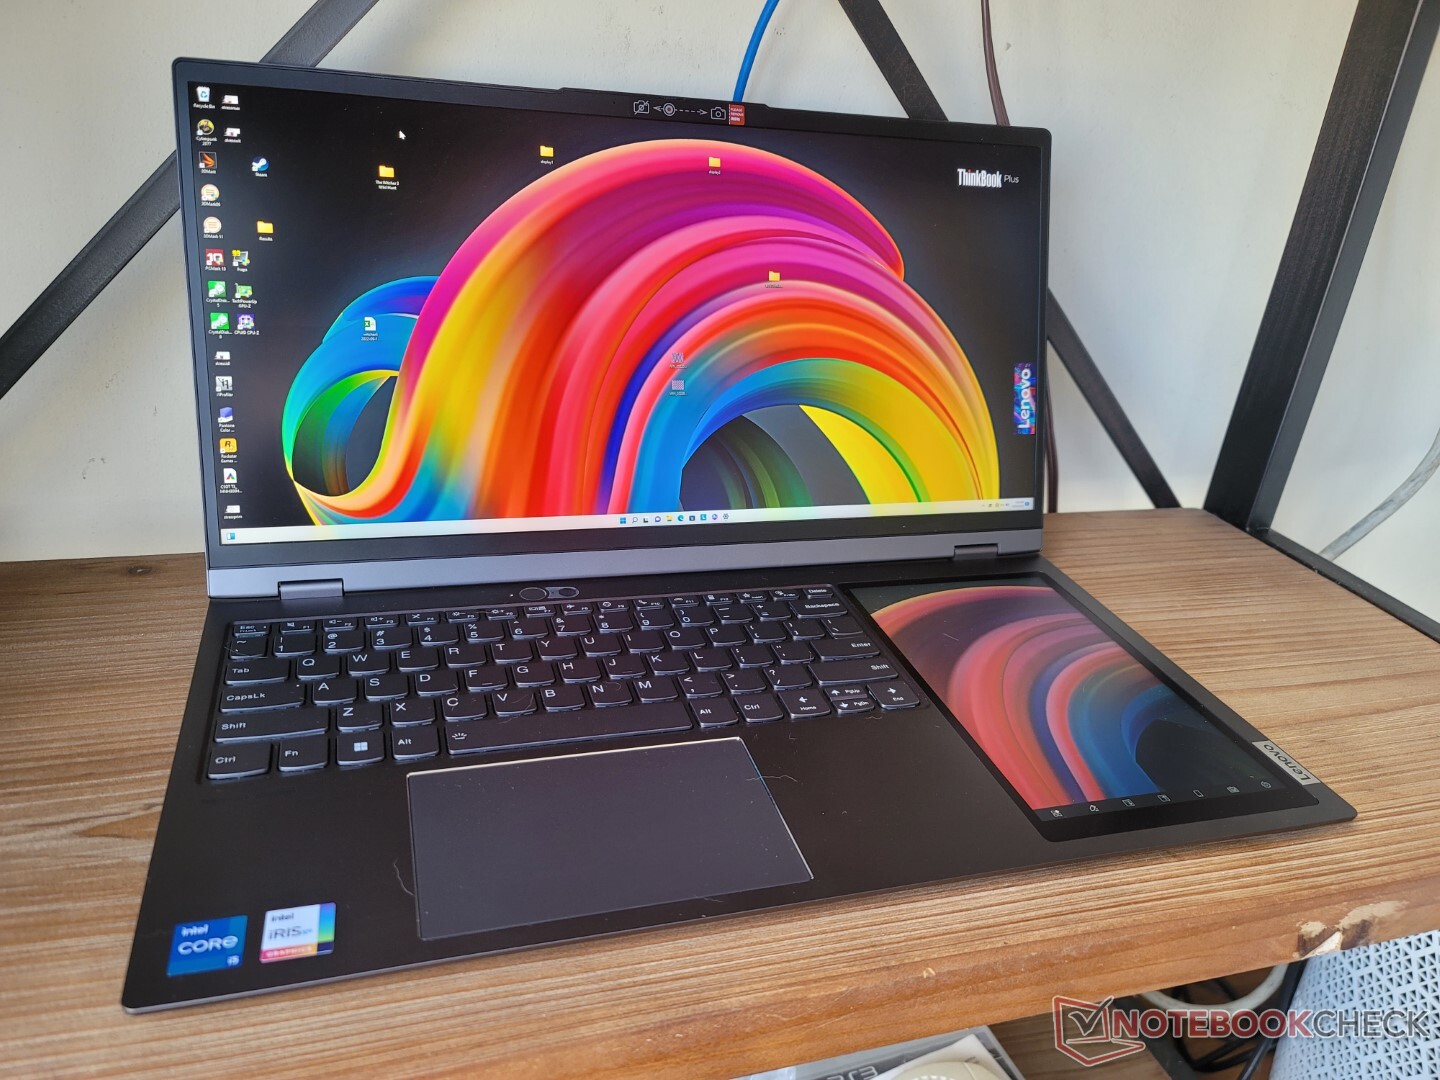
Secondary Display — So Much Extra Screen Space
From a utility standpoint, the secondary screen works smoothly and perfectly for snapping different windows back and forth to the main display. It's 10:16 aspect ratio in particular works better for a wider variety of applications and programs when compared to the narrower secondary displays on the competing Asus ZenBook Duo series.
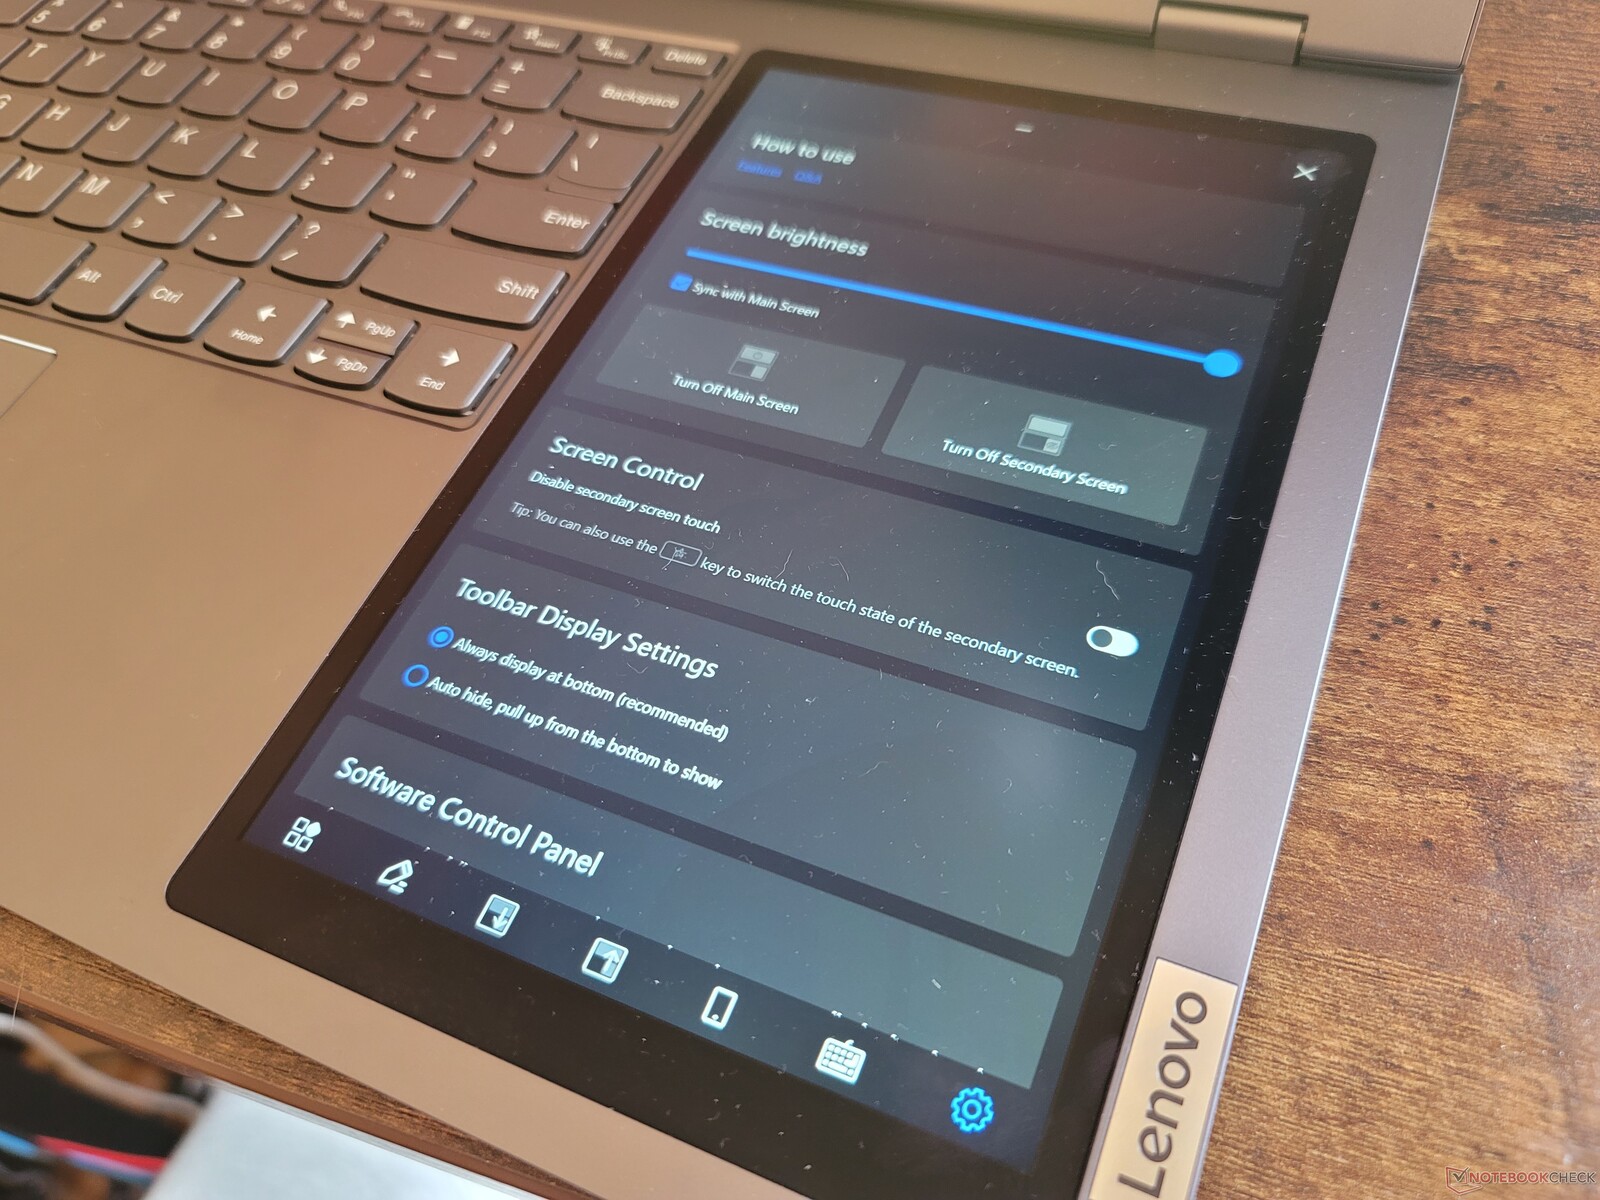
The screen also comes with unique auxiliary features not found on Asus models. For example, there are options to sync the brightness with the main display or to mirror only a specific 800 x 1280 pixel portion of the main display.


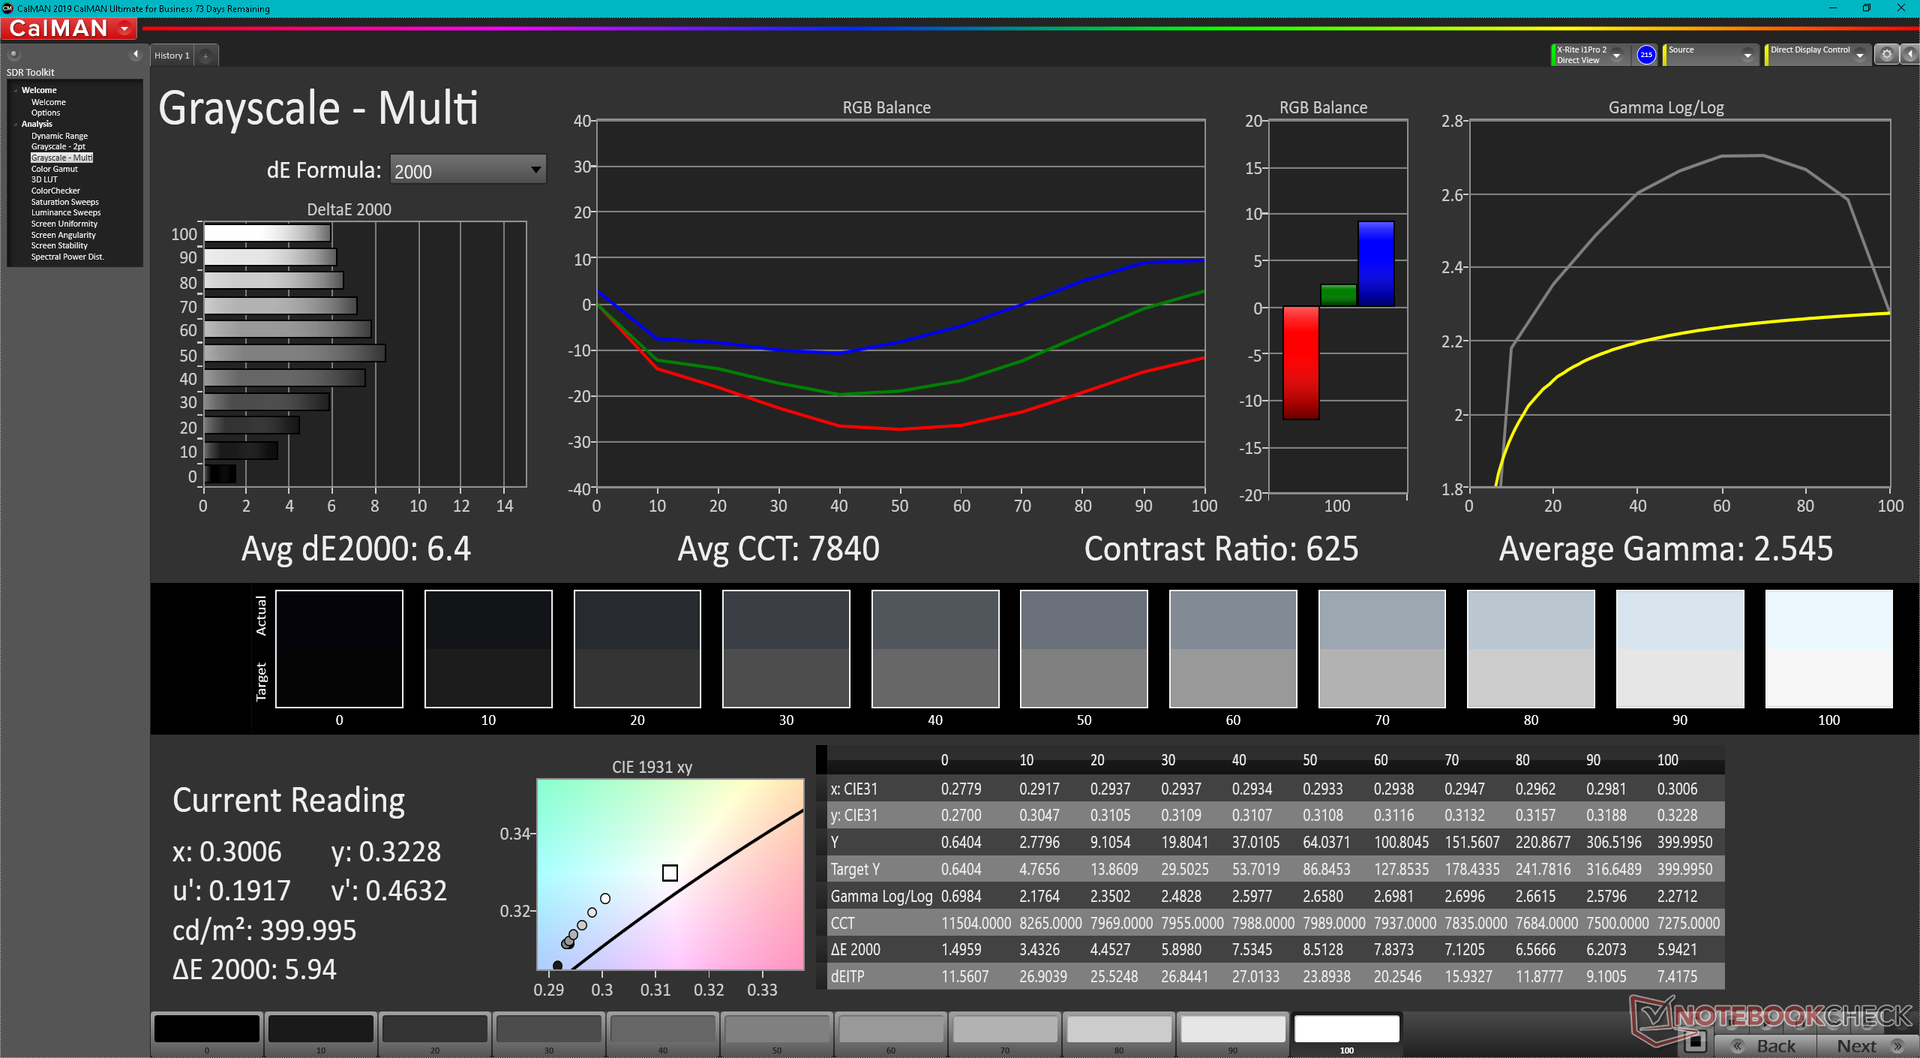
| 8-inch Secondary IPS Touchscreen | 800 x 1280 Resolution |
|---|---|
| Refresh Rate | 60 Hz |
| Maximum Brightness | 393.6 nits |
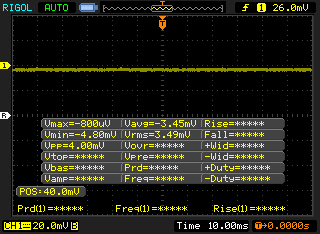
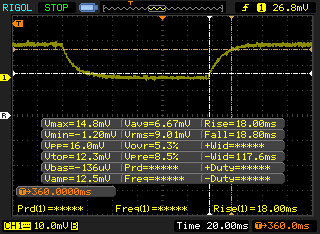
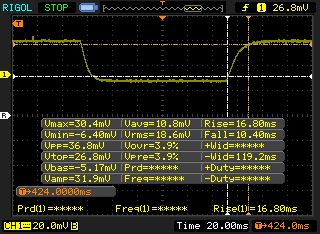
| Black-to-White Response Times | 16.8 ms rise, 10.4 ms fall |
| Gray-to-Gray Response Times | 18.0 ms rise, 18.8 ms fall |
| Contrast Ratio | 579:1 |
| sRGB Coverage | 80.6 percent |
| Gamma | 2.55 |
| CCT | 7840 |
| Grayscale Avg DeltaE2000 | 6.4 |
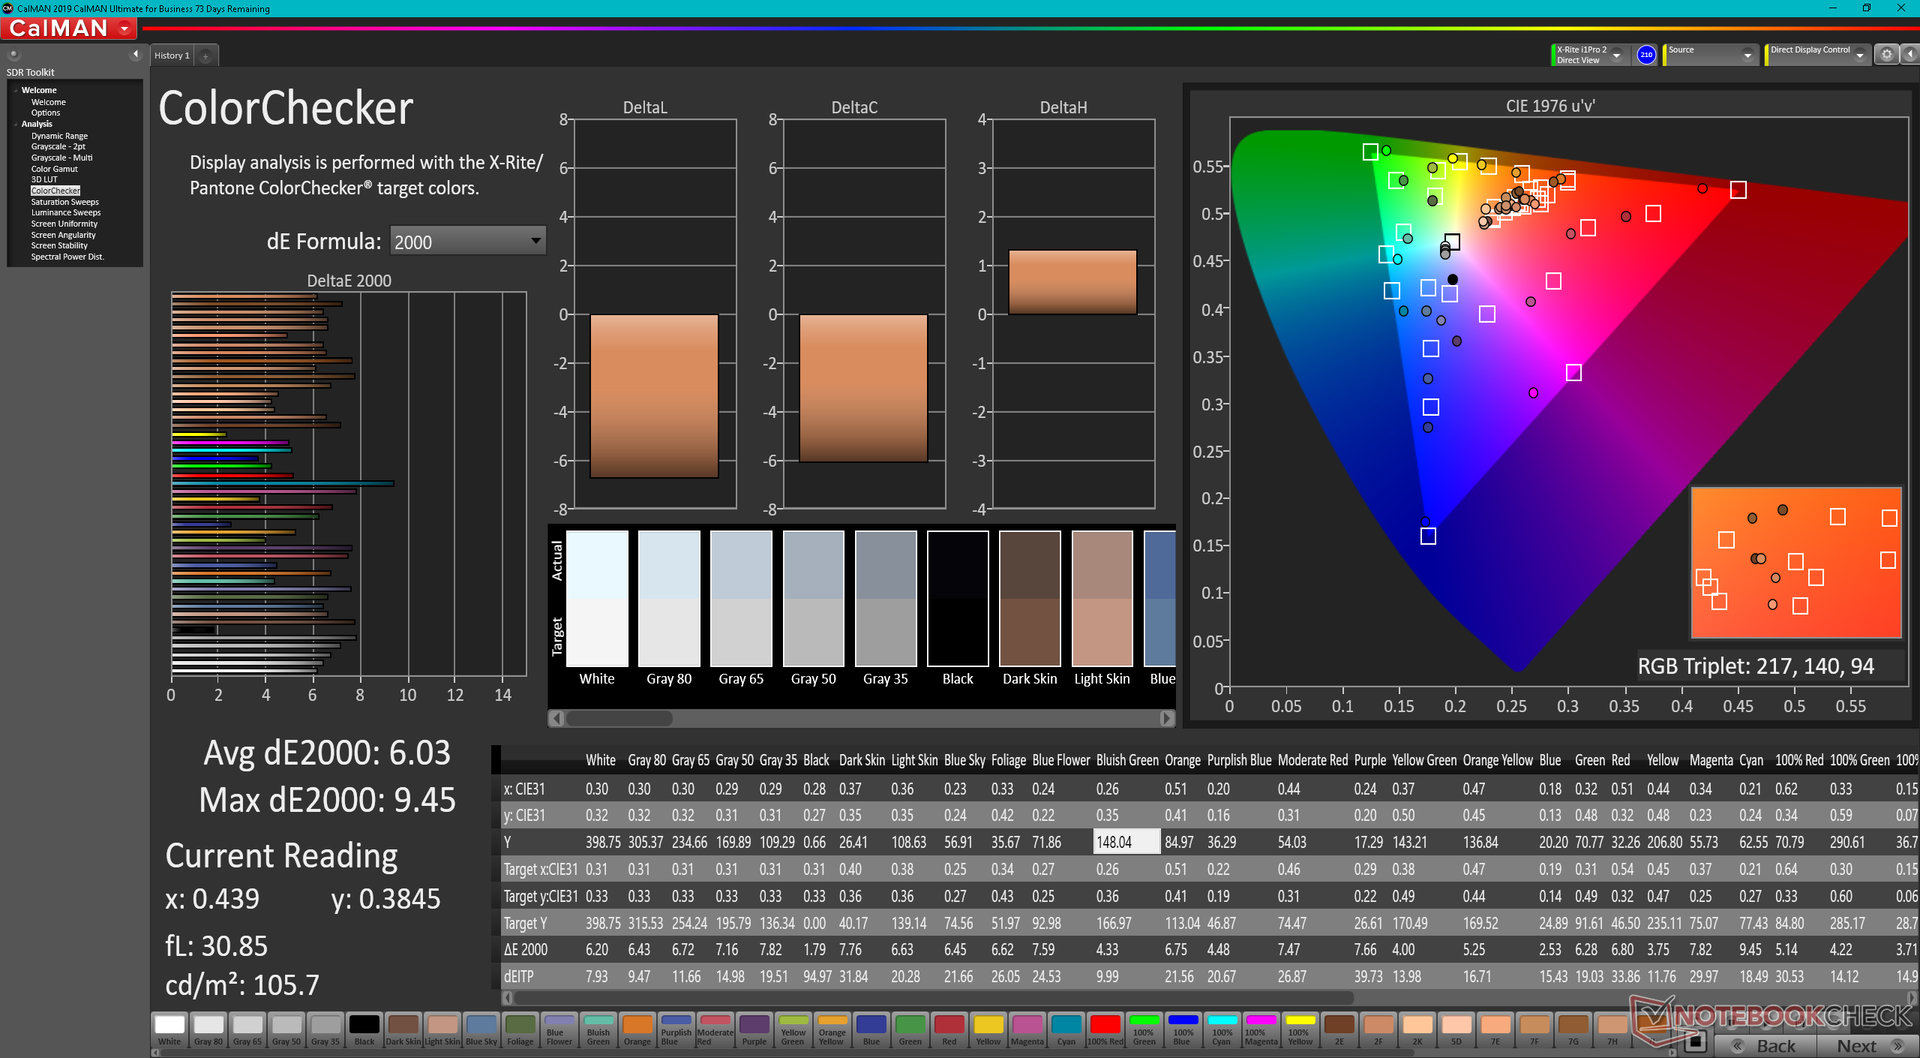
| Colorchecker dE 2000 | 6.03 |
| Colorchecker dE 2000 Max | 9.45 |
Unfortunately, the secondary display comes with similar disadvantages as some early ZenBook Duo models. Its colors, refresh rate, contrast ratio, graininess, and viewing angle glare in particular are all noticeably inferior to the main display. Image quality is more akin to a cheap 8-inch Android tablet rather than an iPad or Samsung Galaxy Tab S. If 1:1 image quality reproduction between the primary and secondary displays is important for your workloads, then dual external displays will still be your best option.
We also experienced several bugs on the second screen. Firstly, its brightness would sometimes not sync with the main display. Secondly, the primary display would often be turned off when waking from sleep leaving only the second display on even if both displays were active prior to entering sleep mode. Thirdly, the screen will respond to touch even if it is disabled through Windows which can lead to many accidental inputs to the main display. Users must remember to manually press the 'S Star' key (or the Insert key) on the keyboard to toggle touch sensitivity. And lastly, many inputs go unregistered on the second screen which can become frustrating during use. Many of these features show promise, but they could certainly benefit from more development time.
Performance — Intel 12th Gen Alder Lake-H
Testing Conditions
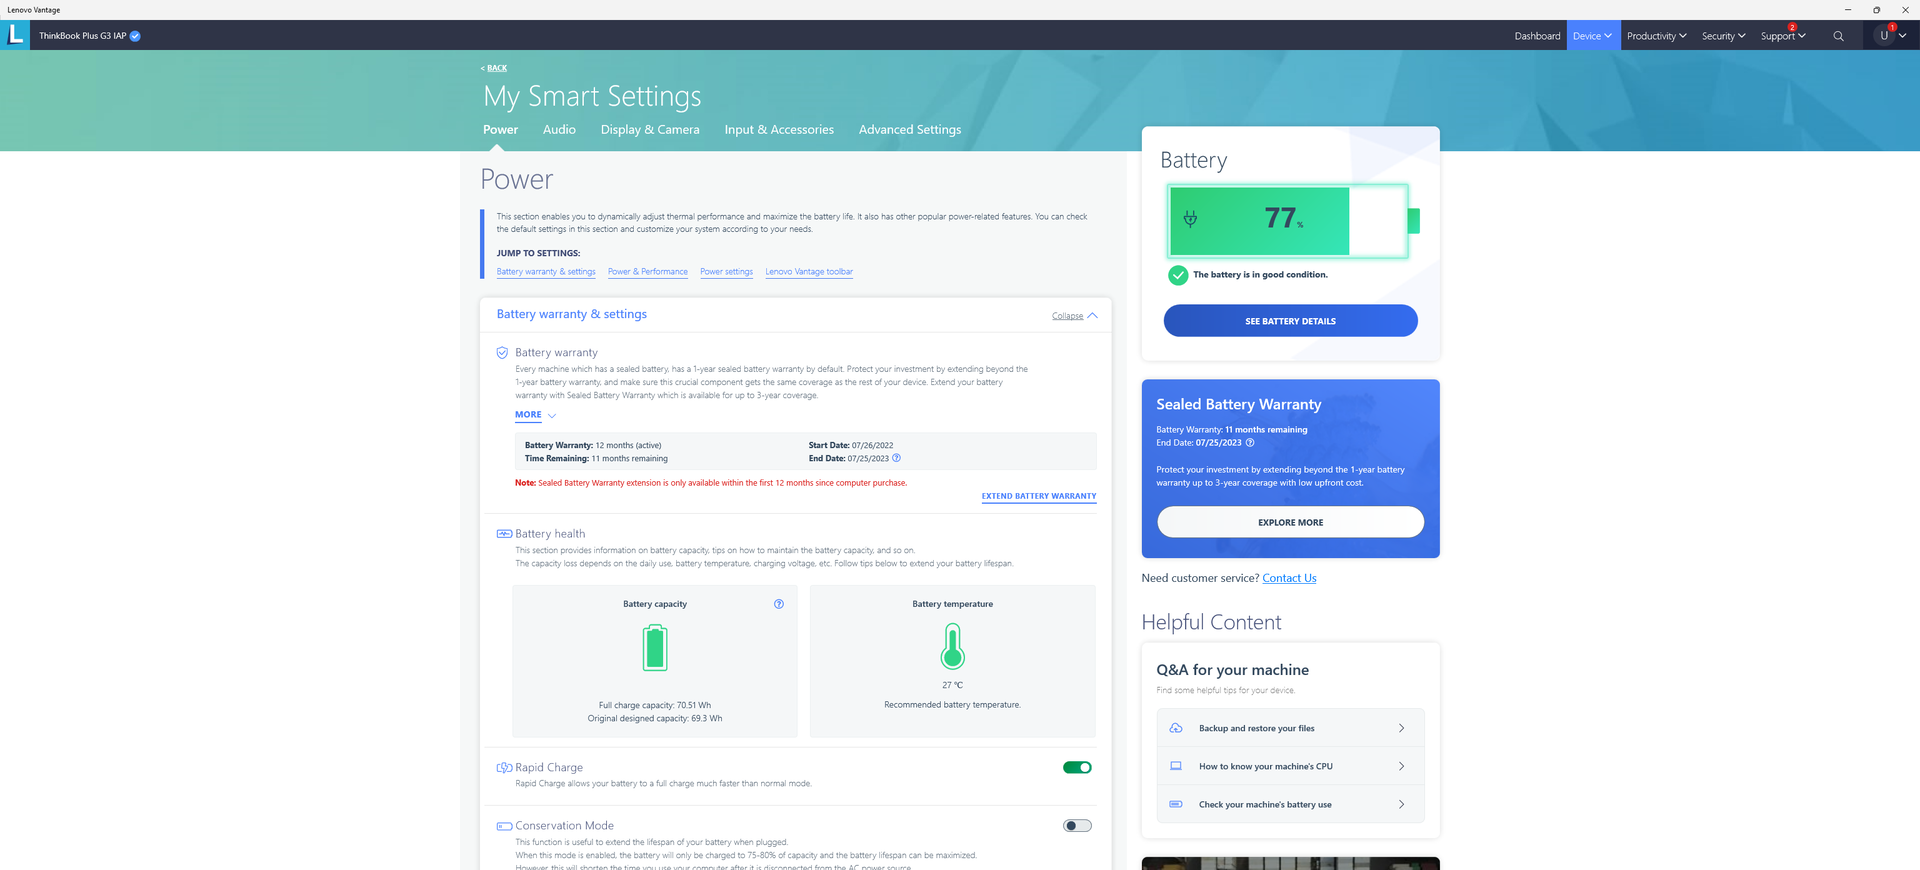
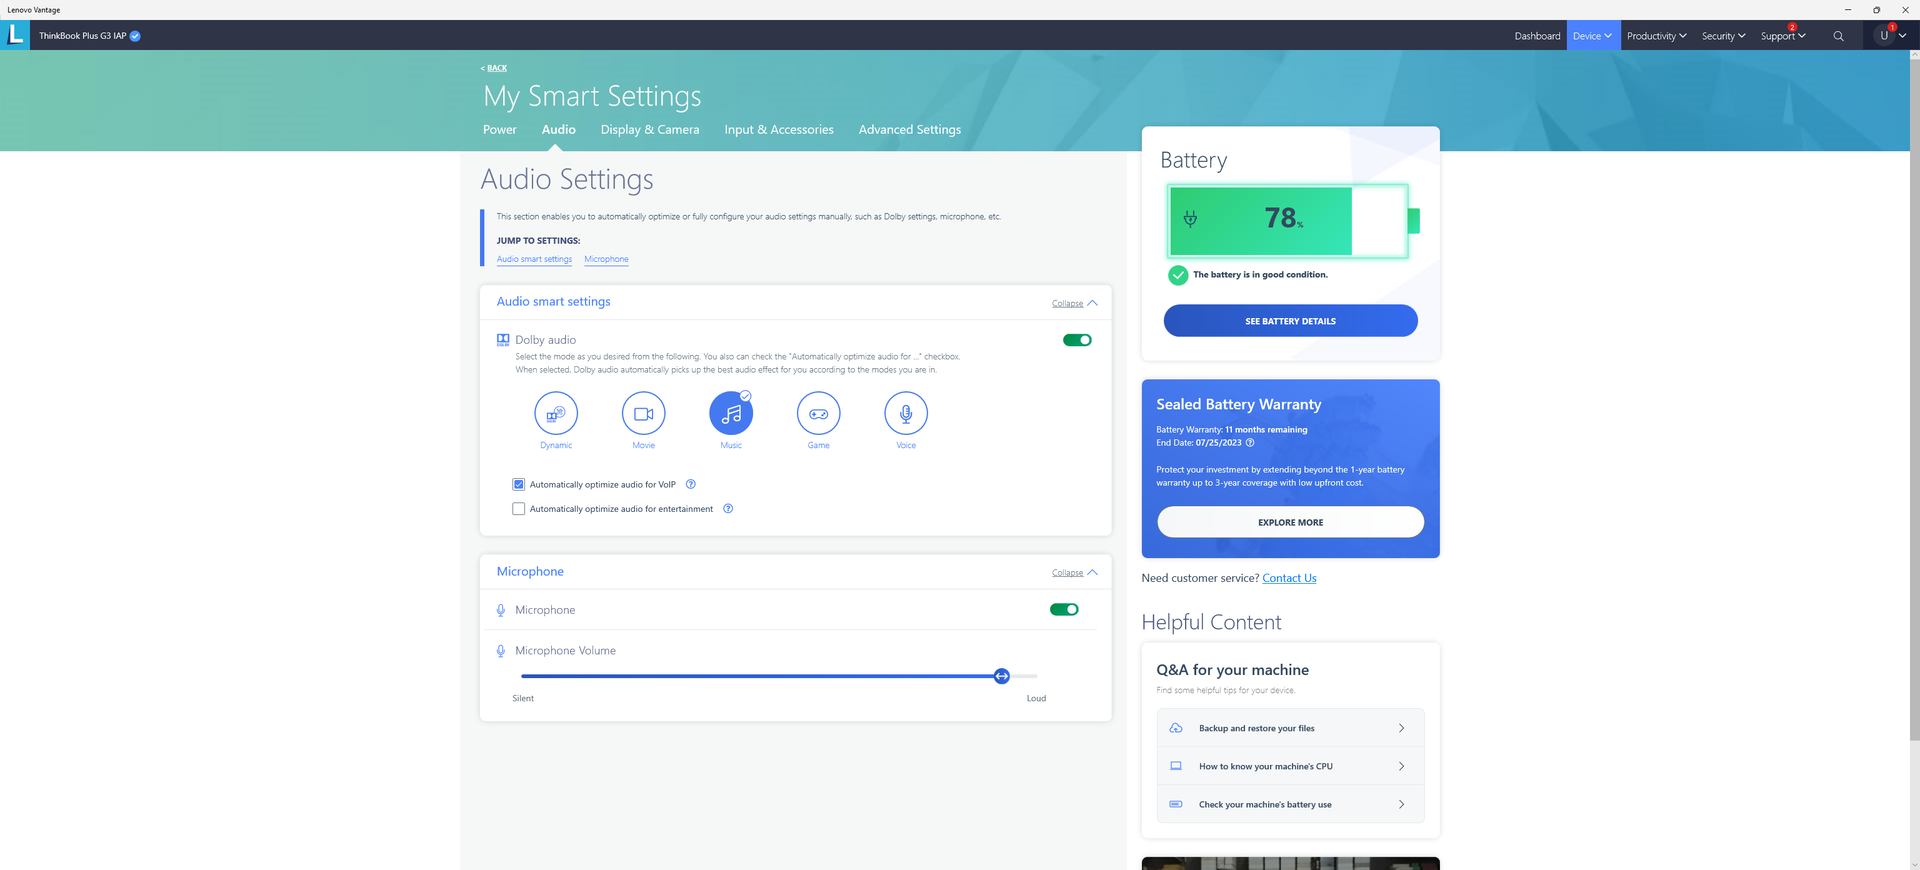
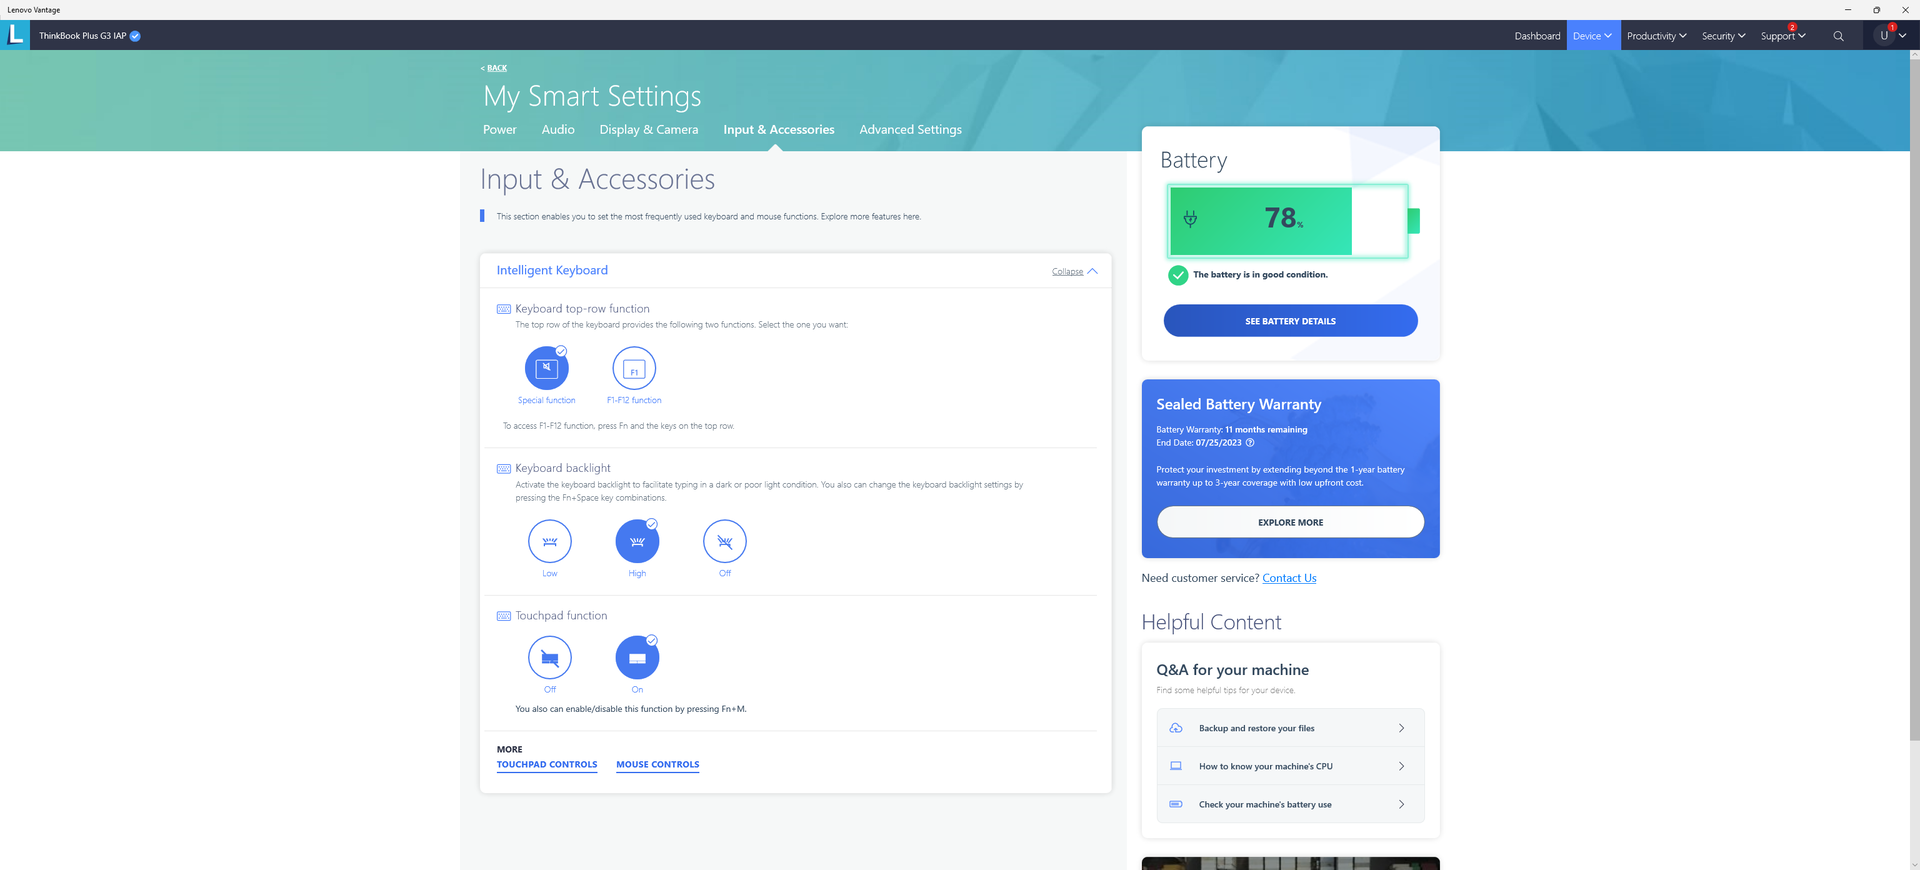
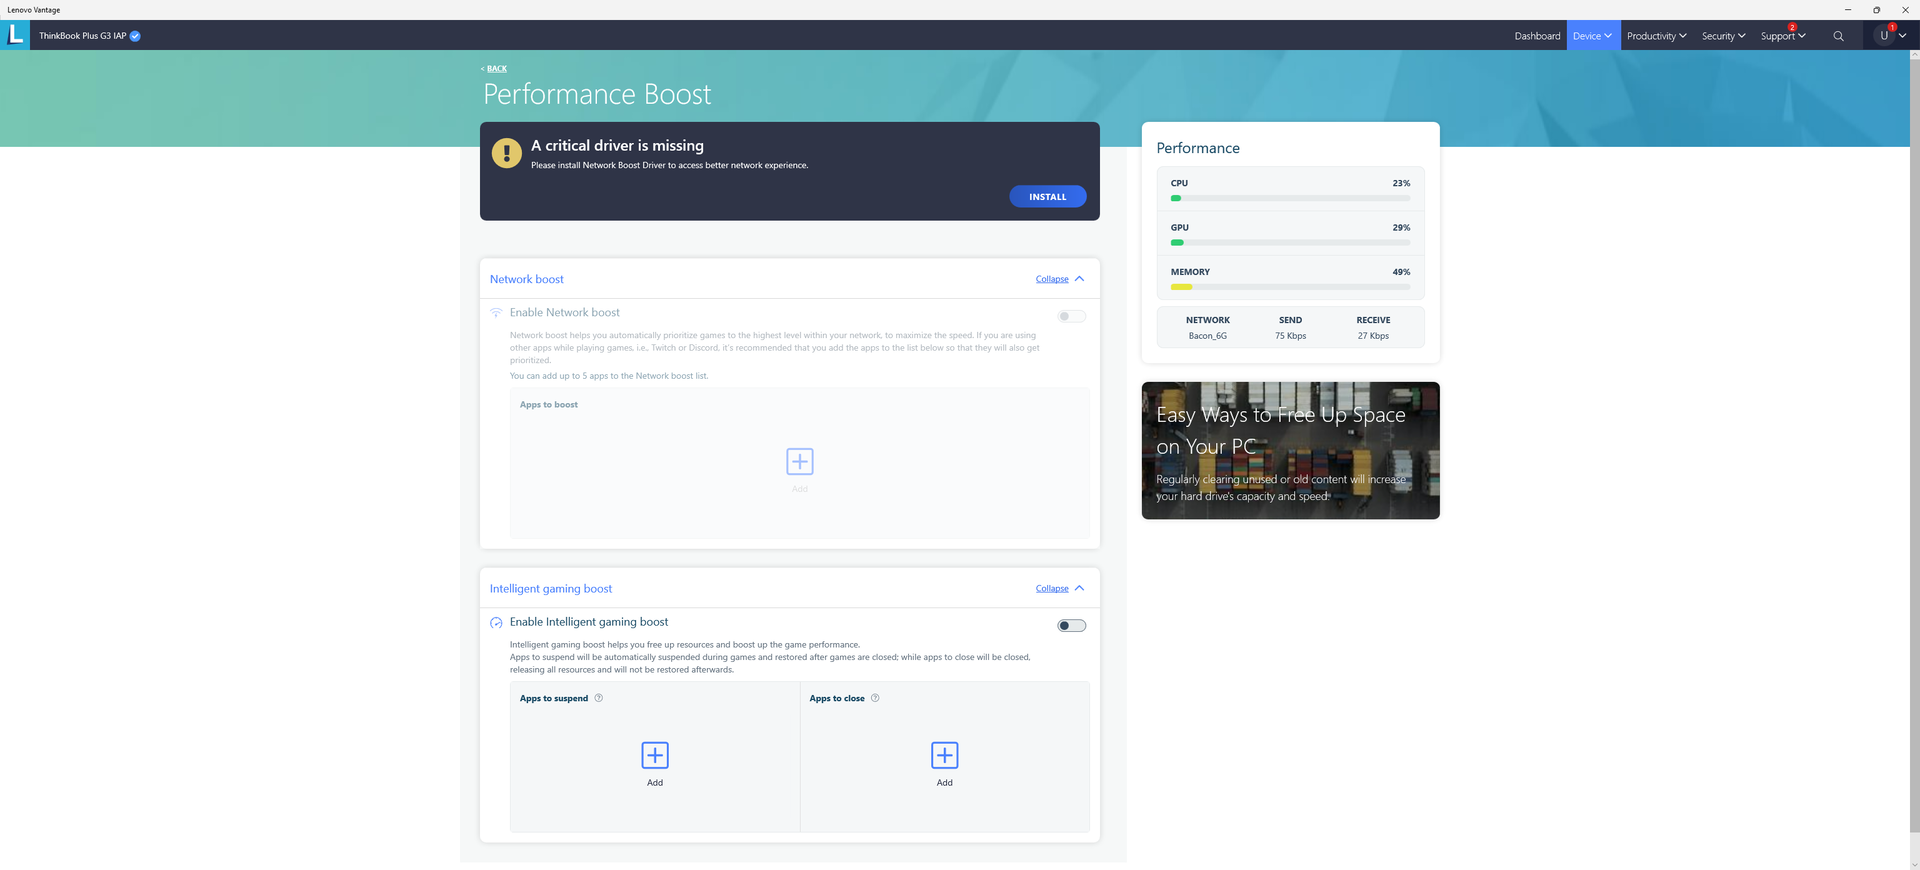
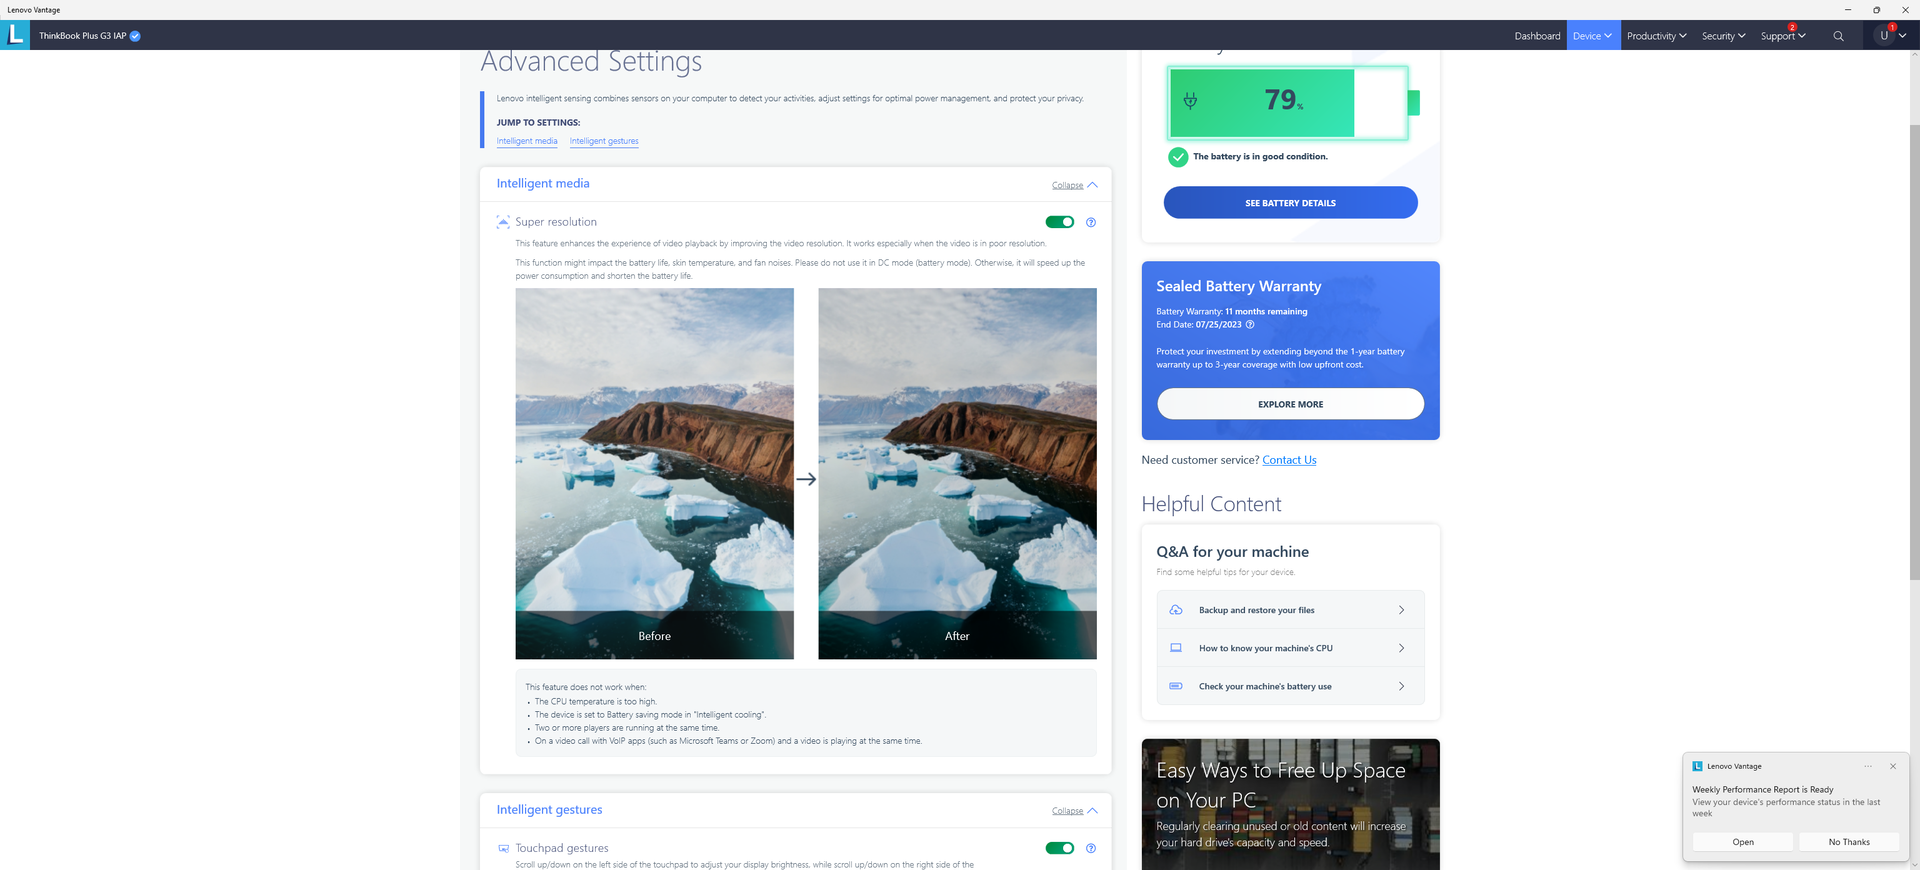
We set our unit to Extreme Performance mode via Lenovo Vantage and Performance mode via Windows prior to running any of the benchmarks below. Owners should become familiar with the pre-installed Vantage software as it is the control center for updates, performance, and auxiliary functions of the laptop. The screenshots below show some of the features available on the software.

Processor
CPU performance is 20 to 25 percent slower than the average Core i7-12700H in our database. The performance deficit is large enough that even laptops with the "slower" Core i5-12500H like the Honor MagicBook 15 can match or outperform our Lenovo. Nonetheless, processor performance is still faster than the lower-power Core i7-1260P or Core i7-1165G7. The advantage is especially wide when compared to the Core i5-1130G7 that powered last year's ThinkBook Plus Gen 2 model.
Cinebench R15 Multi Loop
Cinebench R23: Multi Core | Single Core
Cinebench R15: CPU Multi 64Bit | CPU Single 64Bit
Blender: v2.79 BMW27 CPU
7-Zip 18.03: 7z b 4 | 7z b 4 -mmt1
Geekbench 5.5: Multi-Core | Single-Core
HWBOT x265 Benchmark v2.2: 4k Preset
LibreOffice : 20 Documents To PDF
R Benchmark 2.5: Overall mean
Cinebench R23: Multi Core | Single Core
Cinebench R15: CPU Multi 64Bit | CPU Single 64Bit
Blender: v2.79 BMW27 CPU
7-Zip 18.03: 7z b 4 | 7z b 4 -mmt1
Geekbench 5.5: Multi-Core | Single-Core
HWBOT x265 Benchmark v2.2: 4k Preset
LibreOffice : 20 Documents To PDF
R Benchmark 2.5: Overall mean
* ... smaller is better
AIDA64: FP32 Ray-Trace | FPU Julia | CPU SHA3 | CPU Queen | FPU SinJulia | FPU Mandel | CPU AES | CPU ZLib | FP64 Ray-Trace | CPU PhotoWorxx
| Performance rating | |
| Average Intel Core i7-12700H | |
| Lenovo ThinkBook Plus Gen3 | |
| Dell XPS 17 9720 | |
| Asus ProArt StudioBook Pro 17 W700G3T | |
| LG Gram 17 (2022) | |
| Lenovo ThinkBook Plus Gen2 Core i5 | |
| Gigabyte Aero 17 HDR YD -9! | |
| AIDA64 / FP32 Ray-Trace | |
| Lenovo ThinkBook Plus Gen3 | |
| Average Intel Core i7-12700H (2585 - 17957, n=64) | |
| Asus ProArt StudioBook Pro 17 W700G3T | |
| Dell XPS 17 9720 | |
| LG Gram 17 (2022) | |
| Lenovo ThinkBook Plus Gen2 Core i5 | |
| AIDA64 / FPU Julia | |
| Lenovo ThinkBook Plus Gen3 | |
| Average Intel Core i7-12700H (12439 - 90760, n=64) | |
| Asus ProArt StudioBook Pro 17 W700G3T | |
| Dell XPS 17 9720 | |
| LG Gram 17 (2022) | |
| Lenovo ThinkBook Plus Gen2 Core i5 | |
| AIDA64 / CPU SHA3 | |
| Average Intel Core i7-12700H (833 - 4242, n=64) | |
| Lenovo ThinkBook Plus Gen3 | |
| Dell XPS 17 9720 | |
| Asus ProArt StudioBook Pro 17 W700G3T | |
| Lenovo ThinkBook Plus Gen2 Core i5 | |
| LG Gram 17 (2022) | |
| AIDA64 / CPU Queen | |
| Dell XPS 17 9720 | |
| Average Intel Core i7-12700H (57923 - 103202, n=63) | |
| Lenovo ThinkBook Plus Gen3 | |
| Asus ProArt StudioBook Pro 17 W700G3T | |
| LG Gram 17 (2022) | |
| Lenovo ThinkBook Plus Gen2 Core i5 | |
| AIDA64 / FPU SinJulia | |
| Average Intel Core i7-12700H (3249 - 9939, n=64) | |
| Dell XPS 17 9720 | |
| Lenovo ThinkBook Plus Gen3 | |
| Asus ProArt StudioBook Pro 17 W700G3T | |
| LG Gram 17 (2022) | |
| Lenovo ThinkBook Plus Gen2 Core i5 | |
| AIDA64 / FPU Mandel | |
| Lenovo ThinkBook Plus Gen3 | |
| Average Intel Core i7-12700H (7135 - 44760, n=64) | |
| Asus ProArt StudioBook Pro 17 W700G3T | |
| Dell XPS 17 9720 | |
| LG Gram 17 (2022) | |
| Lenovo ThinkBook Plus Gen2 Core i5 | |
| AIDA64 / CPU AES | |
| Average Intel Core i7-12700H (31839 - 144360, n=64) | |
| Dell XPS 17 9720 | |
| Lenovo ThinkBook Plus Gen3 | |
| Lenovo ThinkBook Plus Gen2 Core i5 | |
| LG Gram 17 (2022) | |
| Asus ProArt StudioBook Pro 17 W700G3T | |
| AIDA64 / CPU ZLib | |
| Average Intel Core i7-12700H (305 - 1171, n=64) | |
| Dell XPS 17 9720 | |
| Lenovo ThinkBook Plus Gen3 | |
| Asus ProArt StudioBook Pro 17 W700G3T | |
| LG Gram 17 (2022) | |
| Lenovo ThinkBook Plus Gen2 Core i5 | |
| Gigabyte Aero 17 HDR YD | |
| AIDA64 / FP64 Ray-Trace | |
| Lenovo ThinkBook Plus Gen3 | |
| Average Intel Core i7-12700H (1437 - 9692, n=64) | |
| Asus ProArt StudioBook Pro 17 W700G3T | |
| Dell XPS 17 9720 | |
| LG Gram 17 (2022) | |
| Lenovo ThinkBook Plus Gen2 Core i5 | |
| AIDA64 / CPU PhotoWorxx | |
| Dell XPS 17 9720 | |
| Lenovo ThinkBook Plus Gen3 | |
| Lenovo ThinkBook Plus Gen2 Core i5 | |
| LG Gram 17 (2022) | |
| Average Intel Core i7-12700H (12863 - 52207, n=64) | |
| Asus ProArt StudioBook Pro 17 W700G3T | |
System Performance
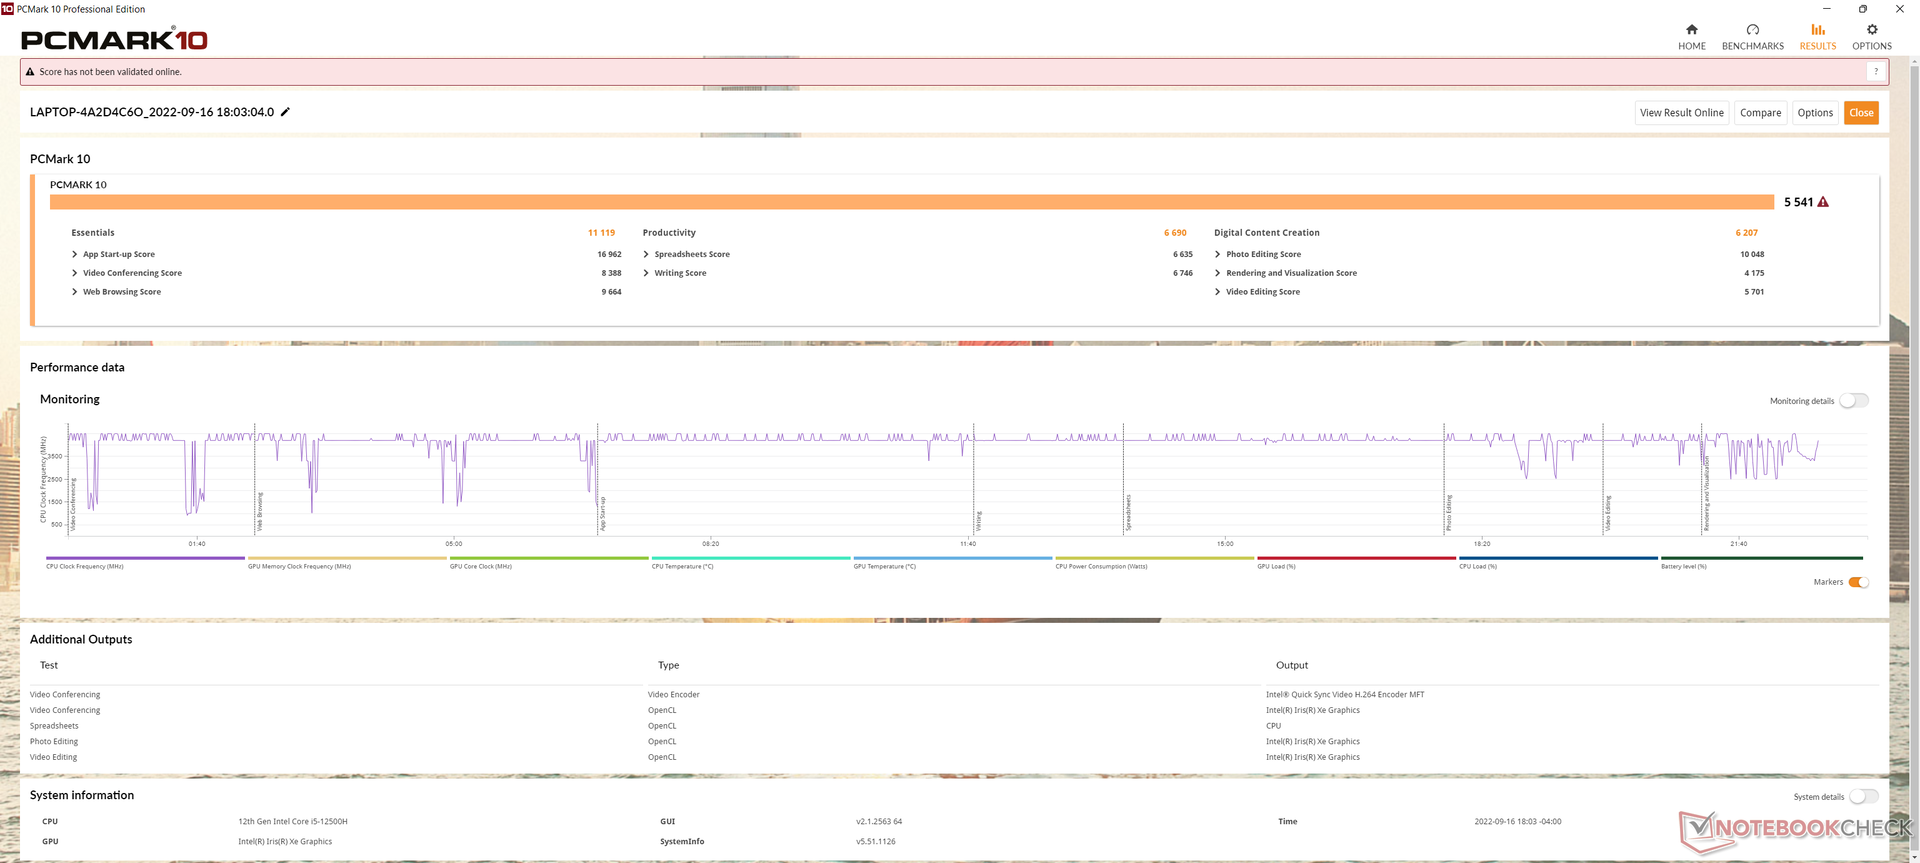
PCMark 10 results are higher than many laptops running on Core U-series or older H-series CPUs while being lower than those with dedicated GPUs like the XPS 17 9720.
CrossMark: Overall | Productivity | Creativity | Responsiveness
| PCMark 10 / Score | |
| Gigabyte Aero 17 HDR YD | |
| Dell XPS 17 9720 | |
| Average Intel Core i7-12700H, Intel Iris Xe Graphics G7 96EUs (5541 - 6281, n=8) | |
| Lenovo ThinkBook Plus Gen3 | |
| LG Gram 17 (2022) | |
| Asus ProArt StudioBook Pro 17 W700G3T | |
| Lenovo ThinkBook Plus Gen2 Core i5 | |
| PCMark 10 / Essentials | |
| Lenovo ThinkBook Plus Gen3 | |
| Average Intel Core i7-12700H, Intel Iris Xe Graphics G7 96EUs (9991 - 11699, n=8) | |
| Dell XPS 17 9720 | |
| Lenovo ThinkBook Plus Gen2 Core i5 | |
| Gigabyte Aero 17 HDR YD | |
| LG Gram 17 (2022) | |
| Asus ProArt StudioBook Pro 17 W700G3T | |
| PCMark 10 / Productivity | |
| Dell XPS 17 9720 | |
| Gigabyte Aero 17 HDR YD | |
| Asus ProArt StudioBook Pro 17 W700G3T | |
| Average Intel Core i7-12700H, Intel Iris Xe Graphics G7 96EUs (6690 - 8038, n=8) | |
| Lenovo ThinkBook Plus Gen3 | |
| LG Gram 17 (2022) | |
| Lenovo ThinkBook Plus Gen2 Core i5 | |
| PCMark 10 / Digital Content Creation | |
| Gigabyte Aero 17 HDR YD | |
| Dell XPS 17 9720 | |
| Average Intel Core i7-12700H, Intel Iris Xe Graphics G7 96EUs (6207 - 7401, n=8) | |
| Lenovo ThinkBook Plus Gen3 | |
| LG Gram 17 (2022) | |
| Asus ProArt StudioBook Pro 17 W700G3T | |
| Lenovo ThinkBook Plus Gen2 Core i5 | |
| CrossMark / Overall | |
| Dell XPS 17 9720 | |
| Average Intel Core i7-12700H, Intel Iris Xe Graphics G7 96EUs (1492 - 1907, n=8) | |
| Lenovo ThinkBook Plus Gen3 | |
| LG Gram 17 (2022) | |
| CrossMark / Productivity | |
| Dell XPS 17 9720 | |
| Average Intel Core i7-12700H, Intel Iris Xe Graphics G7 96EUs (1499 - 1832, n=8) | |
| Lenovo ThinkBook Plus Gen3 | |
| LG Gram 17 (2022) | |
| CrossMark / Creativity | |
| Dell XPS 17 9720 | |
| Lenovo ThinkBook Plus Gen3 | |
| Average Intel Core i7-12700H, Intel Iris Xe Graphics G7 96EUs (1507 - 2016, n=8) | |
| LG Gram 17 (2022) | |
| CrossMark / Responsiveness | |
| Dell XPS 17 9720 | |
| Average Intel Core i7-12700H, Intel Iris Xe Graphics G7 96EUs (1384 - 1831, n=8) | |
| LG Gram 17 (2022) | |
| Lenovo ThinkBook Plus Gen3 | |
| PCMark 10 Score | 5541 points | |
Help | ||
| AIDA64 / Memory Copy | |
| Dell XPS 17 9720 | |
| Lenovo ThinkBook Plus Gen3 | |
| LG Gram 17 (2022) | |
| Lenovo ThinkBook Plus Gen2 Core i5 | |
| Average Intel Core i7-12700H (25615 - 80511, n=64) | |
| Asus ProArt StudioBook Pro 17 W700G3T | |
| AIDA64 / Memory Read | |
| Lenovo ThinkBook Plus Gen3 | |
| Dell XPS 17 9720 | |
| LG Gram 17 (2022) | |
| Lenovo ThinkBook Plus Gen2 Core i5 | |
| Average Intel Core i7-12700H (25586 - 79442, n=64) | |
| Asus ProArt StudioBook Pro 17 W700G3T | |
| AIDA64 / Memory Write | |
| Dell XPS 17 9720 | |
| Lenovo ThinkBook Plus Gen2 Core i5 | |
| LG Gram 17 (2022) | |
| Lenovo ThinkBook Plus Gen3 | |
| Average Intel Core i7-12700H (23679 - 88660, n=64) | |
| Asus ProArt StudioBook Pro 17 W700G3T | |
| AIDA64 / Memory Latency | |
| Lenovo ThinkBook Plus Gen3 | |
| LG Gram 17 (2022) | |
| Lenovo ThinkBook Plus Gen2 Core i5 | |
| Dell XPS 17 9720 | |
| Average Intel Core i7-12700H (76.2 - 133.9, n=62) | |
| Asus ProArt StudioBook Pro 17 W700G3T | |
| Gigabyte Aero 17 HDR YD | |
* ... smaller is better
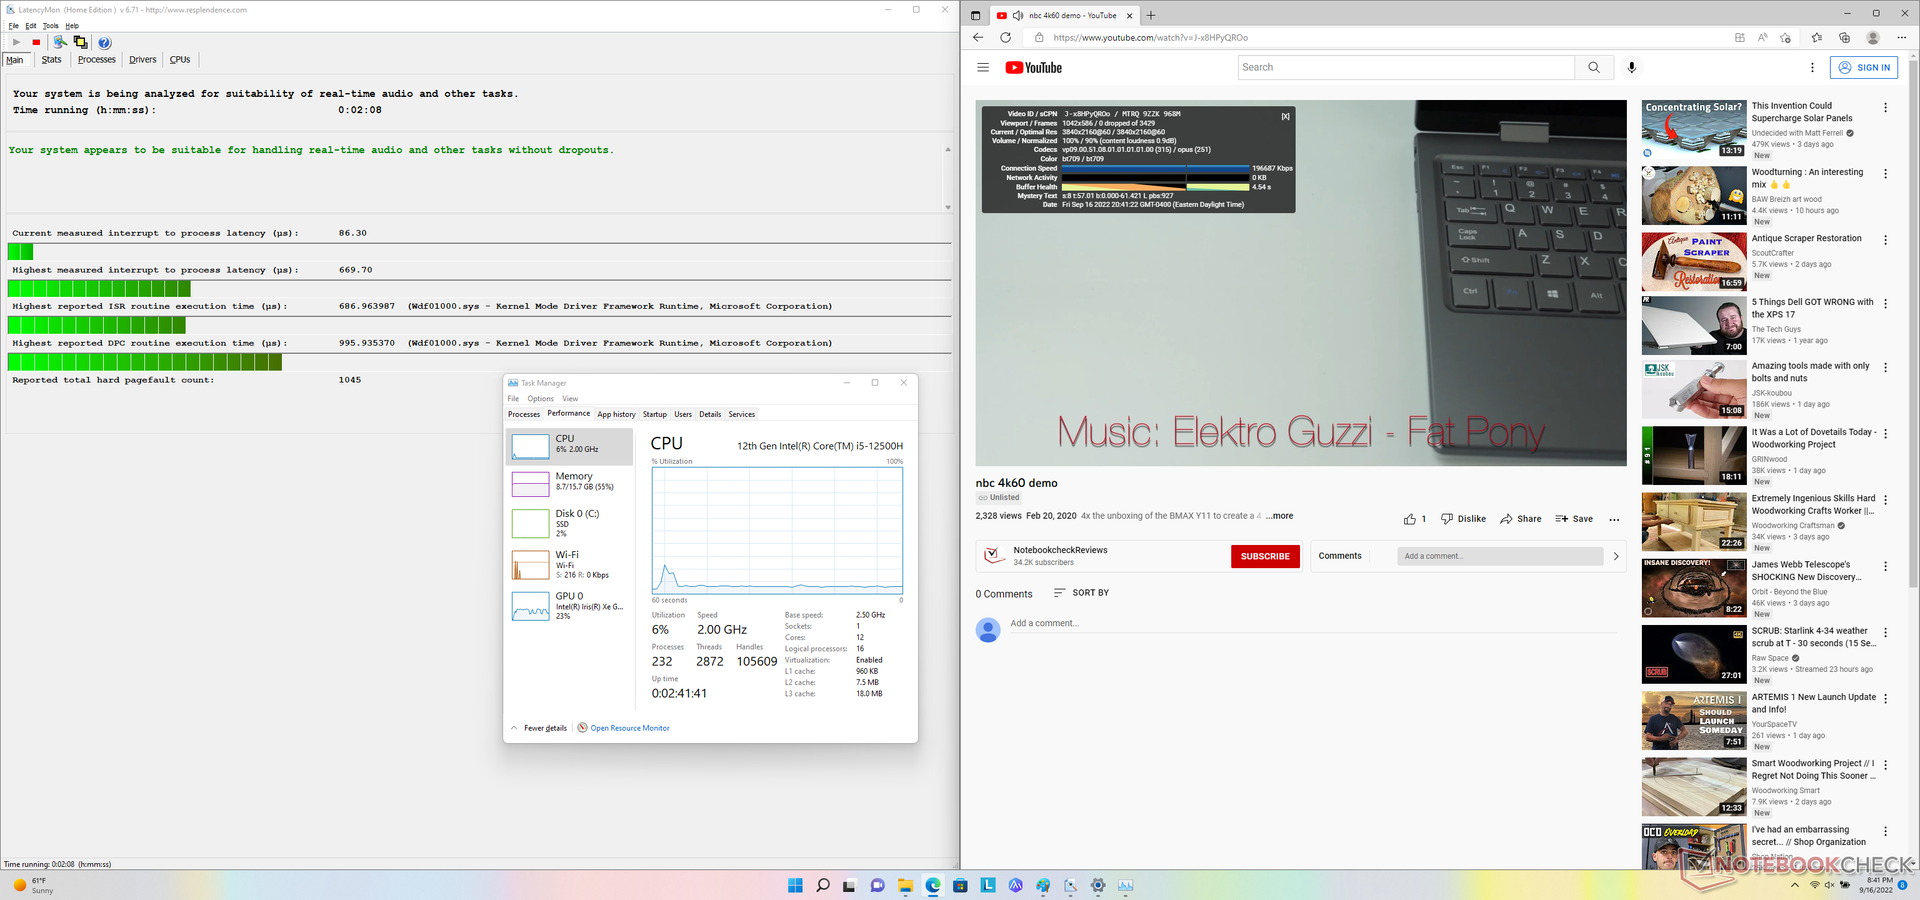
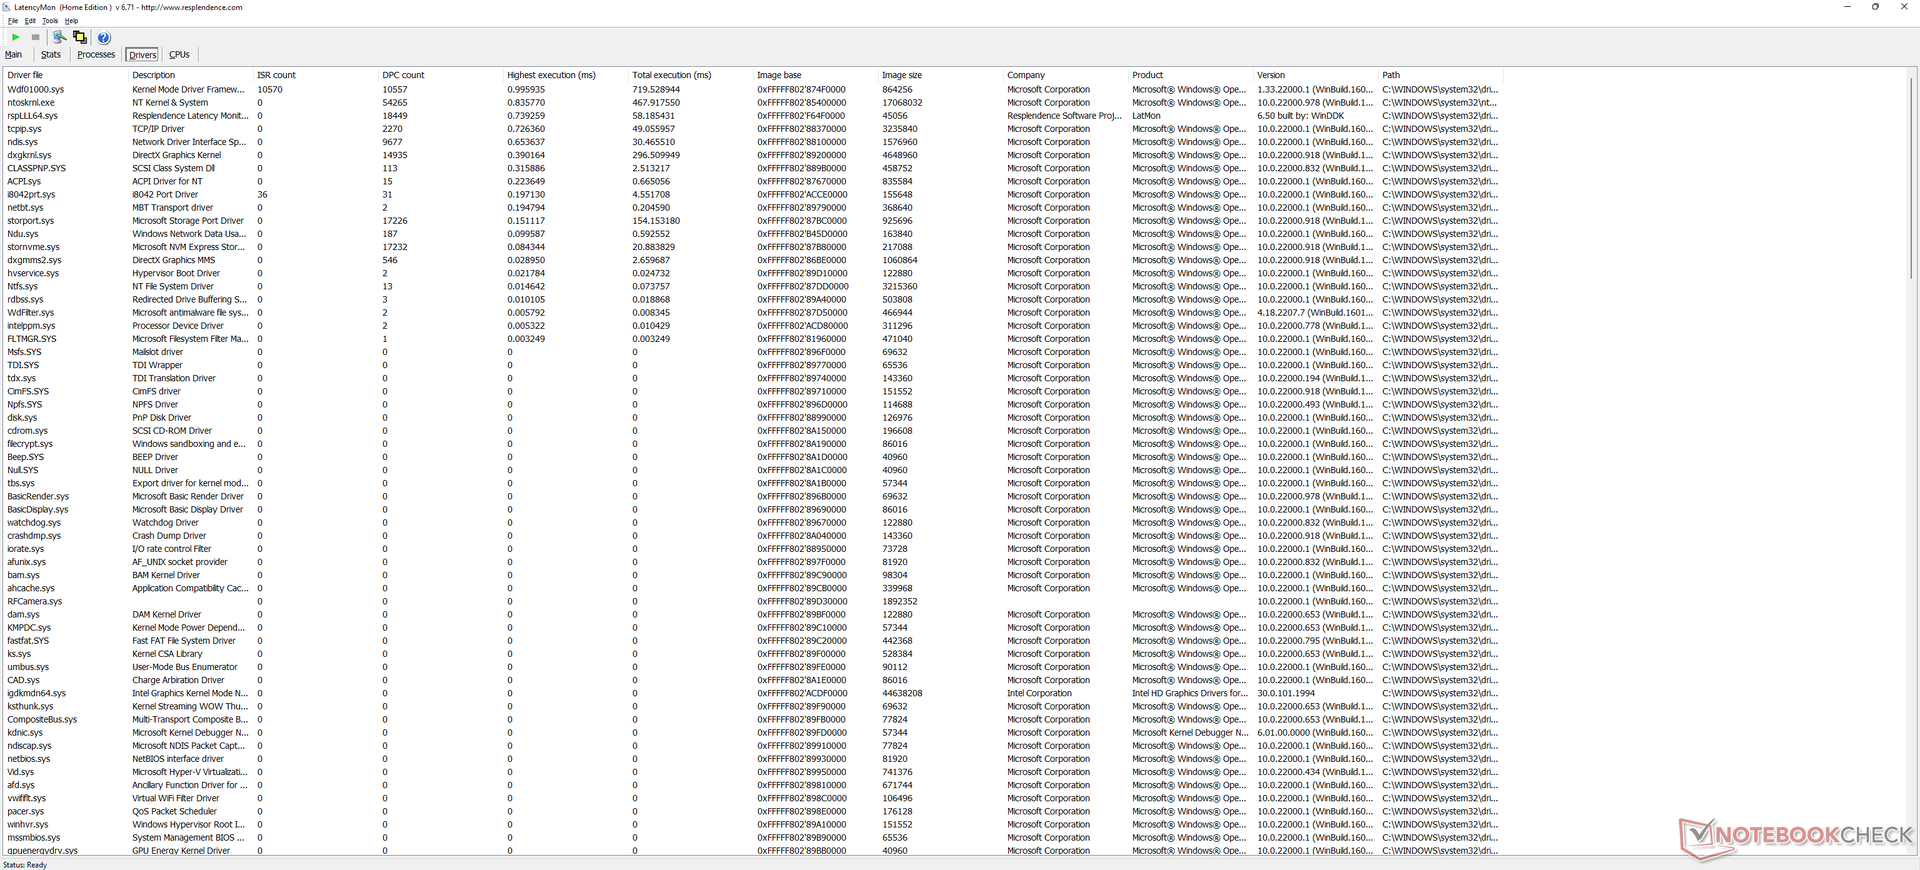
DPC Latency
LatencyMon reveals no major DPC issues when opening multiple browser tabs of our homepage or when running Prime95 stress for 30 seconds. 4K video playback at 60 FPS is also perfect with no dropped frames.
| DPC Latencies / LatencyMon - interrupt to process latency (max), Web, Youtube, Prime95 | |
| Gigabyte Aero 17 HDR YD | |
| Lenovo ThinkBook Plus Gen2 Core i5 | |
| Dell XPS 17 9720 | |
| Lenovo ThinkBook Plus Gen3 | |
| LG Gram 17 (2022) | |
* ... smaller is better
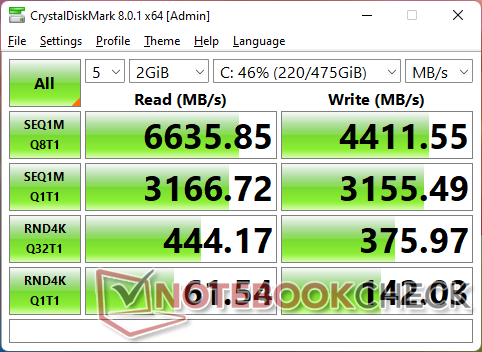
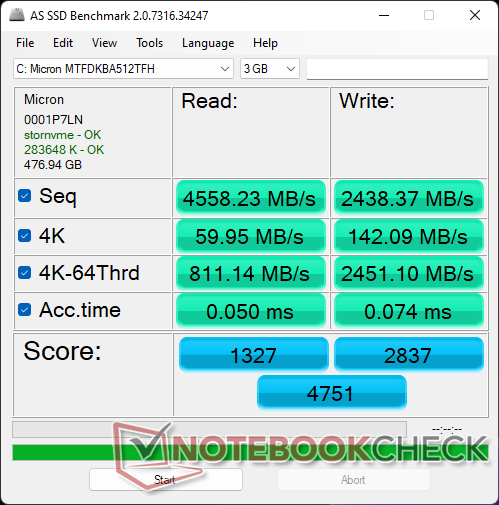
Storage Devices
Our test unit ships with the same 512 GB Micron 3400 MTFDKBA512TFH SSD as found on the Dell XPS 17 9720. Though not as speedy as the Samsung PM9A1 series, the drive would exhibit no throttling issues for a consistent level of performance even when stressed.

| Drive Performance rating - Percent | |
| Gigabyte Aero 17 HDR YD | |
| LG Gram 17 (2022) | |
| Lenovo ThinkBook Plus Gen2 Core i5 | |
| Dell XPS 17 9720 | |
| Lenovo ThinkBook Plus Gen3 | |
| Asus ProArt StudioBook Pro 17 W700G3T | |
* ... smaller is better
Disk Throttling: DiskSpd Read Loop, Queue Depth 8
GPU Performance — Integrated Iris Xe Only
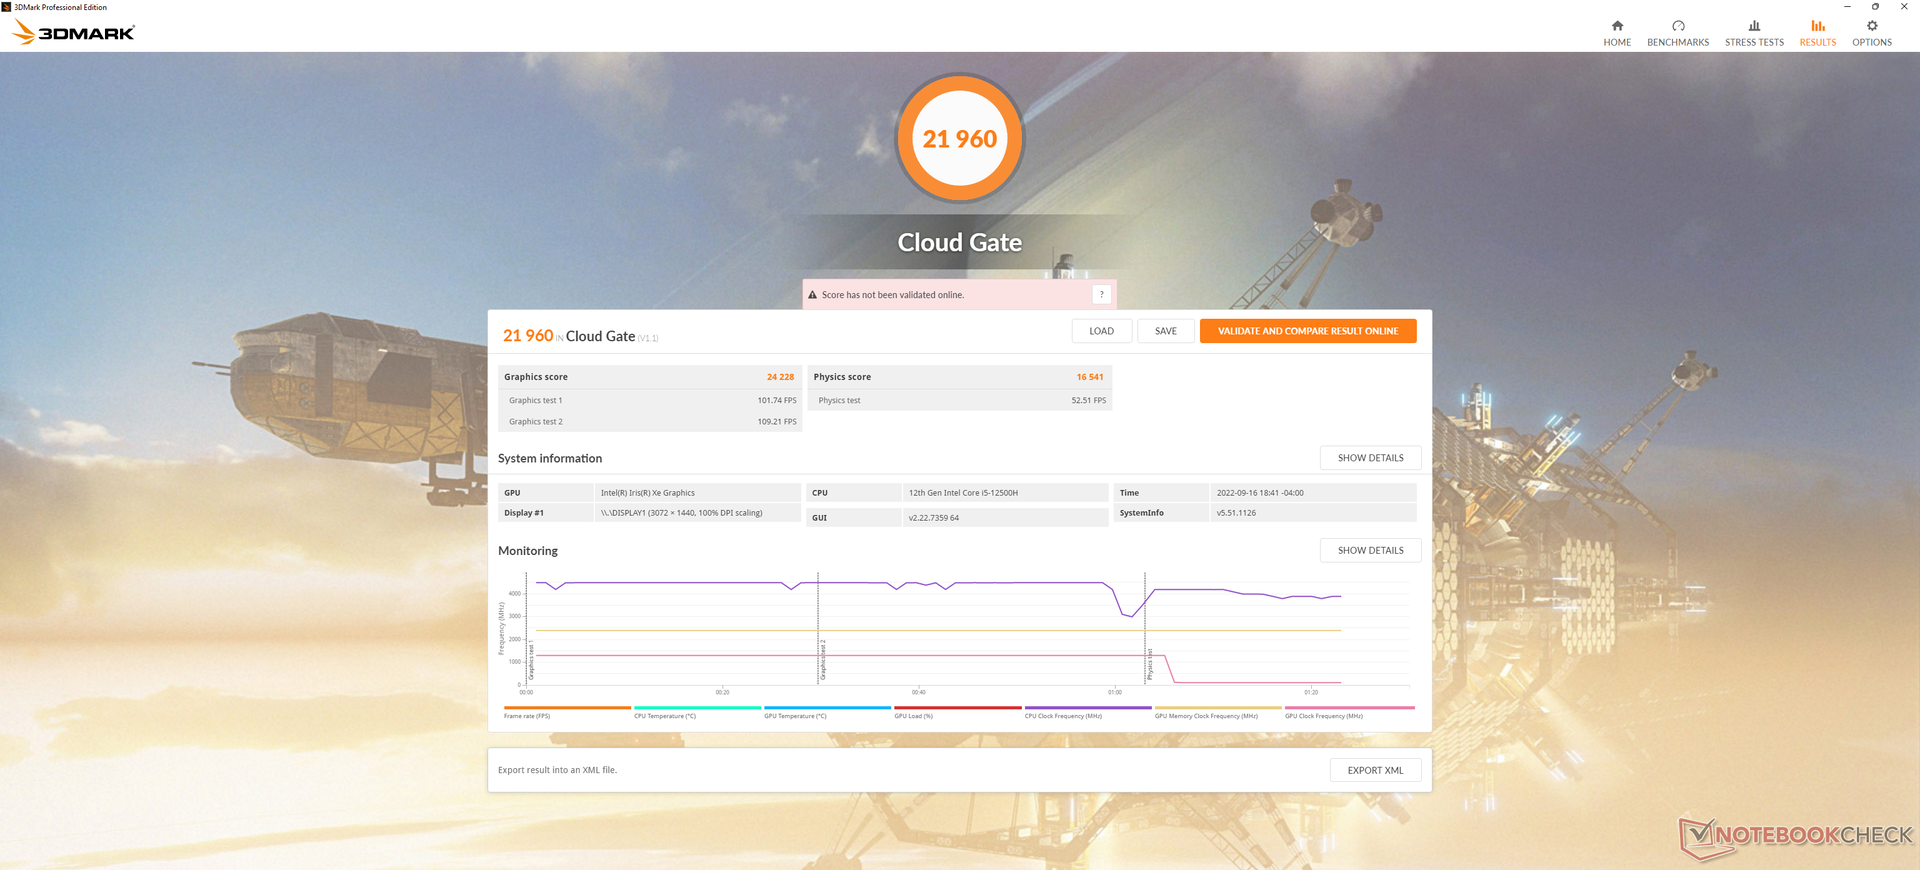
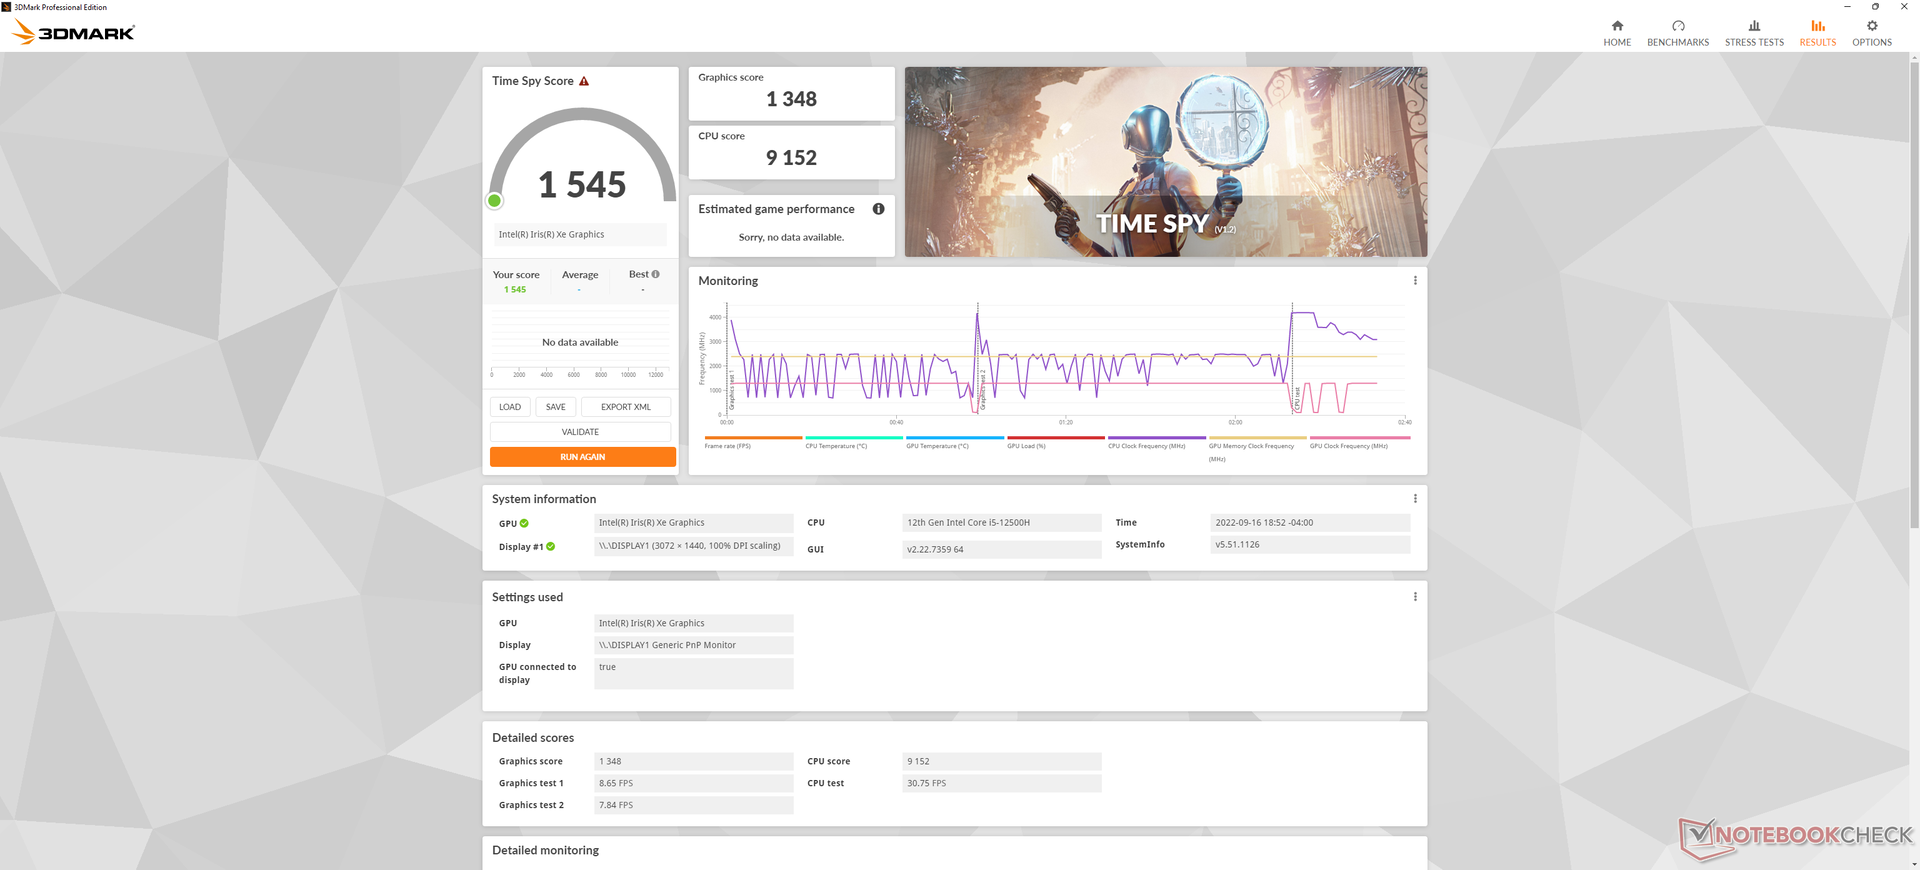
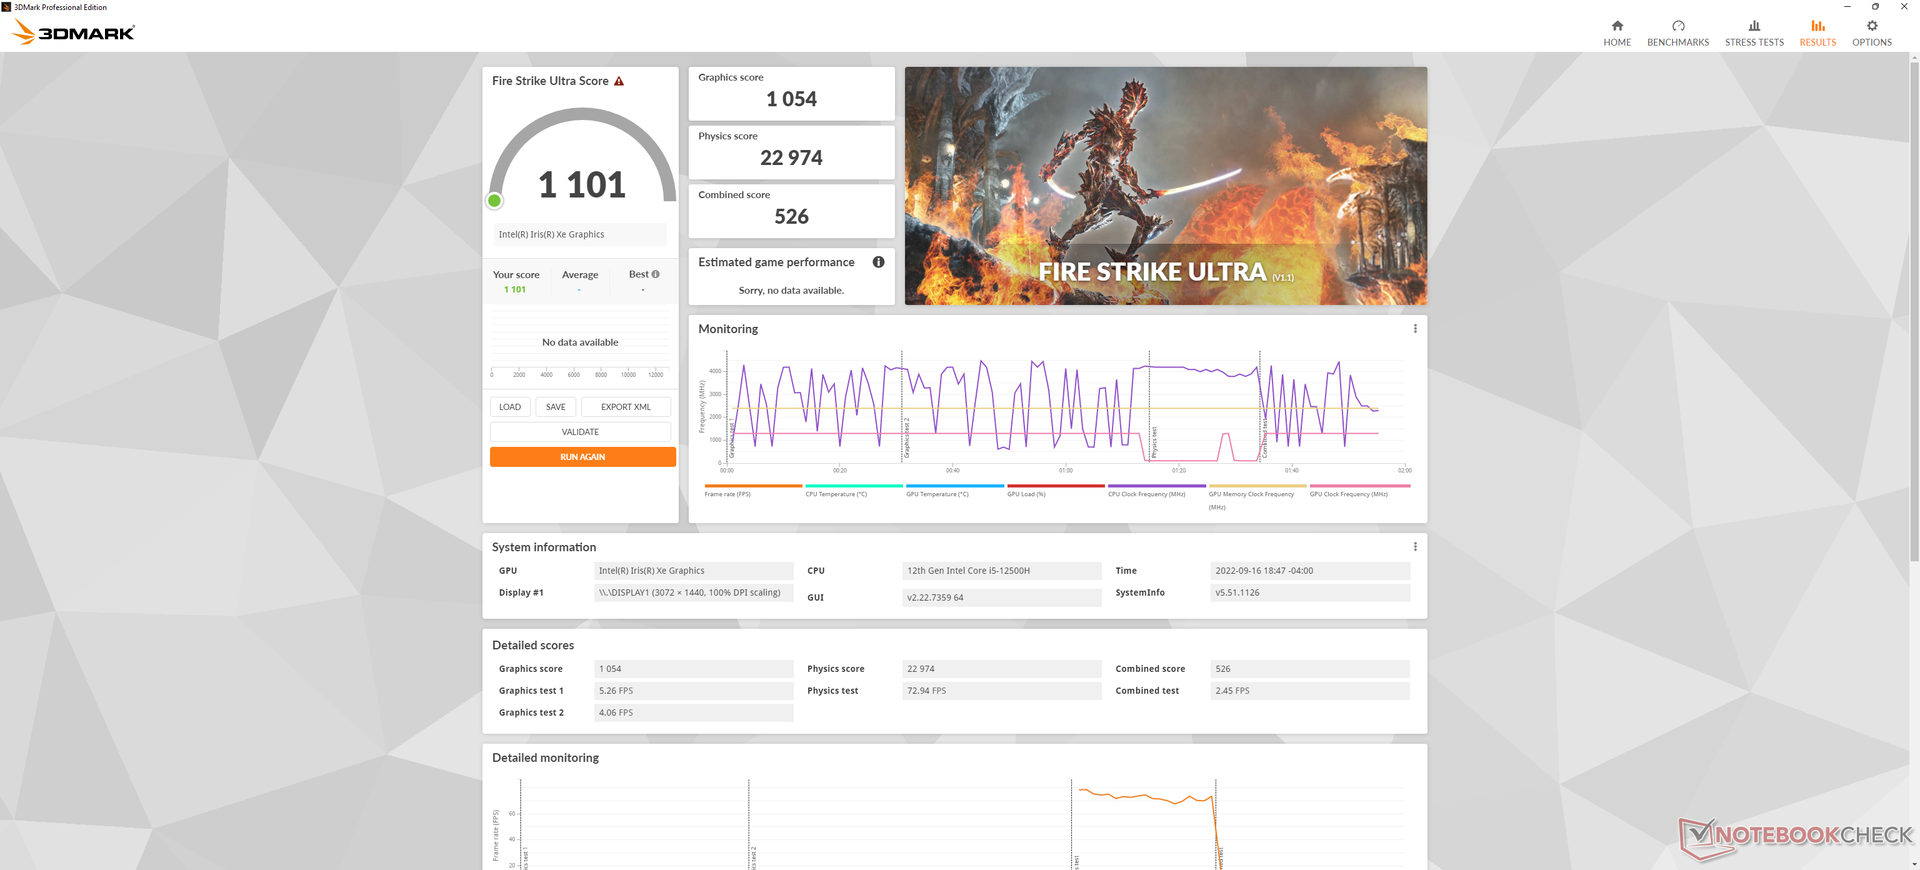
Raw graphics performance is a few percentage points slower than the average laptop in our database with the same integrated Iris Xe 96 EUs GPU. It's too bad that there are no discrete GeForce GTX/RTX or even MX options to choose from which could have boosted graphics performance significantly. The integrated Intel solution is on the slower side when considering the large 17-inch category.
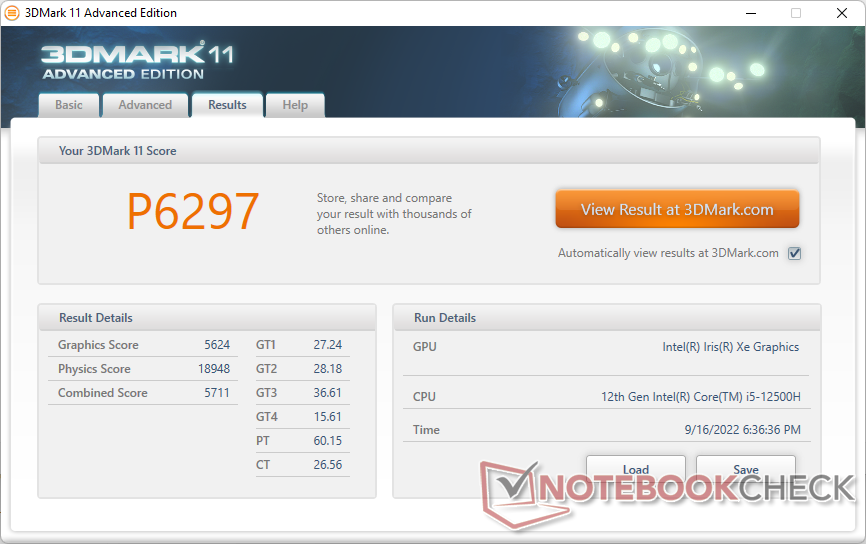
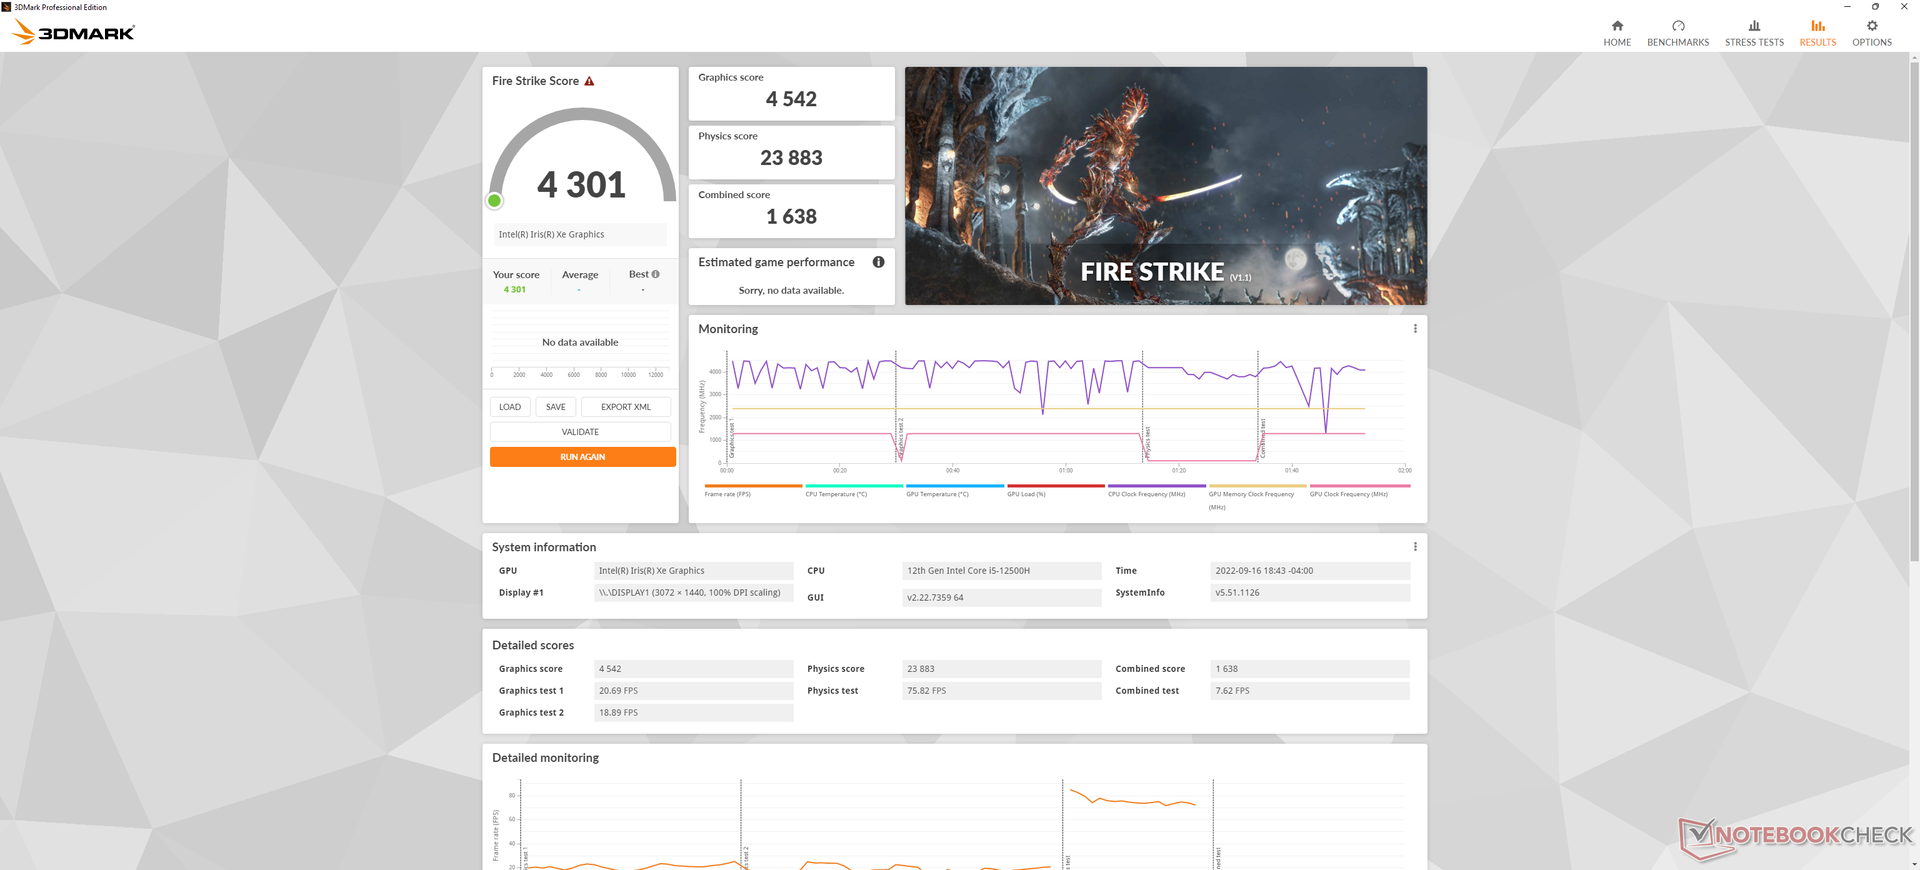
| 3DMark 11 Performance | 6297 points | |
| 3DMark Cloud Gate Standard Score | 21960 points | |
| 3DMark Fire Strike Score | 4301 points | |
| 3DMark Time Spy Score | 1545 points | |
Help | ||
Witcher 3 FPS Chart
| low | med. | high | ultra | |
|---|---|---|---|---|
| GTA V (2015) | 100.1 | 60.9 | 20 | 8.96 |
| The Witcher 3 (2015) | 87.1 | 51.2 | 30.4 | 13.4 |
| Dota 2 Reborn (2015) | 126 | 94.1 | 48.6 | 44.9 |
| Final Fantasy XV Benchmark (2018) | 39 | 21.3 | 16.8 | |
| X-Plane 11.11 (2018) | 43.5 | 34 | 30.4 | |
| Strange Brigade (2018) | 74.6 | 32 | 25.5 | 20.2 |
| Cyberpunk 2077 1.6 (2022) | 16 | 13.4 | 10.6 | 8.6 |
Emissions
System Noise — Loud Under Load
Fan noise when idling on desktop ranges between 26 and 28 dB(A) depending on the power profile against a silent background of 22.7 dB(A). Thus, the internal fans are never truly silent in most scenarios which is perhaps the consequence of utilizing a Core H-series CPU instead of the slower but more efficient Core U option. The fans tend to pulse up to 35 dB(A) if web browsing or word processing on Extreme Performance mode and so we recommend Balanced or "Intelligent Cooling" mode when running undemanding applications.
Running higher loads like games induces a fan noise between 39 and 43 dB(A) which is much louder than on the smaller ThinkBook Plus Gen 2.
Noise level
| Idle |
| 26.3 / 26.3 / 27.9 dB(A) |
| Load |
| 42.2 / 46.5 dB(A) |
 | ||
30 dB silent 40 dB(A) audible 50 dB(A) loud |
||
min: | ||
| Lenovo ThinkBook Plus Gen3 Iris Xe G7 96EUs, i7-12700H, Micron 3400 MTFDKBA512TFH 512GB | Lenovo ThinkBook Plus Gen2 Core i5 Iris Xe G7 80EUs, i5-1130G7, Samsung PM9A1 MZVL2512HCJQ | Asus ProArt StudioBook Pro 17 W700G3T Quadro RTX 3000 Max-Q, i7-9750H, Samsung SSD PM981 MZVLB1T0HALR | LG Gram 17 (2022) Iris Xe G7 80EUs, i5-1240P, Samsung PM9A1 MZVL2512HCJQ | Dell XPS 17 9720 GeForce RTX 3050 4GB Laptop GPU, i7-12700H, Micron 3400 MTFDKBA512TFH 512GB | Gigabyte Aero 17 HDR YD GeForce RTX 3080 Laptop GPU, i9-11980HK, Samsung PM9A1 MZVL2512HCJQ | |
|---|---|---|---|---|---|---|
| Noise | 6% | 2% | 6% | -1% | -21% | |
| off / environment * (dB) | 22.7 | 25.4 -12% | 29.4 -30% | 25.1 -11% | 24 -6% | 25 -10% |
| Idle Minimum * (dB) | 26.3 | 25.4 3% | 29.4 -12% | 25.12 4% | 24 9% | 30 -14% |
| Idle Average * (dB) | 26.3 | 27.4 -4% | 29.9 -14% | 25.15 4% | 24 9% | 32 -22% |
| Idle Maximum * (dB) | 27.9 | 32.2 -15% | 29.9 -7% | 26 7% | 24 14% | 41 -47% |
| Load Average * (dB) | 42.2 | 32.2 24% | 31.6 25% | 36.9 13% | 43.9 -4% | 43 -2% |
| Witcher 3 ultra * (dB) | 39.8 | 32.2 19% | 31.6 21% | 48.4 -22% | 51 -28% | |
| Load Maximum * (dB) | 46.5 | 34.5 26% | 31.6 32% | 37.2 20% | 48.4 -4% | 59 -27% |
* ... smaller is better
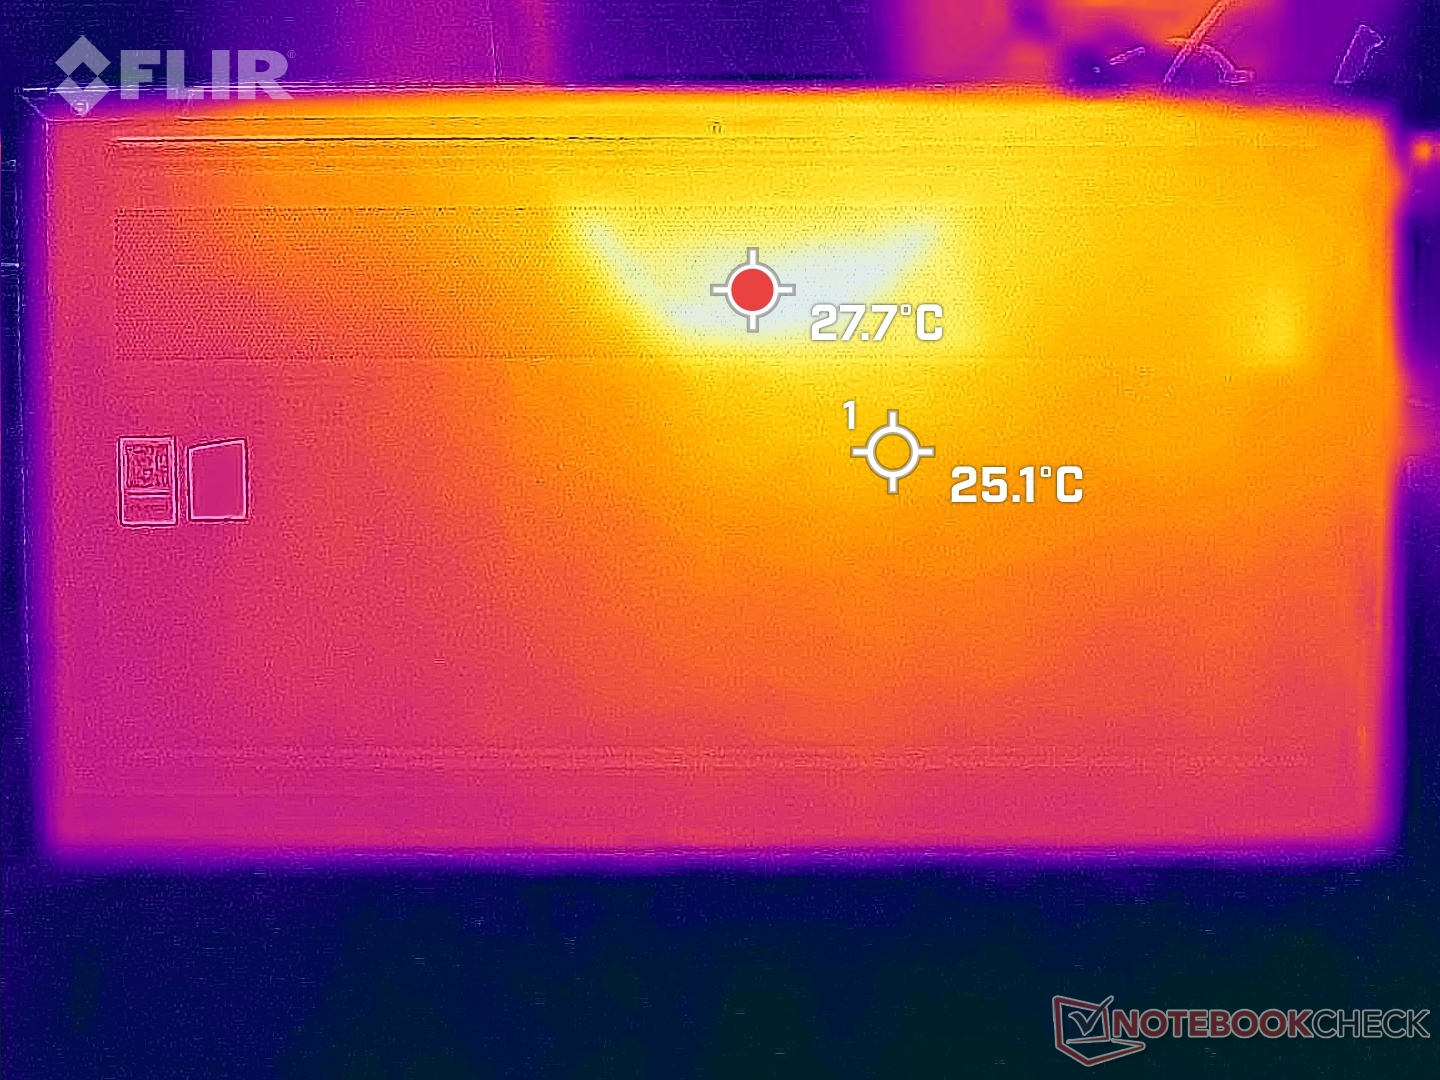
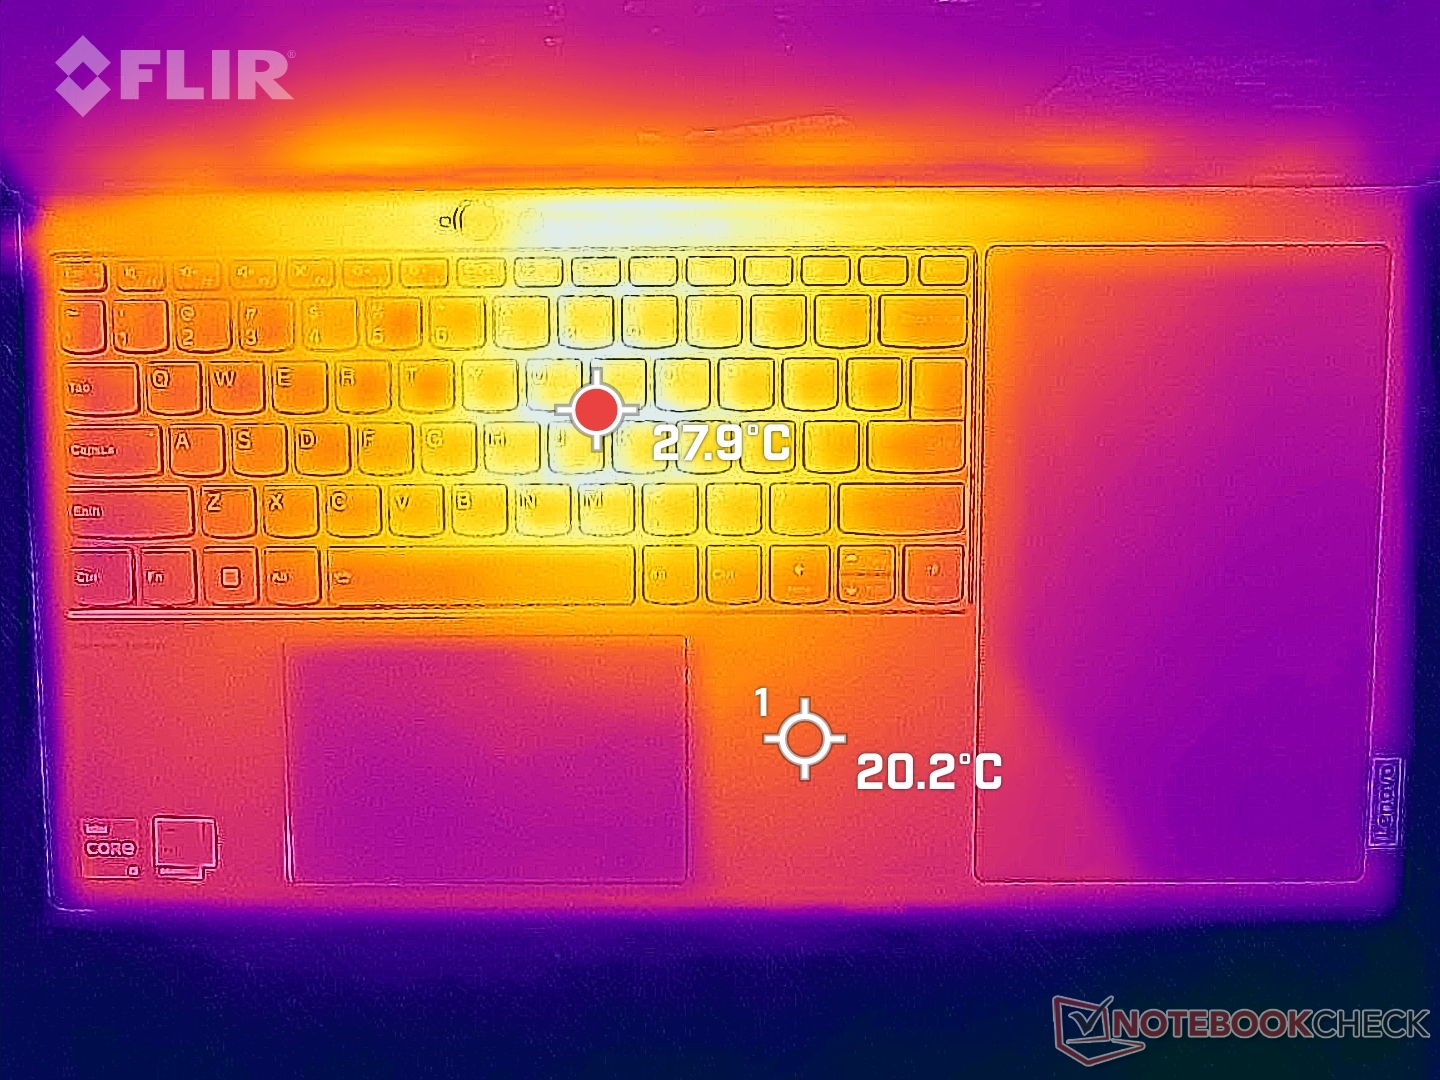
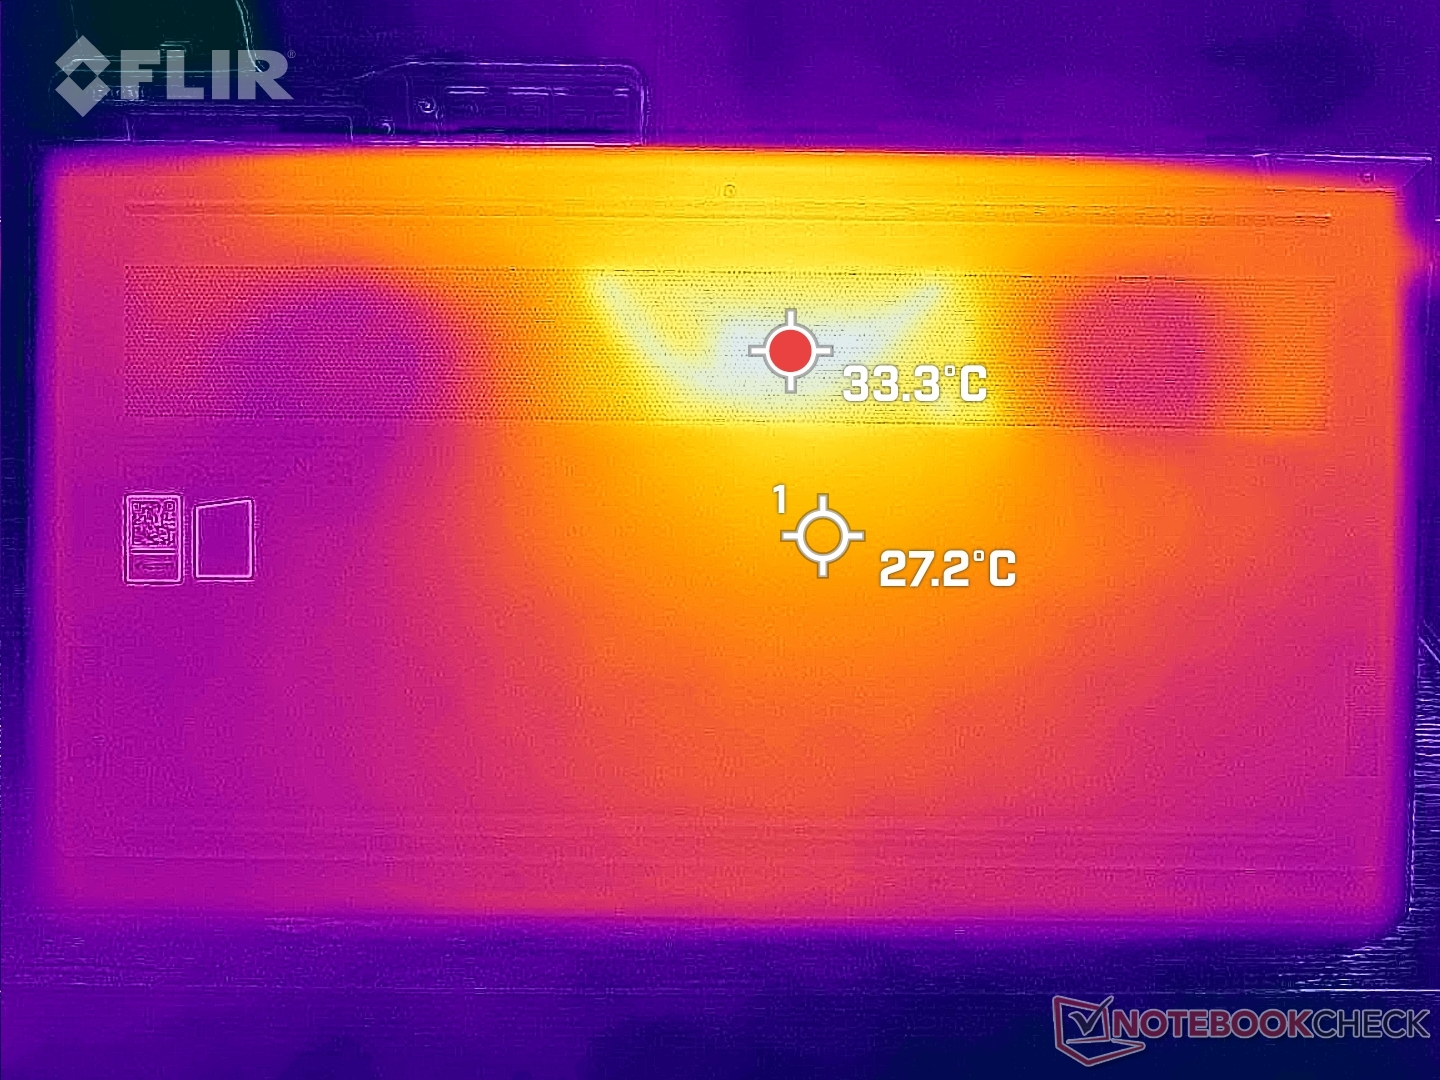
Temperature — Pretty Cool
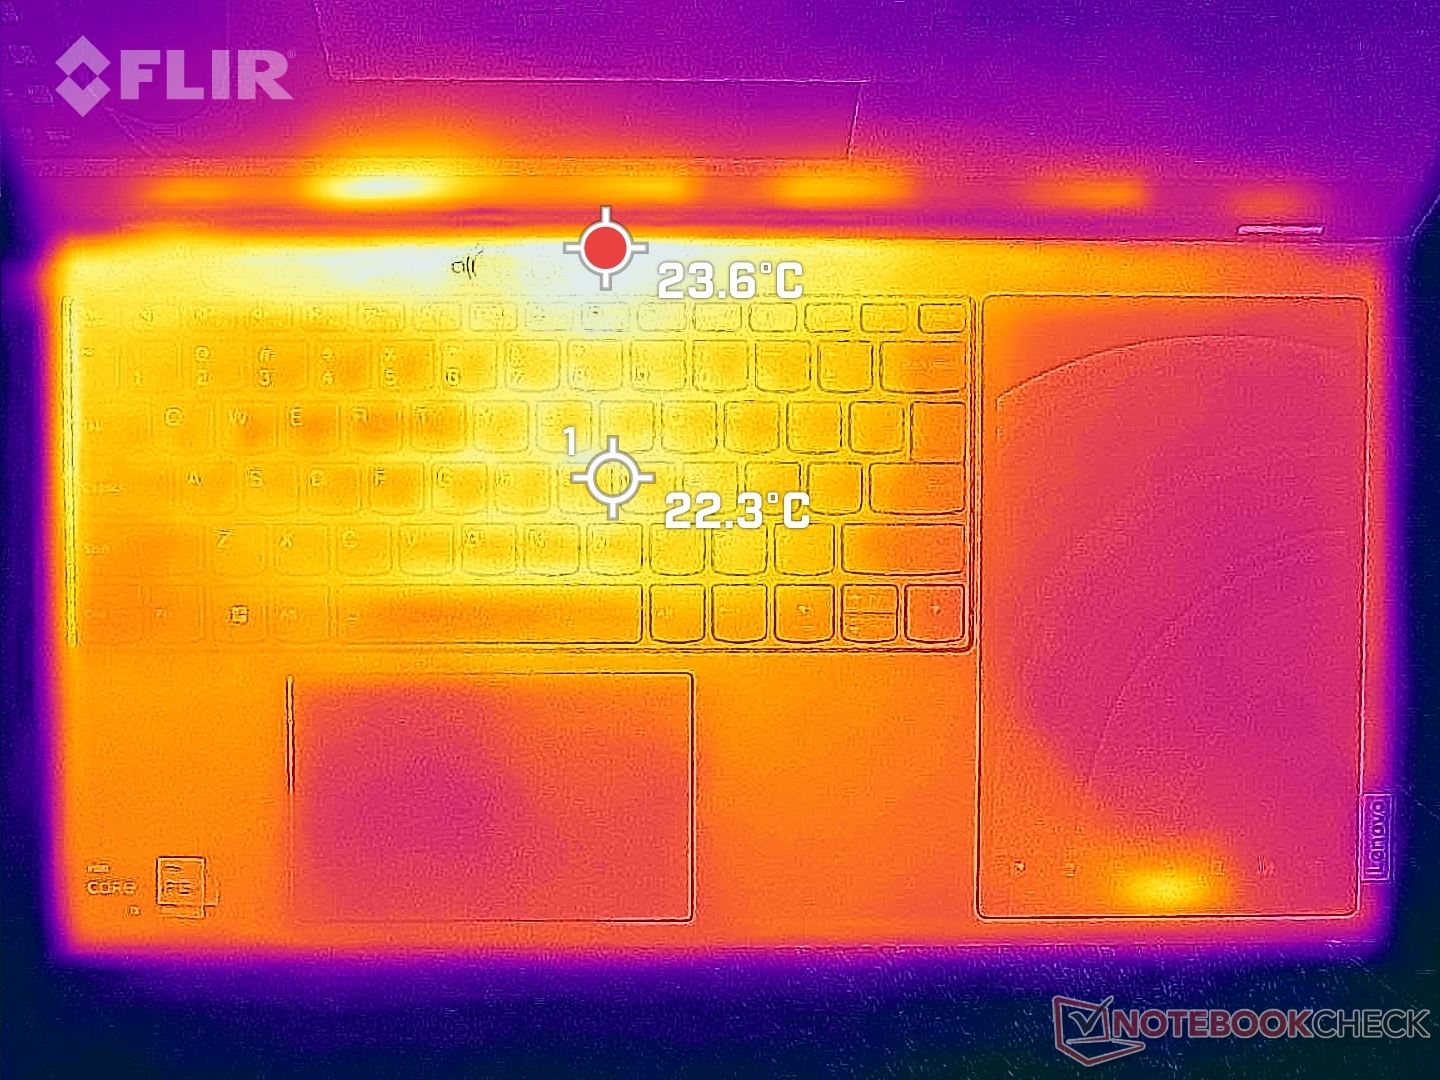
Surface temperatures are cooler than expected even when running demanding loads. Hot spots are only about 33 C on the top and bottom, respectively, compared to 50 C or warmer on the LG Gram 17 under similar conditions. The larger surface area of the wide 21:10 aspect ratio has a positive effect on overall temperature development.
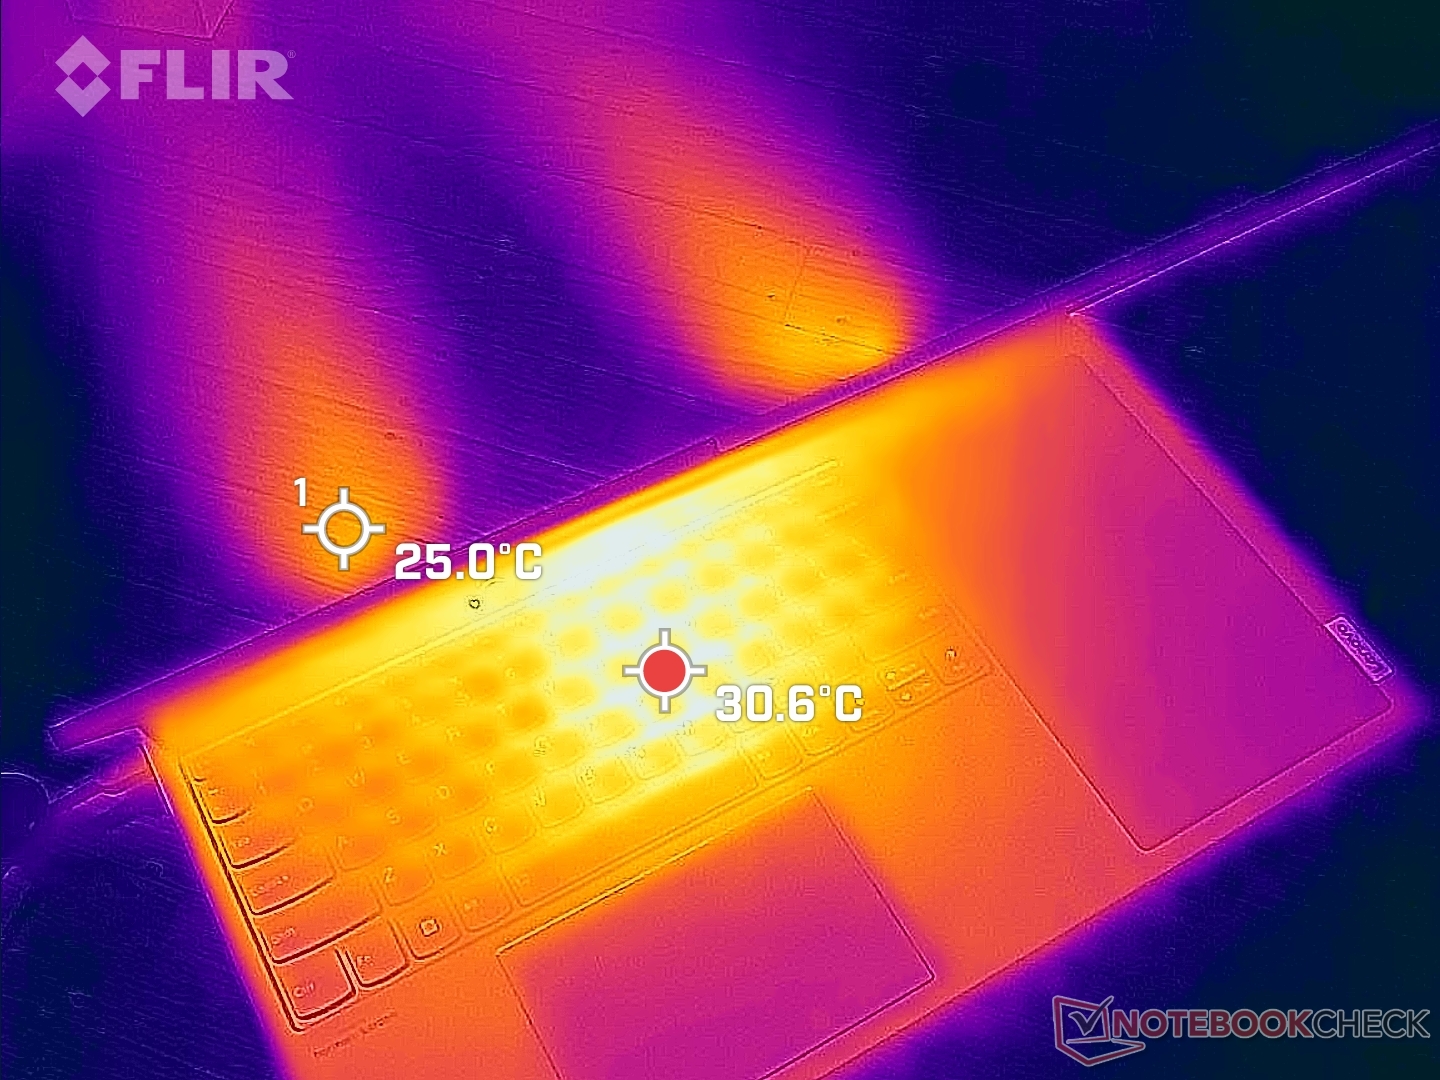
(+) The maximum temperature on the upper side is 33.2 °C / 92 F, compared to the average of 34.3 °C / 94 F, ranging from 21.2 to 62.5 °C for the class Office.
(+) The bottom heats up to a maximum of 32.8 °C / 91 F, compared to the average of 36.8 °C / 98 F
(+) In idle usage, the average temperature for the upper side is 27.2 °C / 81 F, compared to the device average of 29.5 °C / 85 F.
(+) The palmrests and touchpad are cooler than skin temperature with a maximum of 26.4 °C / 79.5 F and are therefore cool to the touch.
(±) The average temperature of the palmrest area of similar devices was 27.5 °C / 81.5 F (+1.1 °C / 2 F).
| Lenovo ThinkBook Plus Gen3 Intel Core i7-12700H, Intel Iris Xe Graphics G7 96EUs | Lenovo ThinkBook Plus Gen2 Core i5 Intel Core i5-1130G7, Intel Iris Xe Graphics G7 80EUs | Asus ProArt StudioBook Pro 17 W700G3T Intel Core i7-9750H, NVIDIA Quadro RTX 3000 Max-Q | LG Gram 17 (2022) Intel Core i5-1240P, Intel Iris Xe Graphics G7 80EUs | Dell XPS 17 9720 Intel Core i7-12700H, NVIDIA GeForce RTX 3050 4GB Laptop GPU | Gigabyte Aero 17 HDR YD Intel Core i9-11980HK, NVIDIA GeForce RTX 3080 Laptop GPU | |
|---|---|---|---|---|---|---|
| Heat | -17% | -12% | -30% | -13% | -32% | |
| Maximum Upper Side * (°C) | 33.2 | 42 -27% | 45.4 -37% | 50 -51% | 49.5 -49% | 44 -33% |
| Maximum Bottom * (°C) | 32.8 | 44.5 -36% | 53.7 -64% | 50 -52% | 38.4 -17% | 56 -71% |
| Idle Upper Side * (°C) | 29.8 | 29.8 -0% | 22.2 26% | 31.5 -6% | 28 6% | 32 -7% |
| Idle Bottom * (°C) | 30.4 | 31.9 -5% | 21.8 28% | 33.5 -10% | 27.8 9% | 35 -15% |
* ... smaller is better
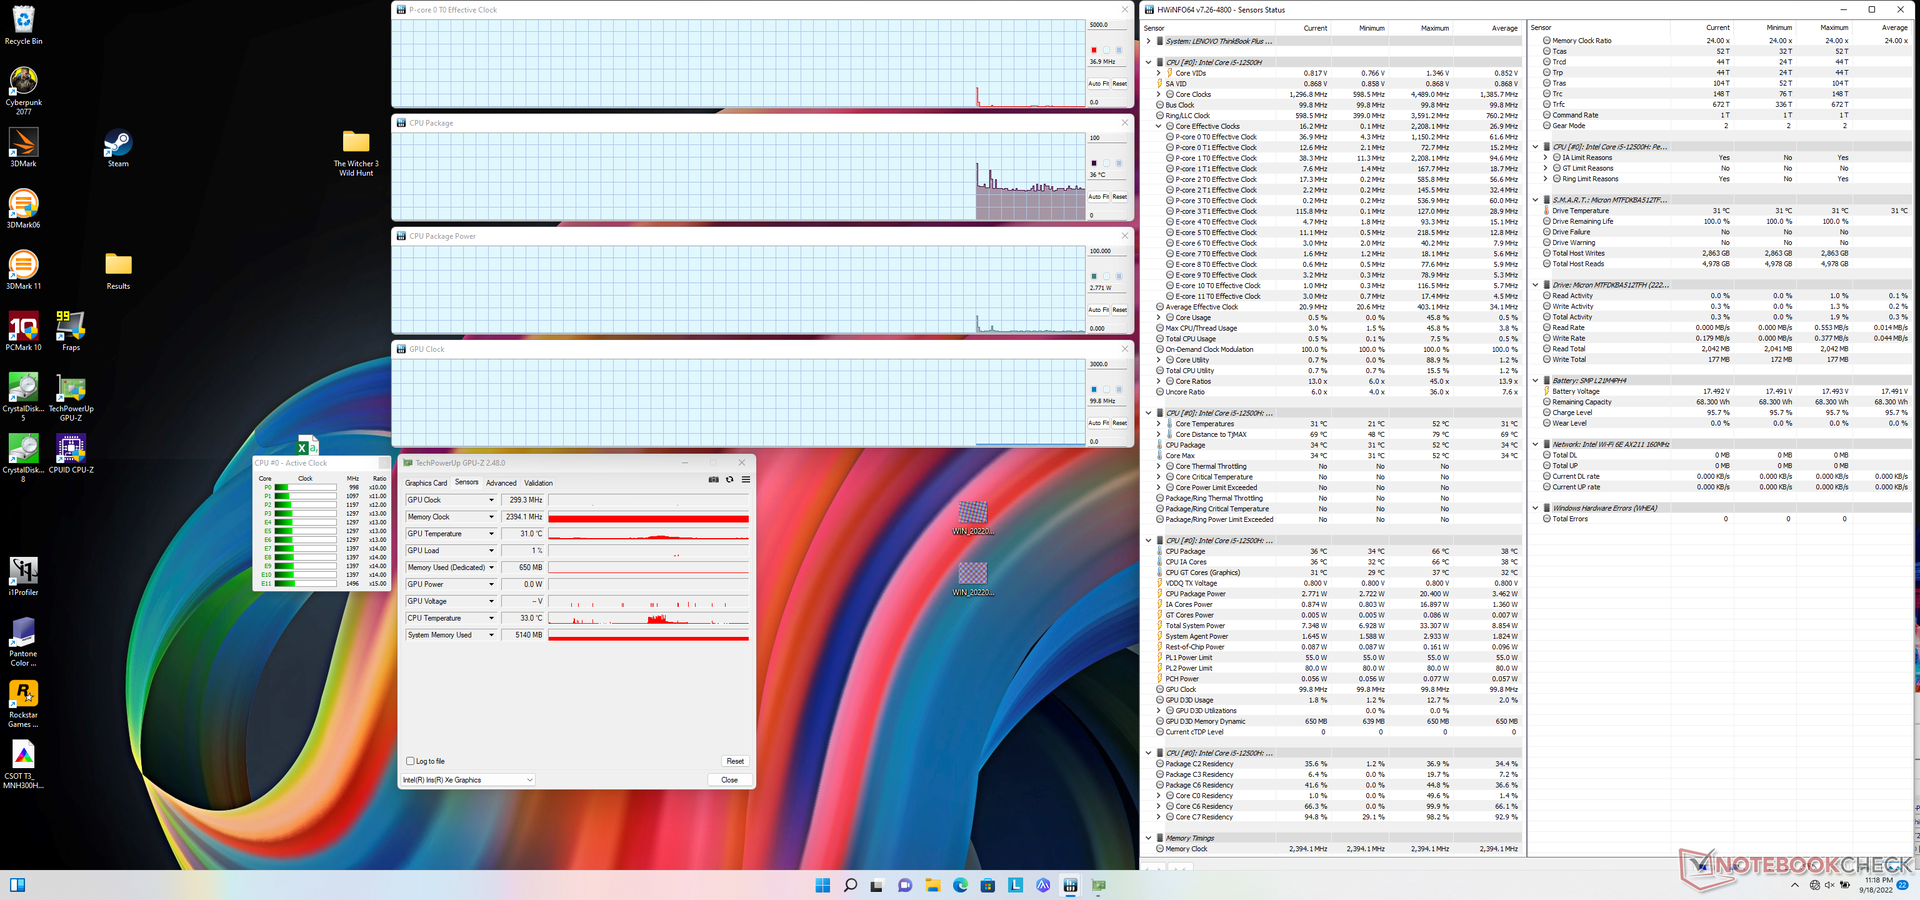
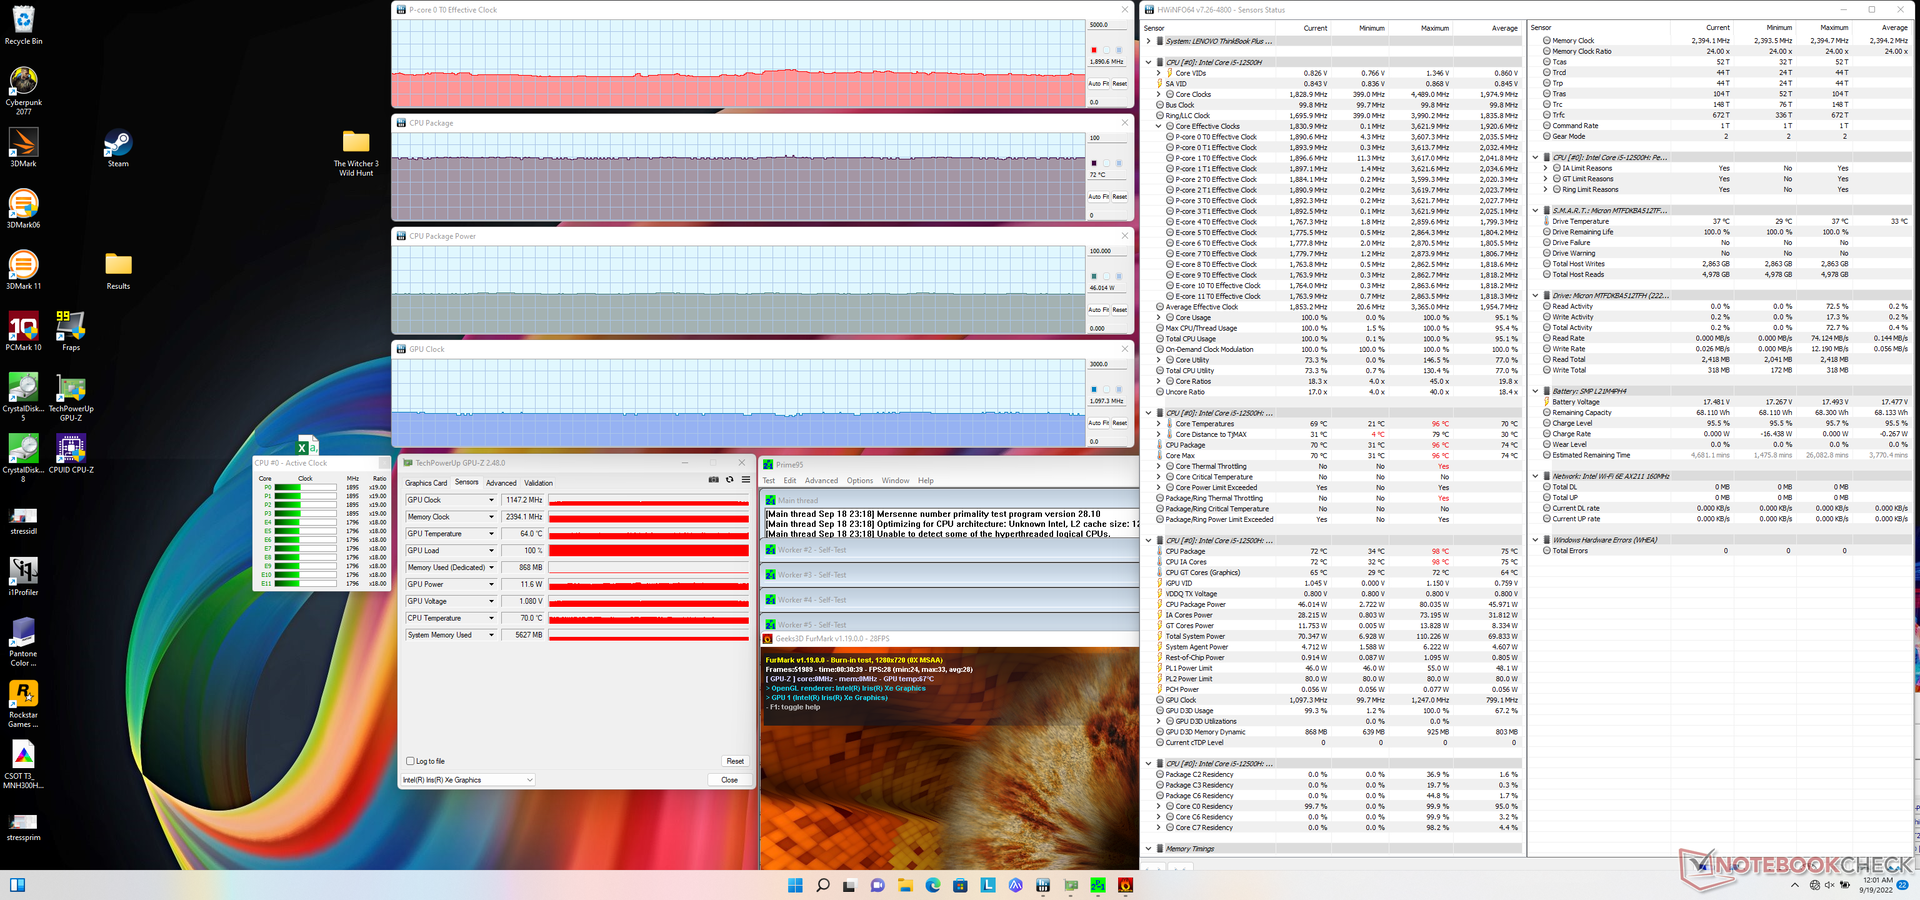
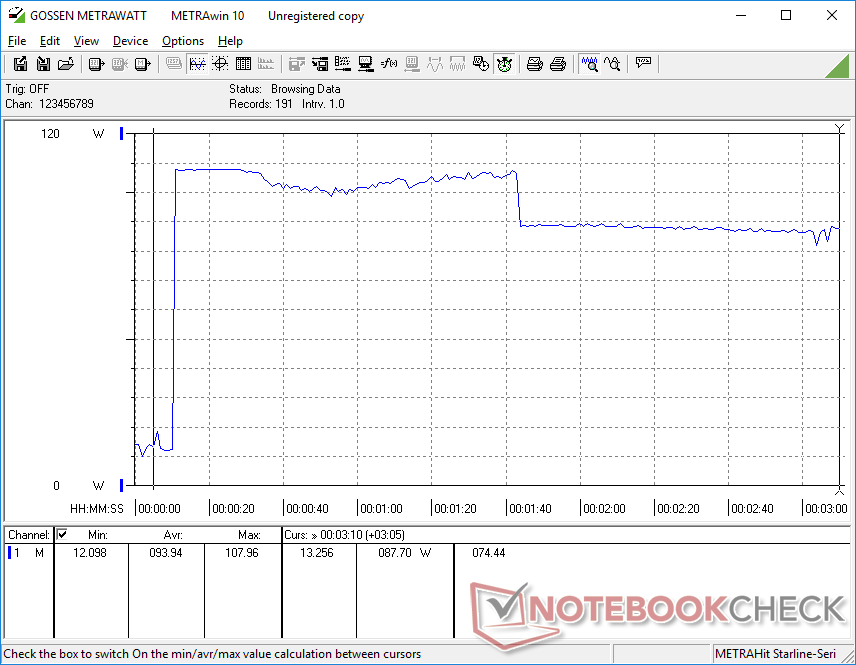
Stress Test
When running Prime95 to stress the CPU, clock rates and board power draw would spike to 3.6 GHz and 80 W, respectively, lasting for only a few seconds and reaching a core temperature of 98 C. Clock rates and board power draw would then swiftly fall to 3 GHz and 60 W before eventually stabilizing at 2.8 GHz and 52 W, respectively, to keep core temperatures just under 90 C. Repeating this test on the XPS 17 with the same Core i7-12700H CPU would result in similar clock rates but at a cooler core temperature of 75 C.
GPU clock rates and temperature when running Witcher 3 would stabilize at 1297 MHz and 85 C, respectively, which is a common range for thin Core H-powered multimedia laptops like the Dell Inspiron 16 Plus 7620.
Running on battery power impacts performance. A 3DMark 11 run on batteries would return Physics and Graphics scores of 16704 and 5421 points, respectively, compared to 18948 and 6524 points when on mains.
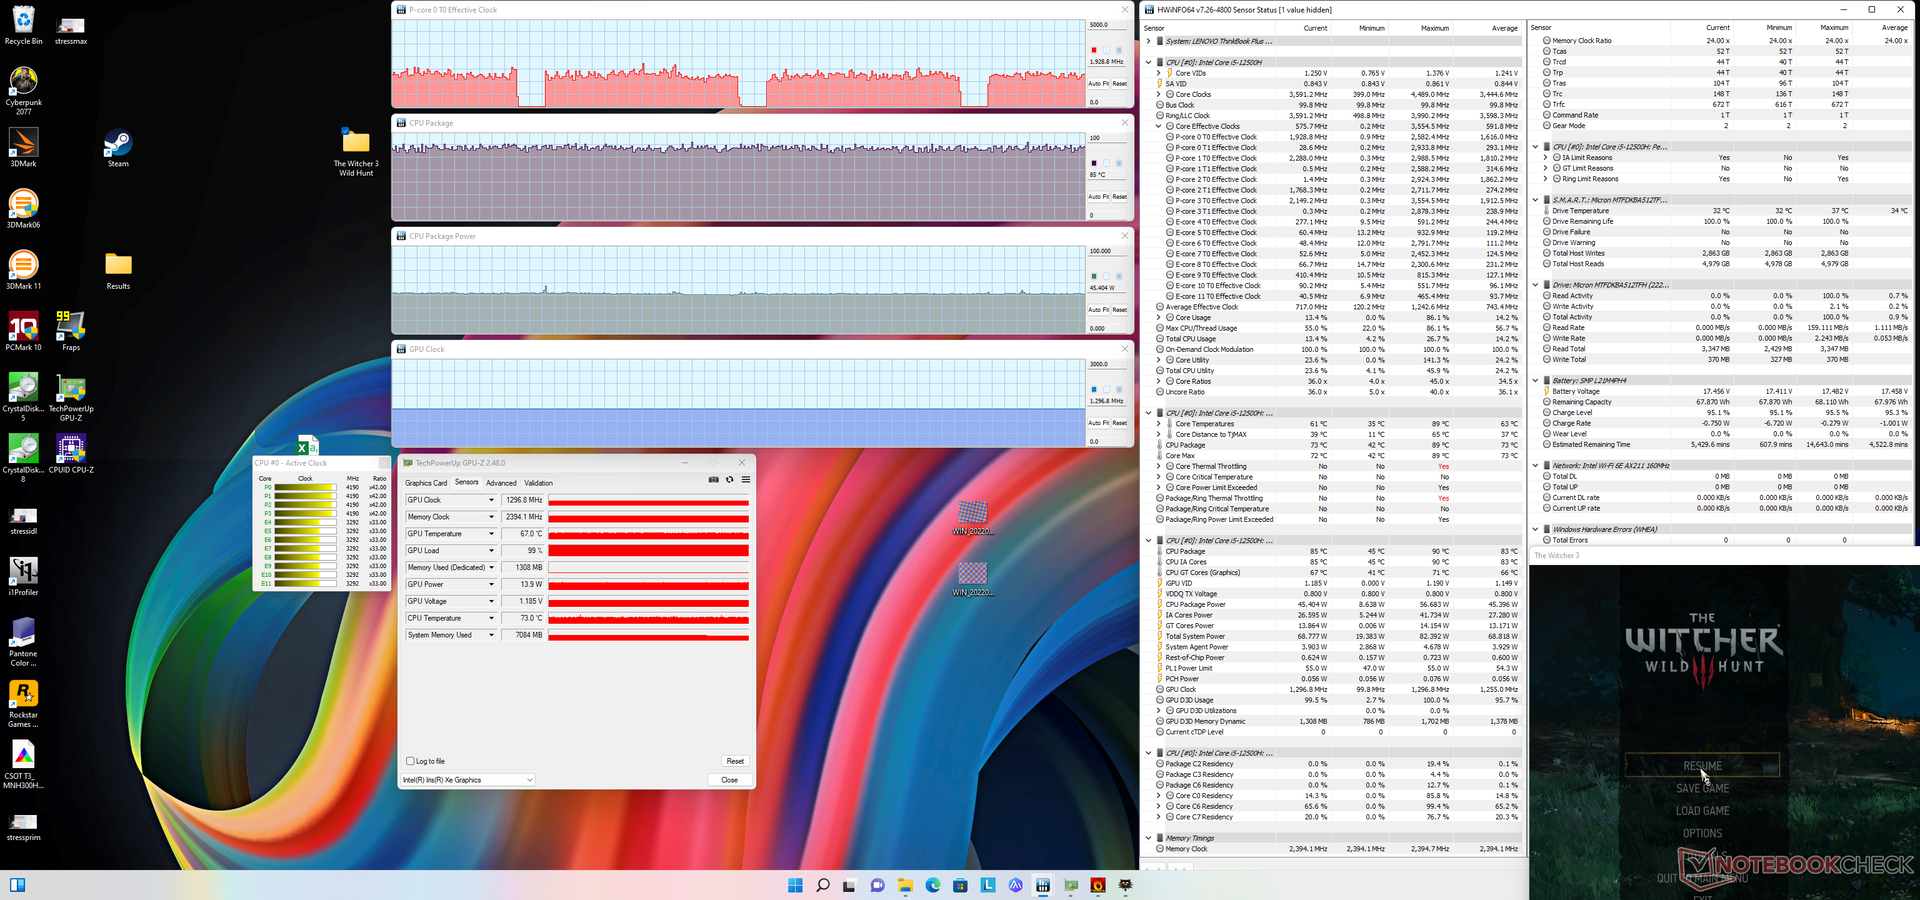
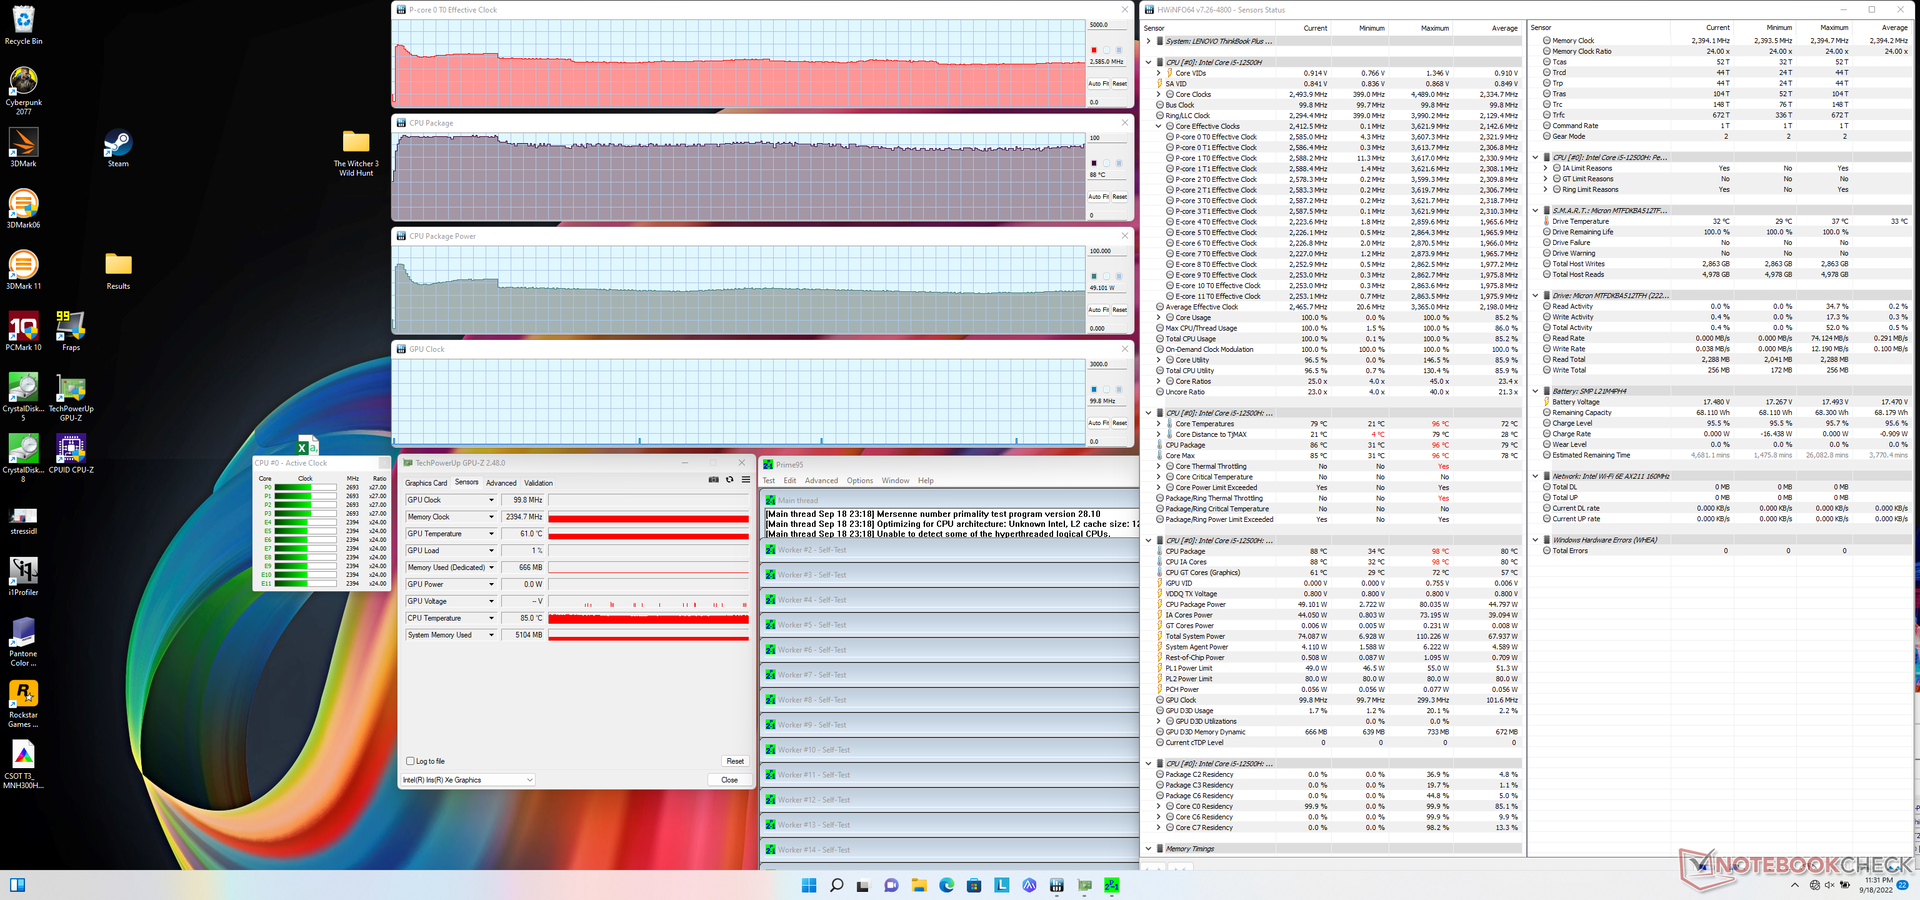
| CPU Clock (GHz) | GPU Clock (MHz) | Average CPU Temperature (°C) | |
| System Idle | -- | -- | 36 |
| Prime95 Stress | 2.6 | -- | 88 |
| Prime95 + FurMark Stress | 1.9 | 1147 | 72 |
| Witcher 3 Stress | ~1.9 | 1297 | 85 |
Speakers
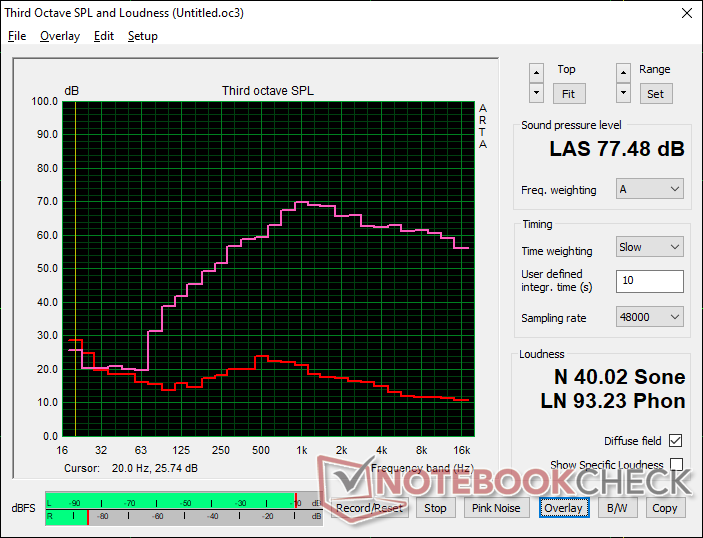
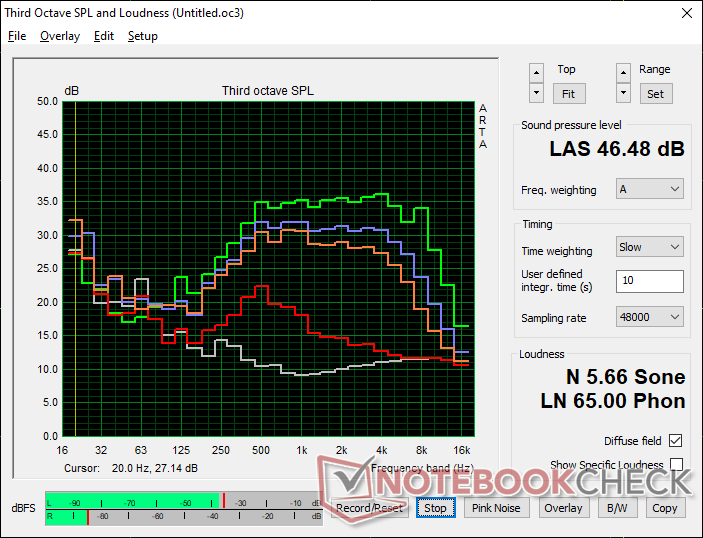
Lenovo ThinkBook Plus Gen3 audio analysis
(±) | speaker loudness is average but good (77.5 dB)
Bass 100 - 315 Hz
(±) | reduced bass - on average 14% lower than median
(±) | linearity of bass is average (9.4% delta to prev. frequency)
Mids 400 - 2000 Hz
(±) | higher mids - on average 5% higher than median
(+) | mids are linear (5% delta to prev. frequency)
Highs 2 - 16 kHz
(+) | balanced highs - only 1.4% away from median
(+) | highs are linear (2.5% delta to prev. frequency)
Overall 100 - 16.000 Hz
(±) | linearity of overall sound is average (16% difference to median)
Compared to same class
» 18% of all tested devices in this class were better, 6% similar, 76% worse
» The best had a delta of 7%, average was 21%, worst was 53%
Compared to all devices tested
» 25% of all tested devices were better, 5% similar, 70% worse
» The best had a delta of 4%, average was 24%, worst was 134%
Apple MacBook Pro 16 2021 M1 Pro audio analysis
(+) | speakers can play relatively loud (84.7 dB)
Bass 100 - 315 Hz
(+) | good bass - only 3.8% away from median
(+) | bass is linear (5.2% delta to prev. frequency)
Mids 400 - 2000 Hz
(+) | balanced mids - only 1.3% away from median
(+) | mids are linear (2.1% delta to prev. frequency)
Highs 2 - 16 kHz
(+) | balanced highs - only 1.9% away from median
(+) | highs are linear (2.7% delta to prev. frequency)
Overall 100 - 16.000 Hz
(+) | overall sound is linear (4.6% difference to median)
Compared to same class
» 0% of all tested devices in this class were better, 0% similar, 100% worse
» The best had a delta of 5%, average was 17%, worst was 45%
Compared to all devices tested
» 0% of all tested devices were better, 0% similar, 100% worse
» The best had a delta of 4%, average was 24%, worst was 134%
Energy Management
Power Consumption
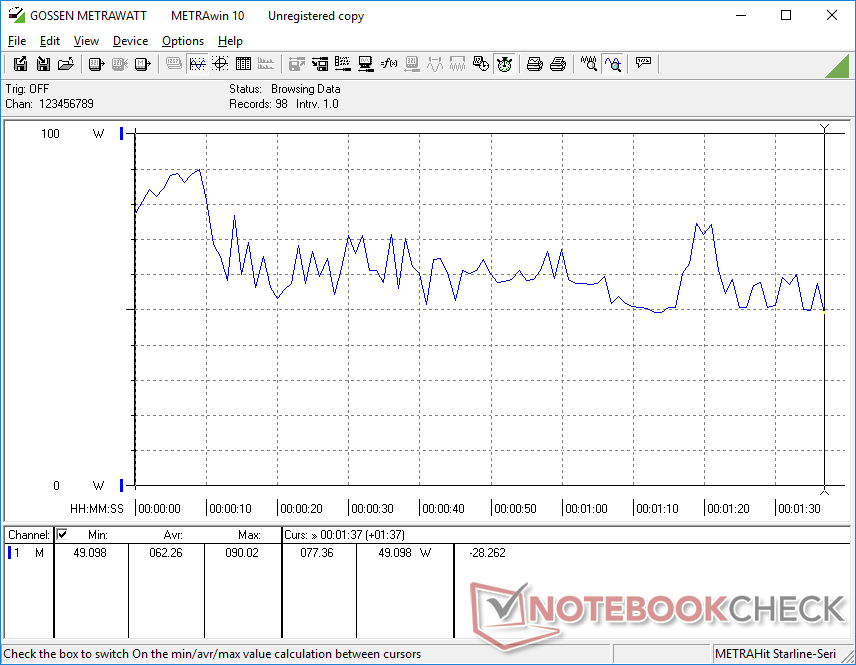
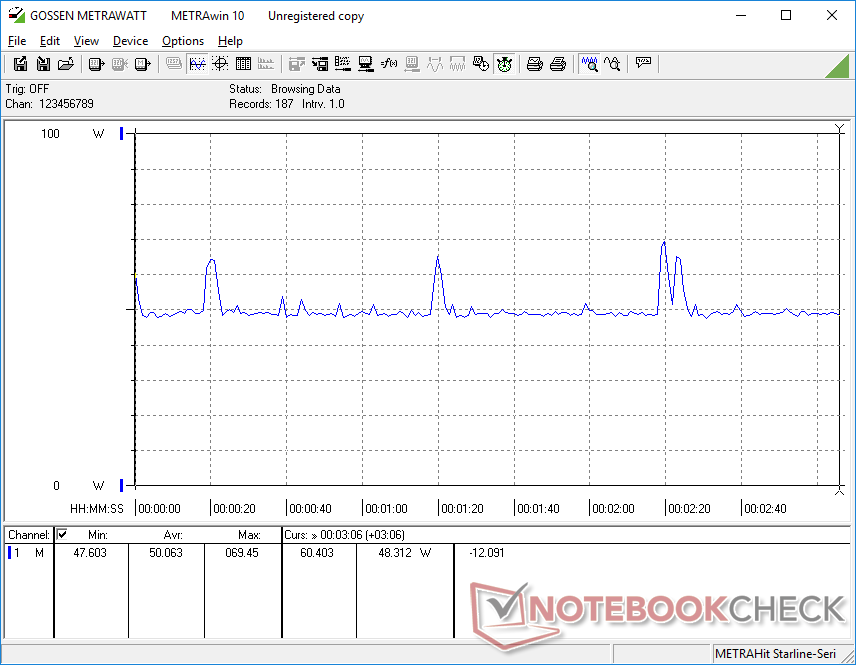
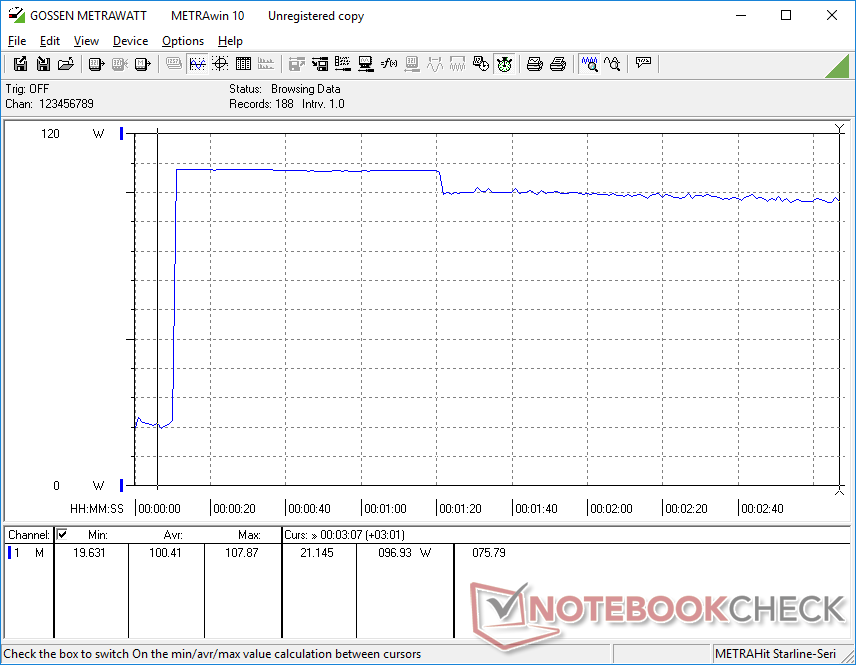
Idling on desktop on Power Saver mode draws as little as 7 W when at the minimum brightness level and with the secondary screen off. If the secondary screen is enabled and set to its maximum brightness level, consumption will be about 2.8 W higher. Idling on desktop with both screens set to maximum brightness and on Extreme Performance mode demands just under 17 W to be as much as faster 17-inch laptops with discrete GPUs.
Running higher loads like games demands between 50 and 65 W compared to only ~40 W on most Core U- or P-series laptops with the same integrated Iris Xe 96 EUs GPU like the LG Gram 17.
Overall power consumption is about 2x higher than the previous generation ThinkBook Plus Gen 2 in most cases due to the increase in size and performance and the added utility from the secondary display.
| Off / Standby | |
| Idle | |
| Load |
|
Key:
min: | |
| Lenovo ThinkBook Plus Gen3 i7-12700H, Iris Xe G7 96EUs, Micron 3400 MTFDKBA512TFH 512GB, IPS, 3072x1440, 17.3" | Lenovo ThinkBook Plus Gen2 Core i5 i5-1130G7, Iris Xe G7 80EUs, Samsung PM9A1 MZVL2512HCJQ, IPS, E-Ink, 2560x1600, 13.3" | Asus ProArt StudioBook Pro 17 W700G3T i7-9750H, Quadro RTX 3000 Max-Q, Samsung SSD PM981 MZVLB1T0HALR, IPS, 1920x1200, 17" | LG Gram 17 (2022) i5-1240P, Iris Xe G7 80EUs, Samsung PM9A1 MZVL2512HCJQ, IPS, 2560x1600, 17" | Dell XPS 17 9720 i7-12700H, GeForce RTX 3050 4GB Laptop GPU, Micron 3400 MTFDKBA512TFH 512GB, IPS, 3840x2400, 17" | Gigabyte Aero 17 HDR YD i9-11980HK, GeForce RTX 3080 Laptop GPU, Samsung PM9A1 MZVL2512HCJQ, IPS, 3840x2160, 17.3" | |
|---|---|---|---|---|---|---|
| Power Consumption | 46% | -48% | 33% | -40% | -150% | |
| Idle Minimum * (Watt) | 7.4 | 5 32% | 11.3 -53% | 4 46% | 7.8 -5% | 25 -238% |
| Idle Average * (Watt) | 16.4 | 7.9 52% | 16 2% | 12.2 26% | 15.1 8% | 28 -71% |
| Idle Maximum * (Watt) | 16.8 | 8.3 51% | 16.8 -0% | 13.2 21% | 17 -1% | 40 -138% |
| Load Average * (Watt) | 62.3 | 30.9 50% | 93.6 -50% | 34 45% | 114 -83% | 114 -83% |
| Witcher 3 ultra * (Watt) | 50 | 25.2 50% | 106 -112% | 39.4 21% | 115.2 -130% | 176 -252% |
| Load Maximum * (Watt) | 107.9 | 66.8 38% | 186.6 -73% | 65.9 39% | 135.6 -26% | 236 -119% |
* ... smaller is better
Power Consumption Witcher 3 / Stresstest
Power Consumption external Monitor
Battery Life — Not That Long
Runtimes are average at best for a 17-inch laptop. Battery capacity is smaller than on the LG Gram 17 or Dell XPS 17 for a WLAN runtime that is several hours shorter. We're able to clock in just under 5.5 hours of real-world WLAN usage with the secondary display active compared to 9+ hours each on the aforementioned Asus and Dell.
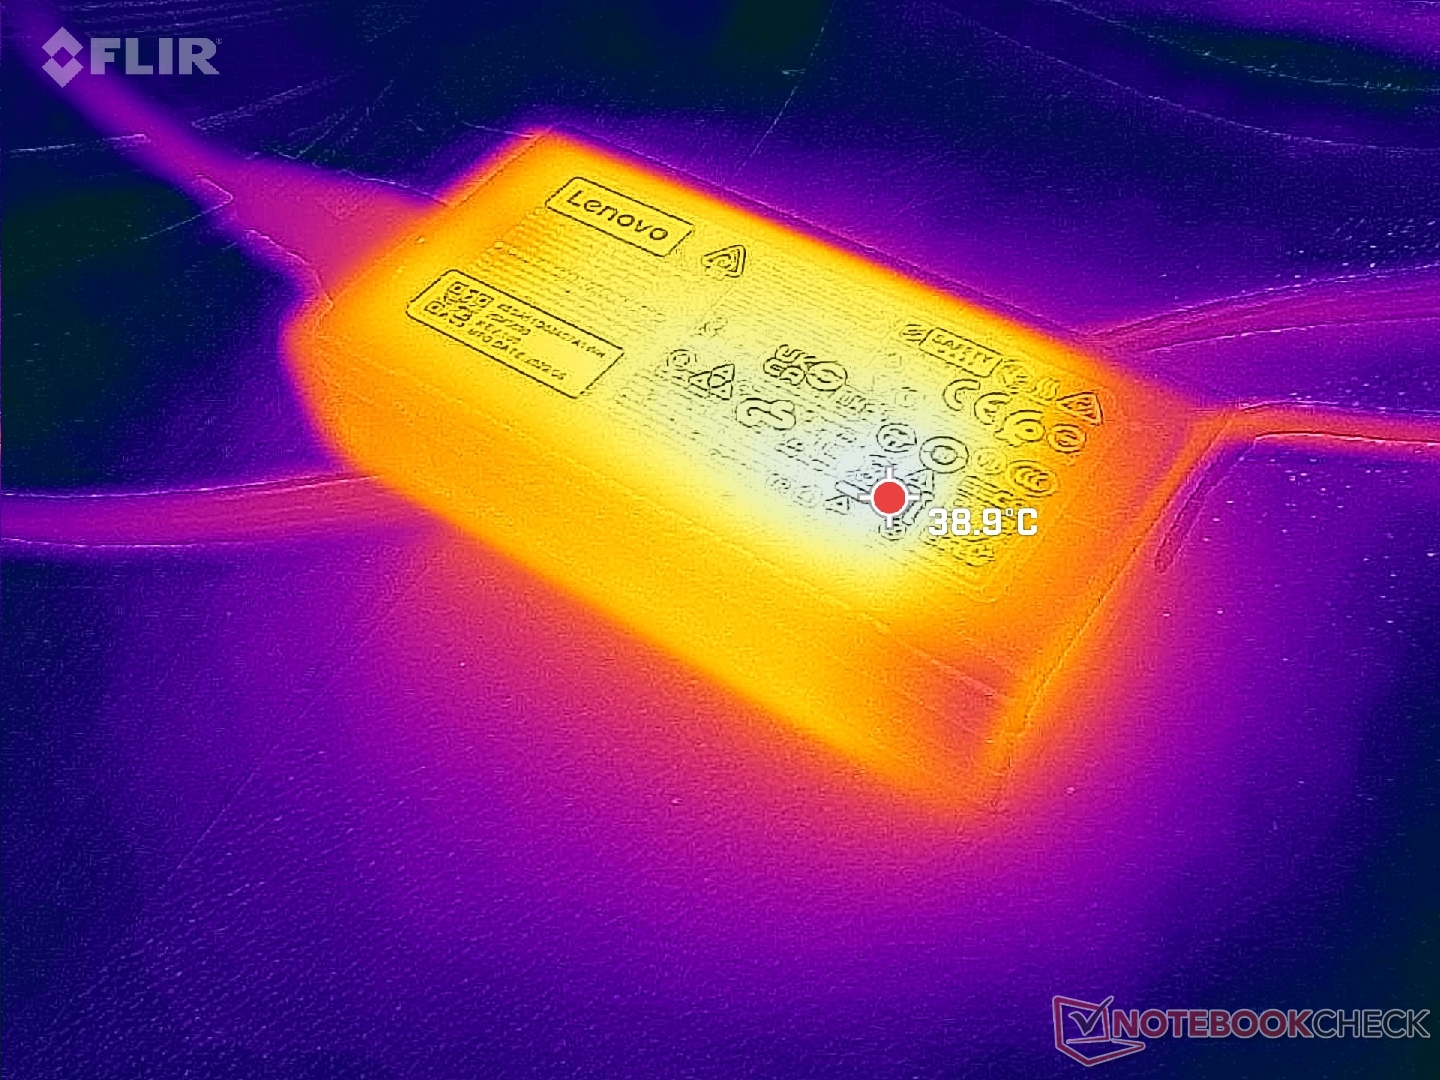
Charging from empty to full capacity takes between 1 and 1.5 hours when Rapid Charge is enabled.
| Lenovo ThinkBook Plus Gen3 i7-12700H, Iris Xe G7 96EUs, 70 Wh | Lenovo ThinkBook Plus Gen2 Core i5 i5-1130G7, Iris Xe G7 80EUs, 53 Wh | Asus ProArt StudioBook Pro 17 W700G3T i7-9750H, Quadro RTX 3000 Max-Q, 57 Wh | LG Gram 17 (2022) i5-1240P, Iris Xe G7 80EUs, 80 Wh | Dell XPS 17 9720 i7-12700H, GeForce RTX 3050 4GB Laptop GPU, 97 Wh | Gigabyte Aero 17 HDR YD i9-11980HK, GeForce RTX 3080 Laptop GPU, 99 Wh | |
|---|---|---|---|---|---|---|
| Battery runtime | 43% | 41% | 186% | 47% | 13% | |
| Reader / Idle (h) | 8.1 | 28.2 248% | ||||
| WiFi v1.3 (h) | 5.3 | 7.6 43% | 5.9 11% | 11.2 111% | 9.2 74% | 5.6 6% |
| Load (h) | 1 | 1.7 70% | 3 200% | 1.2 20% | 1.2 20% | |
| H.264 (h) | 6.9 | 14.1 | 11.2 | |||
| Witcher 3 ultra (h) | 1.7 |
Pros
Cons
Verdict — Great For Tight Work Spaces
The ThinkBook Plus Gen 3 is unique in its size category and not just for its 8-inch secondary display or 21:10 form factor. More specifically, it is one of the few 17-inch laptops to ship with an Intel 12th gen Core H processor and absolutely no discrete graphics options at all. This approach has allowed for a relatively slim and light chassis design in spite of the second display and longer chassis dimensions.
A key disadvantage to the model is that it may be underpowered for some users. CPU performance is slower than many other 17-inch laptops with the same Core i7-12700H processor and the lack of a dGPU will likely turn away most power users. The latter is a shame because the primary display has the colors and features for graphics editing while the secondary display can be inherently useful for heavy multitasking. As long as your workloads aren't particularly GPU heavy, then this drawback shouldn't be too much of an issue.
The ThinkBook Plus Gen 3 optimizes productivity by giving users more screen real-estate than most other laptops in the market. You'll have to give up a bit of graphics performance along the way, however.
As for the integrated secondary display, the feature is most useful for file explorer windows, texts, command lines, and other applications where color accuracy isn't a huge concern. Its touchscreen functionality isn't as reliable as on a smartphone or tablet, however, and so we find the display easiest to use with a mouse instead.
If you have the desk space for an external secondary monitor like the Lepow C2, then the ThinkBook Plus Gen 3 becomes much less compelling. Users who are constantly on the move or don't have space for external monitors are the ones who will find this Lenovo surprisingly spacious when compared to other 17-inch models.
Price and Availability
The ThinkBook Plus Gen 3 is not yet available at major resellers like Amazon, Best Buy, or Newegg. Users can purchase directly from Lenovo starting at $1500 USD for the Core i5 option or $1600 for our Core i7 configuration.
Lenovo ThinkBook Plus Gen3
- 09/21/2022 v7 (old)
Allen Ngo
Price comparison
