MSI Creator Z17 Laptop review: What are creatives and gamers getting for around 4,000 Euro?
The new Creator Z17 follows in the footsteps of the Creator 17 (2020), but its design has been completely revised. We have already got a taste of the new design when reviewing the Creator Z16P, which is the 16-inch variant of this expensive workstation aimed at creatives.
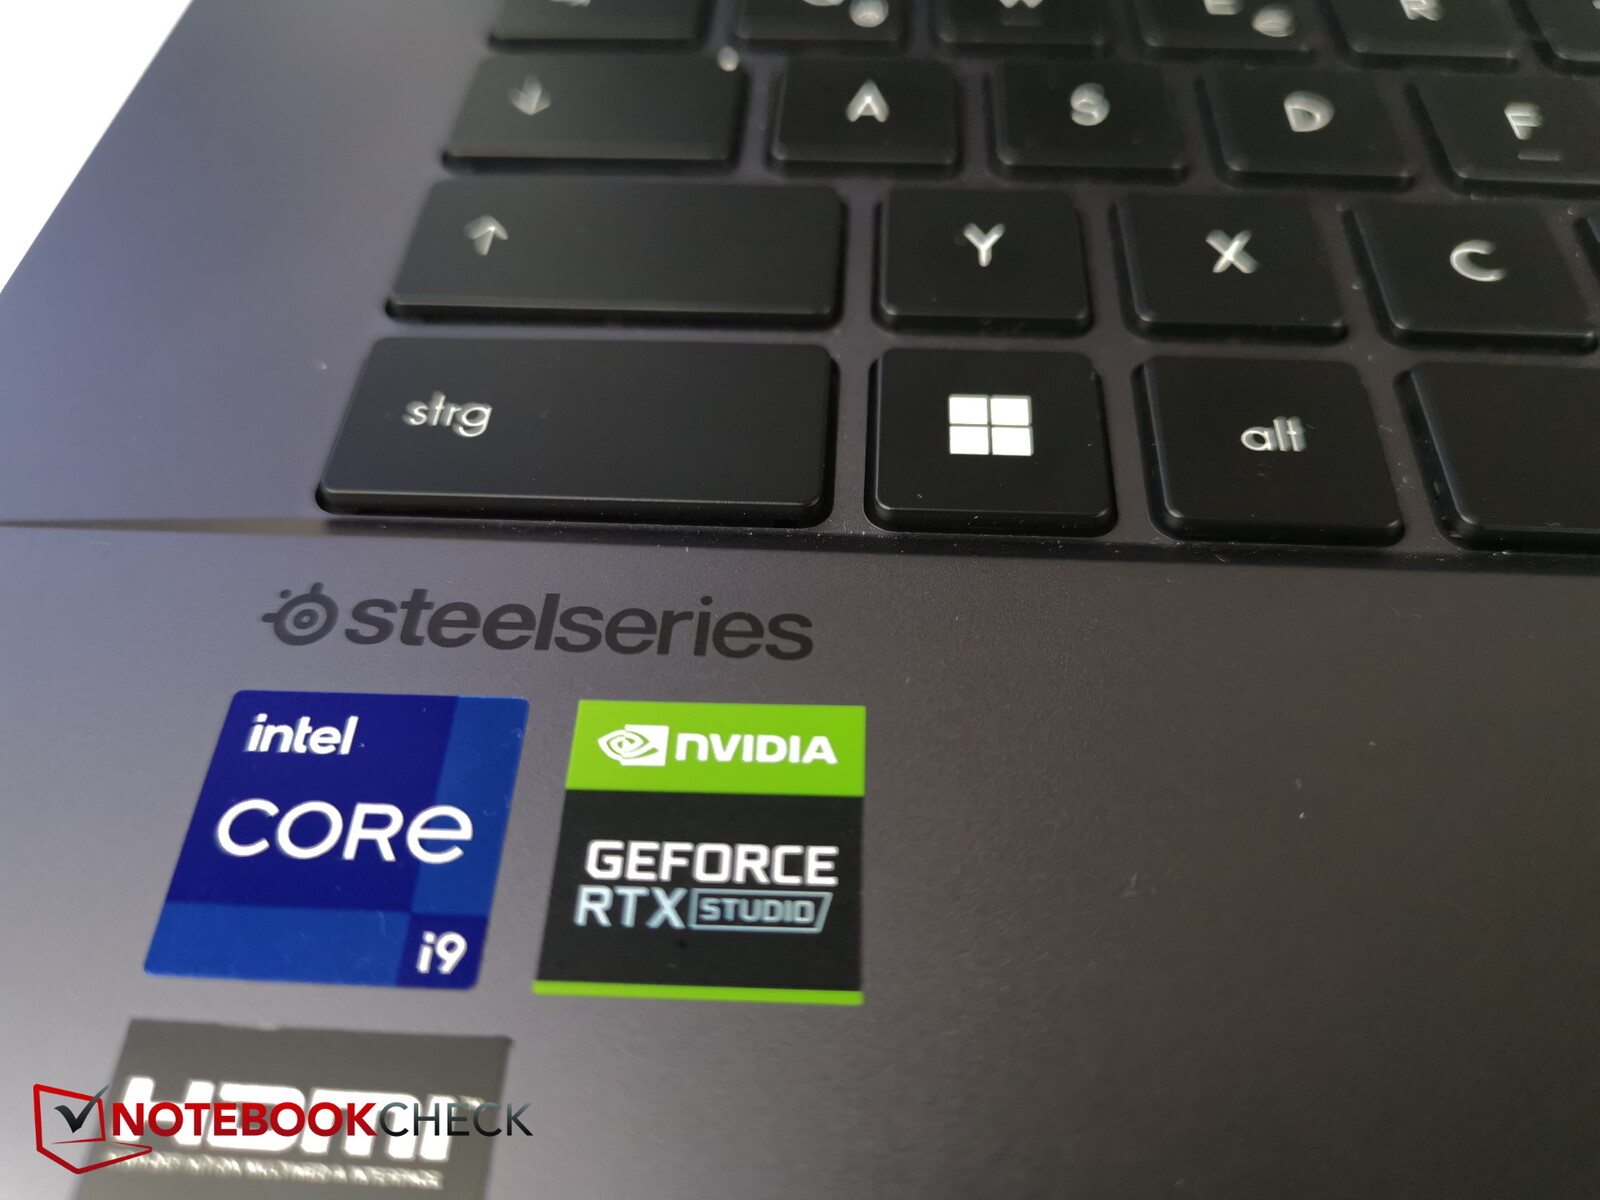
Featuring a Core i9-12900H and an RTX 3070 Ti, the Creator Z17 is certainly also going to appeal to gamers. But the high price, the thin metal chassis, the reflective 2.2K touchscreen and, not to mention, a graphics card that is unable to run at full power mean the device is more targeted at those who do creative work.
In our opinion, the Z17 is competing with multimedia or gaming laptops with similar hardware, such as the Razer Blade 17. Besides the Razer, we also had to include the Aorus 17X XES and Dell XPS 17 (unfortunately only available with RTX 3060) in our comparison. And because the 16-inch model from MSI is available to us, it is going to be part of the comparison as well. Finally, we will be taking a look at the two-year-old predecessor to see what has changed.
Comparison of possible competitors
Rating | Date | Model | Weight | Height | Size | Resolution | Price |
|---|---|---|---|---|---|---|---|
| 83.8 % v7 (old) | 09 / 2022 | MSI Creator Z17 A12UGST-054 i9-12900H, GeForce RTX 3070 Ti Laptop GPU | 2.5 kg | 19 mm | 17.00" | 2560x1600 | |
| 82.5 % v7 (old) | 07 / 2020 | MSI Creator 17 A10SGS i7-10875H, GeForce RTX 2080 Super Max-Q | 2.4 kg | 20 mm | 17.30" | 3840x2160 | |
| 83.7 % v7 (old) | 06 / 2022 | MSI Creator Z16P B12UHST i9-12900H, GeForce RTX 3080 Ti Laptop GPU | 2.4 kg | 20.4 mm | 16.00" | 2560x1600 | |
| 90.1 % v7 (old) | 05 / 2022 | Razer Blade 17 (i7-12800H, RTX 3070 Ti) i7-12800H, GeForce RTX 3070 Ti Laptop GPU | 2.8 kg | 19.9 mm | 17.30" | 2560x1440 | |
| 83.7 % v7 (old) | 08 / 2022 | Aorus 17X XES i9-12900HX, GeForce RTX 3070 Ti Laptop GPU | 2.7 kg | 30 mm | 17.30" | 1920x1080 | |
| 88.8 % v7 (old) | 05 / 2022 | Dell XPS 17 9720 RTX 3060 i7-12700H, GeForce RTX 3060 Laptop GPU | 2.5 kg | 19.5 mm | 17.00" | 3840x2400 |
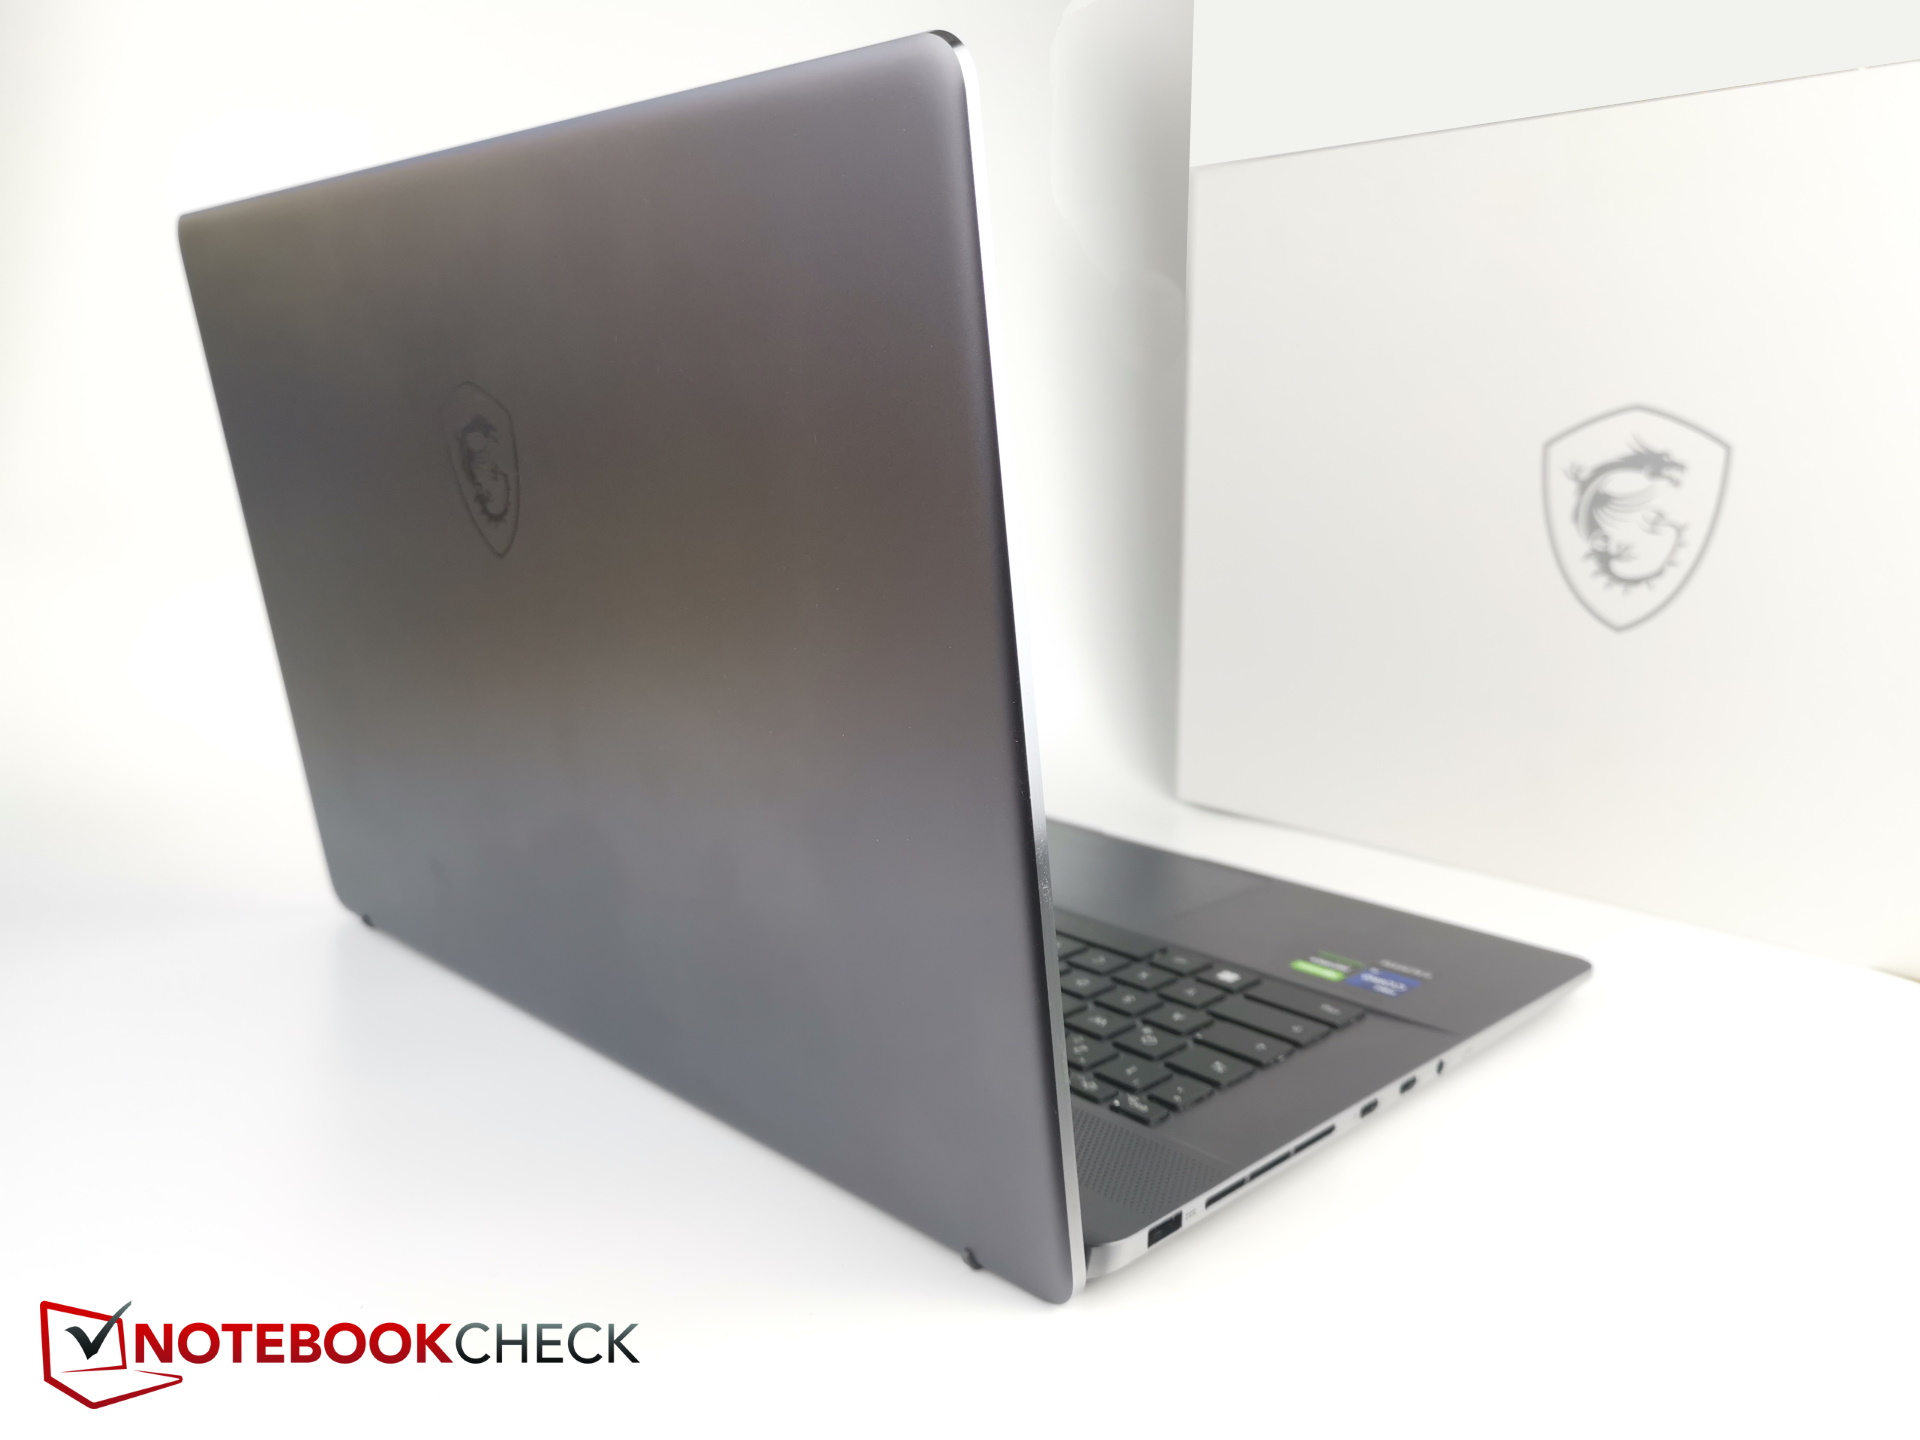
Chassis - Ultra-thin, sturdy and made of metal
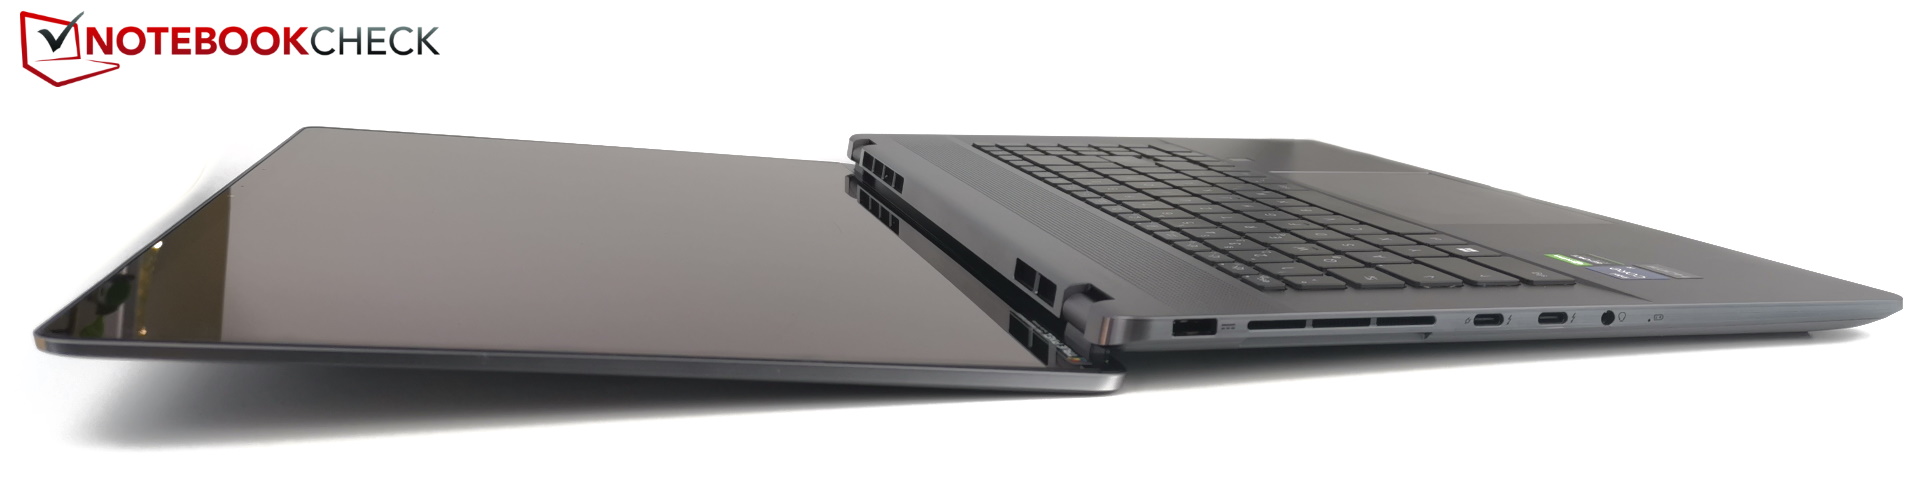
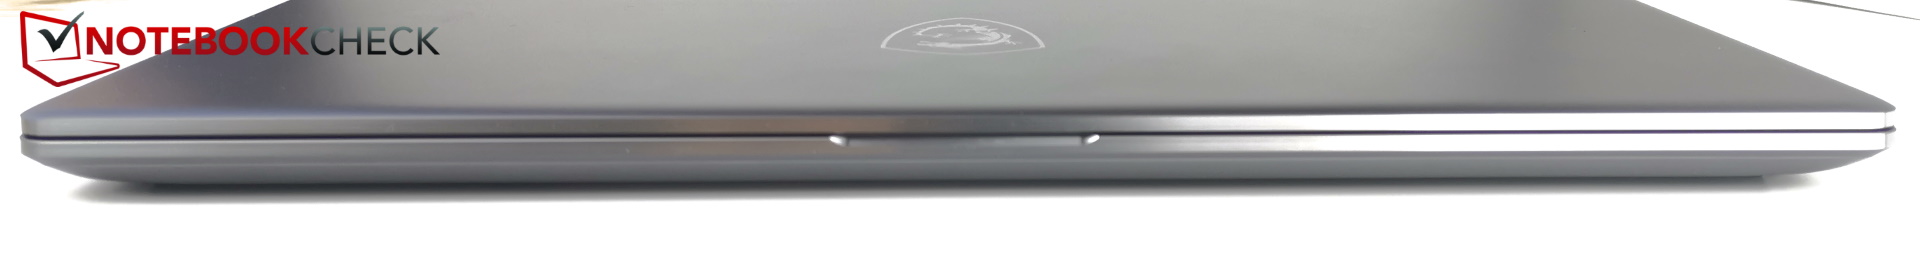
The chassis is only 19 mm (0.75") thin and seems to be almost completely made of metal. This makes the device extremely sturdy. As a result, it exhibits hardly any flex when twisted and only makes very minor creaking sounds, particularly around the ports on the right side. Even the display lid, which can be opened to 180 degrees, is pleasantly resistant to torsion.
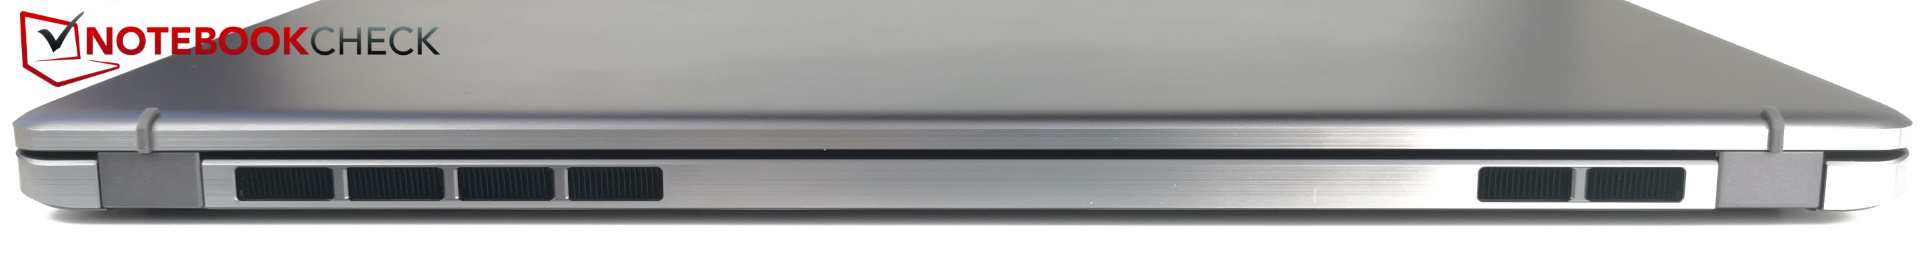
The dark-grey metal design is clean and stylish. Almost all the edges and corners are rounded. There are air vents everywhere, but those at the sides are so small that they are quite inconspicuous.
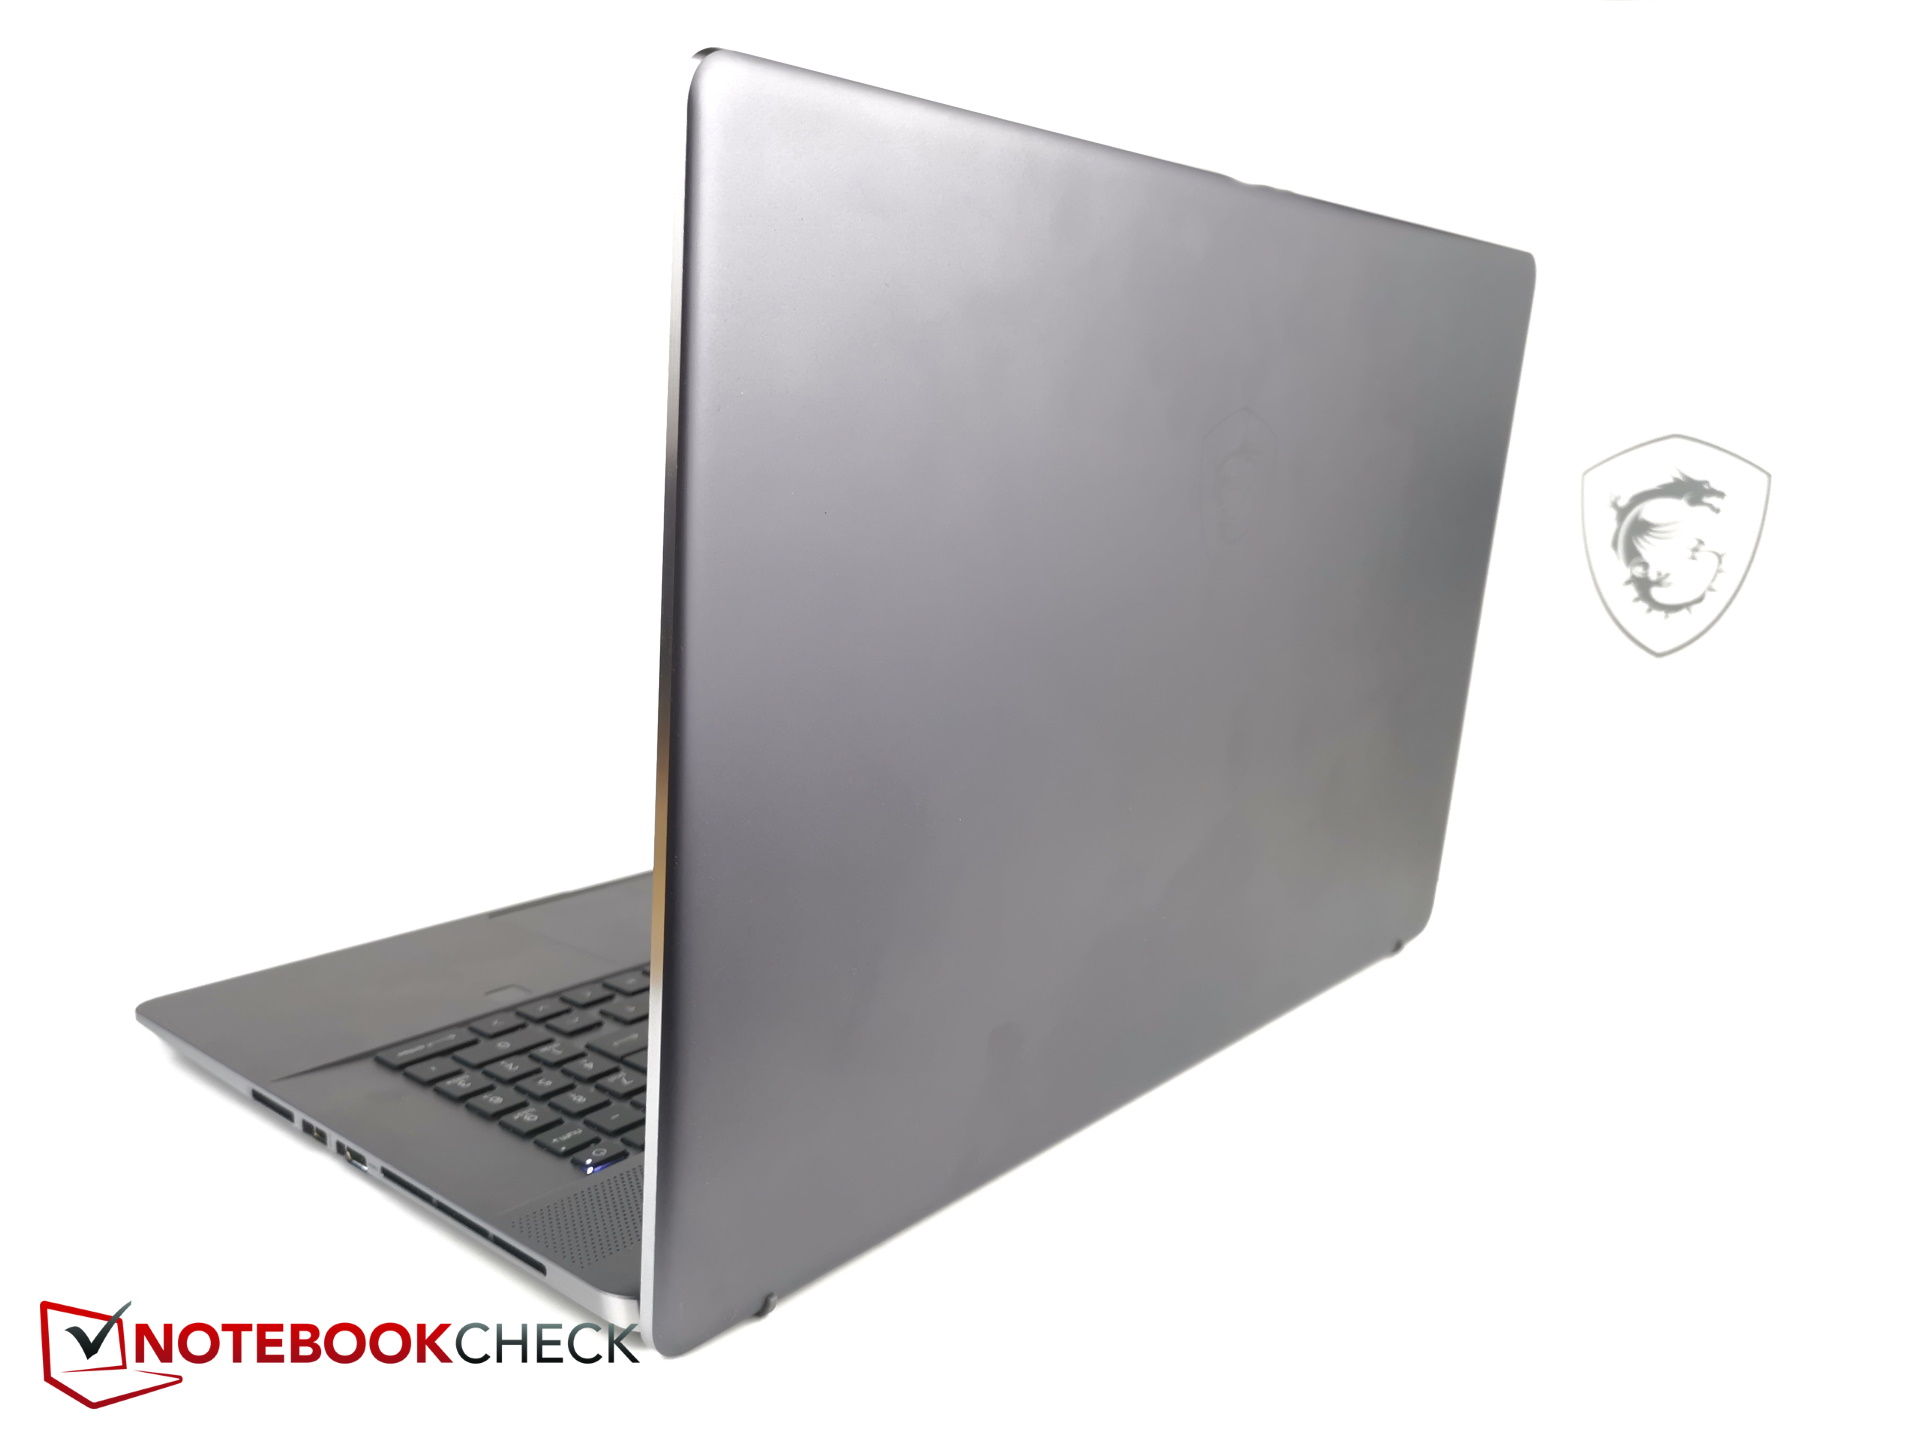
The Z17 is a little more compact than its predecessor, particularly in width. It has a thickness of just 19 mm (0.75"). Even the very thin Razer Blade is about 1 mm (0.04") thicker and can't match how slim the Creator is.
Weighing around 2.5 kg (5.5 lb), the Creator Z17 is also about 300 g (0.66 lb) lighter than the Blade 17. Overall, the device is the thinnest in our comparison as well as one of the smallest 17-inch laptops.
Features - Slim MSI workstation
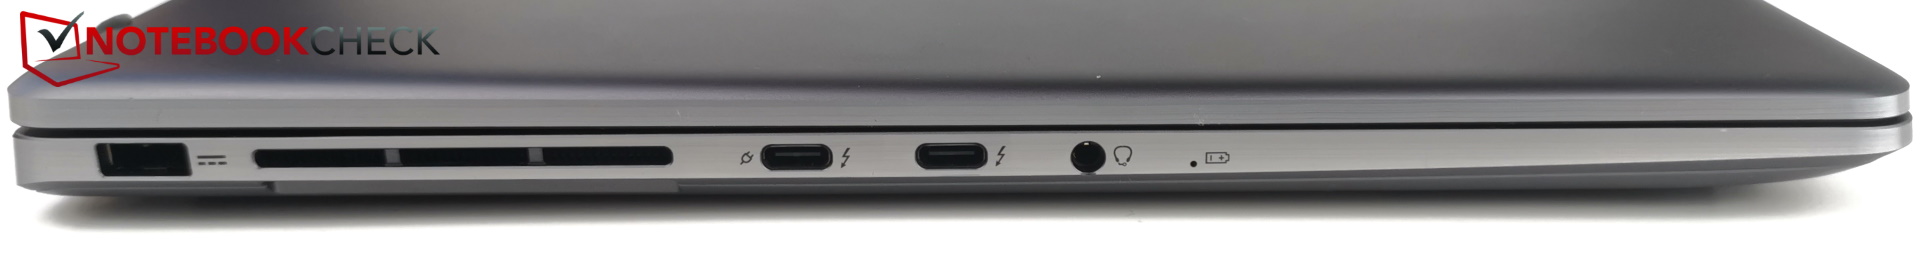
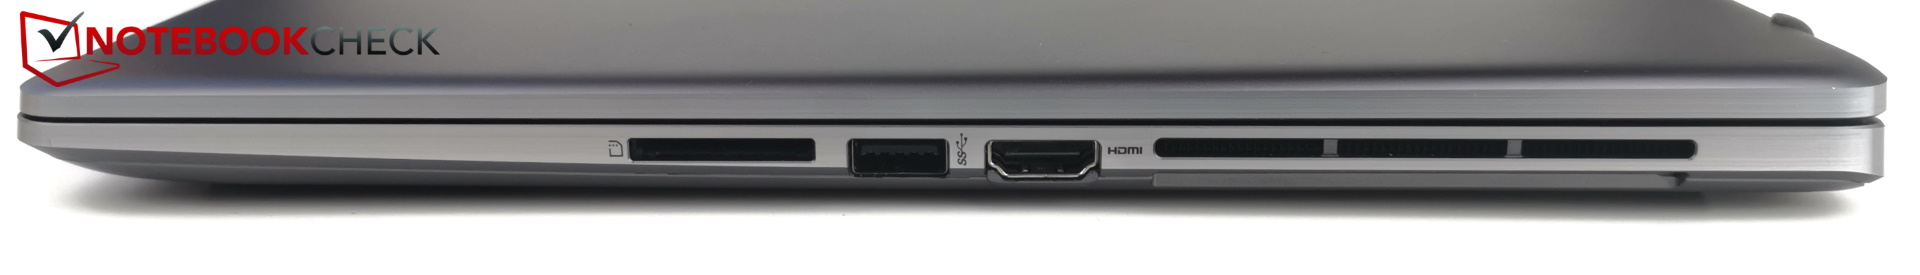
The port selection is rather slim for a 17-inch device. There are a total of three USB ports, one headphone jack, an HDMI output and an SD card reader. The Z17 doesn't even have an Ethernet port nor a Kensington lock slot. You will need to buy an optional USB adapter for Ethernet connectivity.
On a positive note, the two USB-C ports support Thunderbolt 4. Unfortunately, this also means there is only one USB-A port available on the device. For creatives, it is therefore almost essential to use a hub for work.
Despite the small selection of ports, the way they are arranged is less than optimal – at least on the right side. The HDMI output and USB-A port, of all things, are located very close together and are almost certainly going to interfere with each other.
SD card reader
When you insert an SD card into the reader, it doesn't lock in place but rather just sits there with about half of it sticking out. The transfer rates achieved with our reference SD card (AV PRO microSD 128 GB V60) were rather modest. You should be able to expect more from a laptop of this price. For instance, the Razer Blade is twice as fast, and the XPS 17 is even faster in this department.
| SD Card Reader | |
| average JPG Copy Test (av. of 3 runs) | |
| Dell XPS 17 9720 RTX 3060 (Toshiba Exceria Pro SDXC 64 GB UHS-II) | |
| Razer Blade 17 (i7-12800H, RTX 3070 Ti) | |
| Average of class Multimedia (23 - 531, n=42, last 2 years) | |
| MSI Creator Z17 A12UGST-054 (AV Pro SD microSD 128 GB V60) | |
| MSI Creator Z16P B12UHST (AV PRO microSD 128 GB V60) | |
| maximum AS SSD Seq Read Test (1GB) | |
| Dell XPS 17 9720 RTX 3060 (Toshiba Exceria Pro SDXC 64 GB UHS-II) | |
| Average of class Multimedia (37.3 - 1455, n=41, last 2 years) | |
| Razer Blade 17 (i7-12800H, RTX 3070 Ti) | |
| MSI Creator Z17 A12UGST-054 (AV Pro SD microSD 128 GB V60) | |
Connectivity
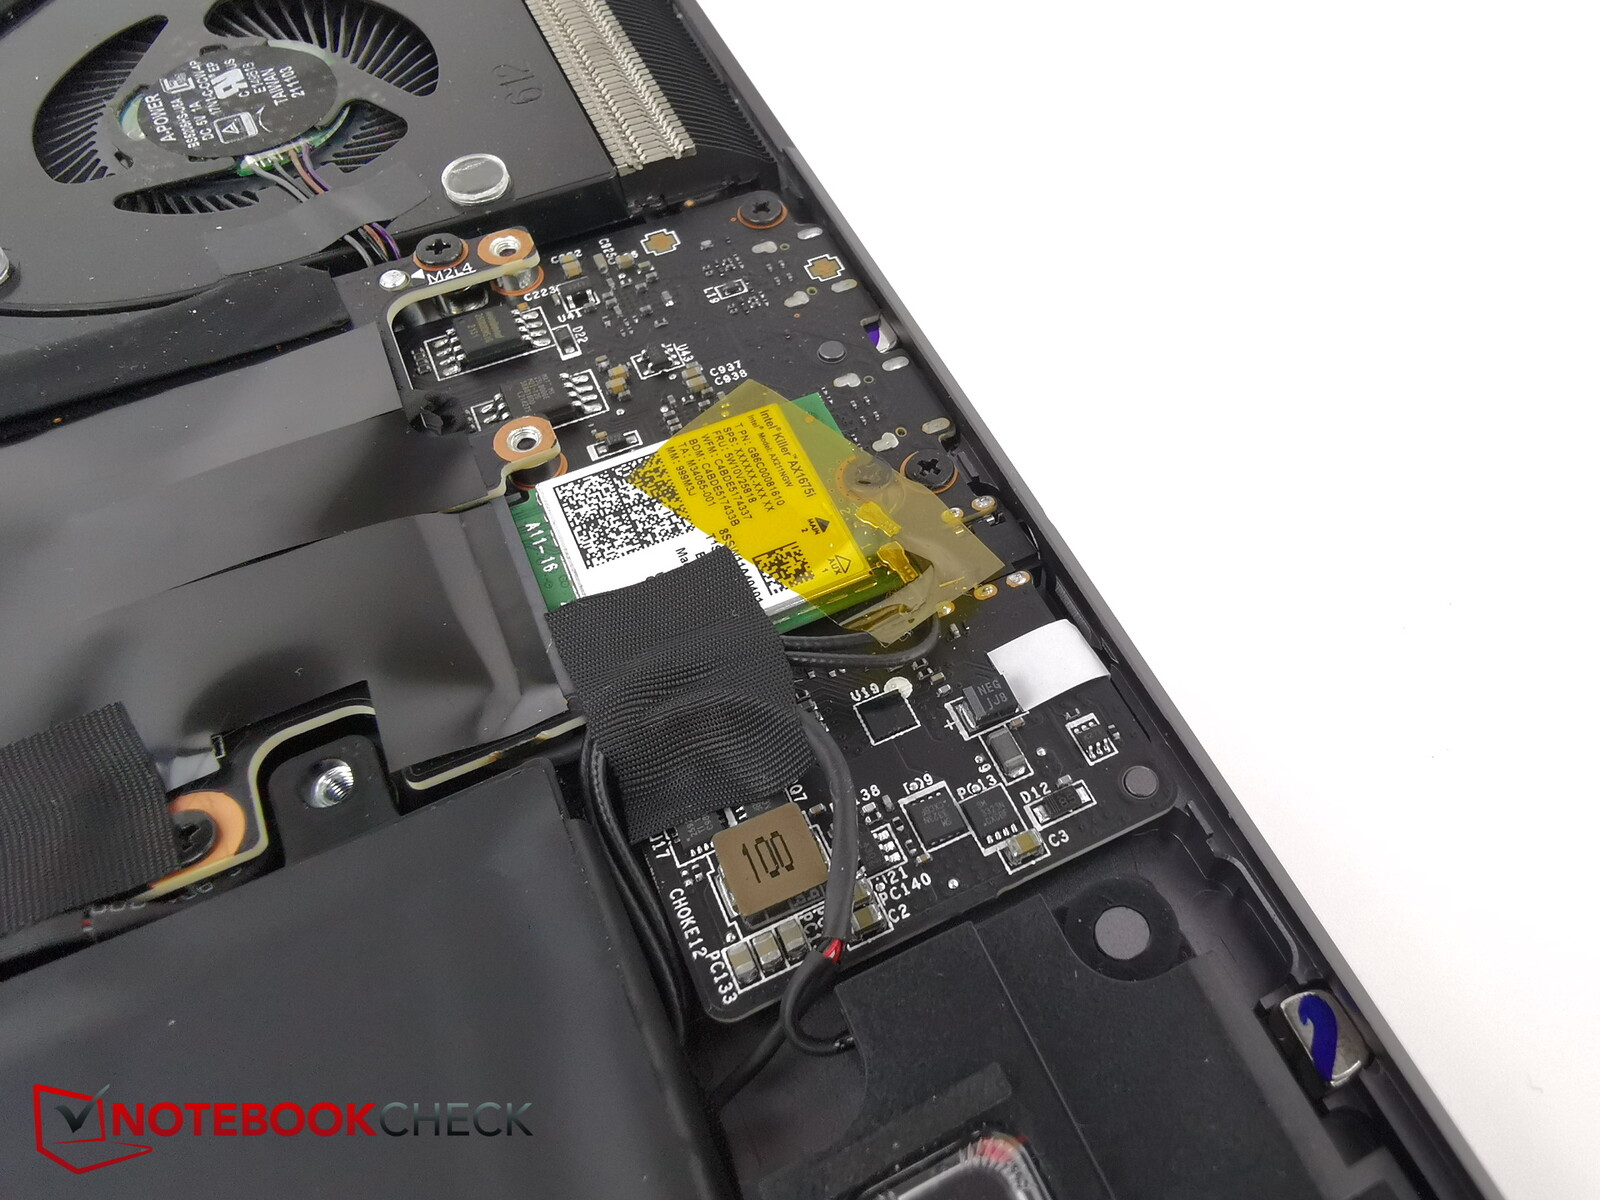
As previously mentioned, an Ethernet port is missing on the Z17. Without an adapter, you are limited to using wireless connections even when at home. But MSI at least included a Killer wireless module that supports Wi-Fi 6E.
Transfer rates are nice and fast, especially when using the 6 GHz band. In two test runs, there was each a minor dip in transfer rate.
Webcam
MSI included a Full HD webcam with IR sensor and facial recognition. The image quality is decent, but colour deviations tend to be a little reddish.


Security
The Creator Z17 features a fingerprint sensor. Furthermore, its camera is equipped with an IR sensor and supports login using facial recognition.
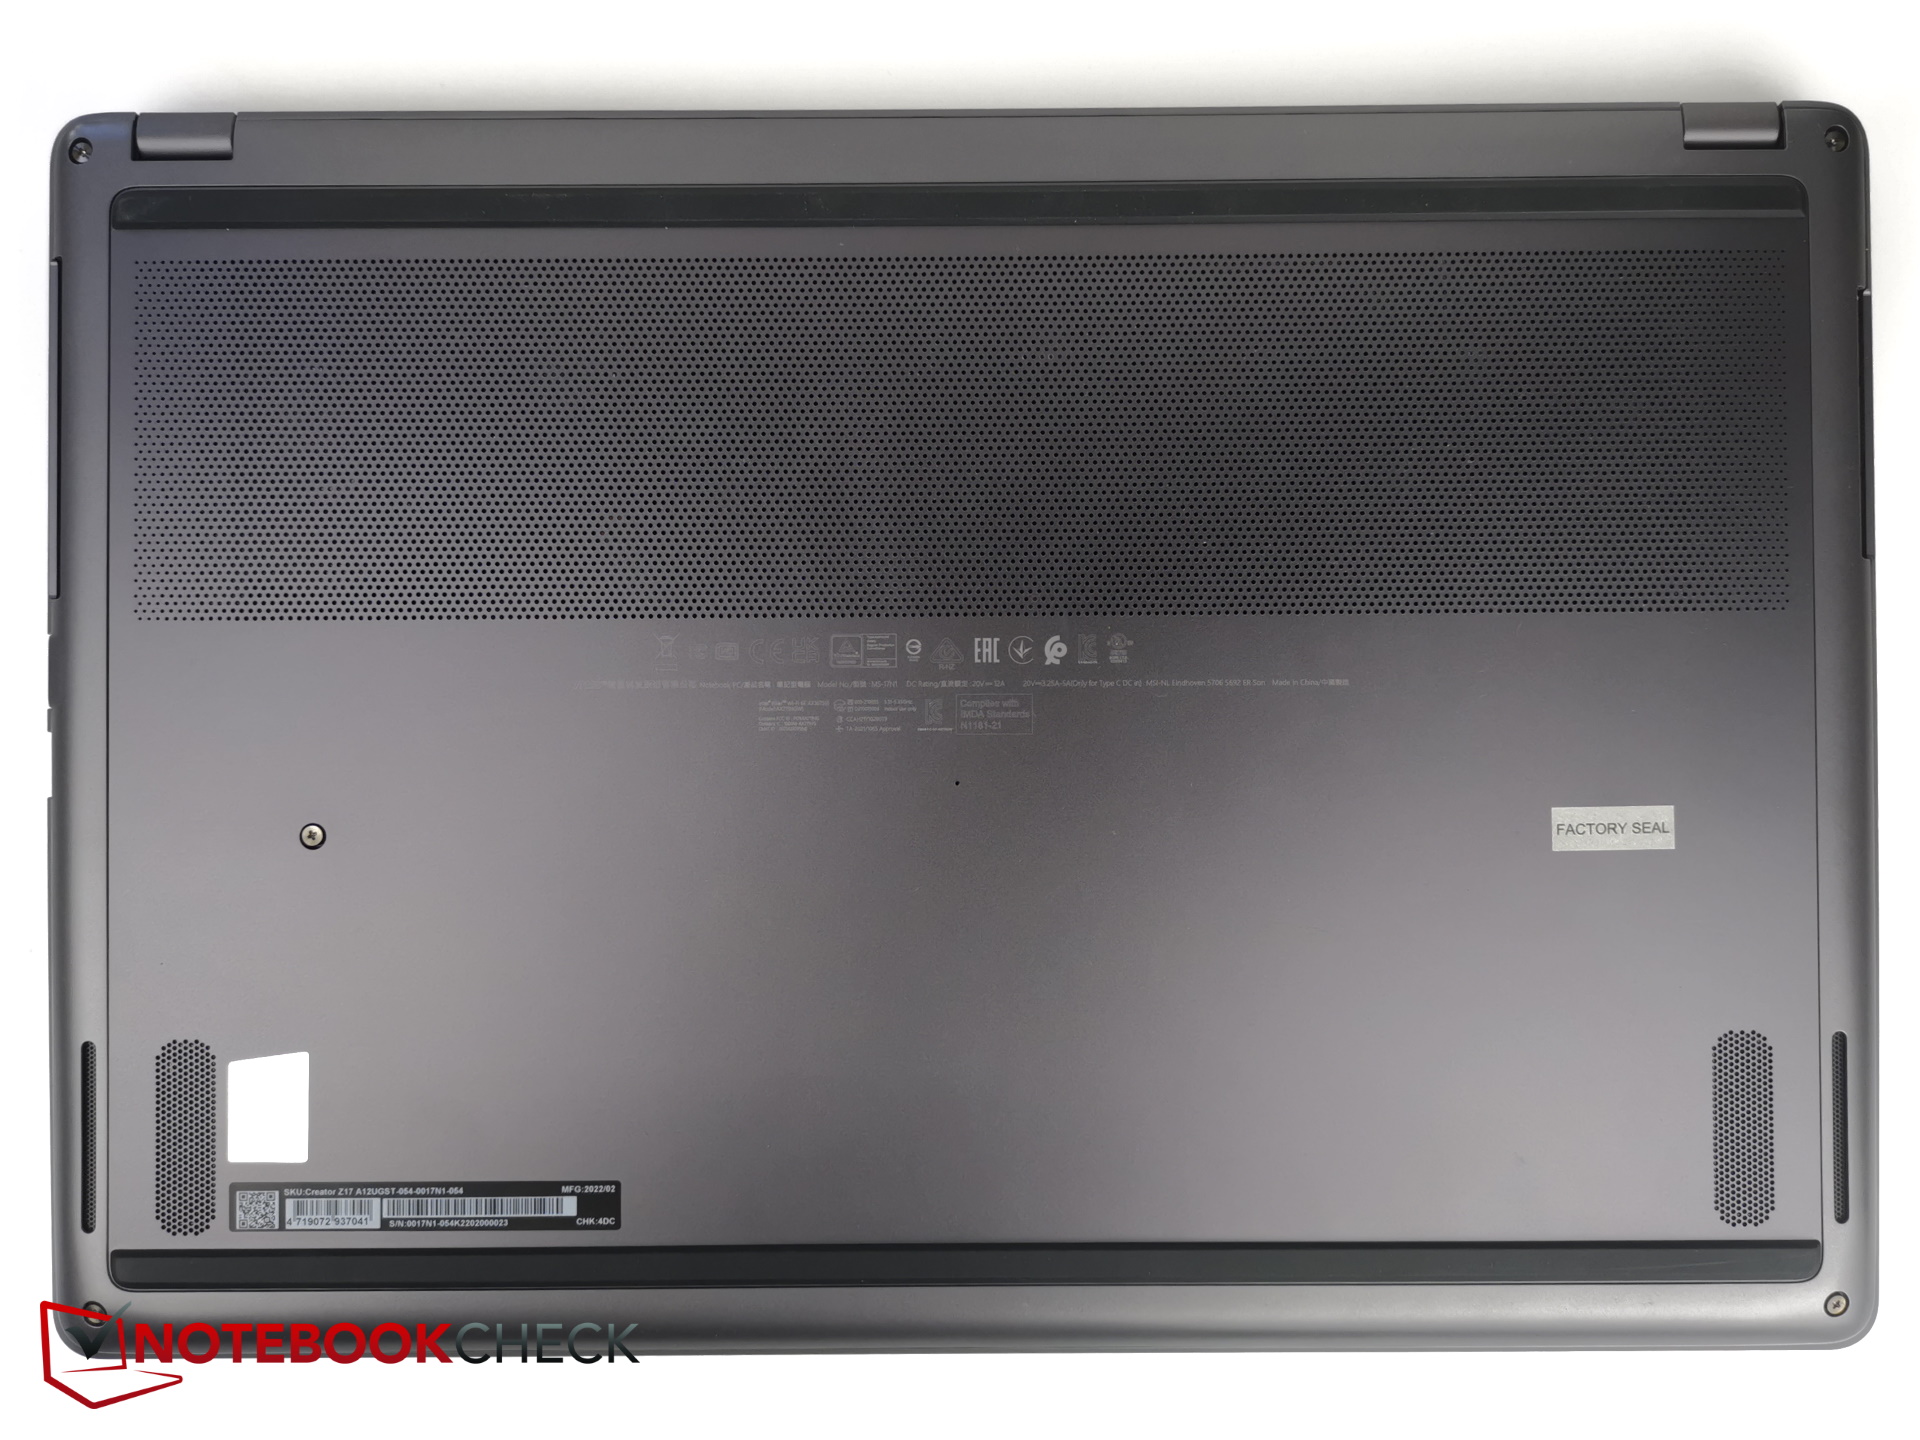
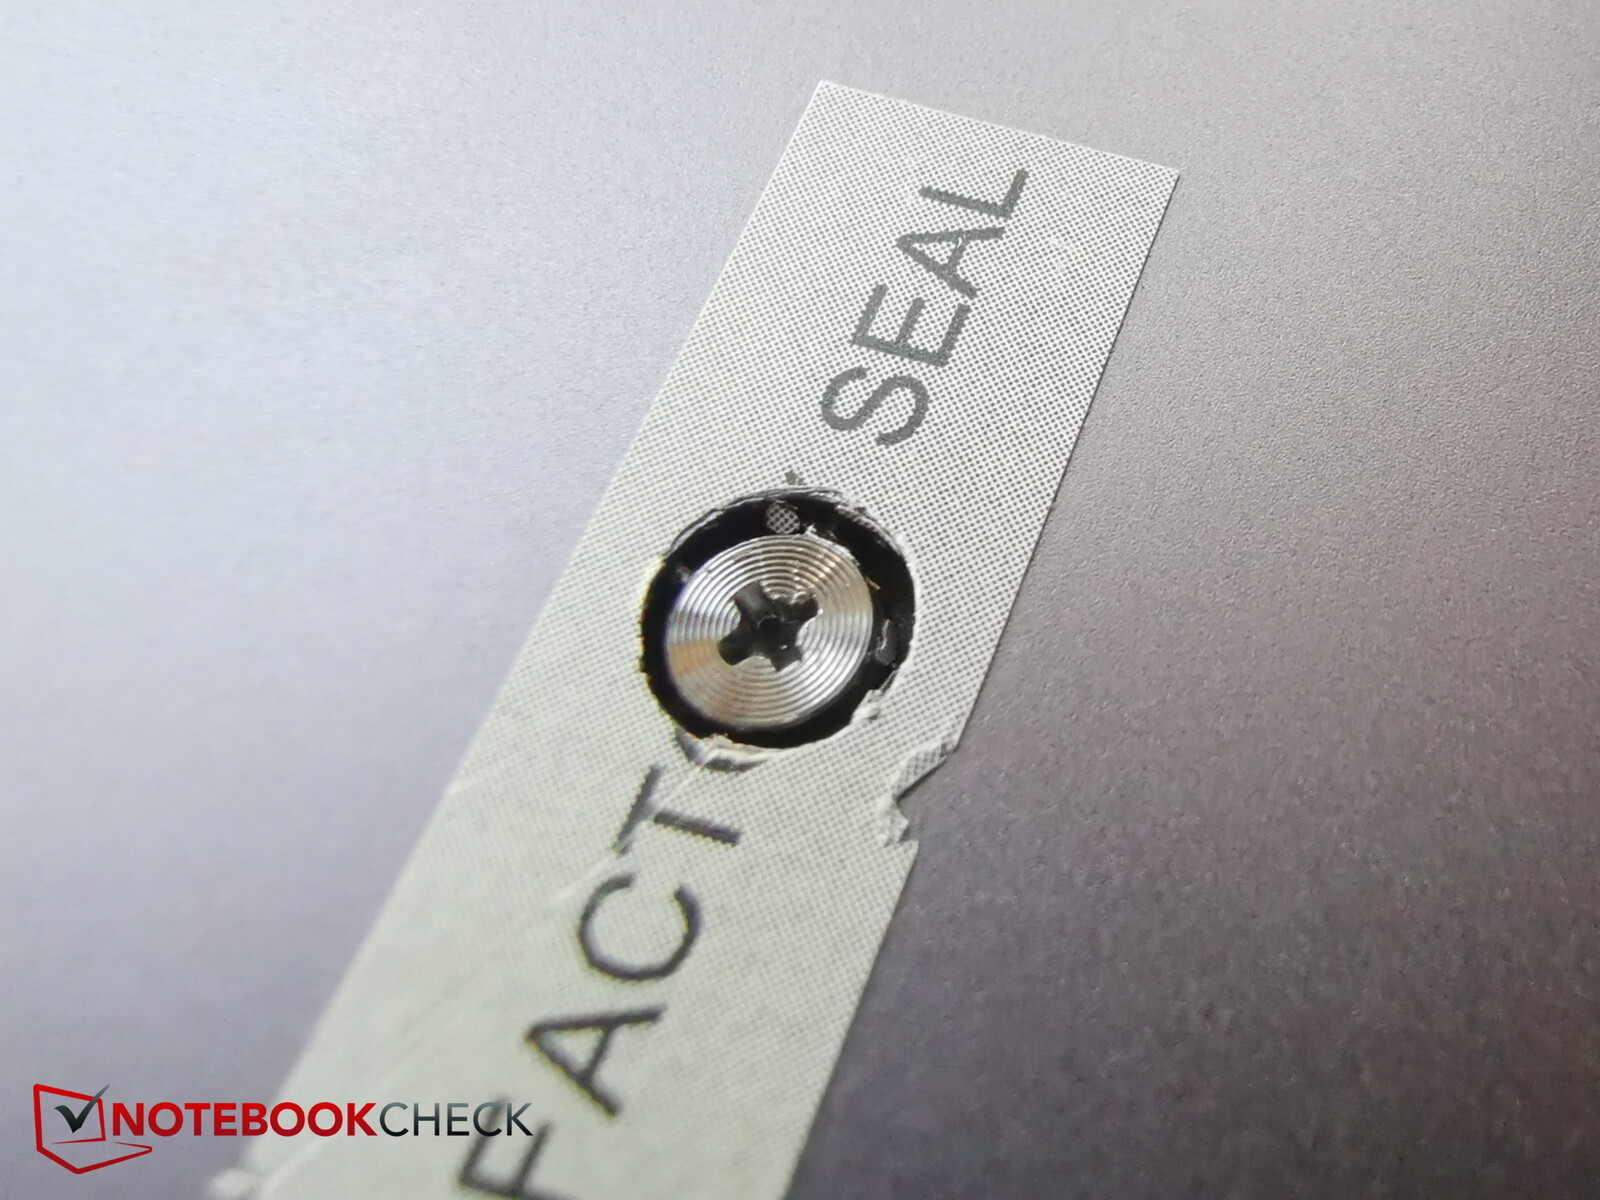
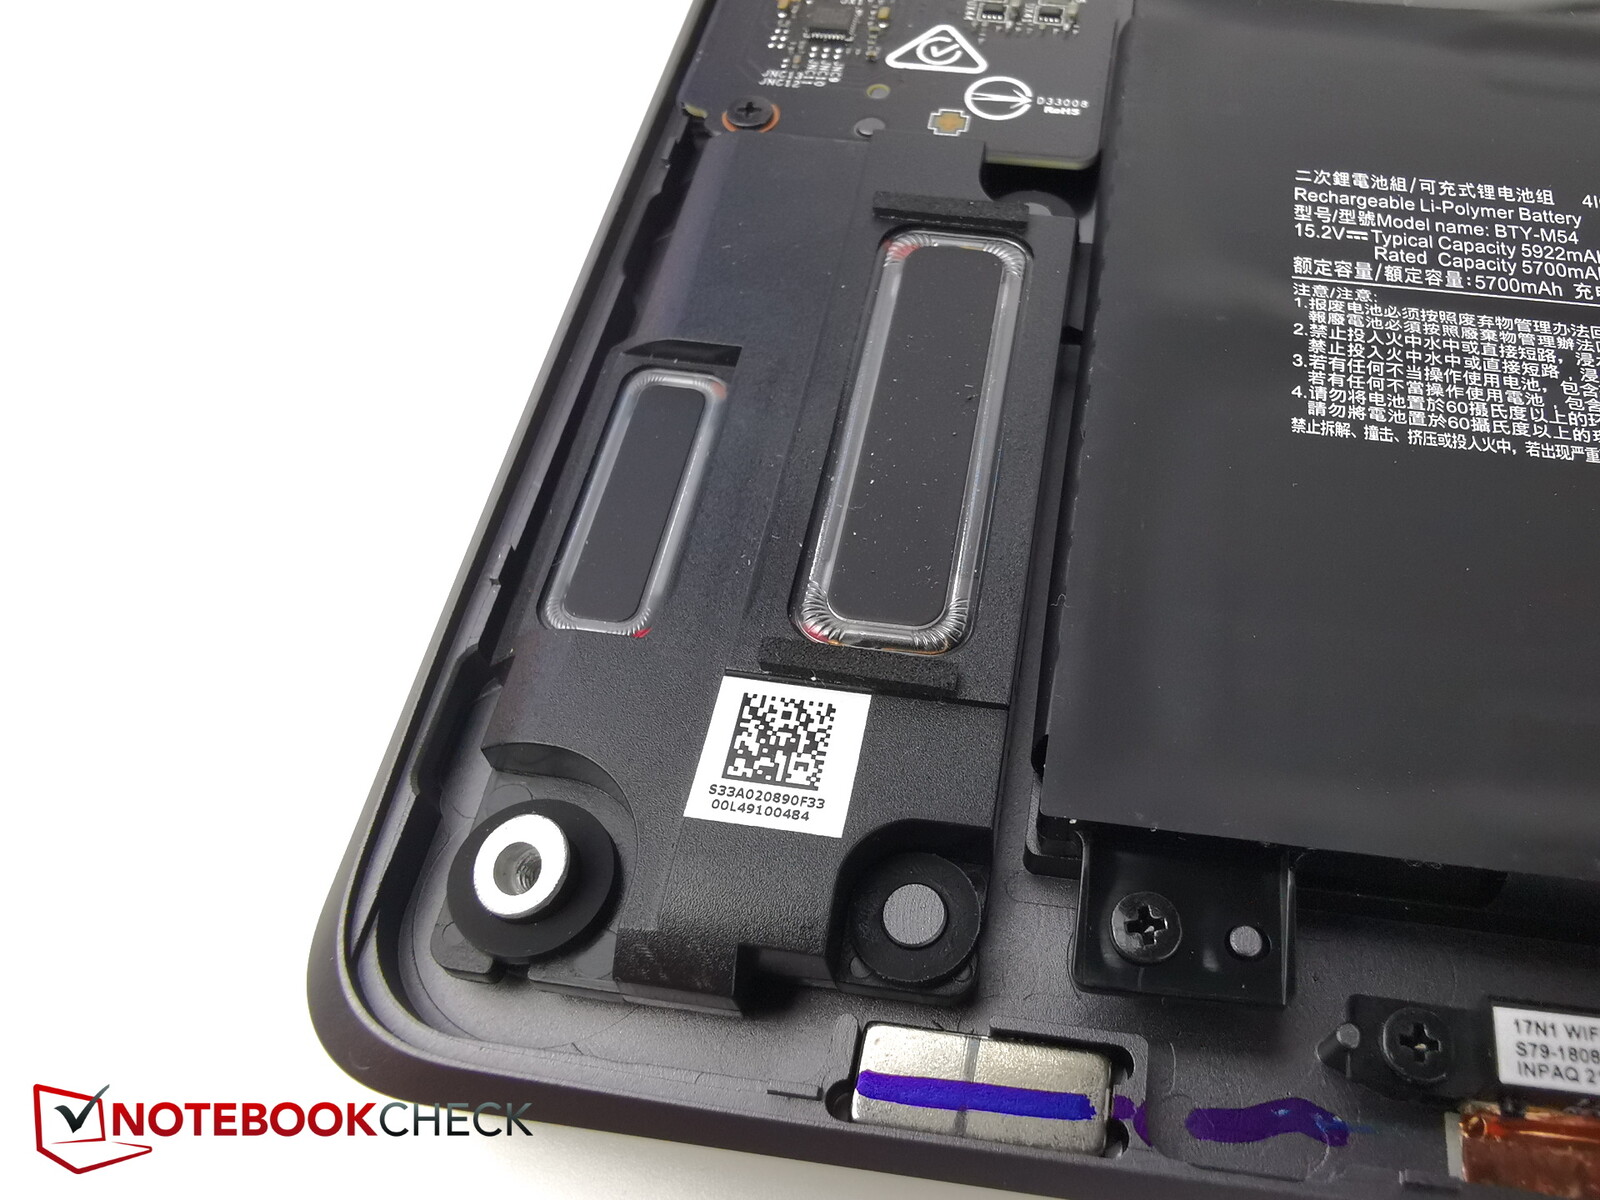
Maintenance
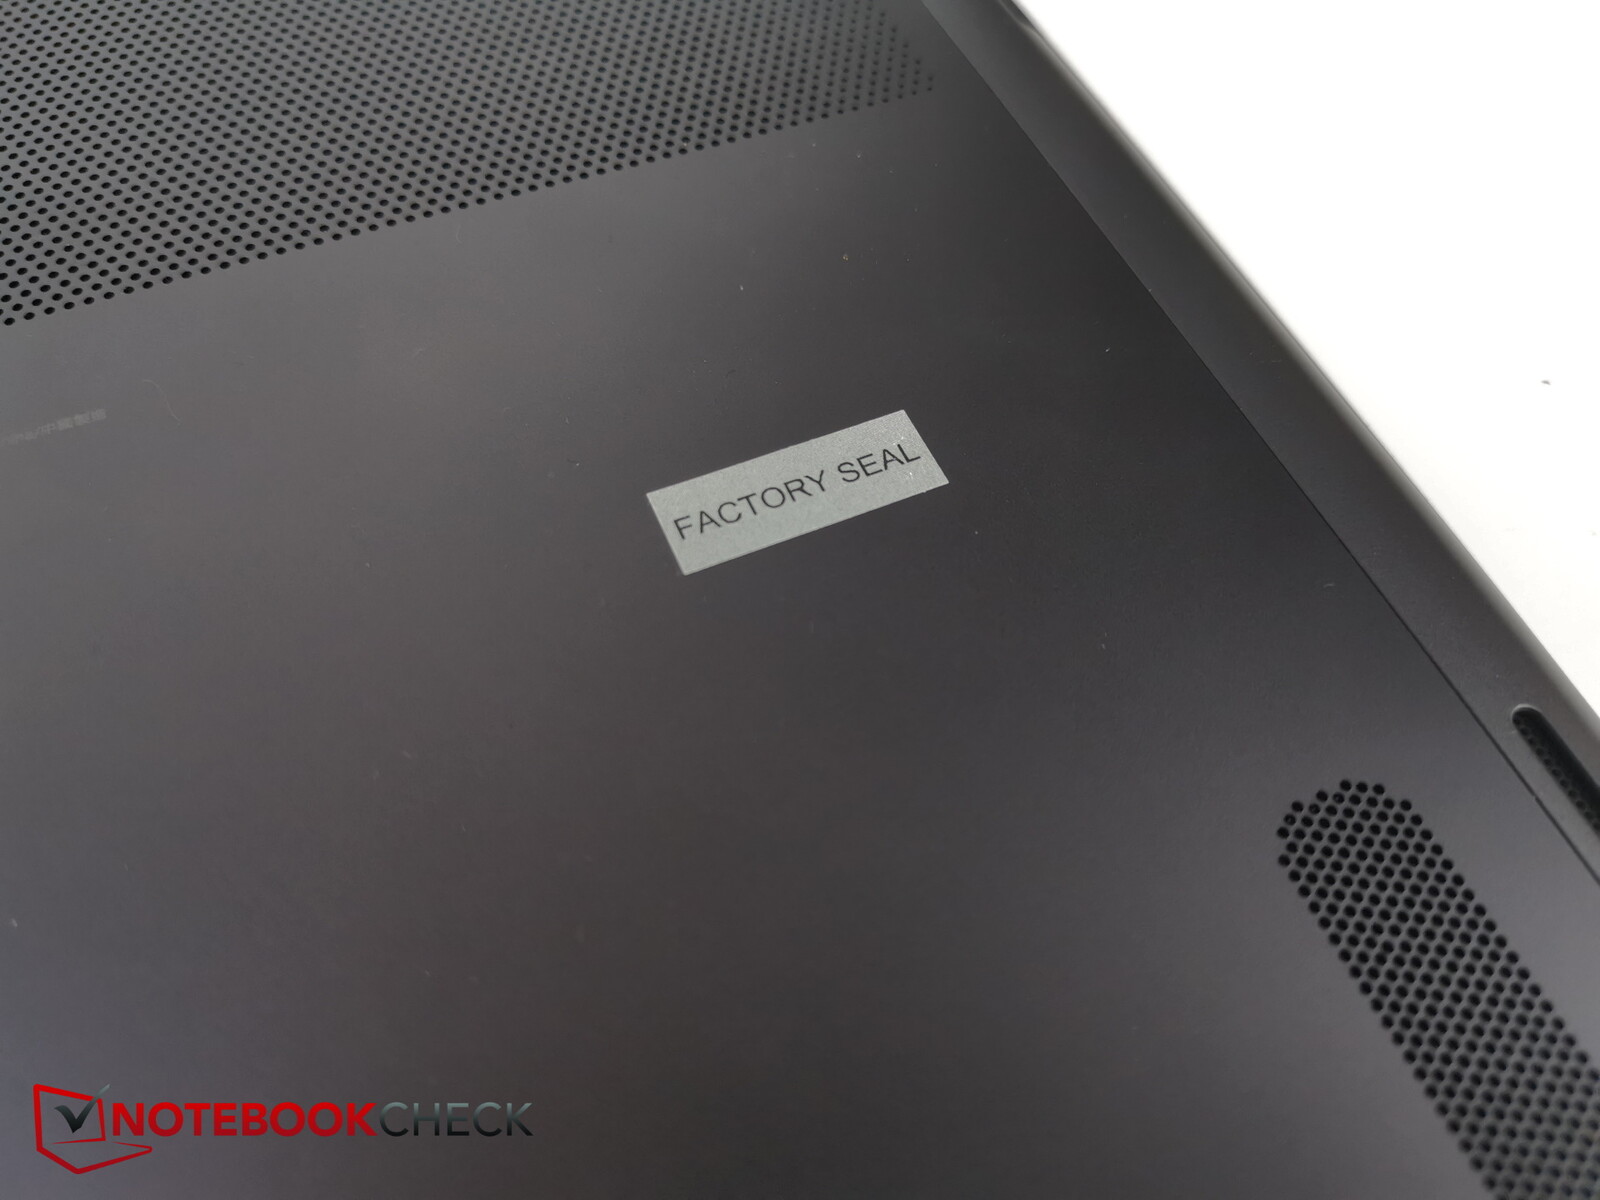
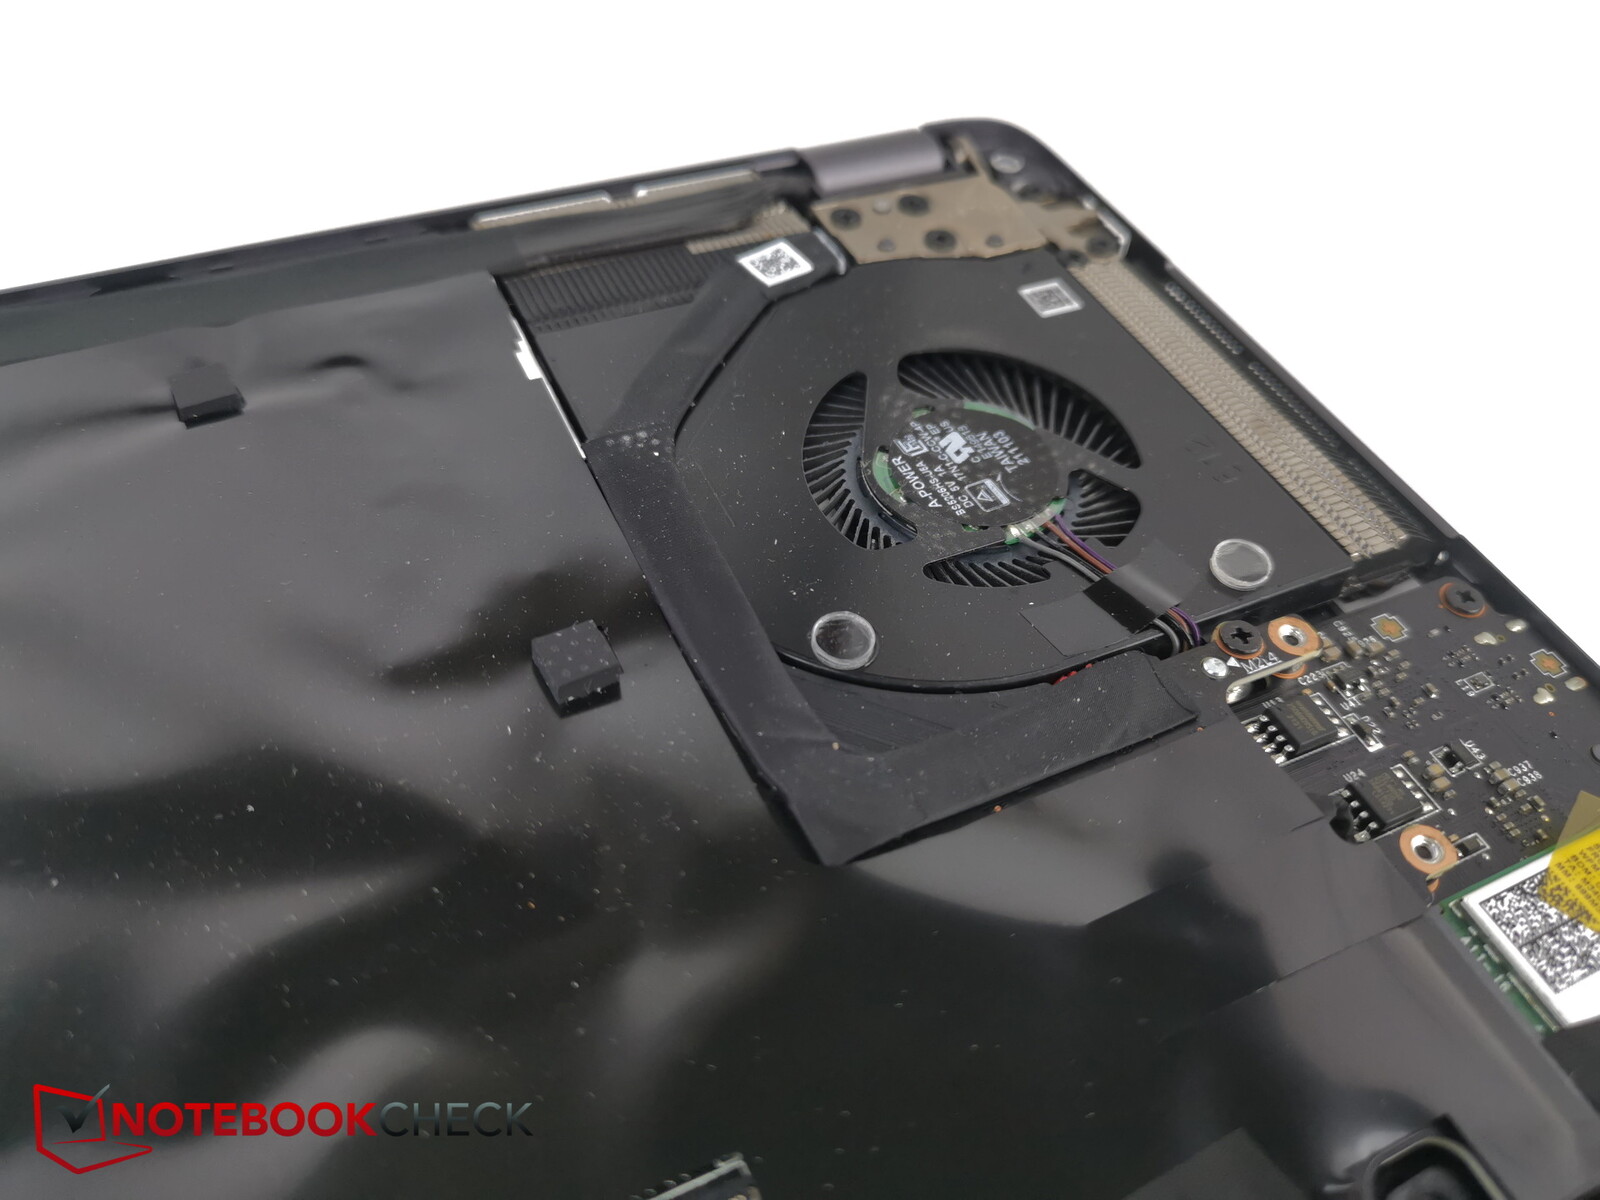
The bottom panel is secured in place with just six Phillips screws. Unfortunately, there is a factory seal sticker covering one of them. Damaging the sticker may affect the validity of any future warranty claims. You will first need a tool to prise open the panel. After that, the panel can be removed quickly and effortlessly.
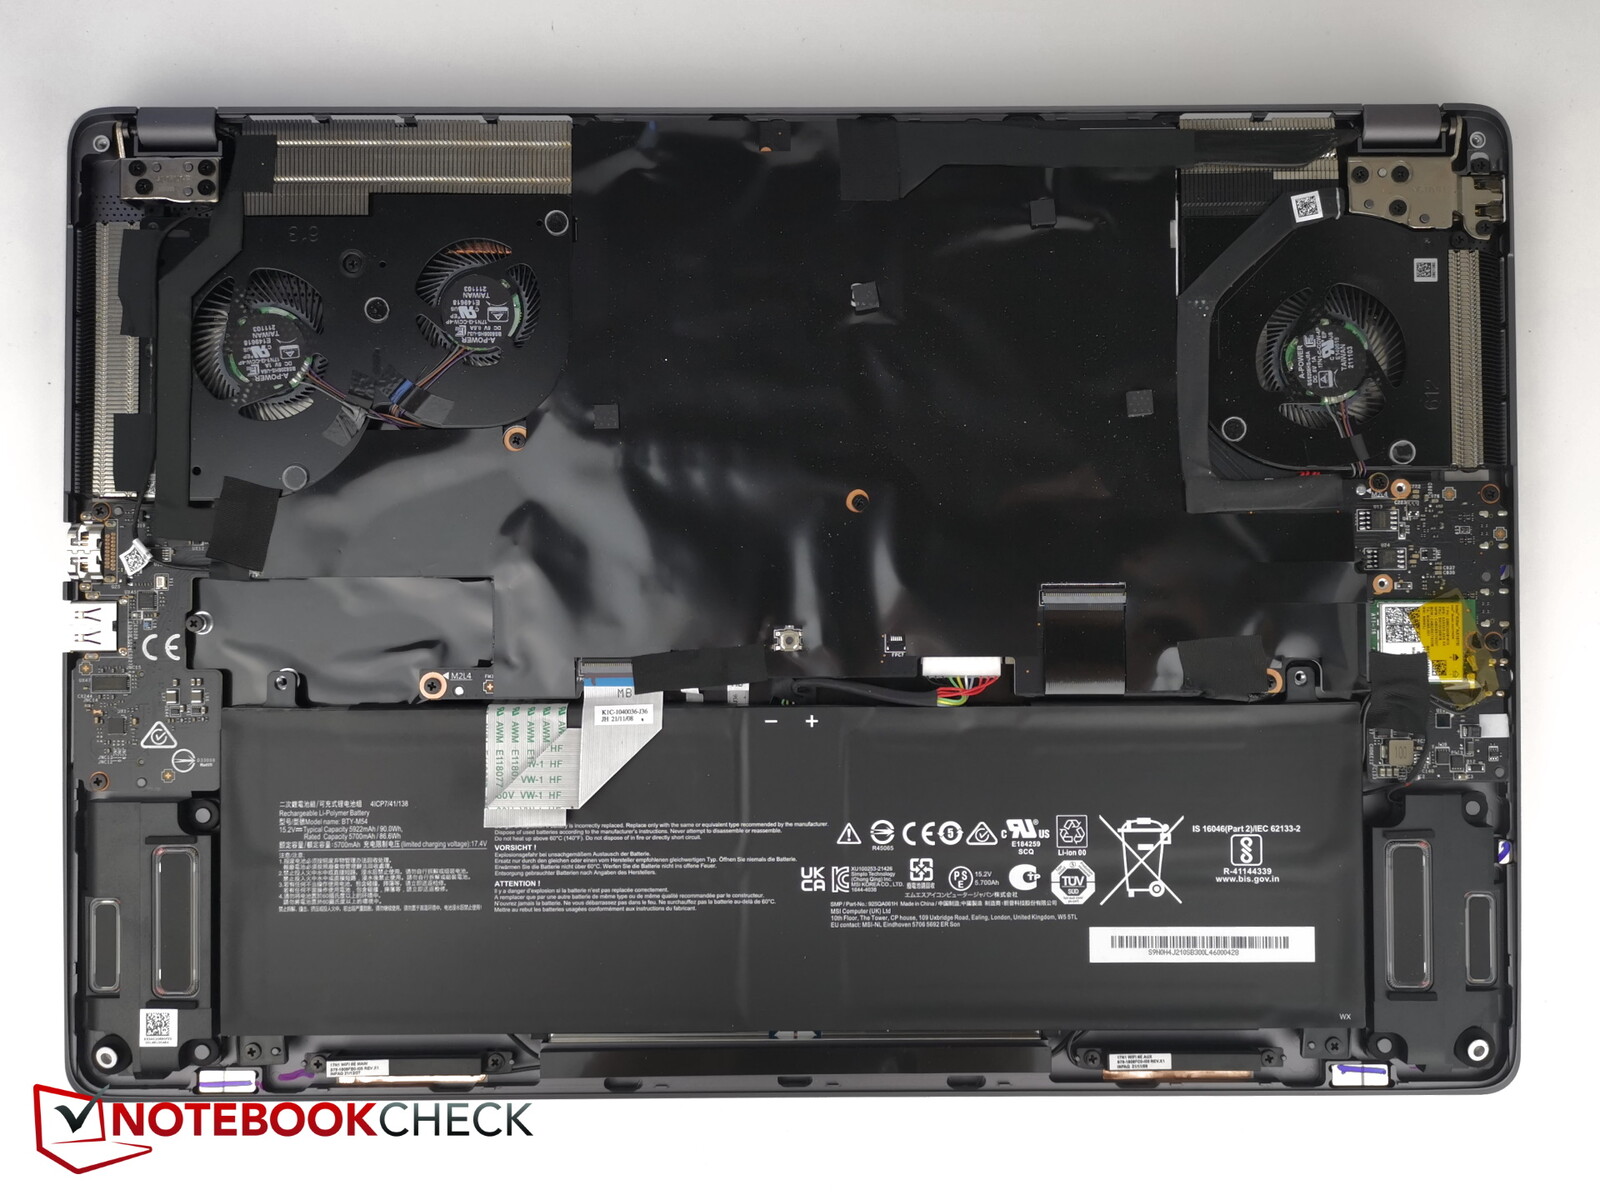
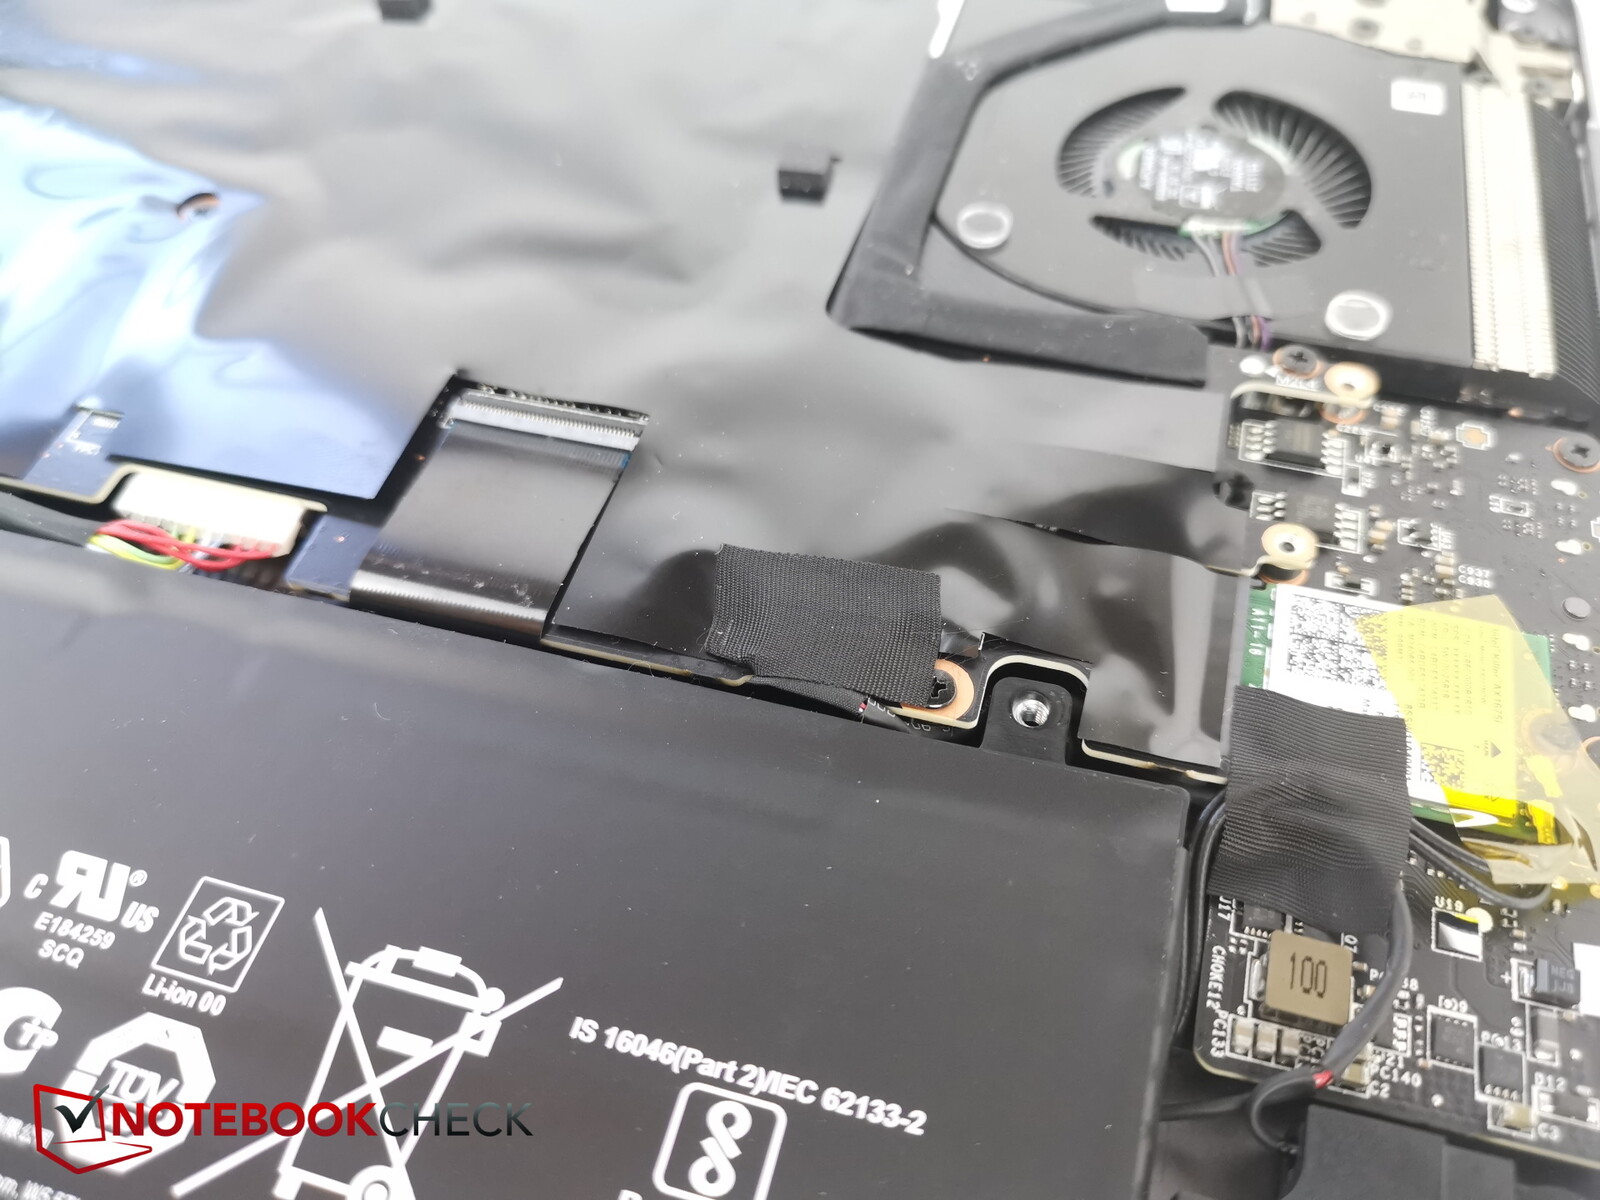
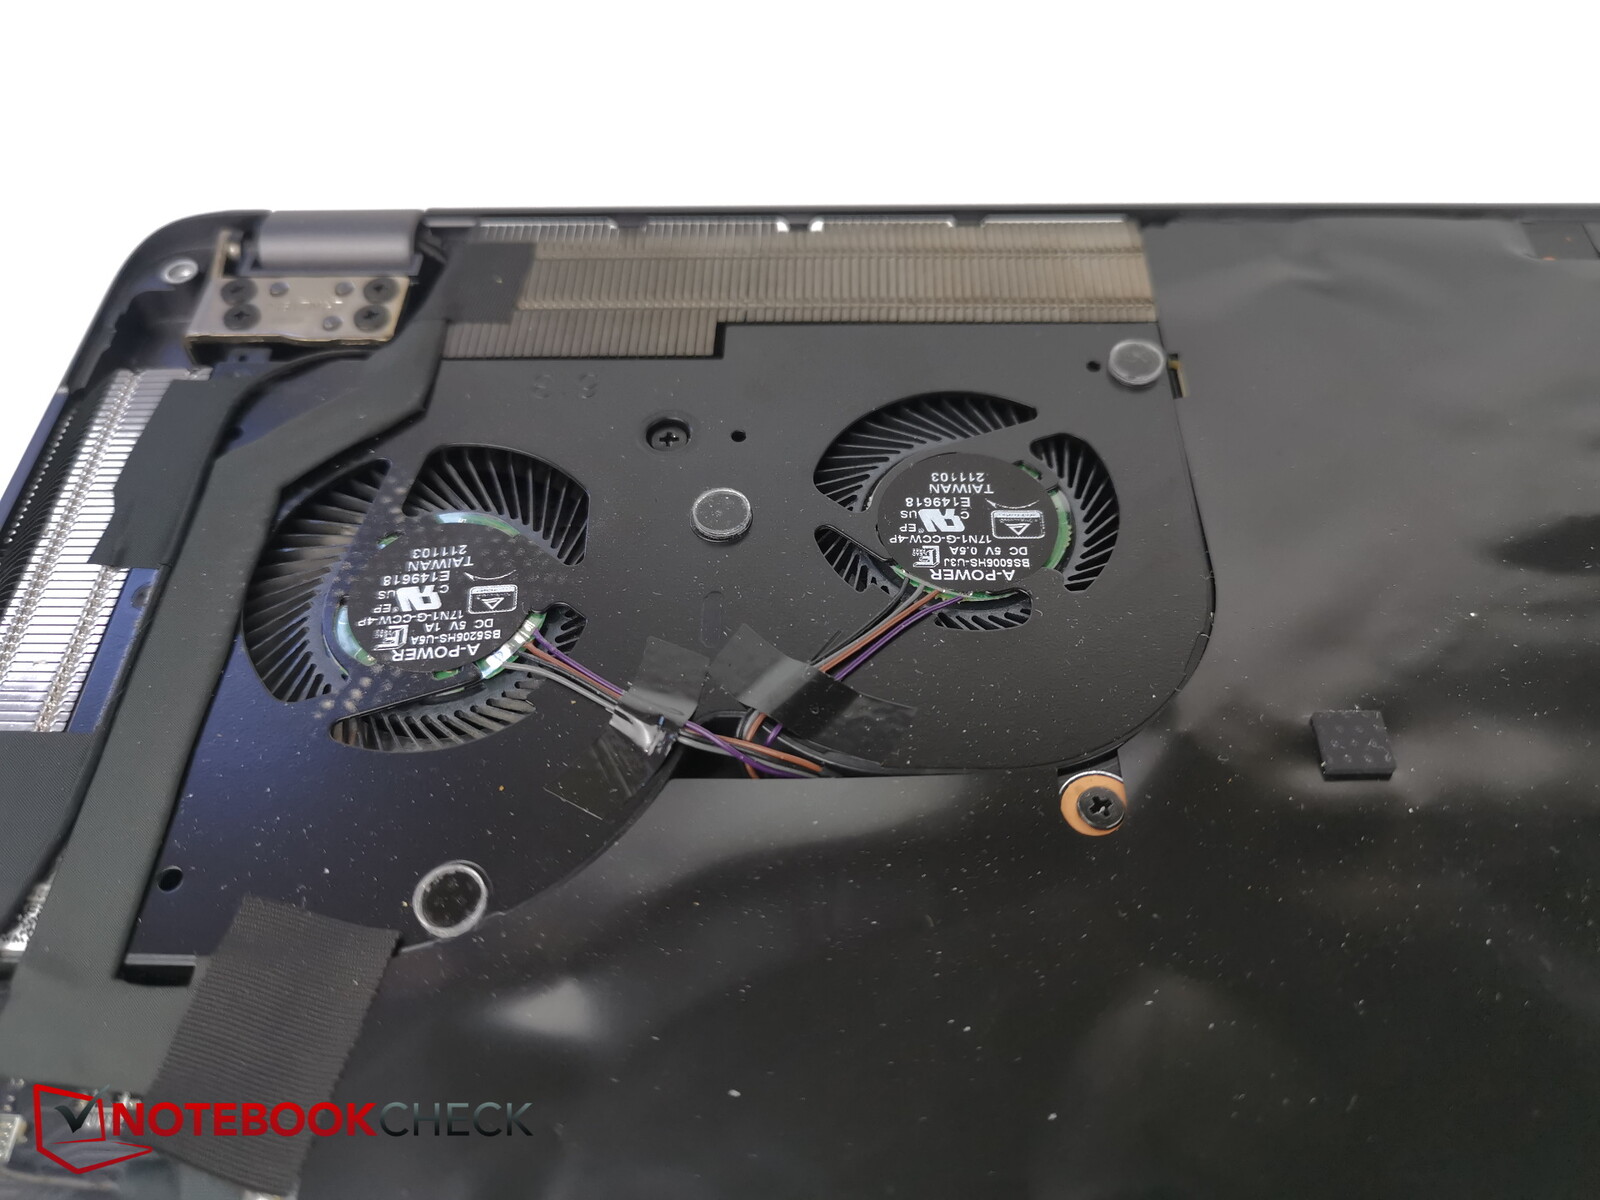
The internals of the Z17 are quite difficult to service and upgrade, as almost all components are covered by a large sheet of black film. Only the Wi-Fi module and fans are accessible immediately. Even after peeking under the corners of the film, we weren't able to find where the RAM and SSD are located. The sheet has been glued on such that it can't be removed without damaging anything.
Accessories and warranty
Despite the device's hefty price tag, no accessories are included in the box. A USB-to-Ethernet adapter would at least have been nice to have.
In Germany, MSI provides a two-year warranty on the laptop, including a pick-up & return service. In the US, the warranty period is one year.
Input devices - Solid options for creators
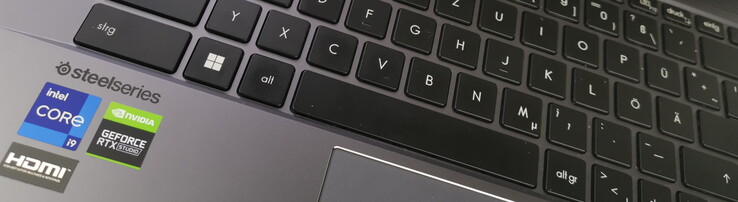
Keyboard
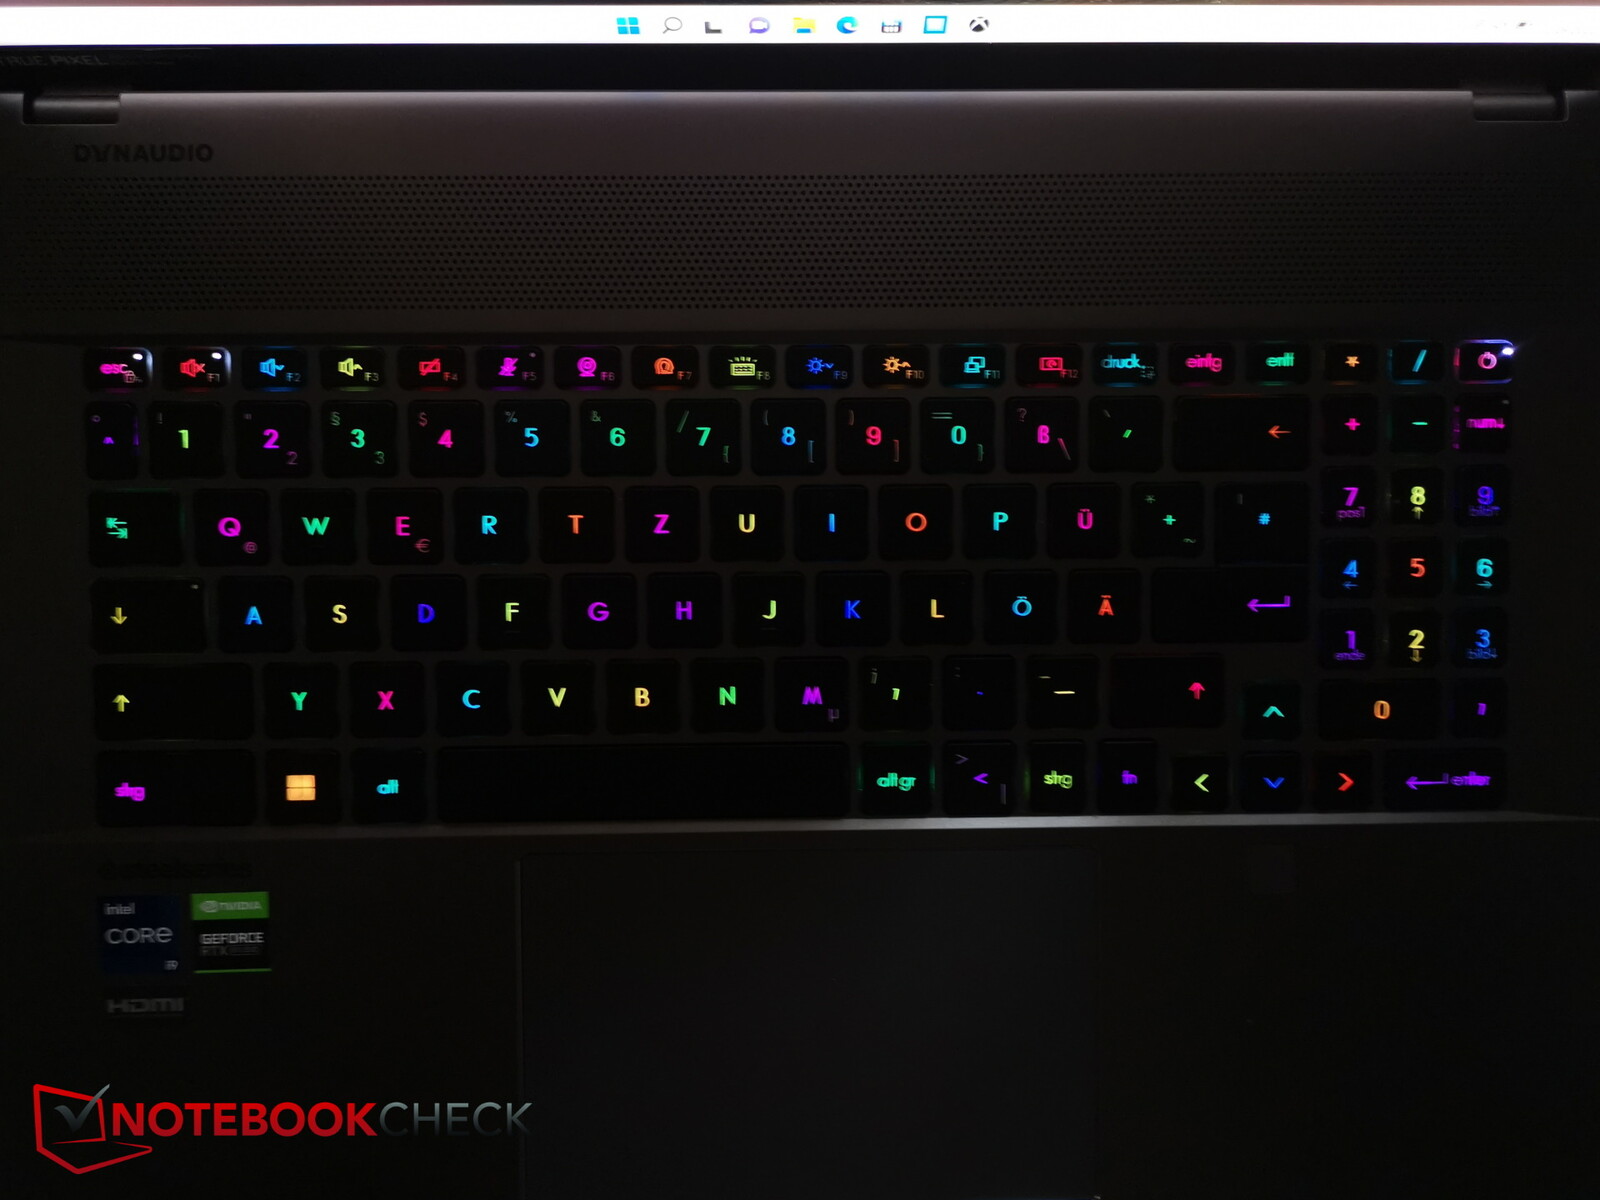
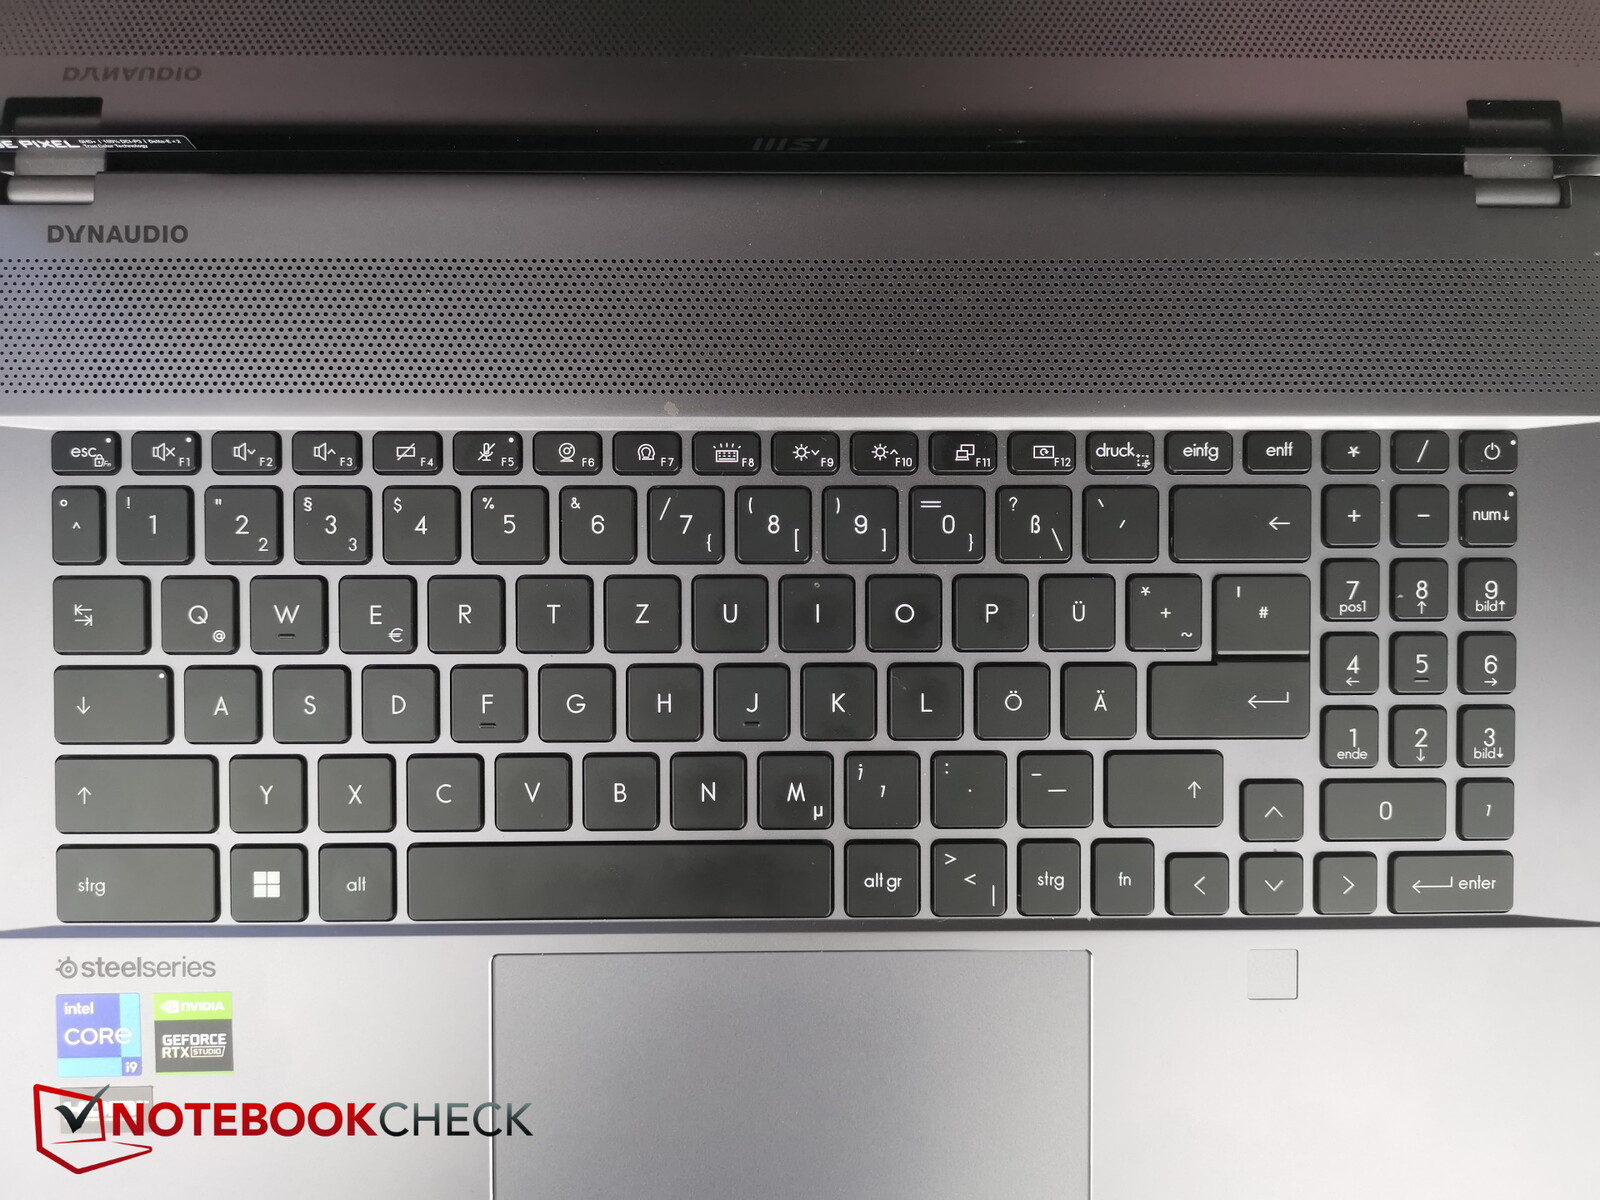
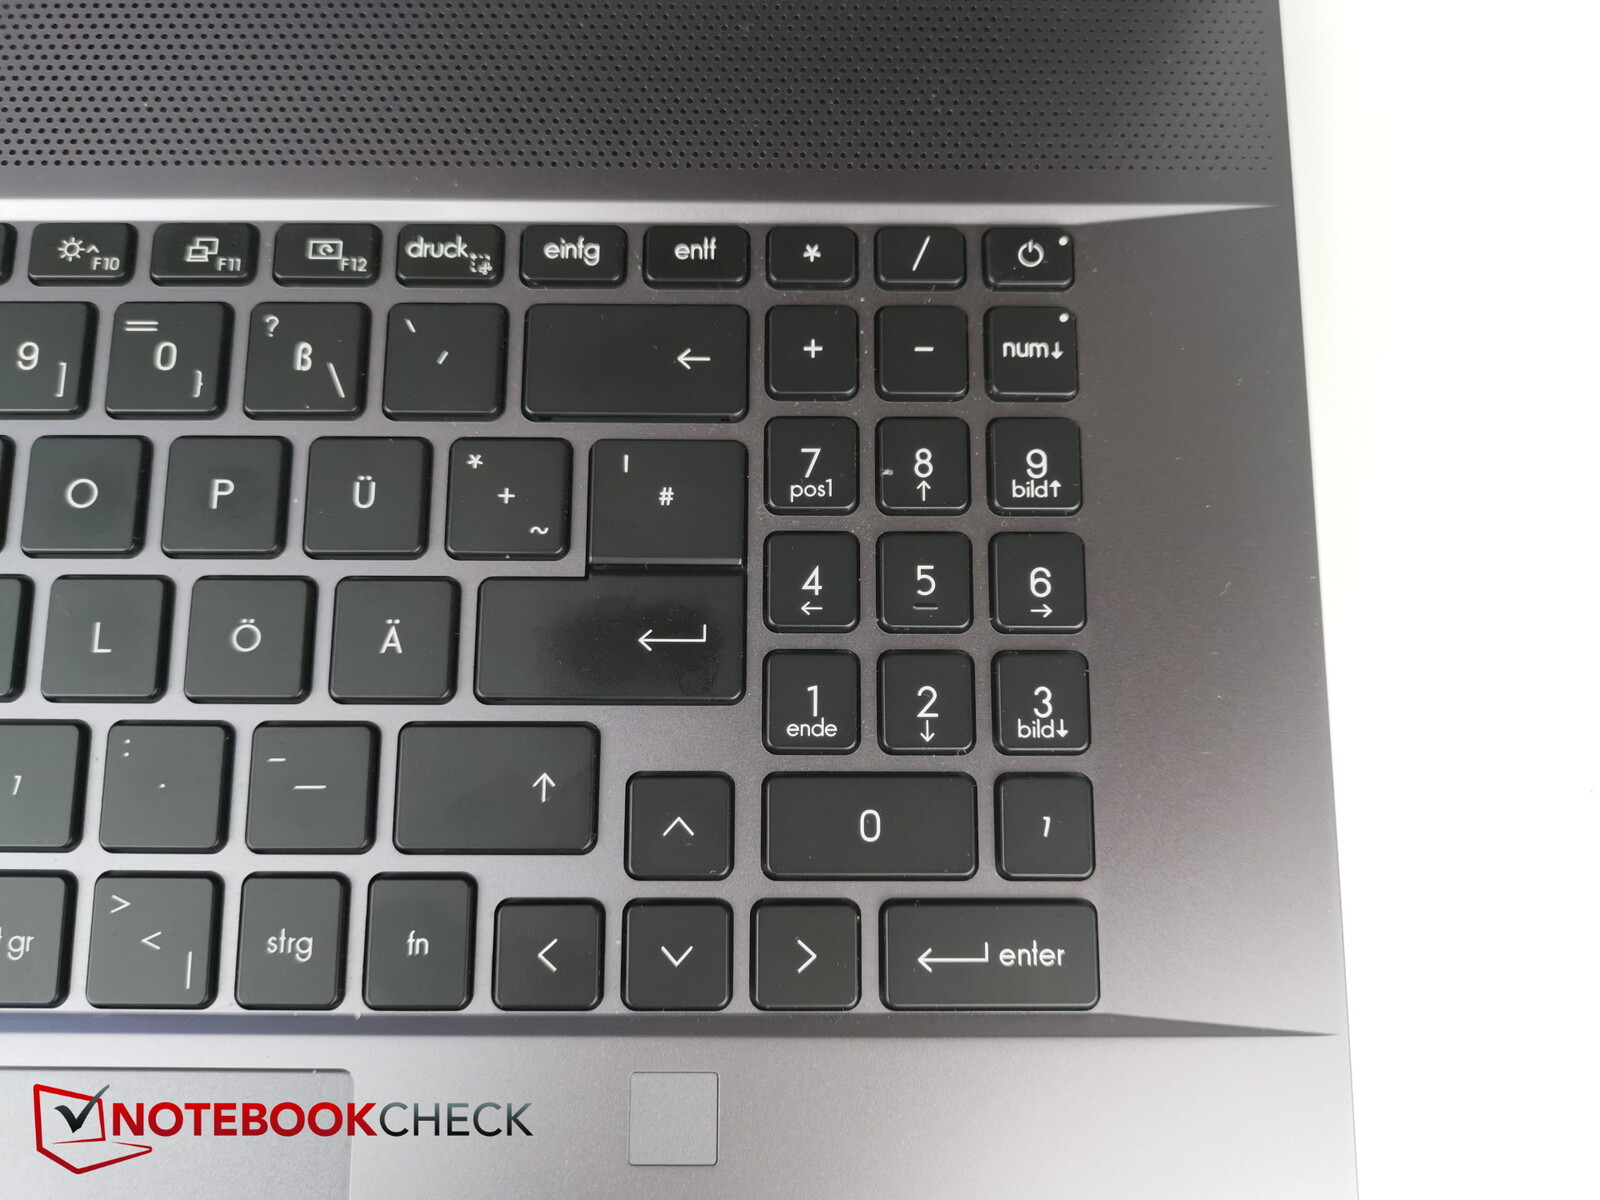
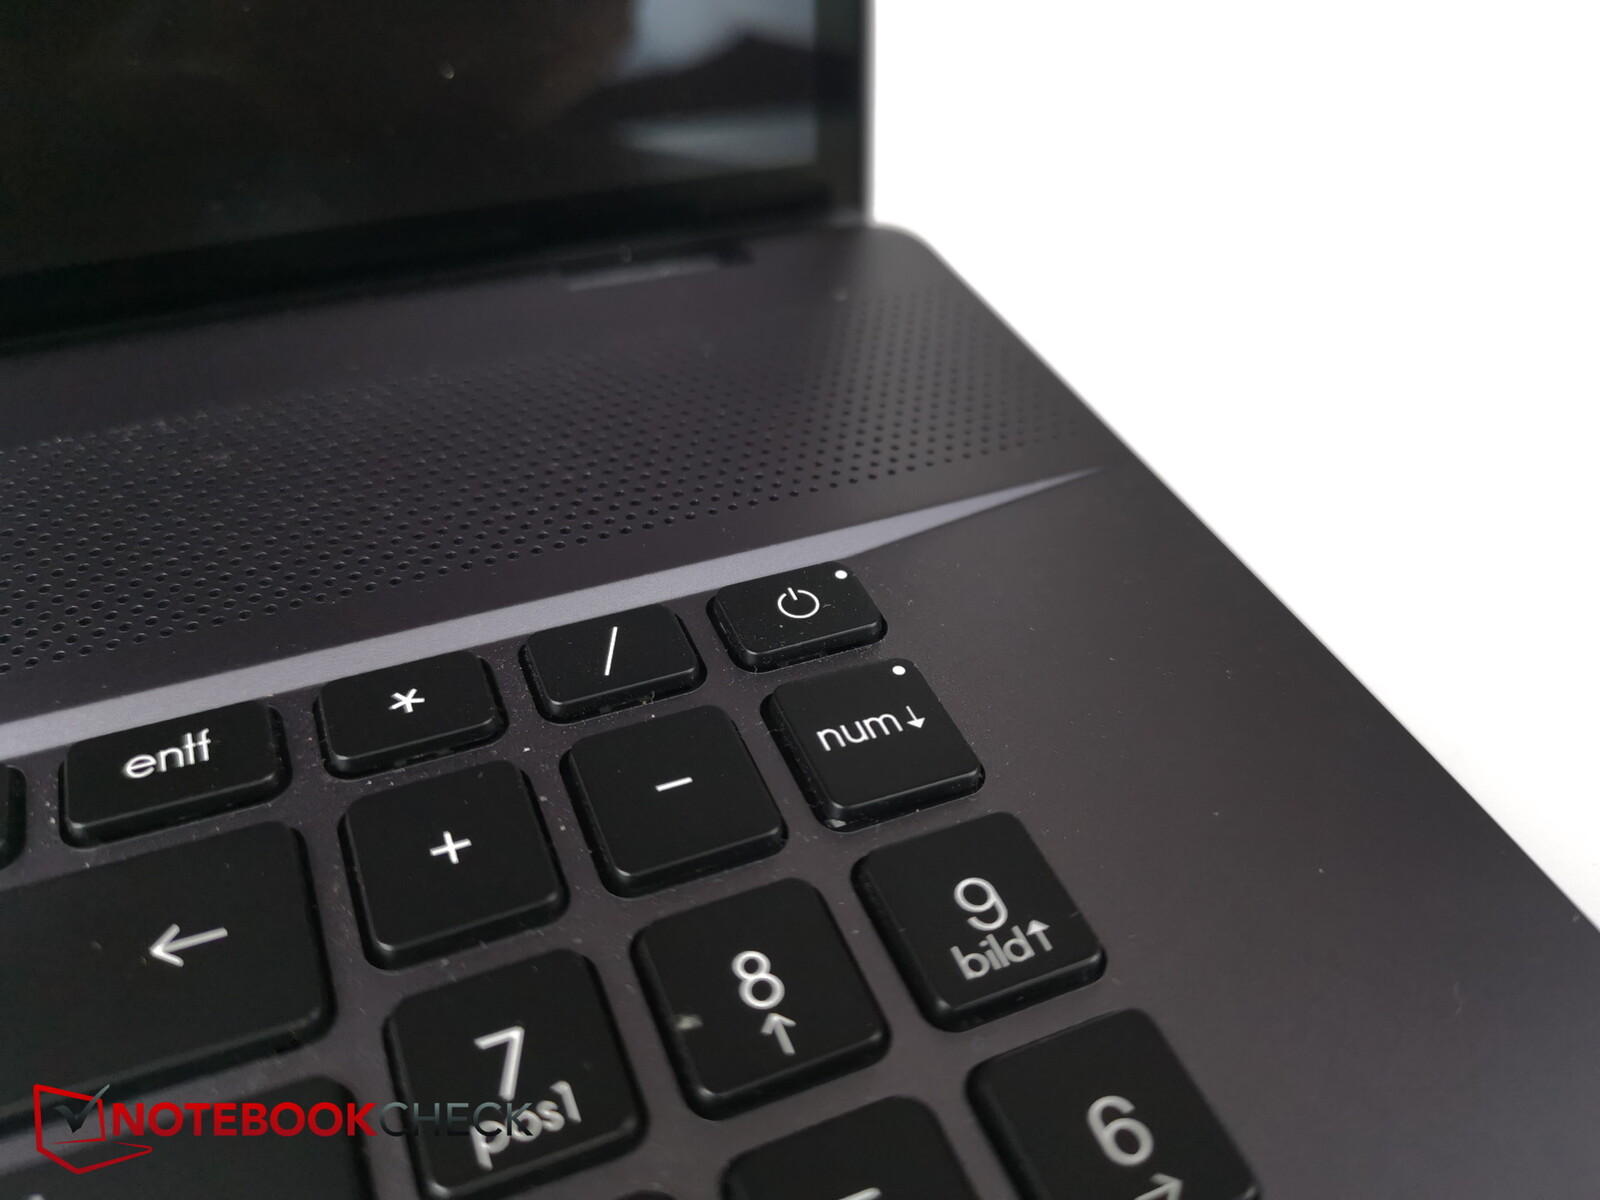
Although this is a 17-inch laptop, it doesn't make use of its entire width for the keyboard. Whilst the normal keys are large enough and well spaced apart, the numeric keypad on the right looks too small and squished together. However, the font on the keys is clearly visible and legible throughout.
The arrow keys are likewise very small. The same applies to the right Ctrl key and the narrow Fn key (which, unlike on most keyboards, is found only on the right side).
The keys themselves have quite a short travel but offer clear feedback to allow for fast typing. The centre of the keyboard doesn't have any noticeable flex when you are typing – everything feels rigid.
The keyboard has individual RGB lighting for use in low-light environments. There are four brightness levels to choose from, and the lighting can of course be switched off.
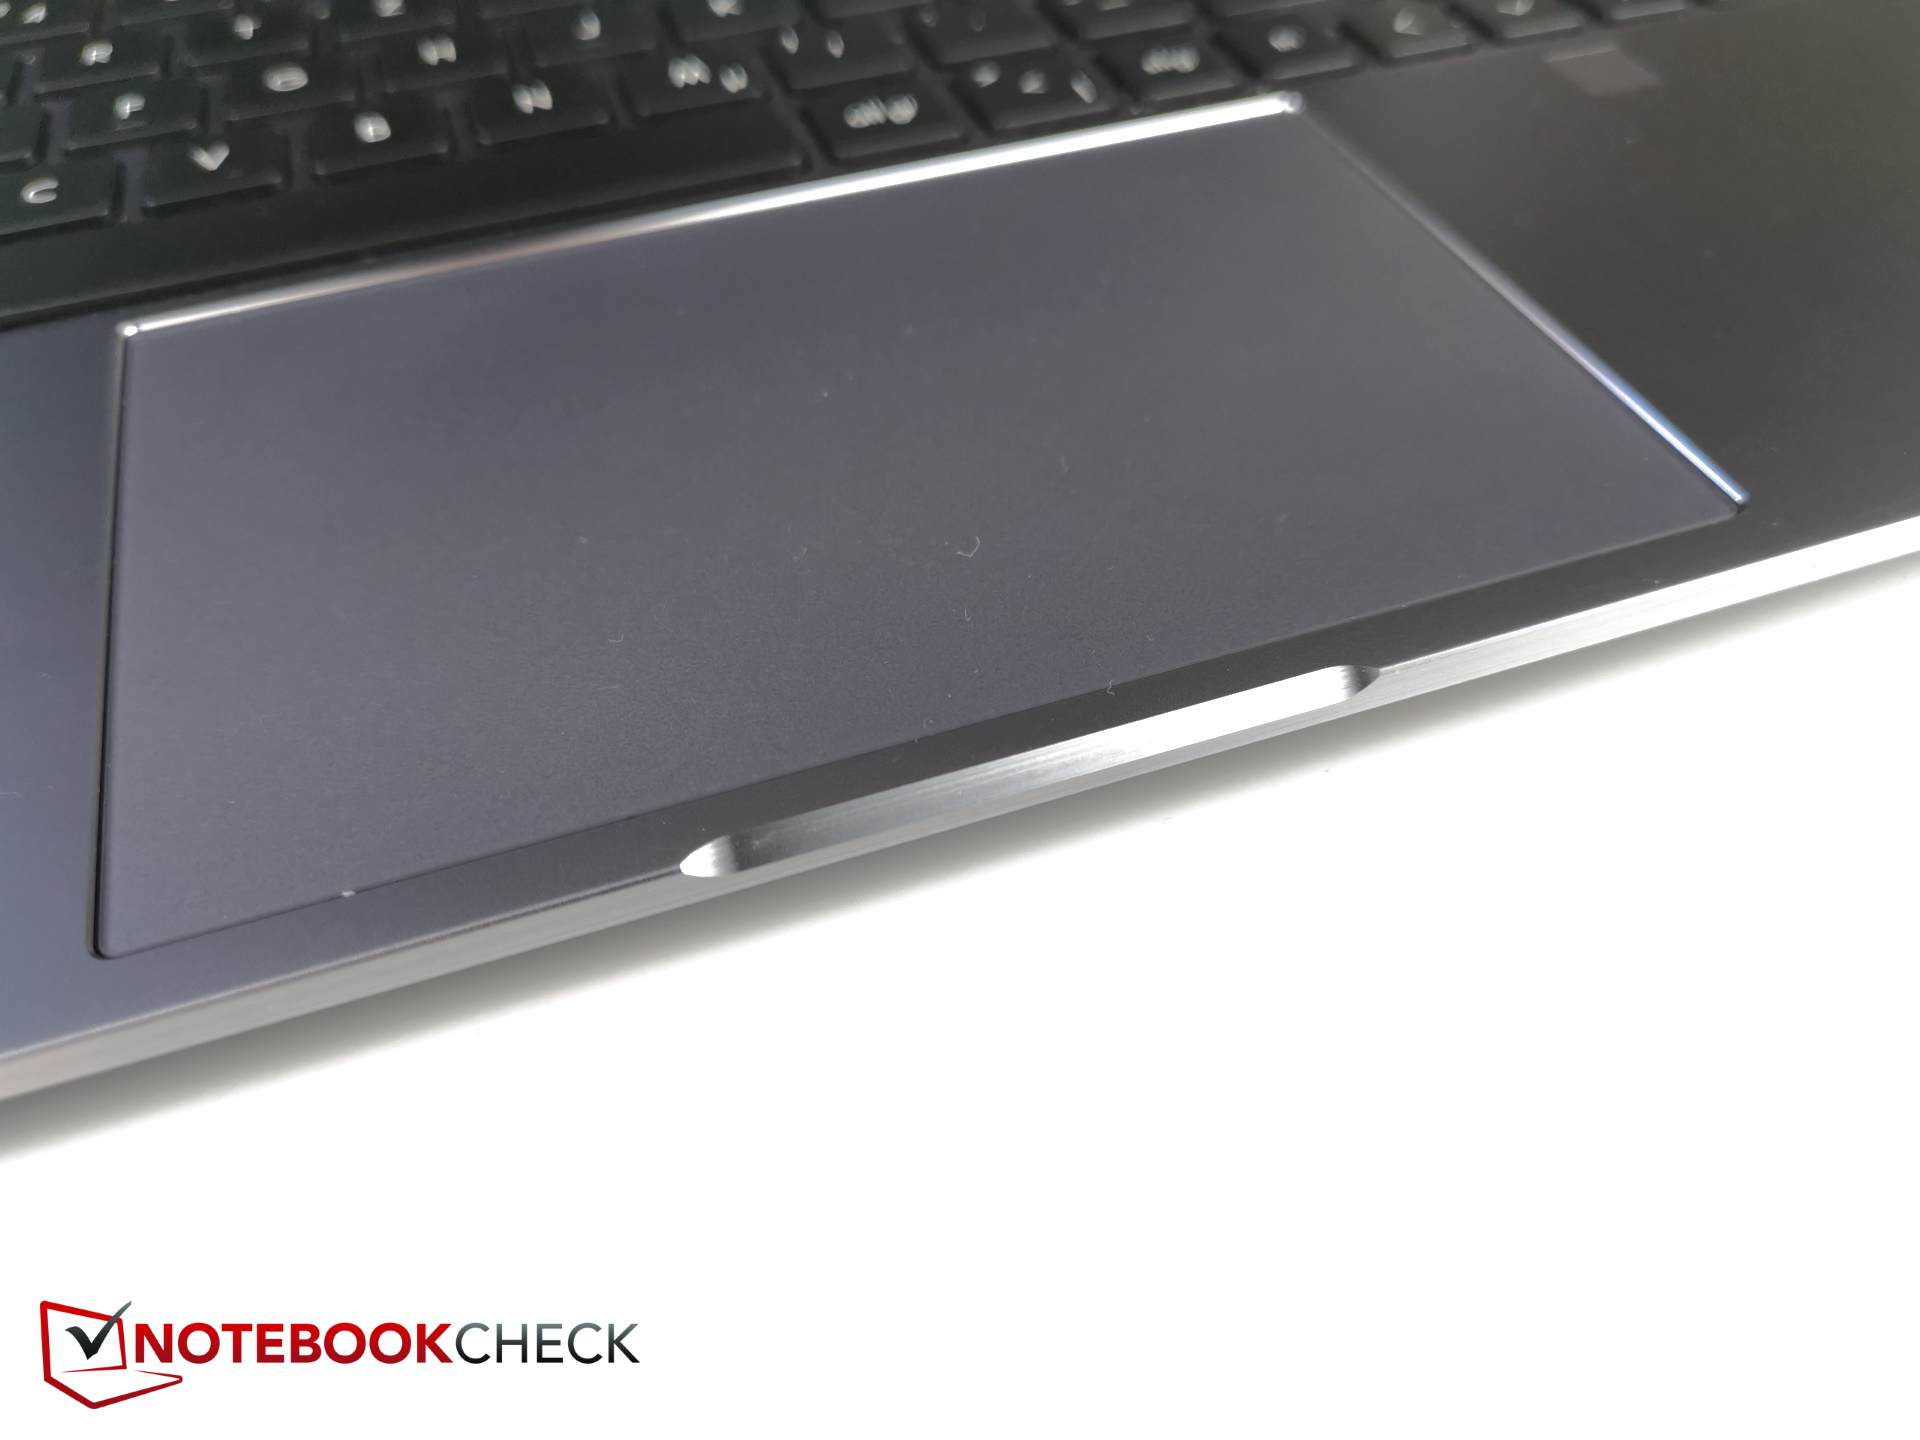
Touchpad
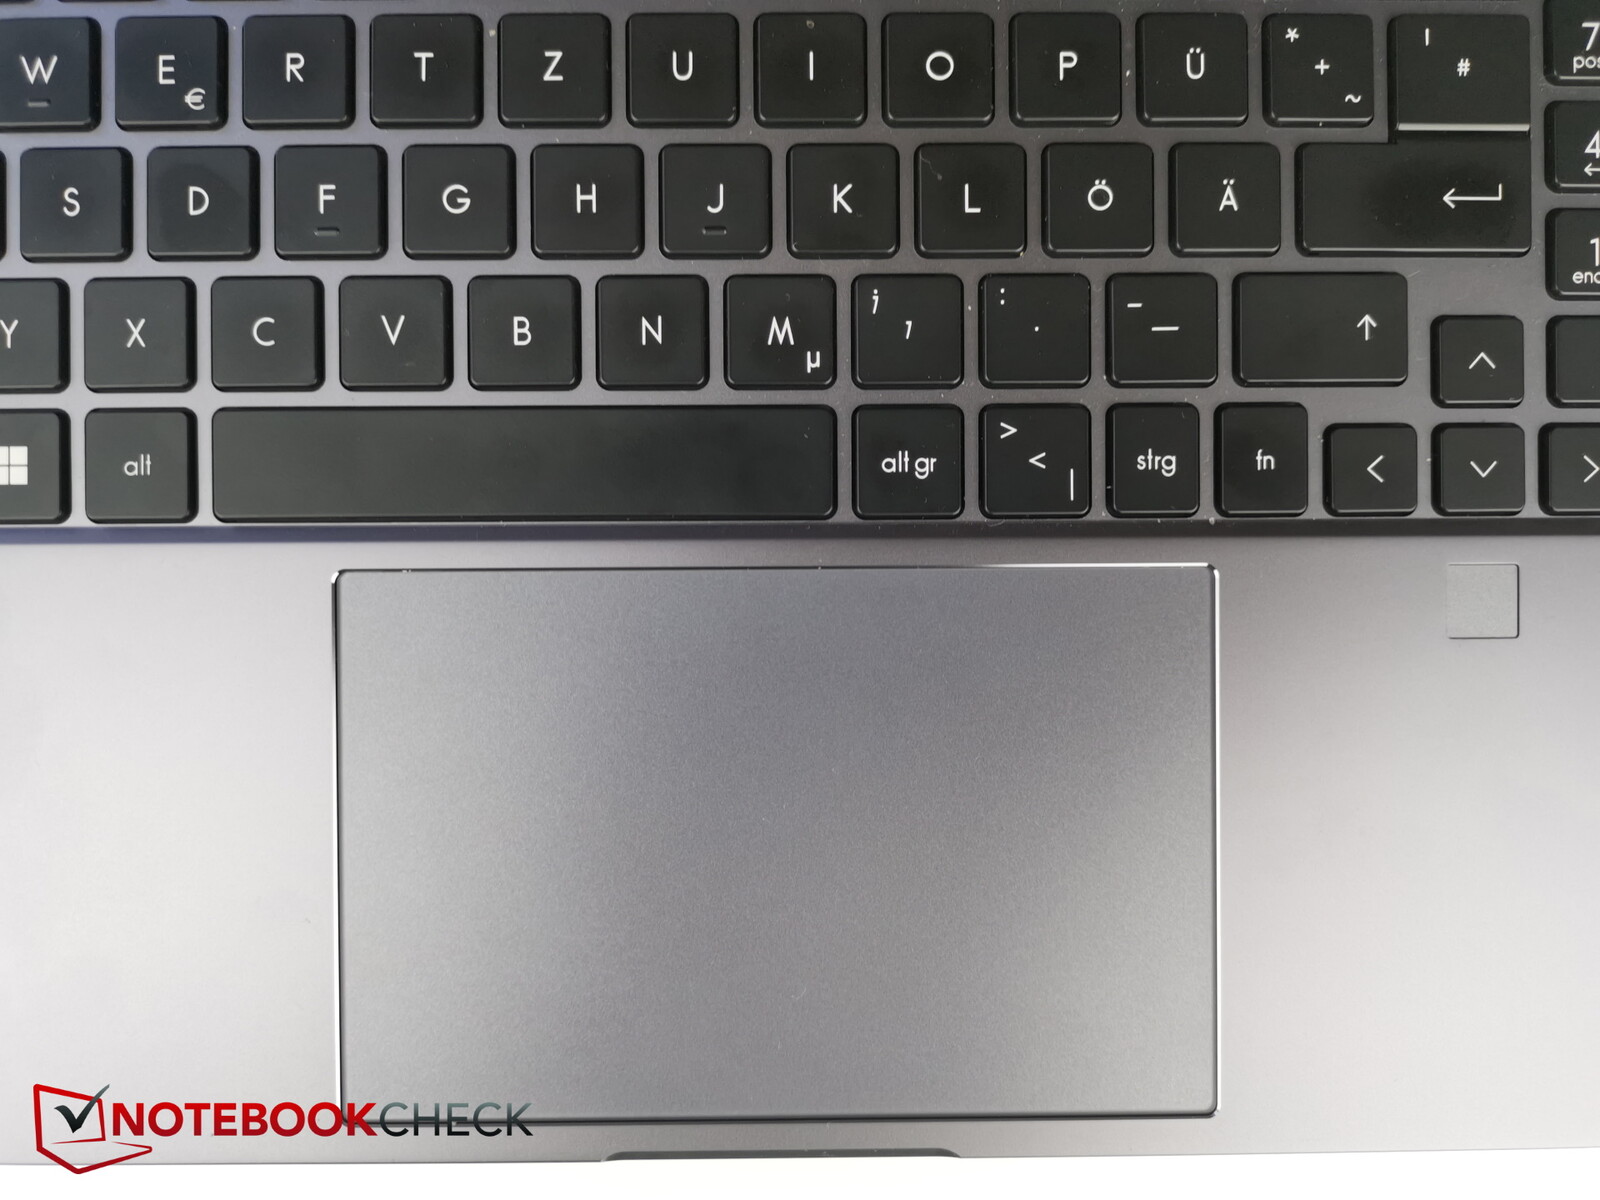
The first thing you will notice about the touchpad is how spacious it is (approx. 13.1 x 8.2 cm, or 5.16 x 3.23"). The surface is superbly smooth and doesn't feel grippy at all even when you are sliding your fingers across very slowly.
The integrated buttons have a distinct pressure point. The amount of force required to press the buttons is just right, or perhaps ever so slightly higher than necessary. The click sound from the touchpad is very reasonable.
Touchscreen
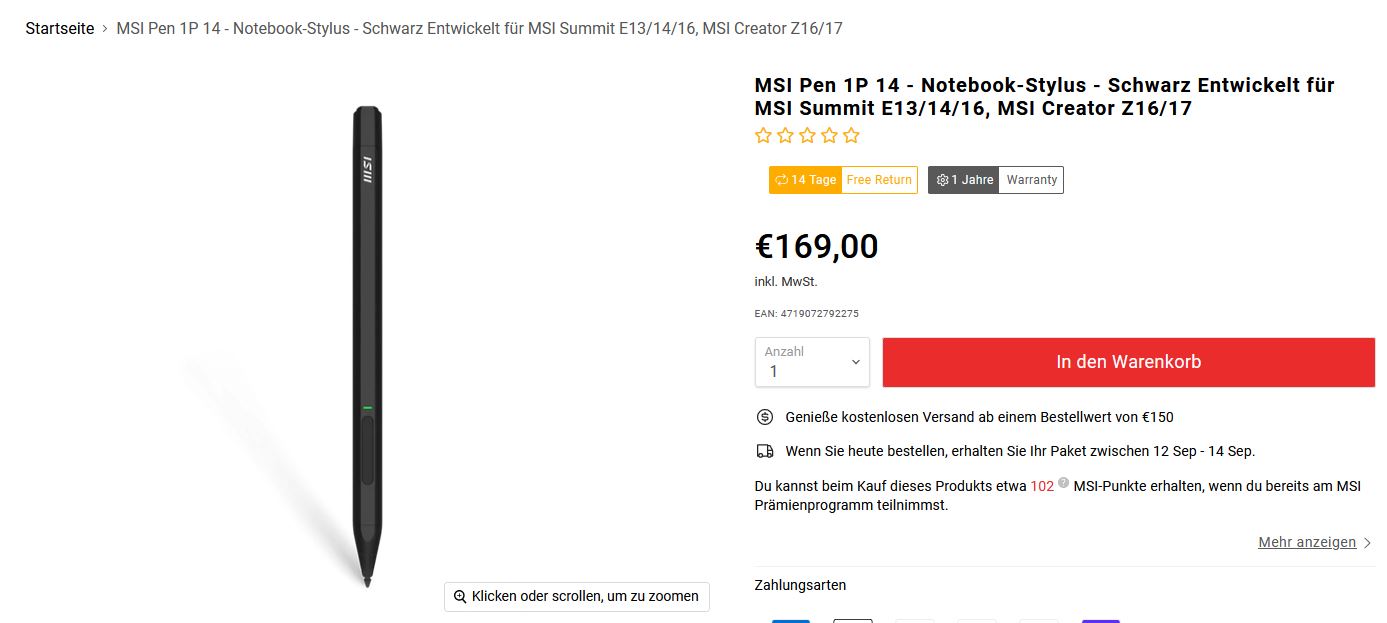
Touch inputs are registered without any noticeable delays, resulting in a touchscreen that is really easy to use. The MSI Creator Z17 also supports pen input, but a stylus is sadly not included despite the high price of the product. On its own, the MSI Pen costs a whopping 169 Euro (US$99 on Amazon.com). Using the touchscreen with your fingers tends to leave unsightly marks.
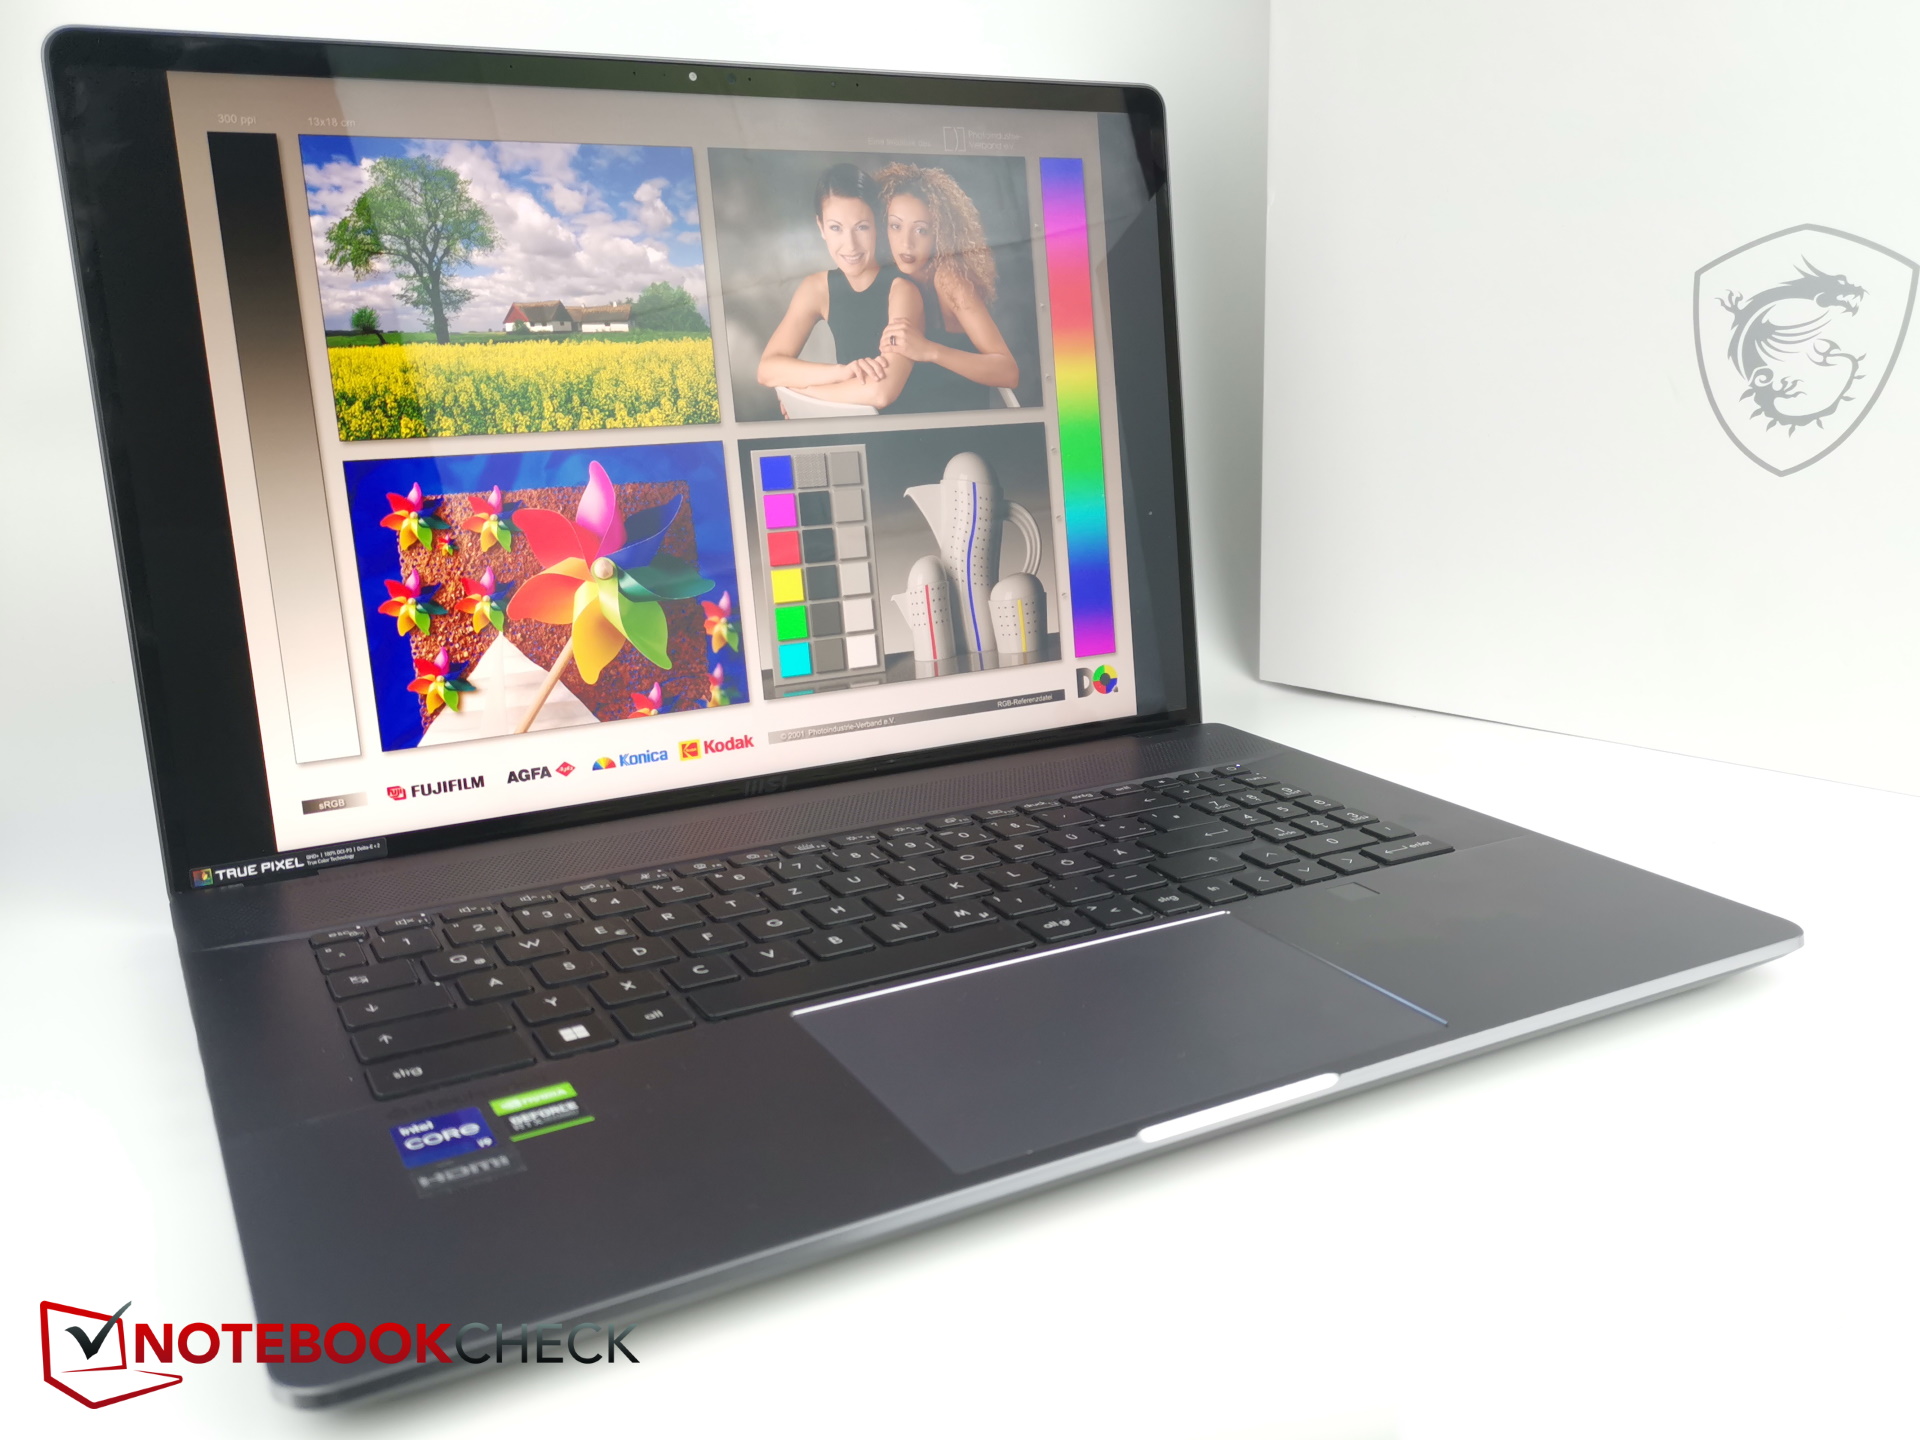
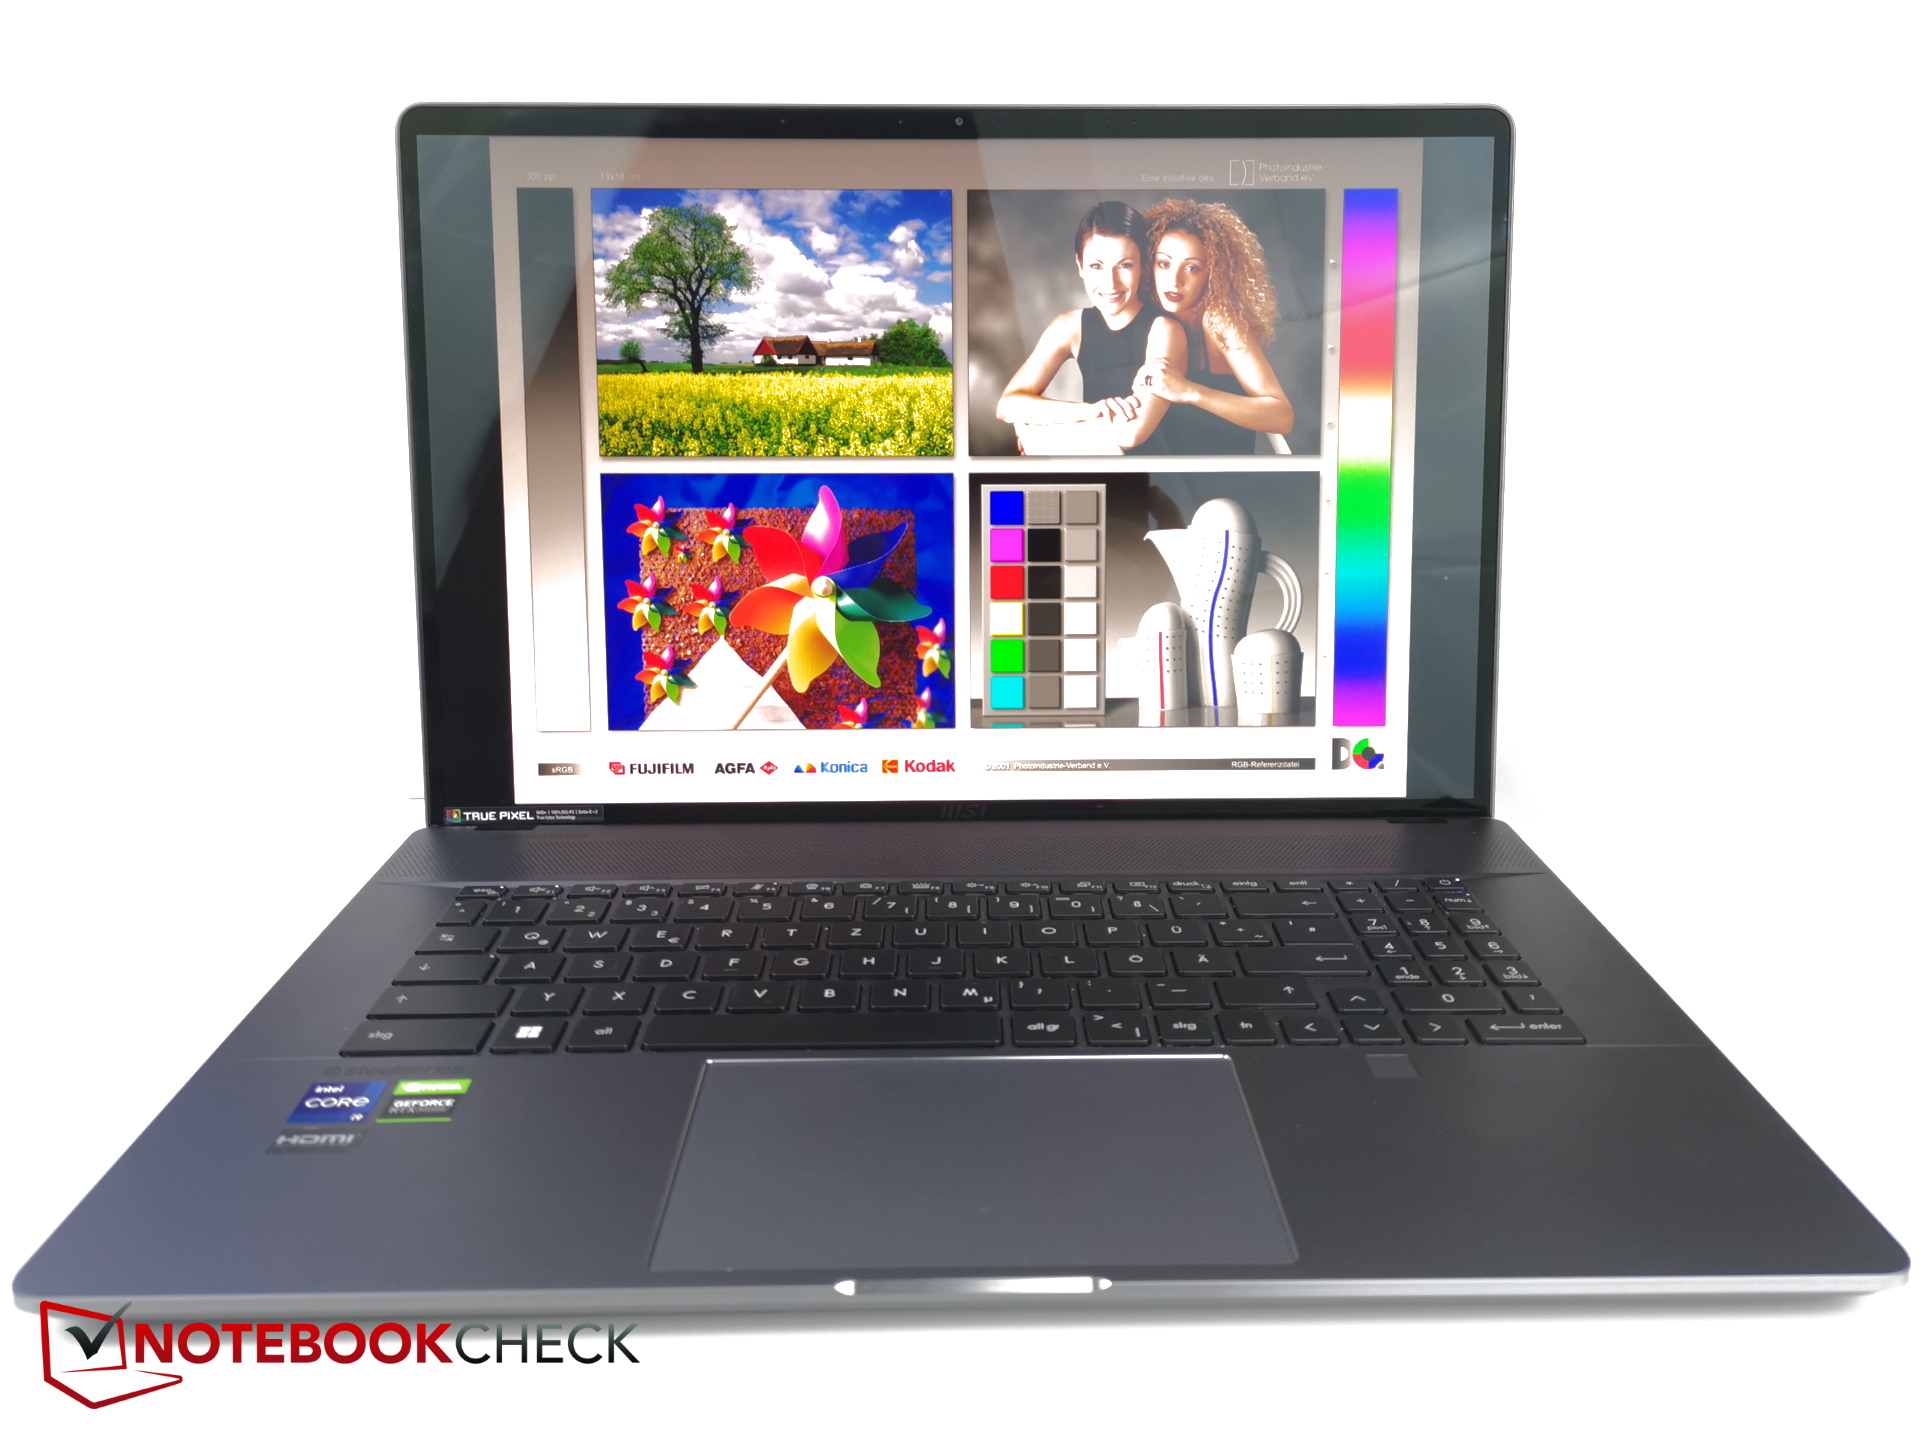
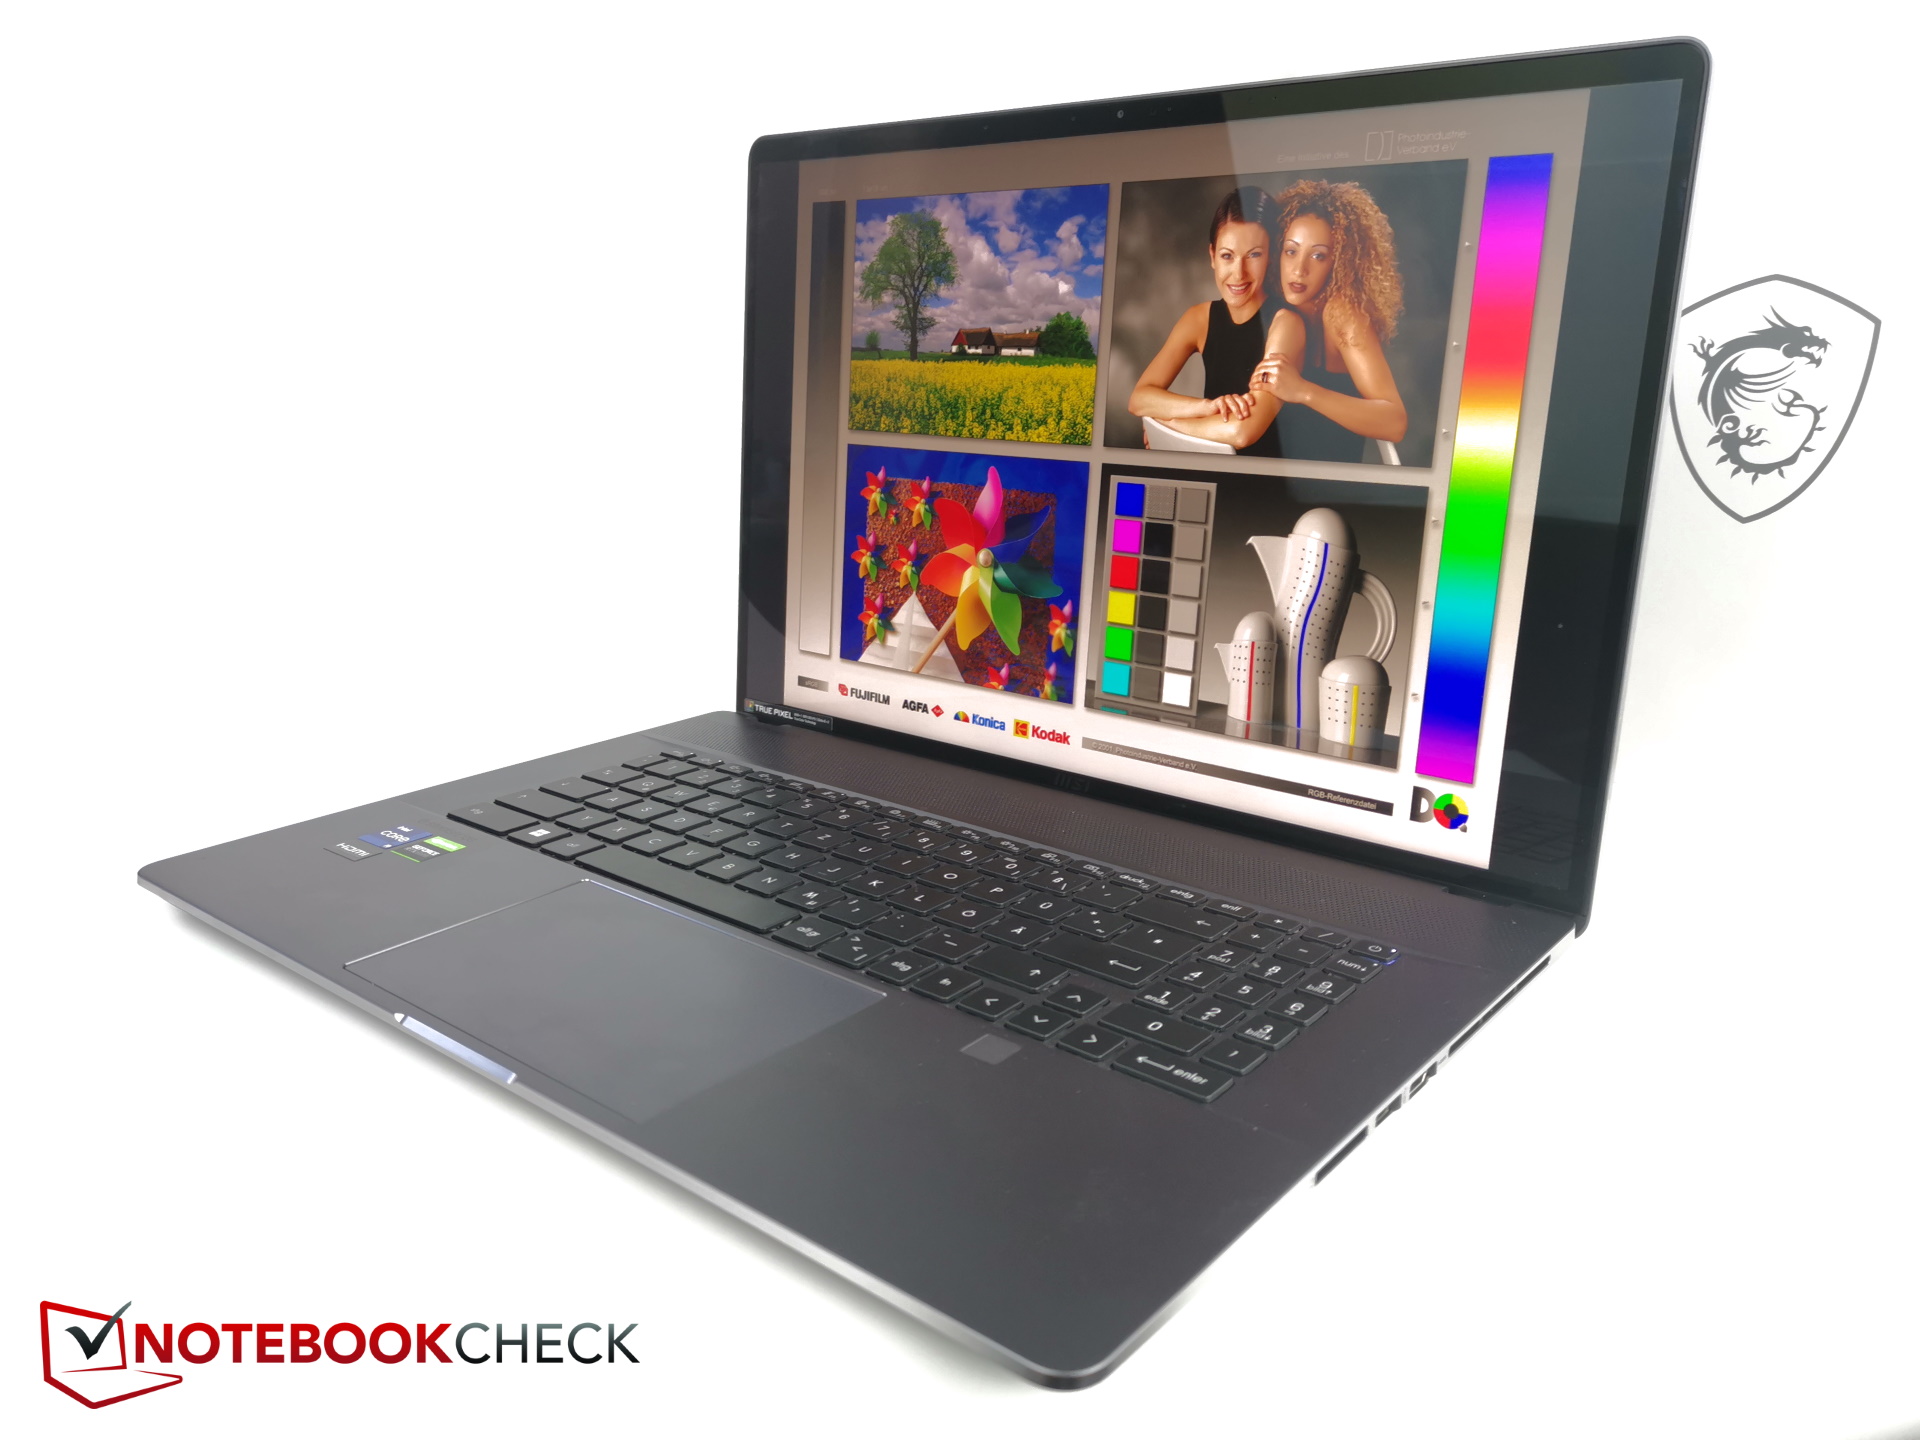
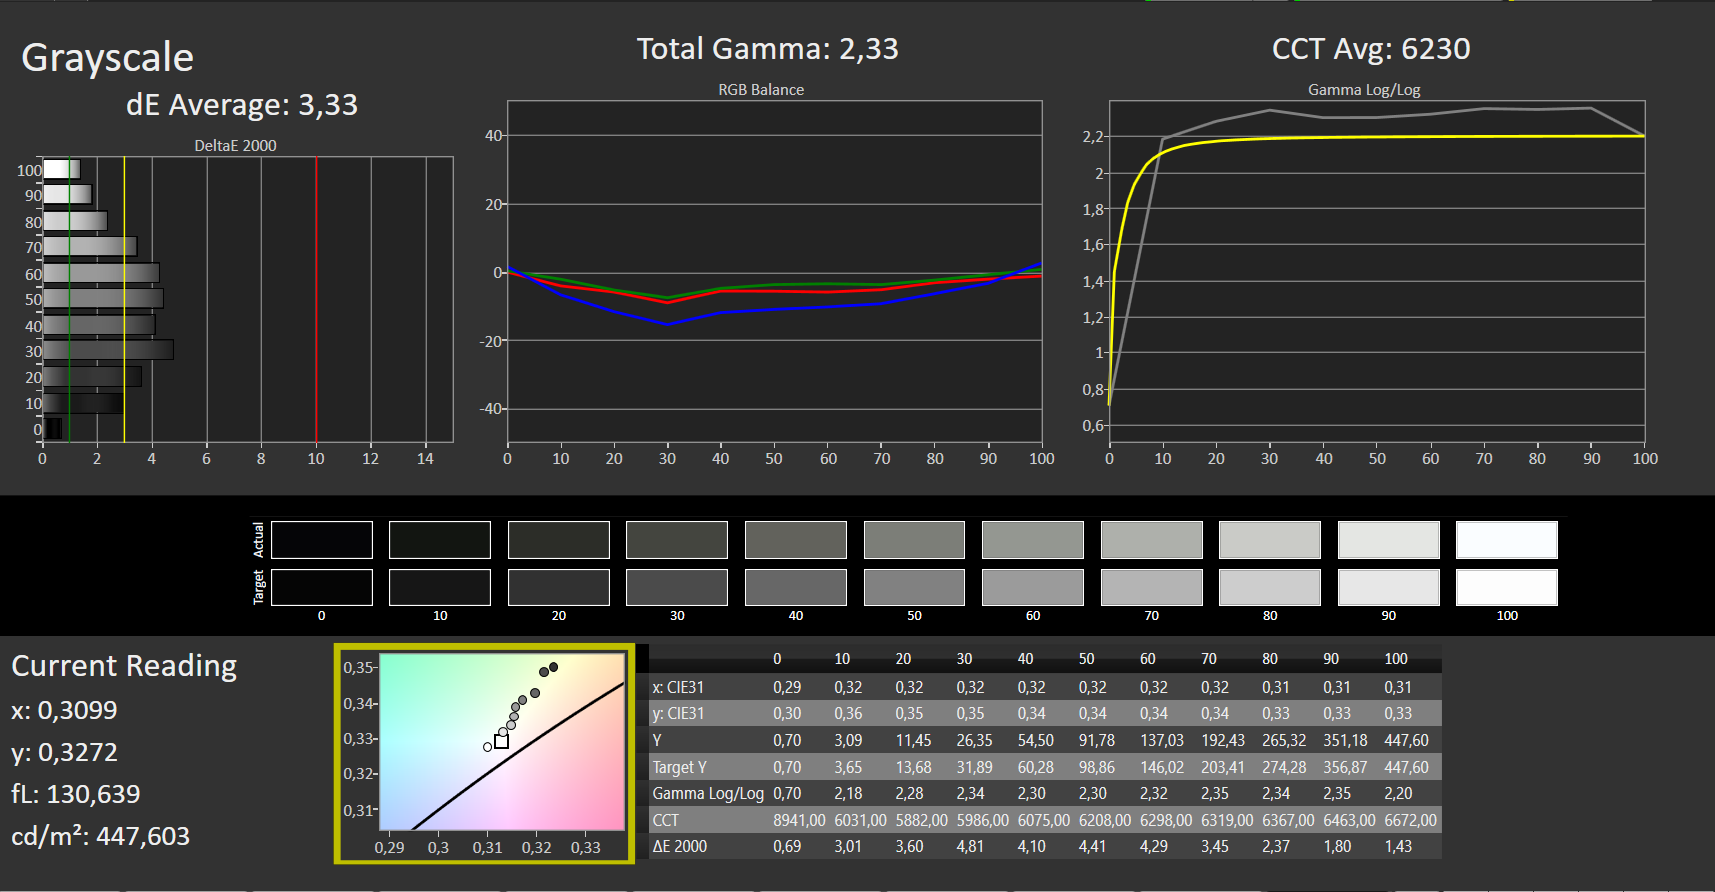
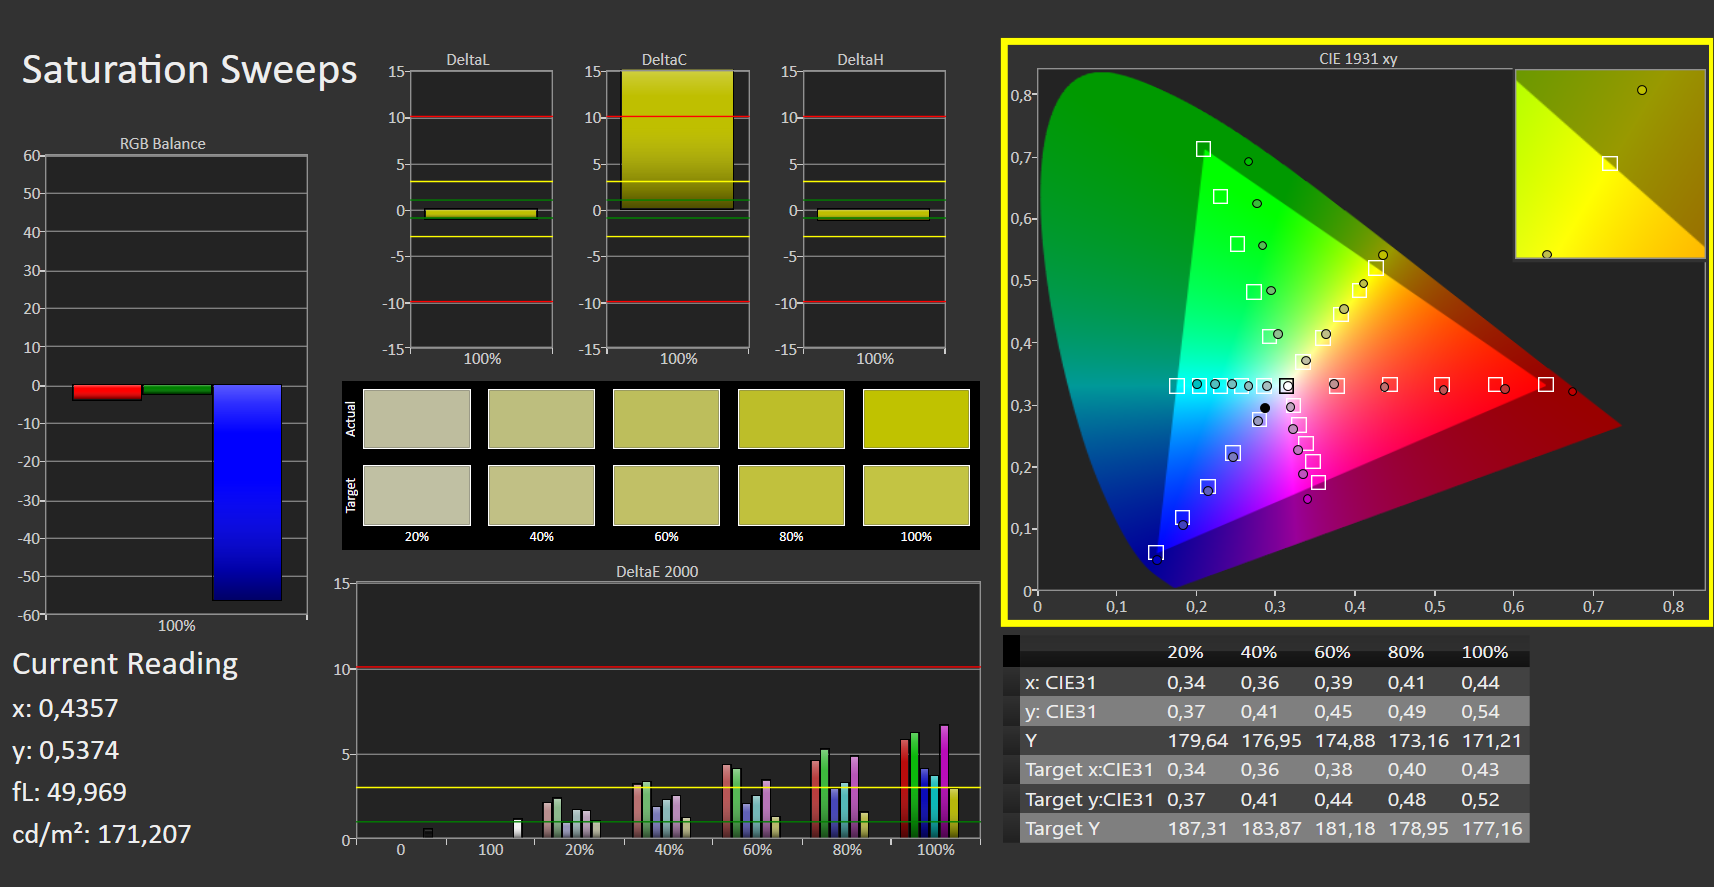
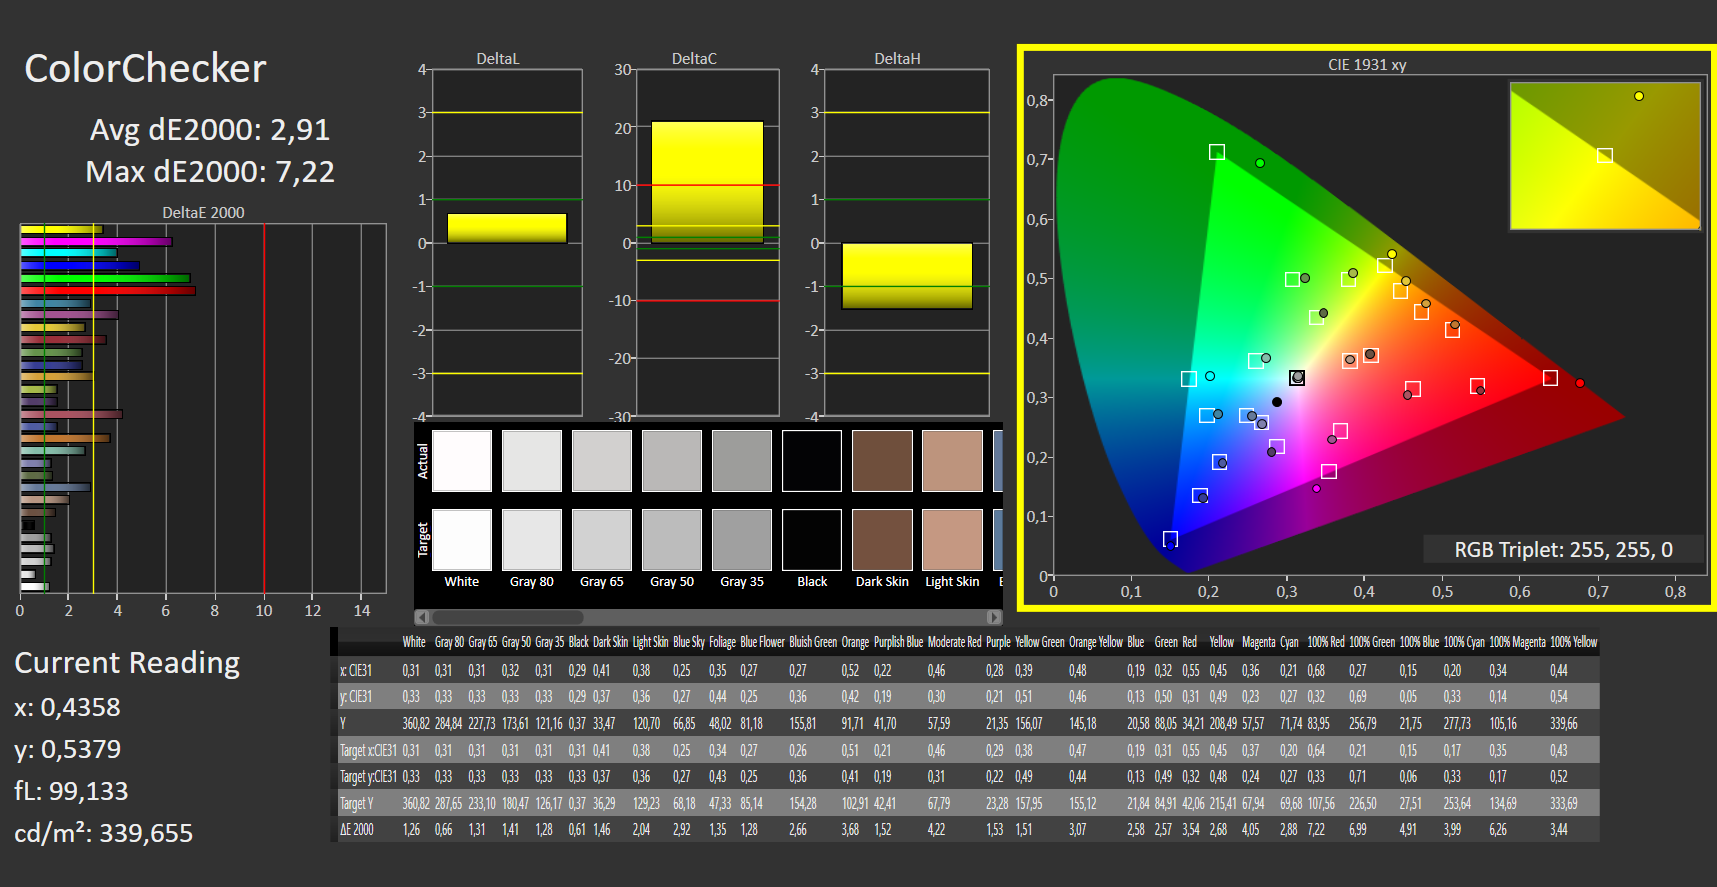
Display - Glossy touchscreen with full Display P3

MSI went with a glossy 17-inch touchscreen for the laptop. It is a 165 Hz IPS panel with a resolution of 2,560 x 1,600 (i.e. 16:10 aspect ratio).
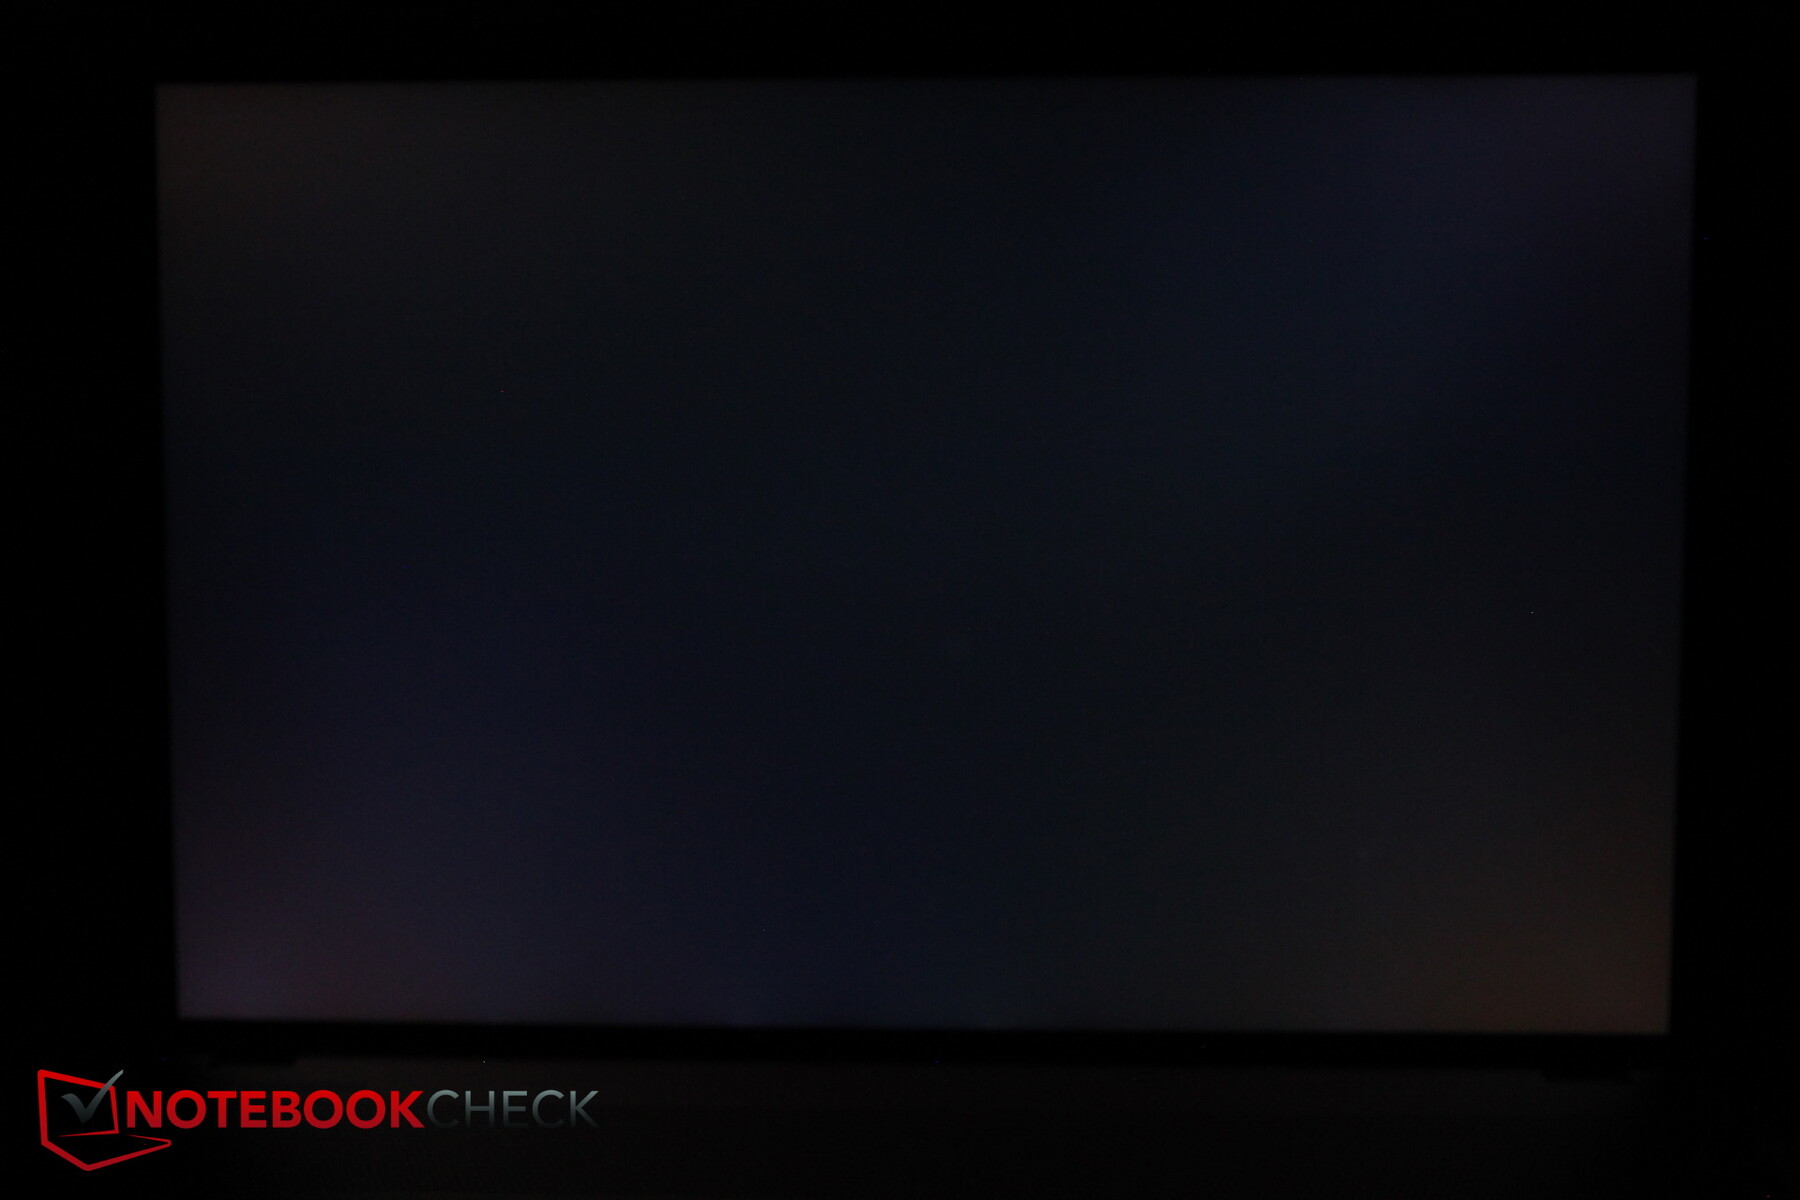
The display is capable of delivering a fairly high peak brightness of 400 nits. And it is also considered quite evenly lit with a brightness distribution of 88 per cent. The black level and contrast are slightly disappointing with regard to the values we measured. Based on our subjective impressions, however, colours appear very lively due to the glossy surface.
Gamers will also be pleased with the blazingly fast response times. Screen bleeding is only minimally visible along the lower edge of the screen in very dark surroundings.
| |||||||||||||||||||||||||
Brightness Distribution: 88 %
Center on Battery: 444 cd/m²
Contrast: 634:1 (Black: 0.7 cd/m²)
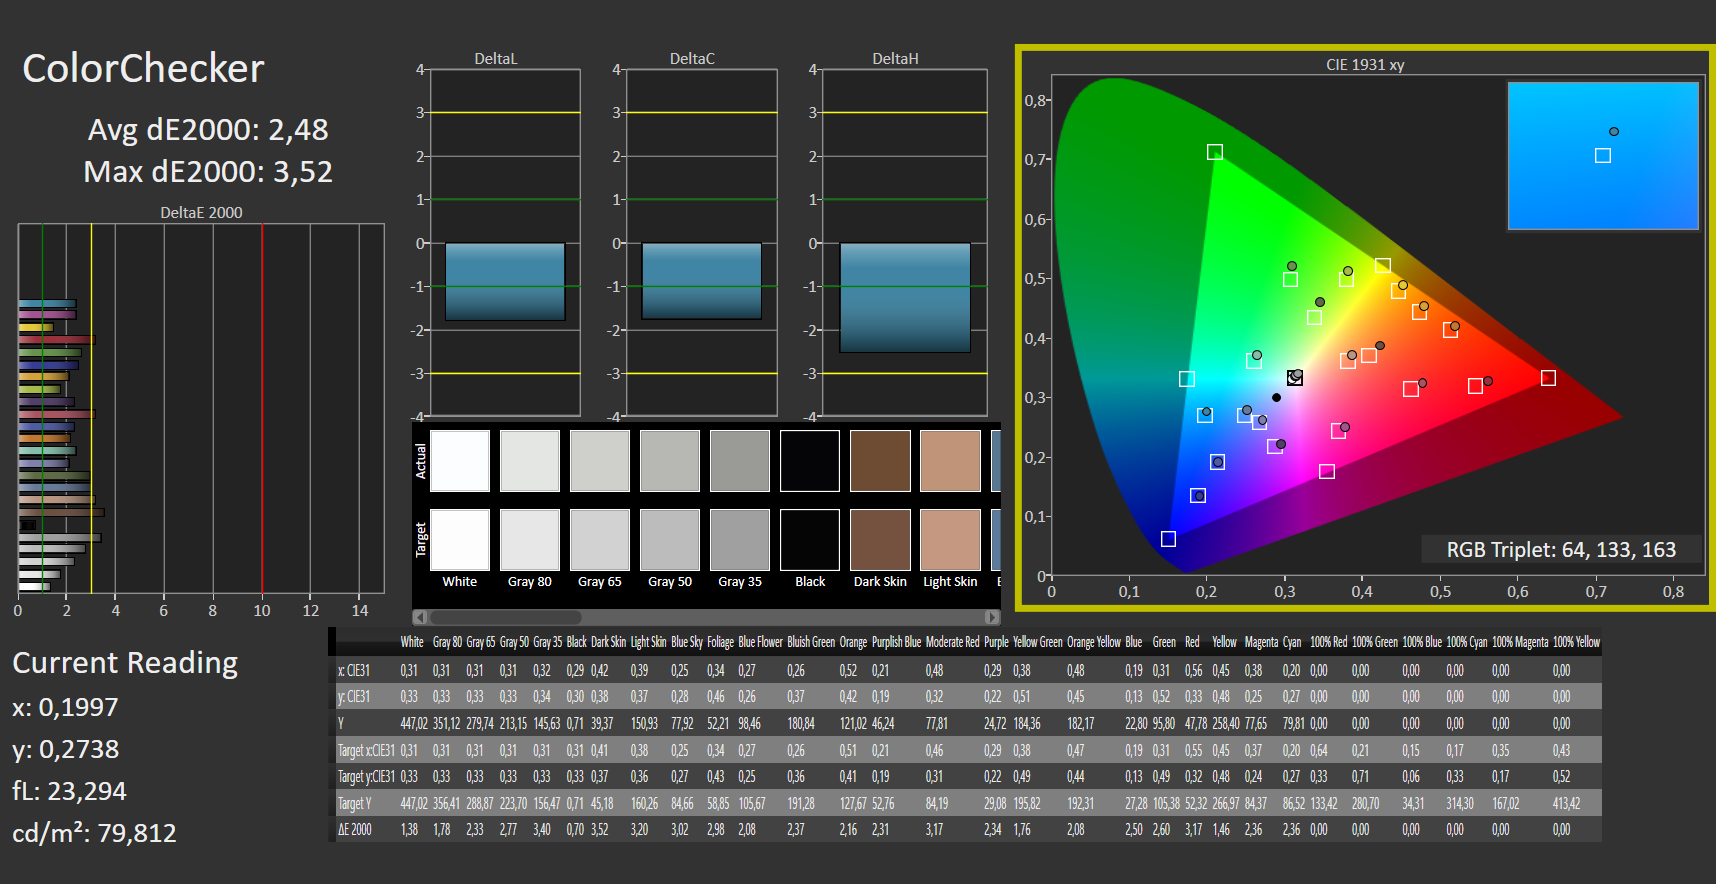
ΔE ColorChecker Calman: 2.48 | ∀{0.5-29.43 Ø4.72}
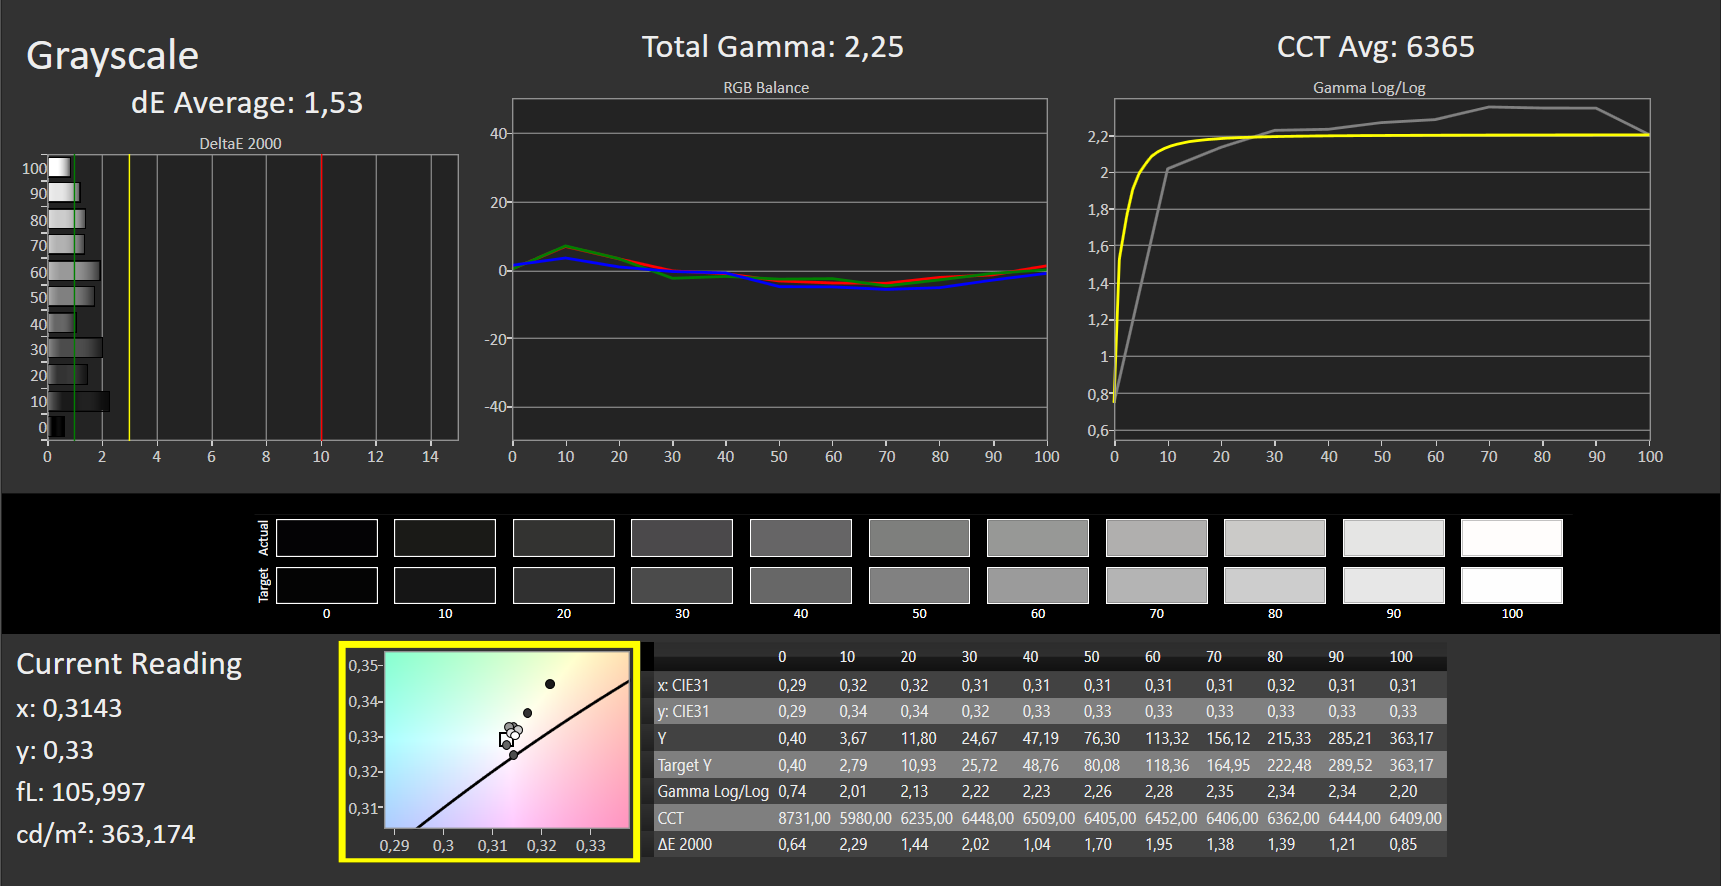
calibrated: 2.91
ΔE Greyscale Calman: 3.33 | ∀{0.09-98 Ø4.97}
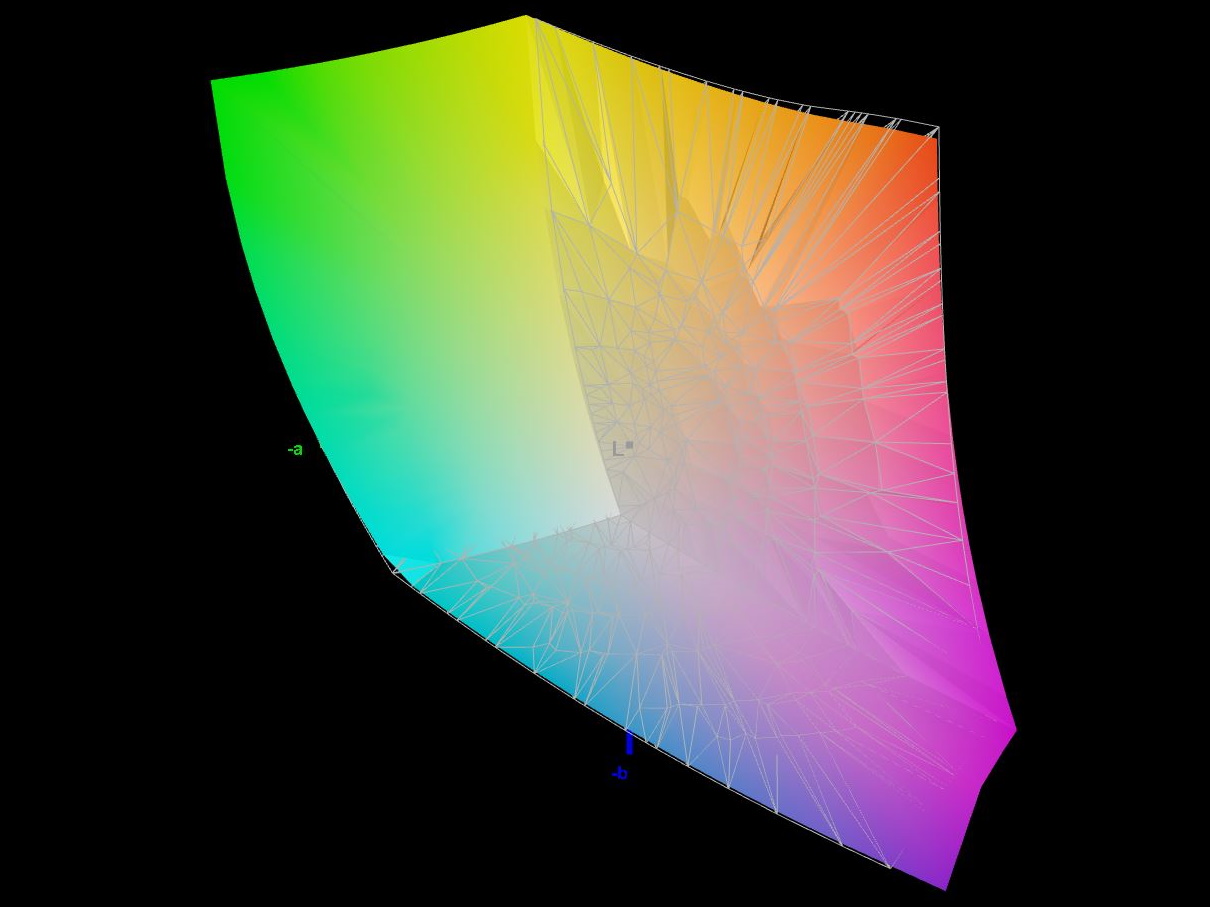
86.4% AdobeRGB 1998 (Argyll 3D)
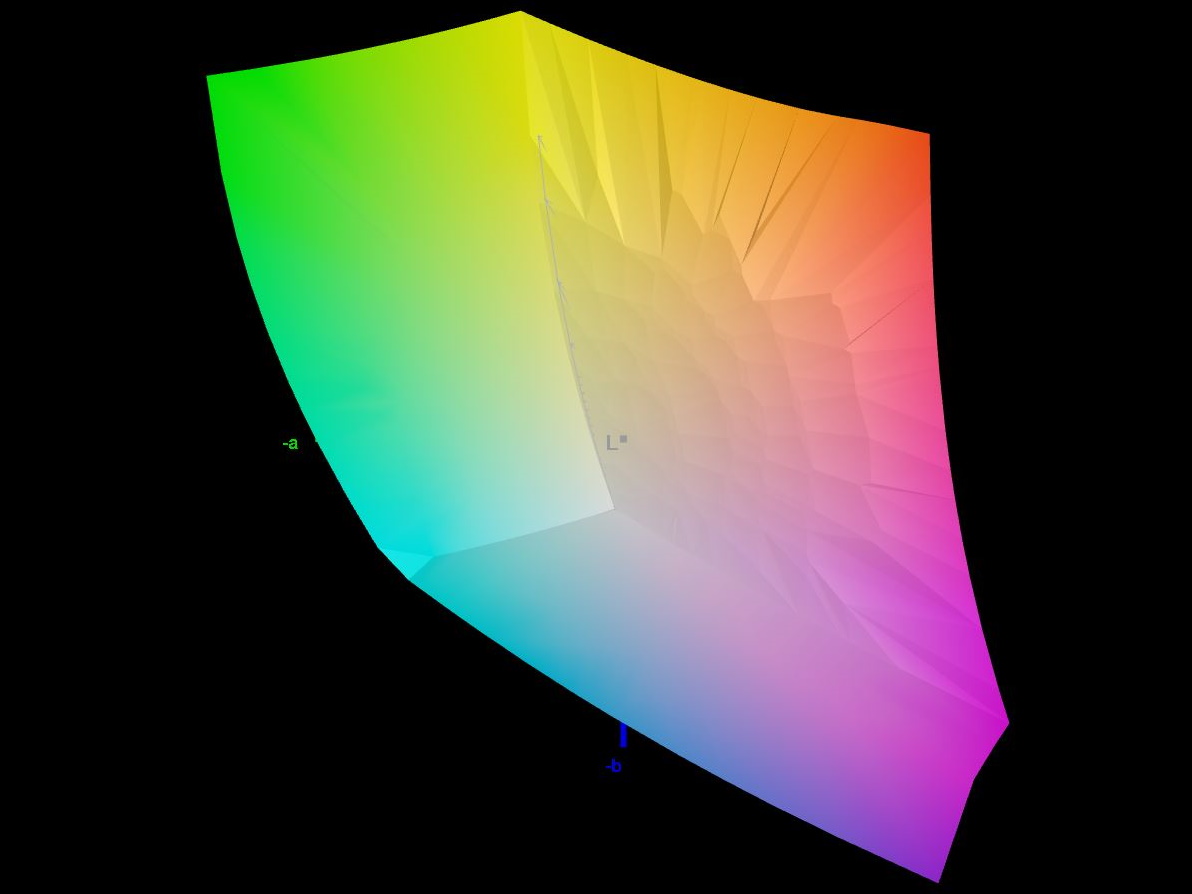
99.9% sRGB (Argyll 3D)
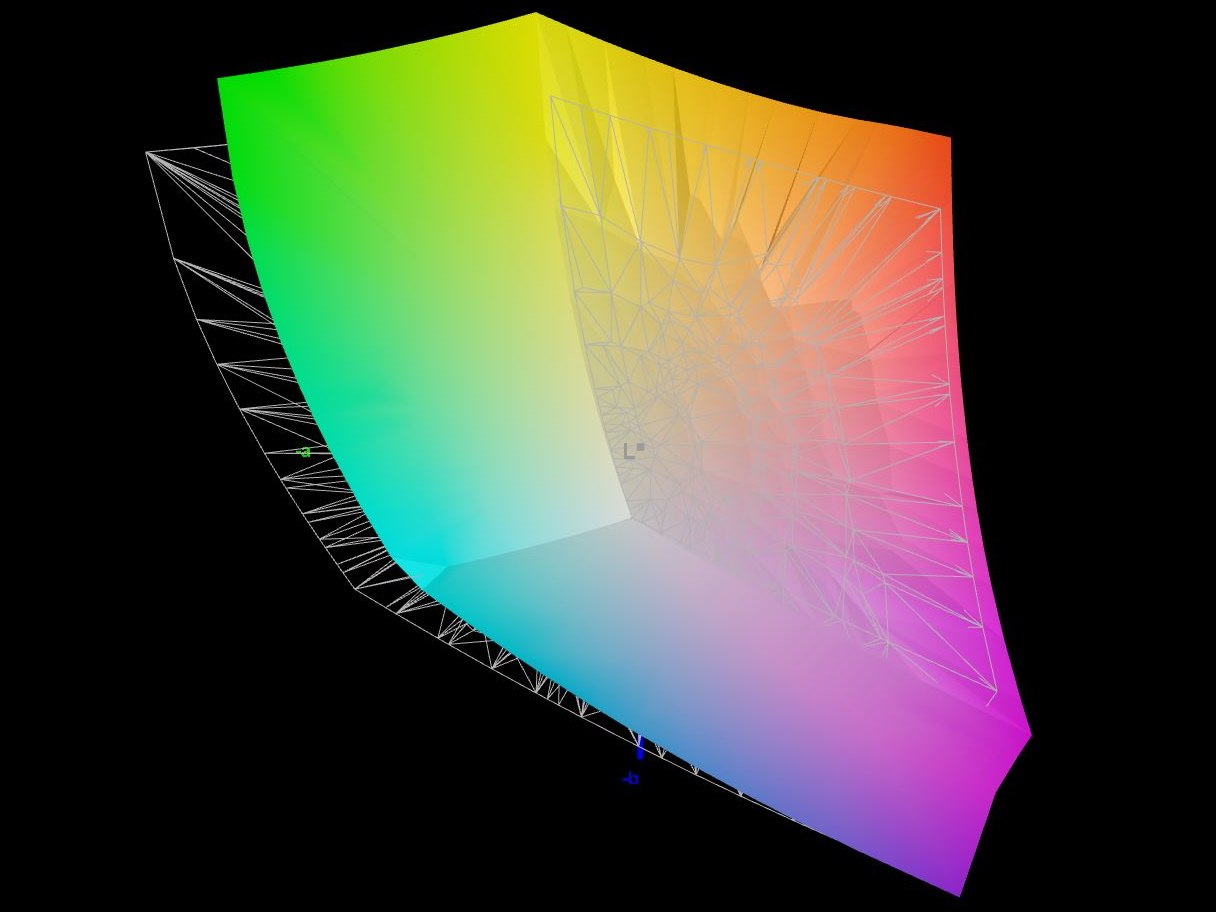
98.9% Display P3 (Argyll 3D)
Gamma: 2.33
CCT: 6230 K
| MSI Creator Z17 A12UGST-054 AUO3C9B (B170QAN01.0), IPS, 2560x1600, 17" | MSI Creator 17 A10SGS B173ZAN05.0 (AUO278E), Mini-LED IPS-Level, 3840x2160, 17.3" | MSI Creator Z16P B12UHST AUOD298, IPS True Pixel (~100% DCI-P3), 2560x1600, 16" | Razer Blade 17 (i7-12800H, RTX 3070 Ti) BOE CQ NE173QHM-NZ1 (BOE09F9), IPS, 2560x1440, 17.3" | Aorus 17X XES Sharp SHP1563, IPS, 1920x1080, 17.3" | Dell XPS 17 9720 RTX 3060 Sharp LQ170R1, IPS, 3840x2400, 17" | |
|---|---|---|---|---|---|---|
| Display | -7% | -0% | -1% | -15% | -2% | |
| Display P3 Coverage (%) | 98.9 | 82 -17% | 97.6 -1% | 97.9 -1% | 70.1 -29% | 92.9 -6% |
| sRGB Coverage (%) | 99.9 | 97.5 -2% | 99.9 0% | 99.9 0% | 99.9 0% | 100 0% |
| AdobeRGB 1998 Coverage (%) | 86.4 | 84 -3% | 86.8 0% | 85.5 -1% | 71.9 -17% | 85.3 -1% |
| Response Times | -76% | -23% | -81% | 27% | -485% | |
| Response Time Grey 50% / Grey 80% * (ms) | 11 ? | 12.9 ? -17% | 15.2 ? -38% | 3.4 ? 69% | 51.2 ? -365% | |
| Response Time Black / White * (ms) | 5 ? | 8.8 ? -76% | 6.4 ? -28% | 11.2 ? -124% | 5.8 ? -16% | 35.2 ? -604% |
| PWM Frequency (Hz) | 26600 ? | |||||
| Screen | 26% | 16% | -28% | -28% | -34% | |
| Brightness middle (cd/m²) | 444 | 996 124% | 428 -4% | 341 -23% | 278 -37% | 512.7 15% |
| Brightness (cd/m²) | 415 | 952 129% | 394 -5% | 308 -26% | 273 -34% | 463 12% |
| Brightness Distribution (%) | 88 | 93 6% | 86 -2% | 82 -7% | 79 -10% | 85 -3% |
| Black Level * (cd/m²) | 0.7 | 0.68 3% | 0.42 40% | 0.45 36% | 0.26 63% | 0.32 54% |
| Contrast (:1) | 634 | 1465 131% | 1019 61% | 758 20% | 1069 69% | 1602 153% |
| Colorchecker dE 2000 * | 2.48 | 4.21 -70% | 1.67 33% | 4.16 -68% | 3.96 -60% | 5.98 -141% |
| Colorchecker dE 2000 max. * | 3.52 | 6.79 -93% | 5.71 -62% | 8.14 -131% | 10.78 -206% | 12.09 -243% |
| Colorchecker dE 2000 calibrated * | 2.91 | 2.03 30% | 0.71 76% | 3 -3% | 1.07 63% | |
| Greyscale dE 2000 * | 3.33 | 4.1 -23% | 3.1 7% | 5.09 -53% | 6.8 -104% | 7.2 -116% |
| Gamma | 2.33 94% | 2.207 100% | 2.195 100% | 2.48 89% | 2.224 99% | 2.54 87% |
| CCT | 6230 104% | 7491 87% | 6498 100% | 6884 94% | 7651 85% | 6914 94% |
| Color Space (Percent of AdobeRGB 1998) (%) | 84 | |||||
| Color Space (Percent of sRGB) (%) | 97 | |||||
| Total Average (Program / Settings) | -19% /
11% | -2% /
7% | -37% /
-30% | -5% /
-18% | -174% /
-96% |
* ... smaller is better
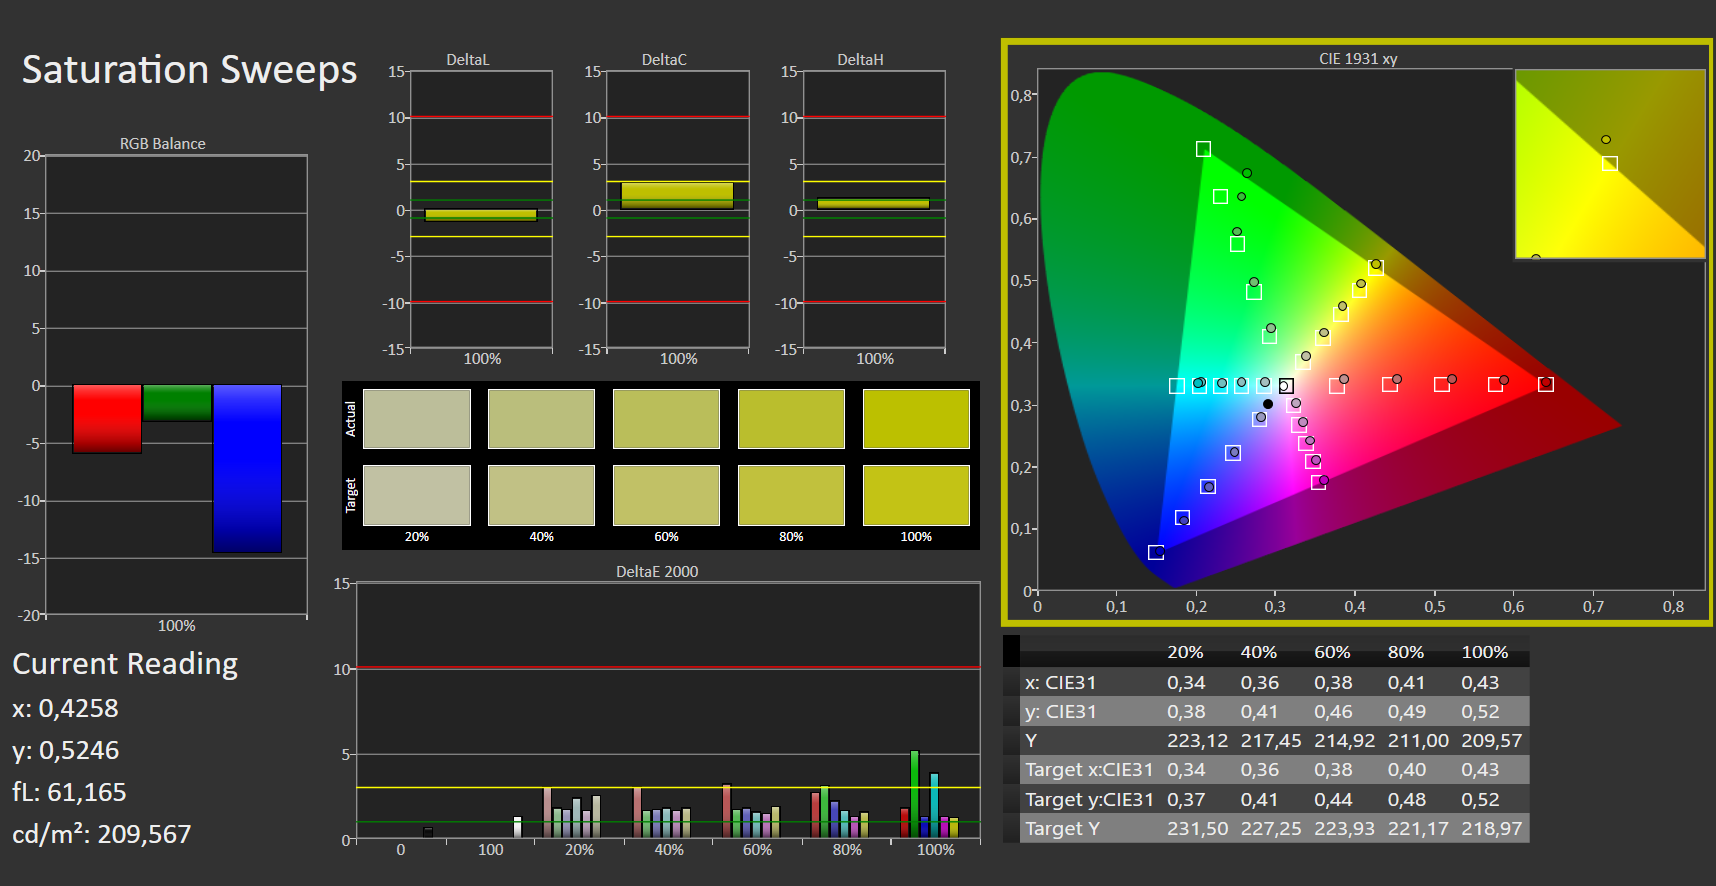
Good news for creatives: the display has full coverage of Display P3 and sRGB and is even able to cover up to 86 per cent of the AdobeRGB colour space.
The display is already well calibrated right out of the box. Delta E values range between 2 and 3 for colours and shades of grey. Manual calibration didn't improve the results any further.
Display Response Times
| ↔ Response Time Black to White | ||
|---|---|---|
| 5 ms ... rise ↗ and fall ↘ combined | ↗ 2 ms rise |  |
| ↘ 3 ms fall | ||
| The screen shows very fast response rates in our tests and should be very well suited for fast-paced gaming. In comparison, all tested devices range from 0.1 (minimum) to 240 (maximum) ms. » 18 % of all devices are better. This means that the measured response time is better than the average of all tested devices (19.8 ms). | ||
| ↔ Response Time 50% Grey to 80% Grey | ||
| 11 ms ... rise ↗ and fall ↘ combined | ↗ 5 ms rise |  |
| ↘ 6 ms fall | ||
| The screen shows good response rates in our tests, but may be too slow for competitive gamers. In comparison, all tested devices range from 0.165 (minimum) to 636 (maximum) ms. » 25 % of all devices are better. This means that the measured response time is better than the average of all tested devices (31 ms). | ||
Screen Flickering / PWM (Pulse-Width Modulation)
| Screen flickering / PWM not detected |    | ||
In comparison: 52 % of all tested devices do not use PWM to dim the display. If PWM was detected, an average of 7750 (minimum: 5 - maximum: 343500) Hz was measured. | |||
The glossy surface makes the laptop significantly more difficult to use outdoors. Its disadvantages are only partly alleviated by the screen's fairly high brightness. You should probably look for a shady spot if you intend to work outside.
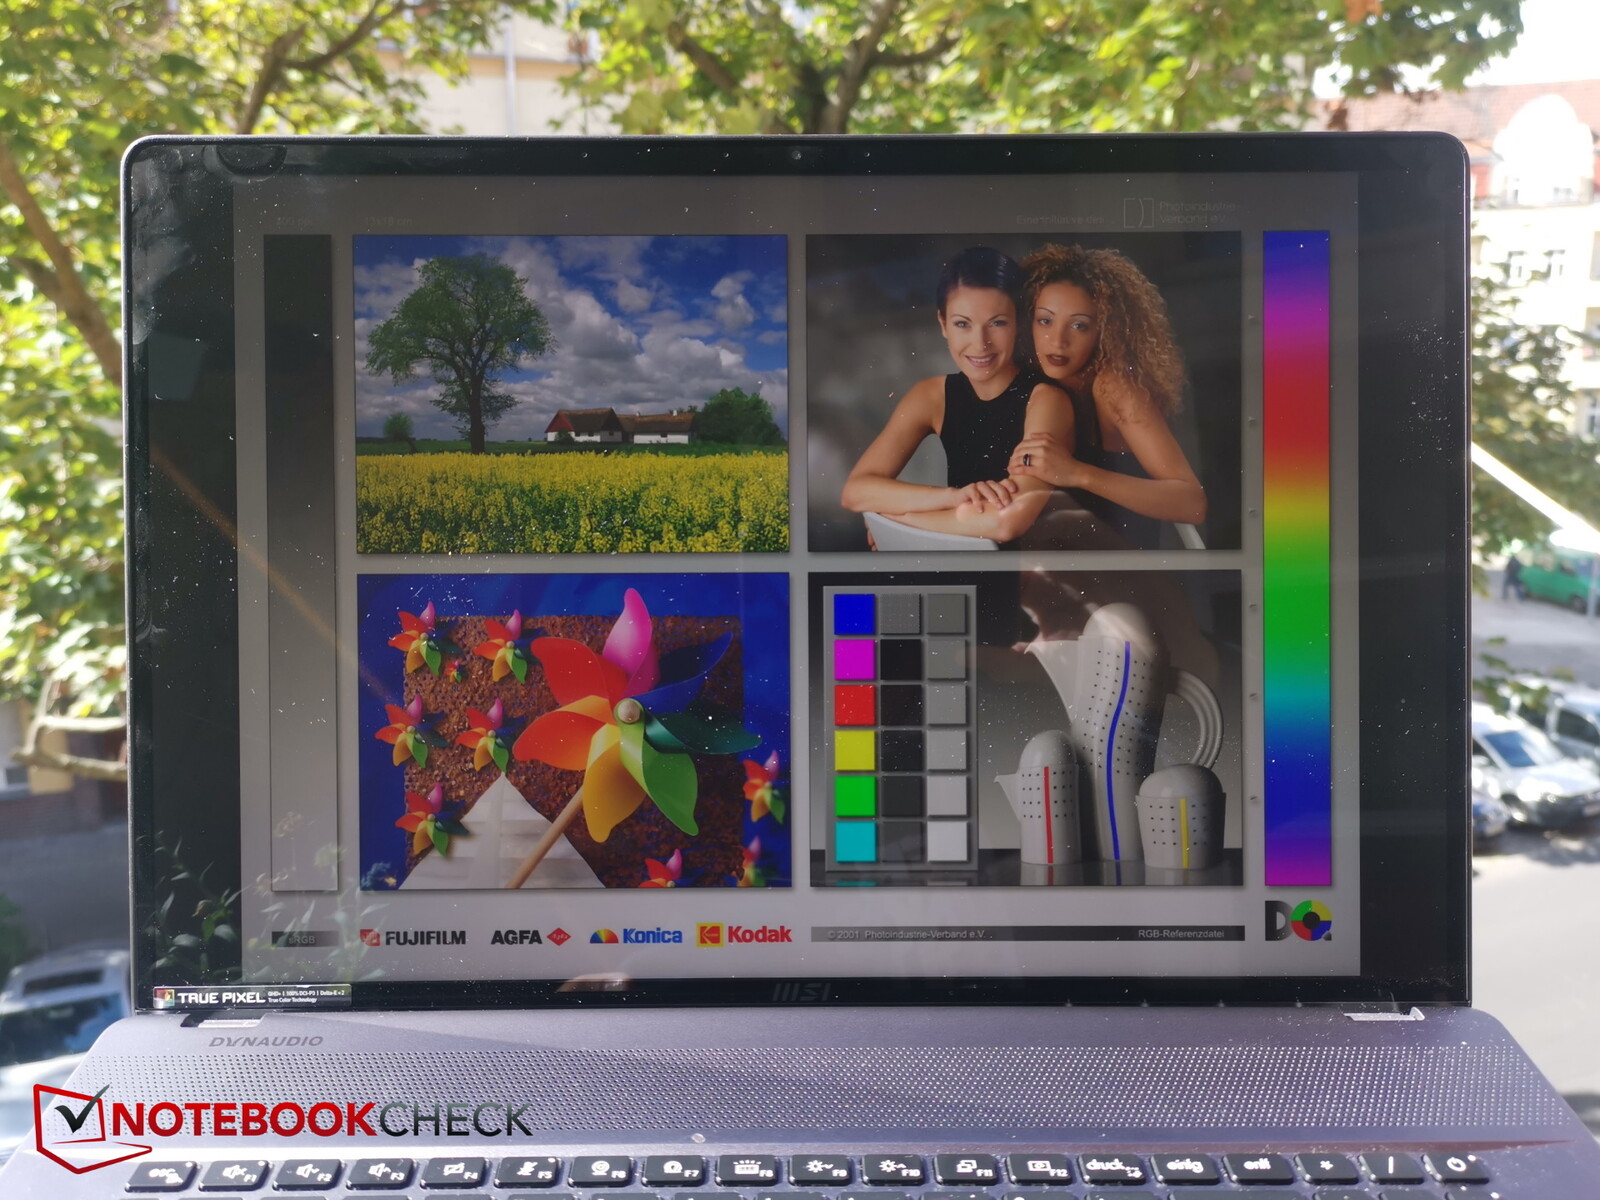
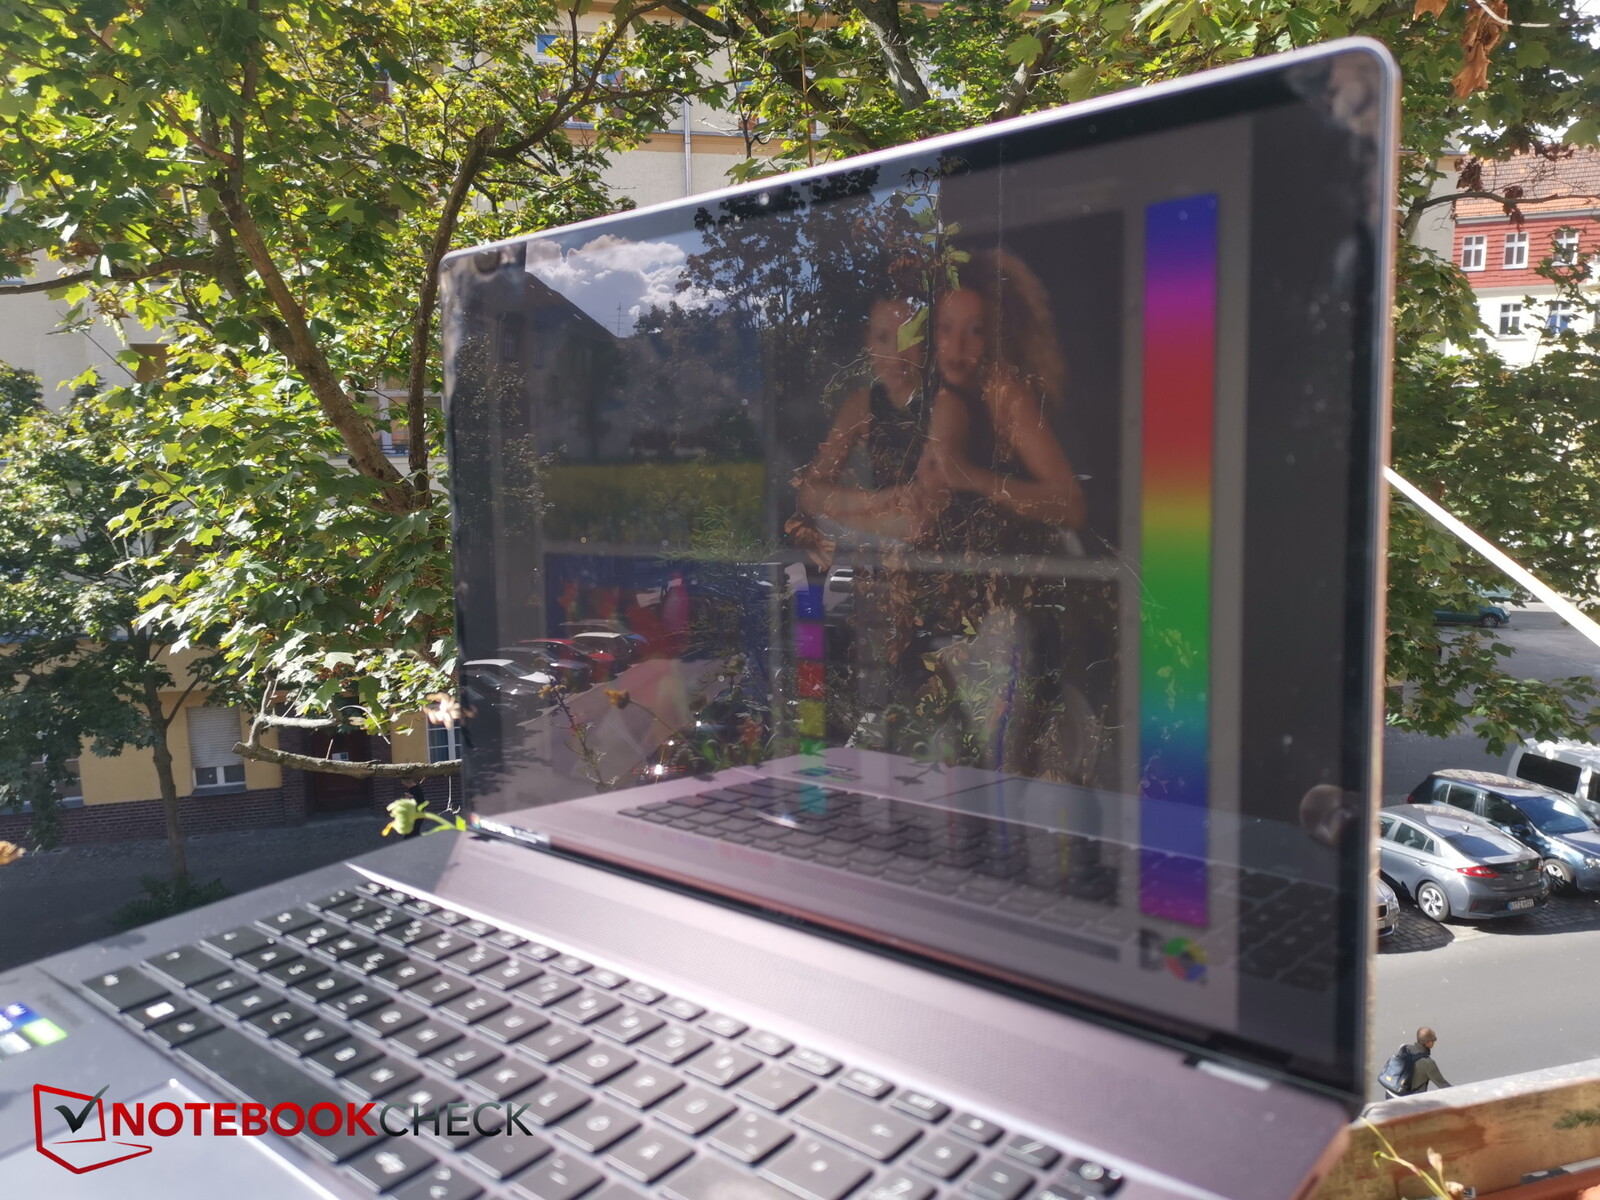
The display has a pretty wide viewing angle. Brightness and contrast only start dropping off when the screen is viewed from extreme angles.

Performance - Slim chassis costs the Z17 its performance
The combination of the powerful Core i9-12900H and RTX 3070 Ti should make both gamers and content creators excited. The great touchscreen, in particular, is something that is going attract content creators. The laptop also has a generous 32 GB of RAM, which is just the right amount for creative projects.
The Z17 is available in three configurations. Apart from the review configuration, there is also one with an RTX 3080 and 2 TB of SSD storage as well as the top-spec model, which is equipped with an RTX 3080 Ti, 64 GB of RAM and 2 TB of SSD storage. All three models use the same CPU and display.
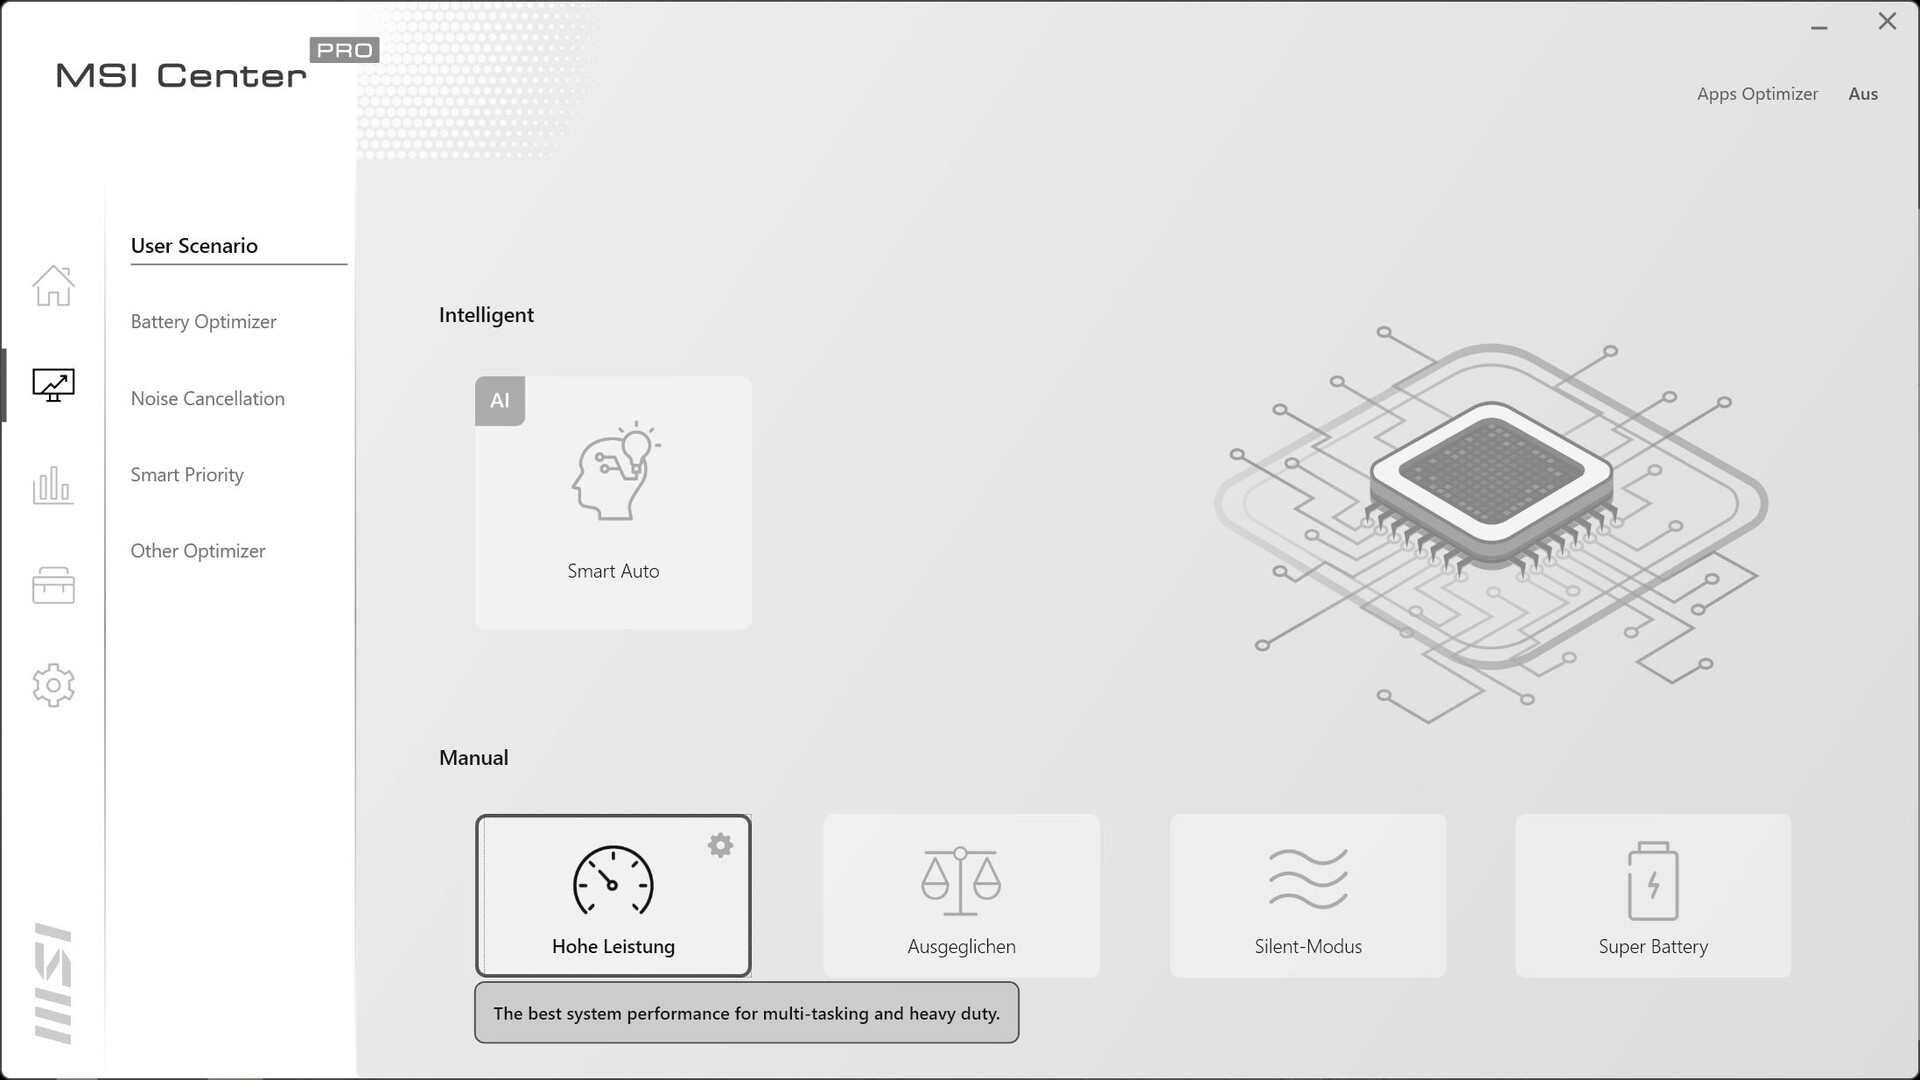
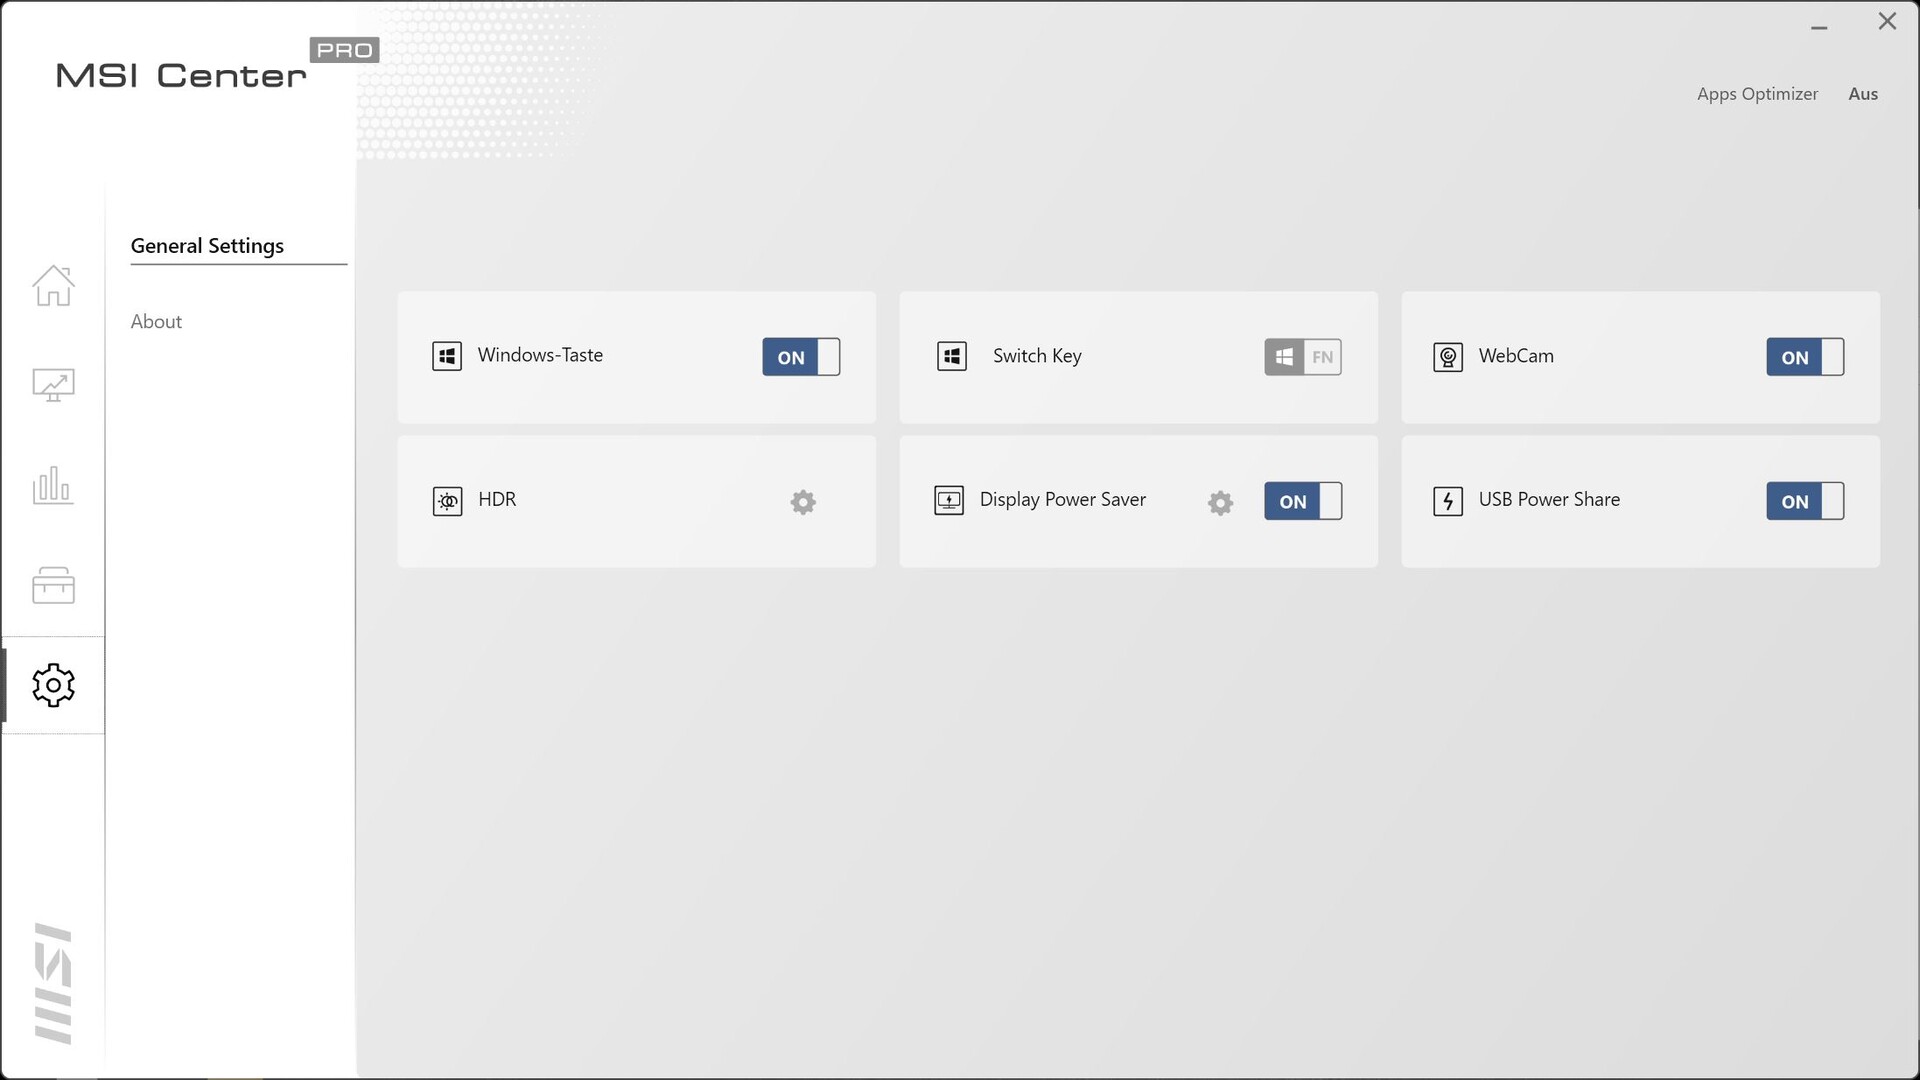
Test conditions
The laptop comes with the MSI Center Pro – the manufacturer's own software that lets you customise various system settings. Other than the battery test, all the other benchmarks were conducted with the laptop in high-performance mode in order to obtain the best possible results. The software takes a while to start up after you boot up the laptop.
Processor
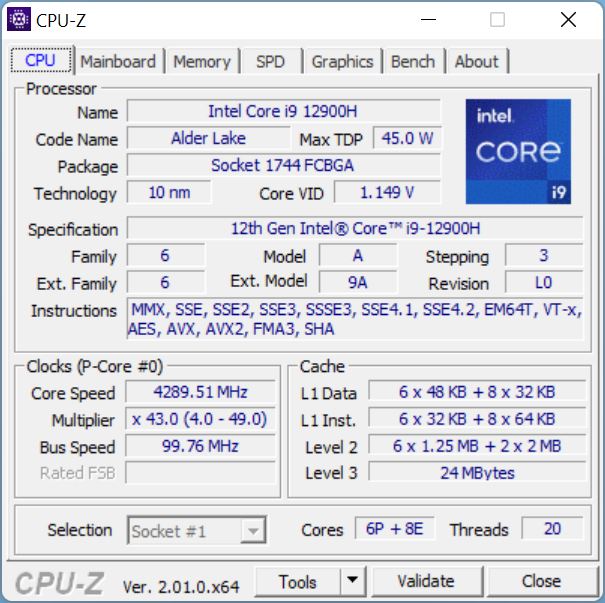
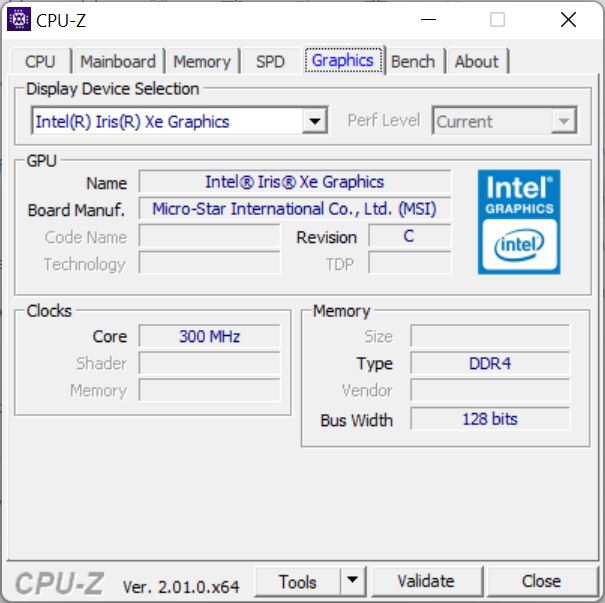
With the Intel Core i9-12900H, MSI has put one of the fastest current-gen Alder Lake processors in the Z17. This is rather unusual for a device with such a slim form factor. There are a total of 14 cores (20 threads; 6 P-cores & 8 E-cores) with clock speeds ranging from 1.8 to 5 GHz. The processor supports the full "Enterprise" feature set of vPro (management features). All 96 EUs are active on the integrated Xe Graphics.
In the Cinebench loop test, the competitors were completely outclassed by the Z17, at least in terms of sustained CPU performance. Nevertheless, those laptops also don't come installed with a top-end CPU. The Core i7-12800H in the Blade 17 was able to outperform the i9-12900H in the Z17 at the start. But the Z17 still has better sustained performance.
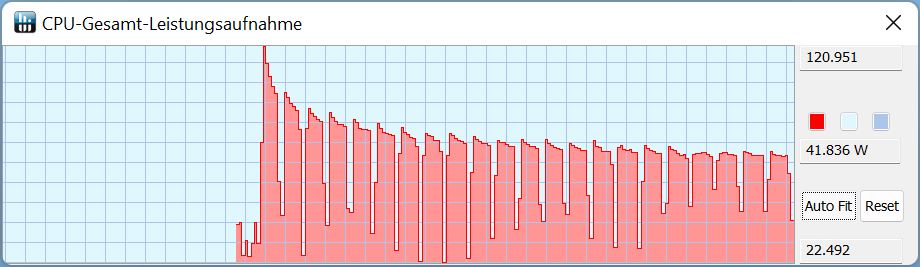
You can tell how the CPU behaves from the screenshot on the right. The TDP only hit 120 watts during the first run; then the power consumption started gradually dropping over time. The TDP also decreased slightly within each run.
Overall, the Z17 showed a markedly less severe decrease in performance than the Razer Blade with an i7 after the first few runs. Interestingly, the same i9 processor in the Z16P is consistently about 10 to 15 per cent faster despite the laptop's smaller form factor. This means the i9 in the Z17 isn't running at its full potential at all. Thus, the very minimal performance gain over the competitors doesn't justify the use of the power-hungry Core i9 processor. The single-thread performance is somewhat below what is expected of an i9-12900H.
Whilst running on battery, the laptop lost around 25 per cent of its CPU performance, as measured using Cinebench R15. The CPU only managed to hit a TDP of 50 watts.
Cinebench R15 Multi Sustained Load
Cinebench R23: Multi Core | Single Core
Cinebench R20: CPU (Multi Core) | CPU (Single Core)
Cinebench R15: CPU Multi 64Bit | CPU Single 64Bit
Blender: v2.79 BMW27 CPU
7-Zip 18.03: 7z b 4 | 7z b 4 -mmt1
Geekbench 5.5: Multi-Core | Single-Core
HWBOT x265 Benchmark v2.2: 4k Preset
LibreOffice : 20 Documents To PDF
R Benchmark 2.5: Overall mean
| CPU Performance rating | |
| Aorus 17X XES | |
| MSI Creator Z16P B12UHST | |
| MSI Creator Z17 A12UGST-054 | |
| Average of class Multimedia | |
| Dell XPS 17 9720 RTX 3060 | |
| Razer Blade 17 (i7-12800H, RTX 3070 Ti) | |
| Average Intel Core i9-12900H | |
| MSI Creator 17 A10SGS -2! | |
| Cinebench R23 / Multi Core | |
| MSI Creator Z16P B12UHST | |
| Aorus 17X XES | |
| Dell XPS 17 9720 RTX 3060 | |
| Average of class Multimedia (4861 - 33362, n=79, last 2 years) | |
| MSI Creator Z17 A12UGST-054 | |
| Razer Blade 17 (i7-12800H, RTX 3070 Ti) | |
| Average Intel Core i9-12900H (7359 - 19648, n=28) | |
| Cinebench R23 / Single Core | |
| Average of class Multimedia (1128 - 2459, n=71, last 2 years) | |
| Aorus 17X XES | |
| MSI Creator Z16P B12UHST | |
| MSI Creator Z17 A12UGST-054 | |
| Average Intel Core i9-12900H (1634 - 1930, n=28) | |
| Razer Blade 17 (i7-12800H, RTX 3070 Ti) | |
| Dell XPS 17 9720 RTX 3060 | |
| Cinebench R20 / CPU (Multi Core) | |
| Aorus 17X XES | |
| MSI Creator Z16P B12UHST | |
| Dell XPS 17 9720 RTX 3060 | |
| Average of class Multimedia (1887 - 12912, n=62, last 2 years) | |
| MSI Creator Z17 A12UGST-054 | |
| Average Intel Core i9-12900H (2681 - 7471, n=28) | |
| Razer Blade 17 (i7-12800H, RTX 3070 Ti) | |
| MSI Creator 17 A10SGS | |
| Cinebench R20 / CPU (Single Core) | |
| Aorus 17X XES | |
| MSI Creator Z16P B12UHST | |
| Average of class Multimedia (425 - 853, n=62, last 2 years) | |
| MSI Creator Z17 A12UGST-054 | |
| Razer Blade 17 (i7-12800H, RTX 3070 Ti) | |
| Average Intel Core i9-12900H (624 - 738, n=28) | |
| Dell XPS 17 9720 RTX 3060 | |
| MSI Creator 17 A10SGS | |
| Cinebench R15 / CPU Multi 64Bit | |
| MSI Creator Z16P B12UHST | |
| Aorus 17X XES | |
| Razer Blade 17 (i7-12800H, RTX 3070 Ti) | |
| MSI Creator Z17 A12UGST-054 | |
| Average of class Multimedia (856 - 5224, n=66, last 2 years) | |
| Average Intel Core i9-12900H (1395 - 3077, n=28) | |
| Dell XPS 17 9720 RTX 3060 | |
| MSI Creator 17 A10SGS | |
| Cinebench R15 / CPU Single 64Bit | |
| Average of class Multimedia (184.8 - 326, n=64, last 2 years) | |
| Aorus 17X XES | |
| MSI Creator Z16P B12UHST | |
| Razer Blade 17 (i7-12800H, RTX 3070 Ti) | |
| Average Intel Core i9-12900H (235 - 277, n=29) | |
| MSI Creator Z17 A12UGST-054 | |
| Dell XPS 17 9720 RTX 3060 | |
| MSI Creator 17 A10SGS | |
| Blender / v2.79 BMW27 CPU | |
| MSI Creator 17 A10SGS | |
| Average of class Multimedia (100 - 557, n=63, last 2 years) | |
| Average Intel Core i9-12900H (160 - 451, n=28) | |
| Razer Blade 17 (i7-12800H, RTX 3070 Ti) | |
| Dell XPS 17 9720 RTX 3060 | |
| MSI Creator Z17 A12UGST-054 | |
| Aorus 17X XES | |
| MSI Creator Z16P B12UHST | |
| 7-Zip 18.03 / 7z b 4 | |
| MSI Creator Z16P B12UHST | |
| Dell XPS 17 9720 RTX 3060 | |
| Aorus 17X XES | |
| MSI Creator Z17 A12UGST-054 | |
| Razer Blade 17 (i7-12800H, RTX 3070 Ti) | |
| Average Intel Core i9-12900H (34684 - 76677, n=28) | |
| Average of class Multimedia (26062 - 130368, n=60, last 2 years) | |
| MSI Creator 17 A10SGS | |
| 7-Zip 18.03 / 7z b 4 -mmt1 | |
| Aorus 17X XES | |
| MSI Creator Z16P B12UHST | |
| Average of class Multimedia (3666 - 7545, n=61, last 2 years) | |
| MSI Creator Z17 A12UGST-054 | |
| Average Intel Core i9-12900H (5302 - 6289, n=28) | |
| Razer Blade 17 (i7-12800H, RTX 3070 Ti) | |
| Dell XPS 17 9720 RTX 3060 | |
| MSI Creator 17 A10SGS | |
| Geekbench 5.5 / Multi-Core | |
| Aorus 17X XES | |
| MSI Creator Z16P B12UHST | |
| MSI Creator Z17 A12UGST-054 | |
| Average of class Multimedia (4652 - 20422, n=60, last 2 years) | |
| Razer Blade 17 (i7-12800H, RTX 3070 Ti) | |
| Dell XPS 17 9720 RTX 3060 | |
| Average Intel Core i9-12900H (8519 - 14376, n=31) | |
| MSI Creator 17 A10SGS | |
| Geekbench 5.5 / Single-Core | |
| Average of class Multimedia (805 - 2974, n=60, last 2 years) | |
| Aorus 17X XES | |
| MSI Creator Z16P B12UHST | |
| MSI Creator Z17 A12UGST-054 | |
| Average Intel Core i9-12900H (1631 - 1897, n=31) | |
| Razer Blade 17 (i7-12800H, RTX 3070 Ti) | |
| Dell XPS 17 9720 RTX 3060 | |
| MSI Creator 17 A10SGS | |
| HWBOT x265 Benchmark v2.2 / 4k Preset | |
| Aorus 17X XES | |
| MSI Creator Z16P B12UHST | |
| Average of class Multimedia (5.26 - 36.1, n=61, last 2 years) | |
| MSI Creator Z17 A12UGST-054 | |
| Average Intel Core i9-12900H (8.05 - 22.5, n=28) | |
| Razer Blade 17 (i7-12800H, RTX 3070 Ti) | |
| Dell XPS 17 9720 RTX 3060 | |
| MSI Creator 17 A10SGS | |
| LibreOffice / 20 Documents To PDF | |
| MSI Creator 17 A10SGS | |
| Average of class Multimedia (23.9 - 146.7, n=62, last 2 years) | |
| Average Intel Core i9-12900H (36.8 - 59.8, n=28) | |
| Dell XPS 17 9720 RTX 3060 | |
| Razer Blade 17 (i7-12800H, RTX 3070 Ti) | |
| MSI Creator Z17 A12UGST-054 | |
| MSI Creator Z16P B12UHST | |
| Aorus 17X XES | |
| R Benchmark 2.5 / Overall mean | |
| MSI Creator 17 A10SGS | |
| Average of class Multimedia (0.3604 - 0.947, n=61, last 2 years) | |
| Dell XPS 17 9720 RTX 3060 | |
| Razer Blade 17 (i7-12800H, RTX 3070 Ti) | |
| Average Intel Core i9-12900H (0.4218 - 0.506, n=28) | |
| MSI Creator Z17 A12UGST-054 | |
| MSI Creator Z16P B12UHST | |
| Aorus 17X XES | |
* ... smaller is better
AIDA64: FP32 Ray-Trace | FPU Julia | CPU SHA3 | CPU Queen | FPU SinJulia | FPU Mandel | CPU AES | CPU ZLib | FP64 Ray-Trace | CPU PhotoWorxx
| Performance rating | |
| Aorus 17X XES | |
| Average of class Multimedia | |
| Average Intel Core i9-12900H | |
| MSI Creator Z16P B12UHST | |
| MSI Creator Z17 A12UGST-054 | |
| Dell XPS 17 9720 RTX 3060 | |
| Razer Blade 17 (i7-12800H, RTX 3070 Ti) | |
| MSI Creator 17 A10SGS | |
| AIDA64 / FP32 Ray-Trace | |
| Average of class Multimedia (2214 - 50388, n=58, last 2 years) | |
| Aorus 17X XES | |
| Average Intel Core i9-12900H (4074 - 18289, n=29) | |
| MSI Creator 17 A10SGS | |
| MSI Creator Z16P B12UHST | |
| MSI Creator Z17 A12UGST-054 | |
| Razer Blade 17 (i7-12800H, RTX 3070 Ti) | |
| Dell XPS 17 9720 RTX 3060 | |
| AIDA64 / FPU Julia | |
| Average of class Multimedia (12867 - 201874, n=59, last 2 years) | |
| Aorus 17X XES | |
| Average Intel Core i9-12900H (22307 - 93236, n=29) | |
| MSI Creator 17 A10SGS | |
| MSI Creator Z16P B12UHST | |
| MSI Creator Z17 A12UGST-054 | |
| Razer Blade 17 (i7-12800H, RTX 3070 Ti) | |
| Dell XPS 17 9720 RTX 3060 | |
| AIDA64 / CPU SHA3 | |
| Average of class Multimedia (626 - 8623, n=59, last 2 years) | |
| Aorus 17X XES | |
| Average Intel Core i9-12900H (1378 - 4215, n=29) | |
| MSI Creator Z16P B12UHST | |
| MSI Creator Z17 A12UGST-054 | |
| Razer Blade 17 (i7-12800H, RTX 3070 Ti) | |
| Dell XPS 17 9720 RTX 3060 | |
| MSI Creator 17 A10SGS | |
| AIDA64 / CPU Queen | |
| MSI Creator Z16P B12UHST | |
| MSI Creator Z17 A12UGST-054 | |
| Aorus 17X XES | |
| Average Intel Core i9-12900H (78172 - 111241, n=28) | |
| Dell XPS 17 9720 RTX 3060 | |
| Razer Blade 17 (i7-12800H, RTX 3070 Ti) | |
| MSI Creator 17 A10SGS | |
| Average of class Multimedia (13483 - 181505, n=46, last 2 years) | |
| AIDA64 / FPU SinJulia | |
| Aorus 17X XES | |
| MSI Creator Z16P B12UHST | |
| Razer Blade 17 (i7-12800H, RTX 3070 Ti) | |
| MSI Creator Z17 A12UGST-054 | |
| Average Intel Core i9-12900H (5709 - 10410, n=29) | |
| Dell XPS 17 9720 RTX 3060 | |
| Average of class Multimedia (886 - 28794, n=59, last 2 years) | |
| MSI Creator 17 A10SGS | |
| AIDA64 / FPU Mandel | |
| Average of class Multimedia (6395 - 105740, n=58, last 2 years) | |
| Aorus 17X XES | |
| Average Intel Core i9-12900H (11257 - 45581, n=29) | |
| MSI Creator 17 A10SGS | |
| MSI Creator Z16P B12UHST | |
| MSI Creator Z17 A12UGST-054 | |
| Razer Blade 17 (i7-12800H, RTX 3070 Ti) | |
| Dell XPS 17 9720 RTX 3060 | |
| AIDA64 / CPU AES | |
| Aorus 17X XES | |
| MSI Creator Z16P B12UHST | |
| MSI Creator Z17 A12UGST-054 | |
| Average Intel Core i9-12900H (31935 - 151546, n=29) | |
| Dell XPS 17 9720 RTX 3060 | |
| Average of class Multimedia (8171 - 126790, n=59, last 2 years) | |
| Razer Blade 17 (i7-12800H, RTX 3070 Ti) | |
| MSI Creator 17 A10SGS | |
| AIDA64 / CPU ZLib | |
| MSI Creator Z16P B12UHST | |
| Razer Blade 17 (i7-12800H, RTX 3070 Ti) | |
| Aorus 17X XES | |
| Average of class Multimedia (143.8 - 2022, n=59, last 2 years) | |
| MSI Creator Z17 A12UGST-054 | |
| Average Intel Core i9-12900H (449 - 1193, n=29) | |
| Dell XPS 17 9720 RTX 3060 | |
| MSI Creator 17 A10SGS | |
| AIDA64 / FP64 Ray-Trace | |
| Average of class Multimedia (1014 - 26875, n=59, last 2 years) | |
| Aorus 17X XES | |
| Average Intel Core i9-12900H (2235 - 10511, n=29) | |
| MSI Creator Z16P B12UHST | |
| MSI Creator 17 A10SGS | |
| MSI Creator Z17 A12UGST-054 | |
| Dell XPS 17 9720 RTX 3060 | |
| Razer Blade 17 (i7-12800H, RTX 3070 Ti) | |
| AIDA64 / CPU PhotoWorxx | |
| Average of class Multimedia (8187 - 88154, n=59, last 2 years) | |
| Dell XPS 17 9720 RTX 3060 | |
| Aorus 17X XES | |
| MSI Creator Z16P B12UHST | |
| MSI Creator Z17 A12UGST-054 | |
| Average Intel Core i9-12900H (20960 - 48269, n=30) | |
| Razer Blade 17 (i7-12800H, RTX 3070 Ti) | |
| MSI Creator 17 A10SGS | |
System performance
Surprisingly, the Z17 delivered slightly below average performance in PCMark 10. Repeating the test didn't produce any improved results. Other laptops with the same CPU/GPU combo perform 8 per cent better on average.
Nevertheless, based on our experience with the Z17, it runs smoothly and without issues during day-to-day work.

CrossMark: Overall | Productivity | Creativity | Responsiveness
| PCMark 10 / Score | |
| MSI Creator Z16P B12UHST | |
| Aorus 17X XES | |
| Average Intel Core i9-12900H, NVIDIA GeForce RTX 3070 Ti Laptop GPU (7087 - 8072, n=6) | |
| Average of class Multimedia (4325 - 10386, n=56, last 2 years) | |
| Dell XPS 17 9720 RTX 3060 | |
| Razer Blade 17 (i7-12800H, RTX 3070 Ti) | |
| MSI Creator Z17 A12UGST-054 | |
| MSI Creator 17 A10SGS | |
| PCMark 10 / Essentials | |
| MSI Creator Z16P B12UHST | |
| Average Intel Core i9-12900H, NVIDIA GeForce RTX 3070 Ti Laptop GPU (10266 - 11663, n=6) | |
| Dell XPS 17 9720 RTX 3060 | |
| Aorus 17X XES | |
| Average of class Multimedia (8025 - 11664, n=55, last 2 years) | |
| MSI Creator Z17 A12UGST-054 | |
| Razer Blade 17 (i7-12800H, RTX 3070 Ti) | |
| MSI Creator 17 A10SGS | |
| PCMark 10 / Productivity | |
| Average of class Multimedia (7323 - 18233, n=55, last 2 years) | |
| MSI Creator Z16P B12UHST | |
| Aorus 17X XES | |
| Average Intel Core i9-12900H, NVIDIA GeForce RTX 3070 Ti Laptop GPU (9402 - 10742, n=6) | |
| MSI Creator Z17 A12UGST-054 | |
| Dell XPS 17 9720 RTX 3060 | |
| Razer Blade 17 (i7-12800H, RTX 3070 Ti) | |
| MSI Creator 17 A10SGS | |
| PCMark 10 / Digital Content Creation | |
| Aorus 17X XES | |
| MSI Creator Z16P B12UHST | |
| Average Intel Core i9-12900H, NVIDIA GeForce RTX 3070 Ti Laptop GPU (10009 - 12541, n=6) | |
| Razer Blade 17 (i7-12800H, RTX 3070 Ti) | |
| Average of class Multimedia (3651 - 16240, n=55, last 2 years) | |
| Dell XPS 17 9720 RTX 3060 | |
| MSI Creator Z17 A12UGST-054 | |
| MSI Creator 17 A10SGS | |
| CrossMark / Overall | |
| Aorus 17X XES | |
| MSI Creator Z17 A12UGST-054 | |
| Dell XPS 17 9720 RTX 3060 | |
| Average Intel Core i9-12900H, NVIDIA GeForce RTX 3070 Ti Laptop GPU (1664 - 2044, n=6) | |
| Average of class Multimedia (866 - 2728, n=65, last 2 years) | |
| Razer Blade 17 (i7-12800H, RTX 3070 Ti) | |
| CrossMark / Productivity | |
| Aorus 17X XES | |
| MSI Creator Z17 A12UGST-054 | |
| Average Intel Core i9-12900H, NVIDIA GeForce RTX 3070 Ti Laptop GPU (1591 - 1968, n=6) | |
| Dell XPS 17 9720 RTX 3060 | |
| Average of class Multimedia (931 - 2489, n=65, last 2 years) | |
| Razer Blade 17 (i7-12800H, RTX 3070 Ti) | |
| CrossMark / Creativity | |
| Aorus 17X XES | |
| MSI Creator Z17 A12UGST-054 | |
| Average of class Multimedia (907 - 3465, n=65, last 2 years) | |
| Dell XPS 17 9720 RTX 3060 | |
| Average Intel Core i9-12900H, NVIDIA GeForce RTX 3070 Ti Laptop GPU (1797 - 2148, n=6) | |
| Razer Blade 17 (i7-12800H, RTX 3070 Ti) | |
| CrossMark / Responsiveness | |
| Aorus 17X XES | |
| MSI Creator Z17 A12UGST-054 | |
| Average Intel Core i9-12900H, NVIDIA GeForce RTX 3070 Ti Laptop GPU (1514 - 2069, n=6) | |
| Dell XPS 17 9720 RTX 3060 | |
| Razer Blade 17 (i7-12800H, RTX 3070 Ti) | |
| Average of class Multimedia (605 - 2024, n=65, last 2 years) | |
| PCMark 10 Score | 7087 points | |
Help | ||
| AIDA64 / Memory Copy | |
| Average of class Multimedia (11299 - 132135, n=59, last 2 years) | |
| MSI Creator Z16P B12UHST | |
| Dell XPS 17 9720 RTX 3060 | |
| Aorus 17X XES | |
| MSI Creator Z17 A12UGST-054 | |
| Average Intel Core i9-12900H (34438 - 74264, n=29) | |
| Razer Blade 17 (i7-12800H, RTX 3070 Ti) | |
| MSI Creator 17 A10SGS | |
| AIDA64 / Memory Read | |
| Average of class Multimedia (11624 - 174586, n=59, last 2 years) | |
| Aorus 17X XES | |
| Dell XPS 17 9720 RTX 3060 | |
| MSI Creator Z16P B12UHST | |
| MSI Creator Z17 A12UGST-054 | |
| Average Intel Core i9-12900H (36365 - 74642, n=29) | |
| Razer Blade 17 (i7-12800H, RTX 3070 Ti) | |
| MSI Creator 17 A10SGS | |
| AIDA64 / Memory Write | |
| Average of class Multimedia (11755 - 134998, n=59, last 2 years) | |
| MSI Creator Z16P B12UHST | |
| MSI Creator Z17 A12UGST-054 | |
| Dell XPS 17 9720 RTX 3060 | |
| Aorus 17X XES | |
| Average Intel Core i9-12900H (32276 - 67858, n=29) | |
| Razer Blade 17 (i7-12800H, RTX 3070 Ti) | |
| MSI Creator 17 A10SGS | |
| AIDA64 / Memory Latency | |
| Average of class Multimedia (7 - 535, n=58, last 2 years) | |
| MSI Creator Z16P B12UHST | |
| MSI Creator Z17 A12UGST-054 | |
| Dell XPS 17 9720 RTX 3060 | |
| Aorus 17X XES | |
| Average Intel Core i9-12900H (74.7 - 118.1, n=28) | |
| MSI Creator 17 A10SGS | |
| Razer Blade 17 (i7-12800H, RTX 3070 Ti) | |
* ... smaller is better
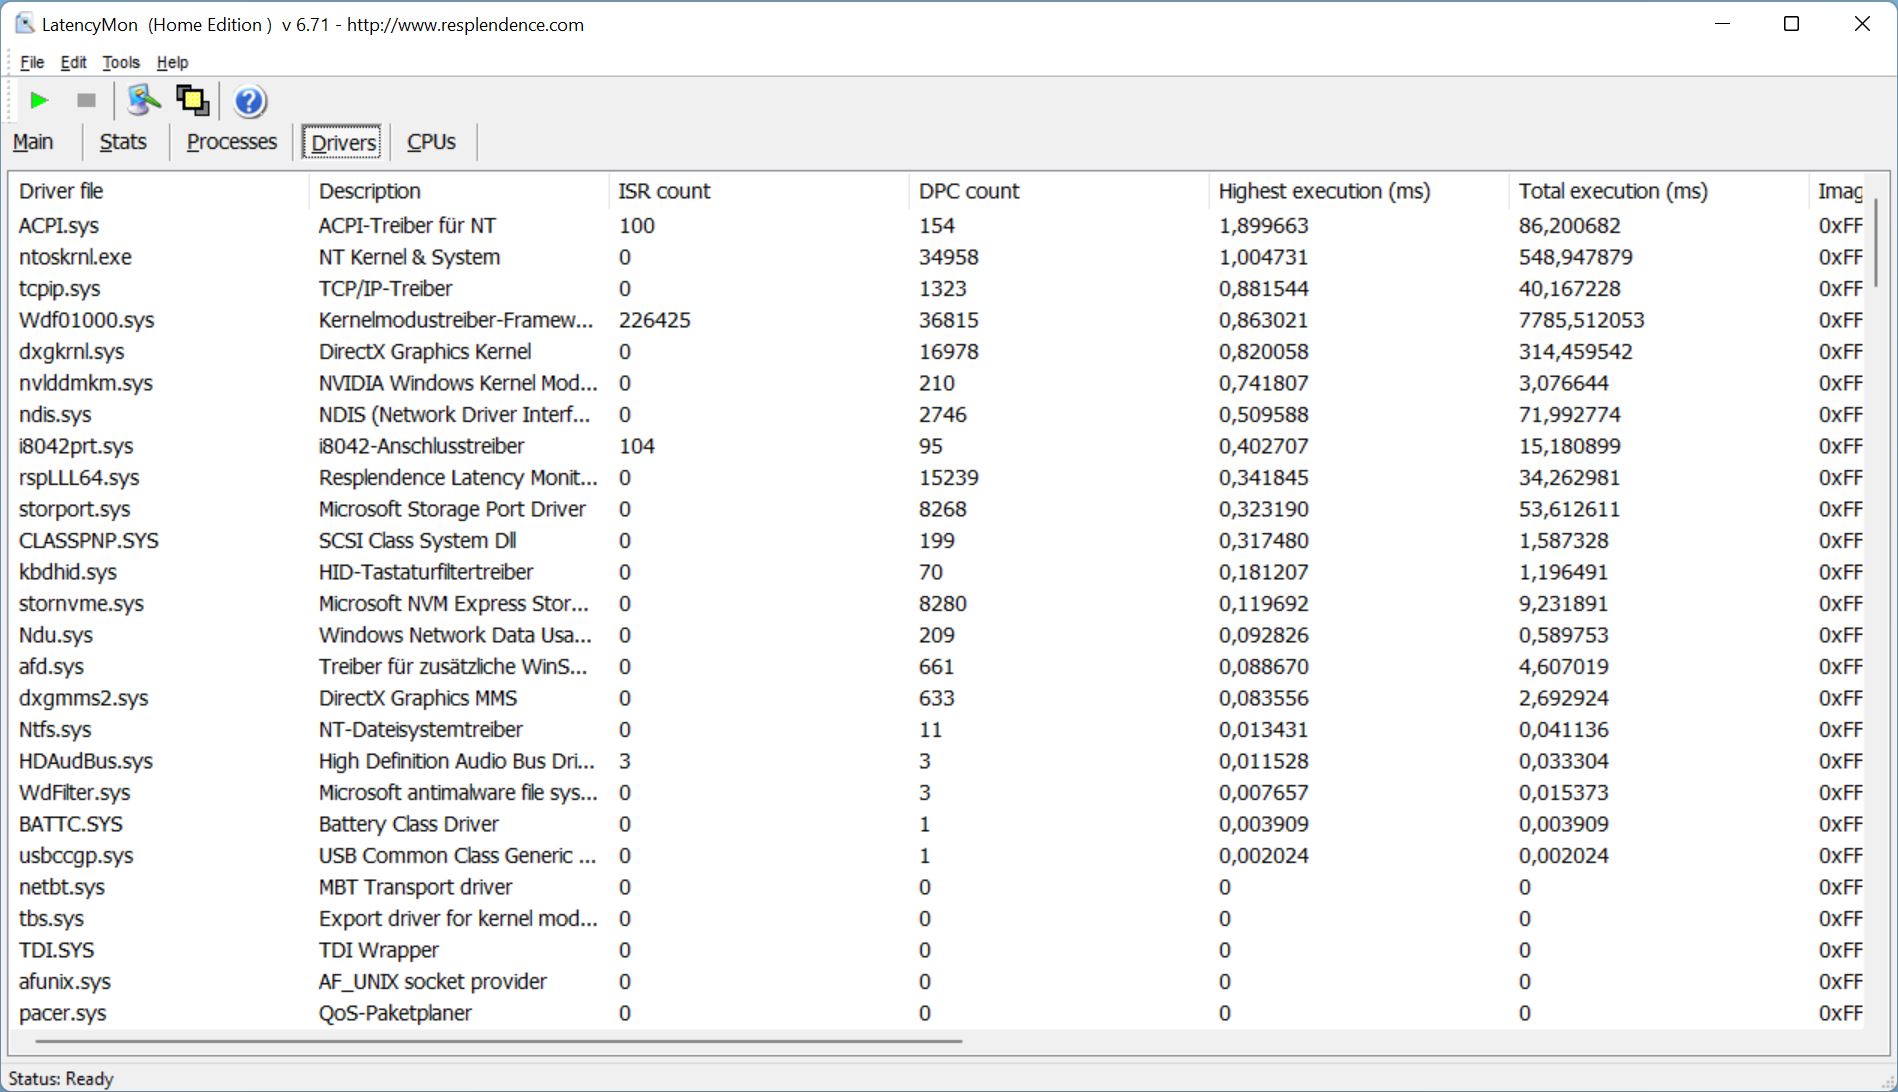
DPC latency
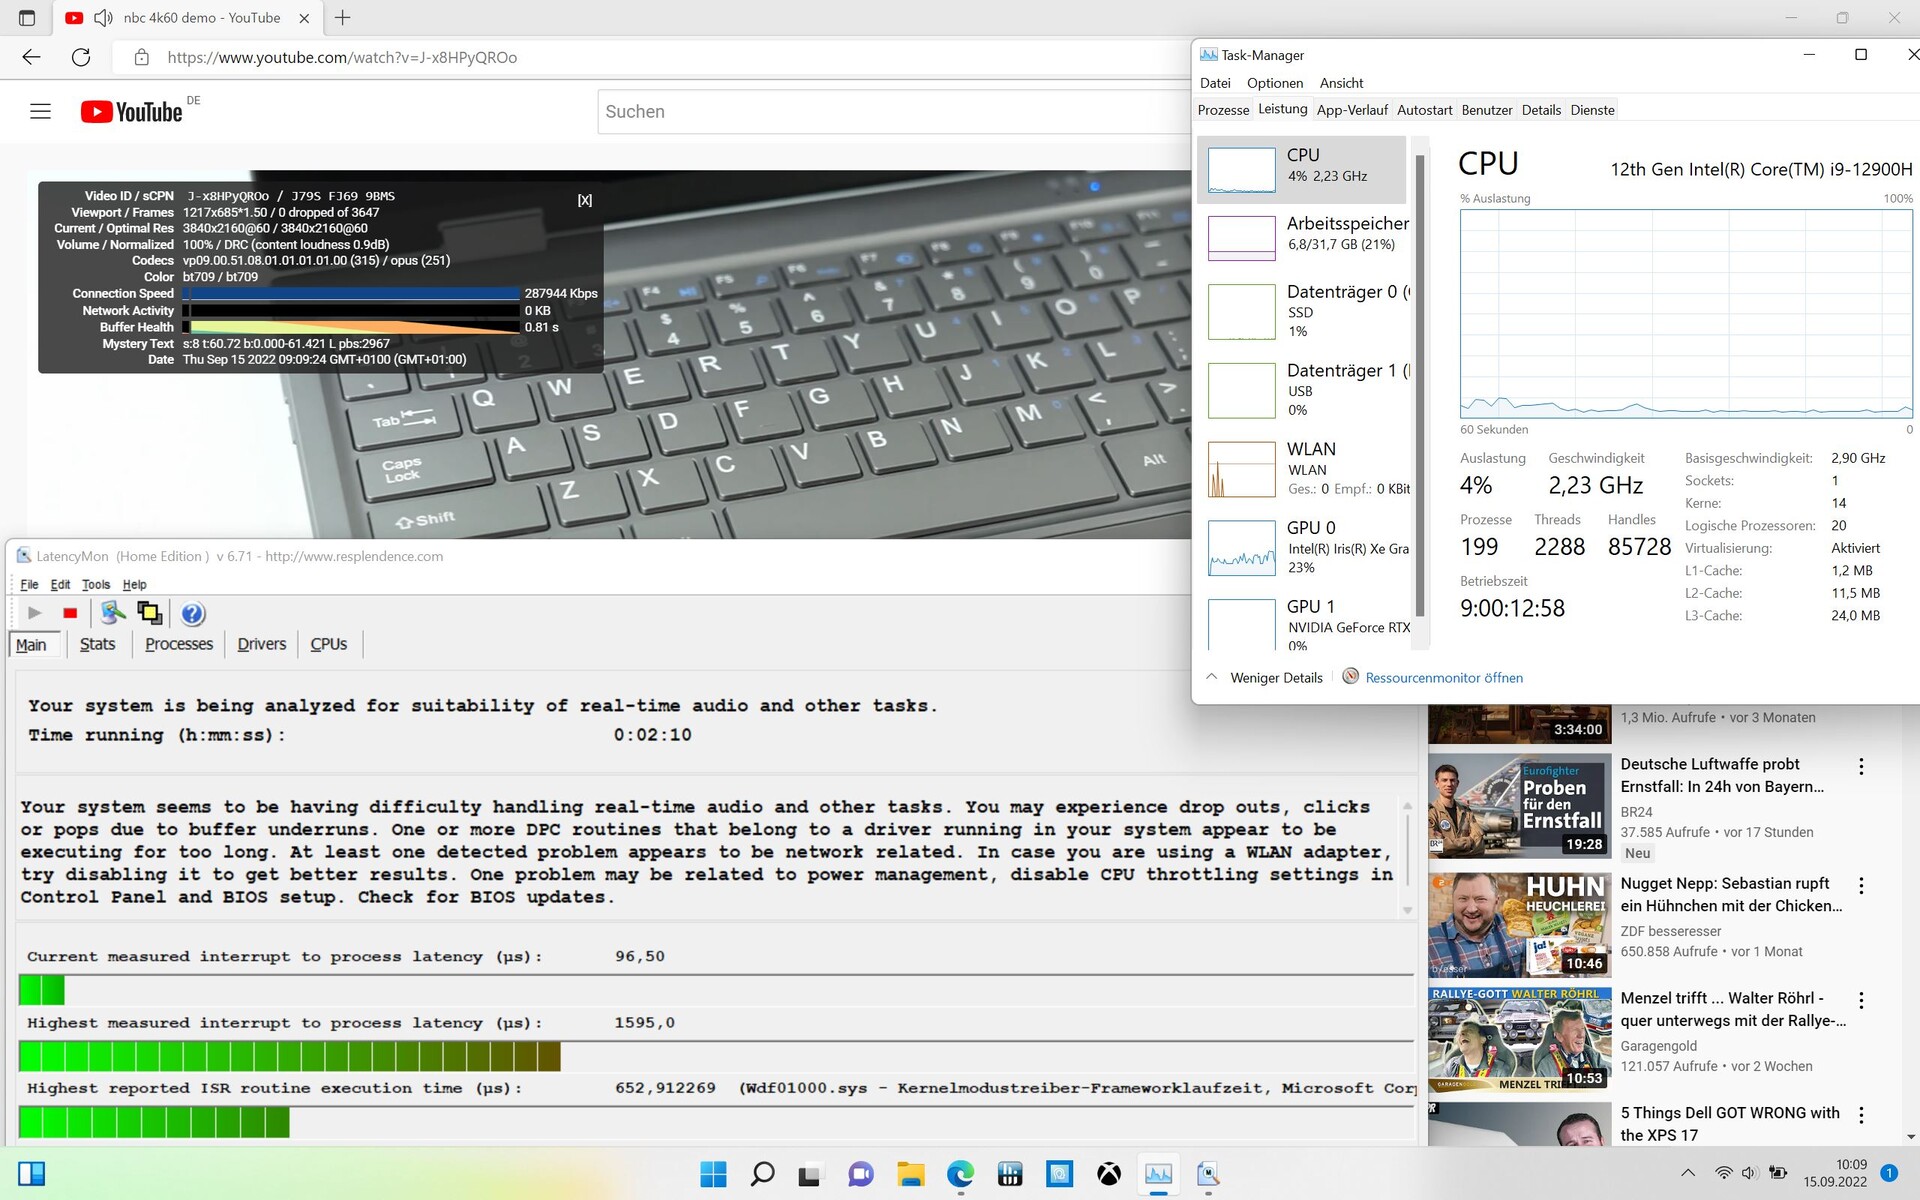
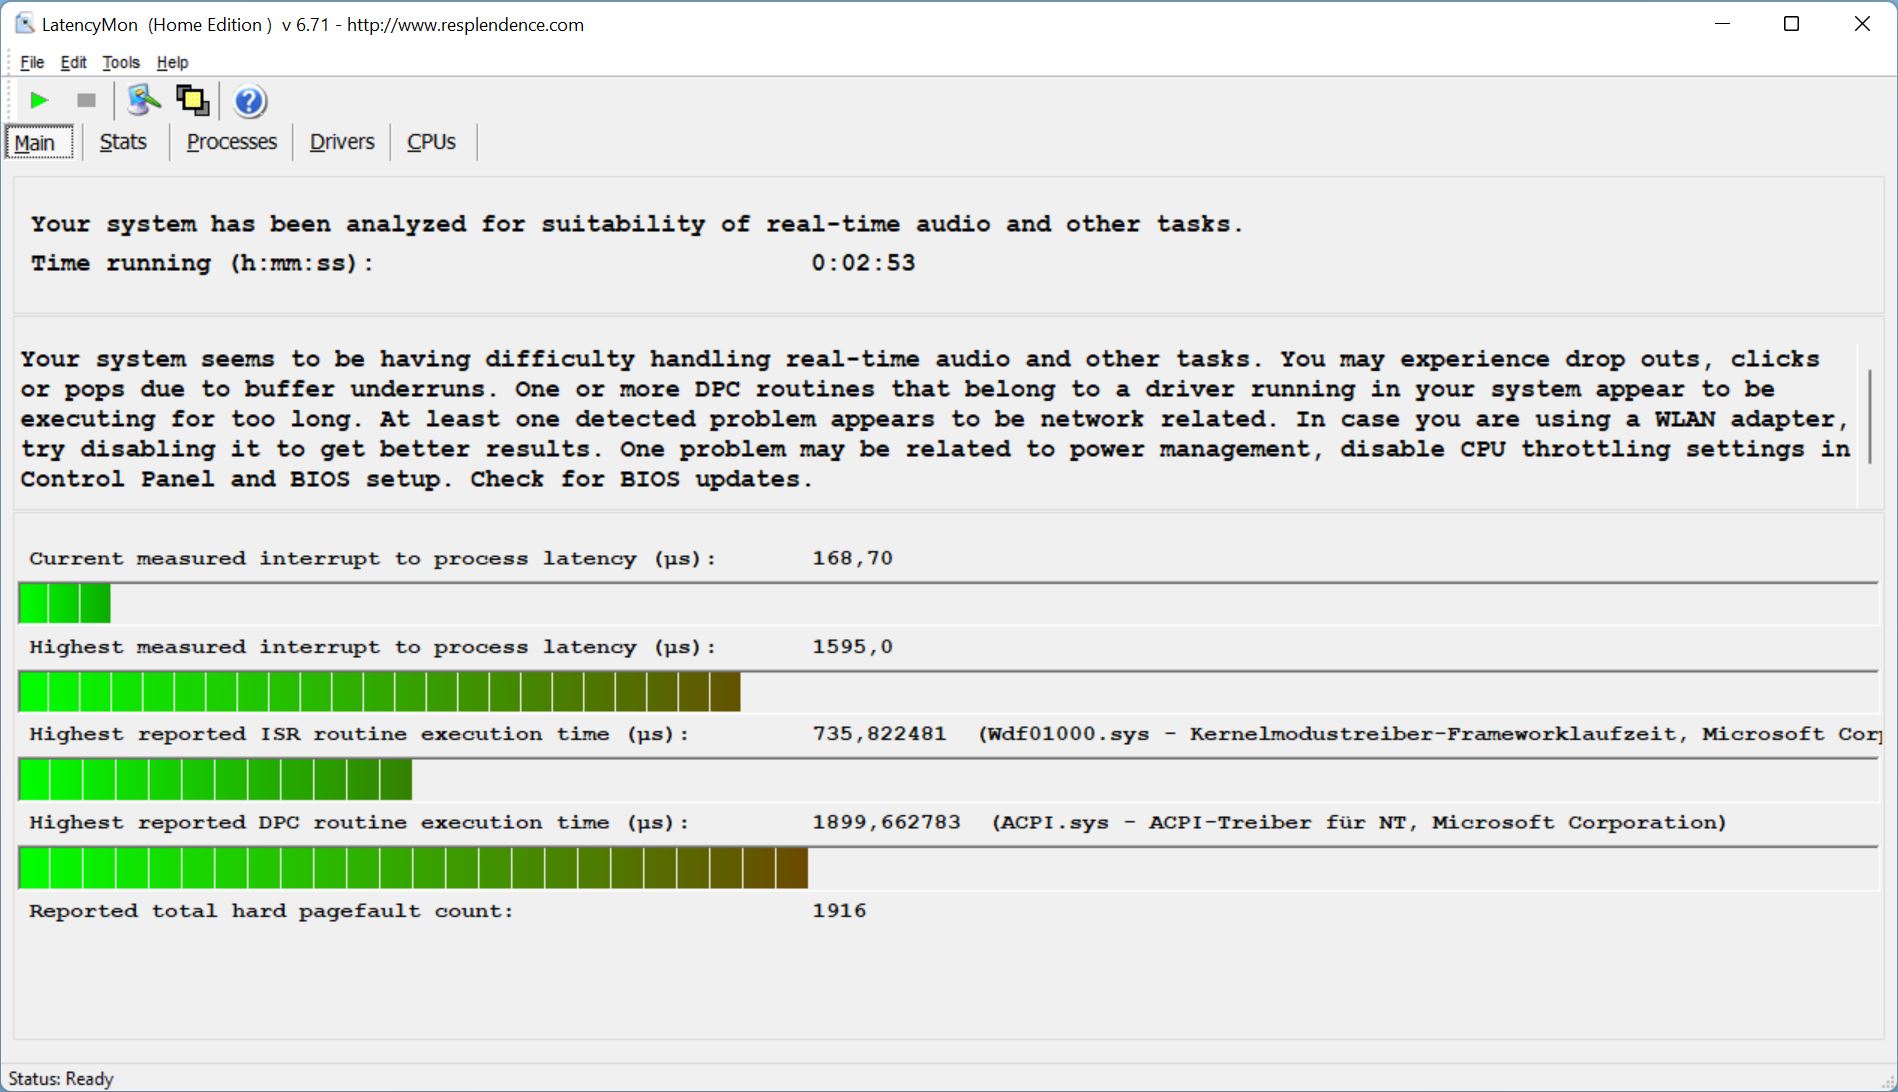
LatencyMon didn't detect any problems when a browser was opened. This was, however, not the case when several tabs were opened at once to display our home page. The latency is disappointingly high for a creator laptop.
Nonetheless, playback of our 4K 60FPS YouTube videos was smooth and didn't result in any dropped frames.
During our review, we got a blue screen error once right after booting up the laptop. Hopefully, the manufacturer can quickly fix the issues via a BIOS update.
| DPC Latencies / LatencyMon - interrupt to process latency (max), Web, Youtube, Prime95 | |
| MSI Creator Z17 A12UGST-054 | |
| Aorus 17X XES | |
| MSI Creator 17 A10SGS | |
| Razer Blade 17 (i7-12800H, RTX 3070 Ti) | |
| MSI Creator Z16P B12UHST | |
| Dell XPS 17 9720 RTX 3060 | |
* ... smaller is better
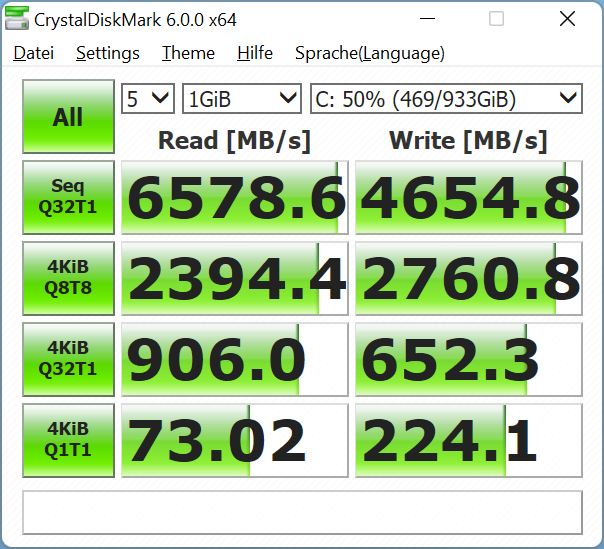
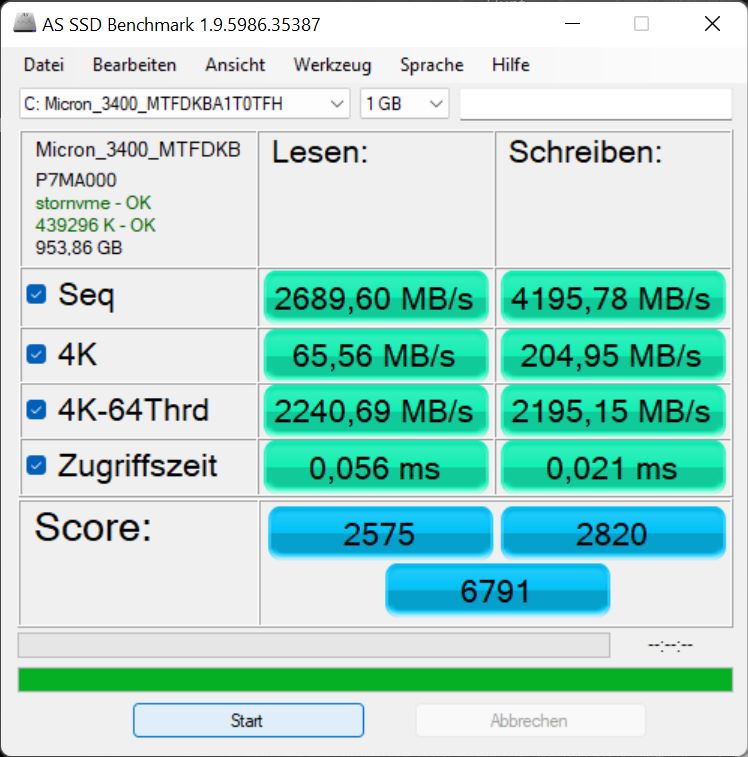
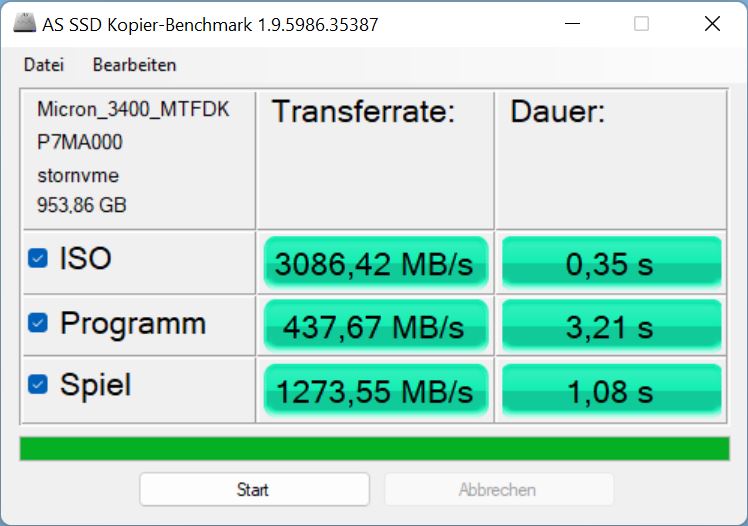
Mass storage
On our model, MSI installed a Micron 3400 SSD with a capacity of 1 TB. The PCIe 4 drive ranks 63rd on our SSD comparison chart. The manufacturer claims that it has a maximum read speed of 6,600 MB/s – something our measurements can definitely attest to. The drive also has very stable sustained performance.
Nevertheless, the Samsung PM9A1 drives in the Razer Blade 17 and MSI's own Z16P are a little faster, as is the Gigabyte SSD in the Aorus. But this small difference could hardly account for the rather poor system performance of Z17.

* ... smaller is better
Sustained Read Performance: DiskSpd Read Loop, Queue Depth 8
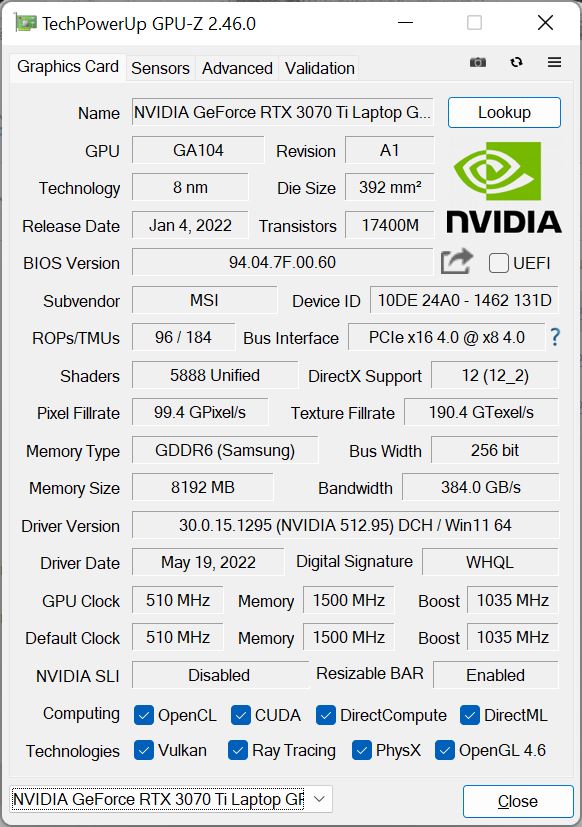
Graphics card
The Z17 features a GeForce RTX 3070 Ti with 8 GB of video memory. Theoretically, this is a very powerful graphics card, but it only has access to 90 watts of power (including Dynamic Boost) in the thin Z17. For comparison, the GPU in the Blade 17 has 150 watts at its disposal.
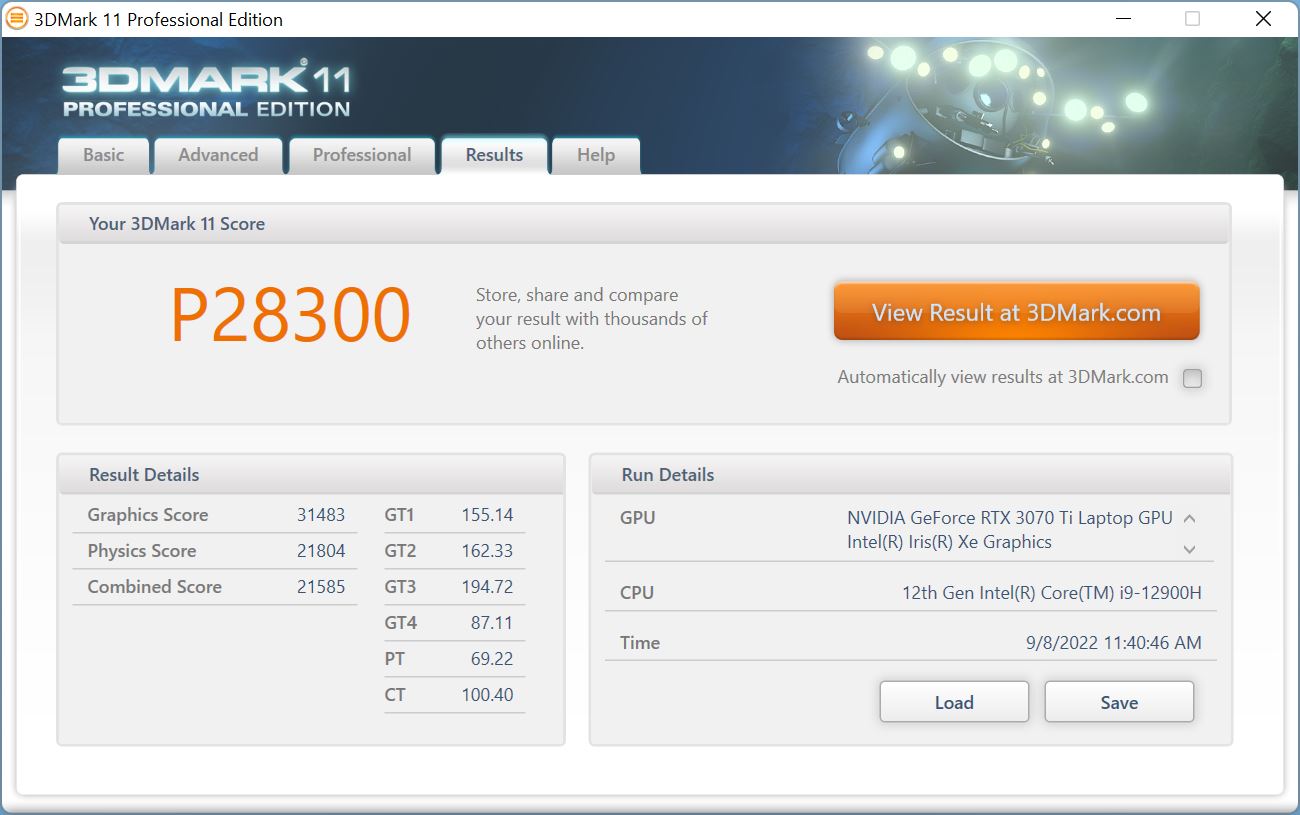
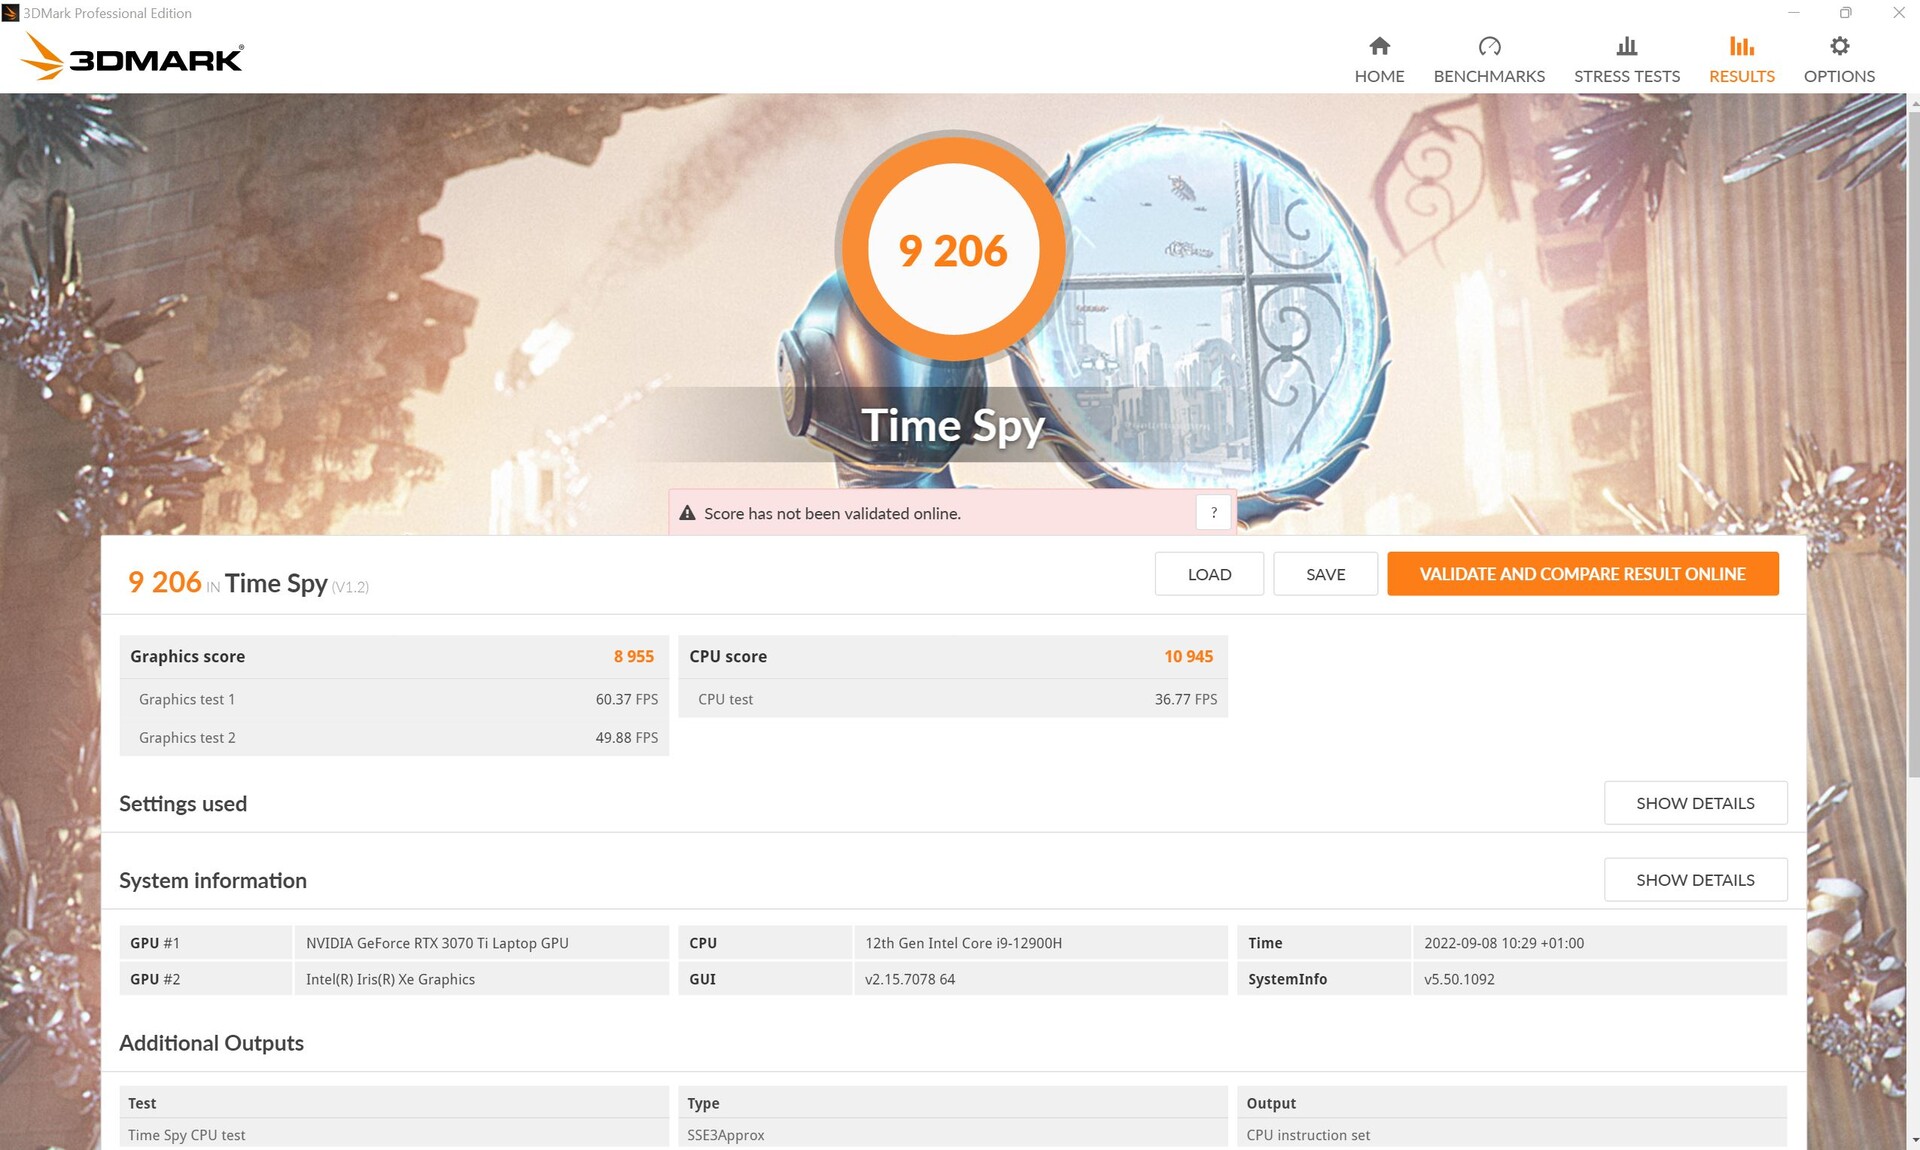
Consequently, the Creator Z17's performance in the synthetic 3DMark benchmarks is at least 5 per cent below the average of all laptops with the same GPU.
While running on battery, the laptop lost around 45 per cent of its GPU performance in 3DMark 11.
| 3DMark 11 Performance | 28300 points | |
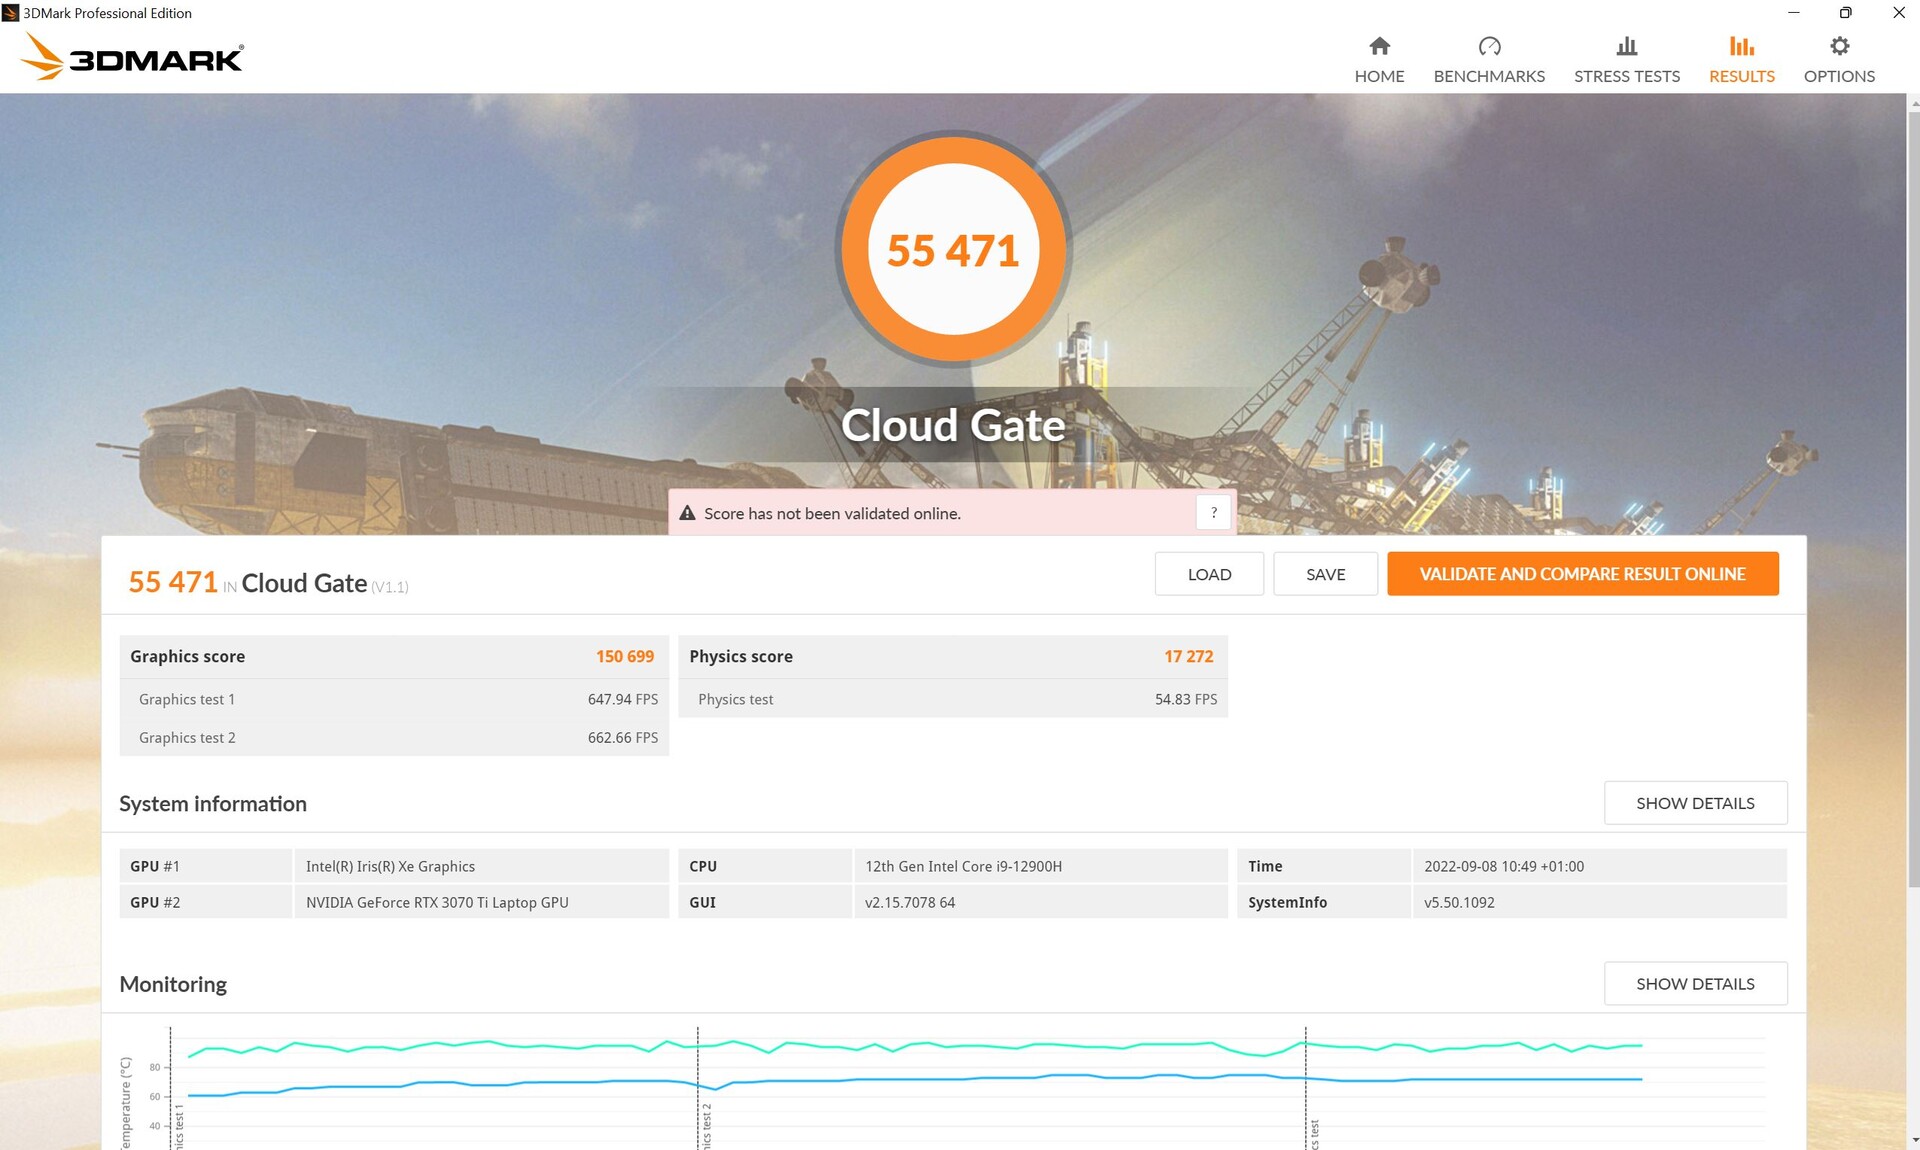
| 3DMark Cloud Gate Standard Score | 55471 points | |
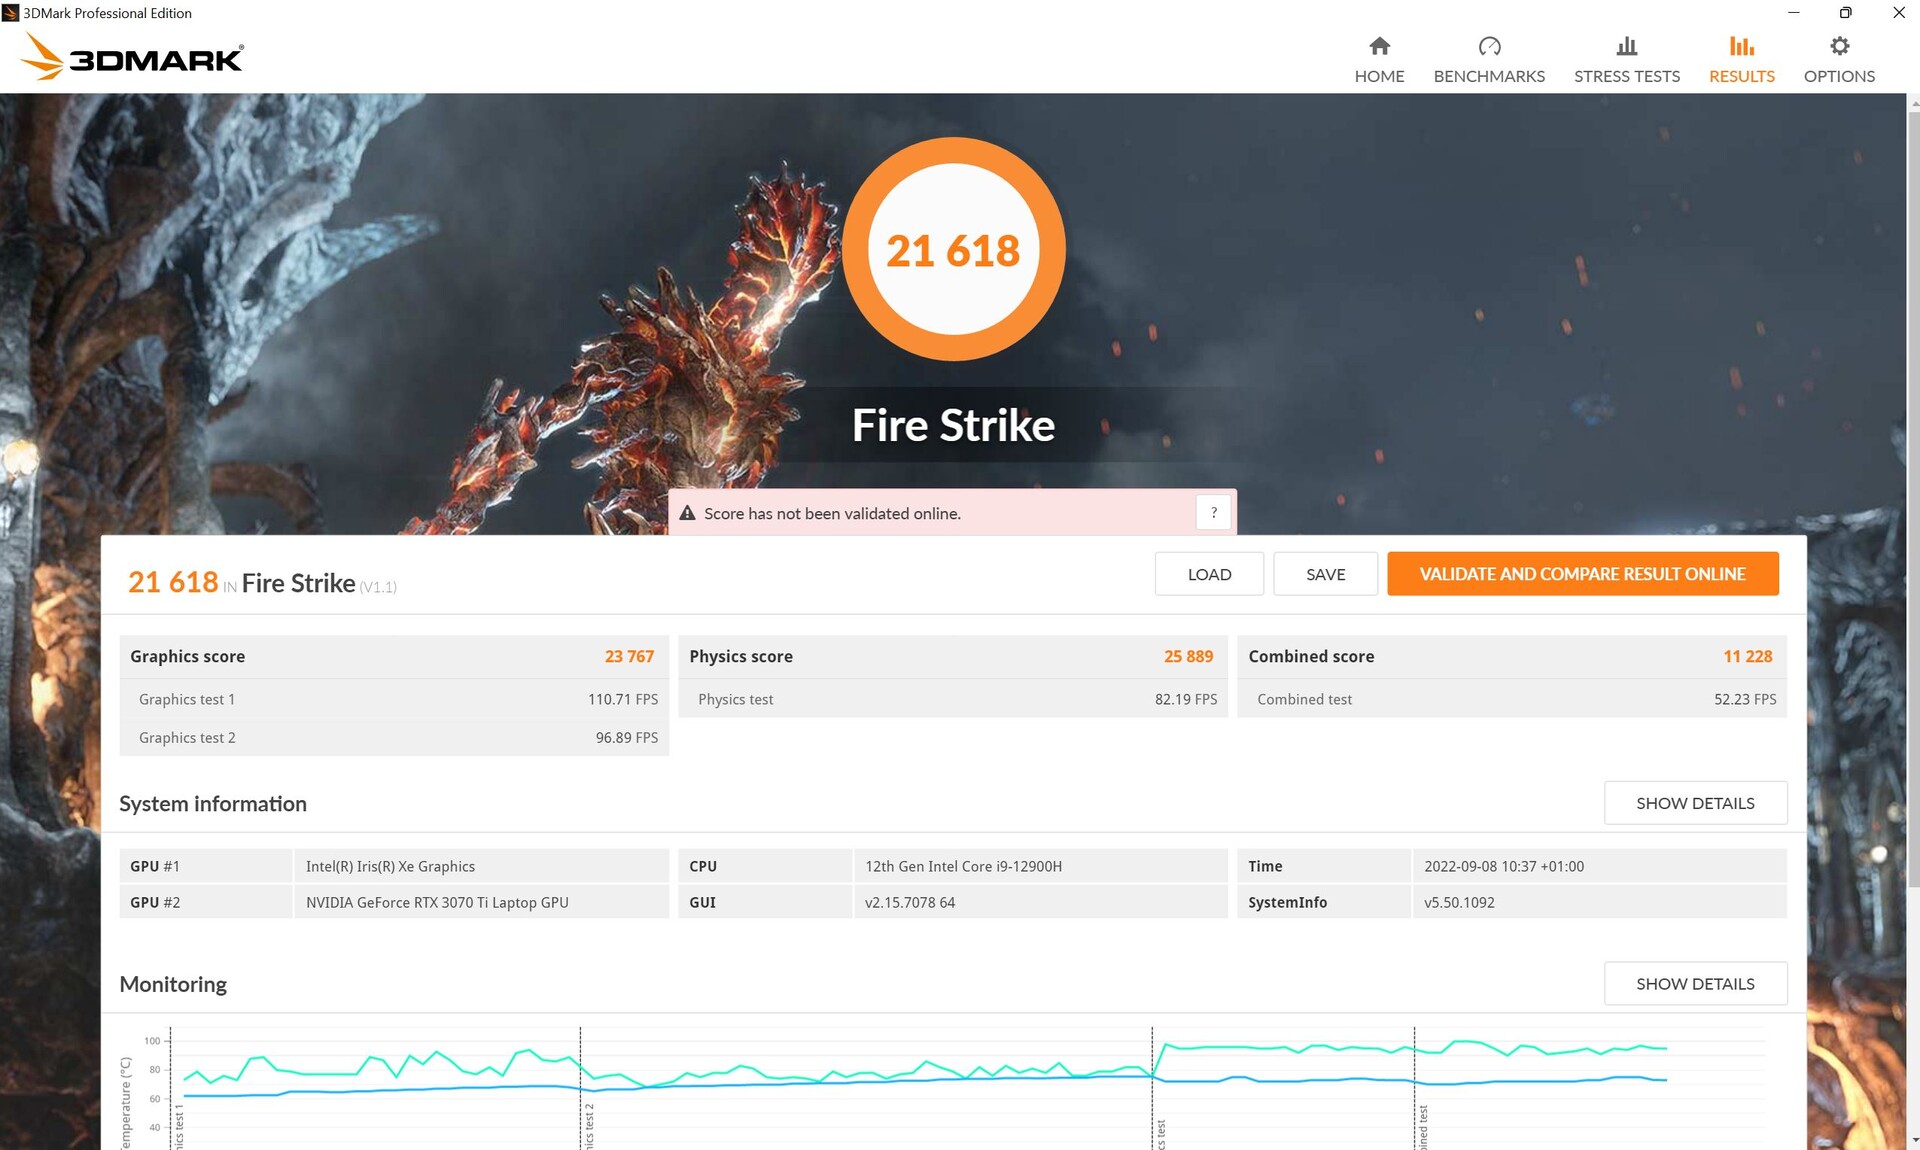
| 3DMark Fire Strike Score | 21618 points | |
| 3DMark Time Spy Score | 9206 points | |
Help | ||
| Blender | |
| v3.3 Classroom OPTIX/RTX | |
| Average of class Multimedia (12 - 105, n=24, last 2 years) | |
| Aorus 17X XES | |
| v3.3 Classroom CUDA | |
| Average of class Multimedia (20 - 186, n=24, last 2 years) | |
| Aorus 17X XES | |
| v3.3 Classroom CPU | |
| Average of class Multimedia (134.5 - 1042, n=65, last 2 years) | |
| Aorus 17X XES | |
* ... smaller is better
Gaming performance
The great showing in Far Cry 5 appears to be more or less an exception. Overall, rated at 90 watts, the RTX 3070 Ti performed at least 5 to 10 per cent below average. Compared with the Blade 17, performance differentials can be as high as 20 per cent, depending on the game and settings used. That said, the difference is much less dramatic in most games.
| The Witcher 3 | |
| 1920x1080 High Graphics & Postprocessing (Nvidia HairWorks Off) | |
| Average NVIDIA GeForce RTX 3070 Ti Laptop GPU (139.7 - 226, n=27) | |
| Razer Blade 17 (i7-12800H, RTX 3070 Ti) | |
| MSI Creator Z17 A12UGST-054 | |
| Aorus 17X XES | |
| MSI Creator Z16P B12UHST | |
| MSI Creator 17 A10SGS | |
| Dell XPS 17 9720 RTX 3060 | |
| Average of class Multimedia (22 - 224, n=11, last 2 years) | |
| 1920x1080 Ultra Graphics & Postprocessing (HBAO+) | |
| Razer Blade 17 (i7-12800H, RTX 3070 Ti) | |
| Average NVIDIA GeForce RTX 3070 Ti Laptop GPU (76.8 - 124.1, n=39) | |
| Aorus 17X XES | |
| MSI Creator Z17 A12UGST-054 | |
| MSI Creator 17 A10SGS | |
| MSI Creator Z16P B12UHST | |
| Dell XPS 17 9720 RTX 3060 | |
| Average of class Multimedia (11 - 121, n=11, last 2 years) | |
During the Witcher 3 loop test, performance decreased over the course of an hour. Between the start and the end, the frame rate dropped by a full 18 per cent, which is quite a lot. This could be due to the high temperatures preventing the Z17 from constantly delivering its peak performance.
CPU clock speeds fluctuated between 2.5 and 3.3 GHz (depending on the core), with CPU temperatures averaging 91°C (196°F). The overall power consumption decreased from 50 to 34 watts over the test duration.
At the same time, GPU clock speed briefly hit 1.6 GHz before falling to just 1.1 GHz. The memory clock speed remained constant. GPU temperatures were around 84°C (183°F), but there were hot spots that reached 99°C (210°F). The GPU drew approximately 79 watts of power in total.
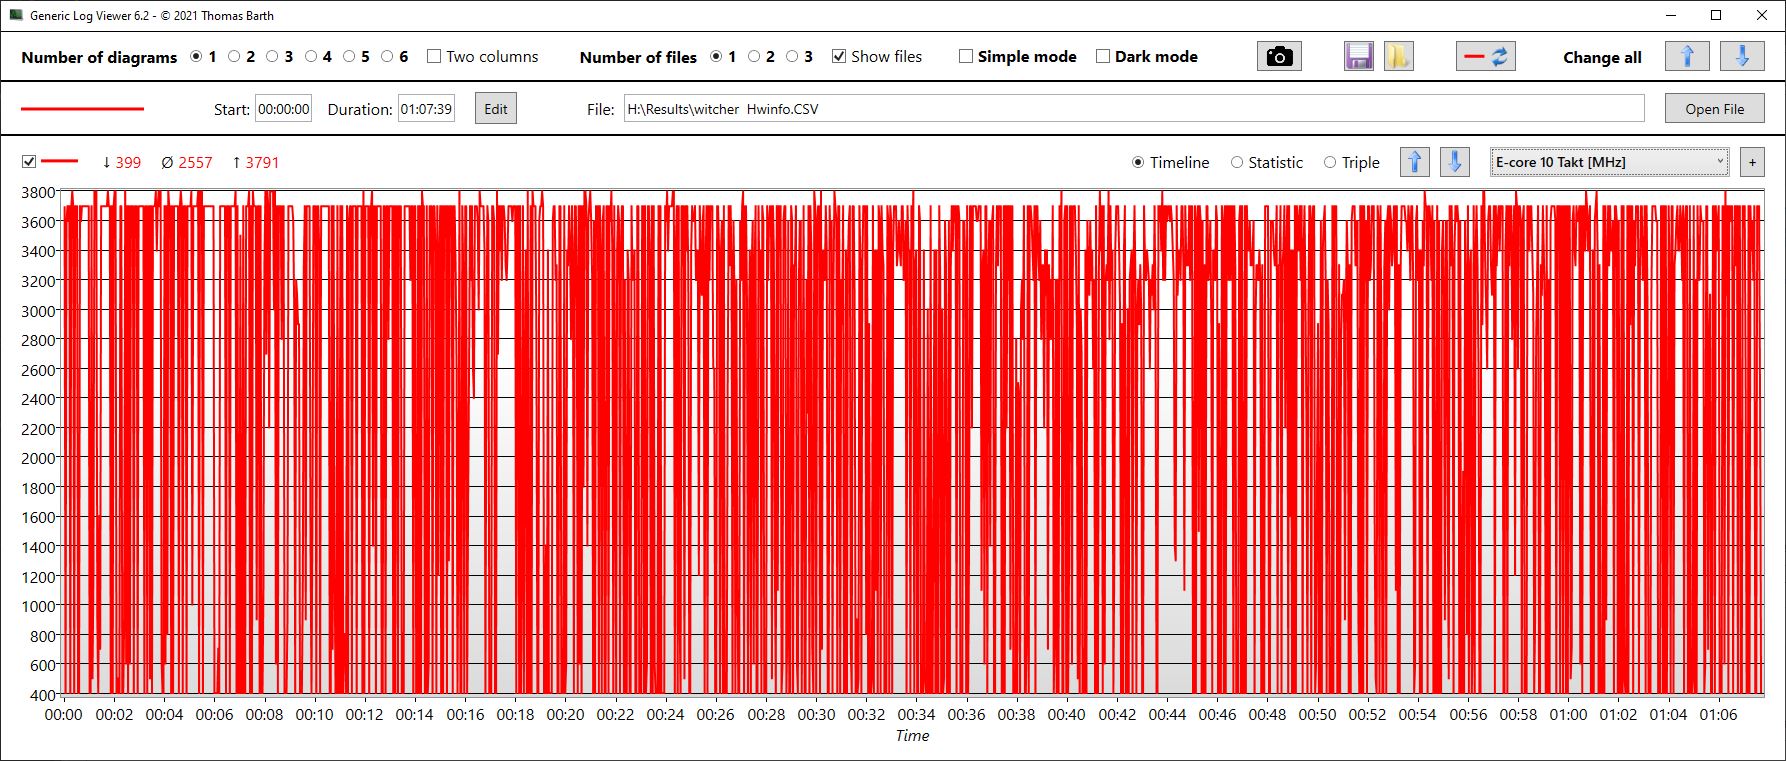
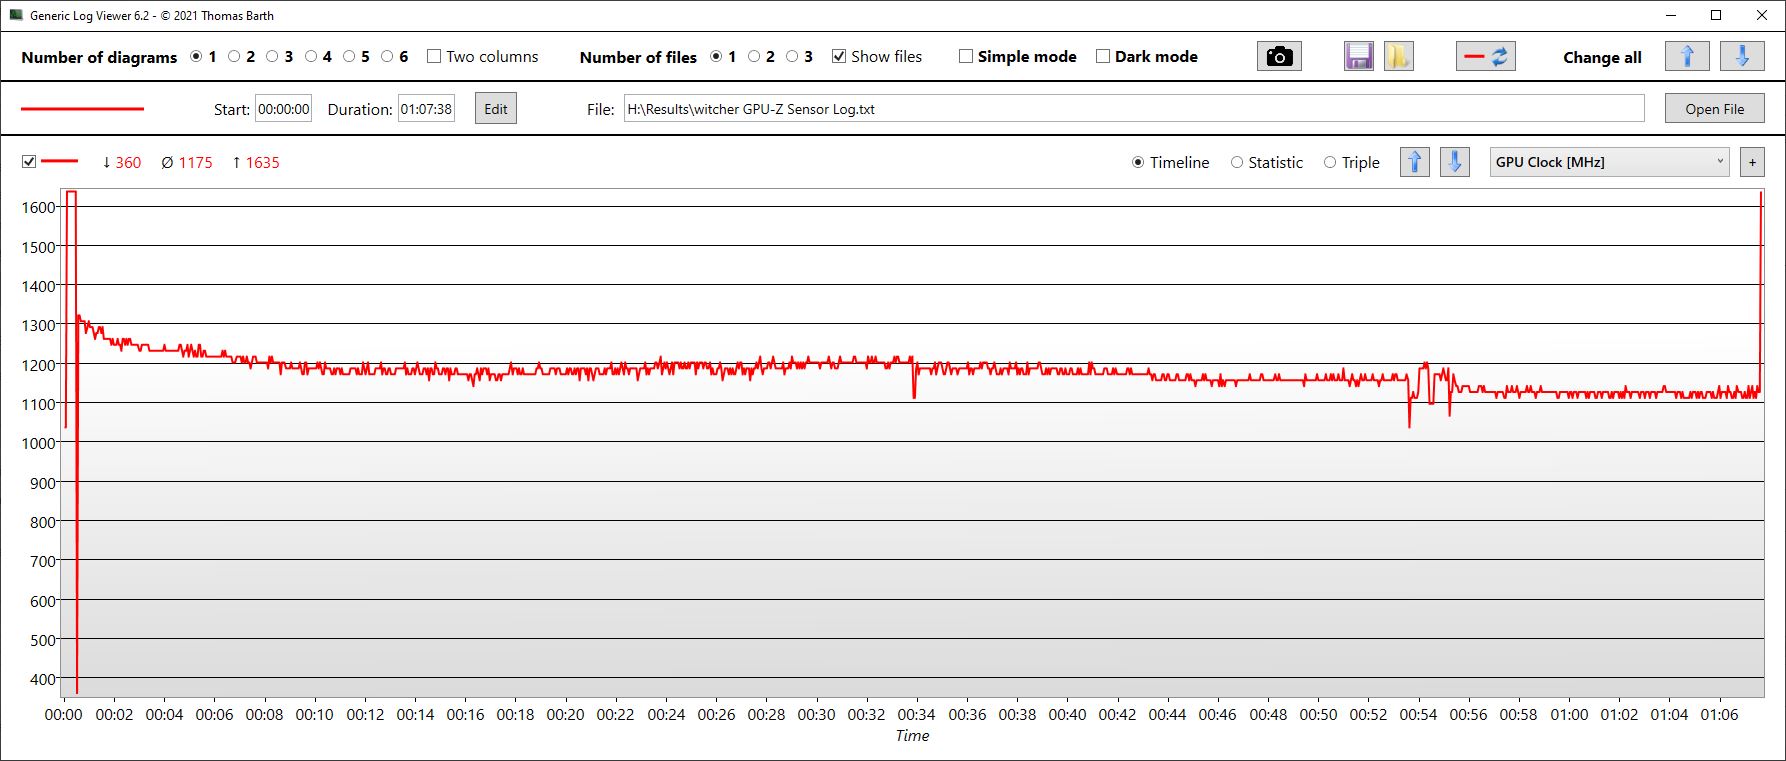
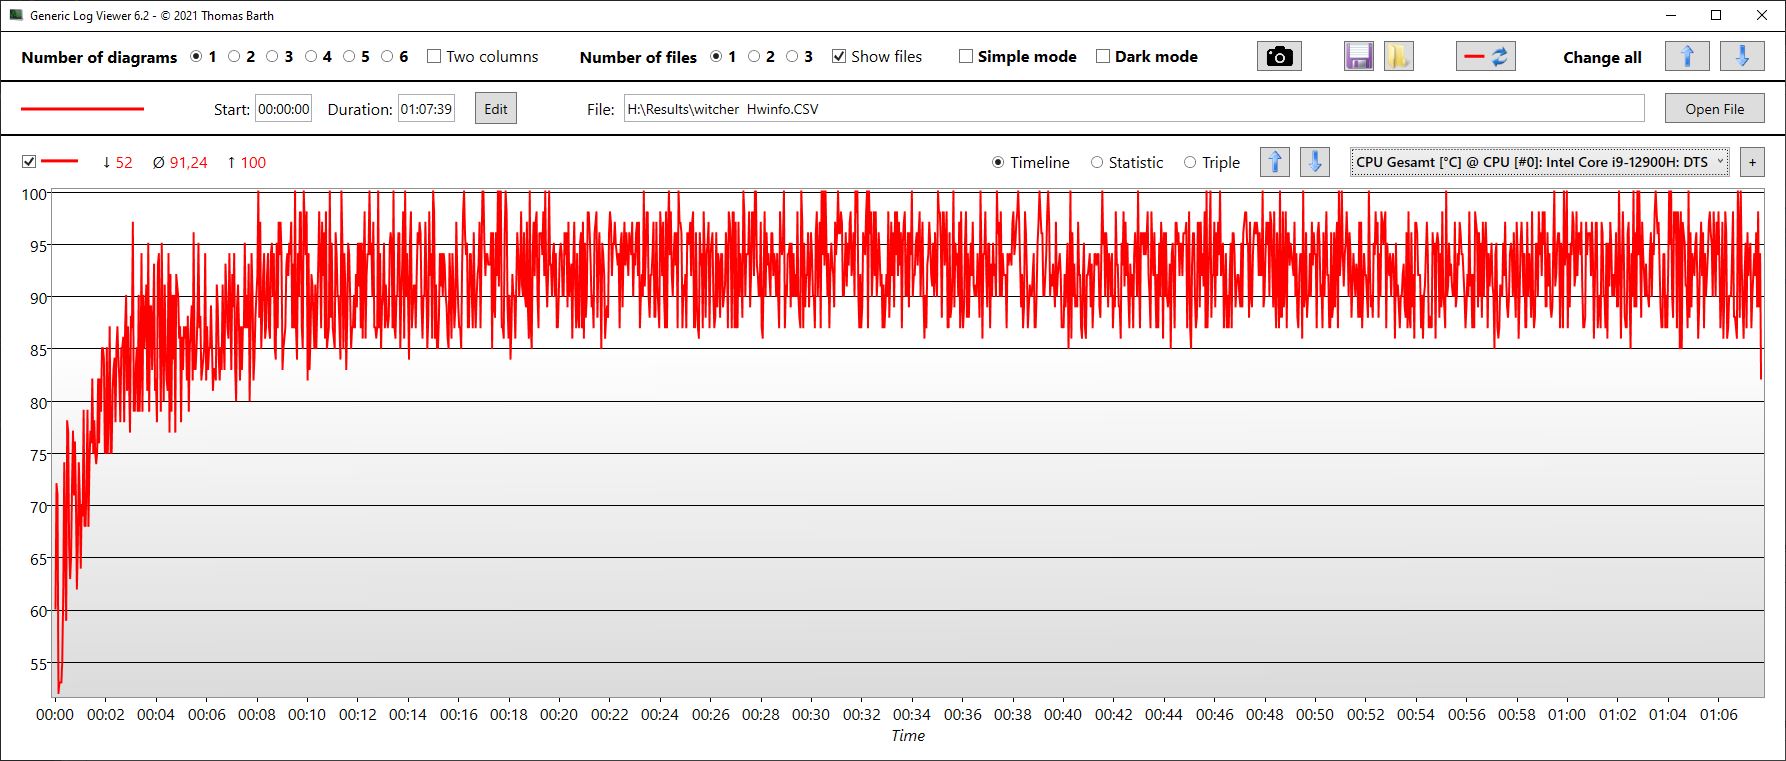
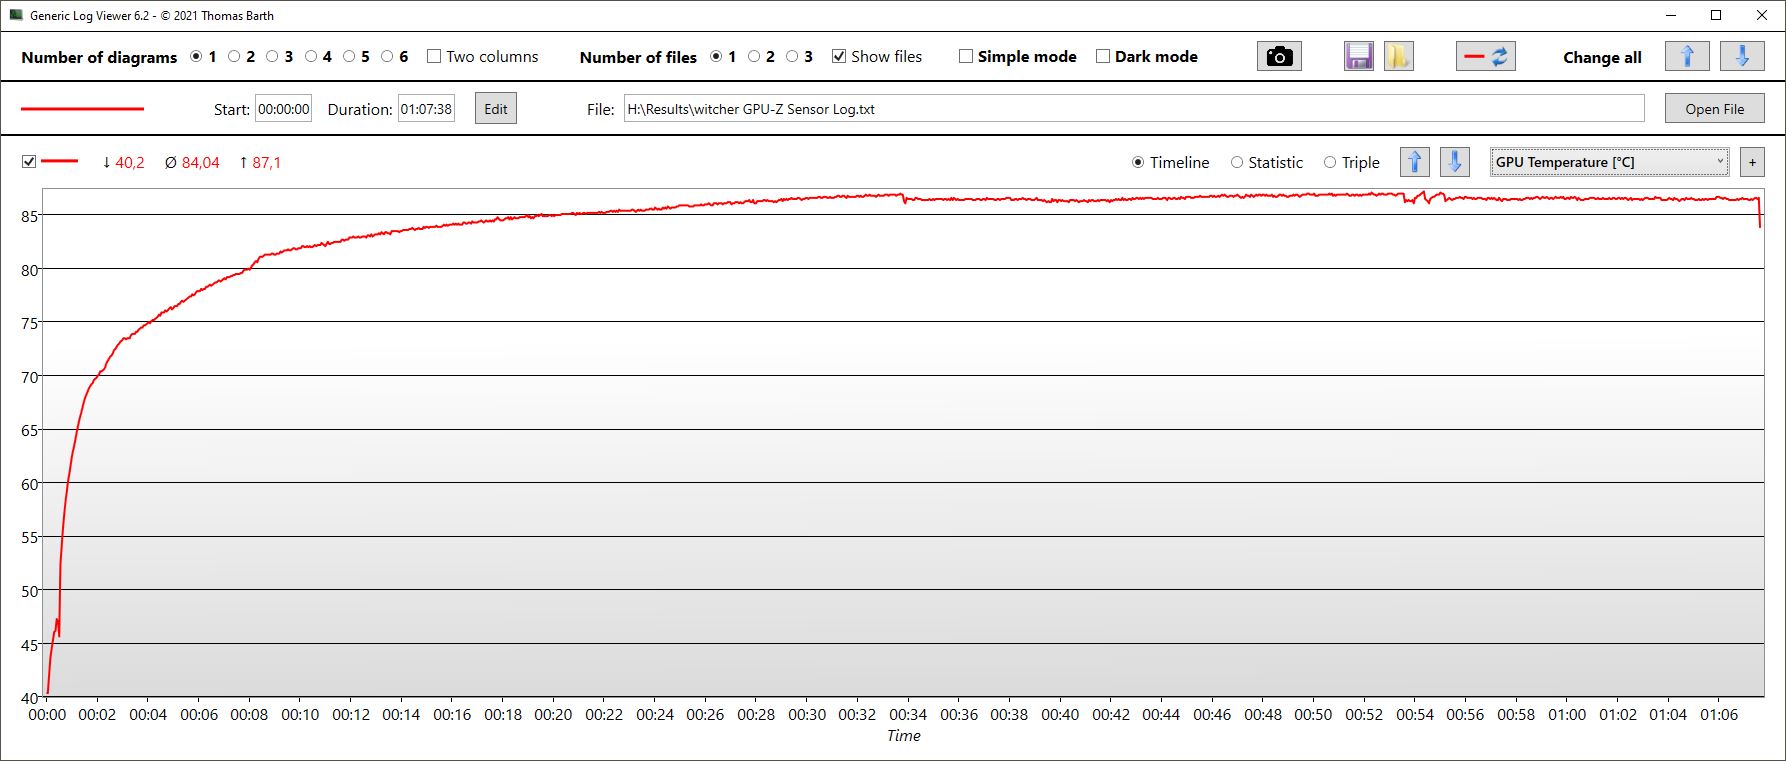
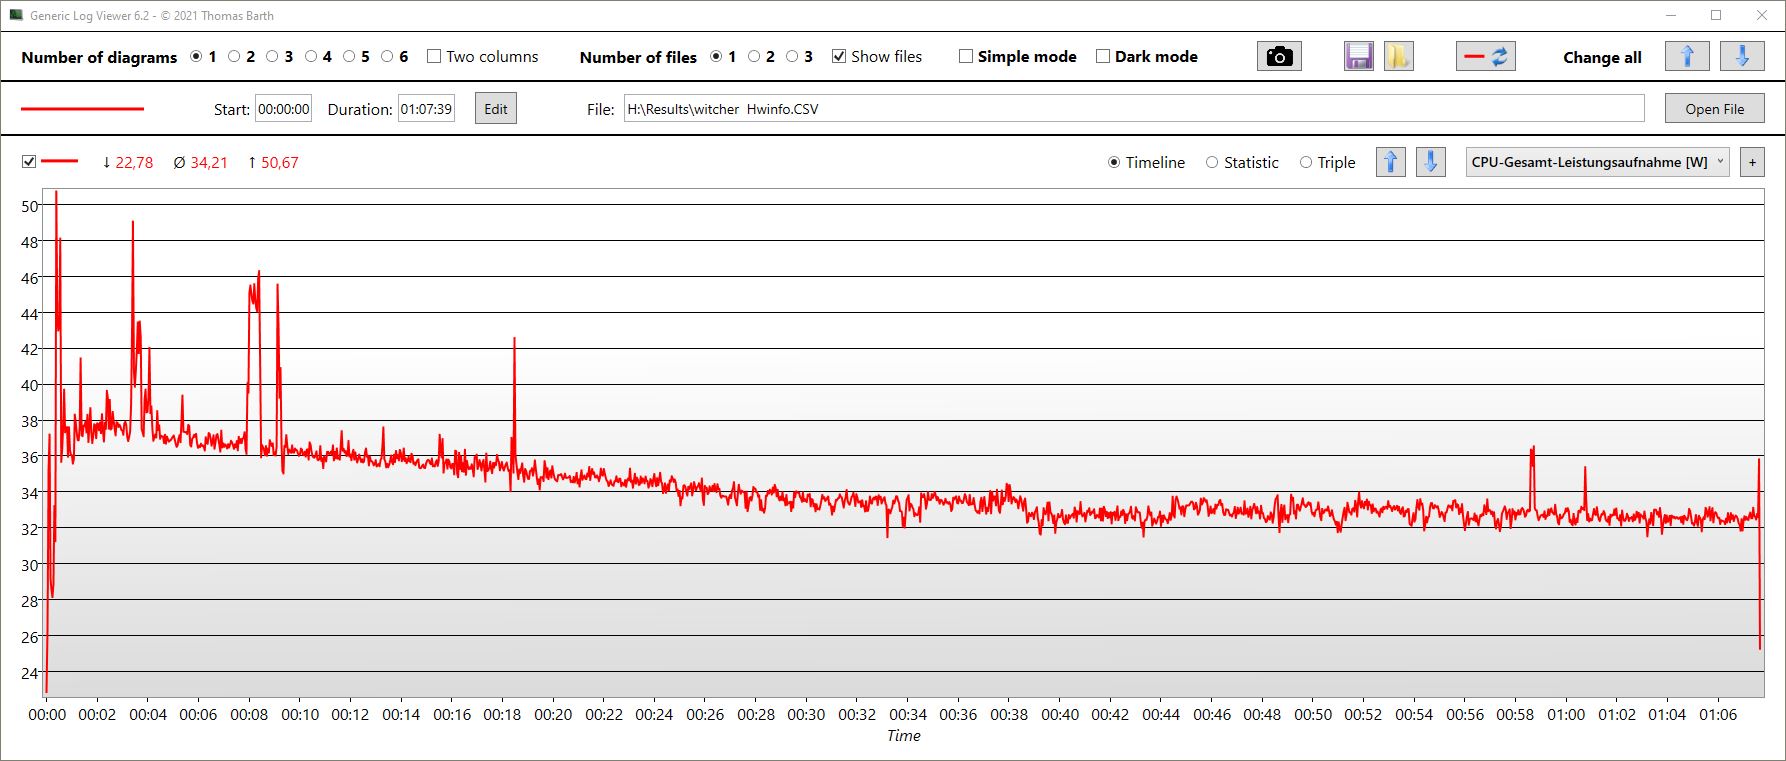
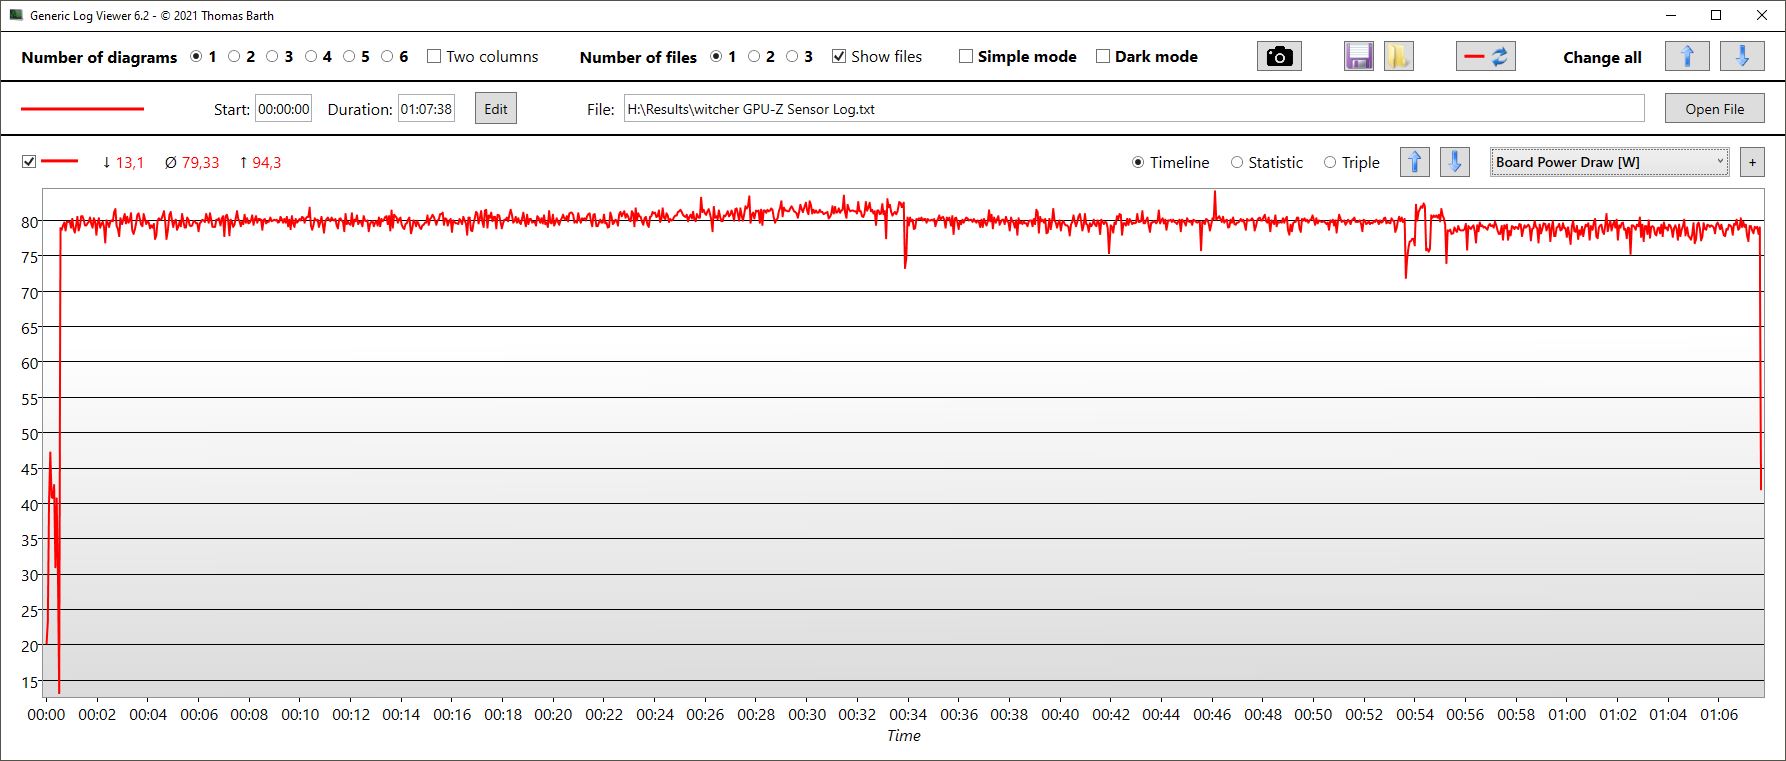
Witcher 3, FPS graph
| low | med. | high | ultra | QHD | |
|---|---|---|---|---|---|
| GTA V (2015) | 118.7 | 90.7 | |||
| The Witcher 3 (2015) | 307 | 289.4 | 165.6 | 90.5 | |
| Dota 2 Reborn (2015) | 191.9 | 177.5 | 168.3 | 158.5 | |
| Final Fantasy XV Benchmark (2018) | 186.6 | 117.9 | 85.4 | 62.5 | |
| X-Plane 11.11 (2018) | 152.5 | 135.3 | 107.6 | ||
| Far Cry 5 (2018) | 187 | 145 | 137 | 124 | 93 |
| Strange Brigade (2018) | 160.6 | 119.8 | |||
| Dying Light 2 (2022) | 100 | 81 | 67.2 | 46.7 |
Emissions - Creator Z17 is hot and loud
Noise emissions
The fans in the Z17 almost never stop running, thus making the slim laptop louder than its competitors even at idle. The "Silent" mode in the MSI Center Pro is almost a bit of a joke. After activating it, you will most likely be waiting in vain for the fans to stop spinning at some point.
Unfortunately, the noise situation continues when the device is under load. Only the thicker and significantly more performant Aorus is marginally louder under stress. To further illustrate the point, the Razer Blade 17, which is at least just as fast, is 10 to 30 per cent quieter than the Z17 under load.
Noise level
| Idle |
| 31.8 / 31.8 / 31.8 dB(A) |
| Load |
| 53.9 / 54.9 dB(A) |
 | ||
30 dB silent 40 dB(A) audible 50 dB(A) loud |
||
min: | ||
| MSI Creator Z17 A12UGST-054 GeForce RTX 3070 Ti Laptop GPU, i9-12900H, Micron 3400 1TB MTFDKBA1T0TFH | MSI Creator 17 A10SGS GeForce RTX 2080 Super Max-Q, i7-10875H, Samsung SSD PM981 MZVLB2T0HMLB | MSI Creator Z16P B12UHST GeForce RTX 3080 Ti Laptop GPU, i9-12900H, Samsung PM9A1 MZVL22T0HBLB | Razer Blade 17 (i7-12800H, RTX 3070 Ti) GeForce RTX 3070 Ti Laptop GPU, i7-12800H, Samsung PM9A1 MZVL21T0HCLR | Aorus 17X XES GeForce RTX 3070 Ti Laptop GPU, i9-12900HX, Gigabyte AG470S1TB-SI B10 | Dell XPS 17 9720 RTX 3060 GeForce RTX 3060 Laptop GPU, i7-12700H, Samsung PM9A1 MZVL21T0HCLR | |
|---|---|---|---|---|---|---|
| Noise | -1% | 12% | 21% | -1% | 18% | |
| off / environment * (dB) | 26 | 30 -15% | 26 -0% | 23 12% | 26 -0% | 23.8 8% |
| Idle Minimum * (dB) | 31.8 | 32 -1% | 27 15% | 23 28% | 28 12% | 24.1 24% |
| Idle Average * (dB) | 31.8 | 33 -4% | 29 9% | 23 28% | 32 -1% | 24.1 24% |
| Idle Maximum * (dB) | 31.8 | 40 -26% | 31 3% | 23 28% | 38 -19% | 24.1 24% |
| Load Average * (dB) | 53.9 | 47 13% | 43 20% | 36.92 32% | 53 2% | 43.2 20% |
| Witcher 3 ultra * (dB) | 53.9 | 46 15% | 43 20% | 50 7% | 54 -0% | 48 11% |
| Load Maximum * (dB) | 54.9 | 48 13% | 46 16% | 50 9% | 55 -0% | 48 13% |
* ... smaller is better
Temperature
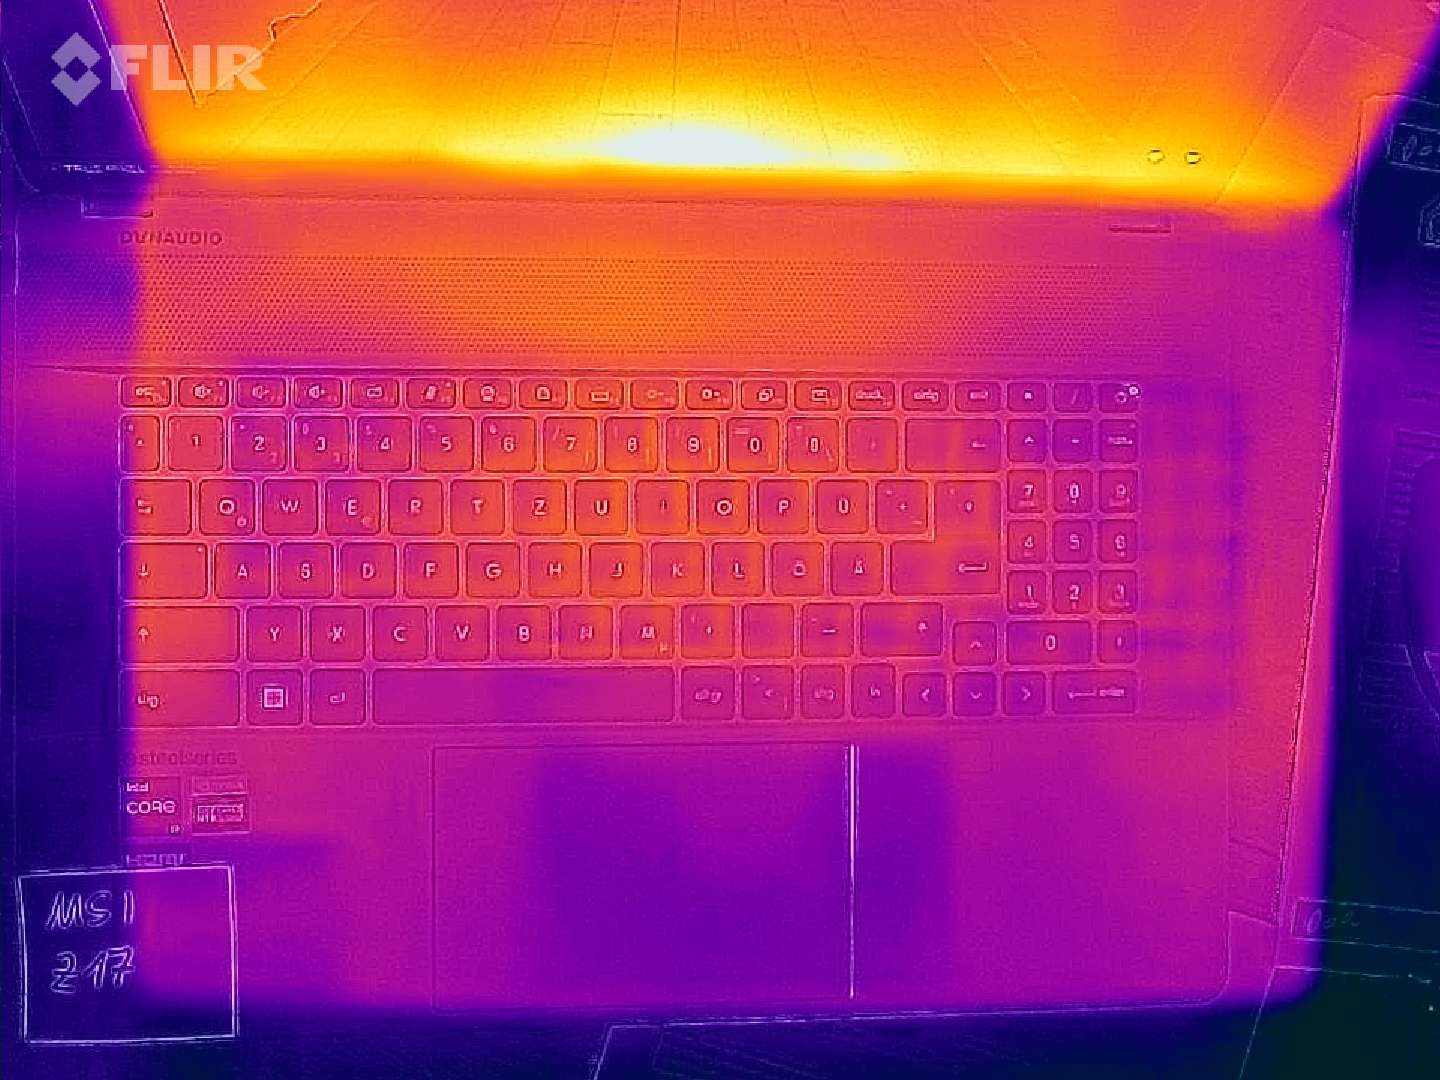
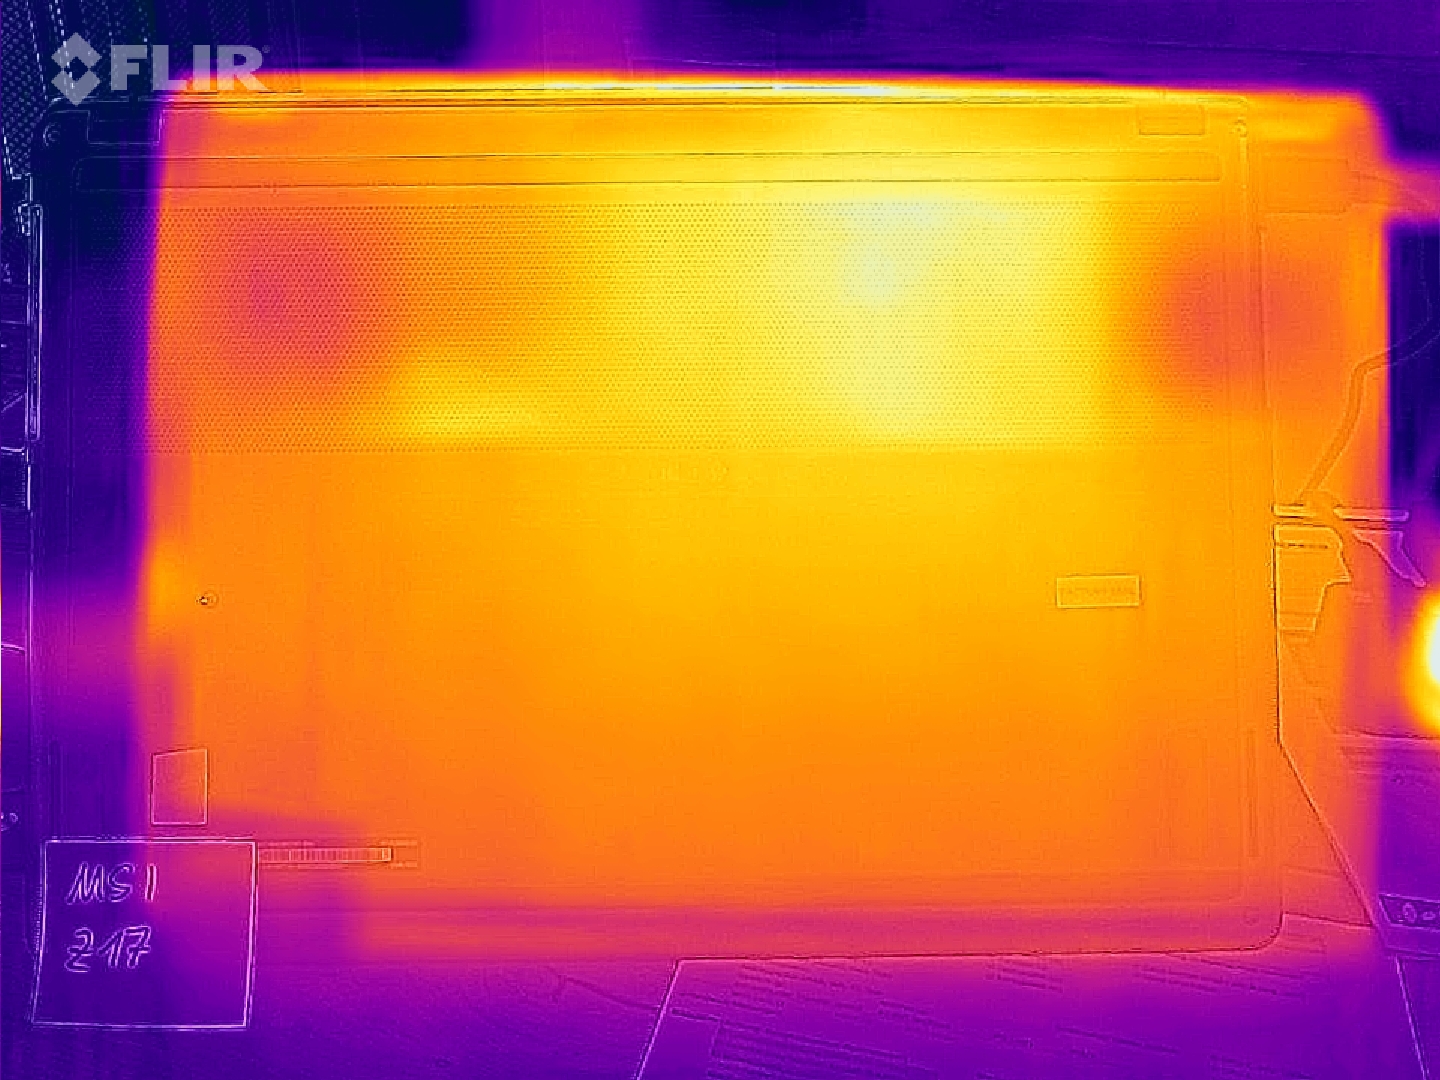
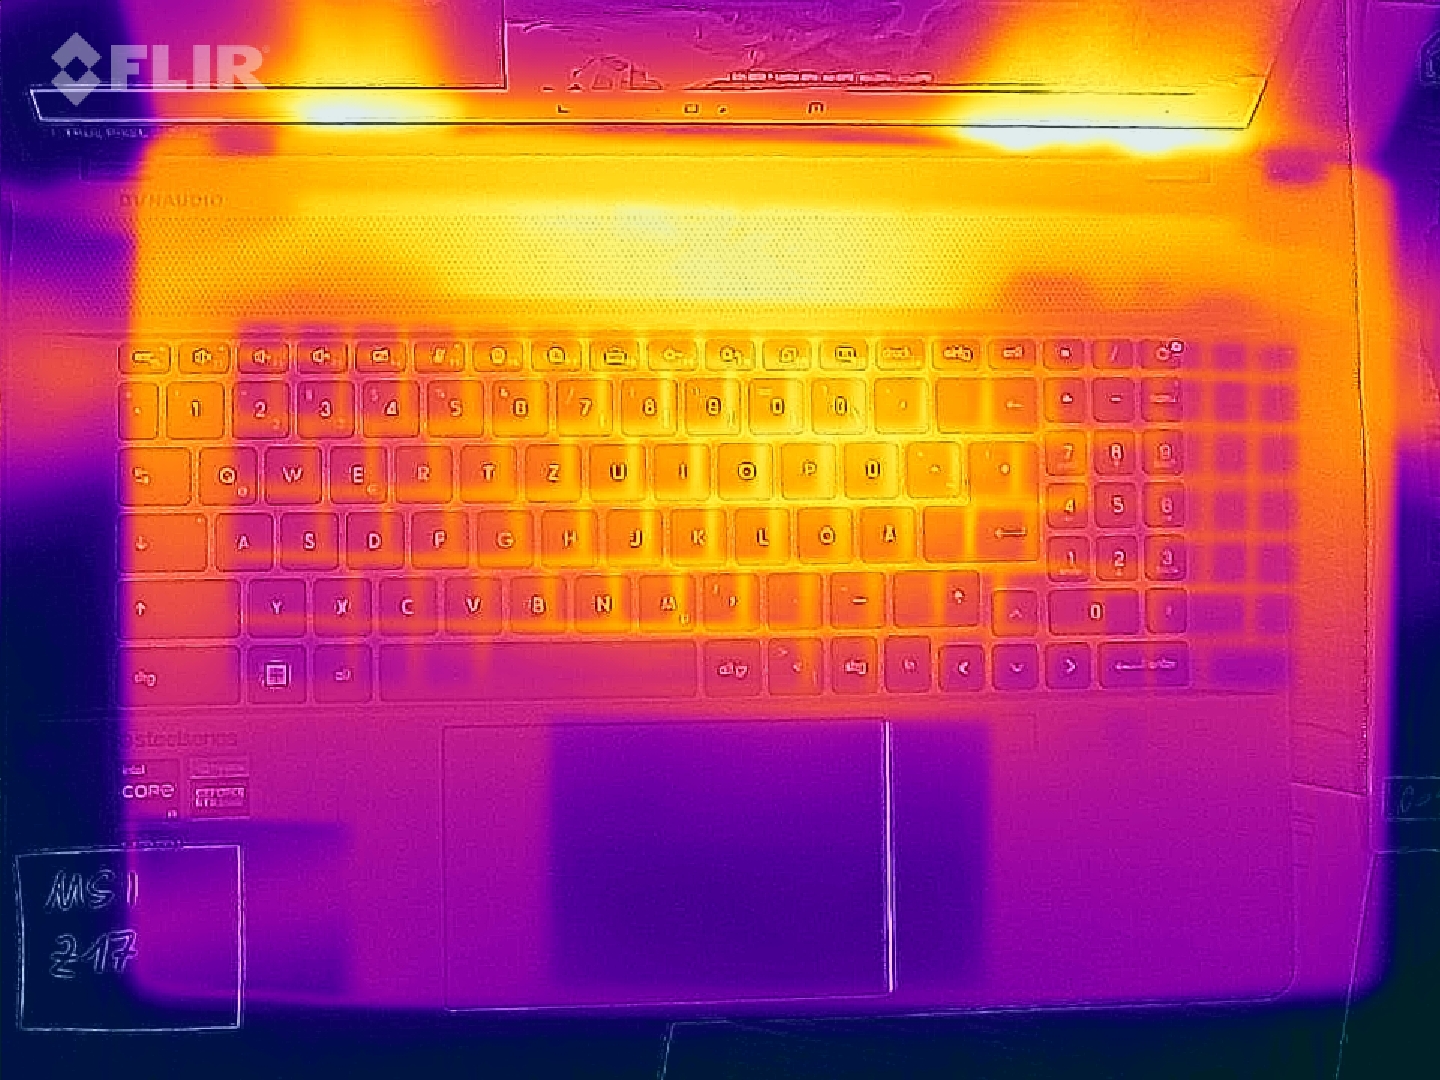
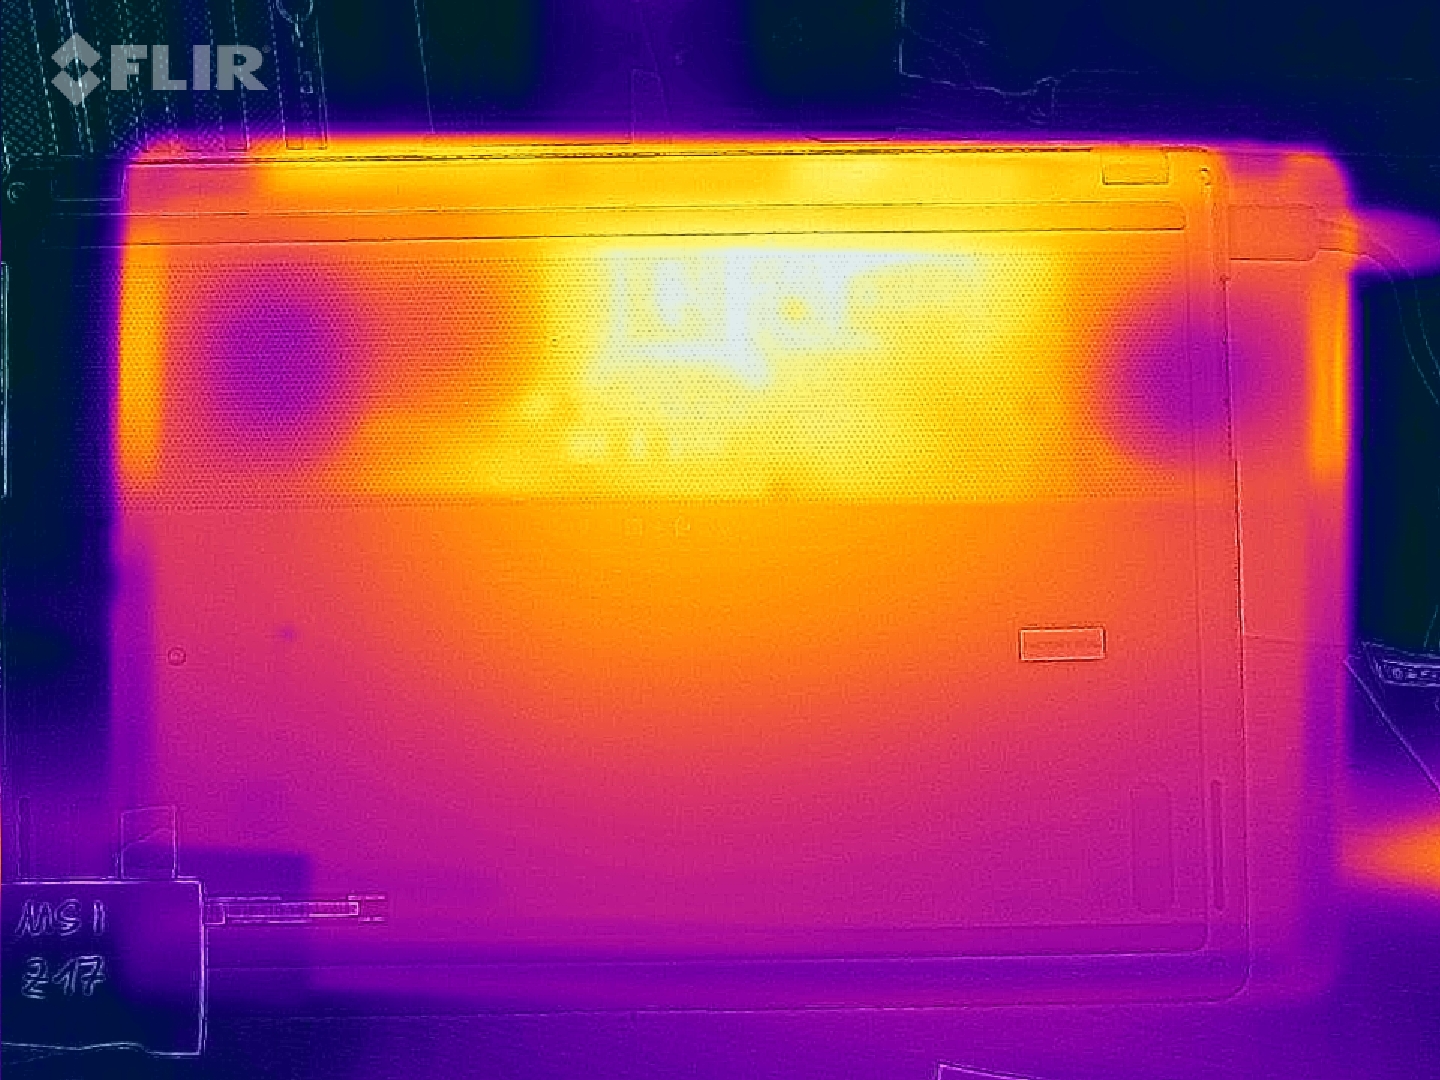
You would be mistaken for thinking that the loud fans would at least keep the chassis cool. Under load (stress test), there were hot spots with temperatures as high as 68°C (154°F) in the middle of the bottom panel (near the display). Competing products from other companies are at least 10°C (50°F) cooler both under load and during gaming.
Even the palm rests were close to 40°C (104°F) during the stress test and reached 36°C (97°F) when the laptop was running Witcher 3. These are likewise the highest values within the comparison group.
(-) The maximum temperature on the upper side is 63.9 °C / 147 F, compared to the average of 36.8 °C / 98 F, ranging from 21 to 71 °C for the class Multimedia.
(-) The bottom heats up to a maximum of 68 °C / 154 F, compared to the average of 39.1 °C / 102 F
(+) In idle usage, the average temperature for the upper side is 27 °C / 81 F, compared to the device average of 31.3 °C / 88 F.
(-) Playing The Witcher 3, the average temperature for the upper side is 44.6 °C / 112 F, compared to the device average of 31.3 °C / 88 F.
(-) The palmrests and touchpad can get very hot to the touch with a maximum of 40 °C / 104 F.
(-) The average temperature of the palmrest area of similar devices was 28.7 °C / 83.7 F (-11.3 °C / -20.3 F).
| MSI Creator Z17 A12UGST-054 Intel Core i9-12900H, NVIDIA GeForce RTX 3070 Ti Laptop GPU | MSI Creator 17 A10SGS Intel Core i7-10875H, NVIDIA GeForce RTX 2080 Super Max-Q | MSI Creator Z16P B12UHST Intel Core i9-12900H, NVIDIA GeForce RTX 3080 Ti Laptop GPU | Razer Blade 17 (i7-12800H, RTX 3070 Ti) Intel Core i7-12800H, NVIDIA GeForce RTX 3070 Ti Laptop GPU | Aorus 17X XES Intel Core i9-12900HX, NVIDIA GeForce RTX 3070 Ti Laptop GPU | Dell XPS 17 9720 RTX 3060 Intel Core i7-12700H, NVIDIA GeForce RTX 3060 Laptop GPU | |
|---|---|---|---|---|---|---|
| Heat | 1% | -1% | 11% | -8% | 5% | |
| Maximum Upper Side * (°C) | 63.9 | 52 19% | 67 -5% | 43 33% | 54 15% | 51.8 19% |
| Maximum Bottom * (°C) | 68 | 59 13% | 69 -1% | 44 35% | 58 15% | 44.2 35% |
| Idle Upper Side * (°C) | 28.3 | 34 -20% | 29 -2% | 32 -13% | 37 -31% | 34.8 -23% |
| Idle Bottom * (°C) | 30.2 | 33 -9% | 29 4% | 34 -13% | 39 -29% | 33.2 -10% |
* ... smaller is better
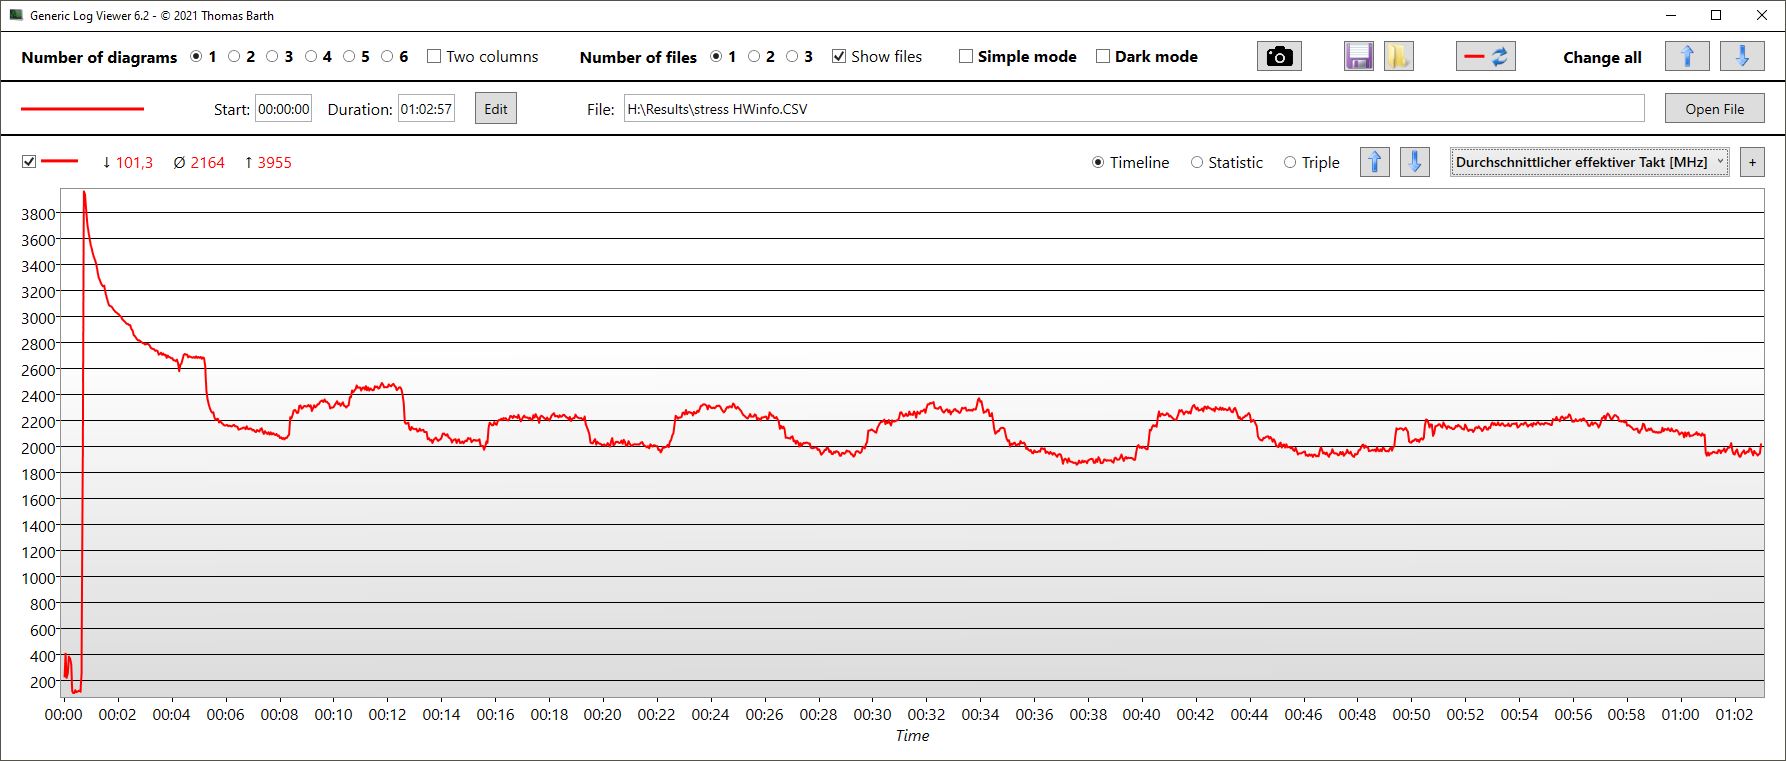
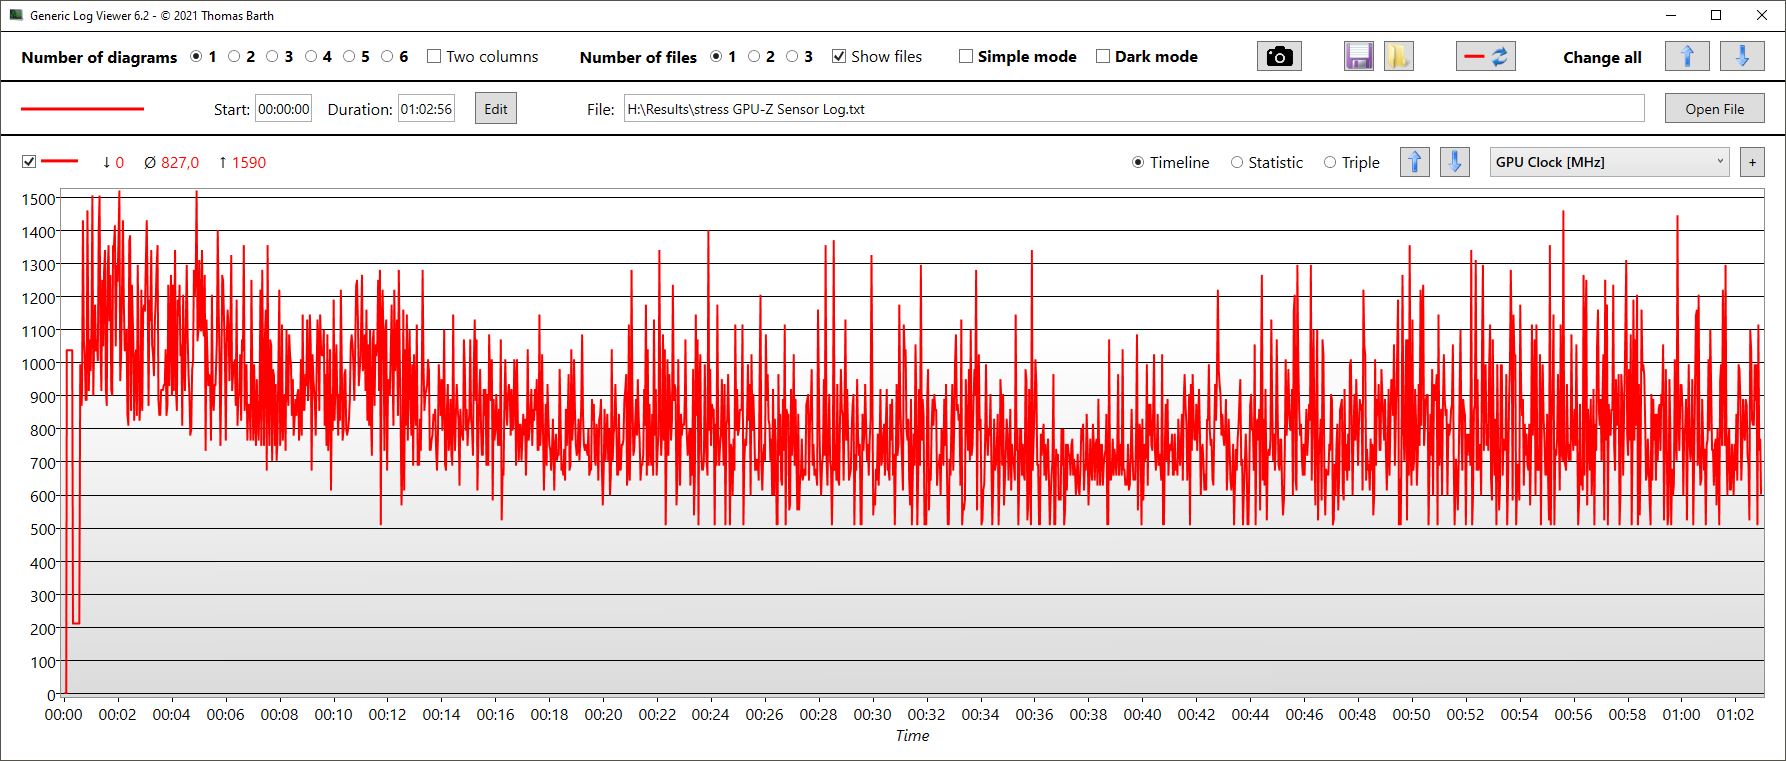
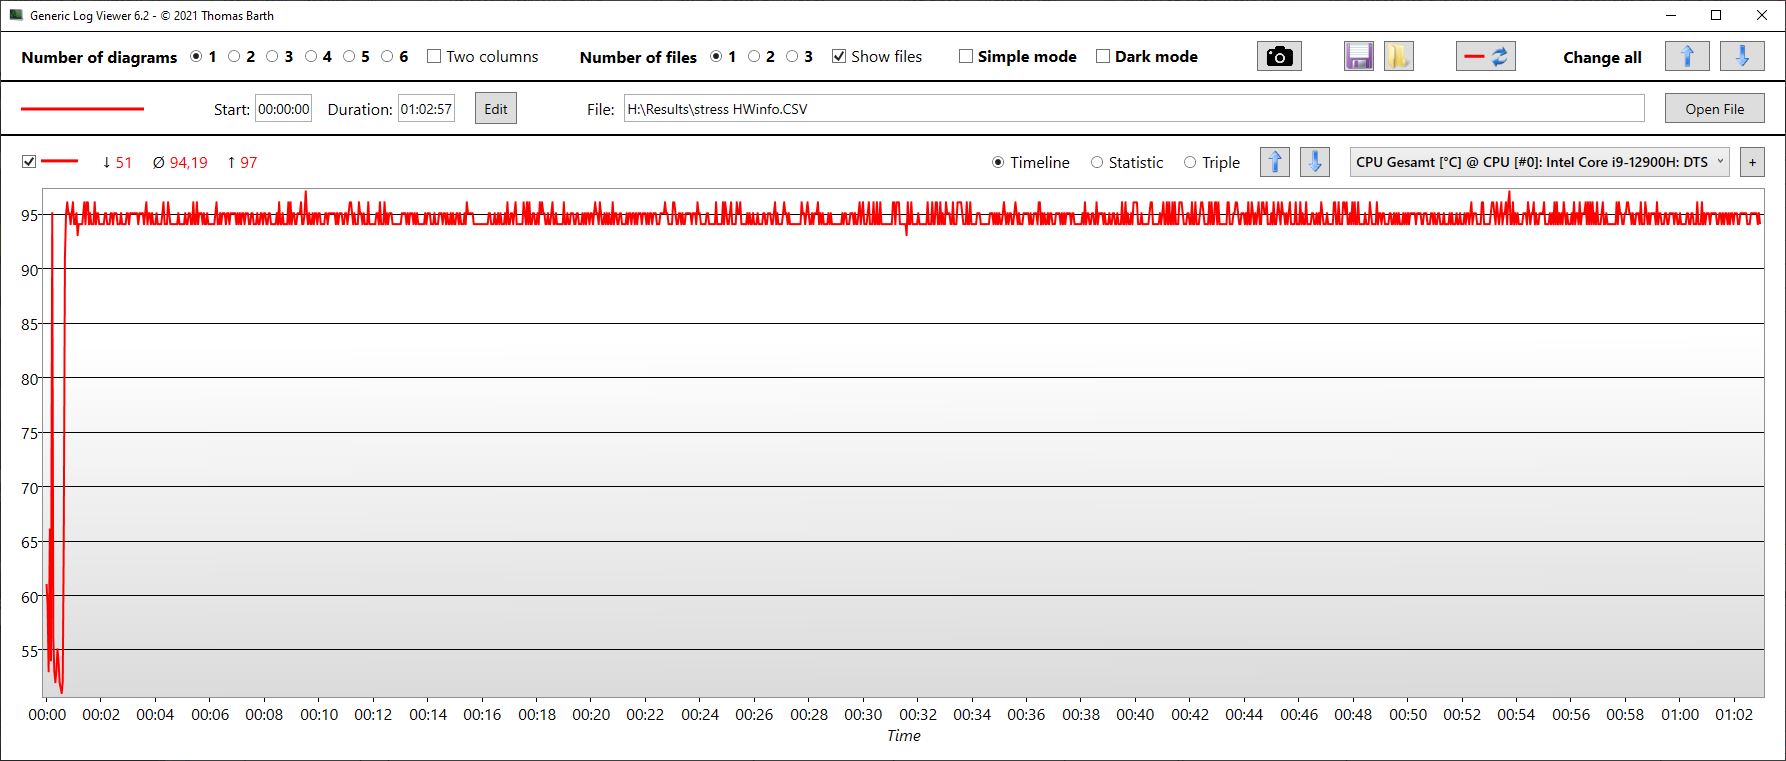
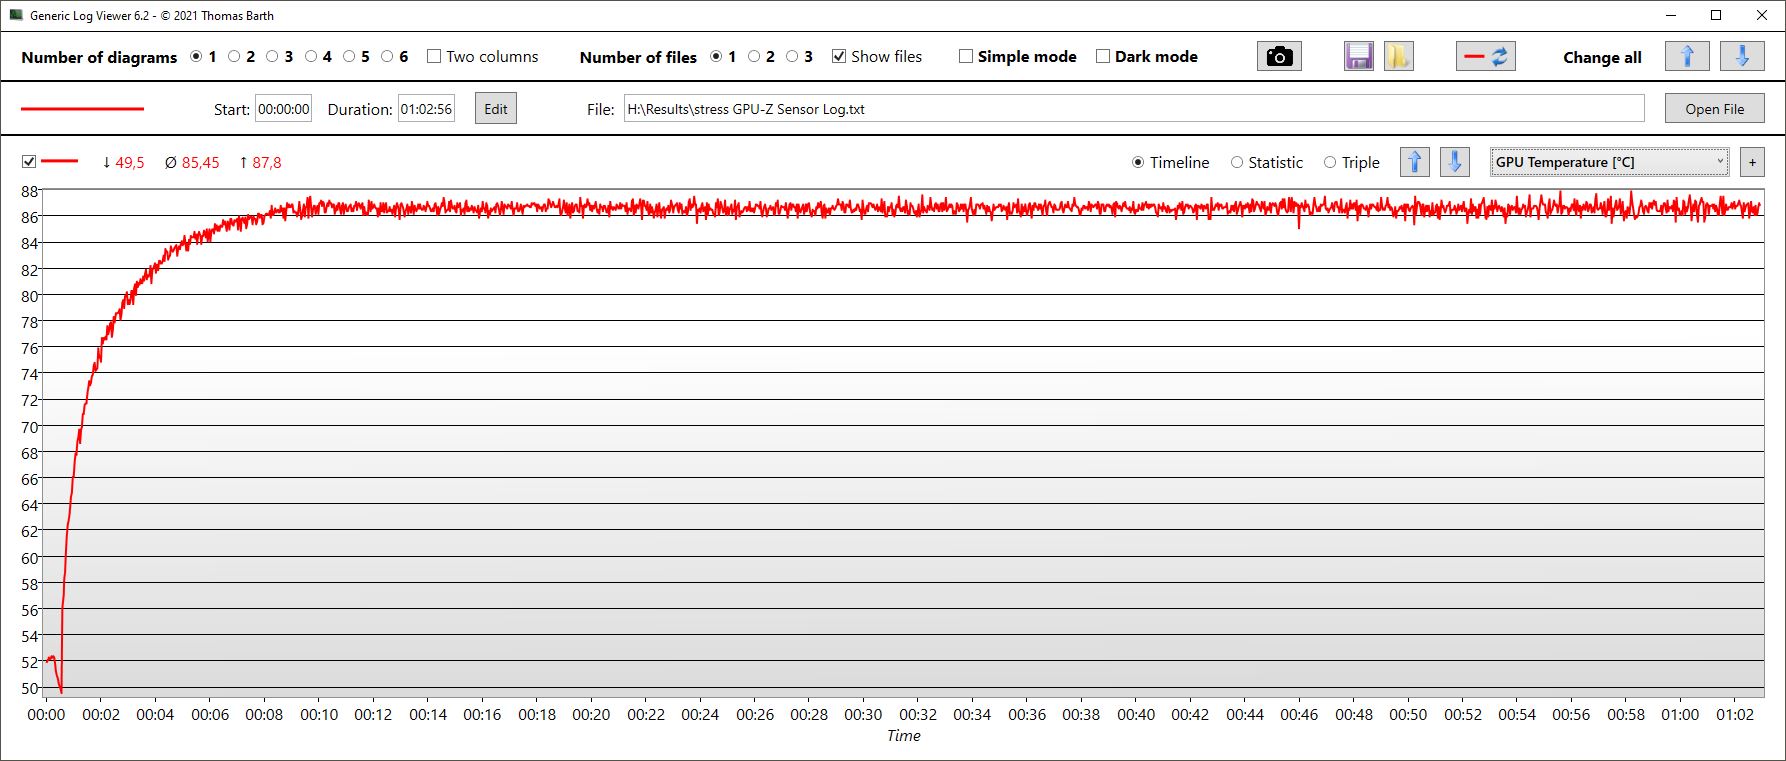
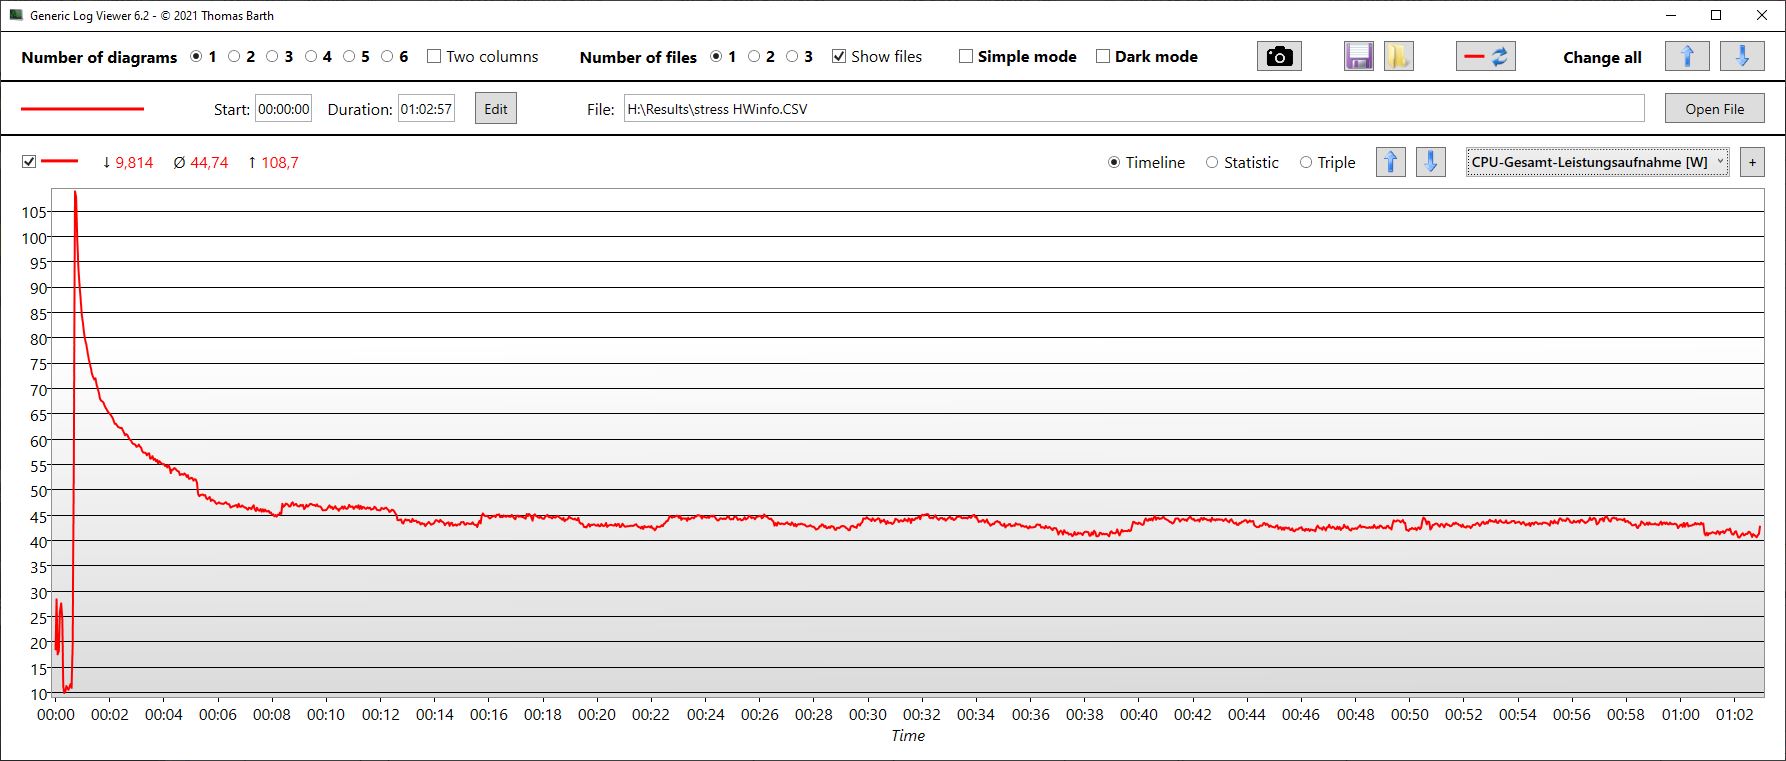
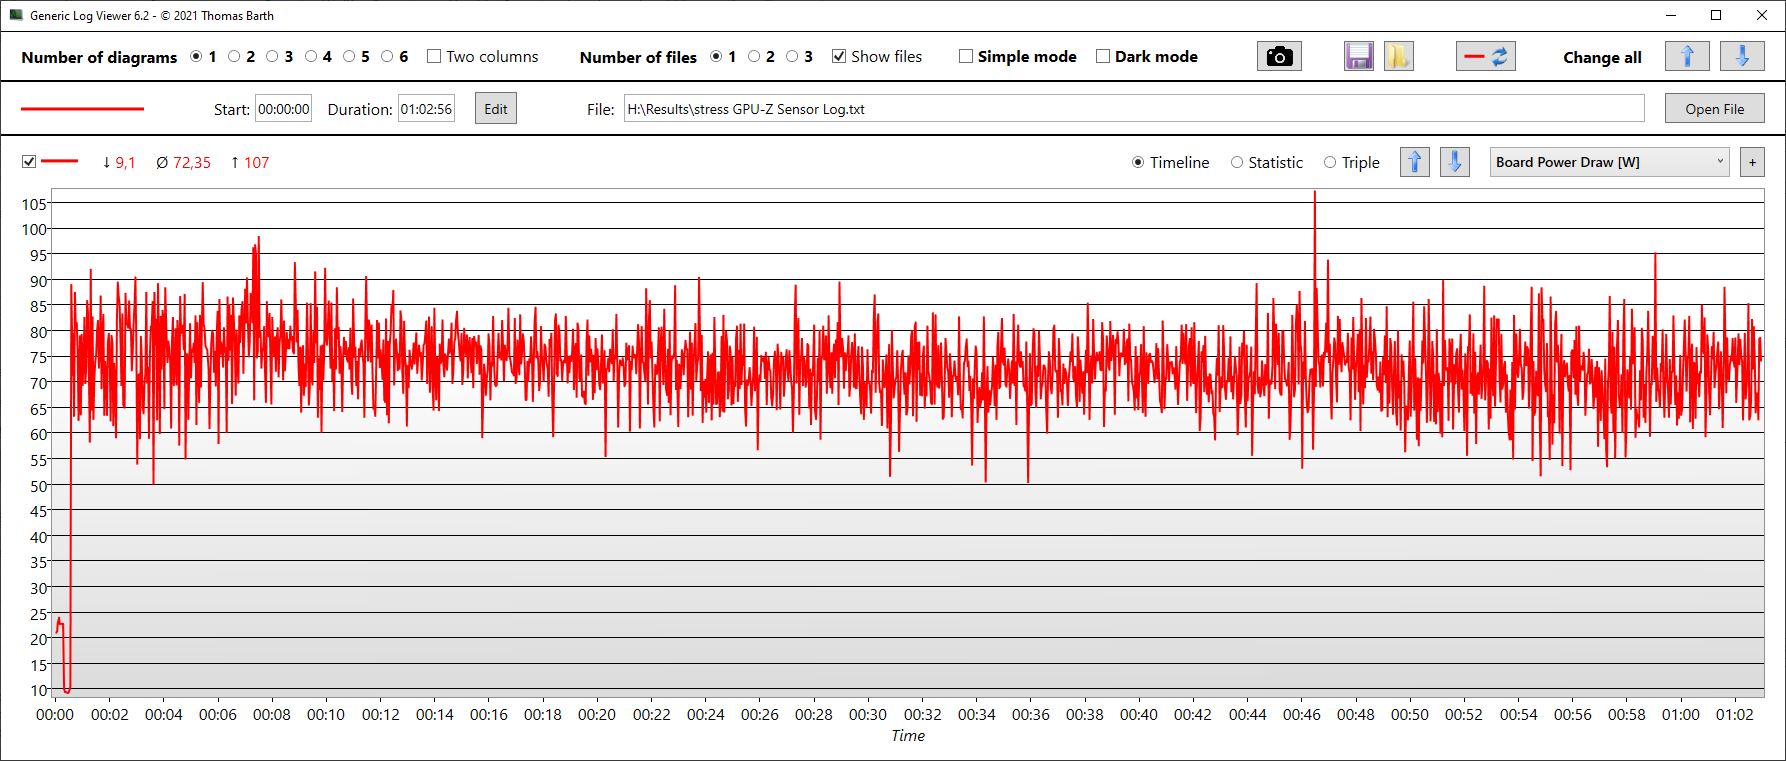
Stress test
At the beginning of our one-hour stress test, the CPU clock speed very briefly approached 4 GHz. Then it fell rapidly due to high temperatures before stabilising at around 2.1 to 2.2 GHz. The cores were hitting their temperature limit and running at 94°C (201°C) on average.
At the same time, GPU clock speeds fluctuated drastically between 500 MHz and 1.4 GHz, averaging a fairly low 827 MHz. The GPU remained at a constant 85°C (185°F) and drew about 72 watts of power.
Speakers
Even though the two-way stereo speakers can get loud, they have hardly any bass to speak of. We had expected more from the stereo speakers. There is only a headphone jack available for connecting analogue playback devices.
MSI Creator Z17 A12UGST-054 audio analysis
(+) | speakers can play relatively loud (84.8 dB)
Bass 100 - 315 Hz
(-) | nearly no bass - on average 29.6% lower than median
(±) | linearity of bass is average (12.8% delta to prev. frequency)
Mids 400 - 2000 Hz
(+) | balanced mids - only 2.4% away from median
(±) | linearity of mids is average (8.9% delta to prev. frequency)
Highs 2 - 16 kHz
(±) | higher highs - on average 6.8% higher than median
(+) | highs are linear (6.5% delta to prev. frequency)
Overall 100 - 16.000 Hz
(±) | linearity of overall sound is average (20.9% difference to median)
Compared to same class
» 71% of all tested devices in this class were better, 8% similar, 21% worse
» The best had a delta of 5%, average was 17%, worst was 45%
Compared to all devices tested
» 57% of all tested devices were better, 8% similar, 35% worse
» The best had a delta of 4%, average was 23%, worst was 134%
Apple MacBook Pro 16 2021 M1 Pro audio analysis
(+) | speakers can play relatively loud (84.7 dB)
Bass 100 - 315 Hz
(+) | good bass - only 3.8% away from median
(+) | bass is linear (5.2% delta to prev. frequency)
Mids 400 - 2000 Hz
(+) | balanced mids - only 1.3% away from median
(+) | mids are linear (2.1% delta to prev. frequency)
Highs 2 - 16 kHz
(+) | balanced highs - only 1.9% away from median
(+) | highs are linear (2.7% delta to prev. frequency)
Overall 100 - 16.000 Hz
(+) | overall sound is linear (4.6% difference to median)
Compared to same class
» 0% of all tested devices in this class were better, 0% similar, 100% worse
» The best had a delta of 5%, average was 17%, worst was 45%
Compared to all devices tested
» 0% of all tested devices were better, 0% similar, 100% worse
» The best had a delta of 4%, average was 23%, worst was 134%
Power management - Workstation in line with expectation
Power consumption
Like the performance, the power consumption is reasonable under load. In comparison, the Razer Blade 17 uses significantly more power during gaming or whilst running at max load. The same is also true for the Aorus.
By contrast, the Z17's power usage is quite unusual – it is twice as high as that of the competitors. Because the Creator Z16P uses only half as much power at idle as the Z17 despite having a more powerful GPU, we believe that a process is causing the RTX GPU to be activated.
We measured a peak power usage of 220 watts. The 240-watt charger (approx. 16.4 x 7.5 x 2.5 cm, or 6.5 x 3.0 x 1.0") should have no problem handling this level of power use.
| Off / Standby | |
| Idle | |
| Load |
|
Key:
min: | |
| MSI Creator Z17 A12UGST-054 i9-12900H, GeForce RTX 3070 Ti Laptop GPU, Micron 3400 1TB MTFDKBA1T0TFH, IPS, 2560x1600, 17" | MSI Creator 17 A10SGS i7-10875H, GeForce RTX 2080 Super Max-Q, Samsung SSD PM981 MZVLB2T0HMLB, Mini-LED IPS-Level, 3840x2160, 17.3" | MSI Creator Z16P B12UHST i9-12900H, GeForce RTX 3080 Ti Laptop GPU, Samsung PM9A1 MZVL22T0HBLB, IPS True Pixel (~100% DCI-P3), 2560x1600, 16" | Razer Blade 17 (i7-12800H, RTX 3070 Ti) i7-12800H, GeForce RTX 3070 Ti Laptop GPU, Samsung PM9A1 MZVL21T0HCLR, IPS, 2560x1440, 17.3" | Aorus 17X XES i9-12900HX, GeForce RTX 3070 Ti Laptop GPU, Gigabyte AG470S1TB-SI B10, IPS, 1920x1080, 17.3" | Dell XPS 17 9720 RTX 3060 i7-12700H, GeForce RTX 3060 Laptop GPU, Samsung PM9A1 MZVL21T0HCLR, IPS, 3840x2400, 17" | Average NVIDIA GeForce RTX 3070 Ti Laptop GPU | Average of class Multimedia | |
|---|---|---|---|---|---|---|---|---|
| Power Consumption | 18% | 33% | 21% | 3% | 45% | 31% | 68% | |
| Idle Minimum * (Watt) | 34.6 | 15 57% | 11 68% | 14.4 58% | 18 48% | 5.9 83% | 14.2 ? 59% | 5.65 ? 84% |
| Idle Average * (Watt) | 43 | 20 53% | 17 60% | 20 53% | 28 35% | 15.8 63% | 19.9 ? 54% | 10 ? 77% |
| Idle Maximum * (Watt) | 44.9 | 42 6% | 26 42% | 21.5 52% | 36 20% | 26.7 41% | 26.2 ? 42% | 12.3 ? 73% |
| Load Average * (Watt) | 145 | 150 -3% | 124 14% | 119 18% | 153 -6% | 117.4 19% | 125.8 ? 13% | 65.1 ? 55% |
| Witcher 3 ultra * (Watt) | 152.4 | 170 -12% | 133.5 12% | 218 -43% | 221 -45% | 114.8 25% | ||
| Load Maximum * (Watt) | 220 | 210 5% | 212 4% | 248 -13% | 290 -32% | 136.6 38% | 248 ? -13% | 112.5 ? 49% |
* ... smaller is better
Power consumption Witcher 3 / stress test
Power consumption with external monitor
Battery life
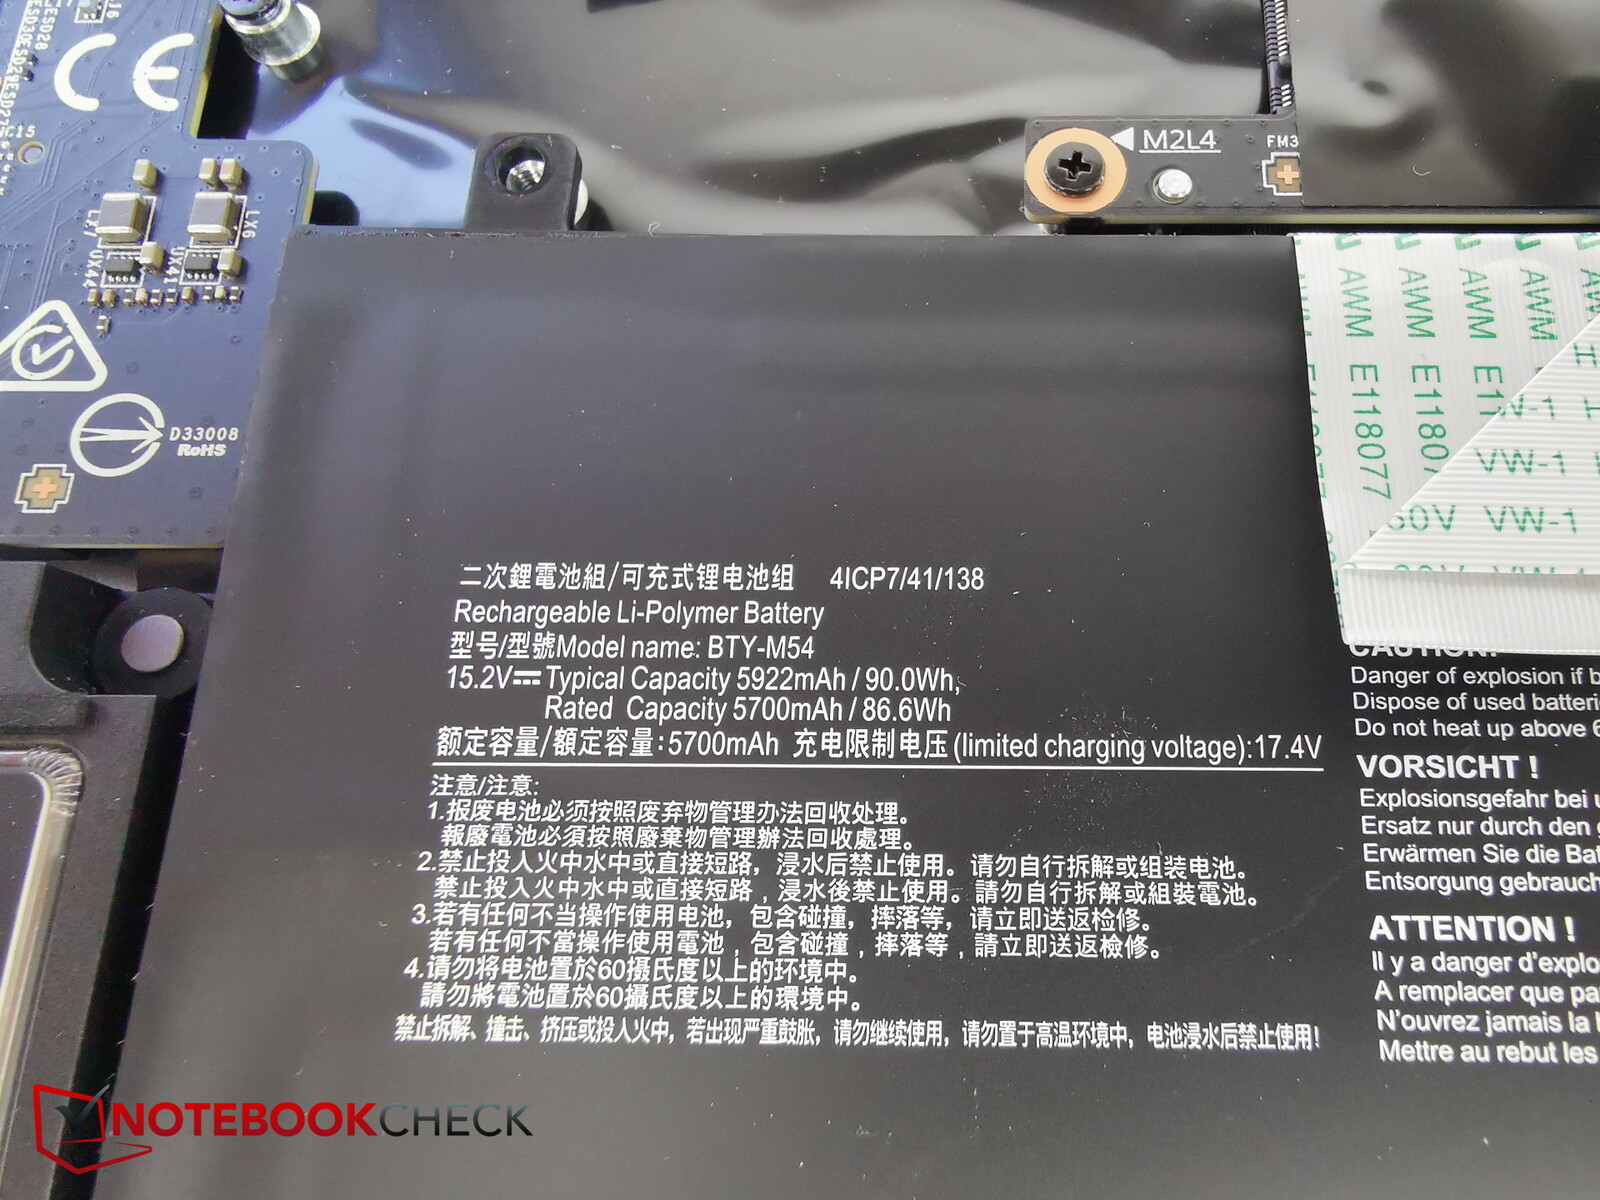
The Creator Z17 is powered by a 90 Wh battery when unplugged, which is on par with the other laptops in the comparison. The resulting battery life is more on the upper end amongst the devices in the comparison. Despite having a marginally smaller battery, the Razer Blade 17 is able to last almost as long on a single charge. In order to maximise a laptop's battery, it is crucial to reduce the display's refresh rate to 60 Hz. On the Z17, this happens pretty much automatically when the device is unplugged.
The Z17 will last between 4.5 and 5.5 hours (depending on screen brightness) when browsing the web. The battery life is in the same range for video playback.
| MSI Creator Z17 A12UGST-054 i9-12900H, GeForce RTX 3070 Ti Laptop GPU, 90 Wh | MSI Creator 17 A10SGS i7-10875H, GeForce RTX 2080 Super Max-Q, 82 Wh | MSI Creator Z16P B12UHST i9-12900H, GeForce RTX 3080 Ti Laptop GPU, 90 Wh | Razer Blade 17 (i7-12800H, RTX 3070 Ti) i7-12800H, GeForce RTX 3070 Ti Laptop GPU, 82 Wh | Aorus 17X XES i9-12900HX, GeForce RTX 3070 Ti Laptop GPU, 99 Wh | Dell XPS 17 9720 RTX 3060 i7-12700H, GeForce RTX 3060 Laptop GPU, 97 Wh | Average of class Multimedia | |
|---|---|---|---|---|---|---|---|
| Battery runtime | -35% | -18% | -7% | -29% | 2% | 96% | |
| H.264 (h) | 5.5 | 5.8 5% | 4.9 -11% | 3.8 -31% | 16.2 ? 195% | ||
| WiFi v1.3 (h) | 5.5 | 4.4 -20% | 5.2 -5% | 5.9 7% | 4.4 -20% | 8.7 58% | 12 ? 118% |
| Load (h) | 2.2 | 1.1 -50% | 1 -55% | 1.8 -18% | 1.4 -36% | 1 -55% | 1.669 ? -24% |
| Reader / Idle (h) | 7.2 | 25.2 ? |
Pros
Cons
Verdict - Eye-watering 4,000 Euro for the MSI Workstation
At first glance, the MSI Creator Z17 seems to be a great work laptop for creatives. Its hefty price tag is attributed to not only its powerful hardware, but also its sturdy metal chassis, exceptional thin form factor, great touchscreen and so on.
Admittedly, we have set the bar relatively high for the Z17, but it has still disappointed us as a whole. This is mainly due to the fact that the device generates a lot of heat and noise: despite having three fans, the cooling system is not optimal for the thin chassis. This means that the Z17 is hotter and louder than its competitors and even performs worse in 3D applications because the RTX 3070 Ti only has 90 watts of power at its disposal. It is not possible to increase the wattage given the already high temperatures.
We could have overlooked the somewhat below average performance in a work laptop if it ran quieter and cooler than the competitors. However, the opposite is true for the Z17.
The Creator Z17 has a fantastic size, great touchscreen, and good fit and finish, but it is marred by that the fact that the cooling solution appears to be slightly overwhelmed and causing performance to drop over time.
The excellent Razer Blade 17 is a great alternative to the Z17. It is just as thin and premium, but is quieter, cooler and even able to deliver a more consistent performance. MSI's own Creator Z16P also does some things a little better than the Z17, such as noise levels.
Price and availability
The Z17 was supposed to cost more than 4,000 Euro (US$3,875), which we think is too pricey considering the alternatives available. However, a model with similar specifications is now available on Amazon.com for US$3,049.
MSI Creator Z17 A12UGST-054
- 09/20/2022 v7 (old)
Christian Hintze
Price comparison

