MSI Creator 17 A10SGS Laptop Review: Winning with a Mini LED

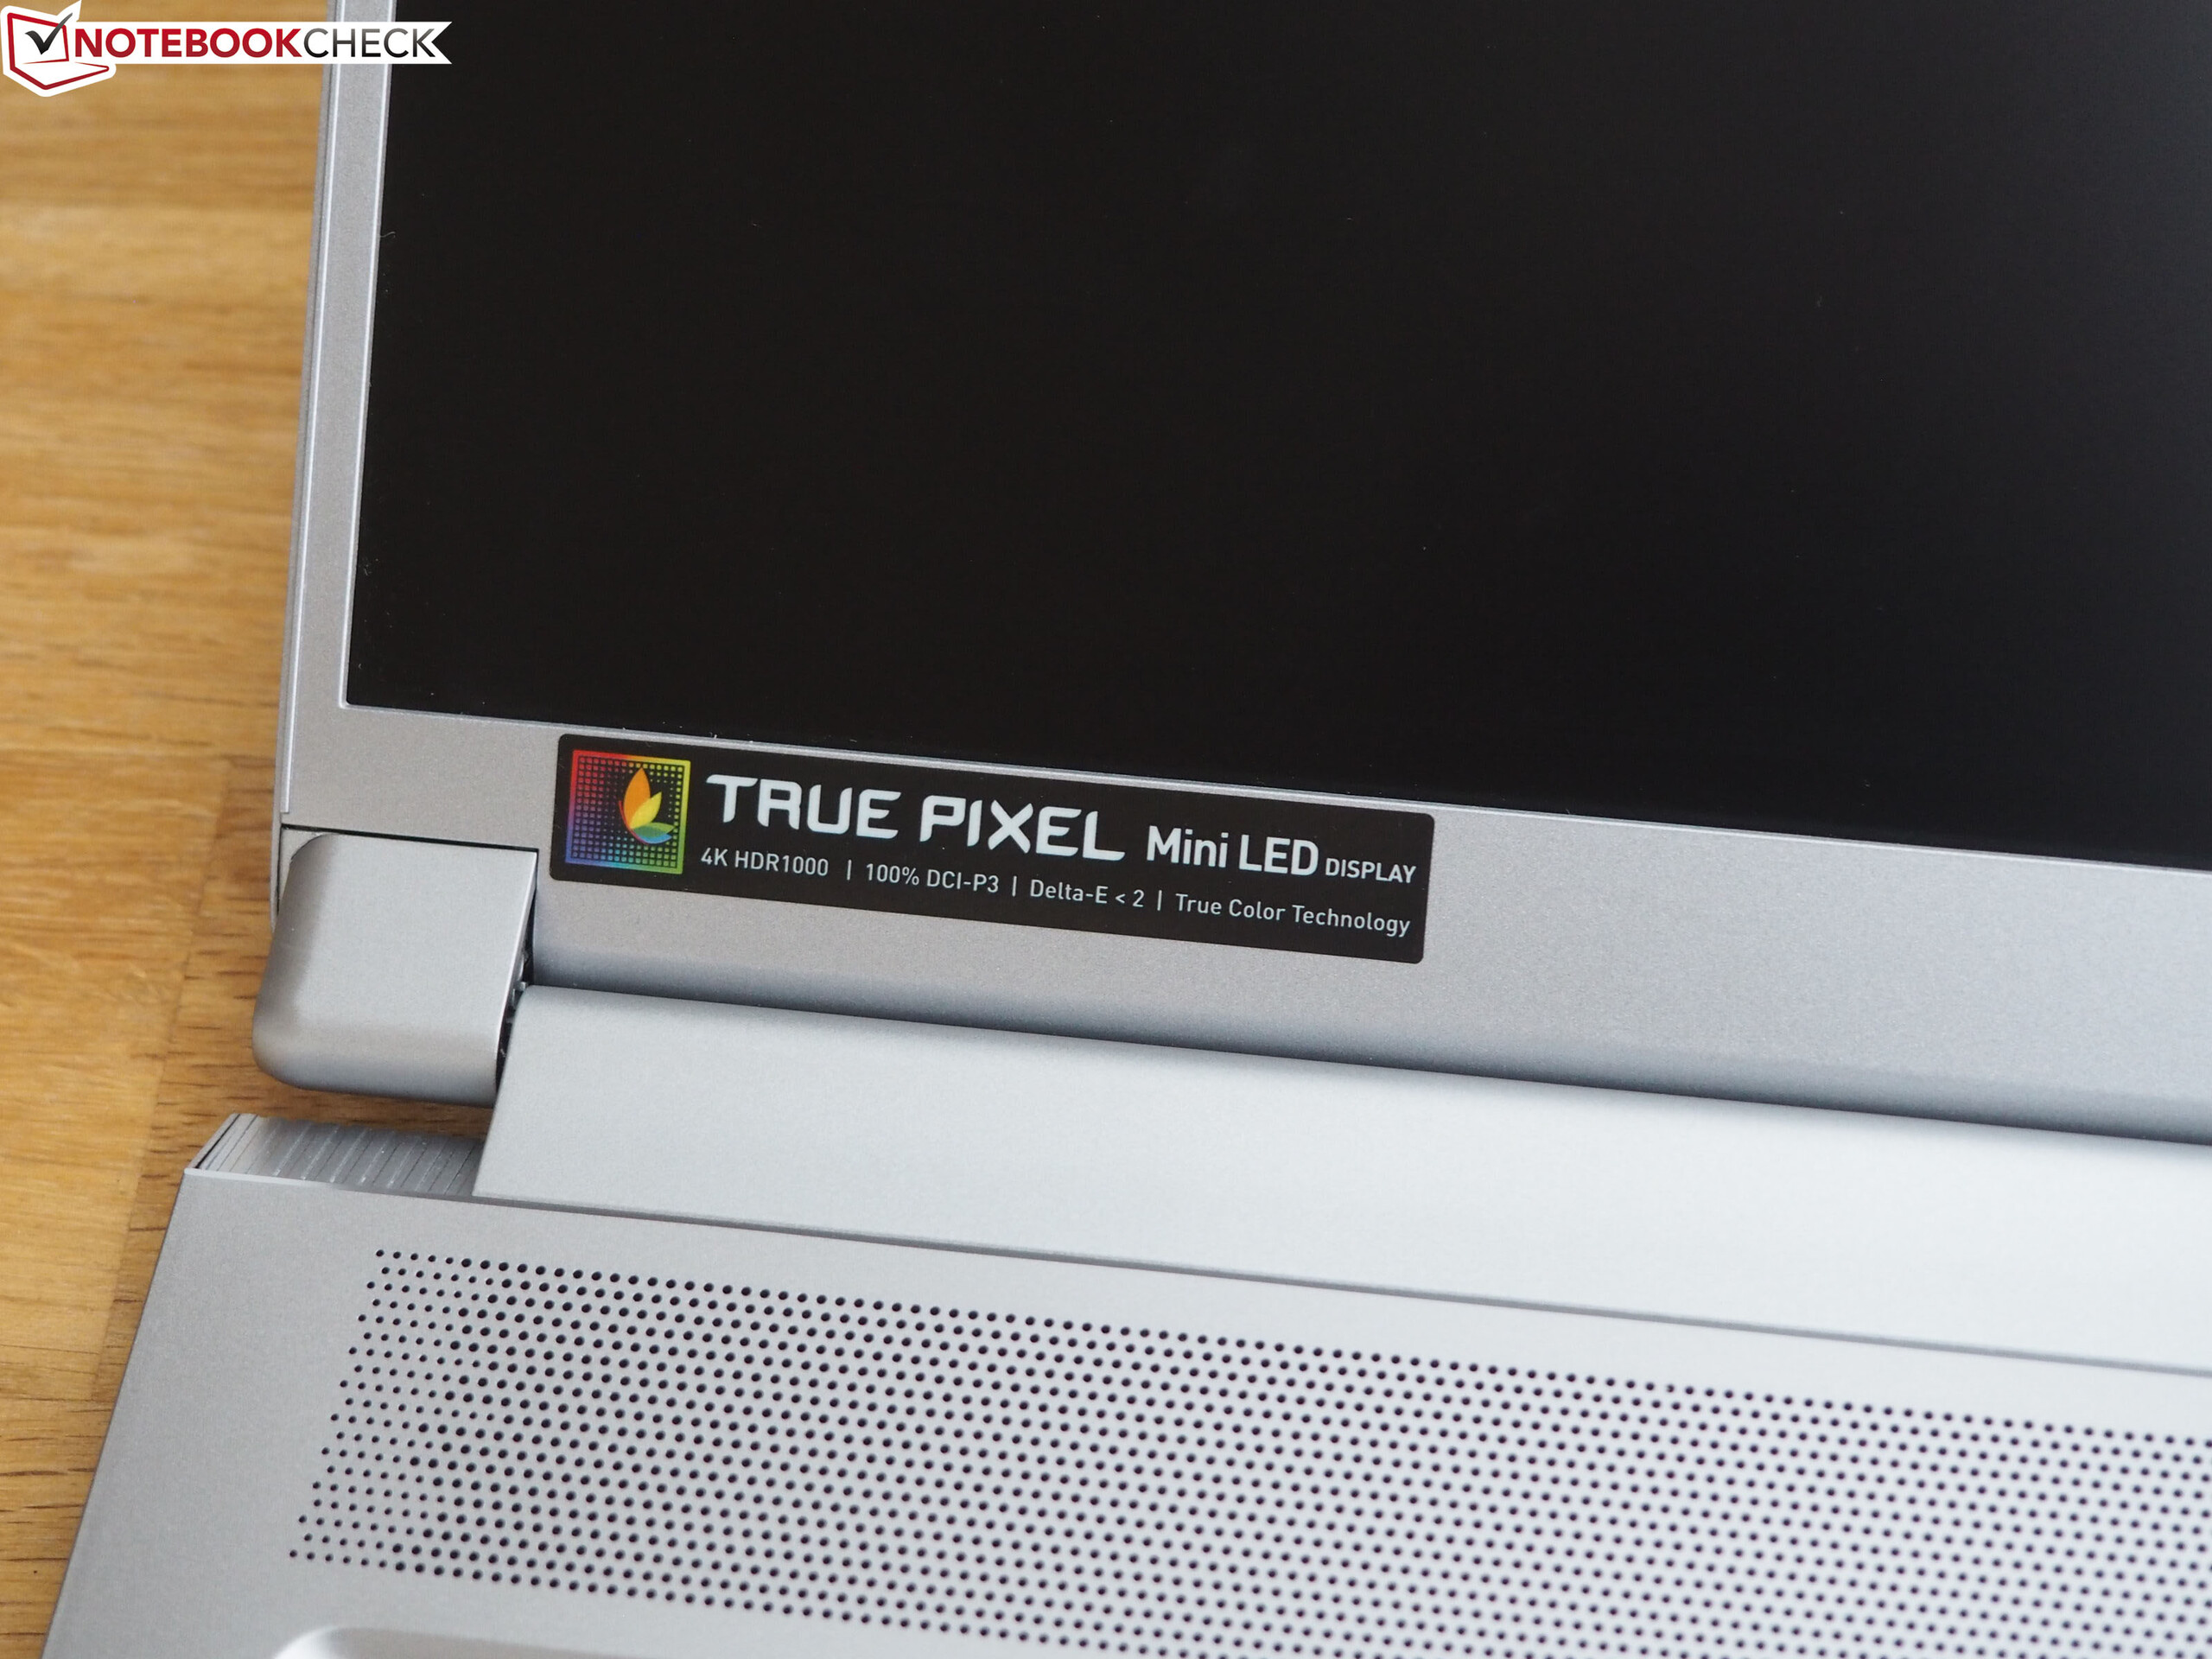
The MSI website currently lists four basic configurations for the Creator 17. While the A10SE model uses a GeForce RTX 2060, the A10SF is equipped with an RTX 2070 Max-Q and the A10SFS with an RTX 2070 Super Max-Q. Our test unit, the A10SGS model that uses an RTX 2080 Super Max-Q, is particularly expensive. In terms of the display, you can either choose a 144-Hz Full HD panel or a 60-Hz UHD panel (including the Mini LED technology or not). With this, MSI is the first manufacturer that introduces a Mini LED laptop to the market.
The competitors of the Creator 17 include other 17-inch high-end laptops with a slim build such as the Razer Blade Pro 17, the Asus Zephyrus S GX701GXR, the Alienware m17 R2, and the MSI GS75 9SG sibling we already mentioned above.
Rating | Date | Model | Weight | Height | Size | Resolution | Price |
|---|---|---|---|---|---|---|---|
| 82.5 % v7 (old) | 07 / 2020 | MSI Creator 17 A10SGS i7-10875H, GeForce RTX 2080 Super Max-Q | 2.4 kg | 20 mm | 17.30" | 3840x2160 | |
| 82.9 % v7 (old) | 06 / 2019 | MSI GS75 Stealth 9SG i7-9750H, GeForce RTX 2080 Max-Q | 2.3 kg | 18.9 mm | 17.30" | 1920x1080 | |
| 87.7 % v7 (old) | 06 / 2019 | Razer Blade Pro 17 RTX 2080 Max-Q i7-9750H, GeForce RTX 2080 Max-Q | 2.8 kg | 19.9 mm | 17.30" | 1920x1080 | |
| 81.2 % v7 (old) | 12 / 2019 | Asus ROG Zephyrus S GX701GXR i7-9750H, GeForce RTX 2080 Max-Q | 2.7 kg | 18.7 mm | 17.30" | 1920x1080 | |
| 84.2 % v7 (old) | 02 / 2020 | Alienware m17 R2 P41E i9-9980HK, GeForce RTX 2080 Max-Q | 2.6 kg | 20.5 mm | 17.30" | 1920x1080 |
Case
Unfortunately, the case does not give justice to its premium price. Even though it is mostly made from aluminum, the materials creak a lot when trying to warp the case, which is similar to a cheap budget notebook and reduces the otherwise high-quality impression. Similarly to the GS75, the MSI leaves a lot to be desired in terms of the stability. Despite the use of metal, the lid and base unit can be pressed down noticeably. Other MSI models do markedly better here. But at least the workmanship is at the expected level.
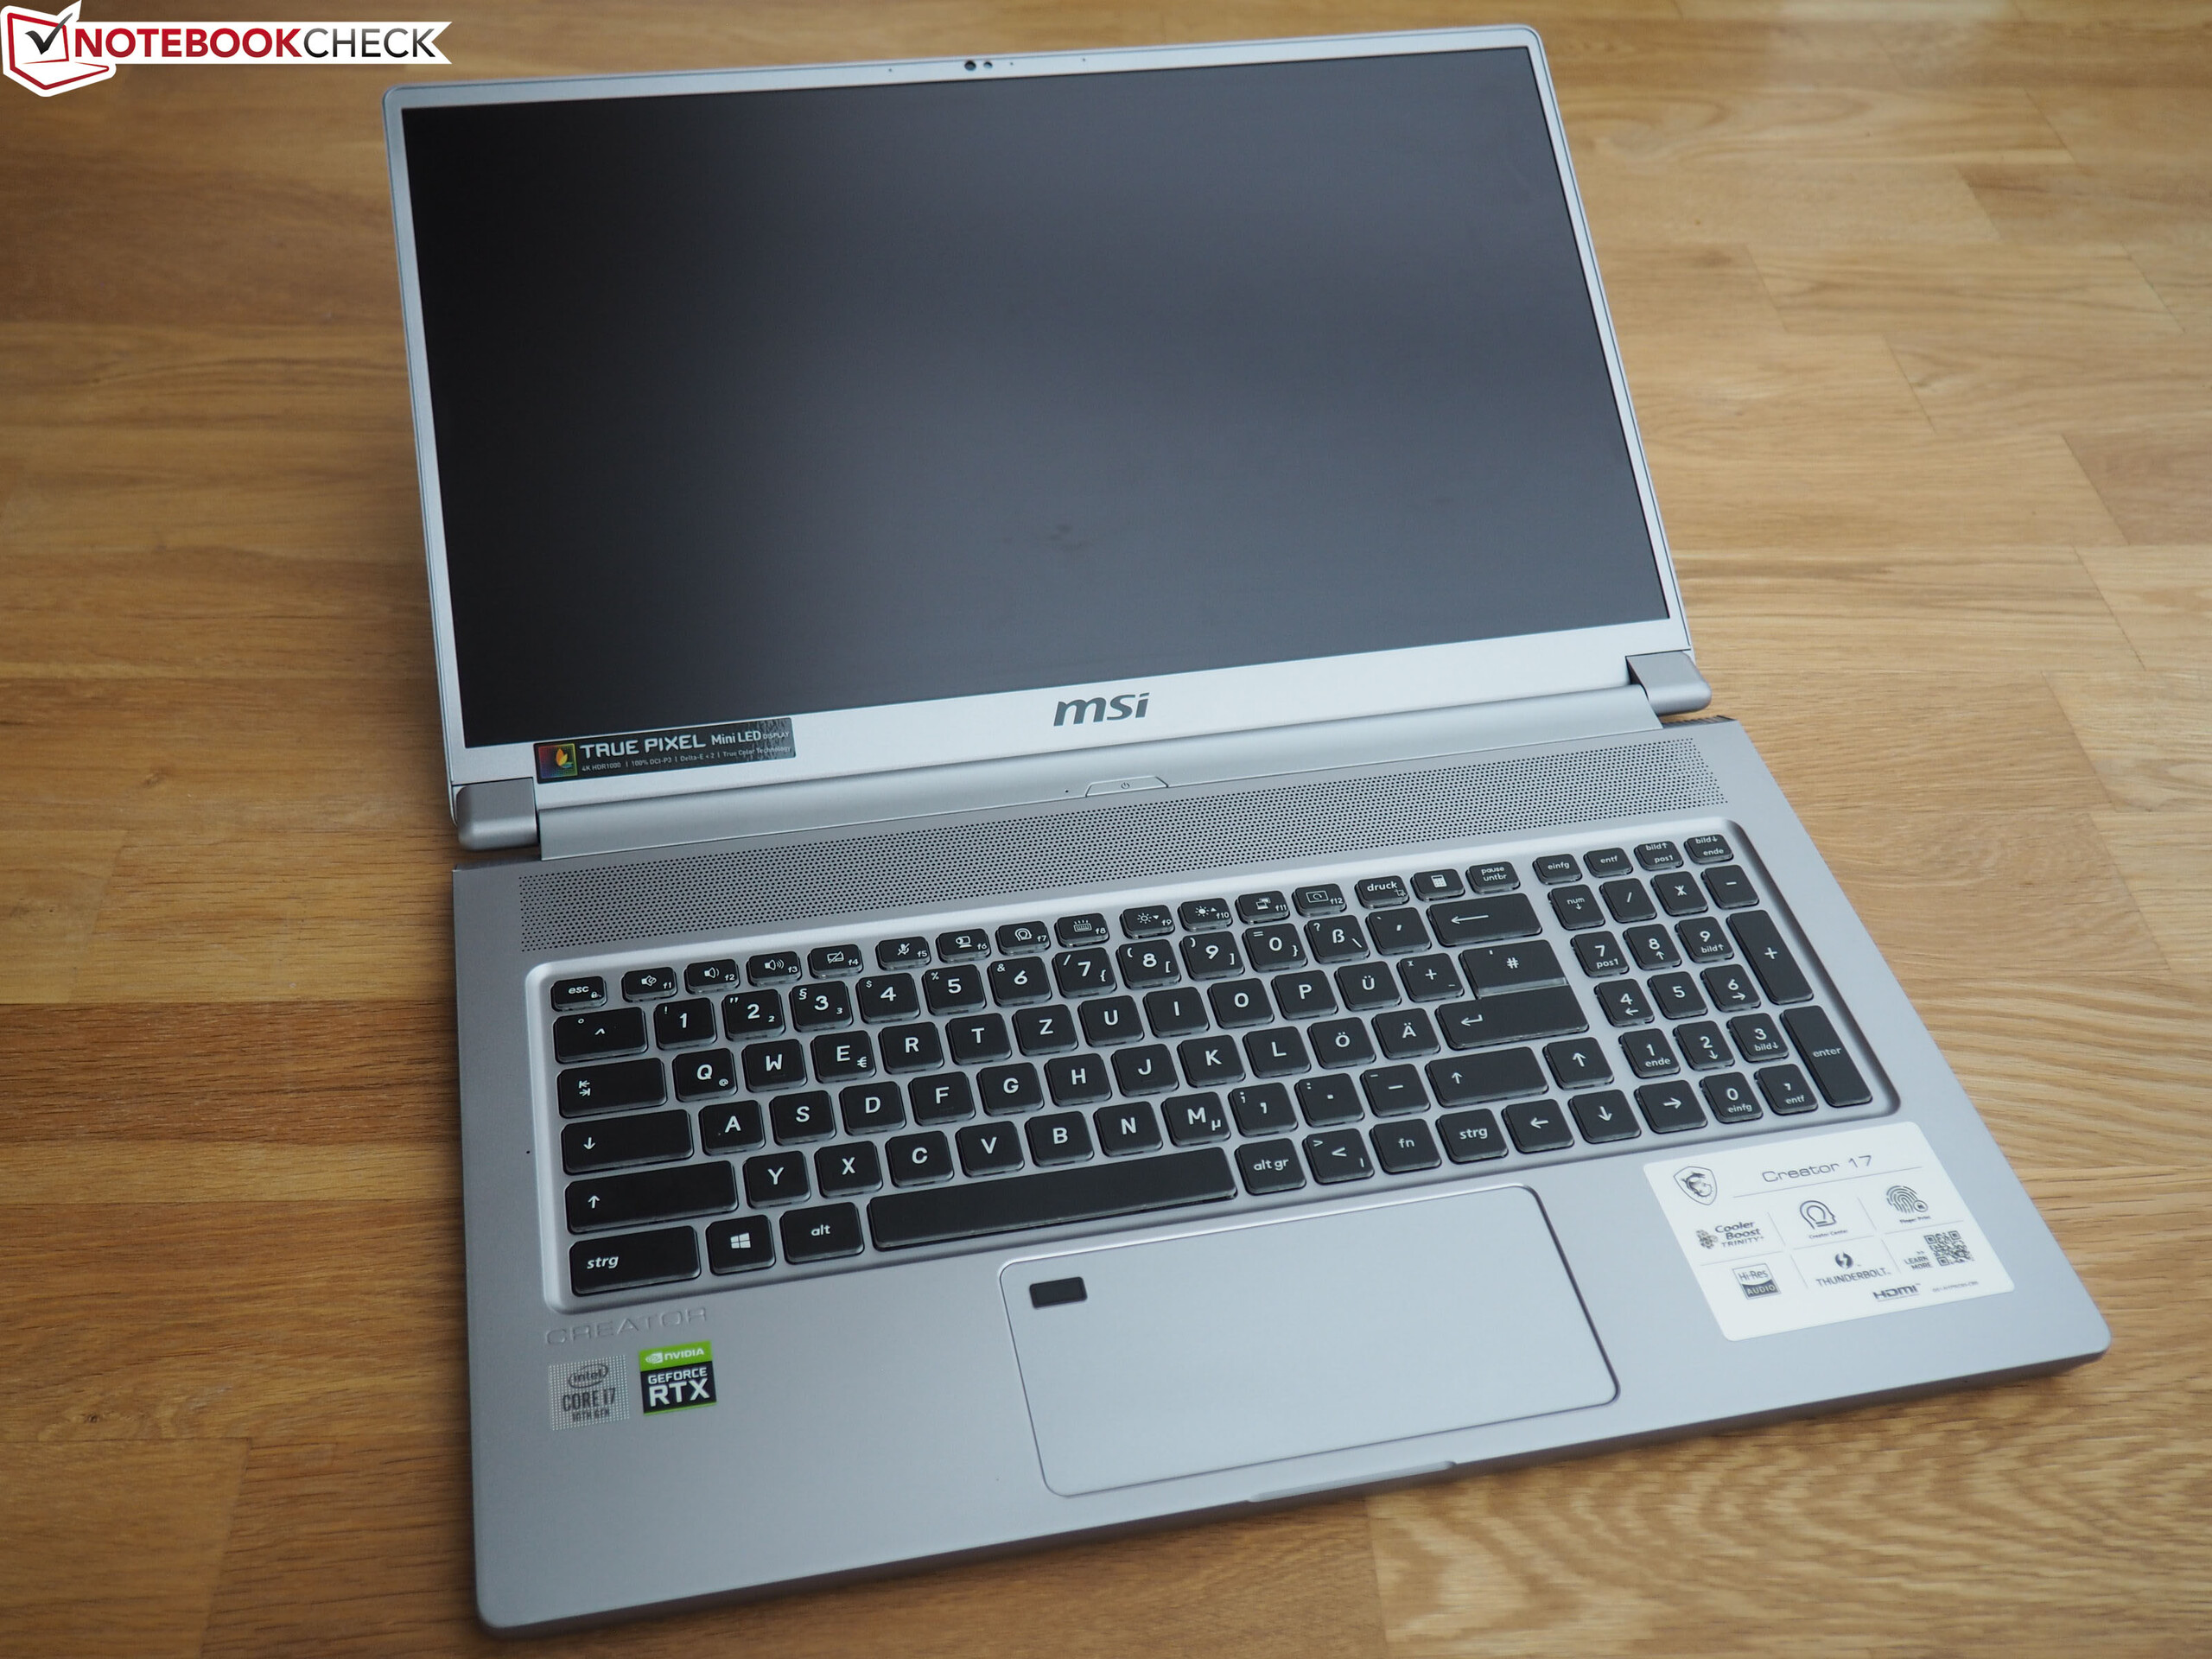
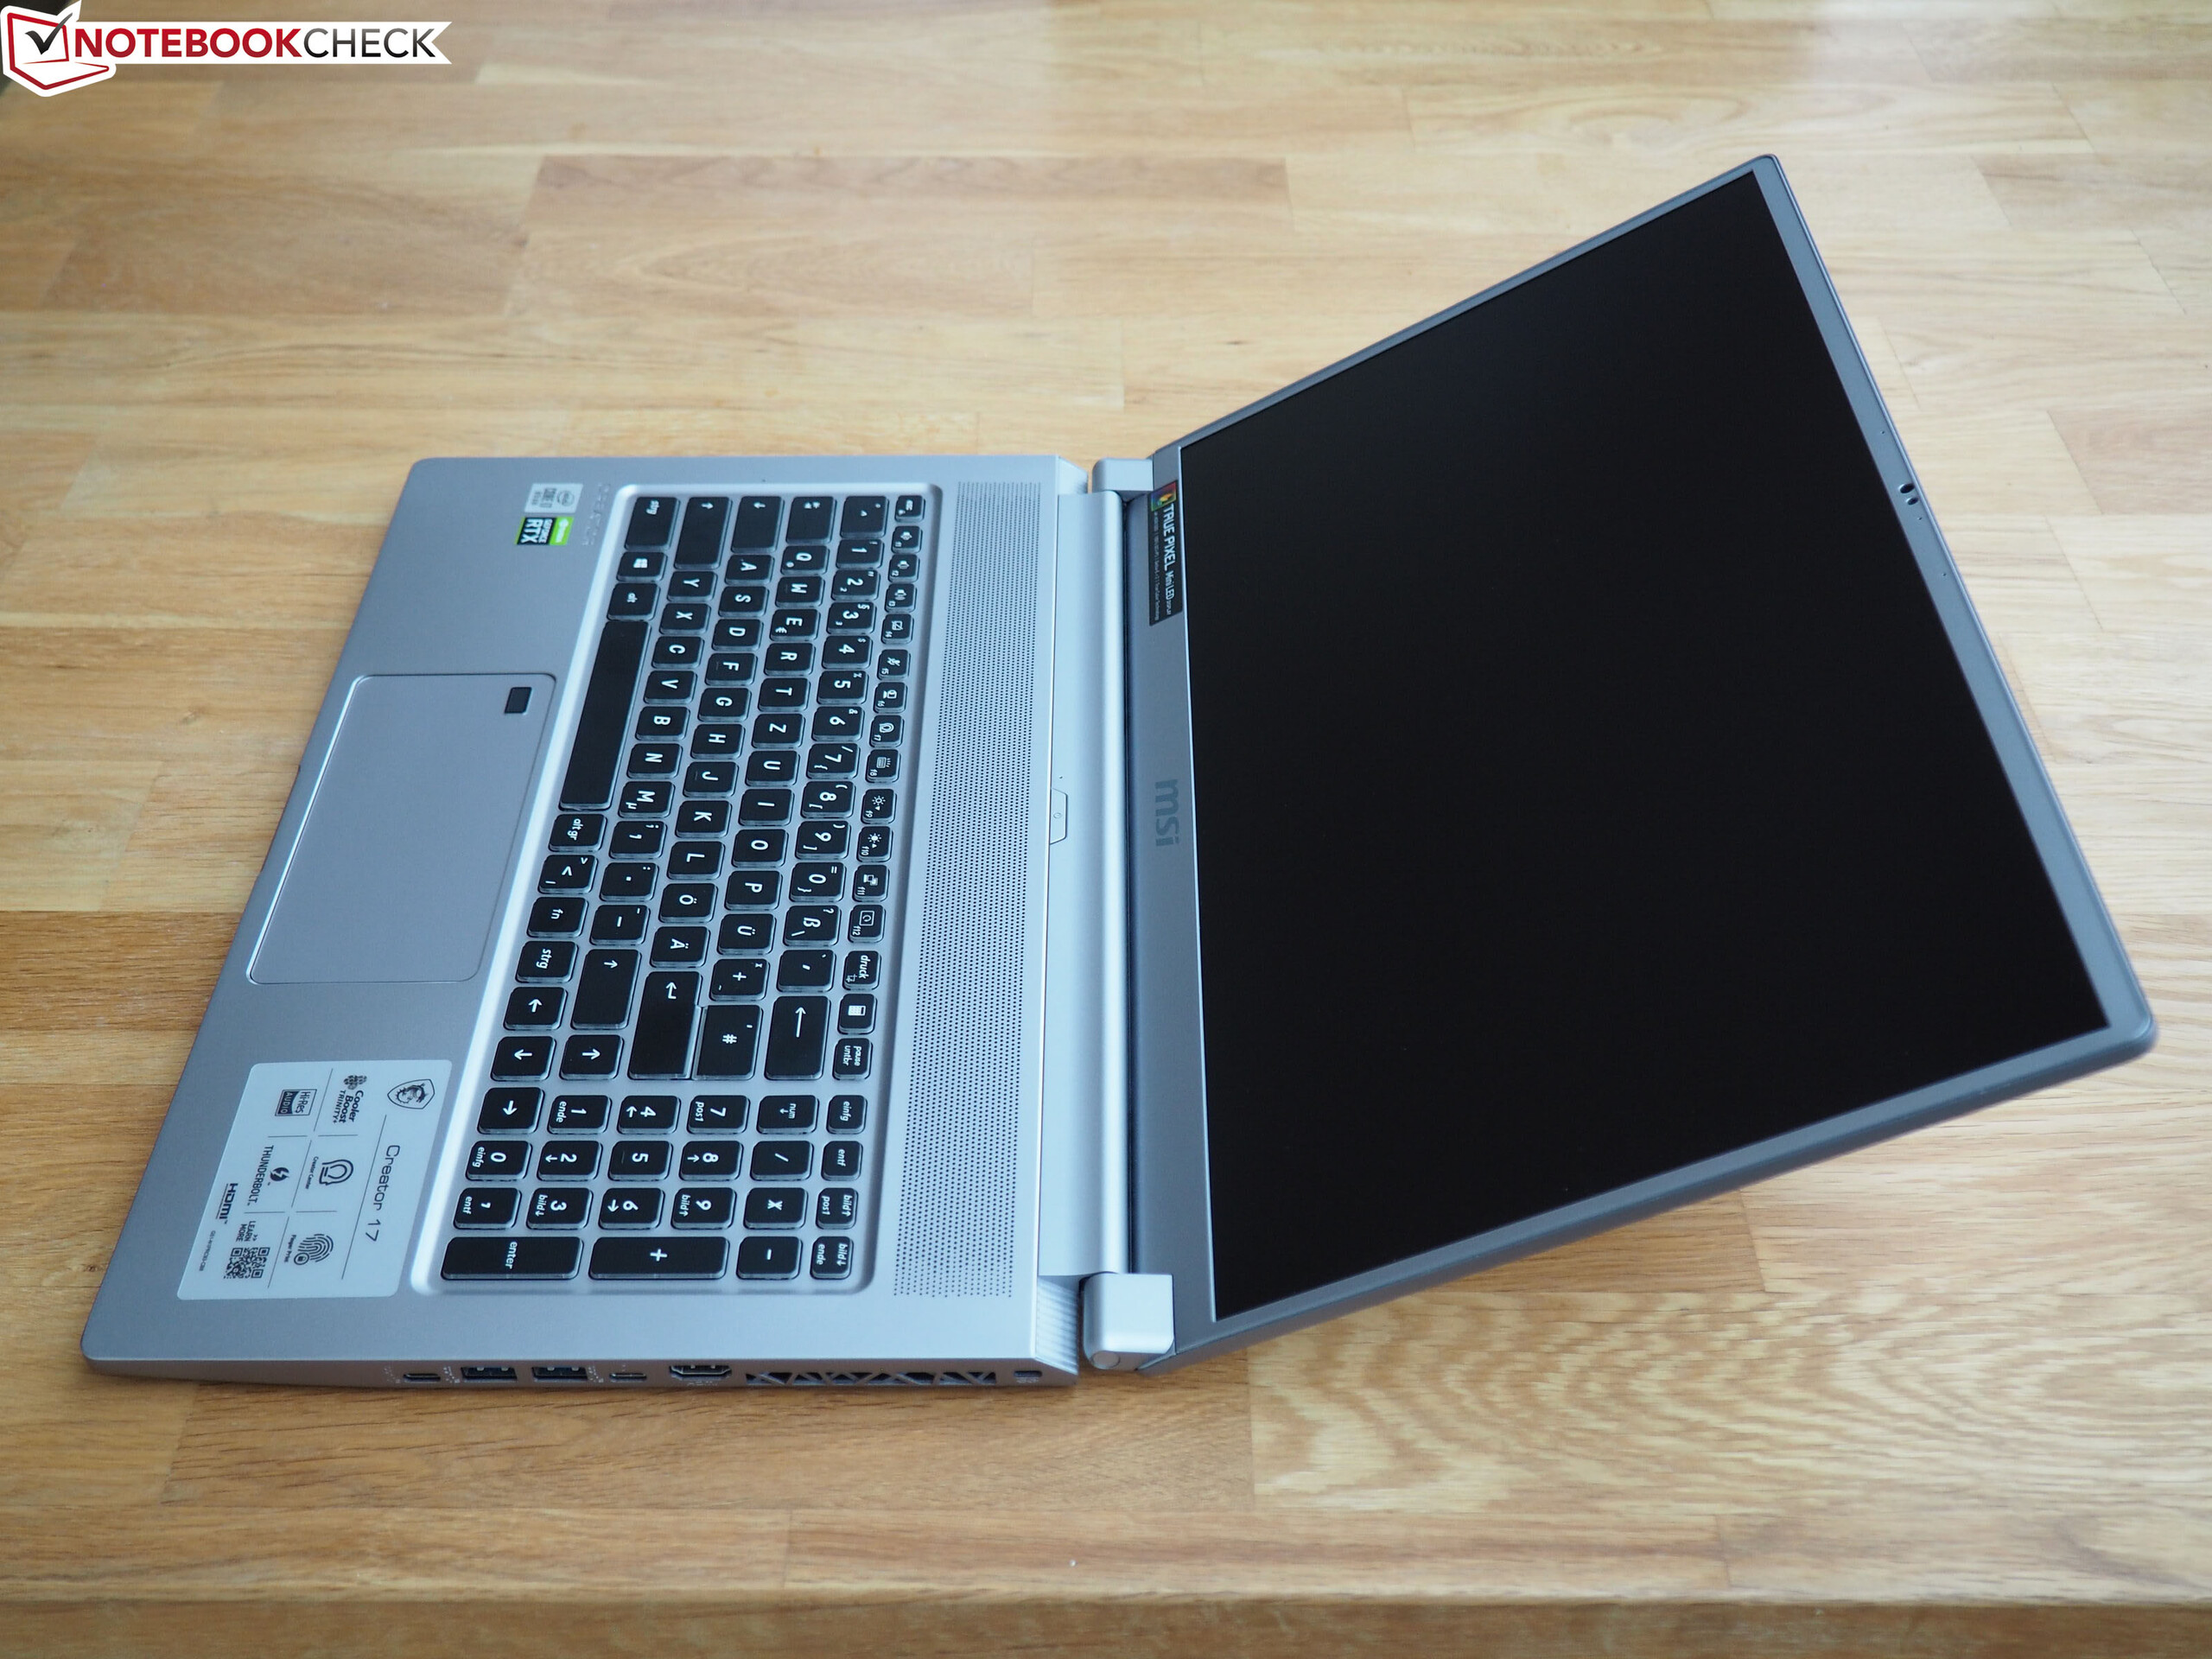
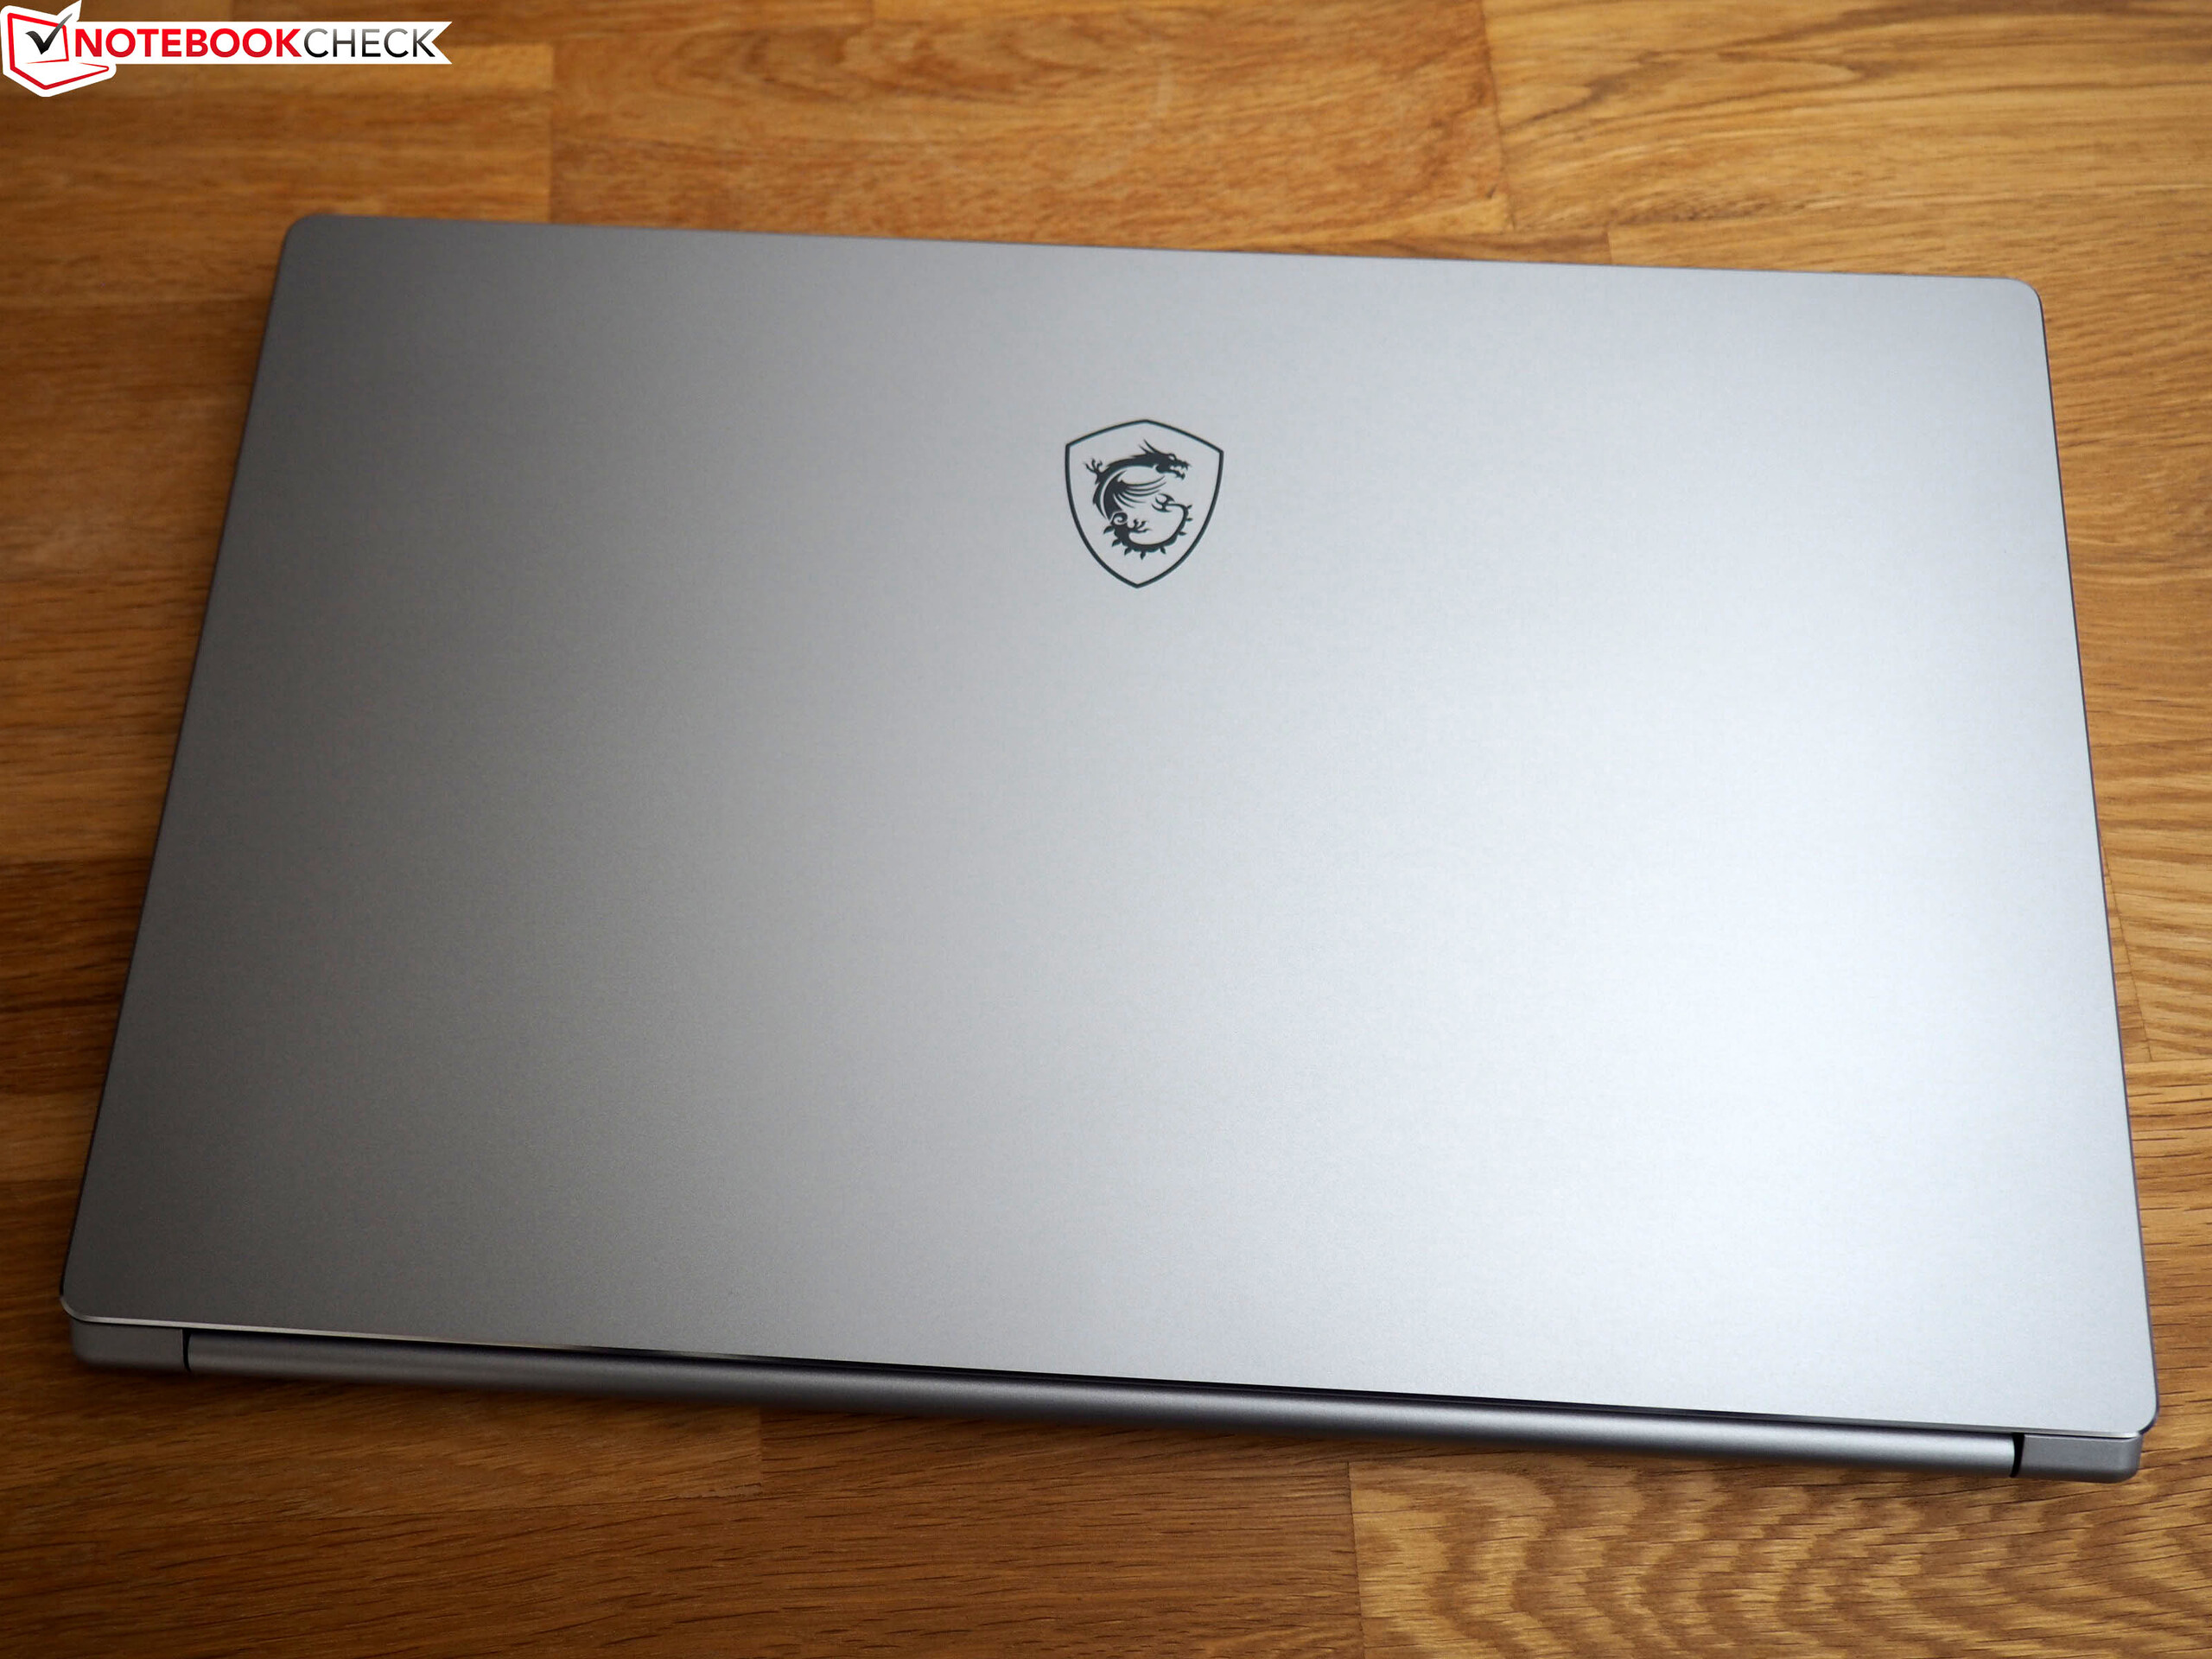
In terms of pure visuals, the Creator 17 strikes a very good figure. The combination of the silver-gray color, slim-bezel design, and low height (2.0 cm, ~0.8 in) guarantee a very sleek and modern look that is neither too drab nor too playful and fits any situation. At around 2.4 kg (~5.3 lb), the weight is at the lower end of the scale of the 17-inch laptops and competitors. In addition, users will also be pleased with the relatively large opening angle of 150°.
Equipment
Connections
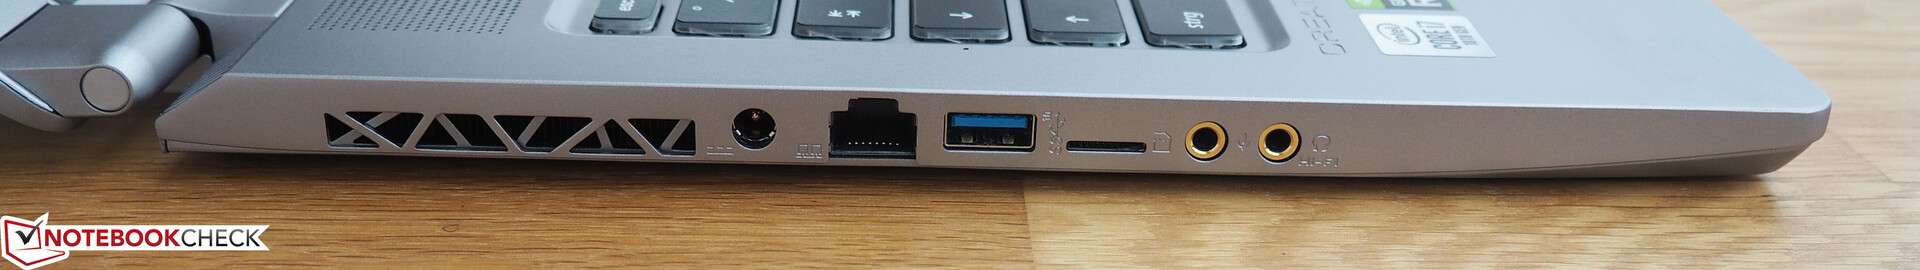
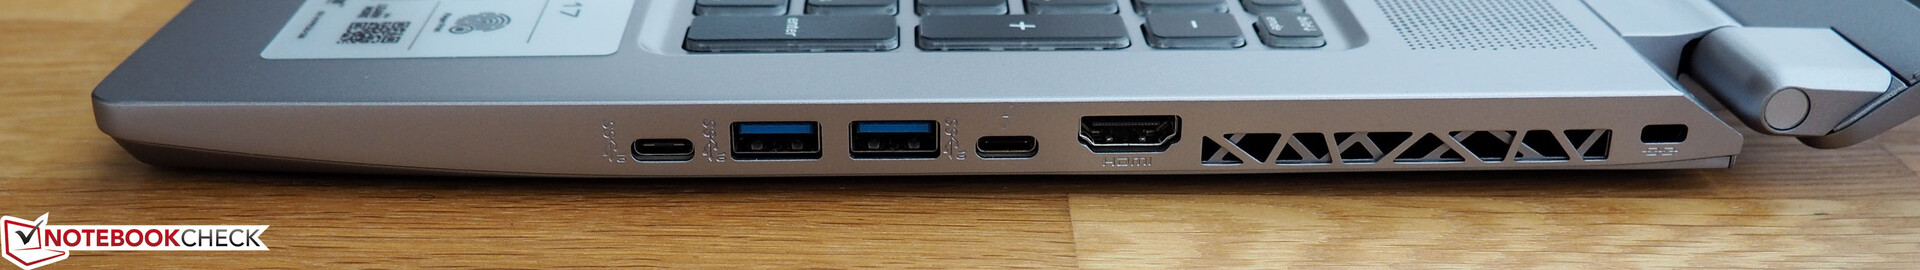
In terms of the connections, MSI hardly makes any compromises. If you disregard the microSD card reader (we would have preferred a standard model here), the Creator 17 offers an ample selection of connections, be it the RJ45 port, the two audio ports, the HDMI-2.0 port, or the Kensington lock opening. Those are accompanied by one Thunderbolt-3 port, one USB-C 3.1 Gen2 port, and according to the MSI home page, three USB-A 3.0 ports (while the labels on the case indicate 3.1 Gen2 = SS10). Since the connections are all located in the center area of both sides, there might be some limits in terms of movement with a lot of connected cables, if you are using a mouse.
Communication
Due to our recently changed test setup using an ax router instead of an ac router, the test results can only be compared with those of the Asus ROG Zephyrus S. The 1270 Mb/s when sending and 1340 Mb/s when receiving data achieved by the Creator 17 at a one-meter distance show the advantages of a very modern Wi-Fi chip. Instead of the Wireless AC 9560 that used to be very popular, the Wi-Fi 6 AX201 handles wireless connections here.
Webcam
Like most manufacturers, MSI uses only a mediocre webcam, to say the least. The image sharpness and color accuracy leave something to be desired.


Security
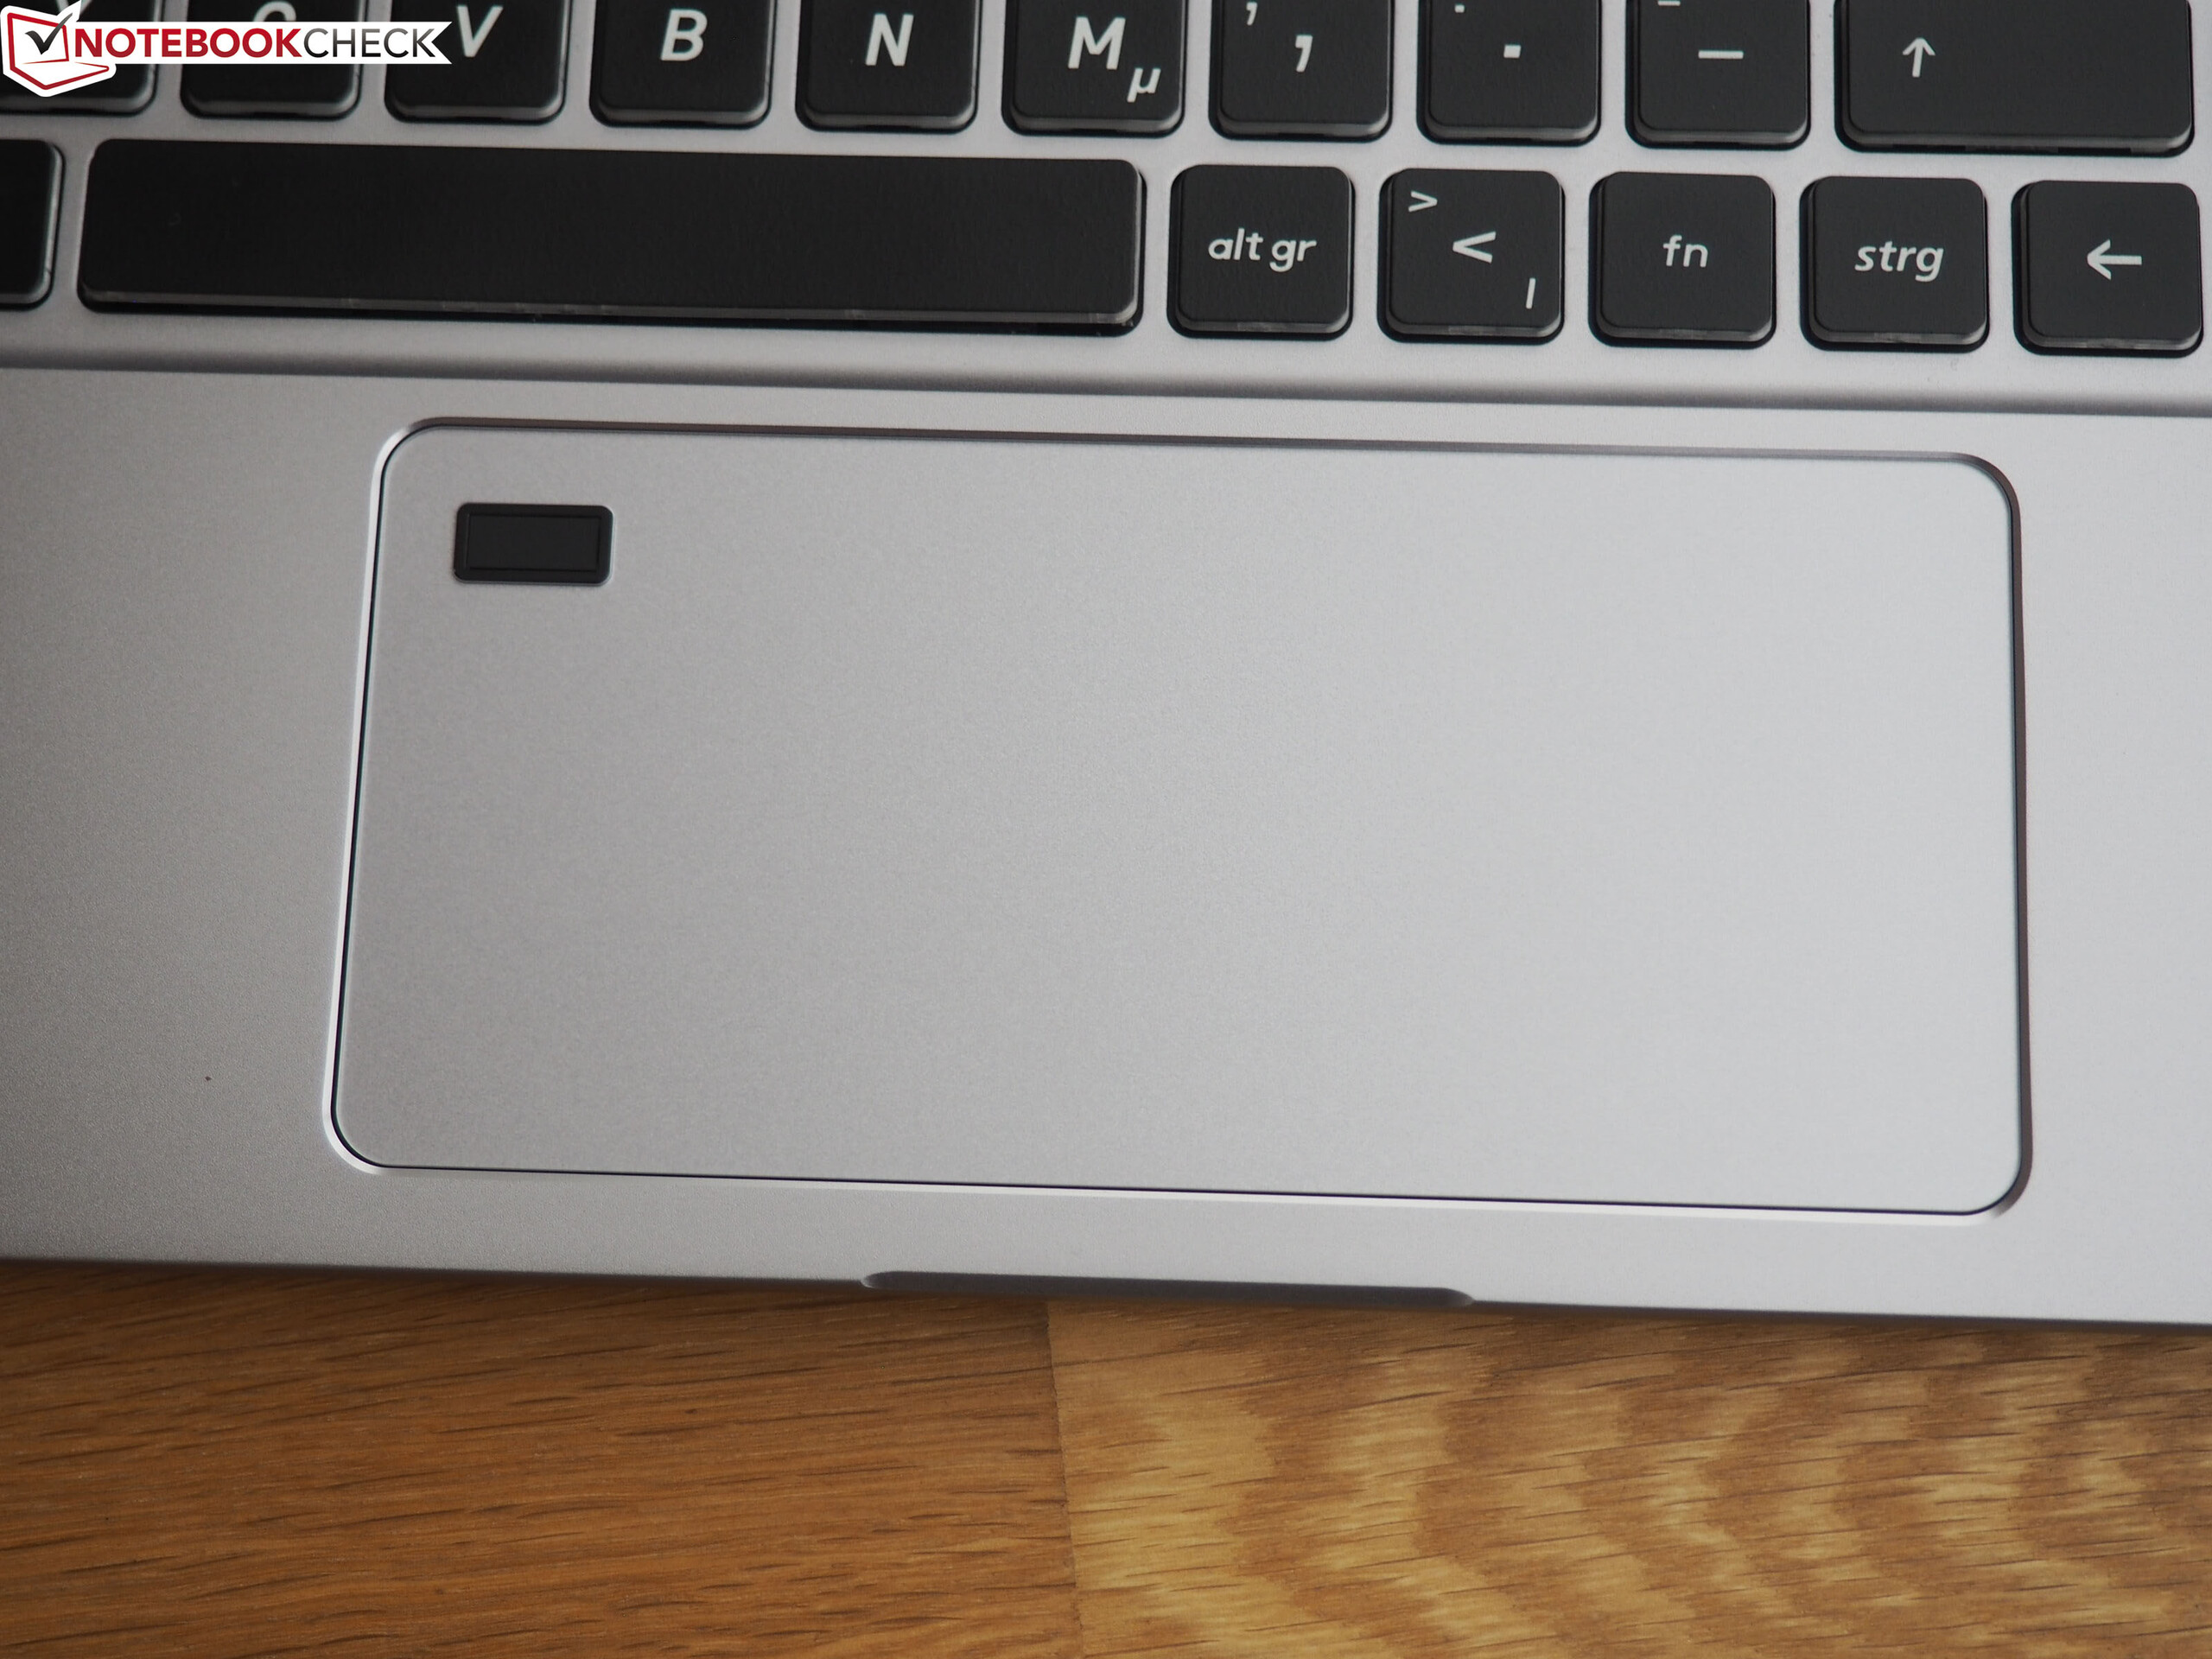
Besides the selection of colors, the fingerprint sensor integrated into the touchpad represents one of the most important differences to the GS75.
Accessories
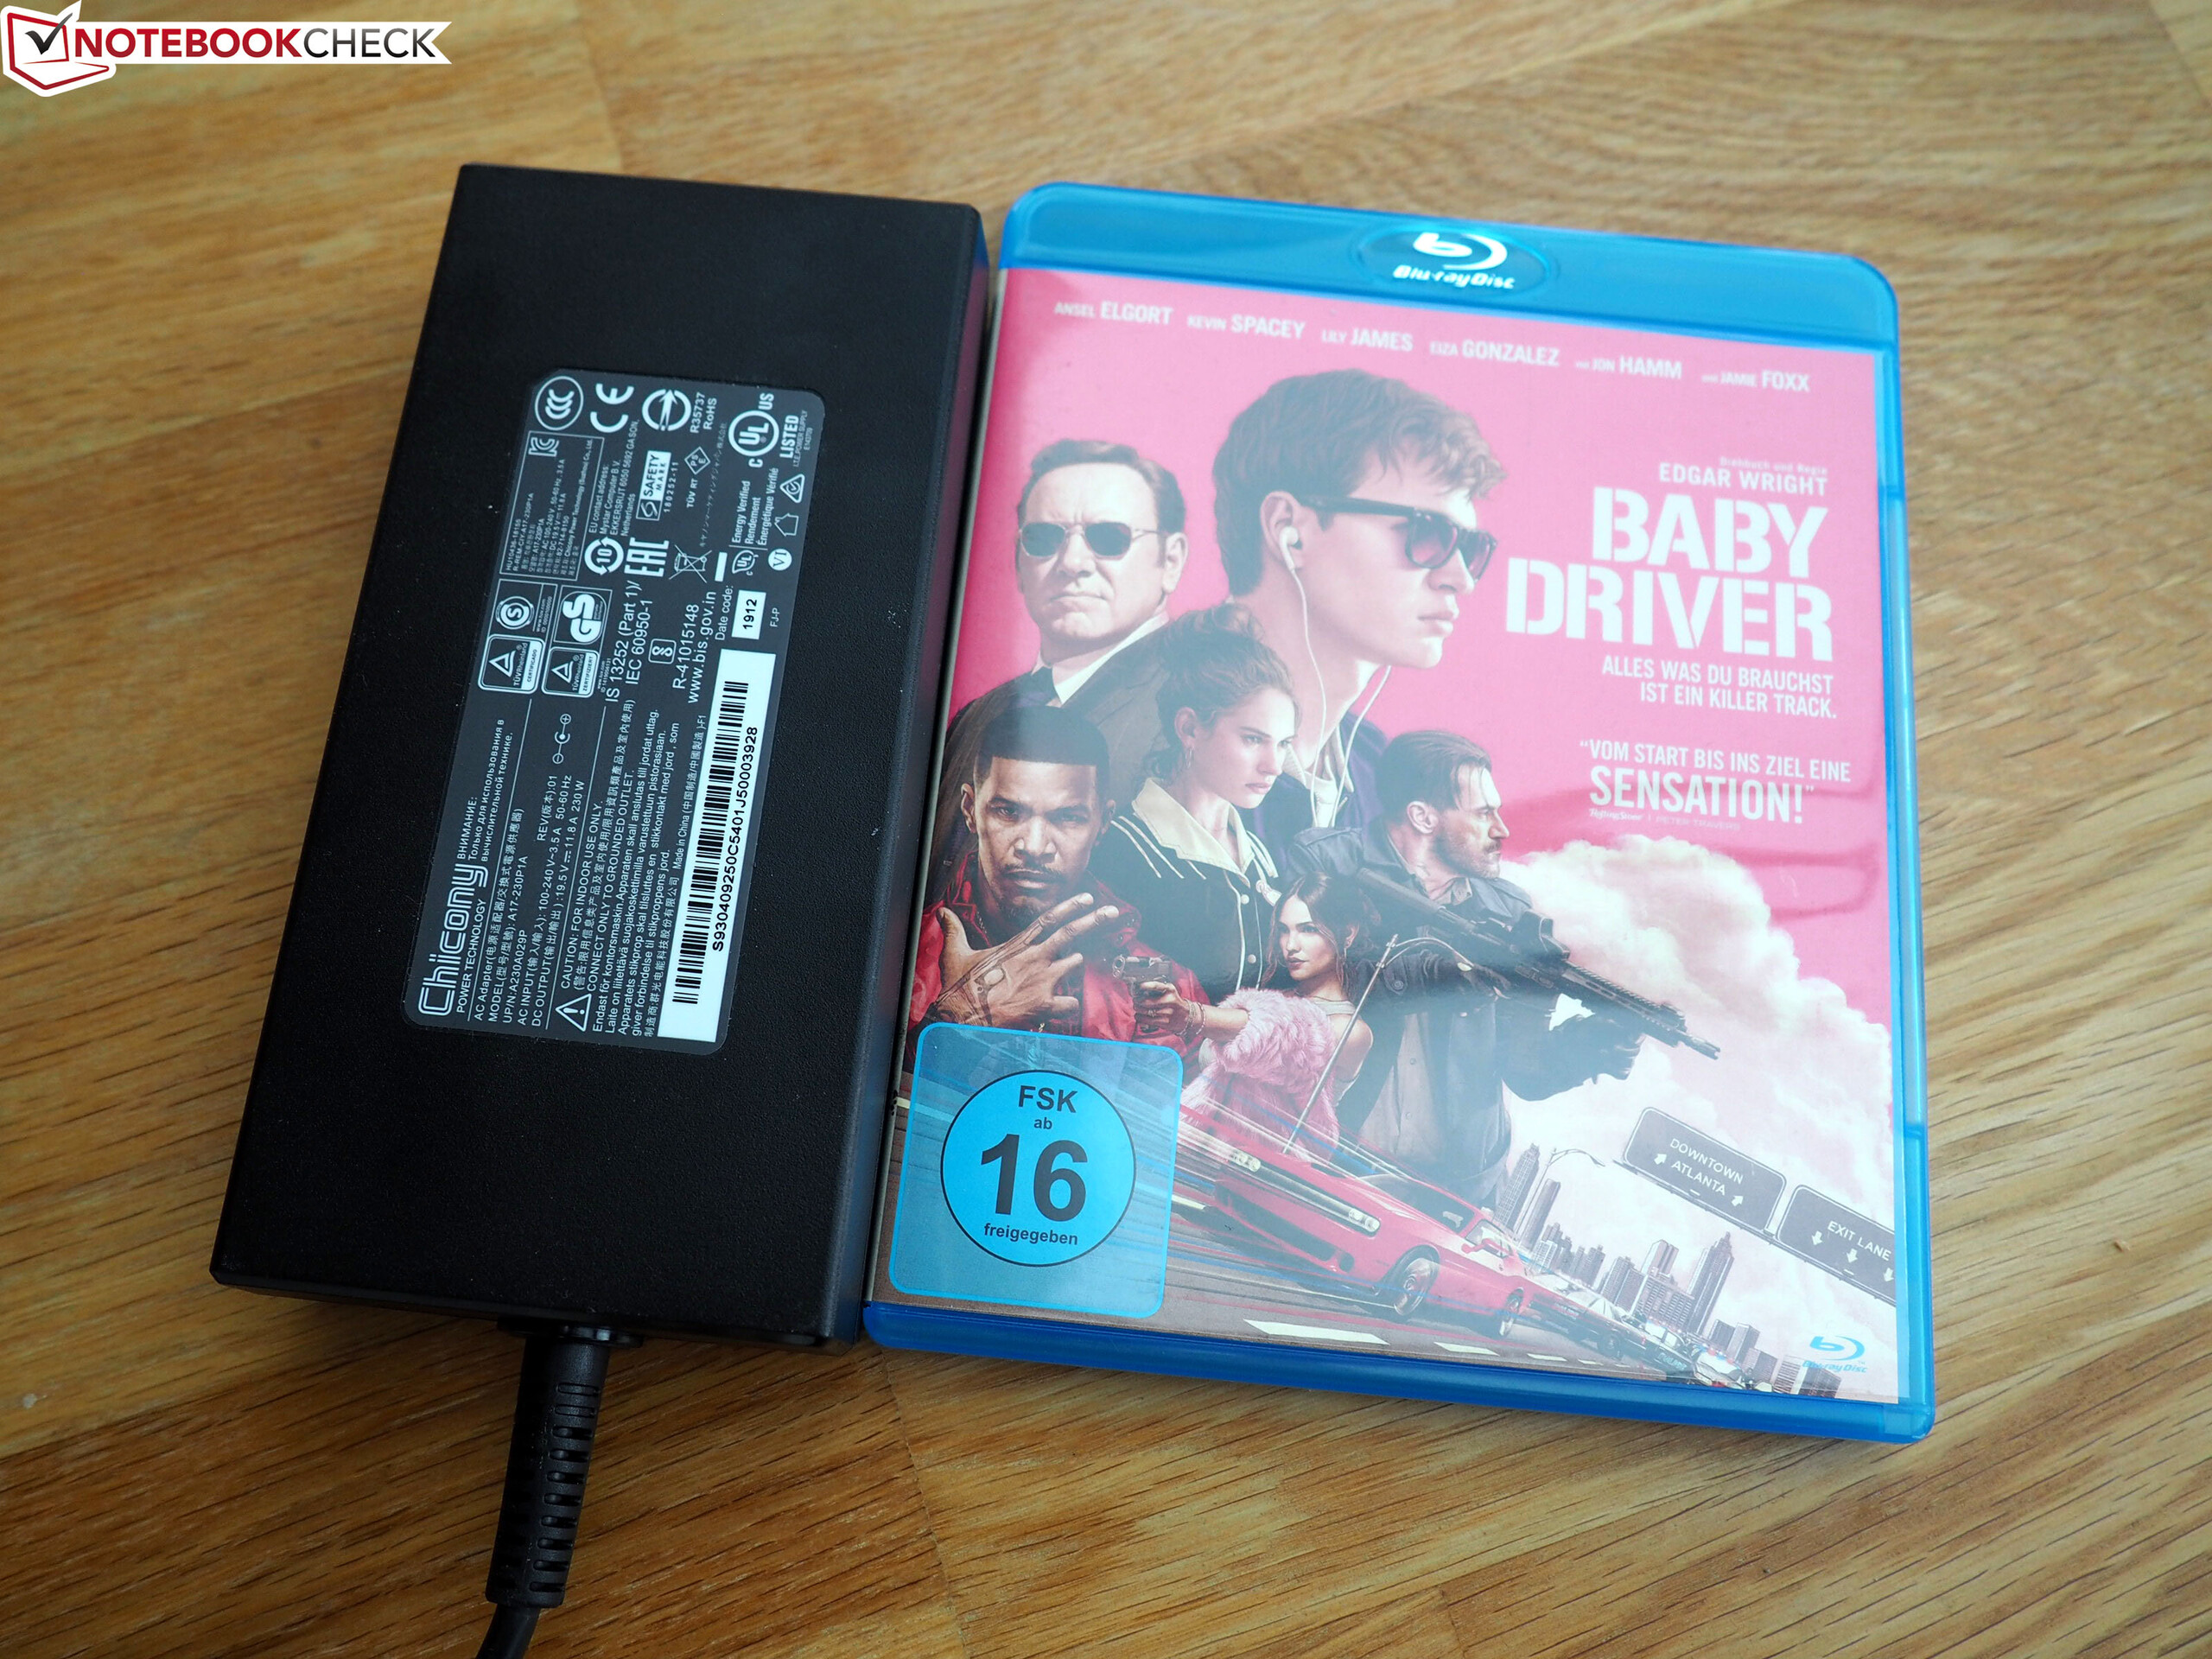
A 230-watt power supply weighing about 0.7 kg (~1.5 lb) and measuring 15 x 7 x 3 cm (~5.9 x 2.8 x 1.2 in) is included.
Maintenance
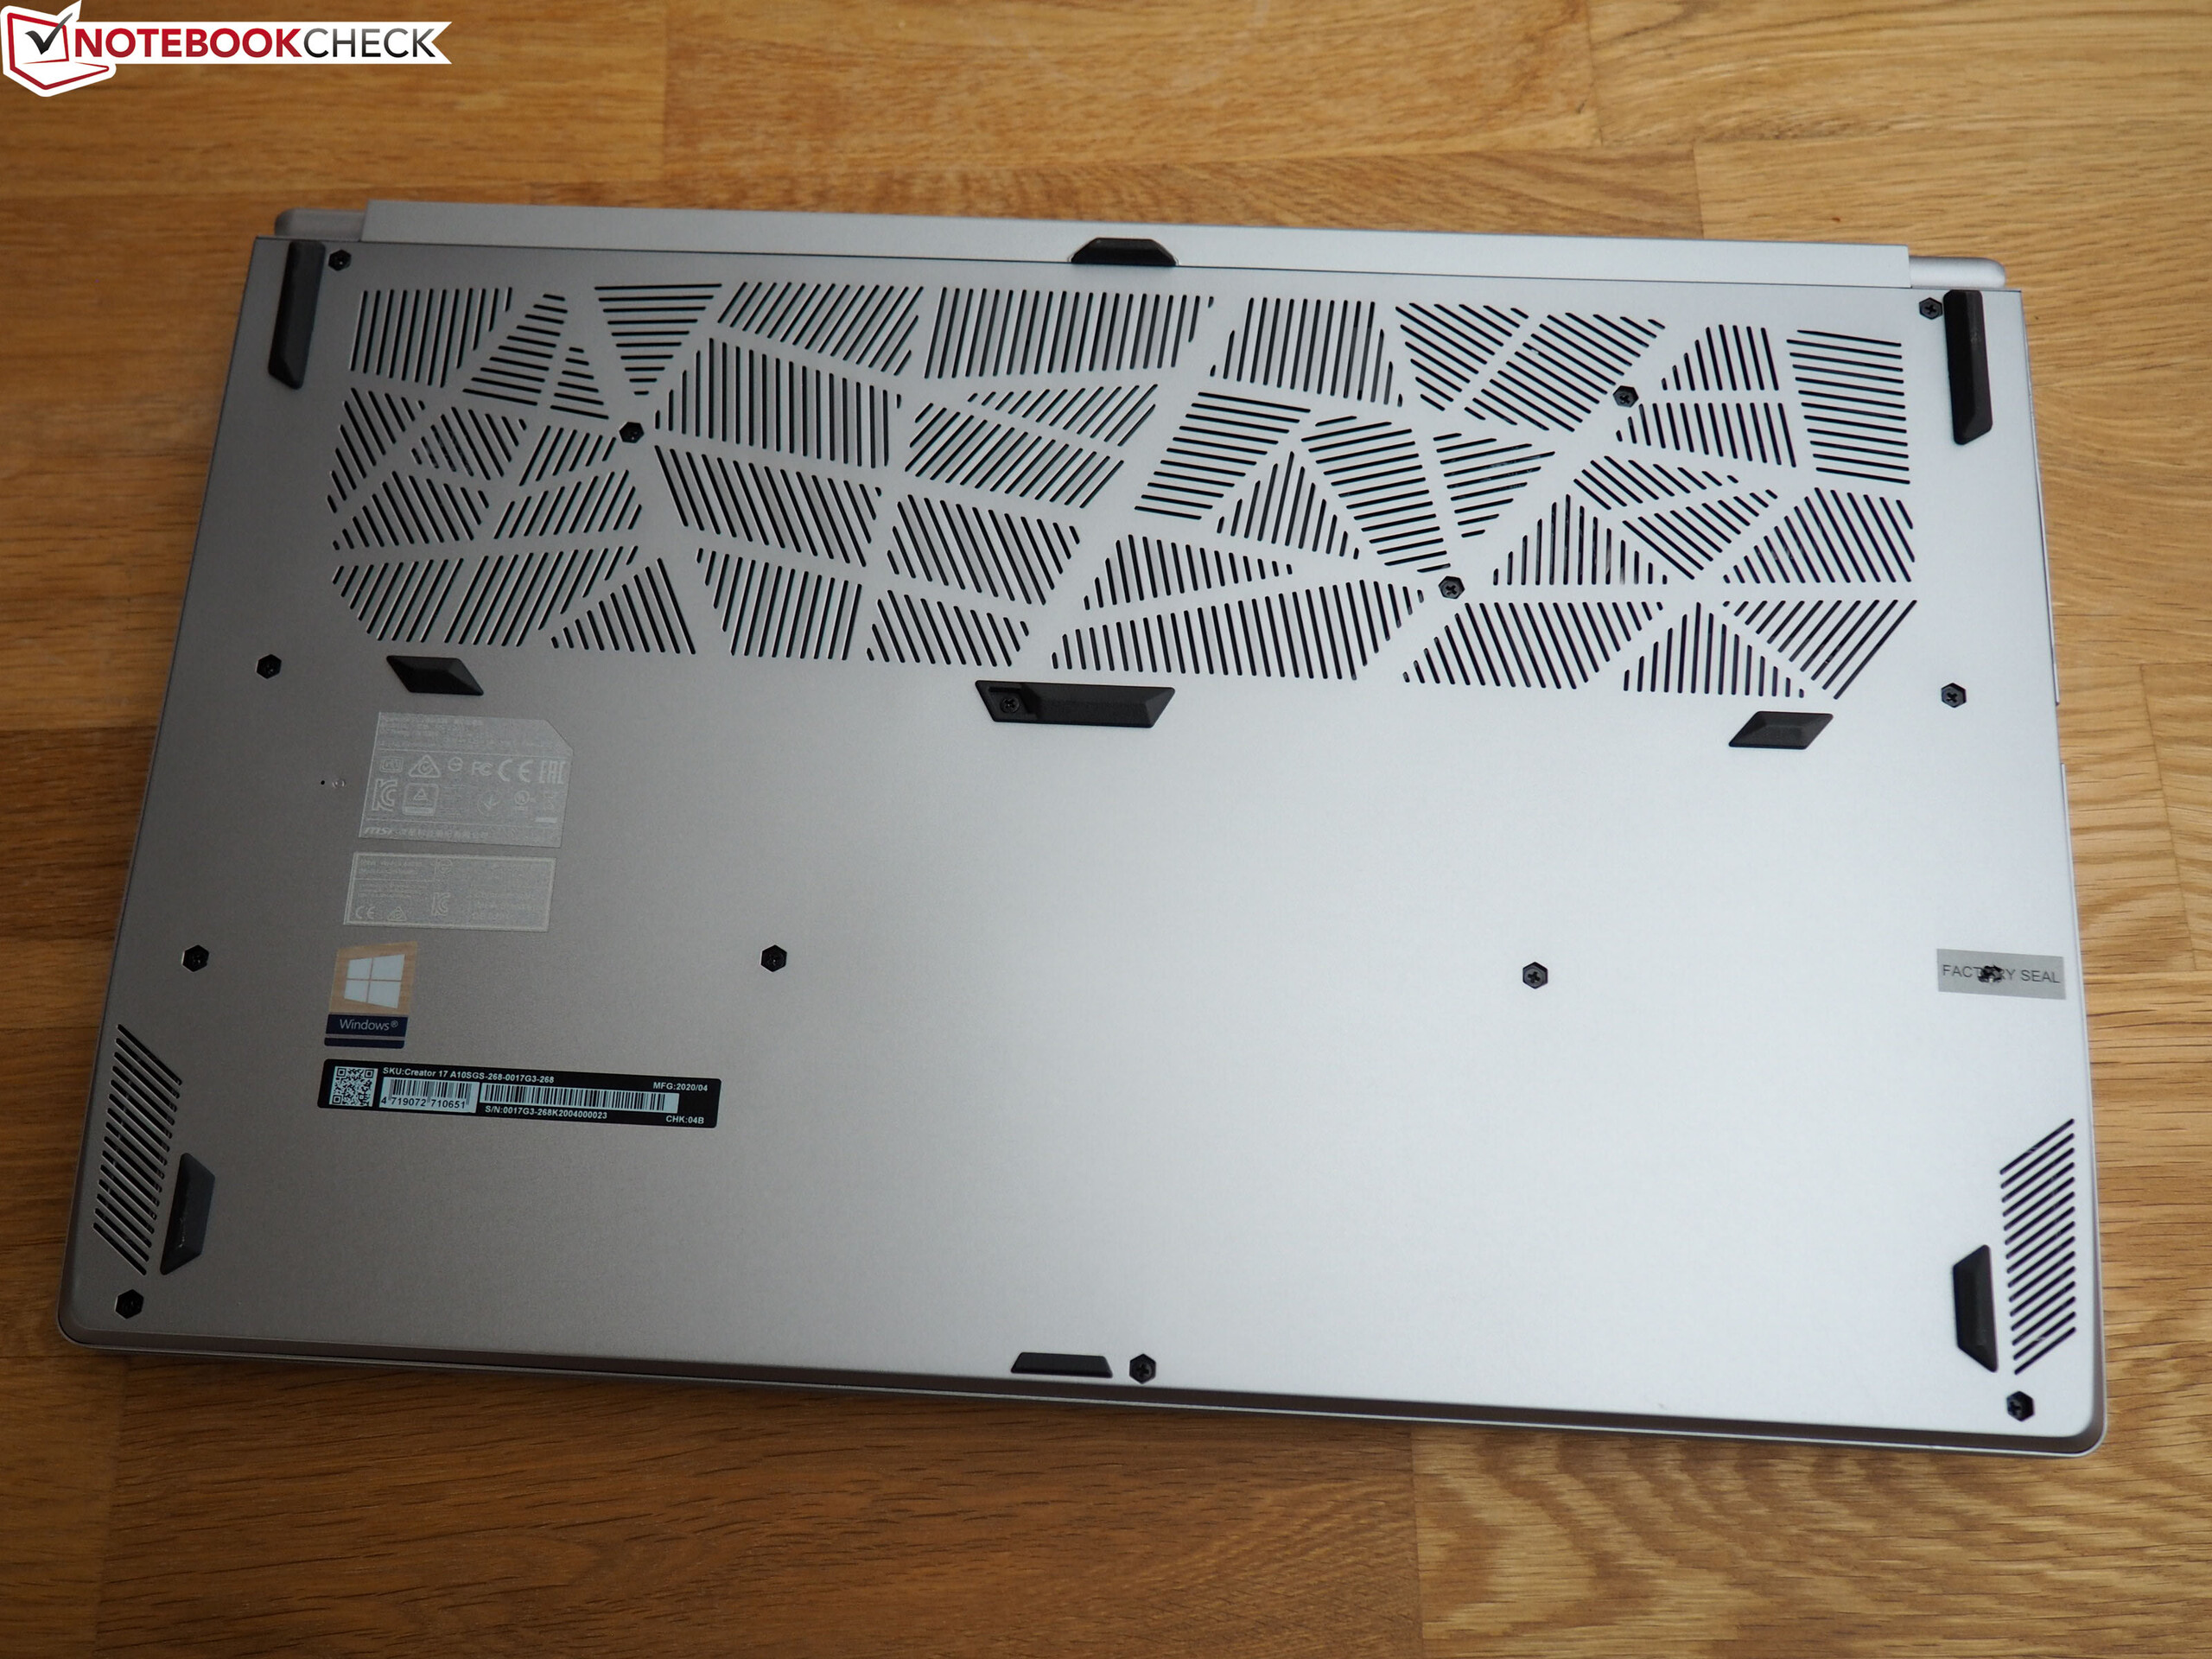
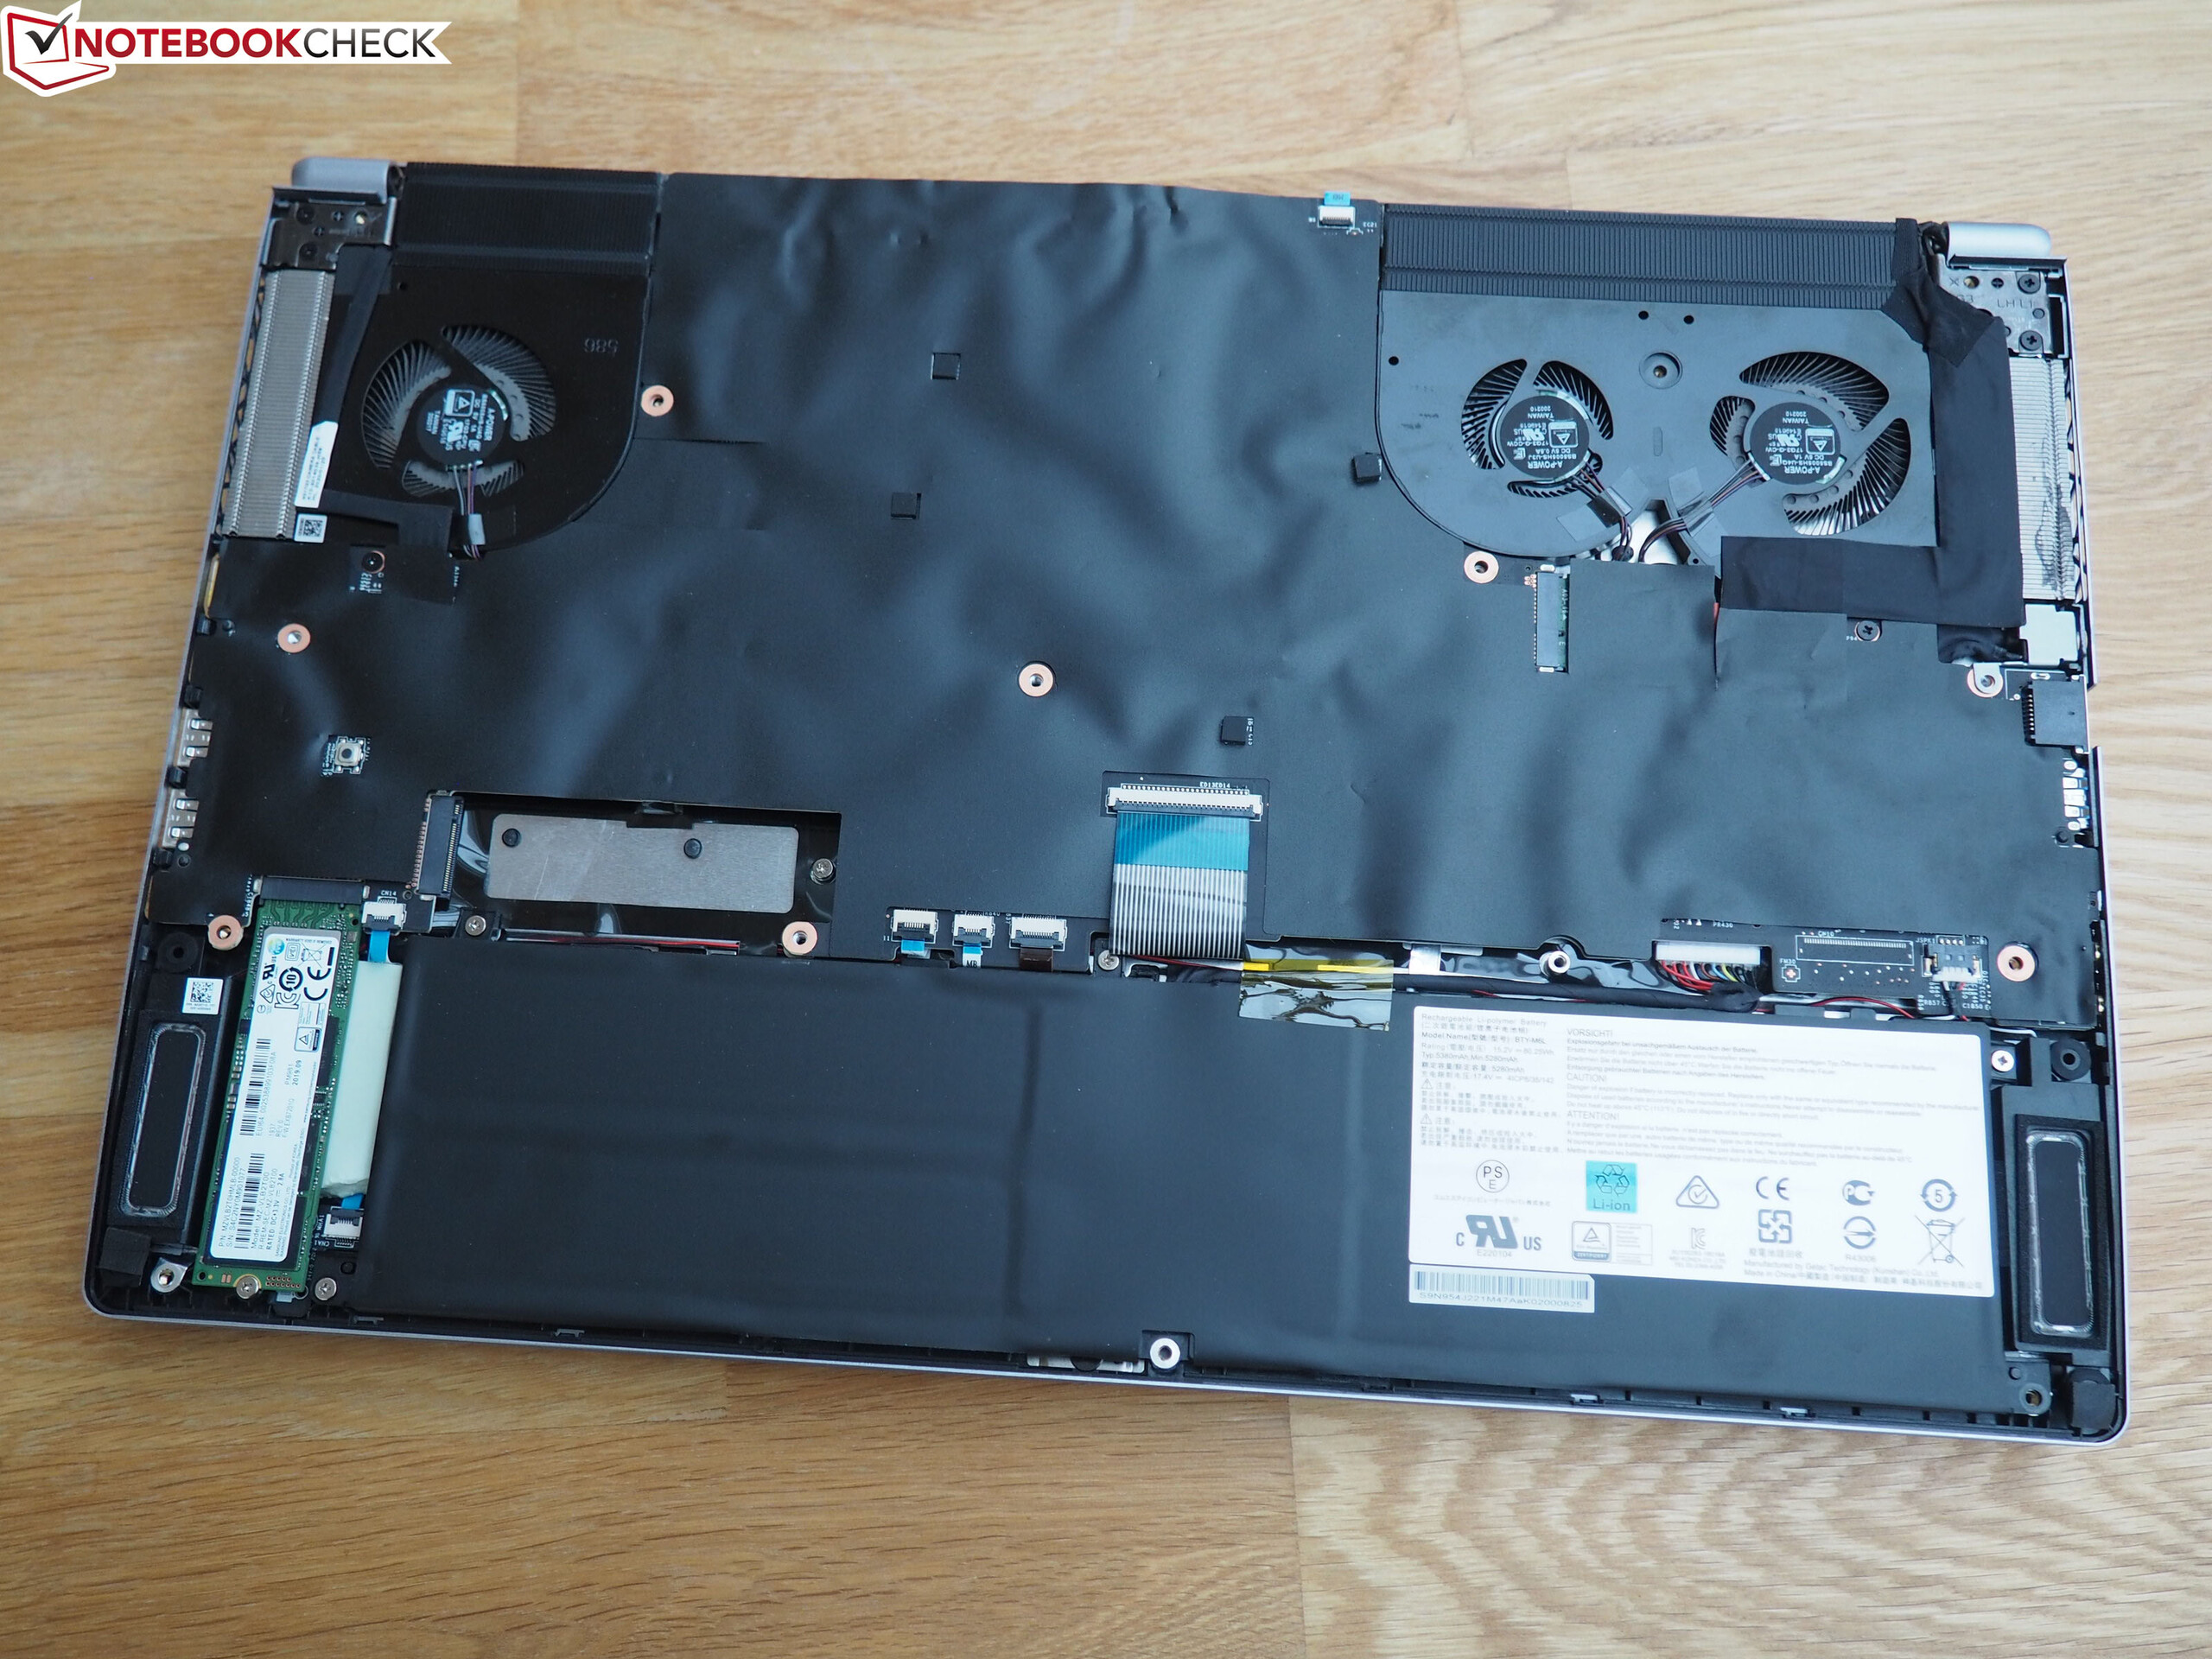
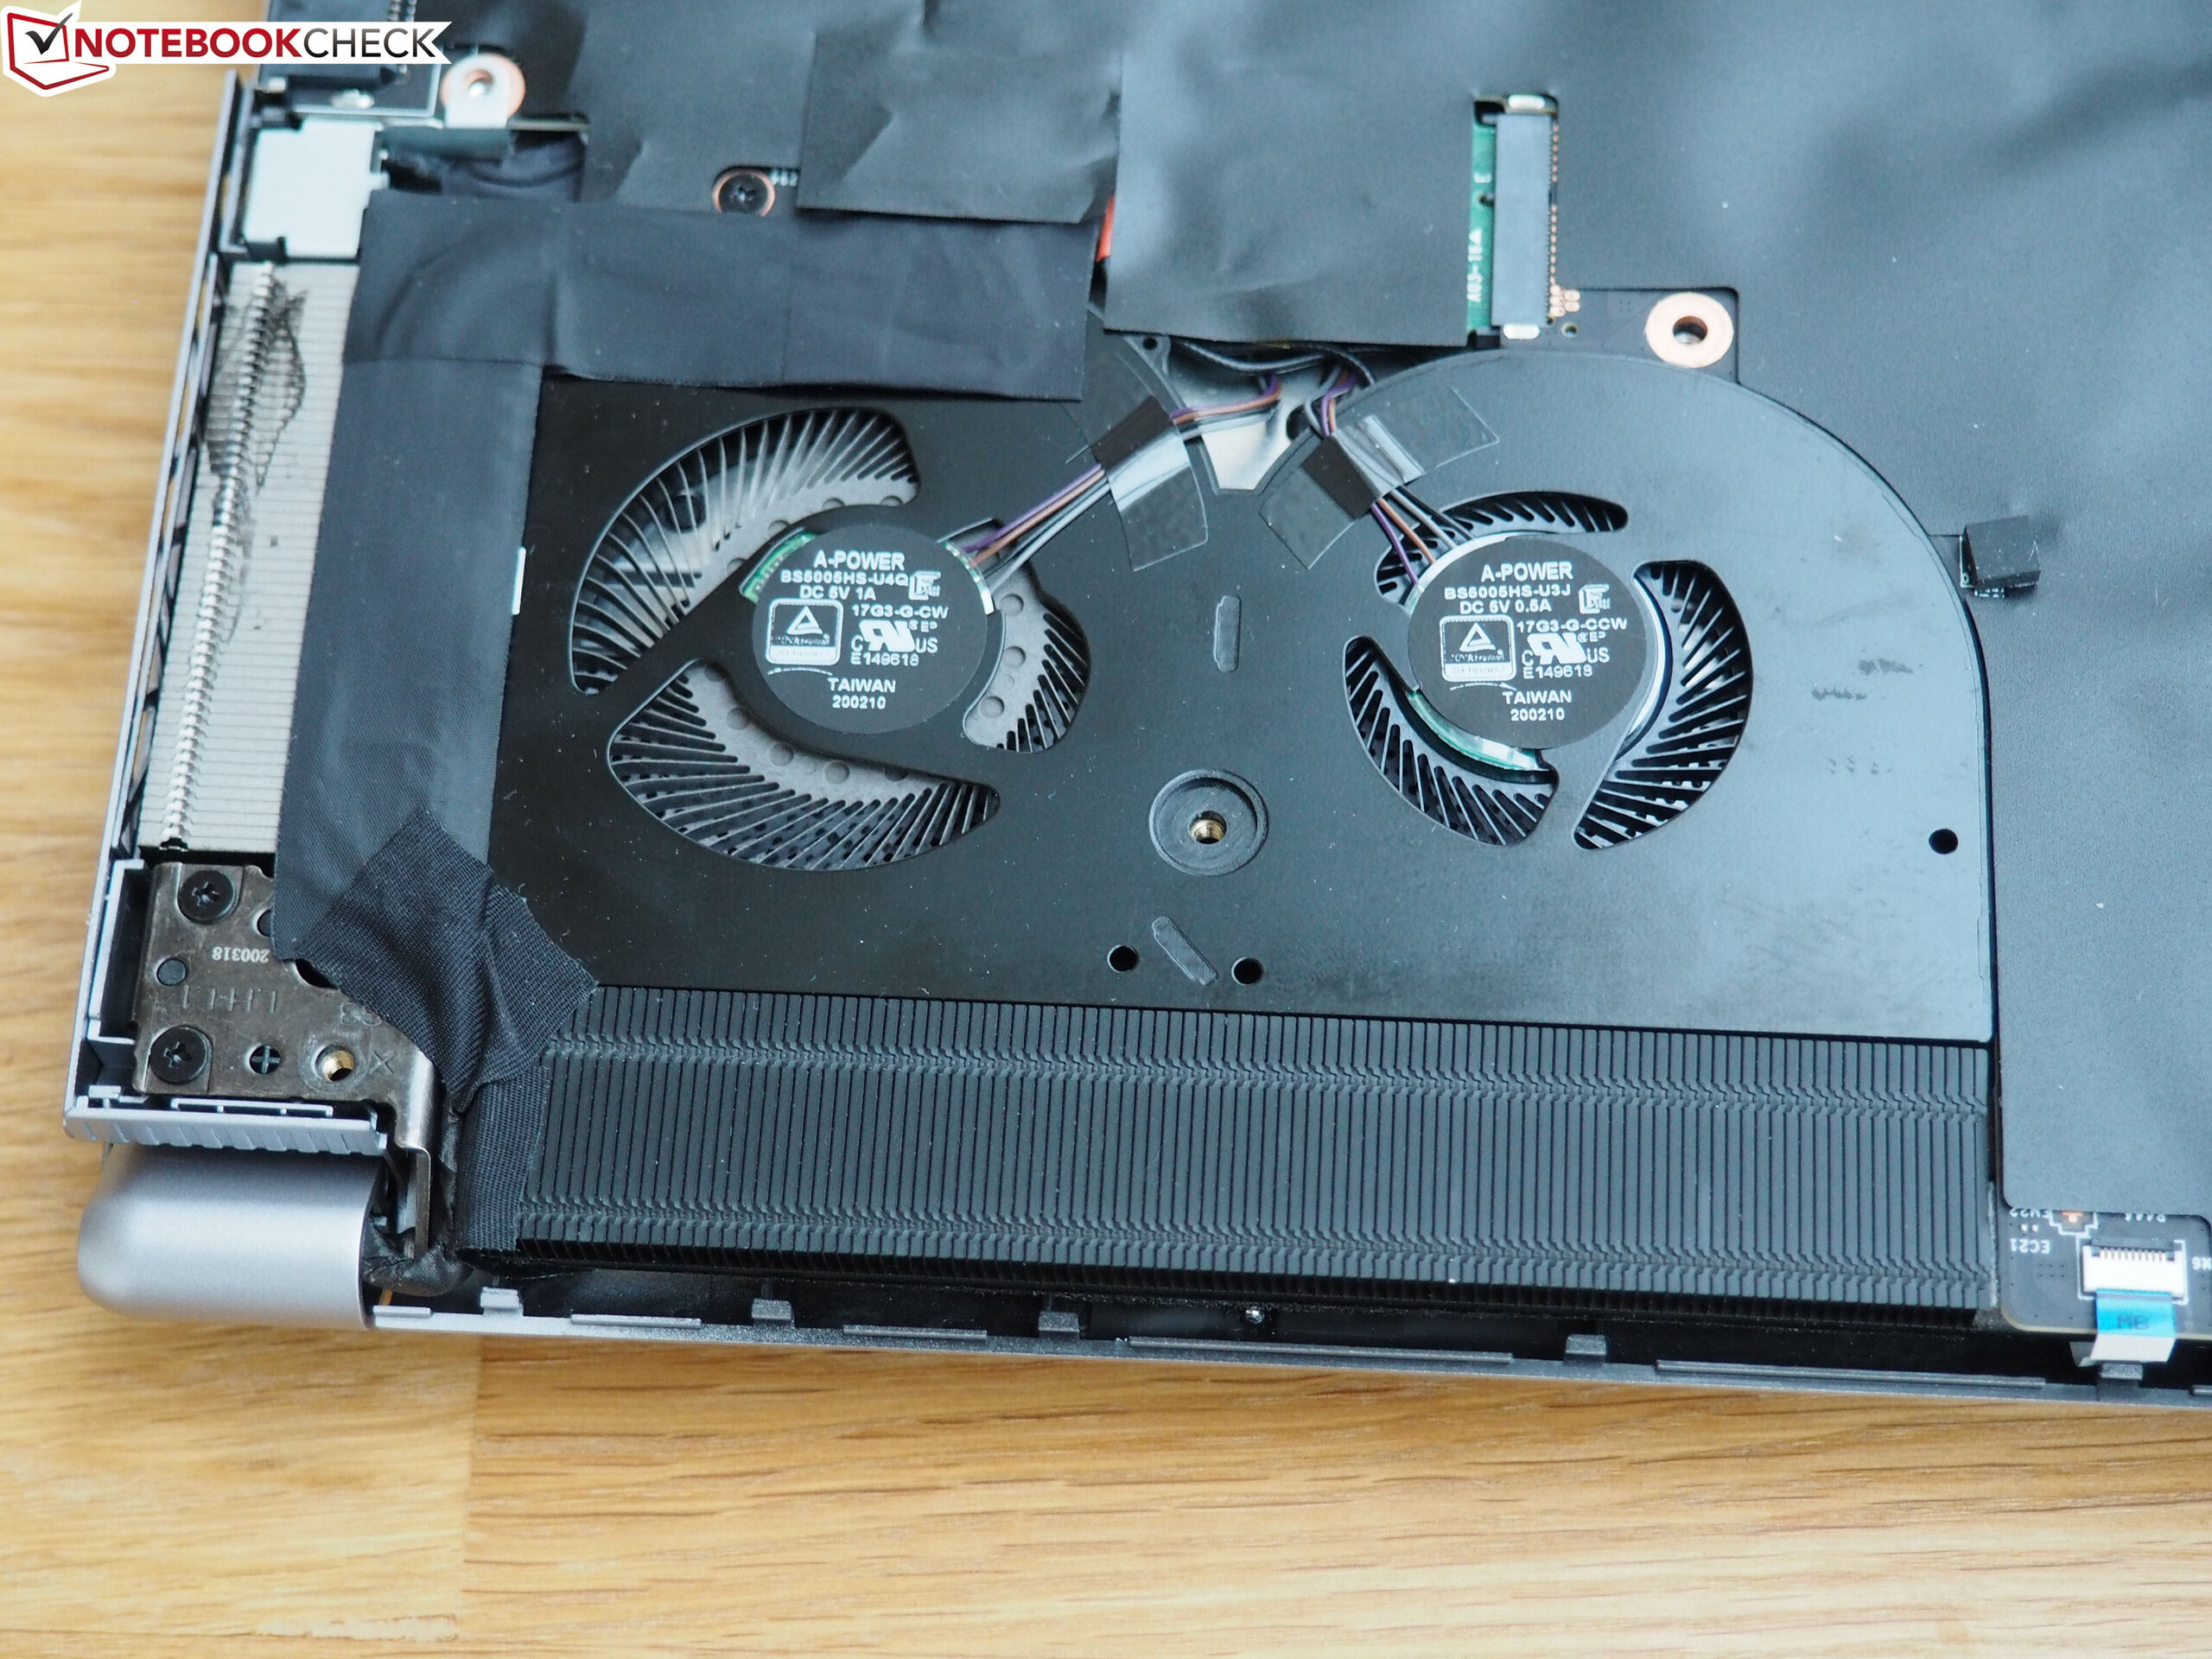
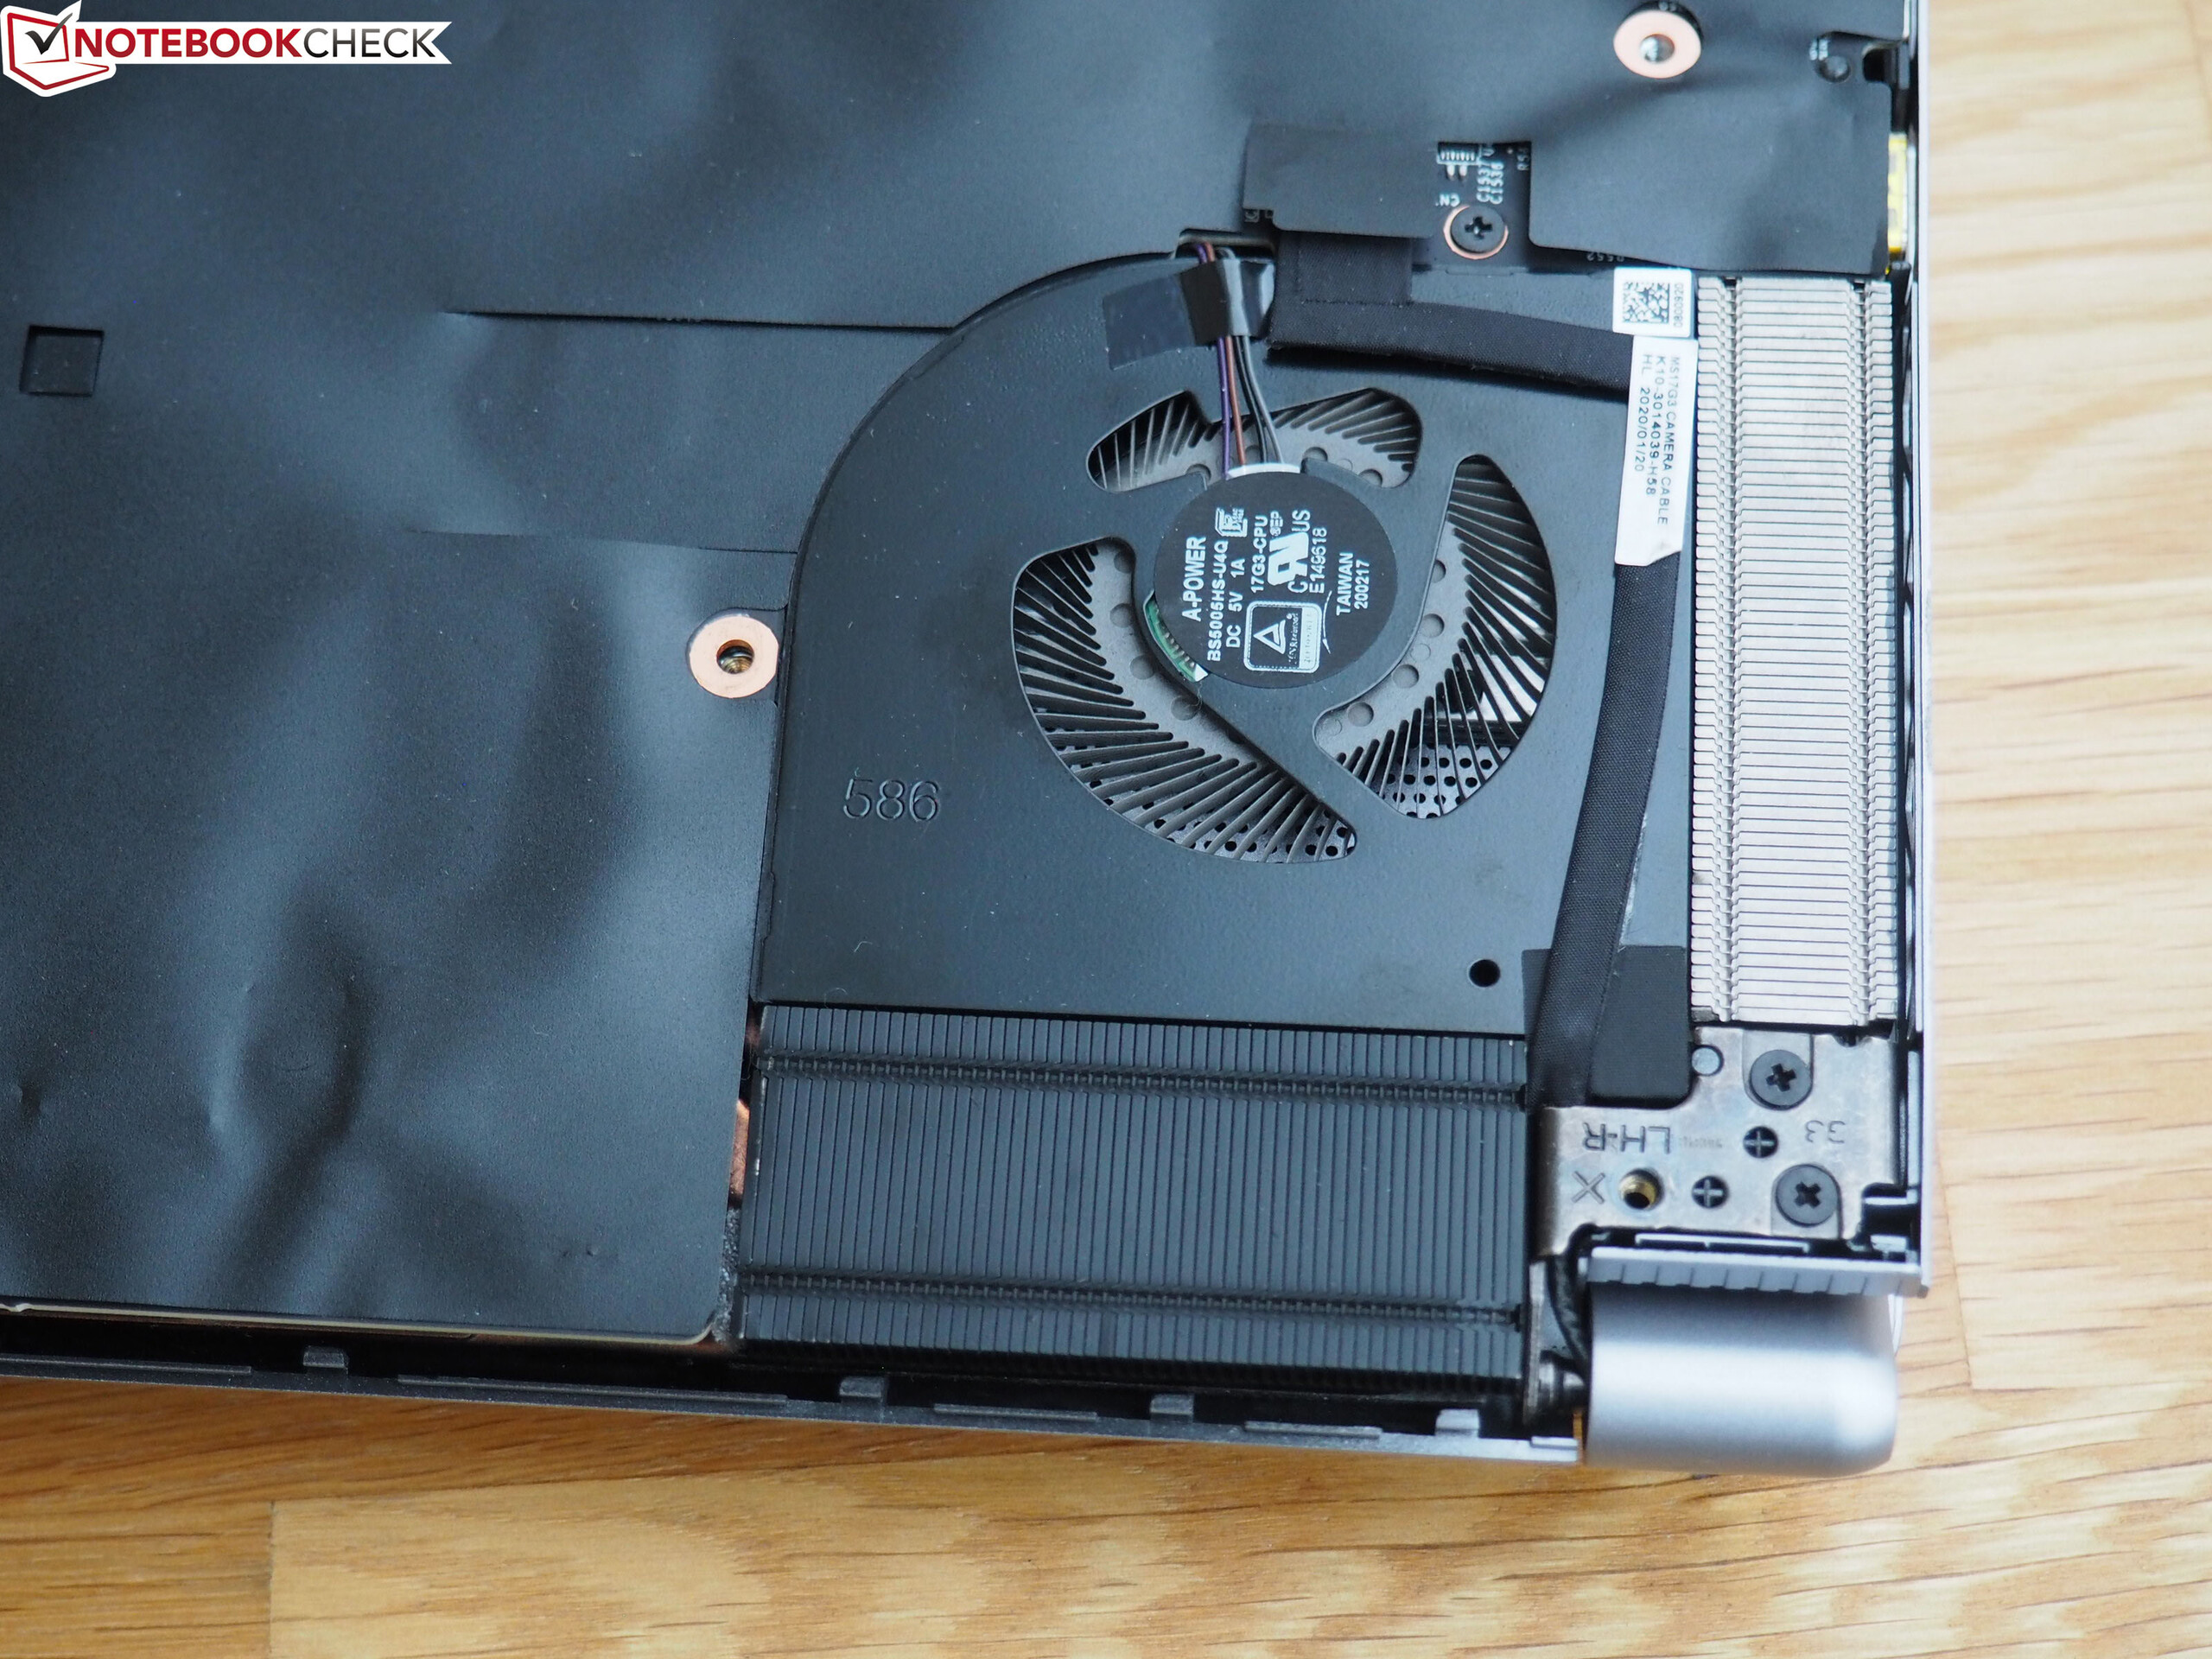
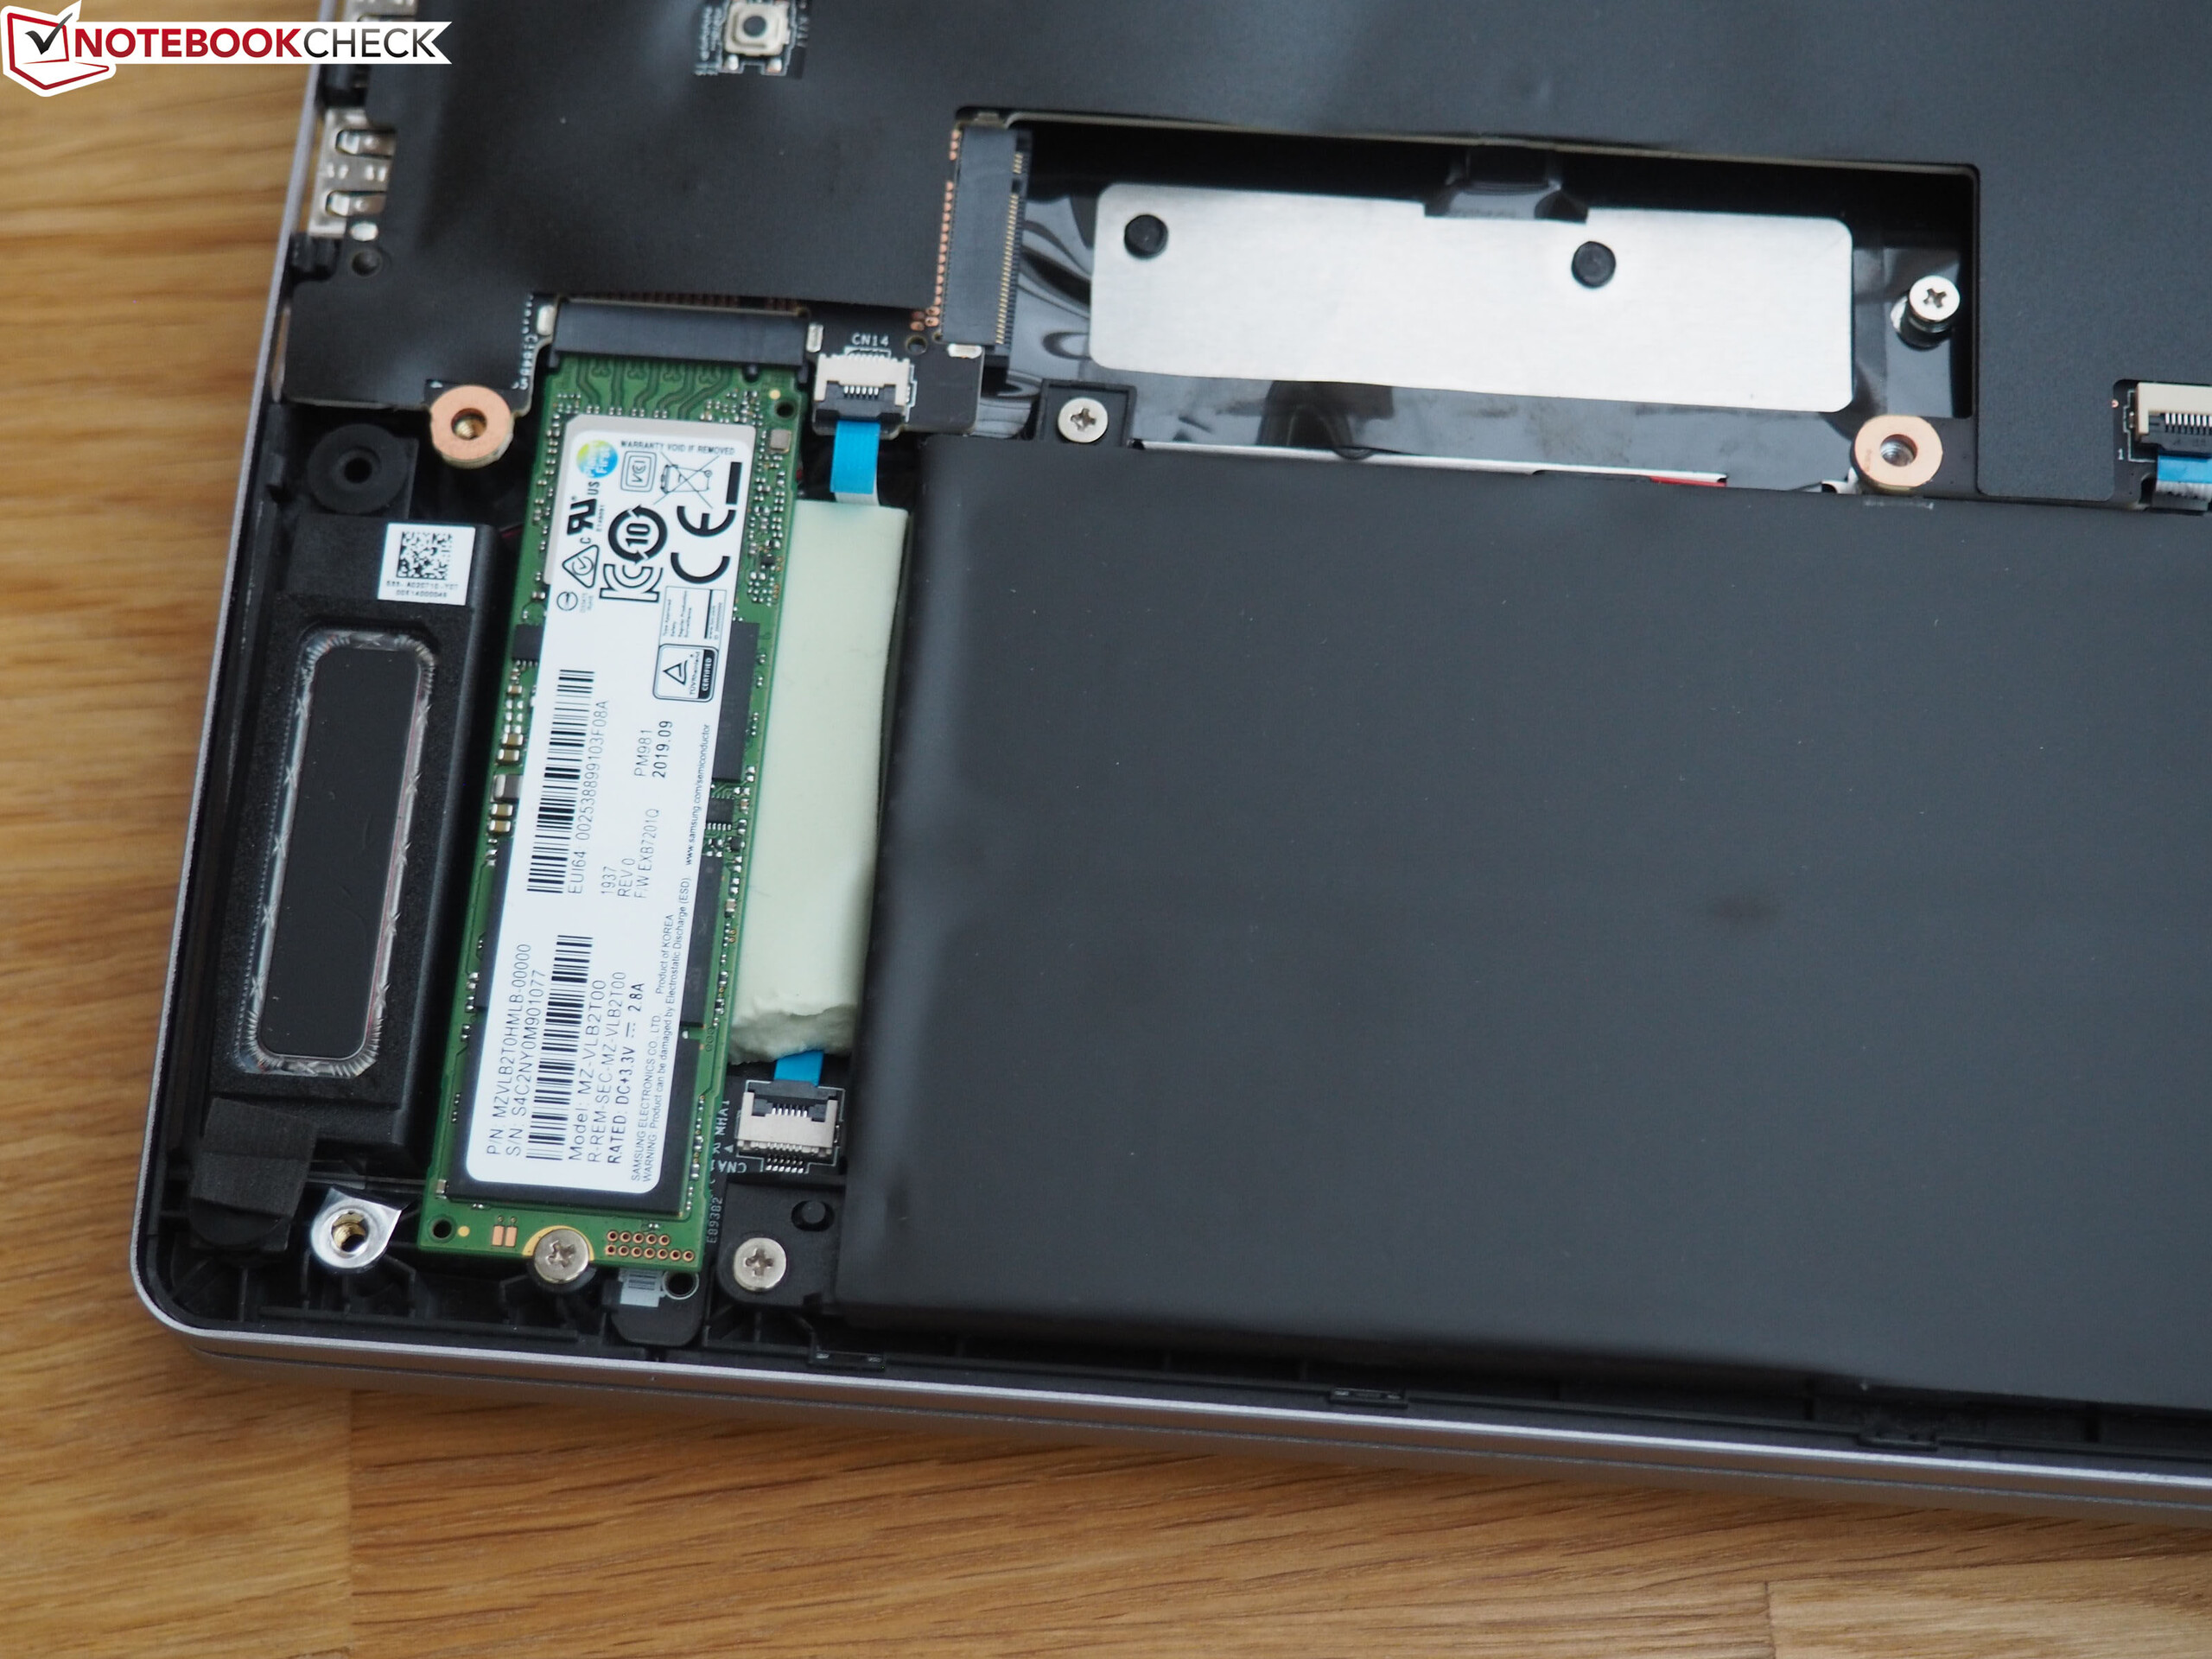
In order to reach the insides, you first have to remove a total of 15 screws from the case bottom and then pry it from its moorings. As you can see in the photos, some parts of the components are covered by a black foil, leaving only the fans, the battery, and the two M.2 slots directly accessible.
Input Devices
Keyboard
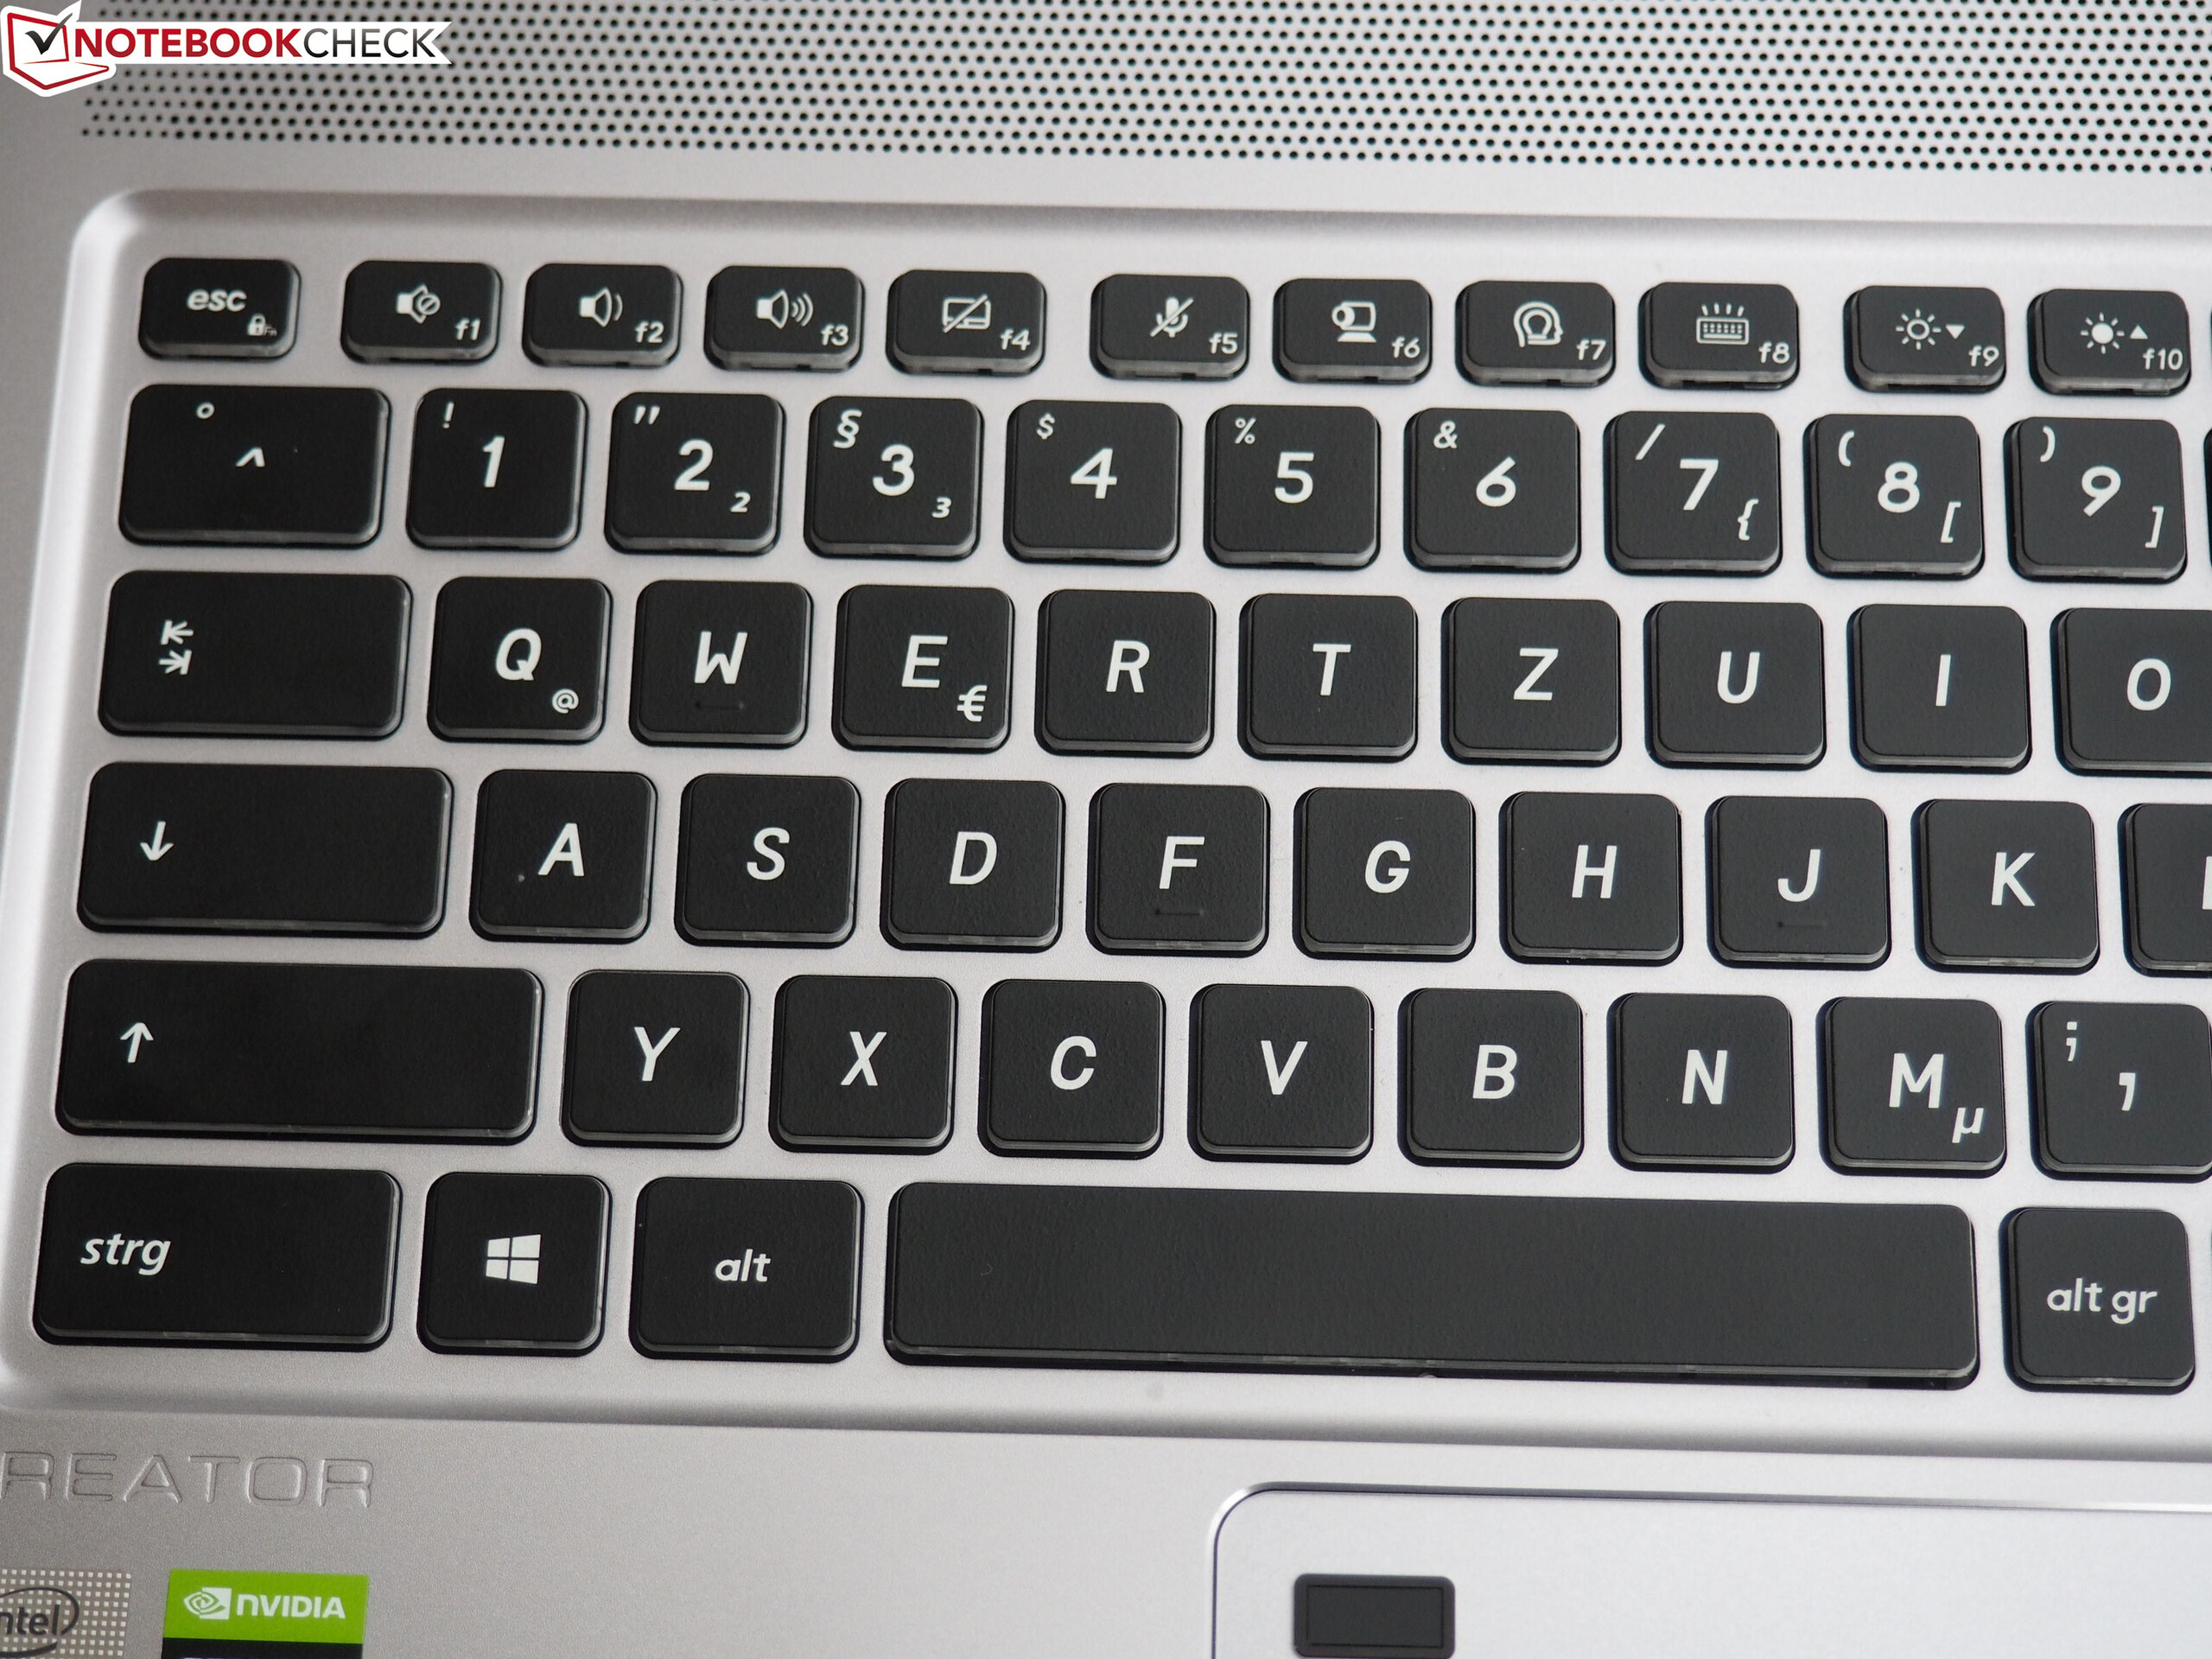
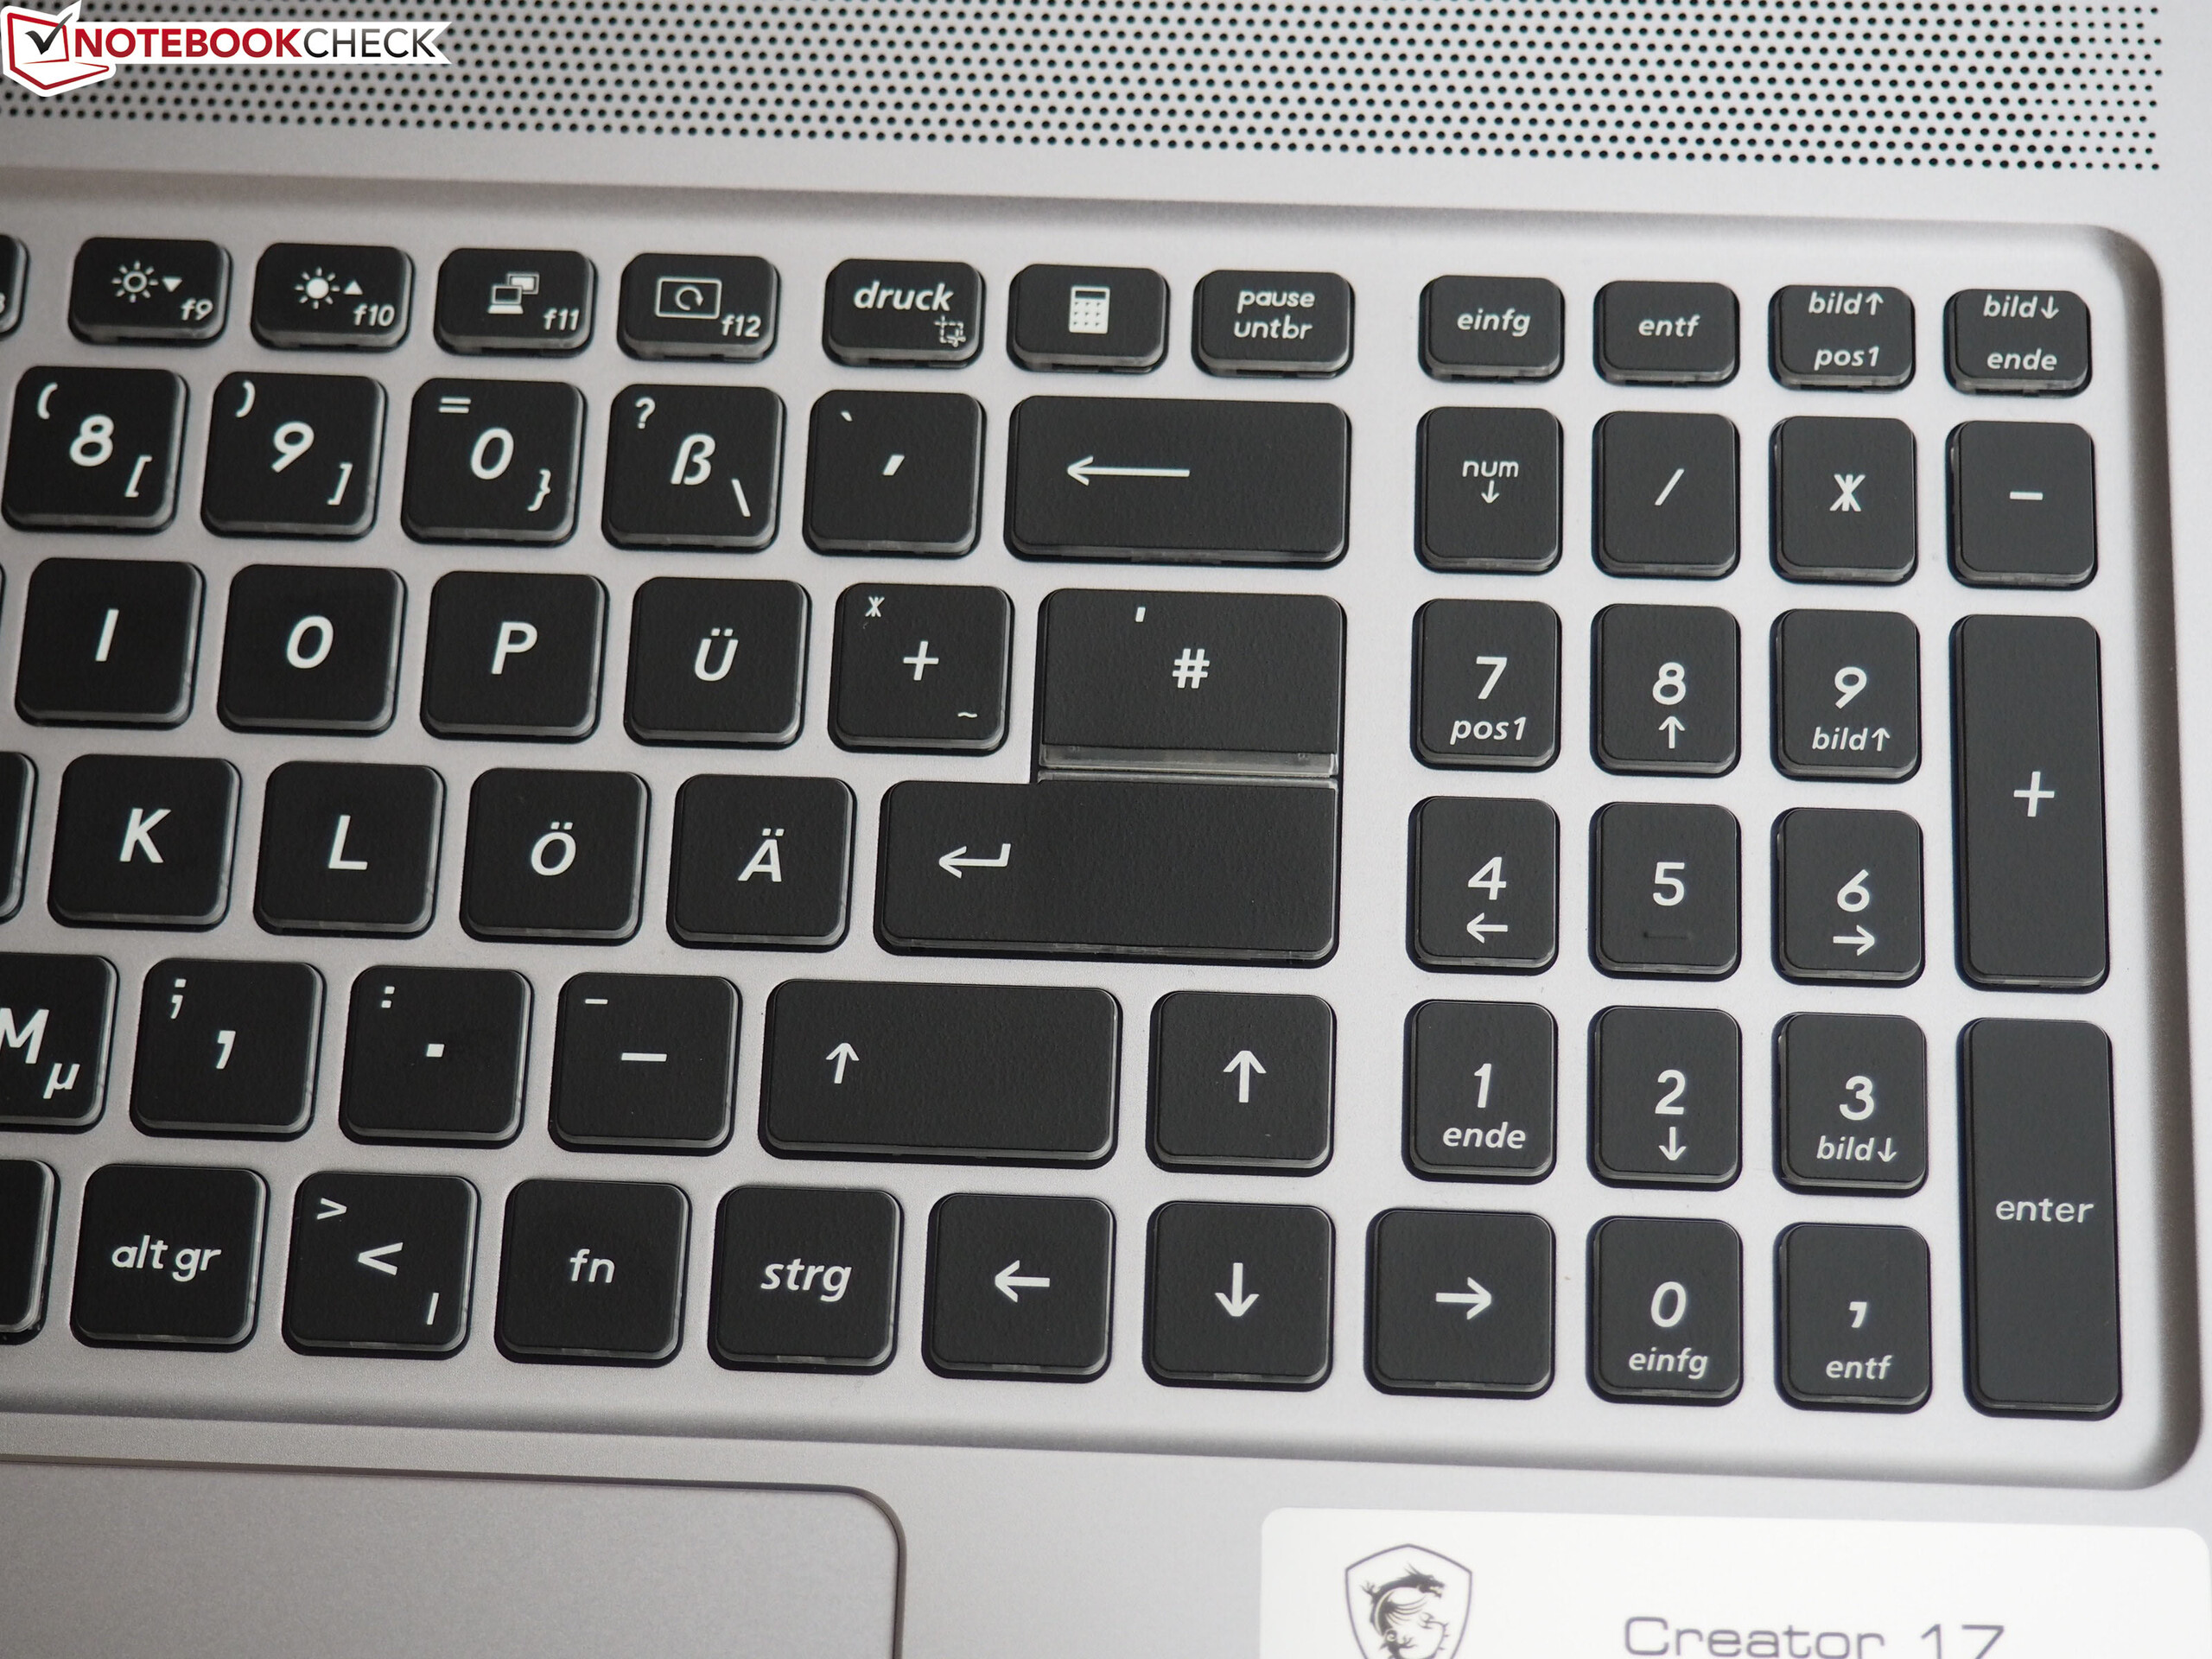
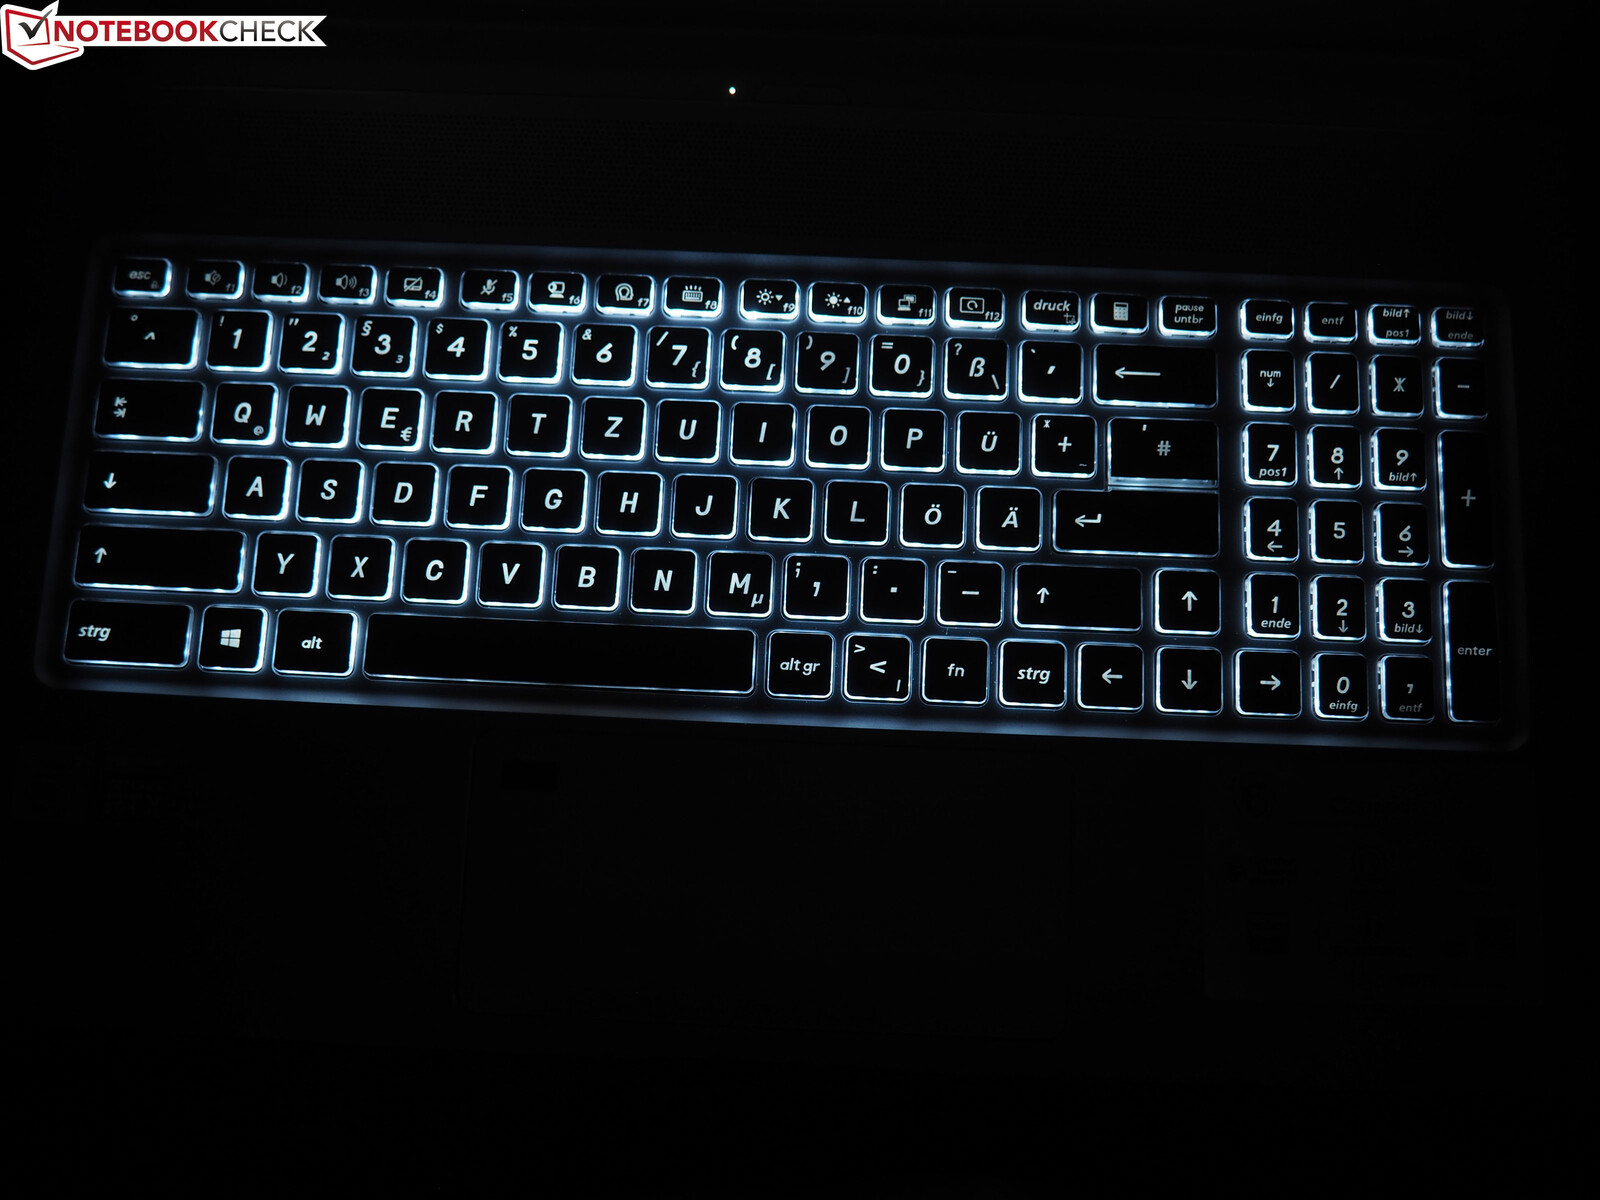
The keyboard reminds us very much of the MSI gaming models. German buyers have to live with a unique layout in the Creator 17 keyboard that requires some getting used to. Among other things, this also concerns the position of the <>| key and the #‘ key. The latter leads to an Enter key of only a single line, which should deter some of those who type frequently. The presence of a dedicated number block is a matter of taste, as usual. We would call the typing experience good. In order to be able to use the 17-incher optimally also at night and in dark surroundings, the keyboard offers a white illumination that can be adjusted in several steps.
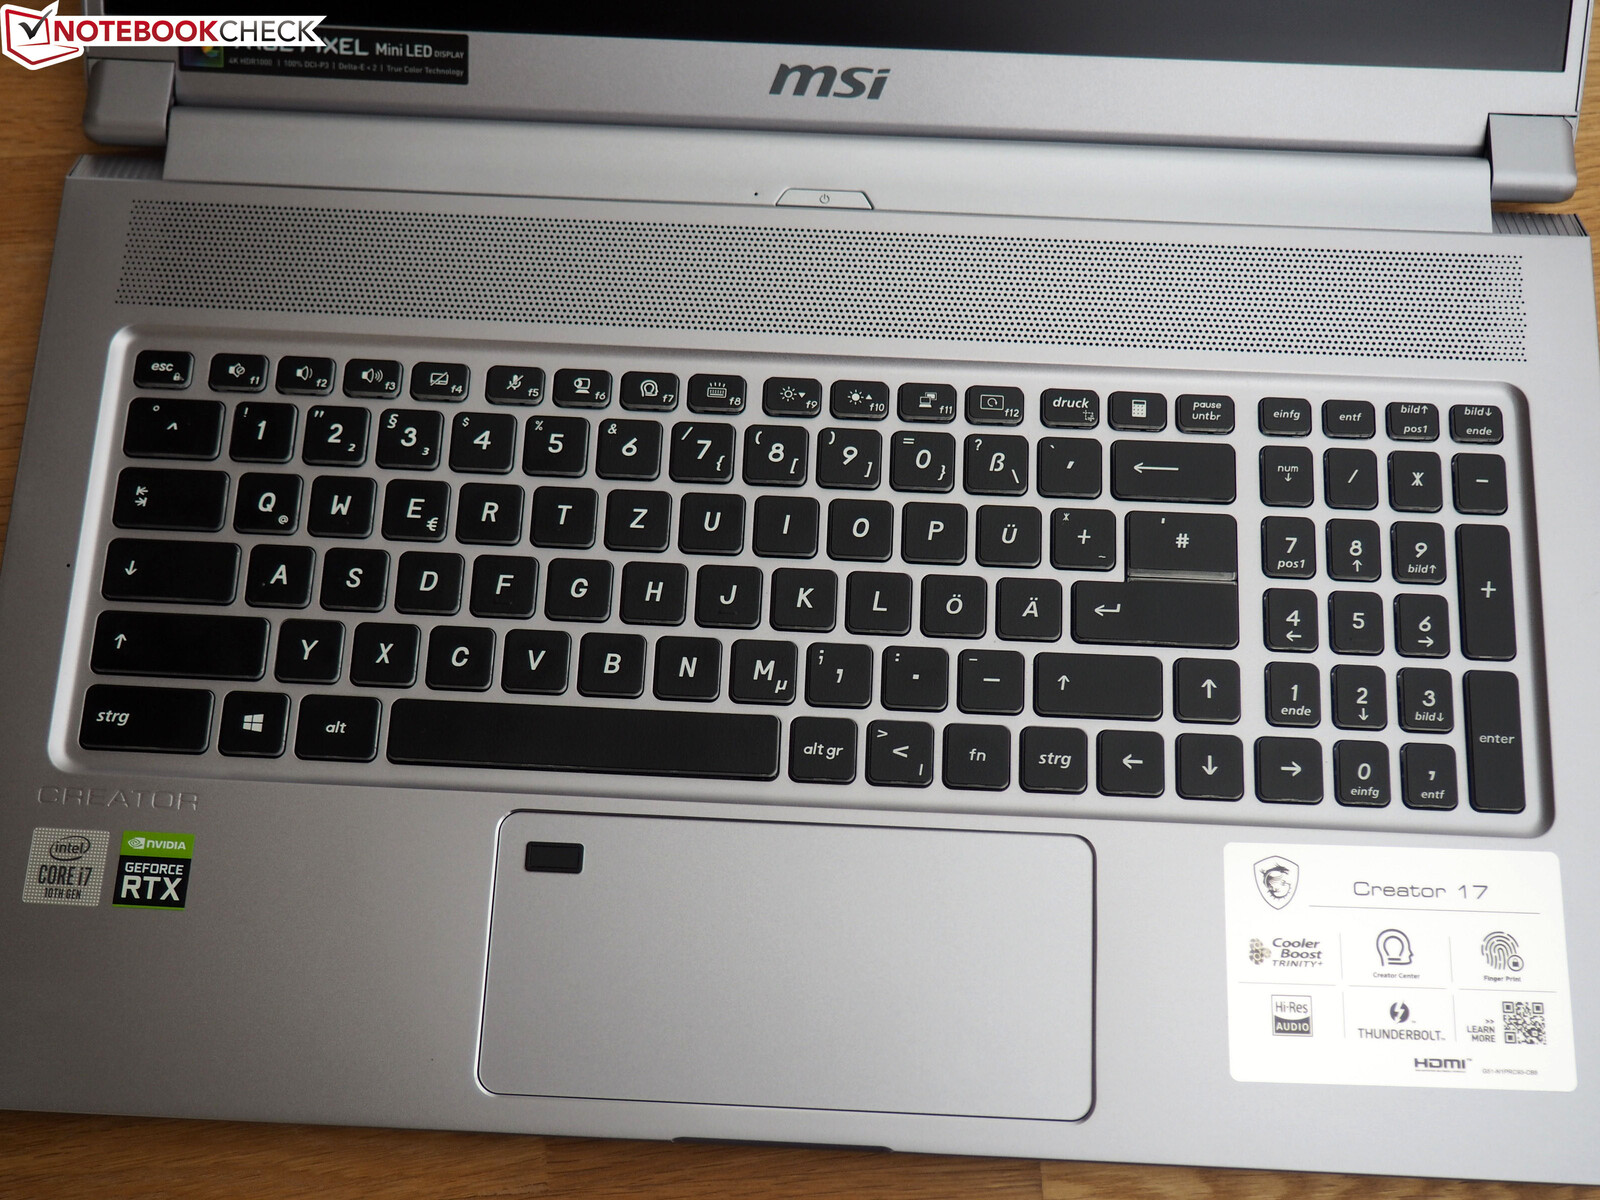
Touchpad
The touchpad mainly stands out with its width. 14 cm (~5.5 in) offers a lot of space for horizontal mouse movements. On the other hand, the vertical space is only 6.5 cm (~2.6 in). The smooth finish allows the fingers to slide comfortably and quickly across the surface. The gesture support (scrolling and zooming with two fingers, for example) also scores some positive points, even though this is the standard at this point. Left and right clicks in the lower corners of the touchpad are mostly recognized reliably, but they produce a quite loud clattering sound.
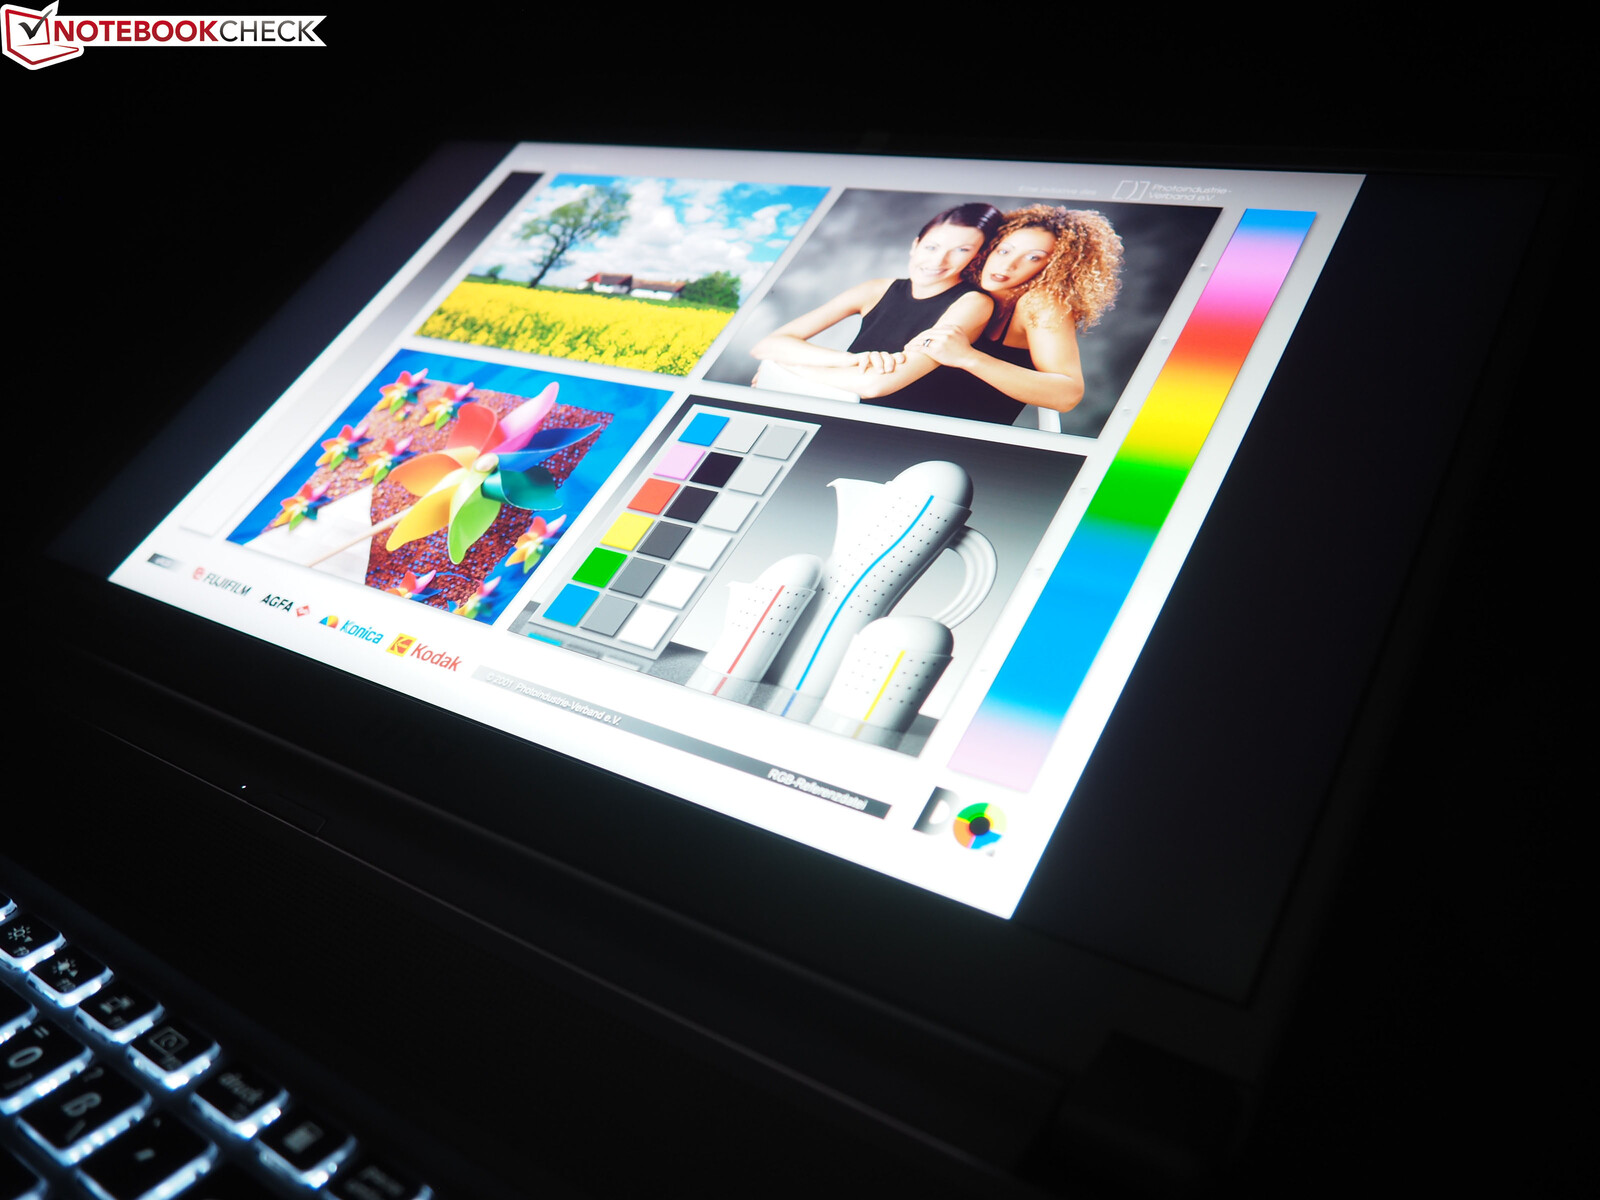
Display
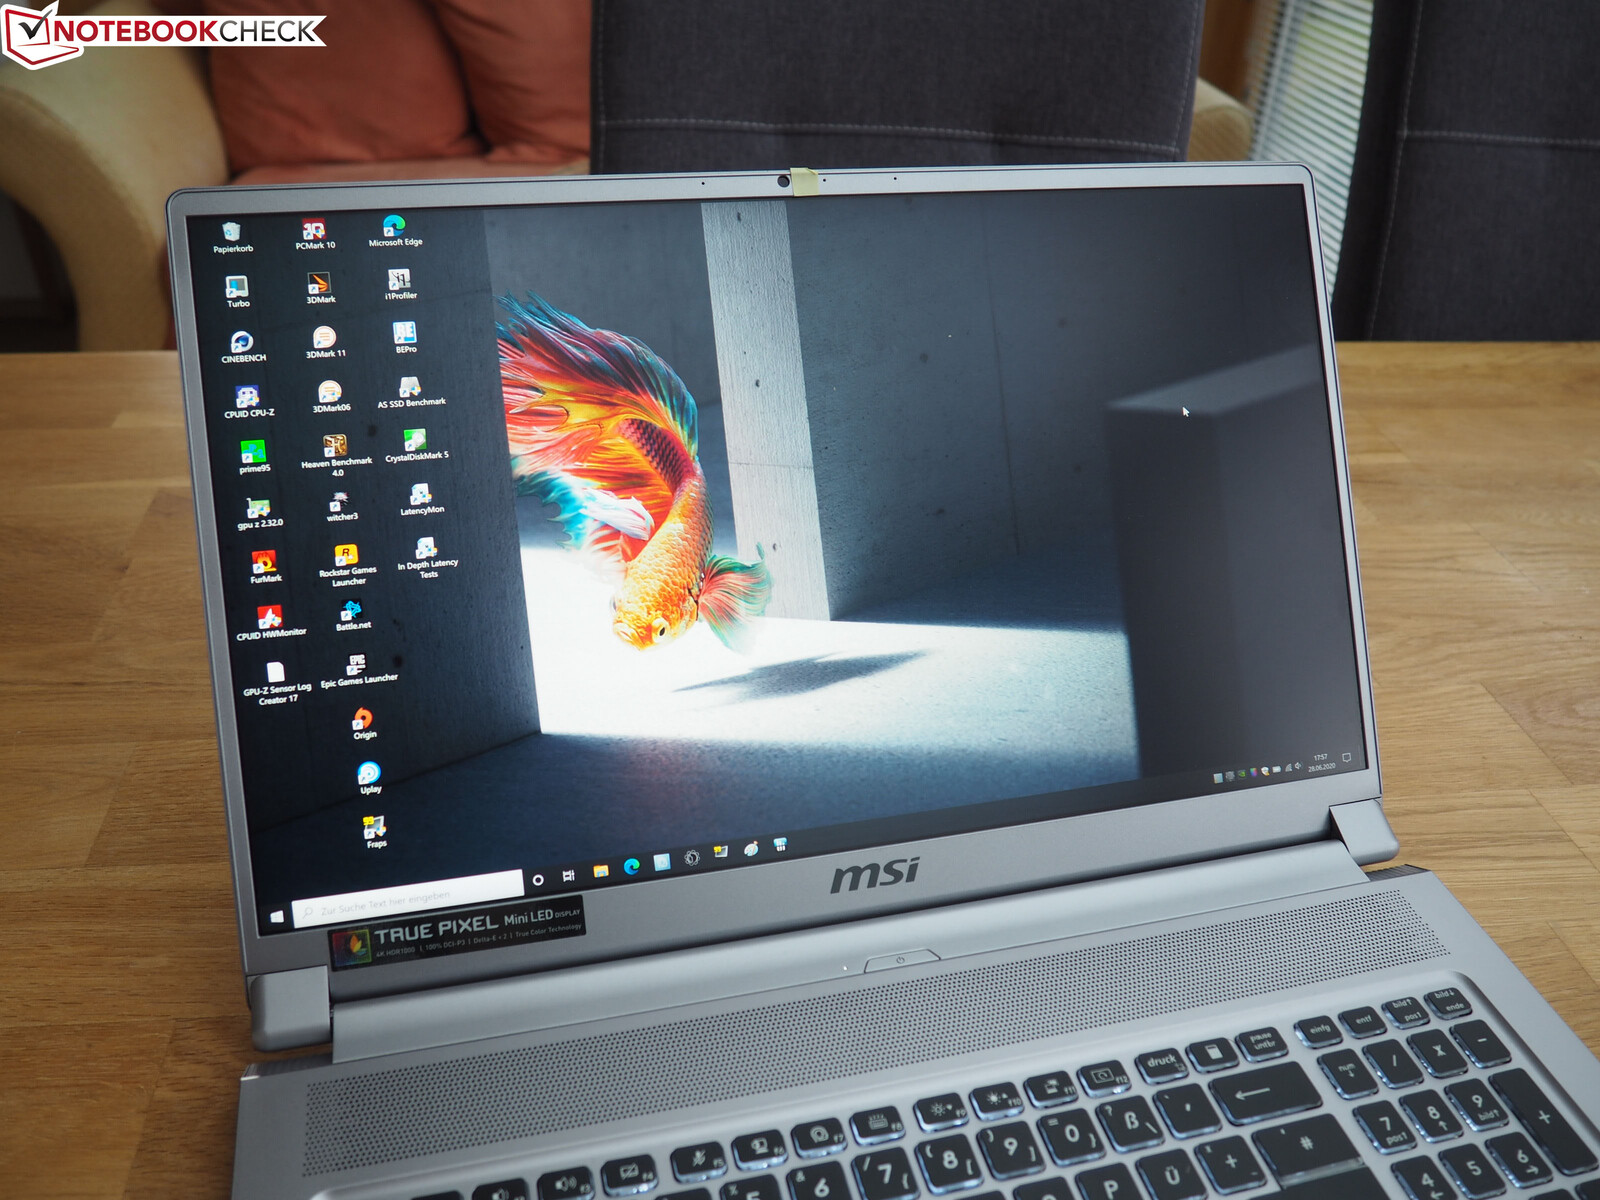
The new Mini LED display turns out to be the absolute highlight of the Creator 17. Unless mentioned otherwise, the following values were produced without HDR, because when using HDR, the MSI color profiles did not run as they were supposed to, and there were also some software and hardware problems with our measurement tools.
| |||||||||||||||||||||||||
Brightness Distribution: 93 %
Center on Battery: 996 cd/m²
Contrast: 1465:1 (Black: 0.68 cd/m²)
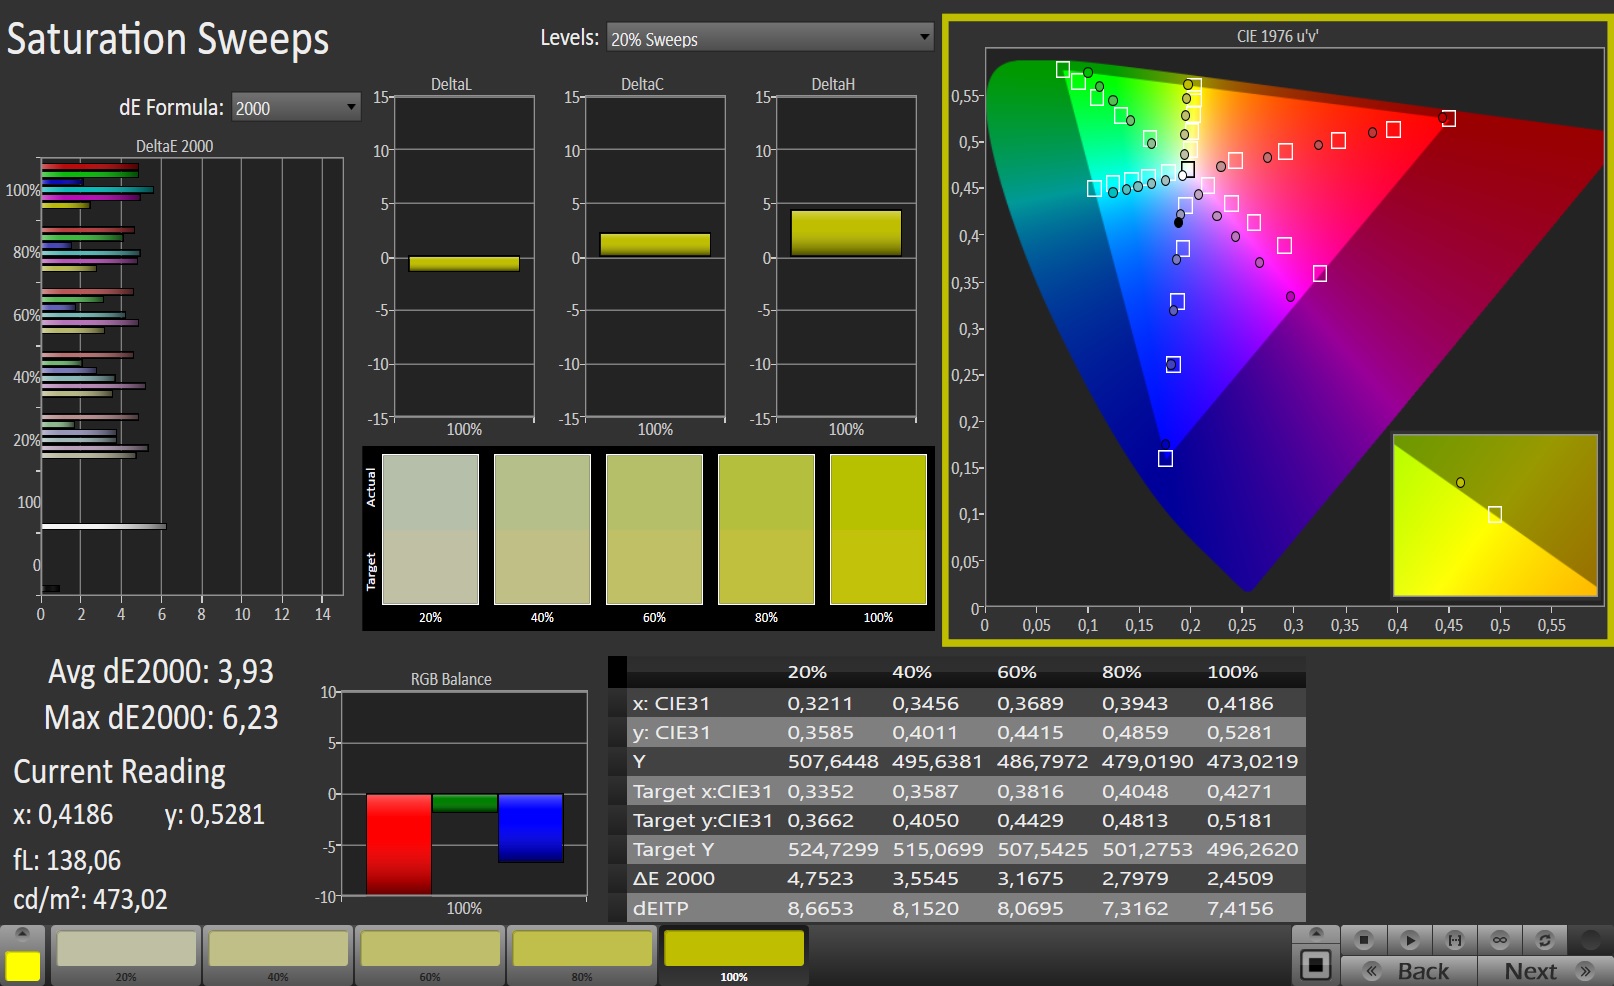
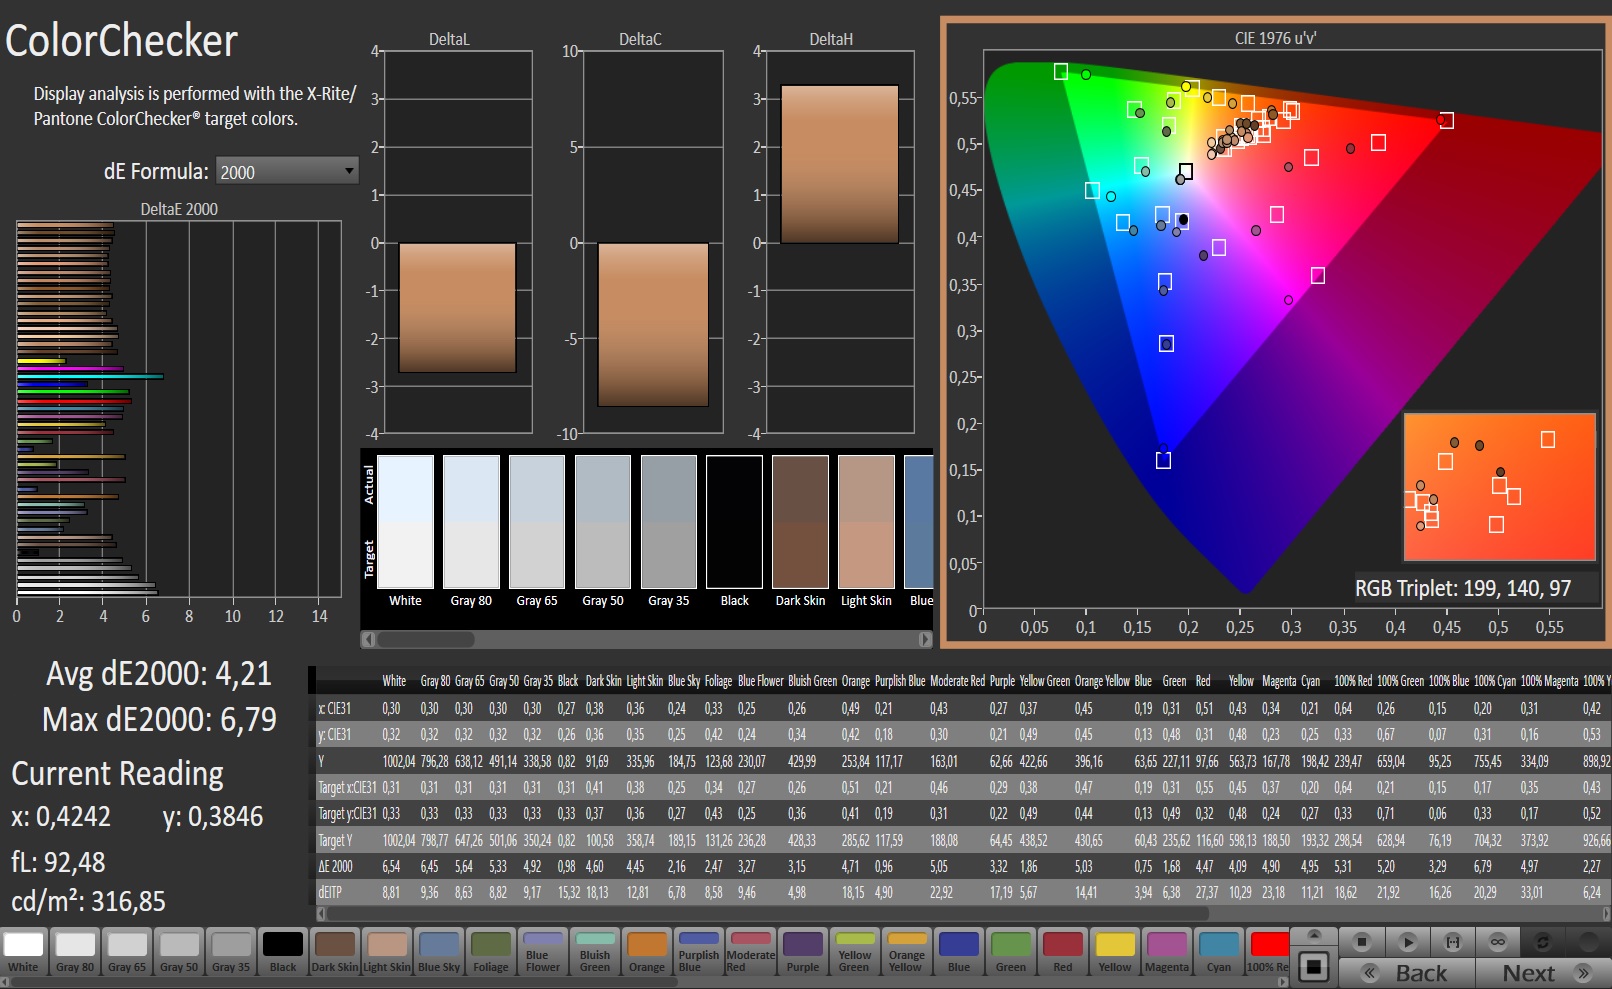
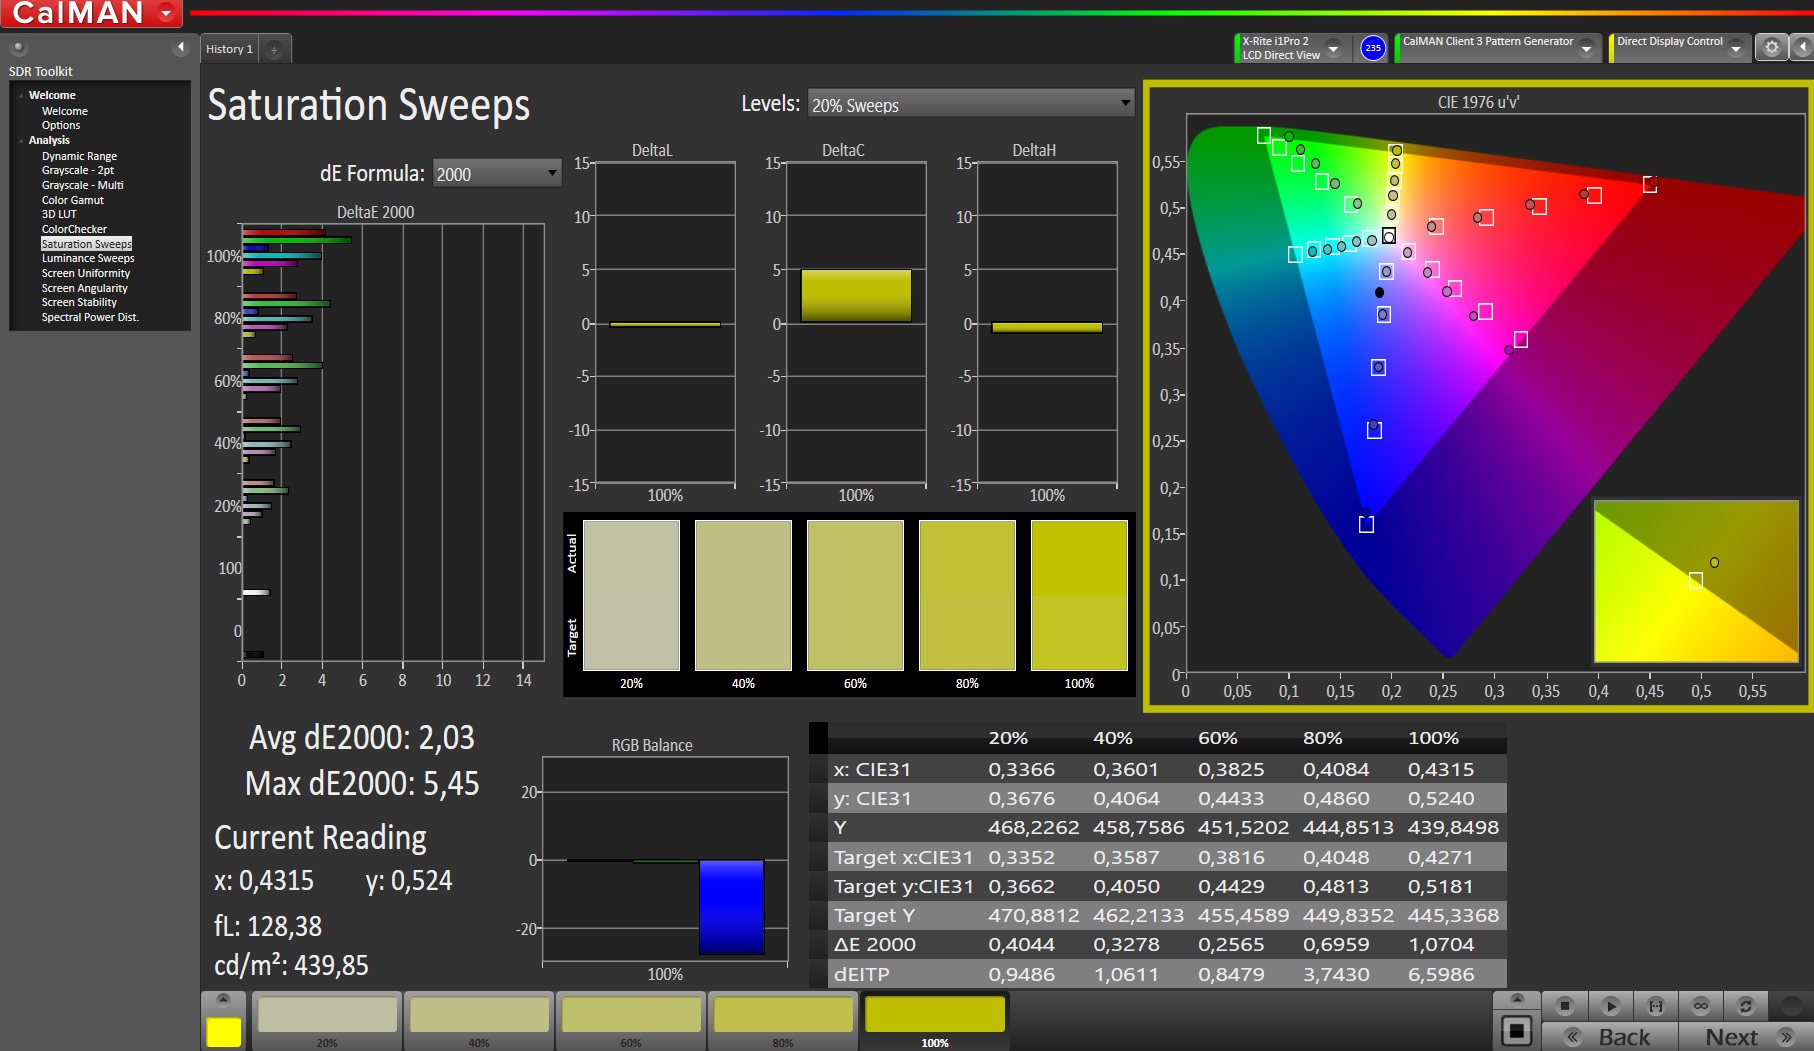
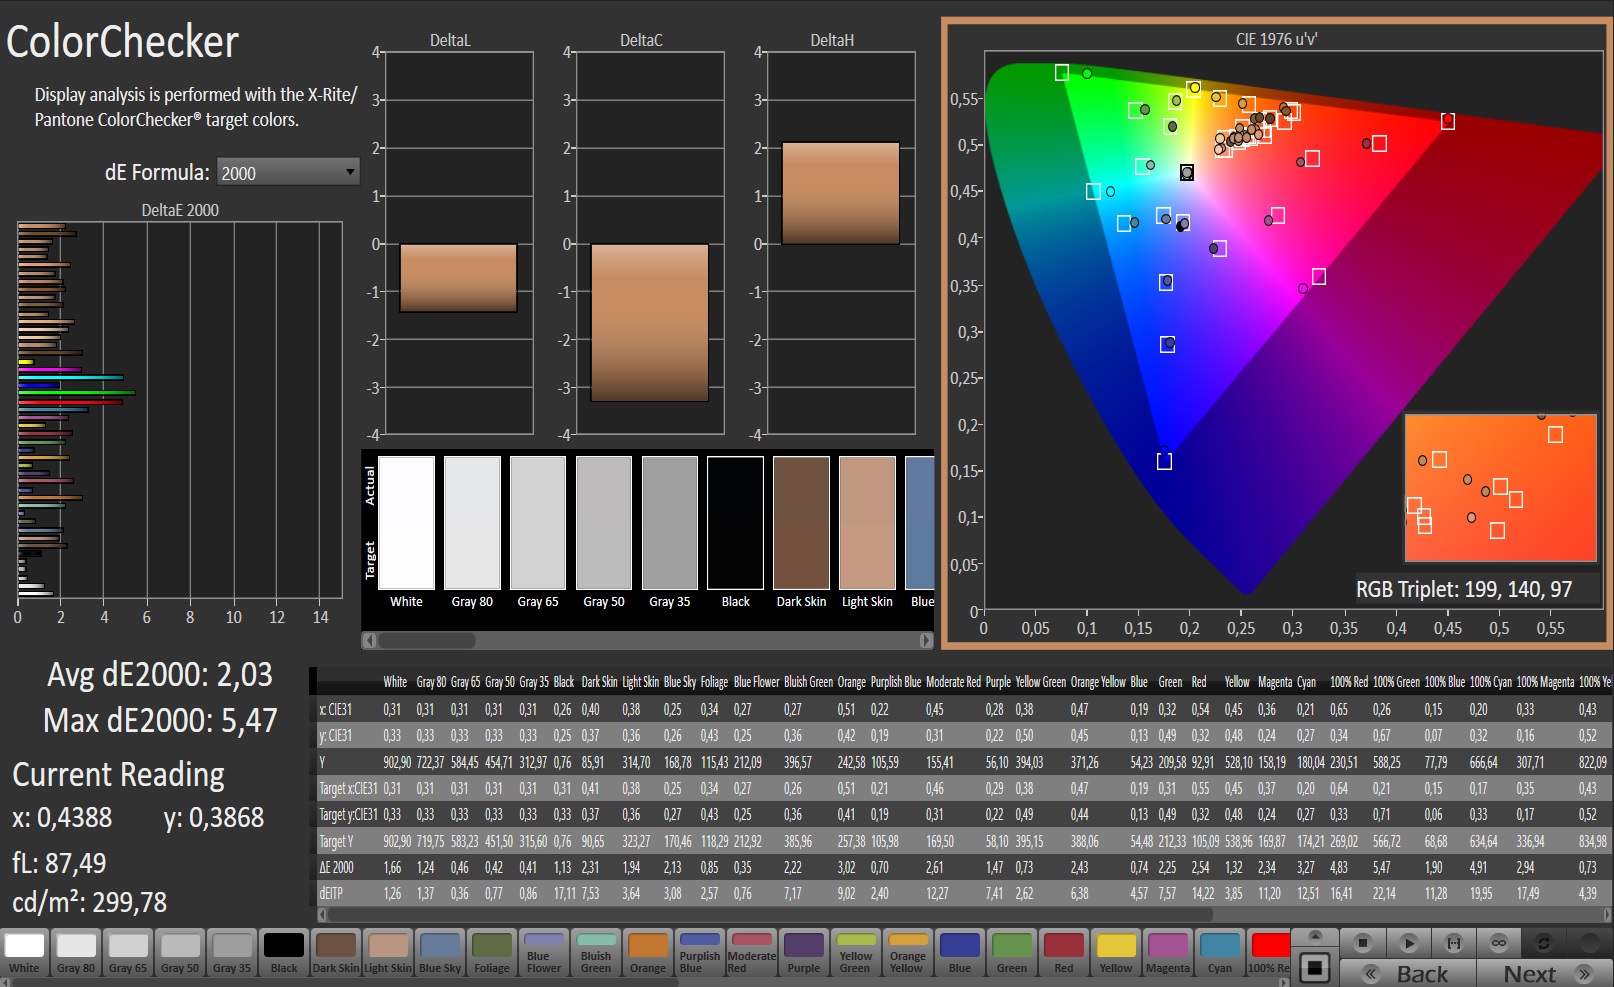
ΔE ColorChecker Calman: 4.21 | ∀{0.5-29.43 Ø4.73}
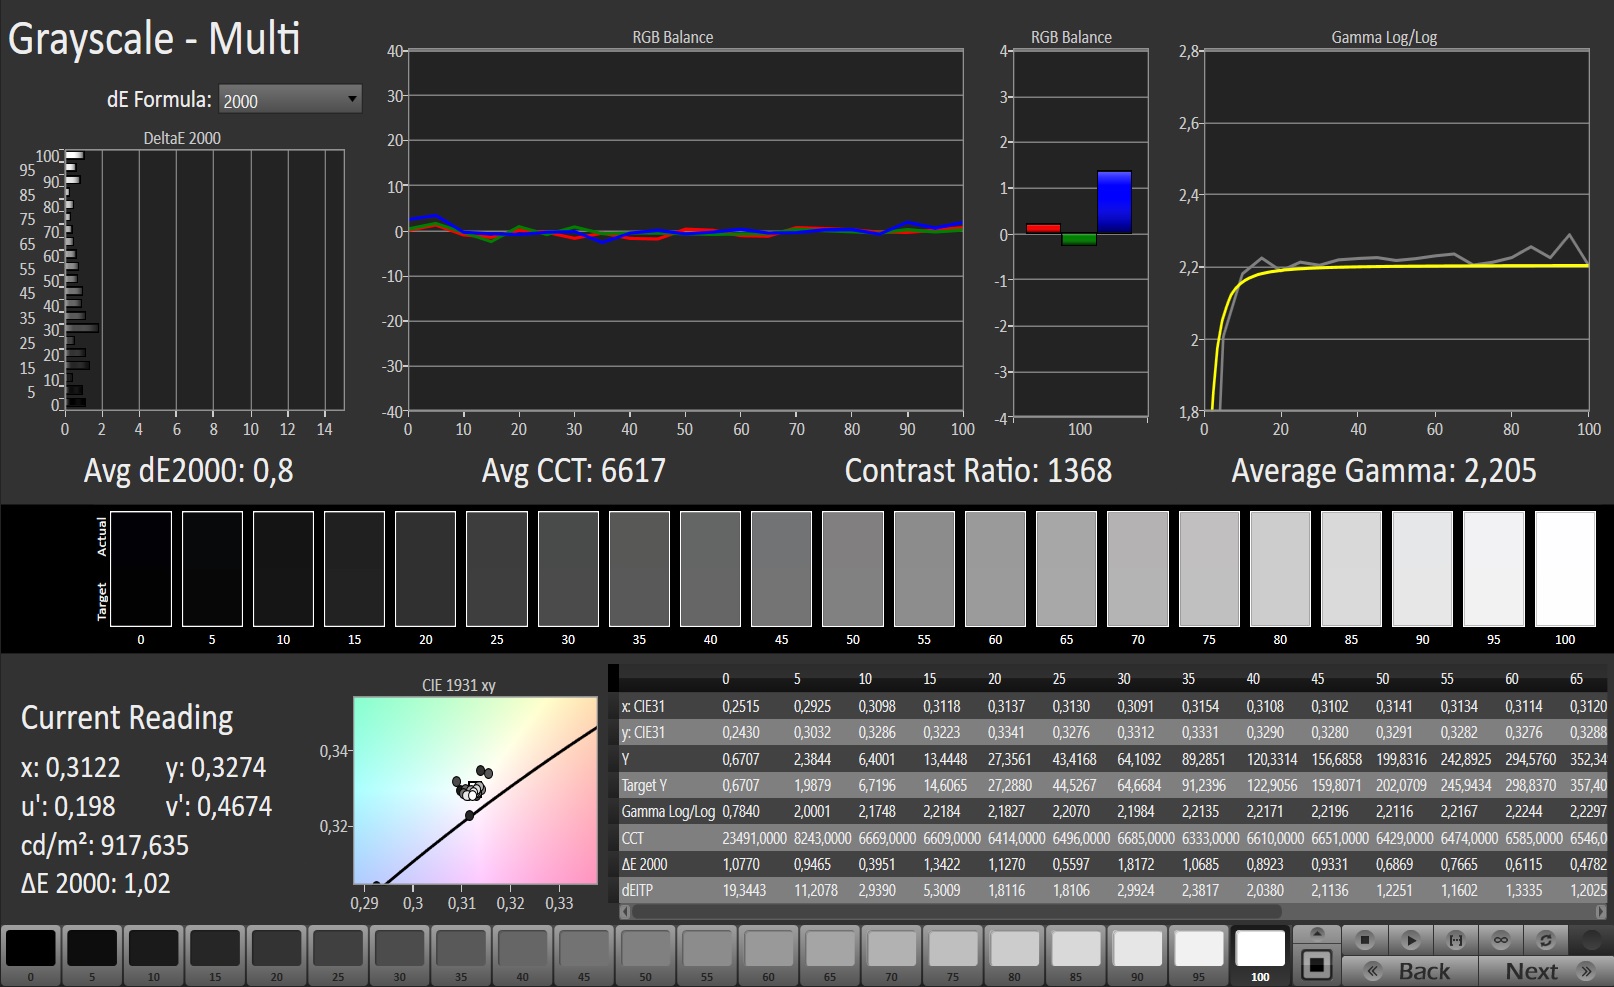
calibrated: 2.03
ΔE Greyscale Calman: 4.1 | ∀{0.09-98 Ø4.97}
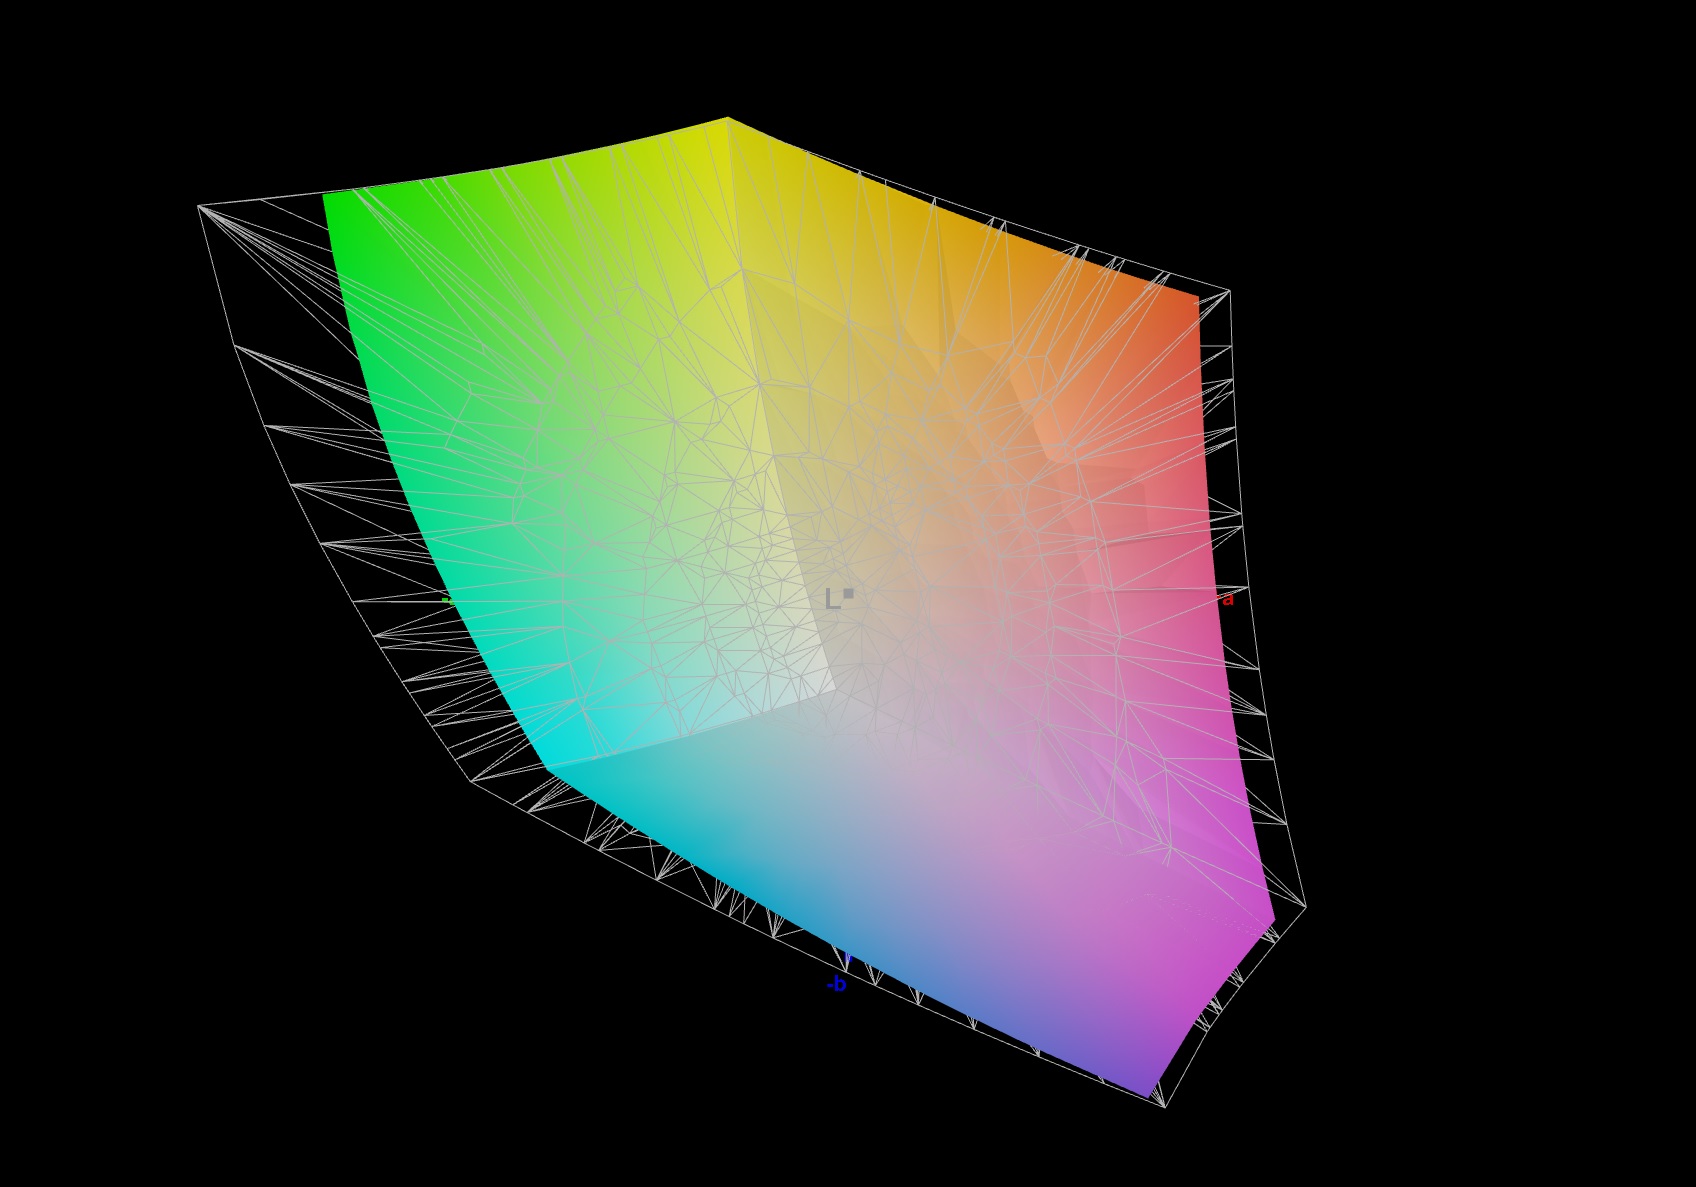
97% sRGB (Argyll 1.6.3 3D)
84% AdobeRGB 1998 (Argyll 1.6.3 3D)
84% AdobeRGB 1998 (Argyll 3D)
97.5% sRGB (Argyll 3D)
82% Display P3 (Argyll 3D)
Gamma: 2.207
CCT: 7491 K
| MSI Creator 17 A10SGS B173ZAN05.0 (AUO278E), Mini-LED IPS-Level, 3840x2160 | MSI Creator 17 A10SGS HDR 3840x2160 | MSI GS75 Stealth 9SG Chi Mei N173HCE-G33 (CMN175C), IPS, 1920x1080 | Razer Blade Pro 17 RTX 2080 Max-Q AU Optronics B173HAN04.0, IPS, 1920x1080 | Asus ROG Zephyrus S GX701GXR AU Optronics B173HAN05.1, IPS, 1920x1080 | Alienware m17 R2 P41E Chi Mei 173HCE, CMN175F, IPS, 1920x1080 | |
|---|---|---|---|---|---|---|
| Display | -17% | -20% | -10% | -9% | ||
| Display P3 Coverage (%) | 82 | 62.6 -24% | 60.6 -26% | 70 -15% | 70.8 -14% | |
| sRGB Coverage (%) | 97.5 | 93.5 -4% | 89 -9% | 96.6 -1% | 98.5 1% | |
| AdobeRGB 1998 Coverage (%) | 84 | 64.7 -23% | 62.1 -26% | 72.3 -14% | 72.2 -14% | |
| Response Times | 0% | -14% | -9% | 14% | -23% | |
| Response Time Grey 50% / Grey 80% * (ms) | 7.2 ? | 6.8 ? | 5.6 ? | 17.2 ? | ||
| Response Time Black / White * (ms) | 8.8 ? | 8.8 ? -0% | 10 ? -14% | 9.6 ? -9% | 7.6 ? 14% | 10.8 ? -23% |
| PWM Frequency (Hz) | 26600 ? | 26600 ? | 25510 ? | 26320 ? | ||
| Screen | 102% | 11% | -10% | 3% | 11% | |
| Brightness middle (cd/m²) | 996 | 770 -23% | 366 -63% | 299.3 -70% | 288 -71% | 384.2 -61% |
| Brightness (cd/m²) | 952 | 759 -20% | 343 -64% | 294 -69% | 276 -71% | 357 -62% |
| Brightness Distribution (%) | 93 | 94 1% | 91 -2% | 94 1% | 93 0% | 90 -3% |
| Black Level * (cd/m²) | 0.68 | 0.07 90% | 0.29 57% | 0.29 57% | 0.24 65% | 0.29 57% |
| Contrast (:1) | 1465 | 11000 651% | 1262 -14% | 1032 -30% | 1200 -18% | 1325 -10% |
| Colorchecker dE 2000 * | 4.21 | 1.51 64% | 2.55 39% | 1.92 54% | 1.35 68% | |
| Colorchecker dE 2000 max. * | 6.79 | 3.22 53% | 4.73 30% | 4.57 33% | 3.45 49% | |
| Colorchecker dE 2000 calibrated * | 2.03 | 0.71 65% | 2.9 -43% | 1.14 44% | 1.42 30% | |
| Greyscale dE 2000 * | 4.1 | 1.93 53% | 3.5 15% | 3.08 25% | 1.2 71% | |
| Gamma | 2.207 100% | 2.38 92% | 2.28 96% | 2.42 91% | 2.23 99% | |
| CCT | 7491 87% | 6881 94% | 7101 92% | 7055 92% | 6580 99% | |
| Color Space (Percent of AdobeRGB 1998) (%) | 84 | 94 12% | 60 -29% | 57 -32% | 65 -23% | 65.5 -22% |
| Color Space (Percent of sRGB) (%) | 97 | 99 2% | 94 -3% | 88.7 -9% | 96 -1% | 98.5 2% |
| Total Average (Program / Settings) | 51% /
89% | -7% /
3% | -13% /
-12% | 2% /
1% | -7% /
5% |
* ... smaller is better
To just say it right out: With an average brightness of about 950 cd/m², not only is the Creator 17 perfect for outside use, but it also outshines the rest of the competitors. With few exceptions, classic laptop displays only achieve between 300 and 400 cd/m², if even that. 97% coverage of the sRGB color space and 84% of AdobeRGB are also excellent and should satisfy professional users.
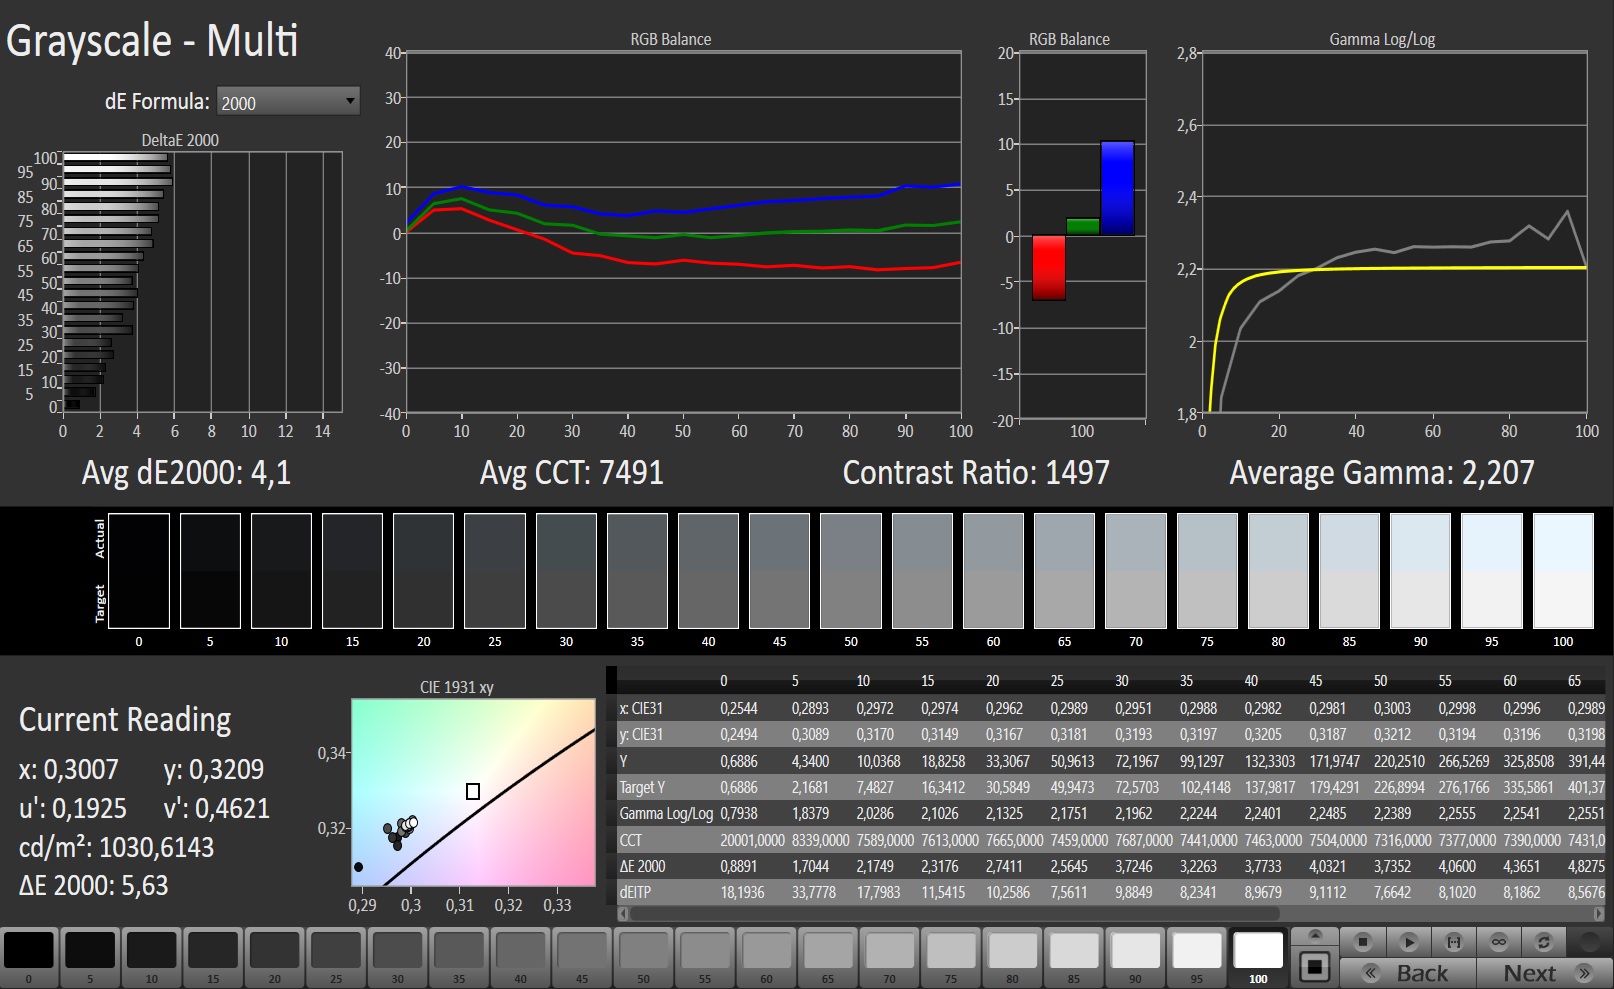
Due to the mediocre black value (0.68 cd/m² at full brightness), the contrast is only slightly above those of the competitors, even though 1465:1 still deserves some respect. With HDR activated, the brightness drops by about 200 cd/m², but the black value improves to 0.07 cd/m², resulting in a contrast of about 11,000:1 – an outstanding value, if you don't look at OLED panels. The viewing angles of the Creator 17 tend towards typical IPS levels.

Despite its relatively good response time (8.8 ms black-to-white), the 4K screen is only suited to a limited extent for gamers, who are not part of the target group anyways. A 60 Hz frame rate is not ideal in 2020 anymore, and at this point, many Full-HD panels support 240 or even 300 Hz. In addition, buyers will have to make do without G-Sync. The fact that the display flickers slightly below a brightness of 83% should not create any problems for sensitive users due to the high PWM frequency (26 kHz).
Display Response Times
| ↔ Response Time Black to White | ||
|---|---|---|
| 8.8 ms ... rise ↗ and fall ↘ combined | ↗ 1.2 ms rise | 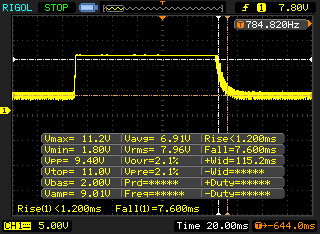 |
| ↘ 7.6 ms fall | ||
| The screen shows fast response rates in our tests and should be suited for gaming. In comparison, all tested devices range from 0.1 (minimum) to 240 (maximum) ms. » 24 % of all devices are better. This means that the measured response time is better than the average of all tested devices (19.9 ms). | ||
Screen Flickering / PWM (Pulse-Width Modulation)
| Screen flickering / PWM detected | 26600 Hz | ≤ 83 % brightness setting | 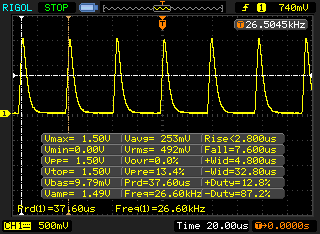 |
The display backlight flickers at 26600 Hz (worst case, e.g., utilizing PWM) Flickering detected at a brightness setting of 83 % and below. There should be no flickering or PWM above this brightness setting. The frequency of 26600 Hz is quite high, so most users sensitive to PWM should not notice any flickering. In comparison: 52 % of all tested devices do not use PWM to dim the display. If PWM was detected, an average of 7794 (minimum: 5 - maximum: 343500) Hz was measured. | |||
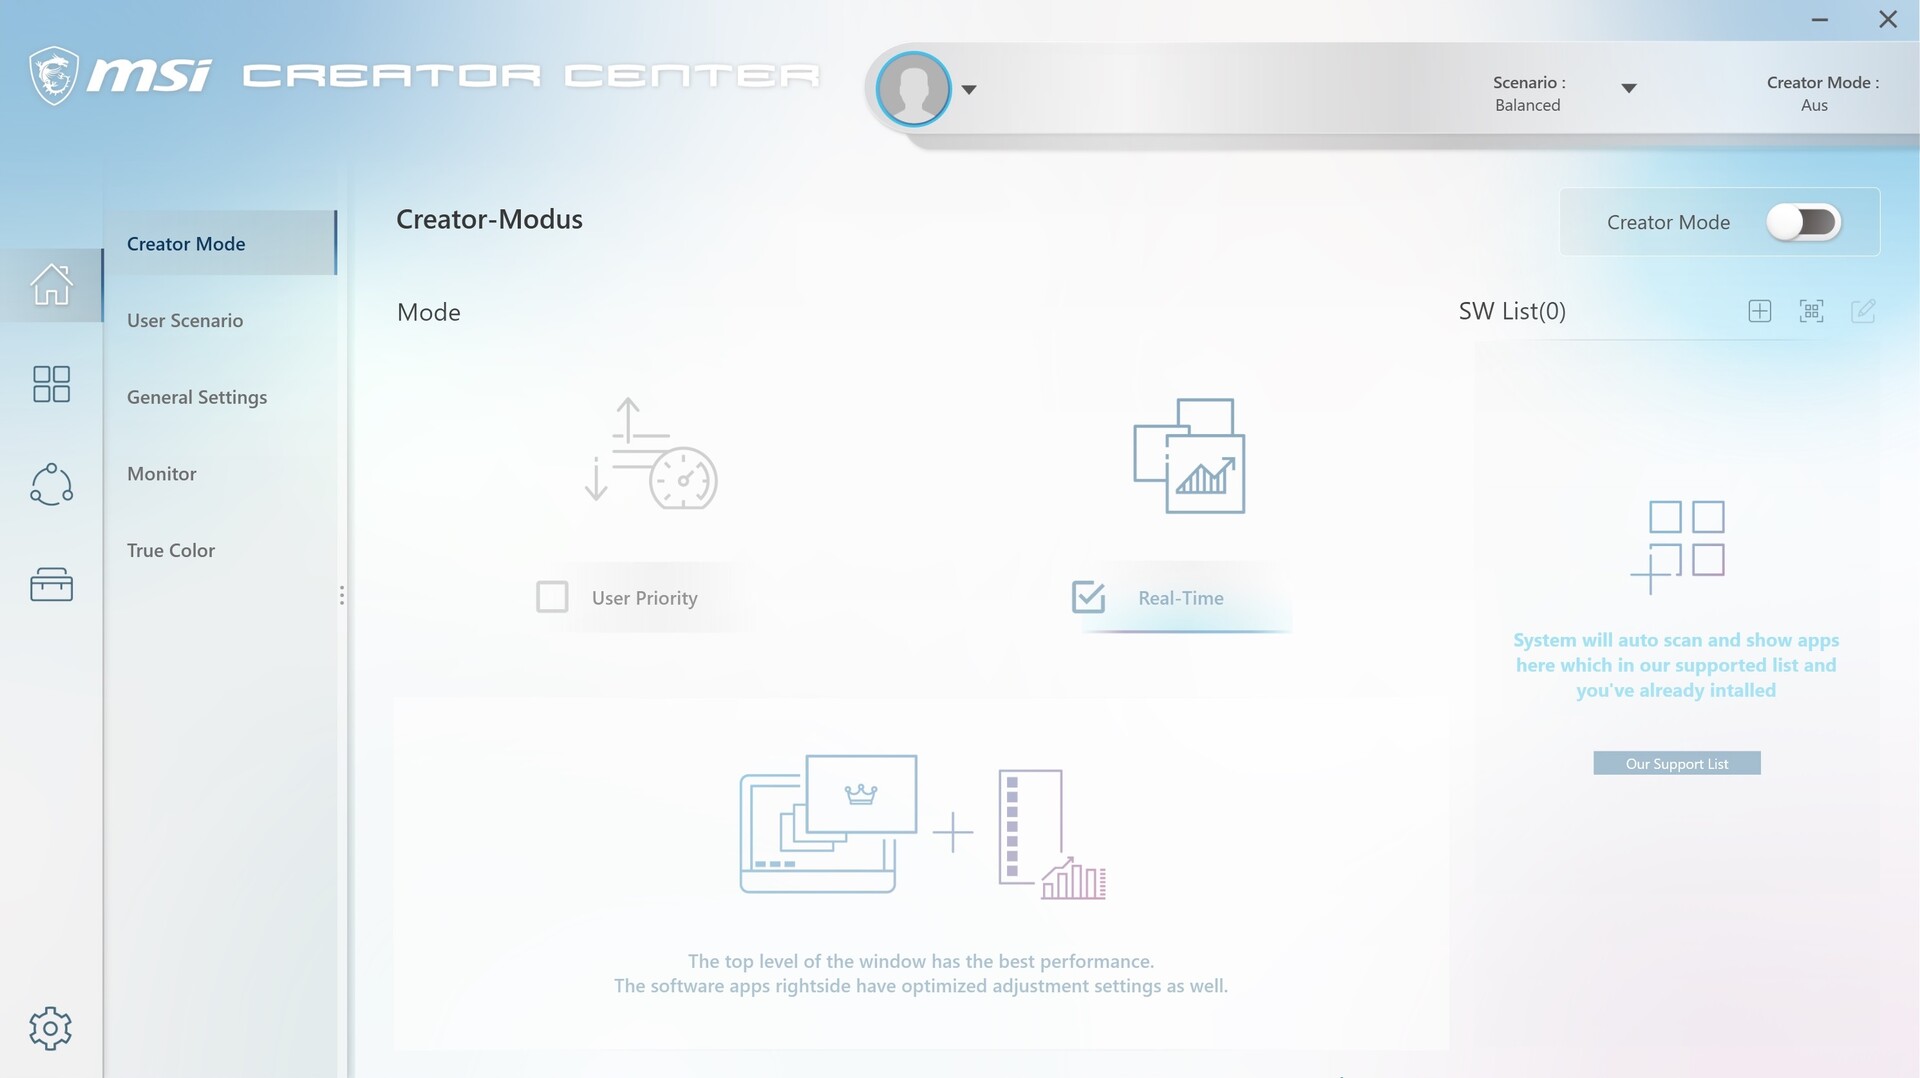
Test Conditions
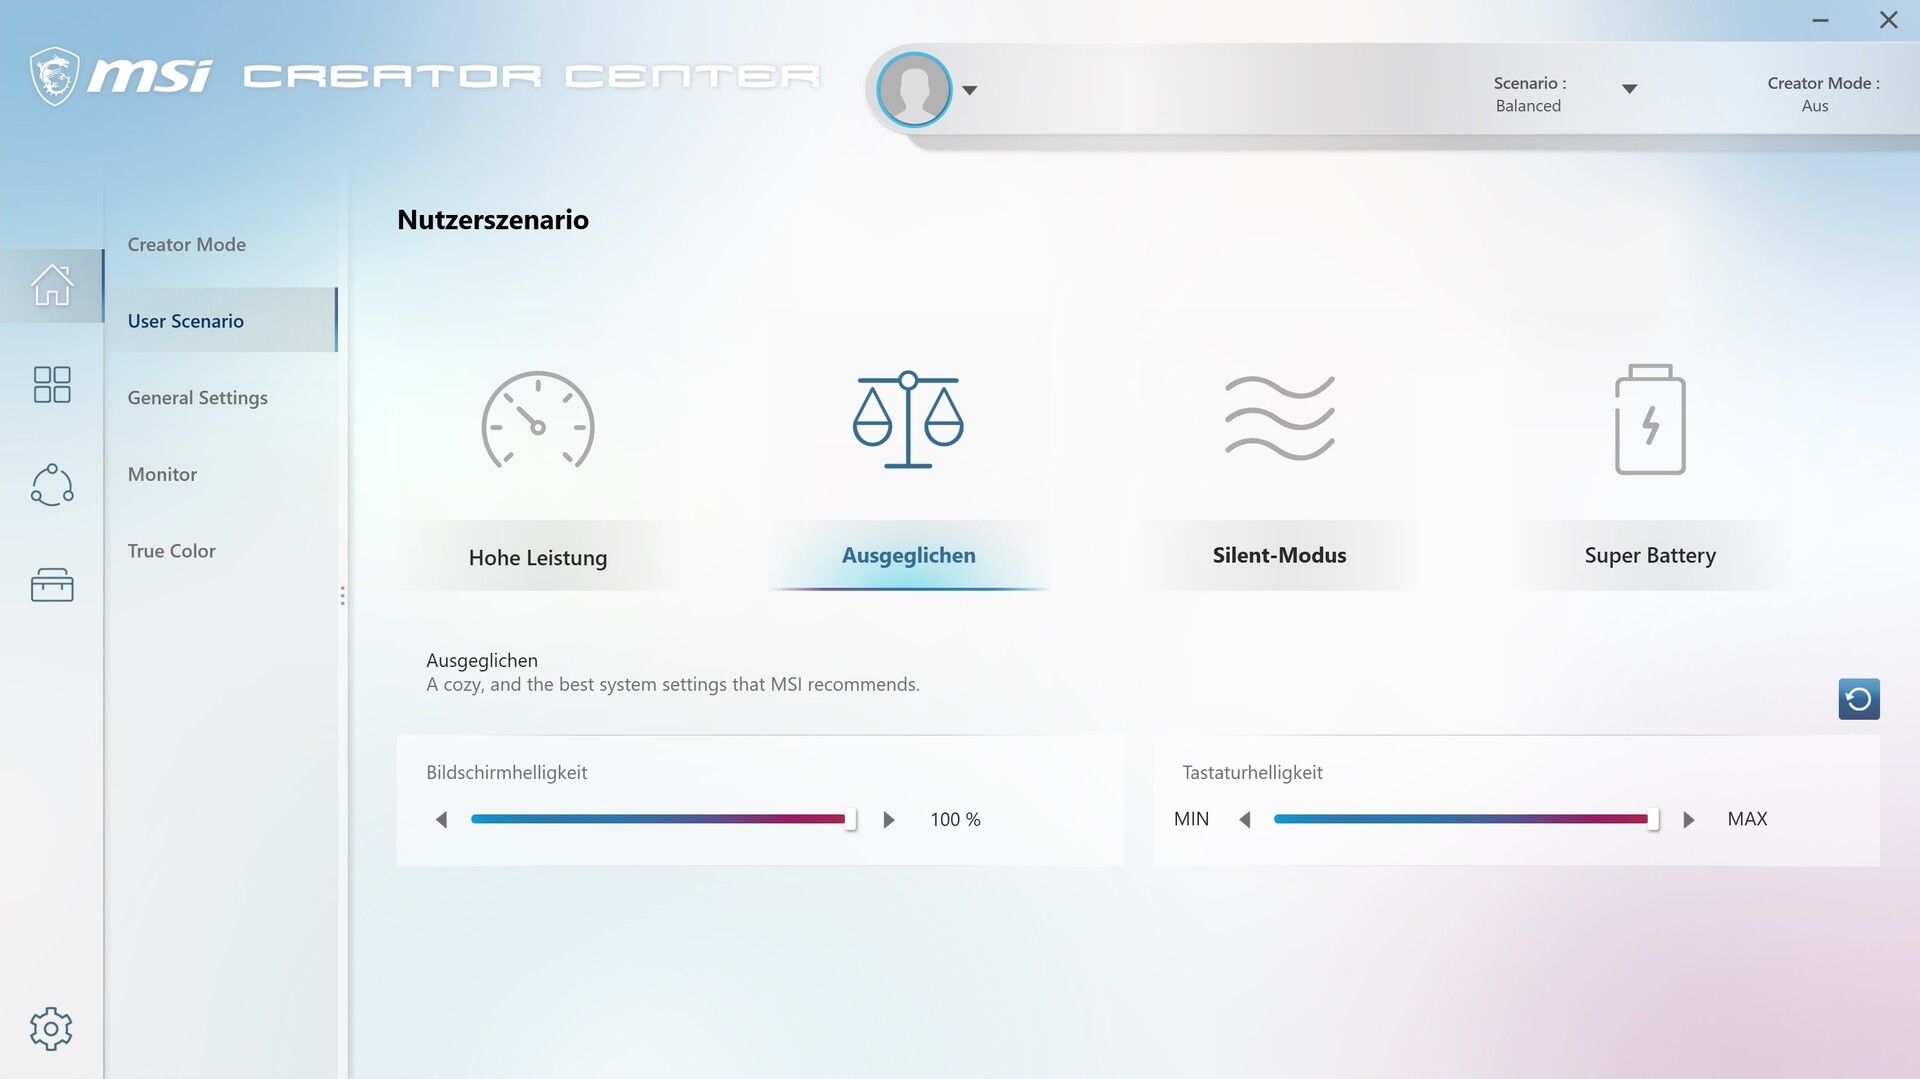
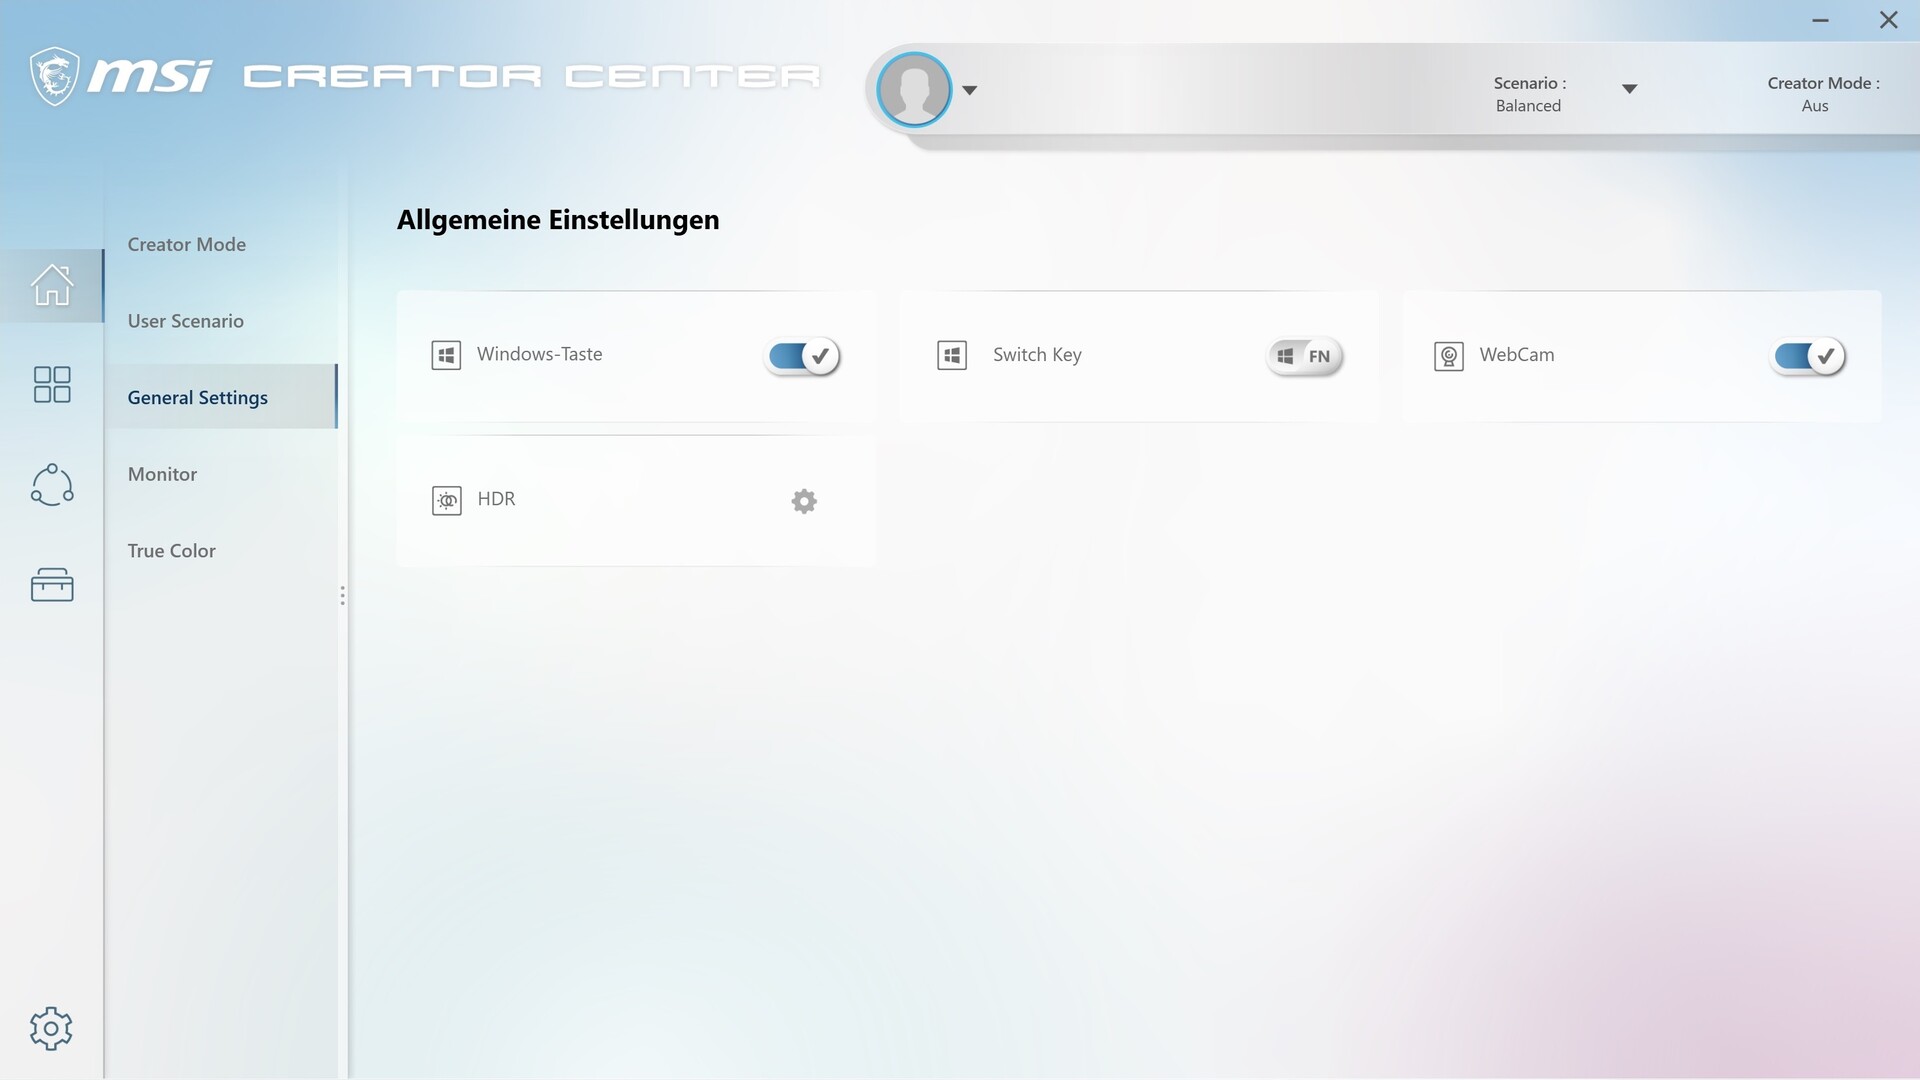
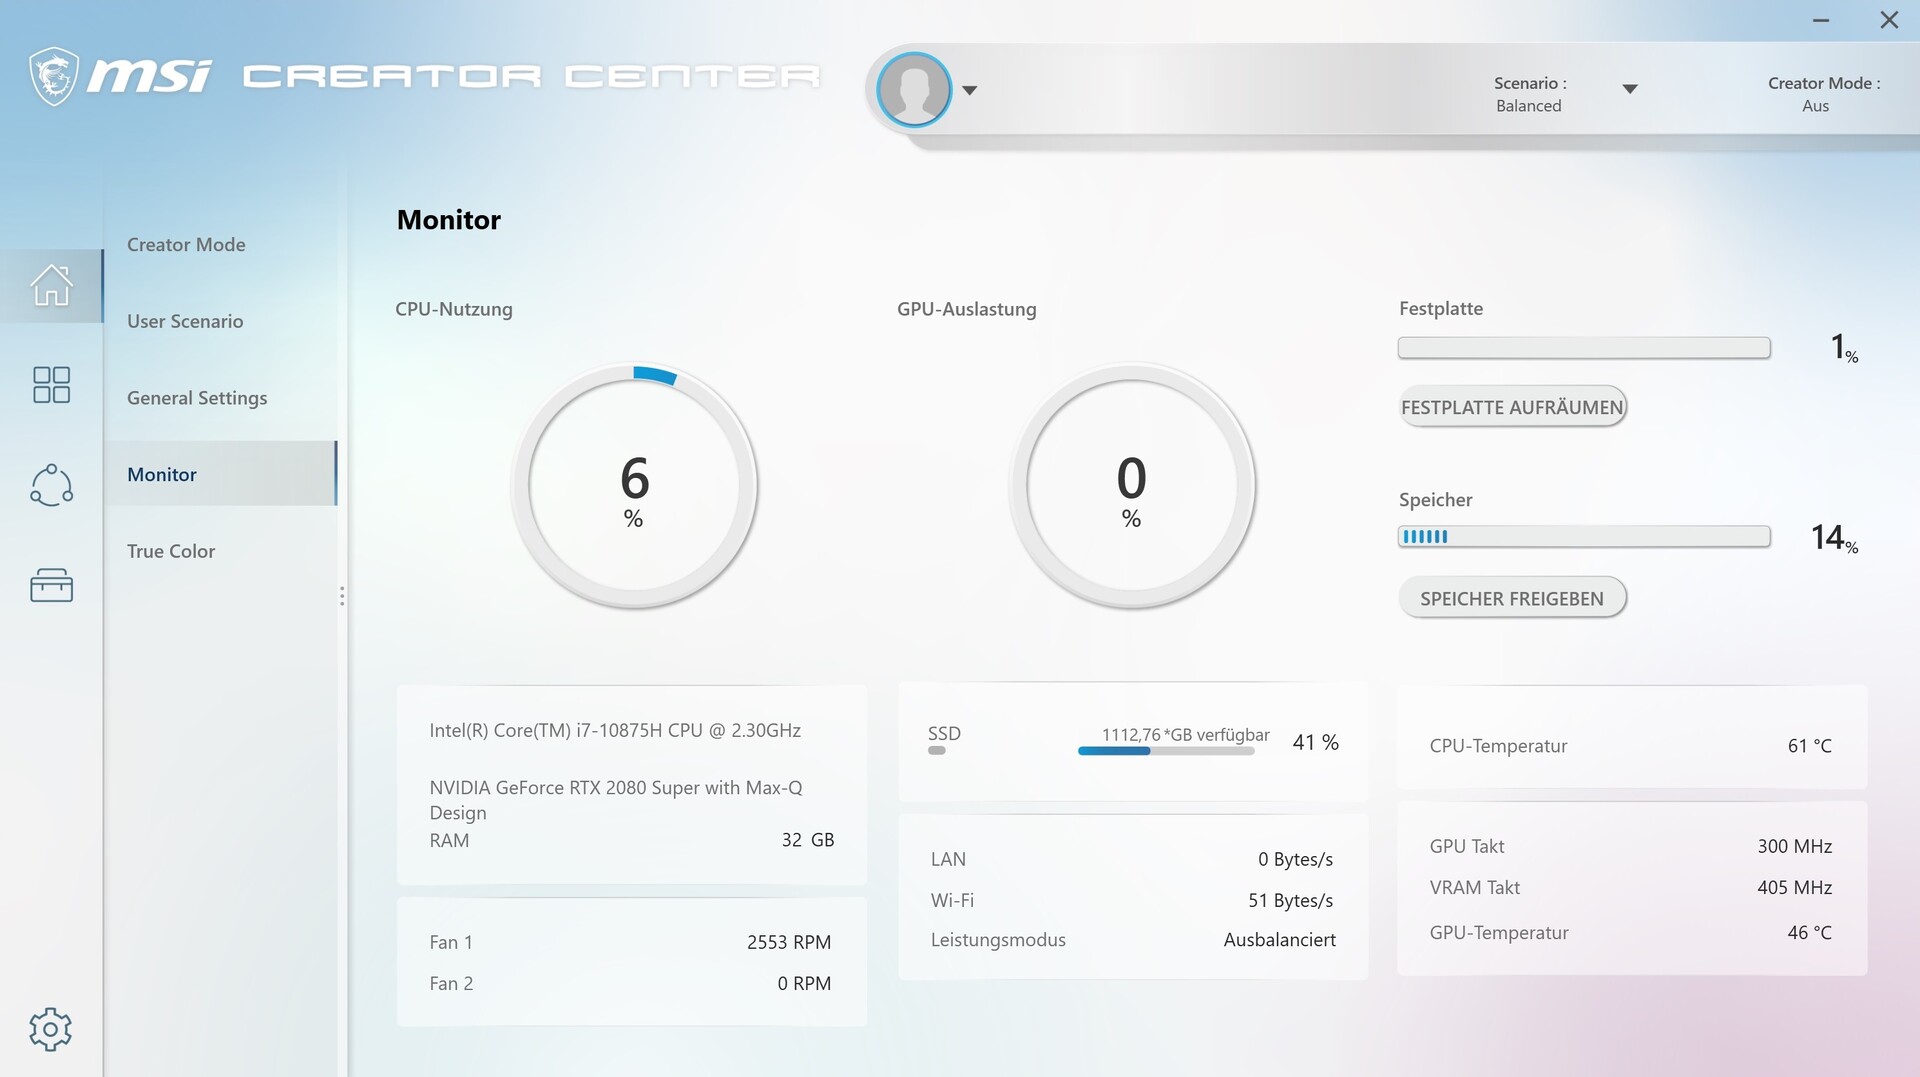
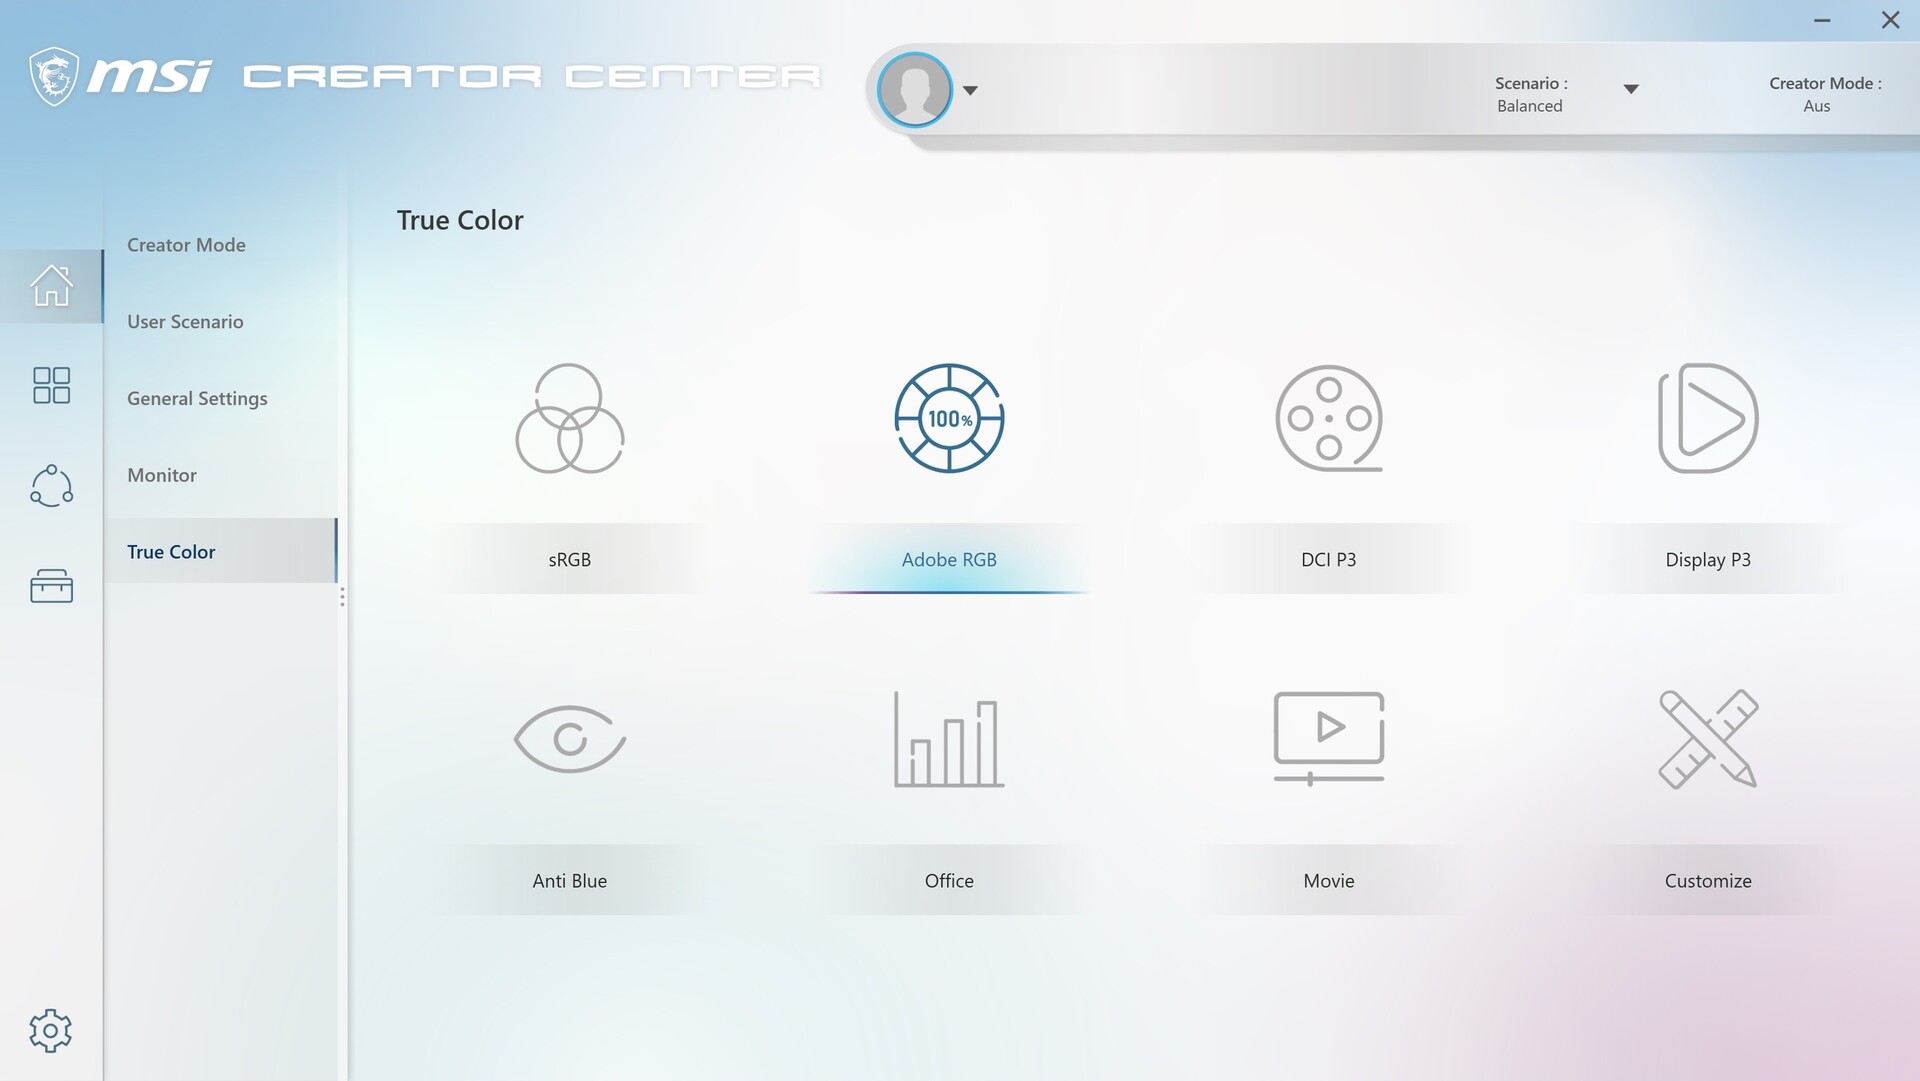
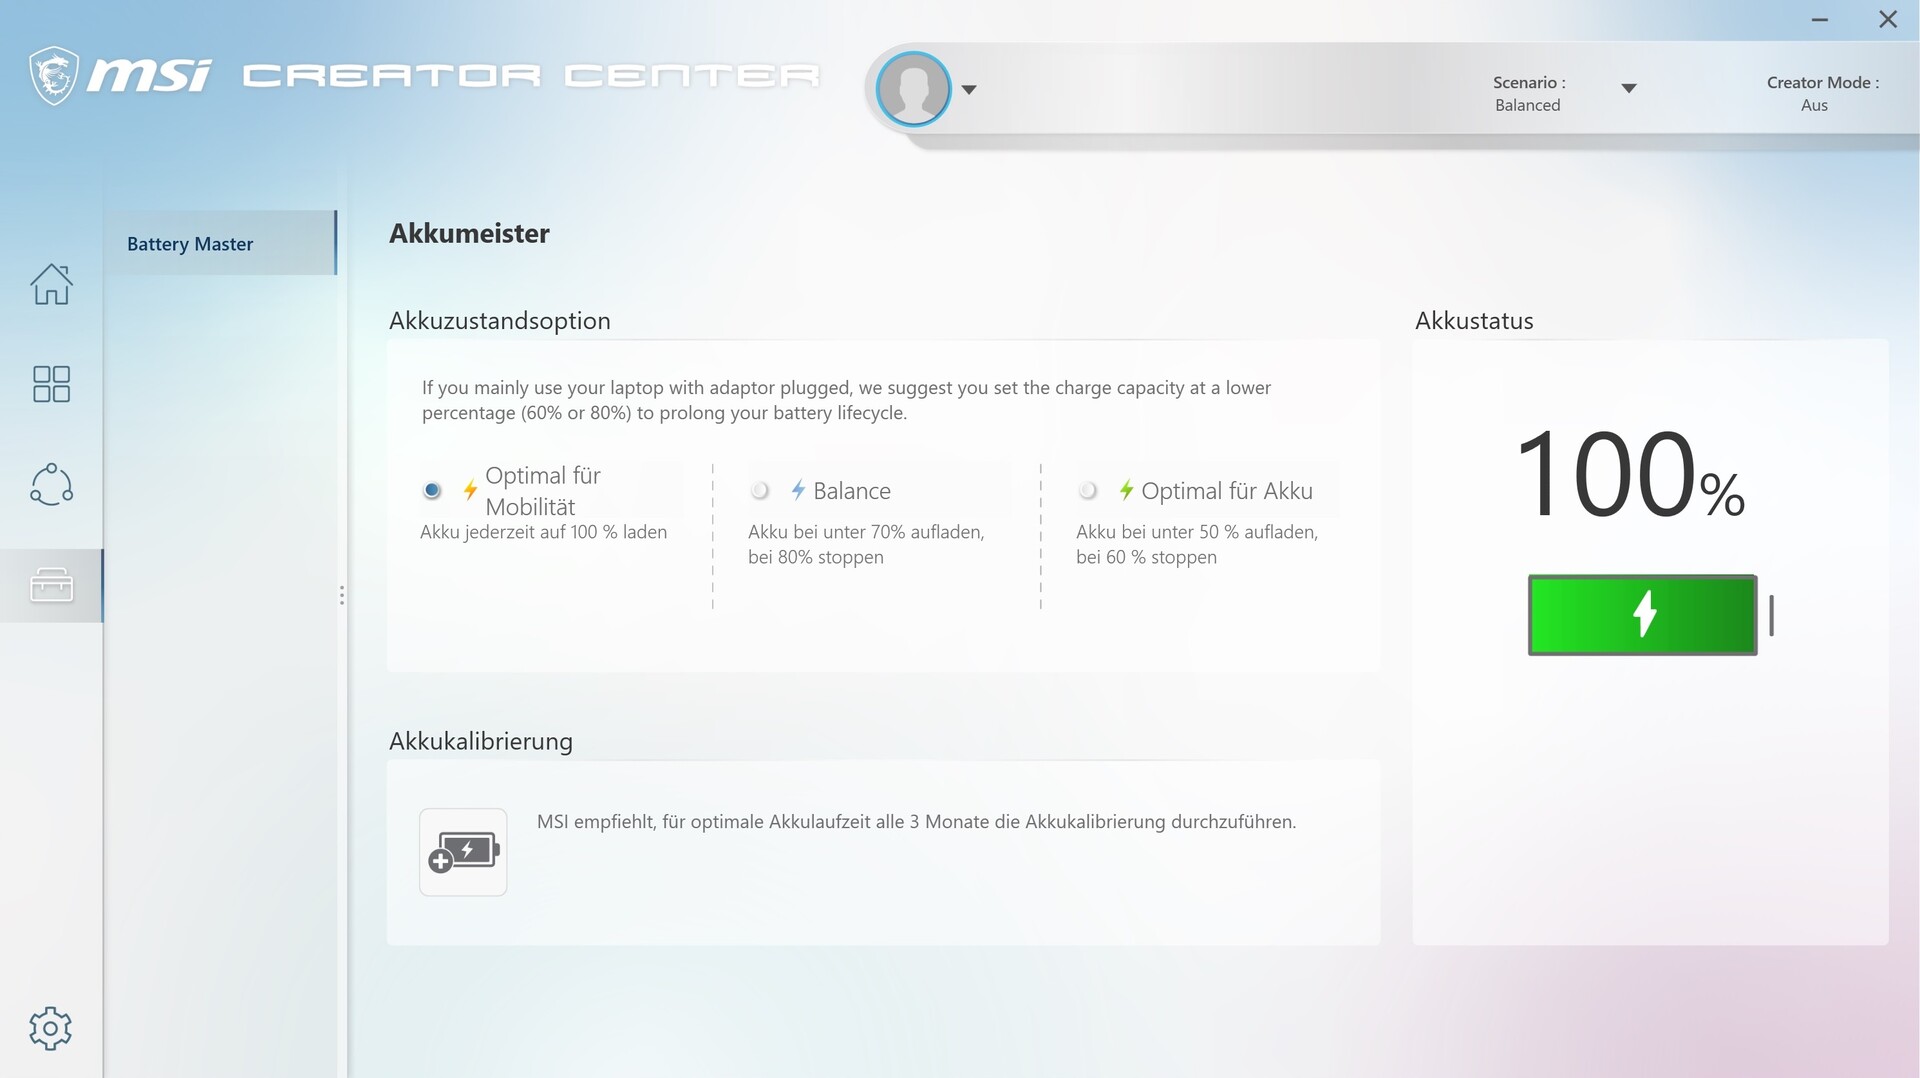
The preinstalled Creator Center resembles the Dragon Center from MSI's gaming laptops (see screenshots). Our measurements were produced with the "Balanced" user mode.
Performance
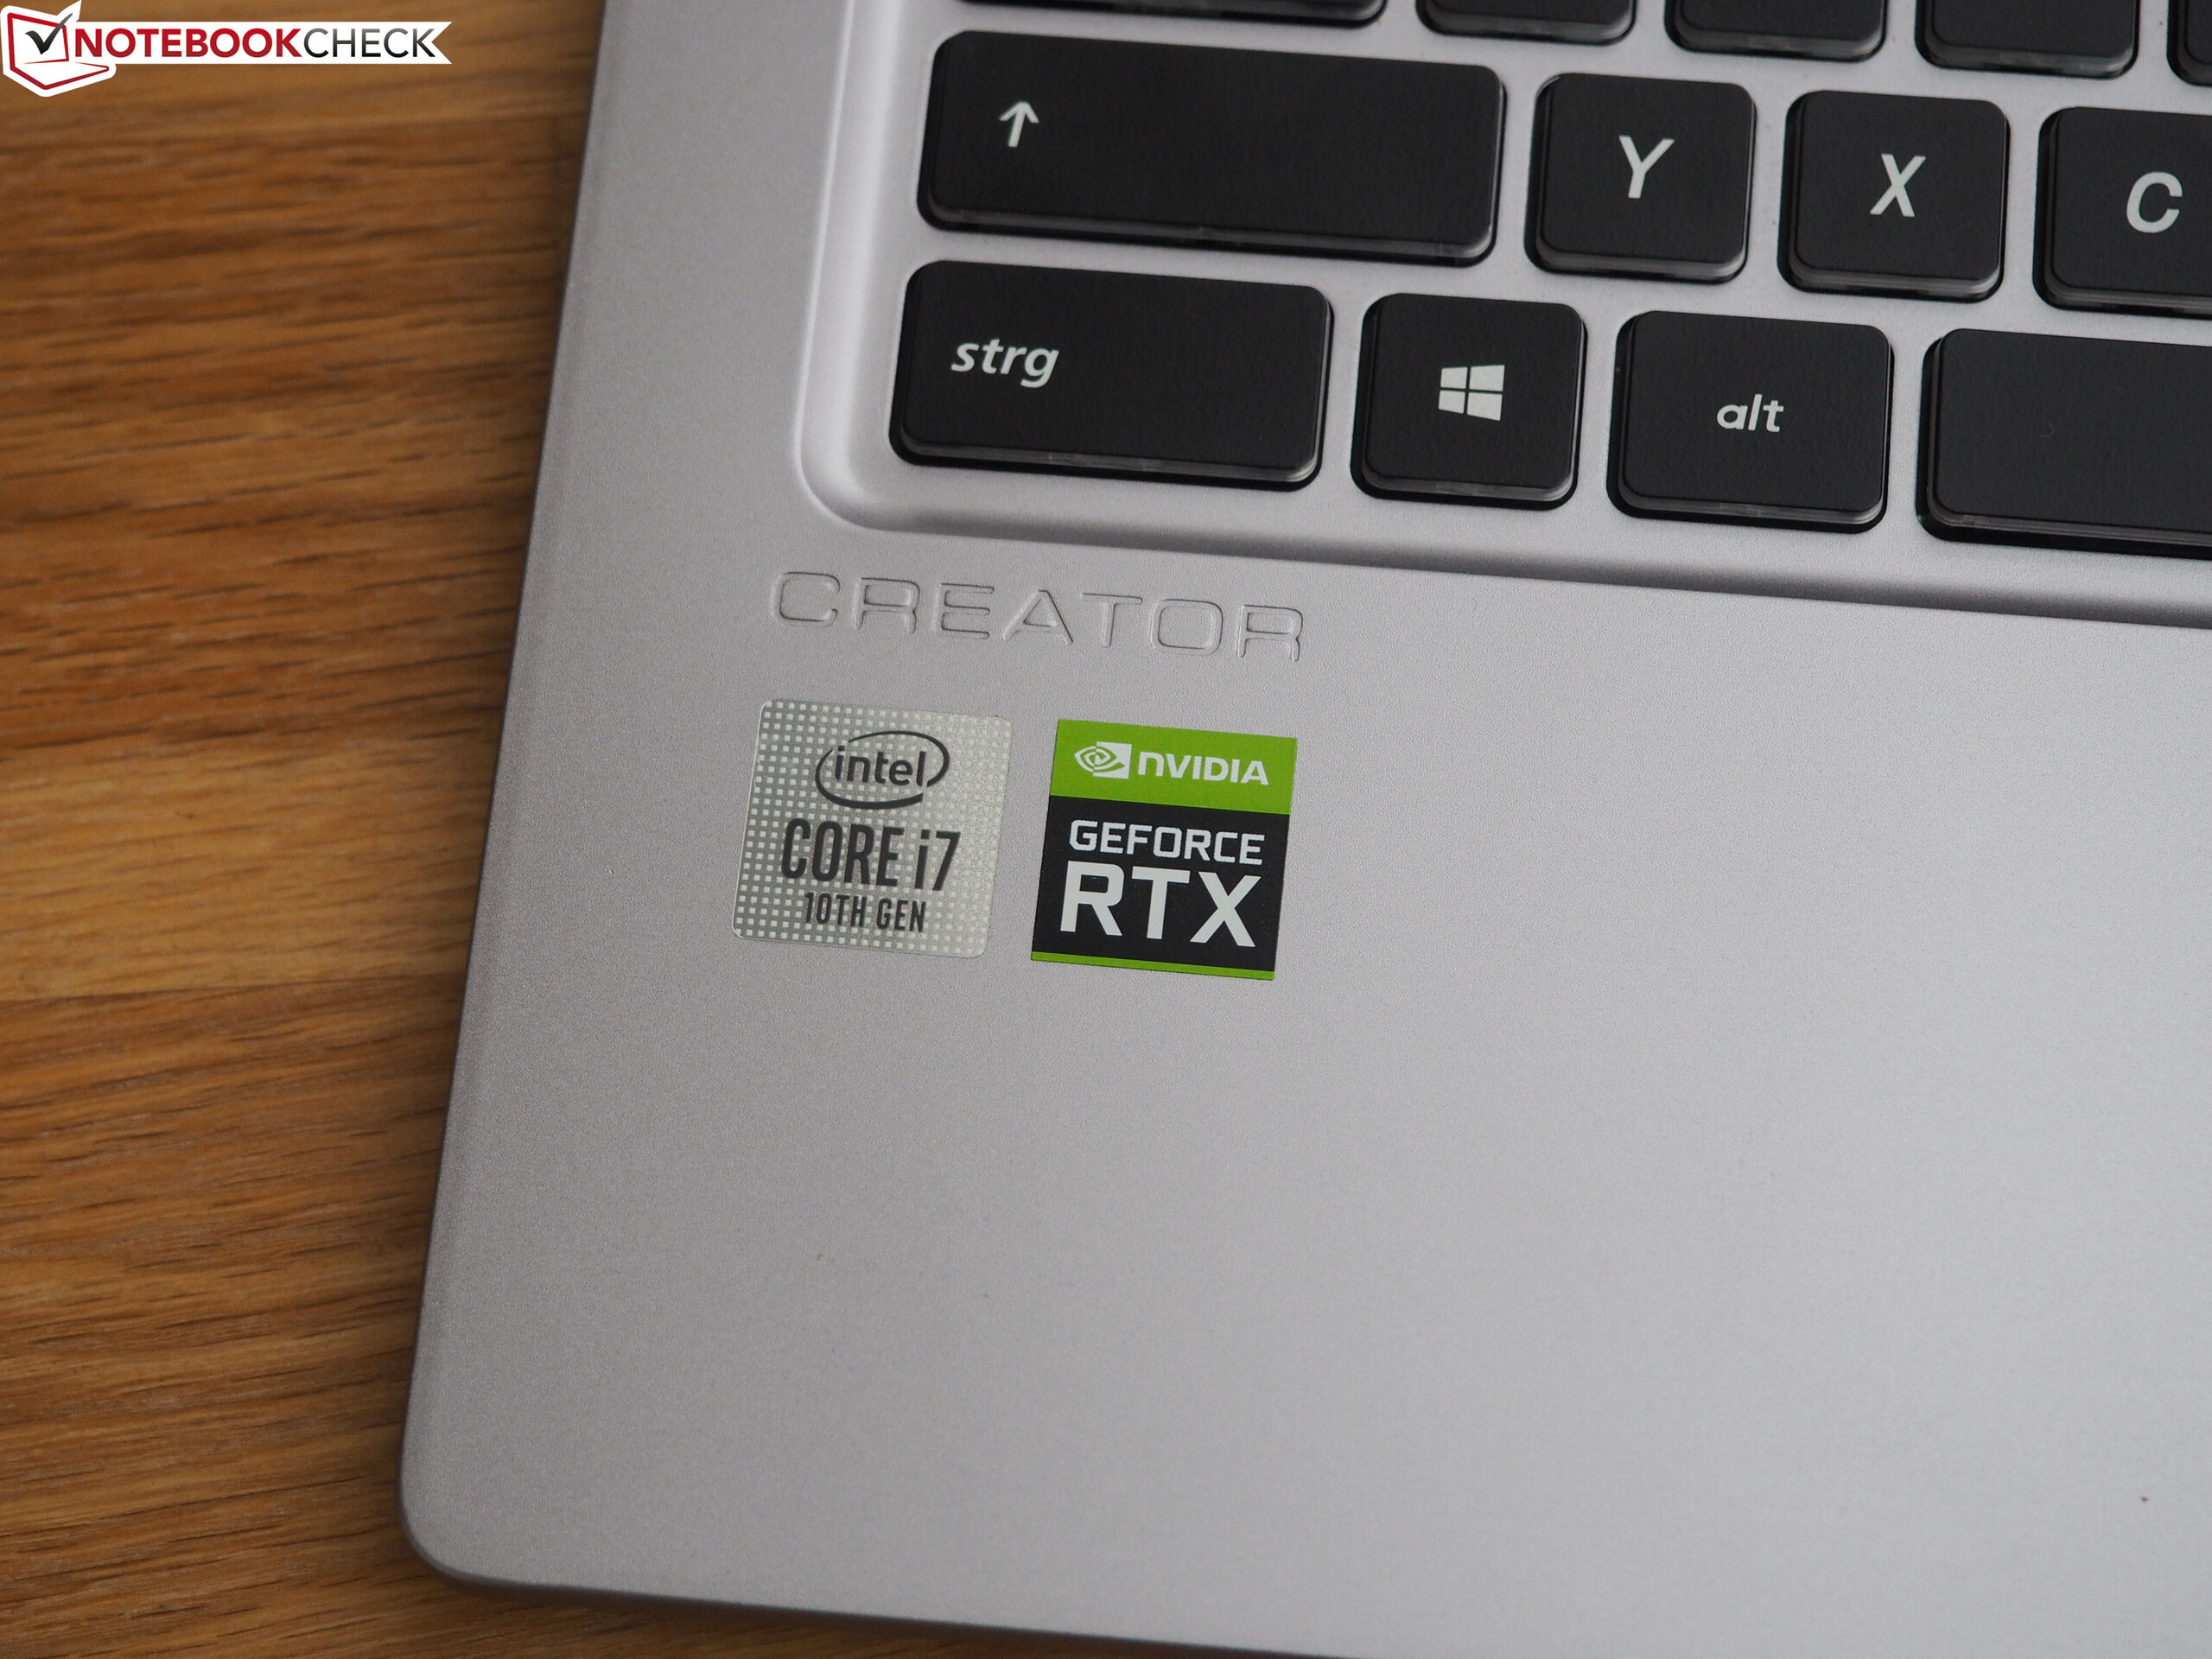
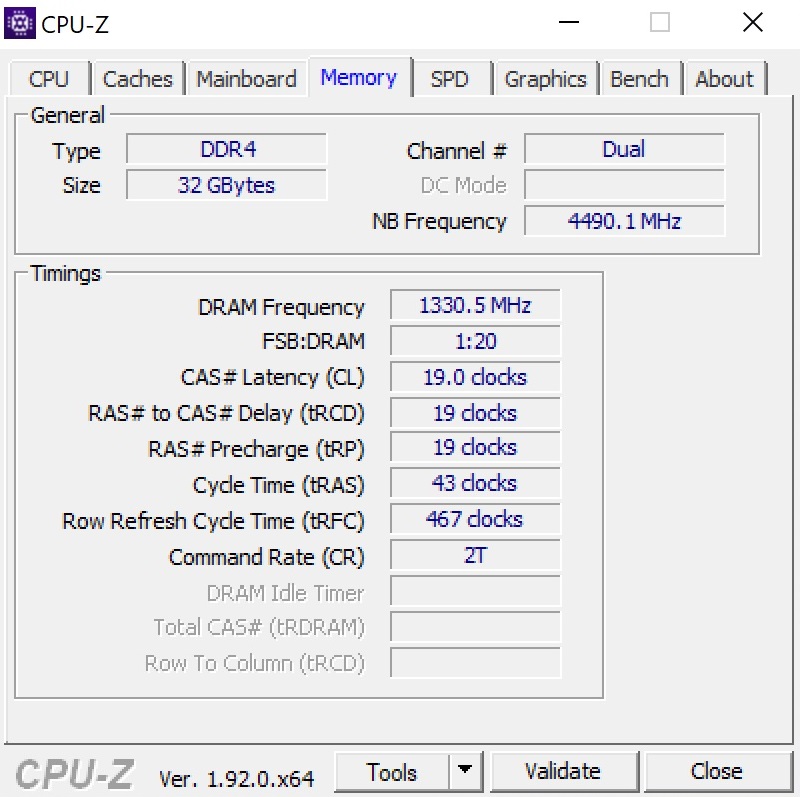
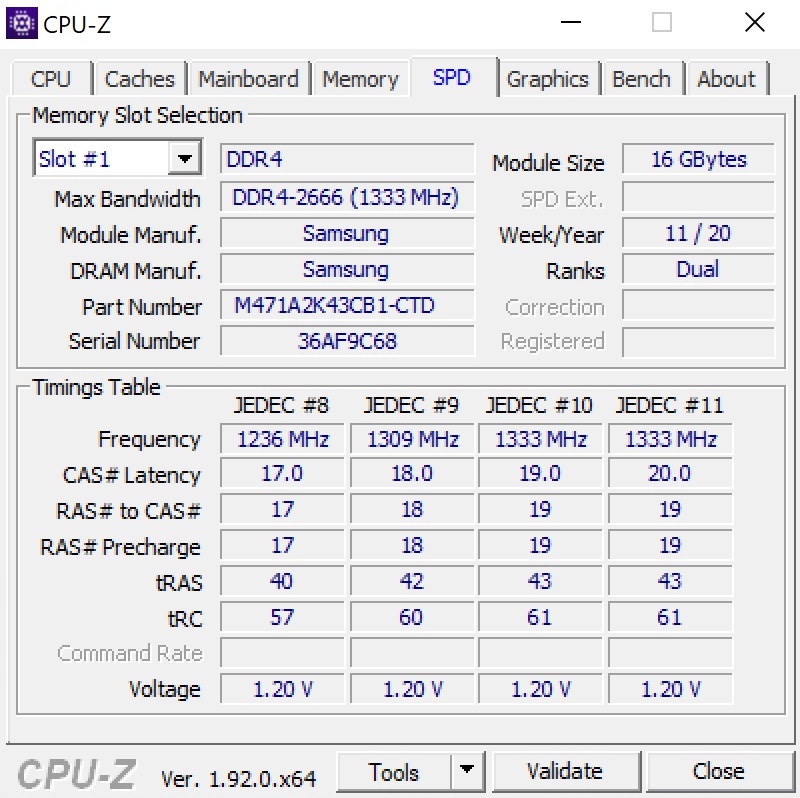
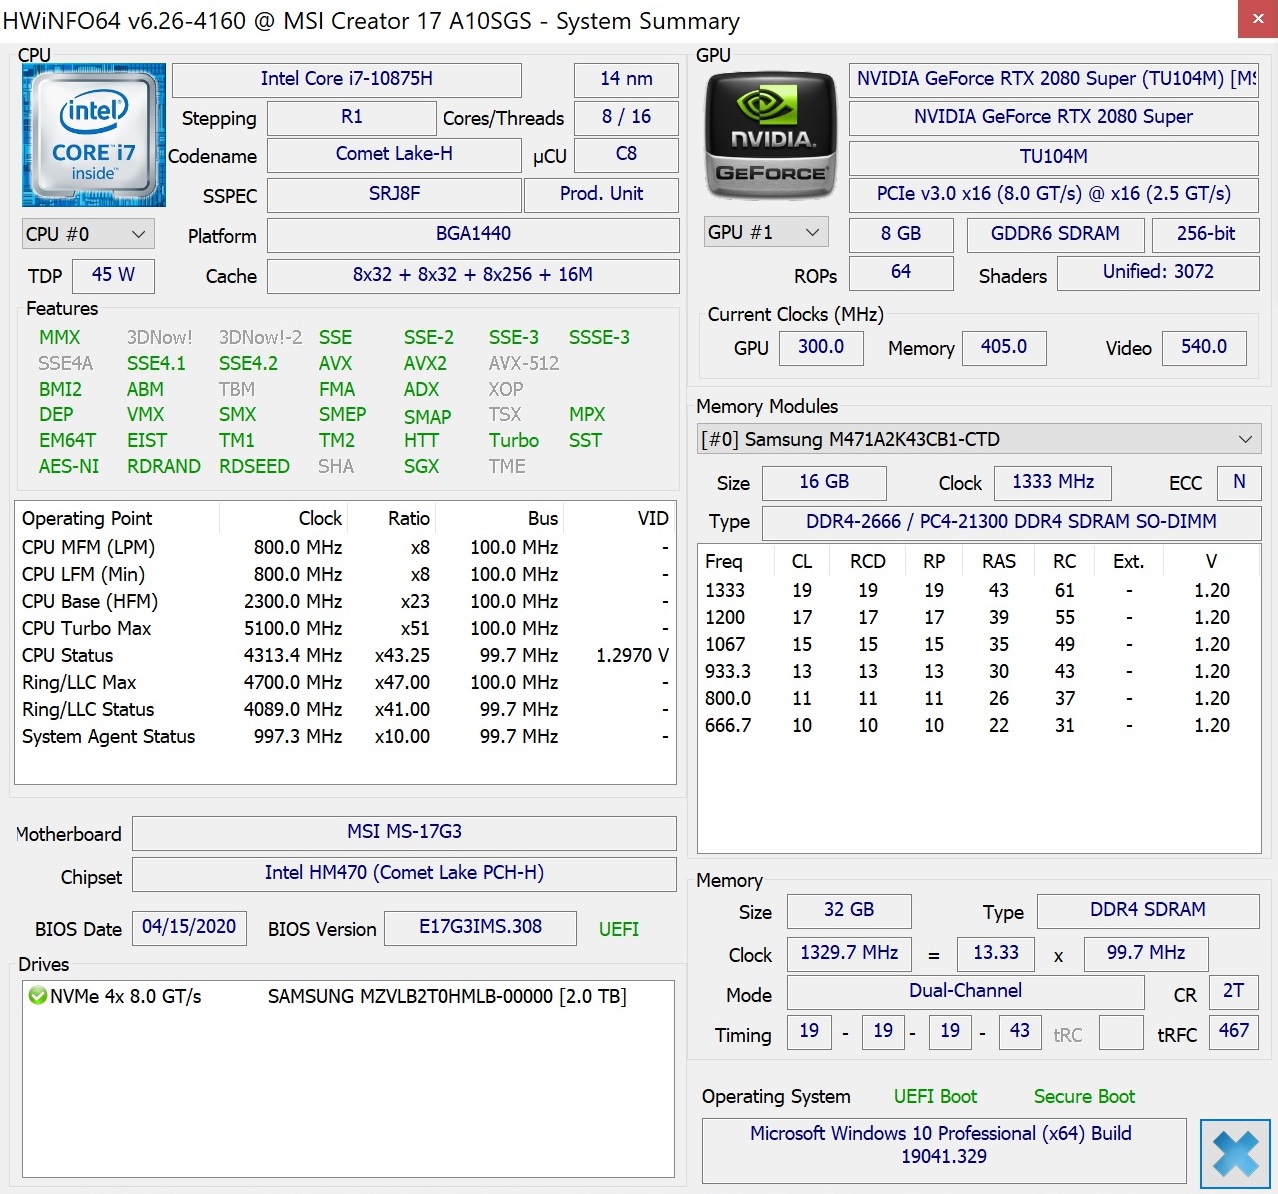
With an octa-core CPU, 32 GB of RAM, a 2 TB SSD, and an 8 GB graphics card, the Creator 17 definitely belongs to the high-end segment and should also offer sufficient reserves for future years – as long as you don't insist on the UHD resolution in 3D applications.

Processor
While in the past, the lead of Intel's mobile Core-i processors remained mostly uncontested, with its Ryzen-4000 series AMD not only caught up but in parts also surpassed the prior laptop champion (the best example is the Ryzen 7 4800H). Correspondingly, despite its high performance we are unable to praise the Core i7-10875H used in the Creator 17 as much as we did a few months ago.
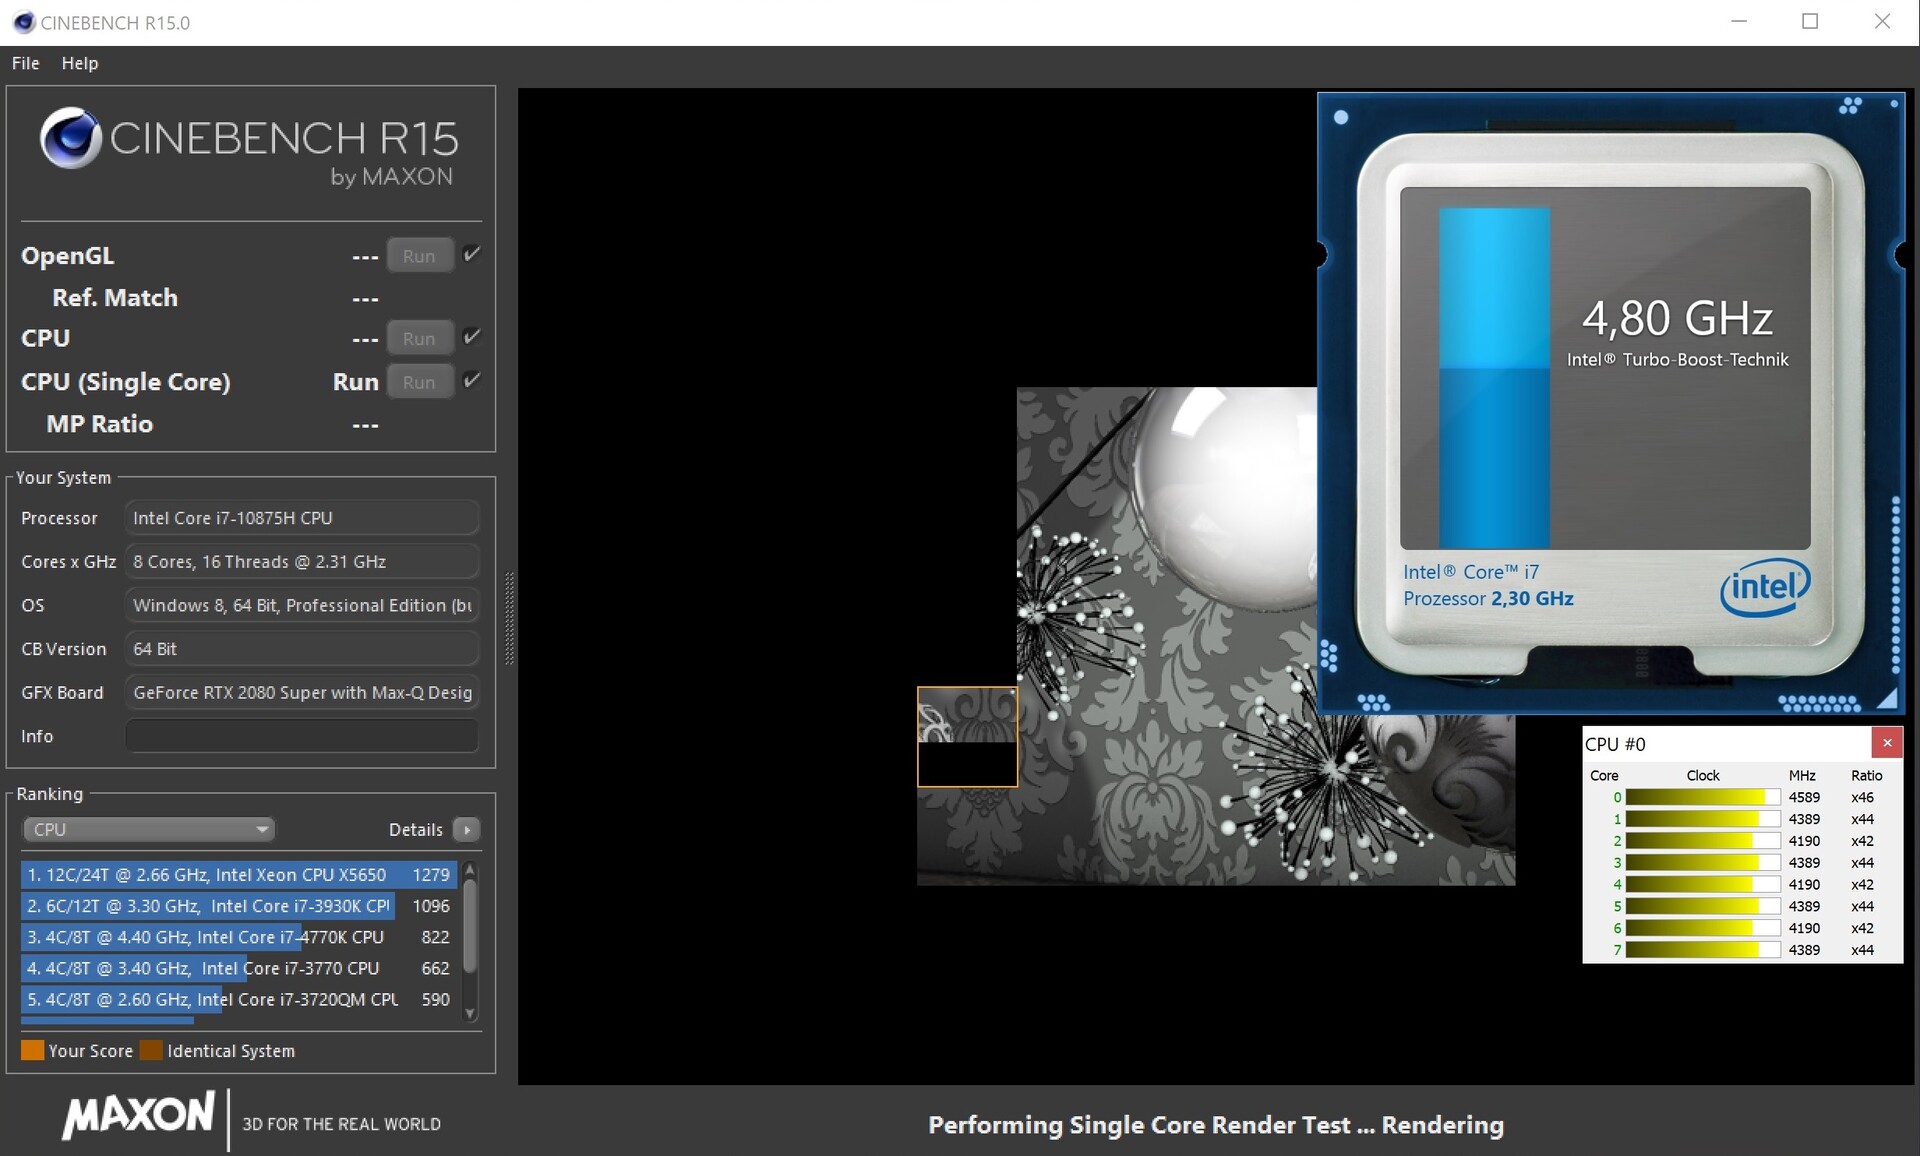
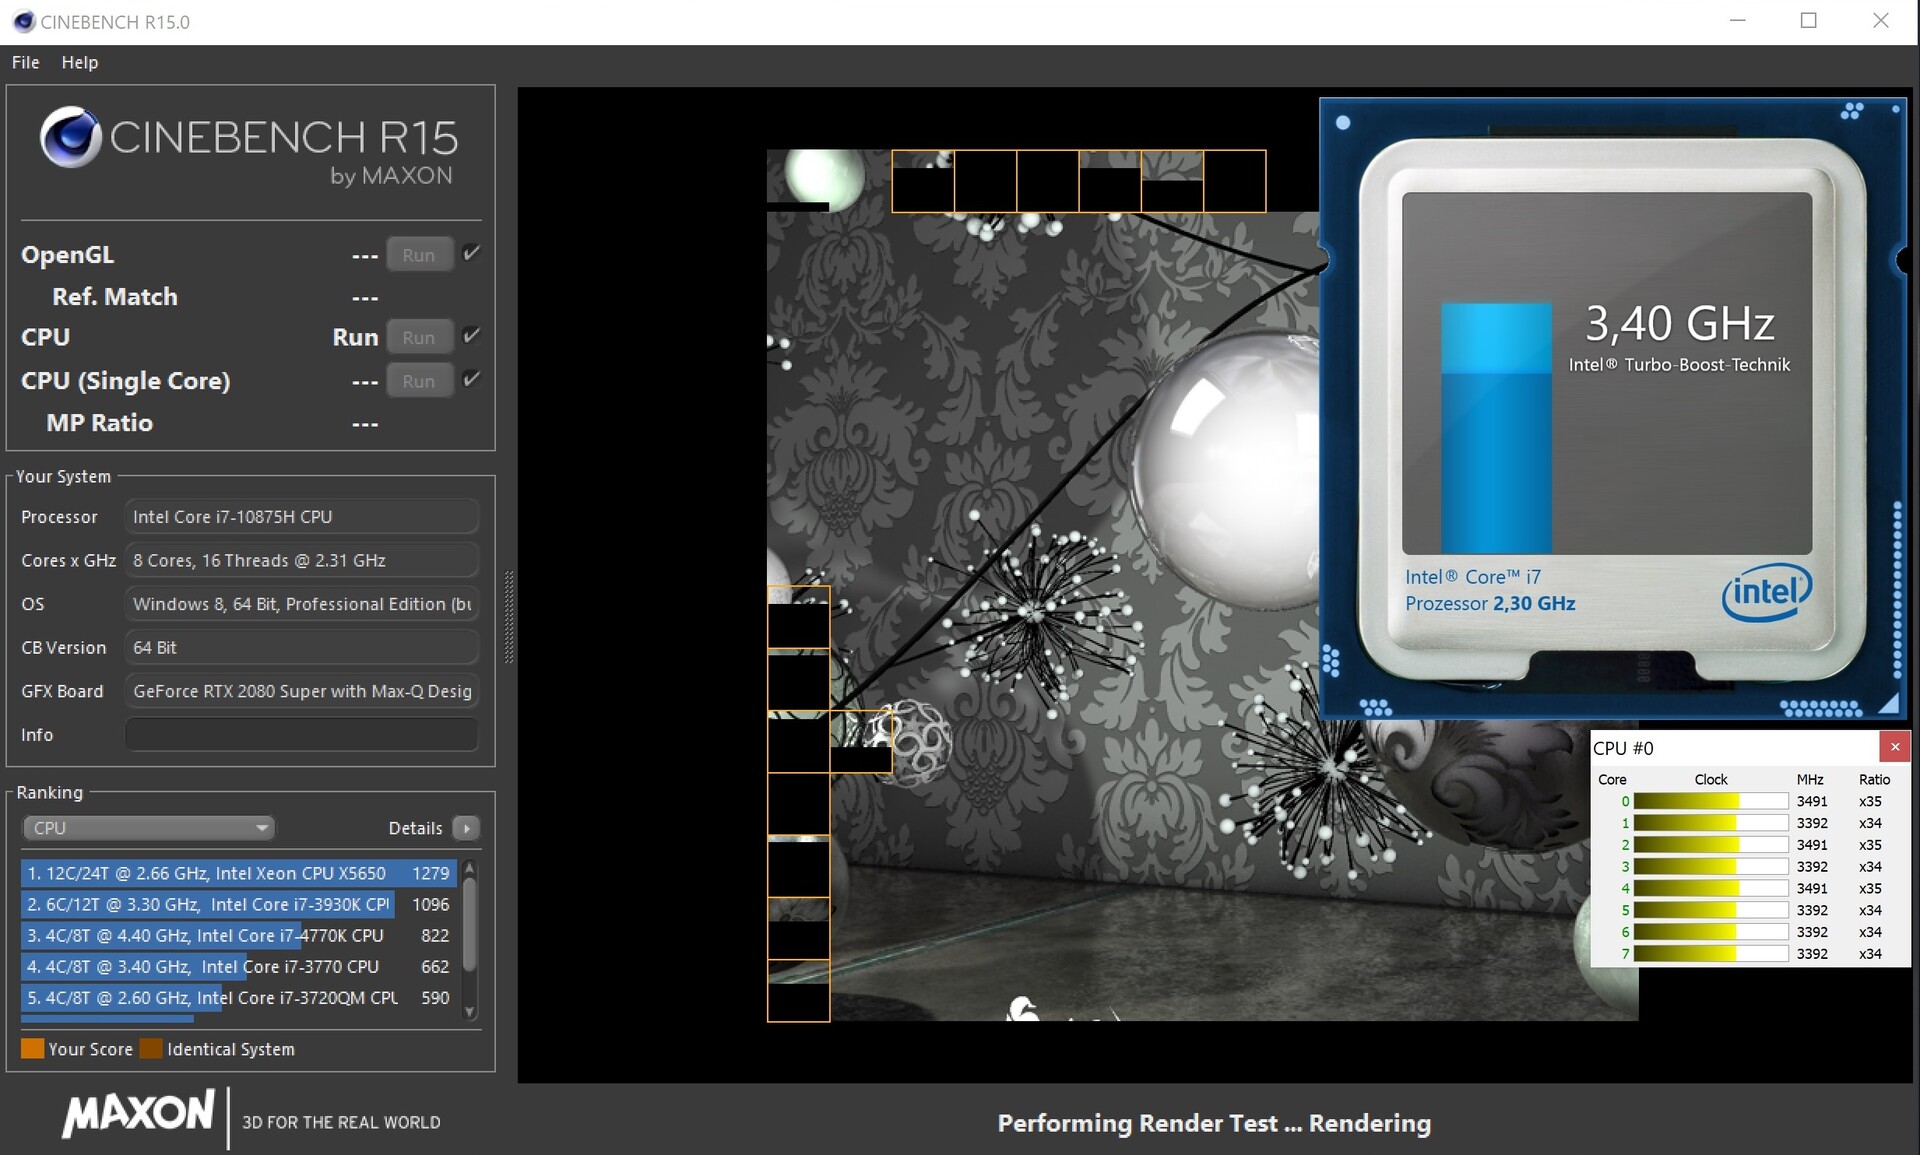
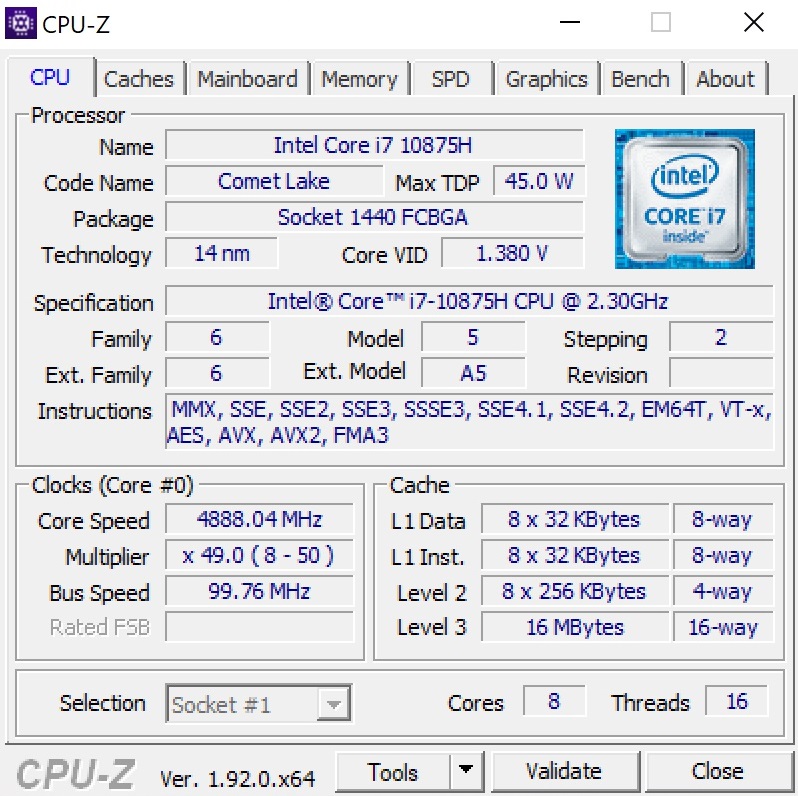
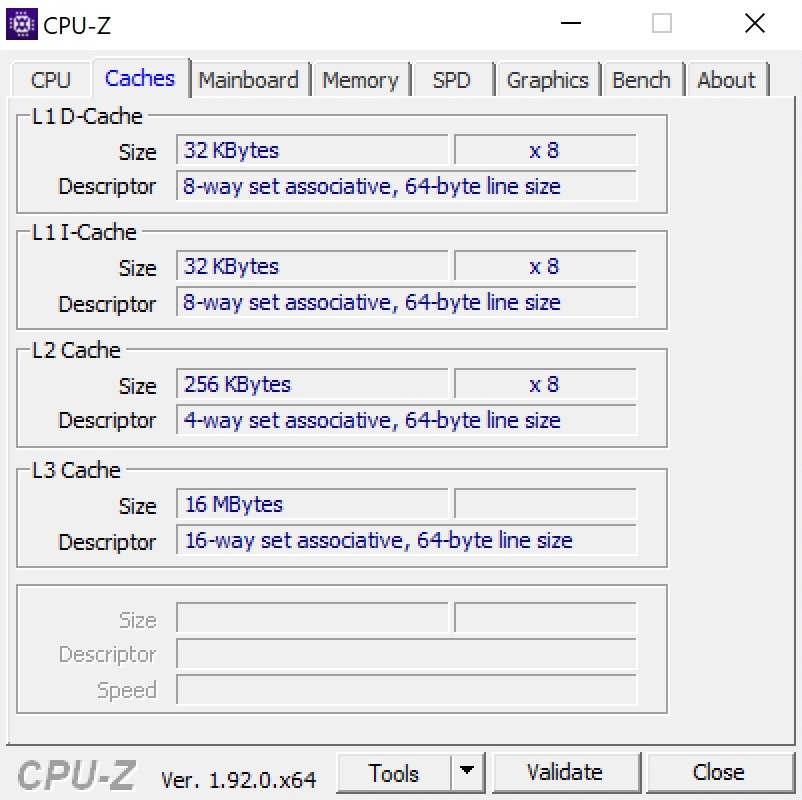
The octa-core model, which comes from the Comet Lake generation and is able to handle up to 16 threads in parallel via Hyper-Threading, offers 16 MB of L3 cache and a basic clock speed of 2.3 GHz. Via Turbo Boost, up to 5.1 GHz is possible under load. However, the Creator 17 is only able to make use of its overclocking potential to a limited extent. About 3.4 GHz under load of all cores (4.2 to 4.8 GHz under single-core load) points to a borderline cooling system.
Despite its limited Turbo, the 10875H is able to move slightly ahead of the old Core i7-9750H hexa-core darling, which is used in many of the competing laptops, as our Cinebench loop and the rest of the CPU benchmarks show.
| Blender - v2.79 BMW27 CPU | |
| MSI Creator 17 A10SGS | |
| Average of class Multimedia (100 - 557, n=65, last 2 years) | |
| 7-Zip 18.03 | |
| 7z b 4 -mmt1 | |
| Average of class Multimedia (3666 - 7545, n=63, last 2 years) | |
| MSI Creator 17 A10SGS | |
| 7z b 4 | |
| Average of class Multimedia (29095 - 130368, n=62, last 2 years) | |
| MSI Creator 17 A10SGS | |
| Geekbench 5.5 | |
| Single-Core | |
| Average of class Multimedia (805 - 2974, n=62, last 2 years) | |
| MSI Creator 17 A10SGS | |
| Multi-Core | |
| Average of class Multimedia (4652 - 20422, n=62, last 2 years) | |
| MSI Creator 17 A10SGS | |
| HWBOT x265 Benchmark v2.2 - 4k Preset | |
| Average of class Multimedia (5.26 - 36.1, n=63, last 2 years) | |
| MSI Creator 17 A10SGS | |
| LibreOffice - 20 Documents To PDF | |
| MSI Creator 17 A10SGS | |
| Average of class Multimedia (23.9 - 146.7, n=64, last 2 years) | |
| R Benchmark 2.5 - Overall mean | |
| MSI Creator 17 A10SGS | |
| Average of class Multimedia (0.3604 - 0.947, n=63, last 2 years) | |
* ... smaller is better
System Performance
According to PCMark 10, the Creator 17 lands in third place behind the Asus GX701GXR and the MSI GS75 9SG in the system performance. As expected, the laptop operates very quickly in terms of booting up, starting programs, and other load times.
| V-Ray Benchmark Next 4.10 | |
| CPU | |
| Average of class Multimedia (4772 - 35165, n=60, last 2 years) | |
| MSI Creator 17 A10SGS | |
| GPU | |
| Average of class Multimedia (32 - 1191, n=60, last 2 years) | |
| MSI Creator 17 A10SGS | |
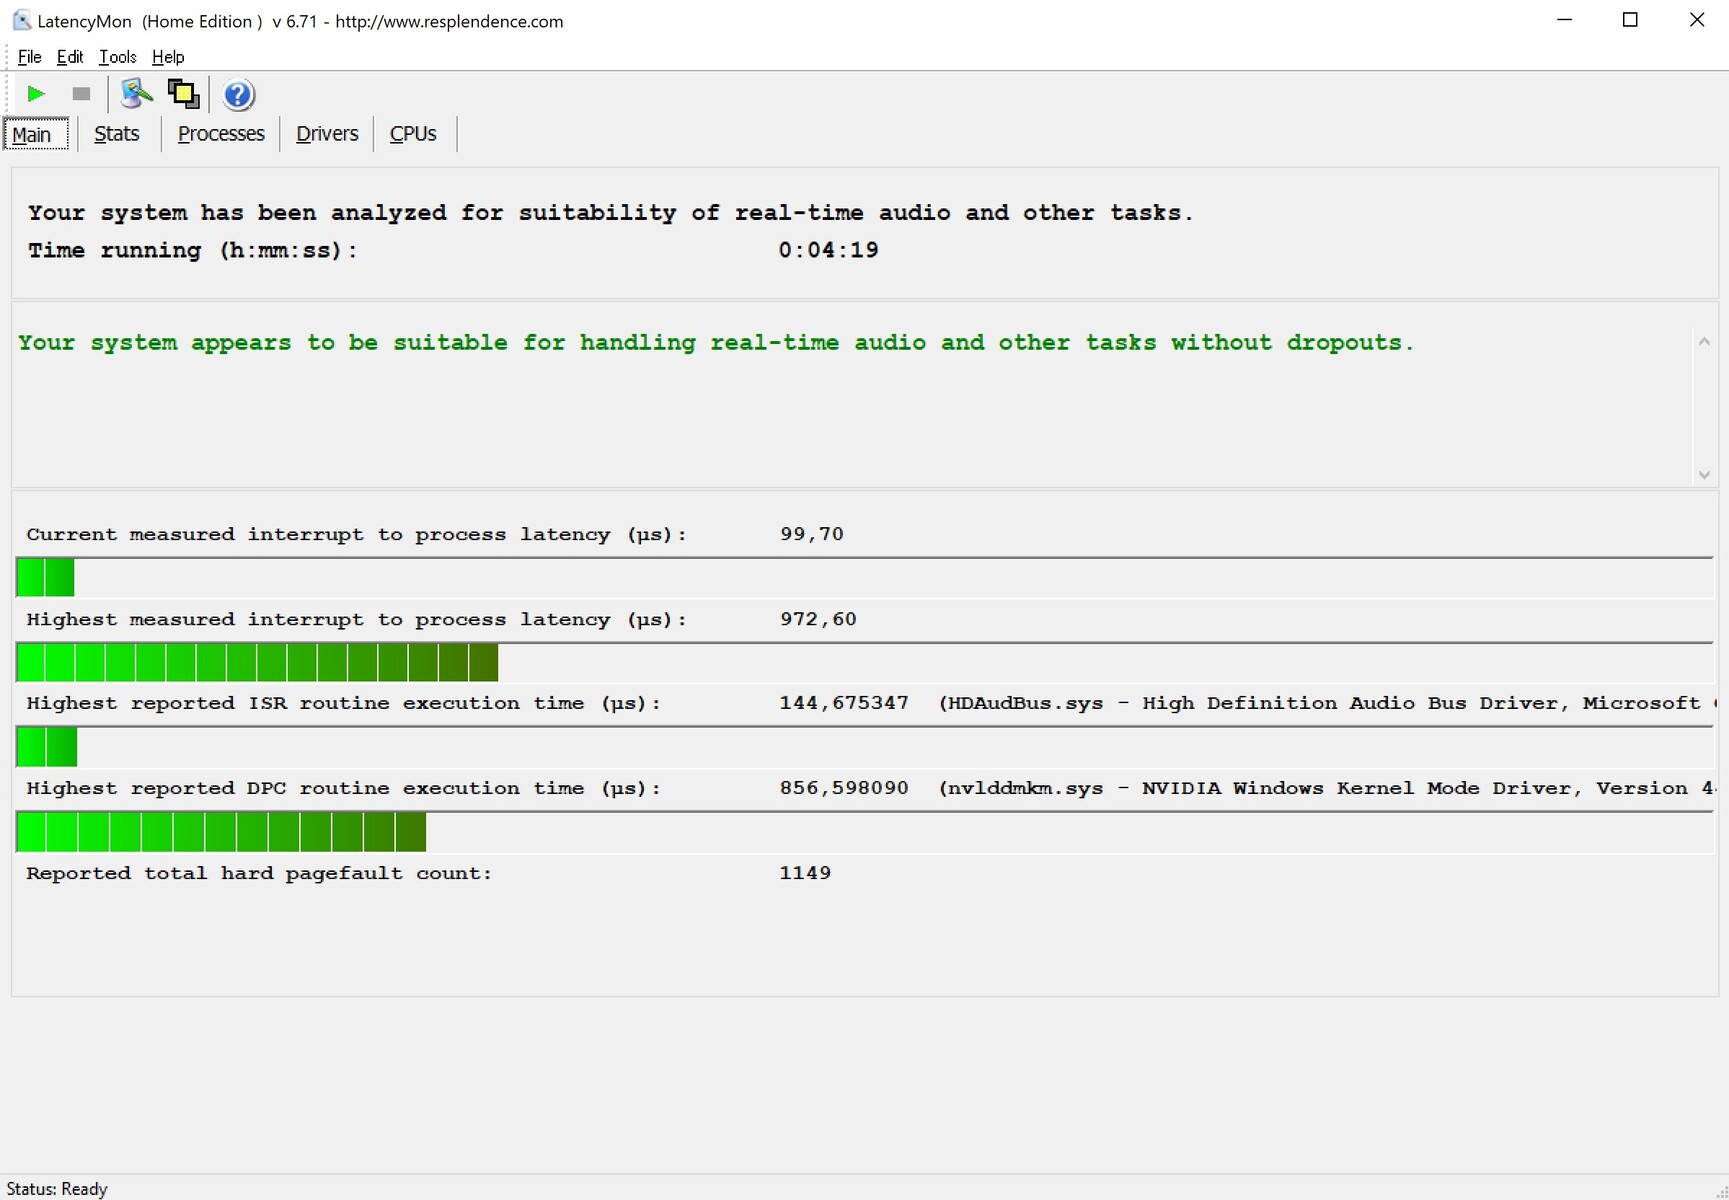
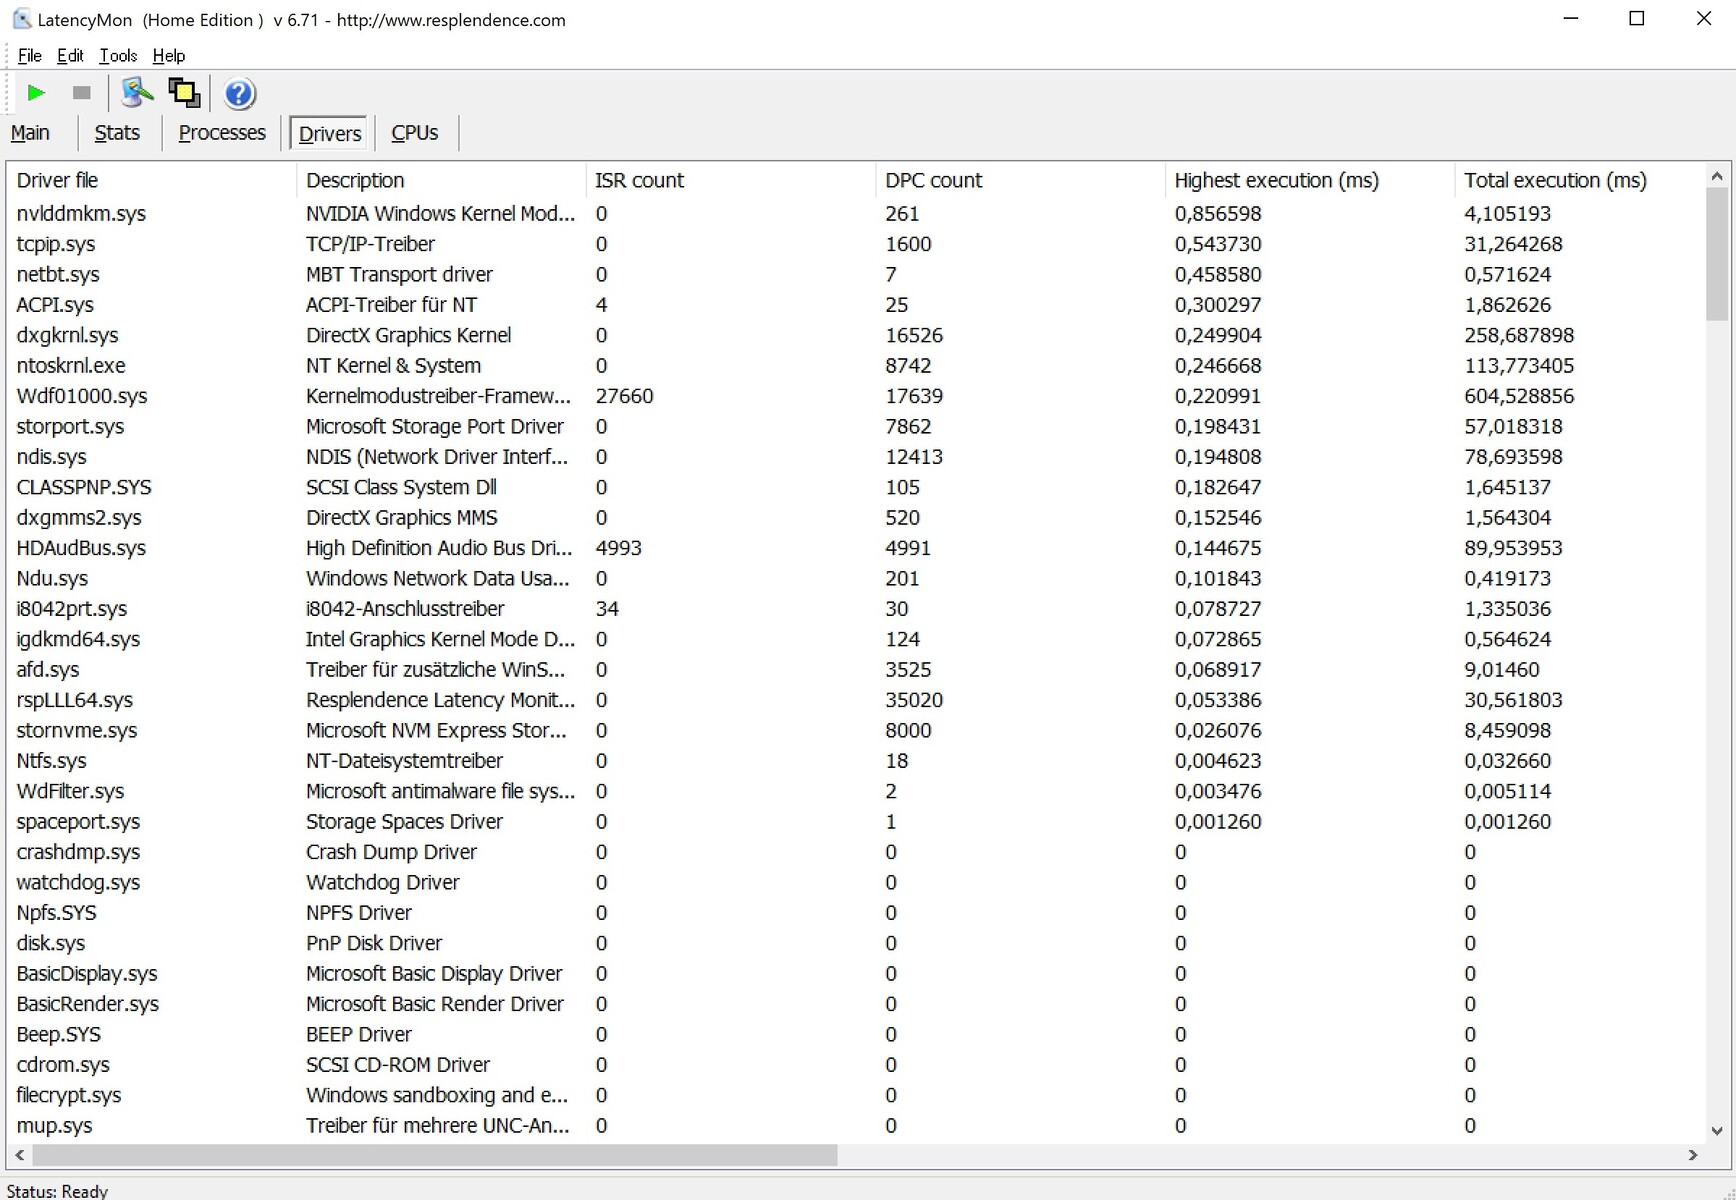
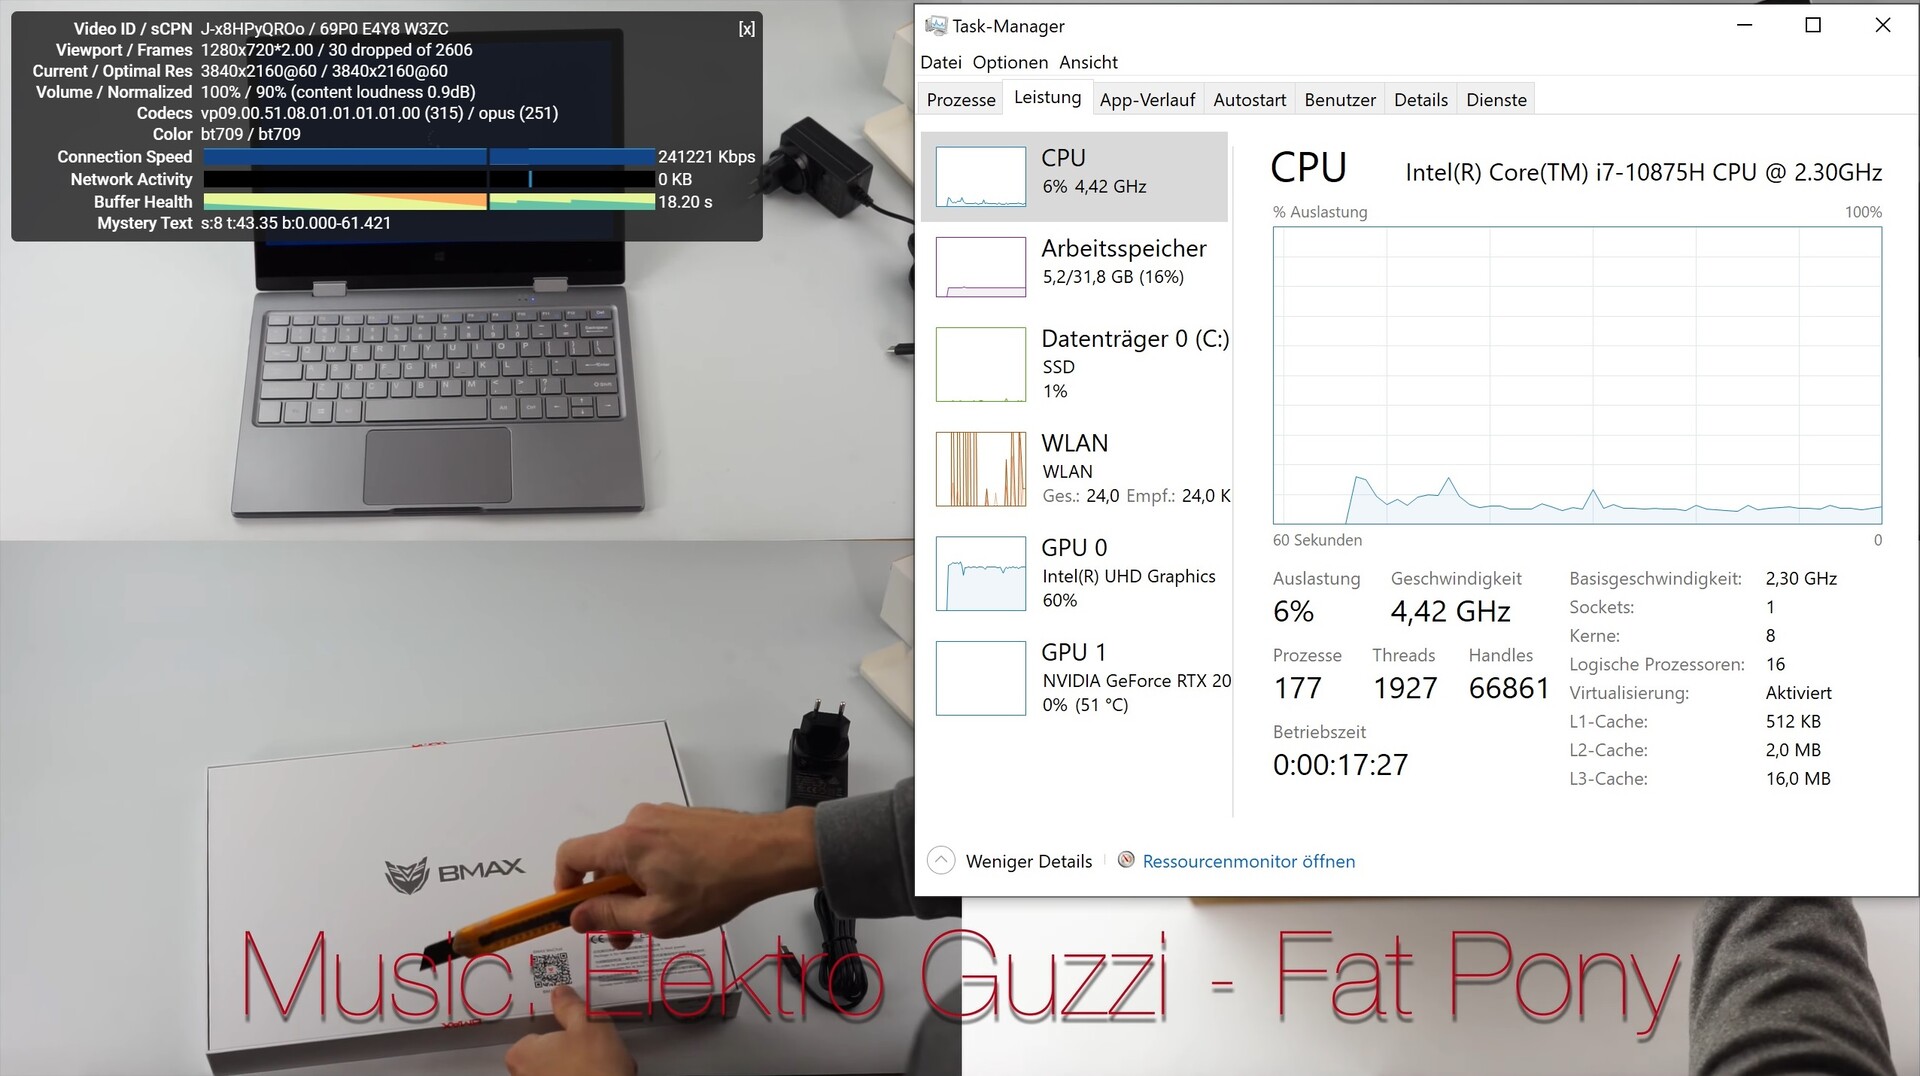
DPC Latencies
Our LatencyMon tool did not find any latency problems in the Creator 17. However, according to the YouTube statistics, our 4K video test did not run quite cleanly (producing frame drops).
| DPC Latencies / LatencyMon - interrupt to process latency (max), Web, Youtube, Prime95 | |
| MSI Creator 17 A10SGS | |
* ... smaller is better
Storage Solution
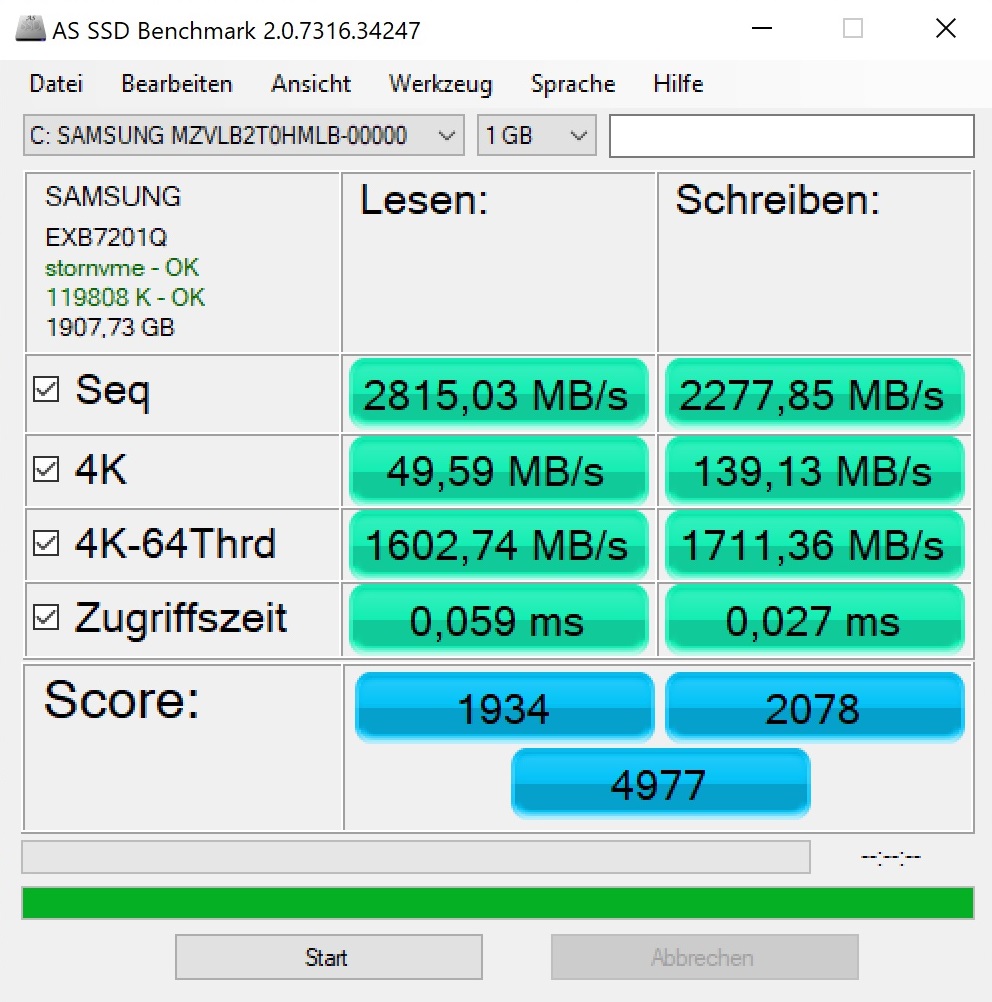
MSI has equipped our test unit with a 2 TB NVMe SSD from Samsung. The PM981 is known for its high performance, which also goes for the Creator 17. The slightly smaller models in the Razer Blade Pro 17 and Asus ROG Zephyrus S, which come from the same build series, are beaten by about 20% in the CrystalDiskMark test. In contrast, the RAID combinations of the GS75 Stealth and Alienware m17 R2 perform at the same level.
| MSI Creator 17 A10SGS Samsung SSD PM981 MZVLB2T0HMLB | MSI GS75 Stealth 9SG 2x Samsung SSD PM981 MZVLB1T0HALR (RAID 0) | Razer Blade Pro 17 RTX 2080 Max-Q Samsung SSD PM981 MZVLB512HAJQ | Asus ROG Zephyrus S GX701GXR Samsung SSD PM981 MZVLB1T0HALR | Alienware m17 R2 P41E 2x SK Hynix PC601 NVMe 512 GB (RAID 0) | |
|---|---|---|---|---|---|
| CrystalDiskMark 5.2 / 6 | 8% | -23% | -22% | 1% | |
| Write 4K (MB/s) | 158.7 | 95.5 -40% | 100.7 -37% | 96.1 -39% | 110.6 -30% |
| Read 4K (MB/s) | 41.59 | 42.59 2% | 41.03 -1% | 40.86 -2% | 41.46 0% |
| Write Seq (MB/s) | 2388 | 2851 19% | 1146 -52% | 1317 -45% | 2378 0% |
| Read Seq (MB/s) | 1623 | 2696 66% | 1115 -31% | 1030 -37% | 2114 30% |
| Write 4K Q32T1 (MB/s) | 432.6 | 402.6 -7% | 384.6 -11% | 350.4 -19% | 445.4 3% |
| Read 4K Q32T1 (MB/s) | 526 | 443.9 -16% | 429.5 -18% | 404.1 -23% | 509 -3% |
| Write Seq Q32T1 (MB/s) | 2438 | 3420 40% | 1859 -24% | 2396 -2% | 2735 12% |
| Read Seq Q32T1 (MB/s) | 3457 | 3514 2% | 3179 -8% | 3194 -8% | 3206 -7% |

Constant Reads Performance: DiskSpd Read Loop, Queue Depth 8
Graphics Card
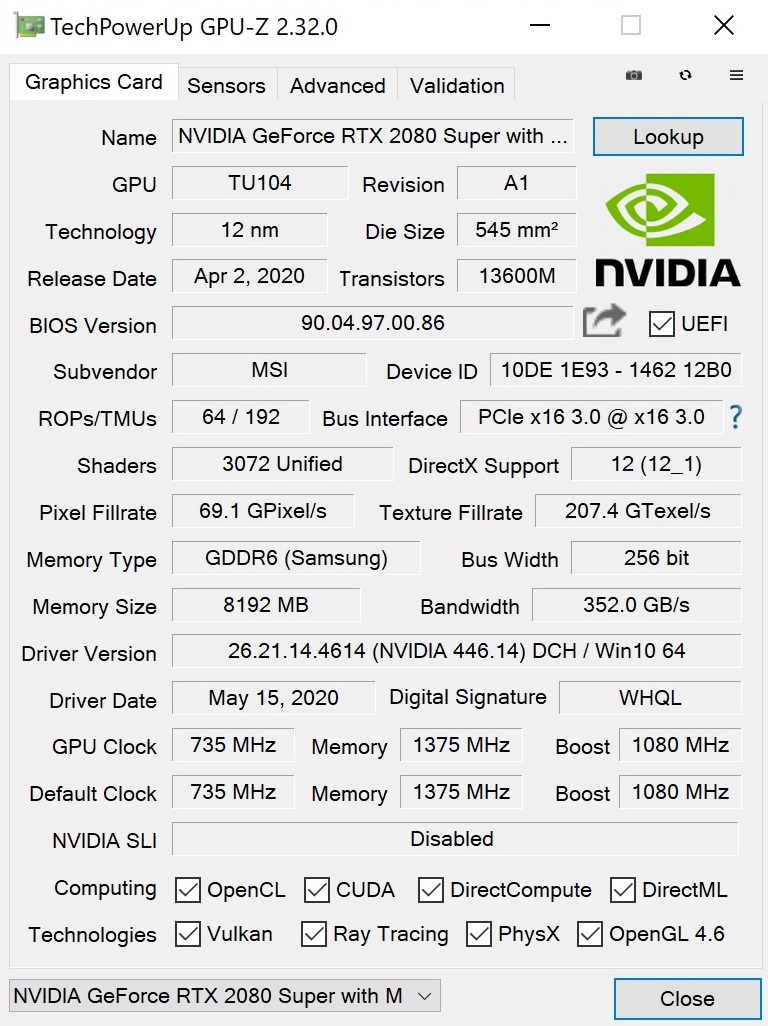
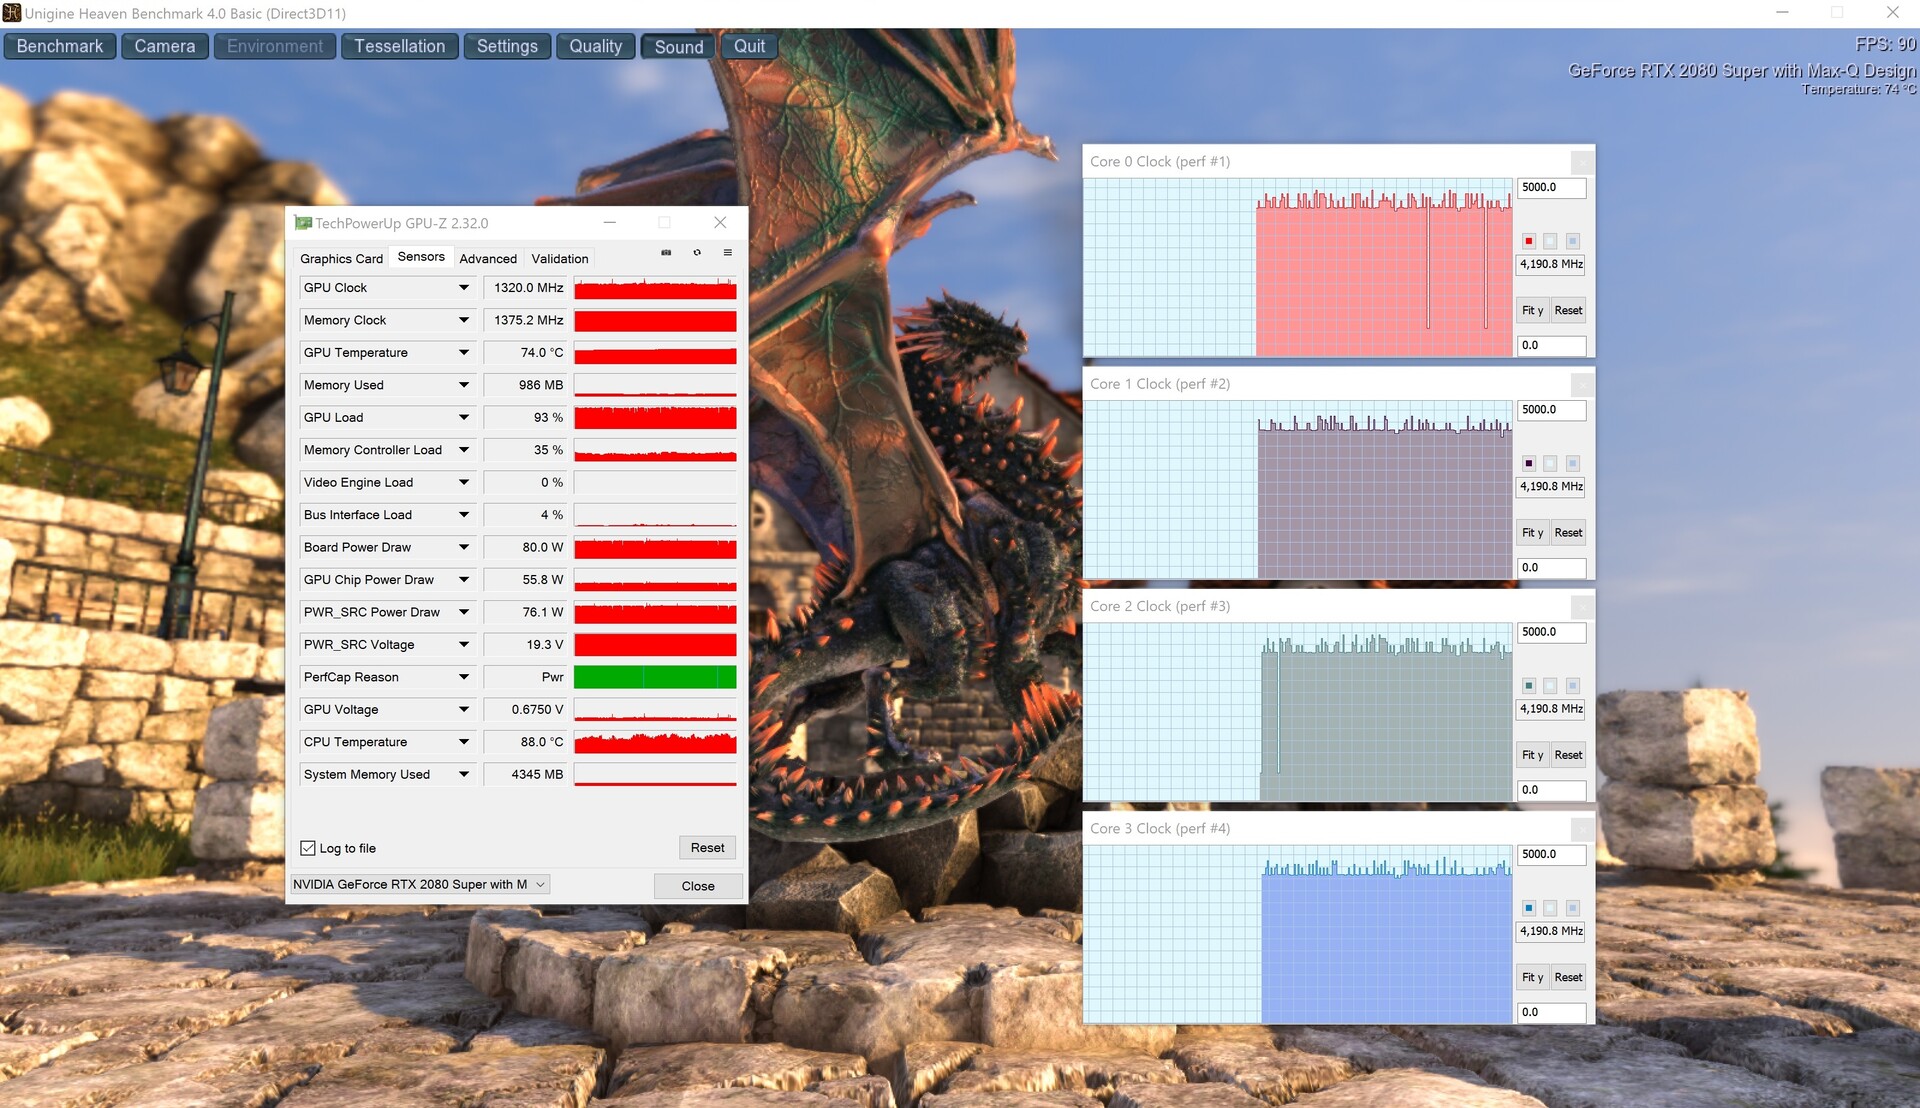
The GeForce RTX 2080 Super Max-Q is a version of the regular RTX 2080 Super that is especially trimmed for efficiency. The RTX 2080 Super is meant for slim laptops designed for mobility. While the amount of shader units (3072) and the size of the video storage (8 GB GDDR6) are identical, the Max-Q version has significantly lower clock speeds. In the case of the Creator 17, the standard clock speed is only 735 instead of 1365 MHz. However, like the CPU, the GPU is able to receive an automatic boost (up to 1845 MHz in the Render test of the GPU-Z tool).
| SPECviewperf 13 | |
| 3ds Max (3dsmax-06) | |
| Average of class Multimedia (n=1last 2 years) | |
| MSI Creator 17 A10SGS | |
| Catia (catia-05) | |
| Average of class Multimedia (n=1last 2 years) | |
| MSI Creator 17 A10SGS | |
| Creo (creo-02) | |
| Average of class Multimedia (n=1last 2 years) | |
| MSI Creator 17 A10SGS | |
| Energy (energy-02) | |
| Average of class Multimedia (n=1last 2 years) | |
| MSI Creator 17 A10SGS | |
| Maya (maya-05) | |
| Average of class Multimedia (n=1last 2 years) | |
| MSI Creator 17 A10SGS | |
| Medical (medical-02) | |
| Average of class Multimedia (n=1last 2 years) | |
| MSI Creator 17 A10SGS | |
| Showcase (showcase-02) | |
| Average of class Multimedia (n=1last 2 years) | |
| MSI Creator 17 A10SGS | |
| Siemens NX (snx-03) | |
| Average of class Multimedia (n=1last 2 years) | |
| MSI Creator 17 A10SGS | |
| Solidworks (sw-04) | |
| Average of class Multimedia (n=1last 2 years) | |
| MSI Creator 17 A10SGS | |
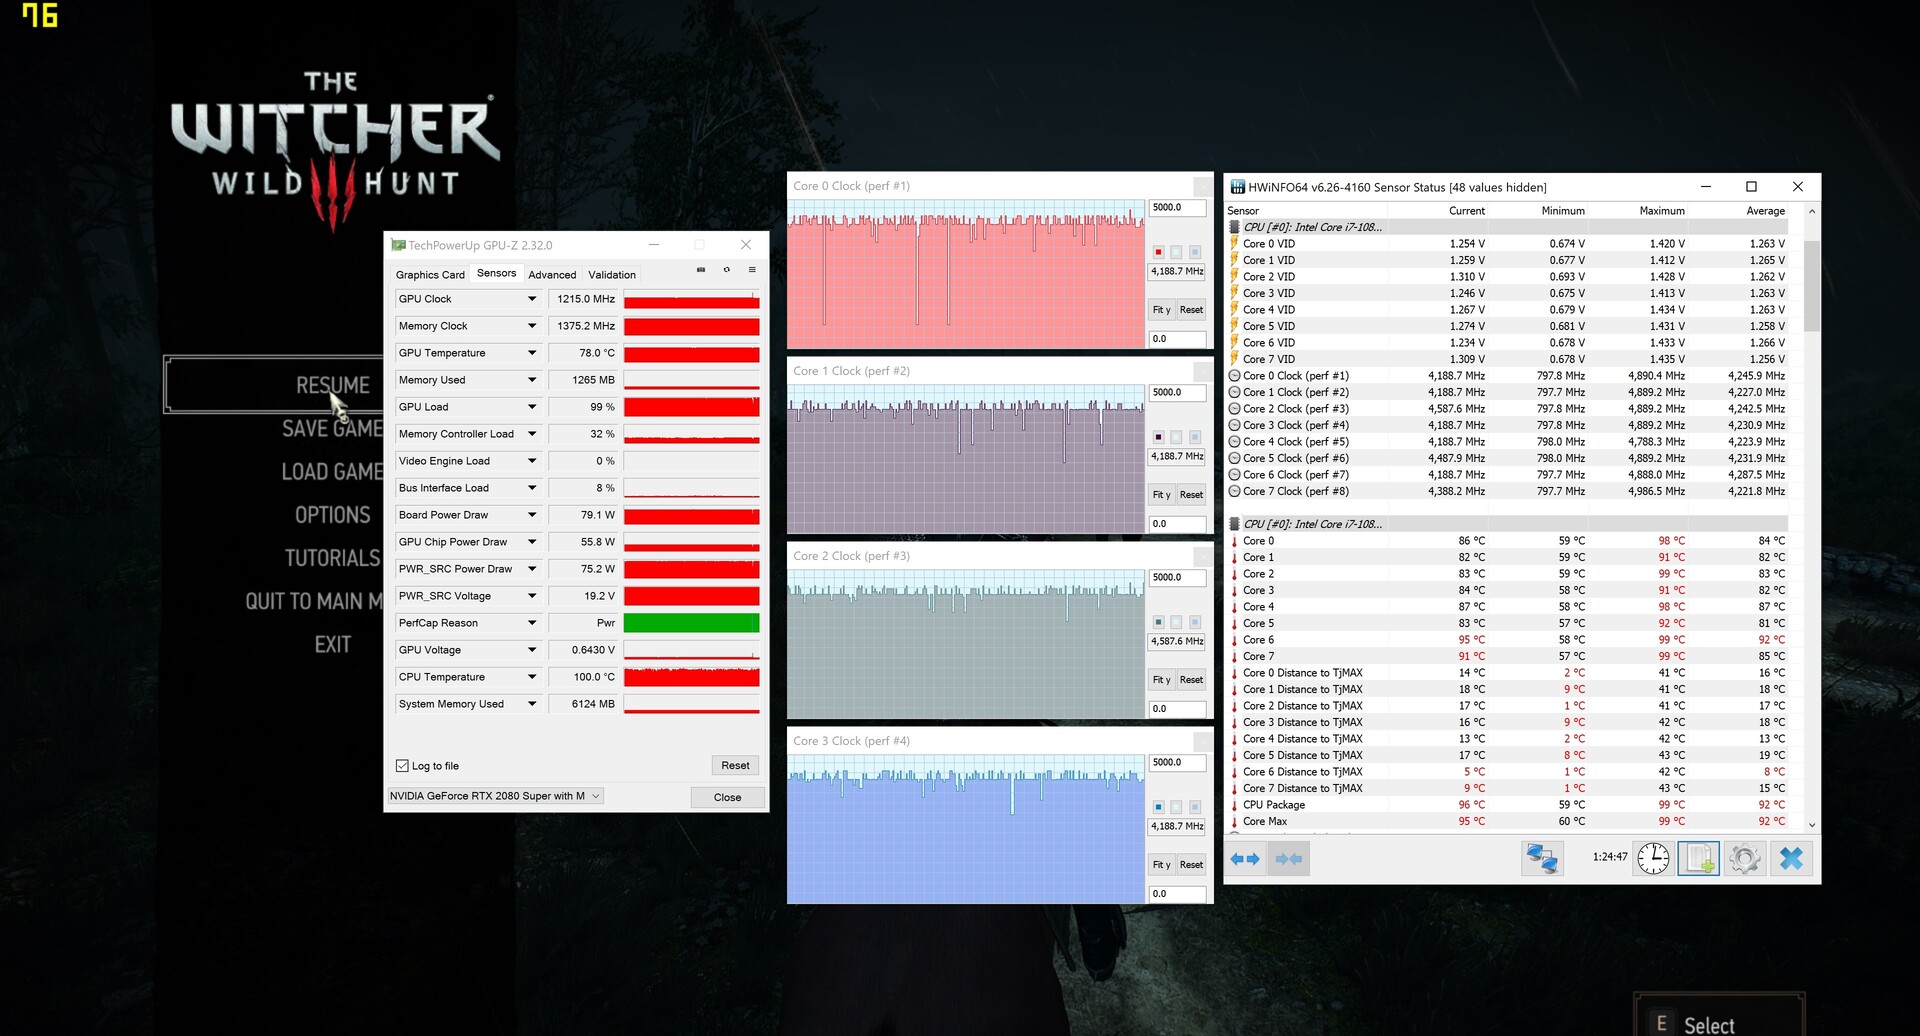
Using our The Witcher 3 role-playing game for one hour, we evaluated how the clock speed behaves over a longer time period. On average, the RTX 2080 Super Max-Q maintained 1215 MHz here. With this value, the Creator 17 ends up at the bottom of our field of comparison devices. Depending on the benchmark, the competitors were between 1 and 20% faster – and that without the "Super" addition. This is not surprising, since the Turing chip is also available with a higher TGP, which explains the better results (990 MHz basic clock speed).
But whether with high or low TGP, overall the RTX 2080 (Super) Max-Q does not really deserve its label, since its performance is hardly any different than that of the RTX 2070 (Super). At times, the latter is even faster. Whether you want to blame Nvidia (specifications) or the laptop manufacturer (cooling system) remains up to you.
| 3DMark 11 Performance | 22567 points | |
| 3DMark Fire Strike Score | 17053 points | |
| 3DMark Time Spy Score | 7482 points | |
Help | ||
Gaming Performance
In the native UHD resolution of 3840x2160 pixels, the RTX 2080 Super Max-Q is unable to run every current game smoothly and at maximum details. More demanding games such as Red Dead Redemption 2 and Control keep stuttering along. Things look much better in the QHD resolution of 2560x1440. Less than 60 FPS is a rarity here. Unfortunately, this resolution is not supported by the internal display, which is too bad. In Full HD resolution (1920x1080), all the games run smoothly.
To repeat it again: The Creator 17 was not designed for pure gaming. There are more affordable and better adjusted alternatives for that. The target group is clearly professional content creators.
| The Witcher 3 - 1920x1080 Ultra Graphics & Postprocessing (HBAO+) | |
| Razer Blade Pro 17 RTX 2080 Max-Q | |
| Asus ROG Zephyrus S GX701GXR | |
| Alienware m17 R2 P41E | |
| MSI GS75 Stealth 9SG | |
| MSI Creator 17 A10SGS | |
| Average of class Multimedia (11 - 121, n=13, last 2 years) | |
| low | med. | high | ultra | QHD | 4K | |
|---|---|---|---|---|---|---|
| GTA V (2015) | 180 | 174 | 157 | 85.3 | 71.5 | |
| The Witcher 3 (2015) | 138 | 75.1 | 49.8 | |||
| Dota 2 Reborn (2015) | 155 | 141 | 139 | 125 | 102 | |
| X-Plane 11.11 (2018) | 113 | 99.8 | 84.3 | 67 | ||
| Shadow of the Tomb Raider (2018) | 105 | 92 | 63 | 32 | ||
| Battlefield V (2018) | 127 | 118 | 95.4 | 52.6 | ||
| Far Cry New Dawn (2019) | 98 | 92 | 78 | 43 | ||
| Rage 2 (2019) | 102 | 101 | 63.8 | 30.9 | ||
| Control (2019) | 71.1 | 46.1 | 22 | |||
| Borderlands 3 (2019) | 79.8 | 71.6 | 51.7 | 26.9 | ||
| FIFA 20 (2019) | 217 | 213 | 189 | 114 | ||
| Call of Duty Modern Warfare 2019 (2019) | 114 | 91.8 | 67.3 | 36.8 | ||
| Star Wars Jedi Fallen Order (2019) | 102 | 95.2 | 72.2 | 36.8 | ||
| Red Dead Redemption 2 (2019) | 62.4 | 41 | 35 | 21.5 | ||
| Gears Tactics (2020) | 114 | 78.4 | 54 | 28.1 |
Emissions
Noise Emissions
You should not expect a low noise level when you buy this. At times, the fans even rev up without any reason already during idle mode, producing a noise level of almost 40 dB(A). Under load, the Creator 17 produces between 46 and 48 dB(A). Although this is not louder than the competitors, the use of headphones is still recommended. In general, the noise characteristic of the Creator 17 fans is slightly uncomfortable (a permanent whirring noise).
Noise level
| Idle |
| 32 / 33 / 40 dB(A) |
| Load |
| 47 / 48 dB(A) |
 | ||
30 dB silent 40 dB(A) audible 50 dB(A) loud |
||
min: | ||
| MSI Creator 17 A10SGS i7-10875H, GeForce RTX 2080 Super Max-Q | MSI GS75 Stealth 9SG i7-9750H, GeForce RTX 2080 Max-Q | Razer Blade Pro 17 RTX 2080 Max-Q i7-9750H, GeForce RTX 2080 Max-Q | Asus ROG Zephyrus S GX701GXR i7-9750H, GeForce RTX 2080 Max-Q | Alienware m17 R2 P41E i9-9980HK, GeForce RTX 2080 Max-Q | Average of class Multimedia | |
|---|---|---|---|---|---|---|
| Noise | 1% | 7% | 3% | 3% | 21% | |
| off / environment * (dB) | 30 | 30 -0% | 28.2 6% | 30 -0% | 29.1 3% | 24.2 ? 19% |
| Idle Minimum * (dB) | 32 | 31 3% | 28.2 12% | 32 -0% | 29.4 8% | 24.4 ? 24% |
| Idle Average * (dB) | 33 | 32 3% | 28.2 15% | 33 -0% | 29.4 11% | 24.8 ? 25% |
| Idle Maximum * (dB) | 40 | 38 5% | 30.8 23% | 34 15% | 31.5 21% | 26.5 ? 34% |
| Load Average * (dB) | 47 | 47 -0% | 42 11% | 40 15% | 49.7 -6% | 37.6 ? 20% |
| Witcher 3 ultra * (dB) | 46 | 48 -4% | 51 -11% | 49 -7% | 49.5 -8% | |
| Load Maximum * (dB) | 48 | 49 -2% | 53 -10% | 50 -4% | 53.3 -11% | 45.9 ? 4% |
* ... smaller is better
Temperature
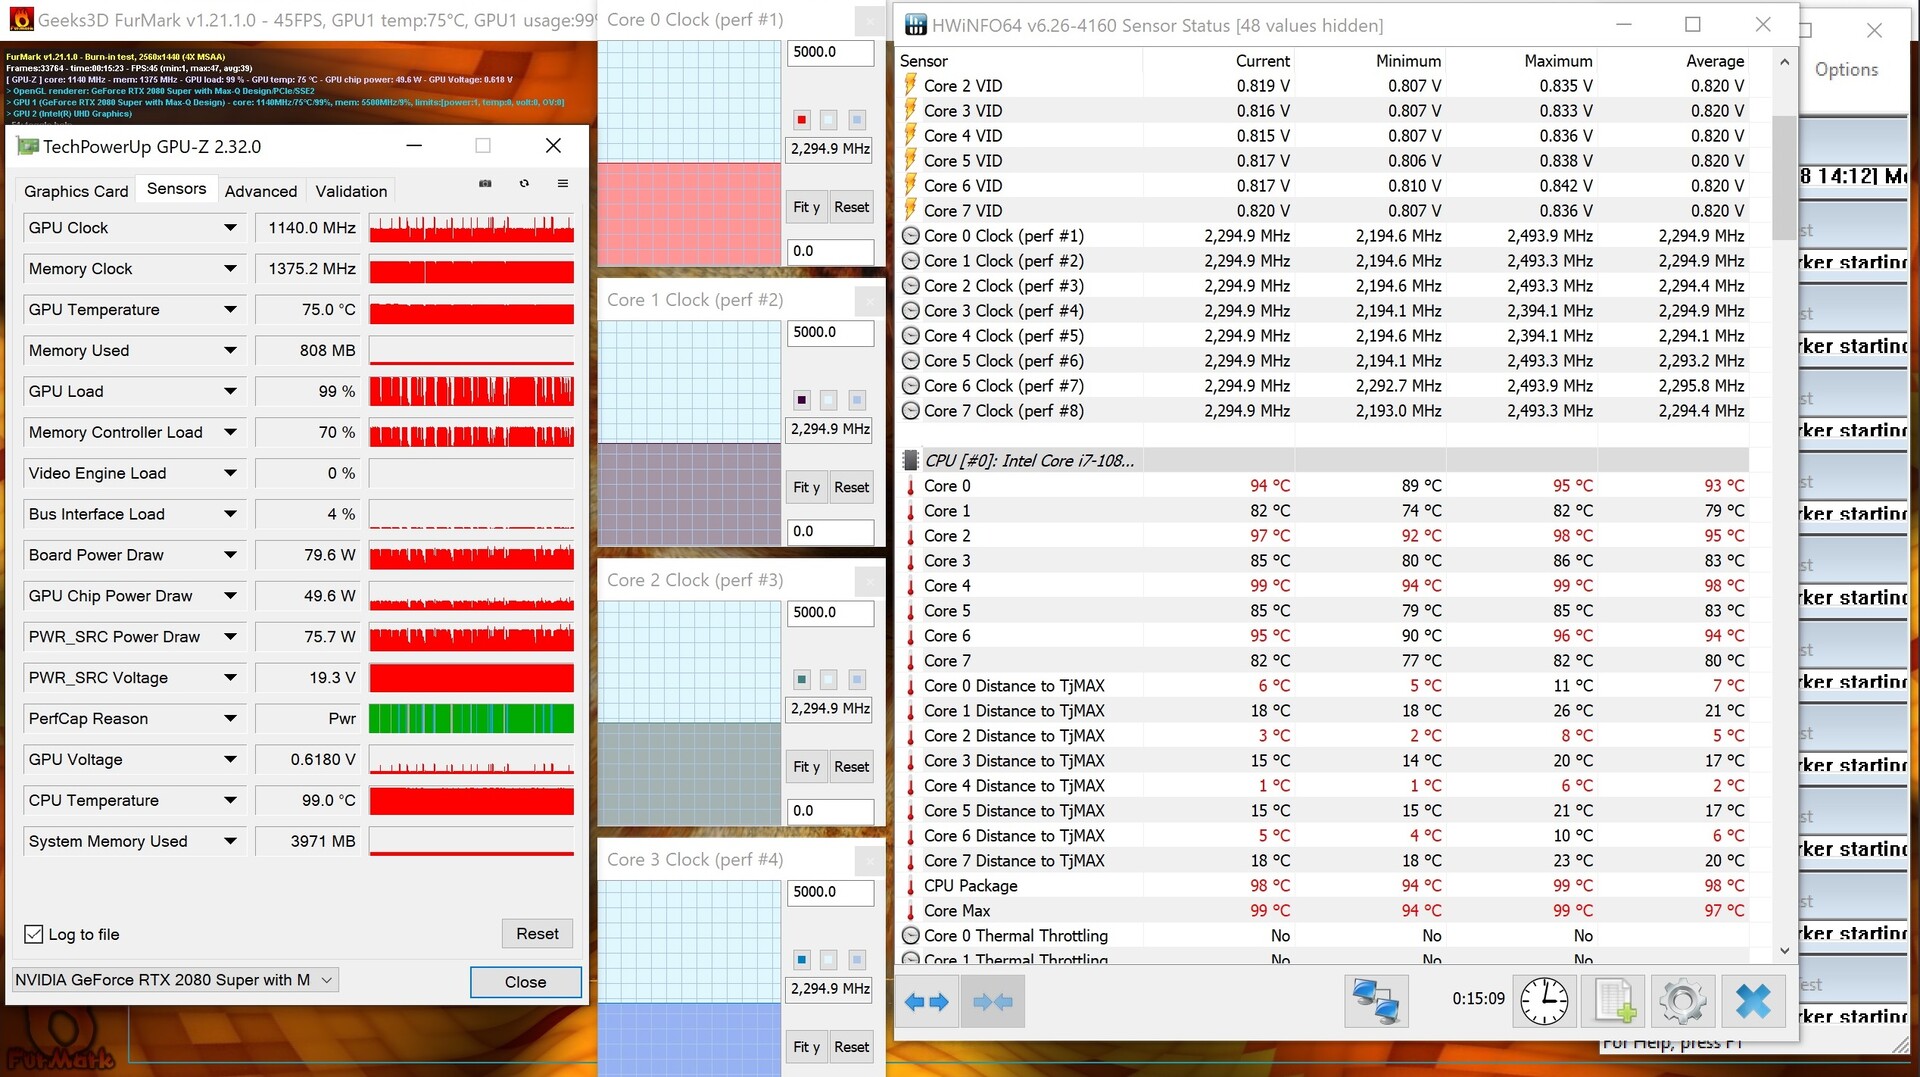
The case temperatures are typical for a high-end notebook that is so fast. At the end of the 60-minute stress test with the FurMark and Prime 95 tools, we measure up to 52 °C (126 °F) on top and 59 °C (138 °F) on the bottom. We would therefore not recommend any 3D sessions holding it on your lap. For the components, our judgment is mixed. While the temperature of the GeForce RTX 2080 Super Max-Q always remains below 80 °C (176 °F), the Core i7-10875H heats up to a maximum of 99 °C (210 °F) according to the HWiNFO tool.
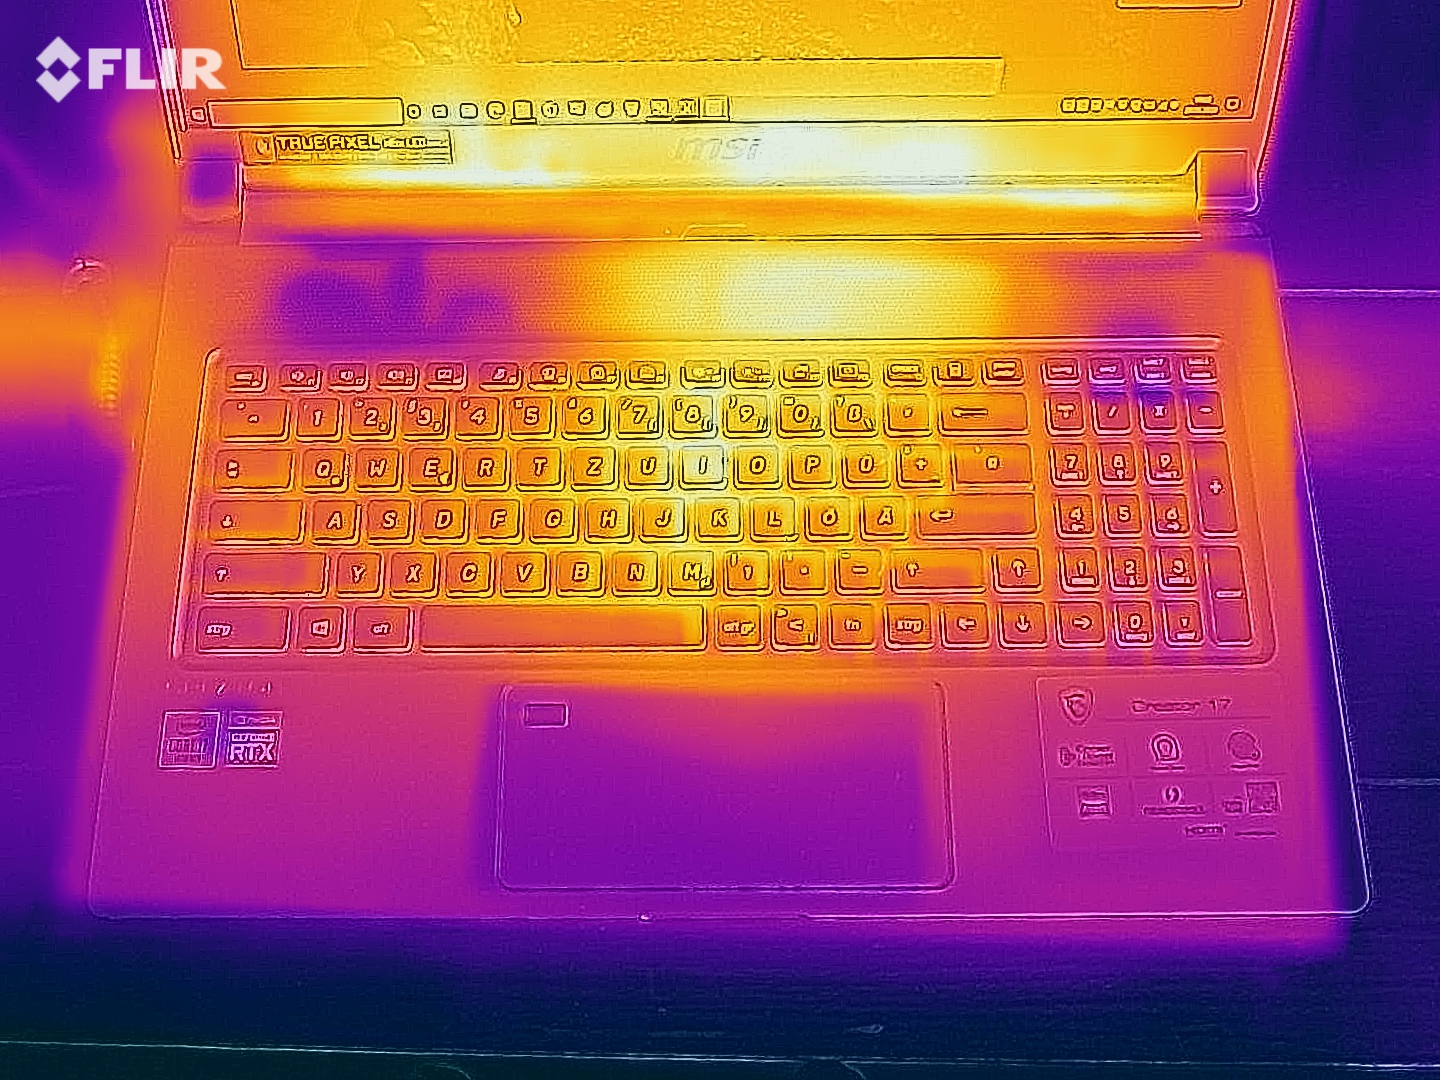
(-) The maximum temperature on the upper side is 52 °C / 126 F, compared to the average of 36.8 °C / 98 F, ranging from 21 to 71 °C for the class Multimedia.
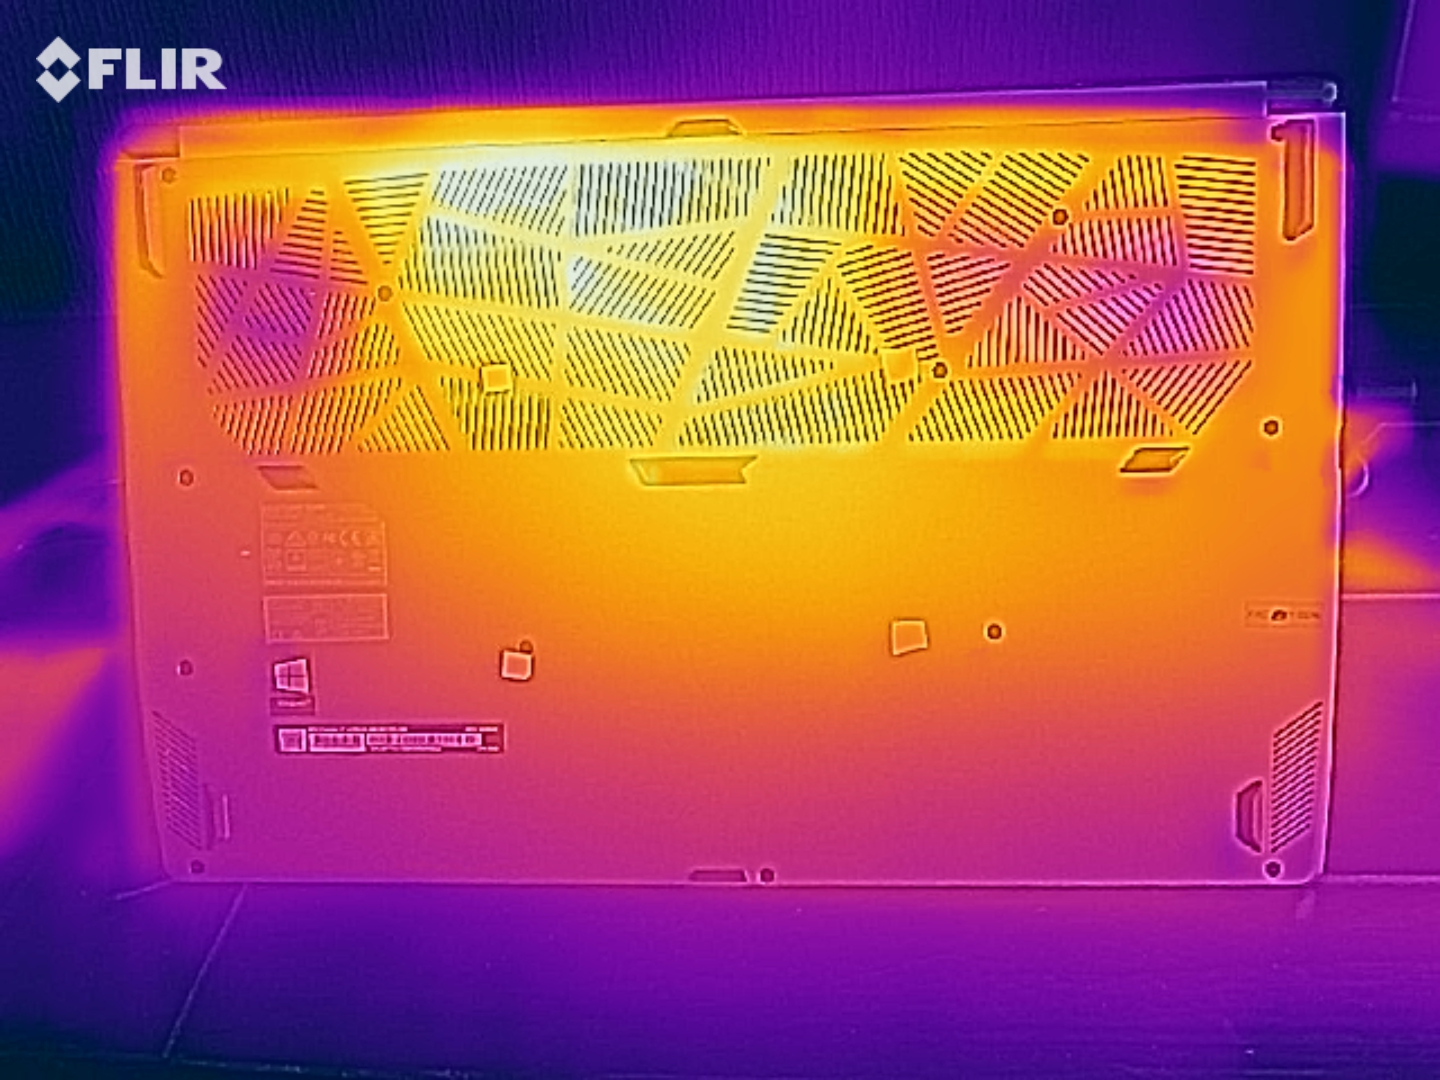
(-) The bottom heats up to a maximum of 59 °C / 138 F, compared to the average of 39.1 °C / 102 F
(+) In idle usage, the average temperature for the upper side is 30.9 °C / 88 F, compared to the device average of 31.3 °C / 88 F.
(-) Playing The Witcher 3, the average temperature for the upper side is 47.4 °C / 117 F, compared to the device average of 31.3 °C / 88 F.
(-) The palmrests and touchpad can get very hot to the touch with a maximum of 43 °C / 109.4 F.
(-) The average temperature of the palmrest area of similar devices was 28.7 °C / 83.7 F (-14.3 °C / -25.7 F).
| MSI Creator 17 A10SGS i7-10875H, GeForce RTX 2080 Super Max-Q | MSI GS75 Stealth 9SG i7-9750H, GeForce RTX 2080 Max-Q | Razer Blade Pro 17 RTX 2080 Max-Q i7-9750H, GeForce RTX 2080 Max-Q | Asus ROG Zephyrus S GX701GXR i7-9750H, GeForce RTX 2080 Max-Q | Alienware m17 R2 P41E i9-9980HK, GeForce RTX 2080 Max-Q | Average of class Multimedia | |
|---|---|---|---|---|---|---|
| Heat | -0% | 17% | 6% | -9% | 20% | |
| Maximum Upper Side * (°C) | 52 | 55 -6% | 43 17% | 50 4% | 54.2 -4% | 41.5 ? 20% |
| Maximum Bottom * (°C) | 59 | 65 -10% | 47.2 20% | 47 20% | 61.4 -4% | 44.1 ? 25% |
| Idle Upper Side * (°C) | 34 | 30 12% | 27.2 20% | 33 3% | 37.8 -11% | 27.1 ? 20% |
| Idle Bottom * (°C) | 33 | 32 3% | 30 9% | 34 -3% | 38.6 -17% | 28 ? 15% |
* ... smaller is better
Speakers
The sound quality places the laptop in the middle of the field. The Creator 17 has two speakers that are hidden in the front area of the two sides. Since there is no subwoofer, the bass is also lacking. Instead, the 2.0 system is able to score with ample volume (up to 91 dB).
MSI Creator 17 A10SGS audio analysis
(+) | speakers can play relatively loud (91 dB)
Bass 100 - 315 Hz
(-) | nearly no bass - on average 33.3% lower than median
(+) | bass is linear (6% delta to prev. frequency)
Mids 400 - 2000 Hz
(±) | higher mids - on average 5.1% higher than median
(±) | linearity of mids is average (7.1% delta to prev. frequency)
Highs 2 - 16 kHz
(+) | balanced highs - only 1.8% away from median
(+) | highs are linear (3.2% delta to prev. frequency)
Overall 100 - 16.000 Hz
(±) | linearity of overall sound is average (19.7% difference to median)
Compared to same class
» 65% of all tested devices in this class were better, 6% similar, 29% worse
» The best had a delta of 5%, average was 17%, worst was 45%
Compared to all devices tested
» 50% of all tested devices were better, 7% similar, 43% worse
» The best had a delta of 4%, average was 24%, worst was 134%
MSI GS75 Stealth 9SG audio analysis
(±) | speaker loudness is average but good (81 dB)
Bass 100 - 315 Hz
(-) | nearly no bass - on average 28.4% lower than median
(±) | linearity of bass is average (7.8% delta to prev. frequency)
Mids 400 - 2000 Hz
(±) | reduced mids - on average 5.8% lower than median
(±) | linearity of mids is average (10% delta to prev. frequency)
Highs 2 - 16 kHz
(+) | balanced highs - only 2.3% away from median
(+) | highs are linear (3.9% delta to prev. frequency)
Overall 100 - 16.000 Hz
(±) | linearity of overall sound is average (23.2% difference to median)
Compared to same class
» 84% of all tested devices in this class were better, 4% similar, 11% worse
» The best had a delta of 6%, average was 18%, worst was 132%
Compared to all devices tested
» 69% of all tested devices were better, 5% similar, 25% worse
» The best had a delta of 4%, average was 24%, worst was 134%
Power Management
Power Consumption
For a Max-Q device with Optimus technology, the power consumption is quite high in parts (up to 42 watts during idle operation). This is not only related to the octa-core processor but also the bright Mini LED display.
| Off / Standby | |
| Idle | |
| Load |
|
Key:
min: | |
| MSI Creator 17 A10SGS i7-10875H, GeForce RTX 2080 Super Max-Q | MSI GS75 Stealth 9SG i7-9750H, GeForce RTX 2080 Max-Q | Razer Blade Pro 17 RTX 2080 Max-Q i7-9750H, GeForce RTX 2080 Max-Q | Asus ROG Zephyrus S GX701GXR i7-9750H, GeForce RTX 2080 Max-Q | Alienware m17 R2 P41E i9-9980HK, GeForce RTX 2080 Max-Q | Average of class Multimedia | |
|---|---|---|---|---|---|---|
| Power Consumption | 16% | 9% | -19% | -38% | 57% | |
| Idle Minimum * (Watt) | 15 | 13 13% | 16.2 -8% | 32 -113% | 24.7 -65% | 5.71 ? 62% |
| Idle Average * (Watt) | 20 | 17 15% | 20.4 -2% | 34 -70% | 35.9 -80% | 10.1 ? 49% |
| Idle Maximum * (Watt) | 42 | 25 40% | 26.1 38% | 36 14% | 69.6 -66% | 12.4 ? 70% |
| Load Average * (Watt) | 150 | 96 36% | 96.5 36% | 95 37% | 141.8 5% | 65 ? 57% |
| Witcher 3 ultra * (Watt) | 170 | 156 8% | 182.9 -8% | 155 9% | 185.8 -9% | |
| Load Maximum * (Watt) | 210 | 239 -14% | 214.3 -2% | 187 11% | 235.4 -12% | 112.2 ? 47% |
* ... smaller is better
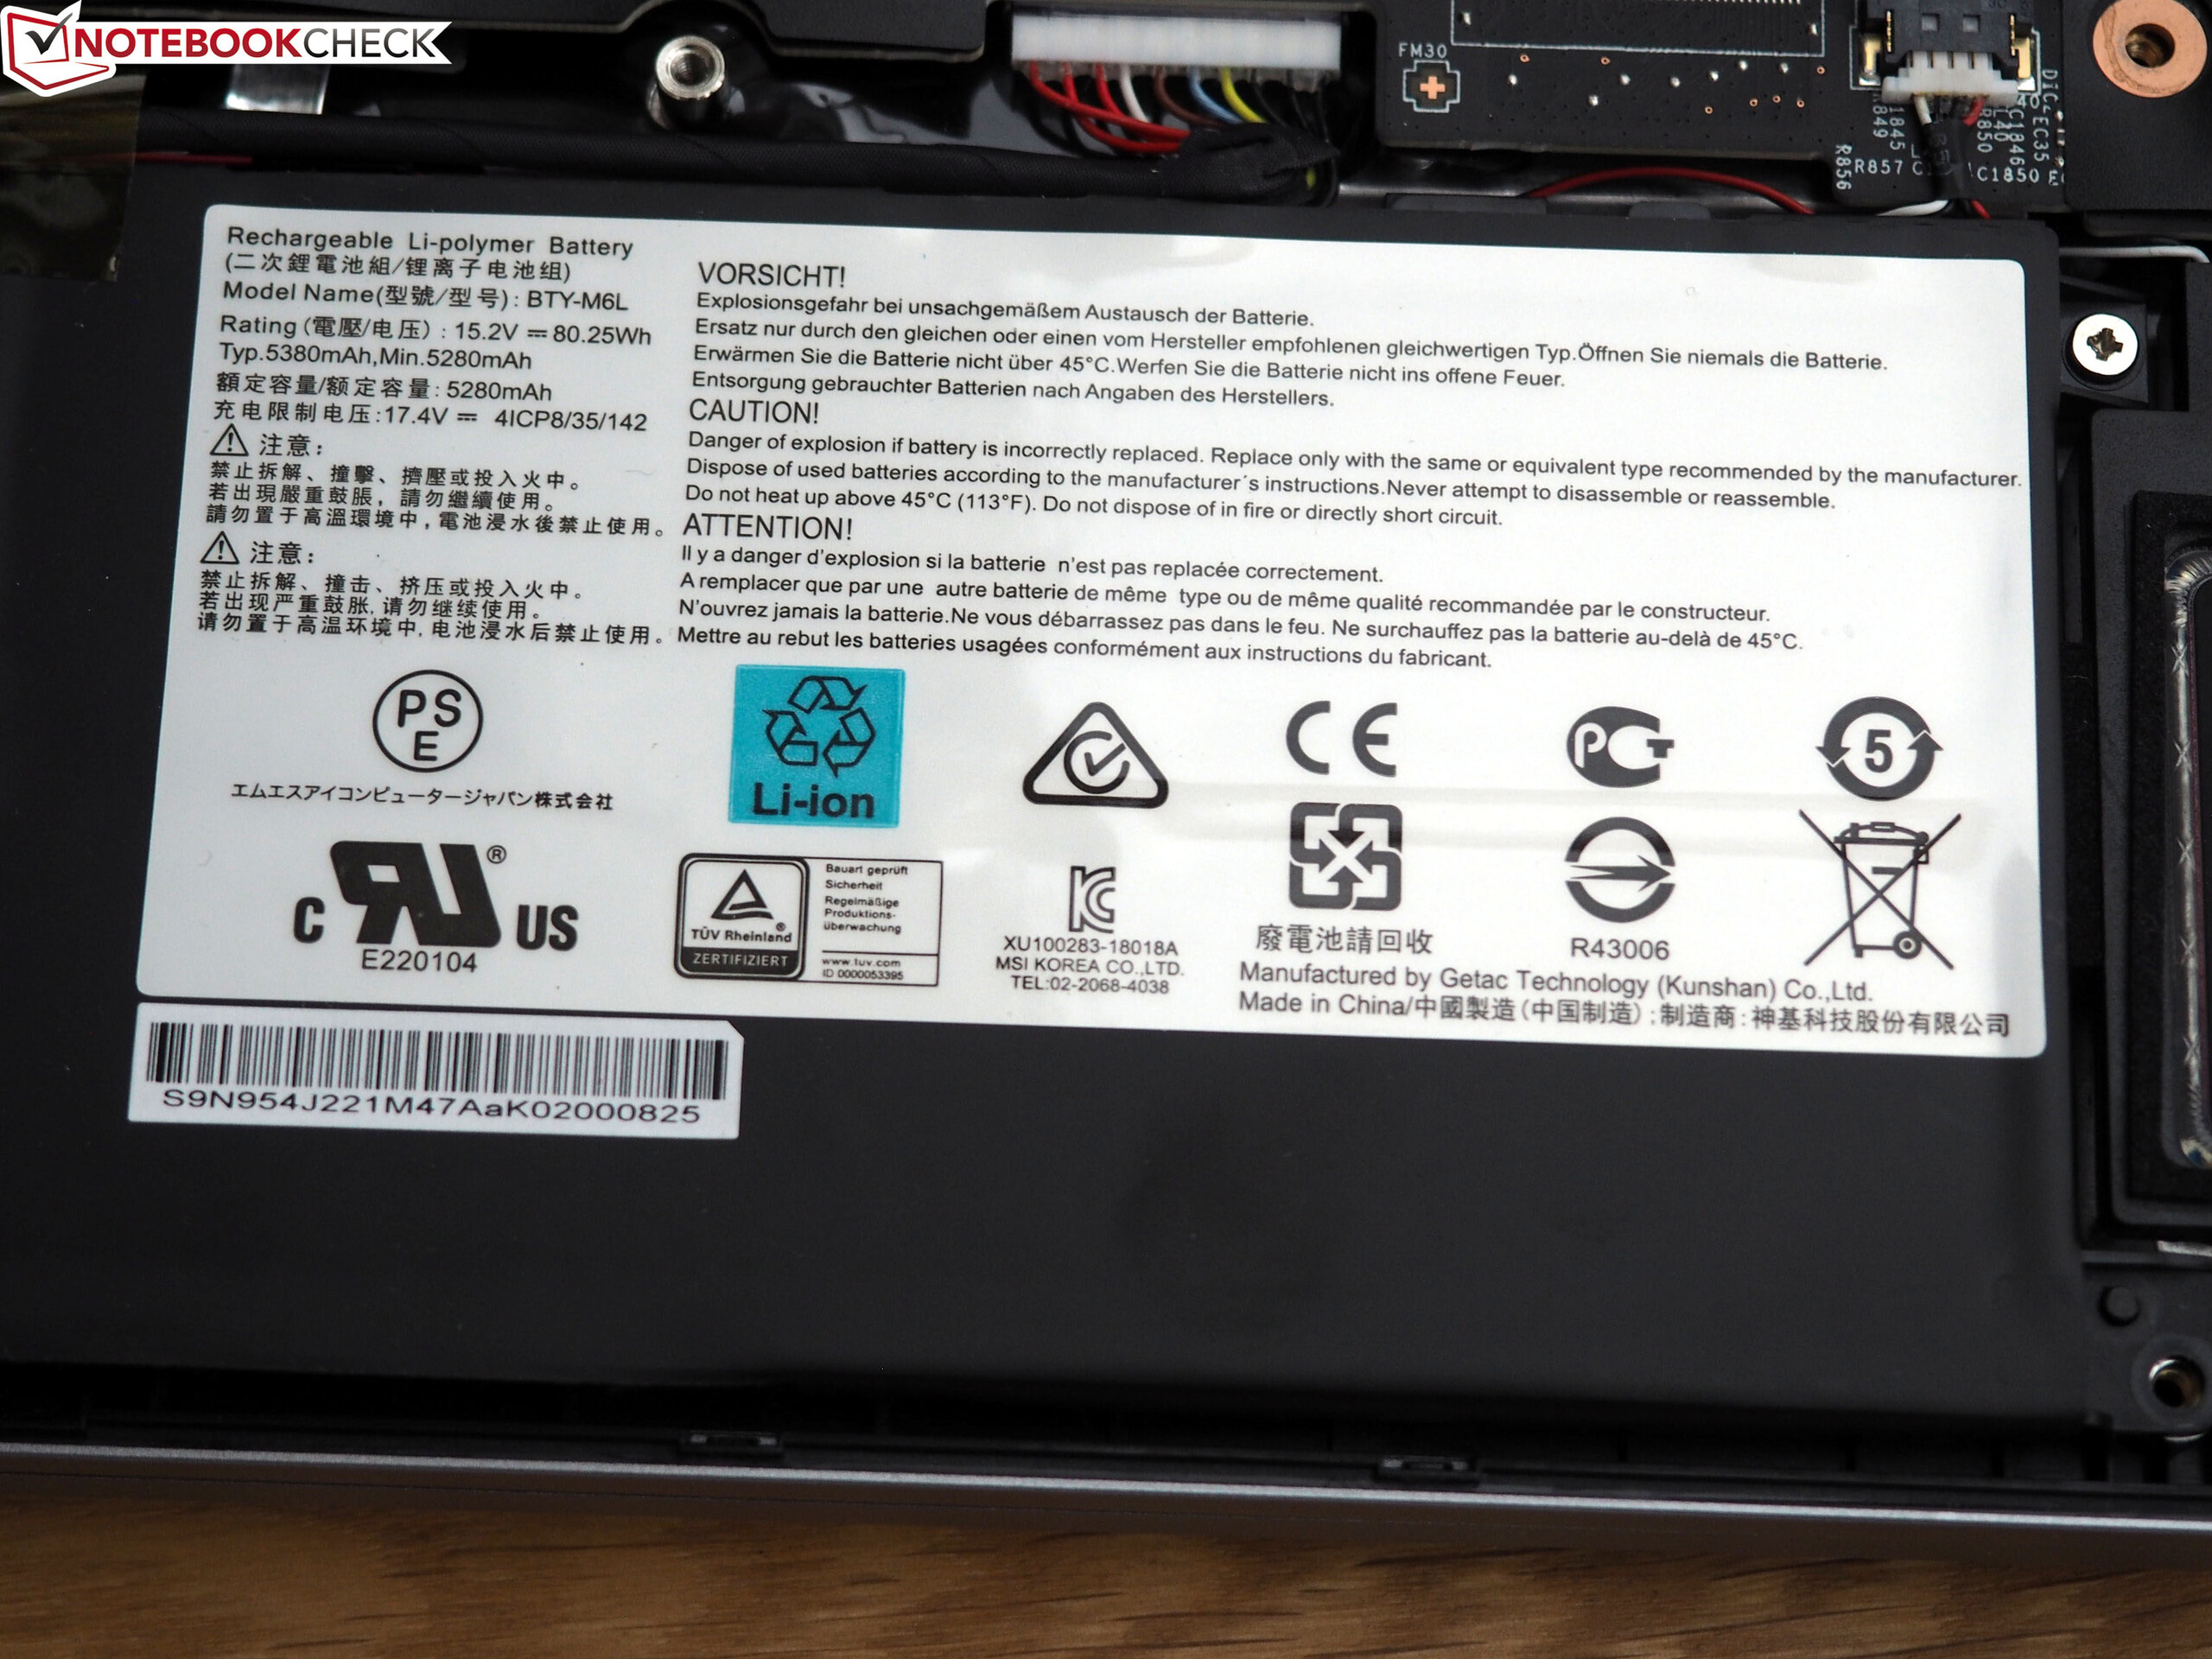
Battery Life
The 82-Wh battery guarantees a solid but not outstanding battery life. Depending on the load and display brightness, the Creator 17 lasts between one and seven hours. When surfing the Internet via WLAN (at medium brightness), you can expect about 4.5 hours.
| MSI Creator 17 A10SGS i7-10875H, GeForce RTX 2080 Super Max-Q, 82 Wh | MSI GS75 Stealth 9SG i7-9750H, GeForce RTX 2080 Max-Q, 80.25 Wh | Razer Blade Pro 17 RTX 2080 Max-Q i7-9750H, GeForce RTX 2080 Max-Q, 70 Wh | Asus ROG Zephyrus S GX701GXR i7-9750H, GeForce RTX 2080 Max-Q, 76 Wh | Alienware m17 R2 P41E i9-9980HK, GeForce RTX 2080 Max-Q, 76 Wh | Average of class Multimedia | |
|---|---|---|---|---|---|---|
| Battery runtime | 17% | 1% | -22% | -16% | 158% | |
| Reader / Idle (h) | 7.2 | 7.7 7% | 4.9 -32% | 4.1 -43% | 7.1 -1% | 25.2 ? 250% |
| WiFi v1.3 (h) | 4.4 | 6 36% | 4.7 7% | 3 -32% | 4.8 9% | 12 ? 173% |
| Load (h) | 1.1 | 1.2 9% | 1.4 27% | 1.2 9% | 0.5 -55% | 1.675 ? 52% |
| H.264 (h) | 6.8 | 2.8 | 16.4 ? |
Pros
Cons
Verdict
The most expensive configuration of the Creator 17 delivered a mixed performance in our test. While the Mini LED display, offered as a first by MSI, is able to convince in all aspects, stealing the show from other competitors (almost 1000 cd/m² brightness!), the case offers less than could be expected (stability, quality impression, etc.).
Considering the performance of the RTX 2080 Super Max-Q, which stands in no relation to the price premium, we would recommend the more affordable version with the RTX 2070 (Super) Max-Q to interested buyers. The use of the Core i7-10875H Turbo could also be better.
The fact that the Creator 17 will land in our Top 10 for Photo and Video Editing table despite those weaknesses, is not least due to its rich connection equipment including Thunderbolt 3. For the successor, we would wish for a more robust and less noisy case with a cooling system that does not operate as close to the limits.
MSI Creator 17 A10SGS
- 07/05/2020 v7 (old)
Florian Glaser
Price comparison

