MSI GS75 Stealth 9SG Laptop Review: A slim and powerful gaming laptop with good battery life

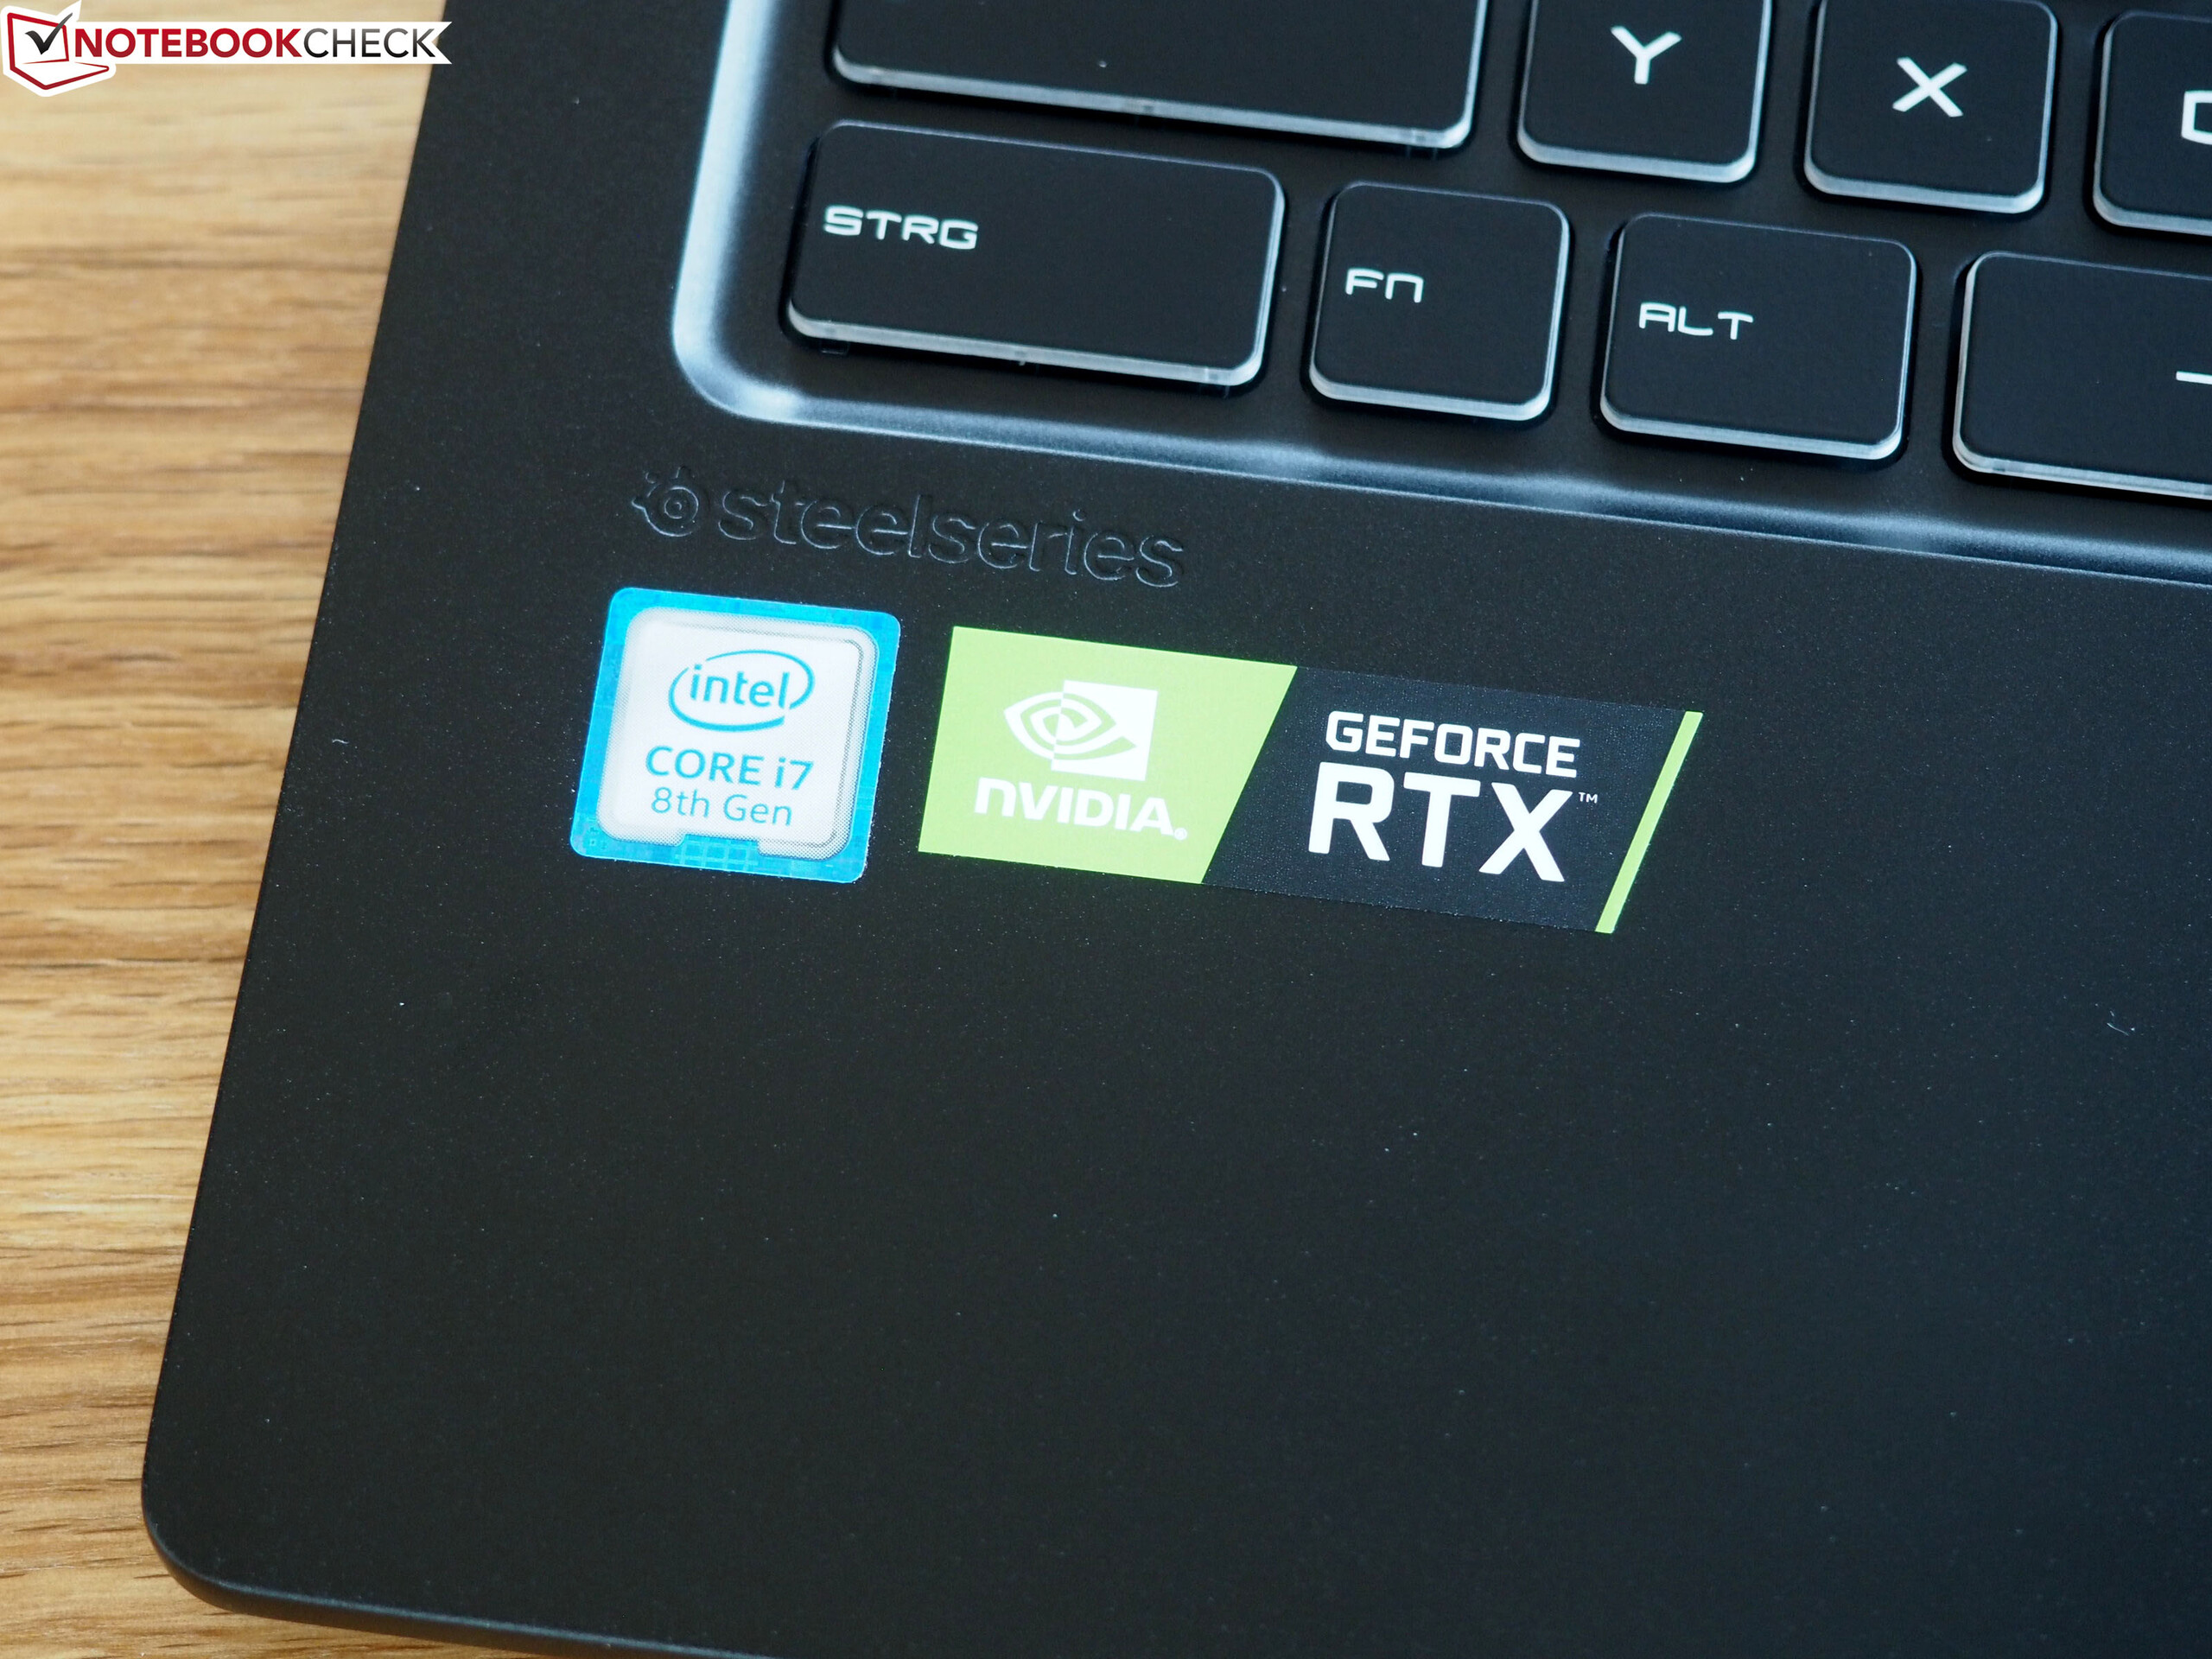
The current MSI GS75 Stealth series is already familiar to us, having reviewed the 8SG in March. The 9SG has now entered our offices, which features a newer CPU, namely the Intel Core i7-9750H. All other components are identical though, with the two devices sharing the same design, connectivity, input devices, display, GPU and speakers. Correspondingly, we shall omit all but the Display and GPU of those for this review. Please see our GS75 8SG Stealth review for our thoughts on the areas that we have not included in this review.
We have chosen to compare the 9SG against other comparably priced 17.3-inch gaming laptops. Our comparison devices will include the Alienware m17, ASUS ROG Zephyrus S GX701GX, Dell G7 17 7790, Lenovo Legion Y740-17ICH and the Schenker XMG Neo 17.

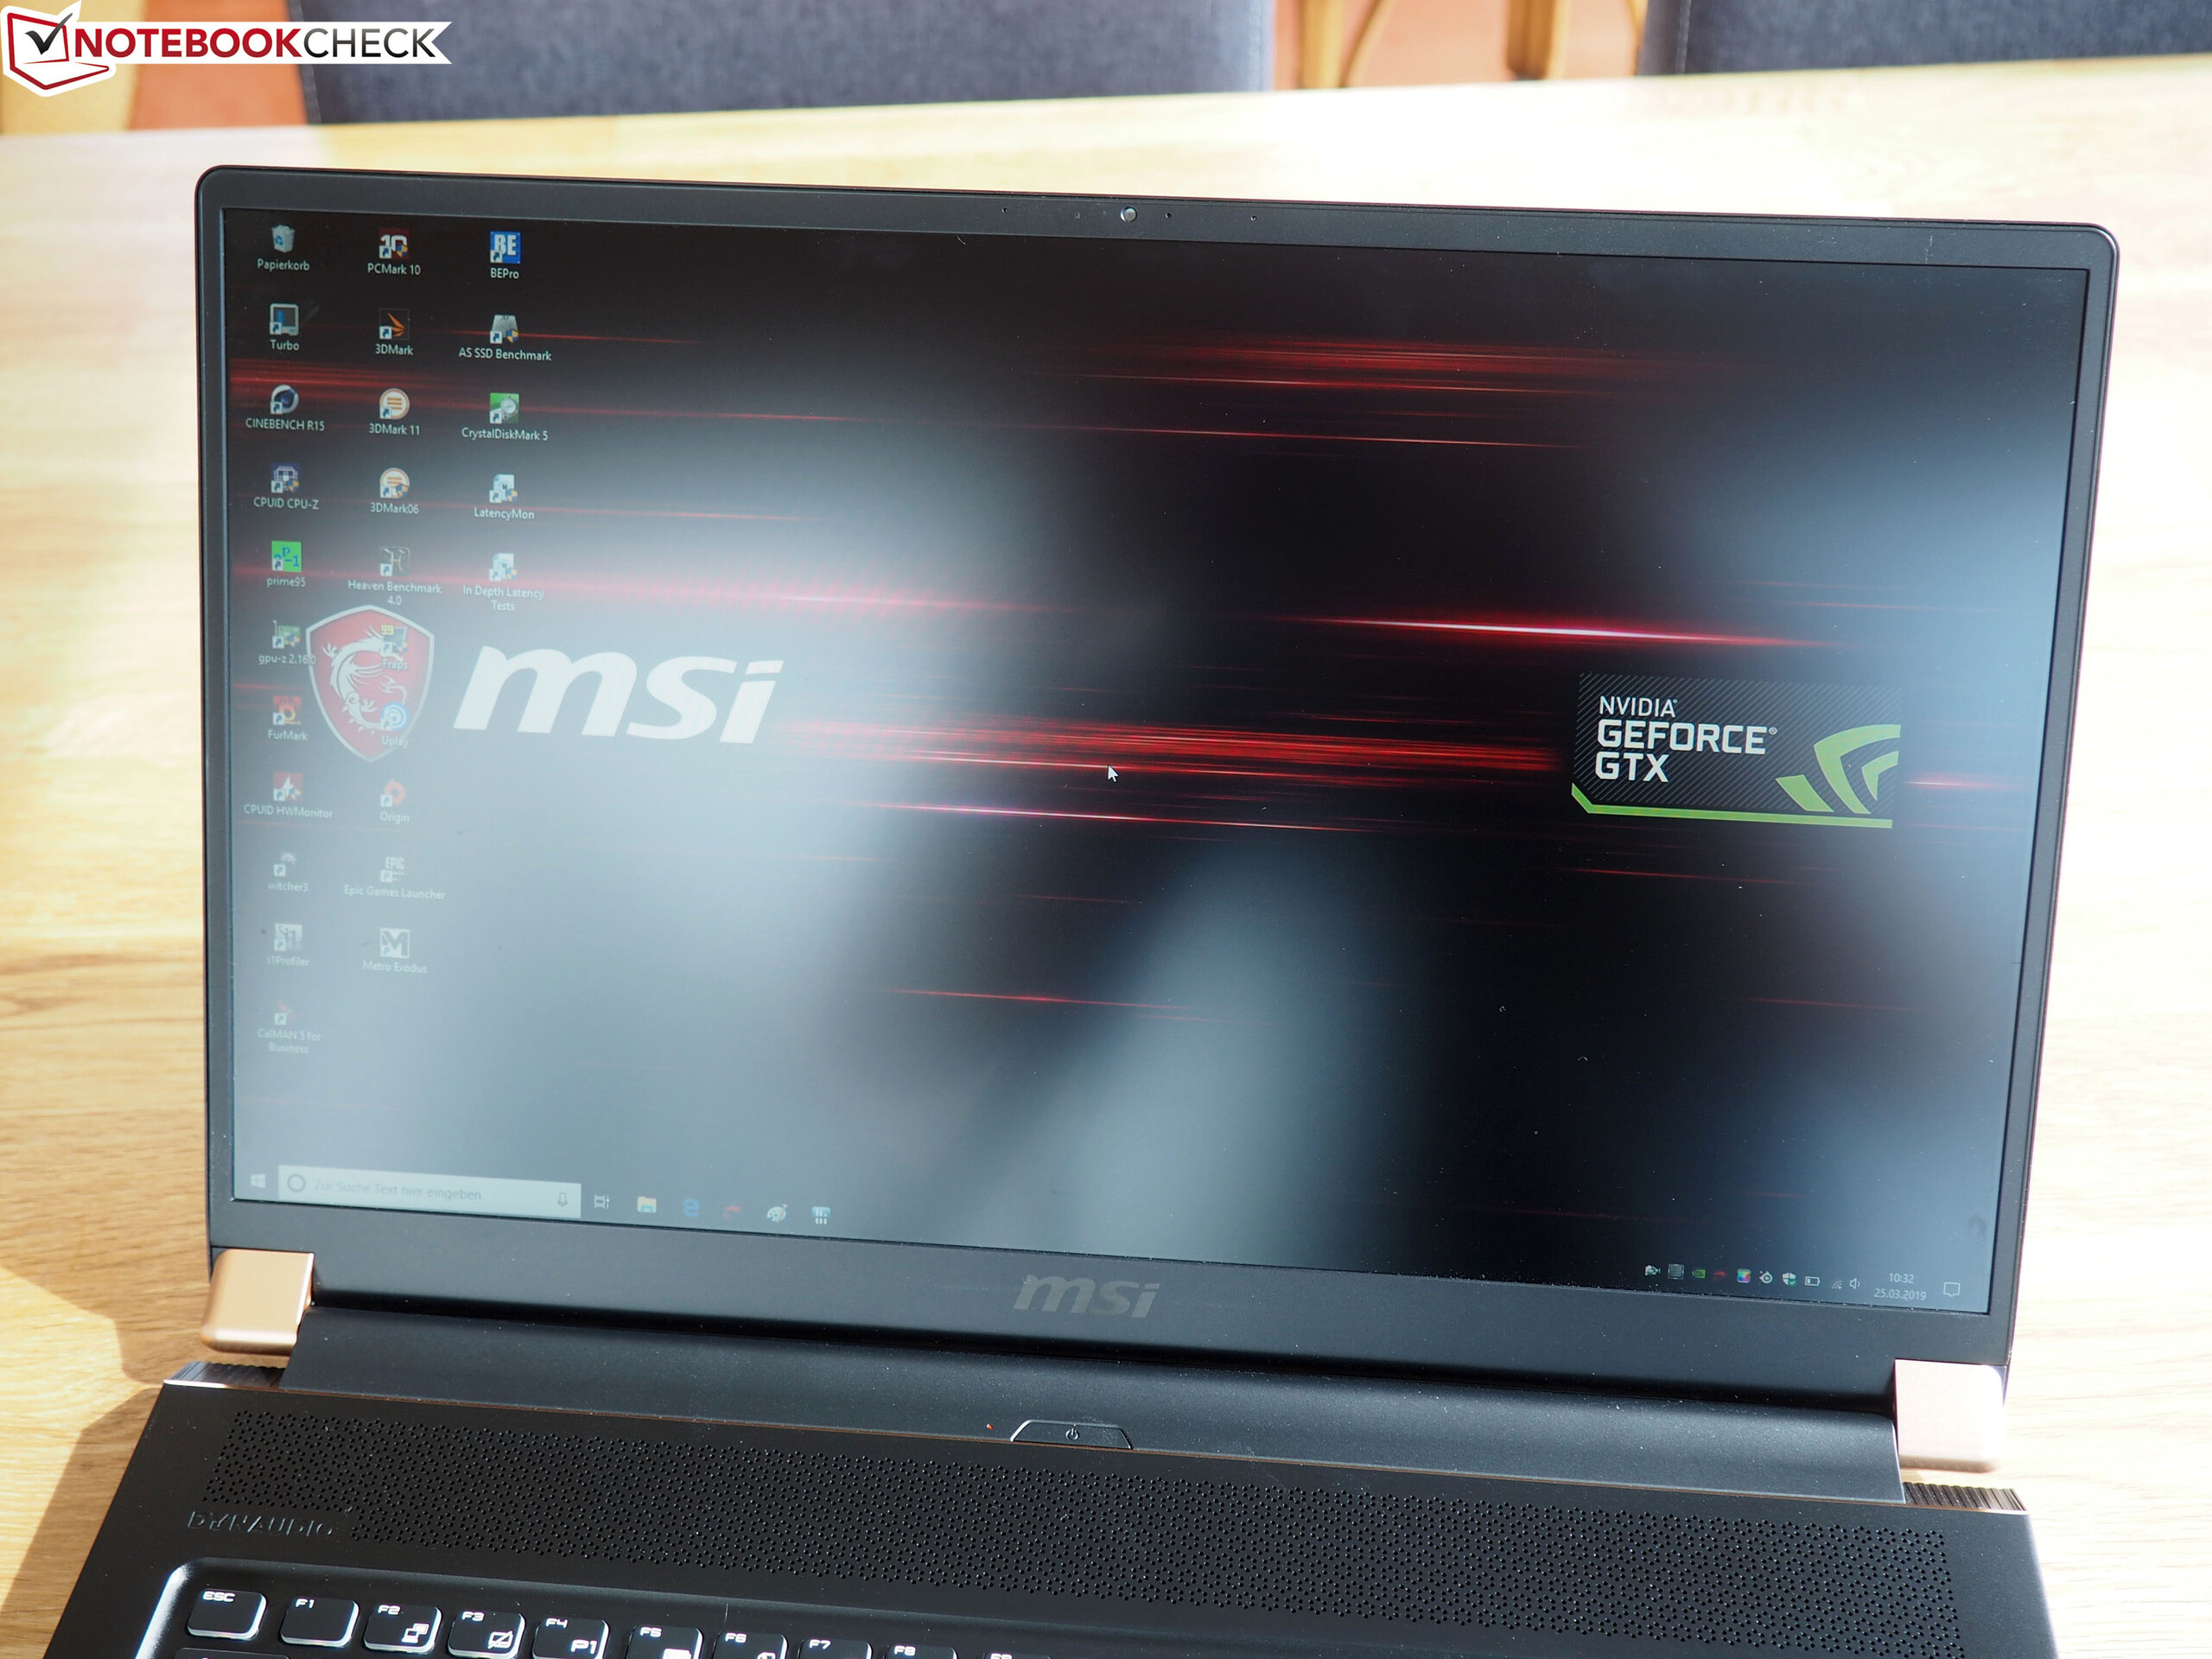
Display
As mentioned above, MSI has equipped the 9SG with the same Chi Mei N173HCE-G33 (CMN175C) display that we found in the GS75 8SG Stealth. The matte 17.3-inch display runs natively at 1,920x1,080, with the one in our review unit achieving an average maximum brightness of 343 cd/m². This is noticeably brighter than the one in our GS75 9SG test device, but it is usual for two supposedly identical displays to vary slightly.
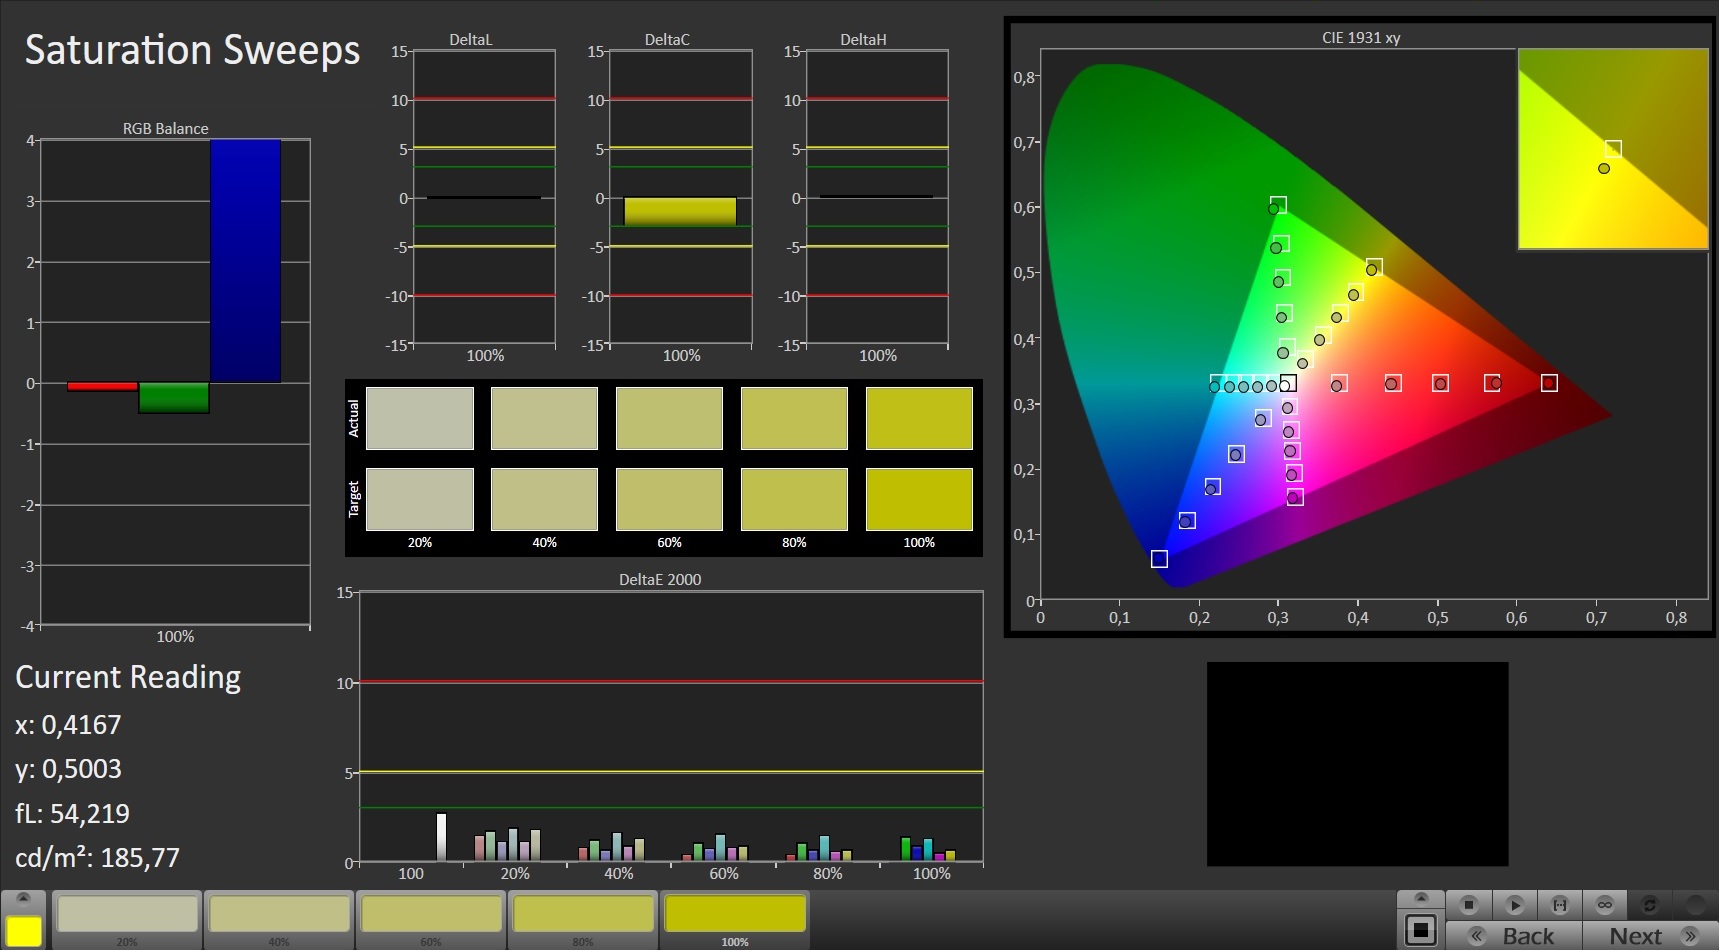
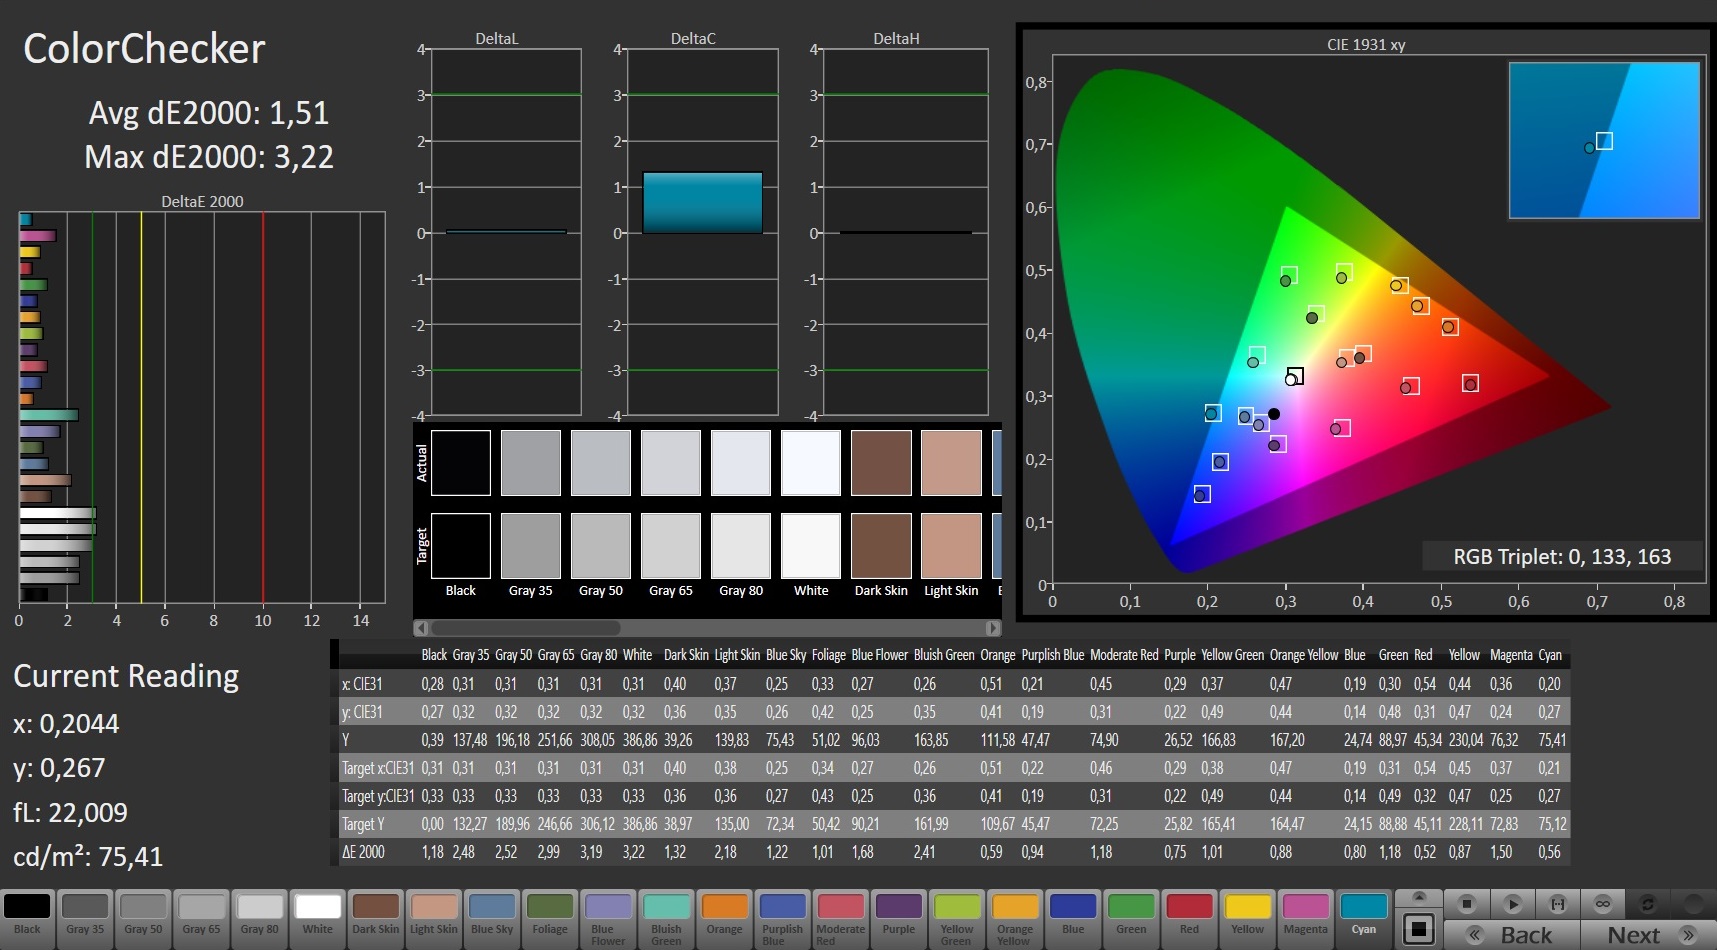
The display in the 9SG also achieved a respectable 1,262:1 contrast ratio thanks to its 0.29 cd/m² black value. The panel also has a 144 Hz refresh rate, a must for modern gaming laptops. Additionally, it has stable viewing angles, short reaction times and accurate colour reproduction. In short, the 9SG has an excellent display, just like its GS75 sibling.
| |||||||||||||||||||||||||
Brightness Distribution: 91 %
Center on Battery: 366 cd/m²
Contrast: 1262:1 (Black: 0.29 cd/m²)
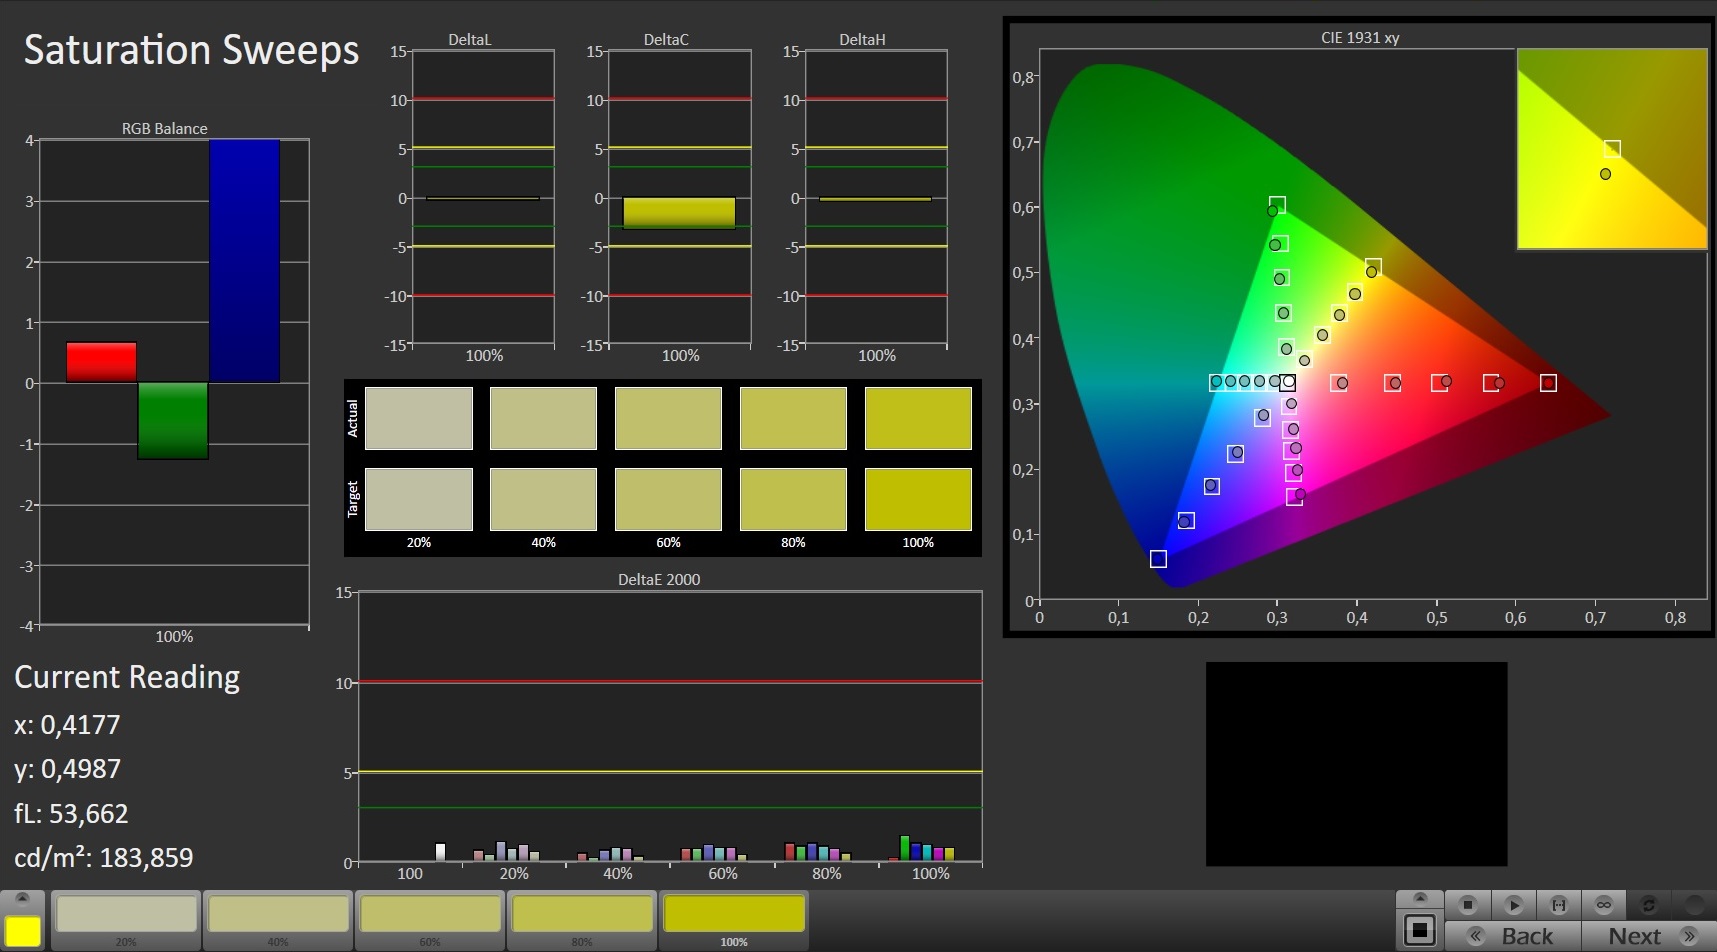
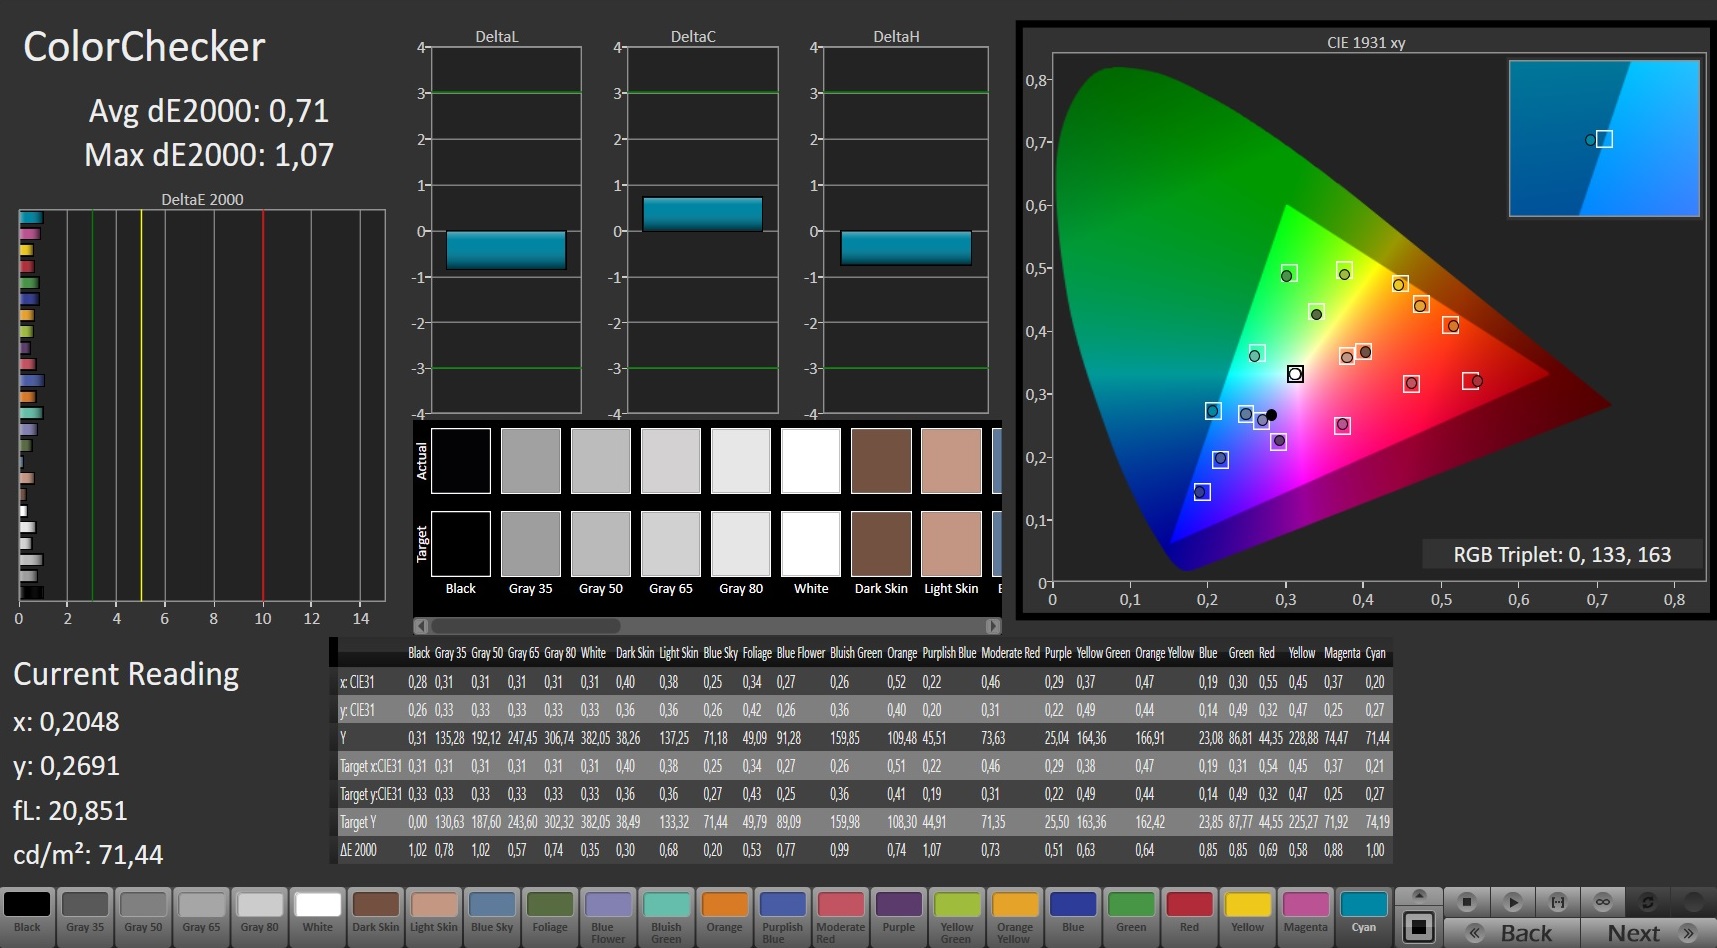
ΔE ColorChecker Calman: 1.51 | ∀{0.5-29.43 Ø4.73}
calibrated: 0.71
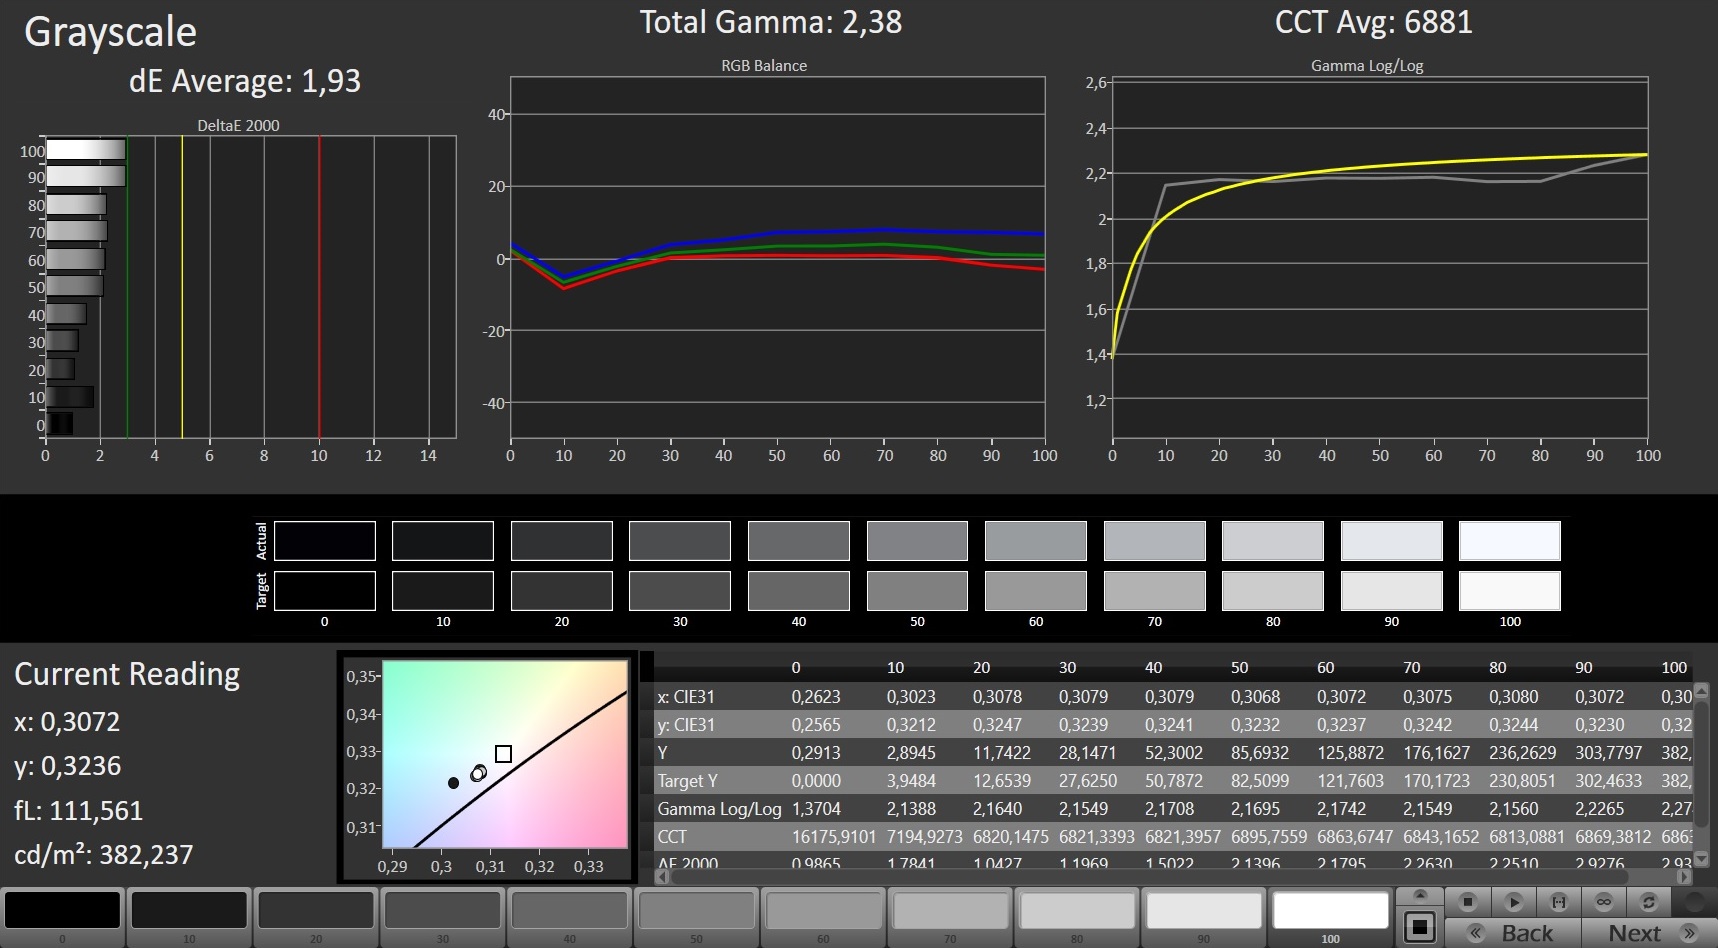
ΔE Greyscale Calman: 1.93 | ∀{0.09-98 Ø4.97}
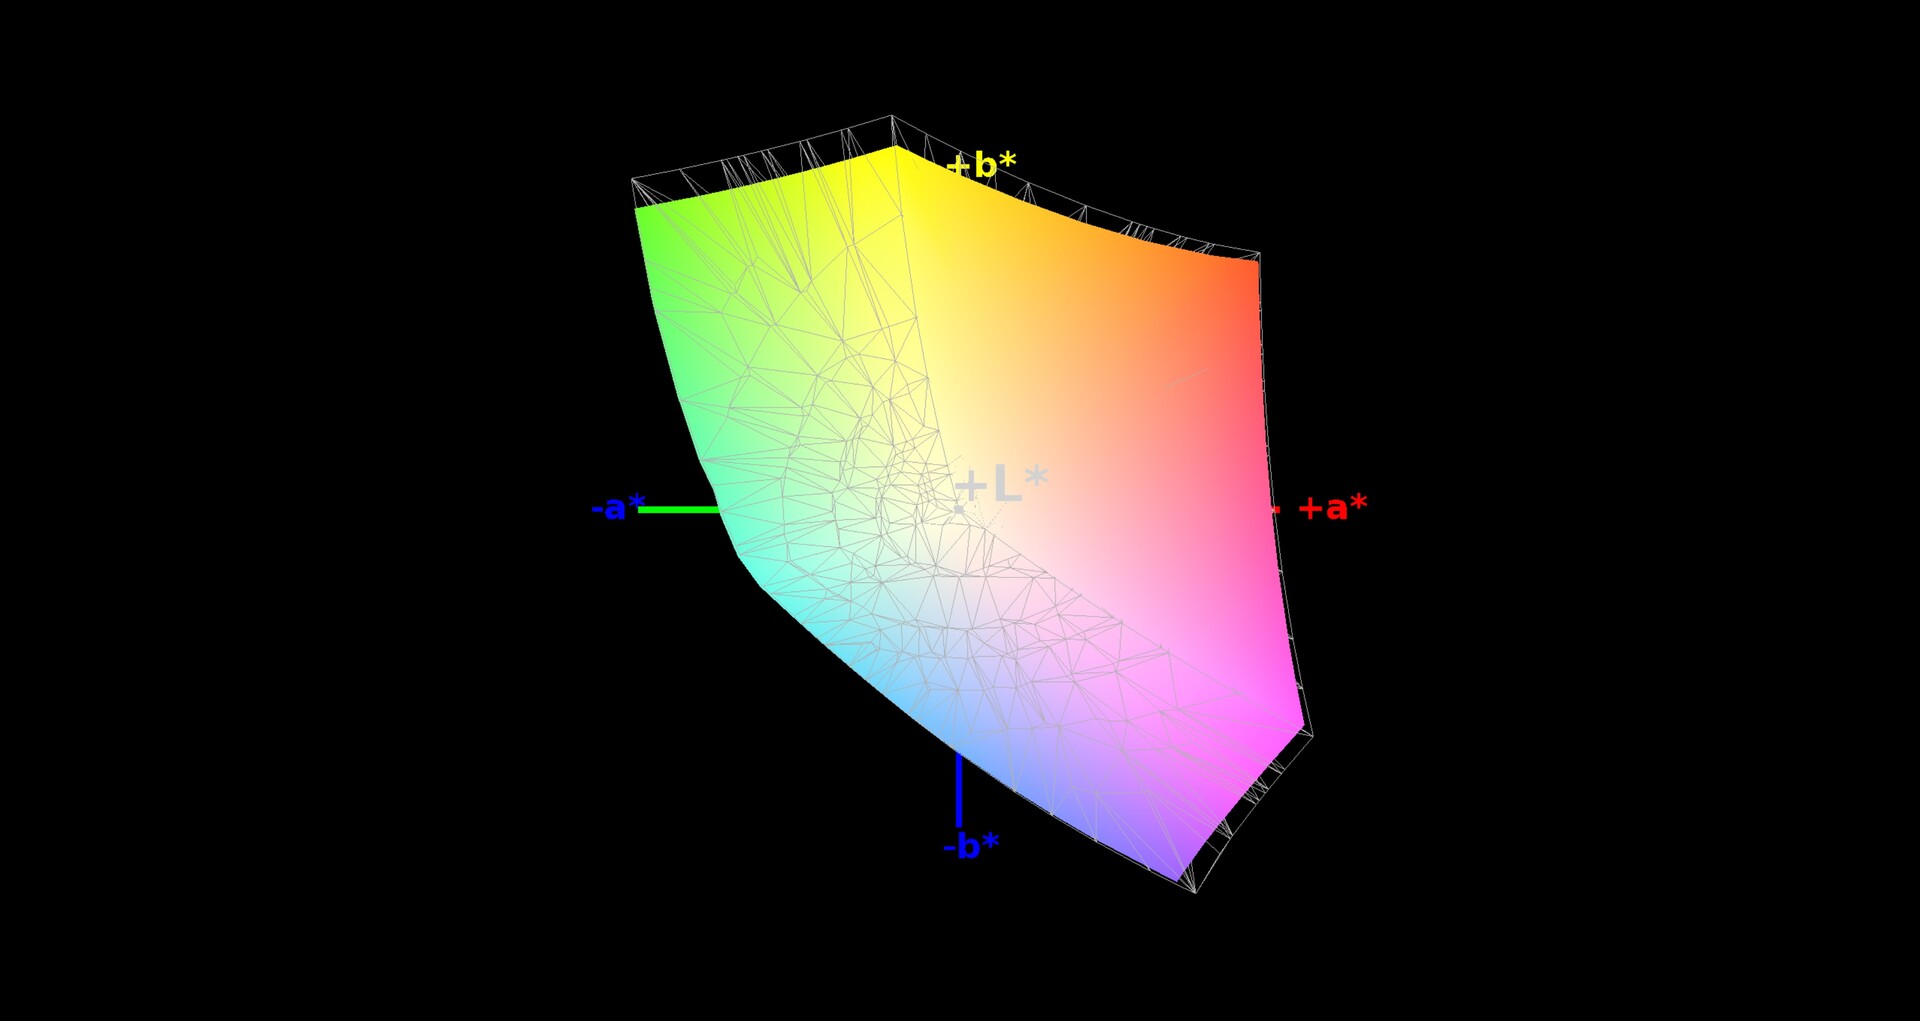
94% sRGB (Argyll 1.6.3 3D)
60% AdobeRGB 1998 (Argyll 1.6.3 3D)
64.7% AdobeRGB 1998 (Argyll 3D)
93.5% sRGB (Argyll 3D)
62.6% Display P3 (Argyll 3D)
Gamma: 2.38
CCT: 6881 K
| MSI GS75 Stealth 9SG Chi Mei N173HCE-G33 (CMN175C), IPS, 1920x1080 | Schenker XMG Neo 17 BOEhydis NV173FHM-N44 (BOE07B6), IPS, 1920x1080 | Dell G7 17 7790 AU Optronics AUO409D, B173HAN, IPS, 1920x1080 | Alienware m17 P37E AU Optronics B173ZAN01.0, IPS, 3840x2160 | Asus Zephyrus S GX701GX B173HAN04.0 (AUO409D), IPS, 1920x1080 | Lenovo Legion Y740-17ICH AU Optronics B173HAN03.2, IPS, 1920x1080 | |
|---|---|---|---|---|---|---|
| Display | 2% | -2% | 33% | -2% | -0% | |
| Display P3 Coverage (%) | 62.6 | 65.2 4% | 61.9 -1% | 86.4 38% | 62.9 0% | 64 2% |
| sRGB Coverage (%) | 93.5 | 92.2 -1% | 89.6 -4% | 99.9 7% | 87.8 -6% | 90.4 -3% |
| AdobeRGB 1998 Coverage (%) | 64.7 | 66.5 3% | 63.2 -2% | 99.1 53% | 63.9 -1% | 64.8 0% |
| Response Times | -91% | -80% | -287% | 2% | -73% | |
| Response Time Grey 50% / Grey 80% * (ms) | 7.2 ? | 18.8 ? -161% | 17.2 ? -139% | 35.6 ? -394% | 7.2 ? -0% | 15.6 ? -117% |
| Response Time Black / White * (ms) | 10 ? | 12 ? -20% | 12 ? -20% | 28 ? -180% | 9.6 ? 4% | 12.8 ? -28% |
| PWM Frequency (Hz) | 25510 ? | 971 ? | ||||
| Screen | -32% | -77% | -135% | -30% | -104% | |
| Brightness middle (cd/m²) | 366 | 304 -17% | 308.6 -16% | 357.9 -2% | 288 -21% | 299.1 -18% |
| Brightness (cd/m²) | 343 | 289 -16% | 299 -13% | 347 1% | 287 -16% | 273 -20% |
| Brightness Distribution (%) | 91 | 90 -1% | 92 1% | 94 3% | 91 0% | 81 -11% |
| Black Level * (cd/m²) | 0.29 | 0.26 10% | 0.29 -0% | 0.33 -14% | 0.2 31% | 0.27 7% |
| Contrast (:1) | 1262 | 1169 -7% | 1064 -16% | 1085 -14% | 1440 14% | 1108 -12% |
| Colorchecker dE 2000 * | 1.51 | 2.65 -75% | 4.26 -182% | 6.57 -335% | 2.33 -54% | 5.07 -236% |
| Colorchecker dE 2000 max. * | 3.22 | 6.11 -90% | 7.83 -143% | 9.86 -206% | 5.34 -66% | 10.55 -228% |
| Colorchecker dE 2000 calibrated * | 0.71 | 1.5 -111% | 2.93 -313% | 6.74 -849% | 2.47 -248% | 3.31 -366% |
| Greyscale dE 2000 * | 1.93 | 2.75 -42% | 5 -159% | 4.3 -123% | 1.19 38% | 6.8 -252% |
| Gamma | 2.38 92% | 2.46 89% | 2.07 106% | 2.6 85% | 2.41 91% | 2.46 89% |
| CCT | 6881 94% | 6763 96% | 7488 87% | 6403 102% | 6710 97% | 7805 83% |
| Color Space (Percent of AdobeRGB 1998) (%) | 60 | 60 0% | 57.8 -4% | 88.4 47% | 57 -5% | 58.5 -2% |
| Color Space (Percent of sRGB) (%) | 94 | 92 -2% | 89.2 -5% | 100 6% | 88 -6% | 89.9 -4% |
| Total Average (Program / Settings) | -40% /
-33% | -53% /
-64% | -130% /
-123% | -10% /
-21% | -59% /
-81% |
* ... smaller is better

Display Response Times
| ↔ Response Time Black to White | ||
|---|---|---|
| 10 ms ... rise ↗ and fall ↘ combined | ↗ 5.2 ms rise | 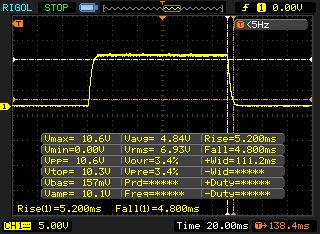 |
| ↘ 4.8 ms fall | ||
| The screen shows good response rates in our tests, but may be too slow for competitive gamers. In comparison, all tested devices range from 0.1 (minimum) to 240 (maximum) ms. » 27 % of all devices are better. This means that the measured response time is better than the average of all tested devices (19.9 ms). | ||
| ↔ Response Time 50% Grey to 80% Grey | ||
| 7.2 ms ... rise ↗ and fall ↘ combined | ↗ 3.8 ms rise | 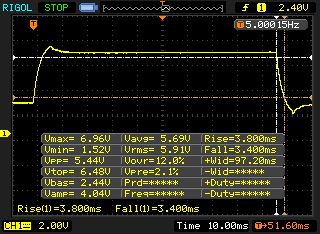 |
| ↘ 3.4 ms fall | ||
| The screen shows very fast response rates in our tests and should be very well suited for fast-paced gaming. In comparison, all tested devices range from 0.165 (minimum) to 636 (maximum) ms. » 20 % of all devices are better. This means that the measured response time is better than the average of all tested devices (31.1 ms). | ||
Screen Flickering / PWM (Pulse-Width Modulation)
| Screen flickering / PWM detected | 25510 Hz | ≤ 17 % brightness setting | 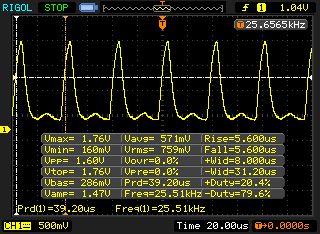 |
The display backlight flickers at 25510 Hz (worst case, e.g., utilizing PWM) Flickering detected at a brightness setting of 17 % and below. There should be no flickering or PWM above this brightness setting. The frequency of 25510 Hz is quite high, so most users sensitive to PWM should not notice any flickering. In comparison: 52 % of all tested devices do not use PWM to dim the display. If PWM was detected, an average of 7794 (minimum: 5 - maximum: 343500) Hz was measured. | |||
Performance
The 9SG is one of the most portable, slim and stylish 17.3-inch gaming laptops that money can buy. It is exceptionally expensive at €3,440 (~$3,911) MSRP but will run all modern triple-A games at maximum graphics in 1080p with ease.


Test Conditions
MSI preinstalls Dragon Center as it does for all its gaming laptops. The program contains numerous options including fan controls, power profiles and RGB backlighting customisations. We conducted all our tests with the fan speed set to automatic and the power mode on Sport.


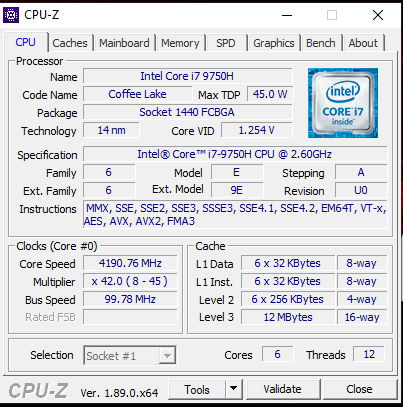
Processor
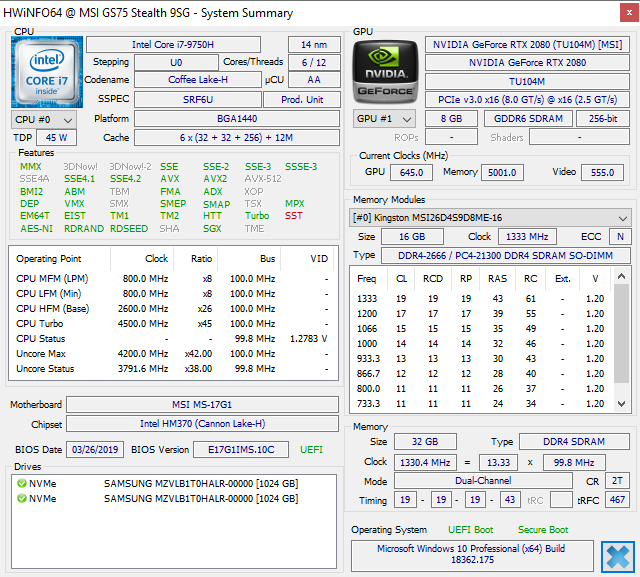
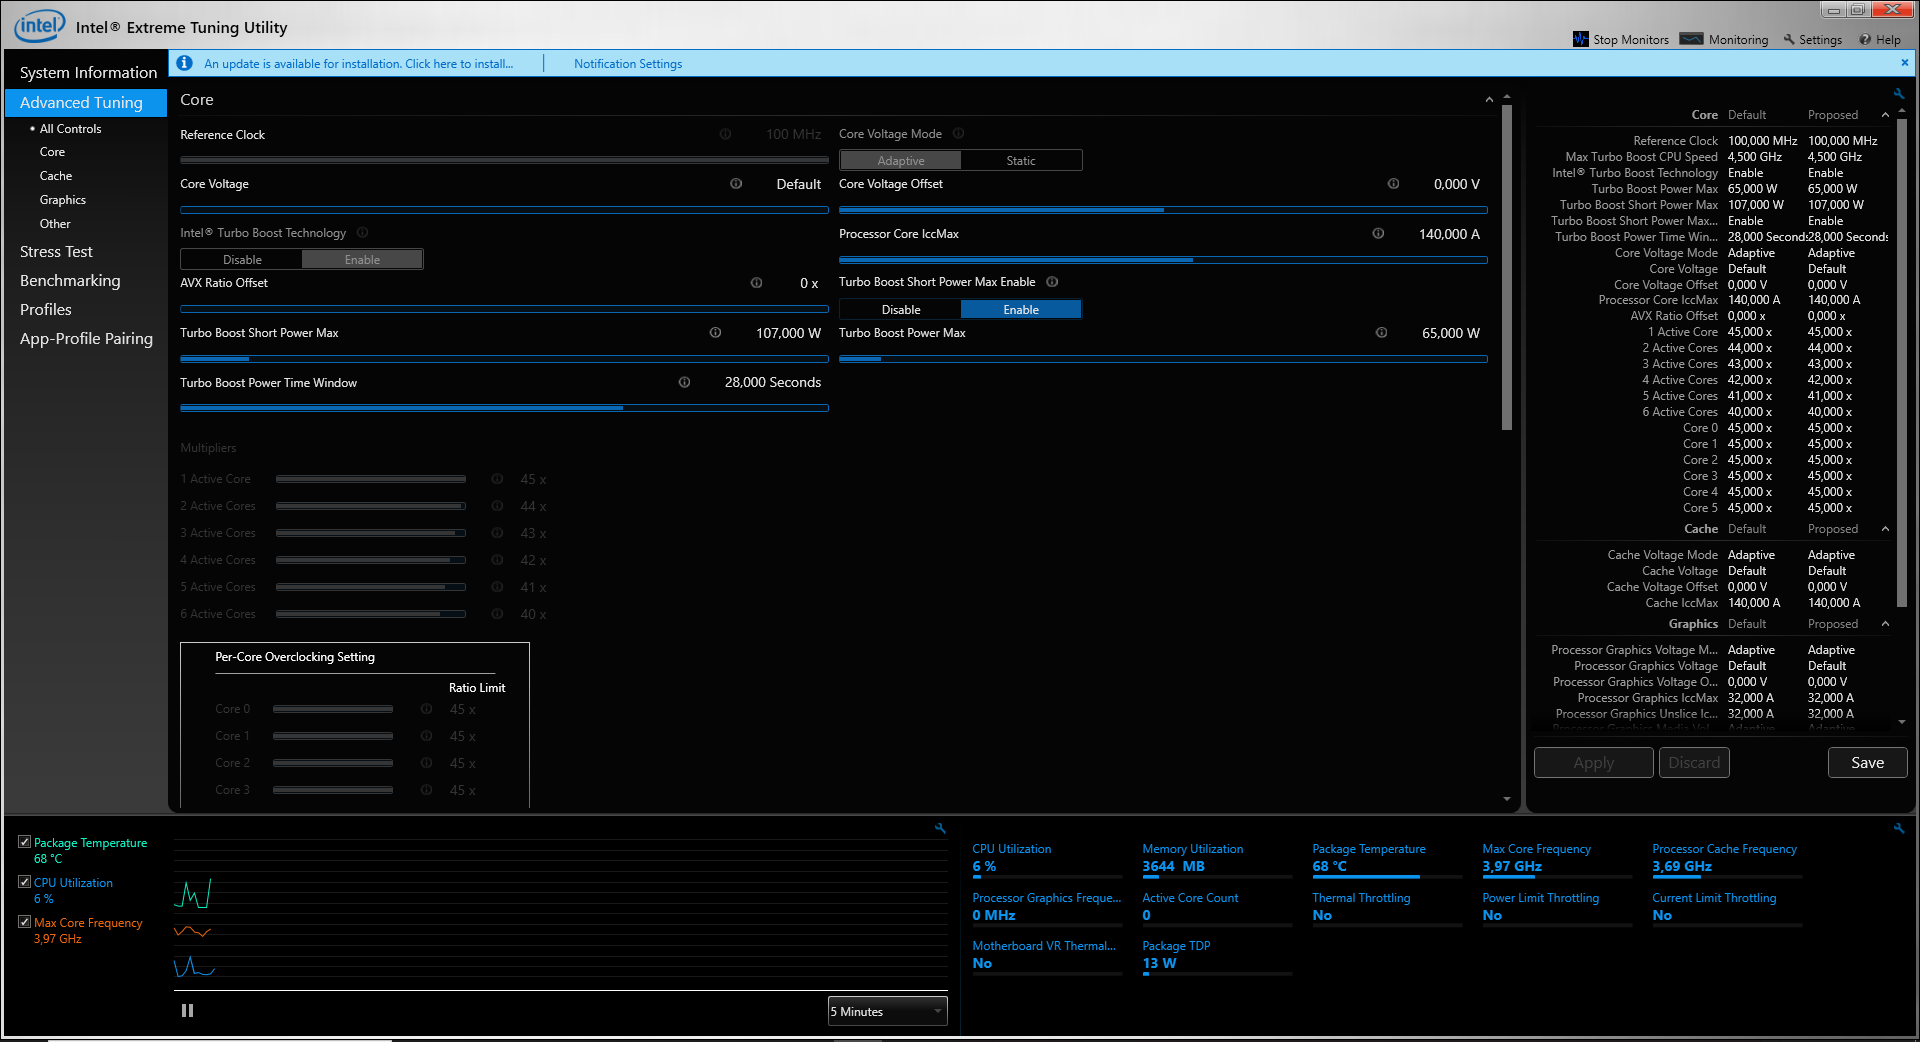
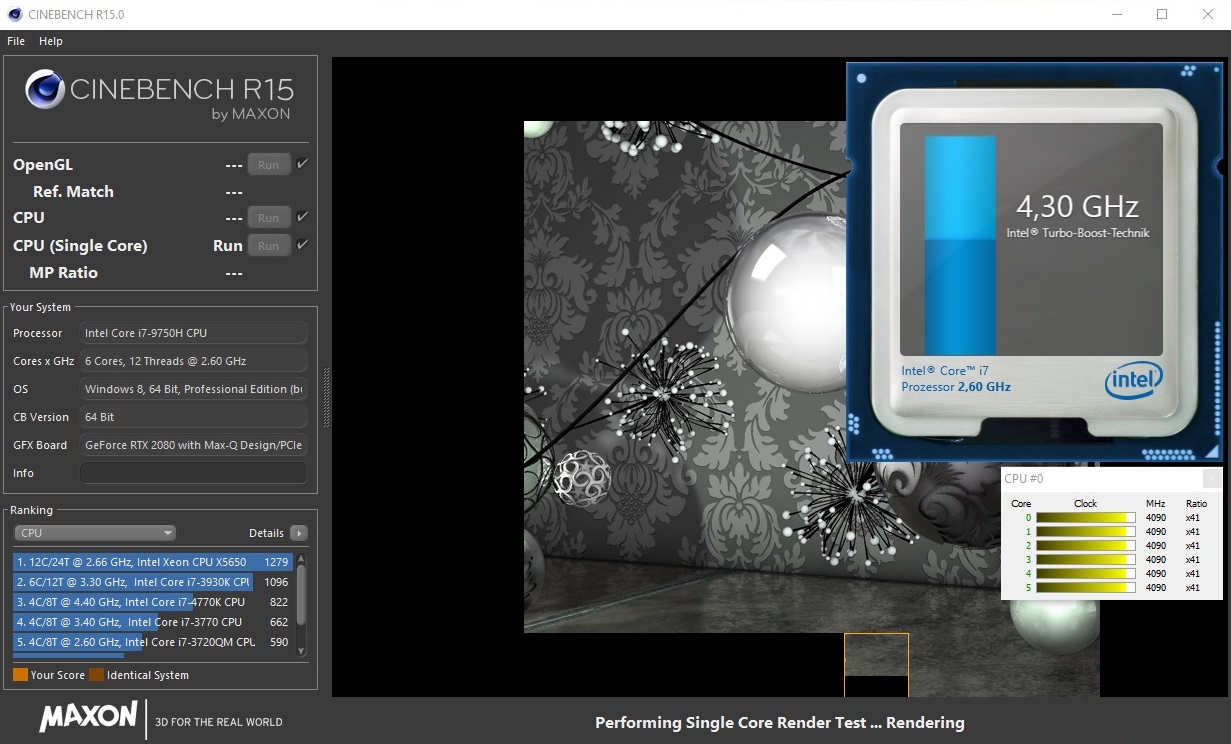
At the heart of the 9SG is an Intel Core i7-9750H processor, the successor to the popular Core i7-8750H. The Core i7-9750H is built on the Coffee Lake Refresh architecture and has a 45-W thermal design power (TDP) with a 2.6 GHz base clock speed. The CPU utilises Intel Hyper-Threading to execute up to 12 threads simultaneously and Intel Turbo Boost to achieve 4 GHz across all cores. Incidentally, the Core i7-9750H can peak at 4.1 GHz on five cores and 100 MHz more for every core it is not using, resulting in a 4.5 GHz single core boost clock.
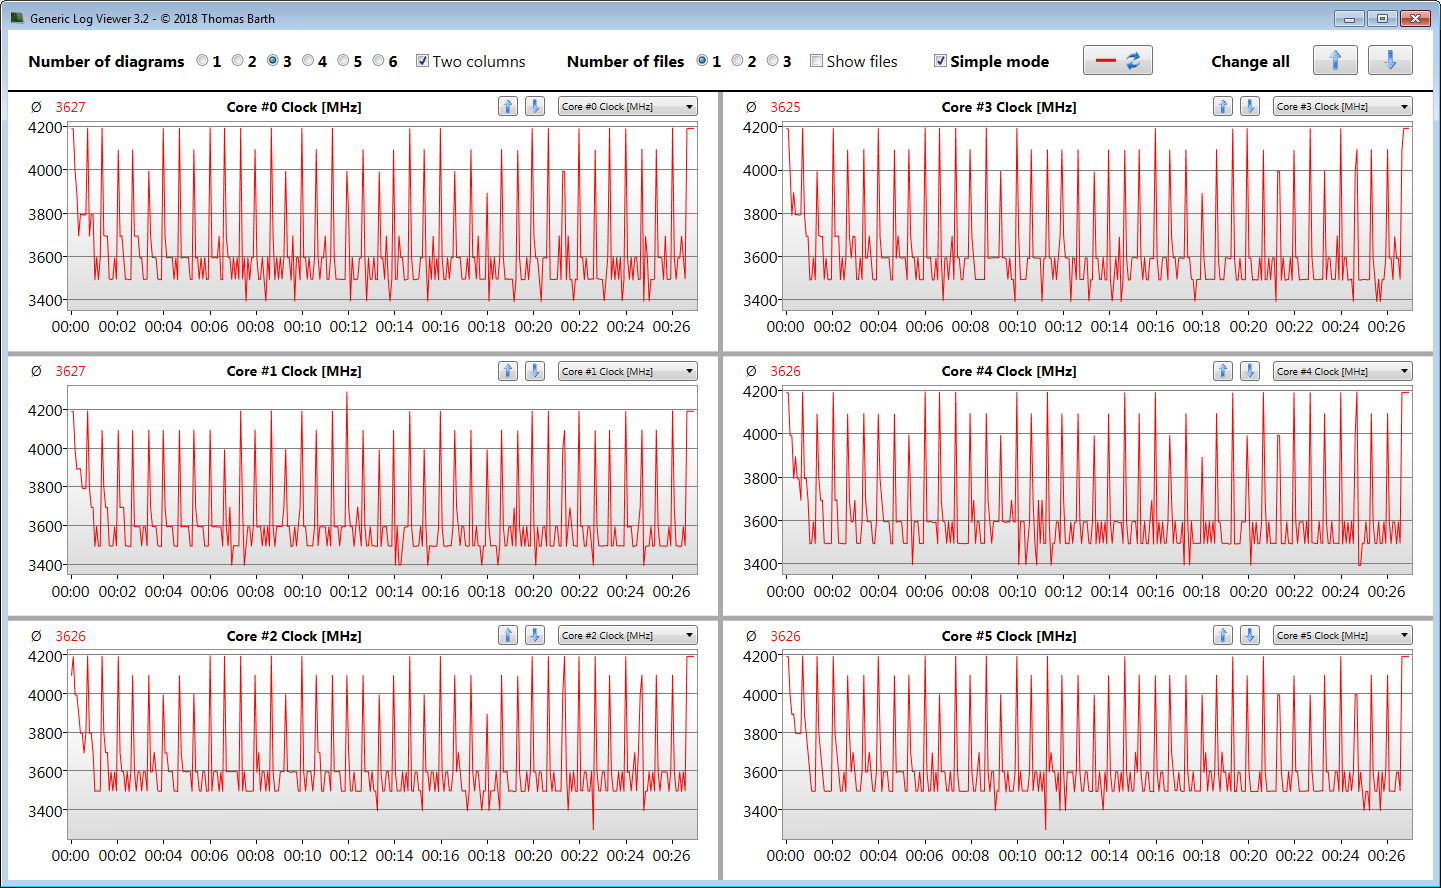
The CPU fluctuates between 3.6 GHz and 4 GHz during a single Cinebench R15 Multi 64Bit benchmark, which harmonises with its quoted performance. This behaviour only applies with the 9SG connected to mains power though, with the CPU going as low as 1.9 GHz when running on battery. By contrast, the CPU always operates at 4.0 to 4.5 GHz in CB R15 Multi 64Bit irrespective of whether it is on charge or not.
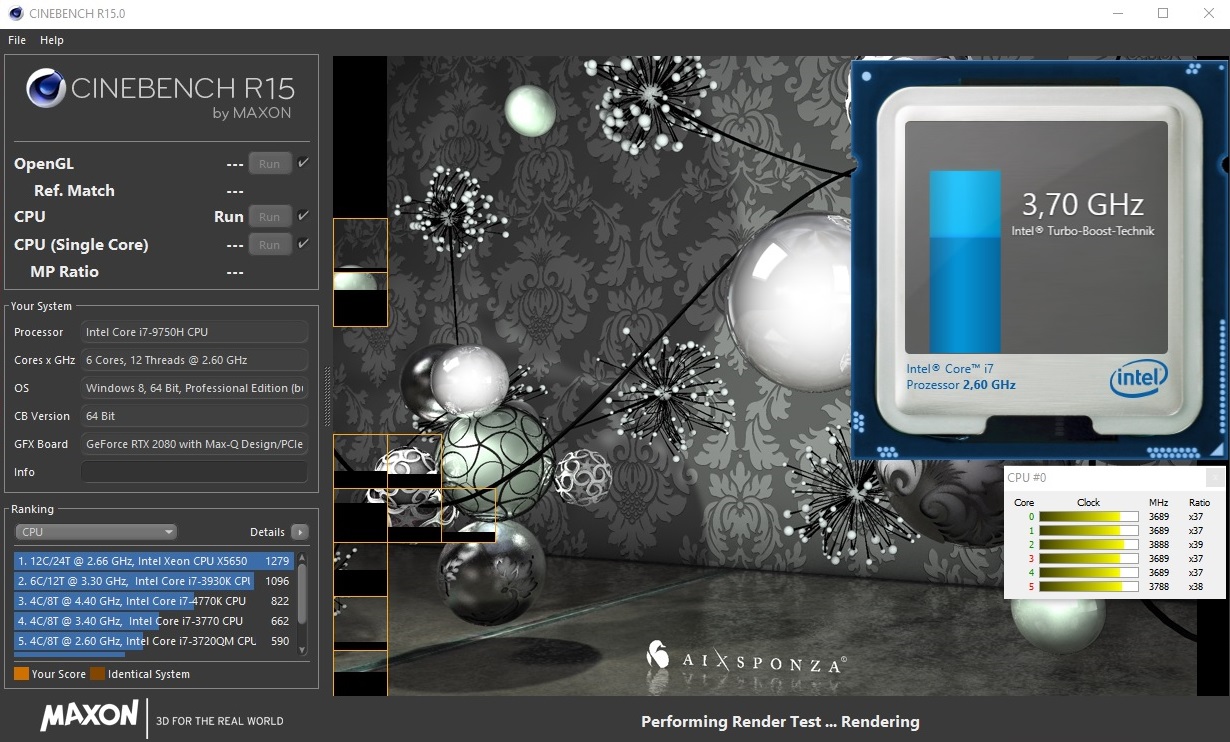
We subjected our review unit to a looped CB R15 Multi 64Bit benchmark, which we left running for 30 minutes, to determine how well the system maintains its performance under sustained load. Most laptop CPUs throttle to some extent after the first run through and the Core i7-9750H in the 9SG is no different. The device initially scored 1,233 points before dropping to 1,141 points by the third benchmark loop. Scores briefly settle at this level before steadily dropping to around 1,120 points. The device recovered to 1,133 points by the end of the test though. Overall, this is standard behaviour and nothing that should have any serious implications in daily use.
| Cinebench R10 | |
| Rendering Single 32Bit | |
| Average of class Gaming (7457 - 11779, n=8, last 2 years) | |
| MSI GS75 Stealth 9SG | |
| Rendering Multiple CPUs 32Bit | |
| Average of class Gaming (42932 - 81339, n=8, last 2 years) | |
| MSI GS75 Stealth 9SG | |
| Cinebench R20 | |
| CPU (Single Core) | |
| Average of class Gaming (442 - 895, n=111, last 2 years) | |
| MSI GS75 Stealth 9SG | |
| CPU (Multi Core) | |
| Average of class Gaming (4029 - 16108, n=111, last 2 years) | |
| MSI GS75 Stealth 9SG | |
| Geekbench 3 | |
| 32 Bit Multi-Core Score | |
| MSI GS75 Stealth 9SG | |
| 32 Bit Single-Core Score | |
| MSI GS75 Stealth 9SG | |
| Geekbench 4.4 | |
| 64 Bit Multi-Core Score | |
| Average of class Gaming (89200 - 97490, n=2, last 2 years) | |
| MSI GS75 Stealth 9SG | |
| 64 Bit Single-Core Score | |
| Average of class Gaming (9335 - 9492, n=2, last 2 years) | |
| MSI GS75 Stealth 9SG | |
| Mozilla Kraken 1.1 - Total | |
| Lenovo Legion Y740-17ICH (Edge 44.17763.1.0) | |
| MSI GS75 Stealth 9SG (Edge 44) | |
| Average of class Gaming (391 - 590, n=105, last 2 years) | |
| Octane V2 - Total Score | |
| Average of class Gaming (87588 - 139447, n=30, last 2 years) | |
| MSI GS75 Stealth 9SG (Edge 44) | |
| Lenovo Legion Y740-17ICH (Edge 44.17763.1.0) | |
| JetStream 1.1 - 1.1 Total | |
| Average of class Gaming (518 - 647, n=5, last 2 years) | |
| MSI GS75 Stealth 9SG (Edge 44) | |
| Lenovo Legion Y740-17ICH (Edge 44.17763.1.0) | |
* ... smaller is better
System Performance
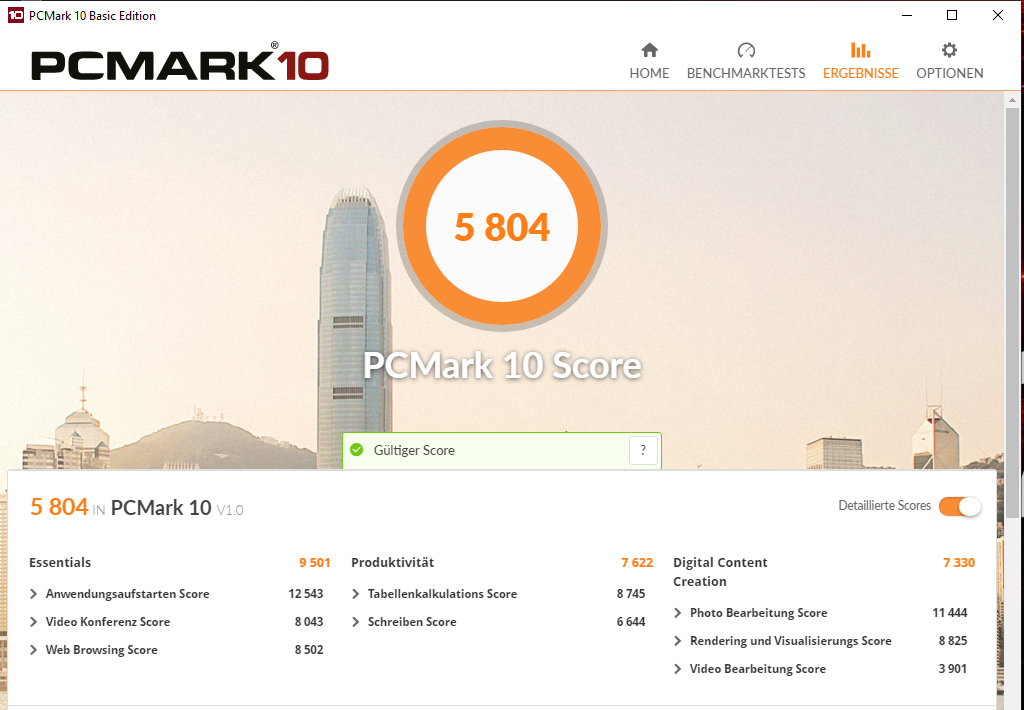
The 9SG will handle practically any tasks that you could throw at it. It is powerful enough for triple-A gaming along with photo and video editing, which PCMark benchmarks confirm. Our review unit finished second to the Legion Y740-17ICH in PCMark 10, but it is well ahead of the class average. We also encountered no performance issues in daily use regardless of how hard we pushed the system.
| PCMark 7 Score | 6948 points | |
| PCMark 8 Home Score Accelerated v2 | 4461 points | |
| PCMark 8 Creative Score Accelerated v2 | 4193 points | |
| PCMark 8 Work Score Accelerated v2 | 5716 points | |
| PCMark 10 Score | 5804 points | |
Help | ||
| PCMark 10 - Score | |
| Average of class Gaming (5828 - 11574, n=95, last 2 years) | |
| Lenovo Legion Y740-17ICH | |
| MSI GS75 Stealth 9SG | |
| Alienware m17 P37E | |
| Asus Zephyrus S GX701GX | |
| Schenker XMG Neo 17 | |
| Dell G7 17 7790 | |
| PCMark 8 | |
| Home Score Accelerated v2 | |
| Average of class Gaming (n=1last 2 years) | |
| Lenovo Legion Y740-17ICH | |
| MSI GS75 Stealth 9SG | |
| Dell G7 17 7790 | |
| Alienware m17 P37E | |
| Work Score Accelerated v2 | |
| Lenovo Legion Y740-17ICH | |
| MSI GS75 Stealth 9SG | |
| Dell G7 17 7790 | |
| Alienware m17 P37E | |
| Average of class Gaming (n=1last 2 years) | |
Storage Devices
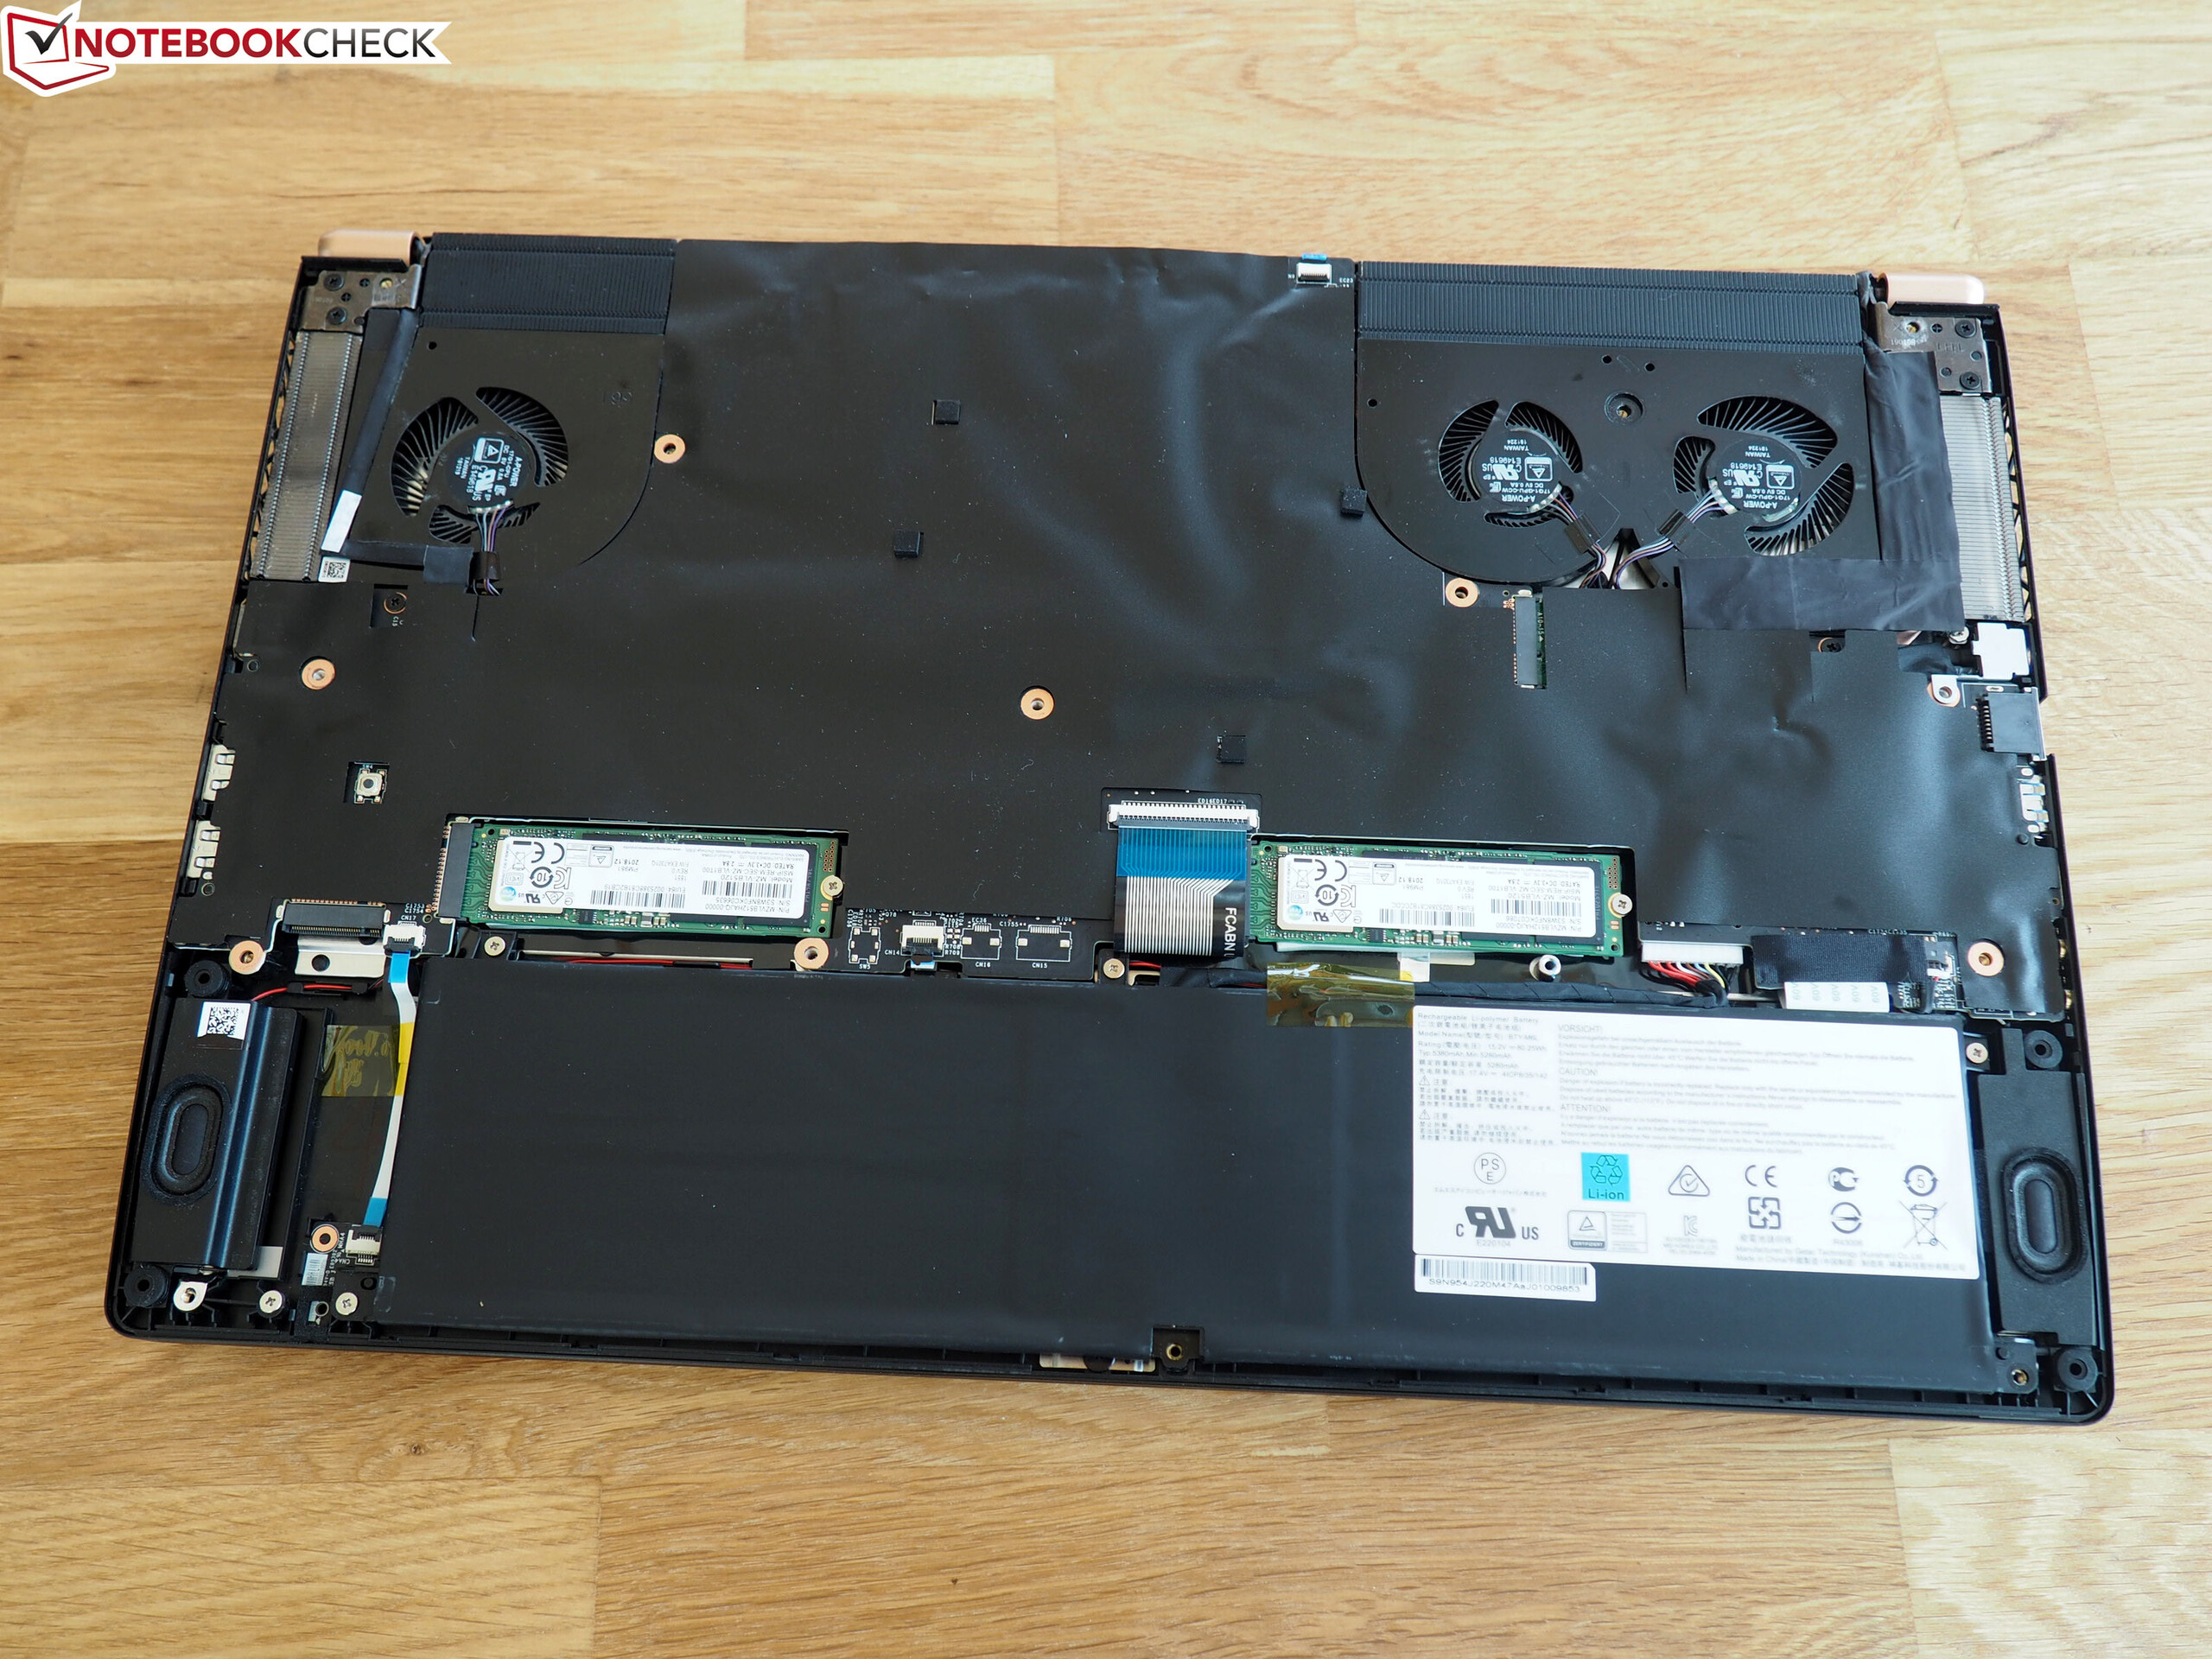
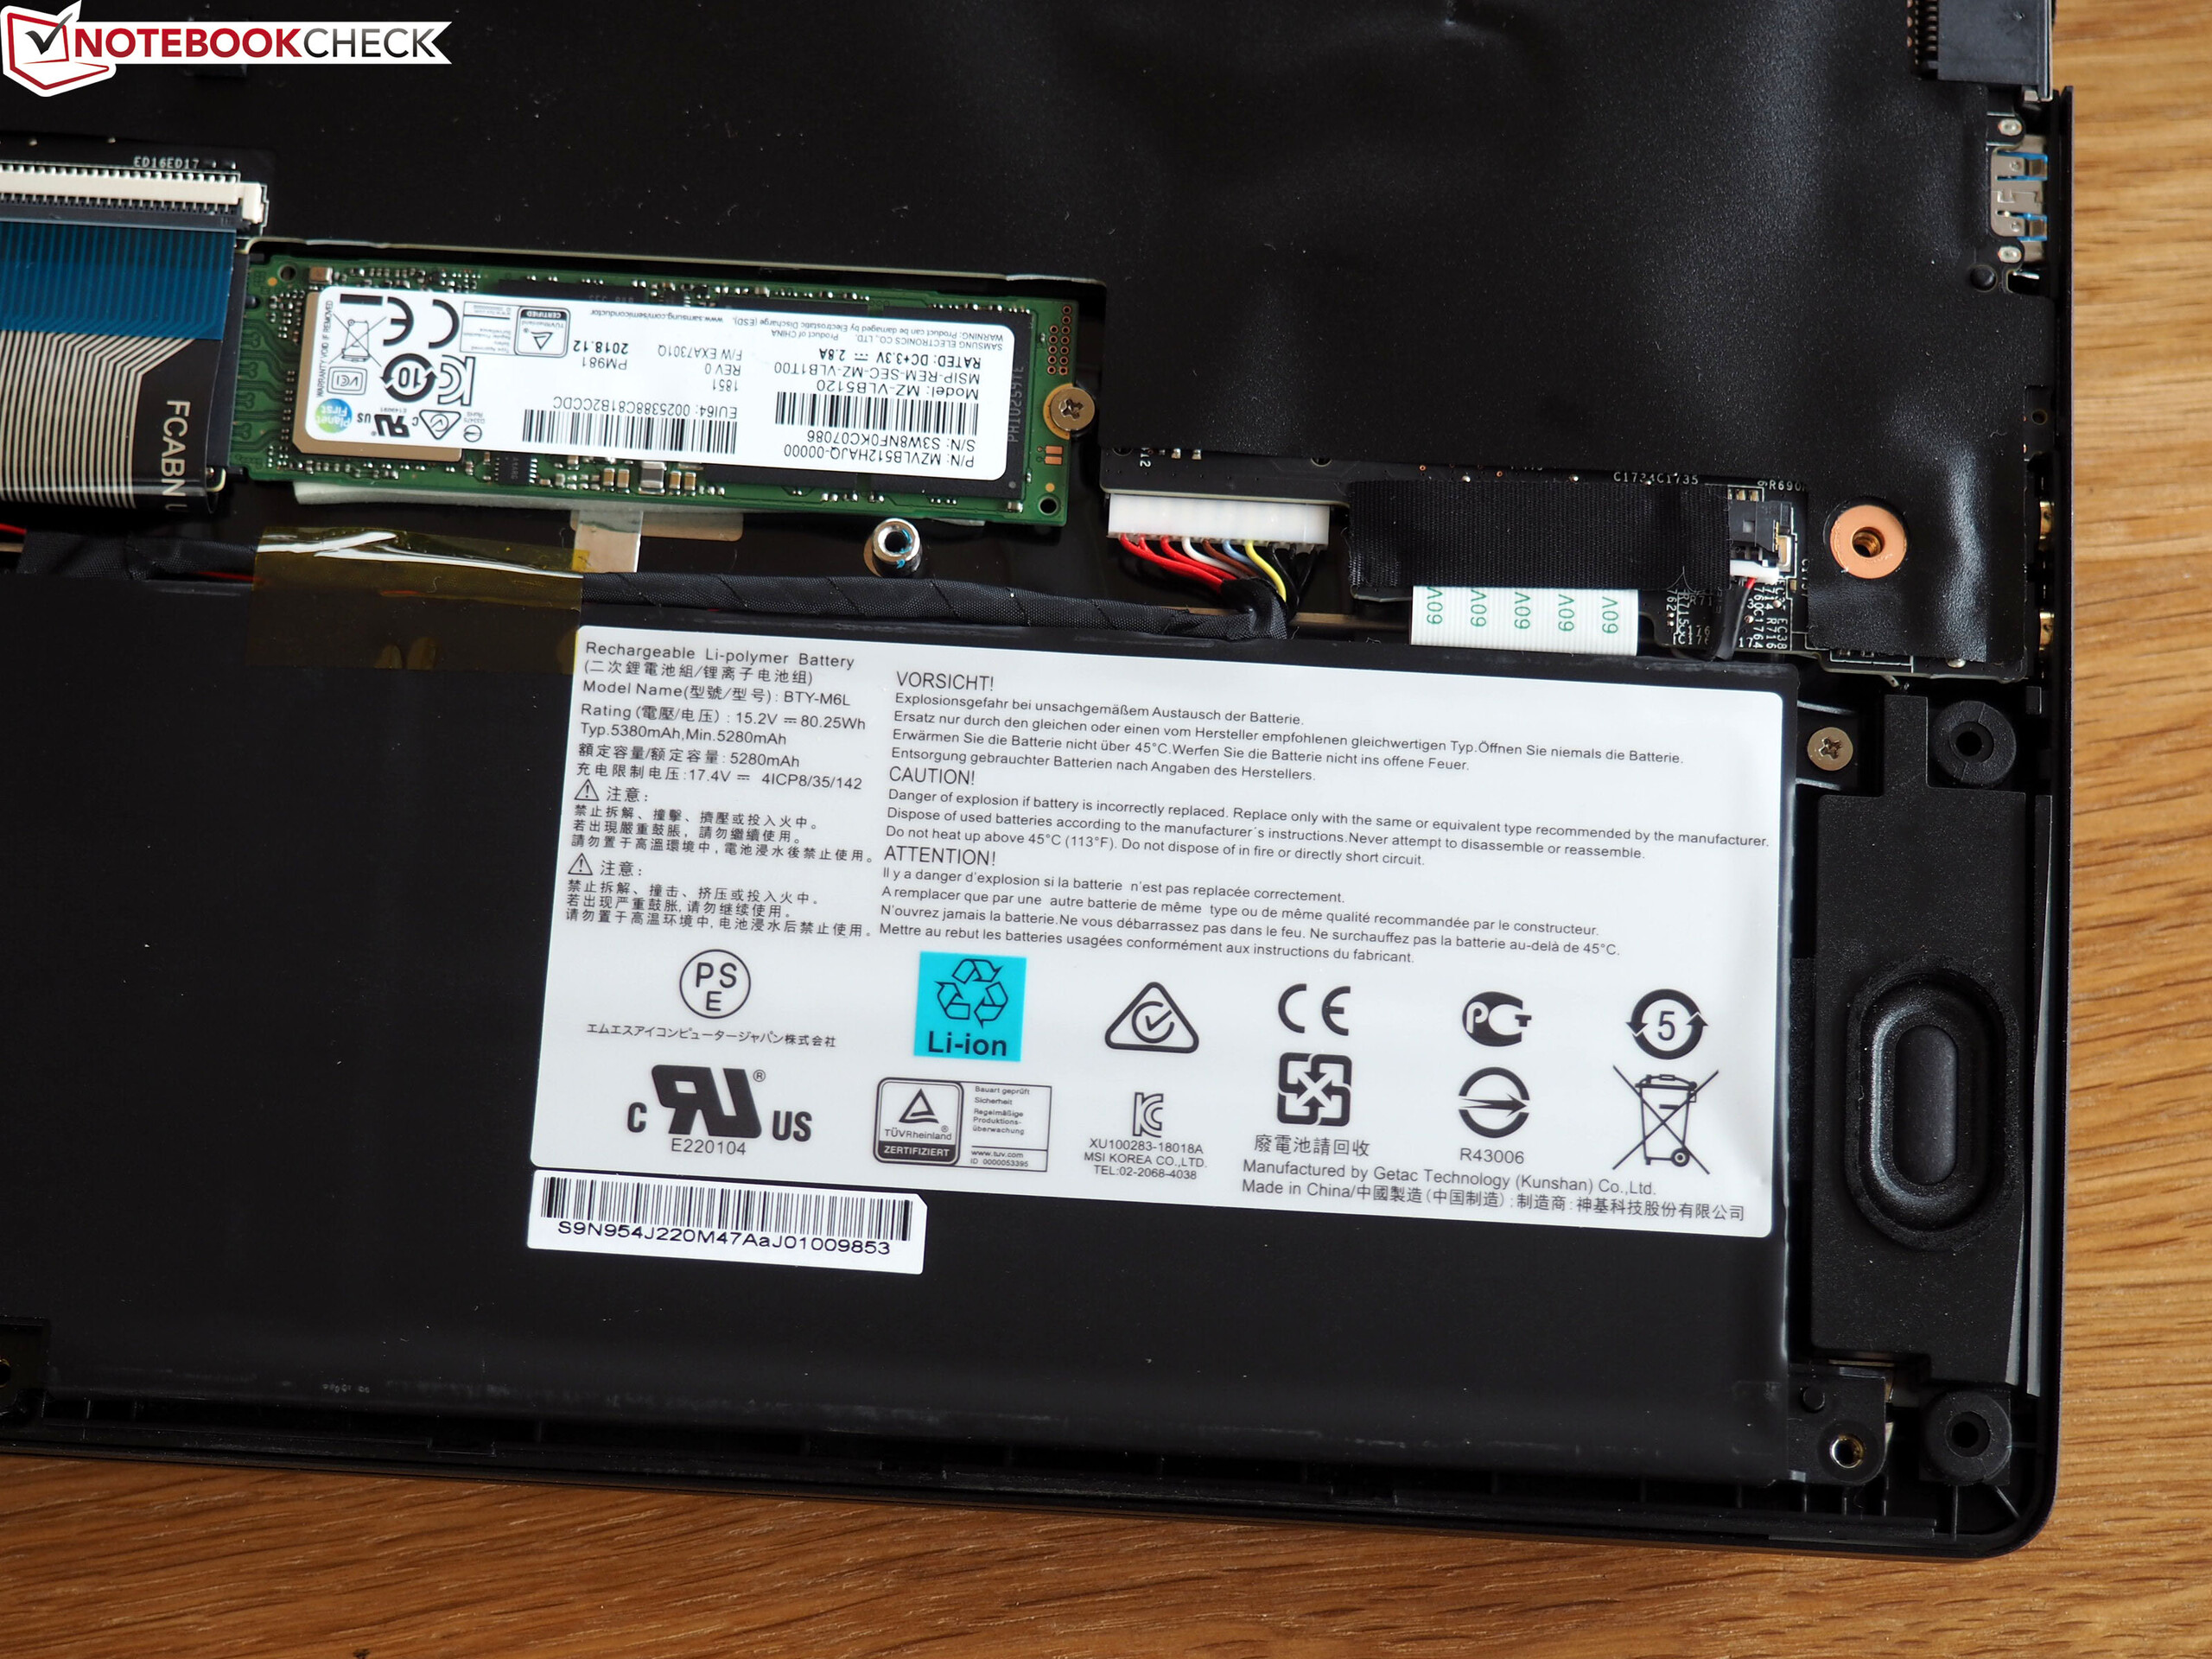
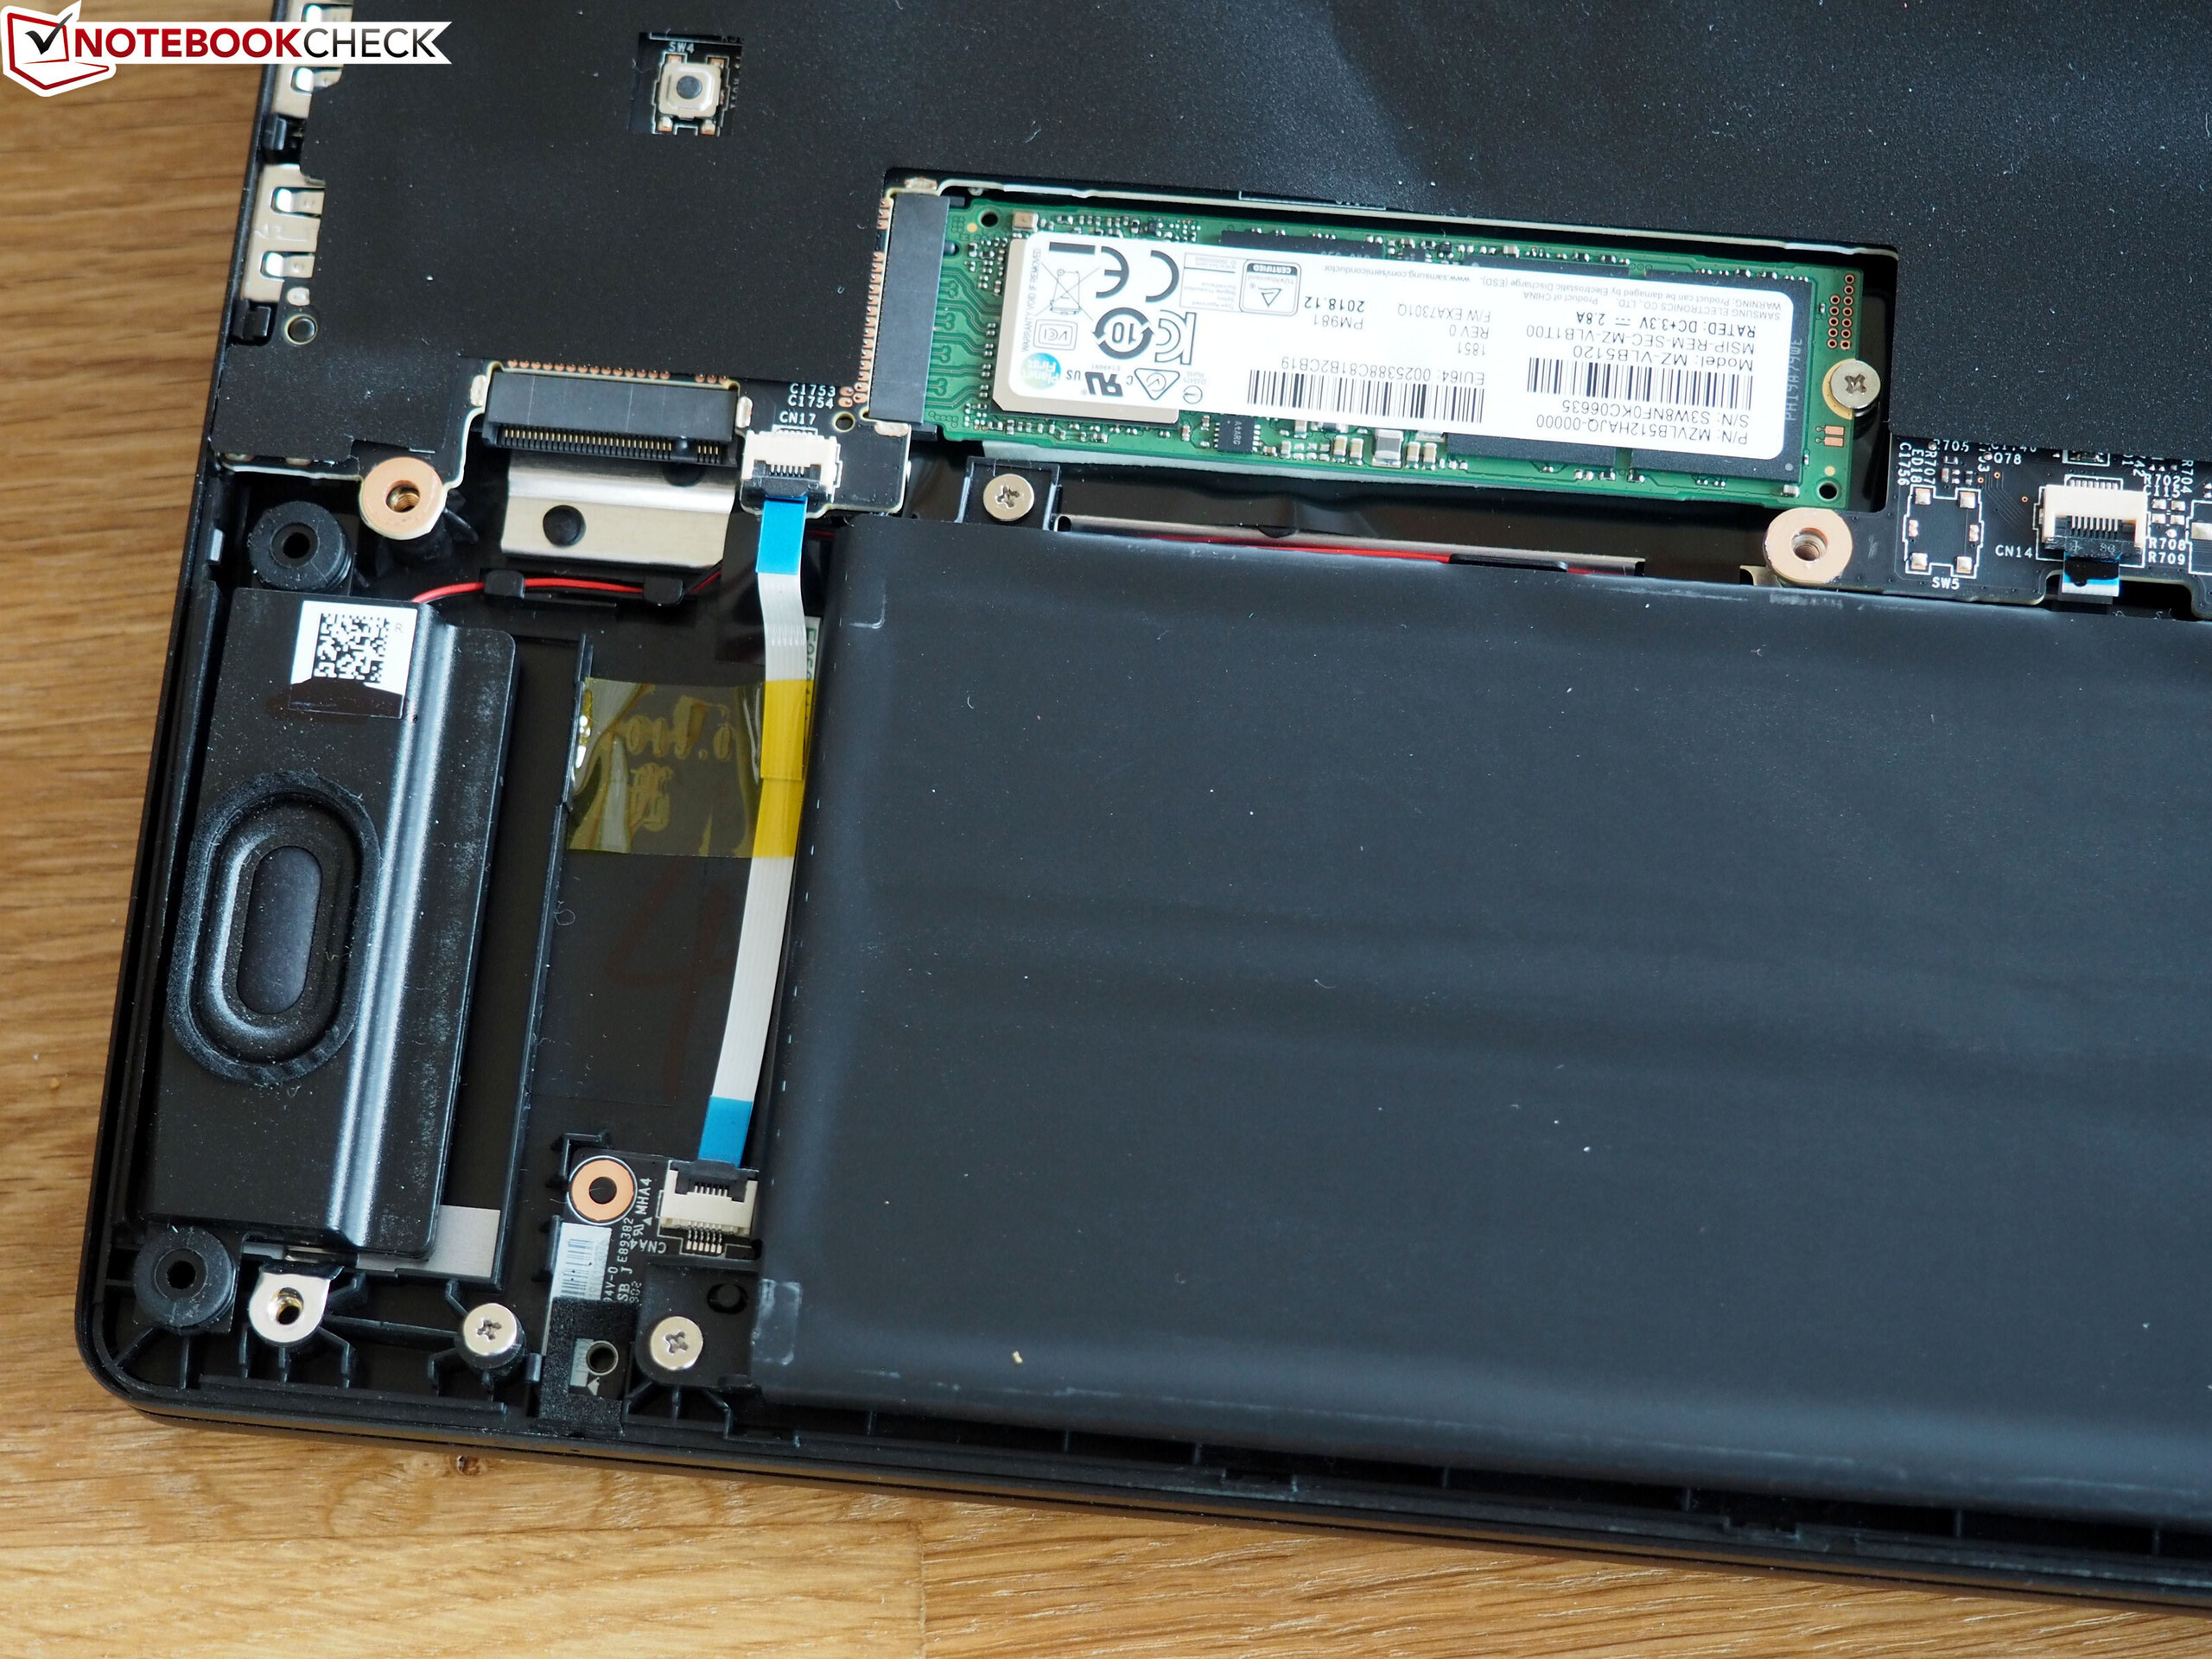
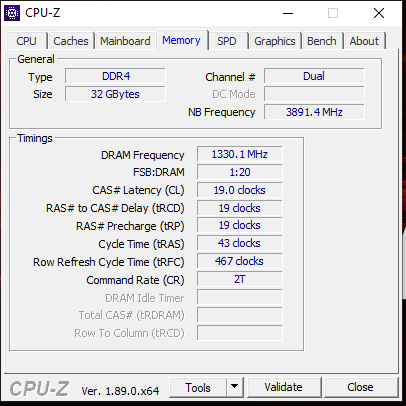
MSI equips the 9SG with two 1 TB Samsung PM981 SSDs. The drives are set to run in RAID 0, which makes Windows 10 see them as one 2 TB drive. RAID 0 also combines the transfer speeds of both drives, which explains why the 9SG is so far out ahead of our comparison devices in CrystalDiskMark. MSI has partitioned the drives into around 1.2 TB reserved for the user and 700 GB for data. Changing this structure would require re-installing Windows 10.
The 9SG has a third M.2 2280 drive bay, so you would be forgiven for thinking that you could add a third Samsung PM981 in RAID 0 for a speed boost. However, the third drive bay can only run at SATA III speeds, limiting its functionality somewhat.

| MSI GS75 Stealth 9SG 2x Samsung SSD PM981 MZVLB1T0HALR (RAID 0) | Schenker XMG Neo 17 Samsung SSD 970 EVO Plus 1TB | Dell G7 17 7790 Toshiba BG3 KBG30ZMS256G | Alienware m17 P37E SK Hynix PC401 512GB M.2 (HFS512GD9TNG) | Asus Zephyrus S GX701GX Samsung SSD PM981 MZVLB1T0HALR | Lenovo Legion Y740-17ICH Samsung SSD PM981 MZVLB256HAHQ | |
|---|---|---|---|---|---|---|
| CrystalDiskMark 5.2 / 6 | -21% | -56% | -17% | -27% | -18% | |
| Write 4K (MB/s) | 95.5 | 92.7 -3% | 78.6 -18% | 120.2 26% | 92.4 -3% | 99.8 5% |
| Read 4K (MB/s) | 42.59 | 41.4 -3% | 31.89 -25% | 44.3 4% | 39.59 -7% | 40.81 -4% |
| Write Seq (MB/s) | 2851 | 1363 -52% | 230.4 -92% | 1278 -55% | 1221 -57% | 1385 -51% |
| Read Seq (MB/s) | 2696 | 1259 -53% | 925 -66% | 1389 -48% | 1005 -63% | 2089 -23% |
| Write 4K Q32T1 (MB/s) | 402.6 | 289.7 -28% | 159.1 -60% | 436.2 8% | 292.5 -27% | 380 -6% |
| Read 4K Q32T1 (MB/s) | 443.9 | 337.5 -24% | 315.6 -29% | 515 16% | 330.8 -25% | 445.5 0% |
| Write Seq Q32T1 (MB/s) | 3420 | 3332 -3% | 230.7 -93% | 1157 -66% | 2385 -30% | 1380 -60% |
| Read Seq Q32T1 (MB/s) | 3514 | 3477 -1% | 1323 -62% | 2671 -24% | 3339 -5% | 3471 -1% |
Graphics Card
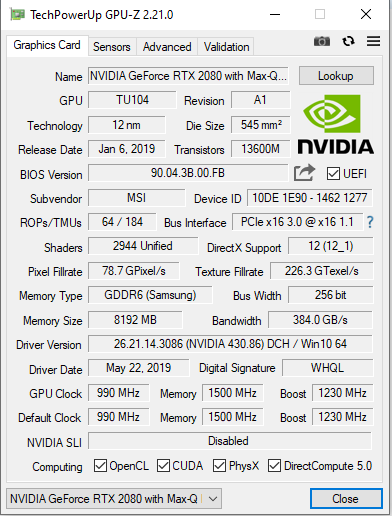
The 9SG also comes with an NVIDIA GeForce RTX 2080 Max-Q GPU, with the Max-Q name indicating that it is a more power efficient version of the regular GeForce RTX 2080. The GeForce RTX 2080 Max-Q supports DirectX 12 and has 8 GB of GDDR6 VRAM with a 990 MHz base clock speed. It can boost to 1,230 MHz when needed too.
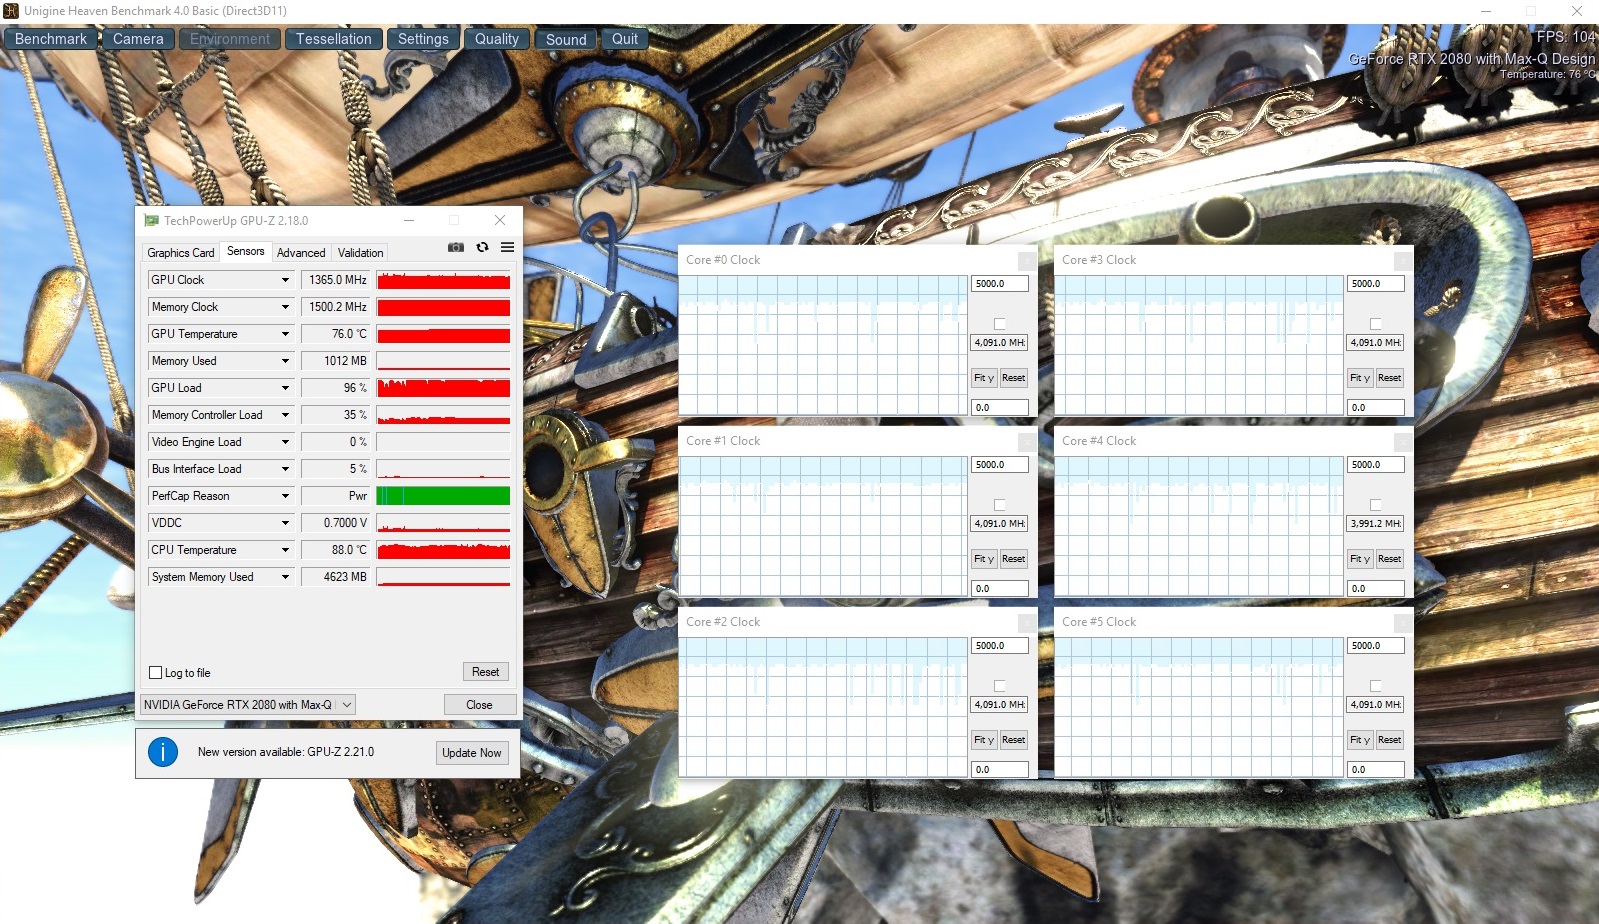
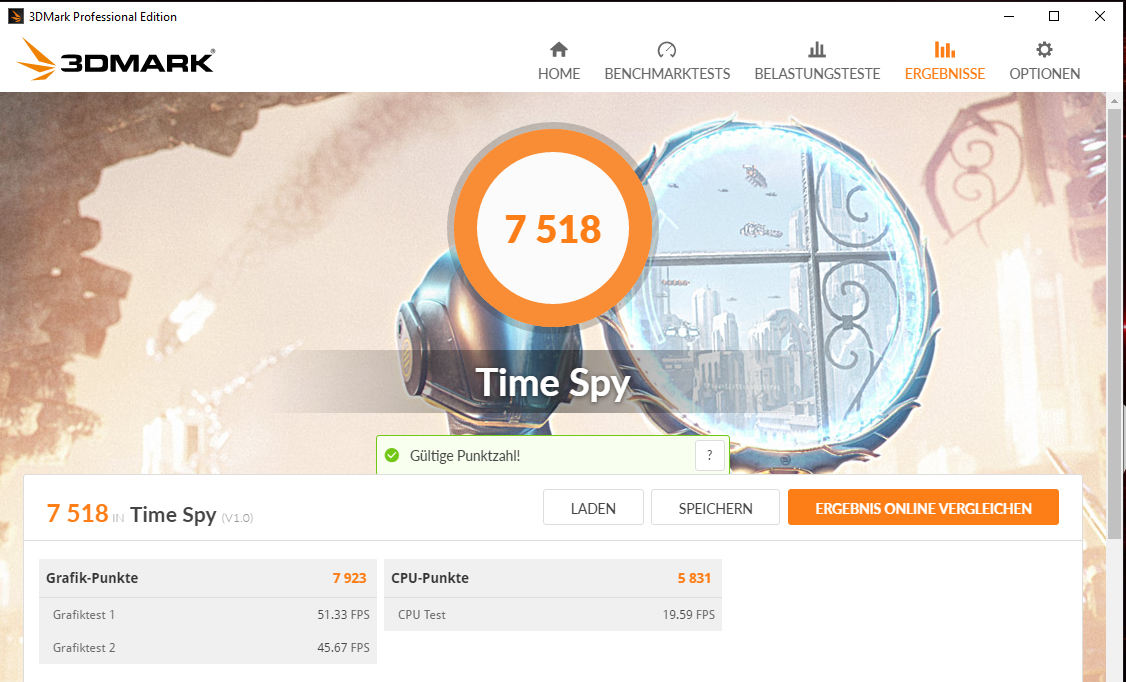
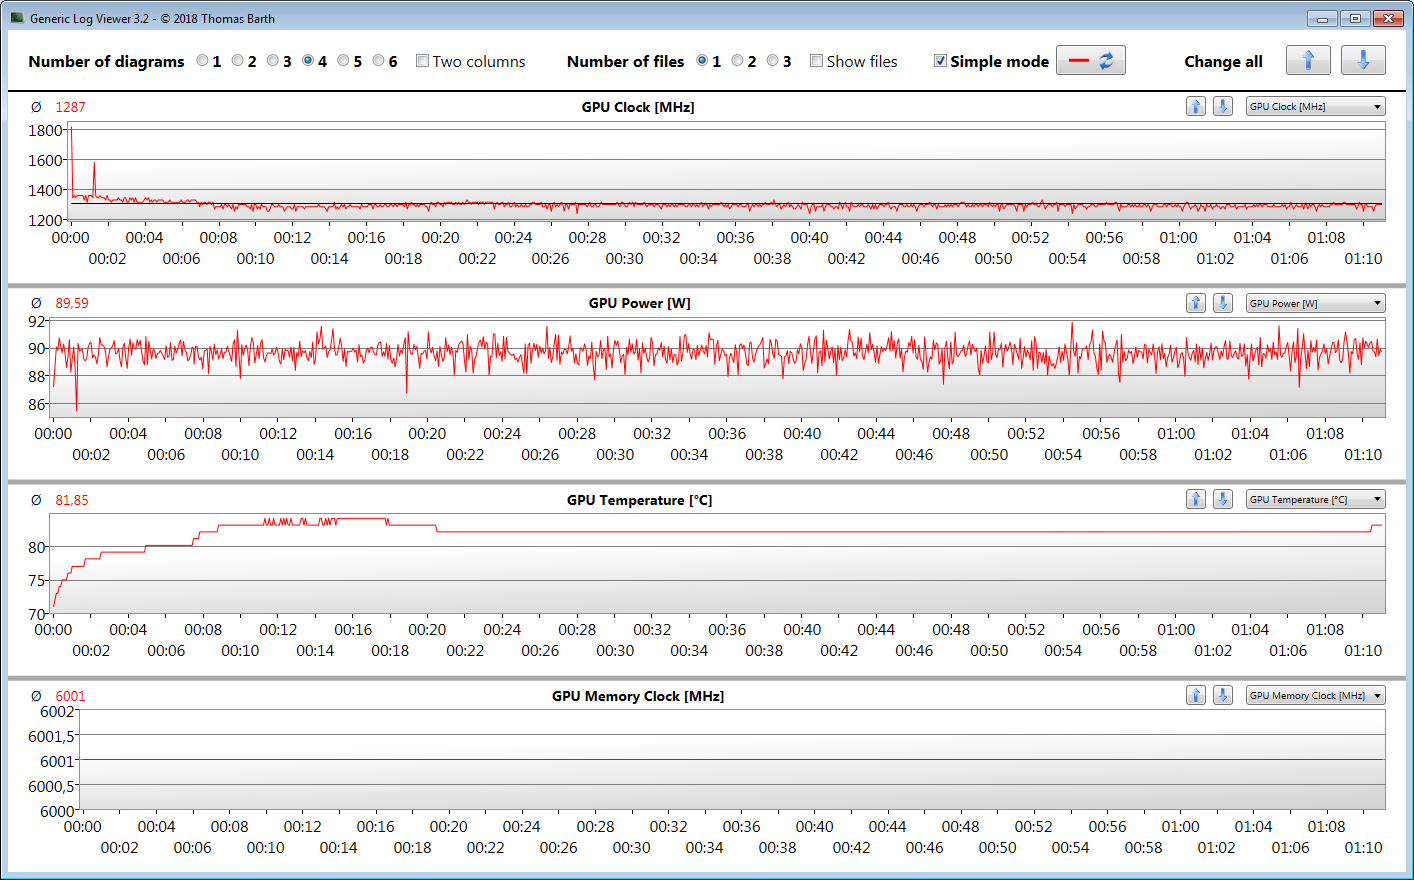
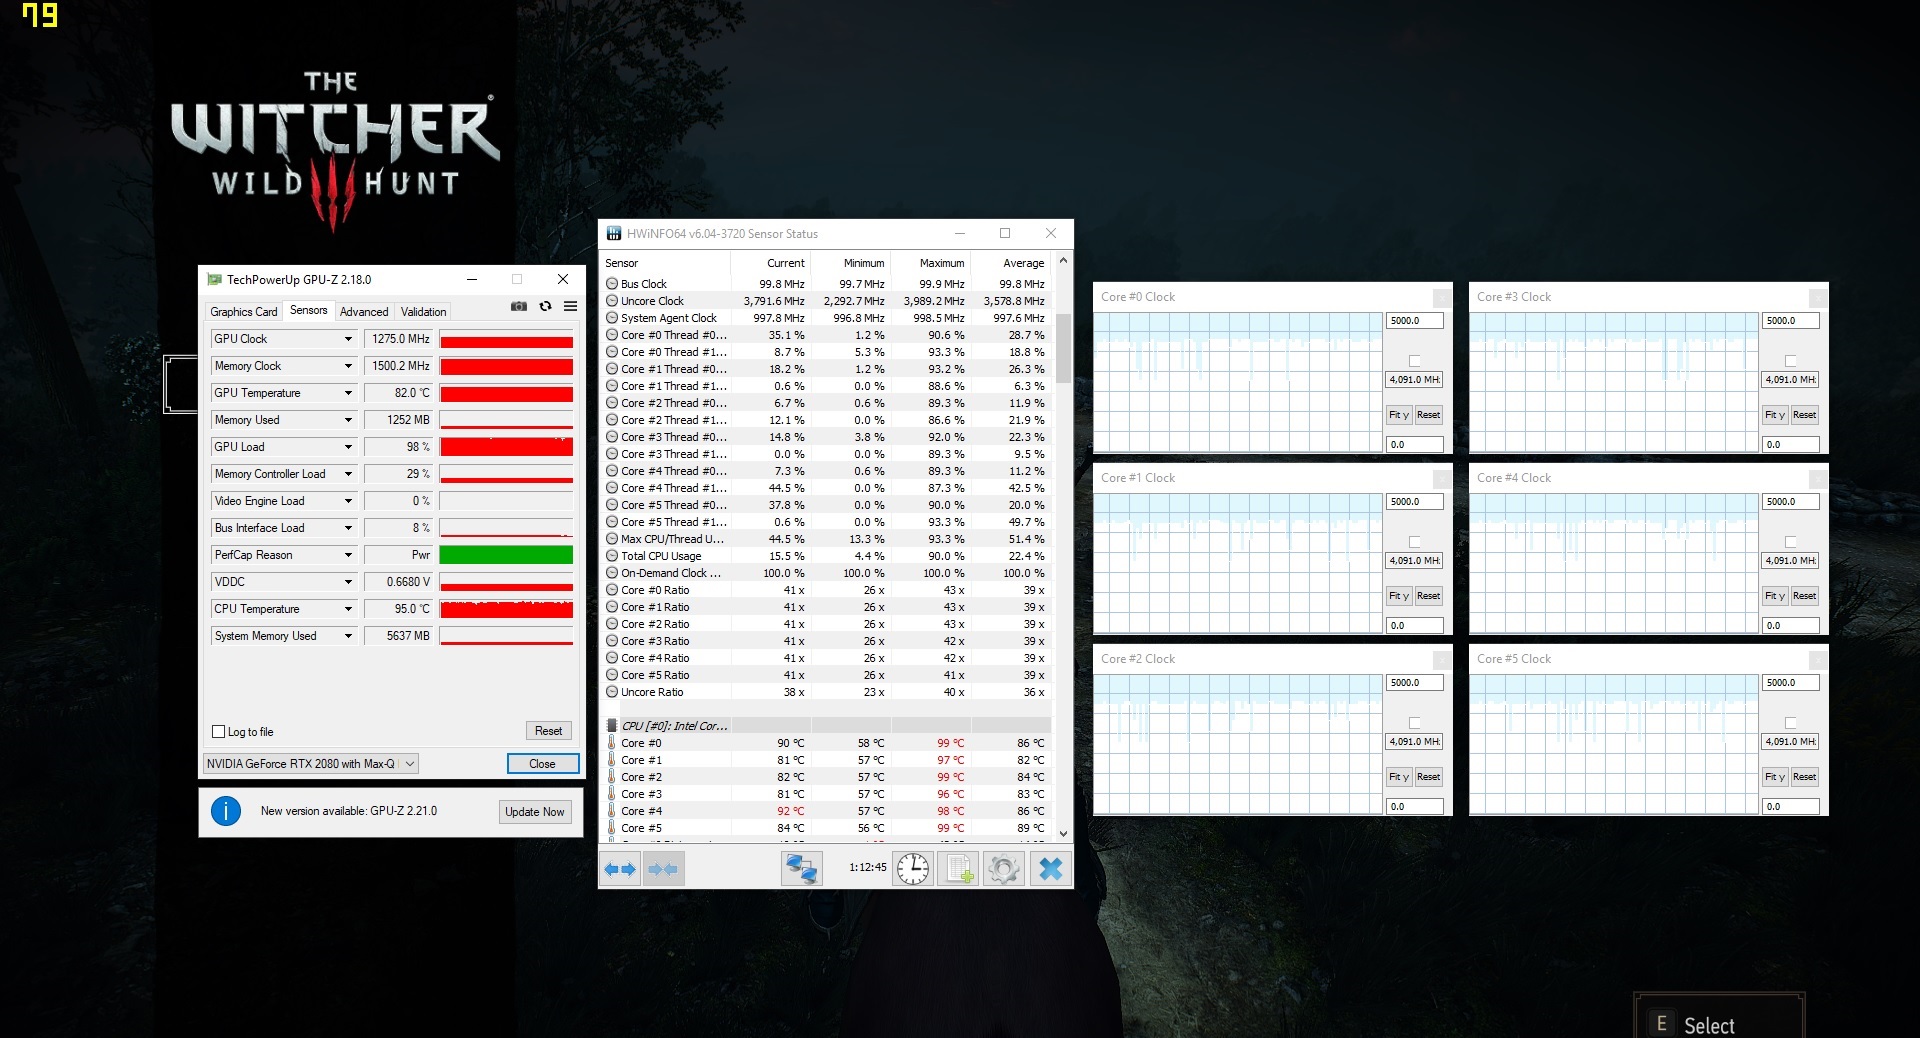
The GPU can achieve even higher clock speeds though if the system can prevent it from thermal throttling. The GeForce RTX 2080 Max-Q in our review unit can briefly hit 1,800 MHz, but it averaged just 1,365 MHz in synthetic benchmarks. The clock speed dropped further to 1,275 MHz while playing "The Witcher 3" too.
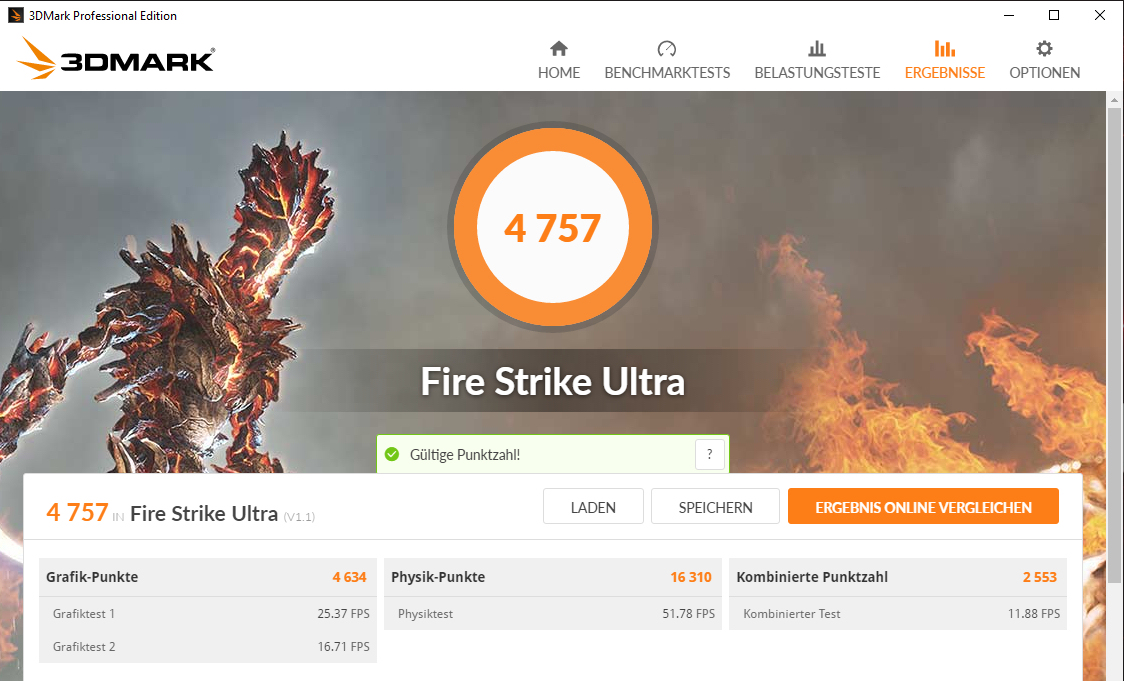
Our review unit performed as expected in 3DMark benchmarks, although it generally trailed the ROG Zephyrus S GX701GX by 7%. Incidentally, the 9SG supports NVIDIA Optimus, which allows it to switch between the GeForce RTX 2080 Max-Q and the UHD Graphics 630 GPU that integrated on the Core i7-9750H. We shall cover the effects of this in the Power Management section of this review.

| 3DMark 06 Standard Score | 37968 points | |
| 3DMark 11 Performance | 21390 points | |
| 3DMark Cloud Gate Standard Score | 34168 points | |
| 3DMark Fire Strike Score | 17182 points | |
| 3DMark Time Spy Score | 7518 points | |
Help | ||
Gaming Performance
Unsurprisingly, the 9SG handles all modern triple-A titles with ease, with it only averaging less than 60 FPS at 1080p in "Ark Survival Evolve" and "Anno 1800" with both set to maximum graphics. Other games such as "Far Cry 5" and "Rage 2" run at above 90 FPS at the same settings, which makes use of the 9SG’s 144 Hz panel.
The device should be powerful enough to play games in 4K too. You may have to drop the graphics level to balance the increased volume of pixels being rendered. You should have no issues with playing older games such as "BioShock Infinite" in 4K at maximum graphics though.
| The Witcher 3 - 1920x1080 Ultra Graphics & Postprocessing (HBAO+) | |
| Average of class Gaming (95 - 240, n=8, last 2 years) | |
| Asus Zephyrus S GX701GX | |
| MSI GS75 Stealth 9SG | |
| Alienware m17 P37E | |
| Lenovo Legion Y740-17ICH | |
| Schenker XMG Neo 17 | |
| Dell G7 17 7790 | |
| BioShock Infinite - 1920x1080 Ultra Preset, DX11 (DDOF) | |
| Alienware m17 P37E | |
| MSI GS75 Stealth 9SG | |
| Lenovo Legion Y740-17ICH | |
| Dell G7 17 7790 | |
| Far Cry New Dawn - 1920x1080 Ultra Preset | |
| MSI GS75 Stealth 9SG | |
| Schenker XMG Neo 17 | |
| Batman: Arkham Knight - 1920x1080 High / On AA:SM AF:16x | |
| MSI GS75 Stealth 9SG | |
We also left "The Witcher 3" running for an hour in 1080p and maximum graphics to see how our review unit maintained its performance during a prolonged gaming session. We did not move the character during this period, for reference. Framerates fluctuated between 52 and 82 FPS during this test, with the device averaging 76 FPS. This puts the 9SG ahead of all our comparison devices including the GeForce RTX 2080 Max-Q powered ROG Zephyrus S GX701GX and Legion Y740-17ICH.
| low | med. | high | ultra | |
|---|---|---|---|---|
| BioShock Infinite (2013) | 331.1 | 289.6 | 263.6 | 163.7 |
| The Witcher 3 (2015) | 286.3 | 217.2 | 135 | 76.9 |
| Batman: Arkham Knight (2015) | 172 | 161 | 134 | 92 |
| Ashes of the Singularity (2016) | 82.5 | 80.7 | 81.3 | |
| Ark Survival Evolved (2017) | 160.9 | 87.9 | 63.5 | 43.9 |
| Final Fantasy XV Benchmark (2018) | 127.4 | 100.7 | 74 | |
| Far Cry 5 (2018) | 123 | 109 | 99 | 95 |
| Far Cry New Dawn (2019) | 116 | 98 | 94 | 85 |
| Anno 1800 (2019) | 98.5 | 93.9 | 77.7 | 41.2 |
| Rage 2 (2019) | 206.6 | 112.2 | 96.1 | 93.3 |
Emissions
Fan Noise
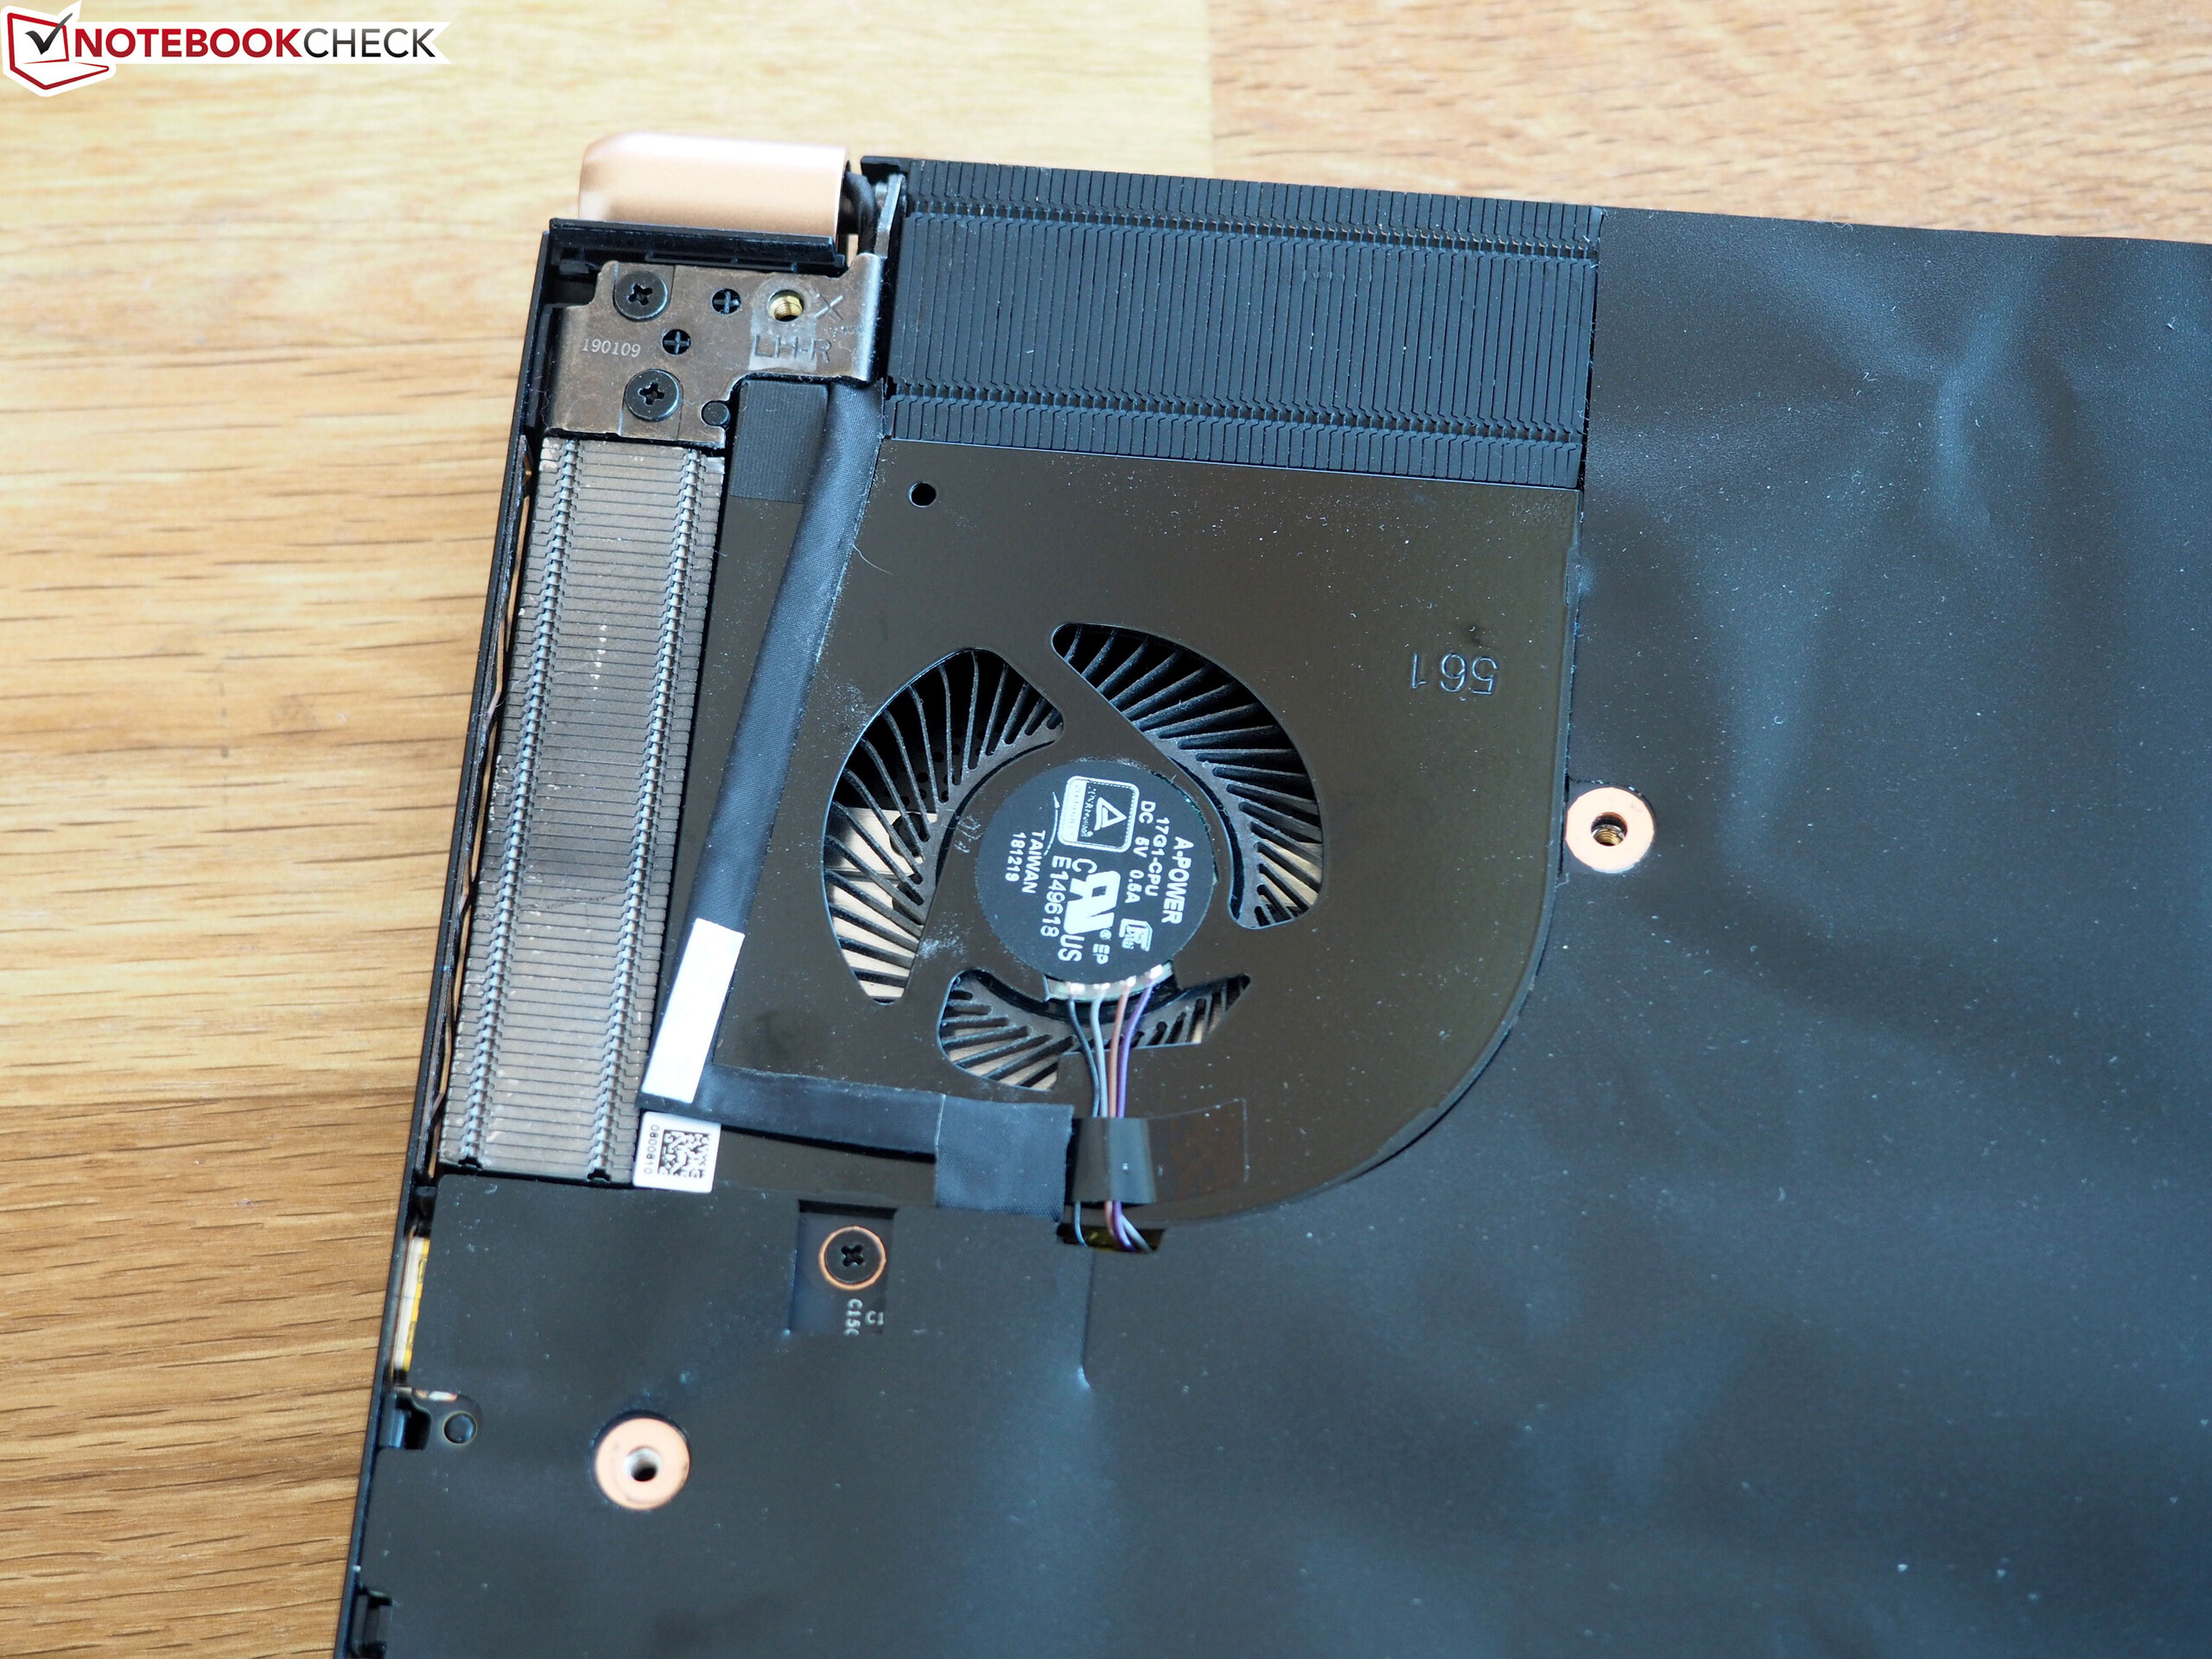
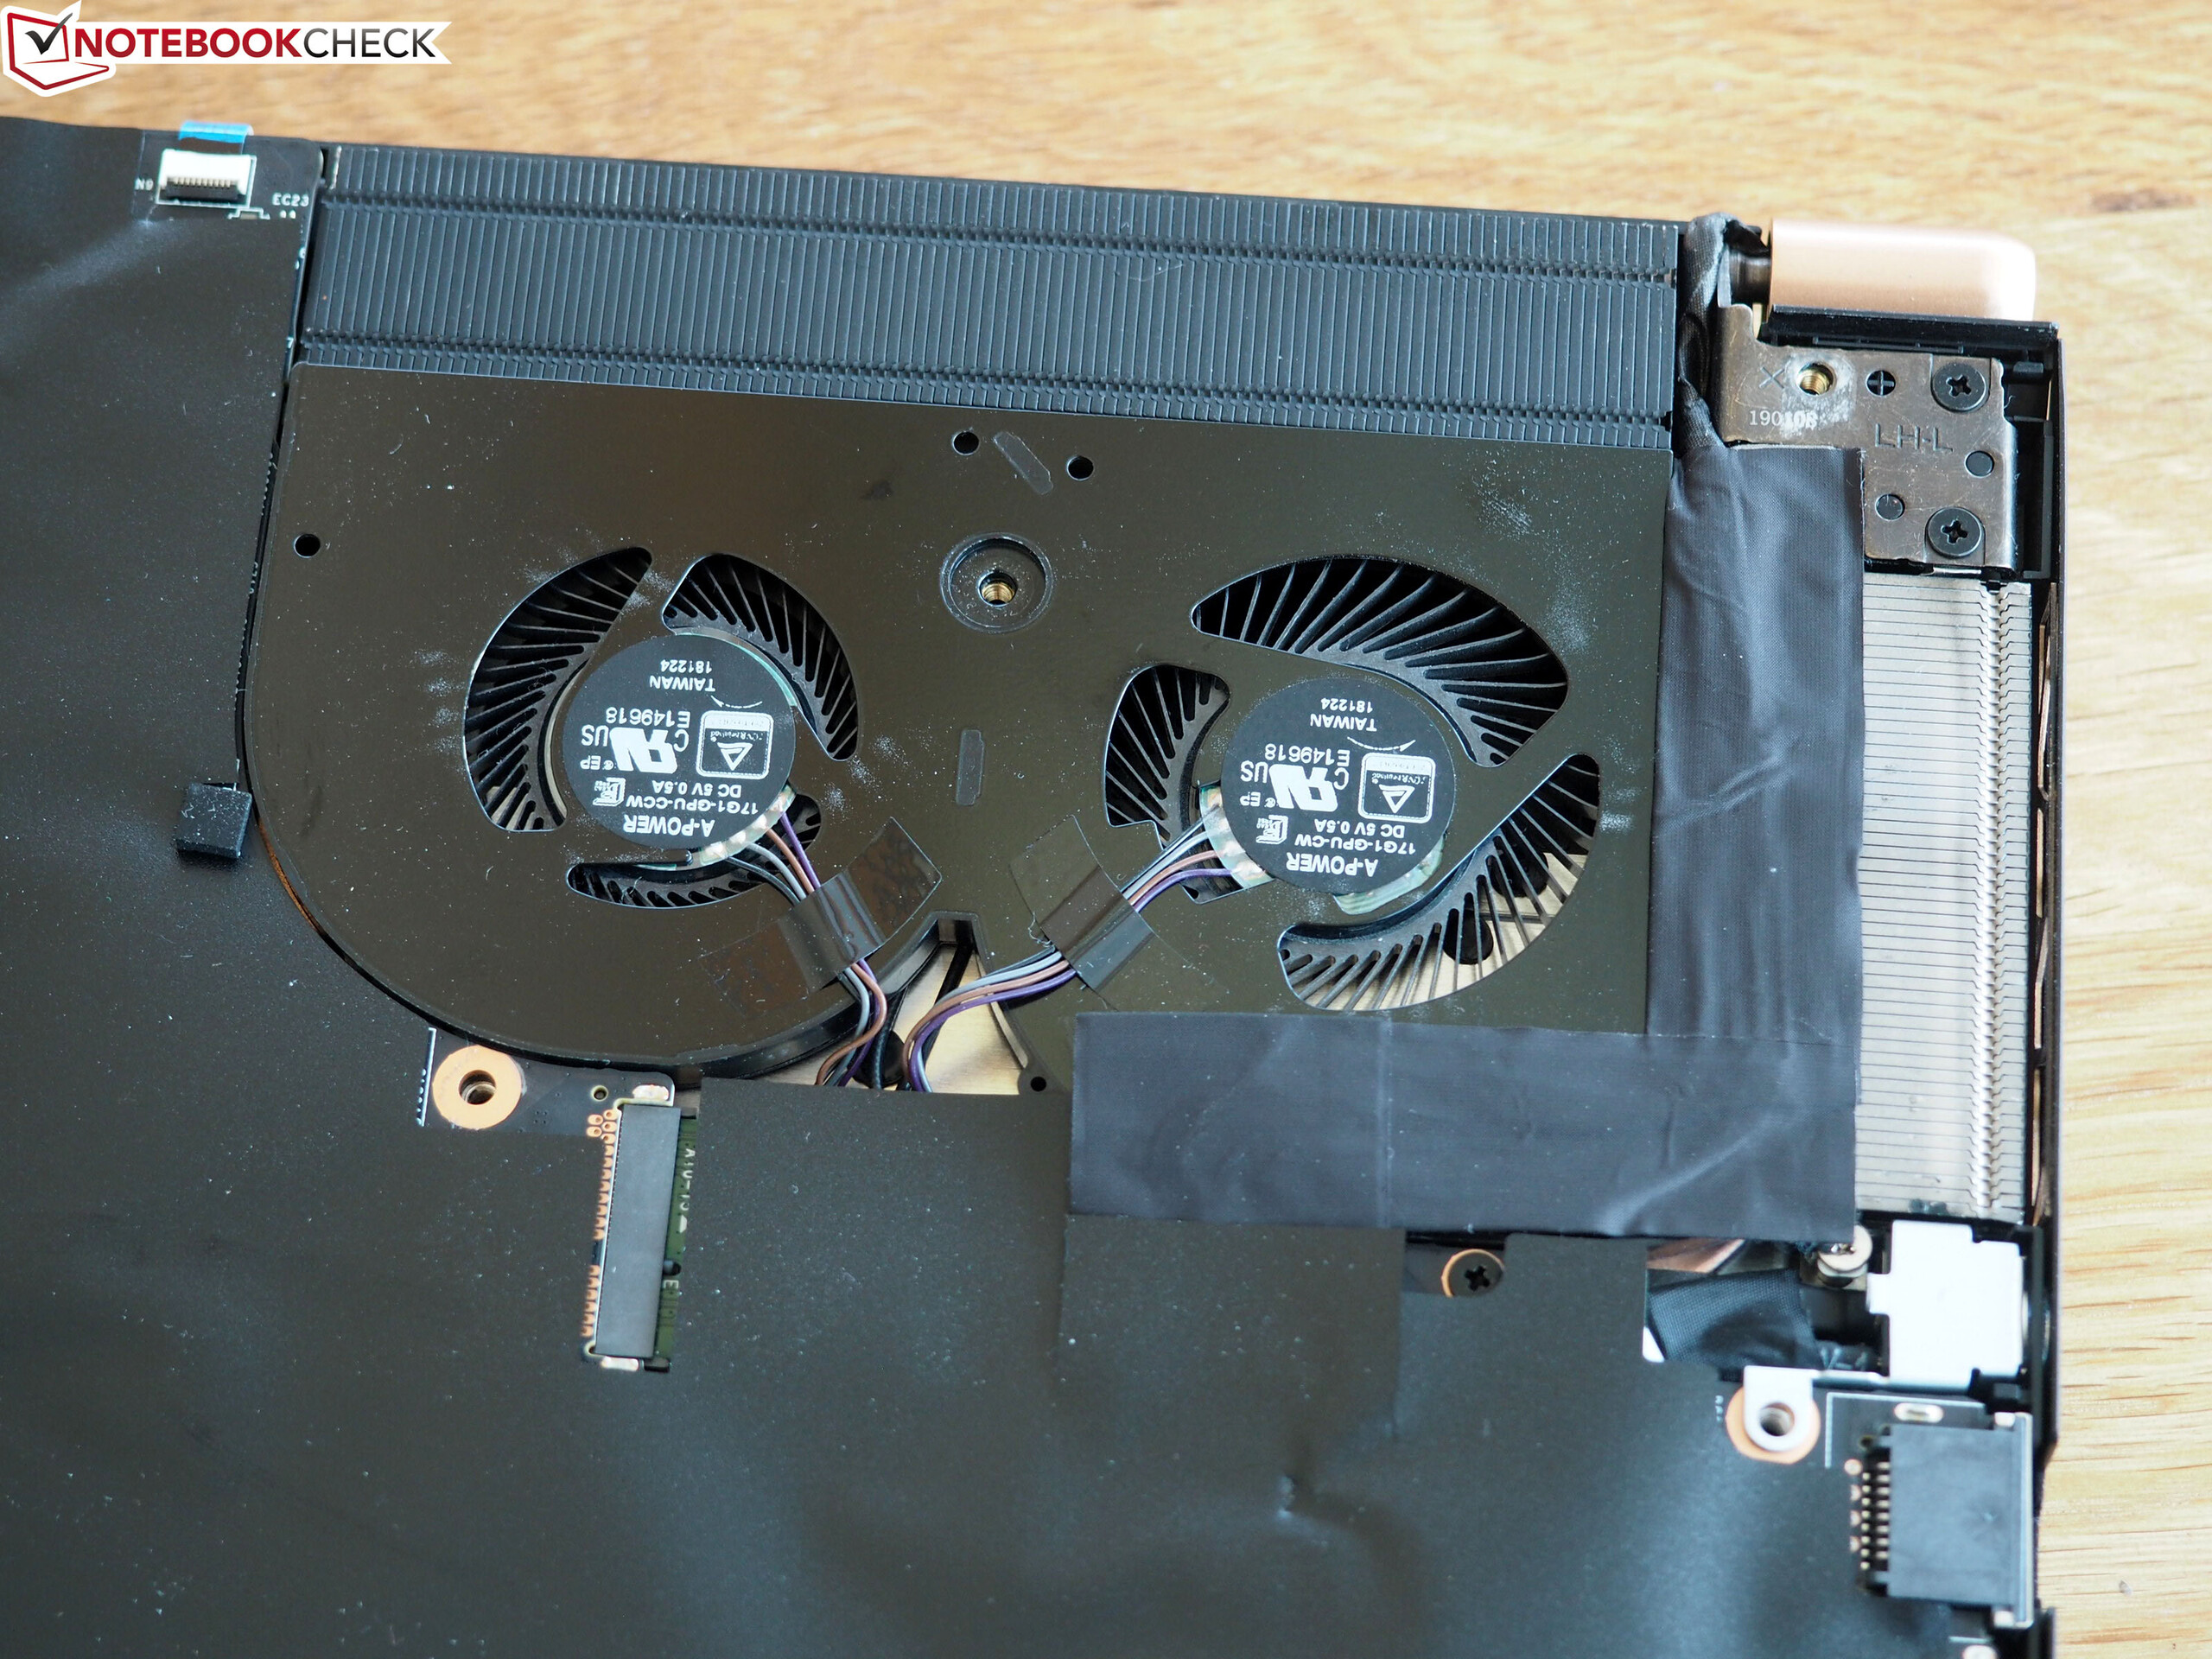
The two fans in the 9SG run constantly, producing between 31 dB(A) and 38 dB(A) at idle. This is about bearable, but the fans reached a disturbingly loud 49 dB(A) during our stress tests. The fans whir at 48 dB(A) while playing games such as "The Witcher 3", completely drowning out the speakers in the process.
Noise level
| Idle |
| 31 / 32 / 38 dB(A) |
| Load |
| 47 / 49 dB(A) |
 | ||
30 dB silent 40 dB(A) audible 50 dB(A) loud |
||
min: | ||
| MSI GS75 Stealth 9SG i7-9750H, GeForce RTX 2080 Max-Q | Schenker XMG Neo 17 i7-8750H, GeForce RTX 2070 Mobile | Dell G7 17 7790 i7-8750H, GeForce RTX 2070 Max-Q | Alienware m17 P37E i9-8950HK, GeForce RTX 2080 Max-Q | Asus Zephyrus S GX701GX i7-8750H, GeForce RTX 2080 Max-Q | Lenovo Legion Y740-17ICH i7-8750H, GeForce RTX 2080 Max-Q | Average of class Gaming | |
|---|---|---|---|---|---|---|---|
| Noise | 4% | 10% | 4% | 2% | 10% | 12% | |
| off / environment * (dB) | 30 | 29 3% | 28.2 6% | 28.2 6% | 29 3% | 28.3 6% | 24.1 ? 20% |
| Idle Minimum * (dB) | 31 | 29 6% | 28.6 8% | 28.2 9% | 29 6% | 31.5 -2% | 25.8 ? 17% |
| Idle Average * (dB) | 32 | 32 -0% | 28.6 11% | 28.2 12% | 32 -0% | 31.6 1% | 27.4 ? 14% |
| Idle Maximum * (dB) | 38 | 33 13% | 28.6 25% | 31 18% | 33 13% | 31.6 17% | 30 ? 21% |
| Load Average * (dB) | 47 | 42 11% | 31.8 32% | 50.8 -8% | 47 -0% | 32.3 31% | 43 ? 9% |
| Witcher 3 ultra * (dB) | 48 | 49 -2% | 50.6 -5% | 50.8 -6% | 49 -2% | 43 10% | |
| Load Maximum * (dB) | 49 | 49 -0% | 50.8 -4% | 50.8 -4% | 51 -4% | 45.5 7% | 54 ? -10% |
* ... smaller is better
Temperature
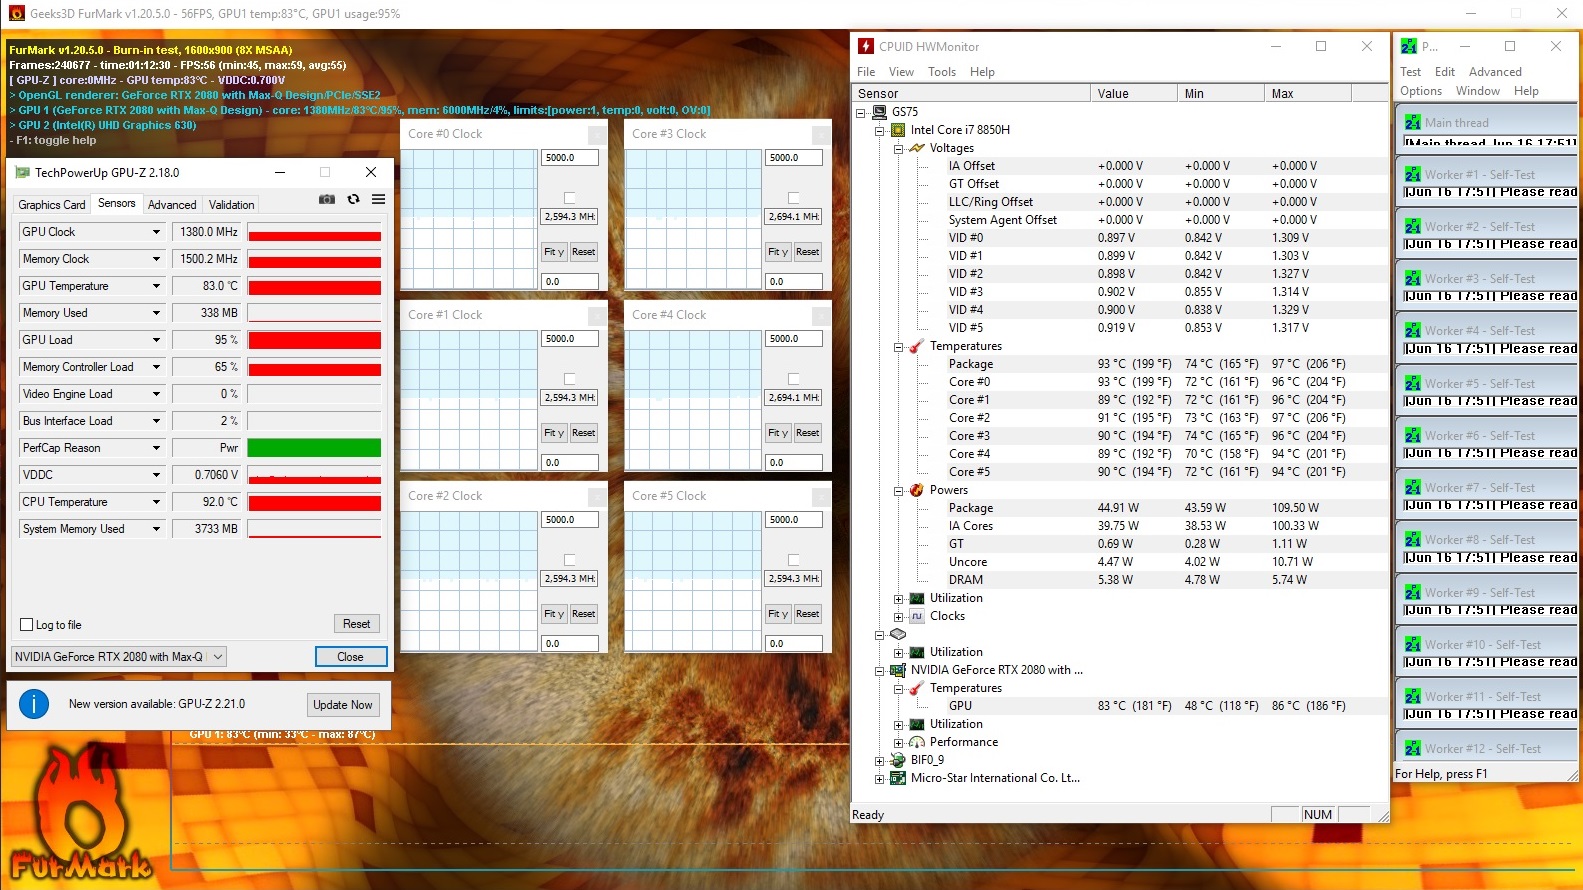
As always, we subjected our review unit to a combined FurMark and Prime95 stress test to determine how well the system manages its performance under extreme load. We left the stress test running for at least an hour and recorded any clock speed changes. The 9SG maintained its CPU at 2.6 to 2.7 GHz when connected to the mains, with the GPU hovering at around 1,380 MHz. The CPU and GPU dropped to 1.2 GHz and 300 MHz respectively though when we re-ran the test with the charger disconnected.
You should not experience this level of throttling in daily use. Our stress test pushes systems to their limits, which will not occur even while playing modern triple-A games.
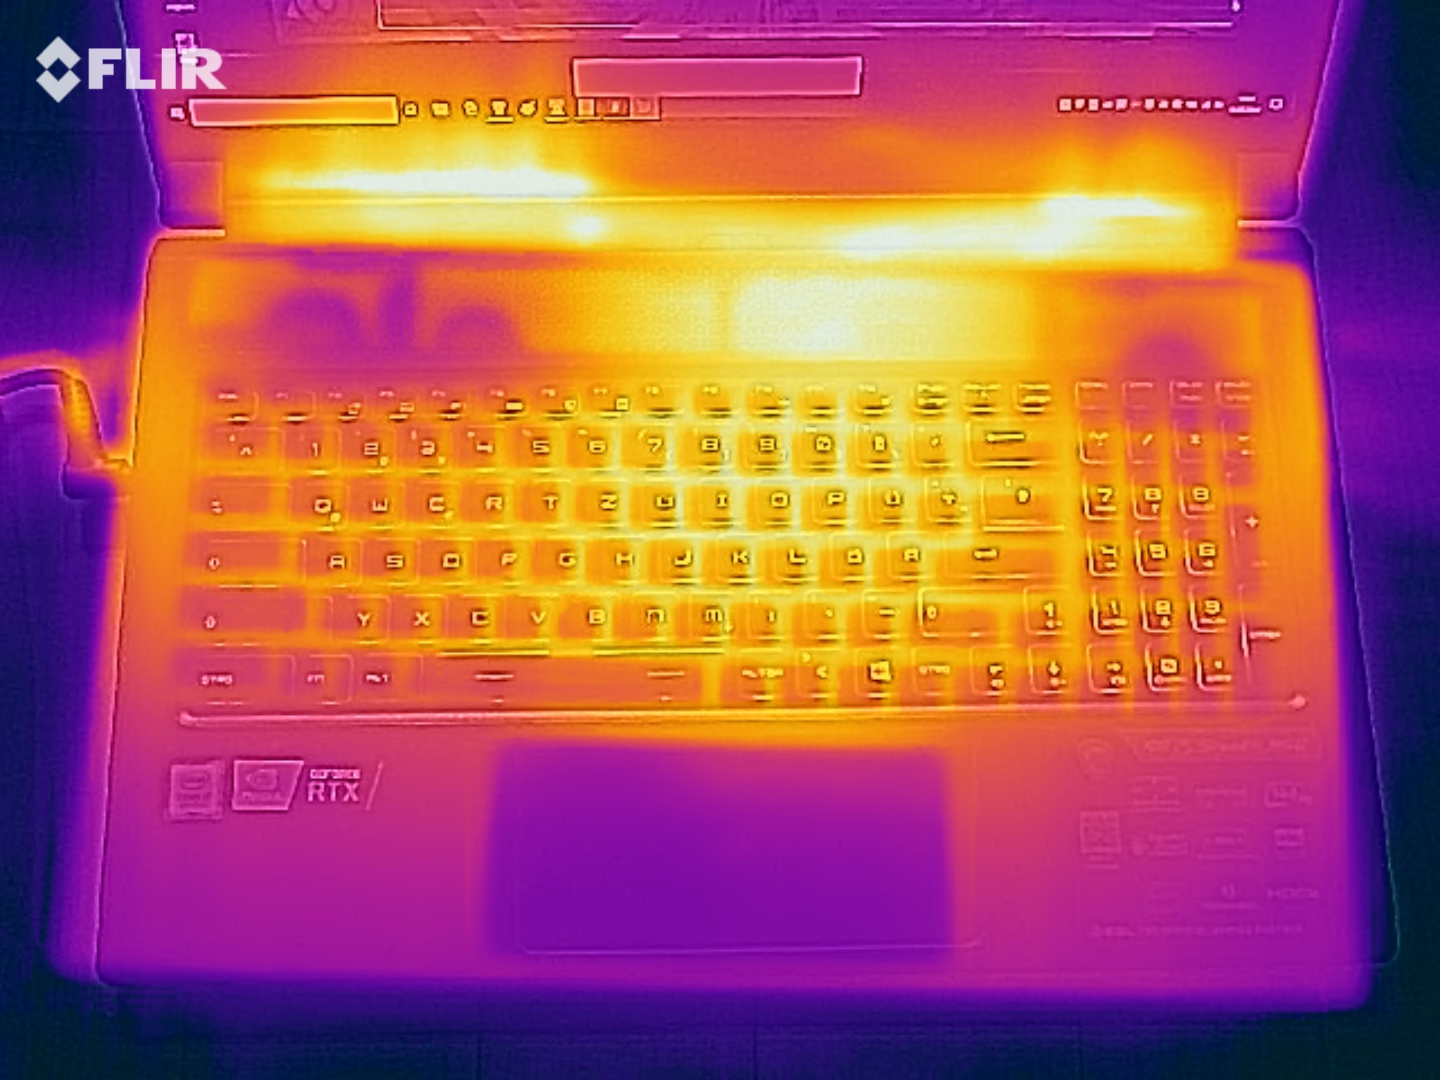
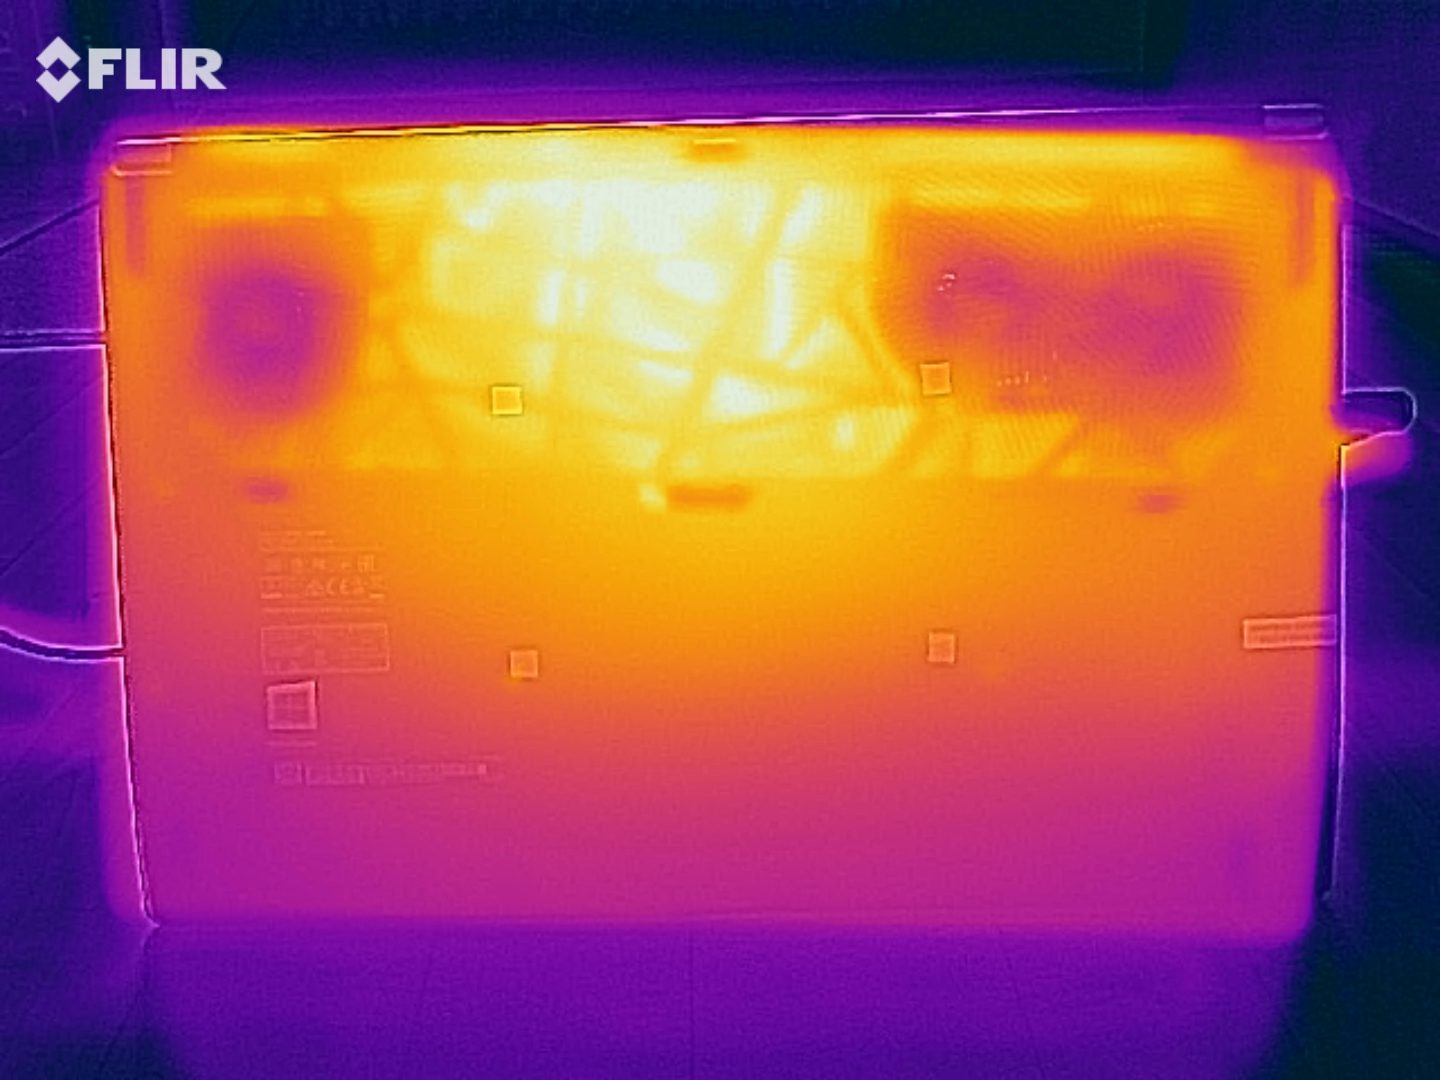
The 9SG manages its surface temperatures well at idle, with our review unit averaging around 29 °C (~84 °F). Some areas reach 32 °C (~90 °F), but this should not feel hot to the touch.
It is a different story under sustained load though, with some areas of our review unit exceeding 60 °C (~140 °F). One area reaches 65 °C (~149 °F), which is dangerously hot. We measured similar temperatures while playing "The Witcher 3", with even the palm rest breaking the 40 °C (~104 °F) barrier. In short, place the 9SG on a table or a flat surface with good ventilation when gaming. The laptop will feel uncomfortably hot on your lap.
(-) The maximum temperature on the upper side is 55 °C / 131 F, compared to the average of 40.4 °C / 105 F, ranging from 21.2 to 68.8 °C for the class Gaming.
(-) The bottom heats up to a maximum of 65 °C / 149 F, compared to the average of 43.2 °C / 110 F
(+) In idle usage, the average temperature for the upper side is 28.9 °C / 84 F, compared to the device average of 33.9 °C / 93 F.
(-) Playing The Witcher 3, the average temperature for the upper side is 47.1 °C / 117 F, compared to the device average of 33.9 °C / 93 F.
(-) The palmrests and touchpad can get very hot to the touch with a maximum of 45 °C / 113 F.
(-) The average temperature of the palmrest area of similar devices was 28.8 °C / 83.8 F (-16.2 °C / -29.2 F).
| MSI GS75 Stealth 9SG i7-9750H, GeForce RTX 2080 Max-Q | Schenker XMG Neo 17 i7-8750H, GeForce RTX 2070 Mobile | Dell G7 17 7790 i7-8750H, GeForce RTX 2070 Max-Q | Alienware m17 P37E i9-8950HK, GeForce RTX 2080 Max-Q | Asus Zephyrus S GX701GX i7-8750H, GeForce RTX 2080 Max-Q | Lenovo Legion Y740-17ICH i7-8750H, GeForce RTX 2080 Max-Q | Average of class Gaming | |
|---|---|---|---|---|---|---|---|
| Heat | 11% | 1% | 2% | 11% | 13% | 8% | |
| Maximum Upper Side * (°C) | 55 | 47 15% | 46.6 15% | 55 -0% | 53 4% | 38.6 30% | 45.2 ? 18% |
| Maximum Bottom * (°C) | 65 | 56 14% | 57 12% | 60 8% | 50 23% | 43.6 33% | 48 ? 26% |
| Idle Upper Side * (°C) | 30 | 28 7% | 34.4 -15% | 30.4 -1% | 27 10% | 30.2 -1% | 31.1 ? -4% |
| Idle Bottom * (°C) | 32 | 30 6% | 34.6 -8% | 31.8 1% | 30 6% | 35 -9% | 34.2 ? -7% |
* ... smaller is better
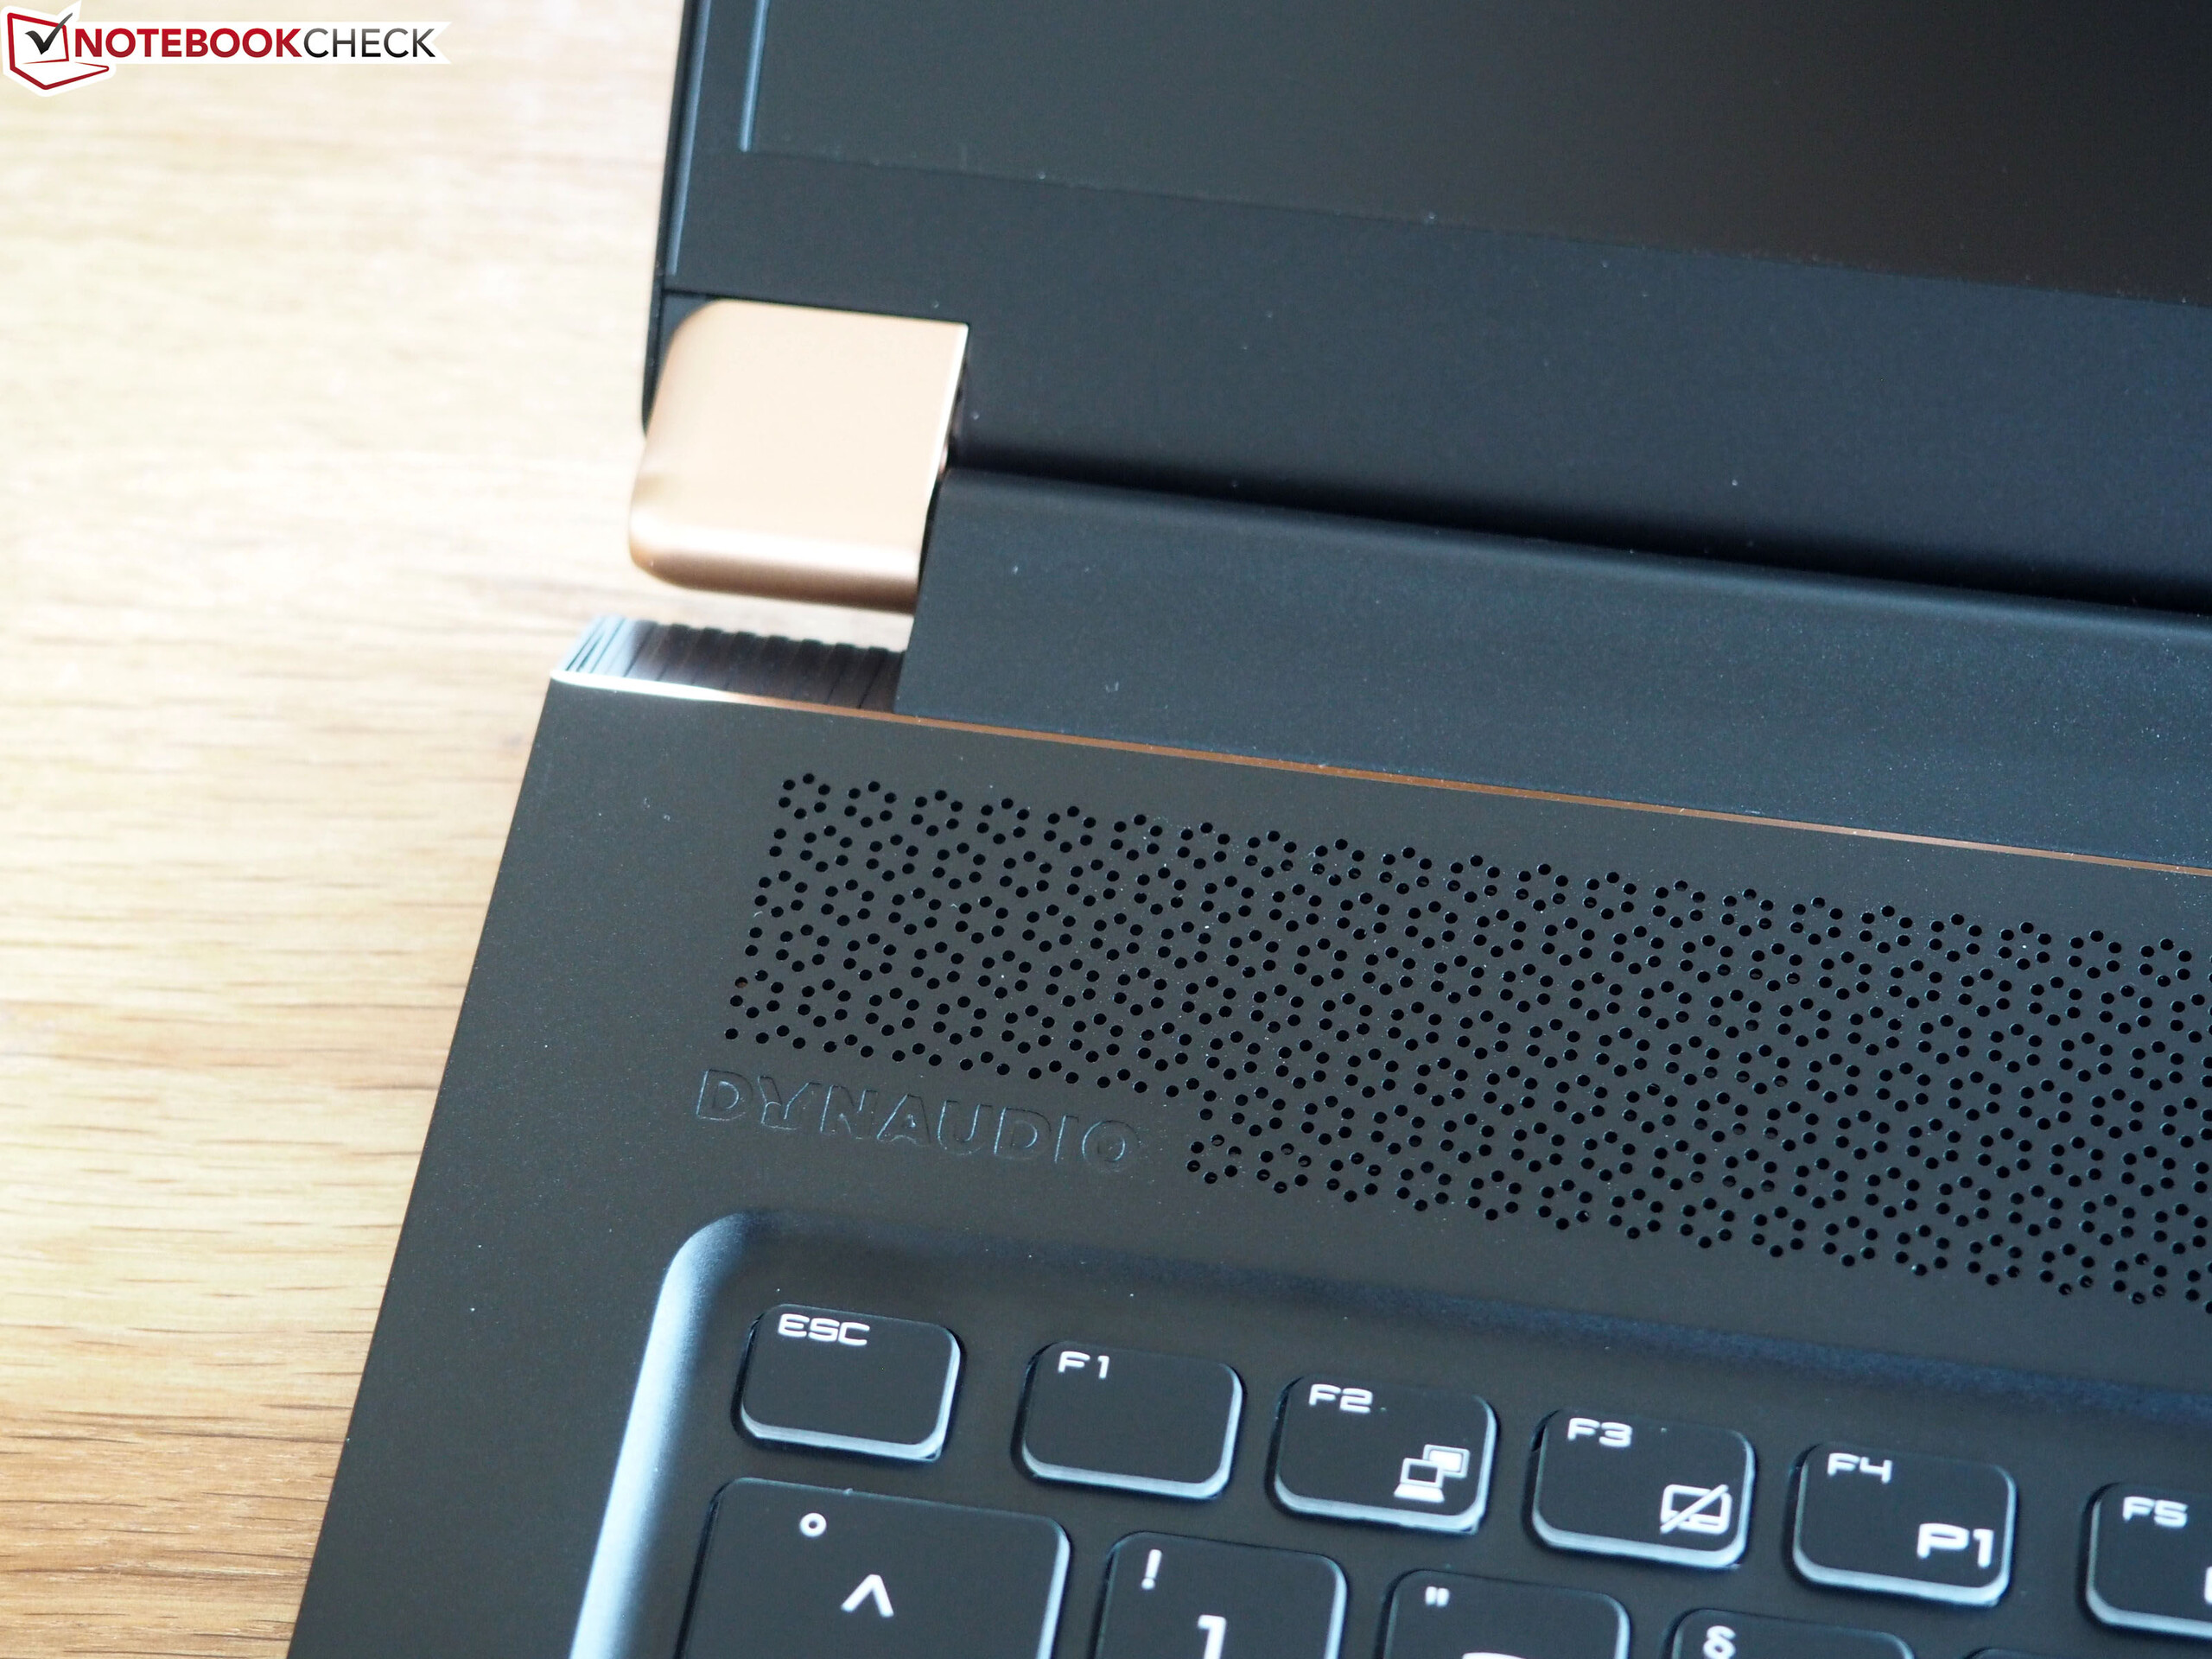
Speakers
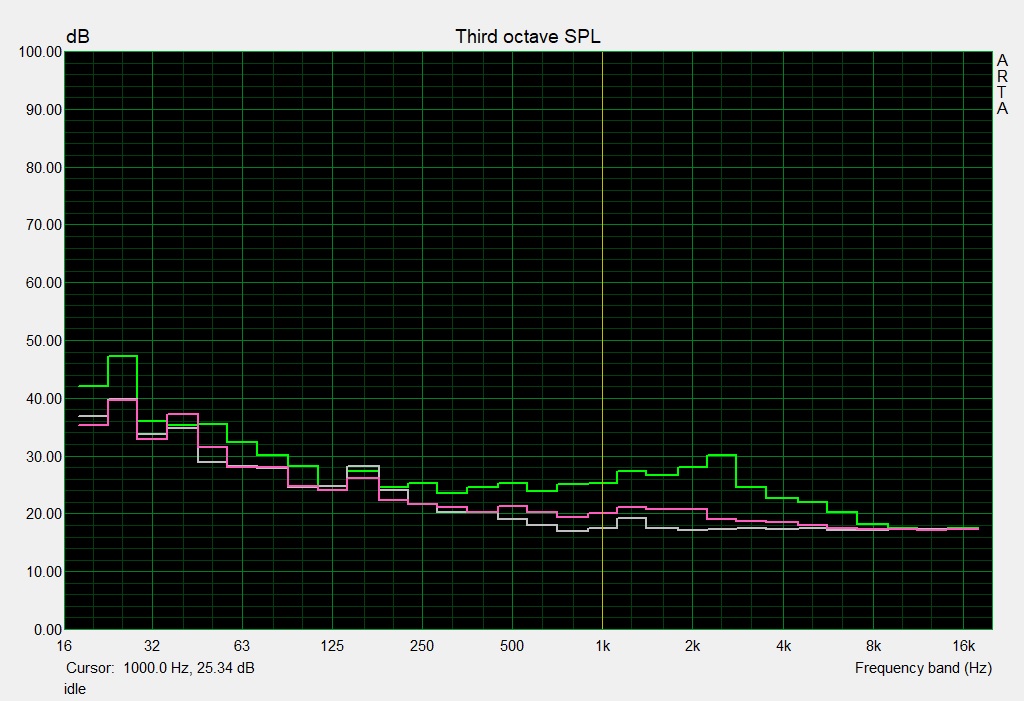
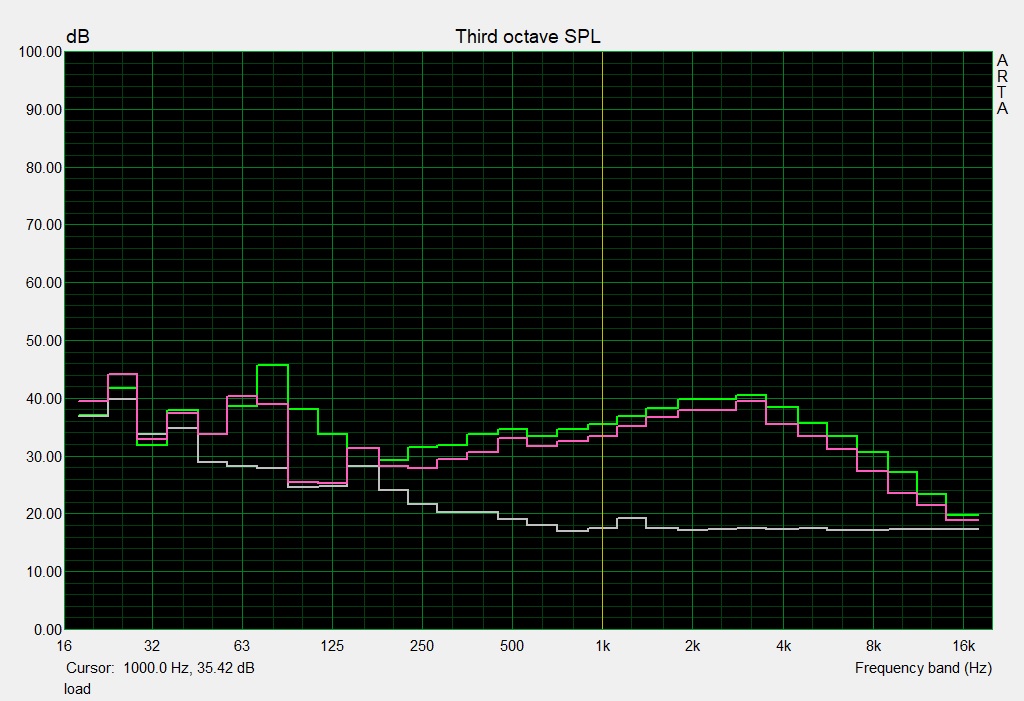
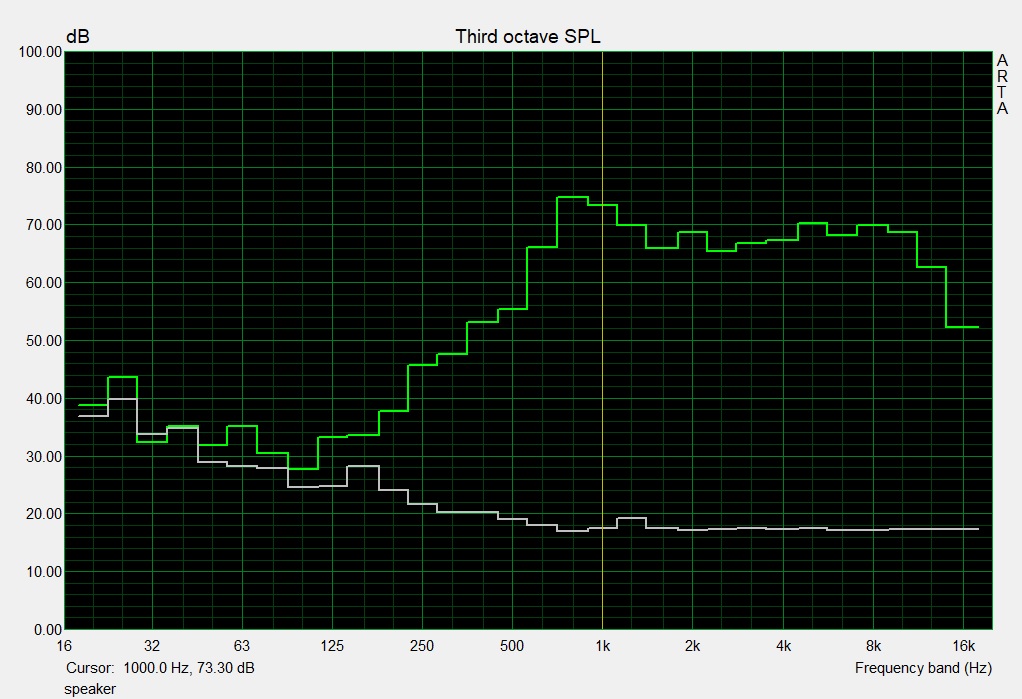
MSI GS75 Stealth 9SG audio analysis
(±) | speaker loudness is average but good (81 dB)
Bass 100 - 315 Hz
(-) | nearly no bass - on average 28.4% lower than median
(±) | linearity of bass is average (7.8% delta to prev. frequency)
Mids 400 - 2000 Hz
(±) | reduced mids - on average 5.8% lower than median
(±) | linearity of mids is average (10% delta to prev. frequency)
Highs 2 - 16 kHz
(+) | balanced highs - only 2.3% away from median
(+) | highs are linear (3.9% delta to prev. frequency)
Overall 100 - 16.000 Hz
(±) | linearity of overall sound is average (23.2% difference to median)
Compared to same class
» 84% of all tested devices in this class were better, 4% similar, 11% worse
» The best had a delta of 6%, average was 18%, worst was 132%
Compared to all devices tested
» 69% of all tested devices were better, 5% similar, 25% worse
» The best had a delta of 4%, average was 24%, worst was 134%
MSI GE75 9SG audio analysis
(+) | speakers can play relatively loud (92.8 dB)
Bass 100 - 315 Hz
(±) | reduced bass - on average 12.2% lower than median
(±) | linearity of bass is average (8.7% delta to prev. frequency)
Mids 400 - 2000 Hz
(±) | higher mids - on average 6.7% higher than median
(±) | linearity of mids is average (11.5% delta to prev. frequency)
Highs 2 - 16 kHz
(+) | balanced highs - only 2.9% away from median
(±) | linearity of highs is average (7.6% delta to prev. frequency)
Overall 100 - 16.000 Hz
(±) | linearity of overall sound is average (16.5% difference to median)
Compared to same class
» 42% of all tested devices in this class were better, 7% similar, 51% worse
» The best had a delta of 6%, average was 18%, worst was 132%
Compared to all devices tested
» 28% of all tested devices were better, 6% similar, 66% worse
» The best had a delta of 4%, average was 24%, worst was 134%
Power Management
Power Consumption
The 9SG is surprisingly energy efficient, with our review unit consuming considerably less than its GeForce RTX 2080 Max-Q contemporaries at idle. The 9SG behaves more like the G7 17 7790 and XMG Neo 17 in this regard, which impressed us. Power consumption briefly peaked at 239 W during our stress test, but our review unit averaged 156 W during our "The Witcher 3" test. The latter value makes the 9SG more efficient than all but the G7 17 7790 and Legion Y740-17ICH of our comparison devices, underlining its credentials as a frugal 17.3-inch gaming laptop.
MSI includes a 230-W power supply in the box. Our tests demonstrate that it will keep the 9SG charging even when the device is being pushed to its limits. While the 9SG can briefly exceed the capacity of its power supply, this will not occur in daily use.
| Off / Standby | |
| Idle | |
| Load |
|
Key:
min: | |
| MSI GS75 Stealth 9SG i7-9750H, GeForce RTX 2080 Max-Q | Schenker XMG Neo 17 i7-8750H, GeForce RTX 2070 Mobile | Dell G7 17 7790 i7-8750H, GeForce RTX 2070 Max-Q | Alienware m17 P37E i9-8950HK, GeForce RTX 2080 Max-Q | Asus Zephyrus S GX701GX i7-8750H, GeForce RTX 2080 Max-Q | Lenovo Legion Y740-17ICH i7-8750H, GeForce RTX 2080 Max-Q | Average of class Gaming | |
|---|---|---|---|---|---|---|---|
| Power Consumption | 5% | 10% | -36% | -16% | -15% | -6% | |
| Idle Minimum * (Watt) | 13 | 13 -0% | 9.5 27% | 21.2 -63% | 19 -46% | 20.2 -55% | 13.2 ? -2% |
| Idle Average * (Watt) | 17 | 16 6% | 16.2 5% | 29.6 -74% | 22 -29% | 27.2 -60% | 18.9 ? -11% |
| Idle Maximum * (Watt) | 25 | 21 16% | 23.8 5% | 34 -36% | 30 -20% | 28.7 -15% | 24.3 ? 3% |
| Load Average * (Watt) | 96 | 96 -0% | 101.7 -6% | 130.9 -36% | 104 -8% | 90.8 5% | 108 ? -13% |
| Witcher 3 ultra * (Watt) | 156 | 172 -10% | 155 1% | 177.5 -14% | 167 -7% | 152.1 2% | |
| Load Maximum * (Watt) | 239 | 191 20% | 172.2 28% | 219.7 8% | 203 15% | 165.4 31% | 254 ? -6% |
* ... smaller is better
Battery Life
MSI has equipped the 9SG with an 80.25 Wh battery, which averages better runtimes than all but the G7 17 7790 of our comparison devices. Our review unit lasted for 5:57 hours in our practical Wi-Fi test, a runtime that is between 17% and 47% longer than our comparison devices and 29% longer than the class average. We conduct this test by running a script that simulates the load required to render websites and adjust the display to approximately 150 cd/m². We also leave the device on the Balanced Windows 10 power plan.
The 9SG also lasted for 6:50 hours in our H.264 looped video test, where we leave the short film Big Buck Bunny running on a loop at 1080p. We also set the device to Energy saving mode, switch off all radios and keep the brightness at approximately 150 cd/m².
Overall, the 9SG has exceptional battery life for a 17.3-inch gaming laptop. Our review unit even managed to outperform its predecessor, the GS75 8SG Stealth, to our surprise.
| MSI GS75 Stealth 9SG i7-9750H, GeForce RTX 2080 Max-Q, 80.25 Wh | Schenker XMG Neo 17 i7-8750H, GeForce RTX 2070 Mobile, 46.74 Wh | Dell G7 17 7790 i7-8750H, GeForce RTX 2070 Max-Q, 60 Wh | Alienware m17 P37E i9-8950HK, GeForce RTX 2080 Max-Q, 90 Wh | Asus Zephyrus S GX701GX i7-8750H, GeForce RTX 2080 Max-Q, 76 Wh | Lenovo Legion Y740-17ICH i7-8750H, GeForce RTX 2080 Max-Q, 76 Wh | Average of class Gaming | |
|---|---|---|---|---|---|---|---|
| Battery runtime | -31% | 14% | -11% | -32% | -47% | 19% | |
| Reader / Idle (h) | 7.7 | 5.3 -31% | 8.5 10% | 9.1 18% | 5 -35% | 8.71 ? 13% | |
| H.264 (h) | 6.8 | 8.26 ? 21% | |||||
| WiFi v1.3 (h) | 6 | 3.7 -38% | 3.9 -35% | 4.9 -18% | 3.8 -37% | 3.2 -47% | 7.02 ? 17% |
| Load (h) | 1.2 | 0.9 -25% | 2 67% | 0.8 -33% | 0.9 -25% | 1.47 ? 23% |
Pros
Cons
Verdict
The MSI GS75 Stealth 9SG is a sleek 17.3-inch gaming laptop that packs a punch. Unfortunately, while the device looks stylish by gaming standards, it could do with being sturdier. Hopefully, MSI addresses this with subsequent models by reinforcing or refreshing the chassis.
Internally, things shape up nicely, with the Core i7-9750H and GeForce RTX 2080 Max-Q combining to deliver excellent gaming performance. These components allow the 9SG to take advantage of its 144 Hz display, with most modern triple-A titles averaging around 90 FPS even at maximum graphics settings. The display scores highly because of its stable viewing angles, high brightness, good contrast ratio, short response times and accurate colour reproduction.
The MSI GS75 Stealth 9SG is a powerful gaming laptop that should make most gamers happy. Its flimsy case and high retail price are reasons to look elsewhere though.
We also like that MSI has included two NVMe SSDs running in RAID-0. The decision gives the 9SG comparatively good transfer speeds and a healthy 2 TB of storage. You can even add a third M.2 2280 drive should you need more space, although sadly MSI opted for a slower SATA III connector instead of NVMe.
The 9SG also has comparatively good battery life thanks to its 80.25 Wh battery and should last a full day’s use between charges. The flimsy case helps keep weight down too, with the 9SG weighing in at just 2.28 kg (~5 lb). Including Thunderbolt 3 was a wise move, and while there should be enough ports for most people, MSI had the space to add a few more. Overall, the MSI GS75 Stealth 9SG is a good option for those who are in the market for a mobile 17.3-inch gaming laptop. If you can overlook the deficiencies with its design, then the 9SG will reward you with cutting-edge performance on a gorgeous 144 Hz panel.
MSI GS75 Stealth 9SG
- 05/14/2020 v7 (old)
Sascha Mölck
Price comparison

