MSI GP65 Leopard 9SE Laptop Review - The best screen on a mid-tier gaming laptop

MSI is a veteran in the gaming notebook arena, and its laptops range from budget devices that cut every corner to high-dollar masterpieces of engineering. Today's review covers an MSI machine right in the middle of the Taiwanese company's catalog. The MSI GP65 Leopard is a mid-range gaming laptop through and through. While it makes some sacrifices in the name of cost, the hardware within leaves a good impression. Additionally, MSI has managed to pack a surprise in the GP65: the display is astoundingly good. As we will see, the 144 Hz panel is one of the most color-accurate we've reviewed, not just for gaming notebooks, but out of most laptops currently on the market.
The GP65 Leopard is a retooling of the GP63 Leopard from last year. To that end, the machines share several things in common, but some small tweaks are welcome improvements. Others are questionable design choices. To get a good picture of the changes MSI has made, we suggest you refer to our review of the GP63 Leopard.
There are several competent competitors in the $1400-1500 price range. We will measure the GP65 Leopard against the Lenovo Legion Y540, the Eurocom Nightsky Ti15, the Asus Strix GL531GV, the HP Omen 15-dc1303ng, and the CUK Model Z.
Case
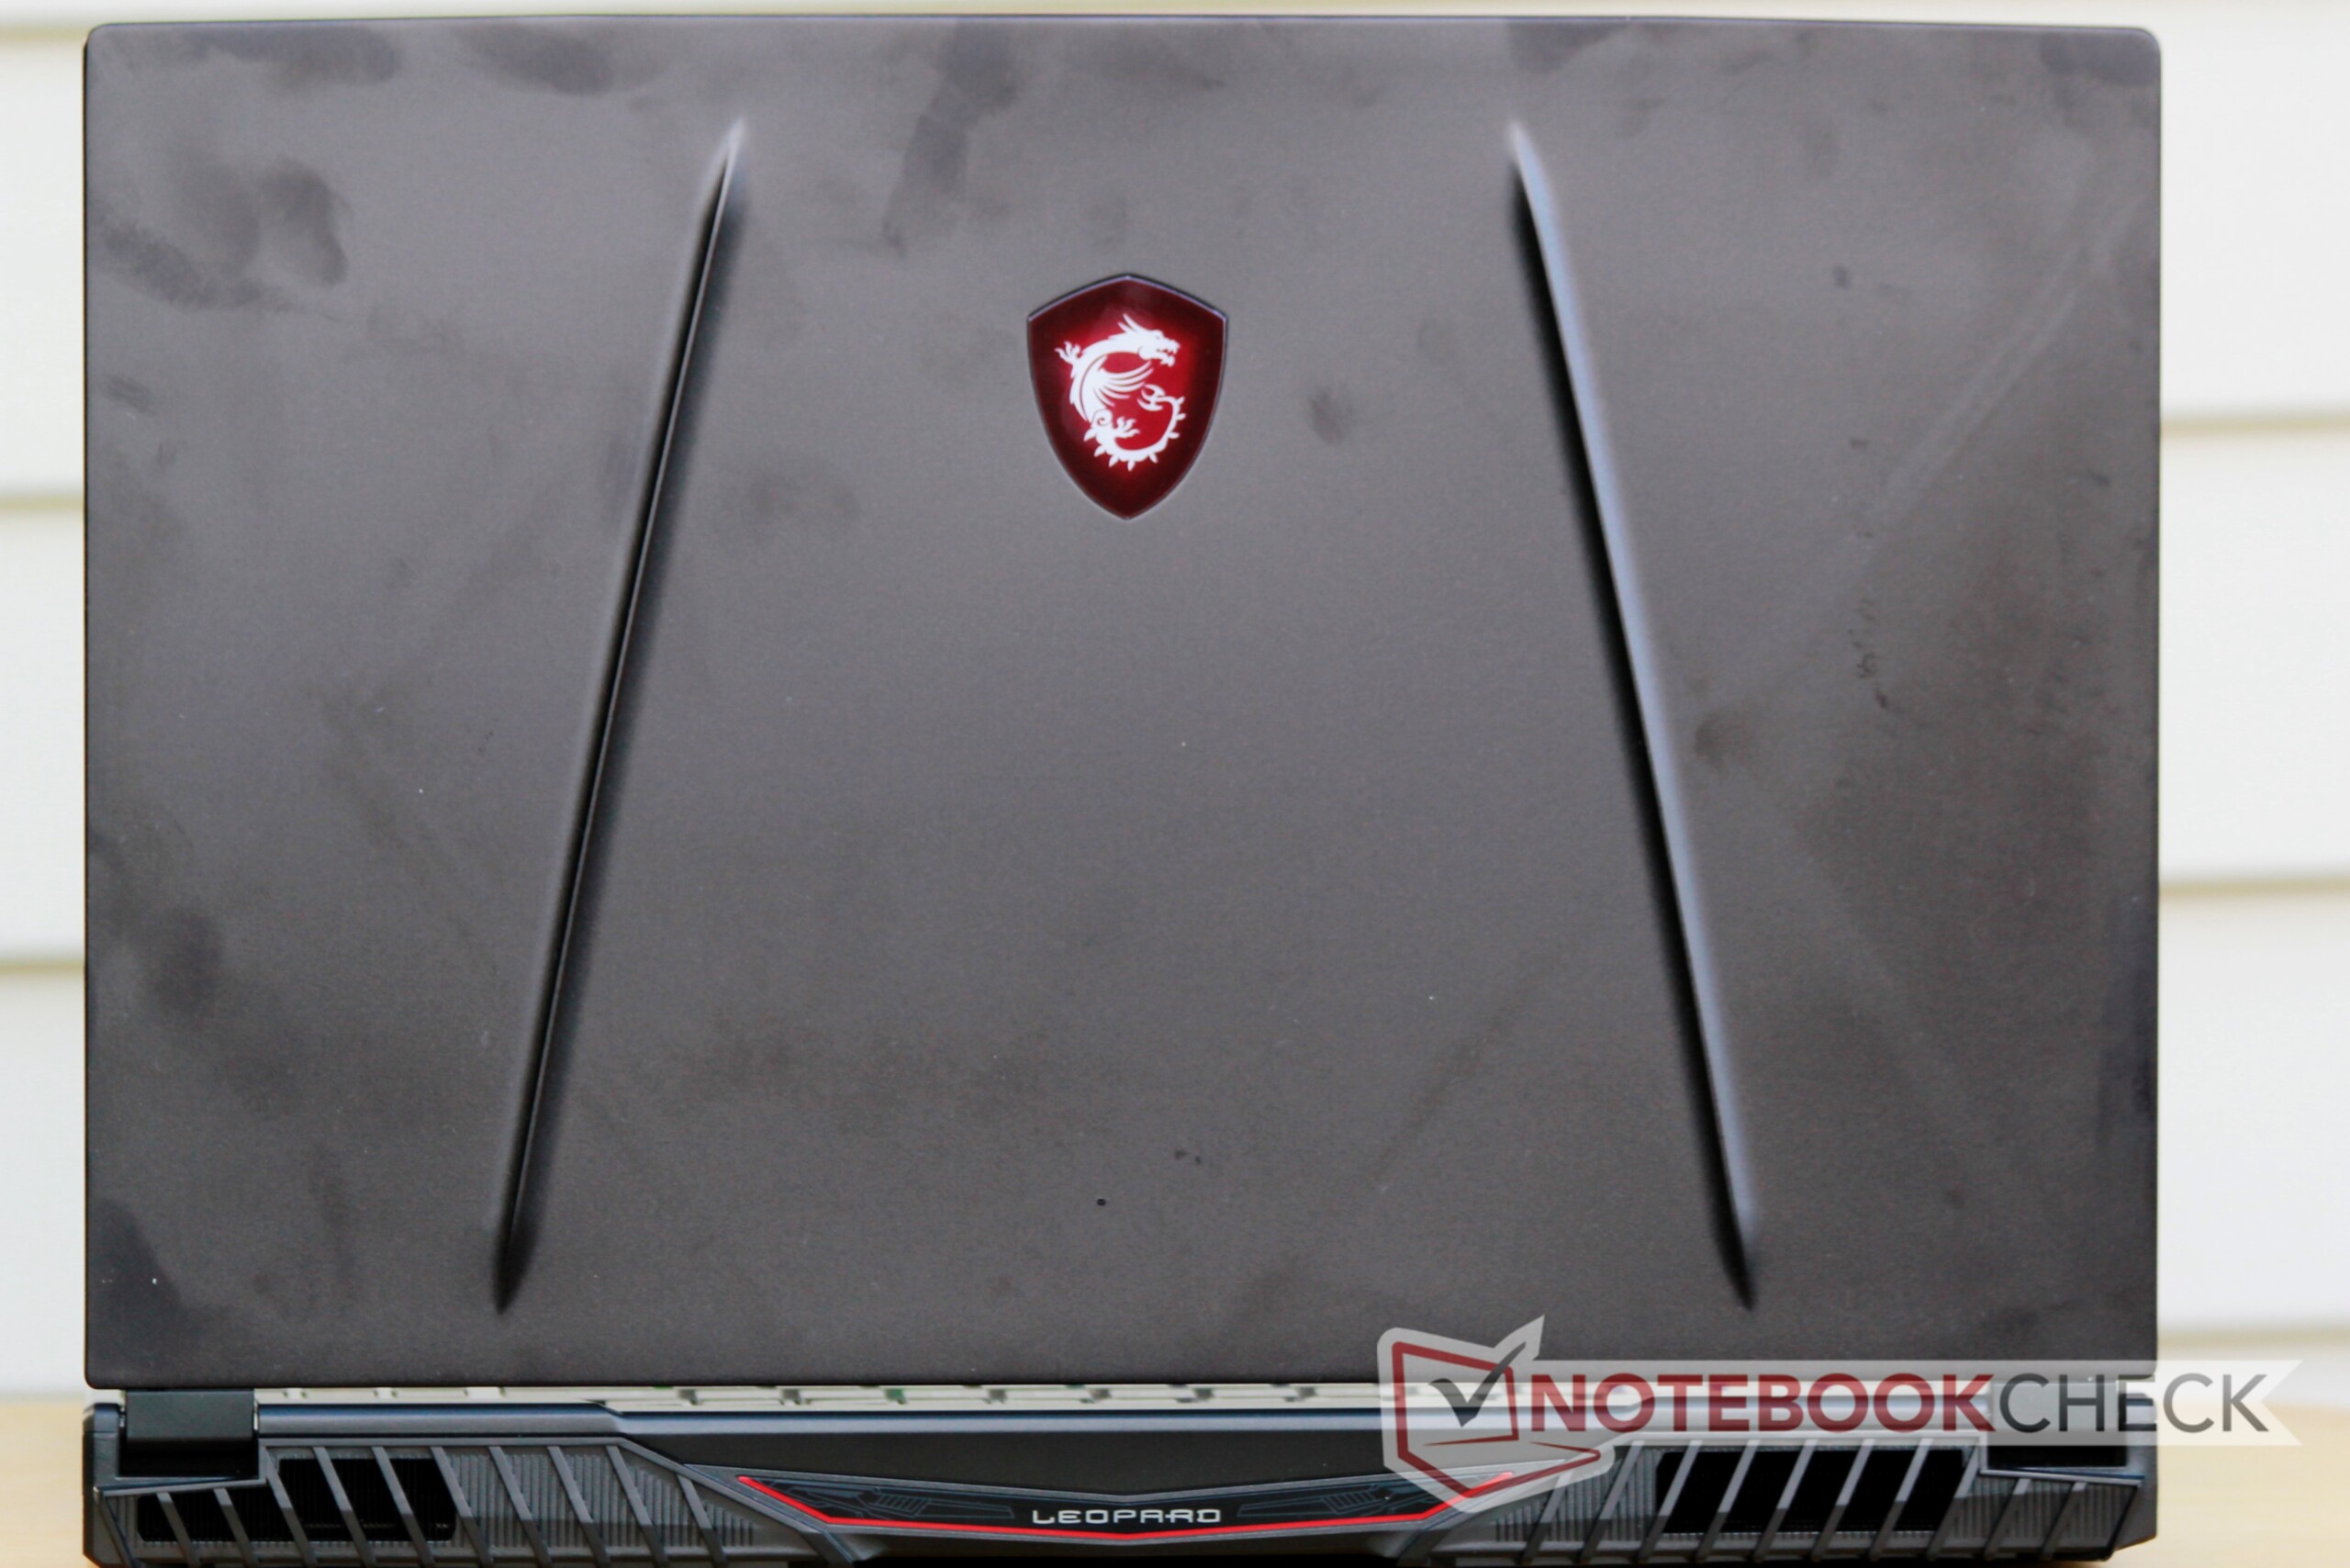
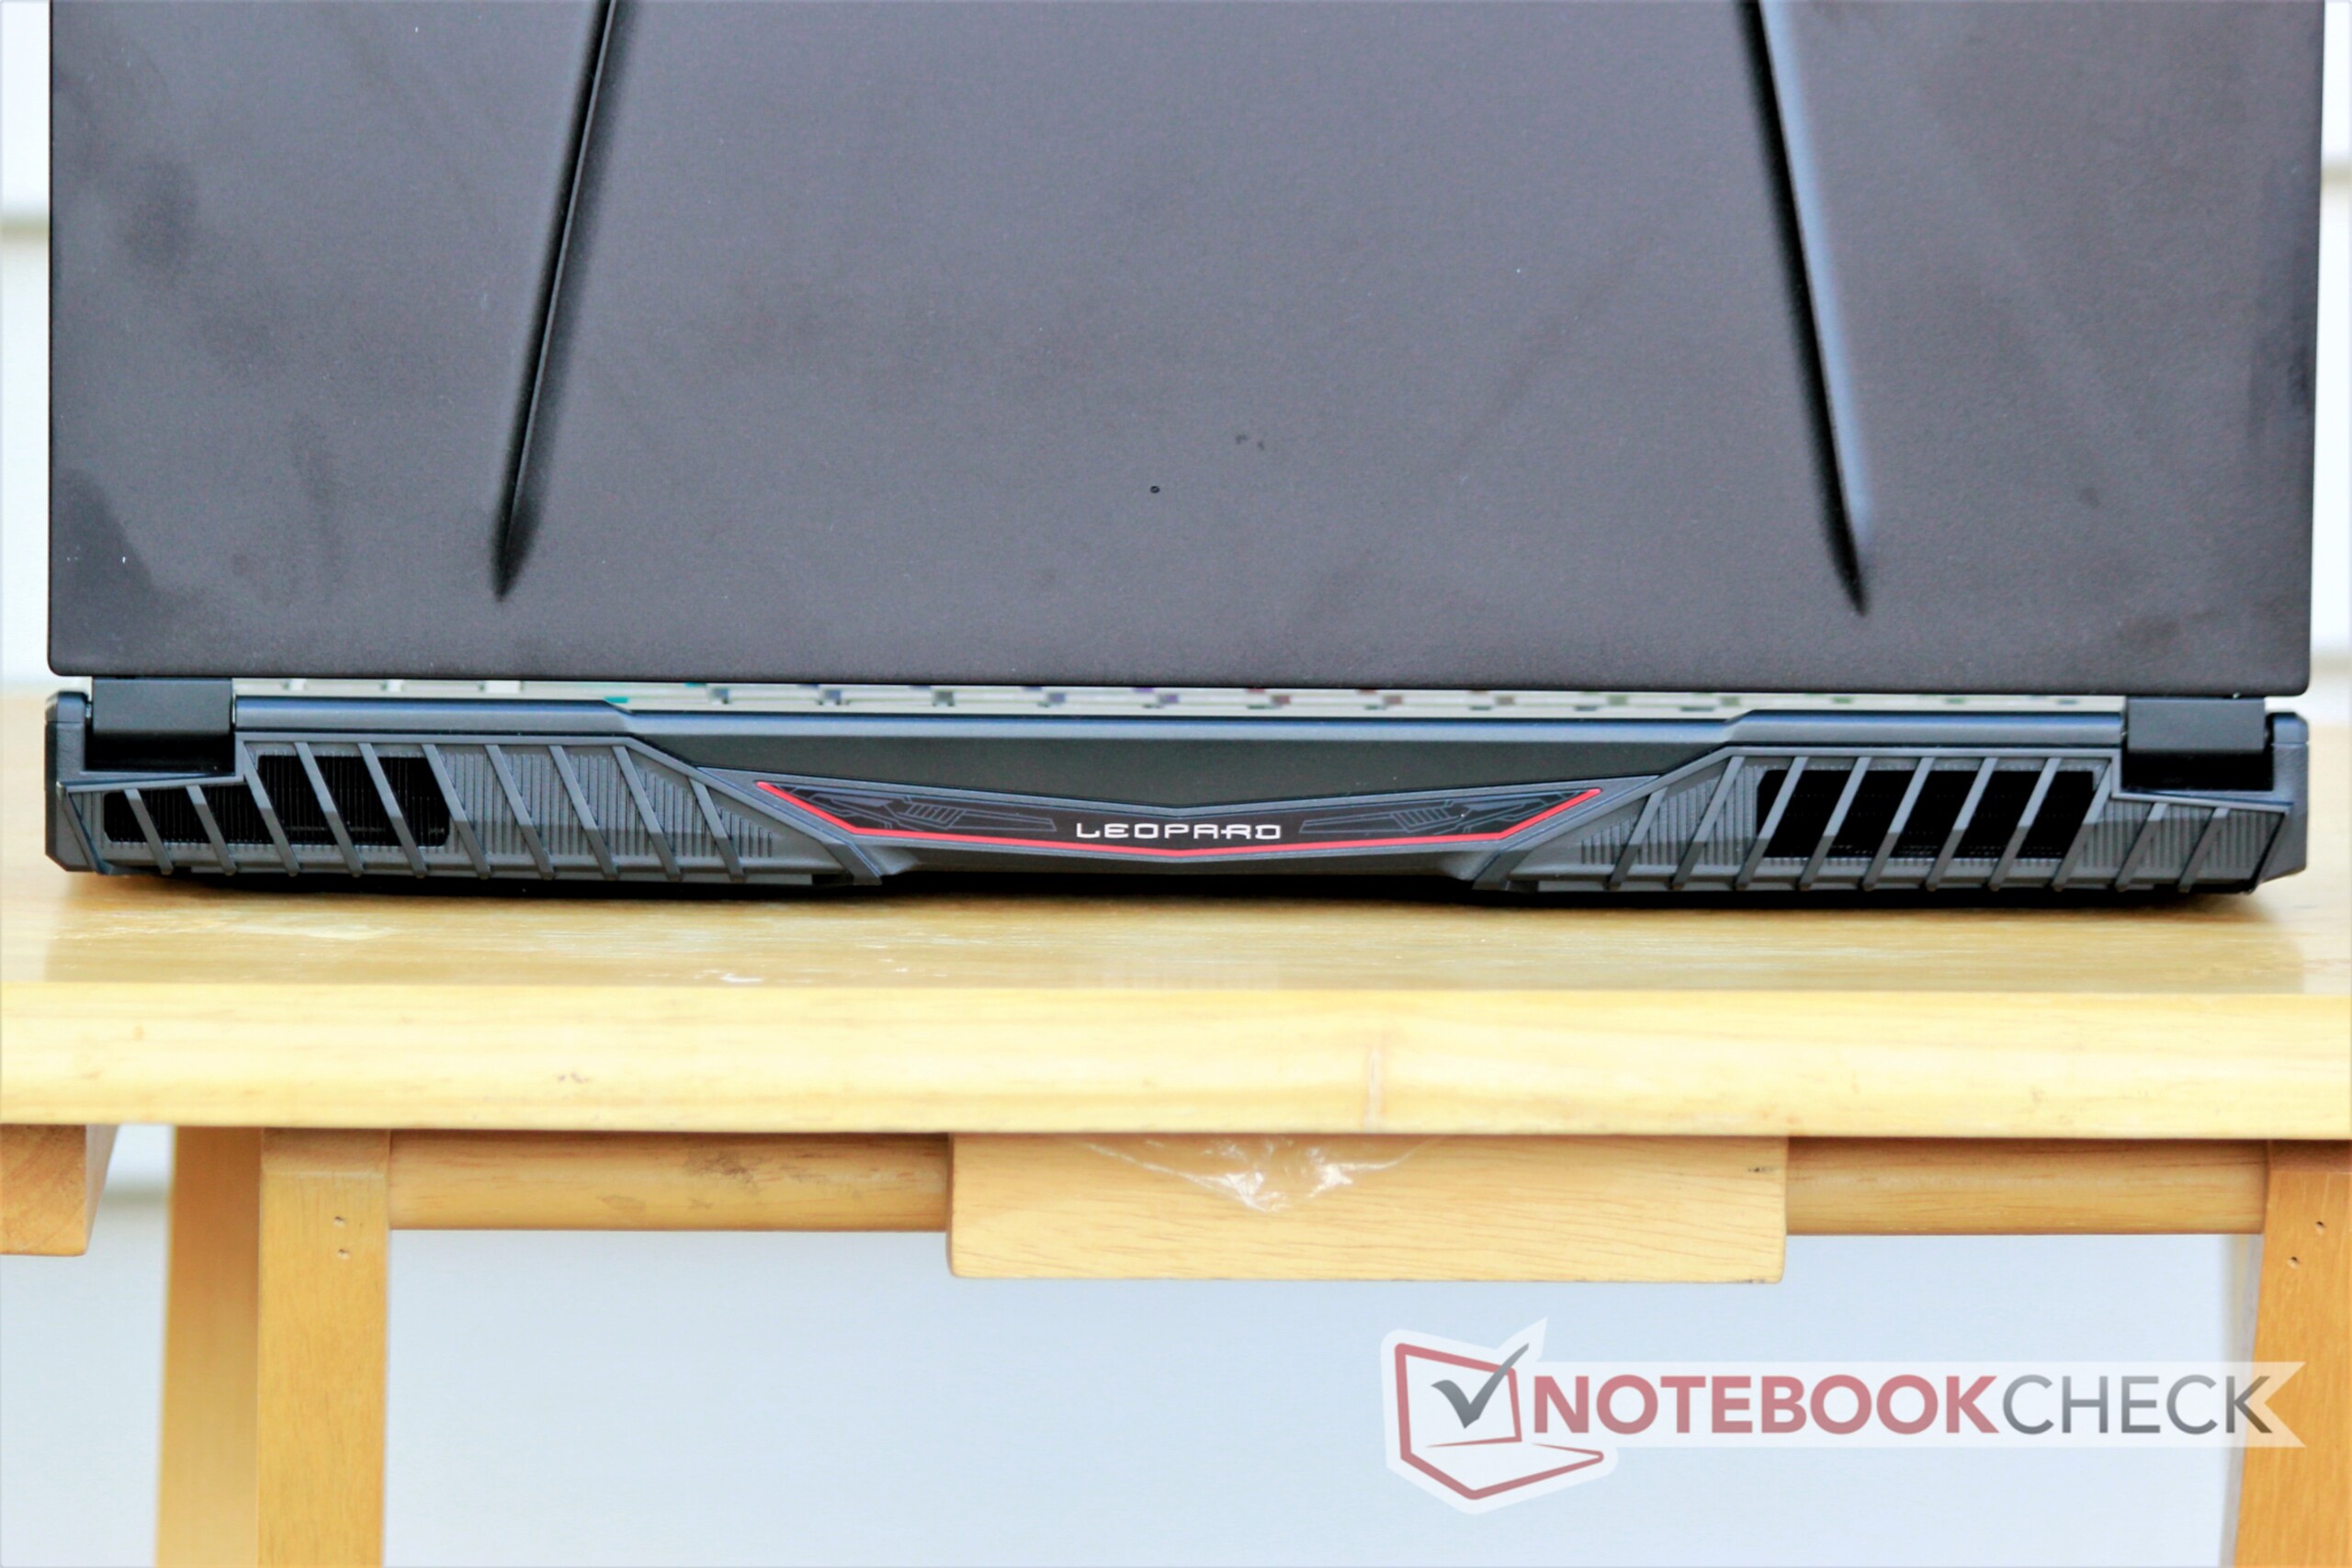
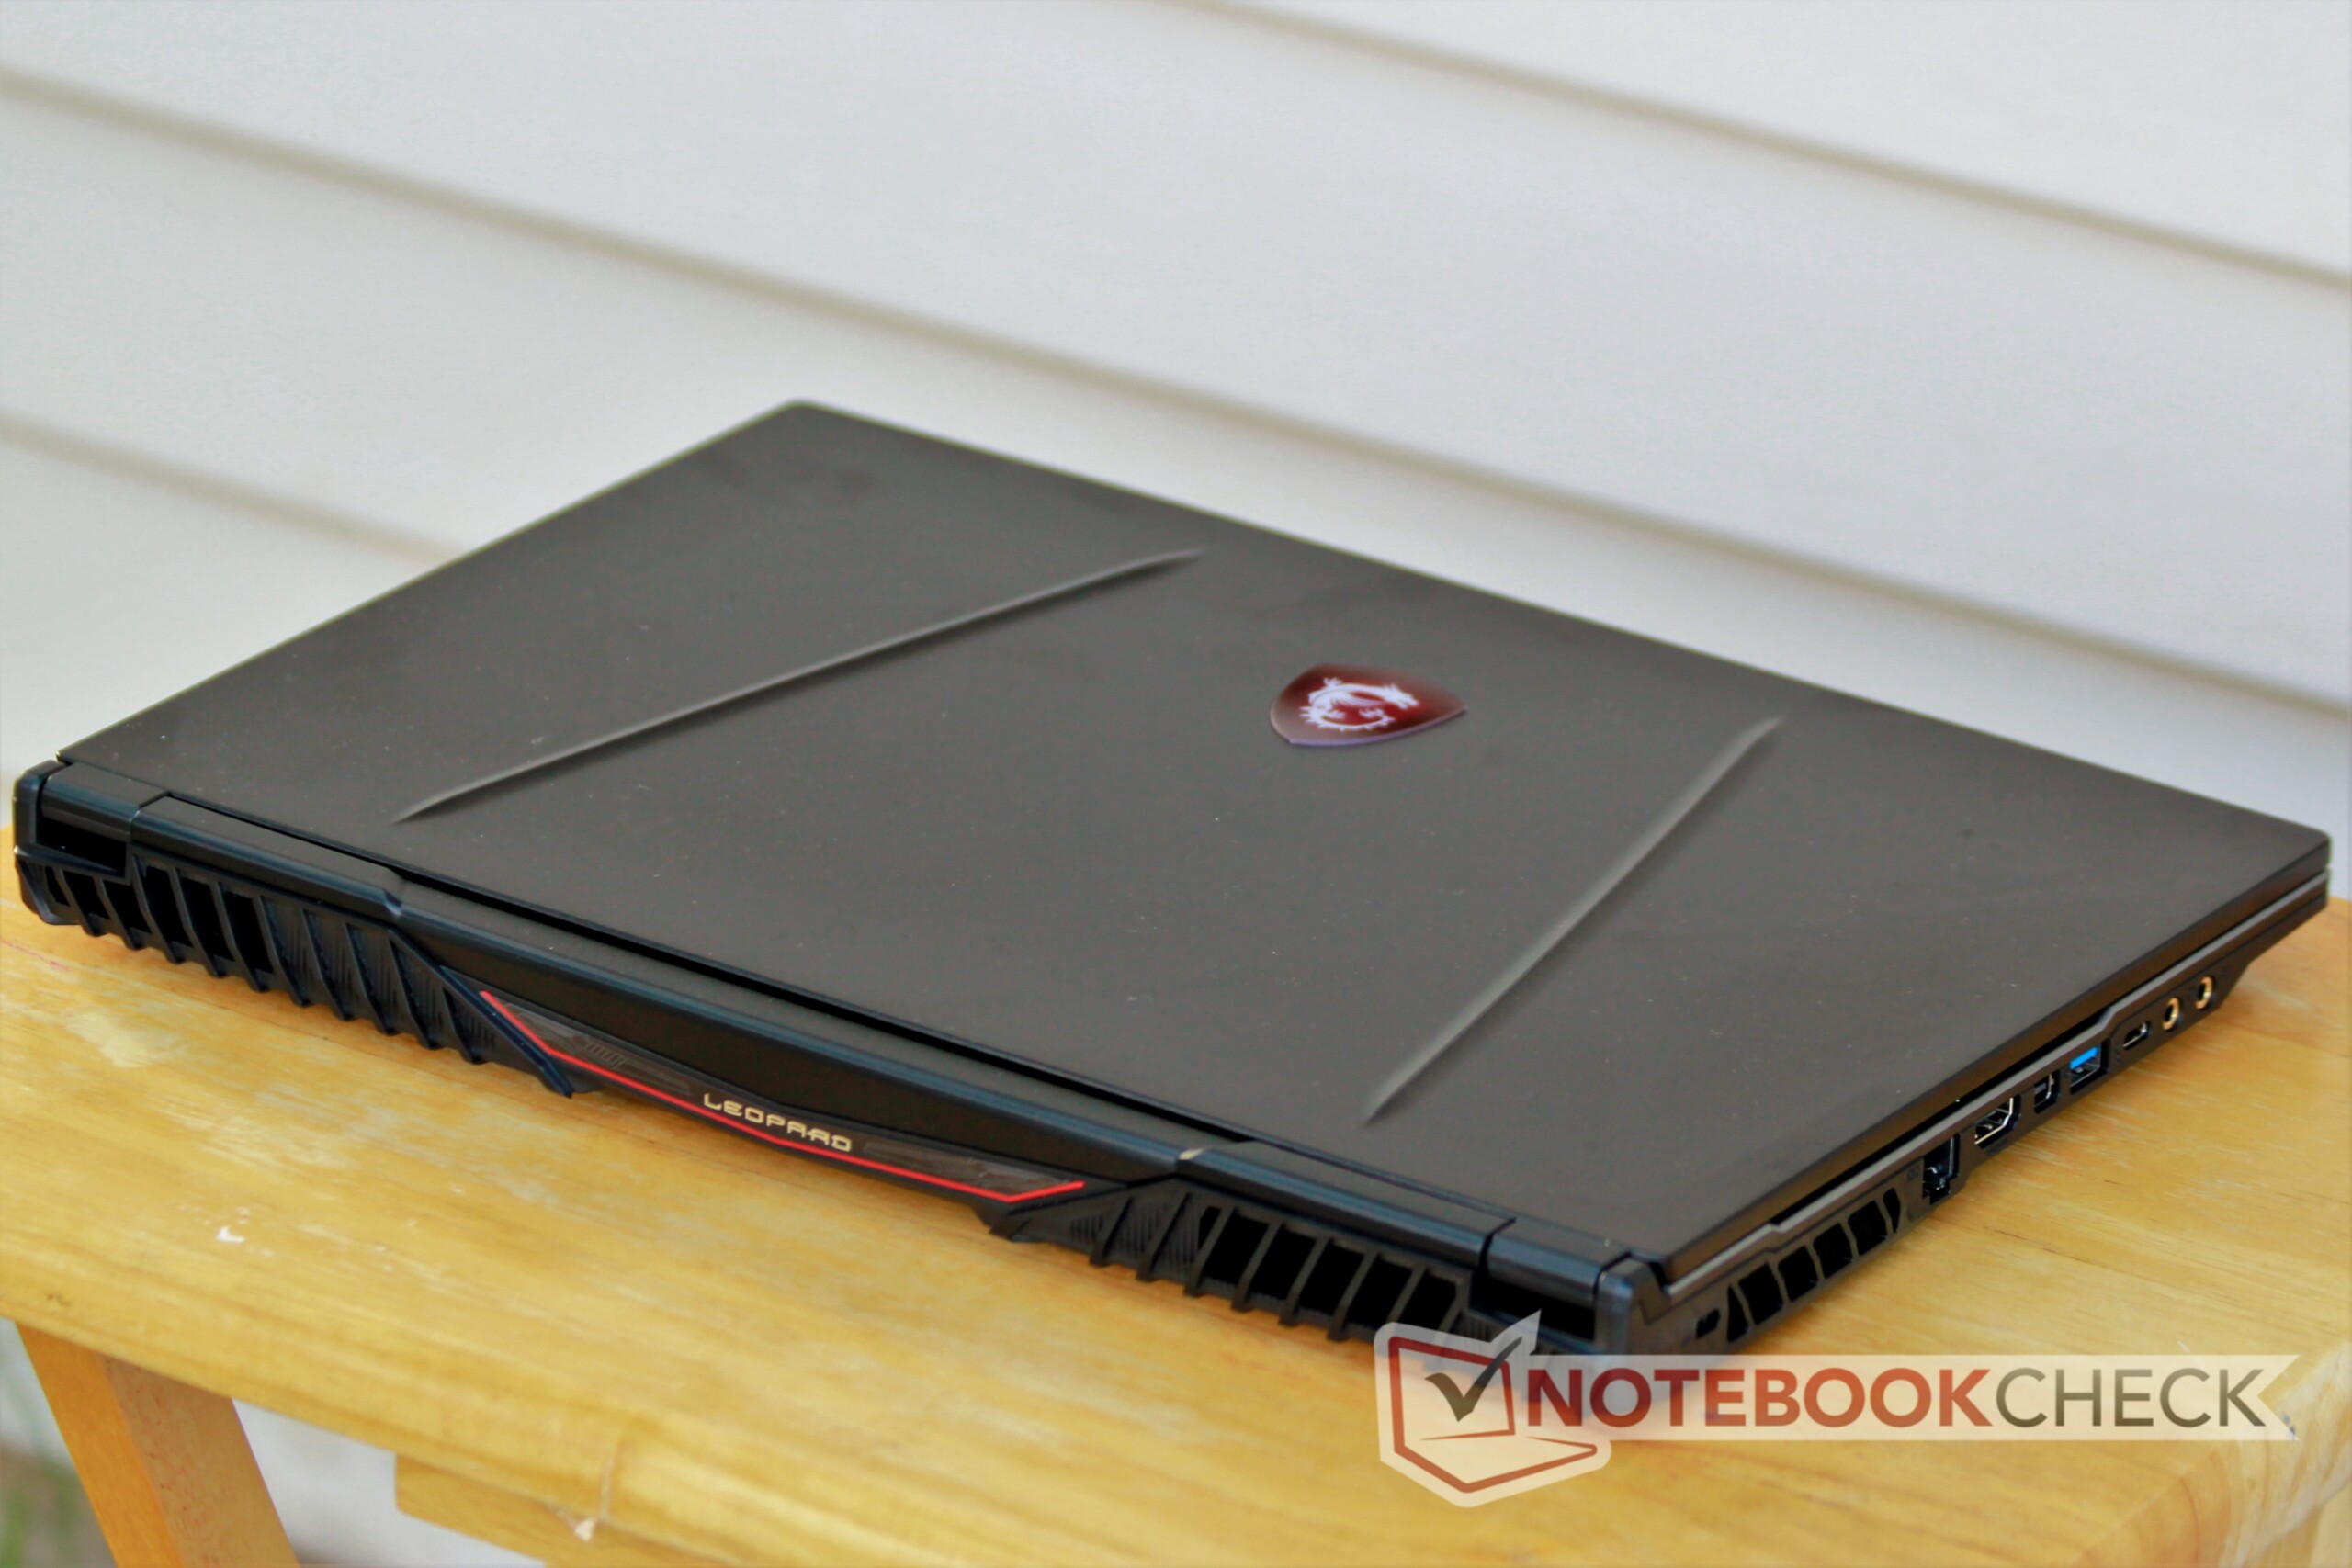
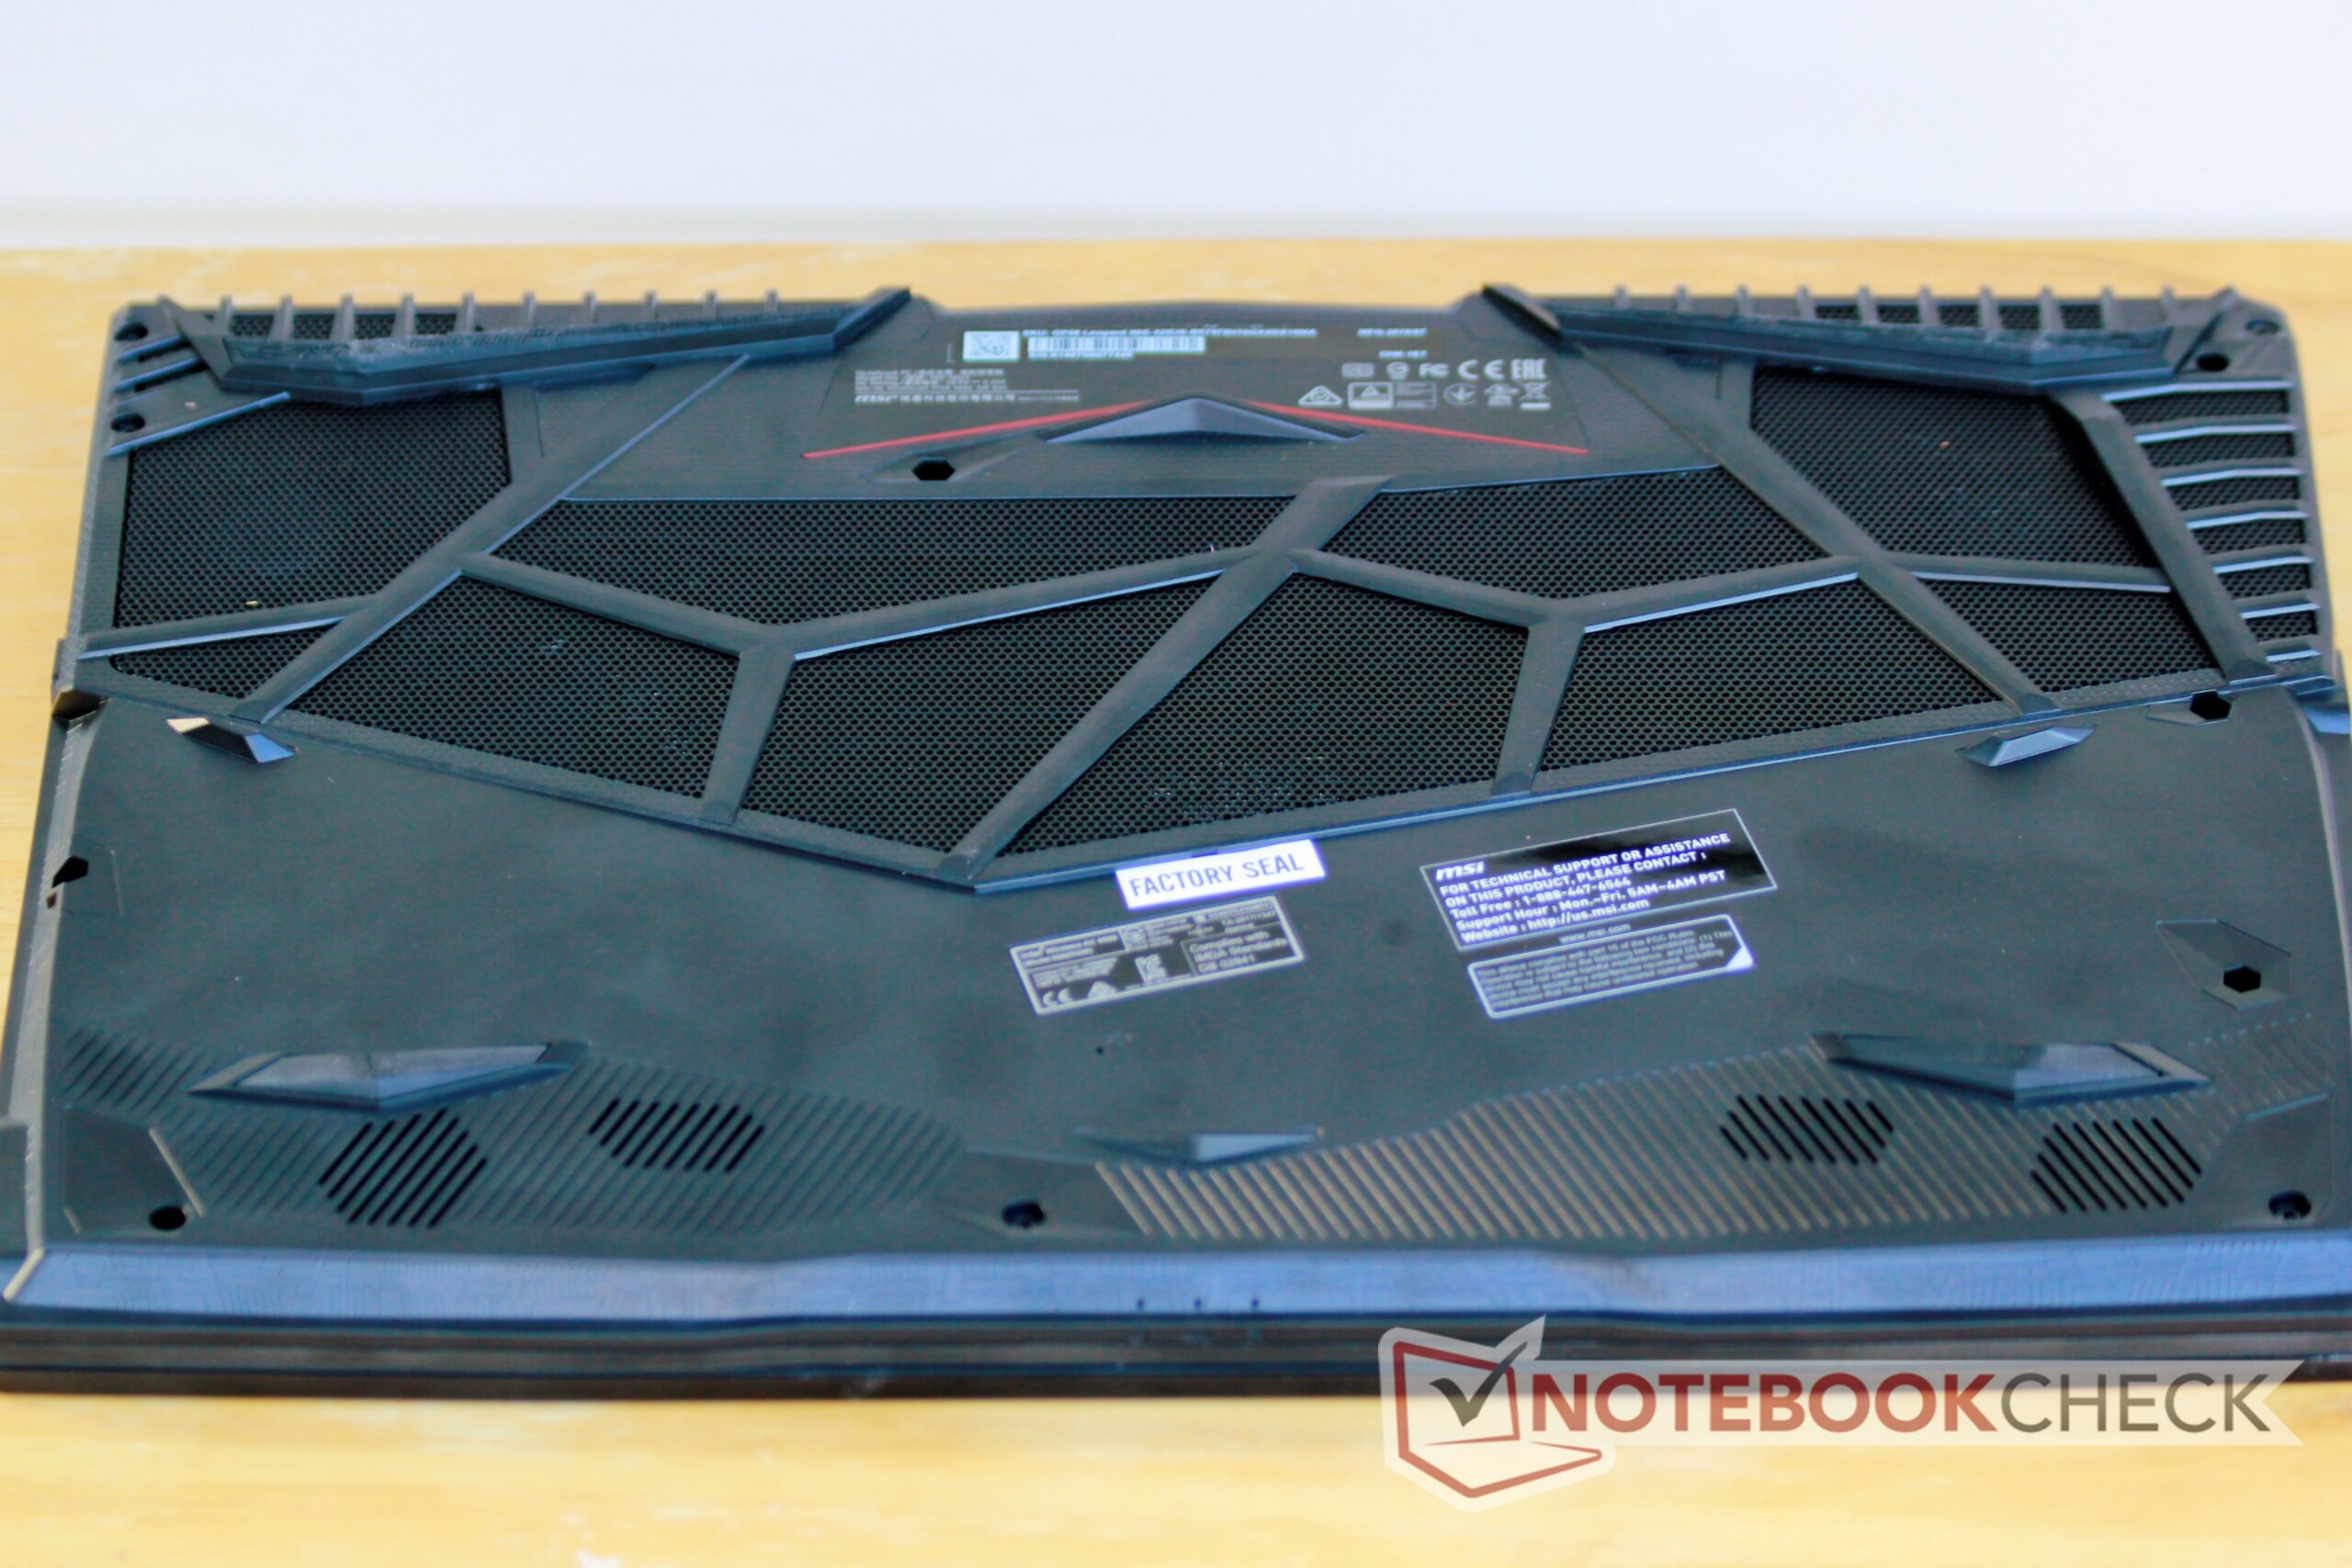
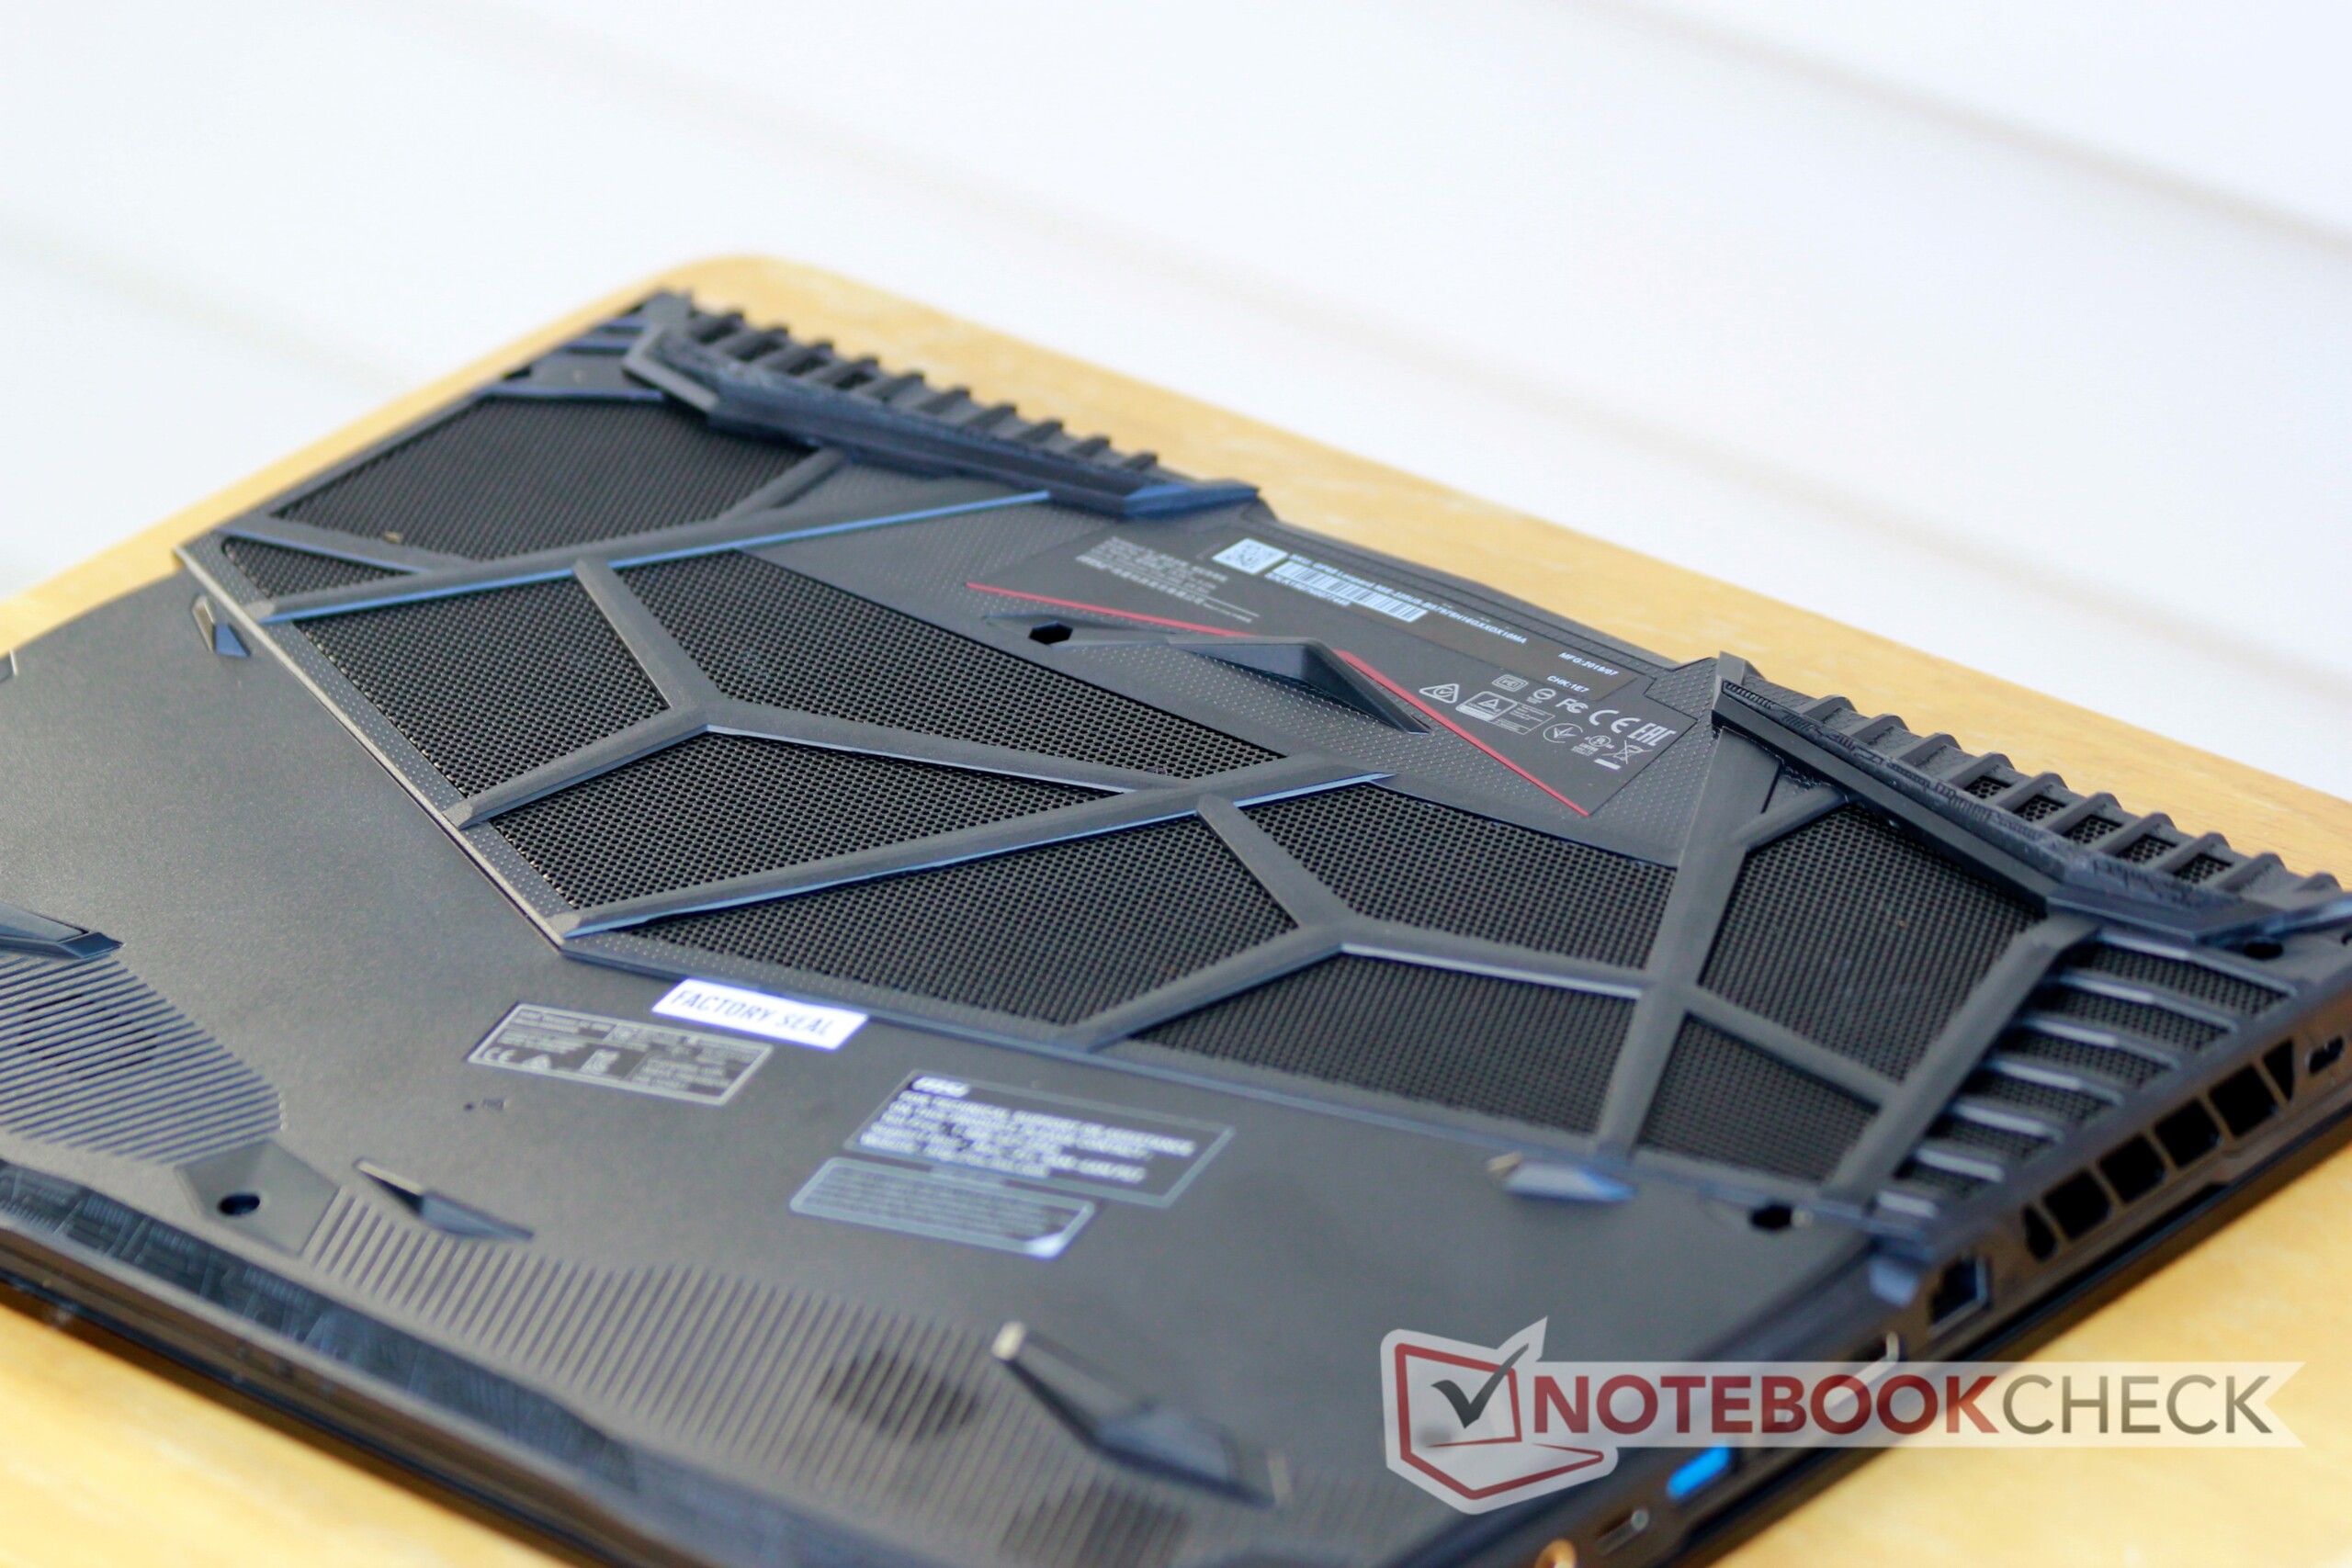
The GP65 Leopard's case is almost a mirror image of last year's GP63 Leopard. That means plastic and lots of it. The outer lid is the only break in the plastic design with its brushed aluminum surface. This surface readily attracts fingerprints (as can be seen in the photos below), and these require concentrated effort to wipe away. The plastic keyboard deck eschews the faux-brushed metal design of the GP63's in favor of a smooth, glossy finish. This surface fares much better in resisting fingerprints. The bottom panel has been redesigned and features much more ventilation; about 1/3 of the bottom panel is perforated to allow for better airflow into the chassis.
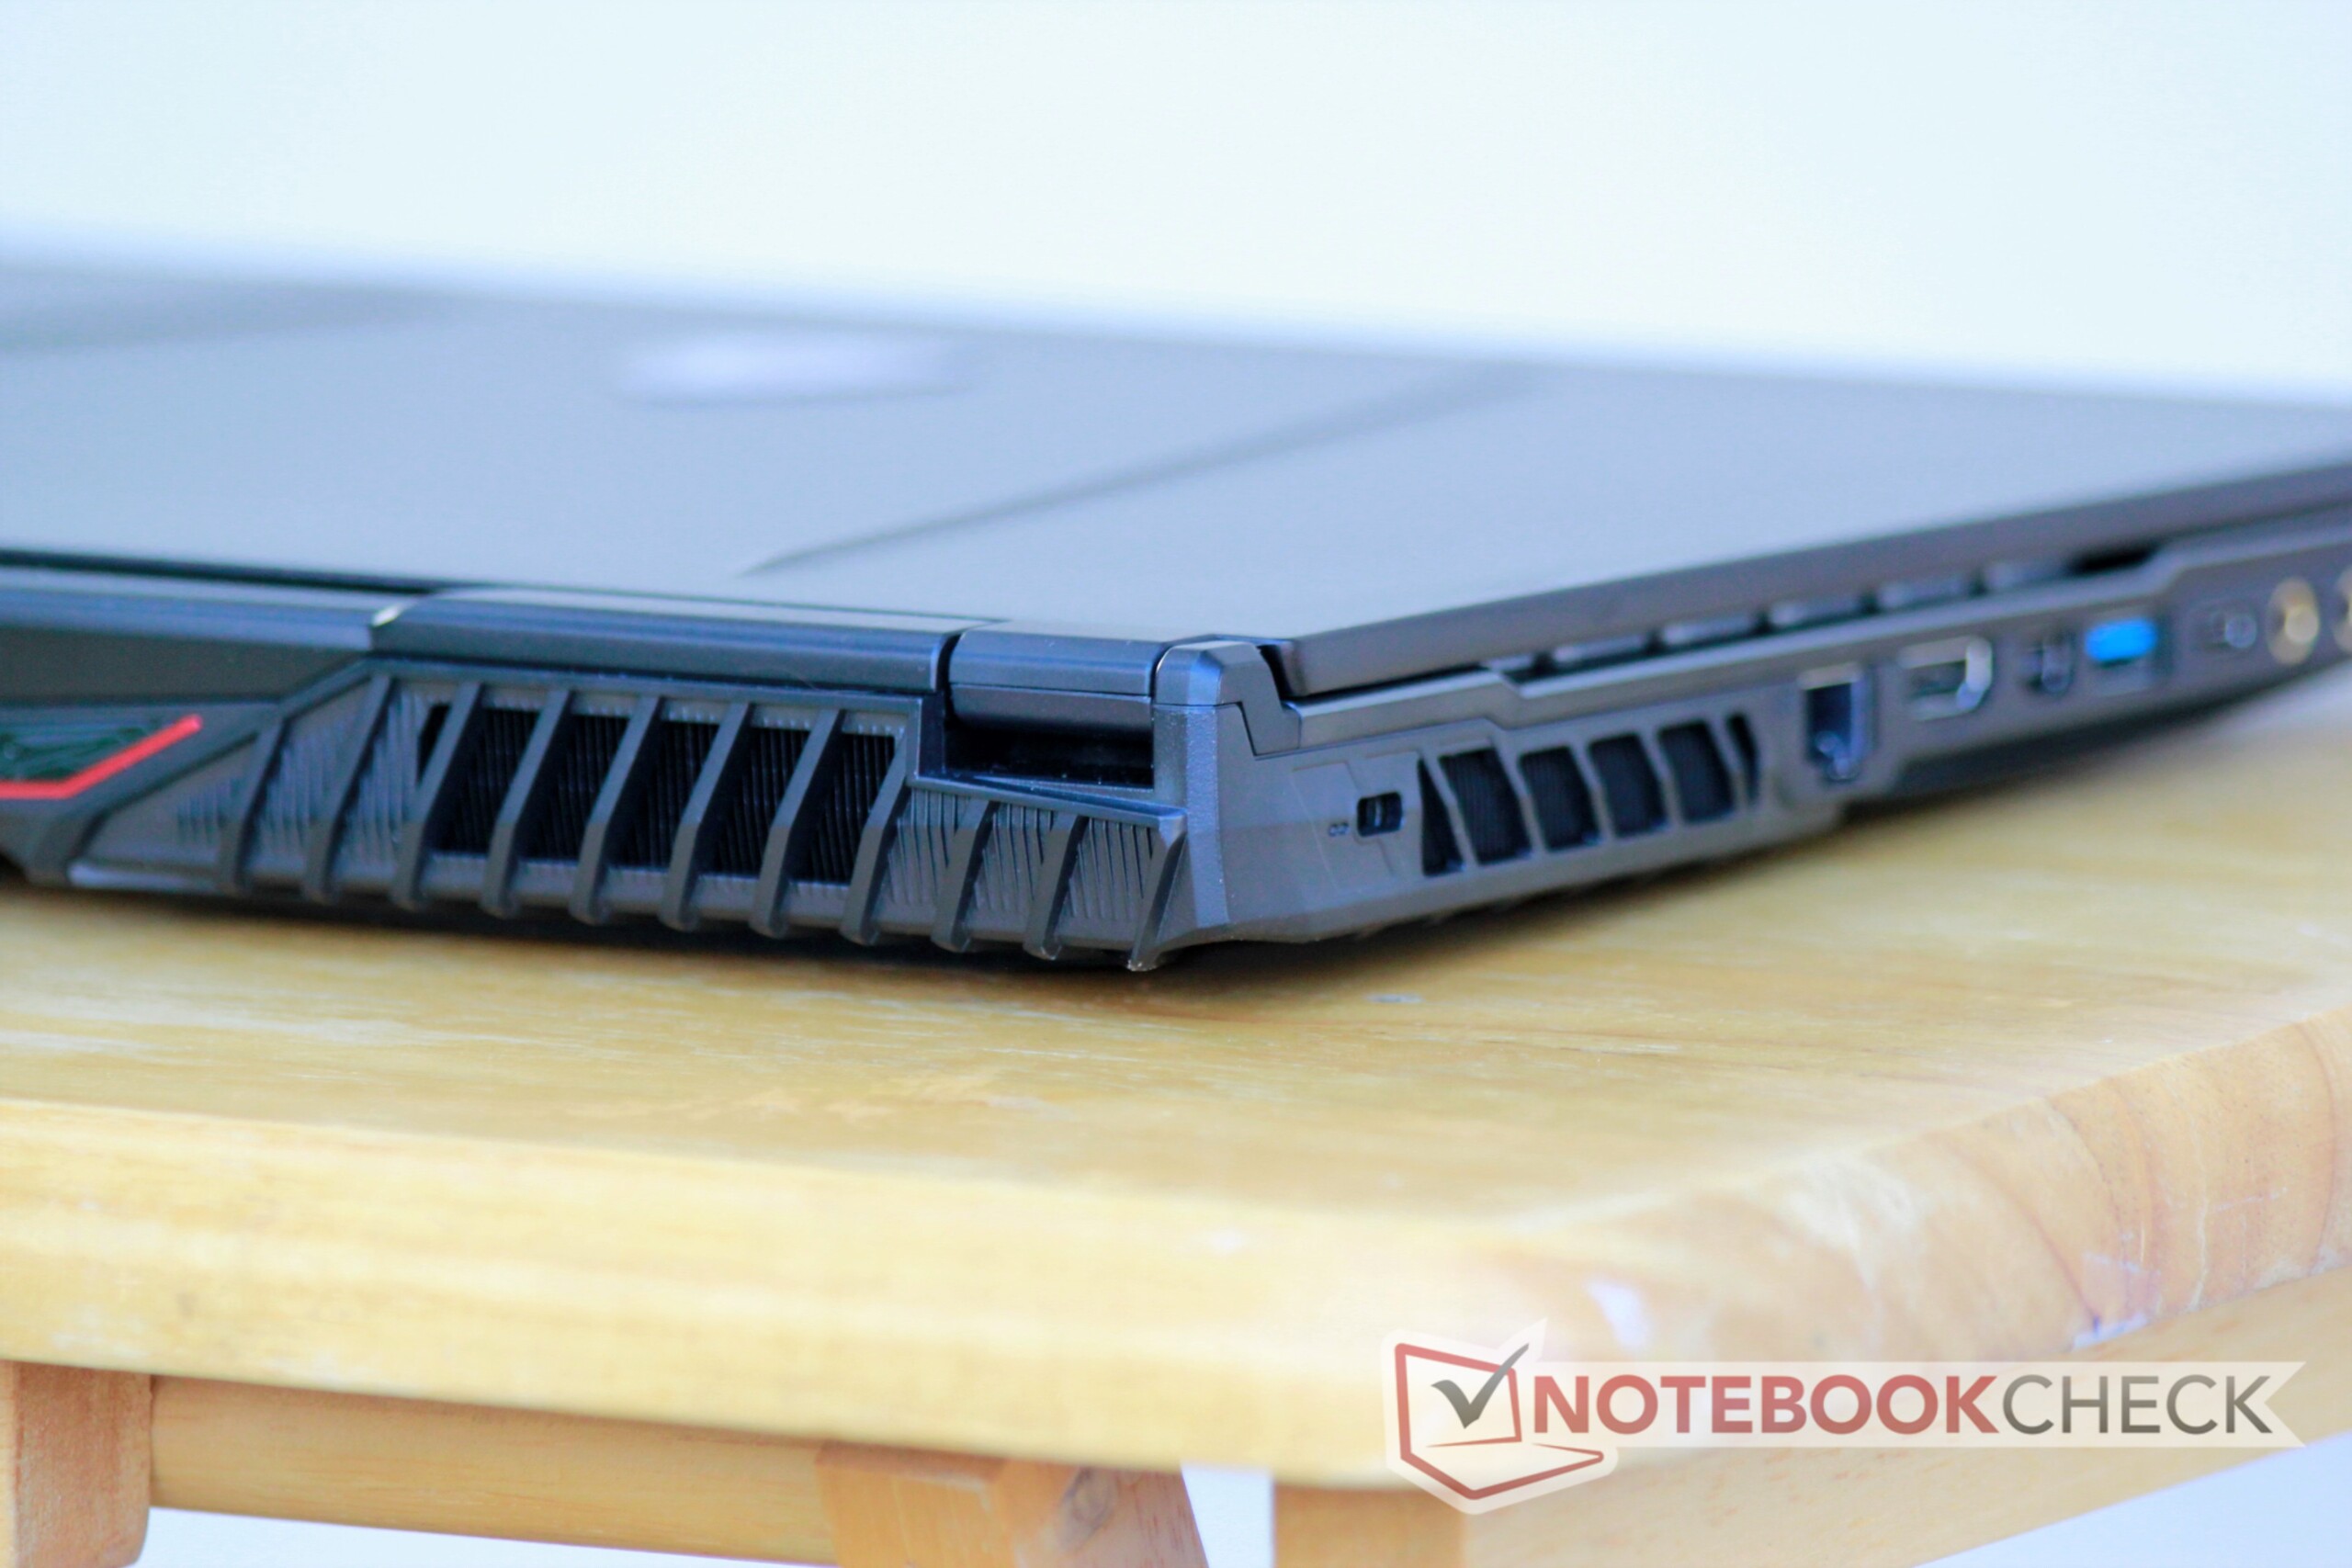
The case itself is fairly stable with minimal flex along the keyboard deck. The palm rests are very sturdy and do not warp under pressure. There are some clicks and creaks when the keyboard deck is pressed. Unfortunately, like the older GP63, the thin lid is highly susceptible to torsion. Particular weak points lie along the bottom of the lid between the hinges and the center. The hinges themselves are well-tuned, allowing for one-handed opening up to about 75°, after which the base begins to lift with the display. The hinges allow the display to open to 150°.
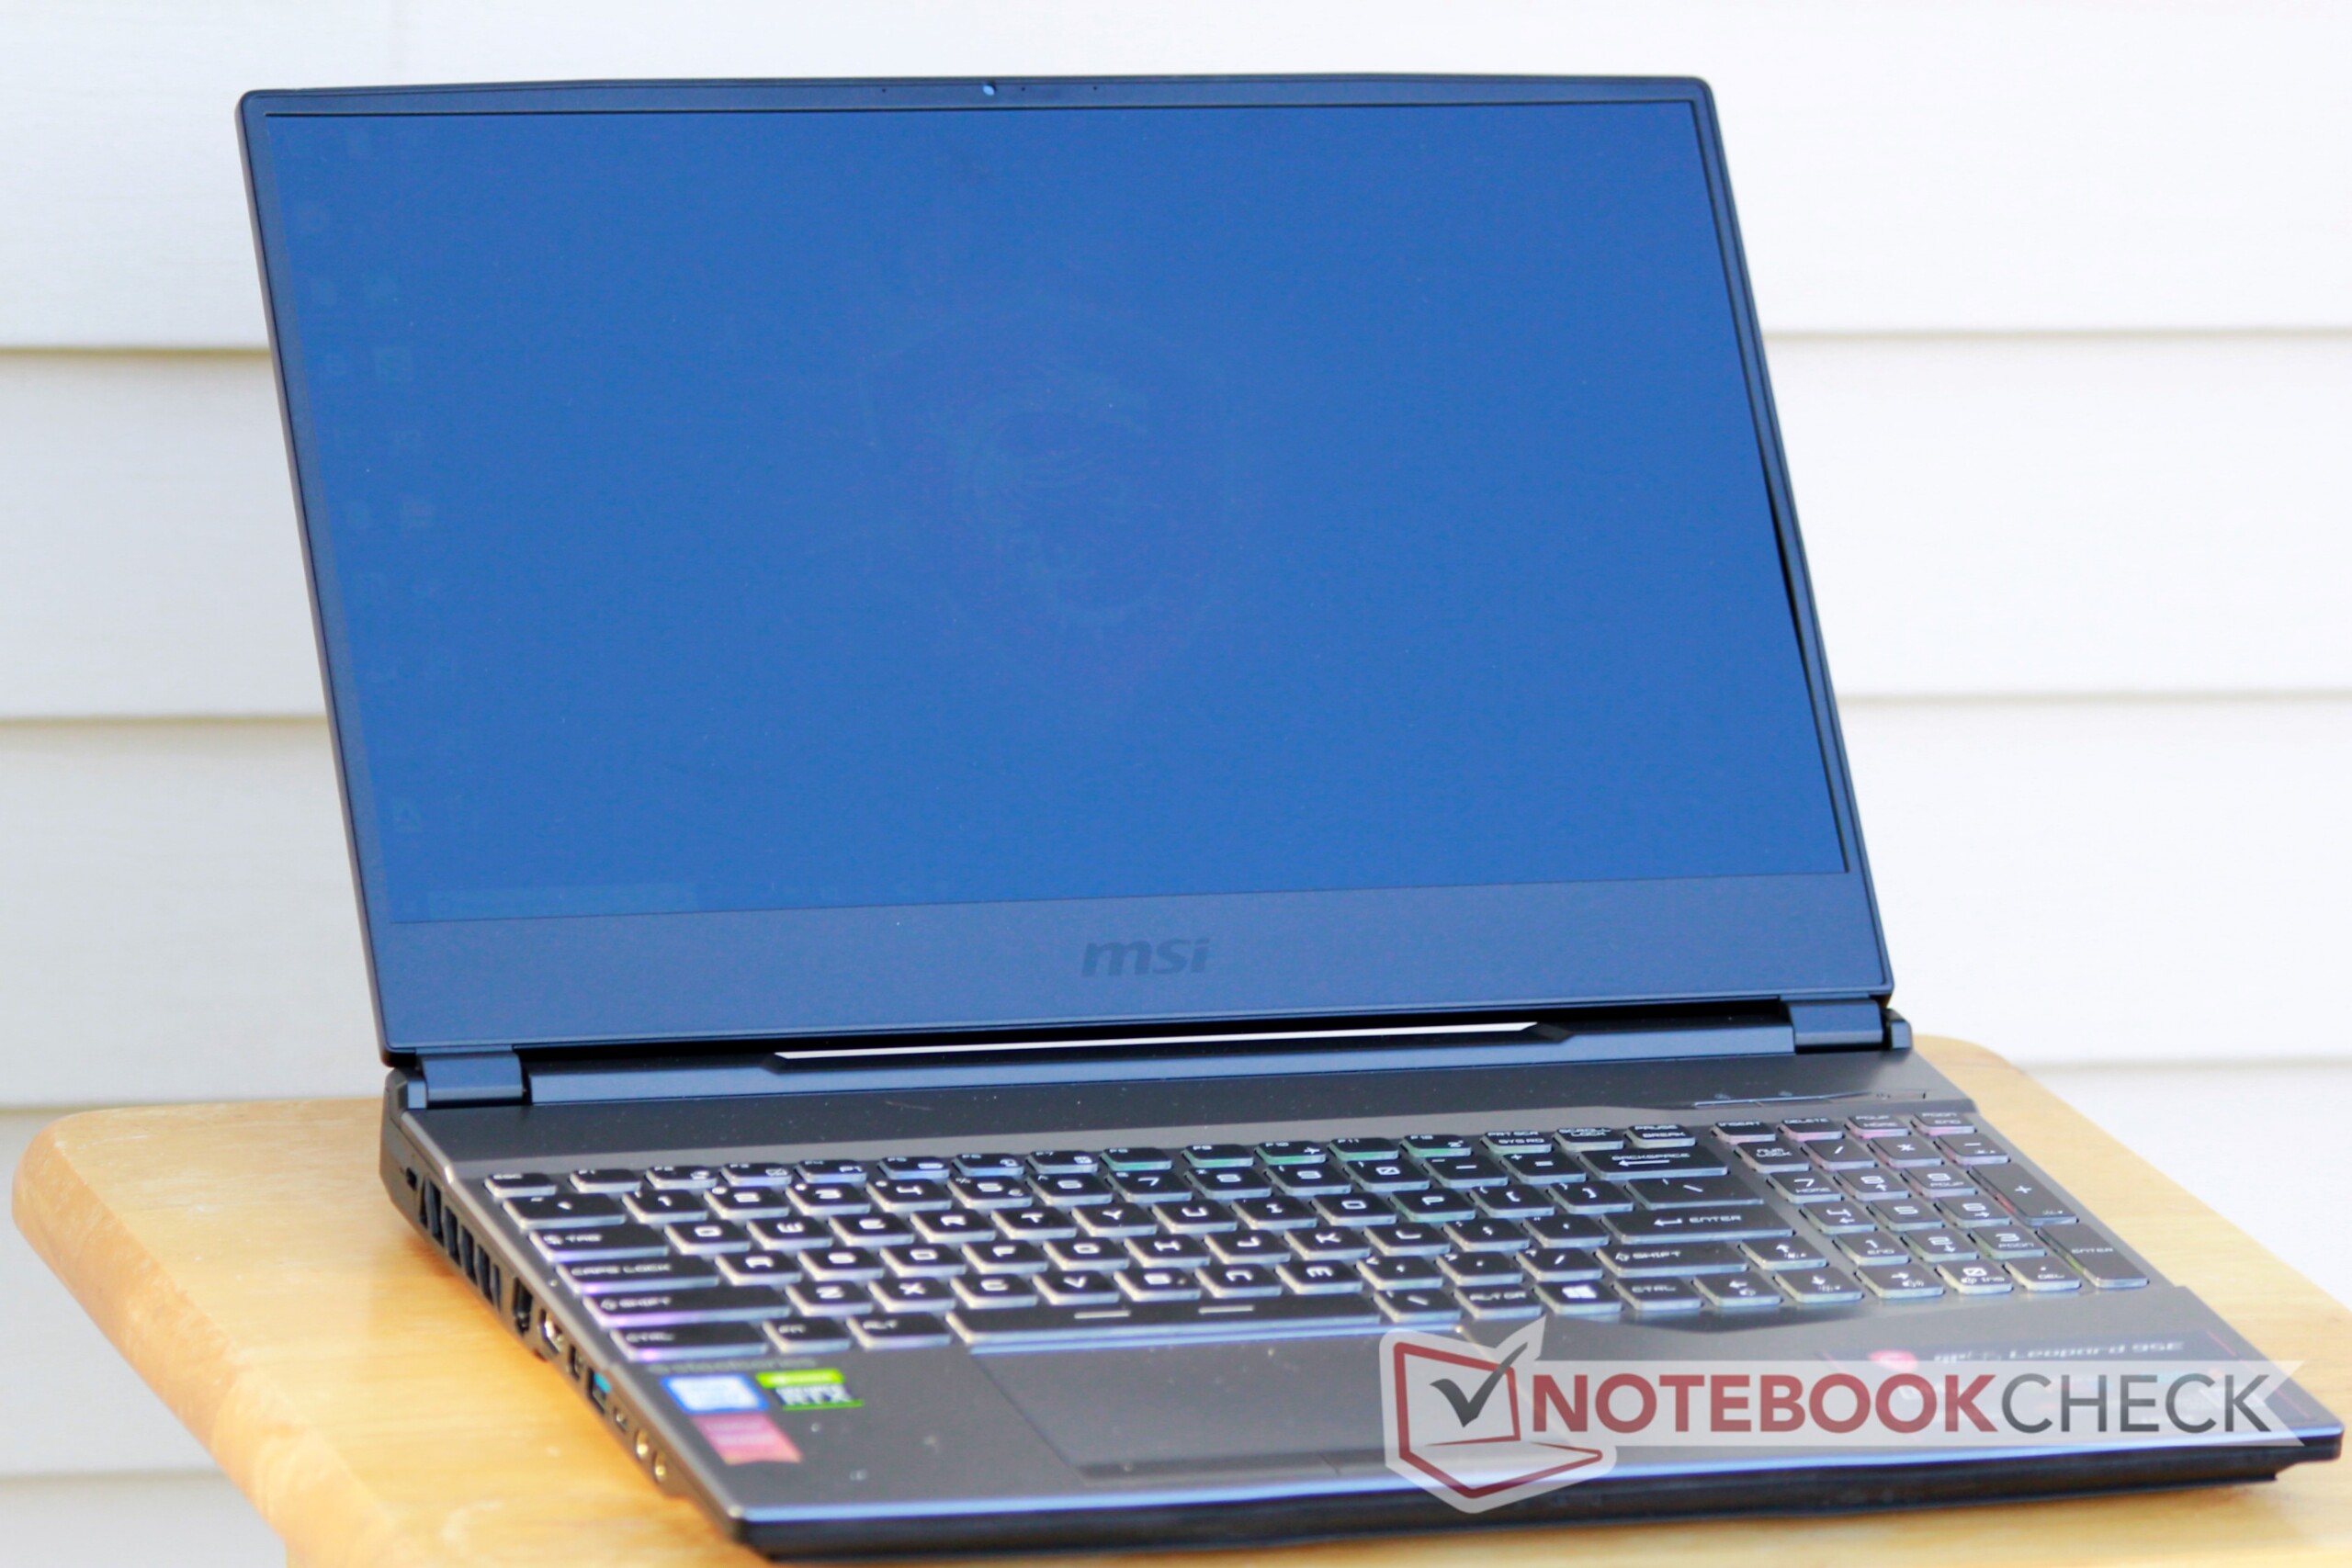
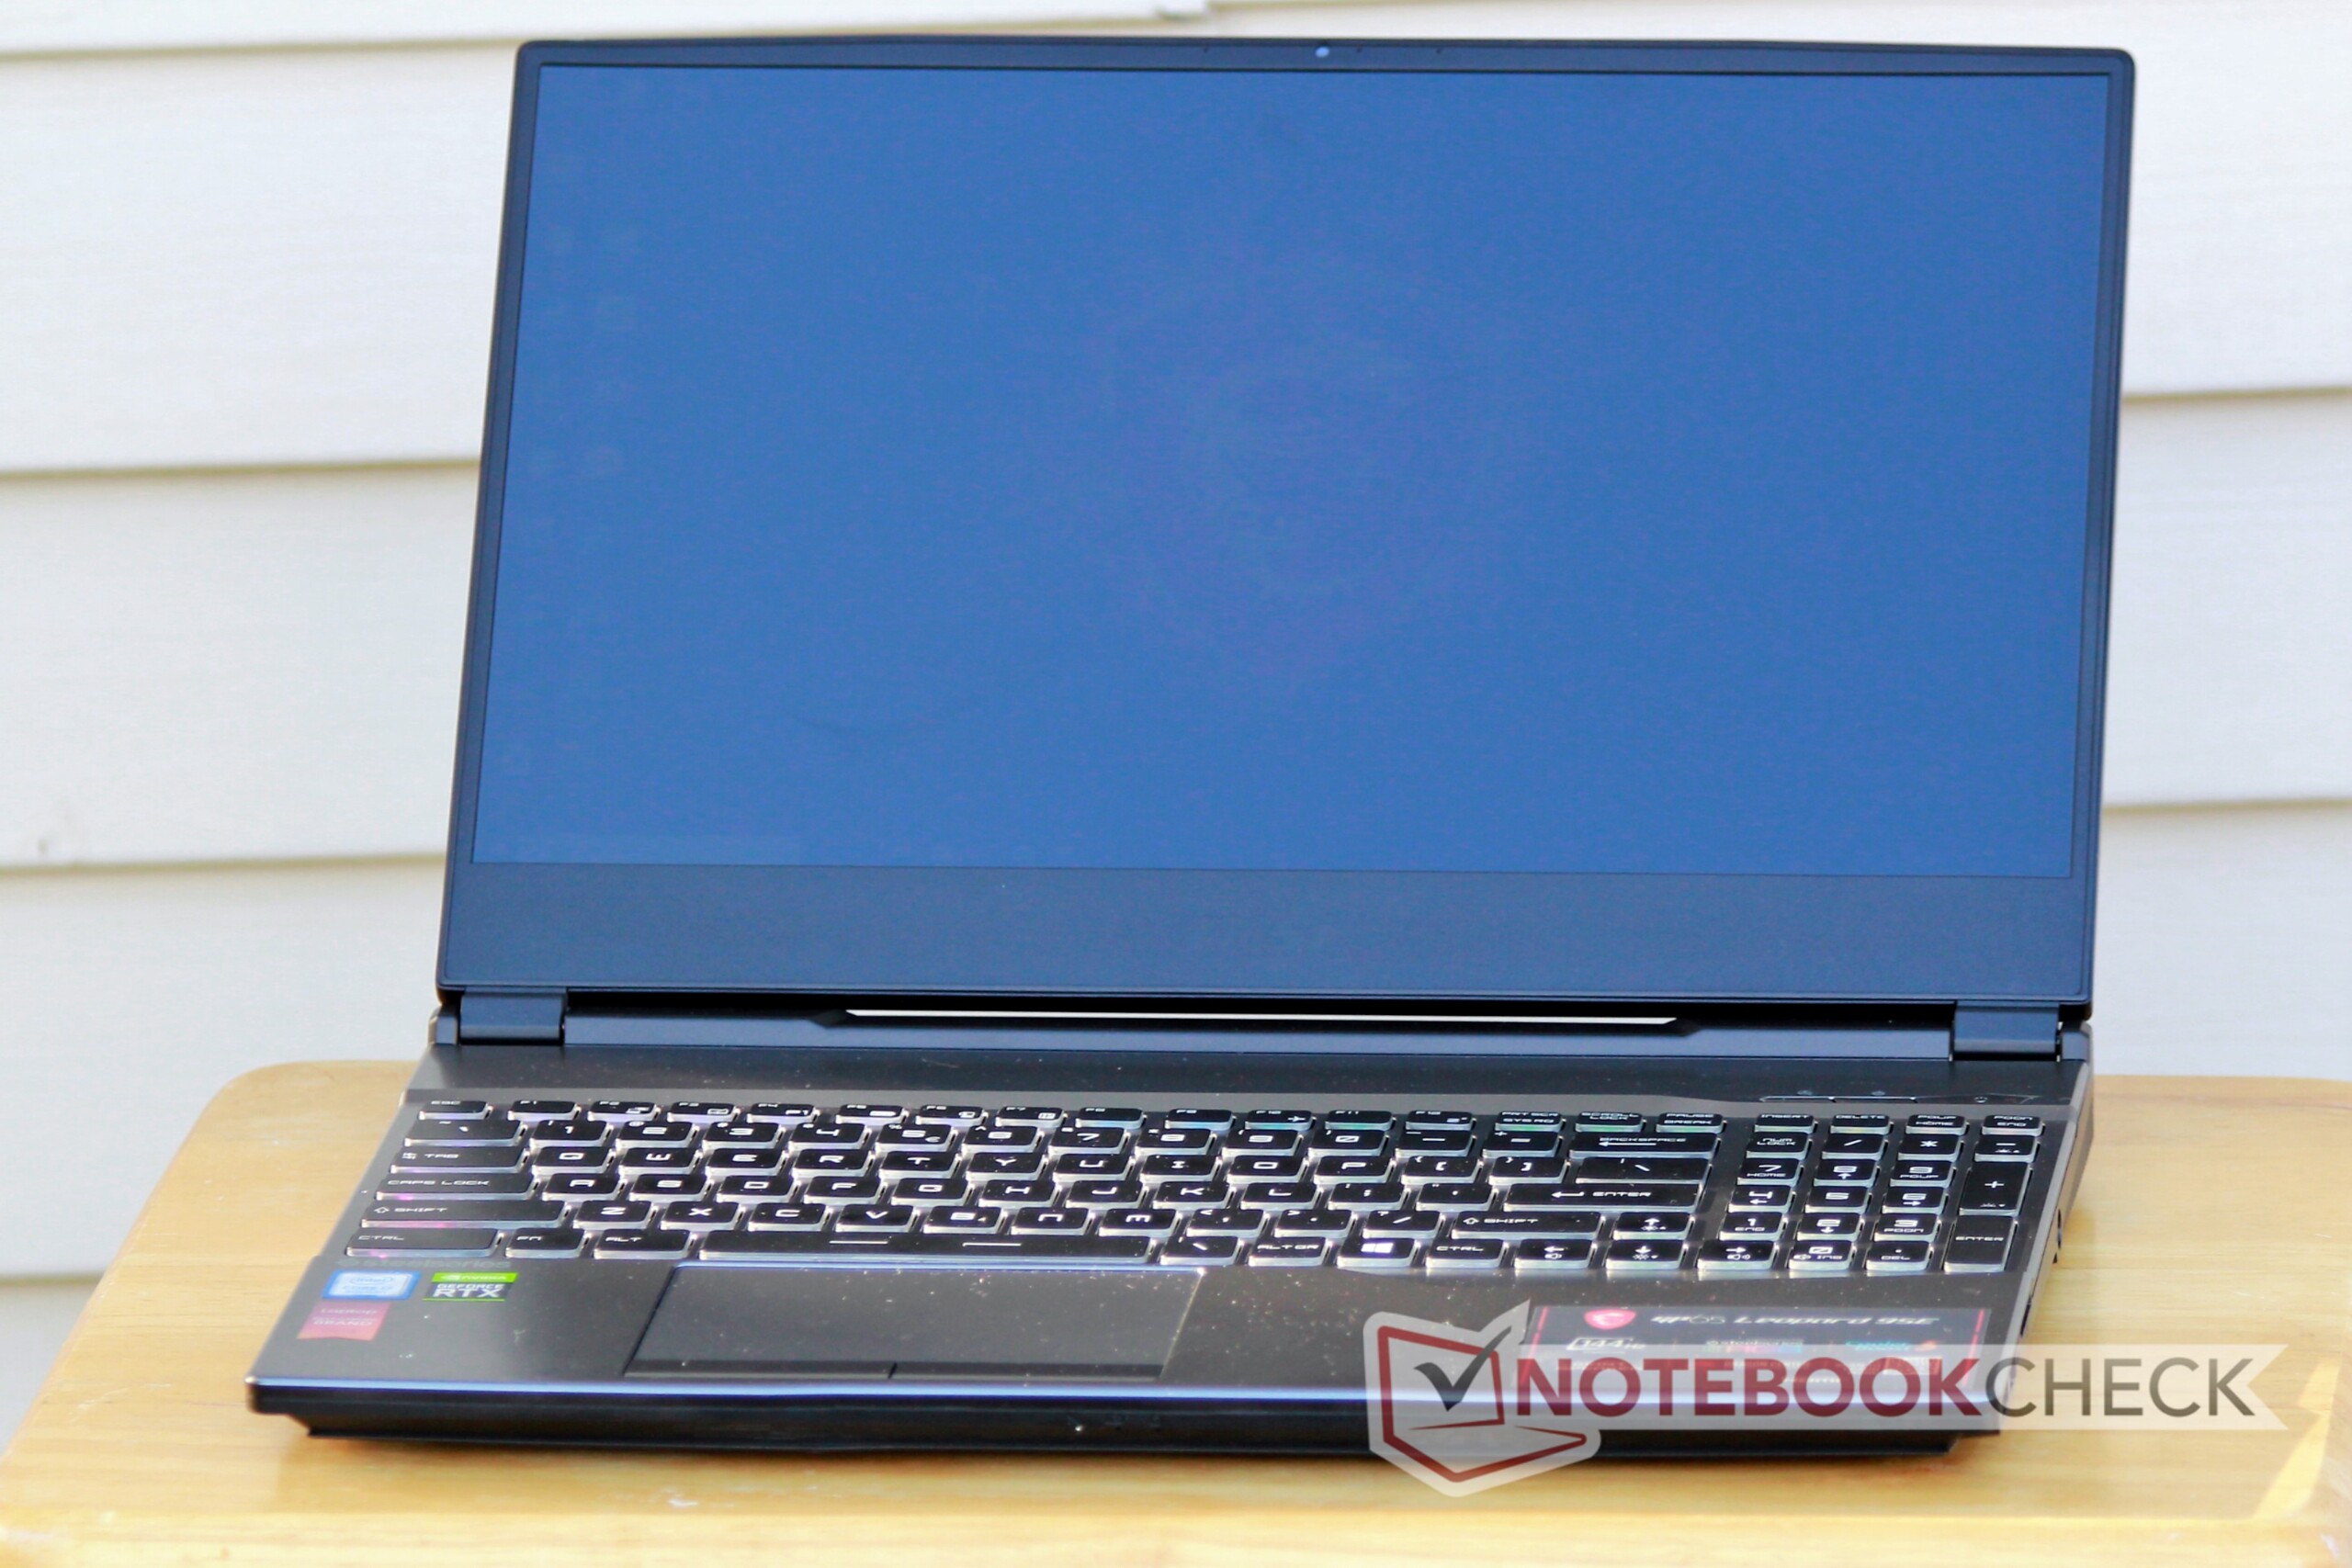
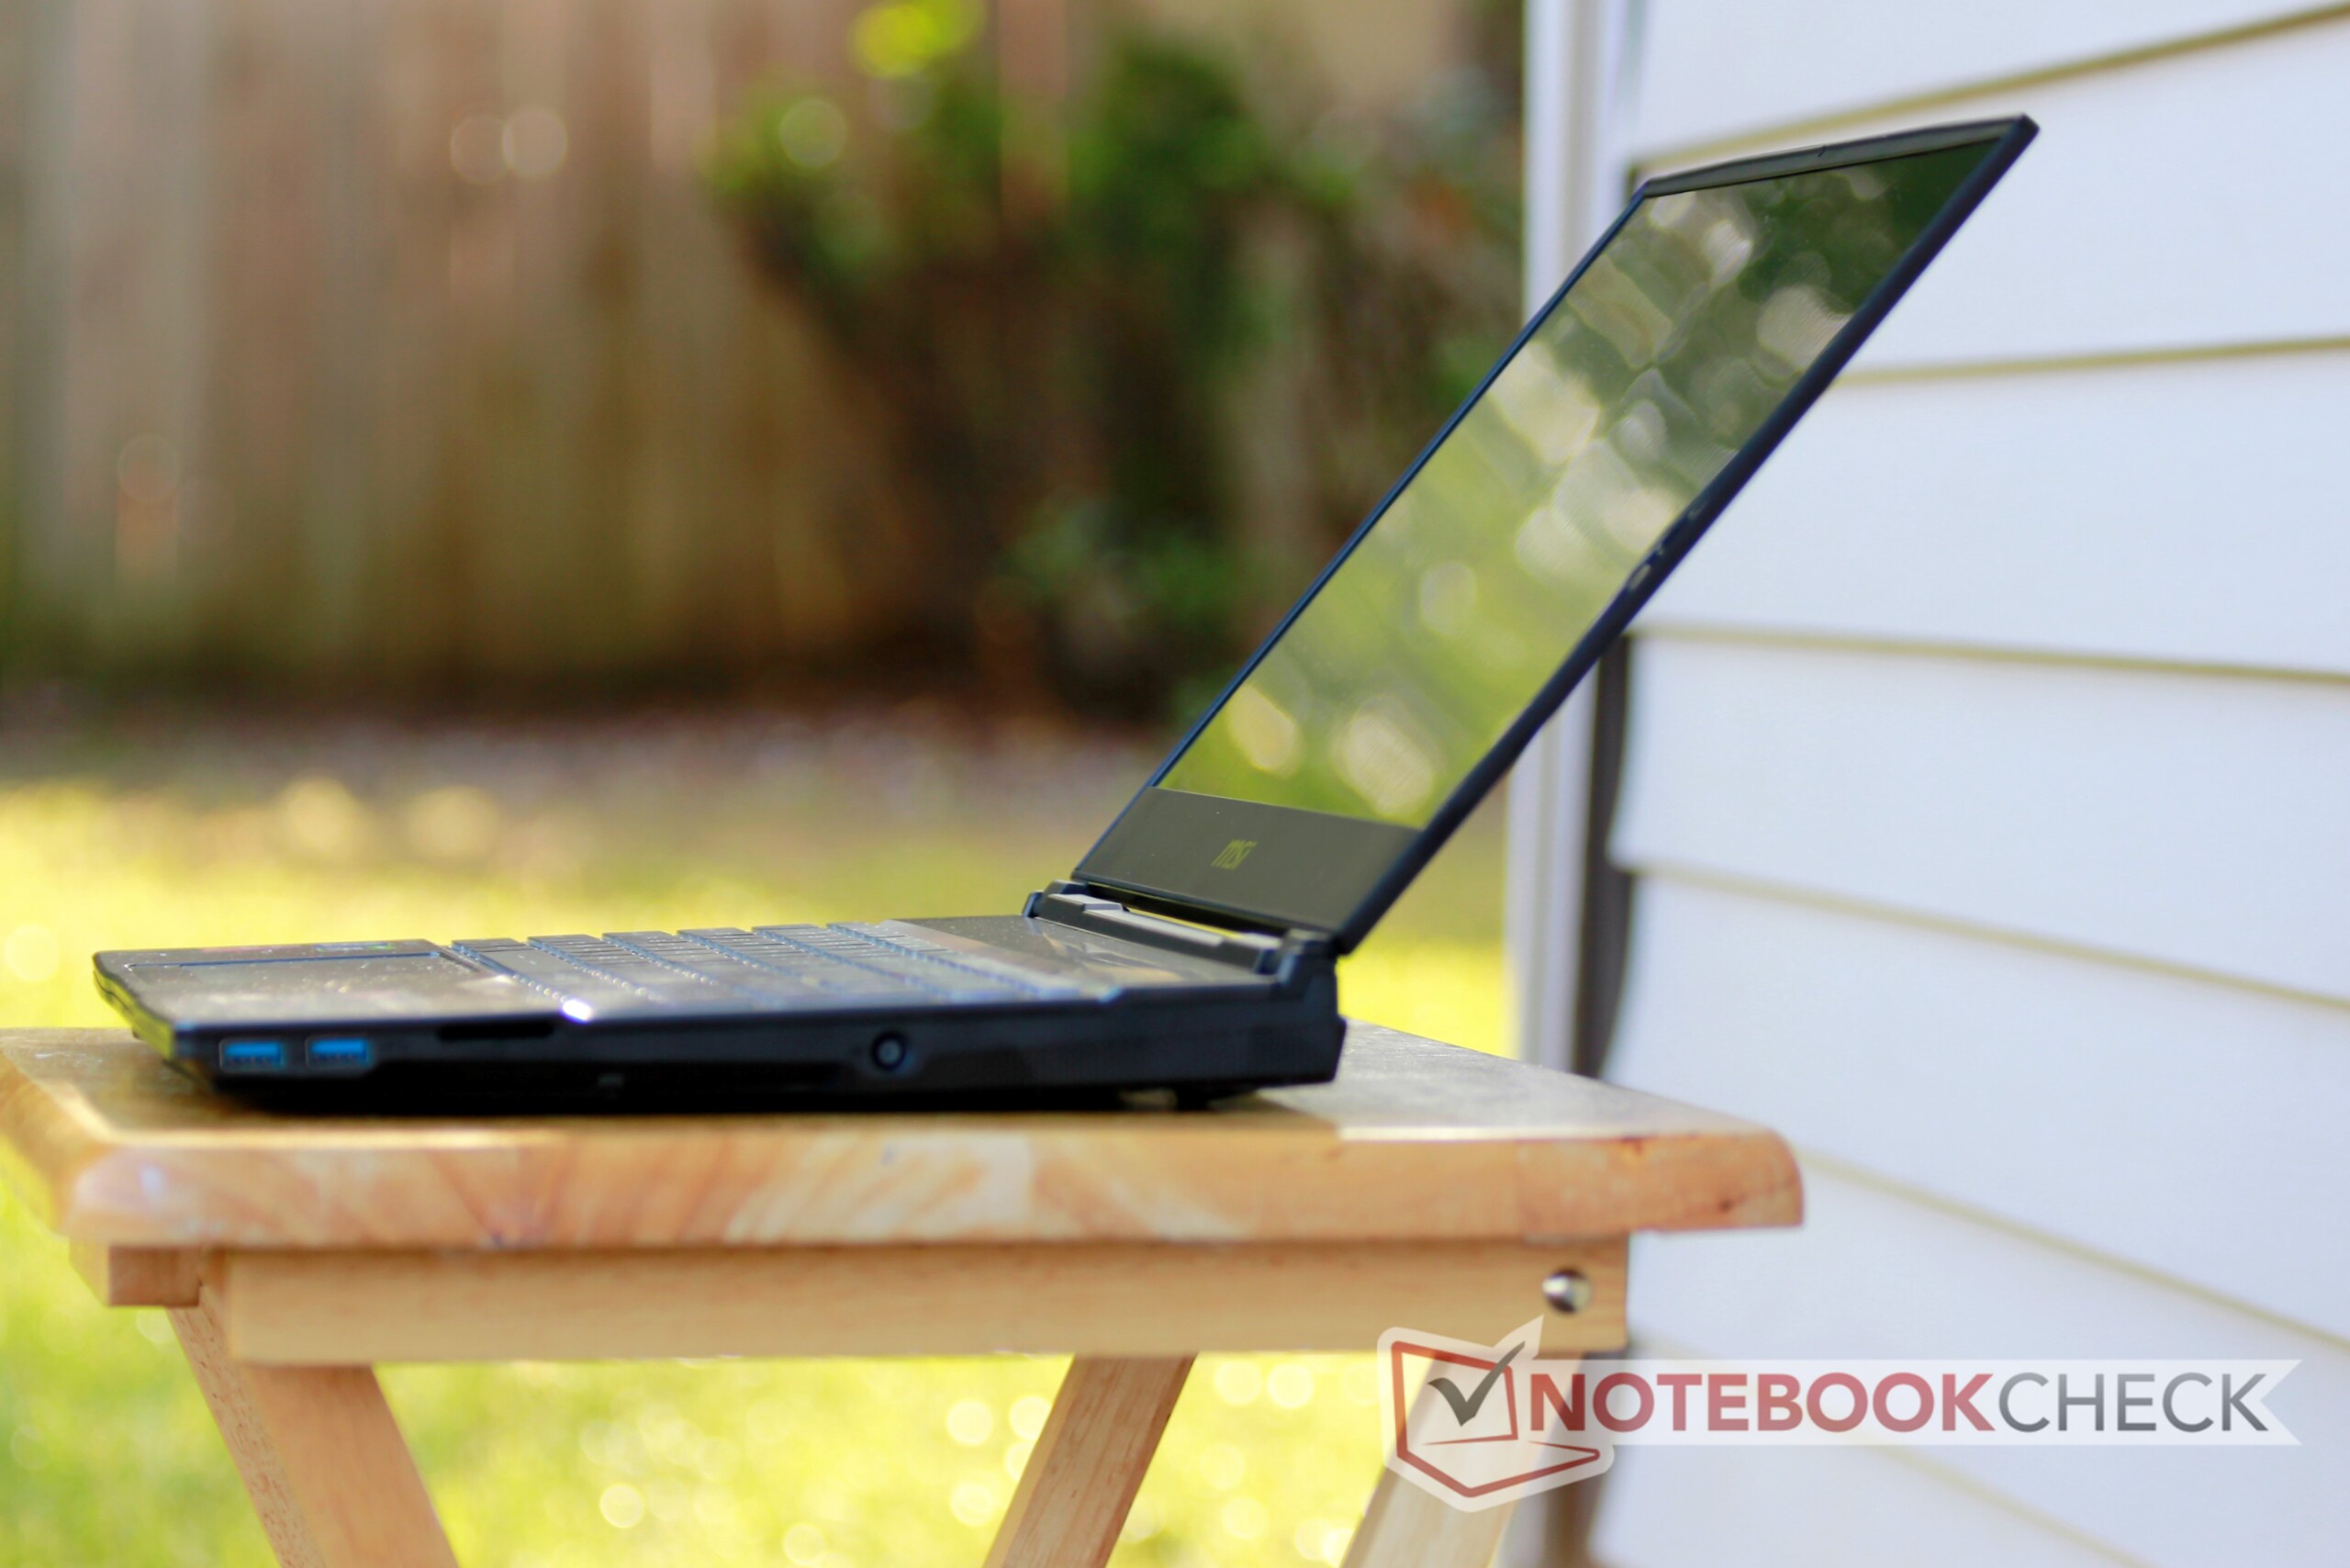

While the GP65 Leopard isn't a thin-and-light gaming laptop, it is reasonably compact for a 15.6-inch gaming machine. This is largely due to the thin bezels around the screen which help to shrink the GP65's footprint considerably from that of the GP63. Still, other manufacturers have also worked to reduce the size of their gaming laptops, so the GP65 is only marginally smaller than competitors. The GP65's 2.3 kg weight is average for a mid-tier 15.6-inch gaming laptop.
Connectivity
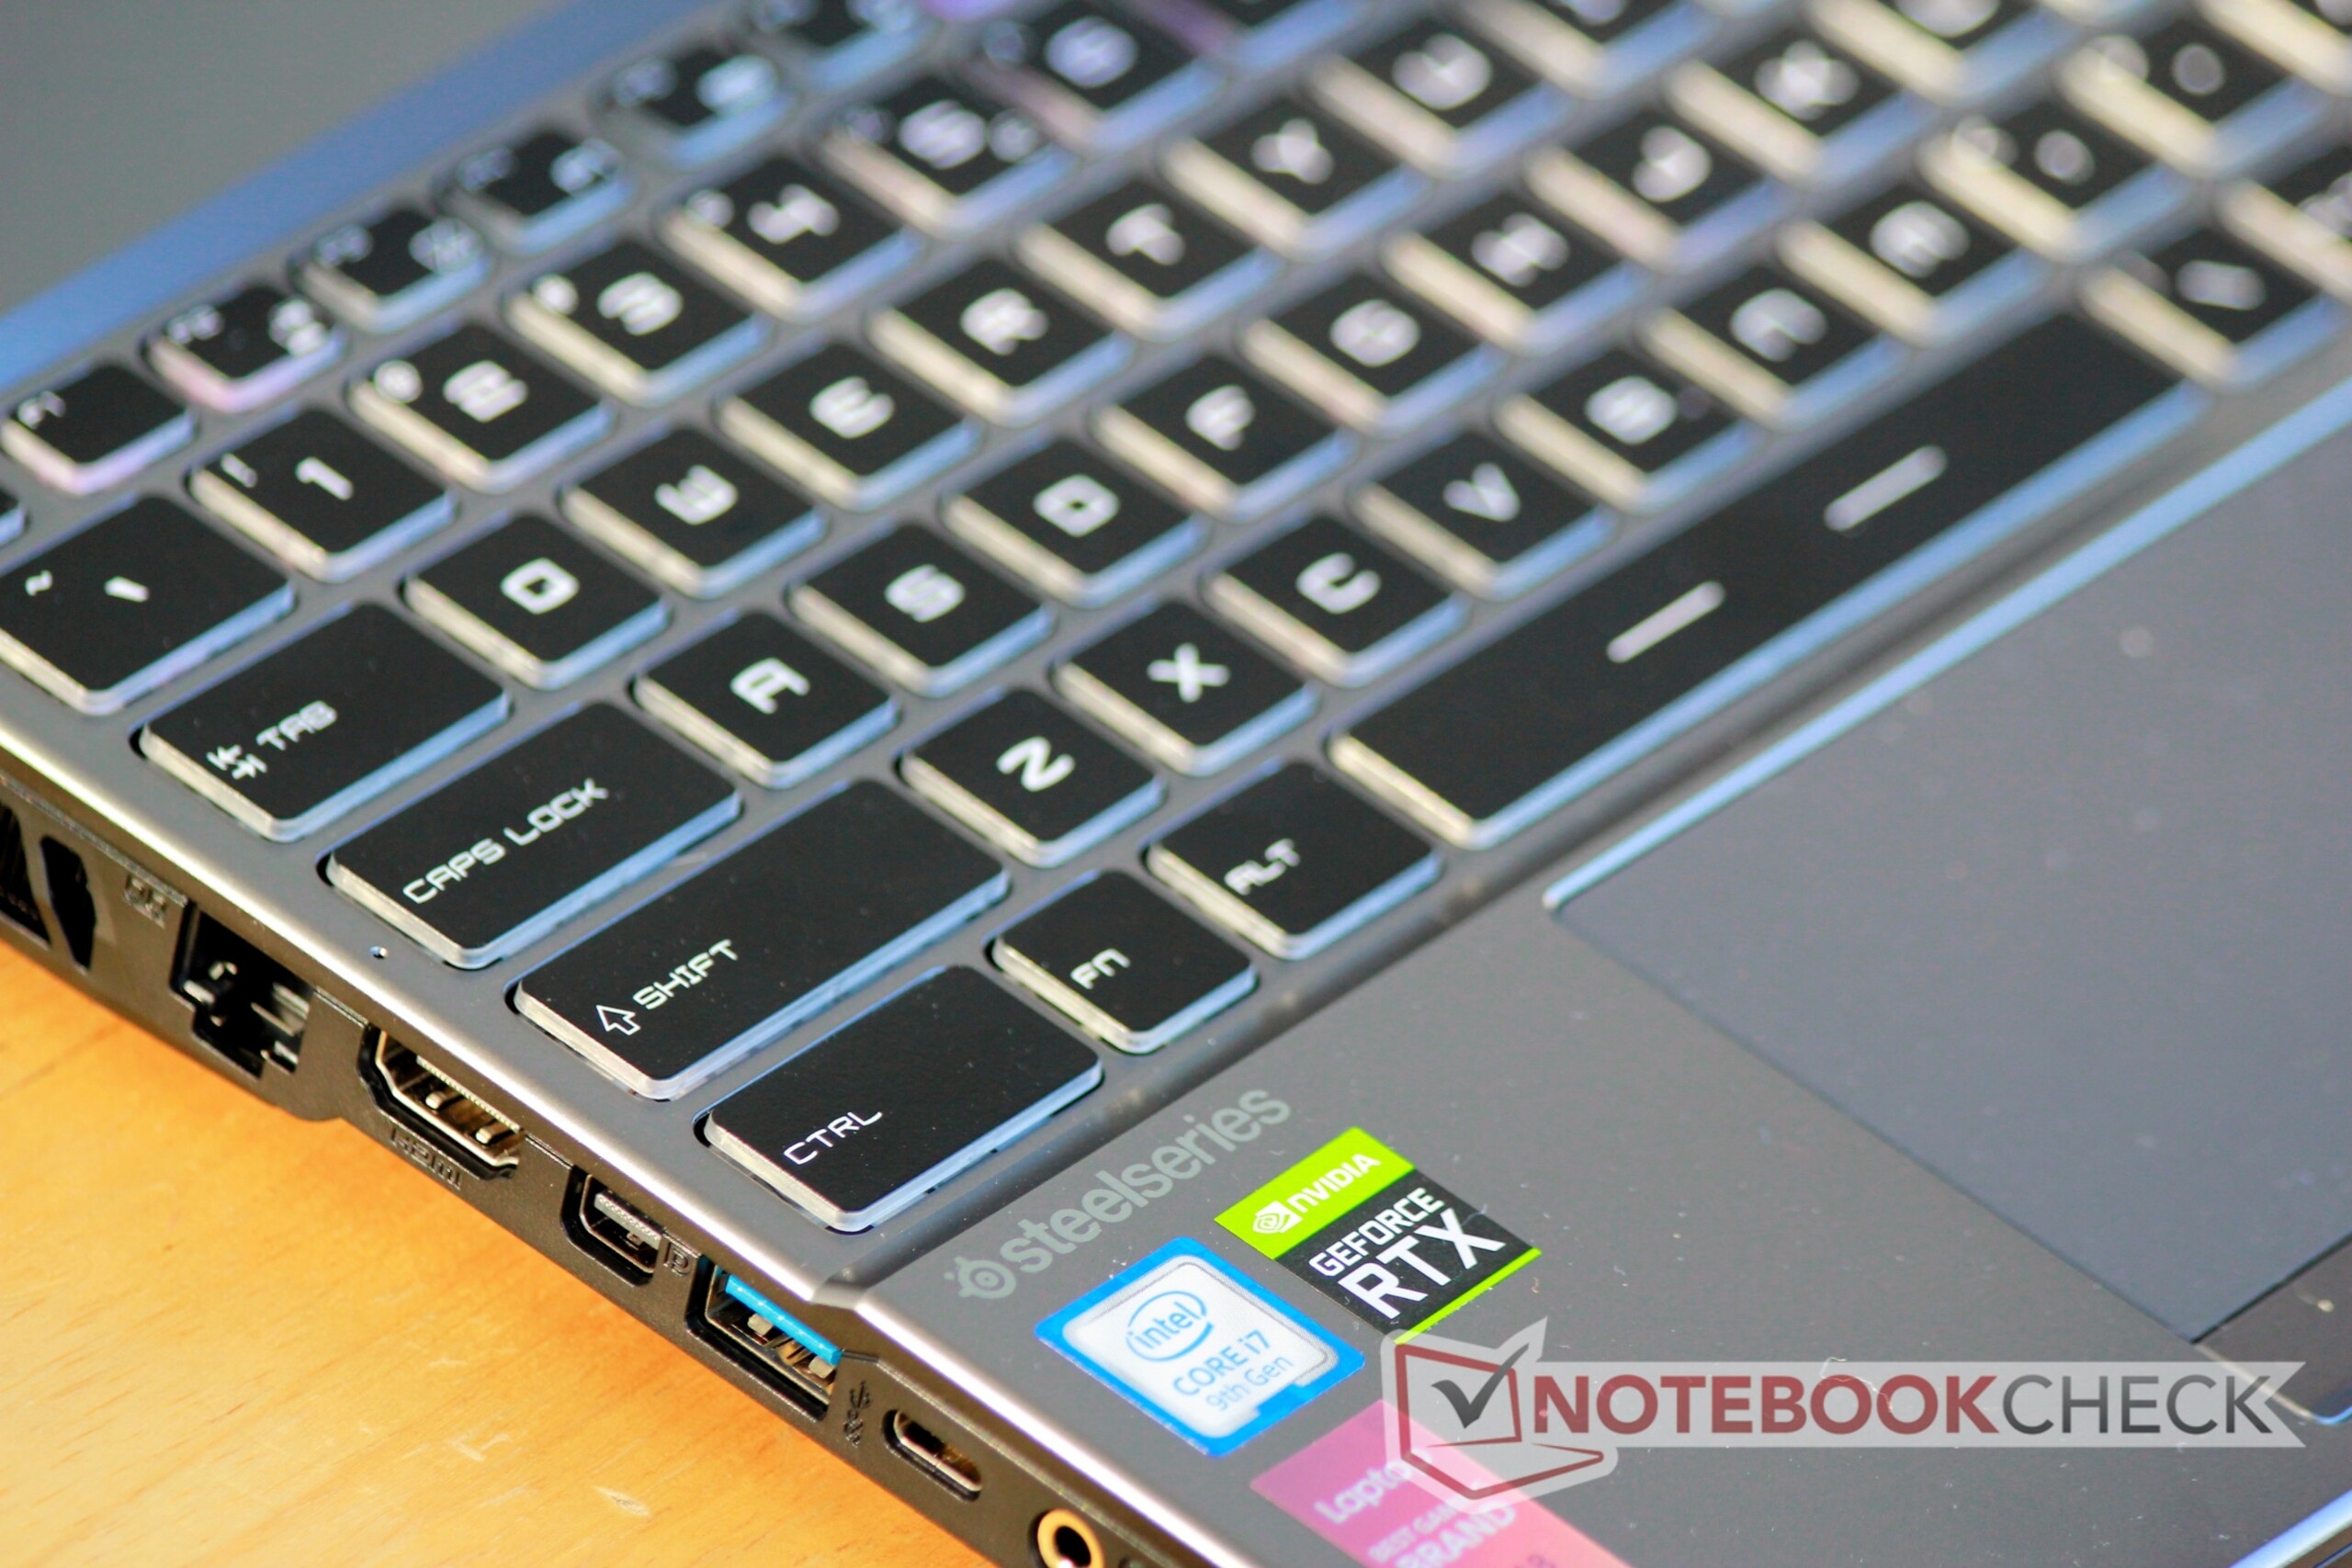
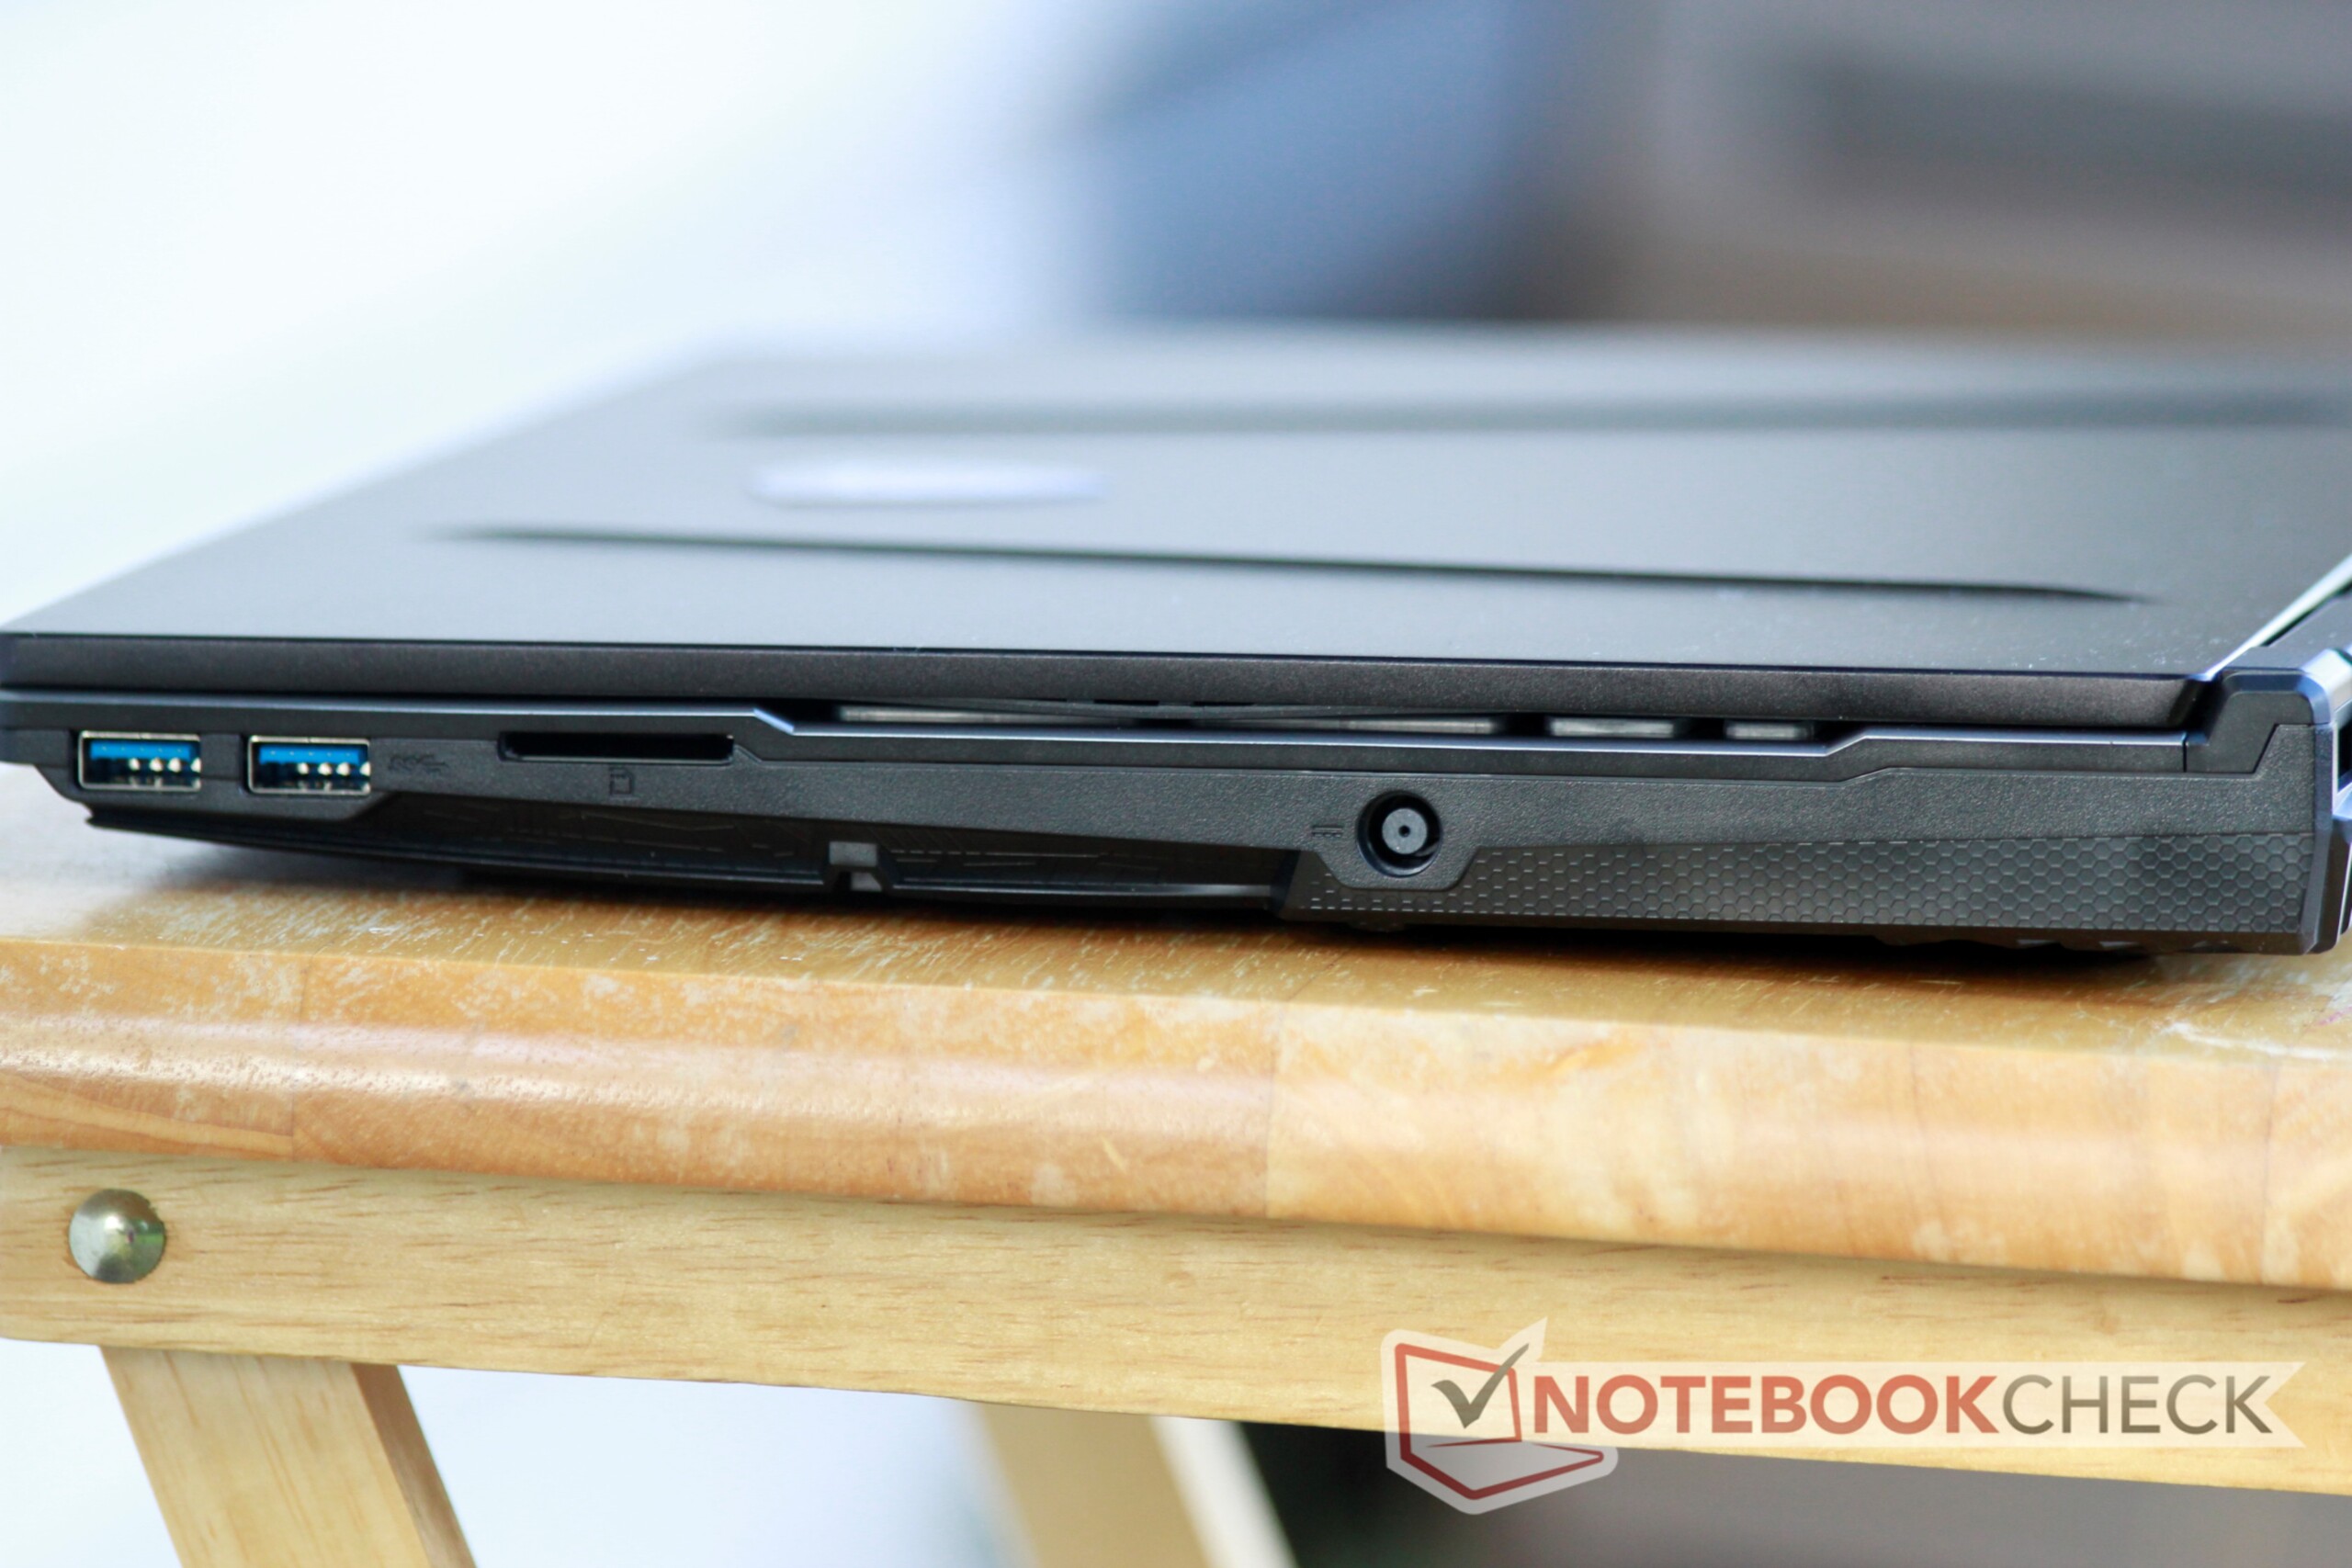
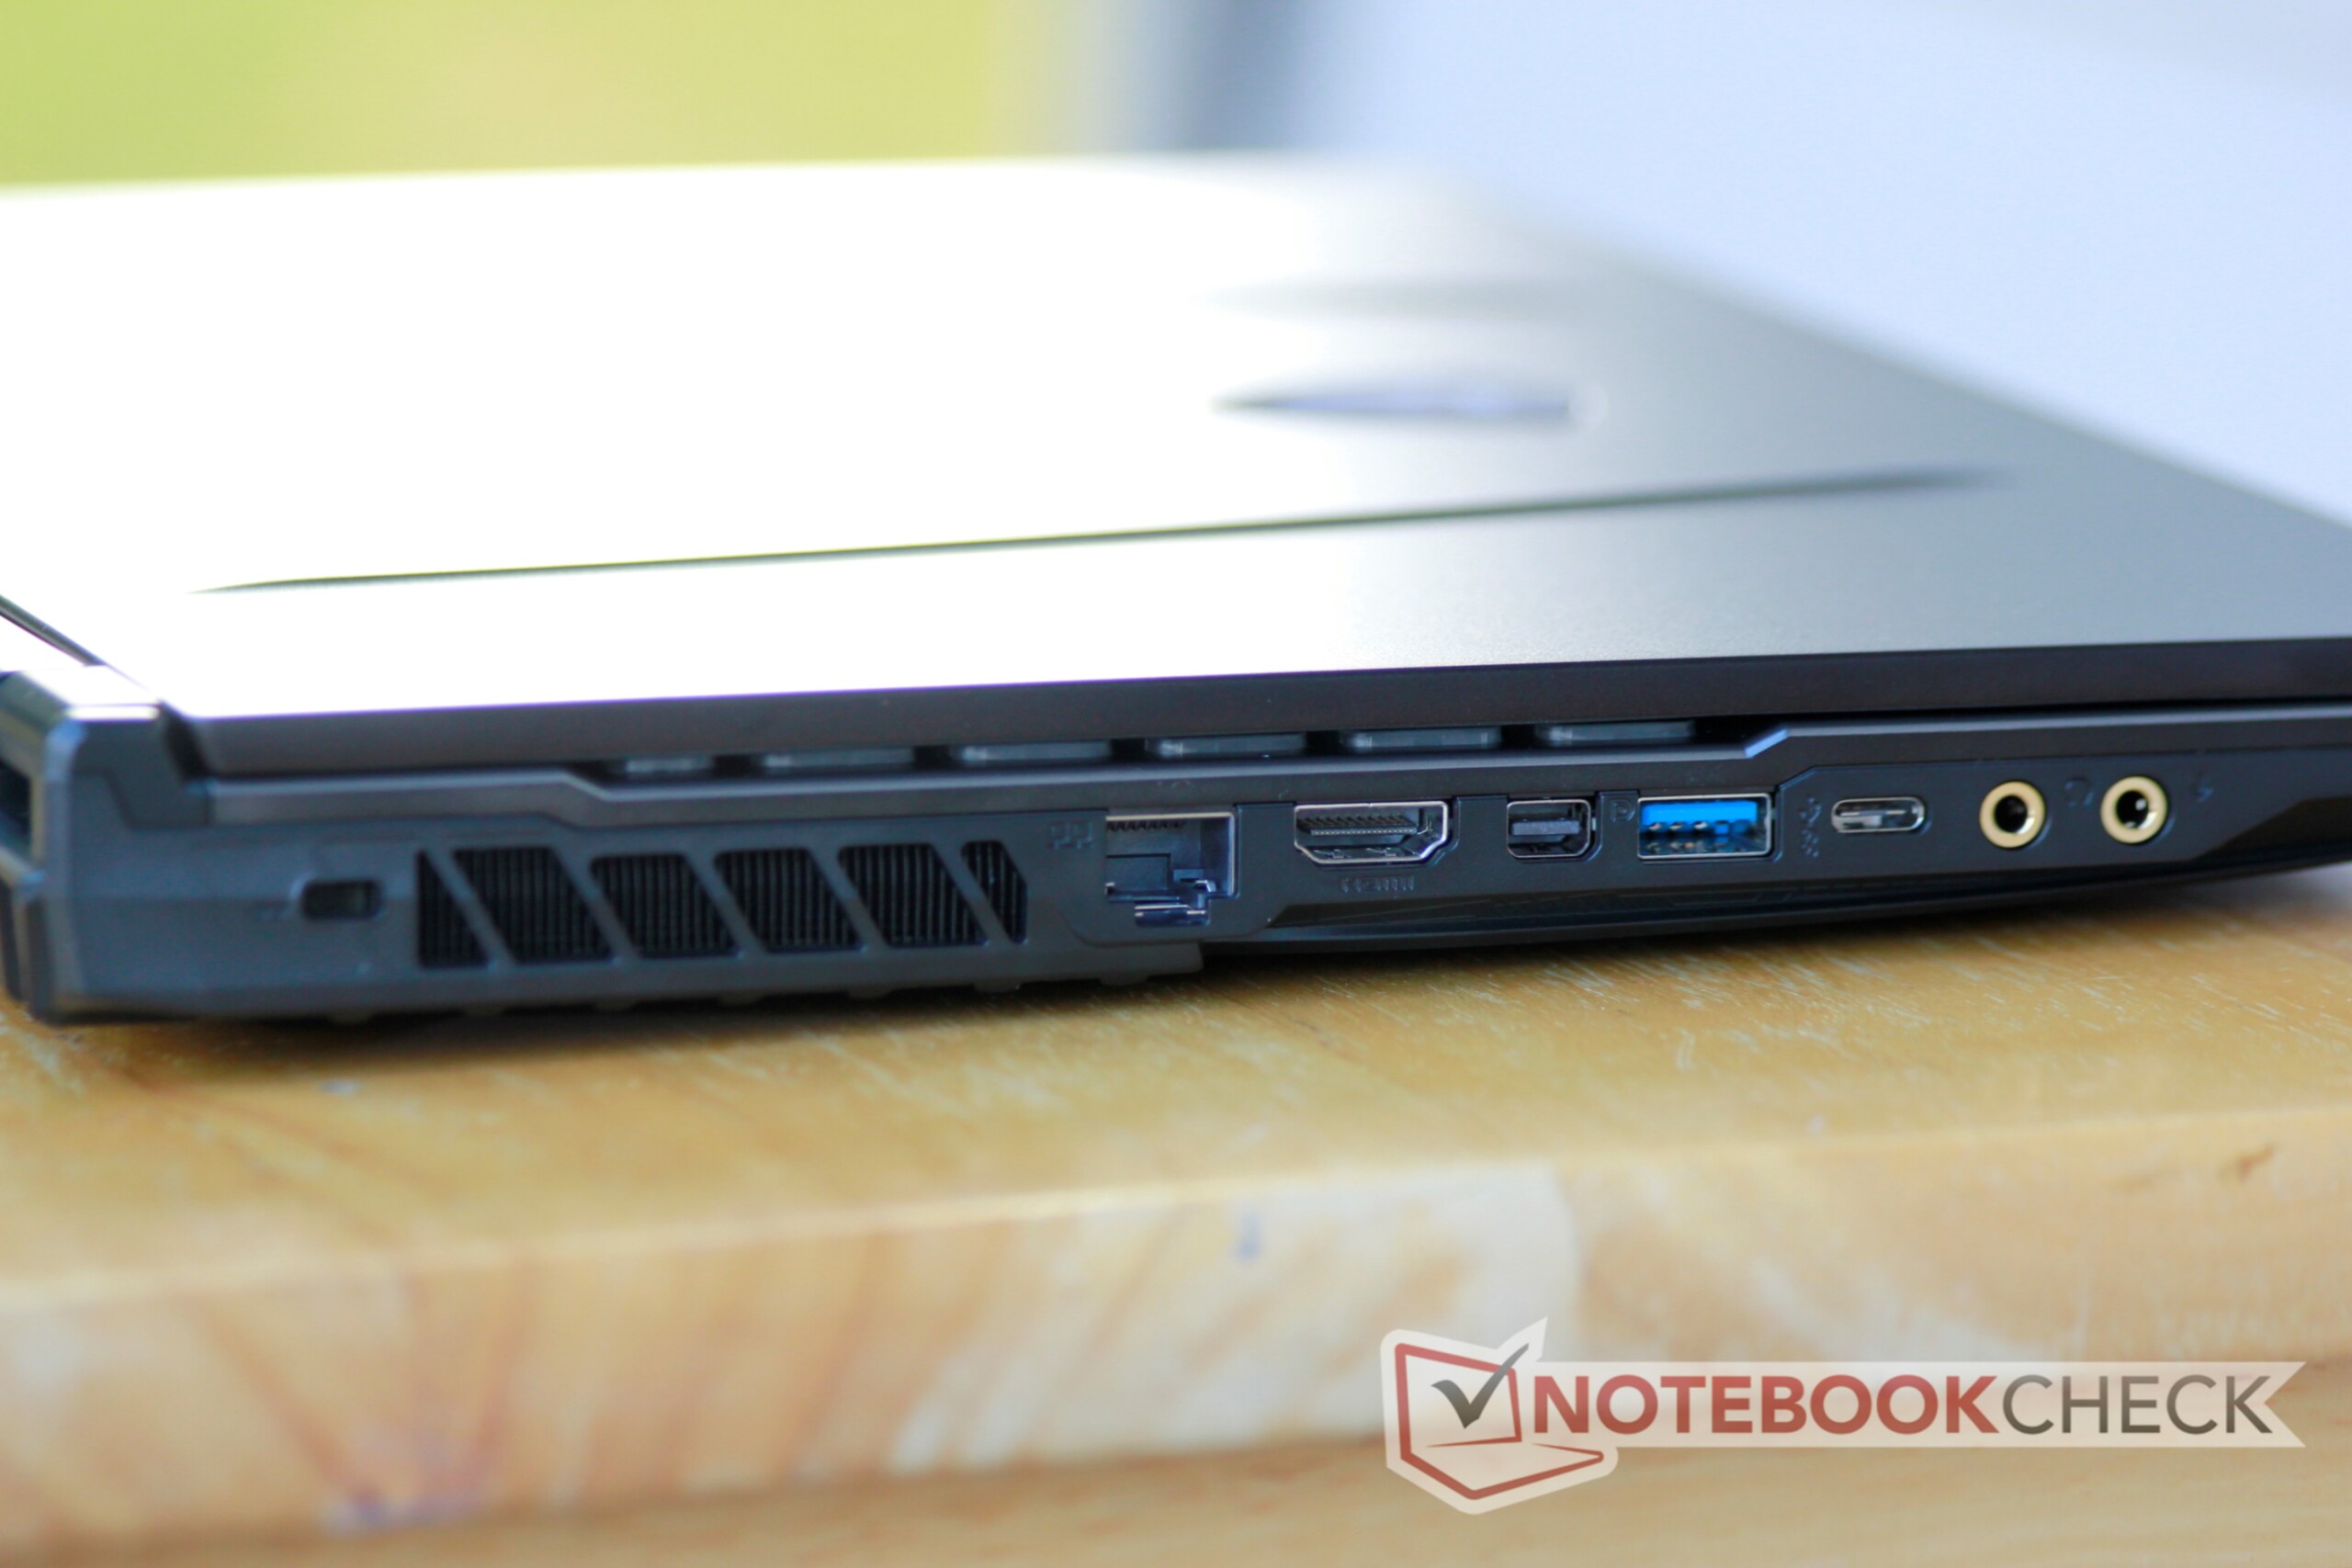
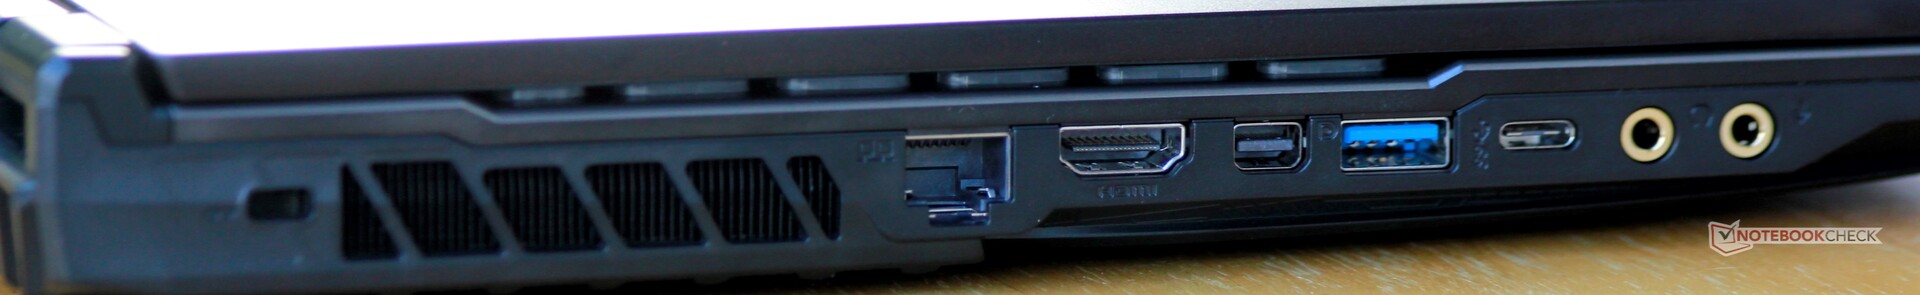
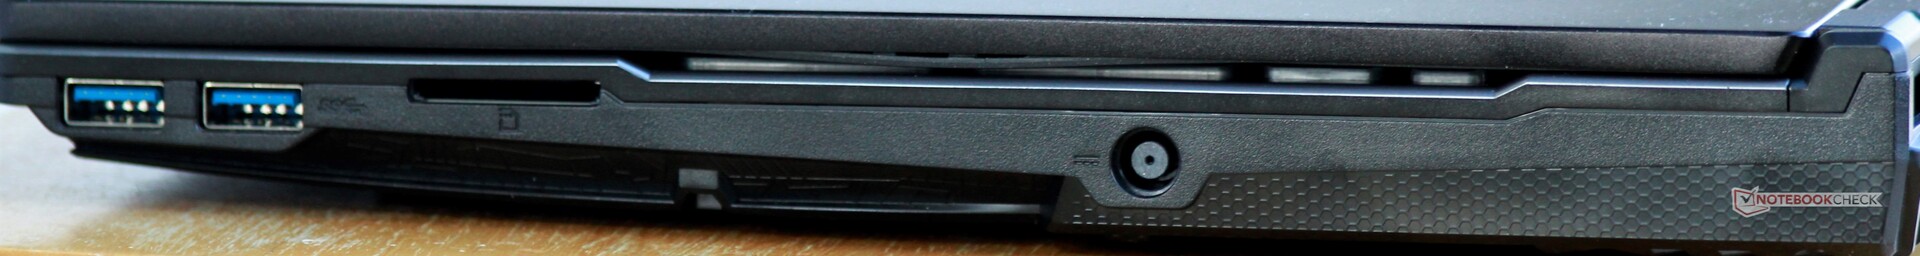
Port selection is varied and offers a good amount of connectivity. Highlights include dedicated microphone and headphone jacks, two display-out options (HDMI 2.0a and miniDP 1.4), and 4 USB ports, two of which are USB 3.2 Gen 2. However, we do find complaint with the placement of the USB ports along the left side. Both USB ports are set at the front of the machine, which makes connecting a corded mouse an unneeded exercise in cable management and can be very annoying. Additionally, the forward placement of the DC input is awkward. The left side ports should be shifted back a fair bit for easier use. The lack of Thunderbolt 3 is noticeable but not unexpected given the price point.
SD Card Reader
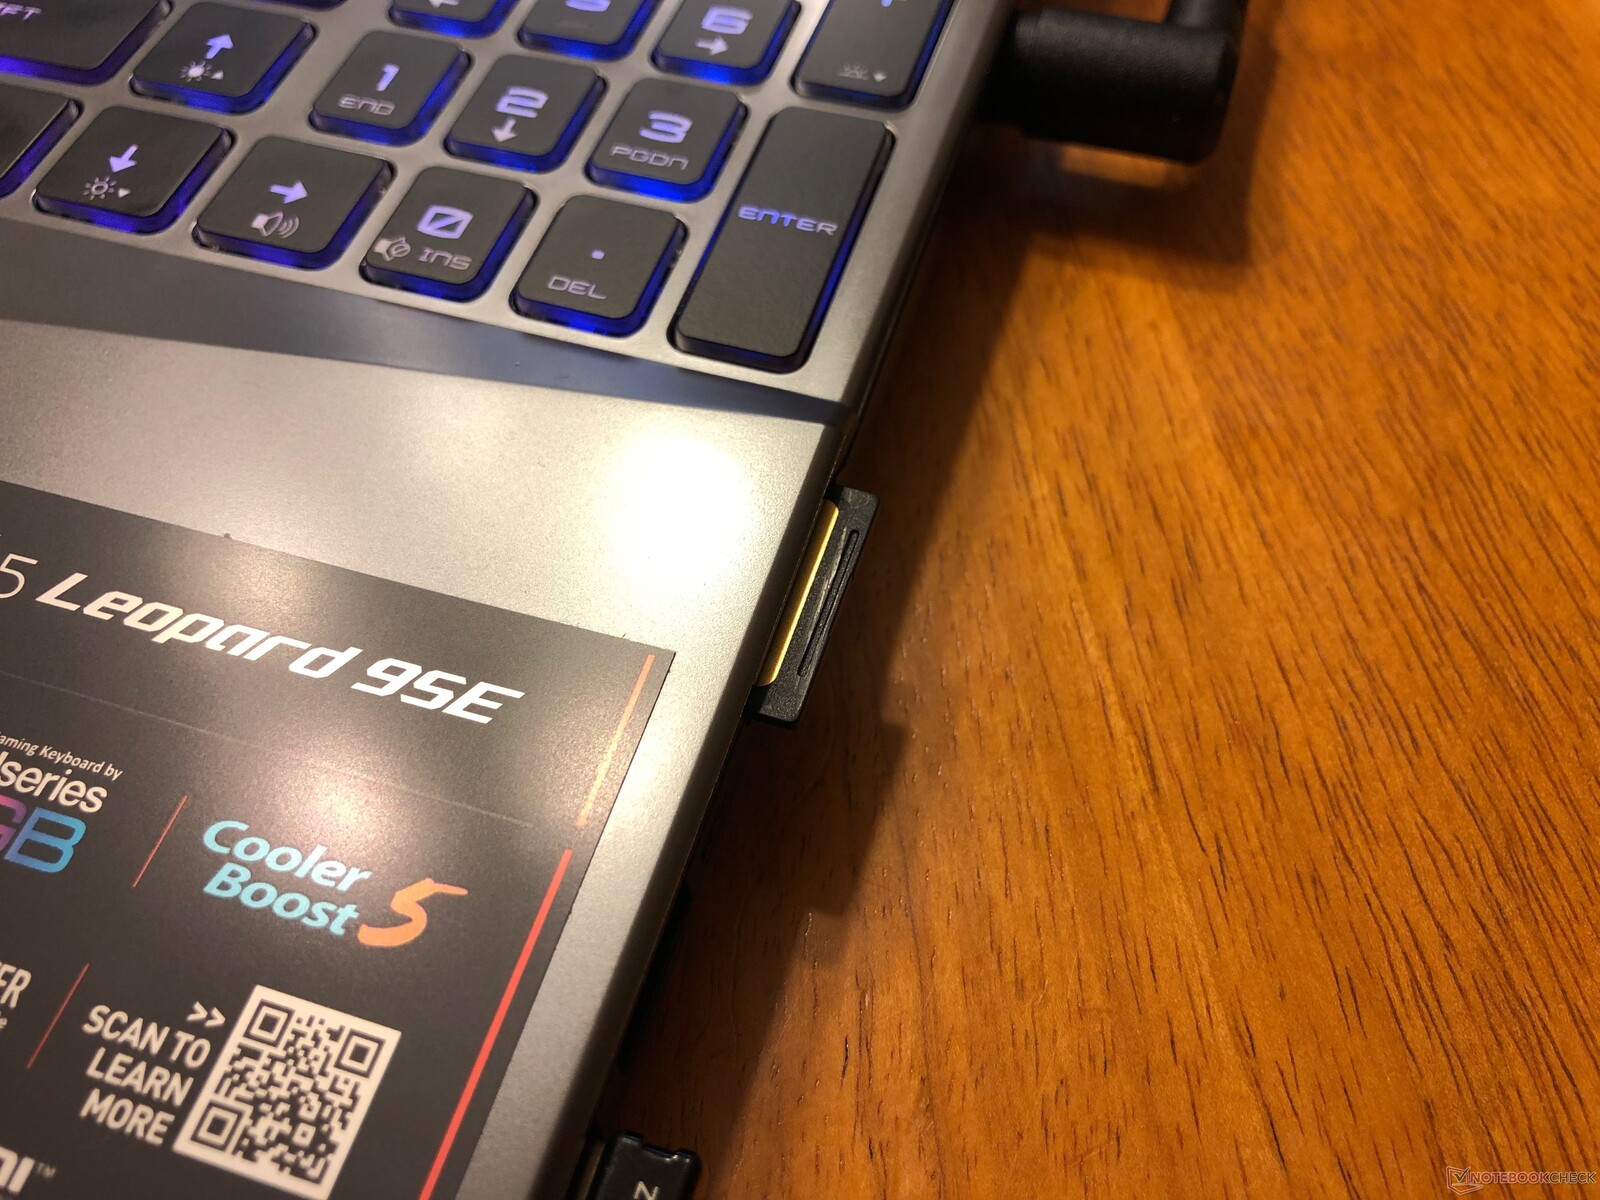
Typical of lower- and mid-tier MSI laptops, the SD card reader is abysmally slow. We measure speeds between 25-30 MB/s, which is unacceptable for a $1000+ gaming laptop in 2019. This is a common sticking point with MSI laptops, and it is disappointing that the company has yet to improve here. On the plus side, SD cards sit nearly flush with the chassis.
| SD Card Reader | |
| average JPG Copy Test (av. of 3 runs) | |
| Eurocom Nightsky Ti15 (Toshiba Exceria Pro SDXC 64 GB UHS-II) | |
| Average of class Gaming (20.9 - 210, n=55, last 2 years) | |
| CUK Model Z GK5CQ7Z (Toshiba Exceria Pro SDXC 64 GB UHS-II) | |
| HP Omen 15-dc1303ng (Toshiba Exceria Pro SDXC 64 GB UHS-II) | |
| MSI GP65 Leopard 9SE-225US | |
| maximum AS SSD Seq Read Test (1GB) | |
| Eurocom Nightsky Ti15 (Toshiba Exceria Pro SDXC 64 GB UHS-II) | |
| Average of class Gaming (25.5 - 261, n=52, last 2 years) | |
| CUK Model Z GK5CQ7Z (Toshiba Exceria Pro SDXC 64 GB UHS-II) | |
| HP Omen 15-dc1303ng (Toshiba Exceria Pro SDXC 64 GB UHS-II) | |
| MSI GP65 Leopard 9SE-225US | |
Communication
The included WiFi card is excellent and in line with most other gaming laptops. Transmit and receive speeds are more than fast enough for most home router solutions, and the built-in Gigabit Ethernet port allows for even faster connections. We measure a stable connection up to about 25 meters from our home router through 1 interior and 1 exterior wall.
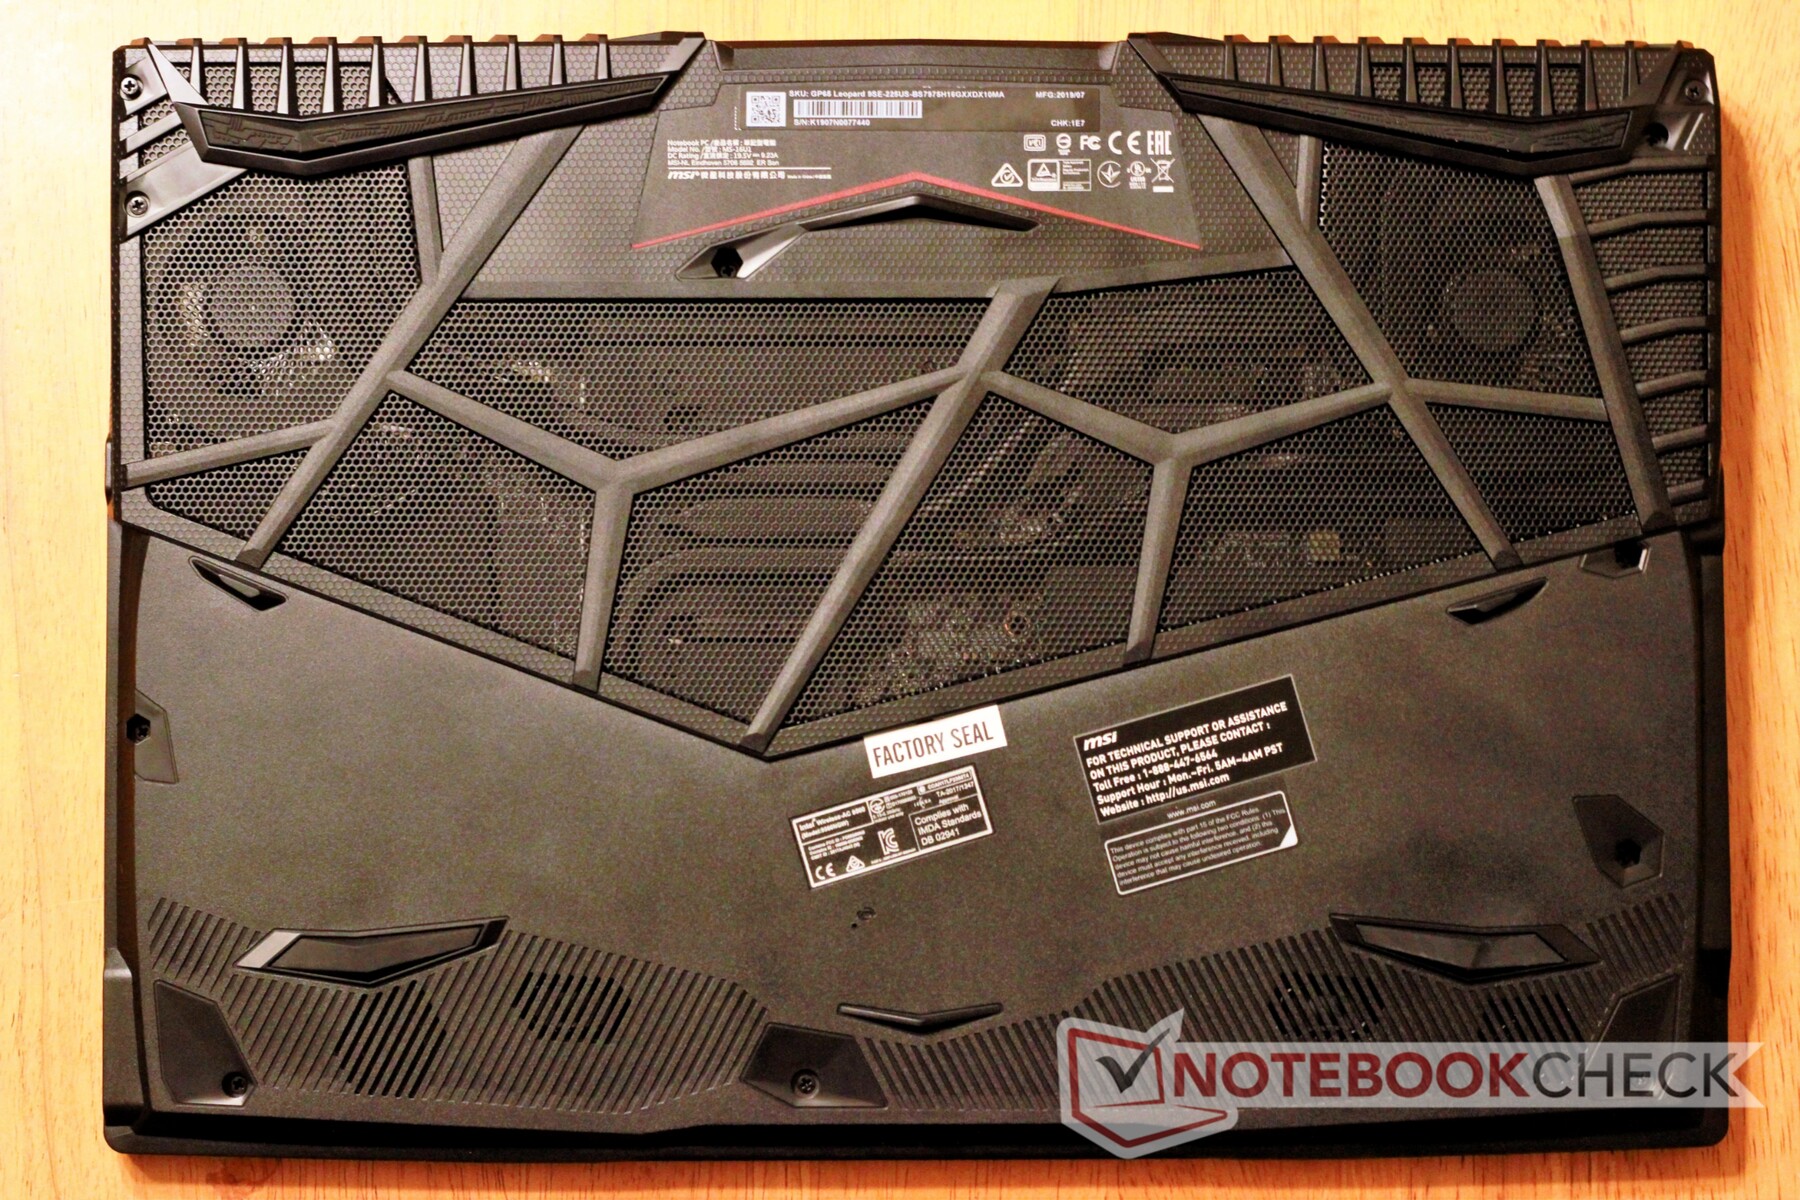
Maintenance
While maintenance on the GP63 Leopard was fairly straightforward, the GP65 thwarted our efforts to get inside the machine. There are eleven Phillips Head #00 screws (one of which is hidden underneath a "Factory Seal" label). These are all uniform in size and are easy enough to remove. However, the bottom panel is secured with stubborn plastic clips. These clips refused to disengage despite our best efforts, and we opted to stop in order to prevent damage to the plastic chassis. Your mileage may vary, but caution should be used.
Warranty
MSI offers a standard 12-month warranty on the GP65 Leopard.
Input Devices
Keyboard
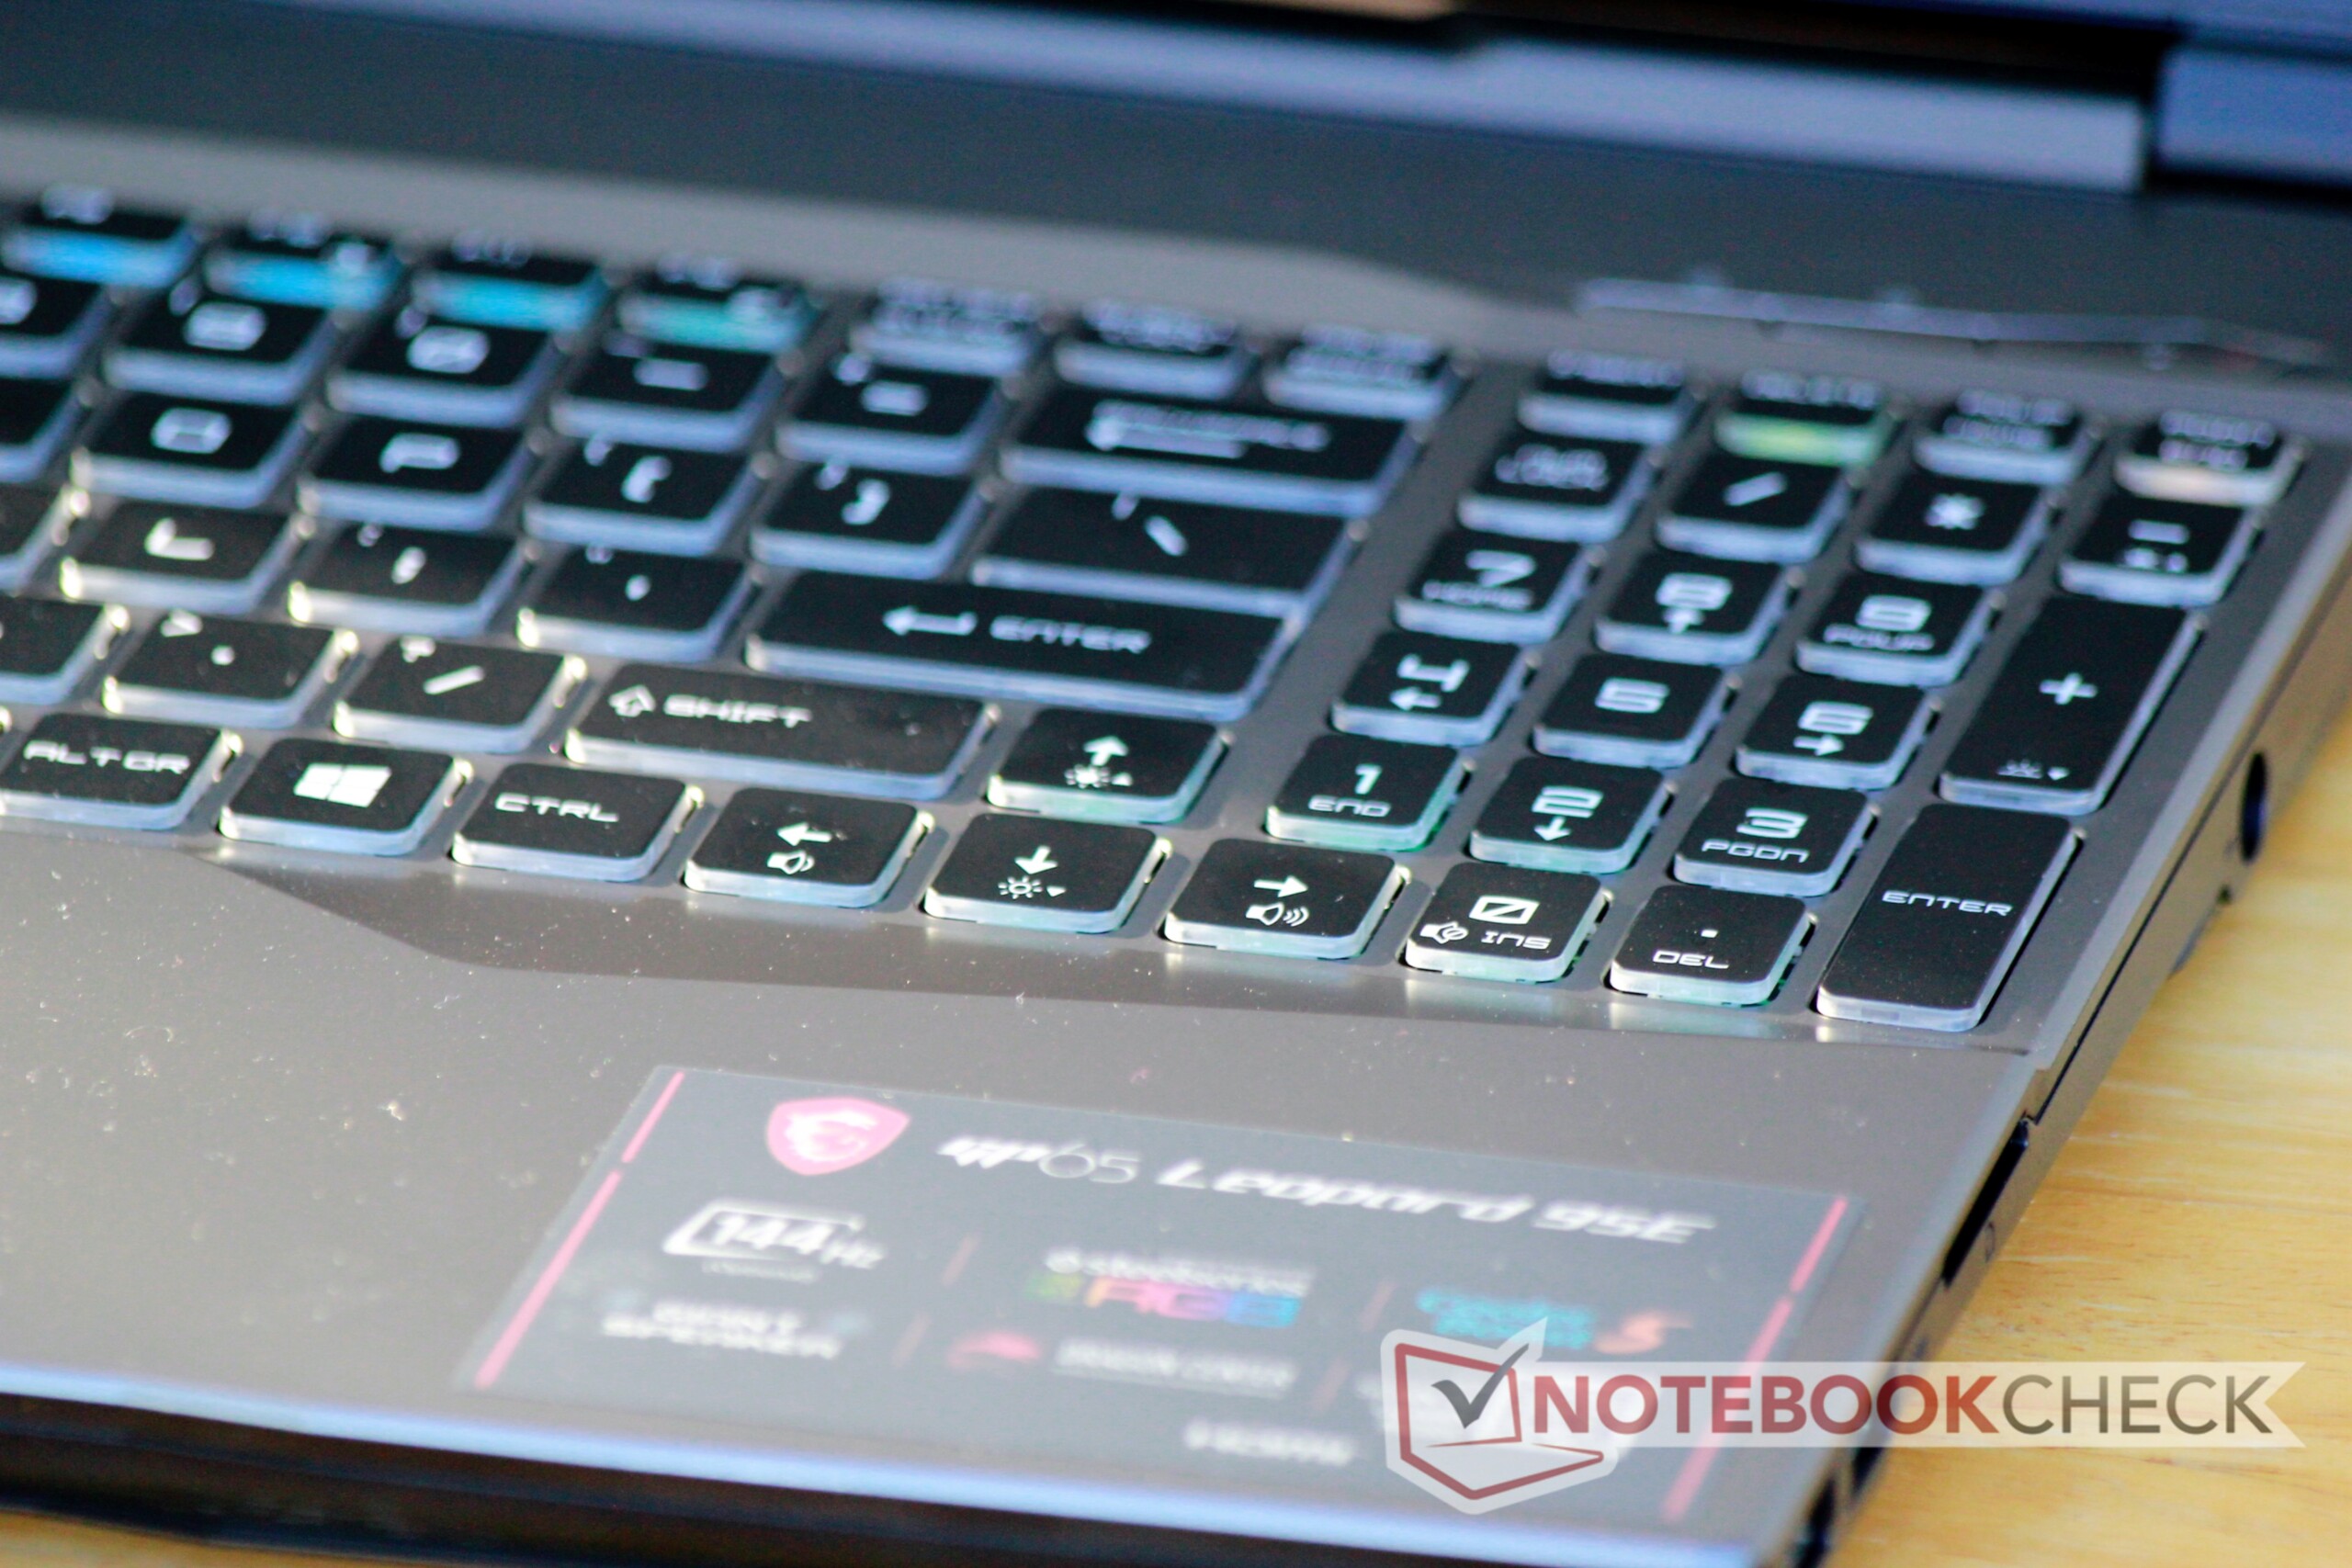
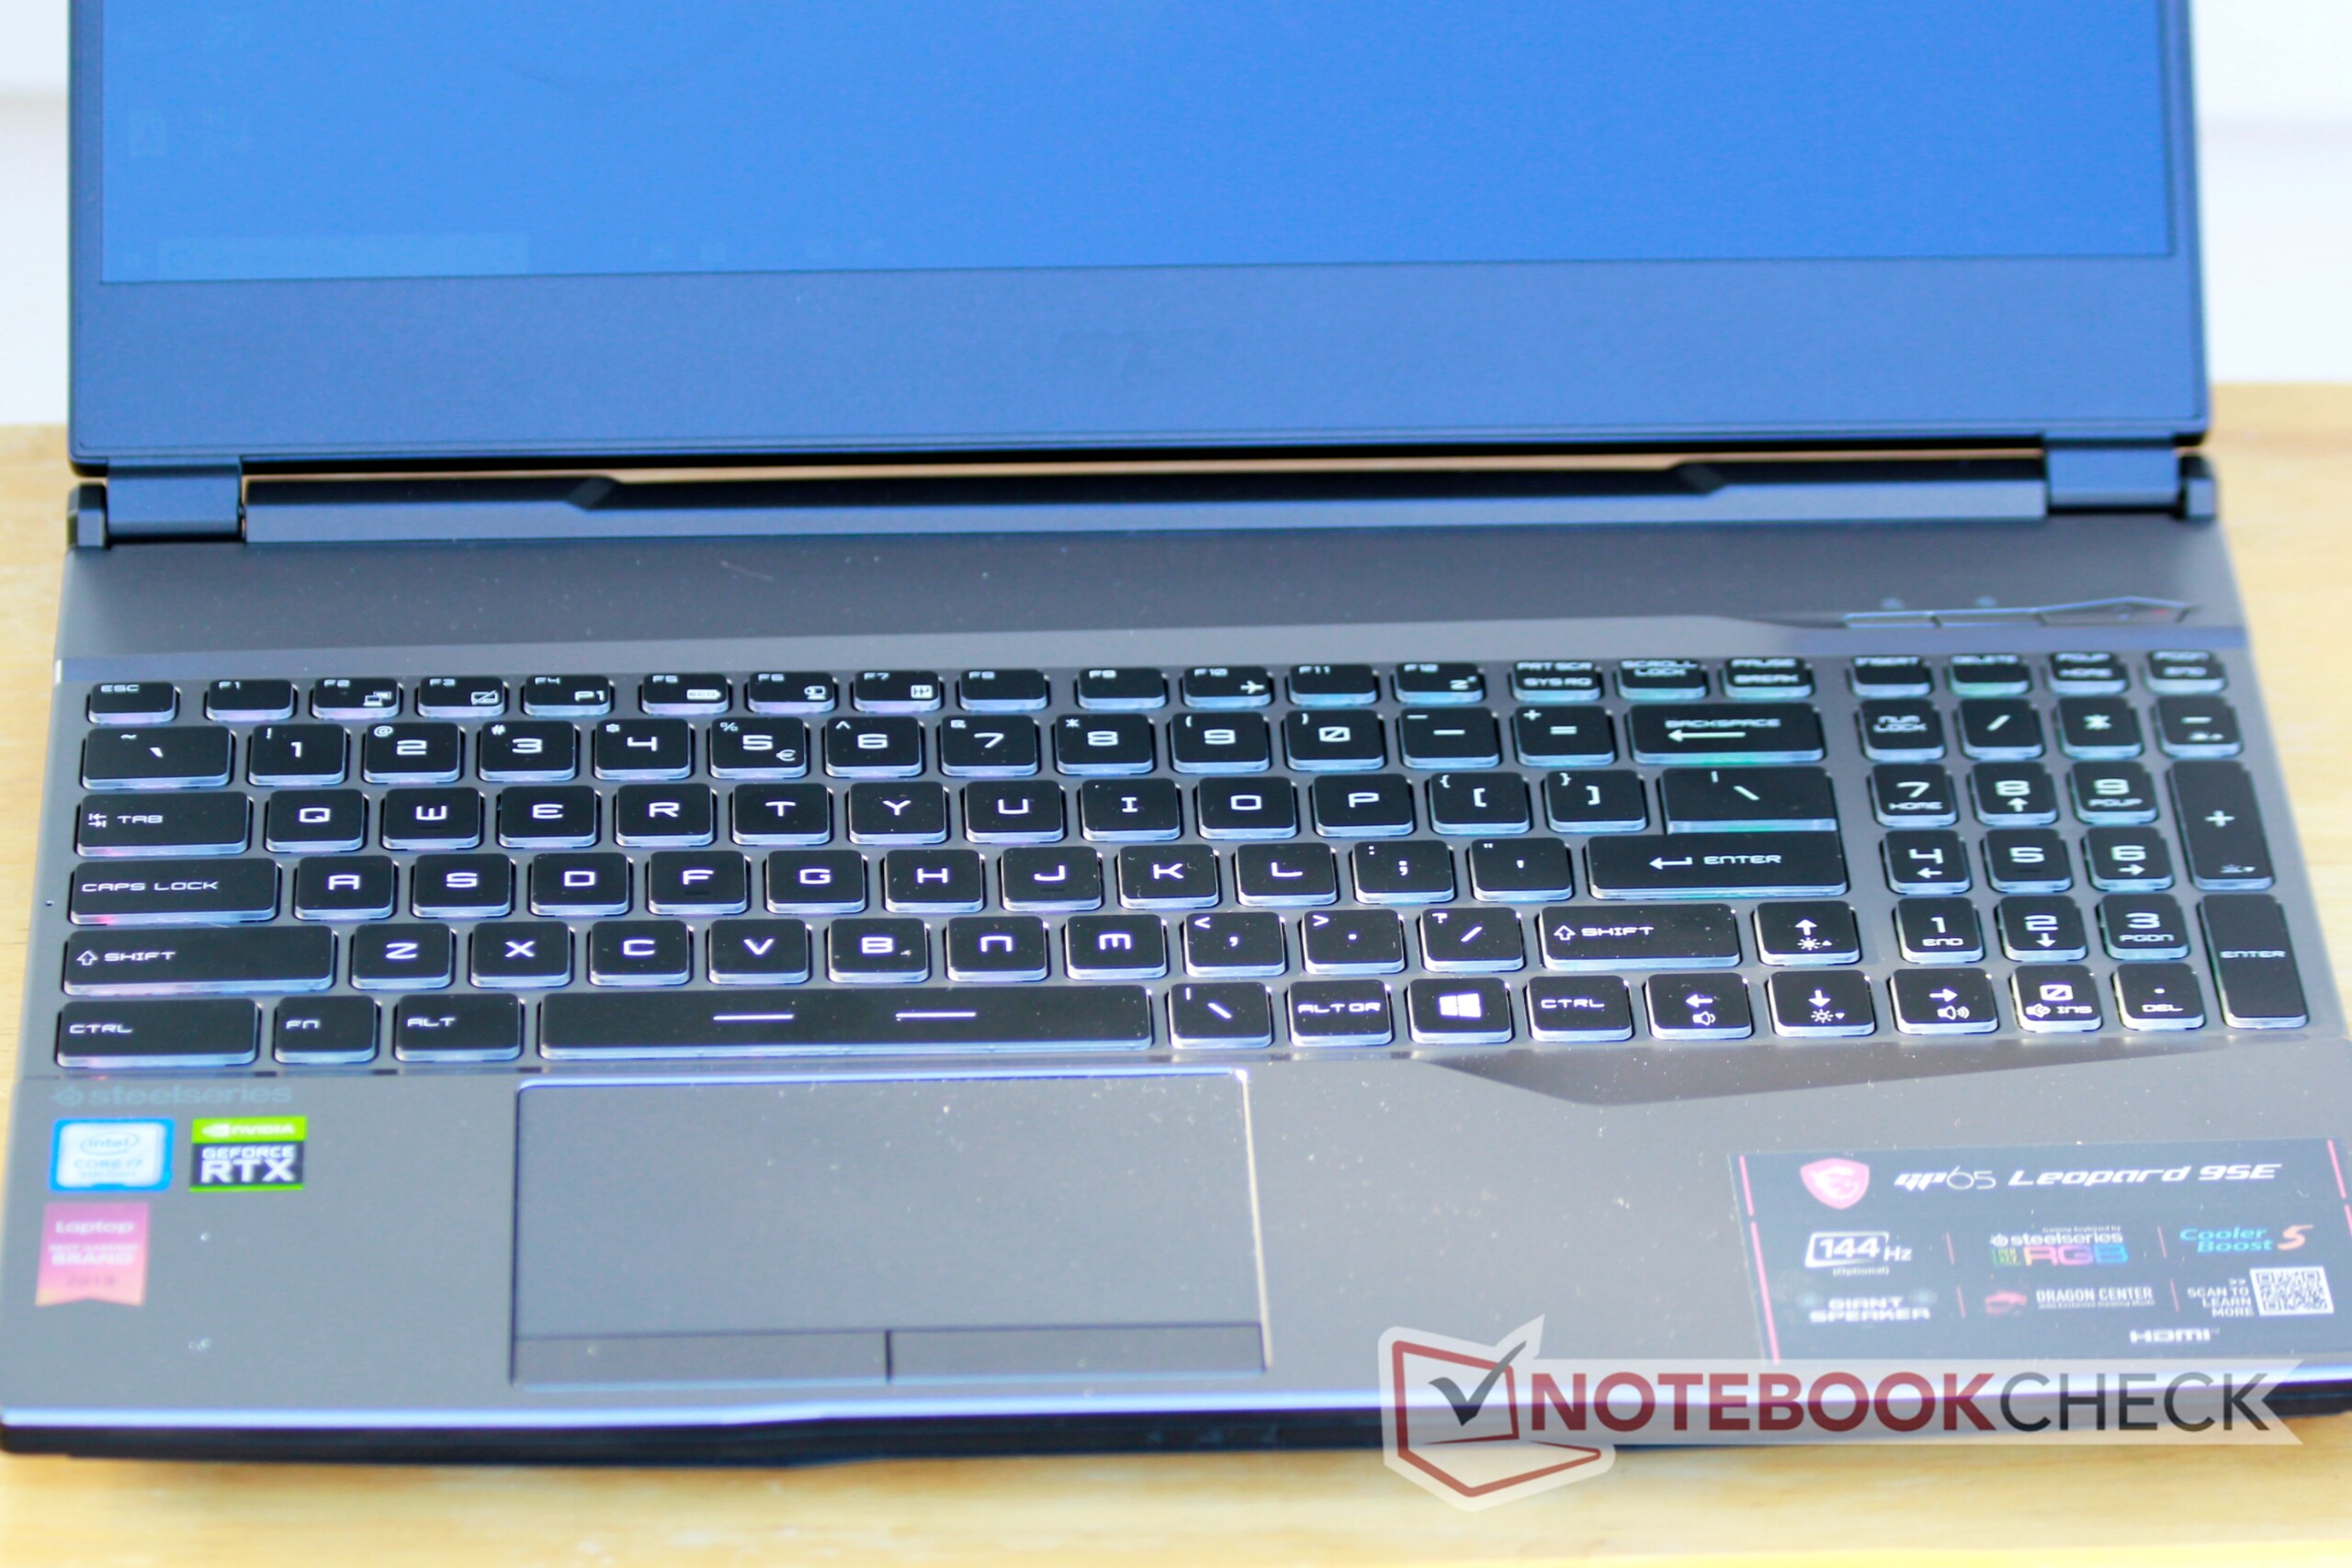
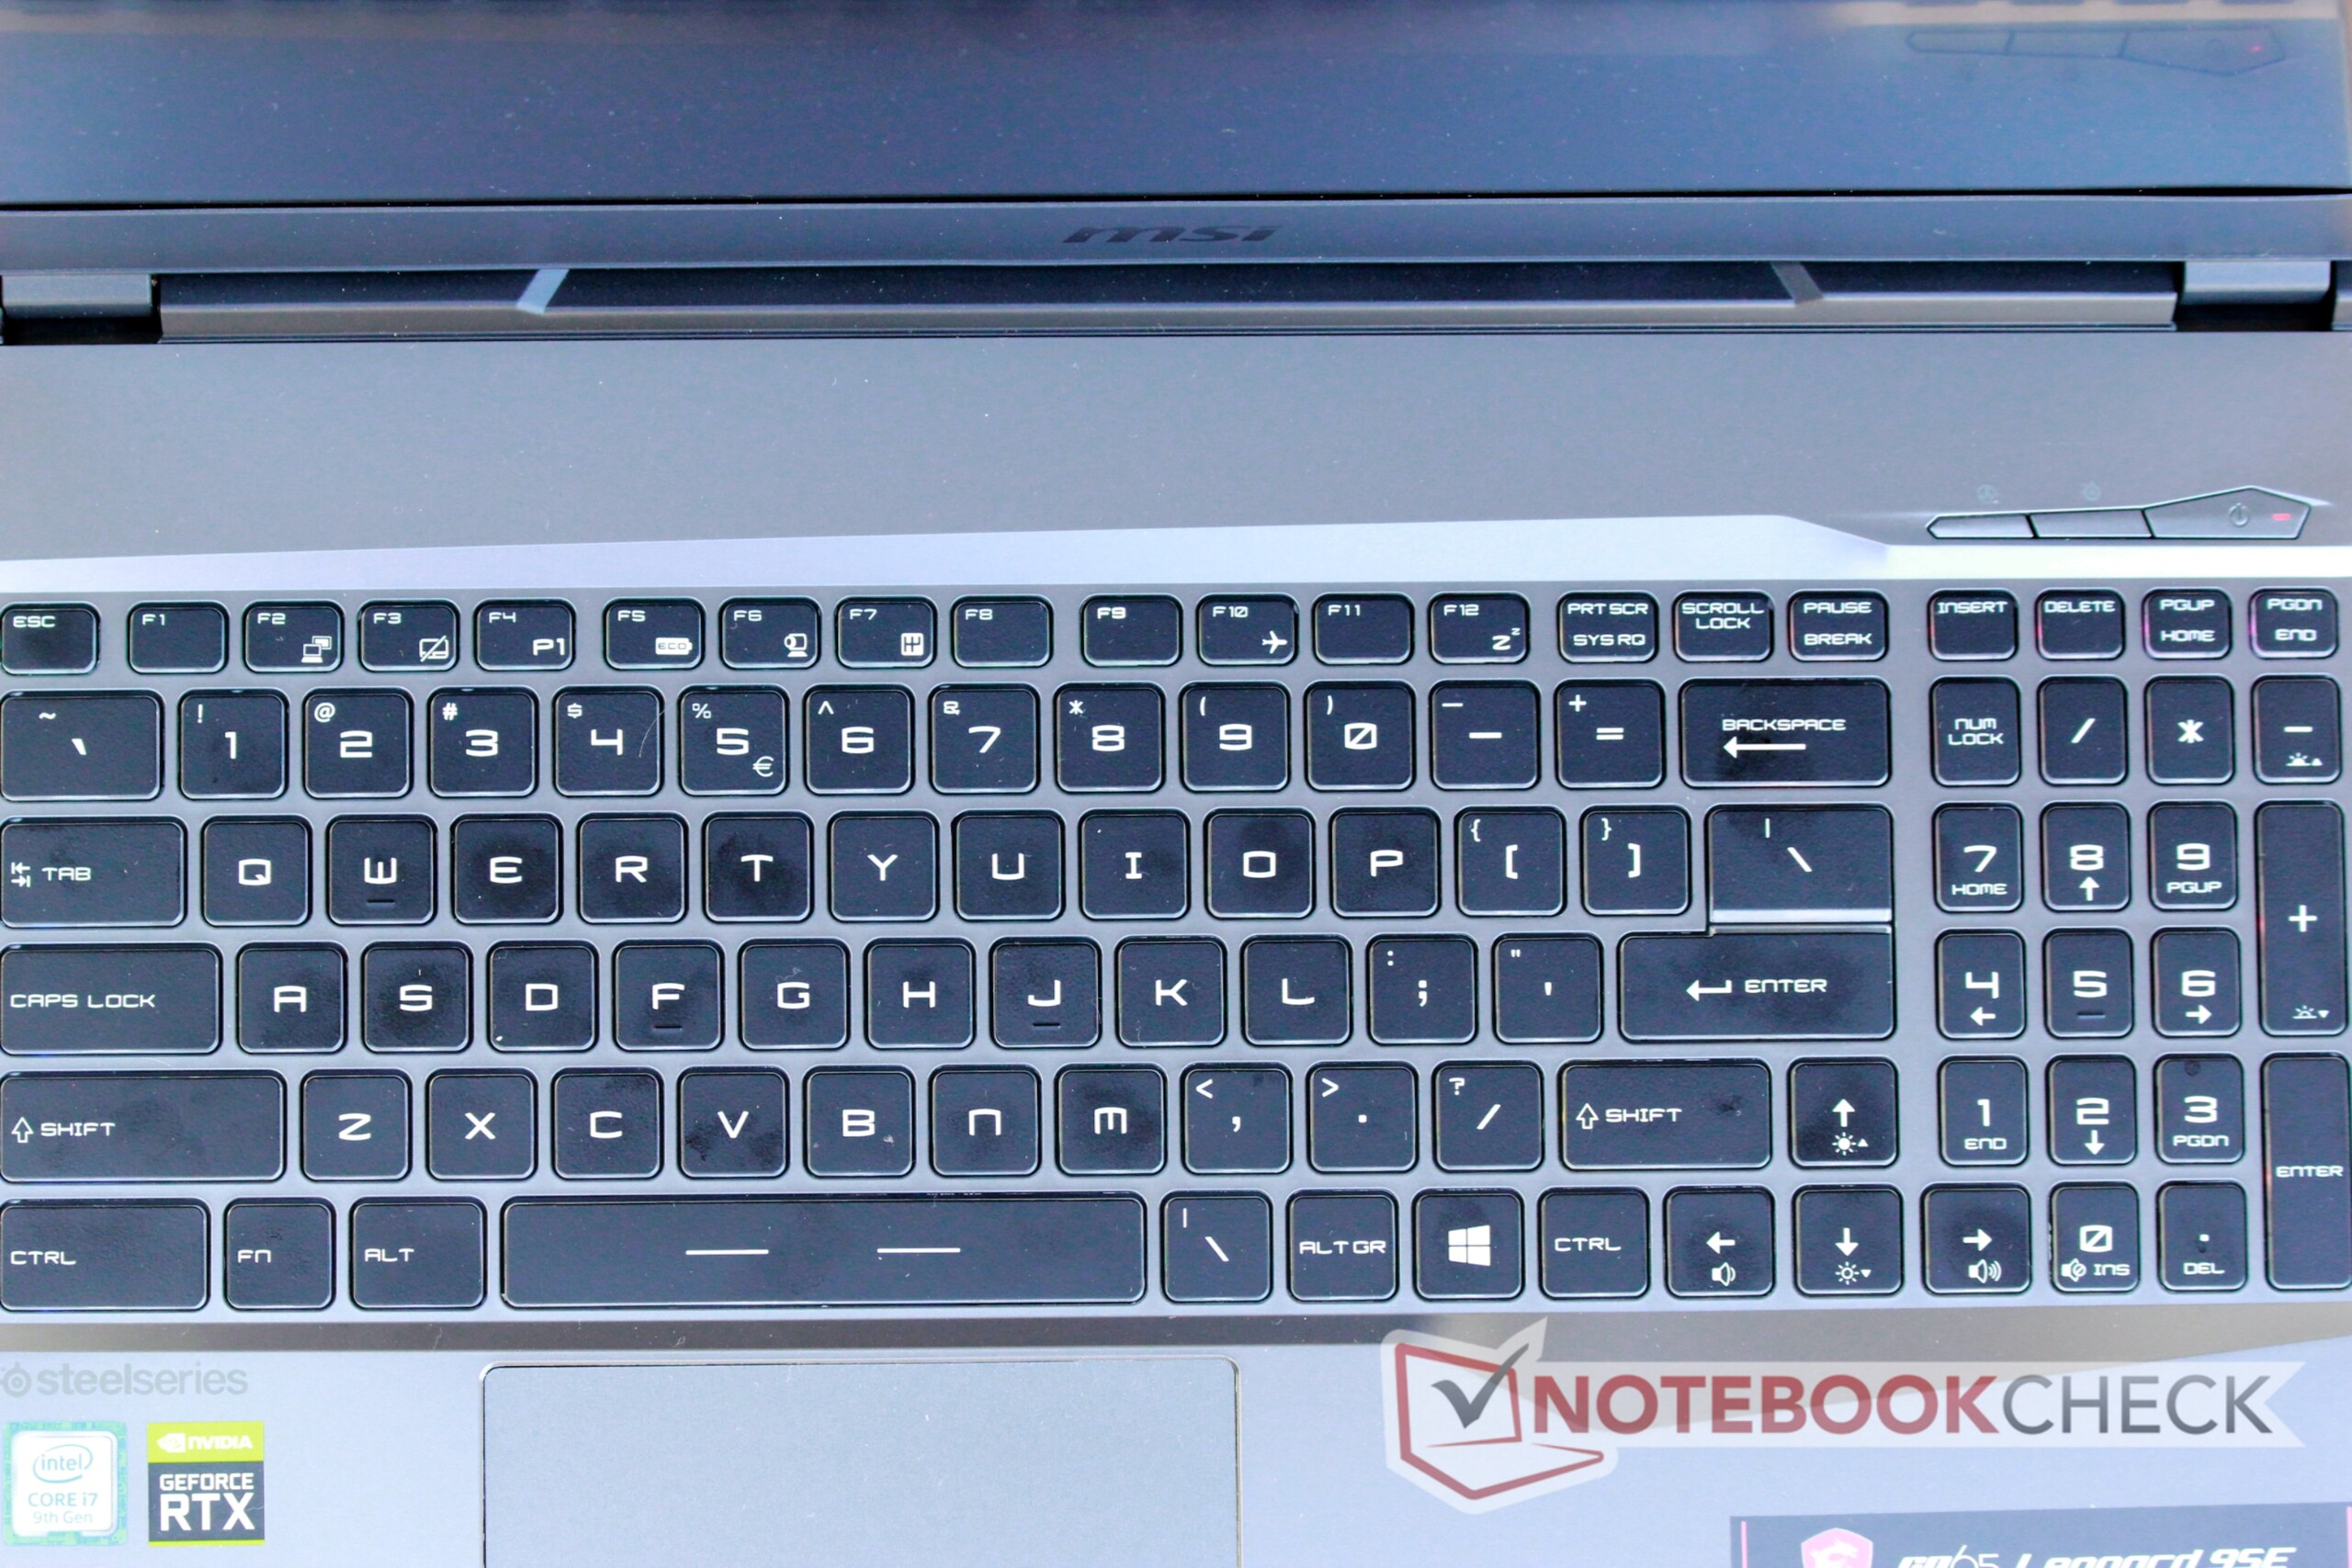
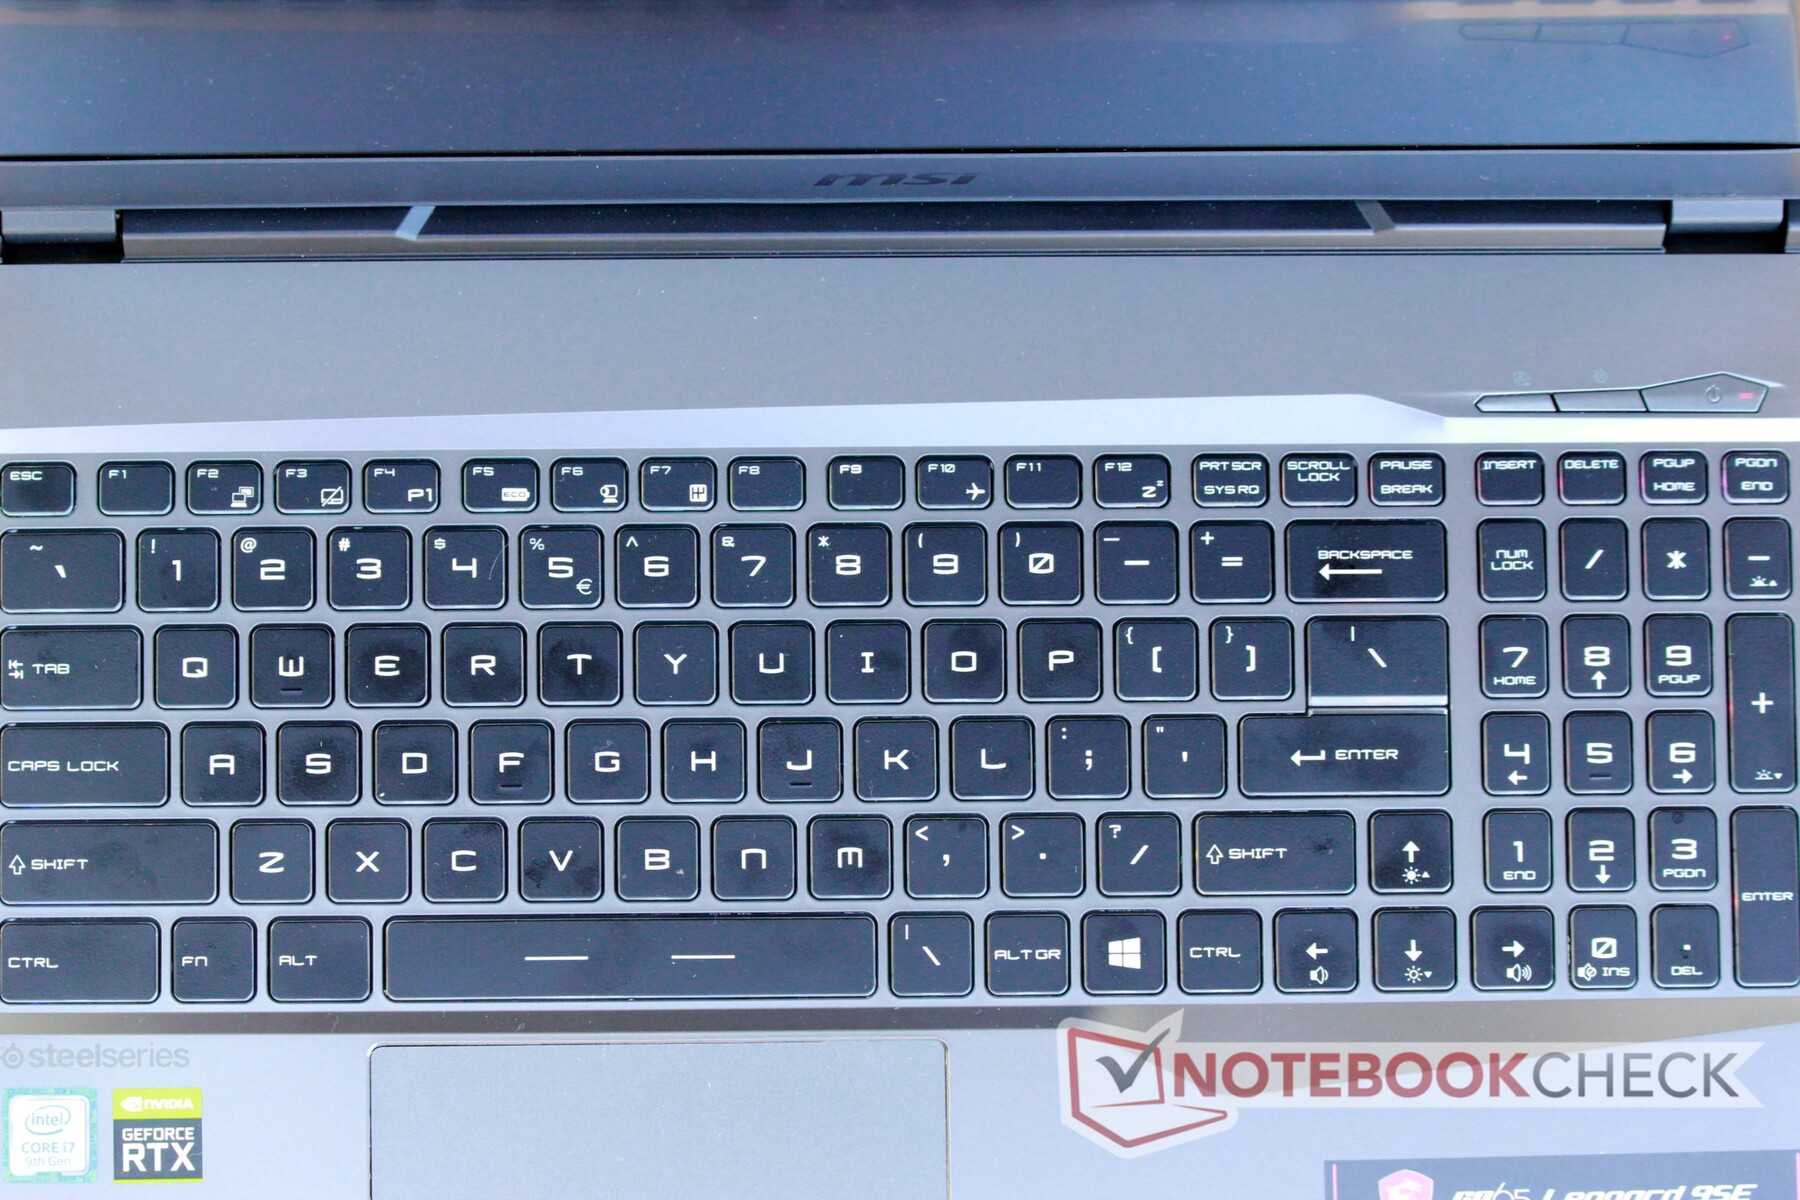
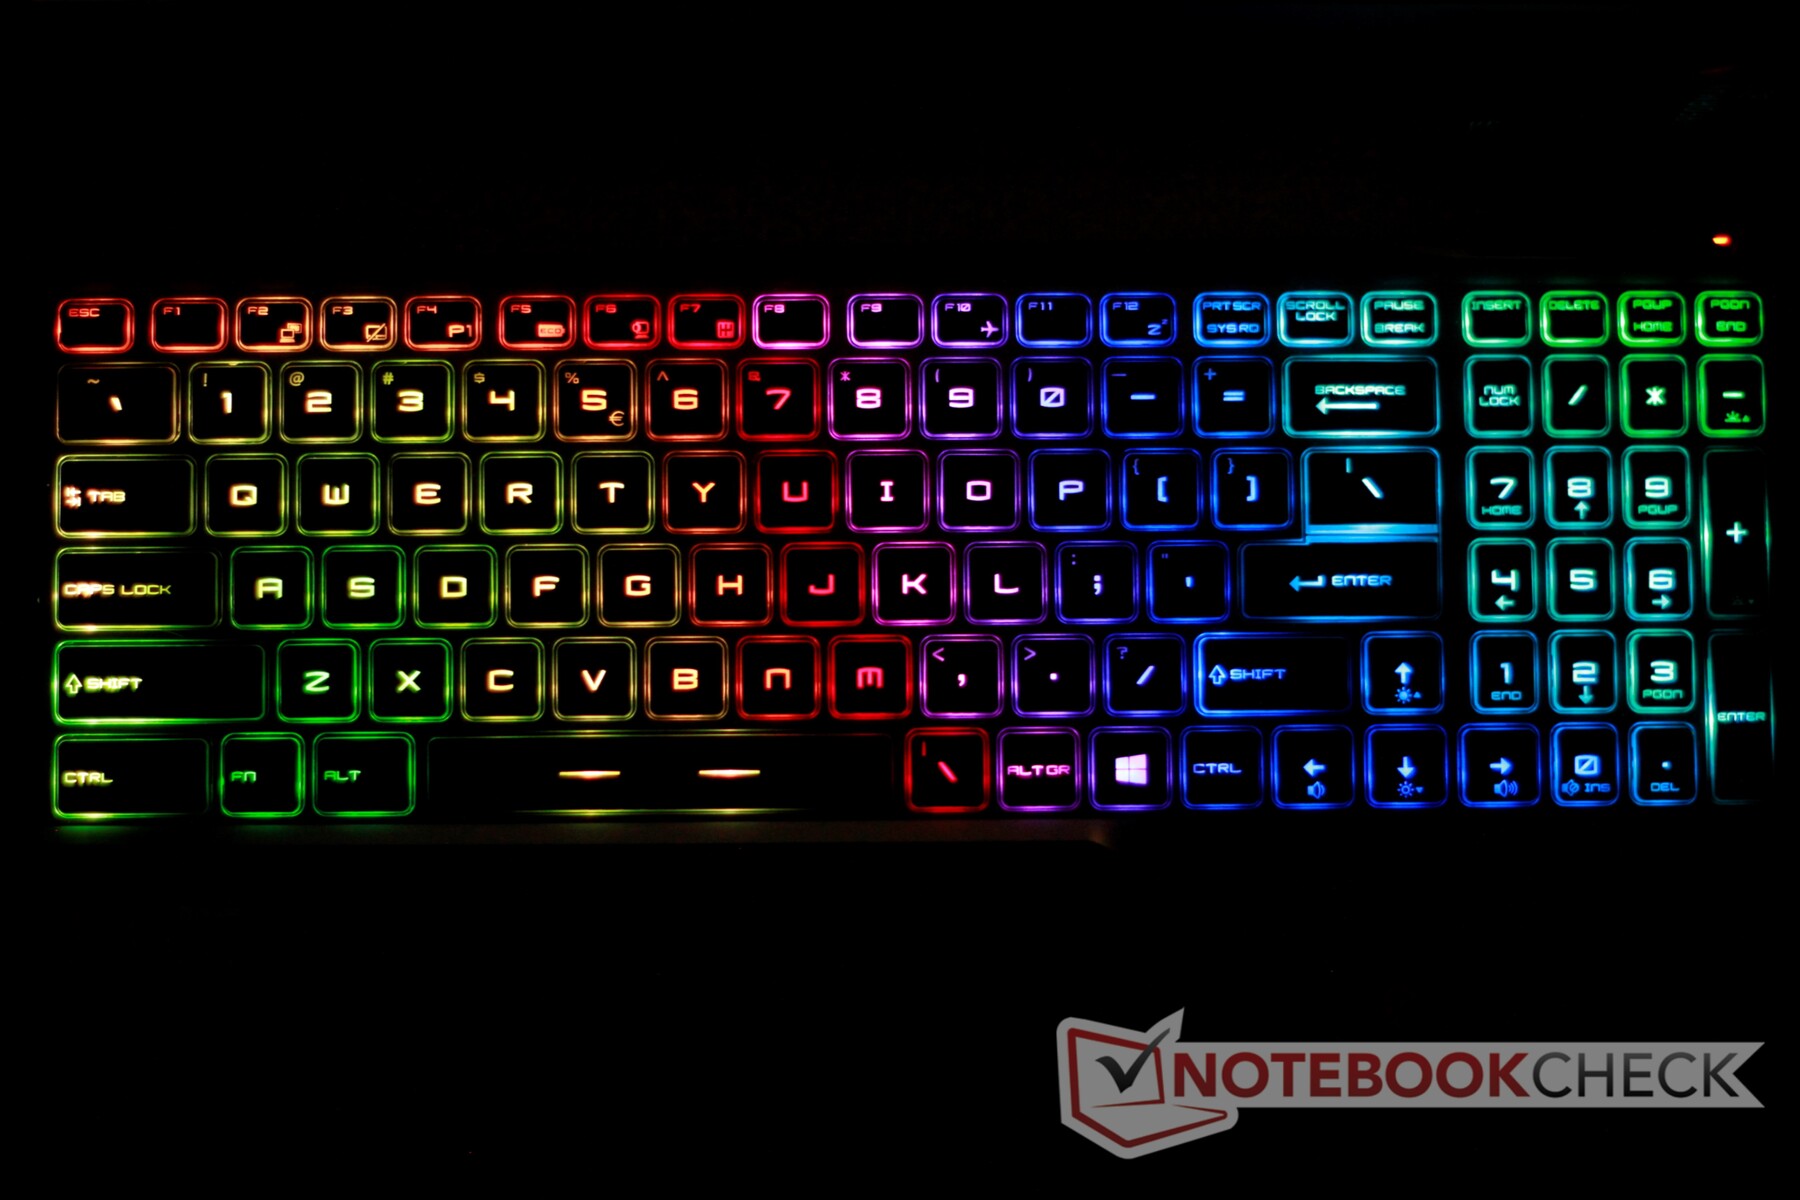
MSI's partnership with SteelSeries has yielded some of the best keyboards found on gaming laptops, and the GP65's keyboard continues this trend. Keys offer good travel with the soft-yet-firm feedback typical of MSI laptops. The layout is good with some quibbles: the Windows key is located on the right side instead of the more common left side, which can be frustrating in non-gaming workflows. The delete key is located too far from the alphanumeric keyboard for comfort. Additionally, the keys are a tad smaller than other MSI keyboards (~19 mm2); consequently, we experienced more typos than we usually do with MSI laptops.
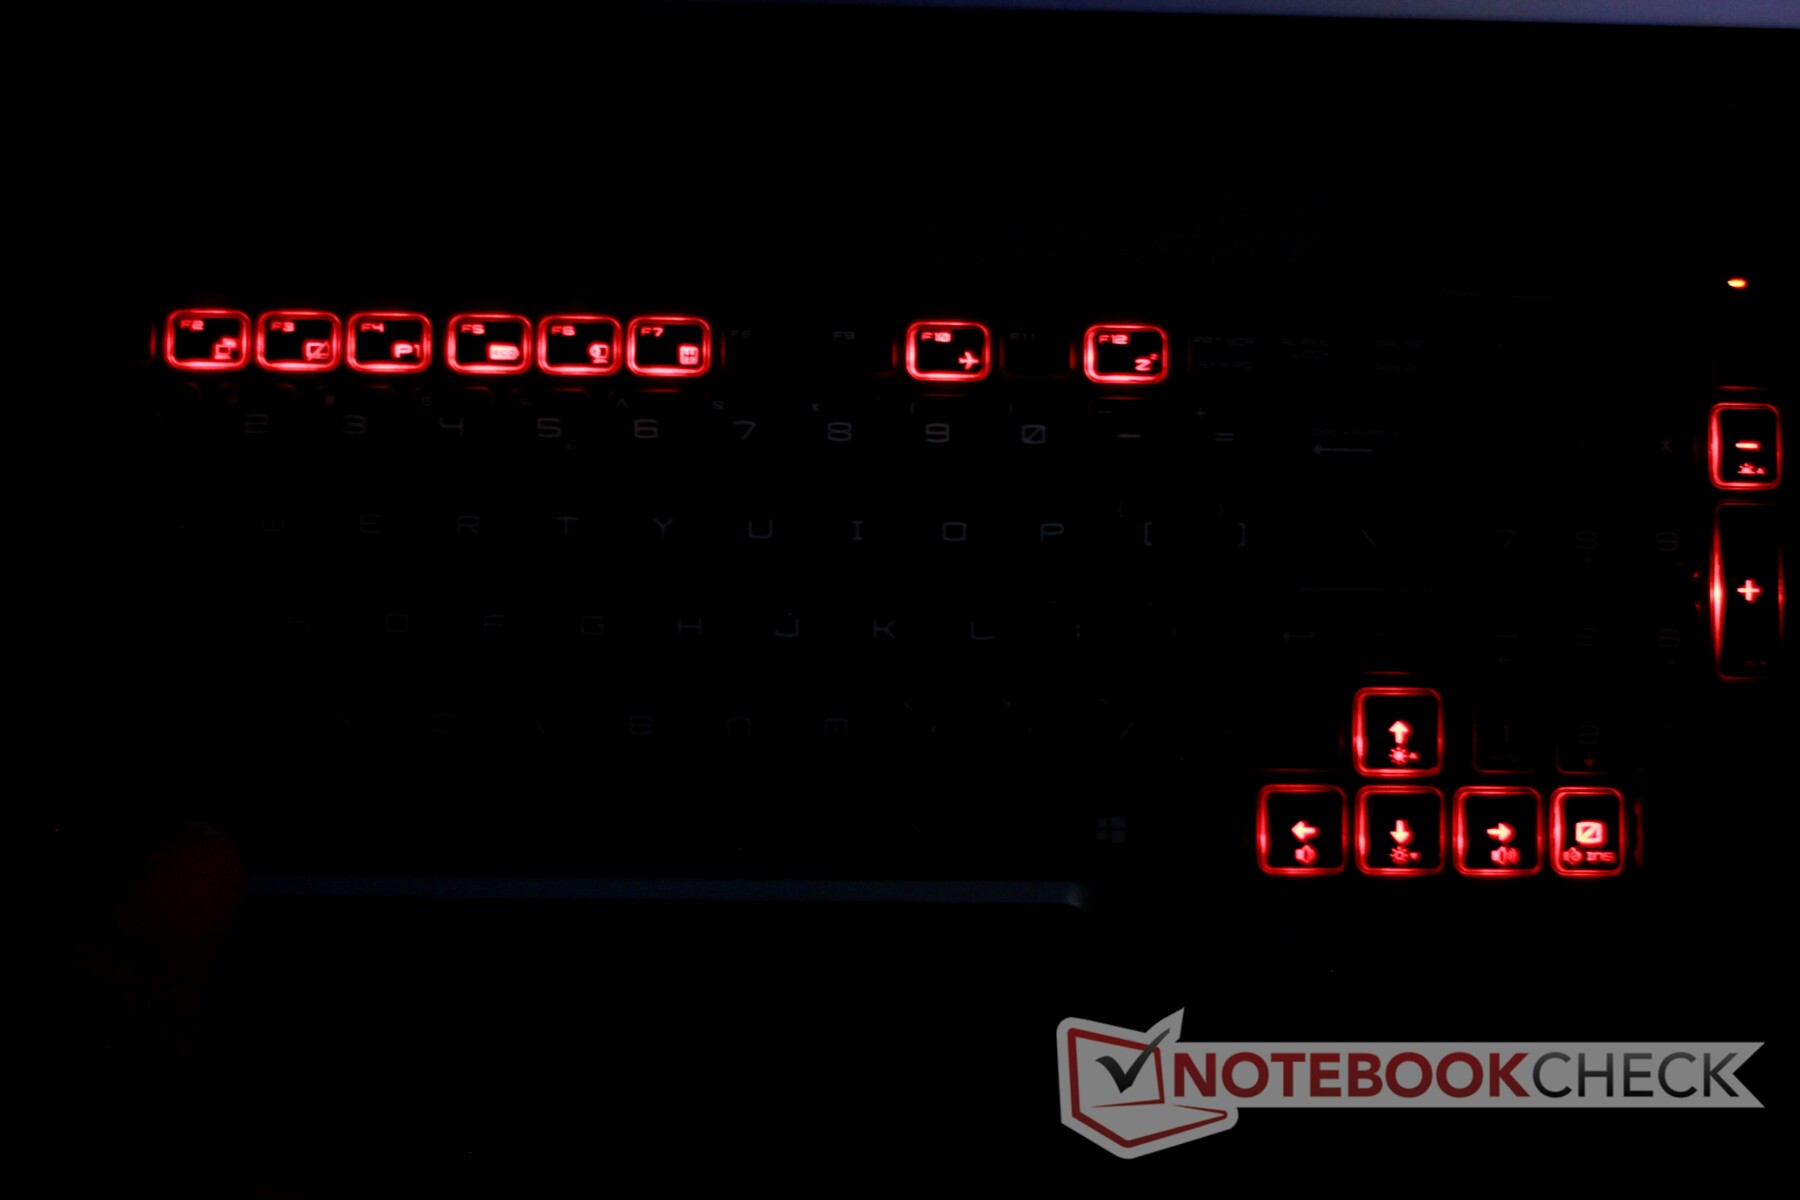
The per-key RGB backlight allows for a high level of customization. MSI includes several preset modes to show off the RGB system in the included SteelSeries Engine 3 software. Most of these are too flashy or distracting to be useful, but they make for a good party trick. The sides of the keys are translucent and allow the RGB lighting to shine bright. A nice touch is the highlighting of function keys when the Fn key is held down; secondary keys like volume and screen brightness controls light up red while the rest of the keyboard backlight is turned off.
Touchpad
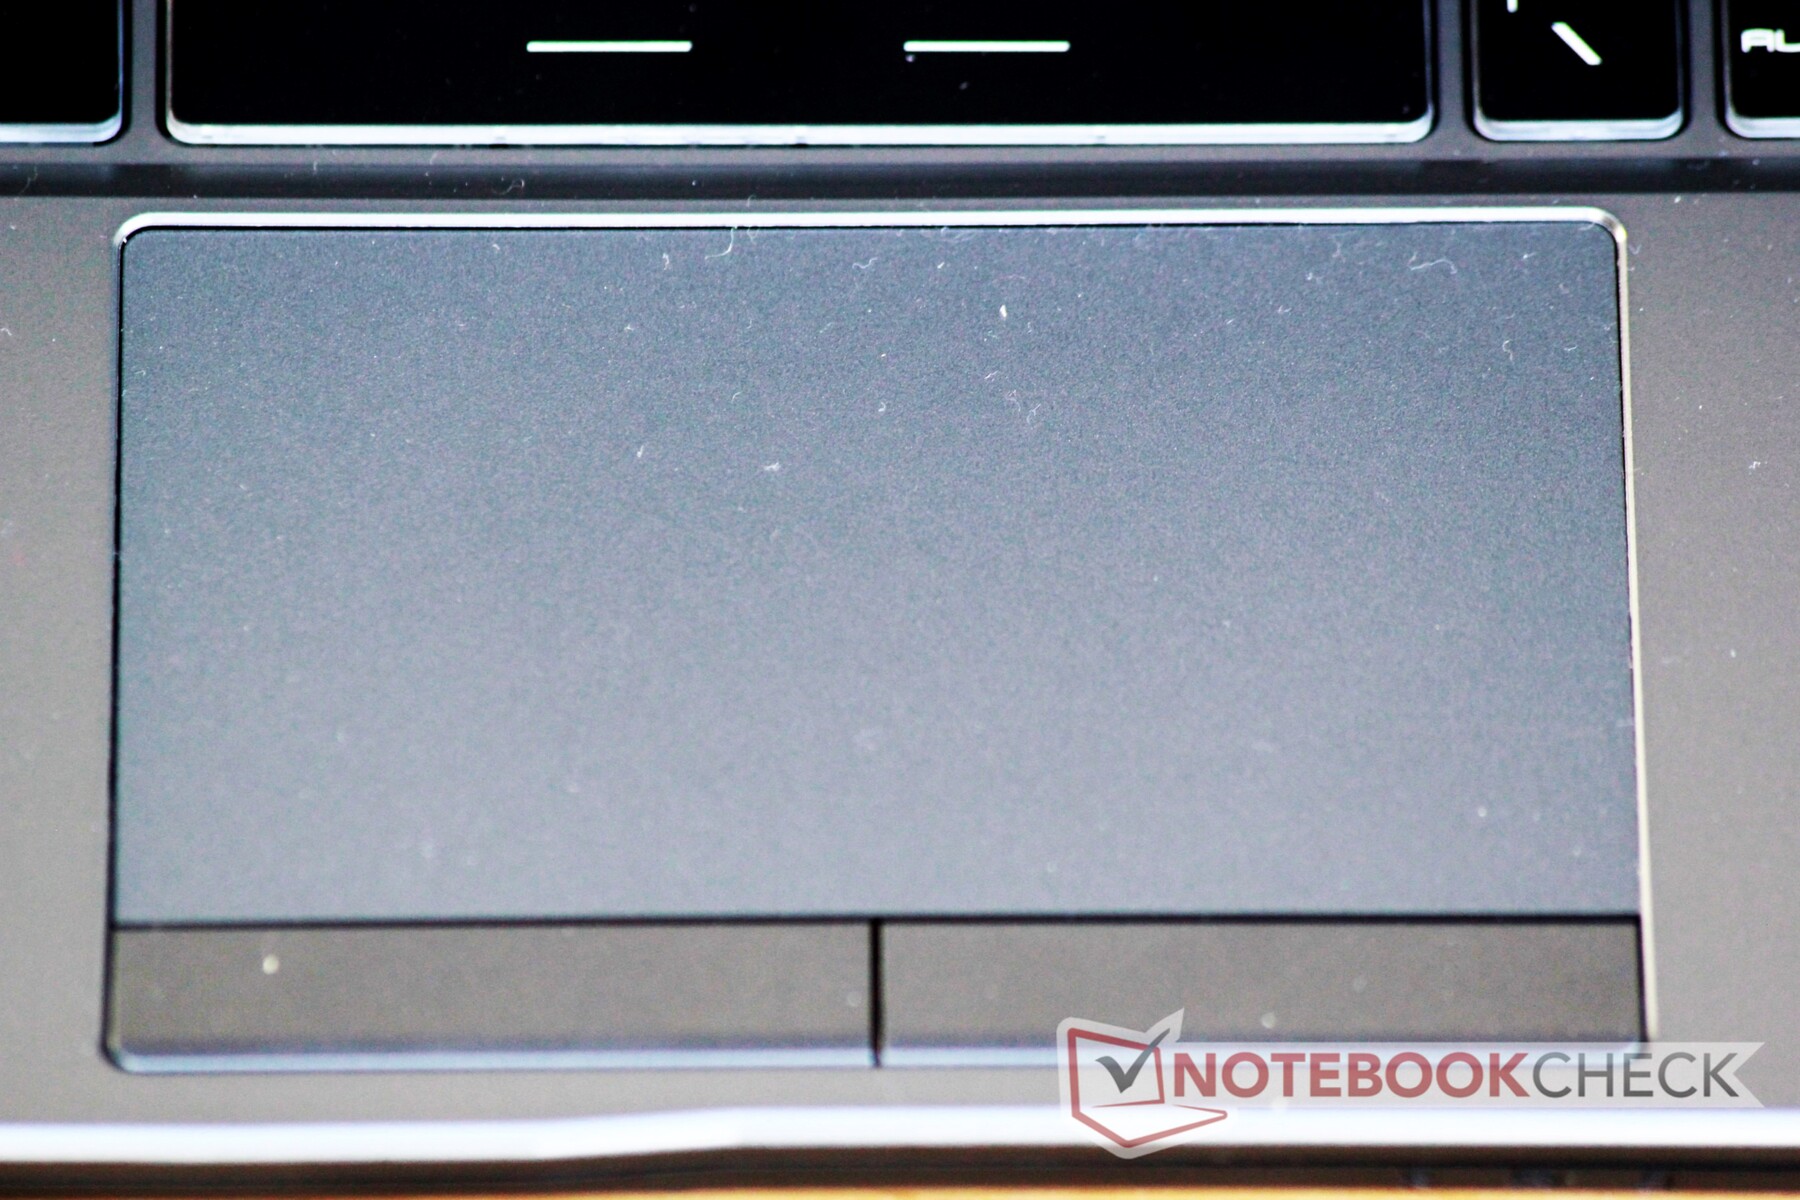
The recessed touchpad (12.1 x 6.4 cm) is smooth underhand and offers good glide. Tracking, however, is a bit finicky; a bit of firm pressure is needed for accurate tracking. A light touch may result in the touchpad not registering user input, which can lead to frustration. The dedicated click buttons are a welcome addition. Feedback is firm and clicks are well-defined, but the mechanism feels and sounds cheap and hollow.
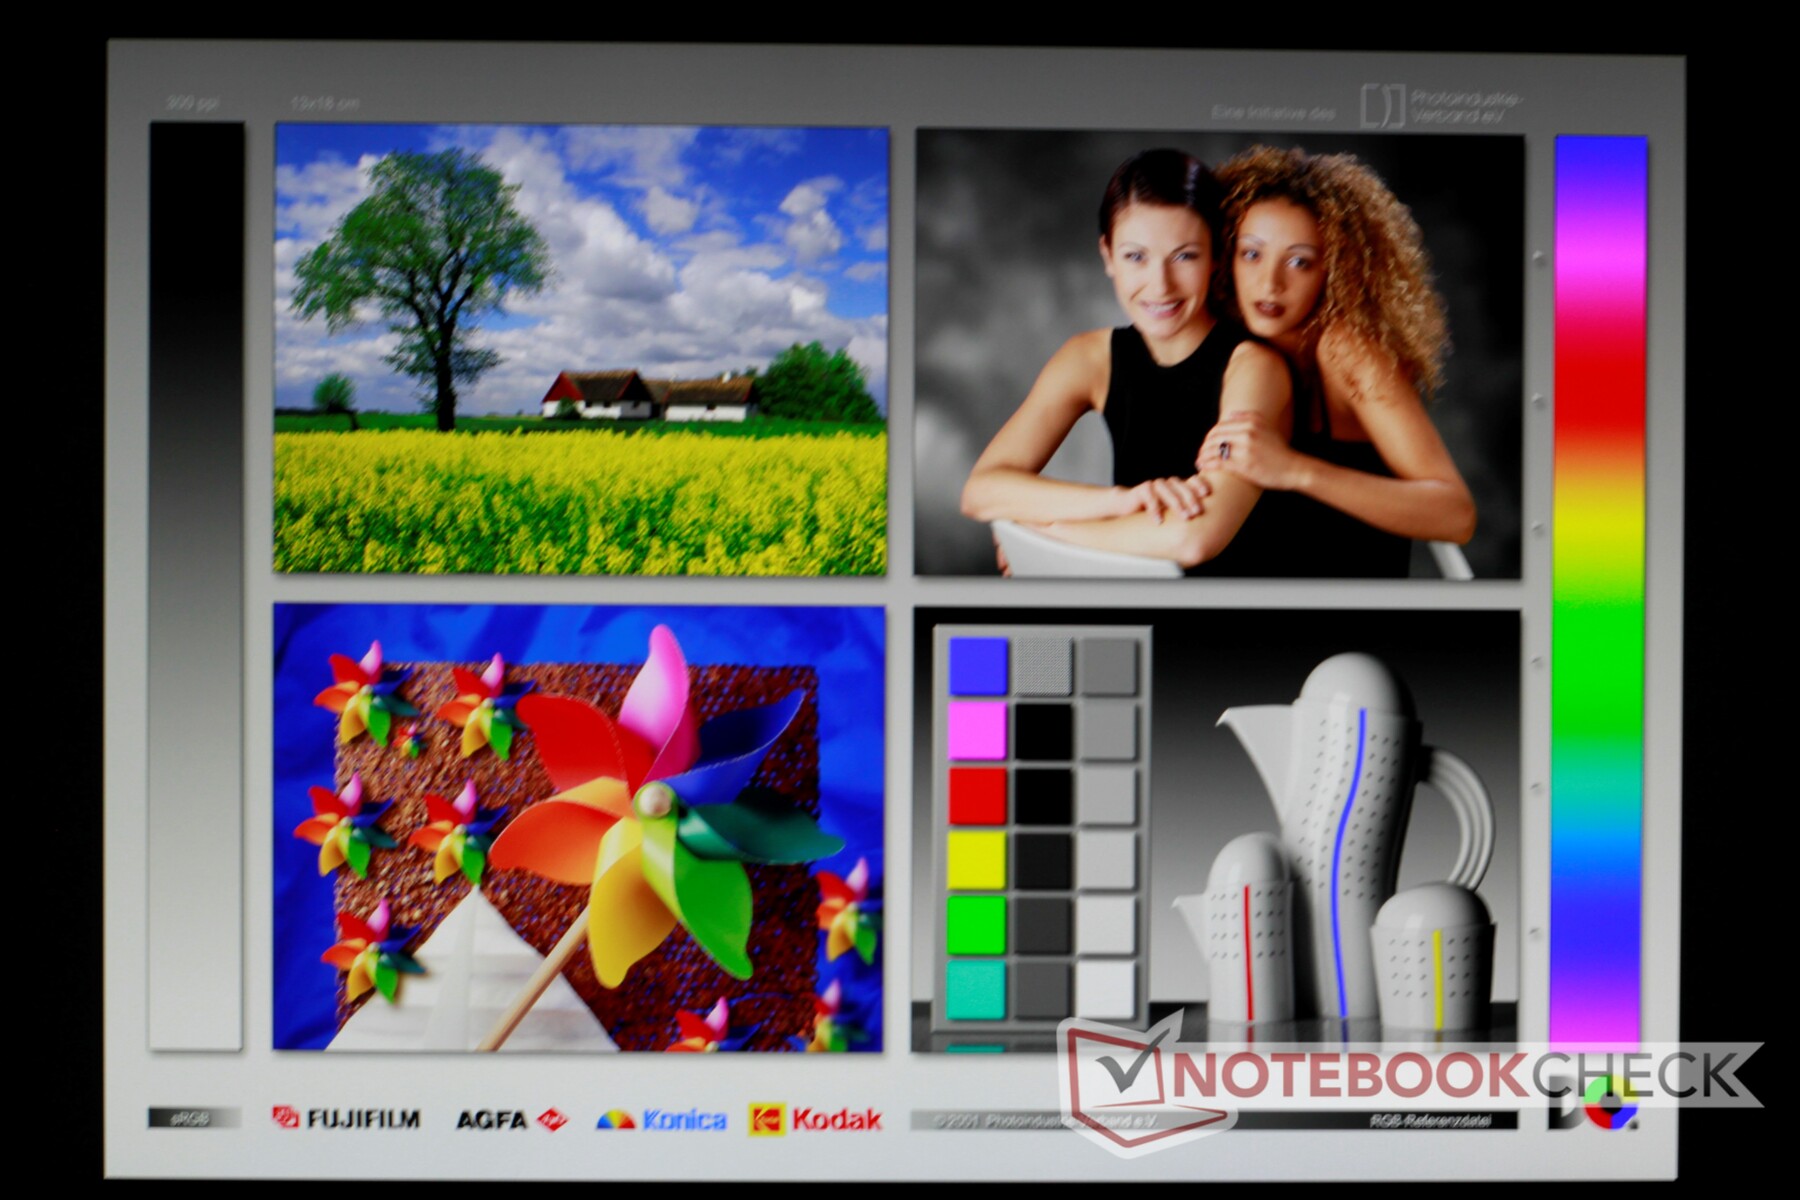
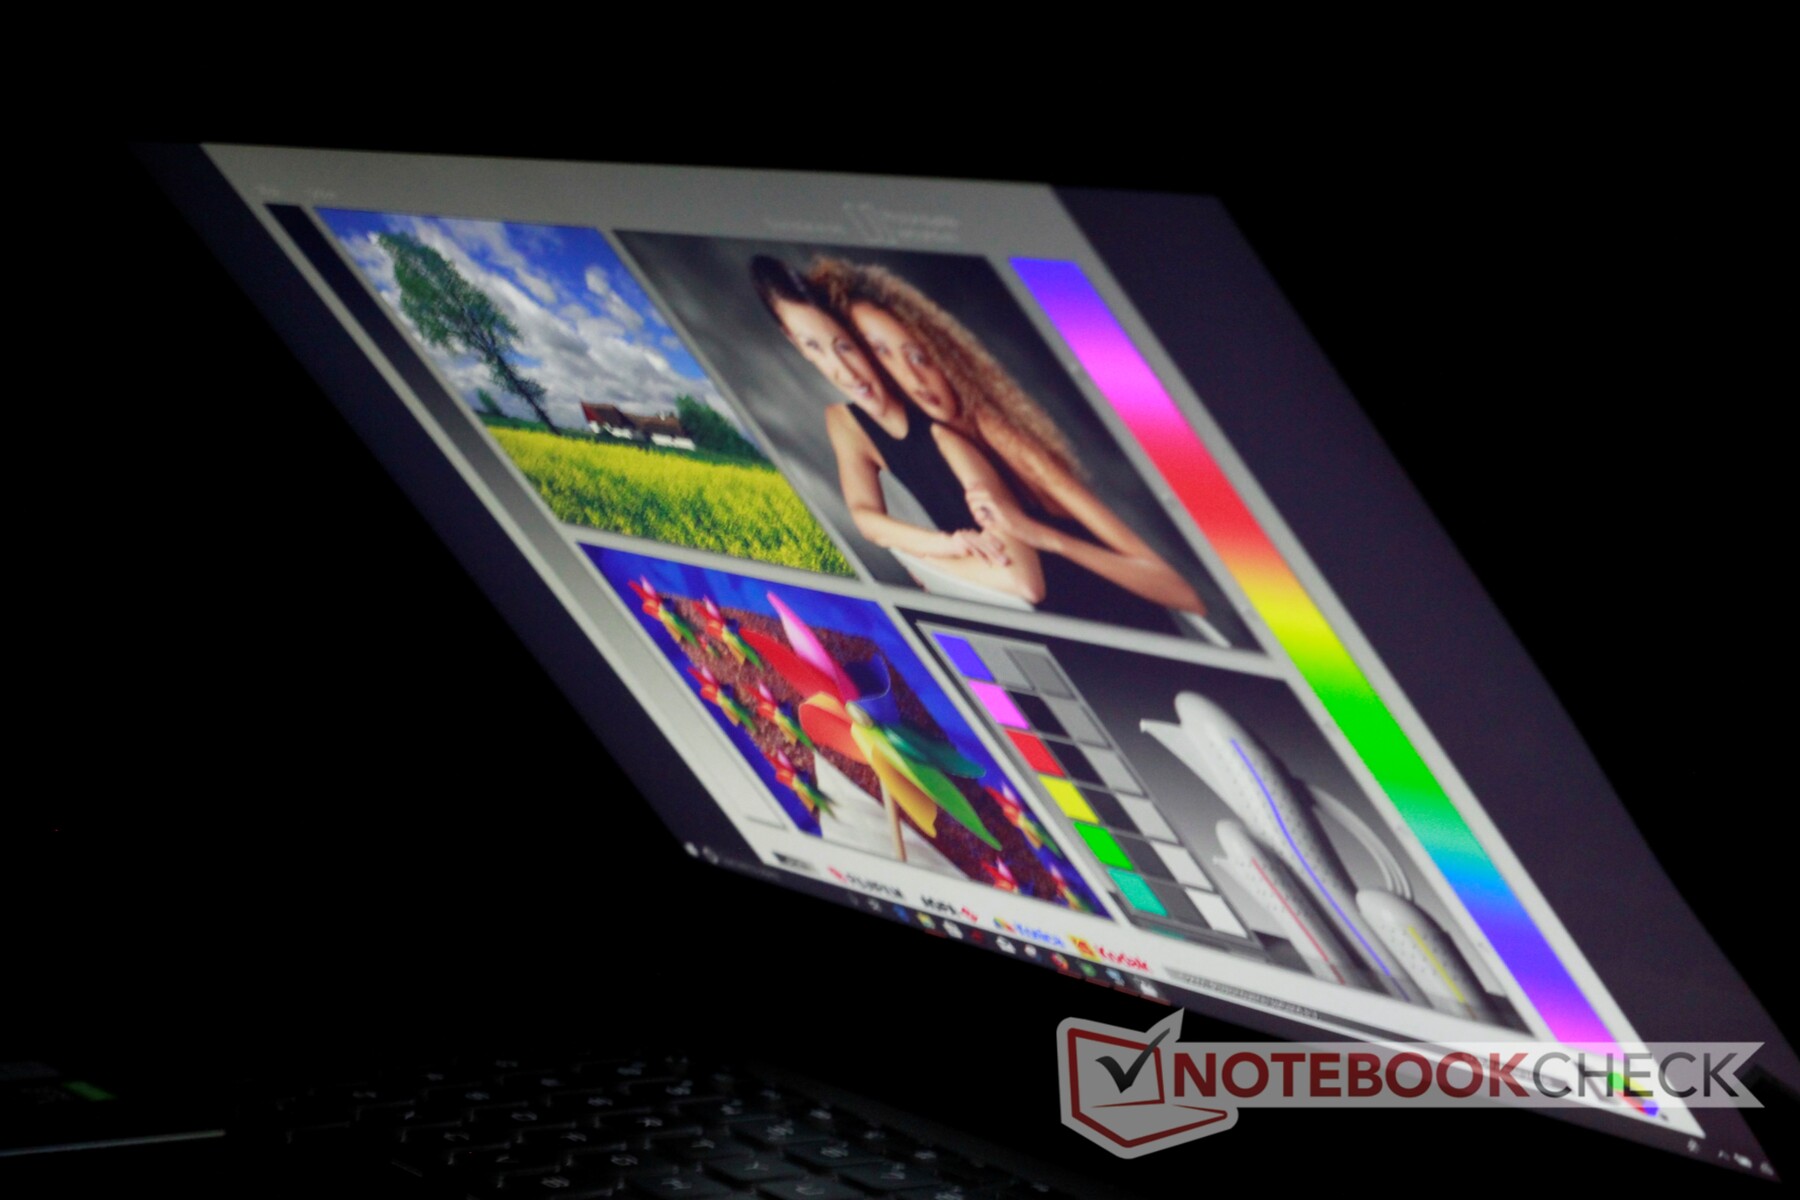
Display
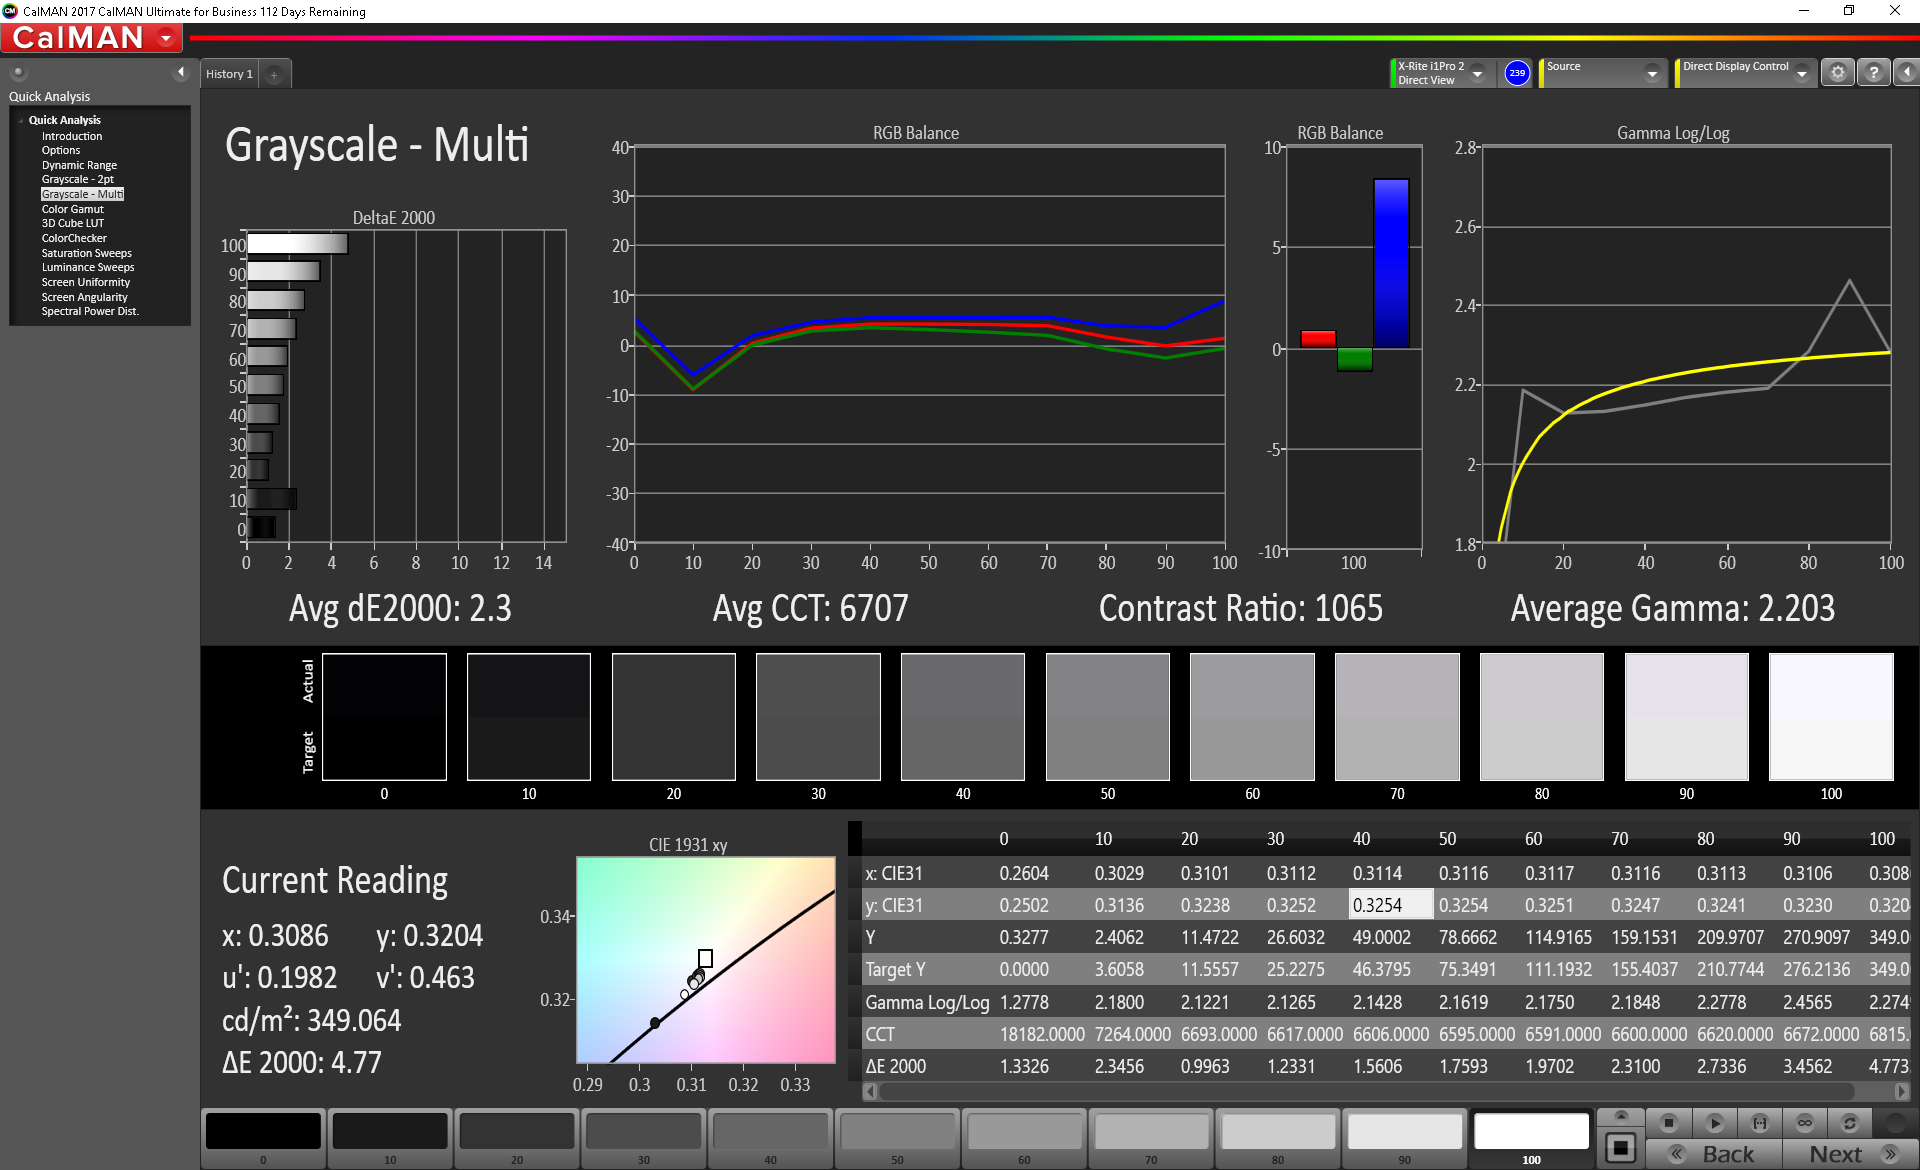
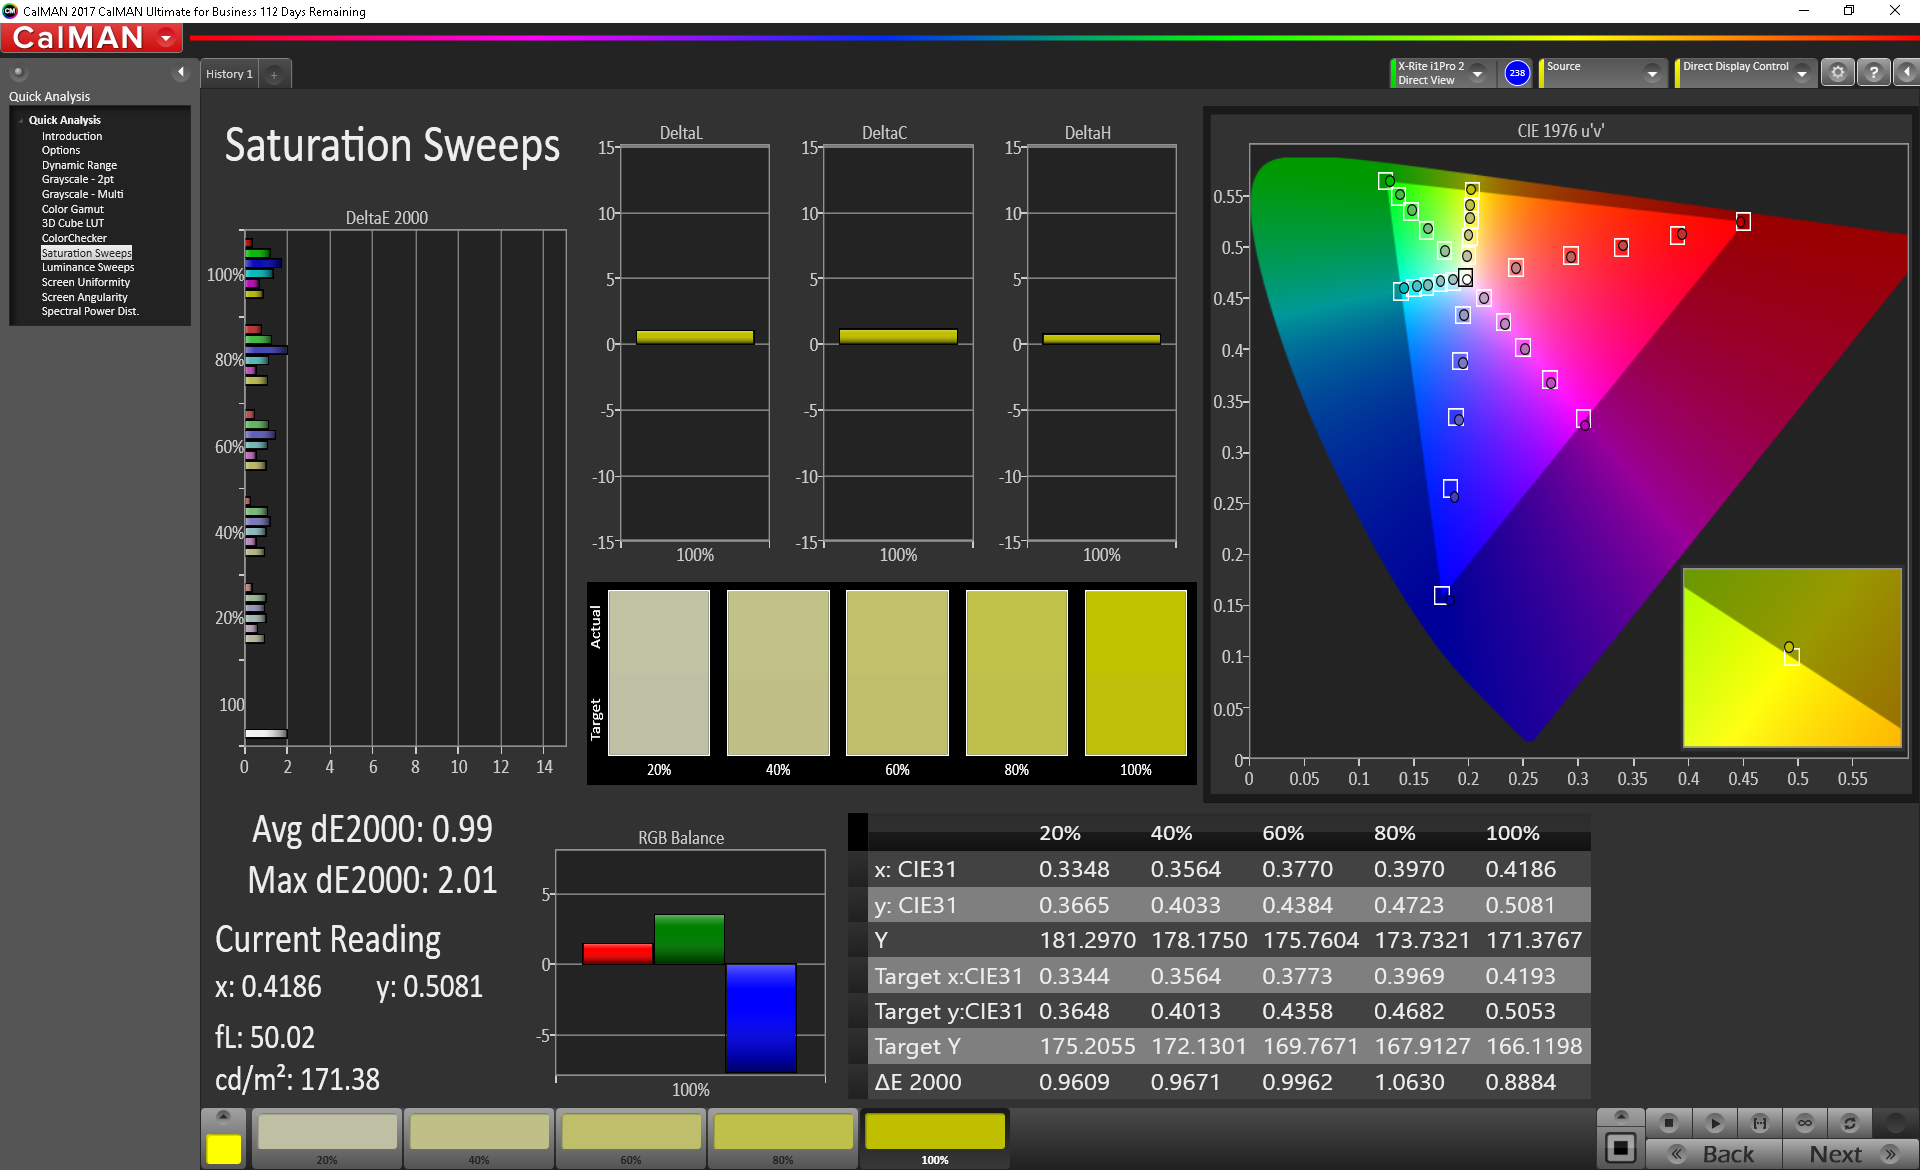
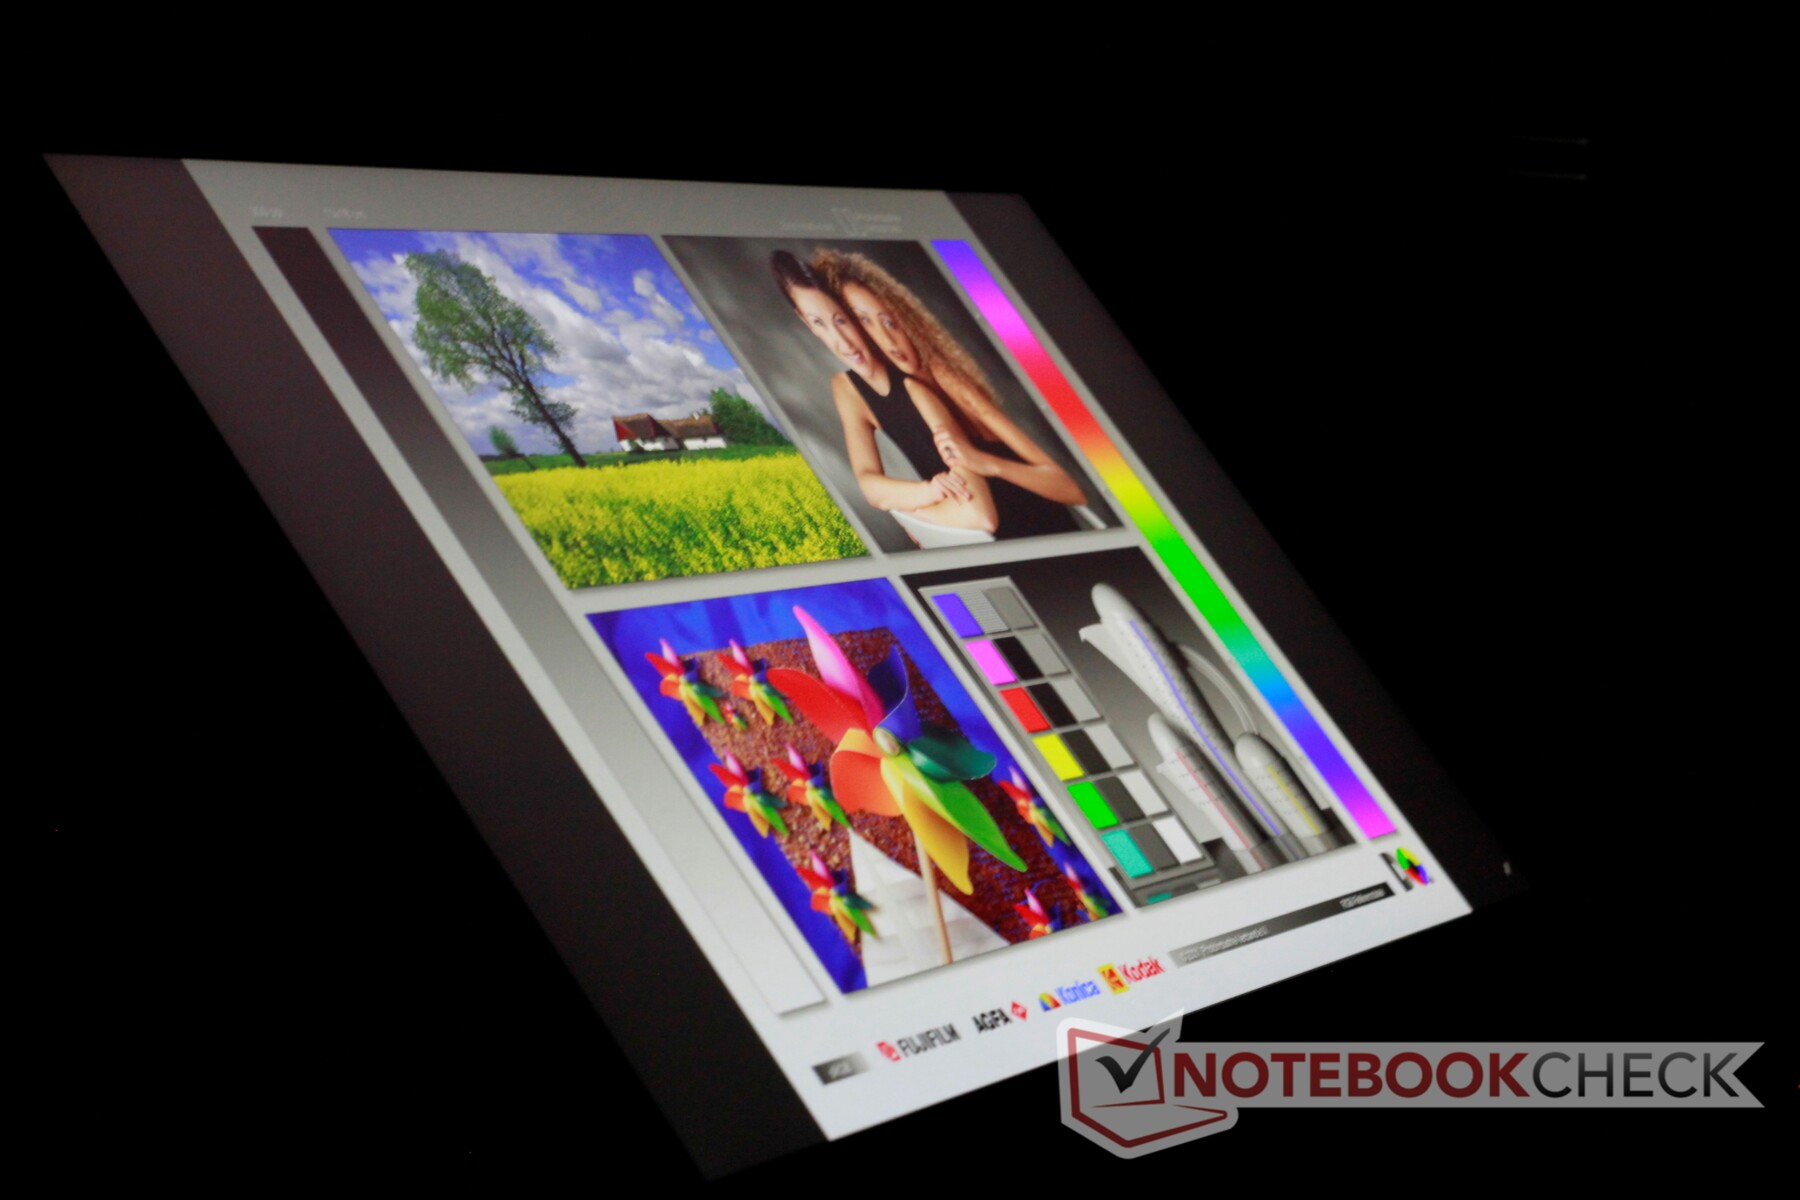
One of the highlights of the GP65 Leopard is its bright and fast 144 Hz IPS display. Considering the price point, the FHD LG panel is phenomenal. Response times are very quick, and the 144 Hz refresh rate makes every animation glide across the screen. Gameplay at higher framerates looks beautifully smooth.
The display's backlight is bright, averaging 327 nits; this is a decent bit higher than the 290-300 nit average of most other mid-tier gaming laptops. However, the backlight is only moderately even; the left side of the screen registers a bit dimmer than the right side. This difference is not noticeable in regular use. Contrast is also a bit low at 871:1 but is adequate. There is no detectable PWM.
| |||||||||||||||||||||||||
Brightness Distribution: 85 %
Center on Battery: 348.3 cd/m²
Contrast: 871:1 (Black: 0.4 cd/m²)
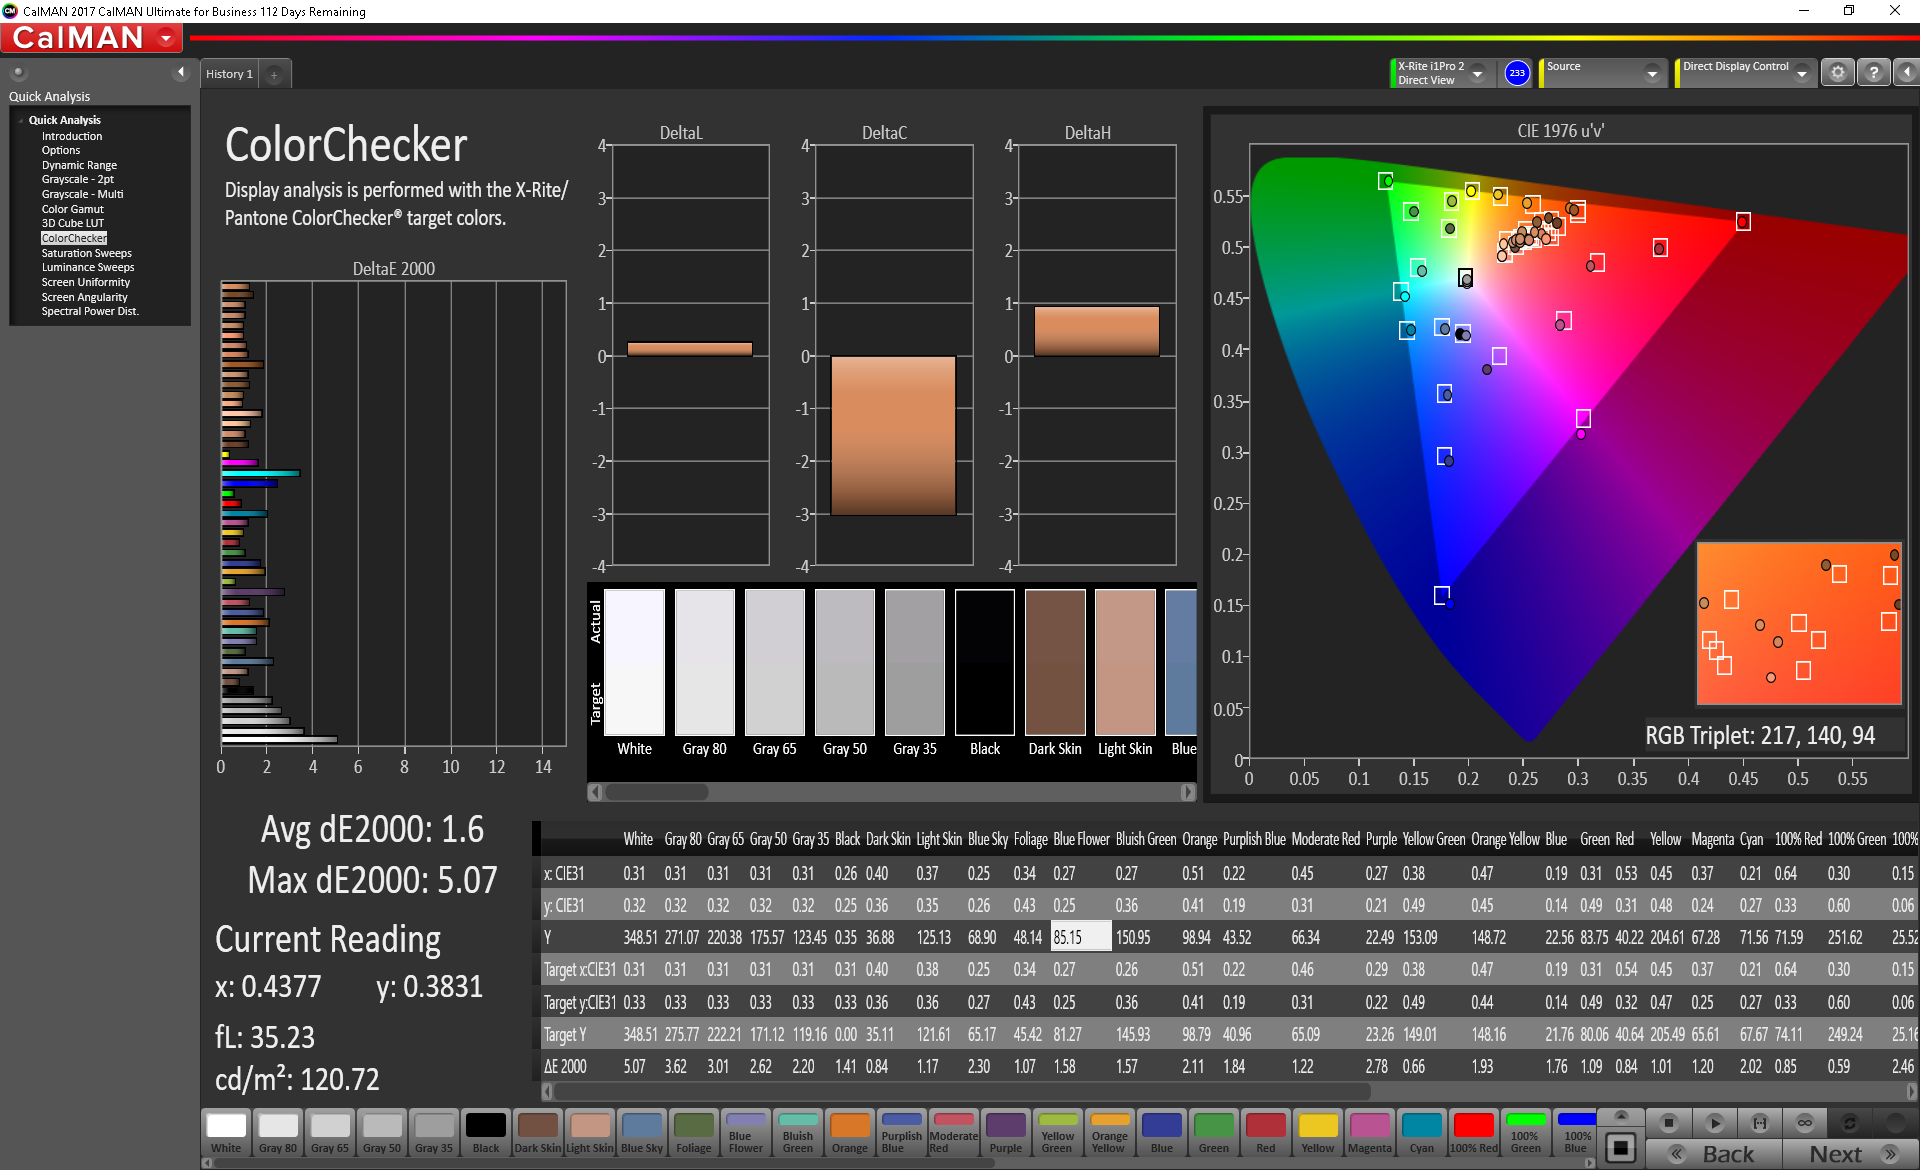
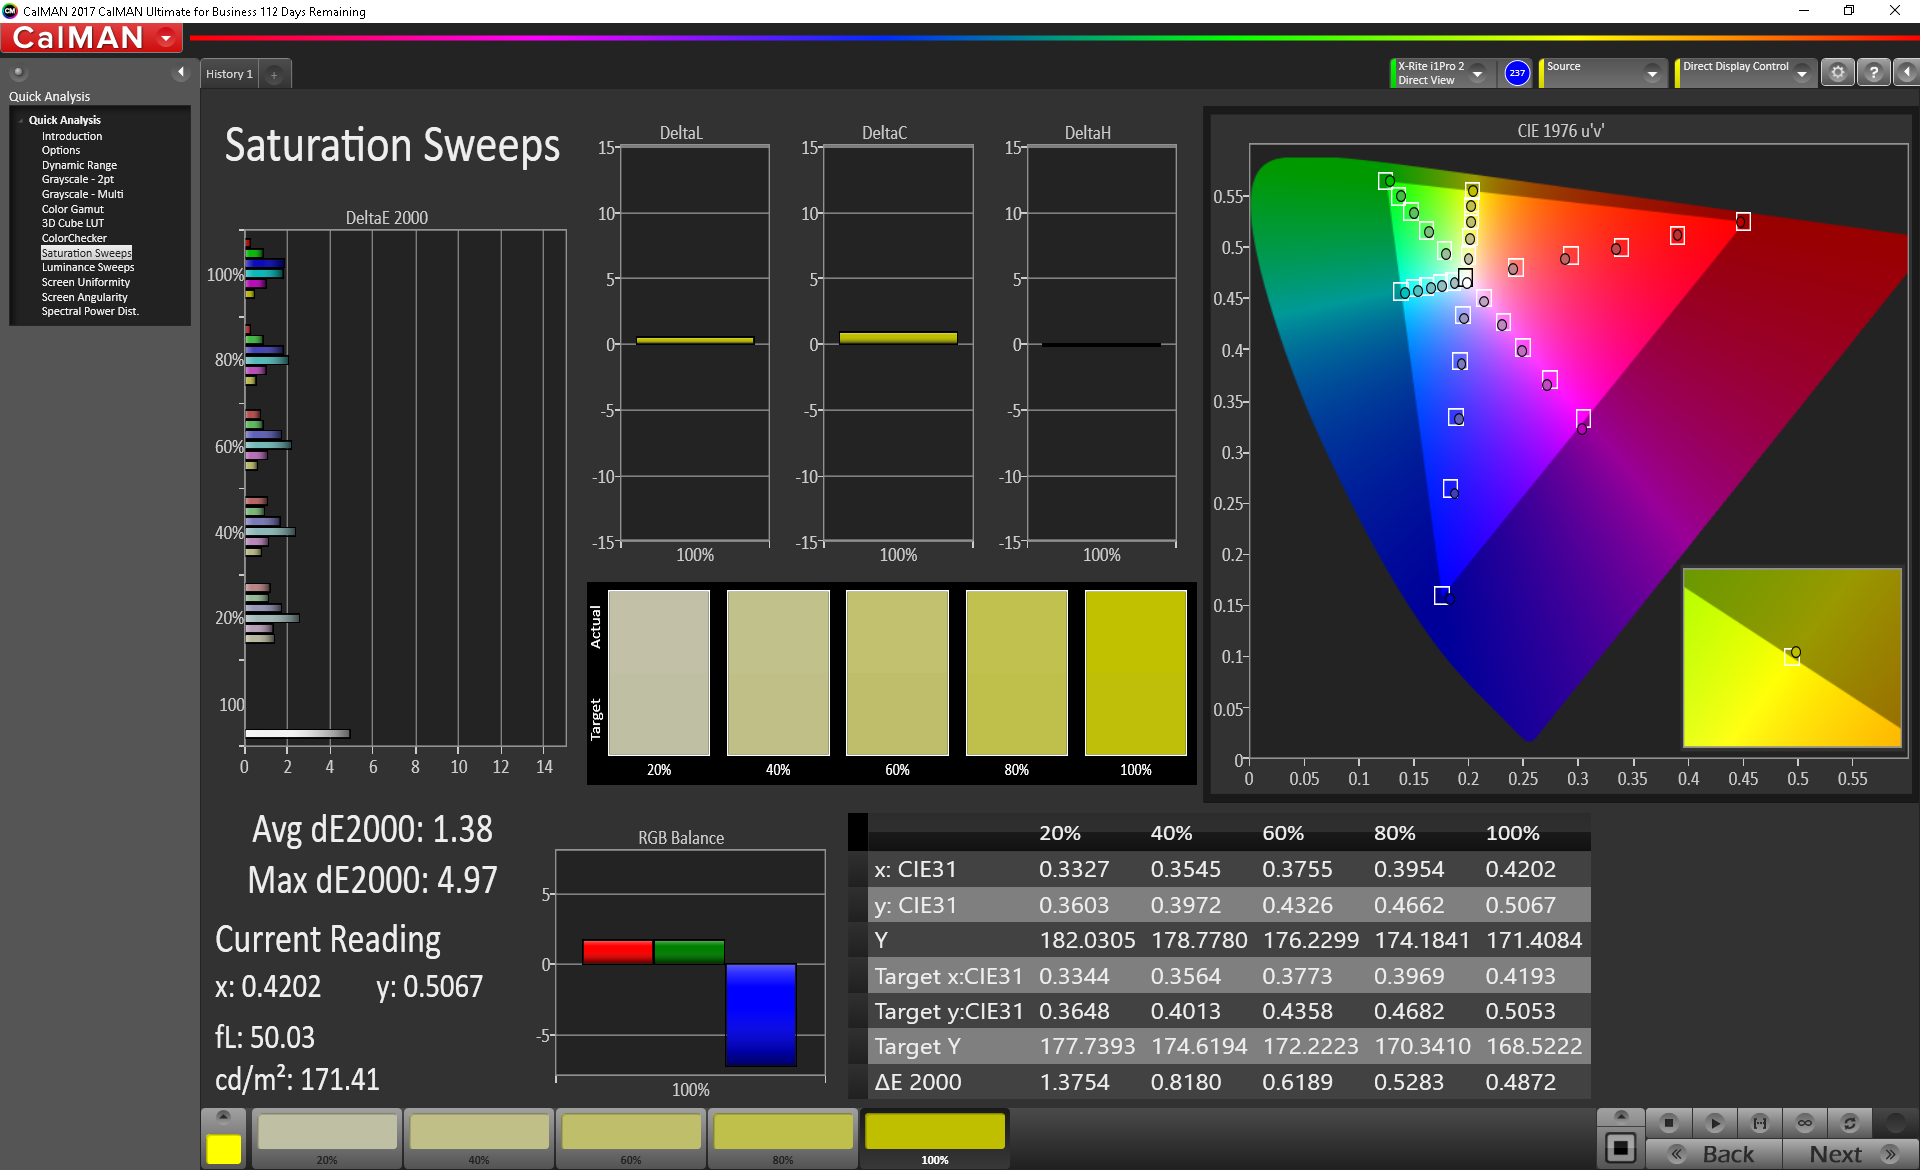
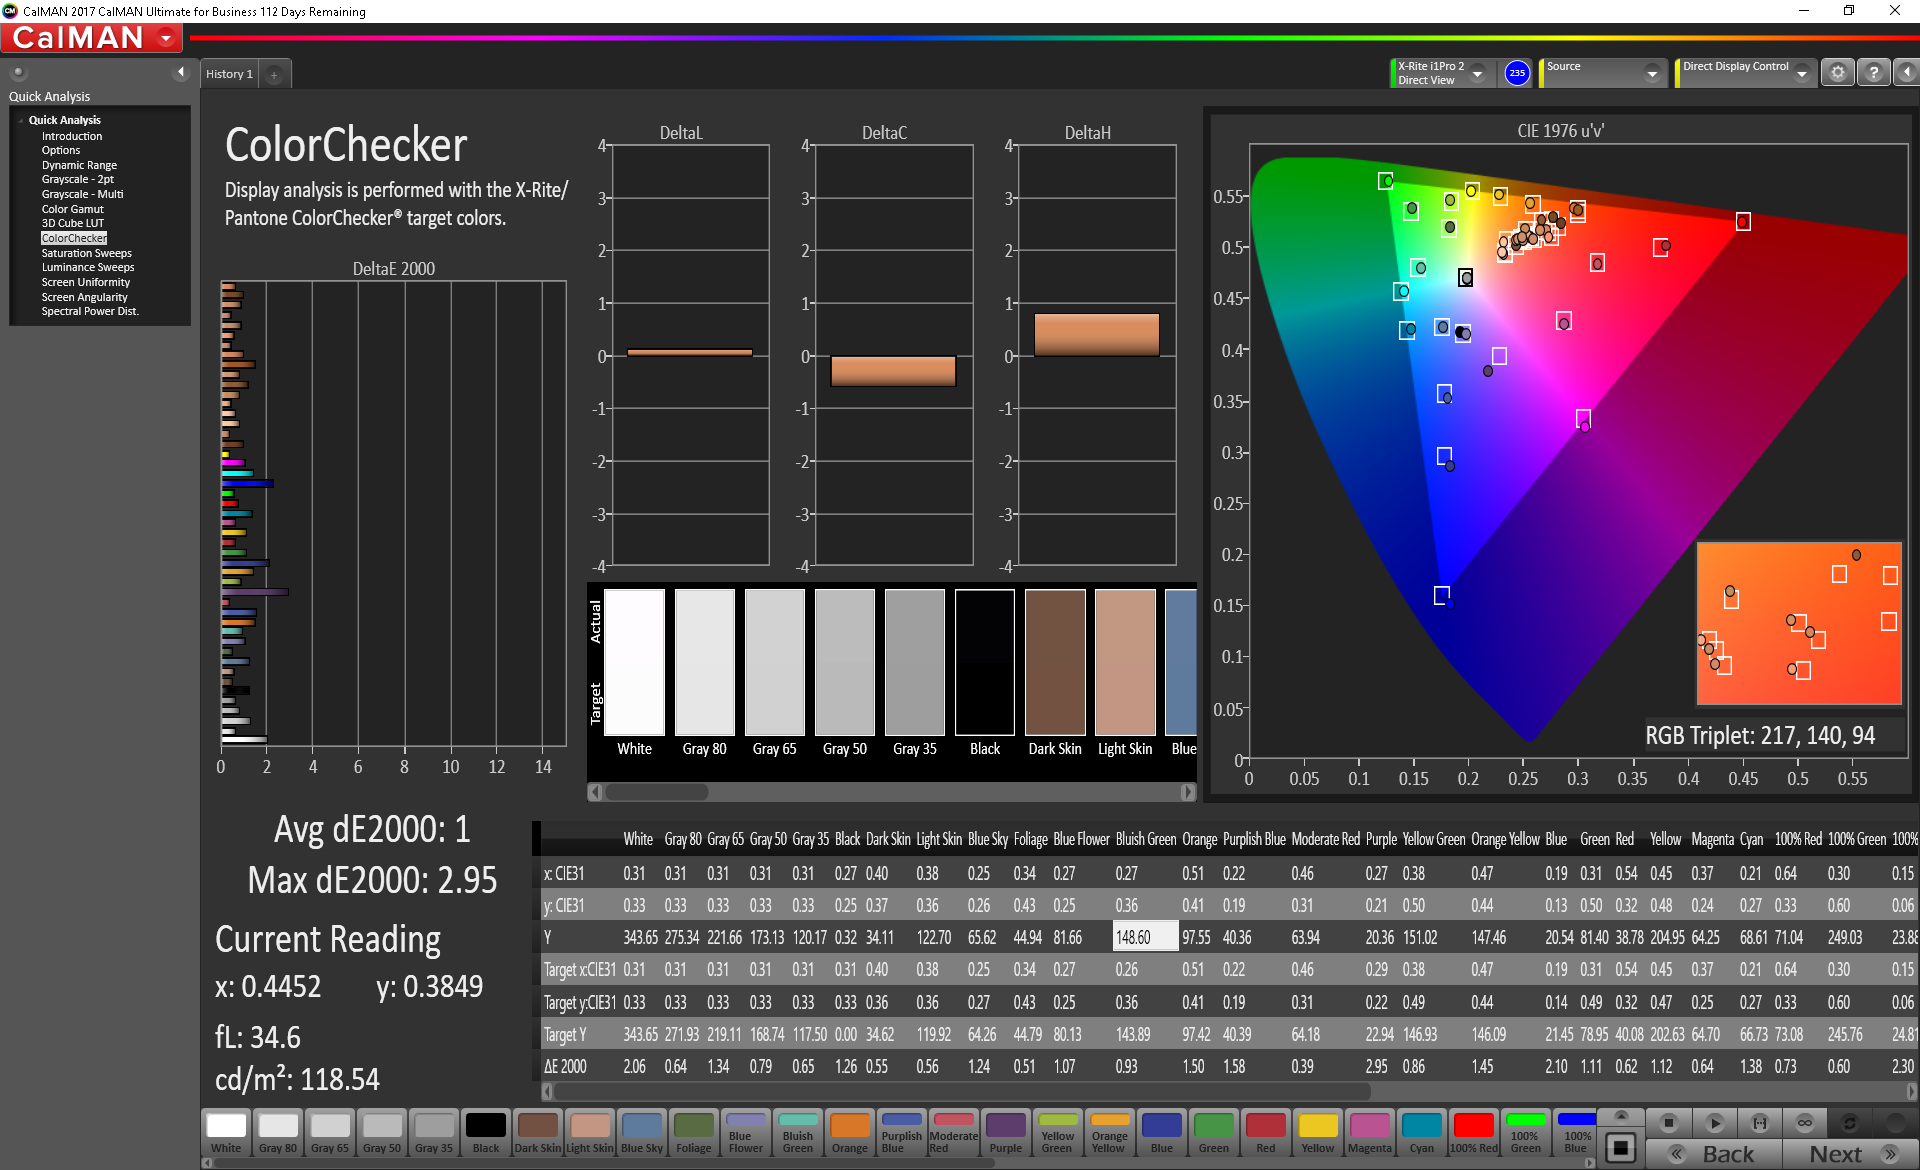
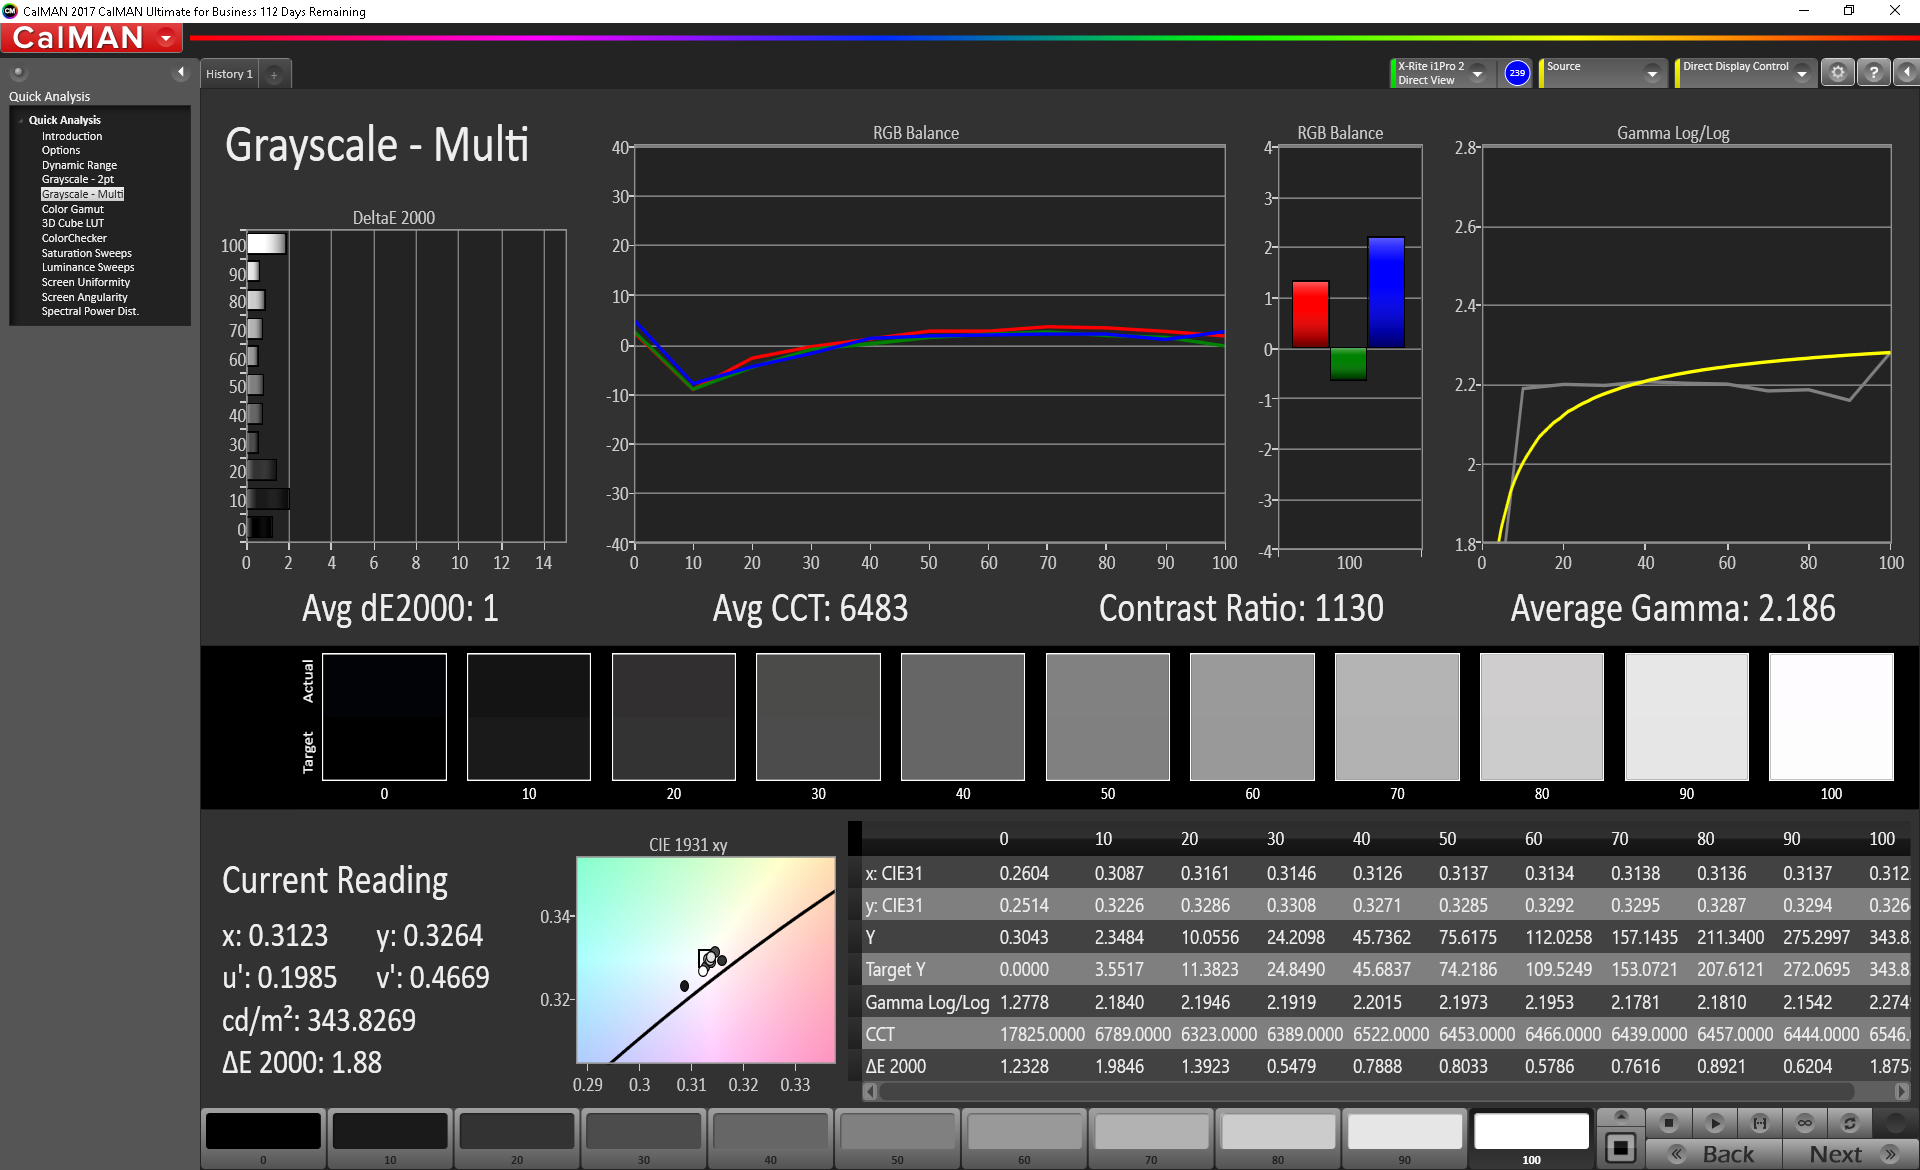
ΔE ColorChecker Calman: 1.6 | ∀{0.5-29.43 Ø4.71}
calibrated: 1
ΔE Greyscale Calman: 2.3 | ∀{0.09-98 Ø4.96}
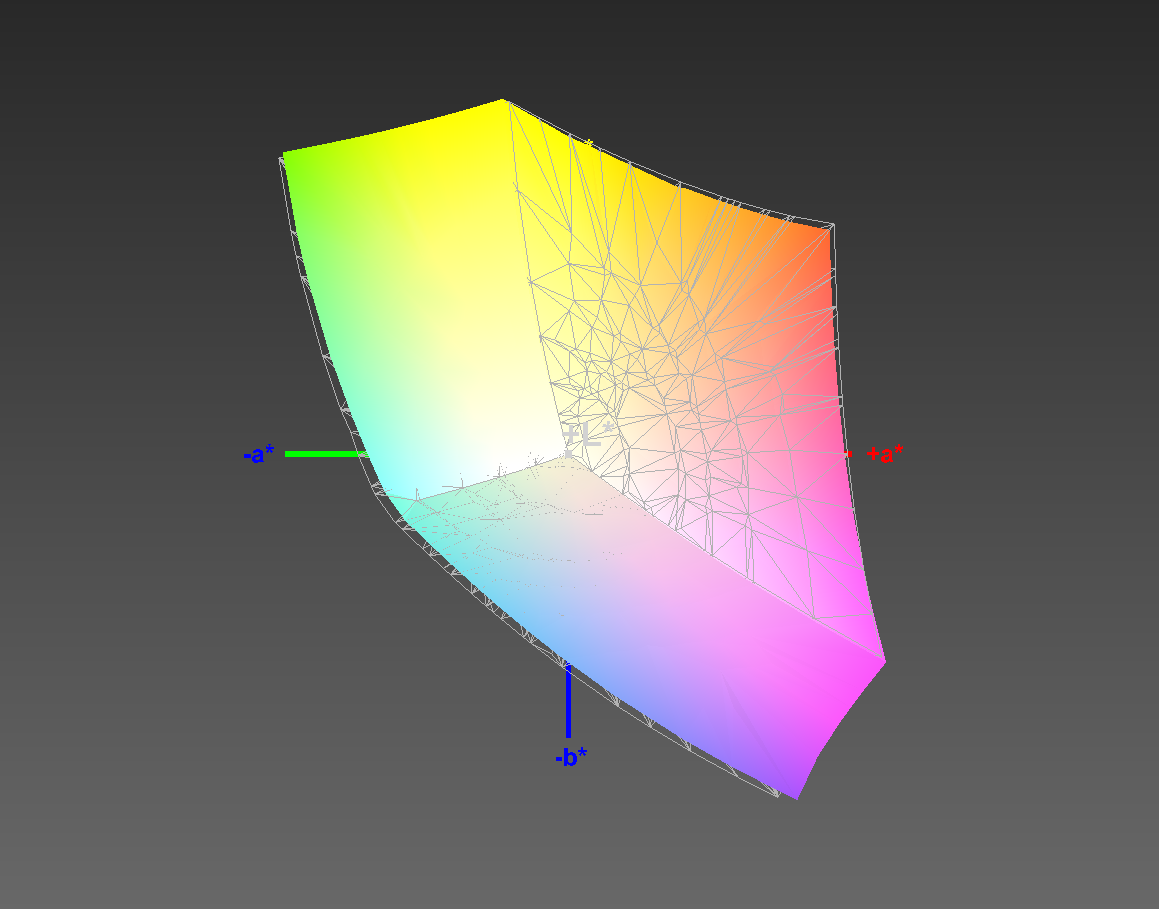
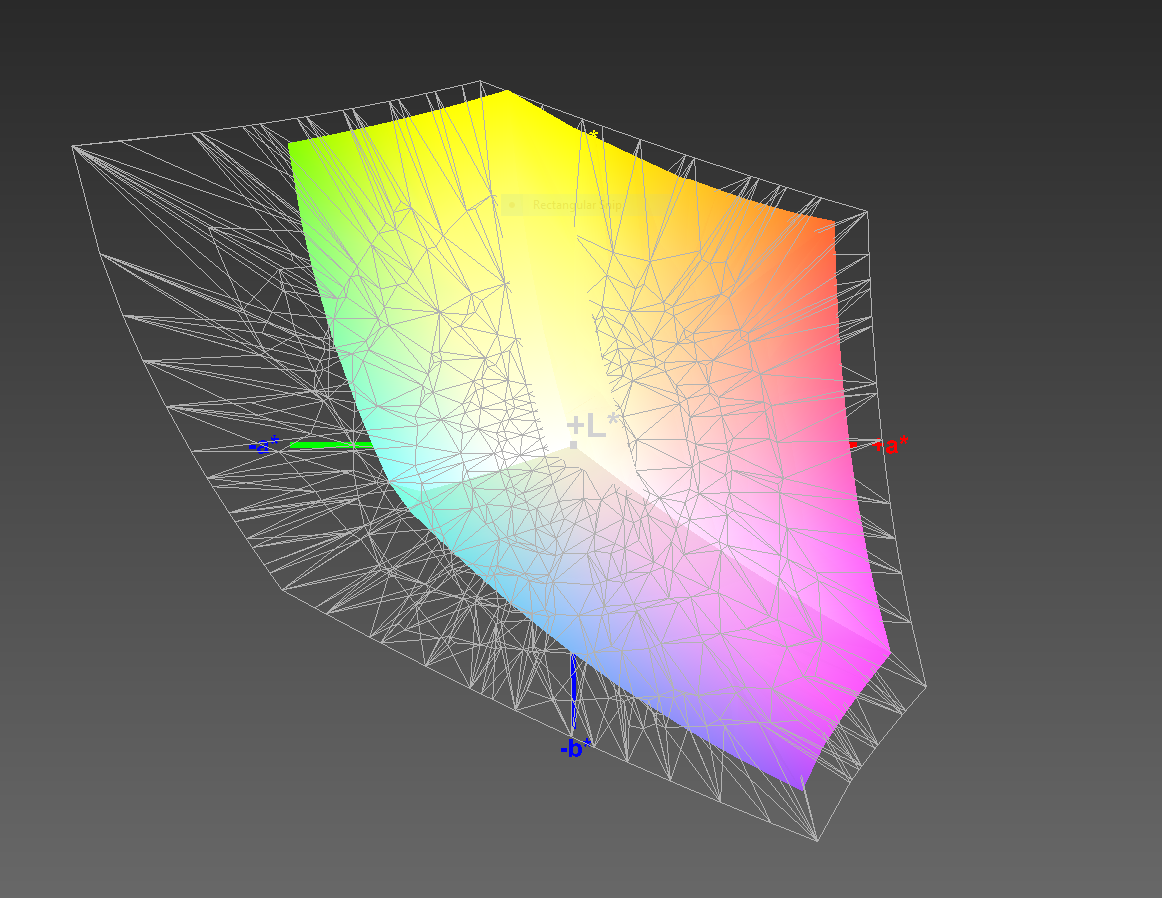
96% sRGB (Argyll 1.6.3 3D)
61% AdobeRGB 1998 (Argyll 1.6.3 3D)
66.3% AdobeRGB 1998 (Argyll 3D)
96.2% sRGB (Argyll 3D)
64.8% Display P3 (Argyll 3D)
Gamma: 2.203
CCT: 6707 K
| MSI GP65 Leopard 9SE-225US LG Philips LGD0625, IPS, 15.6", 1920x1080 | HP Omen 15-dc1303ng LG Philips LGD05C0, IPS, 15.6", 1920x1080 | Lenovo Legion Y540-15IRH-81SX00B2GE BOE 084D, IPS, 15.6", 1920x1080 | Asus Strix GL531GV-PB74 Panda LM156LF-GL02, IPS, 15.6", 1920x1080 | CUK Model Z GK5CQ7Z LG Philips LGD05C0, IPS, 15.6", 1920x1080 | Eurocom Nightsky Ti15 AU Optronics B156HAN, IPS, 15.6", 1920x1080 | |
|---|---|---|---|---|---|---|
| Display | -2% | -3% | -37% | -1% | -2% | |
| Display P3 Coverage (%) | 64.8 | 63.8 -2% | 63.6 -2% | 40.13 -38% | 64.5 0% | 65.2 1% |
| sRGB Coverage (%) | 96.2 | 93.4 -3% | 91.7 -5% | 60.3 -37% | 93 -3% | 90.9 -6% |
| AdobeRGB 1998 Coverage (%) | 66.3 | 65 -2% | 65.2 -2% | 41.48 -37% | 65.7 -1% | 66.3 0% |
| Response Times | -26% | -4% | -159% | -29% | -21% | |
| Response Time Grey 50% / Grey 80% * (ms) | 9.6 ? | 14 ? -46% | 8.8 ? 8% | 26 ? -171% | 13.6 ? -42% | 14.4 ? -50% |
| Response Time Black / White * (ms) | 10.4 ? | 11 ? -6% | 12 ? -15% | 25.6 ? -146% | 12 ? -15% | 9.6 ? 8% |
| PWM Frequency (Hz) | ||||||
| Screen | -17% | -30% | -99% | -26% | -45% | |
| Brightness middle (cd/m²) | 348.3 | 316 -9% | 299 -14% | 290.1 -17% | 306.8 -12% | 331 -5% |
| Brightness (cd/m²) | 327 | 295 -10% | 290 -11% | 274 -16% | 309 -6% | 327 0% |
| Brightness Distribution (%) | 85 | 84 -1% | 89 5% | 86 1% | 87 2% | 83 -2% |
| Black Level * (cd/m²) | 0.4 | 0.42 -5% | 0.29 28% | 0.54 -35% | 0.38 5% | 0.35 13% |
| Contrast (:1) | 871 | 752 -14% | 1031 18% | 537 -38% | 807 -7% | 946 9% |
| Colorchecker dE 2000 * | 1.6 | 2.7 -69% | 3.7 -131% | 5.16 -223% | 3.16 -98% | 4.22 -164% |
| Colorchecker dE 2000 max. * | 5.07 | 5.65 -11% | 7 -38% | 18.09 -257% | 6.05 -19% | 6.95 -37% |
| Colorchecker dE 2000 calibrated * | 1 | 1.58 -58% | 2 -100% | 4.35 -335% | 2.4 -140% | 3.27 -227% |
| Greyscale dE 2000 * | 2.3 | 2.35 -2% | 4.1 -78% | 4.4 -91% | 2.3 -0% | 3.9 -70% |
| Gamma | 2.203 100% | 2.41 91% | 2.19 100% | 2.1 105% | 2.17 101% | 2.26 97% |
| CCT | 6707 97% | 6904 94% | 7166 91% | 7362 88% | 6557 99% | 7392 88% |
| Color Space (Percent of AdobeRGB 1998) (%) | 61 | 60 -2% | 59.3 -3% | 38.1 -38% | 60 -2% | 59 -3% |
| Color Space (Percent of sRGB) (%) | 96 | 93 -3% | 91.5 -5% | 60 -37% | 92.6 -4% | 90.5 -6% |
| Total Average (Program / Settings) | -15% /
-15% | -12% /
-22% | -98% /
-95% | -19% /
-21% | -23% /
-34% |
* ... smaller is better
Surprisingly, the GP65's display is extremely color accurate; this is not common for mid-tier MSI laptops. The DeltaE2000 score for colors sits at a remarkable 1.6, which rivals some of the best displays in the industry (including the Apple MacBook Pro 15 and Razer Blade 15). Grays are also accurate with a DeltaE2000 of 2.3. Calibration further improves these numbers. Additionally, the LG panel has near-perfect Gamma (2.203) and excellent color temperature (6707 K). The GP65 would be suitable for professional color work if it offered better color coverage; as it stands, at 61% of the AdobeRGB and 96% of the sRGB gamuts, the GP65 may not offer enough colors for professionals. That said, gamers (the machine's intended audience) should find very little complaint in the display.
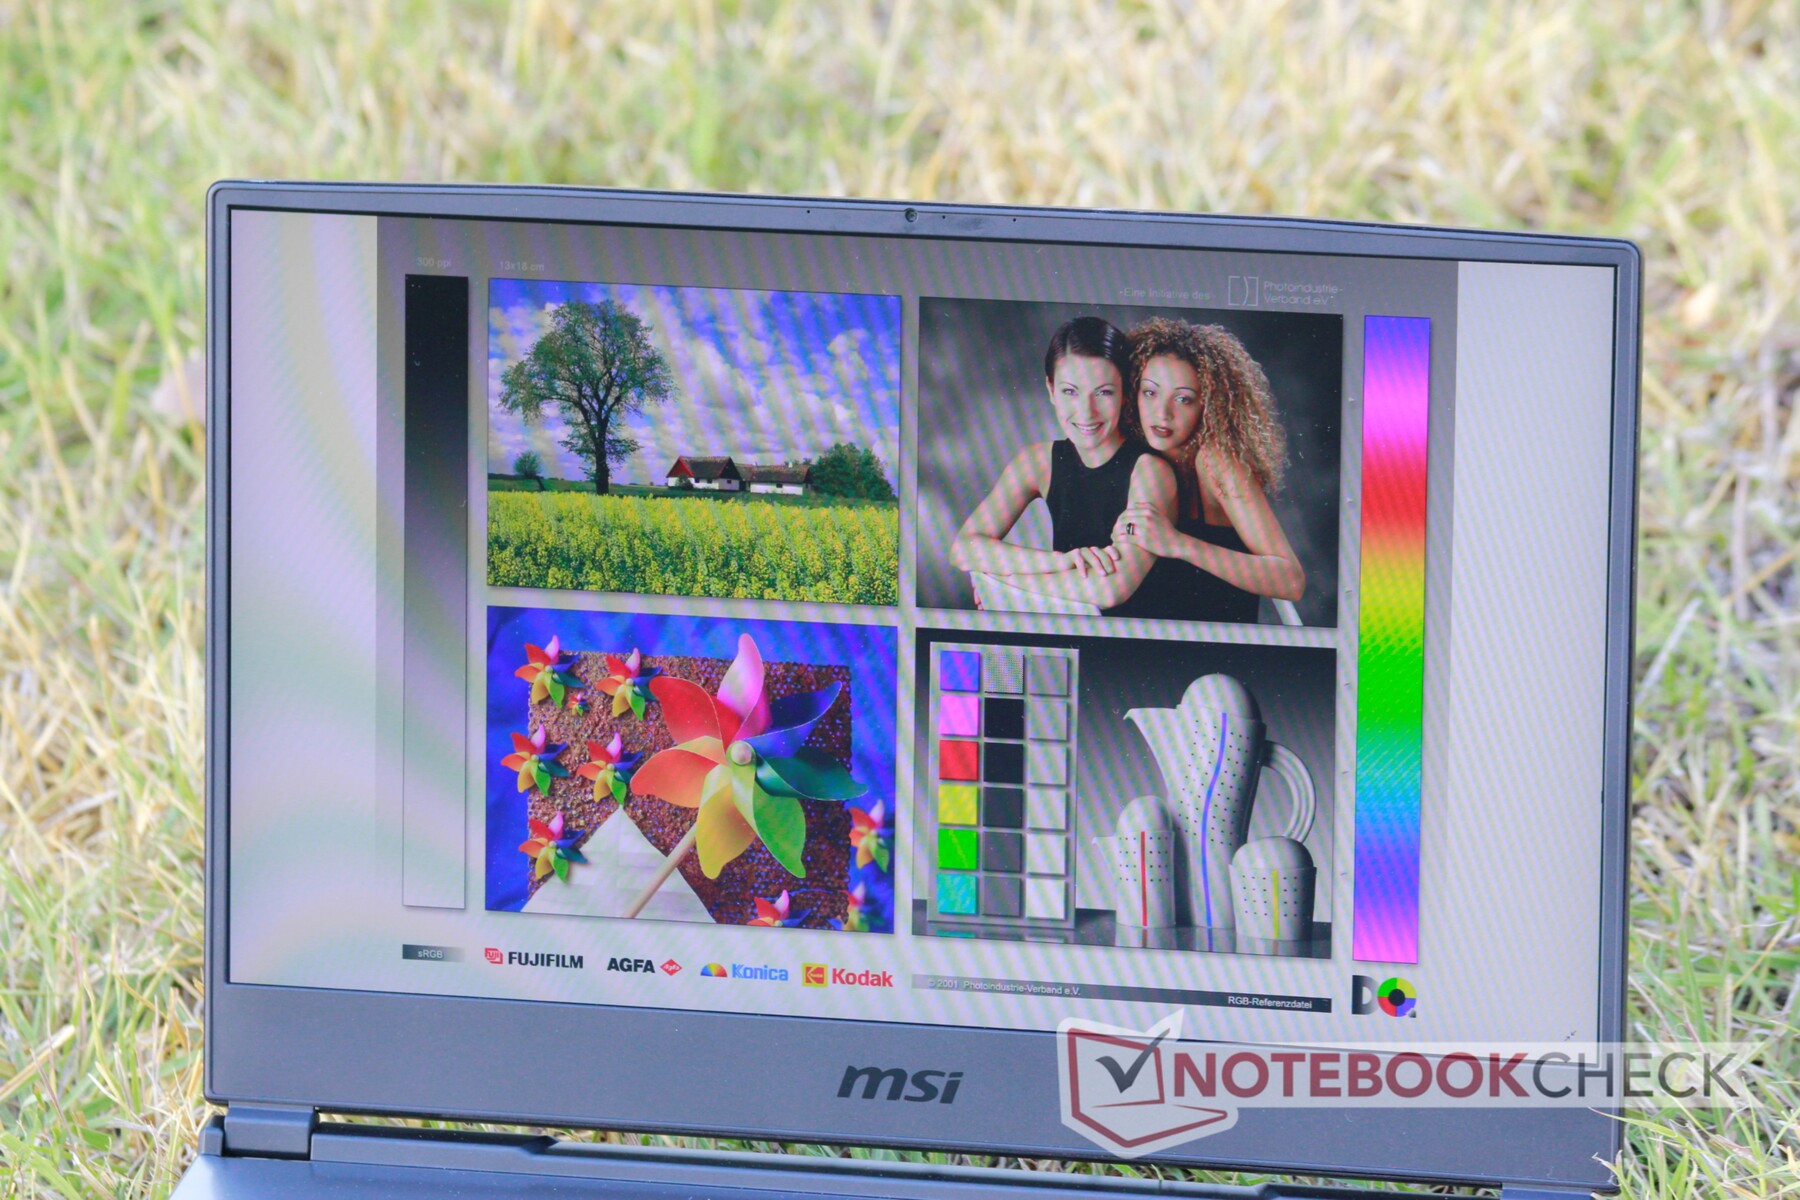
Viewing angles are excellent, which is typical for an IPS display. The matte finish essentially eliminates glare, and the backlight is strong enough to shine through sunlight and other bright lights. While direct sunlight renders the screen difficult to use, the display can be used outdoors under a bit of shade or cloud cover.


Display Response Times
| ↔ Response Time Black to White | ||
|---|---|---|
| 10.4 ms ... rise ↗ and fall ↘ combined | ↗ 6 ms rise | 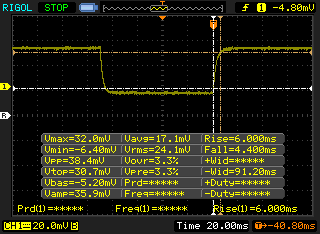 |
| ↘ 4.4 ms fall | ||
| The screen shows good response rates in our tests, but may be too slow for competitive gamers. In comparison, all tested devices range from 0.1 (minimum) to 240 (maximum) ms. » 28 % of all devices are better. This means that the measured response time is better than the average of all tested devices (19.8 ms). | ||
| ↔ Response Time 50% Grey to 80% Grey | ||
| 9.6 ms ... rise ↗ and fall ↘ combined | ↗ 6 ms rise | 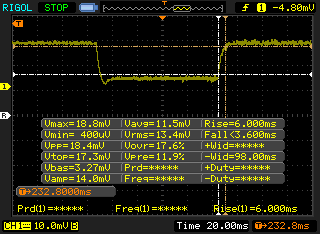 |
| ↘ 3.6 ms fall | ||
| The screen shows fast response rates in our tests and should be suited for gaming. In comparison, all tested devices range from 0.165 (minimum) to 636 (maximum) ms. » 23 % of all devices are better. This means that the measured response time is better than the average of all tested devices (30.9 ms). | ||
Screen Flickering / PWM (Pulse-Width Modulation)
| Screen flickering / PWM not detected | 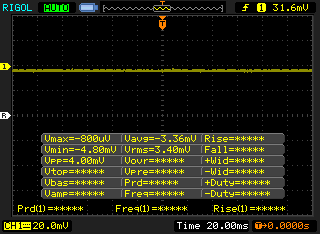 | ||
In comparison: 52 % of all tested devices do not use PWM to dim the display. If PWM was detected, an average of 7748 (minimum: 5 - maximum: 343500) Hz was measured. | |||
Performance
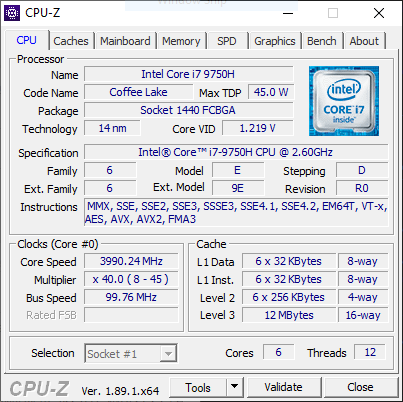
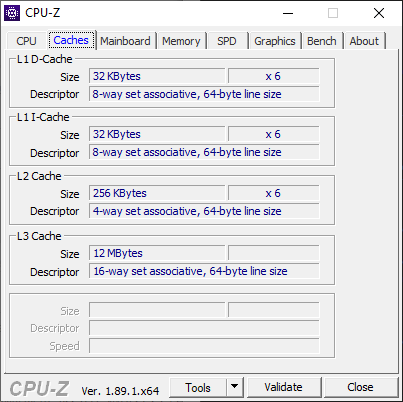
The MSI GP65 Leopard's spec sheet is perhaps the gold standard for a mid-tier gaming laptop in 2019. Equipped with an Intel Core i7-9750H, an Nvidia RTX 2060, 16 GB of DDR4 RAM, and a 512 GB NVMe SSD, the GP65 Leopard checks every box expected of a gaming laptop at the $1500 price point. The GP65 performs well at the expense of high heat output and fan noise.


Processor
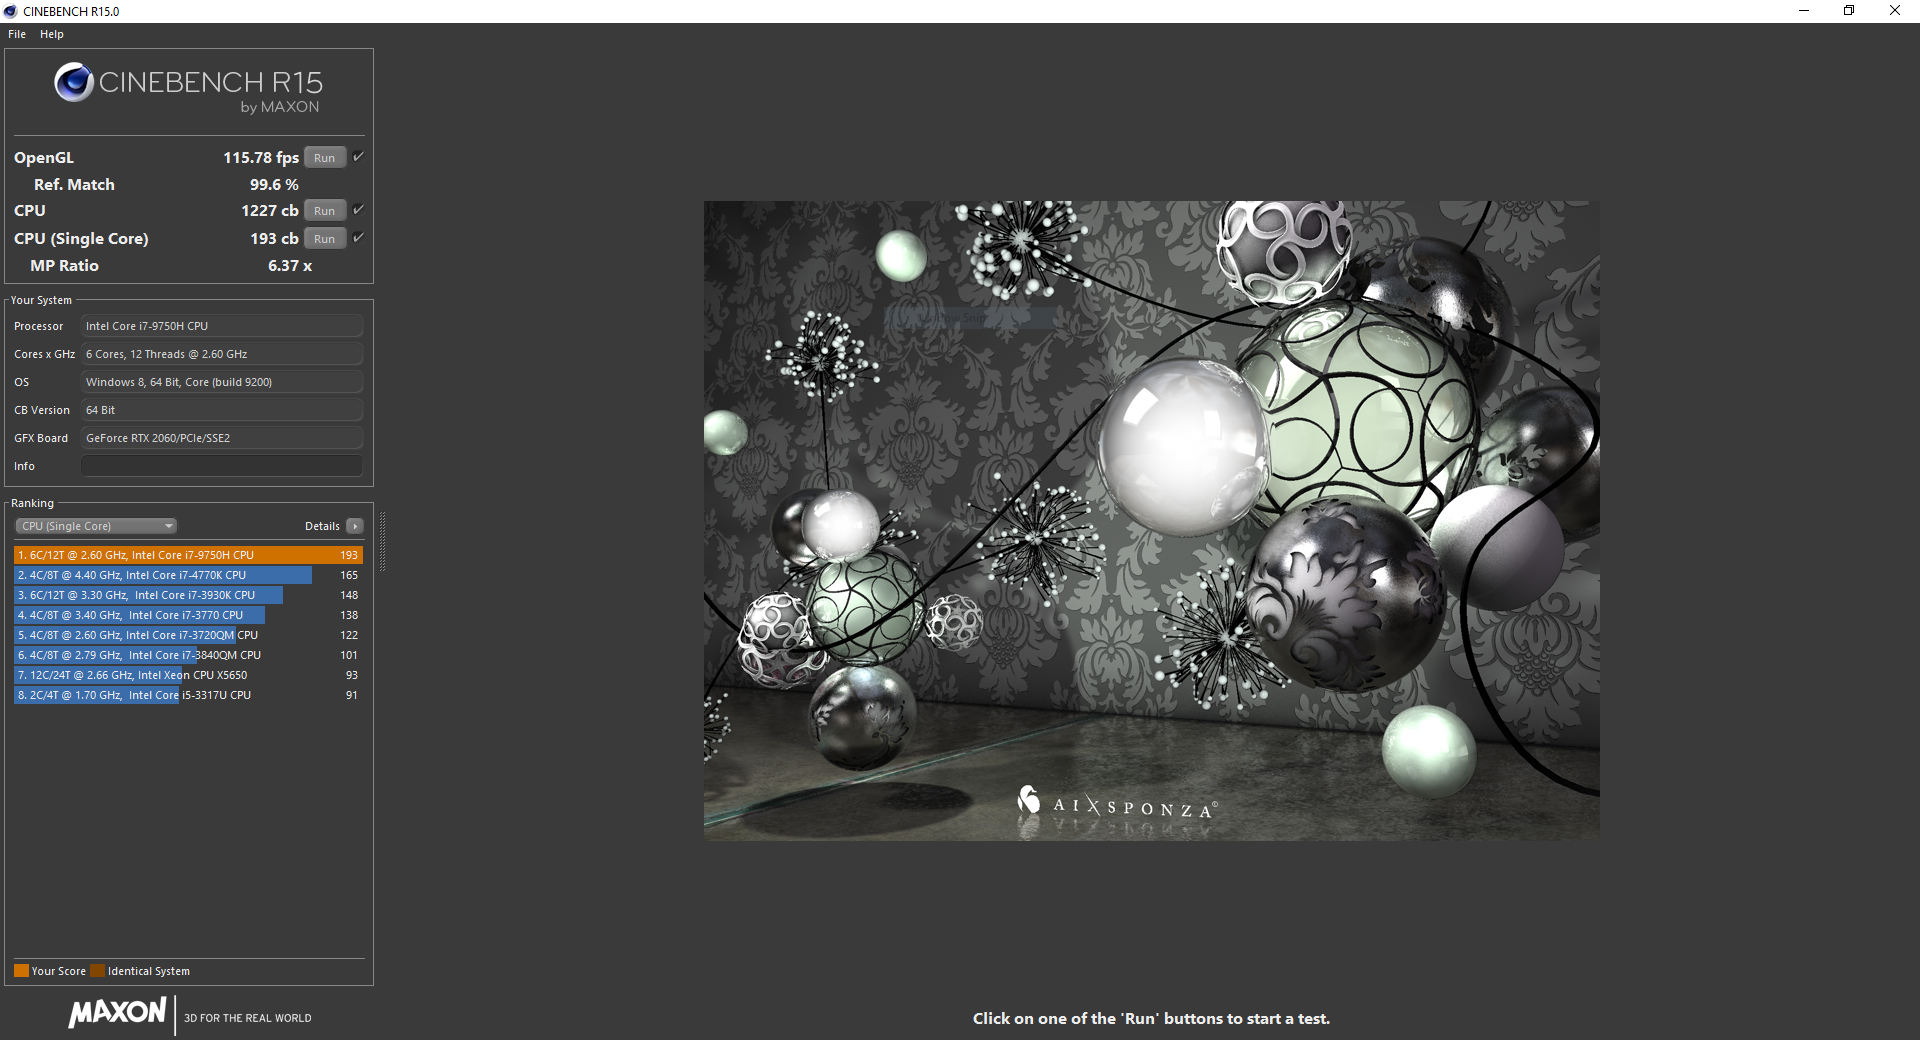
The Intel Core i7-9750H is the new de facto CPU for gaming laptops. Based on the Coffee Lake architecture, there is little changed from last year's Core i7-8750H outside of a small clock speed bump (2.6 GHz base/4.5 GHz boost vs. 2.2 GHz base/4.1 GHz boost) and 33% more L3 cache (12 MB vs. 9 MB). Still, the Core i7-9750H is perhaps the best option for a gaming laptop and strikes a good balance between price, performance, and thermals.
The MSI GP65 Leopard puts forth an excellent showing of the 9750H, scoring about 10% higher in both Cinebench R15's single- and multi-core tests than the Schenker Key 16 and its Core i7-8750H. Intel still trounces AMD when it comes to mobile CPUs; the GP65's i7-9750H obliterates the Ryzen 7 3750H (used in the Asus TUF FX505DT) in Cinebench R15.
Long-term performance is relatively good. Straining the machine with our Cinebench R15 loop (running through Cinebench R15's multi-core test 50 times) gives us a good impression of how the GP65 will handle longer workloads. Aside from a 12% dip in the middle of the test, the GP65 holds fairly steady. (Note that the drop in performance immediately after the first pass is common to this test).
For more information on the Intel Core i7-9750H, please see our dedicated CPU page here.
| Cinebench R15 | |
| CPU Single 64Bit | |
| Average of class Gaming (188.8 - 350, n=107, last 2 years) | |
| Lenovo ThinkPad P1 2019-20QT000RGE | |
| MSI GP65 Leopard 9SE-225US | |
| Schenker Slim 15 Comet Lake U | |
| Average Intel Core i7-9750H (170 - 194, n=82) | |
| Dell Inspiron 7390 2-in-1 | |
| Lenovo Legion Y540-17IRH | |
| Schenker Key 16 | |
| Eurocom Nightsky Ti15 | |
| Asus TUF FX505DT-EB73 | |
| CPU Multi 64Bit | |
| Average of class Gaming (1578 - 6330, n=106, last 2 years) | |
| Eurocom Nightsky Ti15 | |
| MSI GP65 Leopard 9SE-225US | |
| Average Intel Core i7-9750H (952 - 1306, n=85) | |
| Schenker Key 16 | |
| Lenovo ThinkPad P1 2019-20QT000RGE | |
| Lenovo Legion Y540-17IRH | |
| Asus TUF FX505DT-EB73 | |
| Schenker Slim 15 Comet Lake U | |
| Schenker Slim 15 Comet Lake U | |
| Schenker Slim 15 Comet Lake U | |
| Dell Inspiron 7390 2-in-1 | |
| wPrime 2.10 - 1024m | |
| Lenovo ThinkPad P1 2019-20QT000RGE | |
| Average Intel Core i7-9750H (n=1) | |
| Average of class Gaming (33 - 210, n=6, last 2 years) | |
* ... smaller is better
System Performance
The MSI GP65 Leopard strikes a good balance in overall performance as shown by PCMark 10 and PCMark 8. The machine does well in all tests and comes out about 2% above the average Core i7-9750H/RTX 2060 laptop overall.
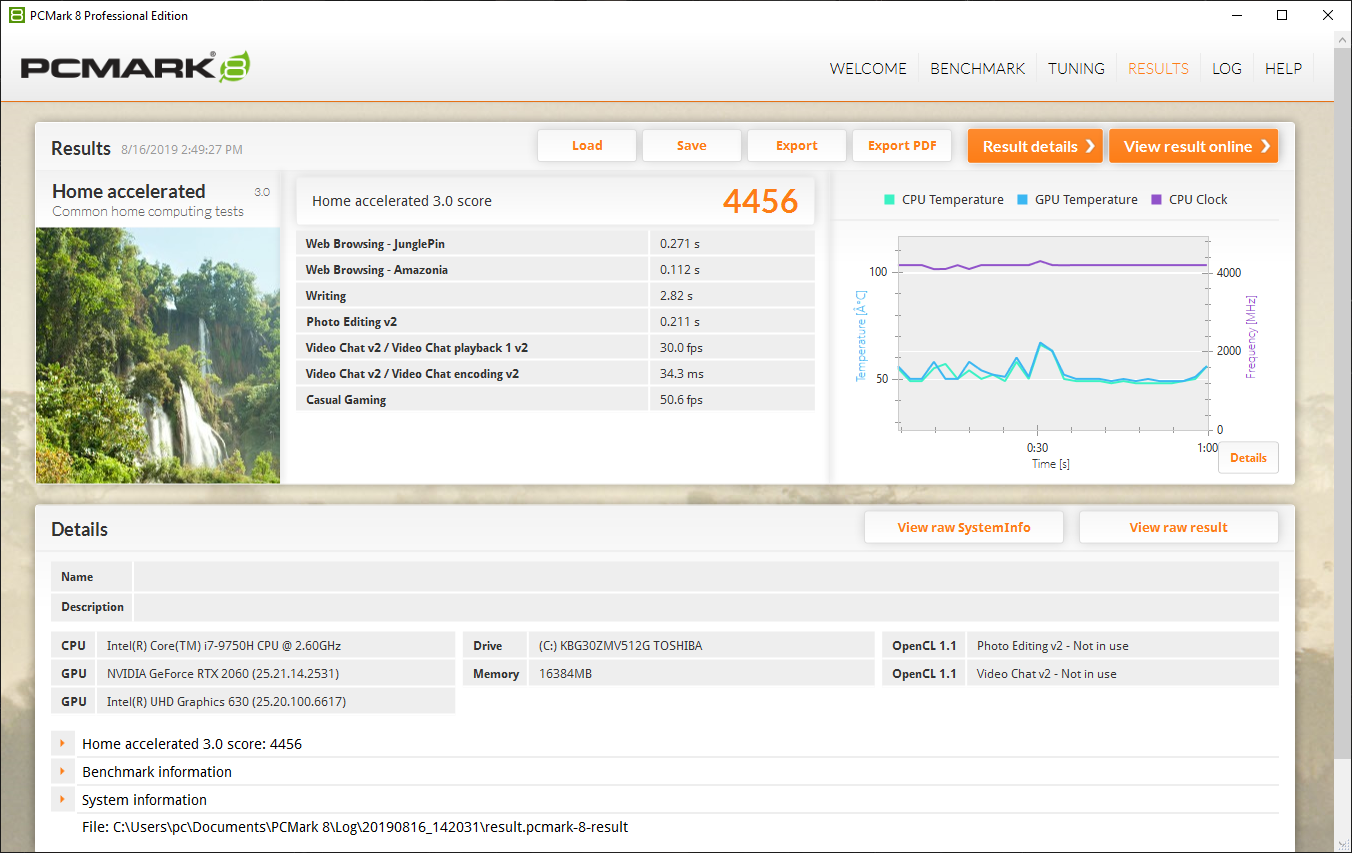
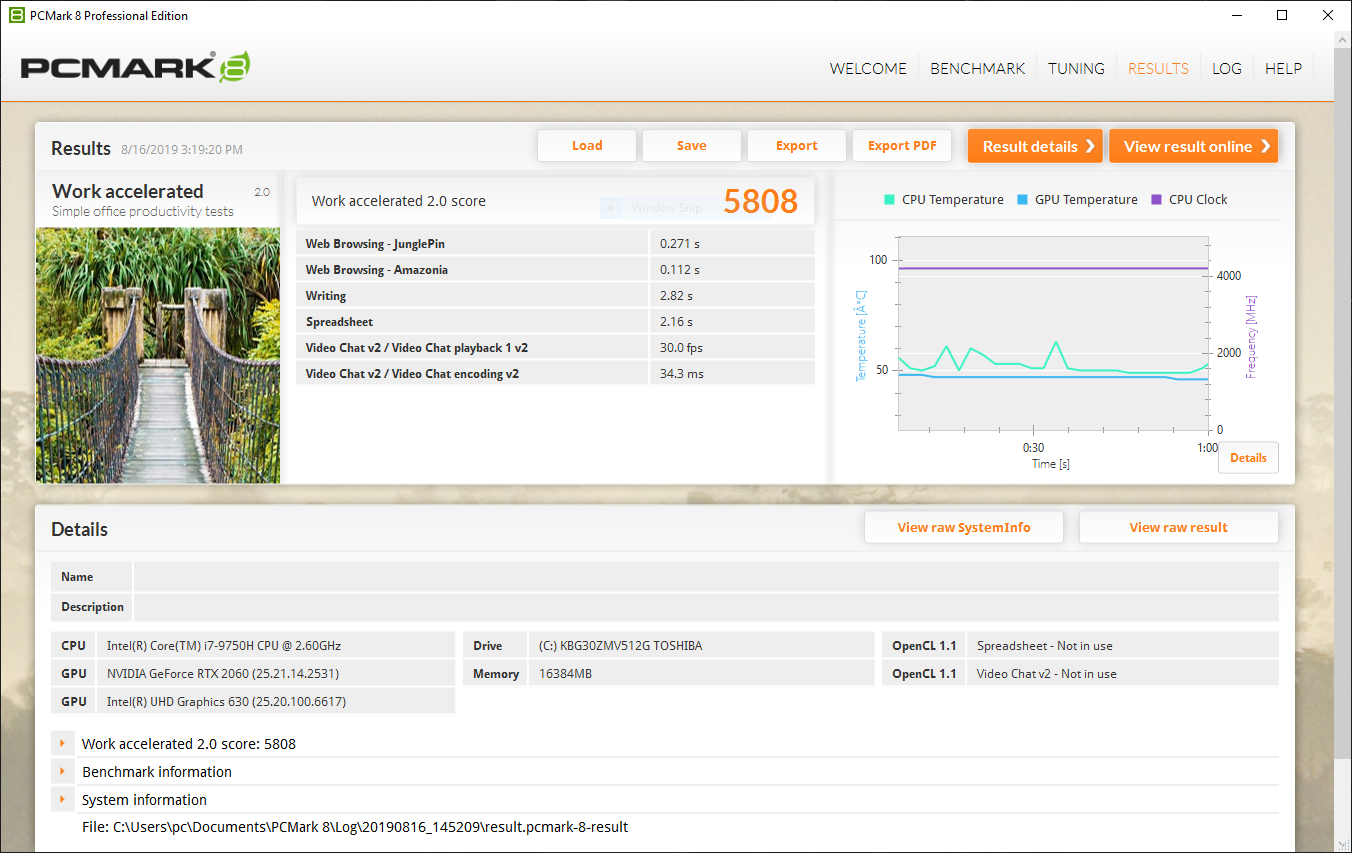
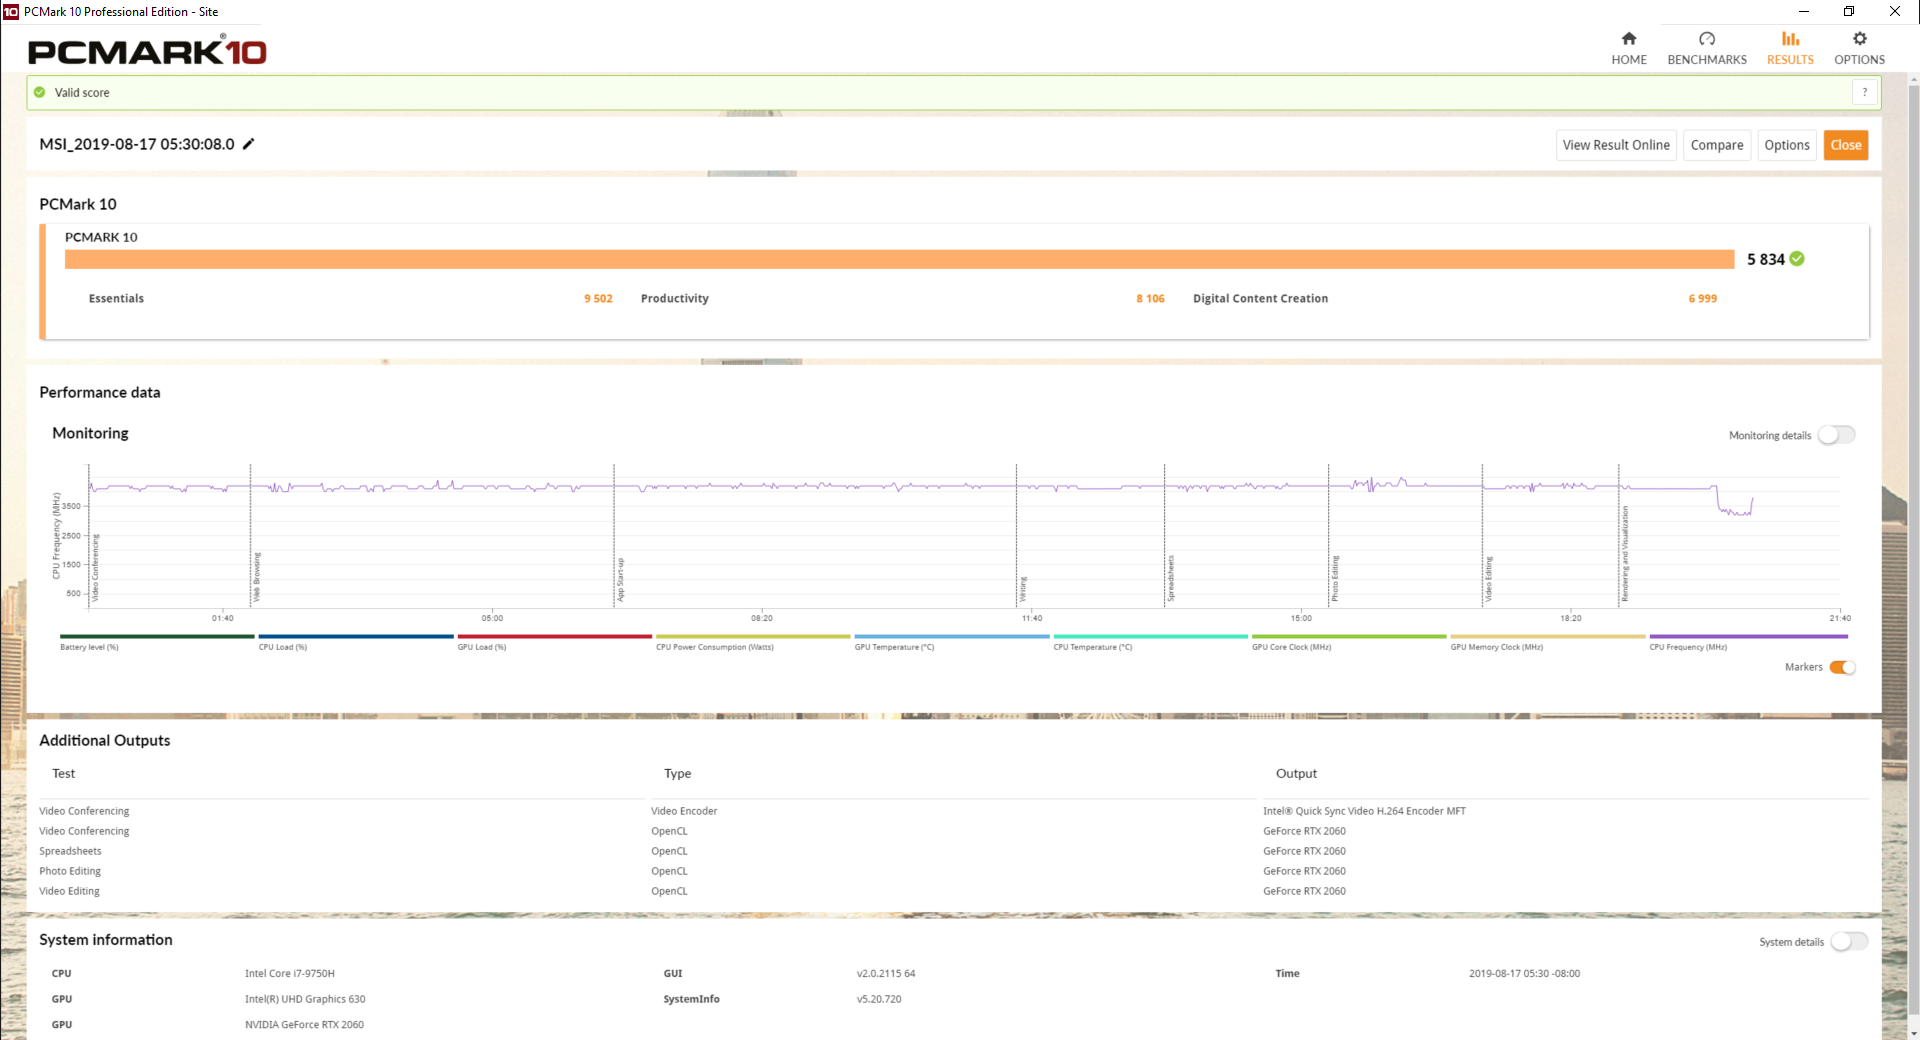
| PCMark 8 Home Score Accelerated v2 | 4456 points | |
| PCMark 8 Work Score Accelerated v2 | 5808 points | |
| PCMark 10 Score | 5834 points | |
Help | ||
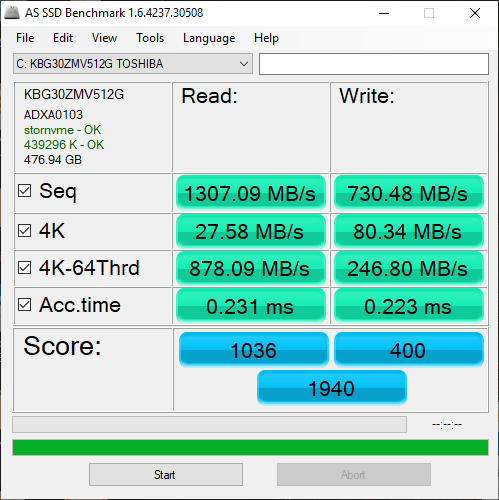
Storage Devices
The MSI GP65 Leopard uses a Toshiba M.2 PCIe NVMe drive for its storage. While this drive is significantly faster than a traditional SATA III-based solution (particularly in read speeds), it is only about half as fast as the Samsung PM981 used in some other gaming laptops. Still, the drive should be fast enough for most use cases. Users can also swap the drive out, provided they can get into the chassis. Per MSI's spec sheet for the GP65 Leopard, the machine has an M.2 PCIe SSD slot, one M.2 PCIe/SATA SSD slot, and a 2.5-inch SATA drive bay.

| MSI GP65 Leopard 9SE-225US Toshiba KBG30ZMT512G | HP Omen 15-dc1303ng Samsung SSD PM981 MZVLB256HAHQ | Lenovo Legion Y540-15IRH-81SX00B2GE WDC PC SN720 SDAPNTW-512G | Asus Strix GL531GV-PB74 Intel SSD 660p SSDPEKNW512G8 | CUK Model Z GK5CQ7Z Intel SSD 660p 2TB SSDPEKNW020T8 | Eurocom Nightsky Ti15 Samsung SSD 970 Pro 512GB | Average Toshiba KBG30ZMT512G | |
|---|---|---|---|---|---|---|---|
| AS SSD | 119% | 151% | 55% | 89% | 196% | 12% | |
| Seq Read (MB/s) | 1307 | 2485 90% | 2927 124% | 1280 -2% | 1283 -2% | 2168 66% | 1326 ? 1% |
| Seq Write (MB/s) | 730 | 1575 116% | 2149 194% | 905 24% | 1730 137% | 2194 201% | 755 ? 3% |
| 4K Read (MB/s) | 27.58 | 53.4 94% | 42.43 54% | 48.73 77% | 49.89 81% | 53.2 93% | 39 ? 41% |
| 4K Write (MB/s) | 80.3 | 113.5 41% | 147.1 83% | 107 33% | 110.1 37% | 128.5 60% | 92.6 ? 15% |
| 4K-64 Read (MB/s) | 878 | 725 -17% | 1286 46% | 321.1 -63% | 904 3% | 1320 50% | 873 ? -1% |
| 4K-64 Write (MB/s) | 246.8 | 1371 456% | 1432 480% | 761 208% | 792 221% | 2162 776% | 349 ? 41% |
| Access Time Read * (ms) | 0.231 | 0.059 74% | 0.065 72% | 0.058 75% | 0.036 84% | 0.04 83% | 0.1463 ? 37% |
| Access Time Write * (ms) | 0.223 | 0.032 86% | 0.026 88% | 0.046 79% | 0.042 81% | 0.029 87% | 0.2073 ? 7% |
| Score Read (Points) | 1036 | 1027 -1% | 1621 56% | 498 -52% | 1082 4% | 1590 53% | 1045 ? 1% |
| Score Write (Points) | 400 | 1642 311% | 1794 349% | 958 140% | 1075 169% | 2510 528% | 517 ? 29% |
| Score Total (Points) | 1940 | 3163 63% | 4208 117% | 1711 -12% | 2745 41% | 4924 154% | 2075 ? 7% |
| Copy ISO MB/s (MB/s) | 993 | 1519 53% | 3089 211% | 935 ? -6% | |||
| Copy Program MB/s (MB/s) | 309.5 | 749 142% | 549 77% | 260 ? -16% | |||
| Copy Game MB/s (MB/s) | 582 | 943 62% | 1171 101% | 591 ? 2% |
* ... smaller is better

GPU Performance
Like the Intel Core i7-9750H, Nvidia's RTX 2060 has become a popular choice for mid-range gaming laptops this year. There's a good reason for this, as the RTX 2060 offers a significant bump in performance over the GTX 1060. The RTX 2060 in the GP65 Leopard also outperforms the Nvidia GTX 1660 Ti by a fair margin (~10%) in 3DMark. The RTX 2060 should be suitable for most moderate graphical workloads and should be able to handle some heavier tasks like dense movie renders and complex modelling.
Additionally, the RTX 2060 supports Real-Time Ray Tracing (which will likely be used more in the future) and Deep Learning Super Sampling, which is becoming more common in games. Keep in mind that both of these features are likely to have a noticeable impact on performance when enabled.
For more information about the Nvidia RTX 2060, please see our dedicated GPU page here.
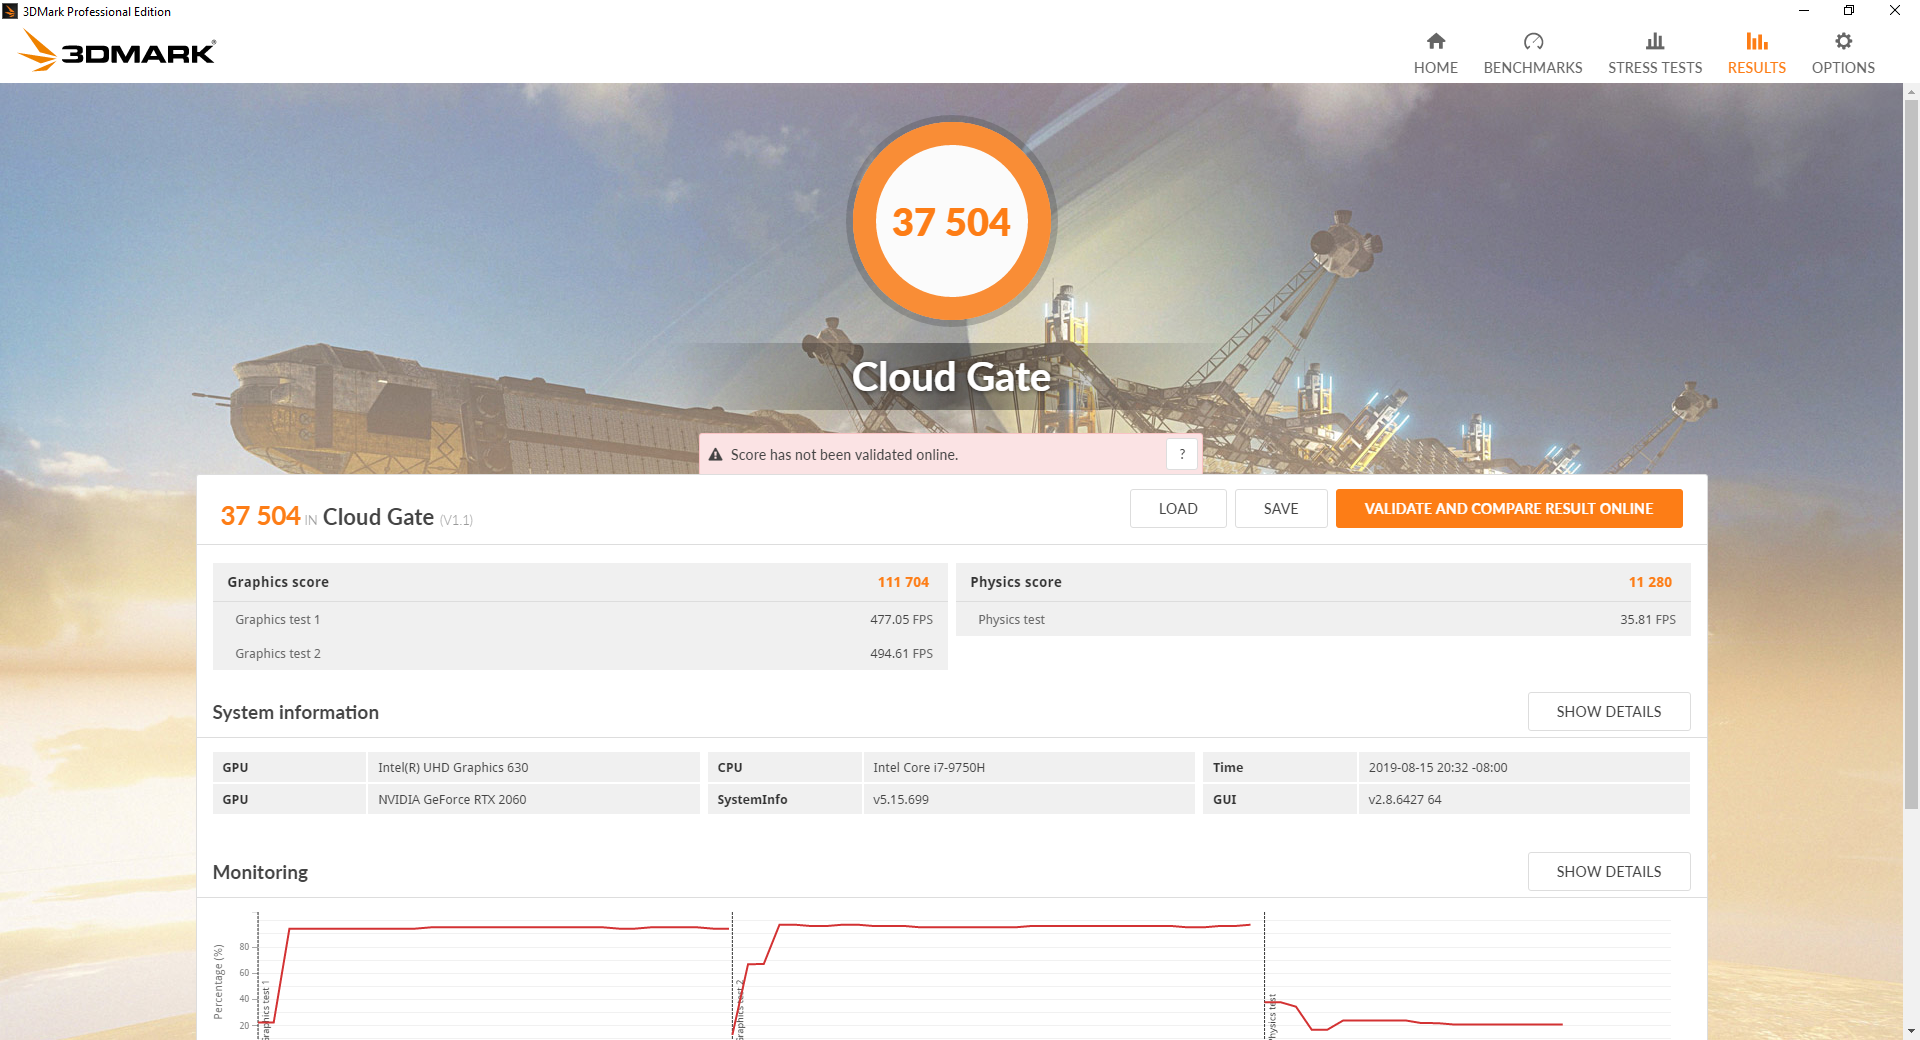
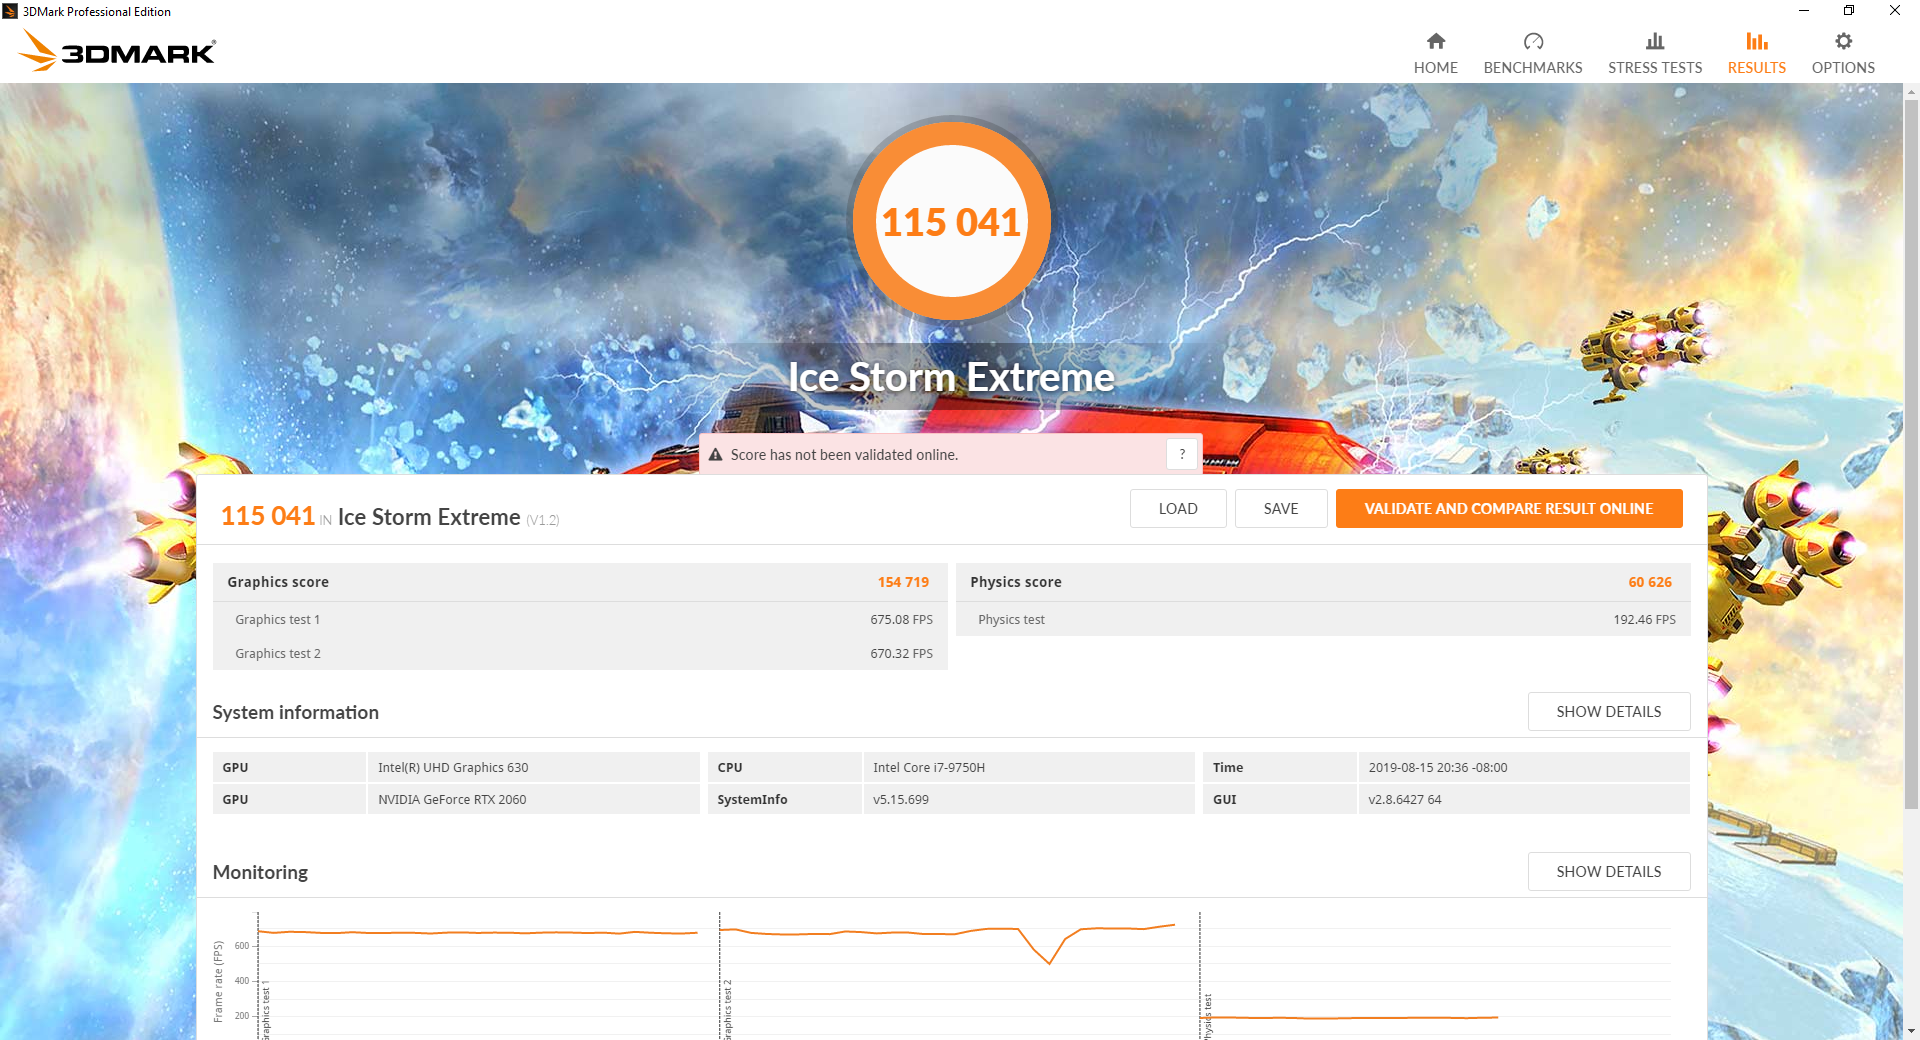
| 3DMark 11 Performance | 18447 points | |
| 3DMark Cloud Gate Standard Score | 37504 points | |
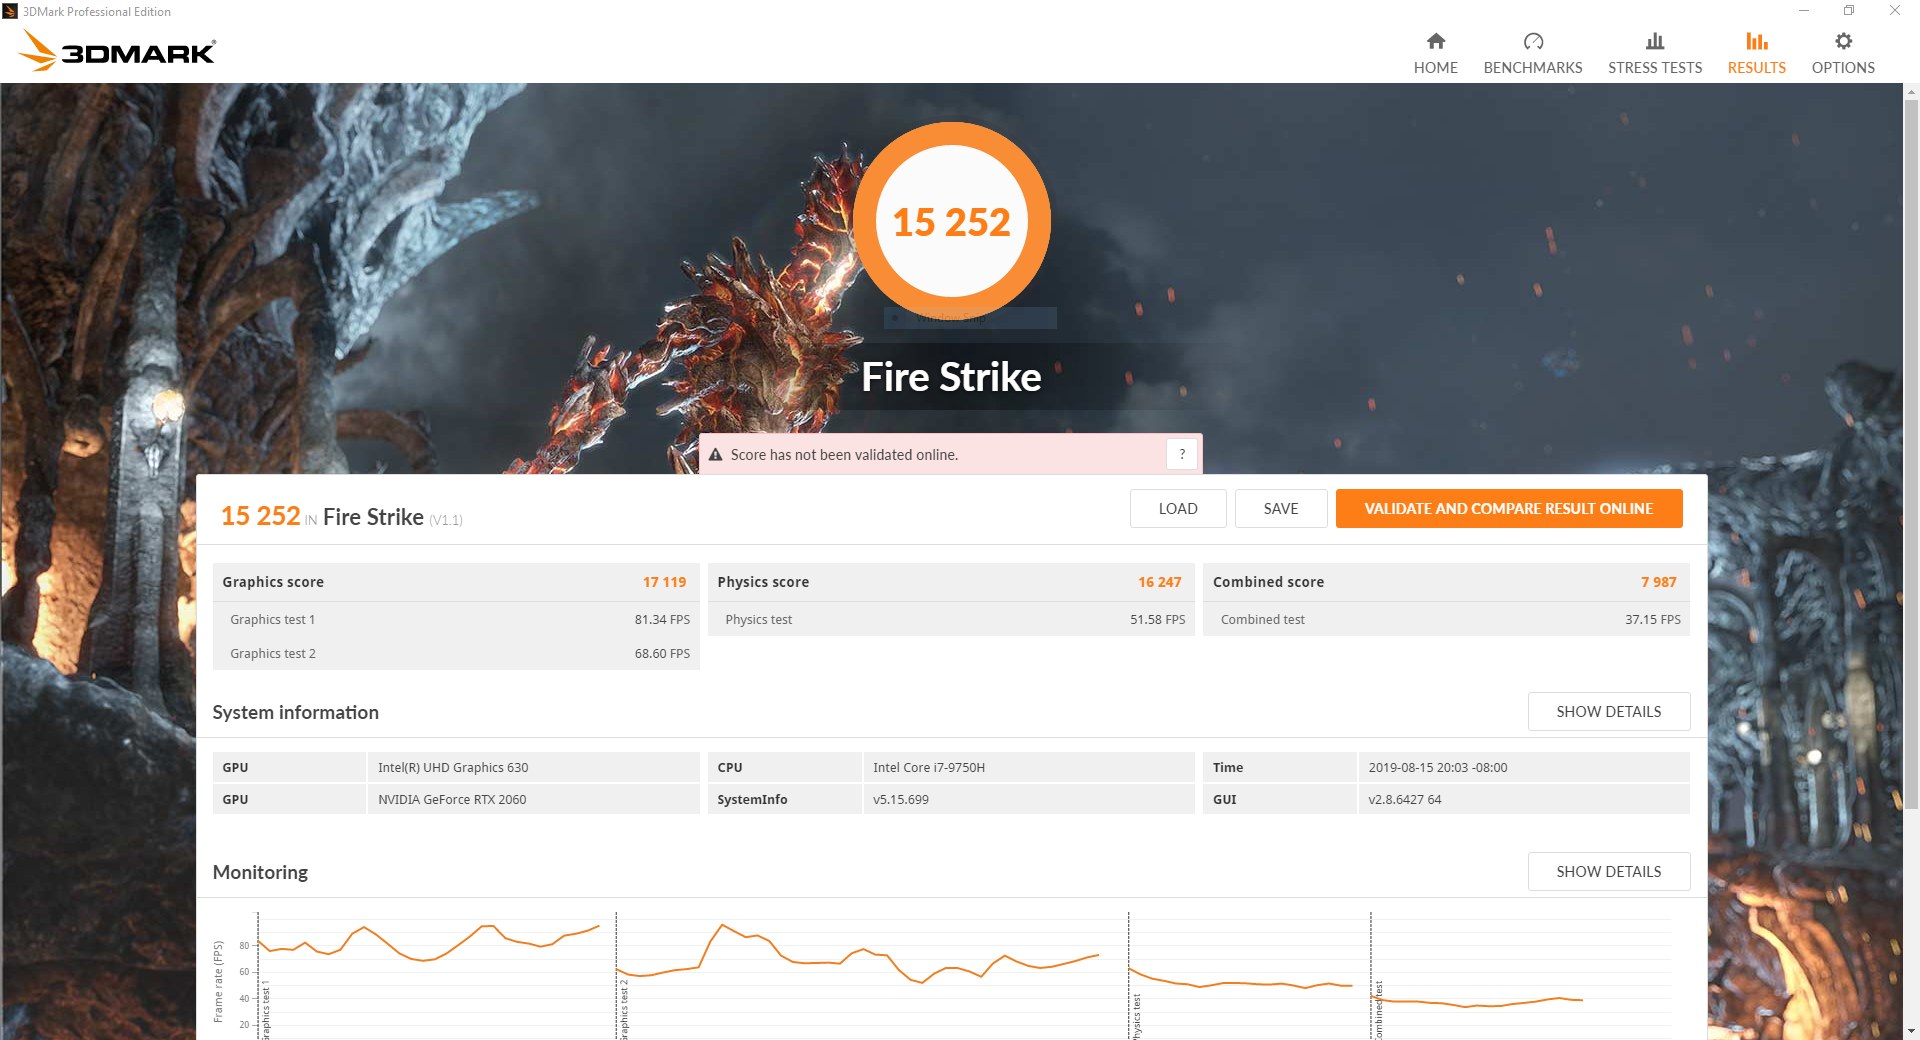
| 3DMark Fire Strike Score | 15252 points | |
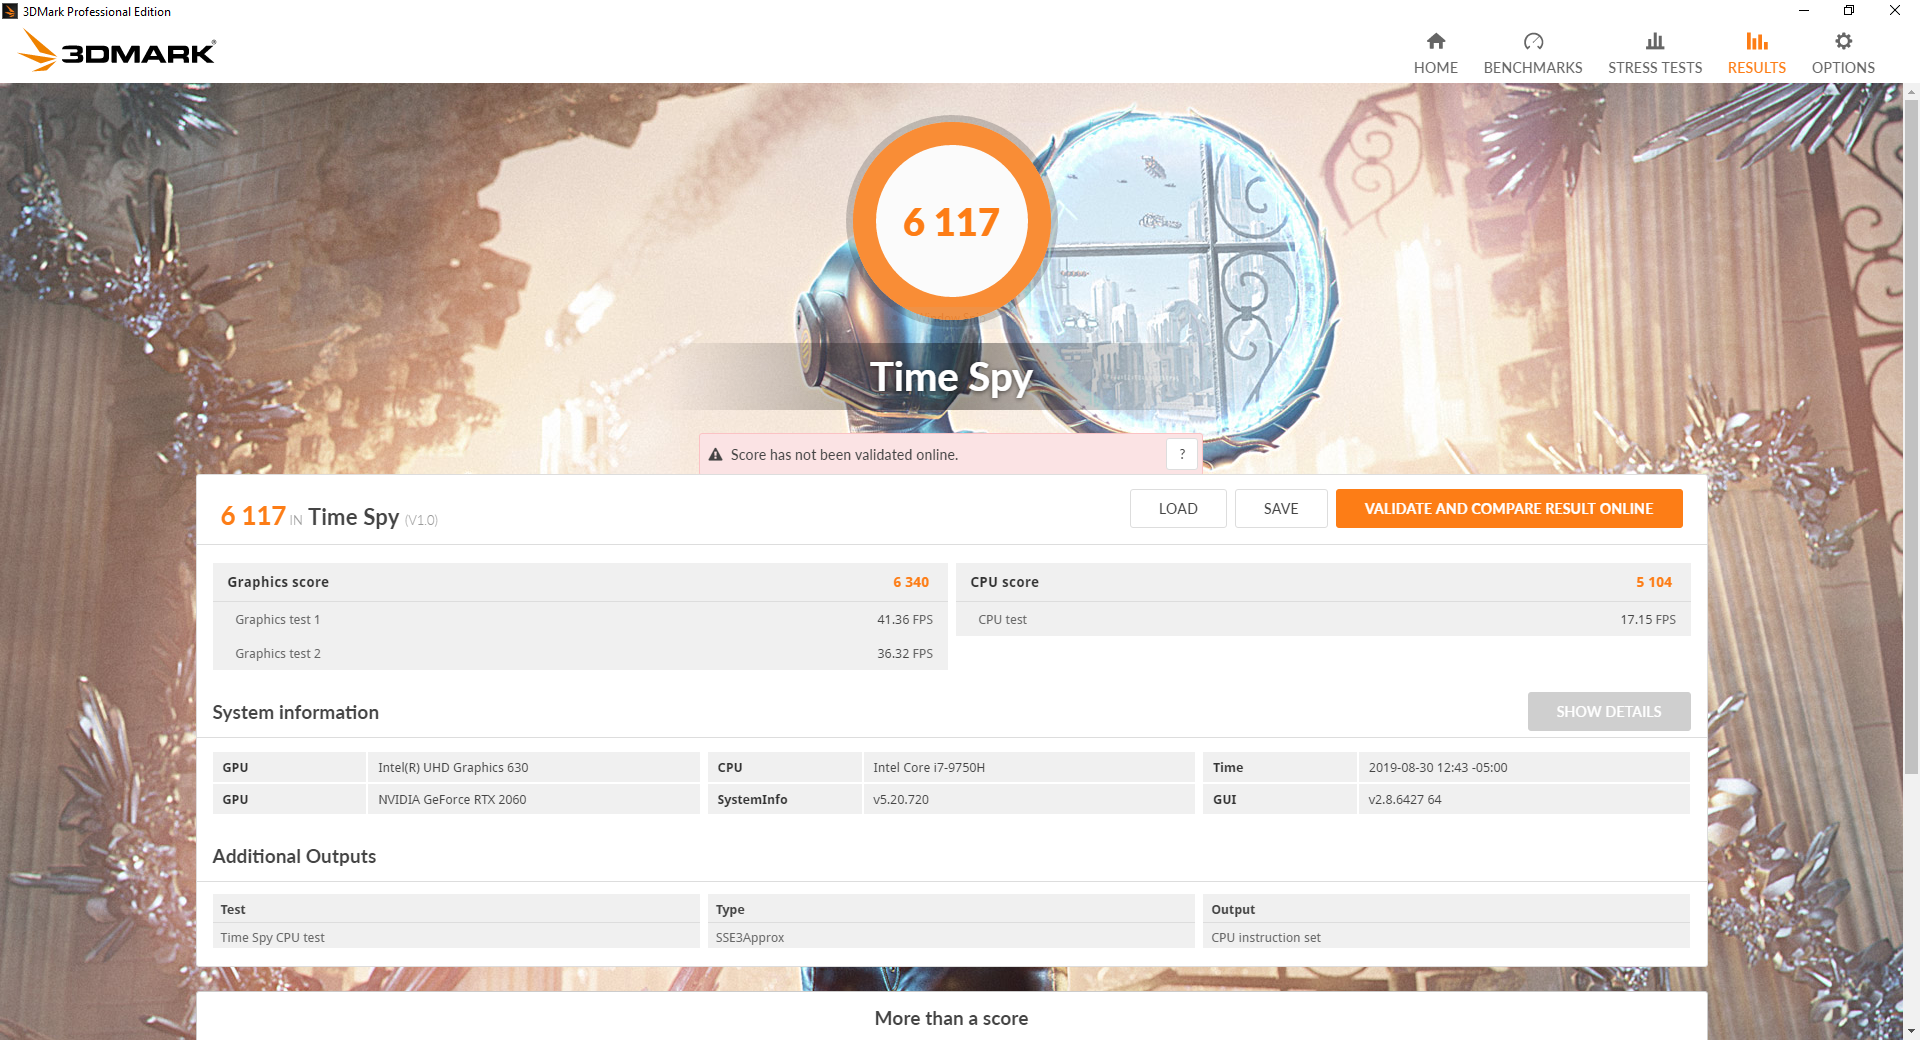
| 3DMark Time Spy Score | 6117 points | |
Help | ||
Gaming Performance
While synthetics can give us a good idea of how a GPU performs in optimal scenarios, real-world gameplay metrics are a better guide for comparison. To that end, the MSI GP65 Leopard is about average for an RTX 2060-equipped gaming laptop. Most titles can be played at 1080p/Ultra settings and still hit or exceed 60 fps. However, to fully take advantage of the high refresh rate display, gamers may want to turn the graphics down to a mix of Medium/High settings to push framerates into the hundreds.
| Rocket League | |
| 1280x720 Performance | |
| MSI GP65 Leopard 9SE-225US | |
| Average NVIDIA GeForce RTX 2060 Mobile (244 - 252, n=4) | |
| 1920x1080 Quality AA:Medium FX | |
| MSI GP65 Leopard 9SE-225US | |
| Average NVIDIA GeForce RTX 2060 Mobile (242 - 250, n=5) | |
| 1920x1080 High Quality AA:High FX | |
| MSI GP65 Leopard 9SE-225US | |
| Average NVIDIA GeForce RTX 2060 Mobile (180.6 - 247, n=5) | |
| Monster Hunter World | |
| 1280x720 Low Preset (Image Quality High) | |
| MSI GP65 Leopard 9SE-225US | |
| Average NVIDIA GeForce RTX 2060 Mobile (n=1) | |
| 1920x1080 Mid Preset (Image Quality High) | |
| Average NVIDIA GeForce RTX 2060 Mobile (102 - 104, n=2) | |
| MSI GP65 Leopard 9SE-225US | |
| 1920x1080 High Preset (Image Quality High) | |
| MSI GP65 Leopard 9SE-225US | |
| Average NVIDIA GeForce RTX 2060 Mobile (89.9 - 96, n=2) | |
| 1920x1080 Highest Preset (Image Quality High) | |
| Average NVIDIA GeForce RTX 2060 Mobile (70 - 70.2, n=2) | |
| MSI GP65 Leopard 9SE-225US | |
| Hitman 2 | |
| 1280x720 Low AF:Trilinear | |
| MSI GP65 Leopard 9SE-225US | |
| Average NVIDIA GeForce RTX 2060 Mobile (n=1) | |
| 1920x1080 Medium AF:4x | |
| MSI GP65 Leopard 9SE-225US | |
| Average NVIDIA GeForce RTX 2060 Mobile (89.4 - 90, n=2) | |
| 1920x1080 High AF:8x | |
| MSI GP65 Leopard 9SE-225US | |
| Average NVIDIA GeForce RTX 2060 Mobile (81.4 - 85, n=2) | |
| 1920x1080 Ultra AF:16x | |
| Average NVIDIA GeForce RTX 2060 Mobile (74 - 78.4, n=2) | |
| MSI GP65 Leopard 9SE-225US | |
| F1 2019 | |
| 1280x720 Ultra Low Preset | |
| Average NVIDIA GeForce RTX 2060 Mobile (166 - 231, n=4) | |
| MSI GP65 Leopard 9SE-225US | |
| 1920x1080 Medium Preset AA:T AF:16x | |
| Average NVIDIA GeForce RTX 2060 Mobile (146 - 177, n=4) | |
| MSI GP65 Leopard 9SE-225US | |
| 1920x1080 High Preset AA:T AF:16x | |
| Average NVIDIA GeForce RTX 2060 Mobile (122 - 149, n=4) | |
| MSI GP65 Leopard 9SE-225US | |
| 1920x1080 Ultra High Preset AA:T AF:16x | |
| Average NVIDIA GeForce RTX 2060 Mobile (97 - 127, n=4) | |
| MSI GP65 Leopard 9SE-225US | |
Long-term gameplay (as measured by an hour-long playthrough of The Witcher 3) present no problems. Framerates remain stable with the expected peaks and troughs typical of this test. The GP65 Leopard should be able to endure long play sessions without trouble.
| low | med. | high | ultra | |
|---|---|---|---|---|
| The Witcher 3 (2015) | 252 | 178 | 111 | 59 |
| Rocket League (2017) | 250 | 250 | 244 | |
| Monster Hunter World (2018) | 141 | 102 | 96 | 70 |
| Shadow of the Tomb Raider (2018) | 116 | 70 | 66 | 54 |
| Hitman 2 (2018) | 116 | 90 | 85 | 74 |
| F1 2019 (2019) | 166 | 146 | 122 | 104 |
Emissions
System Noise
A major chink in the GP65 Leopard's armor is fan noise. The machine offers some control over fan speed through the MSI Dragon Center software with preset profiles. The highest of these settings turns the fans on full tilt, and the sound is piercing due to the high pitch and high volume (52 dB[A]). Using the middle fan setting causes the fans to ramp aggressively; however, the fans do not spin as fast. As a result, noise is subdued but still cuts through ambient sounds. During lighter loads (like web browsing or streaming), the fan turns on but spins quietly and is not audible. There is some audible coil whine that can heard about 2 inches from the keyboard.
| MSI GP65 Leopard 9SE-225US GeForce RTX 2060 Mobile, i7-9750H, Toshiba KBG30ZMT512G | HP Omen 15-dc1303ng GeForce RTX 2070 Max-Q, i7-8750H, Samsung SSD PM981 MZVLB256HAHQ | Lenovo Legion Y540-15IRH-81SX00B2GE GeForce GTX 1660 Ti Mobile, i7-9750H, WDC PC SN720 SDAPNTW-512G | Asus Strix GL531GV-PB74 GeForce RTX 2060 Mobile, i7-9750H, Intel SSD 660p SSDPEKNW512G8 | CUK Model Z GK5CQ7Z GeForce RTX 2070 Max-Q, i7-9750H, Intel SSD 660p 2TB SSDPEKNW020T8 | Eurocom Nightsky Ti15 GeForce GTX 1660 Ti Mobile, i7-9750H, Samsung SSD 970 Pro 512GB | |
|---|---|---|---|---|---|---|
| Noise | -10% | 1% | -9% | -12% | -8% | |
| off / environment * (dB) | 28.2 | 30.5 -8% | 29.3 -4% | 28.2 -0% | 28.6 -1% | 28.4 -1% |
| Idle Minimum * (dB) | 29.5 | 32.8 -11% | 29.3 1% | 28.8 2% | 30.8 -4% | 28.6 3% |
| Idle Average * (dB) | 29.6 | 32.8 -11% | 29.3 1% | 31.4 -6% | 30.8 -4% | 28.6 3% |
| Idle Maximum * (dB) | 29.6 | 32.8 -11% | 29.3 1% | 33.3 -12% | 35 -18% | 28.6 3% |
| Load Average * (dB) | 33 | 42.5 -29% | 35.7 -8% | 46.2 -40% | 45 -36% | 47.8 -45% |
| Witcher 3 ultra * (dB) | 47.2 | 44.2 6% | 50.5 -7% | 51.6 -9% | 53.7 -14% | |
| Load Maximum * (dB) | 52 | 47.5 9% | 45.6 12% | 51.3 1% | 57.8 -11% | 53.7 -3% |
* ... smaller is better
Noise level
| Idle |
| 29.5 / 29.6 / 29.6 dB(A) |
| Load |
| 33 / 52 dB(A) |
 | ||
30 dB silent 40 dB(A) audible 50 dB(A) loud |
||
min: | ||
Temperature
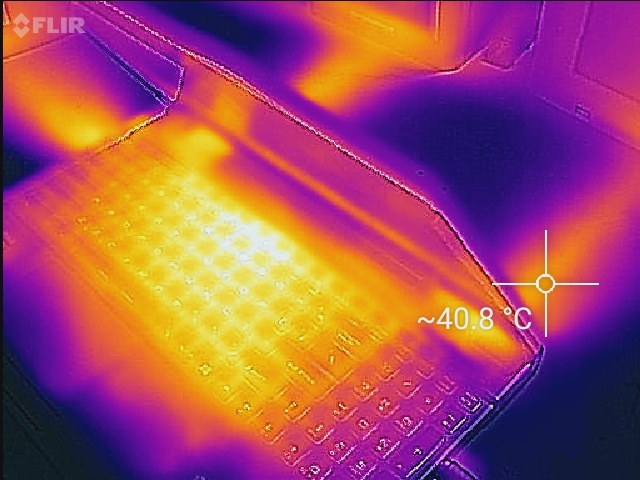
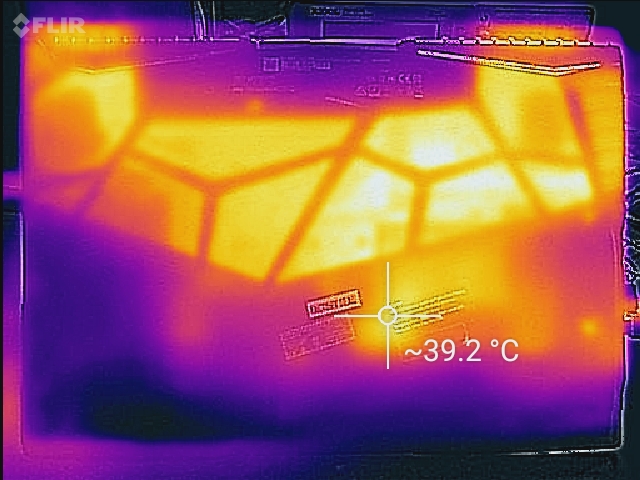
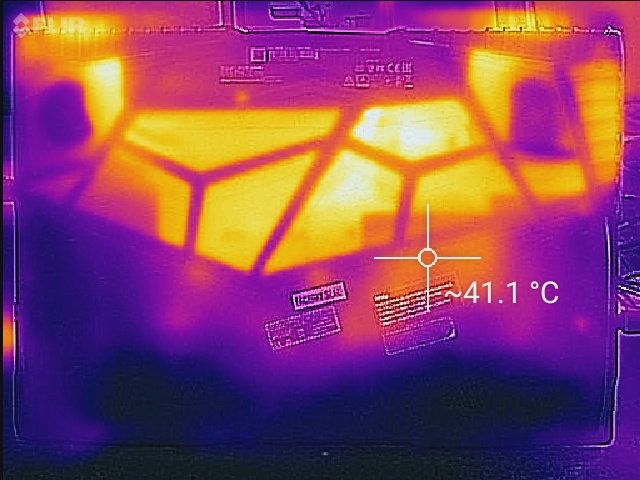
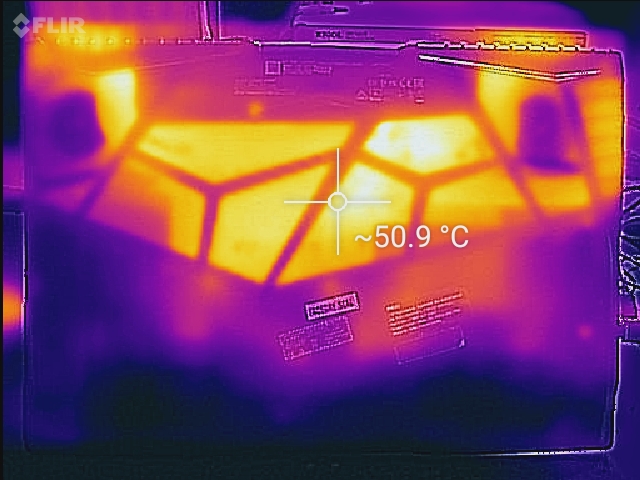
Despite the aggressive dual fans, chassis temperatures get very hot (particularly on the bottom panel) under load. This may be partly due to the copious perforations on the bottom panel; with no substrate through which to travel, heat can easily flow through the open holes and into the user's lap. (It should be noted that our thermometer measured internal components through the perforations, so surface temperatures may be cooler than those reported. However, we feel the GP65 Leopard gets too hot under load for lap use.) As such, we recommend gamers set the device on a flat, level surface. There is some good news: the WASD keys and arrow keys, while warm, do not grow uncomfortably hot under load.
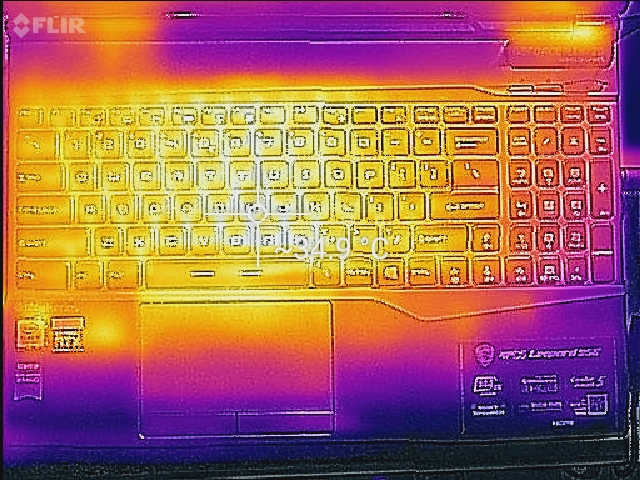
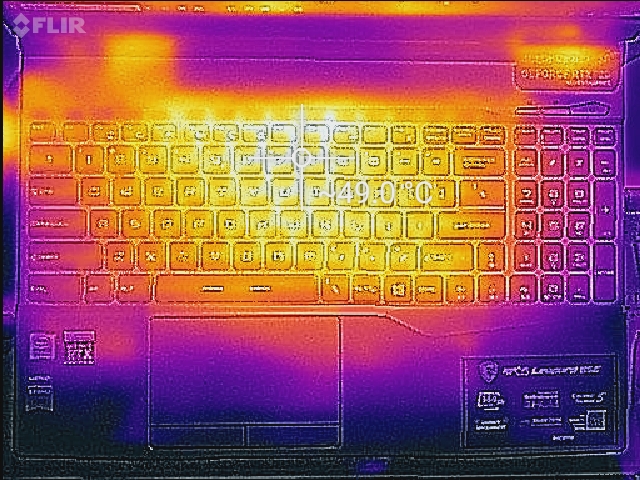
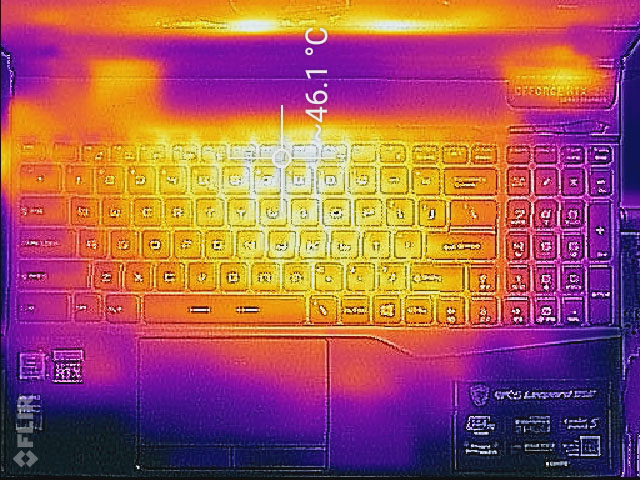
(-) The maximum temperature on the upper side is 48.8 °C / 120 F, compared to the average of 40.4 °C / 105 F, ranging from 21.2 to 68.8 °C for the class Gaming.
(-) The bottom heats up to a maximum of 54 °C / 129 F, compared to the average of 43.2 °C / 110 F
(±) In idle usage, the average temperature for the upper side is 32.4 °C / 90 F, compared to the device average of 33.9 °C / 93 F.
(±) Playing The Witcher 3, the average temperature for the upper side is 35.8 °C / 96 F, compared to the device average of 33.9 °C / 93 F.
(+) The palmrests and touchpad are reaching skin temperature as a maximum (34 °C / 93.2 F) and are therefore not hot.
(-) The average temperature of the palmrest area of similar devices was 28.8 °C / 83.8 F (-5.2 °C / -9.4 F).
Stress Test
Using hour-long runs of Prime95 and FurMark to stress the CPU and GPU, respectively, we get a good picture of how the GP65 Leopard functions under heavy extended loads. CPU temperatures hover between 80-90° C under stress. While these temperatures are hot, they are well within Intel's rated thermal limits. The GPU remains relatively cool at about 70-71° C in all tests. On the plus side, there is little evidence of thermal throttling; even when the system is fully taxed by running Prime95 and FurMark concurrently, the processor is still able to maintain a 3.0 GHz clock across all six cores with intermittent single-core boosts up to 4.2 GHz.
(Note the unusual pop in GPU performance near the end of our Prime95 + FurMark test. This may be caused by the opening of the screen capture software [Snipping Tool] used to record the readouts.)

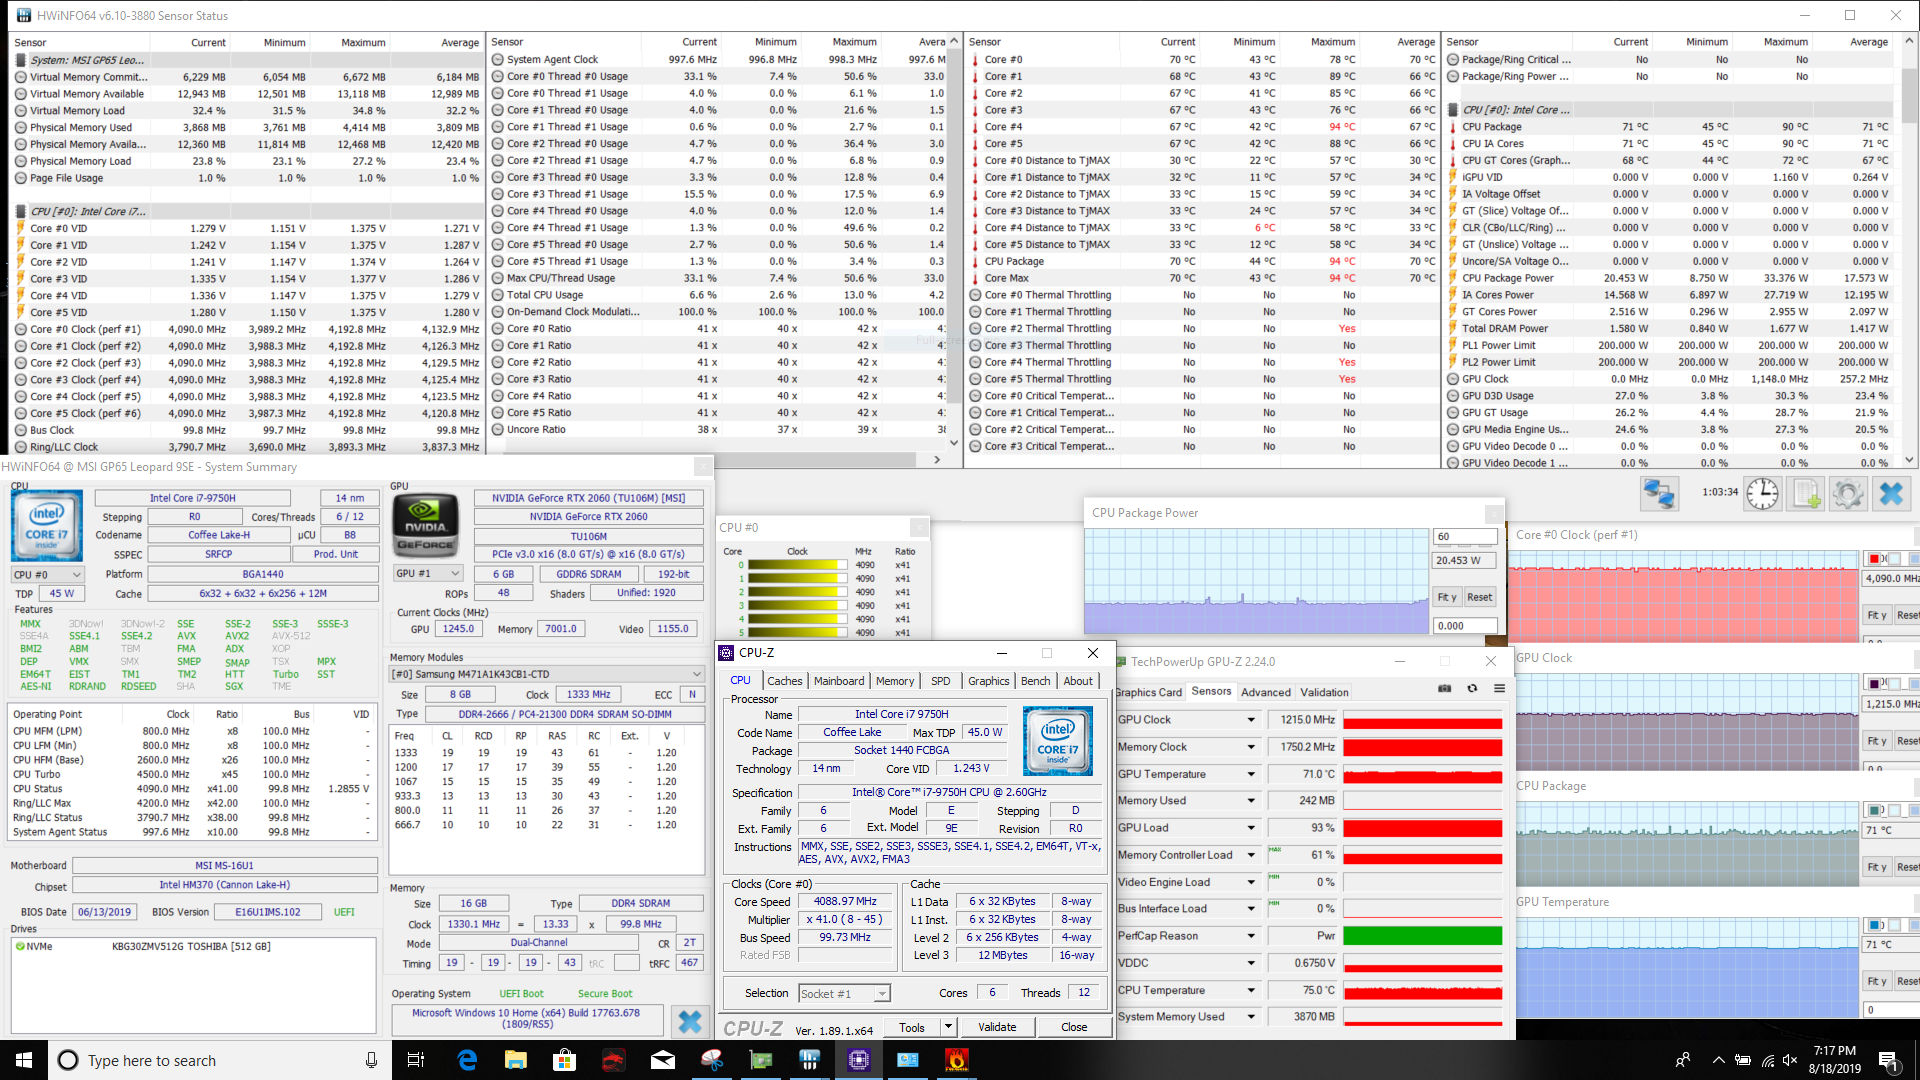
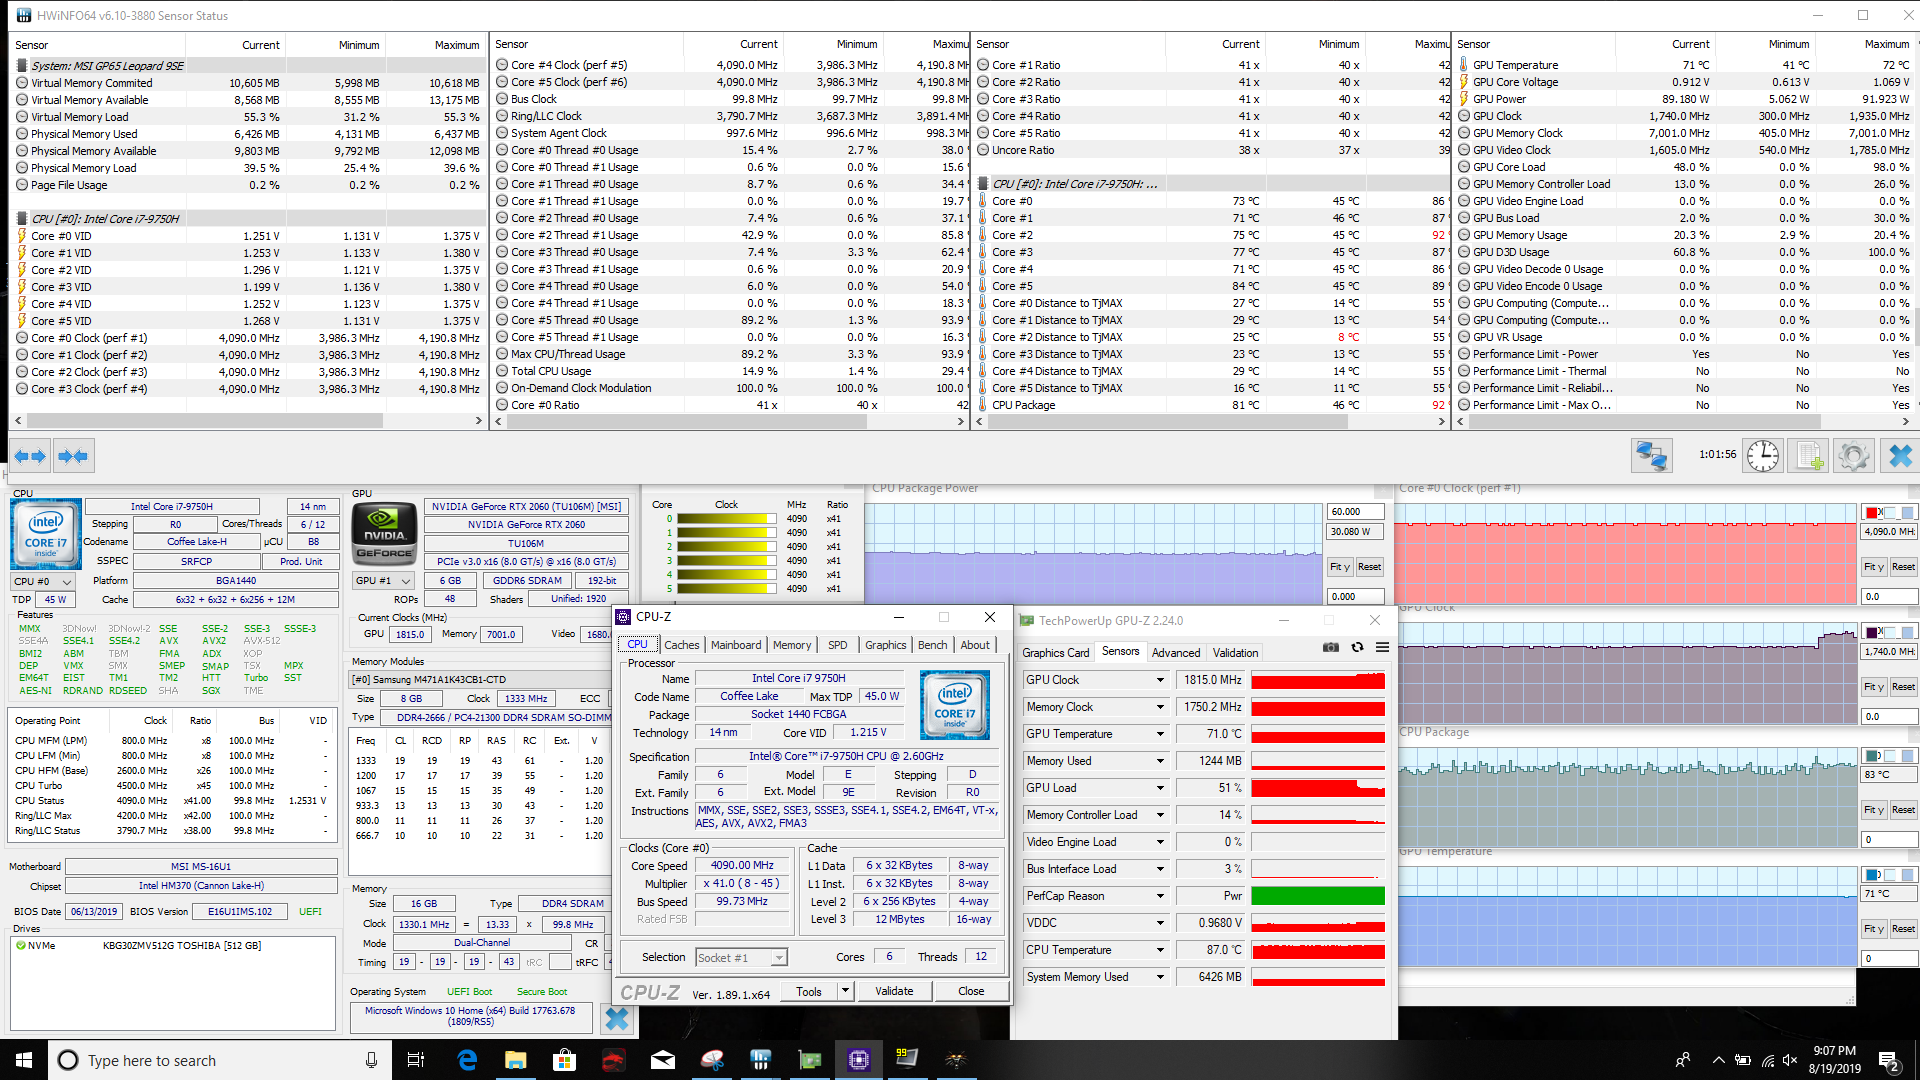
| CPU Clock (GHz) | GPU Clock (MHz) | Average CPU Temperature (°C) | Average GPU Temperature (°C) | |
| Prime95 Stress | 3.3-3.4 | - | 88 | - |
| FurMark Stress | 4.1 | 1215 | 71 | 71 |
| Prime95 + FurMark Stress | 3.0 | 1215 | 90 | 73 |
| Witcher 3 Stress | 4.1 | 1605 | 80 | 71 |
Speakers
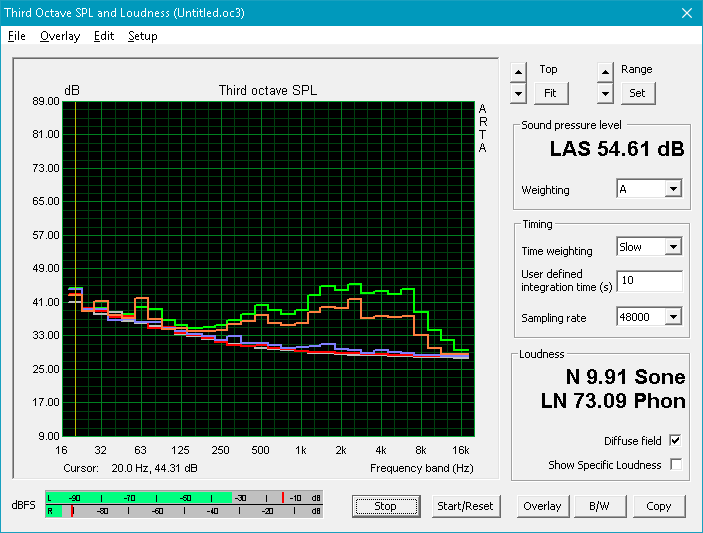
The MSI GP65 Leopard's speakers are not great. While they get reasonably loud (81 dB) and remain clear at any volume level, the sound profile is very poor. Bass is completely absent, and highs are too dominant. The overall sound is extremely tinny, even for laptop speakers, and is thin and unpleasant. Thankfully, the dedicated headphone jack supports S/PDIF and HiFi headphones. According to LatencyMon, there should be minimal audio latency.


MSI GP65 Leopard 9SE-225US audio analysis
(±) | speaker loudness is average but good (81 dB)
Bass 100 - 315 Hz
(-) | nearly no bass - on average 36.8% lower than median
(+) | bass is linear (5.9% delta to prev. frequency)
Mids 400 - 2000 Hz
(±) | reduced mids - on average 9.7% lower than median
(±) | linearity of mids is average (9% delta to prev. frequency)
Highs 2 - 16 kHz
(+) | balanced highs - only 2.2% away from median
(+) | highs are linear (4% delta to prev. frequency)
Overall 100 - 16.000 Hz
(±) | linearity of overall sound is average (29.1% difference to median)
Compared to same class
» 95% of all tested devices in this class were better, 2% similar, 4% worse
» The best had a delta of 6%, average was 18%, worst was 132%
Compared to all devices tested
» 87% of all tested devices were better, 2% similar, 11% worse
» The best had a delta of 4%, average was 23%, worst was 134%
HP Omen 15-dc1303ng audio analysis
(-) | not very loud speakers (67.3 dB)
Bass 100 - 315 Hz
(-) | nearly no bass - on average 20.2% lower than median
(±) | linearity of bass is average (11.4% delta to prev. frequency)
Mids 400 - 2000 Hz
(+) | balanced mids - only 2.2% away from median
(±) | linearity of mids is average (8.2% delta to prev. frequency)
Highs 2 - 16 kHz
(+) | balanced highs - only 2.5% away from median
(+) | highs are linear (5.9% delta to prev. frequency)
Overall 100 - 16.000 Hz
(±) | linearity of overall sound is average (20.3% difference to median)
Compared to same class
» 72% of all tested devices in this class were better, 6% similar, 23% worse
» The best had a delta of 6%, average was 18%, worst was 132%
Compared to all devices tested
» 53% of all tested devices were better, 8% similar, 39% worse
» The best had a delta of 4%, average was 23%, worst was 134%
Lenovo Legion Y540-15IRH-81SX00B2GE audio analysis
(±) | speaker loudness is average but good (77.4 dB)
Bass 100 - 315 Hz
(-) | nearly no bass - on average 17.7% lower than median
(±) | linearity of bass is average (11.6% delta to prev. frequency)
Mids 400 - 2000 Hz
(+) | balanced mids - only 3.7% away from median
(+) | mids are linear (4.5% delta to prev. frequency)
Highs 2 - 16 kHz
(+) | balanced highs - only 3.3% away from median
(+) | highs are linear (5.9% delta to prev. frequency)
Overall 100 - 16.000 Hz
(±) | linearity of overall sound is average (18.1% difference to median)
Compared to same class
» 57% of all tested devices in this class were better, 8% similar, 35% worse
» The best had a delta of 6%, average was 18%, worst was 132%
Compared to all devices tested
» 39% of all tested devices were better, 8% similar, 54% worse
» The best had a delta of 4%, average was 23%, worst was 134%
Energy Management
Power Consumption
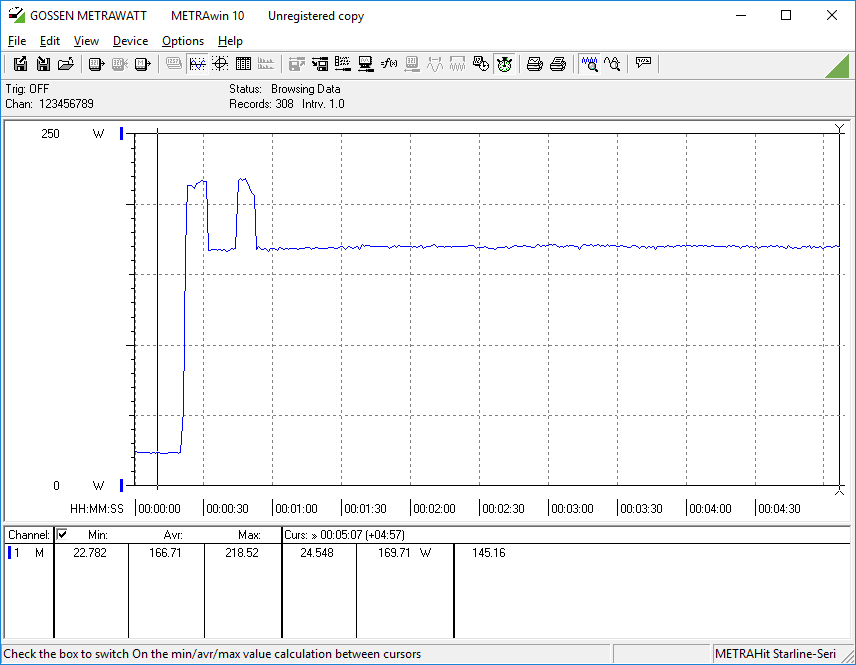
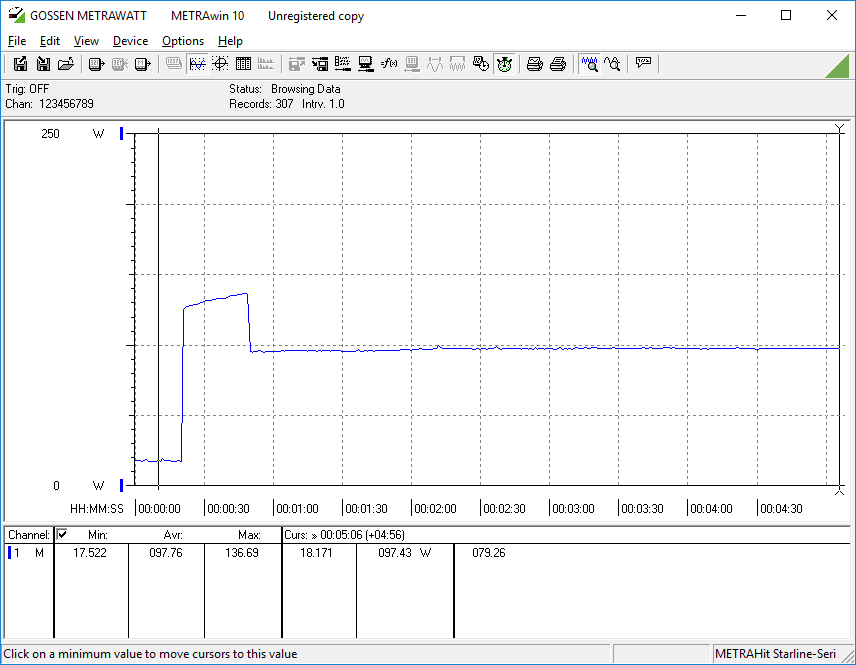
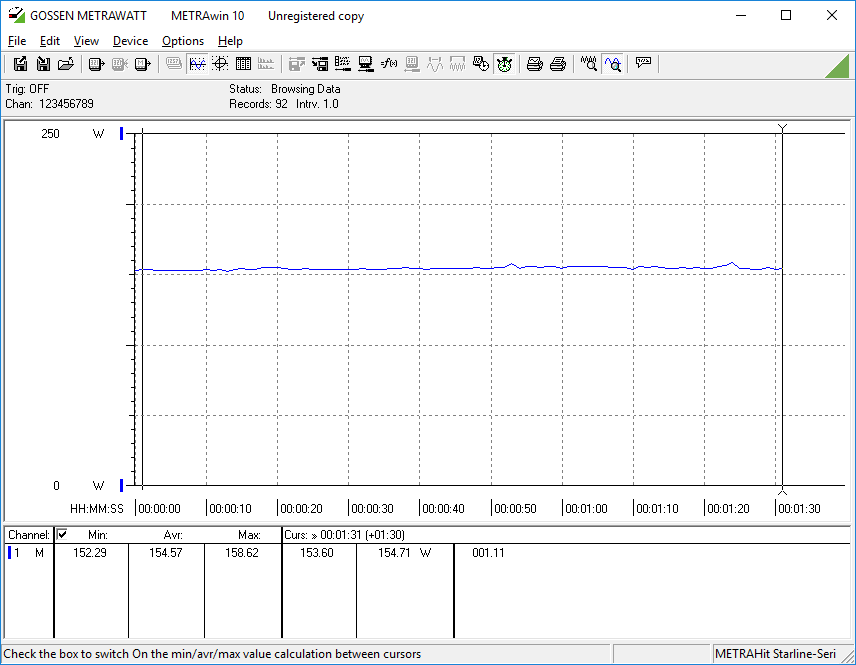
Power draw presents an interesting observation: while the included power adapter is rated for 180 Watts, the system is seen to draw spikes up to 218 Watts. These are short-lived, and the machine drops its power usage back to ~166 Watts during the rest of the load test (Prime95 and FurMark run concurrently). Under normal use cases, users can expect the GP65 Leopard to pull ~100-150 Watts from the wall, which is in line with other mid-tier gaming laptops.
| Off / Standby | |
| Idle | |
| Load |
|
Key:
min: | |
| MSI GP65 Leopard 9SE-225US i7-9750H, GeForce RTX 2060 Mobile, Toshiba KBG30ZMT512G, IPS, 1920x1080, 15.6" | HP Omen 15-dc1303ng i7-8750H, GeForce RTX 2070 Max-Q, Samsung SSD PM981 MZVLB256HAHQ, IPS, 1920x1080, 15.6" | Lenovo Legion Y540-15IRH-81SX00B2GE i7-9750H, GeForce GTX 1660 Ti Mobile, WDC PC SN720 SDAPNTW-512G, IPS, 1920x1080, 15.6" | Asus Strix GL531GV-PB74 i7-9750H, GeForce RTX 2060 Mobile, Intel SSD 660p SSDPEKNW512G8, IPS, 1920x1080, 15.6" | CUK Model Z GK5CQ7Z i7-9750H, GeForce RTX 2070 Max-Q, Intel SSD 660p 2TB SSDPEKNW020T8, IPS, 1920x1080, 15.6" | Eurocom Nightsky Ti15 i7-9750H, GeForce GTX 1660 Ti Mobile, Samsung SSD 970 Pro 512GB, IPS, 1920x1080, 15.6" | |
|---|---|---|---|---|---|---|
| Power Consumption | 6% | 5% | -6% | -30% | -18% | |
| Idle Minimum * (Watt) | 13.6 | 14.7 -8% | 14.5 -7% | 10.9 20% | 23.5 -73% | 16.8 -24% |
| Idle Average * (Watt) | 17.9 | 18.6 -4% | 18.5 -3% | 14.7 18% | 28 -56% | 29 -62% |
| Idle Maximum * (Watt) | 20.6 | 22.6 -10% | 20 3% | 32.4 -57% | 32 -55% | 30.8 -50% |
| Load Average * (Watt) | 96 | 90 6% | 81.6 15% | 121.9 -27% | 102.4 -7% | 89.2 7% |
| Witcher 3 ultra * (Watt) | 154.6 | 132 15% | 143.5 7% | 142.8 8% | 141.1 9% | |
| Load Maximum * (Watt) | 218.6 | 120 45% | 208.1 5% | 209.6 4% | 209 4% | 192.3 12% |
* ... smaller is better
Battery Life
Unsurprisingly, battery life is lackluster. The combination of a 51 Wh battery and 144 Hz panel work to rapidly kill the machine when it is unplugged. The MSI GP65 Leopard managed just under four hours in our WiFi v1.3 battery test (screen set to 150 nits, loading a new web page every 30-40 seconds). While this is a bit above average for a mid-tier gaming laptop, it's not enough for a workday away from an outlet. We've also begun to see respectable battery life (8+ hours) from gaming laptops, but that trend has yet to proliferate through the mid-range sector.
(Note that the MSI GP65 Leopard's screen always runs at 144 Hz, even on battery power.)
| MSI GP65 Leopard 9SE-225US i7-9750H, GeForce RTX 2060 Mobile, 51 Wh | HP Omen 15-dc1303ng i7-8750H, GeForce RTX 2070 Max-Q, 70 Wh | Lenovo Legion Y540-15IRH-81SX00B2GE i7-9750H, GeForce GTX 1660 Ti Mobile, 57 Wh | Asus Strix GL531GV-PB74 i7-9750H, GeForce RTX 2060 Mobile, 66 Wh | CUK Model Z GK5CQ7Z i7-9750H, GeForce RTX 2070 Max-Q, 46.74 Wh | Eurocom Nightsky Ti15 i7-9750H, GeForce GTX 1660 Ti Mobile, 62 Wh | |
|---|---|---|---|---|---|---|
| Battery runtime | -8% | -18% | -51% | -23% | -8% | |
| Reader / Idle (h) | 6 | 5 -17% | 4 -33% | |||
| WiFi v1.3 (h) | 3.9 | 3.3 -15% | 2.4 -38% | 1.9 -51% | 3 -23% | 3.6 -8% |
| Load (h) | 1.1 | 1.2 9% | 1.3 18% |
Pros
Cons
Verdict
The MSI GP65 Leopard continues paving the road started by the GP62 and the GP63. While the chassis looks and feels cheaply made, the hardware housed inside is excellent for the price. The 144 Hz display, in particular, is the star of the show. Not only does the screen offer buttery smooth gameplay, but it is incredibly color accurate, which is unheard of in a mid-tier gaming notebook.
Other premium niceties have started to trickle into the middle of the gaming notebook market as shown by the GP65. The keyboard continues the SteelSeries' brands excellent reputation, and the per-key RGB backlight is a welcome (and fun) addition. Port selection is varied, although the placement is odd and frustrating. Finally, gaming and general performance are great for $1500; the GP65 would make for a decent content creation laptop as well as a gaming machine.
However, the GP65 was not created in a vacuum. There are a few contenders that offer better overall packages at this price point. Namely, Lenovo's Legion Y540 has better thermal management (with quieter fans) and comparable gaming performance for $100 less. The CUK Model Z offers a better case, a mechanical keyboard, and a more powerful GPU (RTX 2070 Max-Q) at the same $1500 price tag. However, the Model Z gets much hotter than the GP65 with the added punch of louder fans.
The decision comes down to what you want your laptop to do. If your primary goal is gaming (and thermals be damned), the CUK Model Z is hard to beat at this price point. If budget is of the utmost concern, the Lenovo Legion Y540 is well-priced with a small tradeoff in gaming performance. (Lenovo frequently offers sales as well.)
Though it makes some compromises in build quality and thermal management, the MSI GP65 Leopard represents an excellent value and is a great "jack of all trades" laptop. The excellent display is good enough for content creations, and gaming performance is sure to leave most gamers satisfied for the near future. At $1500, the GP65 Leopard sits at the far end of the mid-range market, but it also sits as one of the best mid-range gaming laptops available today.
MSI GP65 Leopard 9SE-225US
- 08/25/2019 v6 (old)
Sam Medley
Price comparison
