HP Omen 17 Laptop Review: High-end gaming with some small limitations

HP's Omen series has been producing potent gaming devices with both an attractive exterior and an attractive price for several years now. The 2019 generation is no exception. Let us take a look at the Omen 17, for example, which has a starting price of around $1400. For this price, buyers will receive a Core i7-9750H from Intel and a GeForce GTX 1660 Ti from Nvidia as well as 16 GB of RAM and 1.25 TB of storage capacity (SSD + HDD). On top of all that, the device features a matte 144-Hz IPS panel. Today's test unit is a more elaborate model and is equipped with a Core i9-9880H (8 instead of 6 cores), a GeForce RTX 2080, 32 GB of DDR4 RAM and a total of 3 TB of storage (SSD-RAID + HDD). Its price point: $2500.
As mentioned above, the Omen 17 still is quite affordable compared to its competitors. You will currently need to cough up an additional $1000 for a similarly-equipped MSI GE75 9SG. Other RTX 2080 laptops, such as the MSI GT76 9SG, the Schenker XMG Ultra 17 and the Alienware Area-51m (each with desktop CPU), can cost as much as $4000+ for a similar configuration.
Case
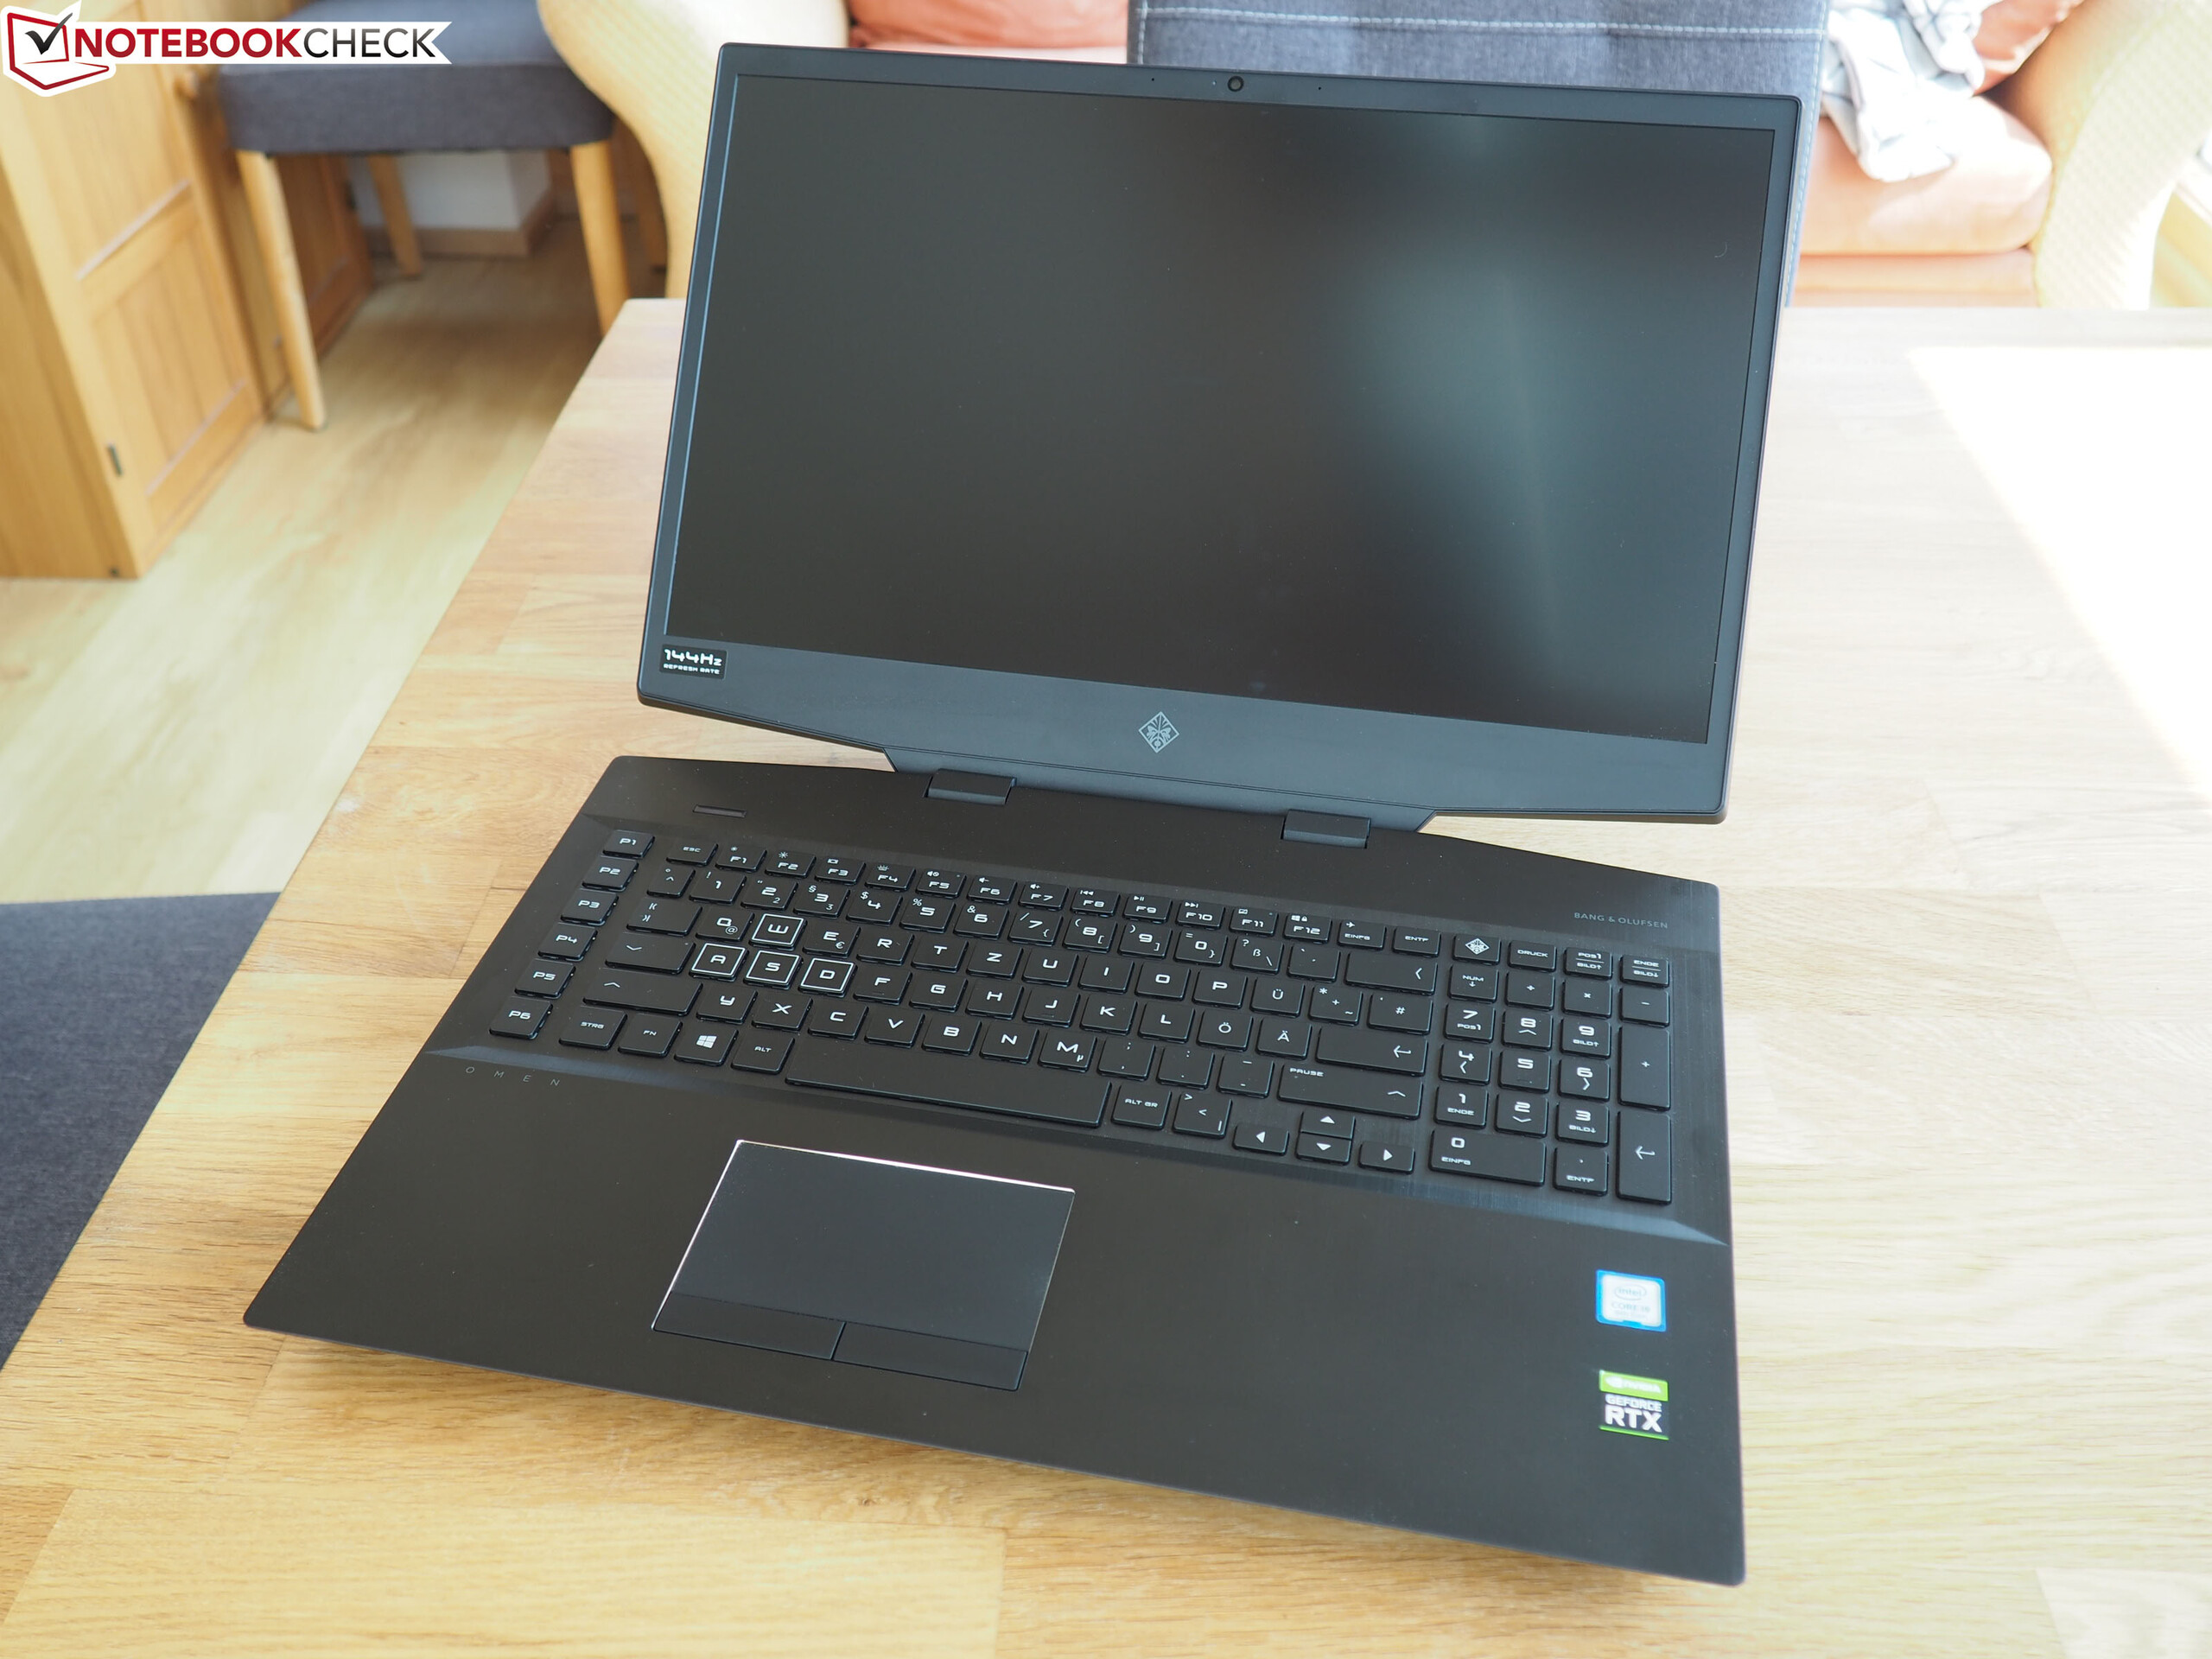
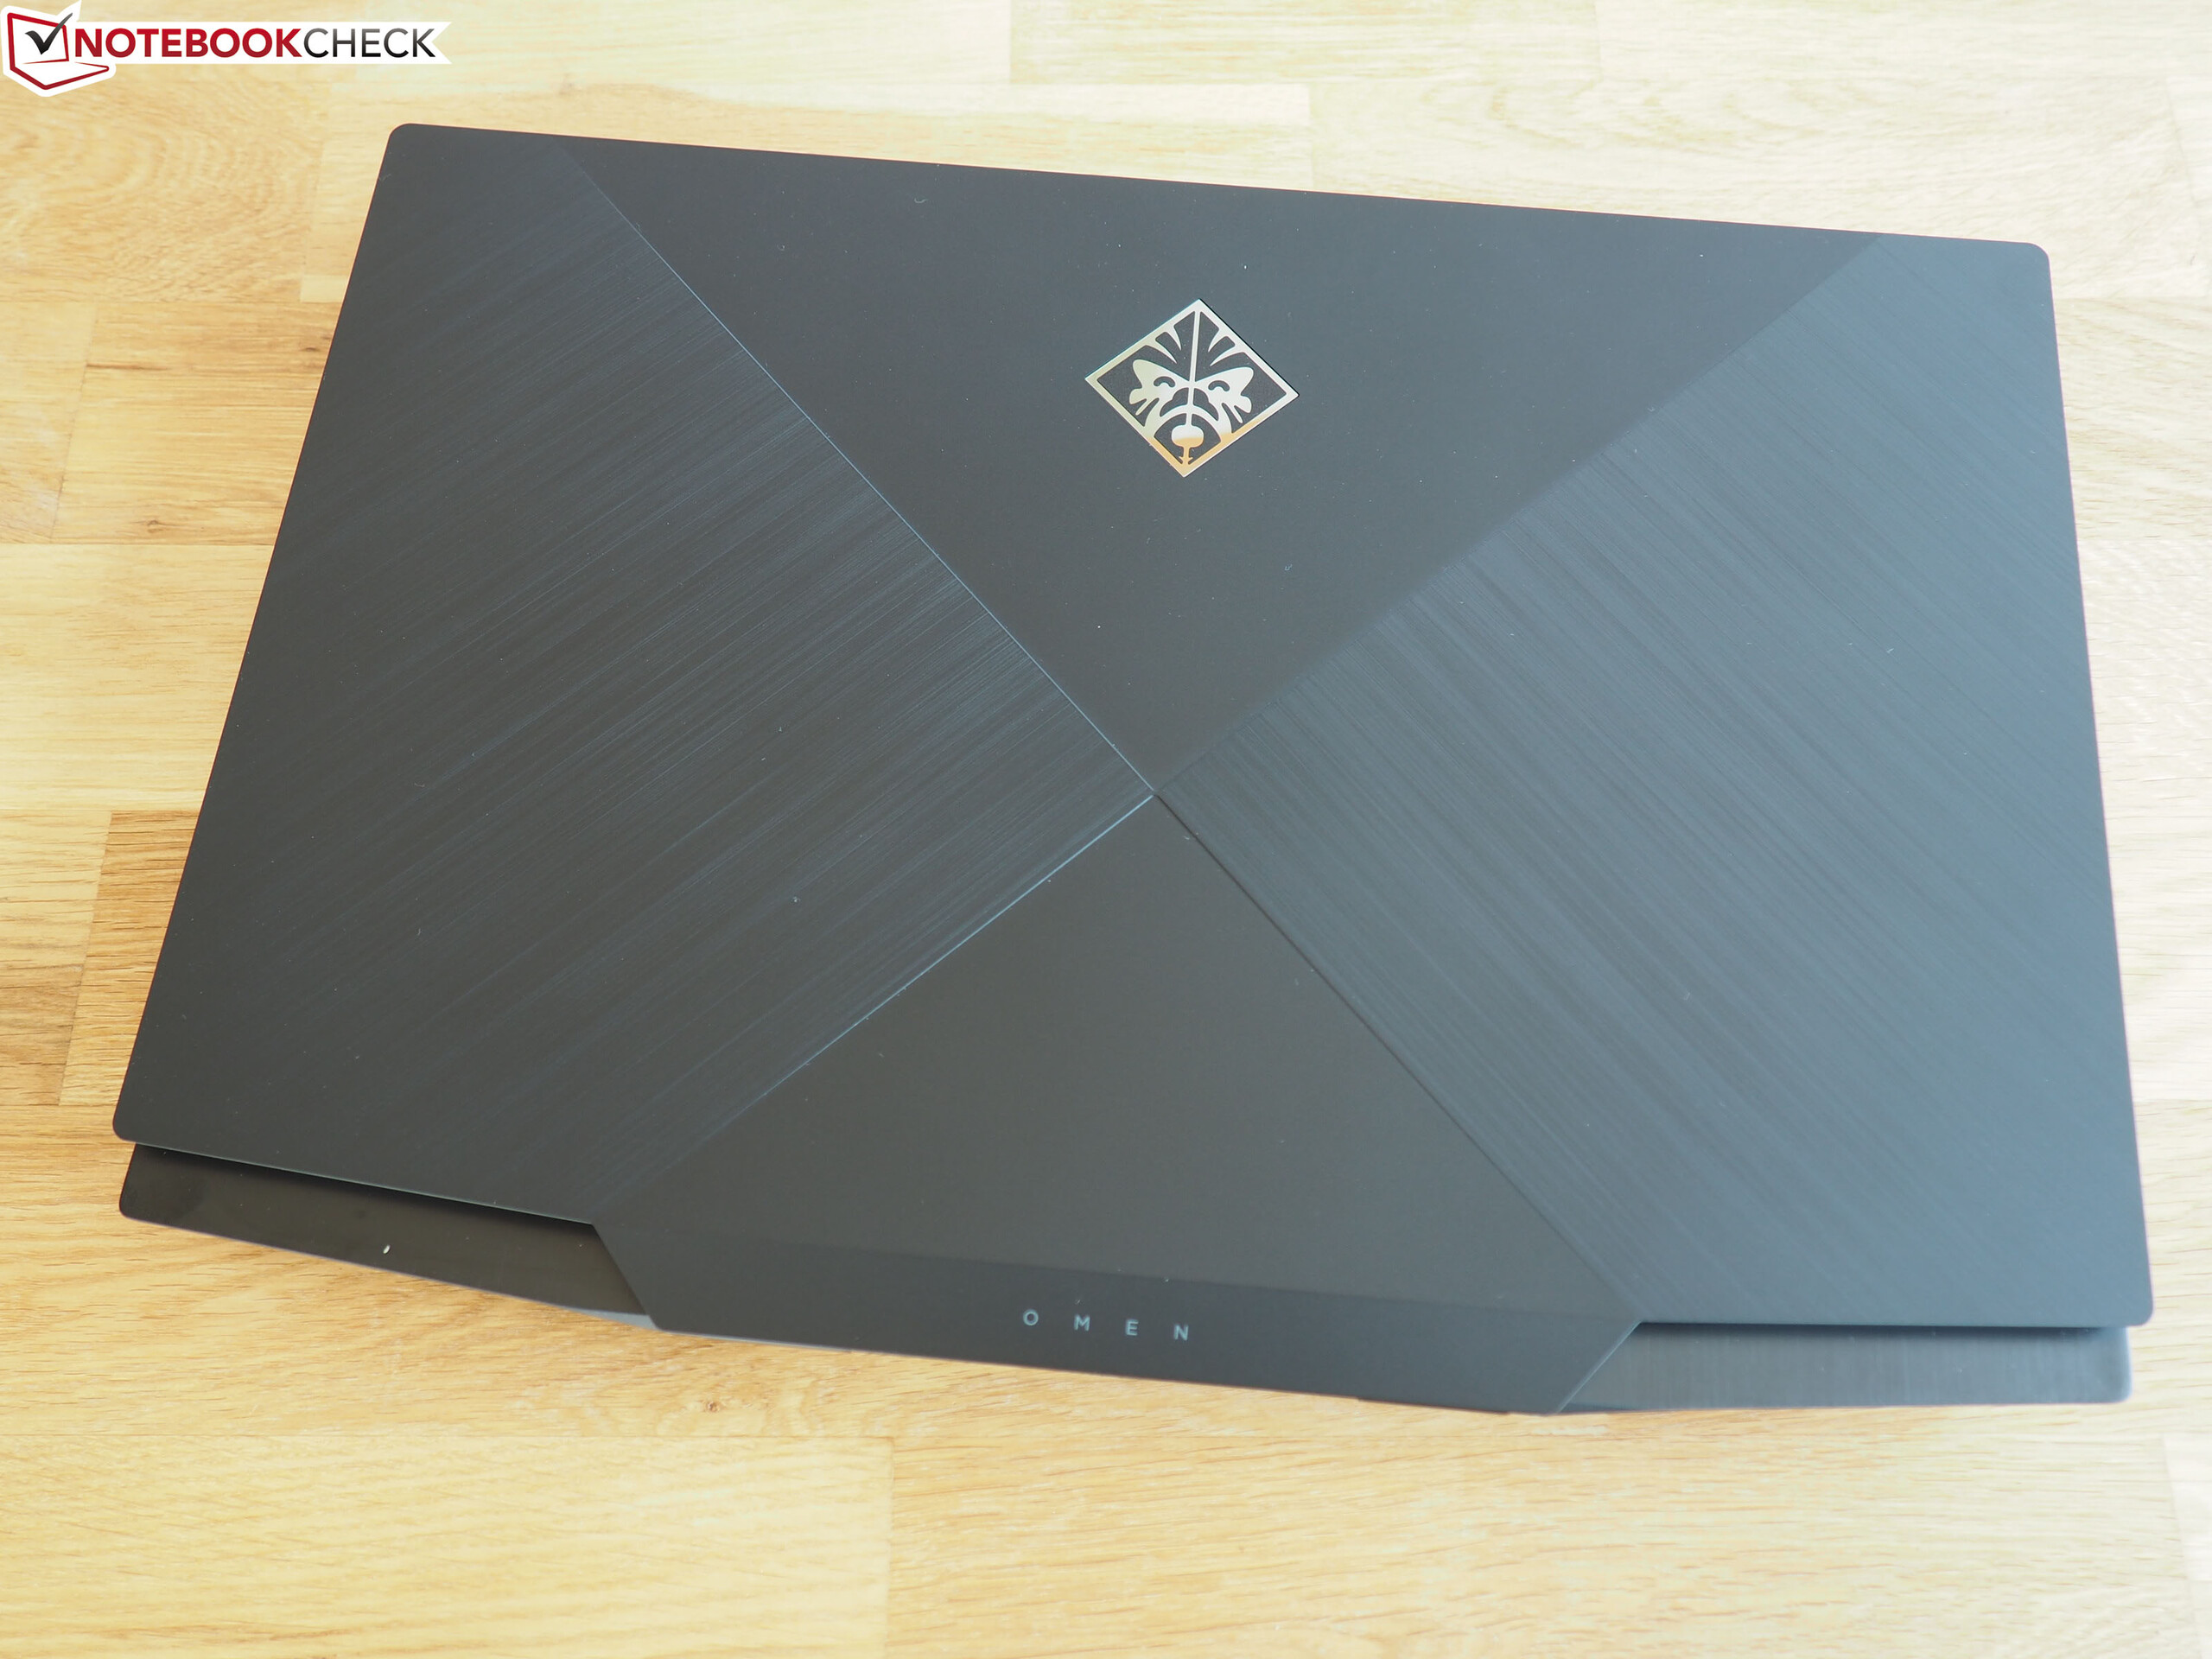
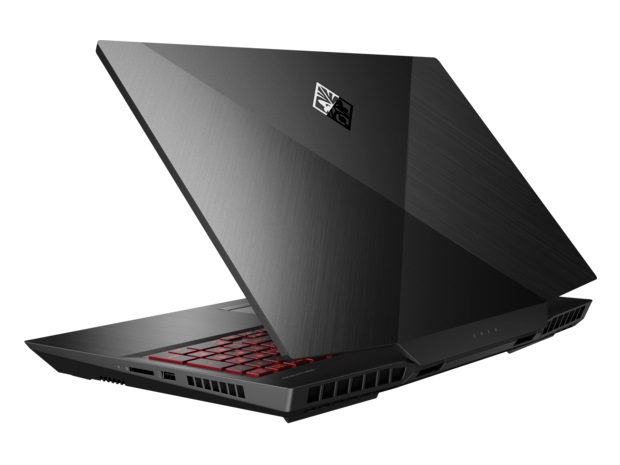
While the quality of the case is not particularly impressive (only the top of the base unit is made of metal), we were still very pleased with it in general. This is mainly due to its unique design, which sets itself apart from other gaming notebooks thanks to its unusual form and contours.
Unlike with the last generation, HP has now decided against using red elements as highlights, which we think was a good choice. This makes the case appear a great deal more grown-up. Although the bottom bezel continues to be rather wide, we appreciate the general change to a slim-bezel design. Particularly the side and top bezels were significantly wider on the predecessor.


Another advantage of the new generation is its lower weight. The Omen 17 now weighs 3.3 kg (~7.3 lb) instead of 3.7 kg (~8.2 lb). This is still heavier than the MSI GE75 9SG (2.7 kg/~6 lb), but lighter than the MSI GT76 9SG, Schenker XMG Ultra 17 and Alienware Area 51m (3.9/~8.6 to 4.3 kg/~9.5 lb). The Omen 17 can beat all of its competitors in terms of thickness: 2.7 cm (~1.1 in) is the lowest you can get in this comparison field.
Apart from its size, weight and look, we would describe this case as average. The workmanship is fine apart from some minor details and the hinges are not particularly noteworthy either. HP could, however, improve the stability of the display cover, as this can be warped and squeezed together quite easily in some areas. But then again, the same can be said for a lot of other notebooks as well. The base unit does not give way even under strong pressure.
Connectivity
Ports
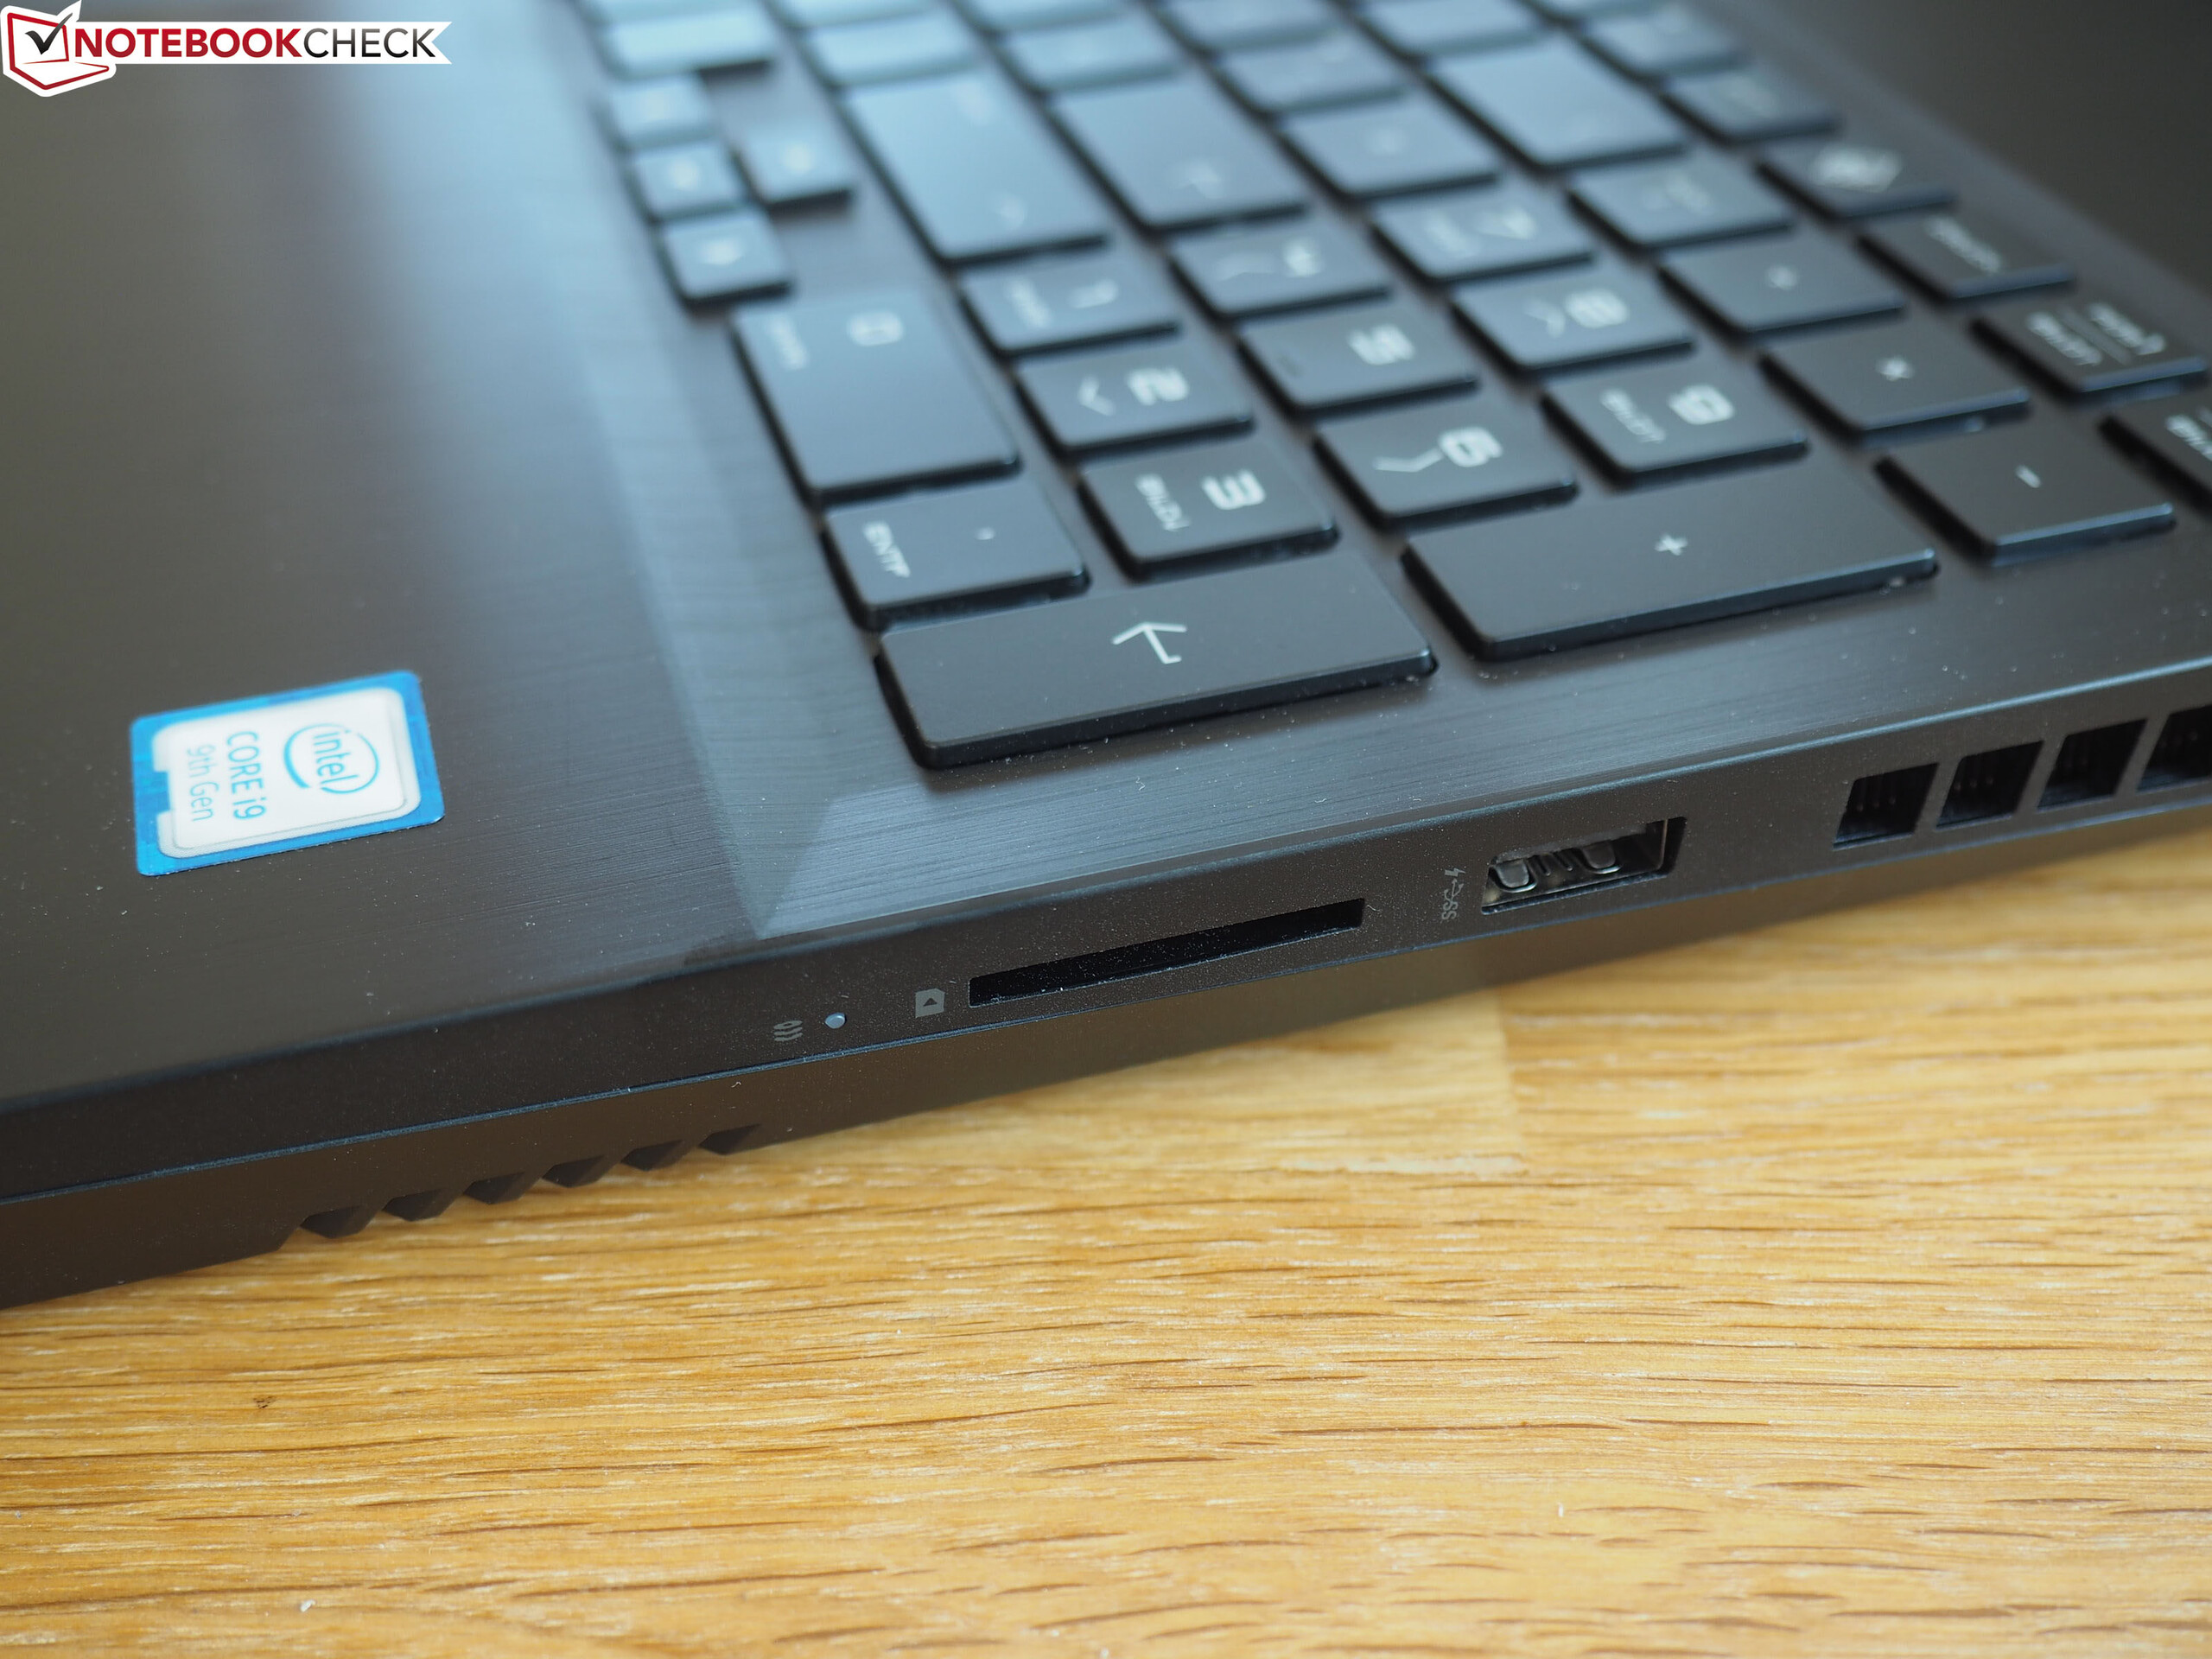
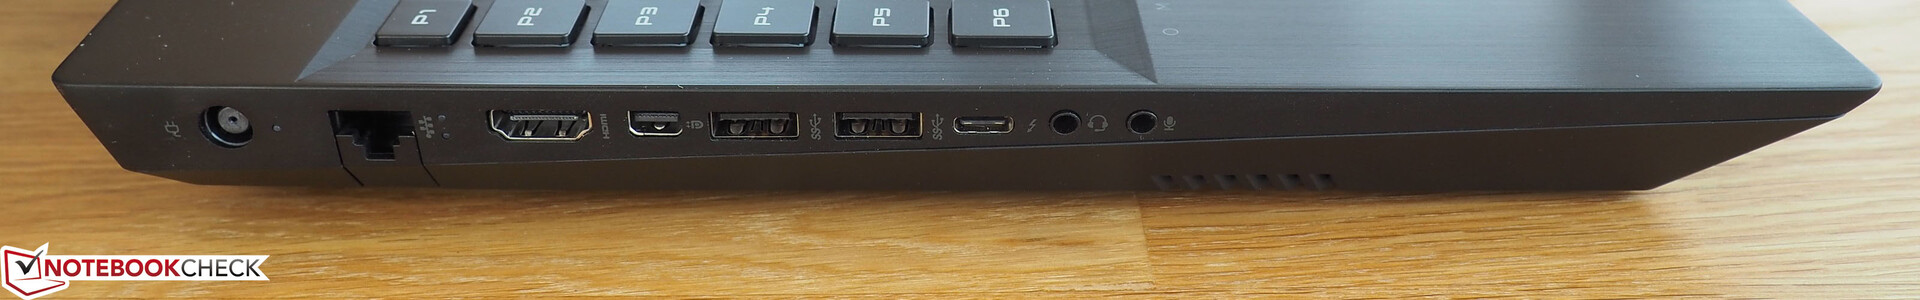
The Omen 17 has a decent port selection that includes three classic USB 3.0 Type A ports as well as a modern Type C port that supports USB 3.1 Gen 2, DisplayPort and Thunderbolt 3. The other ports include an HDMI connector and a Mini-DisplayPort for connecting external monitors, an SD card reader and an RJ45 port as well as two audio jacks. The Omen 17 does not have a Kensington Lock connector.
As most of the ports are positioned towards the back of the sides, there is sufficient space for using a physical mouse on either side of the device.
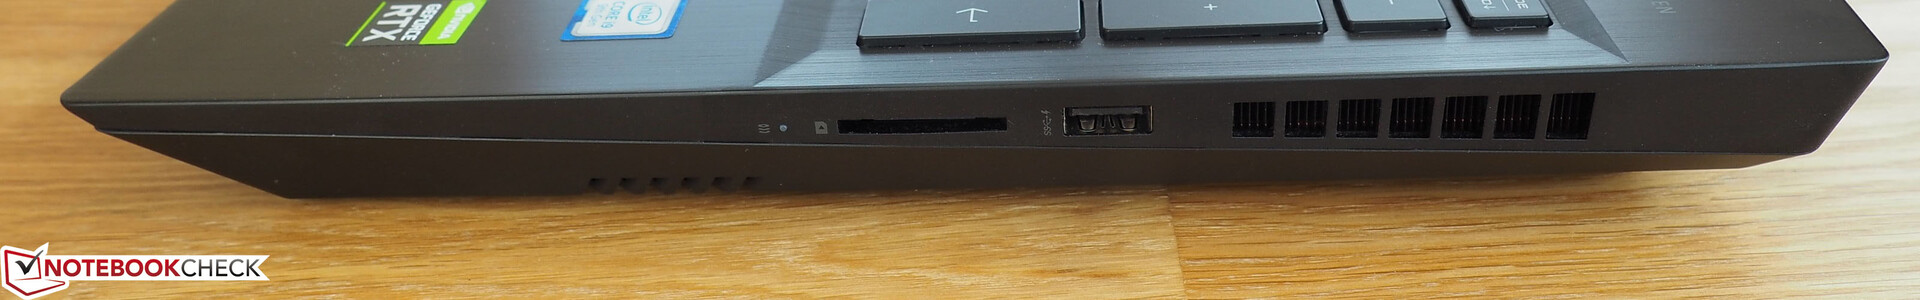
SD card reader
The performance of the card reader is average - neither particularly bad, nor particularly good. We measured a rate of 80 MB/s for sequential reading and transferring photos. This positions the Omen 17 between the MSI GE75 9SG (~30 MB/s) and the Schenker XMG Ultra 17 (~200 MB/s). The MSI GT76 9SG only has space for a microSD card while the Alienware Area 51m has completely foregone an SD card reader.
| SD Card Reader | |
| average JPG Copy Test (av. of 3 runs) | |
| Schenker XMG Ultra 17 Turing (Toshiba Exceria Pro SDXC 64 GB UHS-II) | |
| Average of class Gaming (20.9 - 210, n=54, last 2 years) | |
| HP Omen 17-cb0020ng (Toshiba Exceria Pro SDXC 64 GB UHS-II) | |
| MSI GE75 9SG (Toshiba Exceria Pro SDXC 64 GB UHS-II) | |
| maximum AS SSD Seq Read Test (1GB) | |
| Schenker XMG Ultra 17 Turing (Toshiba Exceria Pro SDXC 64 GB UHS-II) | |
| Average of class Gaming (25.5 - 261, n=51, last 2 years) | |
| HP Omen 17-cb0020ng (Toshiba Exceria Pro SDXC 64 GB UHS-II) | |
| MSI GE75 9SG (Toshiba Exceria Pro SDXC 64 GB UHS-II) | |
Communication
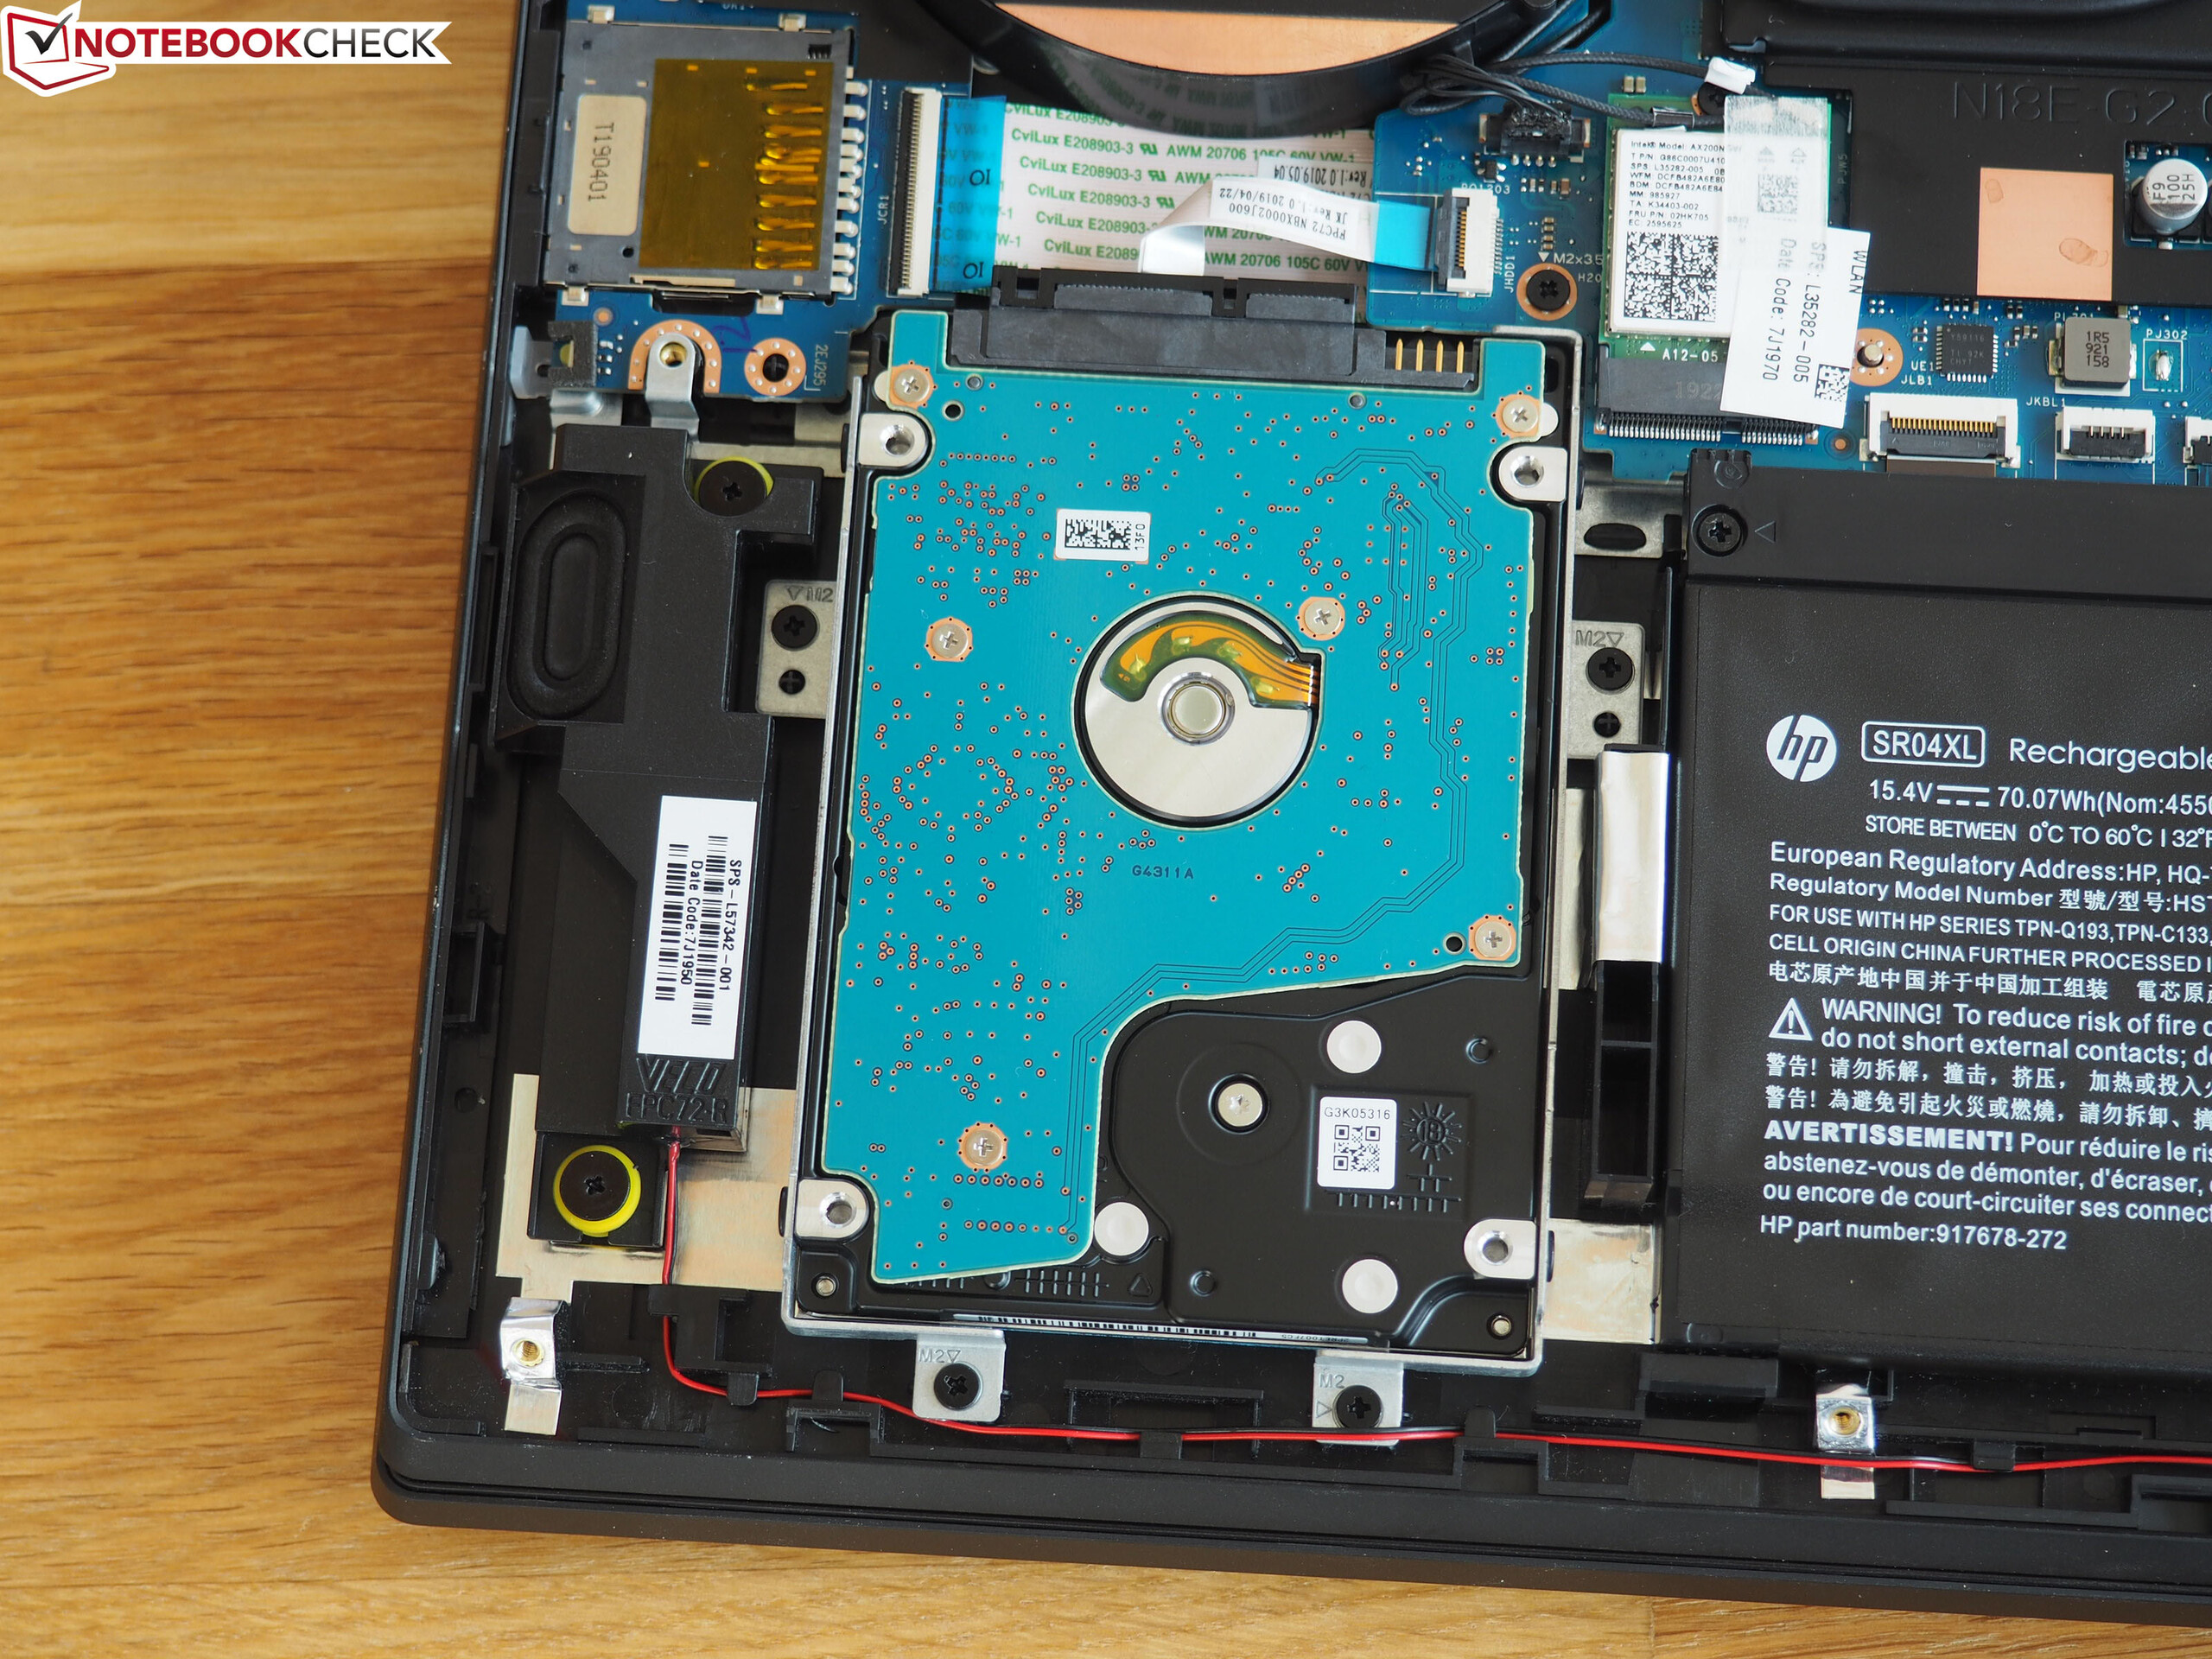
HP has made no compromises in terms of Wi-Fi performance and has equipped our test unit with an Intel Wi-Fi 6 AX200, a very fast and up-to-date WLAN module. The transfer rates of 749 Mbit/s and reception rates of 675 Mbit/s comfortably position our Omen 17 in first and second place, respectively.
Software
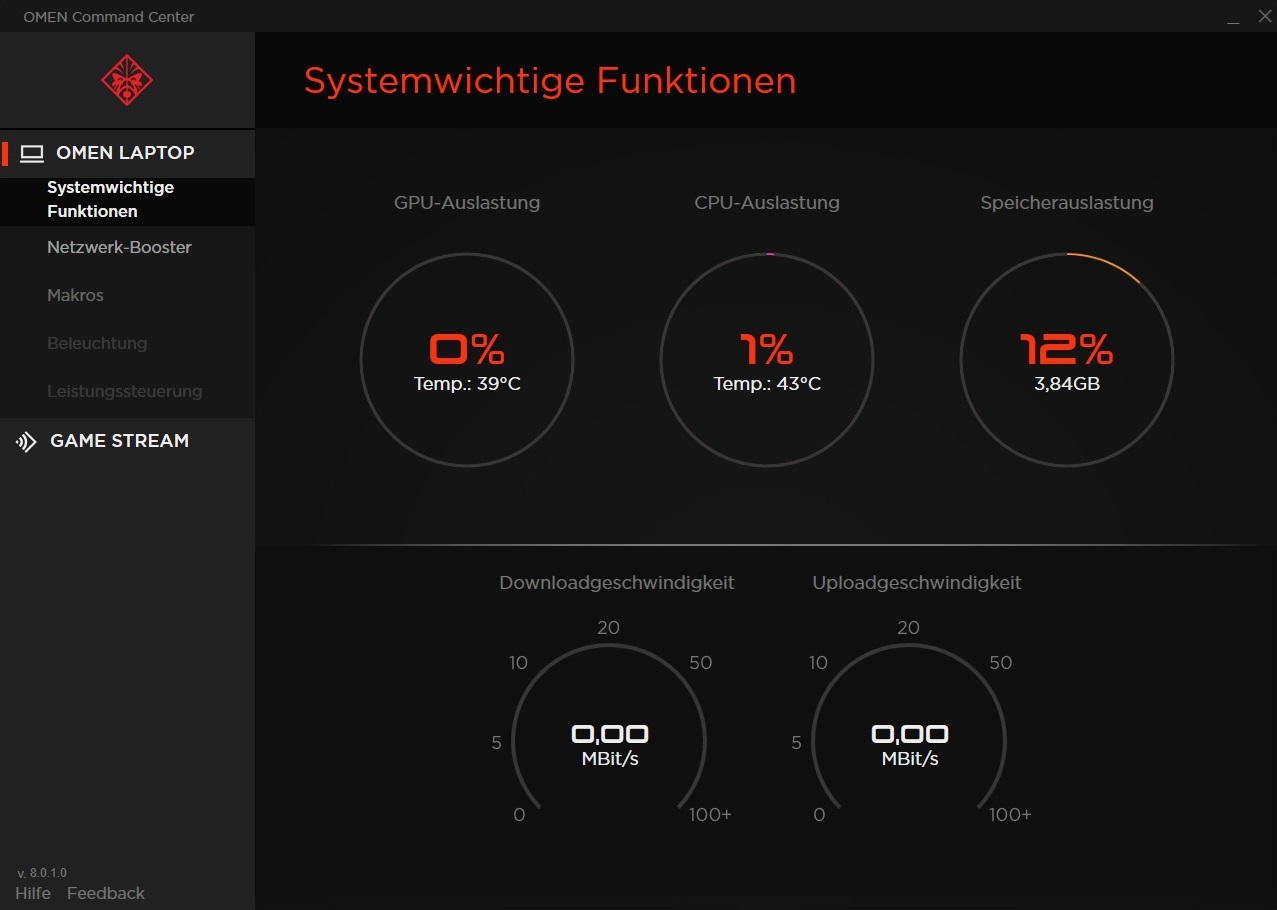
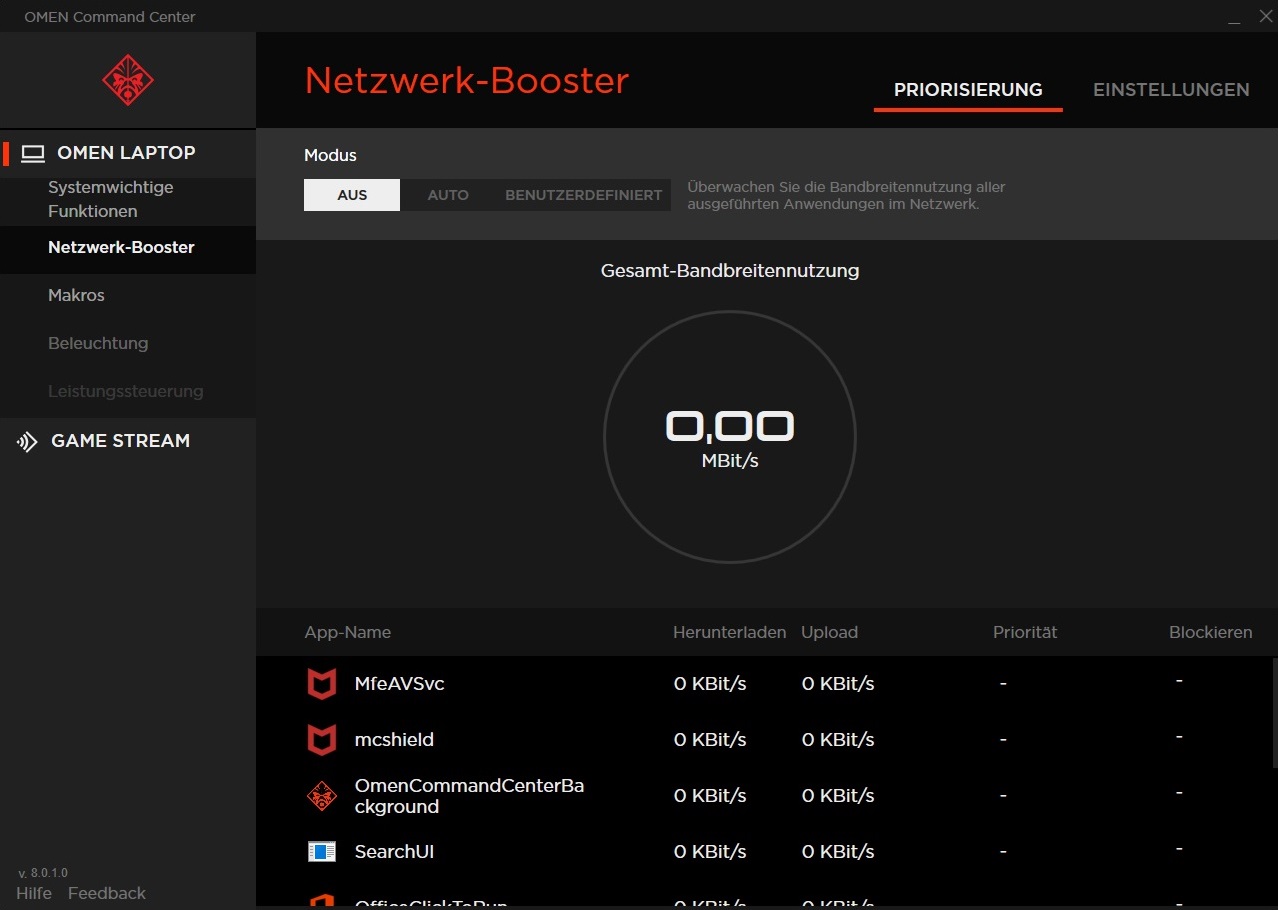
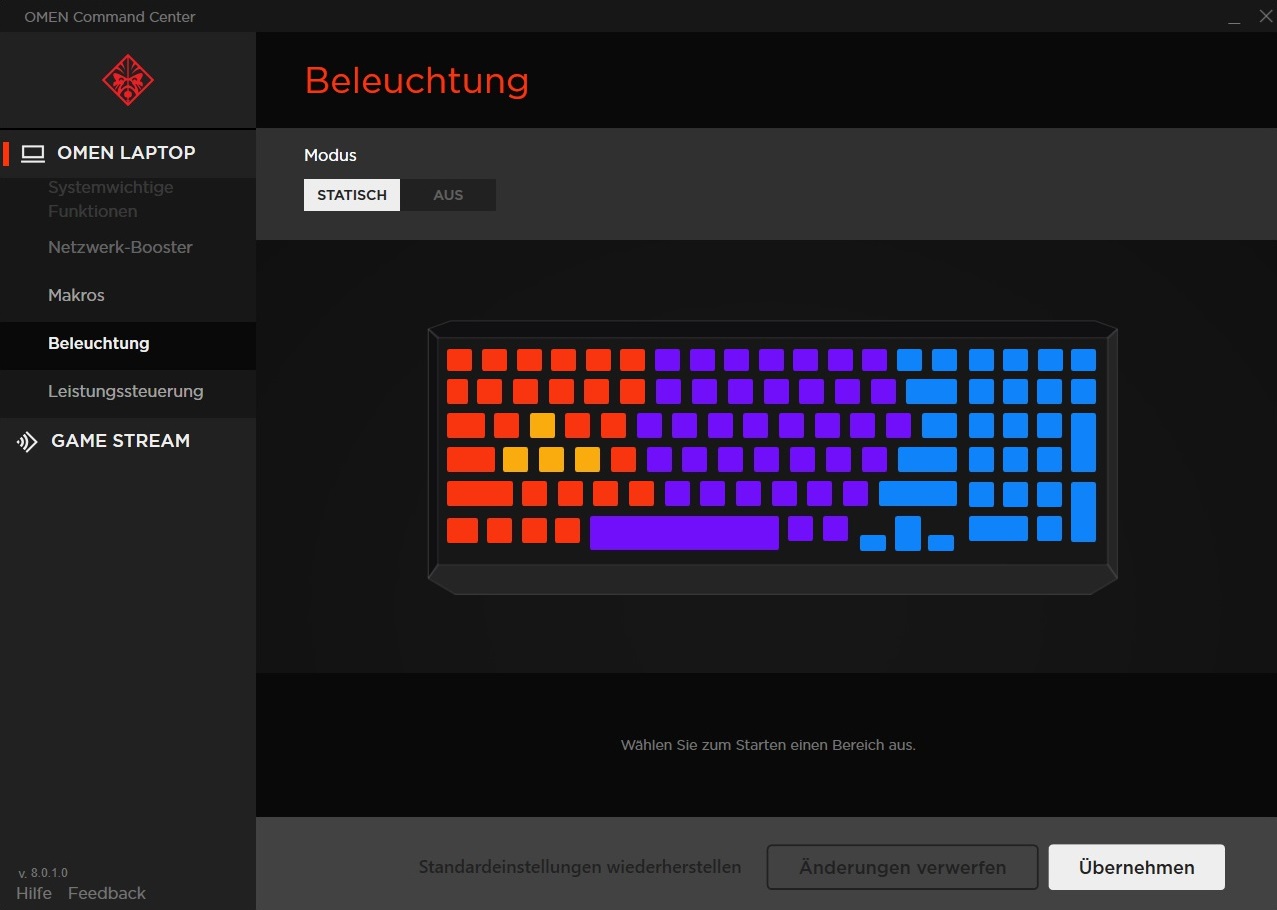
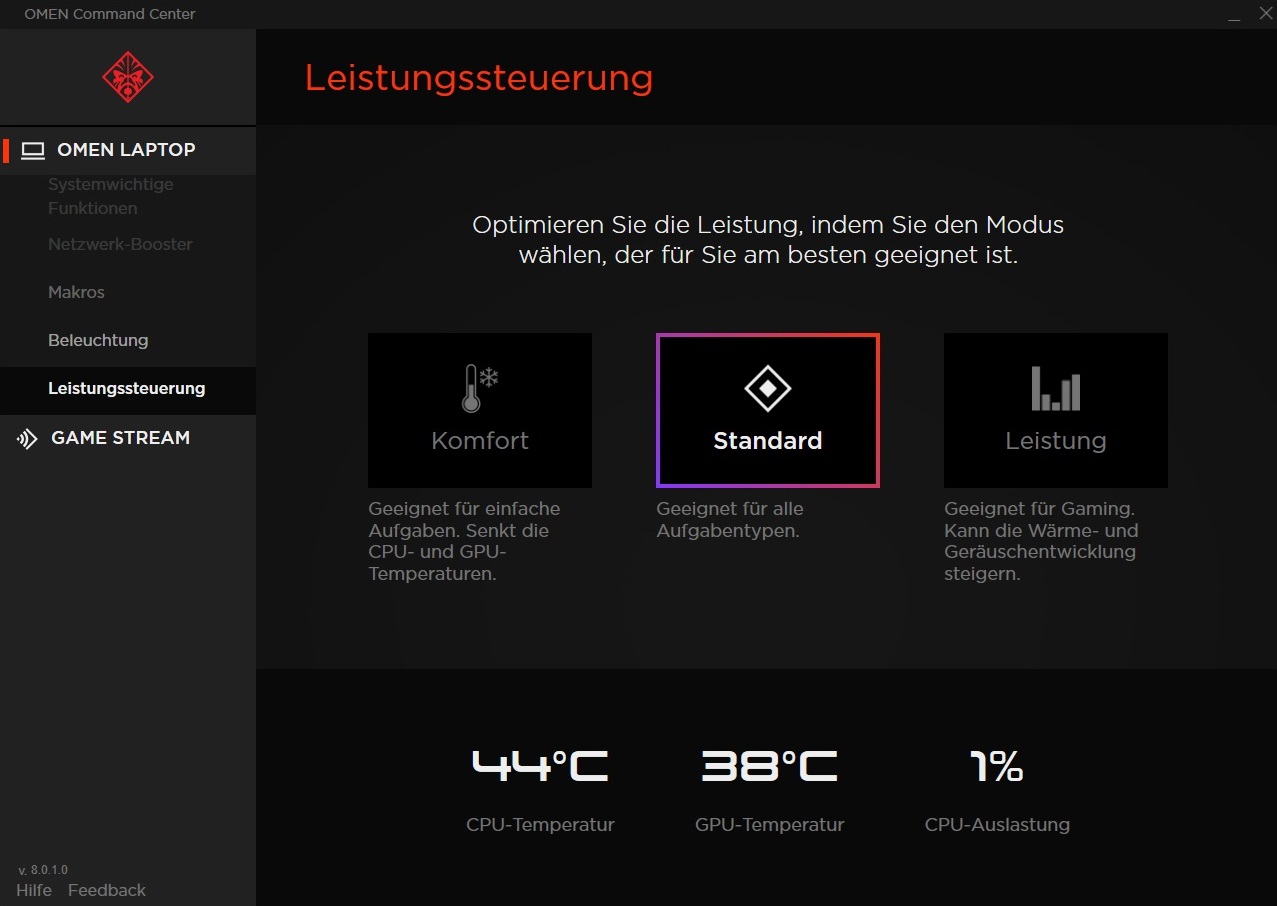
We would like to mention the Command Center, a kind of central hub that pulls together various features, monitoring options and settings. Apart from getting an idea of the load level and temperature of the CPU, GPU and storage, you can also use it to control network traffic (including an optional booster), customize the macro keys, adjust the keyboard backlighting and change the power control. As you can see from the sixth screenshot, the available power modes are comfort, standard and performance. We ran our tests on standard settings, which is the mode that is activated ex-works.

Accessories
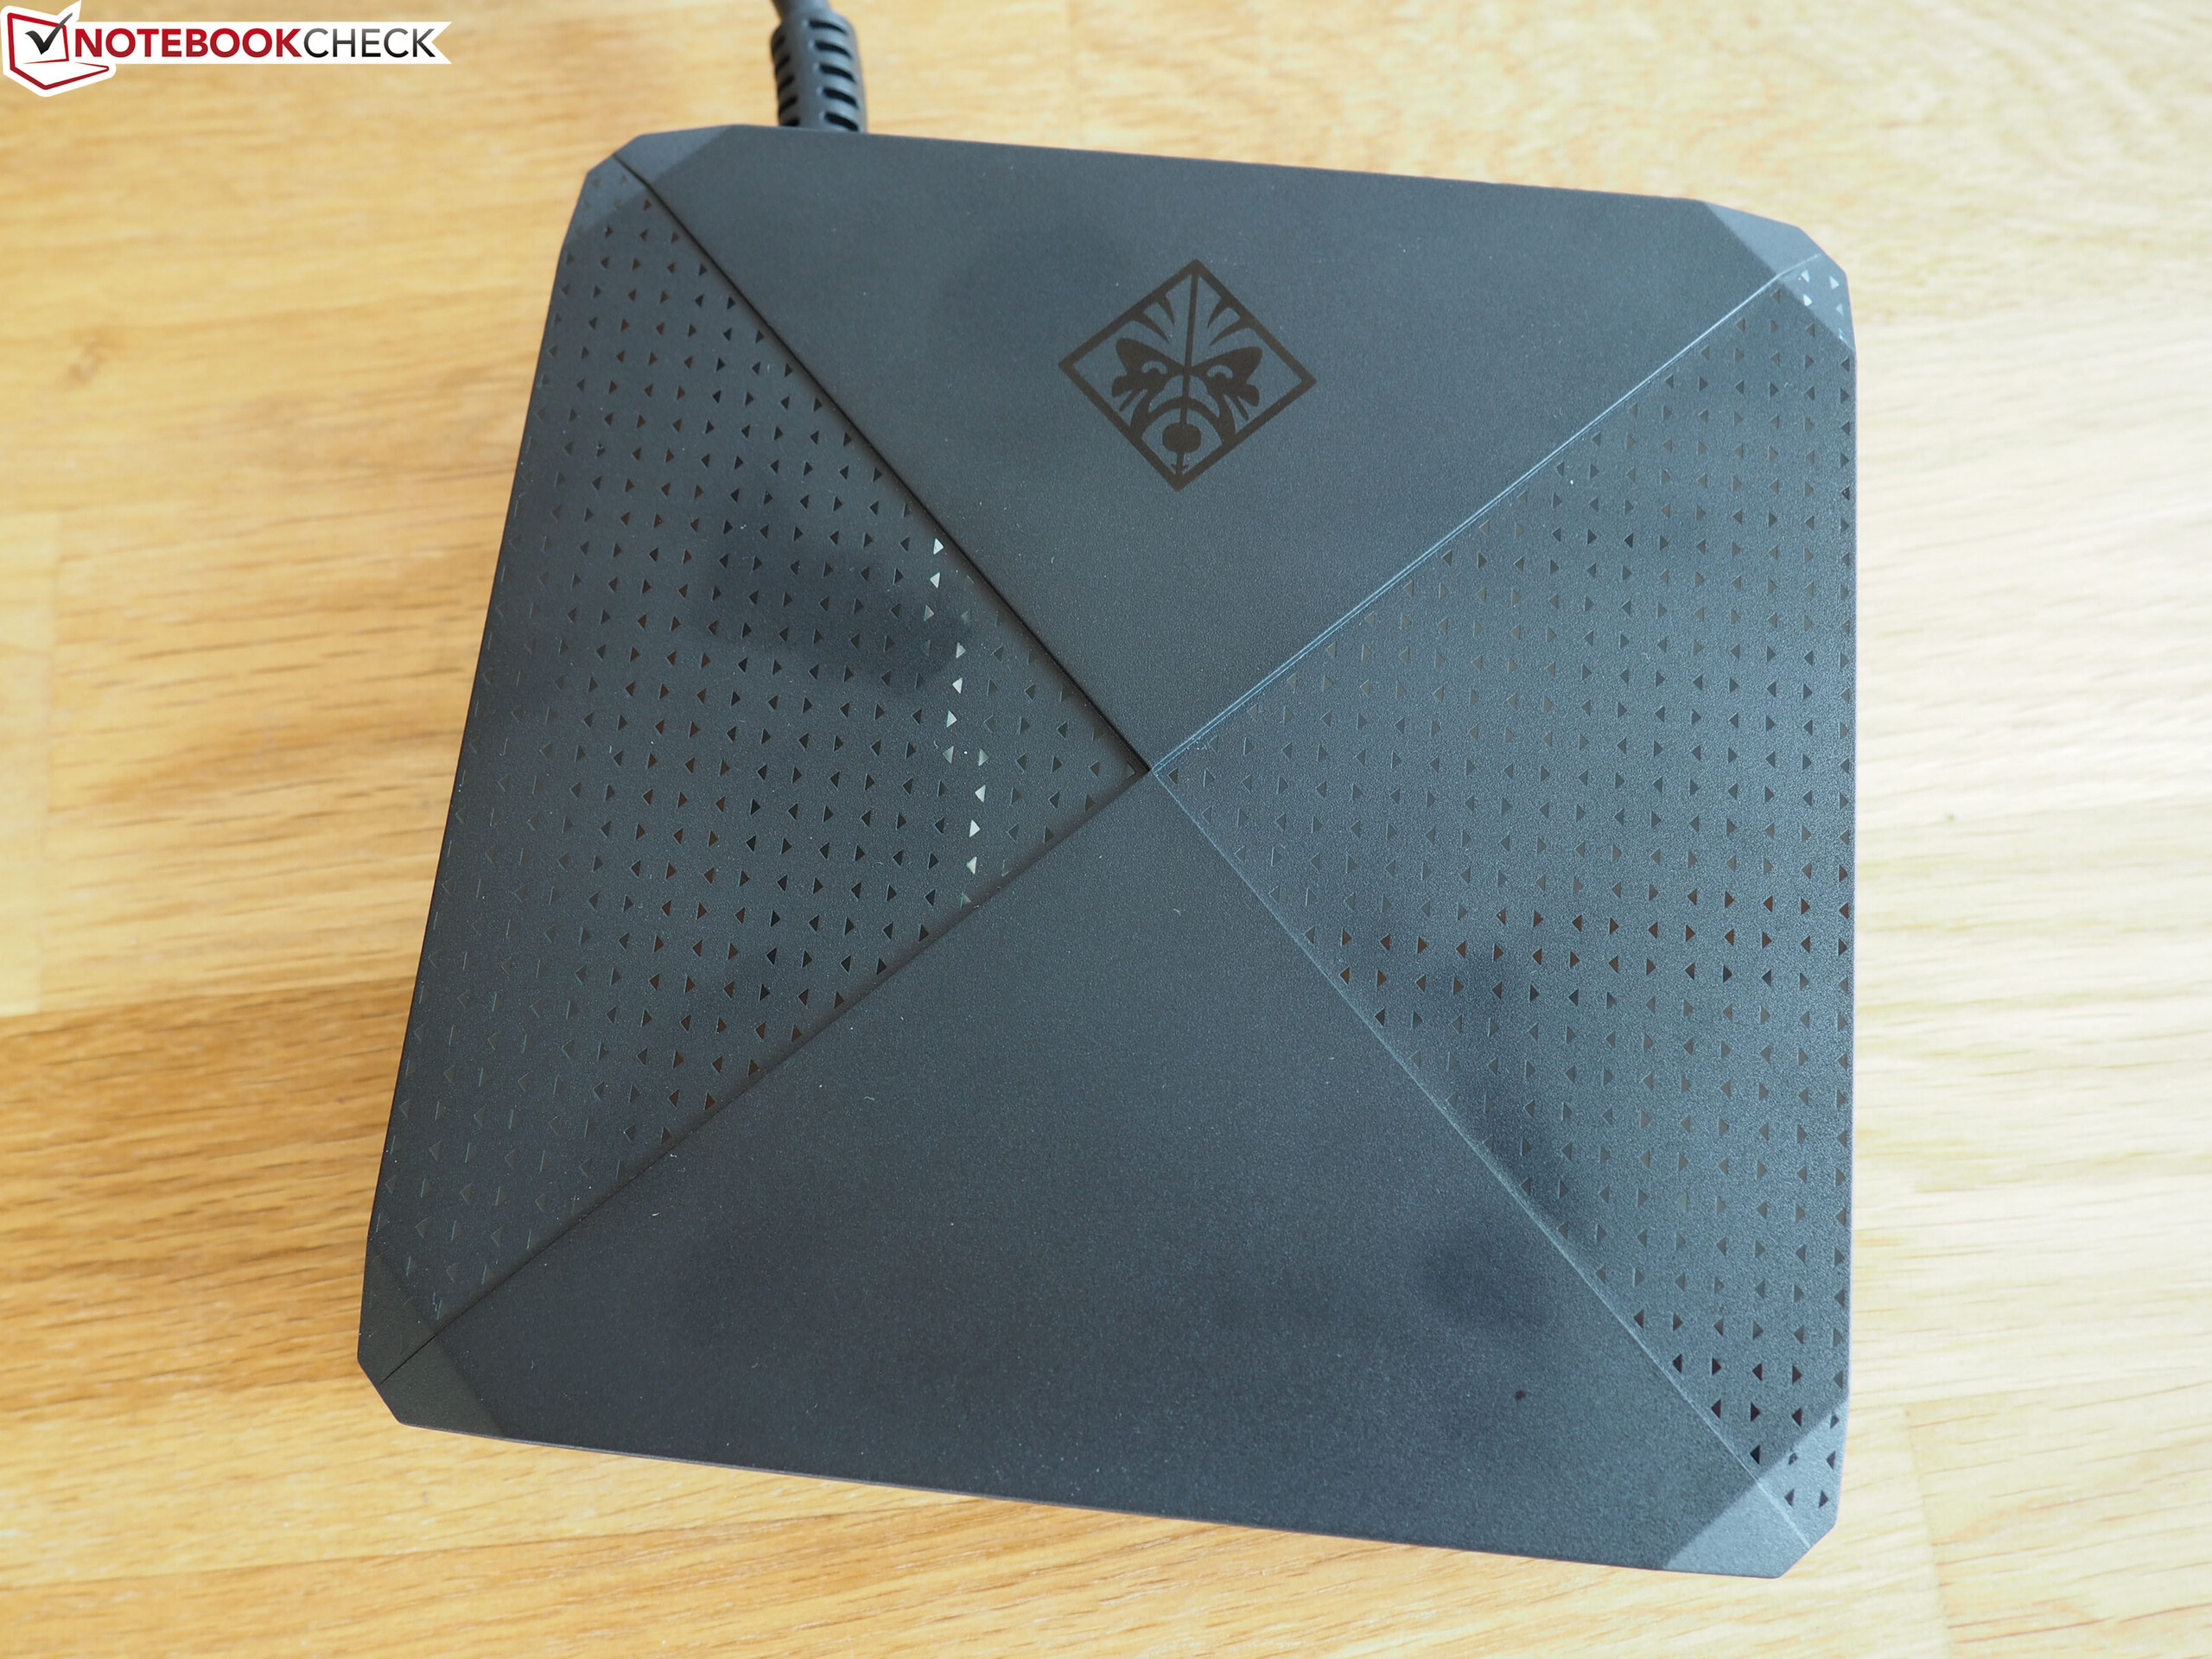
The AC adapter that comes with the RTX 2080 version of the Omen 17 has a rated output of 330 watts and has a rather unusual shape. It is around 15 x 15 x 4 cm (~5.9 x 5.9 x 1.6 in) large. All other 330-watt AC adapters that we have seen up until now were narrower, but usually significantly longer and thicker. The only other thing in the Omen 17's box is a small quick-start guide.
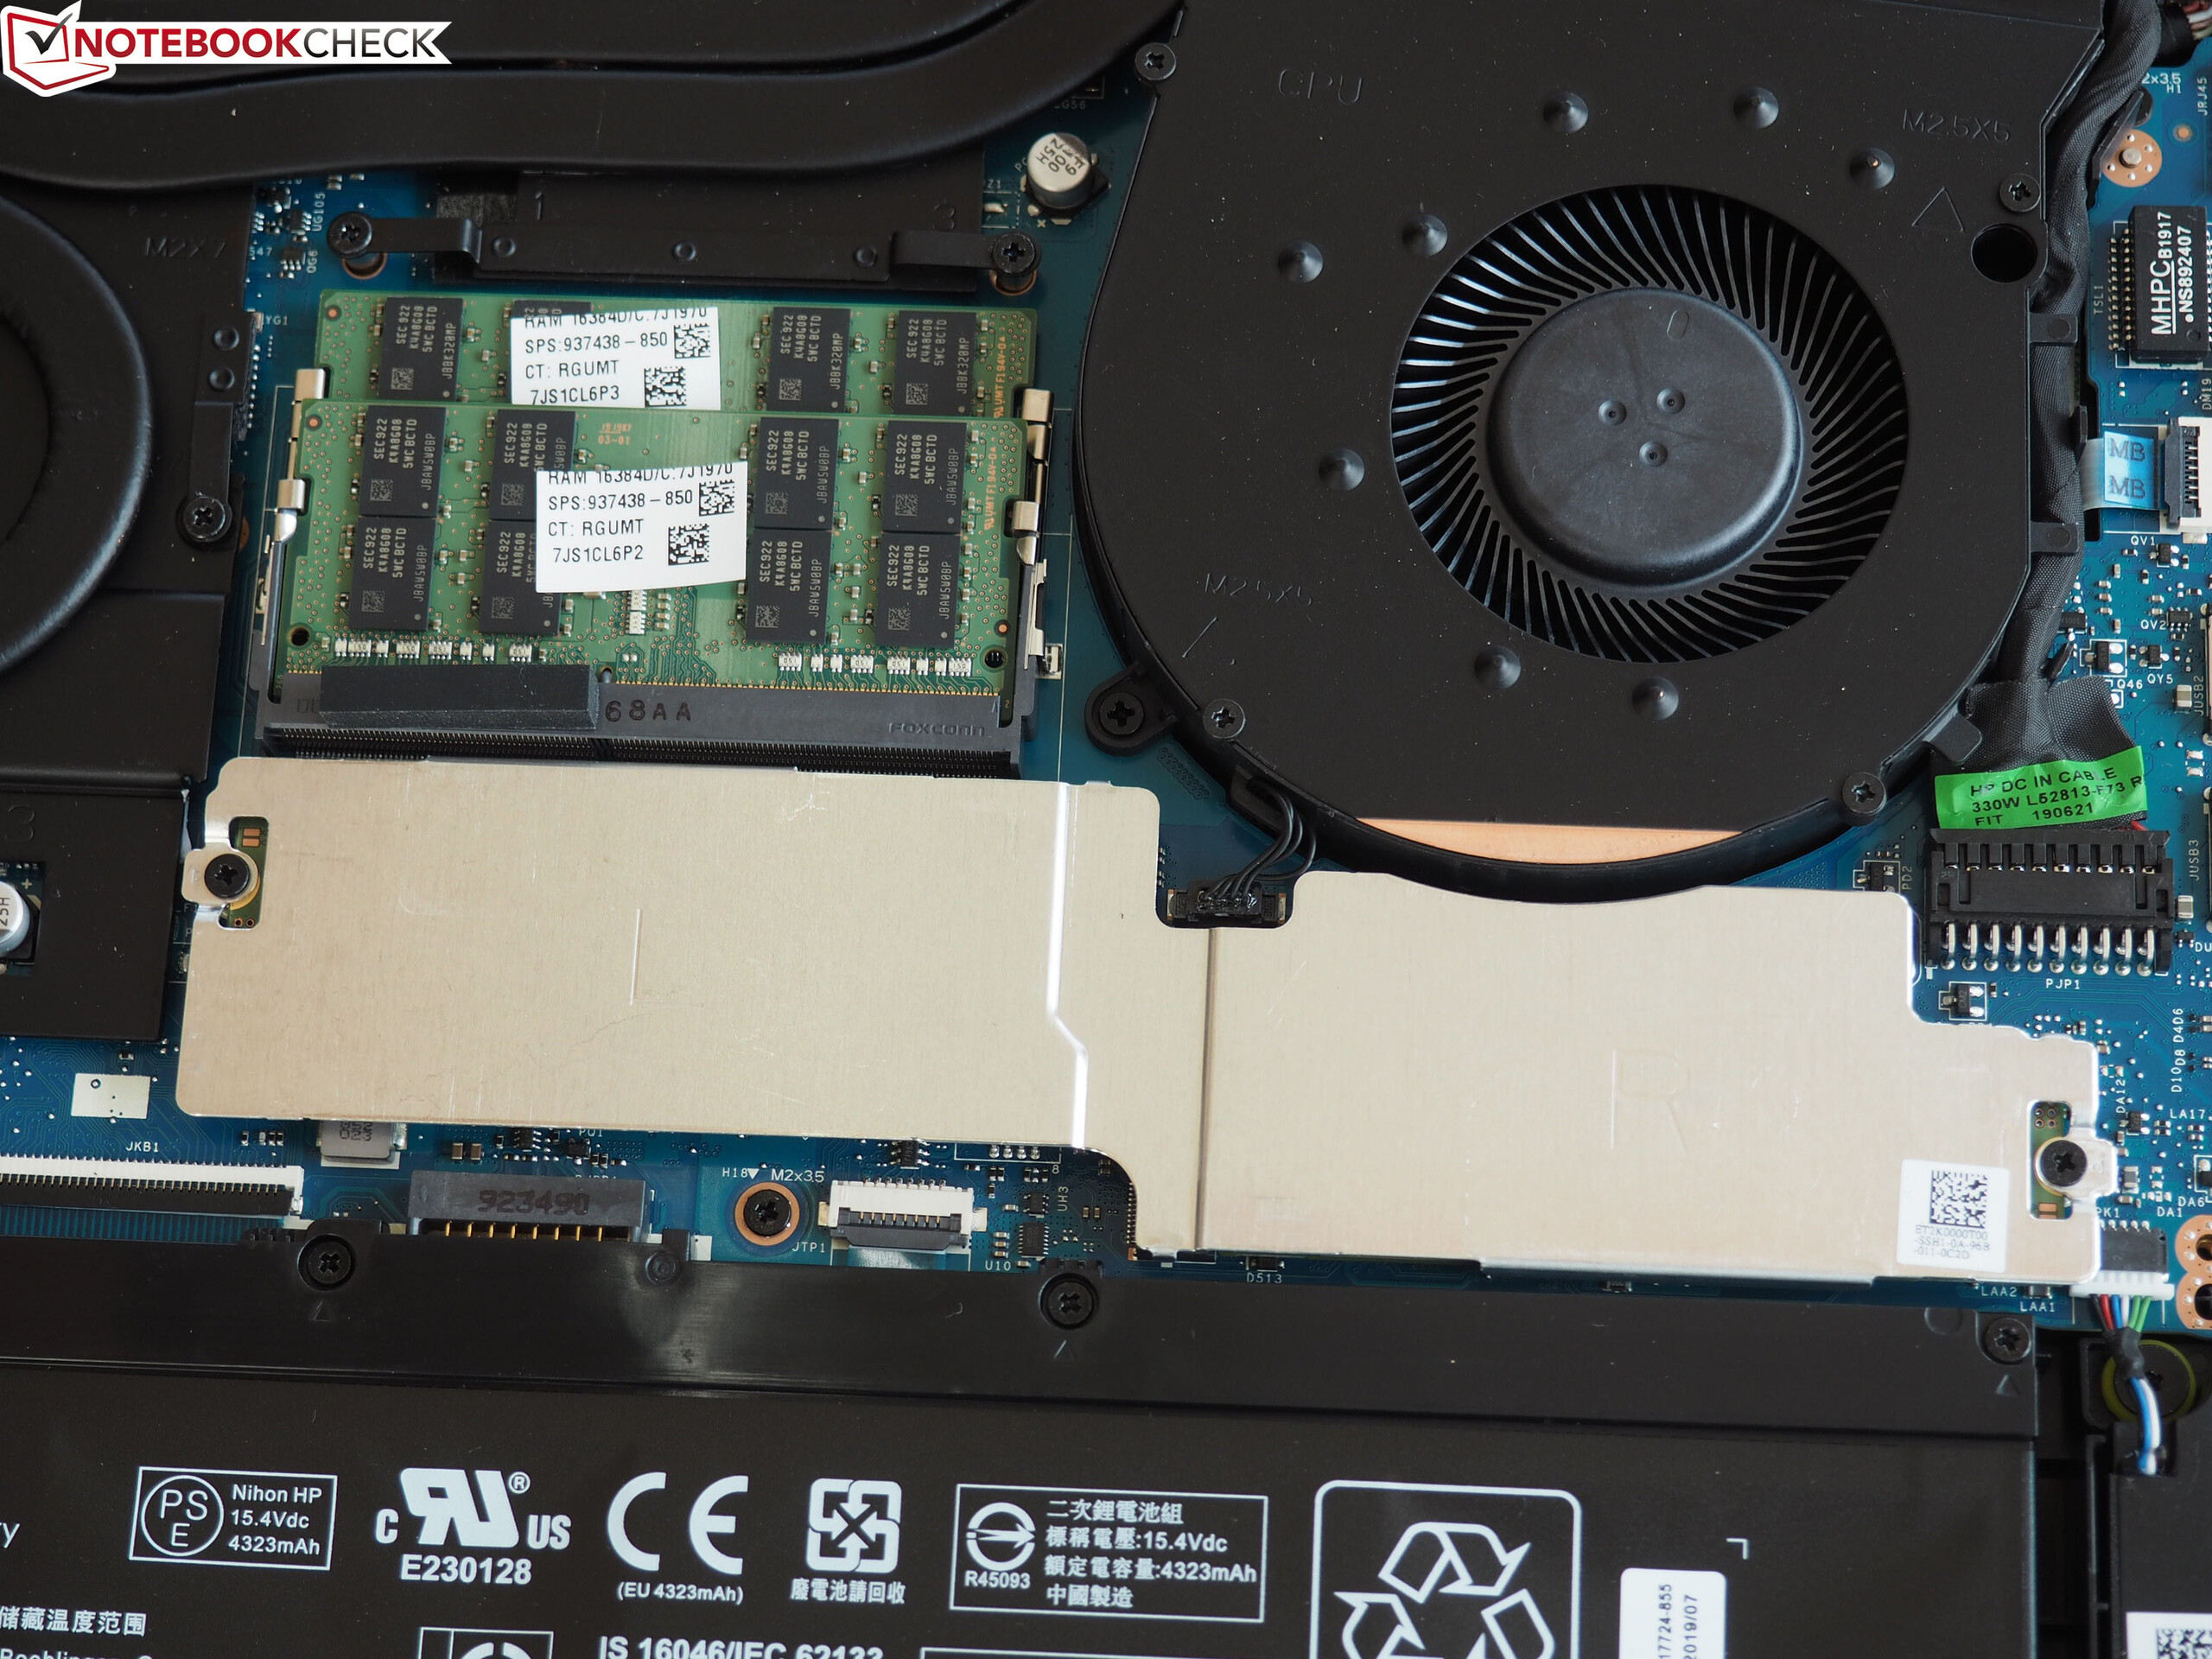
Maintenance
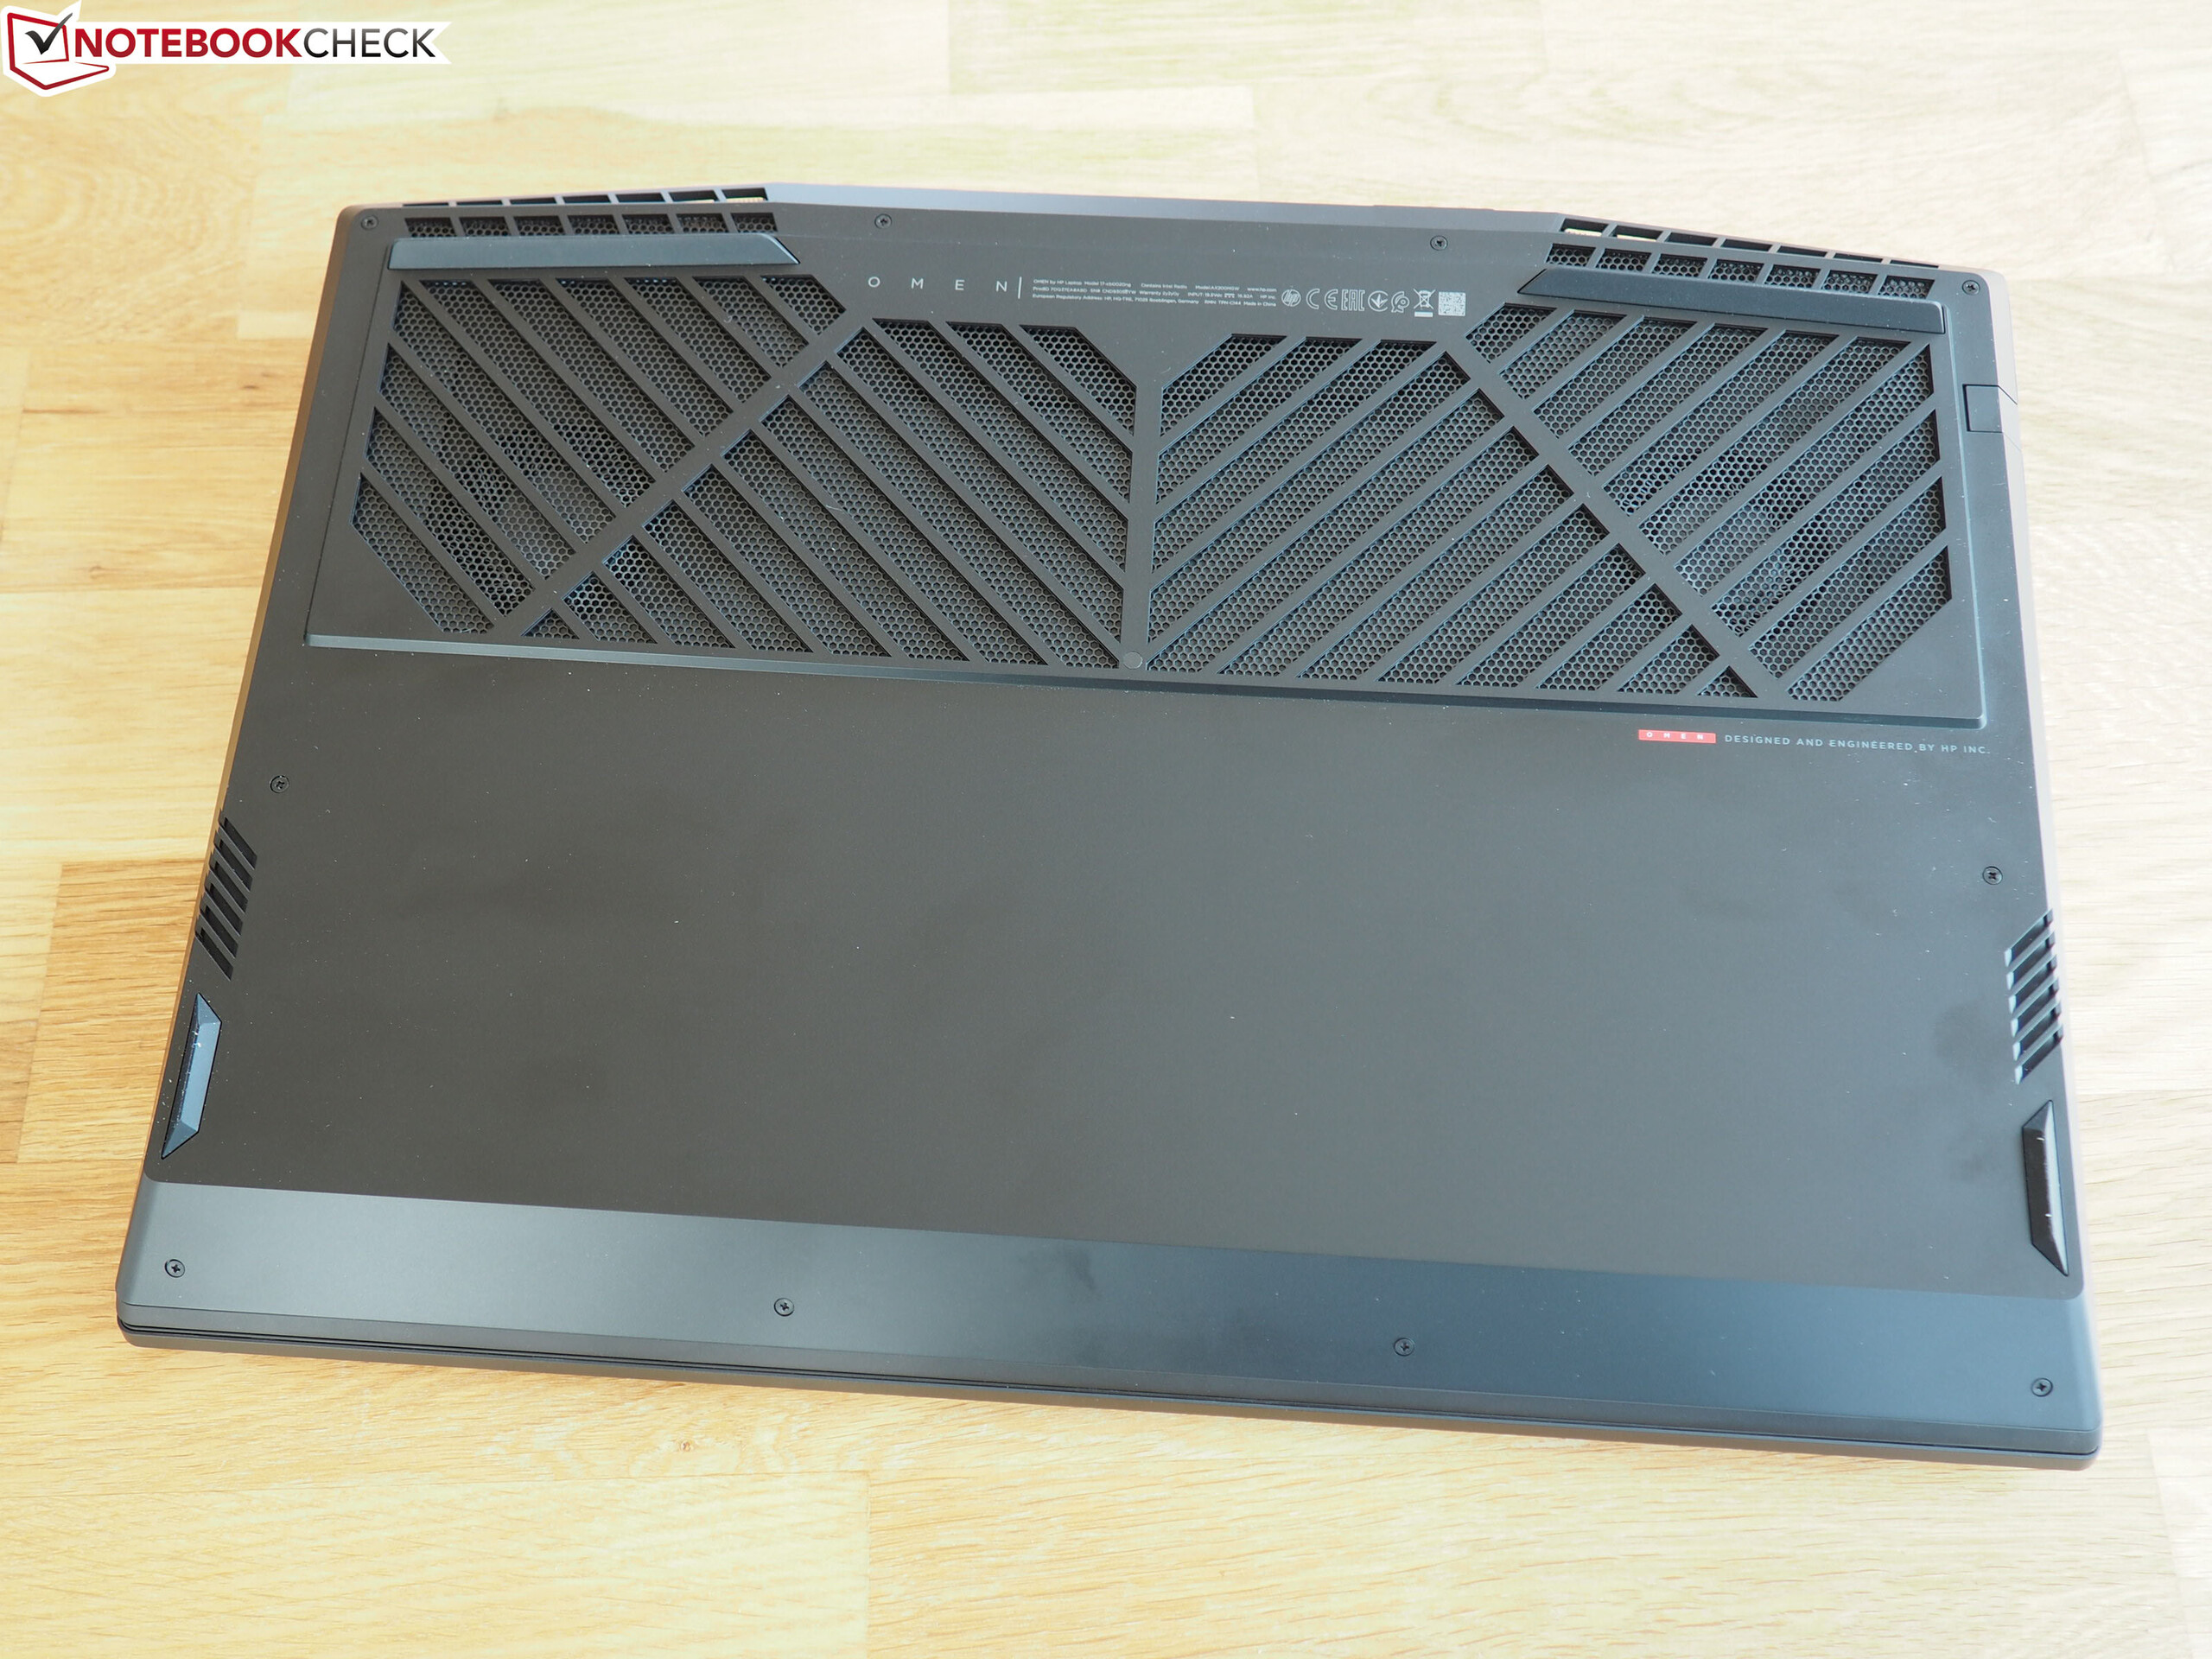
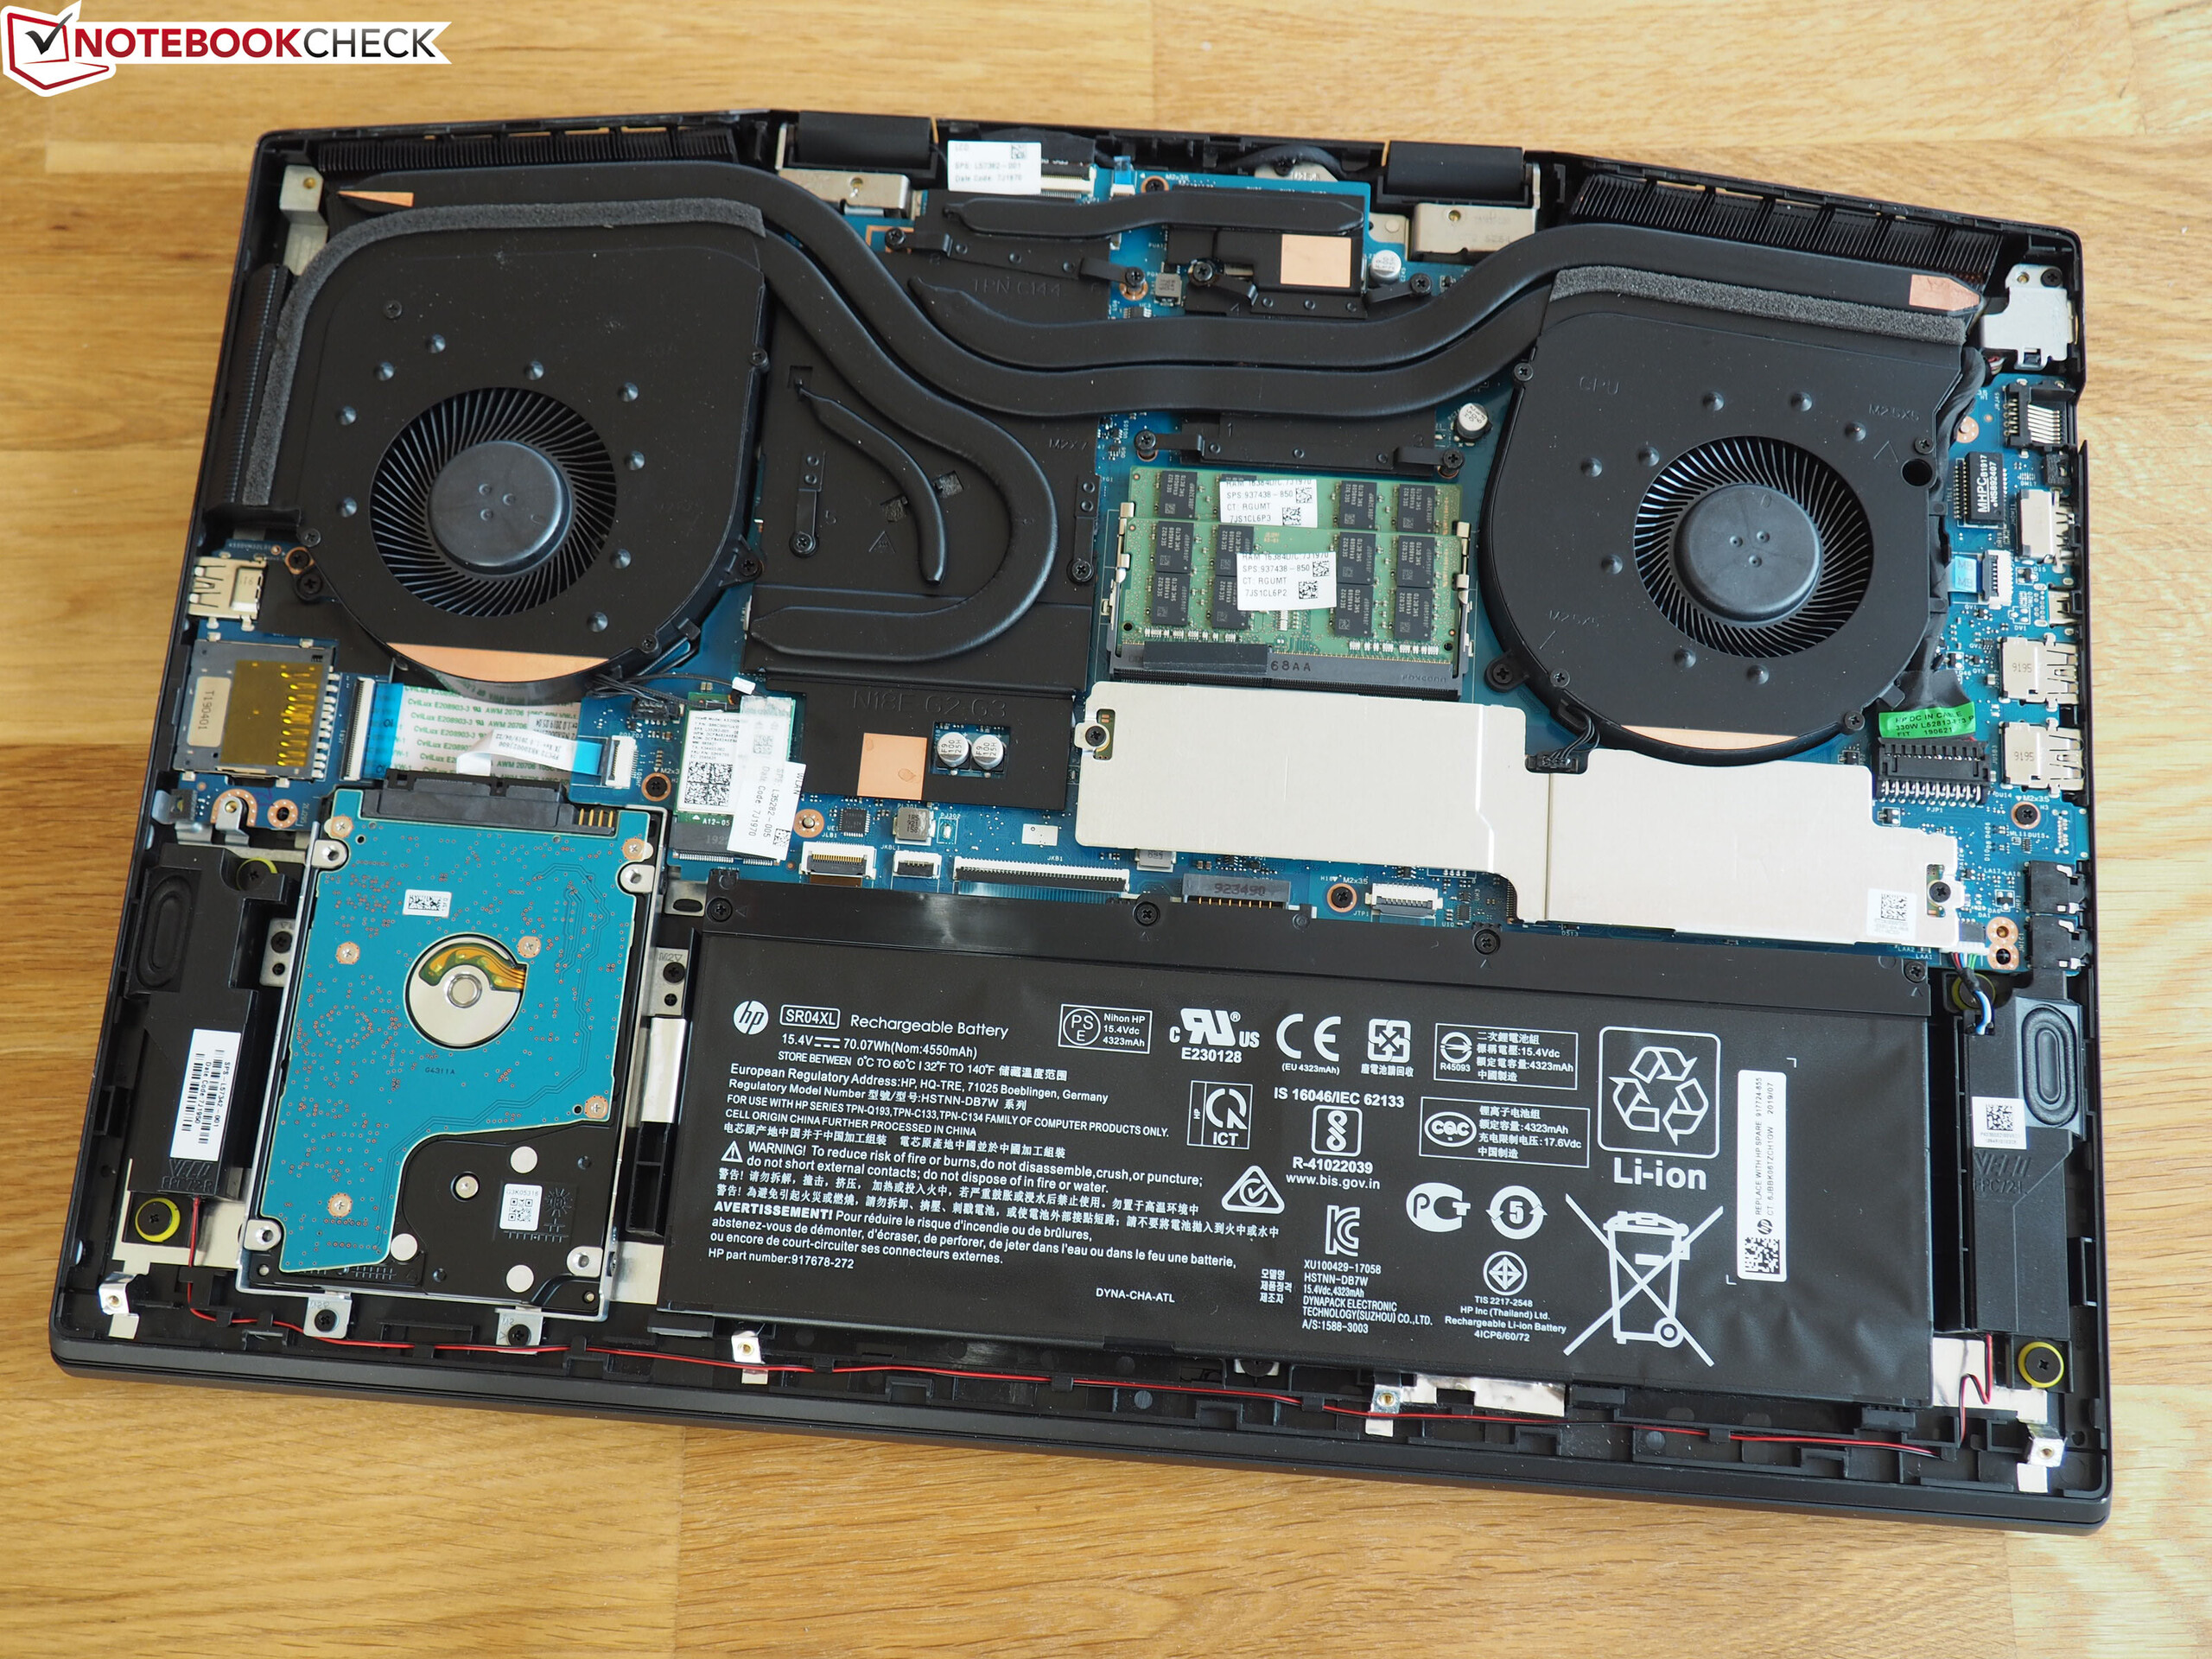
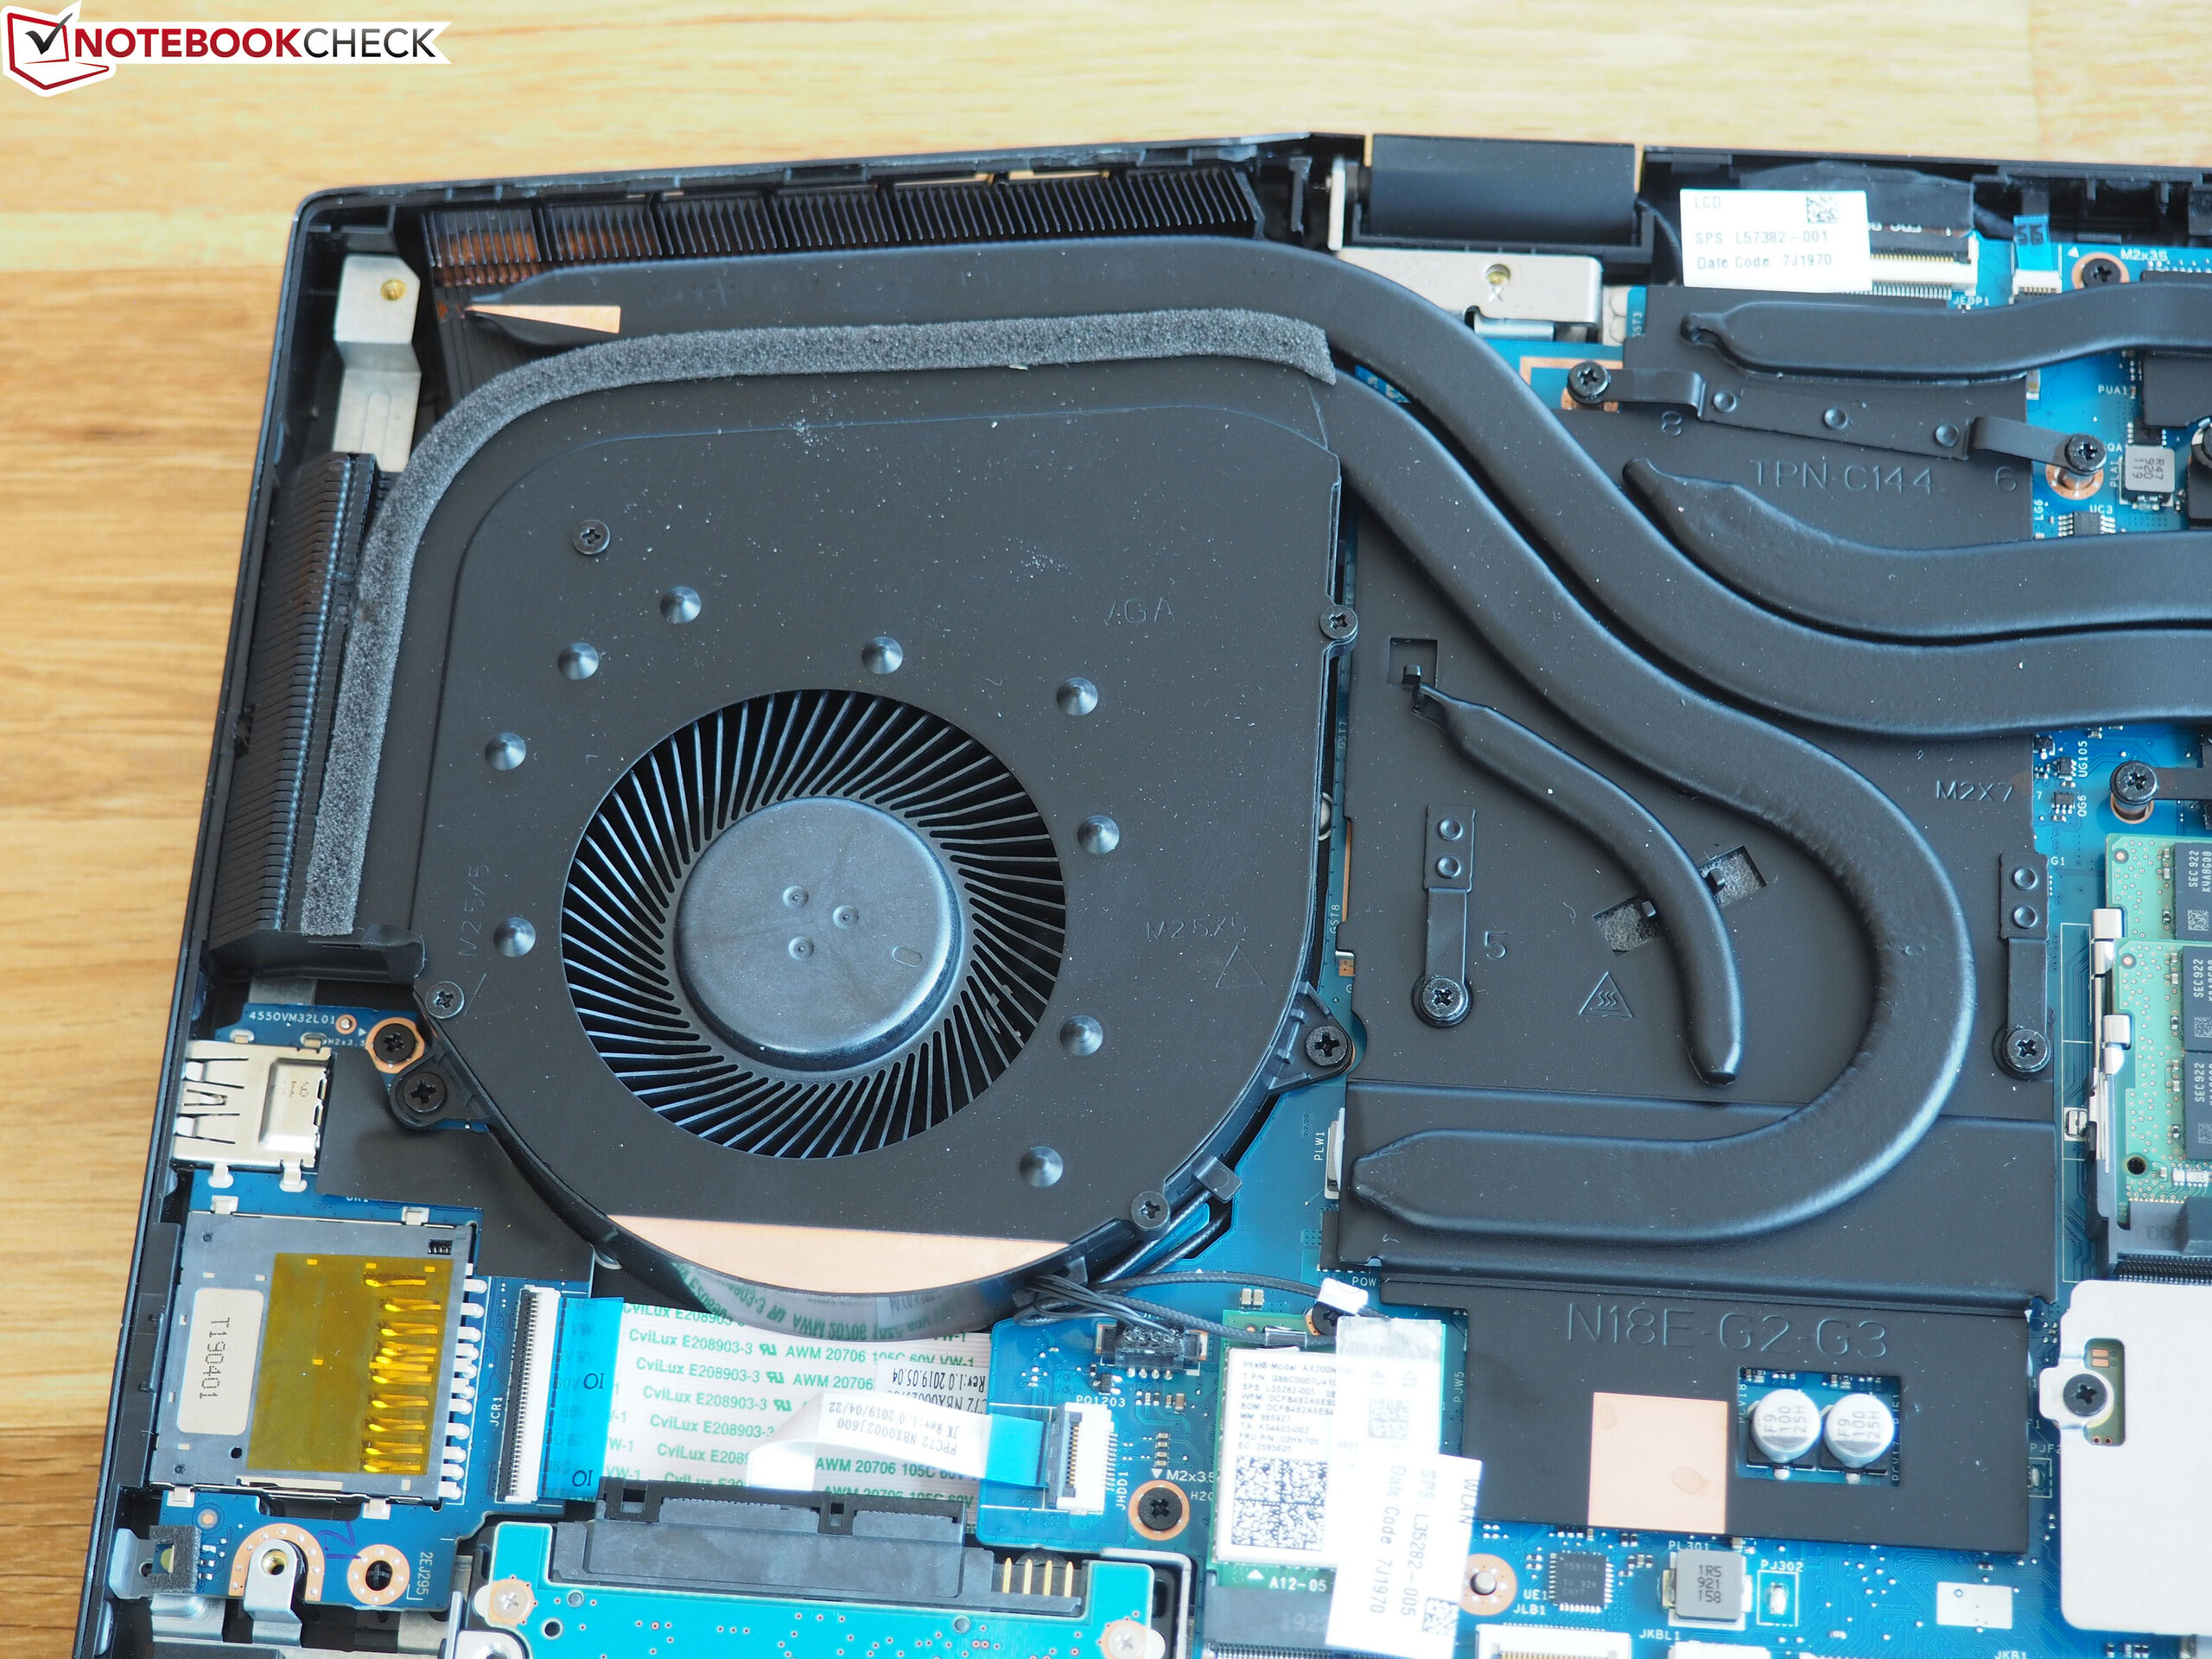
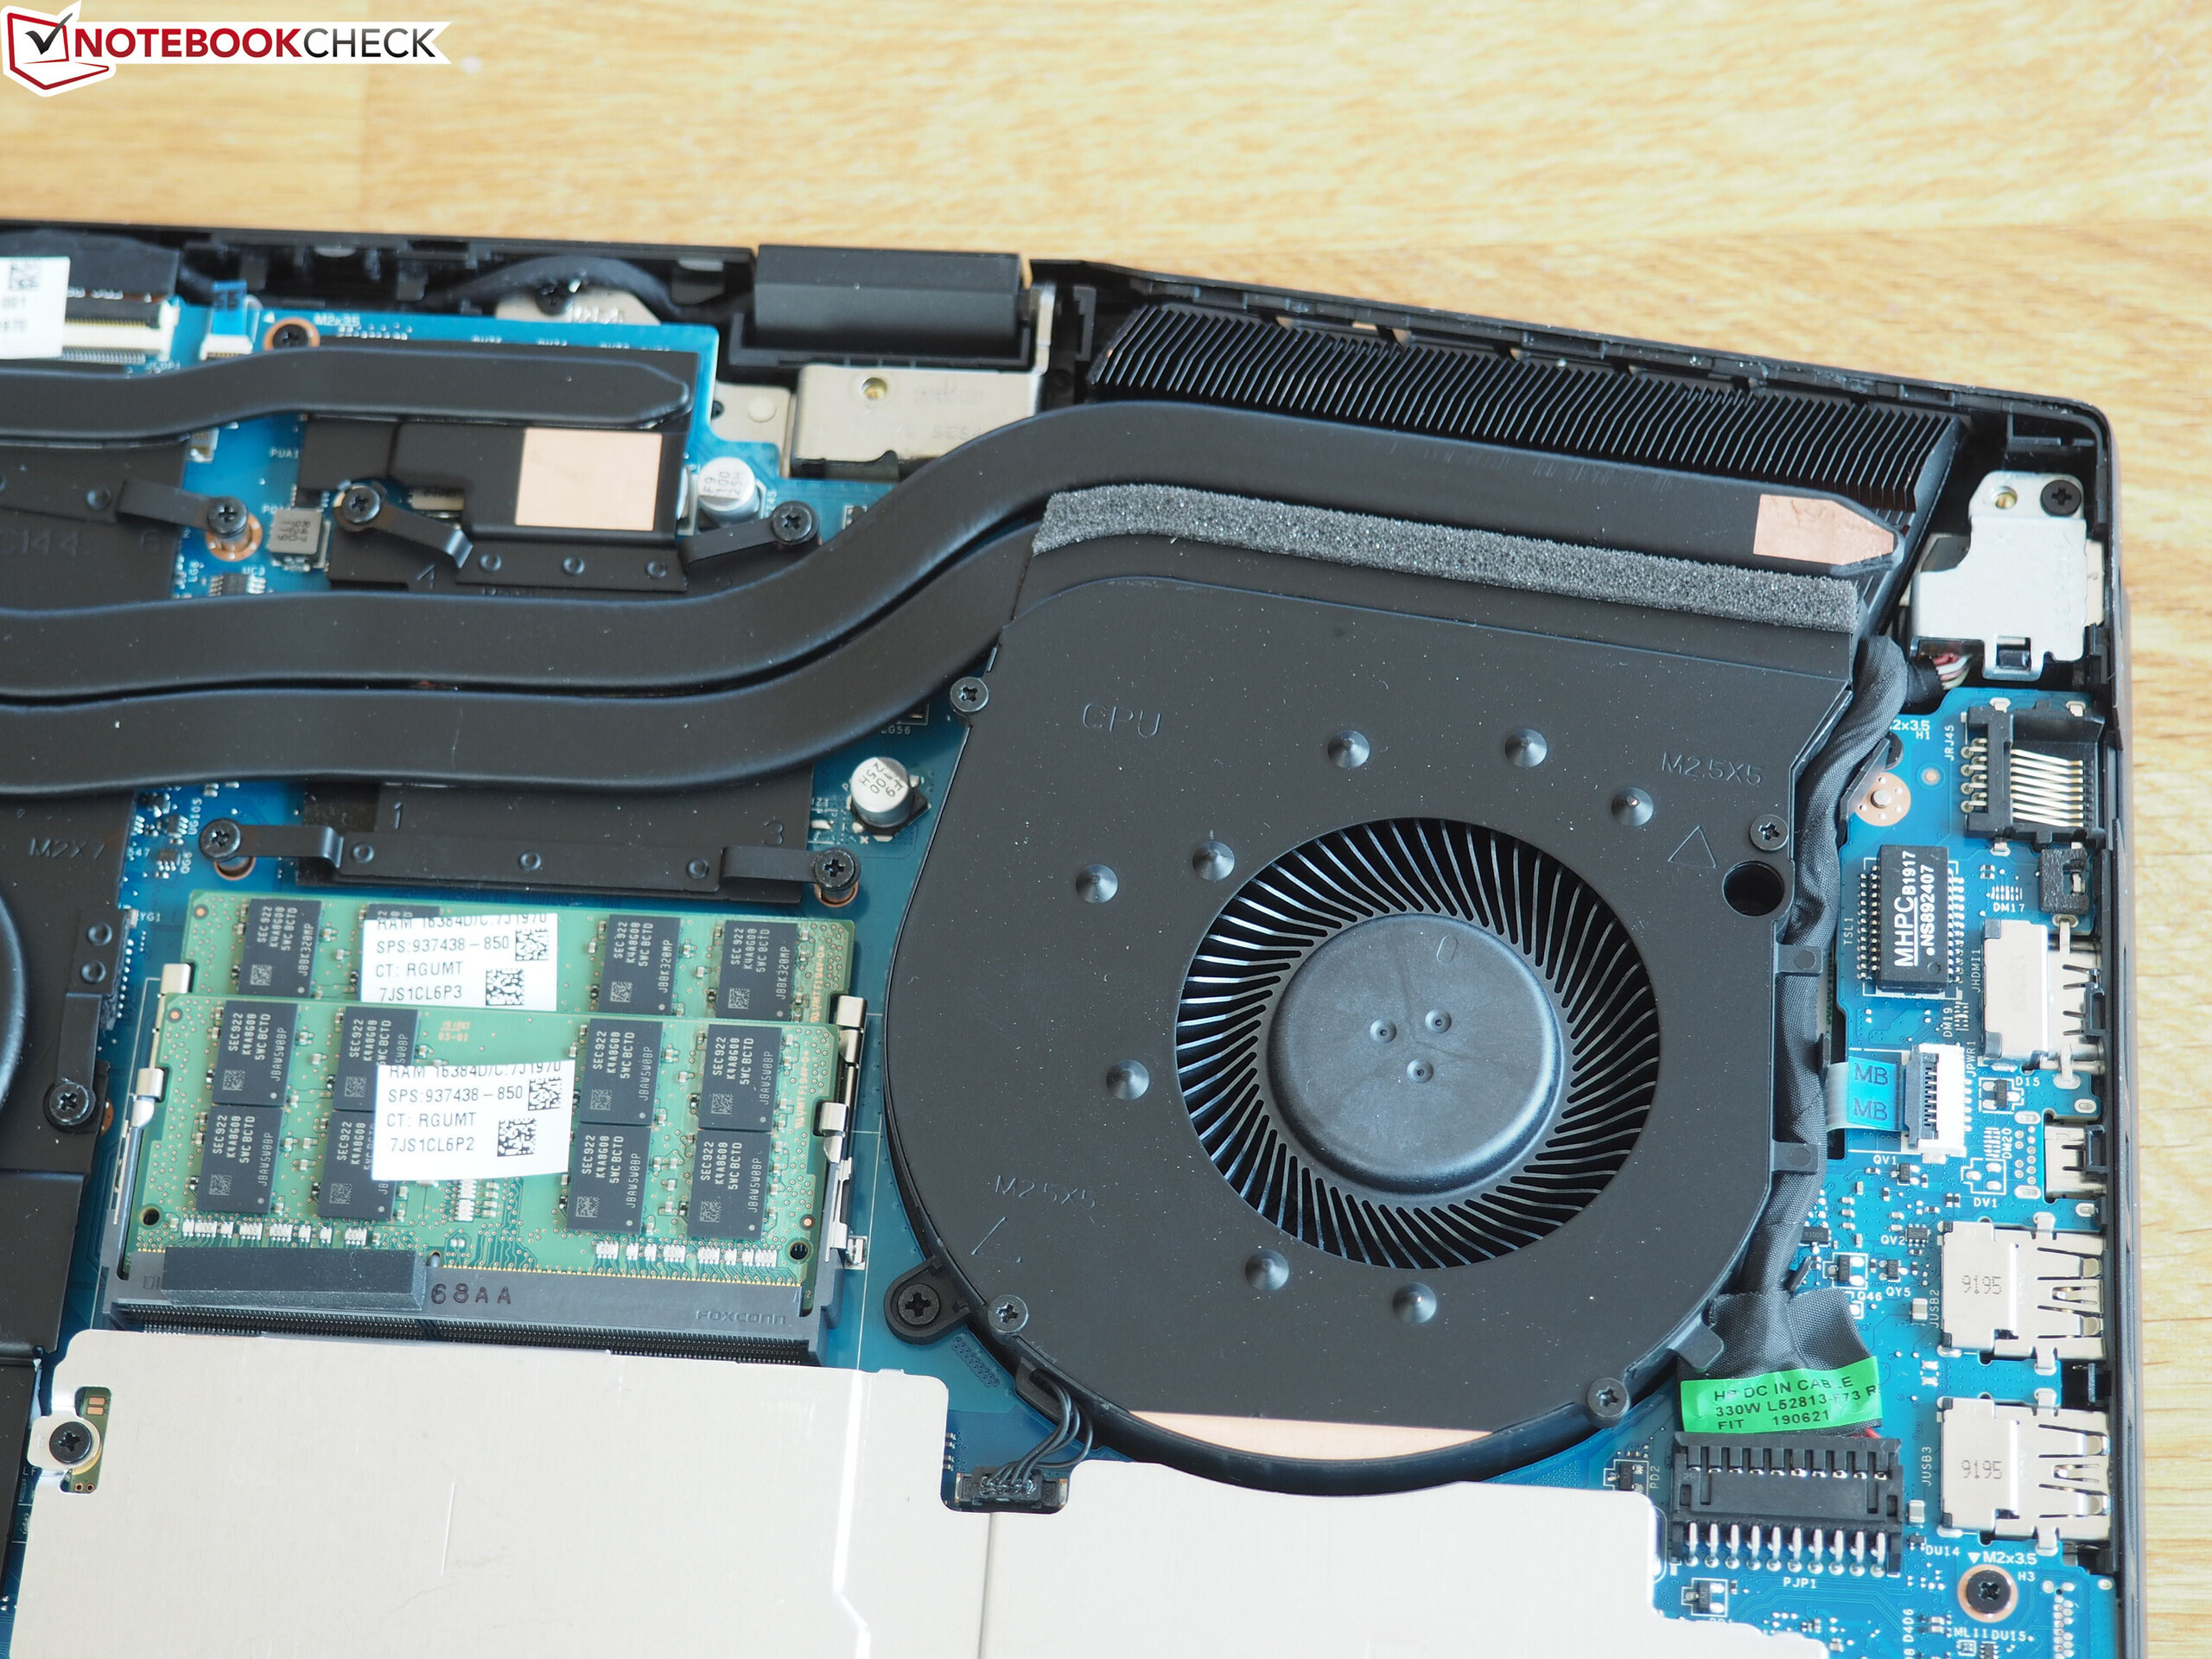
We are not quite sure what to think of maintenance on this 17-inch gamer. The good news is that you can access all components by removing the bottom cover (see photos). The bad news is that the bottom cover is rather difficult to remove in the first place. Users will need a fine spatula, which might discourage some less experienced laptop owners. Removing the 10 Philipps screws was no issue.

Warranty
Like most gaming laptops, the HP Omen 17 comes with a two-year warranty.
Input Devices
Keyboard
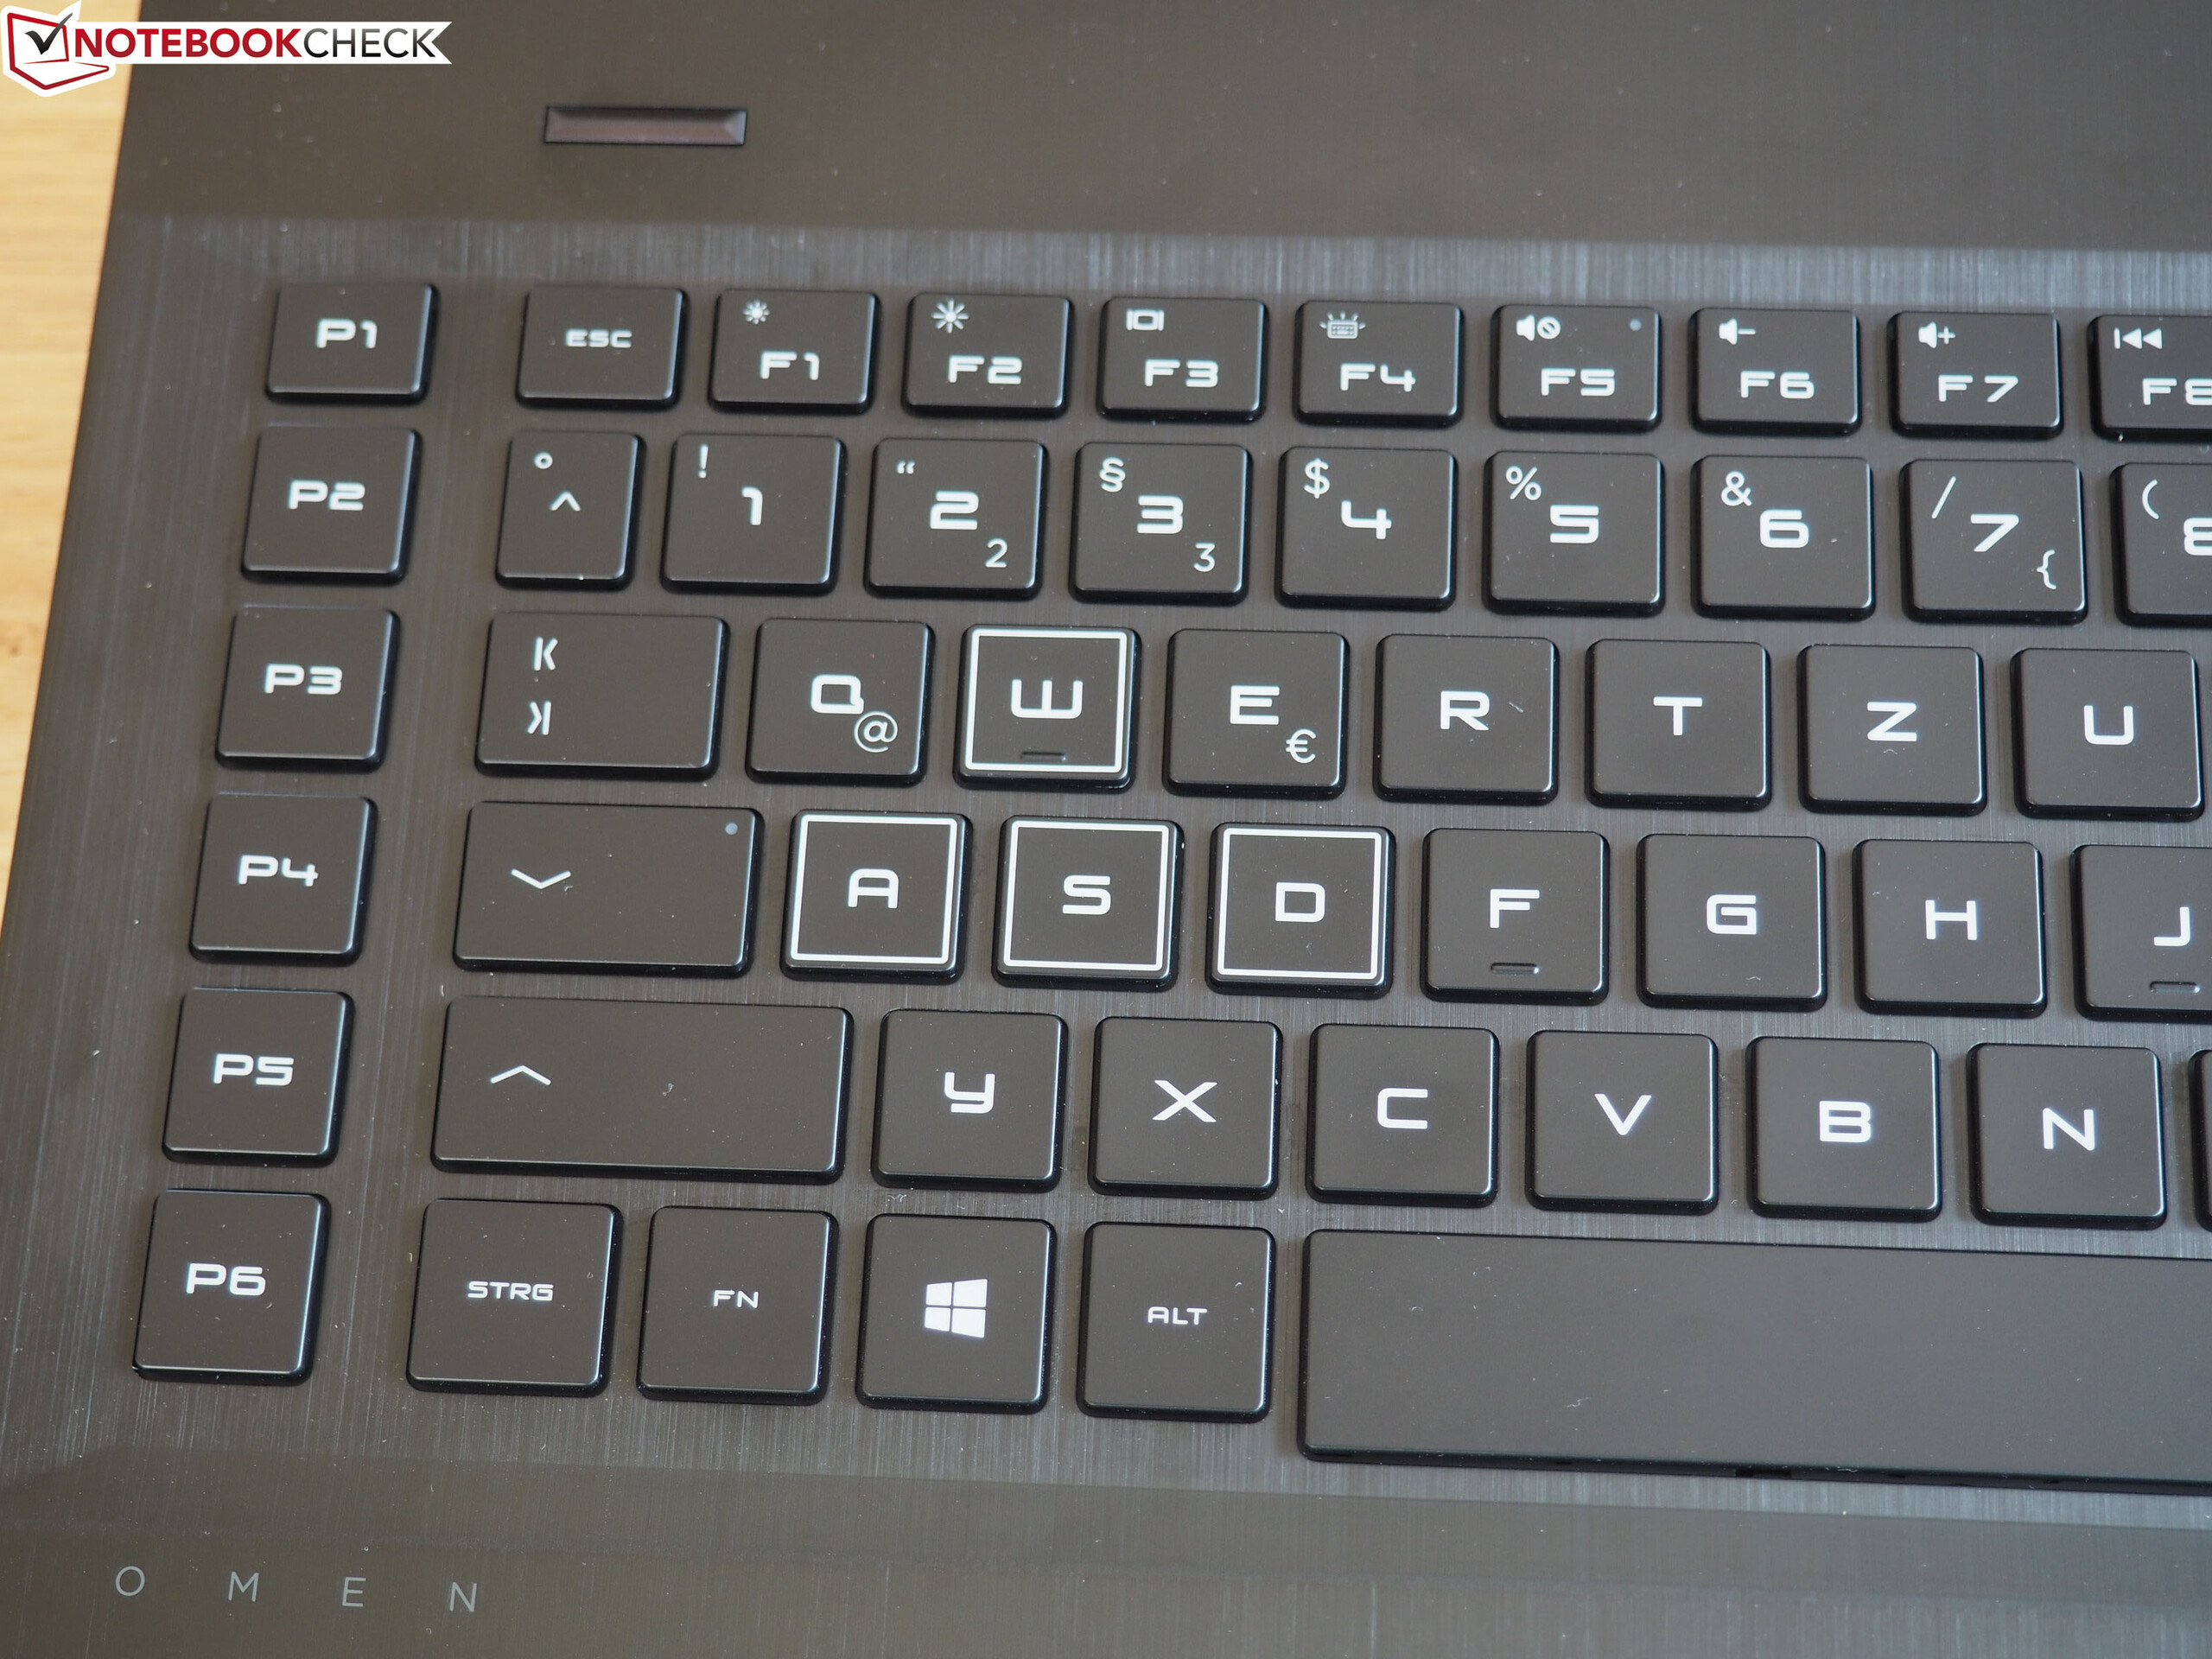
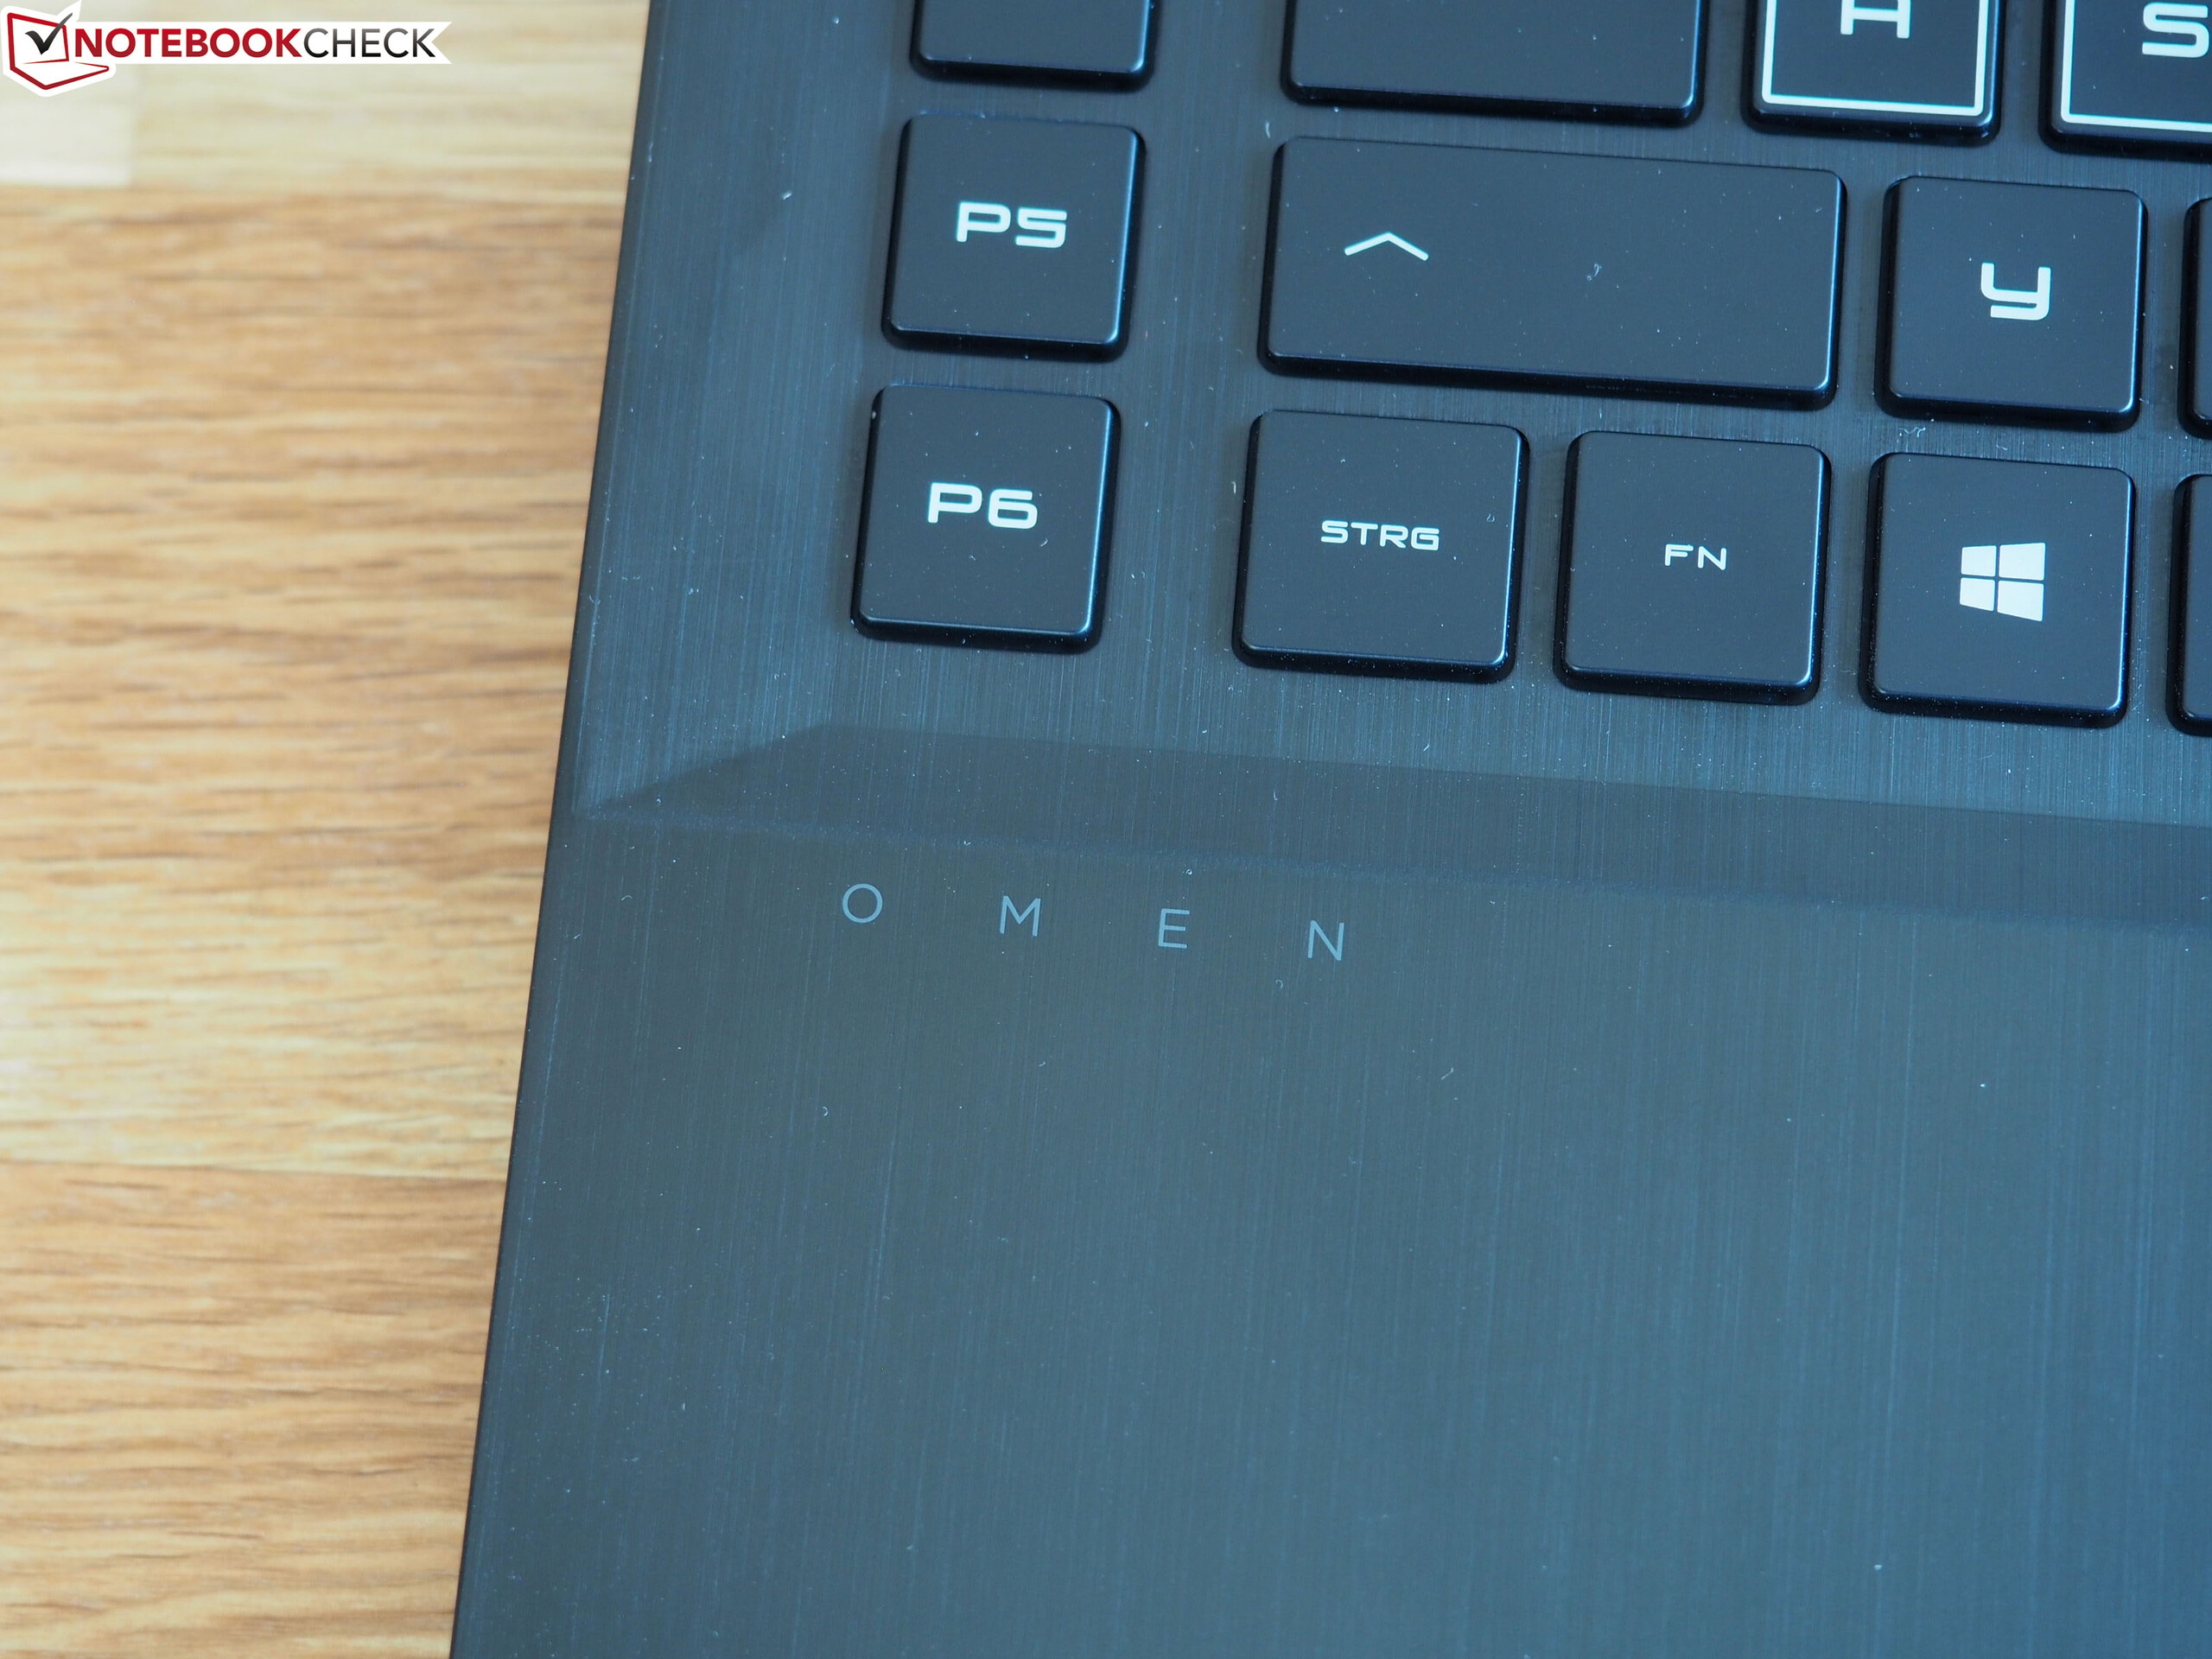
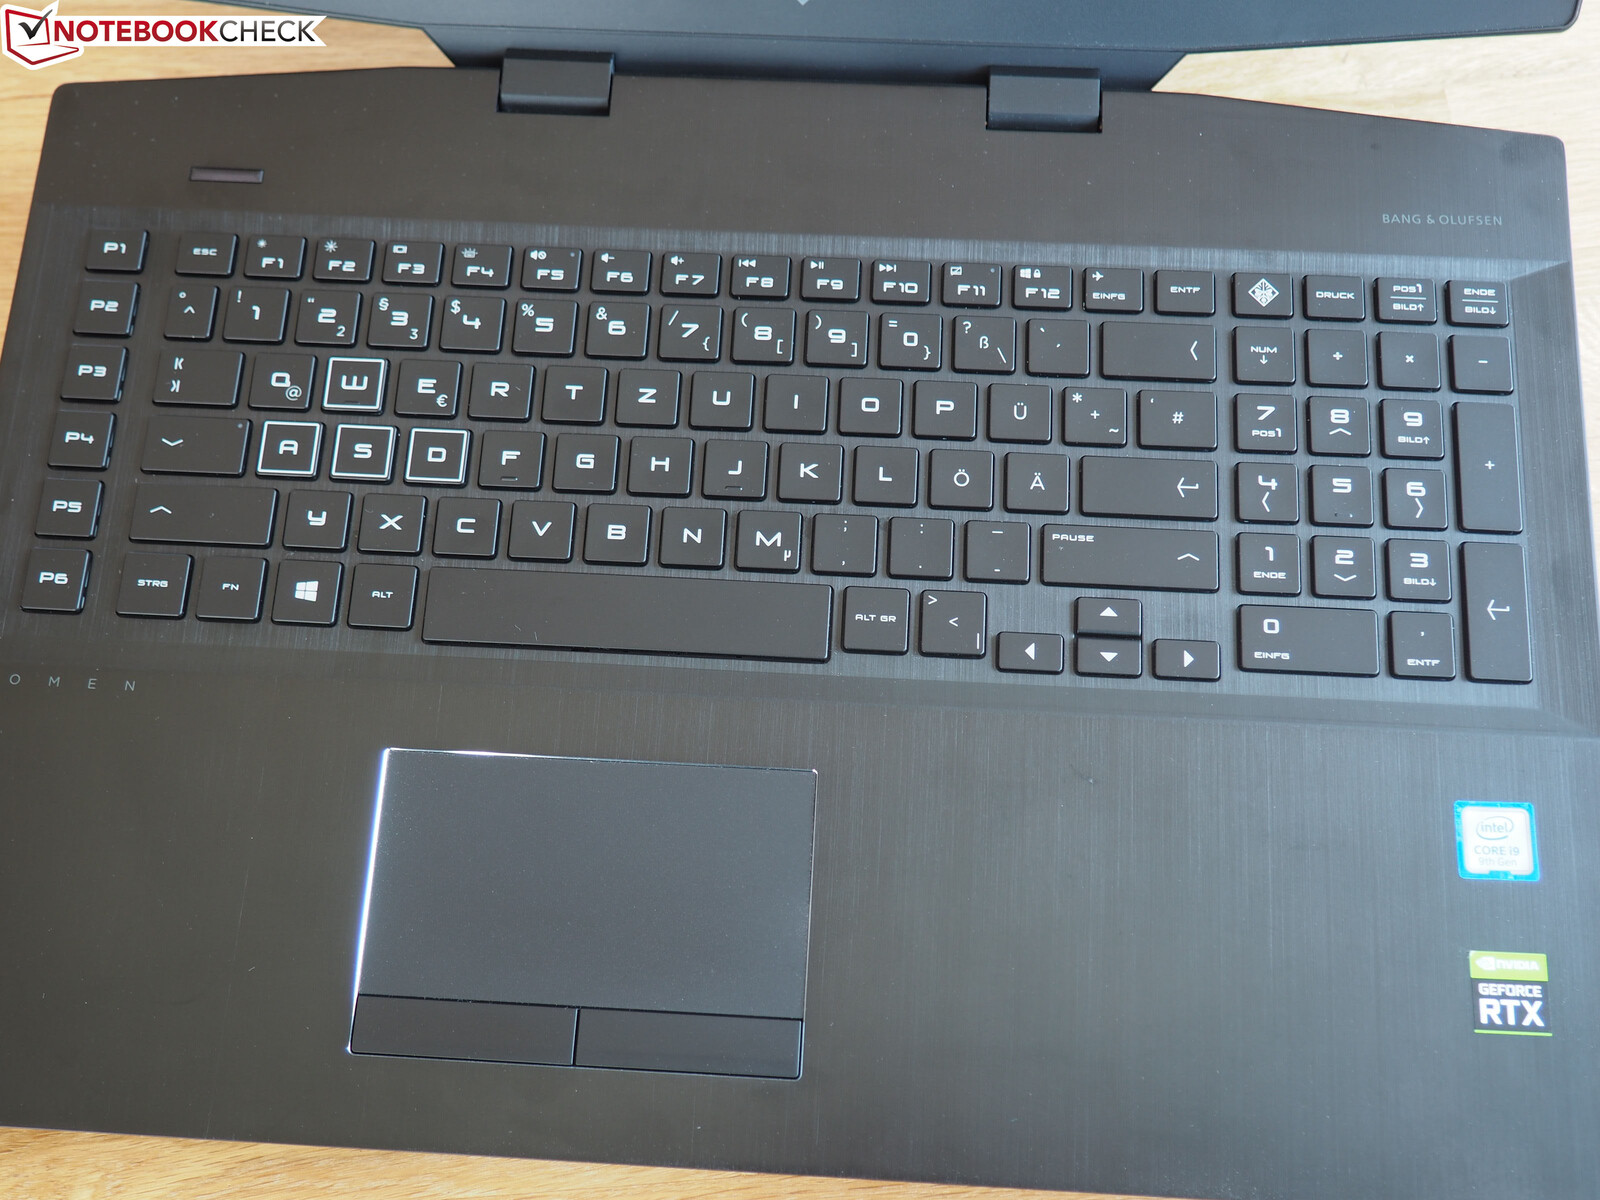
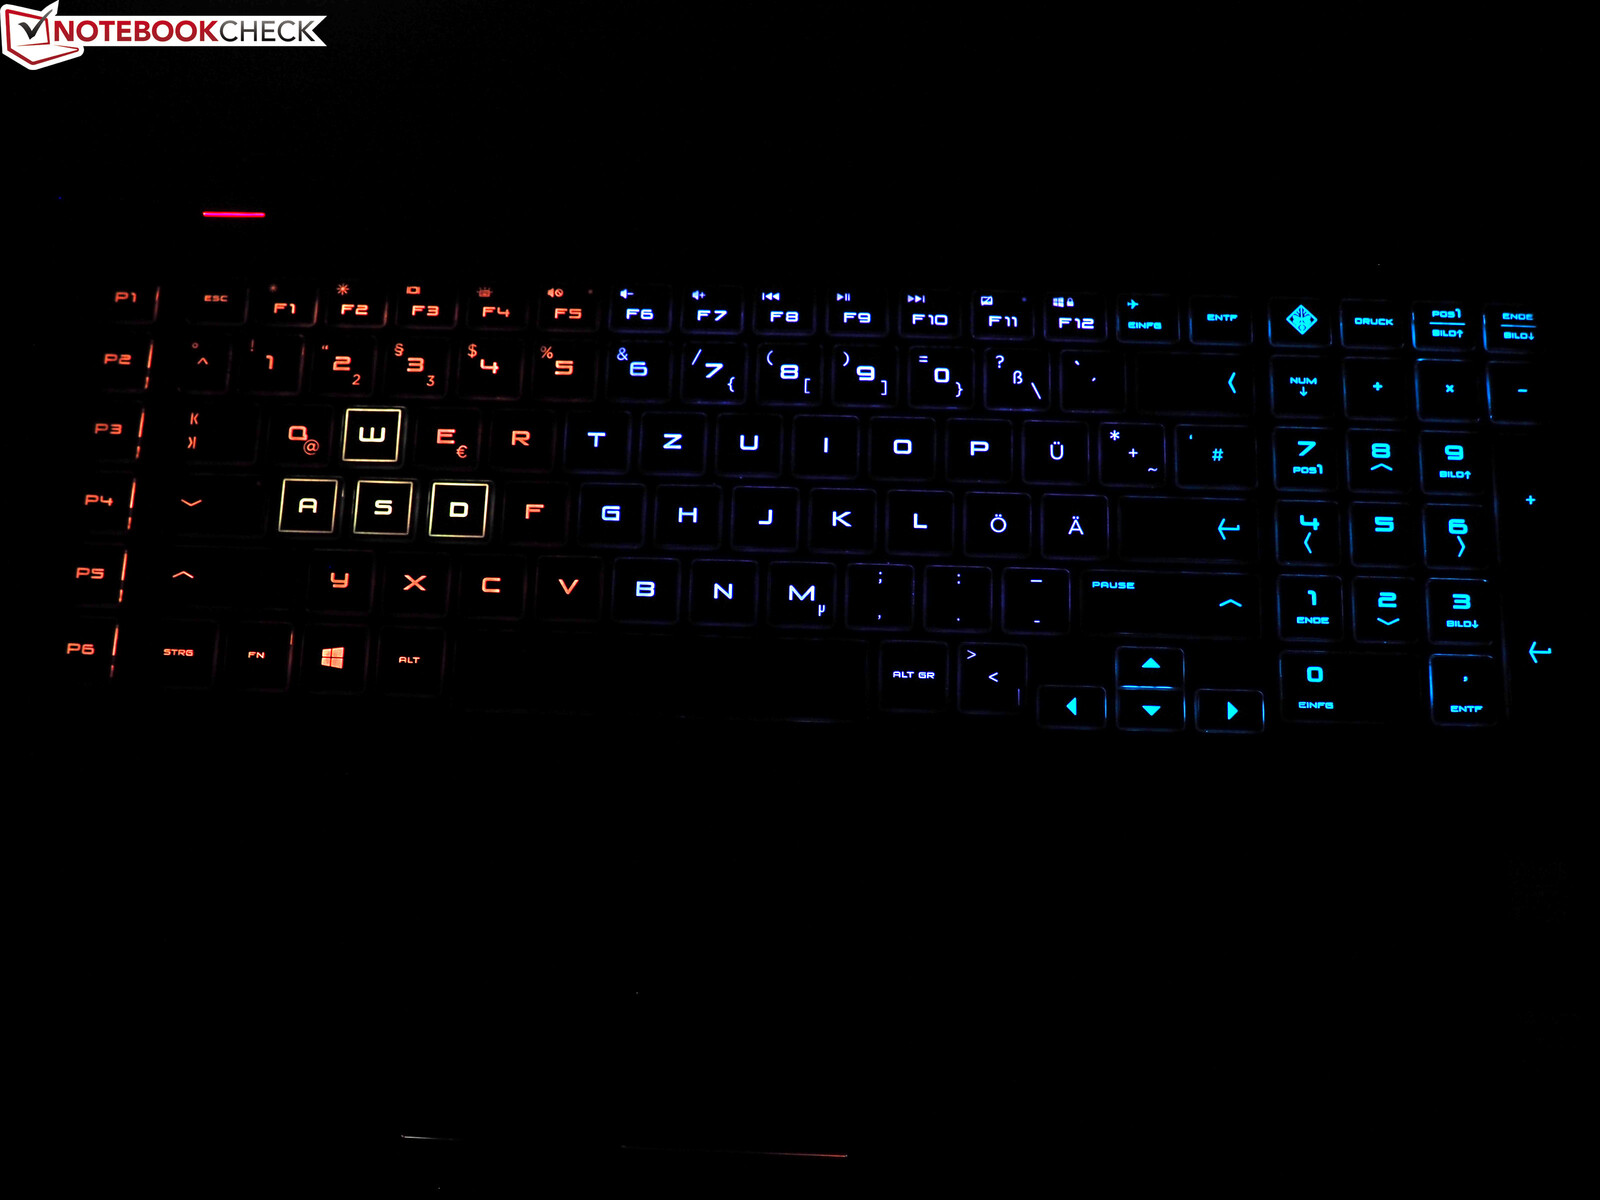
The input devices do a good job, although we are not completely satisfied with them. HP has decided to go with a chiclet keyboard with 4-zone backlighting (which is rather weak, unfortunately). The WASD area is considered an individual zone. These keys are already set-off from the area around them by having a white border.
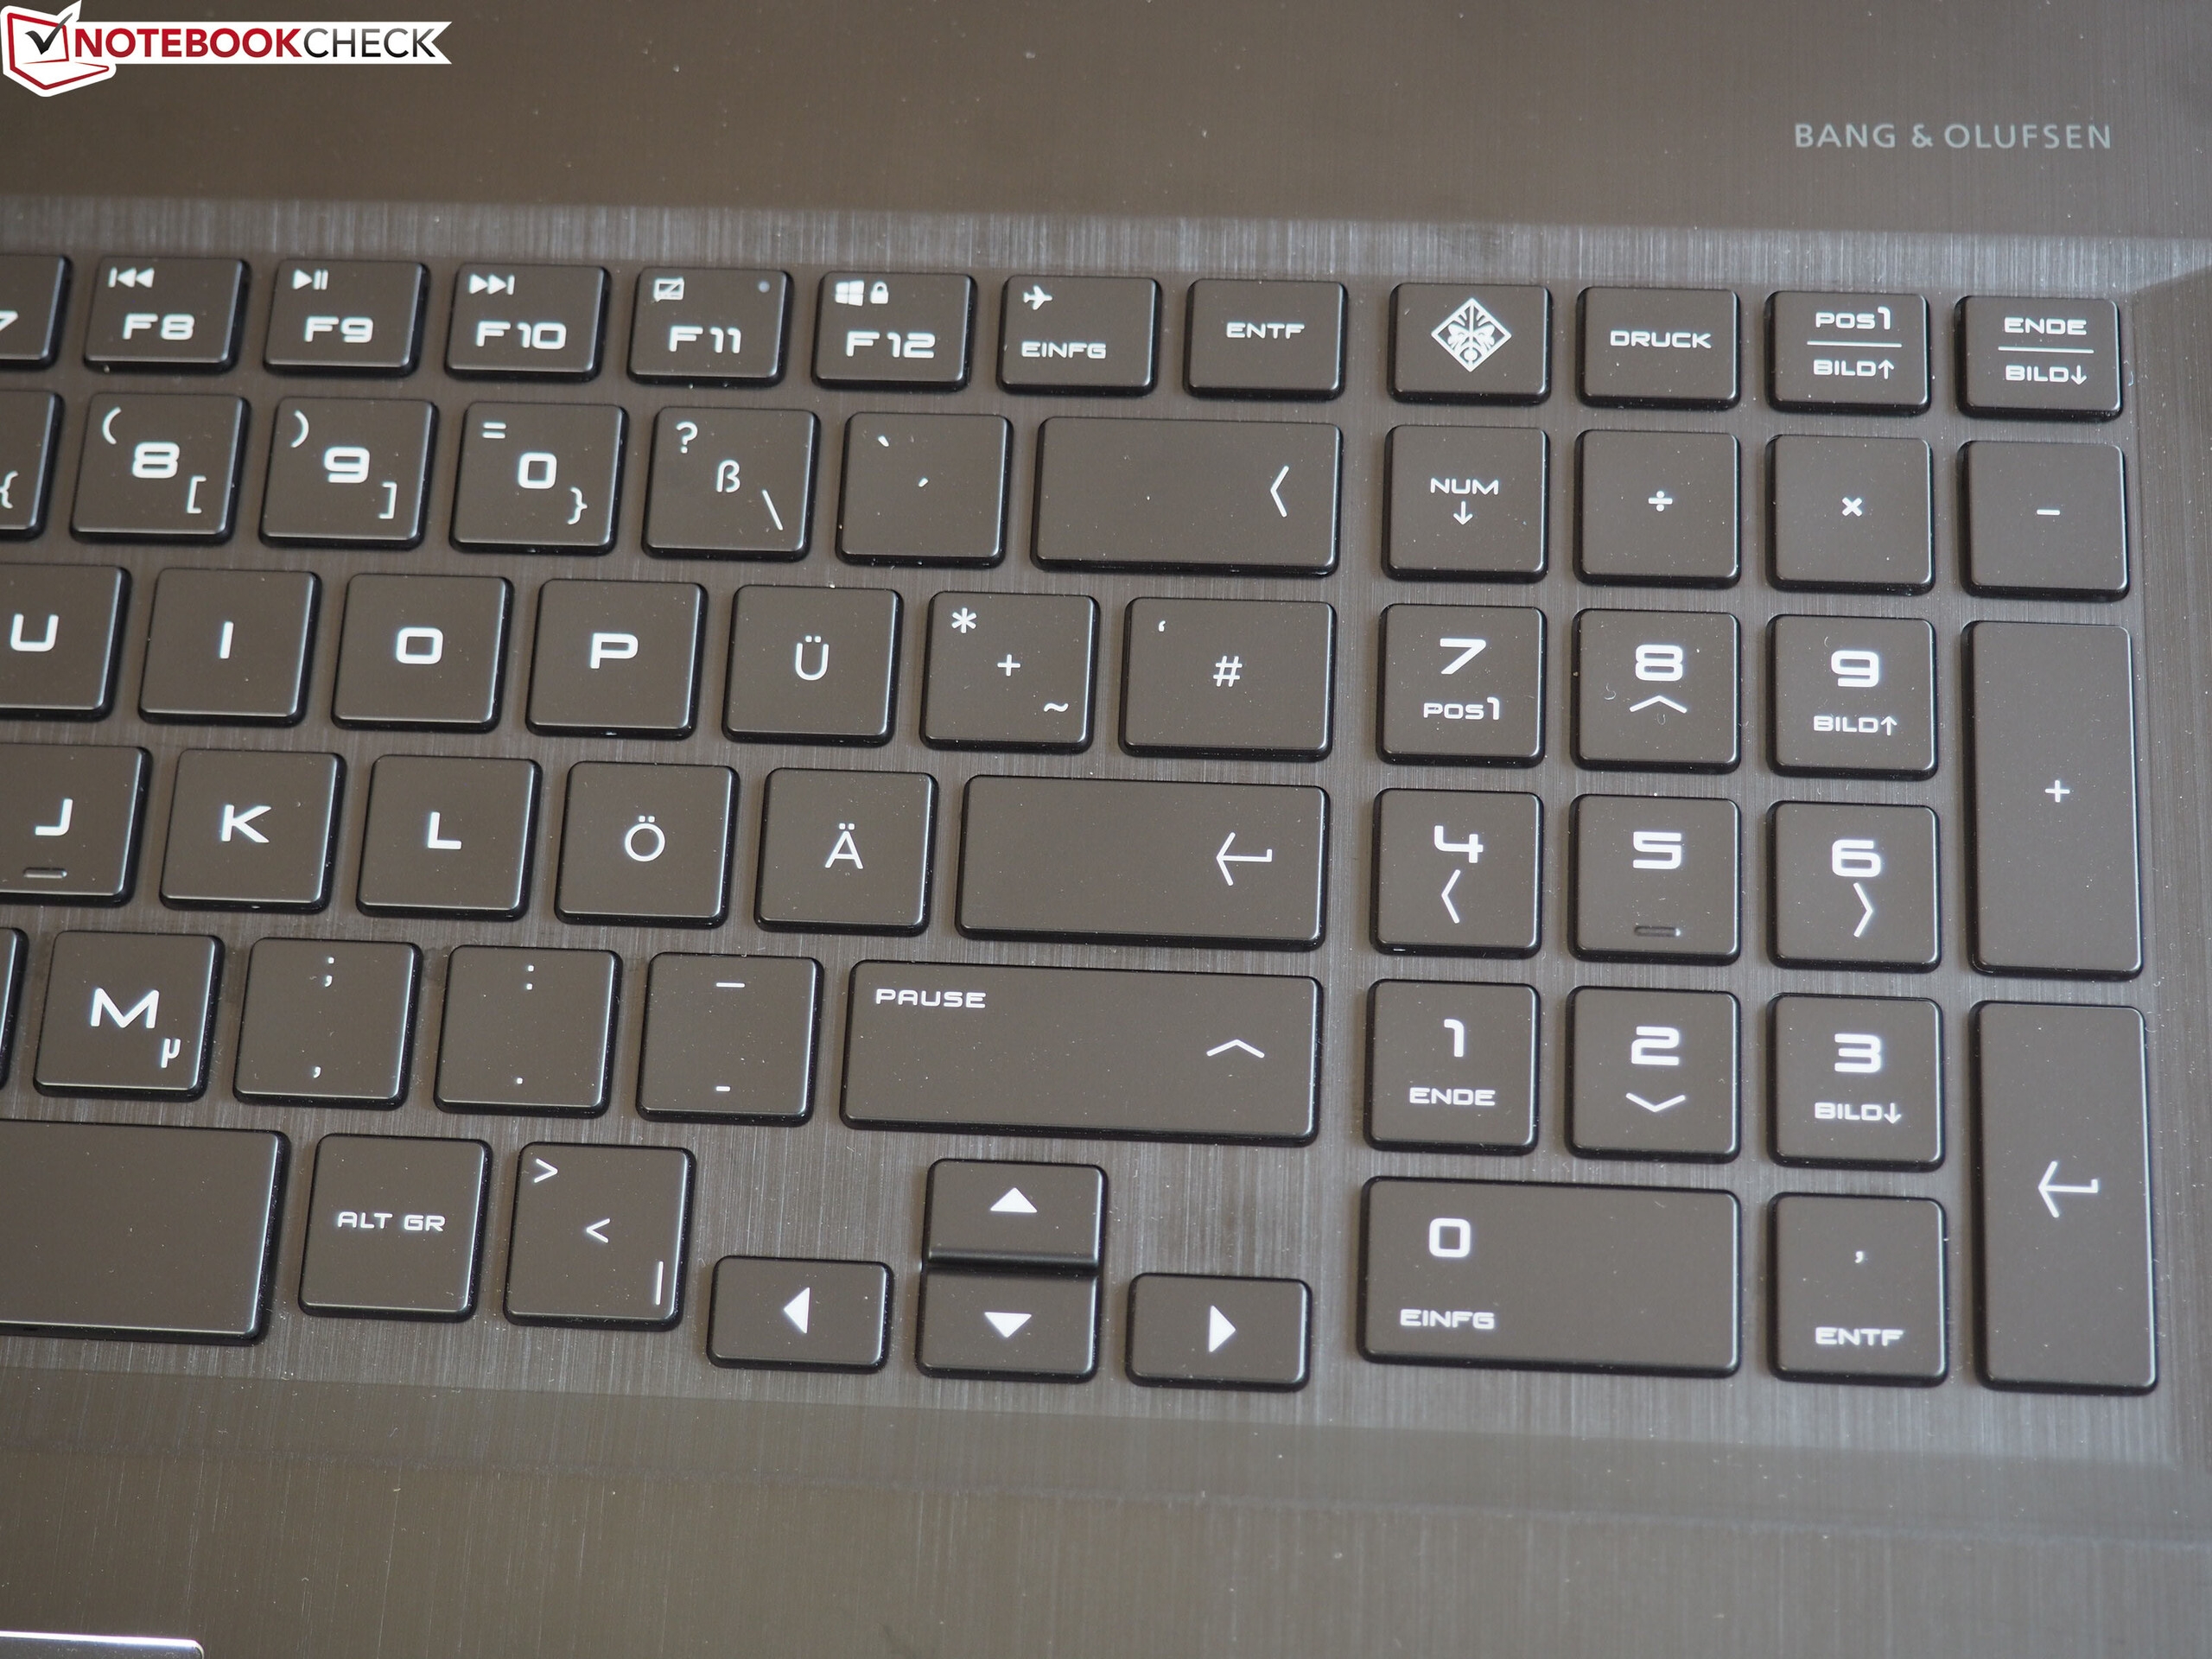
We are quite happy with the size of the keyboard and keys. However, the small arrow keys were a little tiresome during testing. To make up for this, users will be pleased to hear that the Omen 17 features a full-sized number pad. The macro keys to the left of the keyboard are an additional feature which some users will appreciate more than others. Special keys do tend to lead to wrong entries at first, because the main keyboard is moved slightly to the right in order to accommodate them. Typing is comfortable enough. The well-defined stop is accompanied by a relatively loud clatter, which is why the Omen 17 is not really suitable for quiet surroundings.
Touchpad
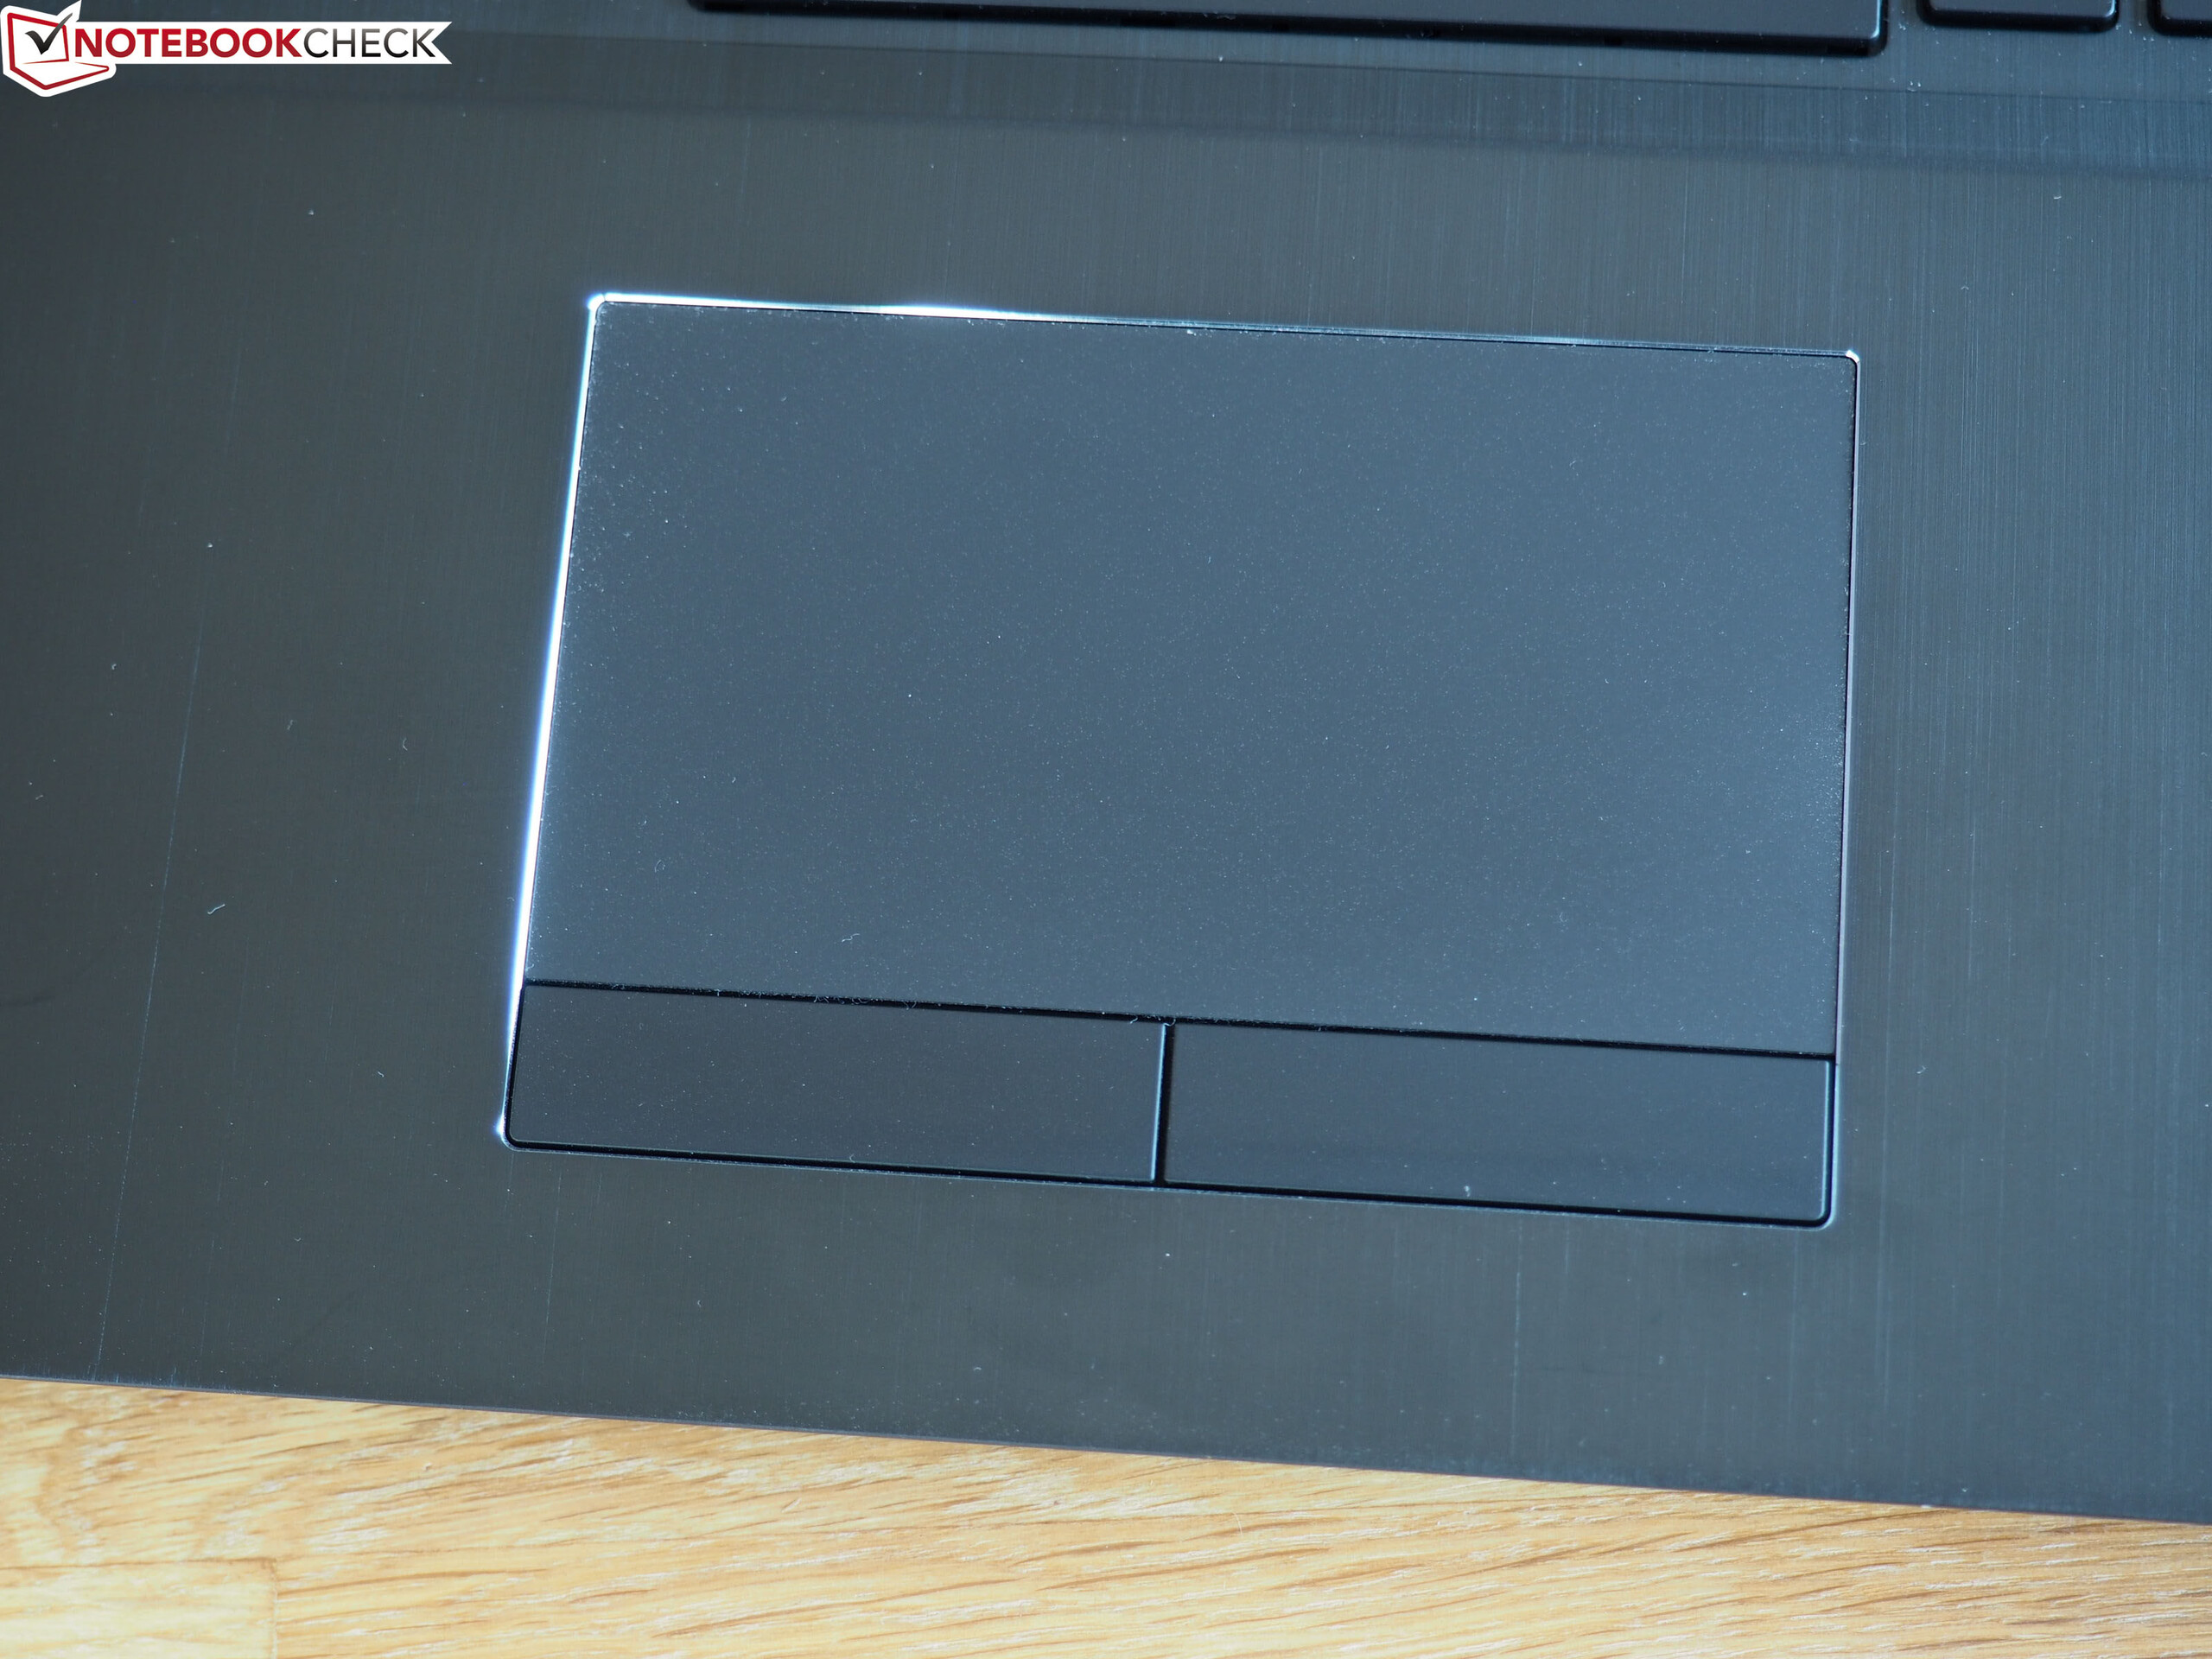
The touchpad has a good size at 10.2 x 5.6 cm (~4 x 2.2 in). Due to its slightly rough finish, fingers do not glide over the surface as easily as on some other gaming notebooks. The dedicated mouse keys have a clear (and loud) pressure point and feedback. Not surprisingly, the touchpad supports several gestures. We had no issues zooming and scrolling with two fingers. The precision of the touchpad is average.
Display
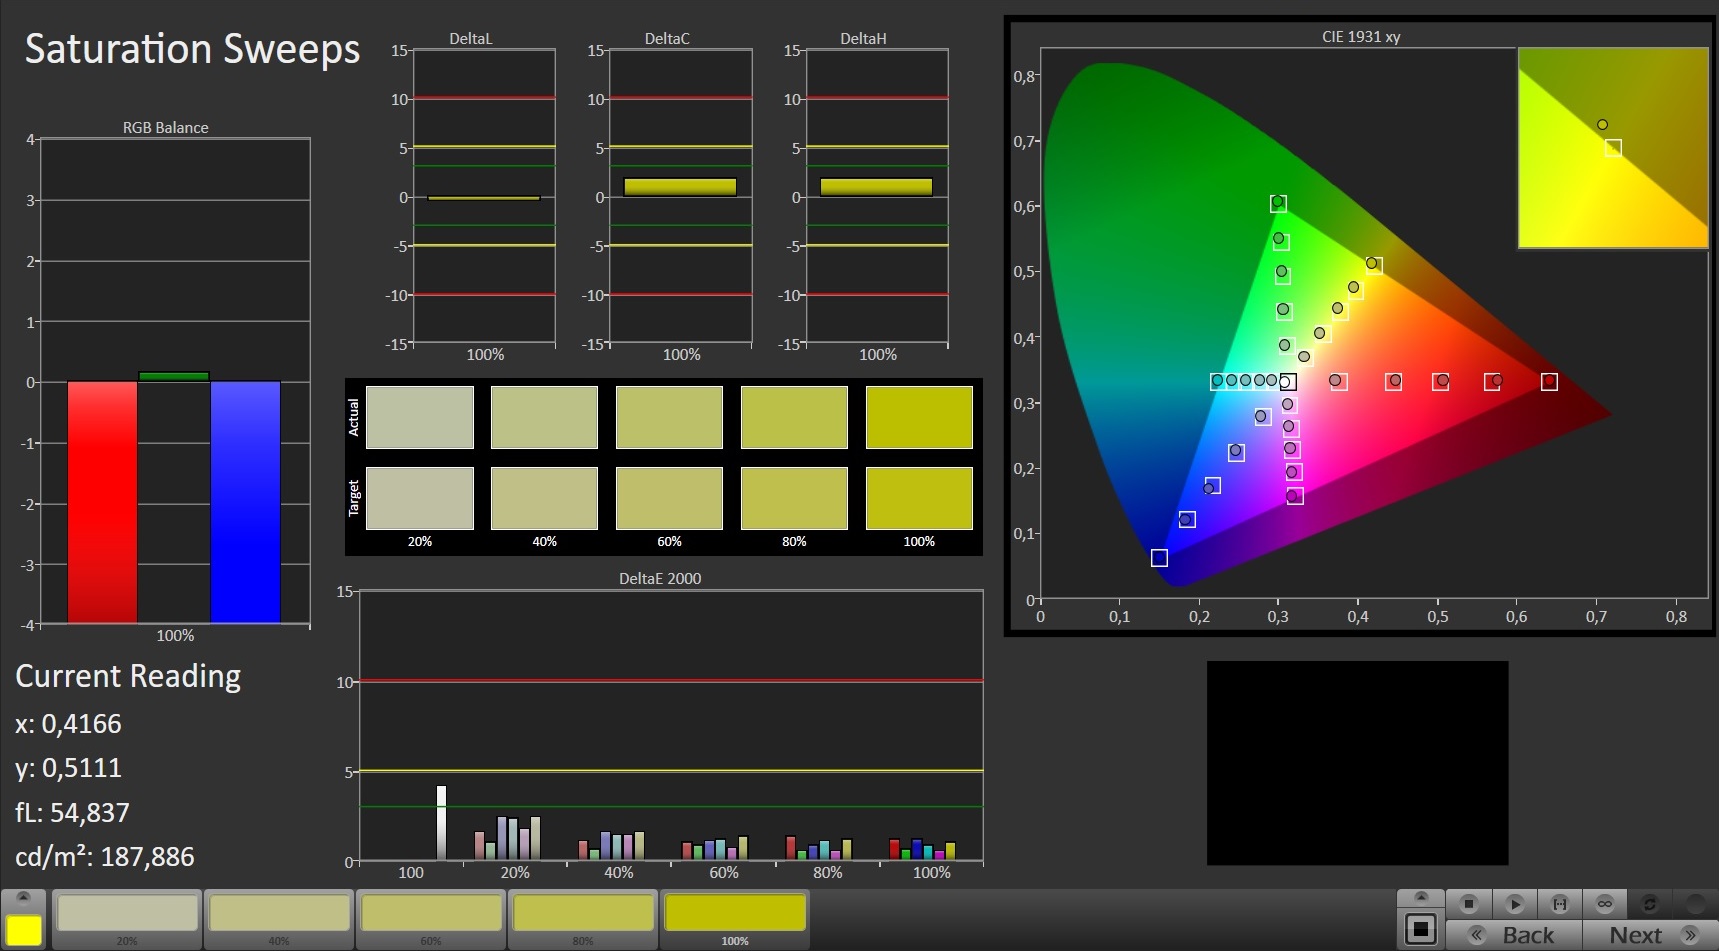
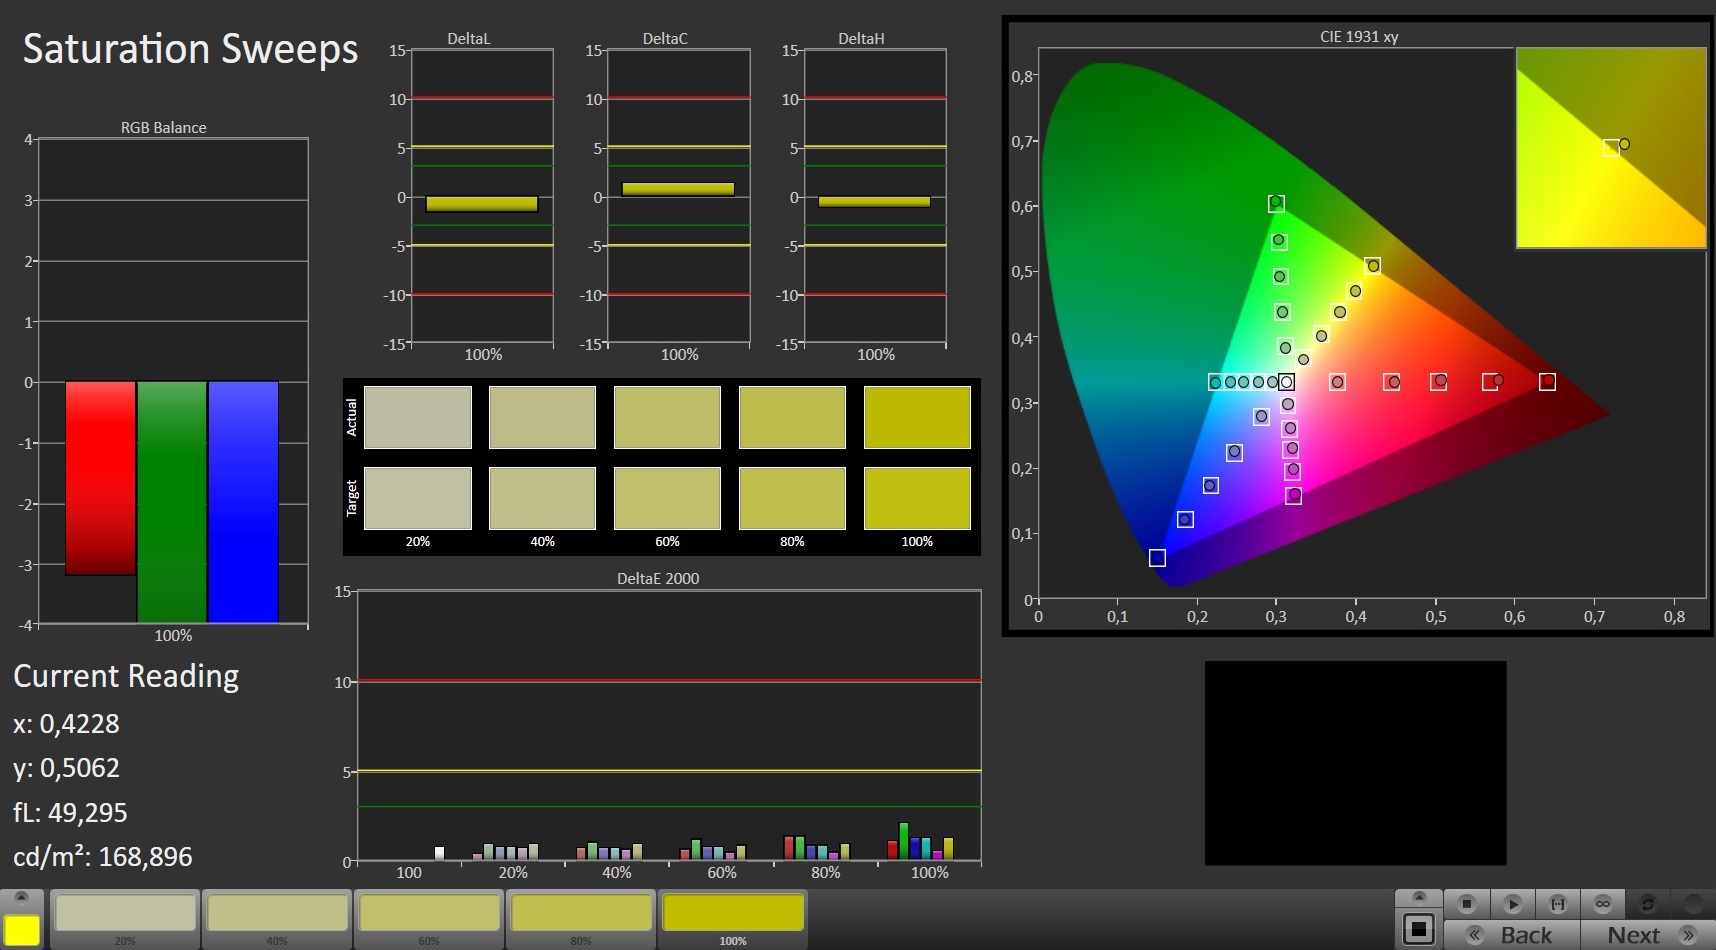
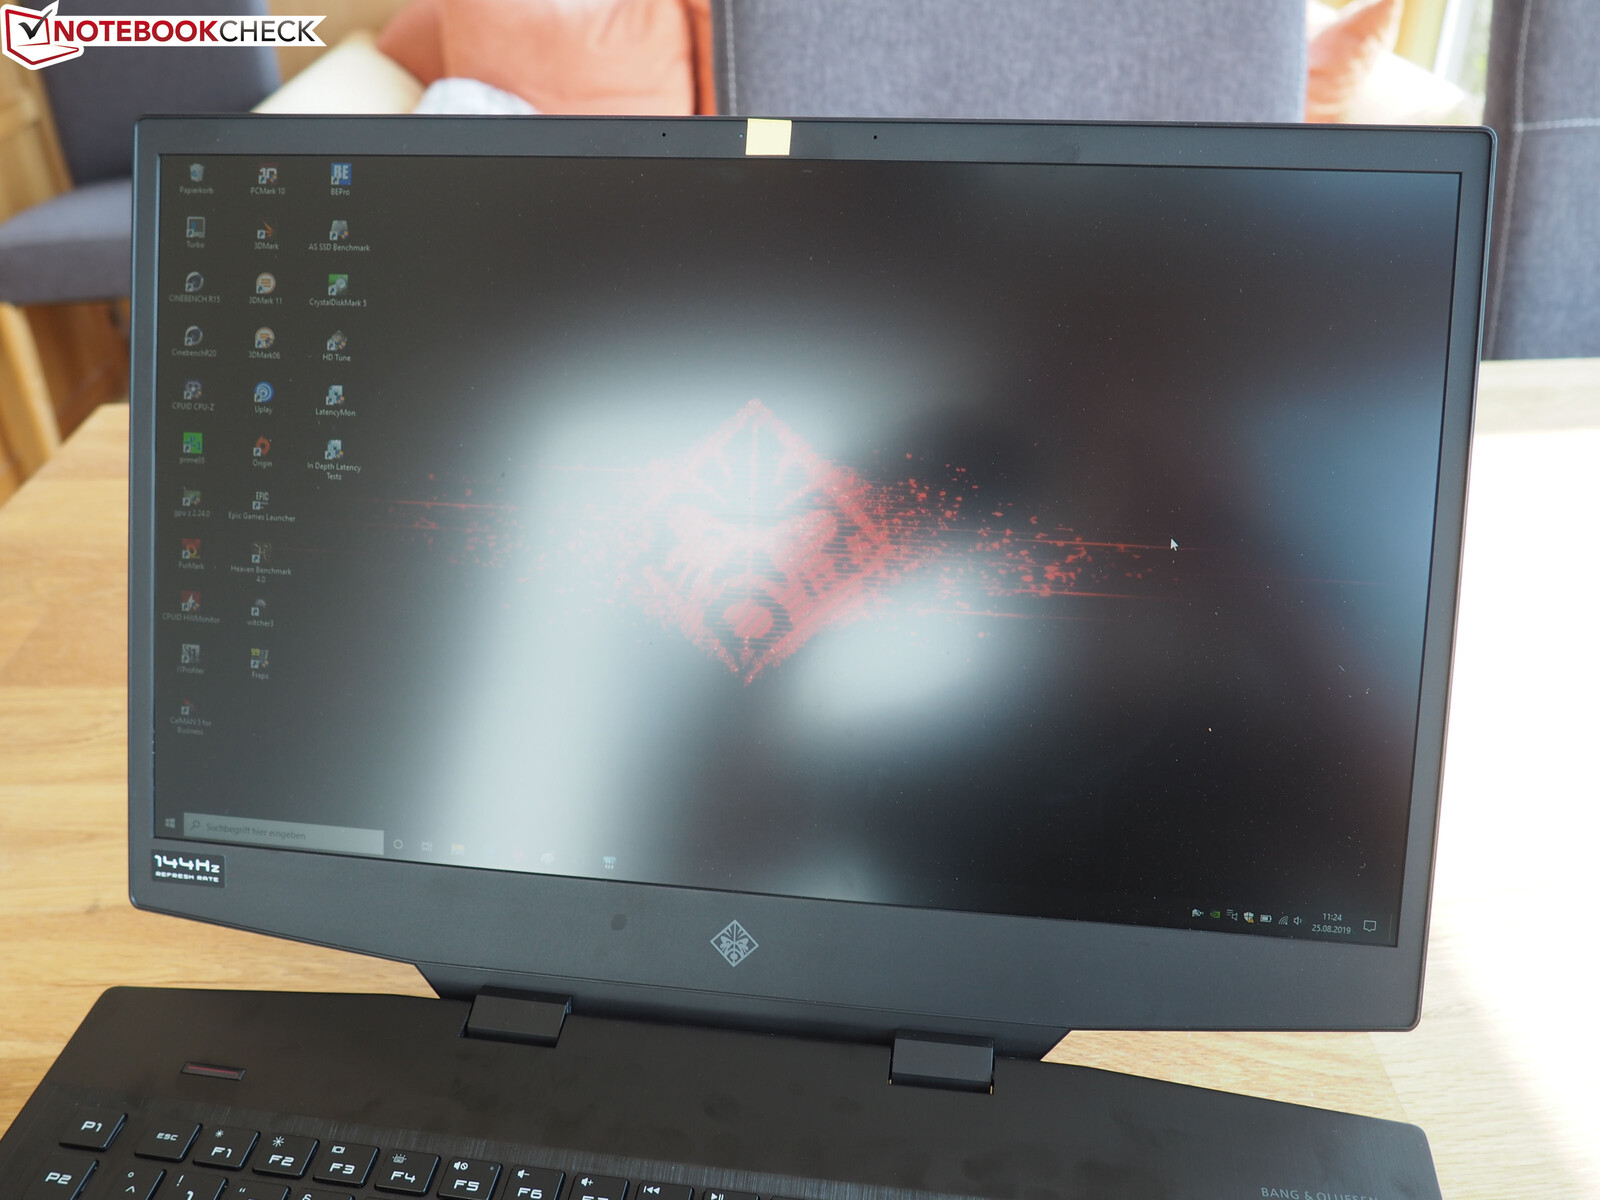
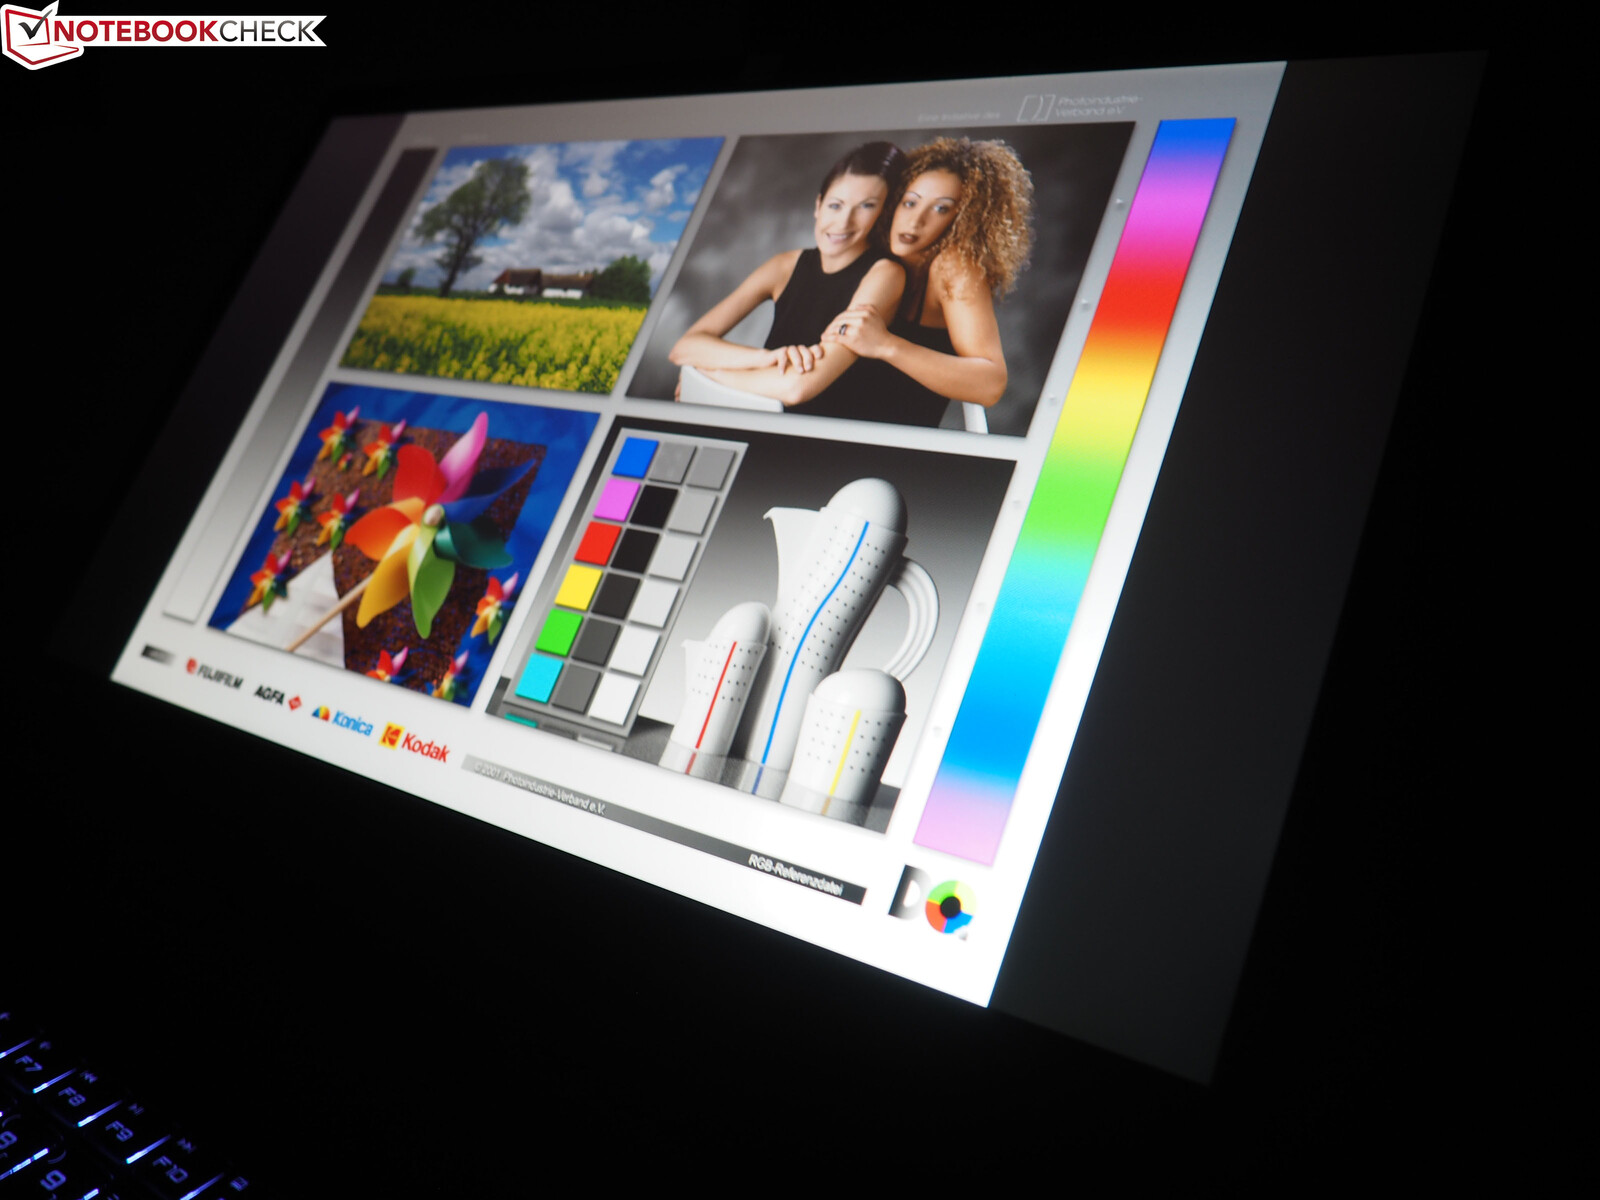
HP has joined in the current trend of using high-refresh-rate displays and has equipped the Omen 17 with a 144-Hz IPS display with a matte surface. The panel (CMN175D) is quite impressive. It has a contrast ratio of 1385:1 and a black value of 0.26 cd/m². This places our 17-inch gamer right at the front of our comparison field.
| |||||||||||||||||||||||||
Brightness Distribution: 91 %
Center on Battery: 360 cd/m²
Contrast: 1385:1 (Black: 0.26 cd/m²)
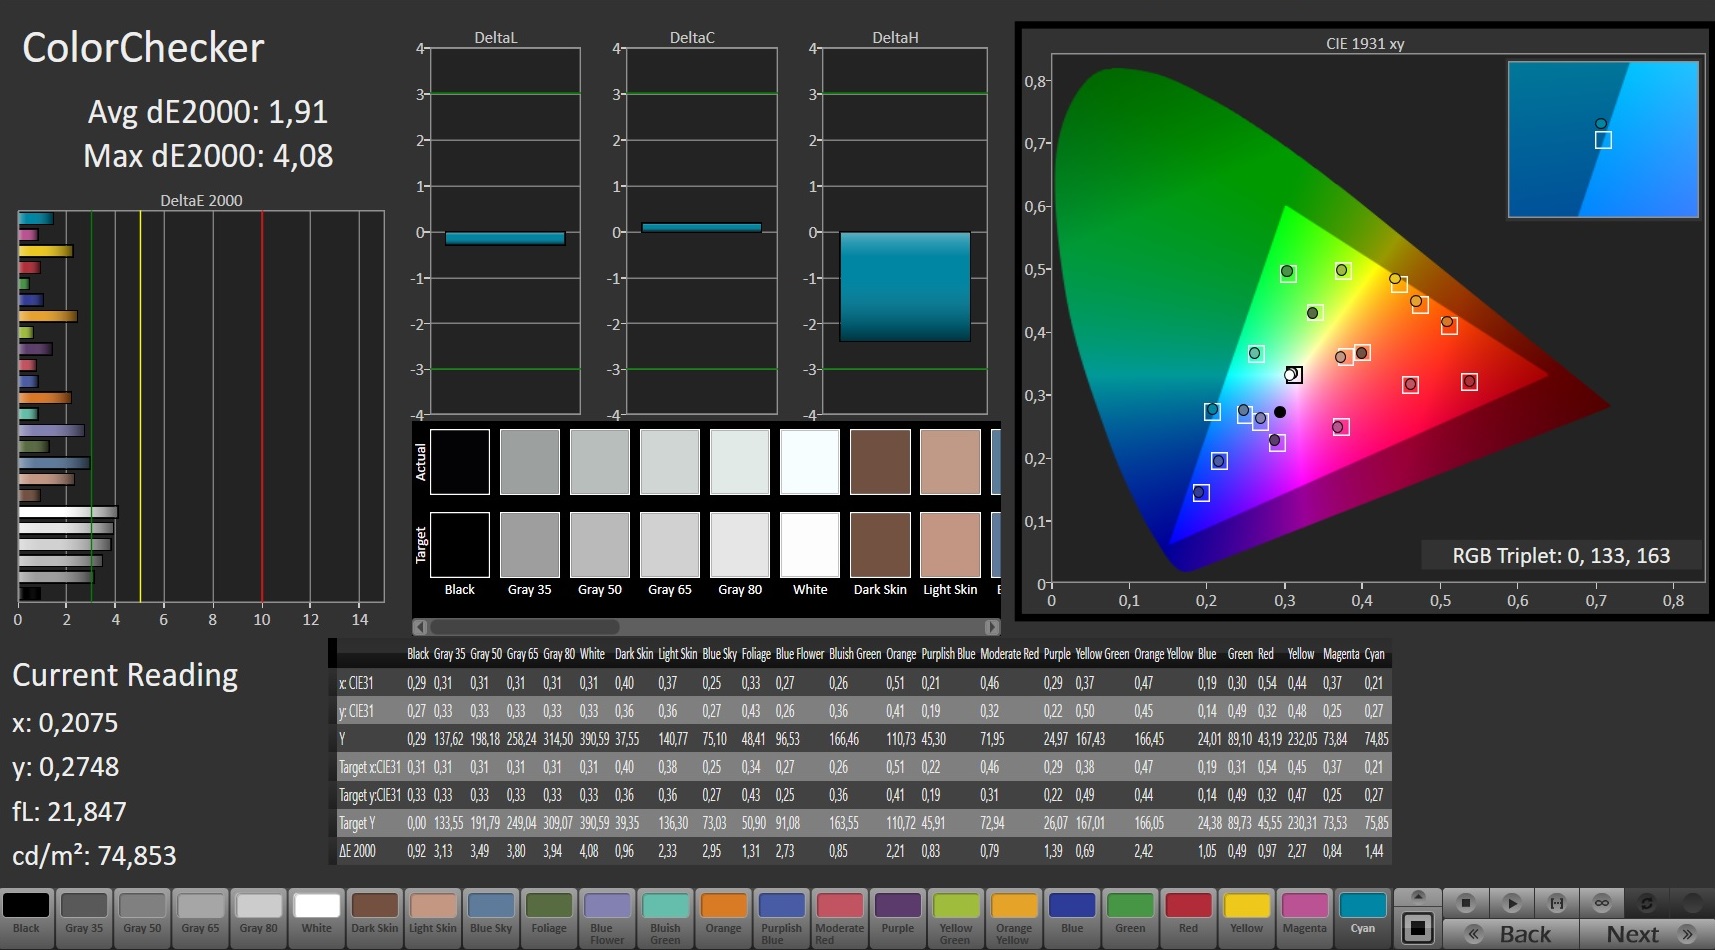
ΔE ColorChecker Calman: 1.91 | ∀{0.5-29.43 Ø4.73}
calibrated: 0.78
ΔE Greyscale Calman: 2.72 | ∀{0.09-98 Ø4.97}
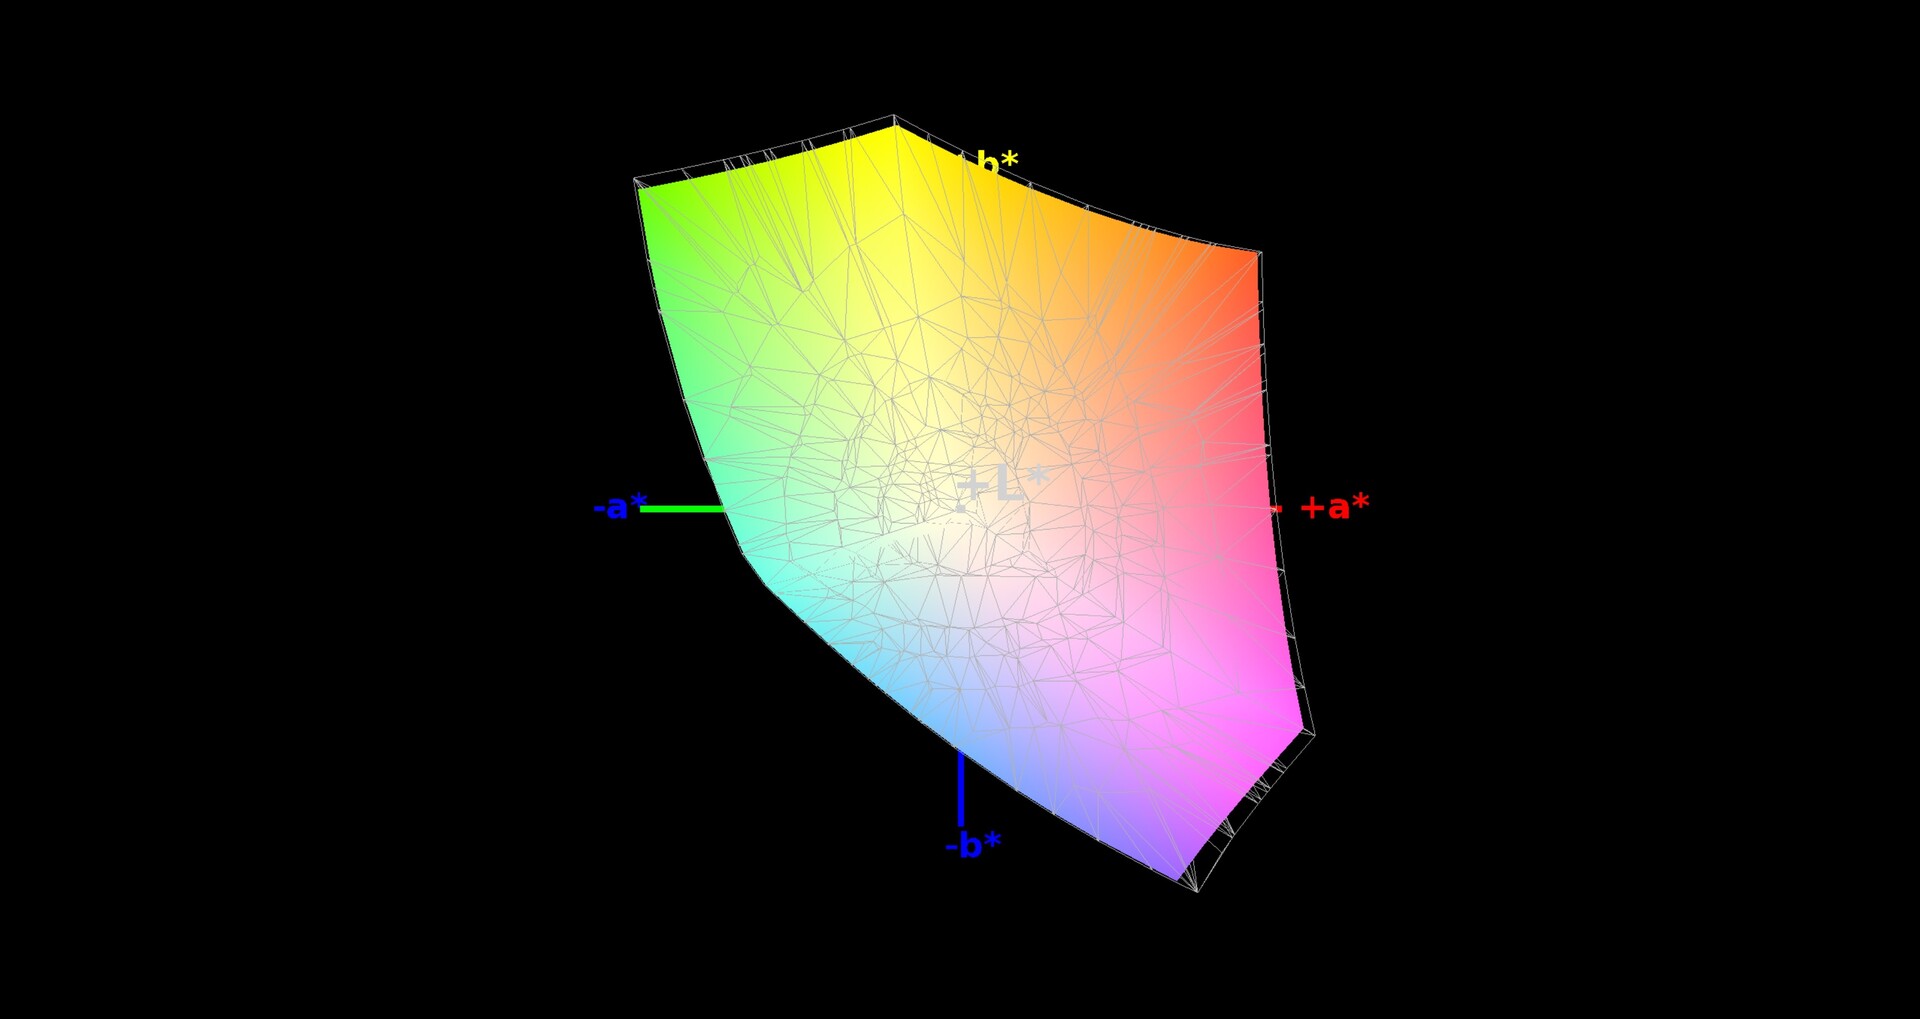
96% sRGB (Argyll 1.6.3 3D)
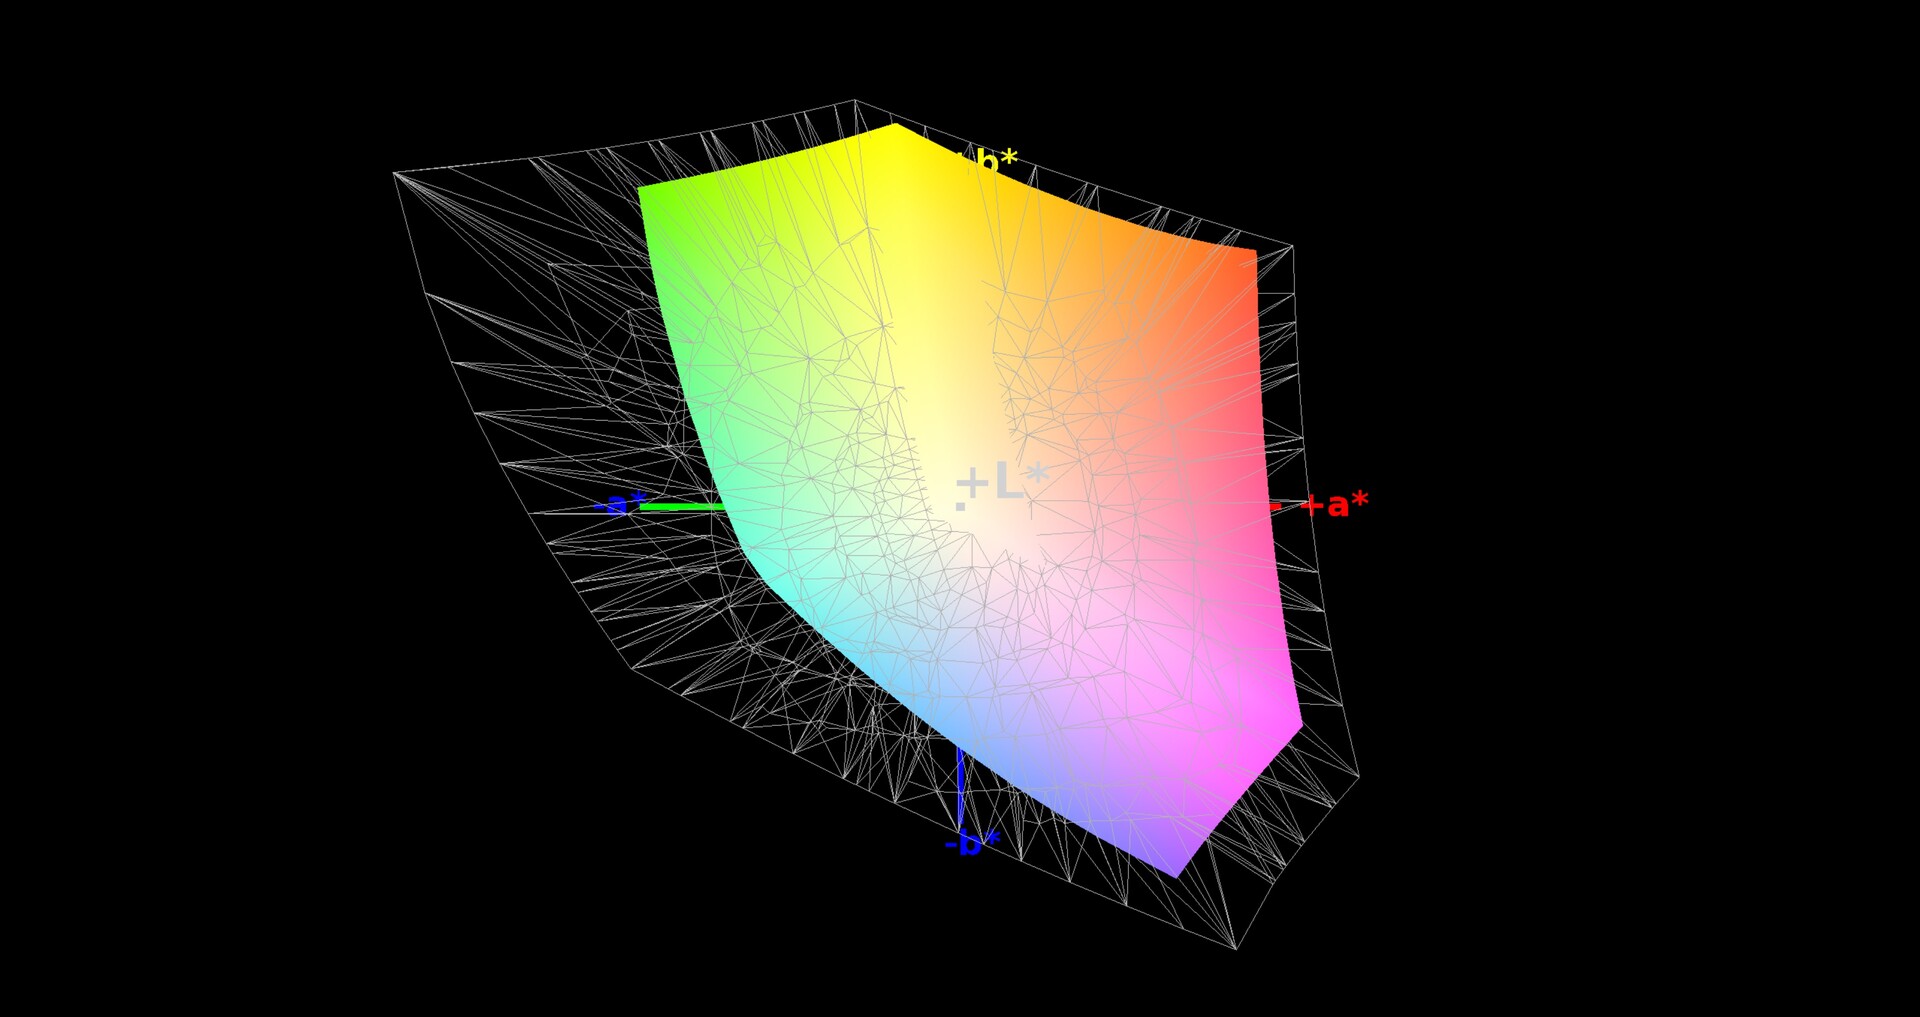
60% AdobeRGB 1998 (Argyll 1.6.3 3D)
65.8% AdobeRGB 1998 (Argyll 3D)
96% sRGB (Argyll 3D)
63.7% Display P3 (Argyll 3D)
Gamma: 2.37
CCT: 6692 K
| HP Omen 17-cb0020ng CMN175D, IPS, 1920x1080 | MSI GE75 9SG Chi Mei N173HCE-G33, AHVA, 1920x1080 | MSI GT76 Titan DT 9SG Chi Mei N173HCE-G33 (CMN175C), IPS, 1920x1080 | Schenker XMG Ultra 17 Turing AU Optronics B173ZAN01.0 (AUO109B), IPS, 3840x2160 | Alienware Area-51m i9-9900K RTX 2080 LG Philips 173WFG, IPS, 1920x1080 | |
|---|---|---|---|---|---|
| Display | -3% | -2% | 30% | 2% | |
| Display P3 Coverage (%) | 63.7 | 61.5 -3% | 62.3 -2% | 86.3 35% | 66.3 4% |
| sRGB Coverage (%) | 96 | 92 -4% | 93.4 -3% | 100 4% | 96.9 1% |
| AdobeRGB 1998 Coverage (%) | 65.8 | 63.5 -3% | 64.3 -2% | 99.1 51% | 66.5 1% |
| Response Times | 50% | 33% | -115% | 15% | |
| Response Time Grey 50% / Grey 80% * (ms) | 17.6 ? | 7.2 ? 59% | 8 ? 55% | 41.6 ? -136% | 13.2 ? 25% |
| Response Time Black / White * (ms) | 11.2 ? | 6.6 ? 41% | 10 ? 11% | 21.6 ? -93% | 10.8 ? 4% |
| PWM Frequency (Hz) | 25510 ? | 26040 ? | 26040 ? | ||
| Screen | -2% | -3% | -37% | -36% | |
| Brightness middle (cd/m²) | 360 | 400.7 11% | 396 10% | 343 -5% | 335.2 -7% |
| Brightness (cd/m²) | 342 | 372 9% | 373 9% | 328 -4% | 297 -13% |
| Brightness Distribution (%) | 91 | 89 -2% | 89 -2% | 82 -10% | 82 -10% |
| Black Level * (cd/m²) | 0.26 | 0.34 -31% | 0.33 -27% | 0.31 -19% | 0.66 -154% |
| Contrast (:1) | 1385 | 1179 -15% | 1200 -13% | 1106 -20% | 508 -63% |
| Colorchecker dE 2000 * | 1.91 | 1.33 30% | 2.04 -7% | 5.03 -163% | 2.02 -6% |
| Colorchecker dE 2000 max. * | 4.08 | 3.51 14% | 3.85 6% | 7.91 -94% | 7.23 -77% |
| Colorchecker dE 2000 calibrated * | 0.78 | 1.39 -78% | 0.82 -5% | 0.86 -10% | 1.17 -50% |
| Greyscale dE 2000 * | 2.72 | 1.3 52% | 2.83 -4% | 6.29 -131% | 3.2 -18% |
| Gamma | 2.37 93% | 2.24 98% | 2.49 88% | 2.38 92% | 2.16 102% |
| CCT | 6692 97% | 6735 97% | 7113 91% | 6389 102% | 6746 96% |
| Color Space (Percent of AdobeRGB 1998) (%) | 60 | 58.2 -3% | 59 -2% | 88 47% | 61.3 2% |
| Color Space (Percent of sRGB) (%) | 96 | 92.1 -4% | 94 -2% | 100 4% | 96.9 1% |
| Total Average (Program / Settings) | 15% /
5% | 9% /
1% | -41% /
-34% | -6% /
-23% |
* ... smaller is better
The average brightness of 342 cd/m² is great as well and enables users to use this device outdoors. We are also impressed by the color accuracy. The display manages to stay within the ideal range (DeltaE below 3) both in the grayscale and the color test. The package is completed with a decent color space, which covers 96 percent of sRGB and 60 percent of the AdobeRGB color space.


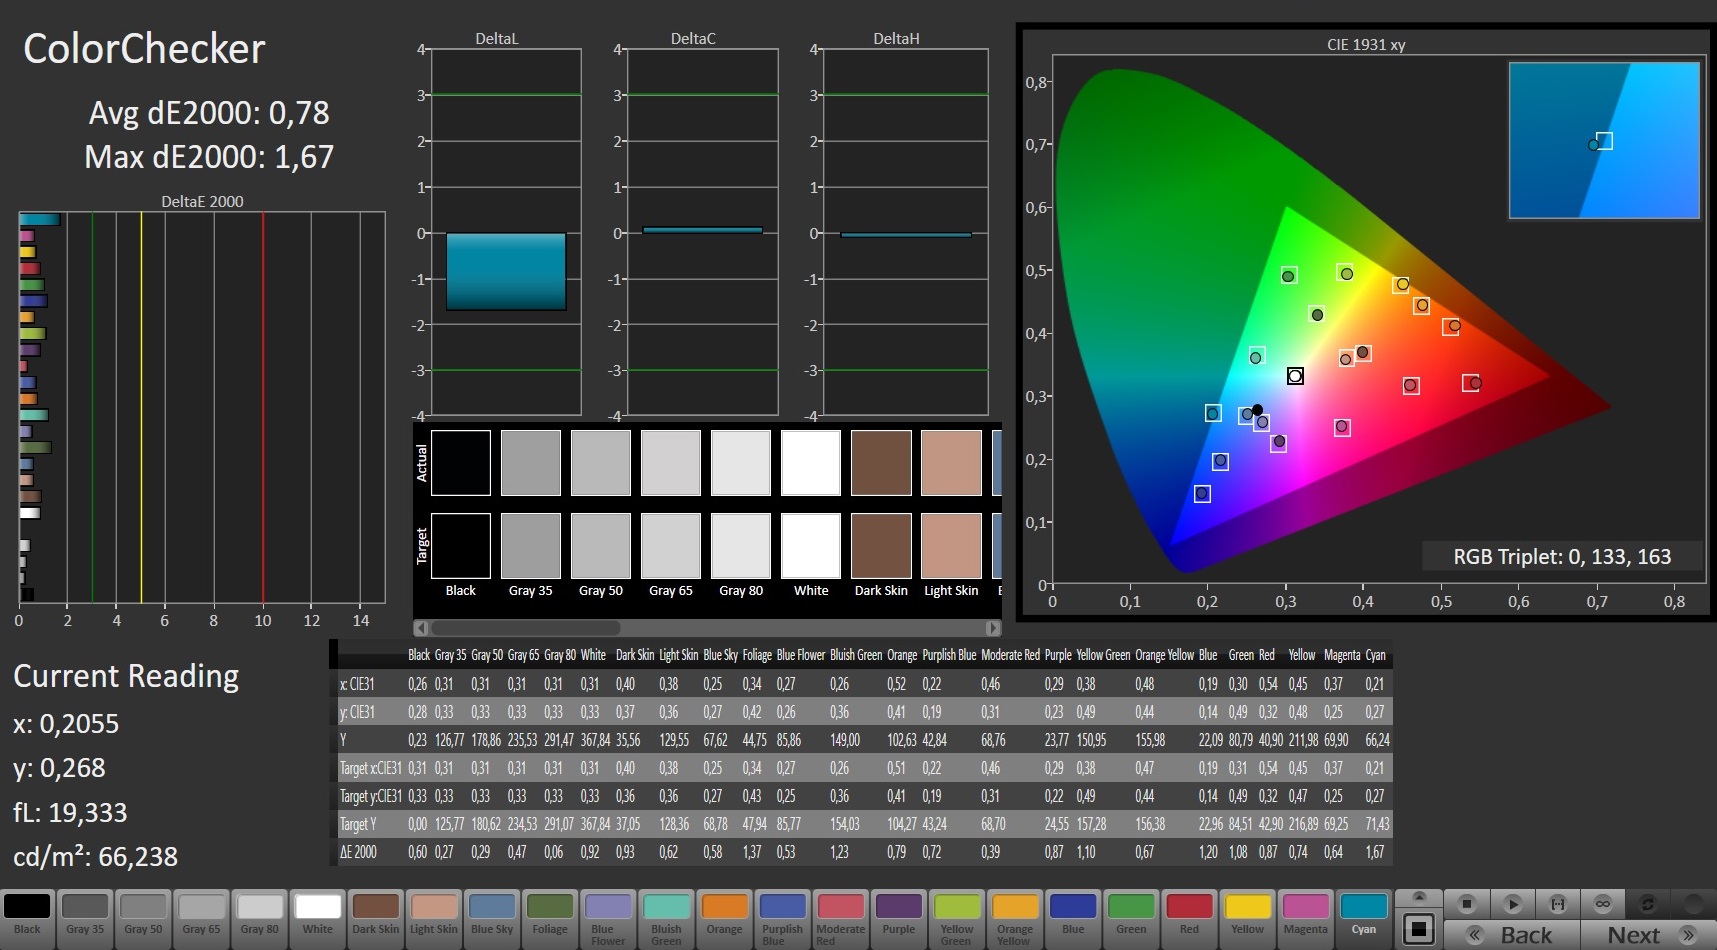
The display also has rather low response times (for an IPS panel). Most gamers should be quite happy with 11.2 ms black-to-white and 17.6 ms grey-to-grey. There is room for improvement in terms of brightness distribution, however. We noticed backlight bleeding both along the top and bottom edge.
PWM is used up to a brightness level of 44 percent. However, this flickering should not be an issue even for sensitive users due to the high frequency of 25 kHz. All in all, the image quality of this panel meets our expectations for this price range.

Display Response Times
| ↔ Response Time Black to White | ||
|---|---|---|
| 11.2 ms ... rise ↗ and fall ↘ combined | ↗ 6 ms rise | 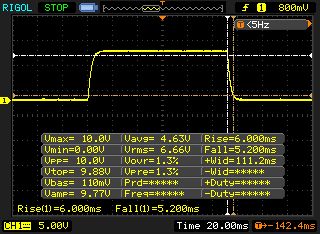 |
| ↘ 5.2 ms fall | ||
| The screen shows good response rates in our tests, but may be too slow for competitive gamers. In comparison, all tested devices range from 0.1 (minimum) to 240 (maximum) ms. » 30 % of all devices are better. This means that the measured response time is better than the average of all tested devices (19.9 ms). | ||
| ↔ Response Time 50% Grey to 80% Grey | ||
| 17.6 ms ... rise ↗ and fall ↘ combined | ↗ 8.4 ms rise | 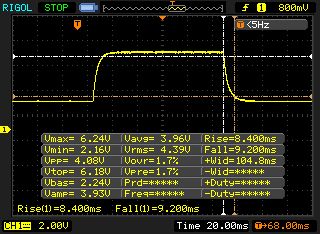 |
| ↘ 9.2 ms fall | ||
| The screen shows good response rates in our tests, but may be too slow for competitive gamers. In comparison, all tested devices range from 0.165 (minimum) to 636 (maximum) ms. » 31 % of all devices are better. This means that the measured response time is better than the average of all tested devices (31.1 ms). | ||
Screen Flickering / PWM (Pulse-Width Modulation)
| Screen flickering / PWM detected | 25510 Hz | ≤ 44 % brightness setting | 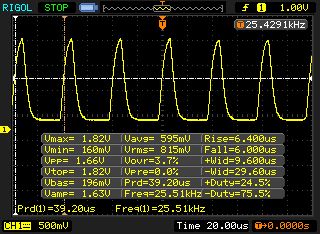 |
The display backlight flickers at 25510 Hz (worst case, e.g., utilizing PWM) Flickering detected at a brightness setting of 44 % and below. There should be no flickering or PWM above this brightness setting. The frequency of 25510 Hz is quite high, so most users sensitive to PWM should not notice any flickering. In comparison: 52 % of all tested devices do not use PWM to dim the display. If PWM was detected, an average of 7798 (minimum: 5 - maximum: 343500) Hz was measured. | |||
Performance
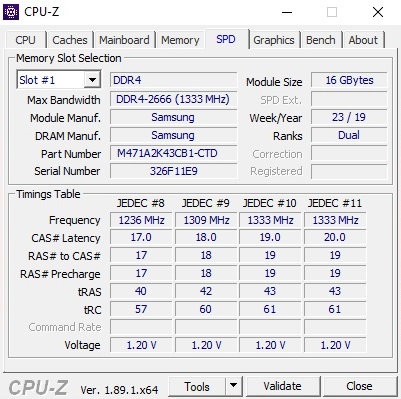
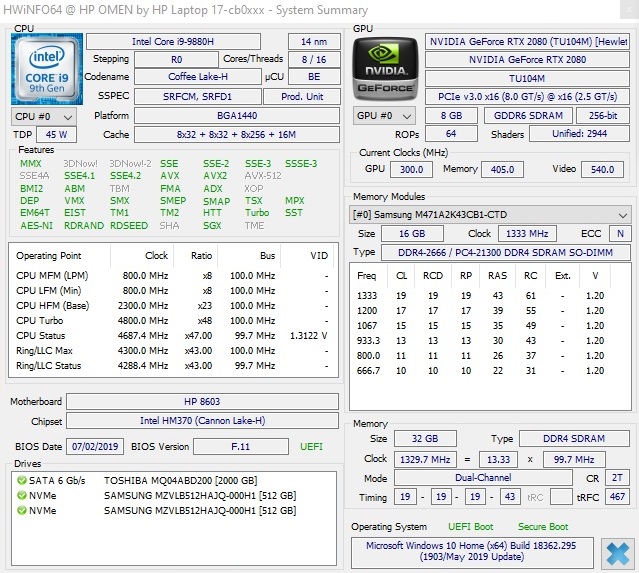
The best configuration of the Omen 17, which we are testing today, features a Core i9-9880H, a GeForce RTX 2080 and 32 GB of DDR4 RAM (2x 16 GB, dual channel). This hardware combination makes this device suitable for almost any area of use and should future-proof it for quite some time. The SSD RAID also guarantees a fast system performance with short load and boot times.
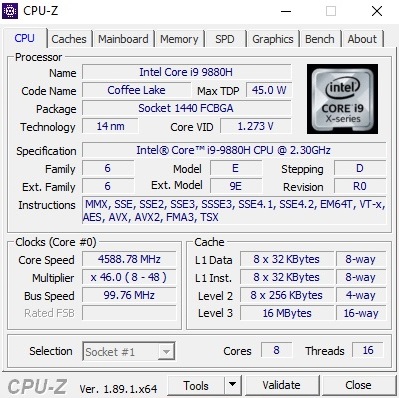


Processor
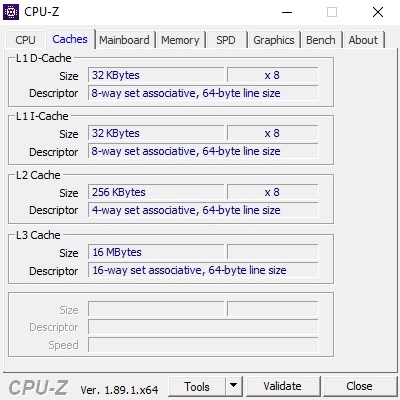
The Core i9-9880H is currently the second fastest mobile processor on the market. The eight-core chip from Intel's optimized Coffee Lake generation has a generous 16-MP L3 cache and, like its slower six-core siblings (the Core i7-9750H, for example), is rated at 45 watts. Thanks to hyperthreading technology, the octa-core processor can work up to 16 threads simultaneously.

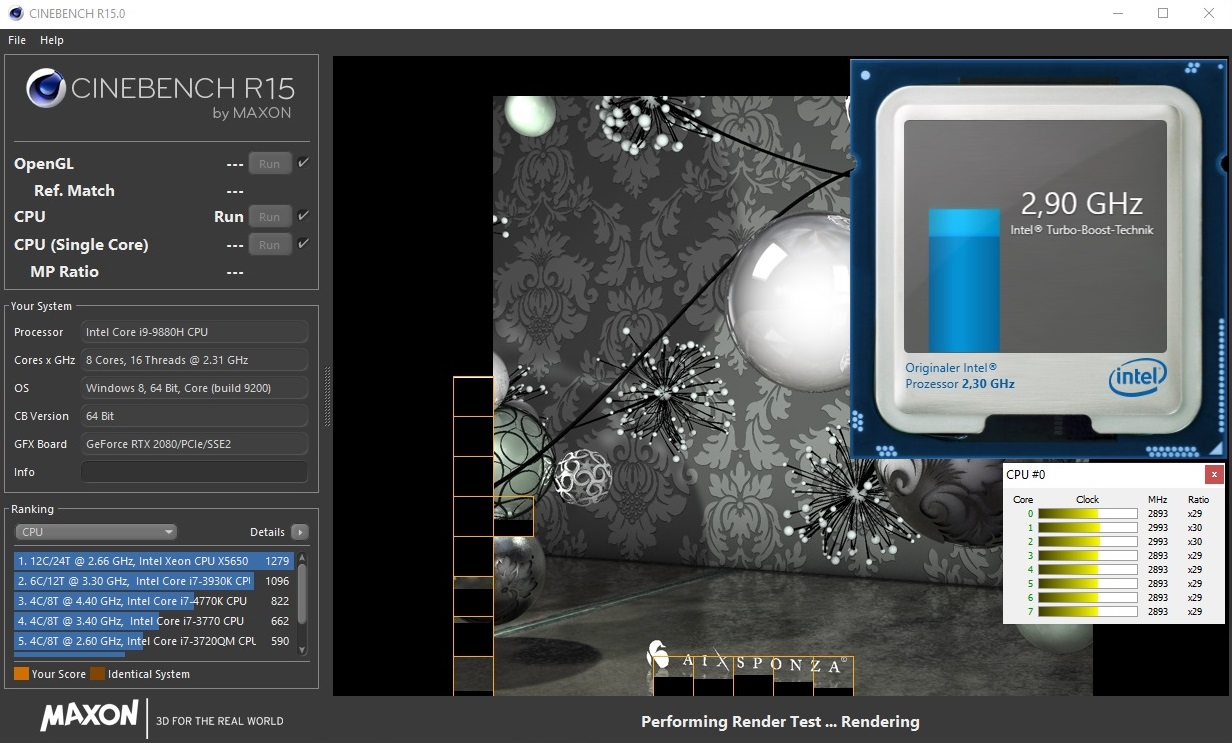
The clock rates are quite impressive, too. As long as the cooling system allows it, the Core i9-9880H can reach clock rates up to 4.8 GHz, which is quite a lot for a laptop. Unfortunately, the Omen 17 cannot make the most out of the CPU's potential. While it does fairly well in single-core and 3D applications with low core utilization, reaching clock rates over 4 GHz, the CPU can only reach between 2.9 and 4.0 GHz in applications that use all cores. The clock rate even drops to 2.9 GHz permanently after a while.
This behavior is depicted very nicely in our Cinebench graph, which shows a drop in performance of around 10 percent from the second round onwards. While other 9880H laptops, such as the MSI GE75 9SG, also lose several percent in this scenario, their clock rate is higher from the start. The Omen 17 cannot compete with notebooks that are equipped with the Core i9-9900K. Both the MSI GT76 9SG and the Schenker XMG Ultra 17, as well as the Alienware Area 51m easily beat the Omen 17 in our Cinebench loop and multi-core test.
System Performance
We cannot criticize the overall system performance of our test unit. The HP notebook does not make the podium in PCMark 10, but its score of 6558 points is very good nonetheless, and promises a fast and smooth-running system.
Storage Devices
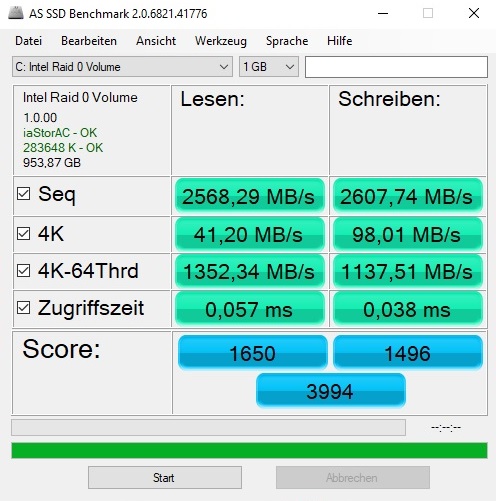
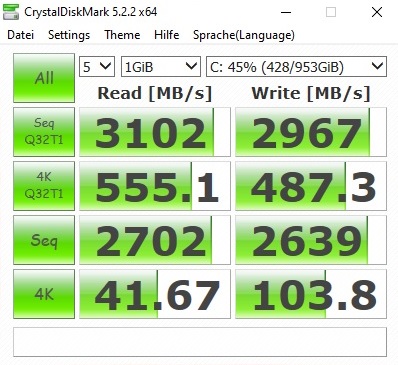
A large part of the Omen 17's strong overall performance is due to the SSD. In order to get the most out of the 17-inch device, HP has combined two M.2 drives from Samsung (PM981) to a RAID 0 set up with a capacity of 1 TB. The CrystalDiskMark shows no weaknesses. The results are great when dealing with both small and large files. Still, some devices manage to reach comparable speeds with only one SSD (see the Samsung 970 Evo Plus in the Schenker XMG Ultra 17).
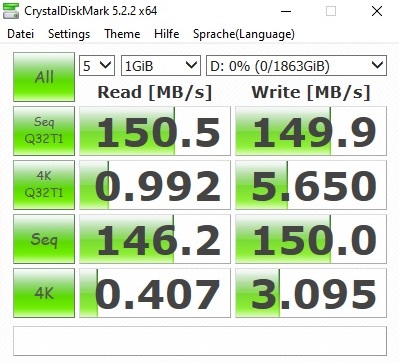
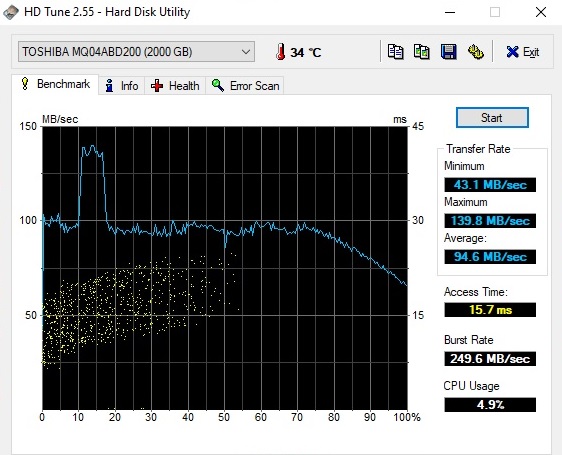
Most users should be well-equipped in terms of storage capacity for quite a while. The combination of the SSD RAID with an additional 2.5-inch HDD hard drive means that this configuration of the Omen 17 has a total storage capacity of 3 TB. The Toshiba MQ04ABD200 HDD, offers a fairly decent performance for a 5400-RPM drive.
| HP Omen 17-cb0020ng 2x Samsung SSD PM981 MZVLB512HAJQ (RAID 0) | MSI GE75 9SG Samsung SSD PM981 MZVLB1T0HALR | MSI GT76 Titan DT 9SG 2x Samsung PM961 MZVLW256HEHP (RAID 0) | Schenker XMG Ultra 17 Turing Samsung SSD 970 EVO Plus 500GB | Alienware Area-51m i9-9900K RTX 2080 2x SK Hynix PC400 512GB (RAID 0) | |
|---|---|---|---|---|---|
| CrystalDiskMark 5.2 / 6 | -13% | -11% | 11% | 5% | |
| Write 4K (MB/s) | 103.8 | 116.1 12% | 101.4 -2% | 183.2 76% | 111.1 7% |
| Read 4K (MB/s) | 41.67 | 44.98 8% | 40.57 -3% | 52.4 26% | 45.47 9% |
| Write Seq (MB/s) | 2639 | 2370 -10% | 2229 -16% | 1790 -32% | 2454 -7% |
| Read Seq (MB/s) | 2702 | 1465 -46% | 2528 -6% | 1743 -35% | 2212 -18% |
| Write 4K Q32T1 (MB/s) | 487.3 | 337.5 -31% | 379.6 -22% | 550 13% | 622 28% |
| Read 4K Q32T1 (MB/s) | 555 | 453.6 -18% | 421.9 -24% | 648 17% | 695 25% |
| Write Seq Q32T1 (MB/s) | 2967 | 2399 -19% | 2439 -18% | 3236 9% | 2675 -10% |
| Read Seq Q32T1 (MB/s) | 3102 | 3087 0% | 3199 3% | 3538 14% | 3184 3% |

Graphics
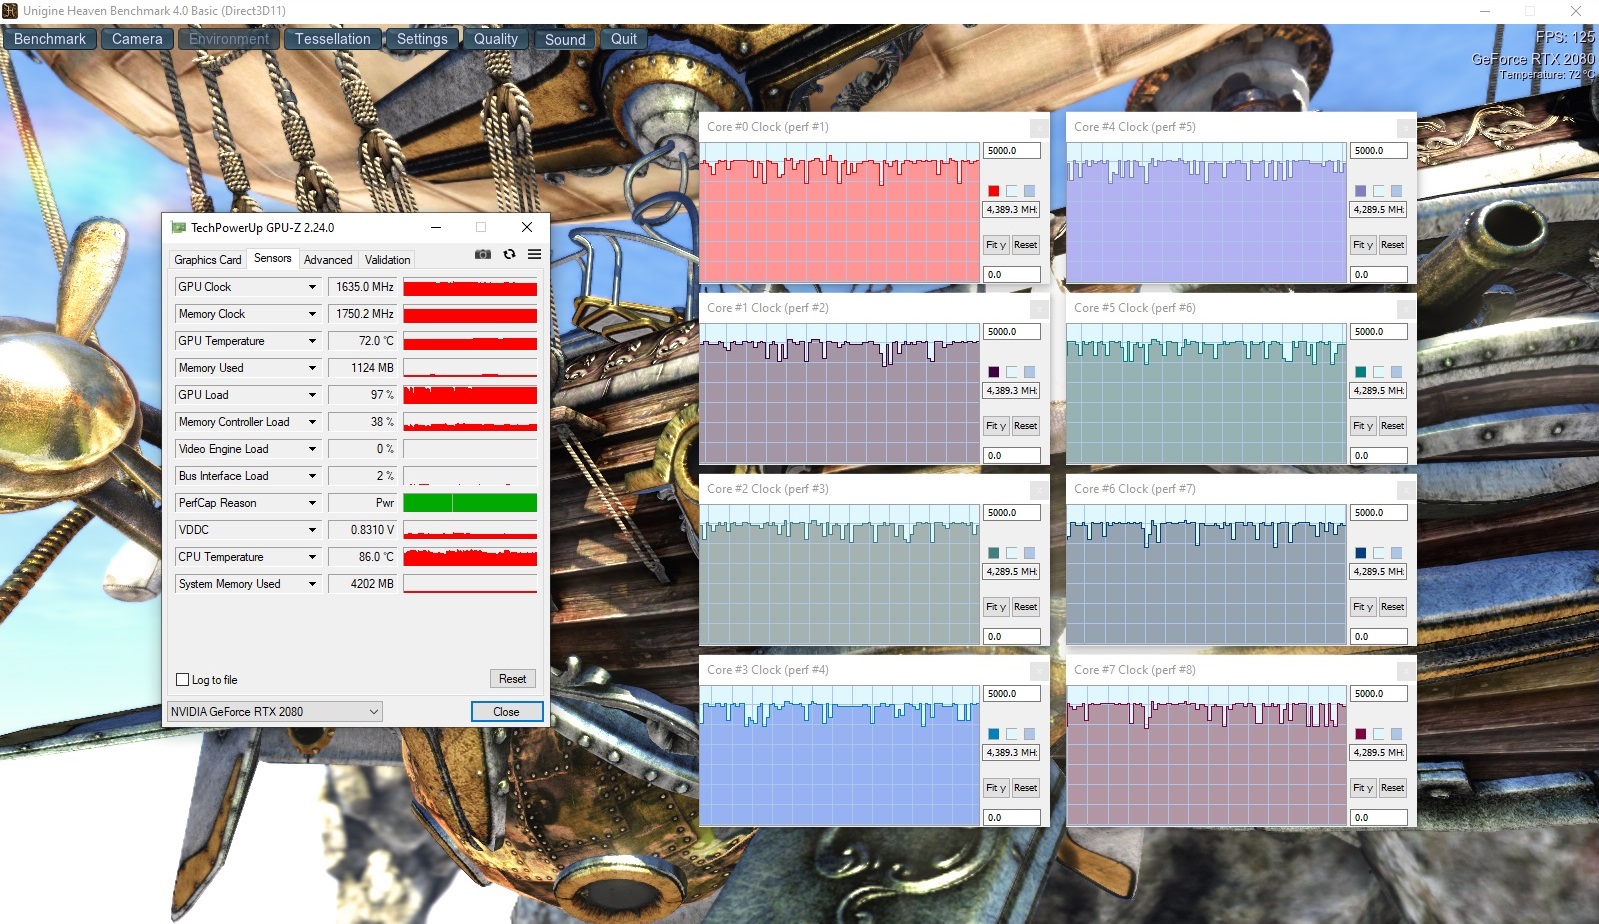
The GeForce RTX 2080 currently is Nvidia's strongest notebook GPU. The Turing-based DirectX 12 monster has 2944 shaders and an 8-GB GDDR6 VRAM (256-bit interface). Its base clock rate is 1380 MHz, although the GPU boost (works similar to Intel's turbo boost) enables far higher clock rates.
| 3DMark 11 Performance | 25017 points | |
| 3DMark Cloud Gate Standard Score | 44234 points | |
| 3DMark Fire Strike Score | 19351 points | |
| 3DMark Time Spy Score | 9177 points | |
Help | ||
As with the CPU, the clock rate of the GPU is not used to its full potential. Both in 3DMark 11 and in 3DMark 12, the performance of the RTX 2080 is around 10 percent below the average of previously tested competitors. The same goes for games, during which the clock rate settles at around 1600 MHz. This is not a particularly bad result, but it does not place our test unit in the top range, either. We would like to mention that almost every competitor pays for the higher performance with a thicker case. The Omen 17, on the other hand, is one of the slimmest RTX 2080 laptops available. This puts the difference in performance into perspective.
We did not notice any anomalies in our gaming test with "The Witcher 3" (1920x1080, maximum details). The frame rate remained constant and there were no drops in performance. By the way, HP has foregone the graphics switching feature Optimus in exchange for using G-Sync to improve the image.
Gaming Performance
The gaming capabilities of the Omen 17 were tested with 13 games dating from 2015 to 2019. In short: Users can play demanding titles such as "Anno 1800" and "Metro Exodus" at native resolution and maximum settings.
| The Witcher 3 - 1920x1080 Ultra Graphics & Postprocessing (HBAO+) | |
| Average of class Gaming (95 - 240, n=8, last 2 years) | |
| Alienware Area-51m i9-9900K RTX 2080 | |
| MSI GT76 Titan DT 9SG | |
| Average NVIDIA GeForce RTX 2080 Mobile (82.2 - 105, n=16) | |
| MSI GE75 9SG | |
| Schenker XMG Ultra 17 Turing | |
| HP Omen 17-cb0020ng | |
The GeForce RTX 2080 displays less CPU-intensive games such as "F1 2019", "Rage 2" and "Apex Legends" at over 100 FPS. Therefore, we can confirm that the 144-Hz panel is here for a reason. The Omen 17 would also do well with an (external) WQHD or 4K display.
| low | med. | high | ultra | |
|---|---|---|---|---|
| The Witcher 3 (2015) | 173 | 91.7 | ||
| Hitman 2 (2018) | 81.2 | 78.5 | ||
| Farming Simulator 19 (2018) | 153 | 140 | ||
| Just Cause 4 (2018) | 117 | 100 | ||
| Apex Legends (2019) | 144 | 144 | ||
| Far Cry New Dawn (2019) | 105 | 93 | ||
| Metro Exodus (2019) | 81.9 | 67.7 | ||
| Anthem (2019) | 102 | 96 | ||
| Dirt Rally 2.0 (2019) | 167 | 98.3 | ||
| The Division 2 (2019) | 125 | 95 | ||
| Anno 1800 (2019) | 78.8 | 45.3 | ||
| Rage 2 (2019) | 118 | 117 | ||
| F1 2019 (2019) | 153 | 142 |
Emissions
System Noise
The combination of high-end hardware, a relatively slim case and the missing graphics switching software leads to very loud system noise. The 17-inch gamer is clearly audible at 34 to 36 dB(A), even while idling. Light to medium loads, such as Windows Updates, soon cause the cooling fan to speed up, which could bother many users.
The device becomes particularly loud when running 3D applications. Although the Omen 17 is quieter than some other RTX 2080 laptops (despite its slim build), sensitive users will still have difficulties with a noise level of 47 to 51 dB(A) under load, which is why we would recommend using headphones in these situations.
Noise level
| Idle |
| 34 / 35 / 36 dB(A) |
| HDD |
| 33 dB(A) |
| Load |
| 51 / 51 dB(A) |
 | ||
30 dB silent 40 dB(A) audible 50 dB(A) loud |
||
min: | ||
| HP Omen 17-cb0020ng i9-9880H, GeForce RTX 2080 Mobile | MSI GE75 9SG i9-9880H, GeForce RTX 2080 Mobile | MSI GT76 Titan DT 9SG i9-9900K, GeForce RTX 2080 Mobile | Schenker XMG Ultra 17 Turing i9-9900K, GeForce RTX 2080 Mobile | Alienware Area-51m i9-9900K RTX 2080 i9-9900K, GeForce RTX 2080 Mobile | Average of class Gaming | |
|---|---|---|---|---|---|---|
| Noise | 5% | -5% | 1% | -1% | 16% | |
| off / environment * (dB) | 30 | 28.2 6% | 30 -0% | 30 -0% | 28.1 6% | 24.1 ? 20% |
| Idle Minimum * (dB) | 34 | 30.4 11% | 33 3% | 30 12% | 28.1 17% | 25.8 ? 24% |
| Idle Average * (dB) | 35 | 30.4 13% | 34 3% | 33 6% | 28.6 18% | 27.4 ? 22% |
| Idle Maximum * (dB) | 36 | 33.4 7% | 44 -22% | 35 3% | 51 -42% | 30 ? 17% |
| Load Average * (dB) | 51 | 37.1 27% | 47 8% | 44 14% | 51 -0% | 43 ? 16% |
| Witcher 3 ultra * (dB) | 47 | 54.2 -15% | 53 -13% | 55 -17% | 51 -9% | |
| Load Maximum * (dB) | 51 | 56.4 -11% | 59 -16% | 58 -14% | 51 -0% | 54 ? -6% |
* ... smaller is better
Temperature
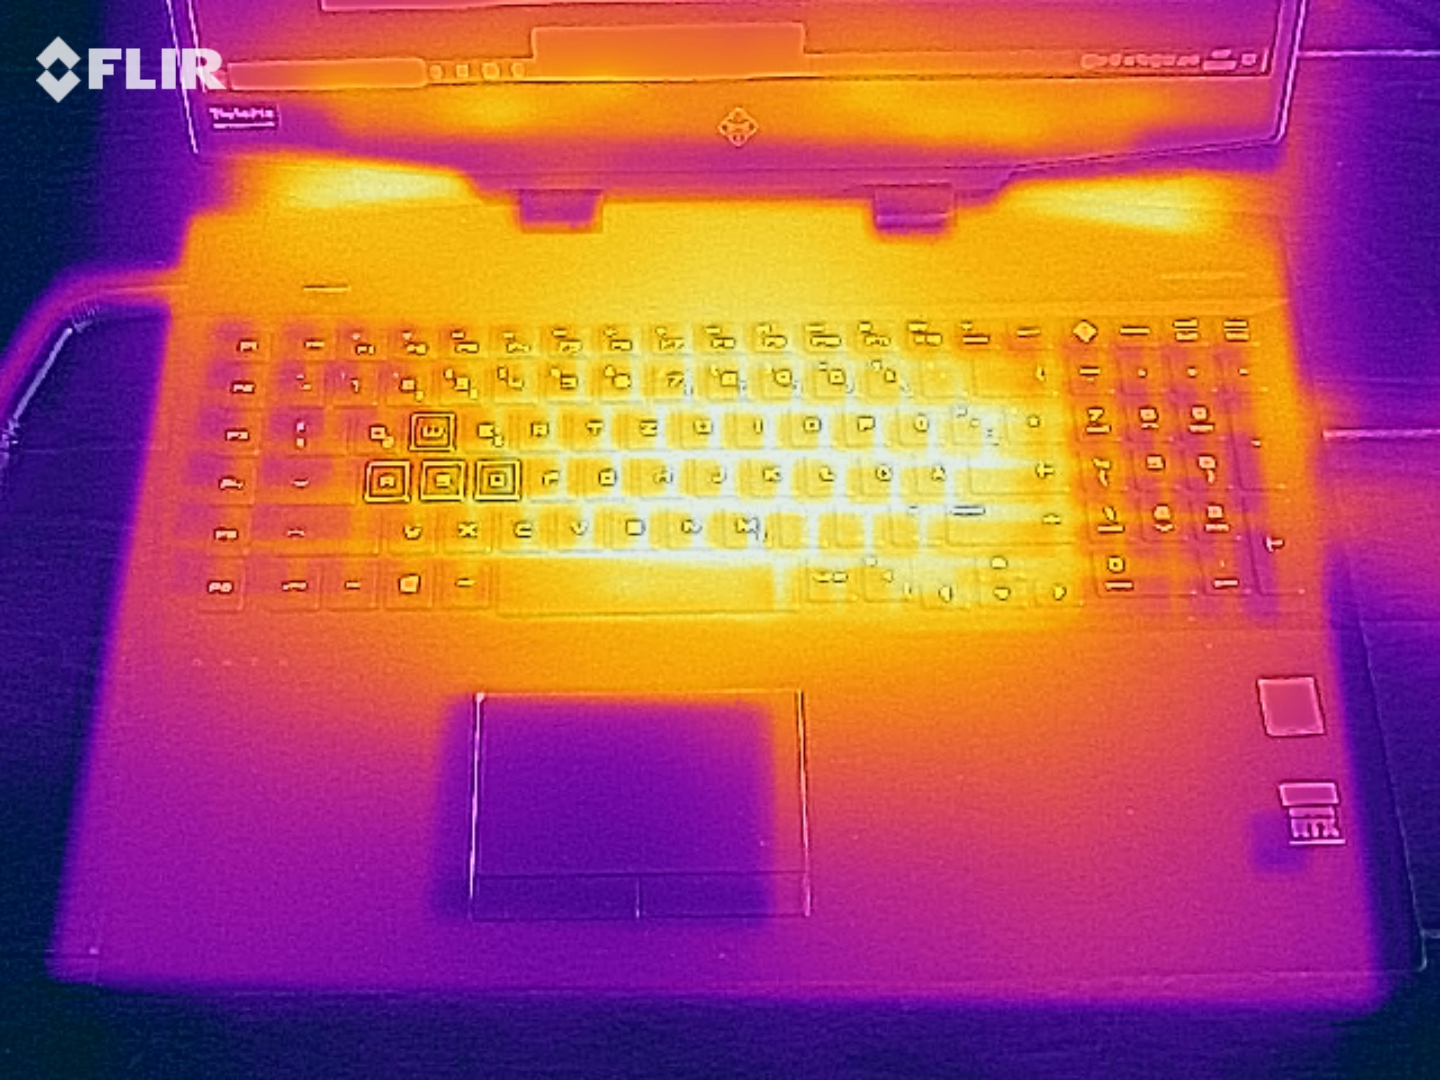
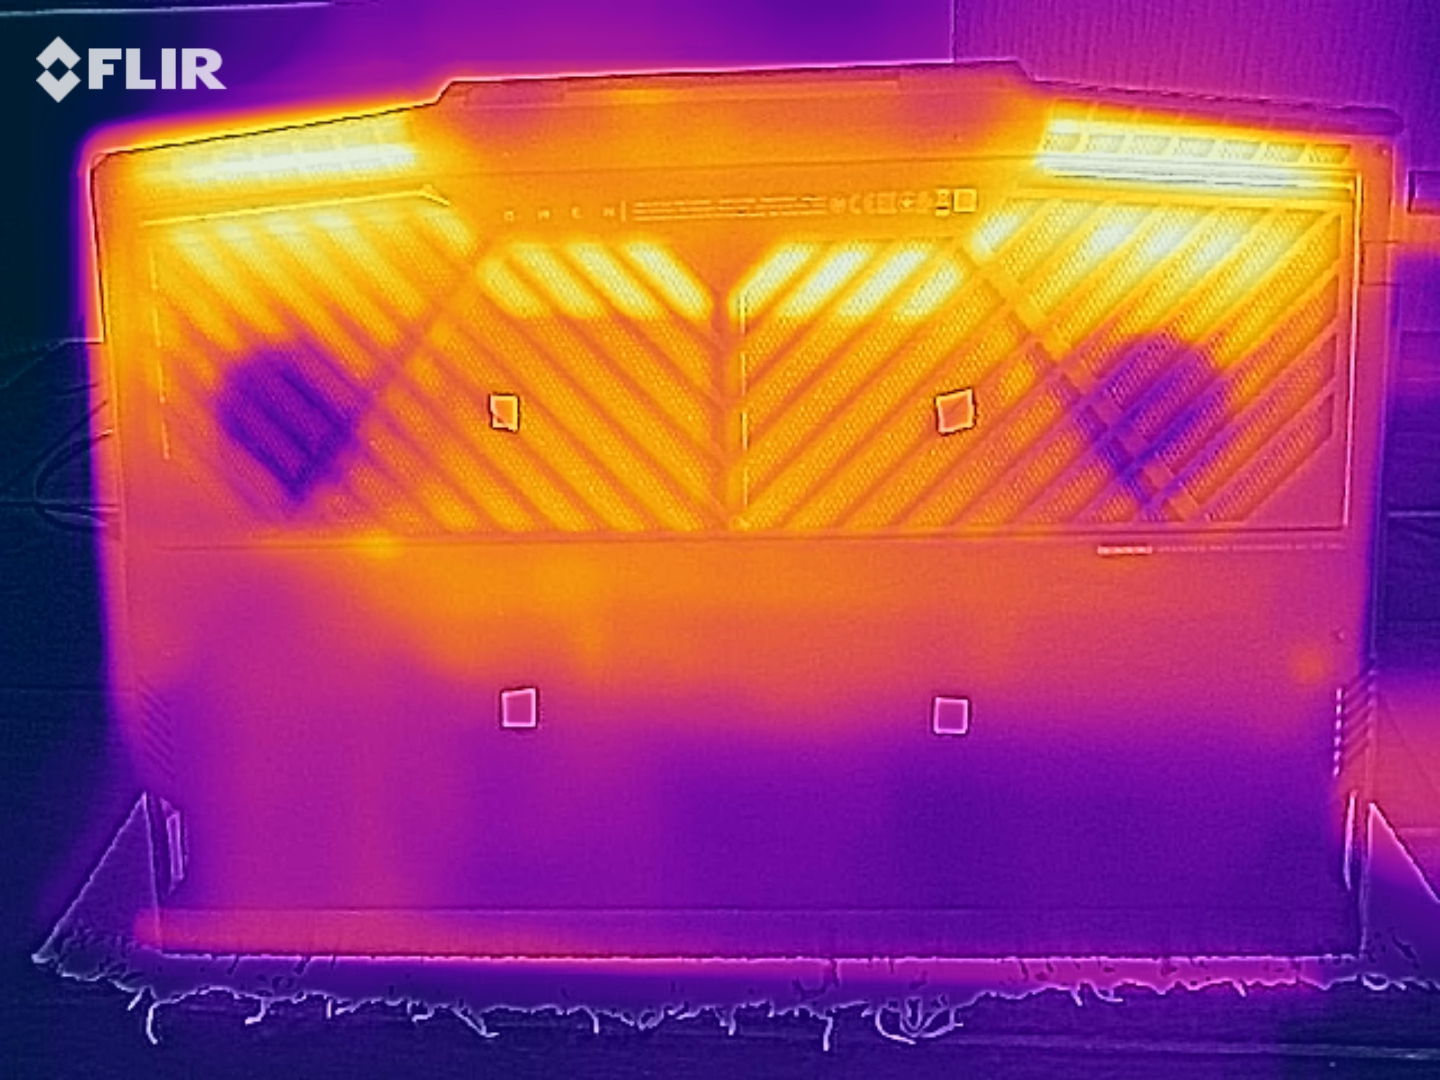
The temperature development of the Omen 17 is similar to that of its competition. The case reaches a maximum of 47 °C (~117 °F) on the top and 54 °C (~129 °F) on the bottom of the base unit, which is typical for a notebook of this performance range. The surface remains relatively cool at around 30 °C (~86 °F) while idling.
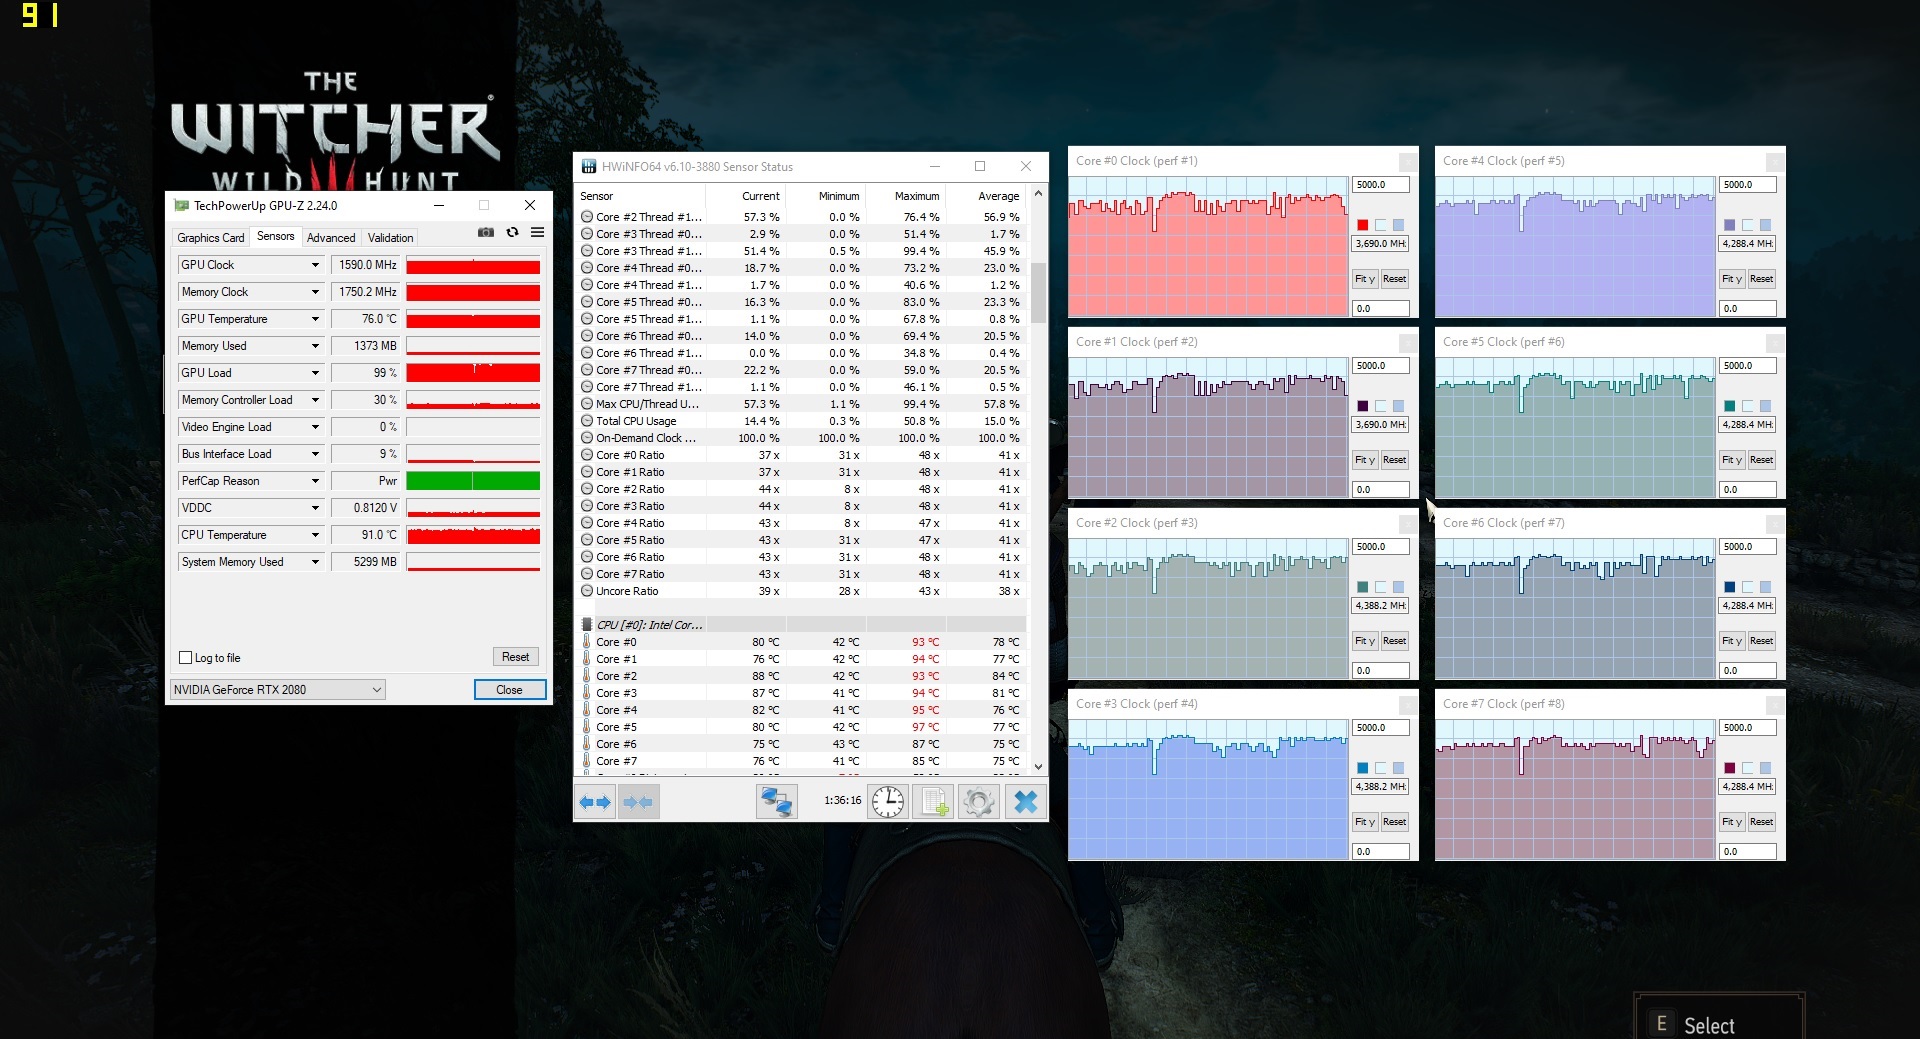
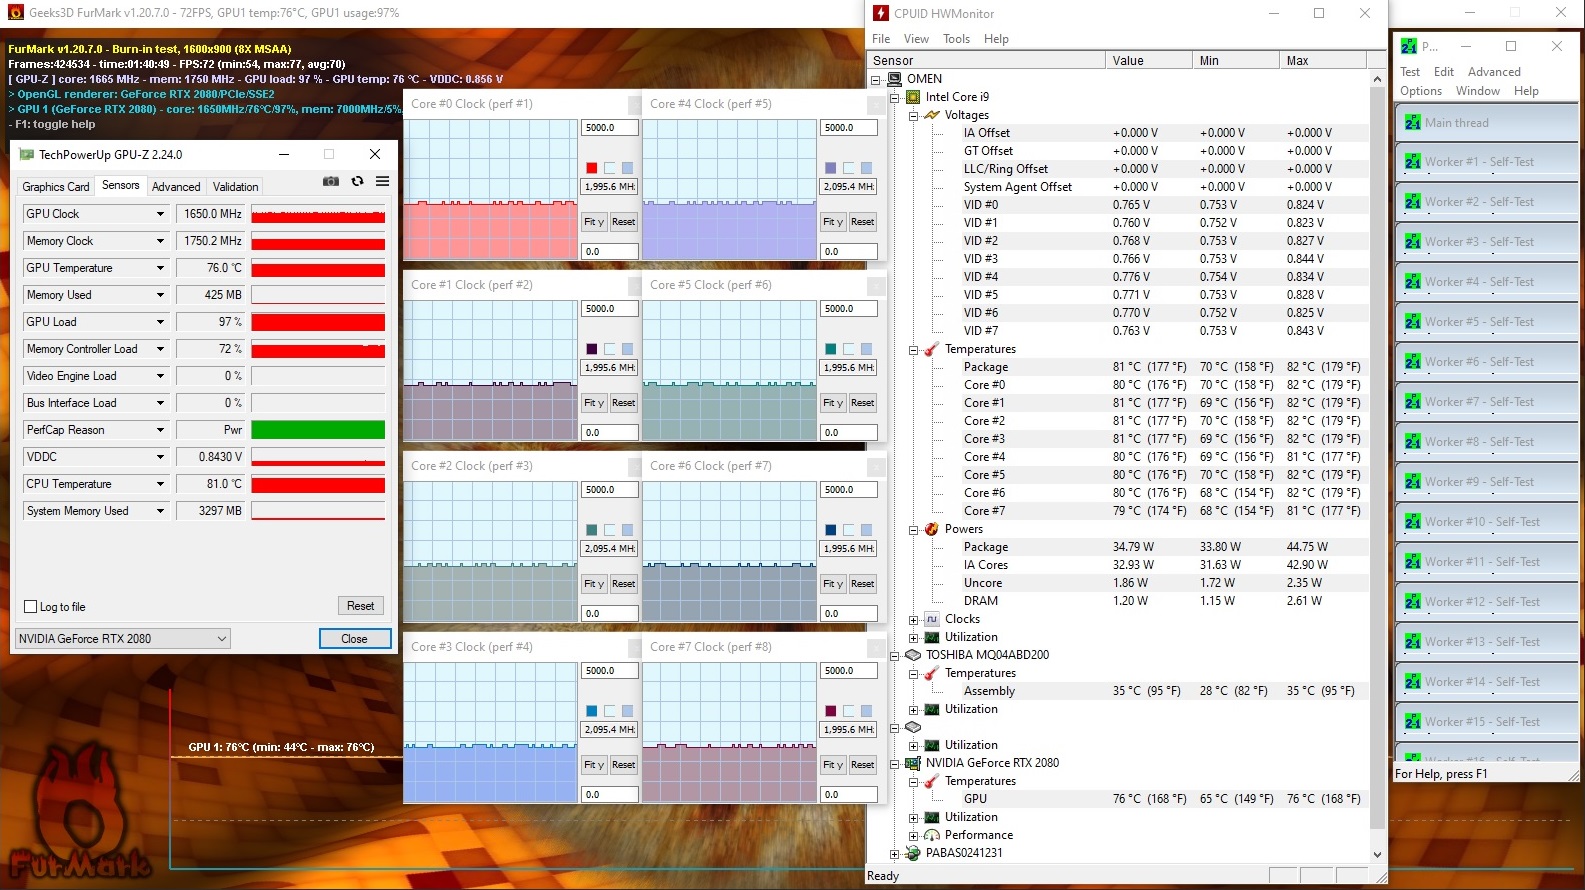
Now let us take a look at the insides. While the components become relatively warm under load, they do not heat up too much. Both during "Witcher 3" and under maximum load using FurMark and Prime95, the CPU and GPU only heat up to around 80 °C (~176 °F). While the GeForce RTX 2080 did not throttle during the stress test, the clock rate of the Core i9-9880H dropped to around 2.0 to 2.1 GHz at maximum load.
(-) The maximum temperature on the upper side is 47 °C / 117 F, compared to the average of 40.4 °C / 105 F, ranging from 21.2 to 68.8 °C for the class Gaming.
(-) The bottom heats up to a maximum of 54 °C / 129 F, compared to the average of 43.2 °C / 110 F
(+) In idle usage, the average temperature for the upper side is 29.2 °C / 85 F, compared to the device average of 33.9 °C / 93 F.
(-) Playing The Witcher 3, the average temperature for the upper side is 42.6 °C / 109 F, compared to the device average of 33.9 °C / 93 F.
(±) The palmrests and touchpad can get very hot to the touch with a maximum of 38 °C / 100.4 F.
(-) The average temperature of the palmrest area of similar devices was 28.8 °C / 83.8 F (-9.2 °C / -16.6 F).
| HP Omen 17-cb0020ng i9-9880H, GeForce RTX 2080 Mobile | MSI GE75 9SG i9-9880H, GeForce RTX 2080 Mobile | MSI GT76 Titan DT 9SG i9-9900K, GeForce RTX 2080 Mobile | Schenker XMG Ultra 17 Turing i9-9900K, GeForce RTX 2080 Mobile | Alienware Area-51m i9-9900K RTX 2080 i9-9900K, GeForce RTX 2080 Mobile | Average of class Gaming | |
|---|---|---|---|---|---|---|
| Heat | -15% | 3% | -1% | -6% | 1% | |
| Maximum Upper Side * (°C) | 47 | 48.8 -4% | 51 -9% | 45 4% | 47 -0% | 45.2 ? 4% |
| Maximum Bottom * (°C) | 54 | 52 4% | 57 -6% | 45 17% | 58.8 -9% | 48 ? 11% |
| Idle Upper Side * (°C) | 32 | 36.2 -13% | 26 19% | 36 -13% | 31 3% | 31.1 ? 3% |
| Idle Bottom * (°C) | 30 | 44.4 -48% | 28 7% | 33 -10% | 35 -17% | 34.2 ? -14% |
* ... smaller is better
Speaker
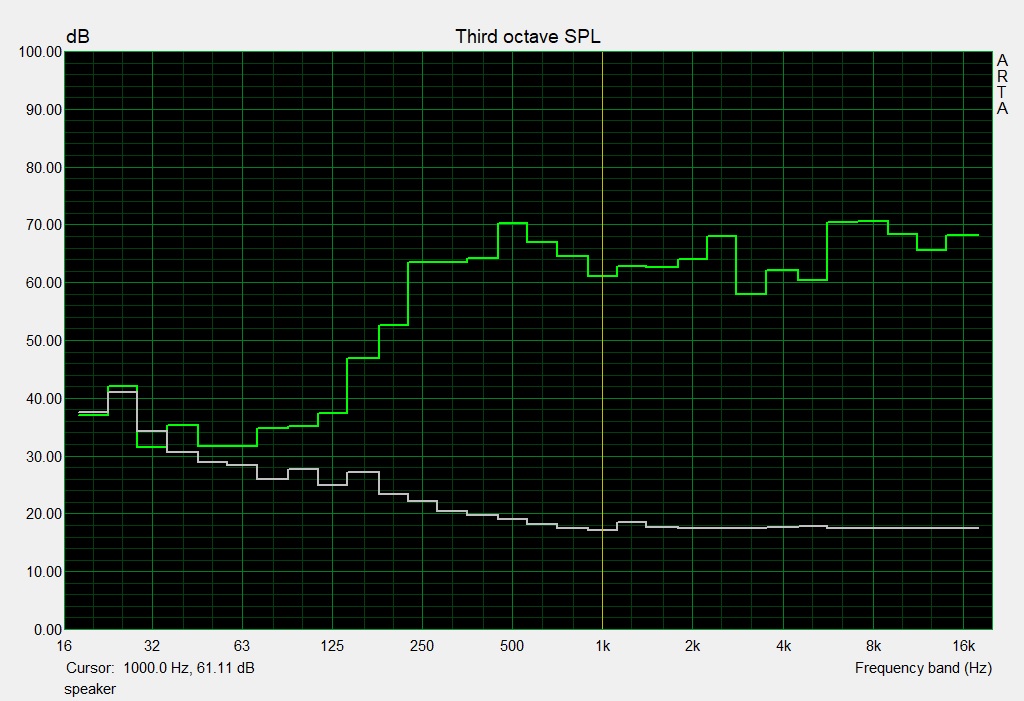
The Omen 17 gets some extra points for its surprisingly good audio quality. The two speakers that are positioned on the sides of the device come from Bang & Olufsen (or rather, they are certified by the company) and offer a fairly balanced sound experience that includes highs, mids and lows - despite not having a subwoofer. Many gaming competitors have to make do with significantly lower sound quality.
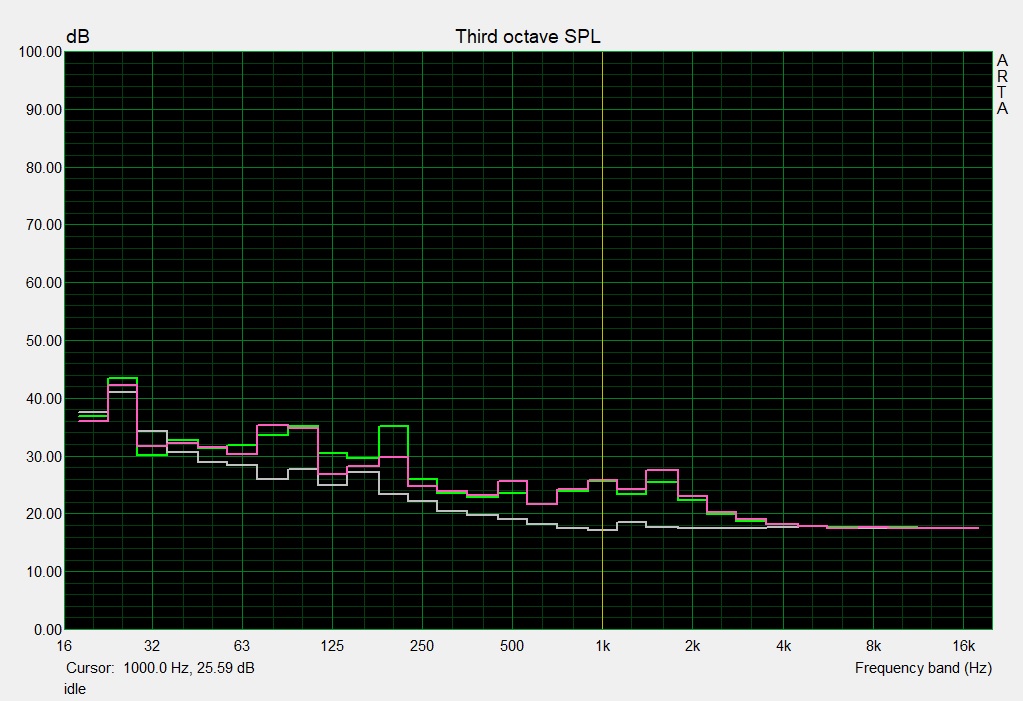
HP Omen 17-cb0020ng audio analysis
(±) | speaker loudness is average but good (78 dB)
Bass 100 - 315 Hz
(±) | reduced bass - on average 13.7% lower than median
(±) | linearity of bass is average (10.5% delta to prev. frequency)
Mids 400 - 2000 Hz
(+) | balanced mids - only 2% away from median
(+) | mids are linear (5.2% delta to prev. frequency)
Highs 2 - 16 kHz
(+) | balanced highs - only 4.8% away from median
(±) | linearity of highs is average (10.1% delta to prev. frequency)
Overall 100 - 16.000 Hz
(±) | linearity of overall sound is average (15.1% difference to median)
Compared to same class
» 32% of all tested devices in this class were better, 6% similar, 62% worse
» The best had a delta of 6%, average was 18%, worst was 132%
Compared to all devices tested
» 21% of all tested devices were better, 4% similar, 75% worse
» The best had a delta of 4%, average was 24%, worst was 134%
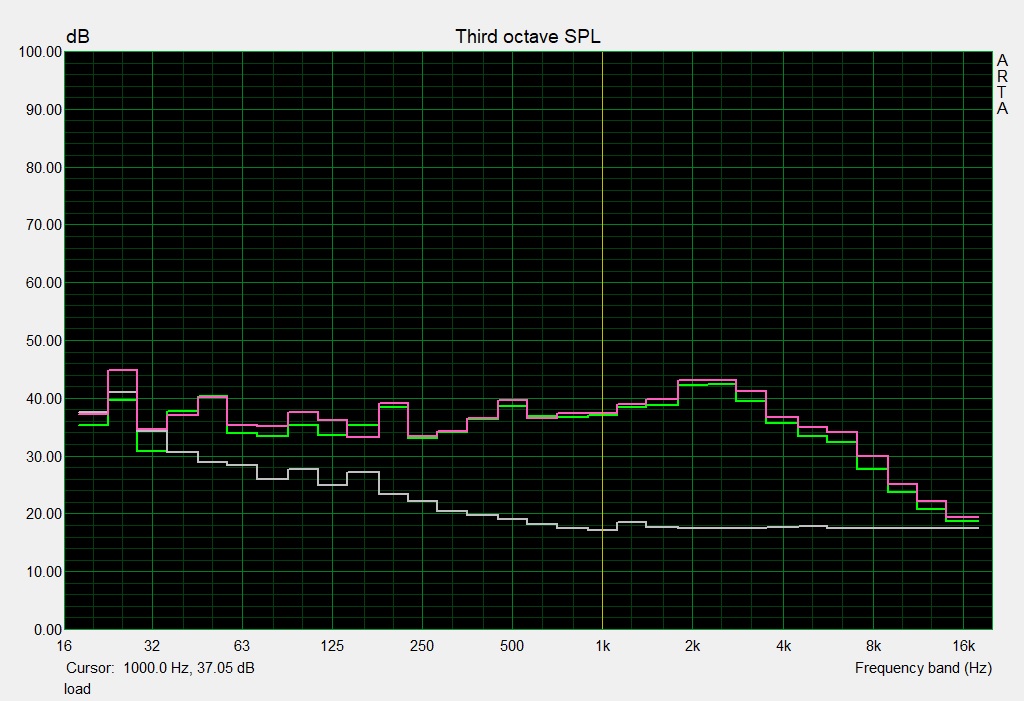
MSI GE75 9SG audio analysis
(+) | speakers can play relatively loud (92.8 dB)
Bass 100 - 315 Hz
(±) | reduced bass - on average 12.2% lower than median
(±) | linearity of bass is average (8.7% delta to prev. frequency)
Mids 400 - 2000 Hz
(±) | higher mids - on average 6.7% higher than median
(±) | linearity of mids is average (11.5% delta to prev. frequency)
Highs 2 - 16 kHz
(+) | balanced highs - only 2.9% away from median
(±) | linearity of highs is average (7.6% delta to prev. frequency)
Overall 100 - 16.000 Hz
(±) | linearity of overall sound is average (16.5% difference to median)
Compared to same class
» 42% of all tested devices in this class were better, 7% similar, 51% worse
» The best had a delta of 6%, average was 18%, worst was 132%
Compared to all devices tested
» 28% of all tested devices were better, 6% similar, 66% worse
» The best had a delta of 4%, average was 24%, worst was 134%
Energy Management
Power Consumption
The lack of Nvidia's Optimus technology has an impact on the power consumption and battery life of the device. The Omen 17 consumes between 26 and 38 watts while idling. This is significantly higher than the power consumption of the MSI notebooks GE75 9SG and GT76 9SG, for example, which is between 14 and 23 watts in this scenario. The HP device is a little more economical than its RTX 2080 competition when working under load. It consumes between 106 and 287 watts under 3D load. The included AC adapter has a rated output of 330 watts, so that still leaves a decent amount of headroom.
| Off / Standby | |
| Idle | |
| Load |
|
Key:
min: | |
| HP Omen 17-cb0020ng i9-9880H, GeForce RTX 2080 Mobile | MSI GE75 9SG i9-9880H, GeForce RTX 2080 Mobile | MSI GT76 Titan DT 9SG i9-9900K, GeForce RTX 2080 Mobile | Schenker XMG Ultra 17 Turing i9-9900K, GeForce RTX 2080 Mobile | Alienware Area-51m i9-9900K RTX 2080 i9-9900K, GeForce RTX 2080 Mobile | Average of class Gaming | |
|---|---|---|---|---|---|---|
| Power Consumption | 19% | 6% | -33% | -22% | 26% | |
| Idle Minimum * (Watt) | 26 | 13.9 47% | 14 46% | 39 -50% | 23.3 10% | 13.2 ? 49% |
| Idle Average * (Watt) | 29 | 18.8 35% | 18 38% | 45 -55% | 33.5 -16% | 18.9 ? 35% |
| Idle Maximum * (Watt) | 38 | 23.1 39% | 23 39% | 55 -45% | 38.4 -1% | 24.3 ? 36% |
| Load Average * (Watt) | 106 | 112.3 -6% | 114 -8% | 122 -15% | 114.1 -8% | 108 ? -2% |
| Witcher 3 ultra * (Watt) | 228 | 231 -1% | 283 -24% | 259 -14% | 339.5 -49% | |
| Load Maximum * (Watt) | 287 | 291.5 -2% | 443 -54% | 346 -21% | 485.1 -69% | 254 ? 11% |
* ... smaller is better
Battery Life
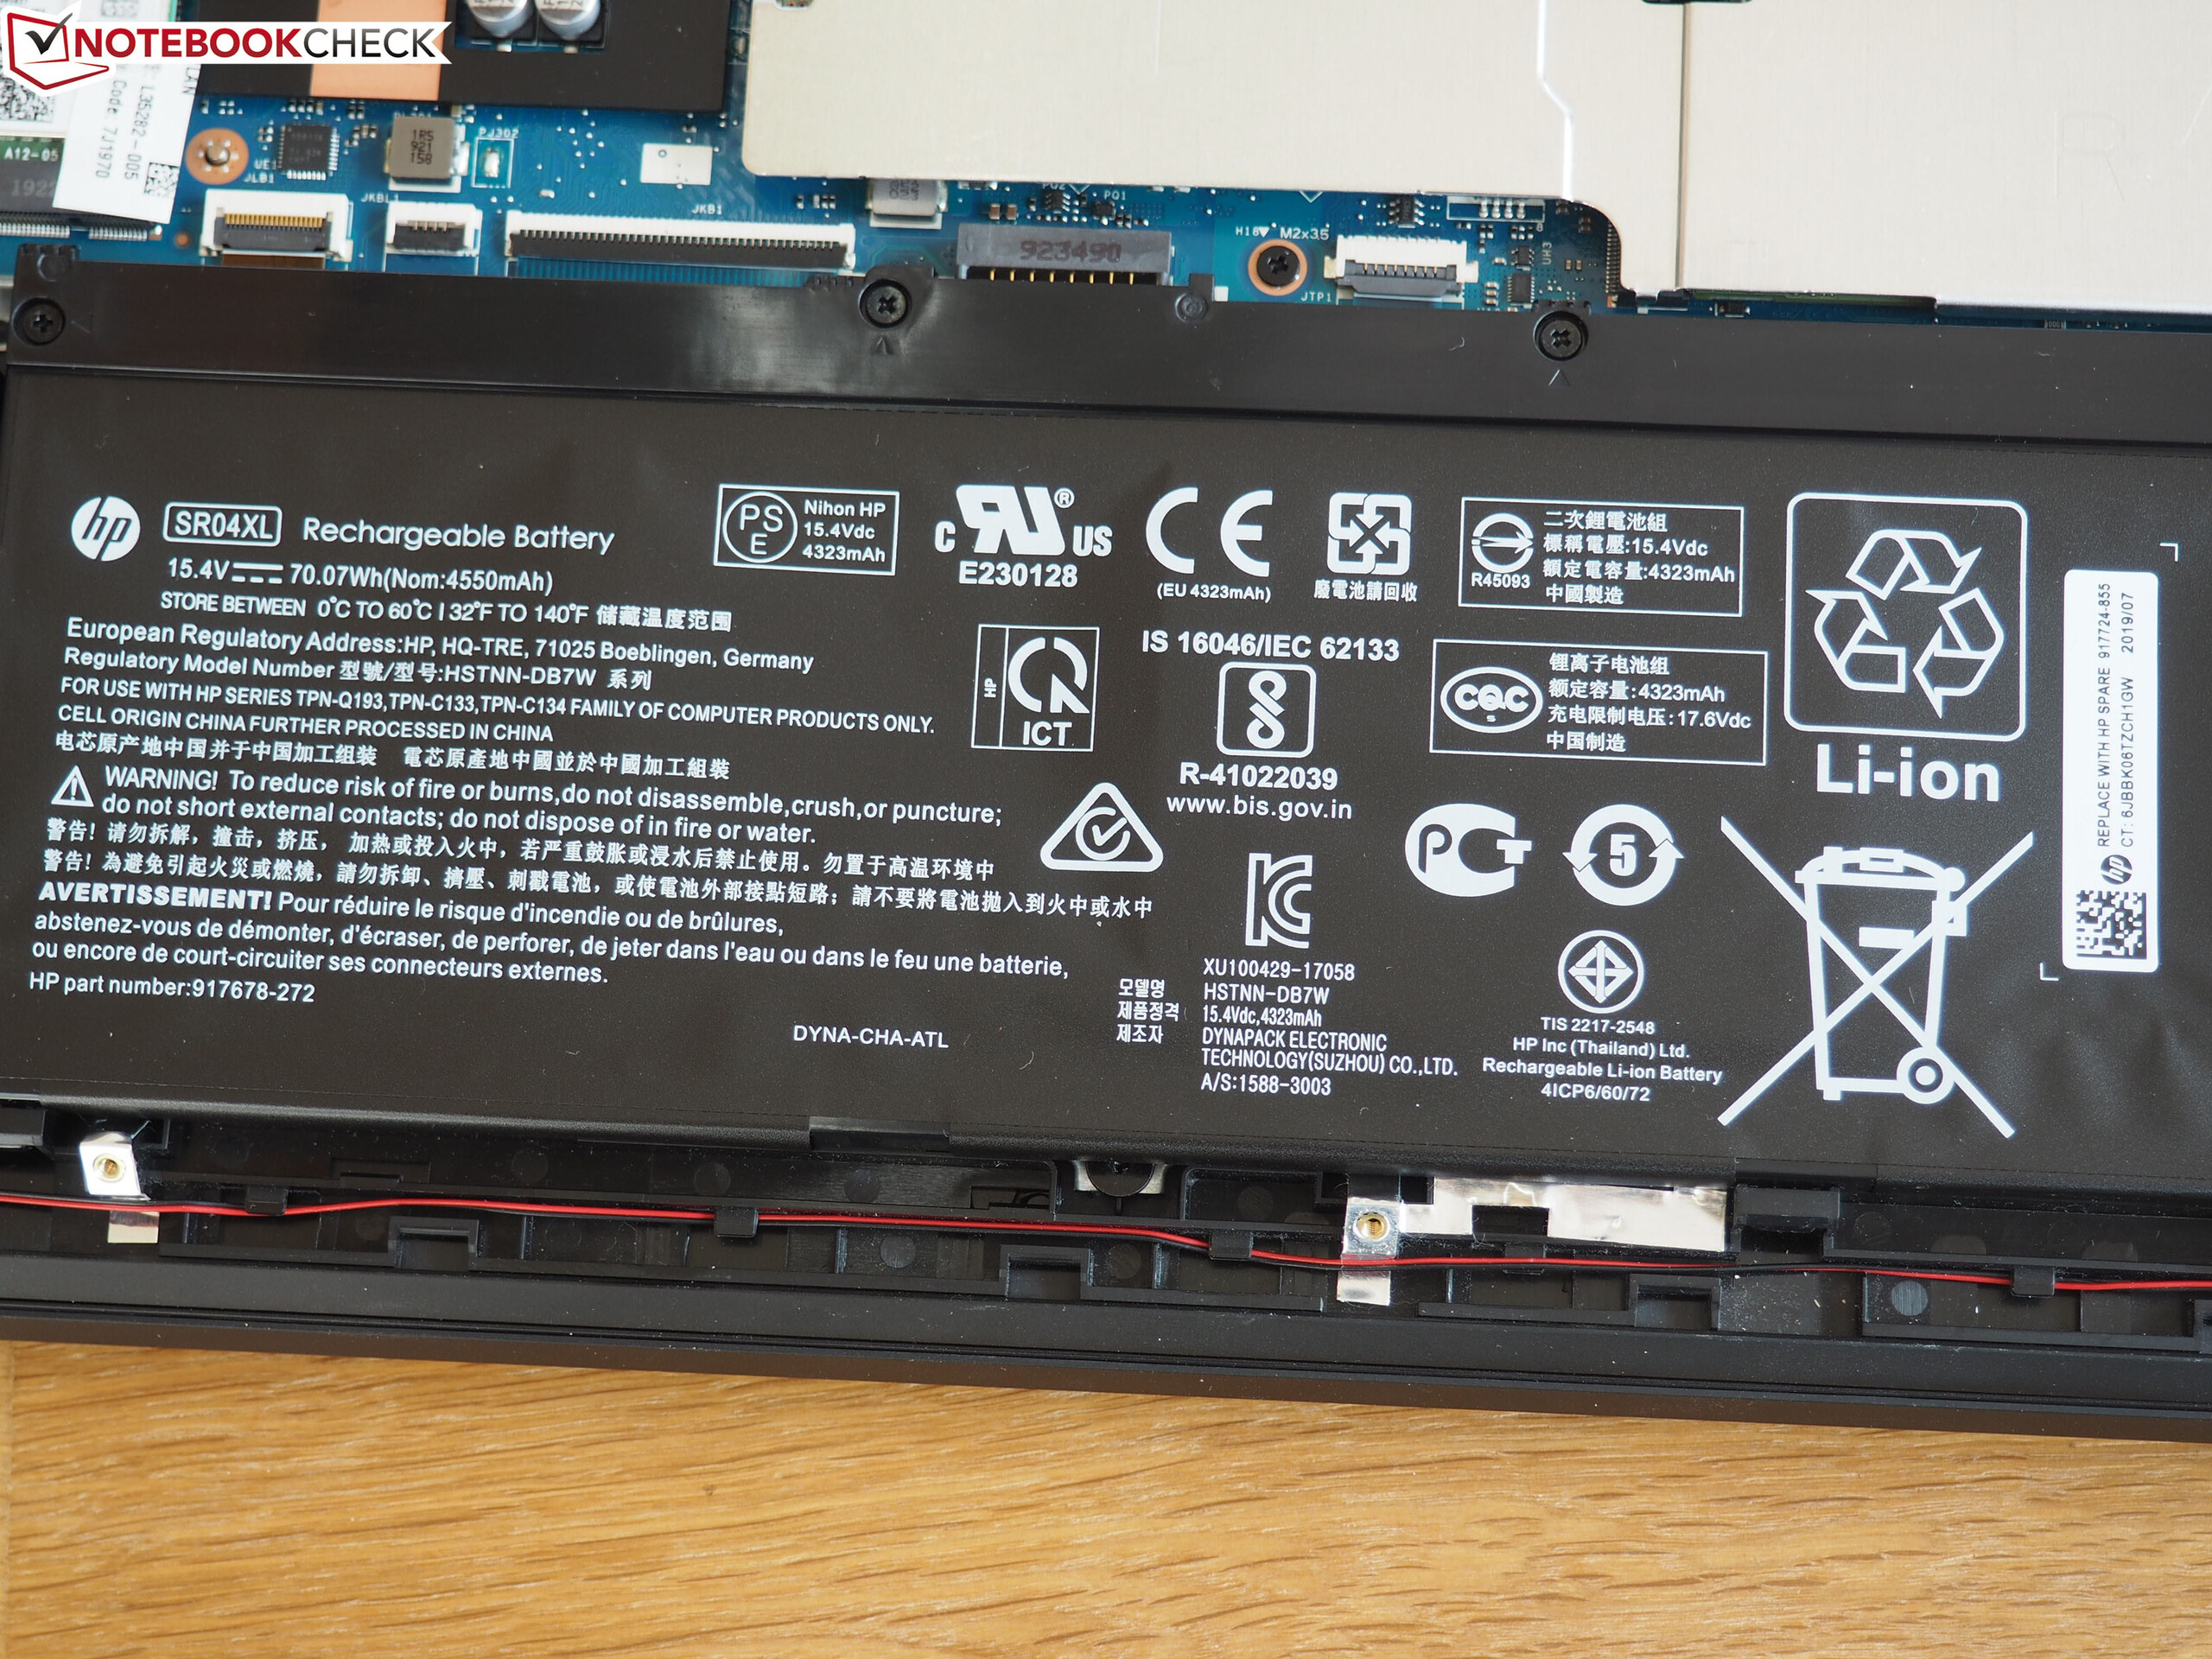
If a long battery life is important to you, you might want to look elsewhere. In 2019, the Omen 17's one to four hours max is meagre, even for a gaming notebook. HP has given the Omen 17 an 8-cell battery with a capacity of 70 Wh. This cannot compare with the batteries of the MSI GT75 9SG, Schenker XMG Ultra 17 or Alienware Area 51m, which have battery capacities ranging from 82 to 90 Wh. Only the MSI GE75 9SG has a smaller battery (65 Wh), but compensates for this by using Nvidia's graphics switching technology.
| HP Omen 17-cb0020ng i9-9880H, GeForce RTX 2080 Mobile, 70 Wh | MSI GE75 9SG i9-9880H, GeForce RTX 2080 Mobile, 65 Wh | MSI GT76 Titan DT 9SG i9-9900K, GeForce RTX 2080 Mobile, 90 Wh | Schenker XMG Ultra 17 Turing i9-9900K, GeForce RTX 2080 Mobile, 82 Wh | Alienware Area-51m i9-9900K RTX 2080 i9-9900K, GeForce RTX 2080 Mobile, 90 Wh | Average of class Gaming | |
|---|---|---|---|---|---|---|
| Battery runtime | 48% | 32% | -21% | -25% | 85% | |
| Reader / Idle (h) | 4.2 | 6.8 62% | 2.8 -33% | 2.6 -38% | 8.71 ? 107% | |
| WiFi v1.3 (h) | 3.3 | 4.9 48% | 5 52% | 2.3 -30% | 2.1 -36% | 7.02 ? 113% |
| Load (h) | 1.1 | 0.9 -18% | 1.1 0% | 1.1 0% | 1.47 ? 34% | |
| H.264 (h) | 2.3 | 8.26 ? |
Pros
Cons
Verdict
At the end of the day, the HP Omen 17-cb0020ng manages to score top marks.
Let us start with the positives. Apart from the relatively good price-to-performance ratio compared to the RTX 2080 competition (granted, the 17-inch laptop is quite expensive nonetheless) we were also impressed by the design of the case. The audio and port selection (Thunderbolt 3), as well as the great 144-Hz display with support for G-Sync, all play their part in making this a good notebook.
We were less impressed by the level of system noise during 3D applications, the subpar maintenance options and the modest CPU clock rate under multi-core load. The limited battery life rounds off the list of rather disappointing aspects.
HP Omen 17-cb0020ng
- 05/14/2020 v7 (old)
Florian Glaser
Price comparison

