Alienware Area-51m (i9-9900K, RTX 2080) Laptop Review
Unveiled at CES 2019, the Area-51m represents a pivotal moment for Dell and Alienware. The OEM has discontinued its venerable Alienware 17 series after all these years to introduce a completely new design that will likely become the baseline for future Alienware laptops. Even the name is a deliberate nod to the original Alienware Area-51 laptop we reviewed over a decade ago.
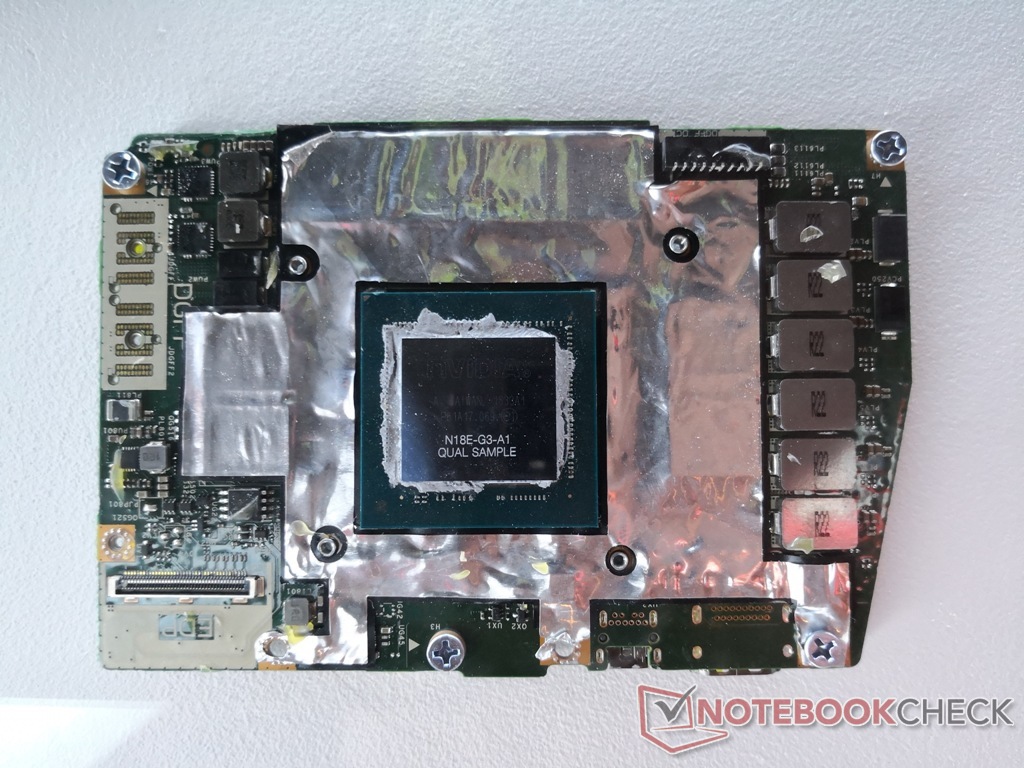
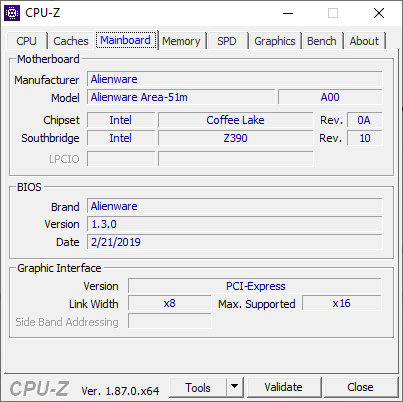
There are several key aspects about the Area-51m that make it special when compared to competing 17.3-inch gaming laptops already in the market. For one, it's one of the few laptops that integrate Tobii eye-tracking for support on certain titles. Secondly, the system utilizes a standard 95+ W desktop Core i9-9900K CPU instead of the usual 45 W mobile Core i7 or i9 series found on most gaming laptops. Lastly, its RTX 2080 GPU is a removable and upgradeable Dell Graphics Form Factor (DGFF) card in the same vein as the MXM GPU. Combine this with a new chassis that optimizes airflow and you have the most powerful Alienware laptop Dell has created yet.
This enthusiast-level gaming laptop doesn't exist in a vacuum, of course, so we'll be comparing it to other 17.3-inch flagship competitors including the Clevo Eurocom Sky X7C, Asus ROG G703GX, MSI GT75 Titan, Acer Predator 17, and the last generation Alienware 17 R5 for good measure. We'll also be comparing it to our reference desktop PC equipped with an equivalent Core i9-9900K CPU and RTX 2080 GPU. After all, Dell is claiming a performance level similar to a desktop and so we'll be putting that to the test.
More Alienware reviews:
Case
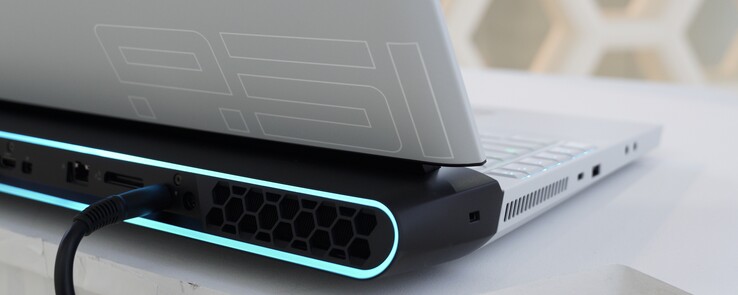
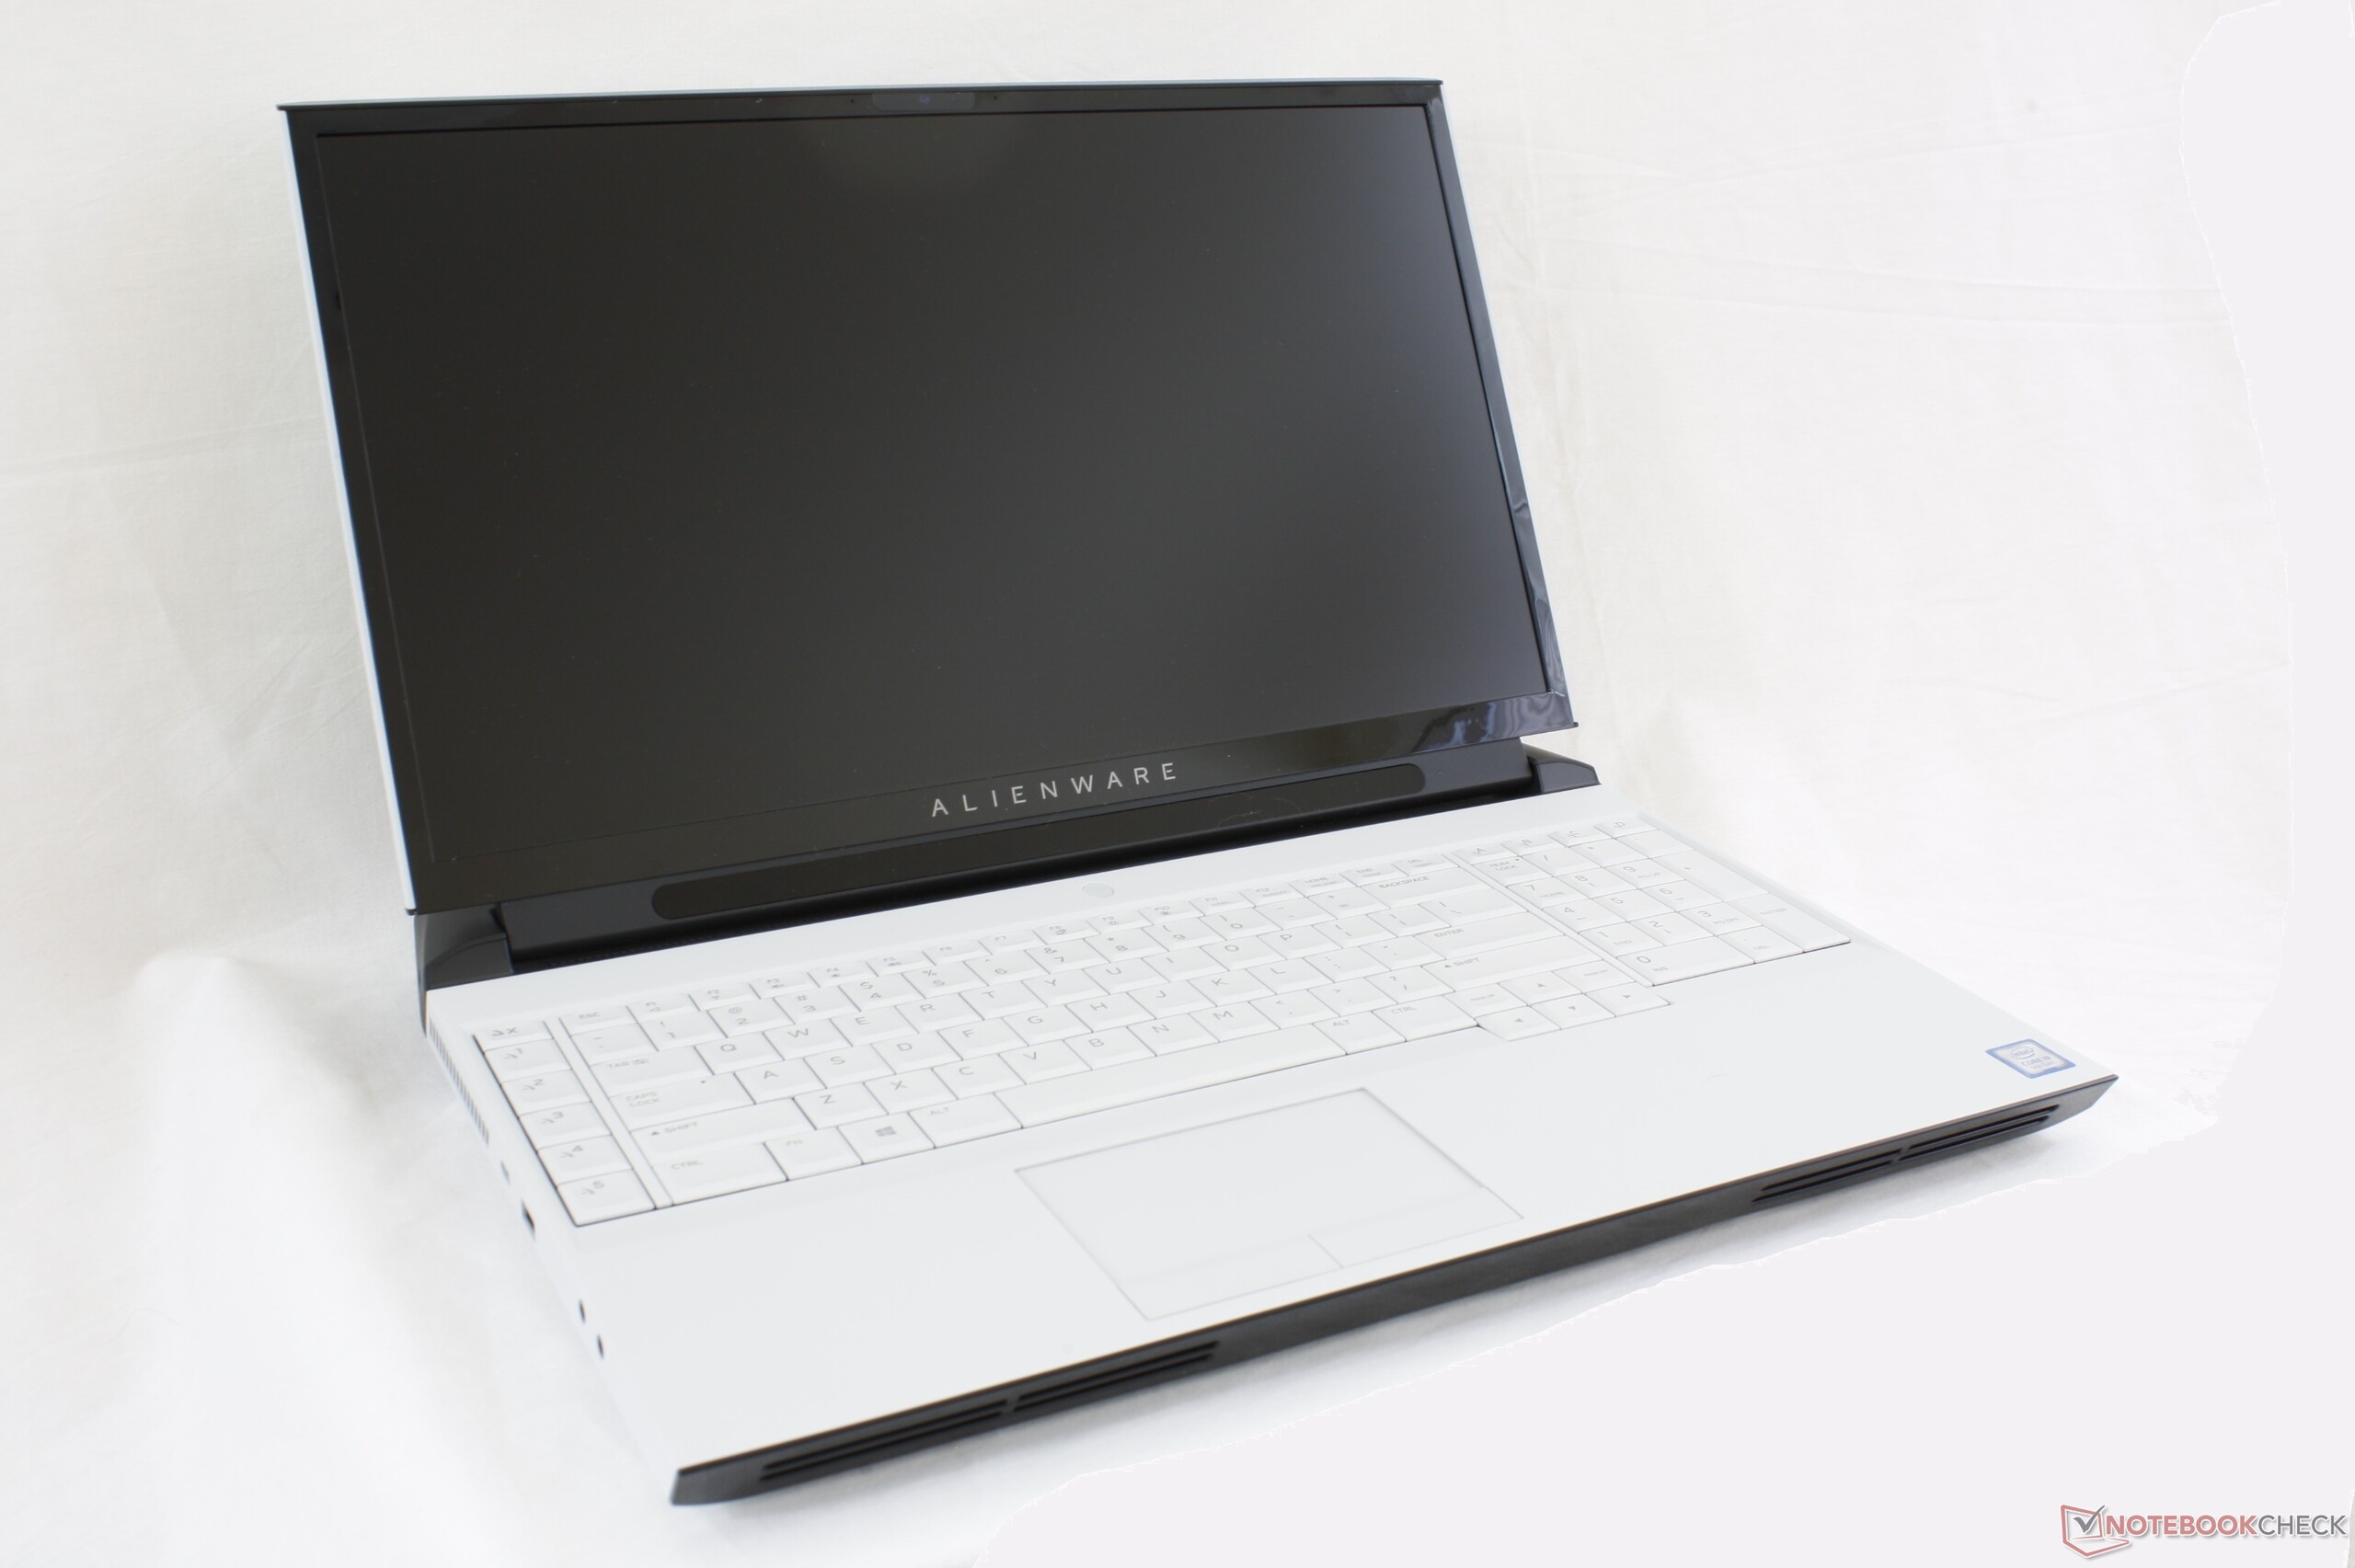
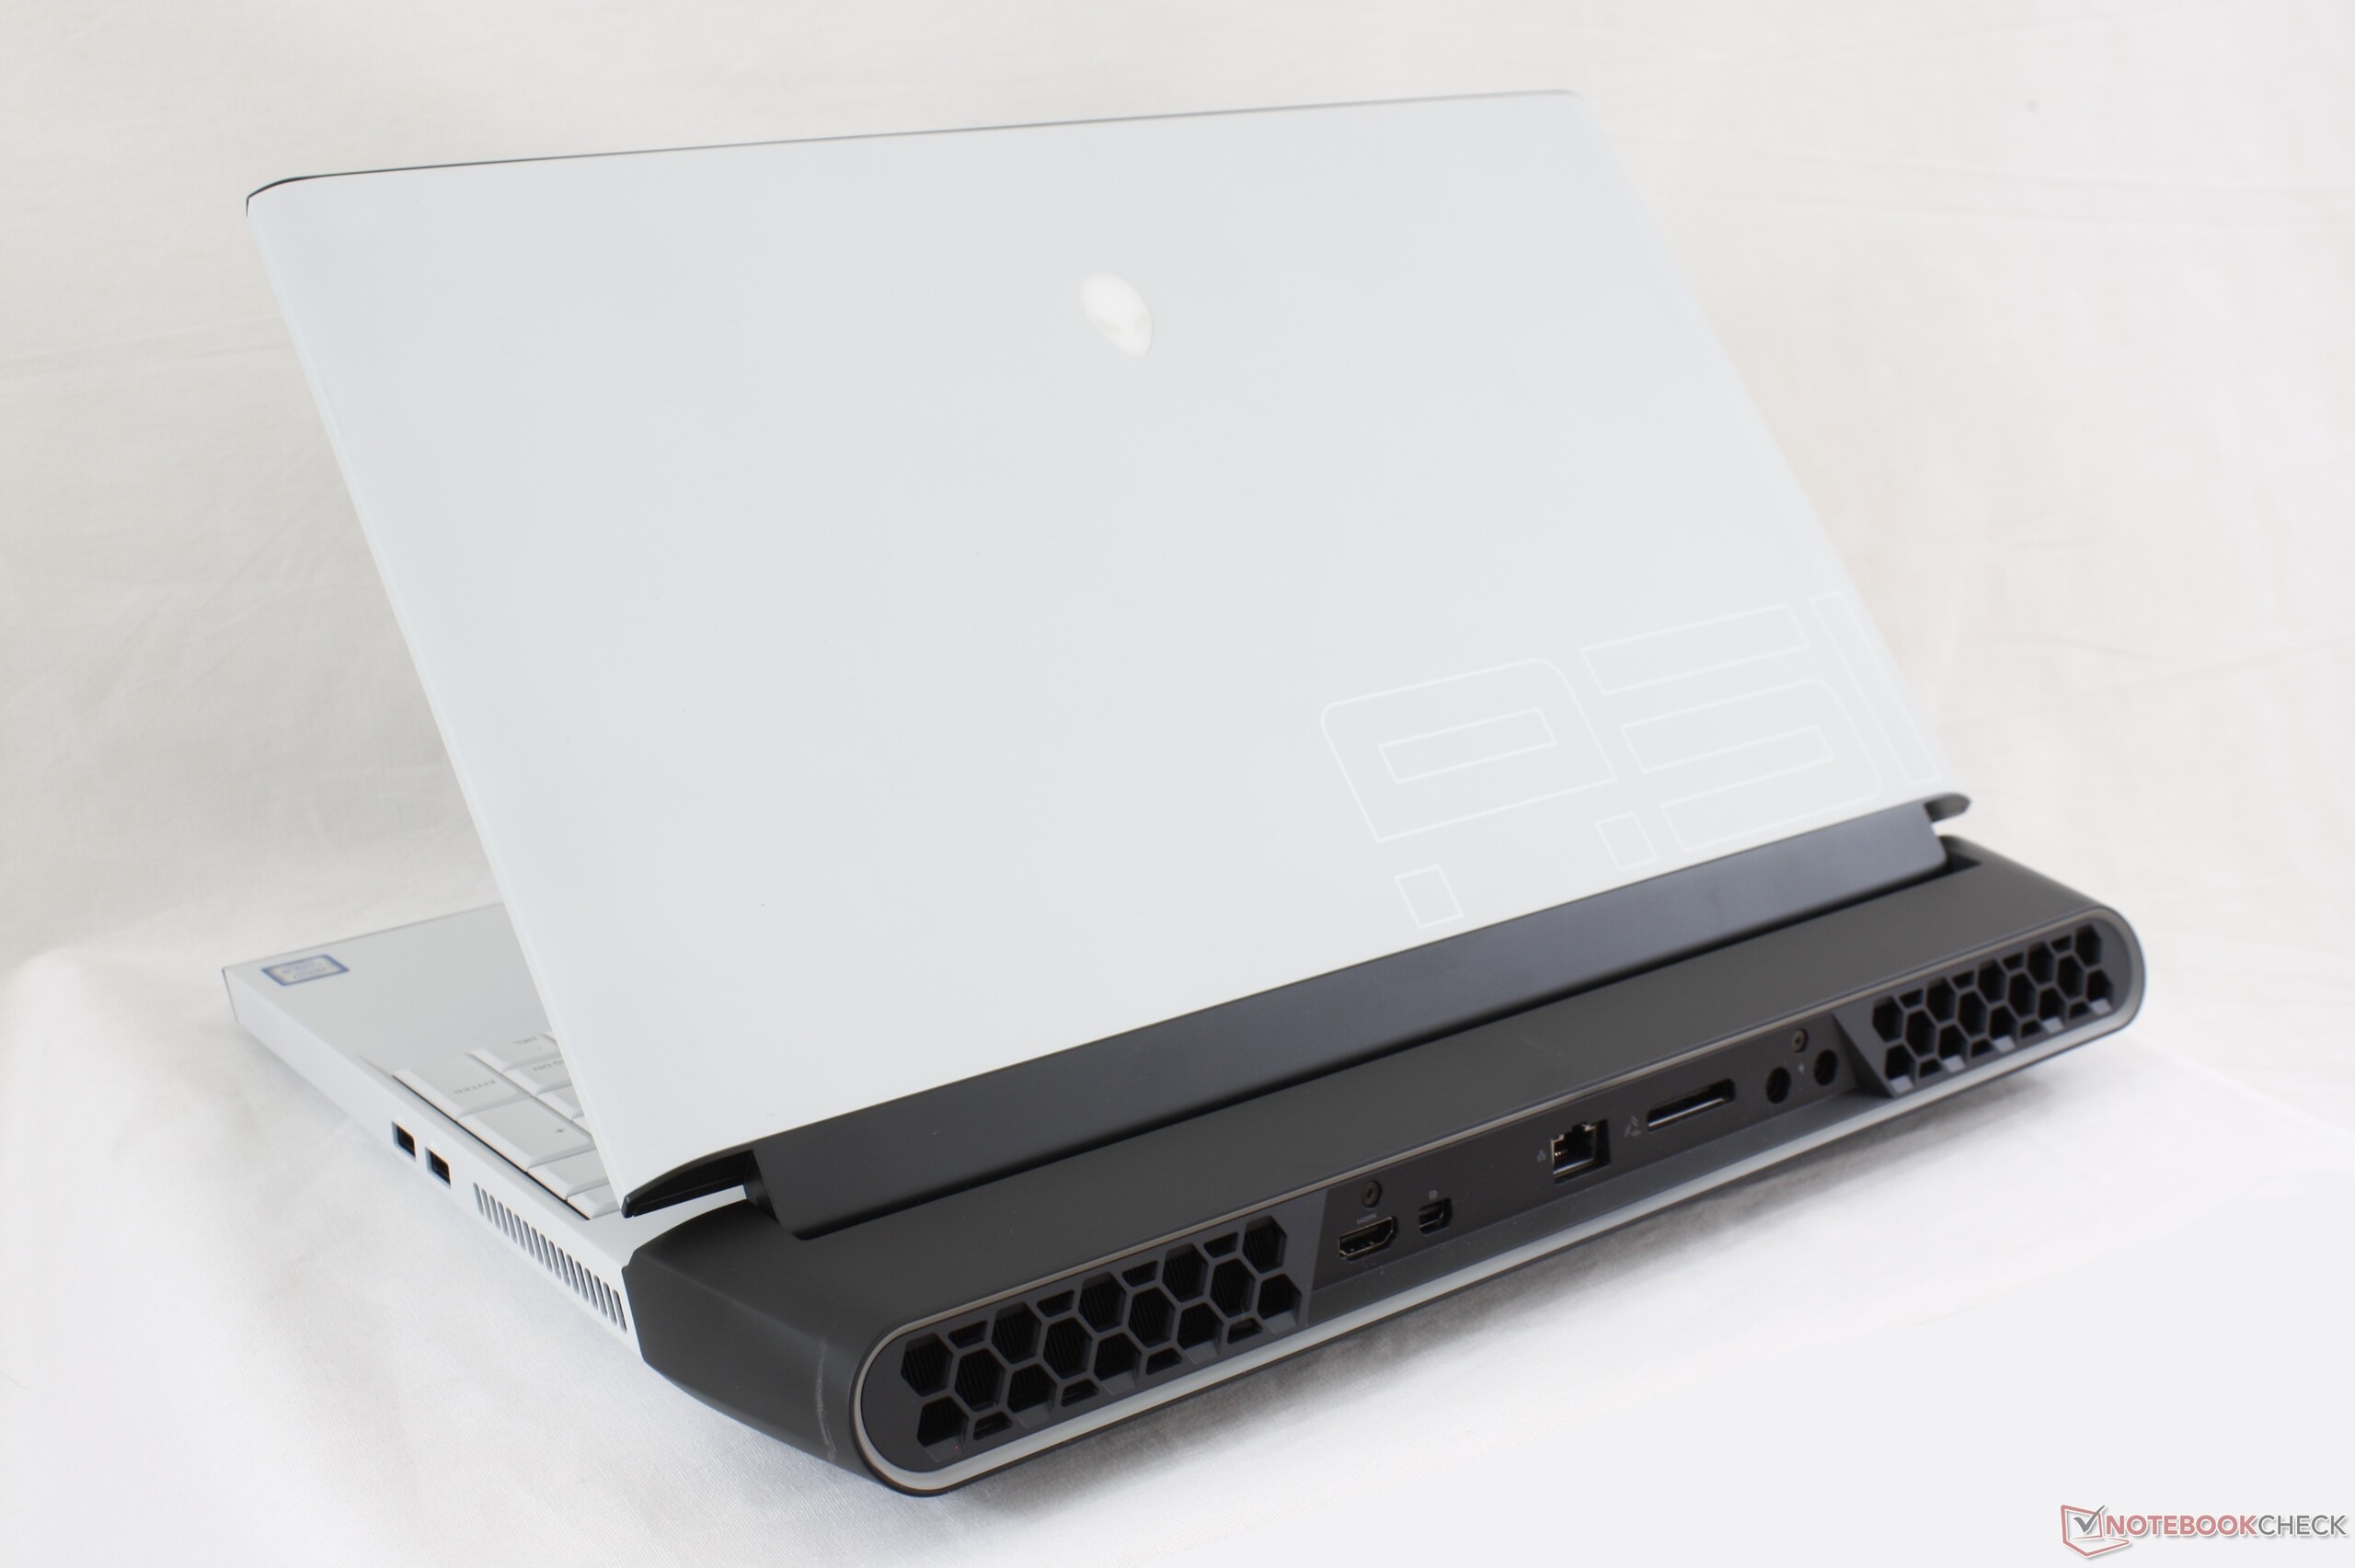
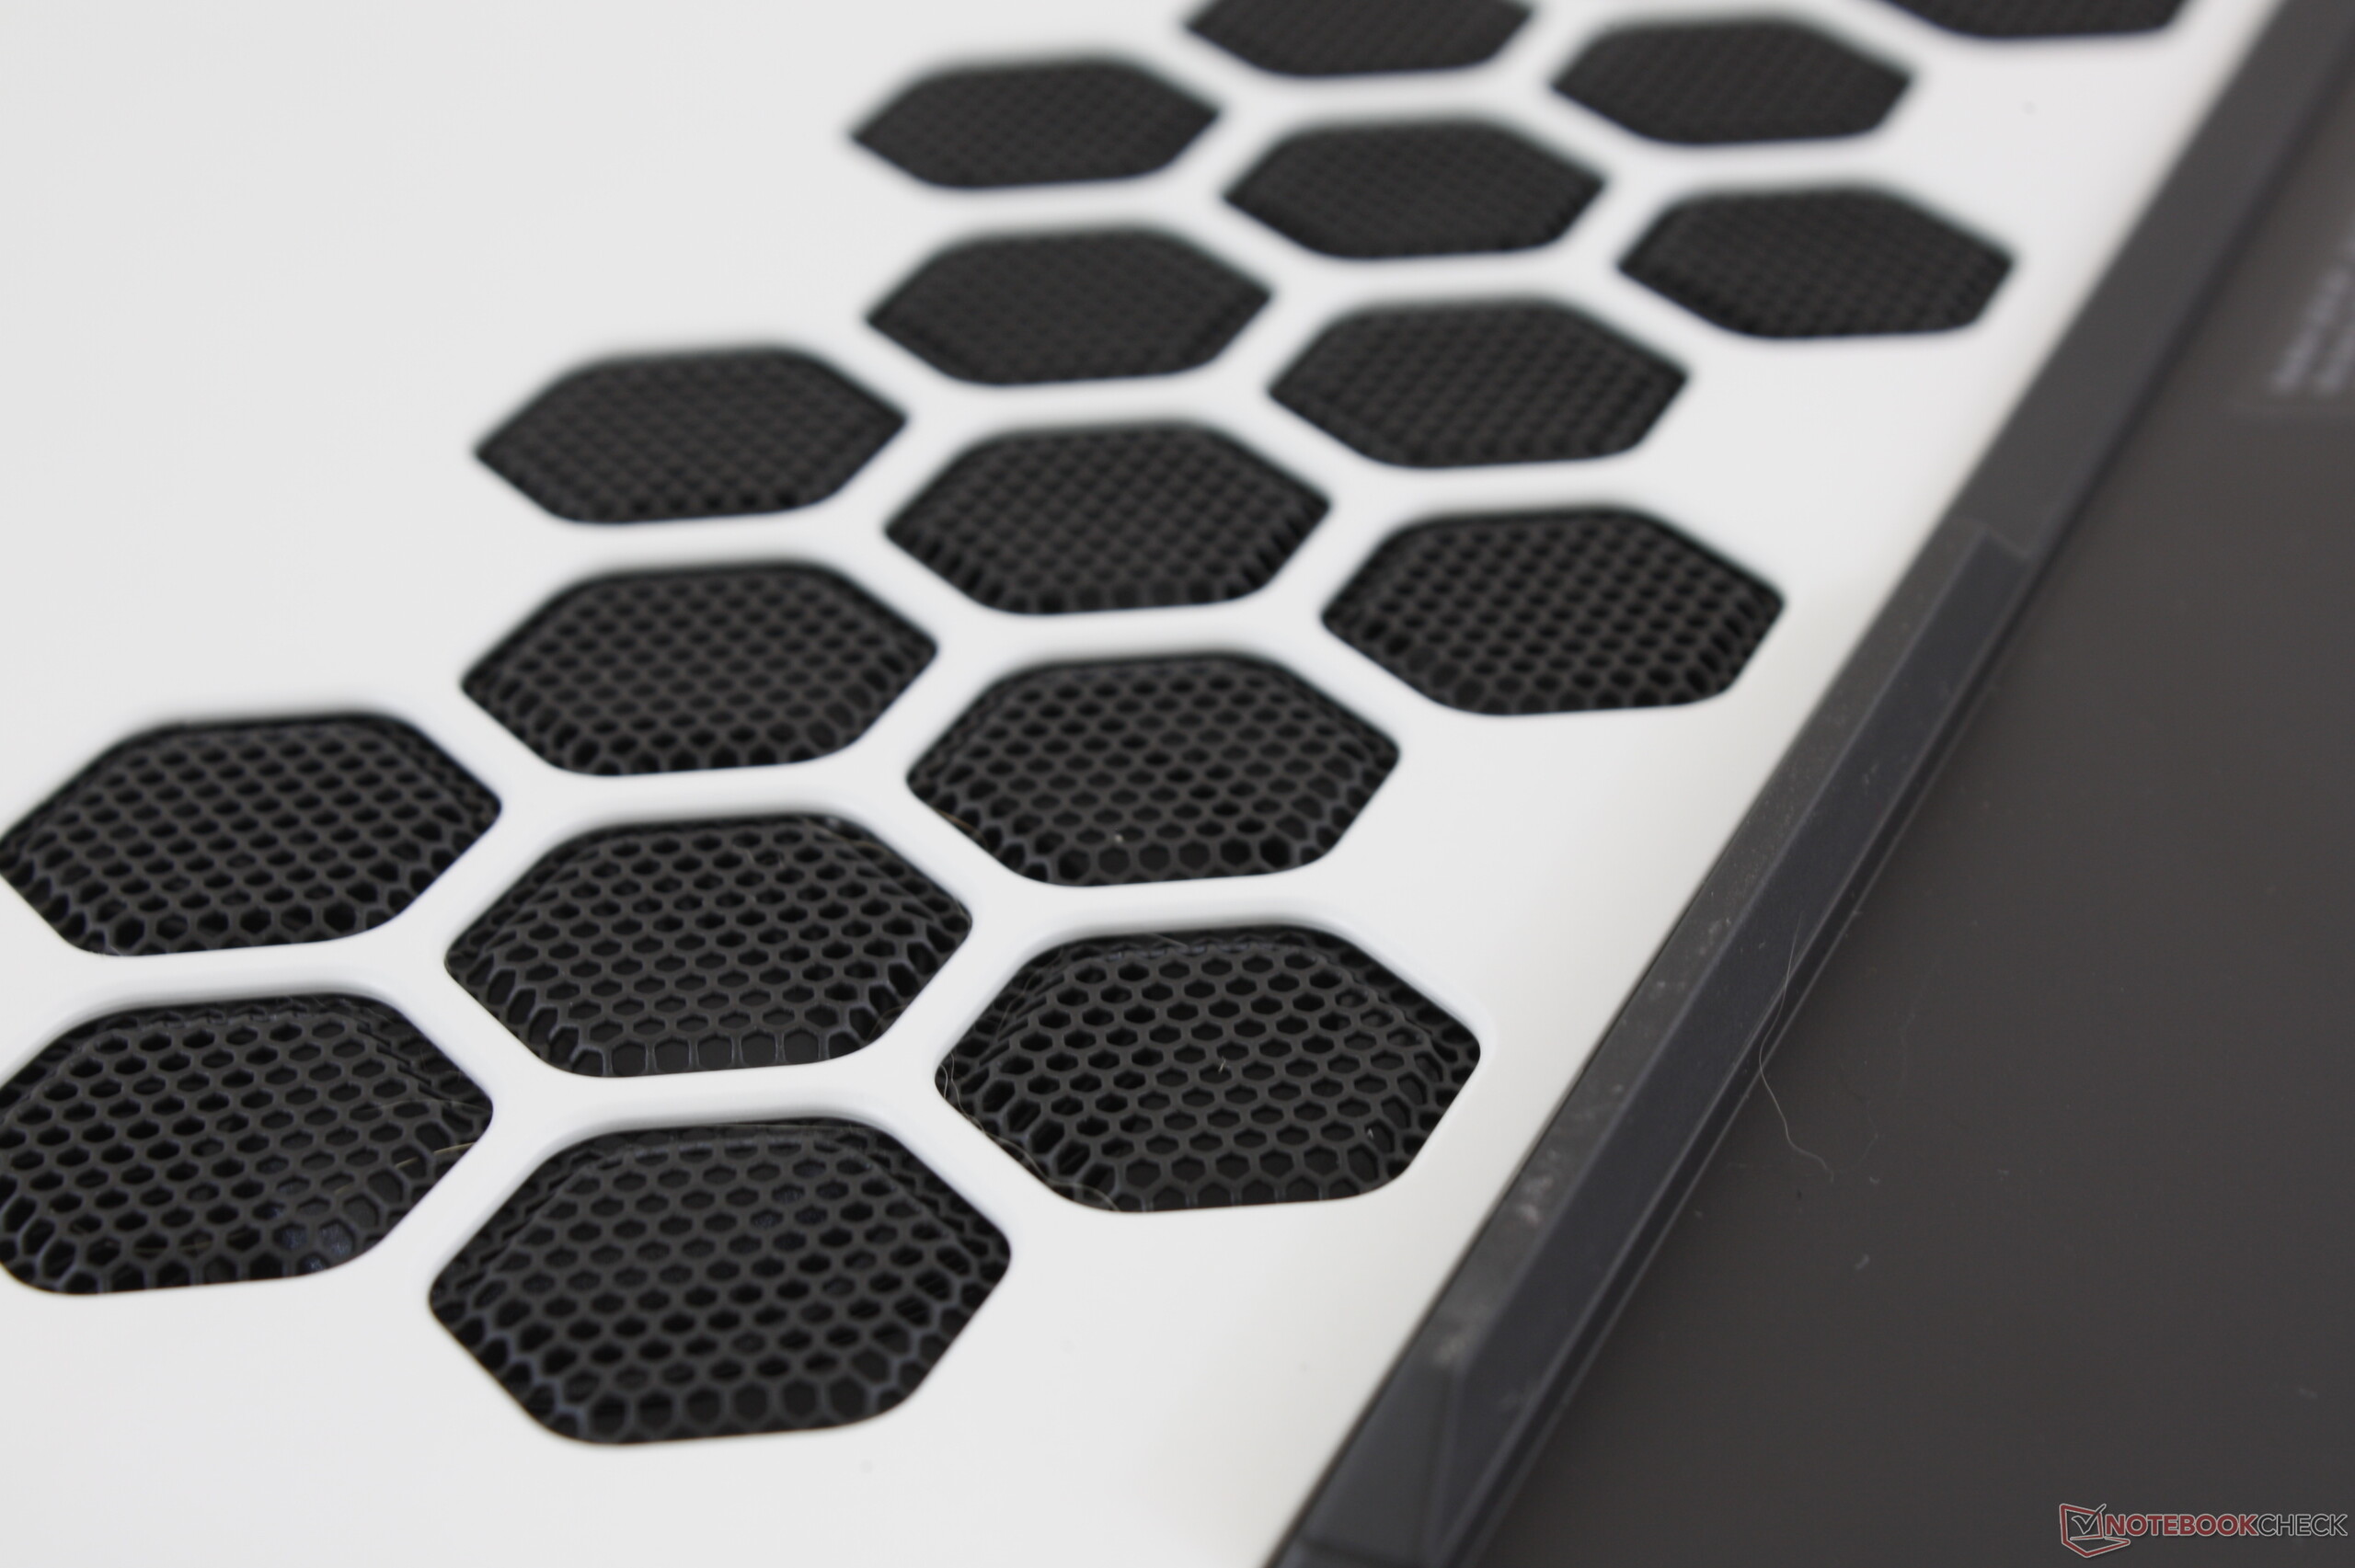
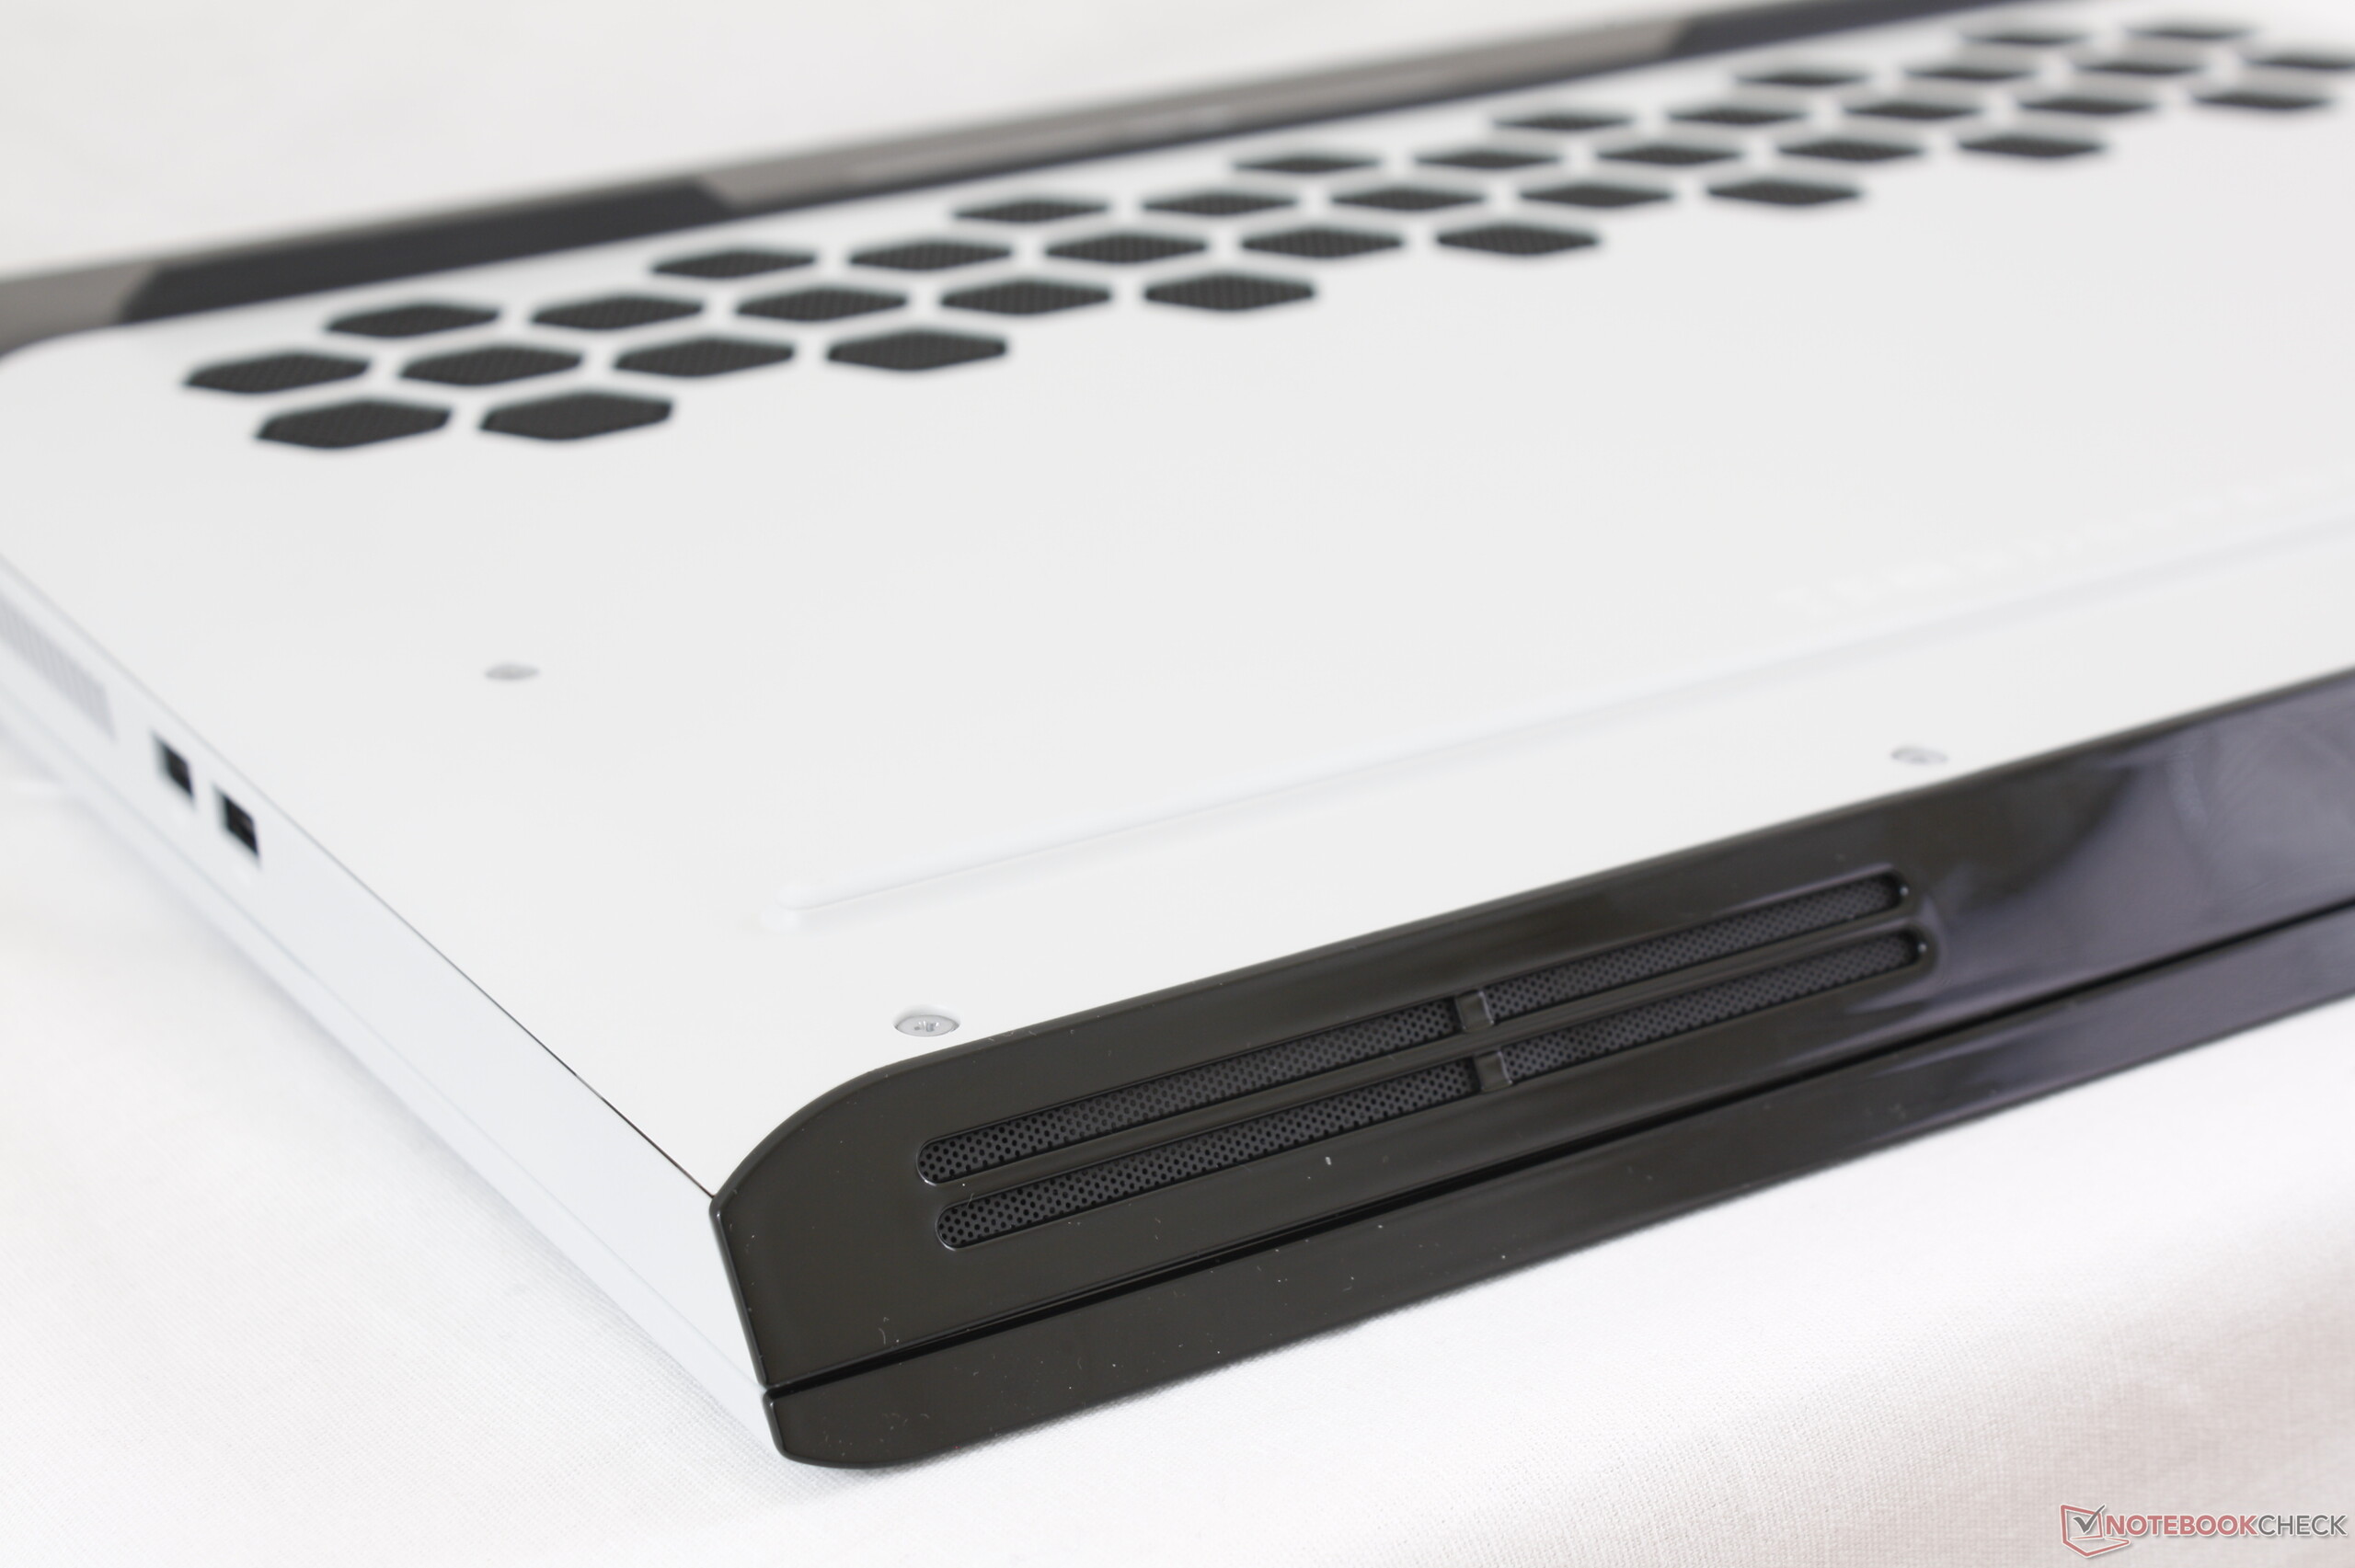
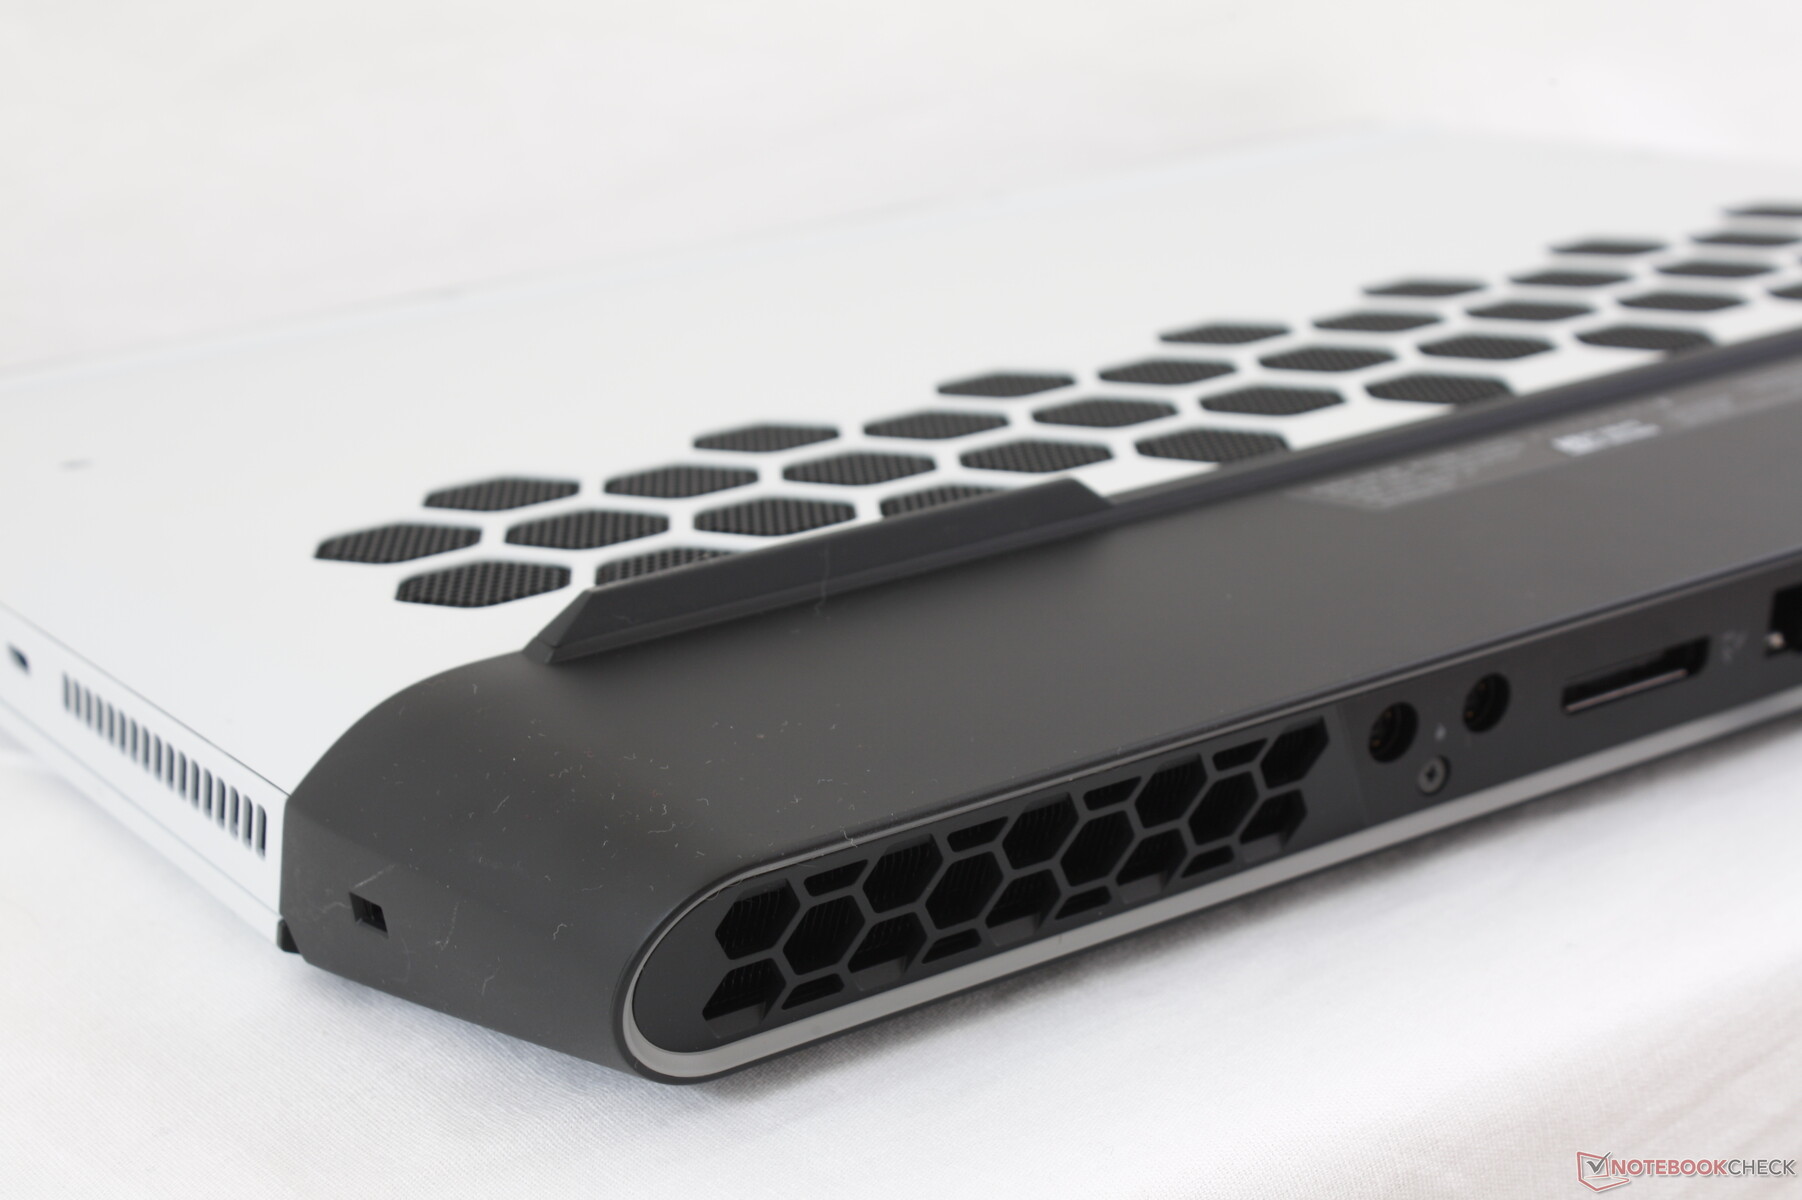
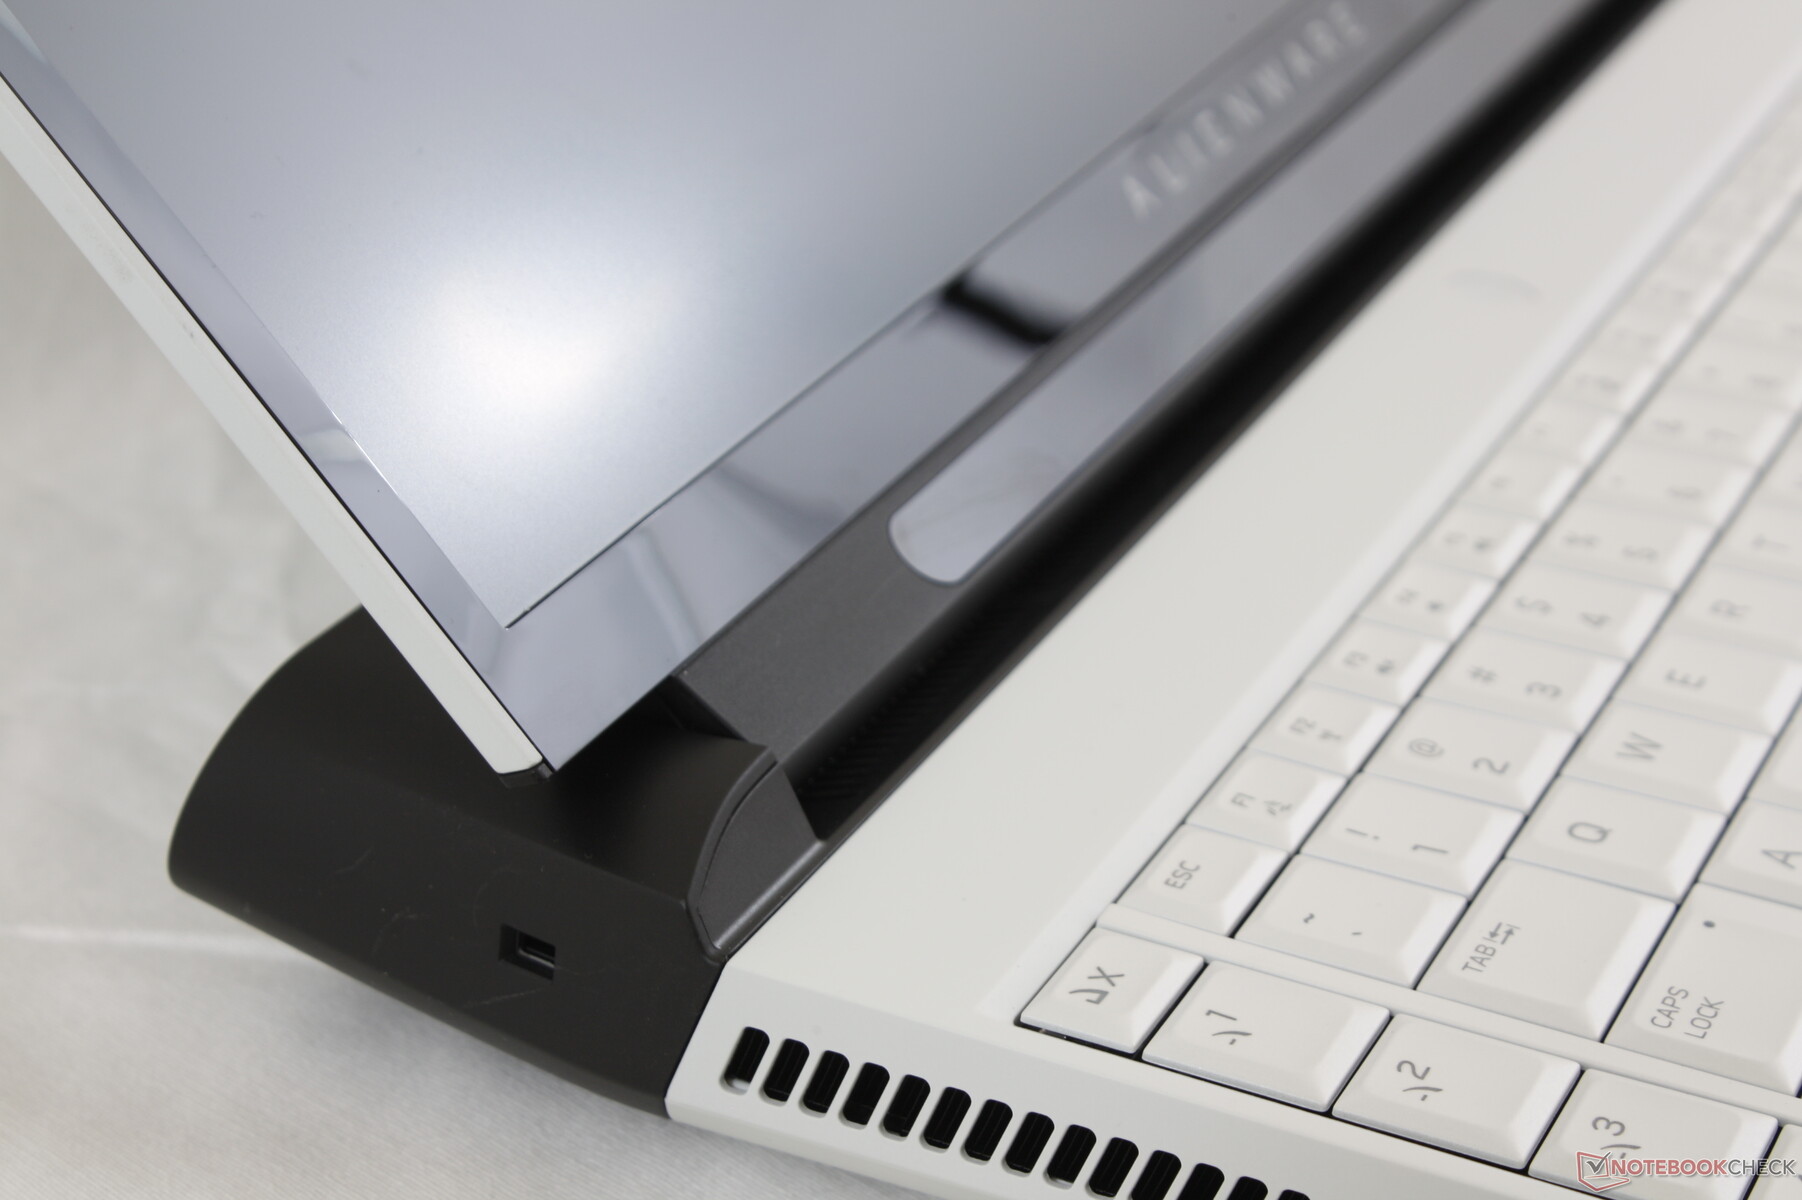
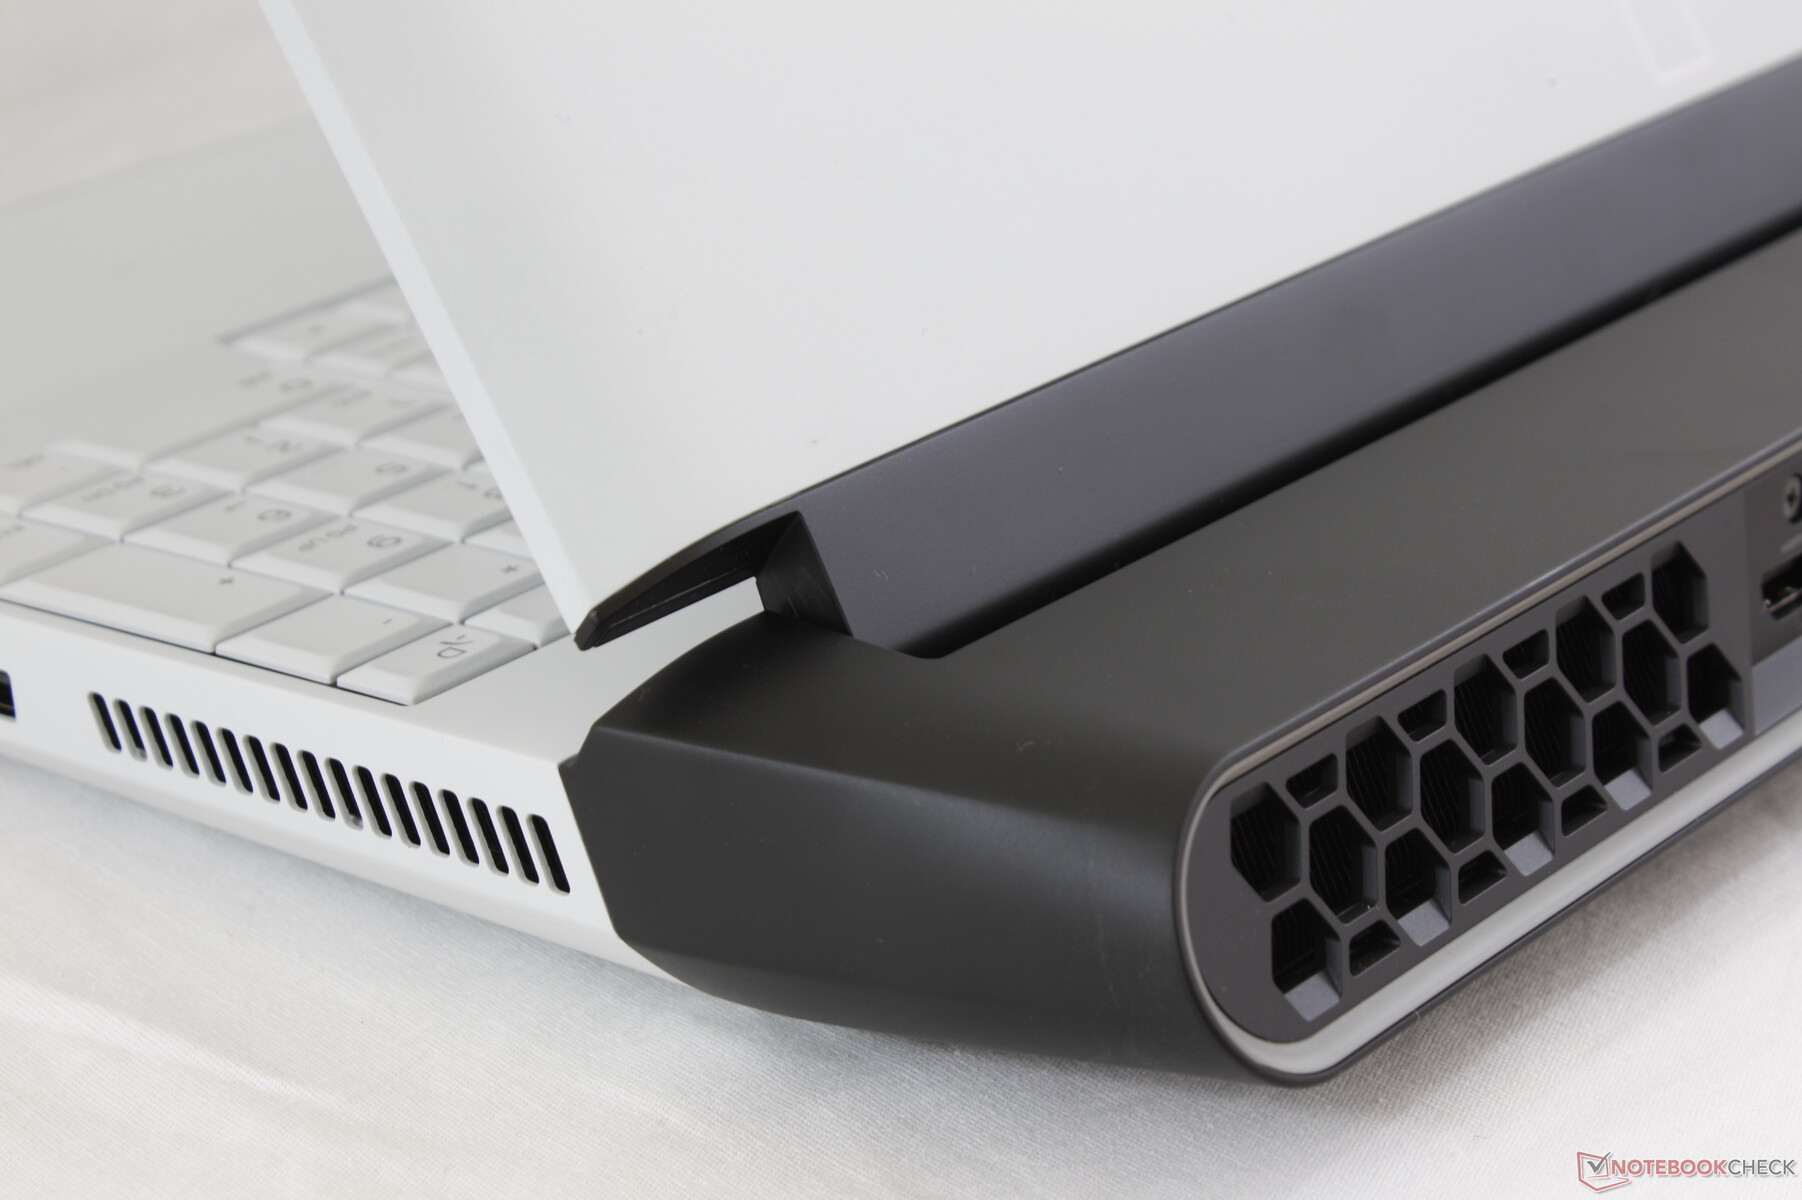
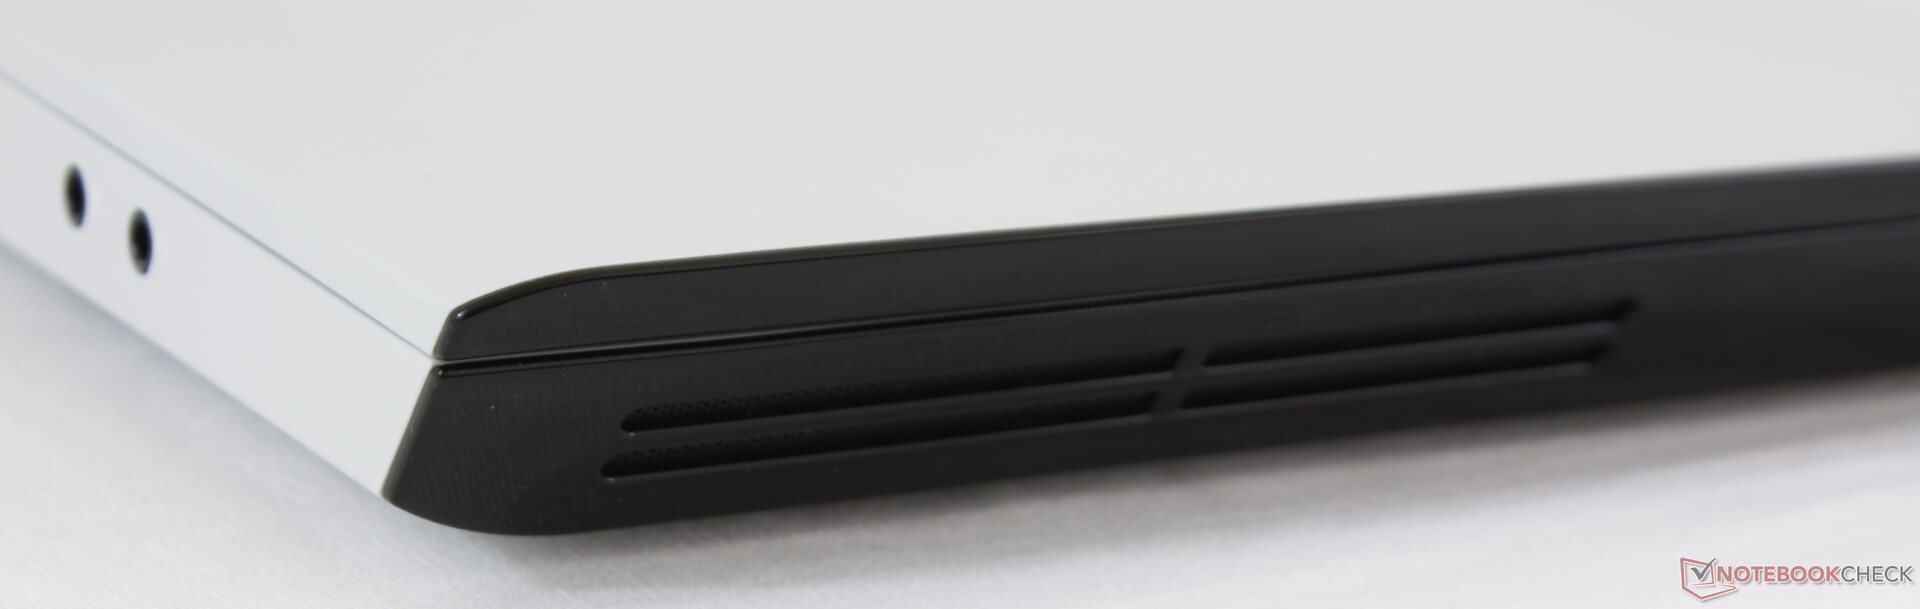
The chassis may look completely different, but that doesn't mean the materials have to change. Alienware laptops are notable for their magnesium alloy chassis and softer matte surfaces in contrast to the smooth brushed aluminum surfaces of comparable MSI laptops. This remains true on the Area-51m as the system feels more like a classic Alienware laptop than the thinner Alienware m17 spin-off. Its most visually striking and unique features are the large ovular rear dedicated to cooling and the honeycomb-style approach to ventilation.
The Alienware 17 series always felt tougher and more rigid than competing models and this remains true on the Area-51m. Our attempts to twist the base or warp the palm rests or keyboard center result in almost no flexing for a very stable impression. The lid is naturally more prone to side-to-side flexing, but much less so than on the competing Eurocom Sky X7C, MSI GT75, or Predator 17. Its hinge is also firmer than most large 17-inch laptops with close to no teetering albeit at a limited maximum angle of only ~140 degrees because of the large rear.
As sound as the chassis may be, it still creaks every so often when opening or closing the lid. It's thankfully minor enough to be of no immediate concern on our particular test unit.
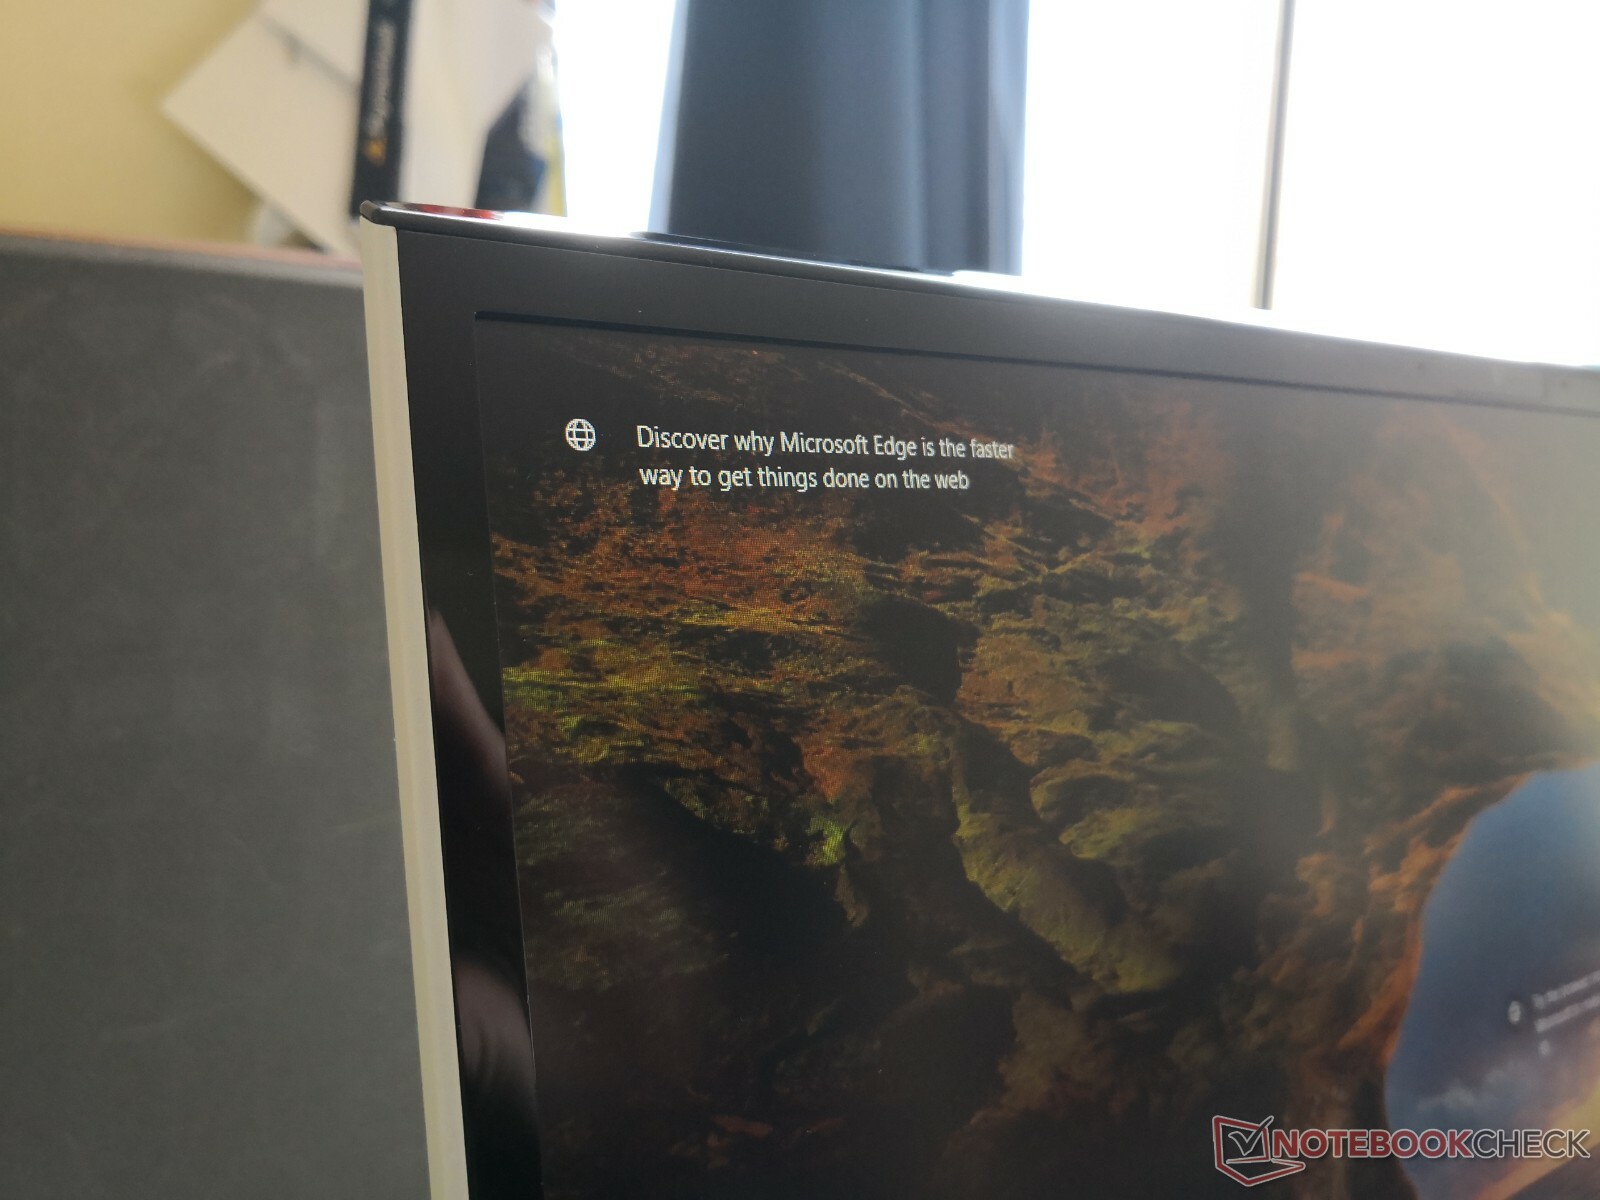
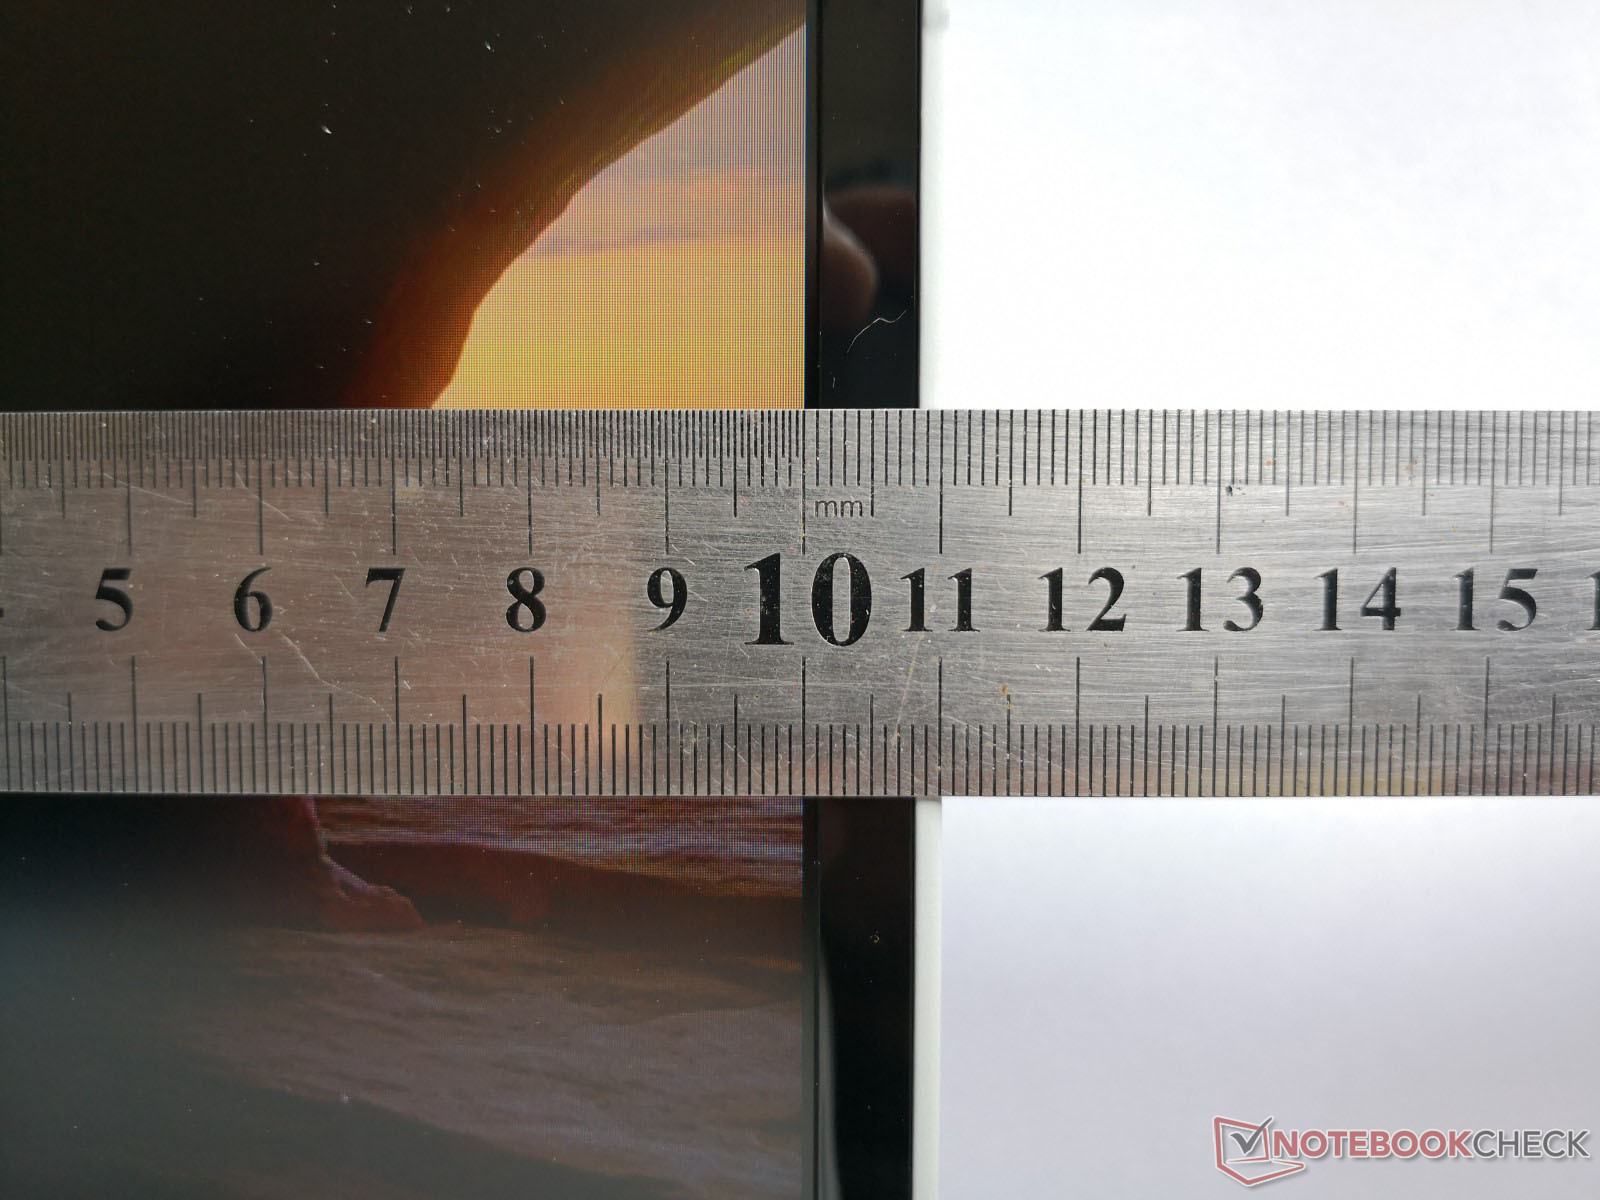
In terms of size, the Area-51m has a smaller footprint than the Alienware 17 R5 that it replaces because of the narrower display bezels. The trade off, however, is that the new chassis is thicker at its thickest point (42 mm) and so it is still a large gaming laptop in contrast to the sleeker Alienware m17 or MSI GS75.
A noteworthy and unexpected advantage of the new Alienware laptop is its weight. At approximately 3.9 kg, the system is several hundred grams lighter than the Eurocom Sky X7C, MSI GT75, and Acer Predator 17 X. That's not to say this isn't a hefty machine, but it's lighter than it looks. Most of the weight is concentrated along the rear of the chassis.
Connectivity
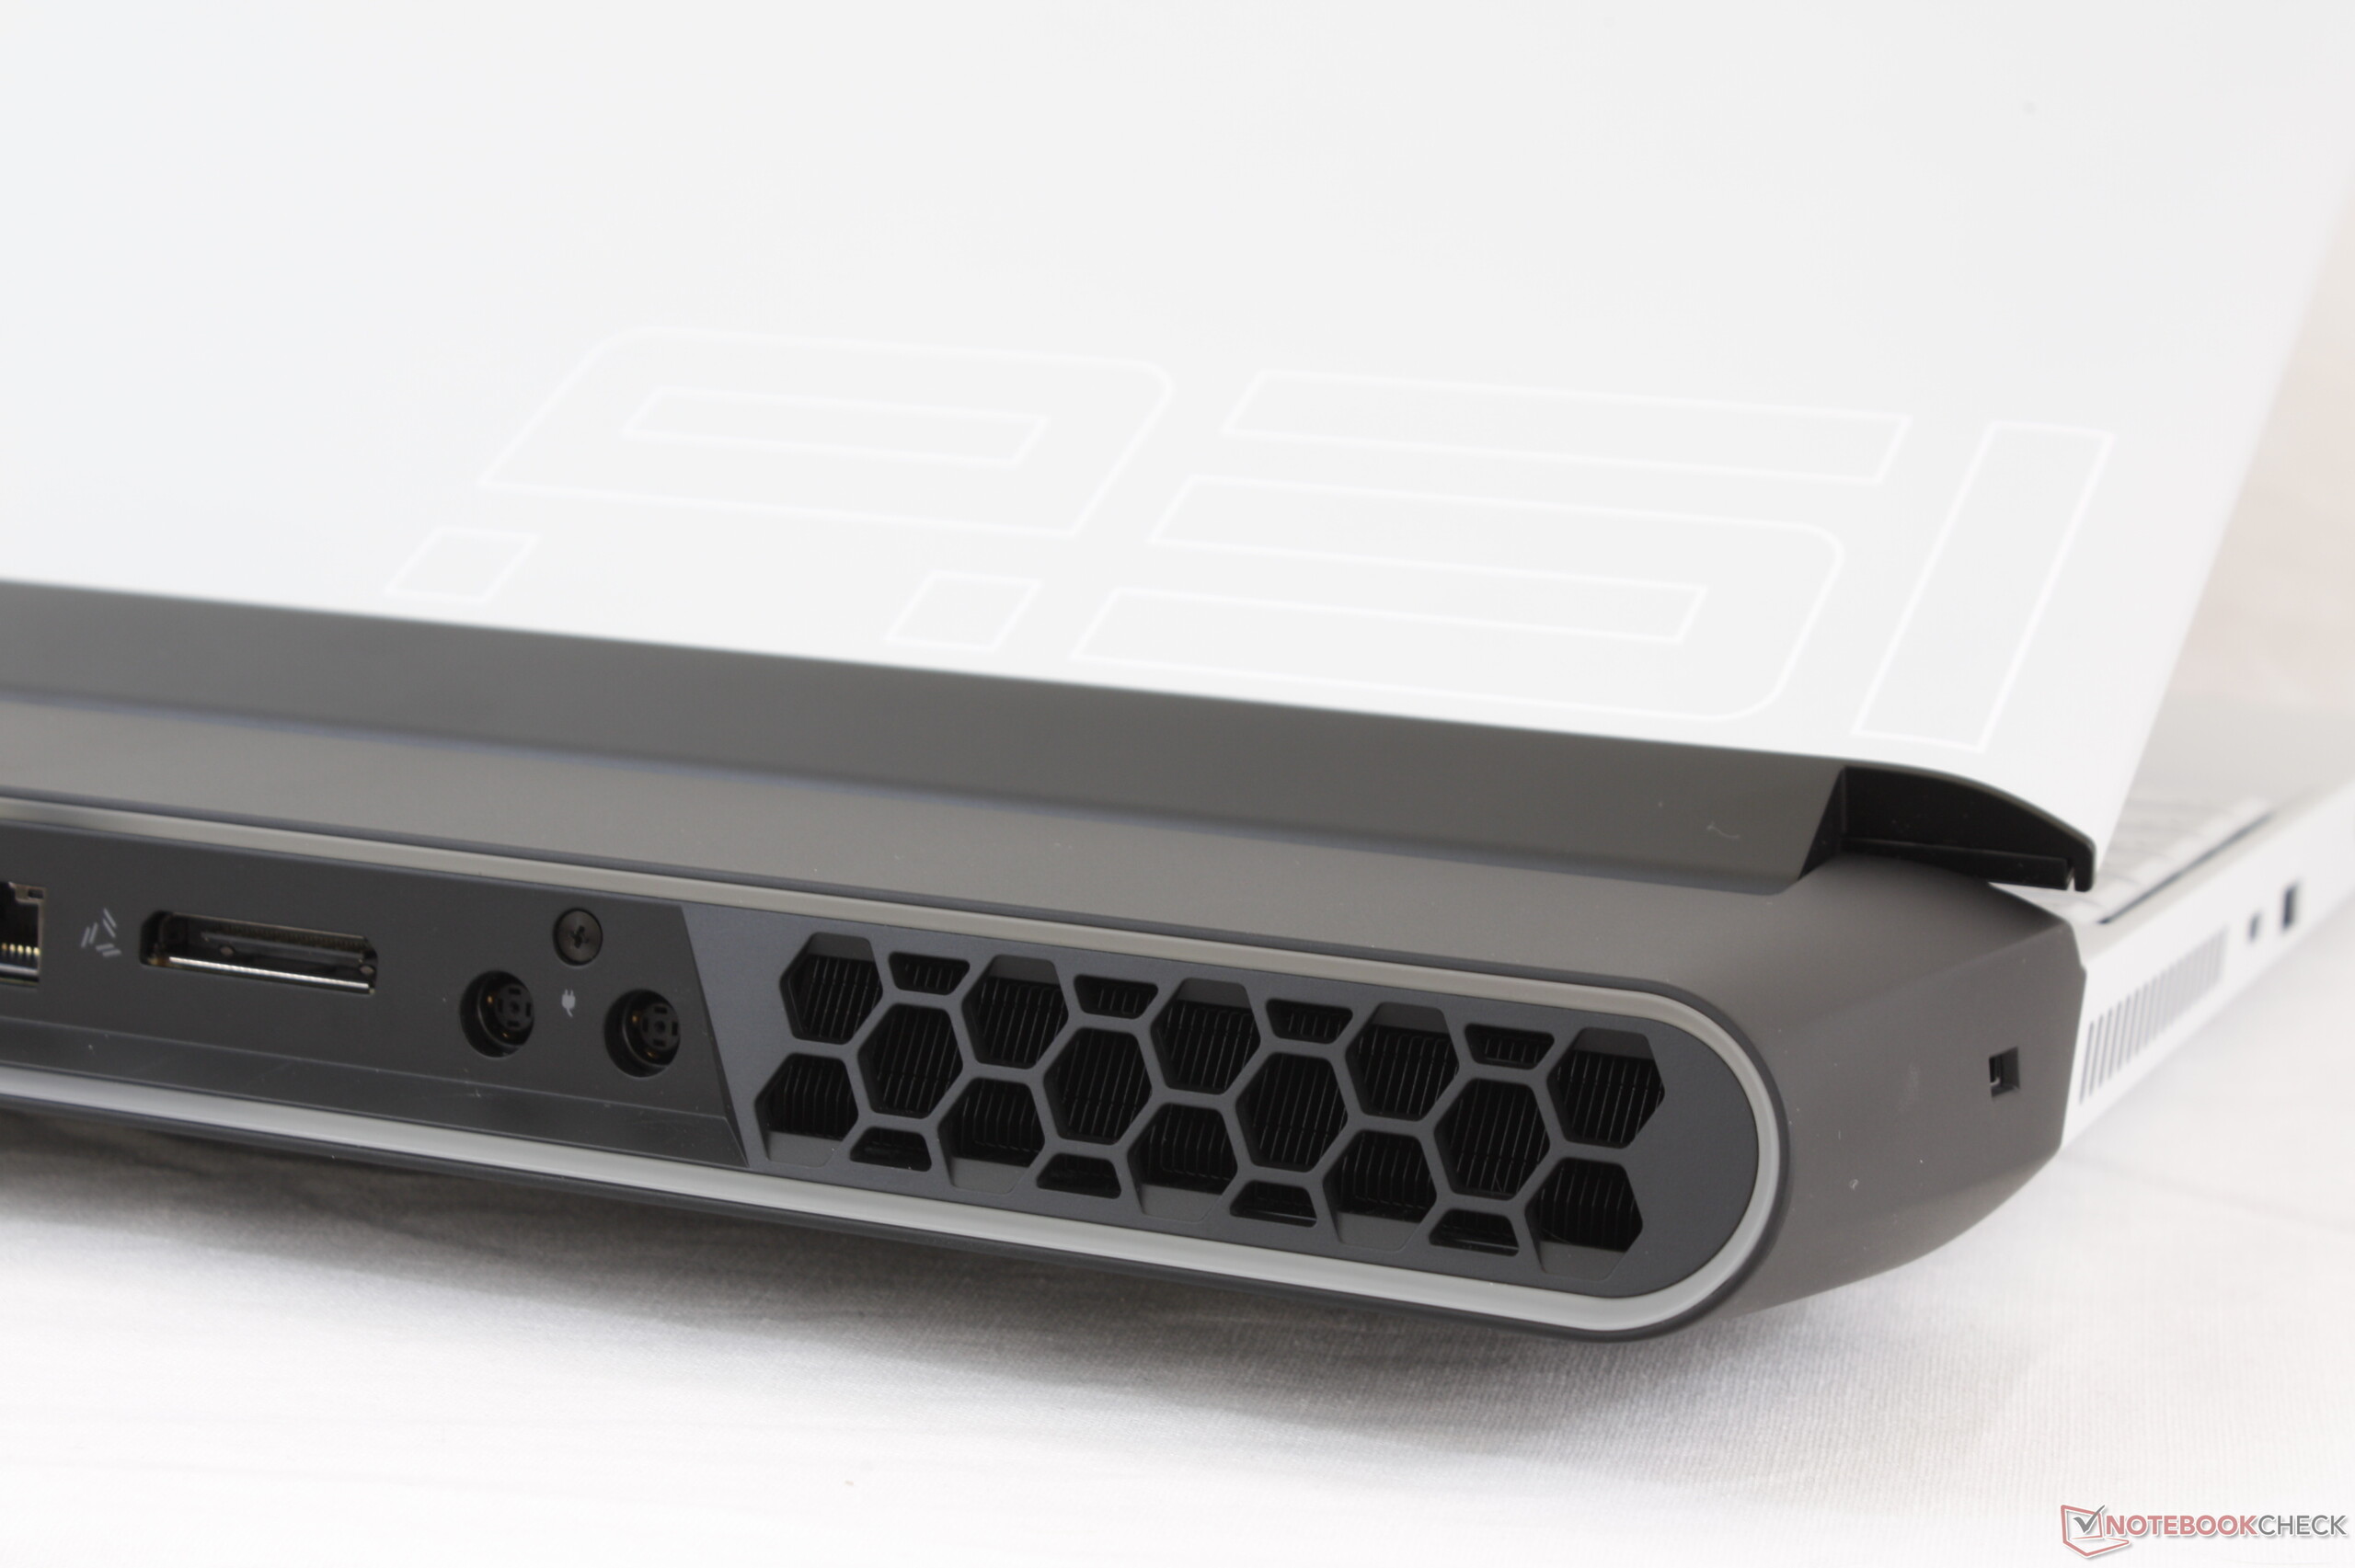
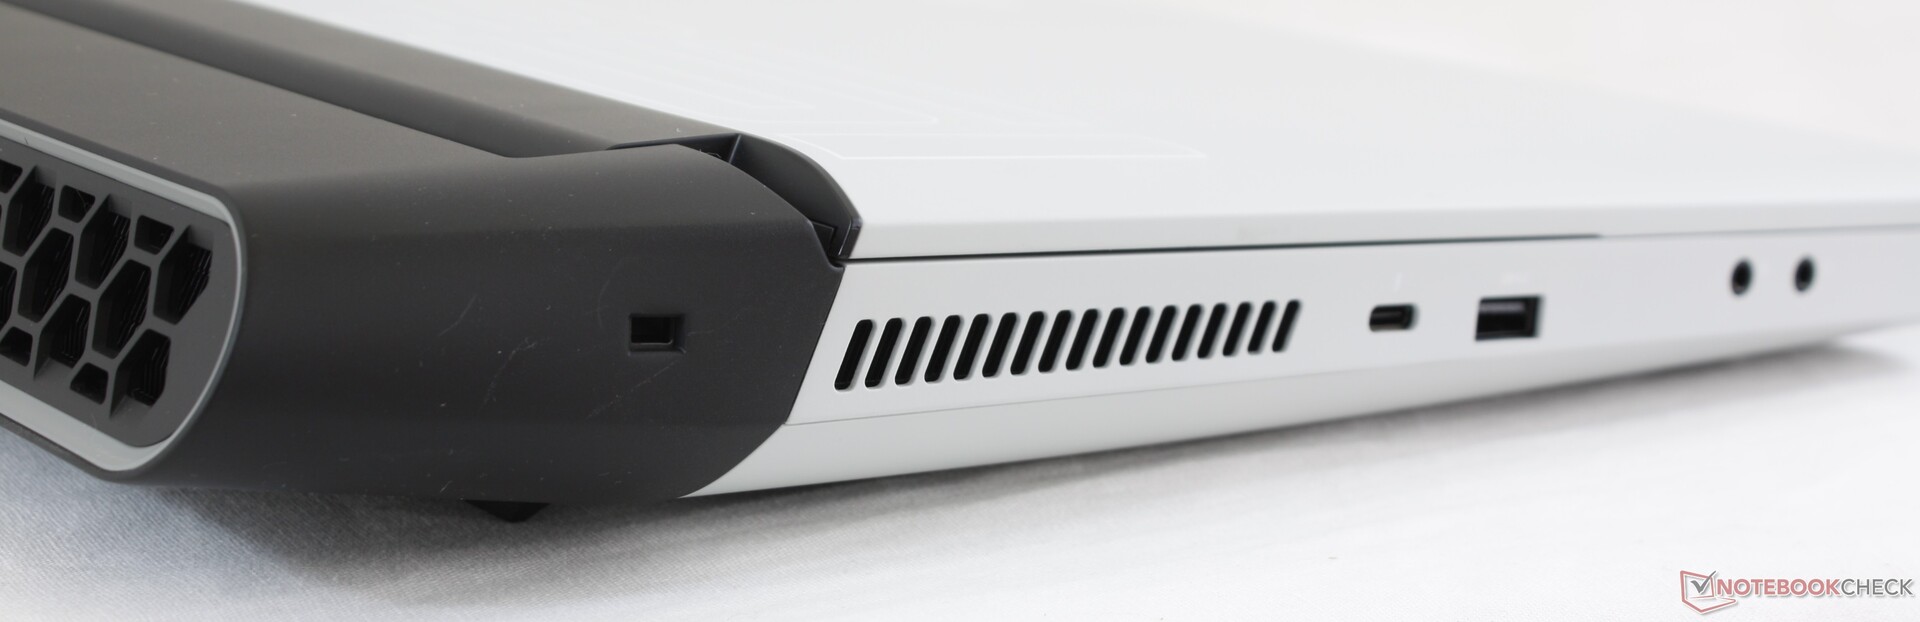
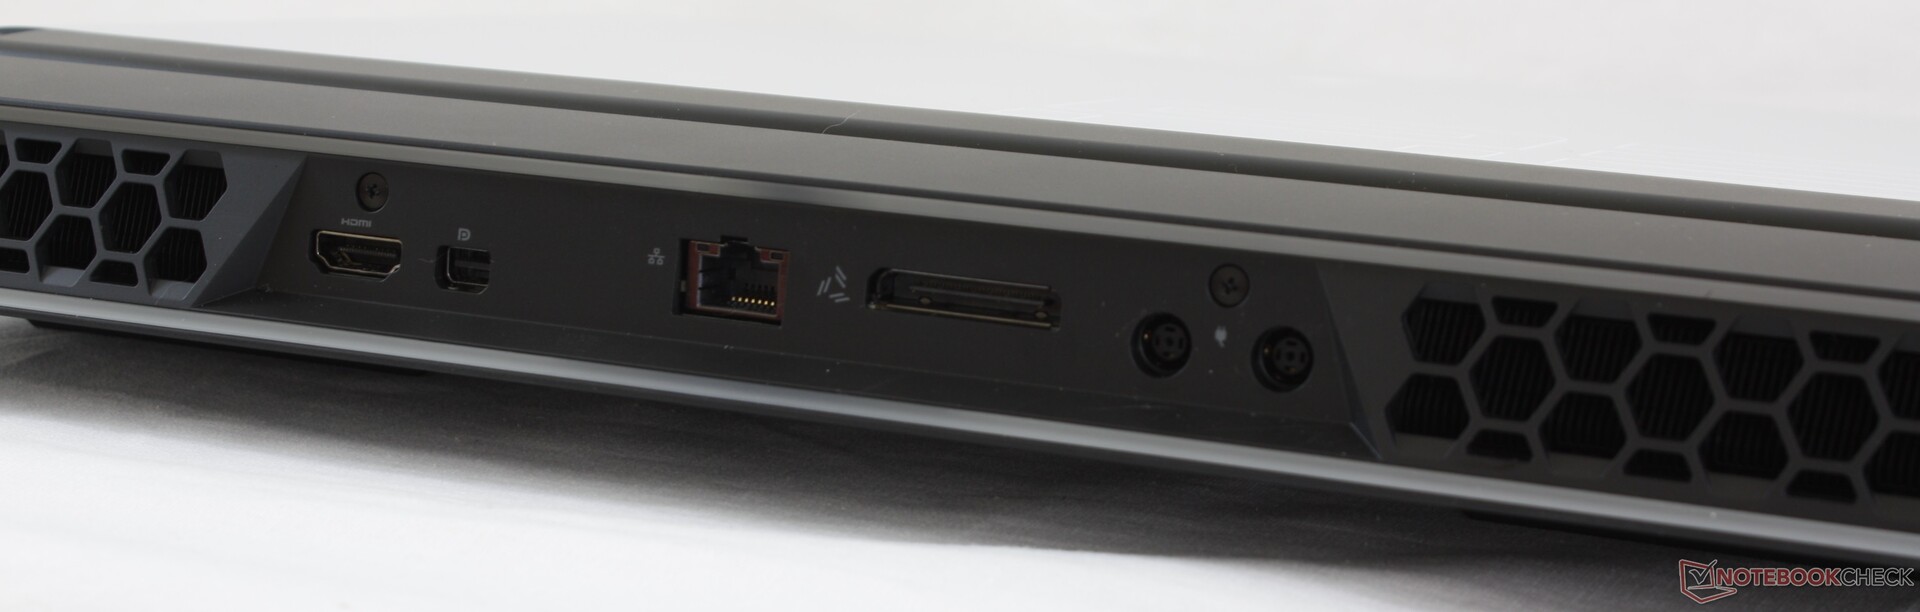
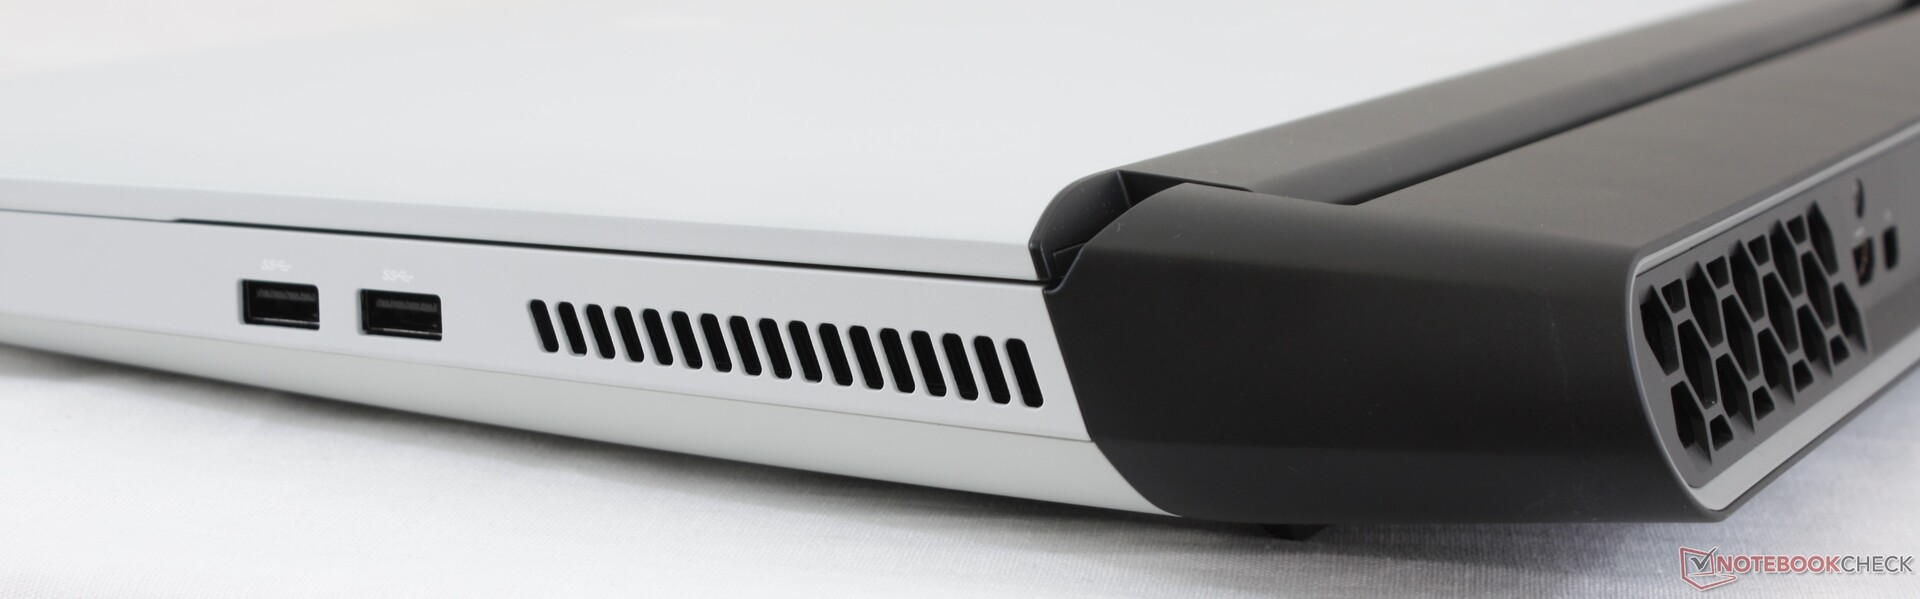
Available ports are comparable to the old Alienware 17 R5 but noticeably fewer than on the Eurocom Sky X7C. The Area-51m has fewer USB ports, DisplayPort ports, and audio ports than the competing Eurocom system. There isn't even an SD card reader.
In return, the system is equipped with Dell's proprietary Graphics Amplifier port for connecting the Alienware eGPU. Its practicality on a laptop already equipped with removable RTX graphics is questionable and so we would have preferred some more basic and commonly used ports instead.
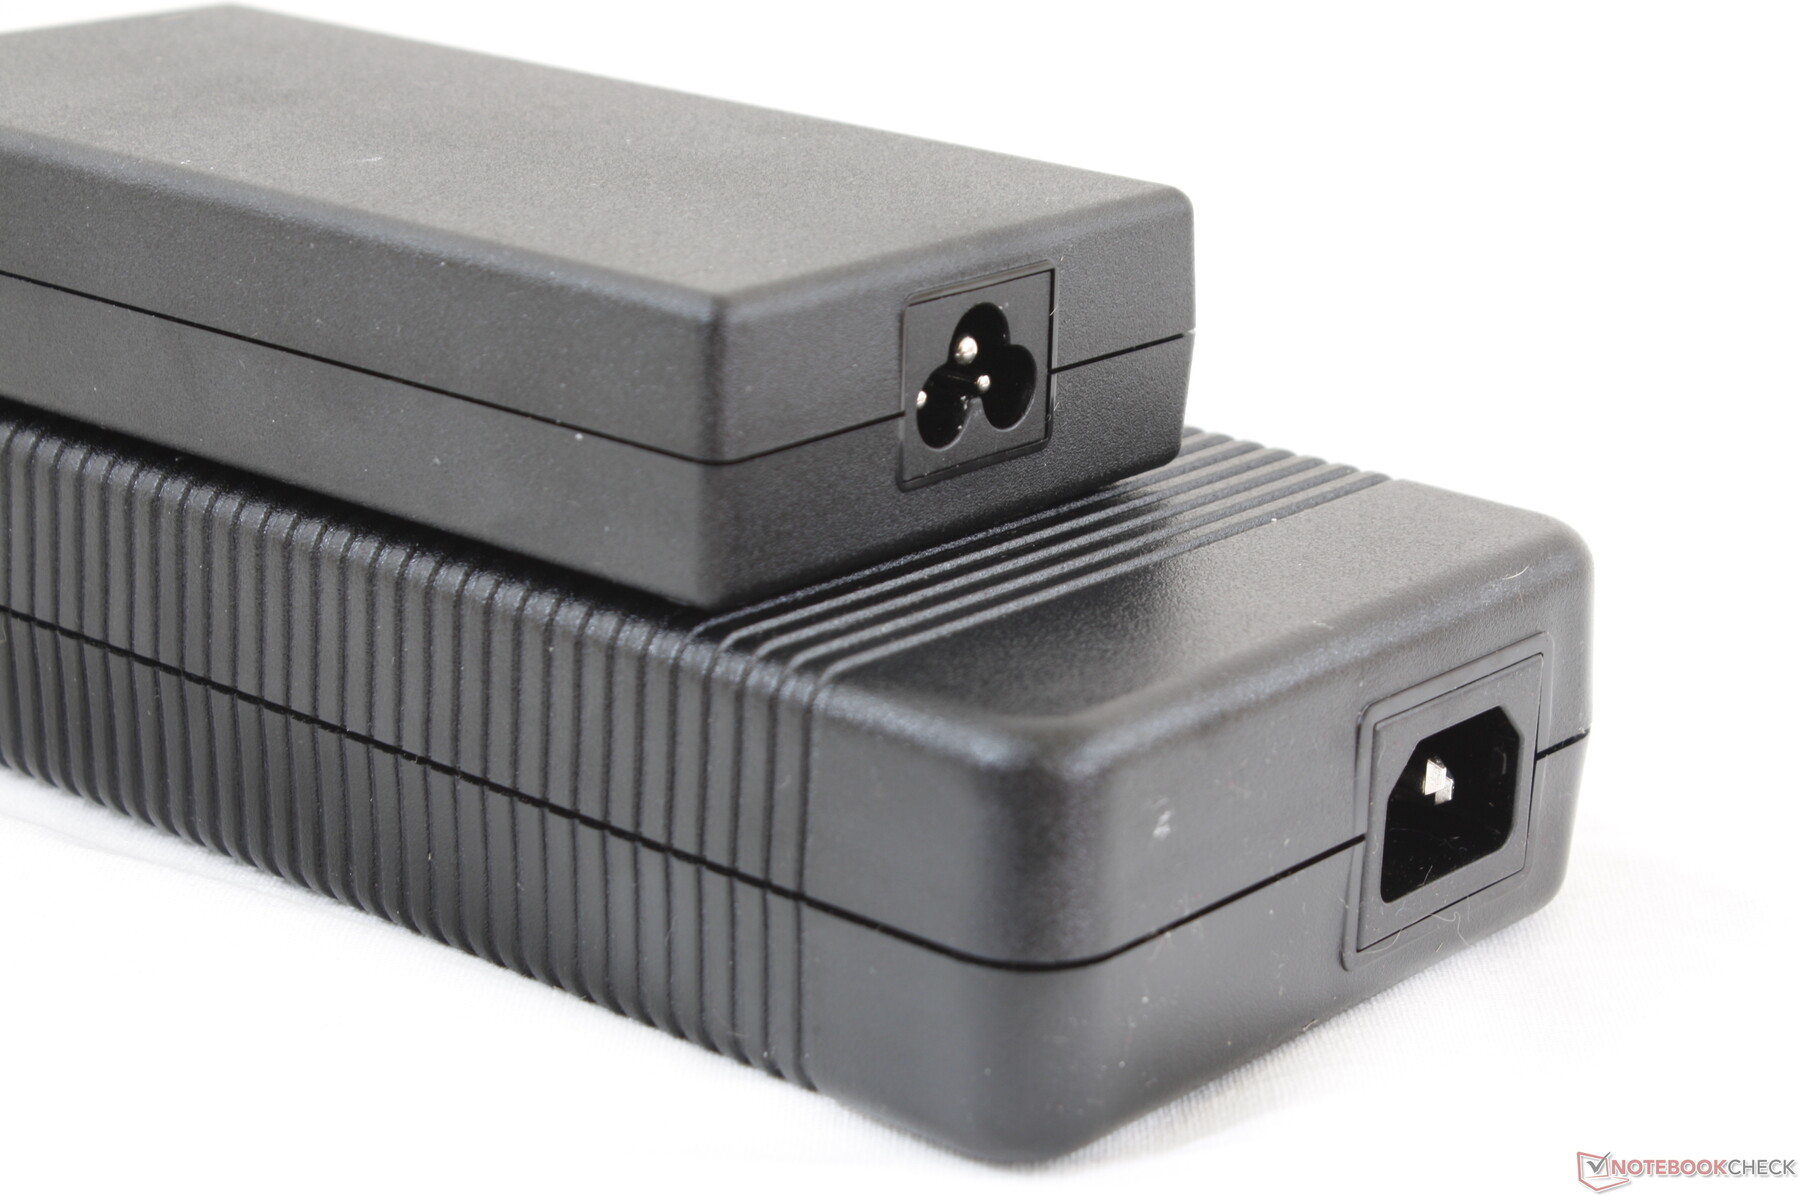
The two AC adapter ports are identical and interchangeable between the two external power bricks.
Communication
Dell XPS and Alienware laptops have been strong proponents of Killer wireless. Our system has been configured with Killer 1550 WLAN and Bluetooth 5 to offer all the customization options as found on the Killer 1535. Theoretical transfer rates are otherwise identical to the less expensive Intel 9560 at up to 1.73 Gbps. Note that our readings below are slower since our server is limited by a 1 Gbps line.
| Networking | |
| iperf3 transmit AX12 | |
| Asus ROG G703GX | |
| MSI GT75 8RG-090 Titan | |
| Alienware Area-51m i9-9900K RTX 2080 | |
| Alienware 17 R5 | |
| iperf3 receive AX12 | |
| MSI GT75 8RG-090 Titan | |
| Asus ROG G703GX | |
| Alienware 17 R5 | |
| Alienware Area-51m i9-9900K RTX 2080 | |
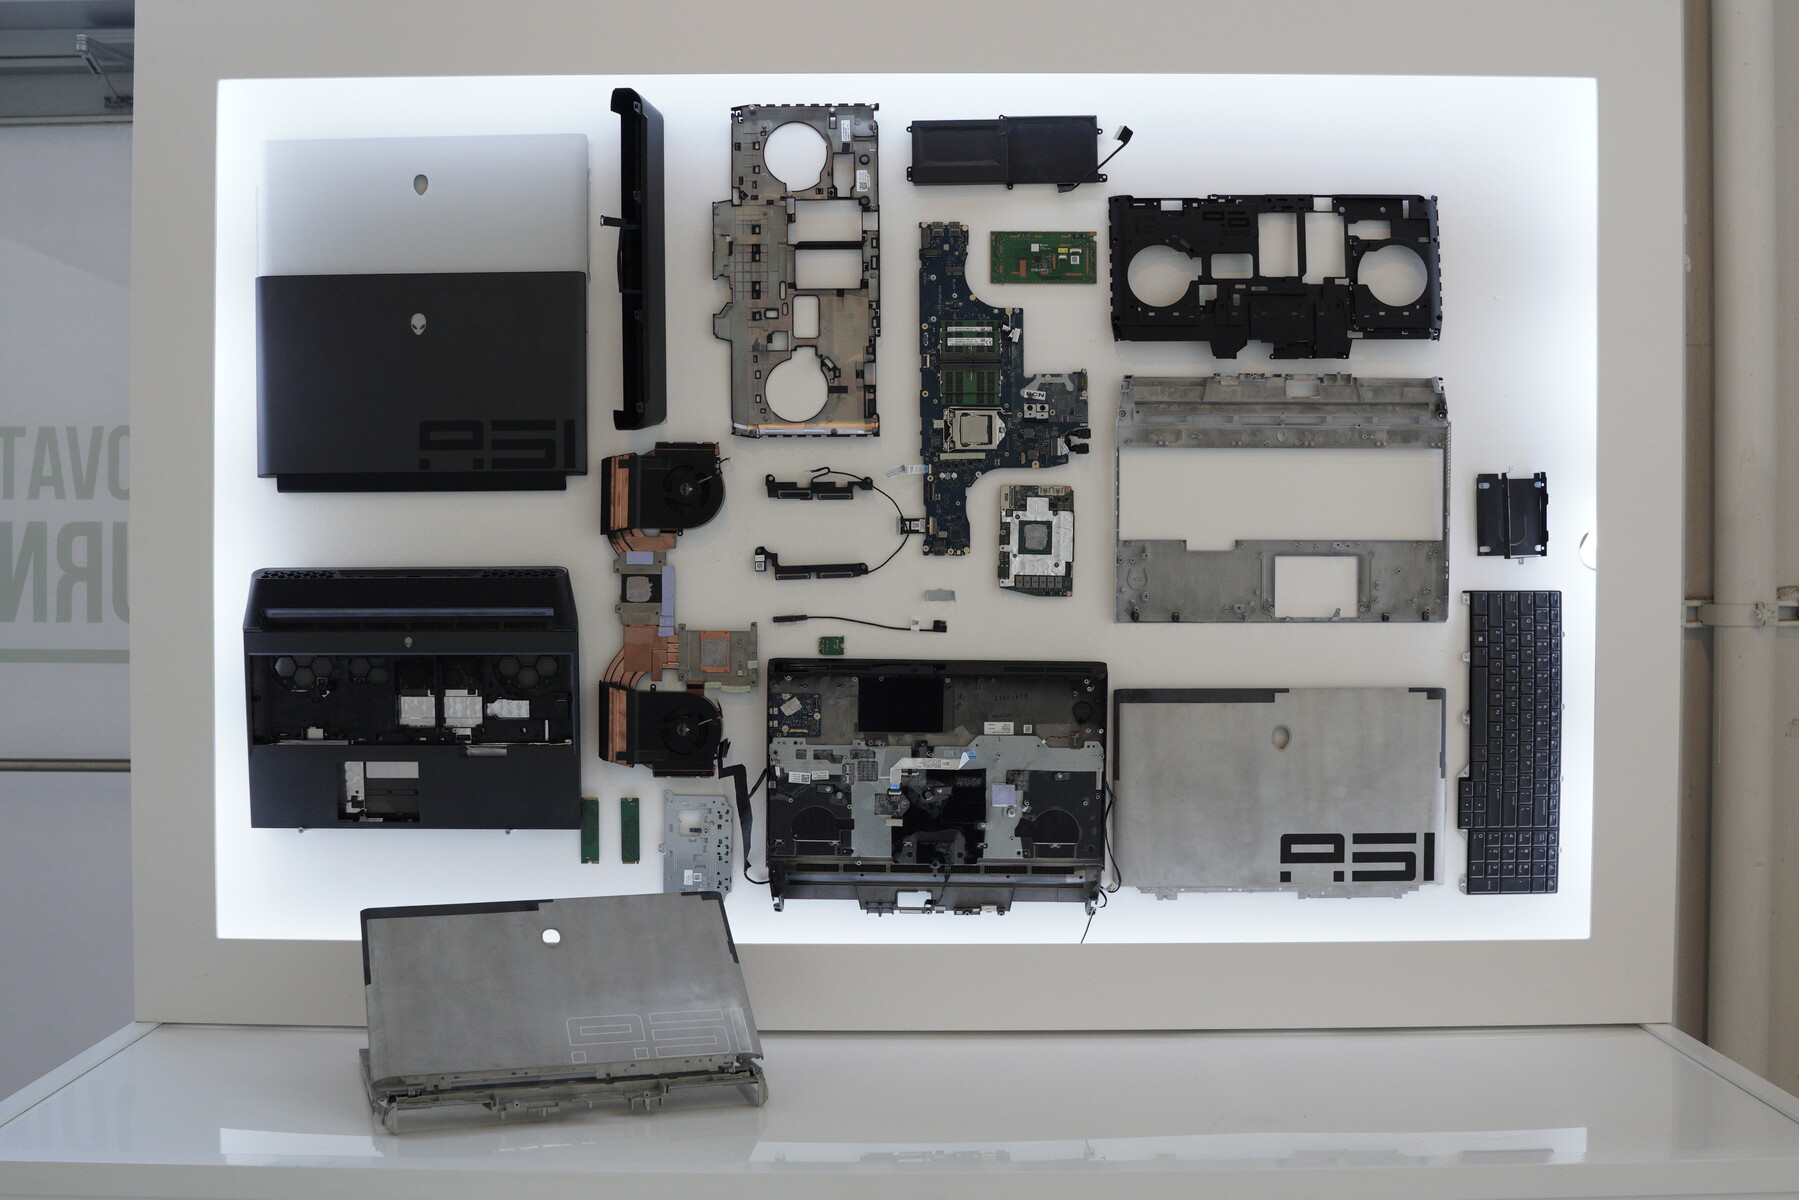
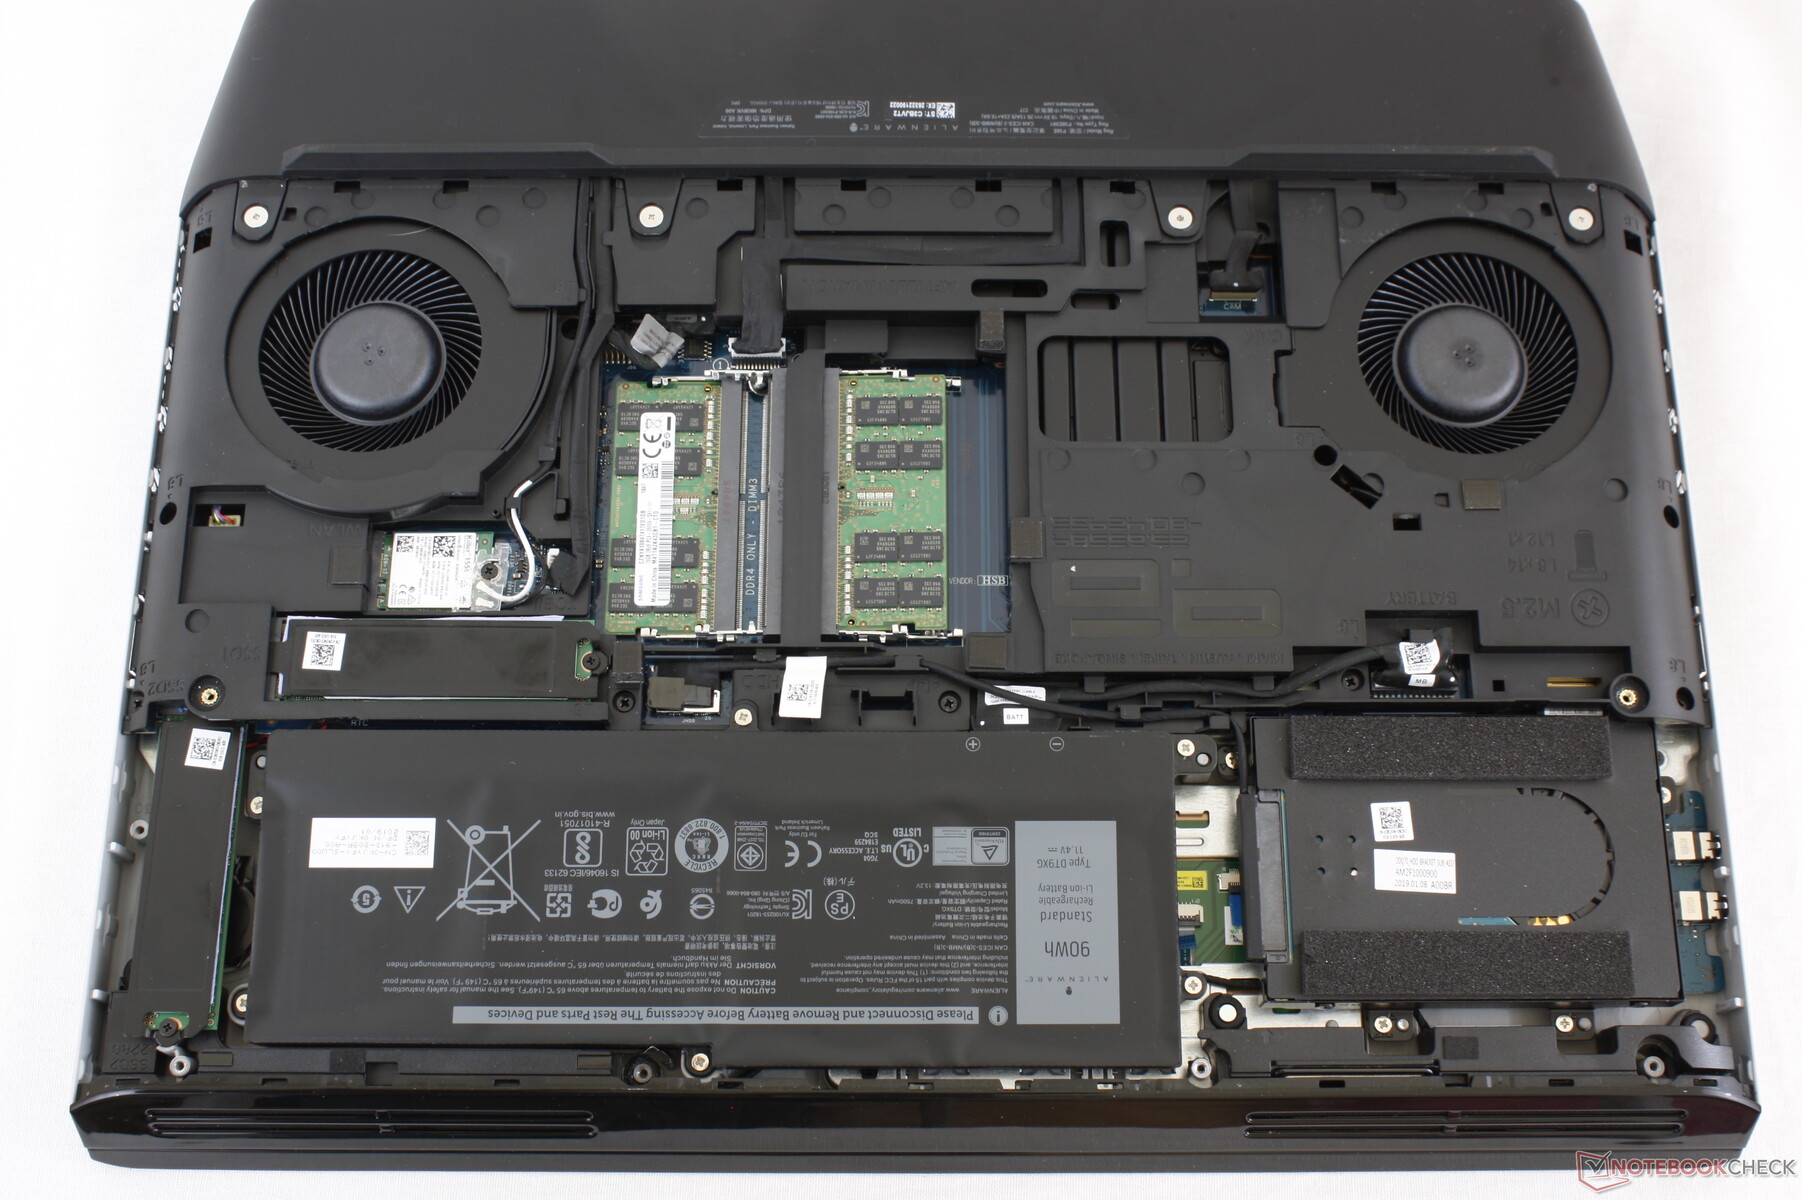
Maintenance
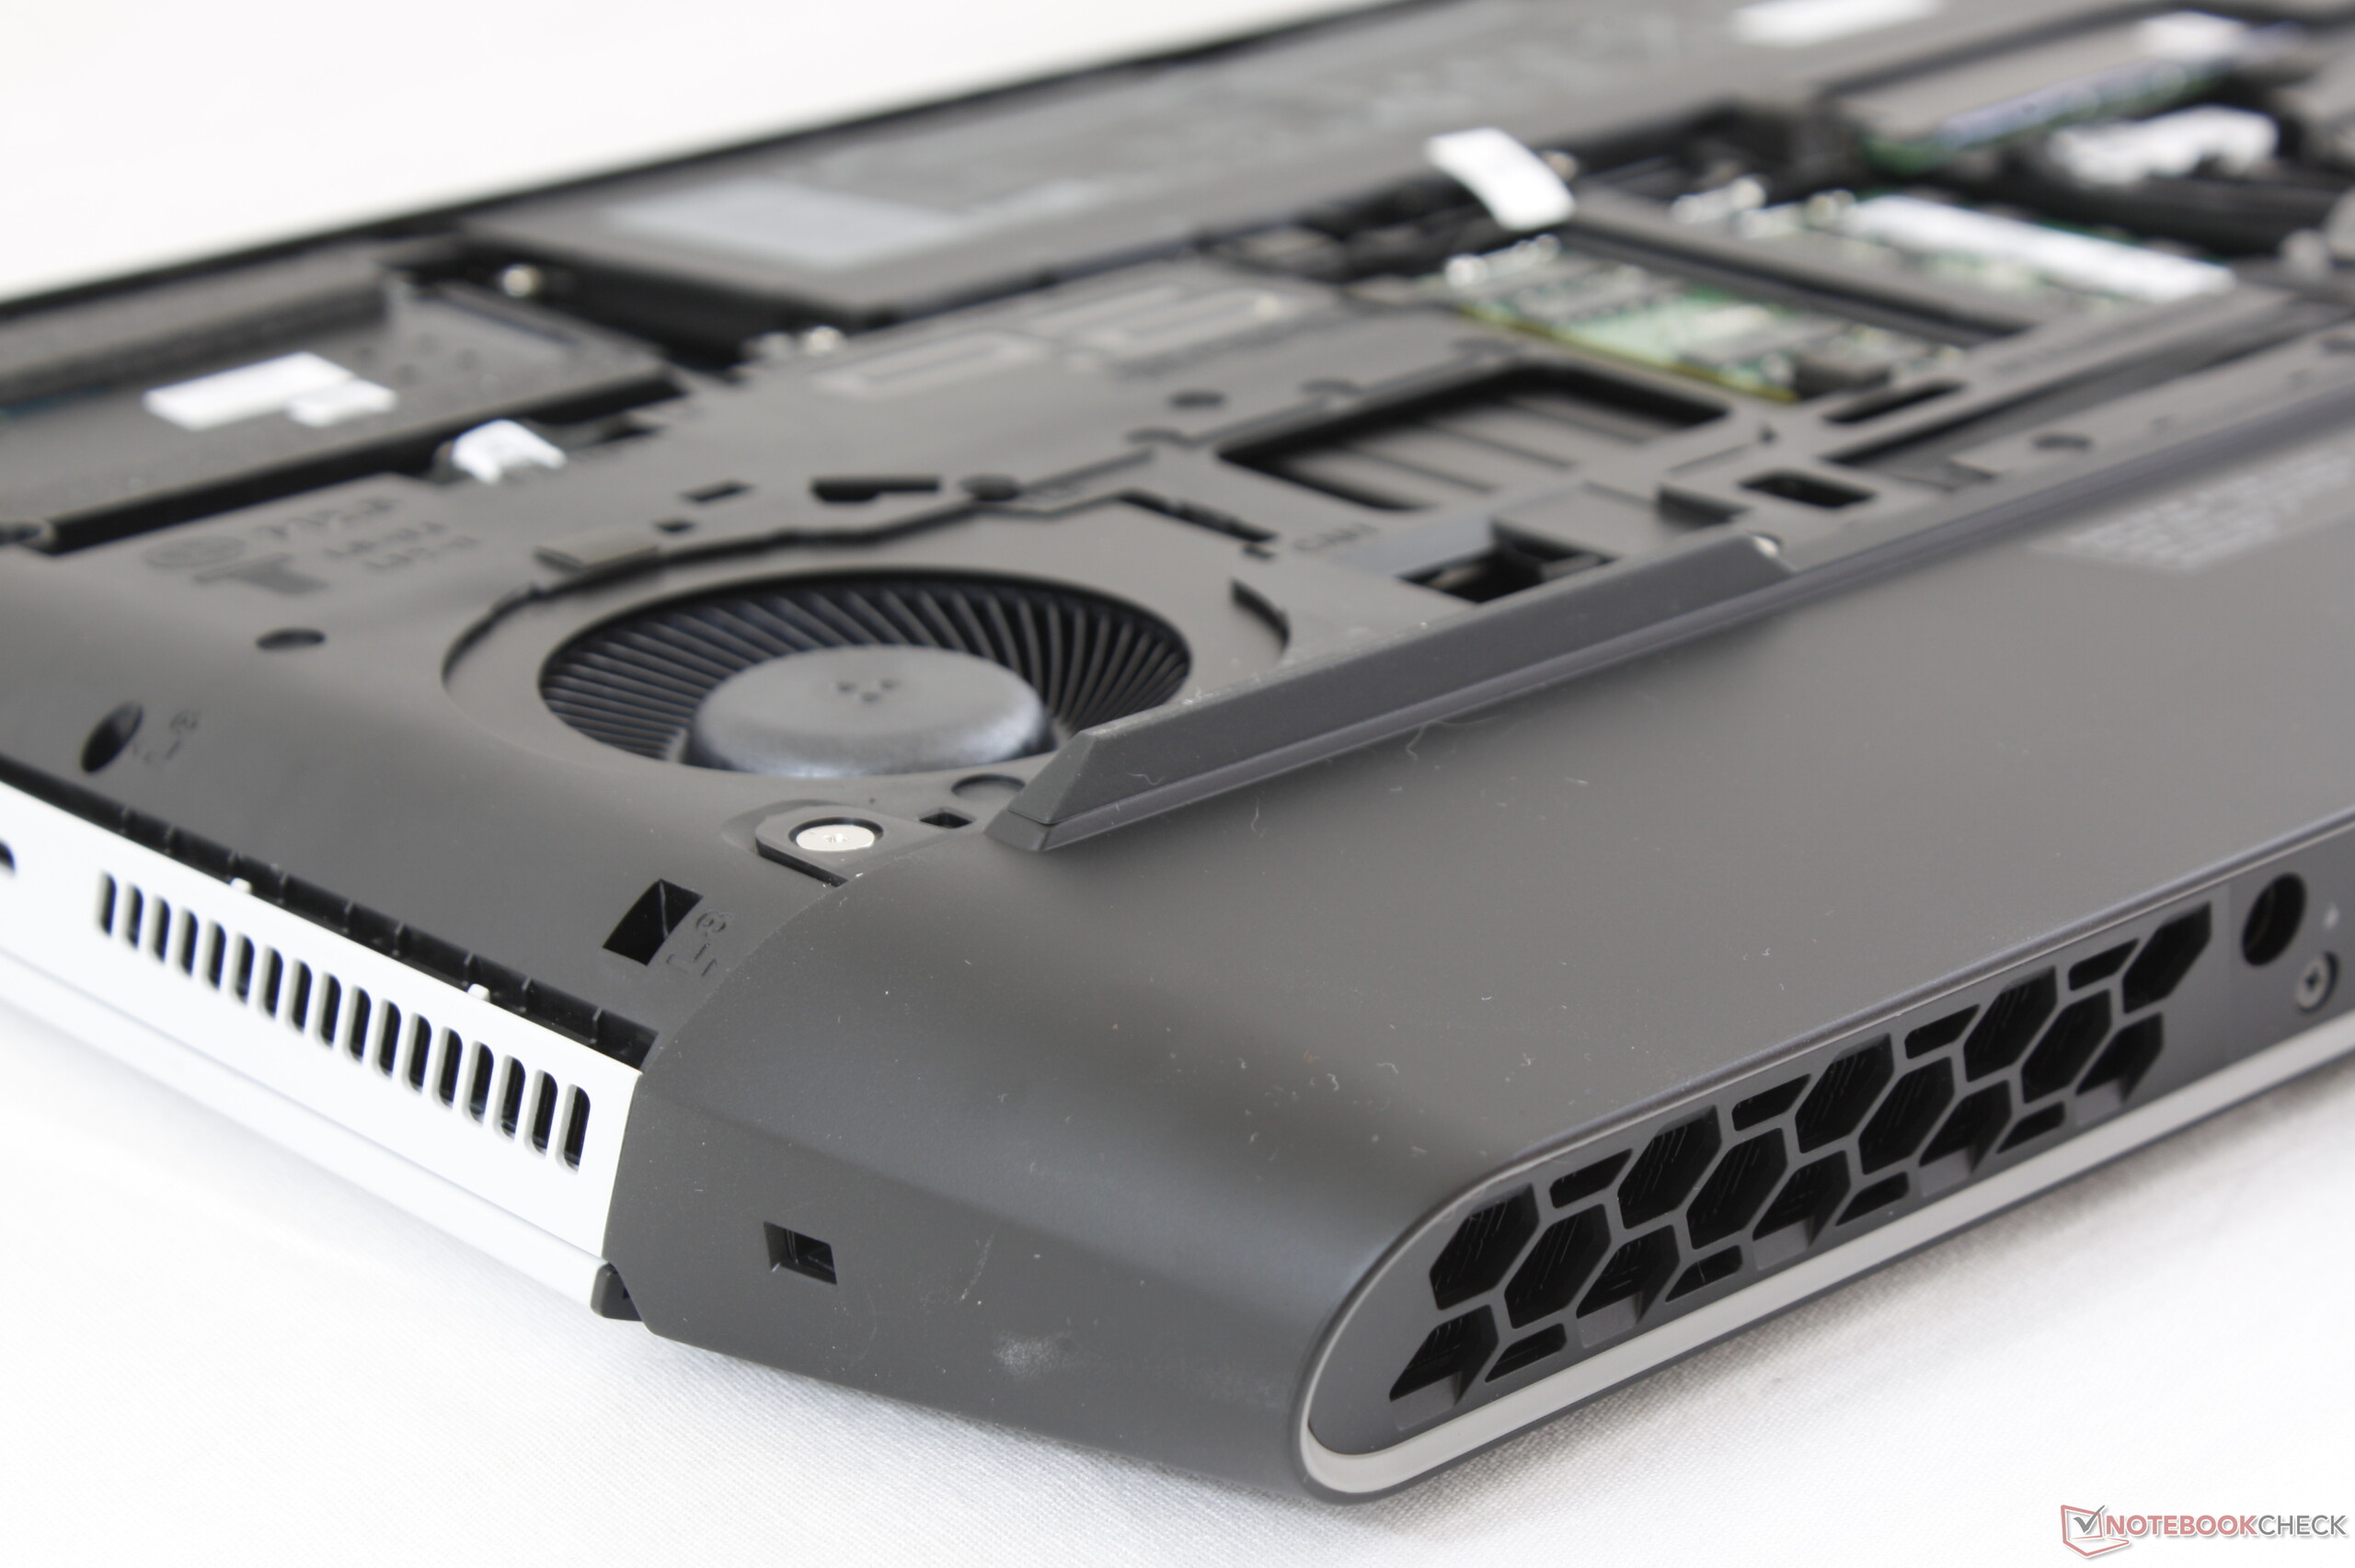
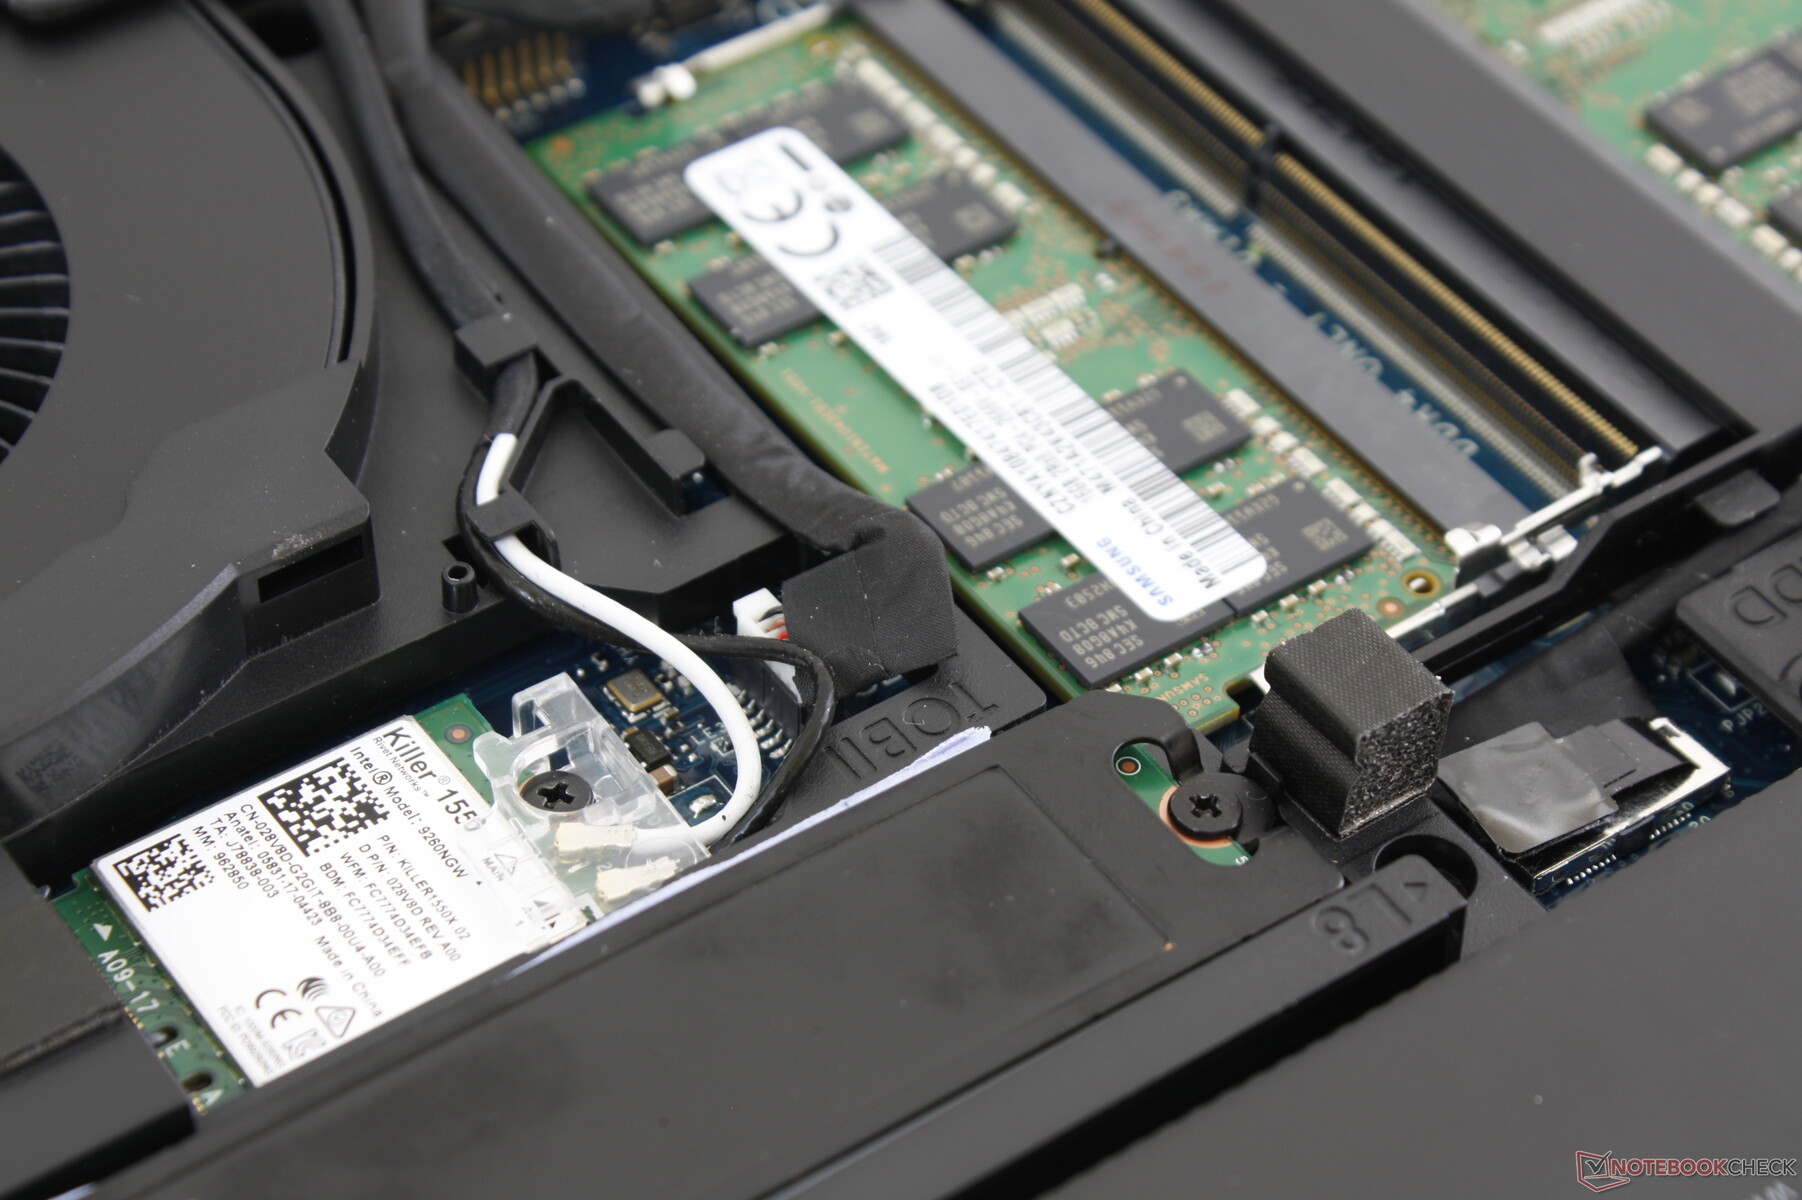
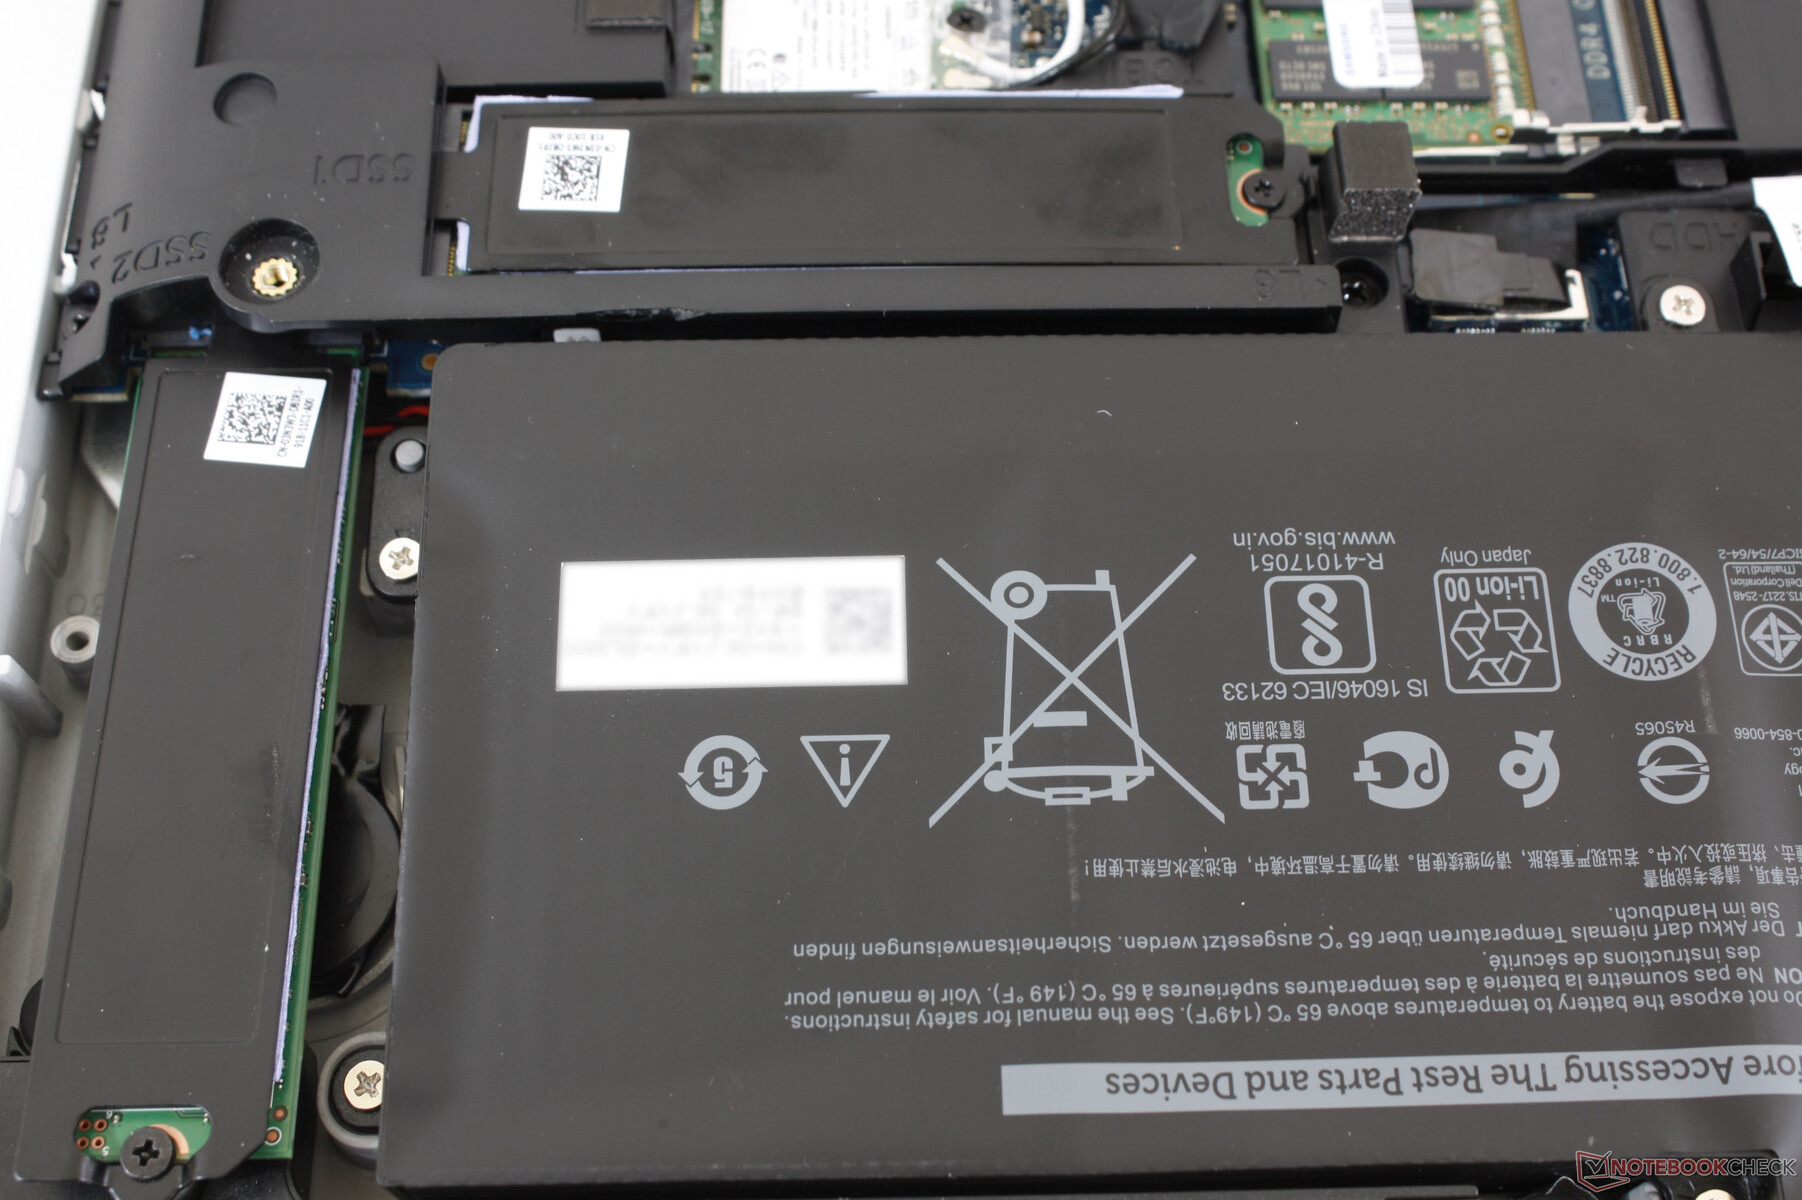
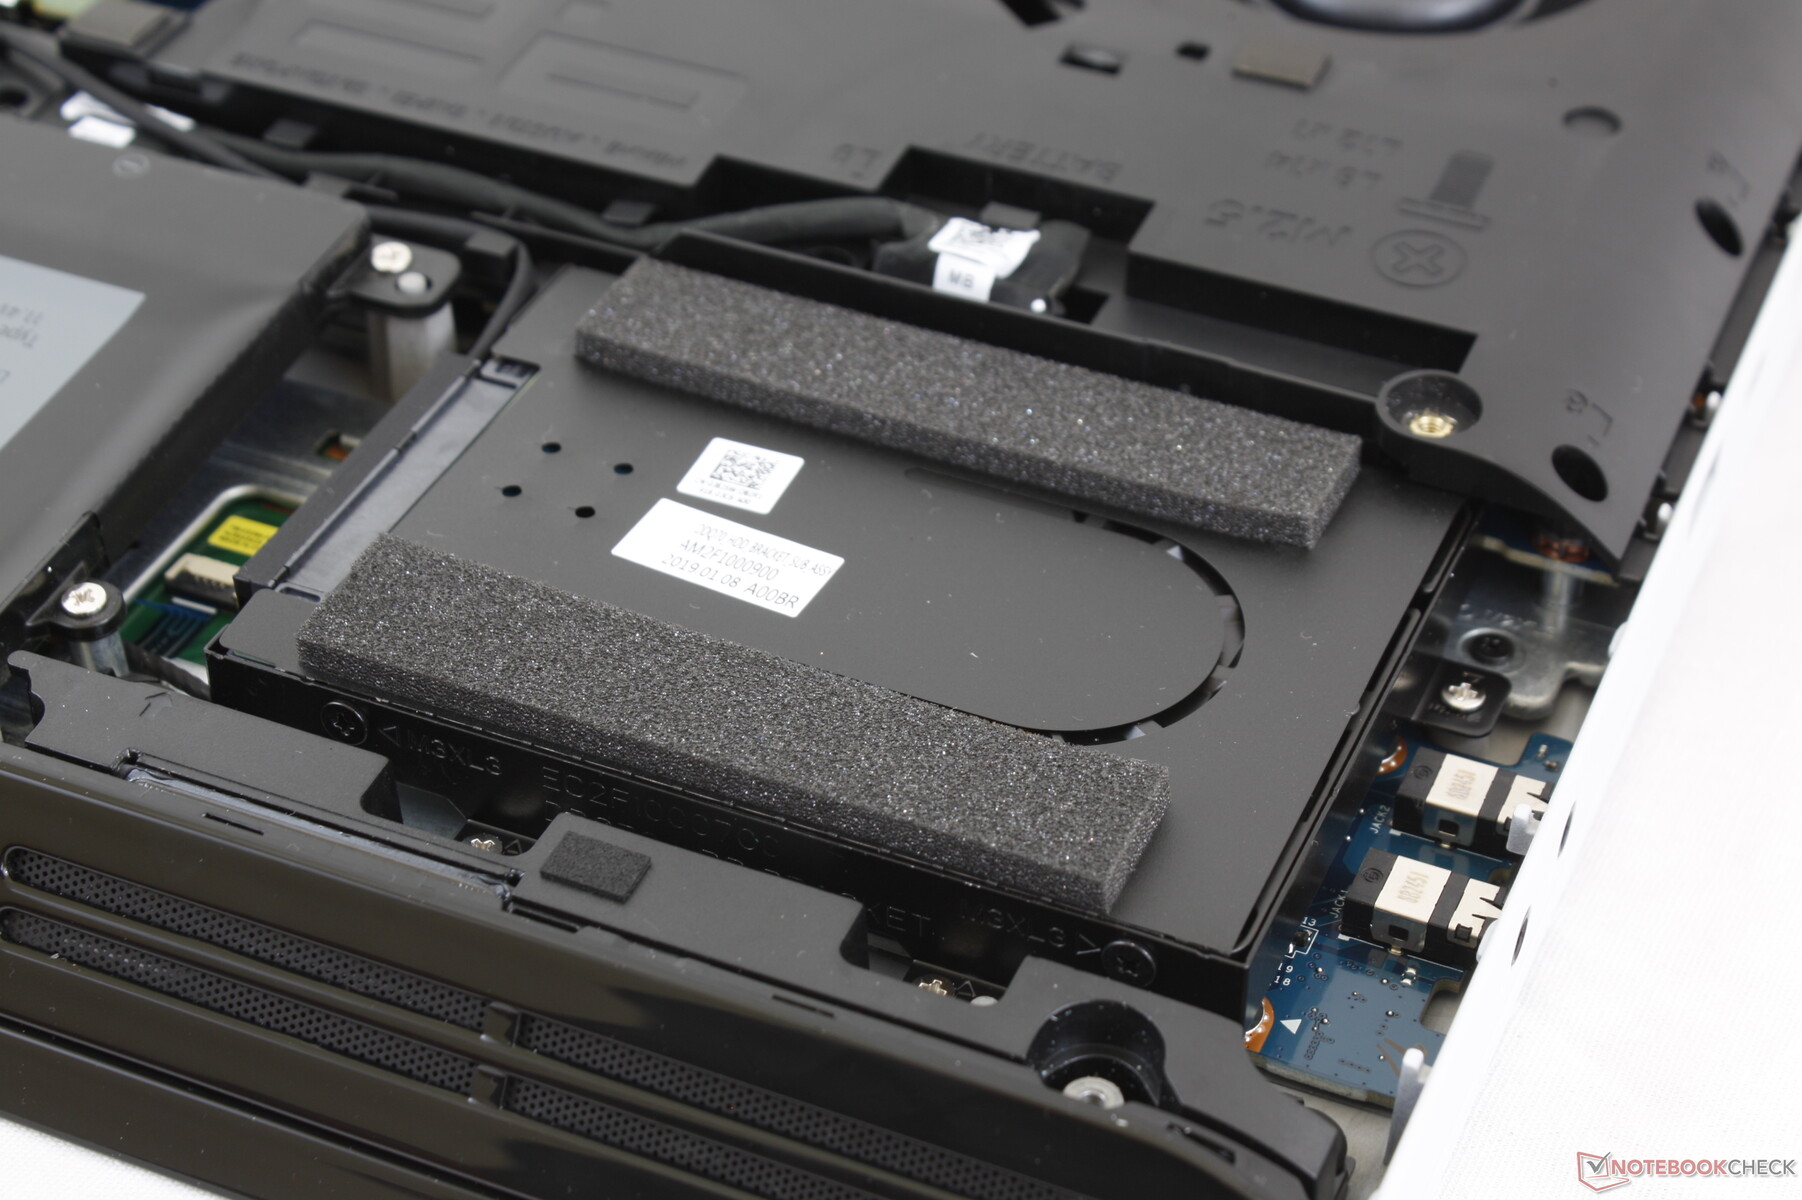
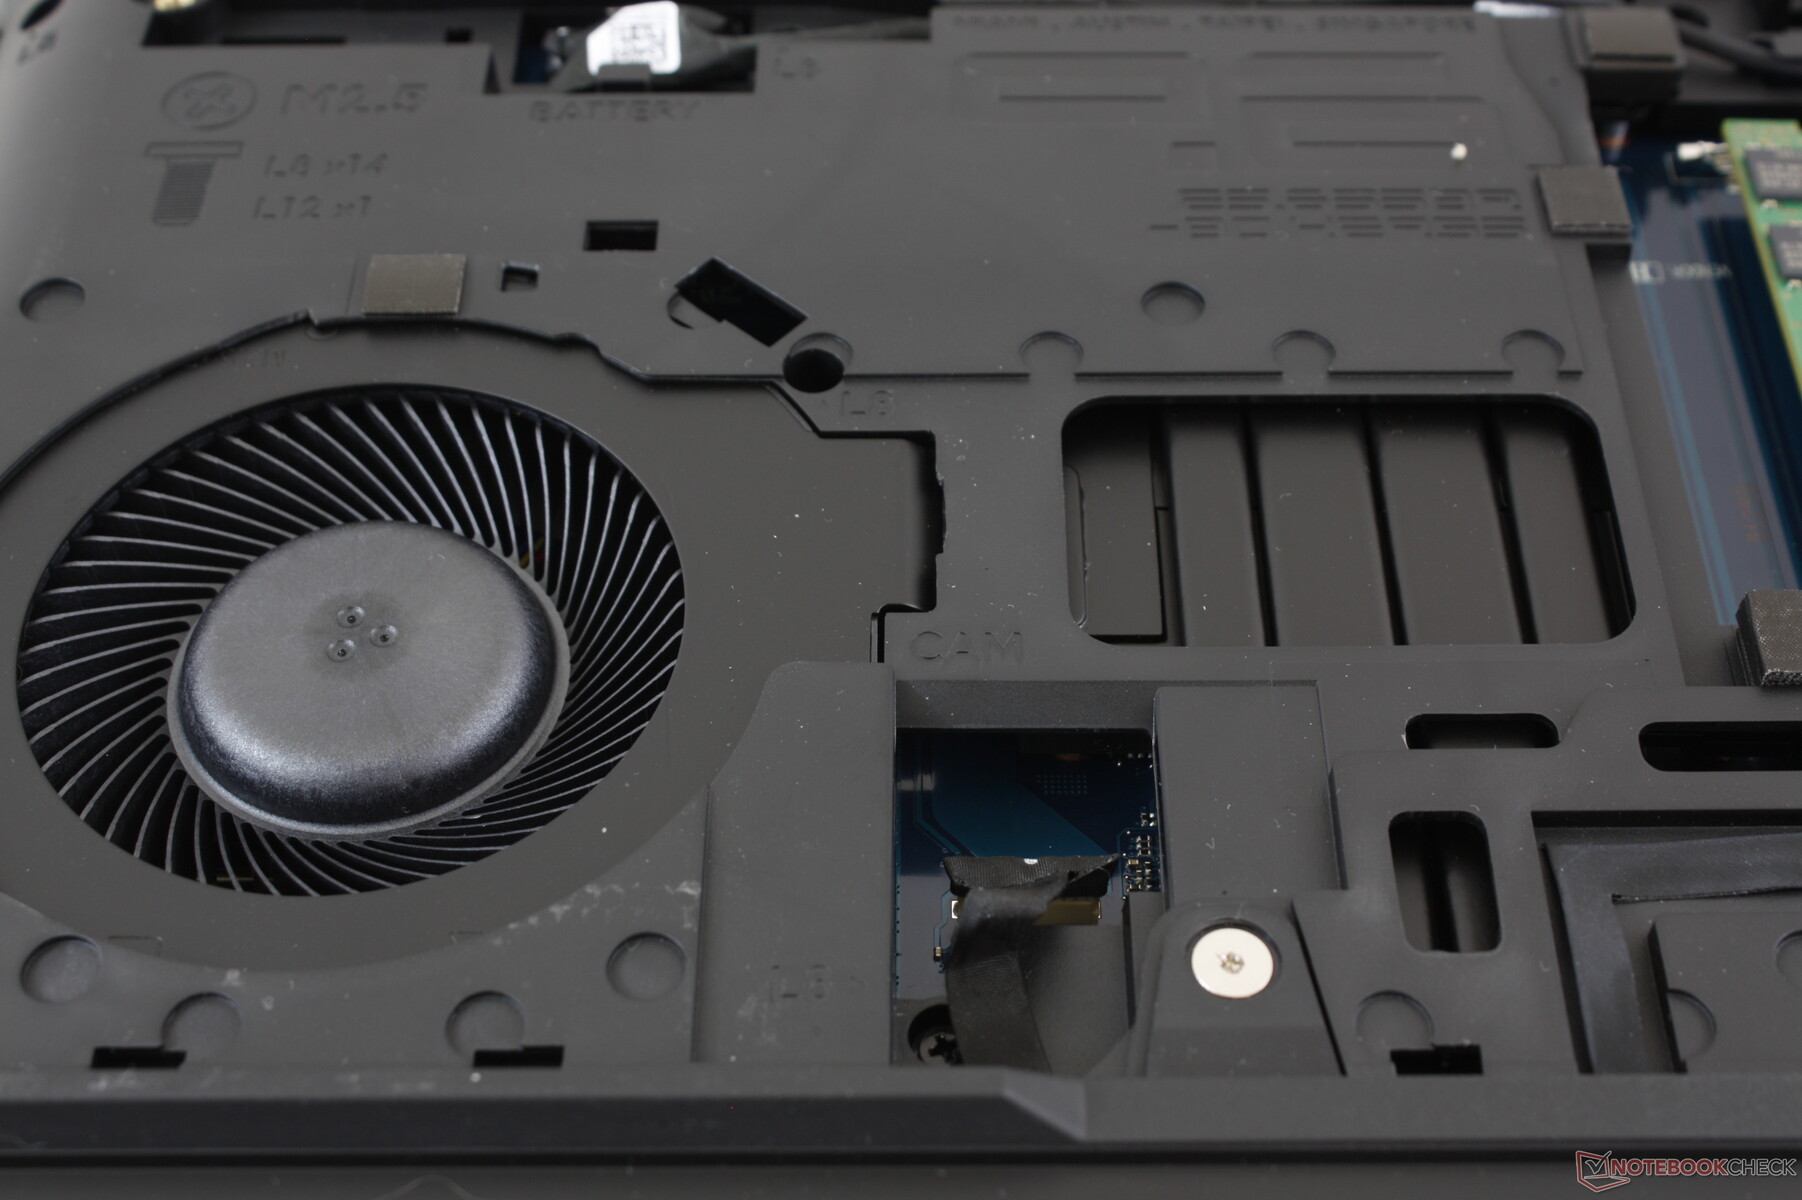
The bottom plate requires only a Philips screwdriver to remove. While taking it out is easy, putting the plate back on is a bit more difficult because of the tight latches around the edges.
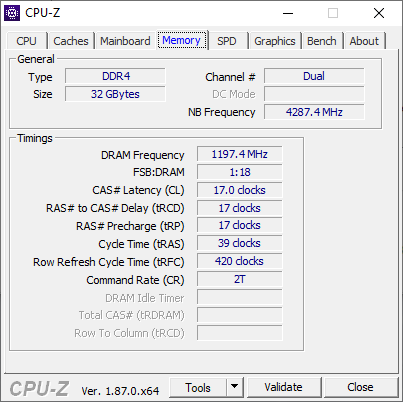
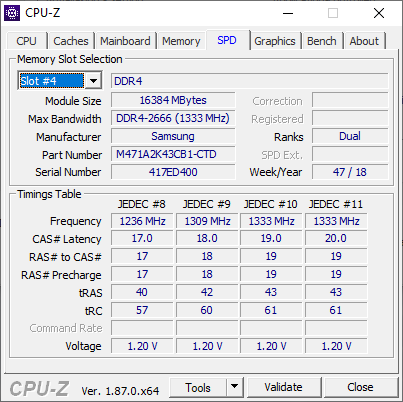
Users have direct access to all four SODIMM slots (up to 64 GB DDR4), all three storage bays, WLAN module, and the internal battery. The layout and reinforced inner skeleton remind us of the Dell Latitude series. Servicing the CPU and GPU will, of course, require additional disassembly of the fans and heat pipes. The LGA 1151 and MXM 3.0 sockets of the Eurocom Sky X7C are easier to access.
There is a fair amount of unused space surrounding the 2.5-inch SATA drive. Perhaps this empty space could have been utilized for another purpose such as a subwoofer or larger battery.
Accessories and Warranty
There are no extras included in the retail box. Dell offers an entire range of Alienware accessories from mice to backpacks to the Graphics Amplifier eGPU docking station should users choose to go that route.
The standard one-year limited warranty applies with extensions of up to 5 years. Dell is promising mail-in services in the near future for buyers who wish to upgrade the GPU.
Input Devices
Keyboard
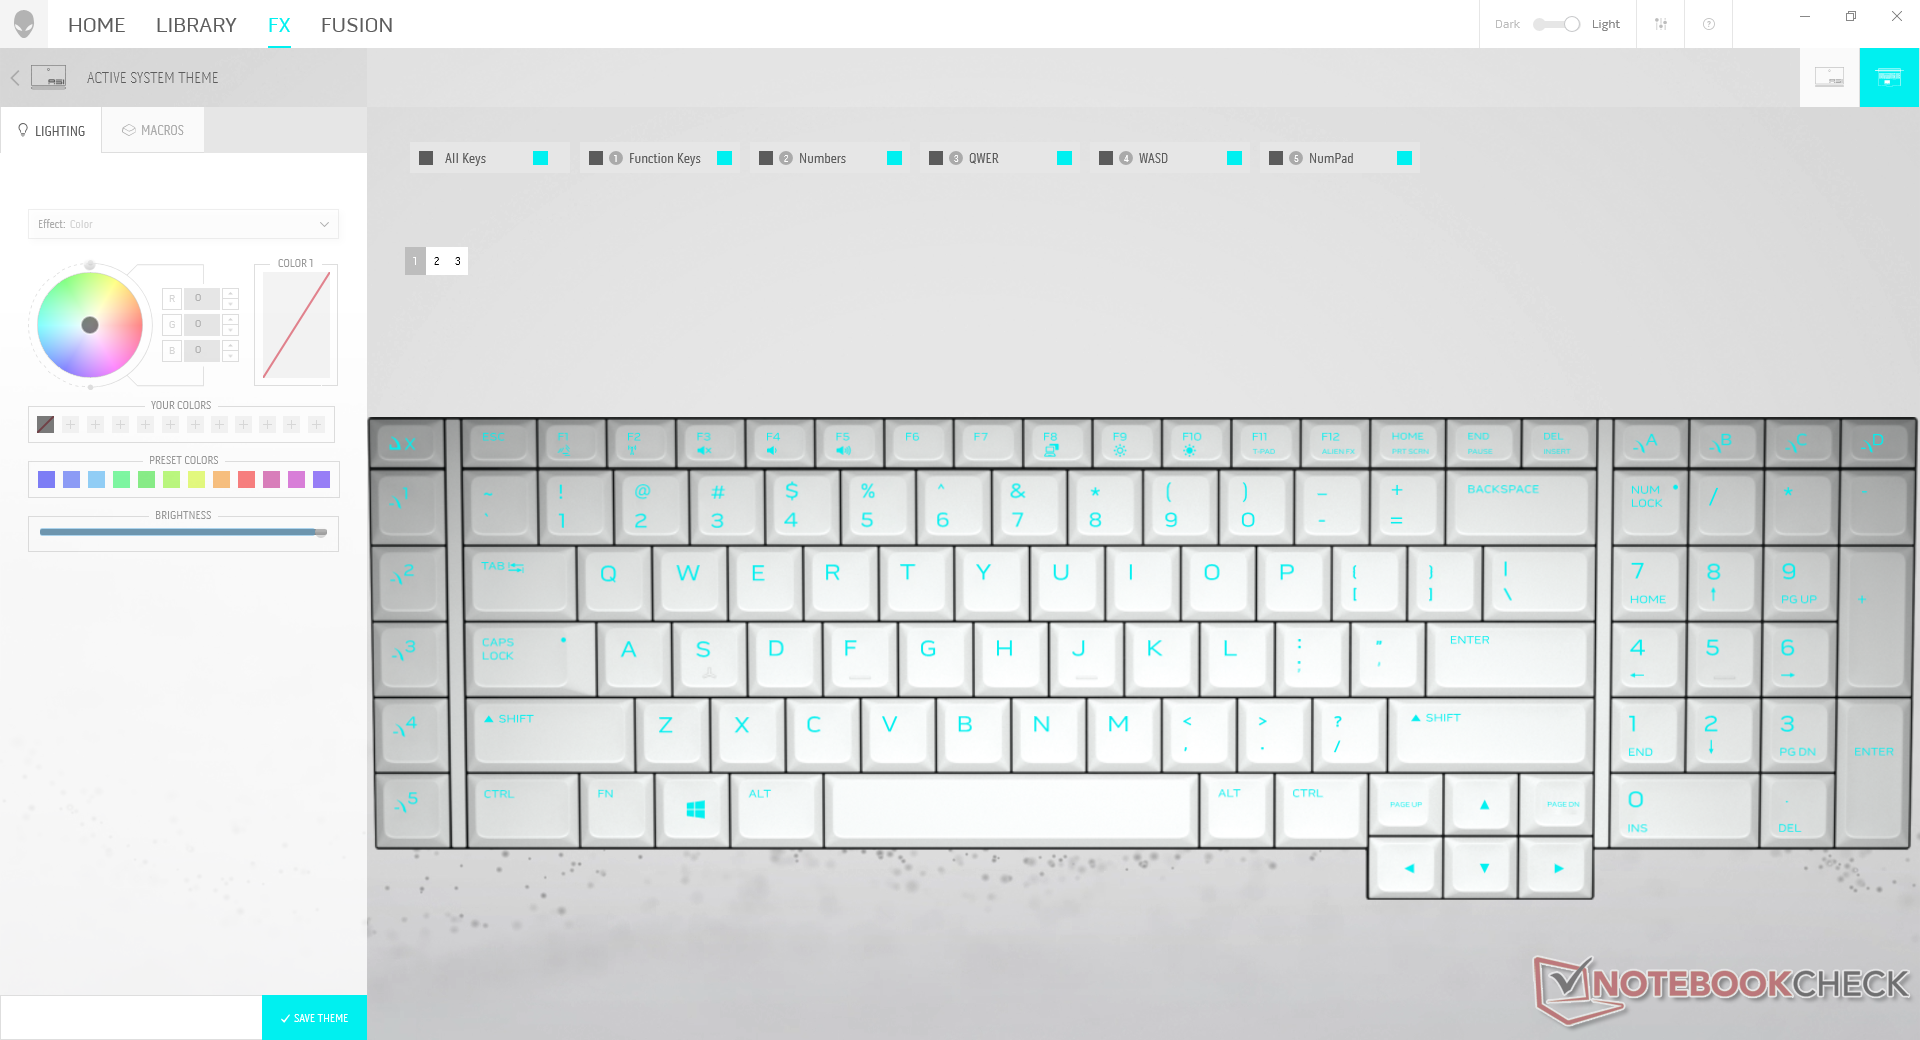
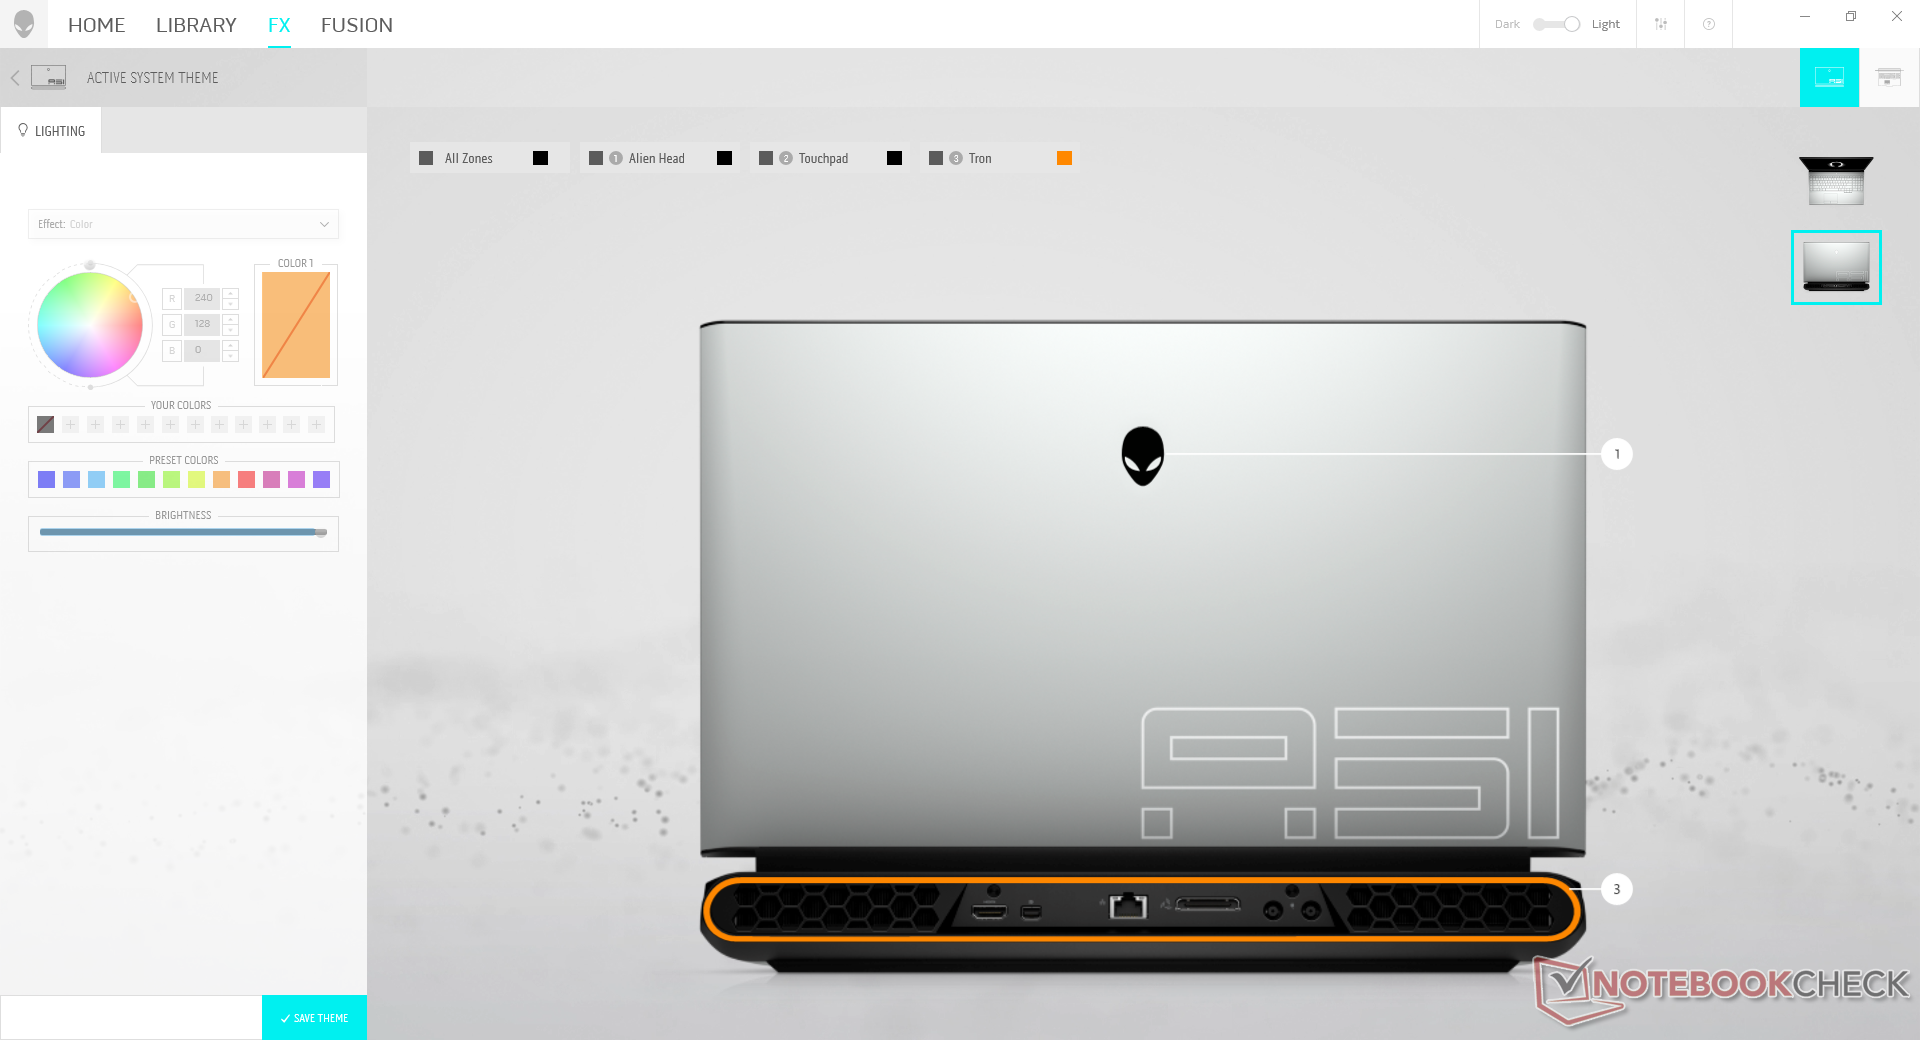
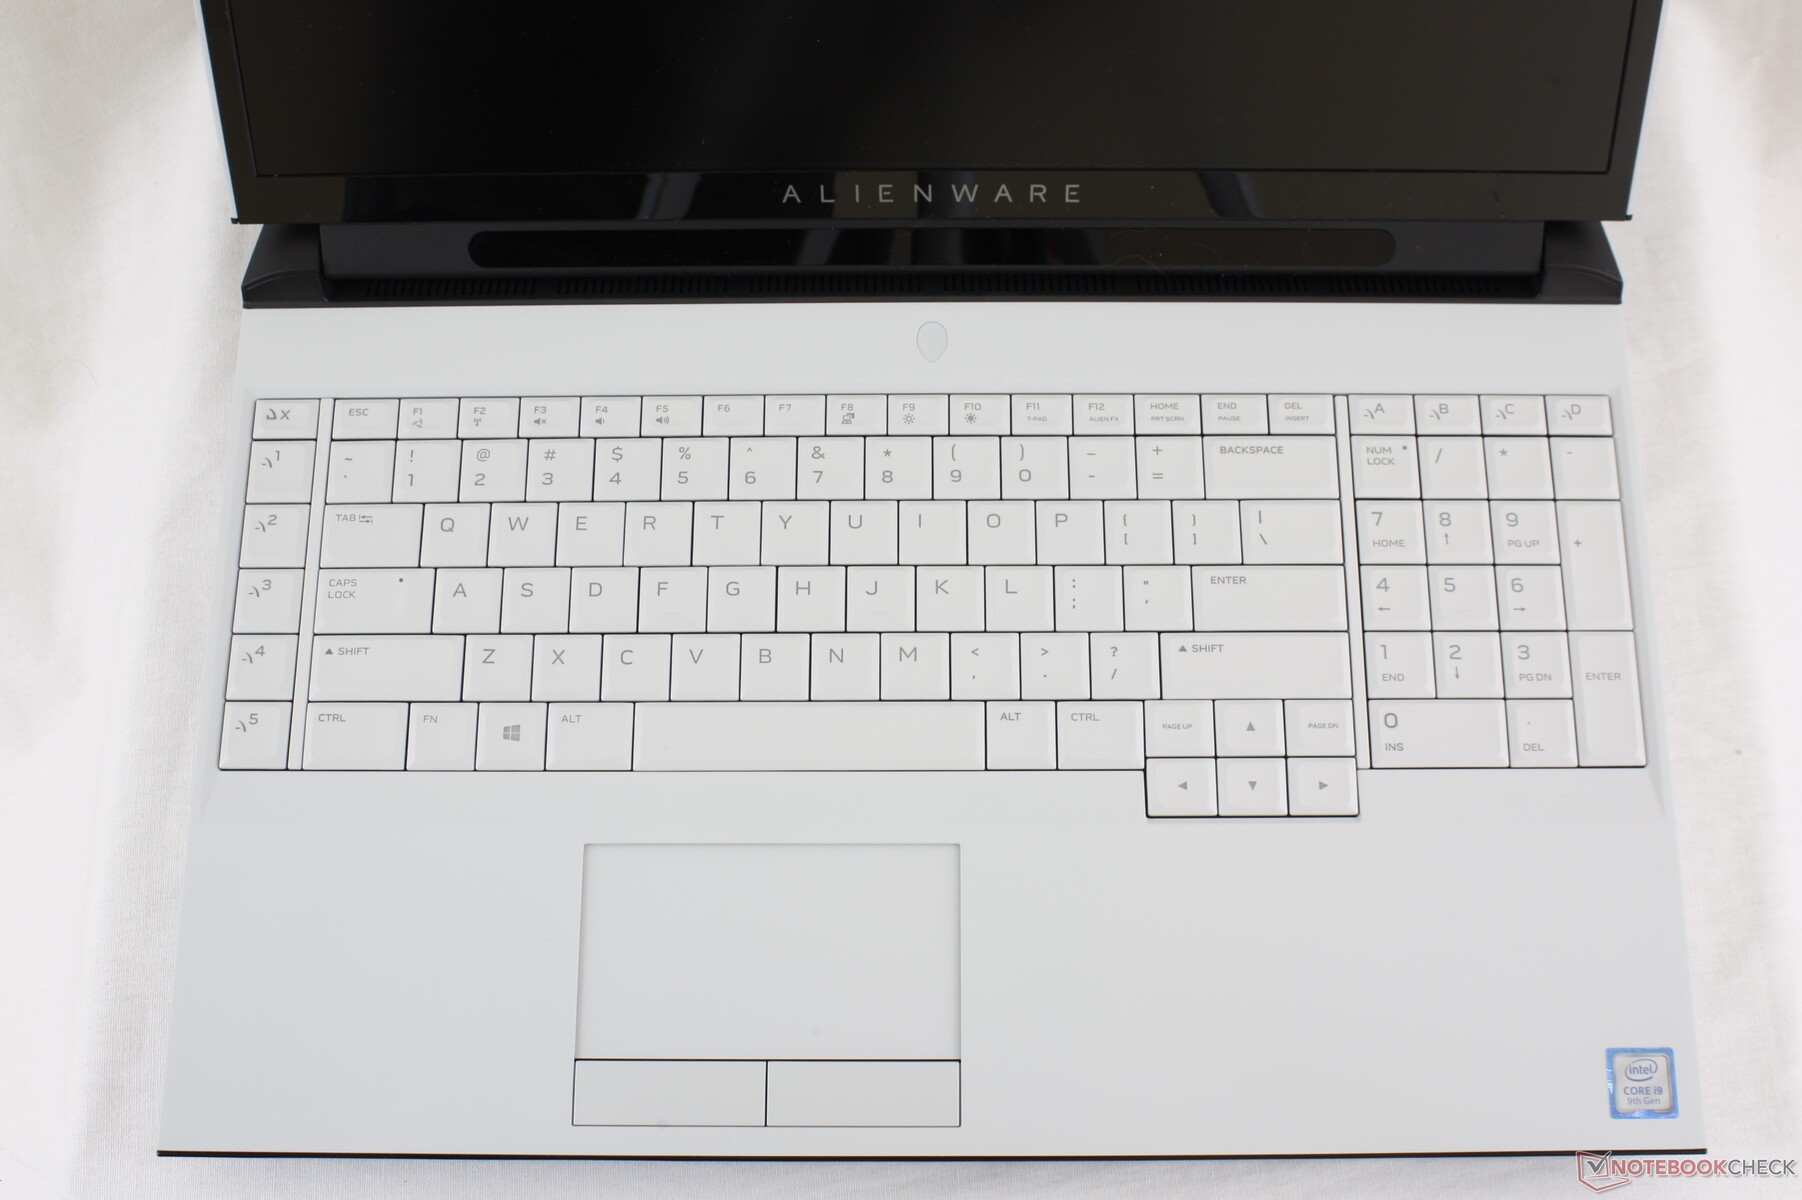
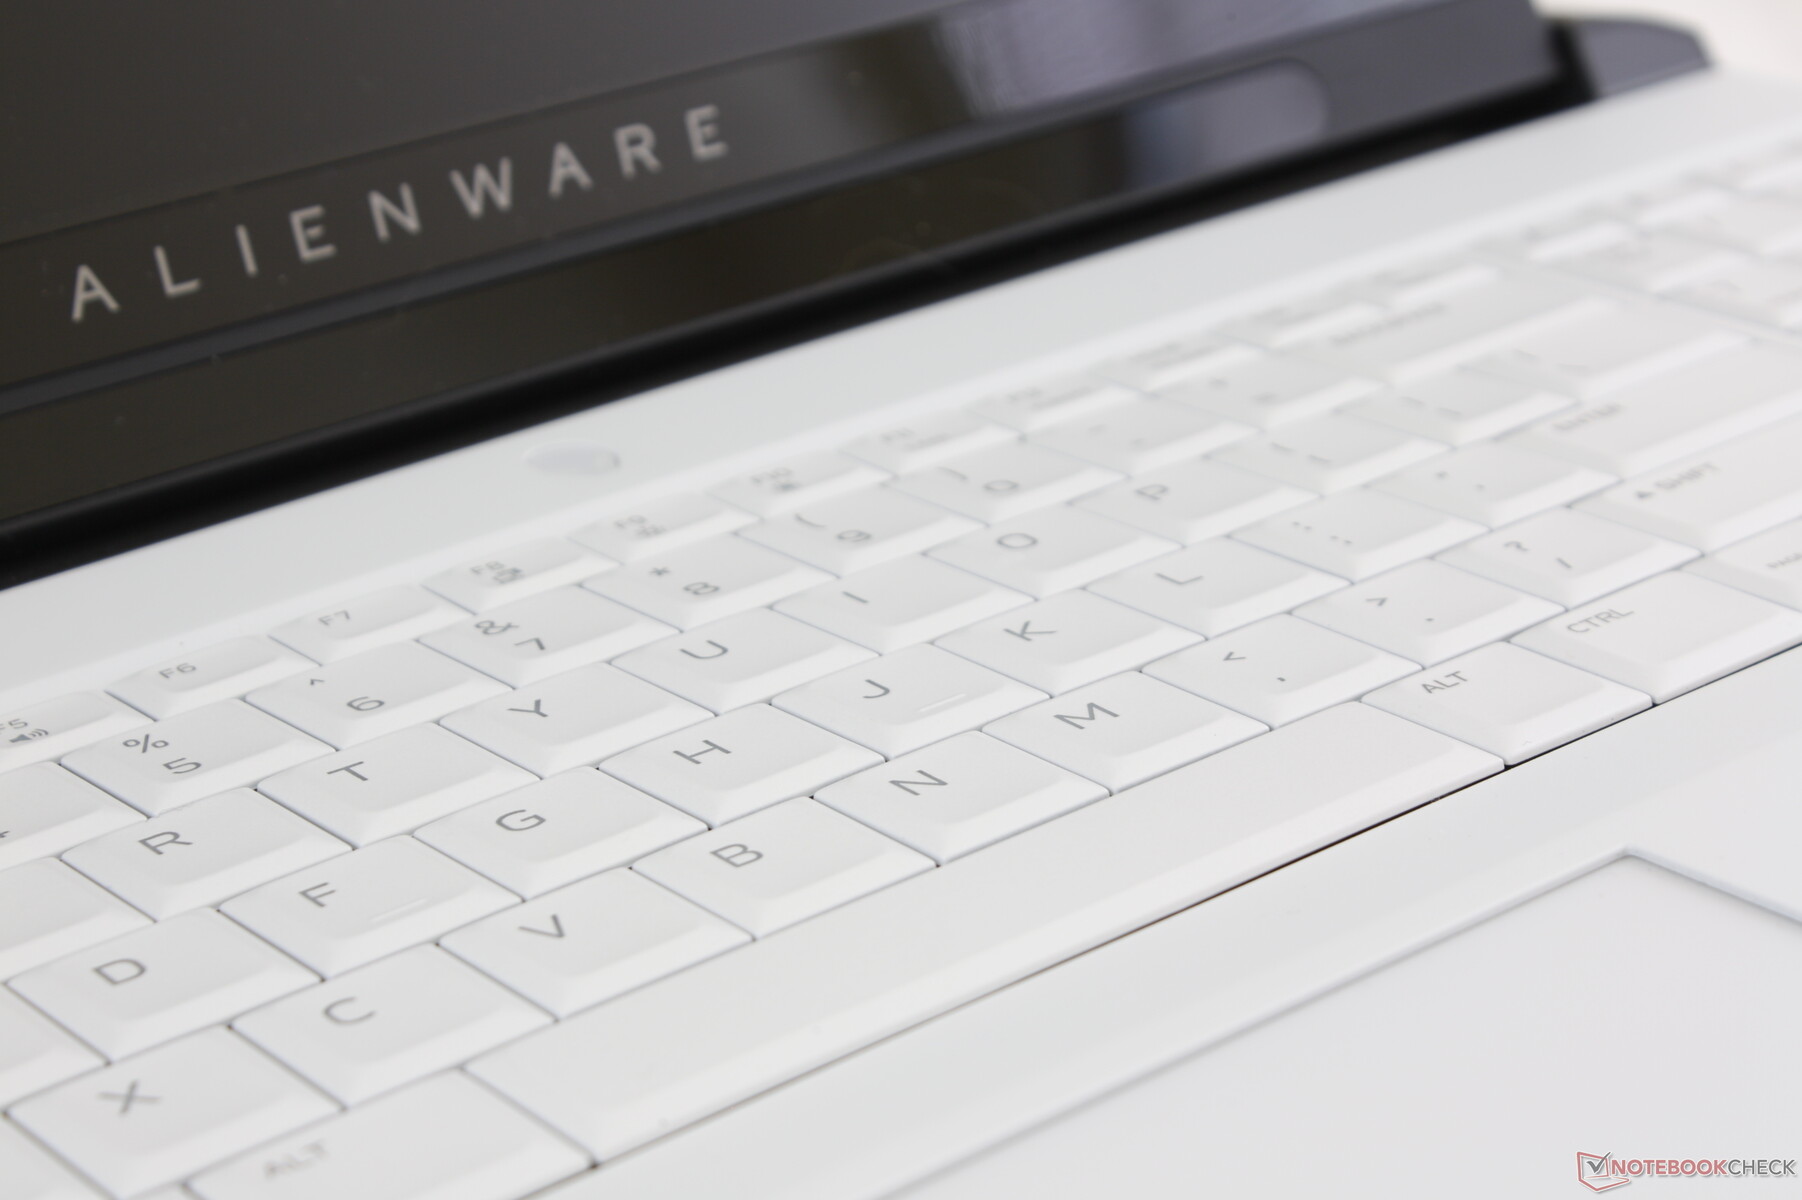
Unlike the chiclet keyboards of the Alienware m15 or m17, the Area-51m keyboard sticks to the beveled layout of the Alienware 15 and 17. Both the full-size NumPad and Macro keys are back whereas most other gaming laptops tend to omit them completely or diminish them in size for a spongier feel. Key feedback on the Area-51m feels crisper and with deeper travel than on the XPS 15 to prove that you don't necessarily need mechanical keys to offer a good typing experience. Users already familiar with the keyboards of the Alienware 15 or 17 will feel right at home.
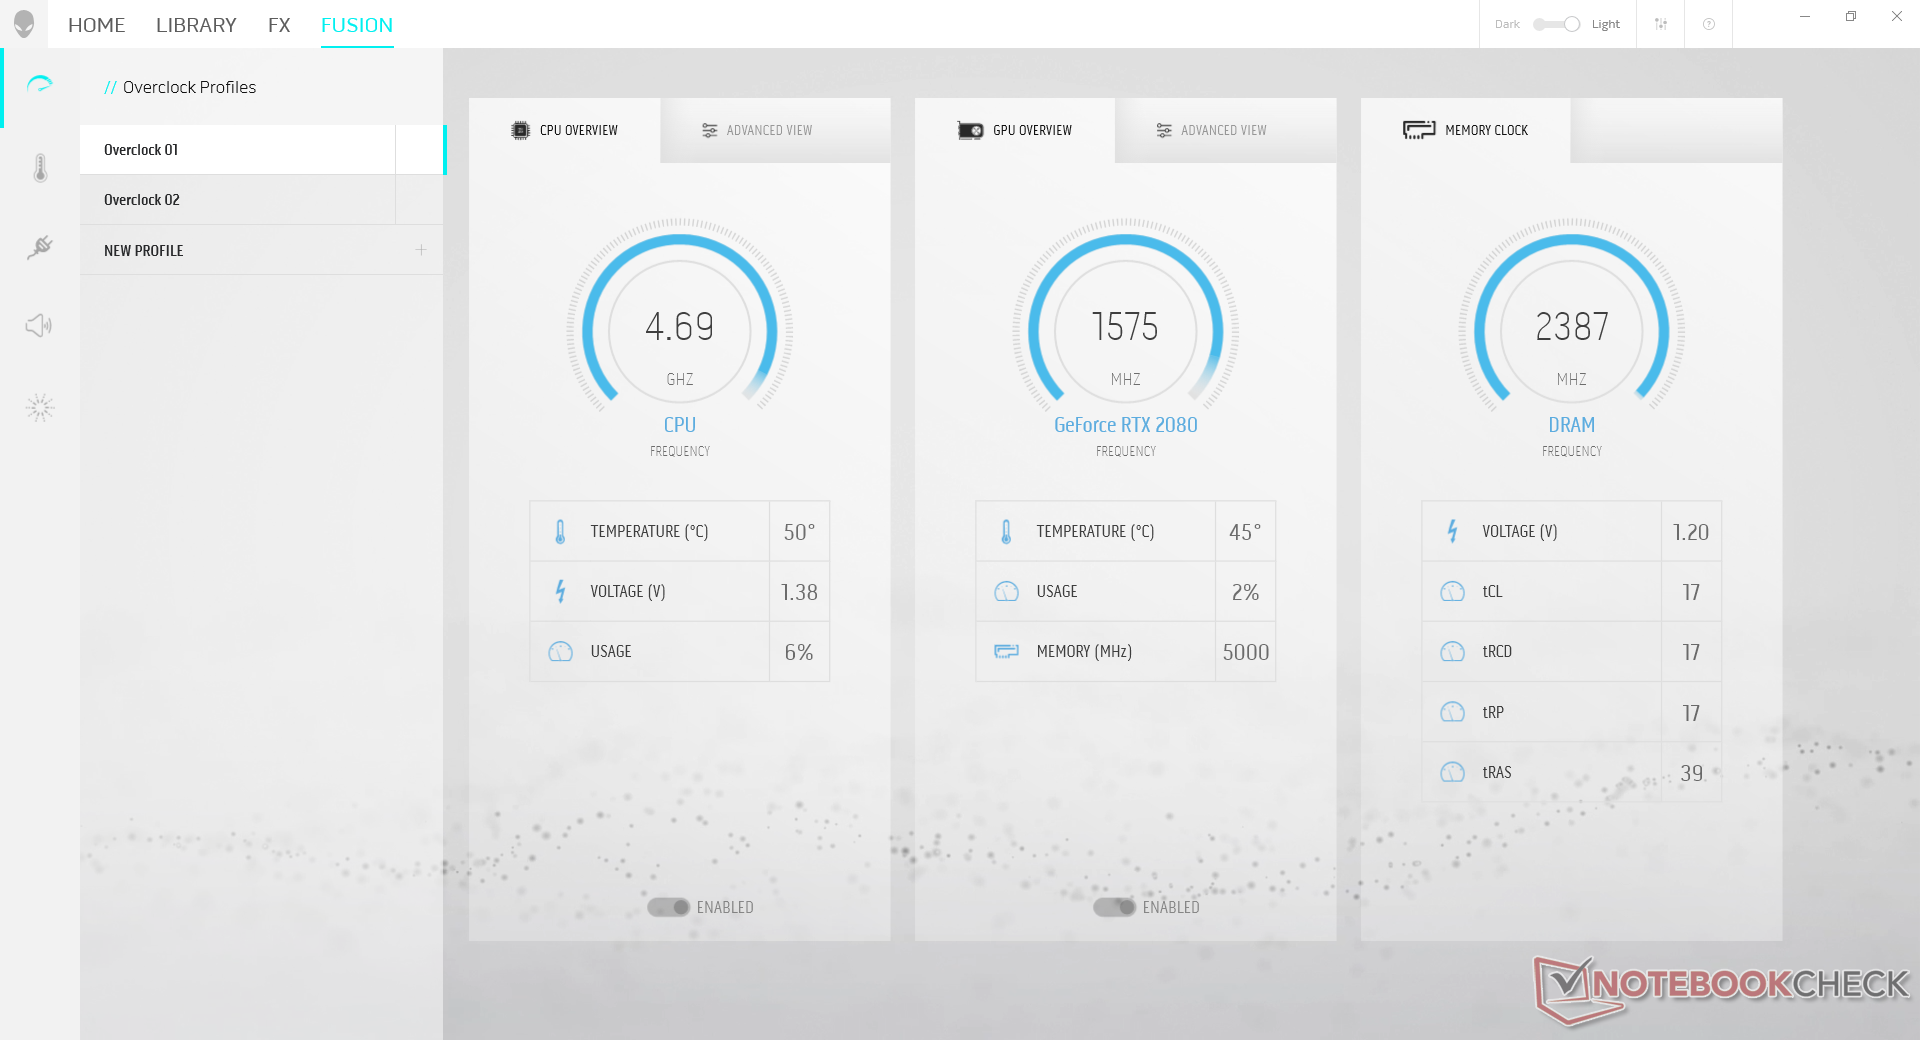
Per-key RGB lighting and trackpad lighting are controlled via AlienFX in the Alienware Control Center software. Annoyingly, there are no default hotkeys on the keyboard for fine-tuning the brightness level of the keyboard backlight.
Touchpad
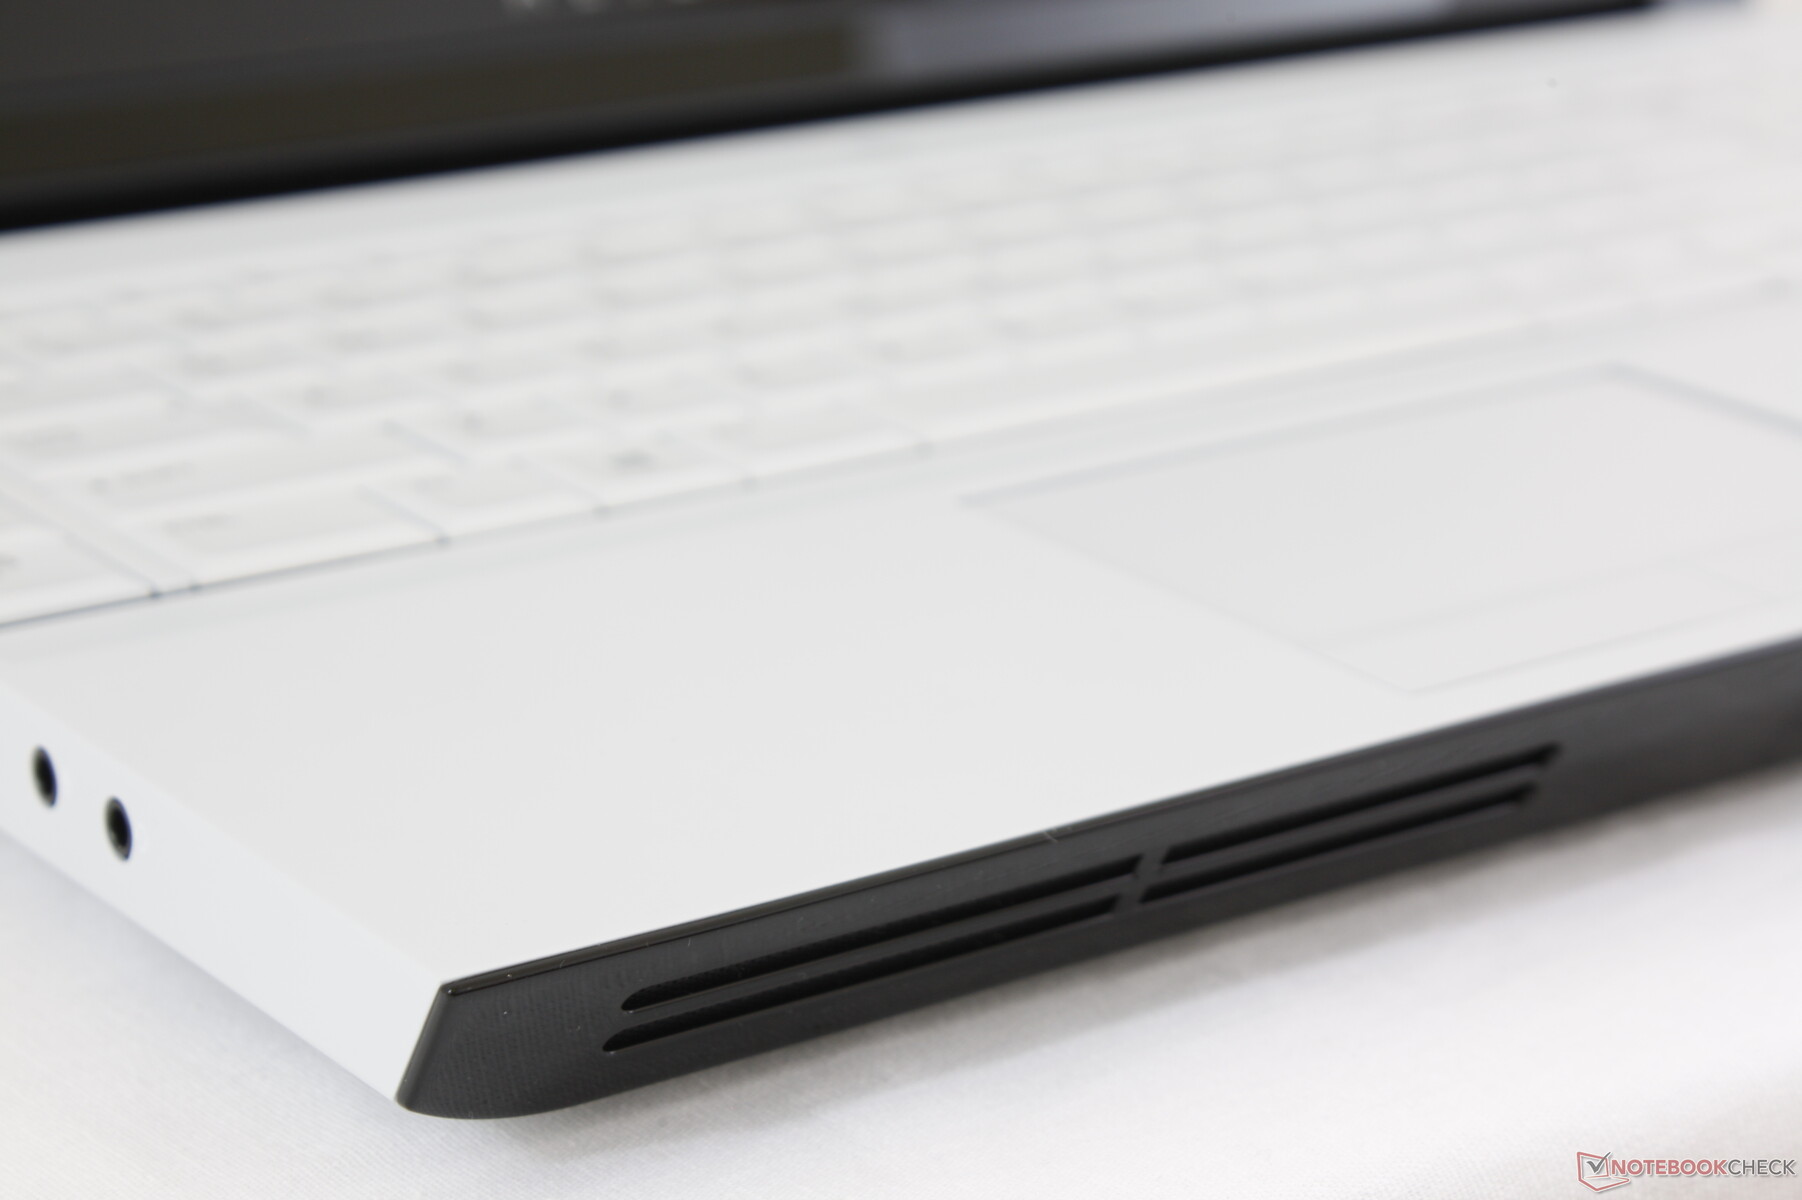
The trackpad is the same size as on the Alienware 17 R5 (~10 x 5.5 cm) and so it is still smaller than the trackpad on the Dell XPS 15 (10.5 x 8.5 cm). In return, it includes dedicated mouse keys for easier and more accurate clicks. The keys themselves are very quiet but with average feedback in contrast to the louder and firmer mouse keys of the MSI GT75.
Gliding on the trackpad surface is smooth and responsive at fast speeds, but it becomes a bit sticky and bouncy at slower speeds. It's a minor complaint for what is otherwise a firm trackpad that does the trick should a mouse be unavailable.
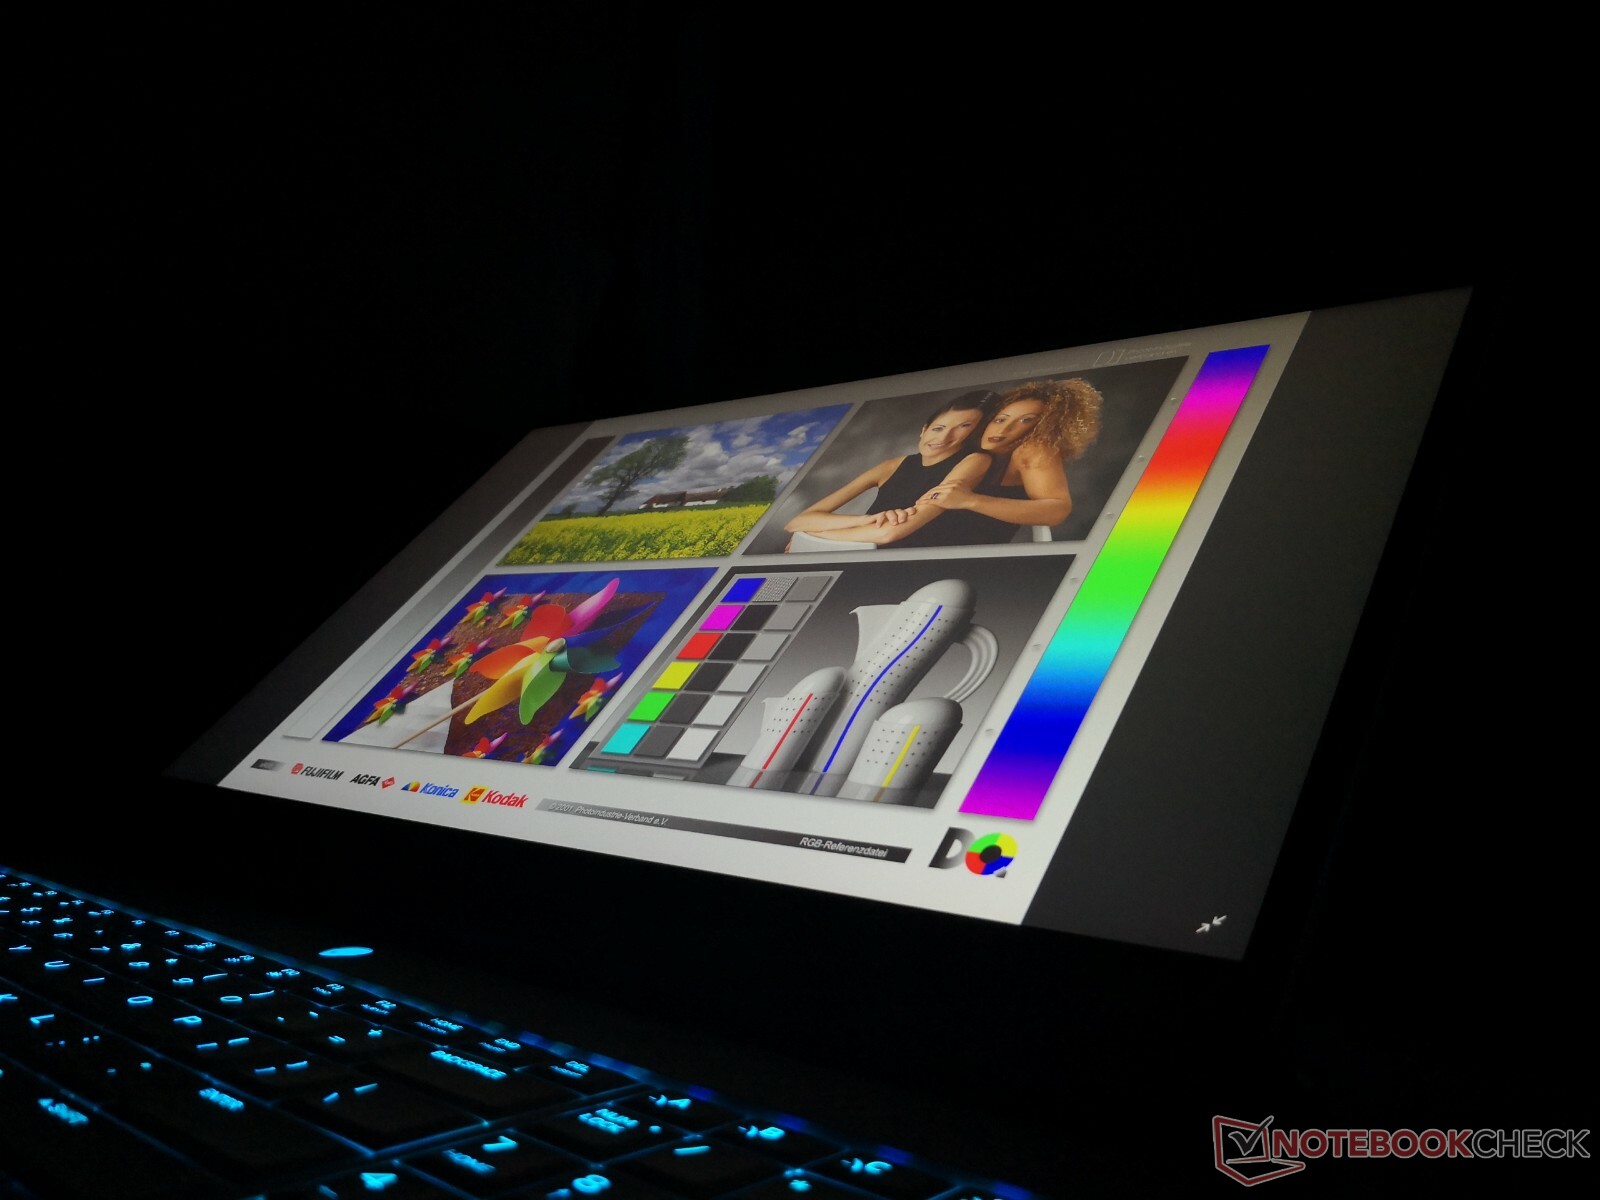
Display
As of this writing, all SKUs come equipped with matte non-touch 1080p IPS panels only. Higher resolution options are purportedly in the works for availability later in the year. Users can choose between 60 Hz or 144 Hz panels with or without integrated Tobii Eye Tracking. We recommend going with the 144 Hz option if configuring with an RTX 2080 since this GPU is more than capable of running titles beyond 60 FPS.
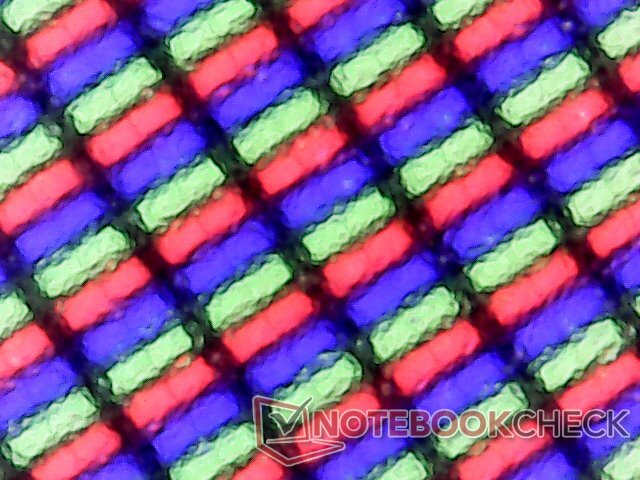
Our test unit is configured with a 1080p144 panel for silky smooth animations. The LG Philips 173WFG IPS panel here is the first one to appear in our database. Black-white and gray-gray response times are fast and comparable to the 5 ms panels often found on many MSI and Asus laptops for no major ghosting issues. Brightness is also comparable to most gaming laptops at around 300 nits.
The one noticeable drawback of the display is its lower contrast ratio. At only about 500:1, this is around half that of the Chi Mei and AU Optronics 1080p panels as found on the MSI GT75 and Asus ROG G703GX, respectively. This means that blacks and grays don't look as deep as they could have been on the Alienware machine.
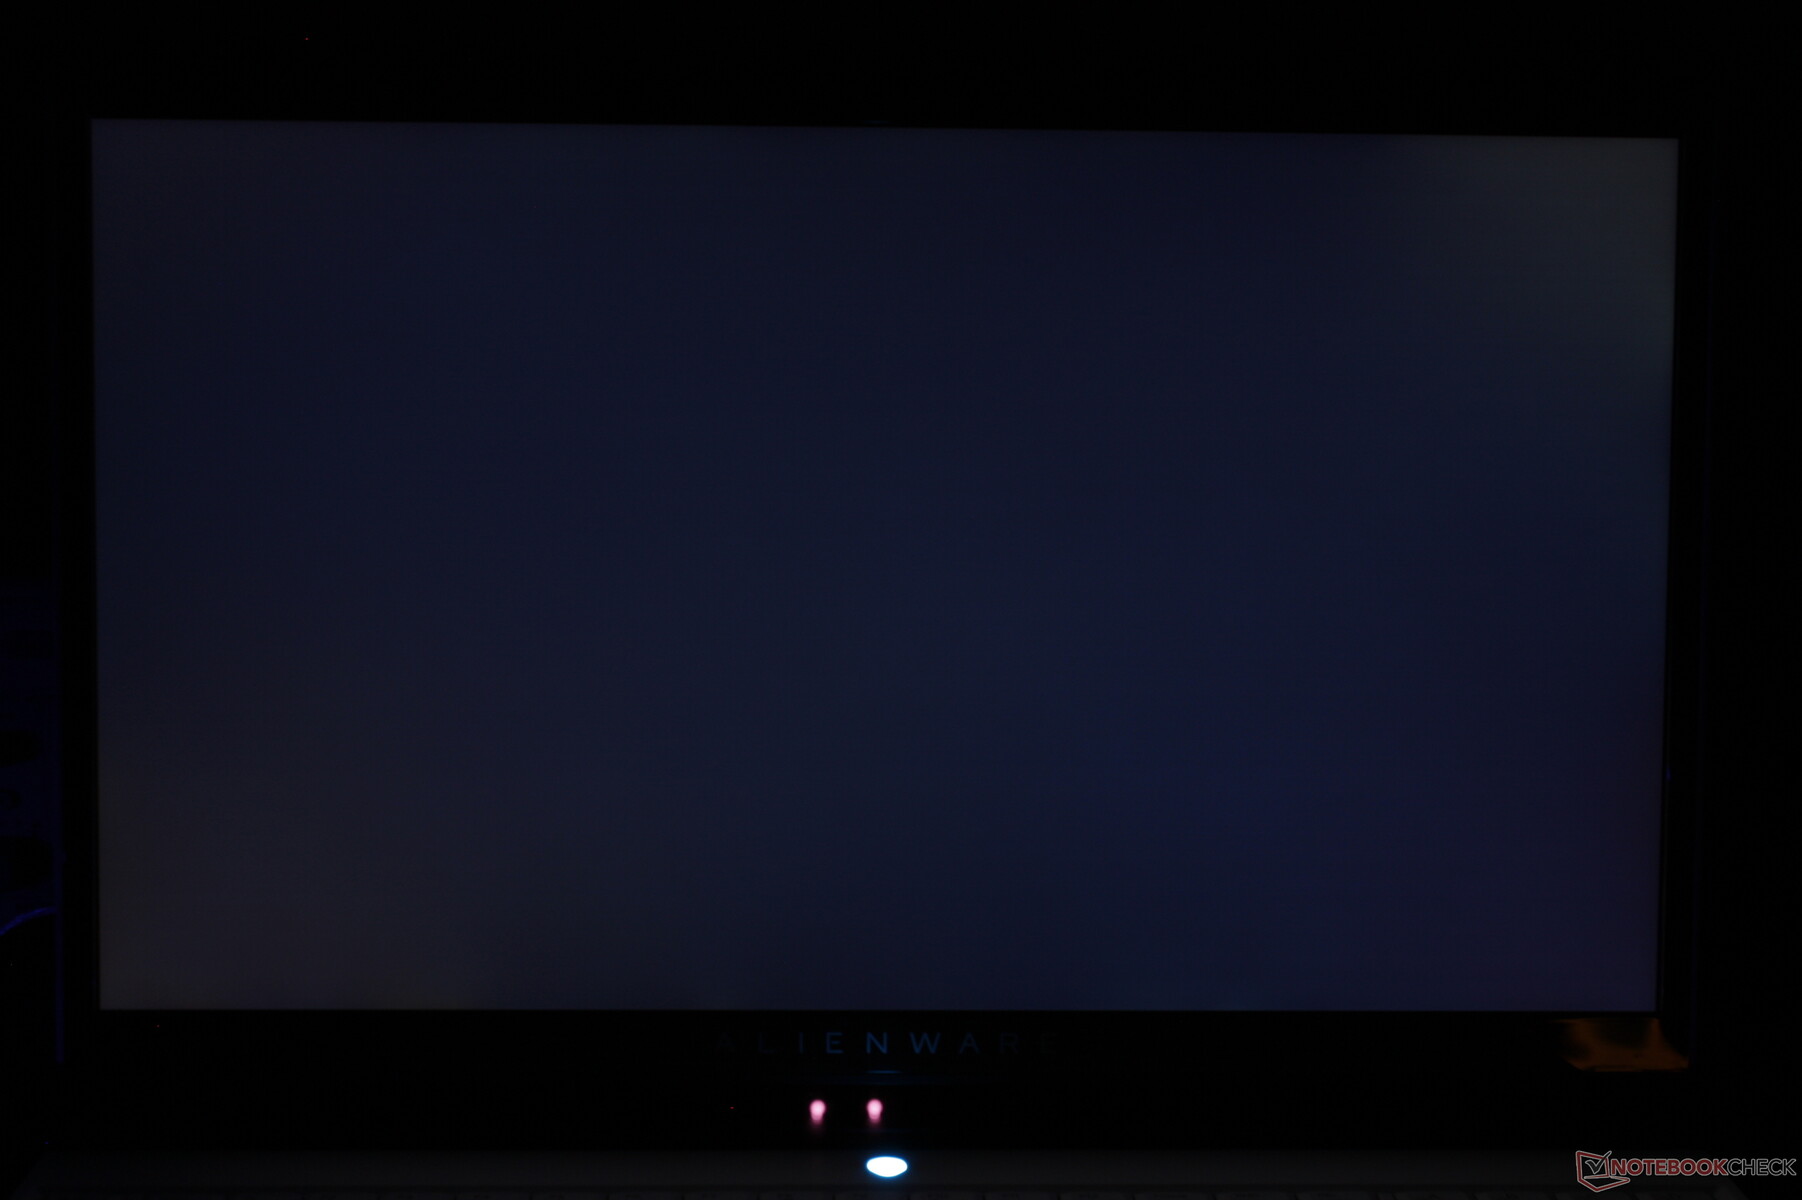
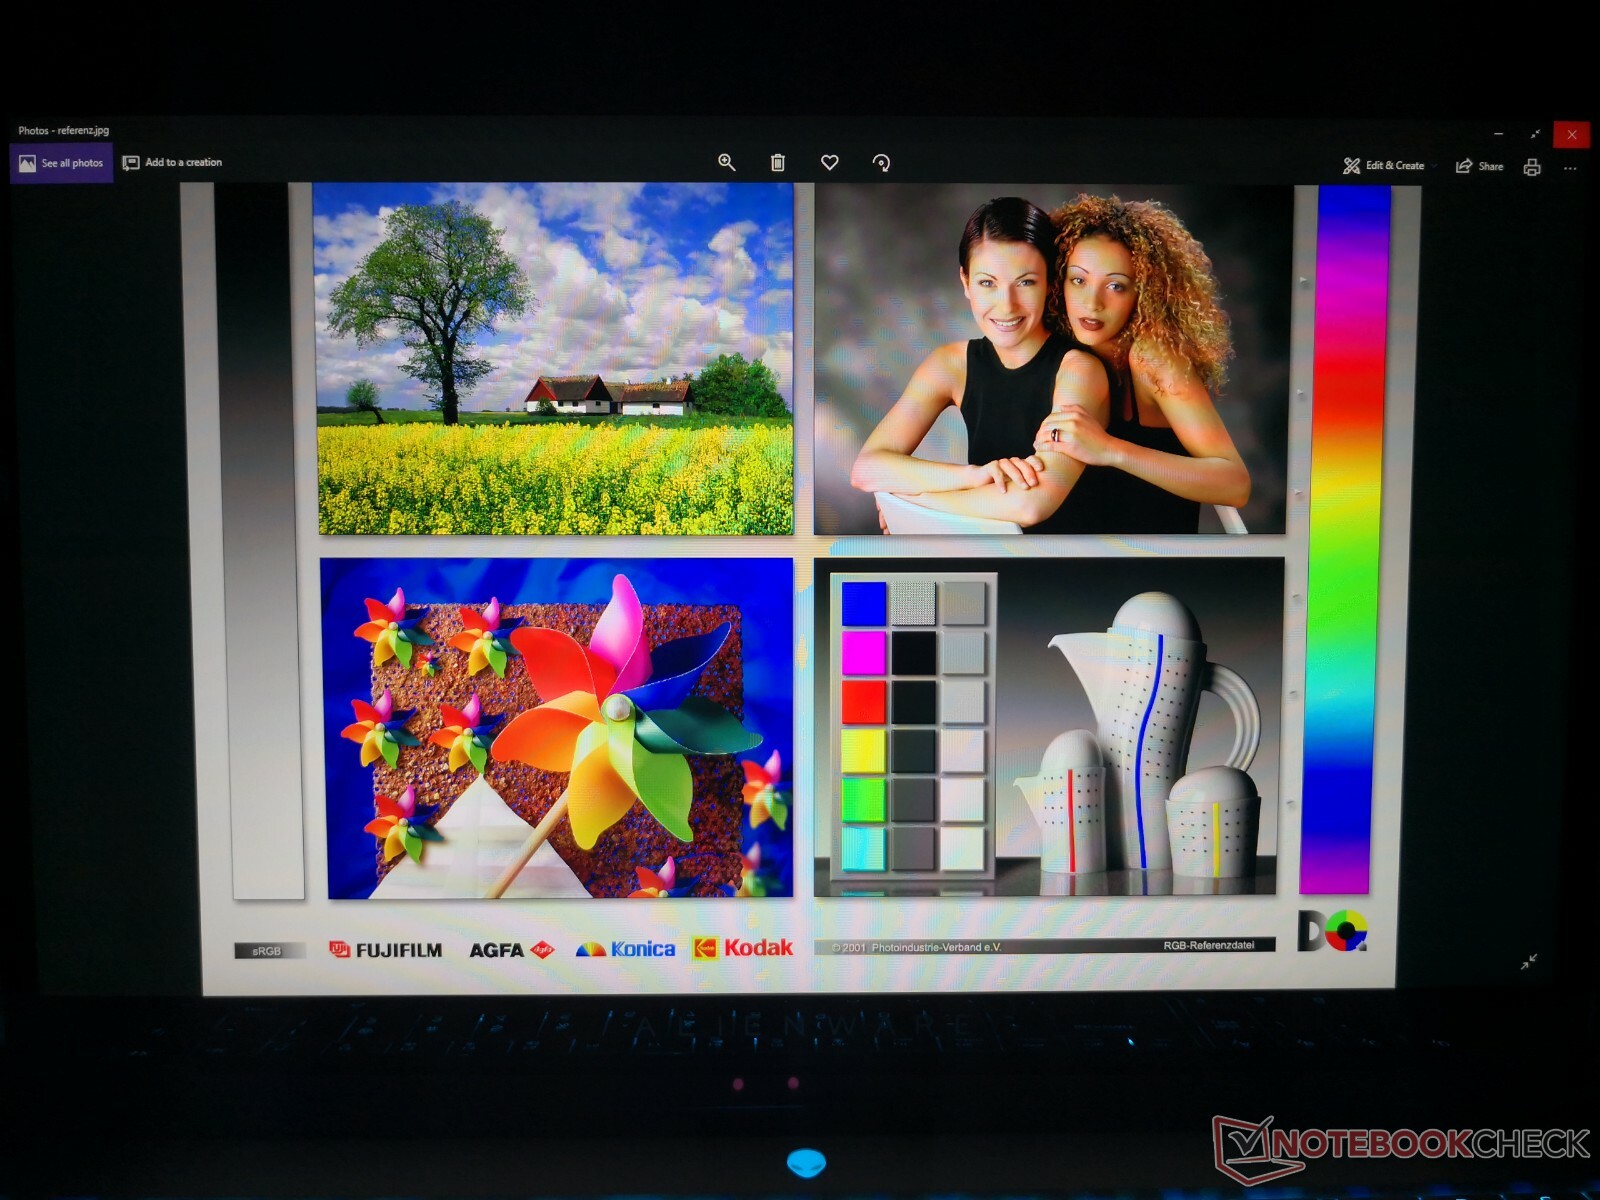
Other than the fault above, this is still a quality panel in every other aspect. Both uneven backlight bleeding and graininess are kept to a minimum.
| |||||||||||||||||||||||||
Brightness Distribution: 82 %
Center on Battery: 355.2 cd/m²
Contrast: 508:1 (Black: 0.66 cd/m²)
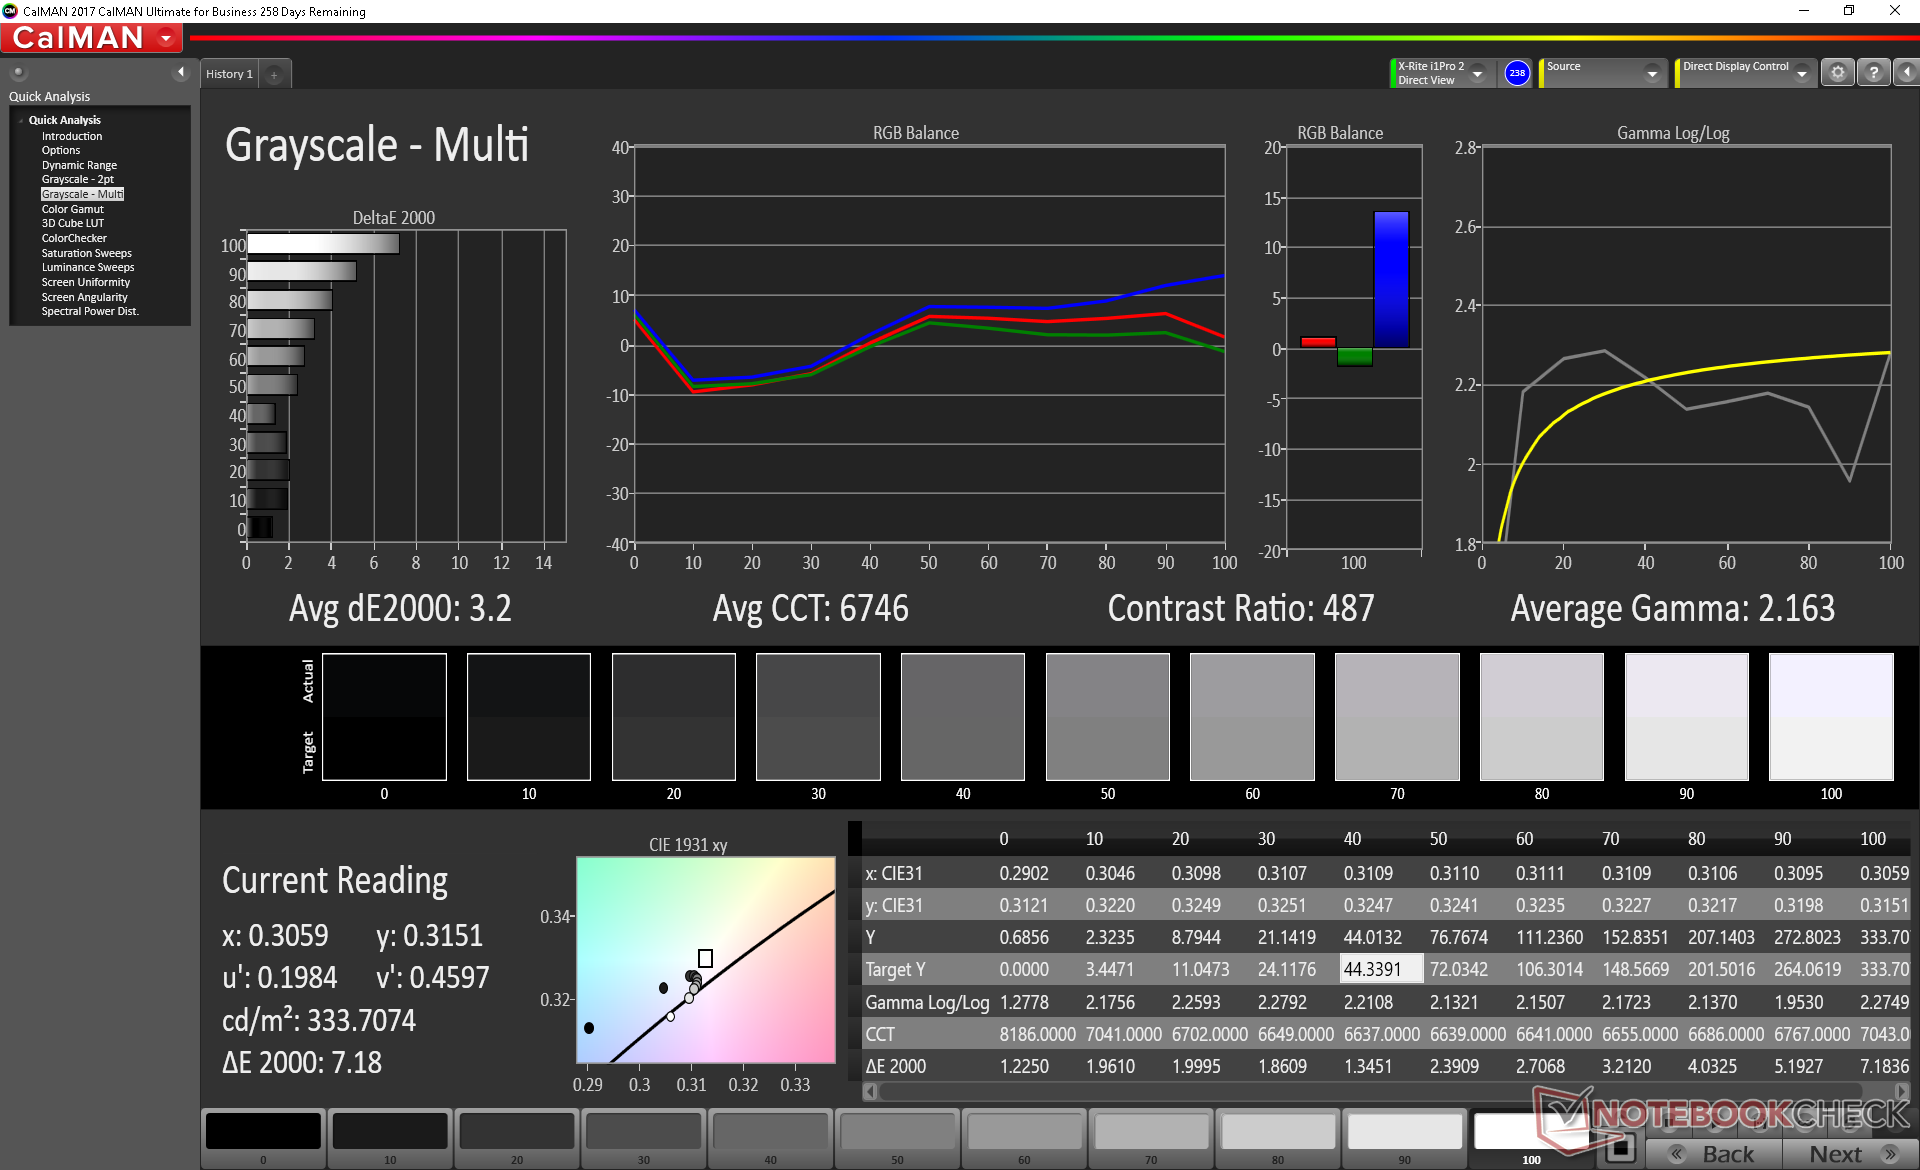
ΔE ColorChecker Calman: 2.02 | ∀{0.5-29.43 Ø4.71}
calibrated: 1.17
ΔE Greyscale Calman: 3.2 | ∀{0.09-98 Ø4.96}
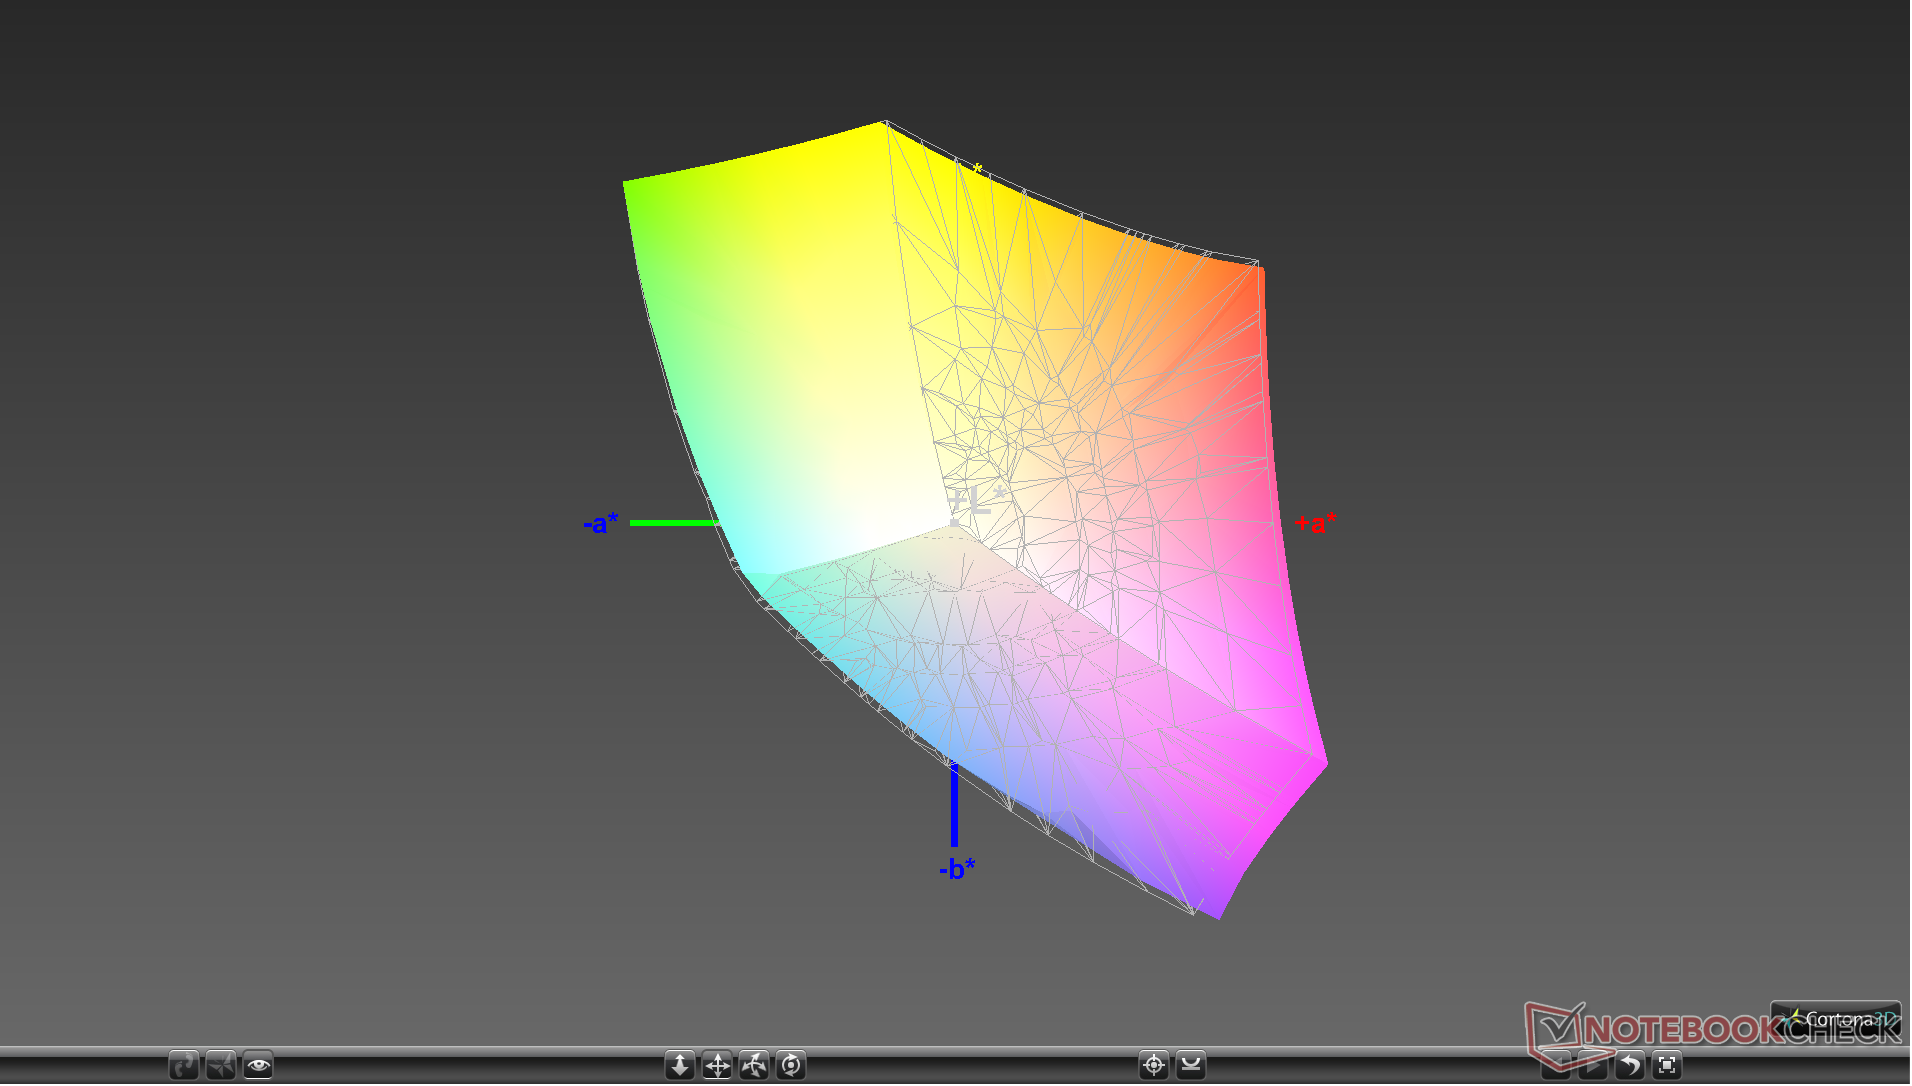
96.9% sRGB (Argyll 1.6.3 3D)
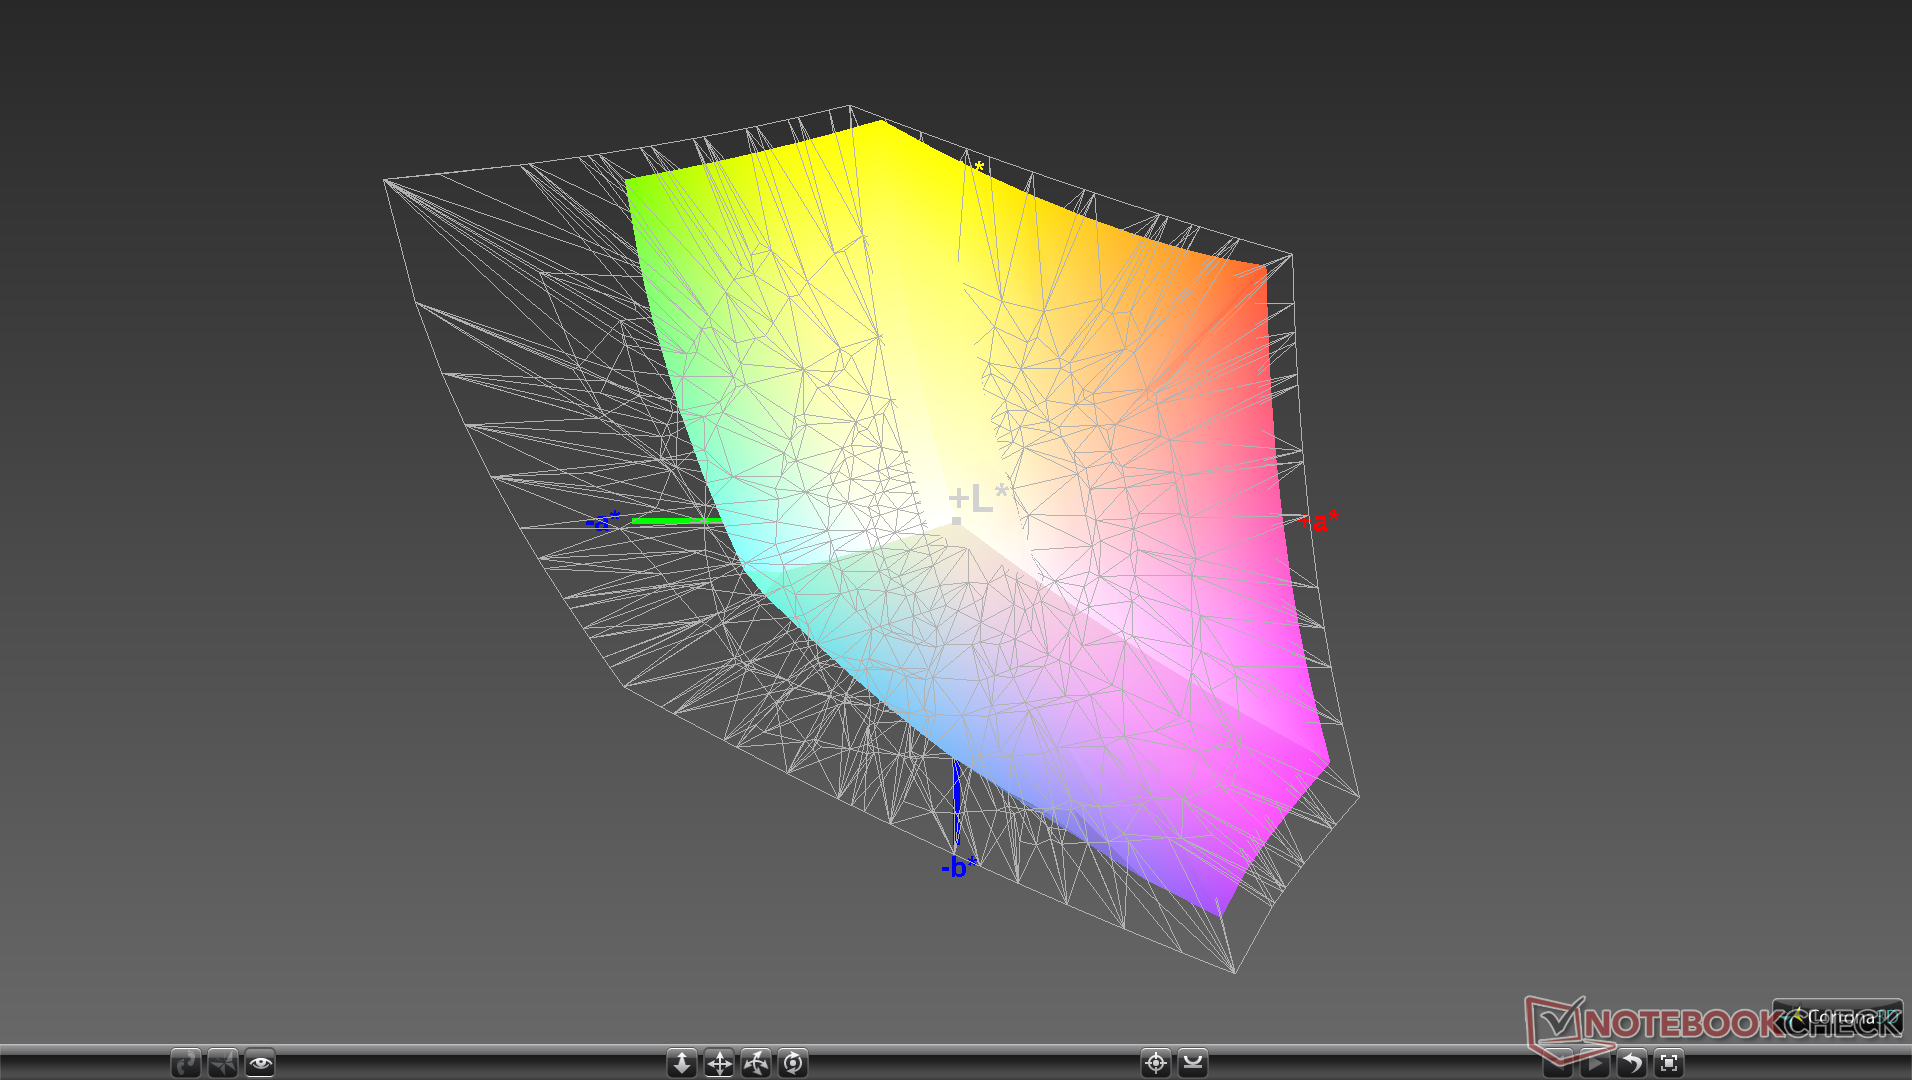
61.3% AdobeRGB 1998 (Argyll 1.6.3 3D)
66.5% AdobeRGB 1998 (Argyll 3D)
96.9% sRGB (Argyll 3D)
66.3% Display P3 (Argyll 3D)
Gamma: 2.16
CCT: 6746 K
| Alienware Area-51m i9-9900K RTX 2080 LG Philips 173WFG, IPS, 17.3", 1920x1080 | MSI GT75 8RG-090 Titan CMN N173HHE-G32 (CMN1747), TN, 17.3", 1920x1080 | Asus ROG G703GX AU Optronics B173HAN03.2 (AUO329D), IPS, 17.3", 1920x1080 | Eurocom Sky X7C i9-9900K AU Optronics B173HAN03.1, IPS, 17.3", 1920x1080 | Razer Blade Pro 2017 Sharp LQ173D1JW33 (SHP145A), IGZO, 17.3", 3840x2160 | Alienware 17 R5 JYWWF_B173QTN (AUO1496), TN, 17.3", 2560x1440 | |
|---|---|---|---|---|---|---|
| Display | 23% | -3% | -4% | 29% | -7% | |
| Display P3 Coverage (%) | 66.3 | 90.9 37% | 64.1 -3% | 64.7 -2% | 88.9 34% | 63.4 -4% |
| sRGB Coverage (%) | 96.9 | 100 3% | 93.3 -4% | 89.1 -8% | 100 3% | 86.1 -11% |
| AdobeRGB 1998 Coverage (%) | 66.5 | 86.2 30% | 65.6 -1% | 65.2 -2% | 99.7 50% | 62.9 -5% |
| Response Times | 44% | 28% | -18% | -309% | -7% | |
| Response Time Grey 50% / Grey 80% * (ms) | 13.2 ? | 8 ? 39% | 7.2 ? 45% | 18 ? -36% | 60.8 ? -361% | 20.8 ? -58% |
| Response Time Black / White * (ms) | 10.8 ? | 5.6 ? 48% | 9.6 ? 11% | 10.8 ? -0% | 38.4 ? -256% | 6 ? 44% |
| PWM Frequency (Hz) | 26000 ? | 204.9 ? | ||||
| Screen | 19% | -9% | -18% | -8% | -27% | |
| Brightness middle (cd/m²) | 335.2 | 240 -28% | 296 -12% | 276.1 -18% | 230 -31% | 398 19% |
| Brightness (cd/m²) | 297 | 248 -16% | 279 -6% | 260 -12% | 207 -30% | 367 24% |
| Brightness Distribution (%) | 82 | 83 1% | 85 4% | 85 4% | 83 1% | 86 5% |
| Black Level * (cd/m²) | 0.66 | 0.22 67% | 0.25 62% | 0.36 45% | 0.2 70% | 0.51 23% |
| Contrast (:1) | 508 | 1091 115% | 1184 133% | 767 51% | 1150 126% | 780 54% |
| Colorchecker dE 2000 * | 2.02 | 2.14 -6% | 4.77 -136% | 3.51 -74% | 5.62 -178% | 5.45 -170% |
| Colorchecker dE 2000 max. * | 7.23 | 5.04 30% | 9.08 -26% | 6.84 5% | 10.24 -42% | 10.36 -43% |
| Colorchecker dE 2000 calibrated * | 1.17 | 1.54 -32% | 1.46 -25% | 3.56 -204% | 2.56 -119% | |
| Greyscale dE 2000 * | 3.2 | 1.62 49% | 5.83 -82% | 2.7 16% | 4.54 -42% | 5.4 -69% |
| Gamma | 2.16 102% | 2.28 96% | 2.47 89% | 2.28 96% | 2.36 93% | 2.4 92% |
| CCT | 6746 96% | 6846 95% | 8076 80% | 6947 94% | 6625 98% | 7453 87% |
| Color Space (Percent of AdobeRGB 1998) (%) | 61.3 | 77 26% | 60 -2% | 57.8 -6% | 88 44% | 56 -9% |
| Color Space (Percent of sRGB) (%) | 96.9 | 100 3% | 93 -4% | 88.8 -8% | 100 3% | 86 -11% |
| Total Average (Program / Settings) | 29% /
23% | 5% /
-3% | -13% /
-16% | -96% /
-41% | -14% /
-21% |
* ... smaller is better
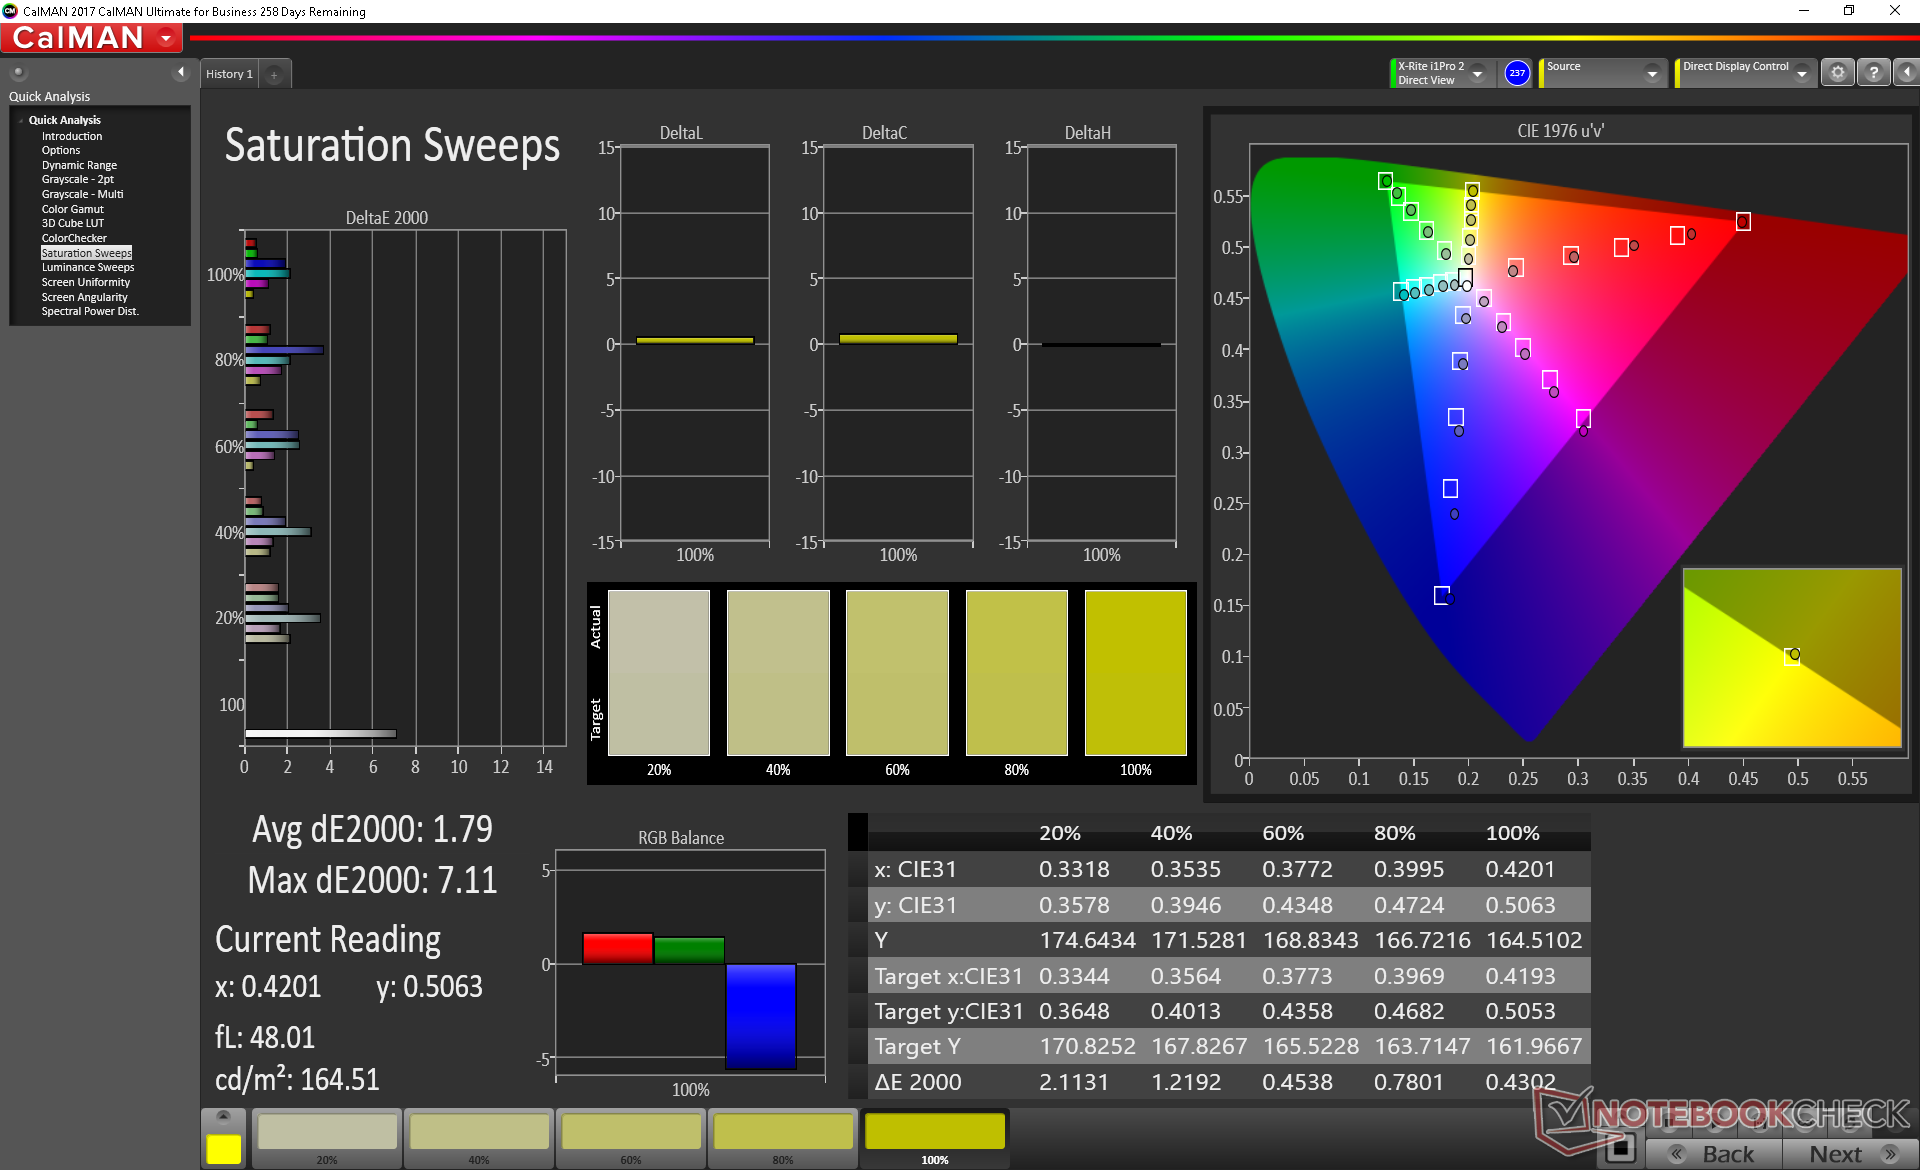
Color space covers approximately 97 percent and 61 percent of sRGB and AdobeRGB, respectively. Systems with even wide color spaces are available such as the Razer Blade Pro or MSI GT75, but such panels typically carry drawbacks including slower response times or more limited TN viewing angles. We find the panel here on the Alienware to offer an excellent balance for gaming purposes.
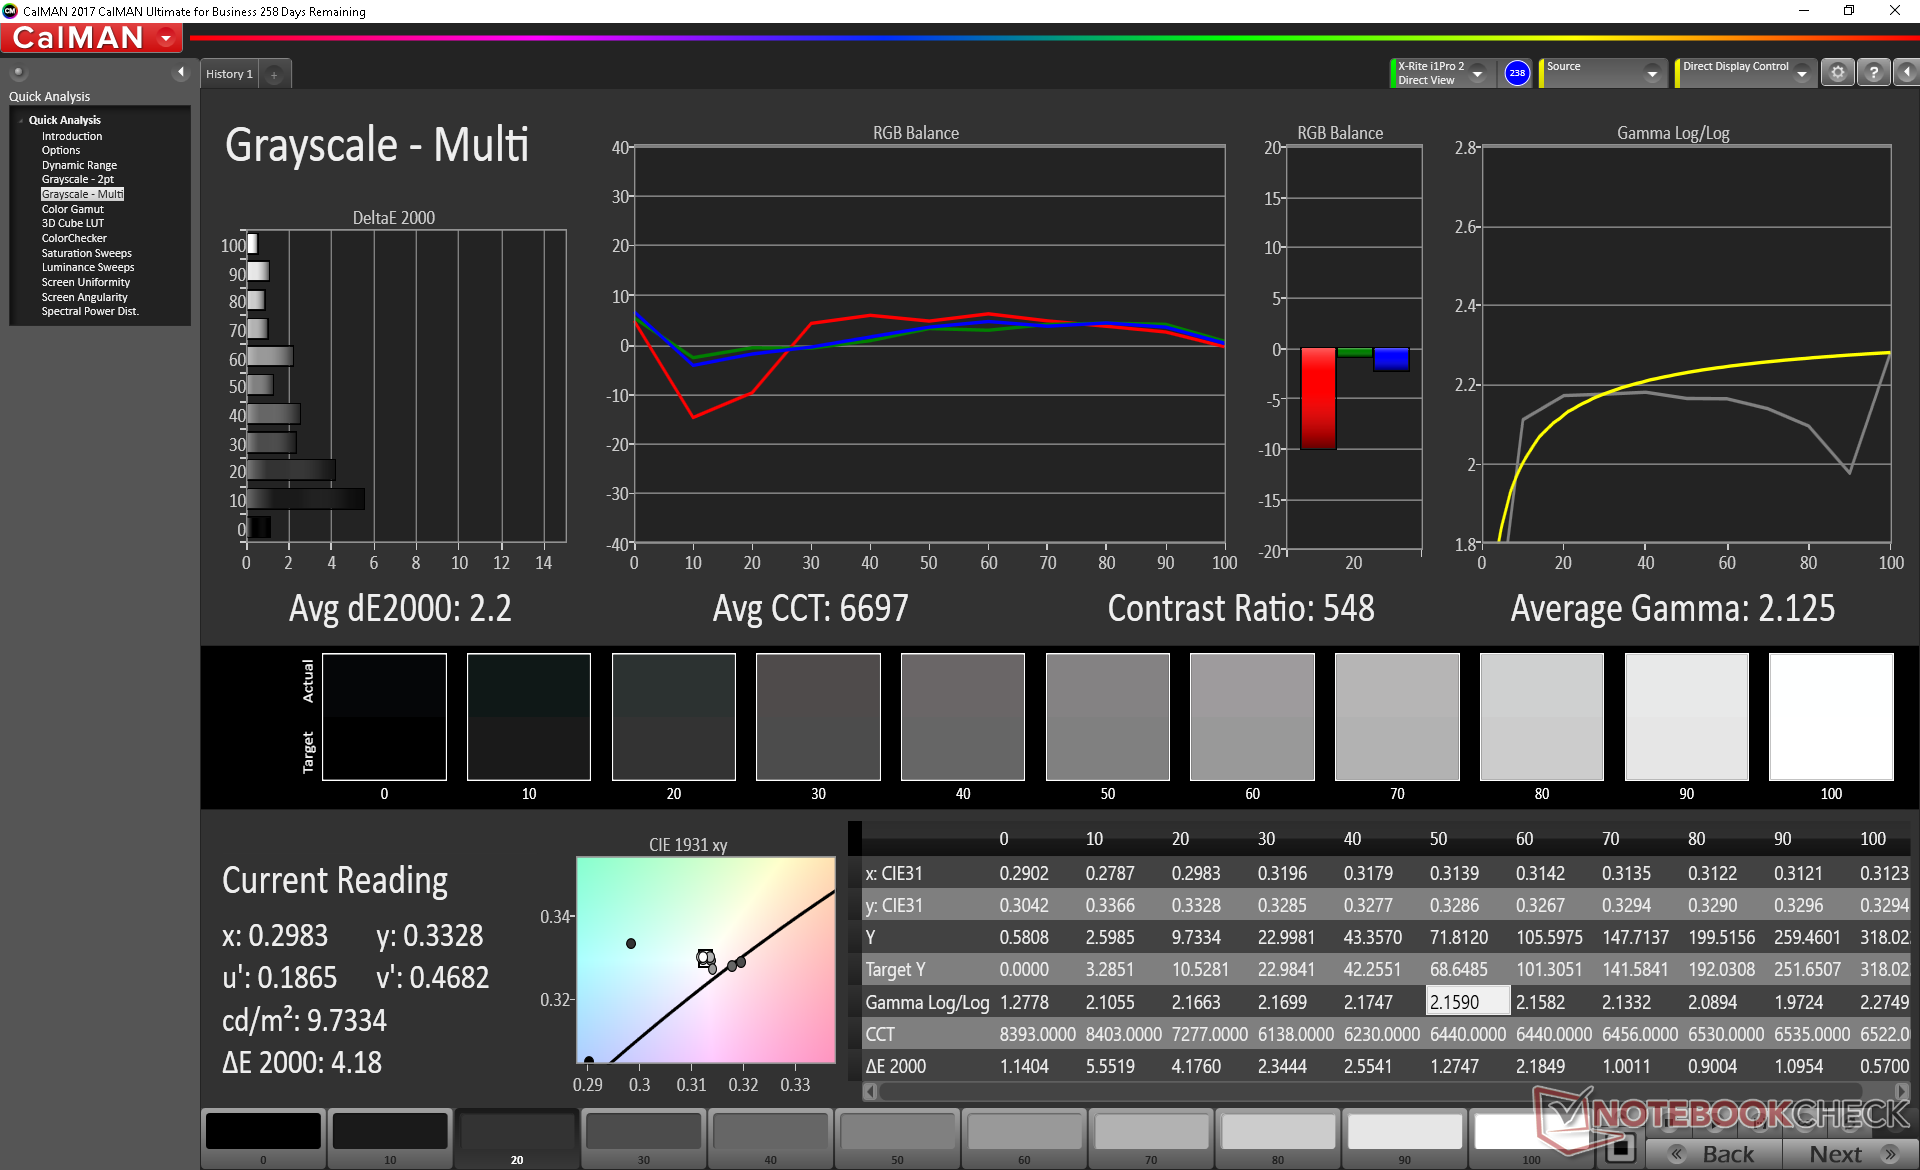
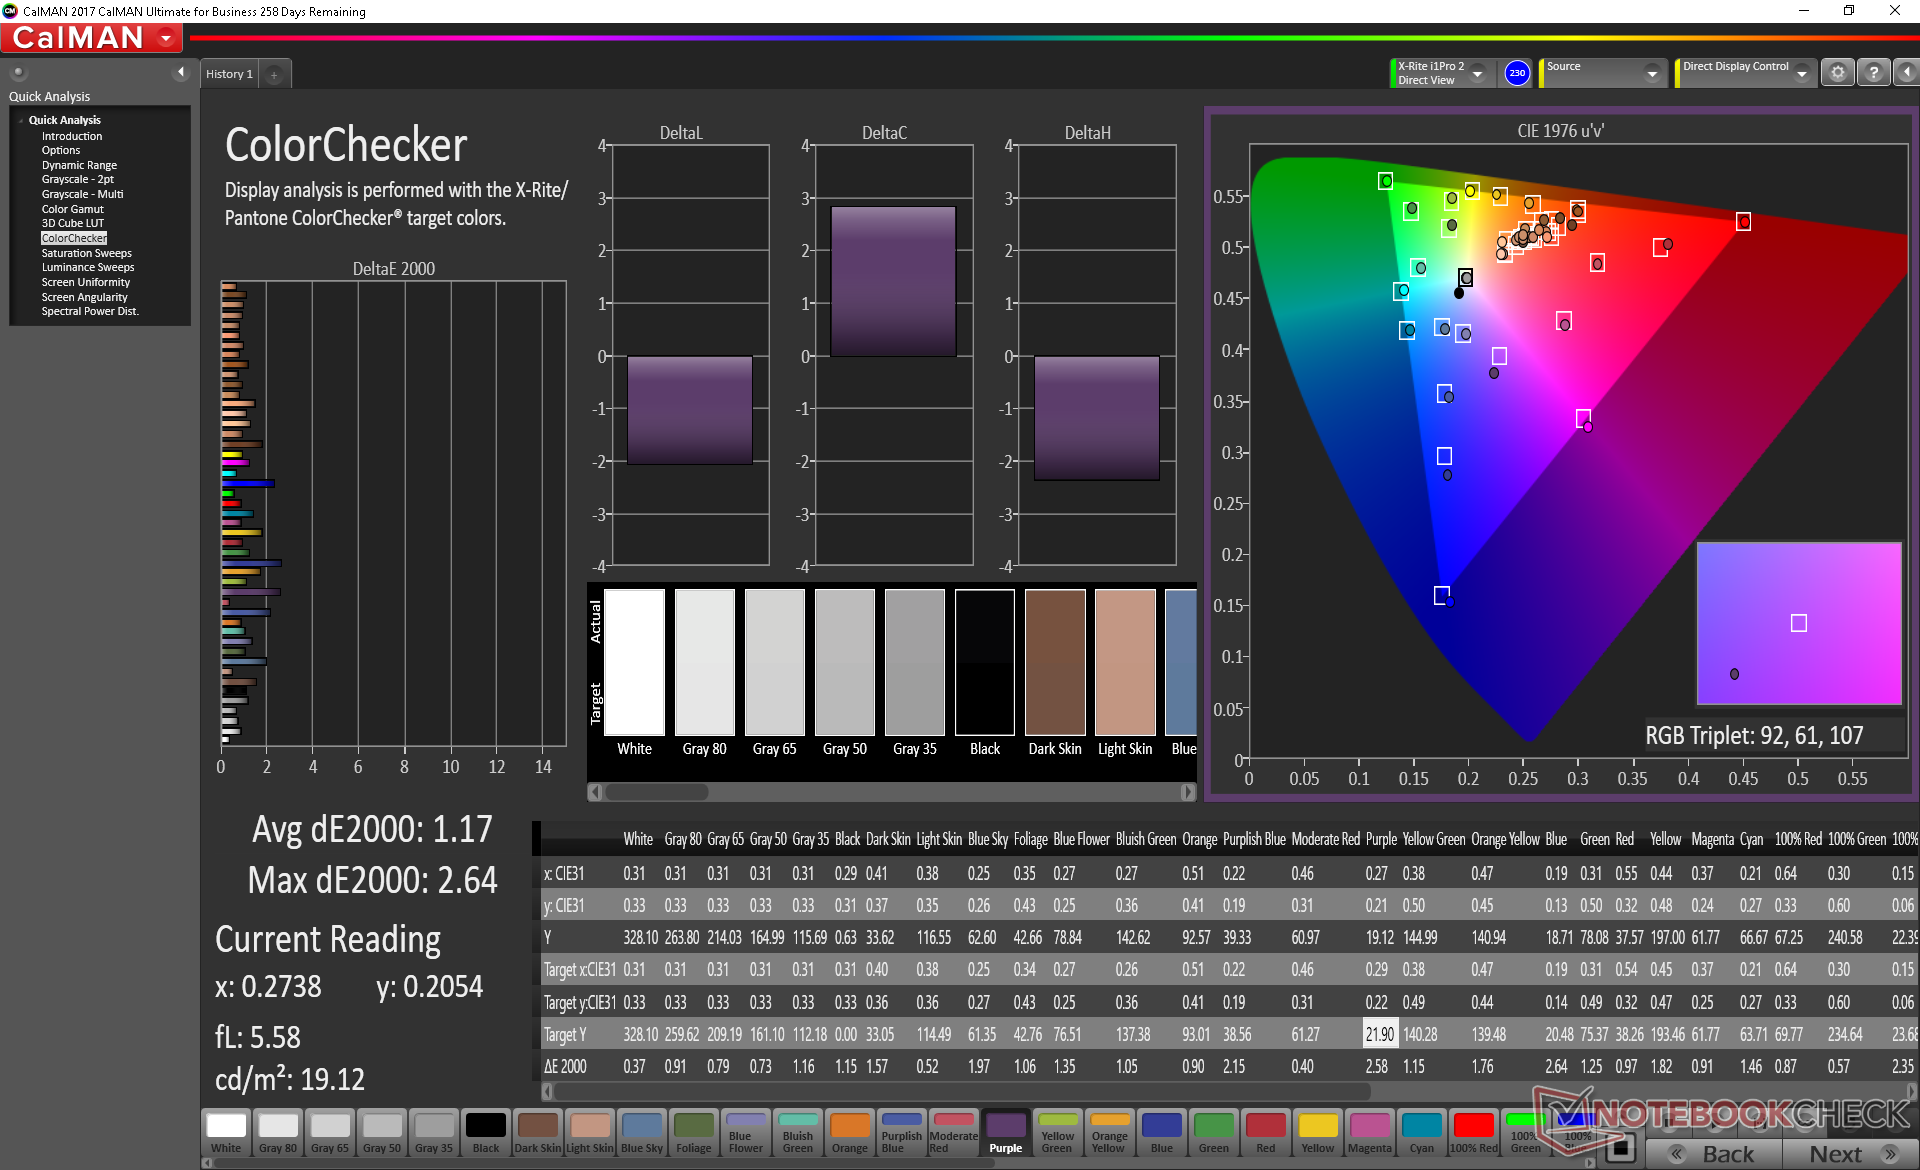
Further measurements with an X-Rite colorimeter reveal an accurate display out of the box, though it could have been better in terms of grayscale and at reproducing the color teal. Our attempt to calibrate the display improves it just slightly with grayscale and color dE2000 values falling from 3.2 to 2.2 and 2.02 to 1.17, respectively.


Display Response Times
| ↔ Response Time Black to White | ||
|---|---|---|
| 10.8 ms ... rise ↗ and fall ↘ combined | ↗ 6 ms rise | 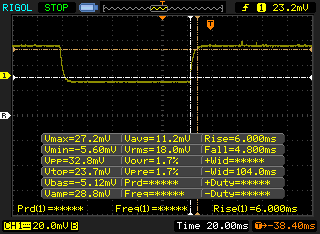 |
| ↘ 4.8 ms fall | ||
| The screen shows good response rates in our tests, but may be too slow for competitive gamers. In comparison, all tested devices range from 0.1 (minimum) to 240 (maximum) ms. » 29 % of all devices are better. This means that the measured response time is better than the average of all tested devices (19.8 ms). | ||
| ↔ Response Time 50% Grey to 80% Grey | ||
| 13.2 ms ... rise ↗ and fall ↘ combined | ↗ 8 ms rise | 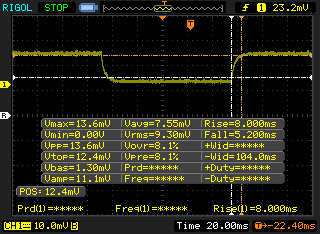 |
| ↘ 5.2 ms fall | ||
| The screen shows good response rates in our tests, but may be too slow for competitive gamers. In comparison, all tested devices range from 0.165 (minimum) to 636 (maximum) ms. » 27 % of all devices are better. This means that the measured response time is better than the average of all tested devices (30.9 ms). | ||
Screen Flickering / PWM (Pulse-Width Modulation)
| Screen flickering / PWM not detected | 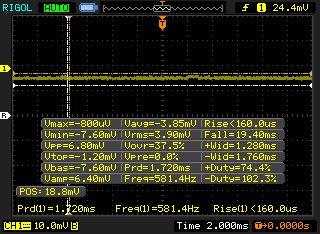 | ||
In comparison: 52 % of all tested devices do not use PWM to dim the display. If PWM was detected, an average of 7744 (minimum: 5 - maximum: 343500) Hz was measured. | |||
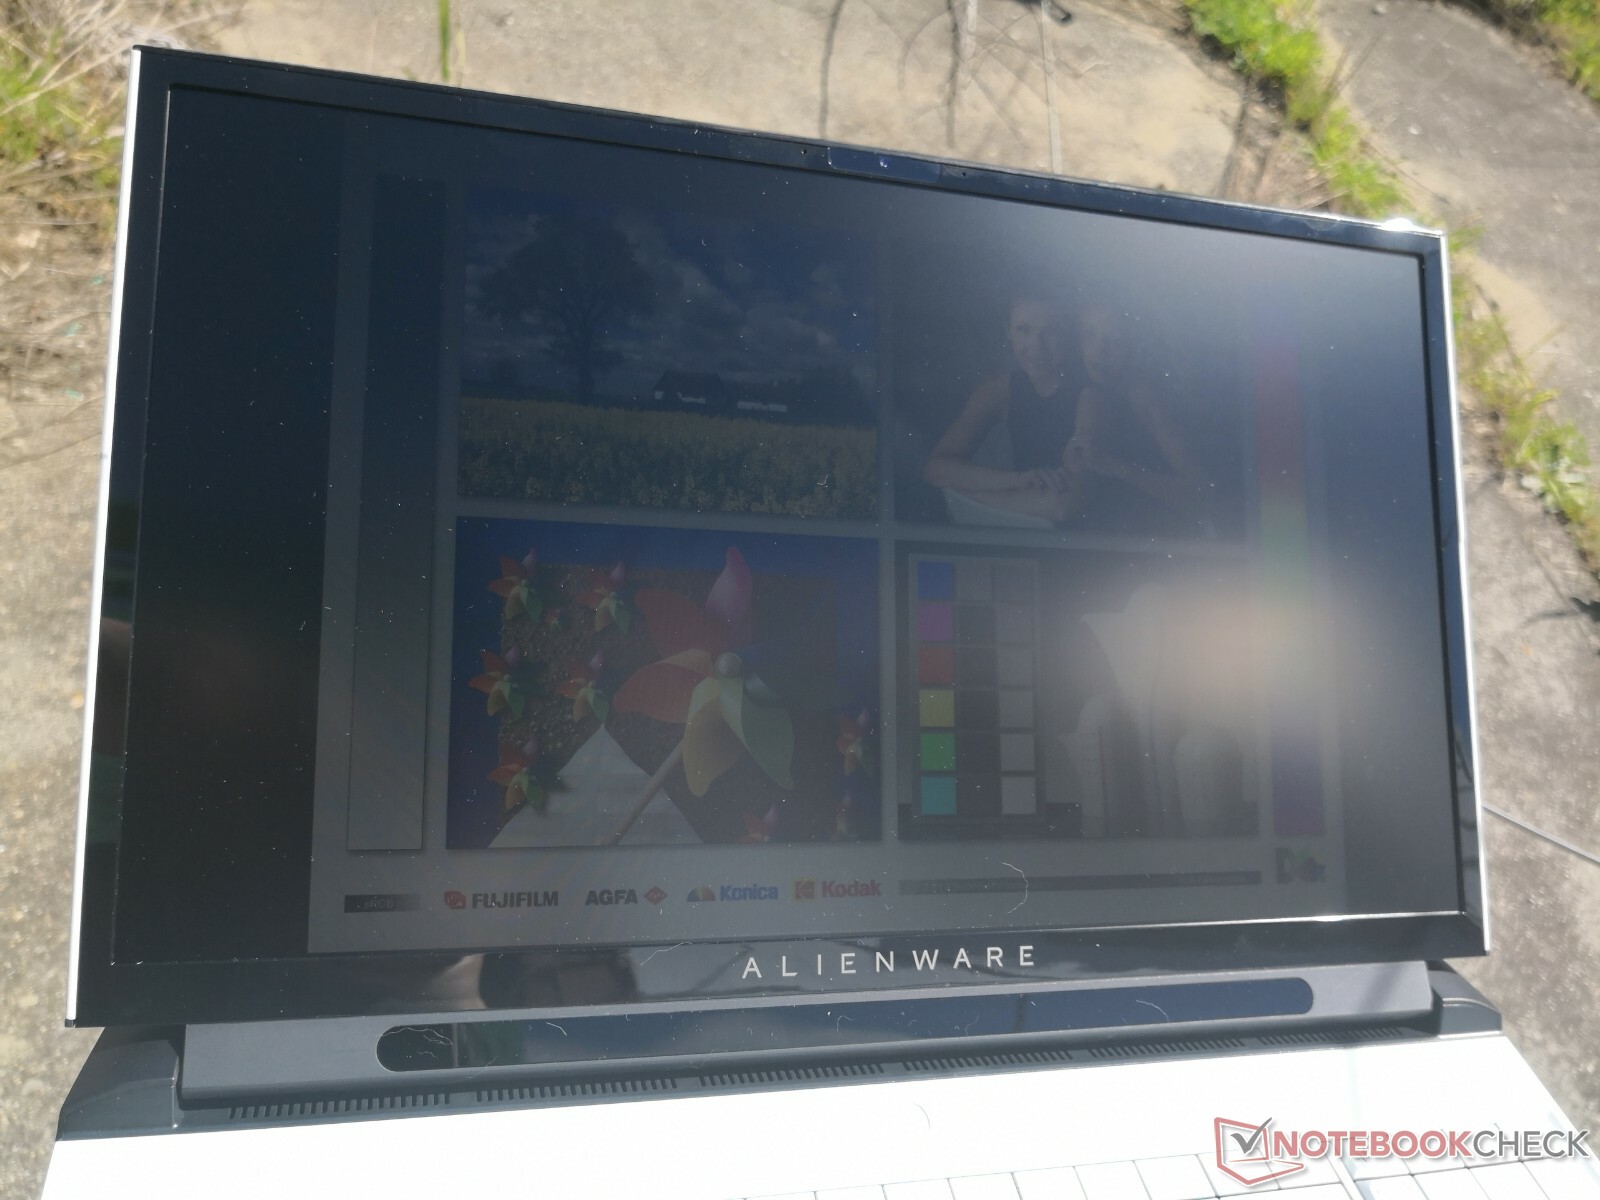
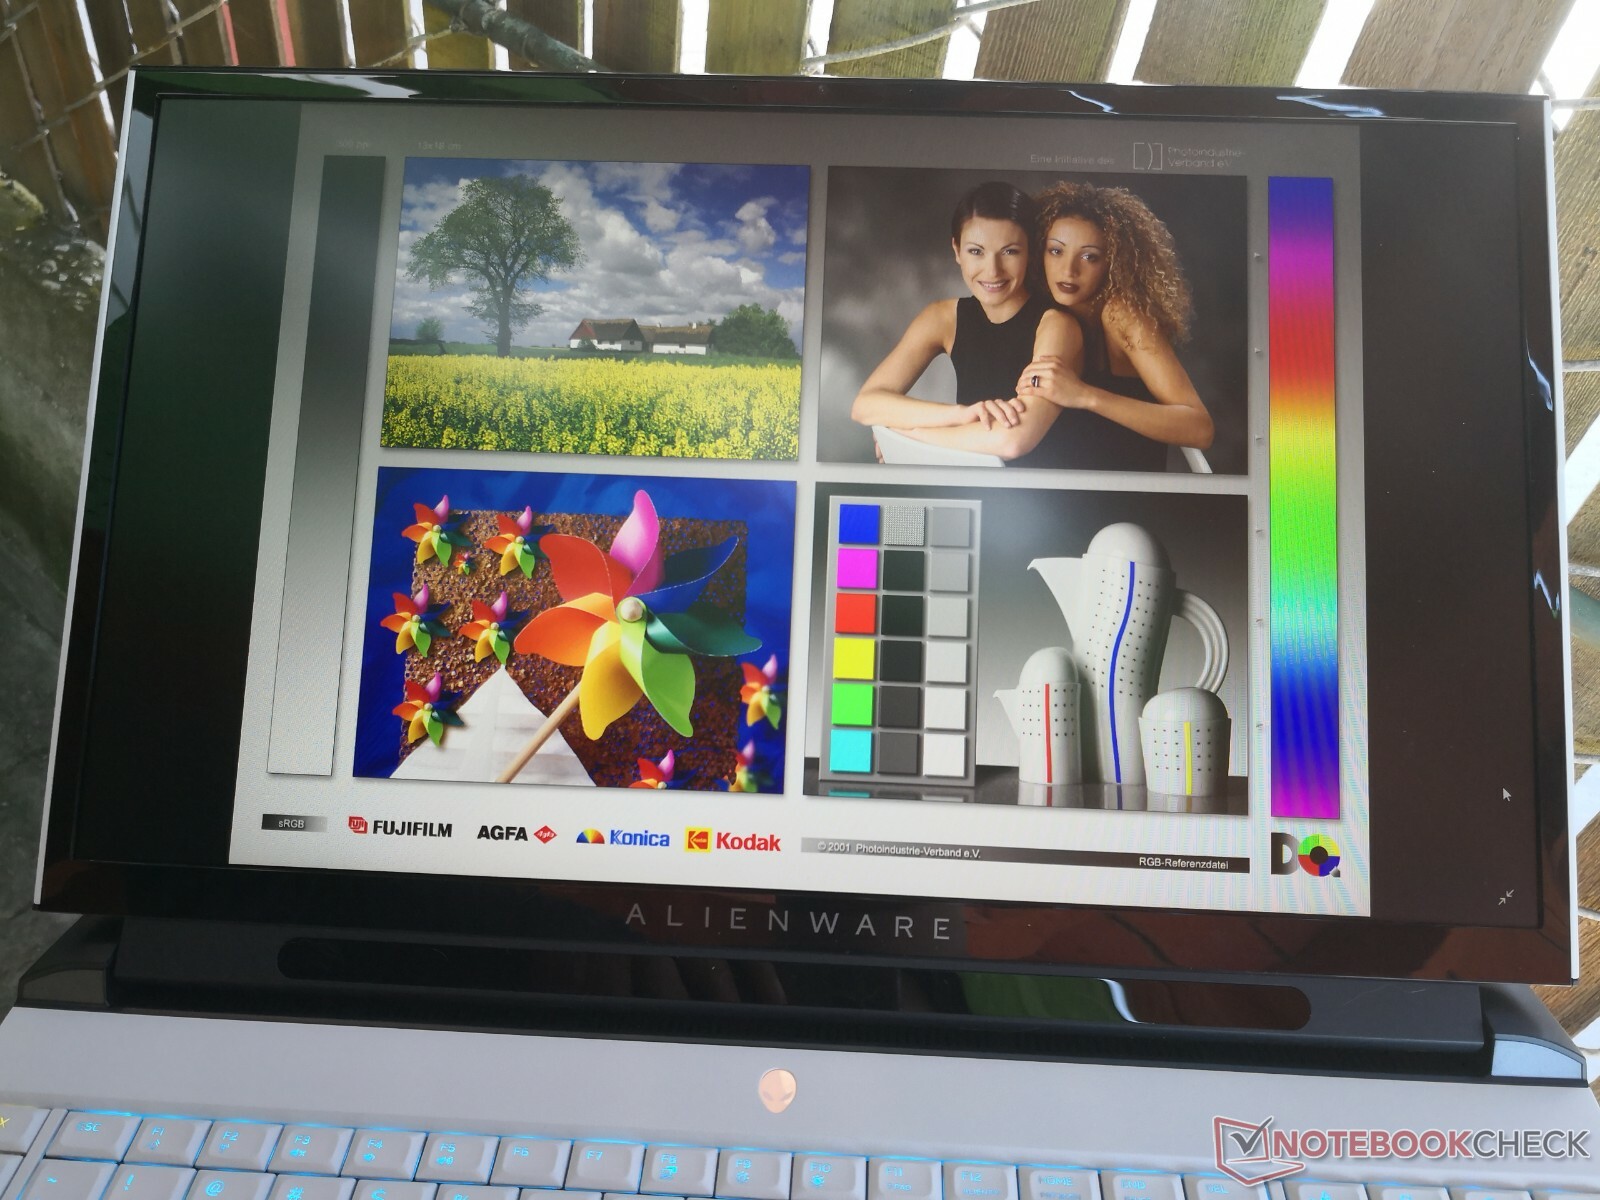
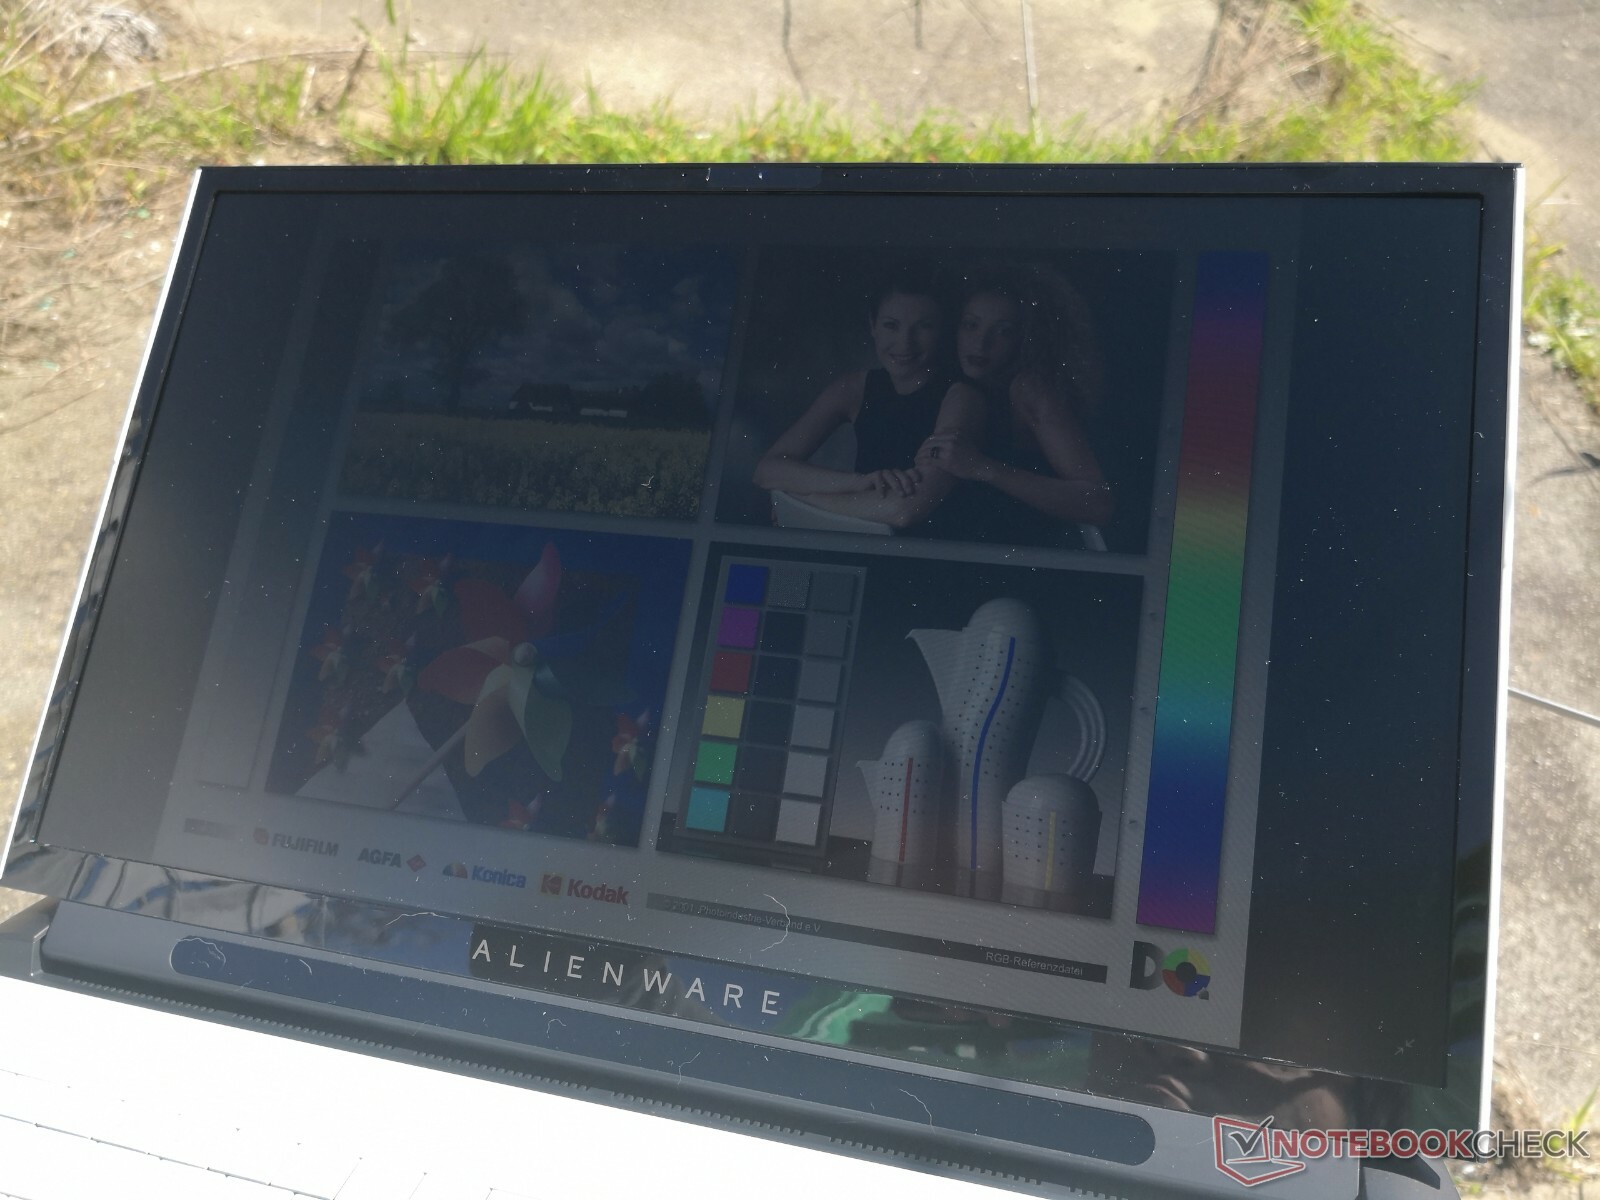
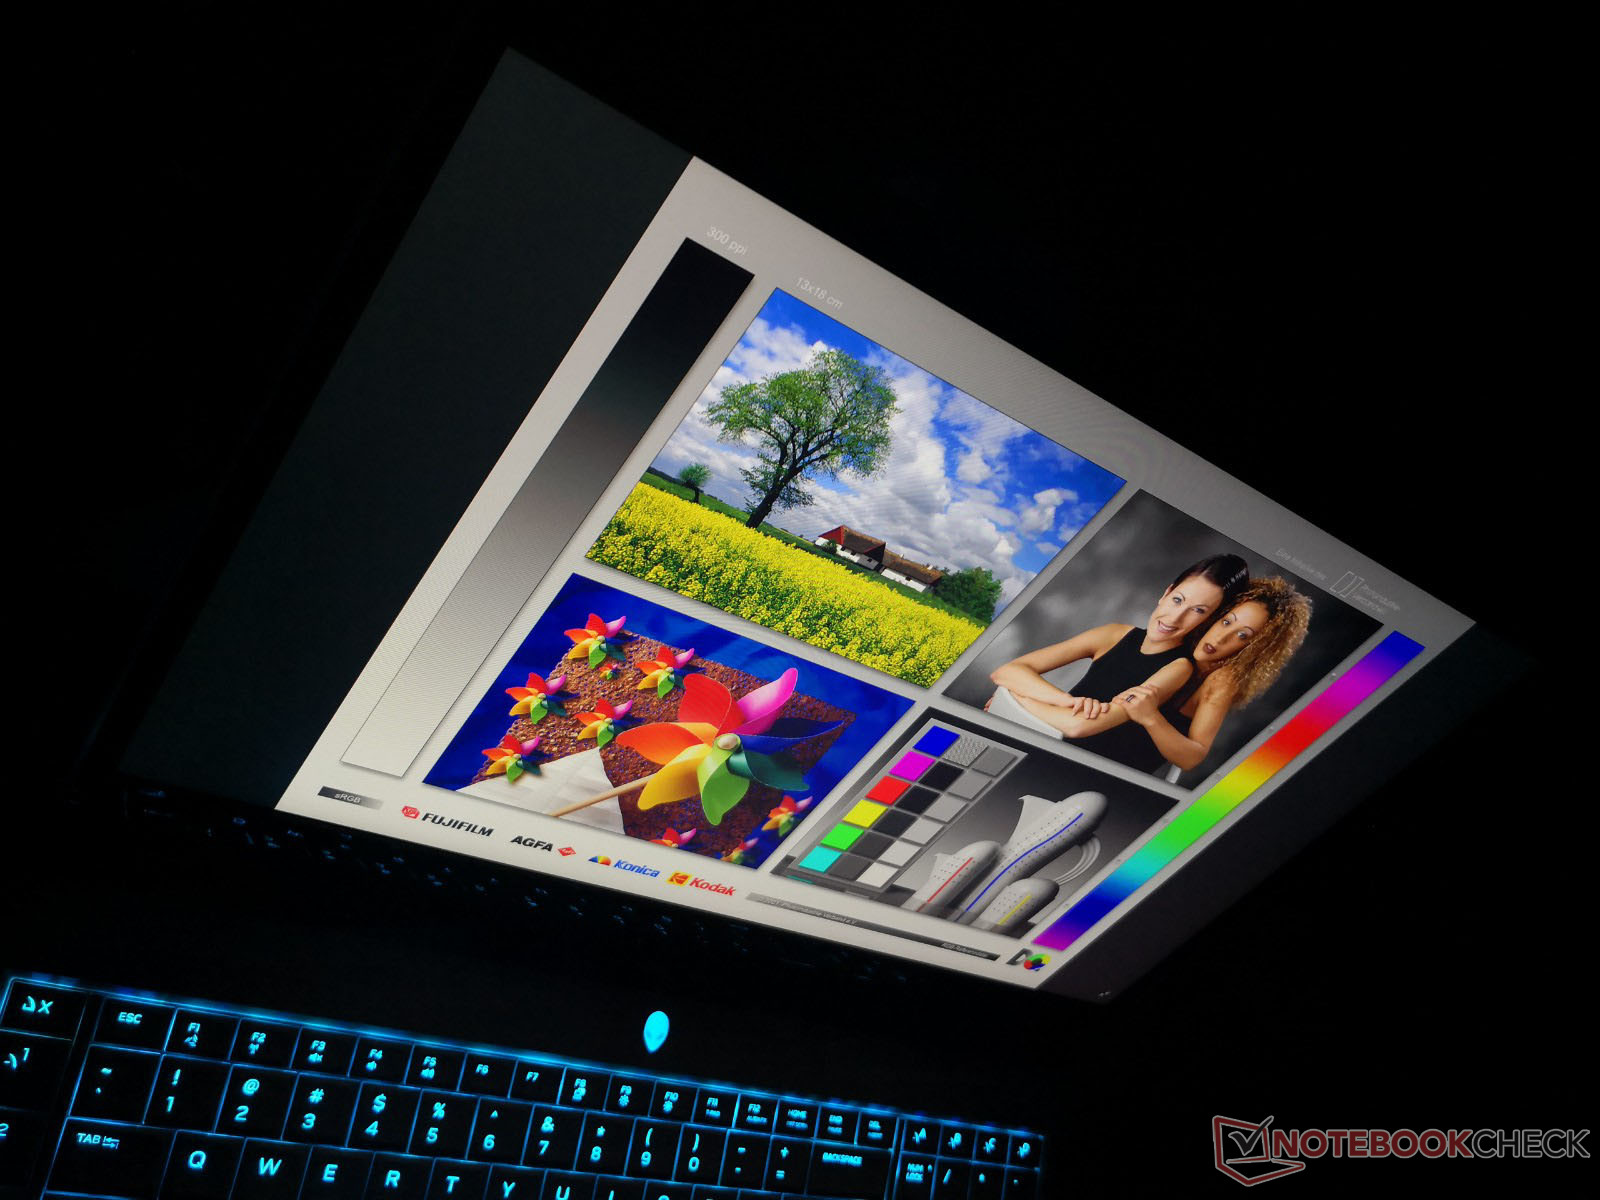
Outdoor visibility is not any better or worse than most other 17.3-inch gaming laptops. In other words, you're not exactly looking at the right category here if outdoor use is priority. Even so, the matte panel and wide IPS viewing angles help to reduce glare. Obtuse viewing angles don't appear to significantly impact contrast or colors for this particular panel.
Performance
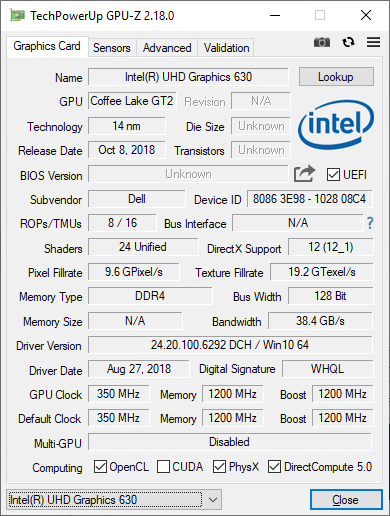
While our specific unit is a higher-end configuration with the Core i9-9900K and RTX 2080, lower-end options ship with the Core i7-8700 and RTX 2060 instead. The ability to swap out both the CPU and GPU is a unique advantage in the gaming laptop space where soldered processors are commonplace. The Area-51m has more in common with Clevo barebone laptops (Schenker, Eurocom, etc.) rather than laptops from MSI or Asus as a result.
There is no Optimus graphics switching since G-Sync is included.
All benchmarks and measurements below were performed with the system set to High Performance mode unless otherwise stated. We want to show off the system at its fastest even if that means having the fans at maximum RPM.
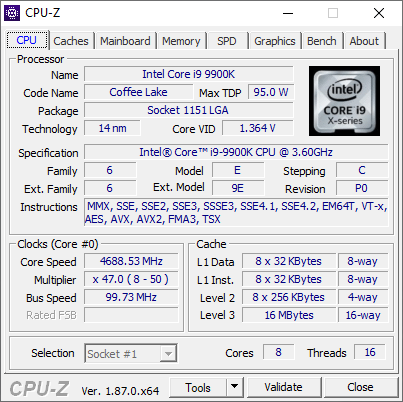
Processor
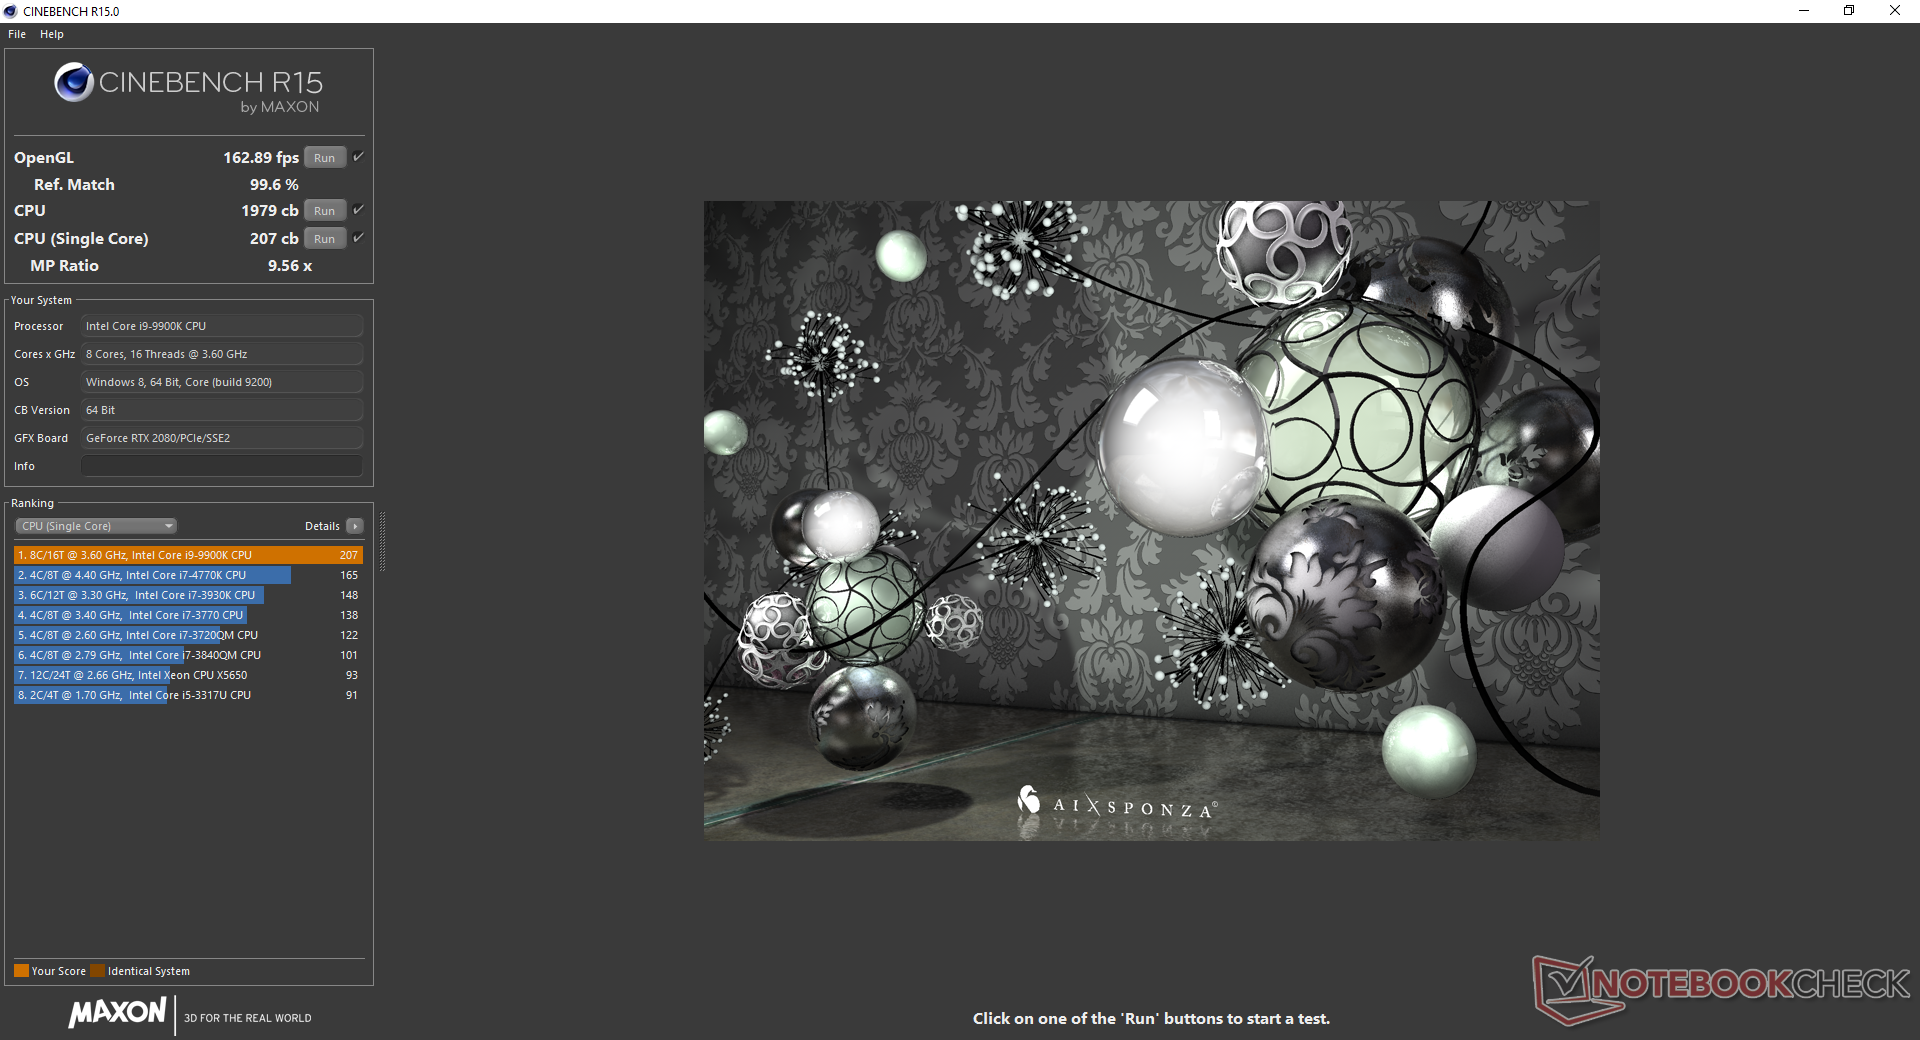
CPU performance is nearly two times faster than the Core i7-8750H in the Alienware 17 R5 and about 45 percent faster than the Core i9-8950HK in the MSI GT75. This fast of a CPU comes in handy when aiming for frame rates above 60 FPS. What we really want to know is how the CPU compares against a traditional desktop with the same Core i9-9900K.
According to CineBench R15 Multi-Thread, the Area-51m is just 2 percent slower than the Core i9-9900K in our desktop PC. This delta begins to widen, however, when running CineBench R15 in a loop because the Alienware laptop struggles to maintain maximum Turbo Boost clock rates for long periods as shown by our comparison graph below. Its initial score of 1941 points drops to about 1862 points towards the end of the loop test. When accounting for this performance throttling, our reference desktop PC performs about 7 to 8 percent faster than our Alienware.
Our Eurocom Sky X7C with the same Core i9-9900K CPU is able to score very similarly in the same CineBench loop test.
| Cinebench R10 | |
| Rendering Multiple CPUs 32Bit | |
| Average Intel Core i9-9900K (36683 - 49142, n=4) | |
| Eurocom Sky X9C | |
| AMD Threadripper 2970WX, AMD Radeon RX Vega 64 | |
| Asus GL702ZC-GC104T | |
| Dell G3 17 3779 | |
| Rendering Single 32Bit | |
| Average Intel Core i9-9900K (7786 - 8042, n=4) | |
| Eurocom Sky X9C | |
| Dell G3 17 3779 | |
| AMD Threadripper 2970WX, AMD Radeon RX Vega 64 | |
| Asus GL702ZC-GC104T | |
| wPrime 2.10 - 1024m | |
| Eurocom Sky X9C | |
| Average Intel Core i9-9900K (85.6 - 98.7, n=3) | |
| AMD Threadripper 2970WX, AMD Radeon RX Vega 64 | |
* ... smaller is better
System Performance
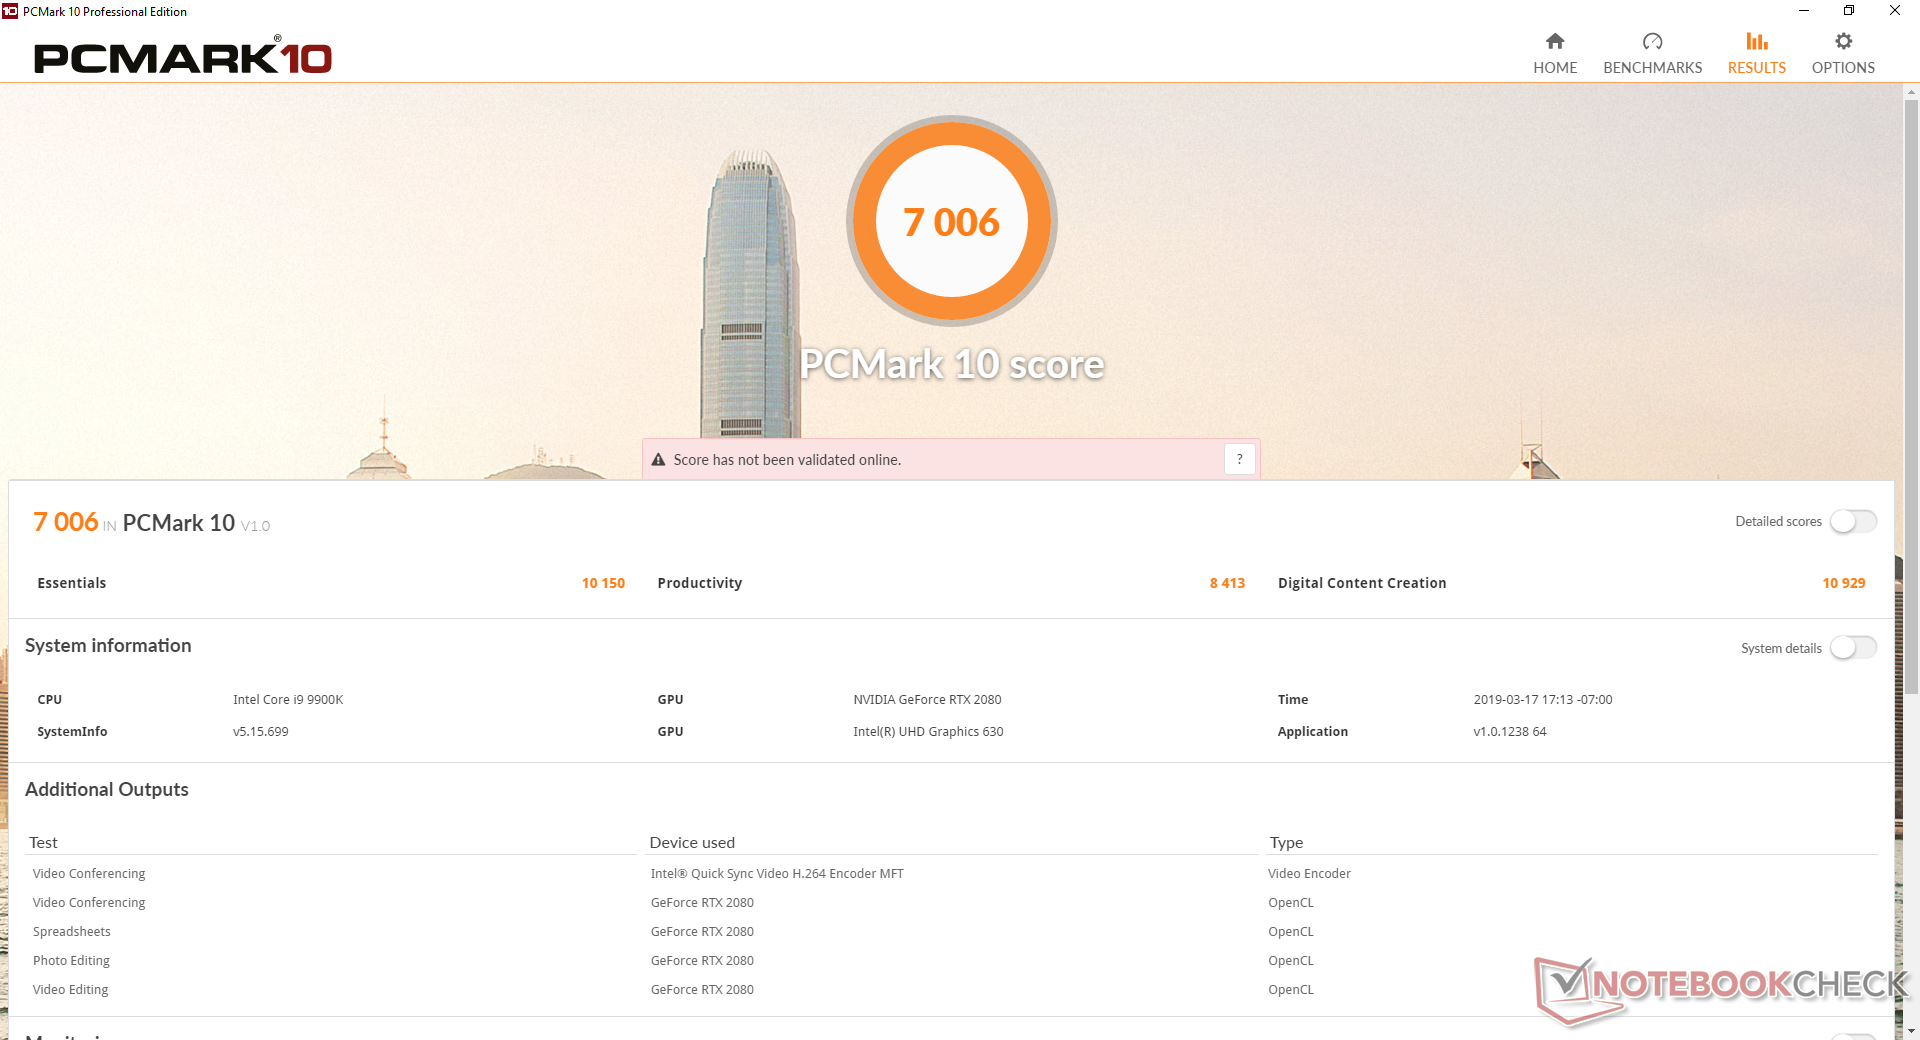
PCMark 10 ranks our Alienware consistently behind the Eurocom Sky X7C equipped with the same CPU and GPU by just 1 to 3 percentage points. This is likely due to our Eurocom unit having 4x the RAM than our Alienware and with faster Samsung SSDs. Even so, these scores are still some of the highest in our database.
We didn't experience any particular software or hardware issues on our test unit save for one annoyance. The screen would automatically dim if it doesn't detect user activity for more than 5 seconds. This can't be changed or disabled through any Windows or Alienware settings that we know of to make it even more frustrating.
(April 5, 2019 update: We've since discovered that the automatic dimming is a feature of the Tobii eye-tracker. It can only be toggled through the Tobii settings.)
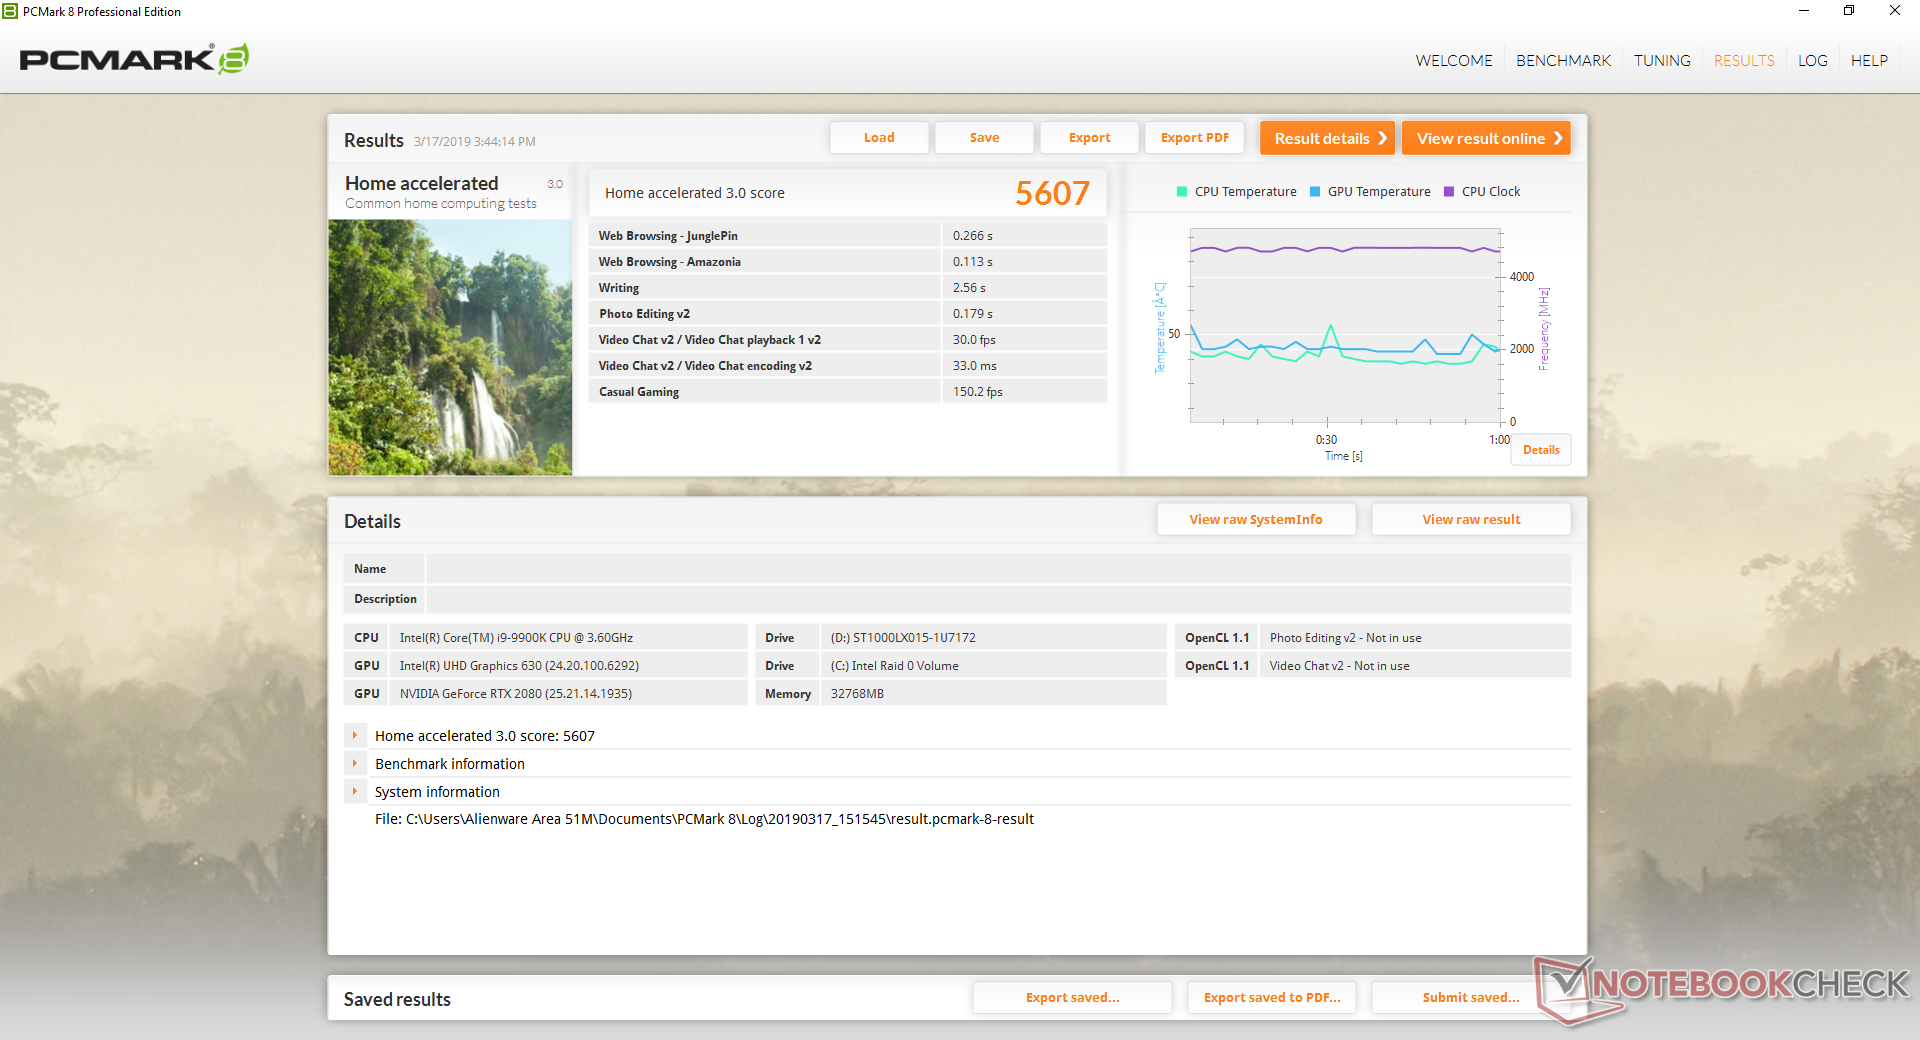
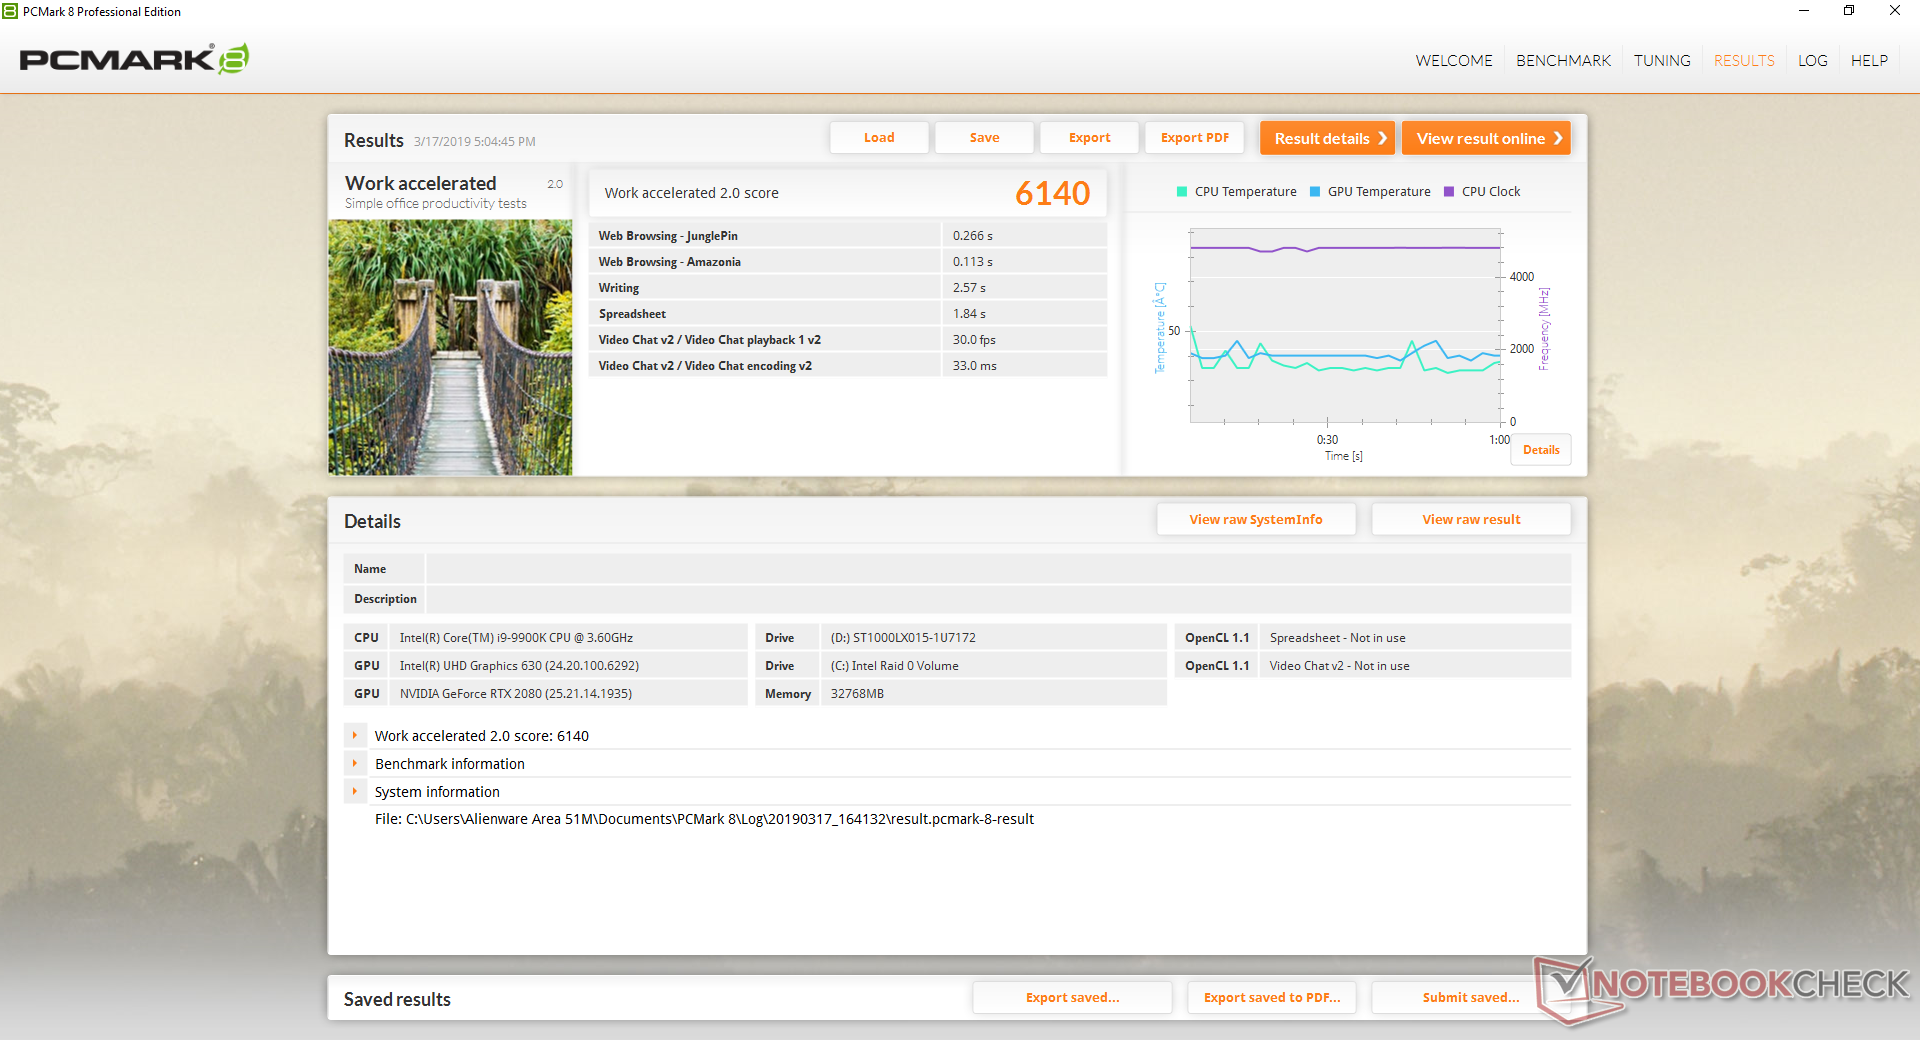
| PCMark 8 Home Score Accelerated v2 | 5607 points | |
| PCMark 8 Work Score Accelerated v2 | 6140 points | |
| PCMark 10 Score | 7006 points | |
Help | ||
Storage Devices
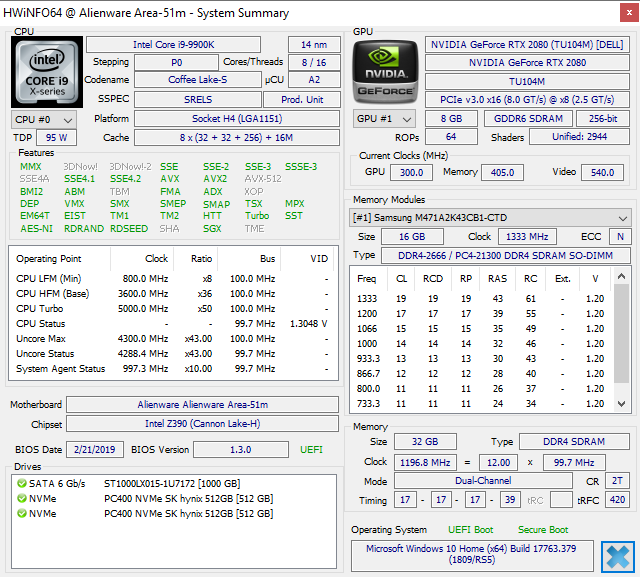
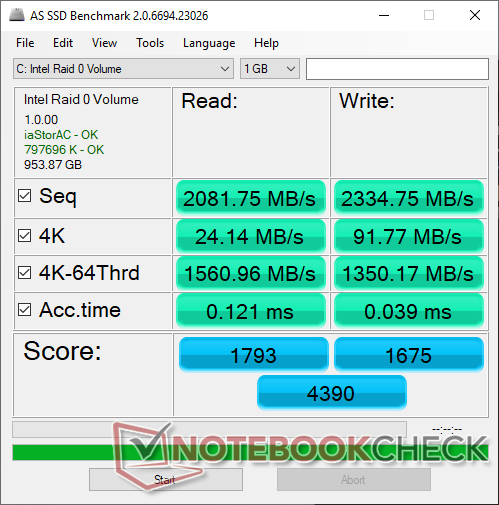
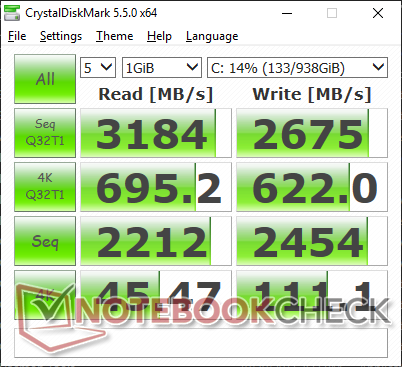
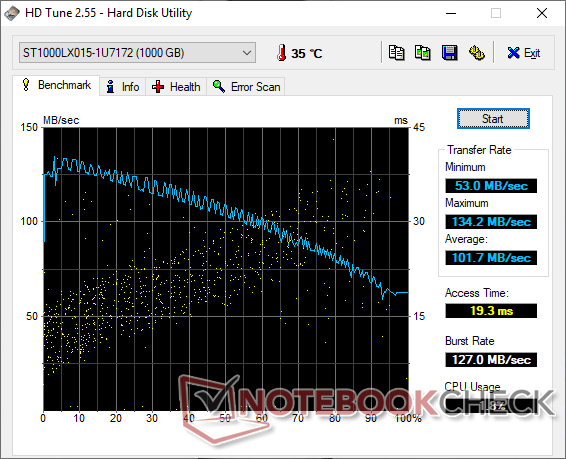
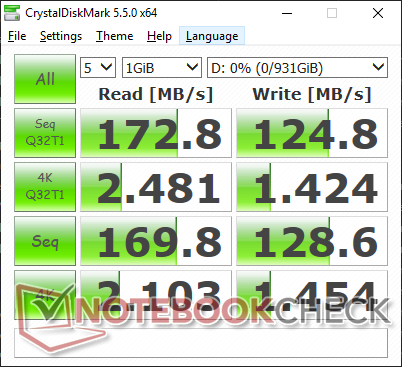
There are a total of three internal storage bays (2x M.2 2280, 1x 2.5-inch SATA III) with Optane support compared to four on the MSI GT75 or Eurocom Sky X7C. Our specific configuration is equipped with two SK Hynix PC400 M.2 NVMe SSDs in RAID 0 alongside a secondary 1 TB Seagate FireCuda ST1000LX015 HDD. Dell offers storage options ranging from 256 GB up to 2 TB, but they unfortunately do not specify the exact model names for these drives. We're hopeful that these drives turn out be Samsung SSDs since they tend to perform faster than those from Toshiba and others.
Transfer rates are excellent from the RAID 0 SK Hynix SSDs with sequential read and write rates at about 2082 MB/s and 2335 MB/s, respectively, according to AS SSD. Results are generally in between that of the Samsung SSD PM981 RAID 0 and Samsung SSD 970 Pro RAID 0.
Meanwhile, the Seagate HDD returns an average transfer rate of 102 MB/s according to HD Tune to be faster than most other 5400 RPM HDDs where <90 MB/s is common. Both 7 mm and 9.5 mm HDDs should be supported.
See our table of SSDs and HDDs for more benchmark comparisons.
| Alienware Area-51m i9-9900K RTX 2080 2x SK Hynix PC400 512GB (RAID 0) | MSI GT75 8RG-090 Titan 2x Samsung PM961 MZVLW256HEHP (RAID 0) | Asus ROG G703GX Samsung SSD PM981 MZVLB512HAJQ | Eurocom Sky X7C i9-9900K 2x Samsung SSD 970 Pro 512GB (RAID 0) | Razer Blade Pro 2017 2x Samsung SSD PM951 MZVLV256HCHP (RAID 0) | |
|---|---|---|---|---|---|
| AS SSD | 11% | 4% | 20% | -11% | |
| Seq Read (MB/s) | 2082 | 3058 47% | 1632 -22% | 2323 12% | 2599 25% |
| Seq Write (MB/s) | 2335 | 2196 -6% | 1767 -24% | 2887 24% | 588 -75% |
| 4K Read (MB/s) | 24.14 | 38.37 59% | 50.4 109% | 30.51 26% | 37.57 56% |
| 4K Write (MB/s) | 91.8 | 97.7 6% | 101.9 11% | 131.8 44% | 104.4 14% |
| 4K-64 Read (MB/s) | 1561 | 1347 -14% | 1196 -23% | 1507 -3% | 1116 -29% |
| 4K-64 Write (MB/s) | 1350 | 1236 -8% | 1631 21% | 1483 10% | 513 -62% |
| Access Time Read * (ms) | 0.121 | 0.056 54% | 0.061 50% | 0.032 74% | 0.051 58% |
| Access Time Write * (ms) | 0.039 | 0.038 3% | 0.037 5% | 0.028 28% | 0.036 8% |
| Score Read (Points) | 1793 | 1691 -6% | 1410 -21% | 1770 -1% | 1414 -21% |
| Score Write (Points) | 1675 | 1553 -7% | 1910 14% | 1904 14% | 676 -60% |
| Score Total (Points) | 4390 | 4066 -7% | 4057 -8% | 4602 5% | 2715 -38% |
| Copy ISO MB/s (MB/s) | 2175 | 2048 -6% | 3044 40% | ||
| Copy Program MB/s (MB/s) | 582 | 428.5 -26% | 574 -1% | ||
| Copy Game MB/s (MB/s) | 1479 | 1173 -21% | 1489 1% |
* ... smaller is better

GPU Performance
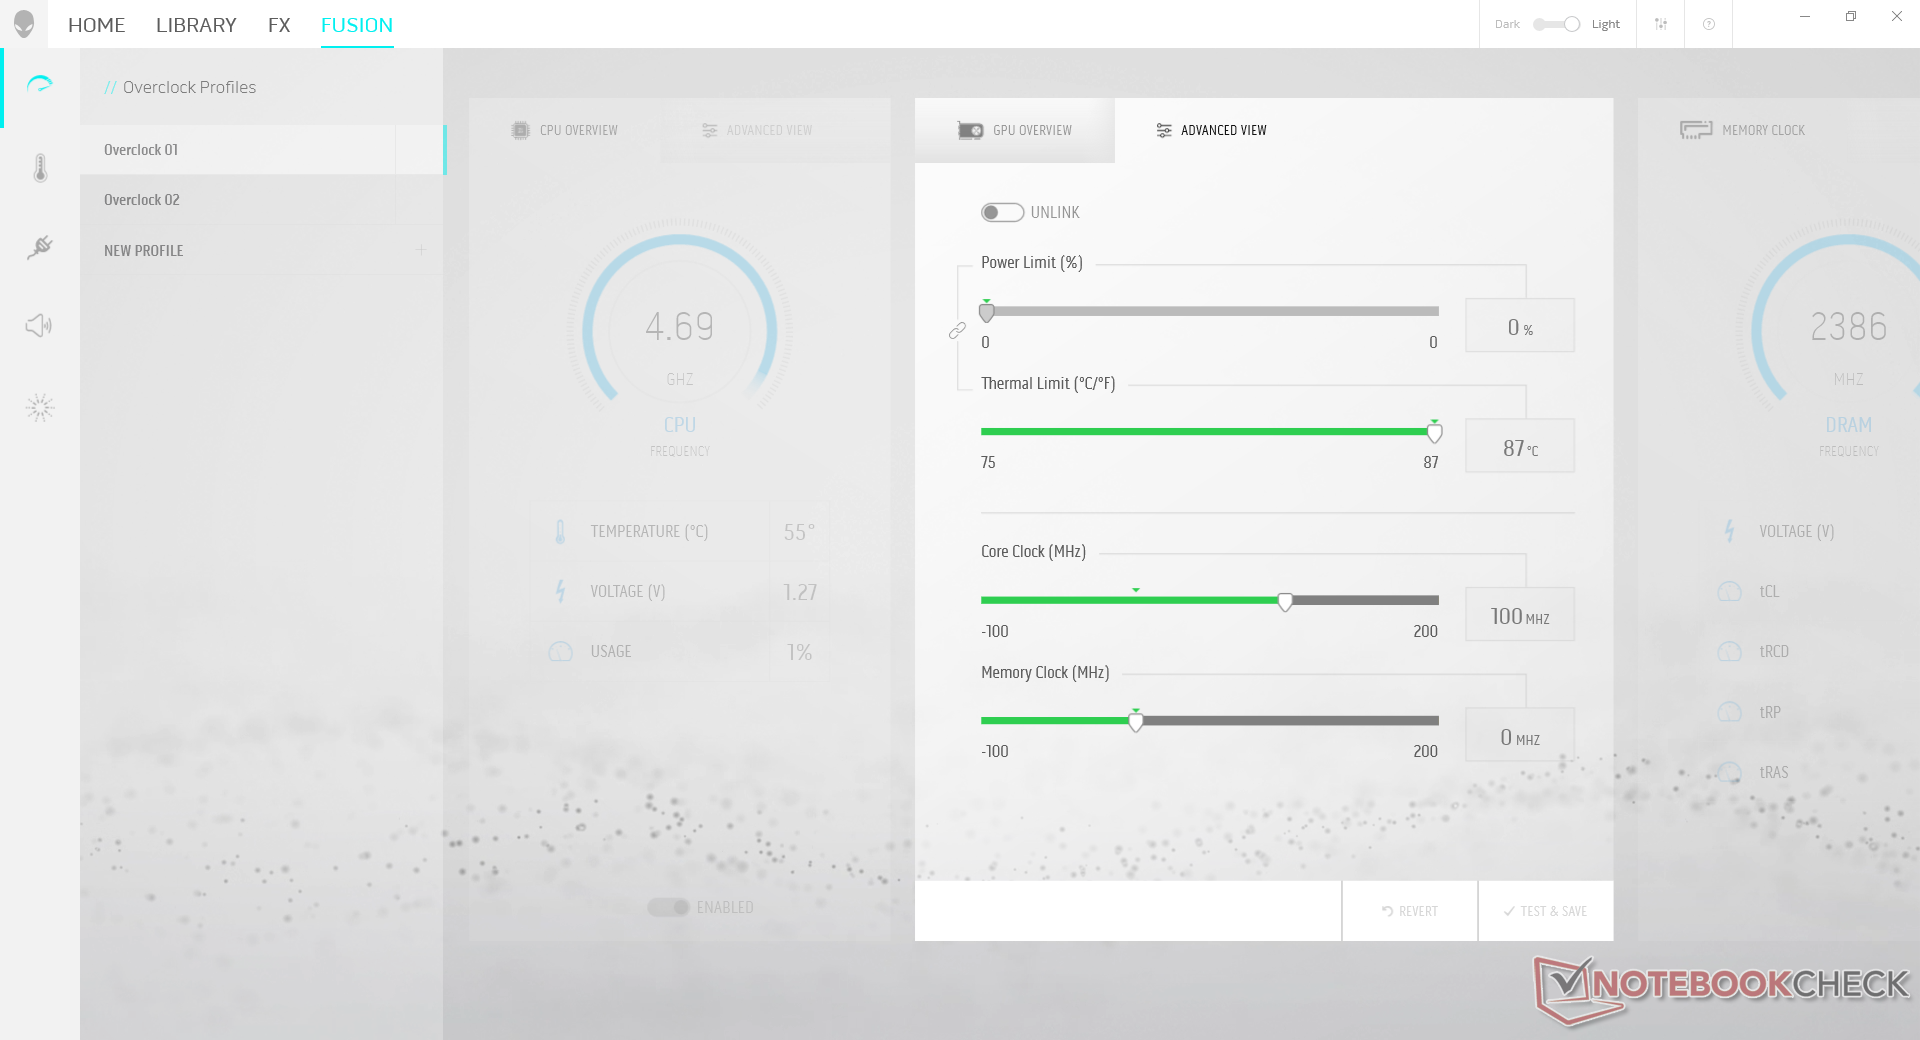
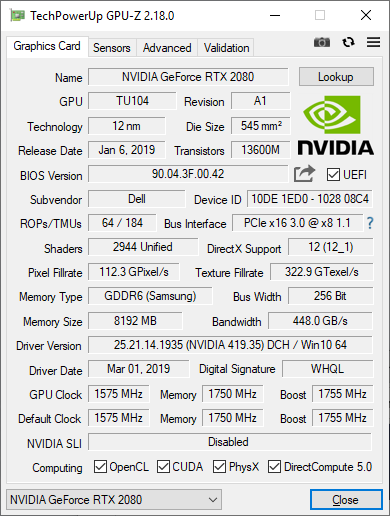
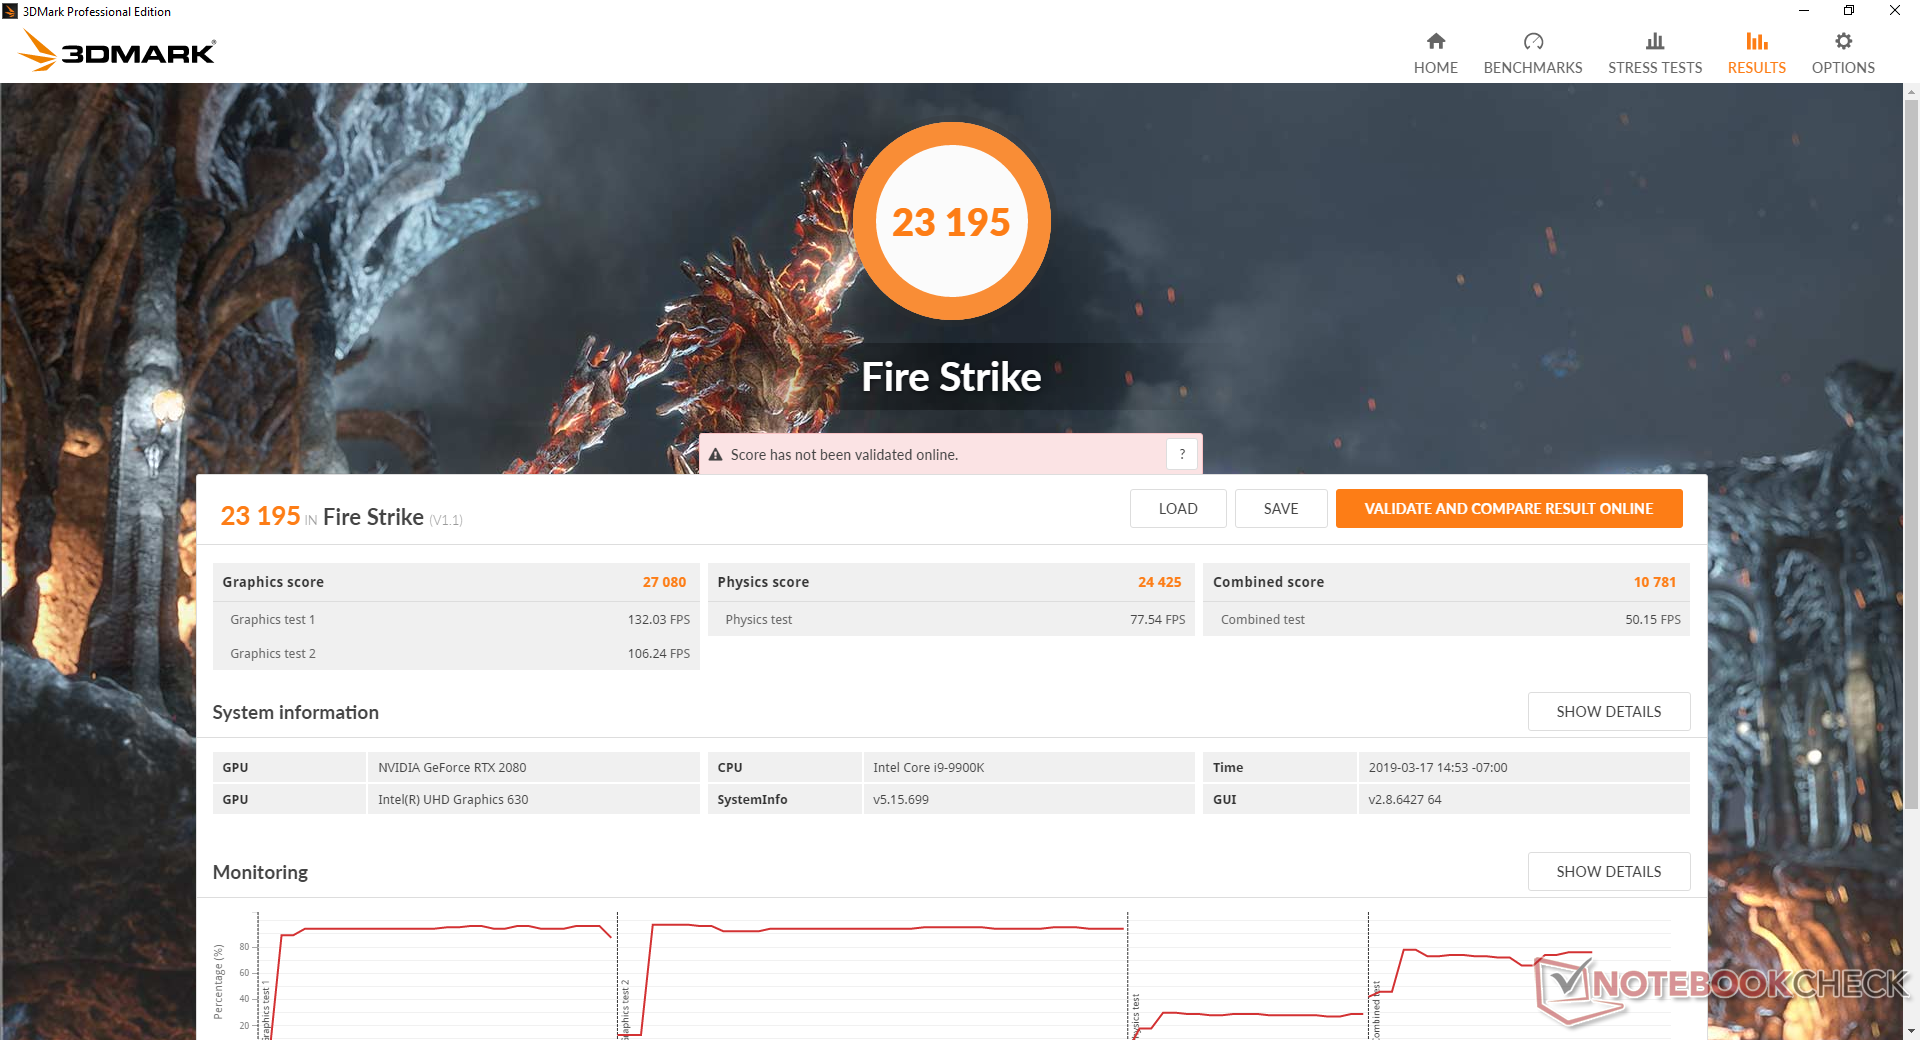
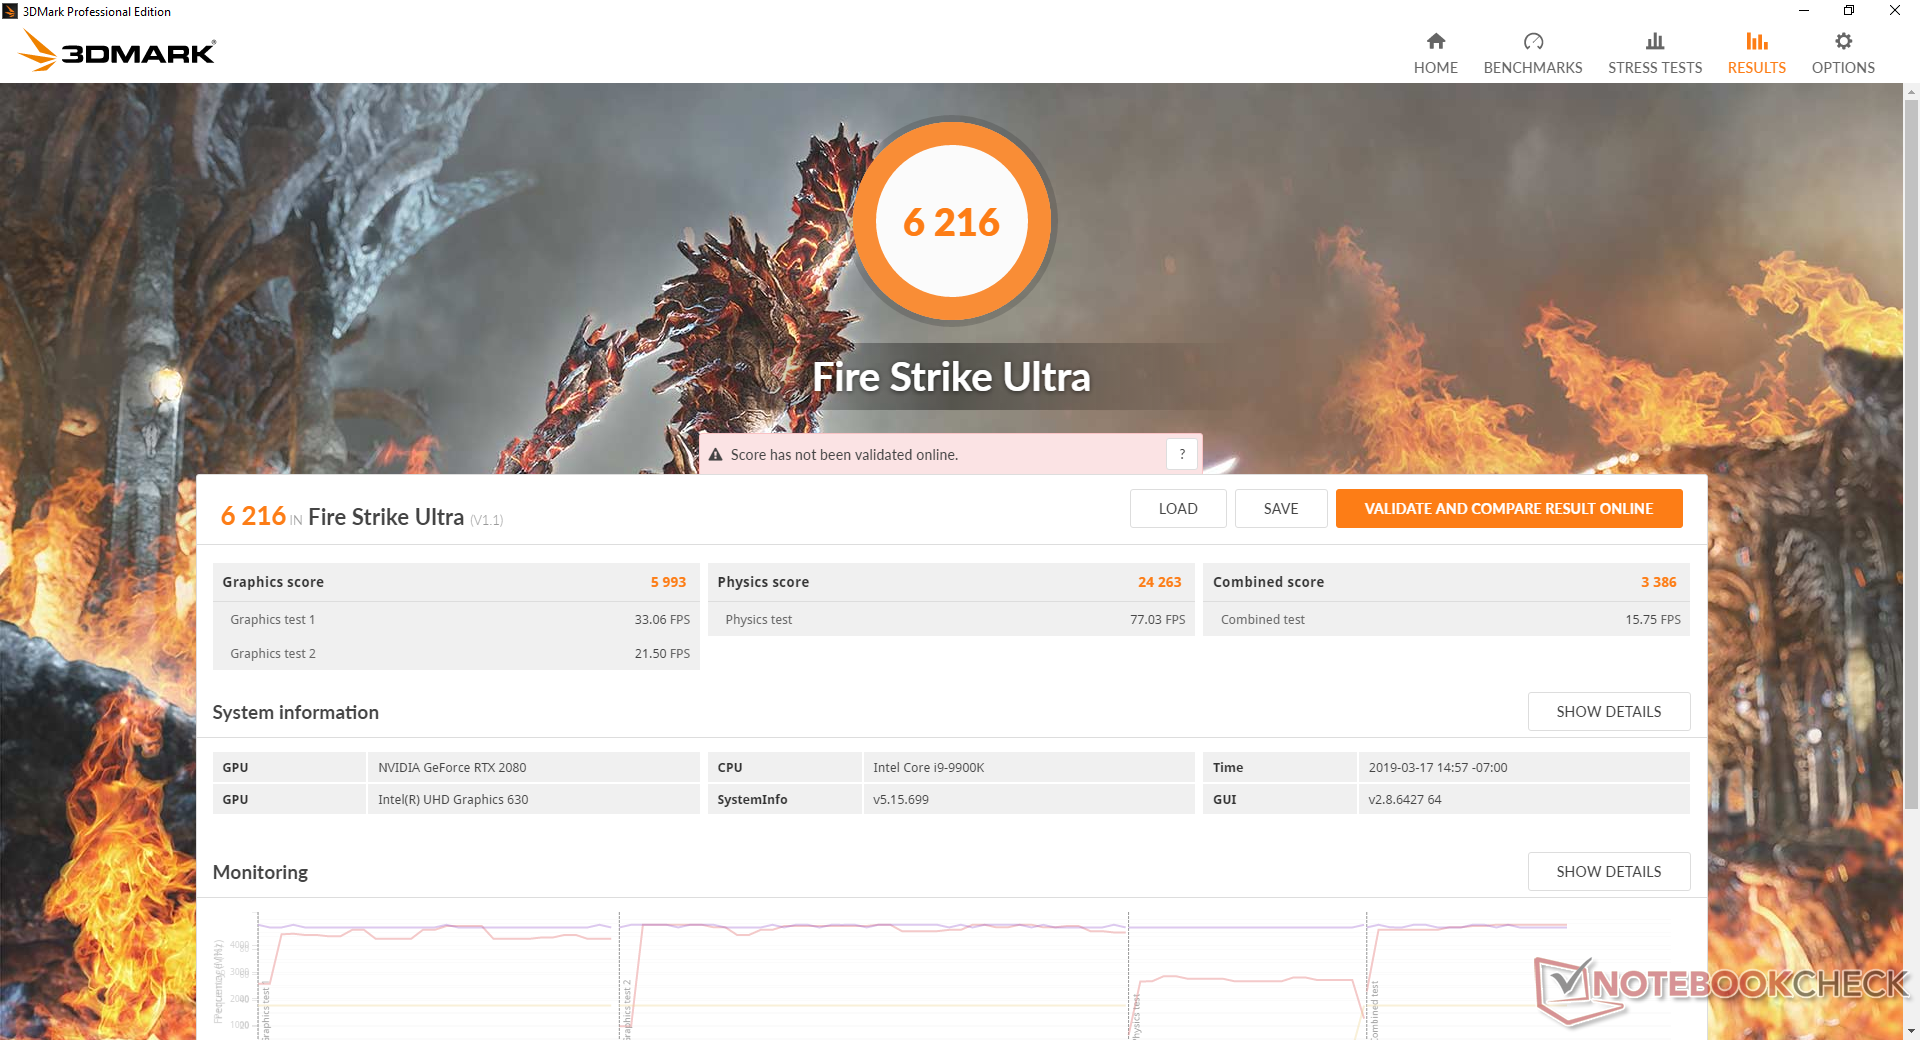
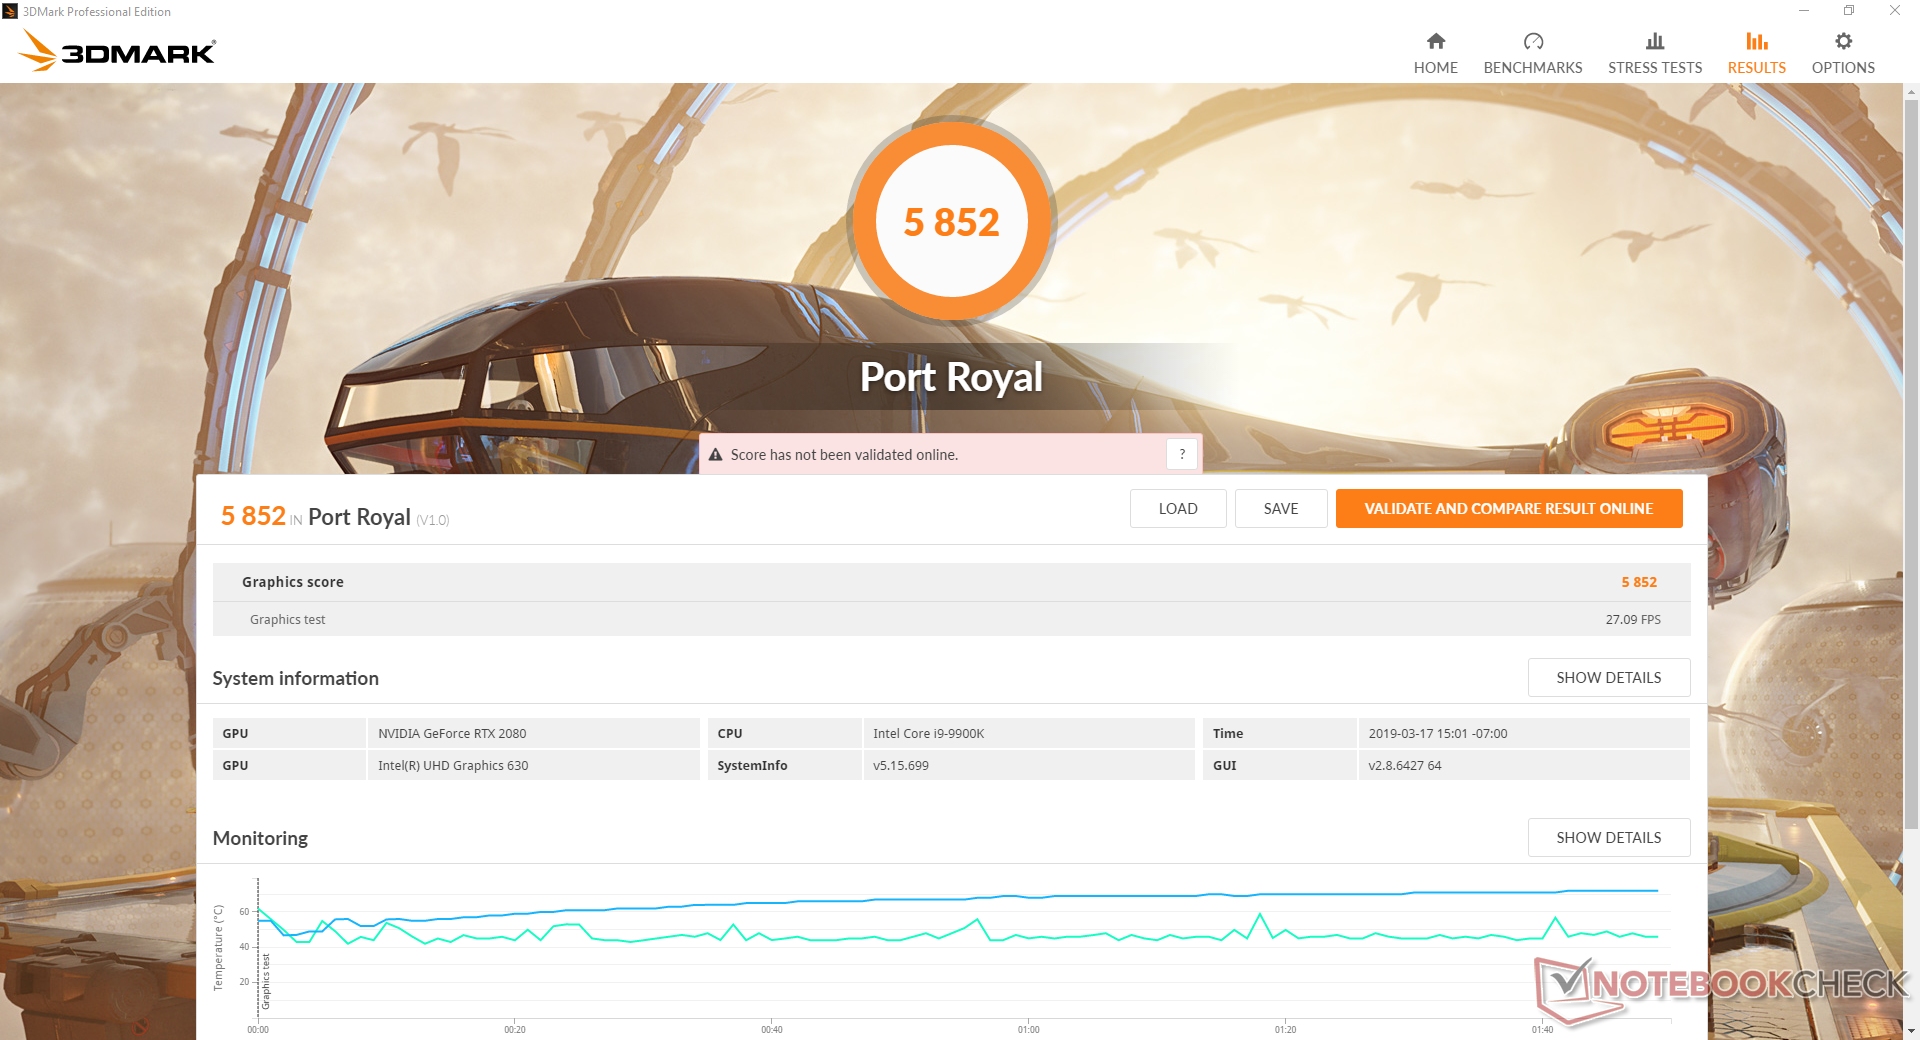
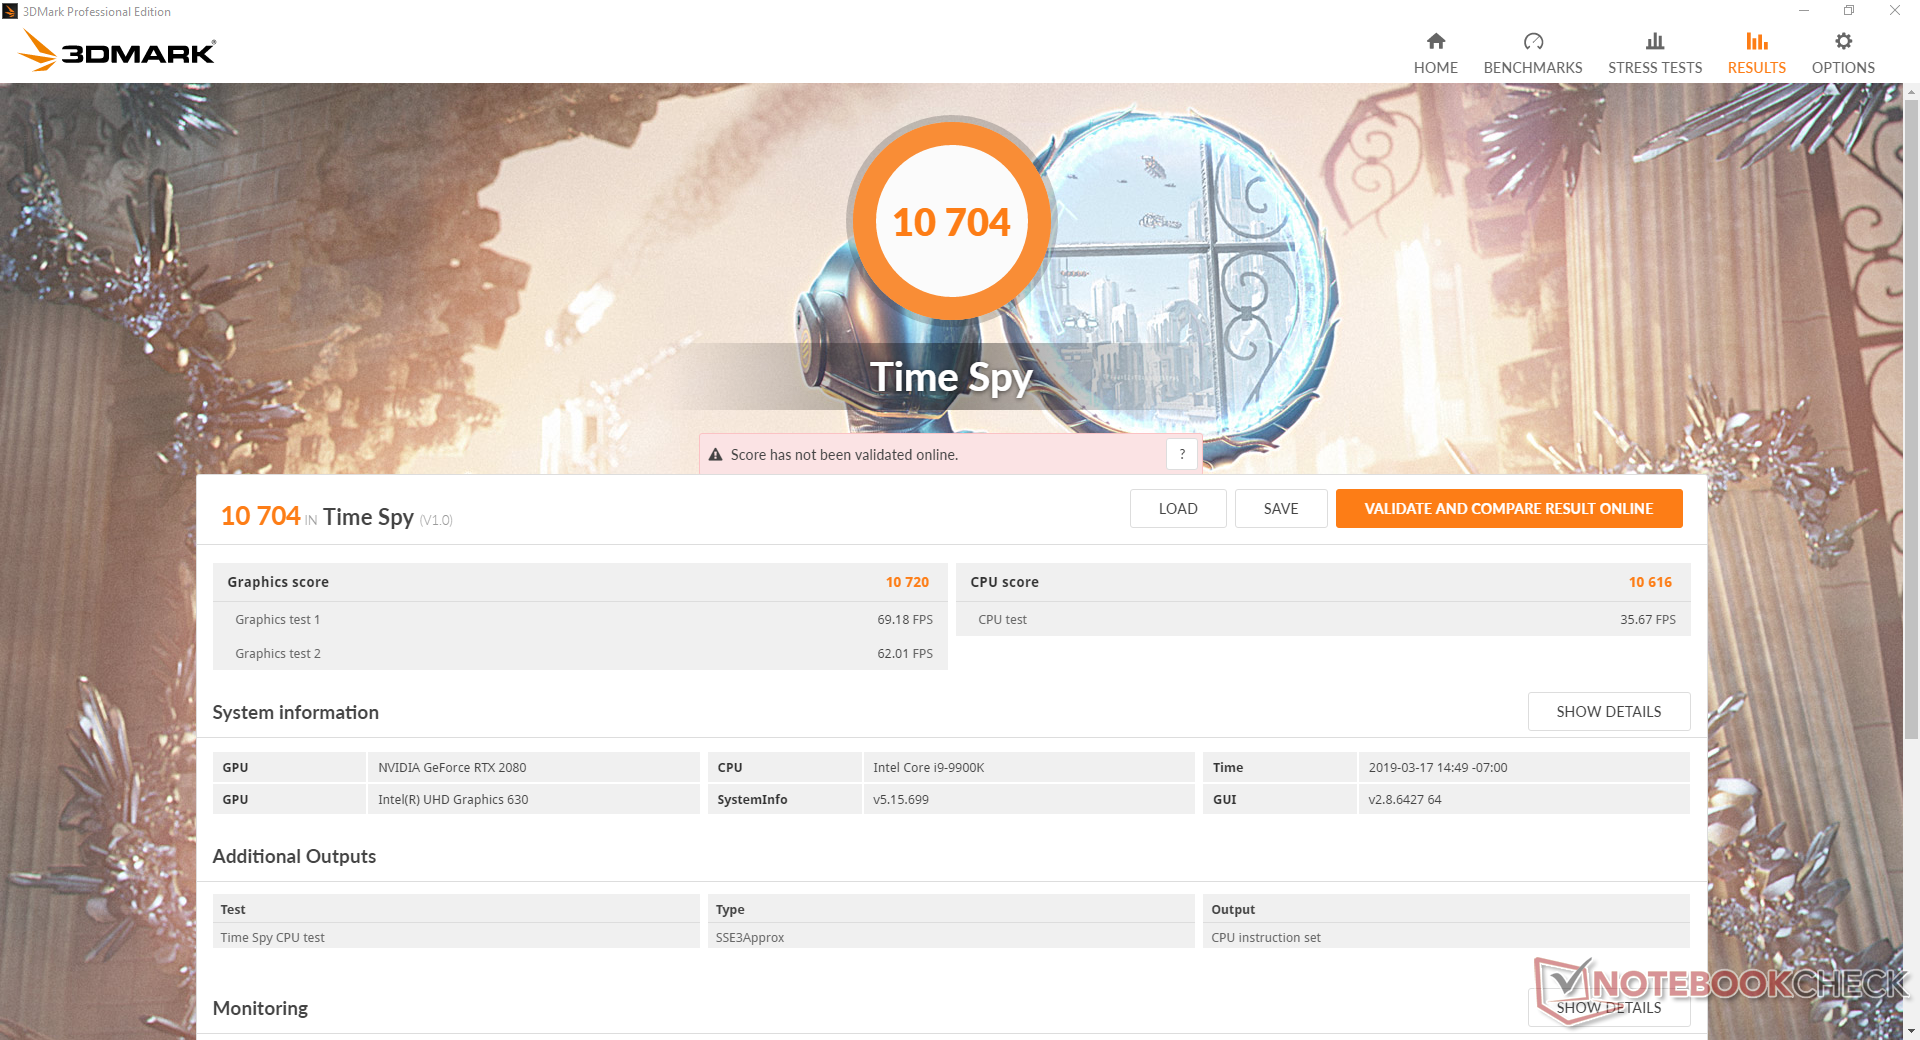
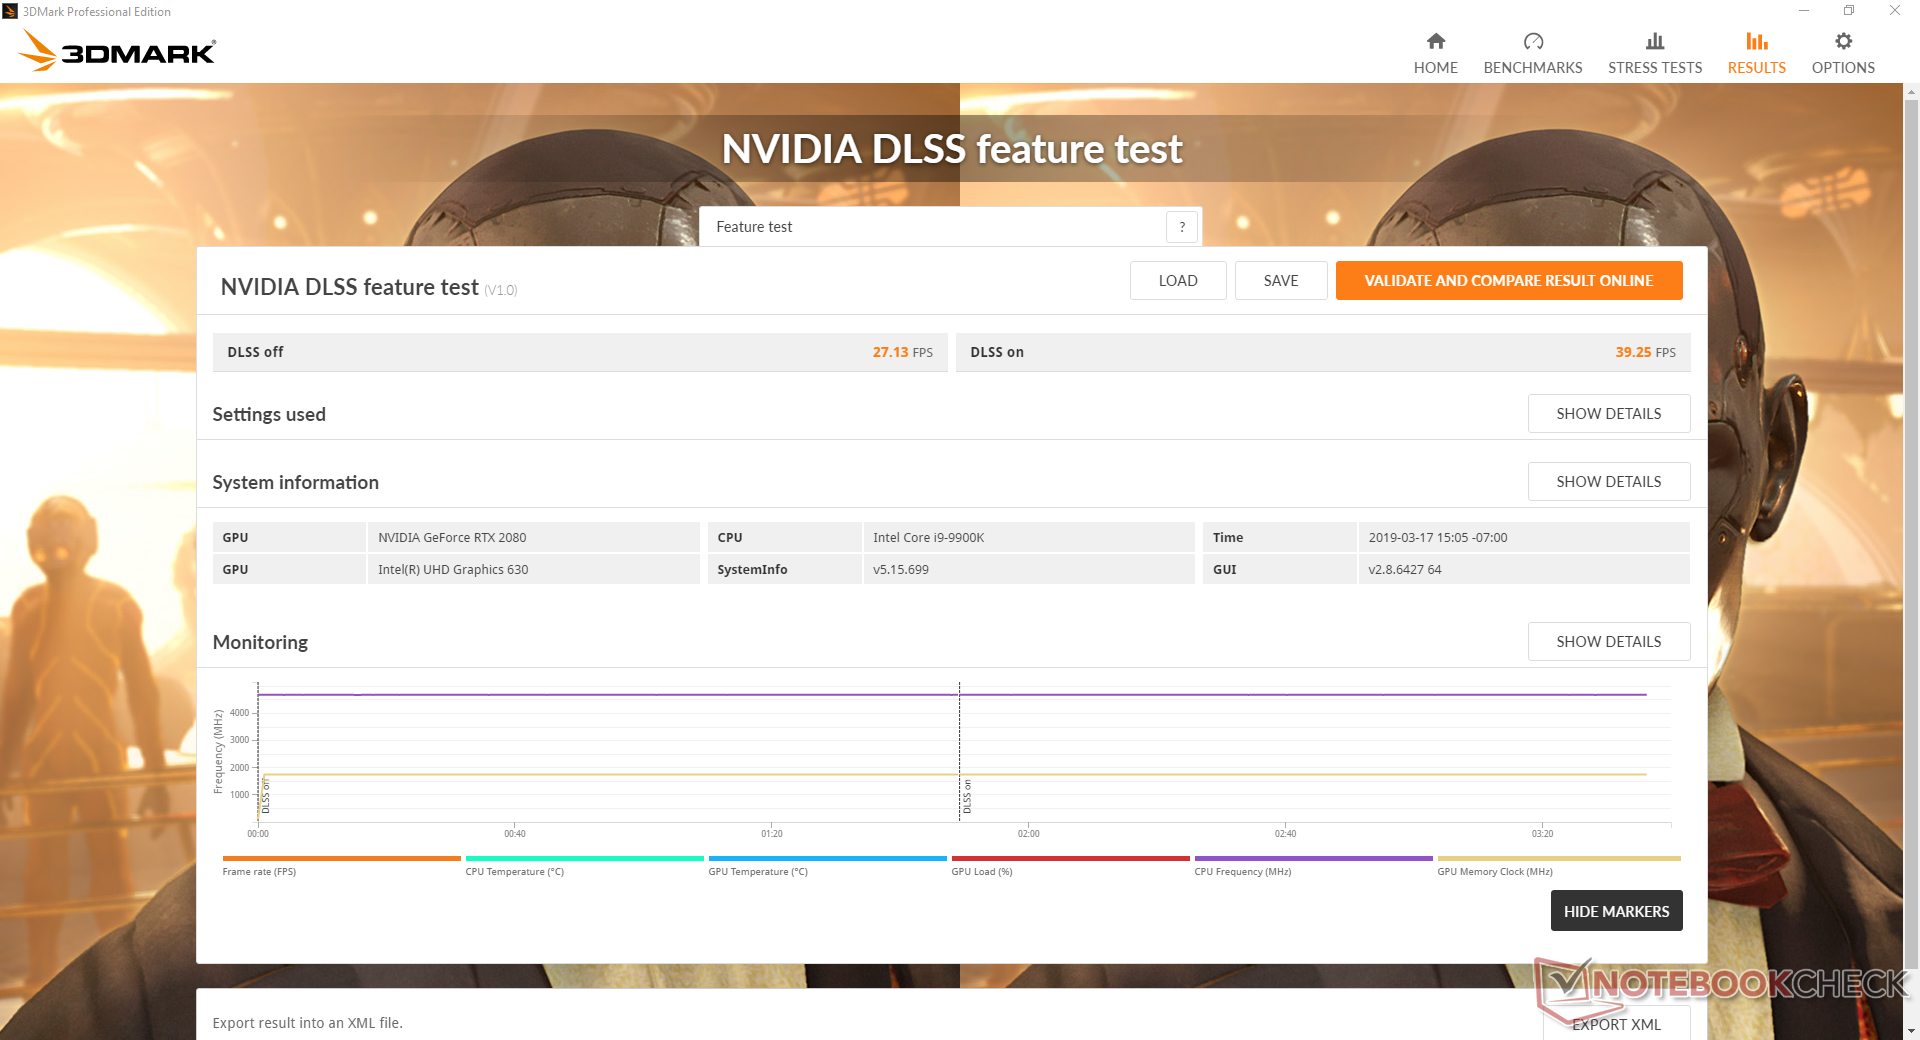
Dell boasts that its removable DGFF GeForce RTX 2080 GPU can run as fast as a desktop RTX 2080 since they both run under similar TDP envelopes. In truth, it definitely comes close. Our "proper" reference desktop PC with RTX 2080 graphics is able to outscore our Alienware-51m by up to 6 percent in 3DMark benchmarks. Users should be able to close that gap by overclocking the Alienware GPU at the cost of higher temperatures (>80 C).
When compared to other laptops with the same RTX 2080 GPU, the Alienware seems to come out on top. For example, both the RTX 2080 GPUs in the Eurocom Sky X7C and Asus ROG G703GX are consistently about 4 to 6 percent slower than the Alienware. The graphics performance advantage on the Dell is there, albeit marginal.
Systems with the RTX 2080 Max-Q like the Alienware m15 or m17 are slower by about 20 to 25 percent.

| 3DMark 11 Performance | 29759 points | |
| 3DMark Cloud Gate Standard Score | 59224 points | |
| 3DMark Fire Strike Score | 23195 points | |
| 3DMark Time Spy Score | 10704 points | |
Help | ||
Gaming Performance
Real-world gaming performance is still essentially identical to a desktop RTX 2080 despite what the synthetic benchmarks above indicate. Running Metro Exodus on maximum settings, for example, is a few frames faster than on our reference desktop. Performance is about 30 to 35 percent faster than a regular GTX 1080 or 40 to 45 percent faster than a regular desktop RTX 2060.
Running Witcher 3 shows no recurring dips in frame rates to suggest no interrupting background activity during gameplay.
See our dedicated page on the RTX 2080 for more benchmarks and our review on the Turing series for more technical details.
| Metro Exodus - 1920x1080 Ultra Quality AF:16x | |
| Alienware Area-51m i9-9900K RTX 2080 | |
| MSI RTX 2080 Gaming X Trio | |
| MSI GeForce GTX 1080 | |
| Schenker XMG Neo 17 | |
| MSI RTX 2060 Gaming Z 6G | |
| i7-7740X Asus X299 Prime | |
| Acer Predator Triton 700 | |
| Gigabyte Aero 15-Y9 | |
| Schenker XMG Neo 15 Turing | |
| The Witcher 3 - 1920x1080 Ultra Graphics & Postprocessing (HBAO+) | |
| MSI RTX 2080 Gaming X Trio | |
| Alienware Area-51m i9-9900K RTX 2080 | |
| Schenker XMG Neo 17 | |
| MSI RTX 2060 Gaming Z 6G | |
| Gigabyte Aero 15-Y9 | |
| Schenker XMG Neo 15 Turing | |
| low | med. | high | ultra | |
|---|---|---|---|---|
| BioShock Infinite (2013) | 447.6 | 380.6 | 348 | 213.4 |
| The Witcher 3 (2015) | 382.5 | 273.3 | 194.4 | 101.1 |
| Rise of the Tomb Raider (2016) | 317 | 224.3 | 188.8 | 158.8 |
| Shadow of the Tomb Raider (2018) | 171 | 140 | 134 | 123 |
| Metro Exodus (2019) | 165 | 120.1 | 91.5 | 76.1 |
Emissions
System Noise
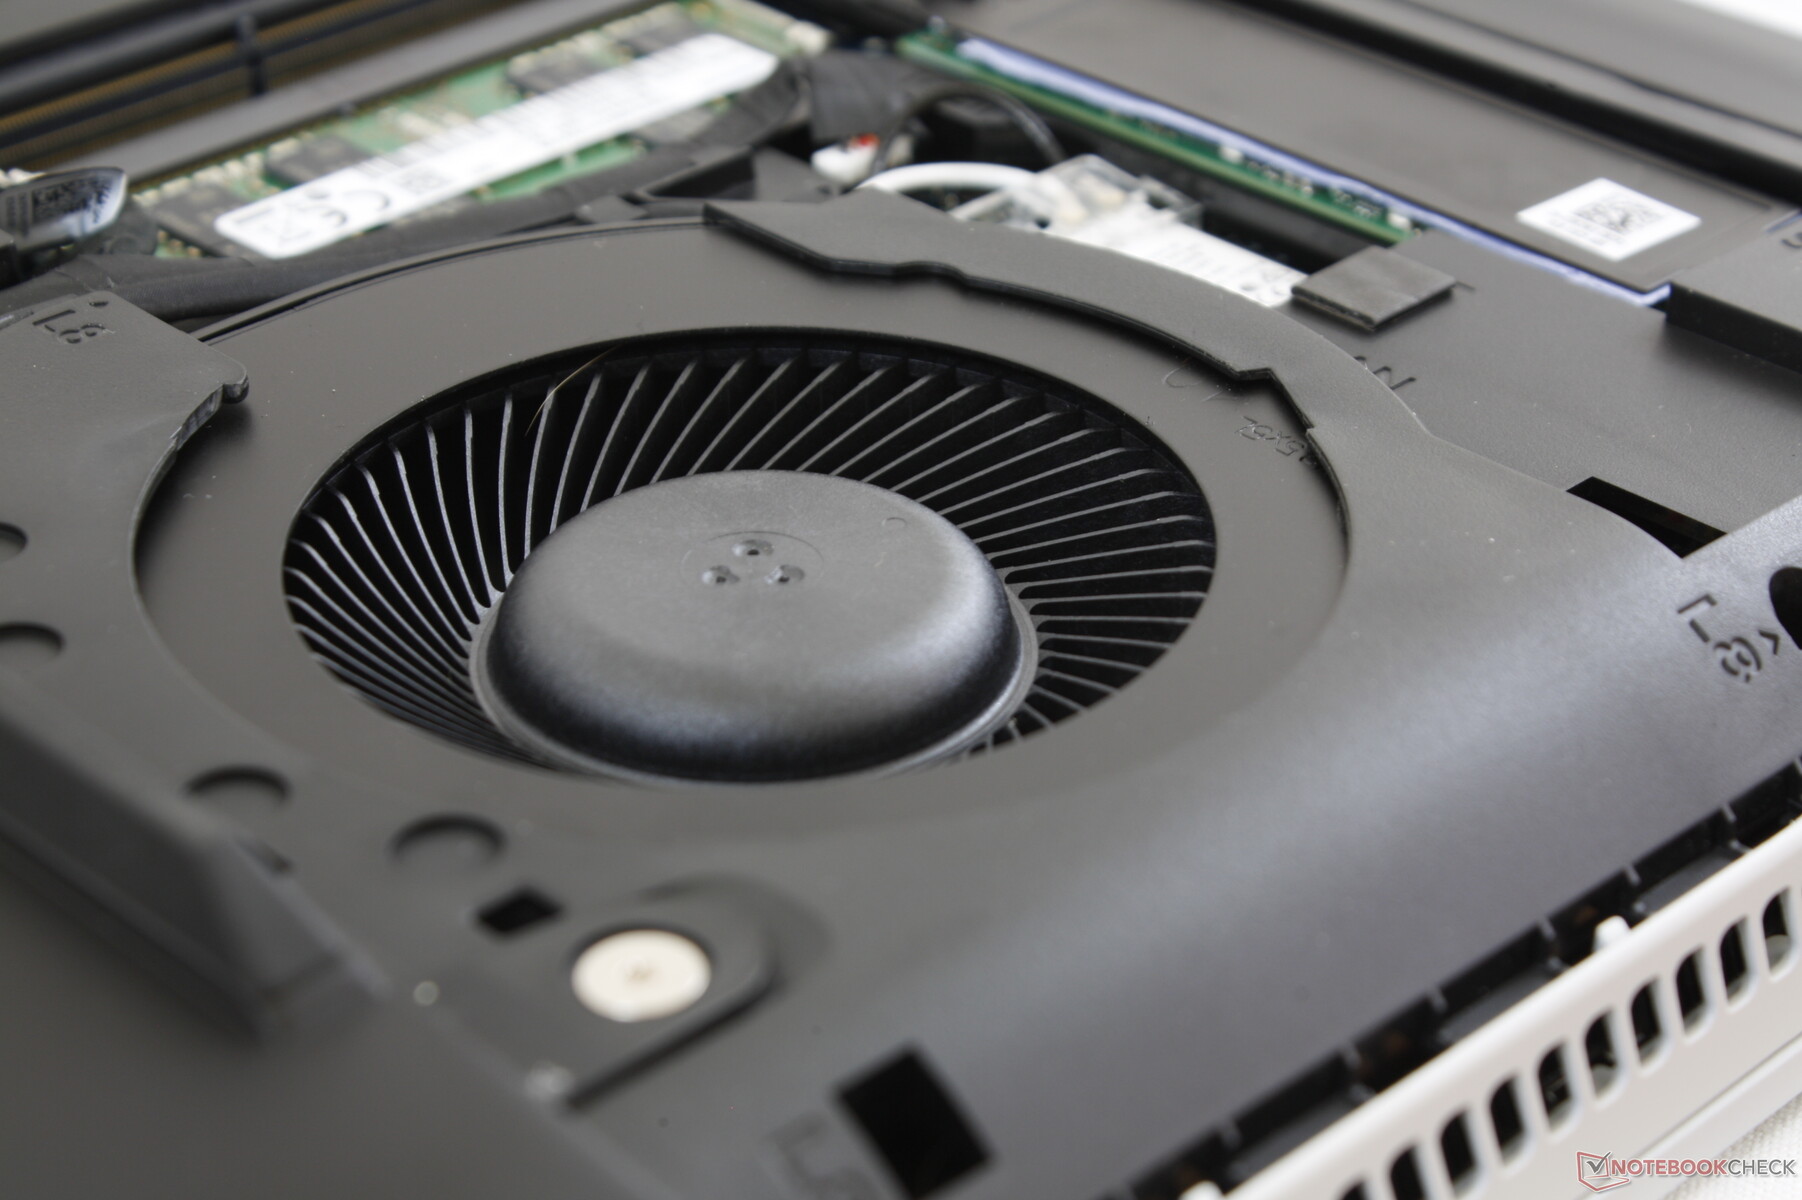
The cooling solution consists of dual ~60 mm fans with 7 heat pipes to be significantly larger and more capable than the cooling solution of the Alienware 17 R5. The lower-end RTX 2060/2070 configurations may carry fewer heat pipes. Even with this in mind, the Area-51m takes a unique approach to fan noise. When set to High Performance mode, the fans will operate at their maximum RPMs for a constant fan noise of 51 dB(A) no matter the onscreen load. The system may be simply idling on desktop and the fans would still be running at full speed. The bright side to this is that fan noise will not pulse when gaming unlike on most other gaming laptops with more sensitive fans.
Perhaps not by coincidence, we're also able to measure 51 dB(A) when gaming on the Alienware 17 R5. Dell managed to significantly up performance without impacting fan noise gen-to-gen.
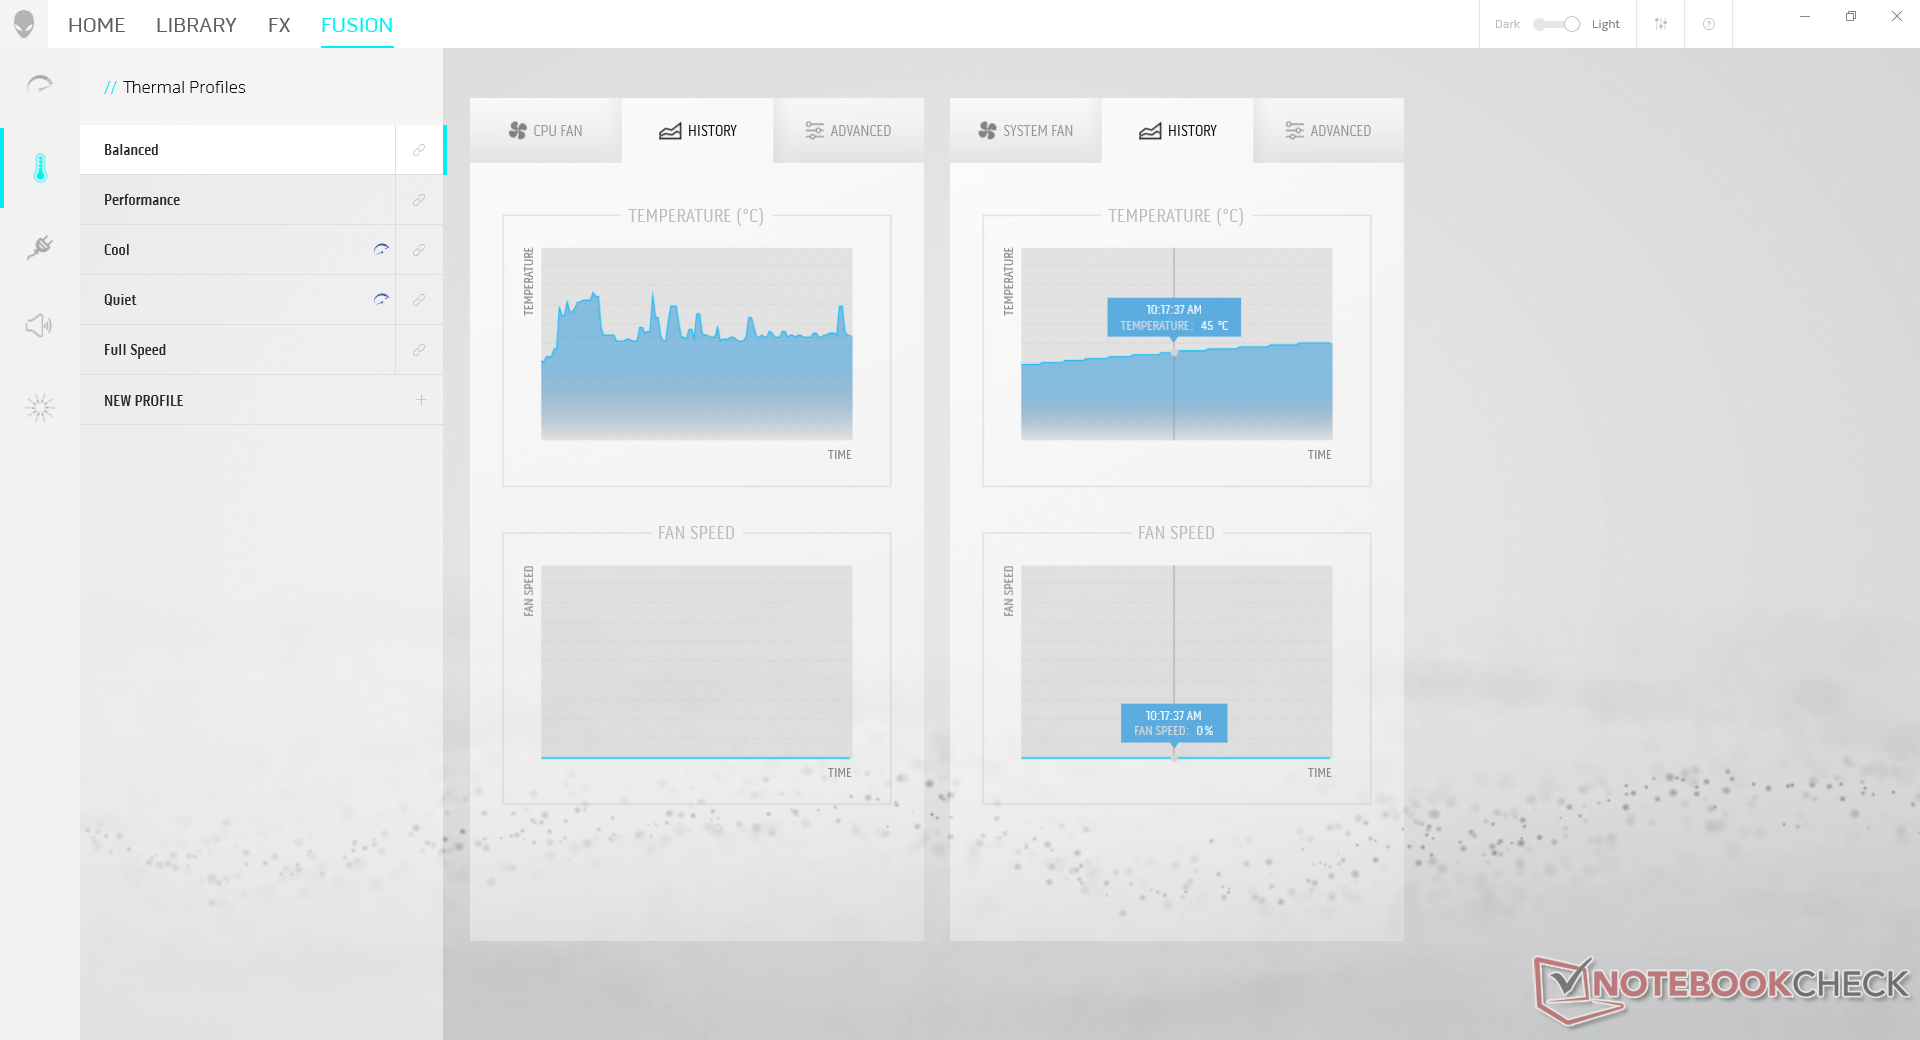
Fan behavior becomes more typical when set to Balanced. We're able to record a fan noise of 31.8 dB(A) and 38.2 dB(A) when browsing the web and running Witcher 3, respectively. This is measurably quieter than most gaming laptops where the low-to-mid 40 dB(A) range is common when playing games.
Some of you may be thinking: why not play games on Balanced mode instead of Performance mode when fan noise is so much louder on the latter? Balanced mode impacts GPU performance rather significantly while CPU performance remains unaffected. A Fire Strike run on Balanced mode returns Physics and Graphics scores of 24490 and 13326, respectively, compared to 24425 and 27080 points when on High Performance mode.
For situations where complete silence is desirable, Dell's preset Quiet mode does the trick. True to its name, the fans will actually idle and remain silent when browsing or video streaming and will only pulse up to 34.4 dB(A) if needed. Performance is throttled even further, of course, but this is fine for undemanding tasks.
We can notice no coil whine on our specific test unit.
| Alienware Area-51m i9-9900K RTX 2080 GeForce RTX 2080 Mobile, i9-9900K, 2x SK Hynix PC400 512GB (RAID 0) | MSI GT75 8RG-090 Titan GeForce GTX 1080 Mobile, i9-8950HK, 2x Samsung PM961 MZVLW256HEHP (RAID 0) | Asus ROG G703GX GeForce RTX 2080 Mobile, i7-8750H, Samsung SSD PM981 MZVLB512HAJQ | Eurocom Sky X7C i9-9900K GeForce RTX 2080 Mobile, i9-9900K, 2x Samsung SSD 970 Pro 512GB (RAID 0) | HP Omen X 17-ap002ng GeForce GTX 1080 Mobile, i7-7820HK | Razer Blade Pro 2017 GeForce GTX 1080 Mobile, i7-7820HK, 2x Samsung SSD PM951 MZVLV256HCHP (RAID 0) | |
|---|---|---|---|---|---|---|
| Noise | -4% | -1% | 7% | 7% | 1% | |
| off / environment * (dB) | 28.1 | 30 -7% | 30 -7% | 28.9 -3% | 30 -7% | 30 -7% |
| Idle Minimum * (dB) | 28.1 | 32 -14% | 30 -7% | 29.7 -6% | 31.6 -12% | 30 -7% |
| Idle Average * (dB) | 28.6 | 34 -19% | 35 -22% | 29.7 -4% | 31.6 -10% | 31 -8% |
| Idle Maximum * (dB) | 51 | 37 27% | 41 20% | 30 41% | 31.7 38% | 33 35% |
| Load Average * (dB) | 51 | 43 16% | 44 14% | 36.5 28% | 38.4 25% | 43 16% |
| Witcher 3 ultra * (dB) | 51 | 57 -12% | 51 -0% | 49 4% | 47.2 7% | 55 -8% |
| Load Maximum * (dB) | 51 | 62 -22% | 52 -2% | 57 -12% | 48.1 6% | 58 -14% |
* ... smaller is better
Noise level
| Idle |
| 28.1 / 28.6 / 51 dB(A) |
| Load |
| 51 / 51 dB(A) |
 | ||
30 dB silent 40 dB(A) audible 50 dB(A) loud |
||
min: | ||
Temperature
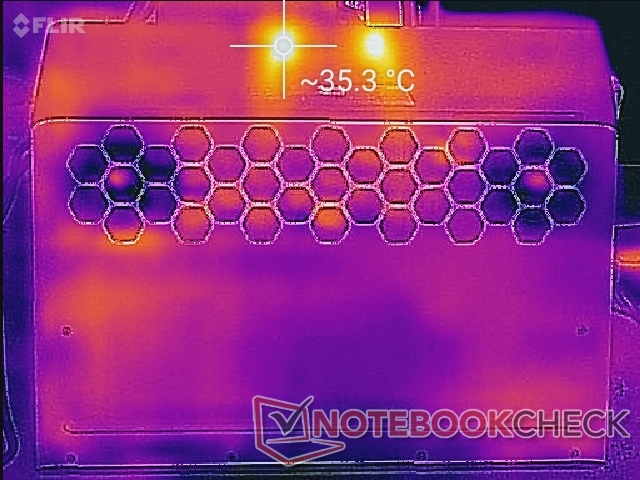
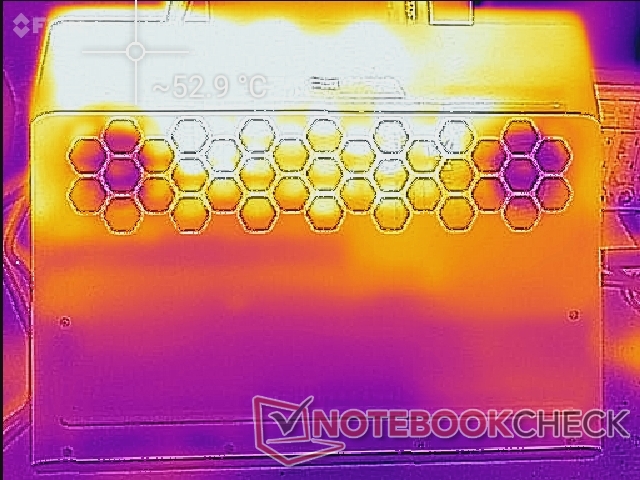
The Alienware-51m incorporates far more ventilation grilles and breathing room when compared to the Alienware 17 that it replaces. In addition to the four sets of grilles along the rear, there are large honeycomb openings on the bottom for improved airflow. Dell says this approach is better while being just as rigid as the typical dotted mesh or parallel cuts seen on most other laptops.
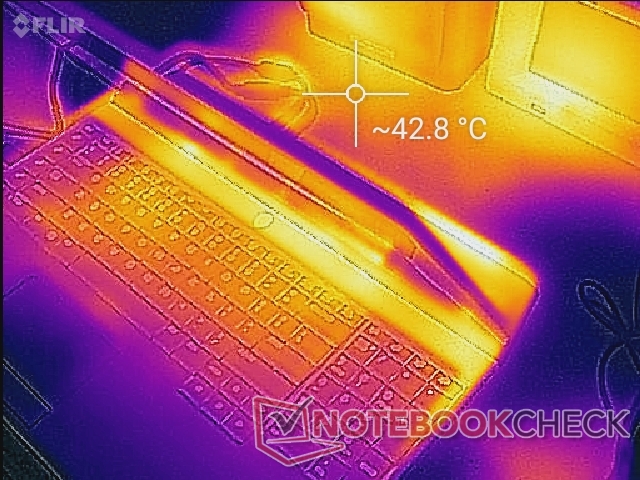
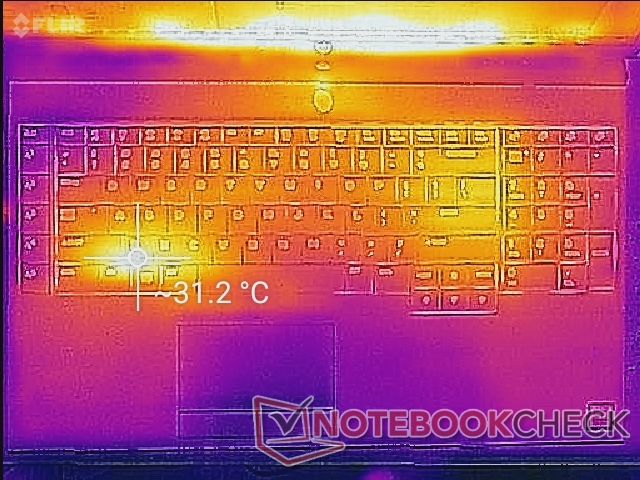
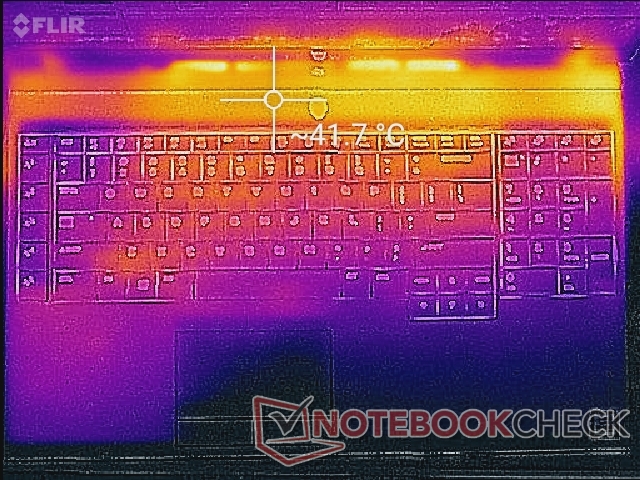
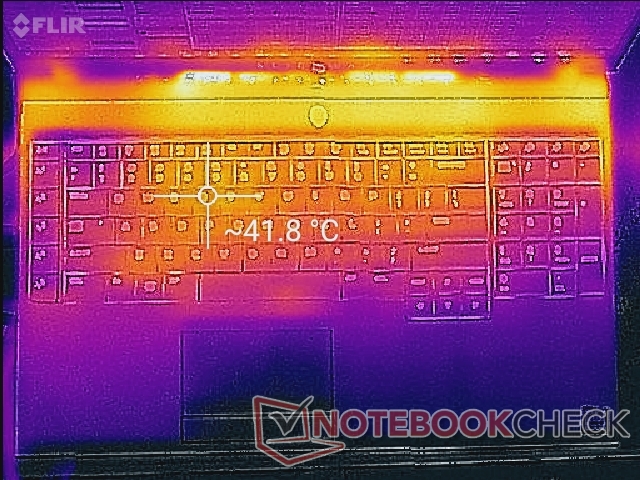
Surface temperatures are never uncomfortably warm on the trackpad or palm rests. The main QWERTY keys can reach 41 C when gaming not unlike what we found on the Alienware 17 R5. While we would have liked cooler temperatures, this is still impressive considering that the Area-51m has a much more powerful CPU under the hood.
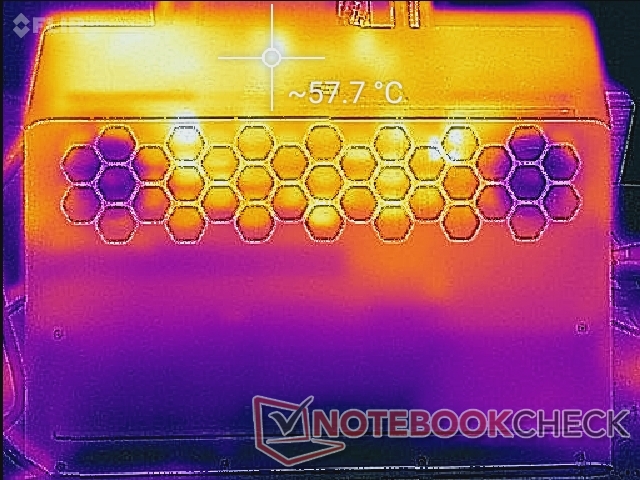
The warmest areas of the system are on the protruding rear as shown by our temperature maps below. Surfaces here can reach well over 50 C, but this is thankfully away from where users will be touching. The Eurocom Sky X7C has the Alienware beat yet again with cooler surface temperatures when under heavy loads.
It's worth mentioning that surfaces are warmer in Quiet mode when compared to Balanced mode. Since the fans are idling on this mode, the palm rests and keyboard keys will be a few degrees warmer at about 30 C to 32 C.
Stress Test
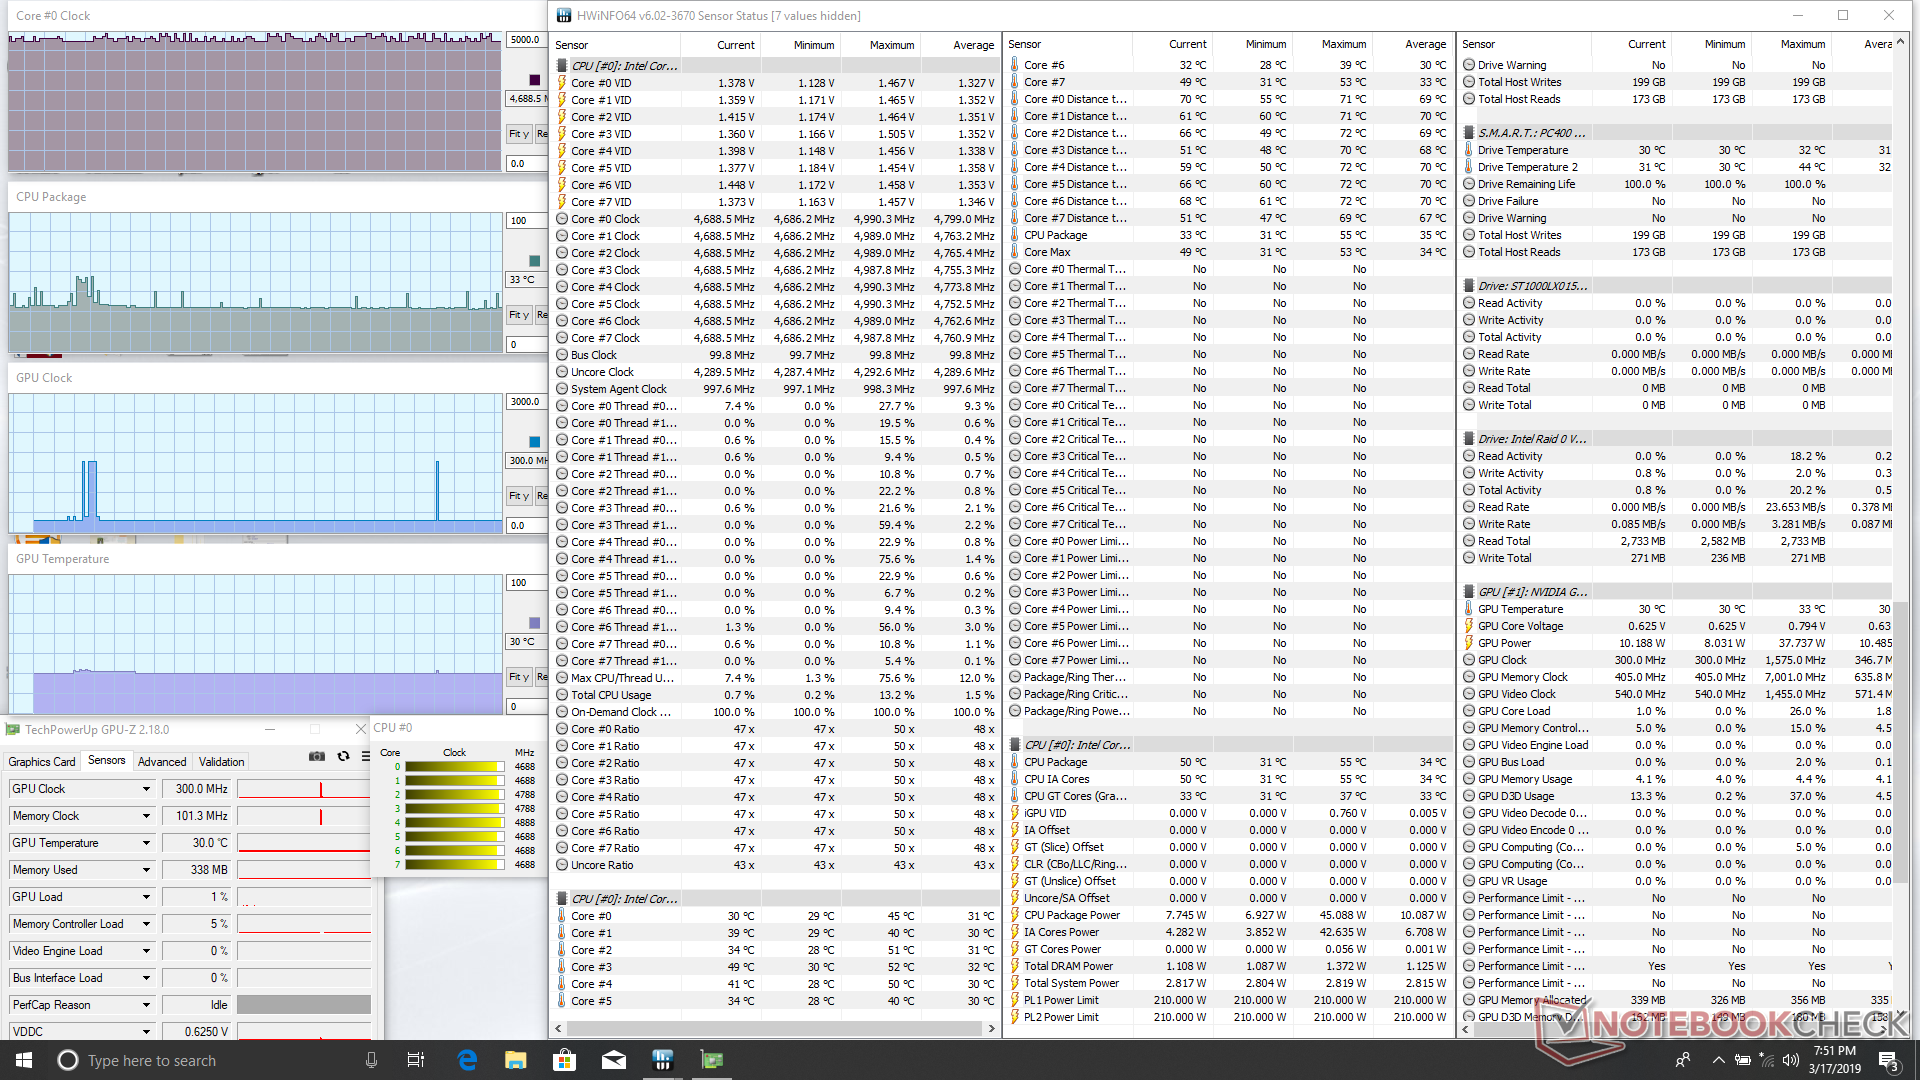
We stress the laptop with synthetic loads to identify for any potential throttling or stability issues. When running Prime95, we can observe the CPU operating at 4.7 GHz for the first 30 seconds or so before hitting a core temperature of 100 C. Thereafter, clock rates alternate between 4.4 GHz and 4.7 GHz in order to prevent the processor from becoming any warmer. Needless to say, there isn't much of an overclocking headroom through the Alienware Command Center utility. The same Core i9-9900K CPU in the competing Eurocom Sky X7C is able to run cooler at 84 C and at similar clock rates as our Alienware. We're a bit disappointed that the Alienware is unable to sustain 4.7 GHz or higher when at 100 percent CPU utilization.
It's worth mentioning that the GPU barely increases in temperature while stressing the CPU since the cooling solutions between the processors are independent. This is in contrast to many ultra-thin gaming laptops where the CPU and GPU often share the same heat pipes and fans.
Running both Prime95 and FurMark simultaneously results in CPU and GPU temperatures of 95 C and 86 C, respectively. Core temperatures when running actual games are thankfully lower at the 74 C to 80 C range for each processor. Results are slightly cooler than on the Asus ROG G703GX by a few degrees, but still warmer than on the Eurocom Sky X7C when under similar gaming loads. There is no throttling in either case.
Running on battery power will severely limit performance even when set to the High Performance profile. A Fire Strike run on batteries returns Physics and Graphics scores of 15252 and 14172 points, respectively, compared to 24425 and 27080 points when on mains.
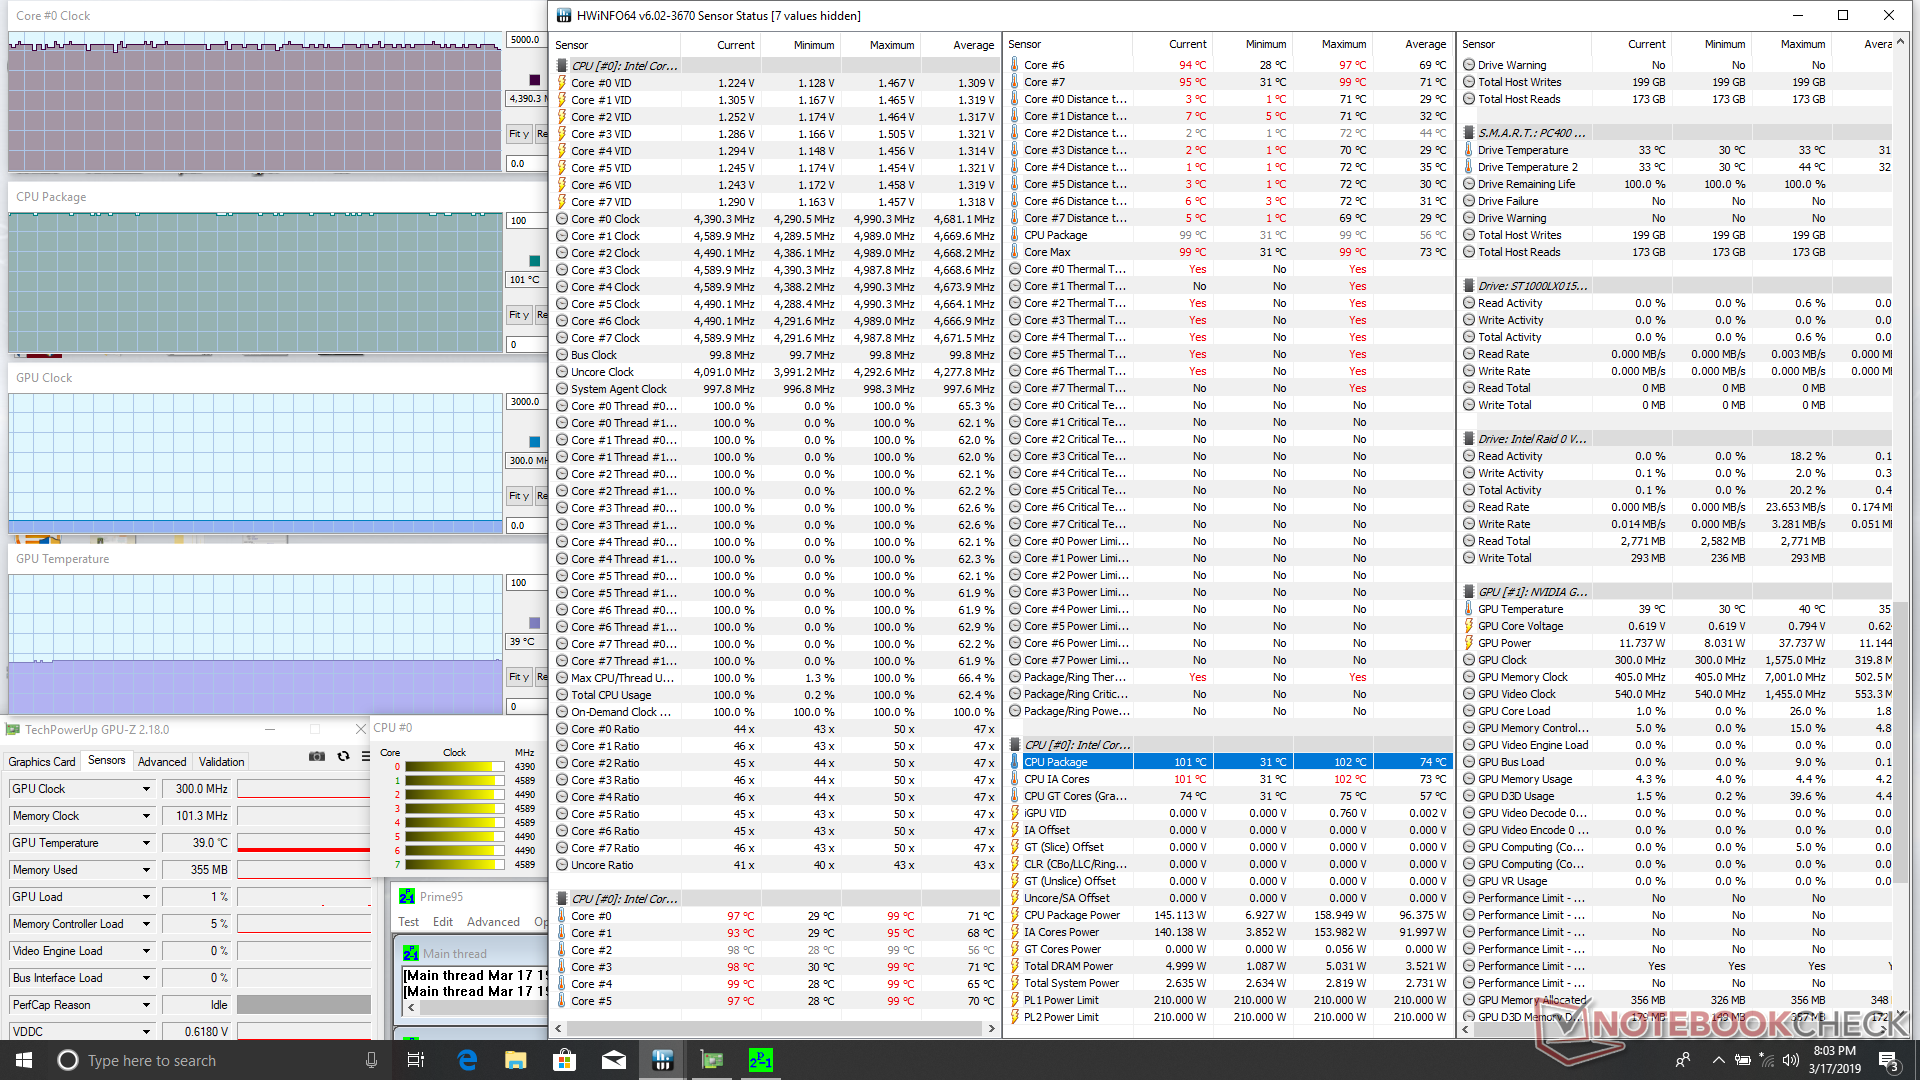
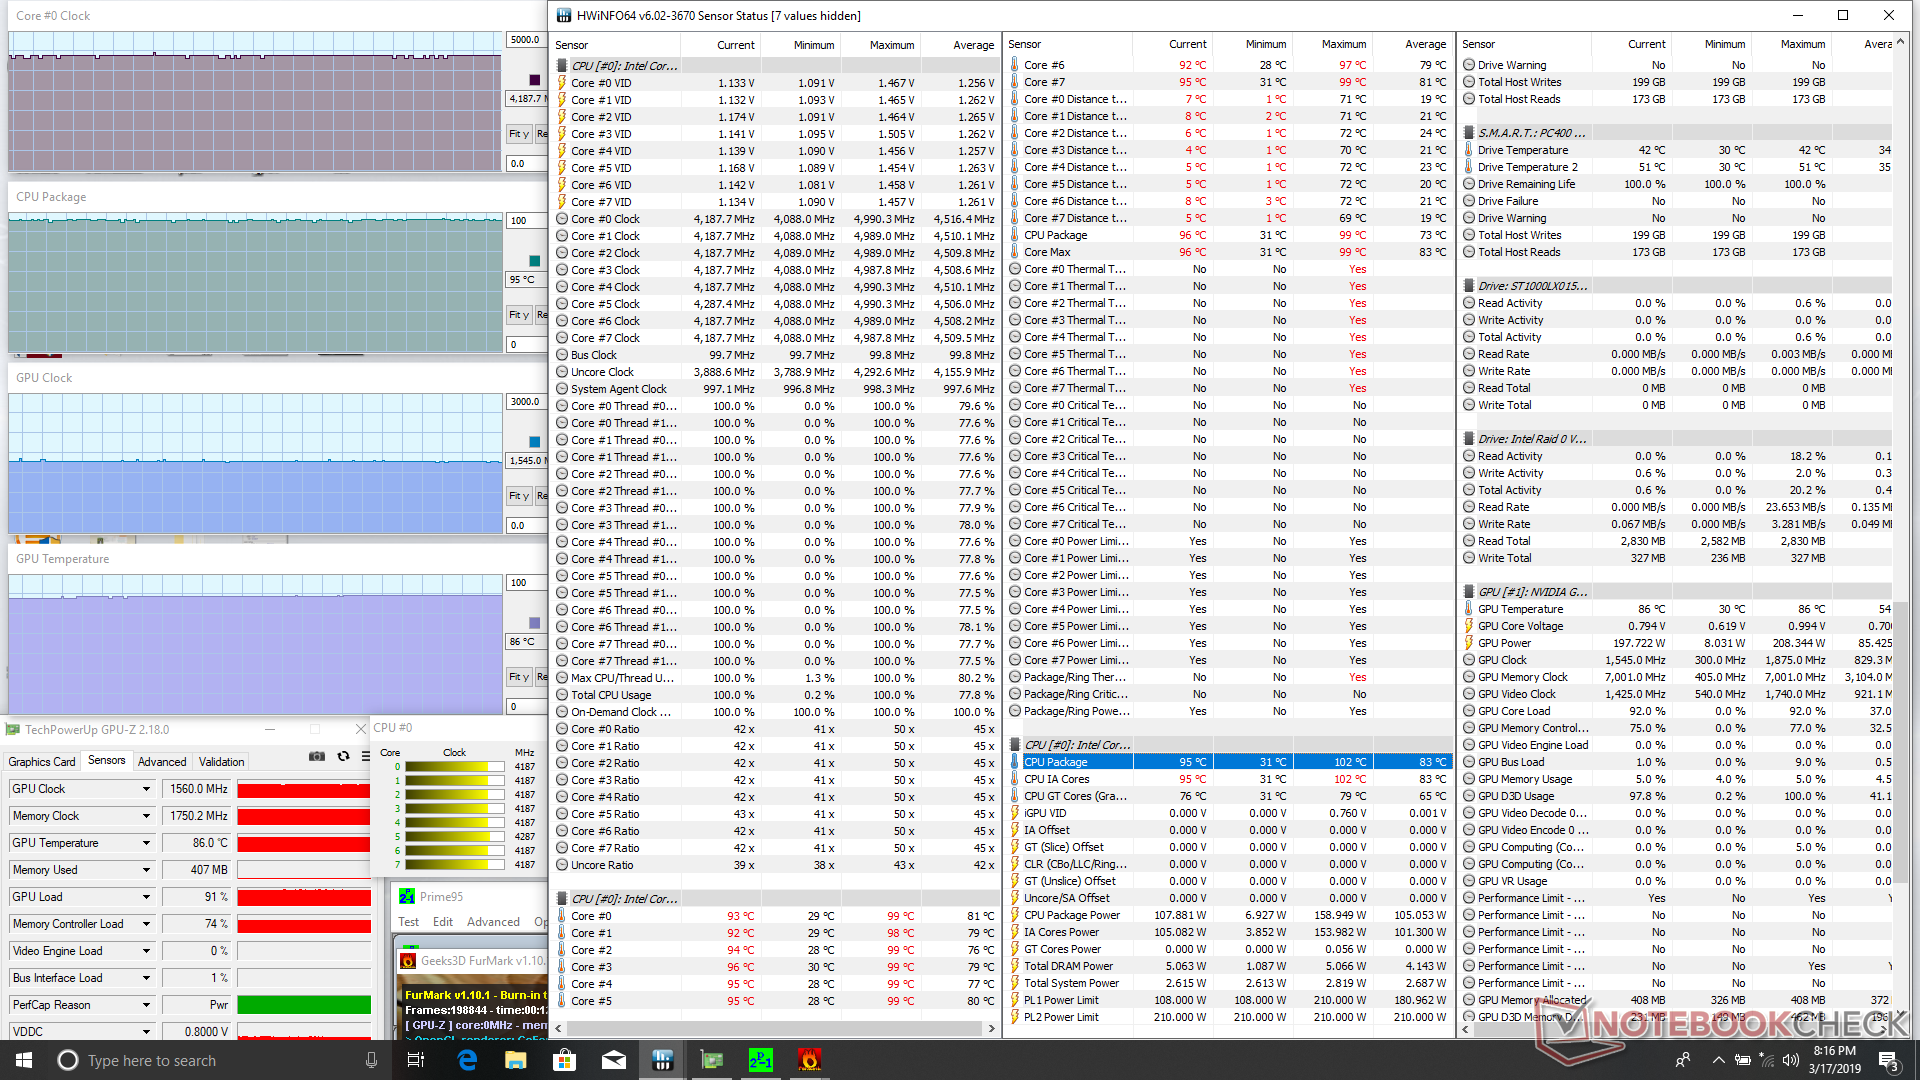
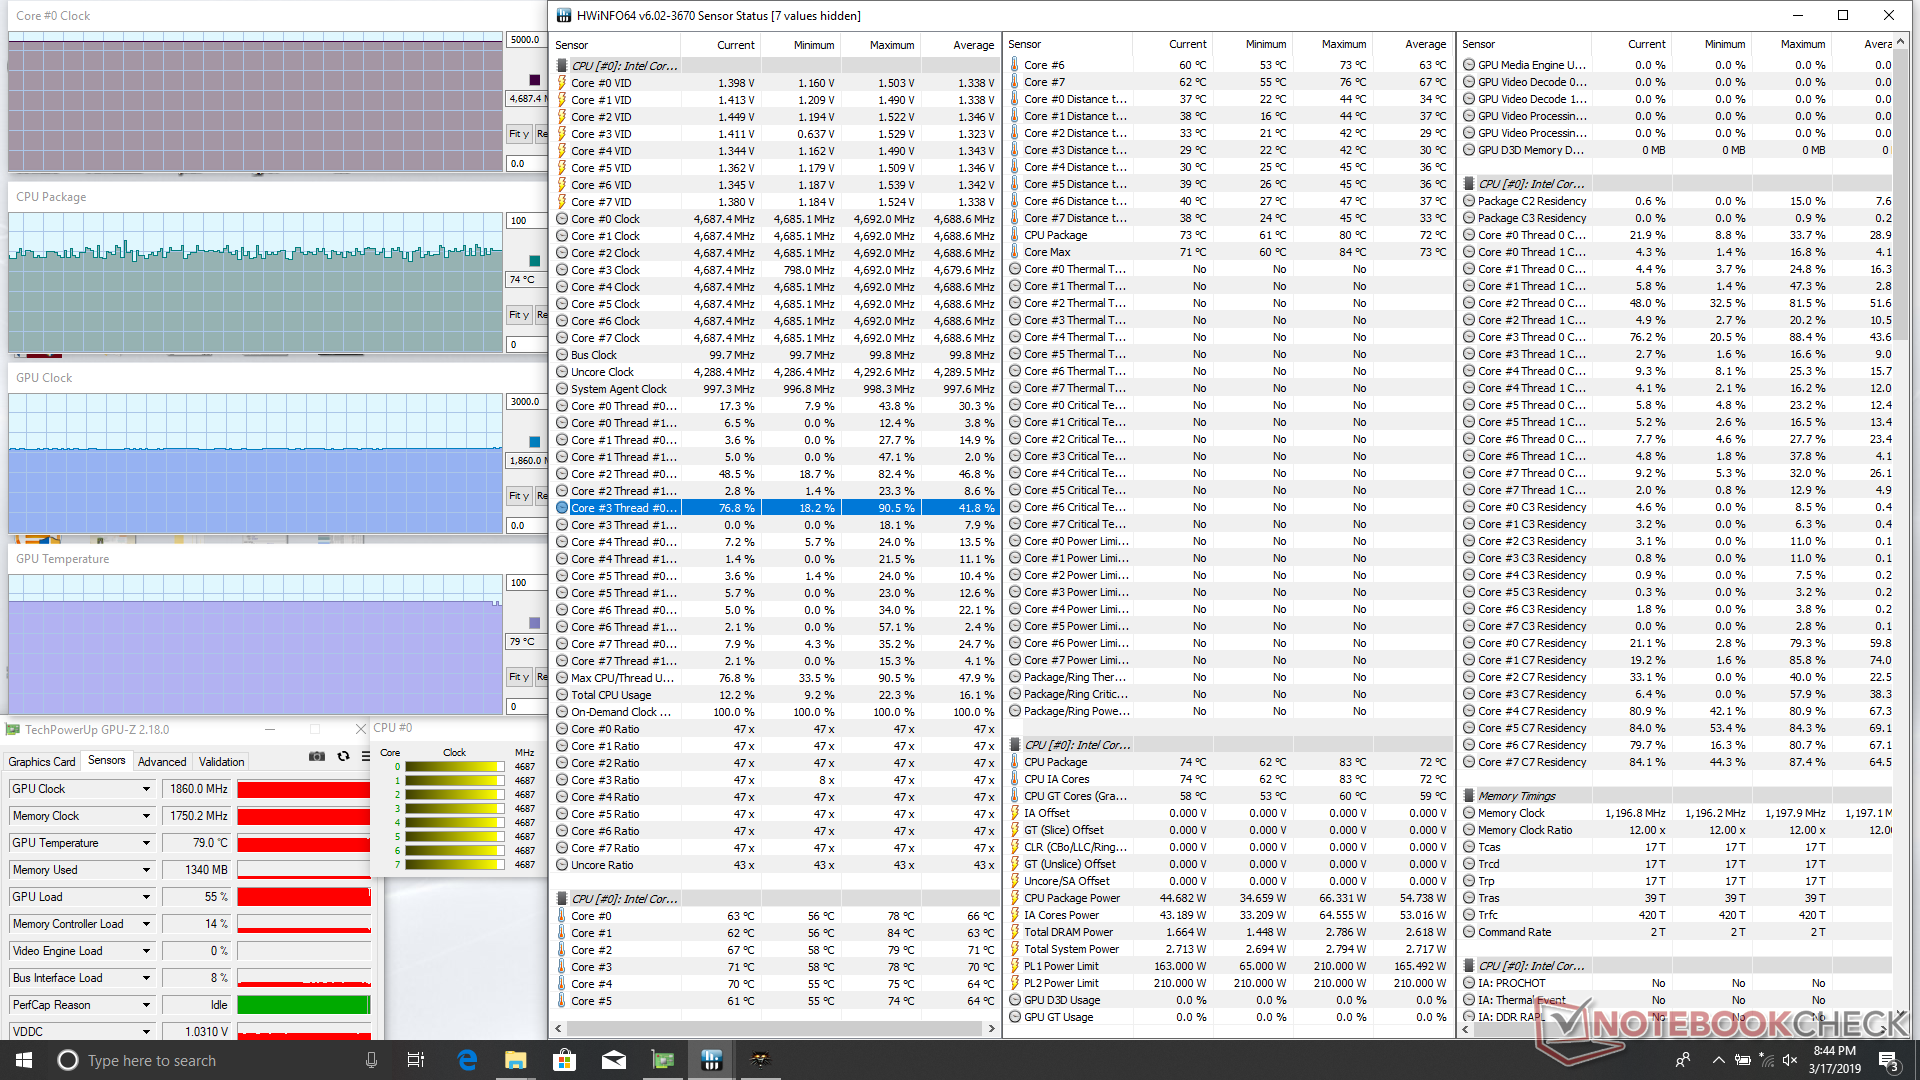
| CPU Clock (GHz) | GPU Clock (MHz) | Average CPU Temperature (°C) | Average GPU Temperature (°C) | |
| System Idle | -- | -- | 33 | 30 |
| Prime95 Stress | 4.4 - 4.7 | -- | 99 - 100 | 39 |
| Prime95 + FurMark Stress | 4.2 | 1560 | 95 | 86 |
| Witcher 3 Stress | 4.7 | 1860 | 74 | 80 |
(-) The maximum temperature on the upper side is 47 °C / 117 F, compared to the average of 40.4 °C / 105 F, ranging from 21.2 to 68.8 °C for the class Gaming.
(-) The bottom heats up to a maximum of 58.8 °C / 138 F, compared to the average of 43.2 °C / 110 F
(+) In idle usage, the average temperature for the upper side is 27.8 °C / 82 F, compared to the device average of 33.9 °C / 93 F.
(±) Playing The Witcher 3, the average temperature for the upper side is 35.3 °C / 96 F, compared to the device average of 33.9 °C / 93 F.
(+) The palmrests and touchpad are reaching skin temperature as a maximum (32 °C / 89.6 F) and are therefore not hot.
(-) The average temperature of the palmrest area of similar devices was 28.8 °C / 83.8 F (-3.2 °C / -5.8 F).
Speakers
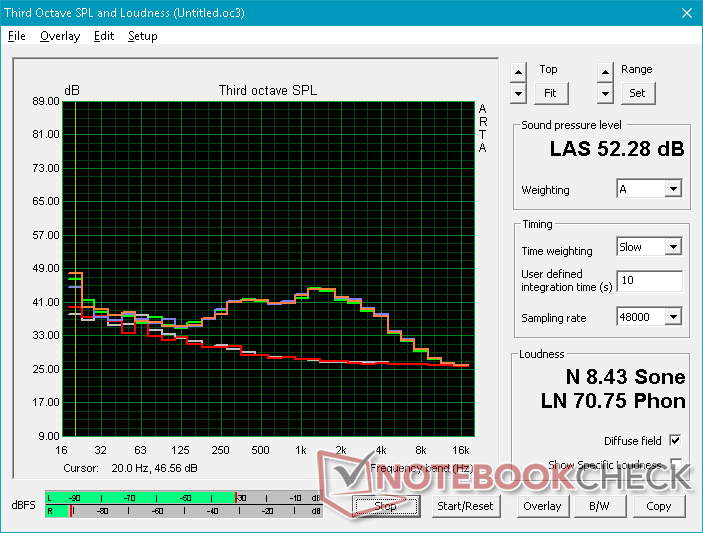
Sound quality from the stereo speakers are very good even though the system lacks a dedicated subwoofer. Our pink noise measurements reveal a generally balanced audio experience with a roll-off at about 250 Hz. Higher volume settings will not introduce any static, though the palm rests will vibrate from the reverberations.


Alienware Area-51m i9-9900K RTX 2080 audio analysis
(+) | speakers can play relatively loud (82.3 dB)
Bass 100 - 315 Hz
(±) | reduced bass - on average 11% lower than median
(±) | linearity of bass is average (14.5% delta to prev. frequency)
Mids 400 - 2000 Hz
(+) | balanced mids - only 3.4% away from median
(±) | linearity of mids is average (7.8% delta to prev. frequency)
Highs 2 - 16 kHz
(+) | balanced highs - only 2.8% away from median
(±) | linearity of highs is average (9.4% delta to prev. frequency)
Overall 100 - 16.000 Hz
(+) | overall sound is linear (11.9% difference to median)
Compared to same class
» 12% of all tested devices in this class were better, 4% similar, 84% worse
» The best had a delta of 6%, average was 18%, worst was 132%
Compared to all devices tested
» 9% of all tested devices were better, 2% similar, 89% worse
» The best had a delta of 4%, average was 23%, worst was 134%
Apple MacBook 12 (Early 2016) 1.1 GHz audio analysis
(+) | speakers can play relatively loud (83.6 dB)
Bass 100 - 315 Hz
(±) | reduced bass - on average 11.3% lower than median
(±) | linearity of bass is average (14.2% delta to prev. frequency)
Mids 400 - 2000 Hz
(+) | balanced mids - only 2.4% away from median
(+) | mids are linear (5.5% delta to prev. frequency)
Highs 2 - 16 kHz
(+) | balanced highs - only 2% away from median
(+) | highs are linear (4.5% delta to prev. frequency)
Overall 100 - 16.000 Hz
(+) | overall sound is linear (10.2% difference to median)
Compared to same class
» 7% of all tested devices in this class were better, 2% similar, 90% worse
» The best had a delta of 5%, average was 18%, worst was 53%
Compared to all devices tested
» 5% of all tested devices were better, 1% similar, 94% worse
» The best had a delta of 4%, average was 23%, worst was 134%
Energy Management
Power Consumption
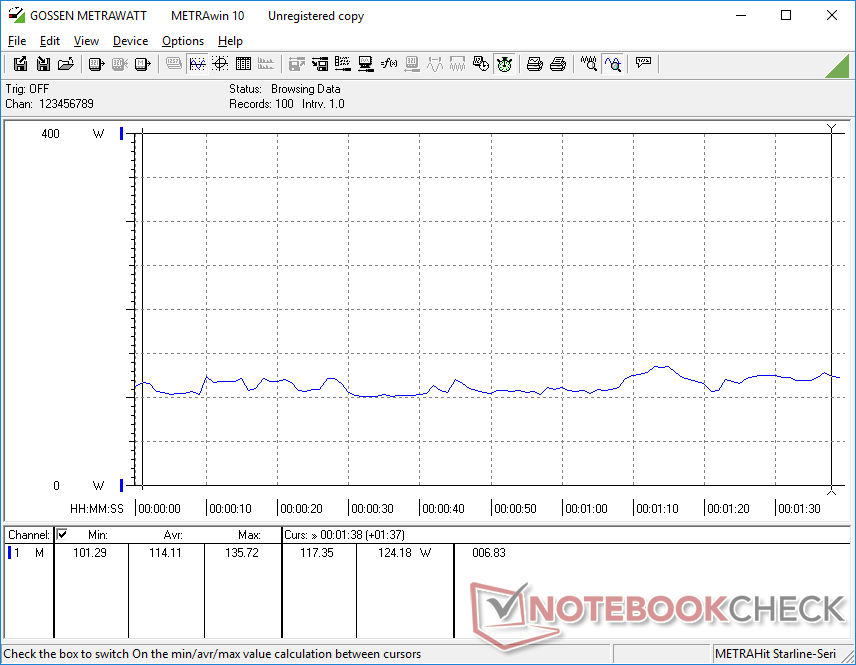
Idling on desktop draws anywhere between 23 W and 39 W depending on the brightness setting and power profile to be comparable to the older Alienware 17 R5. In fact, power consumption is comparable to most other less-powerful 17.3-inch gaming laptops when running low to medium workloads.
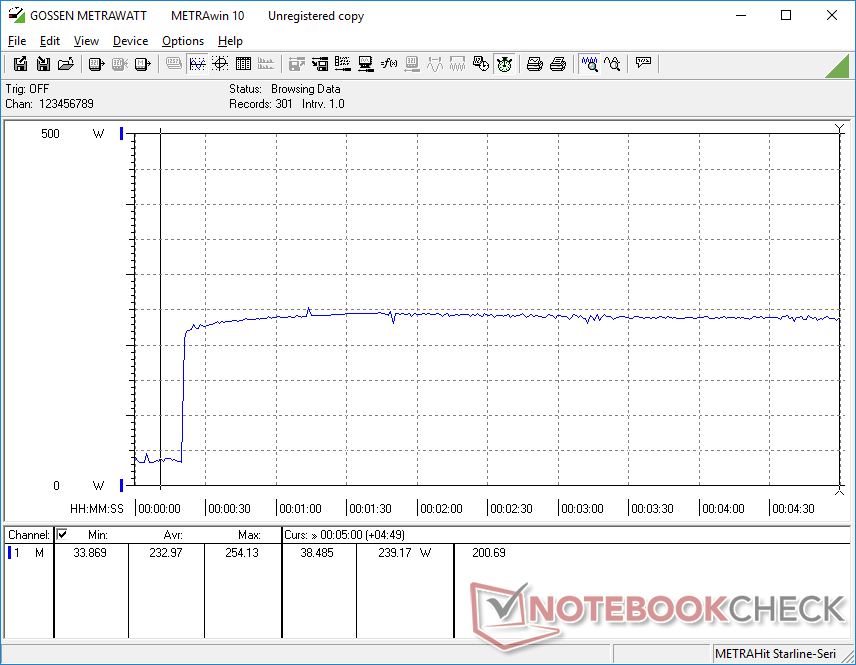
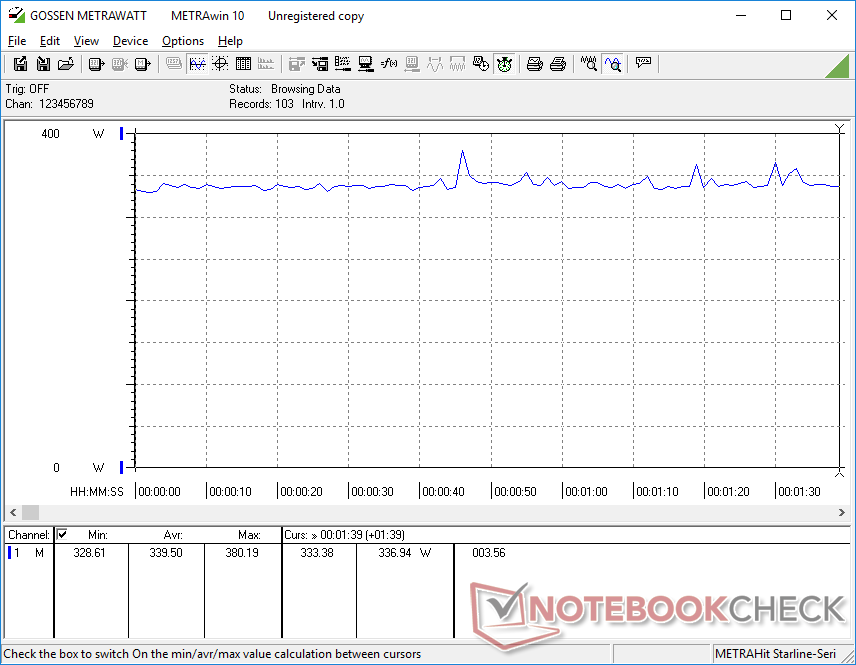
Differences begin to emerge when running more demanding workloads like games. When running Witcher 3, for example, we are able to record a constant power consumption of 340 W compared to only 284 W on the Asus ROG G703GX with the less demanding 45 W Core i7-8750H. It's a 20 percent increase in consumption for a mere 5 percent increase in graphics performance on this particular title. Running a desktop Core i9-9900K at full speed definitely has its consequences in this regard.
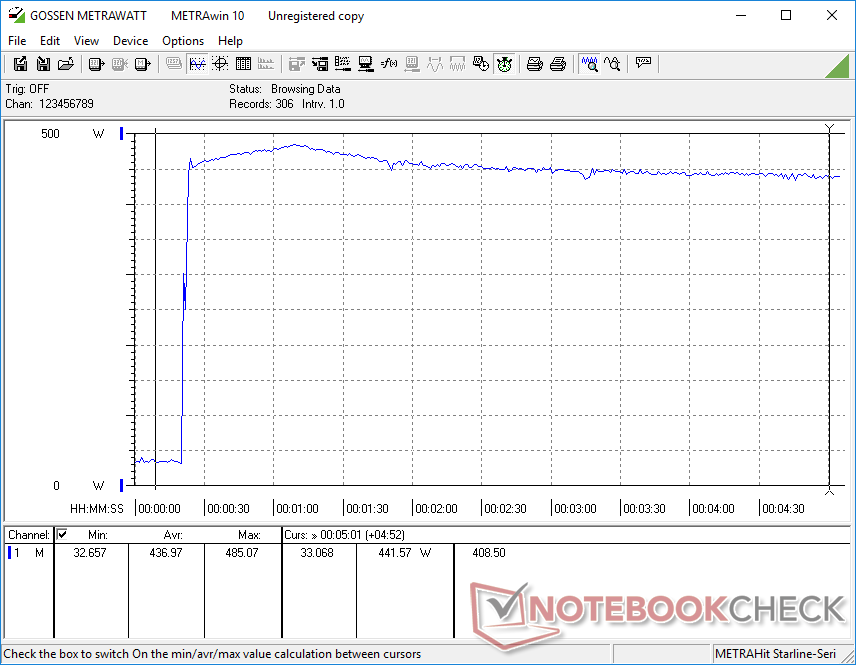
When on maximum load with Prime95 and FurMark running simultaneously, we're able to measure a combined consumption of 485.1 W from the two AC adapters. Note that the laptop is able to run on just one adapter only albeit at reduced performance. One adapter is larger (~20 x 10 x 4.3 cm vs. ~15.5 x 7.5 x 3 cm) and heavier (1441 g vs. 732 g) than the other so you can carry only the small adapter for trips when the full power of the system may not be needed. Some Clevo-based systems like the Eurocom Sky X7C run on a single extra-large AC adapter to avoid the hassle of needing two AC adapters. Of course, there are pros and cons to both the Dell and Clevo solutions.

| Off / Standby | |
| Idle | |
| Load |
|
Key:
min: | |
| Alienware Area-51m i9-9900K RTX 2080 i9-9900K, GeForce RTX 2080 Mobile, 2x SK Hynix PC400 512GB (RAID 0), IPS, 1920x1080, 17.3" | MSI GT75 8RG-090 Titan i9-8950HK, GeForce GTX 1080 Mobile, 2x Samsung PM961 MZVLW256HEHP (RAID 0), TN, 1920x1080, 17.3" | Asus ROG G703GX i7-8750H, GeForce RTX 2080 Mobile, Samsung SSD PM981 MZVLB512HAJQ, IPS, 1920x1080, 17.3" | Eurocom Sky X7C i9-9900K i9-9900K, GeForce RTX 2080 Mobile, 2x Samsung SSD 970 Pro 512GB (RAID 0), IPS, 1920x1080, 17.3" | Razer Blade Pro 2017 i7-7820HK, GeForce GTX 1080 Mobile, 2x Samsung SSD PM951 MZVLV256HCHP (RAID 0), IGZO, 3840x2160, 17.3" | Alienware 17 R5 i7-8750H, GeForce GTX 1070 Mobile, SK hynix PC401 HFS256GD9TNG, TN, 2560x1440, 17.3" | |
|---|---|---|---|---|---|---|
| Power Consumption | -4% | 25% | -12% | 6% | 14% | |
| Idle Minimum * (Watt) | 23.3 | 31 -33% | 5 79% | 41.3 -77% | 31 -33% | 28 -20% |
| Idle Average * (Watt) | 33.5 | 35 -4% | 24 28% | 41.8 -25% | 36 -7% | 32 4% |
| Idle Maximum * (Watt) | 38.4 | 45 -17% | 42 -9% | 46.1 -20% | 44 -15% | 37 4% |
| Load Average * (Watt) | 114.1 | 130 -14% | 112 2% | 116.6 -2% | 107 6% | 112 2% |
| Witcher 3 ultra * (Watt) | 339.5 | 268 21% | 284 16% | 245.9 28% | 212 38% | 192 43% |
| Load Maximum * (Watt) | 485.1 | 374 23% | 320 34% | 352.6 27% | 258 47% | 231 52% |
* ... smaller is better
Battery Life
Battery capacity is smaller than on the outgoing Alienware 17 R5 (90 Wh vs. 99 Wh). Couple this with a much more demanding desktop CPU and it's unsurprising that battery life is shorter. When subjected to WLAN load, we are able to record a runtime of just over 2 hours compared to almost twice that on the Alienware 17 R5 or Asus ROG G703GX. Results are similar to what we observed on the Eurocom Sky X7C equipped with the same CPU and GPU.
Even with everything set to minimum including brightness, Power Saver, and Quiet mode, we are only able to record a runtime of just over 2.5 hours.
Charging from empty to full capacity takes a little over 2 hours. The charging time does not seem to change dramatically if using one or both adapters and when the system is idling or running undemanding loads.
| Alienware Area-51m i9-9900K RTX 2080 i9-9900K, GeForce RTX 2080 Mobile, 90 Wh | MSI GT75 8RG-090 Titan i9-8950HK, GeForce GTX 1080 Mobile, 75 Wh | Asus ROG G703GX i7-8750H, GeForce RTX 2080 Mobile, 96 Wh | Eurocom Sky X7C i9-9900K i9-9900K, GeForce RTX 2080 Mobile, 82 Wh | Razer Blade Pro 2017 i7-7820HK, GeForce GTX 1080 Mobile, 99 Wh | Alienware 17 R5 i7-8750H, GeForce GTX 1070 Mobile, 99 Wh | |
|---|---|---|---|---|---|---|
| Battery runtime | 23% | 67% | -5% | 49% | 48% | |
| Reader / Idle (h) | 2.6 | 3.8 46% | 5 92% | 4.2 62% | 4.5 73% | |
| WiFi v1.3 (h) | 2.1 | 4 90% | 2 -5% | 3.3 57% | 3.6 71% | |
| Load (h) | 1.1 | 1.1 0% | 1.3 18% | 1.4 27% | 1.1 0% |
Pros
Cons
Verdict
From a gen to gen perspective, the Area-51m is a respectable successor to the Alienware 17 R5. It keeps what we love about the older model (beveled keyboard, sturdy design, easy servicing) while updating several aspects we feel needed the most attention (stronger cooling, narrower bezels, faster performance). Battery life is poor, but if that's a real priority then we suggest taking a look at the Alienware m17 instead.
Performance, unsurprisingly, is the real highlight of the laptop. The fact that the machine is only mere percentage points behind our in-house desktop PC reference is impressive in its own right. Fan noise when gaming remains almost identical to the Alienware 17 R5 which is good considering the massive boost in performance, but it's also a letdown for those who were hoping for a quieter machine.
What makes the Area-51m so special also seems to be responsible for its core disadvantages. The upgradeable and supposedly future-proof DGFF graphics card, for example, is an admittedly cool concept. Until an actual RTX 2080 successor comes along, however, it feels almost experimental at this point in time. Secondly, the jump to a 95+ W Core i9-9900K certainly boosts CPU performance over the traditional 45 w Coffee Lake-H solution, but it hurts us to see 99+ C core temperatures when under full utilization.
While such high core temps are not inherently unsafe, we don't think there is an excuse for it. The Eurocom Sky X7C houses the same Core i9 CPU and yet it tops out at 84 c when subjected to the same stress test without needing to throttle clock rates. If Clevo can do it, then there's no reason why Dell shouldn't be able to, either.
The next disadvantage is something we weren't expecting. Contrast ratio is not as deep as on last year's Alienware 17 R5 or the MSI GT75. This may be one of the fastest gaming laptops available, but it doesn't quite have the best display on all fronts.
The drawbacks, while apparent, don't detract from the fact that the Area-51m is still a large leap forward from the aging Alienware 17 series. Should Dell continue with the desktop CPU and DGFF route, then we're hopeful for both quieter fan noise and cooler temperatures on future revisions.
Overkill in the best way possible. There is definitely room for improvement in regard to core temperatures and fan noise when compared to the Eurocom Sky X7C. But as a successor to the Alienware 17, it hits all the right notes to be a strong desktop replacement.
Alienware Area-51m i9-9900K RTX 2080
- 09/20/2019 v7 (old)
Allen Ngo
Price comparison
