MSI GE75 Raider 8SF (i7-8750H, RTX 2070) Laptop Review
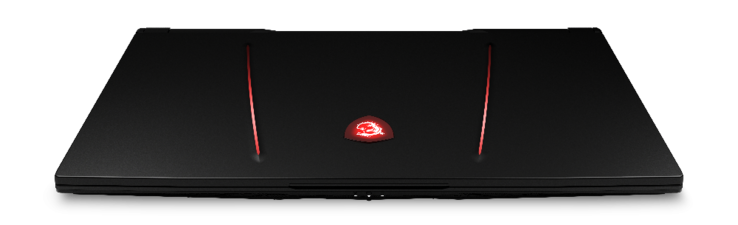
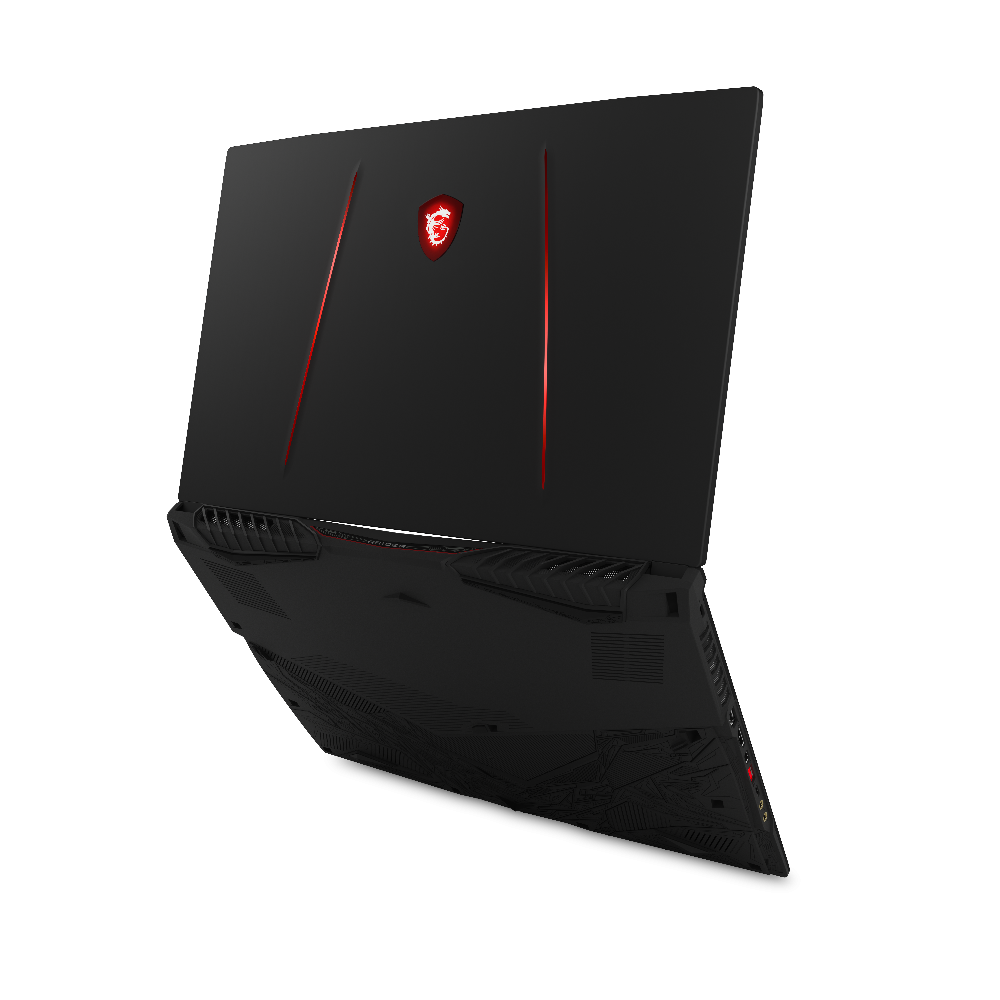
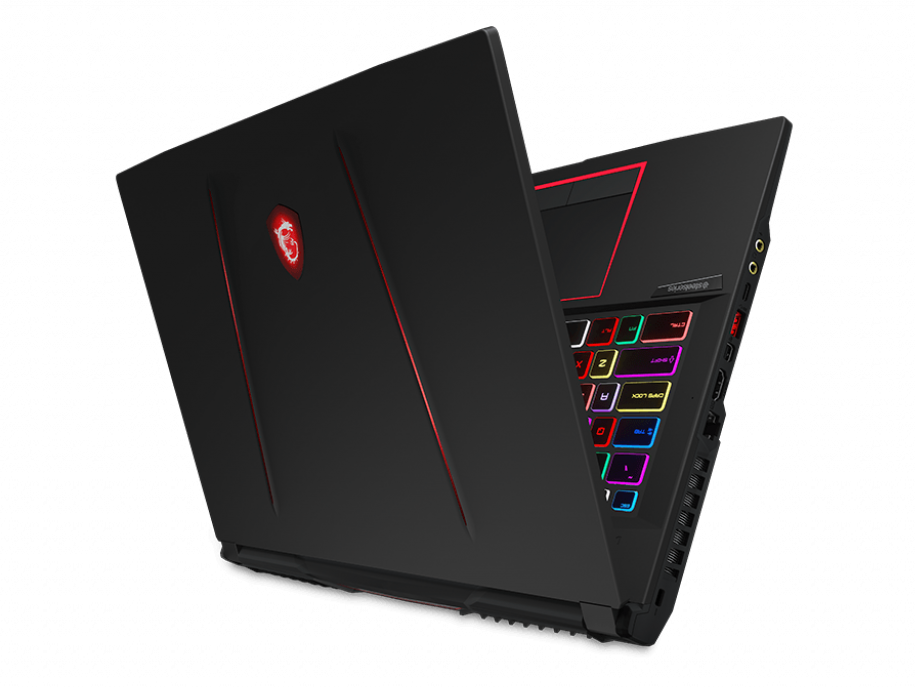
The MSI GE75 is the full chassis refresh of the last generation GE73. Most notably, it brings narrow bezels and GeForce RTX graphics for a significantly smaller and yet more powerful package. The system competes directly with other thin 17.3-inch gaming laptops like the Asus ROG GL704, Lenovo Legion Y740-17ICH, Asus Zephyrus GX701, or Dell Alienware m17.
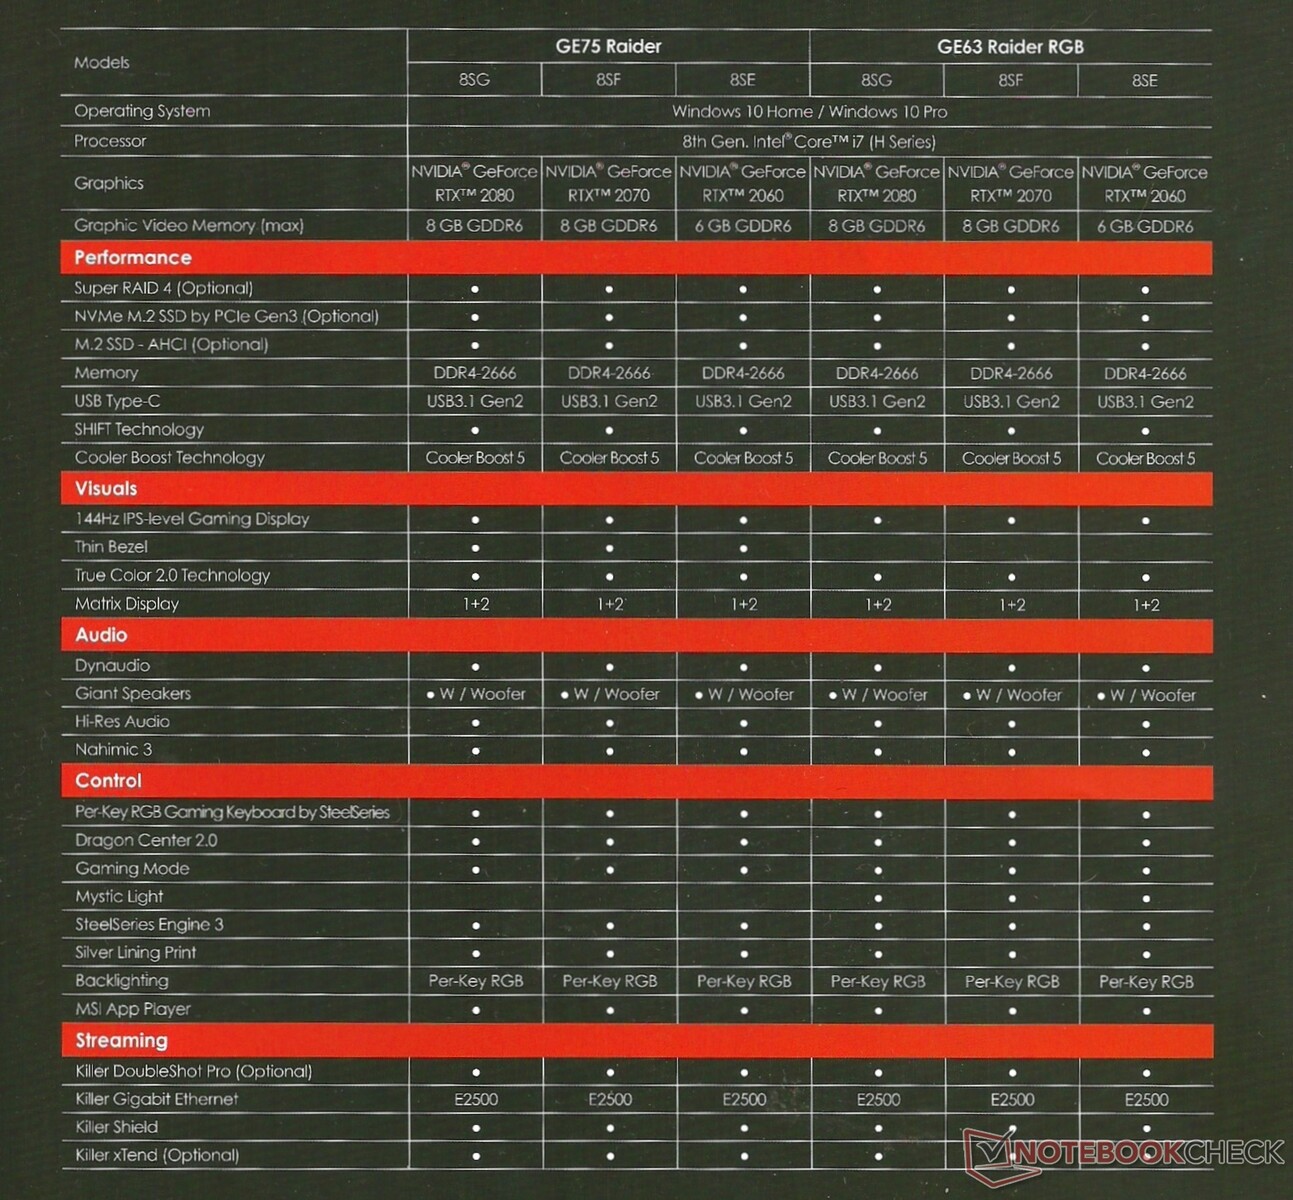
The MSI GE series sits between the lower-end GP series and the higher-end GT series. Thus, the 17.3-inch GE75 and 15.6-inch GE63 are MSI's mid-range gaming models. Our test unit today comes from Xotic PC with a Core i7-8750H CPU, GeForce RTX 2070 GPU, 16 GB of DDR4 RAM, 256 GB NVMe SSD, and a 144 Hz 1080p IPS panel for $2200 USD. We'll be diving right into the performance of our RTX 2070 SKU for this review. For our usual take on the chassis, port options, and per-key RGB keyboard, stay tuned for our review on the GE75 RTX 2080 SKU coming later this month.
See our overview of the MSI G series for a rundown on all the current models.
More MSI reviews:
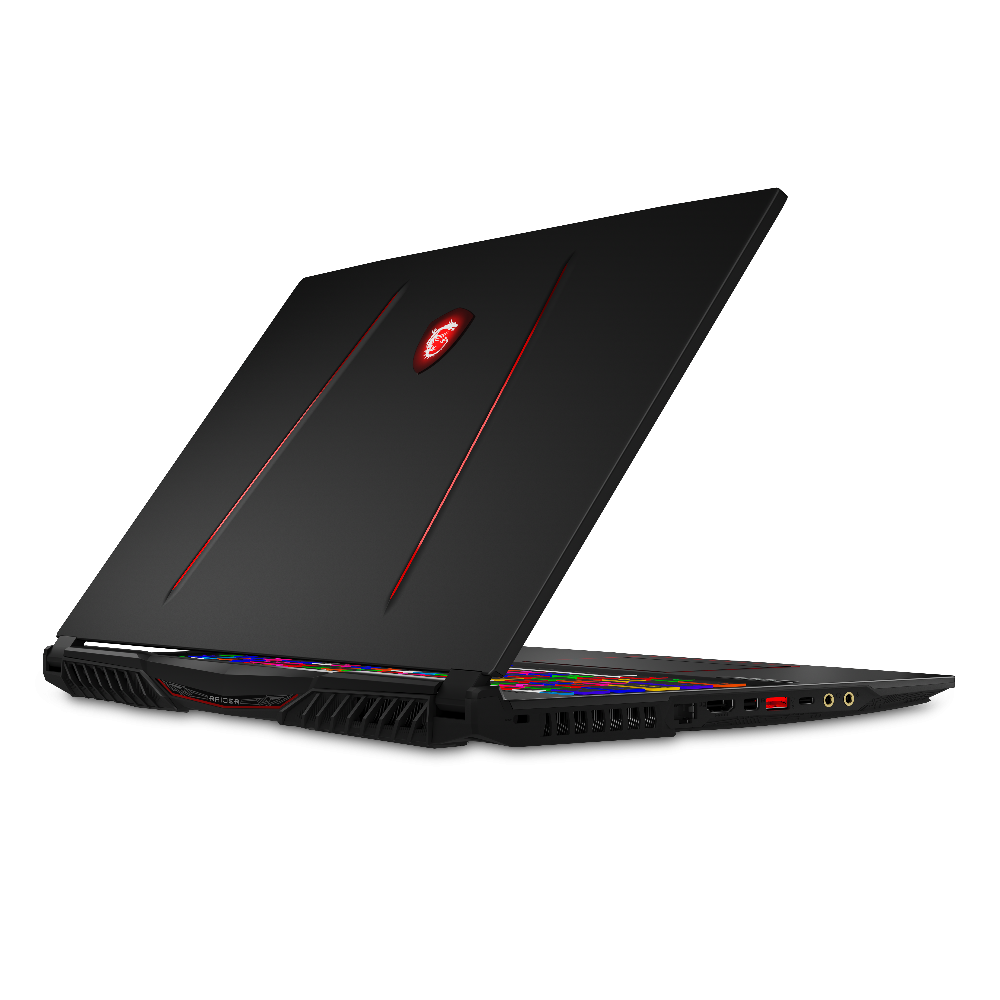
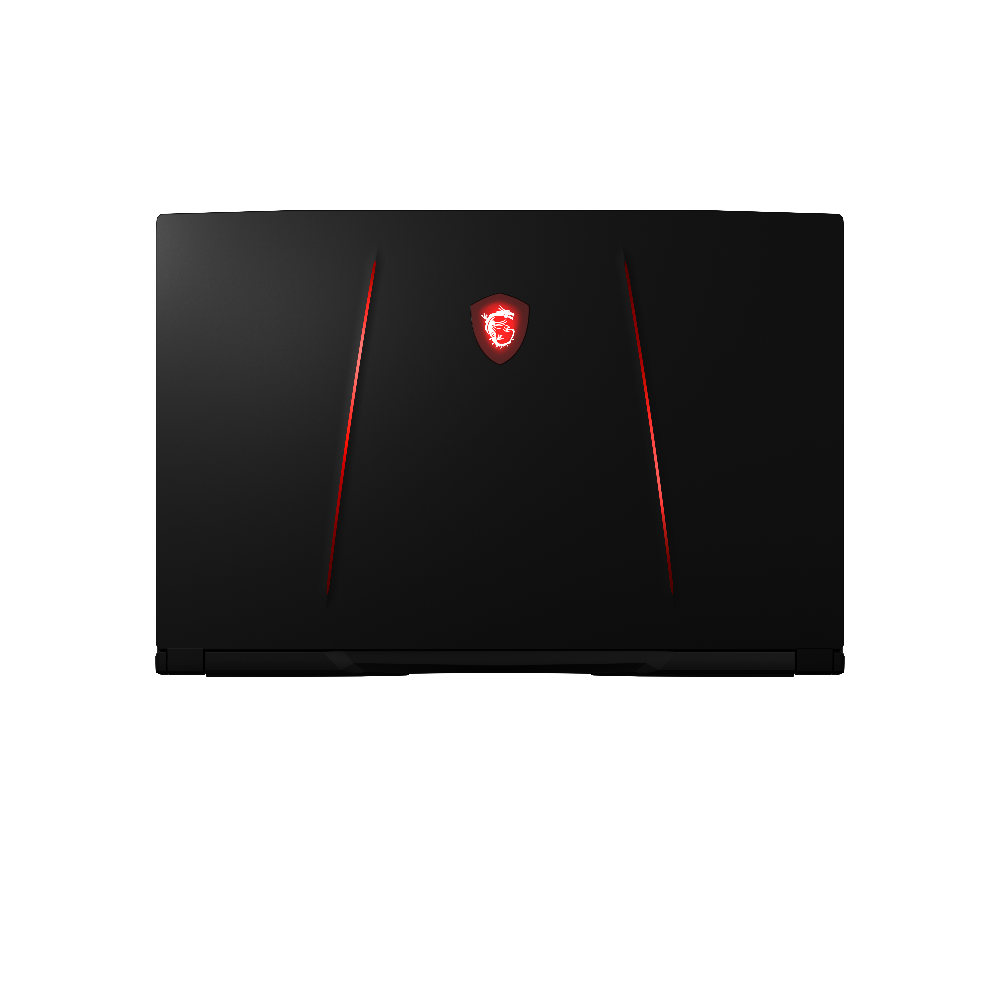
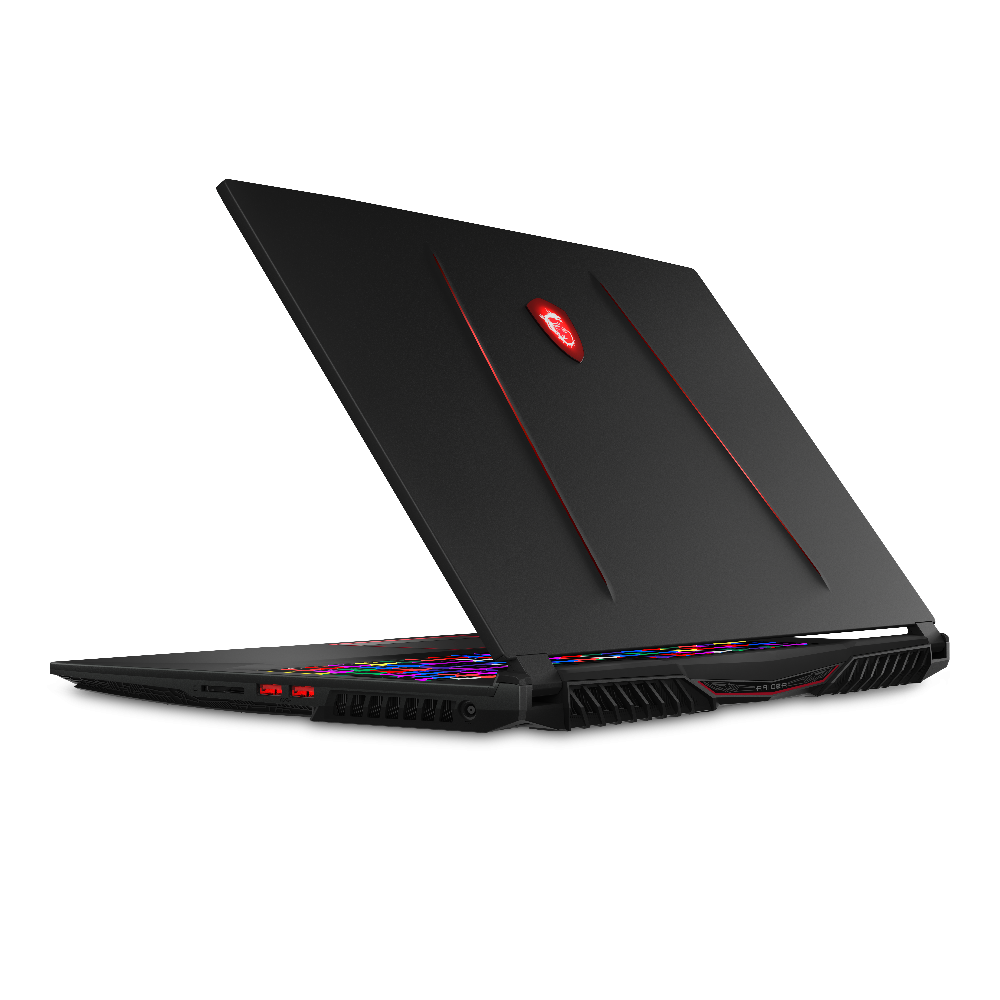
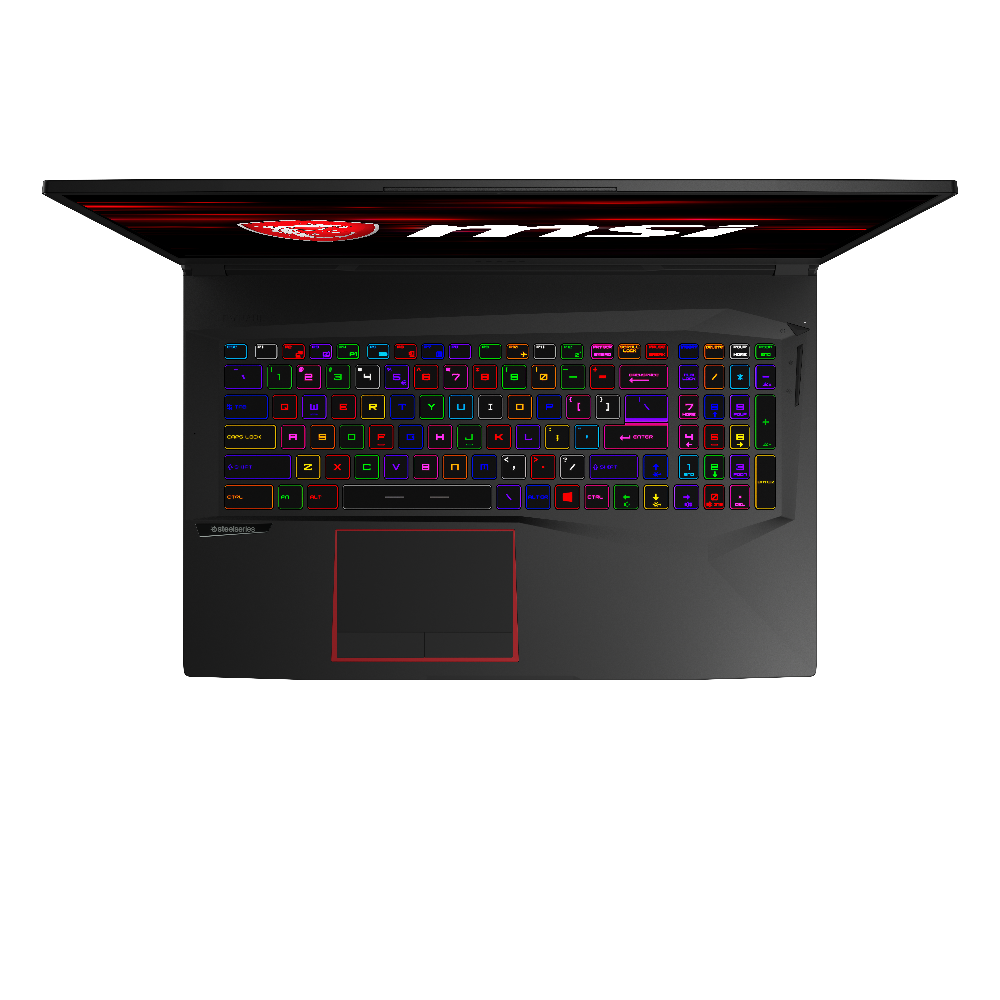
Case


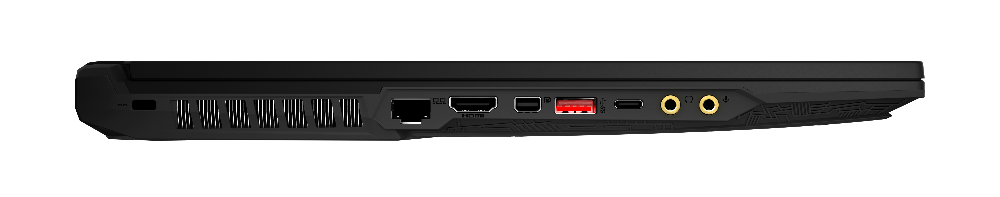
Connectivity
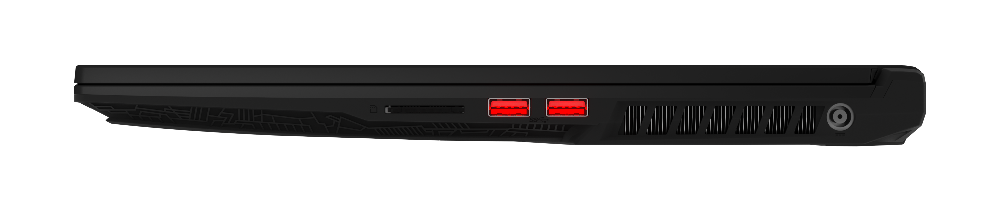
SD Card Reader
Transfer rates from the spring-loaded integrated SD reader are slow. Moving 1 GB worth of pictures from our UHS-II test card to desktop takes almost 40 seconds compared to just under 8 seconds on the Dell XPS 15. We're a bit disappointed by the performance especially from a mid-range gaming laptop.
A fully inserted card protrudes by about 2 mm for safe transporting.
| SD Card Reader | |
| average JPG Copy Test (av. of 3 runs) | |
| MSI GE73VR 7RF Raider (Toshiba Exceria Pro SDXC 64 GB UHS-II) | |
| MSI GT75 8RG-090 Titan (Toshiba Exceria Pro SDXC 64 GB UHS-II) | |
| Asus ROG Strix Scar II GL704GW (Toshiba Exceria Pro SDXC 64 GB UHS-II) | |
| MSI GE75 8SF (Toshiba Exceria Pro SDXC 64 GB UHS-II) | |
| maximum AS SSD Seq Read Test (1GB) | |
| MSI GE73VR 7RF Raider (Toshiba Exceria Pro SDXC 64 GB UHS-II) | |
| MSI GT75 8RG-090 Titan (Toshiba Exceria Pro SDXC 64 GB UHS-II) | |
| Asus ROG Strix Scar II GL704GW (Toshiba Exceria Pro SDXC 64 GB UHS-II) | |
| MSI GE75 8SF (Toshiba Exceria Pro SDXC 64 GB UHS-II) | |
Communication
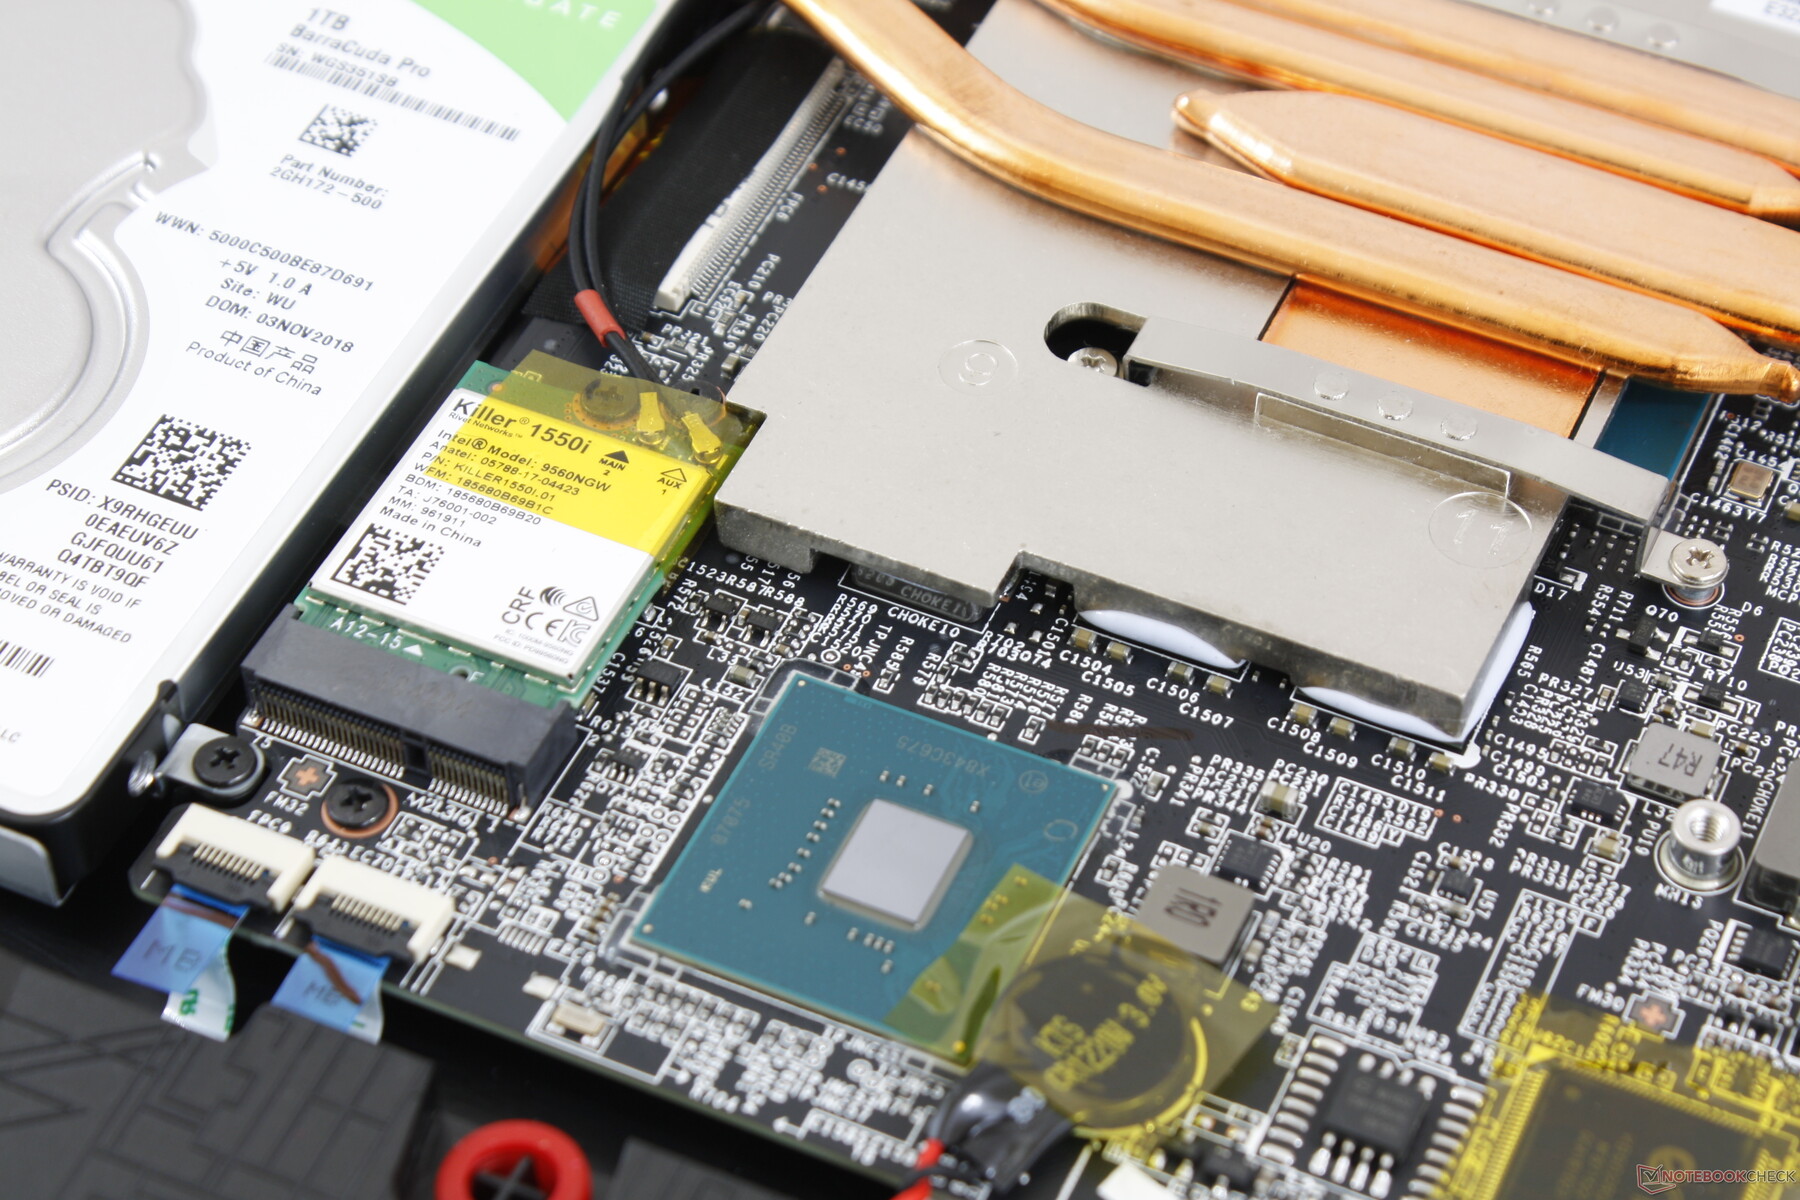
The Intel 9560 on last year's GE73 has been upgraded to the Killer 1550i for the new RTX-enabled GE75. While raw performance is largely the same between them (1.73 Gbps + Bluetooth 5), Killer WLAN modules have game-specific settings and features that the target audience may appreciate.
Transfer rates are faster than what we've recorded below since our server setup is limited by a 1 Gbps line.
| Networking | |
| iperf3 transmit AX12 | |
| MSI GE75 8SF | |
| Asus Zephyrus S GX701GX | |
| Lenovo Legion Y740-17ICH | |
| Asus ROG Strix Scar II GL704GW | |
| iperf3 receive AX12 | |
| Asus Zephyrus S GX701GX | |
| MSI GE75 8SF | |
| Lenovo Legion Y740-17ICH | |
| Asus ROG Strix Scar II GL704GW | |
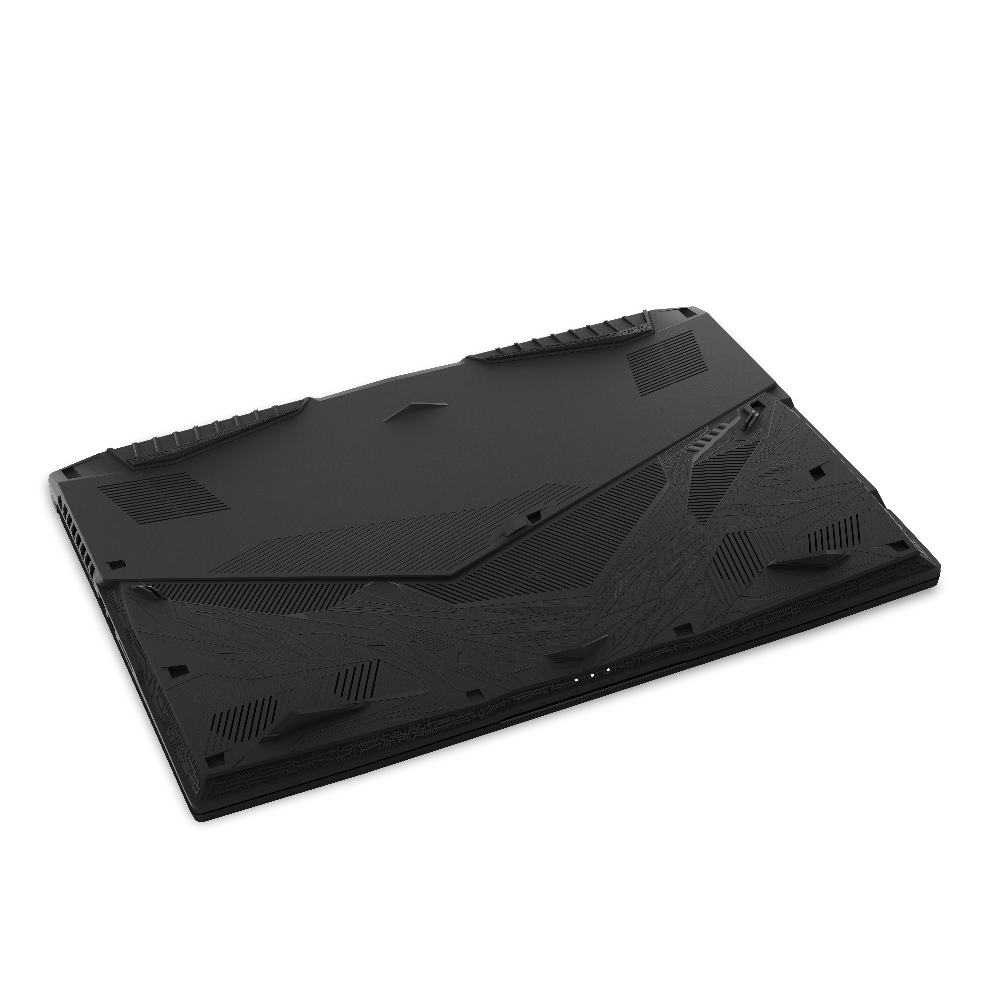
Maintenance
Maintenance requires a Philips screwdriver and a sharp edge. Note that a "Factory Seal" sticker must be broken if servicing the unit much like on most every other MSI laptop, but the OEM has assured us that this will not impact the limited warranty if users are only upgrading storage or RAM.
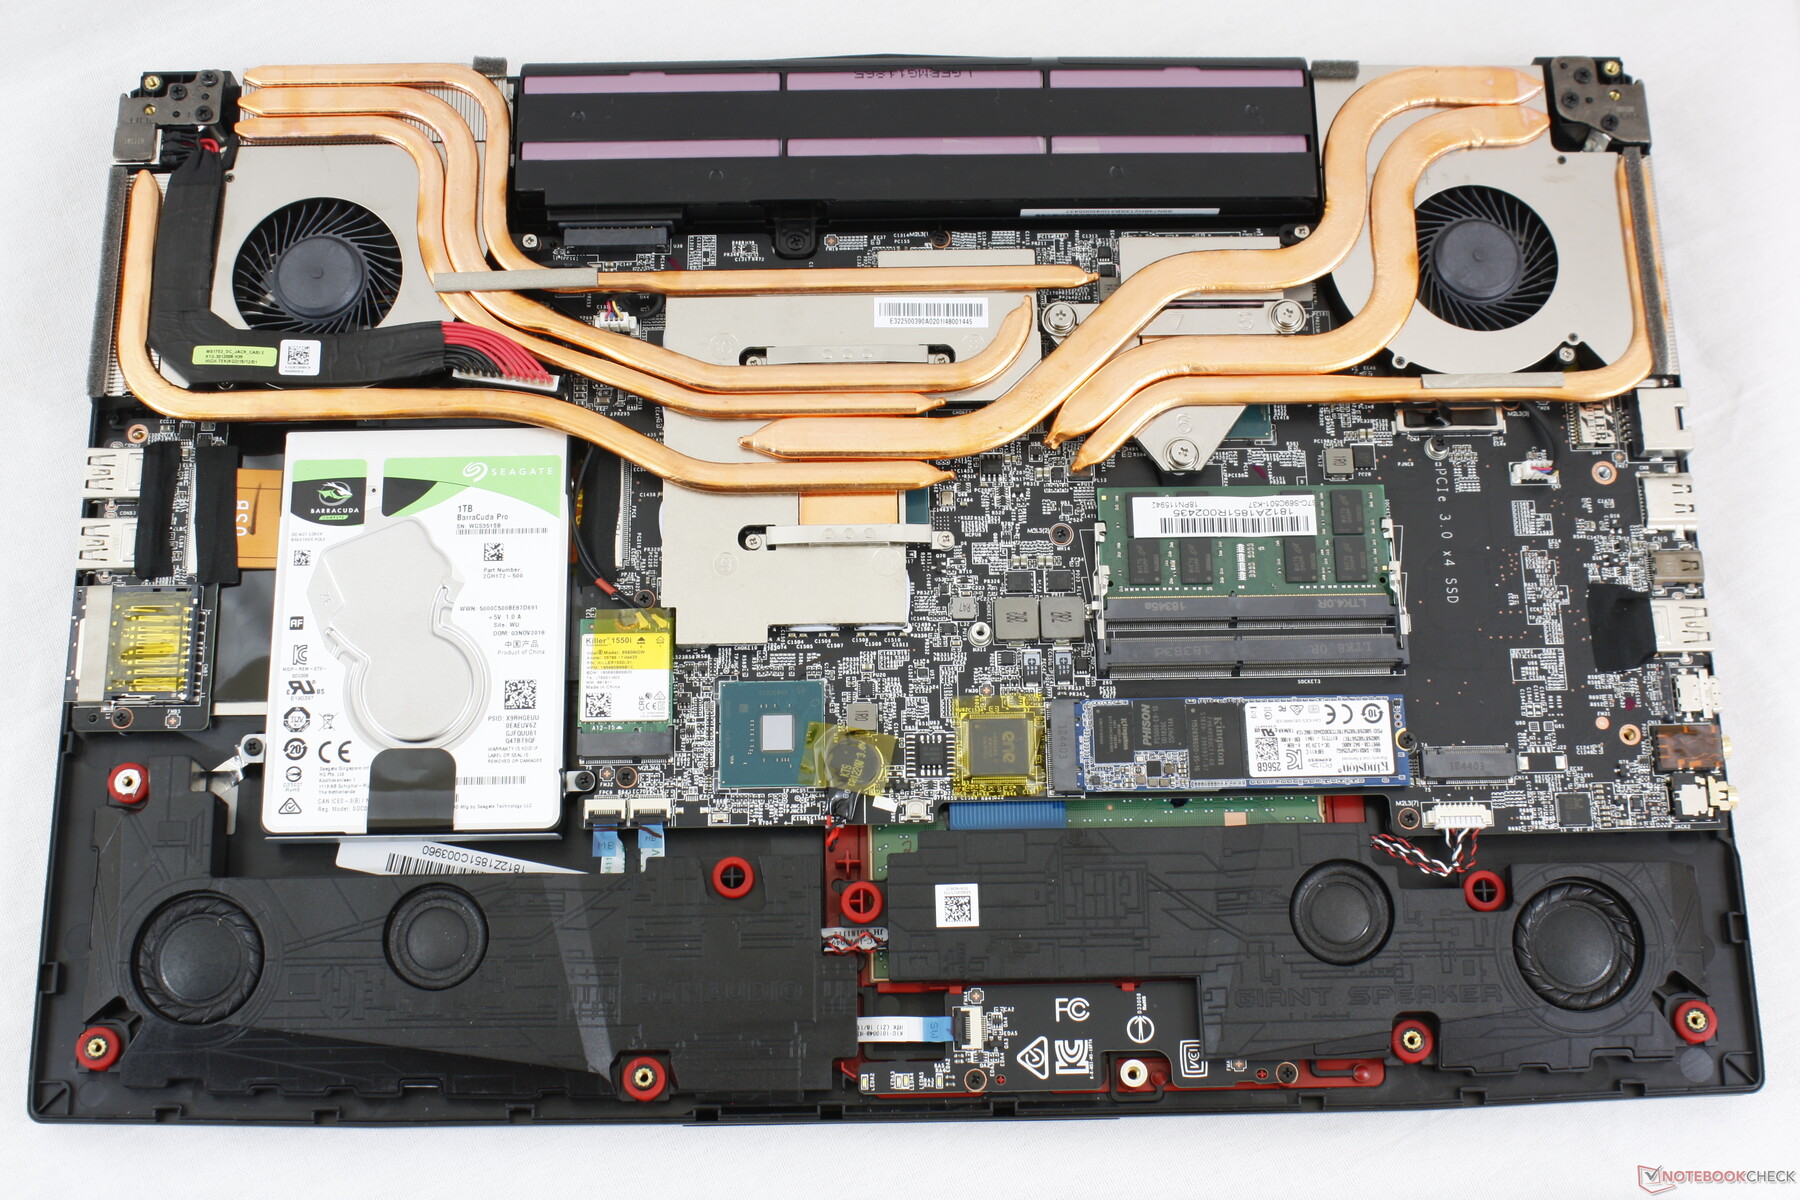
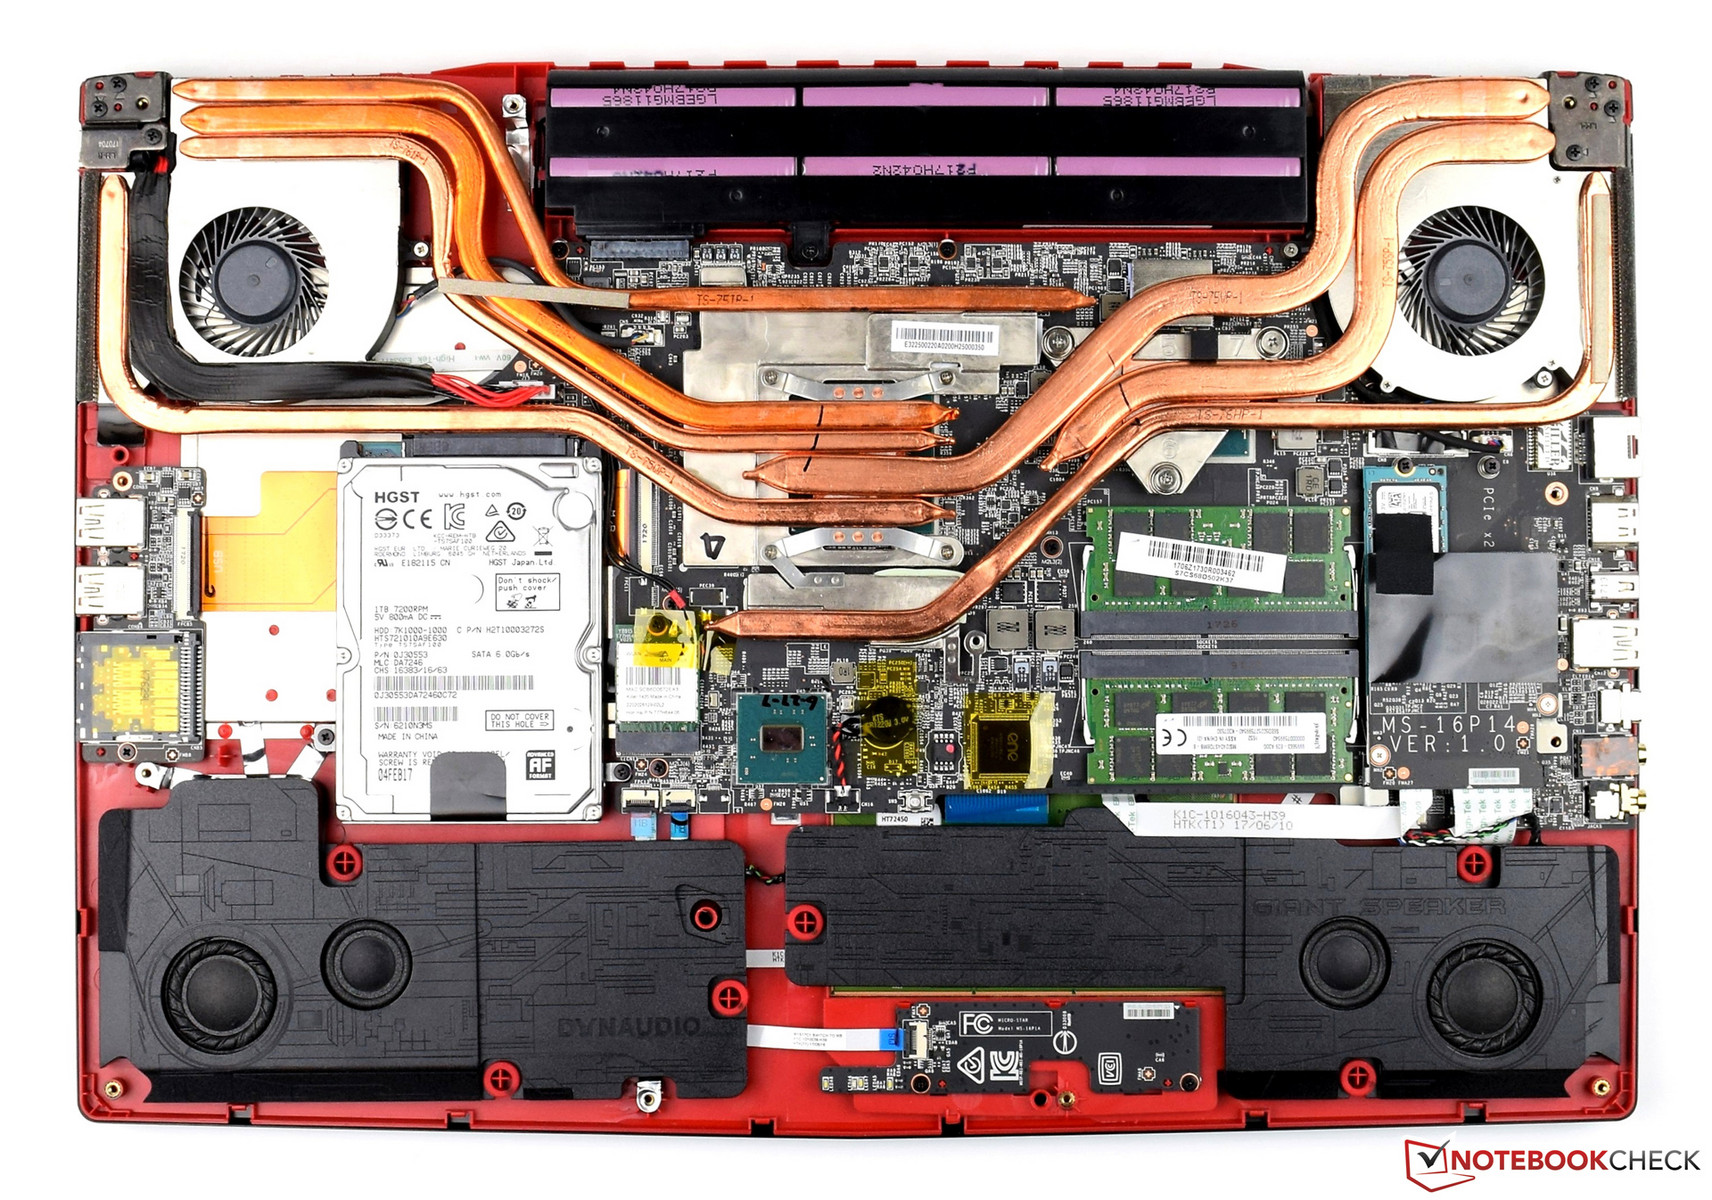
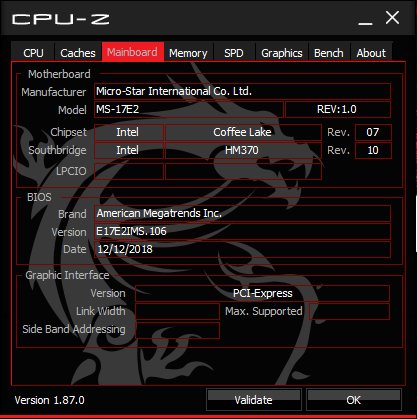
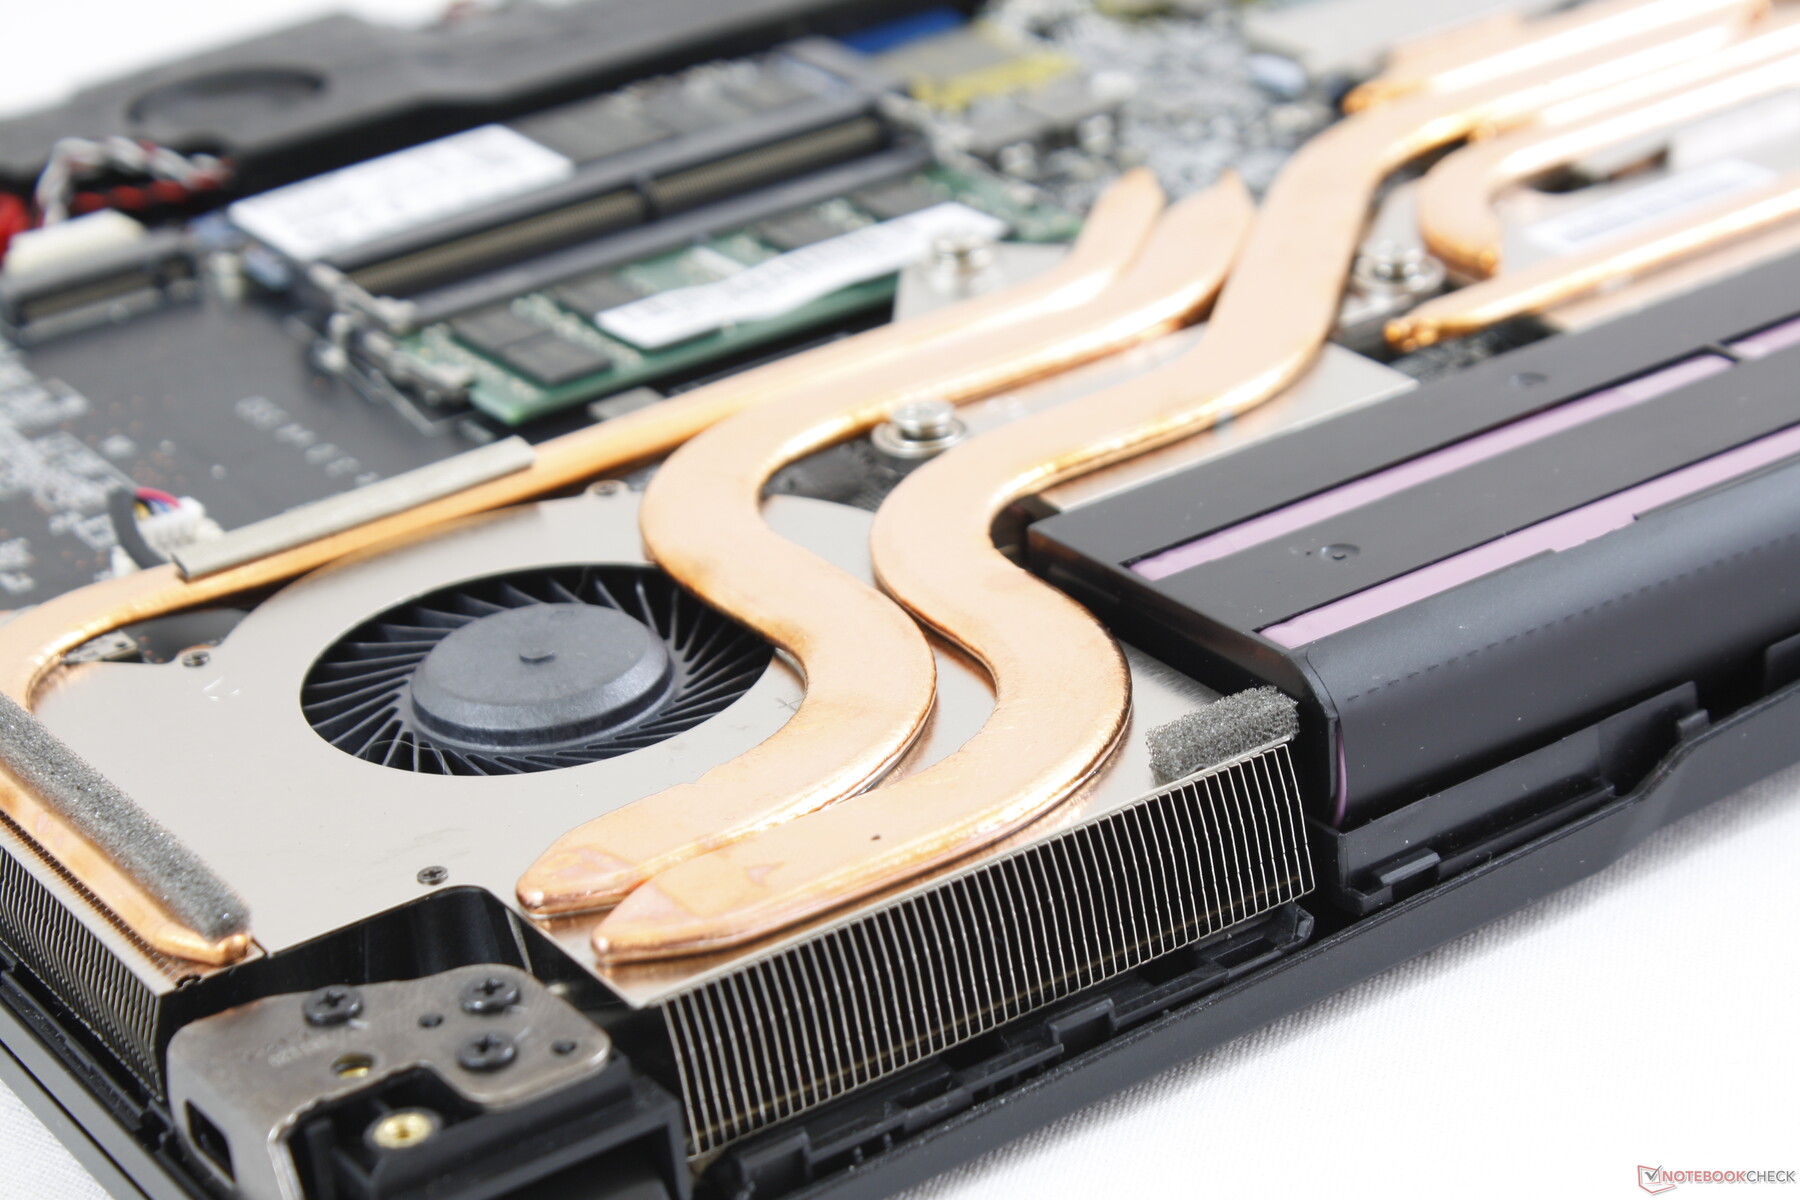
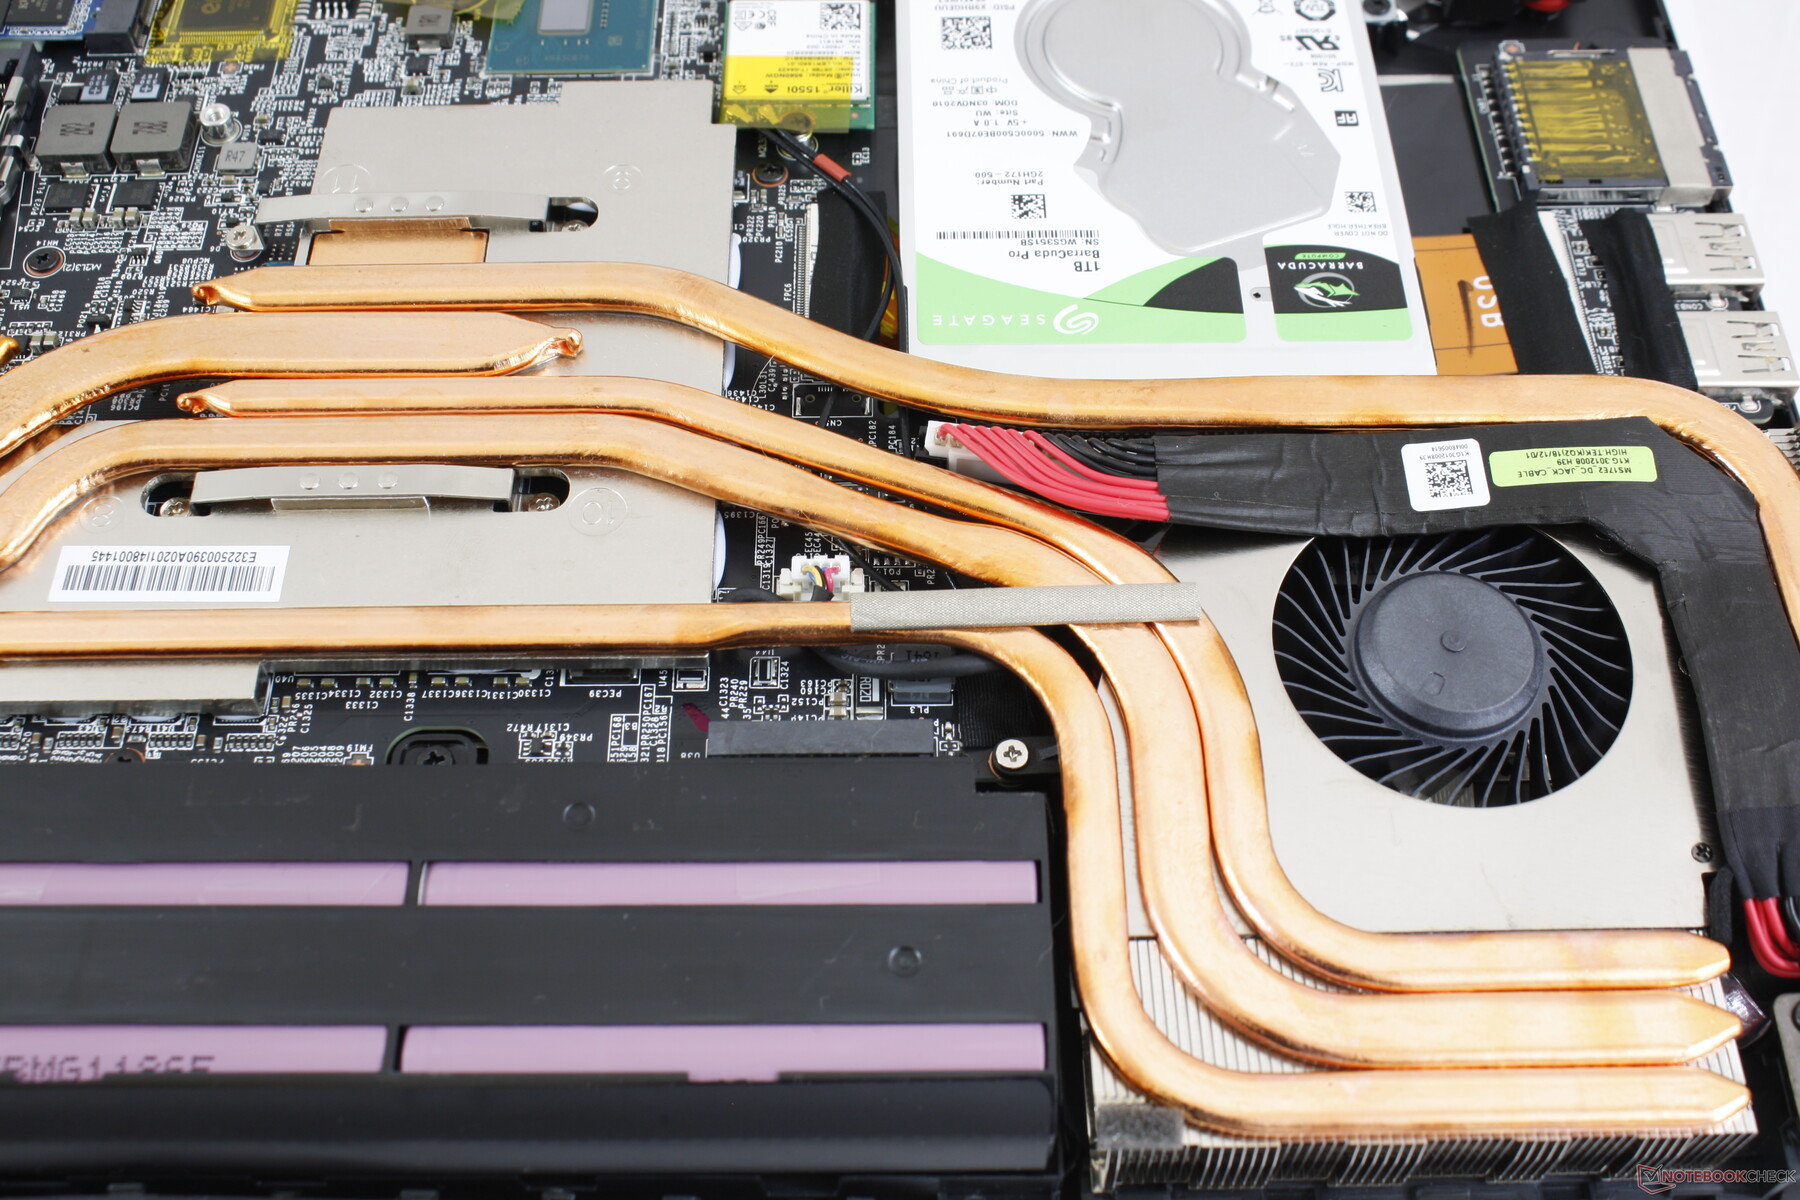
Even so, serviceability could have been easier especially for a gaming laptop. The bottom panel is latched very tightly around the edges and corners and it will take some patience to remove. The motherboard layout has many similarities to the GE73 with a few rearranged components as shown below.
Accessories and Warranty
Included extras are a Quick Start guide and a large velvet cleaning cloth.
The standard one-year limited warranty applies. MSI will extend the base warranty to two years for any of its RTX laptops if purchased from Xotic PC.
Display
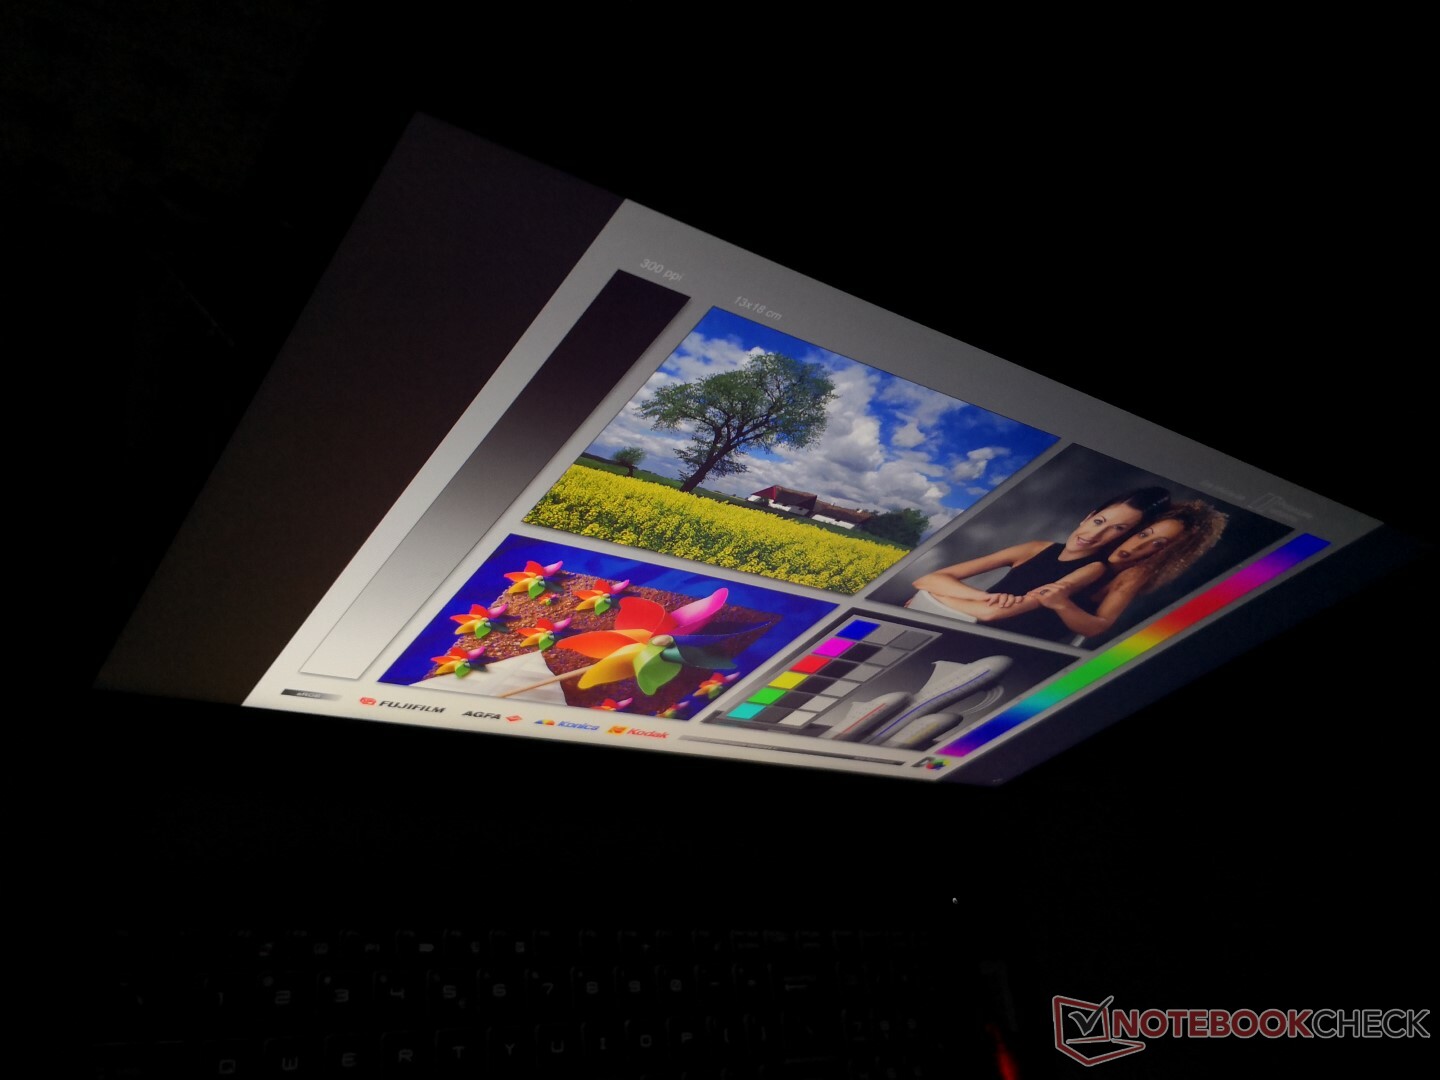
The GE75 currently comes with no other display options than the 144 Hz 1080p IPS panel we have here. This Chi Mei N173HCE-G33 panel can be found on no other laptop in our database as of this writing, but it appears to be the IPS version of the CMN N173HHE-G32 TN panel found on last year's GE73. We suspect that MSI will use this same panel for its future 17.3-inch GT laptops as well. Black-white response times are slightly slower than on last year's model, but the newer panel makes up for this with narrower bezels, wider viewing angles, and better color calibration. In fact, the display is measurably more accurate and brighter than many competing 17.3-inch gaming laptops including the Asus ROG GX701.
Subjectively, the high quality display is both crisp and very smooth because of its high native refresh rate. There is a very slight hint of graininess inherent to most matte panels, but it's not noticeable when viewing from a normal distance. Slight-moderate backlight bleeding, however, is present on our test unit as shown by the image below. Xotic PC offers an optional "minimal backlight bleed" service where the reseller ships only the units showing little to no backlight bleeding.


| |||||||||||||||||||||||||
Brightness Distribution: 89 %
Center on Battery: 370.4 cd/m²
Contrast: 1277:1 (Black: 0.29 cd/m²)
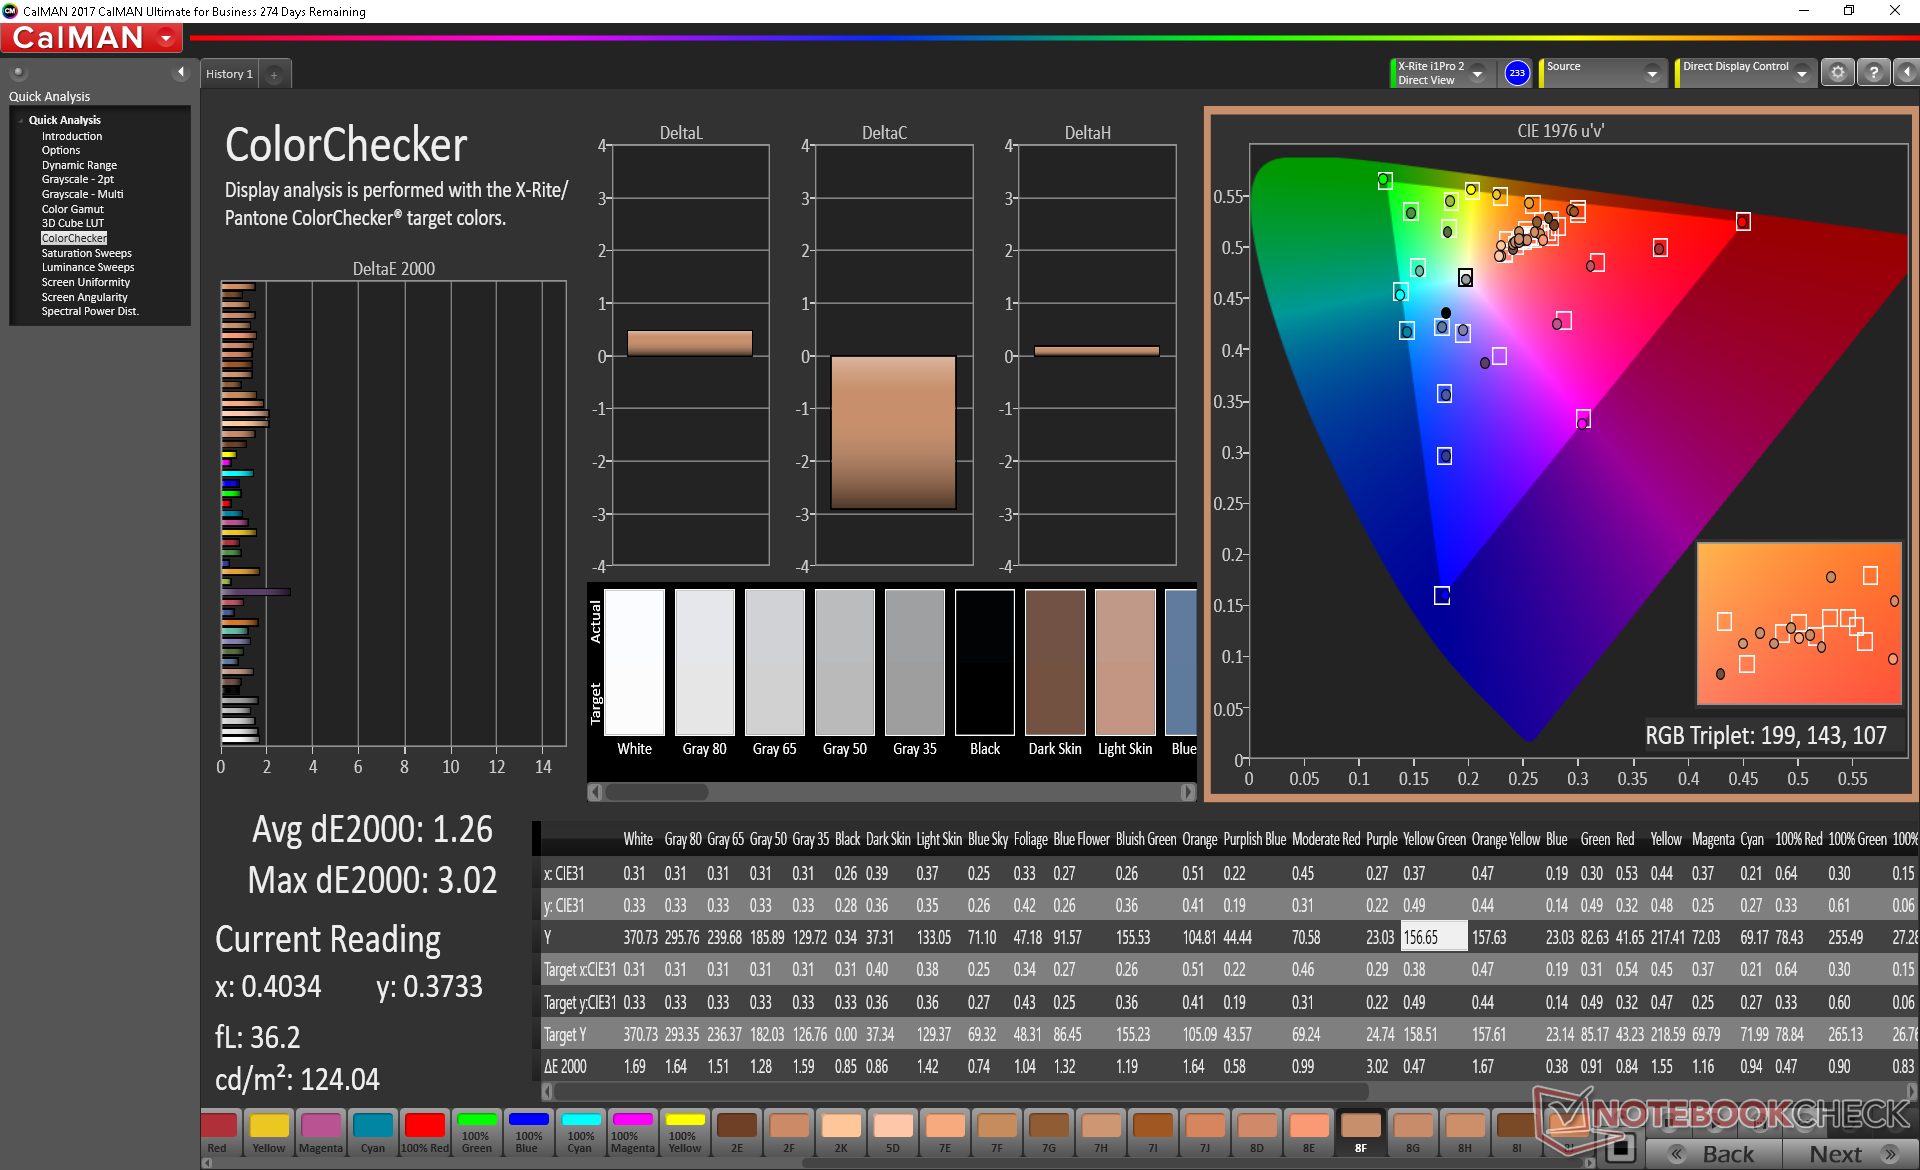
ΔE ColorChecker Calman: 1.26 | ∀{0.5-29.43 Ø4.71}
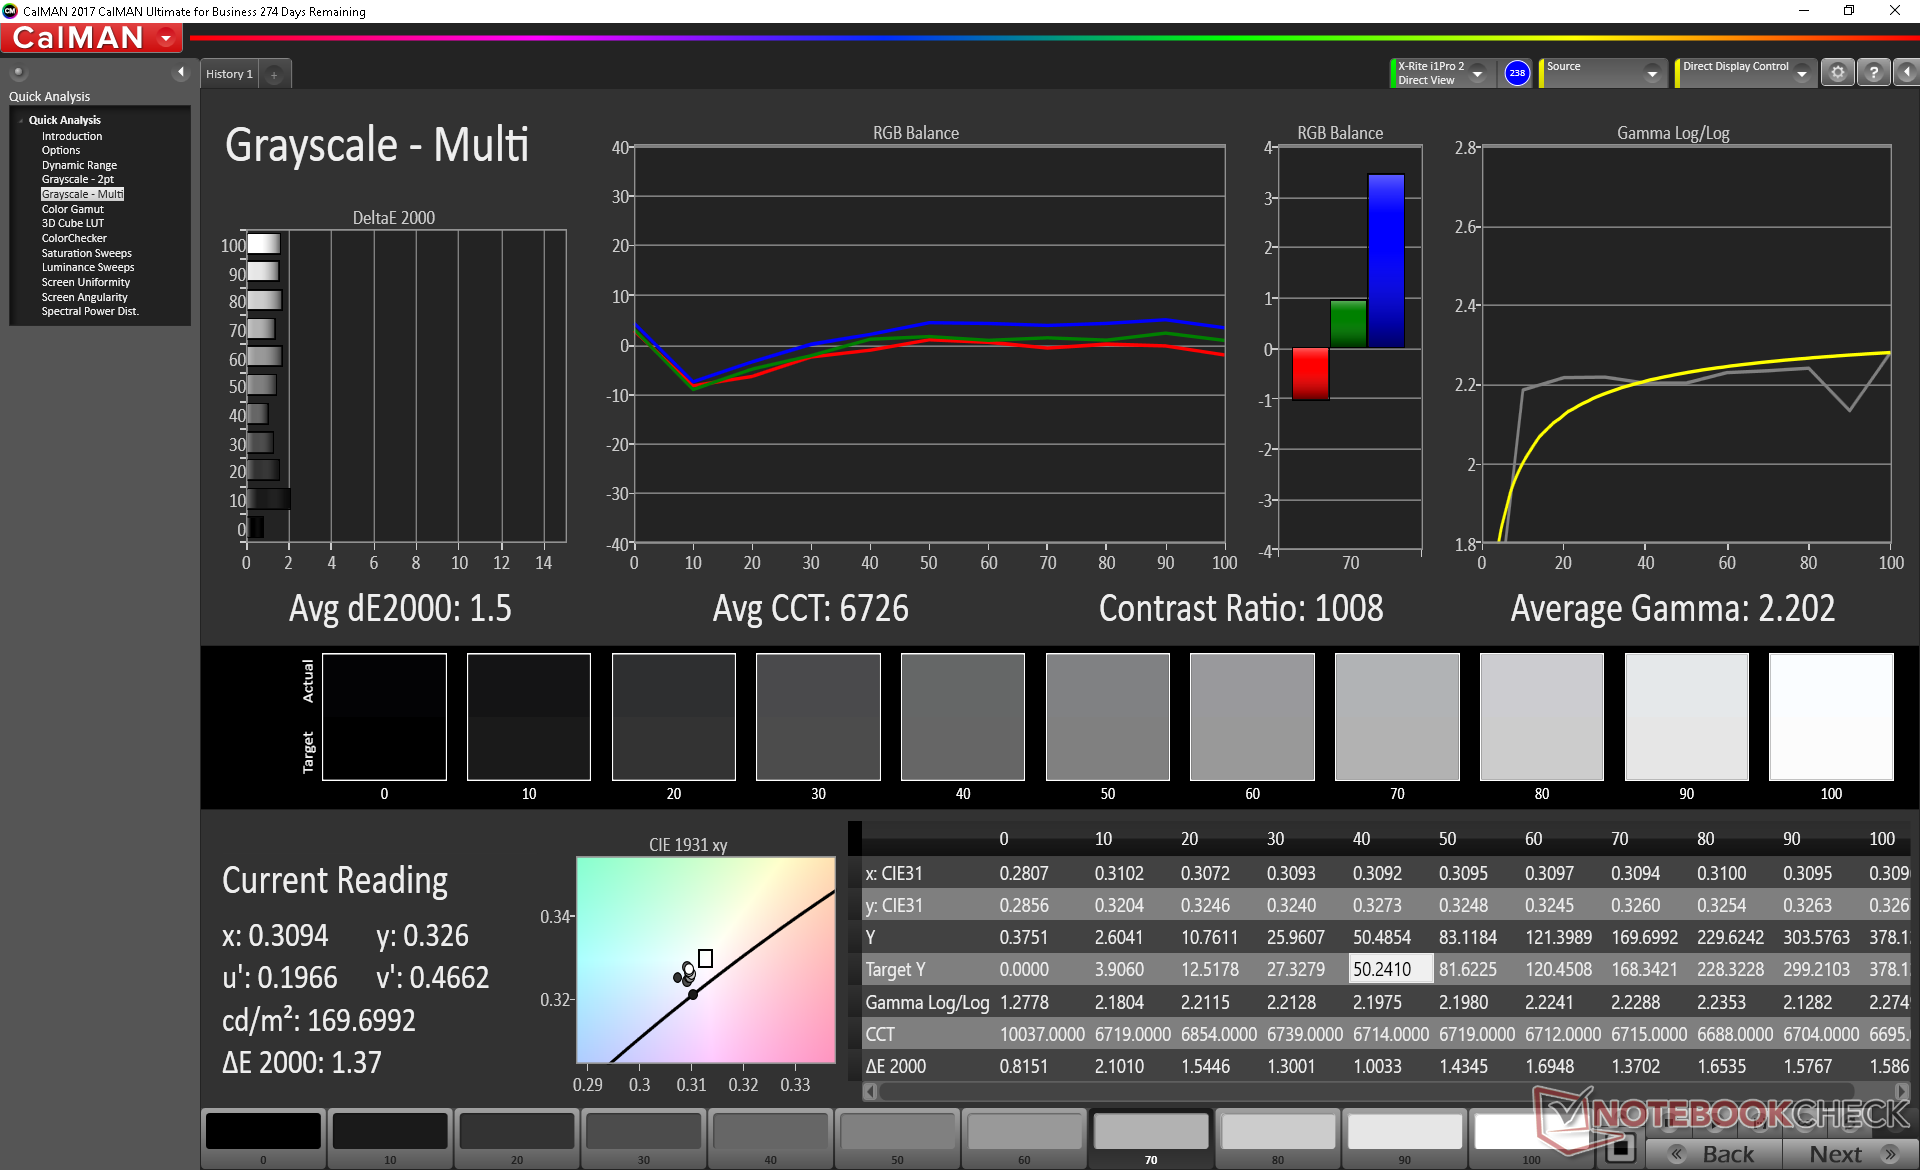
calibrated: 1.21
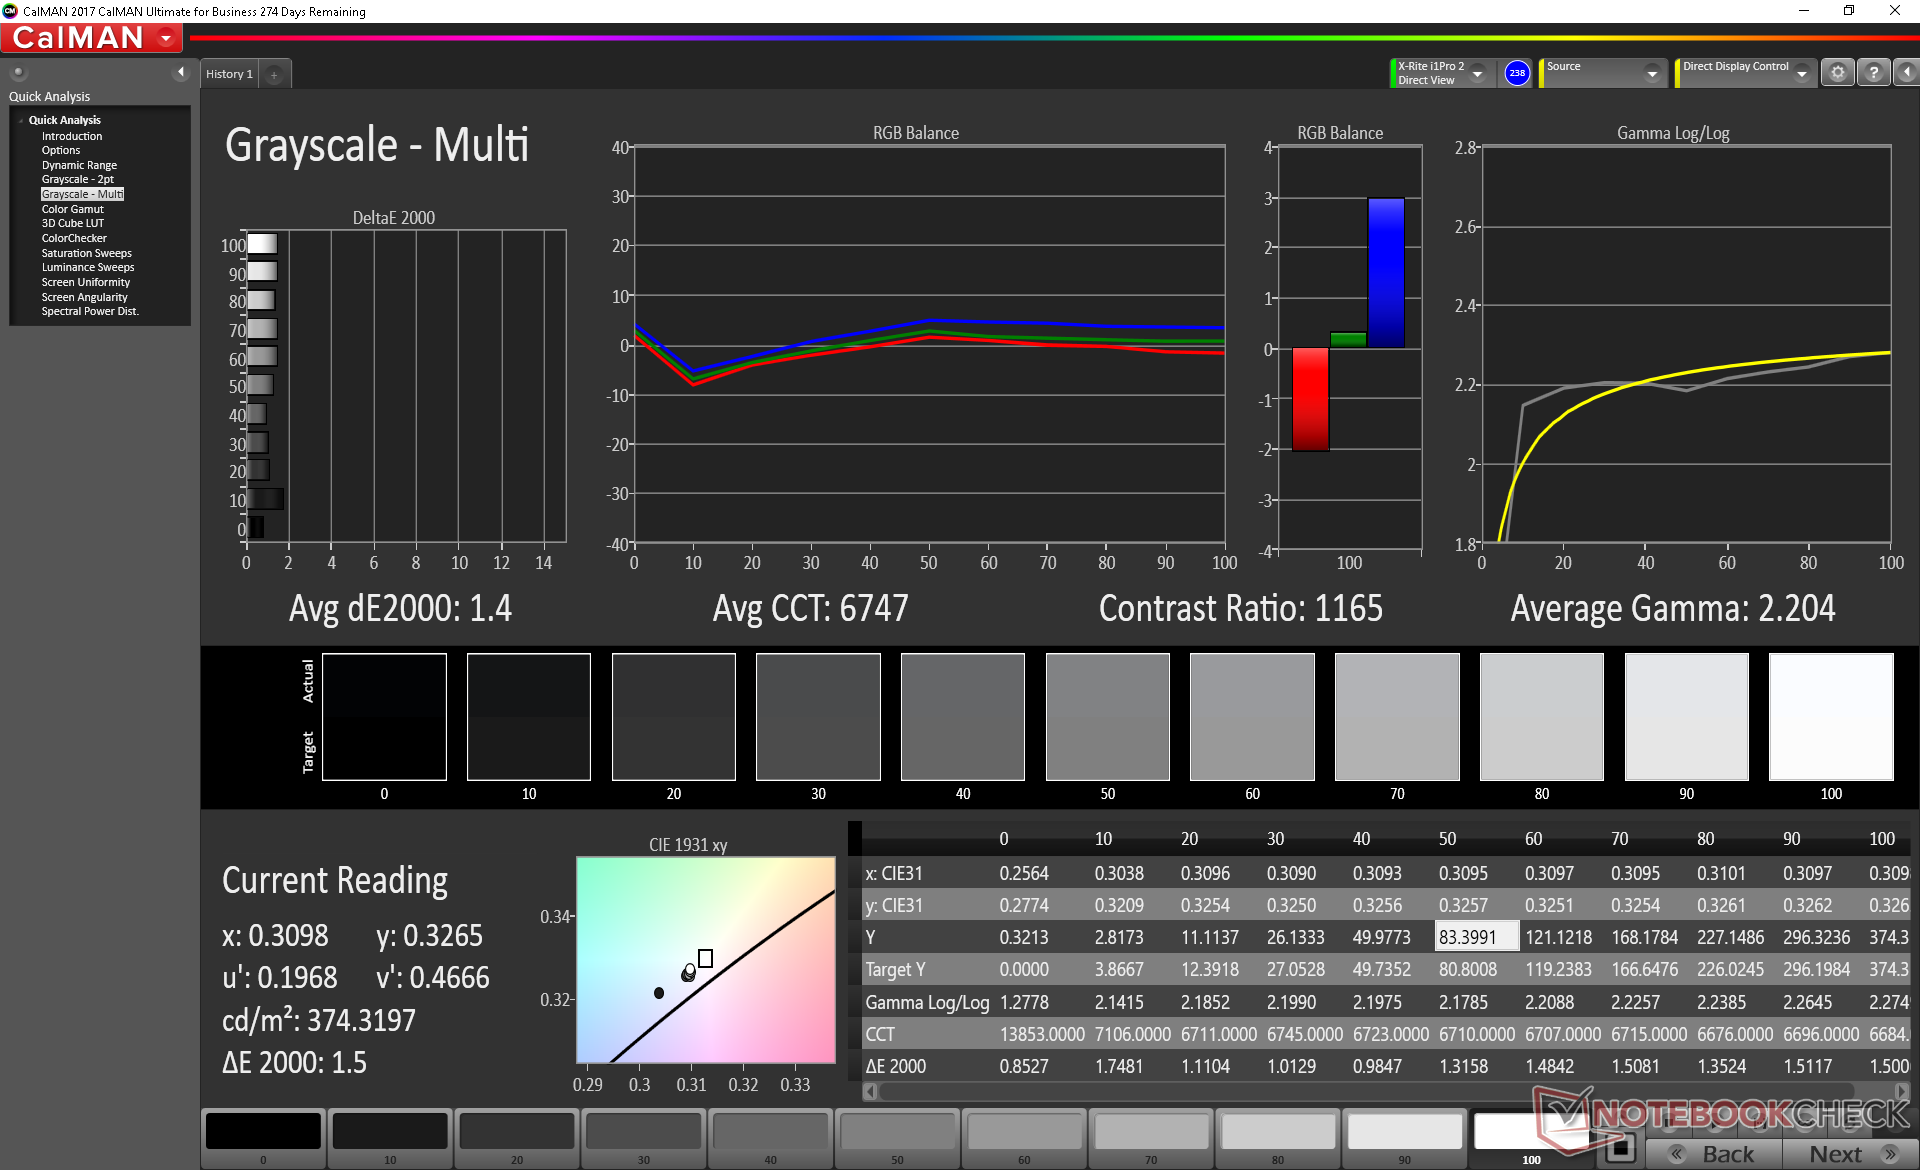
ΔE Greyscale Calman: 1.4 | ∀{0.09-98 Ø4.96}
94.4% sRGB (Argyll 1.6.3 3D)
59.7% AdobeRGB 1998 (Argyll 1.6.3 3D)
65.2% AdobeRGB 1998 (Argyll 3D)
94.4% sRGB (Argyll 3D)
63.1% Display P3 (Argyll 3D)
Gamma: 2.2
CCT: 6747 K
| MSI GE75 8SF Chi Mei N173HCE-G33, IPS, 17.3", 1920x1080 | Lenovo Legion Y740-17ICH AU Optronics B173HAN03.2, IPS, 17.3", 1920x1080 | Asus Zephyrus S GX701GX B173HAN04.0 (AUO409D), IPS, 17.3", 1920x1080 | Asus ROG Strix Scar II GL704GW B173HAN04.0 (AUO409D), AHVA, 17.3", 1920x1080 | MSI GE73 8RF-008 Raider RGB Chi Mei N173HHE-G32 (CMN1747), TN WLED, 17.3", 1920x1080 | MSI GT75 8RG-090 Titan CMN N173HHE-G32 (CMN1747), TN, 17.3", 1920x1080 | |
|---|---|---|---|---|---|---|
| Display | -1% | -3% | -3% | 27% | 27% | |
| Display P3 Coverage (%) | 63.1 | 64 1% | 62.9 0% | 62.9 0% | 90.8 44% | 90.9 44% |
| sRGB Coverage (%) | 94.4 | 90.4 -4% | 87.8 -7% | 87.1 -8% | 99.9 6% | 100 6% |
| AdobeRGB 1998 Coverage (%) | 65.2 | 64.8 -1% | 63.9 -2% | 63.7 -2% | 85.8 32% | 86.2 32% |
| Response Times | -43% | 17% | -46% | -112% | 32% | |
| Response Time Grey 50% / Grey 80% * (ms) | 9.6 ? | 15.6 ? -63% | 7.2 ? 25% | 17.6 ? -83% | 28 ? -192% | 8 ? 17% |
| Response Time Black / White * (ms) | 10.4 ? | 12.8 ? -23% | 9.6 ? 8% | 11.2 ? -8% | 13.6 ? -31% | 5.6 ? 46% |
| PWM Frequency (Hz) | 25770 ? | 25000 ? | 26000 ? | |||
| Screen | -107% | -23% | -42% | -46% | -19% | |
| Brightness middle (cd/m²) | 370.4 | 299.1 -19% | 288 -22% | 295 -20% | 273 -26% | 240 -35% |
| Brightness (cd/m²) | 348 | 273 -22% | 287 -18% | 291 -16% | 273 -22% | 248 -29% |
| Brightness Distribution (%) | 89 | 81 -9% | 91 2% | 96 8% | 90 1% | 83 -7% |
| Black Level * (cd/m²) | 0.29 | 0.27 7% | 0.2 31% | 0.24 17% | 0.26 10% | 0.22 24% |
| Contrast (:1) | 1277 | 1108 -13% | 1440 13% | 1229 -4% | 1050 -18% | 1091 -15% |
| Colorchecker dE 2000 * | 1.26 | 5.07 -302% | 2.33 -85% | 3.2 -154% | 3.52 -179% | 2.14 -70% |
| Colorchecker dE 2000 max. * | 3.02 | 10.55 -249% | 5.34 -77% | 6.64 -120% | 6.34 -110% | 5.04 -67% |
| Colorchecker dE 2000 calibrated * | 1.21 | 3.31 -174% | 2.47 -104% | 2.52 -108% | 2.09 -73% | 1.54 -27% |
| Greyscale dE 2000 * | 1.4 | 6.8 -386% | 1.19 15% | 2.16 -54% | 3.11 -122% | 1.62 -16% |
| Gamma | 2.2 100% | 2.46 89% | 2.41 91% | 2.46 89% | 2.43 91% | 2.28 96% |
| CCT | 6747 96% | 7805 83% | 6710 97% | 6872 95% | 6999 93% | 6846 95% |
| Color Space (Percent of AdobeRGB 1998) (%) | 59.7 | 58.5 -2% | 57 -5% | 57 -5% | 76 27% | 77 29% |
| Color Space (Percent of sRGB) (%) | 94.4 | 89.9 -5% | 88 -7% | 87 -8% | 100 6% | 100 6% |
| Total Average (Program / Settings) | -50% /
-79% | -3% /
-15% | -30% /
-35% | -44% /
-40% | 13% /
-4% |
* ... smaller is better
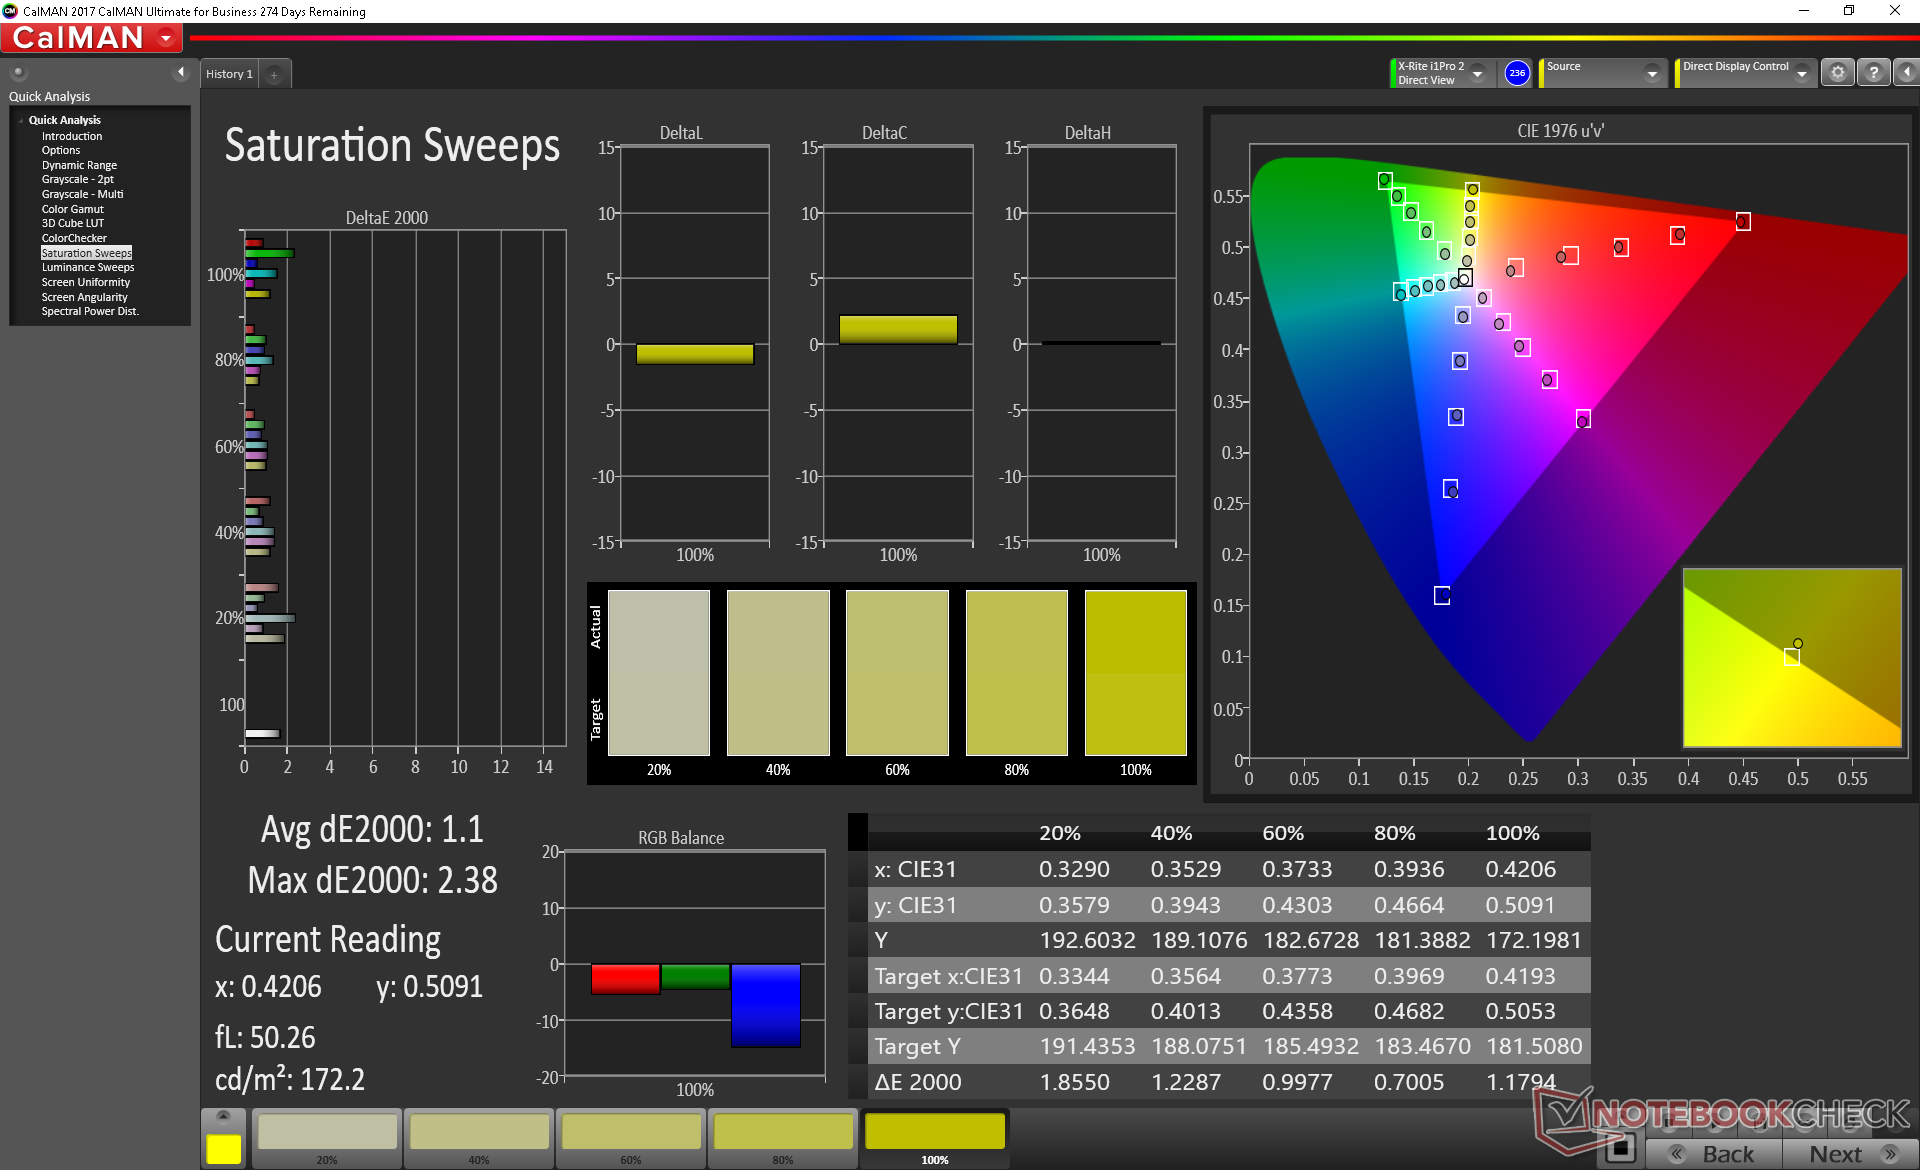
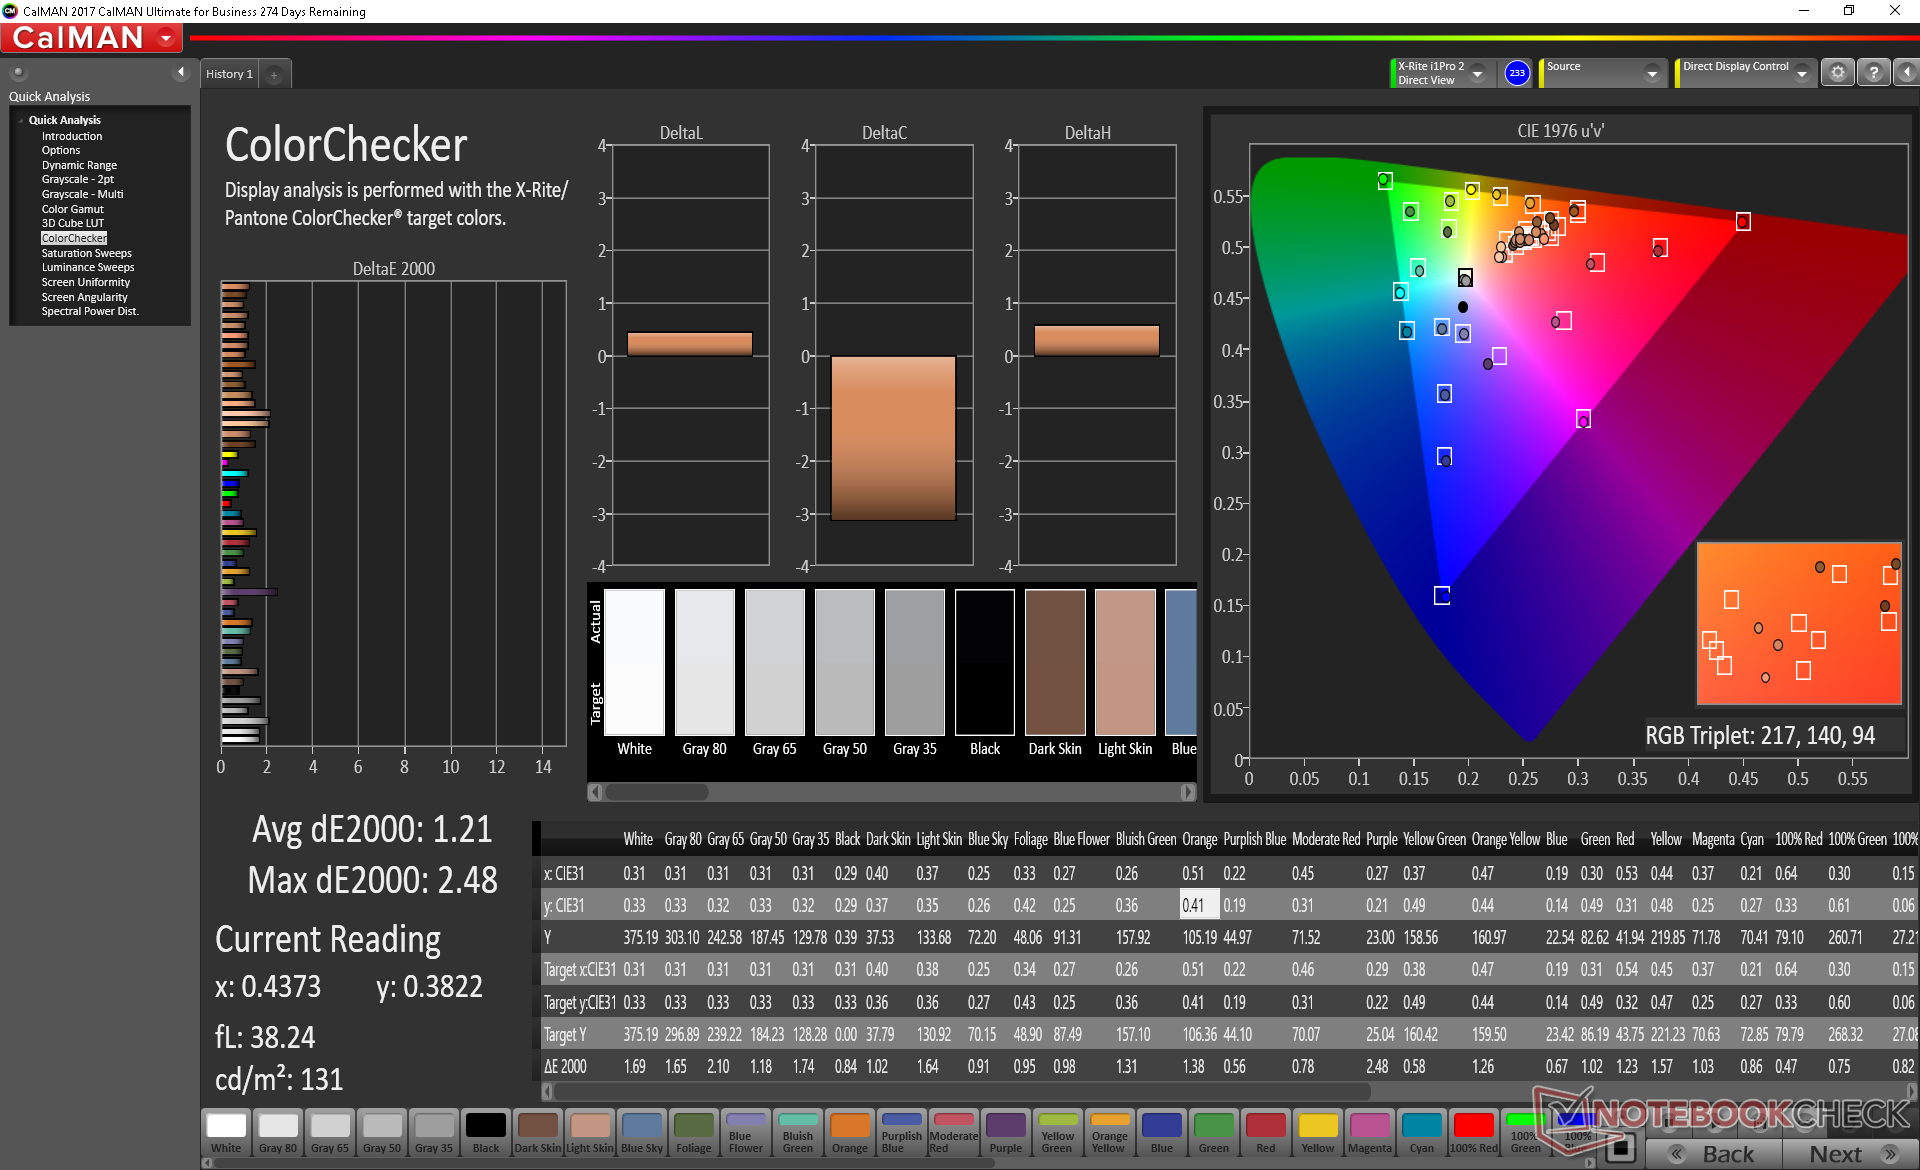
Color space covers approximately 95 percent of sRGB and 60 percent of AdobeRGB. This is noticeably narrower than the Chi Mei TN panels as found on the GE73 and GT75 which cover 77 percent of AdobeRGB. The 144 Hz panel here is nonetheless more than sufficient for gaming purposes where fast response times are priority over deeper colors.
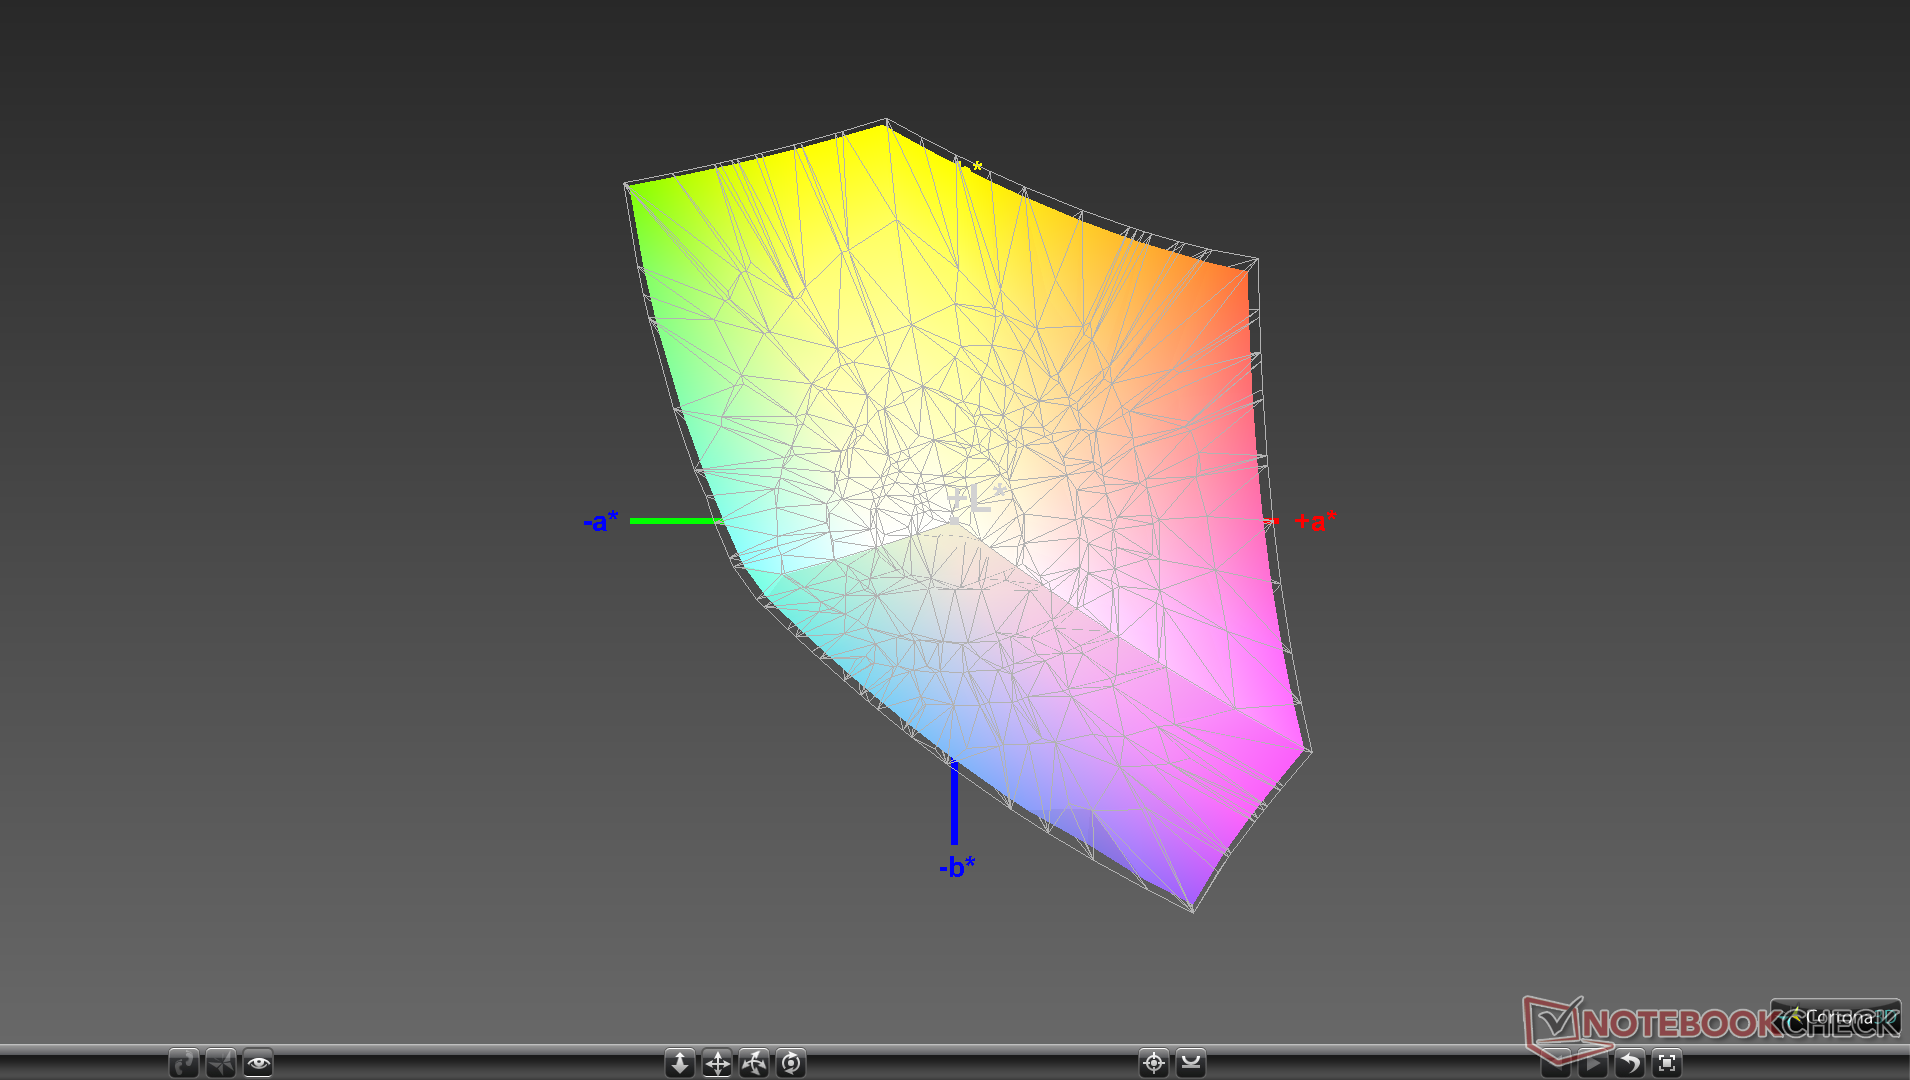
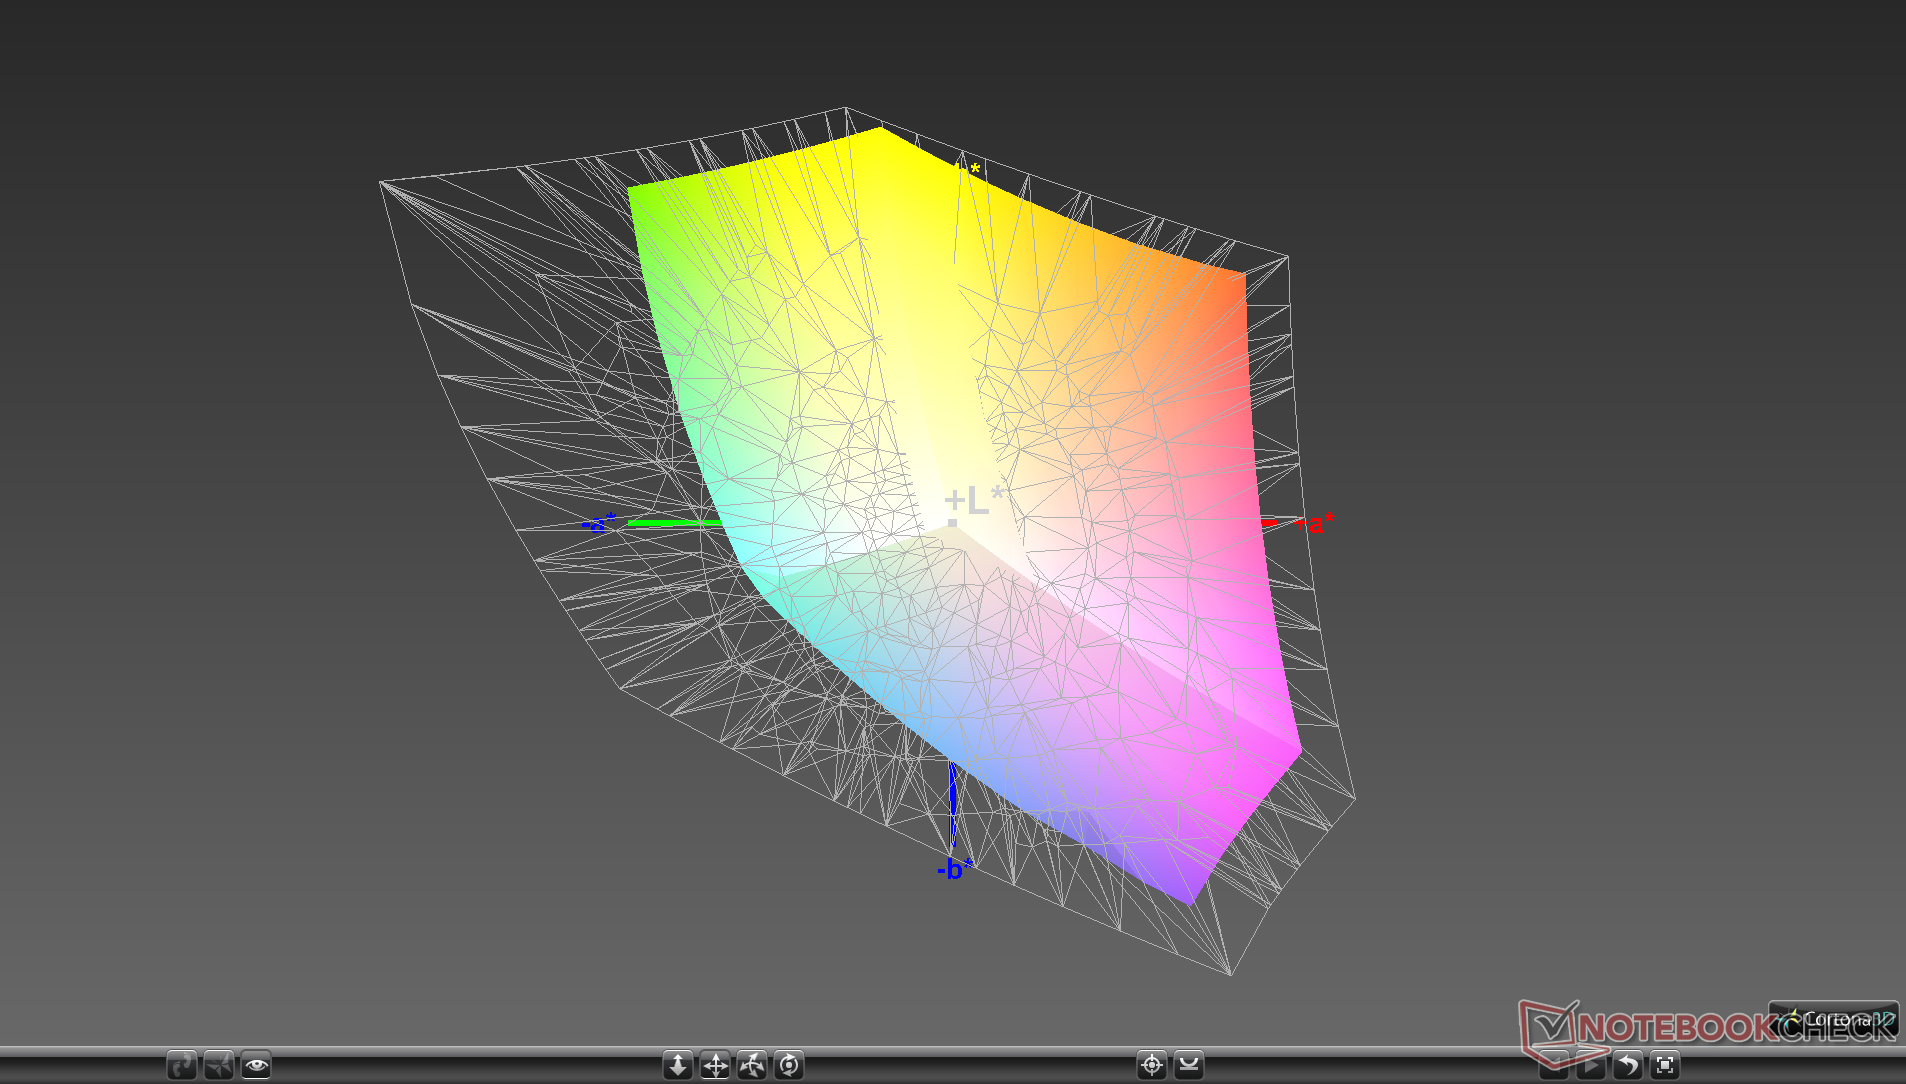
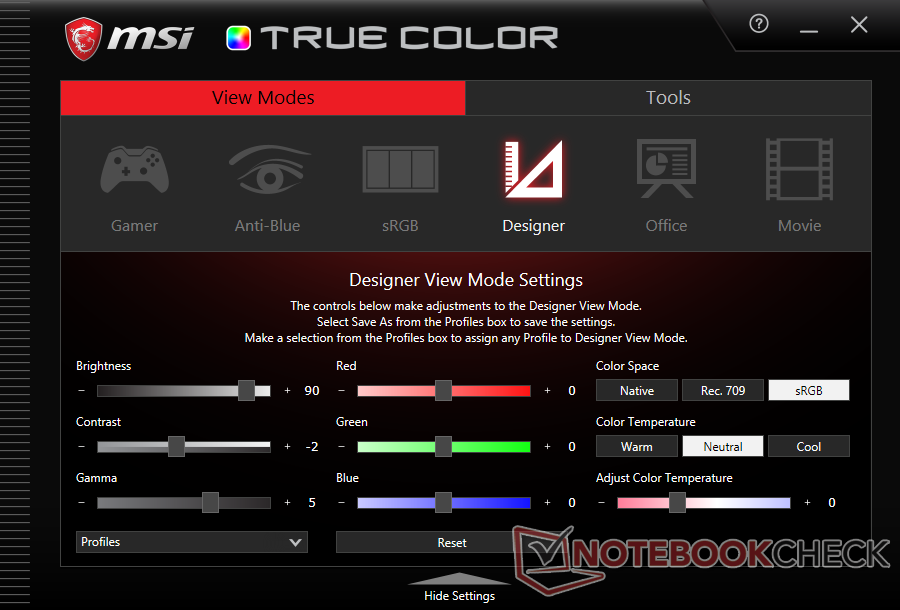
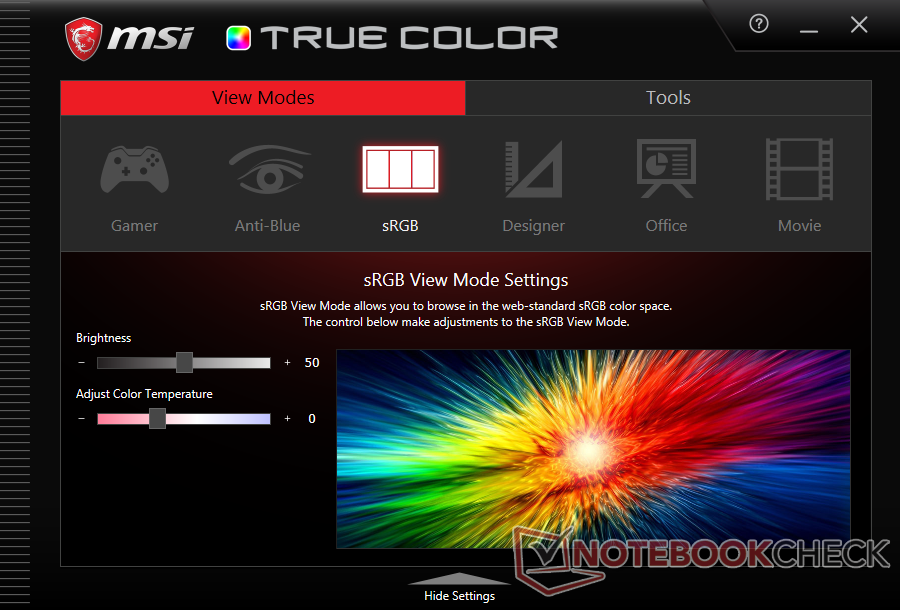
Further measurements with an X-Rite colorimeter reveal a very accurate display out of the box. DeltaE values are already below 1.5 for both grayscale and colors and so an end-user calibration is not required to get the most out of the display. Simply set the MSI True Color utility to sRGB mode and you're good to go.

Display Response Times
| ↔ Response Time Black to White | ||
|---|---|---|
| 10.4 ms ... rise ↗ and fall ↘ combined | ↗ 5.2 ms rise | 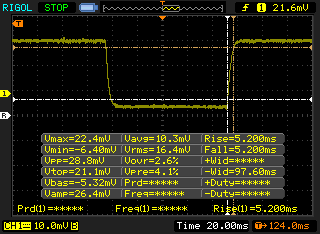 |
| ↘ 5.2 ms fall | ||
| The screen shows good response rates in our tests, but may be too slow for competitive gamers. In comparison, all tested devices range from 0.1 (minimum) to 240 (maximum) ms. » 28 % of all devices are better. This means that the measured response time is better than the average of all tested devices (19.8 ms). | ||
| ↔ Response Time 50% Grey to 80% Grey | ||
| 9.6 ms ... rise ↗ and fall ↘ combined | ↗ 5.2 ms rise | 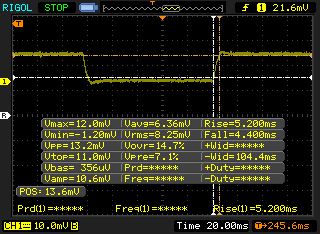 |
| ↘ 4.4 ms fall | ||
| The screen shows fast response rates in our tests and should be suited for gaming. In comparison, all tested devices range from 0.165 (minimum) to 636 (maximum) ms. » 23 % of all devices are better. This means that the measured response time is better than the average of all tested devices (30.9 ms). | ||
Screen Flickering / PWM (Pulse-Width Modulation)
| Screen flickering / PWM detected | 25770 Hz | ≤ 17 % brightness setting | 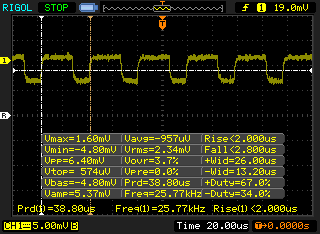 |
The display backlight flickers at 25770 Hz (worst case, e.g., utilizing PWM) Flickering detected at a brightness setting of 17 % and below. There should be no flickering or PWM above this brightness setting. The frequency of 25770 Hz is quite high, so most users sensitive to PWM should not notice any flickering. In comparison: 52 % of all tested devices do not use PWM to dim the display. If PWM was detected, an average of 7741 (minimum: 5 - maximum: 343500) Hz was measured. | |||
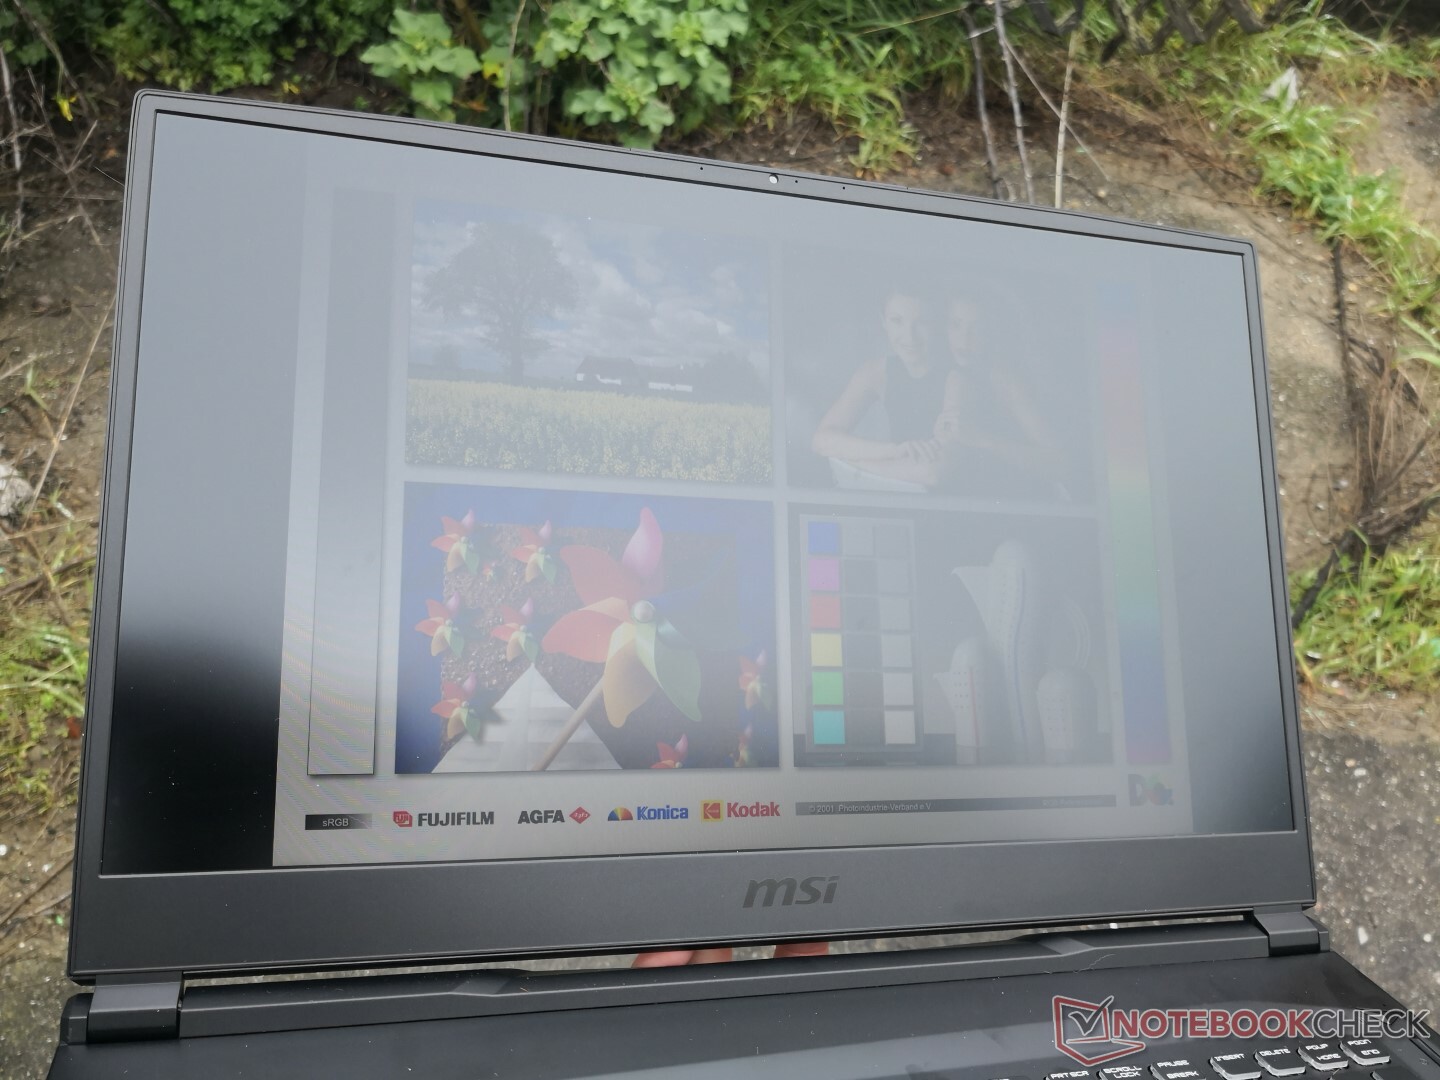
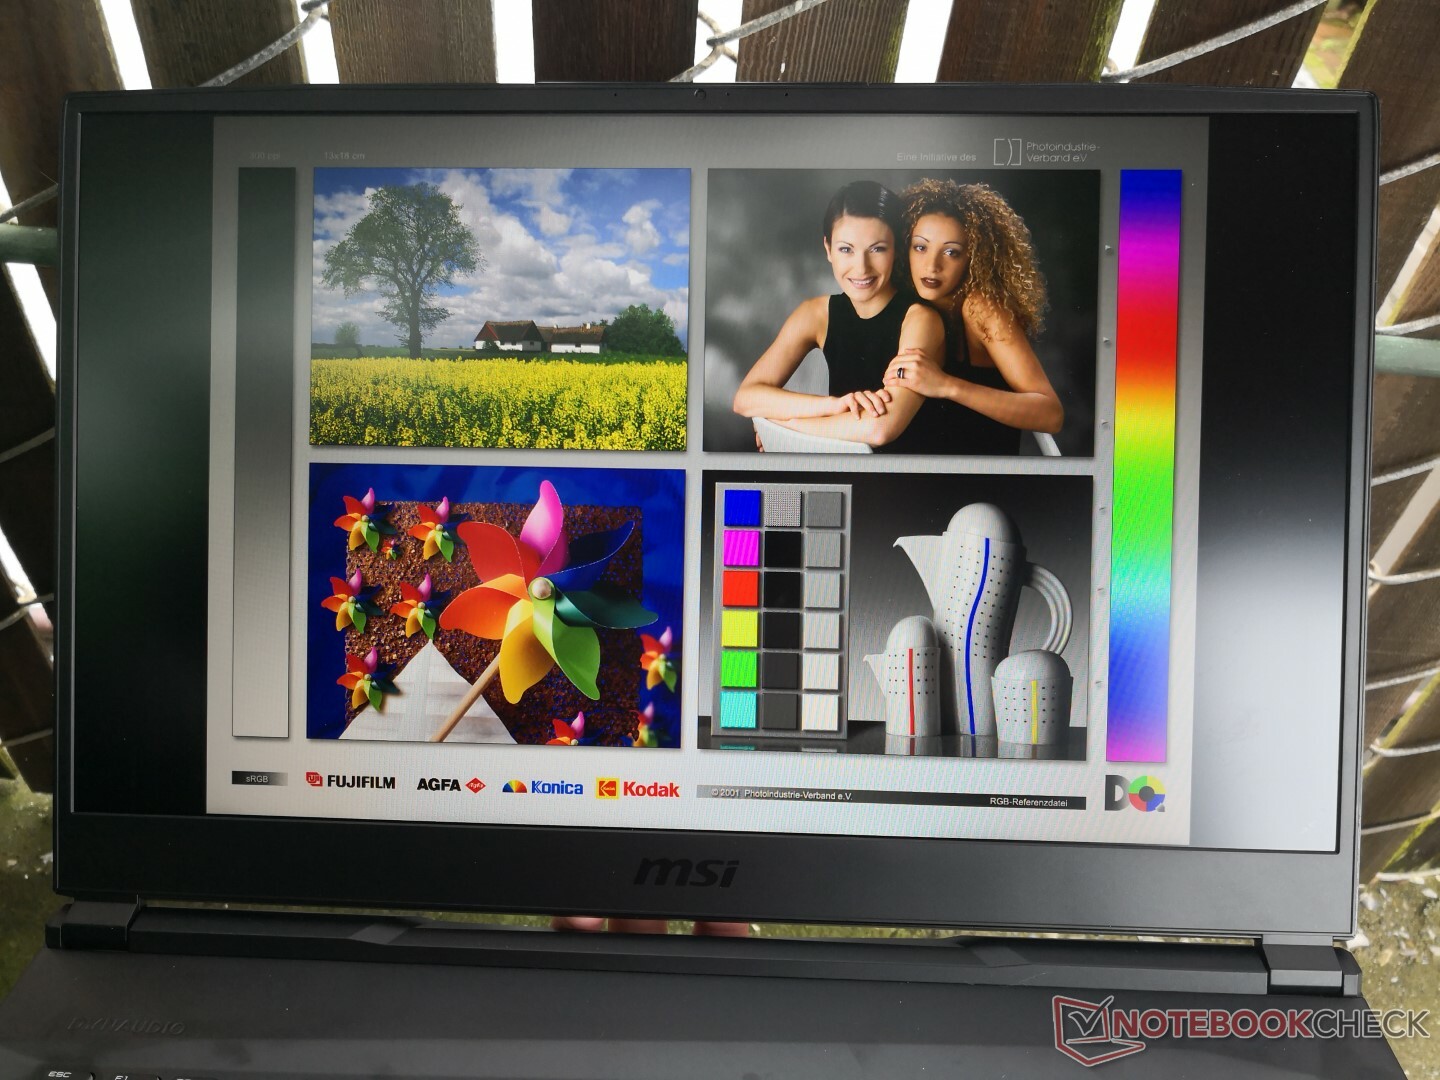
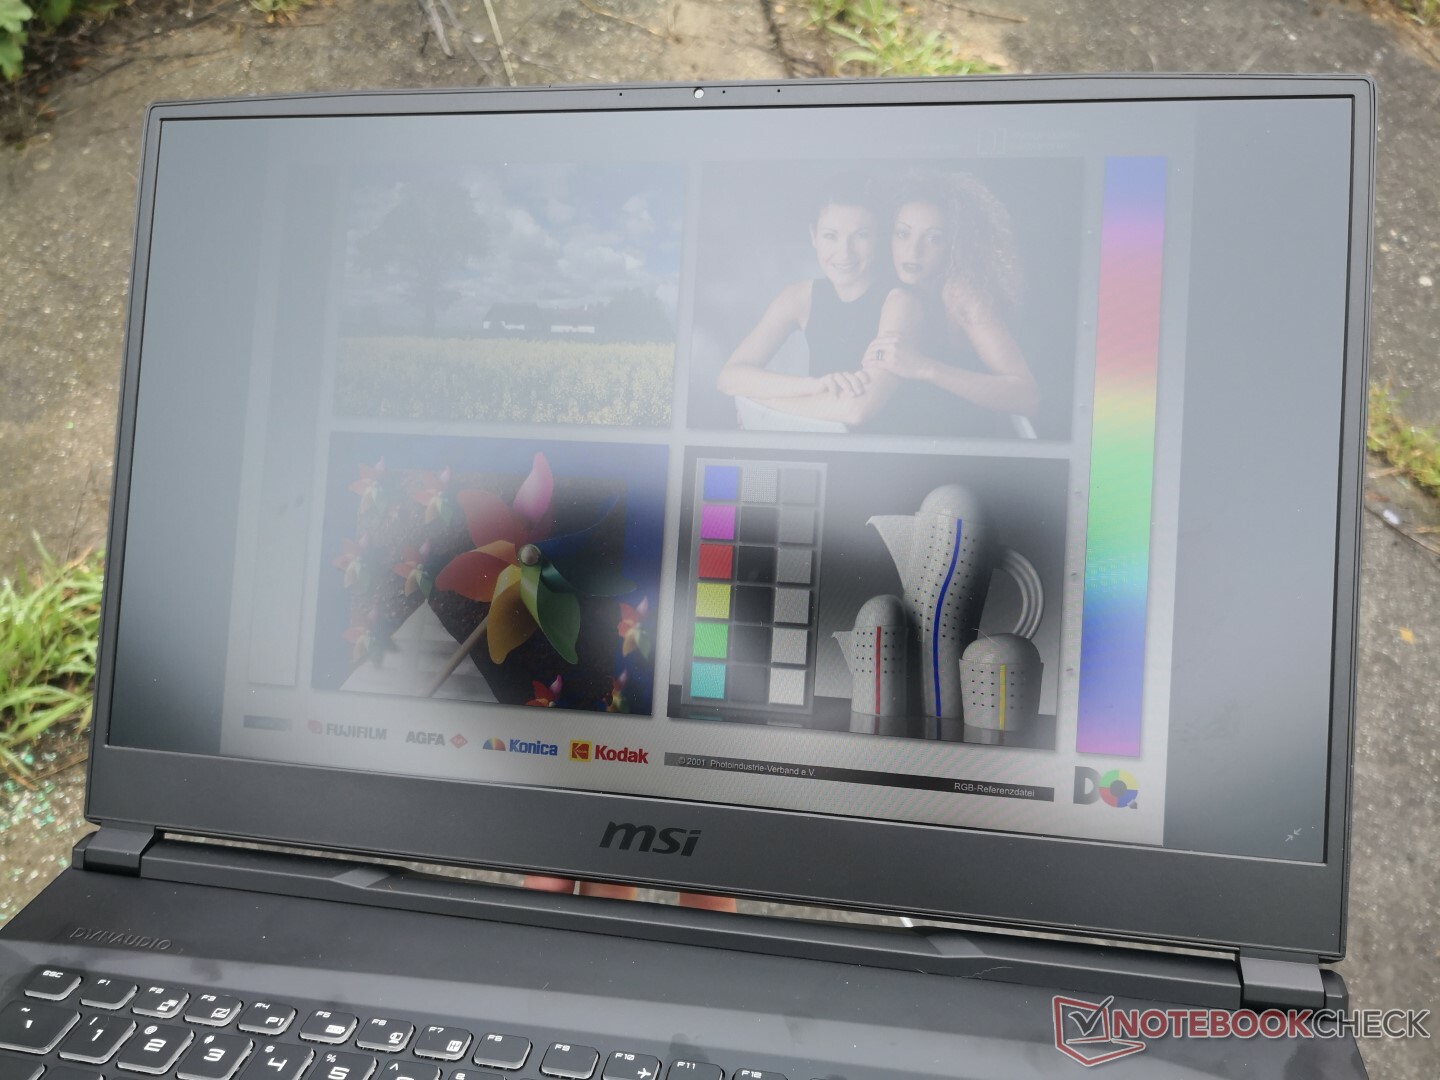
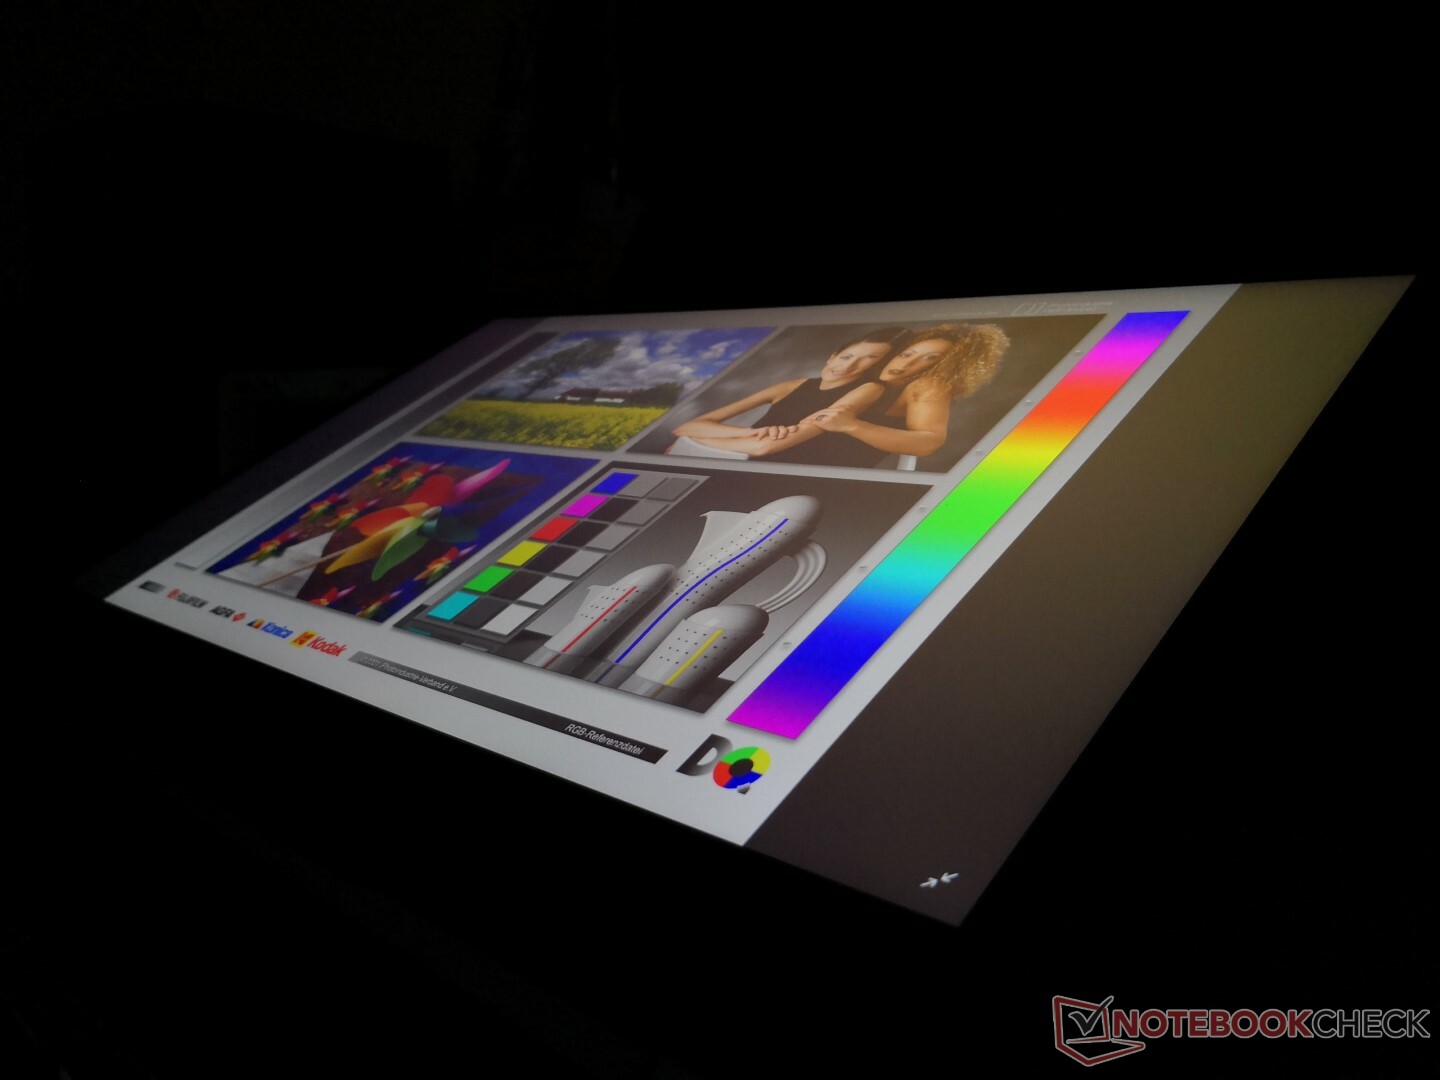
Outdoor visibility is a bit better than most 17-inch gaming laptops since the screen on the GE75 is brighter. Even so, the screen is nowhere near as bright as most flagship Ultrabooks where >400 nits is common and so even a cloudy day will wash out the colors. Viewing angles are otherwise wide with just slight shifts in color and contrast if viewing from obtuse angles.

Performance
Core components are similar to other mainstream to enthusiast gaming laptops in the market. The CPU is currently fixed at the Core i7-8750H as MSI is reserving the Core i9 for its flagship GT series only. Graphics options, however, consist of the full-fledged RTX 2060, RTX 2070, and RTX 2080 with no Max-Q options.
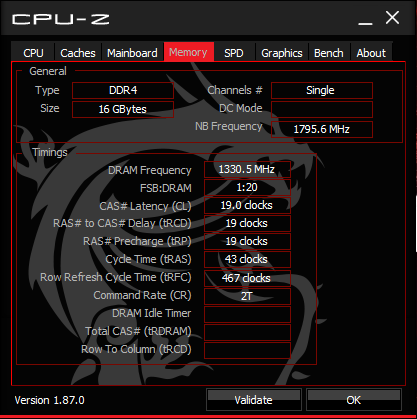
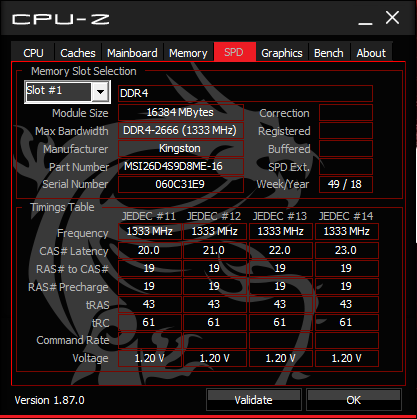
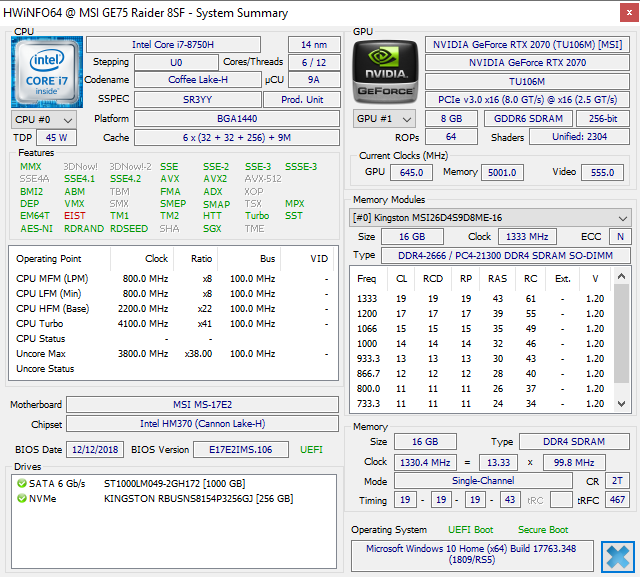
Two DDR4 RAM slots are available. Our specific test unit runs on single-channel memory and so all our benchmark tests below will reflect this. Faster performance can be gained when running on dual-channel memory instead.
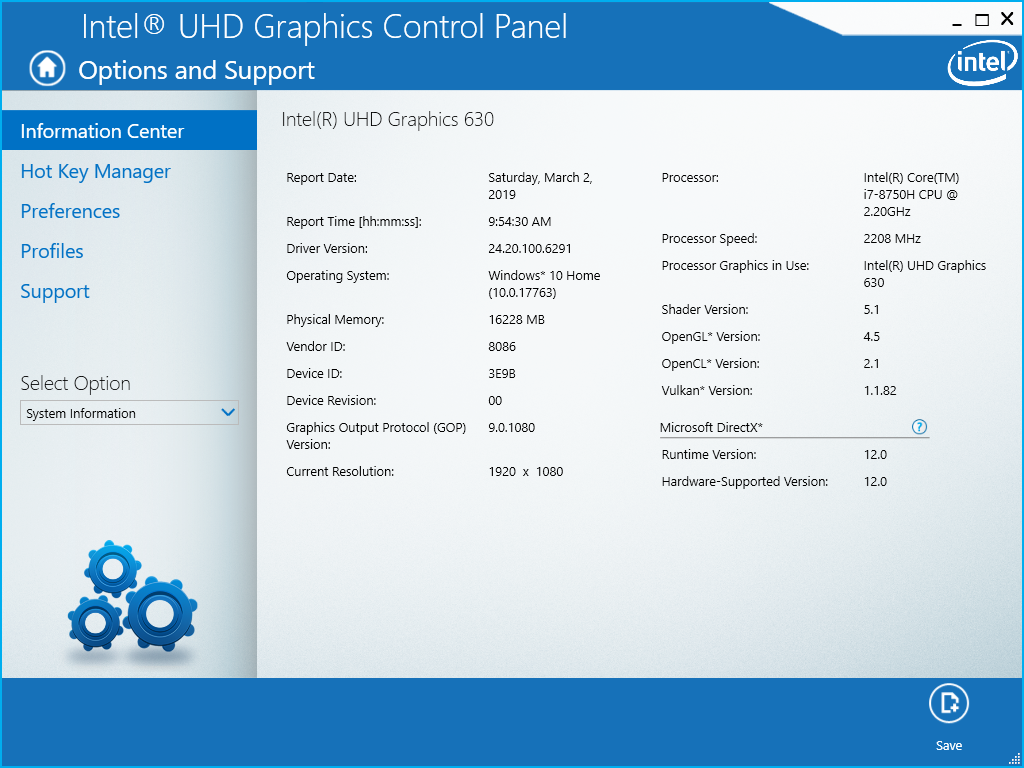
Nvidia Optimus is included for switching to the integrated UHD Graphics 630 when needed. This unfortunately means that G-Sync is currently not an option across the GE75 series.
Processor
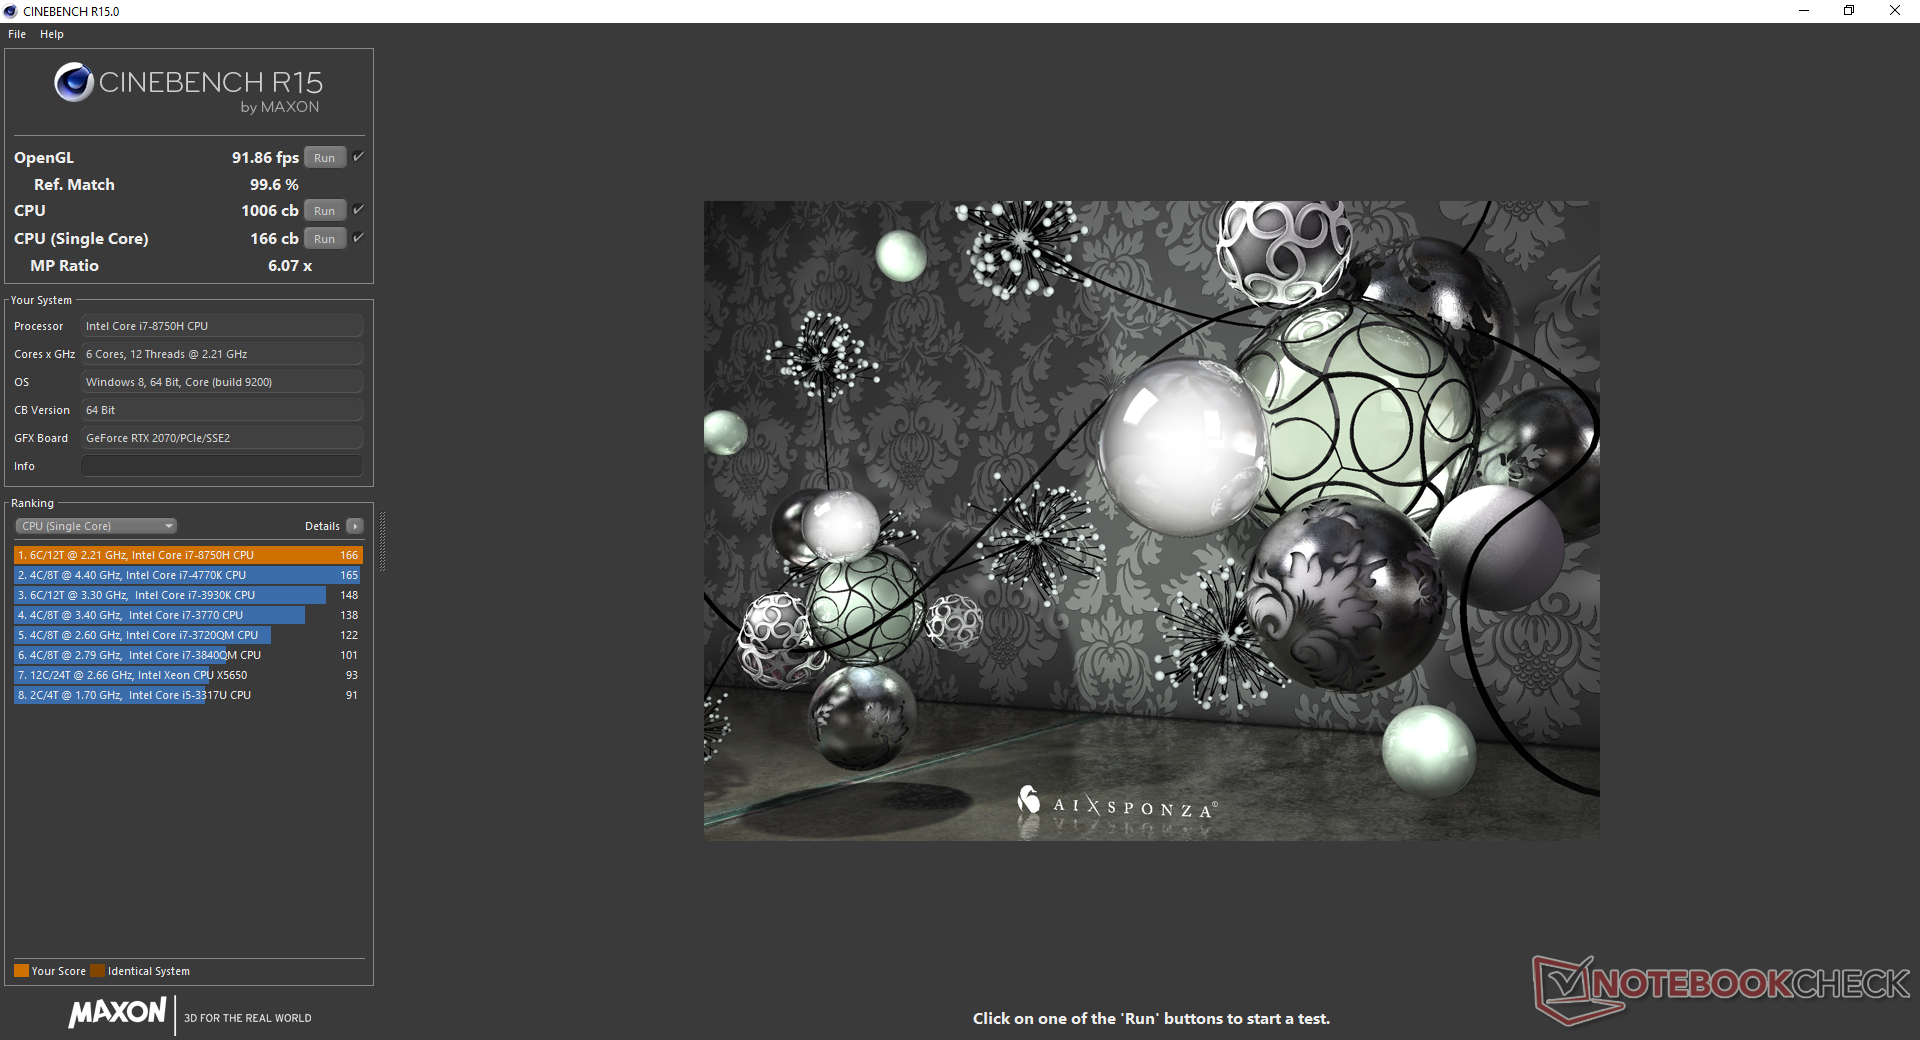
CineBench R15 results are slightly below the average Core i7-8750H taken from 70 other laptops. The Lenovo Legion Y740 with the same CPU, for example, scores 16 percent higher than our MSI in the same benchmark. Even so, multi-thread performance is still about 30 percent and 50 percent faster than the Core i5-8300H and last generation Core i7-7700HQ, respectively.
Turbo Boost sustainability is not great. By running CineBench R15 Multi-Thread in a loop, we can observe CPU performance over time. The initial score of 1046 points drops to 916 points by the second loop to represent a performance dip of 12 percent. CPU performance is slower than competitors like the Acer Predator Triton 500 and Asus Zephyrus S GX701 after accounting for performance throttling as shown by our graph below.
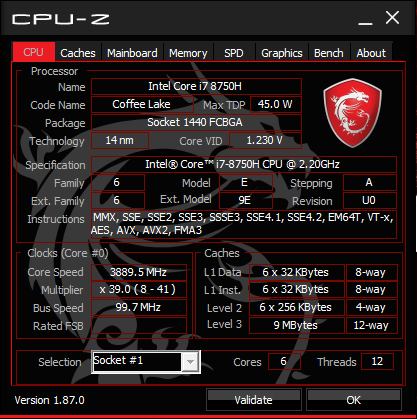
See our dedicated page on the Core i7-8750H for more technical information and benchmark comparisons. This processor is very common on both mainstream and high-end gaming laptops launched in 2018 or later.
System Performance
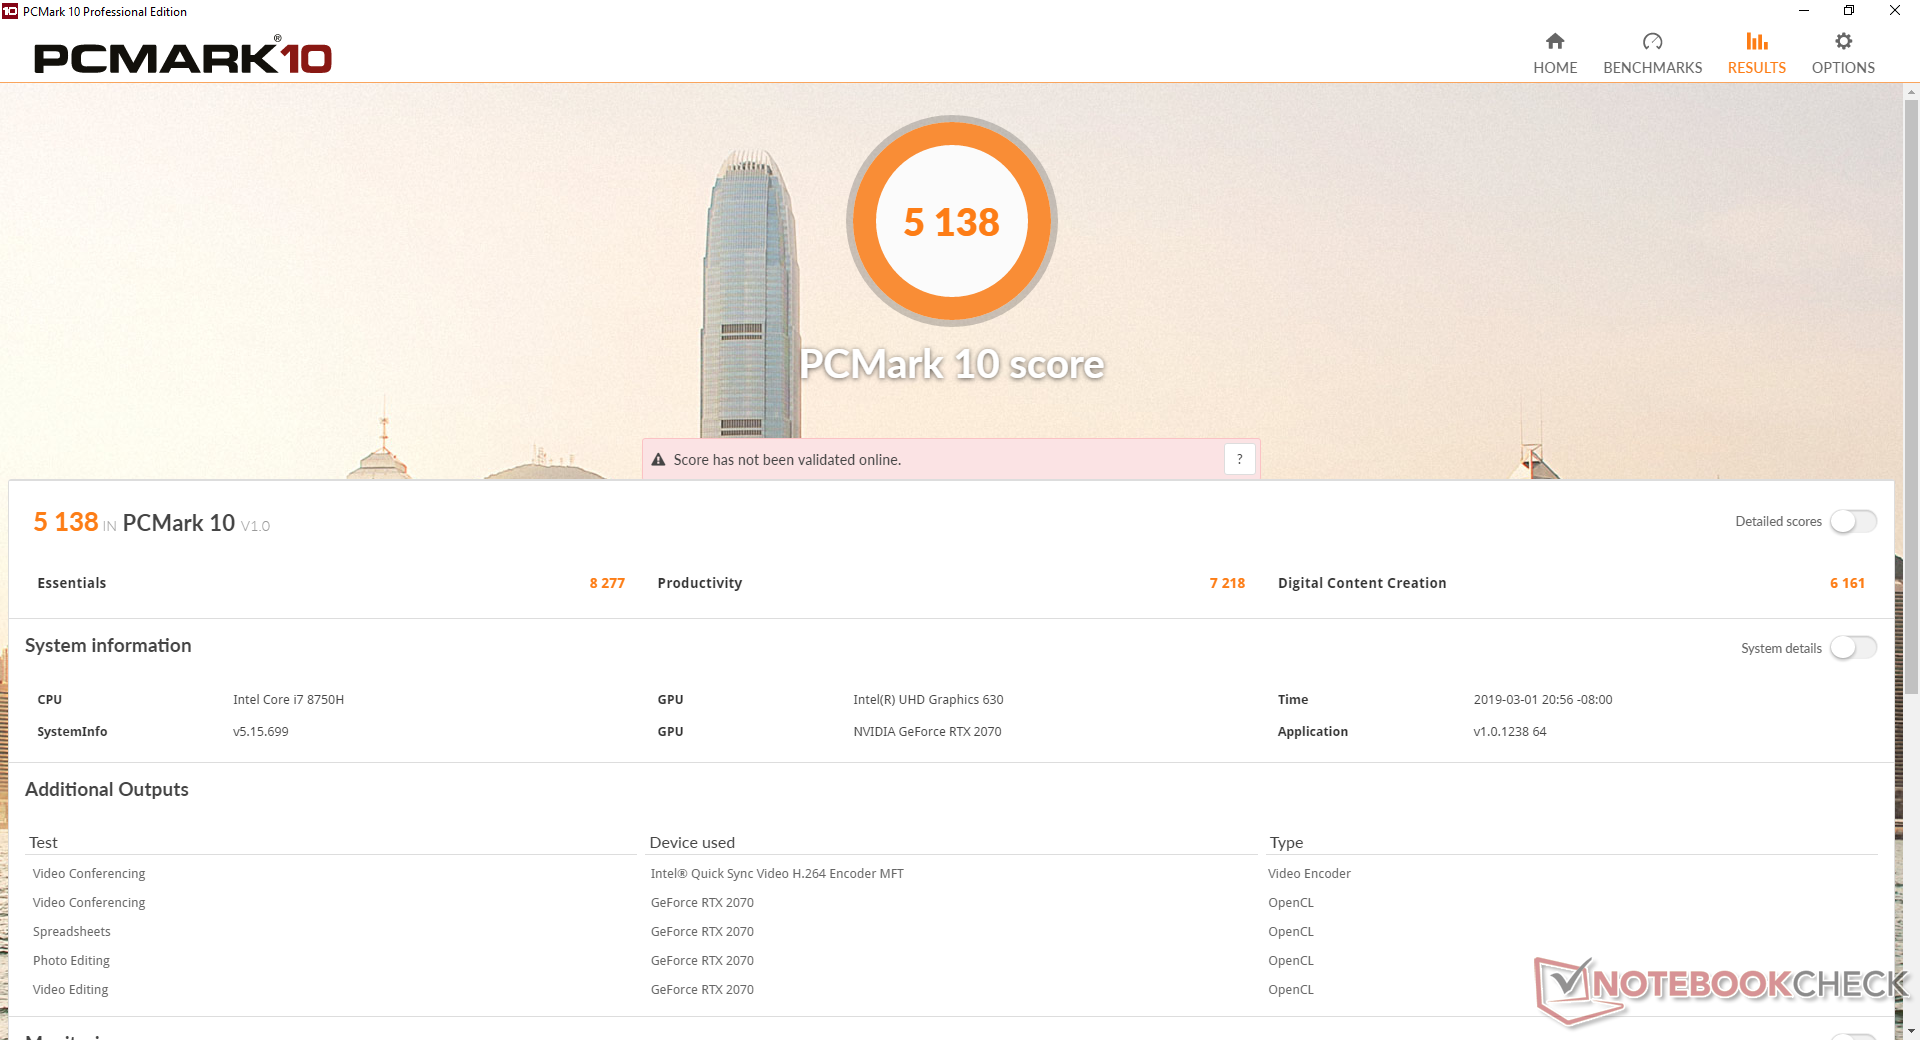
PCMark results are slightly lower than we were anticipating. The Asus ROG GL704GW with the same CPU and GPU, for example, outscores our MSI in every PCMark test. We suspect that this could be attributed to the single-channel memory and slower SSD of our MSI that could easily be addressed before or after purchasing.
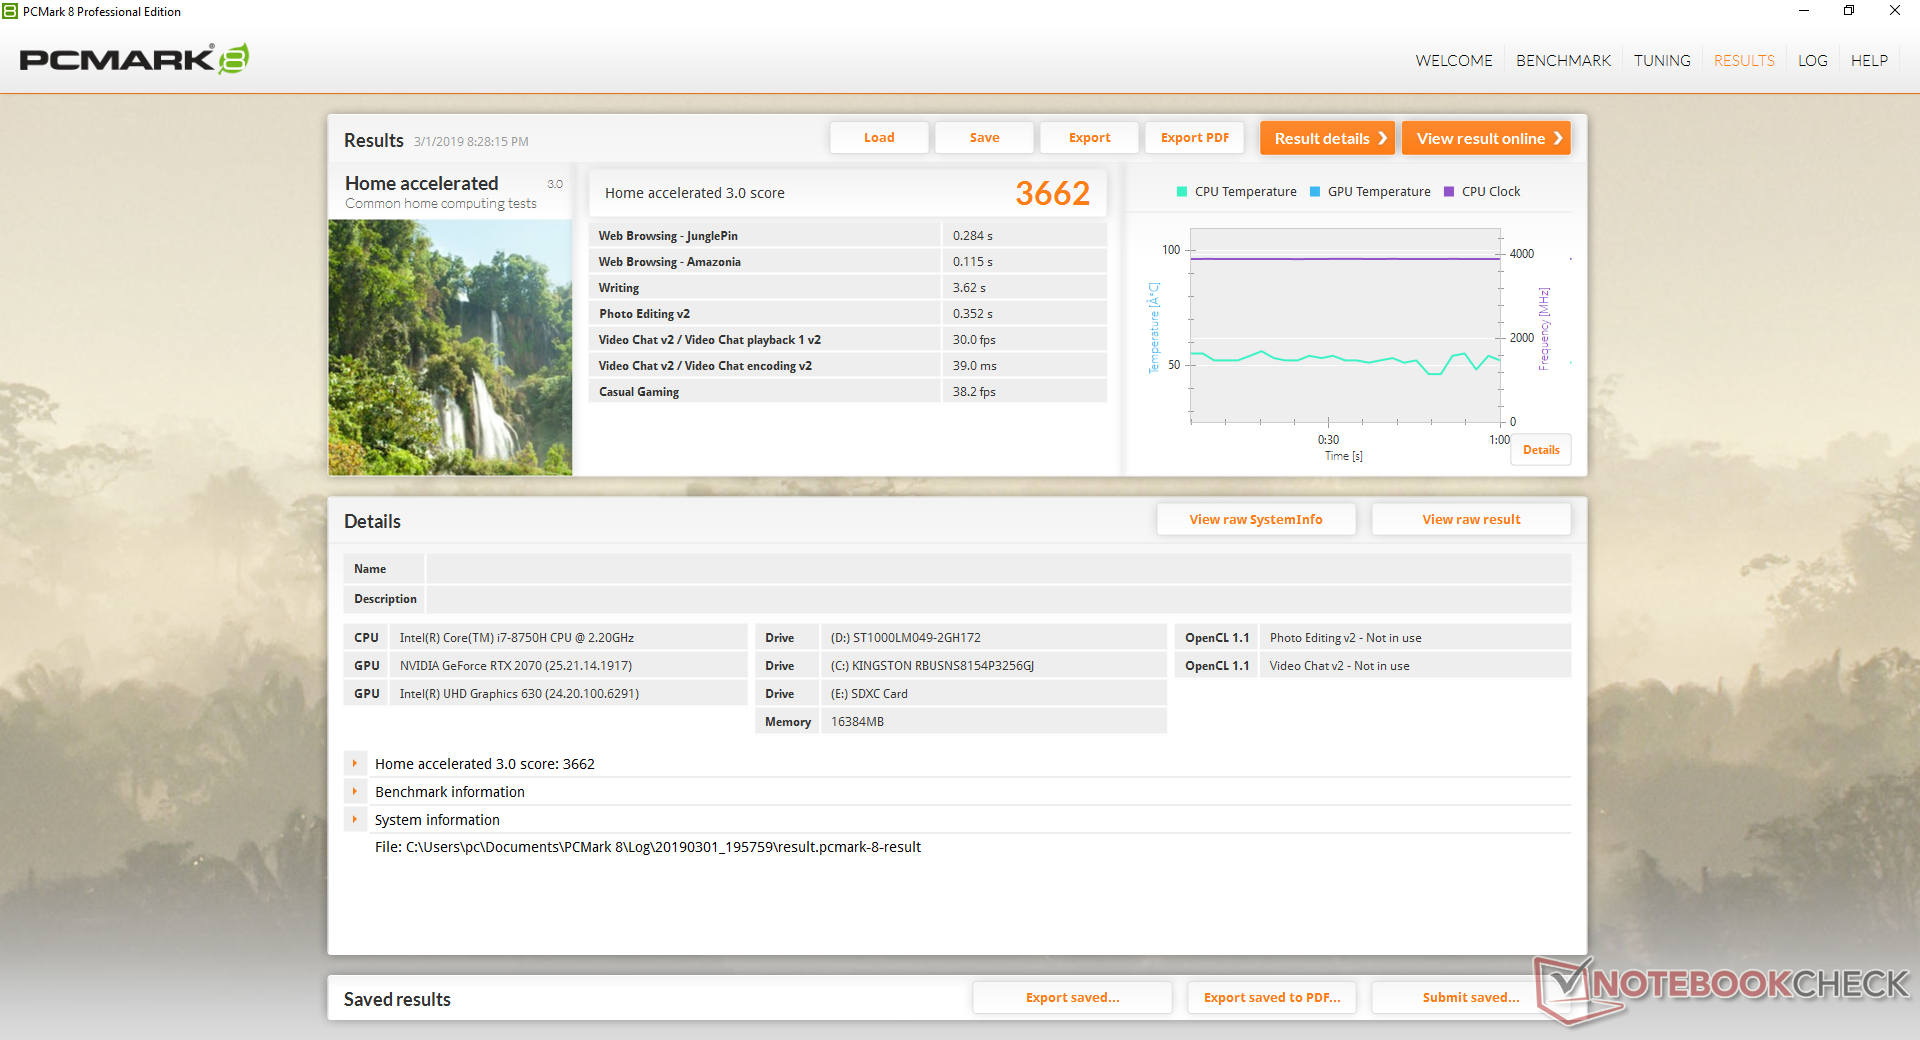
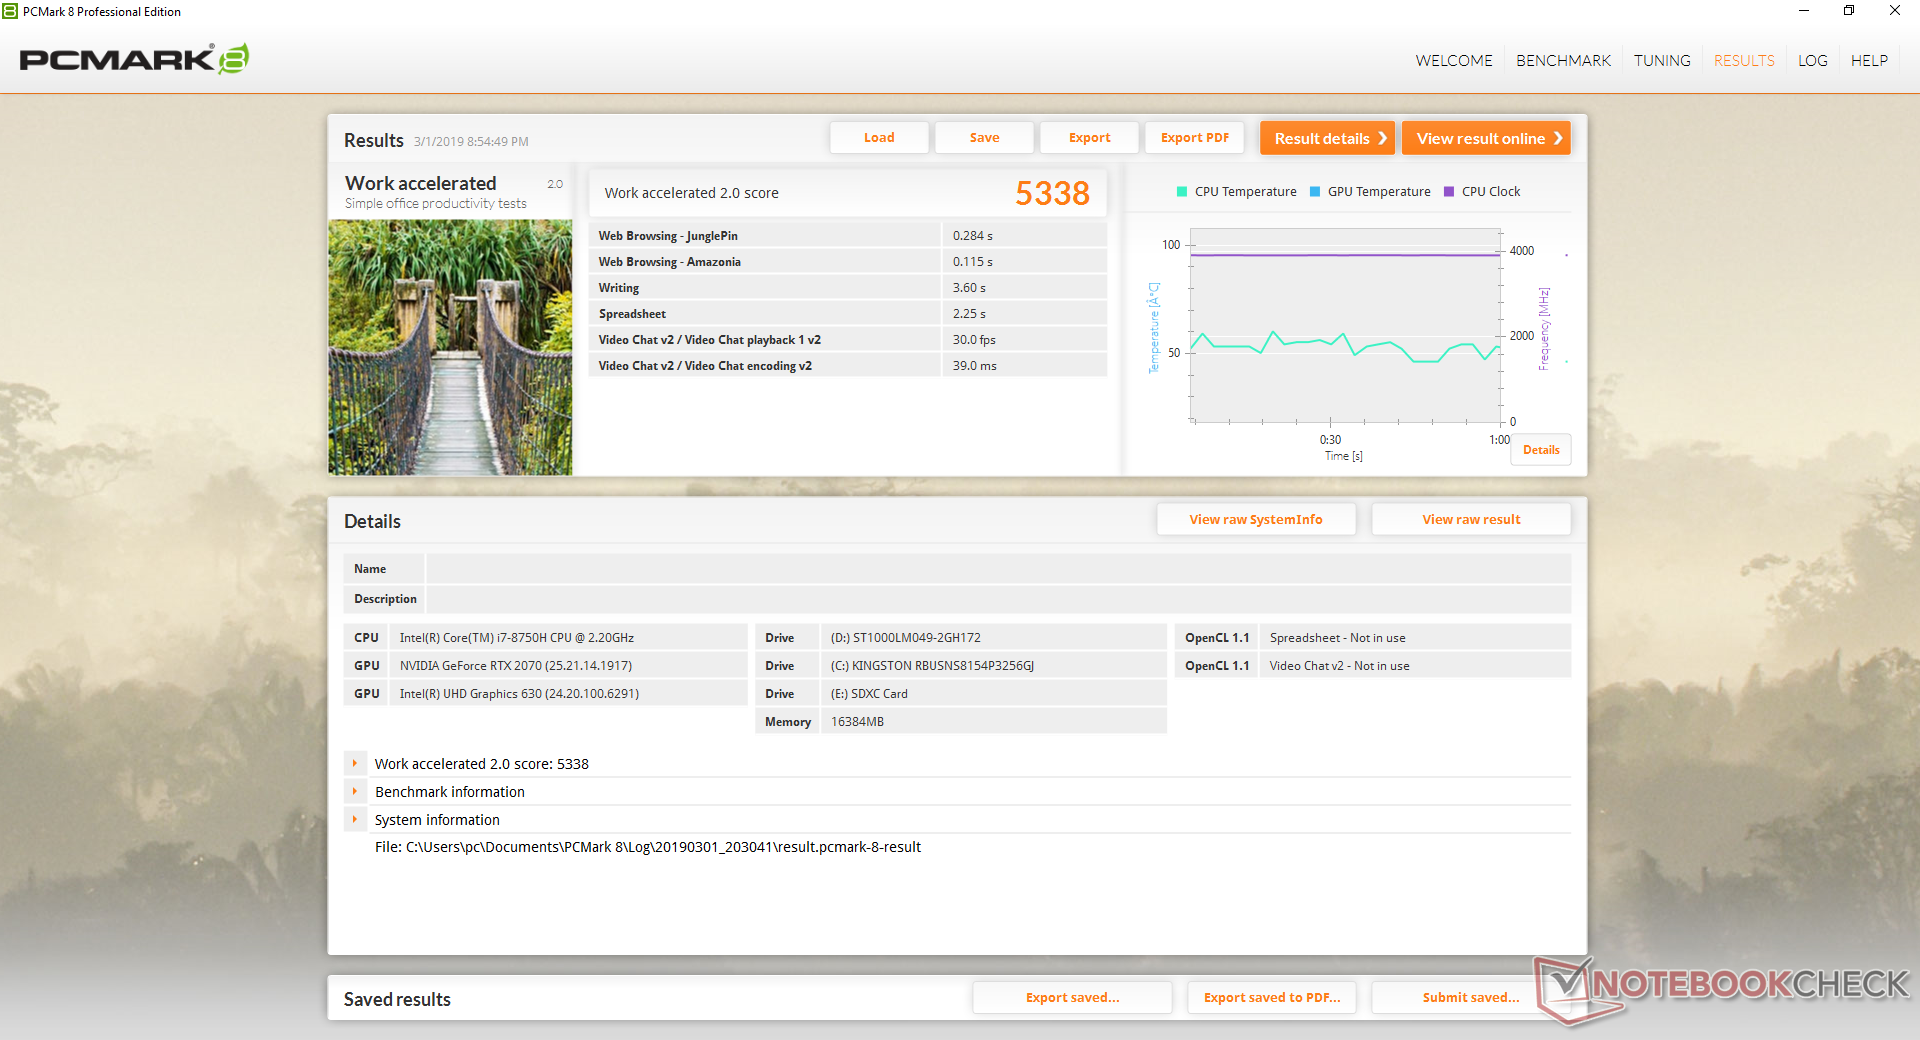
| PCMark 8 Home Score Accelerated v2 | 3662 points | |
| PCMark 8 Work Score Accelerated v2 | 5338 points | |
| PCMark 10 Score | 5138 points | |
Help | ||
Storage Devices
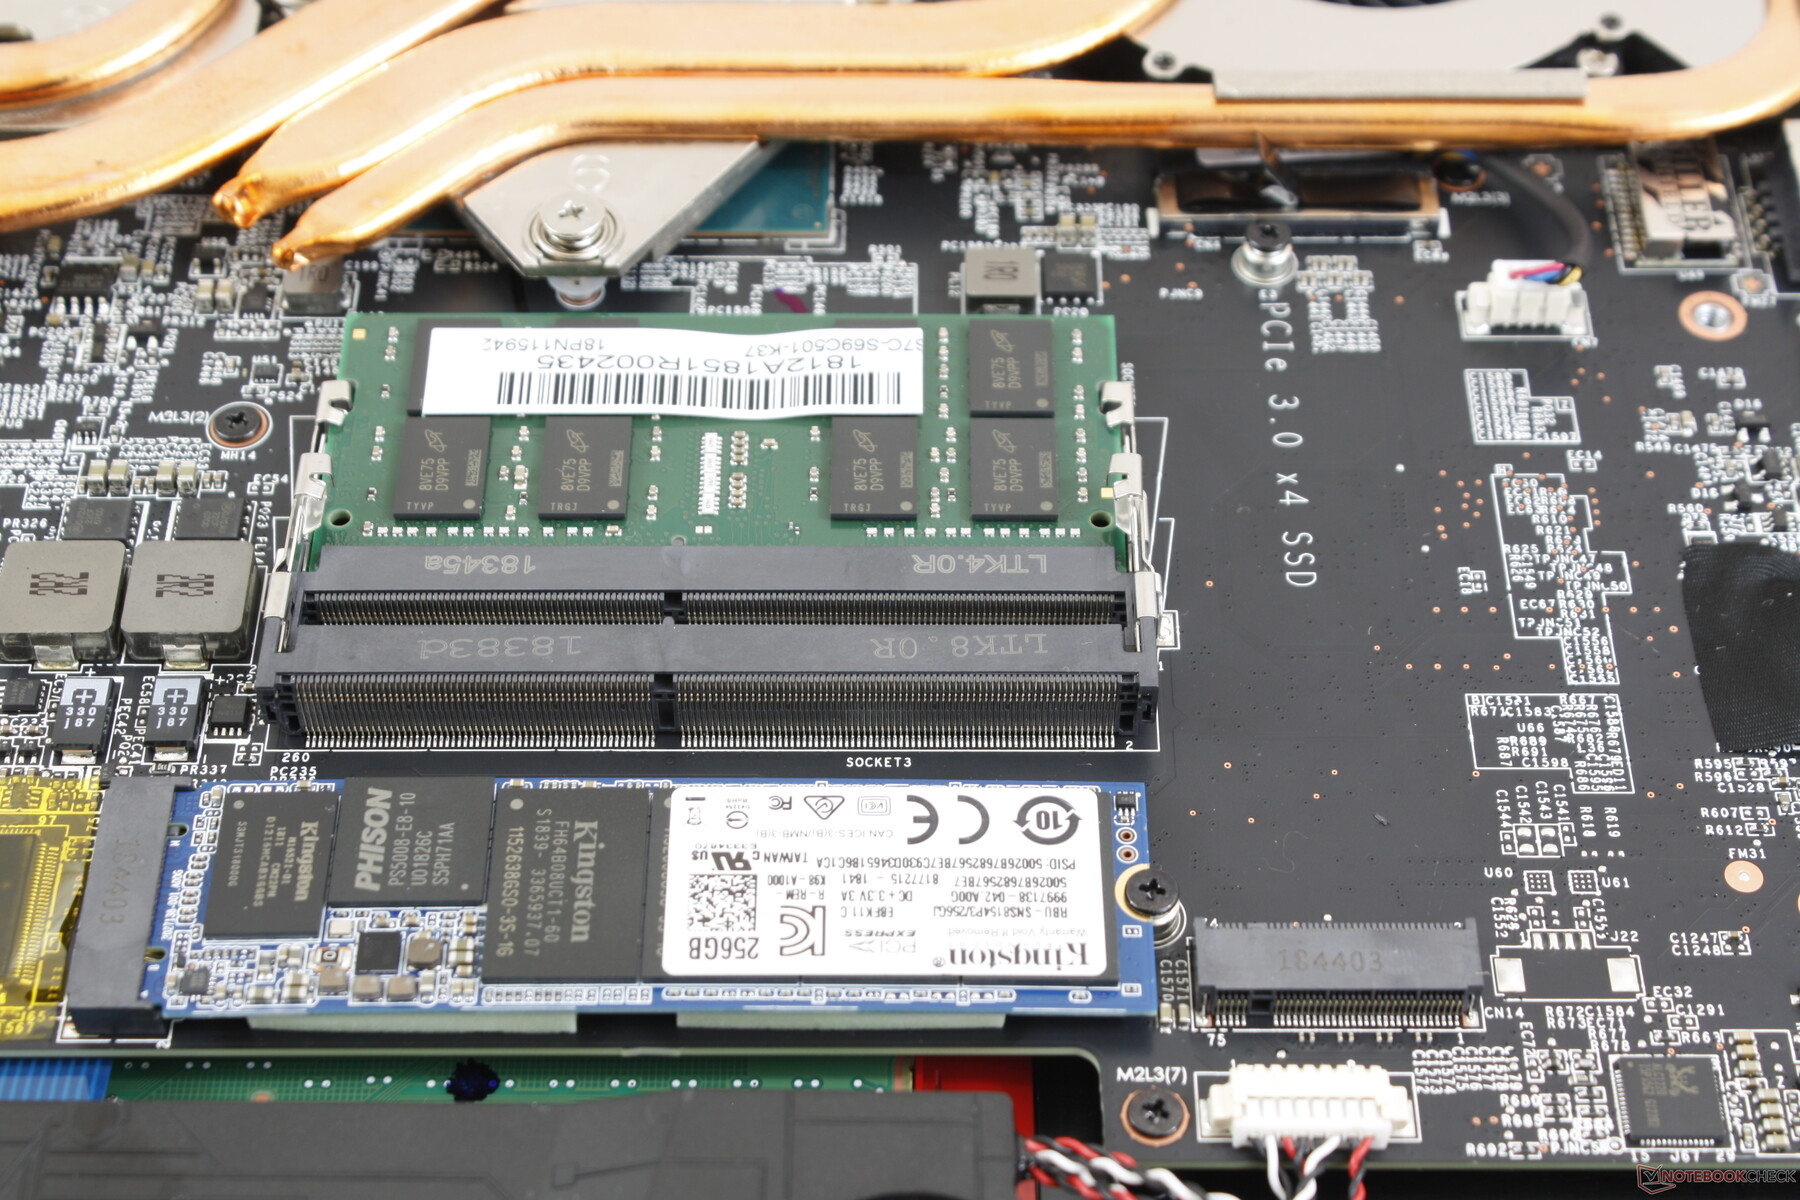
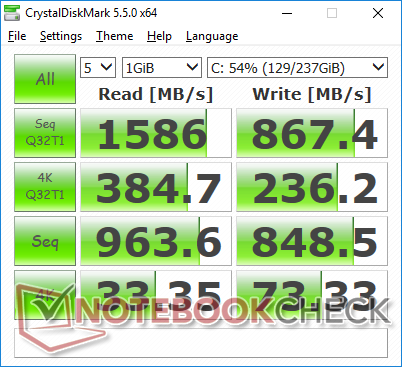
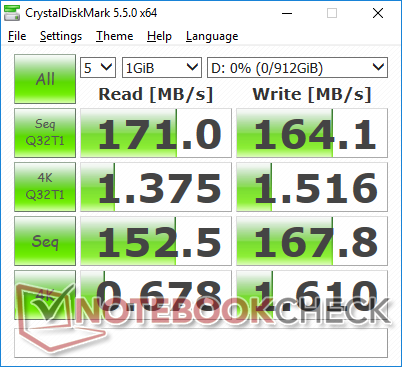
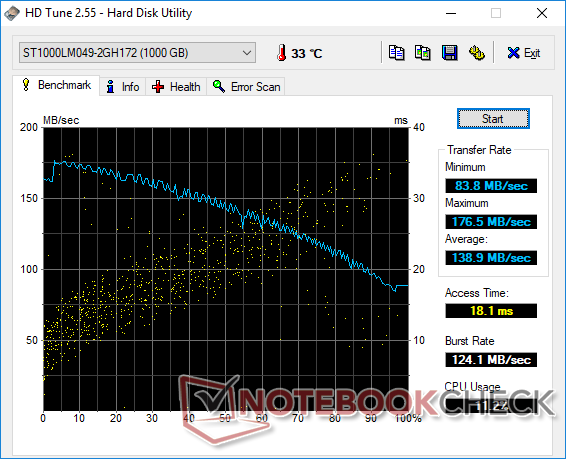
There are a total of three internal storage bays (2x M.2 2280 + 1x 2.5-inch SATA III). Our particular test unit is equipped with a 256 GB Kingston NVMe SSD and a secondary 1 TB Seagate Barracuda Pro HDD.
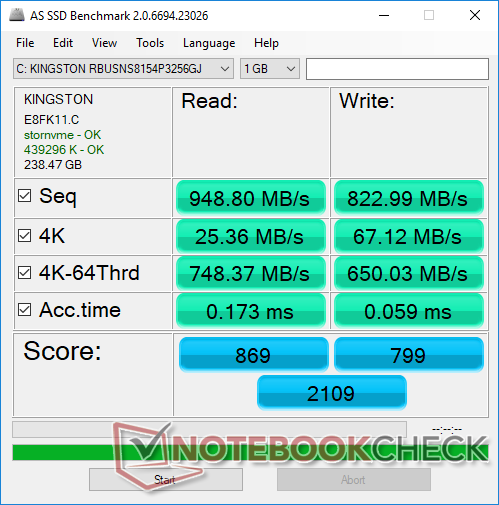
Sequential read and write from the Kingston SSD are balanced at about 900 MB/s each. It's still relatively slow for an NVMe SSD as competing Samsung and Intel SSDs are able to offer faster speeds as shown by the table below. The Kingston drive is certainly a budget solution, but Xotic PC can configure with Samsung EVO SSDs for faster performance if desired.
See our table of HDDs and SSDs for more benchmark comparisons.
| MSI GE75 8SF Kingston RBUSNS8154P3256GJ1 | Lenovo Legion Y740-17ICH Samsung SSD PM981 MZVLB256HAHQ | Asus Zephyrus S GX701GX Samsung SSD PM981 MZVLB1T0HALR | Asus ROG Strix Scar II GL704GW Intel SSD 660p SSDPEKNW512G8 | MSI GE73 8RF-008 Raider RGB Toshiba HG6 THNSNJ256G8NY | MSI GT75 8RG-090 Titan 2x Samsung PM961 MZVLW256HEHP (RAID 0) | |
|---|---|---|---|---|---|---|
| AS SSD | 51% | 103% | 20% | -53% | 95% | |
| Seq Read (MB/s) | 949 | 1153 21% | 911 -4% | 1315 39% | 511 -46% | 3058 222% |
| Seq Write (MB/s) | 823 | 1328 61% | 2347 185% | 927 13% | 425.7 -48% | 2196 167% |
| 4K Read (MB/s) | 25.36 | 35.05 38% | 53 109% | 52.4 107% | 14.07 -45% | 38.37 51% |
| 4K Write (MB/s) | 67.1 | 96 43% | 122.5 83% | 122.8 83% | 38.34 -43% | 97.7 46% |
| 4K-64 Read (MB/s) | 748 | 727 -3% | 1577 111% | 326.5 -56% | 351.4 -53% | 1347 80% |
| 4K-64 Write (MB/s) | 650 | 1212 86% | 1734 167% | 727 12% | 172.7 -73% | 1236 90% |
| Access Time Read * (ms) | 0.173 | 0.063 64% | 0.08 54% | 0.11 36% | 0.235 -36% | 0.056 68% |
| Access Time Write * (ms) | 0.059 | 0.04 32% | 0.031 47% | 0.045 24% | 0.097 -64% | 0.038 36% |
| Score Read (Points) | 869 | 878 1% | 1721 98% | 510 -41% | 417 -52% | 1691 95% |
| Score Write (Points) | 799 | 1441 80% | 2091 162% | 942 18% | 254 -68% | 1553 94% |
| Score Total (Points) | 2109 | 2784 32% | 4771 126% | 1715 -19% | 881 -58% | 4066 93% |
| Copy ISO MB/s (MB/s) | 1121 | 1487 33% | 412.5 -63% | |||
| Copy Program MB/s (MB/s) | 532 | 608 14% | 192.9 -64% | |||
| Copy Game MB/s (MB/s) | 380.5 | 1162 205% | 295.5 -22% |
* ... smaller is better

GPU Performance
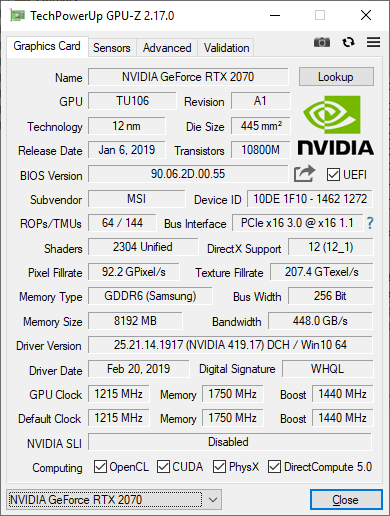
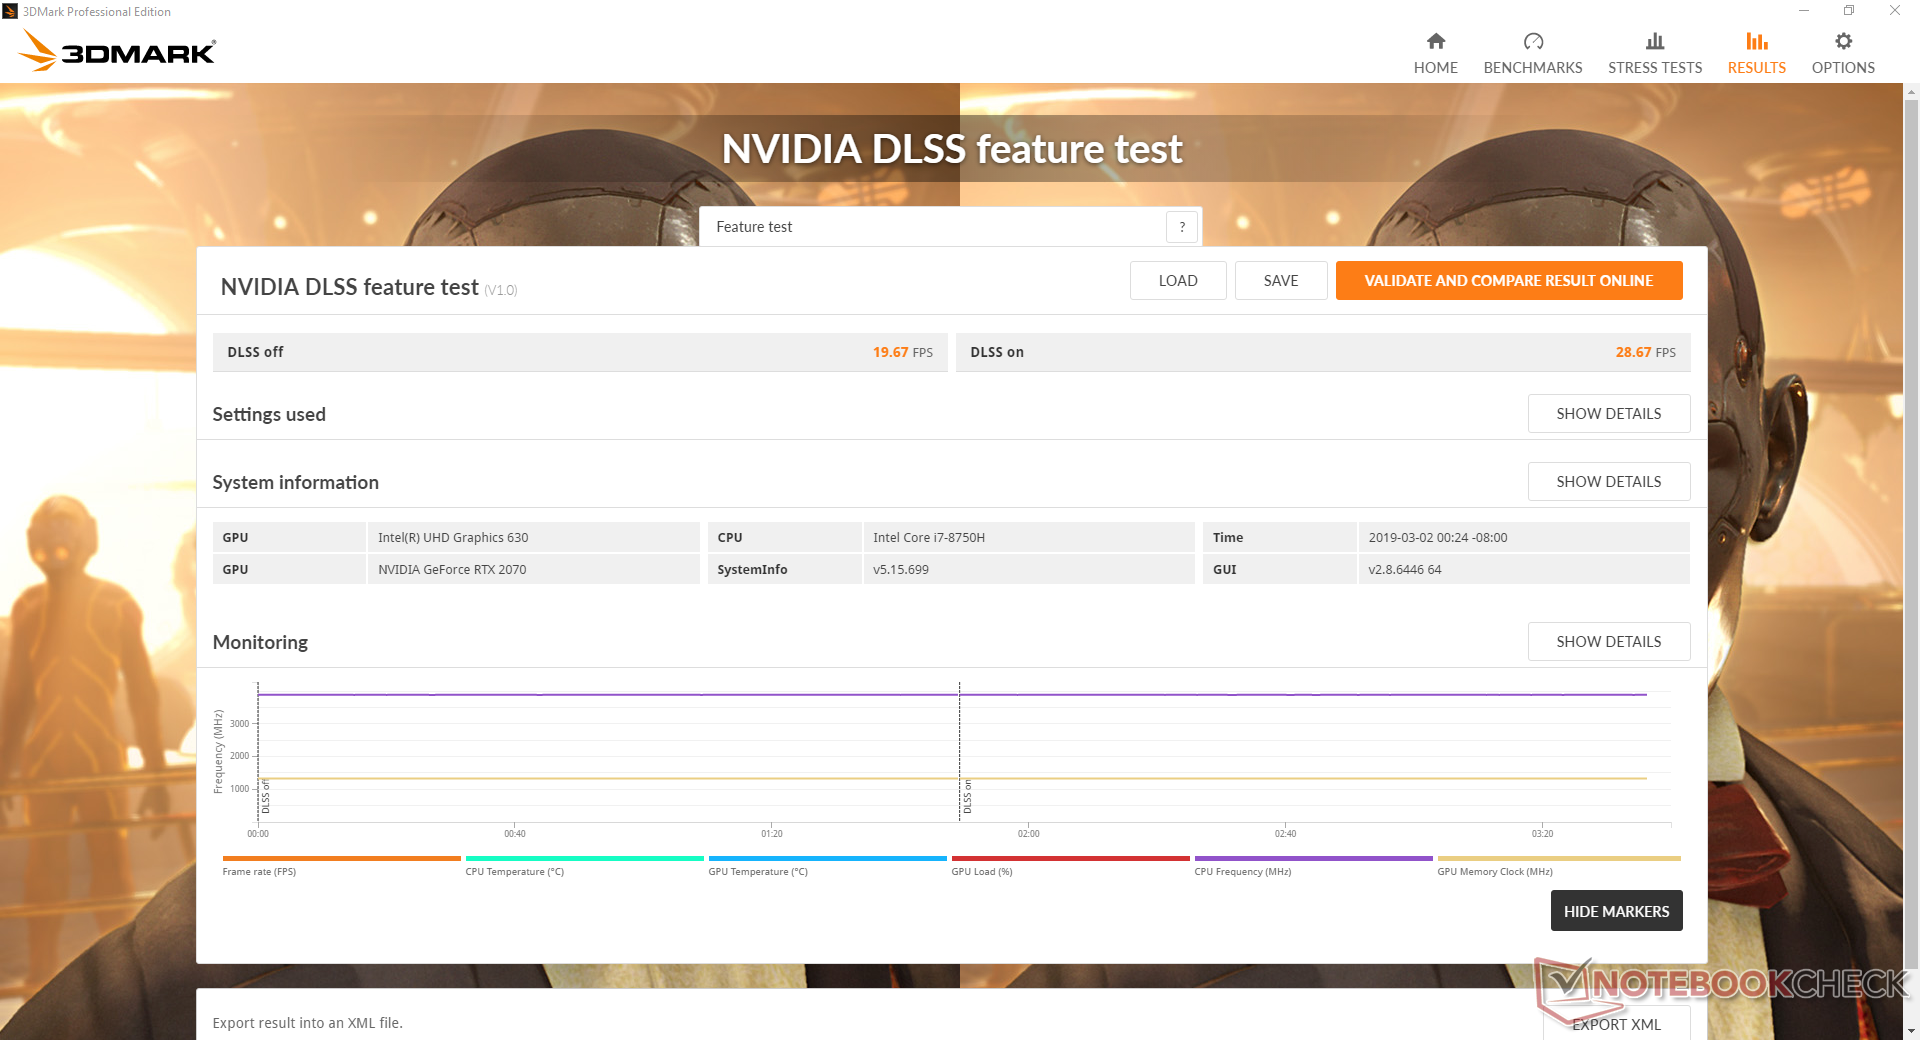
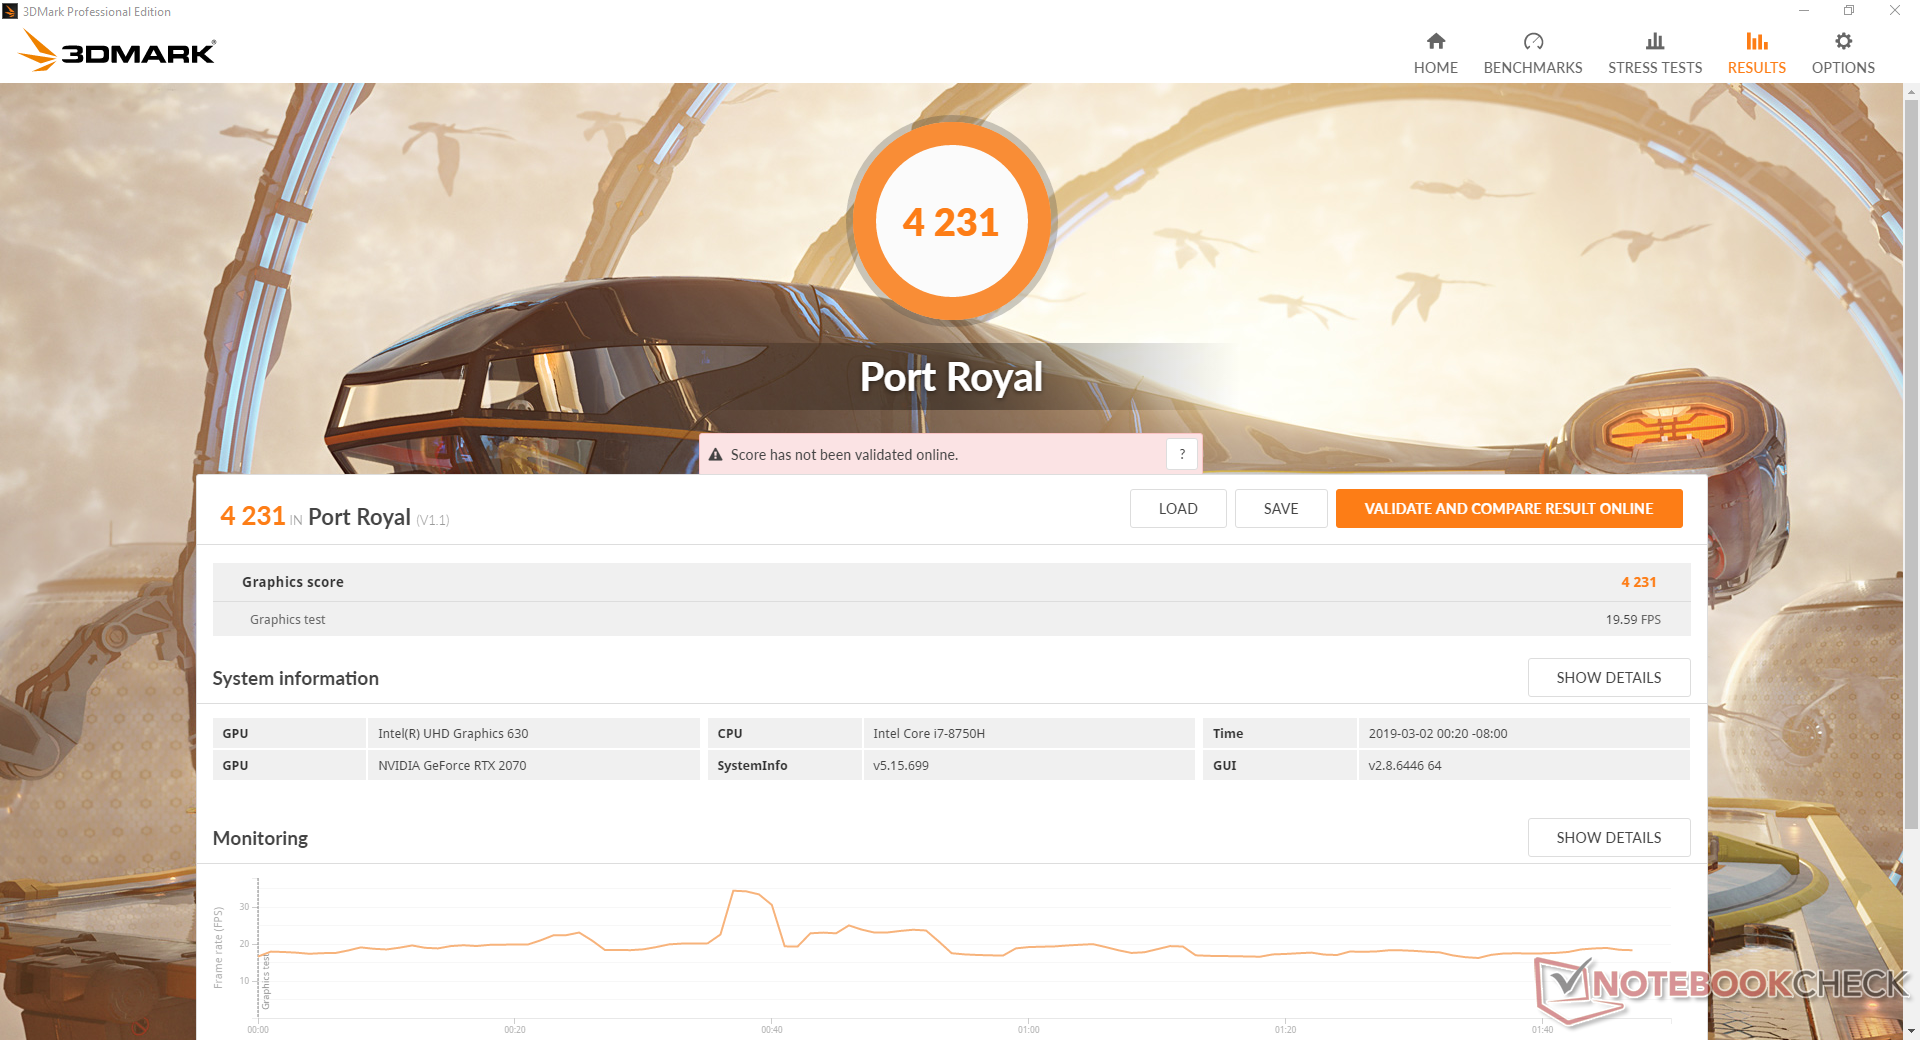
The RTX 2070 in our MSI is performing exactly where we expect it to be in relation to other laptops equipped with the same GPU. Users can expect about up to 35 percent faster performance than the last generation GTX 1070. The performance advantage becomes more pronounced when running DX12 titles at native resolutions higher than 1080p.
Jumping up to the RTX 2080 SKU will offer a 30 percent graphics boost while opting for the less expensive RTX 2060 SKU will result in a performance drop of 20 to 30 percent. Performance is within single-digit percentage points of a standard mobile GTX 1080 before accounting for any DLSS or ray-tracing features.
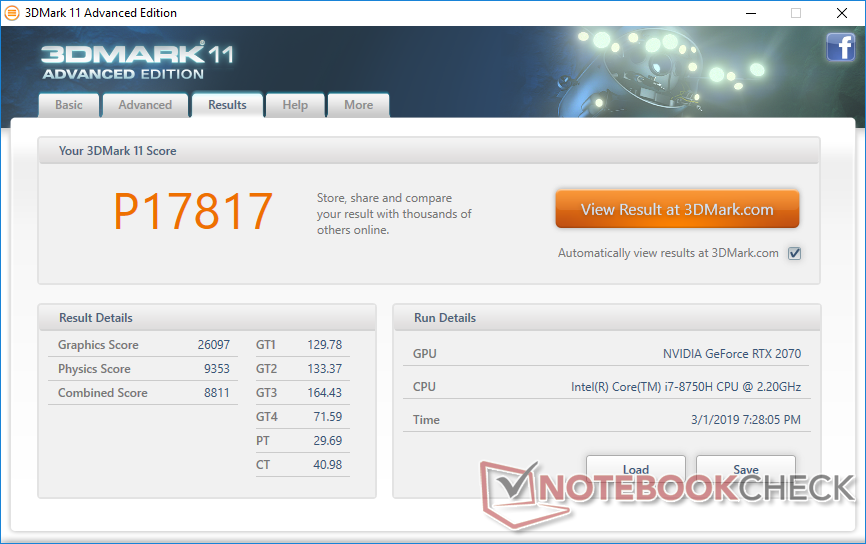
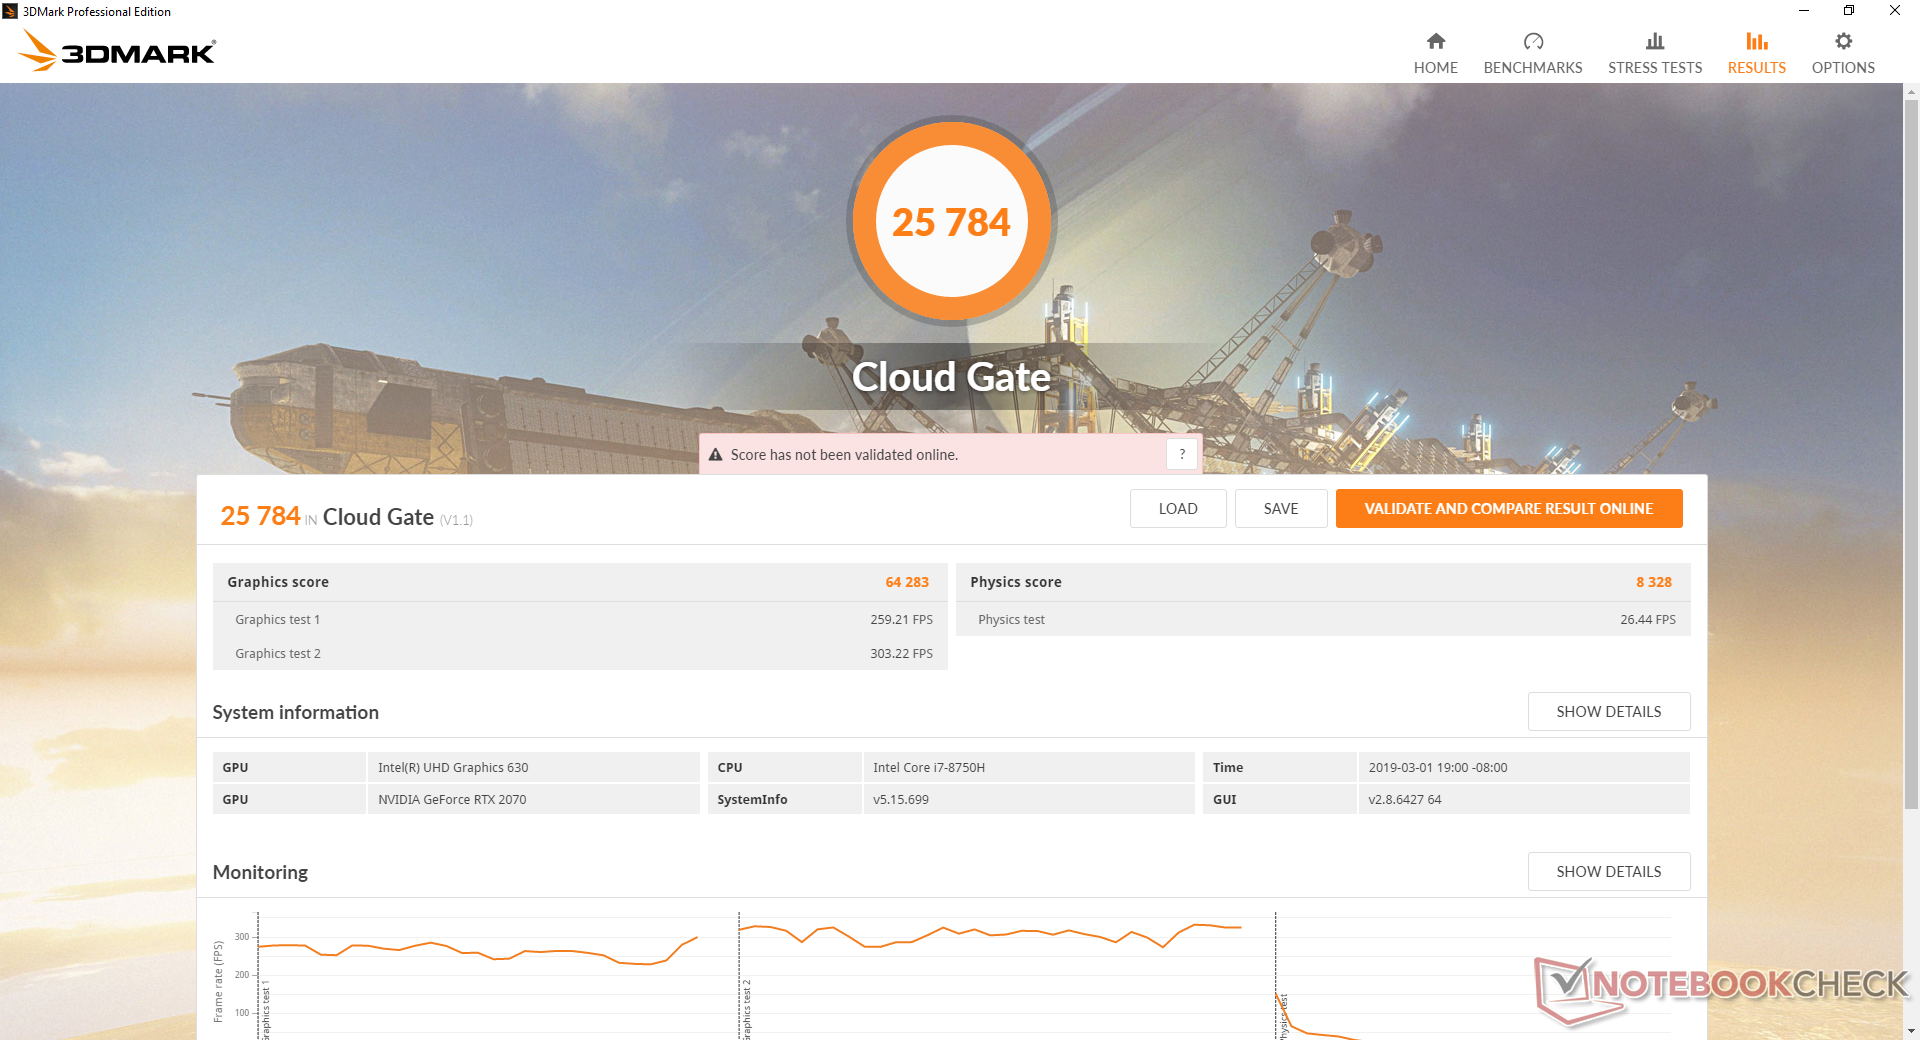
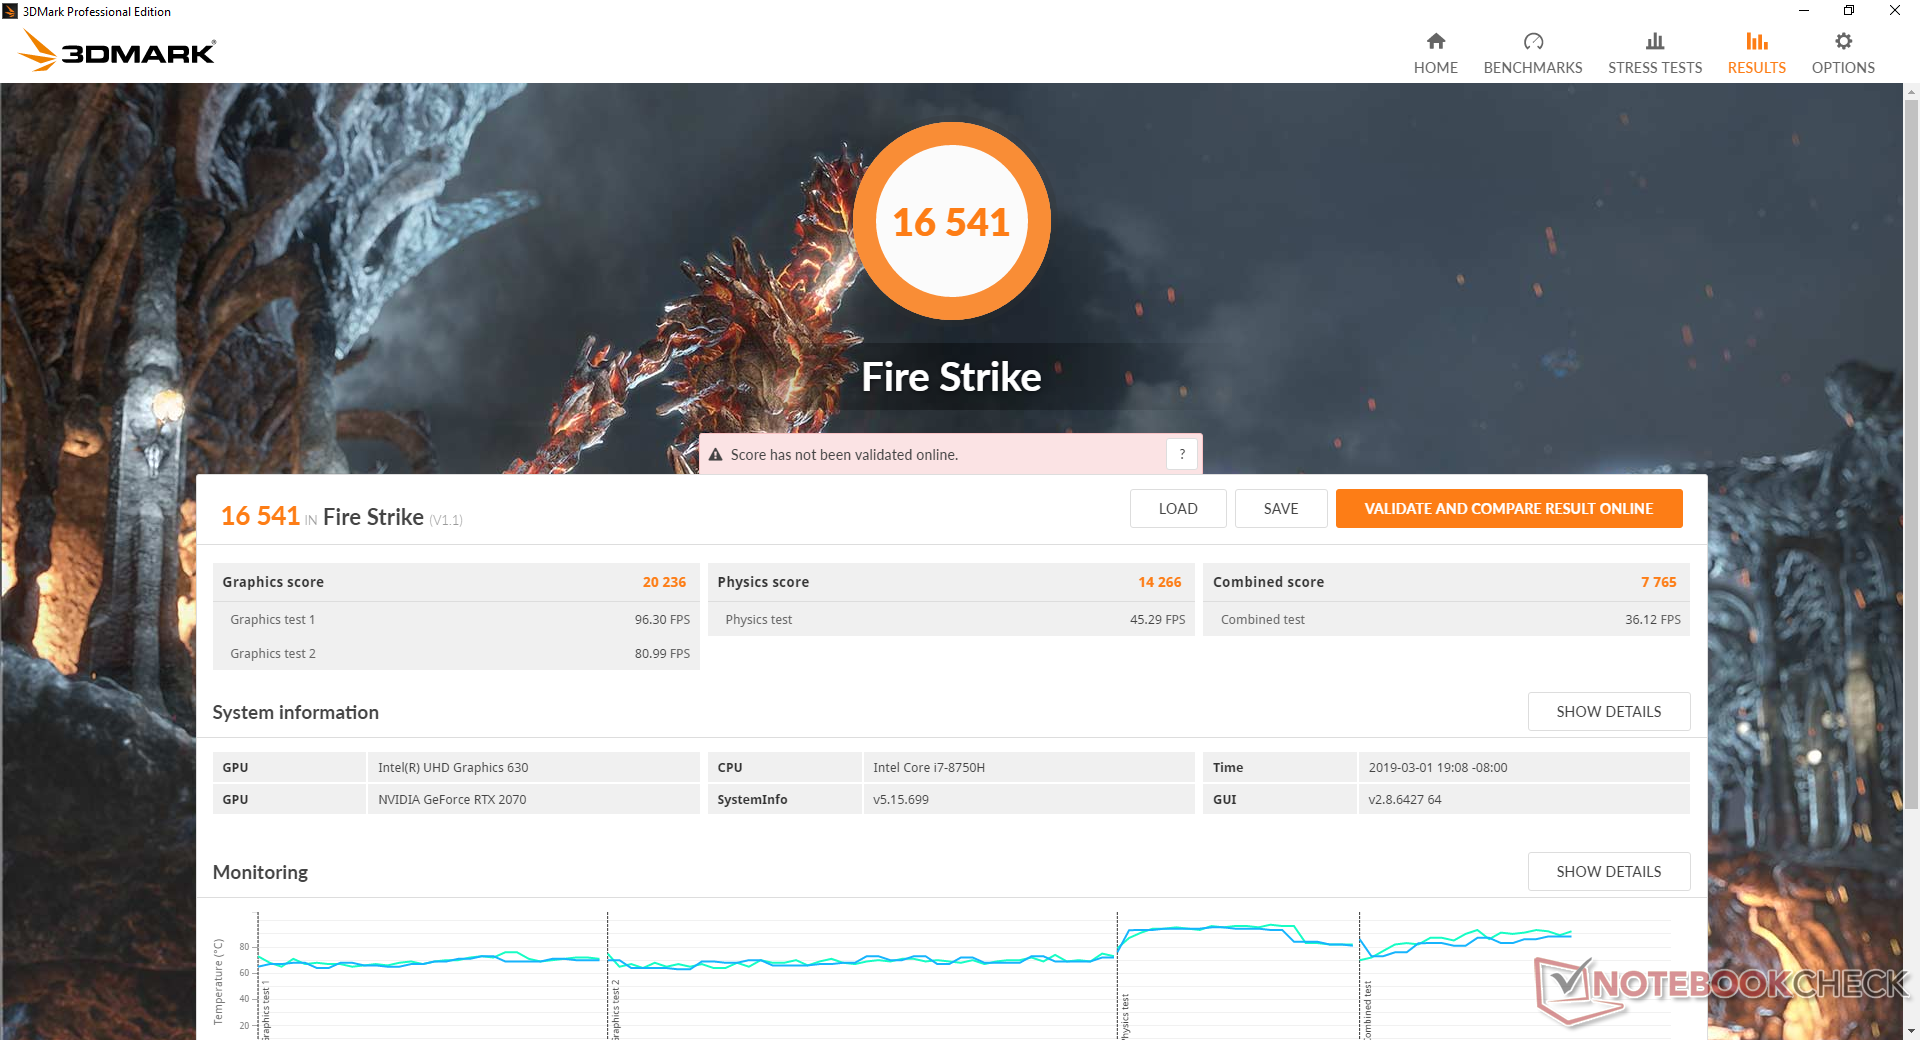
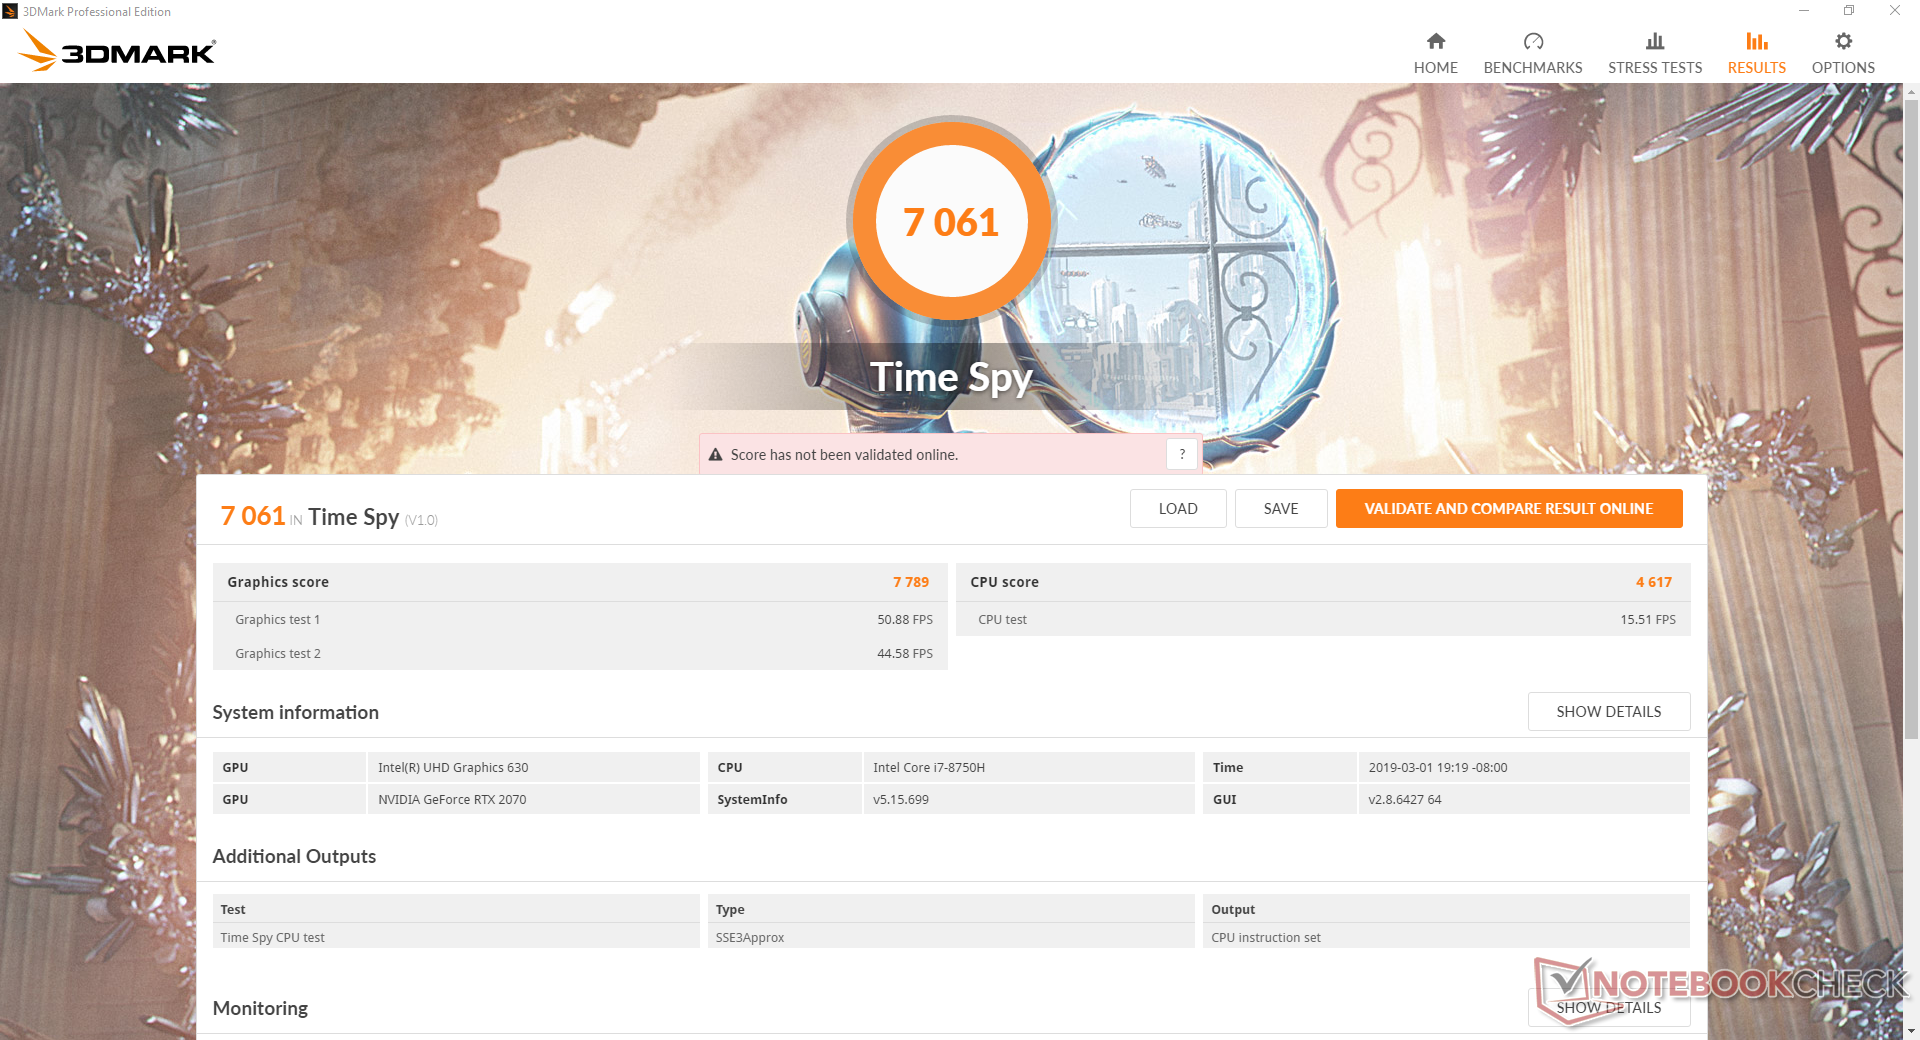
| 3DMark 11 Performance | 17817 points | |
| 3DMark Cloud Gate Standard Score | 25784 points | |
| 3DMark Fire Strike Score | 16541 points | |
| 3DMark Time Spy Score | 7061 points | |
Help | ||
Gaming Performance
The RTX 2070 pairs very well with high refresh rate 1080p panels since it is capable of running the latest titles beyond 60 FPS with ease. Nonetheless, expect screen tearing and uneven frame pacing if v-sync or buffering is not engaged since the GE75 lacks G-Sync. Users can expect gaming performance to be very similar to the GTX 1080 as predicted by 3DMark benchmarks.
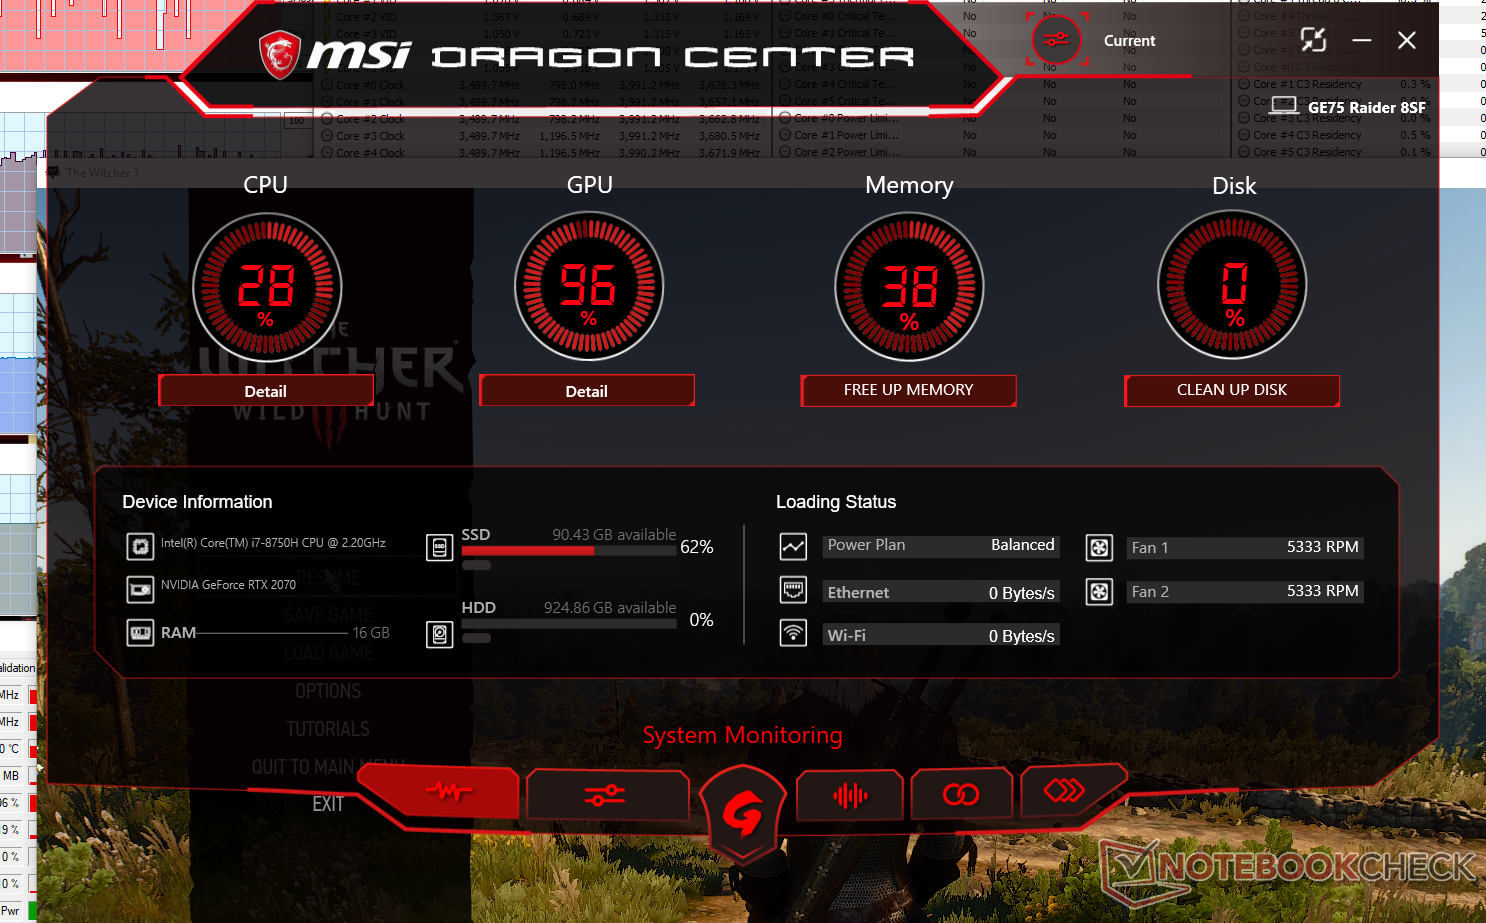
Idling on Witcher 3 shows mostly consistent frame rates over a period of 40 minutes. We recorded two instances of slower frame rates as low as 55 FPS or 65 FPS as shown by the graph below. We're unsure why this occurred, but it could be due to background activity. Since MSI laptops include a fair number of pre-installed software (Dragon Center, True Color, SteelSeries Engine 3, Battery Calibration, Help Desk, etc.), we recommend uninstalling the ones you won't be using.
See our dedicated page on the mobile RTX series for more technical information and gaming benchmarks with the RTX 2070.
| low | med. | high | ultra | |
|---|---|---|---|---|
| BioShock Infinite (2013) | 231 | 208.9 | 193.1 | 136.9 |
| The Witcher 3 (2015) | 193.9 | 154 | 115.7 | 70.9 |
| Rise of the Tomb Raider (2016) | 120 | 111.3 | 92.2 | 89.4 |
Emissions
System Noise
Fan noise has not improved over the GE73 despite the chassis changes. Running Witcher 3 induces a cycling fan noise between 47 dB(A) and 50 dB(A) much like on the Asus GL704GW. In comparison, the Lenovo Legion Y740-17ICH (RTX 2080 Max-Q) and old Zephyrus GX501 (GTX 1080 Max-Q) are much quieter at about 42 dB(A) each when running the same game.
If Turbo Fan is enabled, the fans will operate at maximum RPM for a recorded noise of 56.9 dB(A). This feature is thankfully not needed for gaming as core temperatures are already respectable as our next section will show.
We can notice no coil whine on our test unit.
| MSI GE75 8SF GeForce RTX 2070 Mobile, i7-8750H, Kingston RBUSNS8154P3256GJ1 | Lenovo Legion Y740-17ICH GeForce RTX 2080 Max-Q, i7-8750H, Samsung SSD PM981 MZVLB256HAHQ | Asus Zephyrus S GX701GX GeForce RTX 2080 Max-Q, i7-8750H, Samsung SSD PM981 MZVLB1T0HALR | Asus ROG Strix Scar II GL704GW GeForce RTX 2070 Mobile, i7-8750H, Intel SSD 660p SSDPEKNW512G8 | MSI GE73 8RF-008 Raider RGB GeForce GTX 1070 Mobile, i7-8750H, Toshiba HG6 THNSNJ256G8NY | MSI GT75 8RG-090 Titan GeForce GTX 1080 Mobile, i9-8950HK, 2x Samsung PM961 MZVLW256HEHP (RAID 0) | |
|---|---|---|---|---|---|---|
| Noise | 10% | 1% | -2% | 0% | -6% | |
| off / environment * (dB) | 28.3 | 28.3 -0% | 29 -2% | 29 -2% | 30 -6% | 30 -6% |
| Idle Minimum * (dB) | 33.5 | 31.5 6% | 29 13% | 29 13% | 32 4% | 32 4% |
| Idle Average * (dB) | 33.6 | 31.6 6% | 32 5% | 32 5% | 33 2% | 34 -1% |
| Idle Maximum * (dB) | 35 | 31.6 10% | 33 6% | 40 -14% | 34 3% | 37 -6% |
| Load Average * (dB) | 38 | 32.3 15% | 47 -24% | 46 -21% | 41 -8% | 43 -13% |
| Witcher 3 ultra * (dB) | 50 | 43 14% | 49 2% | 51 -2% | 50 -0% | 57 -14% |
| Load Maximum * (dB) | 56.9 | 45.5 20% | 51 10% | 52 9% | 54 5% | 62 -9% |
* ... smaller is better
Noise level
| Idle |
| 33.5 / 33.6 / 35 dB(A) |
| Load |
| 38 / 56.9 dB(A) |
 | ||
30 dB silent 40 dB(A) audible 50 dB(A) loud |
||
min: | ||
Temperature
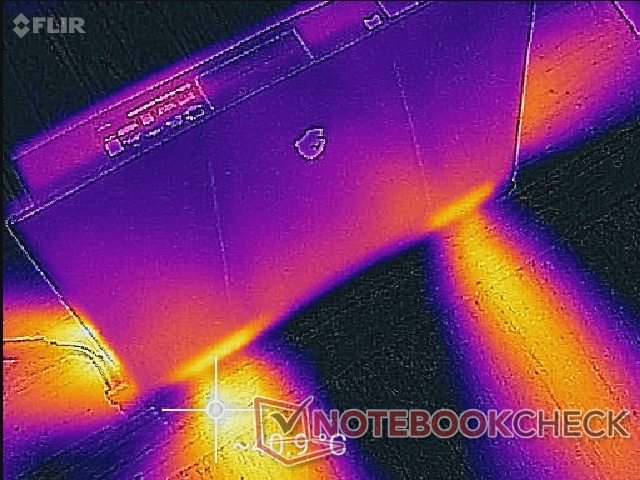
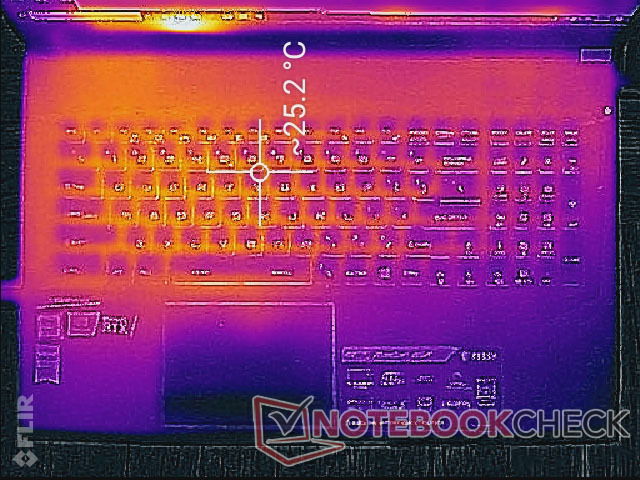
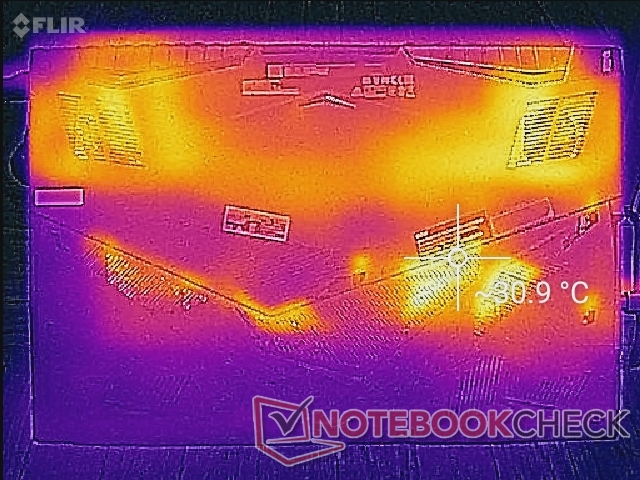
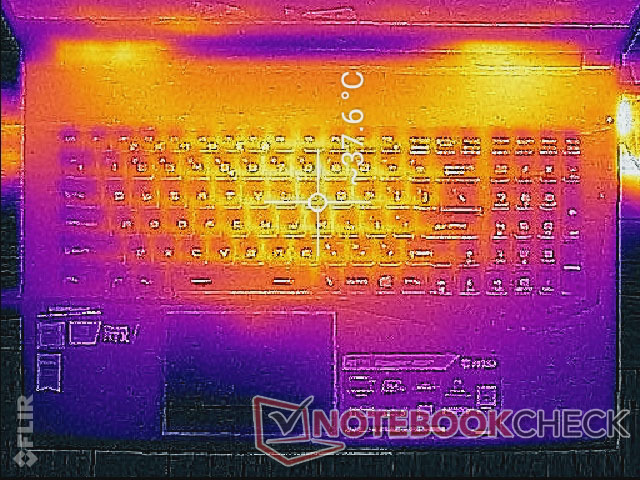
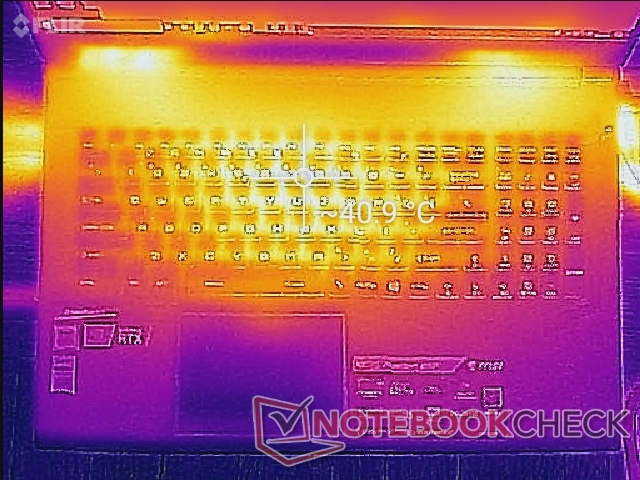
Surface temperatures are generally cooler on the GE75 compared to last year's GE73. When gaming, the center of the keyboard hot spot can become as warm as 41 C whereas the same hot spot on the GE73 would be as warm as 46 C. Fortunately, these very warm areas are away from the palm rests, trackpad, NumPad, and WASD keys for comfortable gaming. The competing Asus ROG GL704 with the same RTX 2070 GPU runs warmer than our GE75 especially around the rear of the unit.
One reason why the GE75 runs cooler than the Asus is its ample amount of ventilation grilles much like on the Legion Y740-17ICH. Be sure to not block any of the many openings for optimal cooling when gaming.


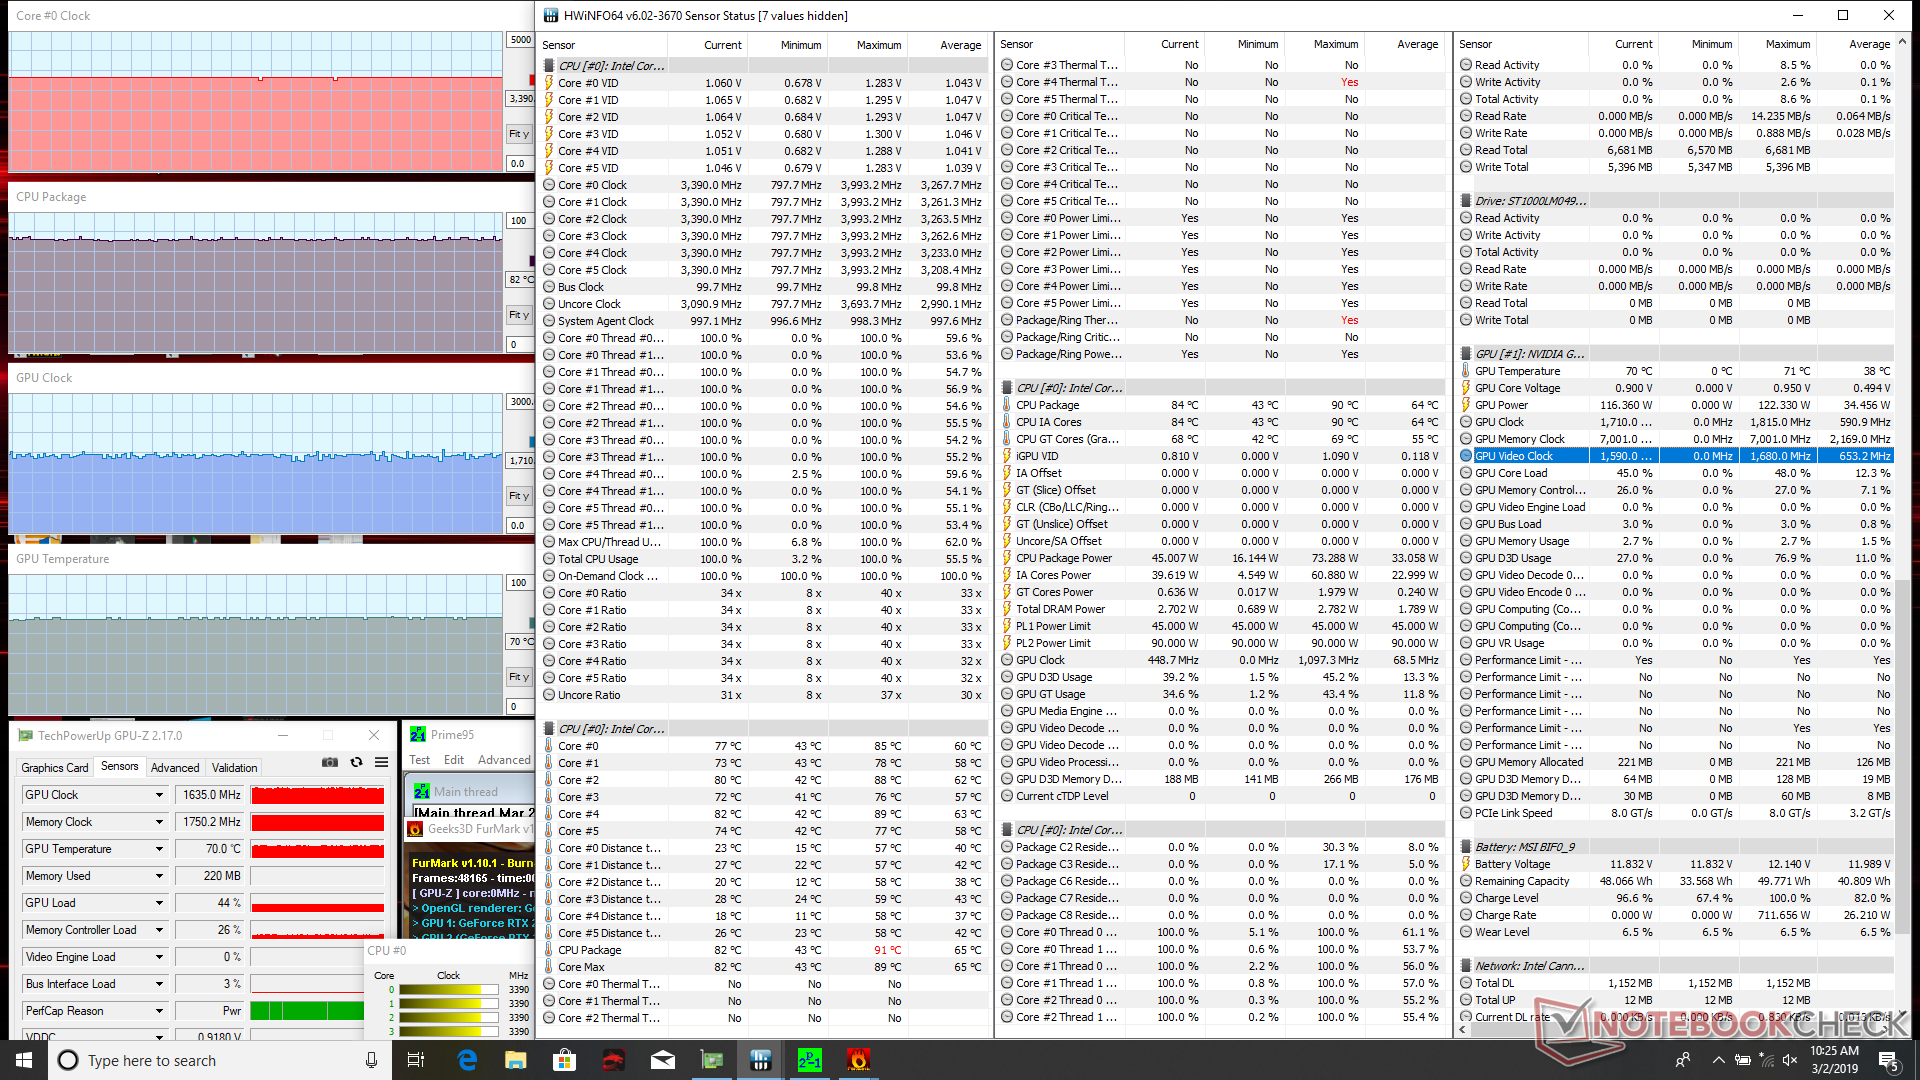
Stress Test
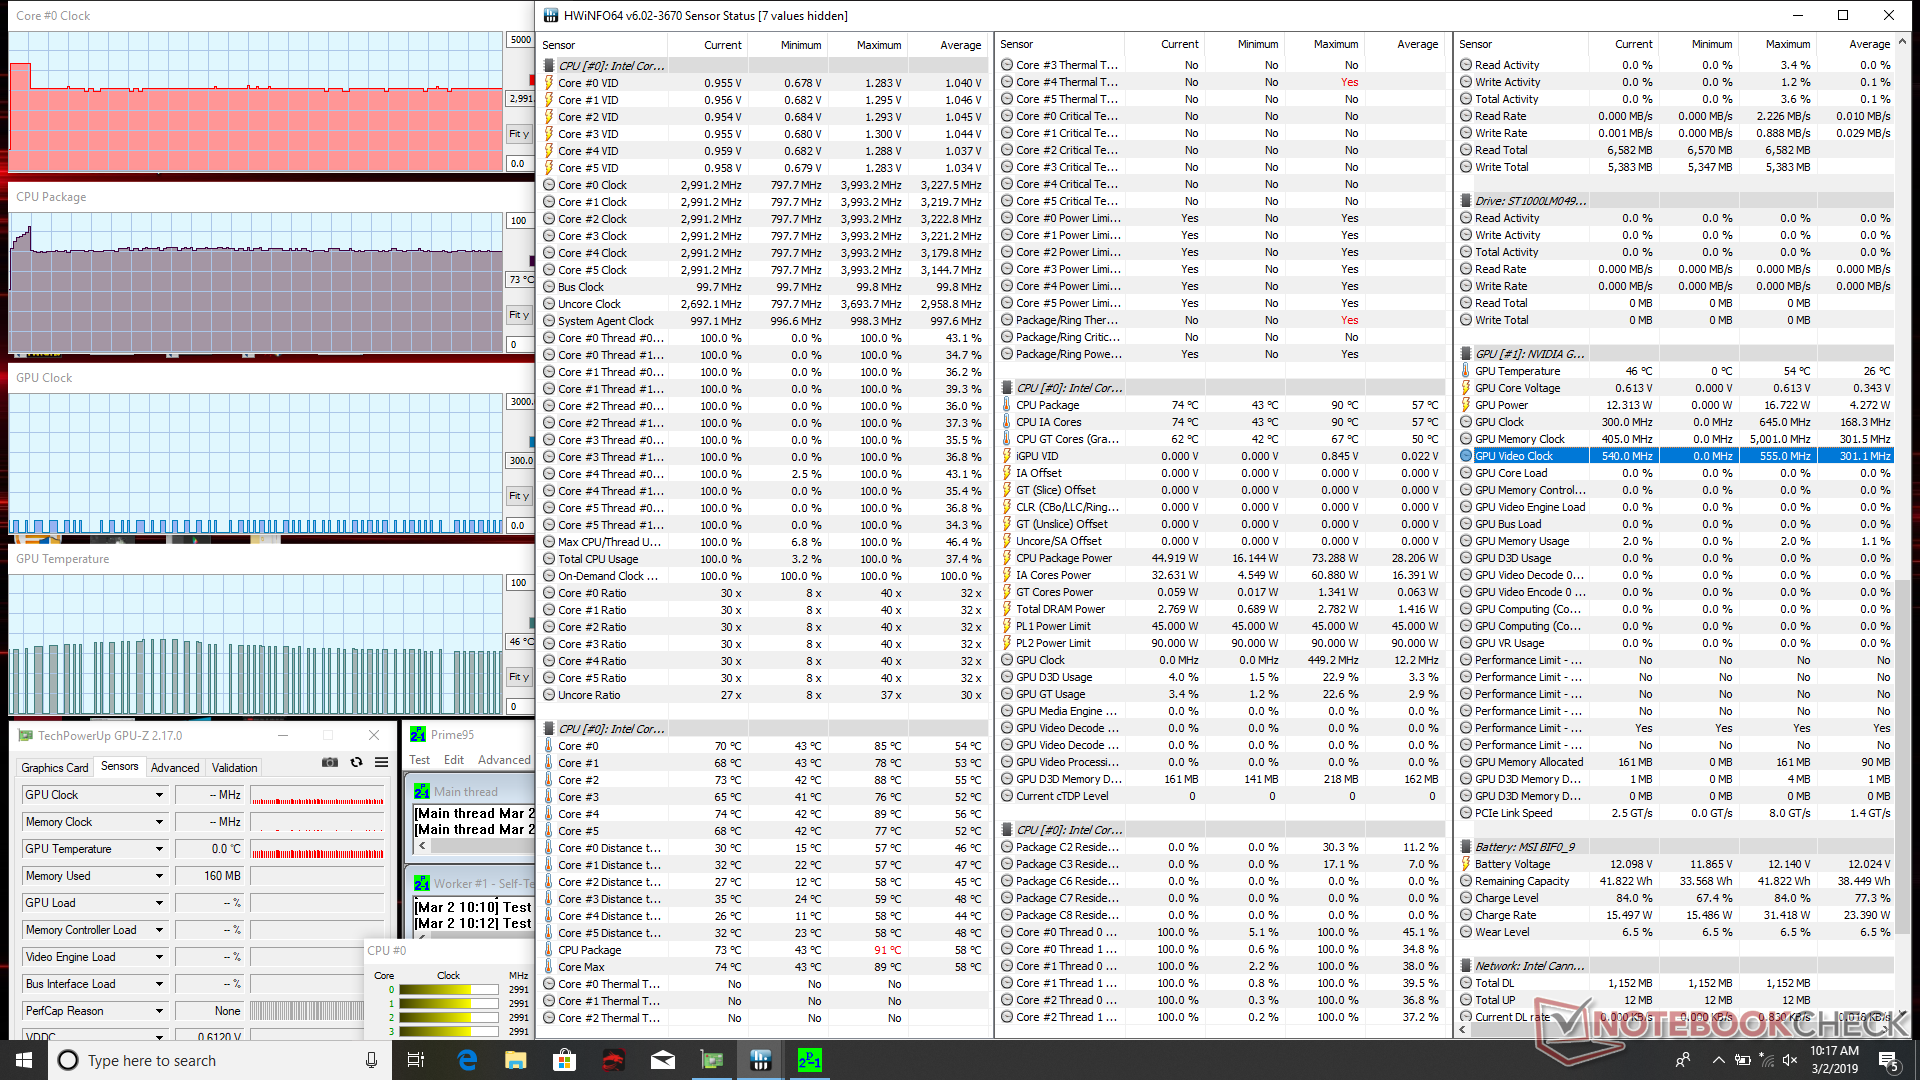
We stress the laptop with synthetic loads to identify for any potential throttling or stability issues. When running Prime95, the CPU will boost up to 3.9 GHz for the first few seconds before reaching a core temperature of 91 C. Thereafter, clock rates stabilize at 3.0 GHz for a cooler core temperature of 73 C. This is still 800 MHz above the base clock rate of the Core i7-8750H for an average level of Turbo Boost sustainability. Some laptops with the same CPU, like the Legion Y740-17ICH, are able to maintain faster core clock rates in the 3.5 GHz range for better processor performance than the MSI.
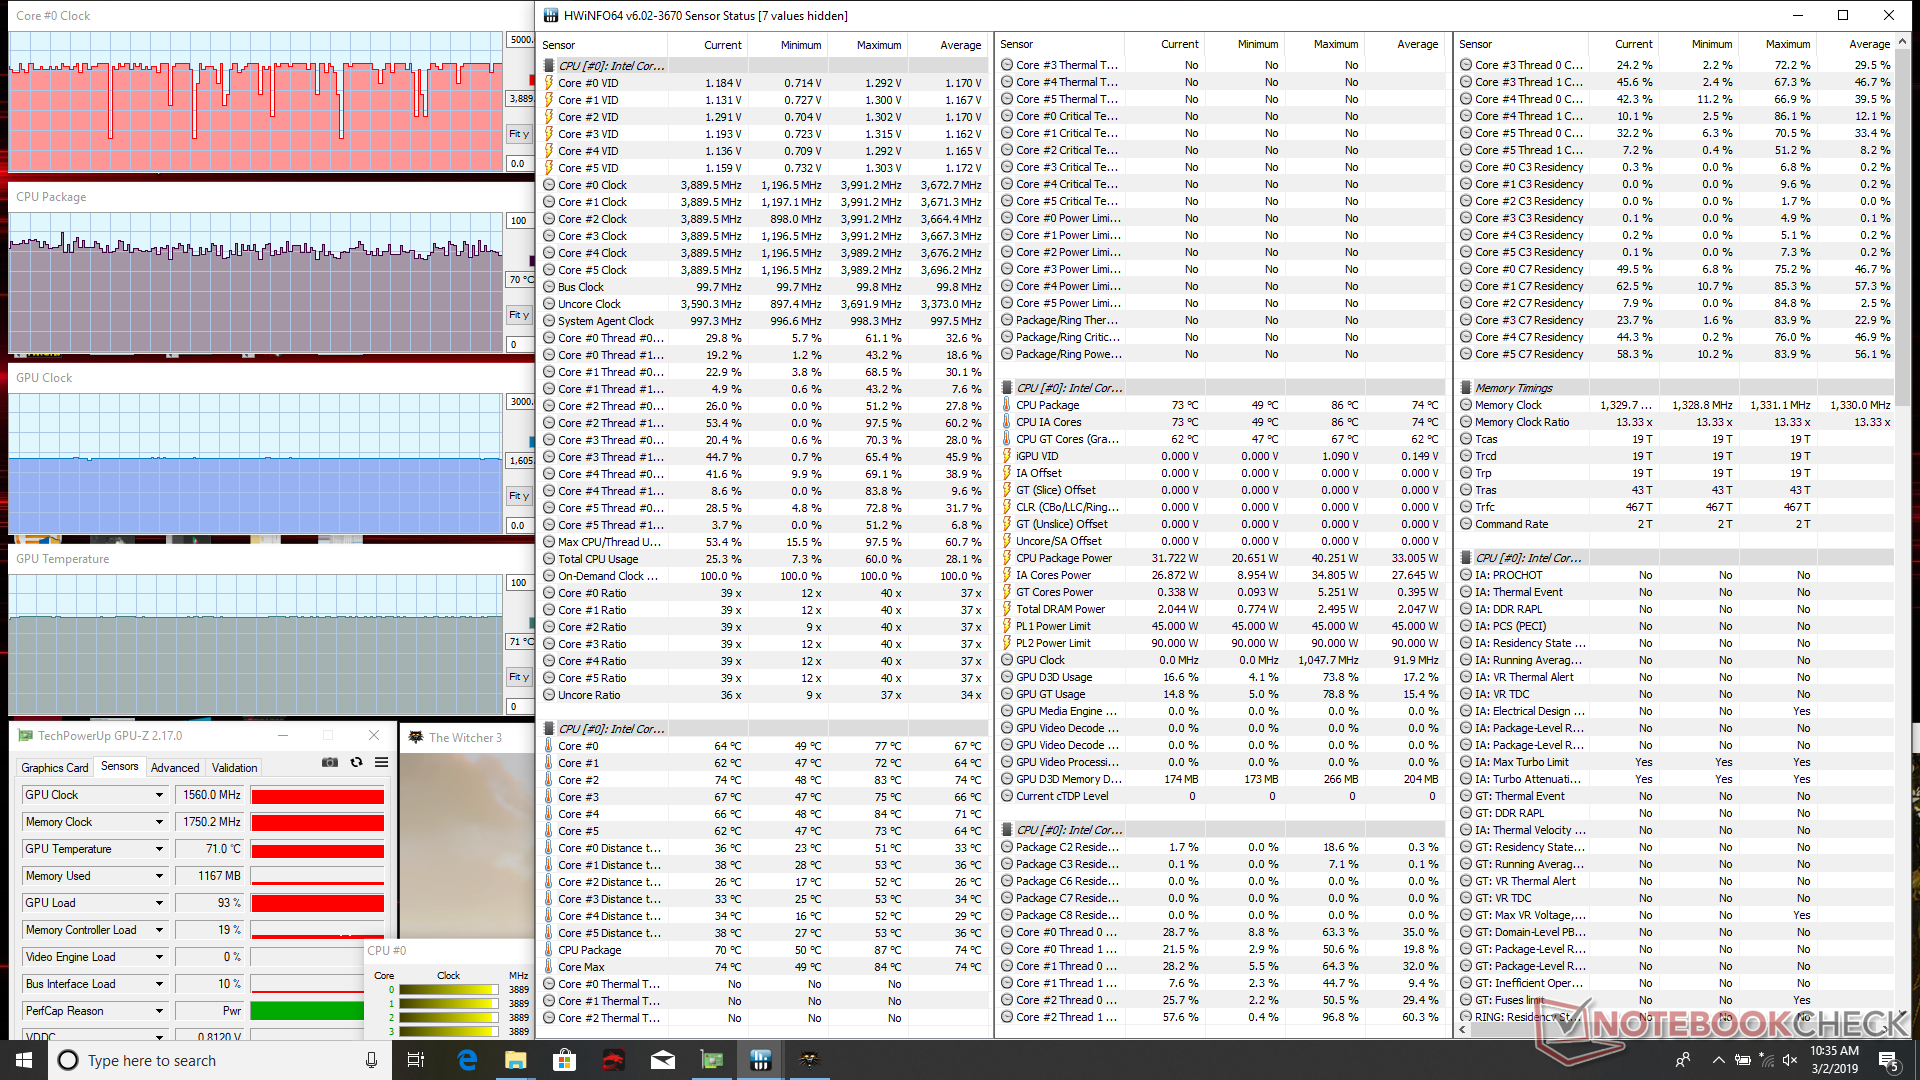
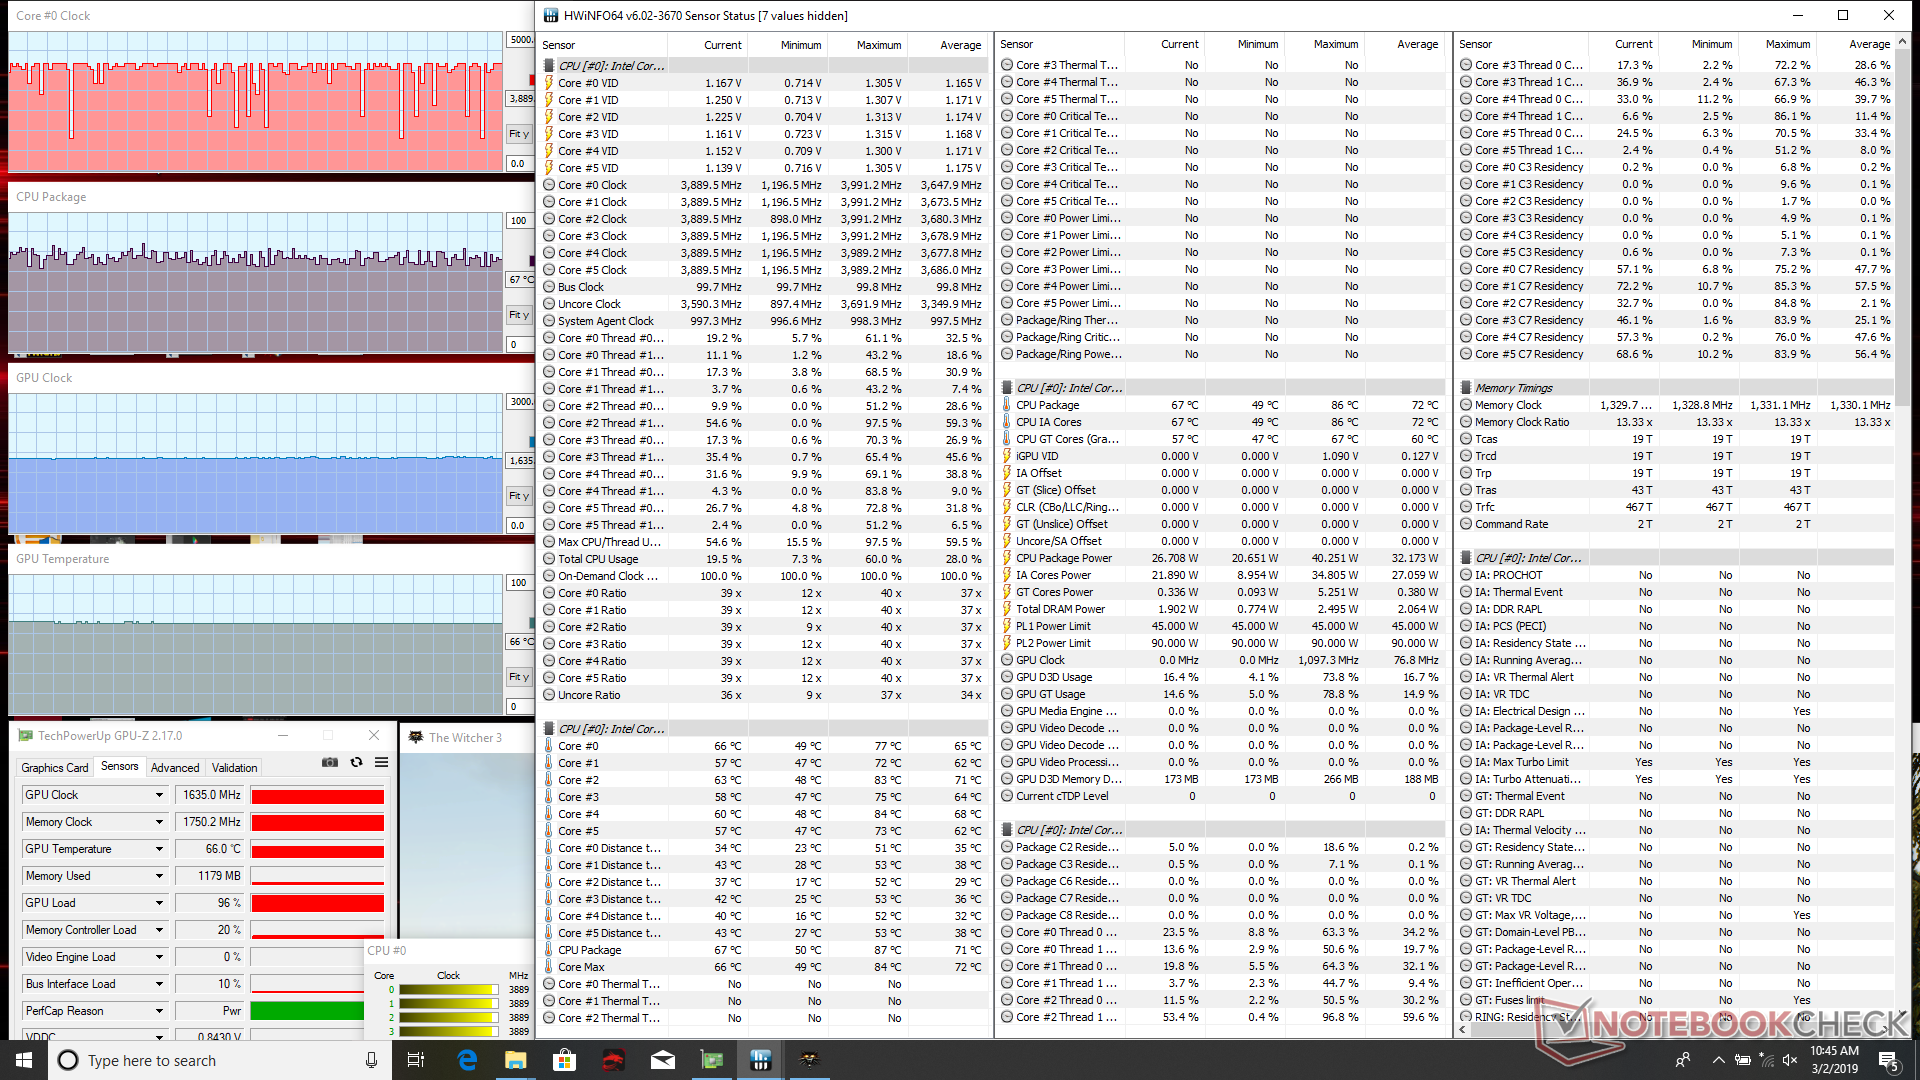
Running Witcher 3 is more representative of real-world gaming stress. Both processors stabilize at about 70 C each with no throttling behavior. Enabling Turbo Fan mode will reduce core temperatures by only 3 C to 5 C when gaming while significantly increasing fan noise. Since core temperatures when gaming are already respectable, we don't find the Turbo Fan feature to be necessary under most circumstances.
Note that enabling Turbo Fan mode will not increase CPU performance and will only bump GPU clock rate just marginally.
Running on battery power will reduce performance even when set to High Performance profiles. A 3DMark Fire Strike run on batteries returns Physics and Graphics scores of 8292 and 5910 points, respectively, compared to 14266 and 20236 points when on mains.
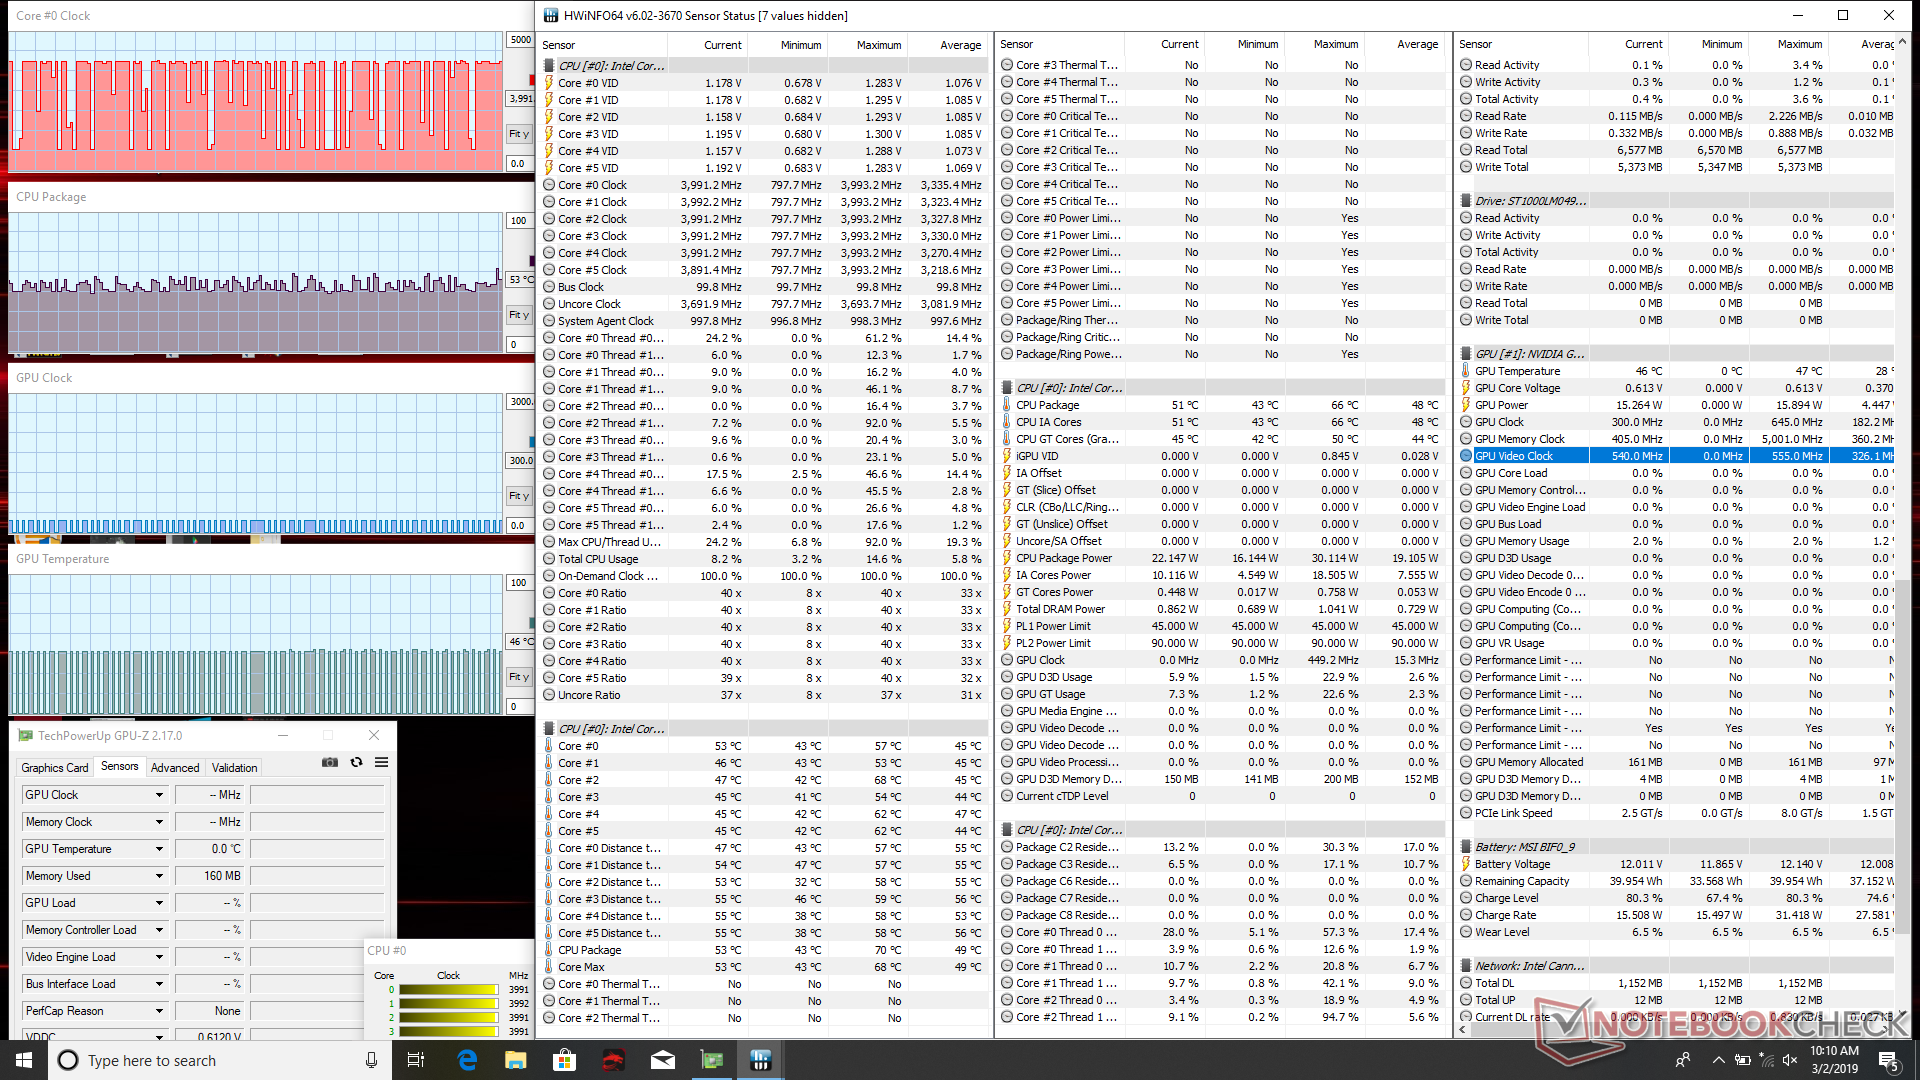
| CPU Clock (GHz) | GPU Clock (MHz) | Average CPU Temperature (°C) | Average GPU Temperature (°C) | |
| System Idle | -- | -- | 53 | 46 |
| Prime95 Stress | 3.0 | -- | 73 | -- |
| Prime95 + FurMark Stress | 3.4 | 1635 | 82 | 70 |
| Witcher 3 Stress | ~3.9 | 1560 | 70 | 71 |
| Witcher 3 Stress (Turbo Fan on) | ~3.9 | 1635 | 67 | 66 |
(±) The maximum temperature on the upper side is 41.2 °C / 106 F, compared to the average of 40.4 °C / 105 F, ranging from 21.2 to 68.8 °C for the class Gaming.
(-) The bottom heats up to a maximum of 46 °C / 115 F, compared to the average of 43.2 °C / 110 F
(+) In idle usage, the average temperature for the upper side is 24.6 °C / 76 F, compared to the device average of 33.9 °C / 93 F.
(+) Playing The Witcher 3, the average temperature for the upper side is 30.7 °C / 87 F, compared to the device average of 33.9 °C / 93 F.
(+) The palmrests and touchpad are cooler than skin temperature with a maximum of 27.4 °C / 81.3 F and are therefore cool to the touch.
(±) The average temperature of the palmrest area of similar devices was 28.8 °C / 83.8 F (+1.4 °C / 2.5 F).
Speakers


MSI GE75 8SF audio analysis
(+) | speakers can play relatively loud (89.3 dB)
Bass 100 - 315 Hz
(±) | reduced bass - on average 13.7% lower than median
(+) | bass is linear (6.8% delta to prev. frequency)
Mids 400 - 2000 Hz
(±) | reduced mids - on average 5.1% lower than median
(±) | linearity of mids is average (7.4% delta to prev. frequency)
Highs 2 - 16 kHz
(+) | balanced highs - only 3.3% away from median
(+) | highs are linear (6.4% delta to prev. frequency)
Overall 100 - 16.000 Hz
(±) | linearity of overall sound is average (16.2% difference to median)
Compared to same class
» 40% of all tested devices in this class were better, 7% similar, 53% worse
» The best had a delta of 6%, average was 18%, worst was 132%
Compared to all devices tested
» 26% of all tested devices were better, 6% similar, 68% worse
» The best had a delta of 4%, average was 23%, worst was 134%
Apple MacBook 12 (Early 2016) 1.1 GHz audio analysis
(+) | speakers can play relatively loud (83.6 dB)
Bass 100 - 315 Hz
(±) | reduced bass - on average 11.3% lower than median
(±) | linearity of bass is average (14.2% delta to prev. frequency)
Mids 400 - 2000 Hz
(+) | balanced mids - only 2.4% away from median
(+) | mids are linear (5.5% delta to prev. frequency)
Highs 2 - 16 kHz
(+) | balanced highs - only 2% away from median
(+) | highs are linear (4.5% delta to prev. frequency)
Overall 100 - 16.000 Hz
(+) | overall sound is linear (10.2% difference to median)
Compared to same class
» 7% of all tested devices in this class were better, 2% similar, 90% worse
» The best had a delta of 5%, average was 18%, worst was 53%
Compared to all devices tested
» 5% of all tested devices were better, 1% similar, 94% worse
» The best had a delta of 4%, average was 23%, worst was 134%
Energy Management
Power Consumption
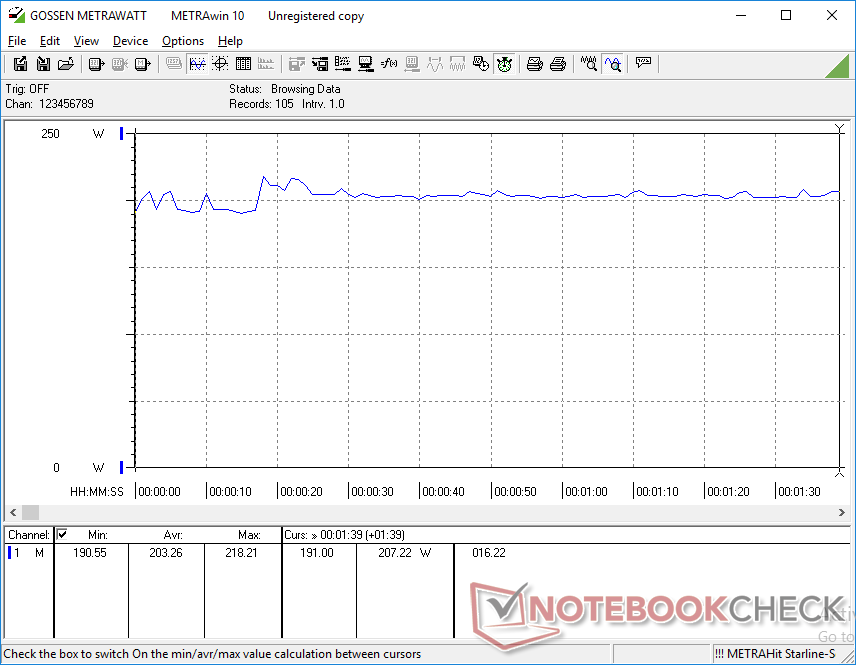
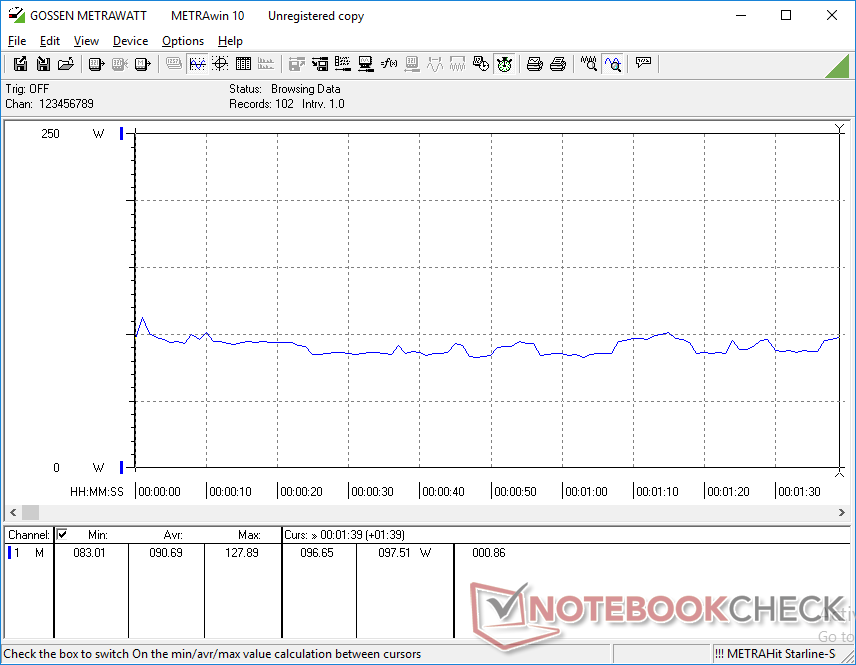
Power consumption when gaming (203 W) is slightly higher than the last generation GE73 with the GTX 1070 GPU (190 W) and significantly higher than the Lenovo Legion Y740-17ICH with the RTX 2080 Max-Q (152 W). This latter revelation is quite surprising because the RTX 2080 Max-Q is 5 to 10 percent faster than the standard RTX 2070 and yet it demands 25 percent less power.
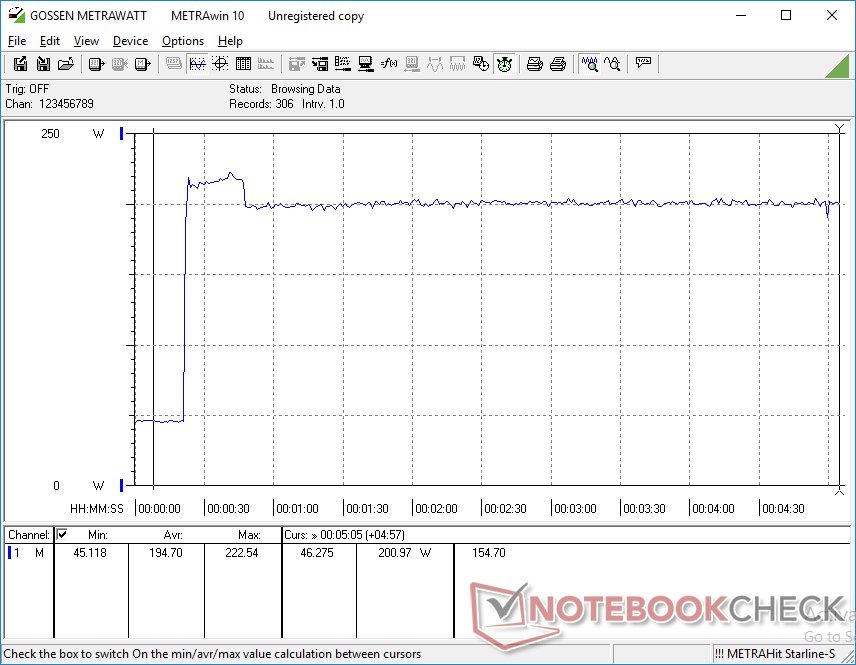
The maximum consumption we can record is 223 W from the relatively large (~18 x 8.5 x 3.5 cm) and heavy (1 kg) 280 W AC adapter when running both Prime95 and FurMark simultaneously. We suspect that the more powerful GE75 RTX 2080 SKU will pull in an additional 30 W to 50 W when under similar conditions.
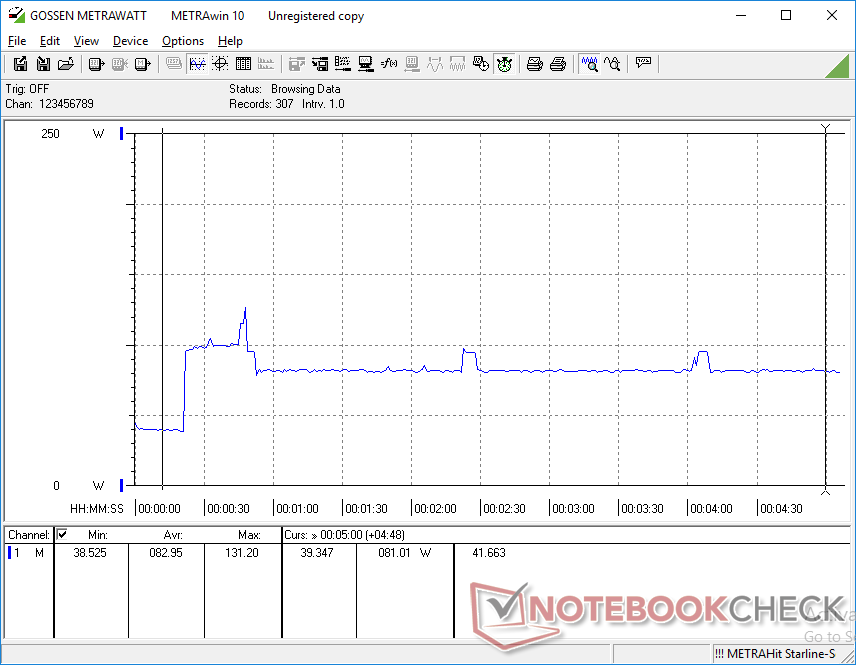
When running Prime95, power consumption spikes to about 100 W for the first few seconds before dropping and stabilizing at 81 W due to limited Turbo Boost sustainability. This behavior mirrors what we observed during our CineBench loop test and stress tests above.
| Off / Standby | |
| Idle | |
| Load |
|
Key:
min: | |
| MSI GE75 8SF i7-8750H, GeForce RTX 2070 Mobile, Kingston RBUSNS8154P3256GJ1, IPS, 1920x1080, 17.3" | Lenovo Legion Y740-17ICH i7-8750H, GeForce RTX 2080 Max-Q, Samsung SSD PM981 MZVLB256HAHQ, IPS, 1920x1080, 17.3" | Asus ROG Strix Scar II GL704GW i7-8750H, GeForce RTX 2070 Mobile, Intel SSD 660p SSDPEKNW512G8, AHVA, 1920x1080, 17.3" | MSI GE73 8RF-008 Raider RGB i7-8750H, GeForce GTX 1070 Mobile, Toshiba HG6 THNSNJ256G8NY, TN WLED, 1920x1080, 17.3" | MSI GT75 8RG-090 Titan i9-8950HK, GeForce GTX 1080 Mobile, 2x Samsung PM961 MZVLW256HEHP (RAID 0), TN, 1920x1080, 17.3" | |
|---|---|---|---|---|---|
| Power Consumption | -2% | -7% | 2% | -62% | |
| Idle Minimum * (Watt) | 16.4 | 20.2 -23% | 19 -16% | 15 9% | 31 -89% |
| Idle Average * (Watt) | 21.9 | 27.2 -24% | 22 -0% | 20 9% | 35 -60% |
| Idle Maximum * (Watt) | 25.4 | 28.7 -13% | 29 -14% | 26 -2% | 45 -77% |
| Load Average * (Watt) | 90.7 | 90.8 -0% | 102 -12% | 97 -7% | 130 -43% |
| Witcher 3 ultra * (Watt) | 203.3 | 152.1 25% | 190 7% | 186 9% | 268 -32% |
| Load Maximum * (Watt) | 222.9 | 165.4 26% | 231 -4% | 239 -7% | 374 -68% |
* ... smaller is better
Battery Life
MSI has upped the battery capacity from 51 Wh on the GE73 to 65 Wh on the GE75. Battery runtimes are subsequently longer this time around but only by about half an hour during real-world WLAN loads for a total of 3.5 hours. While about average for a high-power 17-inch gaming laptop, we're still disappointed because we were expecting more from a system with Nvidia Optimus. Perhaps integrated G-Sync would have been a better feature for the GE75 instead.
Charging from empty to full capacity takes a little over 1.5 hours.
| MSI GE75 8SF i7-8750H, GeForce RTX 2070 Mobile, 65 Wh | Lenovo Legion Y740-17ICH i7-8750H, GeForce RTX 2080 Max-Q, 76 Wh | Asus Zephyrus S GX701GX i7-8750H, GeForce RTX 2080 Max-Q, 76 Wh | Asus ROG Strix Scar II GL704GW i7-8750H, GeForce RTX 2070 Mobile, 66 Wh | MSI GE73 8RF-008 Raider RGB i7-8750H, GeForce GTX 1070 Mobile, 51 Wh | MSI GT75 8RG-090 Titan i9-8950HK, GeForce GTX 1080 Mobile, 75 Wh | |
|---|---|---|---|---|---|---|
| Battery runtime | -9% | 9% | 11% | -11% | ||
| WiFi v1.3 (h) | 3.5 | 3.2 -9% | 3.8 9% | 3.9 11% | 3.1 -11% | |
| Reader / Idle (h) | 5 | 6.2 | 5.1 | 3.8 | ||
| Load (h) | 0.9 | 1.1 | 0.6 | 1.1 | ||
| Witcher 3 ultra (h) | 0.9 |
Pros
Cons
Verdict

The GE75 makes for a good alternative to the recently released GS75. It's slightly cheaper, slightly thicker, and slightly faster since it doesn't rely on Max-Q GPUs. It also makes the last generation GE73 feel obsolete as it's 19 percent smaller and 10 percent lighter while being 35 percent brighter and up to 35 percent faster. The gen-to-gen upgrades are certainly tangible and far from minor.
There are still a handful of aspects we hope future revisions will address. Fan noise hasn't improved and battery life isn't all that much better. Serviceability could be more straightforward and the lack of Thunderbolt 3 is inexcusable for a laptop retailing north of $2000 USD. G-Sync would have also been a better fit for the GE series rather than Optimus to get more out of the 144 Hz display.
The biggest competitor to the GE75 at the moment is the Asus ROG GL704 series. While the Asus system is dimmer and it lacks per-key RGB lighting, we find it to have the more rigid chassis and more serviceable components that the target gaming audience would appreciate. It's still quite the close call between the two.
Smaller, lighter, faster. The GE75 is an amalgamation of the flagship GT series and the super-thin GS series to give the best of both worlds for a cheaper starting price. There are a few cut corners like the slow SD reader and lack of both Thunderbolt 3 and 10 Gbps Ethernet, but they don't detract from the core gaming experience.
MSI GE75 8SF
- 10/03/2019 v7 (old)
Allen Ngo
Price comparison
