MSI GL73 8SE (i7-8750H, RTX 2060) Laptop Review
Nvidia RTX is the new mobile GPU in town with promising advanced features. Even the least expensive model, however, will set you back $1500 while older GTX gaming laptops continue to drop in price. For this review, we'll be checking out the entry-level MSI GL73 which is one of the least expensive RTX gaming laptops currently in the market.
The closest competitor to the 17.3-inch GL73 is the Asus ROG Strix GL704GV equipped with the same GPU. Beyond that, there aren't many 17-inch gaming laptops with RTX 2060 graphics yet since the GPU is still very new. We fully expect existing entry-level 17-inch GTX models like the Dell G3 17 and Lenovo Legion Y730 to eventually make the jump to RTX graphics. In contrast, the 15.6-inch space is littered with a plethora of RTX 2060 options.
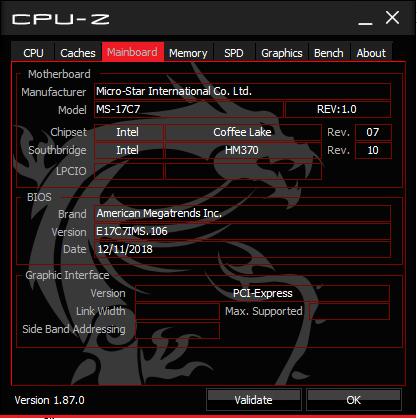
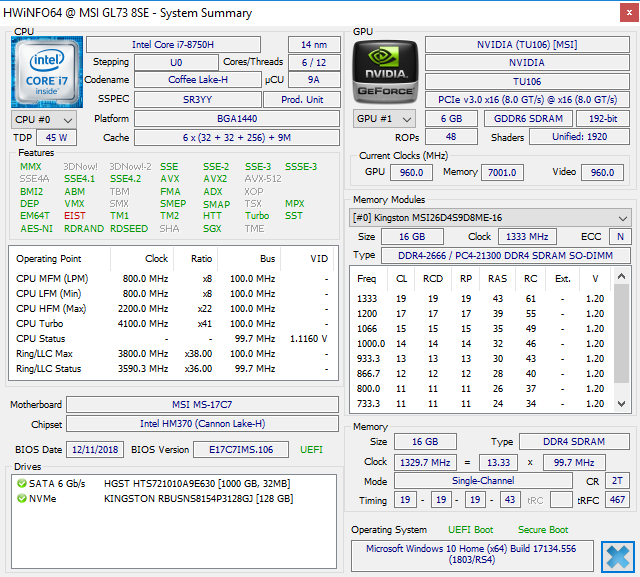
Our GL73 test unit was provided by reseller Xotic PC who offers the model with multiple CPU (i5-8300H and i7-8750H), RAM (16 GB to 32 GB), and storage (128 GB to 256 GB NVMe) options ranging from $1500 to $1700 USD. Although Xotic PC may reskin and overclock specific models, they've assured us that this particular unit has not been tuned outside of the base CPU and GPU manufacturer specifications. In other words, the unit you buy from Xotic PC would be essentially identical to ones purchased directly from MSI.
We recommend checking out our review on the older GL72 since the GL73 directly succeeds it. Naturally, the two models share many similarities both inside and out.
More MSI reviews:
Case
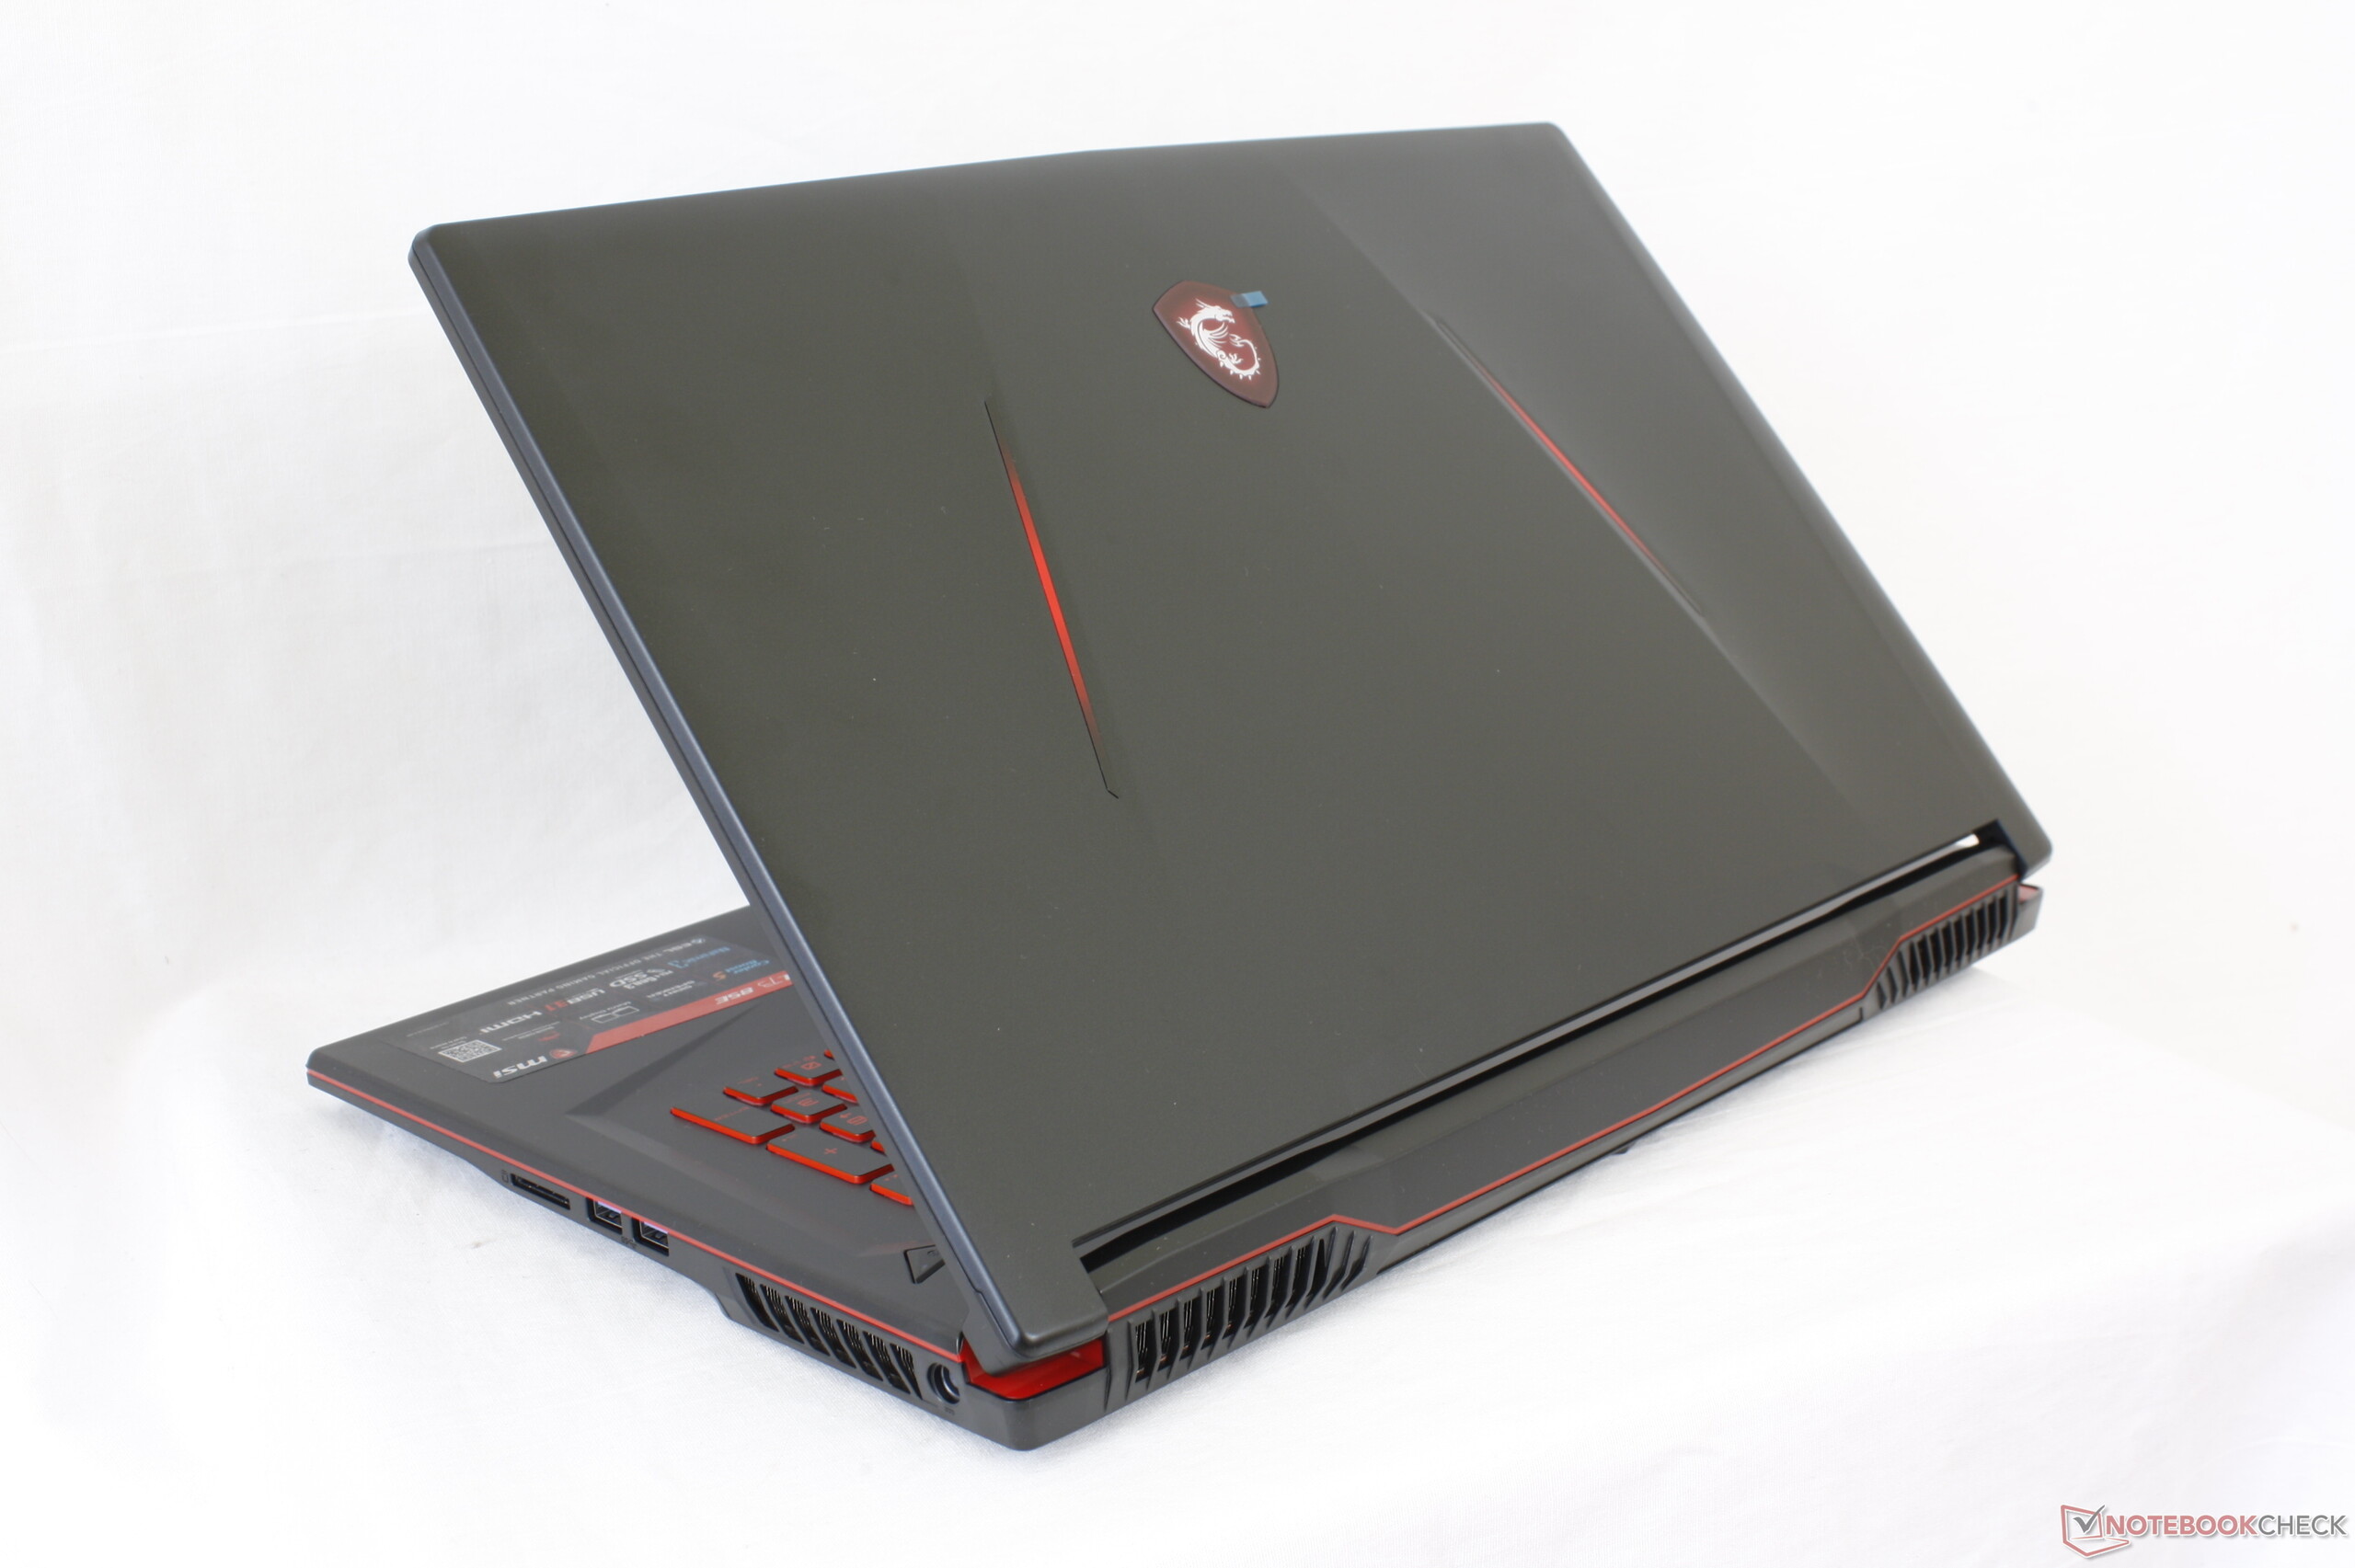
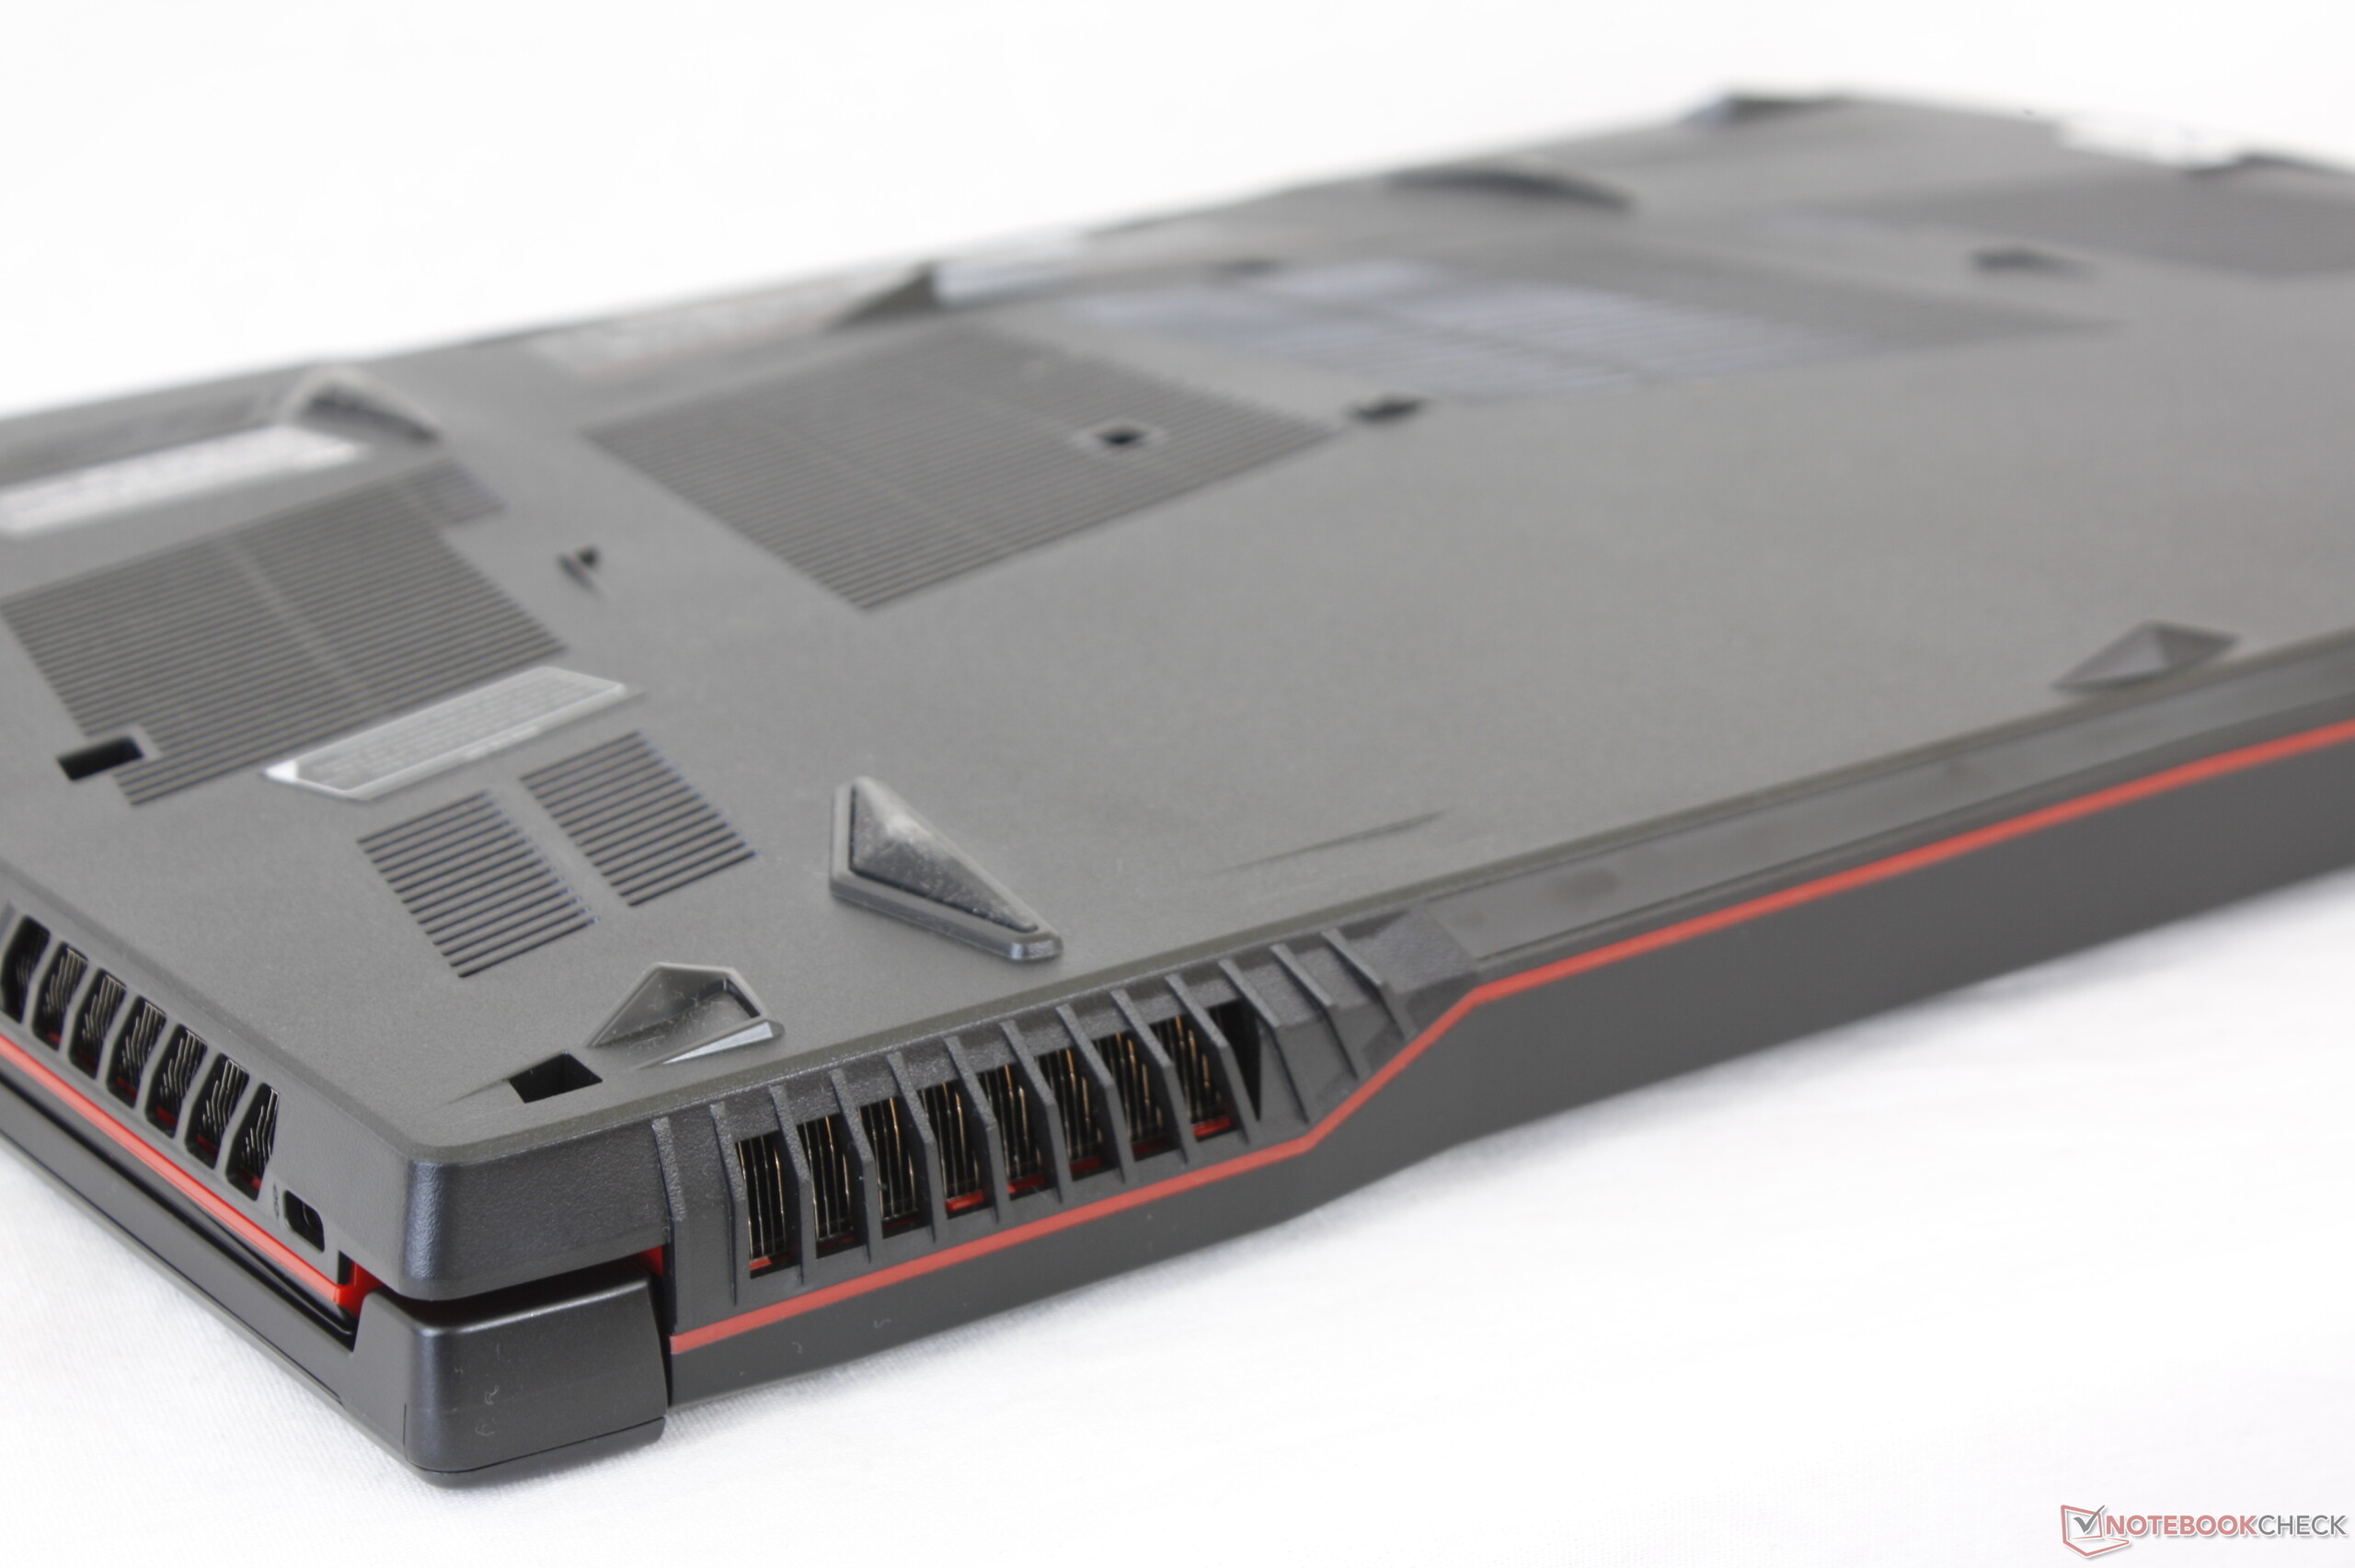
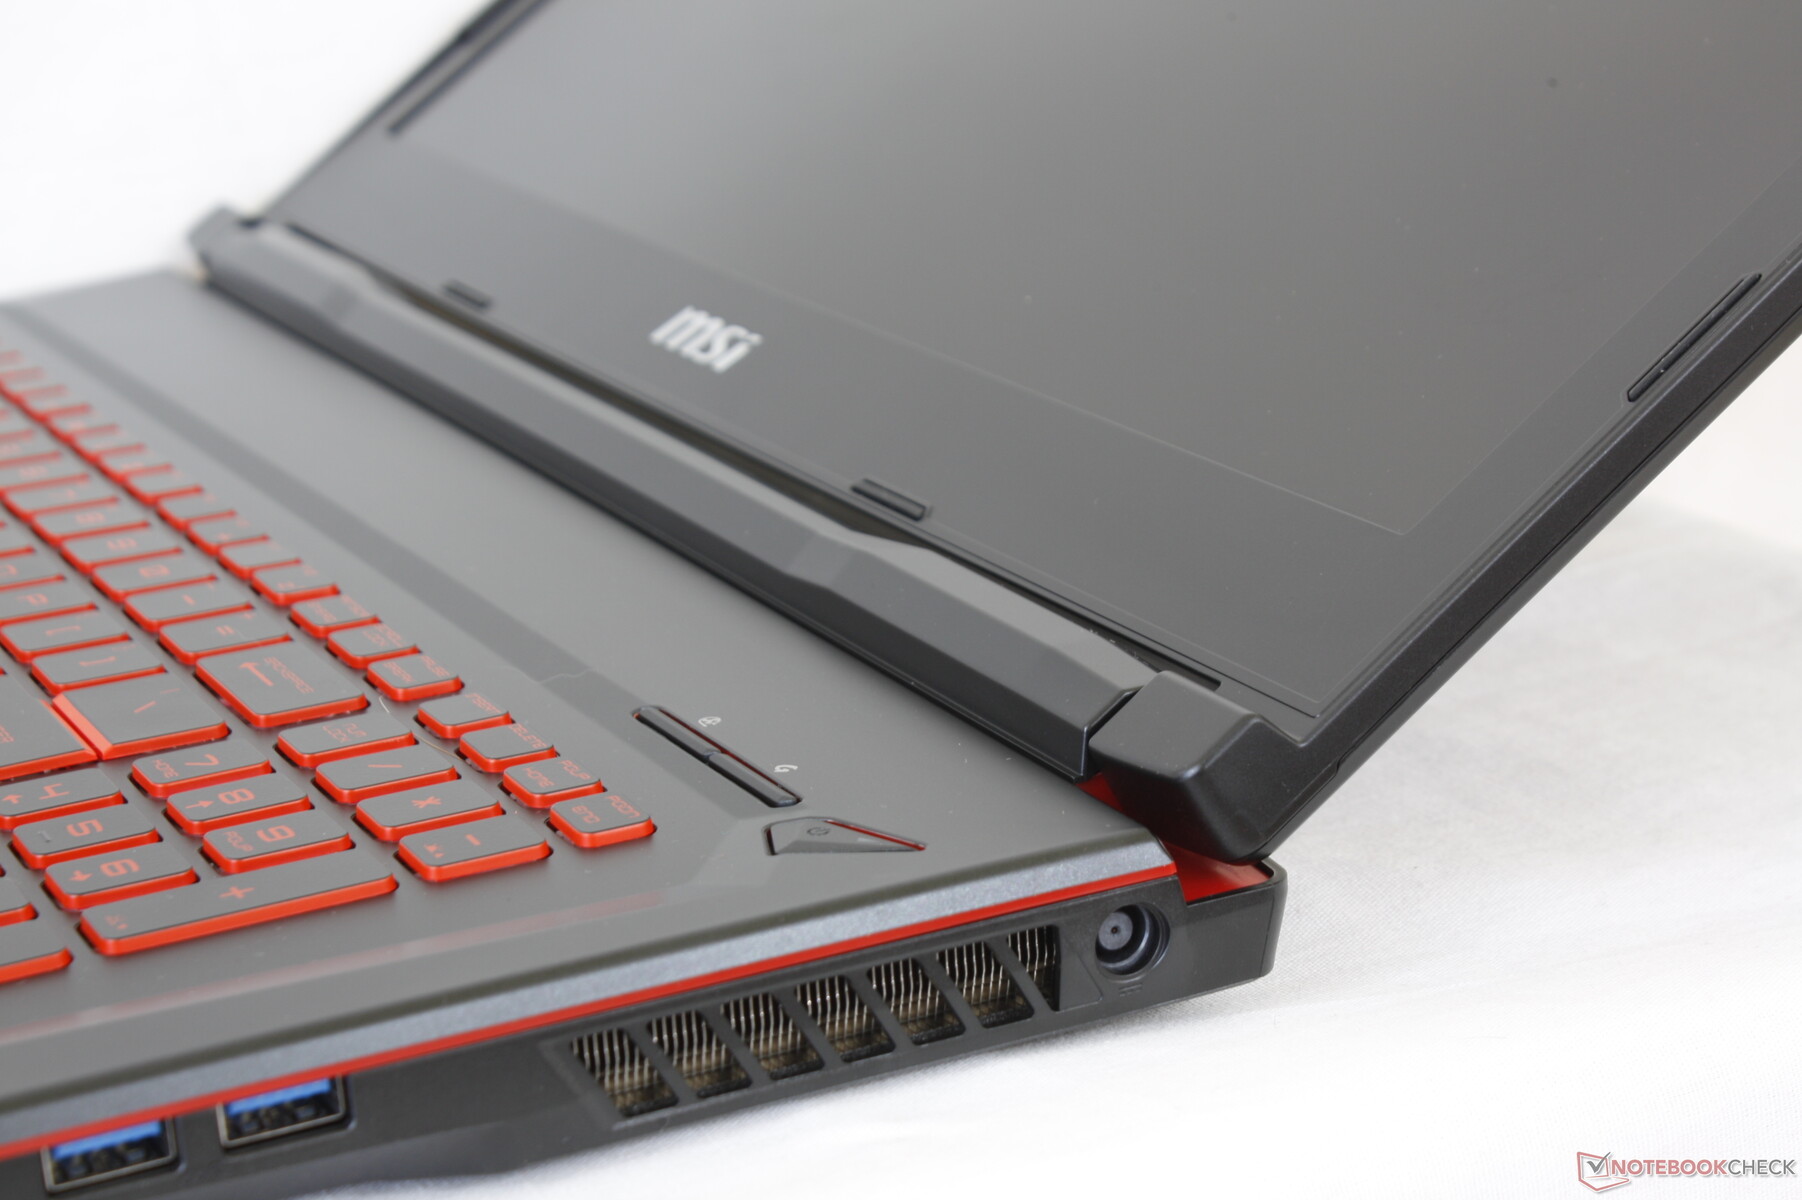
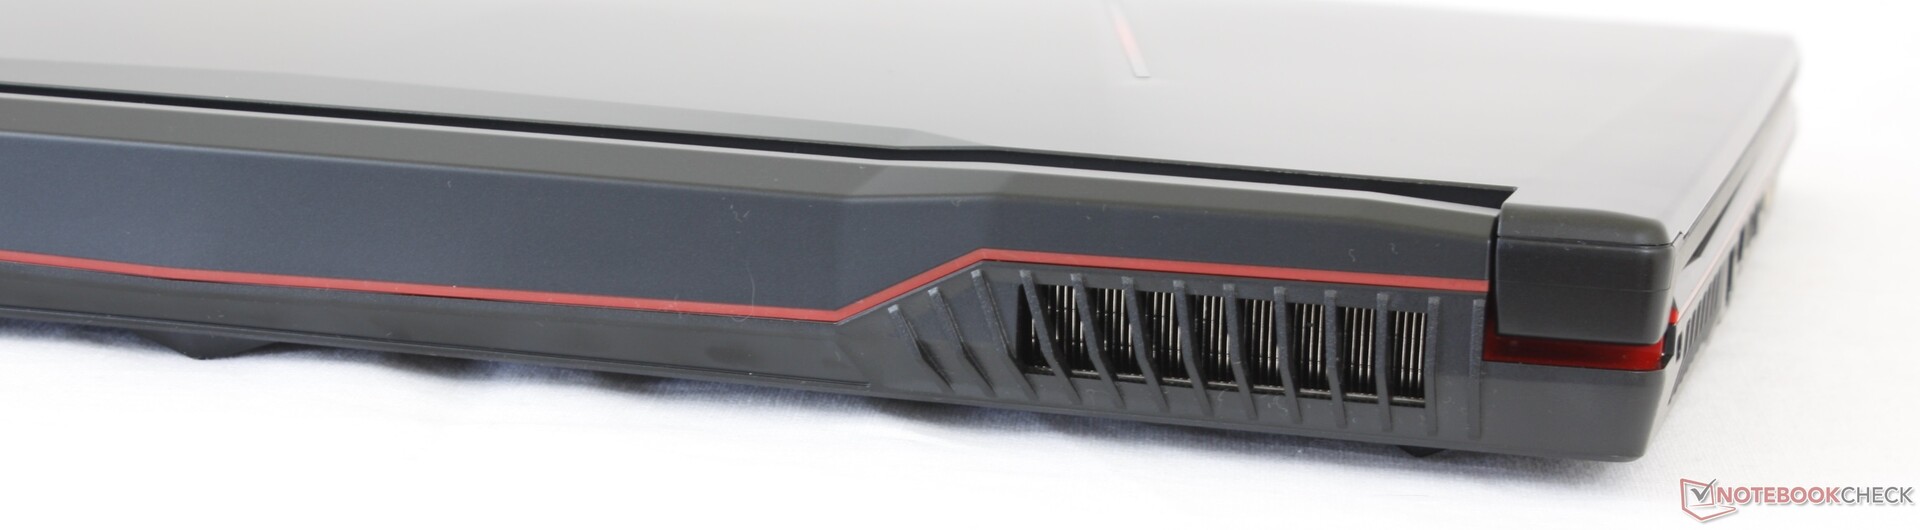
The GL73 is a relatively minor redesign of the GL72. While its overall appearance and chassis material have not changed, the integrated optical drive has been dropped and there are now more ventilation grilles than before. This makes us believe that cooling was a high priority when MSI was designing the successor to the GL72.
Outside of the small superficial differences, the feel and quality of the chassis remain the same. Both the small hinges and the smooth matte plastic surfaces are back for a budget impression in line with the Lenovo Legion Y720 series, Dell G3 and G5 series, and the Asus TUF series. Attempting to twist or warp the base or lid will result in visibly more bending than the much tougher MSI GE or GT series. Overall rigidity feels just slightly better than the Legion Y720 or Y730, but not enough to really stand out from the crowd of inexpensive gaming laptops. In other words, the system looks and feels adequate if not uninspiring.
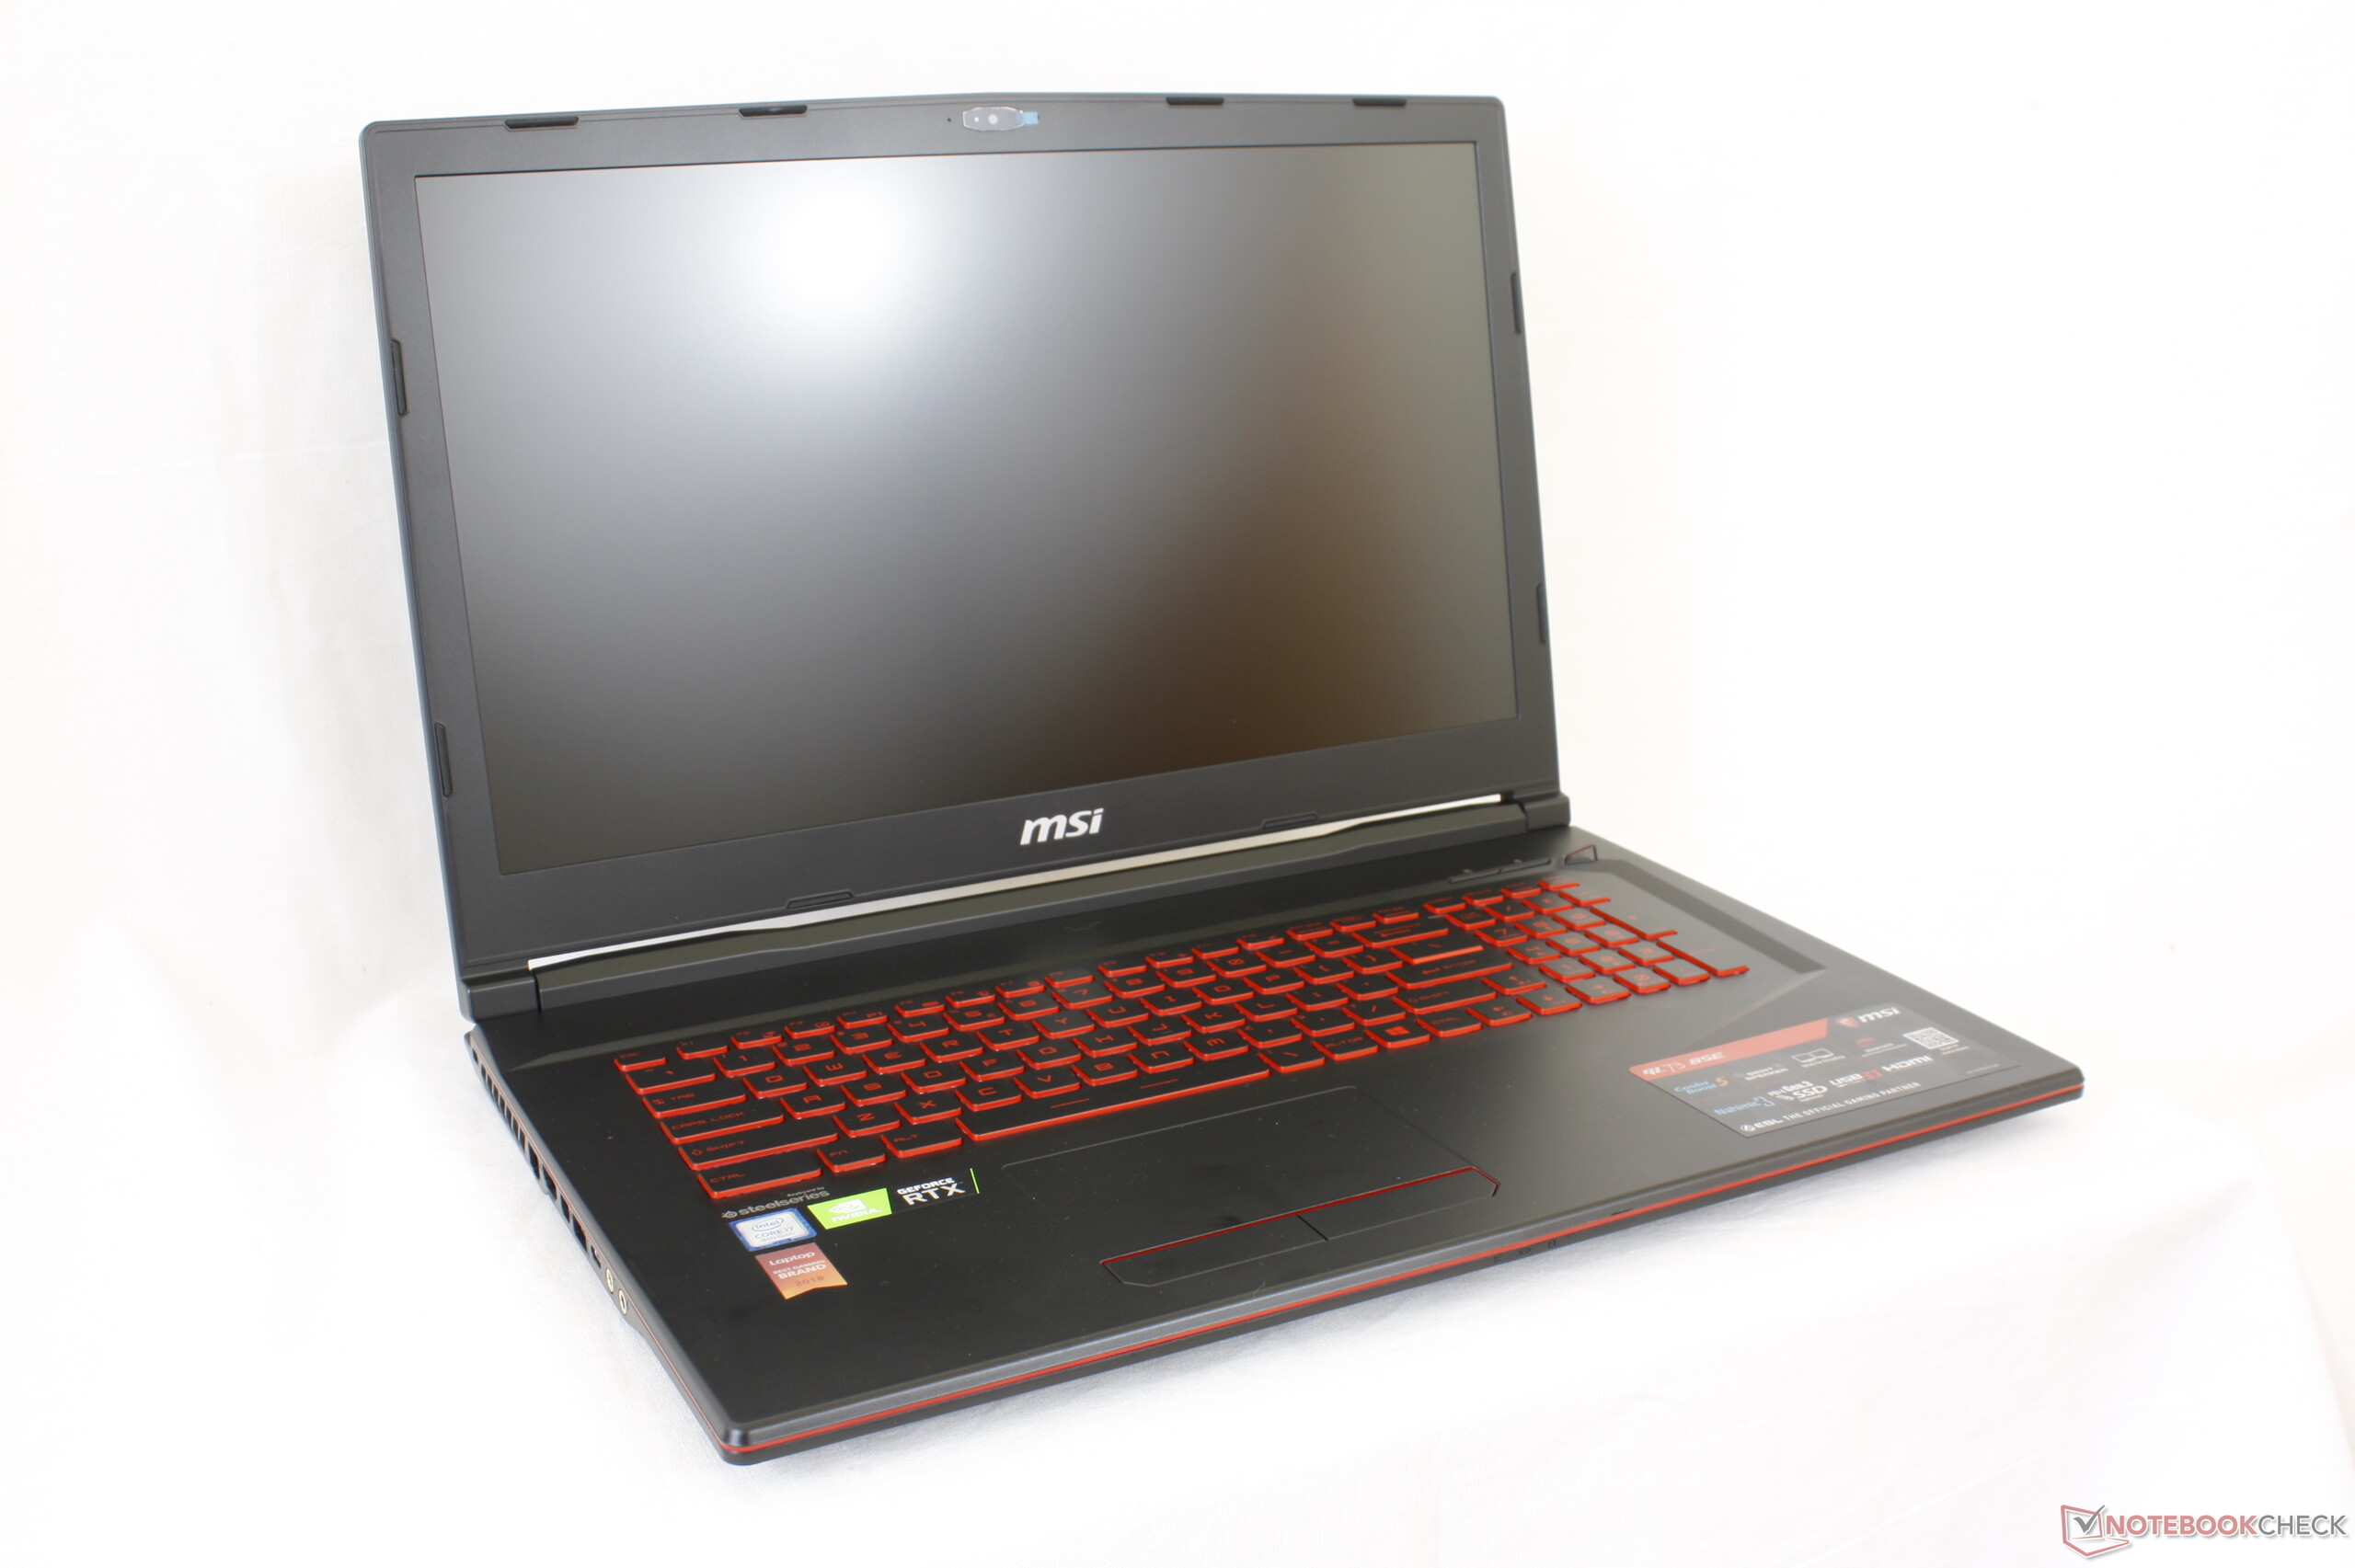
Chassis dimensions are nearly identical to the last generation GL72 while being noticeably lighter by about 200 g to 300 g depending on the installed storage. Even so, the MSI is thicker than many competitors in its budget category including the Dell G3 17, Lenovo Legion Y730, and Asus TUF FX705. The thick and unsightly display bezels of the GL73 don't do it any favors either.
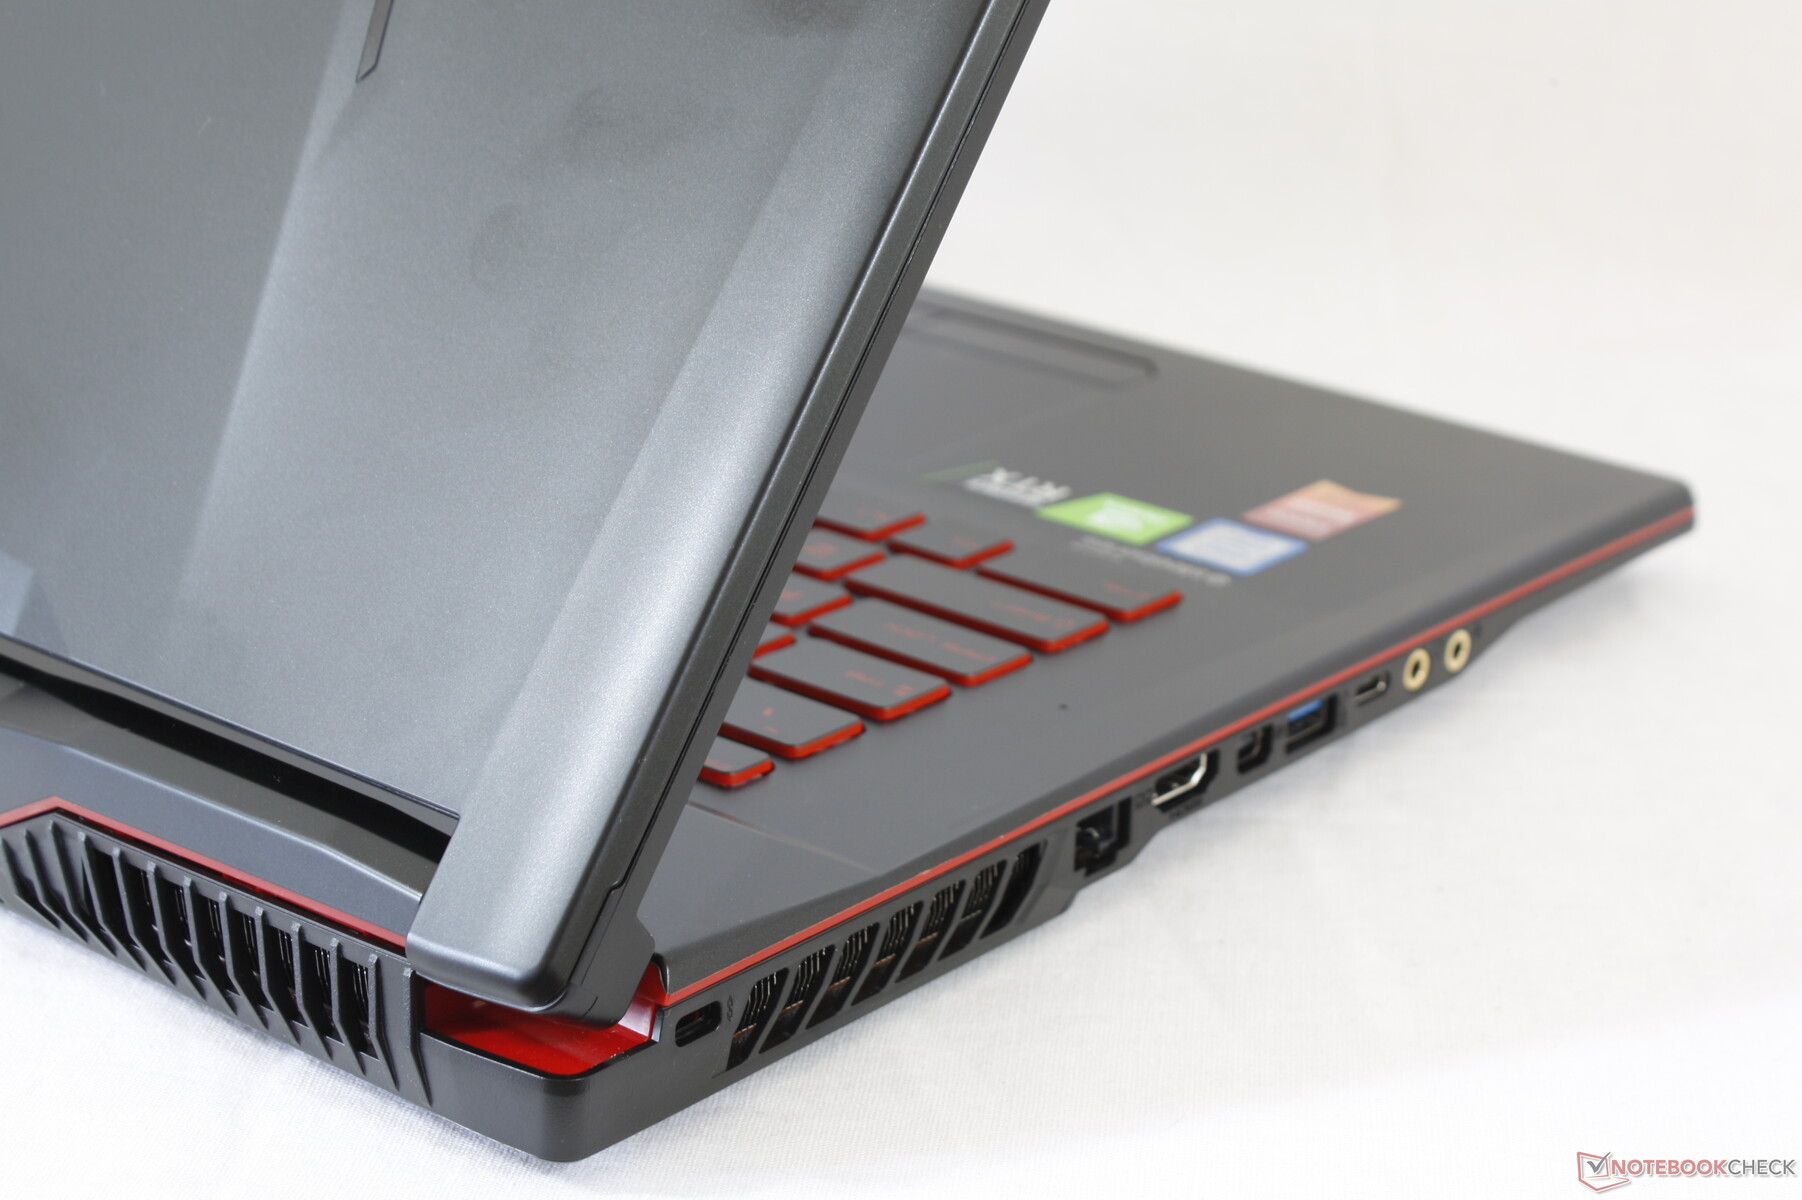
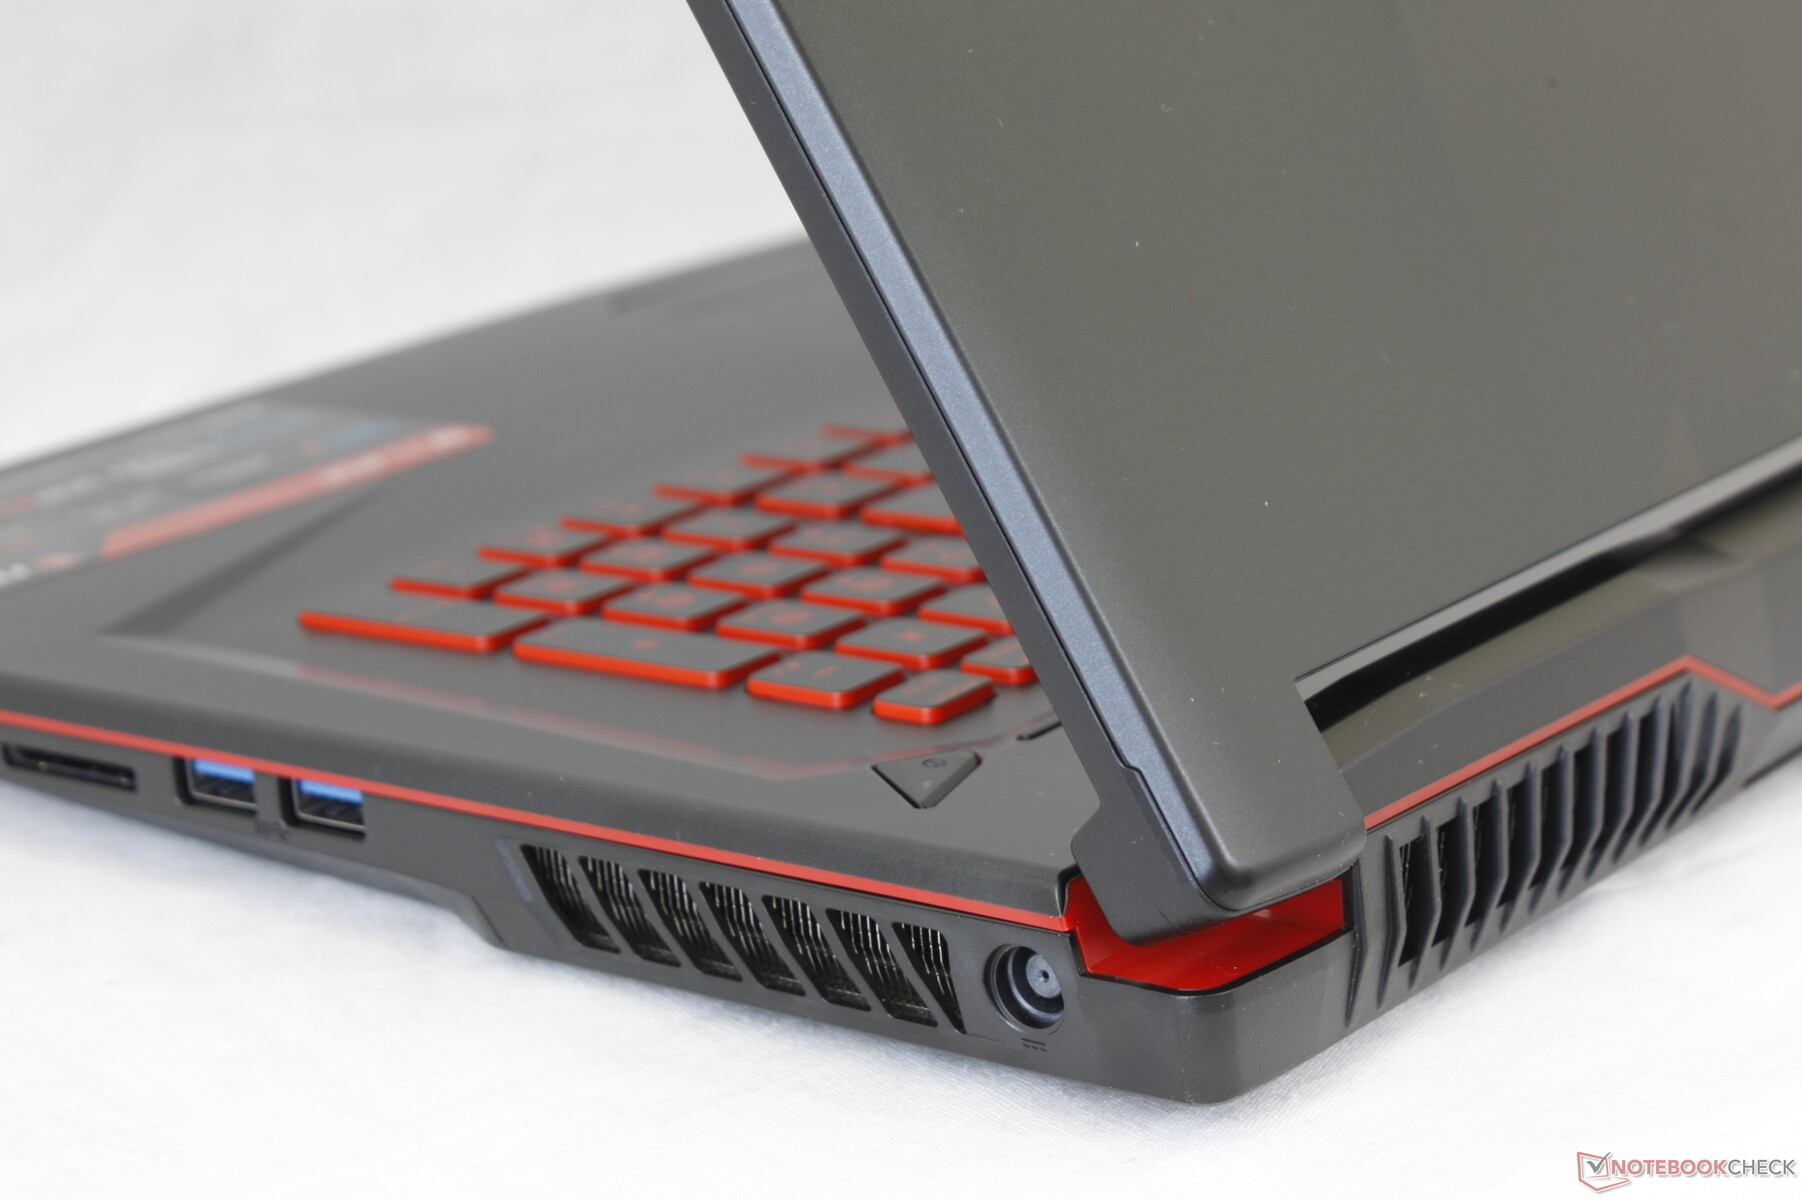
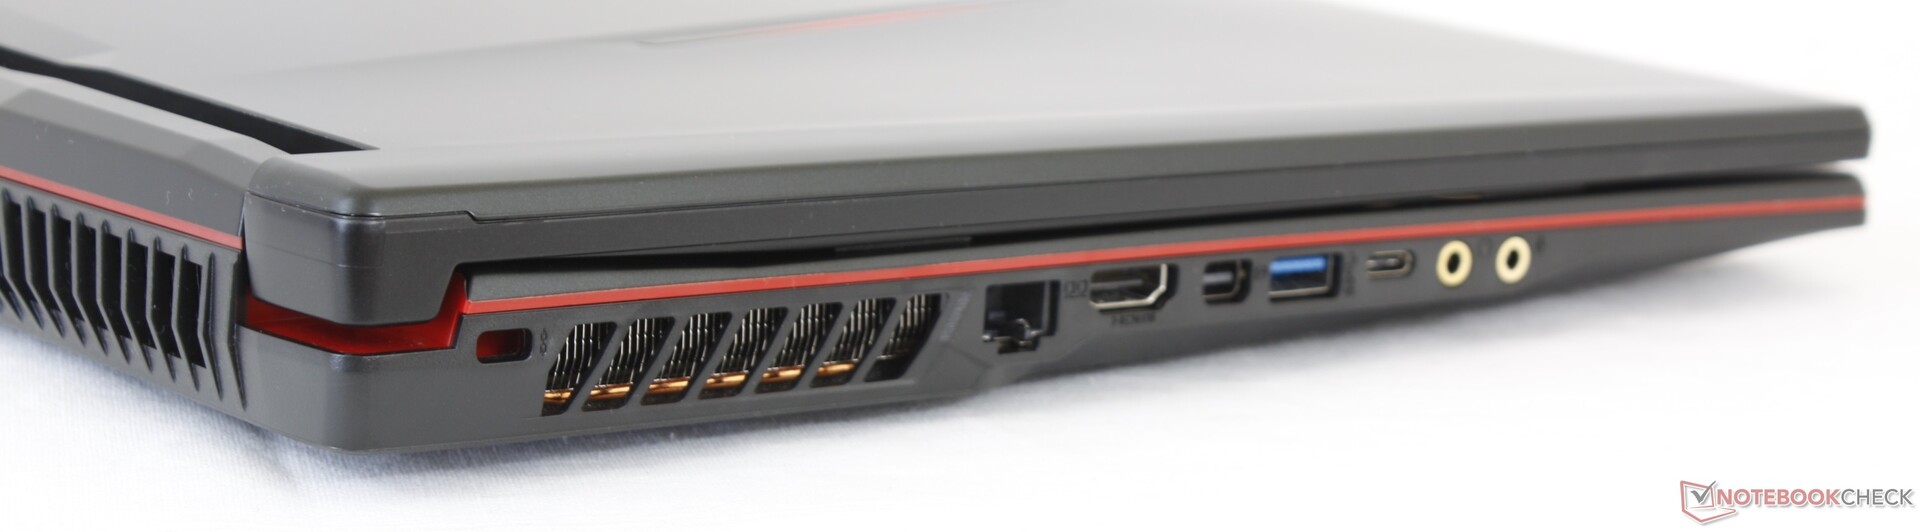
Connectivity
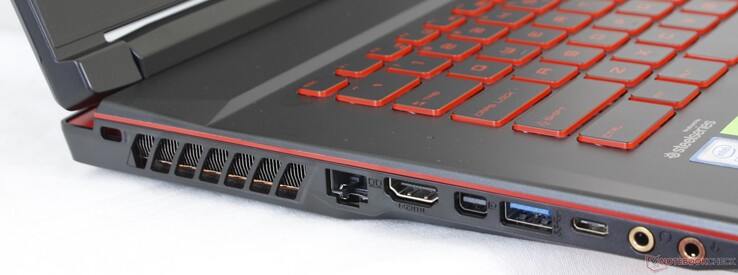
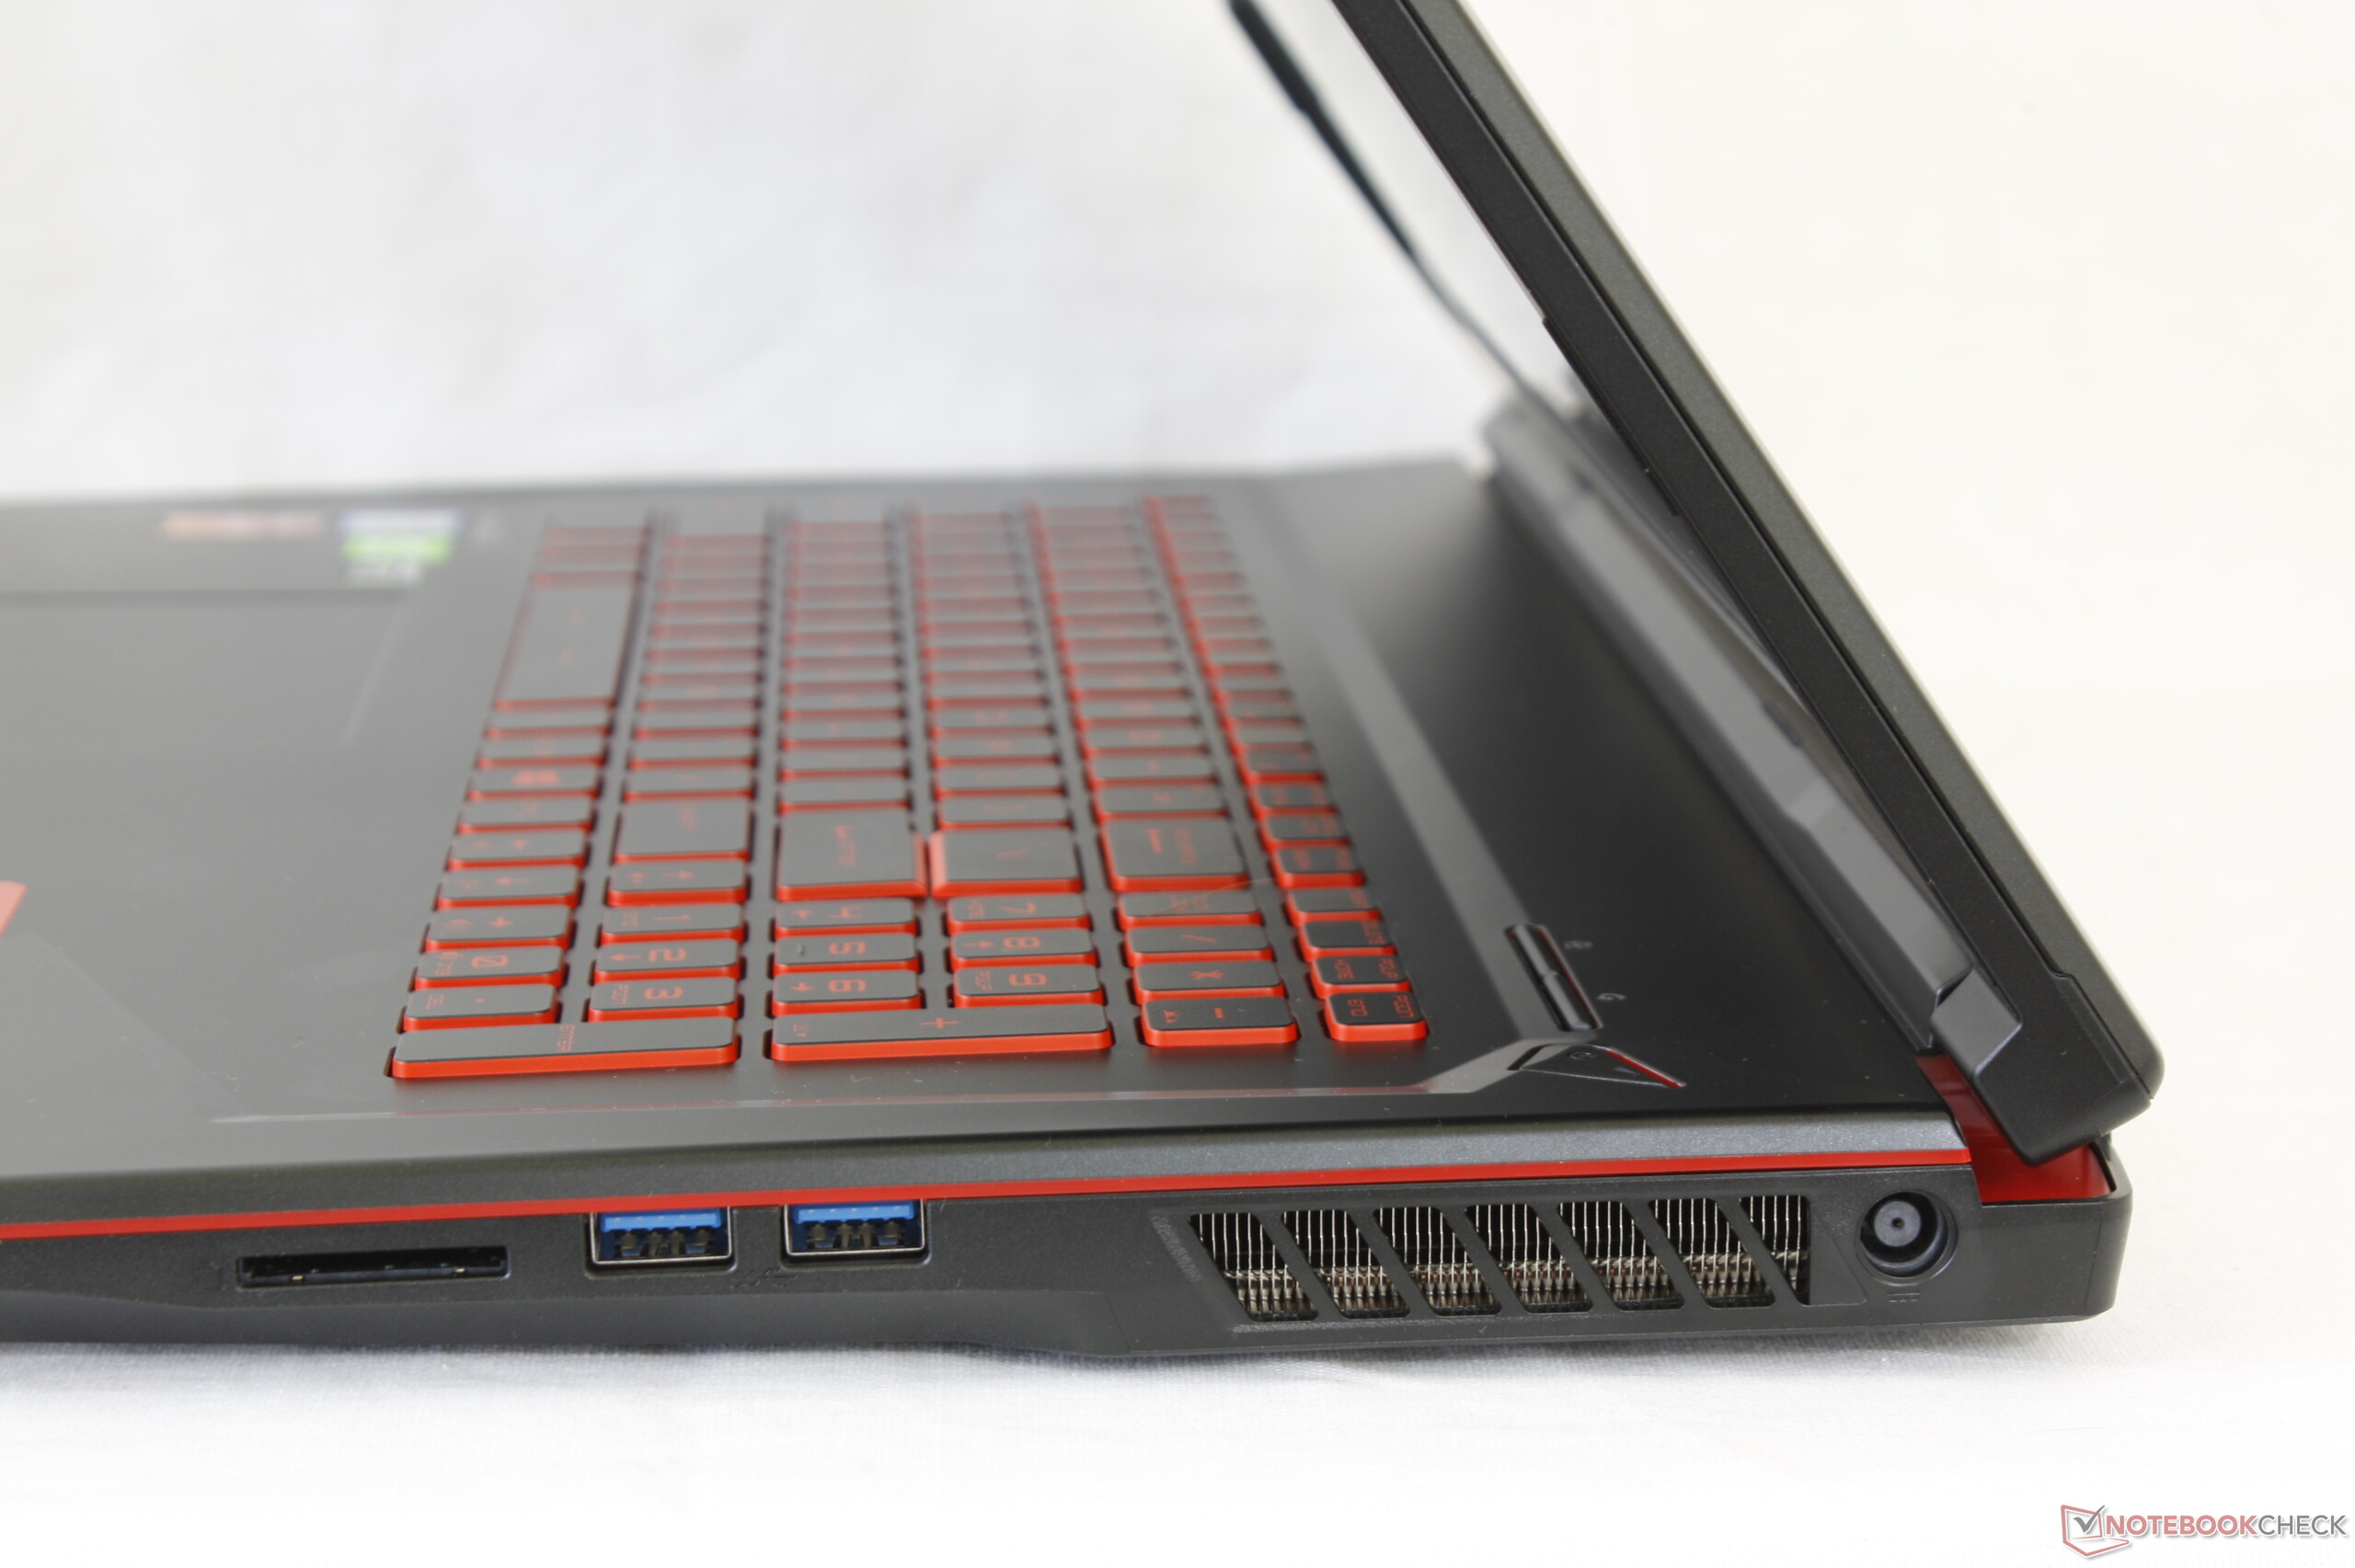
MSI has kept all the ports from the last generation GL72 albeit rearranged on the GL73 in order to make room for the new ventilation grilles. For better or worse, the ports along the left edge are much closer together now as a result. Understandably, there is no Thunderbolt 3 option on this budget model.
Outputting to a native 4K UHD monitor at 60 Hz may only be possible through mDP since 4K60 support on HDMI 1.4 is limited.
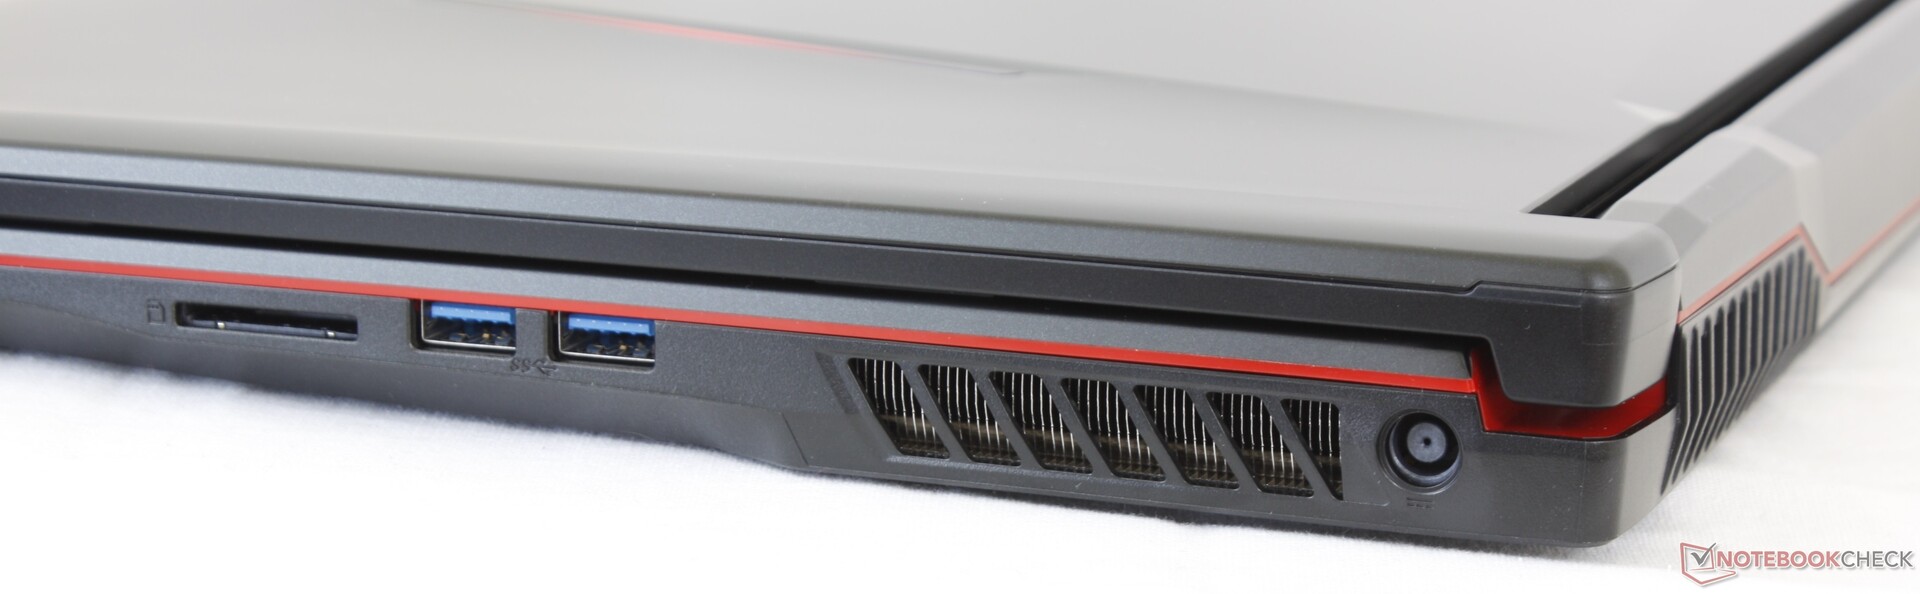
SD Card Reader
SD readers on budget systems tend to be slow and the spring-loaded card reader on the GL73 is no different. We are able to record a transfer rate of just under 31 MB/s with our UHS-II SDXC test card compared to 200+ MB/s on the XPS 15.
A fully inserted SD card still protrudes by about 4 mm and so it's recommended to eject the card before transporting.
| SD Card Reader | |
| average JPG Copy Test (av. of 3 runs) | |
| Gigabyte Sabre 17-W8 (Toshiba Exceria Pro SDXC 64 GB UHS-II) | |
| MSI GL73 8SE-010US (Toshiba Exceria Pro SDXC 64 GB UHS-II) | |
| MSI GE73 8RF-008 Raider RGB (Toshiba Exceria Pro SDXC 64 GB UHS-II) | |
| Dell G3 17 3779 (Toshiba Exceria Pro SDXC 64 GB UHS-II) | |
| MSI GL72 7RDX-602 (Toshiba Exceria Pro SDXC 64 GB UHS-II) | |
| maximum AS SSD Seq Read Test (1GB) | |
| Gigabyte Sabre 17-W8 (Toshiba Exceria Pro SDXC 64 GB UHS-II) | |
| MSI GE73 8RF-008 Raider RGB (Toshiba Exceria Pro SDXC 64 GB UHS-II) | |
| MSI GL73 8SE-010US (Toshiba Exceria Pro SDXC 64 GB UHS-II) | |
| MSI GL72 7RDX-602 (Toshiba Exceria Pro SDXC 64 GB UHS-II) | |
Communication
The Intel 9560 with integrated Bluetooth 5.0 is common amongst flagship Ultrabooks and gaming laptops. Theoretical transfer rates can be up to 1.73 Gbps to easily outclass the 1x1 Intel 3168 on the cheaper GL73 SKU. Performance can be faster than what we've recorded below since our server setup is limited by a 1 Gbps line. Competing modules, like the Killer 1550 in many Dell laptops, offer more gamer-centric software features than our Intel.
We didn't experience any wireless connectivity issues during our time with the test unit.
| Networking | |
| iperf3 transmit AX12 | |
| MSI GE73 8RF-008 Raider RGB | |
| MSI GL73 8SE-010US | |
| Lenovo Legion Y730-17ICH, i7-8750H | |
| MSI GL72 7RDX-602 | |
| Dell G3 17 3779 | |
| MSI GL73 8RD-418US | |
| iperf3 receive AX12 | |
| MSI GE73 8RF-008 Raider RGB | |
| MSI GL73 8SE-010US | |
| Lenovo Legion Y730-17ICH, i7-8750H | |
| MSI GL73 8RD-418US | |
| MSI GL72 7RDX-602 | |
| Dell G3 17 3779 | |
Accessories
There are no included extras outside of a warranty card and Quick Start guide. In comparison, pricier MSI laptops from the GS, GE, or GT series throw in a large velvet cleaning cloth in each box.
Maintenance
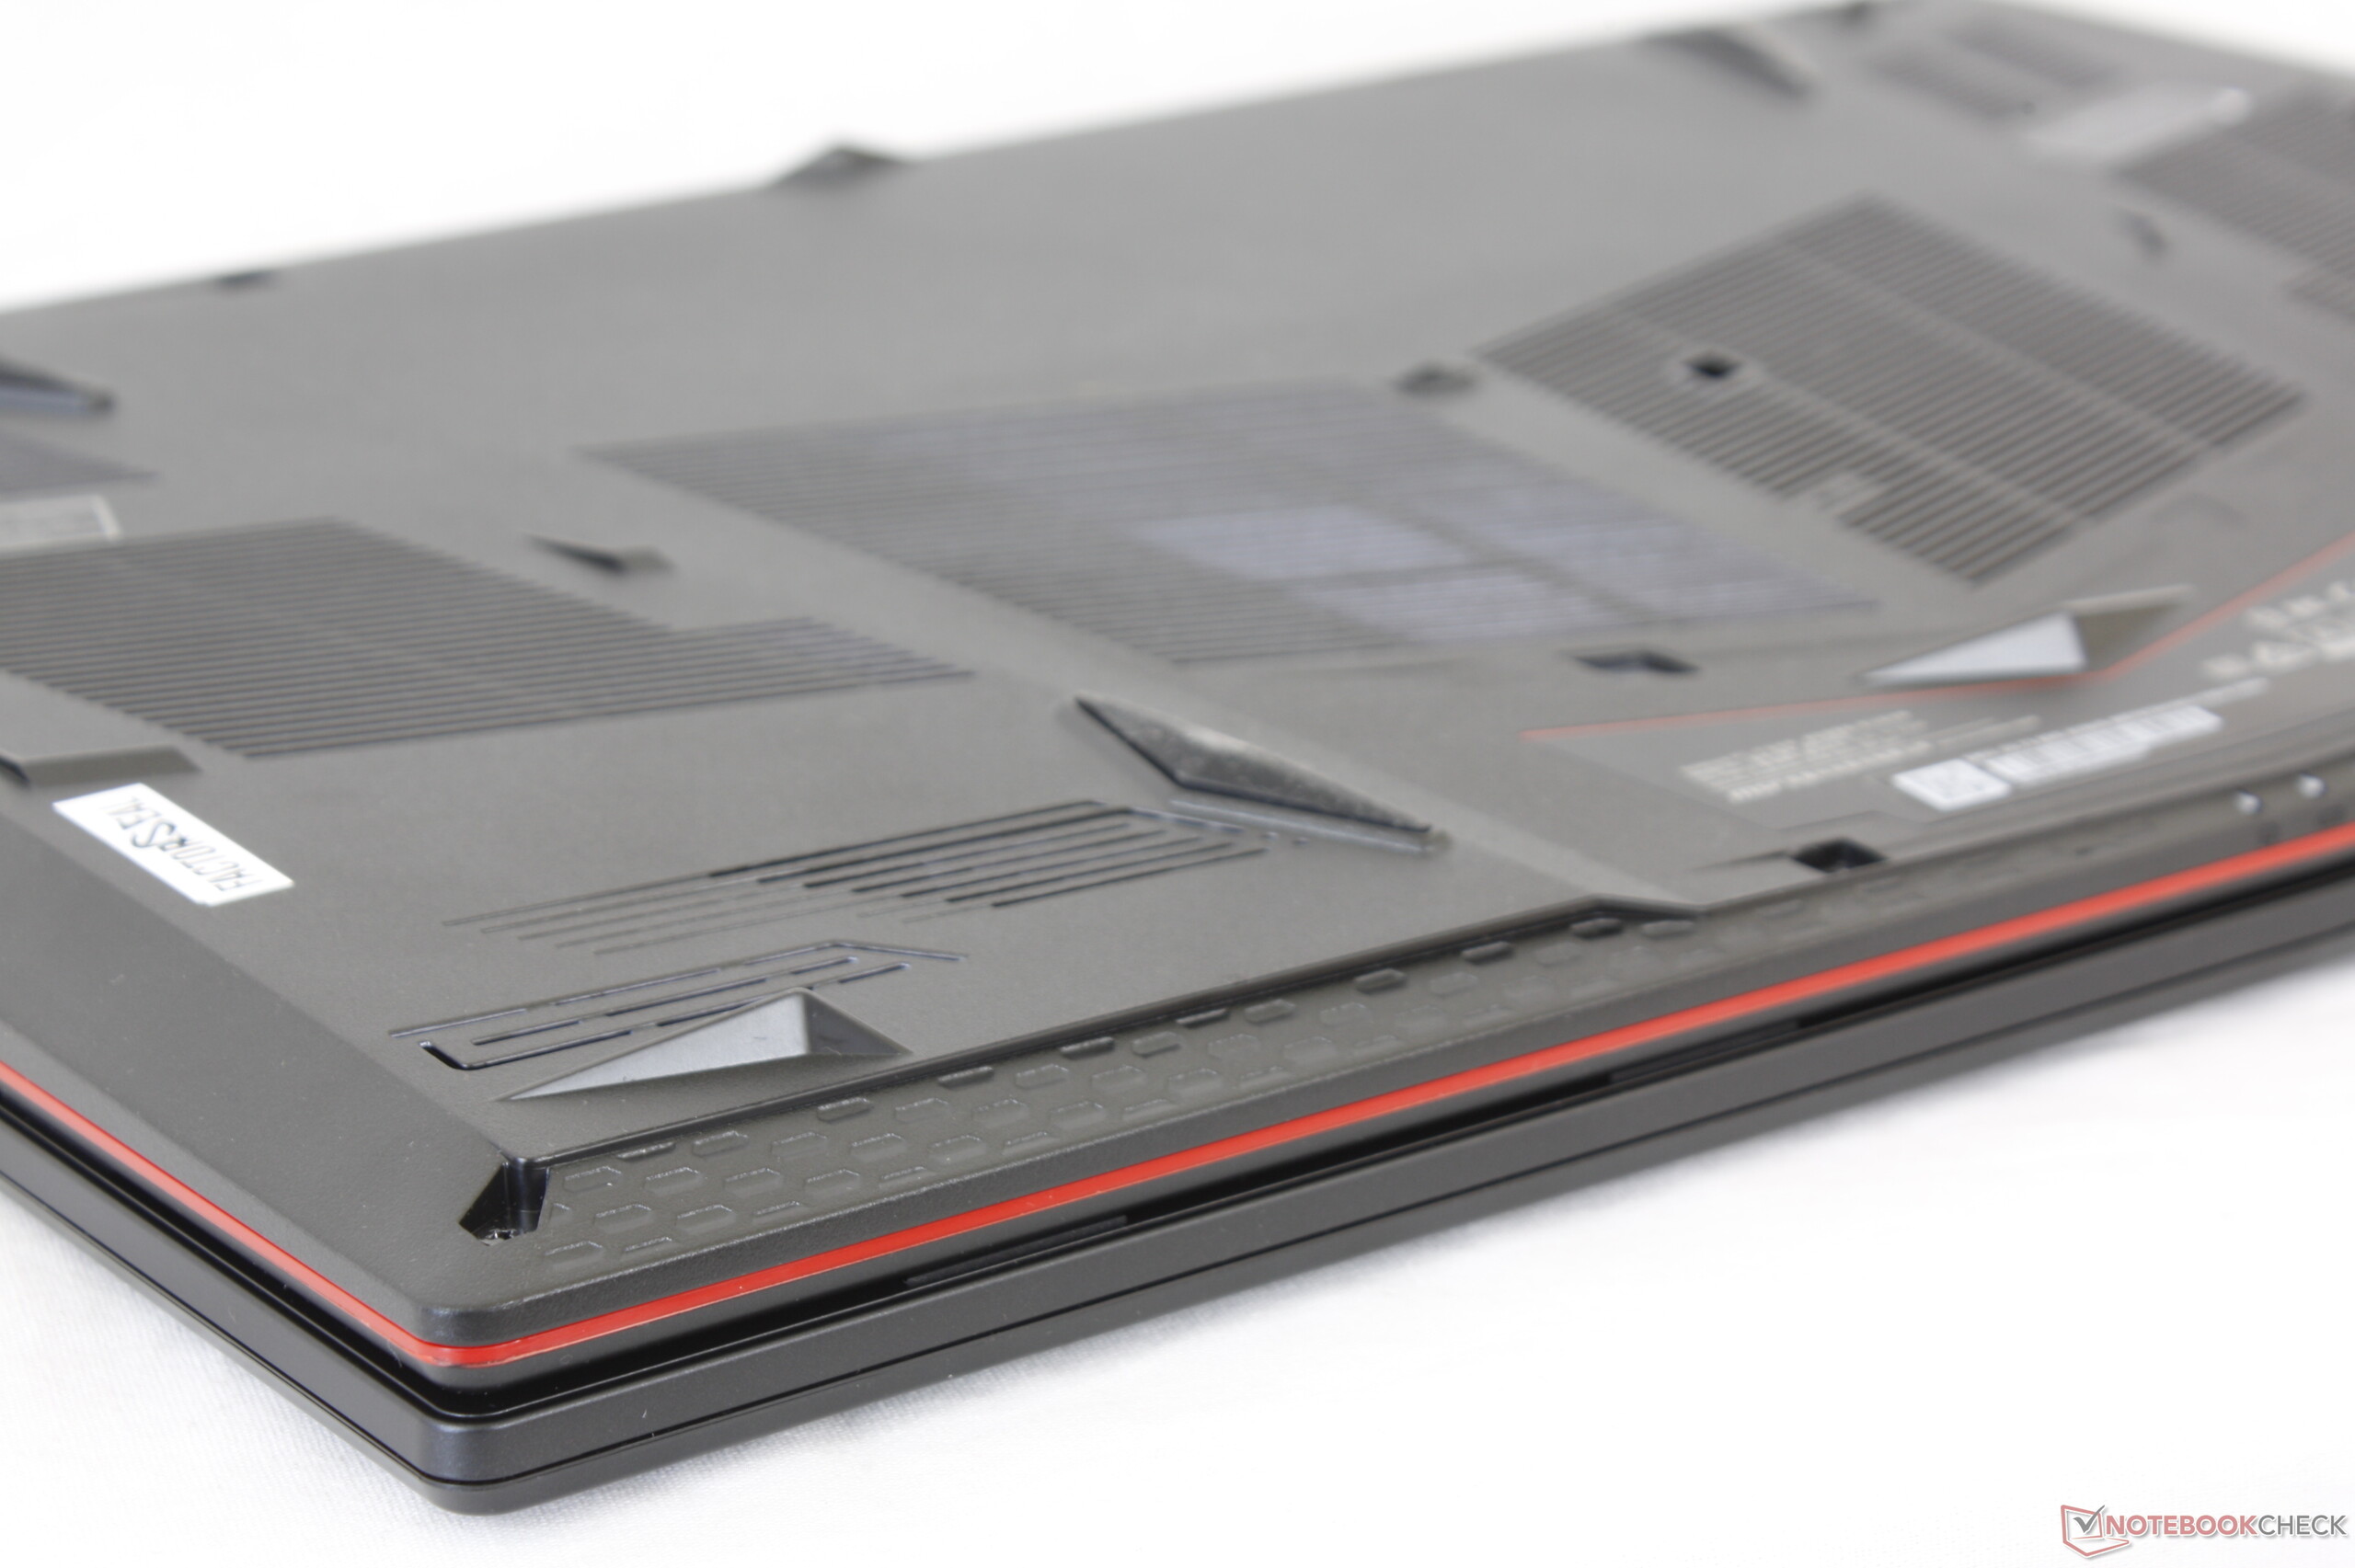
The bottom panel requires only a Philips screwdriver to remove. The latches around the edges, however, are tight and difficult to pry open for novices. Furthermore, a 'Factory Seal' sticker must be torn to discourage end-user tempering. These drawbacks are a shame because there are actually plenty of easy upgrade options available on the system.
Warranty
Purchasing the laptop from Xotic PC will actually come with a two-year limited manufacturer warranty as opposed to only one-year from most other OEMs or larger resellers like Newegg. Registering the product with MSI will also come with free accidental damage protection. Xotic PC also covers upgrade components installed by the reseller and it offers extended warranty options of up to three years total. Please see our Guarantees, Return policies and Warranties article for country-specific information.
Input Devices
Keyboard
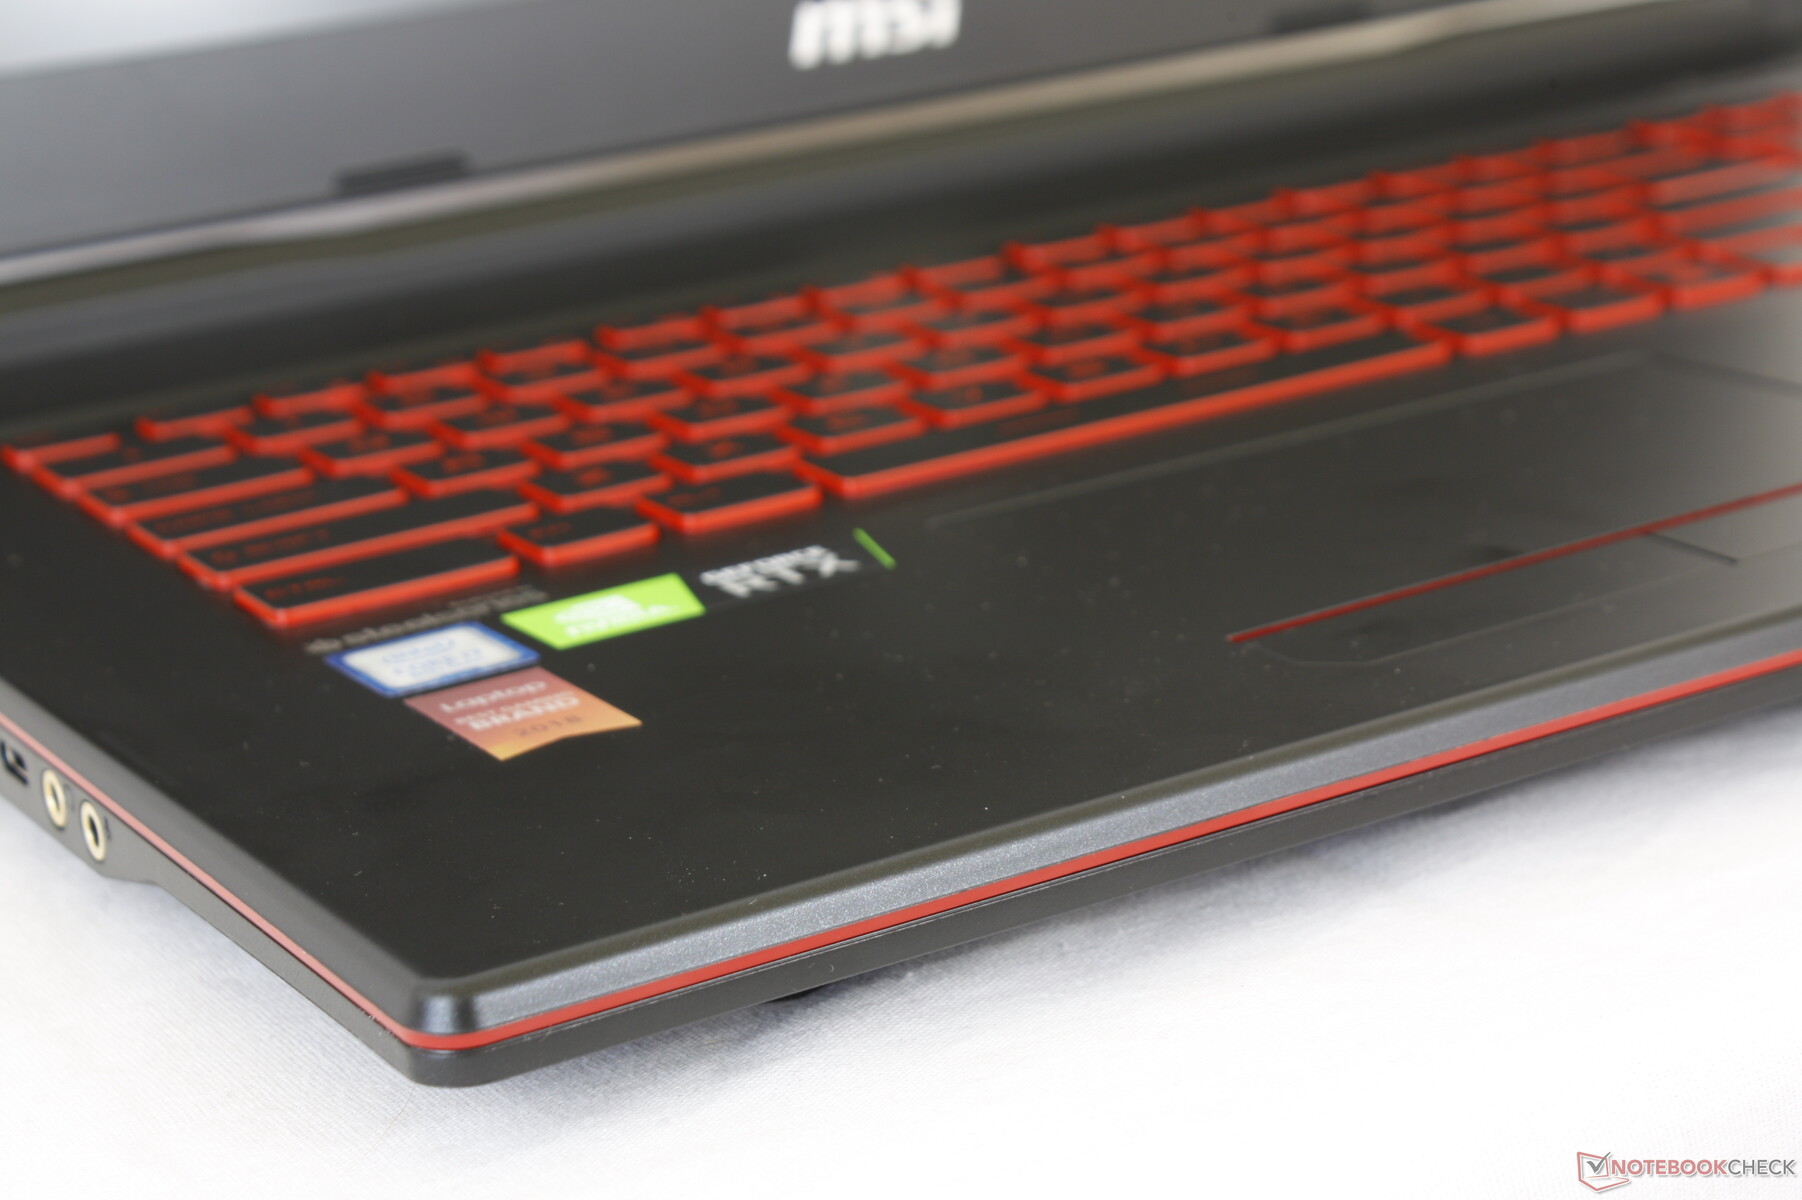
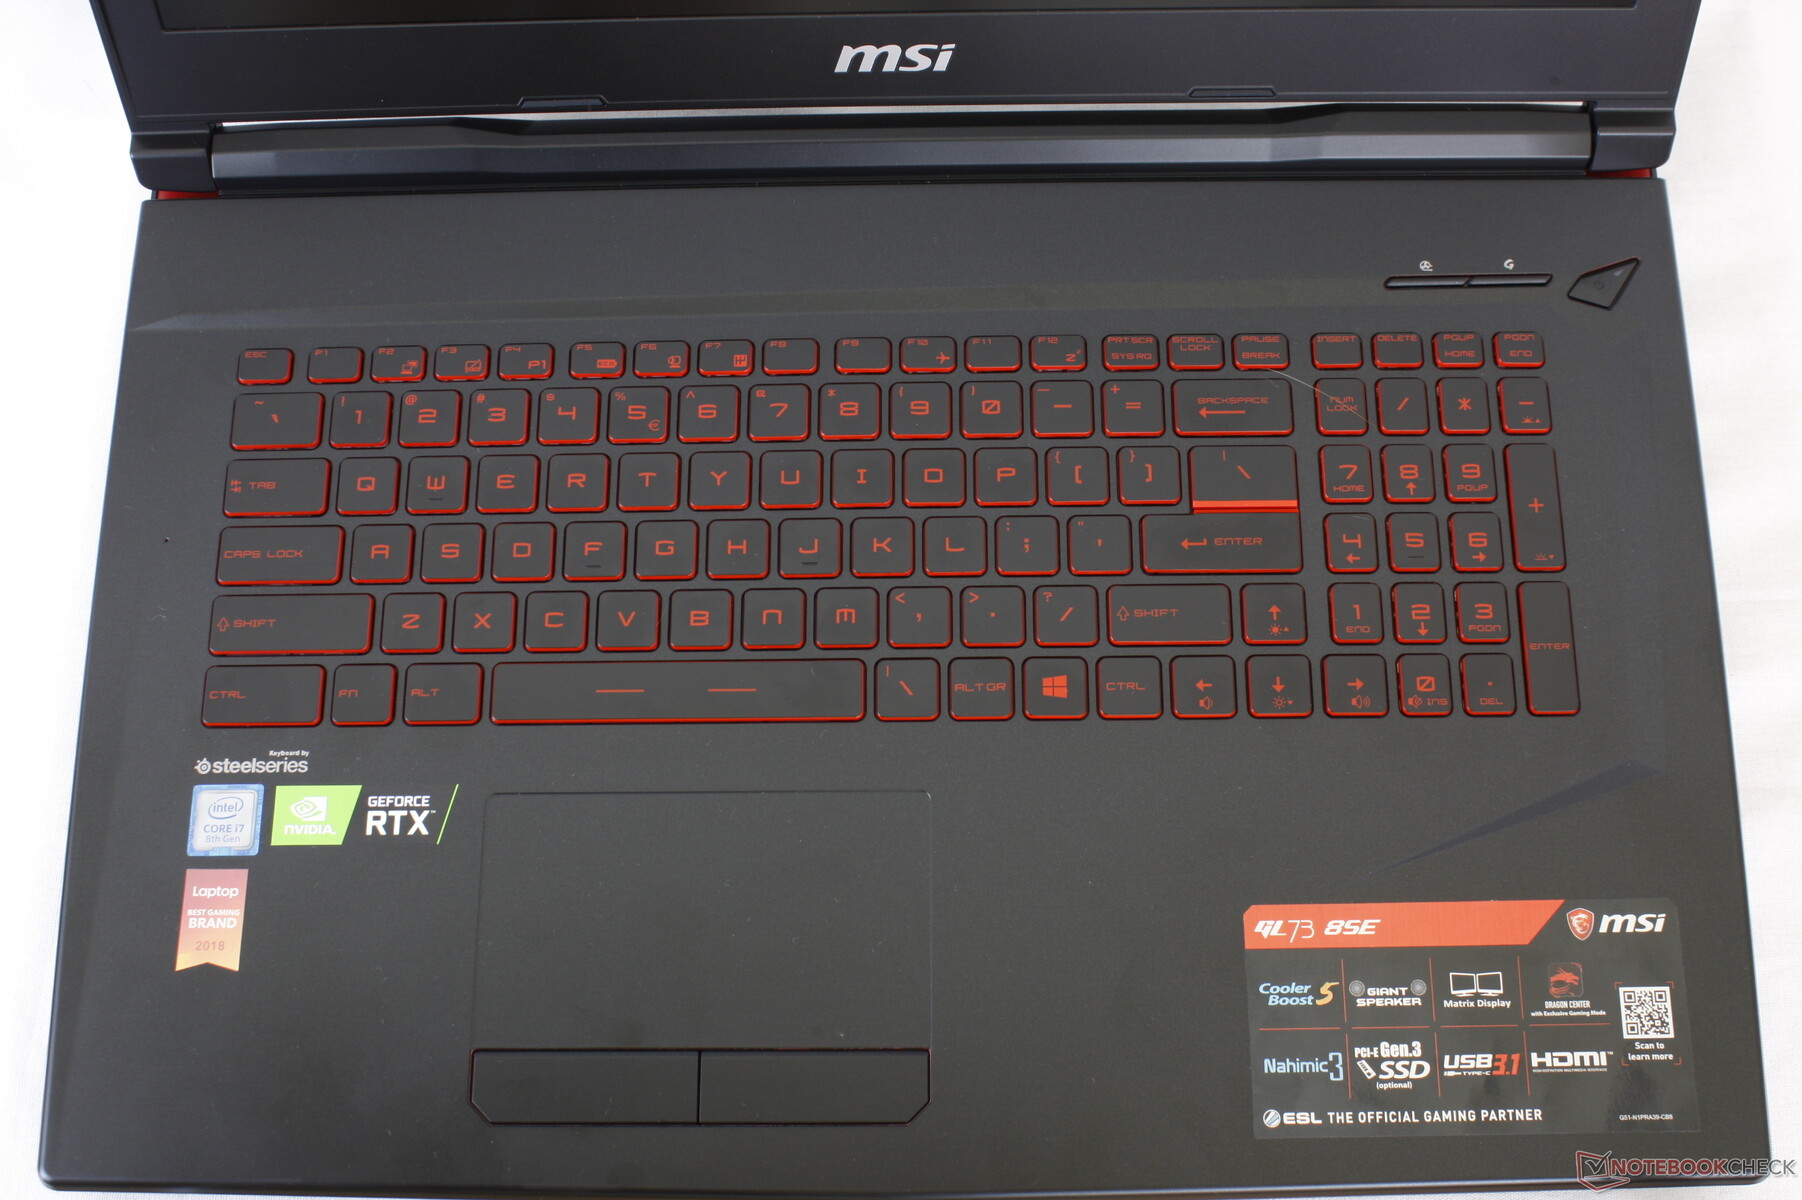
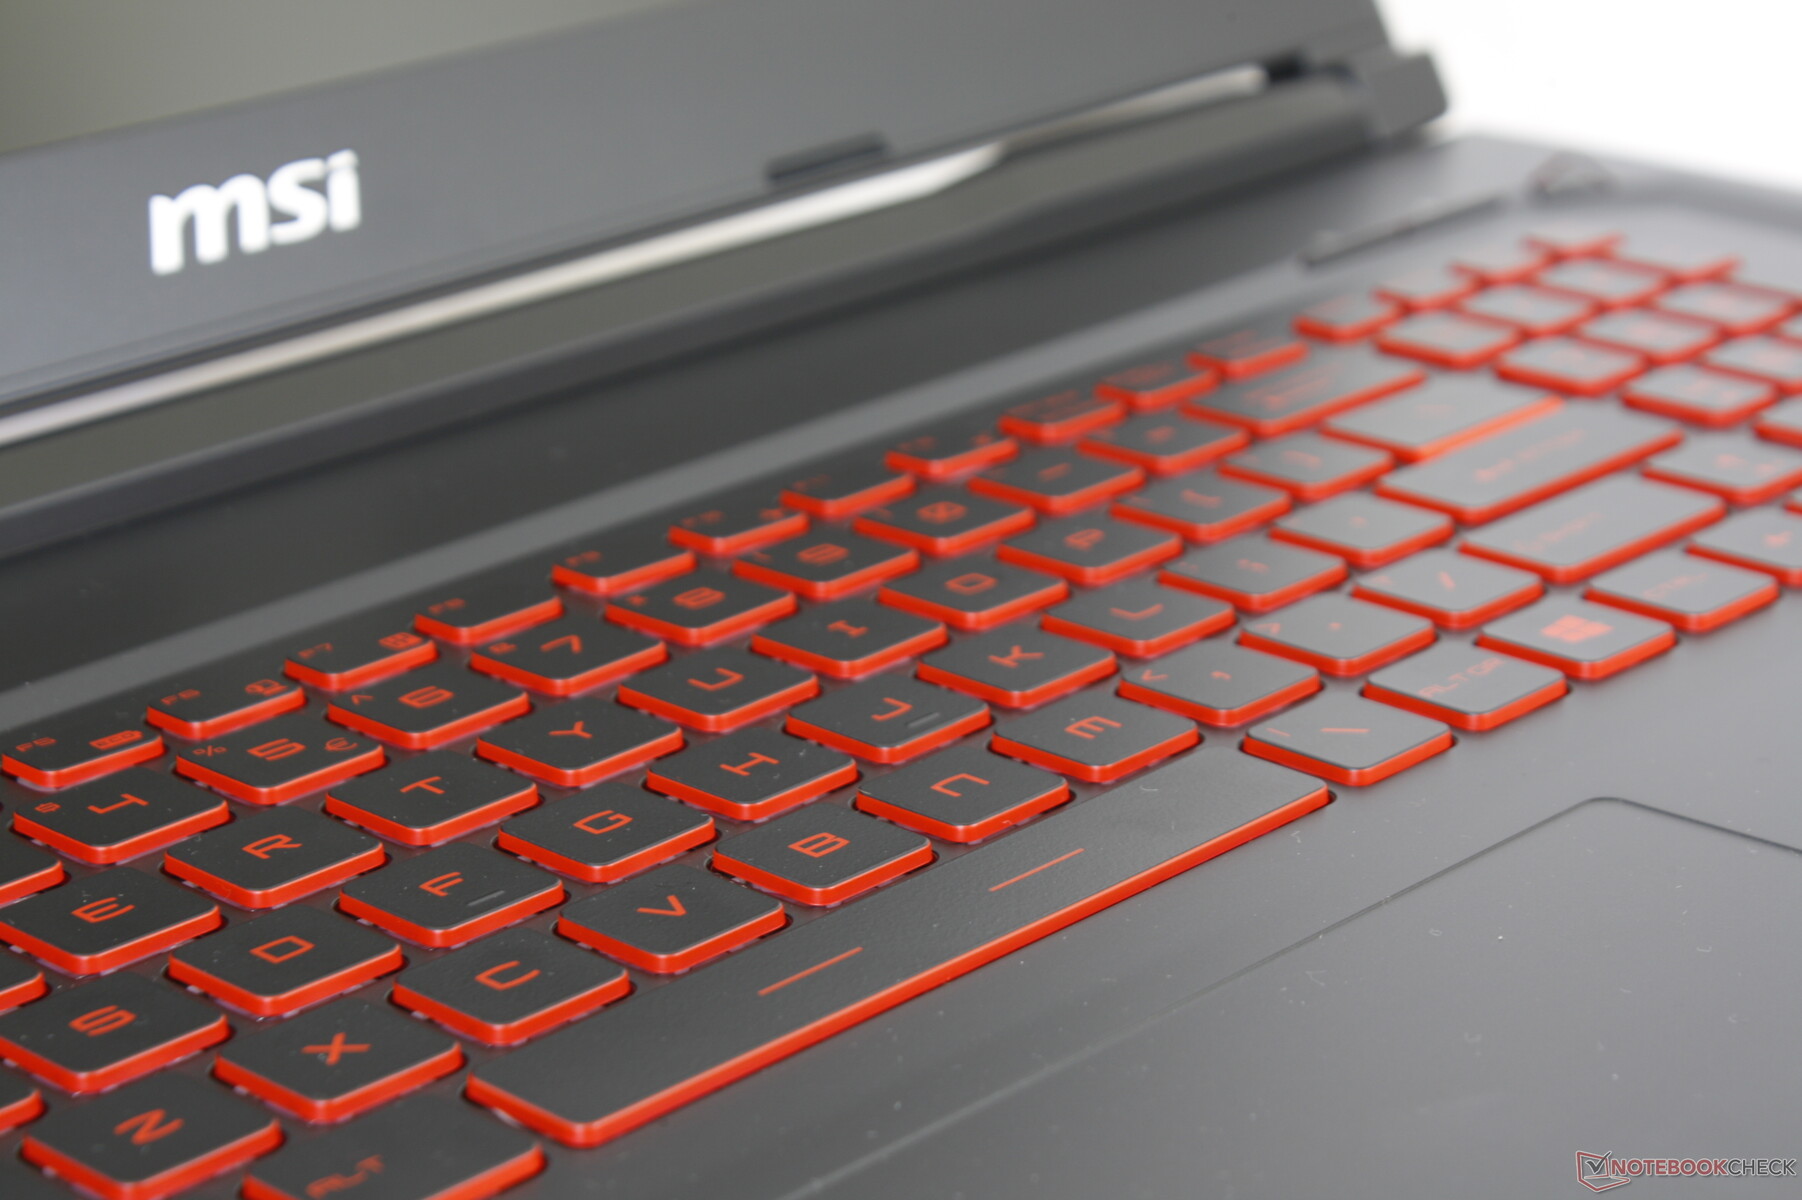
Both the SteelSeries keyboard and trackpad (~11 x 6.3 cm) remain identical to the GL72 albeit now with red trims and a red keyboard backlight as standard. Key feedback is still on the soft side for a relatively quiet clatter not unlike on the Asus TUF FX705. We still prefer it over the Blade 15 keyboard which we find to be far too light and shallow for gaming.
The dedicated Turbo Fan mode and Dragon Center buttons are back. We would love to see dedicated volume keys or Macro keys in the future to improve customization.
Touchpad
There are no textural differences separating the trackpad from the palm rests as they are made from the same matte plastic material. Glide is smooth and uniform no matter the speed, but cursor movements do not translate perfectly. For example, when gliding a finger slowly across the trackpad, the onscreen cursor would sometimes stand still. We're unsure if this is a bug or just an issue on our particular unit and so we recommend any potential GL73 users double-check this as well.
The integrated mouse keys are firm with shallow travel, strong feedback, and a loud satisfying click. We commend MSI for sticking with dedicated mouse keys for many of its larger gaming models.
The Synaptics trackpad does not appear to be Precision-enabled by default.
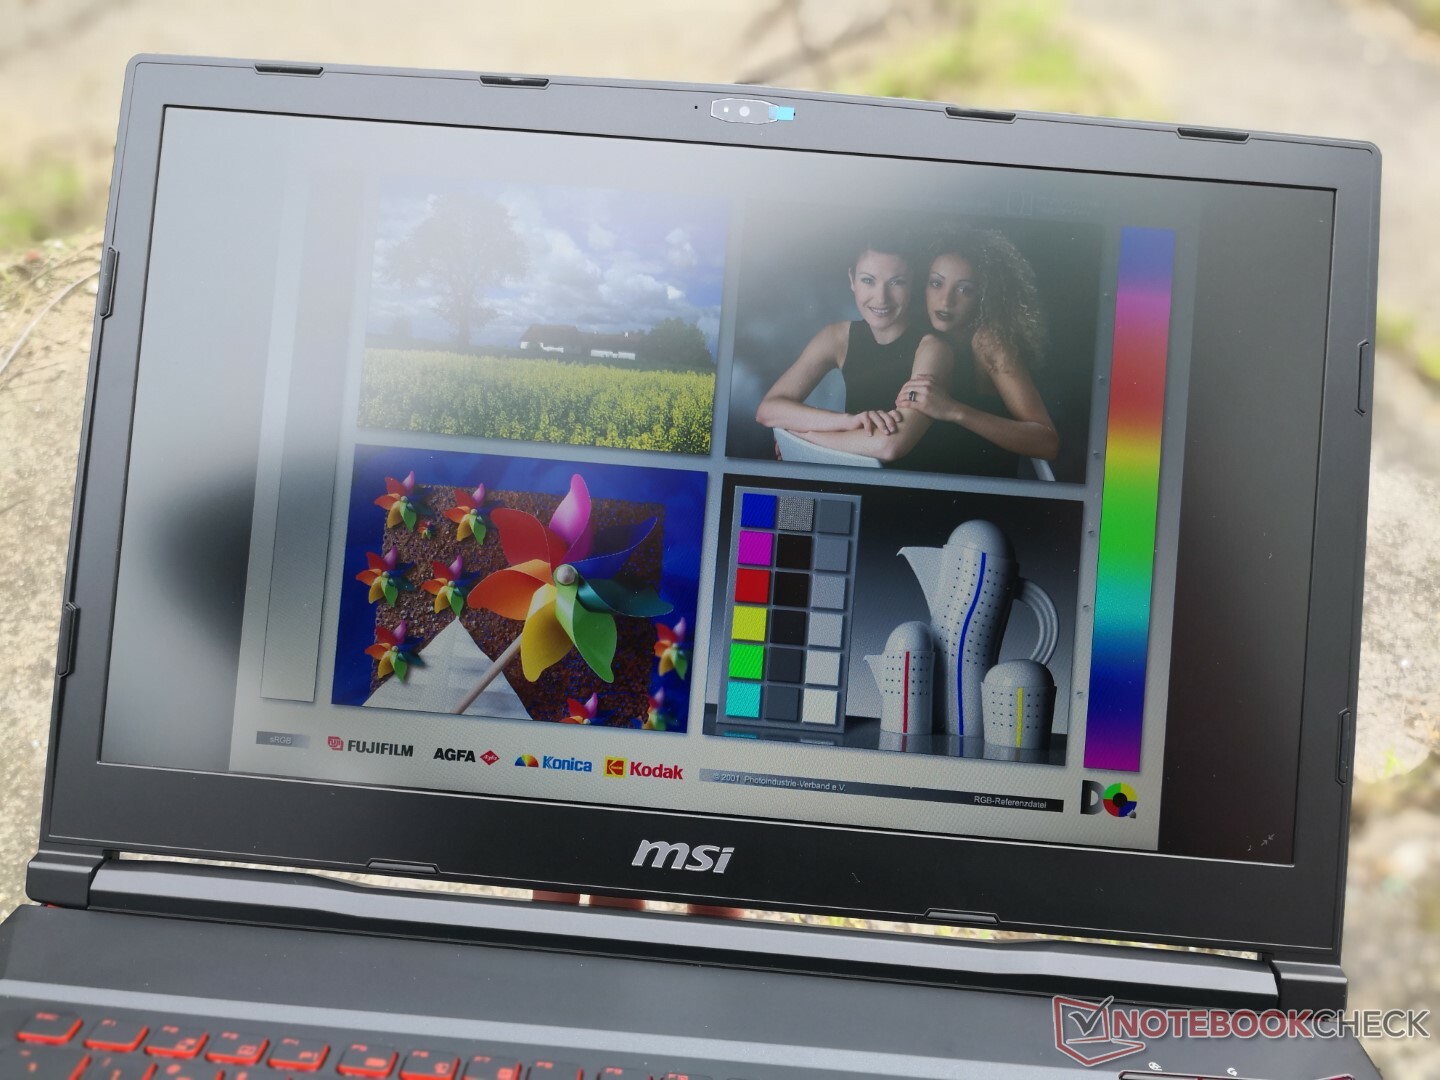
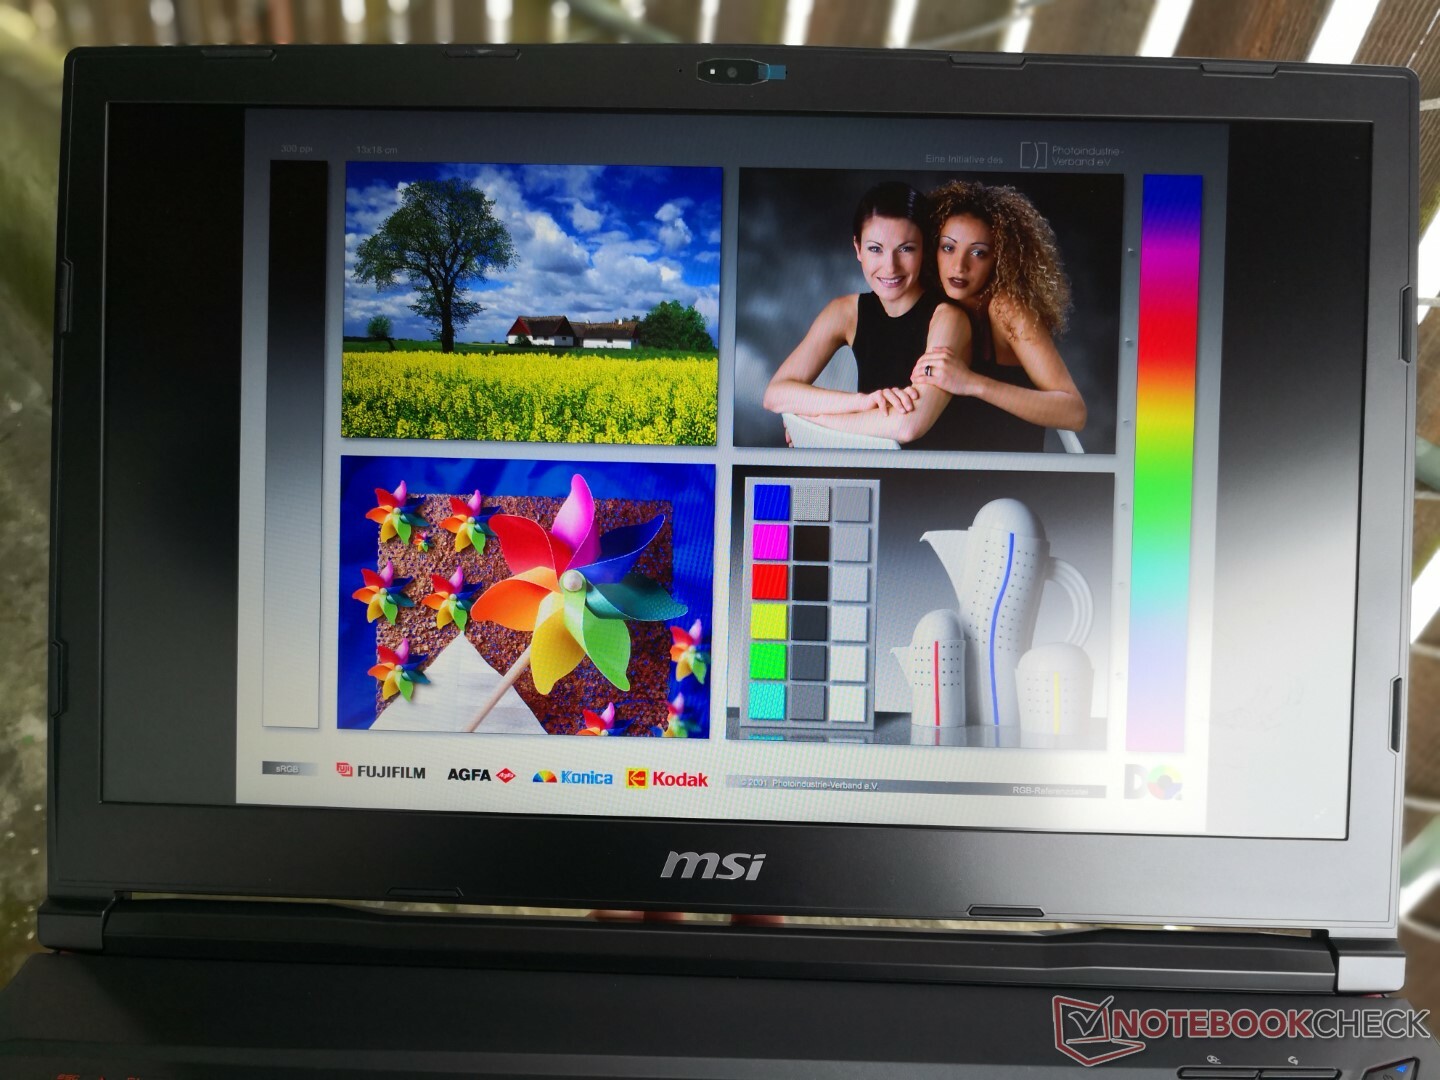
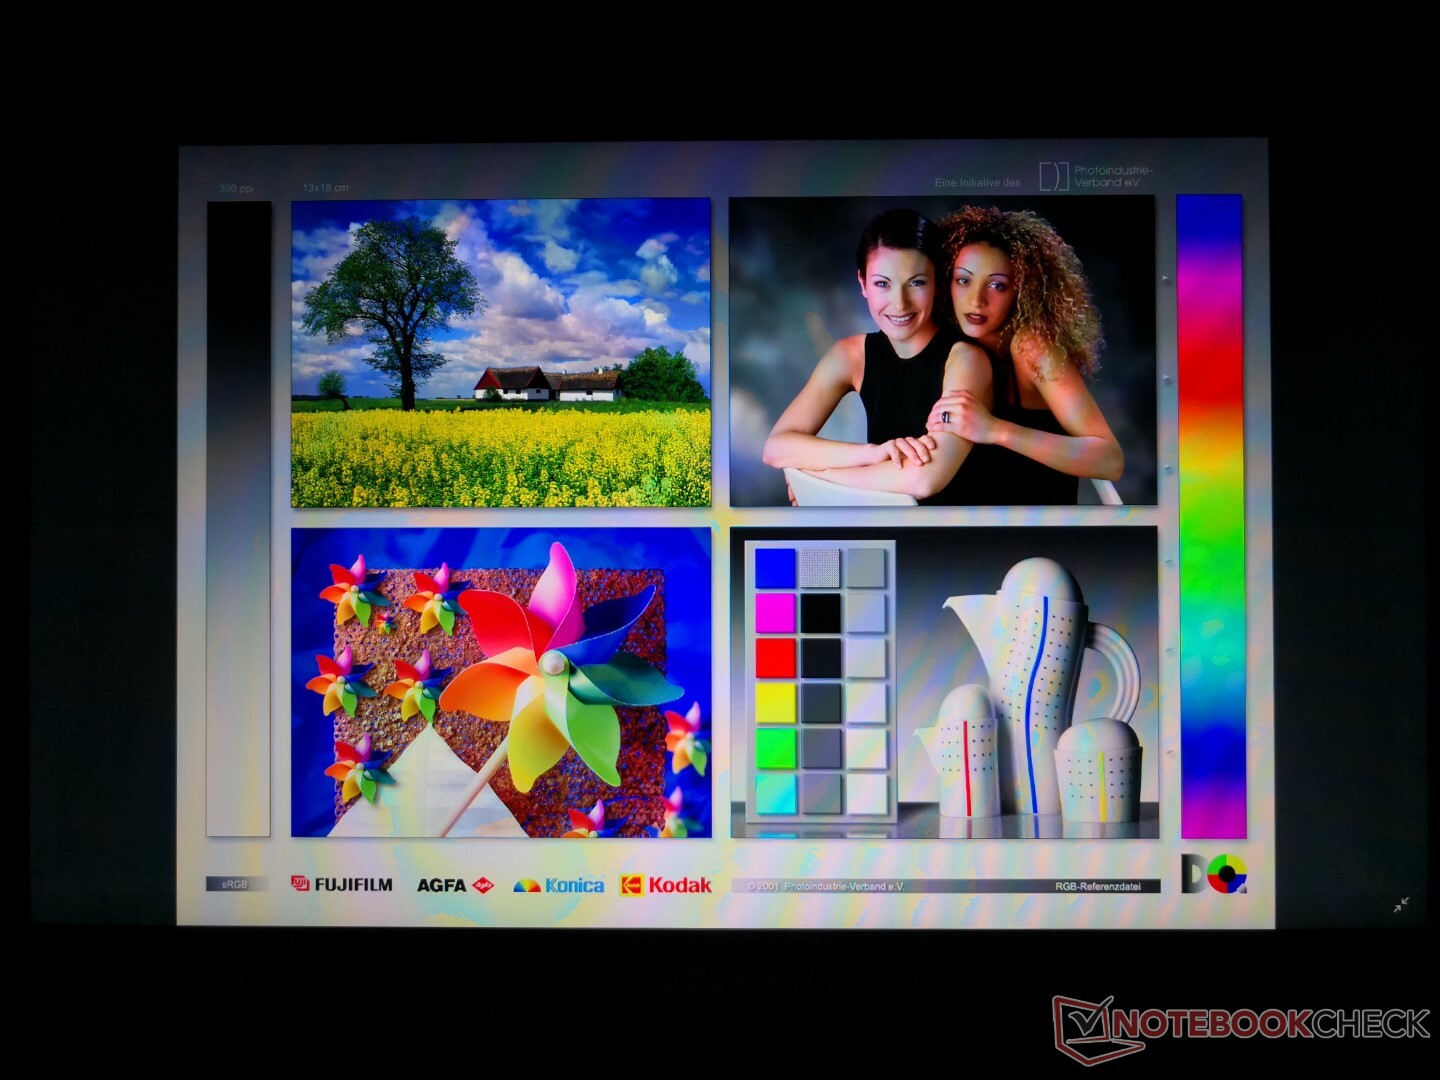
Display
Surprisingly, the GL73 utilizes the same high quality Chi Mei N173HHE-G32 TN panel as found on the pricier MSI GE73 Raider. The fast 5 ms black-white response time reduces ghosting while the 120 Hz native refresh rate ensures a buttery-smooth Windows experience. Other display characteristics such as color space and contrast are very similar to the GE73 Raider with superior results to the LG Philips LP173WF4-SPF6 panel on the Legion Y730. In short, this is a high-end panel on a budget-mainstream laptop.
There are no major graininess issues on the matte panel. It's not as crisp as a full-on glossy display, but it's nowhere near as grainy as what we've experienced on some Clevo systems.

| |||||||||||||||||||||||||
Brightness Distribution: 90 %
Center on Battery: 326.4 cd/m²
Contrast: 1166:1 (Black: 0.28 cd/m²)
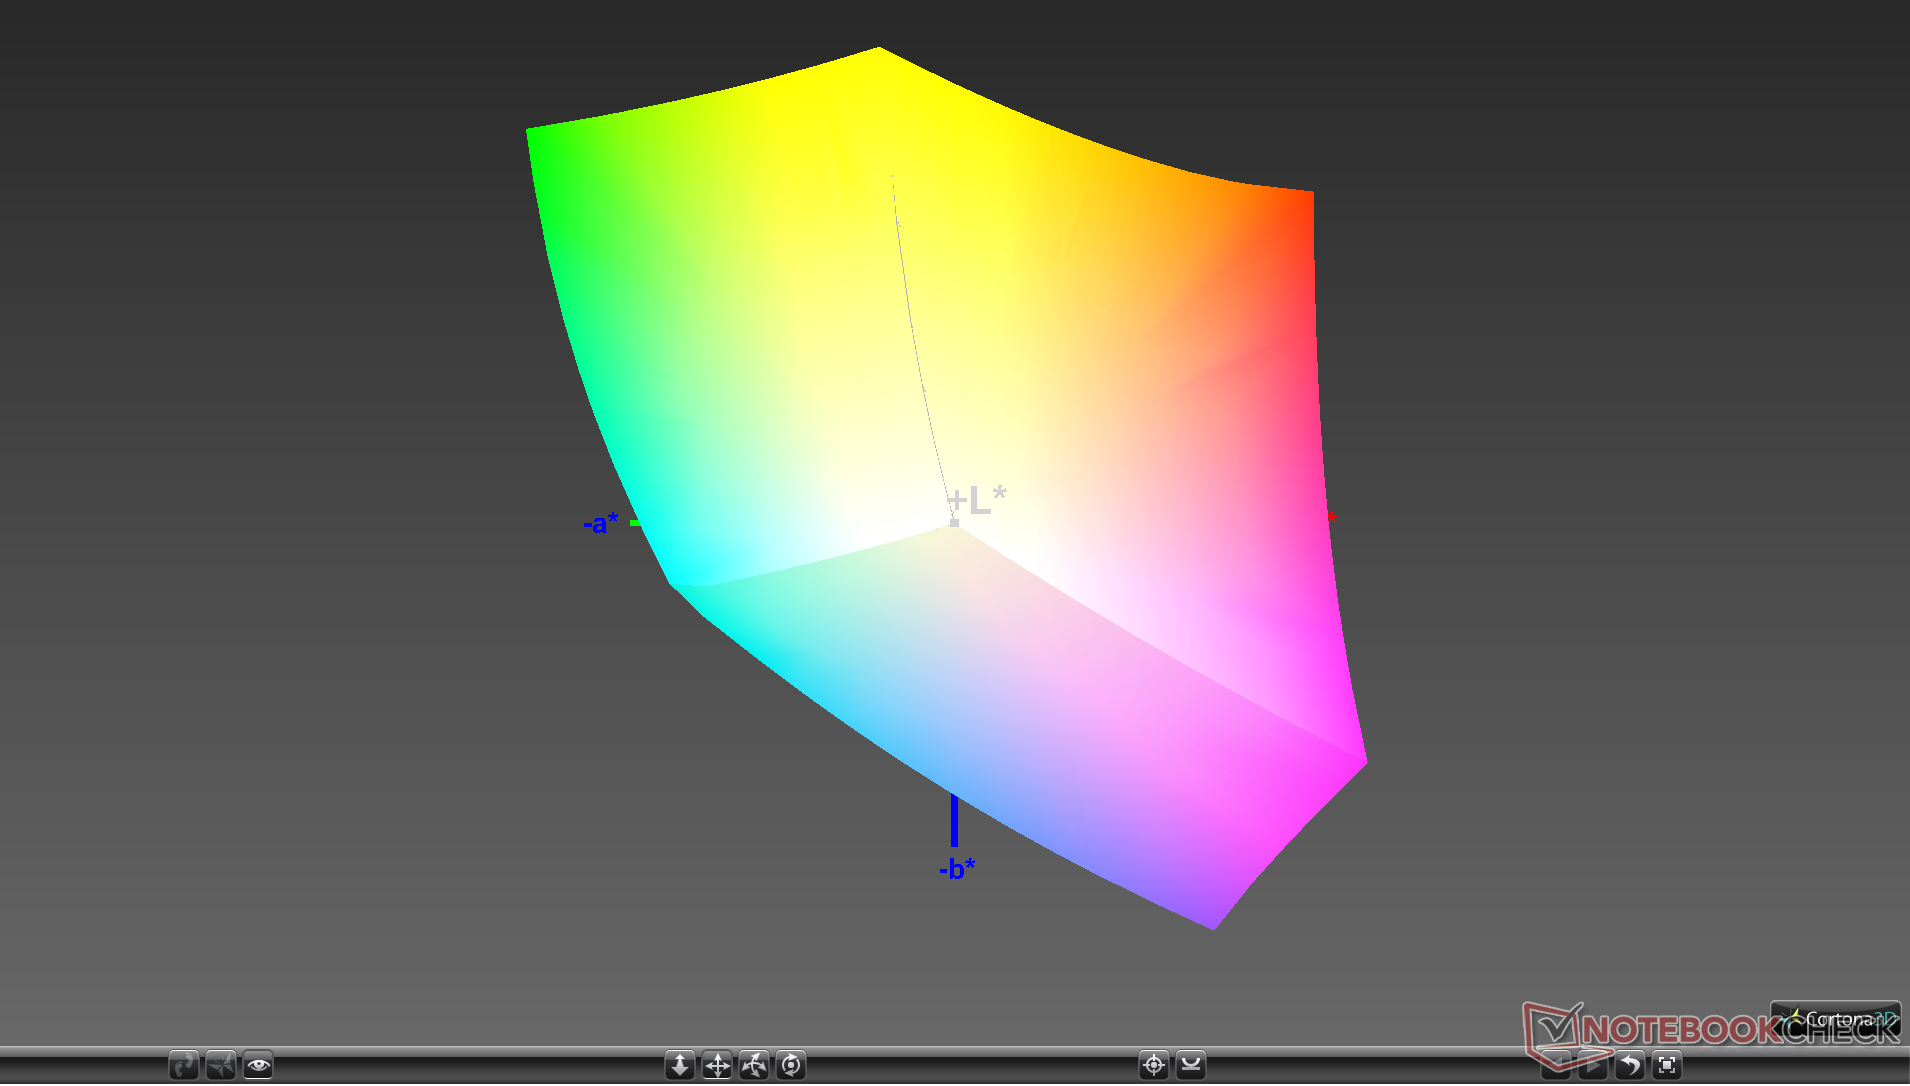
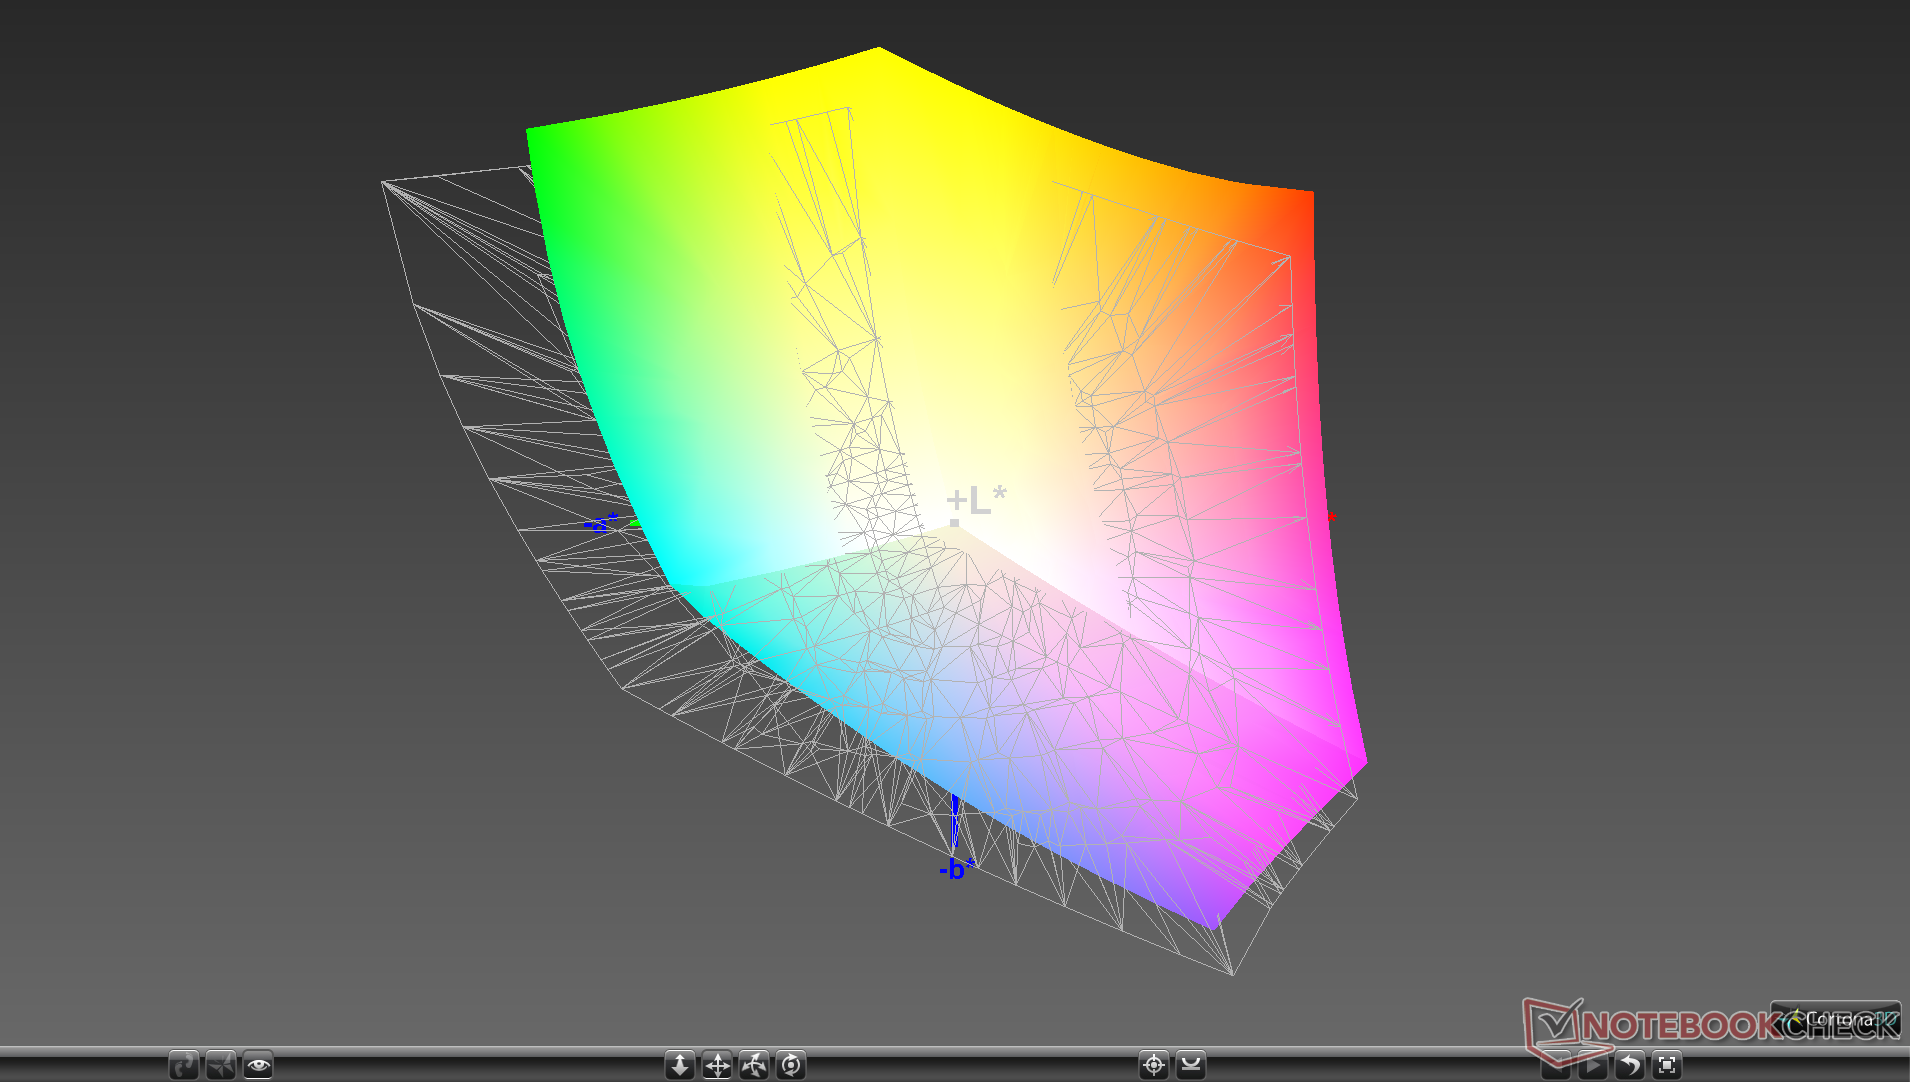
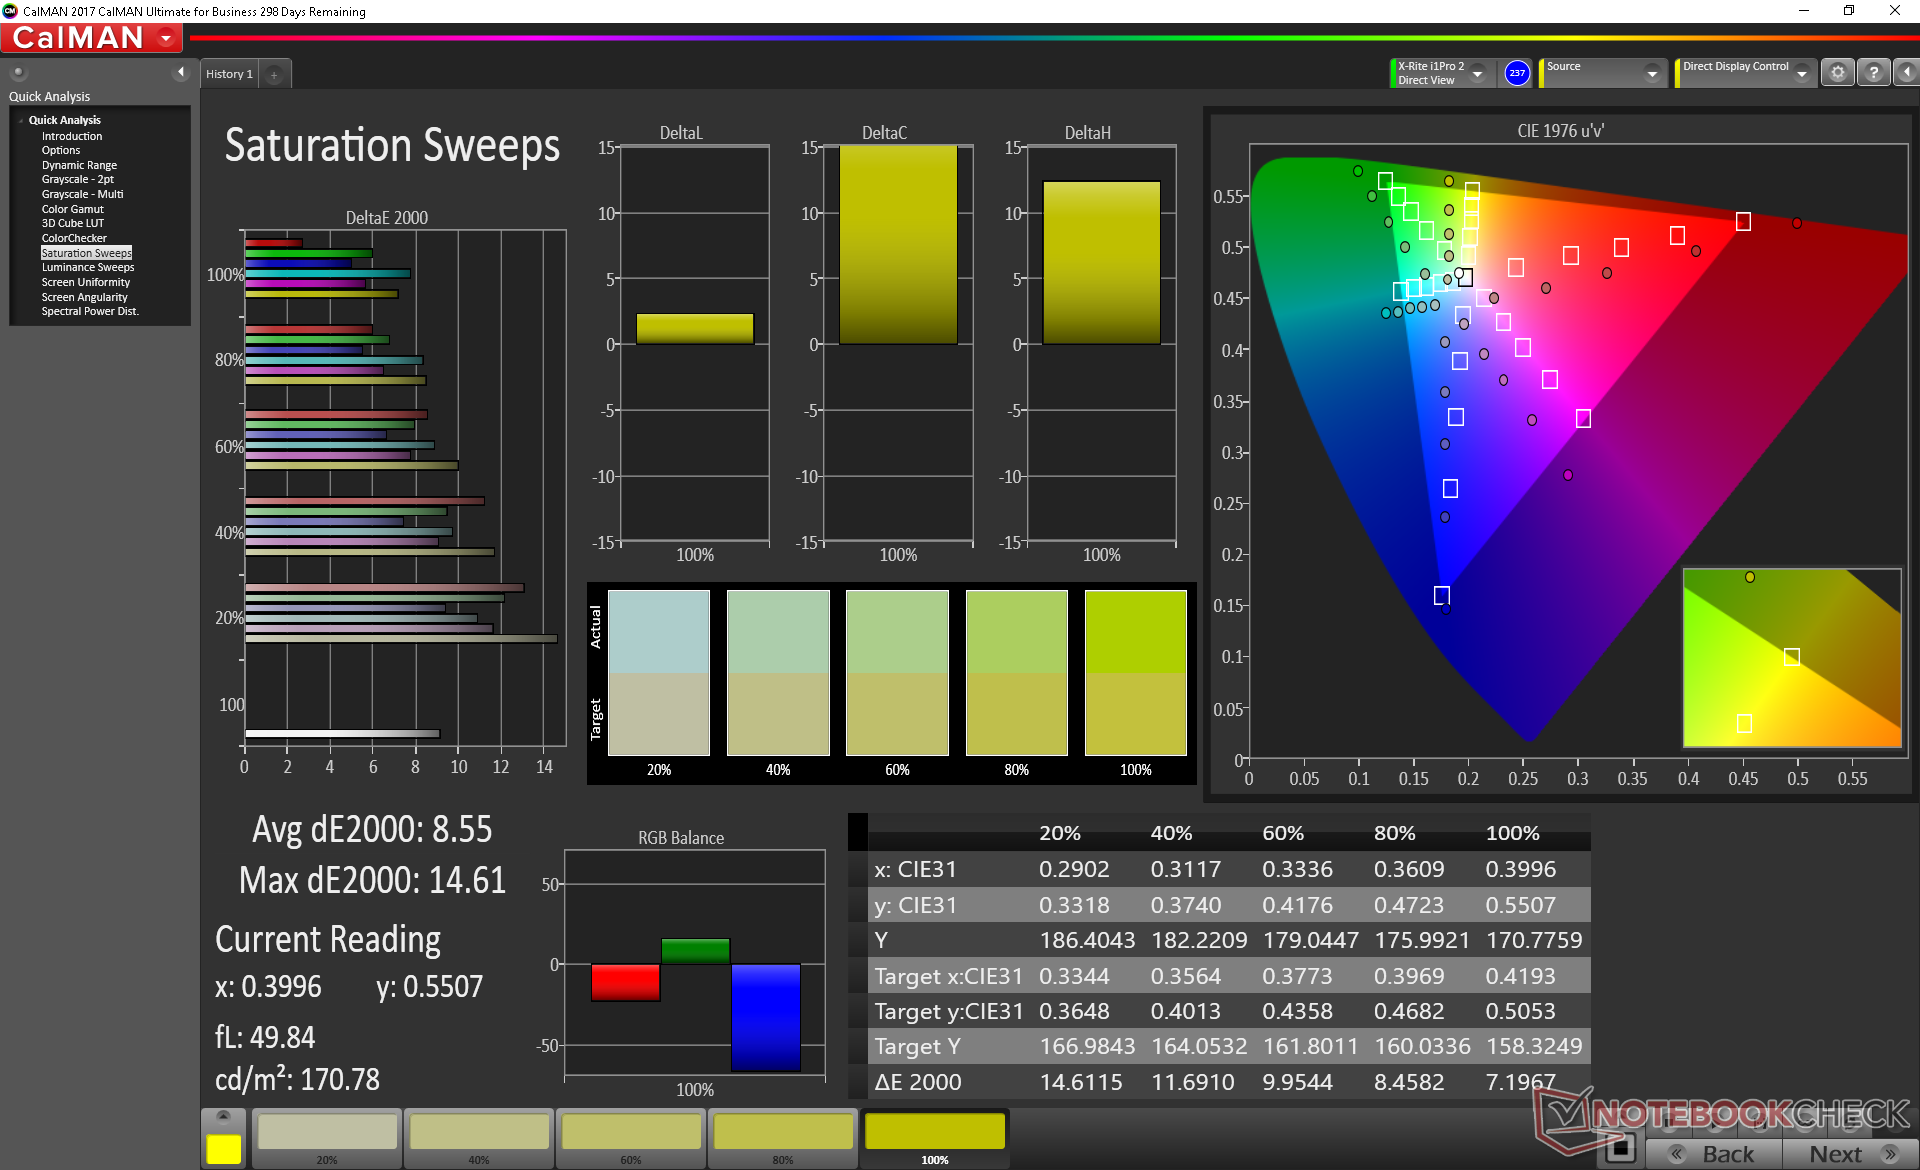
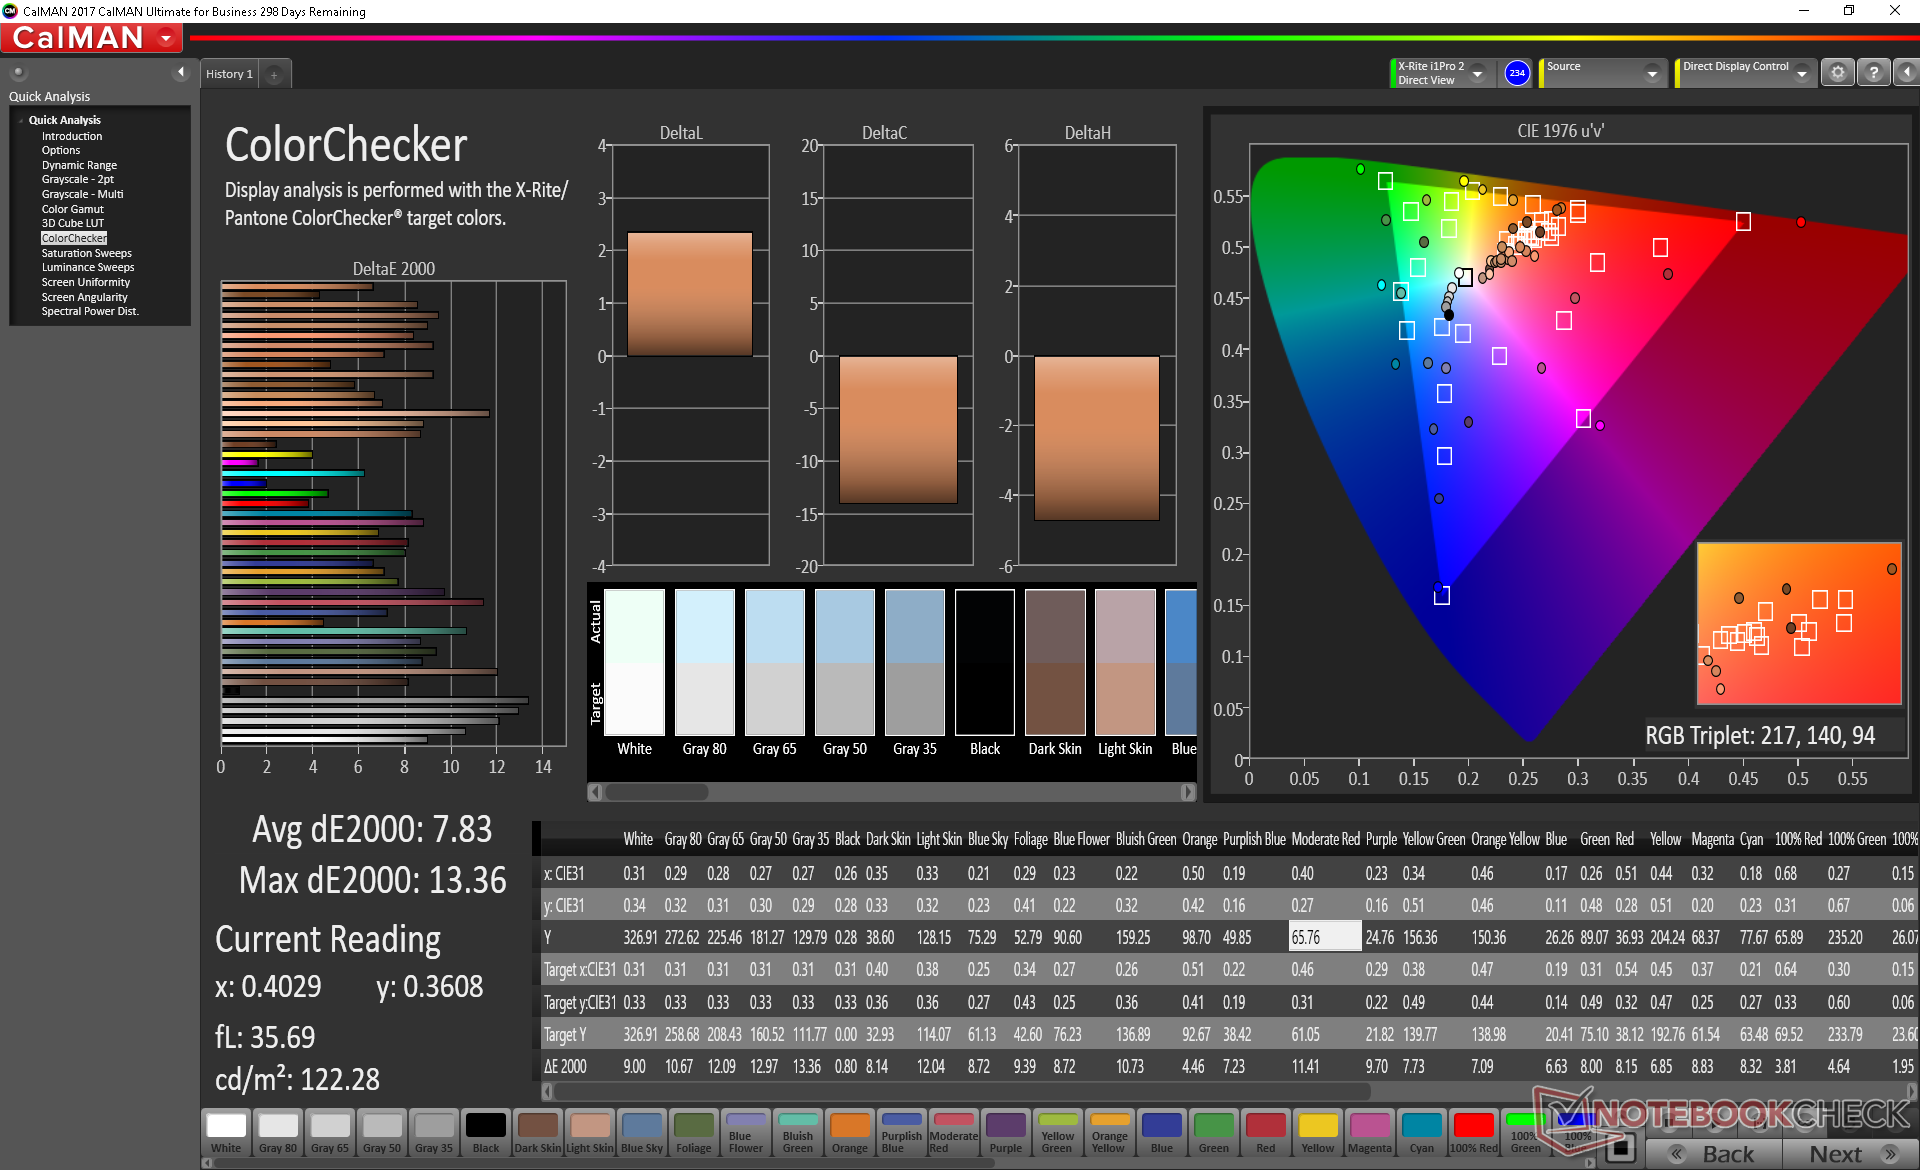
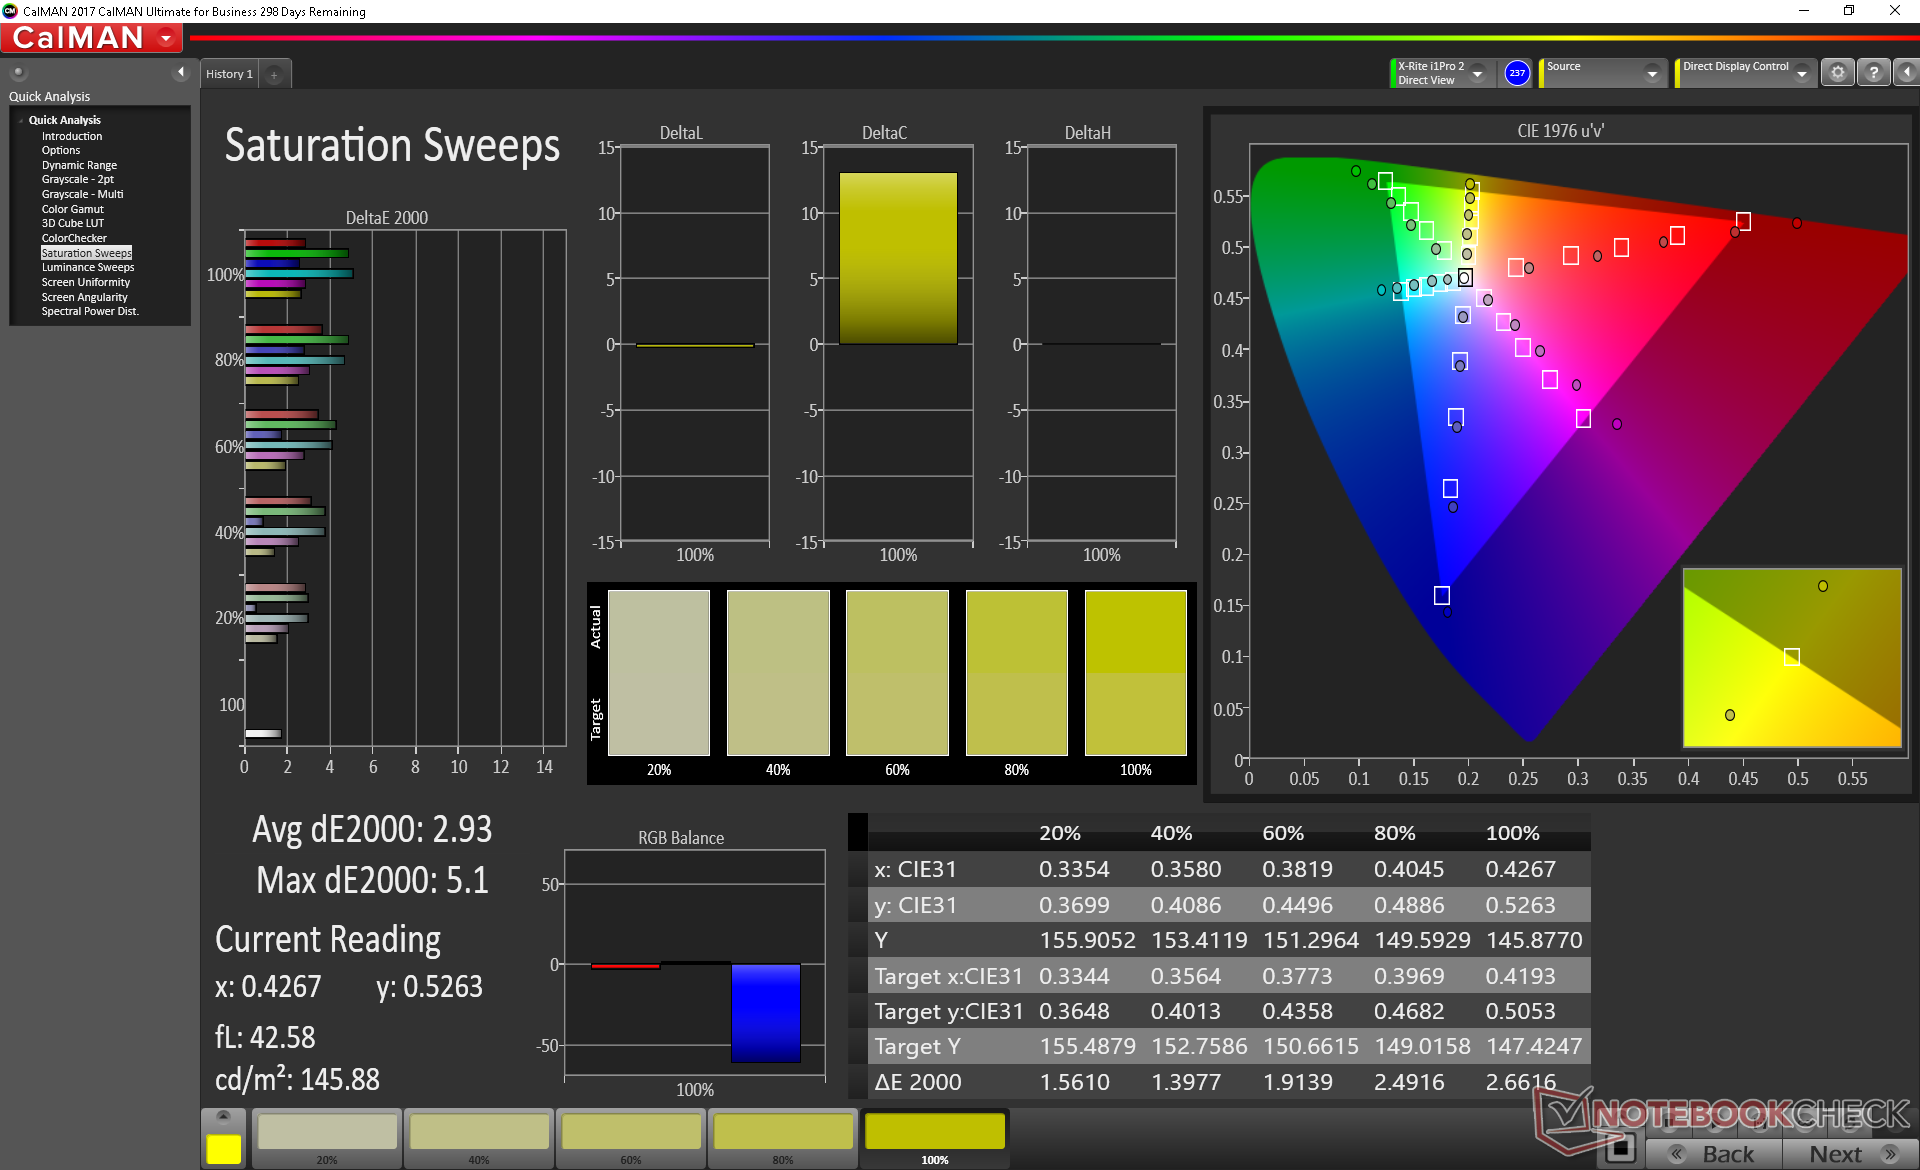
ΔE ColorChecker Calman: 7.83 | ∀{0.5-29.43 Ø4.71}
calibrated: 2.83
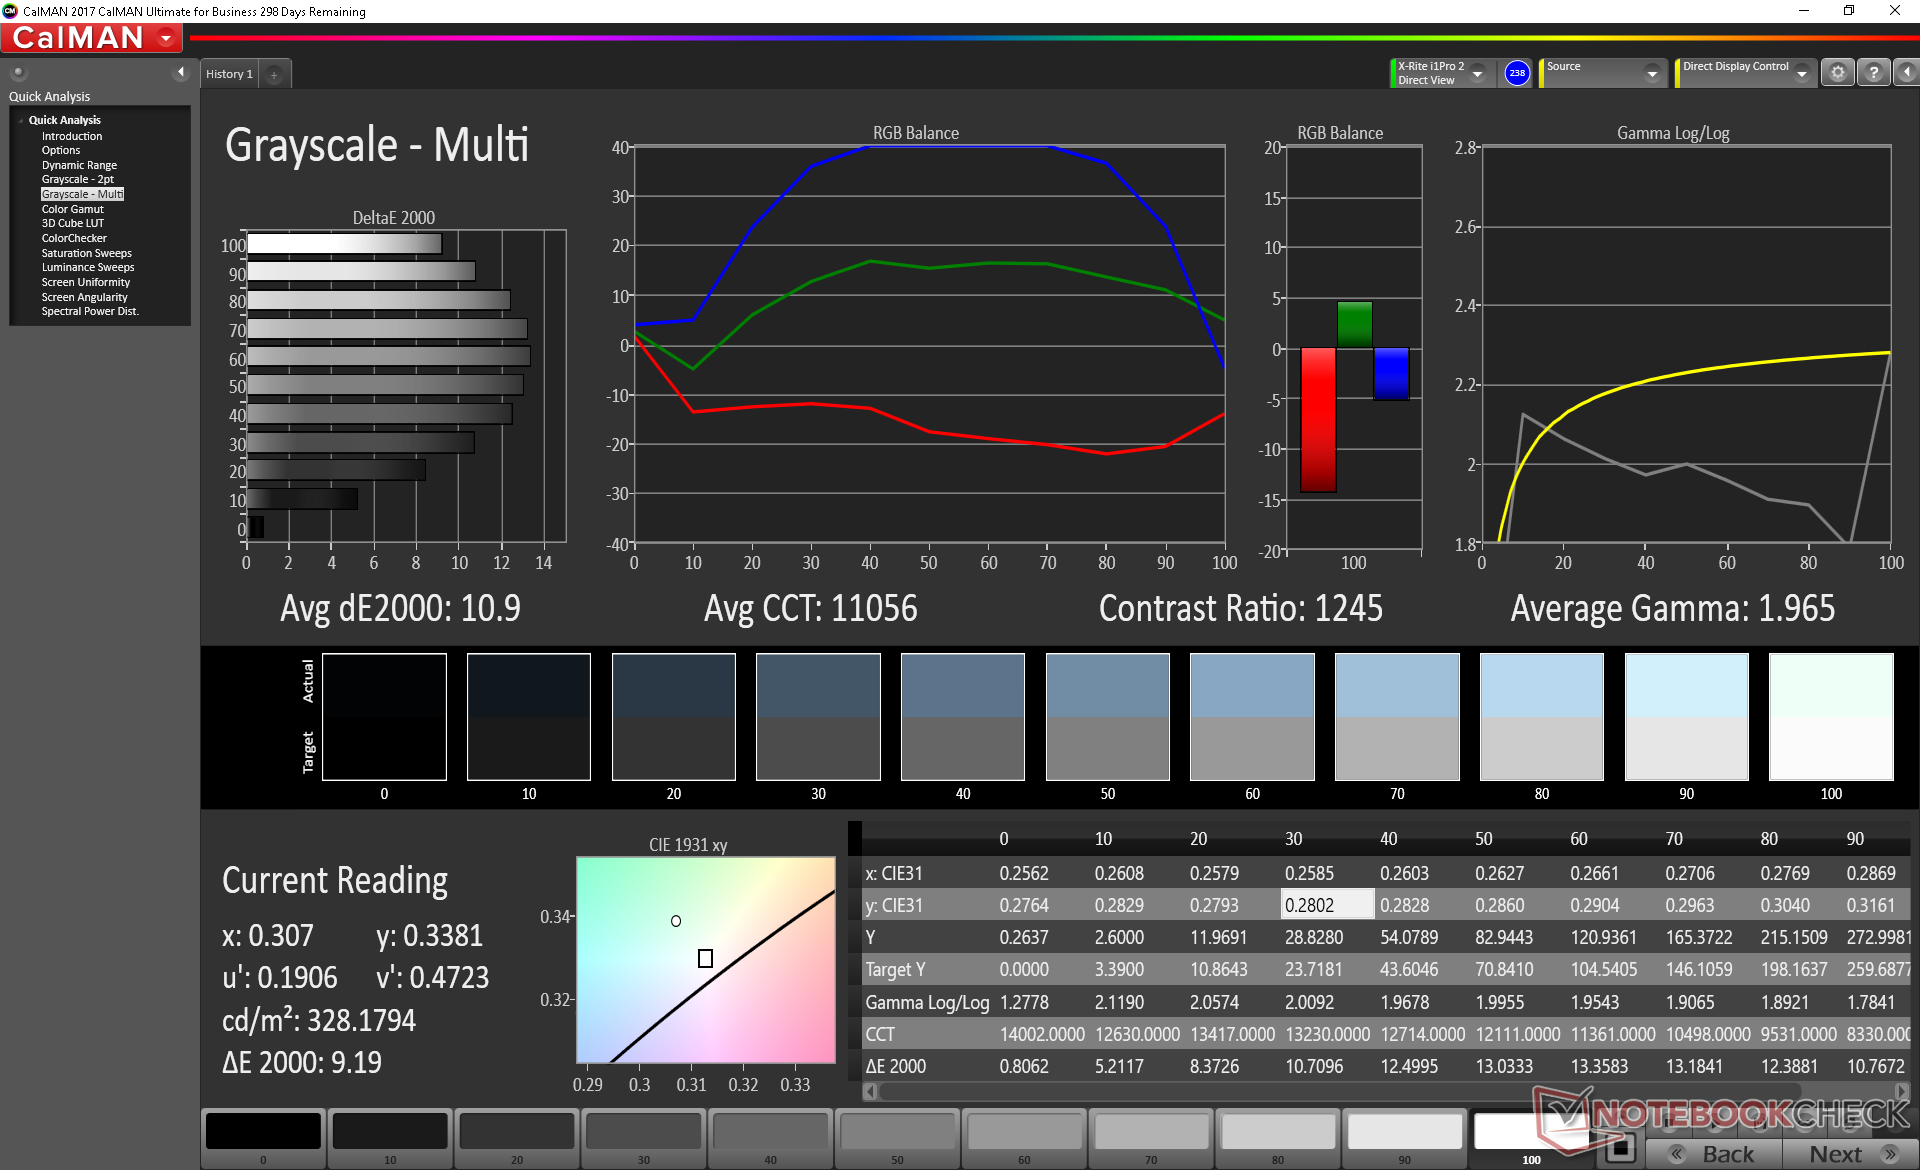
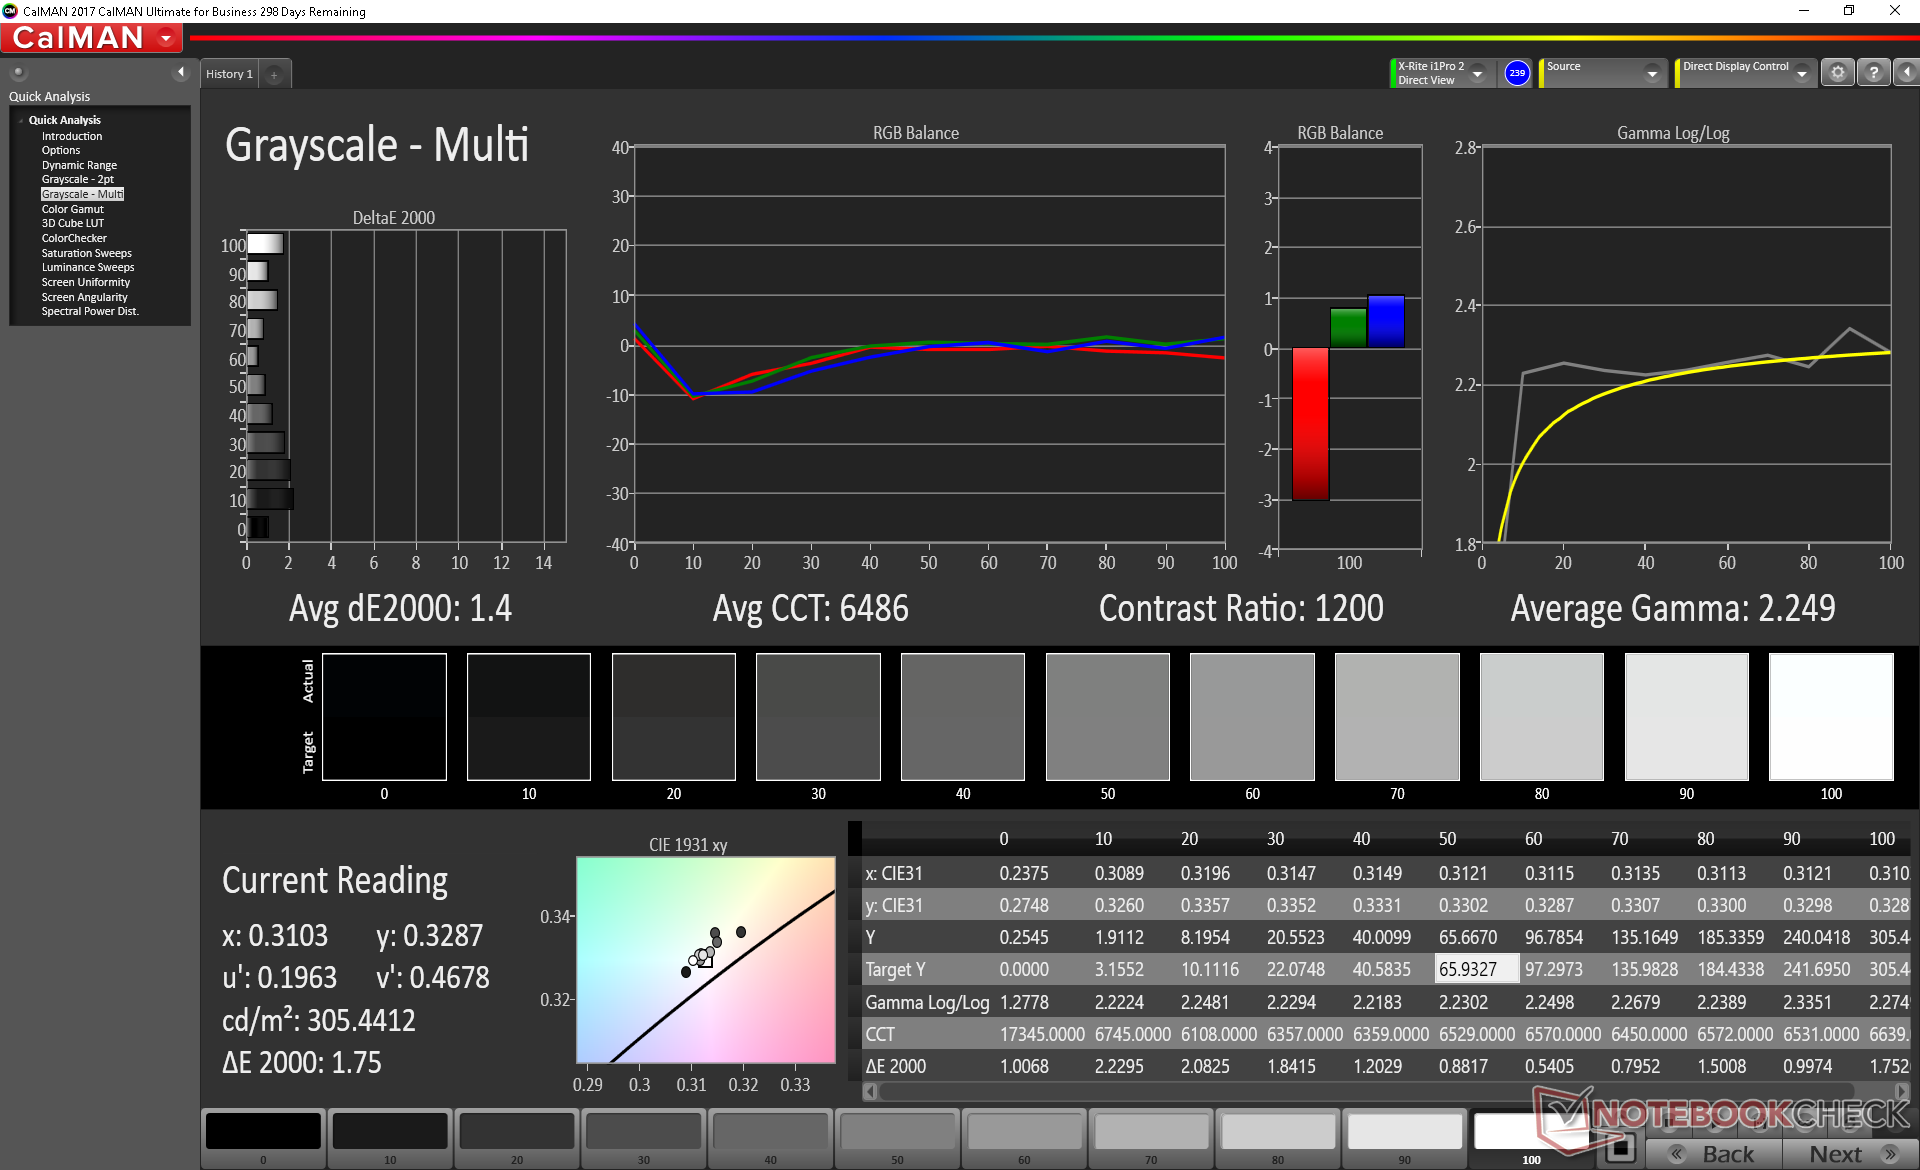
ΔE Greyscale Calman: 10.9 | ∀{0.09-98 Ø4.96}
100% sRGB (Argyll 1.6.3 3D)
75.8% AdobeRGB 1998 (Argyll 1.6.3 3D)
85.4% AdobeRGB 1998 (Argyll 3D)
100% sRGB (Argyll 3D)
91.1% Display P3 (Argyll 3D)
Gamma: 1.97
CCT: 11056 K
| MSI GL73 8SE-010US CMN1747, TN LED, 17.3", 1920x1080 | Lenovo Legion Y730-17ICH, i7-8750H LP173WF4-SPF6, IPS, 17.3", 1920x1080 | MSI GL72 7RDX-602 Chi Mei CMN1735 N173HGE-E11, TN LED, 17.3", 1920x1080 | MSI GE73 8RF-008 Raider RGB Chi Mei N173HHE-G32 (CMN1747), TN WLED, 17.3", 1920x1080 | Asus TUF FX705GM AU Optronics B173HAN04.0 (AUO409D), IPS, 17.3", 1920x1080 | Dell G3 17 3779 AUO, B173HAN01.3, IPS, 17.3", 1920x1080 | MSI GL73 8RD-418US Chi Mei N173HHE-G32, TN LED, 17.3", 1920x1080 | |
|---|---|---|---|---|---|---|---|
| Display | -23% | -19% | 0% | -23% | -21% | -0% | |
| Display P3 Coverage (%) | 91.1 | 66.4 -27% | 65.2 -28% | 90.8 0% | 62.4 -32% | 63.9 -30% | 91.1 0% |
| sRGB Coverage (%) | 100 | 84.9 -15% | 94.3 -6% | 99.9 0% | 88.8 -11% | 89.8 -10% | 99.9 0% |
| AdobeRGB 1998 Coverage (%) | 85.4 | 62.1 -27% | 65.6 -23% | 85.8 0% | 63.8 -25% | 64.9 -24% | 84.8 -1% |
| Response Times | -190% | -172% | -93% | 10% | -207% | -68% | |
| Response Time Grey 50% / Grey 80% * (ms) | 12.8 ? | 36.8 ? -187% | 29 ? -127% | 28 ? -119% | 7.4 ? 42% | 38 ? -197% | 29.6 ? -131% |
| Response Time Black / White * (ms) | 8.2 ? | 24 ? -193% | 26 ? -217% | 13.6 ? -66% | 10 ? -22% | 26 ? -217% | 8.6 ? -5% |
| PWM Frequency (Hz) | 25770 ? | 961 | 25000 ? | 25510 ? | |||
| Screen | -8% | -18% | 16% | 17% | 6% | -4% | |
| Brightness middle (cd/m²) | 326.4 | 328.7 1% | 299 -8% | 273 -16% | 234 -28% | 323 -1% | 290.5 -11% |
| Brightness (cd/m²) | 317 | 318 0% | 274 -14% | 273 -14% | 228 -28% | 306 -3% | 284 -10% |
| Brightness Distribution (%) | 90 | 91 1% | 80 -11% | 90 0% | 85 -6% | 89 -1% | 81 -10% |
| Black Level * (cd/m²) | 0.28 | 0.51 -82% | 0.25 11% | 0.26 7% | 0.2 29% | 0.31 -11% | 0.27 4% |
| Contrast (:1) | 1166 | 645 -45% | 1196 3% | 1050 -10% | 1170 0% | 1042 -11% | 1076 -8% |
| Colorchecker dE 2000 * | 7.83 | 4.91 37% | 12.92 -65% | 3.52 55% | 2.16 72% | 4.96 37% | 8.55 -9% |
| Colorchecker dE 2000 max. * | 13.36 | 10.15 24% | 19.91 -49% | 6.34 53% | 3.39 75% | 8.25 38% | 13.44 -1% |
| Colorchecker dE 2000 calibrated * | 2.83 | 4.27 -51% | 2.09 26% | 2.02 29% | 2.74 3% | ||
| Greyscale dE 2000 * | 10.9 | 3.9 64% | 13.16 -21% | 3.11 71% | 2 82% | 5.65 48% | 11.1 -2% |
| Gamma | 1.97 112% | 2.13 103% | 2.36 93% | 2.43 91% | 2.46 89% | 2.24 98% | 1.85 119% |
| CCT | 11056 59% | 6911 94% | 15046 43% | 6999 93% | 6394 102% | 7441 87% | 10912 60% |
| Color Space (Percent of AdobeRGB 1998) (%) | 75.8 | 55.6 -27% | 60 -21% | 76 0% | 58 -23% | 58 -23% | 75.4 -1% |
| Color Space (Percent of sRGB) (%) | 100 | 84.7 -15% | 94 -6% | 100 0% | 89 -11% | 90 -10% | 99.9 0% |
| Total Average (Program / Settings) | -74% /
-34% | -70% /
-39% | -26% /
-1% | 1% /
9% | -74% /
-28% | -24% /
-11% |
* ... smaller is better
Color space covers sRGB in its entirety and approximately 76 percent of AdobeRGB to satisfy most digital artists. Colors are deeper and more vibrant than on many budget-mainstream gaming laptops. The AUO panel on the Dell G3 17, for example, covers just 58 percent of AdobeRGB.
Further measurements with an X-Rite colorimeter reveal horrendously inaccurate colors and an overly cool grayscale. These are perhaps the consequences of having a high-end panel on an entry-level machine. Fortunately, our calibration addresses these concerns for a significantly more accurate display. We recommend an end-user calibration to get the most out of the display especially since it is capable of reproducing the entire sRGB spectrum.
Display Response Times
| ↔ Response Time Black to White | ||
|---|---|---|
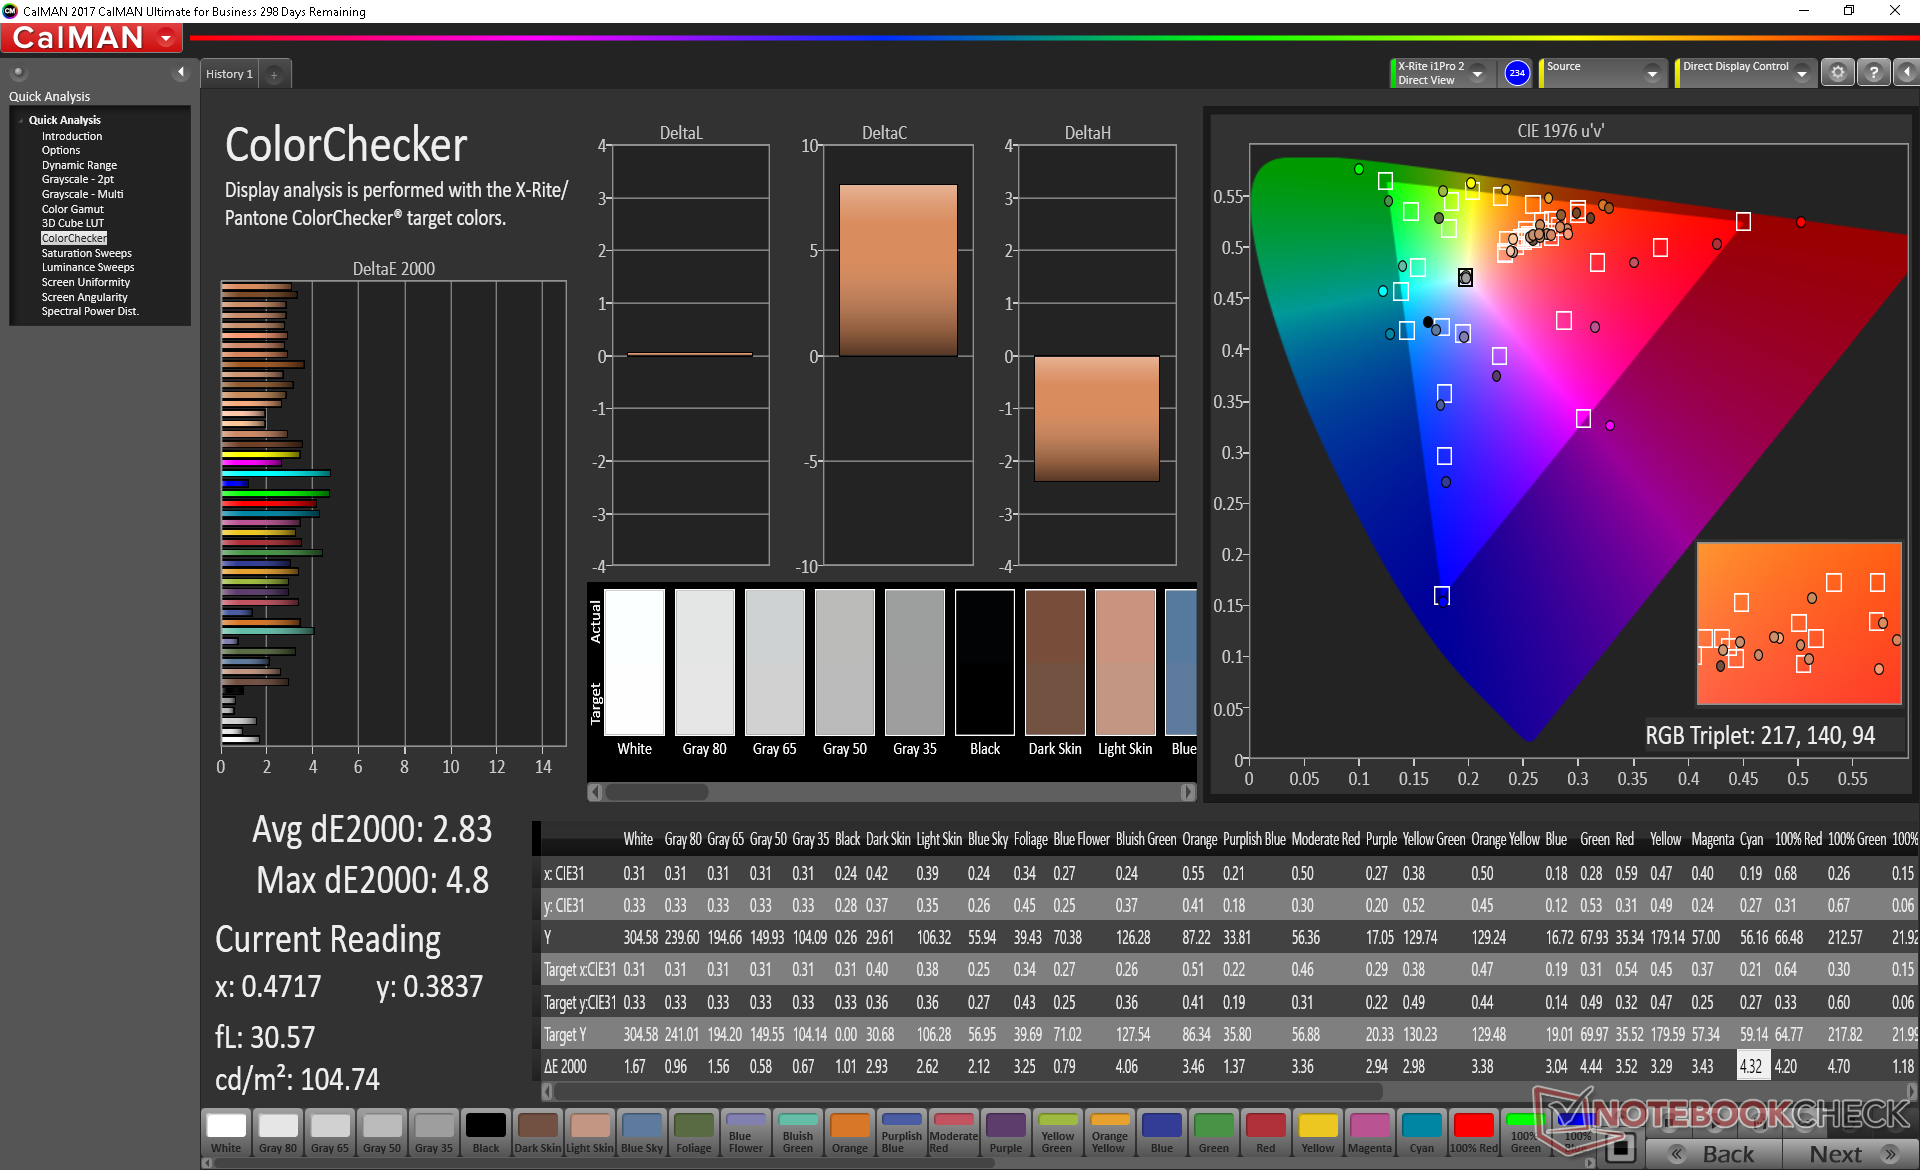
| 8.2 ms ... rise ↗ and fall ↘ combined | ↗ 6 ms rise | 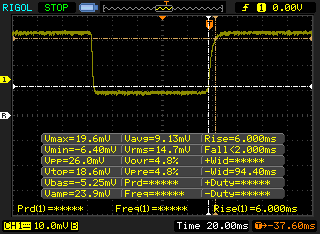 |
| ↘ 2.2 ms fall | ||
| The screen shows fast response rates in our tests and should be suited for gaming. In comparison, all tested devices range from 0.1 (minimum) to 240 (maximum) ms. » 24 % of all devices are better. This means that the measured response time is better than the average of all tested devices (19.8 ms). | ||
| ↔ Response Time 50% Grey to 80% Grey | ||
| 12.8 ms ... rise ↗ and fall ↘ combined | ↗ 6.8 ms rise | 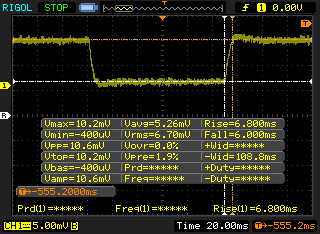 |
| ↘ 6 ms fall | ||
| The screen shows good response rates in our tests, but may be too slow for competitive gamers. In comparison, all tested devices range from 0.165 (minimum) to 636 (maximum) ms. » 26 % of all devices are better. This means that the measured response time is better than the average of all tested devices (31 ms). | ||
Screen Flickering / PWM (Pulse-Width Modulation)
| Screen flickering / PWM detected | 25770 Hz | ≤ 15 % brightness setting |  |
The display backlight flickers at 25770 Hz (worst case, e.g., utilizing PWM) Flickering detected at a brightness setting of 15 % and below. There should be no flickering or PWM above this brightness setting. The frequency of 25770 Hz is quite high, so most users sensitive to PWM should not notice any flickering. In comparison: 52 % of all tested devices do not use PWM to dim the display. If PWM was detected, an average of 7757 (minimum: 5 - maximum: 343500) Hz was measured. | |||
Outdoor visibility is limited when not under shade because of the narrow viewing angles of TN. Attempting to reduce glare by adjusting the lid will cause colors and contrast to quickly shift. The displays of most gaming laptops are not designed for constant use outdoors and the GL73 is no different.
Performance
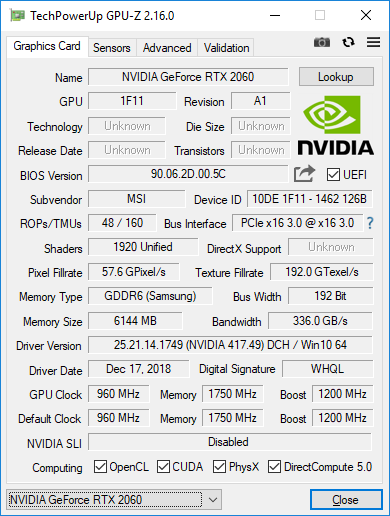
CPU options remain the same as on the last generation MSI GL72. The Core i5-8300H and i7-8750H are commonplace on budget to enthusiast gaming laptops alike. The biggest difference, of course, is the GeForce RTX 2060 Turing GPU to supplant the last generation GeForce GTX 1060 Pascal GPU found on most mainstream gaming laptops of yesteryear.
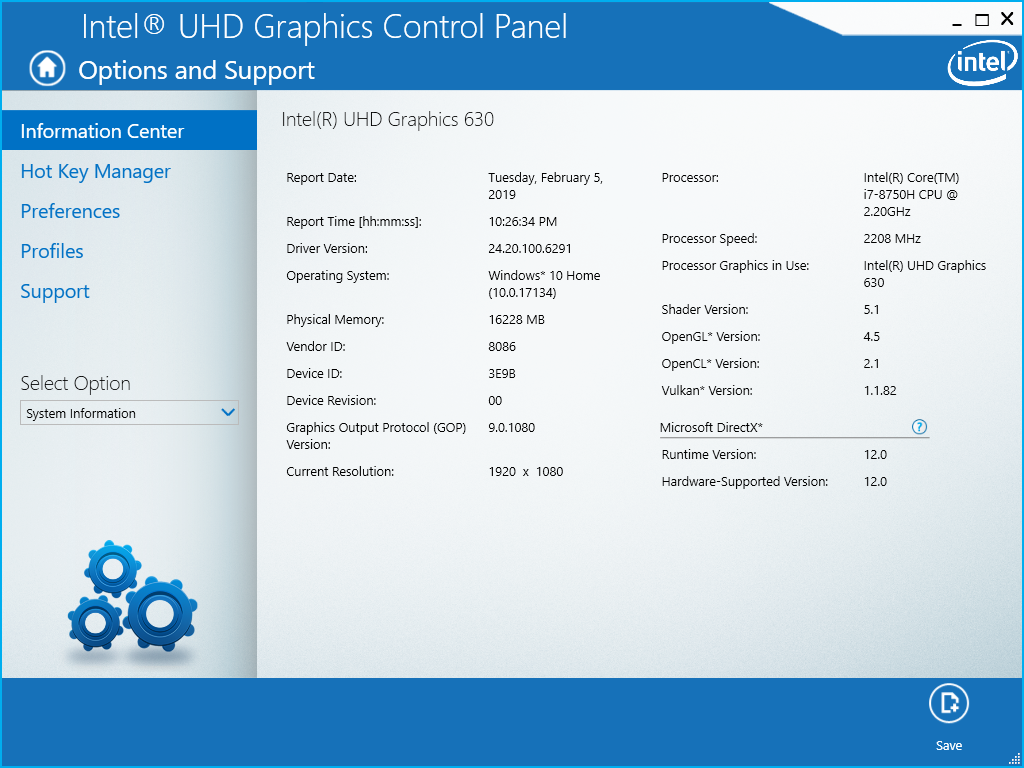
Nvidia Optimus comes standard for automatic graphics switching to the integrated UHD Graphics 630. Consequently, G-Sync is not an option on the GL73.
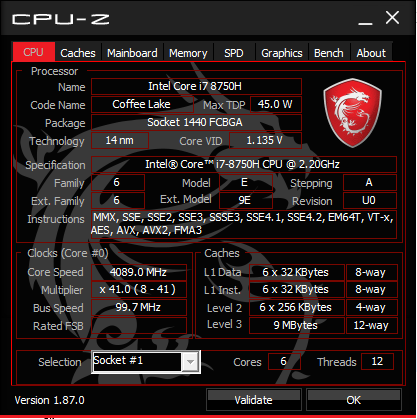
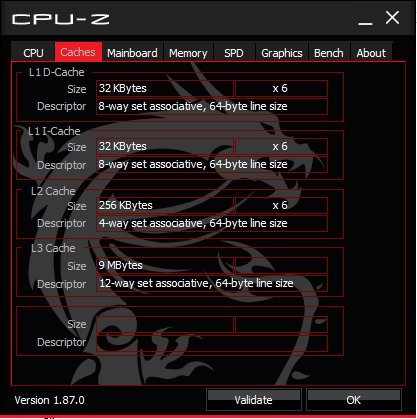
Processor
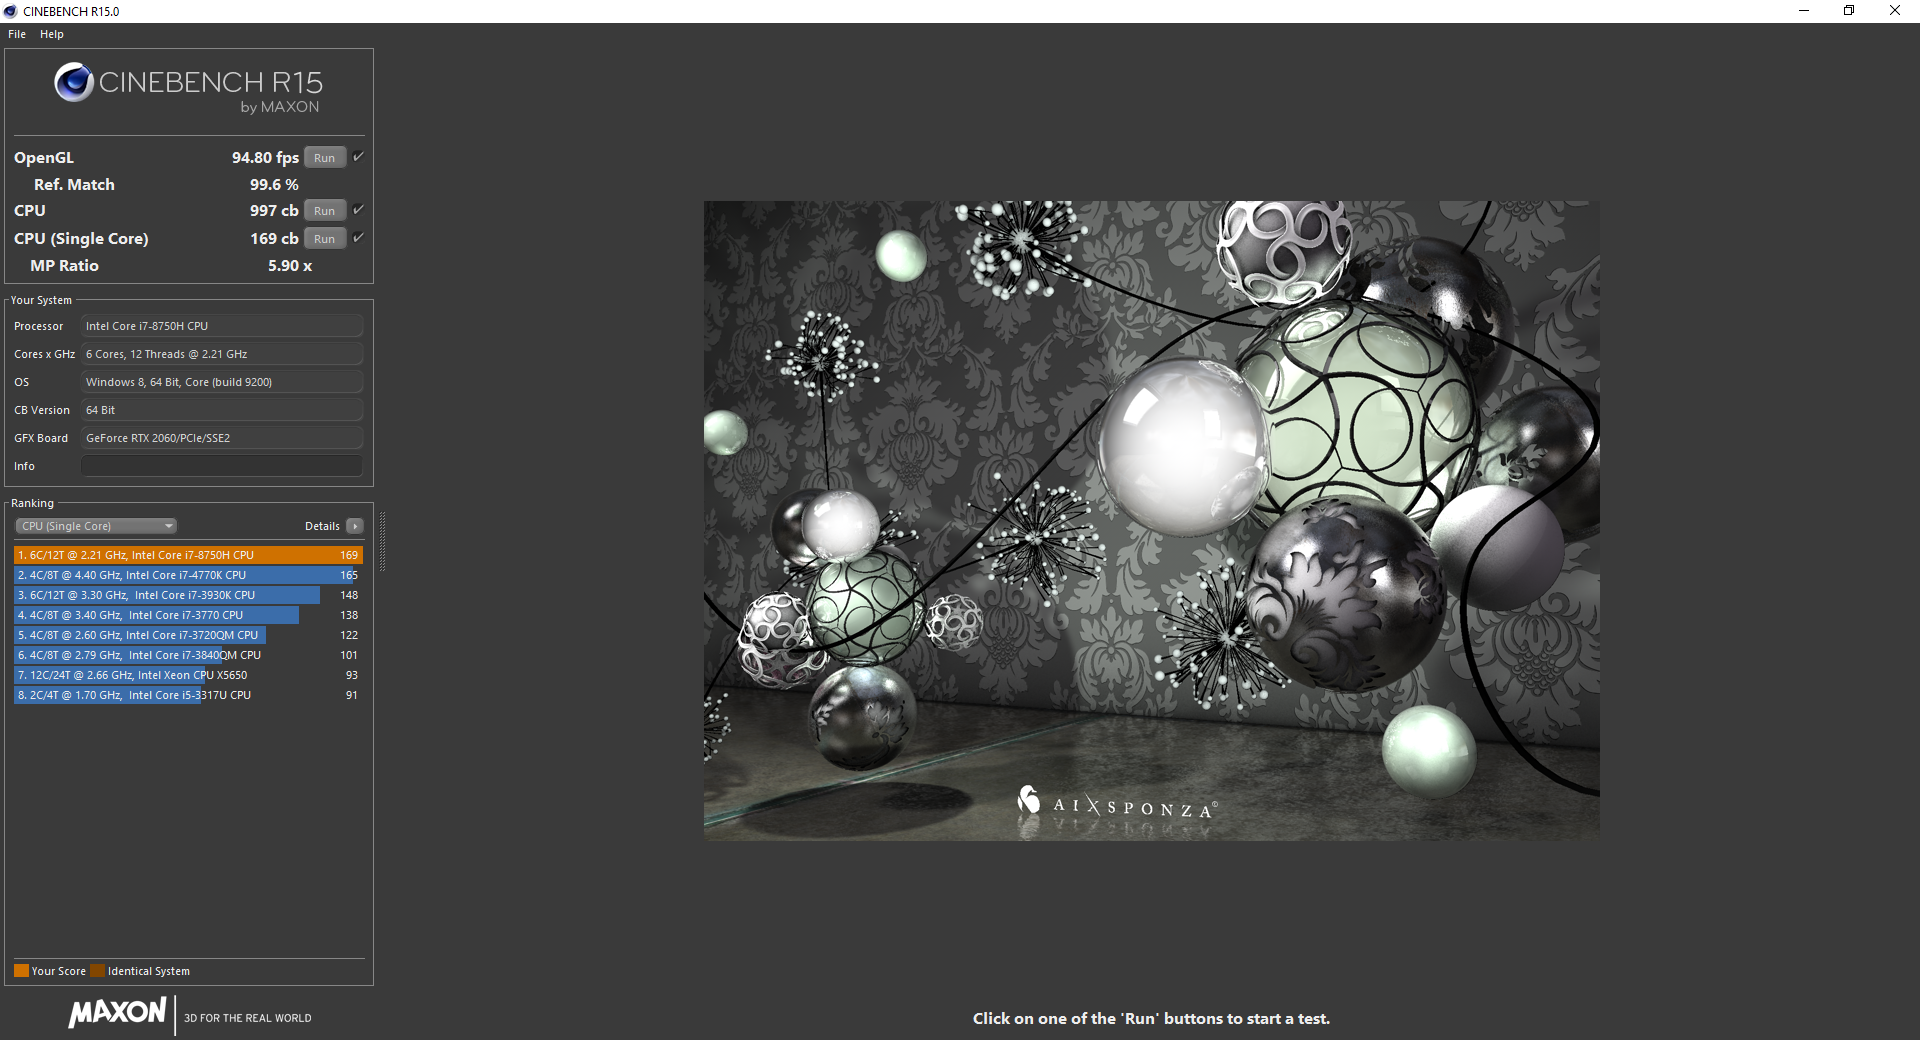
The Core i7-8750H in the MSI underperforms by about 10 percent when compared to the average i7-8750H in our database. This same CPU in the Alienware m15 runs faster by about 22 percent according to CineBench R15 Multi-Thread. The limited Turbo Boost potential of the MSI is responsible for the lower scores as our Stress Test section below will show.
We are able to observe performance throttling by running CineBench R15 Multi-Thread in a loop. The initial score of 1034 points drops to 919 points by the second loop to represent a performance drop of 11 percent. Note that the pricier MSI GE73 has the same CPU as our GL73, but it is able to run the processor at faster clock rates.
See our dedicated page on the Core i7-8750H for more technical information and benchmark comparisons.
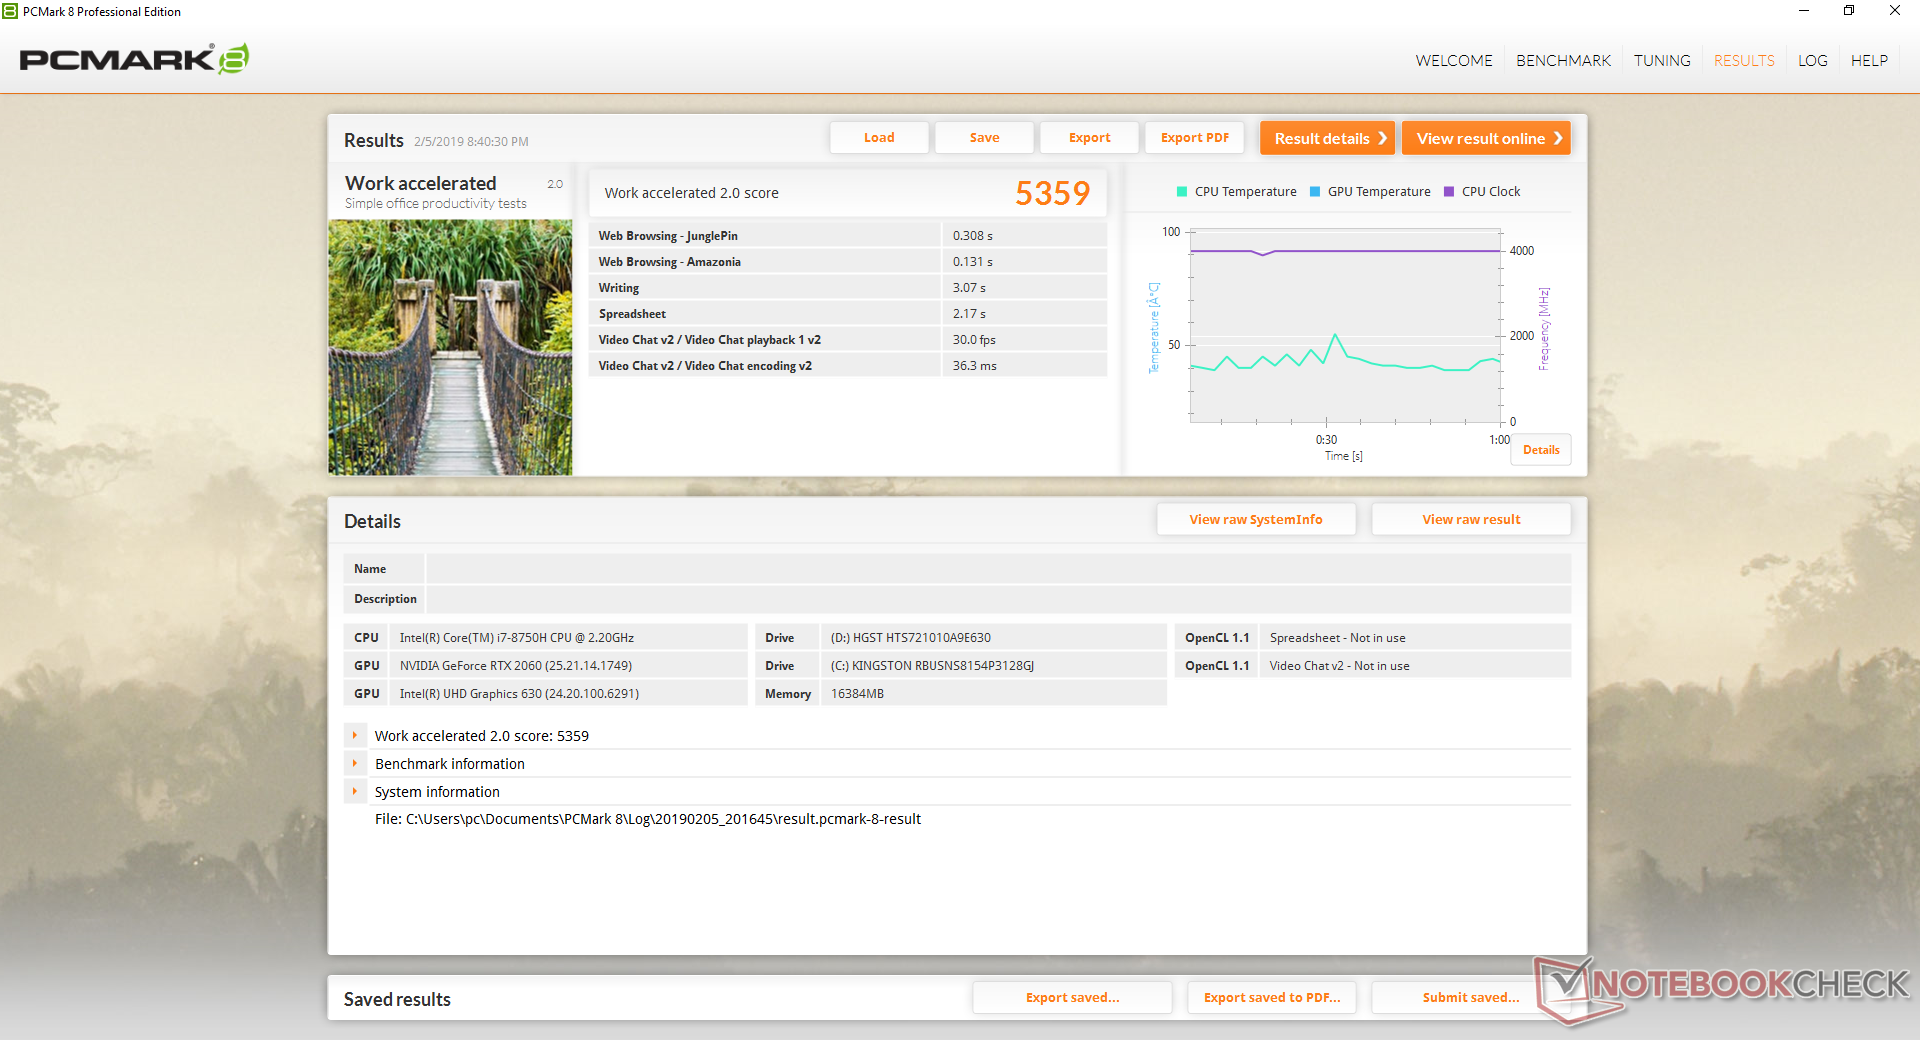
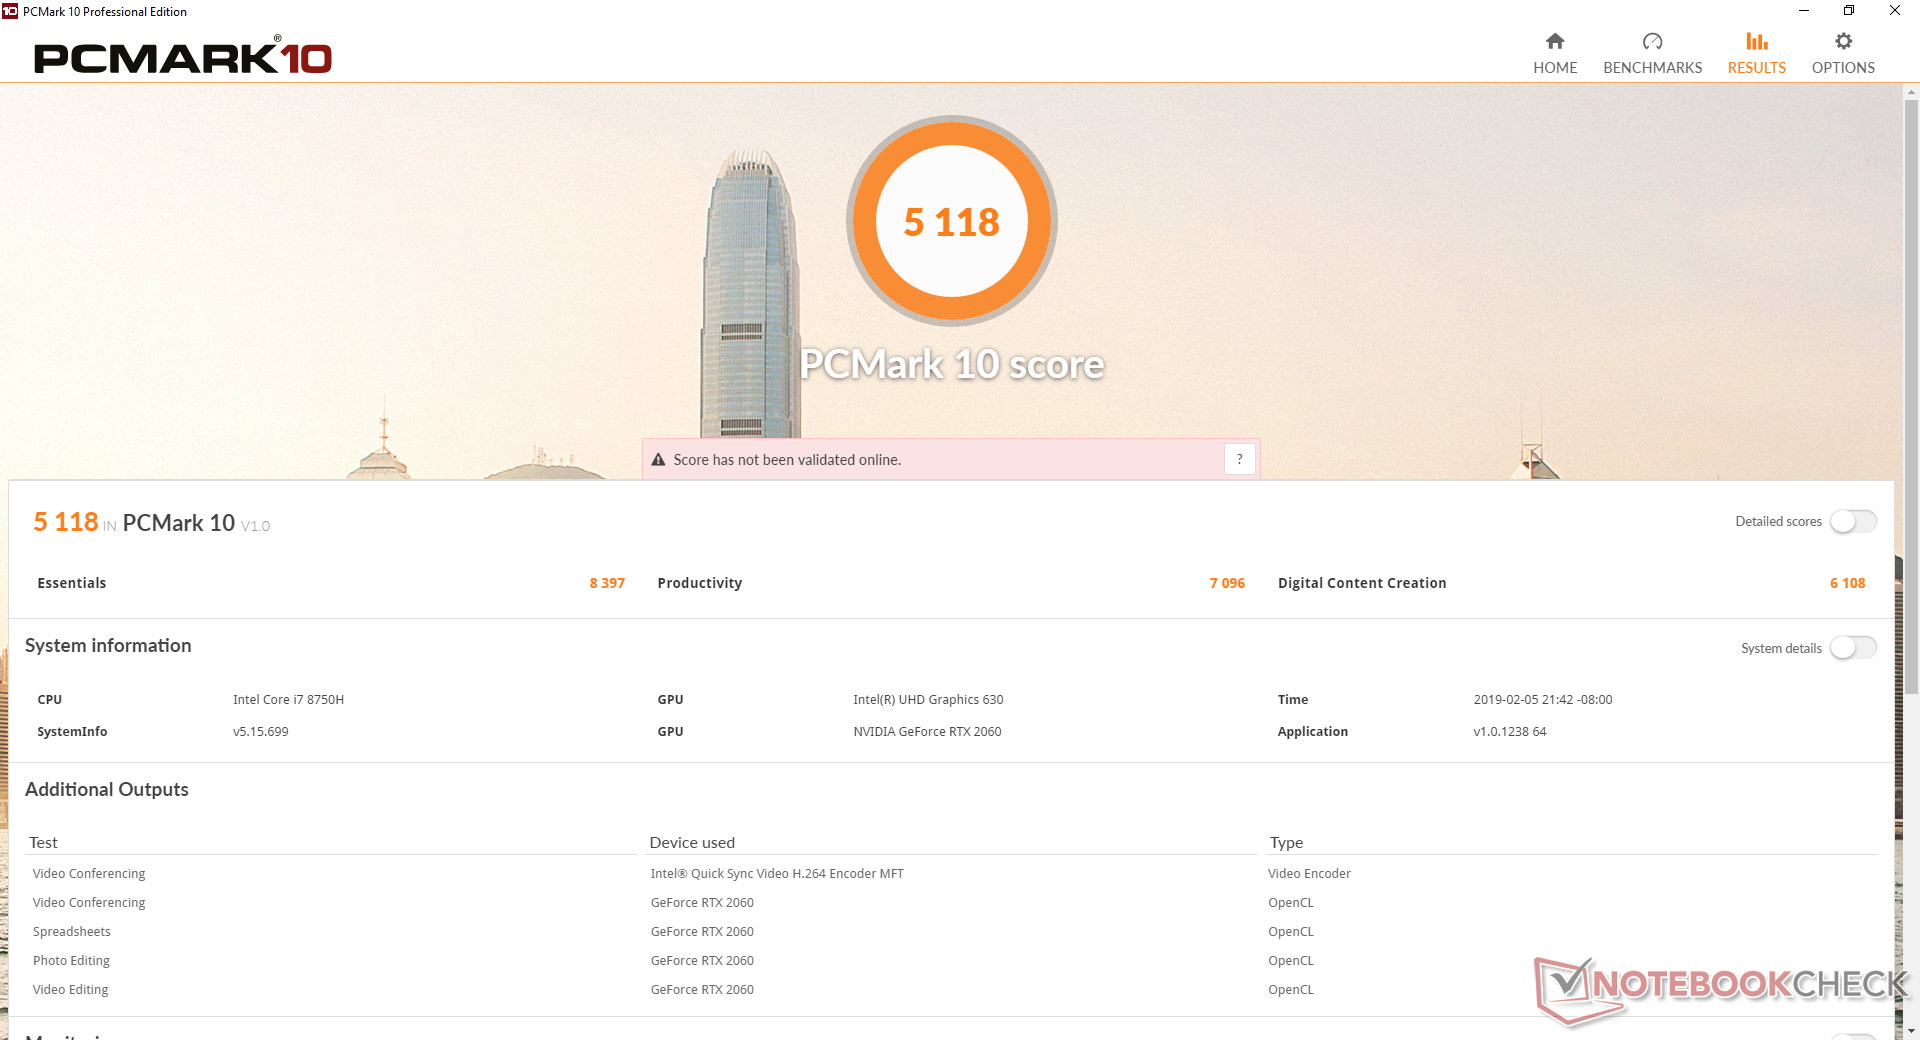
System Performance
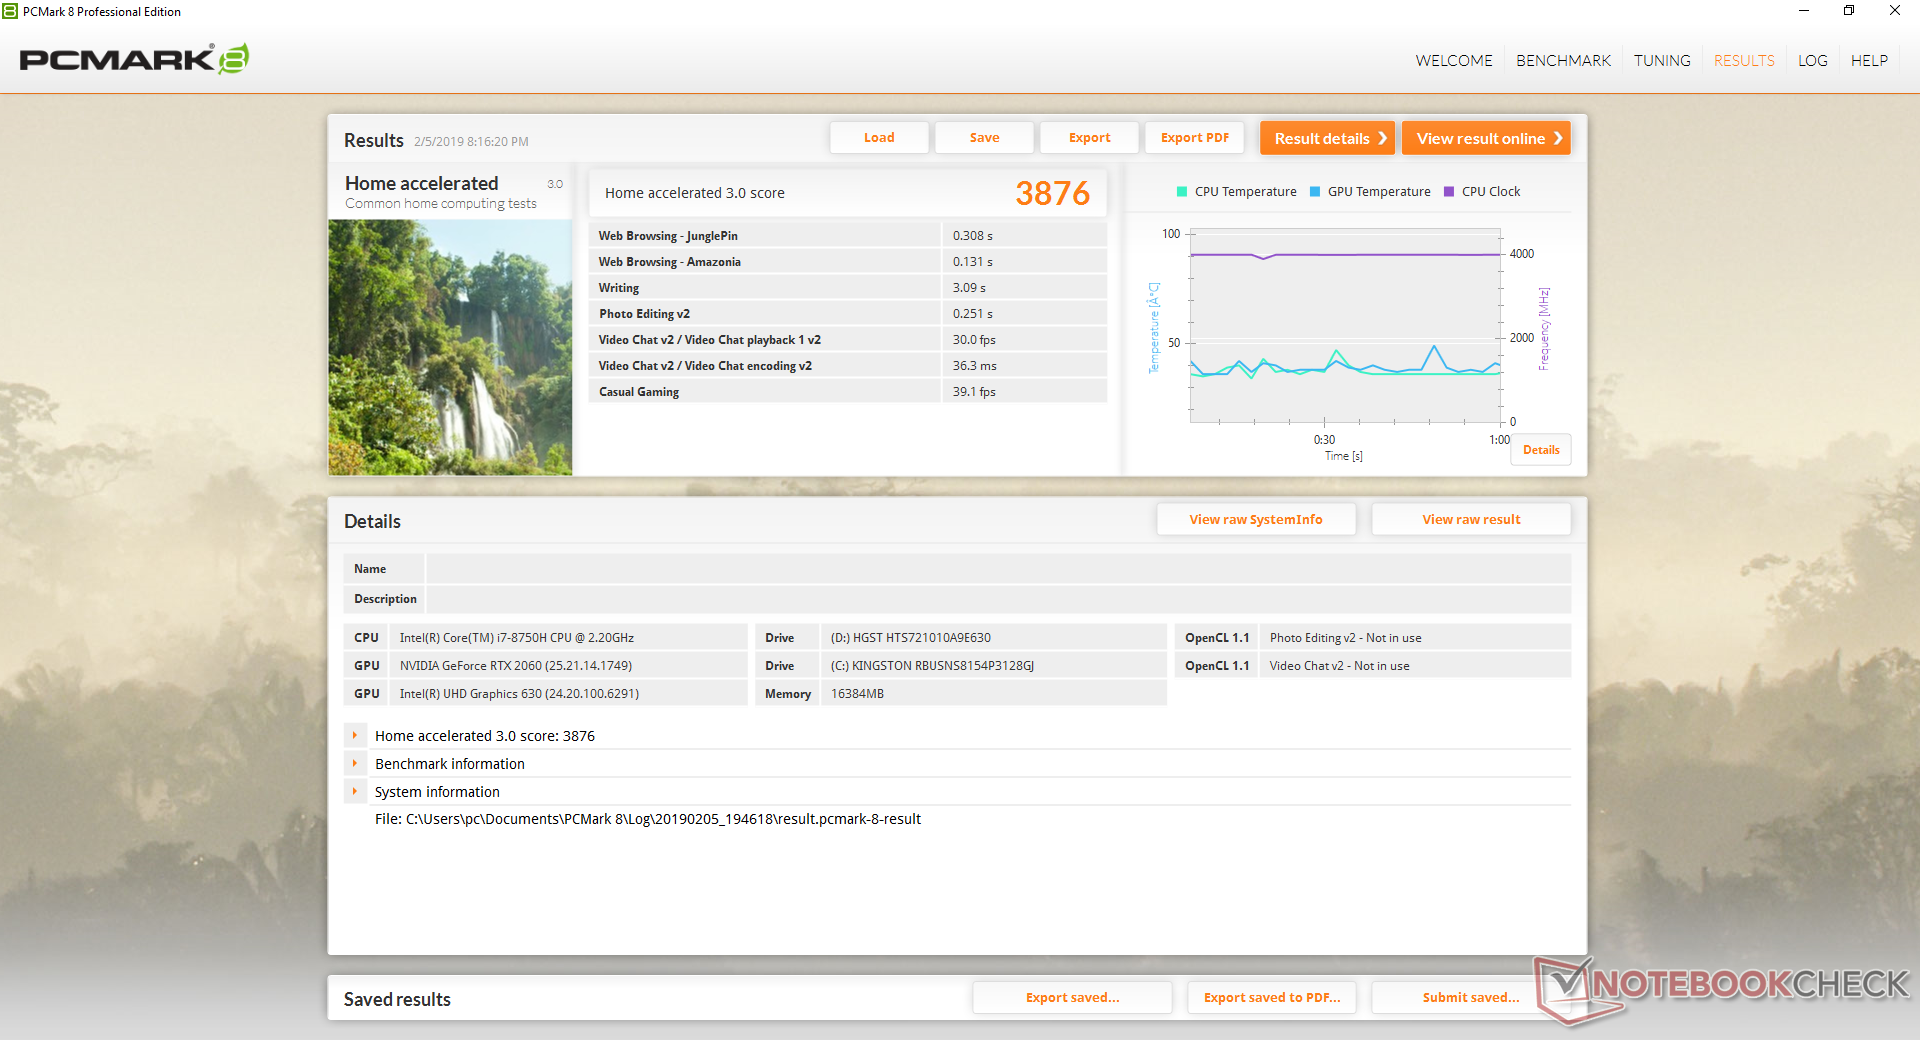
PCMark benchmarks rank our system just a few percentage points higher than the GL73 8RD with the much slower GTX 1050 Ti. Thus, users shouldn't expect a huge boost in day-to-day performance just because the GL73 8SE has a fancy new RTX graphics card. A notable exception is the 20 percent higher Digital Content Creation score as this particular benchmark favors systems with fast GPUs.
We didn't experience any software or hardware issues during our time with the test unit.
| PCMark 8 | |
| Home Score Accelerated v2 | |
| Asus TUF FX705GM | |
| MSI GE73 8RF-008 Raider RGB | |
| Average Intel Core i7-8750H, NVIDIA GeForce RTX 2060 Mobile (3876 - 5077, n=3) | |
| MSI GL73 8RD-418US | |
| Dell G3 17 3779 | |
| MSI GL73 8SE-010US | |
| MSI GL72 7RDX-602 | |
| Work Score Accelerated v2 | |
| Asus TUF FX705GM | |
| Average Intel Core i7-8750H, NVIDIA GeForce RTX 2060 Mobile (5291 - 5899, n=3) | |
| MSI GL73 8RD-418US | |
| MSI GL73 8SE-010US | |
| MSI GE73 8RF-008 Raider RGB | |
| Dell G3 17 3779 | |
| MSI GL72 7RDX-602 | |
| PCMark 8 Home Score Accelerated v2 | 3876 points | |
| PCMark 8 Work Score Accelerated v2 | 5359 points | |
| PCMark 10 Score | 5118 points | |
Help | ||
Storage Devices
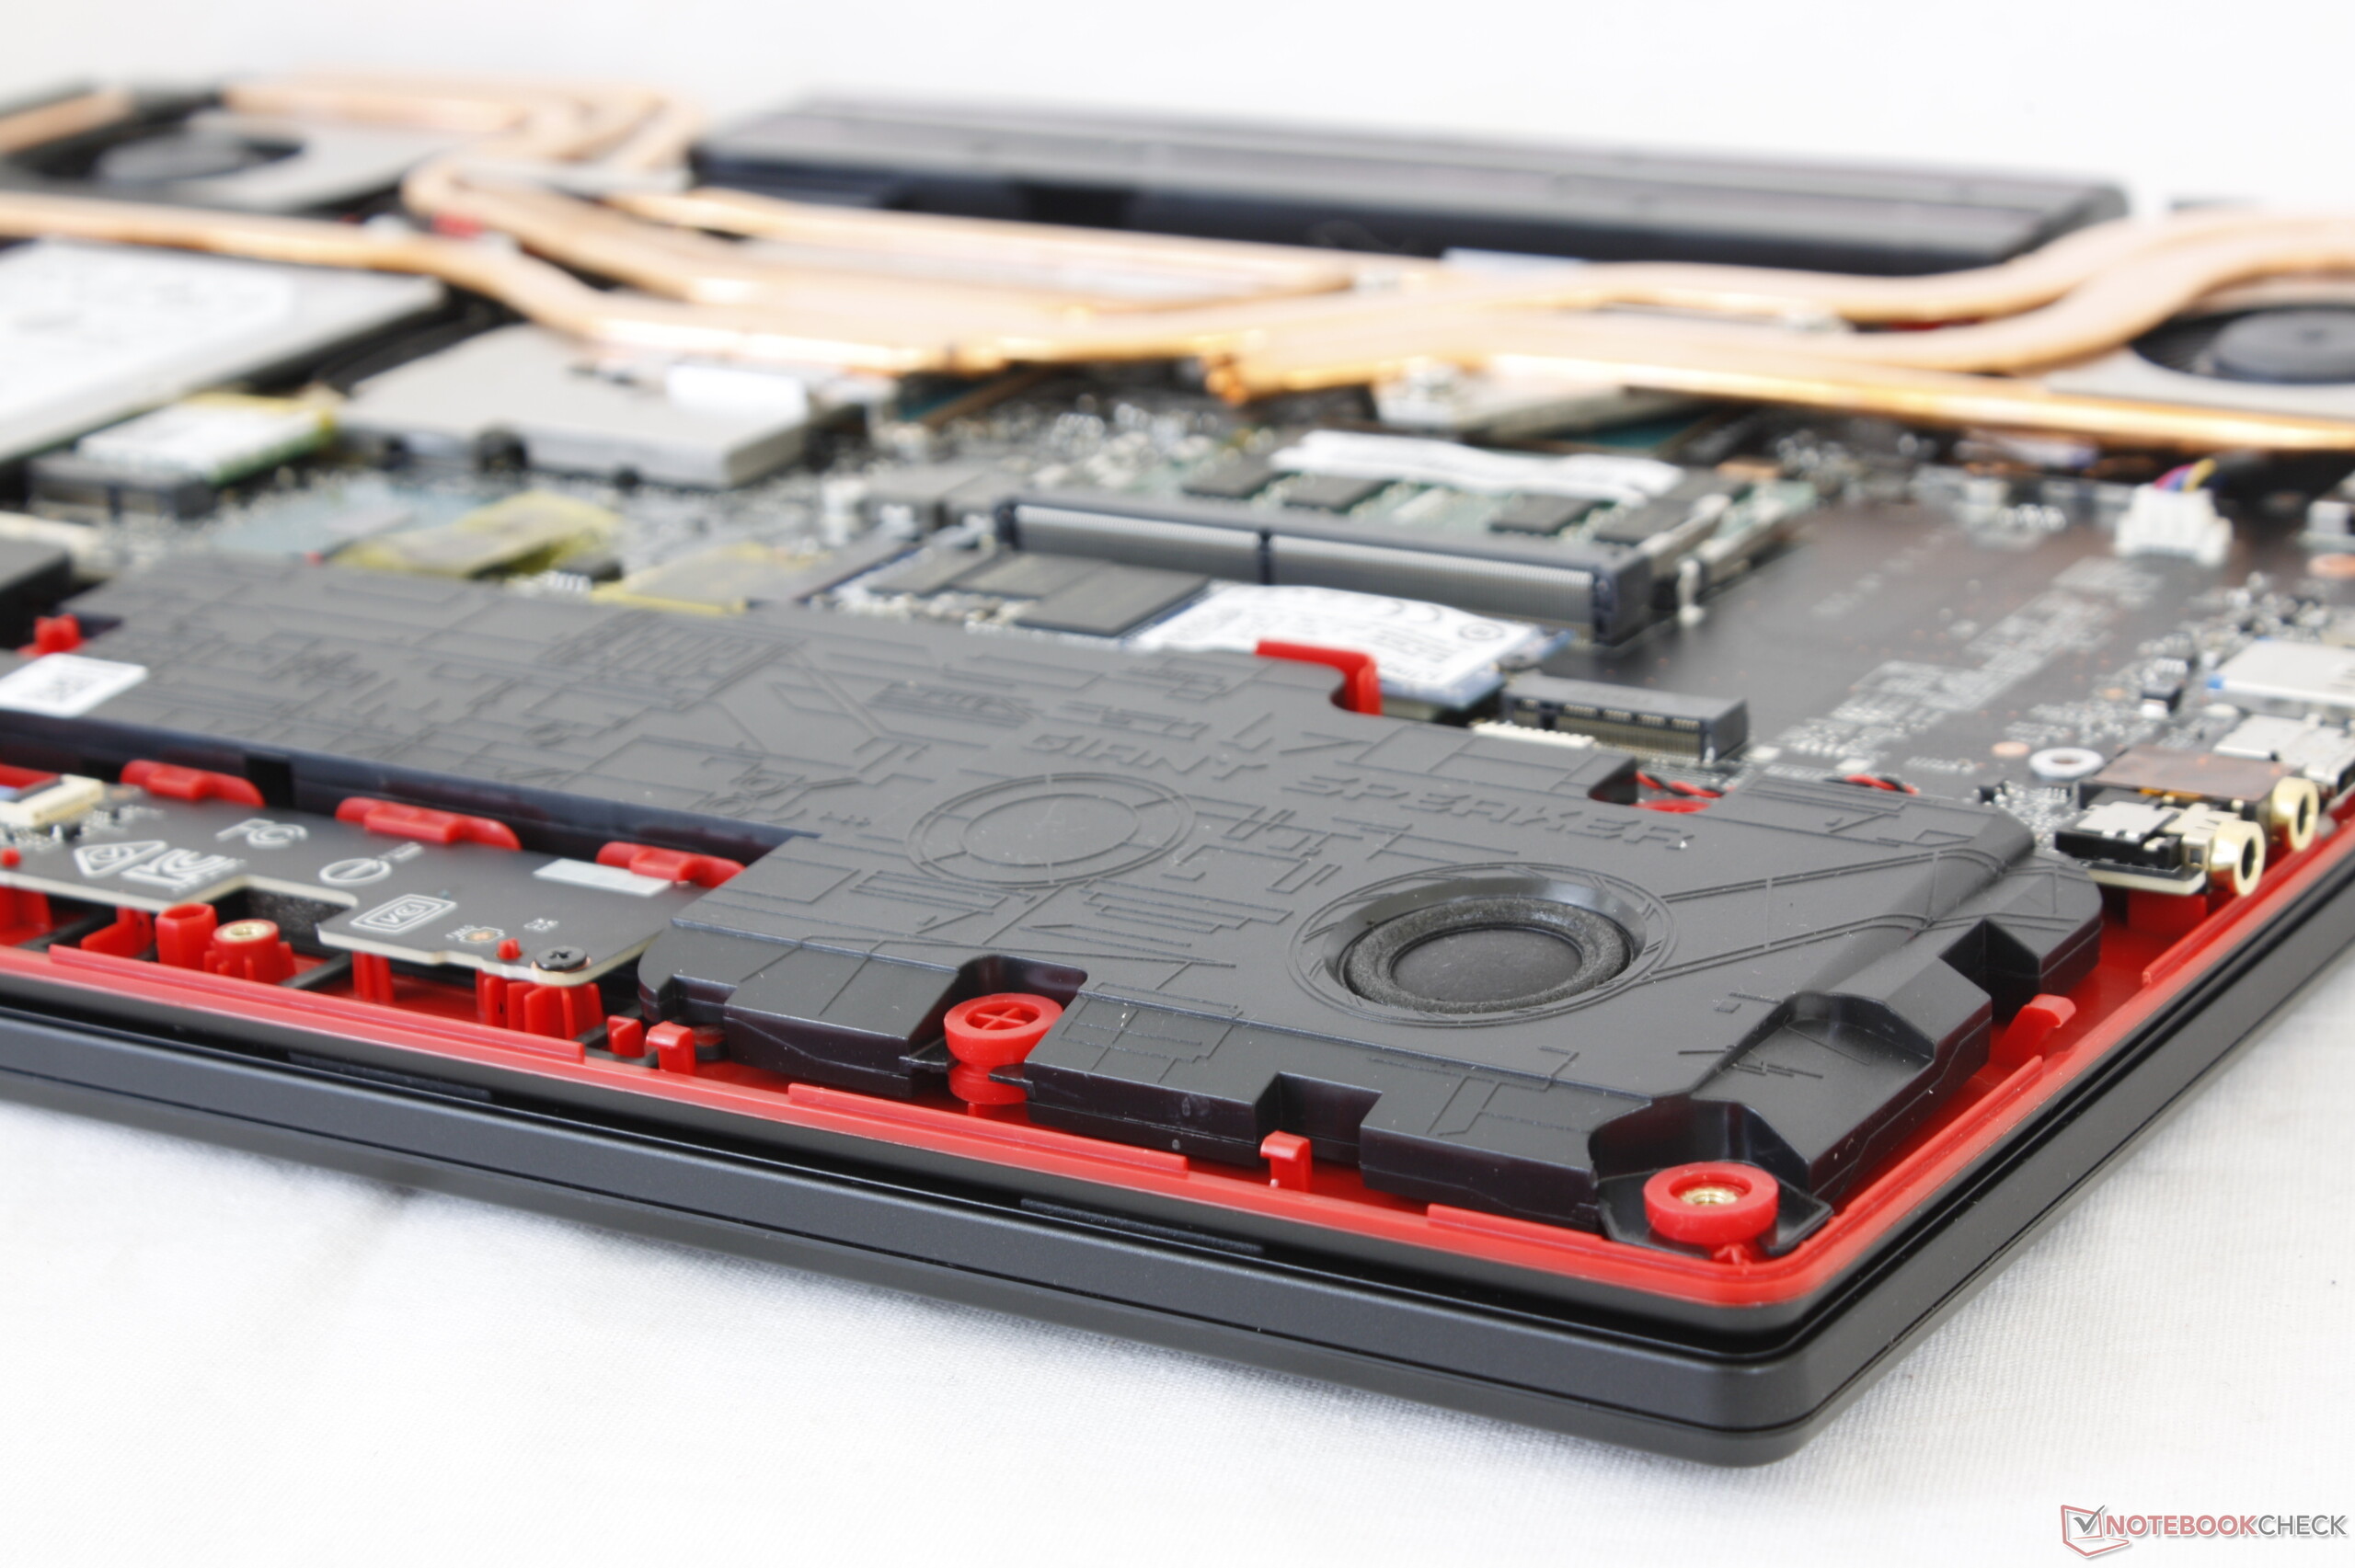
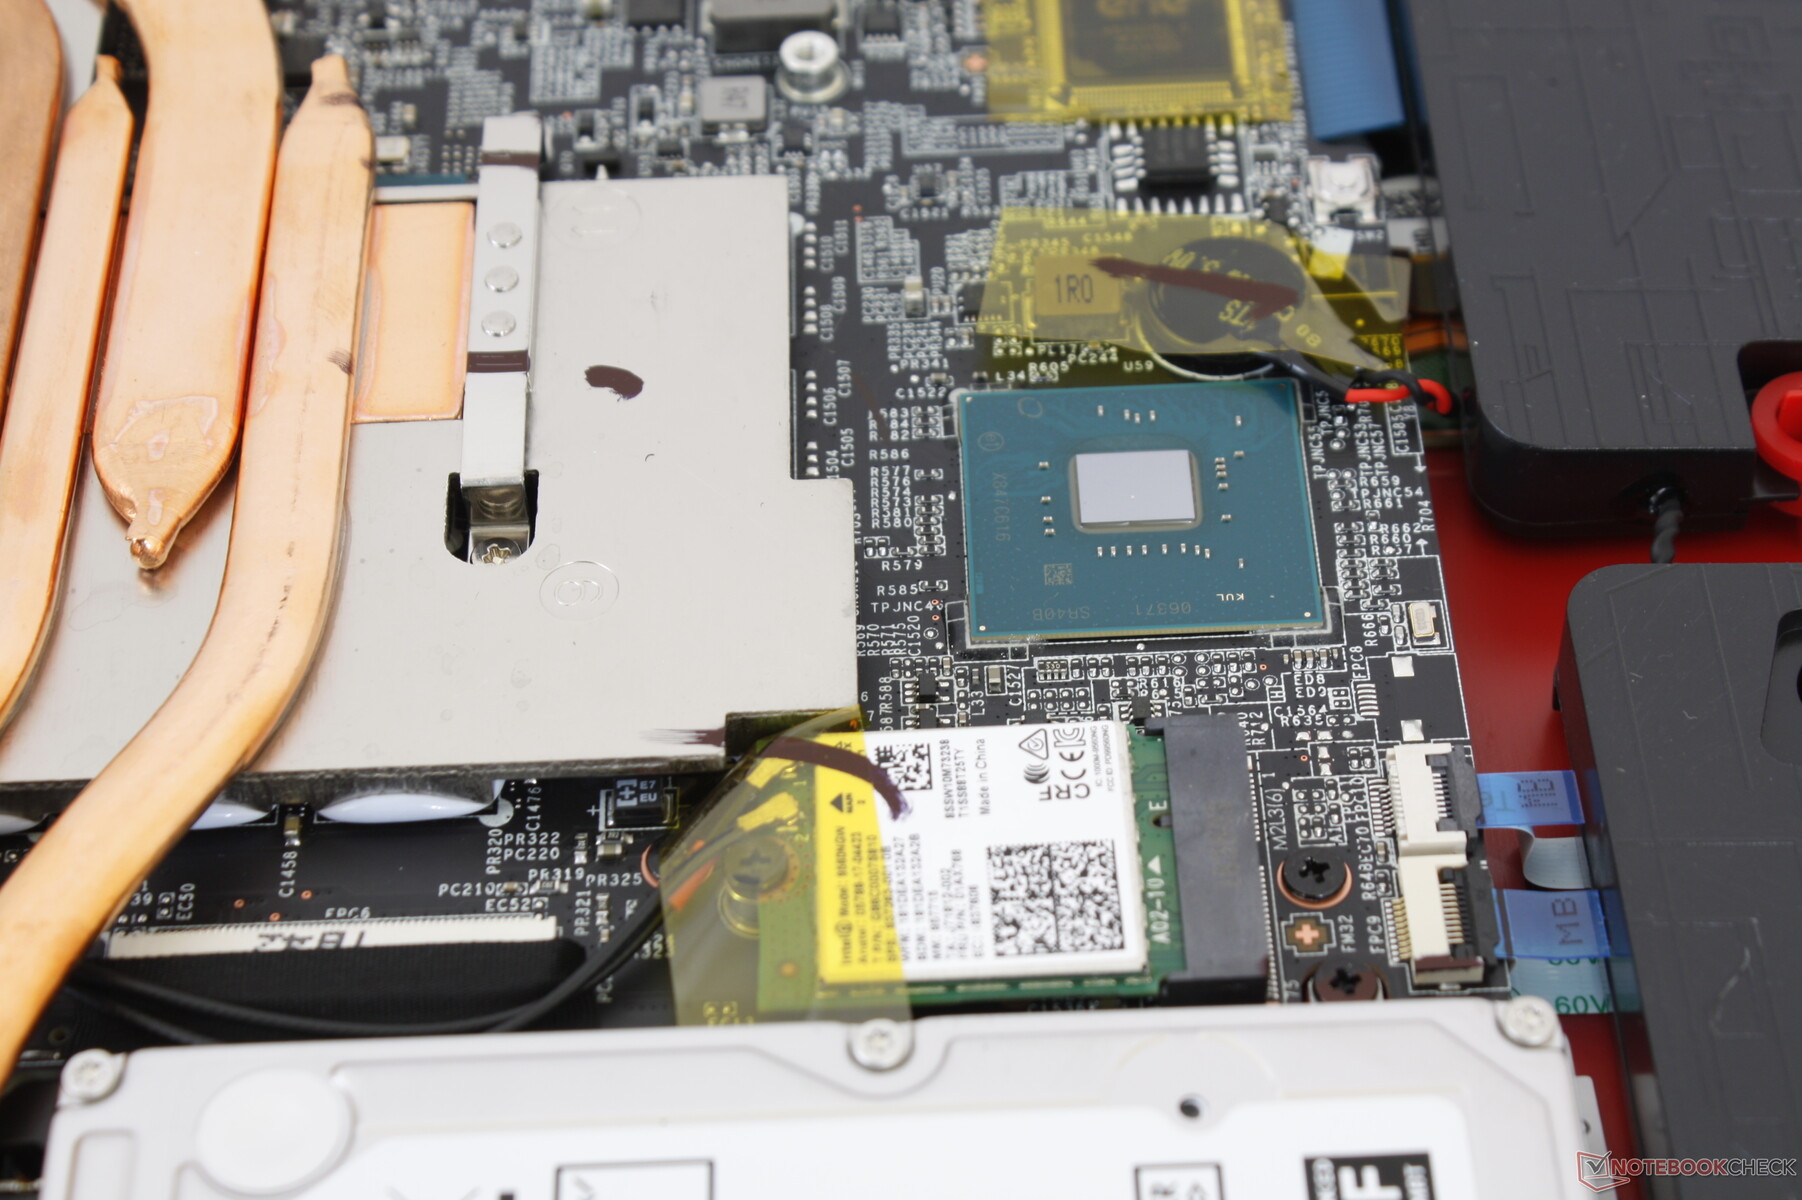
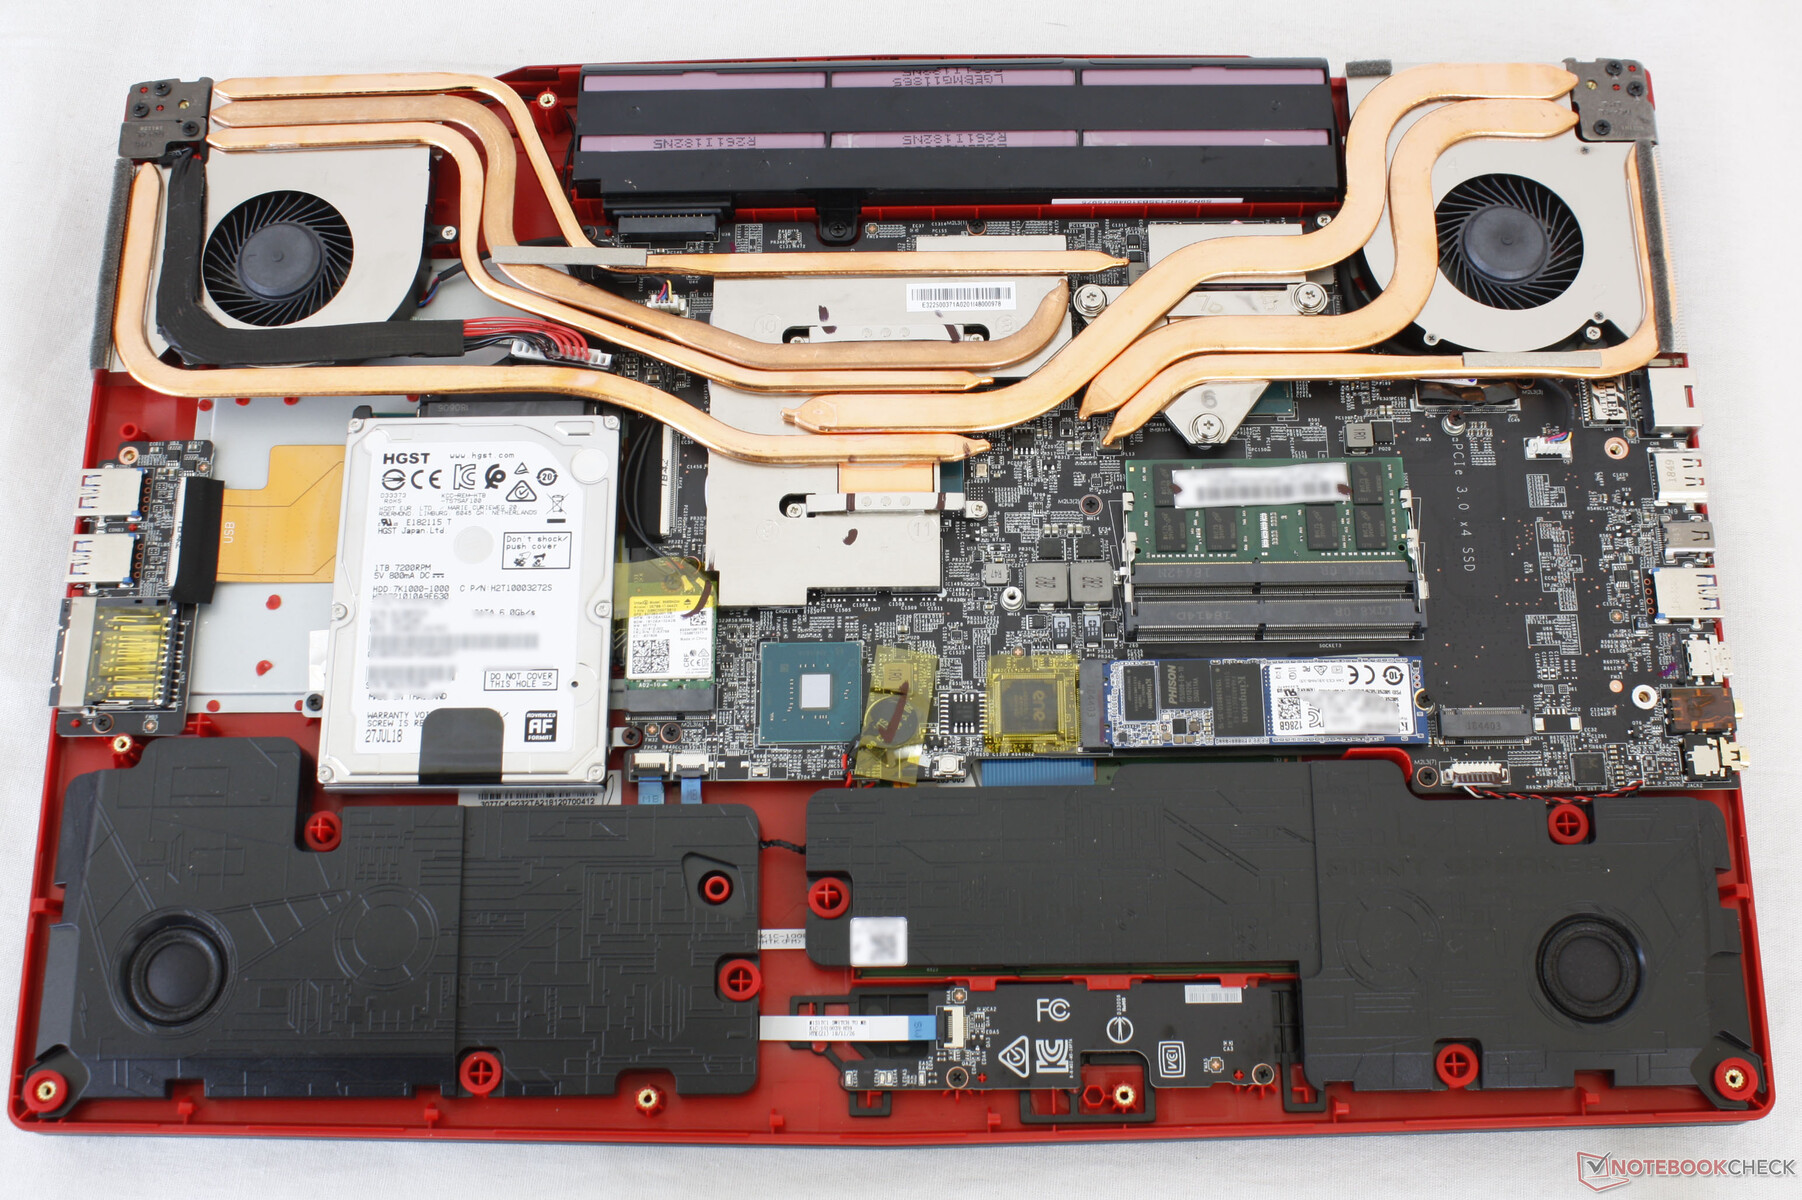
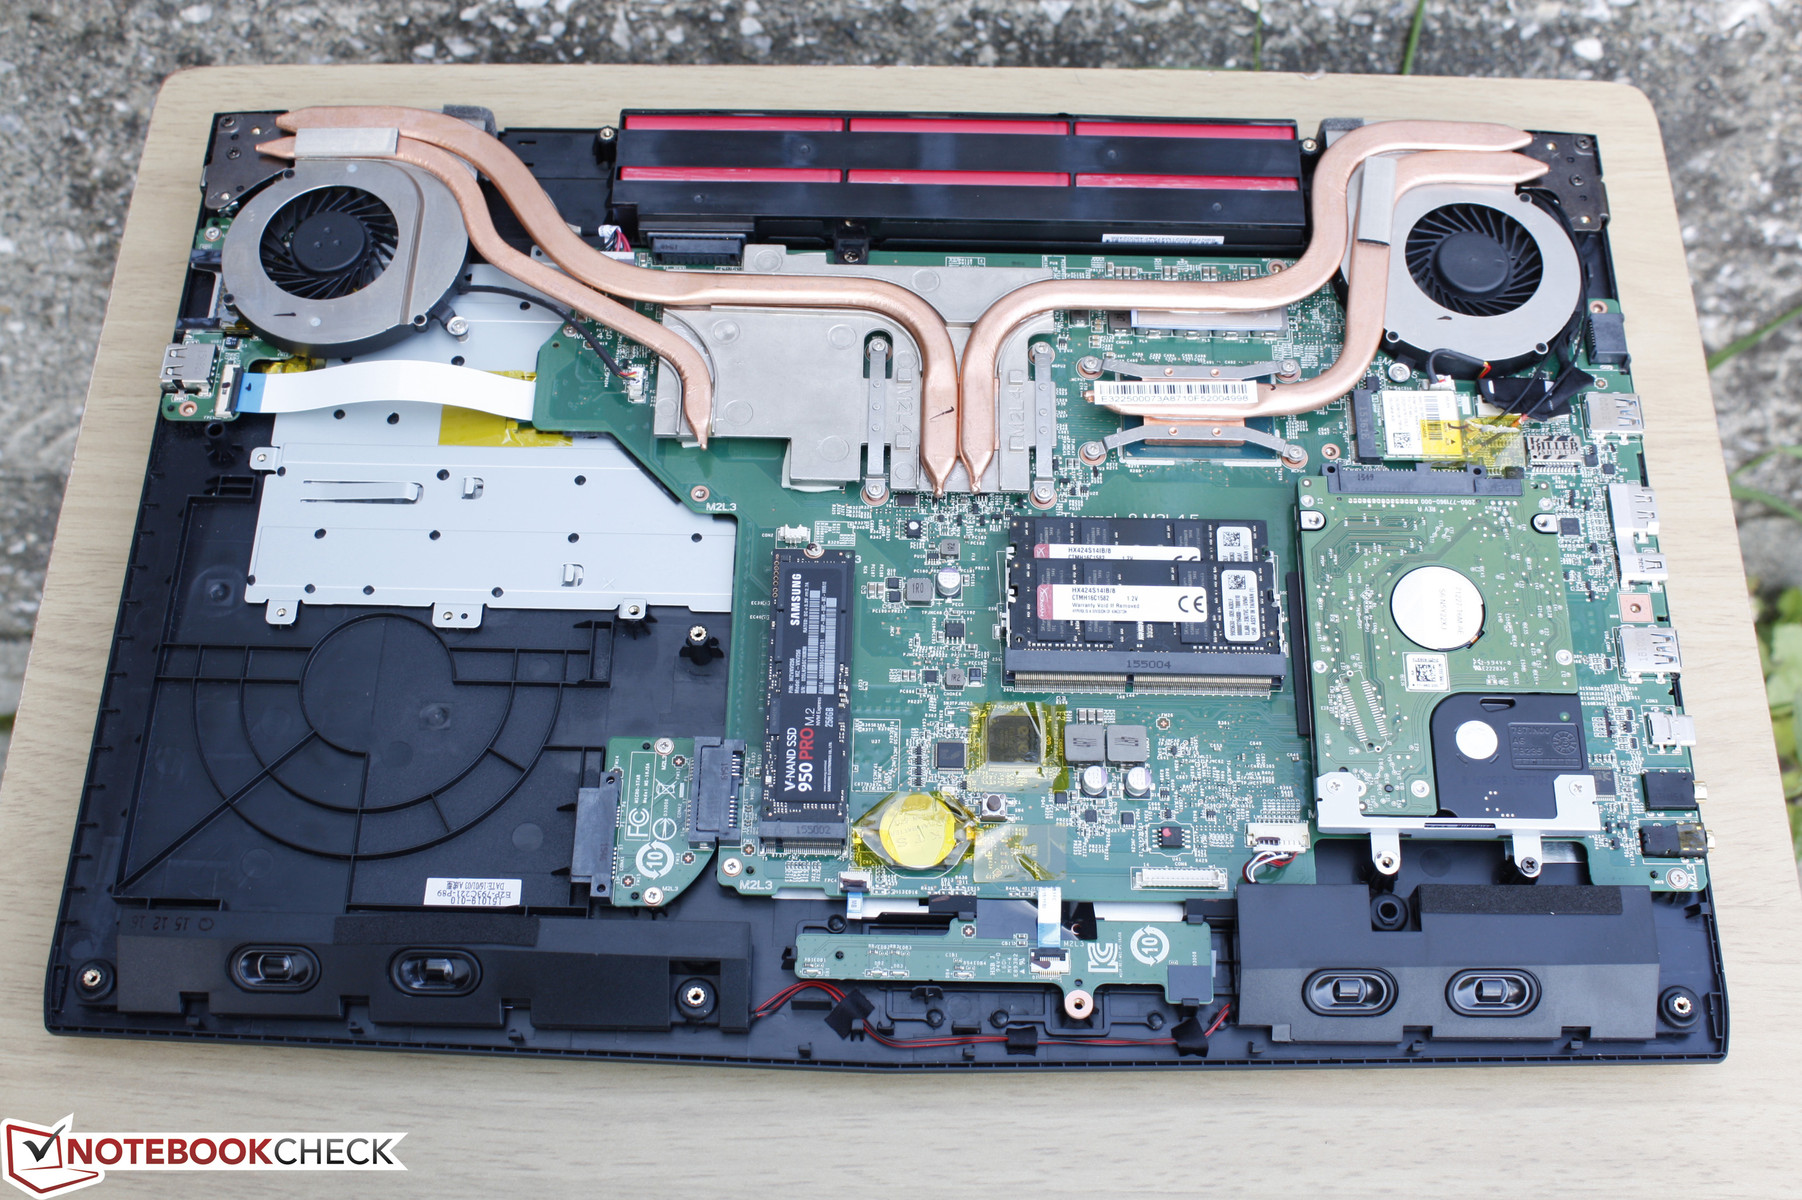
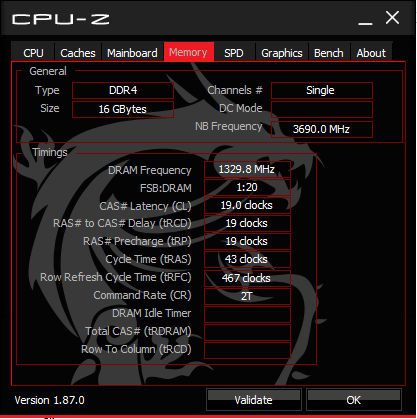
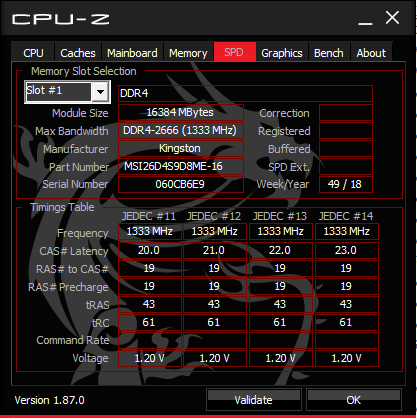
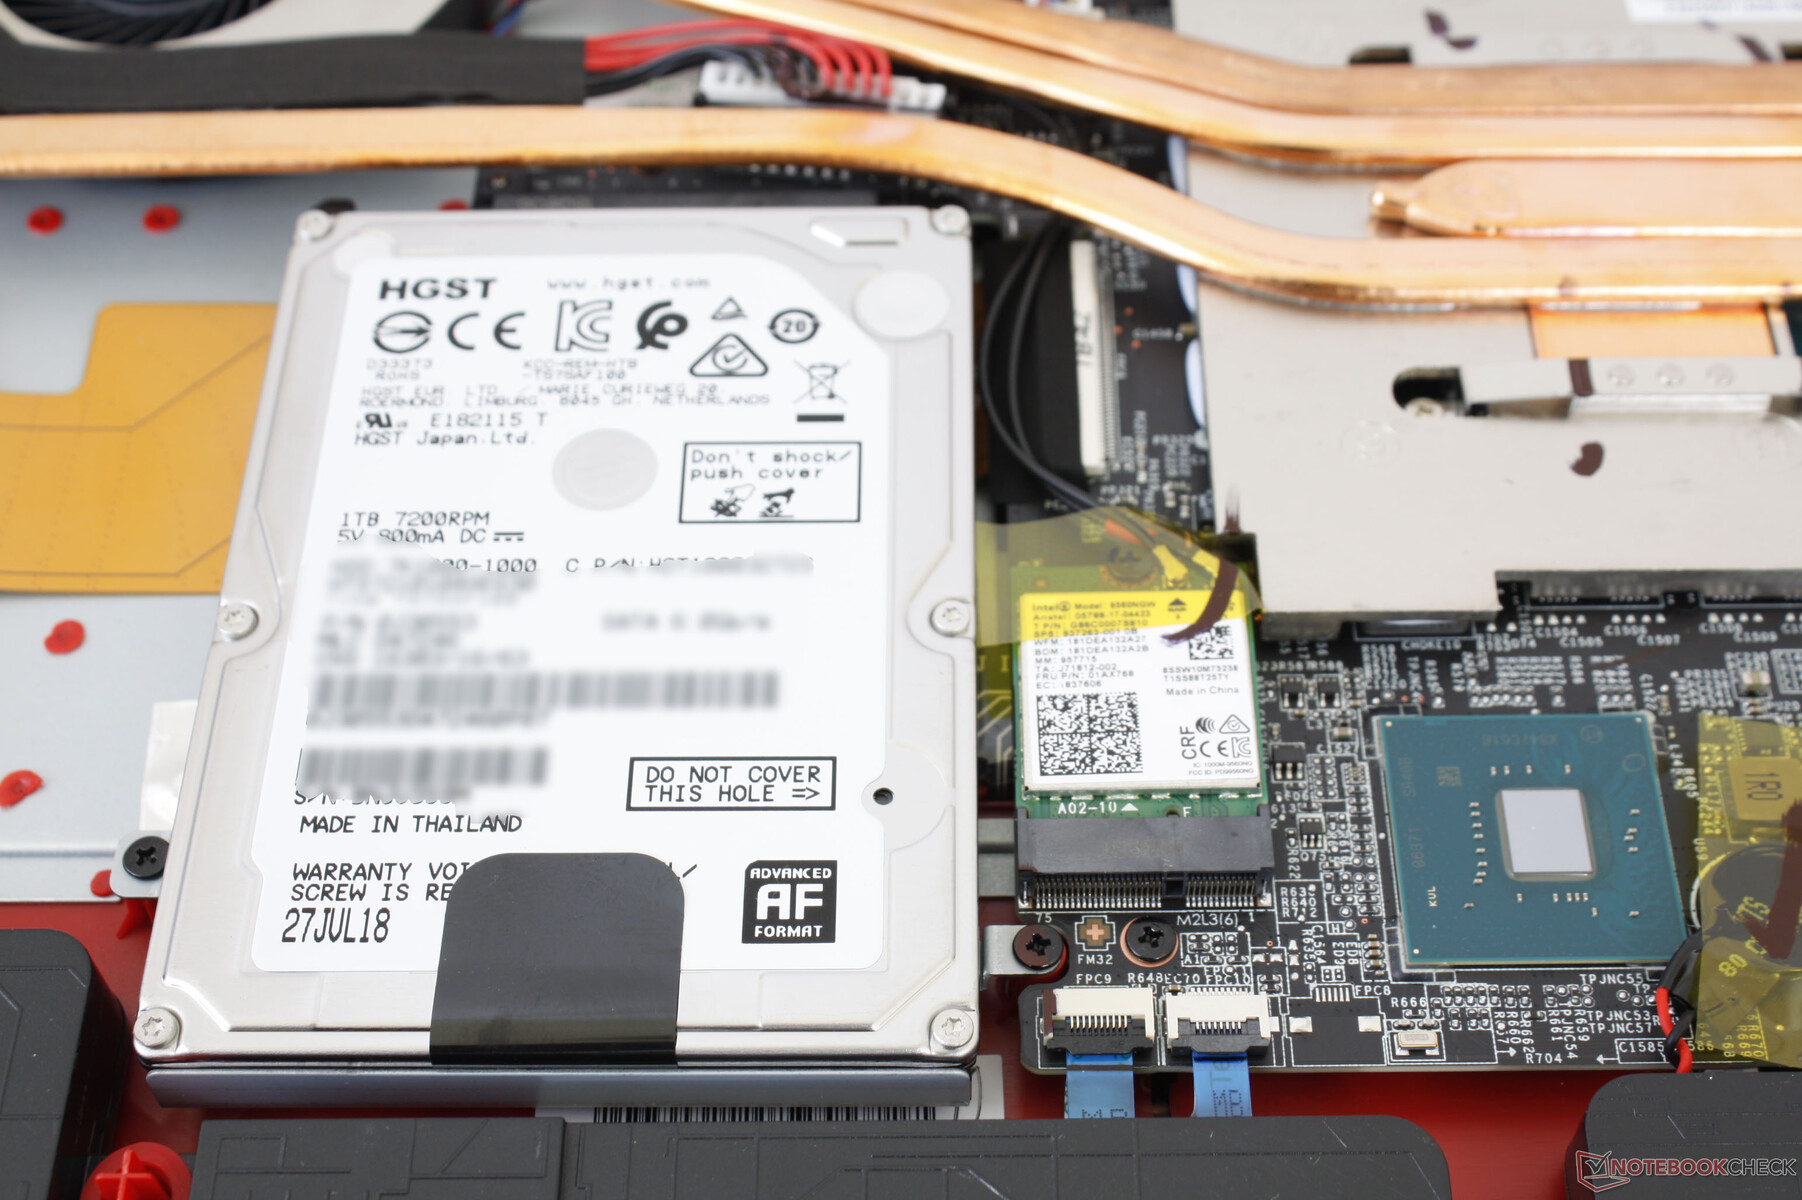
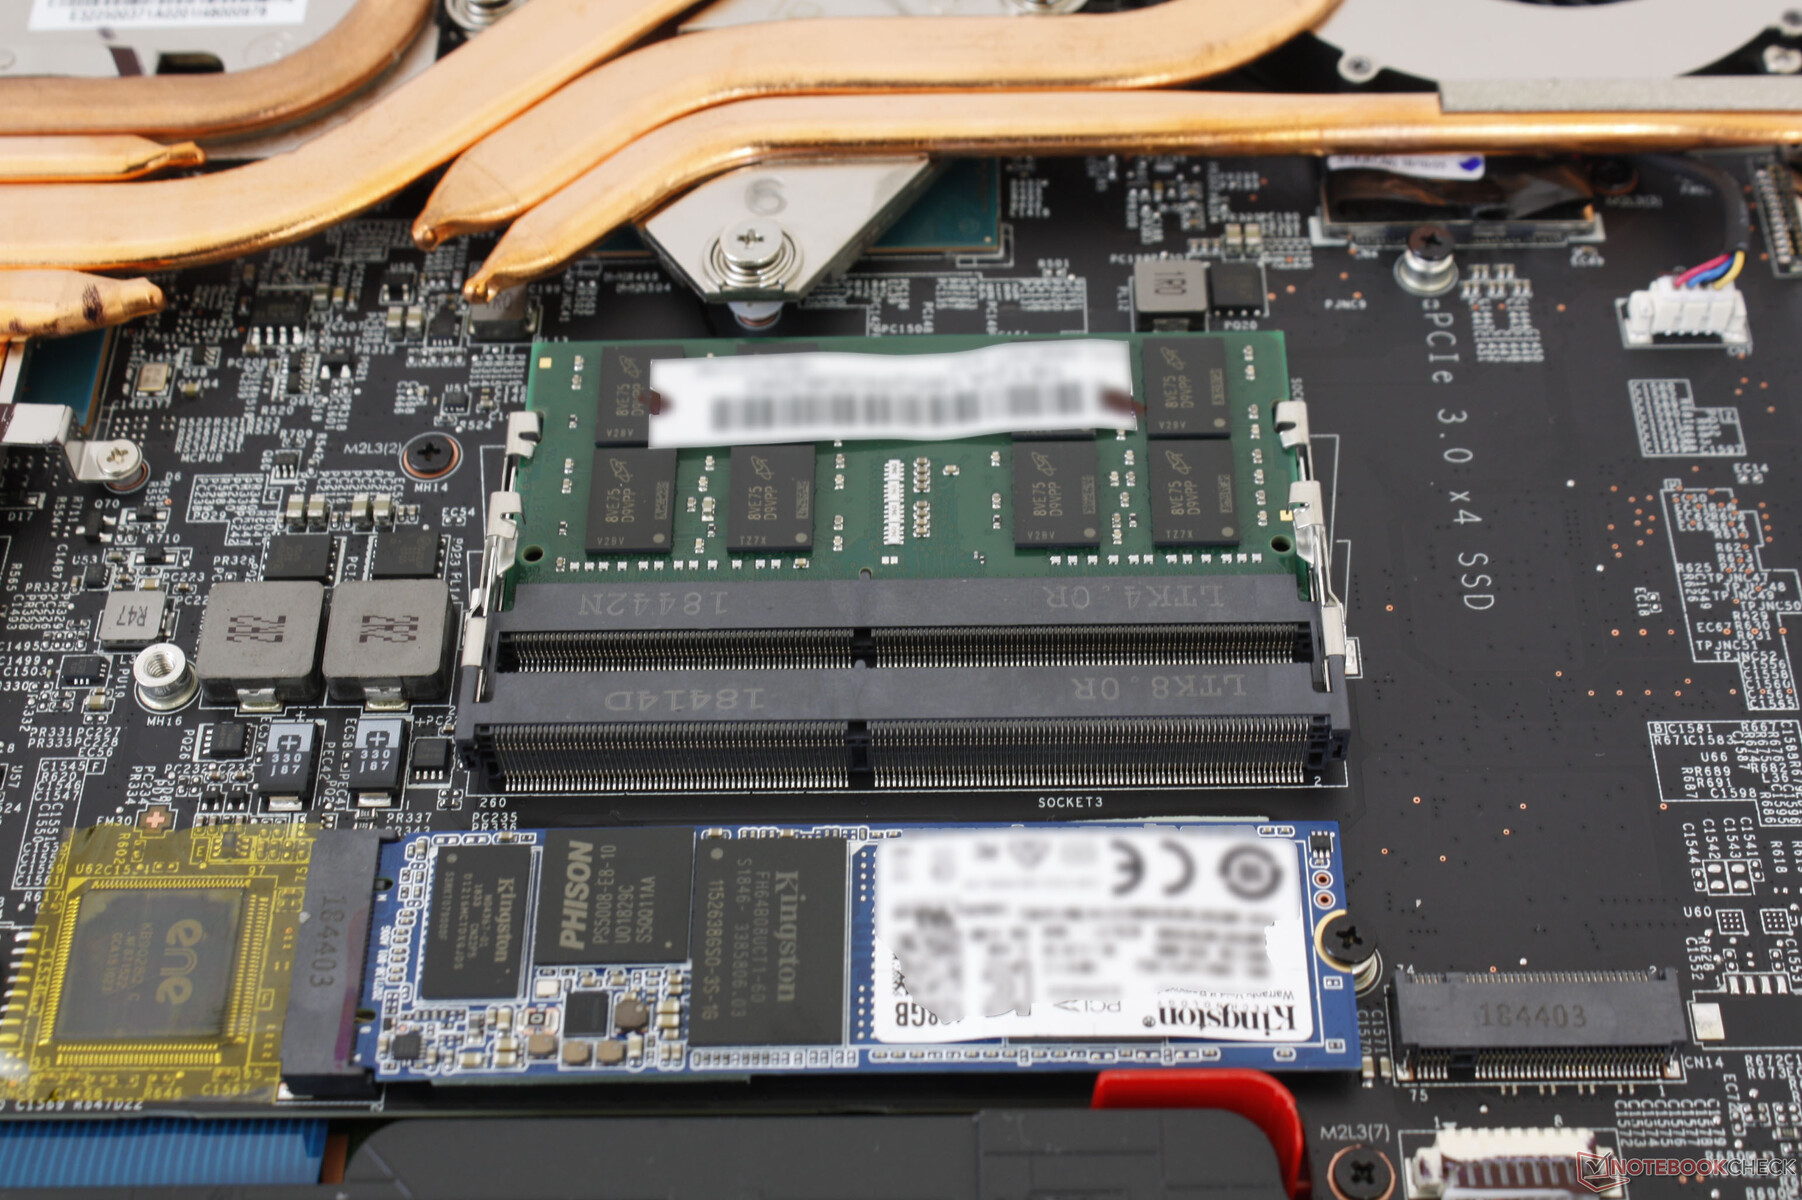
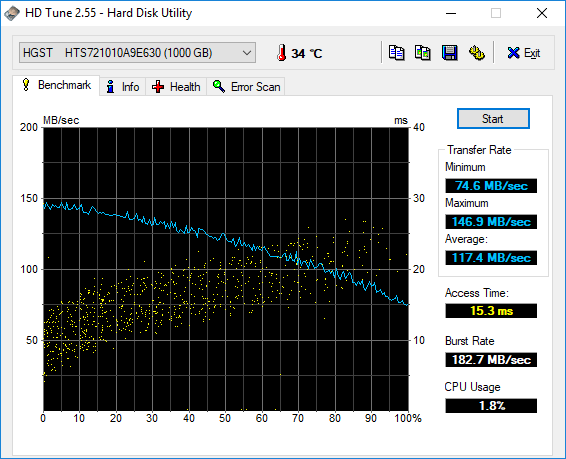
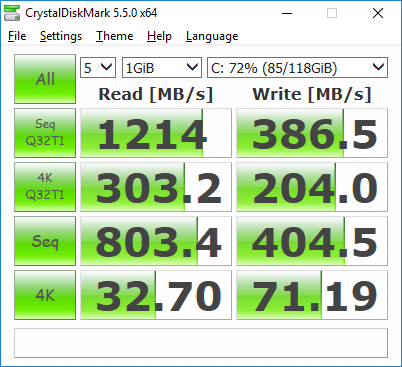
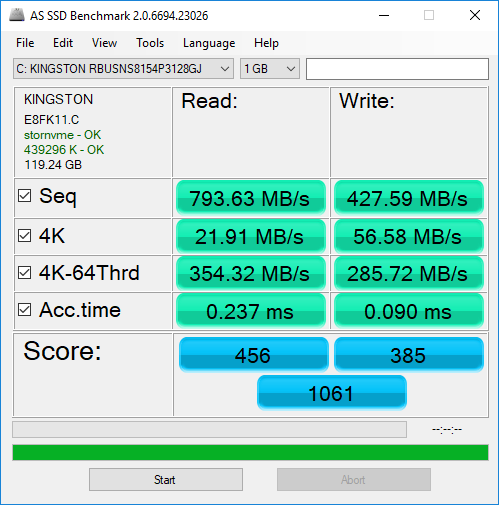
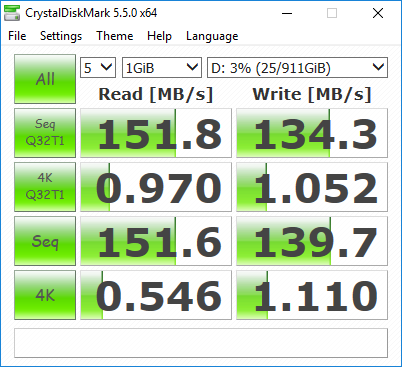
A total of three storage bays are available (2x M.2 2280, 1x 2.5-inch SATA III) compared to only two on the last generation GL72. Our specific test unit is equipped with a 128 GB NVMe Kingston SSD and a secondary 7200 RPM 1 TB HGST HDD. Xotic PC offers more storage options than ordering from MSI.
Transfer rates from the NVMe SSD are slow since it is a budget drive. Sequential read rate is only 793 MB/s compared to almost twice that on the WDC SSD as found on the Asus TUF FX705. Meanwhile, the 7200 RPM HDD returns a respectable average transfer rate of 117 MB/s.
See our table of HDDs and SSDs for more benchmark comparisons.
| MSI GL73 8SE-010US Kingston RBUSNS8154P3128GJ | Lenovo Legion Y730-17ICH, i7-8750H Toshiba KBG30ZMT128G | MSI GE73 8RF-008 Raider RGB Toshiba HG6 THNSNJ256G8NY | Asus TUF FX705GM WDC PC SN520 SDAPNUW-256G | Dell G3 17 3779 SK hynix SC311 SATA | |
|---|---|---|---|---|---|
| AS SSD | -68% | -24% | 116% | -34% | |
| Seq Read (MB/s) | 794 | 979 23% | 511 -36% | 1571 98% | 511 -36% |
| Seq Write (MB/s) | 427.6 | 125.4 -71% | 425.7 0% | 1236 189% | 254.4 -41% |
| 4K Read (MB/s) | 21.91 | 19.73 -10% | 14.07 -36% | 38.49 76% | 24.22 11% |
| 4K Write (MB/s) | 56.6 | 38.73 -32% | 38.34 -32% | 101.9 80% | 58.5 3% |
| 4K-64 Read (MB/s) | 354.3 | 168.6 -52% | 351.4 -1% | 720 103% | 160.7 -55% |
| 4K-64 Write (MB/s) | 285.7 | 31.38 -89% | 172.7 -40% | 856 200% | 114.8 -60% |
| Access Time Read * (ms) | 0.237 | 0.519 -119% | 0.235 1% | 0.106 55% | 0.136 43% |
| Access Time Write * (ms) | 0.09 | 0.324 -260% | 0.097 -8% | 0.036 60% | 0.069 23% |
| Score Read (Points) | 456 | 286 -37% | 417 -9% | 913 100% | 236 -48% |
| Score Write (Points) | 385 | 86 -78% | 254 -34% | 1082 181% | 199 -48% |
| Score Total (Points) | 1061 | 479 -55% | 881 -17% | 2458 132% | 552 -48% |
| Copy ISO MB/s (MB/s) | 811 | 272.7 -66% | 412.5 -49% | 154.9 -81% | |
| Copy Program MB/s (MB/s) | 278 | 182.9 -34% | 192.9 -31% | 99.8 -64% | |
| Copy Game MB/s (MB/s) | 556 | 134.6 -76% | 295.5 -47% | 124.2 -78% |
* ... smaller is better

GPU Performance
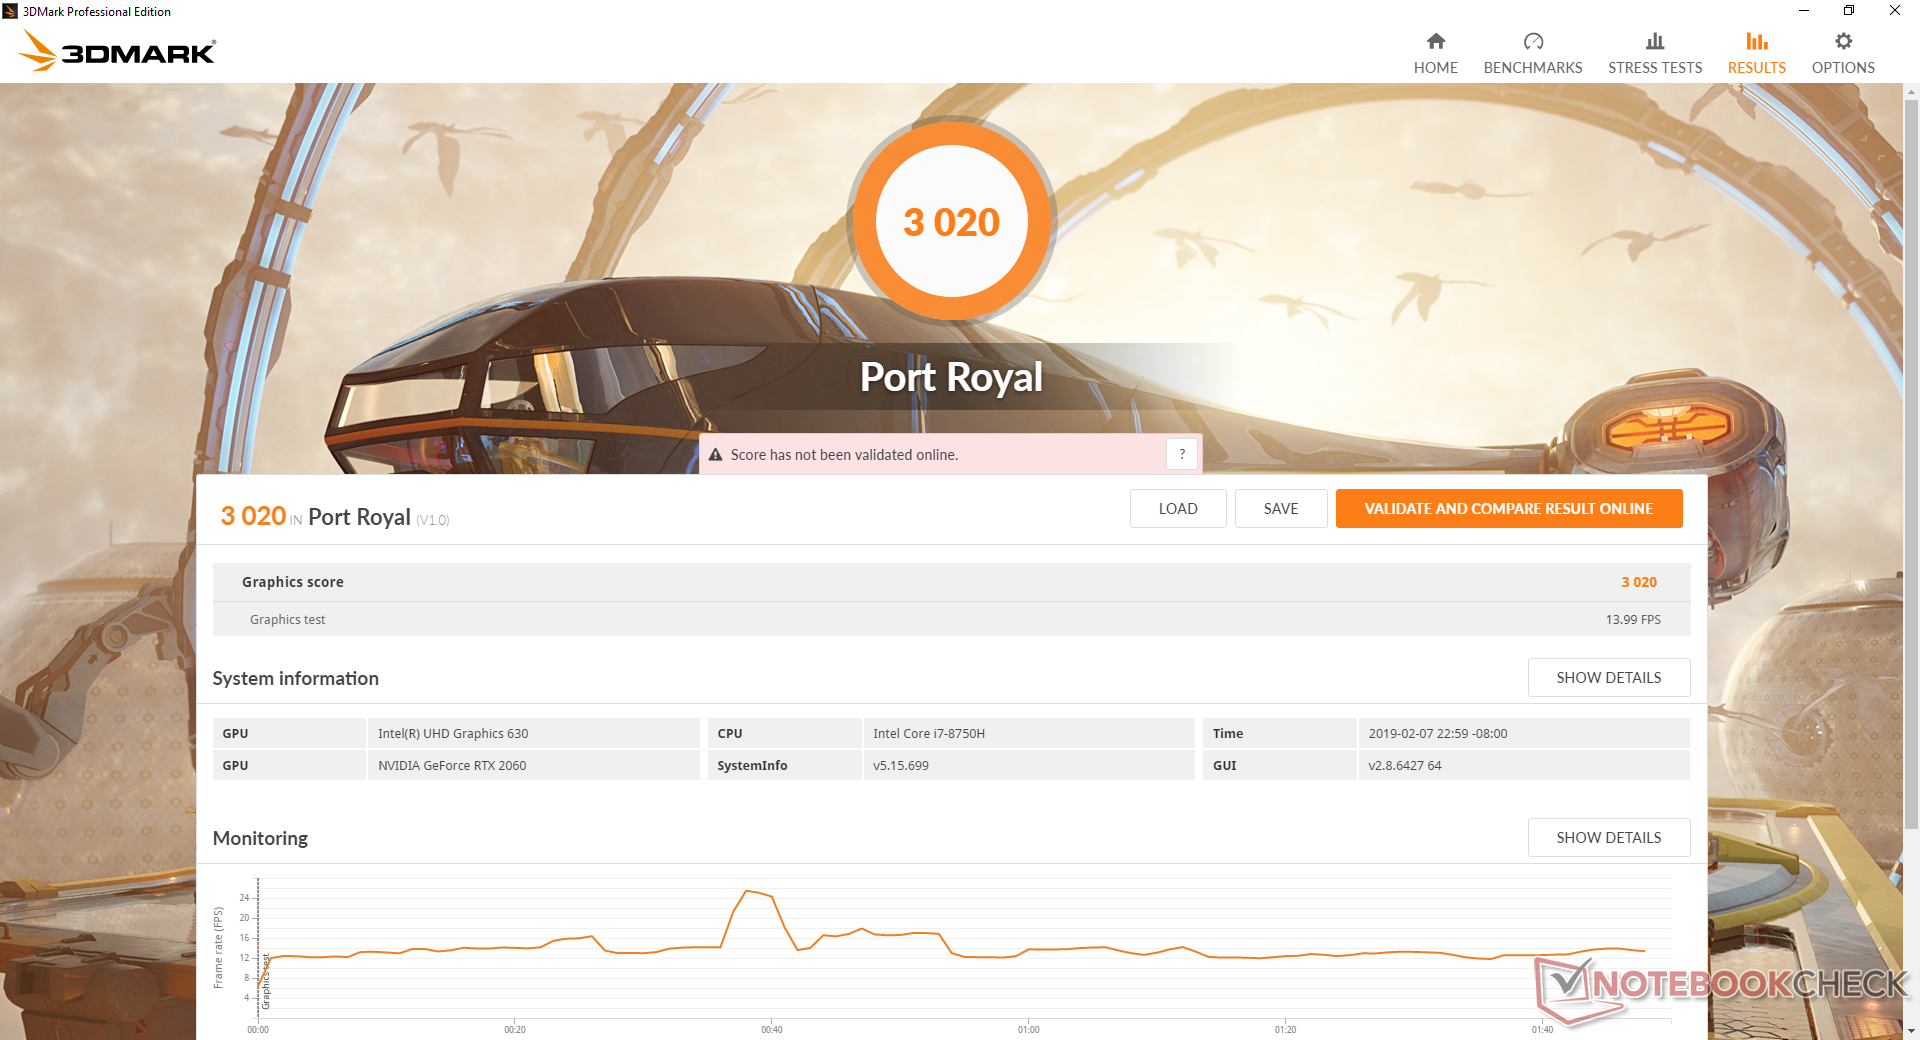
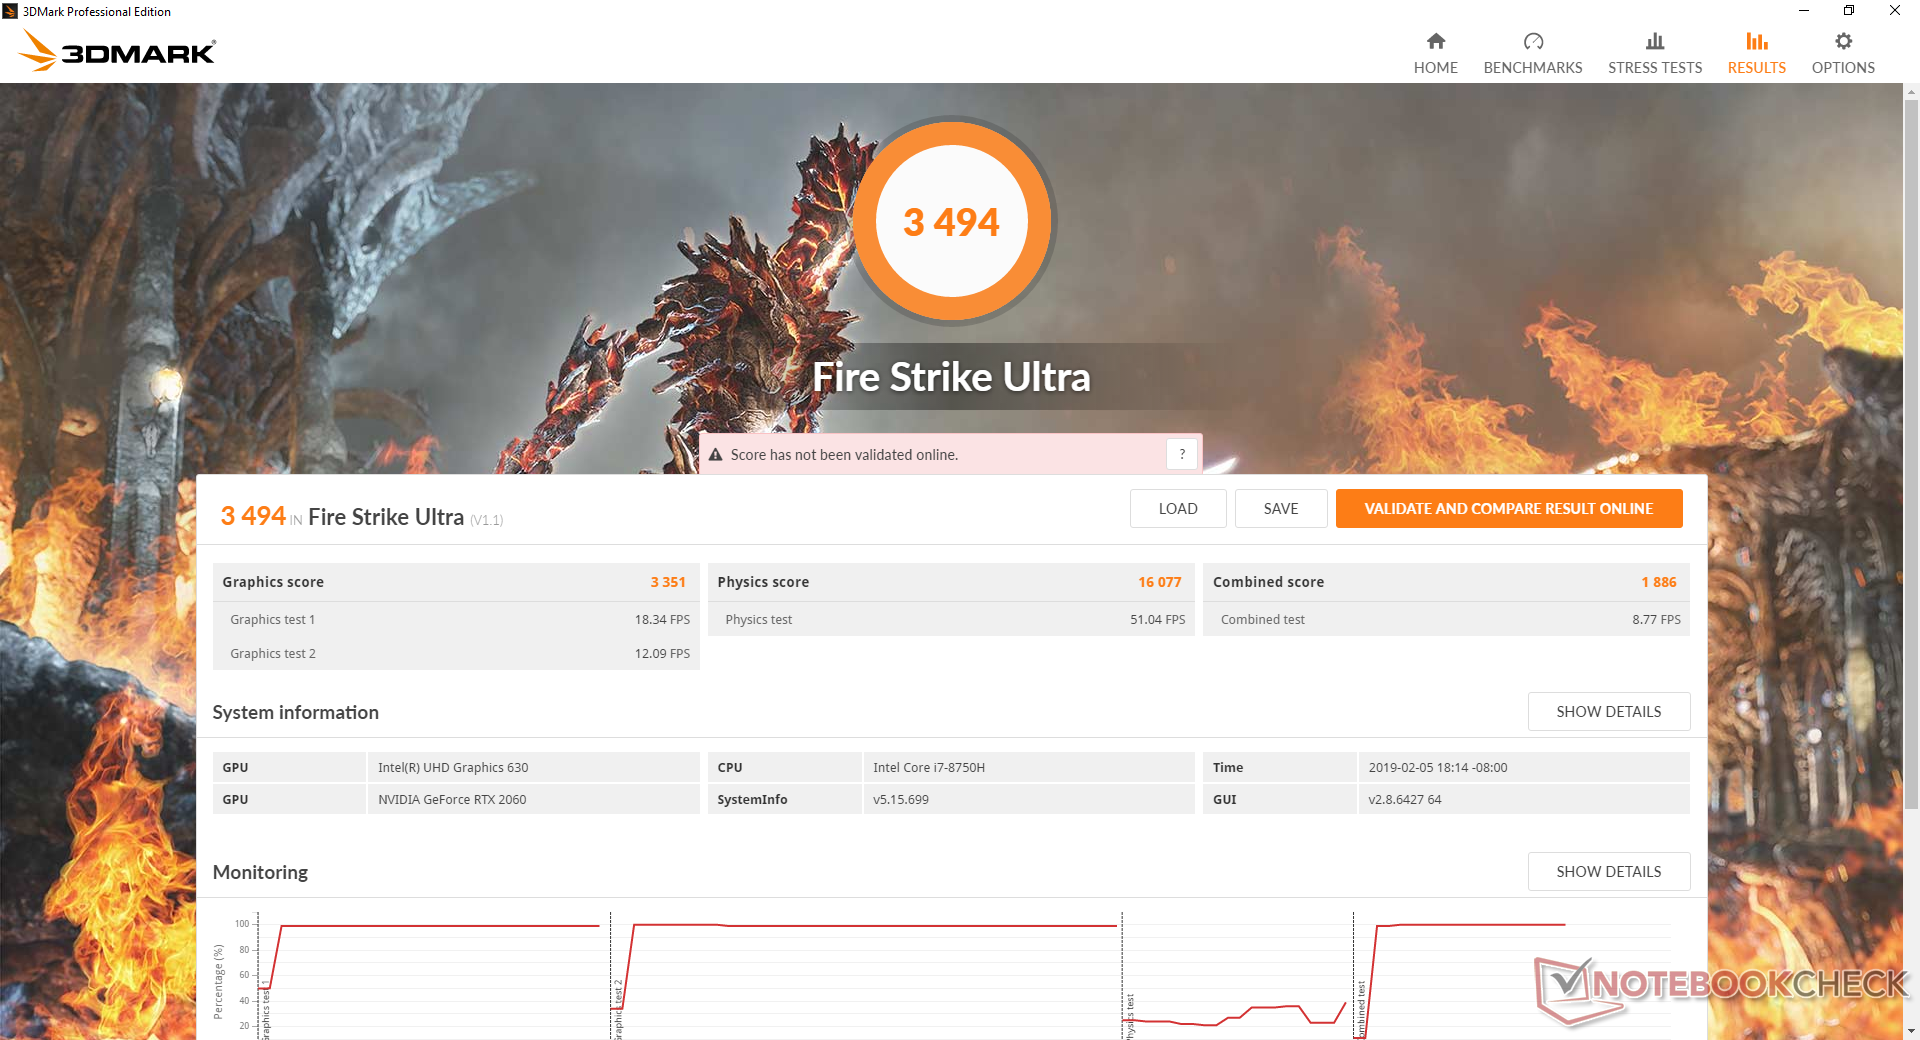
3DMark benchmarks rank the RTX 2060 almost 35 percent faster than the GTX 1060 or just 14 percent slower than the GTX 1070 in the pricier GE73 Raider. Thus, raw gaming performance is closer to the GTX 1070 Max-Q than to the standard GTX 1070 that we were hoping for. It's still a sizable performance leap over the GTX 1060 to make the RTX 2070 even better for users targeting 1080p60 on the latest titles.
Higher performance is attainable once DLSS becomes available for retail games. The feature is looking more promising for lower-end RTX GPUs like the RTX 2060 because it would benefit more percentage-wise from the increase in frame rates. We'll have to wait until we have more RTX laptops in our database before we can draw any firm conclusions on ray-tracing and DLSS across different mobile RTX GPUs.
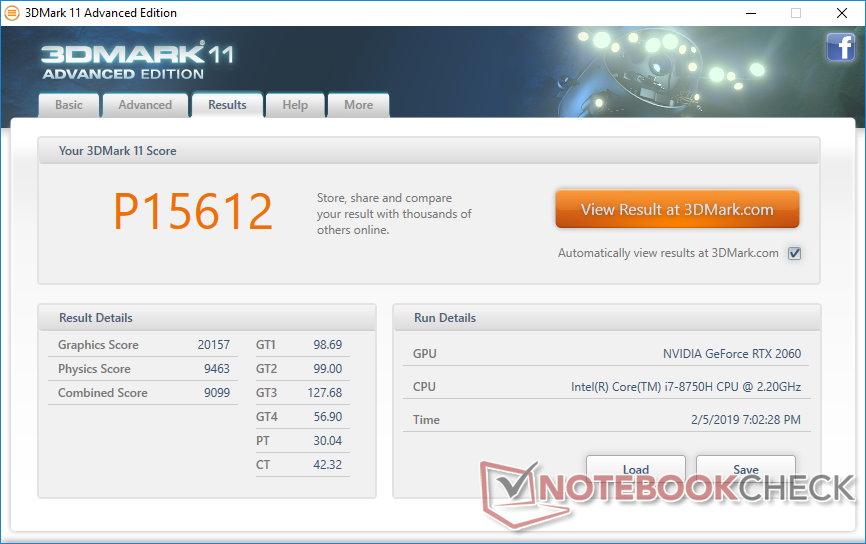
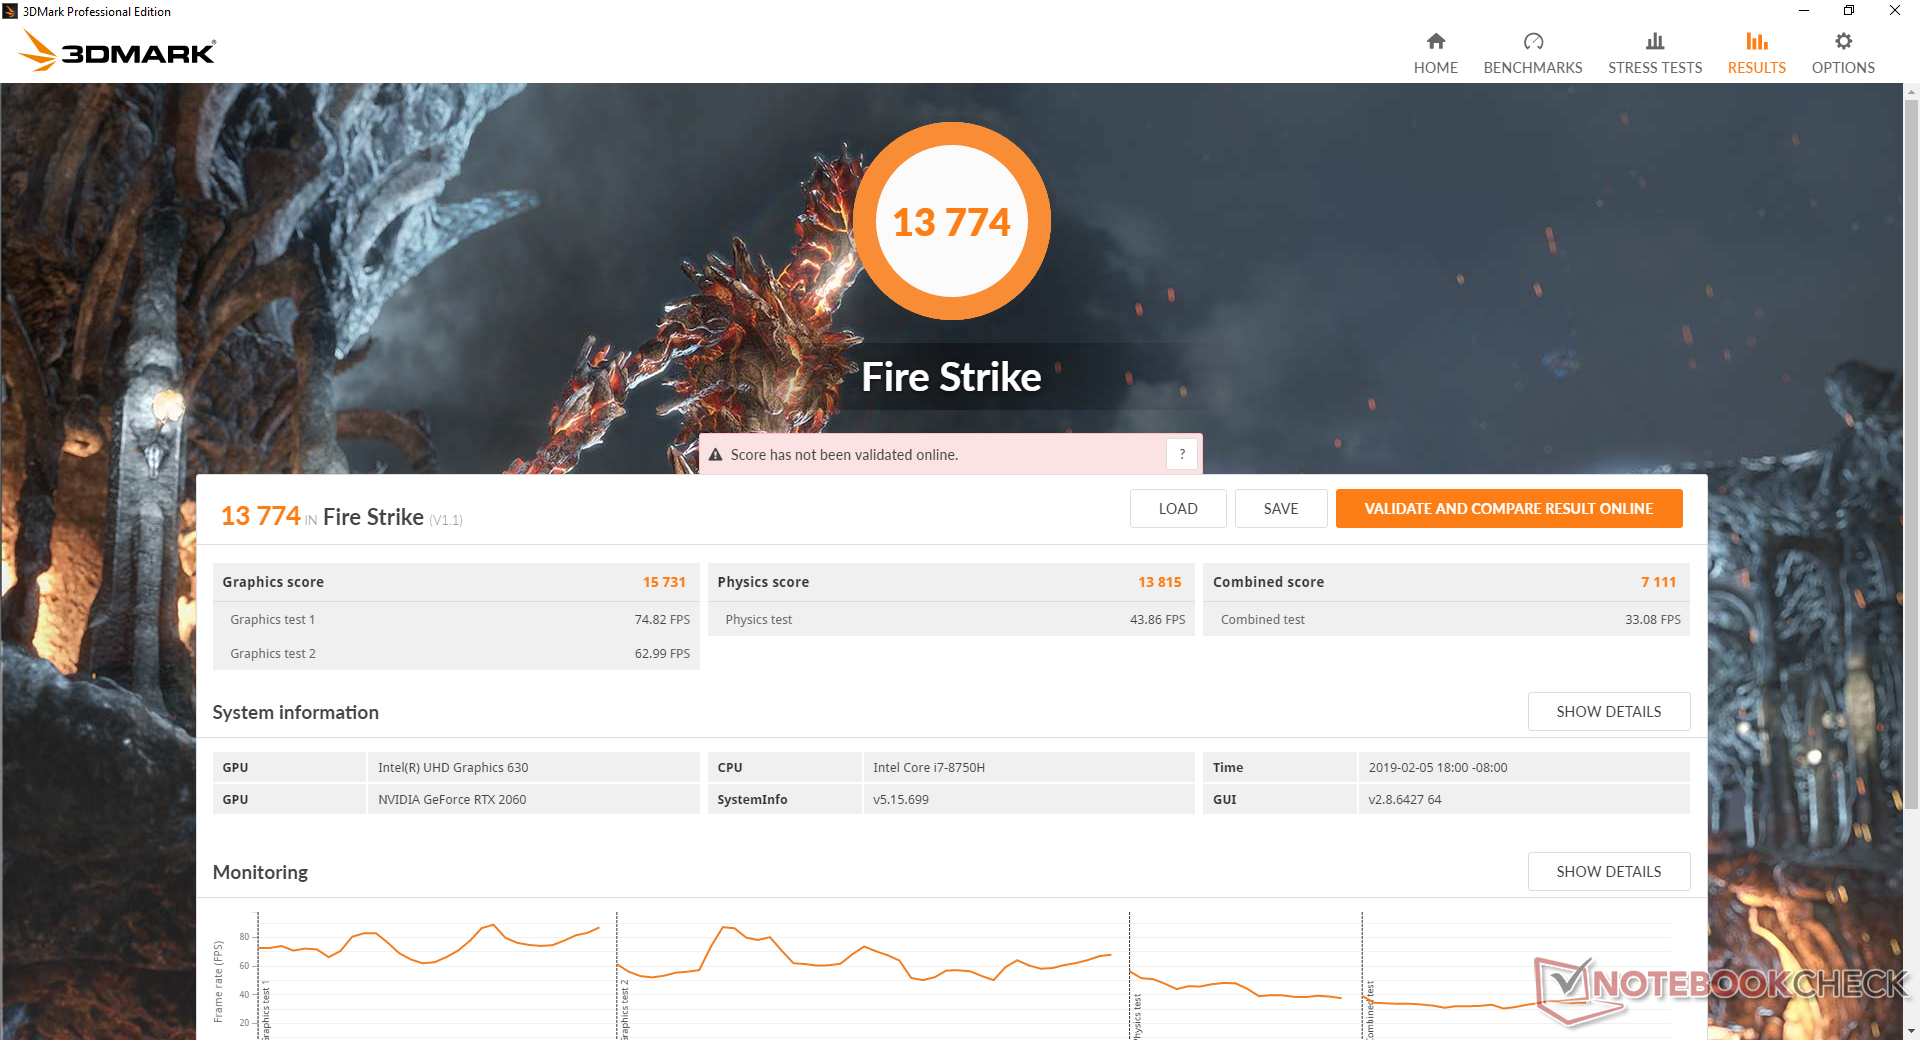
| 3DMark 11 Performance | 15612 points | |
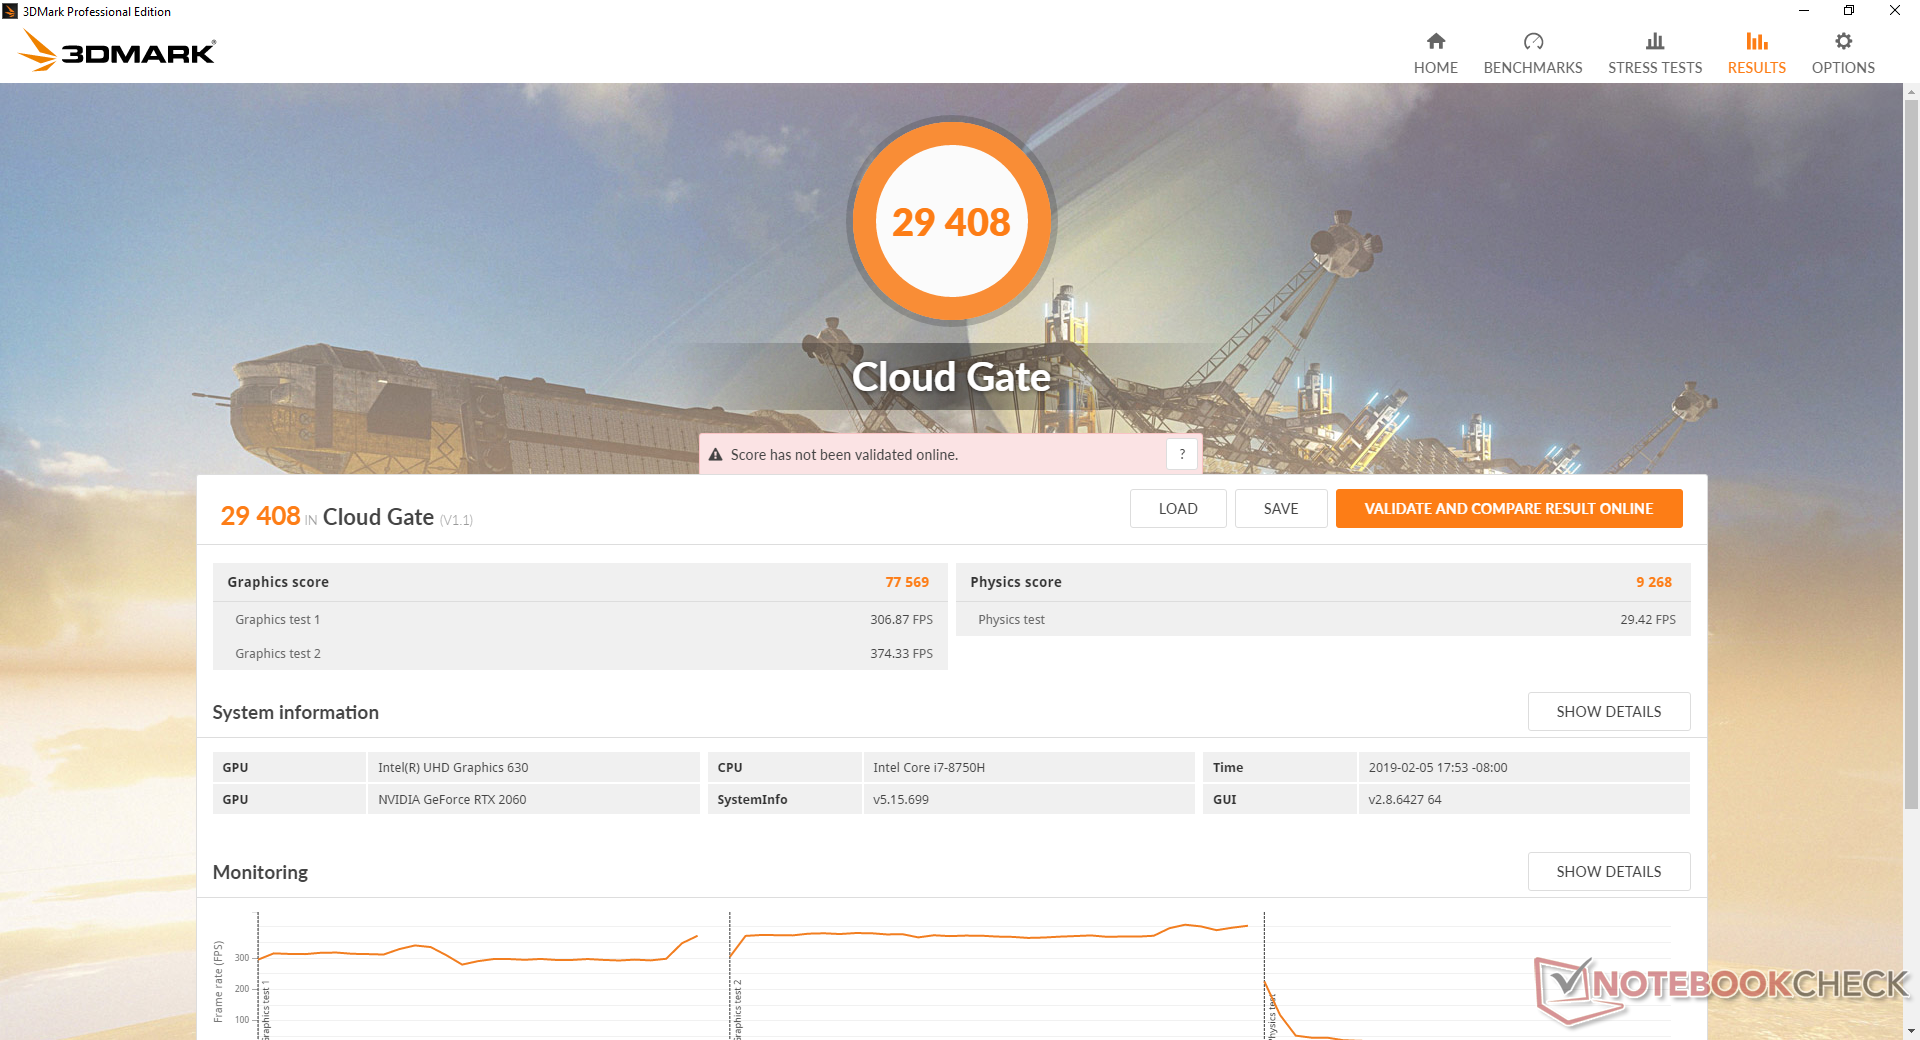
| 3DMark Cloud Gate Standard Score | 29408 points | |
| 3DMark Fire Strike Score | 13774 points | |
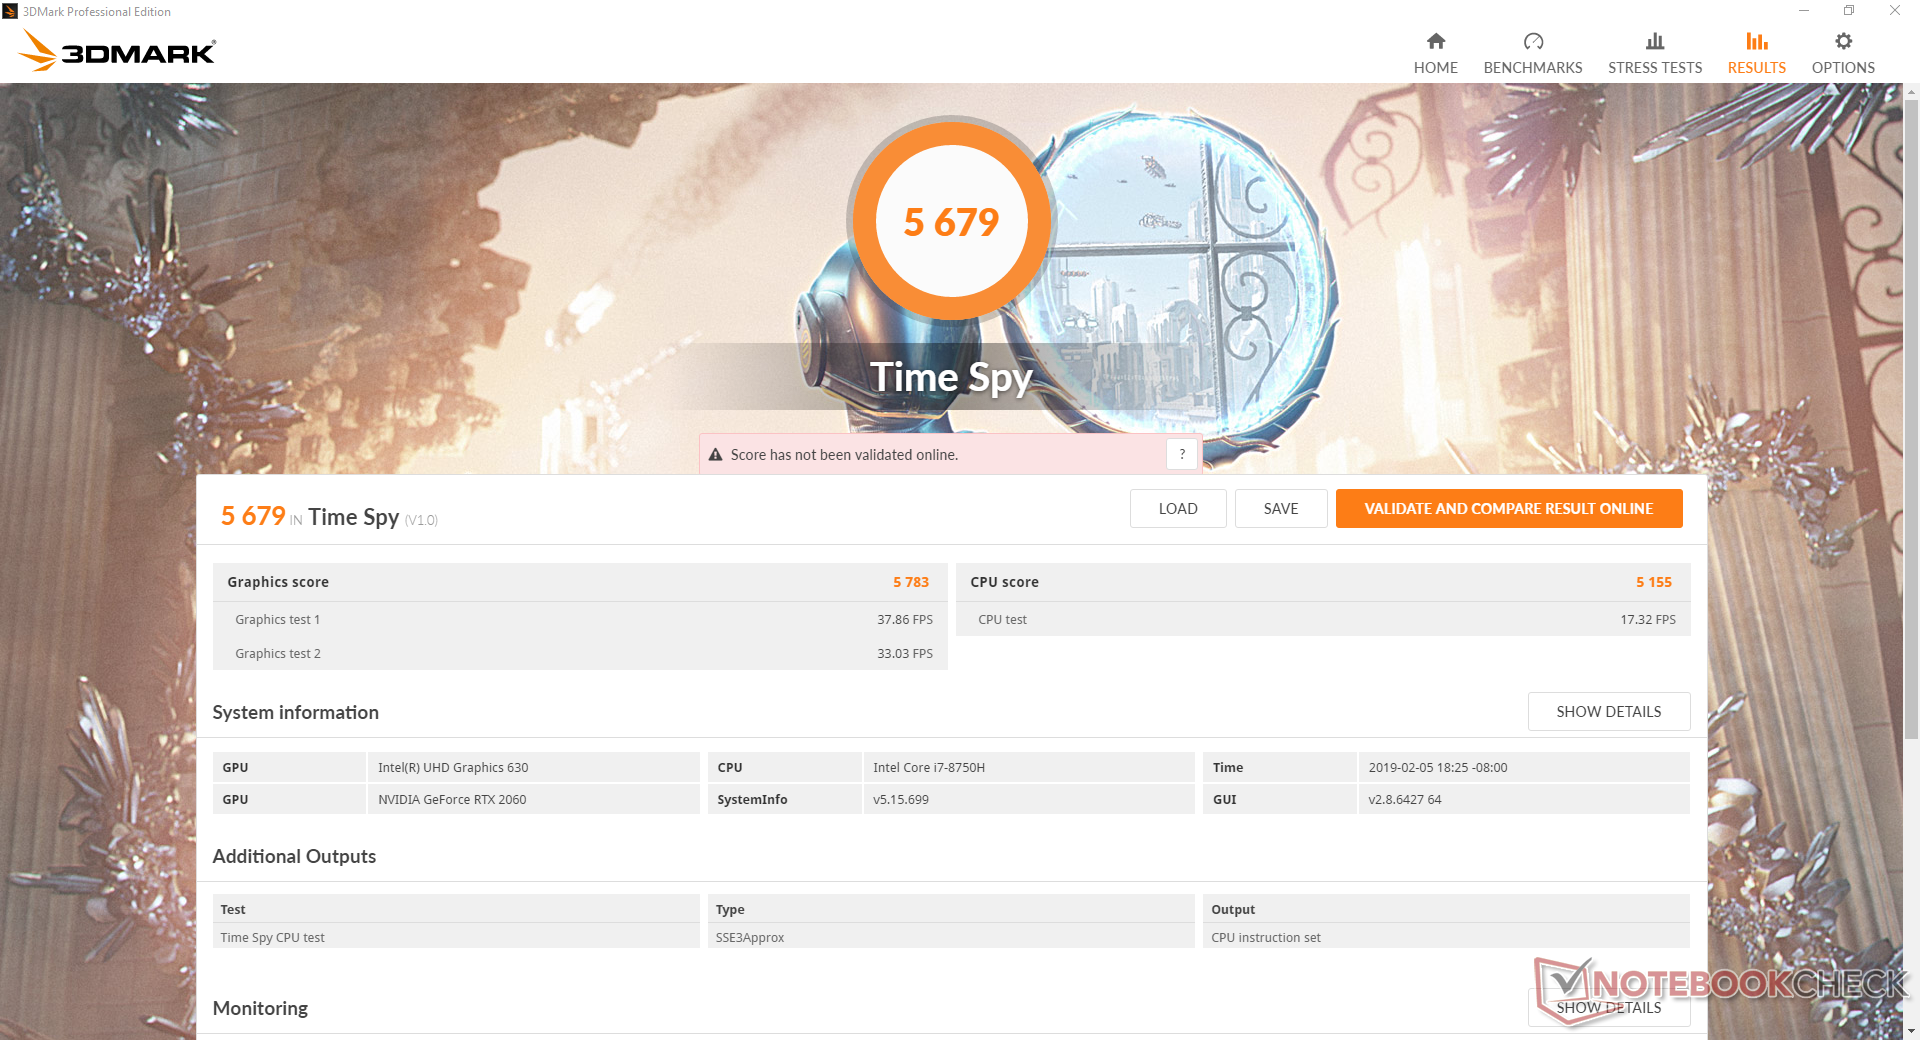
| 3DMark Time Spy Score | 5679 points | |
Help | ||
Gaming Performance
As predicted by 3DMark, real-world performance in games is very similar to the GTX 1070 Max-Q when RTX-specific features like ray-tracing and DLSS are off. The performance boost over a GTX 1060 may be even higher at up to 50 percent likely depending on the title. Reaching a steady 120 FPS at 1080p to take full advantage of the 120 Hz display is possible on modern titles albeit with most graphics options tuned down.
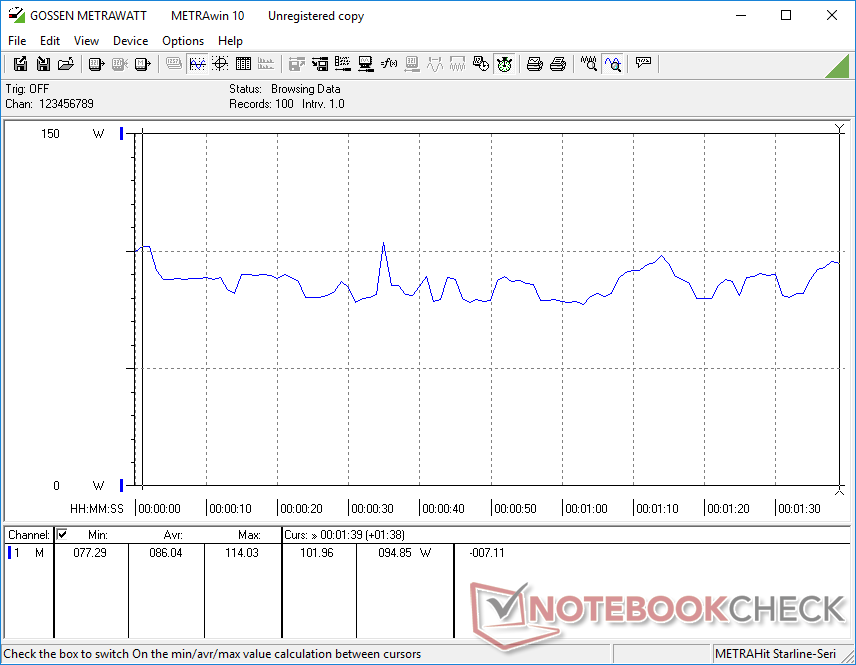
Idling on Witcher 3 shows consistent frame rates over time save for a couple of dips to the mid 40s as shown by the graph below. The sudden and short-lived drops in frame rates are likely due to interrupting background activity. MSI laptops in particular tend to have more software pop-ups than other gaming laptops.
See our review page on the mobile RTX series for more technical information and our dedicated RTX 2060 page for more benchmark comparisons.
| low | med. | high | ultra | |
|---|---|---|---|---|
| BioShock Infinite (2013) | 230.2 | 198.8 | 201.5 | 127.9 |
| The Witcher 3 (2015) | 188.7 | 157.5 | 104.3 | 55.1 |
| Shadow of the Tomb Raider (2018) | 93 | 75 | 70 | 65 |
Emissions
System Noise
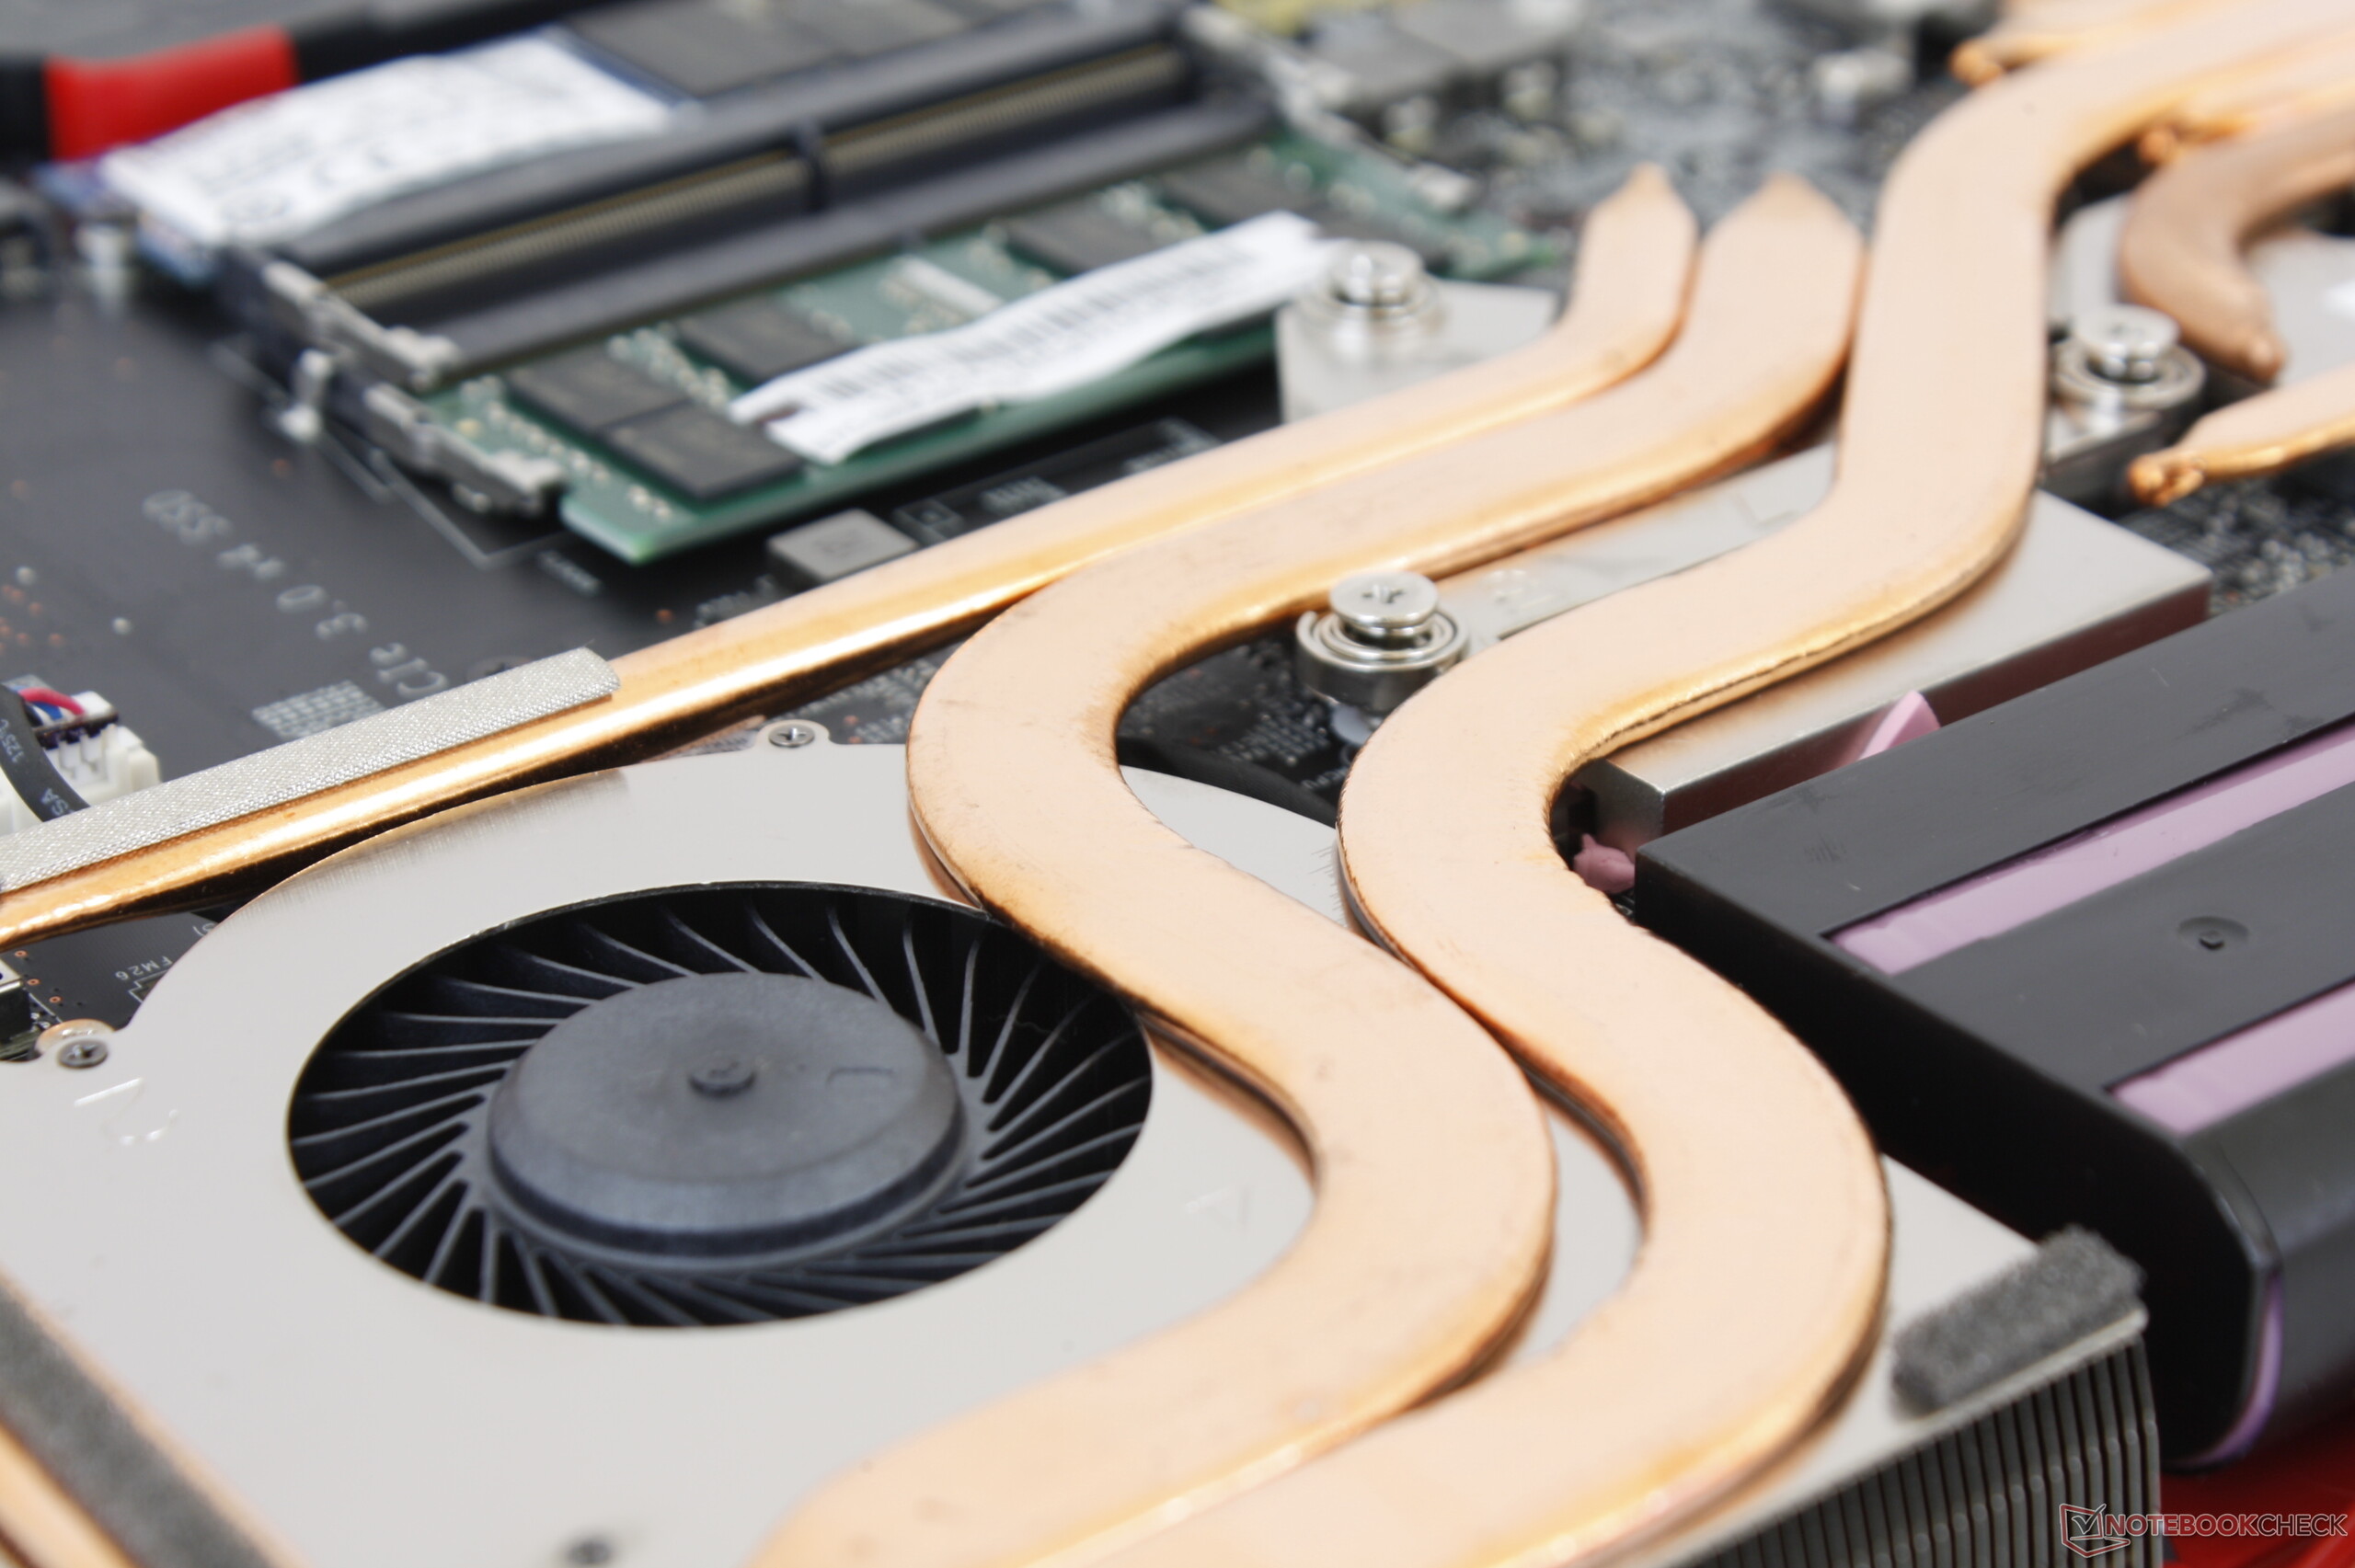
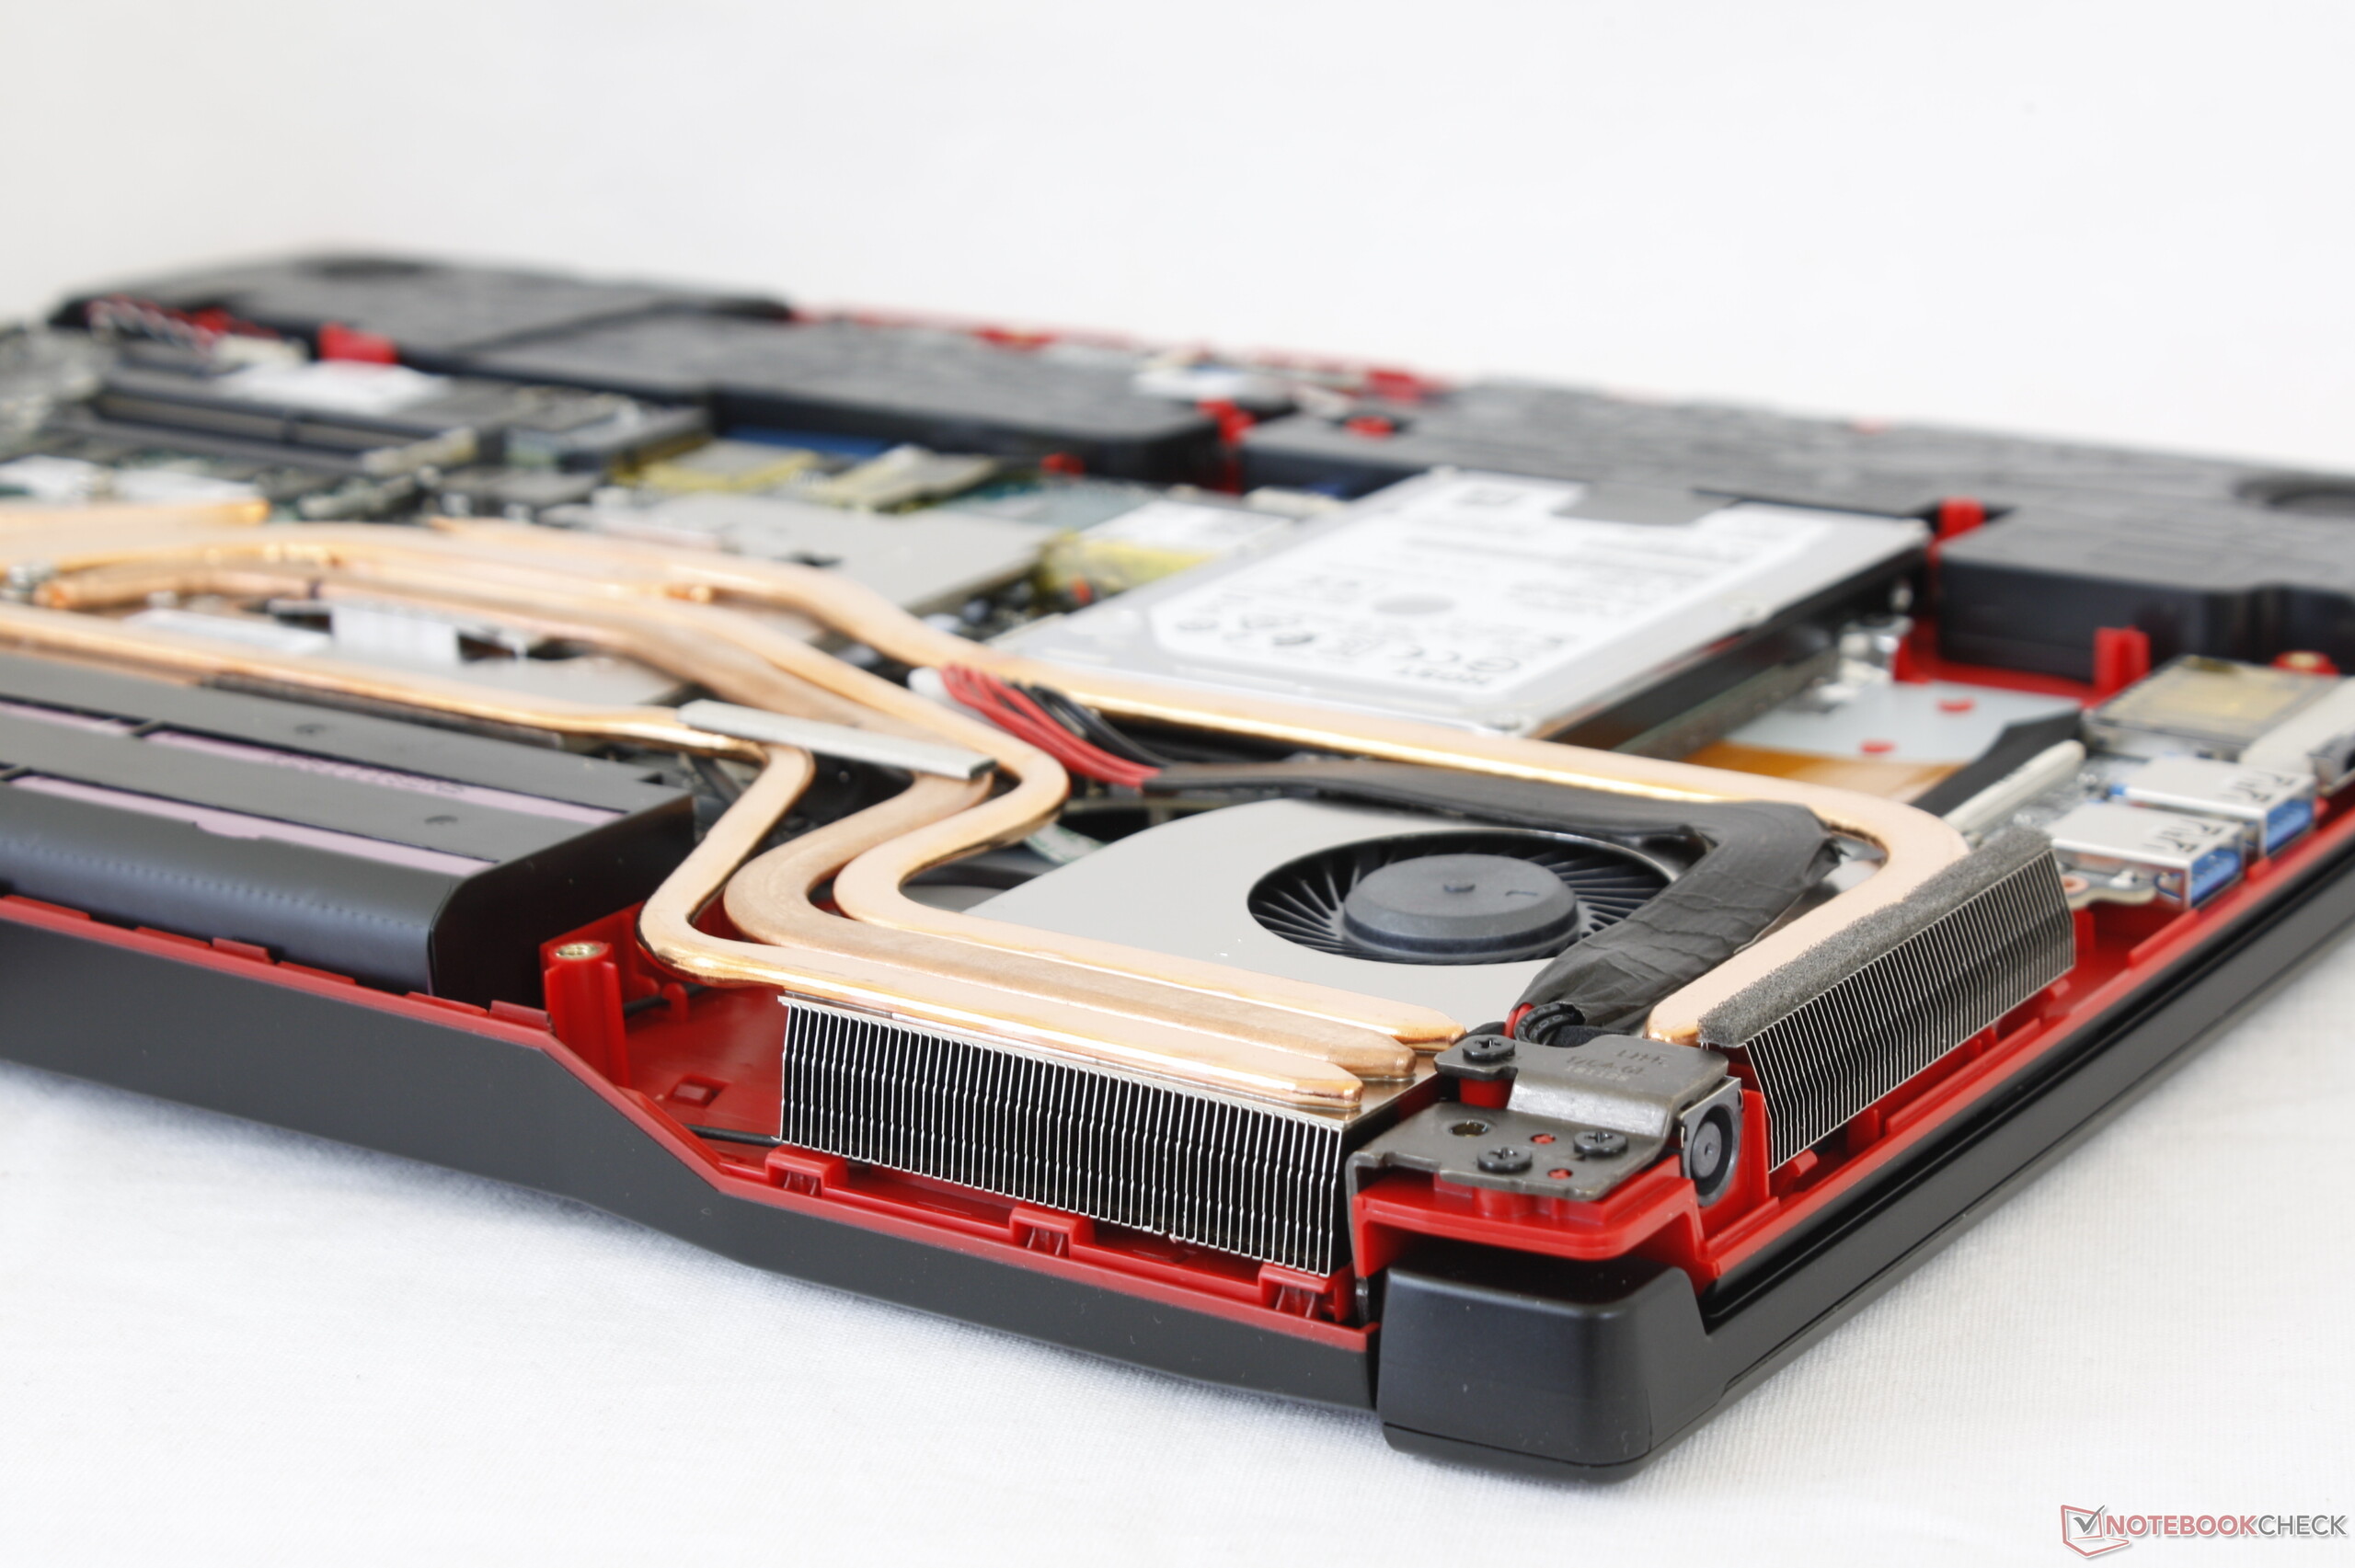
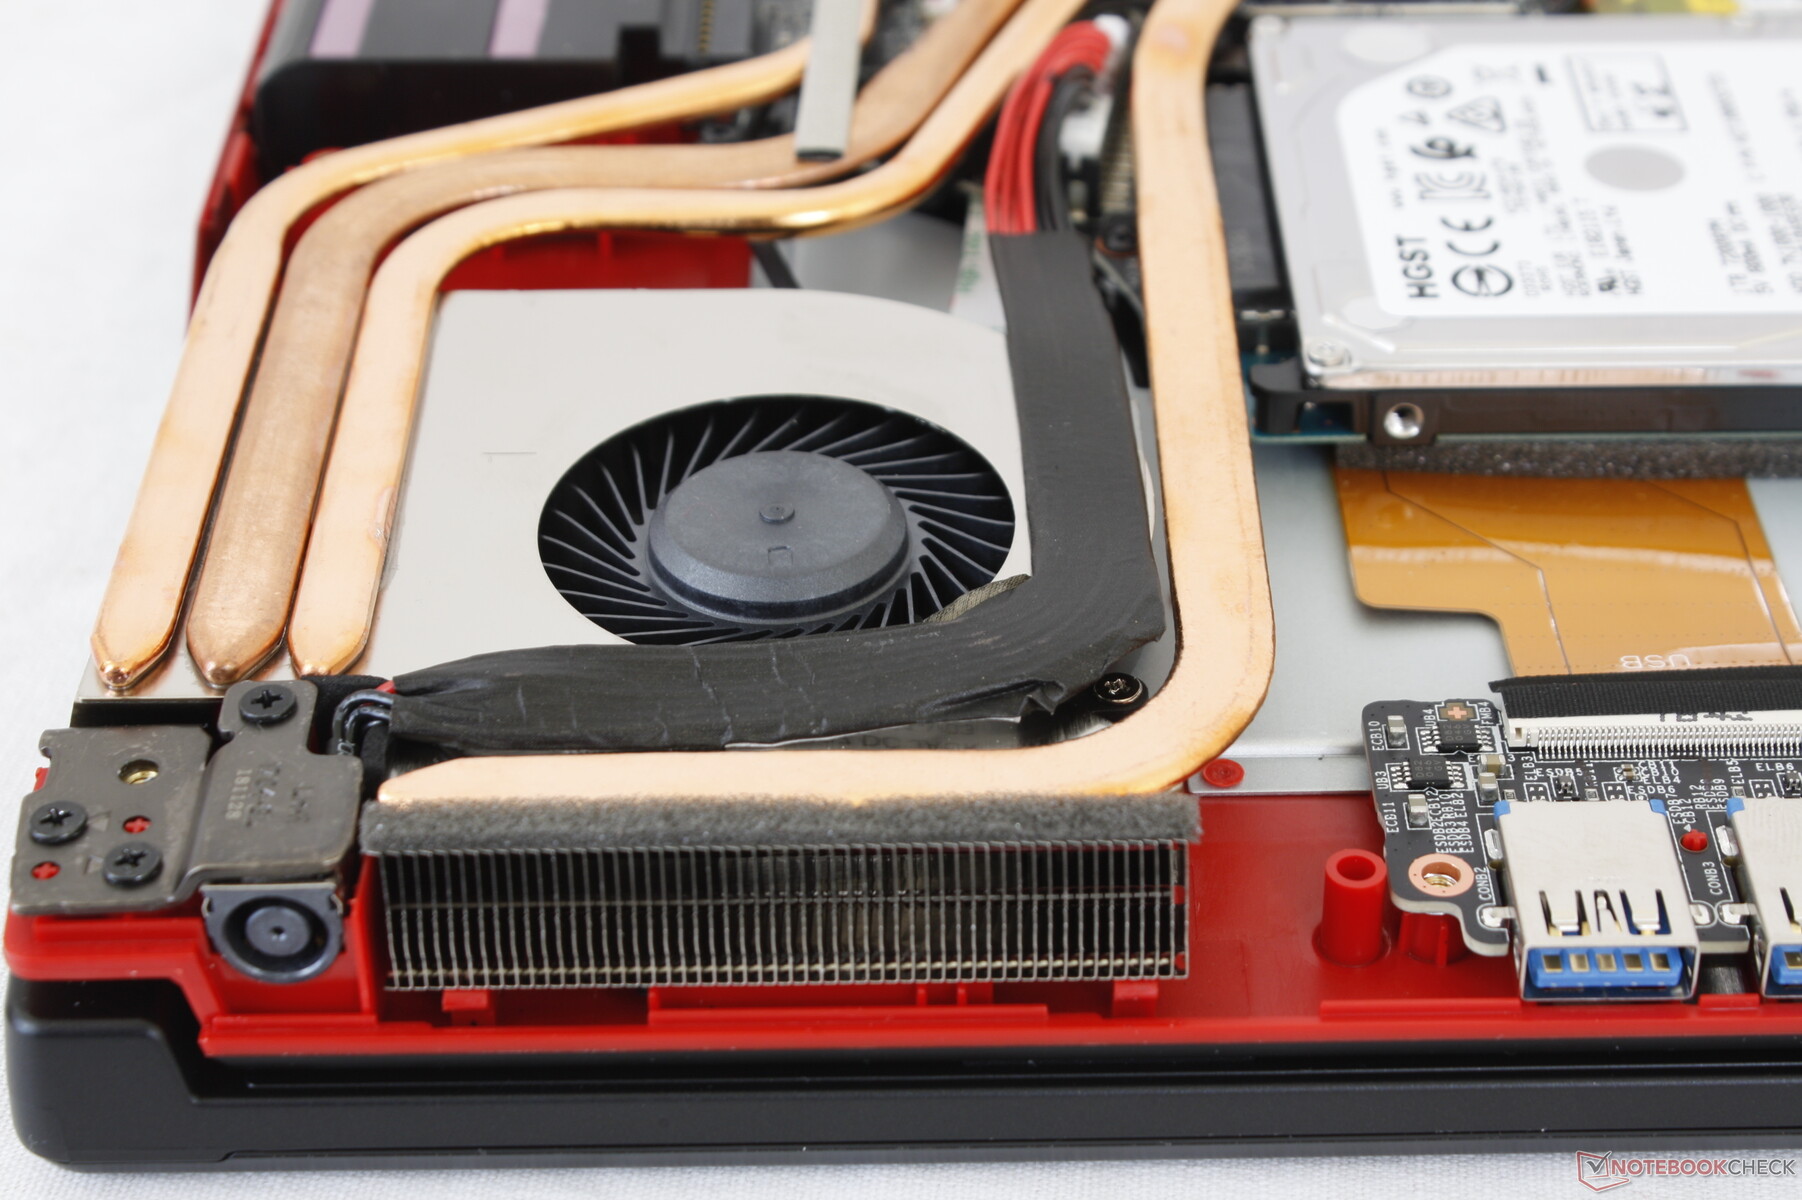
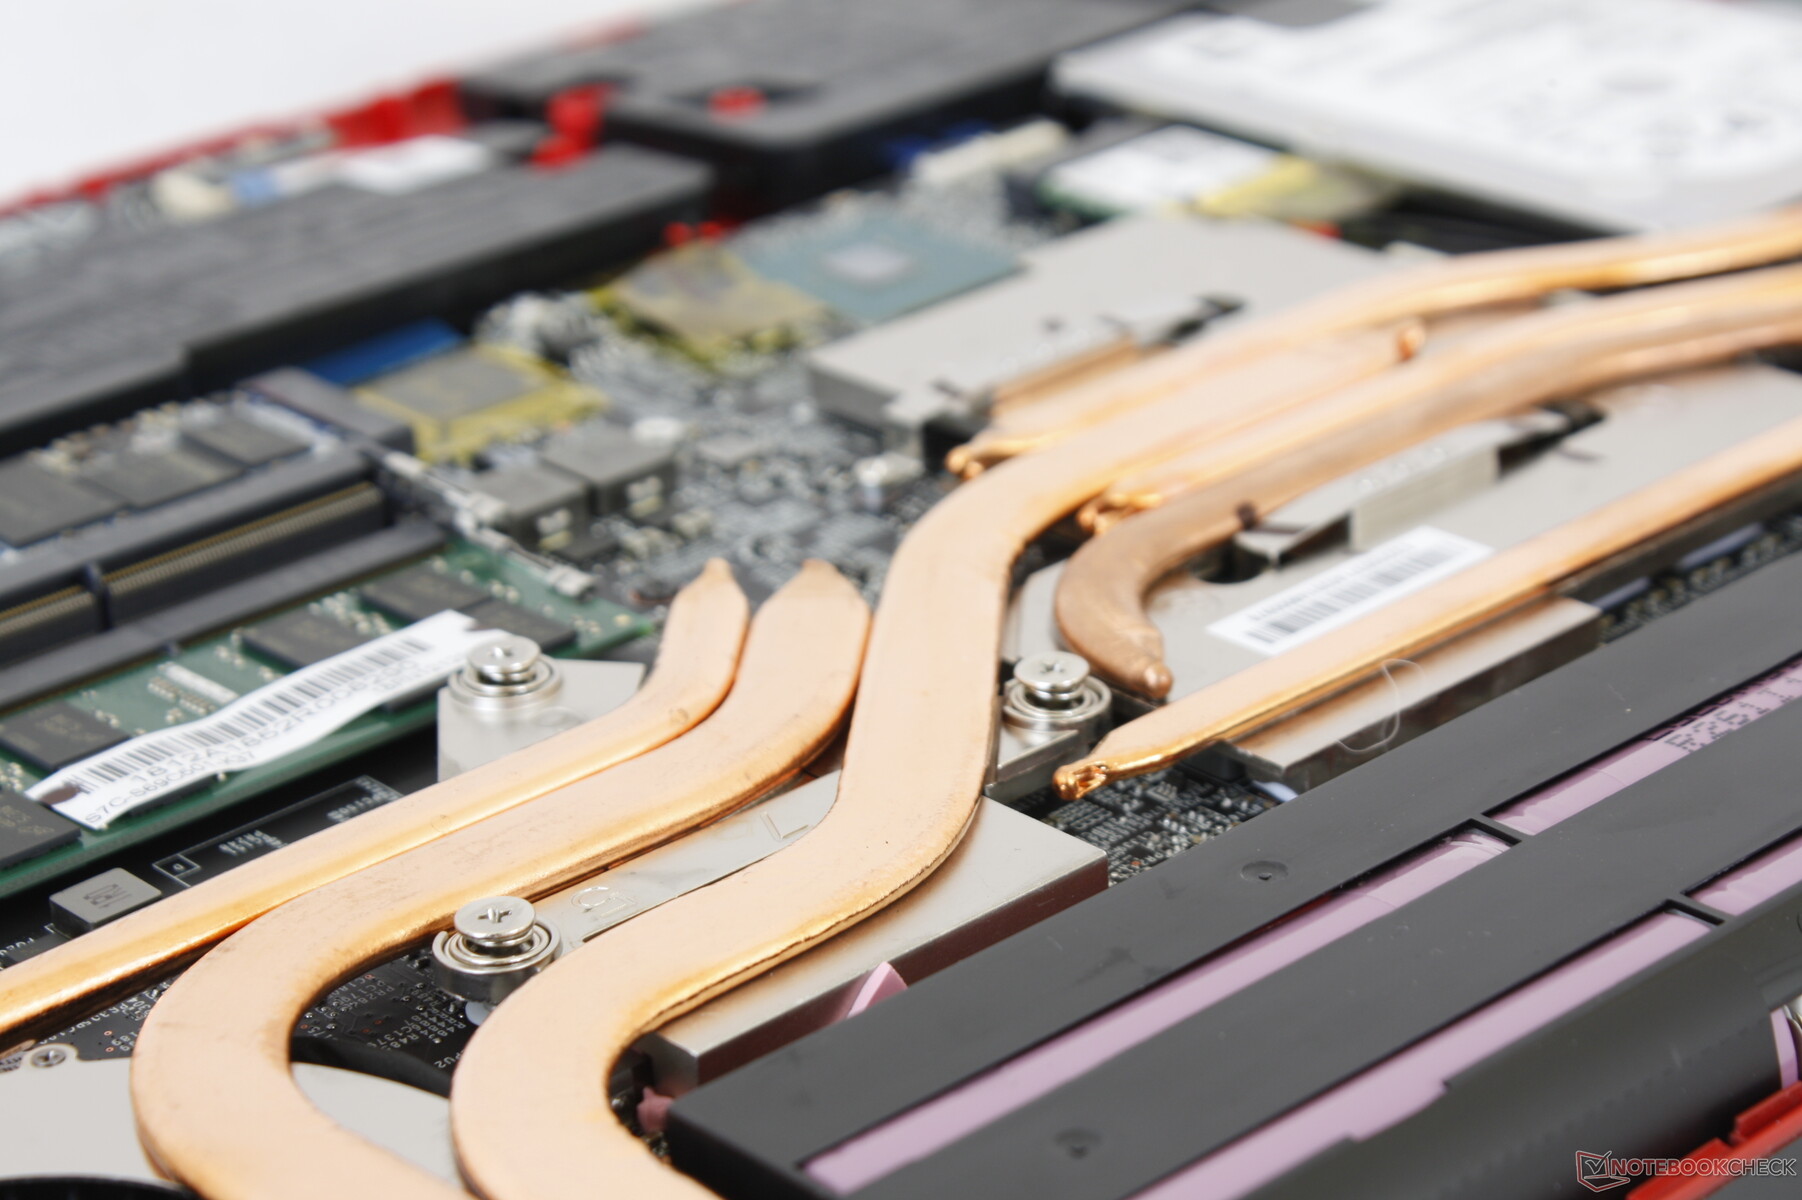
The last time we checked out the GL72, there were only 4 copper heat pipes shared between the CPU and GPU. The newer GL73 has nearly double the heat pipes for a total of 7 while keeping the same twin 50 mm fans as before. The larger cooling solution is likely necessary as the RTX 1060 is much more demanding than the GTX 960M on the last generation SKU.
Unfortunately, all those new heat pipes haven't improved fan noise. Both fans are always active no matter the load by default not unlike on the GE73 Raider. The whirring isn't distracting, but it's undesirable nonetheless especially when just word processing or watching videos.
Fan noise when gaming is louder than we expected as well. When running Witcher 3, the fans would cycle between 44 dB(A) and 47.8 dB(A) compared to the constant 42.7 dB(A) on the GL73 with GTX 1050 Ti graphics. We recorded a similar noise level when gaming on the Asus TUF FX705 as well. In comparison, the new Razer Blade 15 runs at about 42.5 dB(A) when under similar gaming loads to be both quieter and thinner.
If Turbo Fan mode is enabled, fan noise jumps to a constant 59.7 dB(A). Otherwise, maximum fan noise when running Prime95 and FurMark is 52.2 dB(A).
We can notice no electronic noise or coil whine on our specific test unit.
| MSI GL73 8SE-010US GeForce RTX 2060 Mobile, i7-8750H, Kingston RBUSNS8154P3128GJ | Lenovo Legion Y730-17ICH, i7-8750H GeForce GTX 1050 Ti Mobile, i7-8750H, Toshiba KBG30ZMT128G | Gigabyte Sabre 17-W8 GeForce GTX 1060 Mobile, i7-8750H, Toshiba NVMe THNSN5256GPU7 | Asus TUF FX705GM GeForce GTX 1060 Mobile, i7-8750H, WDC PC SN520 SDAPNUW-256G | MSI GL73 8RD-418US GeForce GTX 1050 Ti Mobile, i7-8750H, Kingston RBUSNS8154P3128GJ | MSI GE73 8RF-008 Raider RGB GeForce GTX 1070 Mobile, i7-8750H, Toshiba HG6 THNSNJ256G8NY | |
|---|---|---|---|---|---|---|
| Noise | 11% | -0% | -6% | 11% | -2% | |
| off / environment * (dB) | 28.6 | 28 2% | 30.5 -7% | 29 -1% | 28.5 -0% | 30 -5% |
| Idle Minimum * (dB) | 33.8 | 28 17% | 32.1 5% | 32 5% | 29.2 14% | 32 5% |
| Idle Average * (dB) | 34 | 28 18% | 32.1 6% | 33 3% | 29.3 14% | 33 3% |
| Idle Maximum * (dB) | 34.1 | 31.3 8% | 32.3 5% | 44 -29% | 29.3 14% | 34 -0% |
| Load Average * (dB) | 36.5 | 33.4 8% | 42.9 -18% | 46 -26% | 32.7 10% | 41 -12% |
| Witcher 3 ultra * (dB) | 47.8 | 42.8 10% | 48 -0% | 42.7 11% | 50 -5% | |
| Load Maximum * (dB) | 52.2 | 46.2 11% | 48.8 7% | 50 4% | 45.2 13% | 54 -3% |
* ... smaller is better
Noise level
| Idle |
| 33.8 / 34 / 34.1 dB(A) |
| Load |
| 36.5 / 52.2 dB(A) |
 | ||
30 dB silent 40 dB(A) audible 50 dB(A) loud |
||
min: | ||
Temperature
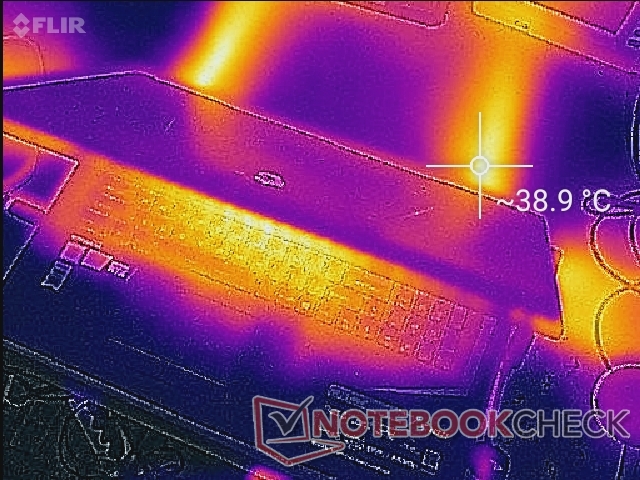
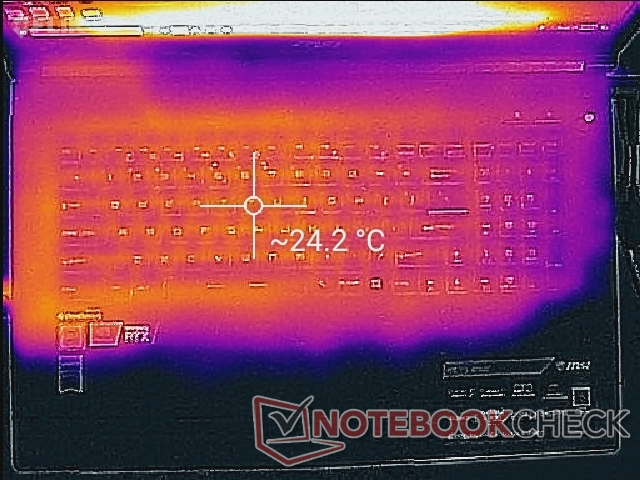
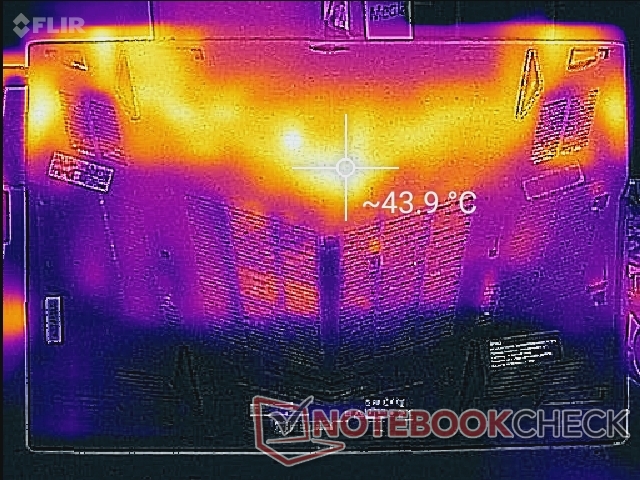
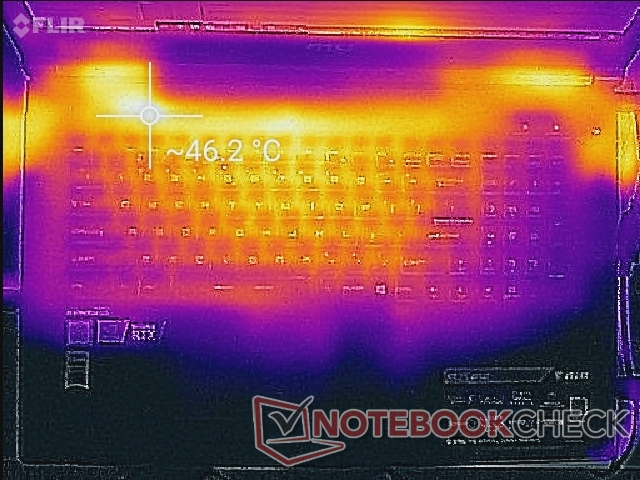
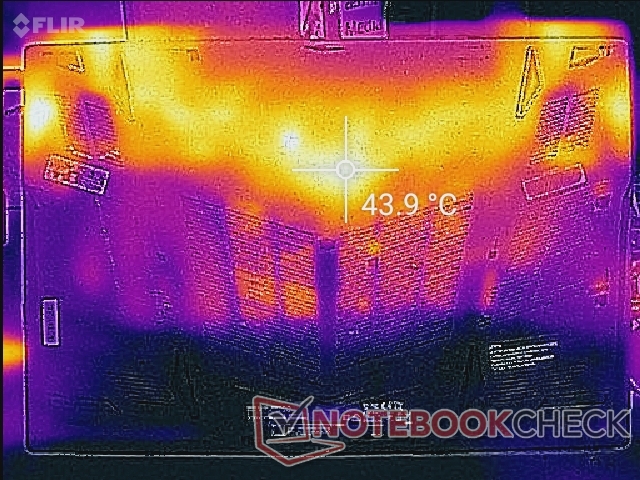
The major benefit of having such a large chassis is the relatively cool surface temperatures when under load. The palm rests and WASD keys remain significantly cooler when compared to thinner systems like the MSI GS65 or Asus TUF FX705GM. At worst, surface temperatures can be as warm as 46 C near the rear corner of the laptop where users are unlikely to touch compared to over 51 C on the older GL72. Just remember to not block any of the many ventilation grilles.
Stress Test
We stress the laptop with synthetic loads to identify for any potential throttling or stability issues. When subjected to Prime95, the CPU can be observed running at up to 3.9 GHz for the first few seconds until core temperature reaches 86 C. At that point, clock rate drops to 3.0 GHz in order to maintain a cooler core temperature of 69 C. Since the base clock rate of the Core i7-8750H is 2.2 GHz, the GL73 is able to maintain a Turbo Boost of +800 MHz when under extreme CPU stress.
Enabling Turbo Fan mode will cause the fans to spin at maximum RPM. This has a noticeable effect on core temperature by up to 10 C when under high processing loads as shown by the table below. Both CPU and GPU clock rates are higher when under Turbo Mode as well, although just marginally and not nearly enough to make a tangible performance difference when gaming. The major increase in fan noise makes Turbo Fan mode unsuitable for many situations and even unnecessary when gaming because core temperatures are already reasonable without it.
Running Witcher 3 is more representative of real-world gaming load when compared to the above conditions. CPU and GPU temperatures are at 76 C and 66 C, respectively, compared to the 75 C GPU of the Asus TUF FX705 Razer Blade 15 Advanced Model (RTX 2070 Max-Q, FHD) Laptop Reviewwhen under similar gaming loads. Thus, the relatively cool core temperatures seemingly come at the cost of loud fan noise as recorded above.
Expect reduced performance when on battery power even when on the High Performance profile with Nvidia Battery Boost off. A 3DMark 11 run on batteries returns Physics and Graphics scores of 4888 and 7910 points, respectively, compared to 9463 and 20157 points when connected to mains.
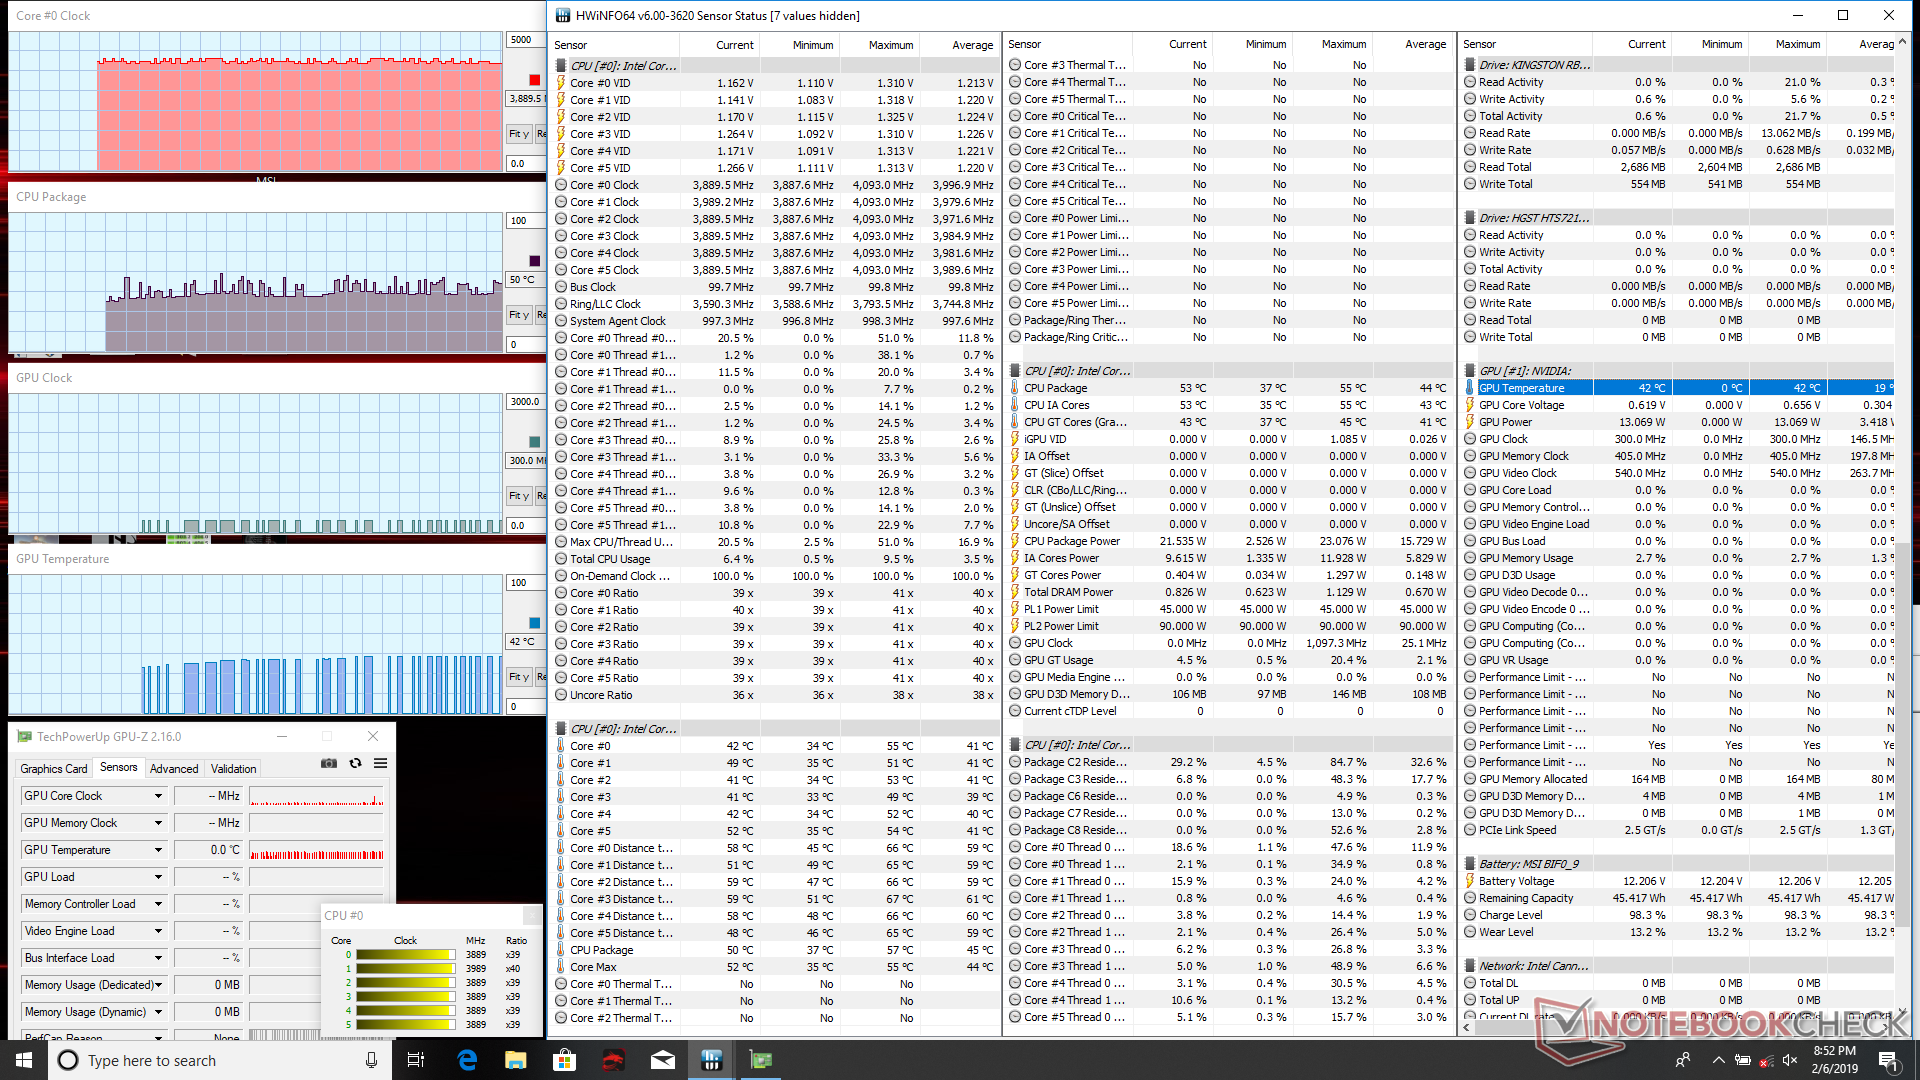
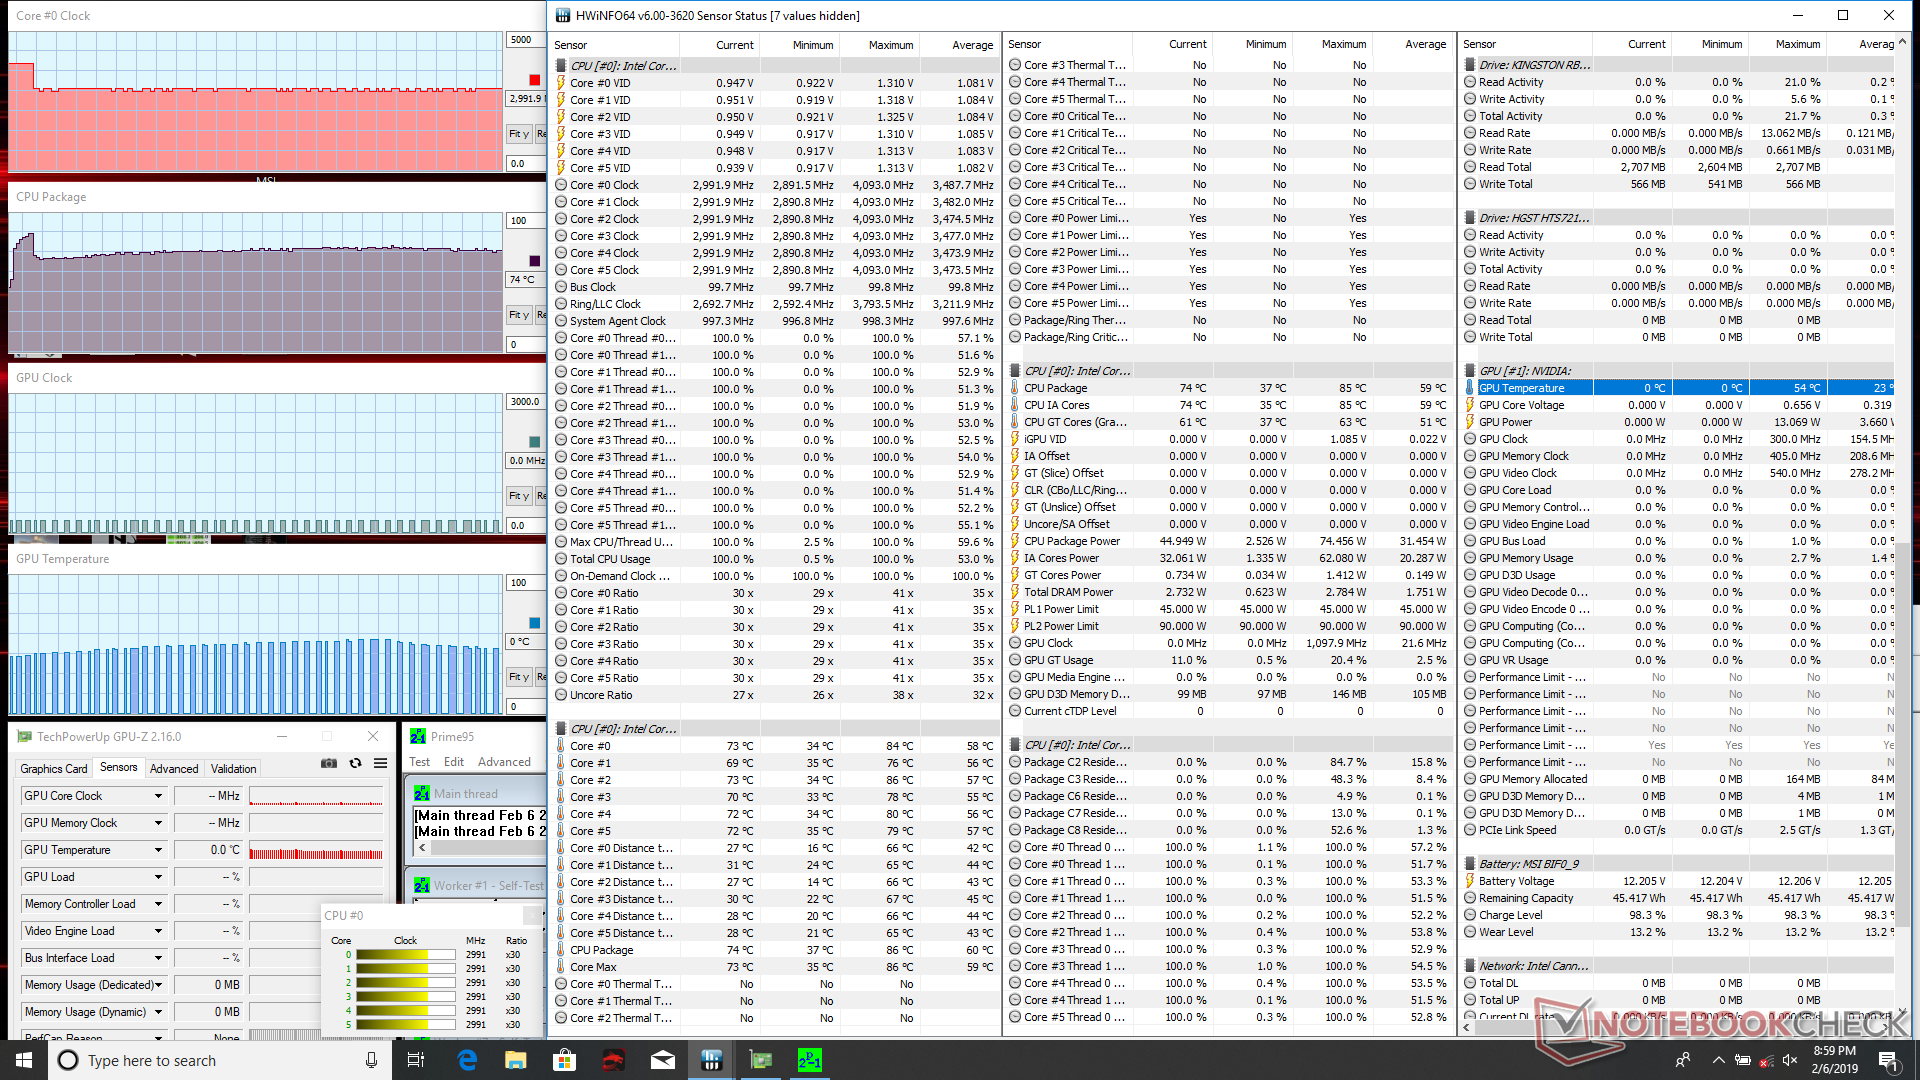
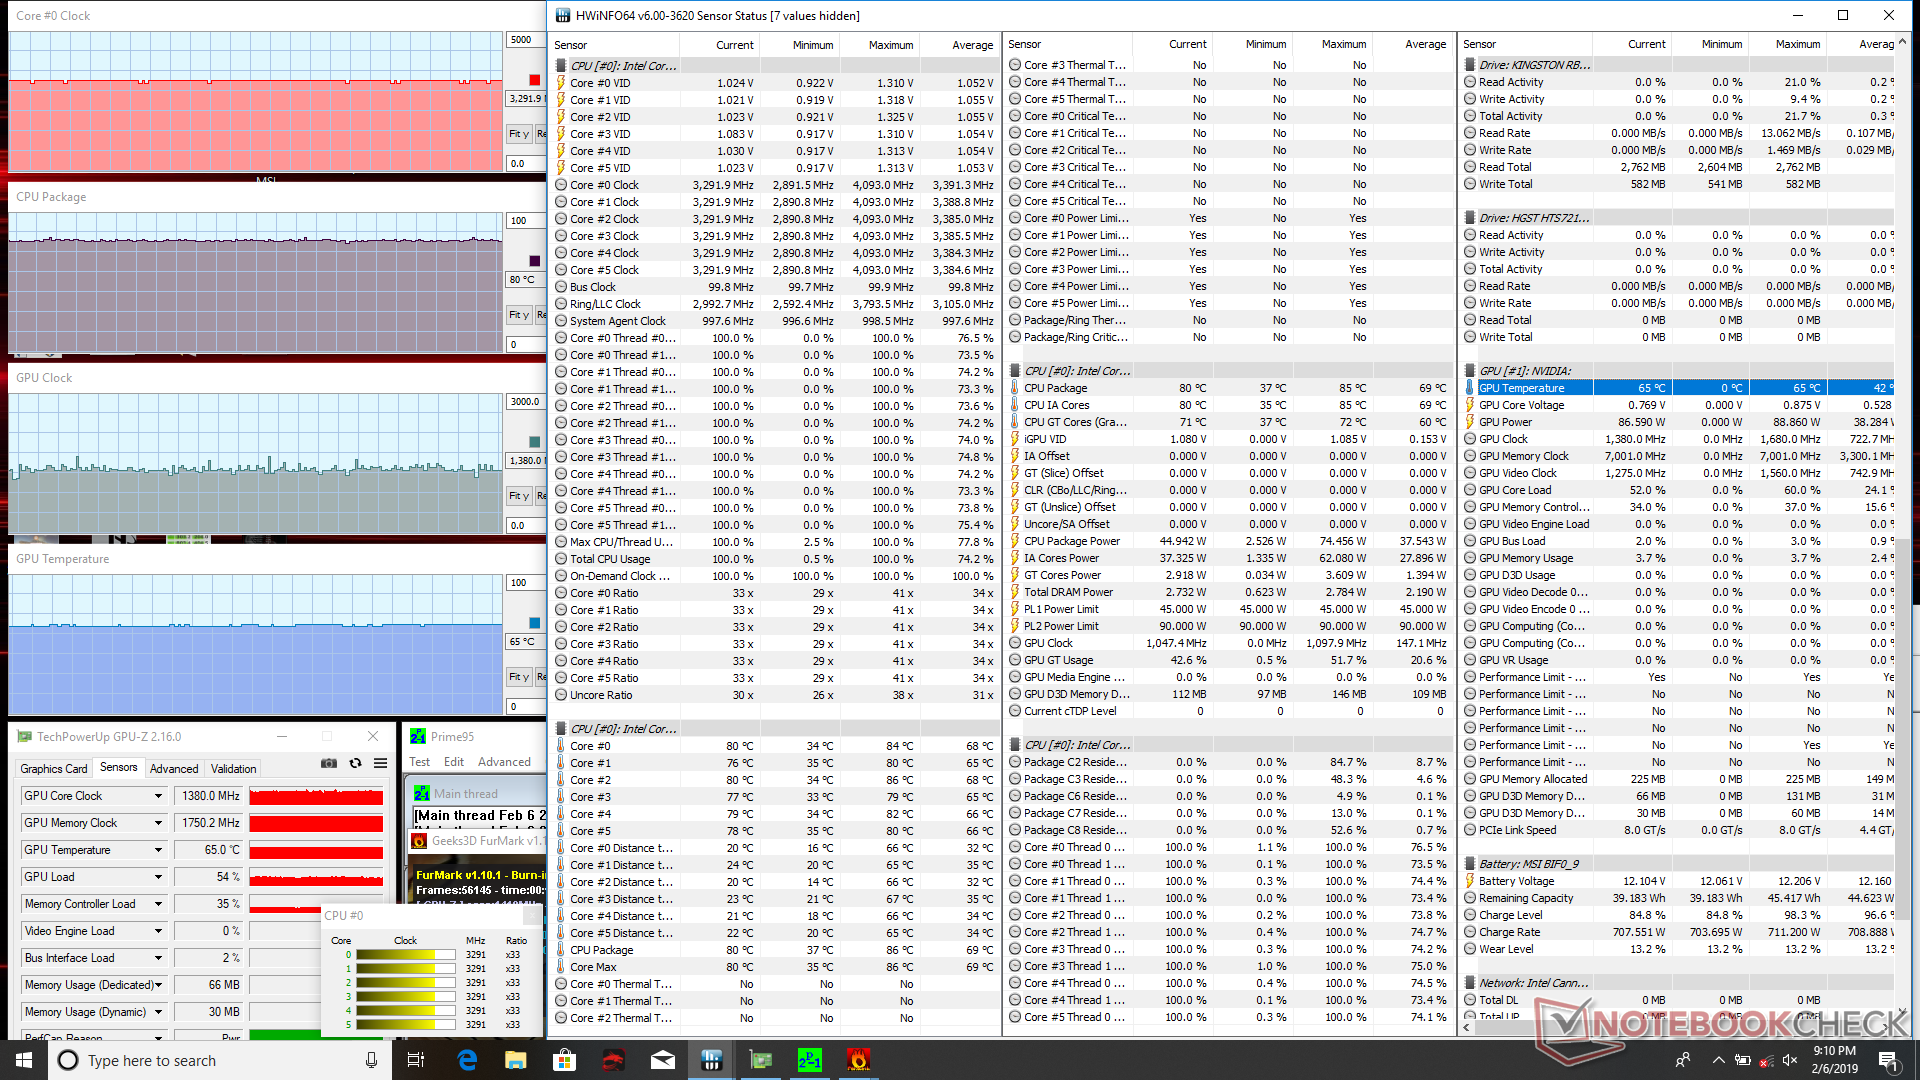
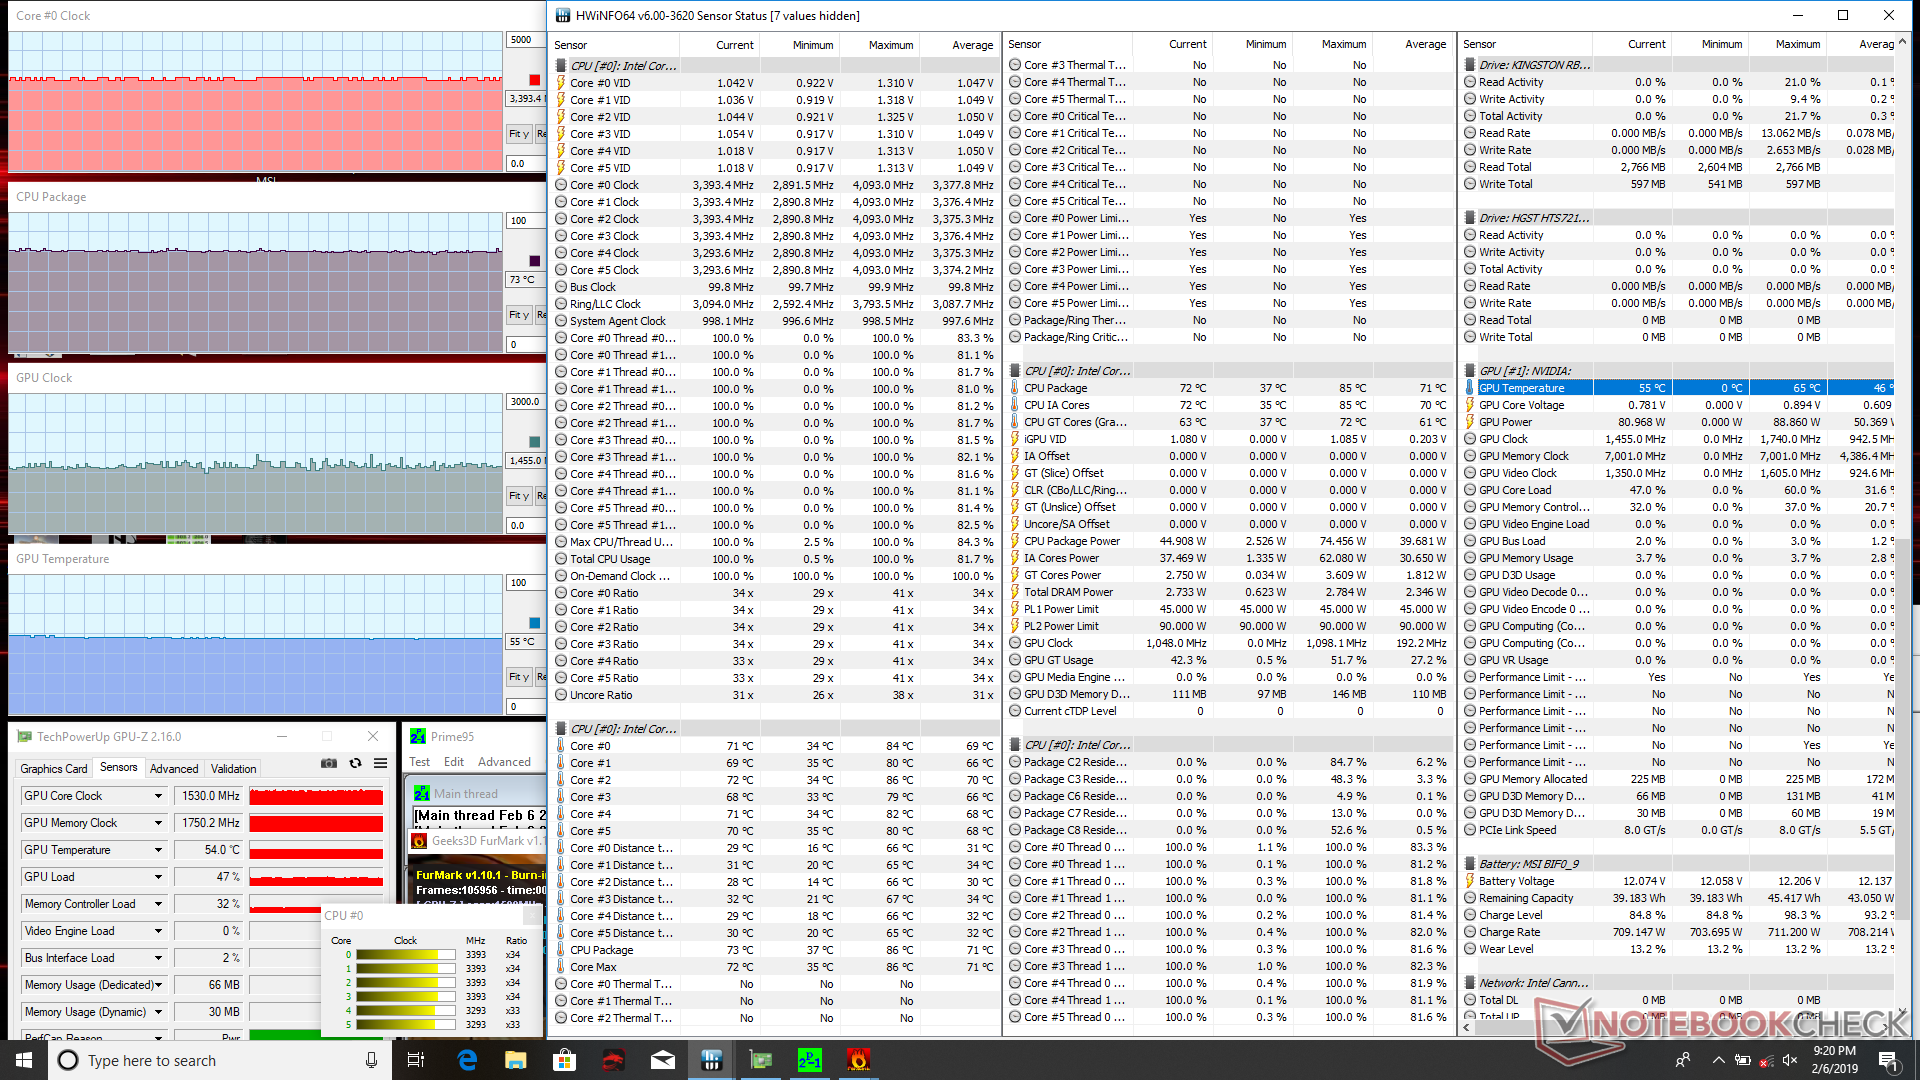
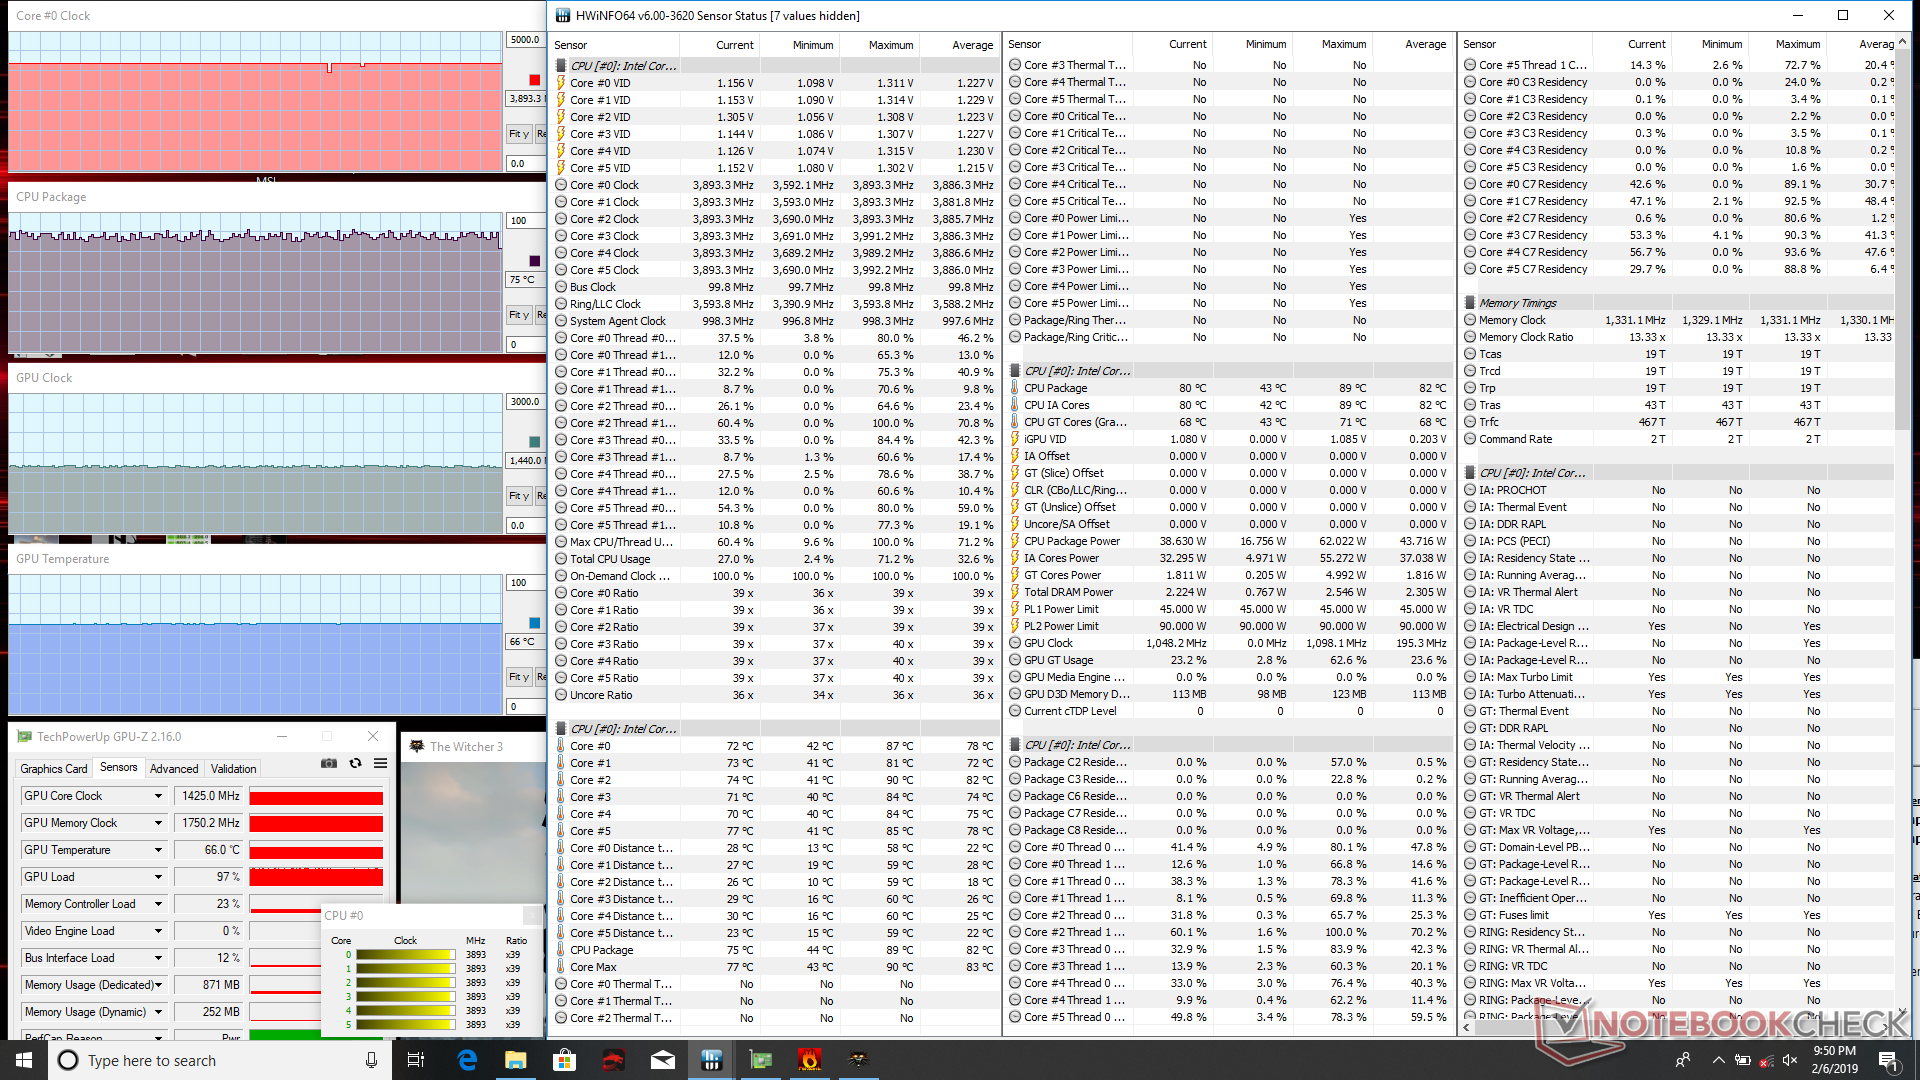
| CPU Clock (GHz) | GPU Clock (MHz) | Average CPU Temperature (°C) | Average GPU Temperature (°C) | |
| System Idle | -- | -- | 48 | 42 |
| Prime95 Stress | 3.0 | -- | 74 | -- |
| Prime95 + FurMark Stress (Turbo Fan off) | 3.3 | 1380 | 80 | 65 |
| Prime95 + FurMark Stress (Turbo Fan on) | 3.4 | 1455 | 73 | 55 |
| Witcher 3 Stress | 3.9 | 1440 | 76 | 66 |
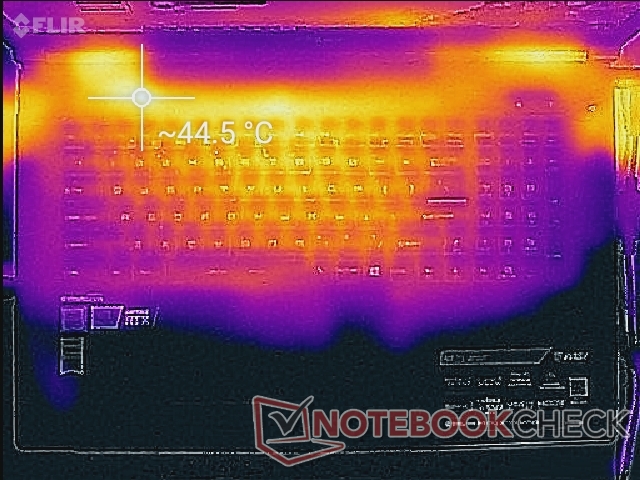
(-) The maximum temperature on the upper side is 47 °C / 117 F, compared to the average of 40.4 °C / 105 F, ranging from 21.2 to 68.8 °C for the class Gaming.
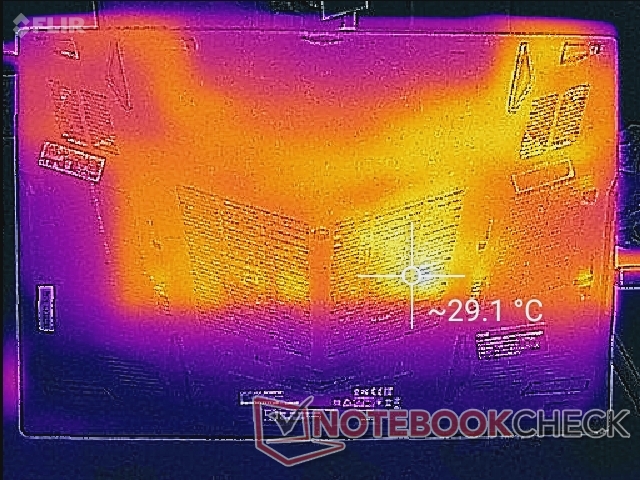
(±) The bottom heats up to a maximum of 44.4 °C / 112 F, compared to the average of 43.2 °C / 110 F
(+) In idle usage, the average temperature for the upper side is 22.3 °C / 72 F, compared to the device average of 33.9 °C / 93 F.
(+) Playing The Witcher 3, the average temperature for the upper side is 29.9 °C / 86 F, compared to the device average of 33.9 °C / 93 F.
(+) The palmrests and touchpad are cooler than skin temperature with a maximum of 22 °C / 71.6 F and are therefore cool to the touch.
(+) The average temperature of the palmrest area of similar devices was 28.8 °C / 83.8 F (+6.8 °C / 12.2 F).
Speakers
Much like the pricier MSI GE and GT series, the GL73 is equipped with more powerful speakers than many other gaming laptops. We were expecting MSI to cut corners here and provide a passable audio experience, but these integrated speakers are some of the loudest we've tested on any laptop, budget or otherwise, at about 89 dB(A) on the maximum setting. Loud volume introduces no static or major vibrations, but bass is unfortunately a bit weak and so high volume settings tend to accentuate treble. The gold-plated audio jack can still provide a more balanced experience.


MSI GL73 8SE-010US audio analysis
(+) | speakers can play relatively loud (88.2 dB)
Bass 100 - 315 Hz
(-) | nearly no bass - on average 23.1% lower than median
(+) | bass is linear (4% delta to prev. frequency)
Mids 400 - 2000 Hz
(+) | balanced mids - only 3.2% away from median
(±) | linearity of mids is average (9.2% delta to prev. frequency)
Highs 2 - 16 kHz
(+) | balanced highs - only 2.6% away from median
(±) | linearity of highs is average (7.1% delta to prev. frequency)
Overall 100 - 16.000 Hz
(±) | linearity of overall sound is average (18.6% difference to median)
Compared to same class
» 61% of all tested devices in this class were better, 9% similar, 31% worse
» The best had a delta of 6%, average was 18%, worst was 132%
Compared to all devices tested
» 42% of all tested devices were better, 8% similar, 50% worse
» The best had a delta of 4%, average was 23%, worst was 134%
Apple MacBook 12 (Early 2016) 1.1 GHz audio analysis
(+) | speakers can play relatively loud (83.6 dB)
Bass 100 - 315 Hz
(±) | reduced bass - on average 11.3% lower than median
(±) | linearity of bass is average (14.2% delta to prev. frequency)
Mids 400 - 2000 Hz
(+) | balanced mids - only 2.4% away from median
(+) | mids are linear (5.5% delta to prev. frequency)
Highs 2 - 16 kHz
(+) | balanced highs - only 2% away from median
(+) | highs are linear (4.5% delta to prev. frequency)
Overall 100 - 16.000 Hz
(+) | overall sound is linear (10.2% difference to median)
Compared to same class
» 7% of all tested devices in this class were better, 2% similar, 90% worse
» The best had a delta of 5%, average was 18%, worst was 53%
Compared to all devices tested
» 5% of all tested devices were better, 1% similar, 94% worse
» The best had a delta of 4%, average was 23%, worst was 134%
Energy Management
Power Consumption
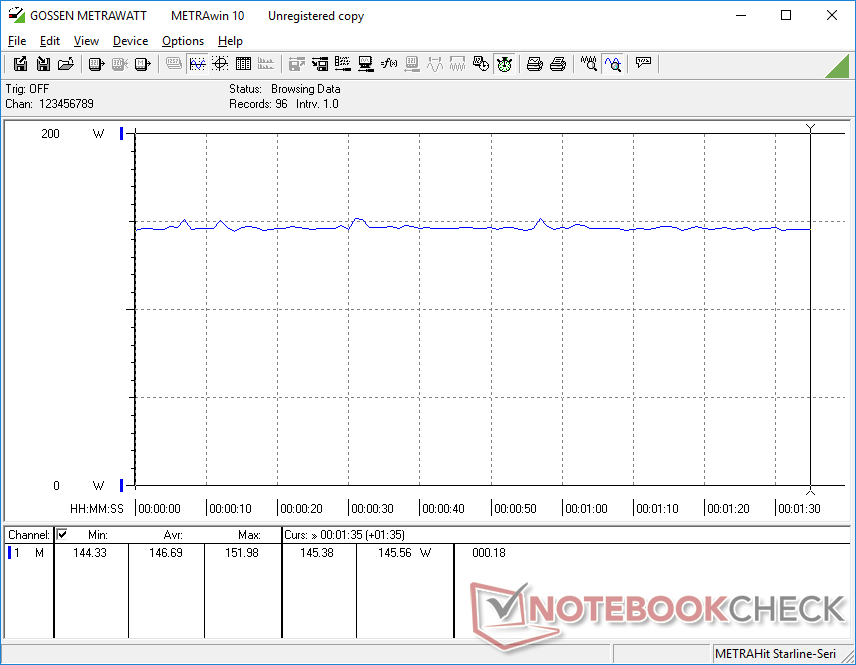
Expect the system to draw about 147 W when gaming compared to 126 W on the MSI GF62 with GTX 1060 graphics. The roughly 17 percent higher power consumption than the last generation GTX 1060 is rather small compared to the 35 to 50 percent boost in gaming performance that the RTX 2060 can provide. Power consumption is more similar to a GTX 1070 Max-Q laptop for which the RTX 2060 is more on par with. The performance-per-Watt of the RTX 2060 over the GTX 1060 looks to be superior based on these early test units.
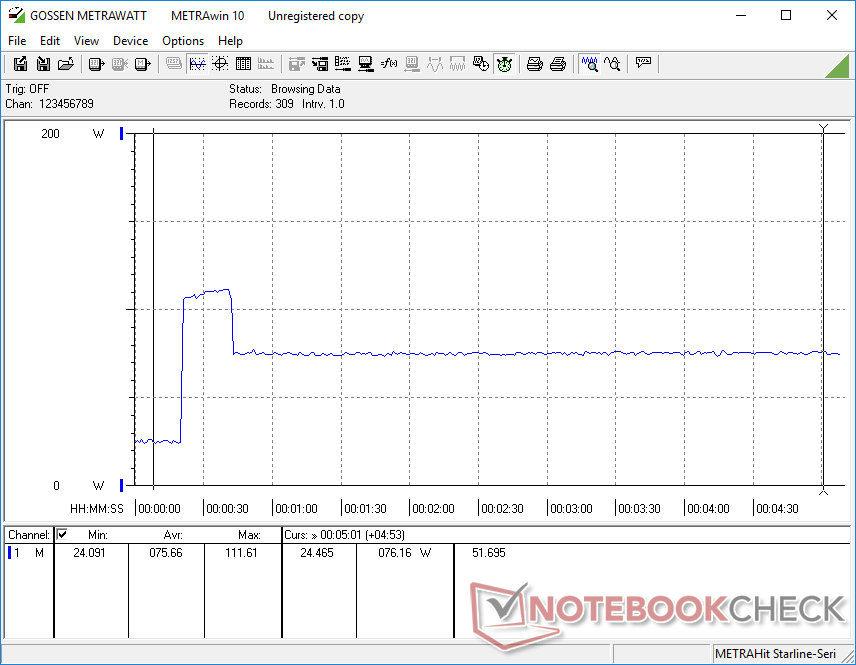
Power consumption spikes to as high as 111 W when running Prime95 before dropping and leveling off at 76 W. This throttling behavior corresponds with the temporary Turbo Boost clock rates in our CineBench R15 loop test above.
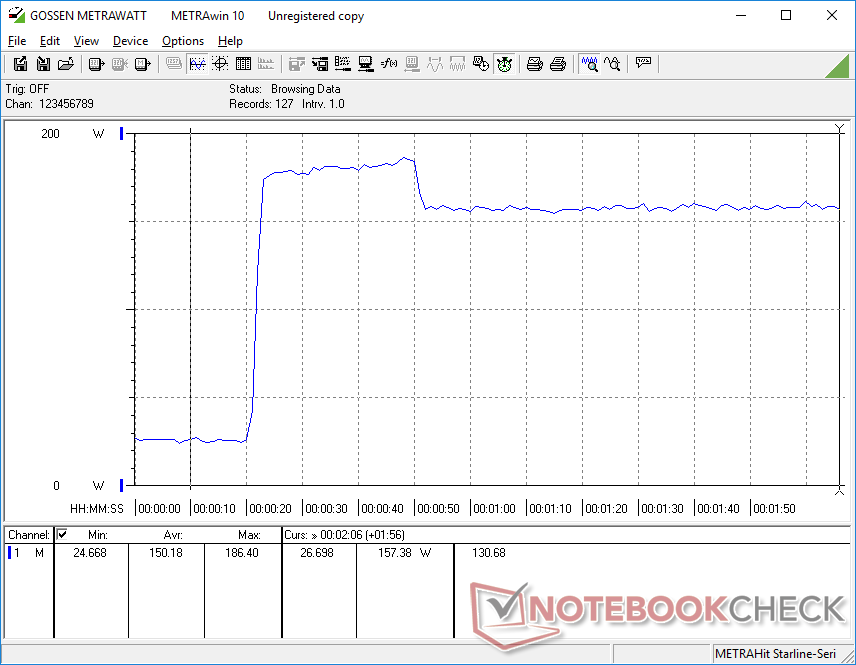
Peak power draw is 186 W from the medium-sized (~16.8 x 8 x 2.6 cm) 180 W AC adapter when running both Prime95 and FurMark simultaneously. This is unsustainable, however, so power demand eventually settles at 150 W as shown by the graph below. MSI would have to ship a more capable AC adapter if it ever wants to equip the GL73 with an RTX 2070 or higher.
| Off / Standby | |
| Idle | |
| Load |
|
Key:
min: | |
| MSI GL73 8SE-010US i7-8750H, GeForce RTX 2060 Mobile, Kingston RBUSNS8154P3128GJ, TN LED, 1920x1080, 17.3" | MSI GE73 8RF-008 Raider RGB i7-8750H, GeForce GTX 1070 Mobile, Toshiba HG6 THNSNJ256G8NY, TN WLED, 1920x1080, 17.3" | MSI GL73 8RD-418US i7-8750H, GeForce GTX 1050 Ti Mobile, Kingston RBUSNS8154P3128GJ, TN LED, 1920x1080, 17.3" | MSI GL72 7RDX-602 i7-7700HQ, GeForce GTX 1050 Mobile, HGST Travelstar 7K1000 HTS721010A9E630, TN LED, 1920x1080, 17.3" | MSI GS73 Stealth 8RF-011 i7-8750H, GeForce GTX 1070 Max-Q, Samsung PM961 MZVLW256HEHP, TN, 1920x1080, 17.3" | MSI GF62VR 7RF-877 i7-7700HQ, GeForce GTX 1060 Mobile, Intel SSD 600p SSDPEKKW256G7, TN LED, 1920x1080, 15.6" | |
|---|---|---|---|---|---|---|
| Power Consumption | -34% | -7% | 4% | -3% | -11% | |
| Idle Minimum * (Watt) | 8.8 | 15 -70% | 11.8 -34% | 9.6 -9% | 8 9% | 16.2 -84% |
| Idle Average * (Watt) | 16.2 | 20 -23% | 18.7 -15% | 15 7% | 14 14% | 18.2 -12% |
| Idle Maximum * (Watt) | 18.3 | 26 -42% | 19.8 -8% | 16.5 10% | 22 -20% | 18.9 -3% |
| Load Average * (Watt) | 86.1 | 97 -13% | 100.8 -17% | 104 -21% | 92 -7% | 82.7 4% |
| Witcher 3 ultra * (Watt) | 146.7 | 186 -27% | 124.4 15% | 154 -5% | 125.7 14% | |
| Load Maximum * (Watt) | 186.4 | 239 -28% | 151.6 19% | 129 31% | 207 -11% | 162.3 13% |
* ... smaller is better
Battery Life
Entry-level MSI gaming families like the GL, GP, and GF all tend to have very short runtimes and the GL73 is no different. Users can expect a real-world WLAN runtime of just under 3 hours to be below average even for a gaming laptop. The culprit is its very small internal battery capacity for its size class at just 41 Wh. In contrast, the Alienware 17 and Razer Blade Pro each have 99 Wh battery packs.
Charging from empty to full capacity takes just over 1.5 hours. If running both Prime95 and FurMark simultaneously, however, the battery will slowly discharge instead even if plugged in. This fortunately does not occur when gaming.
| MSI GL73 8SE-010US i7-8750H, GeForce RTX 2060 Mobile, 41 Wh | Lenovo Legion Y730-17ICH, i7-8750H i7-8750H, GeForce GTX 1050 Ti Mobile, 76 Wh | MSI GL72 7RDX-602 i7-7700HQ, GeForce GTX 1050 Mobile, 43.2 Wh | MSI GE73 8RF-008 Raider RGB i7-8750H, GeForce GTX 1070 Mobile, 51 Wh | Asus TUF FX705GM i7-8750H, GeForce GTX 1060 Mobile, 64 Wh | Dell G3 17 3779 i5-8300H, GeForce GTX 1050 Mobile, 56 Wh | MSI GL73 8RD-418US i7-8750H, GeForce GTX 1050 Ti Mobile, 41 Wh | |
|---|---|---|---|---|---|---|---|
| Battery runtime | 97% | 8% | -4% | 75% | 148% | -7% | |
| Reader / Idle (h) | 6.5 | 13.2 103% | 5.5 -15% | 5.1 -22% | 6.3 -3% | 12.2 88% | |
| WiFi v1.3 (h) | 2.8 | 6.7 139% | 3.4 21% | 3.1 11% | 4.5 61% | 5.8 107% | 2.6 -7% |
| Load (h) | 0.6 | 0.9 50% | 0.7 17% | 0.6 0% | 1.6 167% | 2.1 250% |
Verdict
Pros
Cons

When we checked out the RTX 2070 Max-Q in the Blade 15, we saw that its 1080p performance was just 15 percent ahead of the GTX 1070 Max-Q. Thus, we were expecting the same from the RTX 2060 in relation to the GTX 1060. We're elated to find that the RTX 2060 is actually about 35 percent faster or more than the GTX 1060 for a larger gen-to-gen performance gain. It still falls a bit short when compared to the GTX 1070 and so GTX 1070 owners aren't missing out — at least until DLSS and ray tracing become more commonplace. In fact, the RTX 2060 has more in common with a GTX 1070 Max-Q than the GTX 1070 even down to power consumption.
As for the MSI GL73 itself, standout features include its triple internal storage bays, very loud speakers, and high quality 120 Hz panel which are all relatively uncommon on budget gaming laptops. Keep in mind that its fans can be quite loud when gaming and that its battery life is only a couple of hours at best. The rest of the laptop is standard fare and budget-oriented from its plastic surfaces and small hinges. We recommend an end-user calibration to get a much more color accurate display as well.
The main characteristics preventing us from declaring the MSI GL73 better than the competing Asus TUF FX705 are its thicker bezels and larger size. Core temperatures are cooler than the Asus and there are more storage options, but the value of these trade-offs will depend on the user.
If mobile GeForce RTX is not a must-have option, then systems with the last generation GTX 1070 will make good alternatives especially now that prices of GTX gaming laptops have been dropping.
The MSI GL73 has everything you need for a starter 1080p gaming machine from its wide storage options to its fast 5 ms/120 Hz display and next-gen Nvidia Turing graphics. If you'll be traveling frequently, however, then it may be worth considering the more portable Asus TUF FX705 instead.
MSI GL73 8SE-010US
- 02/12/2019 v6 (old)
Allen Ngo
Price comparison
