Lenovo Legion Y7000 (i7-8750H, GTX 1060) Laptop Review
Lenovo unveiled the Legion Y7000 back in June alongside its Legion Y530 "twin". We use the term loosely as both 15.6-inch gaming laptops are visually distinct and different, but they are otherwise nearly identical from the inside as our review below will detail.
In short, the Y7000 and Y530 use the same motherboard design wrapped in different shells to cater to different market segments. While the Y530 experimented with a gamer-business hybrid design, the Y7000 is all gamer from top to bottom. See our original preview on the two laptops here for a breakdown of their differences.
Specifications include the Core i5-8300H or i7-8750H CPU, GeForce GTX 1050/Ti or GTX 1060 GPU, and a 60 Hz or 144 Hz 1080p IPS display with up to 32 GB of DDR4 RAM. Its starting price of around $1000 USD pits the Y7000 directly against budget-mainstream competitors like the 15.6-inch HP Pavilion Gaming 15, MSI GF63, Acer Aspire Nitro 15, Xiaomi Mi Gaming, and the recently launched Asus FX705. We'll be comparing the Y7000 to these aforementioned popular alternatives as well as its Legion Y530 sibling.
We recommend checking out our existing review on the Legion Y530 since it has many features in common with our Y7000.
More Lenovo Legion reviews:
Case
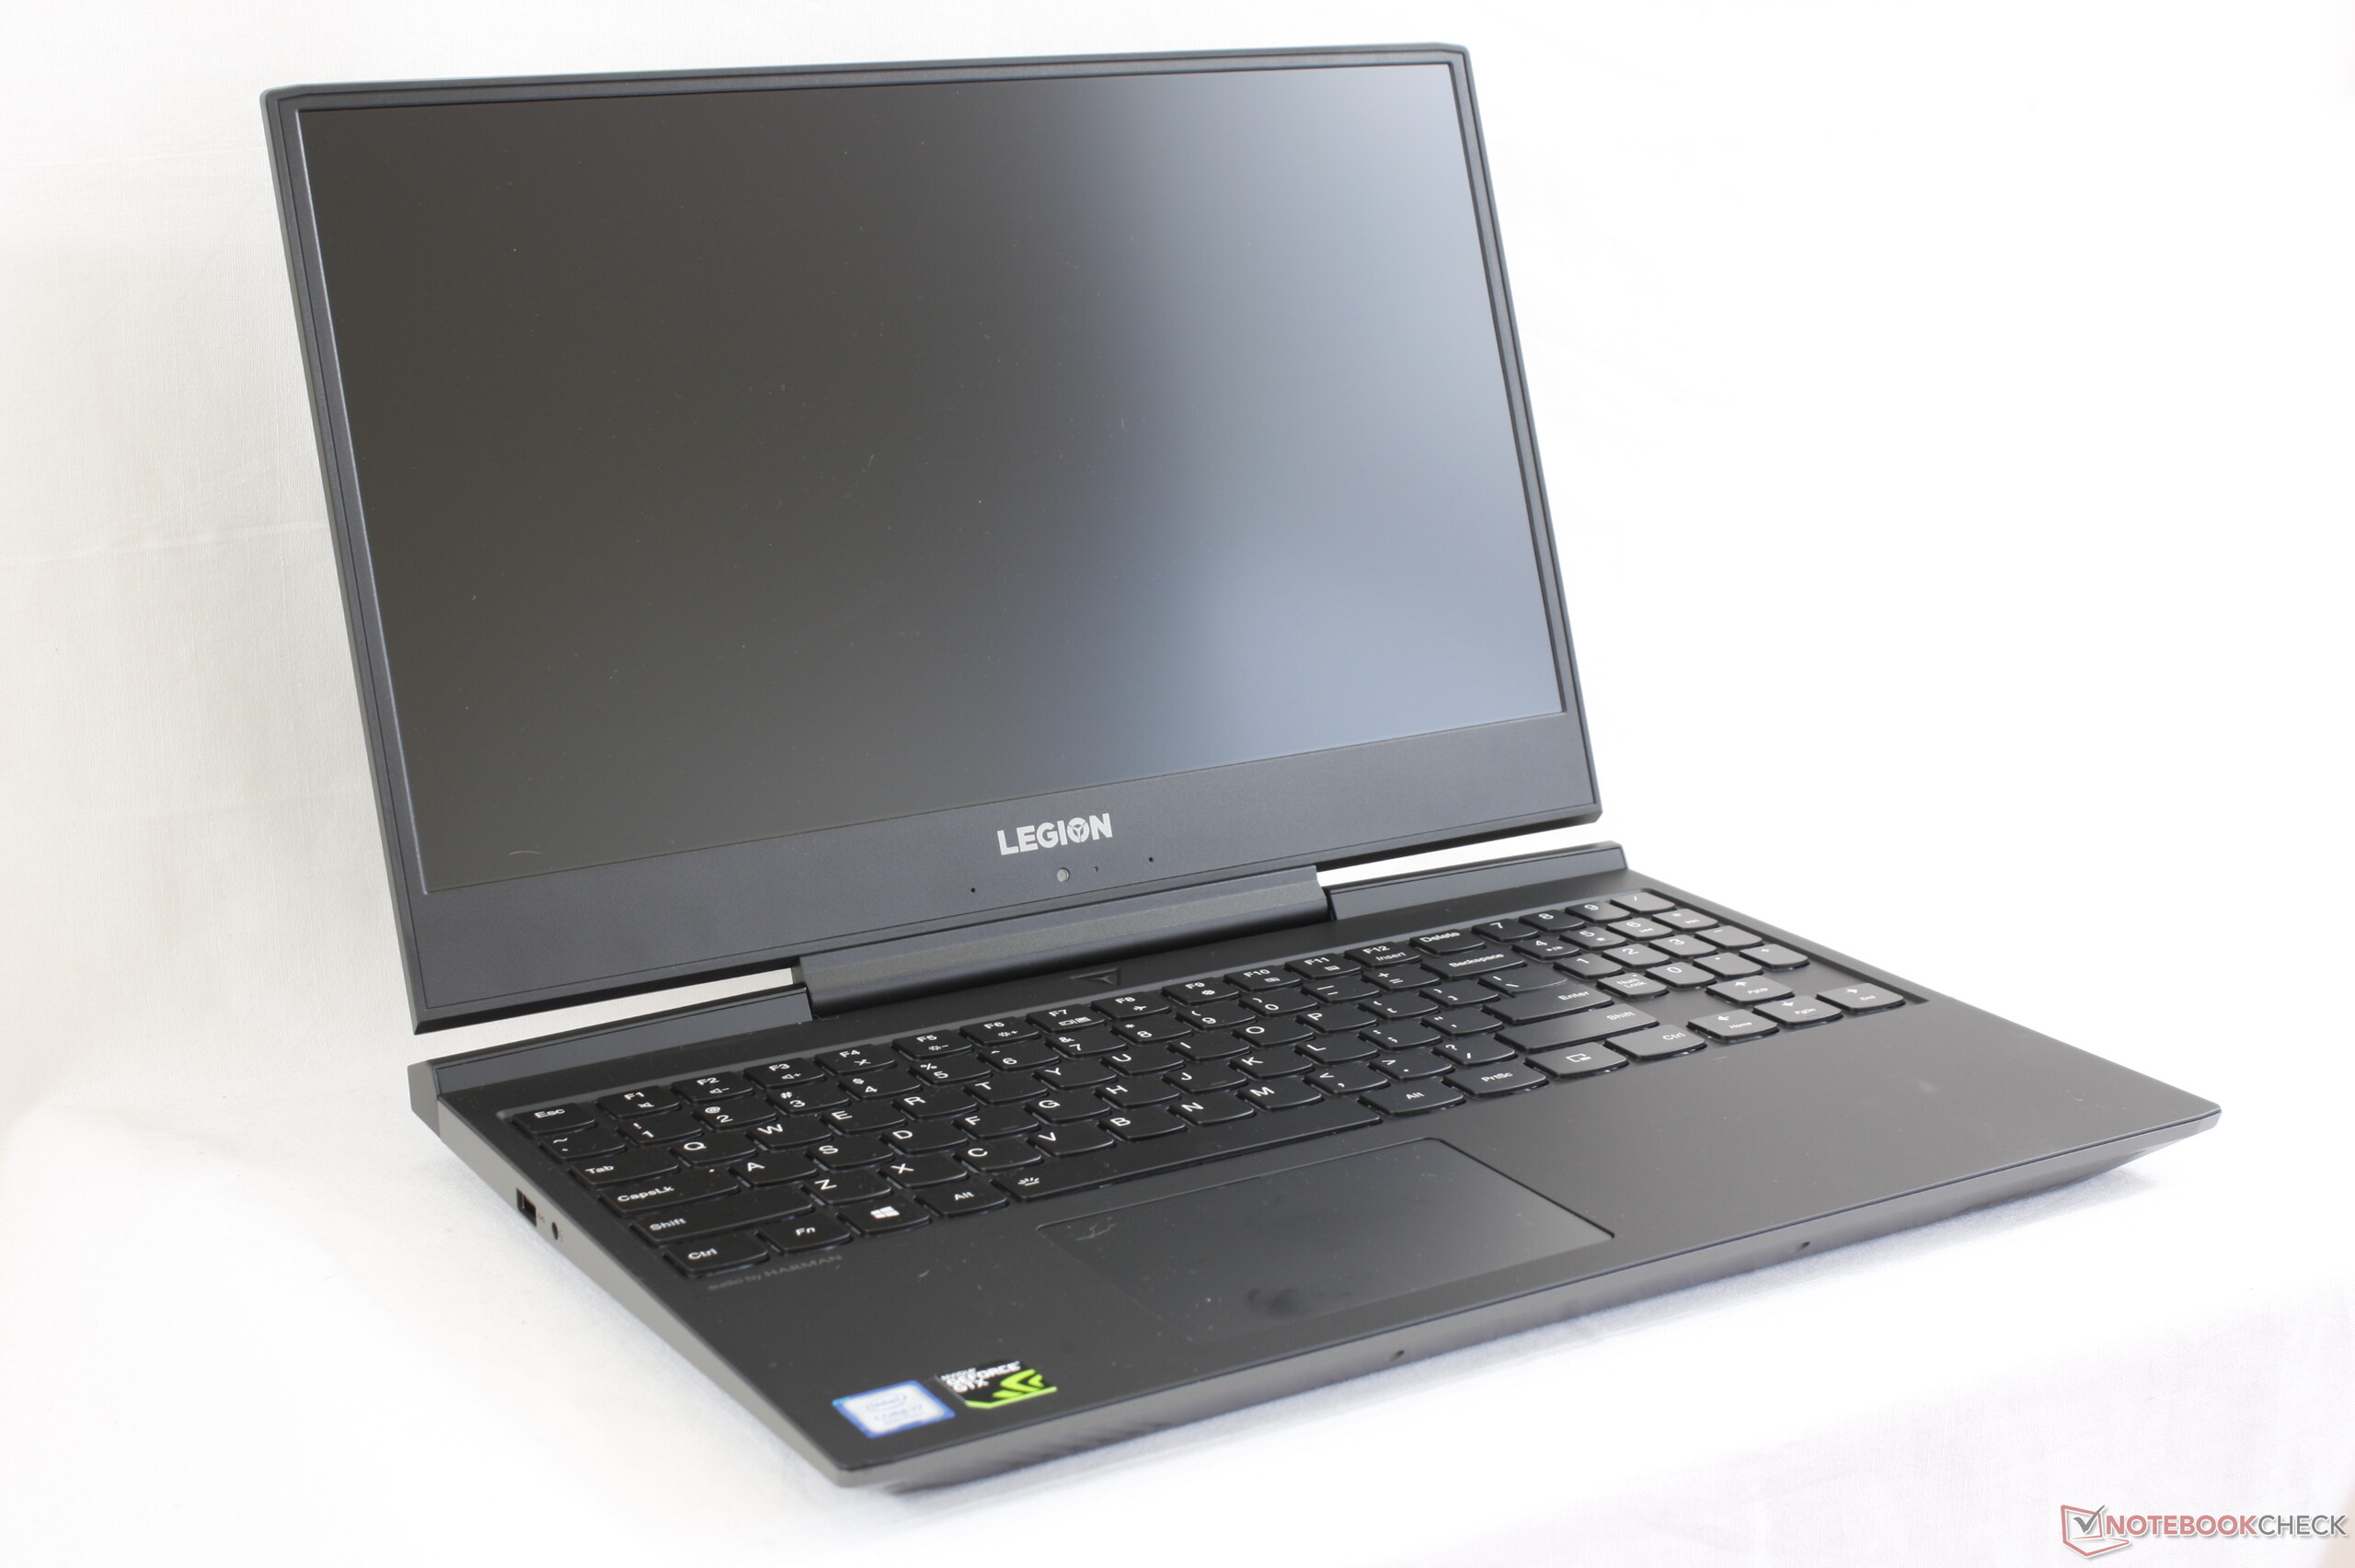
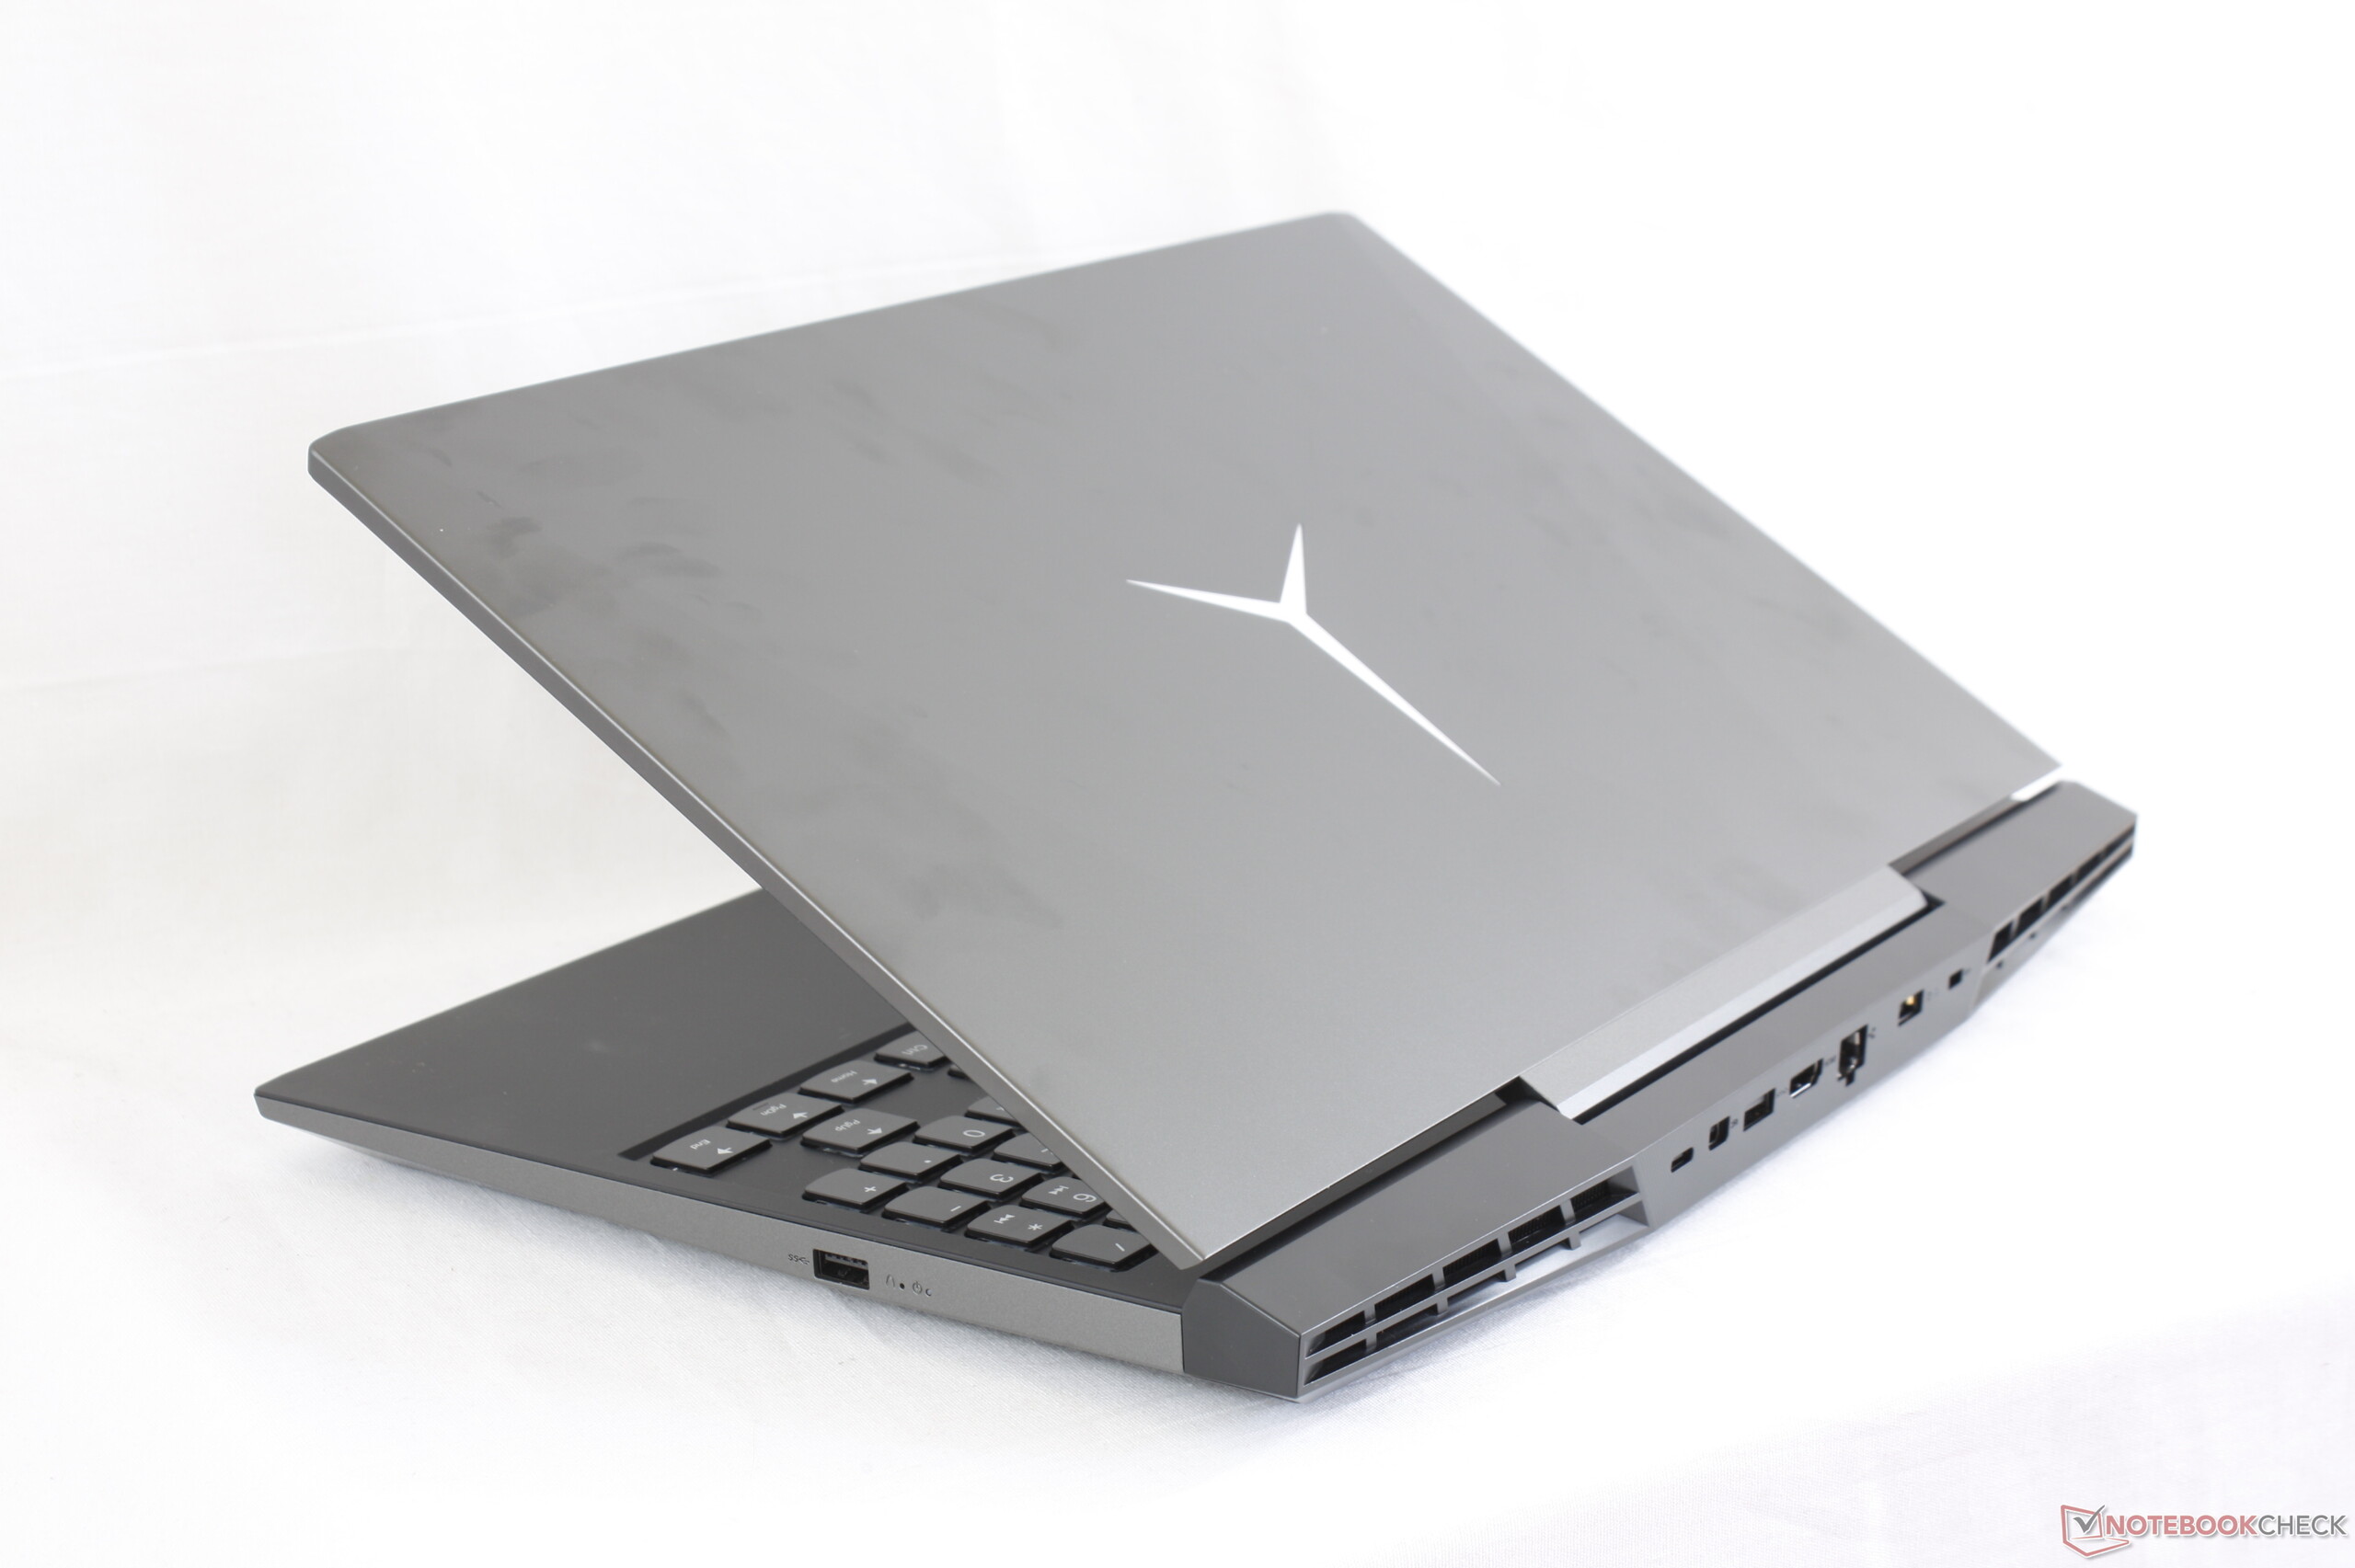
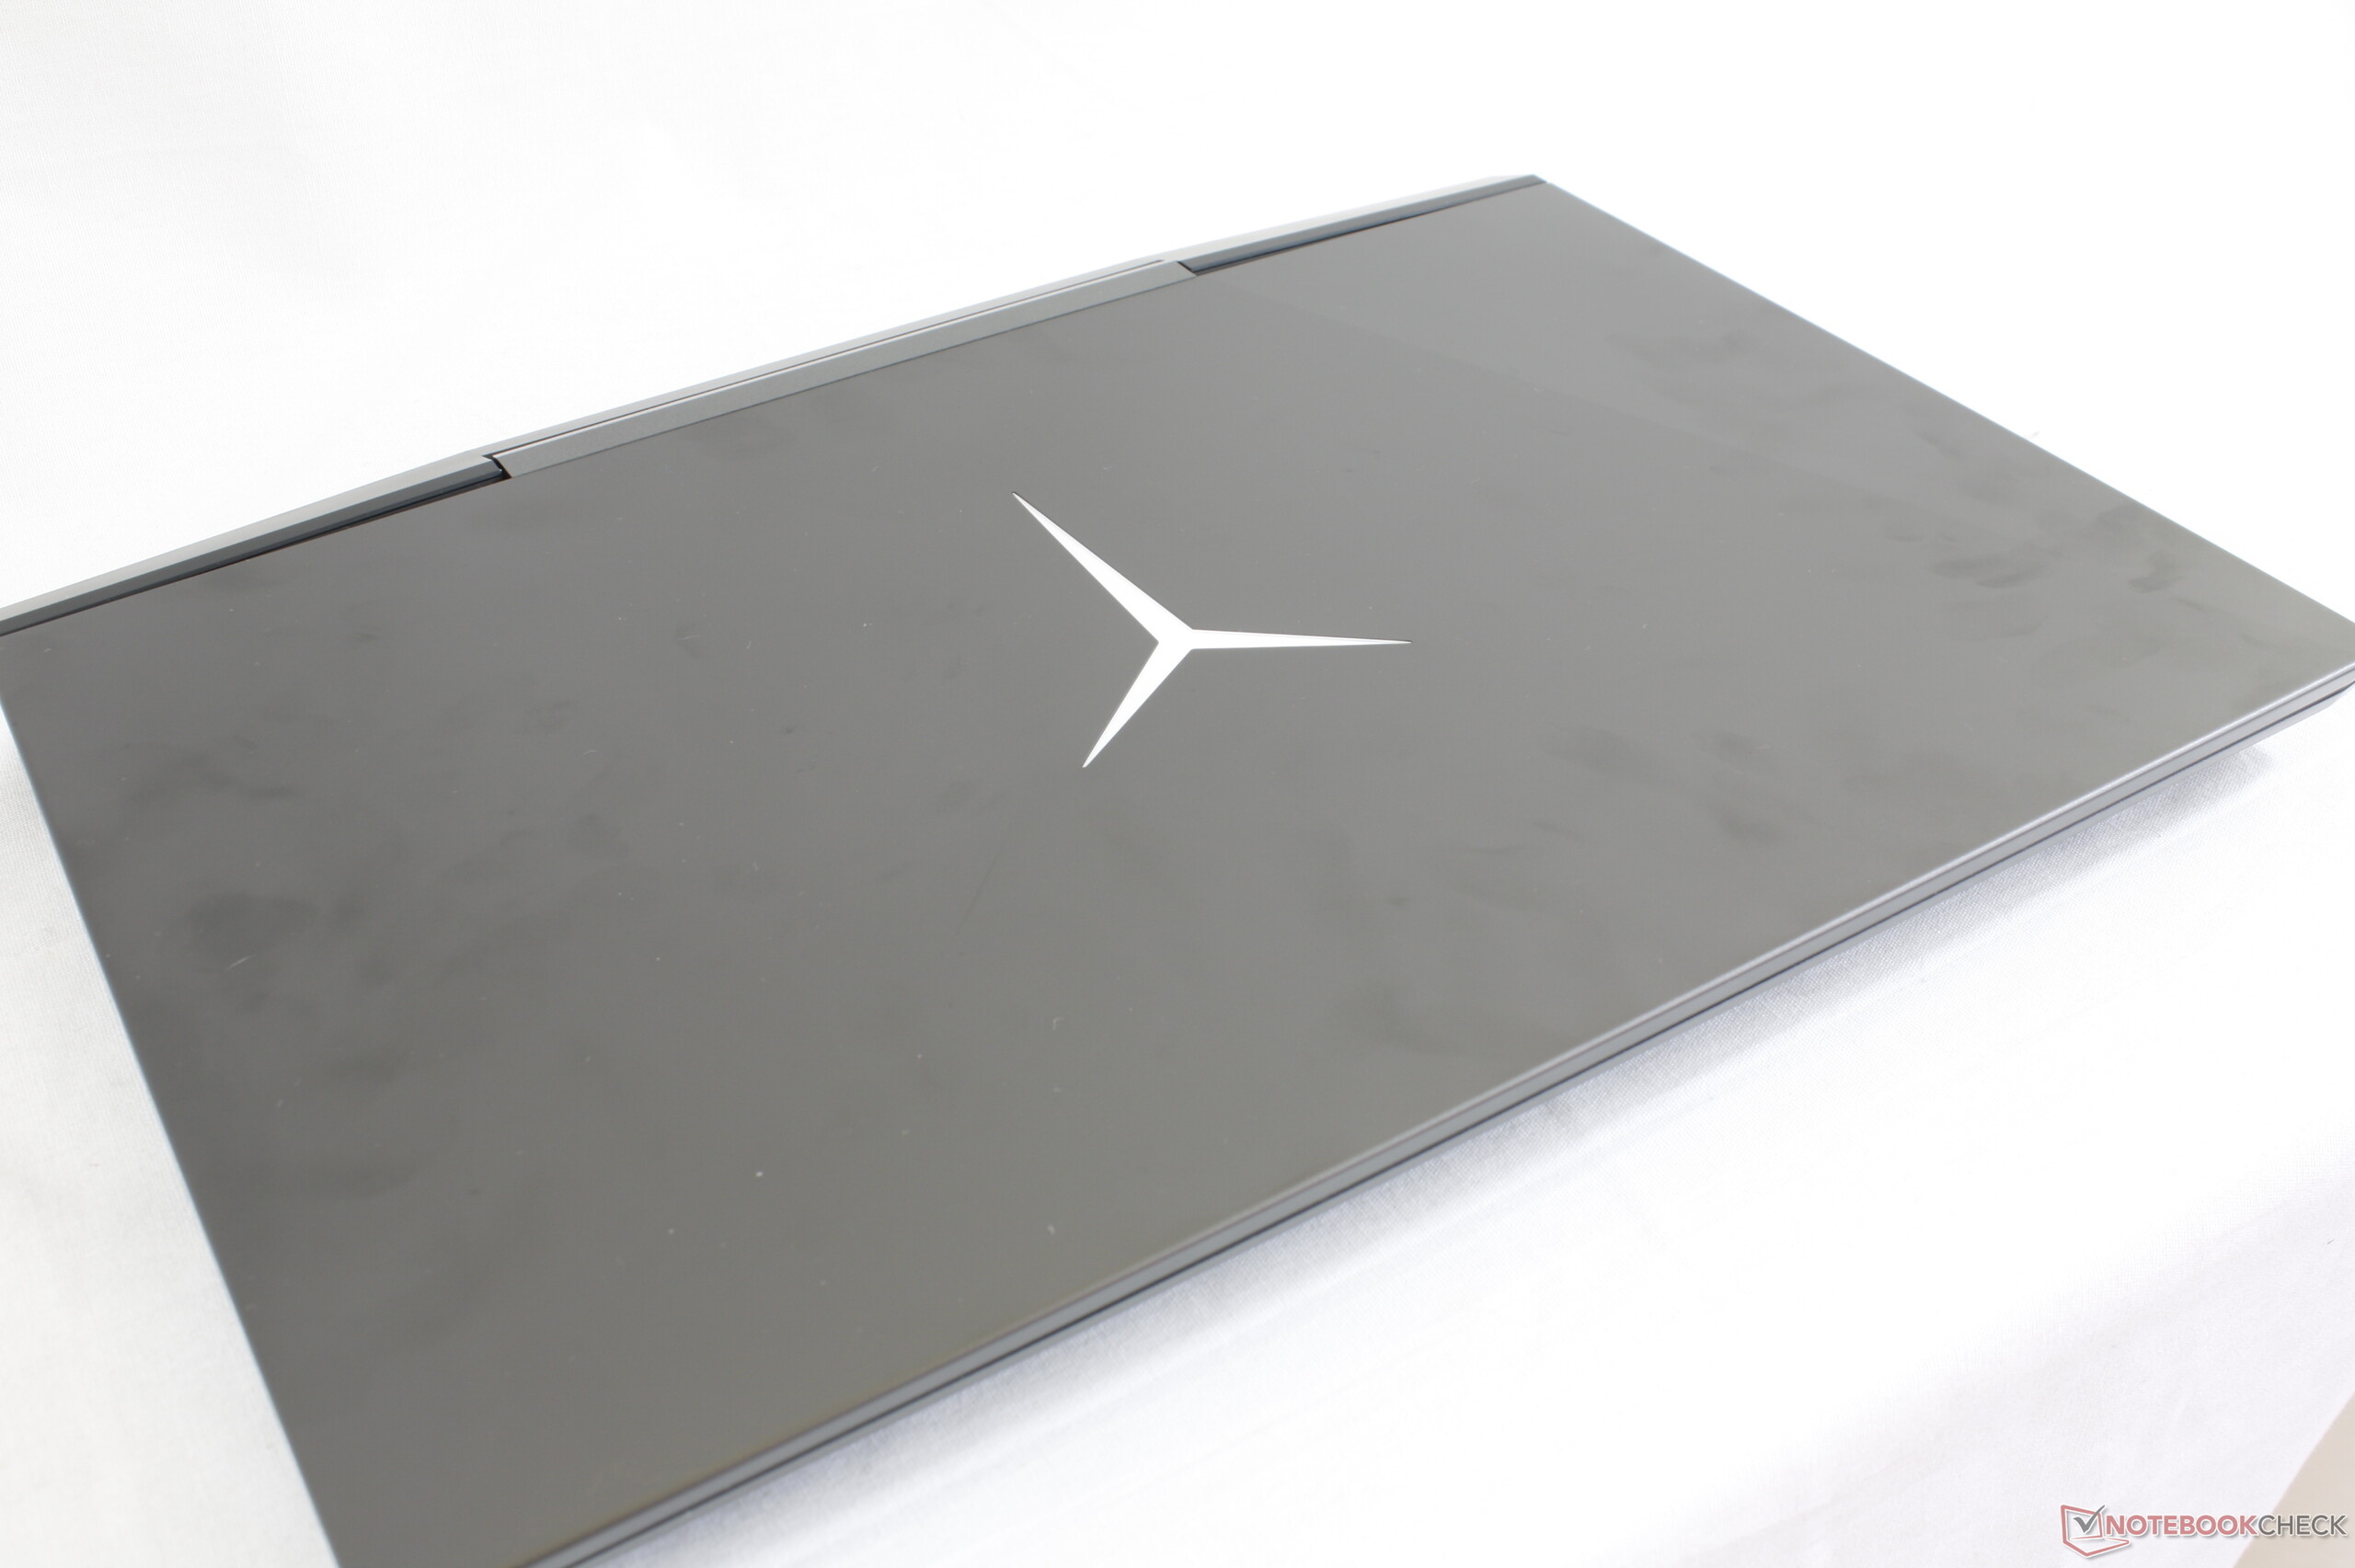
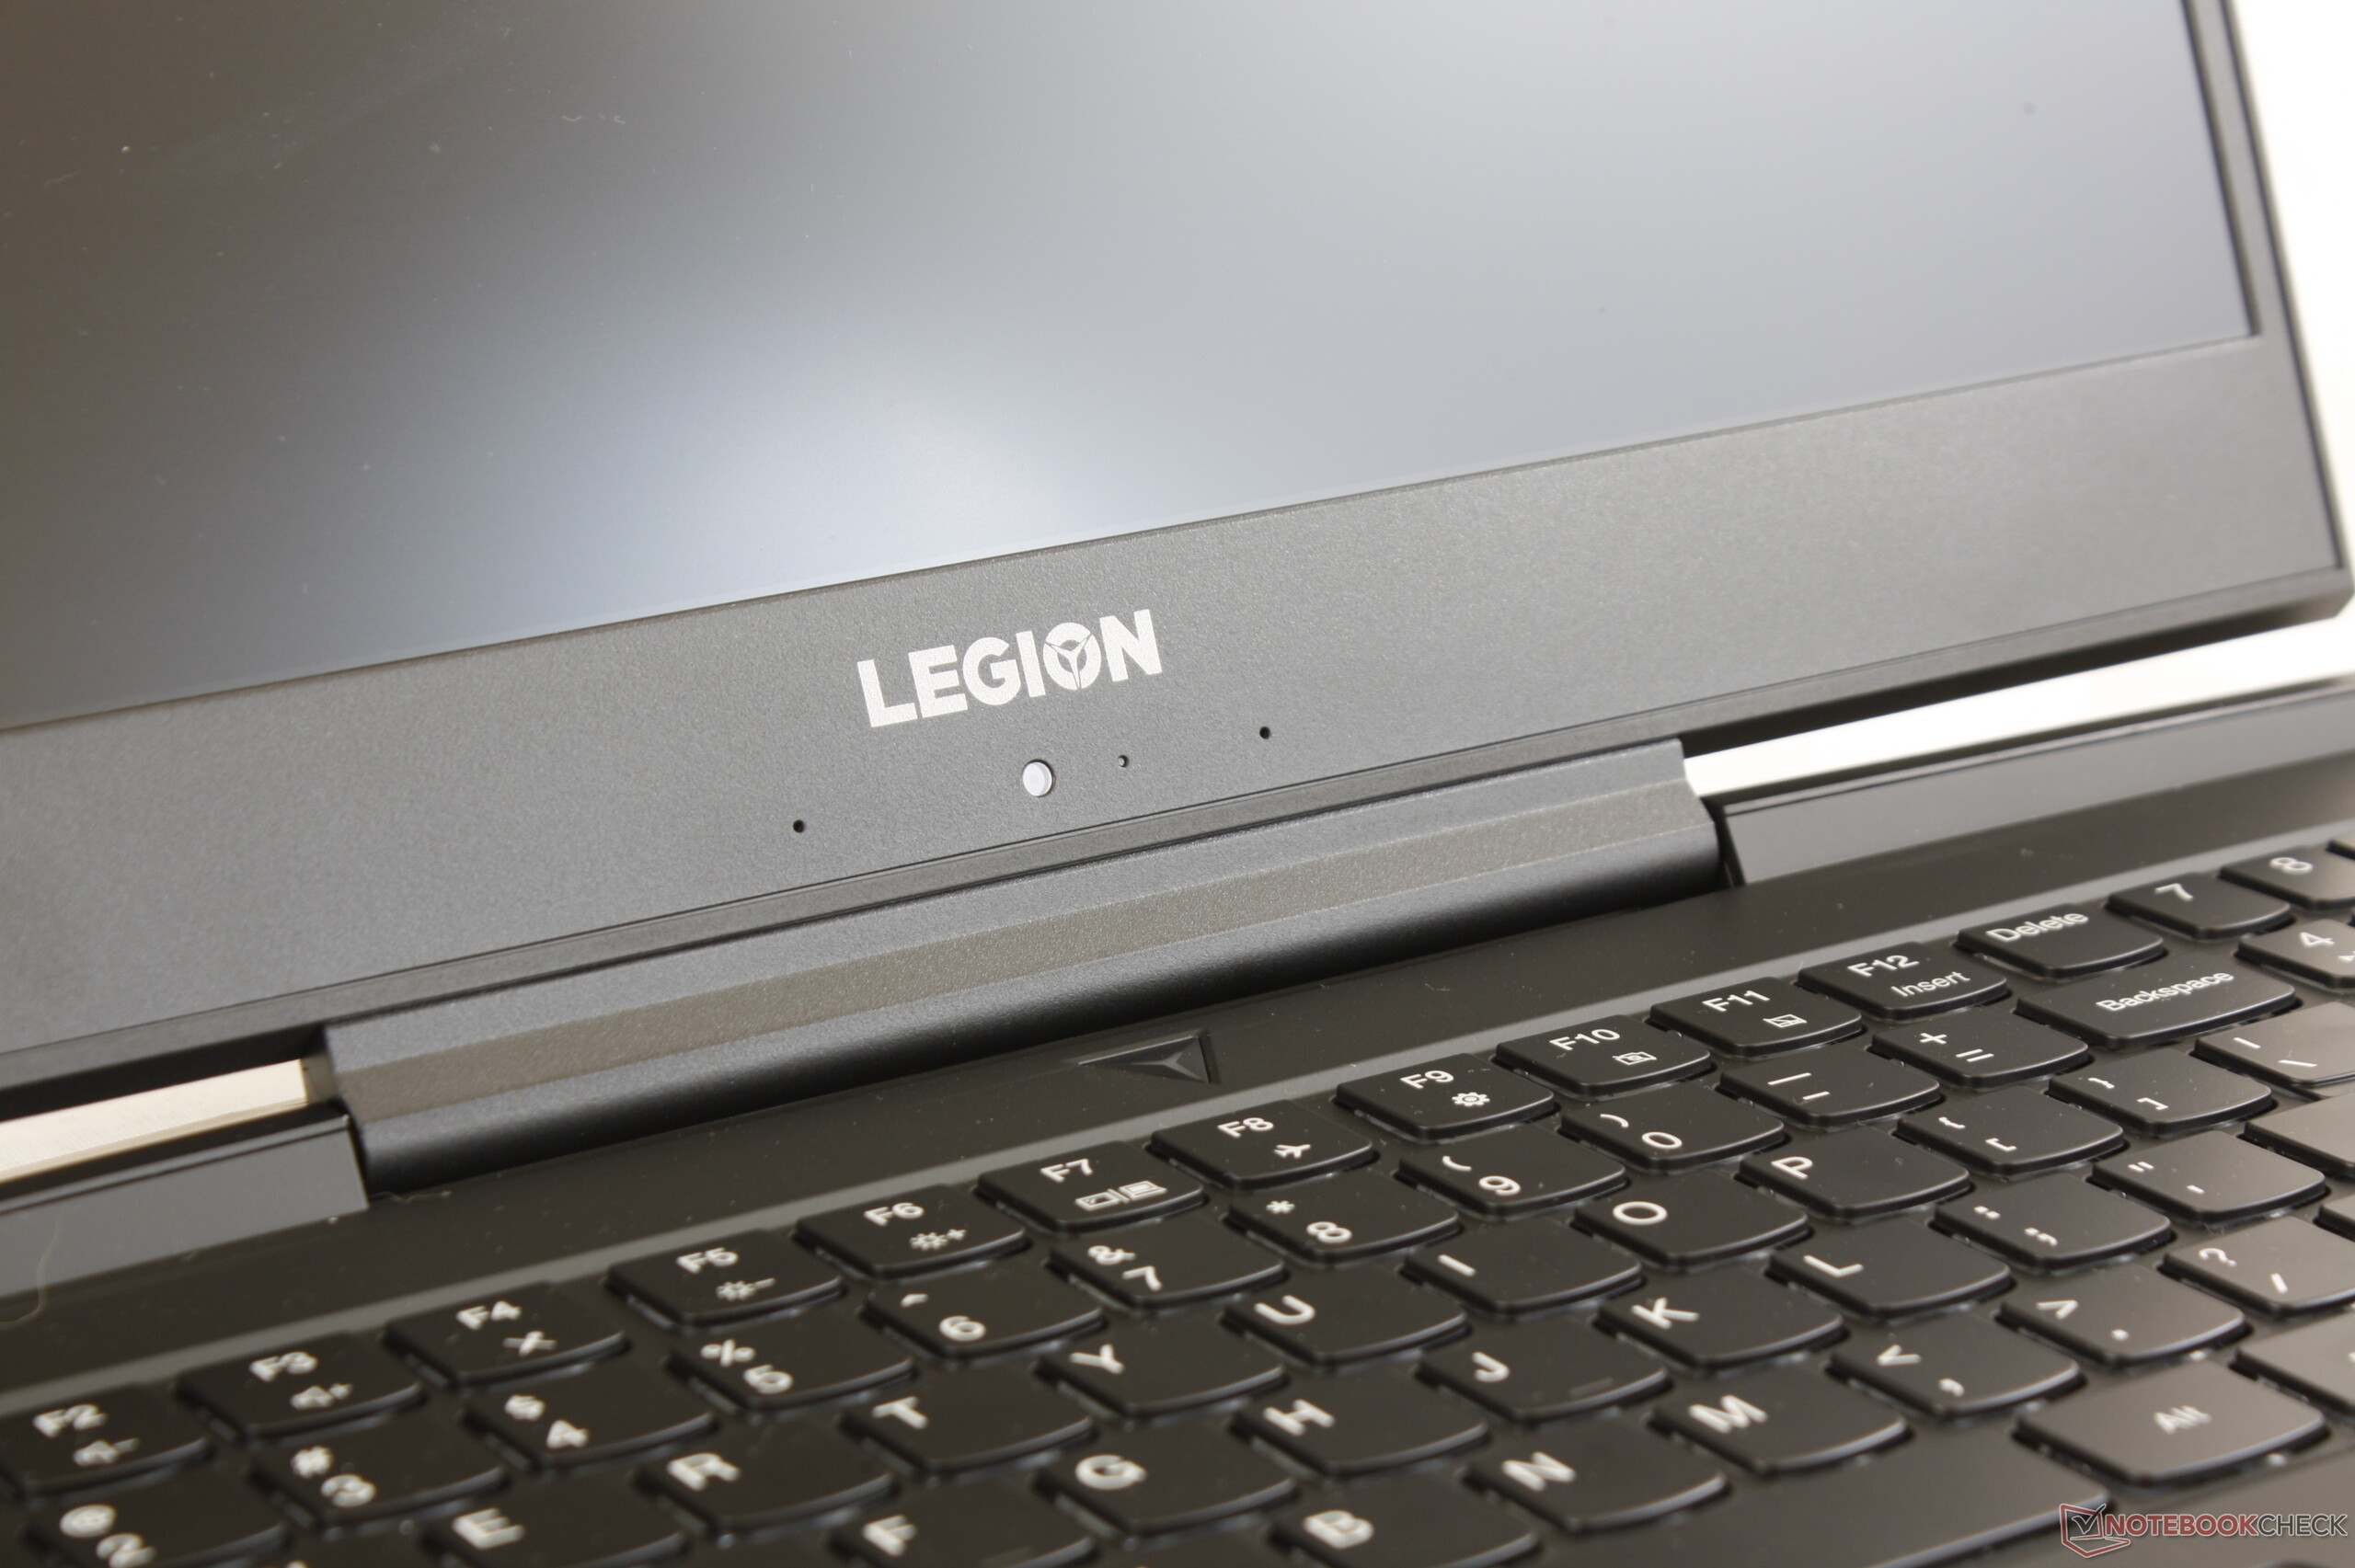
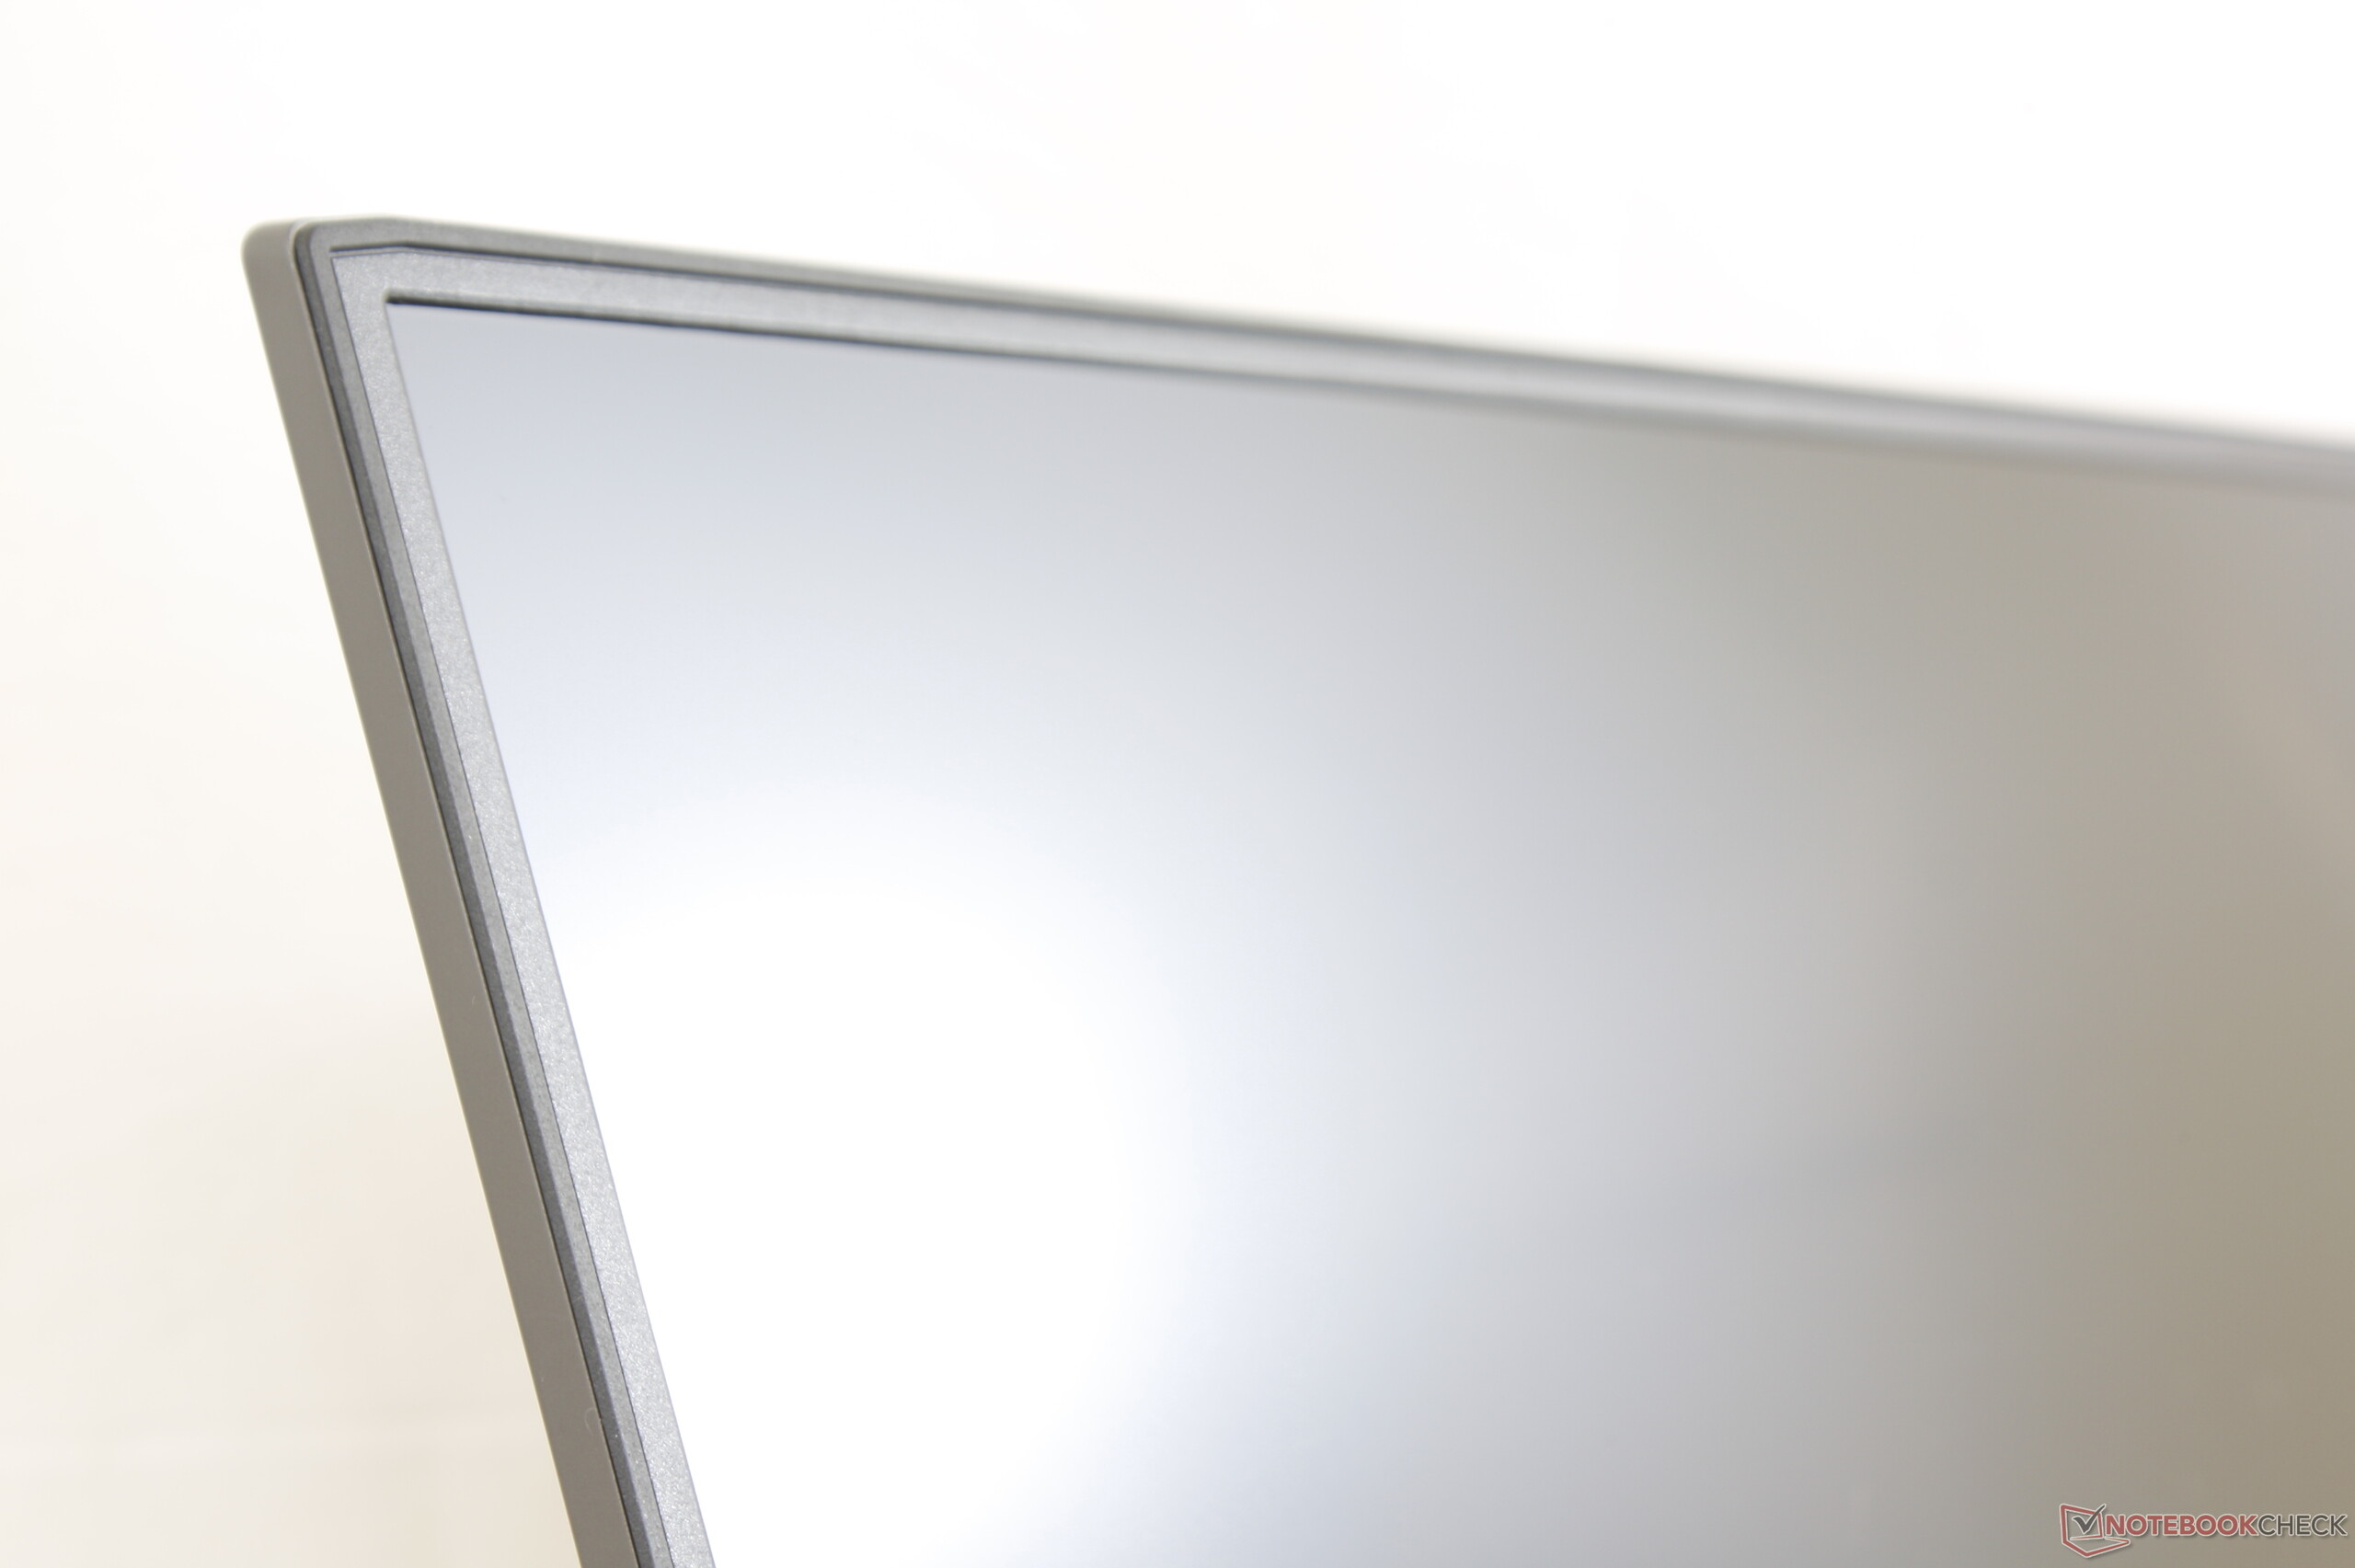
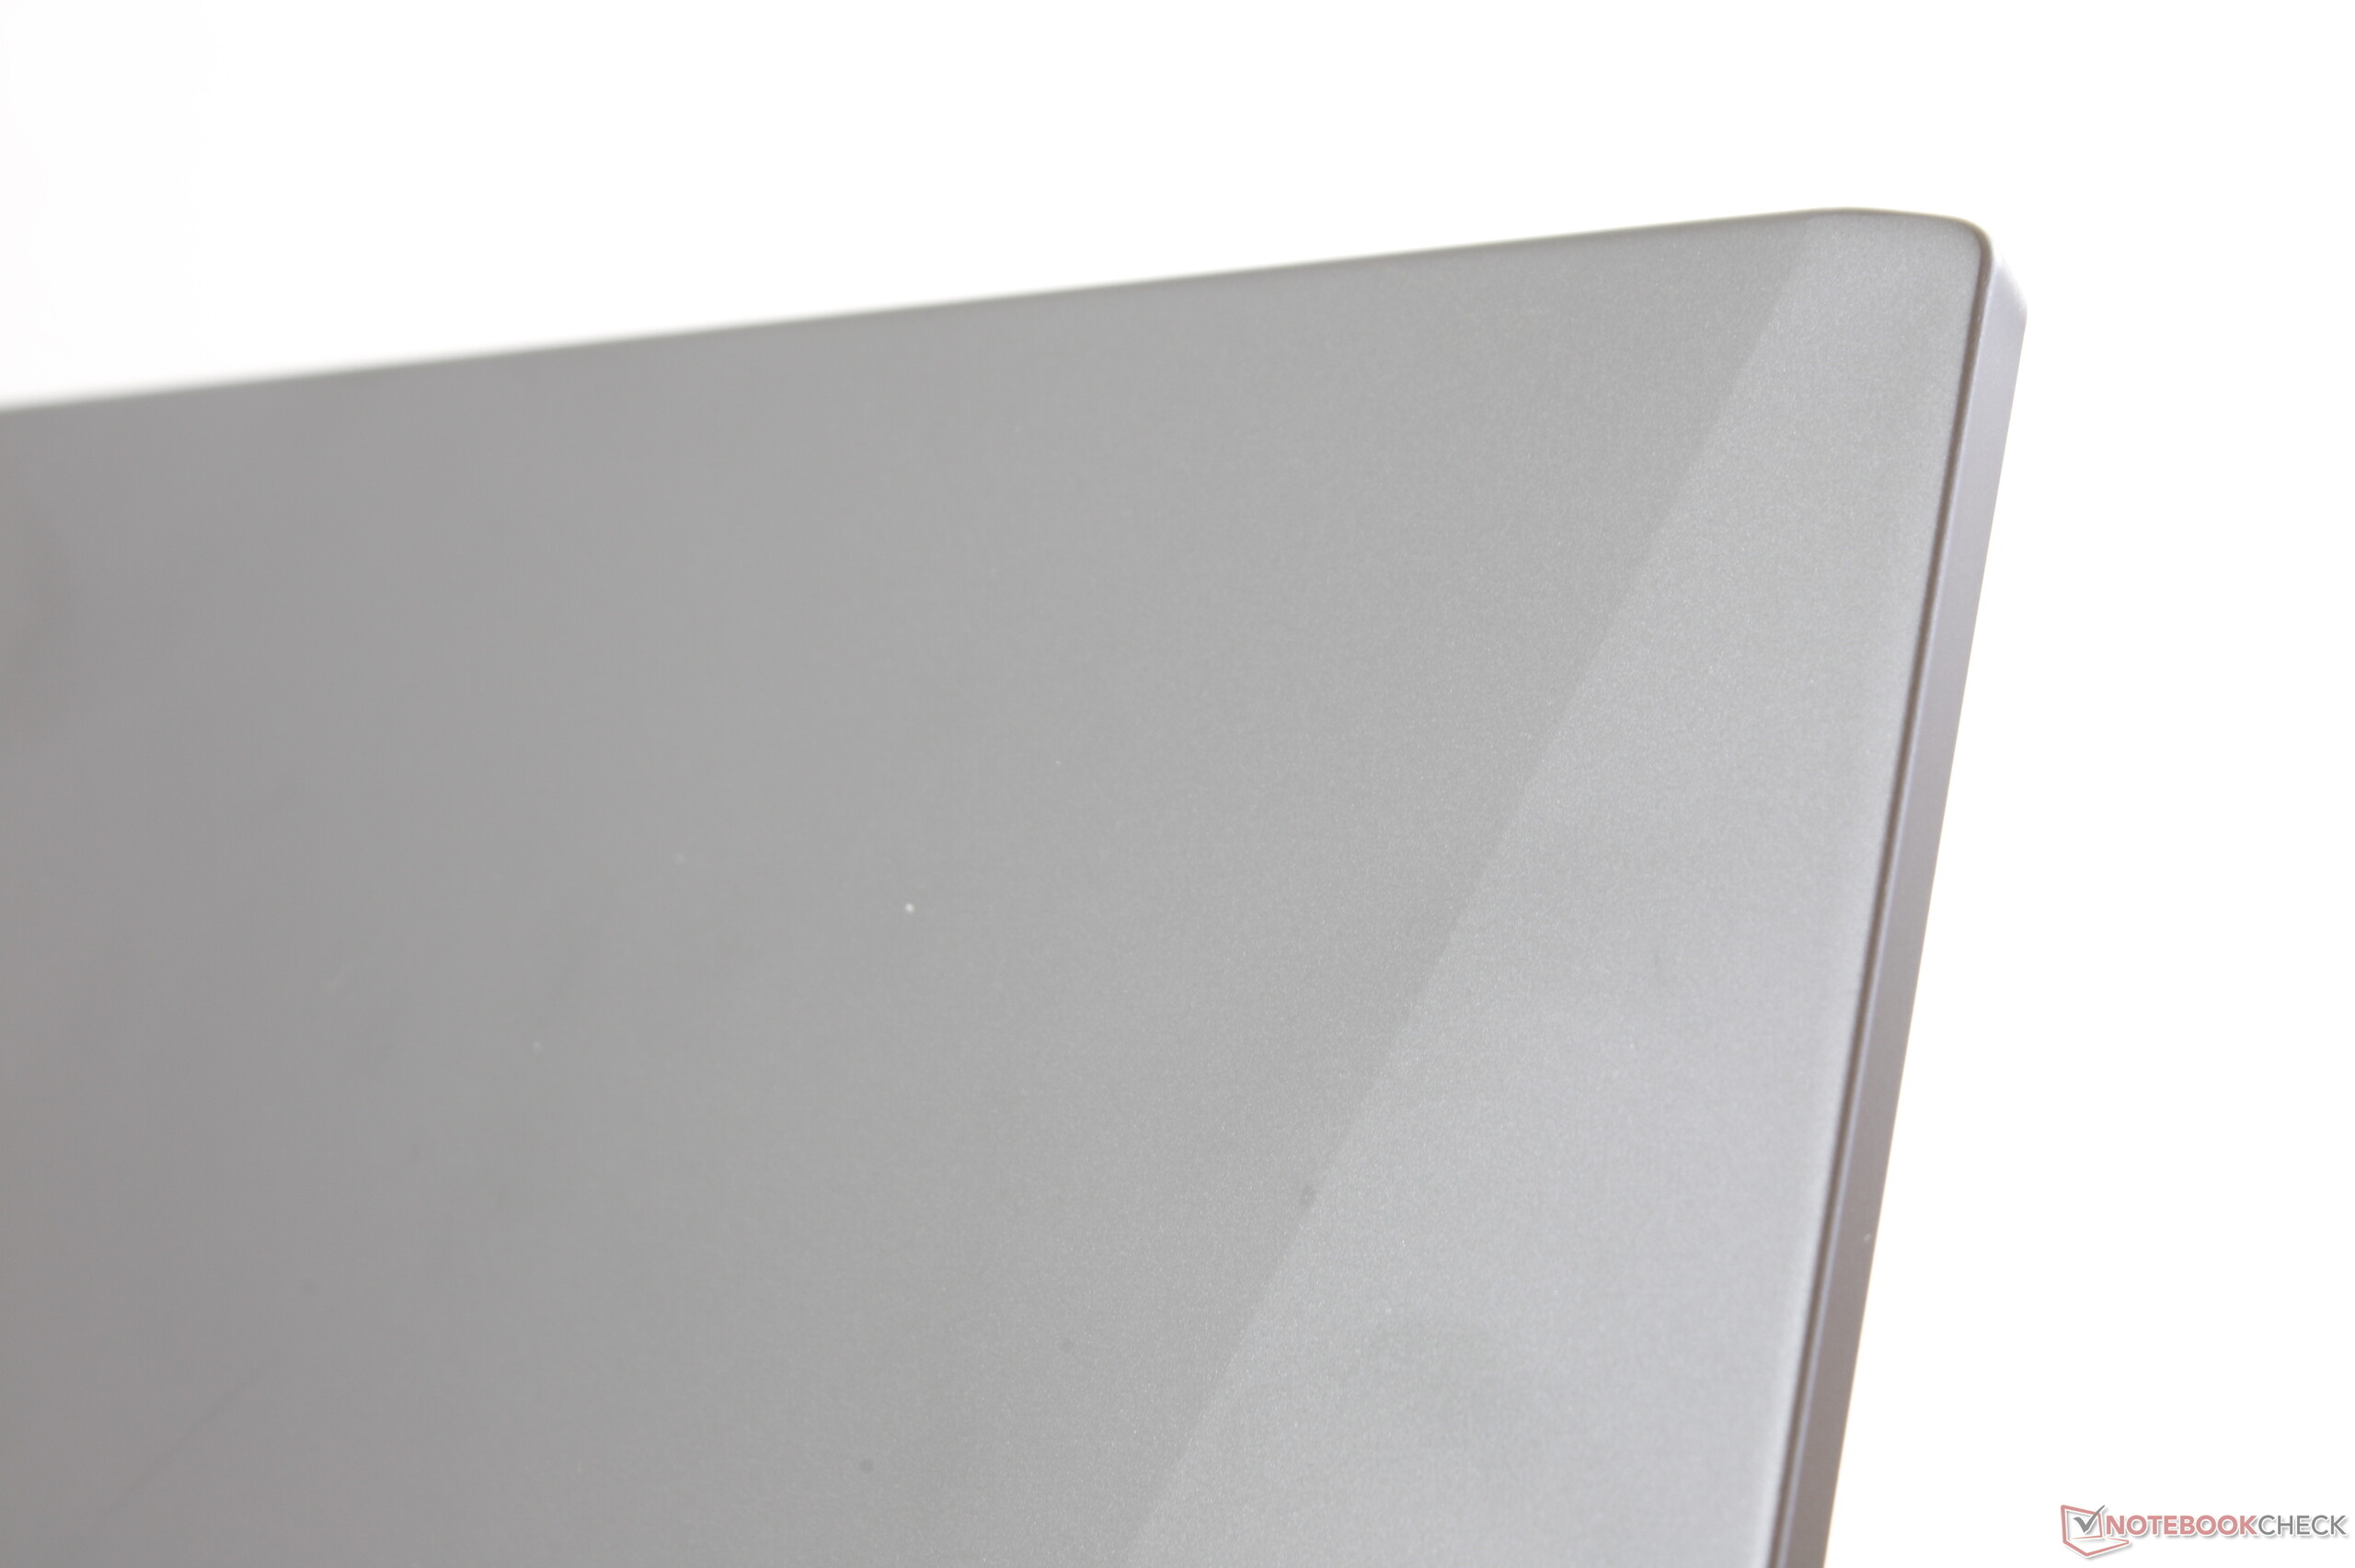
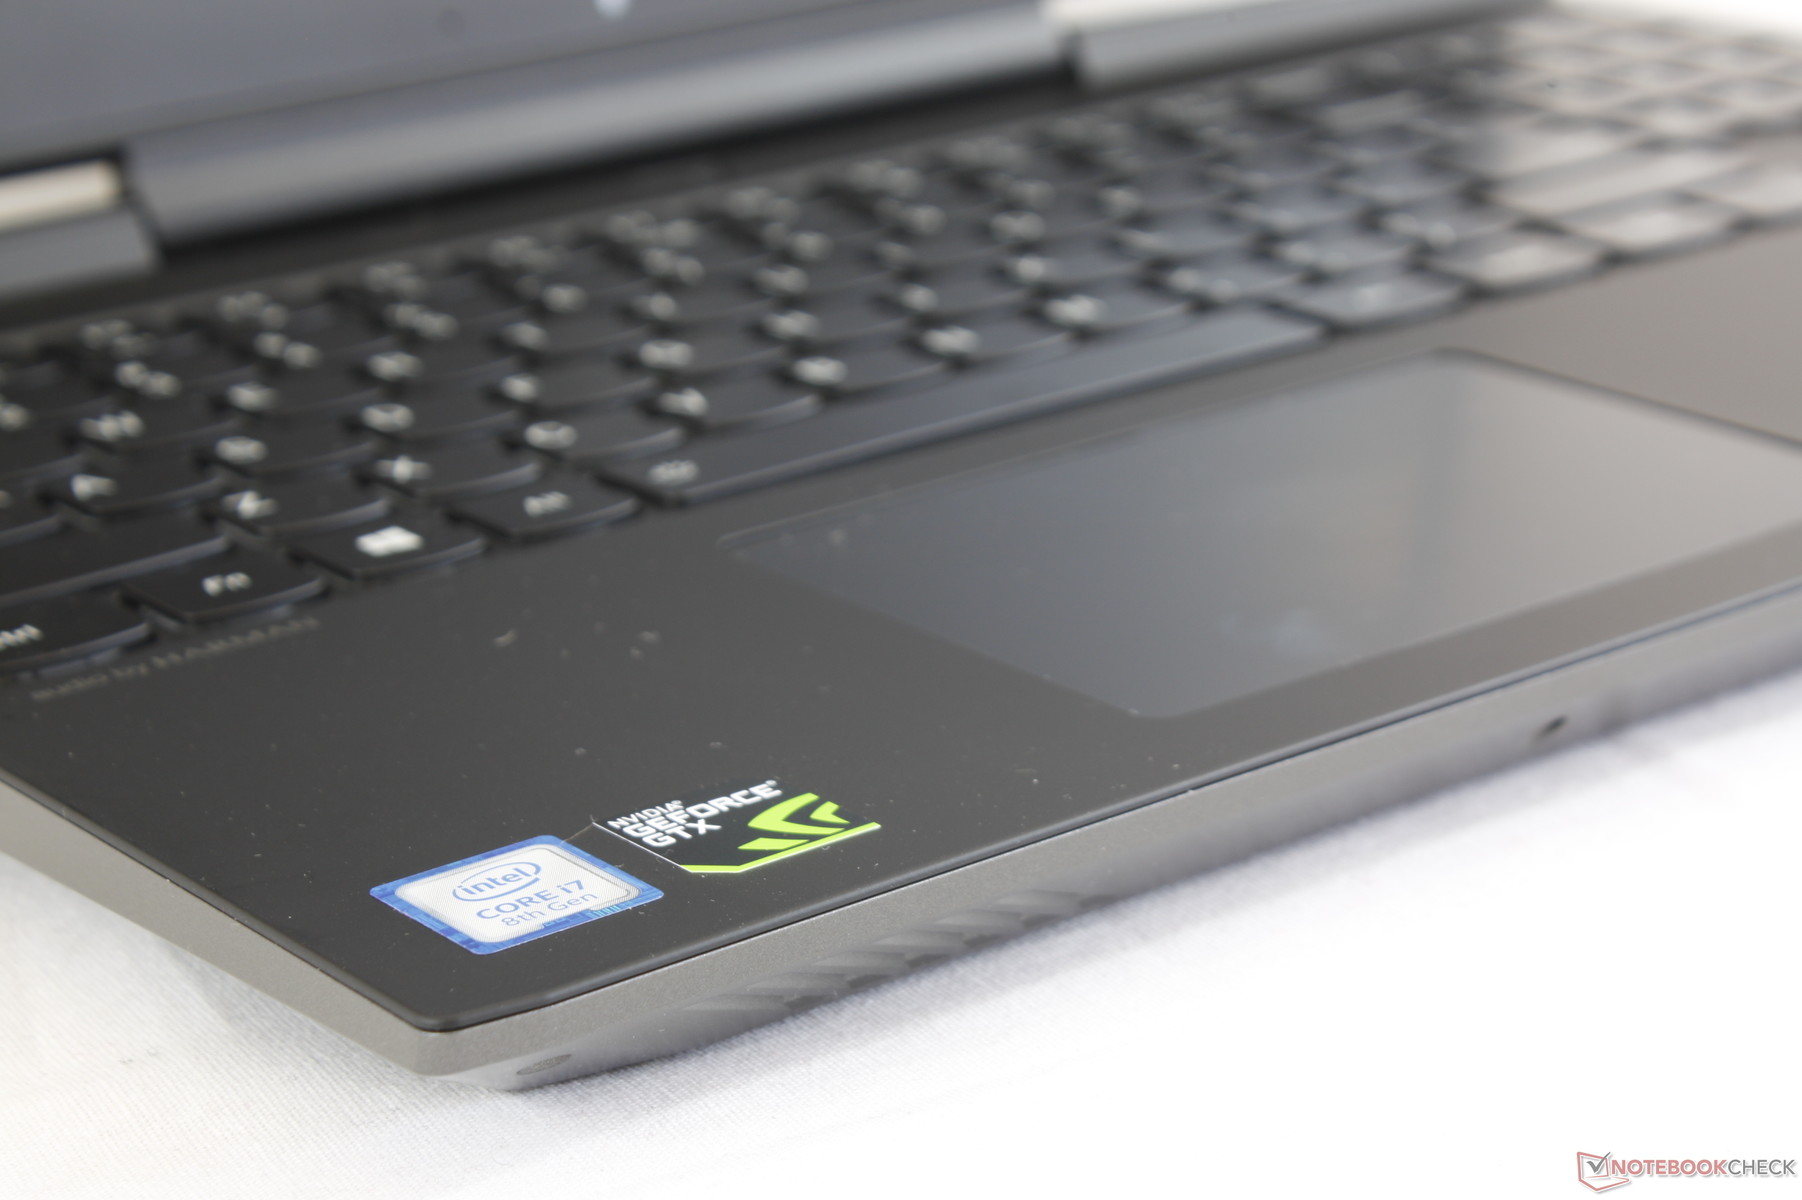
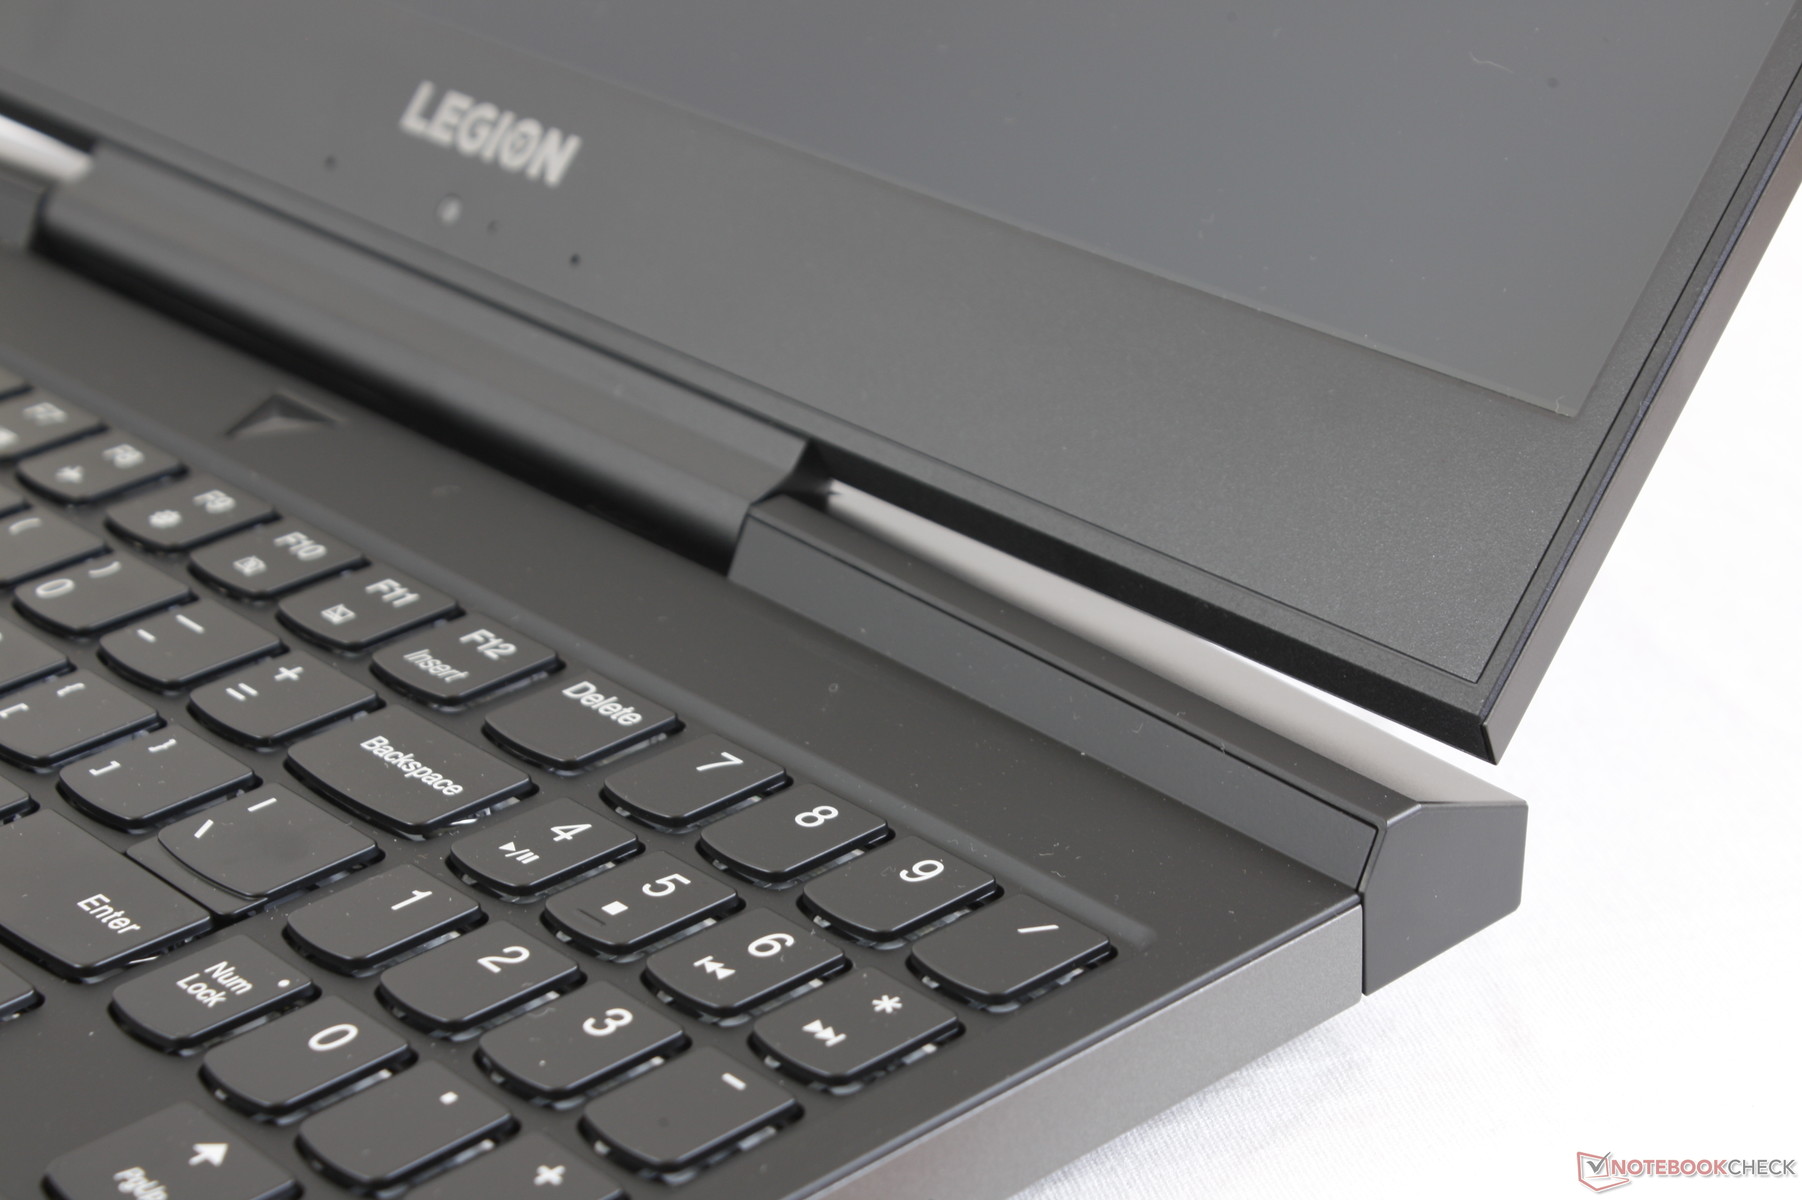
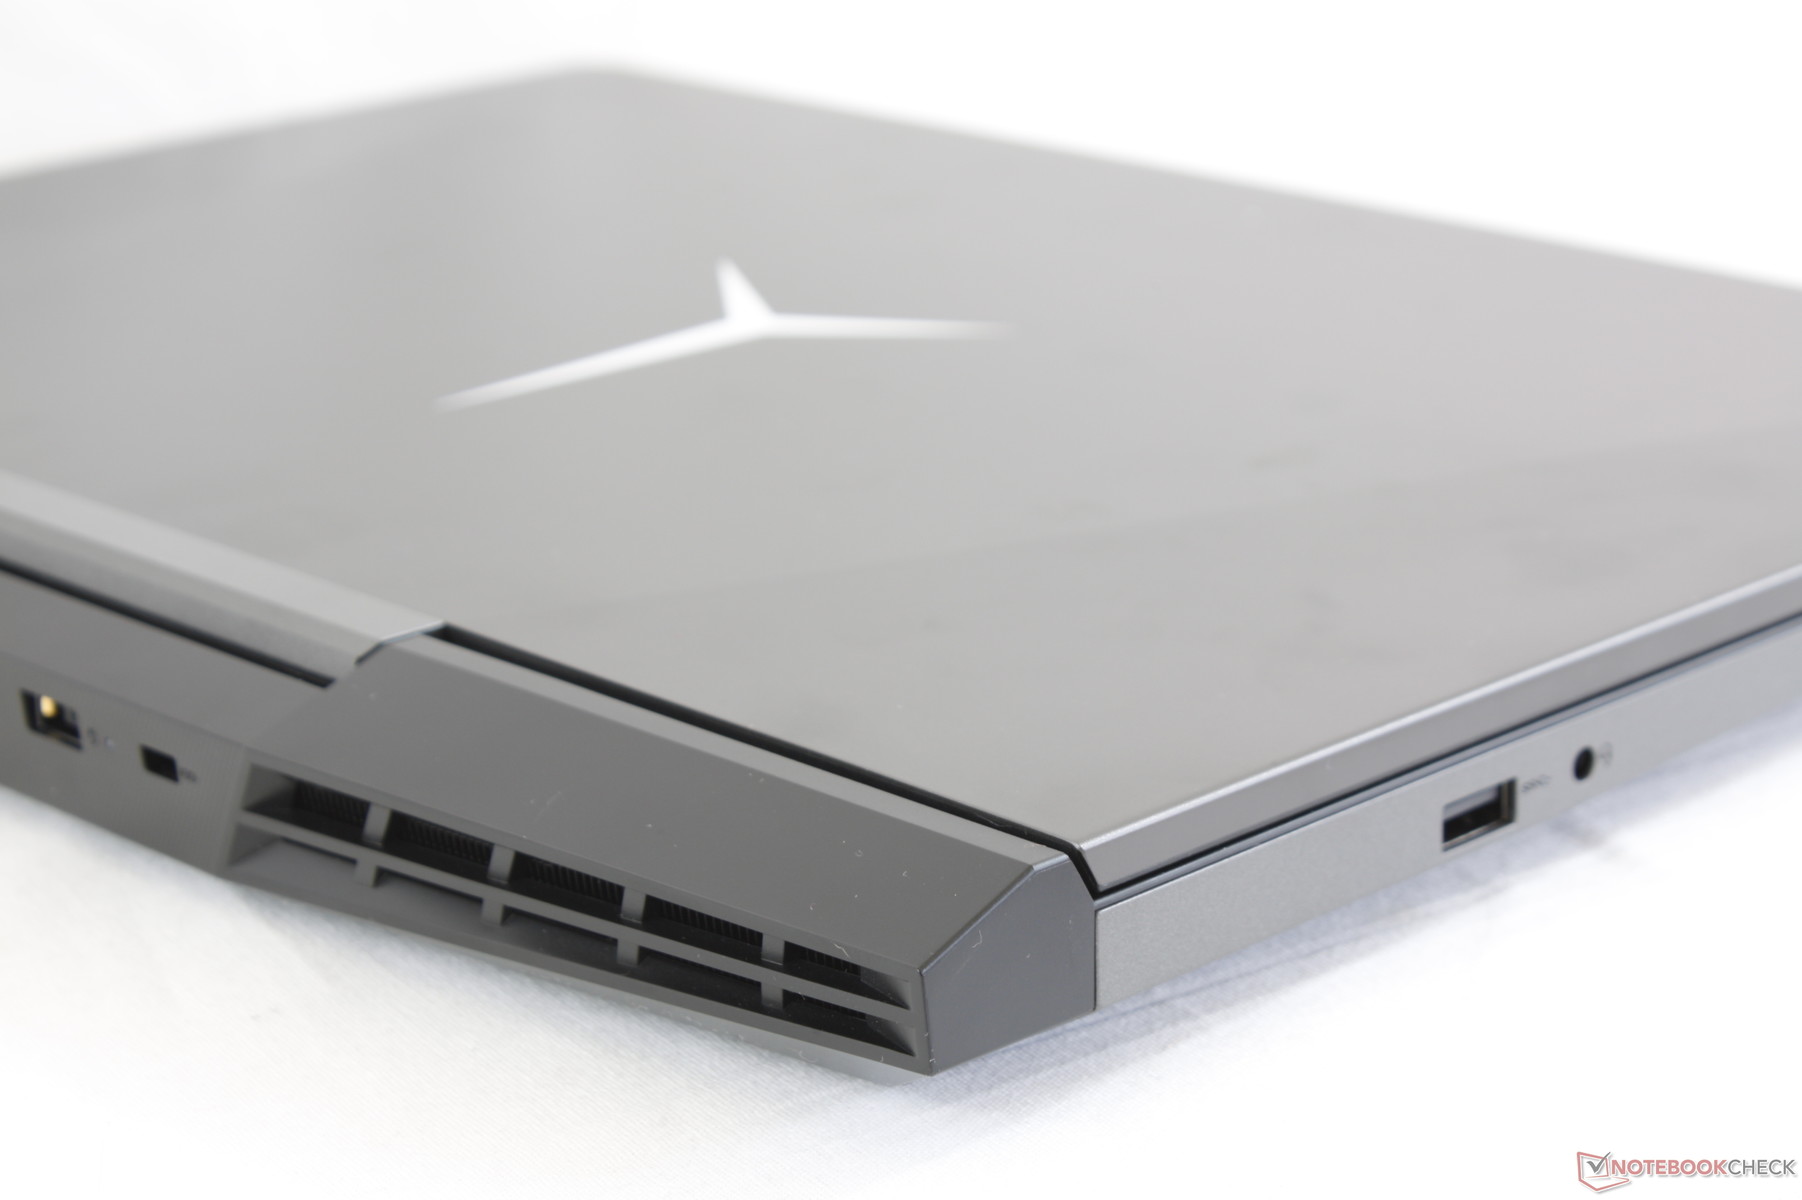
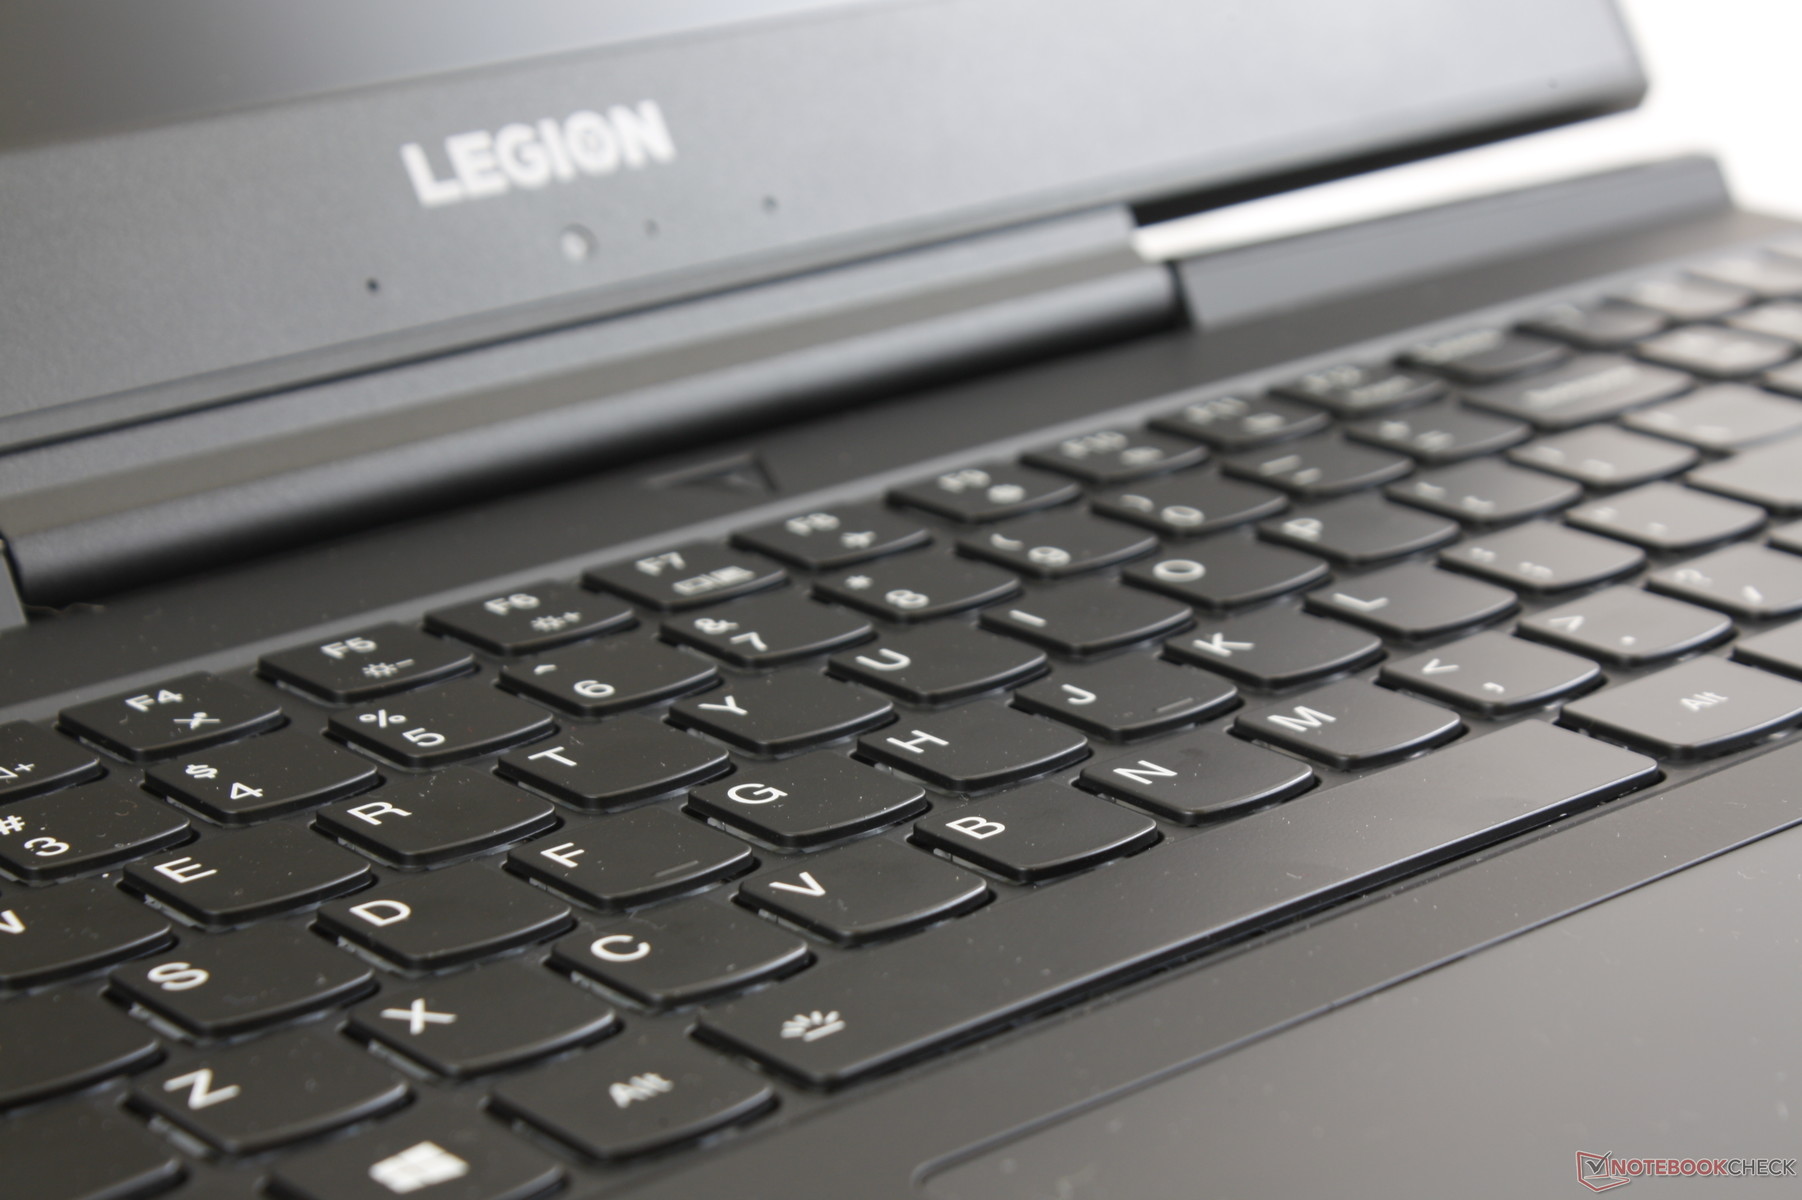
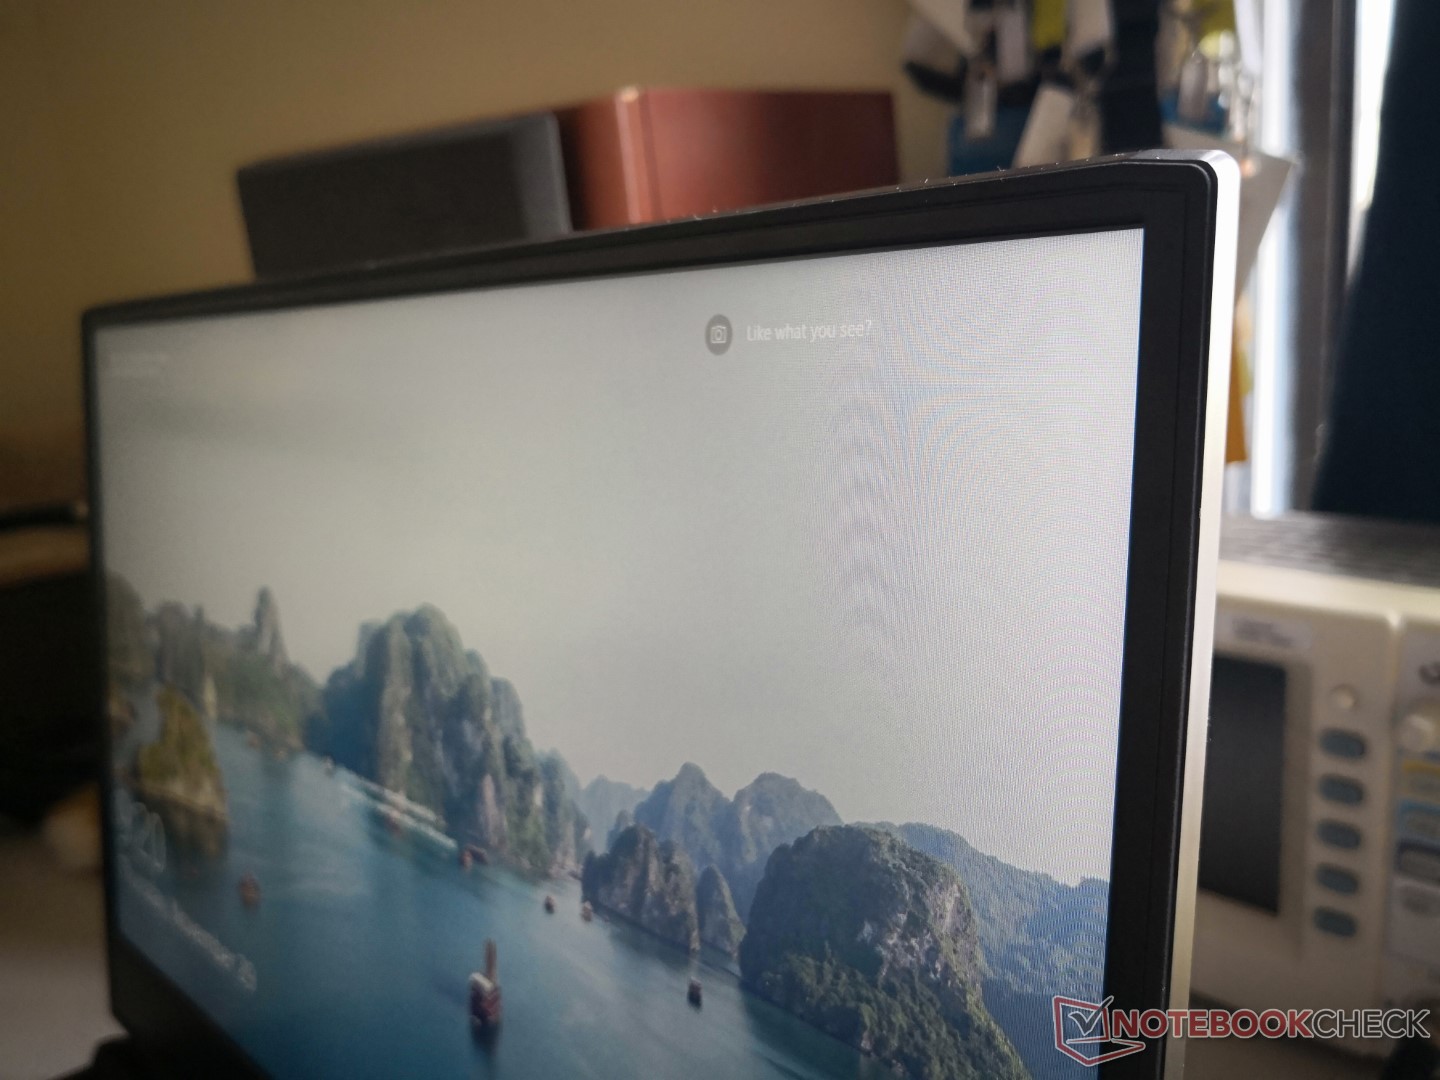
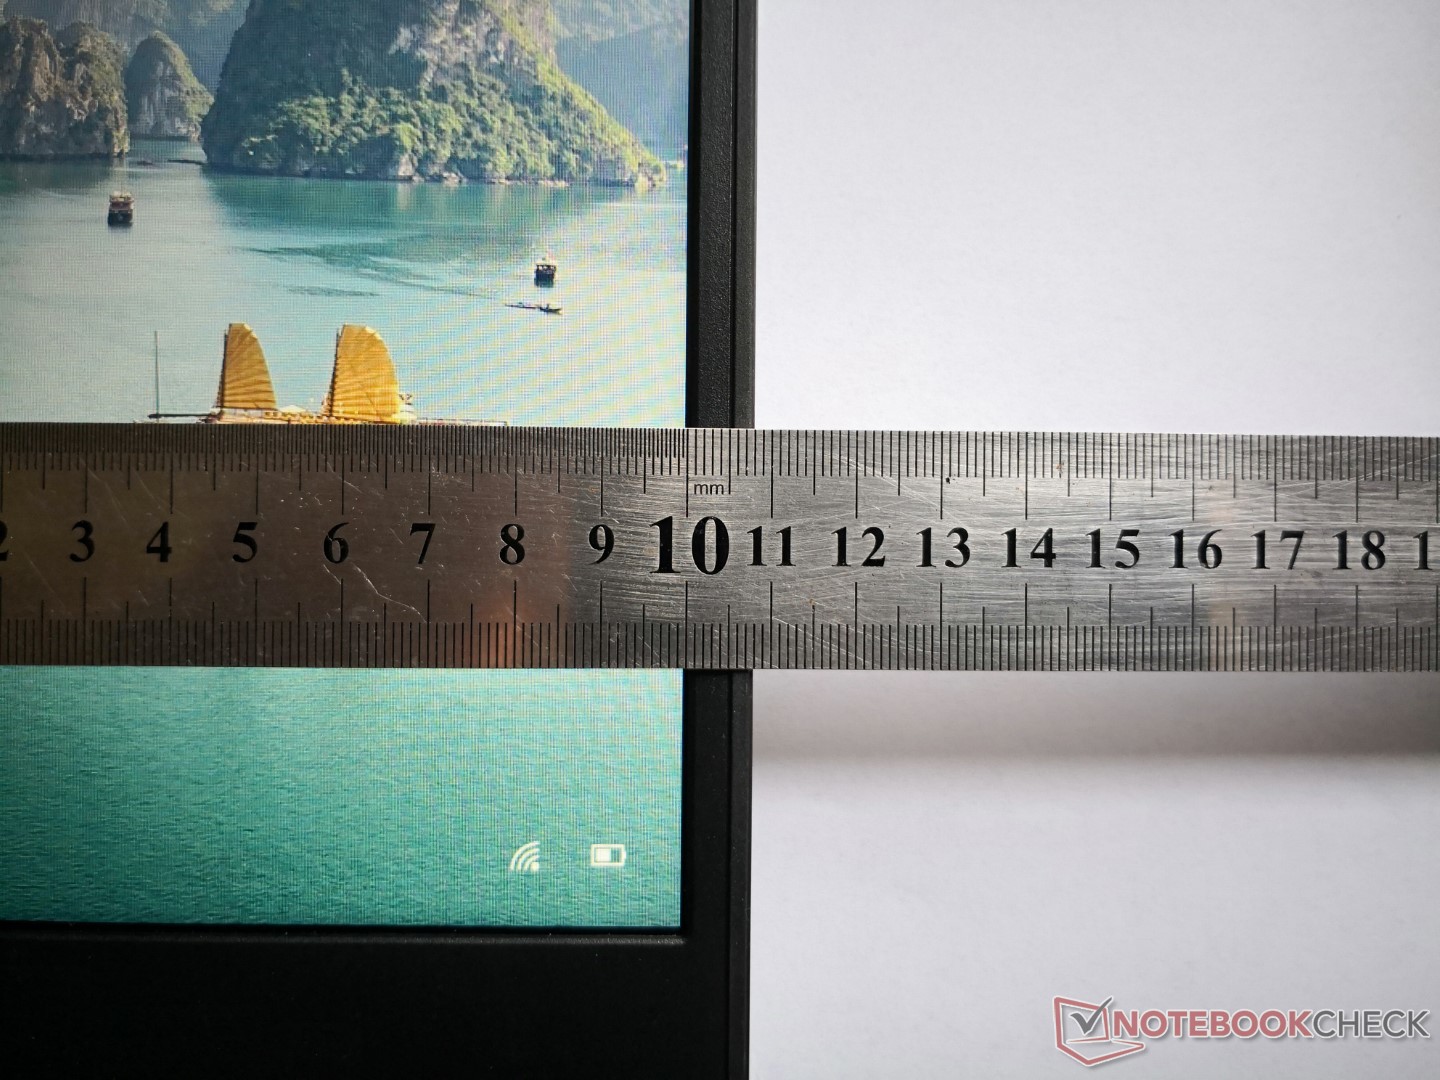
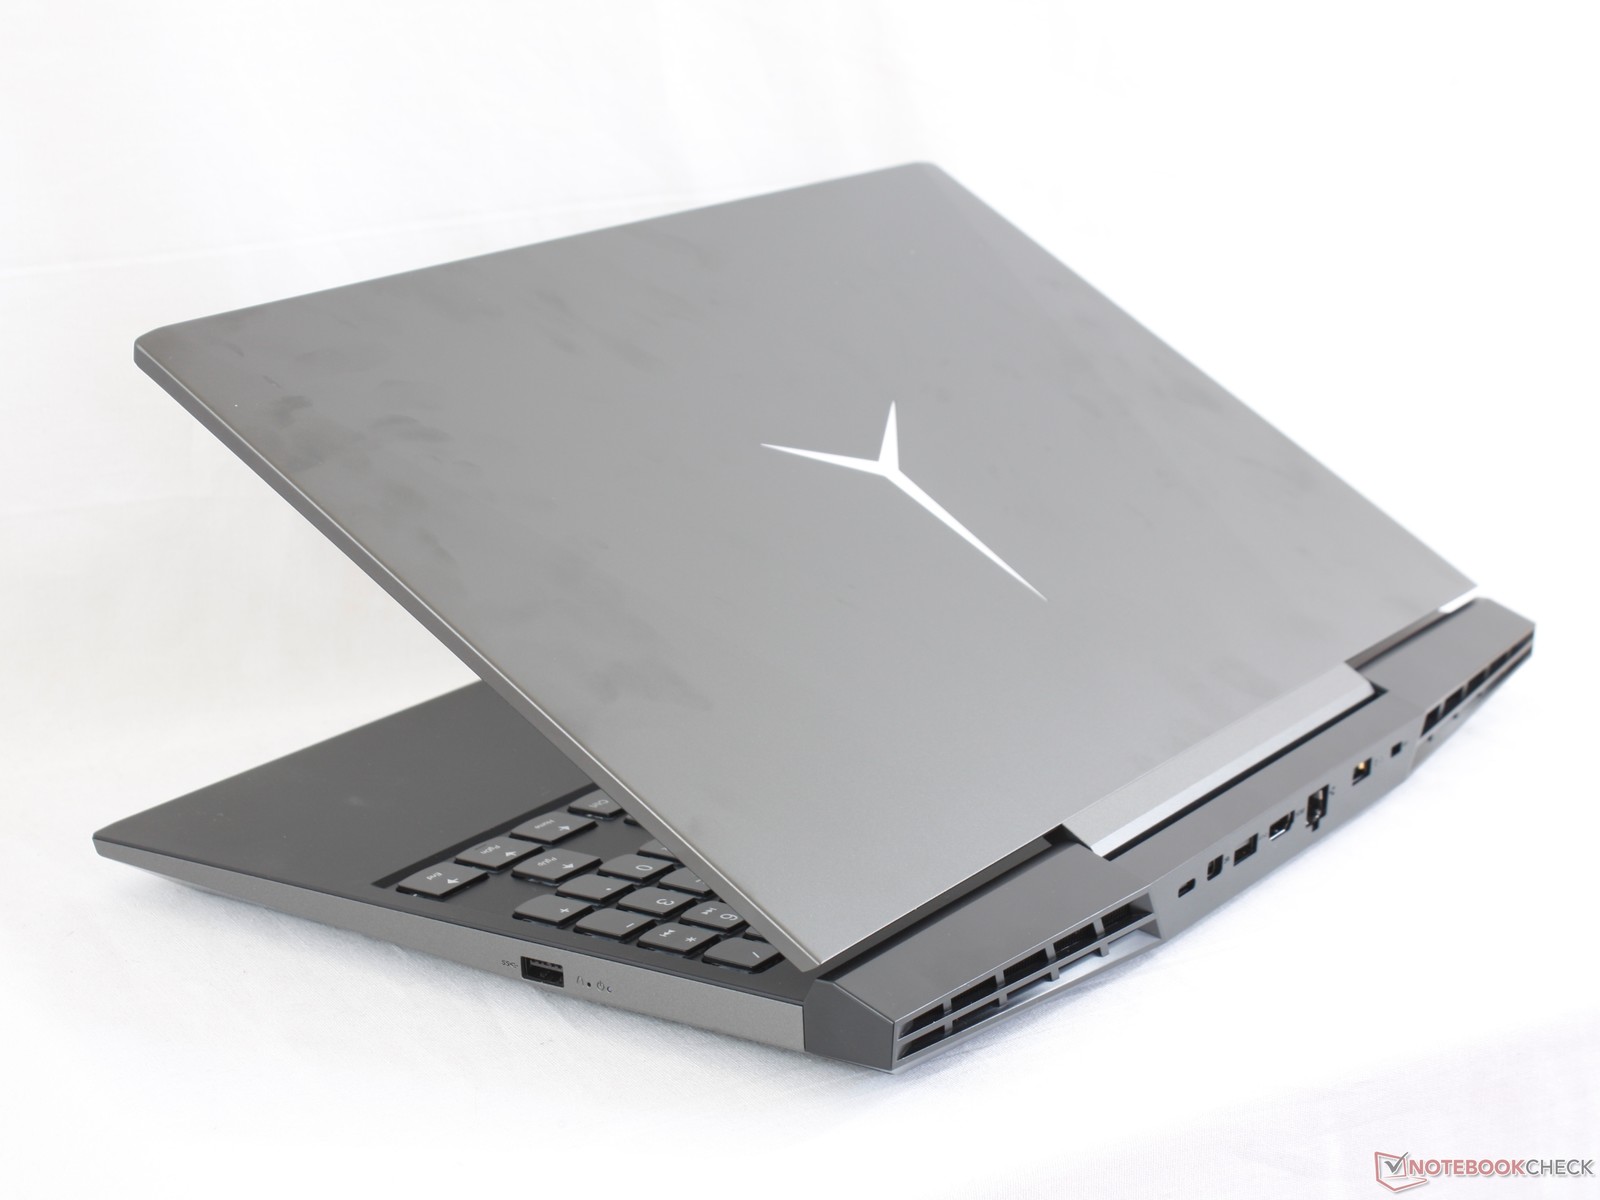
Older Lenovo gaming laptops were overdone from a visual standpoint. The 15-inch Ideapad Y700, for example, had glossy brushed aluminum surfaces, rubberized matte palm rests, red grilles, and a reflective edge-to-edge display all in one. The Legion Y7000 is simpler, all matte, and much less showy than before for an ultimately sleeker gaming aesthetic. The three-sided narrow bezels are reminiscent to the Asus GL504 and FX705 series but with the webcam forced to a suboptimal position below the bottom edge. Fingerprints build up fairly quickly especially on the rubberized palm rests and keyboard deck.
Base rigidity is above average with excellent torsional resistance and no creaking. Nonetheless, it's still a step below the Alienware 15 as pushing down on the keyboard center visibly warps the surface compared to the more hardened Alienware. The lid of the Lenovo is also weaker and more prone to flexing when compared to the aforementioned Asus GL504 or Alienware.
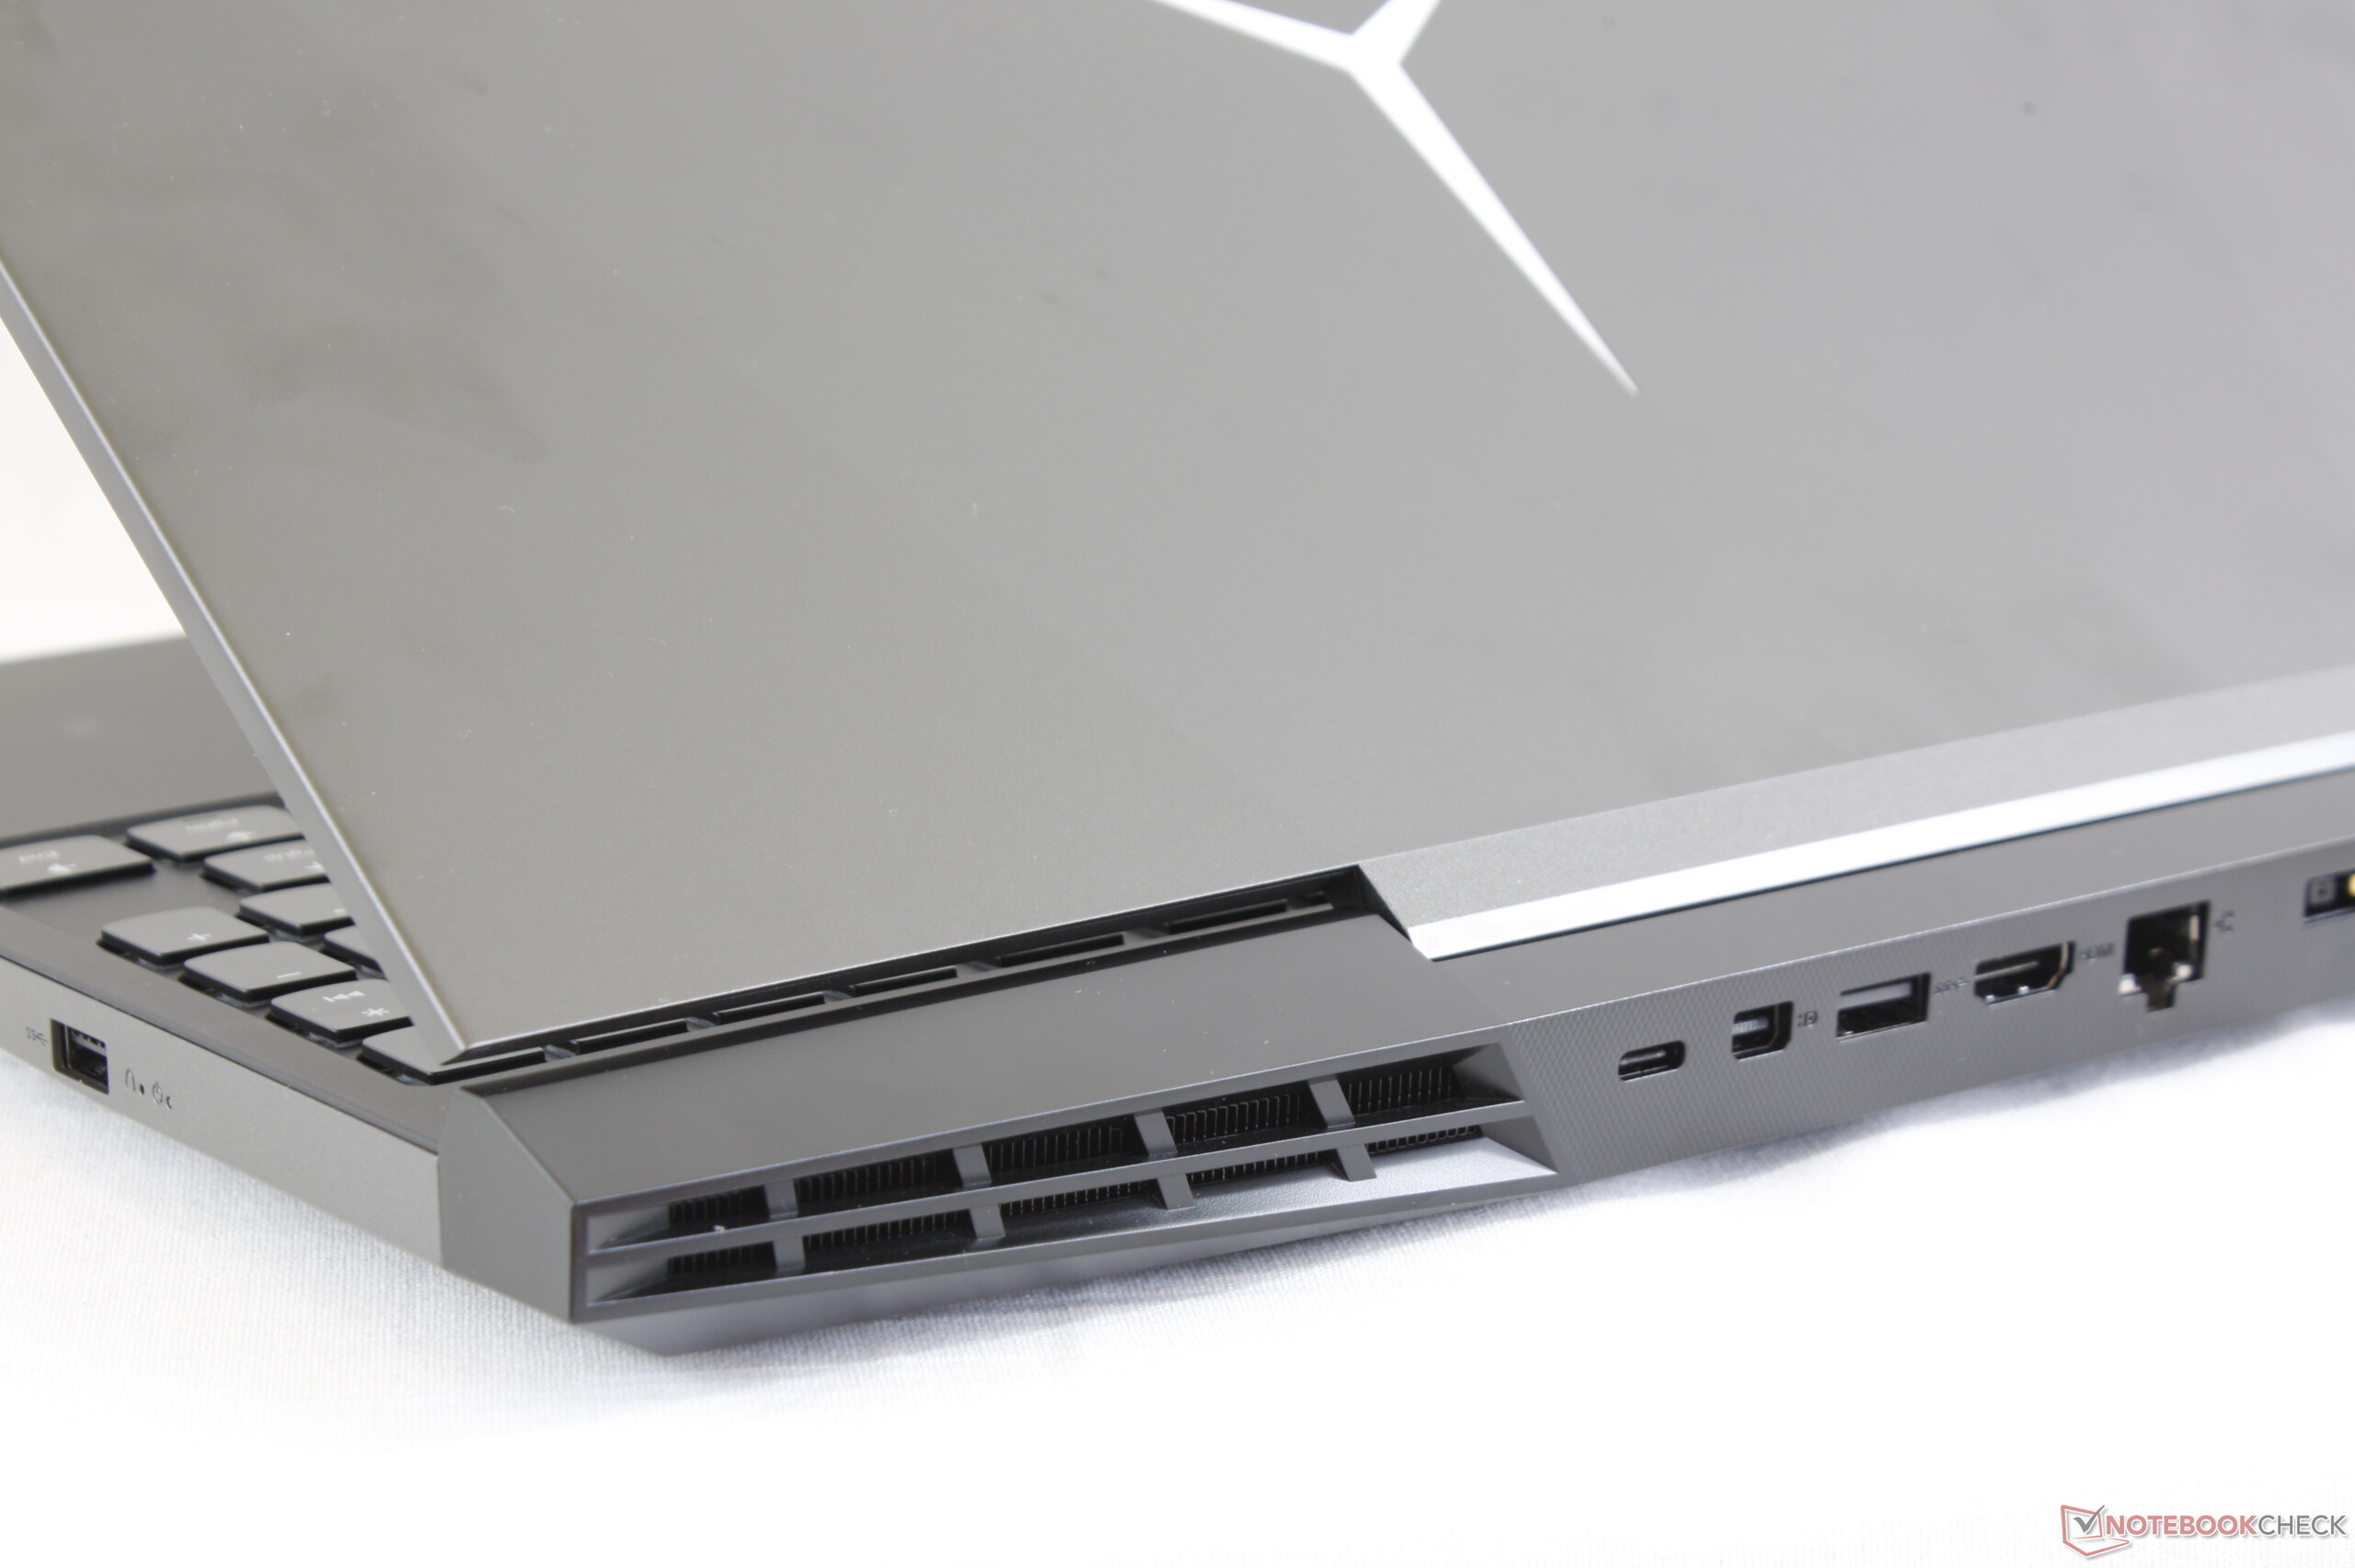
The single center hinge is uniformly firm at all angles with no teetering when typing. Its biggest drawback is the low maximum angle of about 140 degrees compared to 150 degrees or higher on competing models. Even the lid of the Legion Y530 can open up to ~175 degrees if needed.
Construction quality is excellent from top to bottom with no unintended gaps or noticeable defects on our test unit. It's an improvement over our old Ideapad Y50 where the narrow rear grilles were cracked upon arrival.
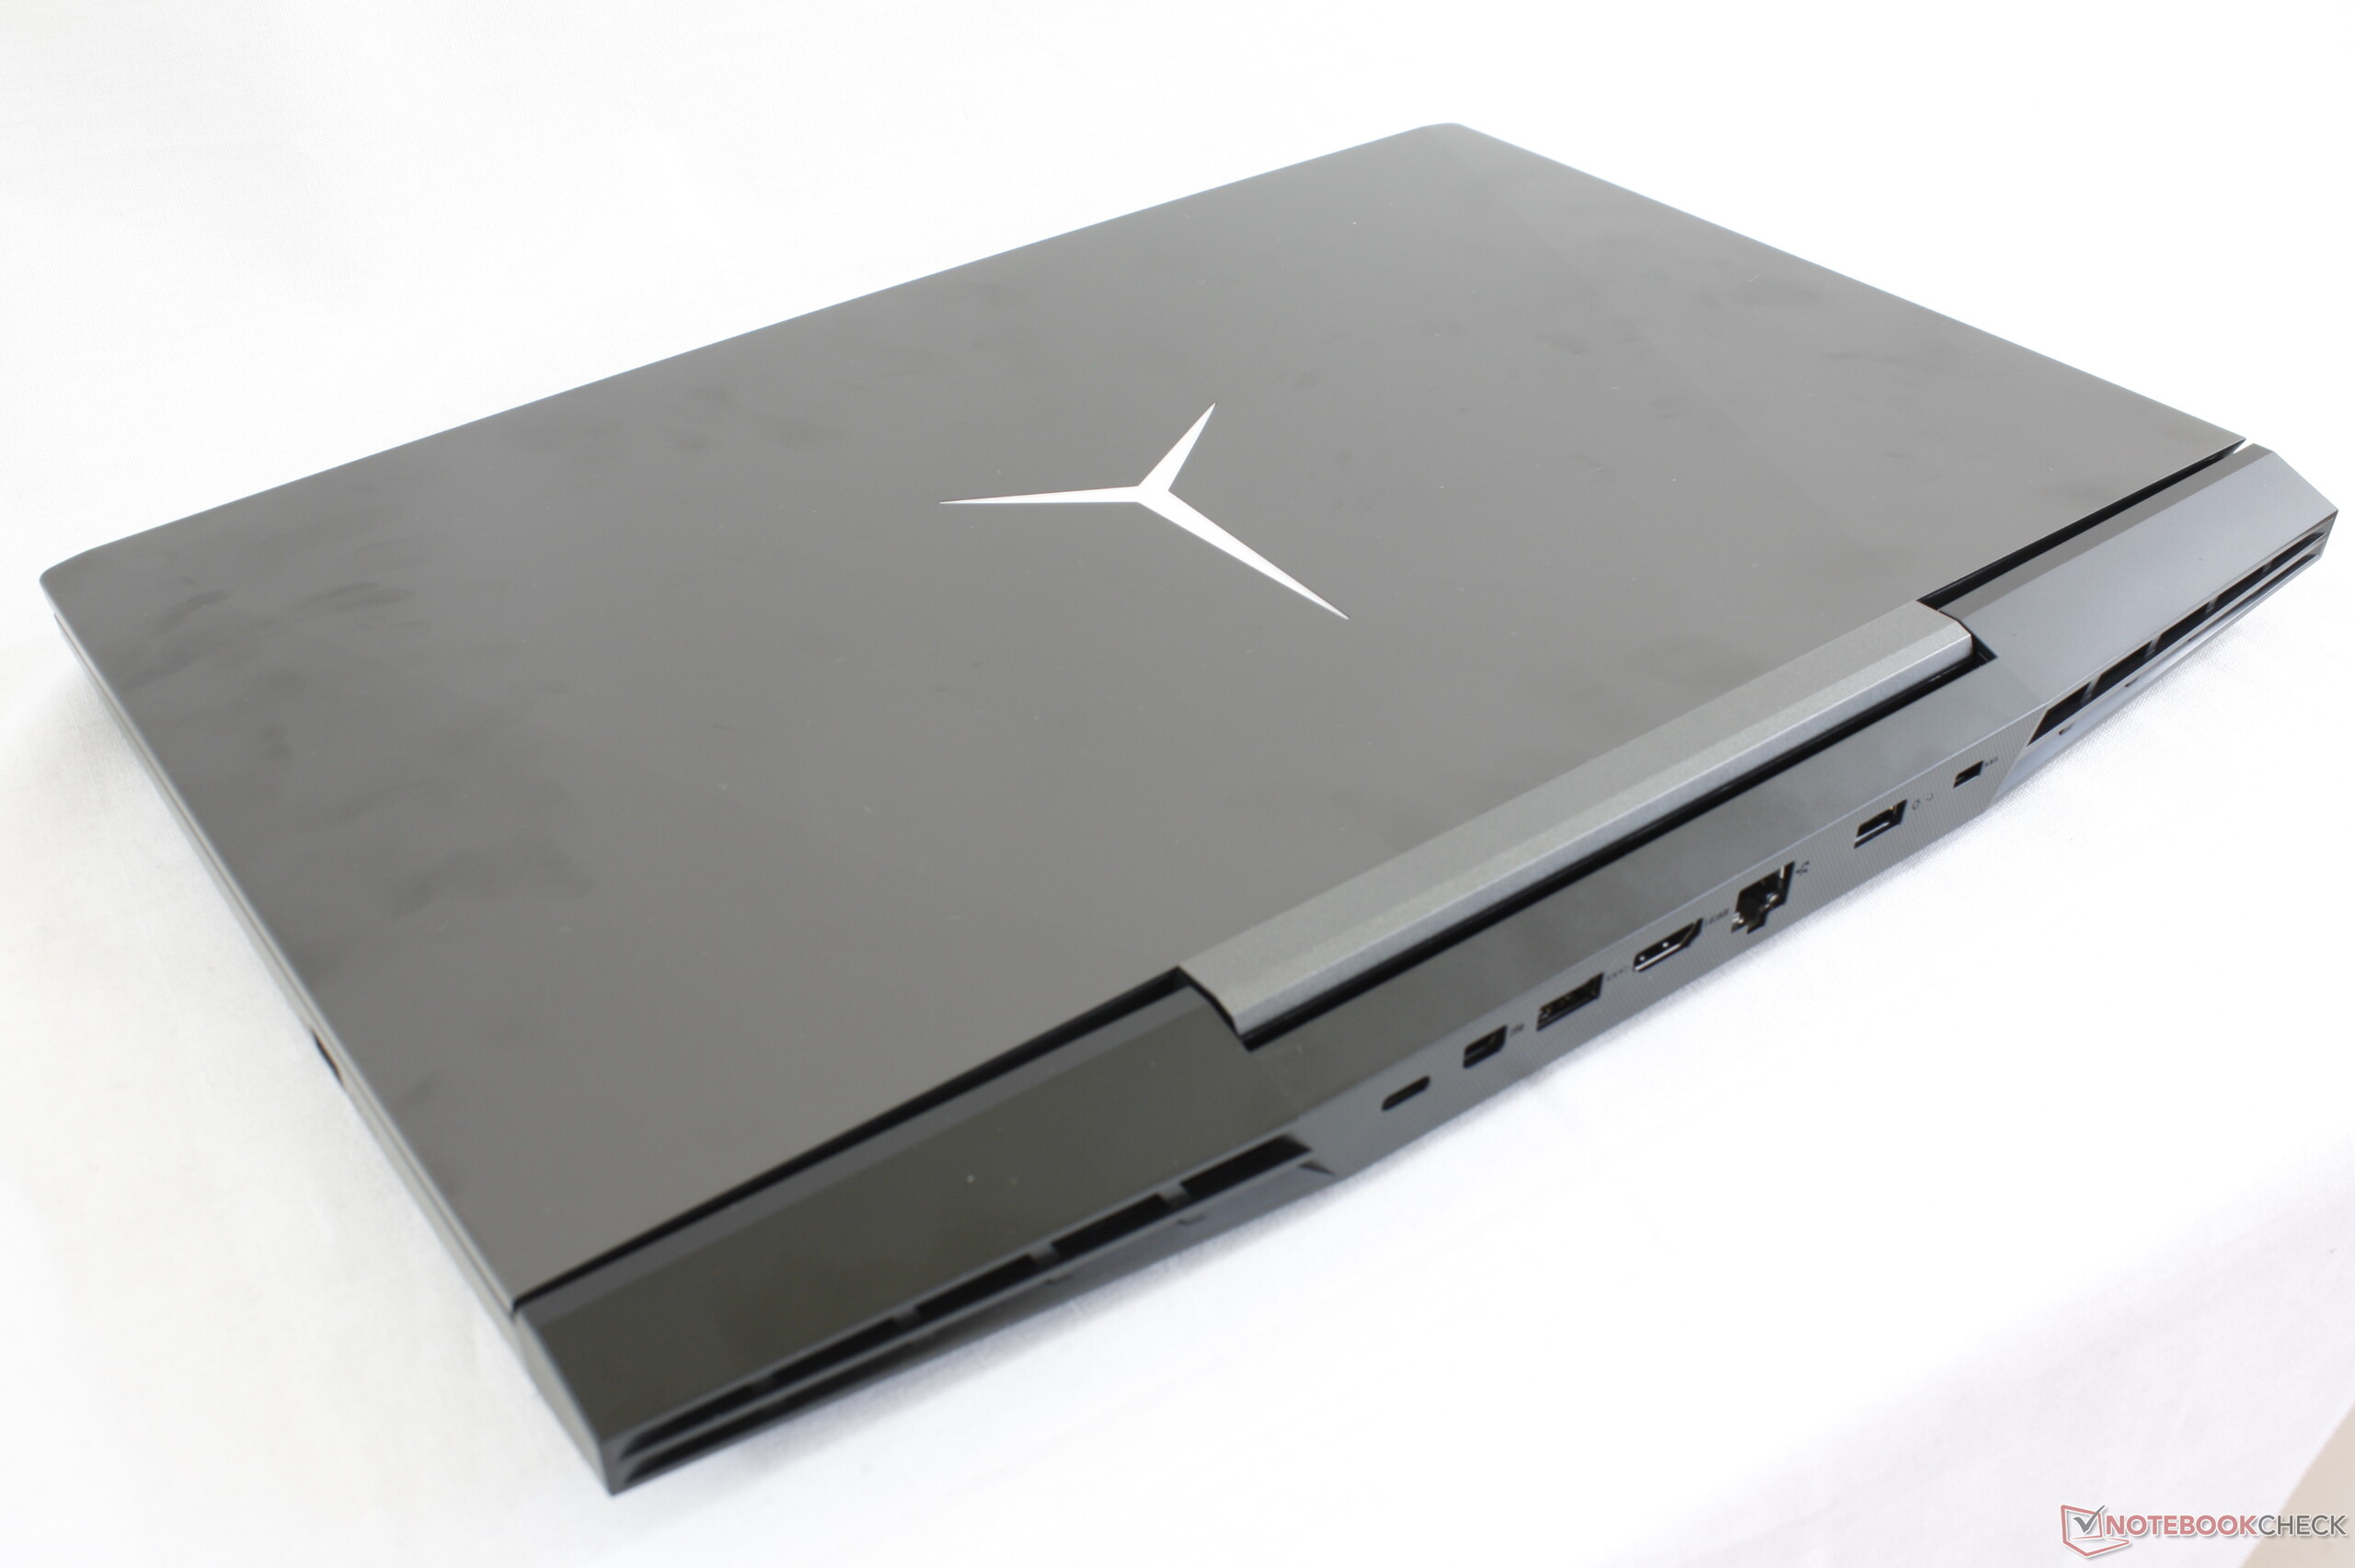
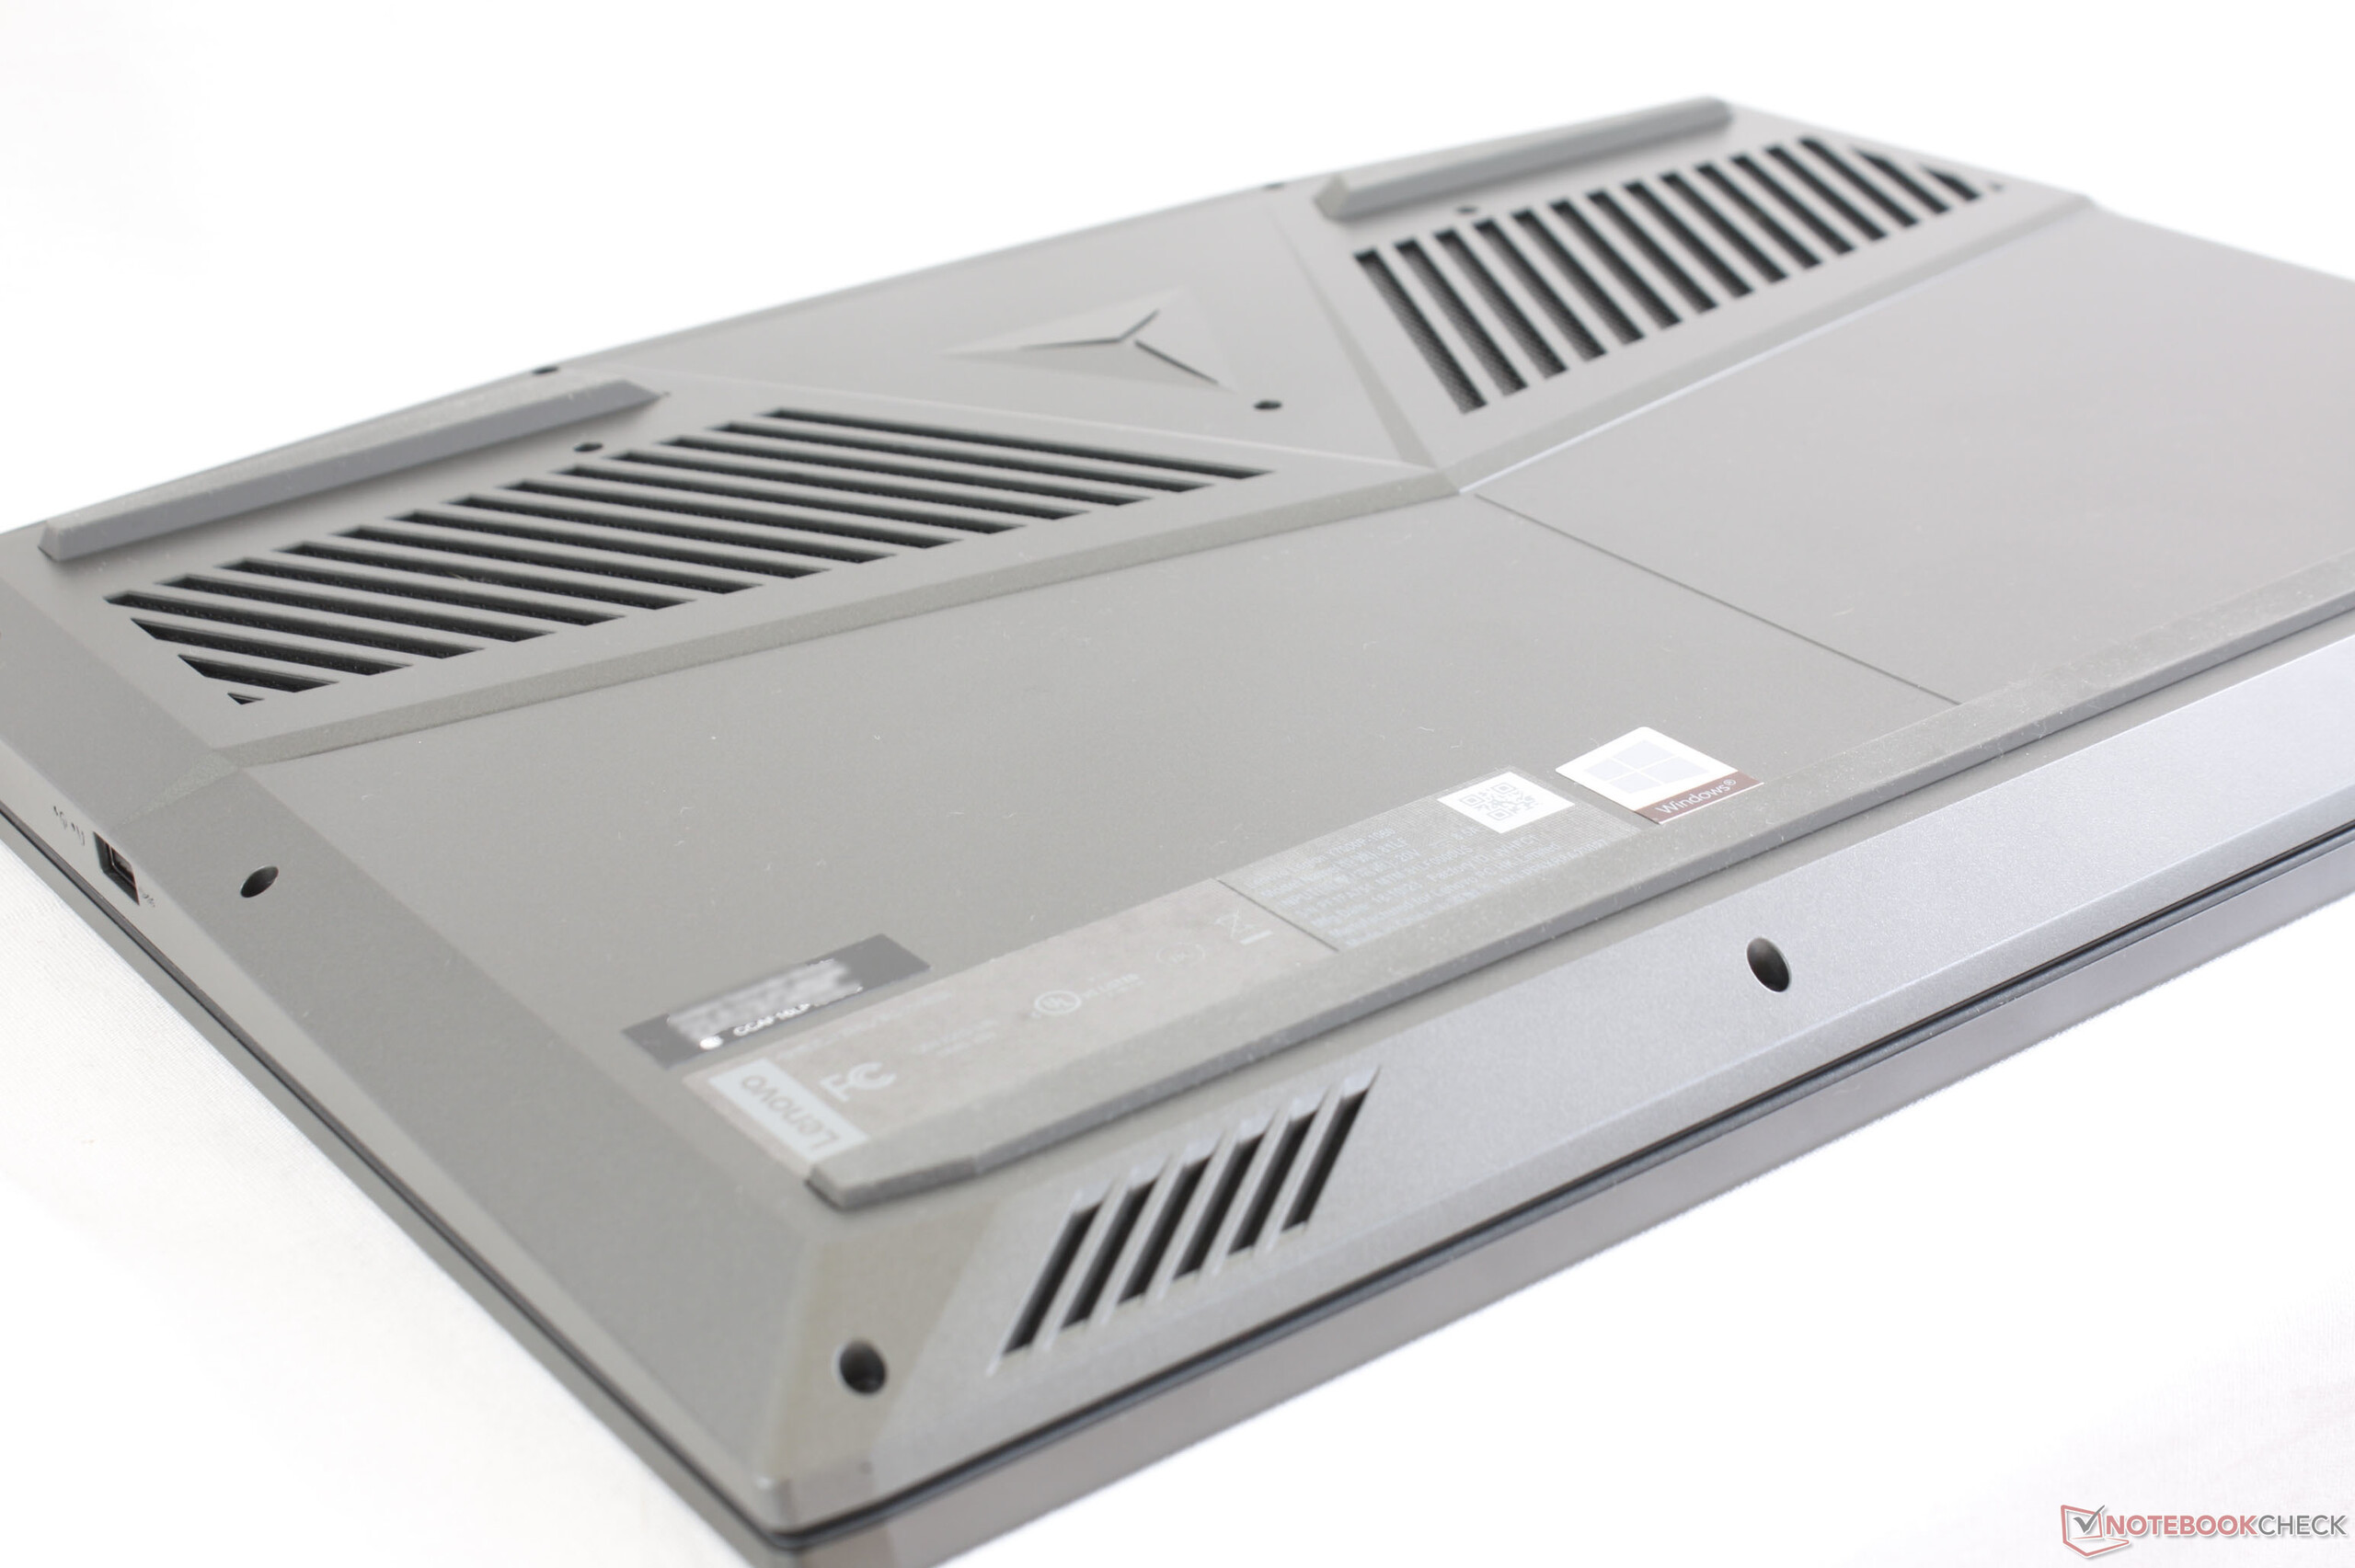
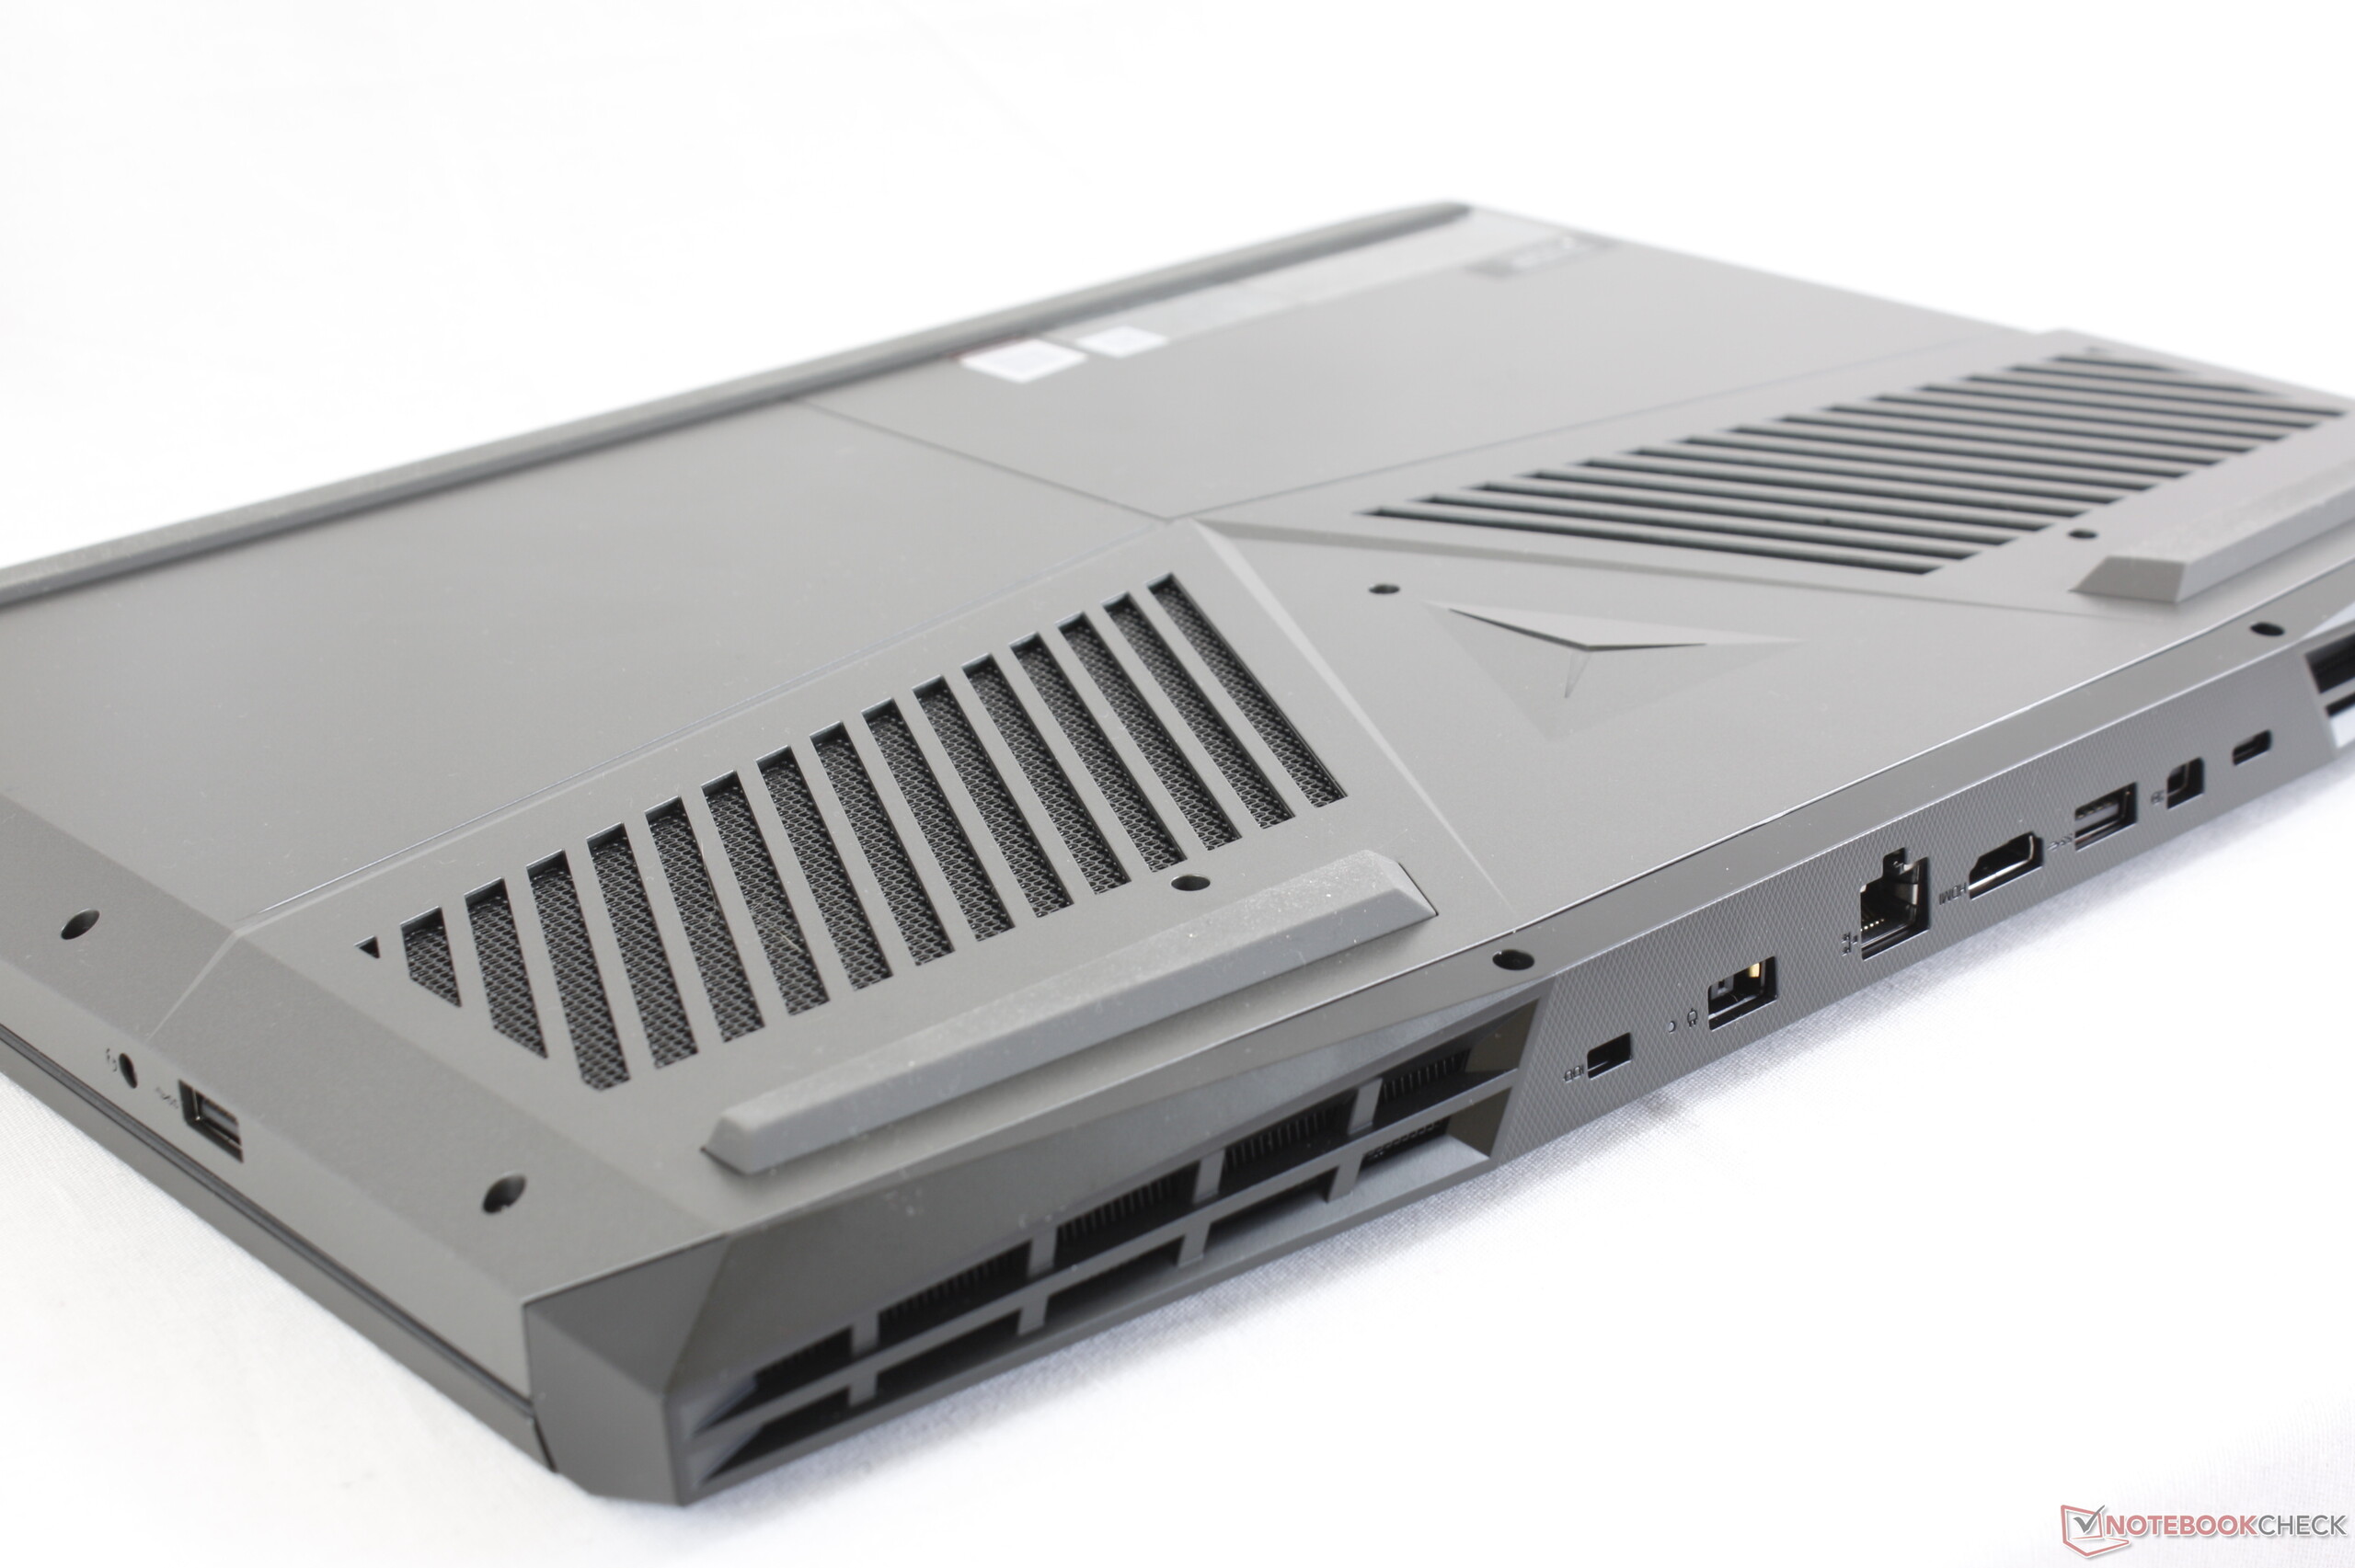
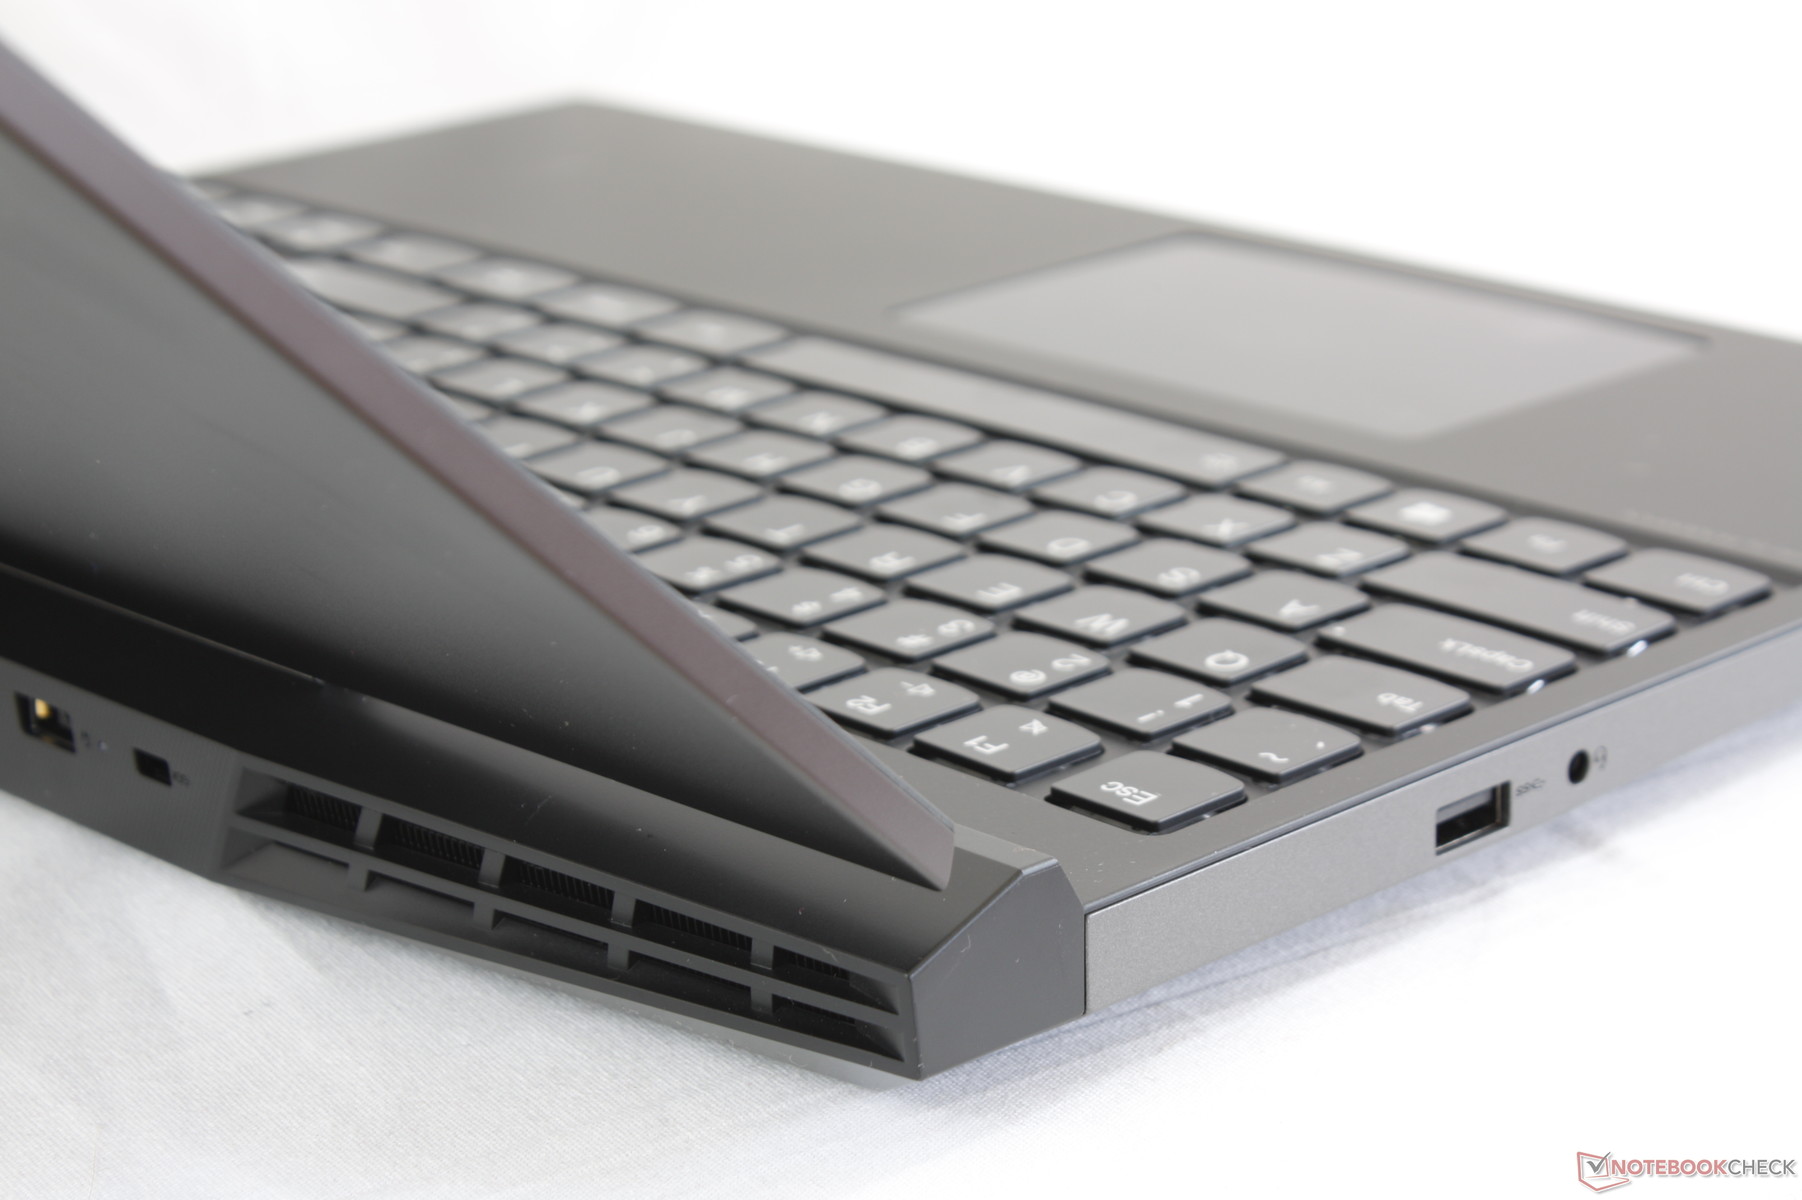
Dimensions and weight are nearly the same as the Legion Y530. Its length is slightly longer than the MSI GF63 or HP Pavilion Gaming 15 since the extended "jet engine" rear improves cooling at the cost of added volume. The larger Alienware 15 and Asus ROG G752 have similar design approaches. Users who want something smaller and lighter with the same performance options as our Legion Y7000 should consider the MSI GS65.
Connectivity
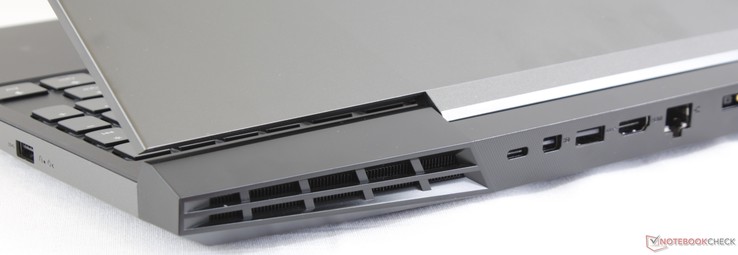
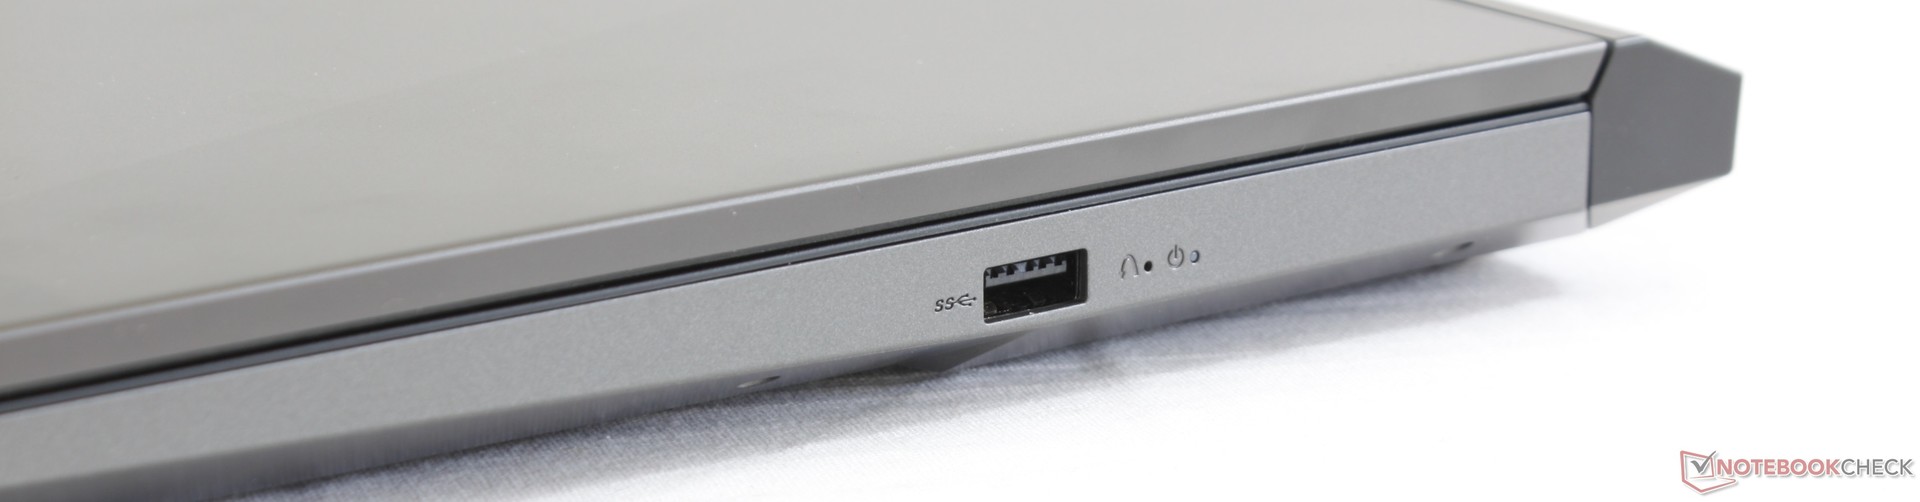
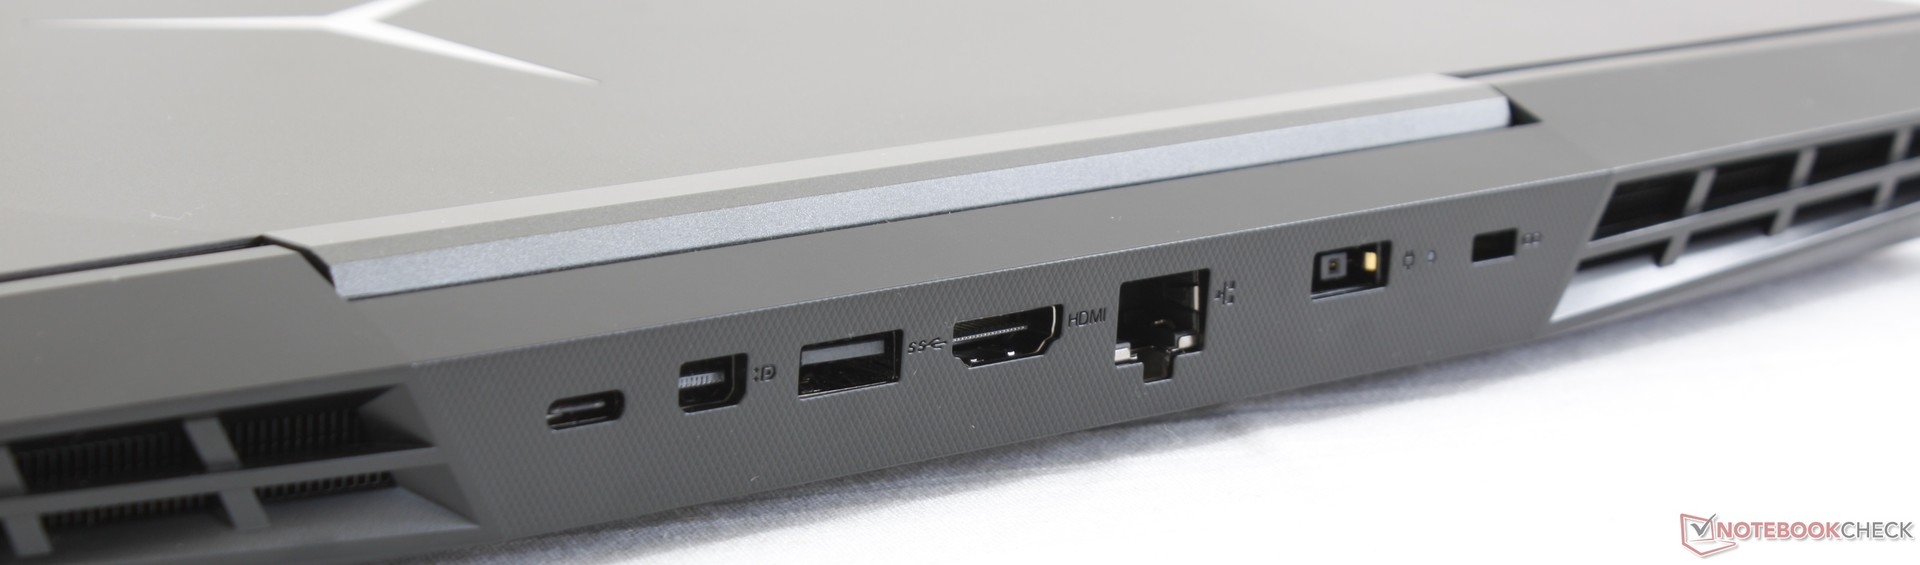
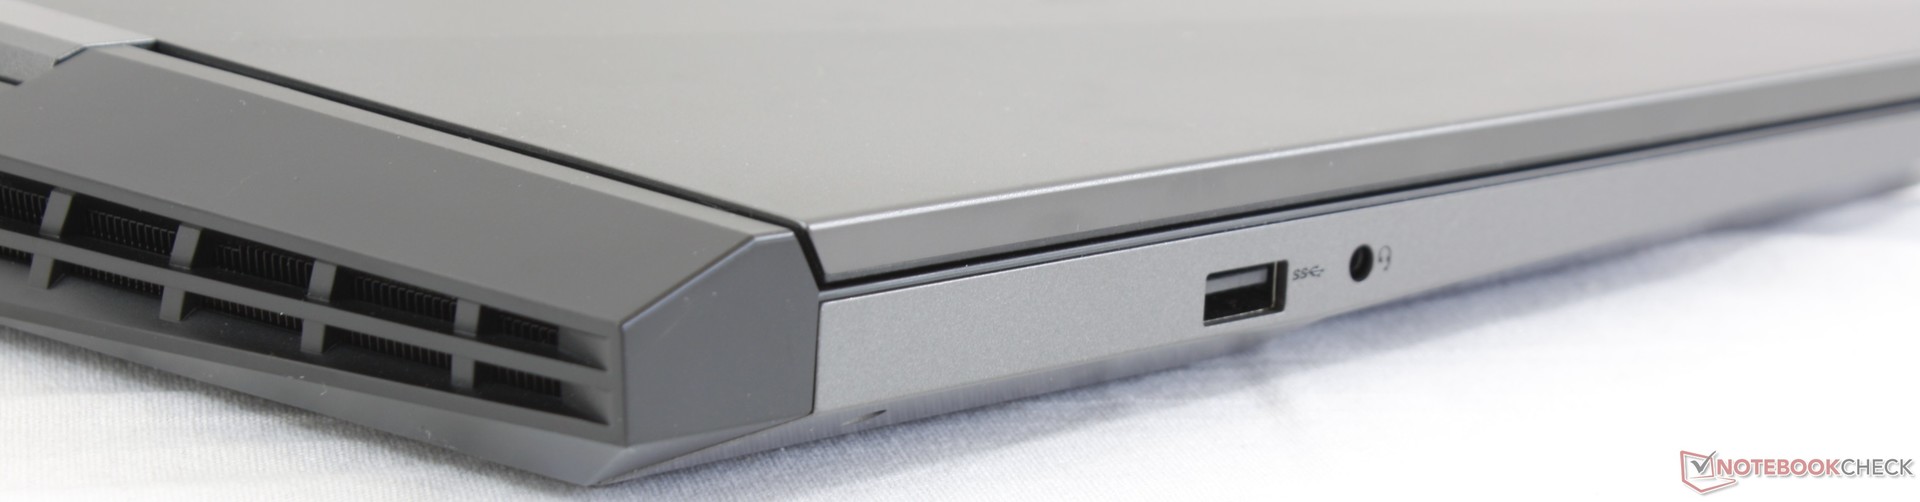
Port selection and even positioning are identical to the Legion Y530. This means that most of the ports are located towards the rear of the system while the two sides have one USB Type-A port each. Lenovo's approach saves on desk space, but commonly used ports like USB Type-C and HDMI are more cumbersome to reach as a result. We can accept the lack of Thunderbolt 3 since the Legion Y7000 is technically a budget-mainstream gaming system, but the absence of a SD card reader sticks out like a sore thumb.
Communication
Whereas the Legion Y530 ships with a 1.73 Gbps Intel 9560 WLAN module, the Y7000 ships with the less expensive Realtek RTL8822BE running at half the maximum theoretical transfer rate. Casual gamers are unlikely to notice the difference in performance. Perhaps more importantly, we experienced no connectivity issues during our time with the test unit.
| Networking | |
| iperf3 transmit AX12 | |
| Lenovo Legion Y7000P-1060 | |
| Lenovo Legion Y530-15ICH | |
| HP Pavilion Gaming 15t-cx0000 | |
| Dell XPS 15 9570 i7 UHD | |
| iperf3 receive AX12 | |
| HP Pavilion Gaming 15t-cx0000 | |
| Lenovo Legion Y530-15ICH | |
| Lenovo Legion Y7000P-1060 | |
| Dell XPS 15 9570 i7 UHD | |
Maintenance
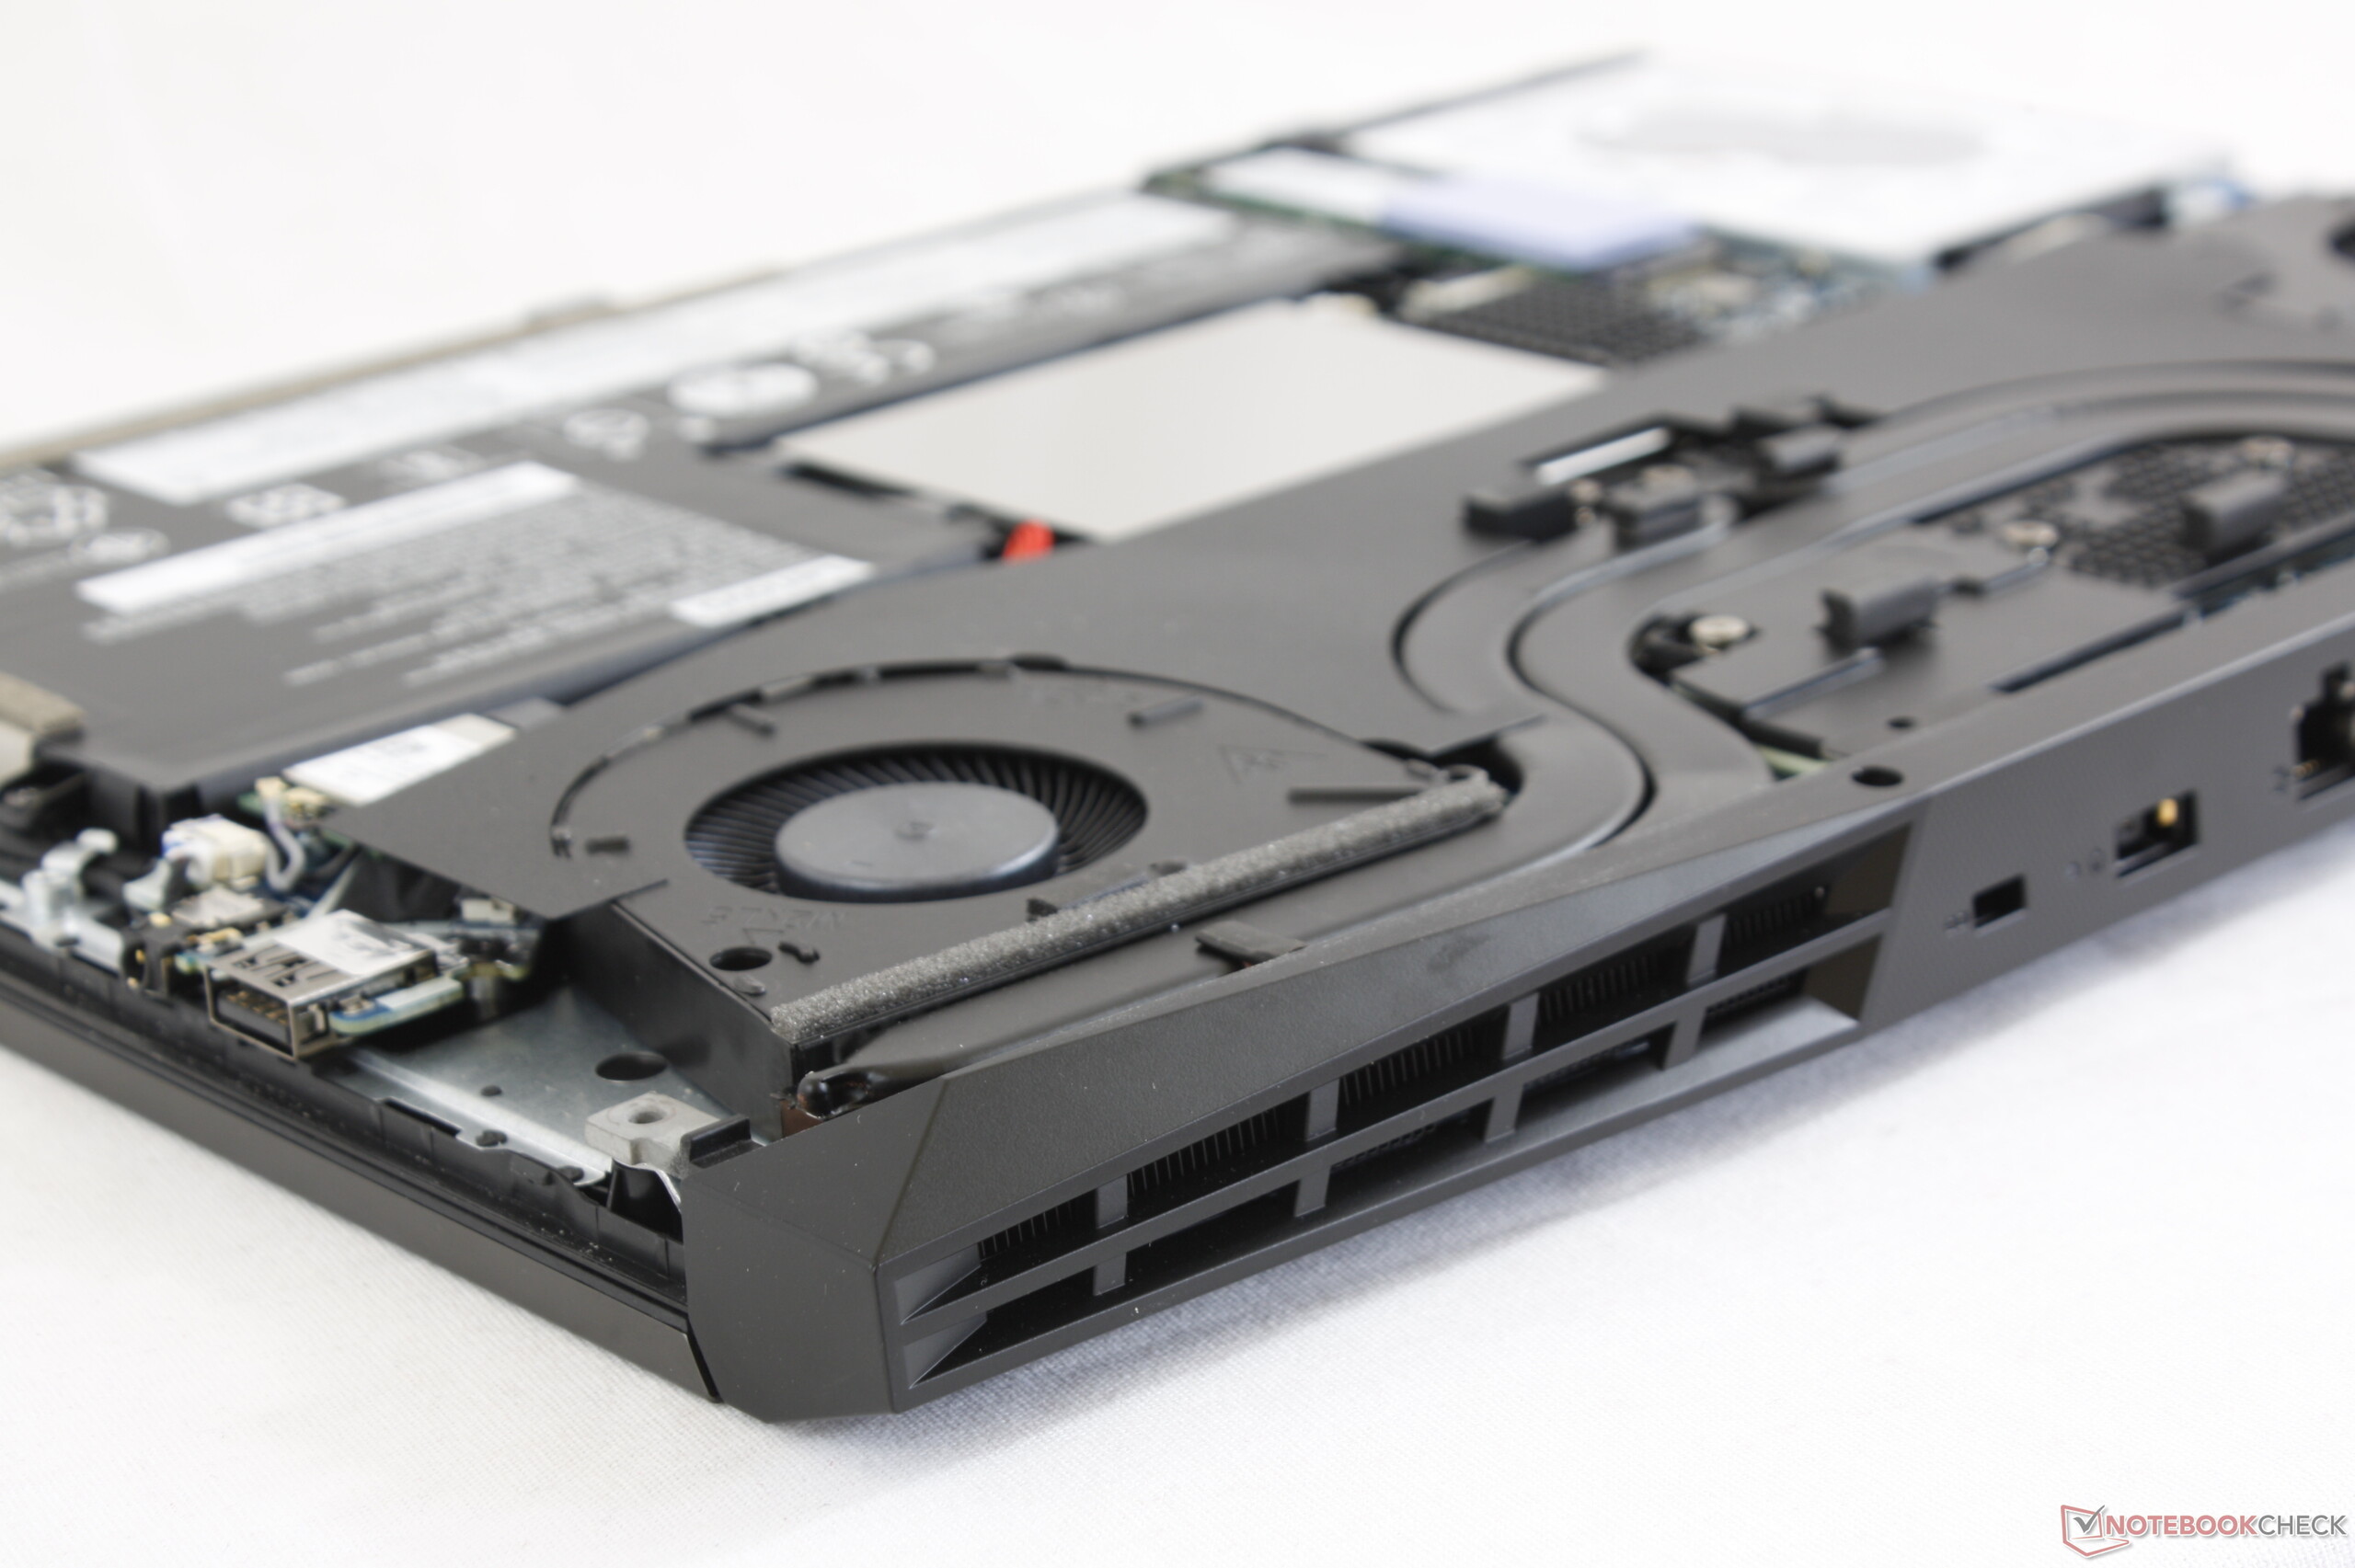
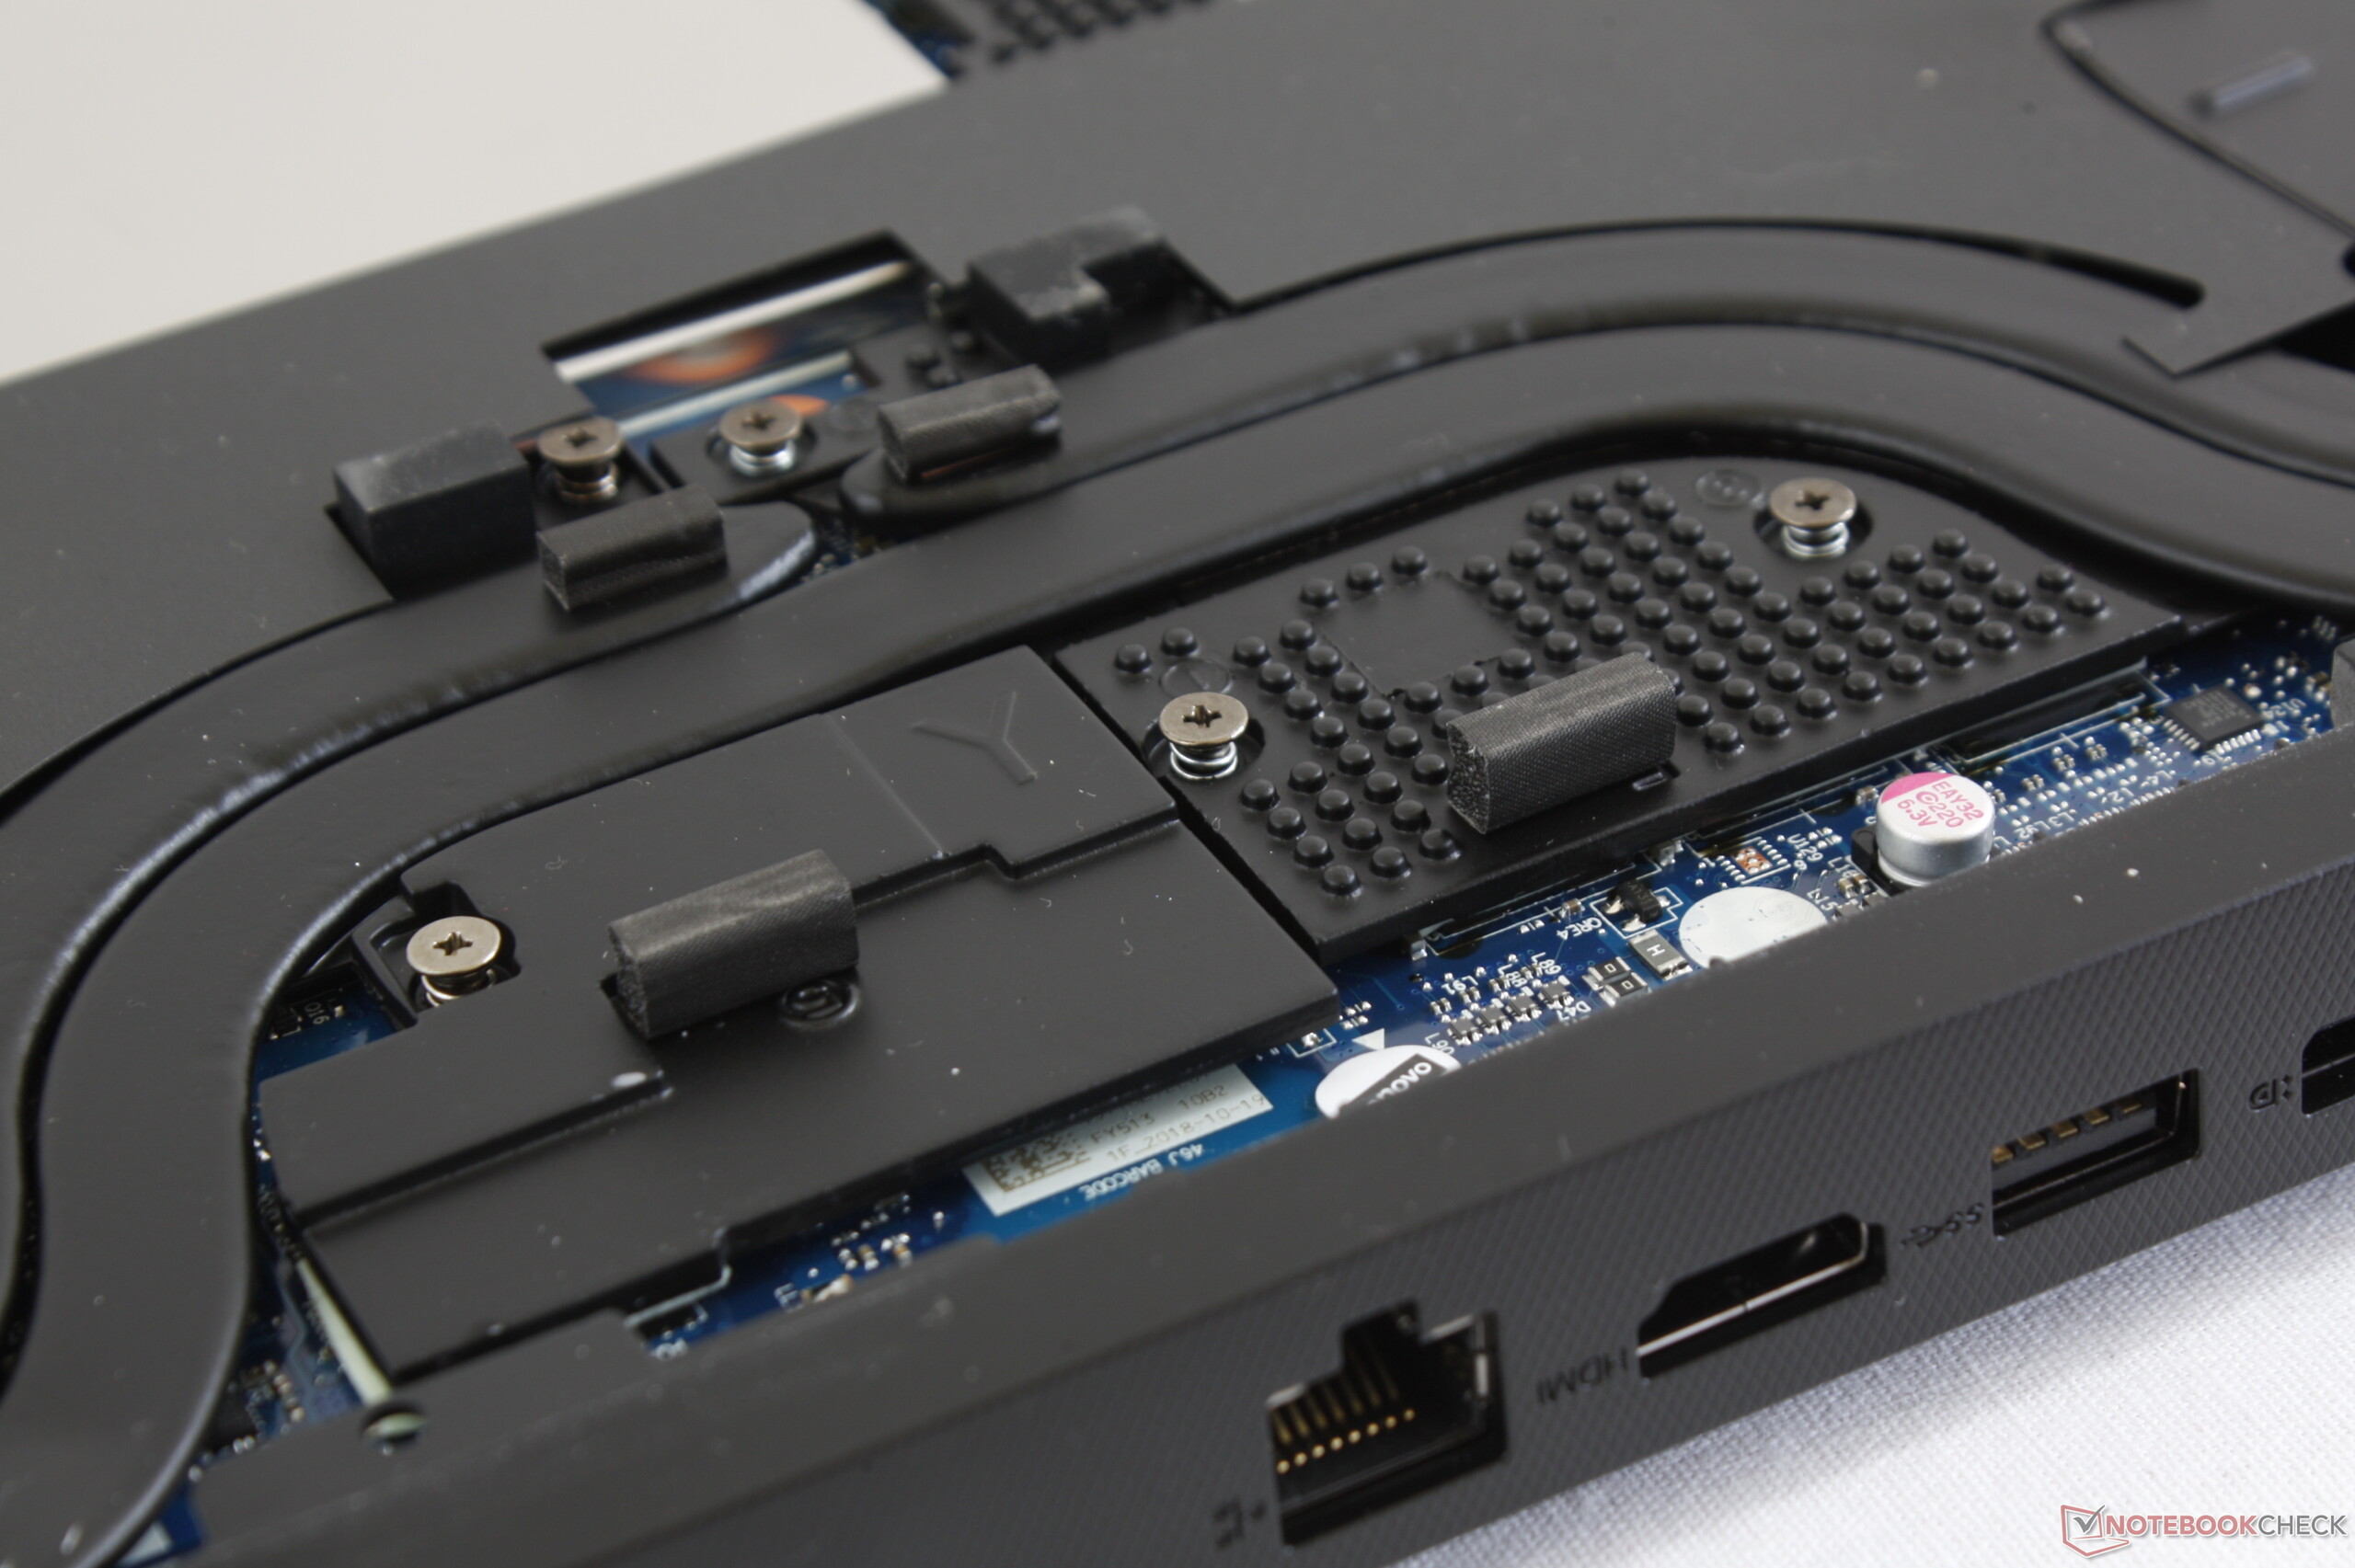
Serviceability requires a Philips screwdriver and a sharp edge. The bottom panel is tightly latched around the edges and it is consequently very tricky to pry open.
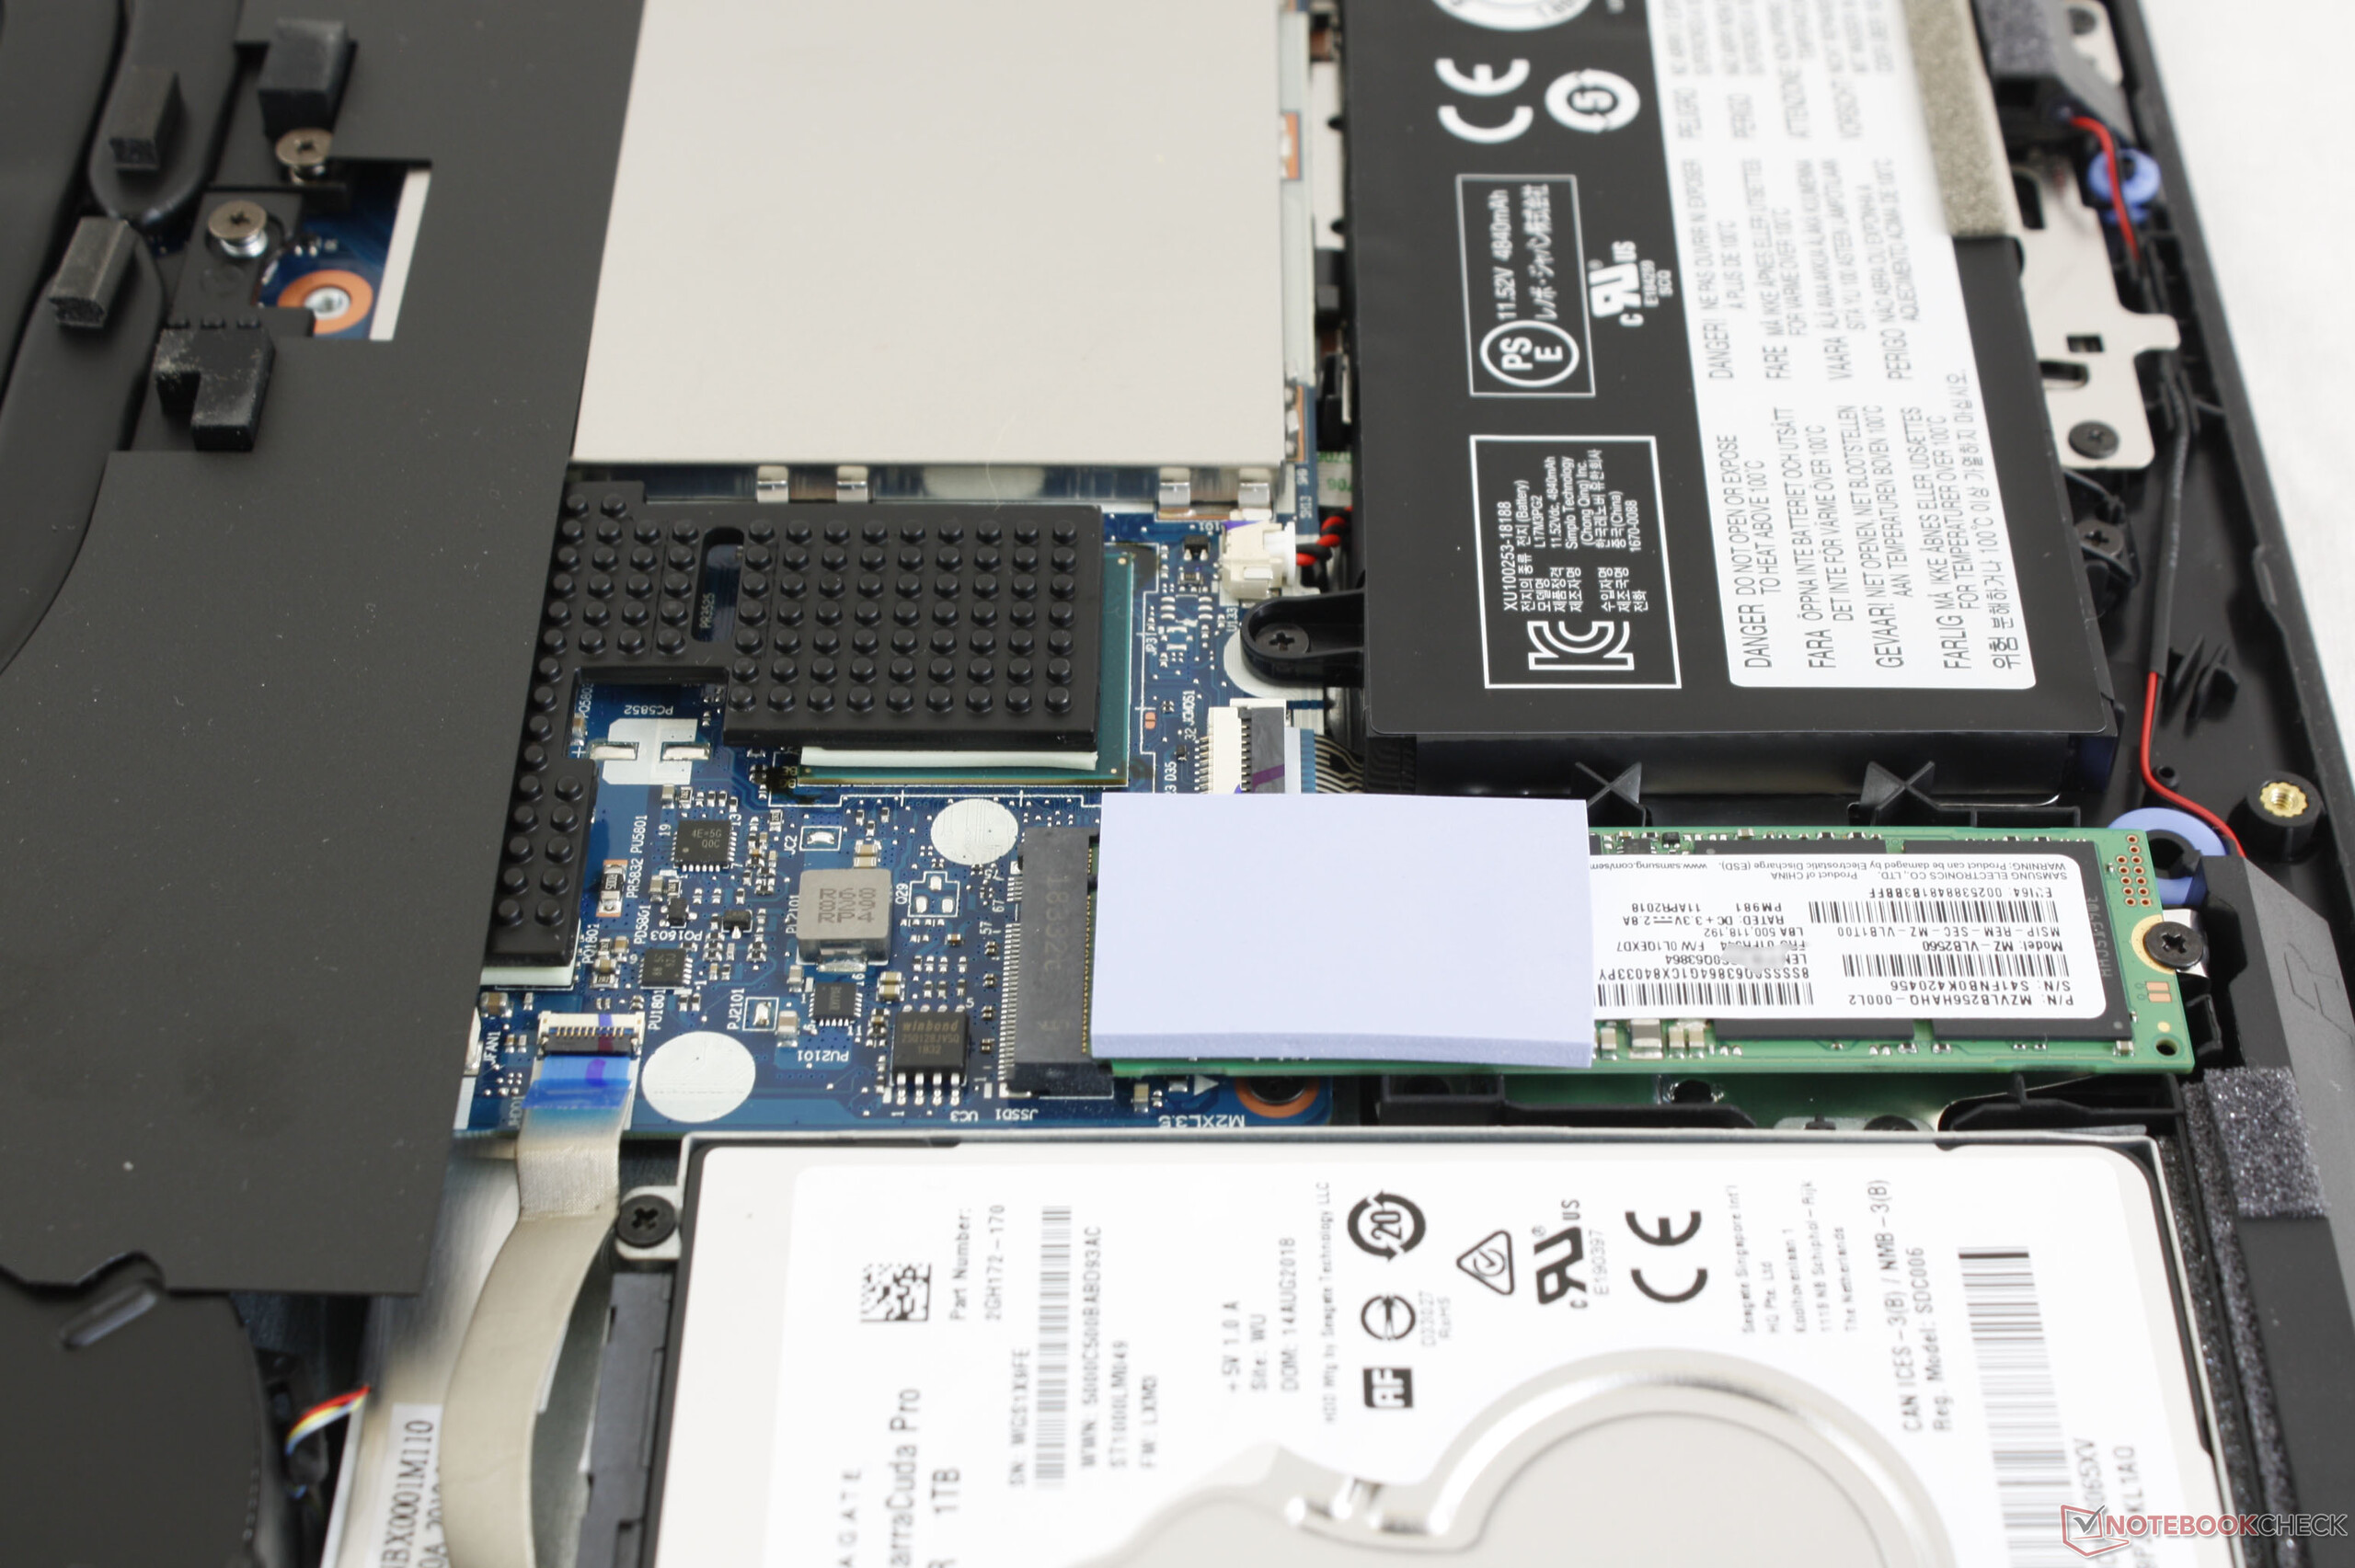
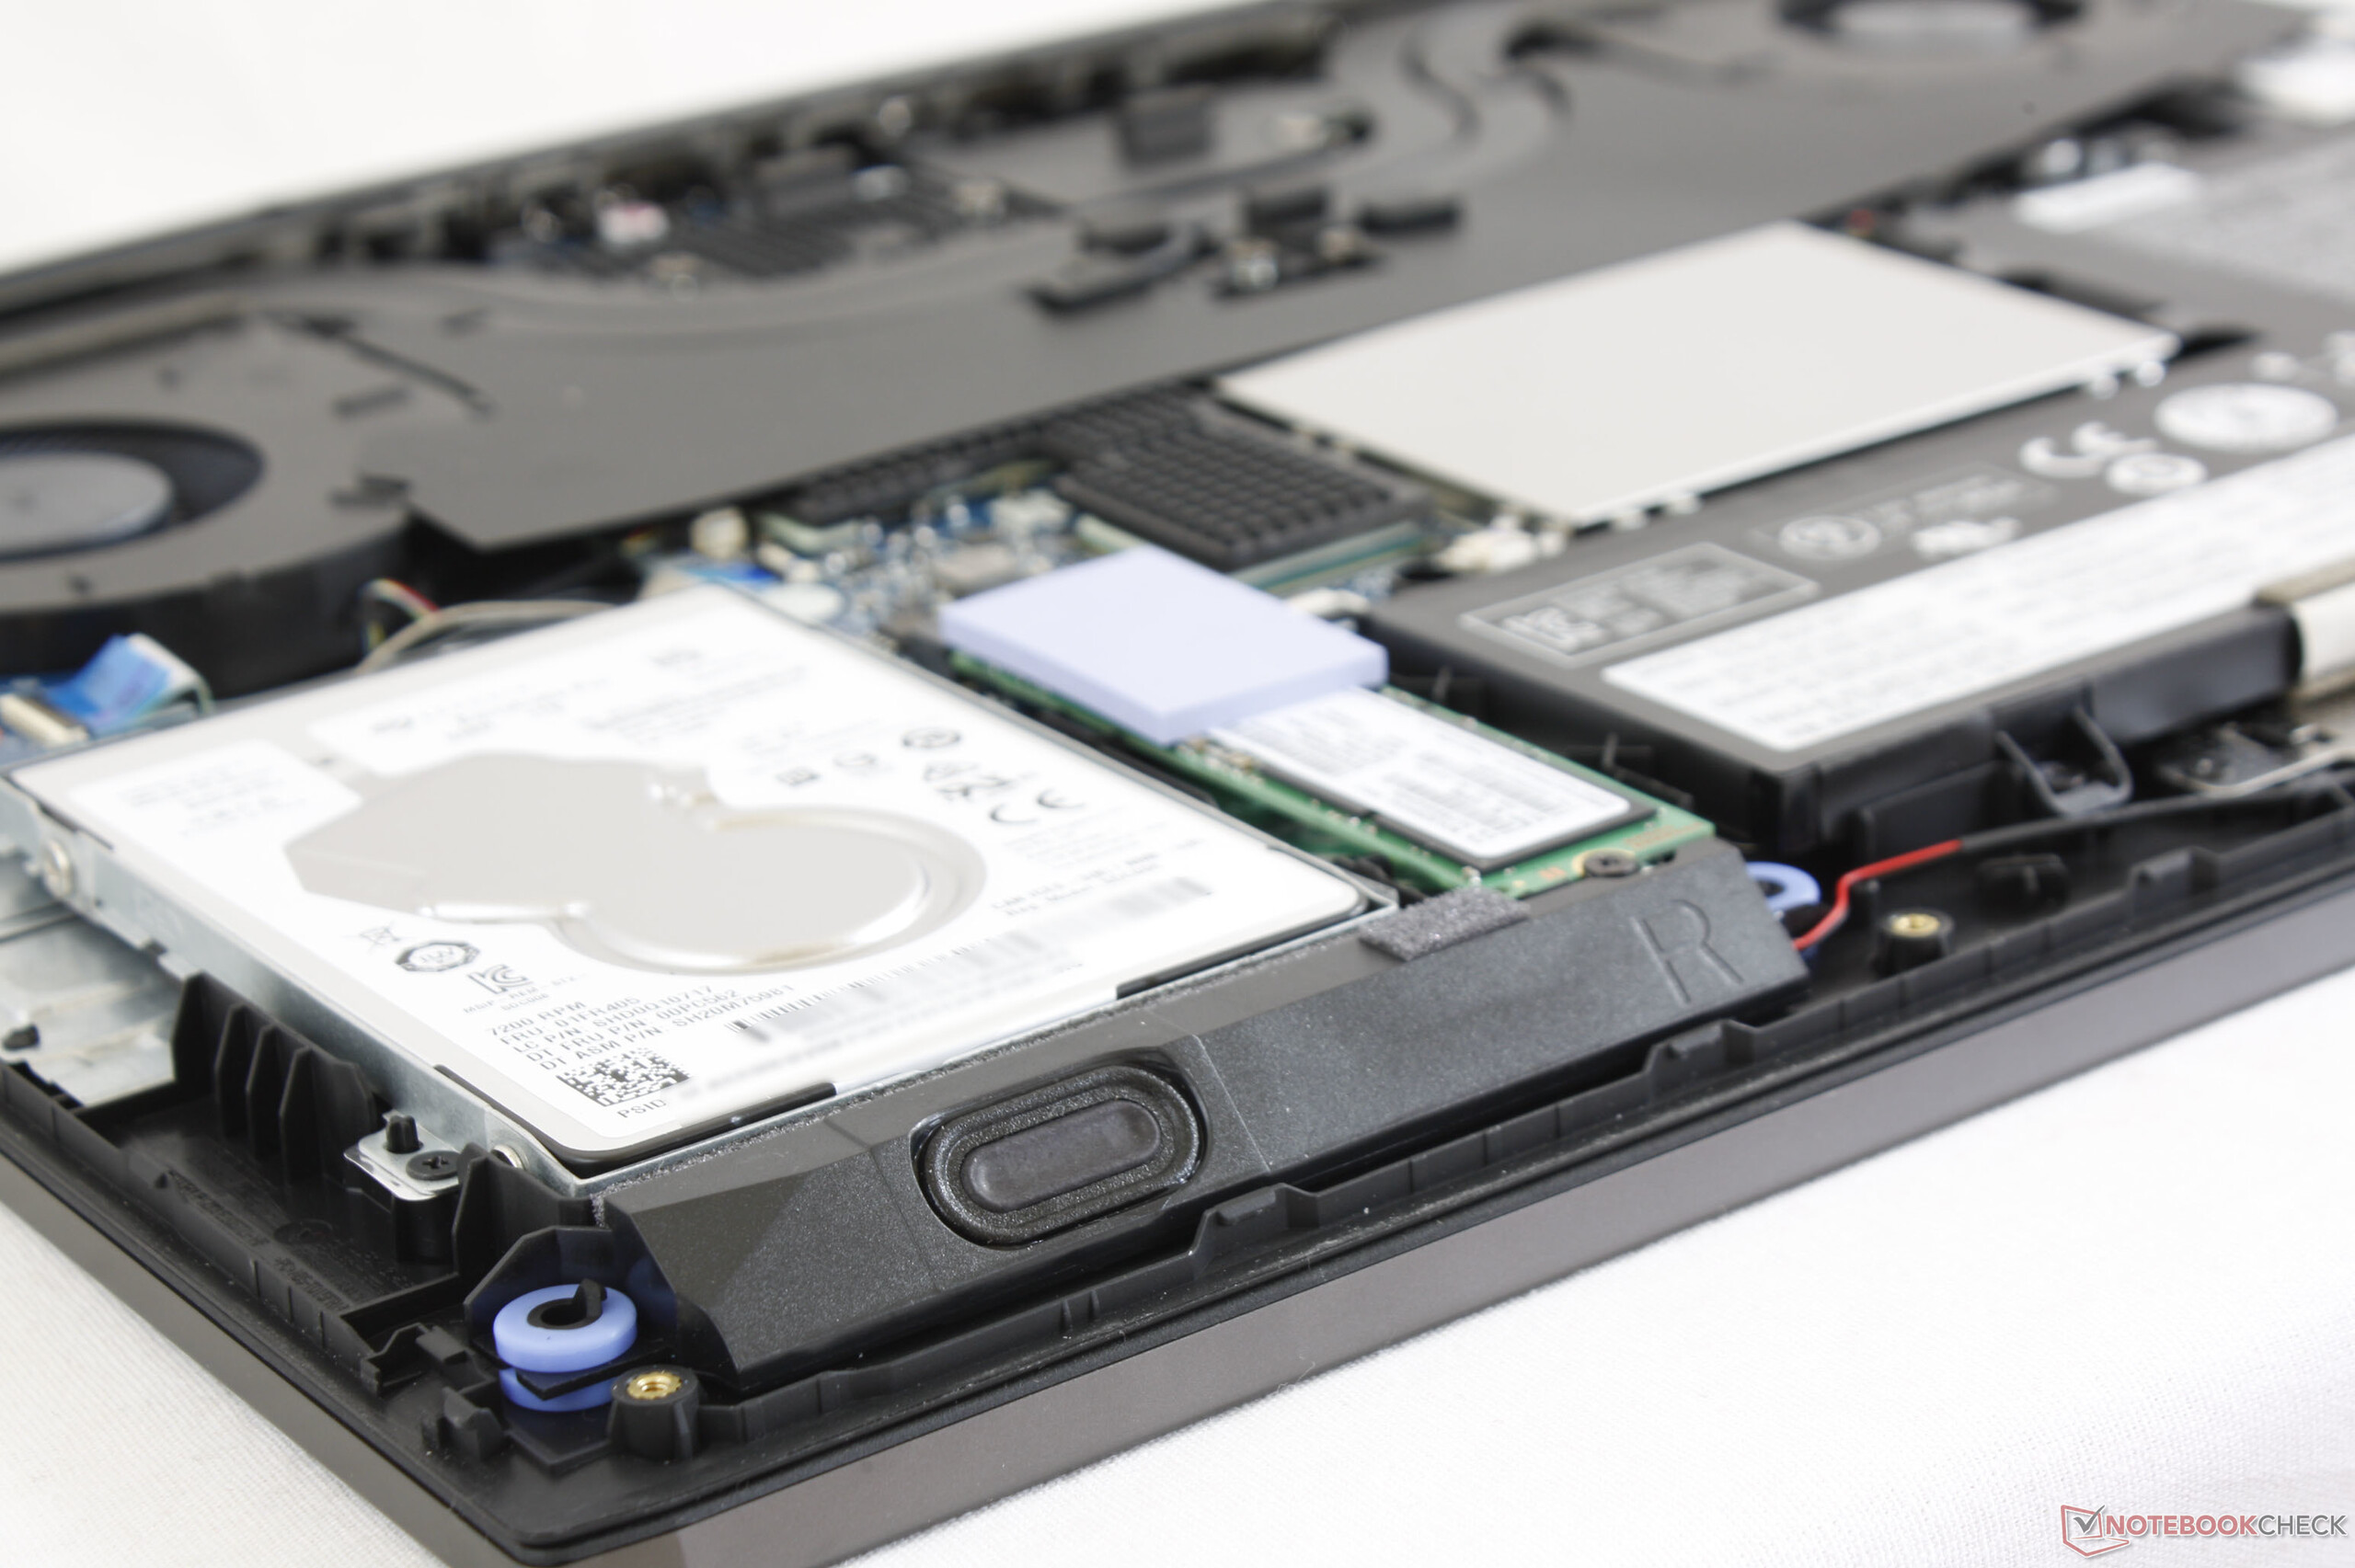
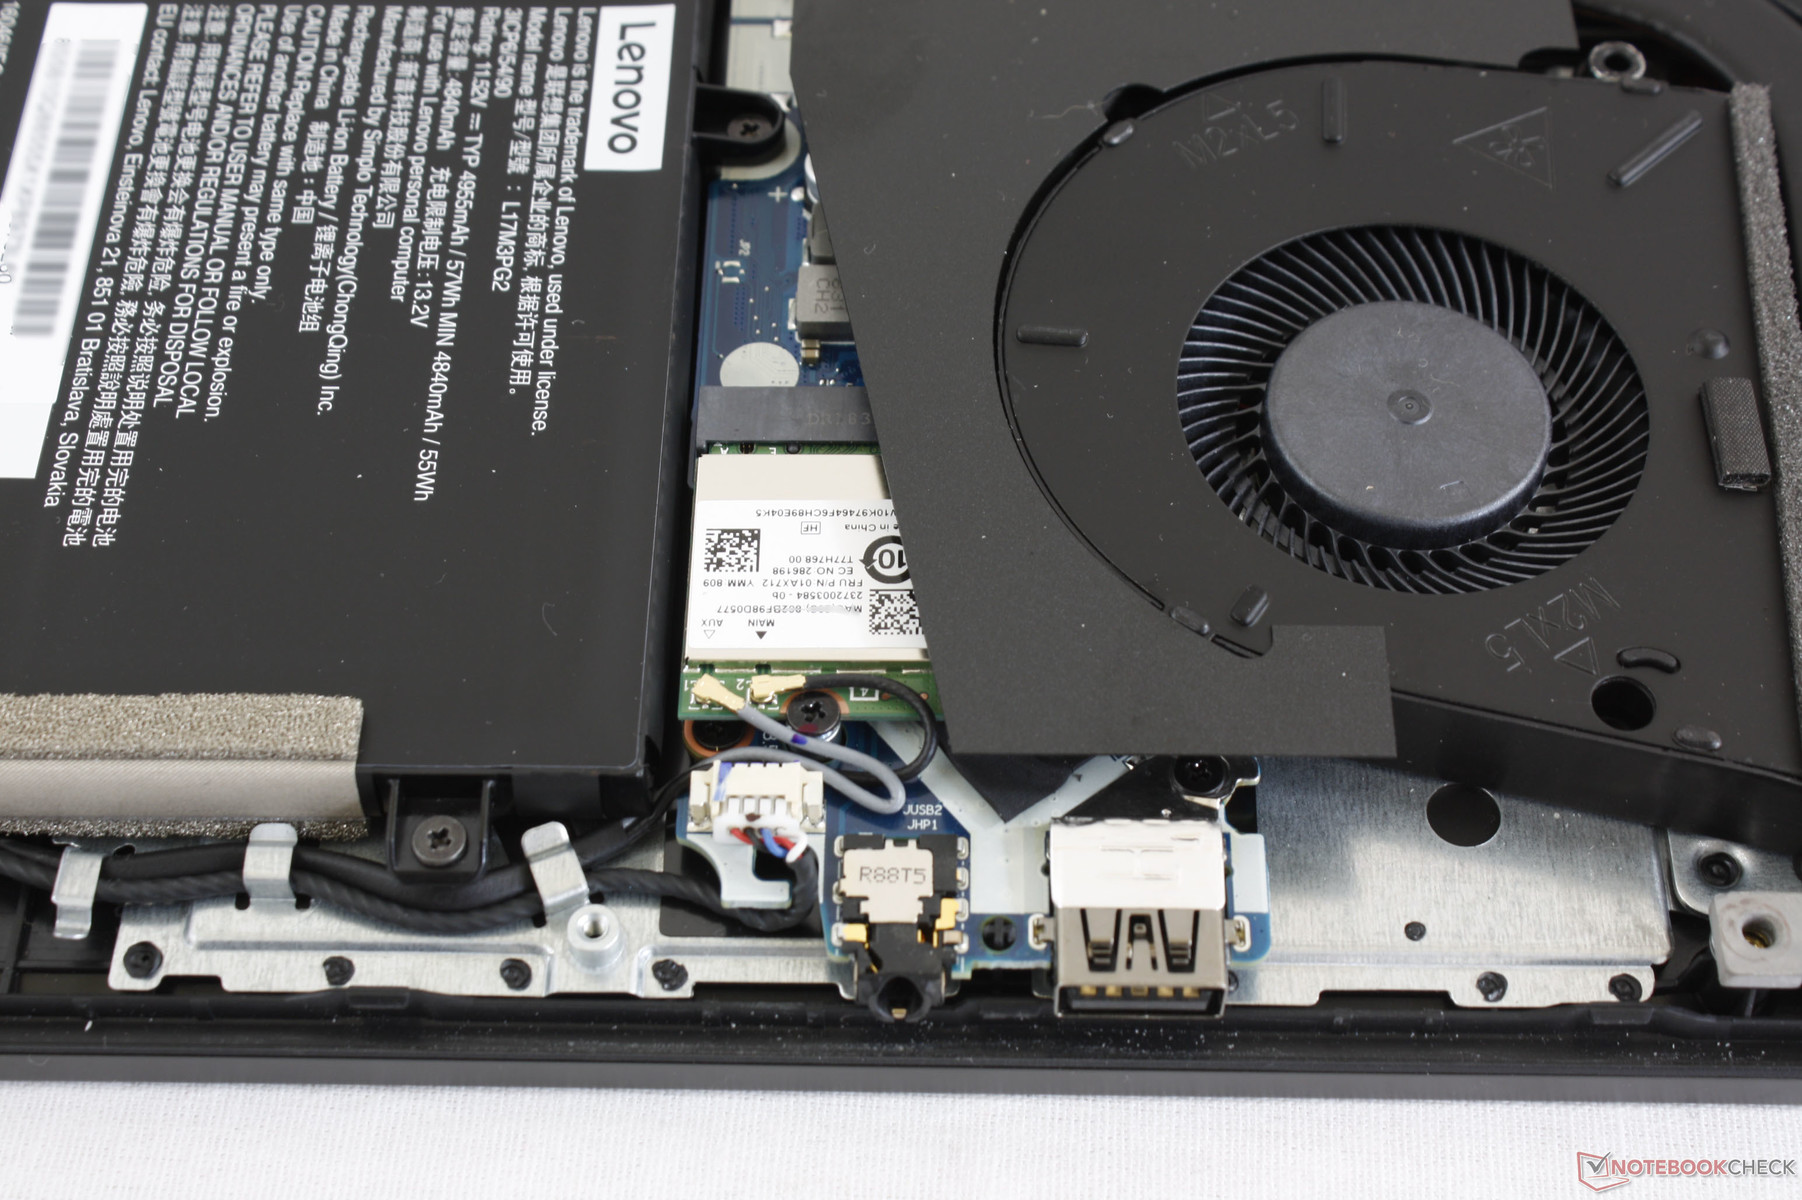
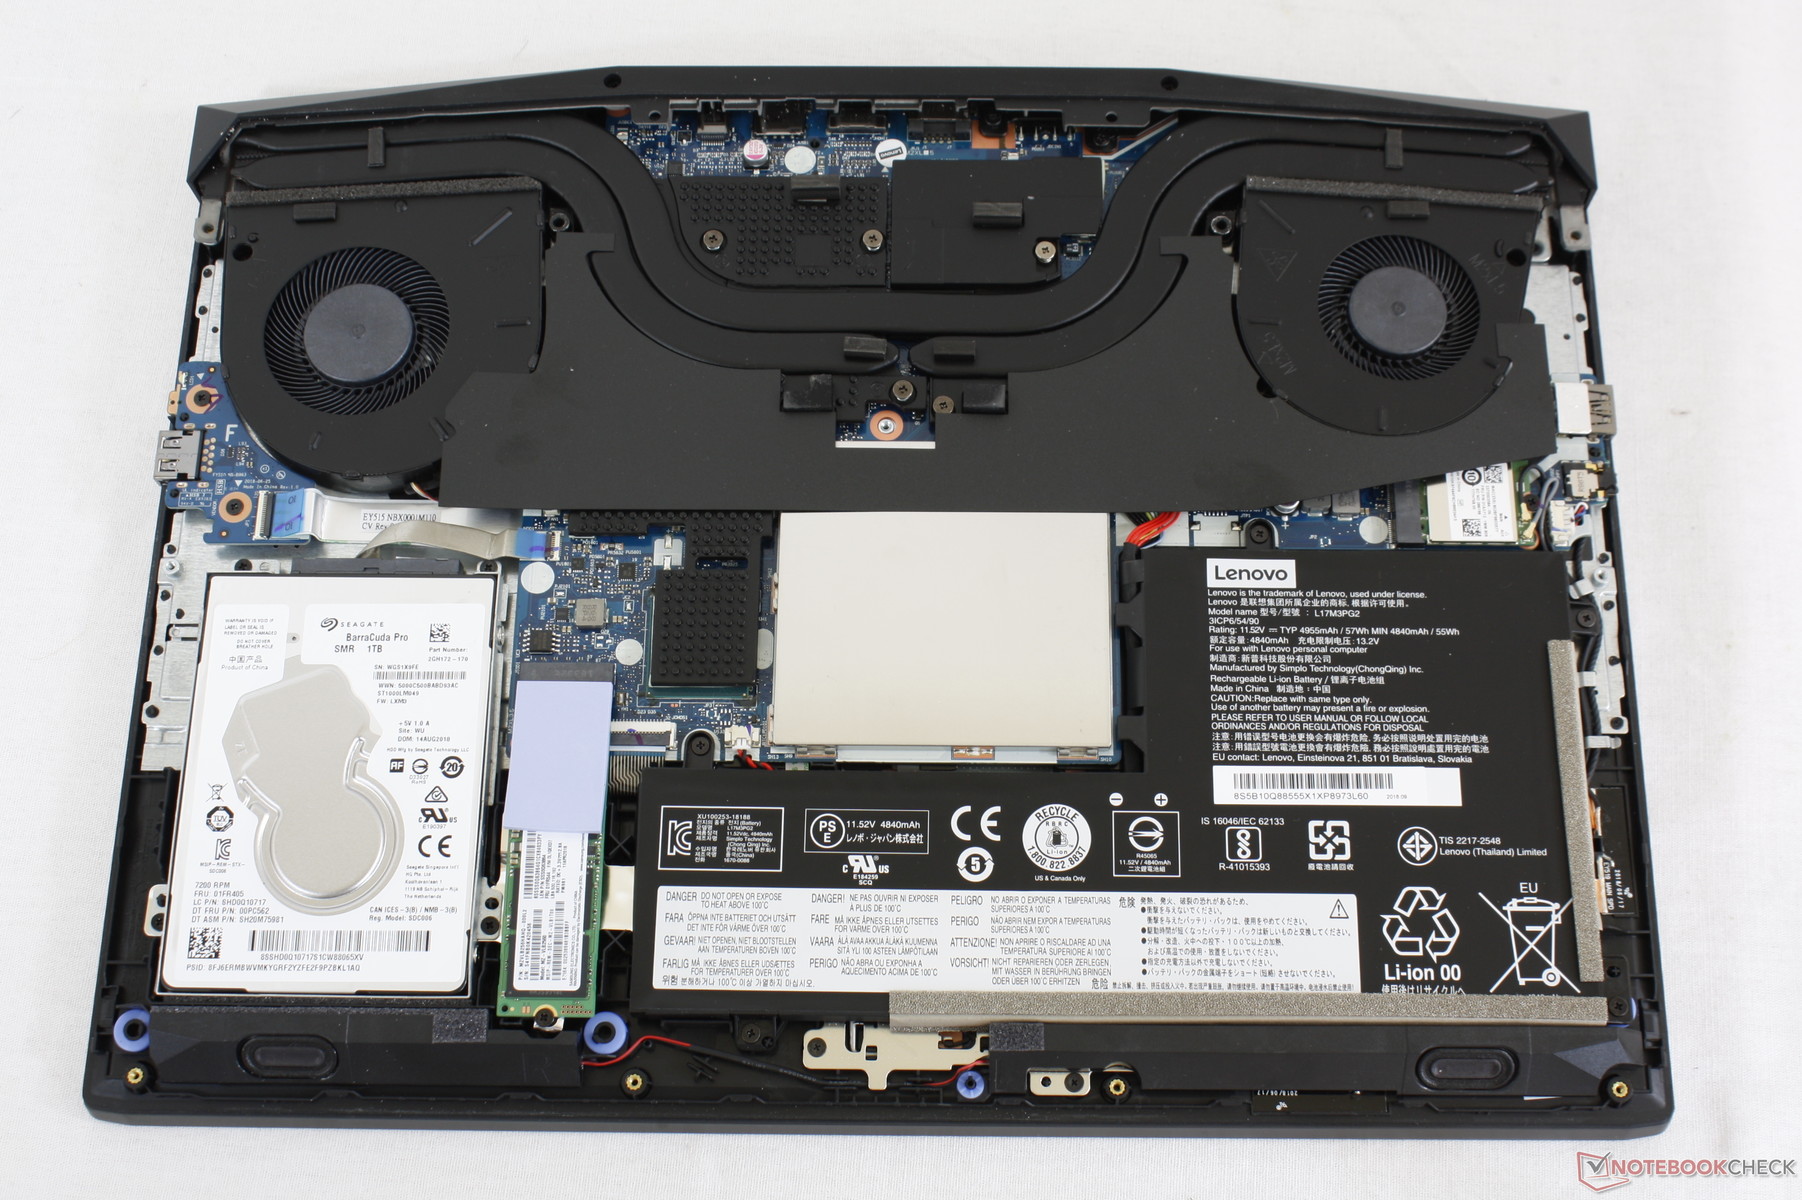
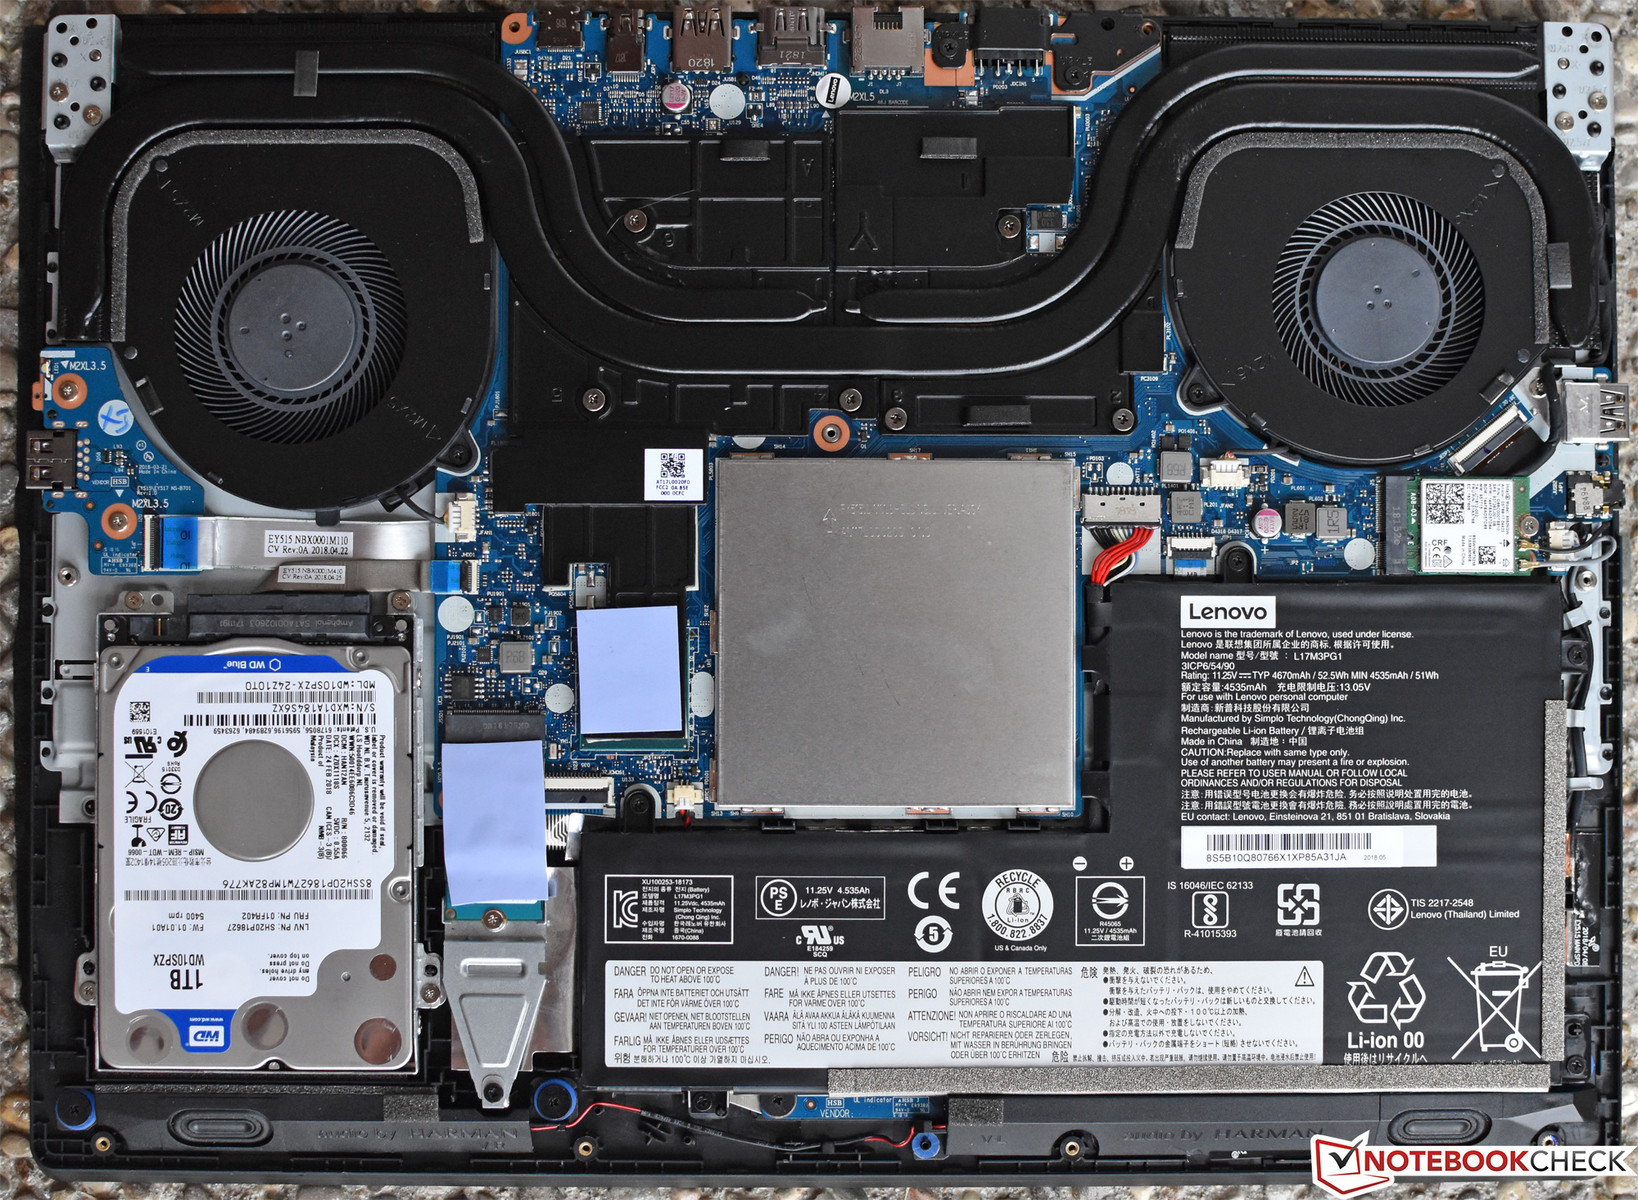
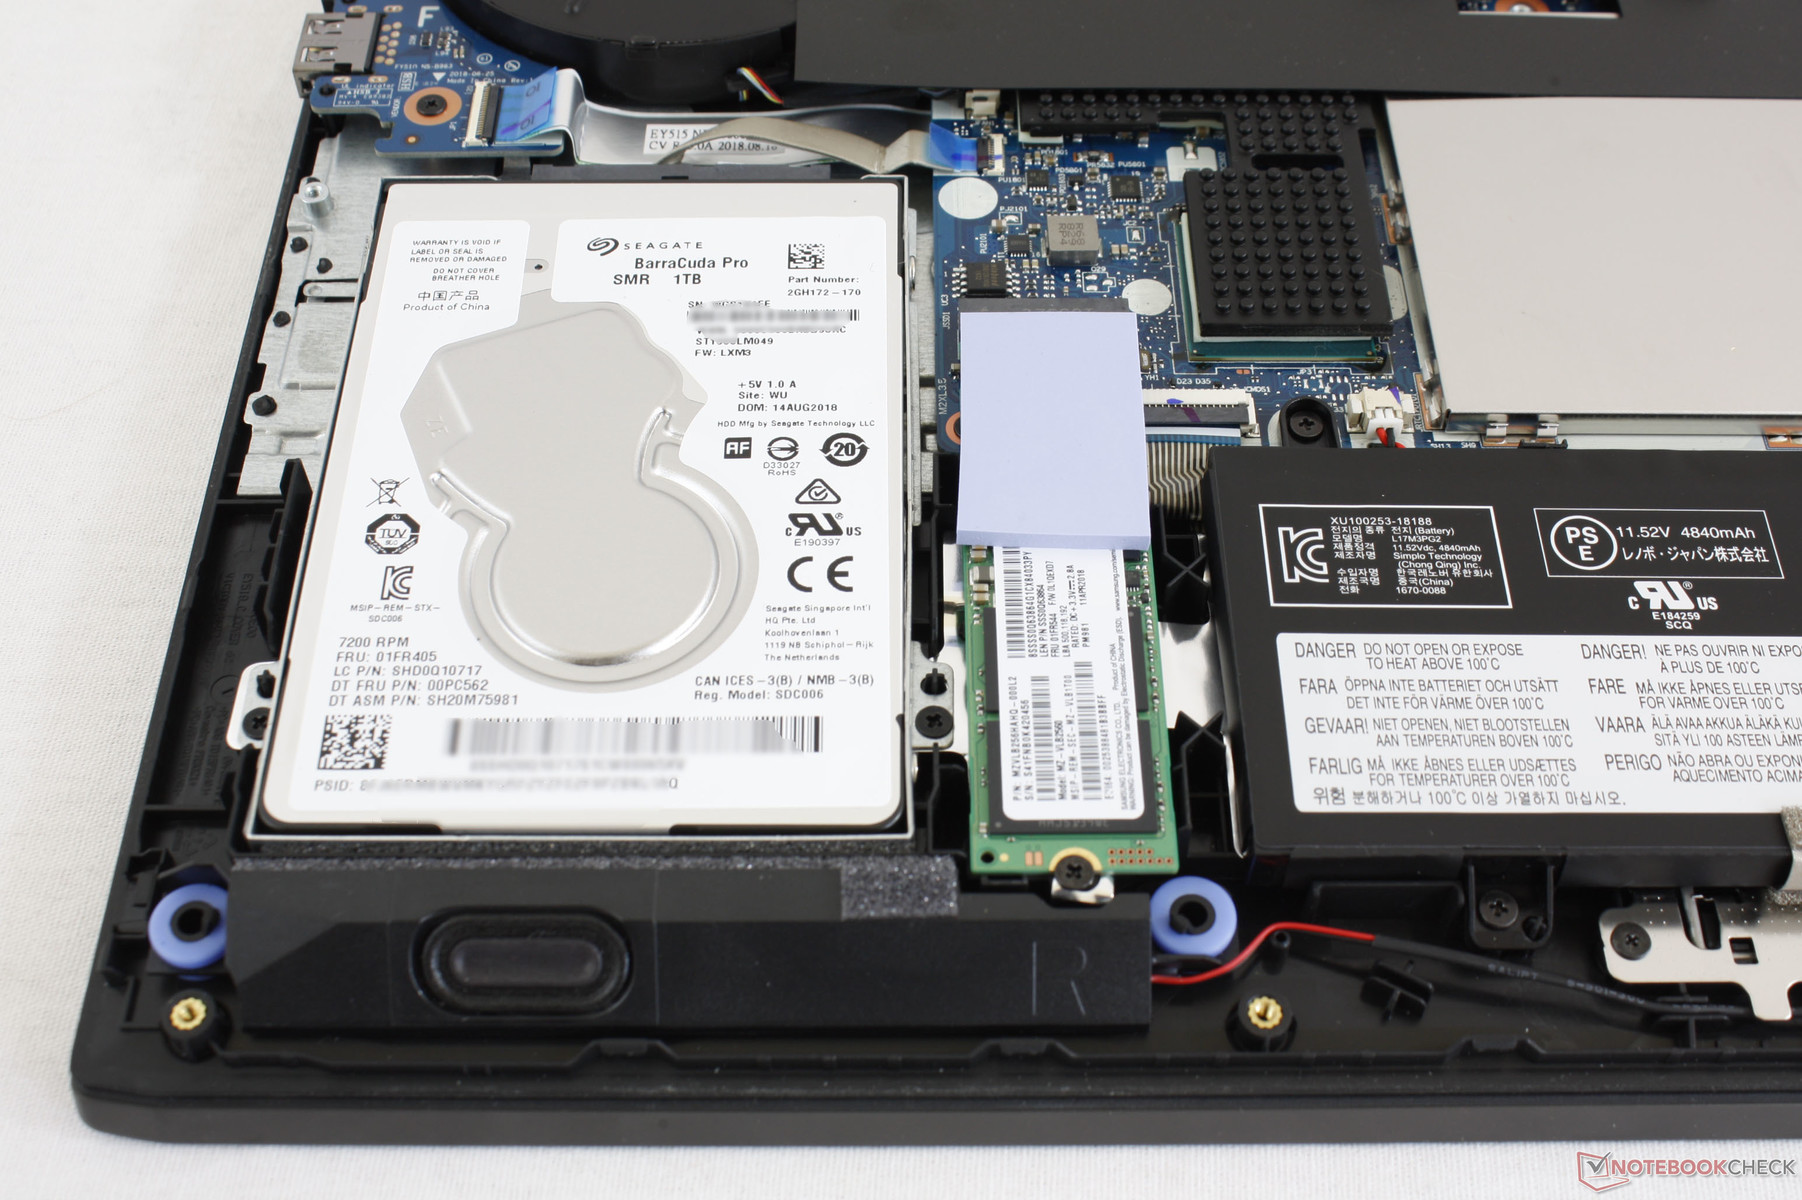
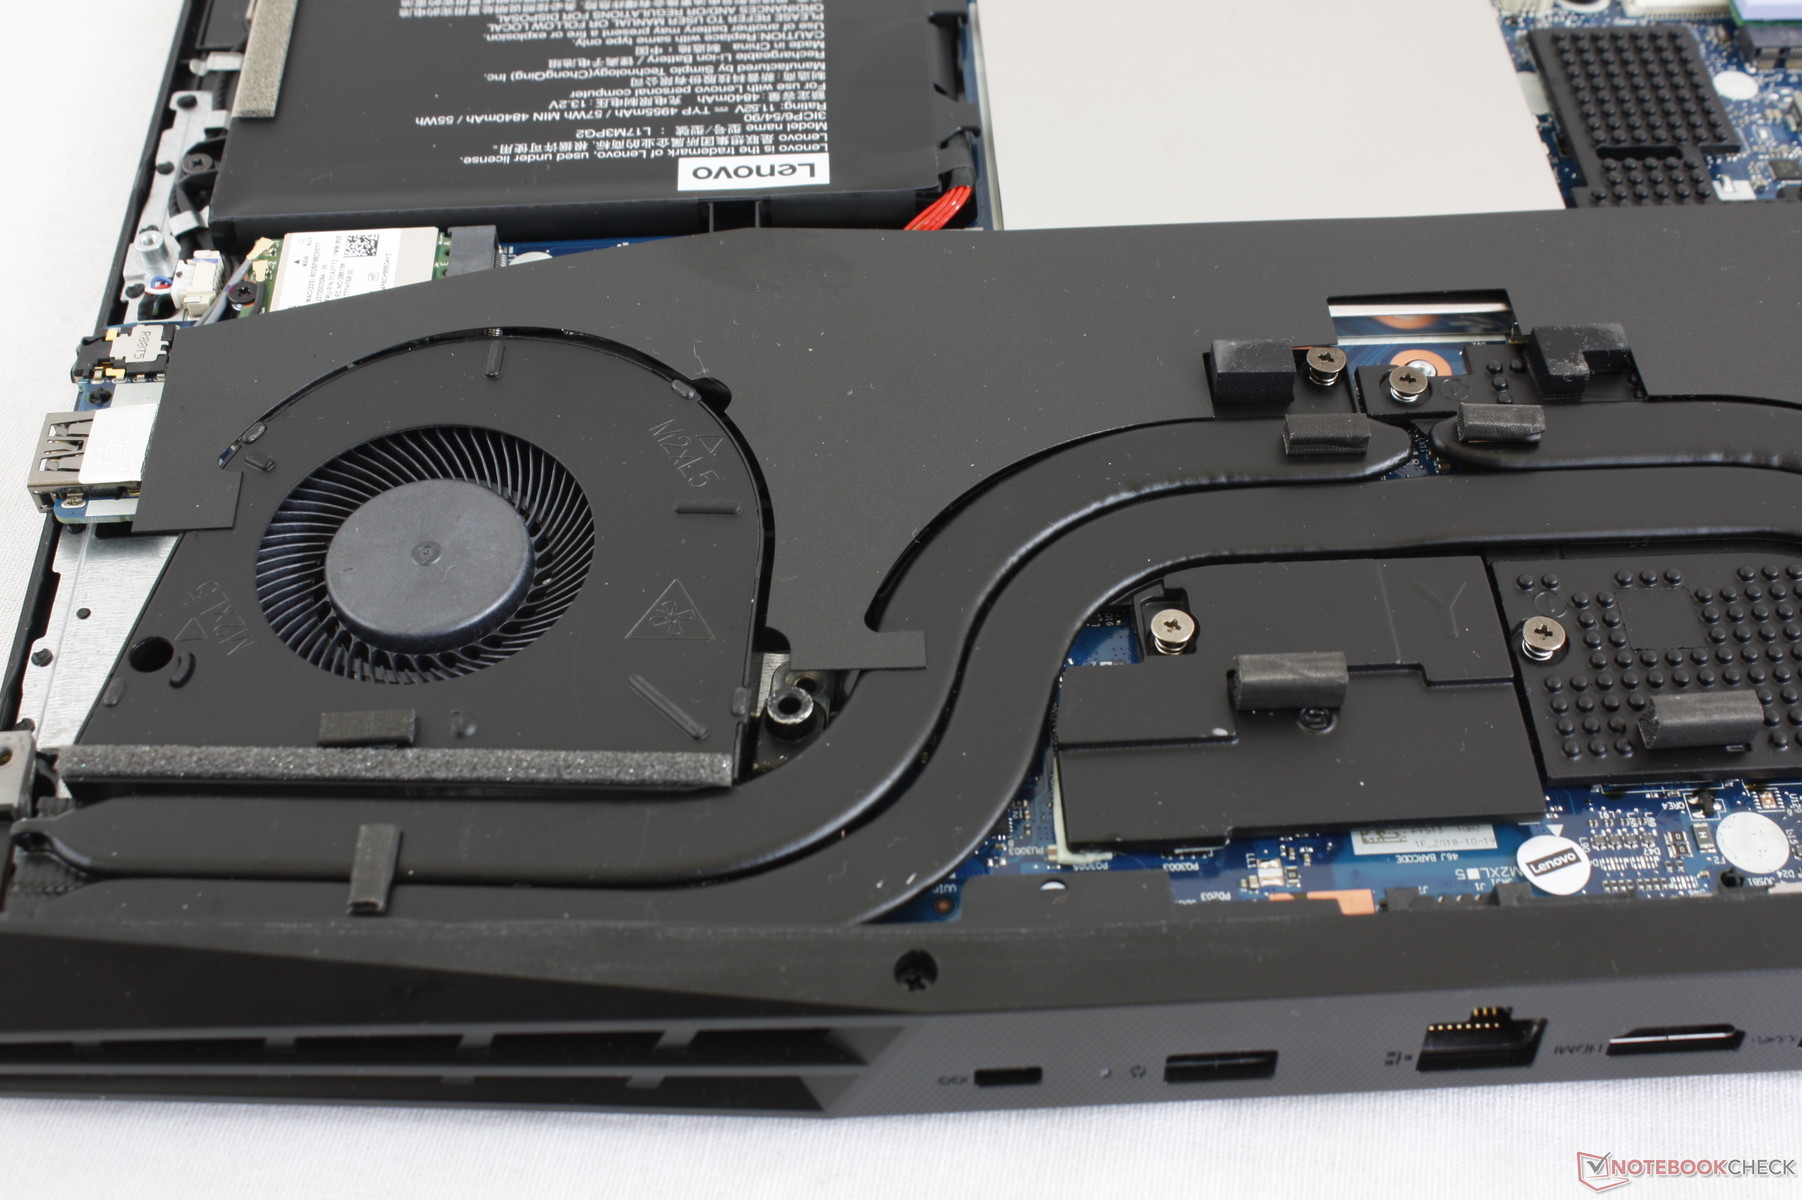
Once inside, users have direct access to the internal battery, WLAN module, both storage bays, and the cooling solution. The two SODIMM slots are inconveniently behind a metal shield.
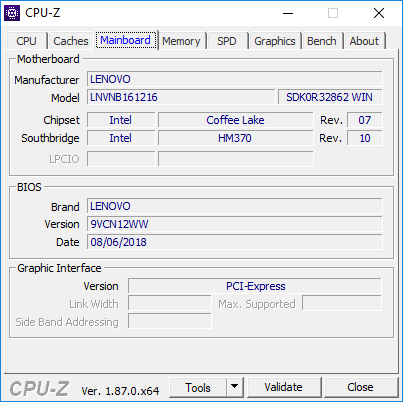
The internal layout is almost identical to the layout of the Y530 as shown below despite their very different external designs.
Accessories and Warranty
There are no included extras in the box outside of the AC adapter and usual paperwork. A velvet cleaning cloth would have been a nice addition.
The standard one-year limited warranty applies. This model is not yet available on the official Lenovo website as of this writing which may impact its extended warranty options with the manufacturer. Please see our Guarantees, Return policies and Warranties FAQ for country-specific information.
Input Devices
Keyboard
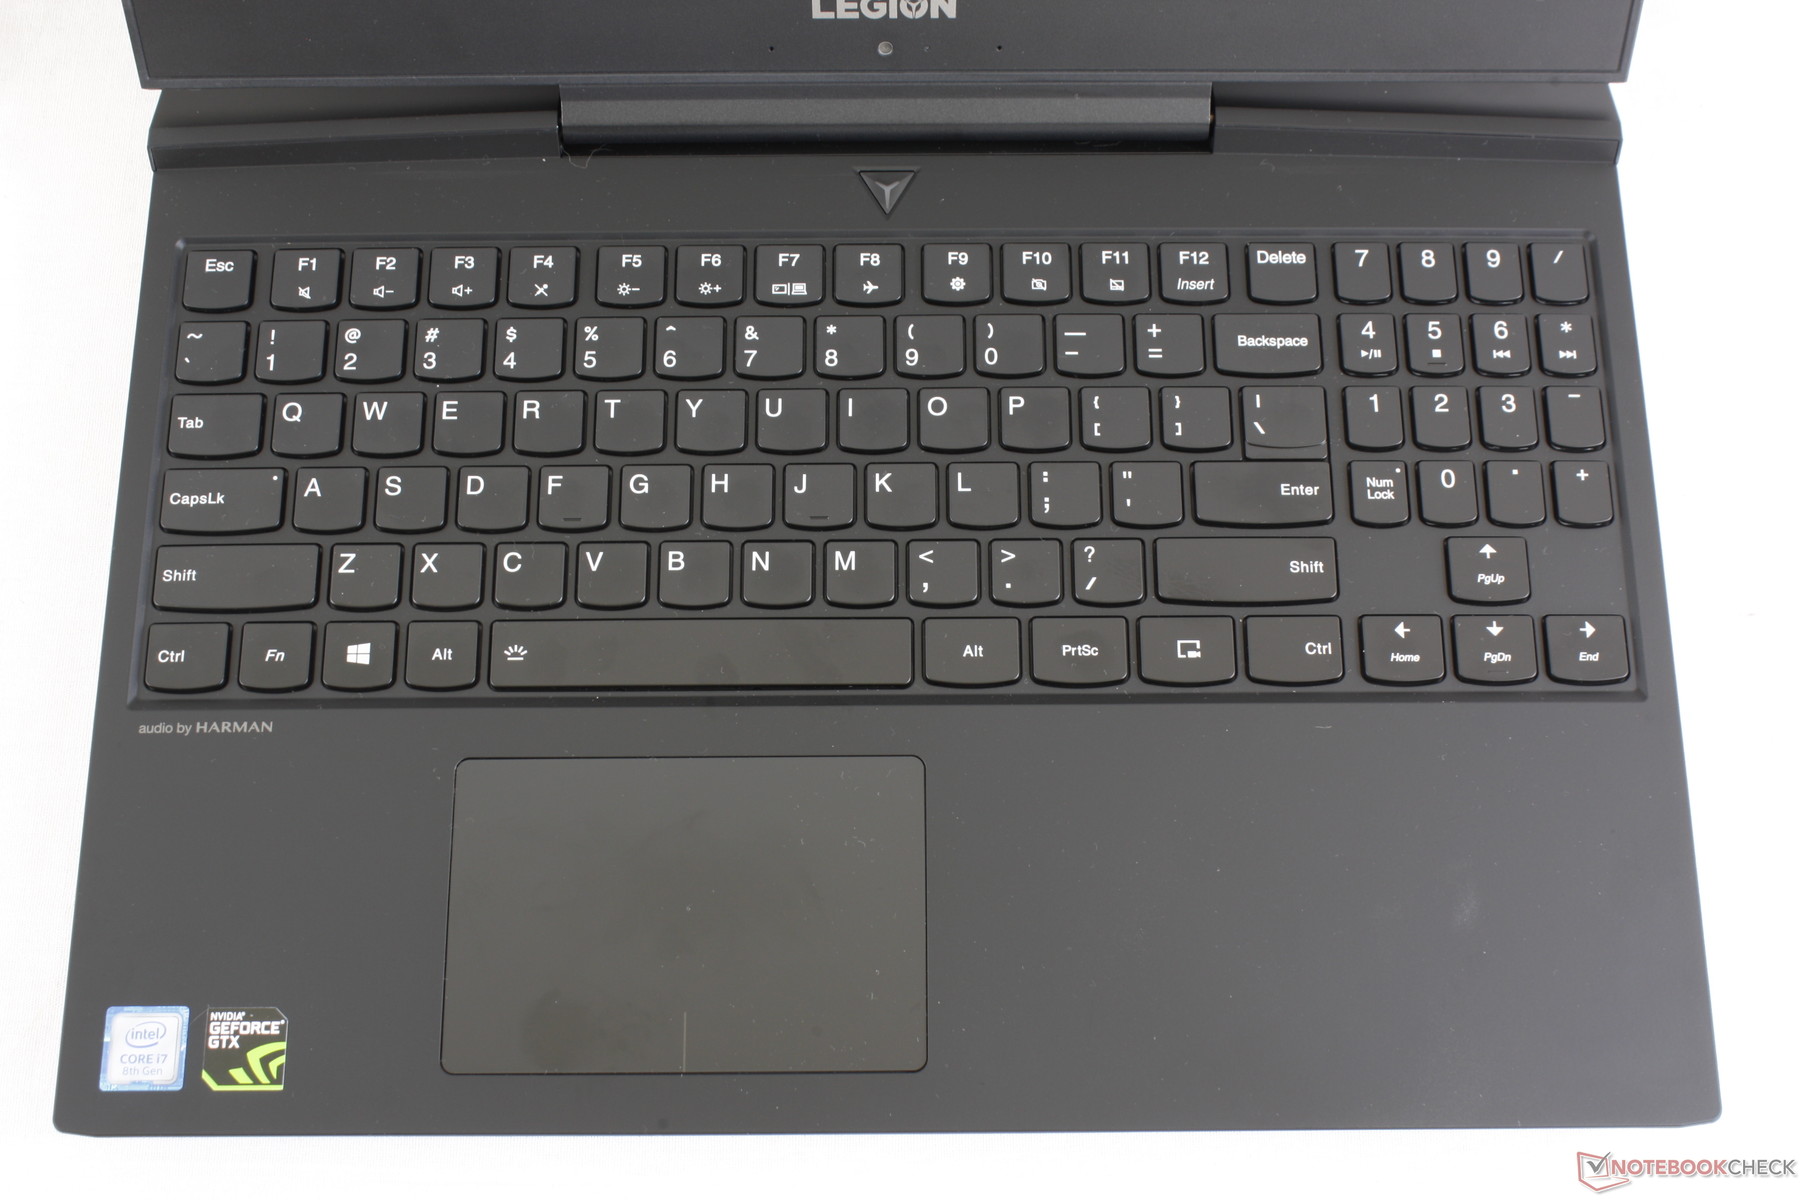
Key size, feedback, and layout are identical to the keyboard of the Y530 and so our same comments apply here. The 1.7 mm travel is deeper than on many Ultrabooks where <1.4 mm is common, but feedback is slightly softer than the keys on the Asus GL504 especially in regards to the smaller NumPad keys. Thankfully, the Arrow keys are large and not cramped unlike on most other 15.6-inch gaming laptops.
The single-zone white backlight has two brightness levels. Users who want RGB colors should consider the Legion Y730 instead.
Touchpad
Unlike the keyboard, the trackpad on the Y7000 is different than the one on the Y530. There are no more dedicated mouse keys in favor of a larger surface area (10.5 x 7.0 cm vs. 10.0 x 5.1 cm). Thus, it's a deliberate double-edged sword as clicking on the clickpad is softer, quieter, and shallower than on the Y530 while multi-touch inputs are now easier. The plastic texture is otherwise similar to the Y530 if not slightly weaker since the larger surface warps more easily to pressure. It's serviceable, but we wish it could have been firmer.
Display
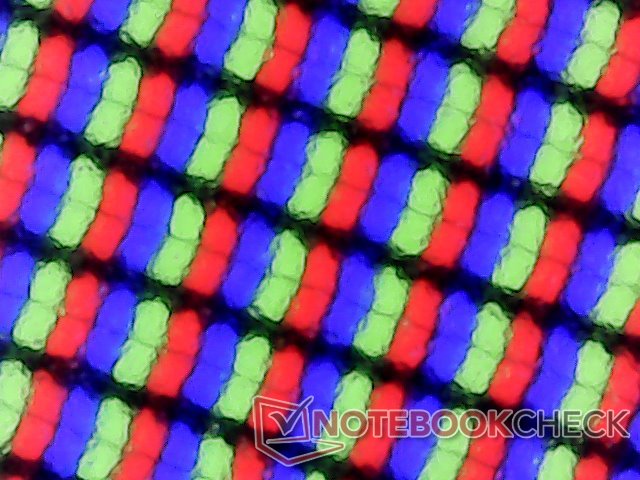
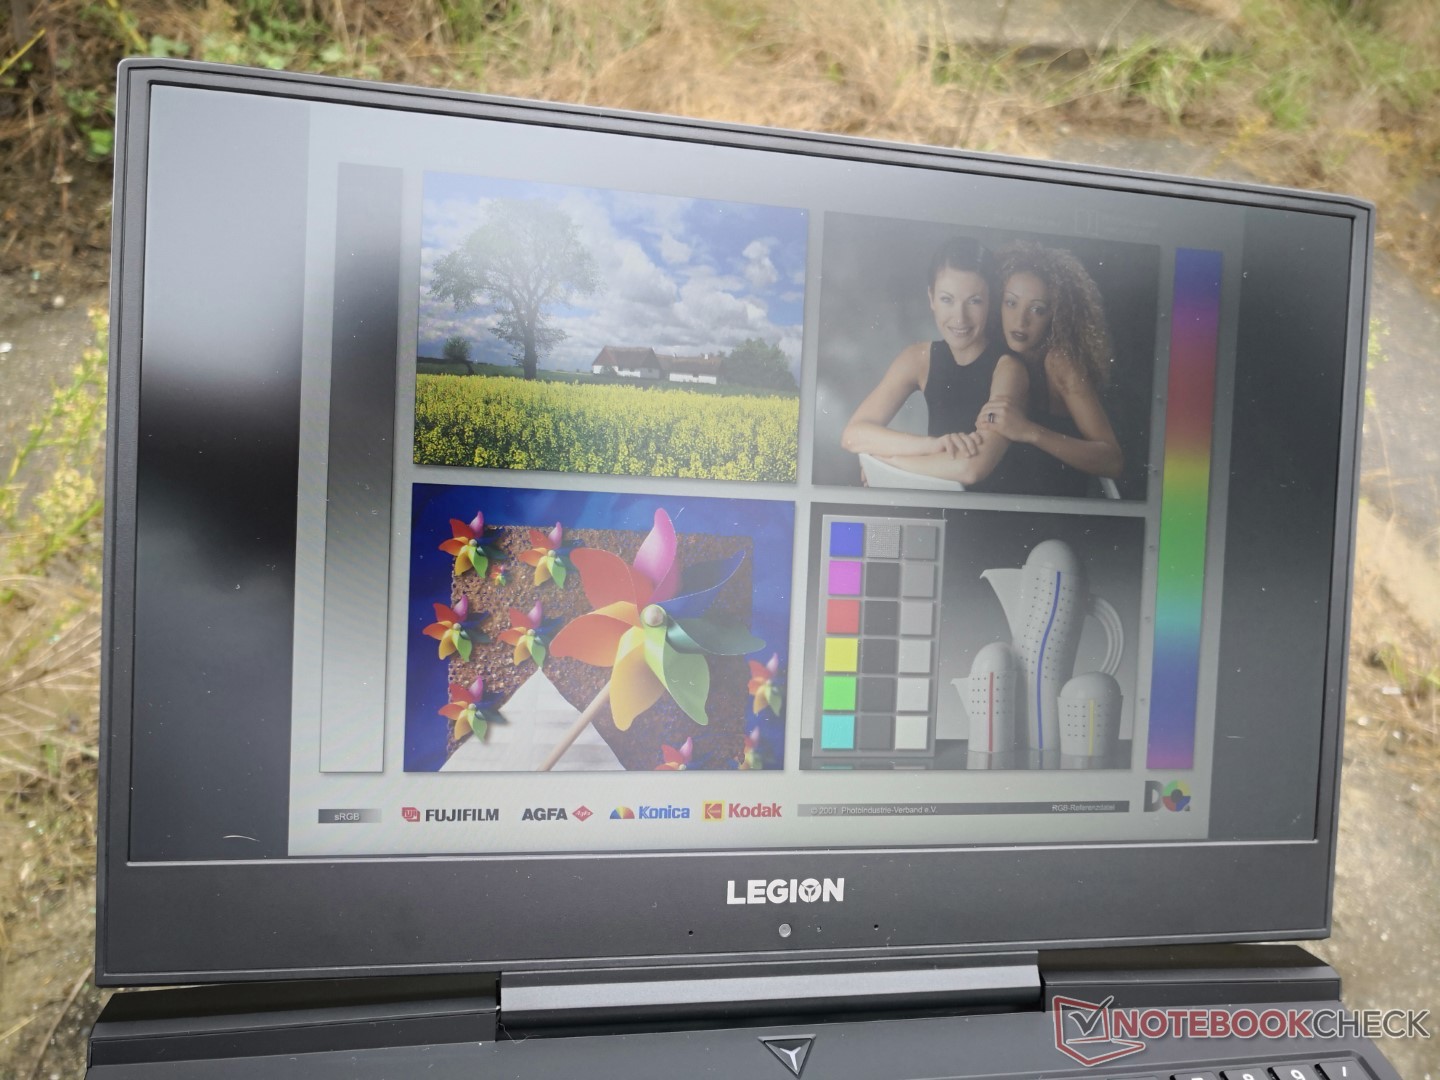
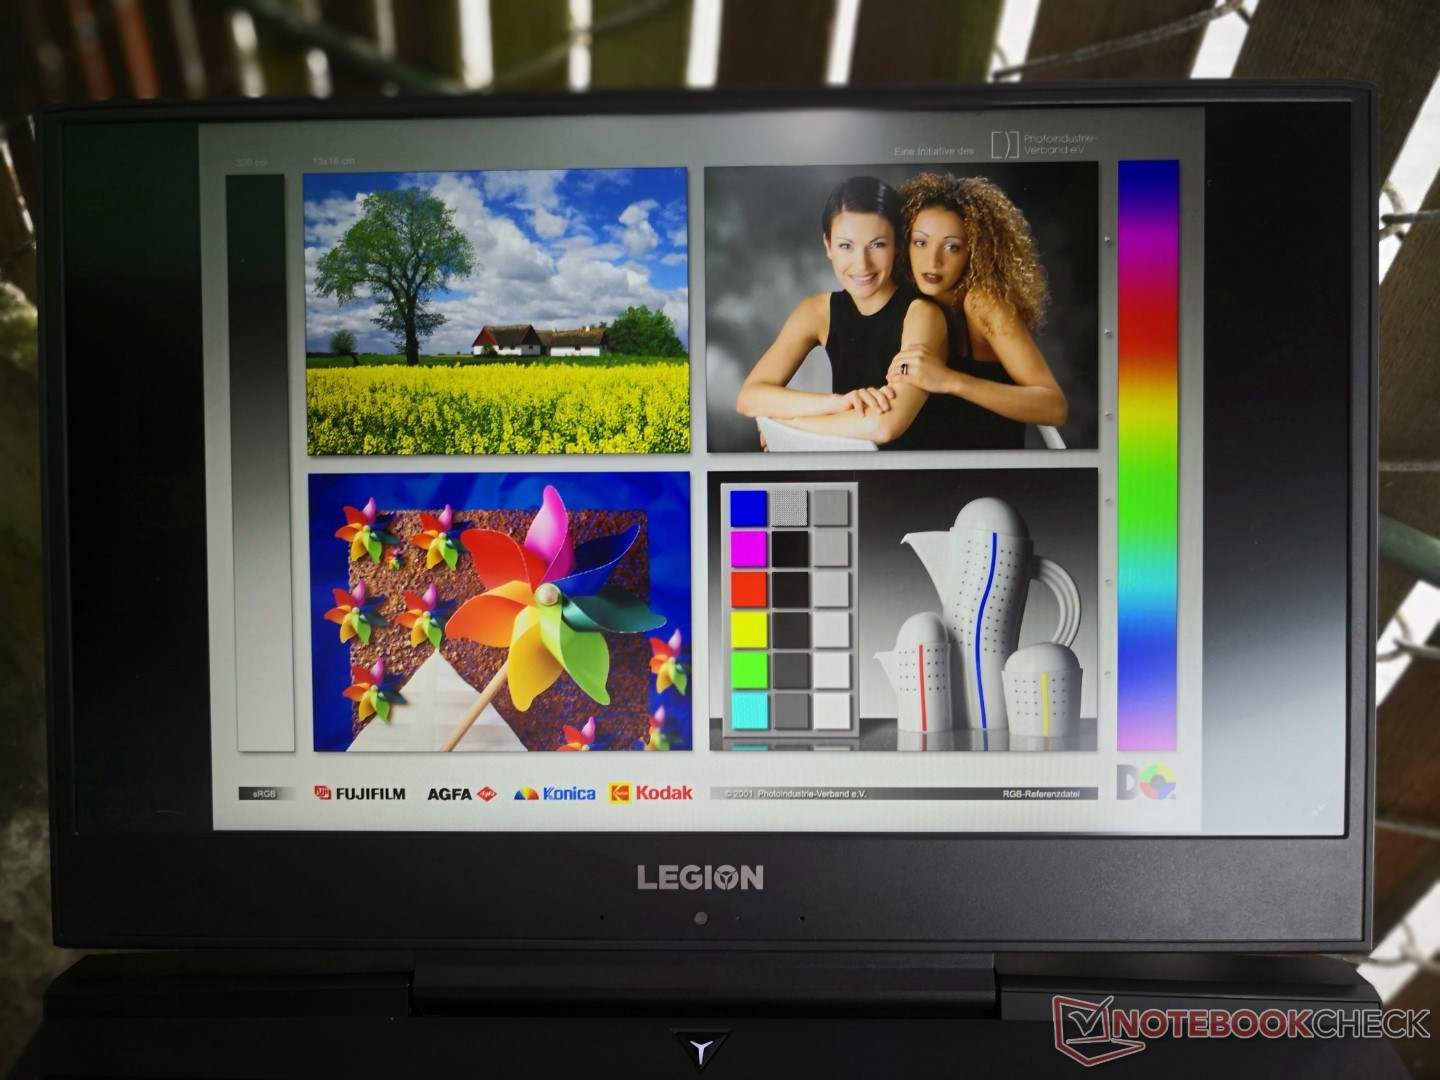
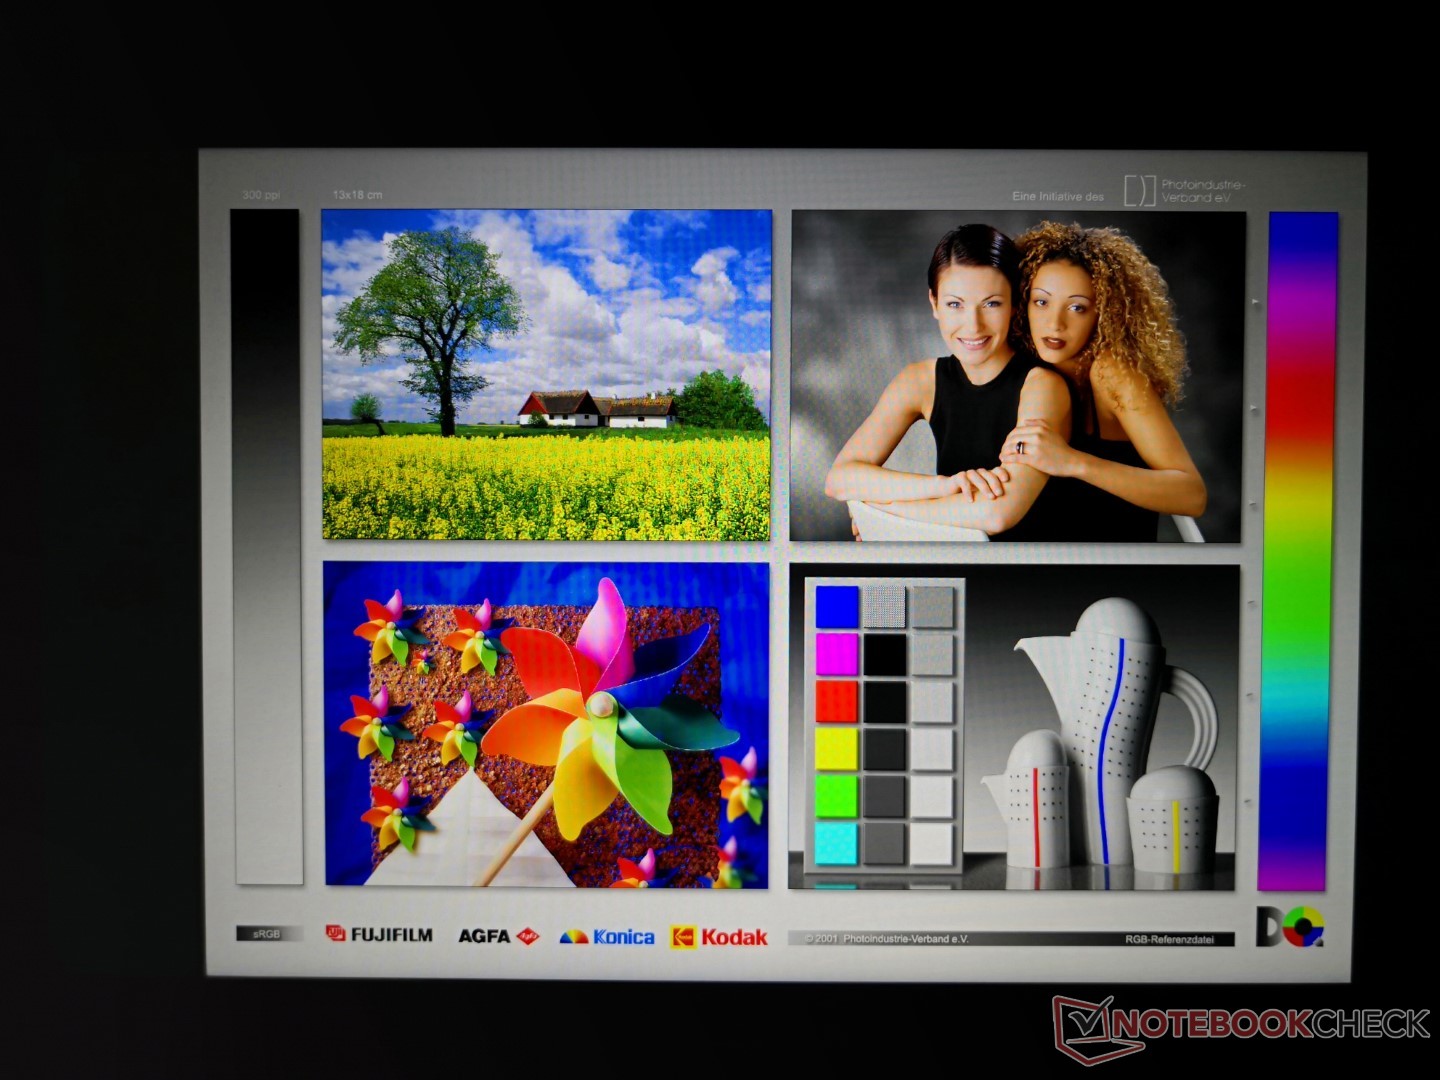
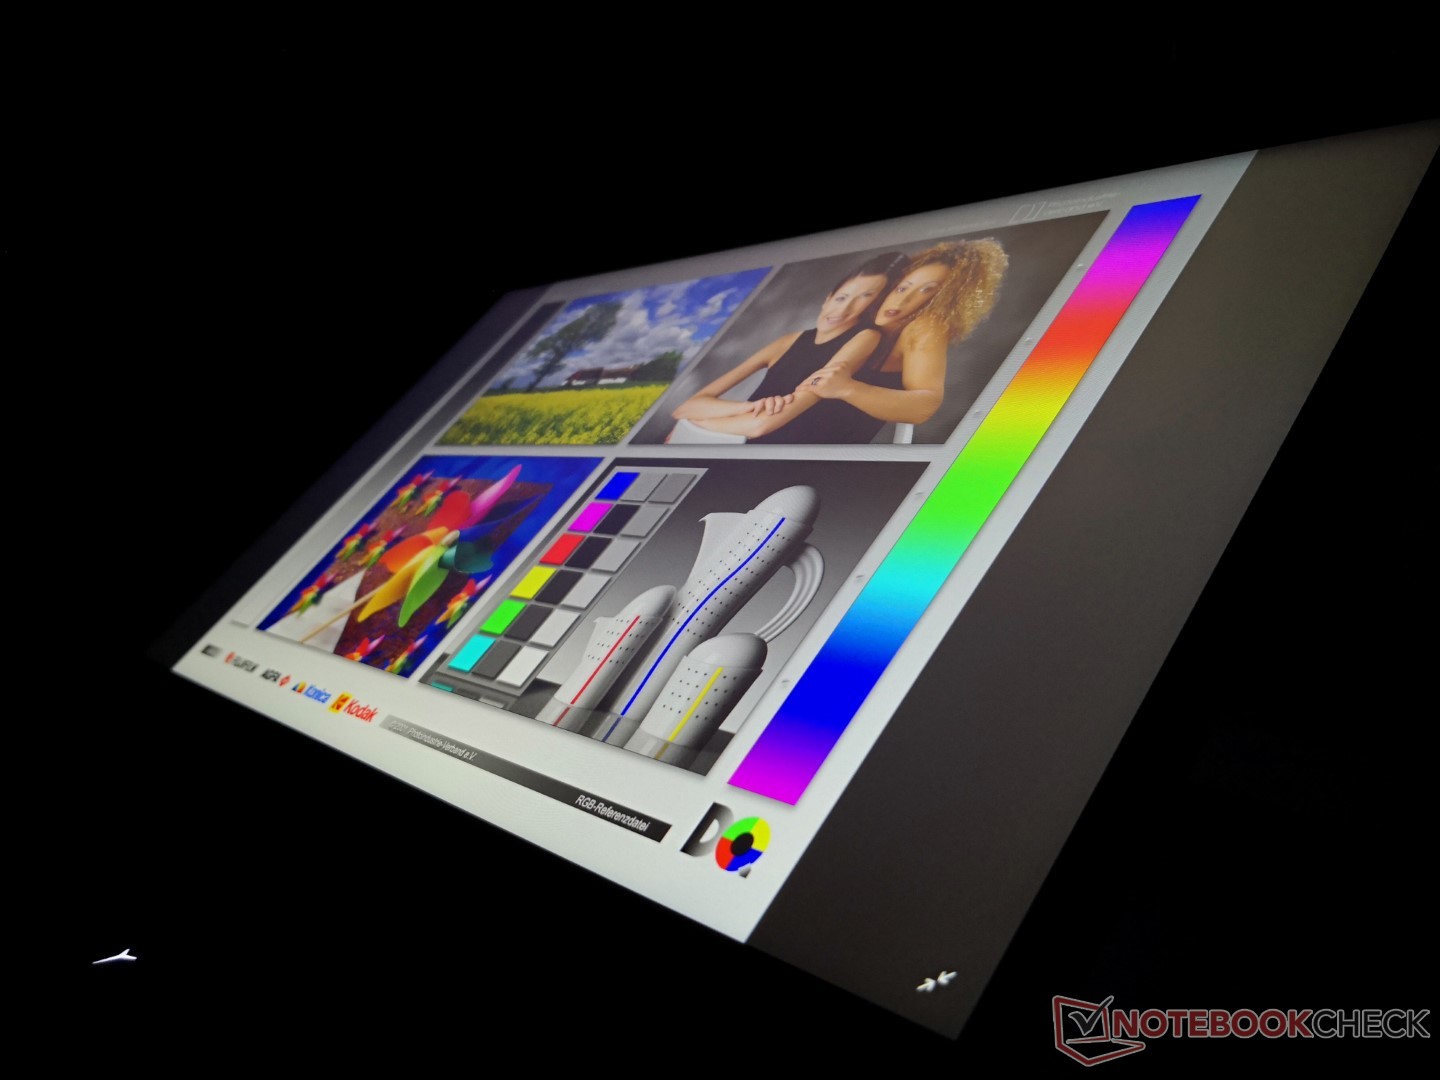
Display options include either 1080p60 or 1080p144 with no glossy, Gorilla Glass, or 4K alternatives. Contrast and maximum brightness are where we expect them to be for a gaming laptop at about 800:1 and 300 nits, respectively. The matte panel does not exhibit any major graininess issues for a very clean picture. A slight level of graininess is noticeable if viewing at an angle or from the side.
Whereas the Legion Y530 uses an AU Optronics B156HAN02.1 IPS panel, the Legion Y7000 uses a BOE NV156FHM-N61 IPS panel instead to offer a wider color coverage. This same BOE panel can also be found on the Xiaomi Mi Notebook Pro, Razer Blade 15 Base Model, and even the ThinkPad X1 Extreme. Consequently, all these 15-inch laptops share similar display properties.
The two noteworthy drawbacks of the display are pulse-width modulation and the slow black-white and gray-gray response times. We are able to detect a high PWM frequency on all brightness levels up to 99 percent that may impact a very small subset of users. Meanwhile, ghosting is more noticeable on our 60 Hz panel. We're unsure if the 144 Hz panel option will have faster 3 ms or 5 ms response times like on the Asus GL504 for an almost ghost-free gaming experience.
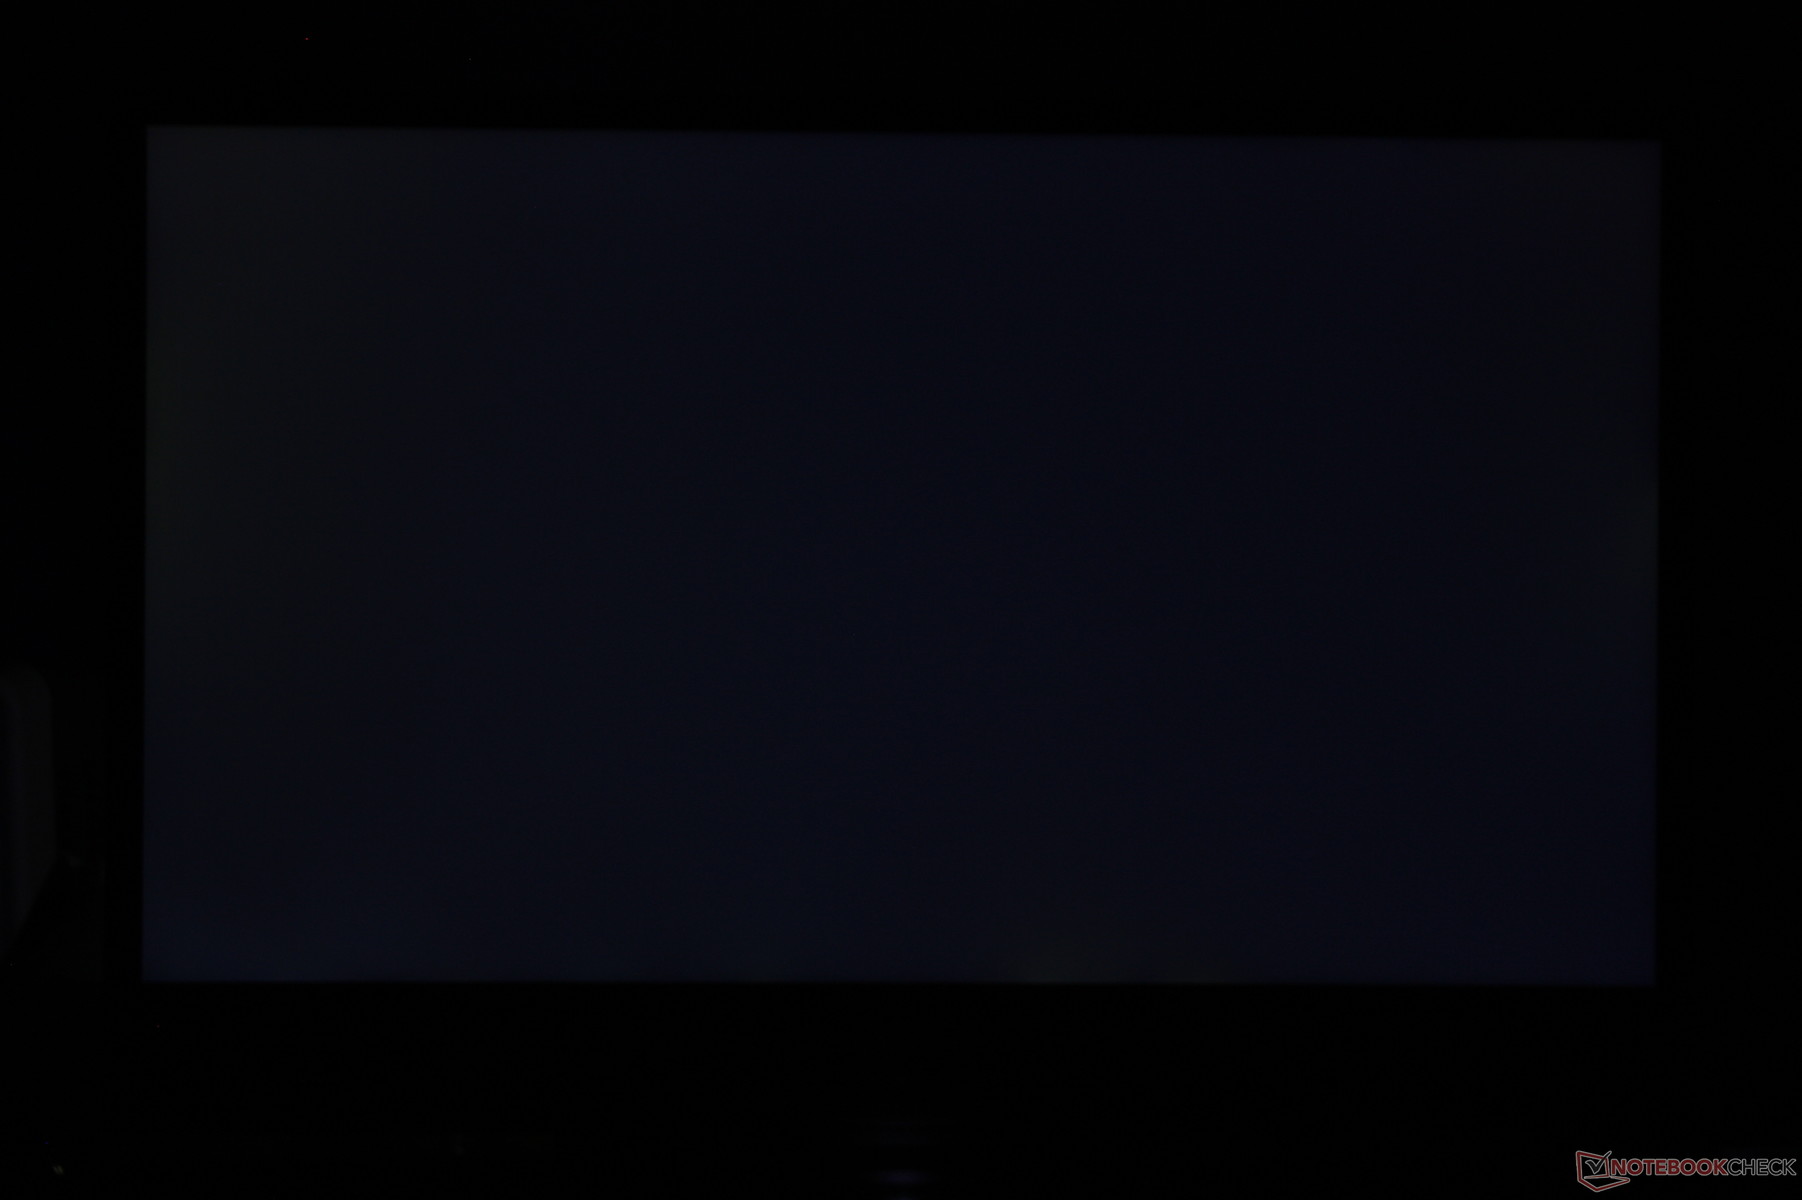
Backlight bleeding is very minor with just a hint of light along the right edge.
| |||||||||||||||||||||||||
Brightness Distribution: 88 %
Center on Battery: 312.9 cd/m²
Contrast: 846:1 (Black: 0.37 cd/m²)
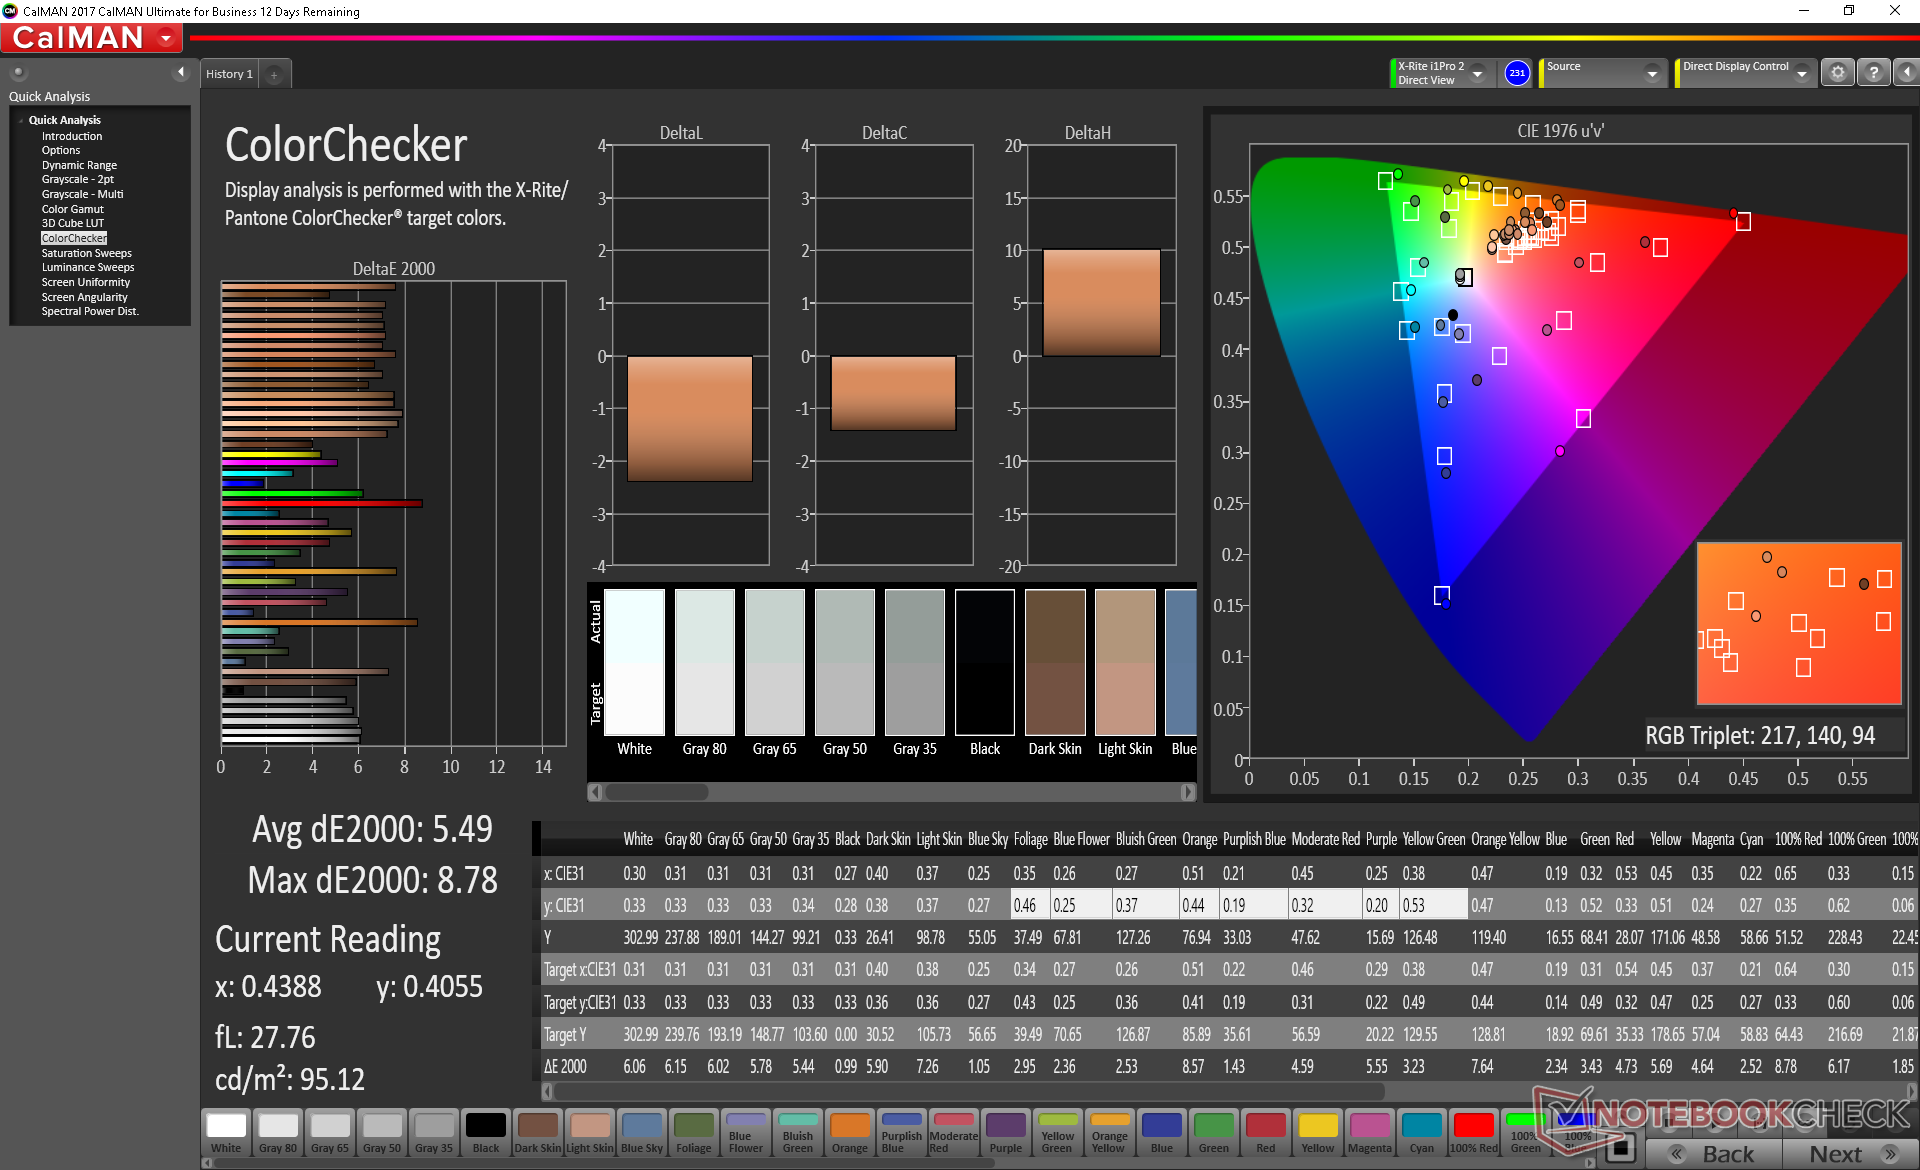
ΔE ColorChecker Calman: 5.49 | ∀{0.5-29.43 Ø4.73}
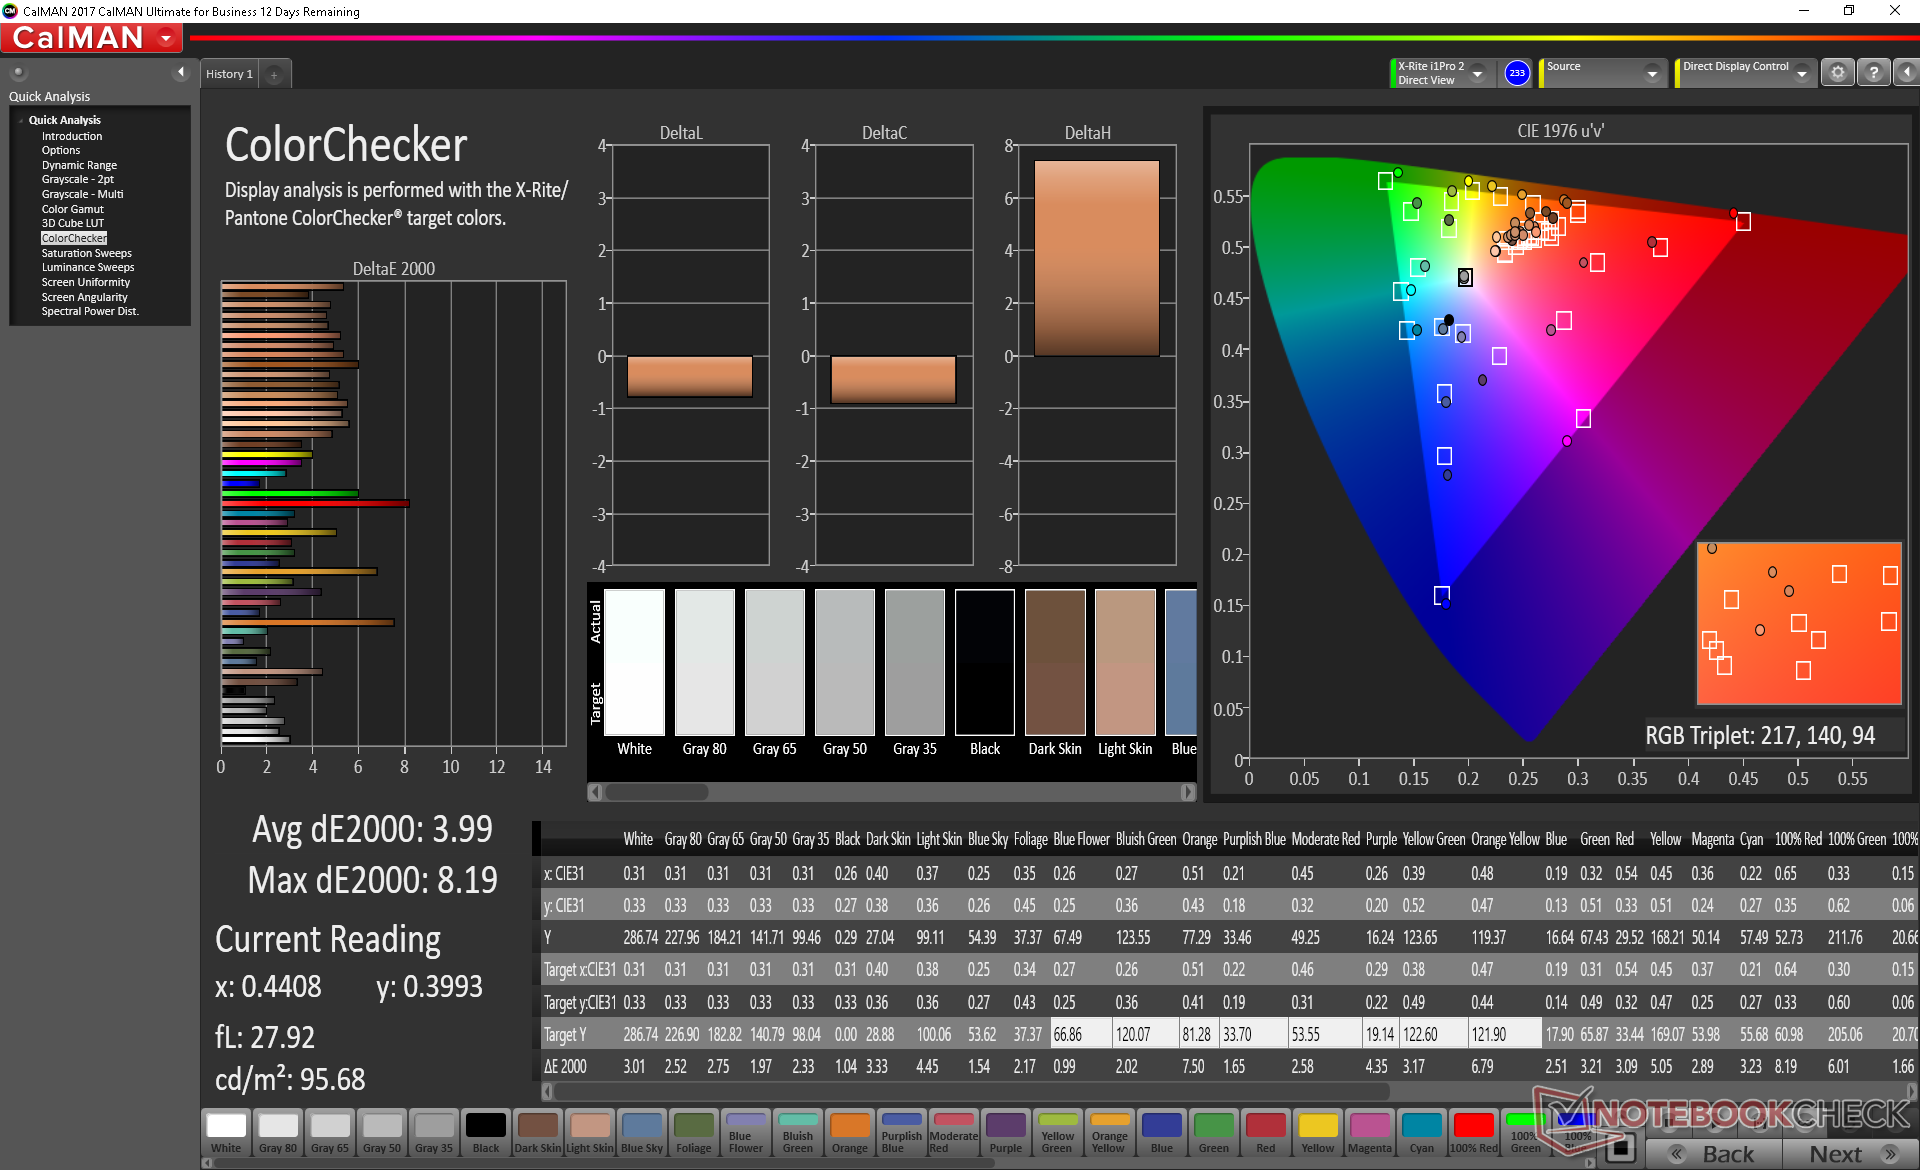
calibrated: 3.99
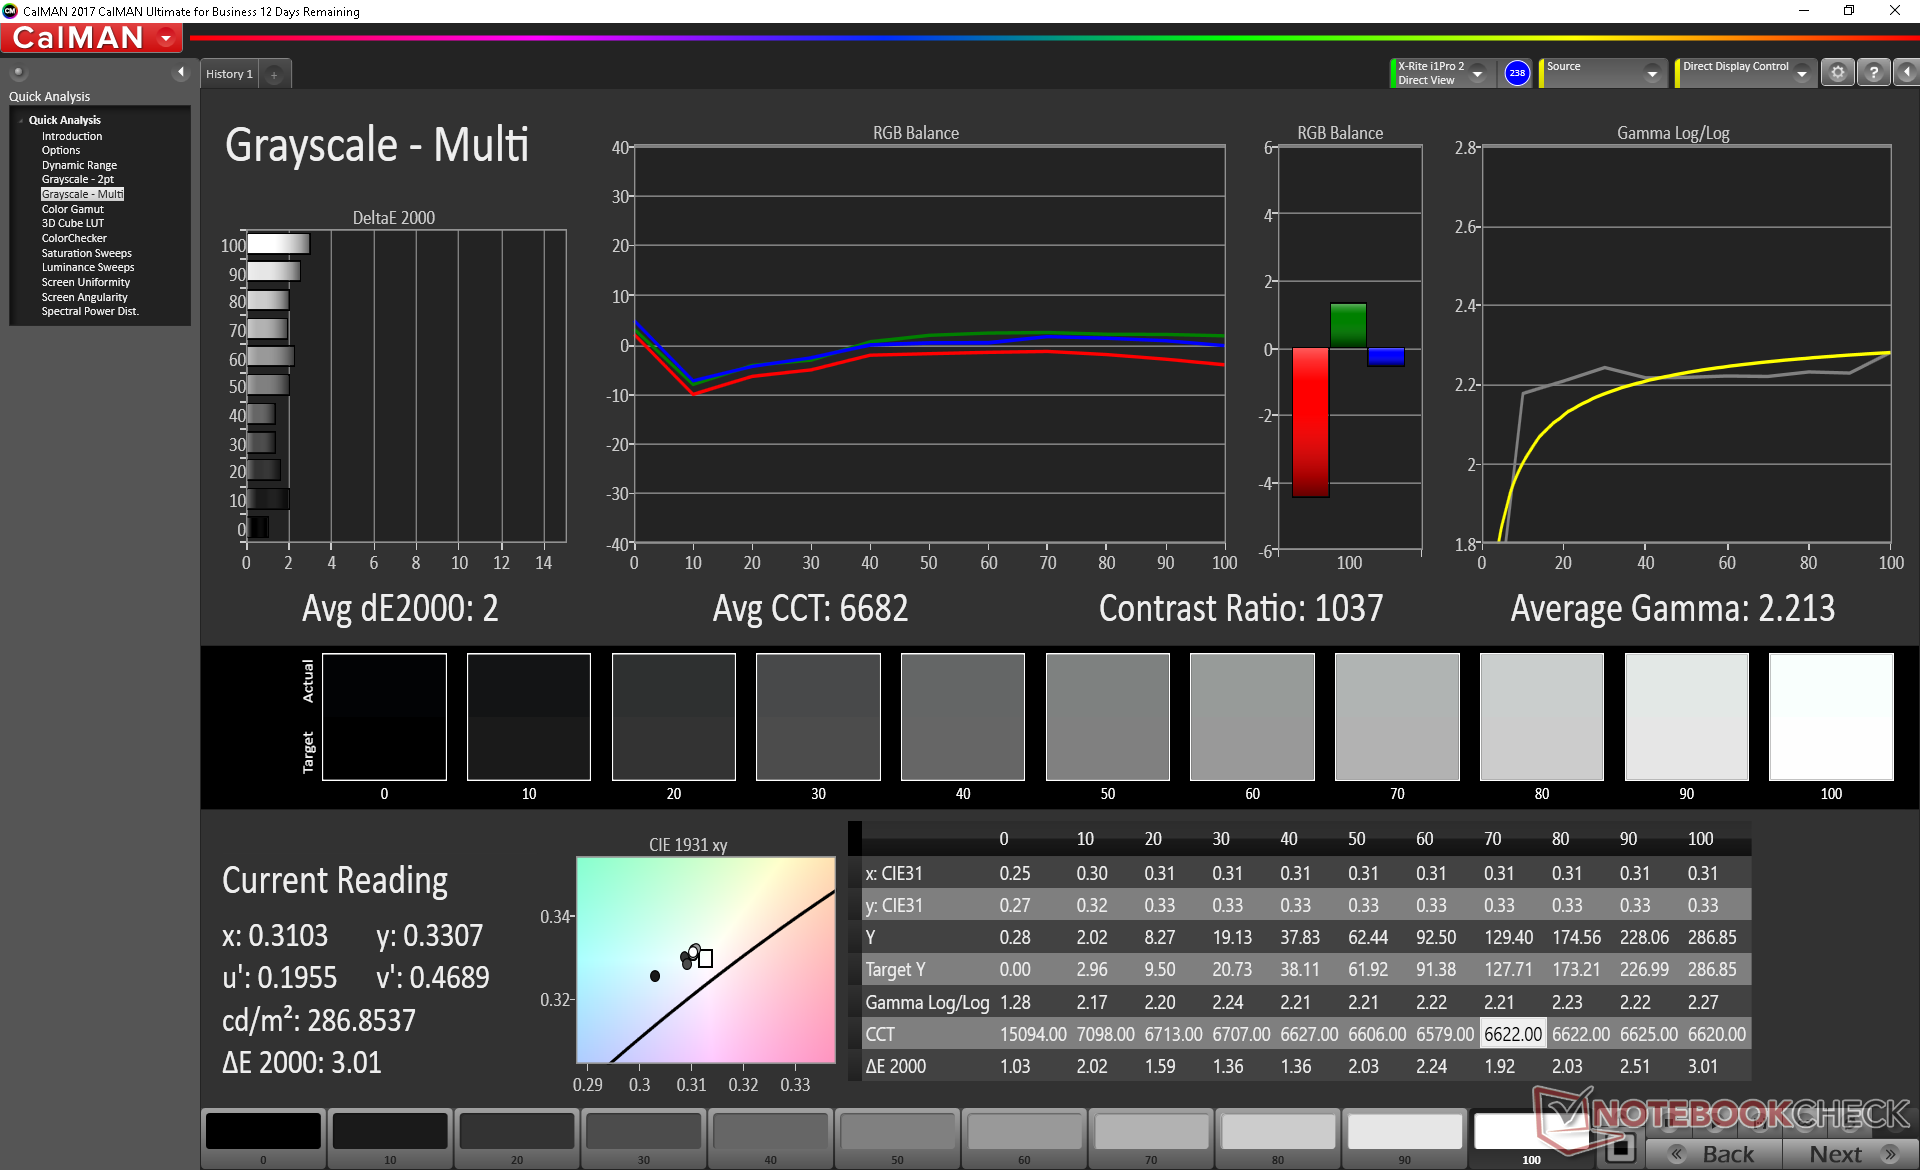
ΔE Greyscale Calman: 4.7 | ∀{0.09-98 Ø4.97}
86.1% sRGB (Argyll 1.6.3 3D)
56.3% AdobeRGB 1998 (Argyll 1.6.3 3D)
63.1% AdobeRGB 1998 (Argyll 3D)
86.4% sRGB (Argyll 3D)
66.1% Display P3 (Argyll 3D)
Gamma: 2.29
CCT: 6779 K
| Lenovo Legion Y7000P-1060 BOE NV156FHM-N61, IPS, 15.6", 1920x1080 | Dell XPS 15 2018 i5 FHD 97Wh Sharp SHP149A LQ156M1, LED IGZO IPS InfinityEdge, 15.6", 1920x1080 | MSI GF63 8RC AU Optronics B156HAN02.1, IPS, 15.6", 1920x1080 | HP Pavilion Gaming 15t-cx0000 AU Optronics AUO82ED, IPS, 15.6", 1920x1080 | Lenovo Legion Y530-15ICH B156HAN02.1, IPS, 15.6", 1920x1080 | Dell G7 15-7588 LG Philips LGD053F, IPS, 15.6", 1920x1080 | |
|---|---|---|---|---|---|---|
| Display | 6% | -35% | 4% | -38% | -39% | |
| Display P3 Coverage (%) | 66.1 | 66 0% | 39.43 -40% | 66.5 1% | 38.31 -42% | 37.82 -43% |
| sRGB Coverage (%) | 86.4 | 96.5 12% | 59.3 -31% | 91.7 6% | 57.3 -34% | 56.2 -35% |
| AdobeRGB 1998 Coverage (%) | 63.1 | 66.7 6% | 40.73 -35% | 67.1 6% | 39.58 -37% | 39.2 -38% |
| Response Times | 2% | 23% | 64% | 4% | 18% | |
| Response Time Grey 50% / Grey 80% * (ms) | 42.8 ? | 49 ? -14% | 33.2 ? 22% | 17.6 ? 59% | 43.6 ? -2% | 38.8 ? 9% |
| Response Time Black / White * (ms) | 36 ? | 30 ? 17% | 27.2 ? 24% | 11.2 ? 69% | 32.4 ? 10% | 26.8 ? 26% |
| PWM Frequency (Hz) | 21740 ? | 961 ? | ||||
| Screen | 33% | -17% | 14% | -18% | -39% | |
| Brightness middle (cd/m²) | 312.9 | 413 32% | 266.6 -15% | 357.5 14% | 282.8 -10% | 250.9 -20% |
| Brightness (cd/m²) | 296 | 378 28% | 257 -13% | 351 19% | 264 -11% | 246 -17% |
| Brightness Distribution (%) | 88 | 86 -2% | 89 1% | 85 -3% | 88 0% | 89 1% |
| Black Level * (cd/m²) | 0.37 | 0.29 22% | 0.29 22% | 0.36 3% | 0.42 -14% | 0.34 8% |
| Contrast (:1) | 846 | 1424 68% | 919 9% | 993 17% | 673 -20% | 738 -13% |
| Colorchecker dE 2000 * | 5.49 | 2.44 56% | 5.93 -8% | 4.19 24% | 4.93 10% | 7.34 -34% |
| Colorchecker dE 2000 max. * | 8.78 | 4.46 49% | 16.28 -85% | 6.97 21% | 17.65 -101% | 28.66 -226% |
| Colorchecker dE 2000 calibrated * | 3.99 | 2.48 38% | 3.6 10% | 3.2 20% | 4.07 -2% | 4.42 -11% |
| Greyscale dE 2000 * | 4.7 | 2.48 47% | 6.8 -45% | 3.5 26% | 3.8 19% | 6.8 -45% |
| Gamma | 2.29 96% | 2.43 91% | 2.43 91% | 2.324 95% | 2.449 90% | 2.164 102% |
| CCT | 6779 96% | 7006 93% | 7192 90% | 7028 92% | 6112 106% | 6780 96% |
| Color Space (Percent of AdobeRGB 1998) (%) | 56.3 | 62 10% | 37.6 -33% | 60 7% | 36 -36% | 36 -36% |
| Color Space (Percent of sRGB) (%) | 86.1 | 96 11% | 59.3 -31% | 91 6% | 57 -34% | 56 -35% |
| Total Average (Program / Settings) | 14% /
24% | -10% /
-16% | 27% /
18% | -17% /
-19% | -20% /
-32% |
* ... smaller is better
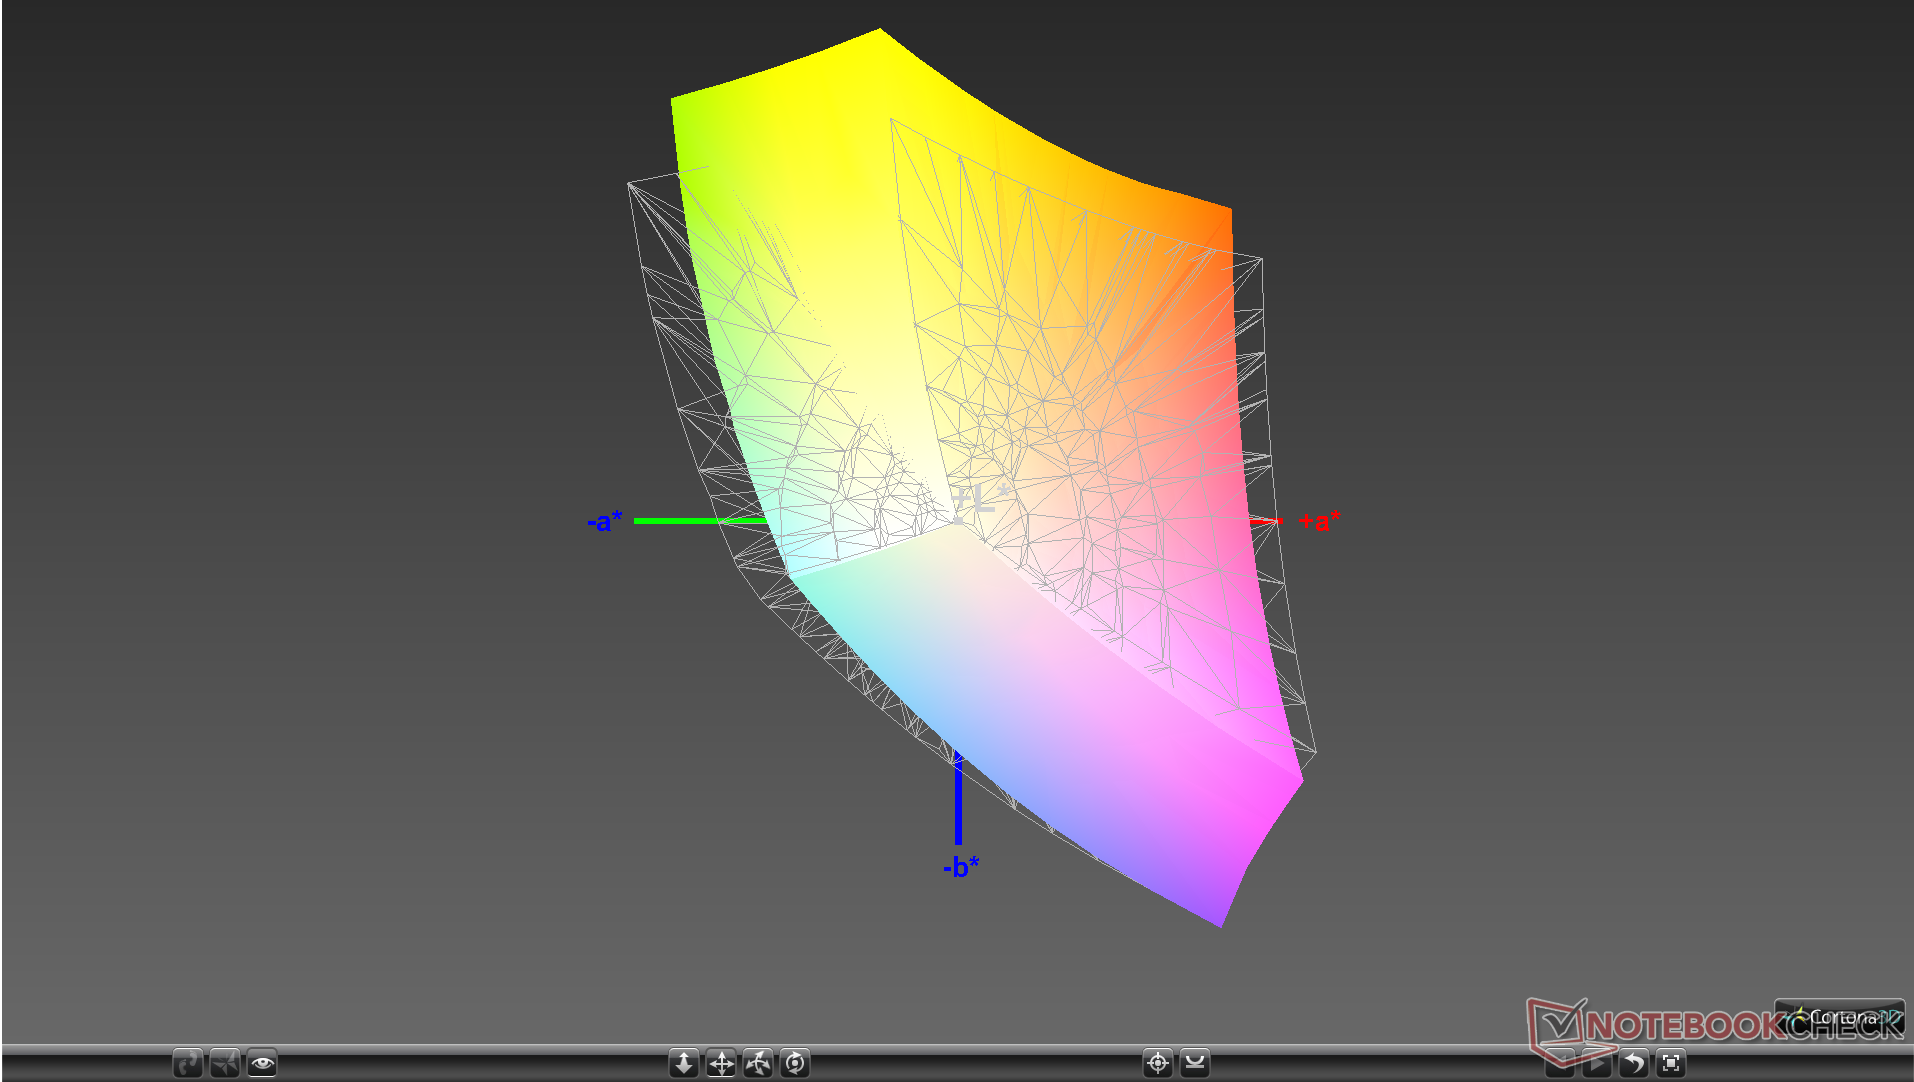
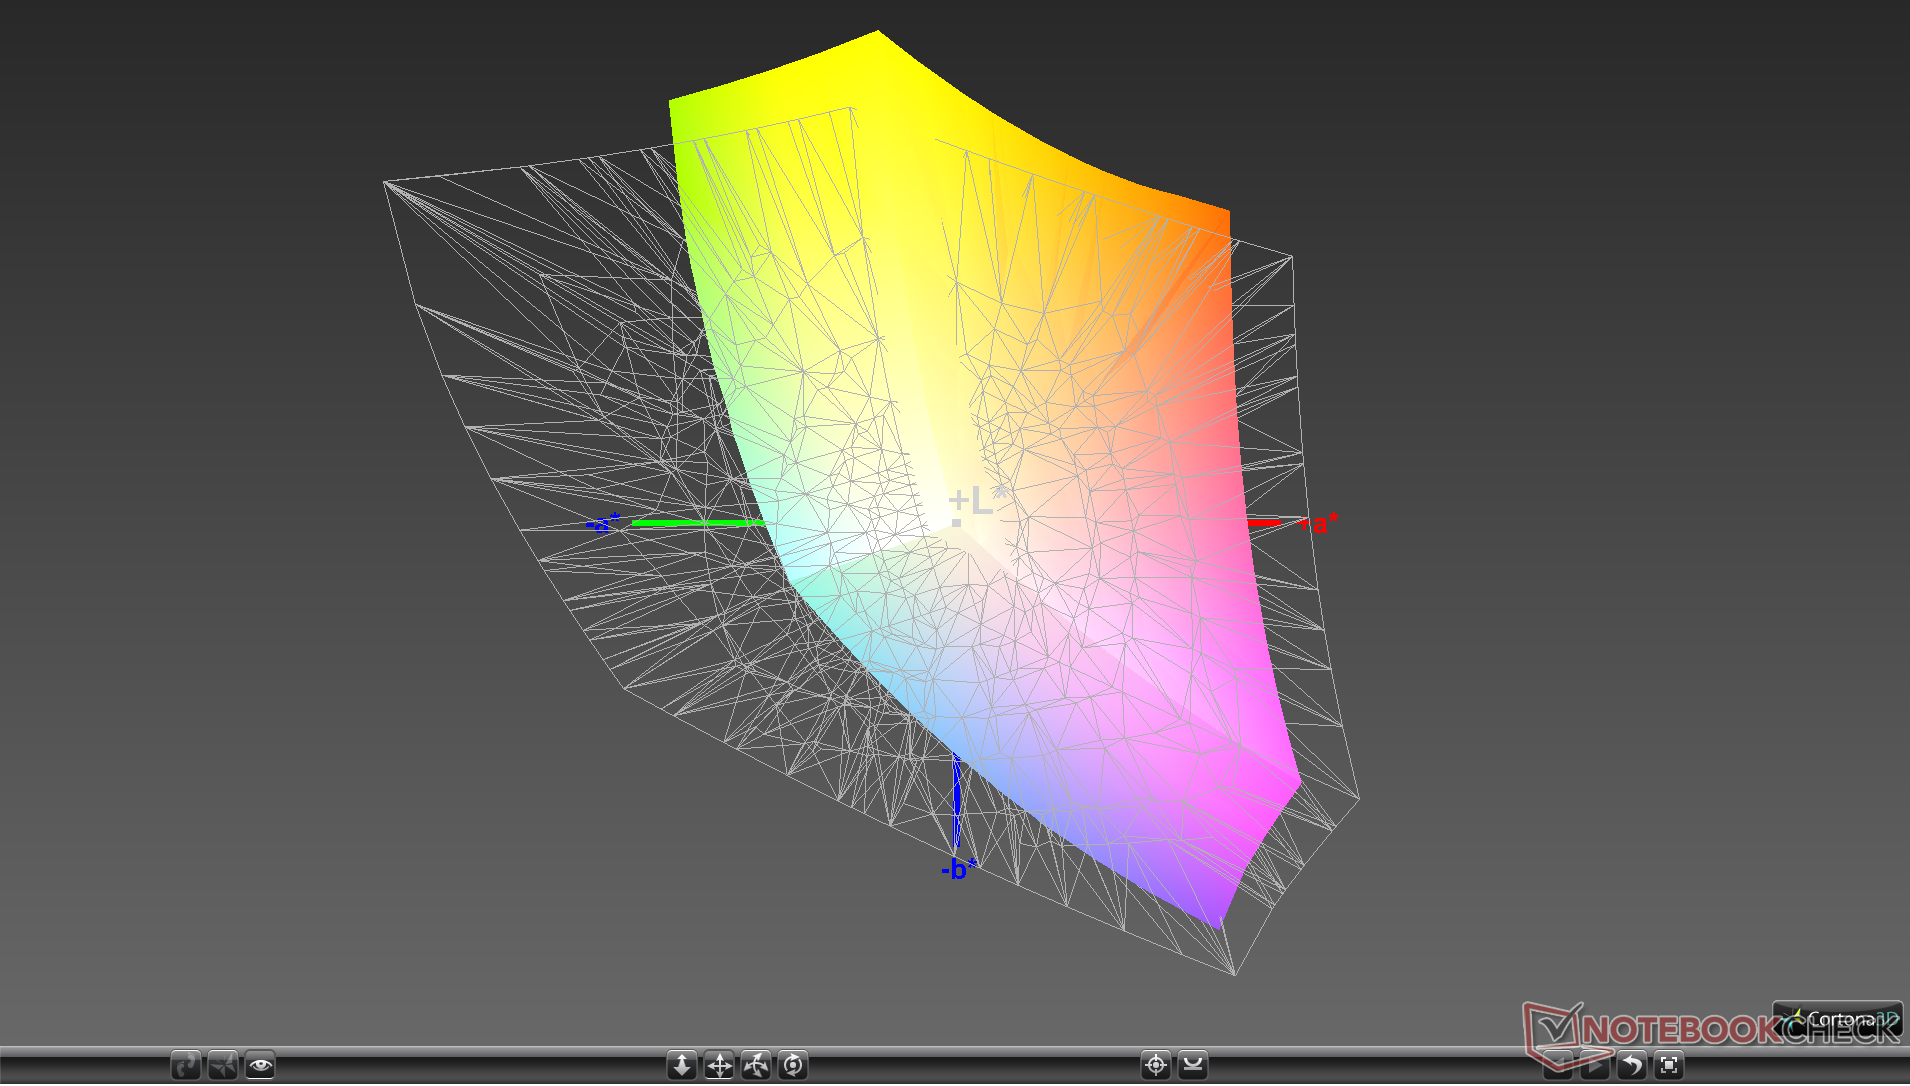
Color space is approximately 86 percent and 56 percent of the AdobeRGB and sRGB standards, respectively, with no options for full sRGB coverage unlike on the larger Asus GL704 series. The Legion Y530 alternative has a narrower color gamut to our surprise. For gaming purposes, however, a very wide gamut is usually not a priority.
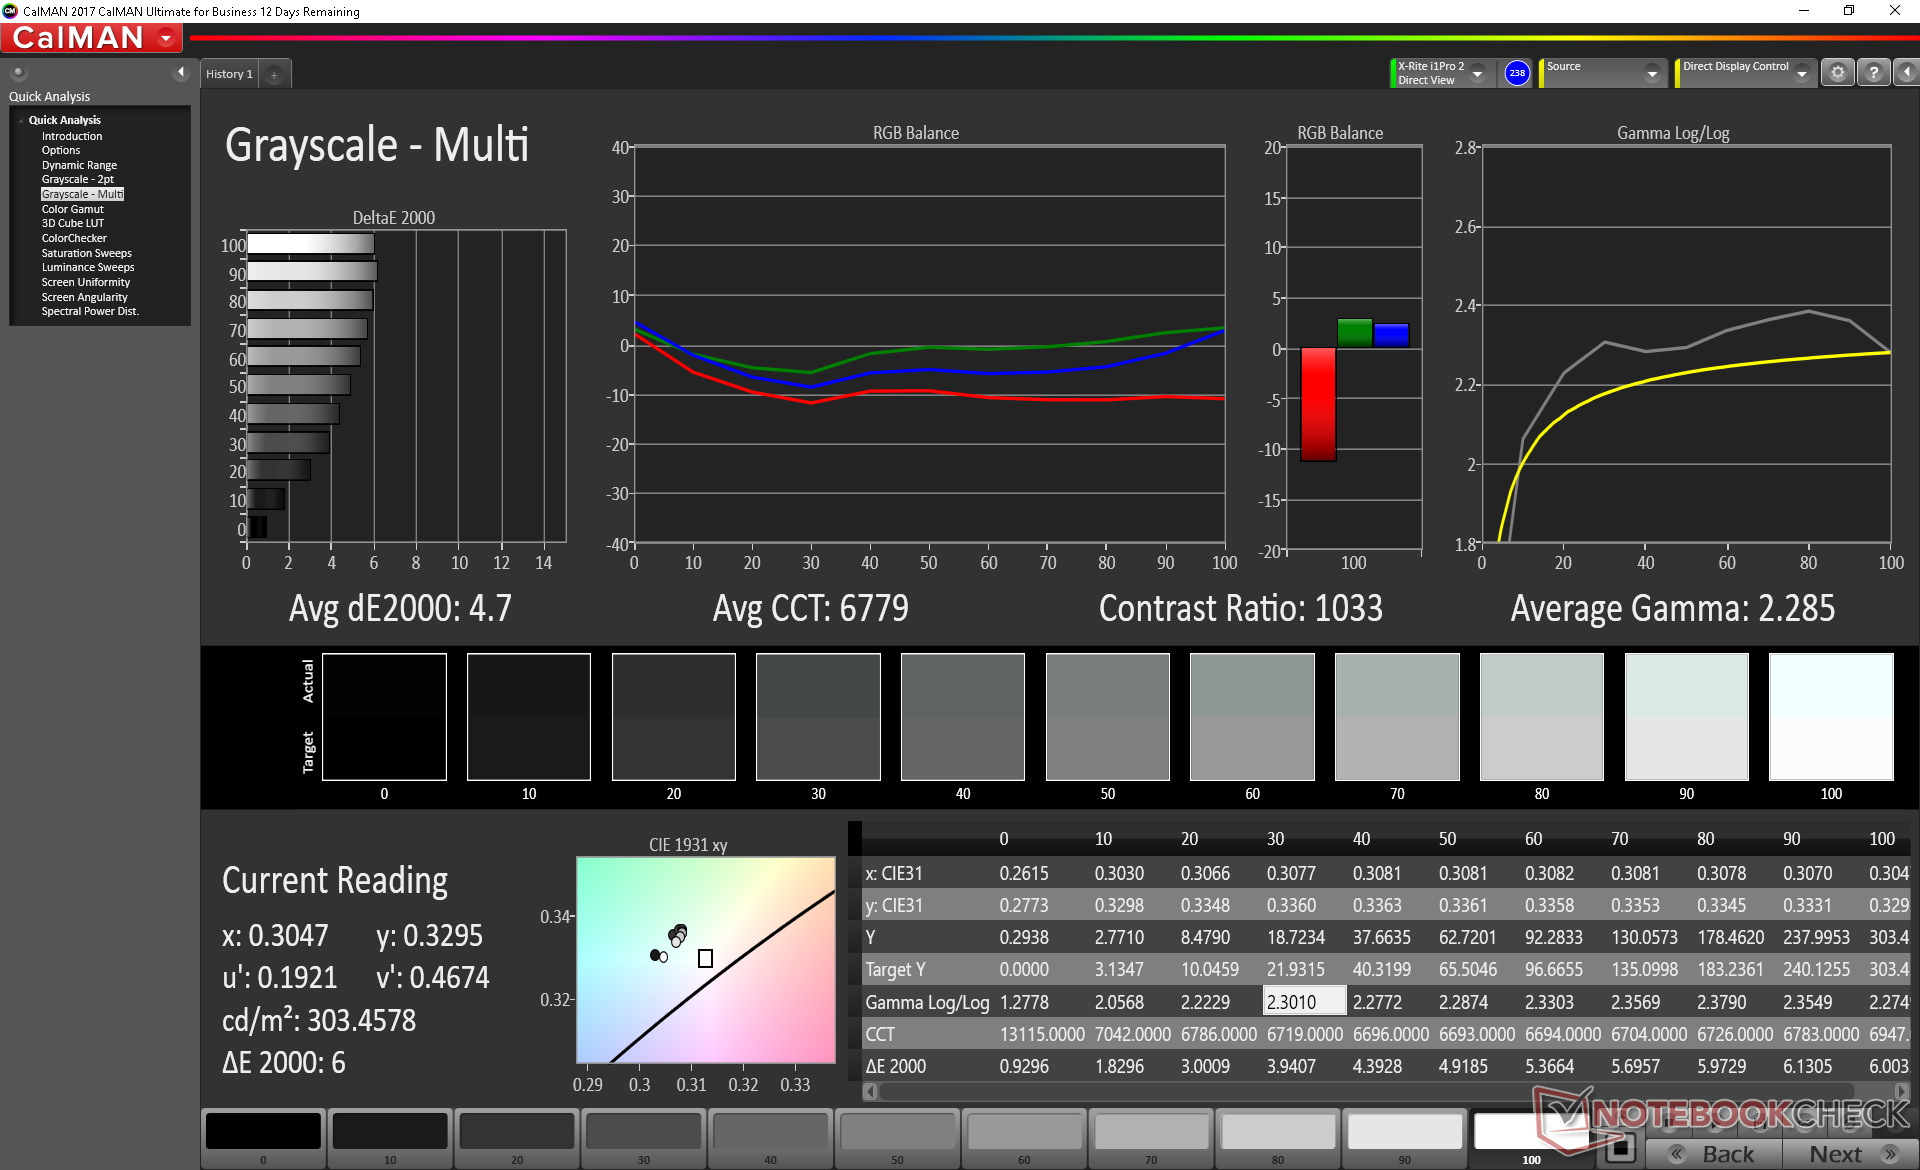
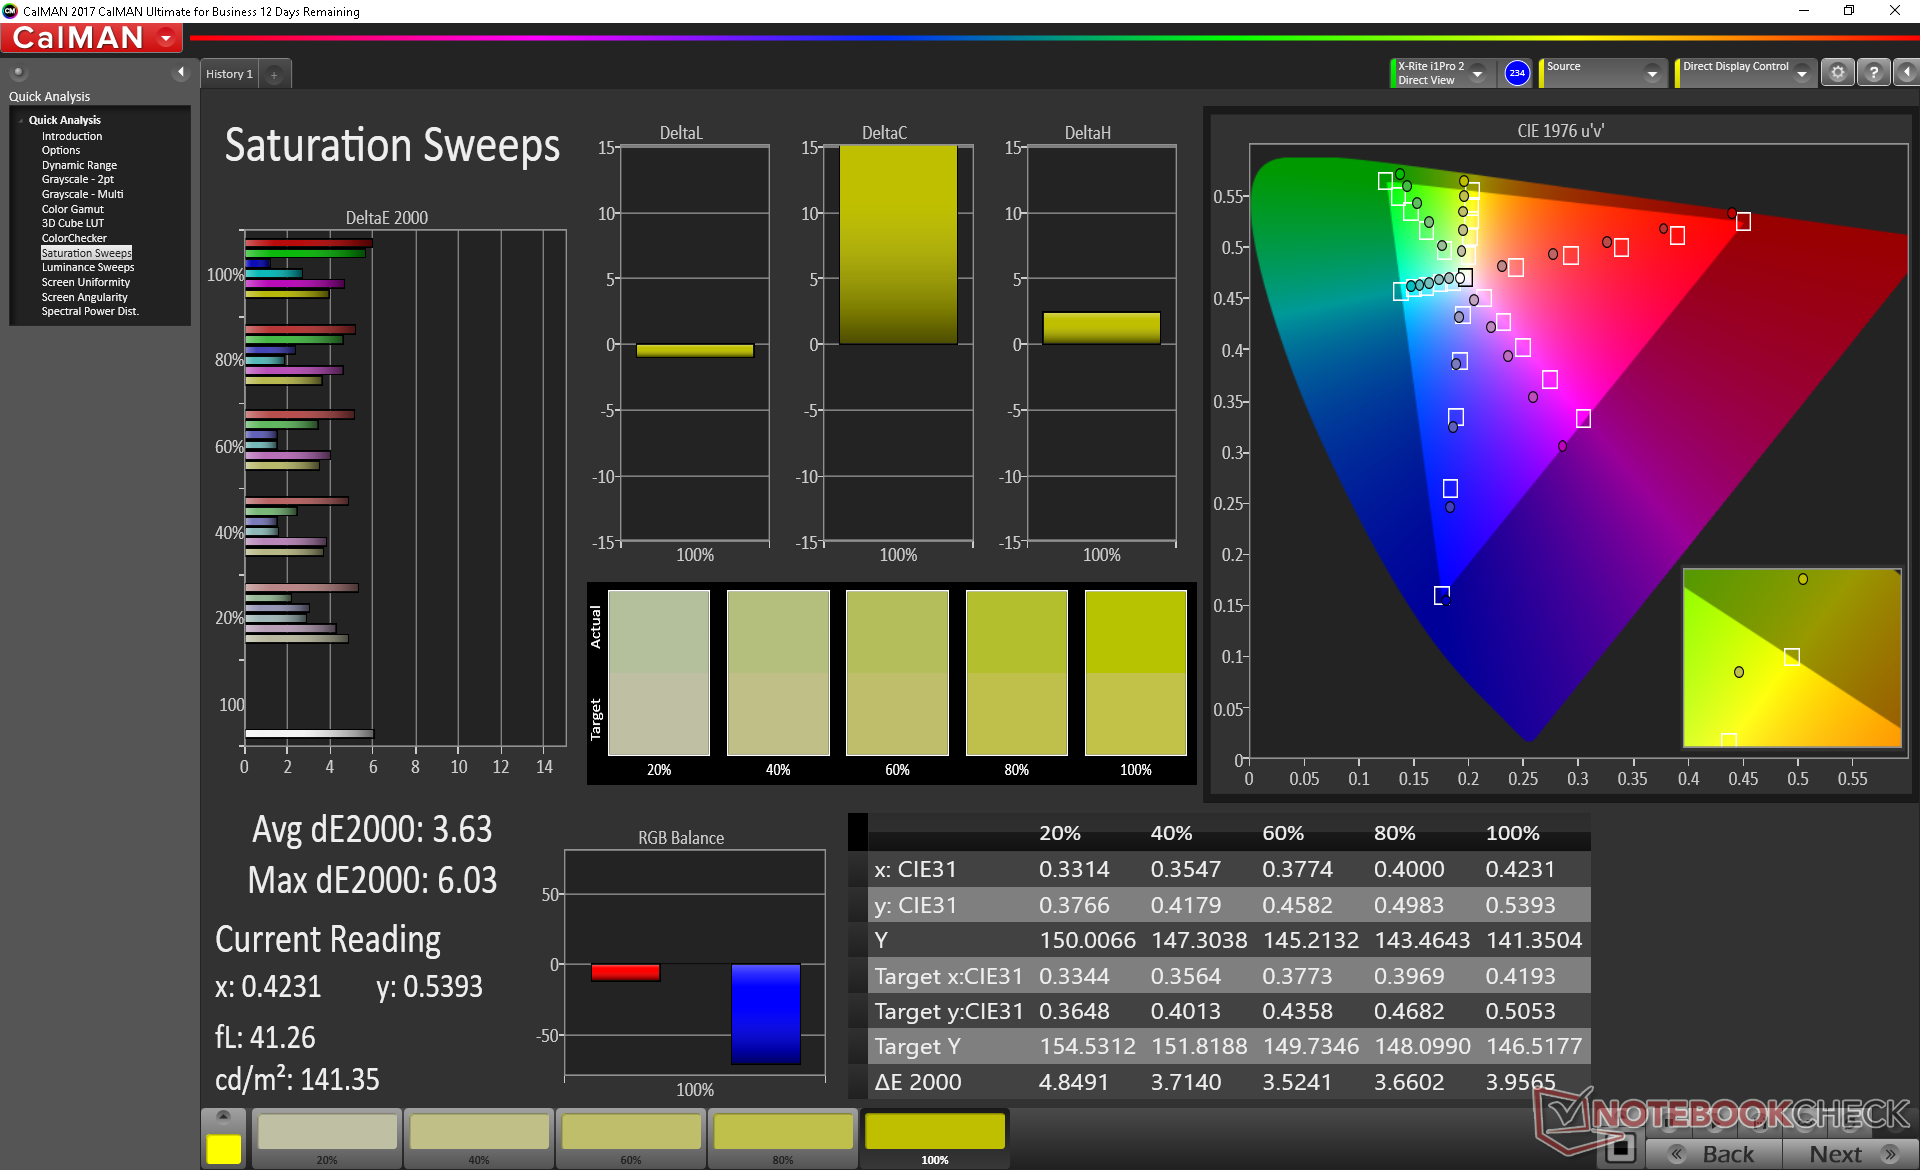
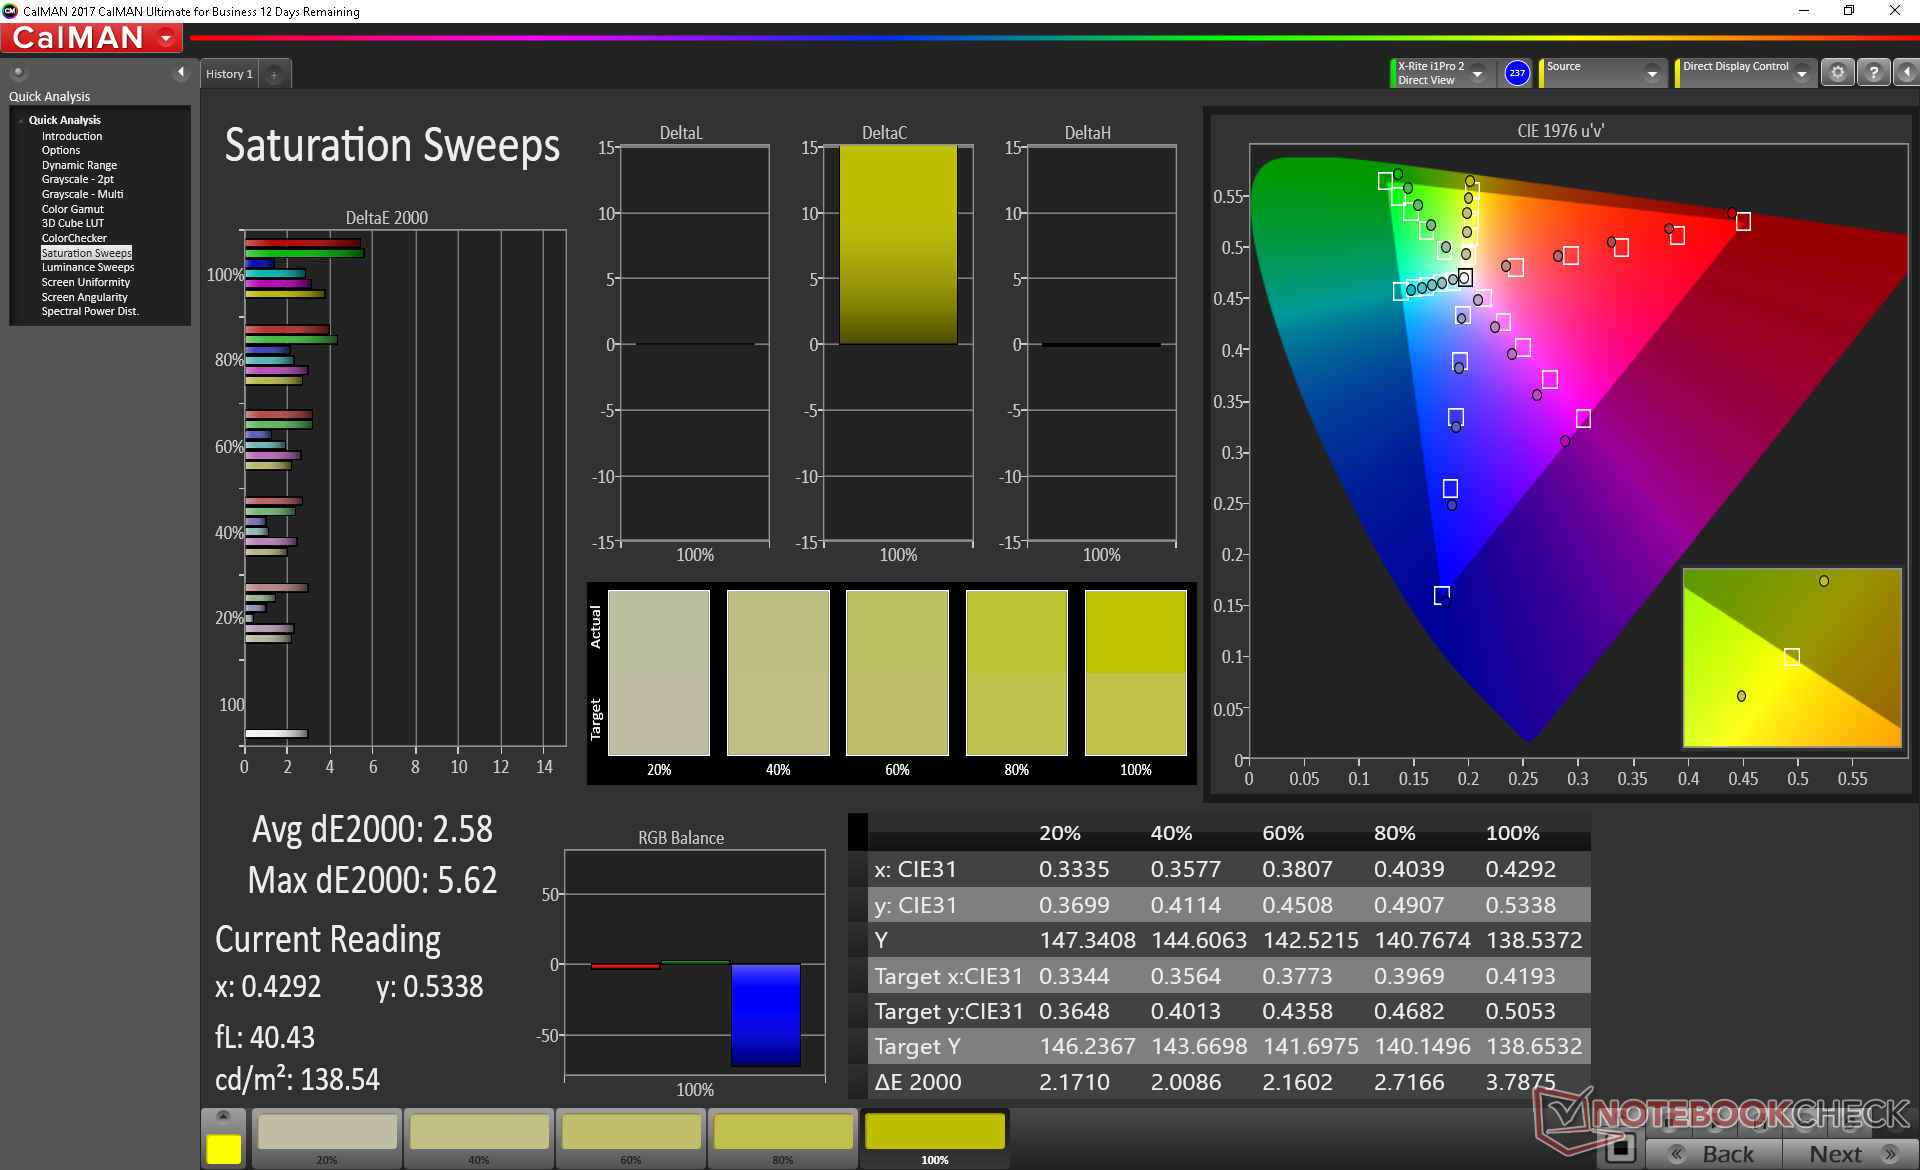
Colorimeter measurements reveal just average colors and grayscale. Our calibration attempts improve nearly every aspect of the display and we recommend it for the most accurate colors and grayscale possible. Colors still become less accurate at higher saturation levels due to the panel's imperfect sRGB coverage.
Display Response Times
| ↔ Response Time Black to White | ||
|---|---|---|
| 36 ms ... rise ↗ and fall ↘ combined | ↗ 19.6 ms rise | 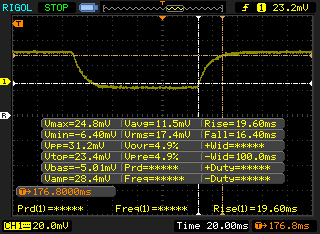 |
| ↘ 16.4 ms fall | ||
| The screen shows slow response rates in our tests and will be unsatisfactory for gamers. In comparison, all tested devices range from 0.1 (minimum) to 240 (maximum) ms. » 94 % of all devices are better. This means that the measured response time is worse than the average of all tested devices (19.9 ms). | ||
| ↔ Response Time 50% Grey to 80% Grey | ||
| 42.8 ms ... rise ↗ and fall ↘ combined | ↗ 22.4 ms rise | 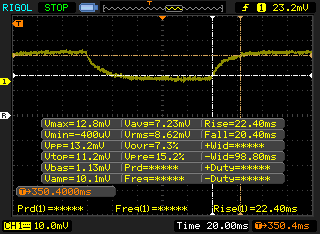 |
| ↘ 20.4 ms fall | ||
| The screen shows slow response rates in our tests and will be unsatisfactory for gamers. In comparison, all tested devices range from 0.165 (minimum) to 636 (maximum) ms. » 70 % of all devices are better. This means that the measured response time is worse than the average of all tested devices (31.1 ms). | ||
Screen Flickering / PWM (Pulse-Width Modulation)
| Screen flickering / PWM detected | 21740 Hz | ≤ 99 % brightness setting | 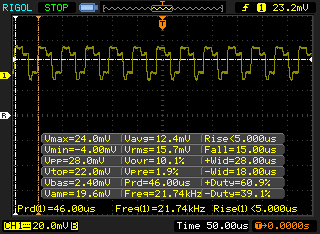 |
The display backlight flickers at 21740 Hz (worst case, e.g., utilizing PWM) Flickering detected at a brightness setting of 99 % and below. There should be no flickering or PWM above this brightness setting. The frequency of 21740 Hz is quite high, so most users sensitive to PWM should not notice any flickering. In comparison: 52 % of all tested devices do not use PWM to dim the display. If PWM was detected, an average of 7798 (minimum: 5 - maximum: 343500) Hz was measured. | |||
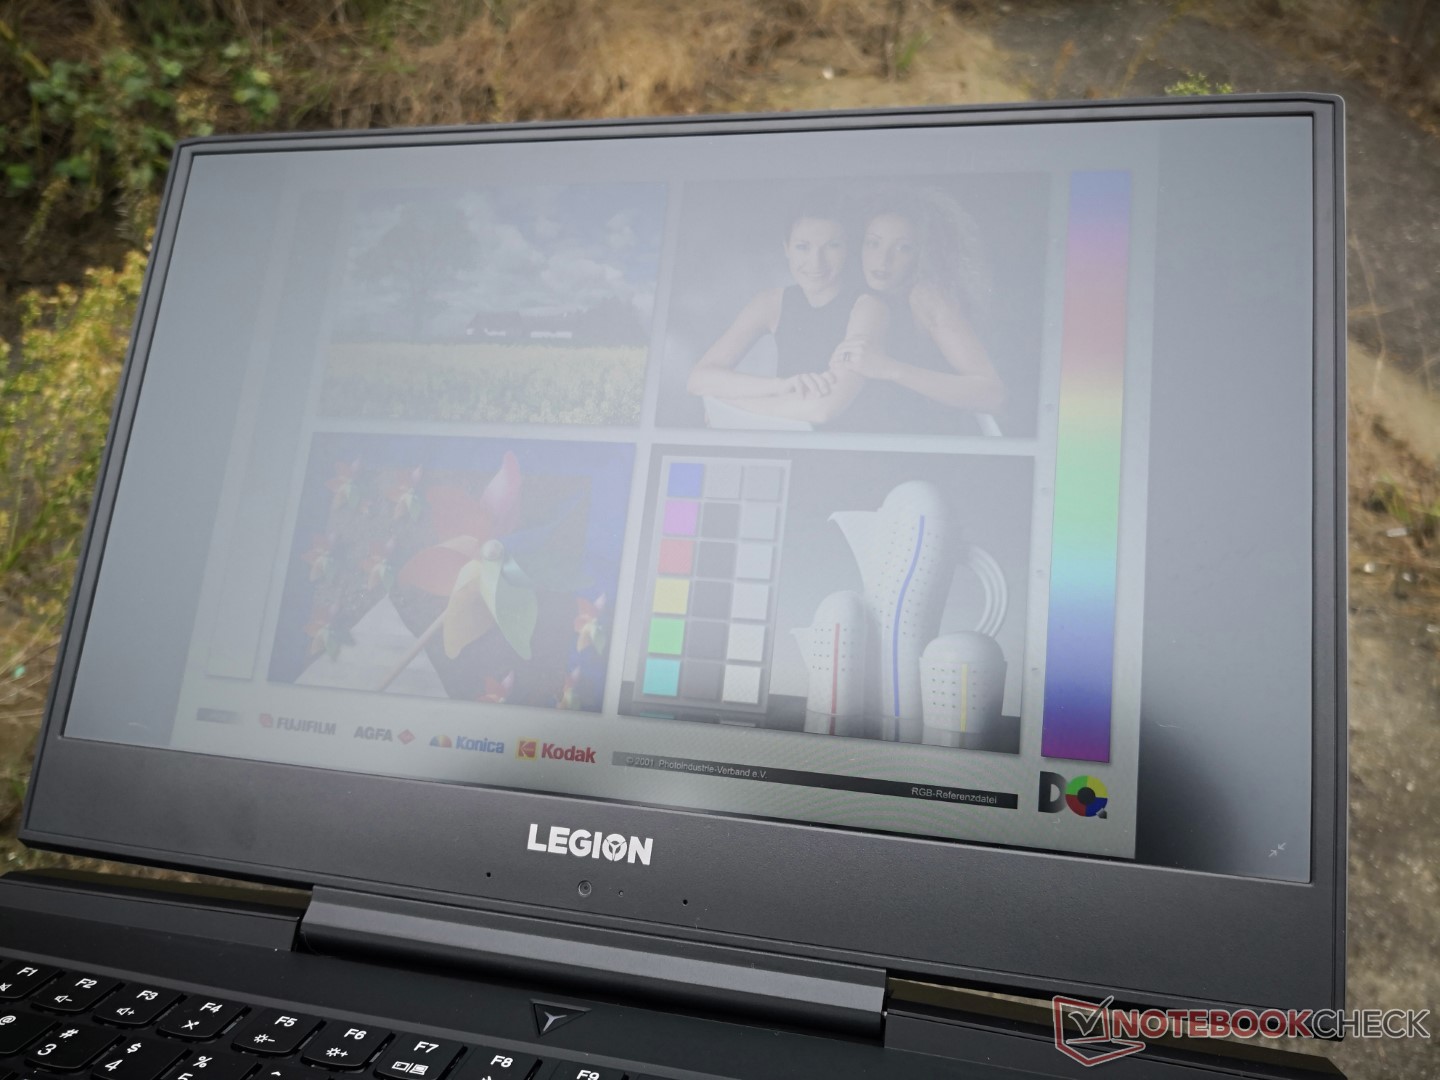
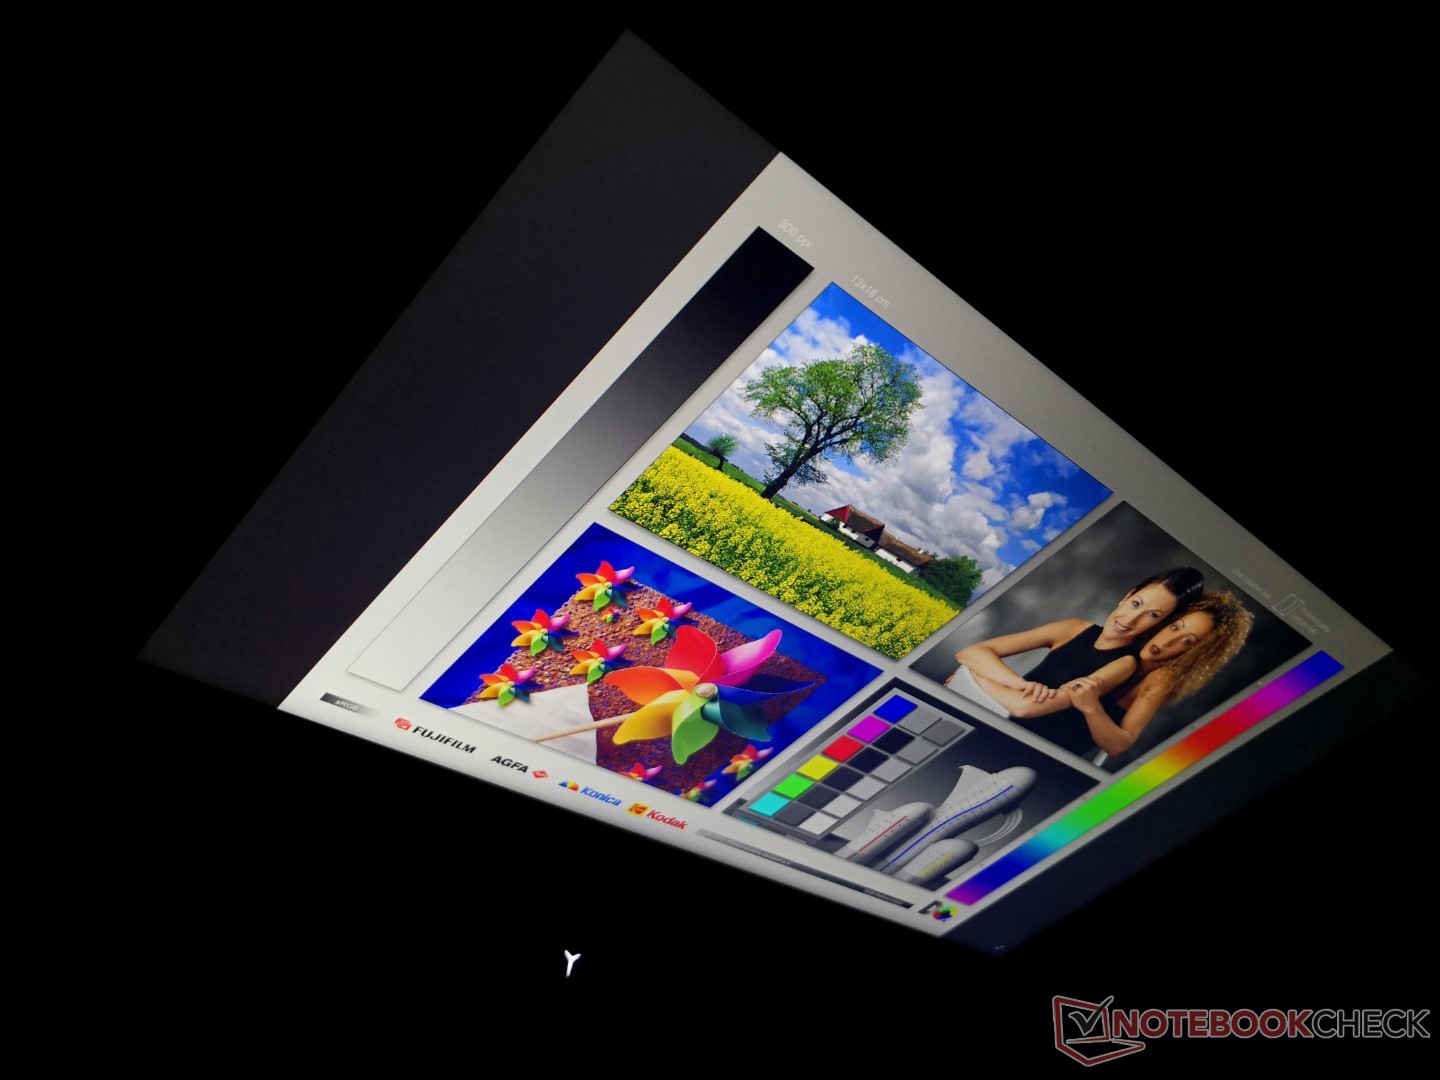
Viewing angles are wide with no major shifts in color and only minor shifts in grays and contrast. Outdoor visibility is average at best since the backlight is dimmer than on many Ultrabooks. The matte panel helps to reduce glare and make viewing slightly easier when under shade.
Performance
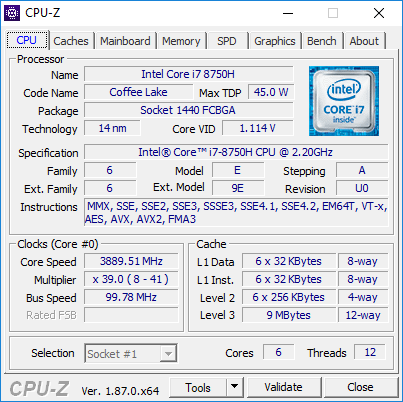
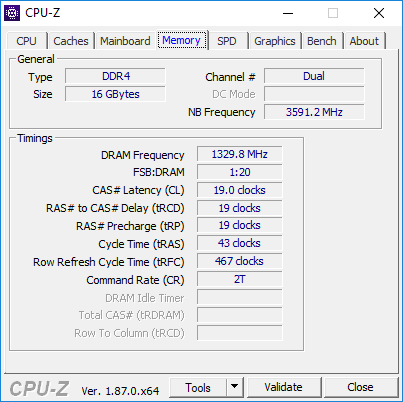
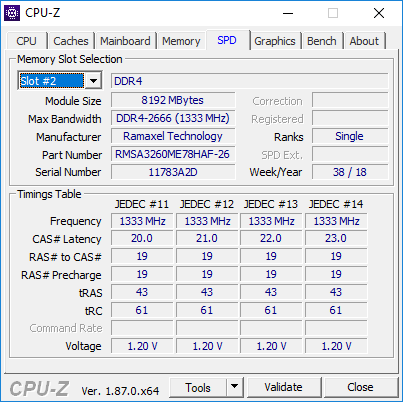
The Coffee Lake-H Core i5-8300H and i7-8750H are common options across the latest lineup of gaming laptops. Instead, it's the GPU that determines whether the gaming laptop is entry-level, mainstream, or high-end. The GTX 1050, 1050 Ti, and 1060 options on the Legion Y7000 place the system in the budget-mainstream category. RAM options range from 8 GB up to 32 GB DDR4.
Nvidia Optimus is included for automatic graphics switching to the integrated UHD Graphics 630.
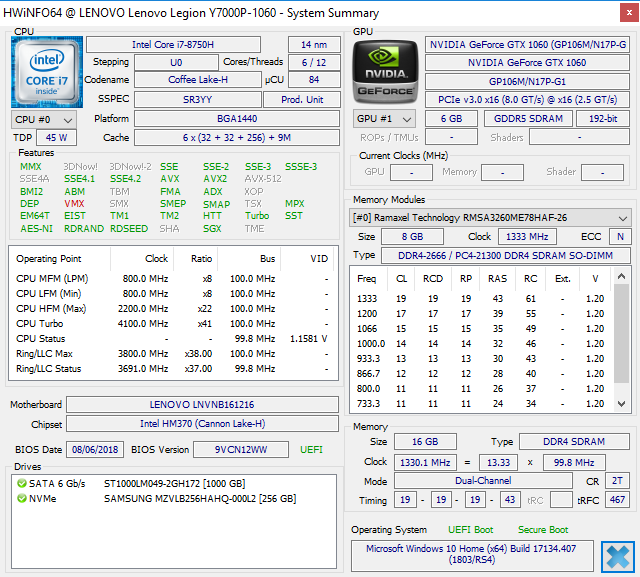
Processor
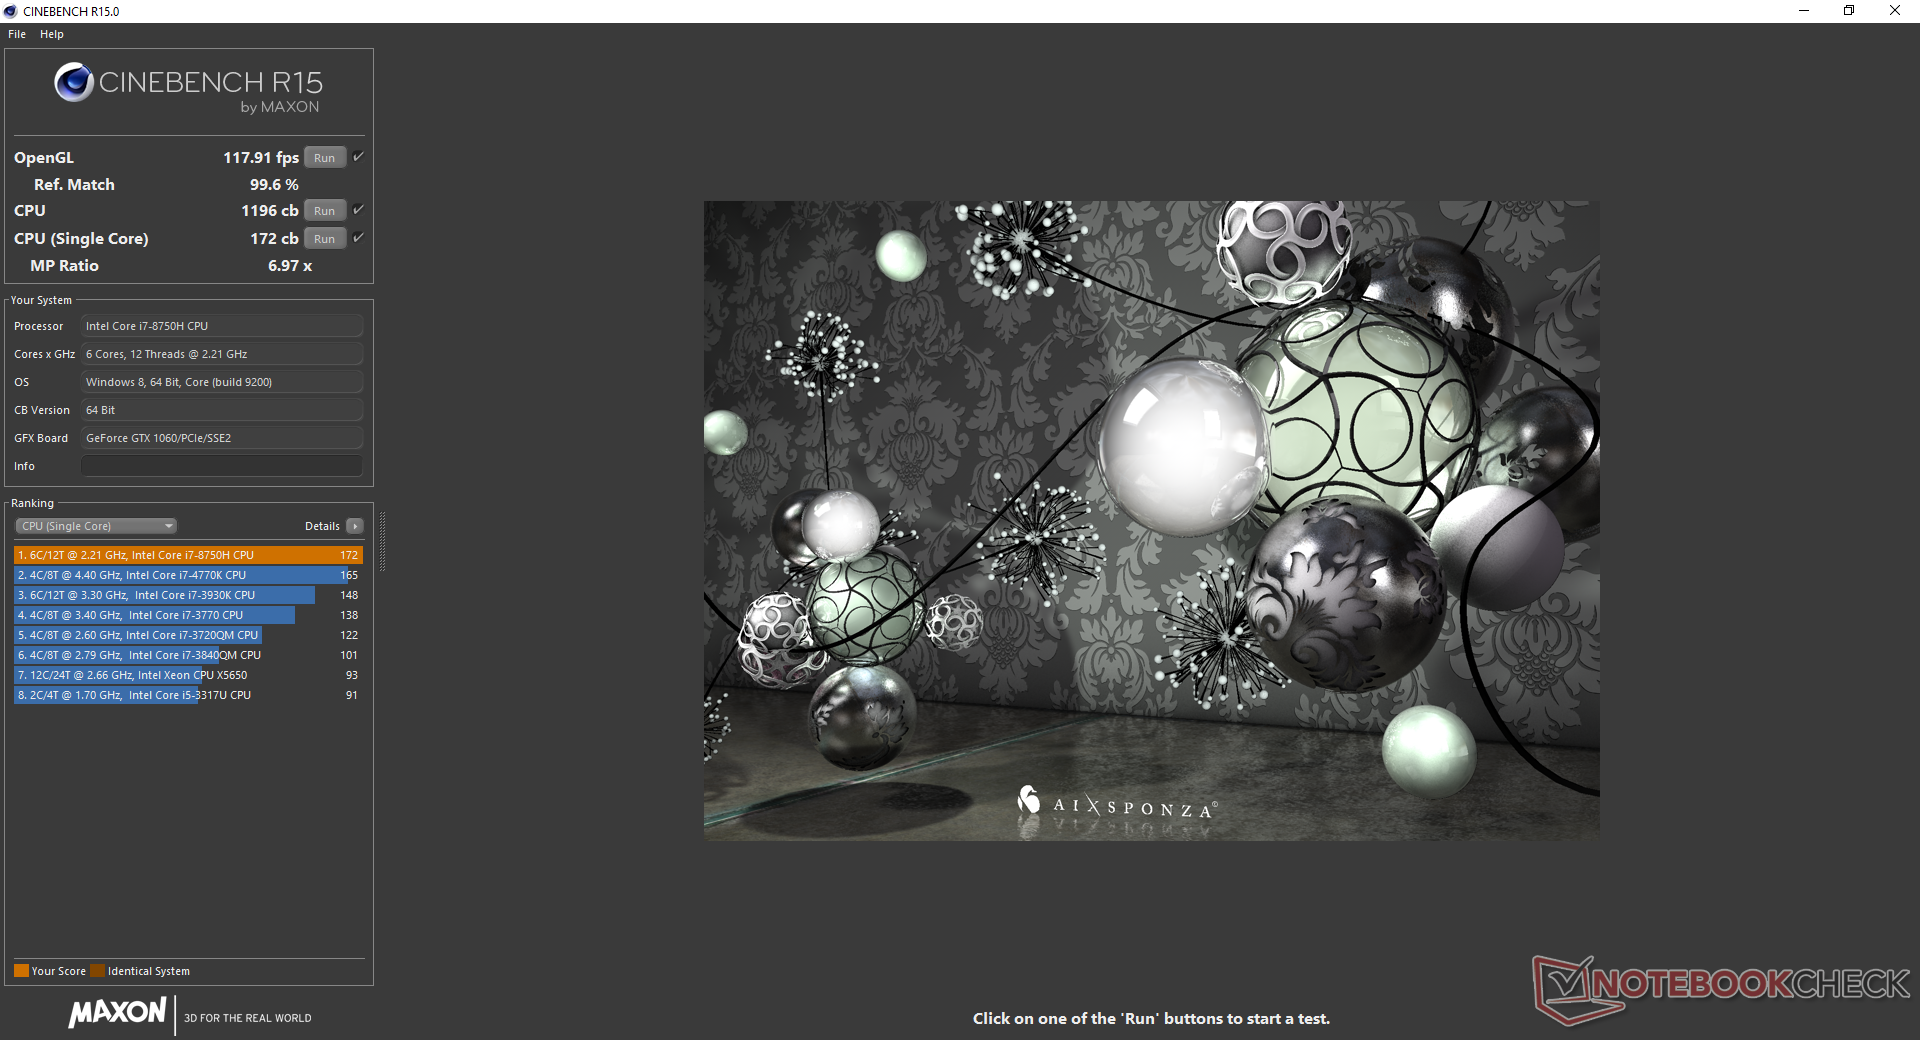
The CineBench R15 Multi-Thread score is about 8 percent higher than the average Core i7-8750H in our database due to strong Turbo Boost performance. By running the benchmark in a loop, we can observe that processor performance in our Lenovo dips by about 11 percent over time due to throttling as shown by our comparison graph below. It's not perfect as we would've preferred a straight line to represent stable Turbo Boost clock rates, but the Asus Zephyrus S GX531GS with the same Core i7 CPU is consistently slower when subjected to the same loop test. Our Stress Test section below reveals that the Legion Y7000 is able to maintain a CPU core clock rate of 3.1 to 3.2 GHz even when under extreme processor stress.
Users who want the lower-cost configuration with the Core i5-8300H instead will take a 32 percent hit in multi-thread performance.
See our dedicated page on the Core i7-8750H for more technical information and benchmark comparisons.
System Performance
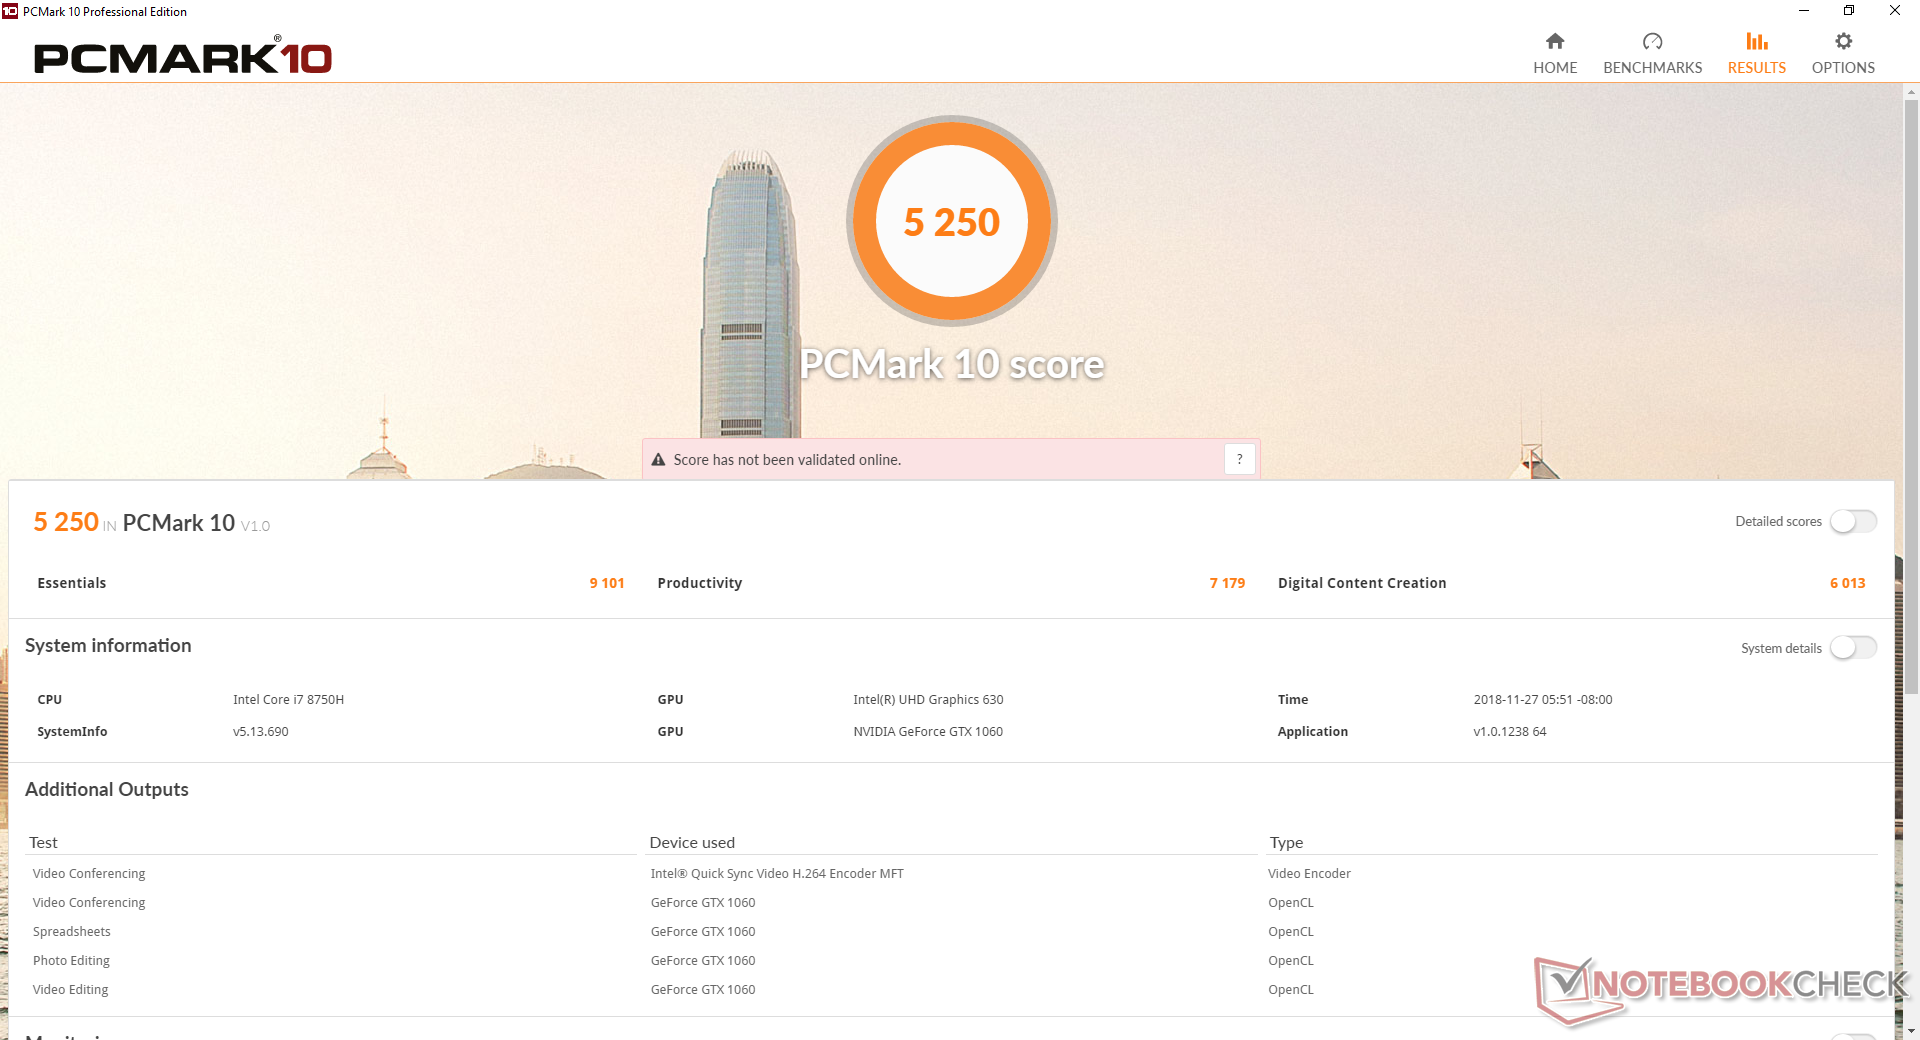
PCMark benchmark scores are within single-digit percentages of other gaming laptops equipped with the same i7-8750H CPU and GTX 1060 GPU. Navigation is smooth and applications launch almost instantaneously as one would expect from a SSD-based laptop. We experienced no software or hardware issues during our time with the unit unlike on the recent Yoga C930 or XPS 15 9570.
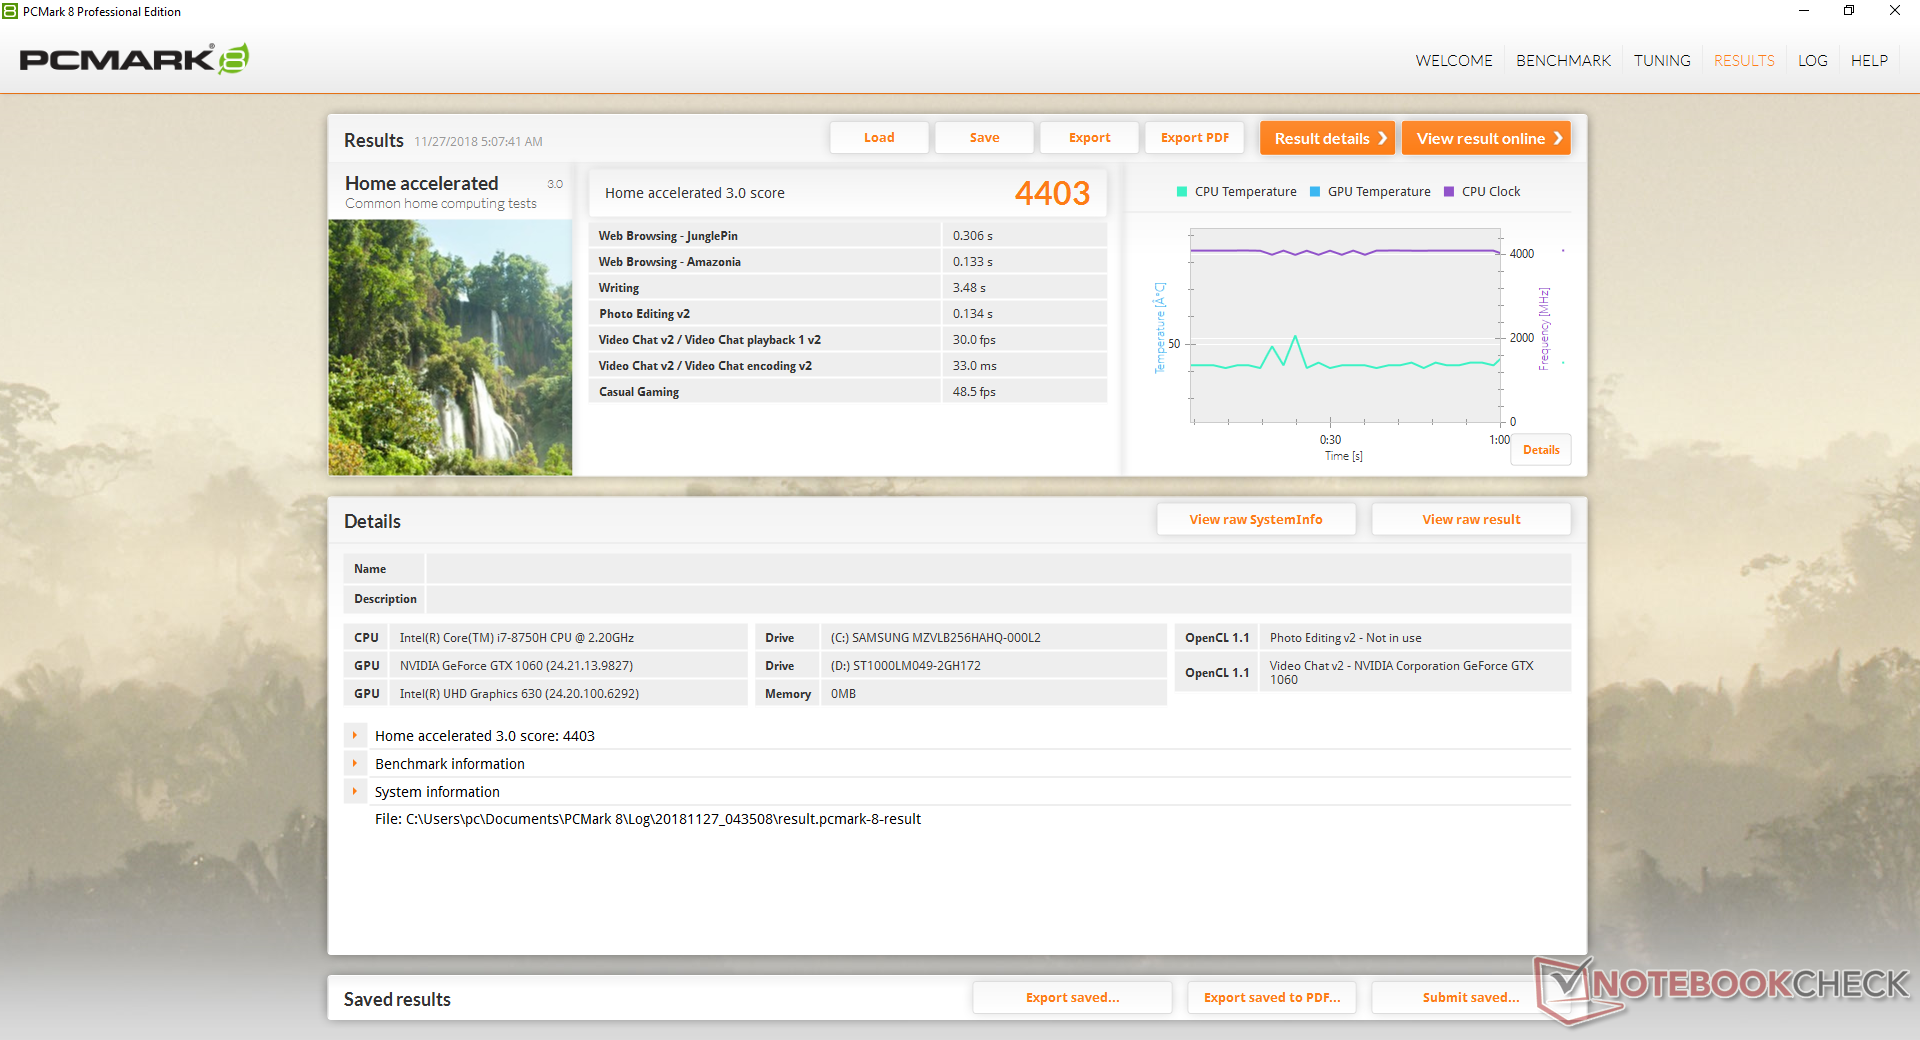
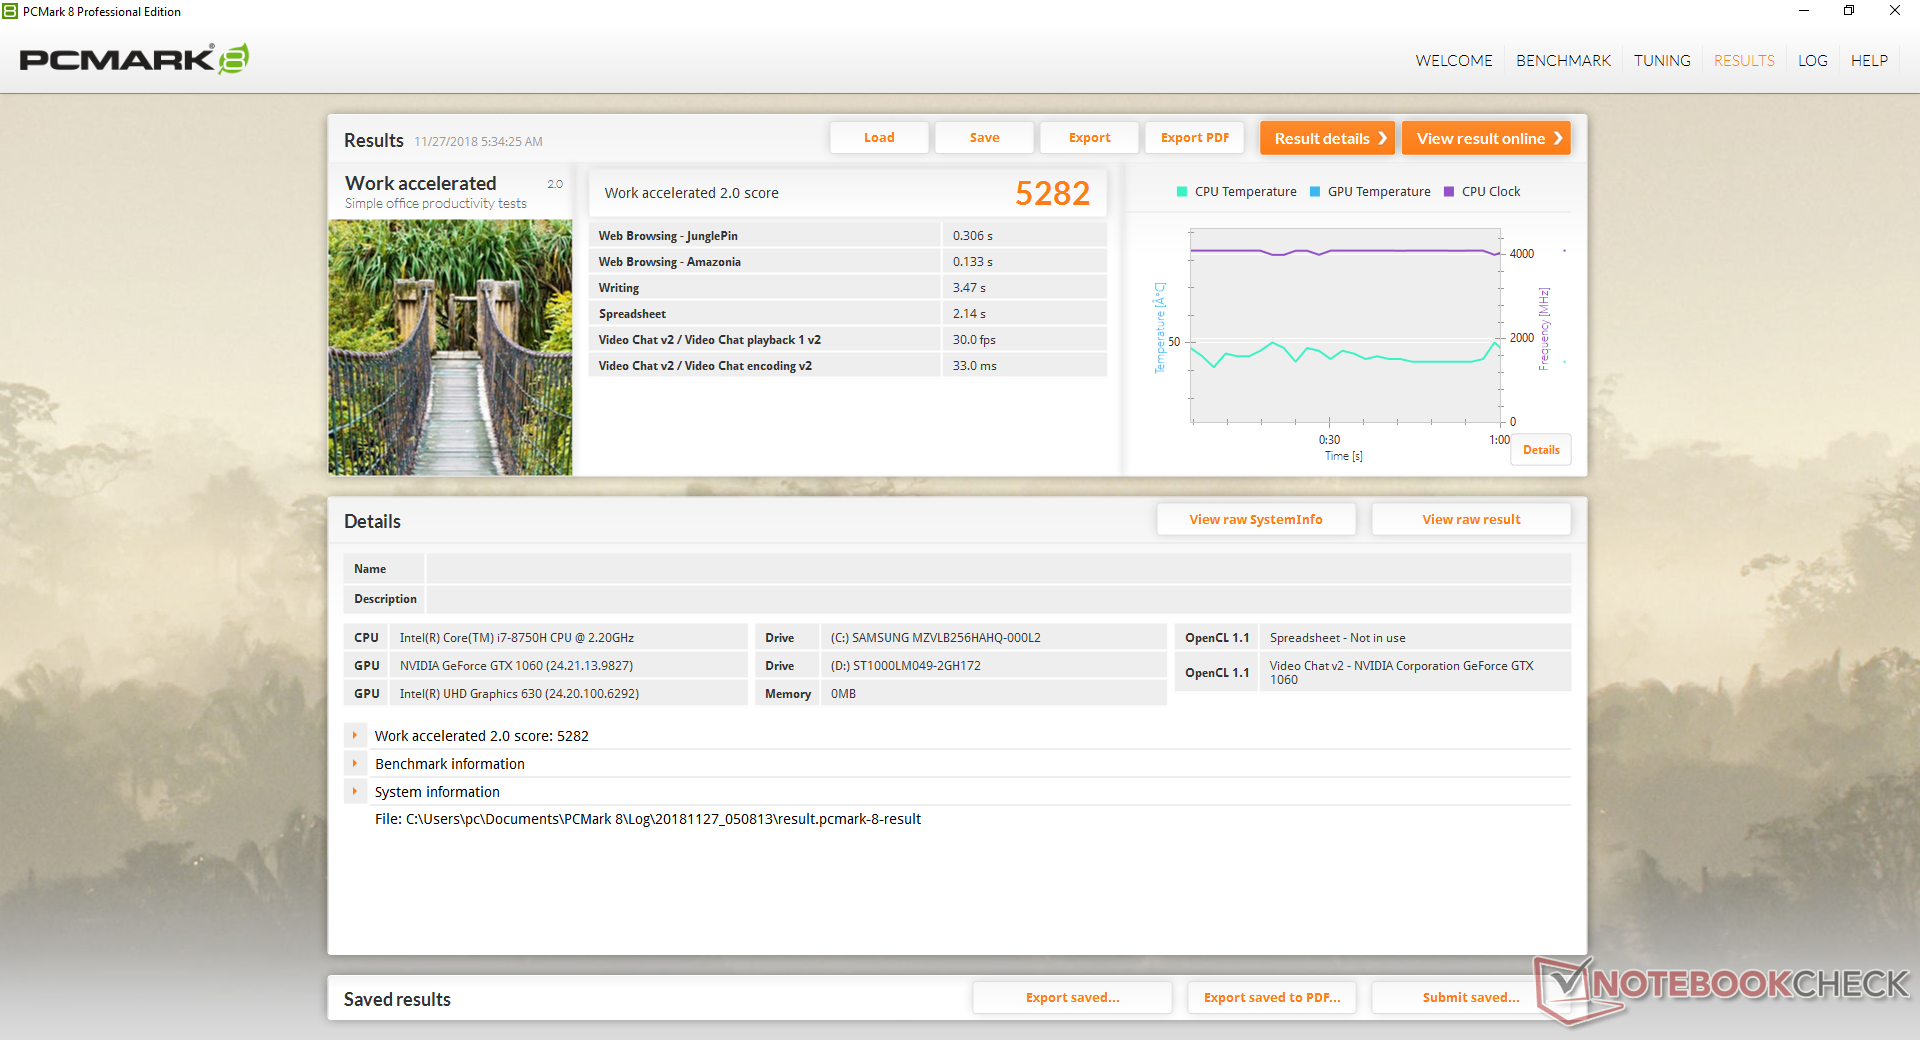
| PCMark 8 Home Score Accelerated v2 | 4403 points | |
| PCMark 8 Work Score Accelerated v2 | 5282 points | |
| PCMark 10 Score | 5250 points | |
Help | ||
Storage Devices
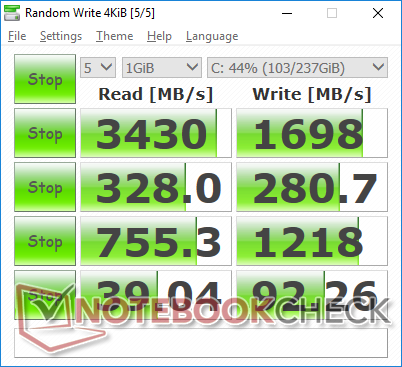
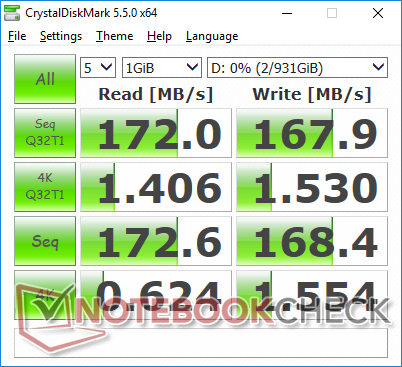
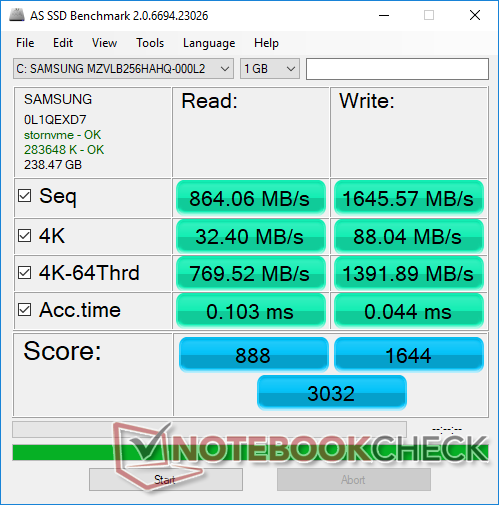
Two internal storage bays are available (2.5-inch SATA III + M.2 NVMe). Our specific test configuration includes a primary 256 GB Samsung SSD PM981 and a secondary 1 TB Seagate Barracuda Pro ST1000LM049. While sequential write rate from the SSD is good, sequential read rate is unusually slow at about 864 MB/s even after multiple retests. The same SSD in our MSI GS65, for example, returns a more impressive sequential read write of 1612 MB/s on the same AS SSD benchmark.
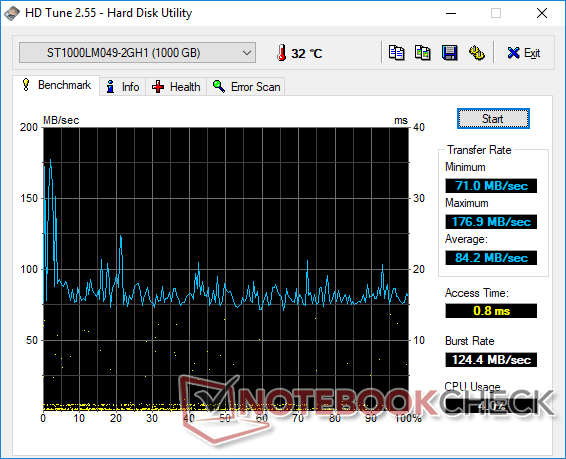
The Seagate HDD has a slow average transfer rate of 84 MB/s according to HD Tune. We were expecting a bit more from the 7200 RPM drive since the Hitachi Travelstar HTS725050A7E630 returns an average transfer rate of 101 MB/s on the same benchmark.
See our table of SSDs and HDDs for more benchmark comparisons.
| Lenovo Legion Y7000P-1060 Samsung SSD PM981 MZVLB256HAHQ | HP Pavilion Gaming 15t-cx0000 Samsung SSD PM981 MZVLB512HAJQ | Lenovo Legion Y530-15ICH Toshiba KBG30ZMT128G | Asus Zephyrus S GX531GS WDC PC SN520 SDAPNUW-512G | Eurocom Sky X4C Samsung SSD 960 Pro 1TB m.2 NVMe | |
|---|---|---|---|---|---|
| AS SSD | 30% | -137% | 7% | 46% | |
| Seq Read (MB/s) | 864 | 1235 43% | 1231 42% | 903 5% | 2541 194% |
| Seq Write (MB/s) | 1646 | 1829 11% | 131.6 -92% | 1261 -23% | 1989 21% |
| 4K Read (MB/s) | 32.4 | 35.03 8% | 38.71 19% | 40.02 24% | 44.83 38% |
| 4K Write (MB/s) | 88 | 95.9 9% | 35.74 -59% | 103.6 18% | 129.6 47% |
| 4K-64 Read (MB/s) | 770 | 1160 51% | 335.3 -56% | 1030 34% | 1646 114% |
| 4K-64 Write (MB/s) | 1392 | 1808 30% | 78.9 -94% | 1285 -8% | 1375 -1% |
| Access Time Read * (ms) | 0.103 | 0.051 50% | 0.626 -508% | 0.129 -25% | 0.032 69% |
| Access Time Write * (ms) | 0.044 | 0.038 14% | 0.287 -552% | 0.036 18% | 0.03 32% |
| Score Read (Points) | 888 | 1319 49% | 497 -44% | 1161 31% | 1945 119% |
| Score Write (Points) | 1644 | 2087 27% | 128 -92% | 1515 -8% | 1703 4% |
| Score Total (Points) | 3032 | 4113 36% | 838 -72% | 3294 9% | 4615 52% |
| Copy ISO MB/s (MB/s) | 1677 | 1908 14% | |||
| Copy Program MB/s (MB/s) | 764 | 467.2 -39% | |||
| Copy Game MB/s (MB/s) | 1298 | 1055 -19% | |||
| CrystalDiskMark 5.2 / 6 | 31% | -39% | 0% | 55% | |
| Write 4K (MB/s) | 92.3 | 129.5 40% | 71.8 -22% | 98.2 6% | 158.6 72% |
| Read 4K (MB/s) | 39.04 | 44.61 14% | 41.03 5% | 39.43 1% | 55.2 41% |
| Write Seq (MB/s) | 1218 | 1268 4% | 349 -71% | 1386 14% | 1568 29% |
| Read Seq (MB/s) | 755 | 992 31% | 736 -3% | 1100 46% | 1411 87% |
| Write 4K Q32T1 (MB/s) | 280.7 | 535 91% | 105.3 -62% | 270.3 -4% | 545 94% |
| Read 4K Q32T1 (MB/s) | 328 | 601 83% | 308 -6% | 340.3 4% | 661 102% |
| Write Seq Q32T1 (MB/s) | 1698 | 1938 14% | 151.4 -91% | 1454 -14% | 2054 21% |
| Read Seq Q32T1 (MB/s) | 3430 | 2306 -33% | 1262 -63% | 1681 -51% | 3155 -8% |
| Total Average (Program / Settings) | 31% /
30% | -88% /
-96% | 4% /
4% | 51% /
49% |
* ... smaller is better

GPU Performance
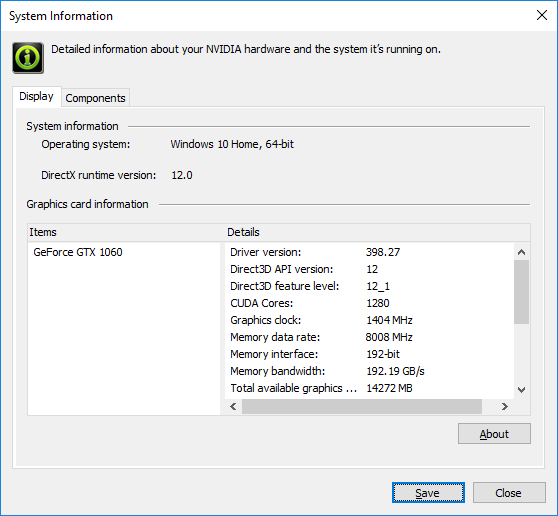
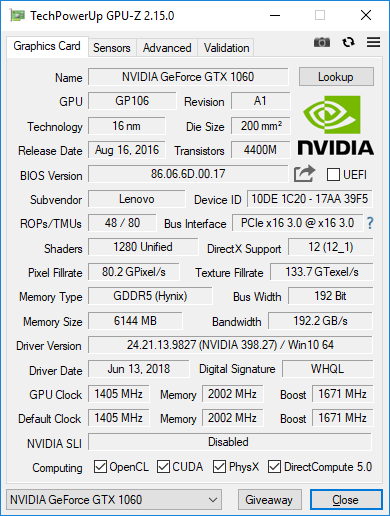
The GTX 1060 is common on mainstream gaming laptops and so our Lenovo holds no surprises. Graphics performance is within 1 percent of the average GTX 1060 taken from 73 other GTX 1060-equipped laptops in our database. Fire Strike scores are 18 percent higher than the GTX 980M and almost 170 percent higher than the GTX 960M in the years-old Ideapad Y700. Users who want the lower-end configuration with GTX 1050 Ti graphics will take a 33 percent hit in graphics power.
Idling on Witcher 3 results in consistent frame rates with no recurring drops or disruptive background activity as shown by our graph below.
See our dedicated page on the GeForce GTX 1060 for more technical information and benchmark comparisons.
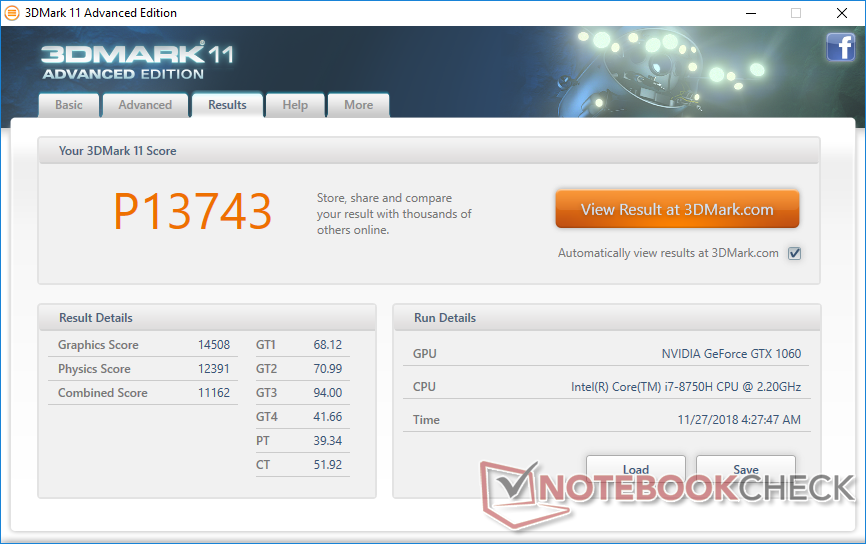
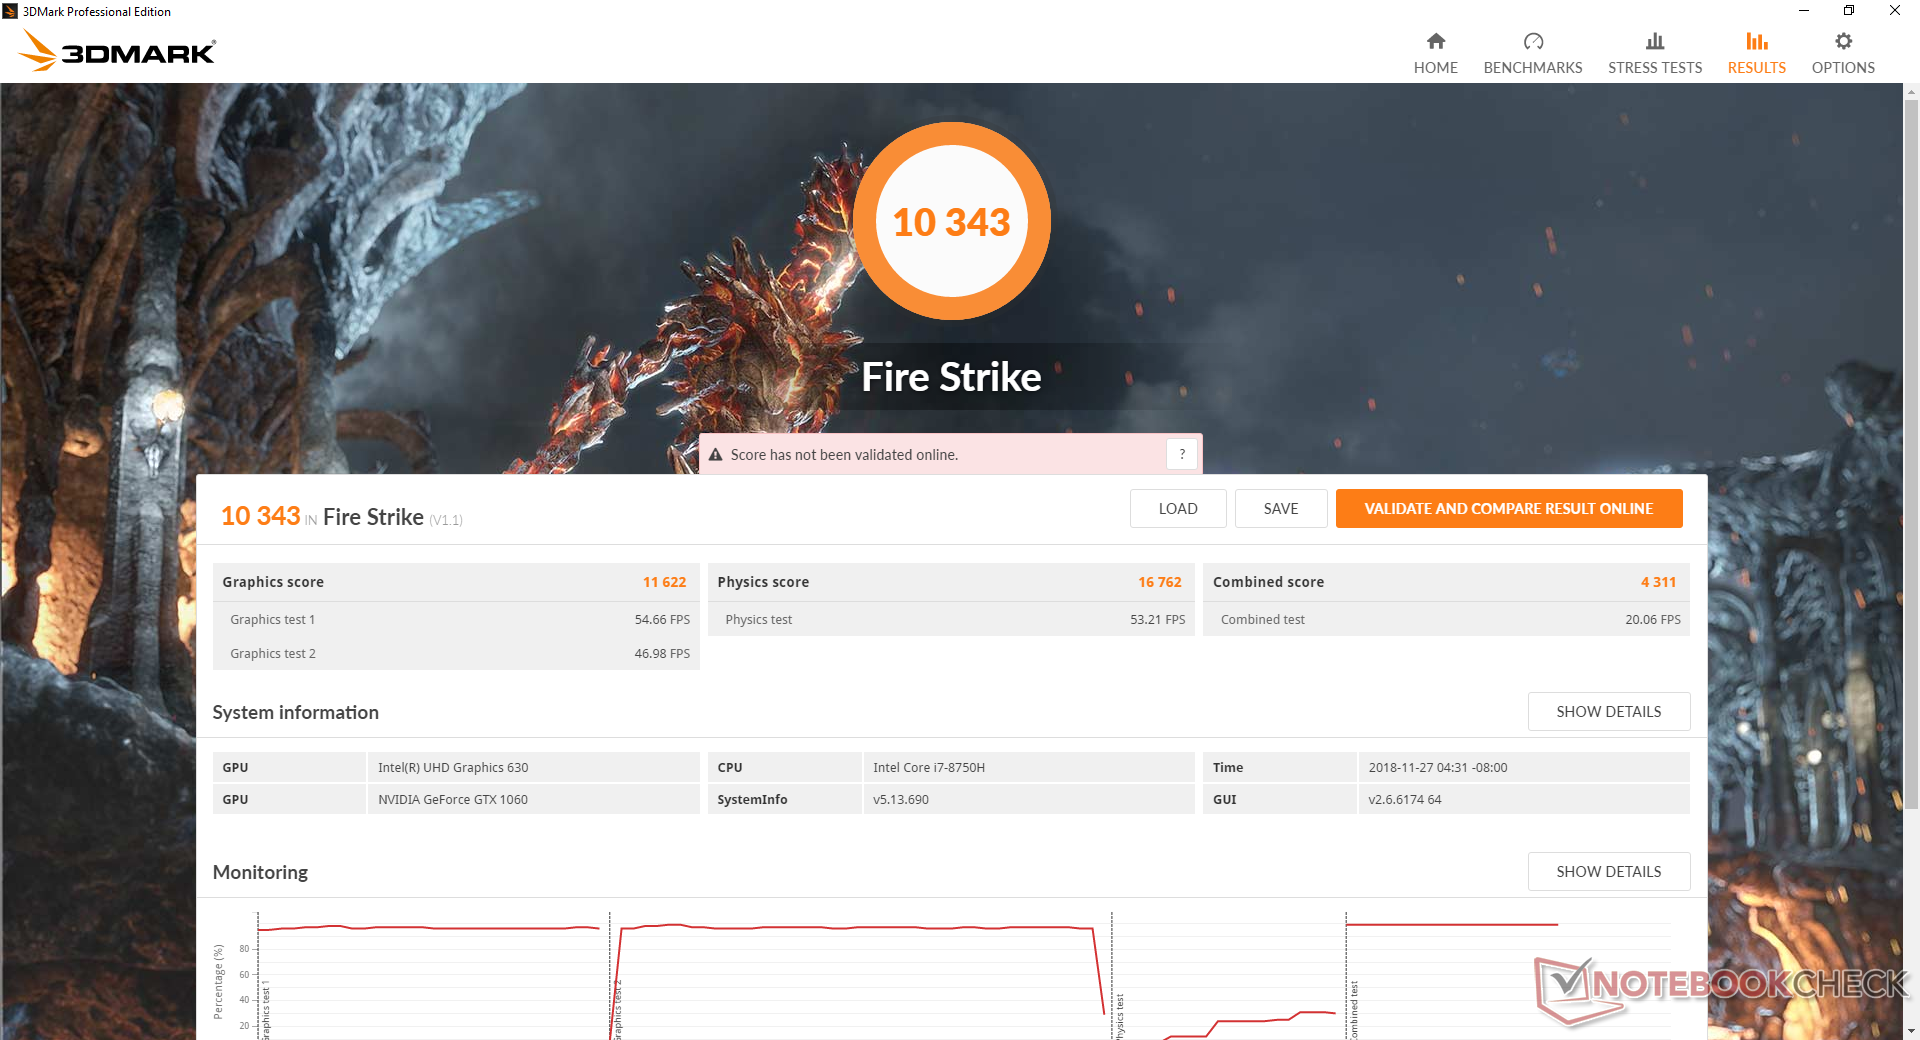
| 3DMark 11 Performance | 13743 points | |
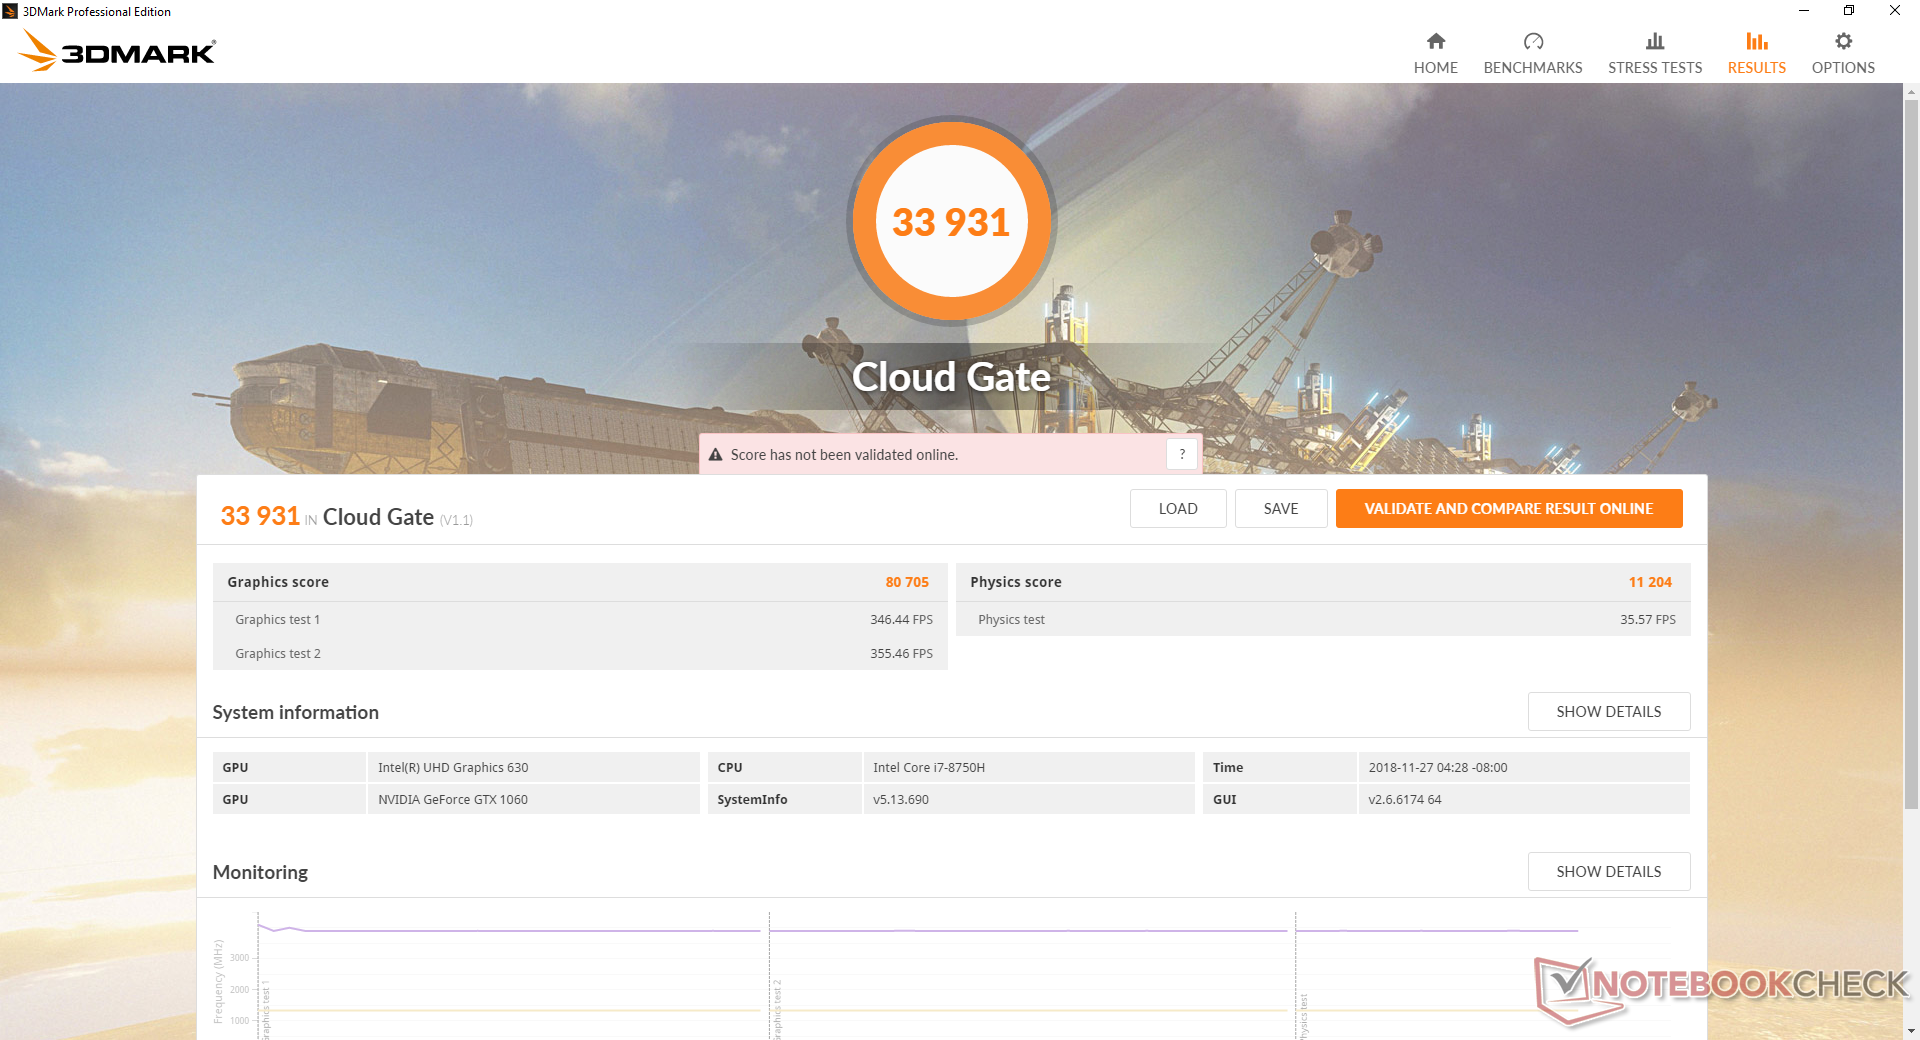
| 3DMark Cloud Gate Standard Score | 33931 points | |
| 3DMark Fire Strike Score | 10343 points | |
Help | ||
| The Witcher 3 - 1920x1080 Ultra Graphics & Postprocessing (HBAO+) | |
| Asus Zephyrus S GX531GS | |
| Nvidia GeForce GTX 1060 Founders Edition 6 GB | |
| MSI GS65 Stealth Thin 8RE-051US | |
| Lenovo Legion Y7000P-1060 | |
| Asus G752VY-GC110T | |
| Medion Erazer P6705-MD61131 | |
| low | med. | high | ultra | |
|---|---|---|---|---|
| BioShock Infinite (2013) | 277.1 | 244 | 224.2 | 111.7 |
| The Witcher 3 (2015) | 194.7 | 130.4 | 73.1 | 37 |
| Rise of the Tomb Raider (2016) | 164.1 | 131.4 | 75.2 | 61.4 |
Emissions
System Noise
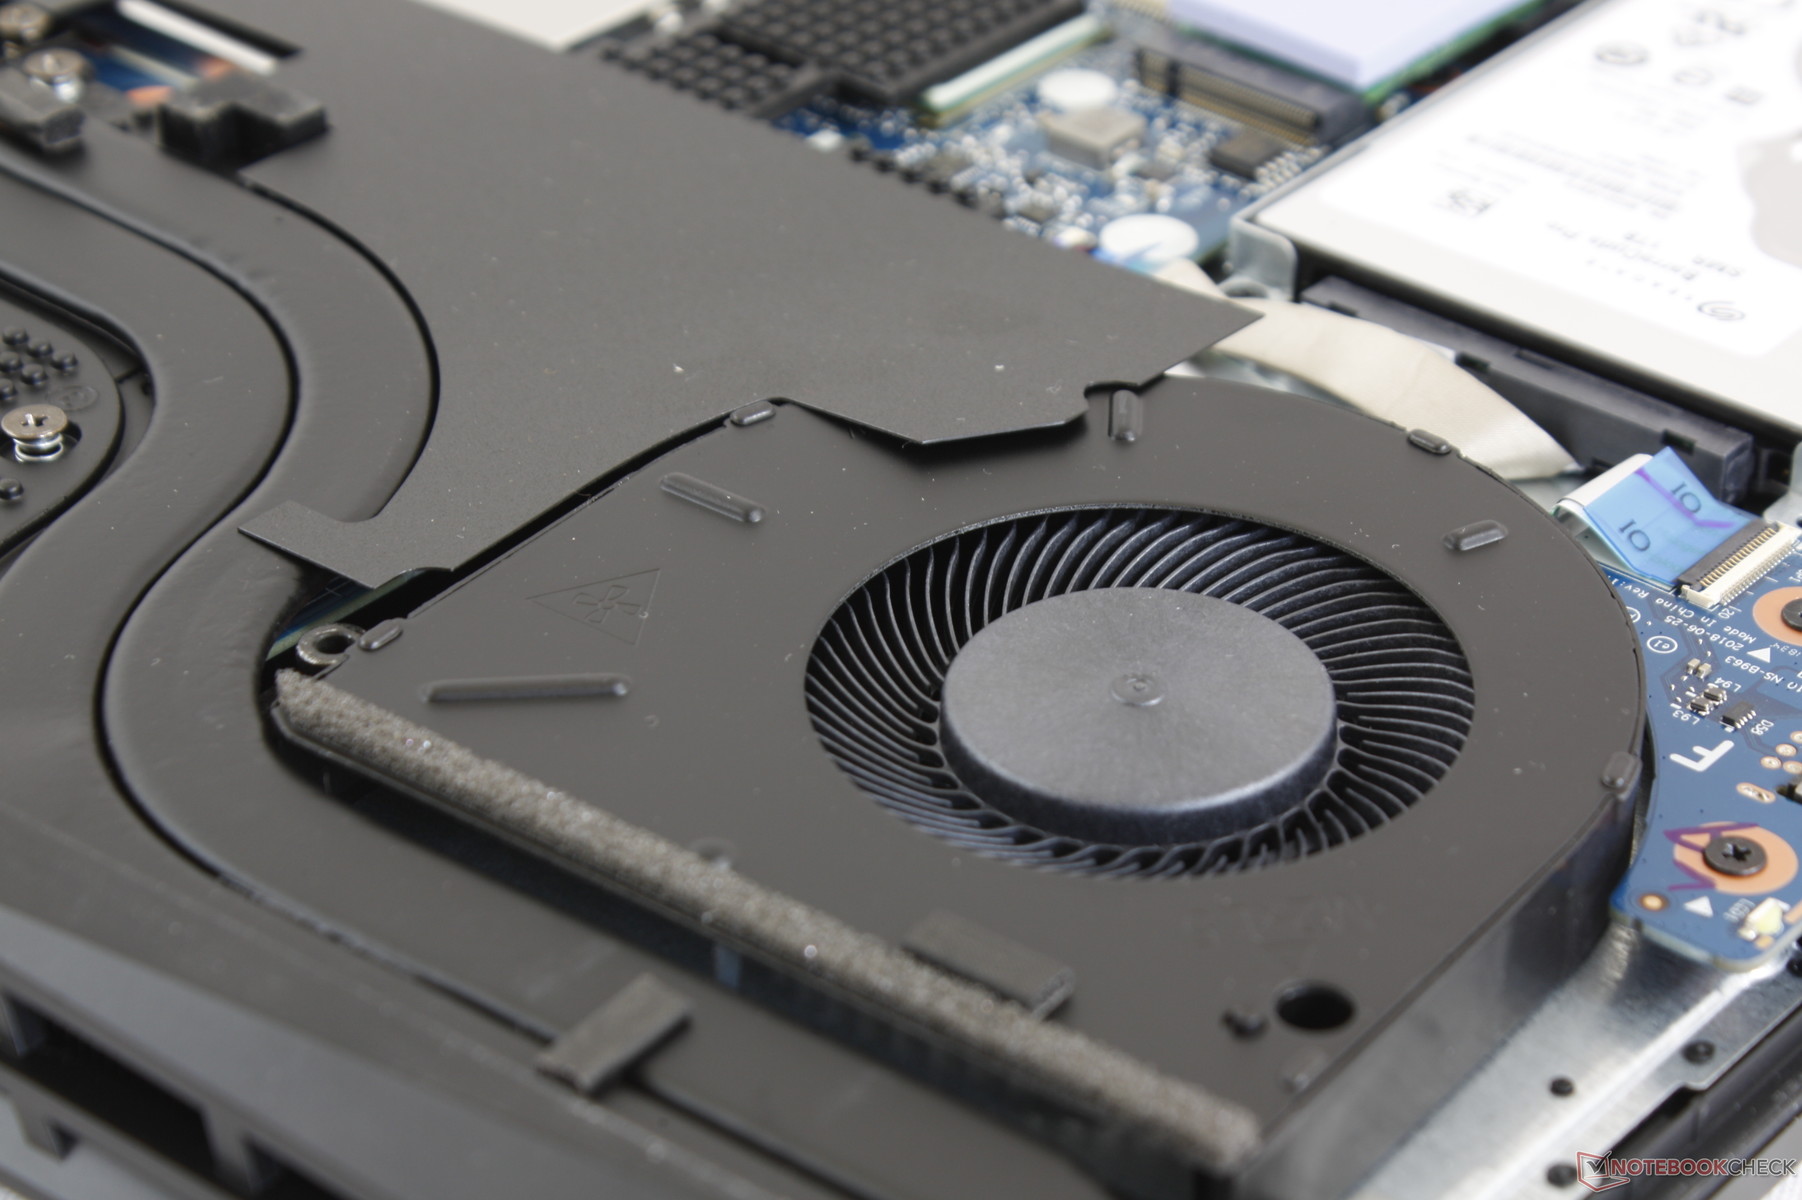
The cooling solution consists of two fans and three heat pipes between them not unlike on the Y530. One fan appears to be slightly smaller in diameter than the other (~45 mm vs. ~50 mm) likely in an attempt to reduce fan pitch when both fans are active.
The system fans will idle for a silent experience during light tasks like word processing. Nonetheless, we are still able to record a noise of about 31 dB(A) against a background of 28.4 dB(A) because of the spinning HDD in our test unit. Fan noise is similar to the MSI GS65 when gaming at about 45 to 46 dB(A). Extreme loads will induce a temporary fan noise of 50 dB(A) for just a few seconds before throttling kicks in. Overall, the Y7000 is louder than our lesser-equipped Y530 since the same fans and heat pipes must cool the more demanding GTX 1060 GPU.
Our test unit suffers from no noticeable electronic noise.
| Lenovo Legion Y7000P-1060 GeForce GTX 1060 Mobile, i7-8750H, Samsung SSD PM981 MZVLB256HAHQ | Asus Zephyrus S GX531GS GeForce GTX 1070 Max-Q, i7-8750H, WDC PC SN520 SDAPNUW-512G | MSI GS65 Stealth Thin 8RE-051US GeForce GTX 1060 Mobile, i7-8750H, Samsung SSD PM981 MZVLB256HAHQ | Lenovo Legion Y530-15ICH GeForce GTX 1050 Ti Mobile, i5-8300H, Toshiba KBG30ZMT128G | Dell G7 15-7588 GeForce GTX 1060 Max-Q, i7-8750H, SK hynix SC311 SATA | |
|---|---|---|---|---|---|
| Noise | -10% | 4% | 9% | 2% | |
| off / environment * (dB) | 28.4 | 29 -2% | 28.4 -0% | 28 1% | 28.1 1% |
| Idle Minimum * (dB) | 31.1 | 33 -6% | 28.4 9% | 28 10% | 29 7% |
| Idle Average * (dB) | 31.1 | 34 -9% | 28.4 9% | 28 10% | 29 7% |
| Idle Maximum * (dB) | 31.2 | 40 -28% | 29.6 5% | 28.5 9% | 29.2 6% |
| Load Average * (dB) | 43.2 | 47 -9% | 43.5 -1% | 34.9 19% | 40.6 6% |
| Witcher 3 ultra * (dB) | 45.3 | 51 -13% | 45.7 -1% | 40 12% | 49.8 -10% |
| Load Maximum * (dB) | 50 | 53 -6% | 45.7 9% | 49.6 1% | 49.8 -0% |
* ... smaller is better
Noise level
| Idle |
| 31.1 / 31.1 / 31.2 dB(A) |
| HDD |
| 31.2 dB(A) |
| Load |
| 43.2 / 50 dB(A) |
 | ||
30 dB silent 40 dB(A) audible 50 dB(A) loud |
||
min: | ||
Temperature
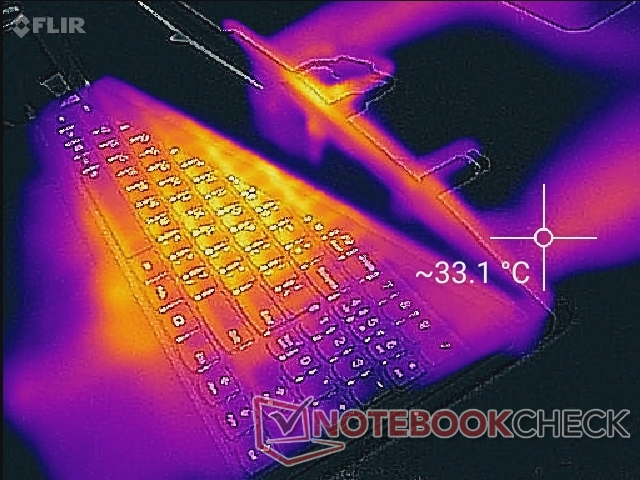
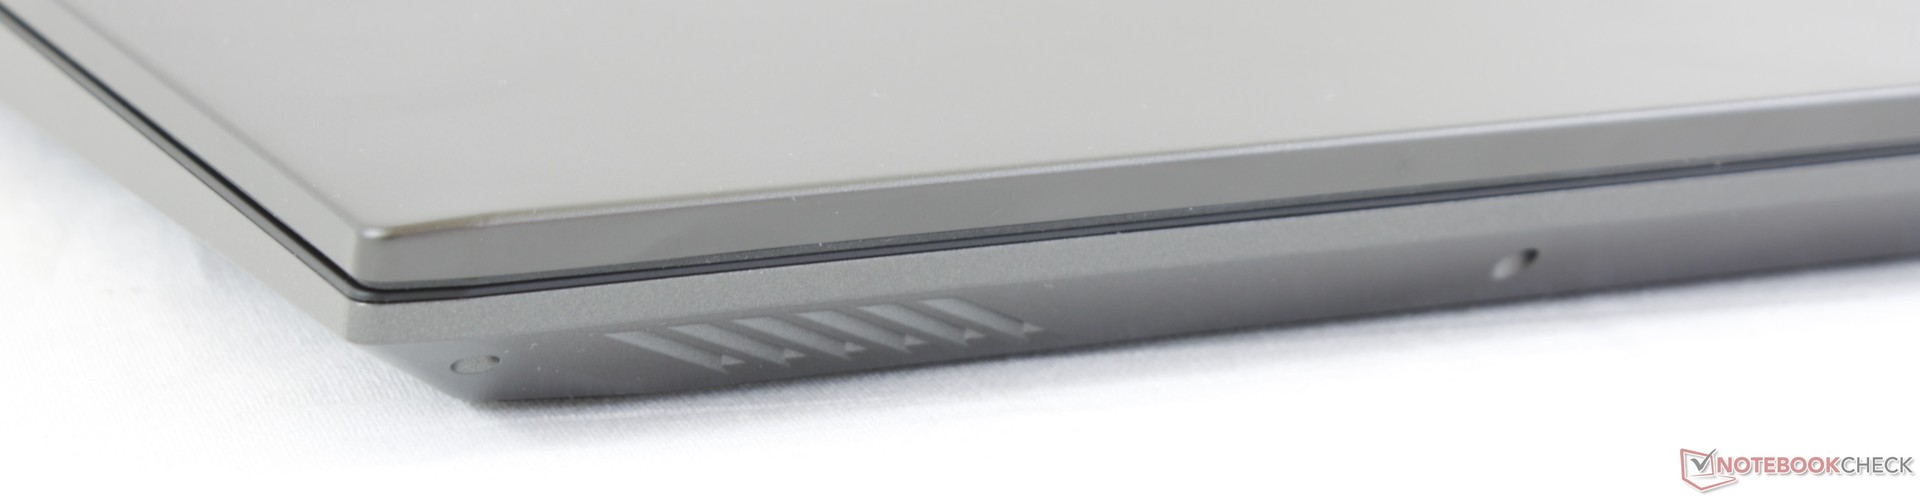
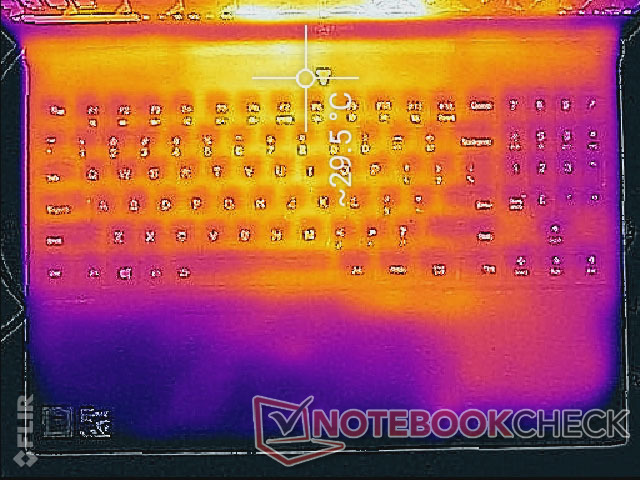
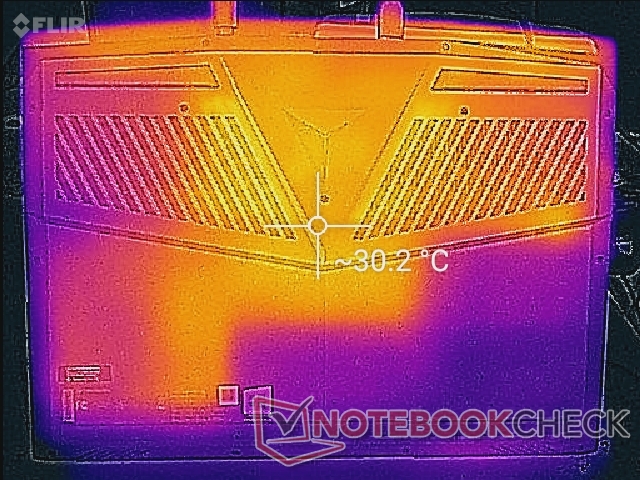
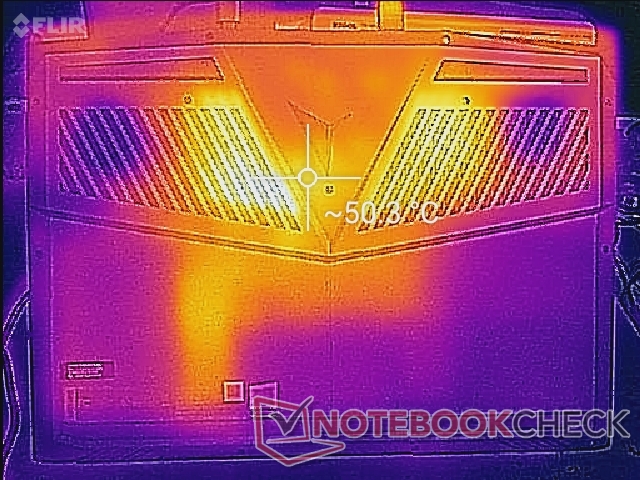
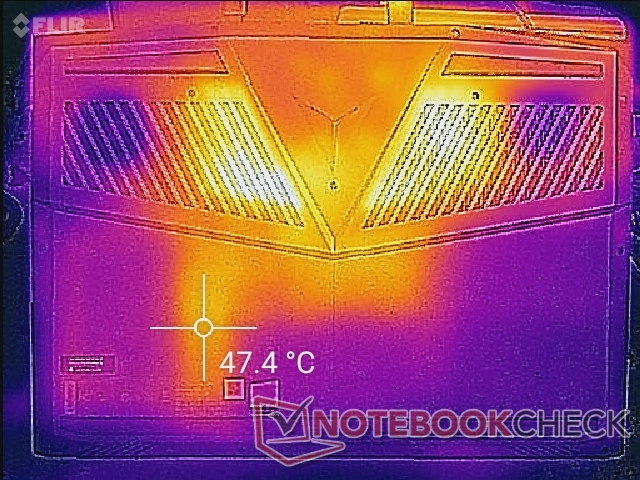
Surface temperatures are warmest towards the center rear of the system since the cooling solution is almost symmetrical. When idling, the center hot spot can reach 30 C whereas the palm rests can be 24 C or 26 C. Note that the right palm will always be warmer than the left since both the HDD and M.2 SSD are positioned directly underneath. The M.2 SSD in particular can cause the bottom surface to be as warm as 47 C when under high load.
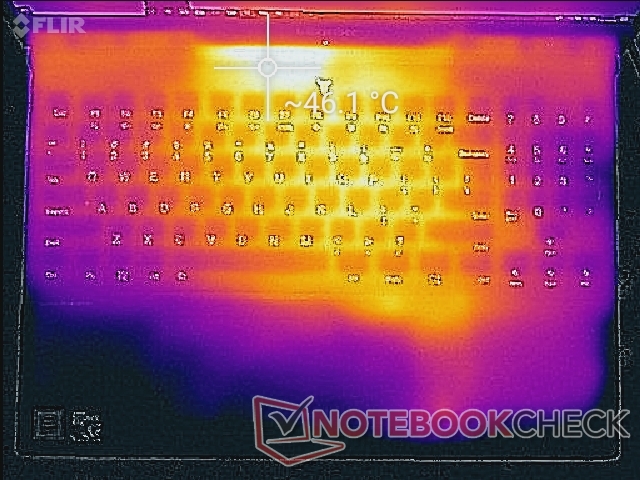
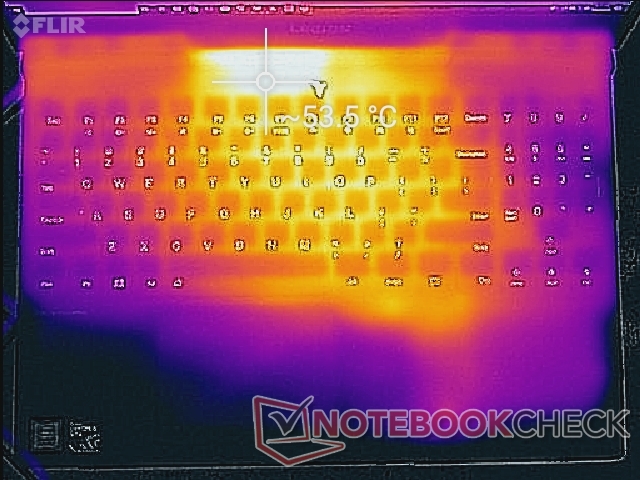
Surface temperatures can be as warm as 46 C or higher when gaming. Fortunately, this hot spot is above the first row of keyboard keys where users are unlikely to touch. The keyboard center will grow quite warm, but it's thankfully never uncomfortable for light-moderate typing. The Dell G7 is a bit cooler overall since it is a thicker and heavier alternative.
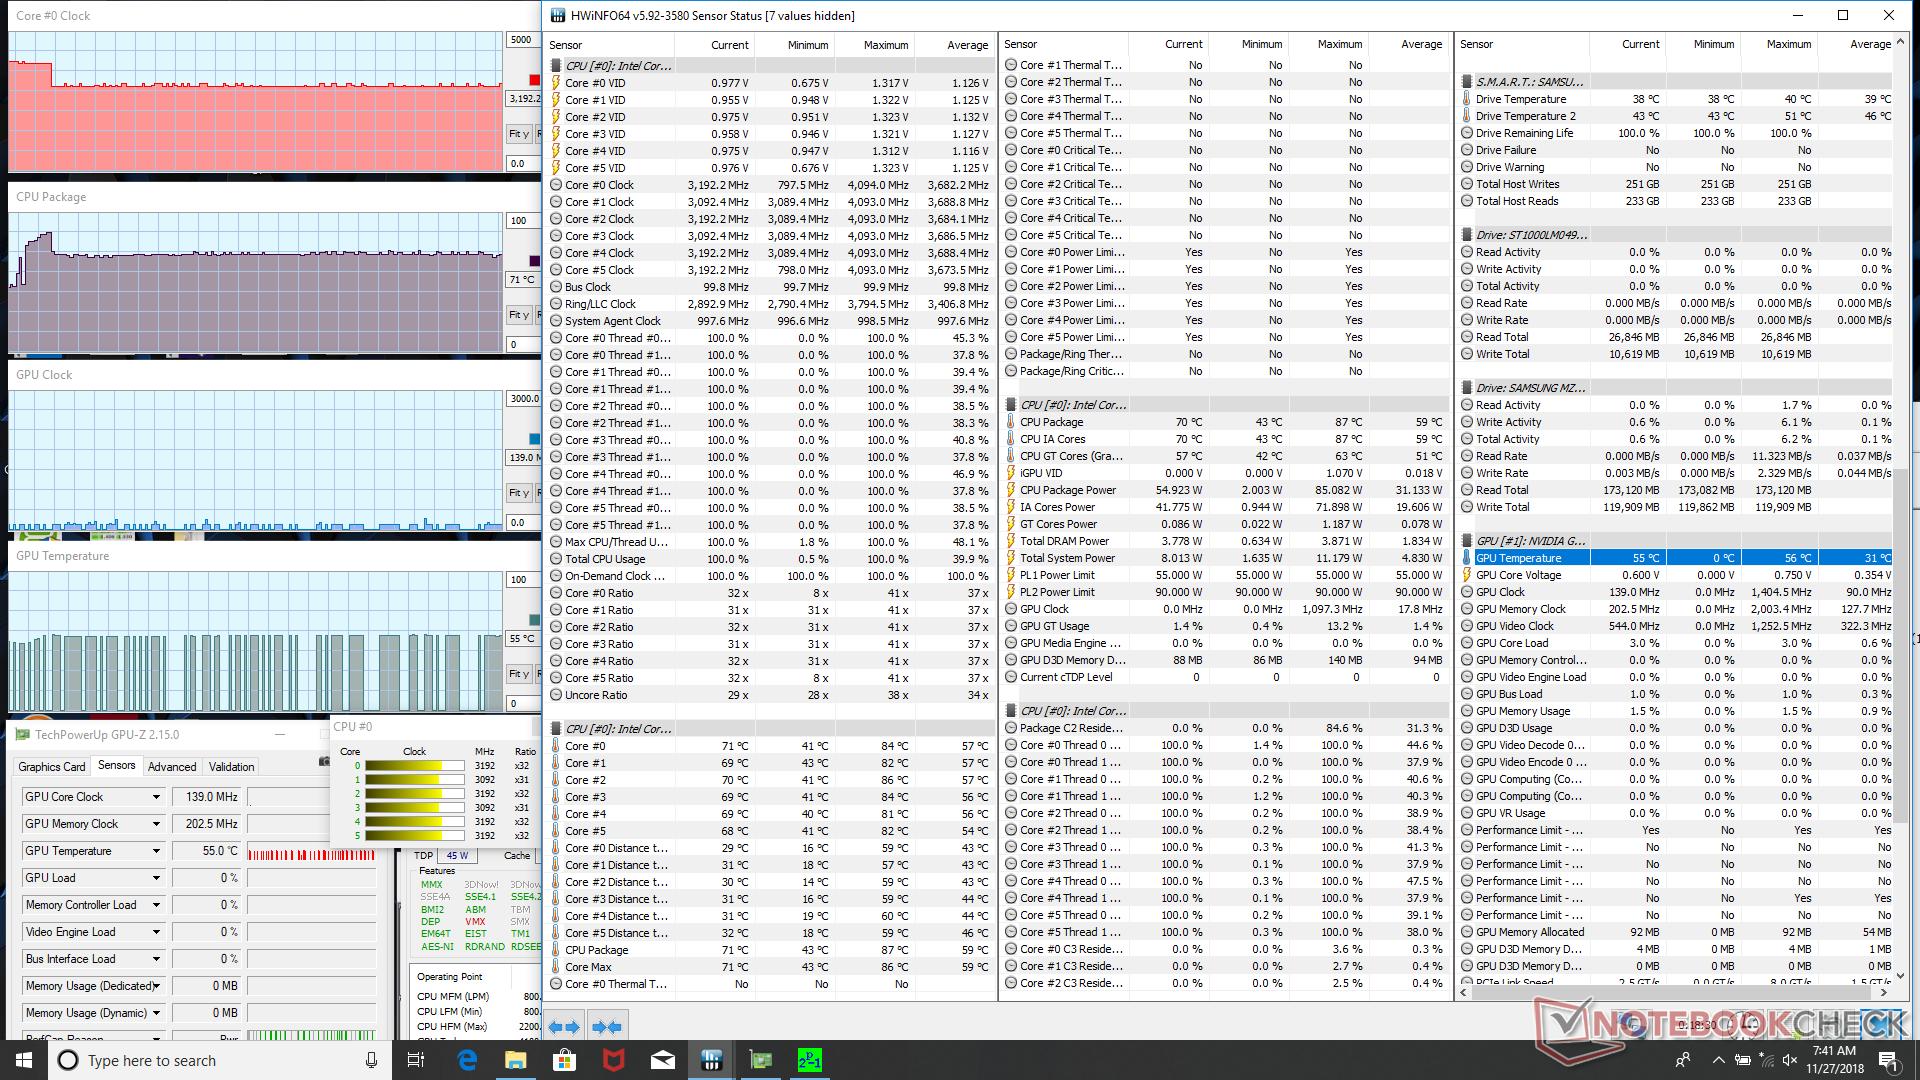
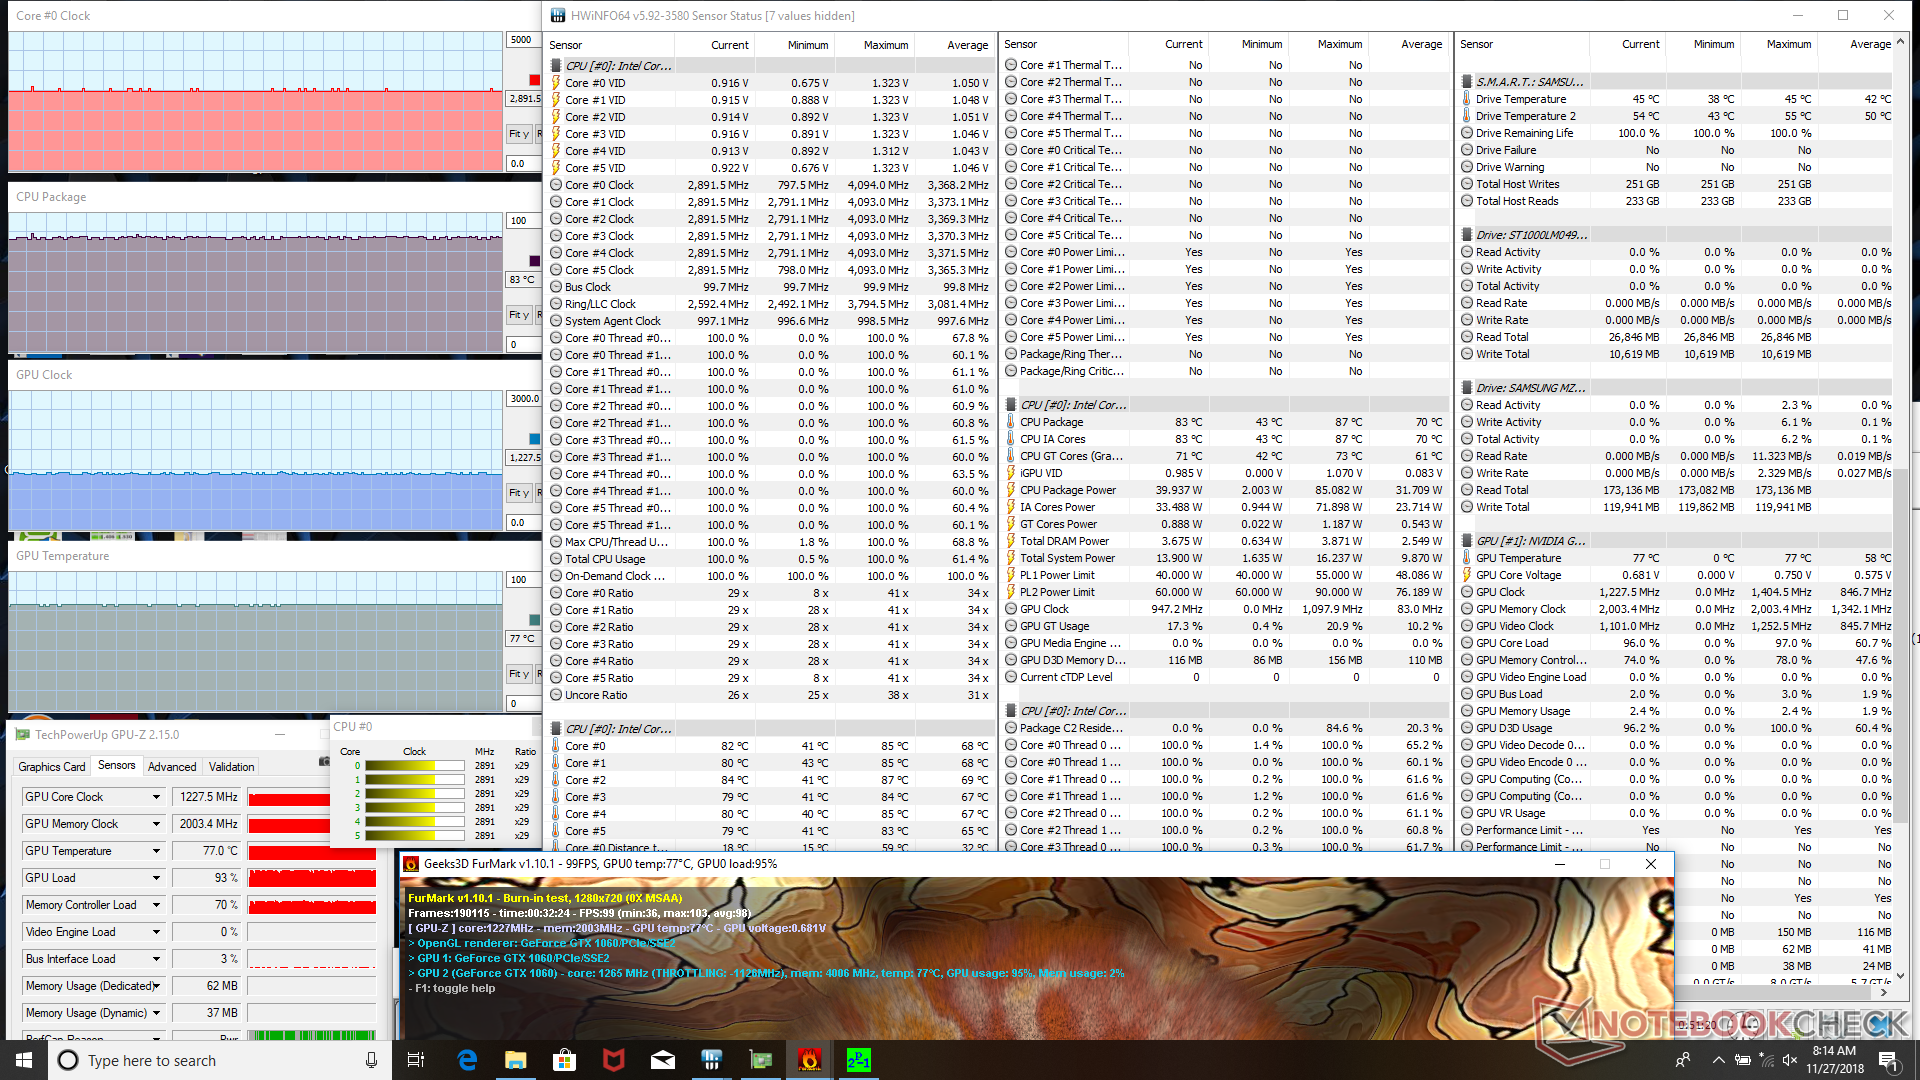
We stress the notebook to identify for any potential throttling or stability issues. When subjected to Prime95 load, the CPU clock rate can be as high as 3.9 GHz for the first few seconds before reaching 87 C. Once this temperature threshold is reached, clock rates drop to 3.1 to 3.2 GHz in order to maintain a steady core temperature of 71 C as shown by our screenshot below. Running both Prime95 and FurMark simultaneously will bump CPU clock rate down to 2.9 GHz while raising core temperature to 83 C. The CPU never throttles below its base clock rate of 2.2 GHz.
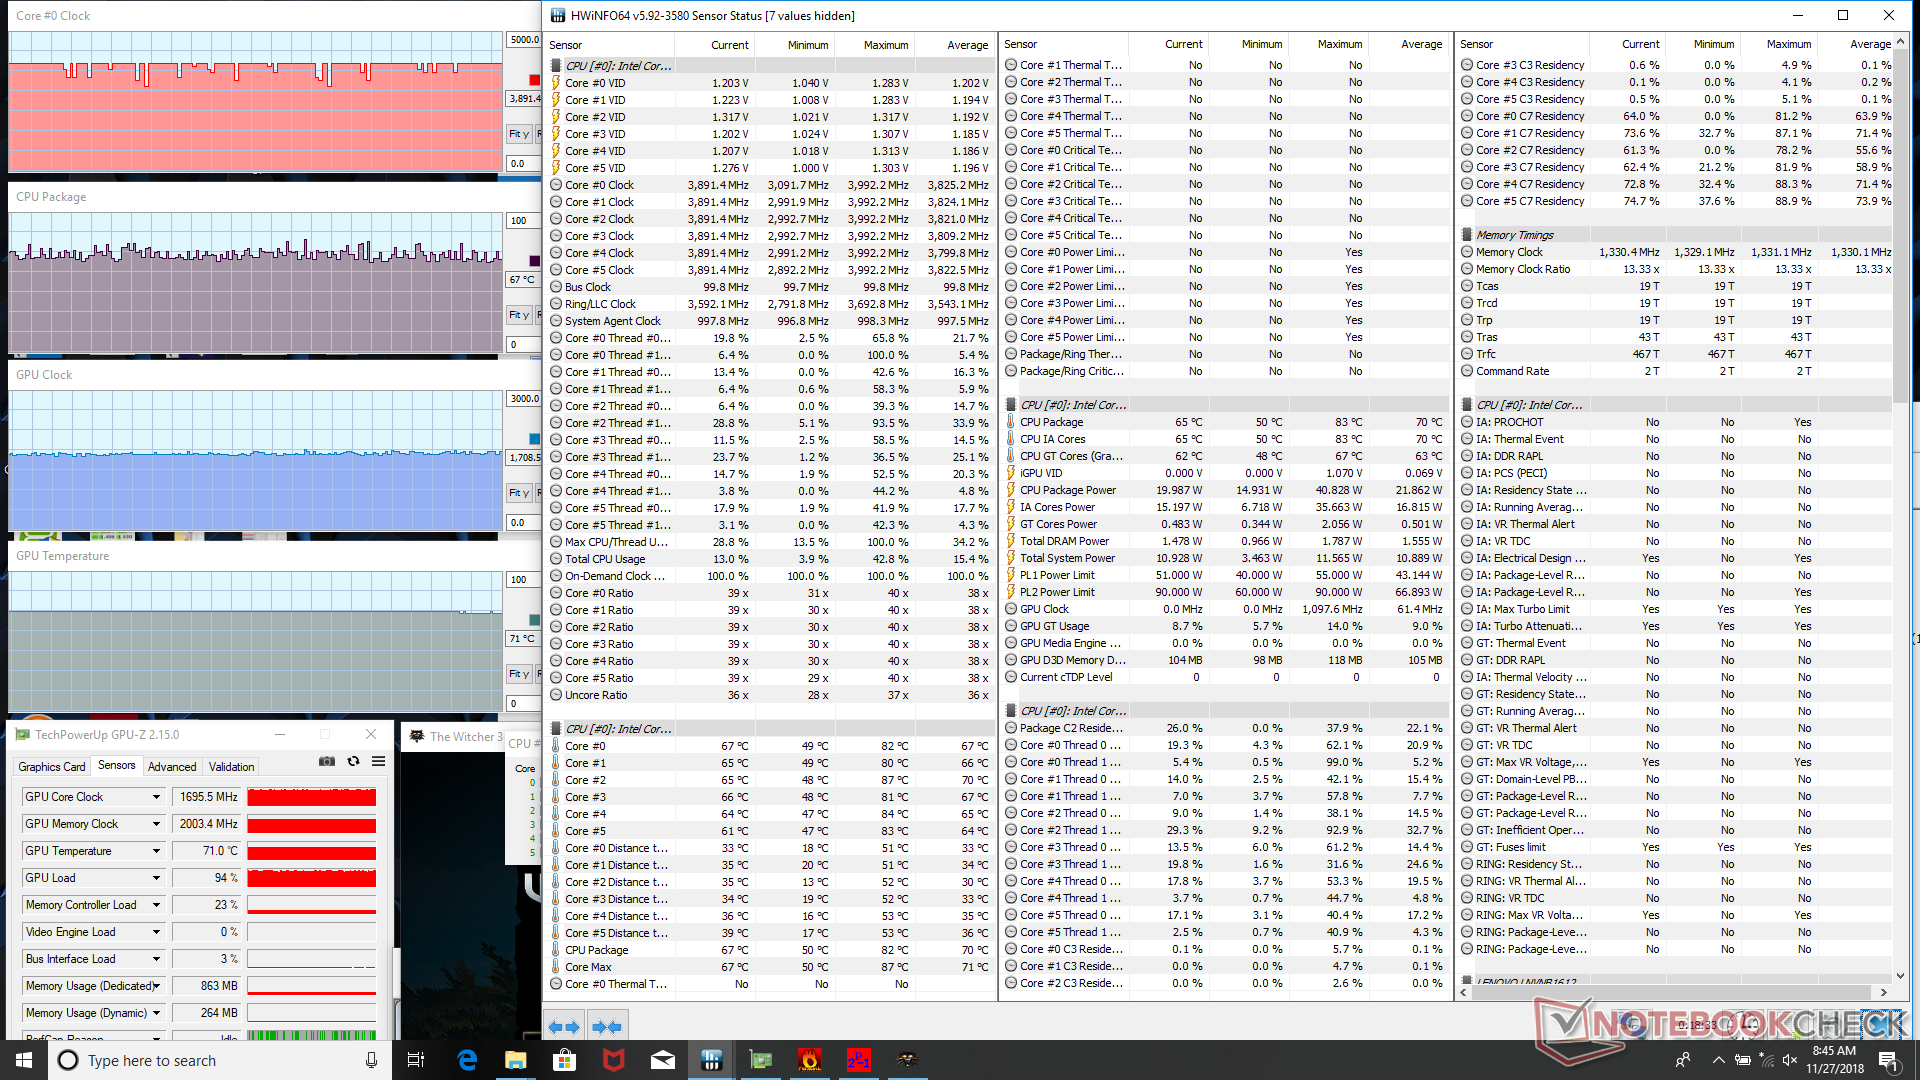
Running Witcher 3 is more representative of real-world gaming loads. We can observe the CPU and GPU running steadily at 3.9 GHz and 1696 MHz, respectively, and at decent core temperatures as low as 70 C. In comparison, the MSI GS65 with the same CPU and GPU stabilizes at a slightly warmer temperature of ~75 C when subjected to the same gaming load.
Running on battery power will throttle performance even when set to High Performance and Prefer Maximum Performance profiles. A 3DMark 11 run on batteries returns Physics and Graphics scores 4947 and 6108 points, respectively, compared to 12391 and 14508 points when on mains.
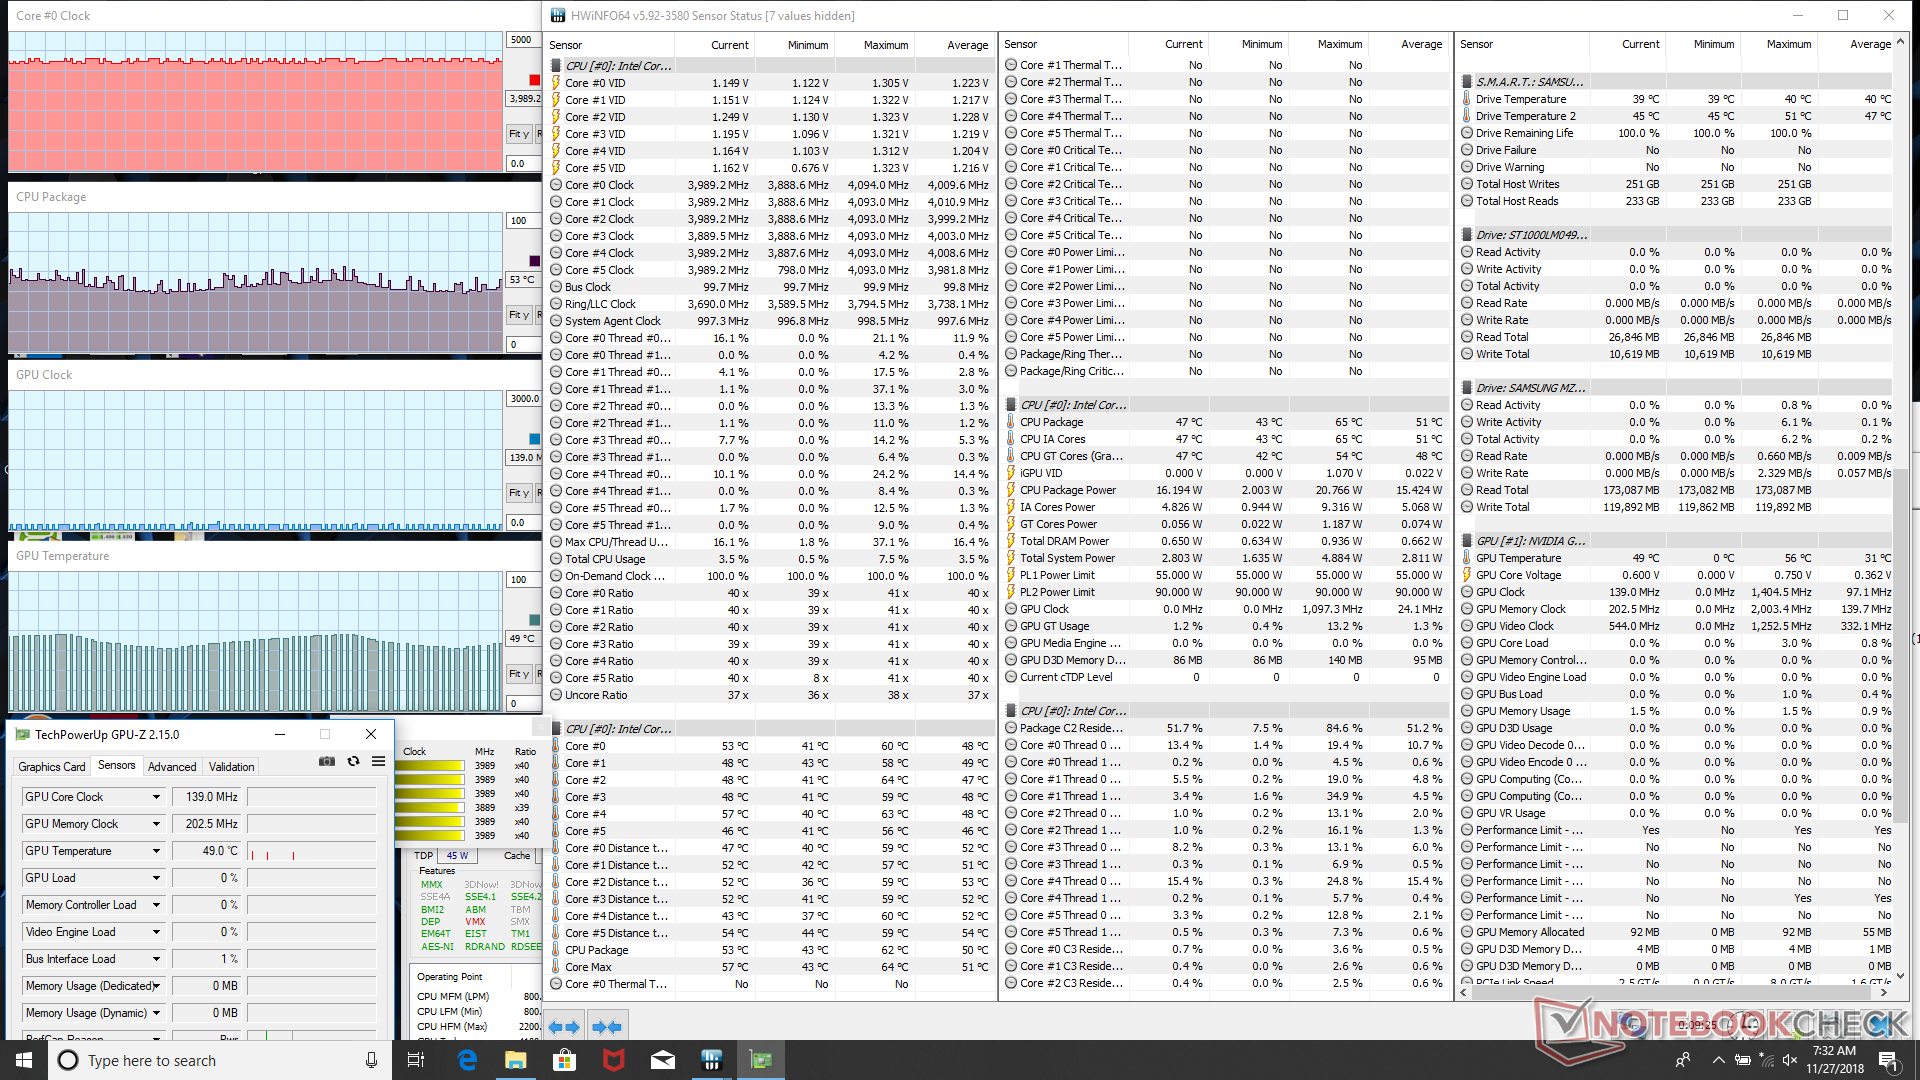
| CPU Clock (GHz) | GPU Clock (MHz) | Average CPU Temperature (°C) | Average GPU Temperature (°C) | |
| System Idle | -- | -- | ~53 | ~48 |
| Prime95 Stress | 3.1 - 3.2 | -- | 55 | 71 |
| Prime95 + FurMark Stress | 2.9 | 1228 | 83 | 77 |
| Witcher 3 Stress | 3.9 | 1696 | ~67 | 71 |
(-) The maximum temperature on the upper side is 53.4 °C / 128 F, compared to the average of 40.4 °C / 105 F, ranging from 21.2 to 68.8 °C for the class Gaming.
(-) The bottom heats up to a maximum of 51 °C / 124 F, compared to the average of 43.2 °C / 110 F
(+) In idle usage, the average temperature for the upper side is 27.1 °C / 81 F, compared to the device average of 33.9 °C / 93 F.
(±) Playing The Witcher 3, the average temperature for the upper side is 33.2 °C / 92 F, compared to the device average of 33.9 °C / 93 F.
(+) The palmrests and touchpad are cooler than skin temperature with a maximum of 31 °C / 87.8 F and are therefore cool to the touch.
(-) The average temperature of the palmrest area of similar devices was 28.8 °C / 83.8 F (-2.2 °C / -4 F).
Speakers
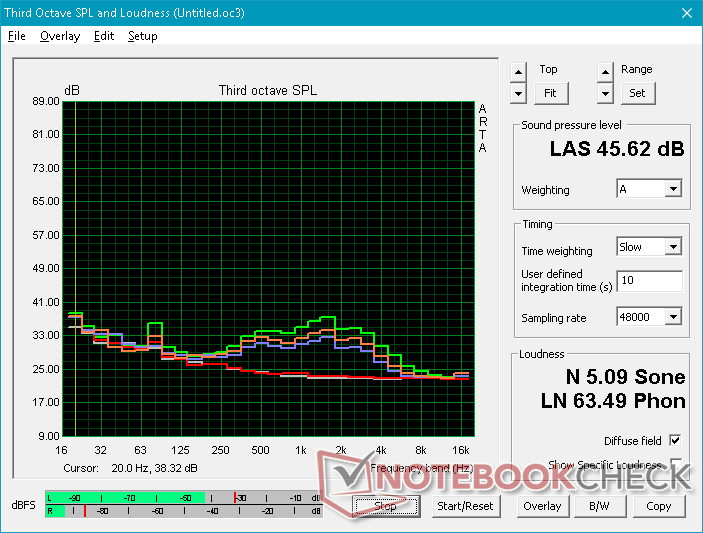
Visually, the Harman stereo speakers appear to be exactly the same as the speakers on the Legion Y530. Nonetheless, our pink noise graphs for the two systems are quite different. The Y530 is seemingly better at providing a more balanced audio experience between bass and treble sounds while the Y7000 is a bit louder. The palm rests reverberate slightly if on higher volume settings since the speakers are so close to the front corners.
There is no special Lenovo software included for fine-tuning the audio experience unlike on gaming notebooks from MSI, Asus, or Dell.


Lenovo Legion Y7000P-1060 audio analysis
(±) | speaker loudness is average but good (73.2 dB)
Bass 100 - 315 Hz
(±) | reduced bass - on average 8% lower than median
(±) | linearity of bass is average (8.3% delta to prev. frequency)
Mids 400 - 2000 Hz
(±) | higher mids - on average 5.5% higher than median
(+) | mids are linear (6.3% delta to prev. frequency)
Highs 2 - 16 kHz
(±) | higher highs - on average 6.1% higher than median
(+) | highs are linear (6.6% delta to prev. frequency)
Overall 100 - 16.000 Hz
(±) | linearity of overall sound is average (20.6% difference to median)
Compared to same class
» 74% of all tested devices in this class were better, 5% similar, 21% worse
» The best had a delta of 6%, average was 18%, worst was 132%
Compared to all devices tested
» 55% of all tested devices were better, 8% similar, 37% worse
» The best had a delta of 4%, average was 24%, worst was 134%
Apple MacBook 12 (Early 2016) 1.1 GHz audio analysis
(+) | speakers can play relatively loud (83.6 dB)
Bass 100 - 315 Hz
(±) | reduced bass - on average 11.3% lower than median
(±) | linearity of bass is average (14.2% delta to prev. frequency)
Mids 400 - 2000 Hz
(+) | balanced mids - only 2.4% away from median
(+) | mids are linear (5.5% delta to prev. frequency)
Highs 2 - 16 kHz
(+) | balanced highs - only 2% away from median
(+) | highs are linear (4.5% delta to prev. frequency)
Overall 100 - 16.000 Hz
(+) | overall sound is linear (10.2% difference to median)
Compared to same class
» 7% of all tested devices in this class were better, 2% similar, 91% worse
» The best had a delta of 5%, average was 18%, worst was 53%
Compared to all devices tested
» 5% of all tested devices were better, 1% similar, 94% worse
» The best had a delta of 4%, average was 24%, worst was 134%
Energy Management
Power Consumption
The Lenovo demands anywhere between 5 W and 17 W when idling on desktop depending on the brightness setting and power profile. Power consumption is slightly higher than the Dell G7 during higher loads since the latter uses the more efficient Max-Q version of our GTX 1060.
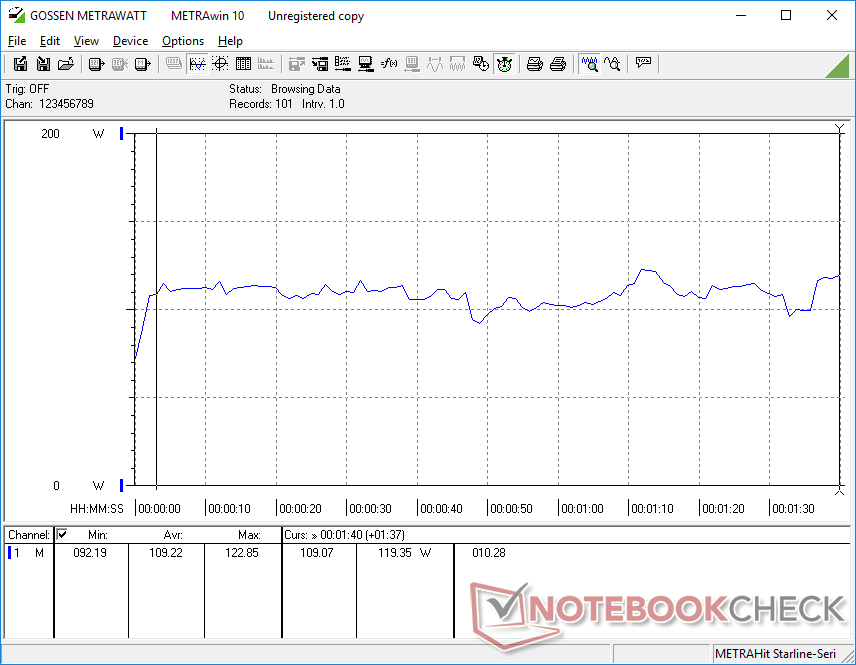
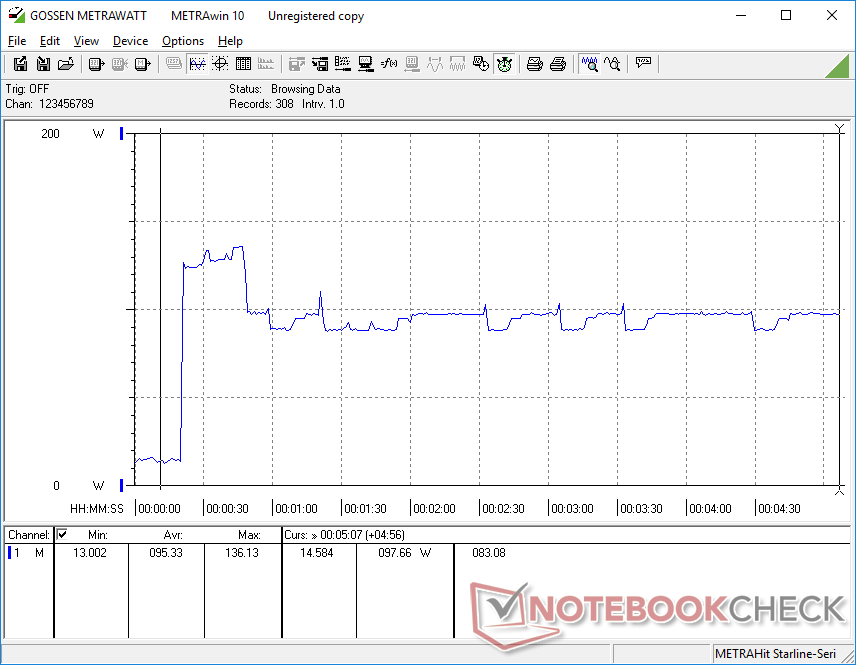
Our graph below shows power consumption over time when running Prime95. Consumption is highest at about 136 W during the first few seconds of testing before promptly dropping and stabilizing at about 95 W. The results mirror our clock rate observations from the Stress Test section above since the CPU is unable to sustain maximum Turbo Boost clock rates indefinitely.
We are able to record a maximum draw of 175 W from the medium-sized (~15.4 x 6.4 x 3.2 cm) 170 W AC adapter when running both Prime95 and FurMark simultaneously. This high of a consumption is unsustainable due to throttling and so a larger AC adapter would likely not have increased system performance.
| Off / Standby | |
| Idle | |
| Load |
|
Key:
min: | |
| Lenovo Legion Y7000P-1060 i7-8750H, GeForce GTX 1060 Mobile, Samsung SSD PM981 MZVLB256HAHQ, IPS, 1920x1080, 15.6" | MSI GF63 8RC i5-8300H, GeForce GTX 1050 Mobile, Seagate BarraCuda Pro Compute 1TB ST1000LM049, IPS, 1920x1080, 15.6" | Lenovo Legion Y530-15ICH i5-8300H, GeForce GTX 1050 Ti Mobile, Toshiba KBG30ZMT128G, IPS, 1920x1080, 15.6" | Dell G7 15-7588 i7-8750H, GeForce GTX 1060 Max-Q, SK hynix SC311 SATA, IPS, 1920x1080, 15.6" | Asus Zephyrus S GX531GS i7-8750H, GeForce GTX 1070 Max-Q, WDC PC SN520 SDAPNUW-512G, IPS, 1920x1080, 15.6" | Asus Strix GL502VY-DS71 6700HQ, GeForce GTX 980M, SanDisk SD8SN8U1T001122, IPS, 1920x1080, 15.6" | |
|---|---|---|---|---|---|---|
| Power Consumption | 13% | 10% | 12% | -86% | -110% | |
| Idle Minimum * (Watt) | 4.9 | 5.4 -10% | 4.5 8% | 5.5 -12% | 17 -247% | 20.6 -320% |
| Idle Average * (Watt) | 8.1 | 10.4 -28% | 10 -23% | 7.6 6% | 20 -147% | 22.1 -173% |
| Idle Maximum * (Watt) | 16.5 | 10.5 36% | 13.8 16% | 9 45% | 29 -76% | 22.5 -36% |
| Load Average * (Watt) | 109.2 | 84.7 22% | 92.5 15% | 94 14% | 112 -3% | 130.6 -20% |
| Witcher 3 ultra * (Watt) | 124.6 | 92.7 26% | 108.1 13% | 116.3 7% | 152 -22% | |
| Load Maximum * (Watt) | 175.2 | 119.9 32% | 123.2 30% | 154.4 12% | 211 -20% | 177.2 -1% |
* ... smaller is better
Battery Life
Battery capacity is just slightly higher than on the Legion Y530, but battery life is strangely much longer. We're able to record a real-world WLAN runtime of almost 6 hours on our Y7000 compared to just 4 hours on the Y530 when subjected to similar loads and conditions. It's possible that background activity like Windows Update, McAfee Anti-Virus, or other auto-pre-installed software was active during the time of our Y530 test. Either way, 4 to 6 hours is slightly above average for mainstream gaming laptops.
Charging from empty to full capacity is slow at 2 to 2.5 hours. Most Ultrabooks take less time to recharge.
| Lenovo Legion Y7000P-1060 i7-8750H, GeForce GTX 1060 Mobile, 57 Wh | MSI GF63 8RC i5-8300H, GeForce GTX 1050 Mobile, 51 Wh | Dell XPS 15 9570 i7 UHD i7-8750H, GeForce GTX 1050 Ti Max-Q, 97 Wh | Lenovo Legion Y530-15ICH i5-8300H, GeForce GTX 1050 Ti Mobile, 52.5 Wh | Dell G7 15-7588 i7-8750H, GeForce GTX 1060 Max-Q, 56 Wh | Asus Zephyrus S GX531GS i7-8750H, GeForce GTX 1070 Max-Q, 50 Wh | |
|---|---|---|---|---|---|---|
| Battery runtime | -7% | 65% | -29% | 61% | -47% | |
| Reader / Idle (h) | 13.6 | 9.5 -30% | 10.9 -20% | 3.6 -74% | ||
| WiFi v1.3 (h) | 5.8 | 5.5 -5% | 9.6 66% | 4.1 -29% | 7.5 29% | 2.6 -55% |
| Load (h) | 0.8 | 0.9 13% | 1.3 63% | 2.2 175% | 0.7 -13% | |
| Witcher 3 ultra (h) | 1 |
Verdict
Pros
Cons
The Lenovo Legion Y7000 can be best described as an Asus ROG GL504GM but with fewer features and better performance-per-Dollar. Both systems carry the same CPU and GPU and both are nearly identical in size. Users who decide to pay extra for the Asus aren't necessarily paying for more performance, but they would be getting a few more features missing from the Lenovo including a SD card reader and multi-zone RGB backlight. From this perspective, the Legion Y7000 offers incredible gaming value for hundreds of dollars less while looking and feeling just as sharp.
The downsides of the system are relatively minor, but they certainly add up. Port positioning may not be ideal for some users and serviceability could have been easier. Better fan controls and webcam placement, a stiffer lid, more rigid trackpad, and perhaps less fingerprint-prone surfaces would have improved the user experience without needing to bump up the price. It's also slightly heavier or thicker than competing narrow-bezel alternatives like the MSI GF63 and the aforementioned ROG GL504. More serious FPS gamers should be wary of the base 60 Hz display option due to its relatively slow black-white response times.
A value gaming machine without feeling or looking like a cheaply-made budget product. The Lenovo Legion Y7000 gets core performance right while dropping auxiliary features to keep prices in check. Some of the new design choices may irk users such as the fingerprint-loving surfaces, inconvenient port placement, and relatively difficult serviceability.
Lenovo Legion Y7000P-1060
- 09/20/2019 v7 (old)
Allen Ngo
Price comparison
