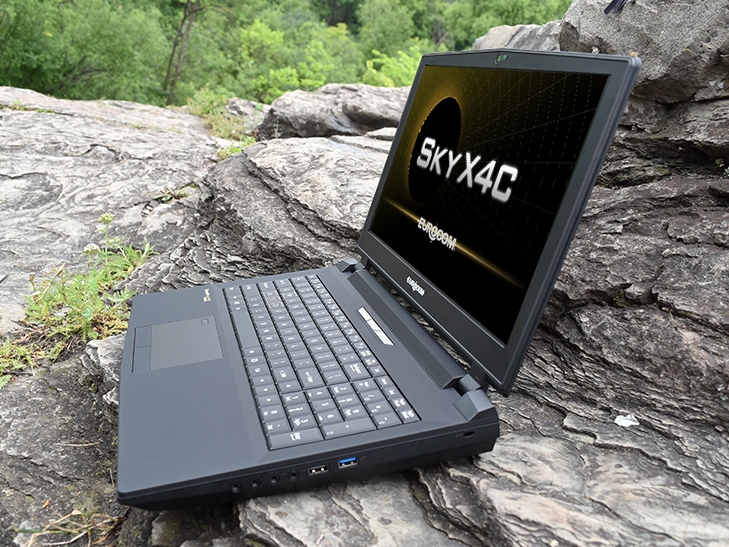
Eurocom Sky X4C (i7-8700K, GTX 1080, Clevo P751TM1-G) Laptop Review
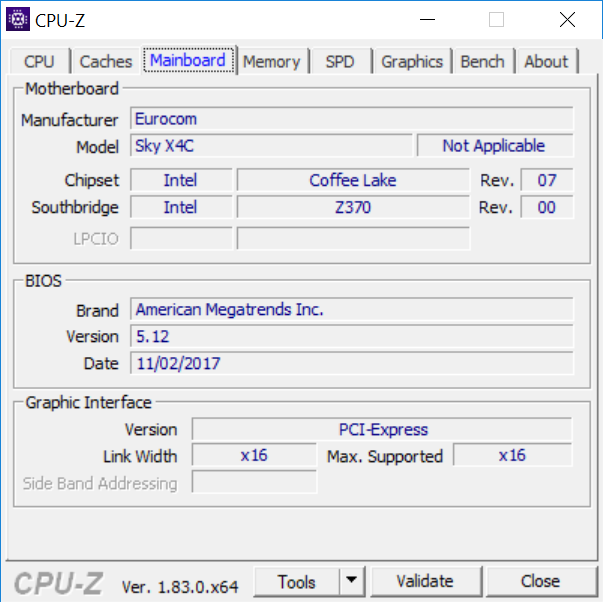
The Sky X4C is one if the first 15.6-inch notebooks to ship with socketed Coffee Lake processors. Like most every system from Eurocom, the notebook aims to be more modular and more powerful than well-known alternatives from MSI, Alienware, HP, Asus, Aorus, or Acer. The Sky X4C is defined by its accessible LGA 1151 socket and MXM 3.0 slot for a wider variety of compatible options than one would expect.
Our test model today is equipped with a Core i7-8700K CPU, GTX 1080 GPU, and 4K UHD display for a rough price of $3500 USD depending on the storage. While Eurocom does not configure the SKy X4C with Quadro graphics, it's still possible to swap out the GeForce card for workstation use. We recommend checking out our existing review on the Schenker XMG U507 with the Core i7-7700K, GTX 1070 GPU, and FHD display for more information on the hardware and its features as the two models share a very similar Clevo barebones design. Owners of older MSI or Alienware laptops can trade in their notebooks for 25 percent off of any Eurocom notebook.
Case
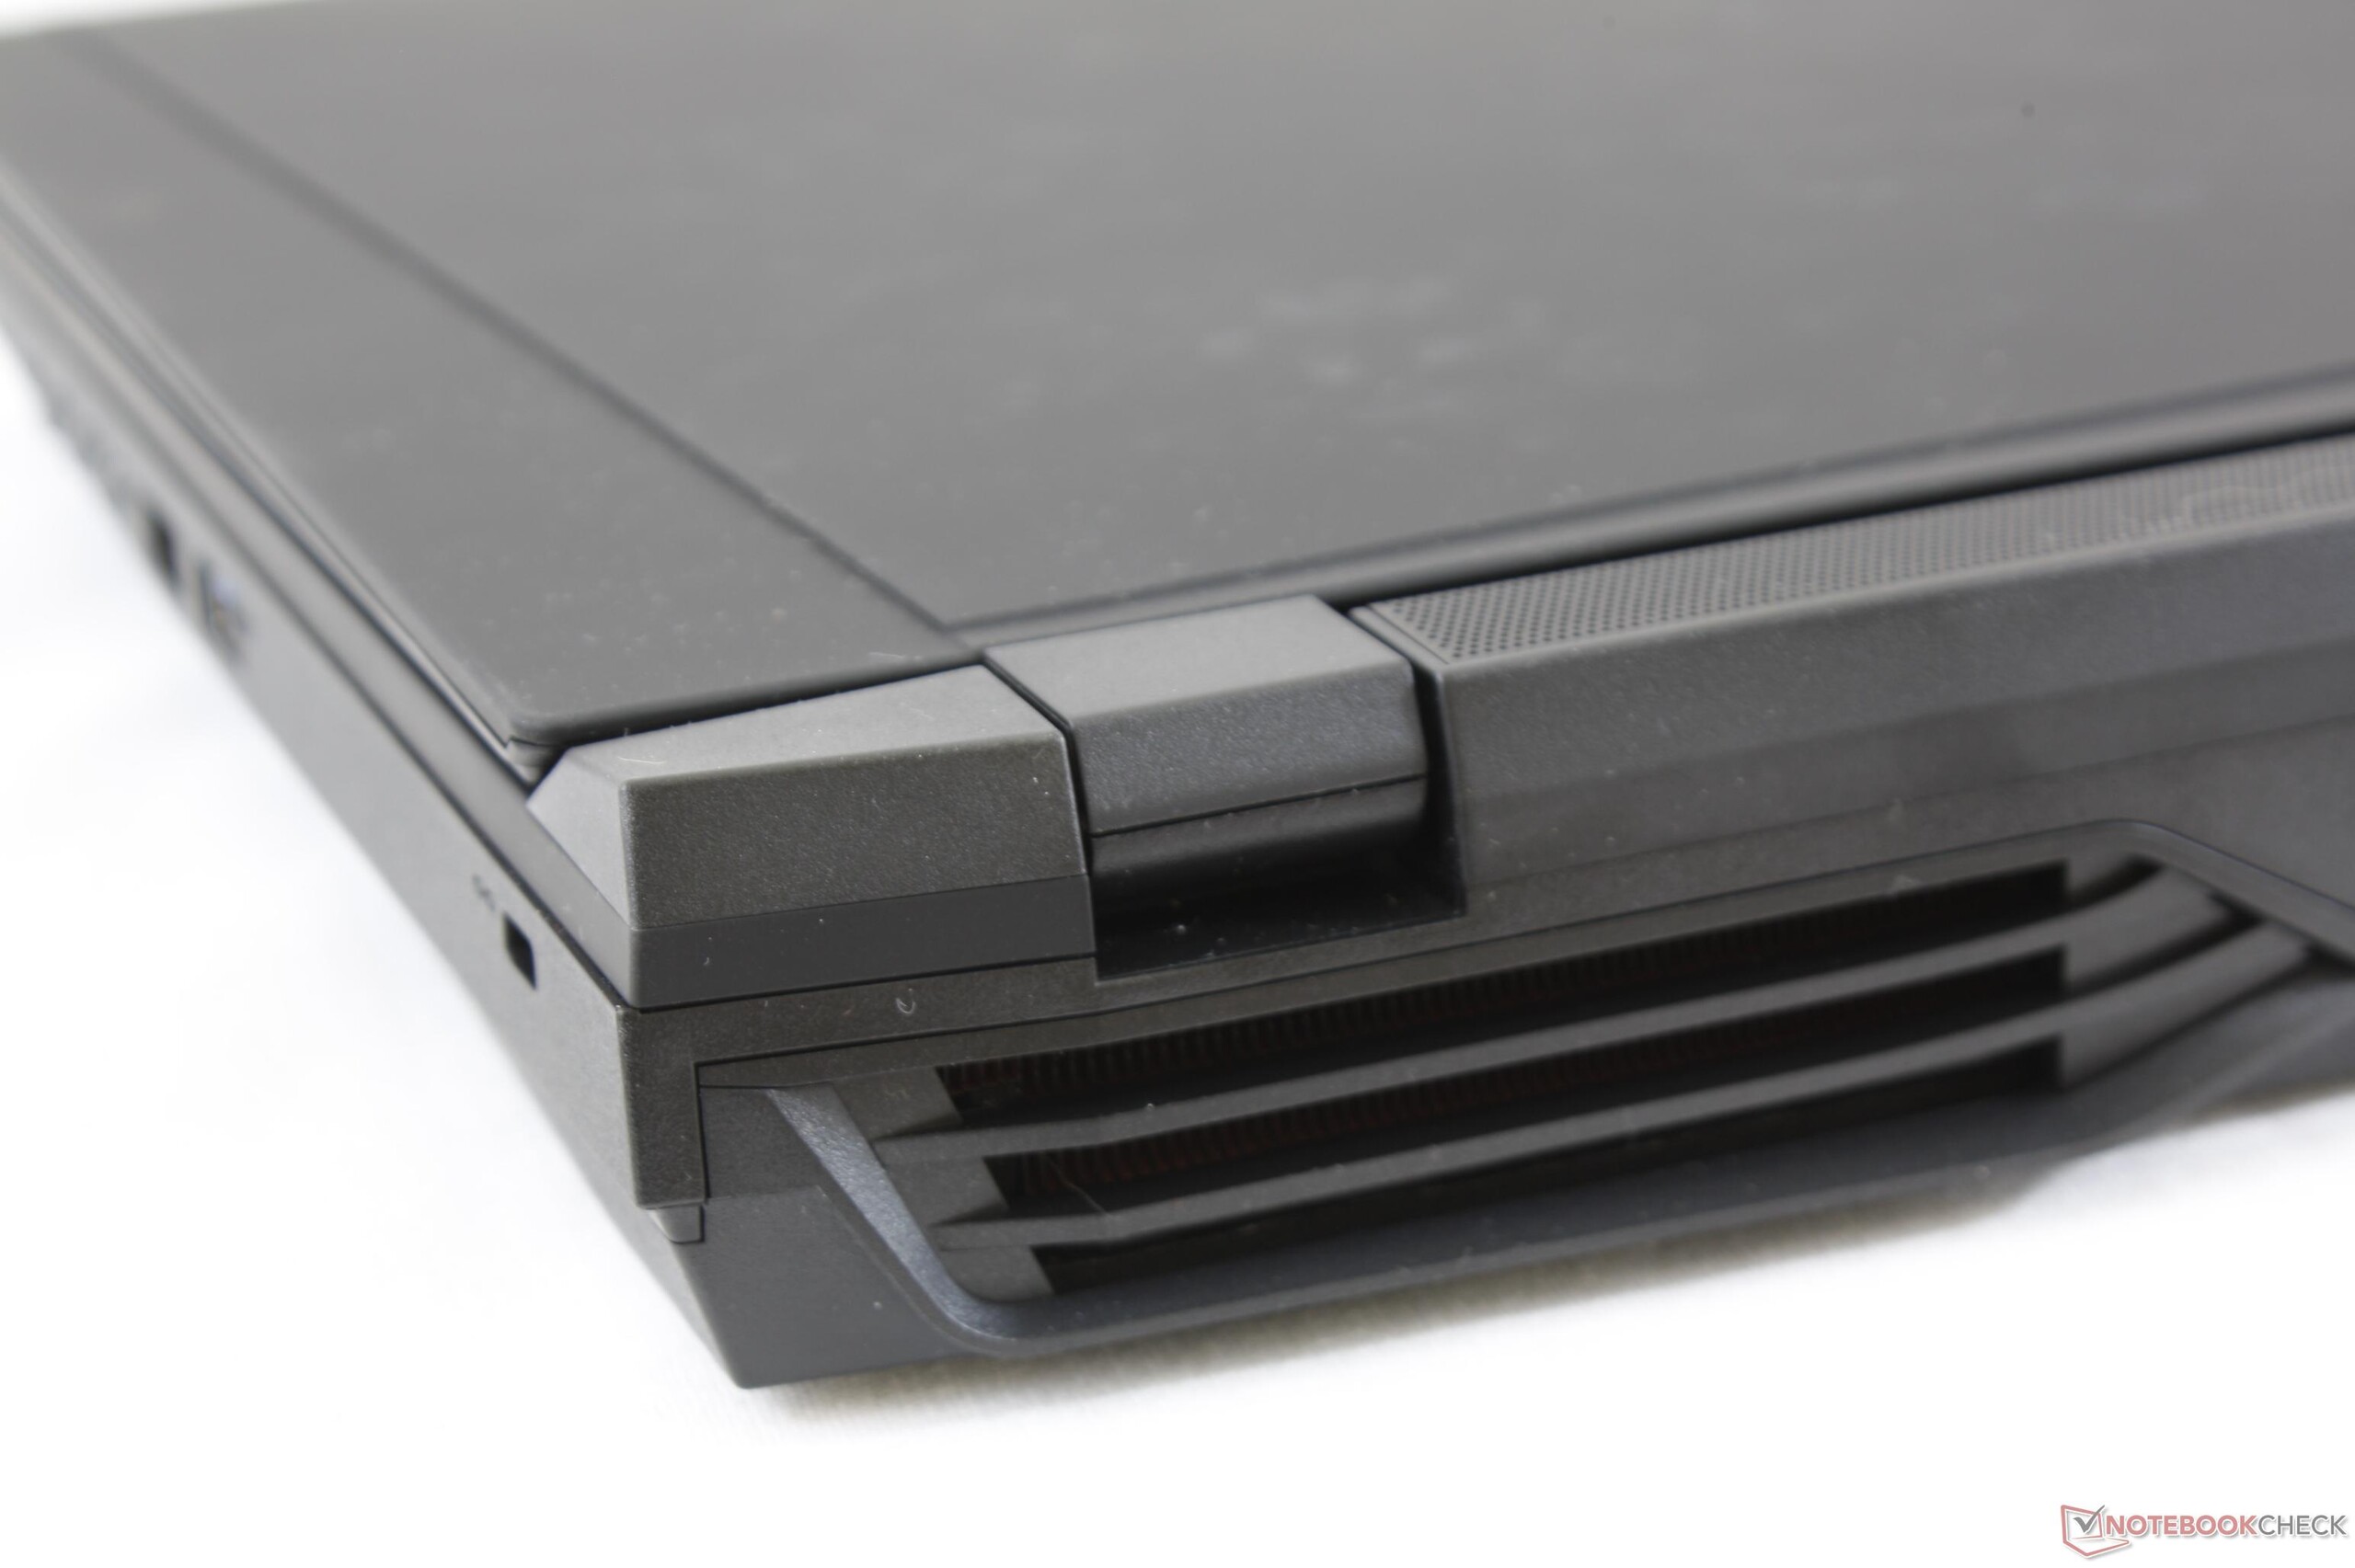
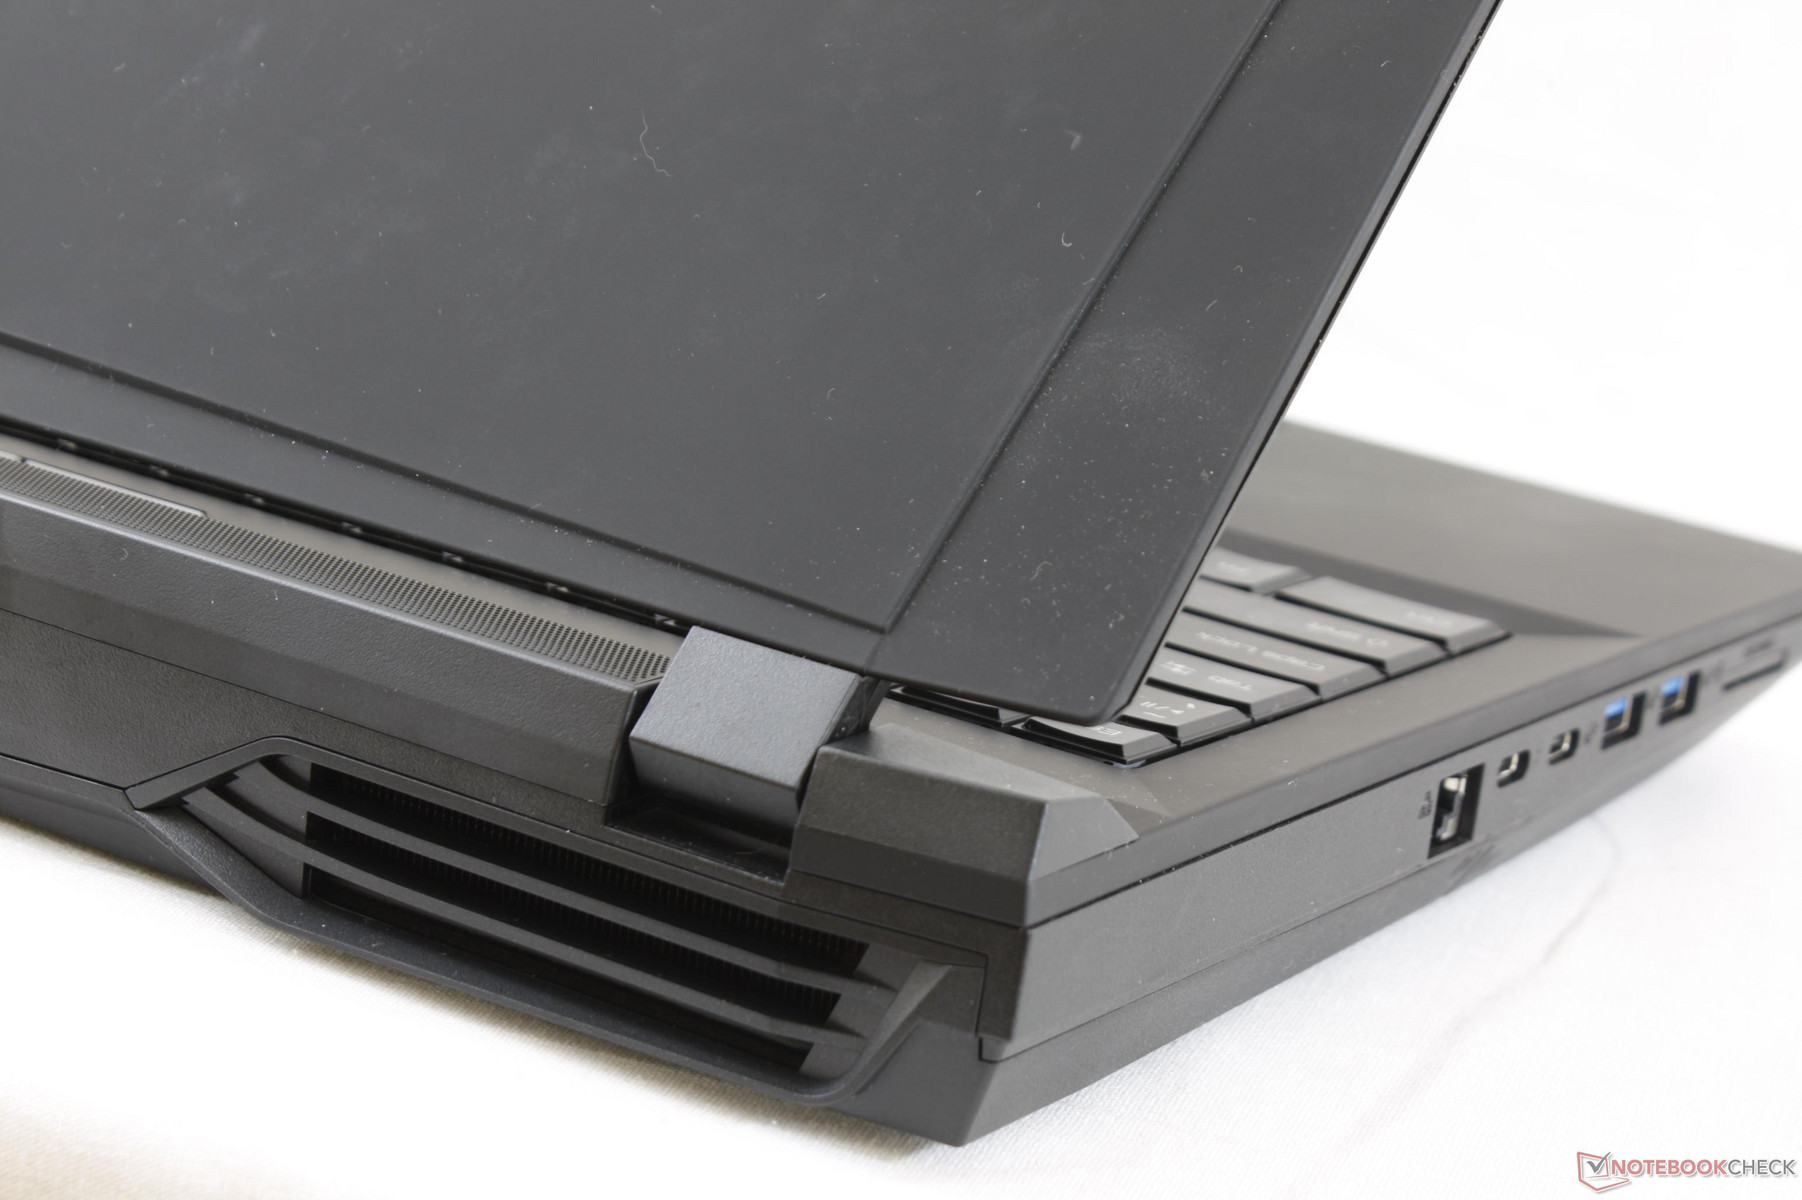
Since the chassis is very similar to the Clevo P751DM2-G, our same comments apply here on the Clevo P751TM1-G. Weak areas include the bendable rear ventilation grilles and relatively flexible lid compared to the more rigid lids of the Alienware 17 and Asus G7x series. The matte rubberized outer surface is an uncommon occurrence on notebooks as it is very susceptible to grease and dust buildup. In contrast, the smooth brushed aluminum surfaces of the Eurocom Q5 and most MSI notebooks are much easier to wipe clean.
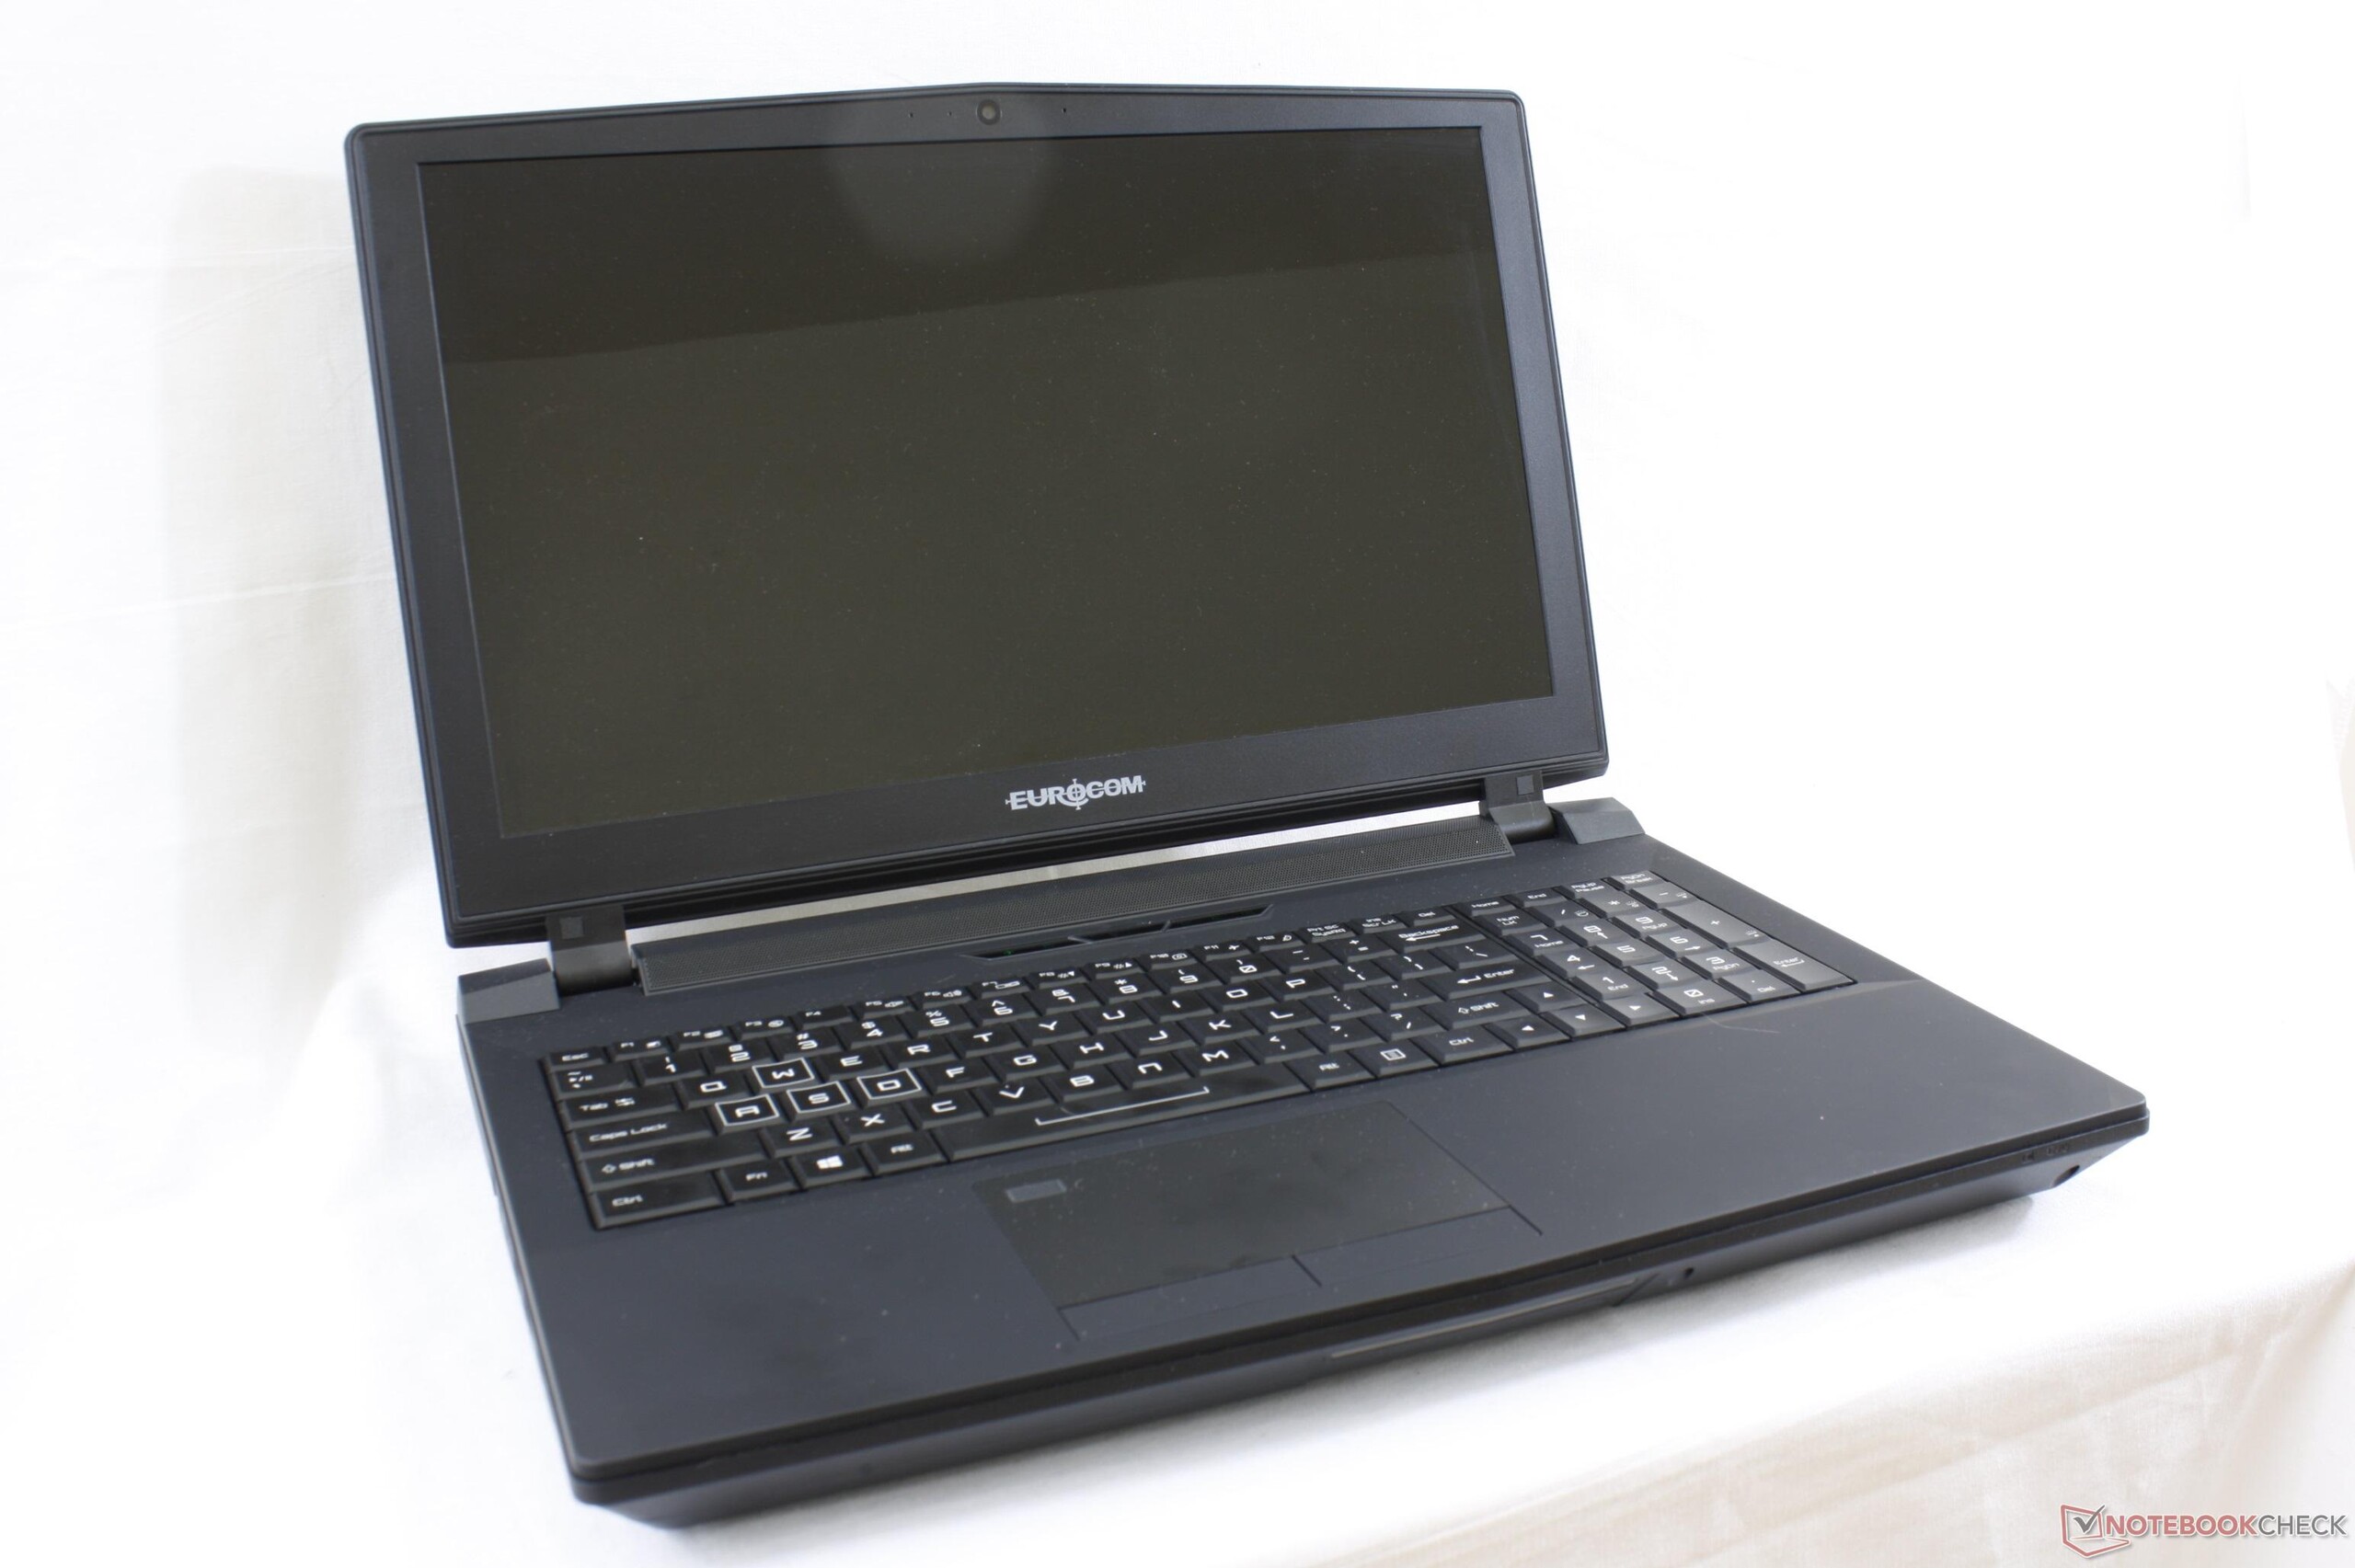
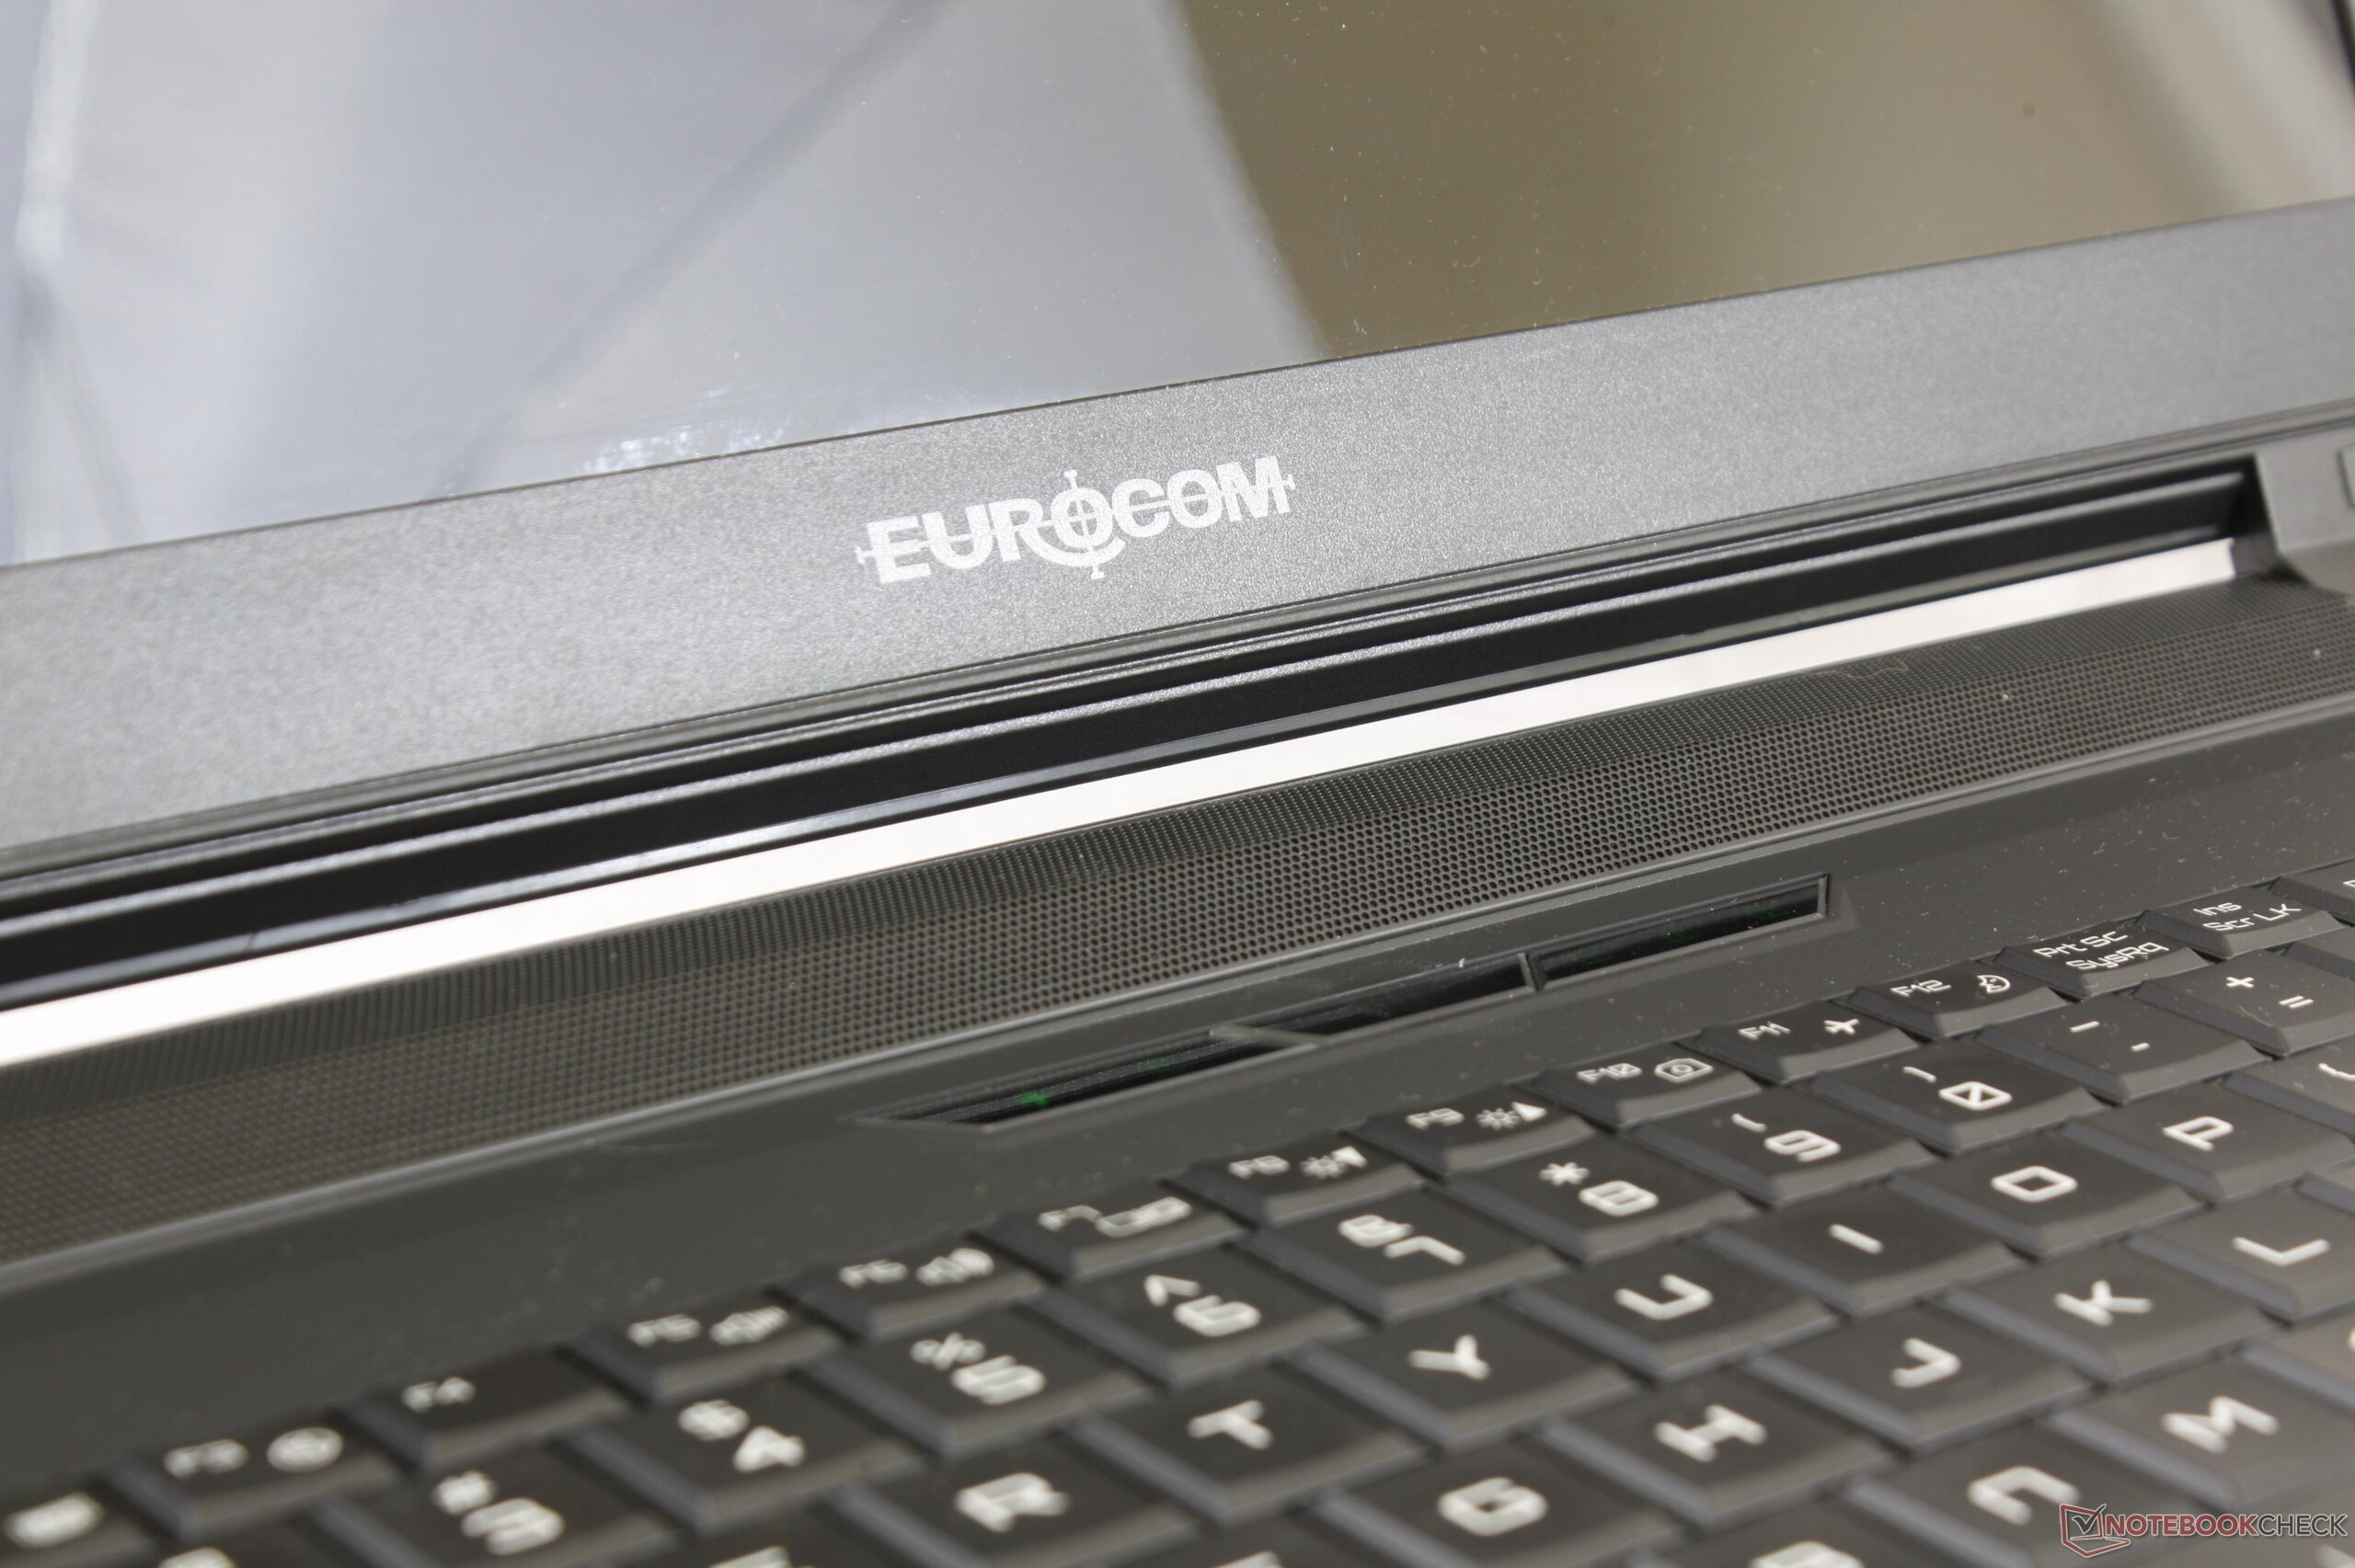
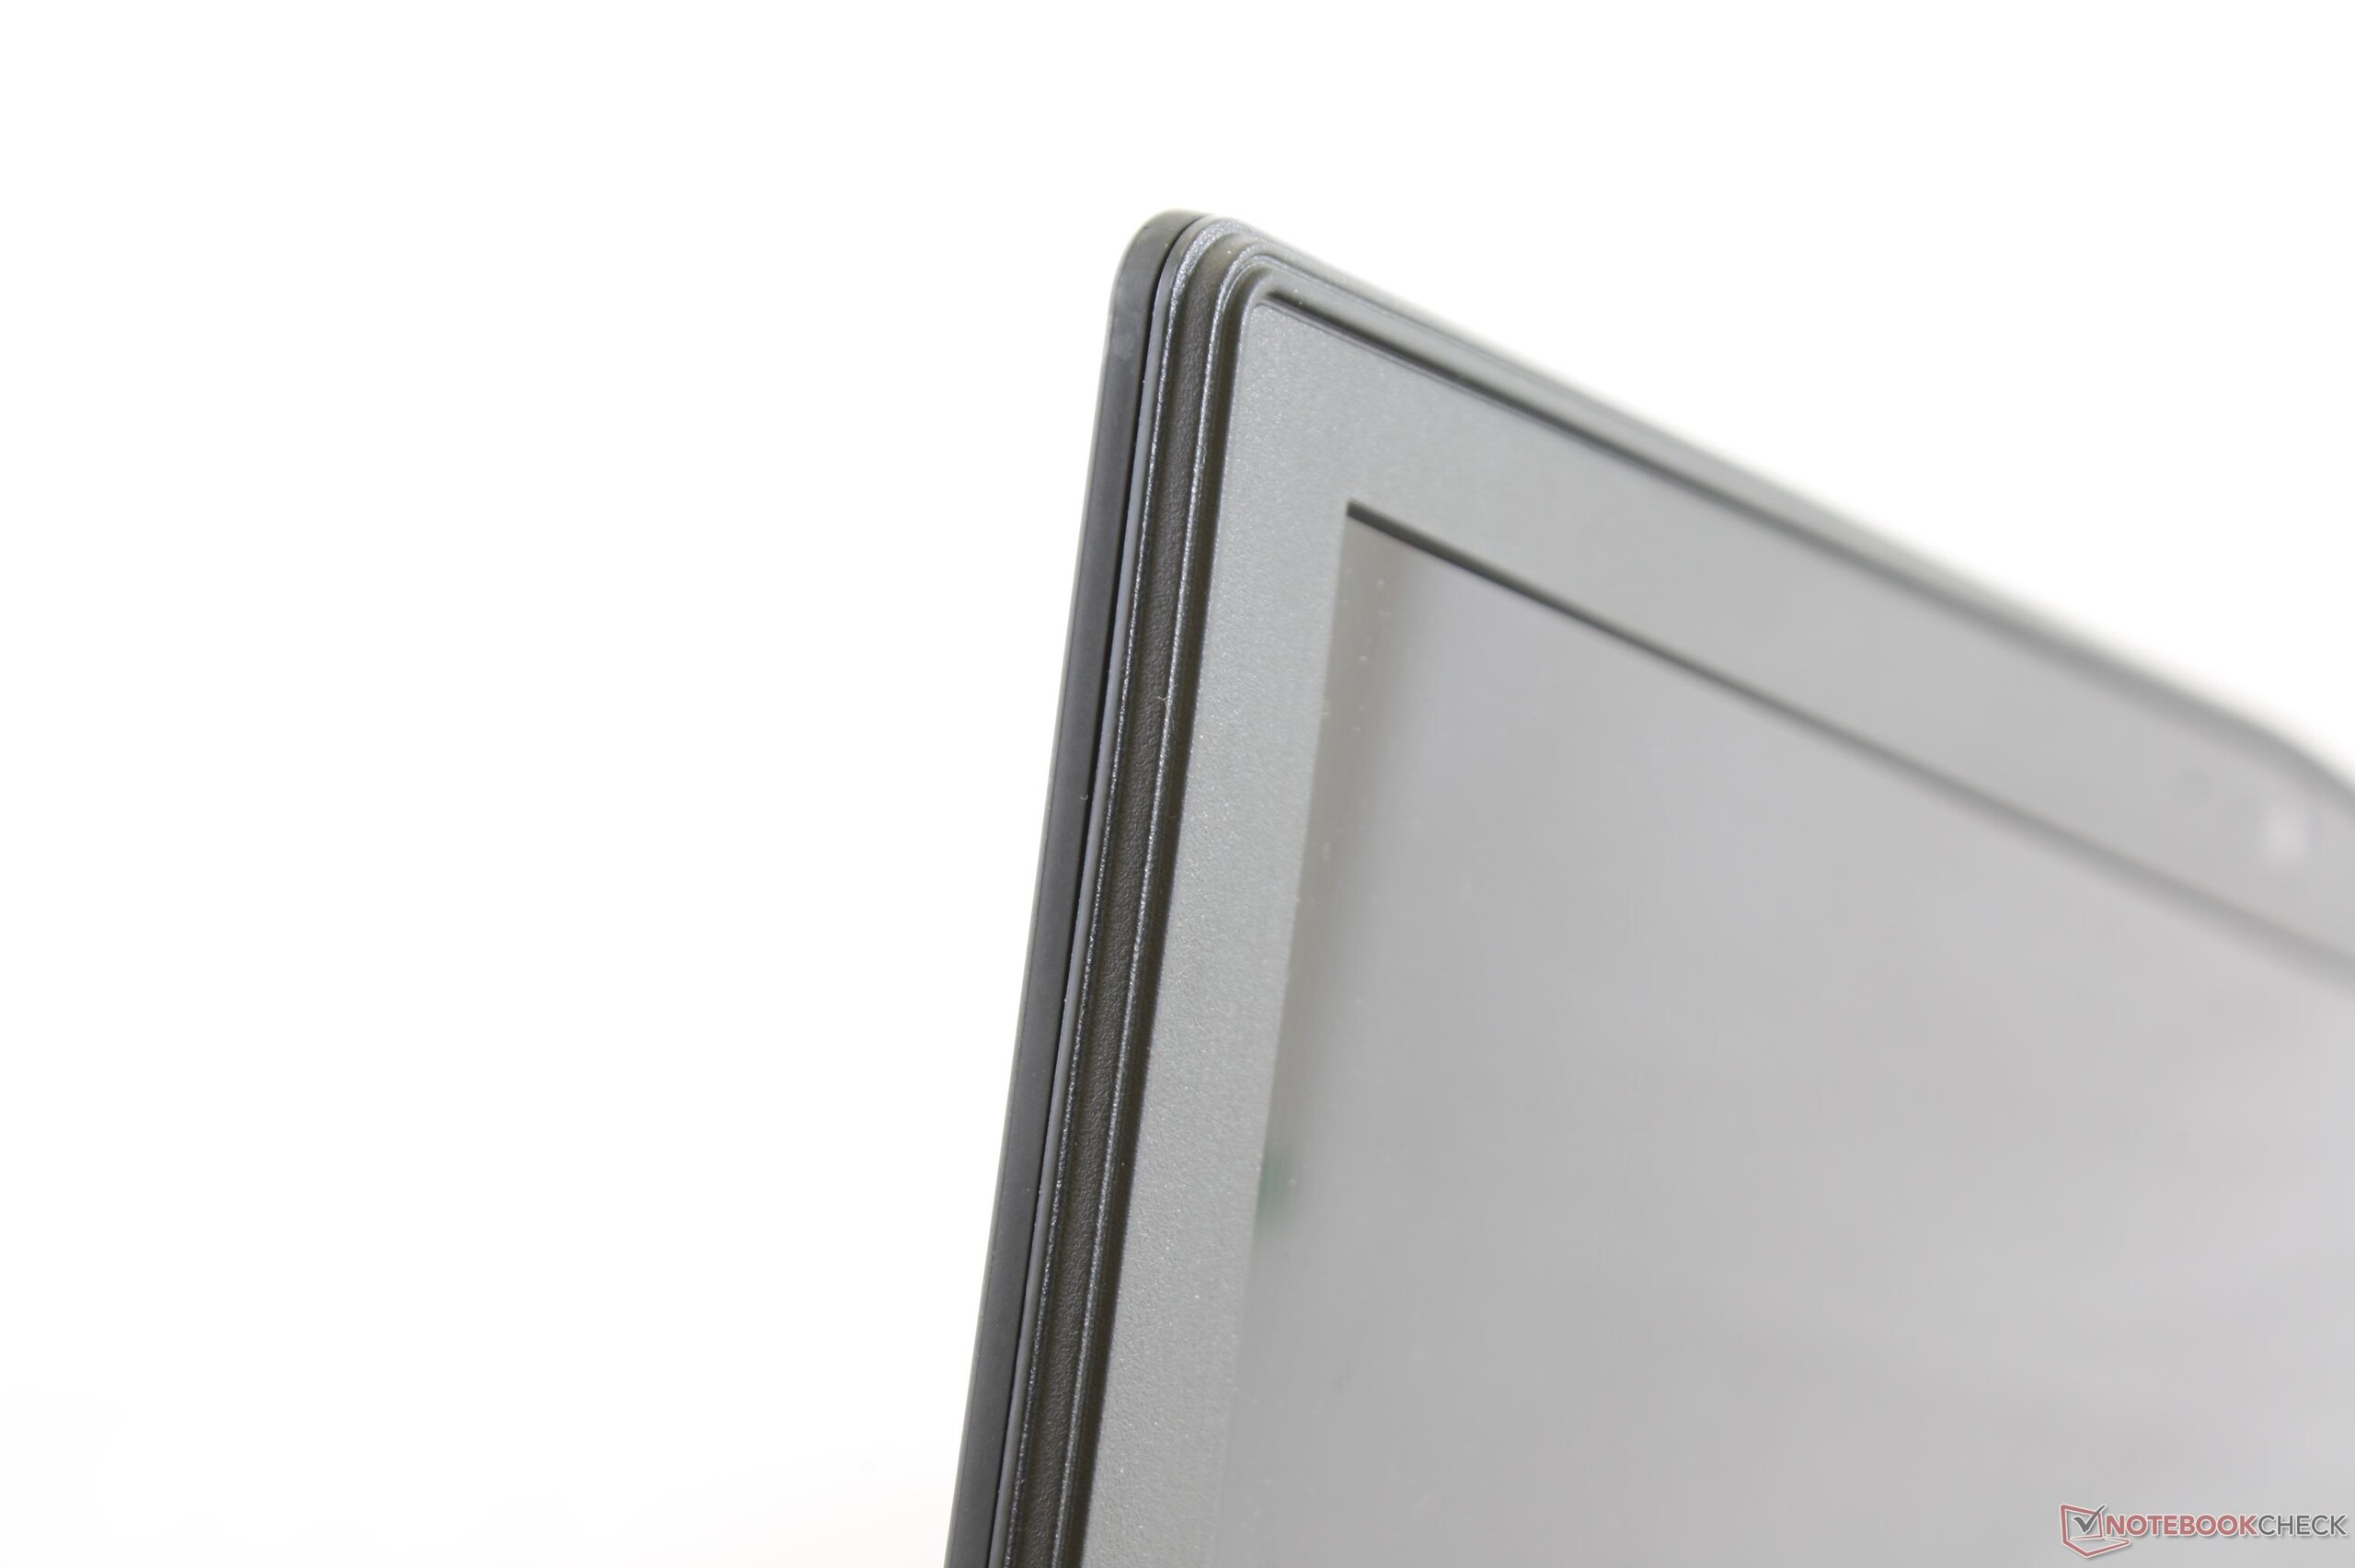
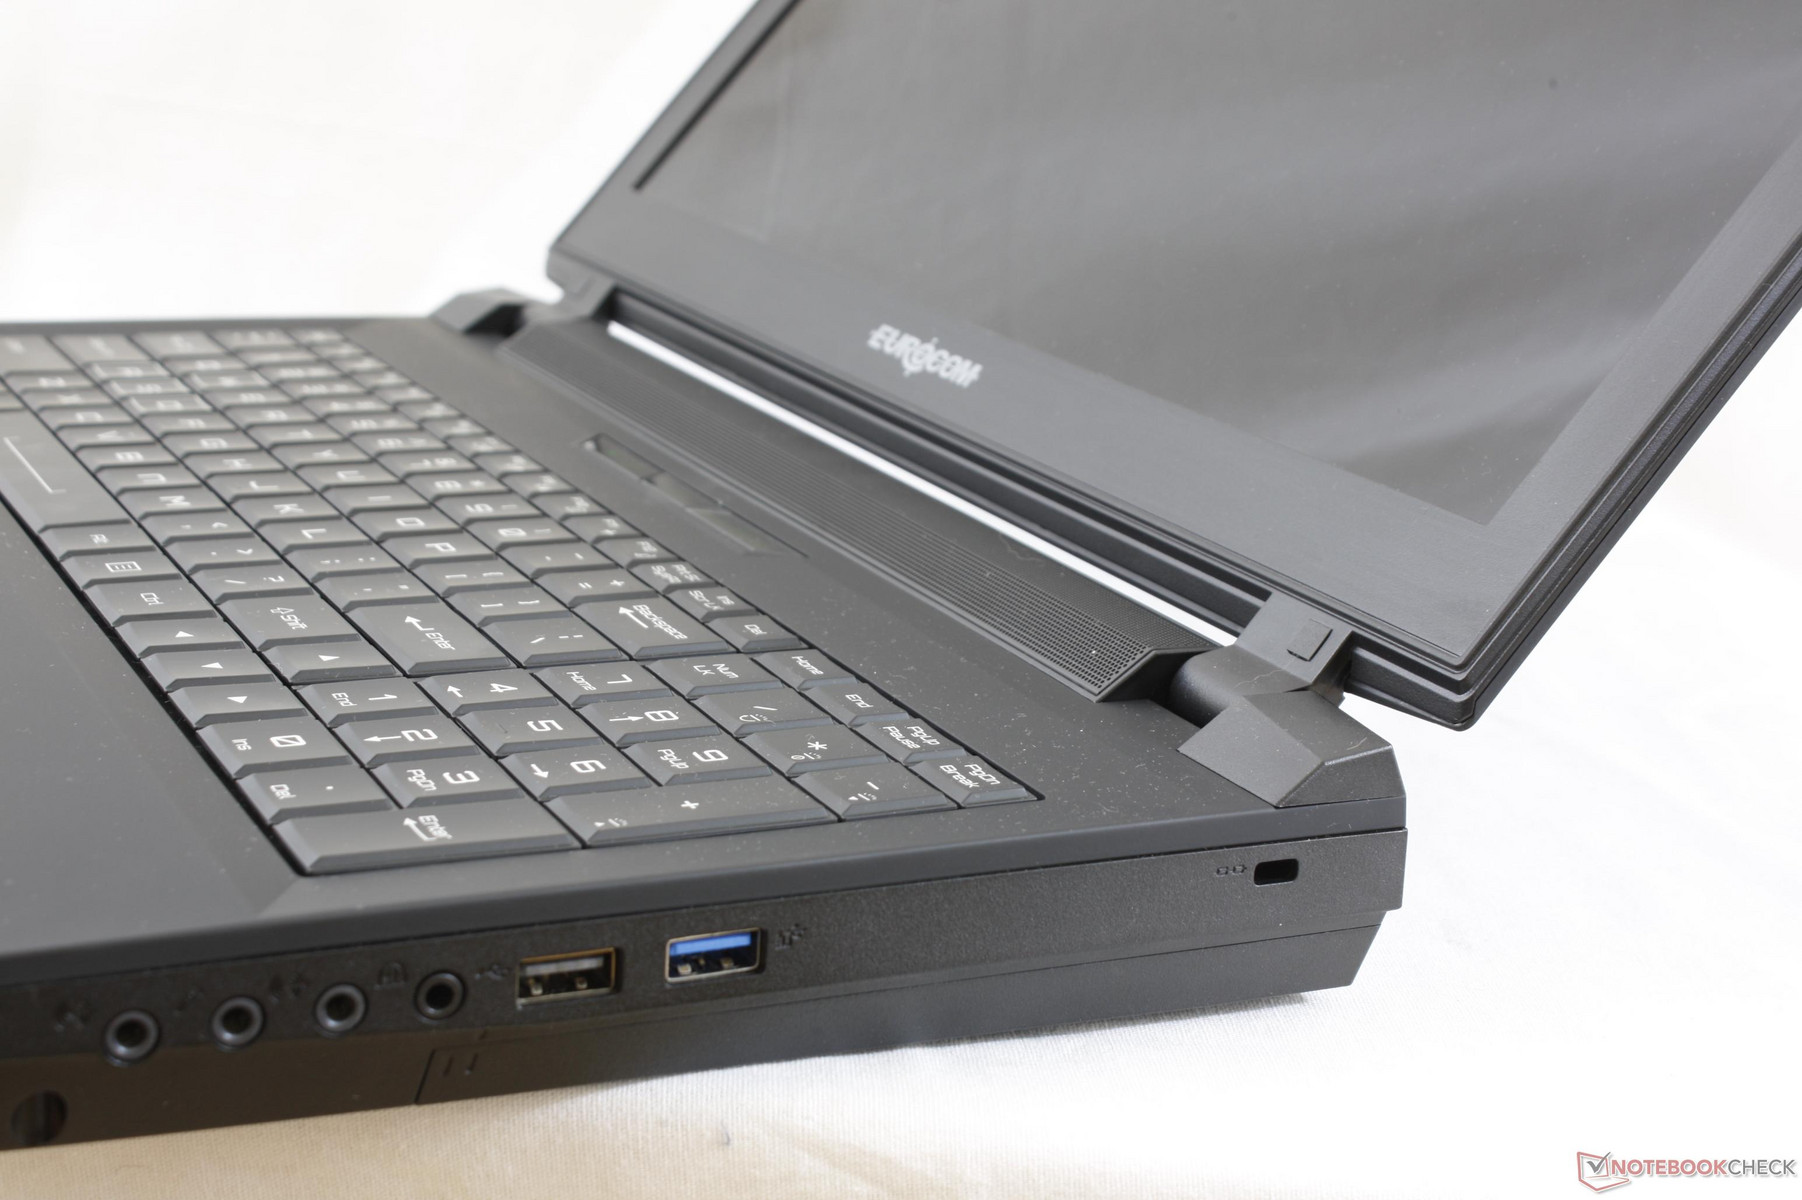
The jet black design is otherwise typical Clevo fare. The base is still very strong with almost no creaking when attempting to twist and bend its corners. The inner bezels of the lid are sitting flat against the edges of the screen this time unlike on some of our previous Eurocom systems. One can argue that the boxy look is uninteresting and outdated from a gamer standpoint, but its understated design can be seen as more appropriate in a formal workstation setting.

In terms of size and weight, the SKy X4C is thicker and heavier than more popular 15.6-inch alternatives like the Alienware 15 R3 or MSI GT62VR due in part to its more demanding hardware. The Acer Predator 15 is slightly heavier and larger, but the Predator series is generally known to be oversized because of its more aggressive "jet engine" rear grilles for cooling and overclocking.
Connectivity
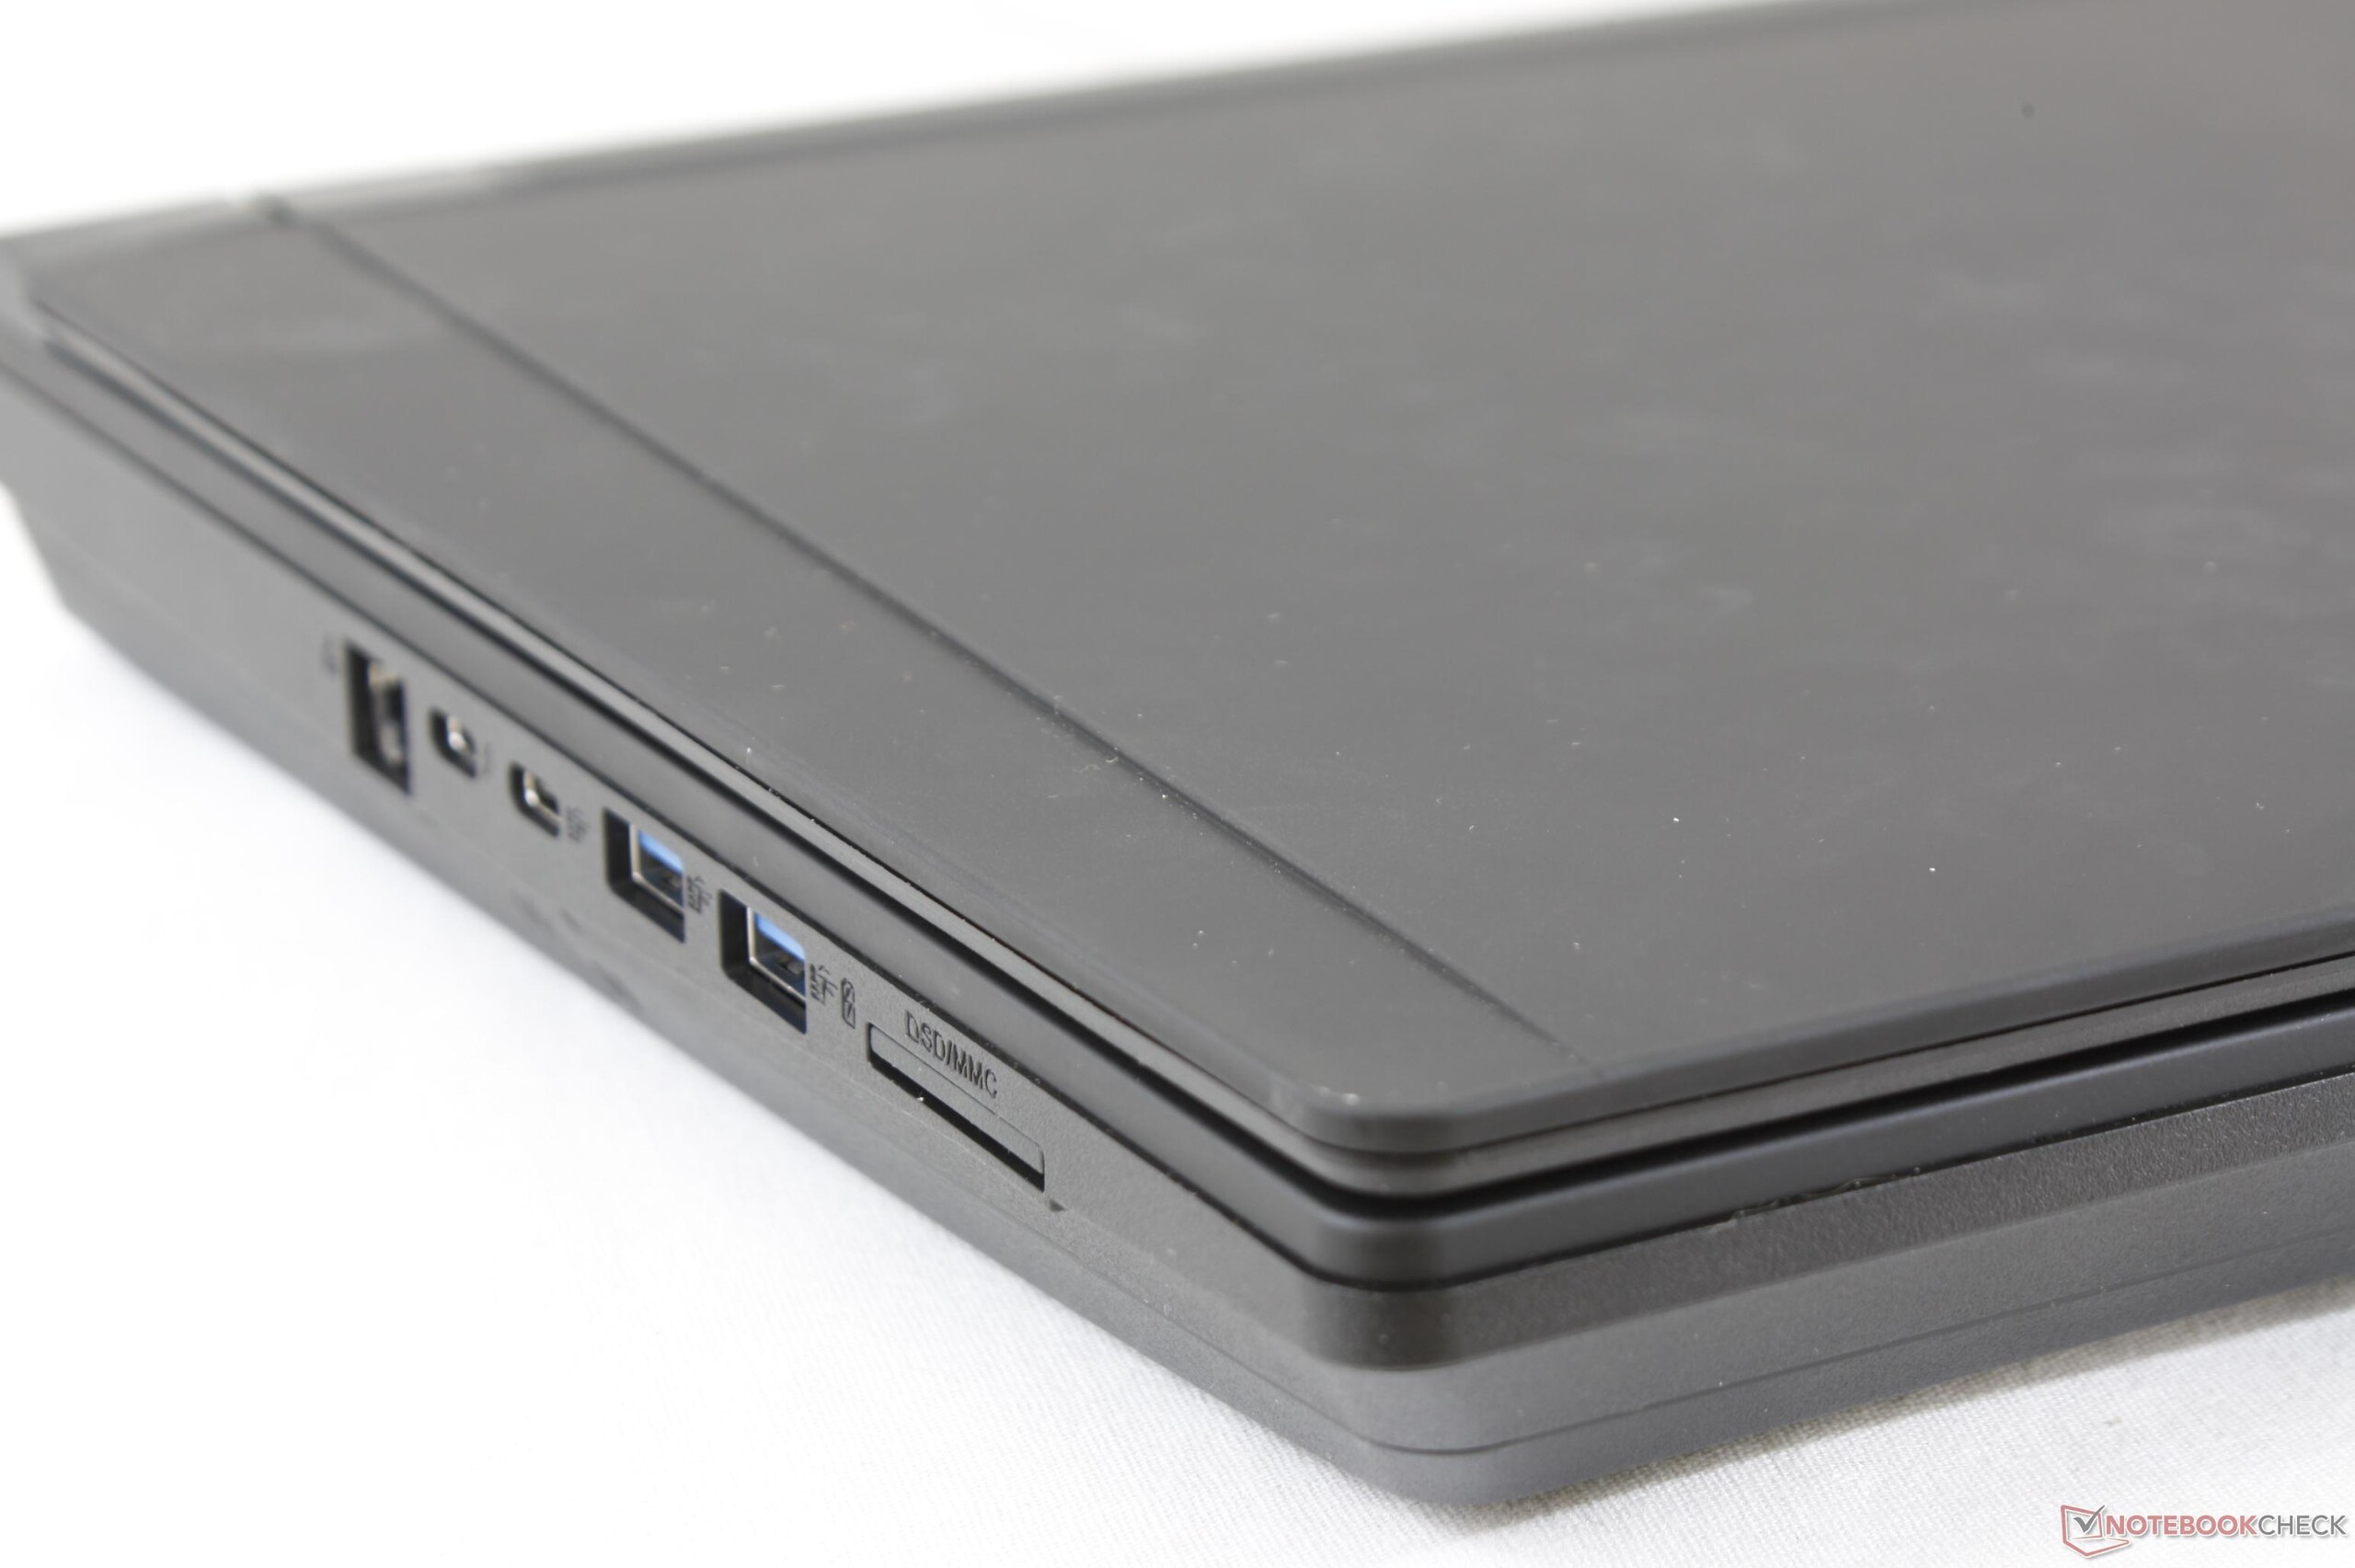
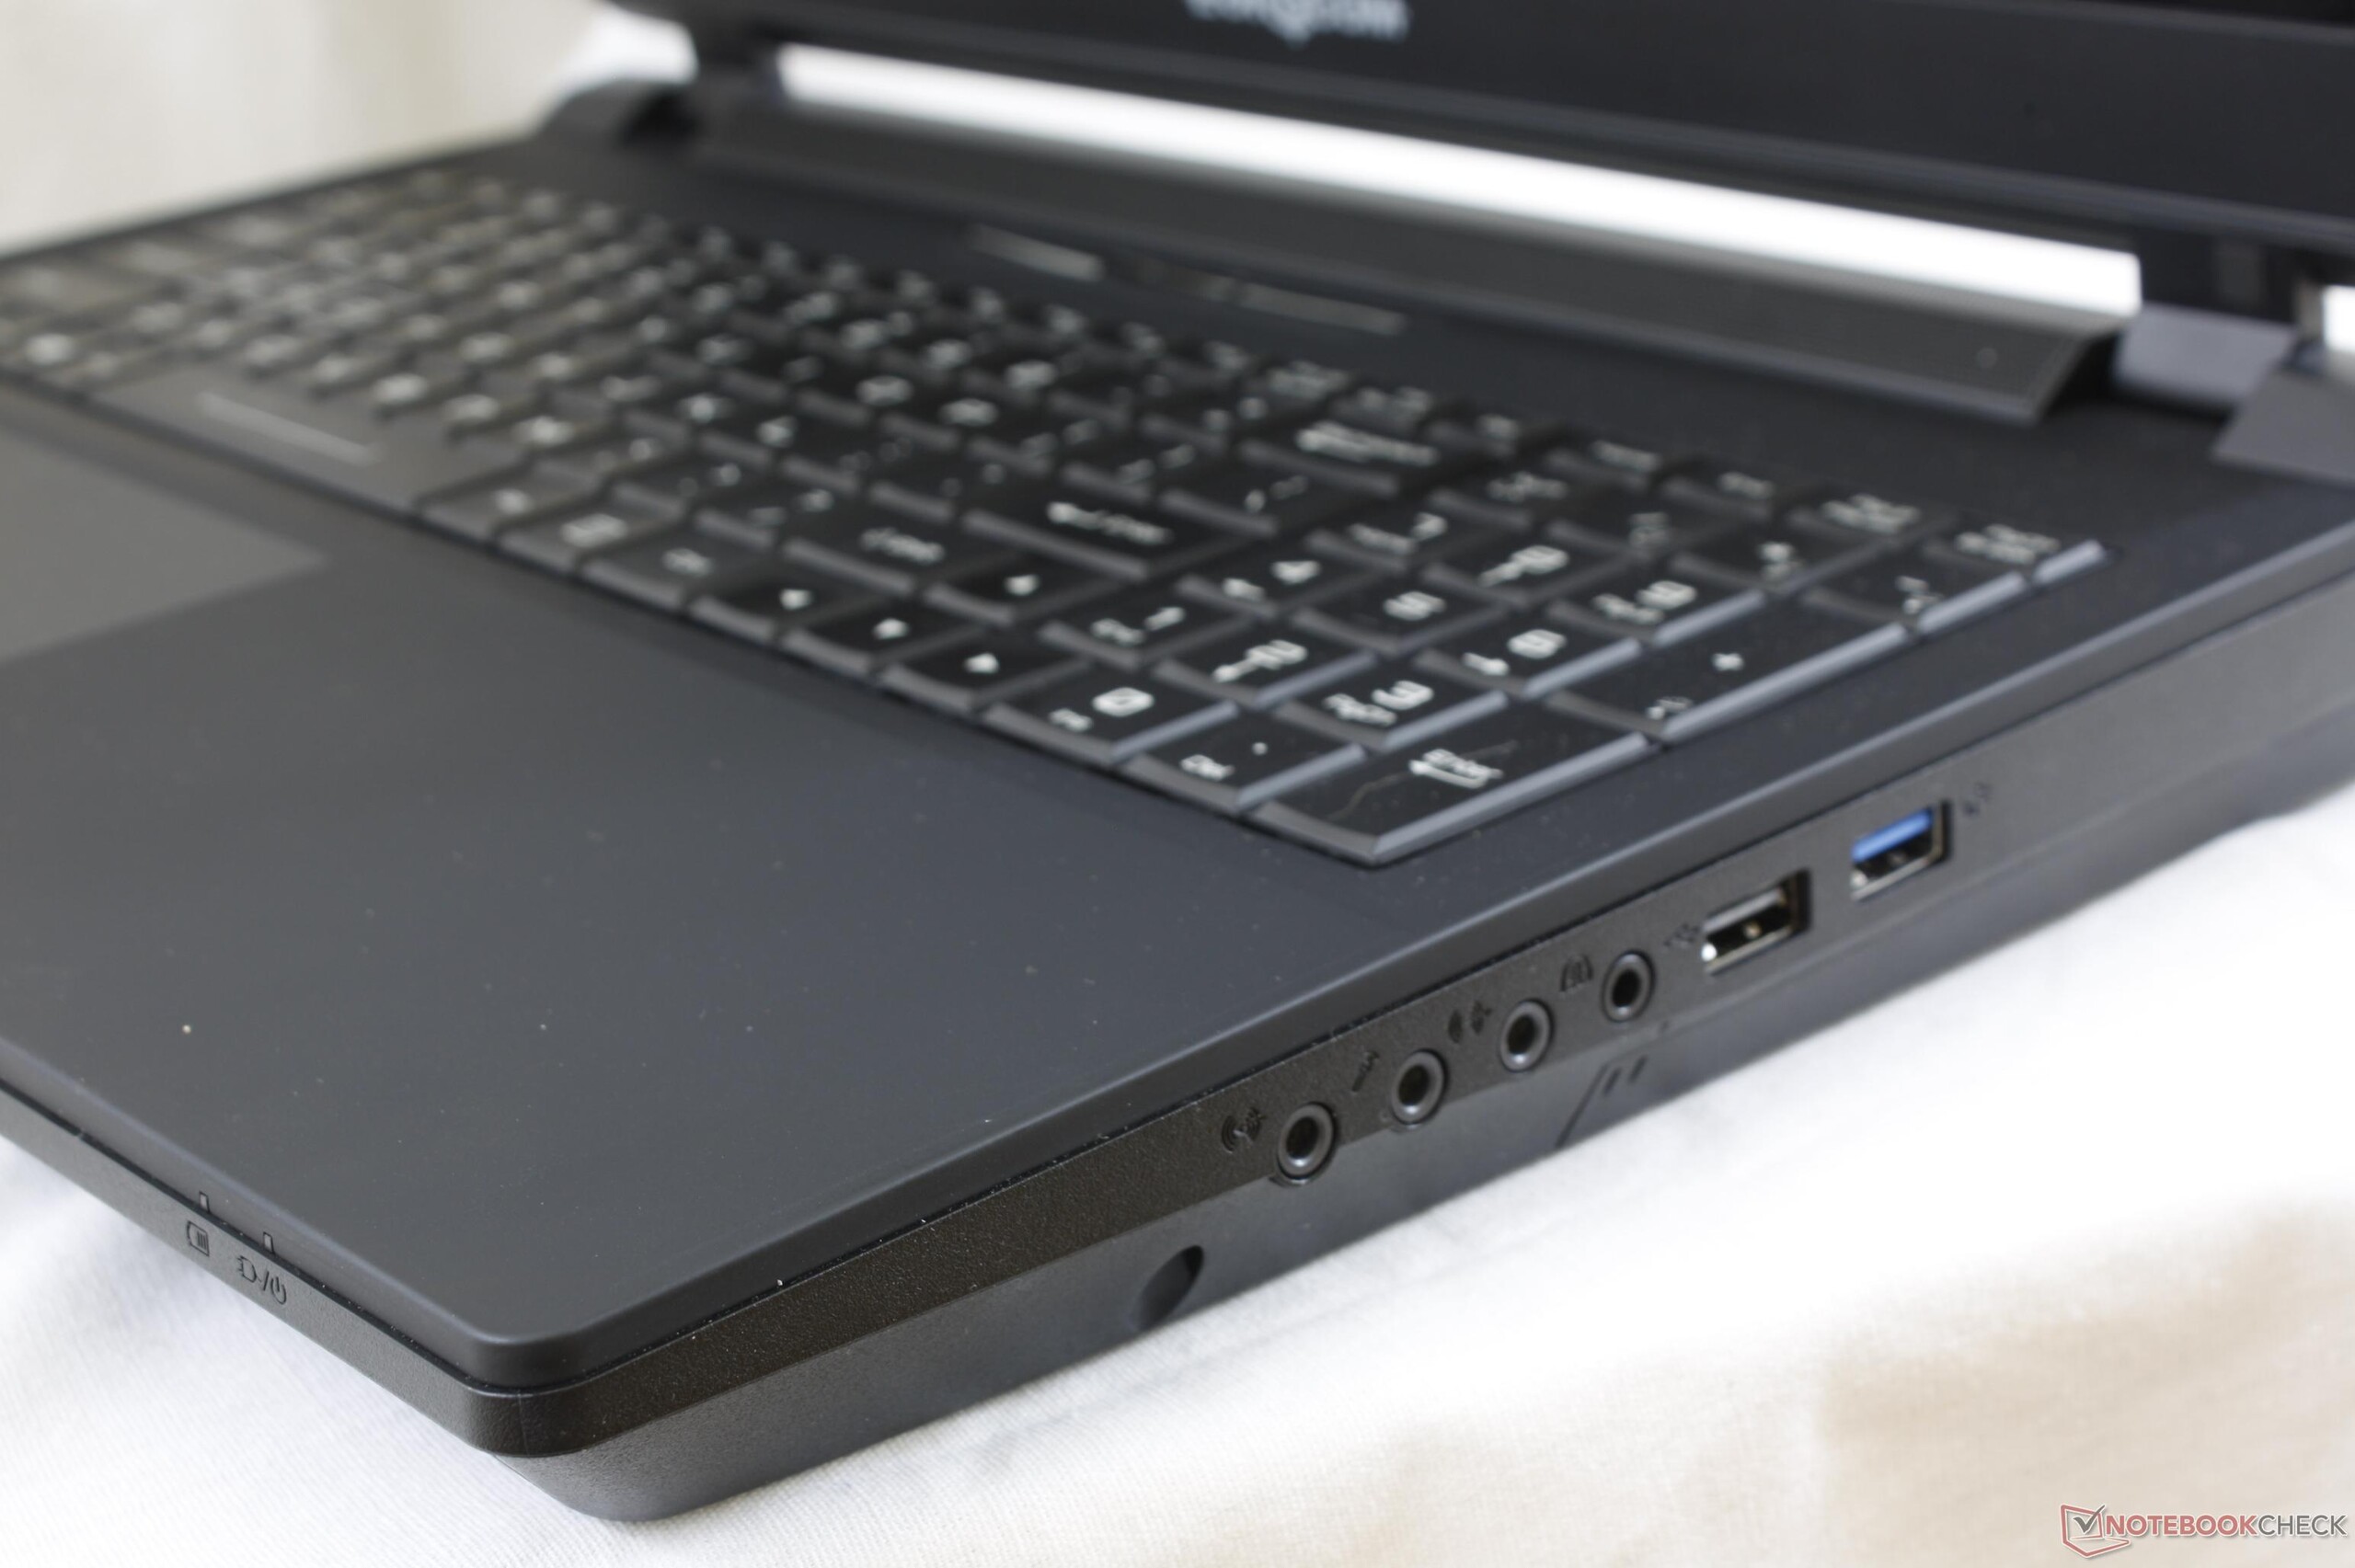
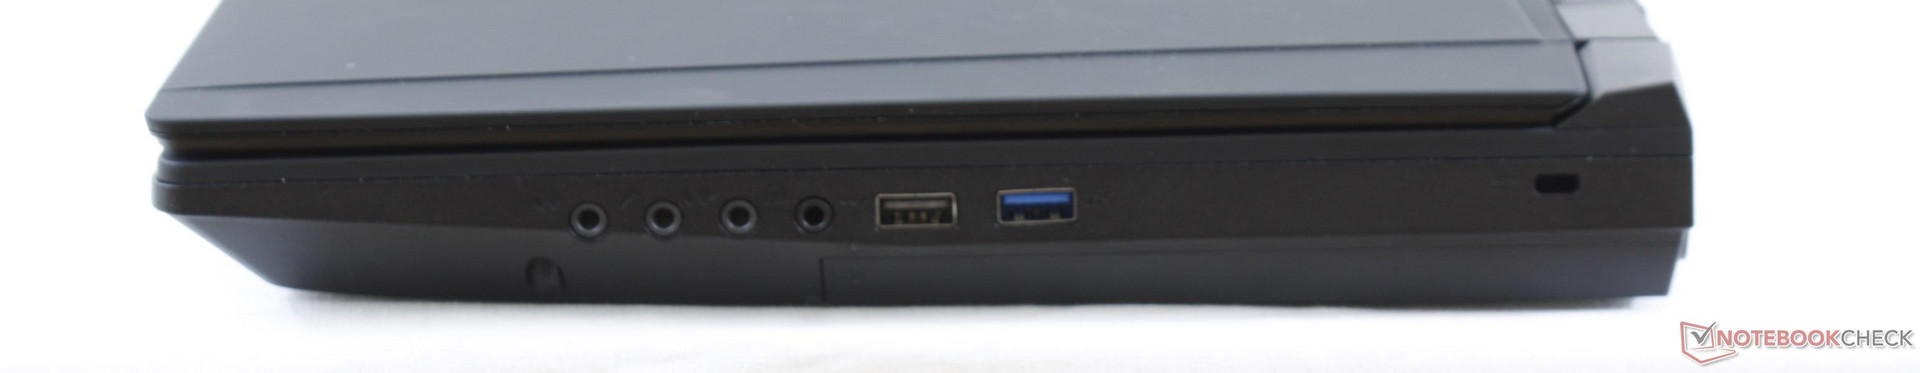
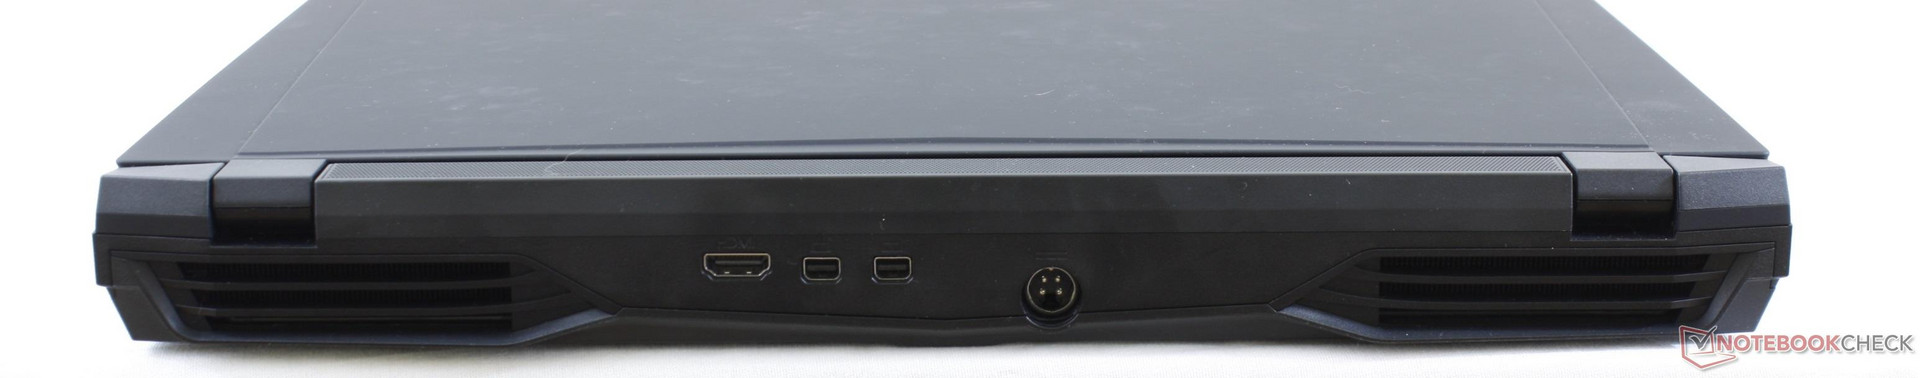
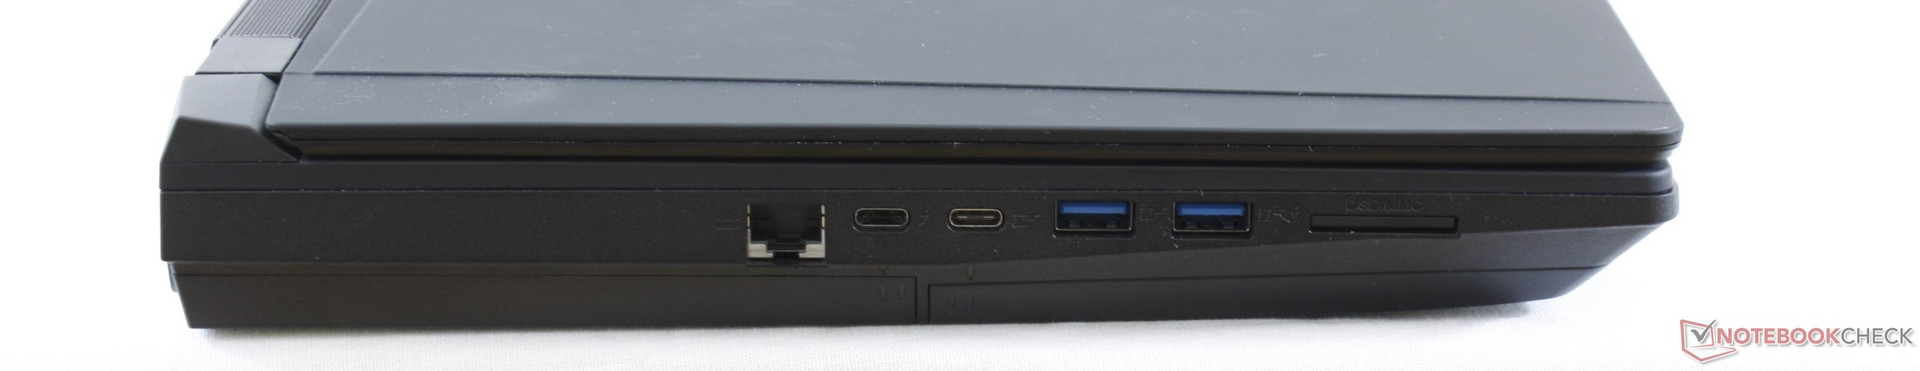
Ports are spaced and distributed quite evenly between three of the four sides of the notebook. We would've preferred the ports along the edges to be pushed further towards the rear of the system to save on desk space, but they are easy to reach nonetheless. A full-size DisplayPort would have been a good addition to the already wide selection.
We hope to see 10 Gbps RJ-45 on future revisions to catch up to the latest notebooks from MSI.
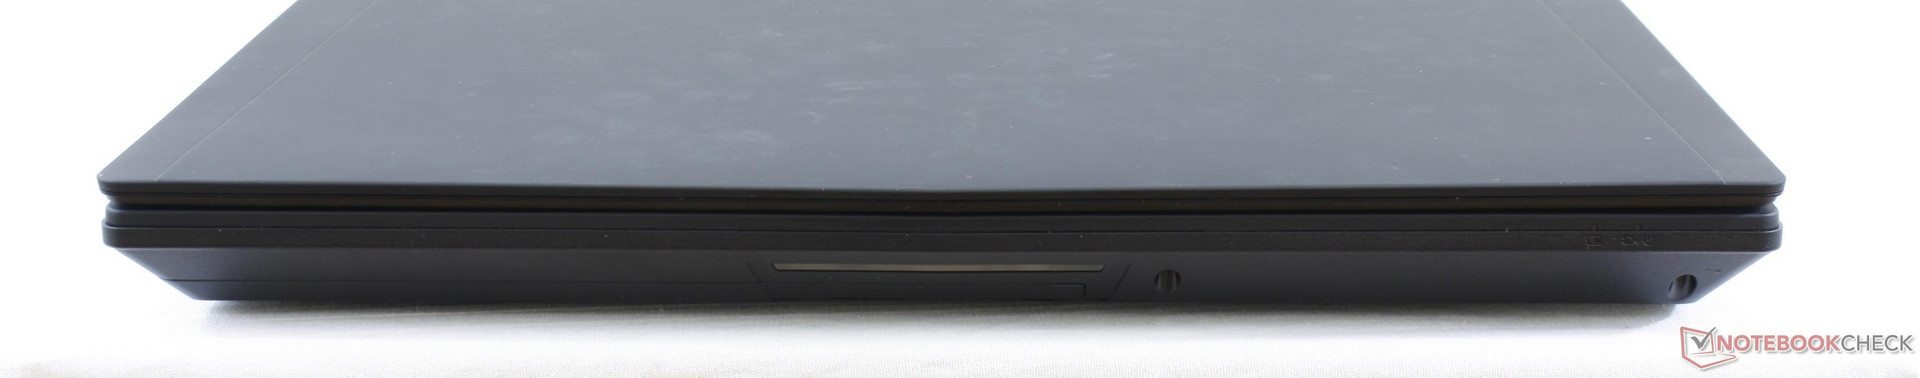
SD Card Reader
The spring-loaded SD card reader returns an average read rate of 201 MB/s on our Toshiba Exceria Pro UHS-II test card rated for up to 270 MB/s. The card reader on the XPS 15 is even faster at over 250 MB/s. Transferring 1 GB worth of photos from card to desktop takes less than 6 seconds.
A fully inserted SD card protrudes by about 2 mm from the edge for safe handling in a bag and easy ejecting.
| SD Card Reader | |
| average JPG Copy Test (av. of 3 runs) | |
| Eurocom Sky X4C (Toshiba Exceria Pro SDXC 64 GB UHS-II) | |
| Dell XPS 15 9560 (i7-7700HQ, UHD) (Toshiba Exceria Pro SDXC 64 GB UHS-II) | |
| Acer Predator 15 G9-593-751X (Toshiba Exceria Pro SDXC 64 GB UHS-II) | |
| maximum AS SSD Seq Read Test (1GB) | |
| Dell XPS 15 9560 (i7-7700HQ, UHD) (Toshiba Exceria Pro SDXC 64 GB UHS-II) | |
| Eurocom Sky X4C (Toshiba Exceria Pro SDXC 64 GB UHS-II) | |
| Acer Predator 15 G9-593-751X (Toshiba Exceria Pro SDXC 64 GB UHS-II) | |
Communication
WLAN is provided by the new Intel 9260 M.2 2230 module with integrated Bluetooth 5 for maximum theoretical throughput of 1.73 Gbps. Less expensive and slower Killer 1535 and Intel 8260 options are available as well. Note that our recorded transfer rates below are significantly slower than the the theoretical because of the limitations of our Linksys EA8500 test router.
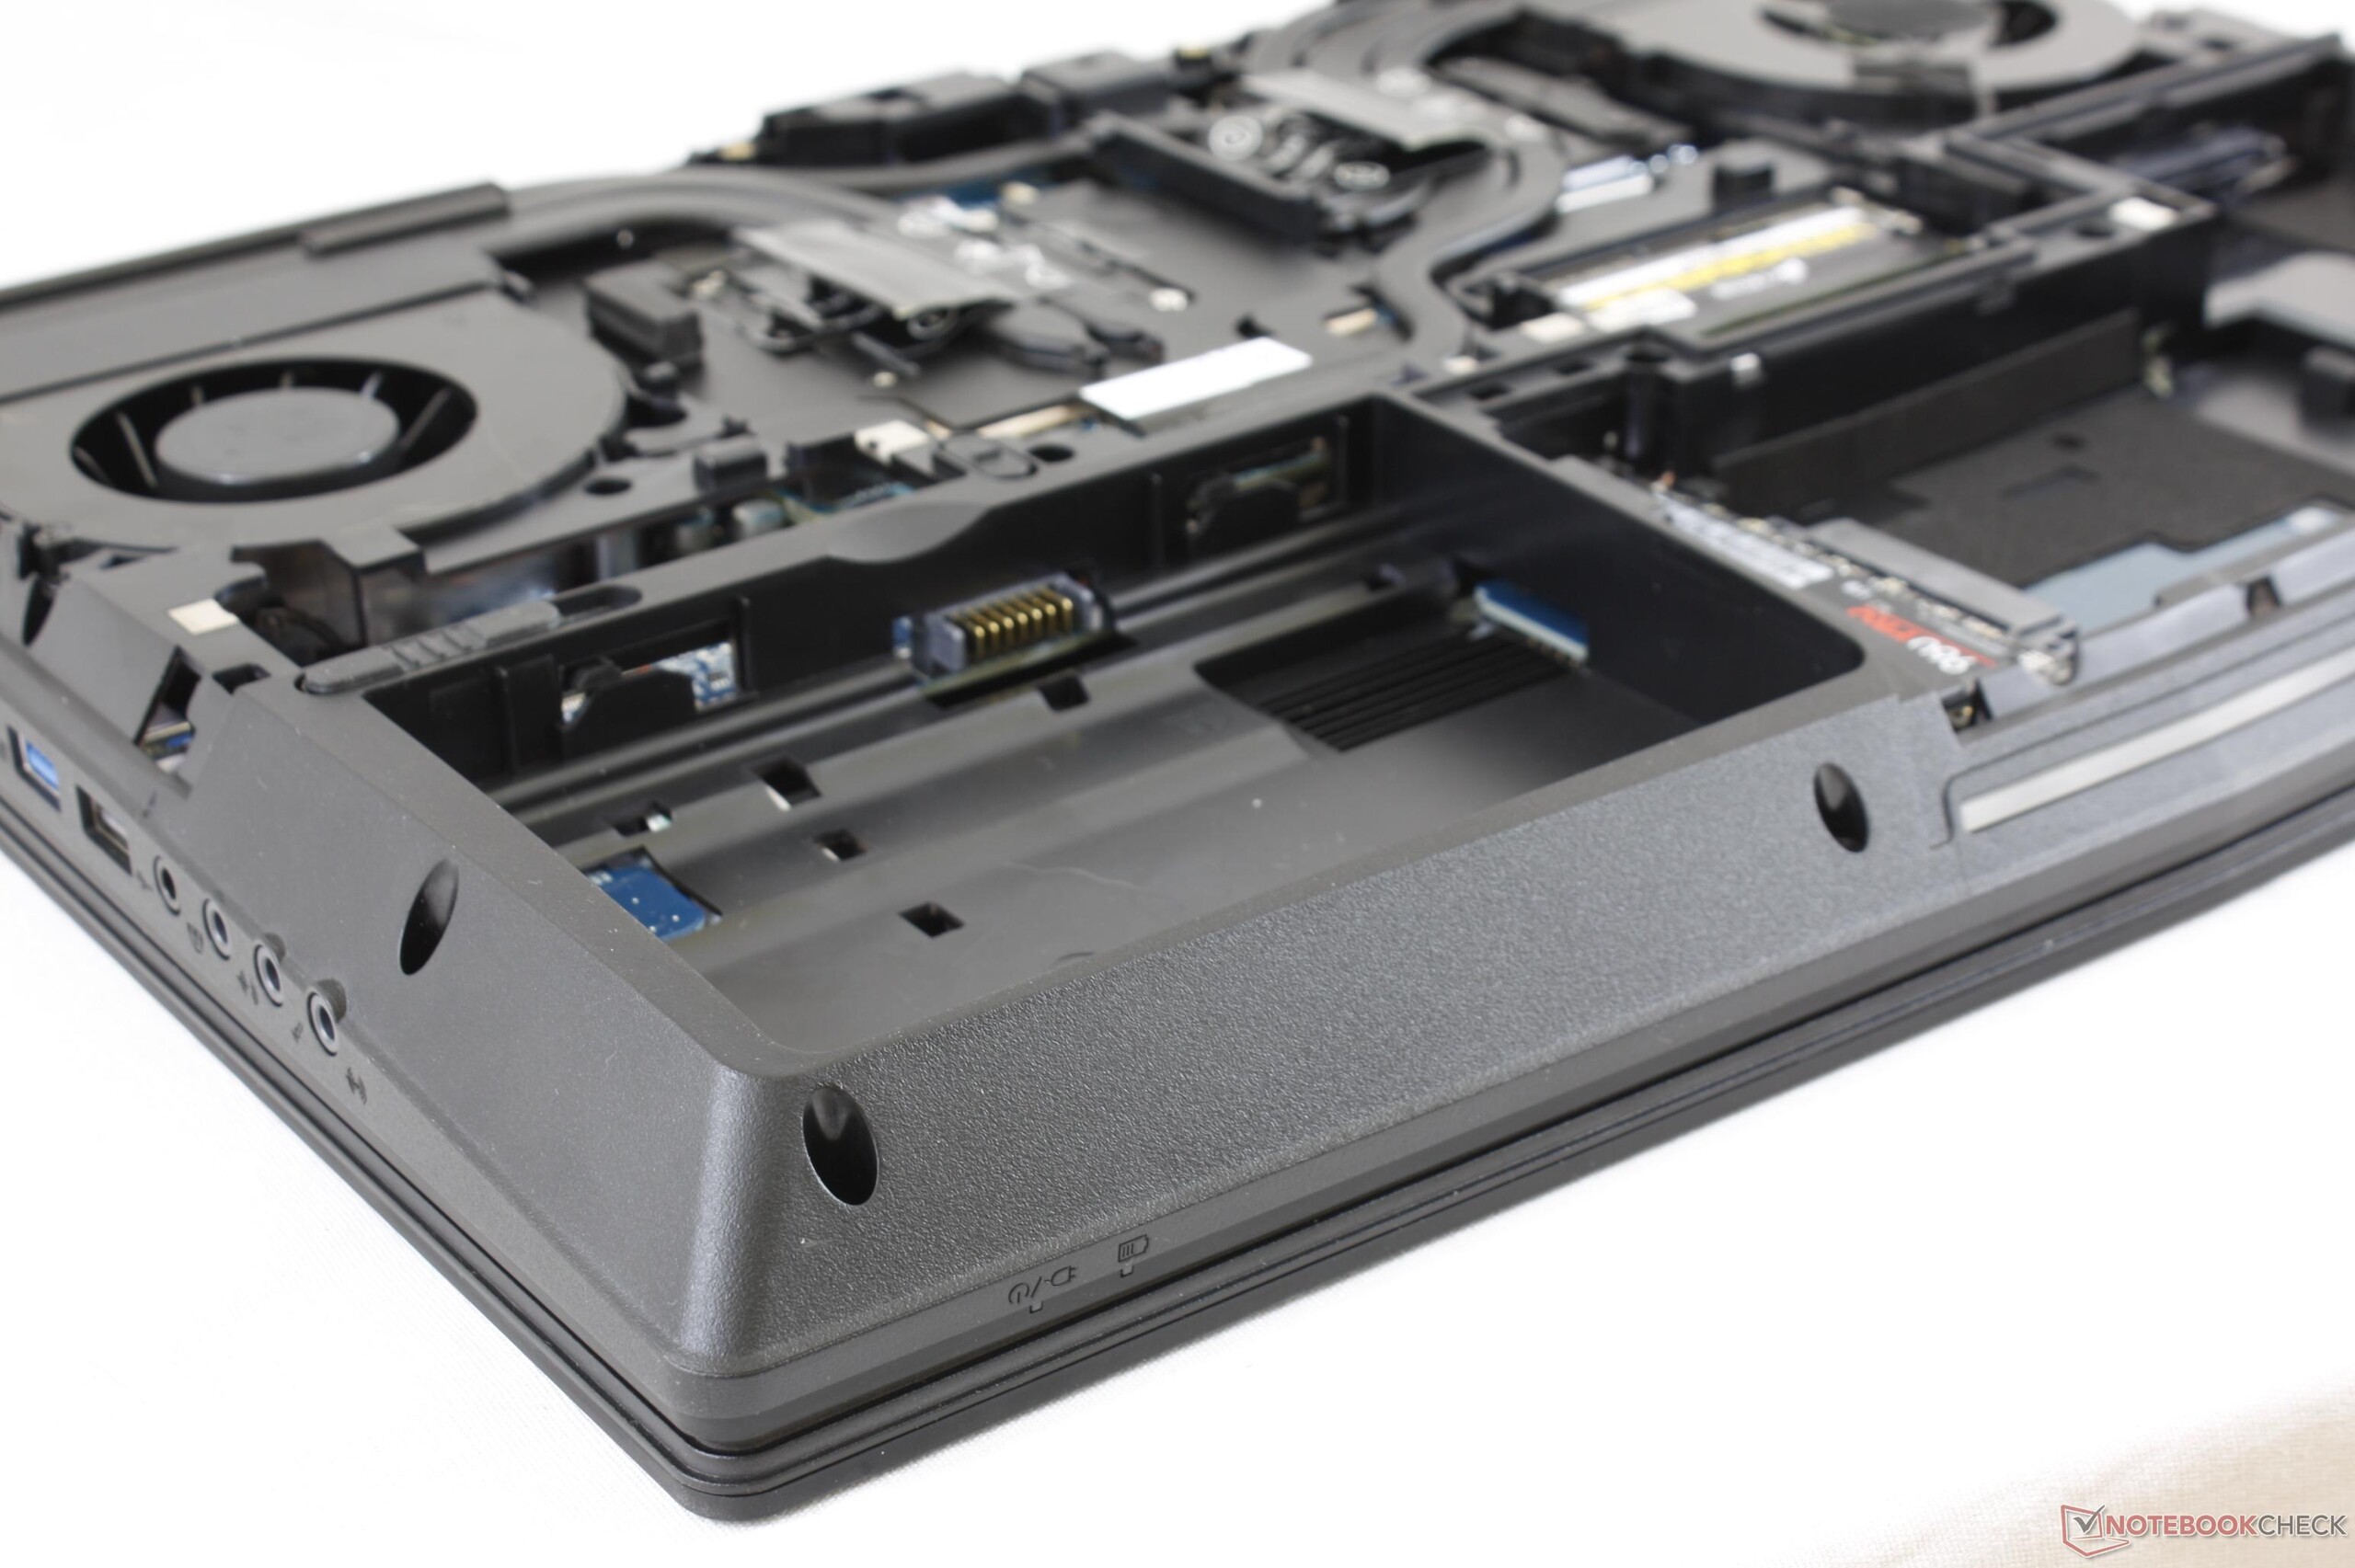
The chassis comes pre-wired with antennae to support WWAN cards with the mini-SIM slot hidden underneath the battery compartment.
| Networking | |
| iperf3 transmit AX12 | |
| Acer Predator 15 G9-593-751X | |
| Eurocom Sky X4C | |
| MSI GT62VR 7RE-223 | |
| iperf3 receive AX12 | |
| Acer Predator 15 G9-593-751X | |
| MSI GT62VR 7RE-223 | |
| Eurocom Sky X4C | |
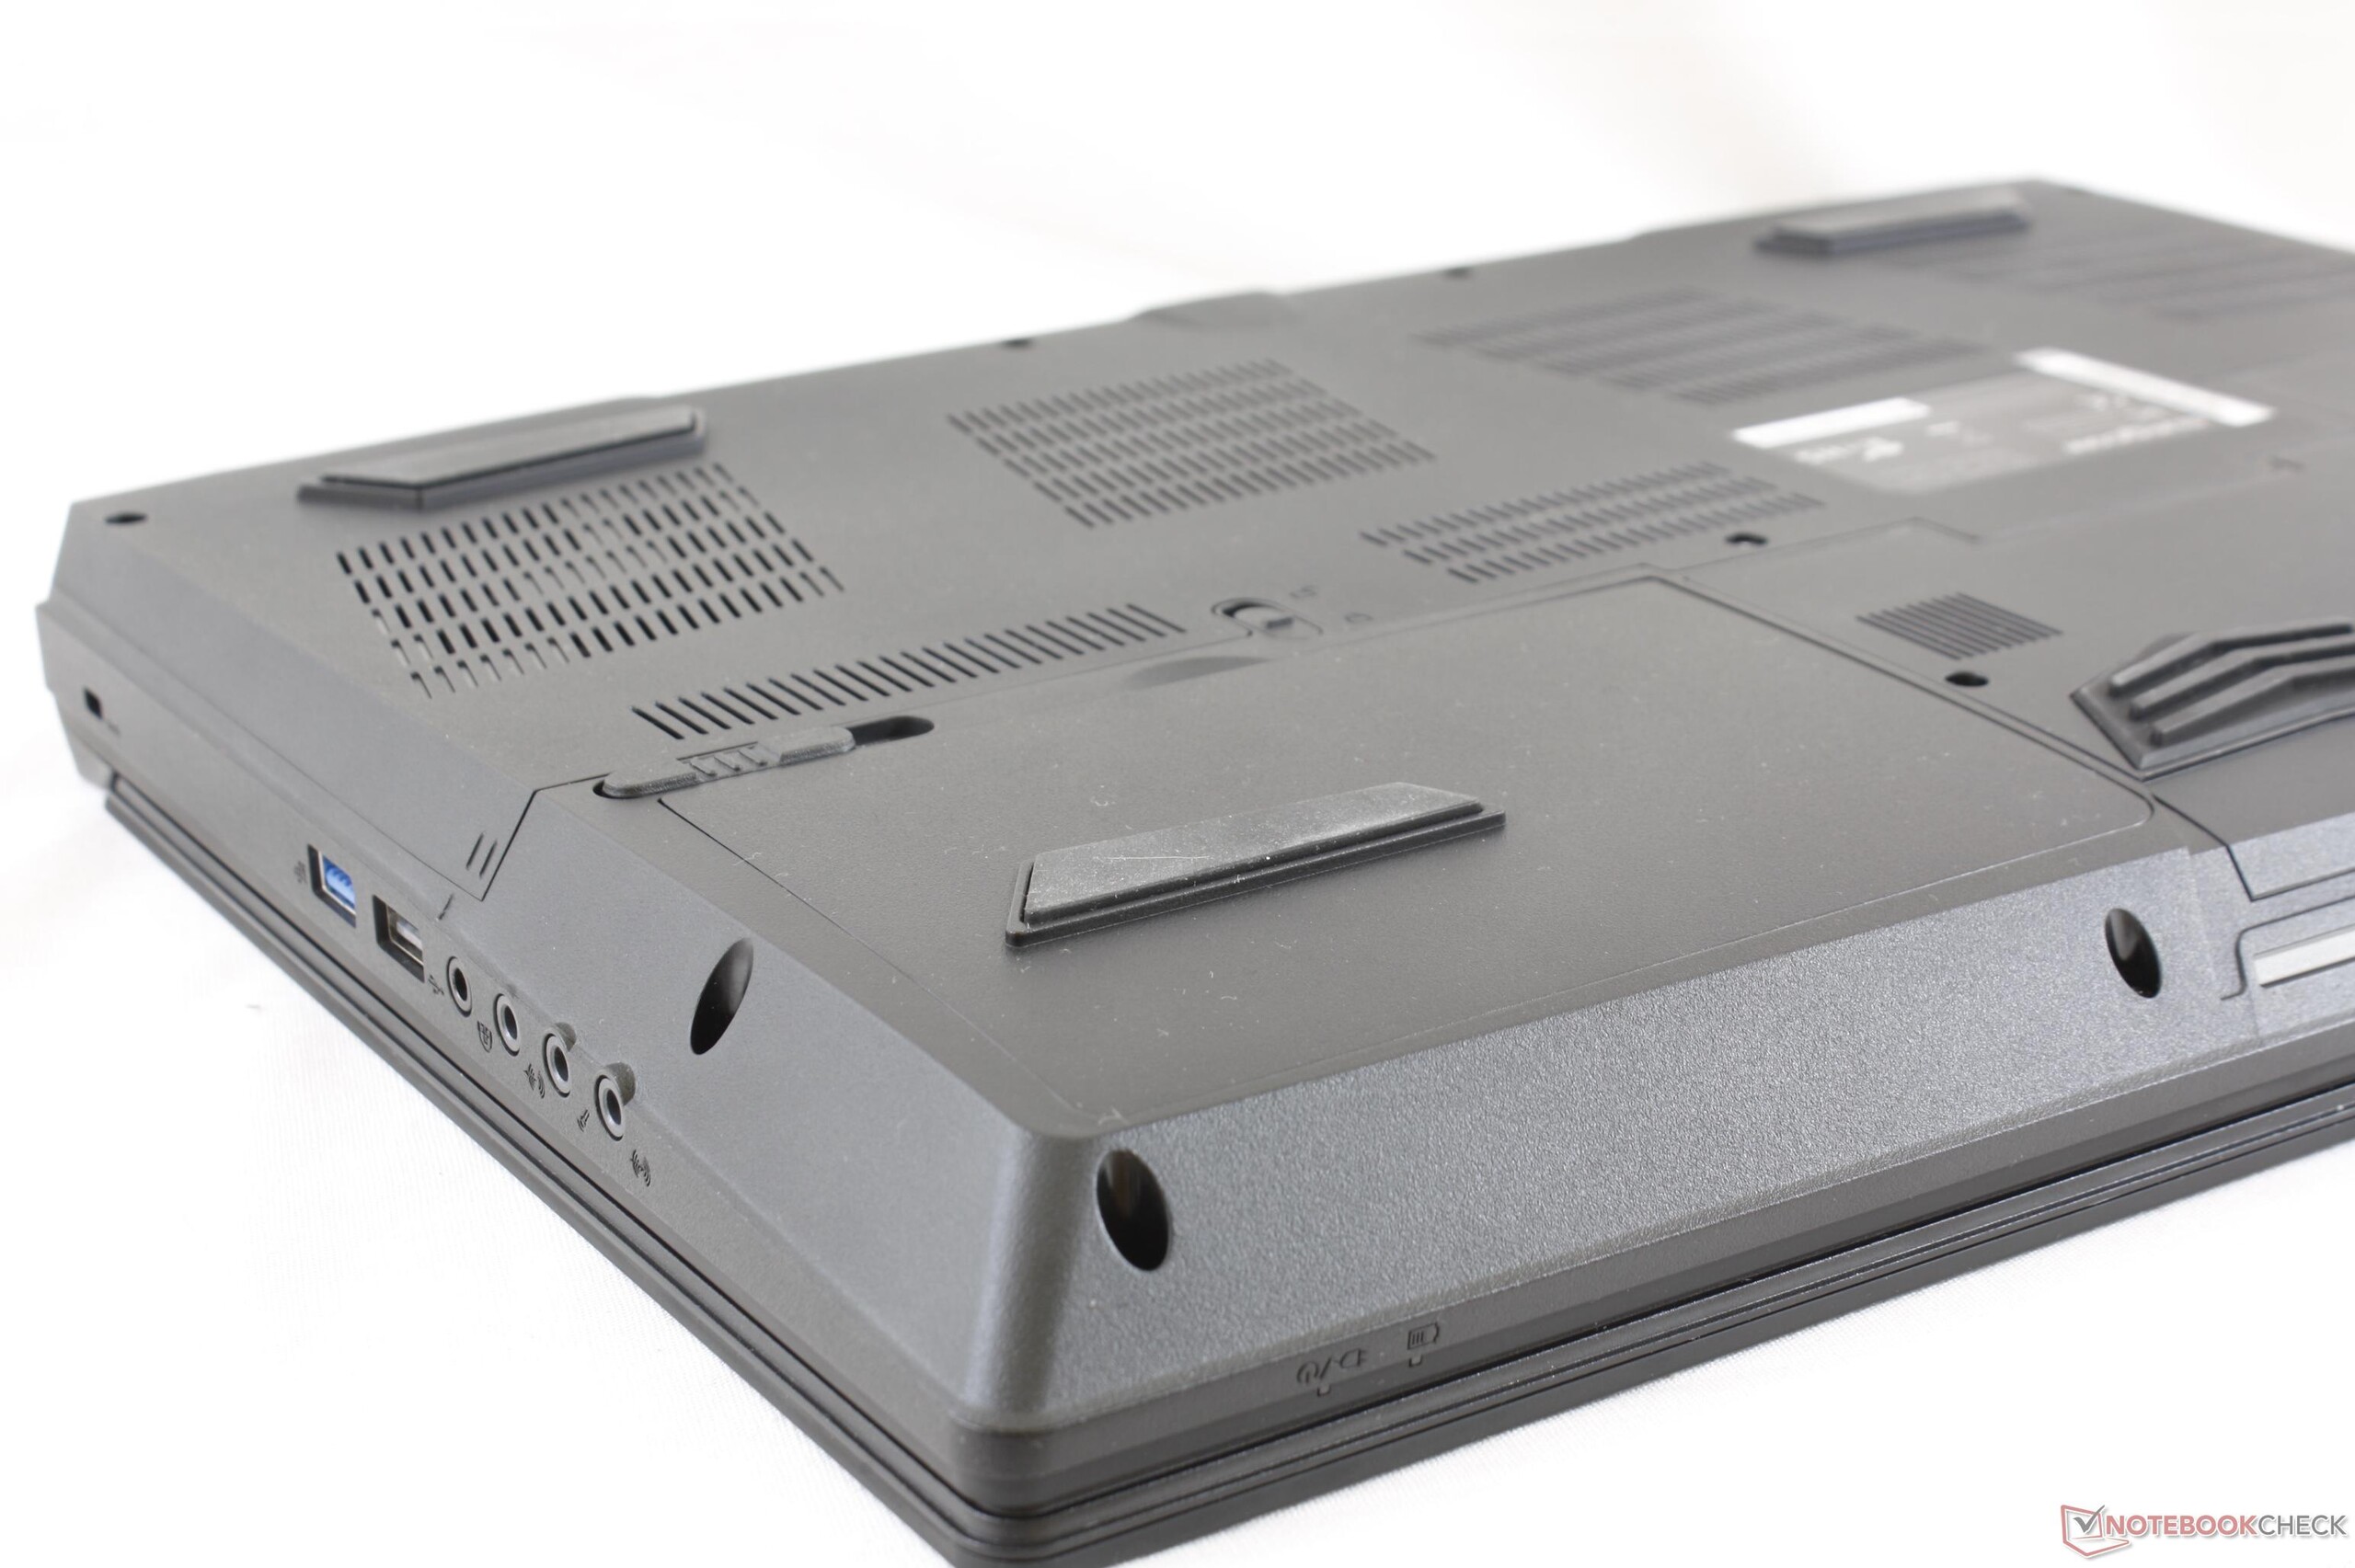
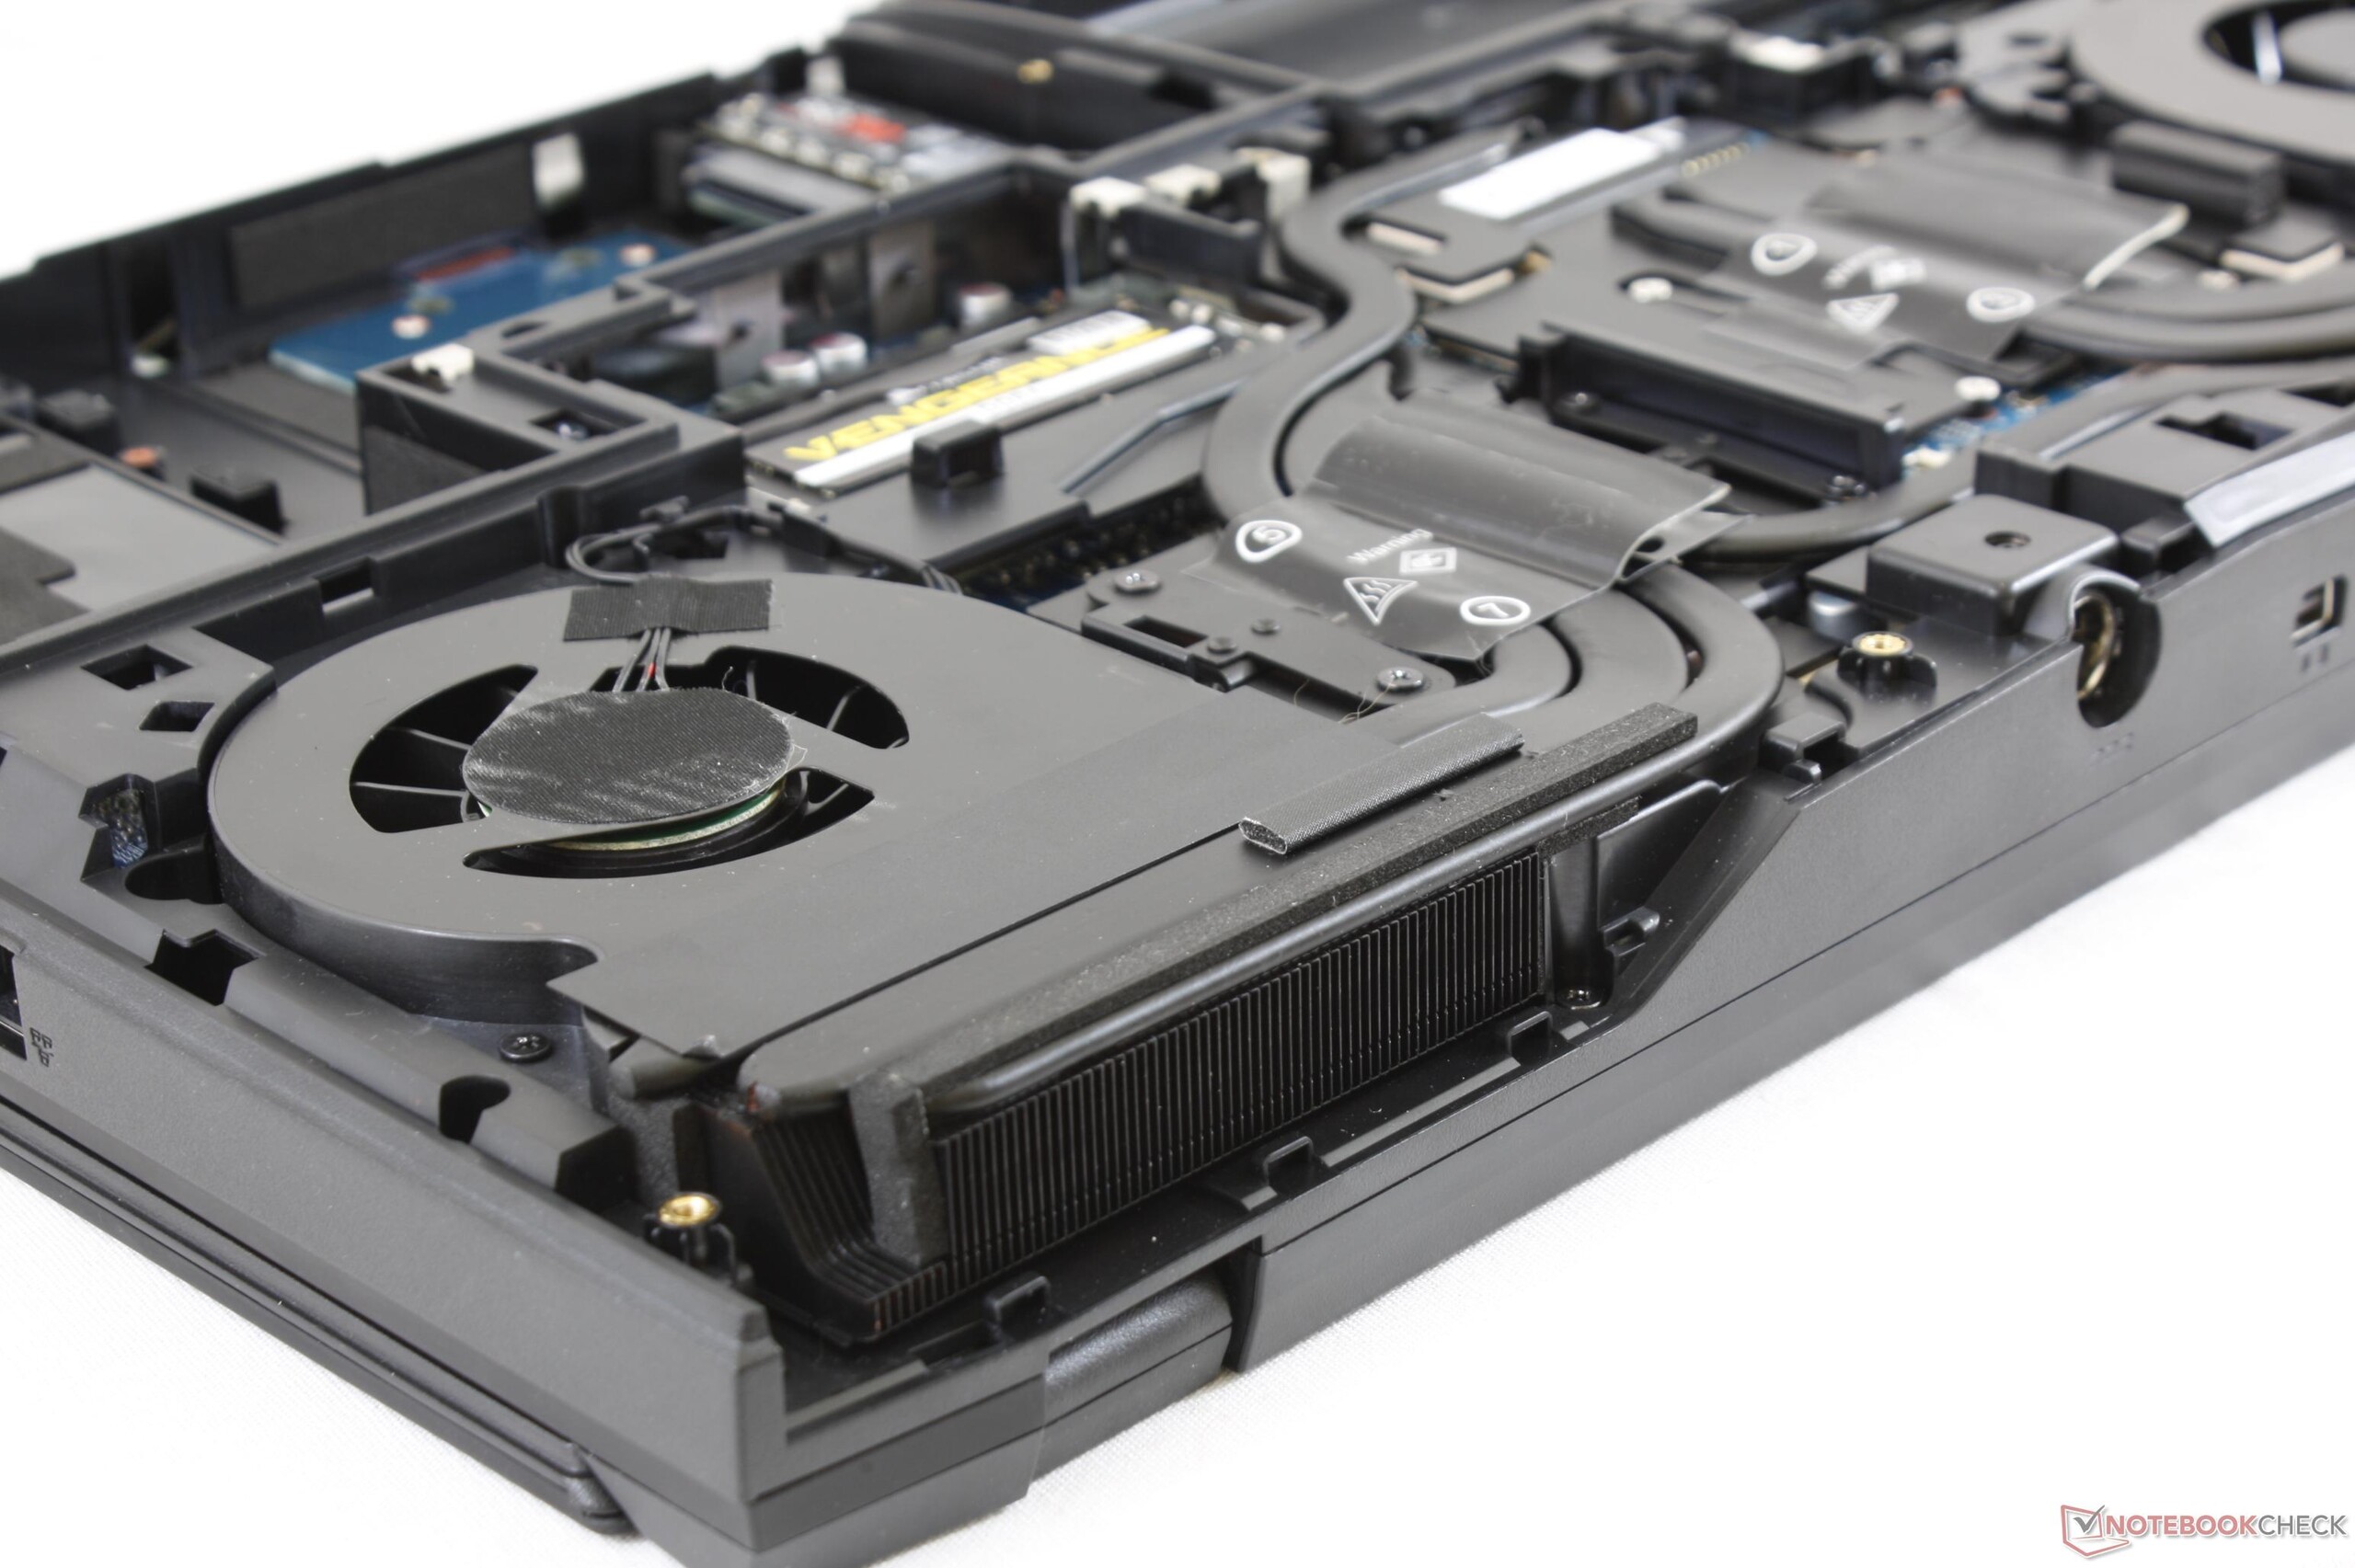
Maintenance
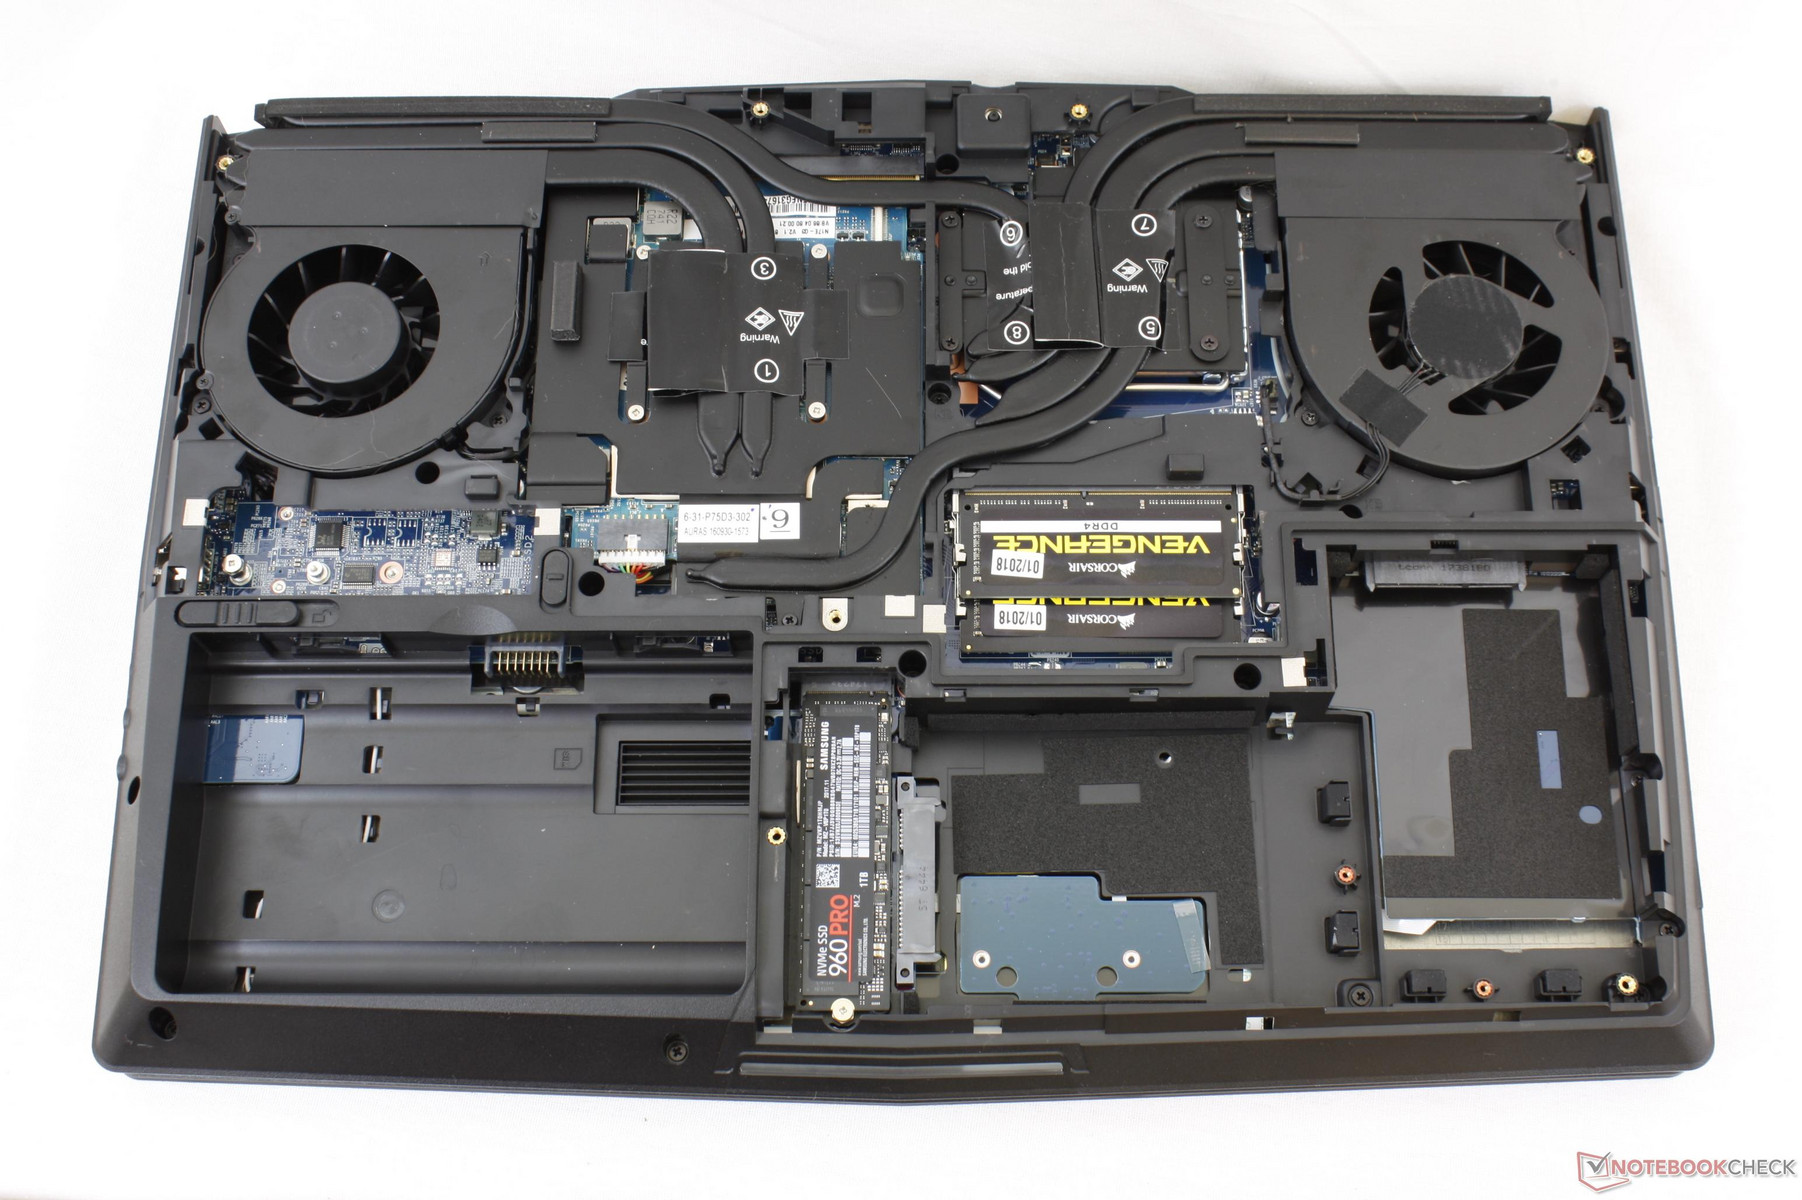
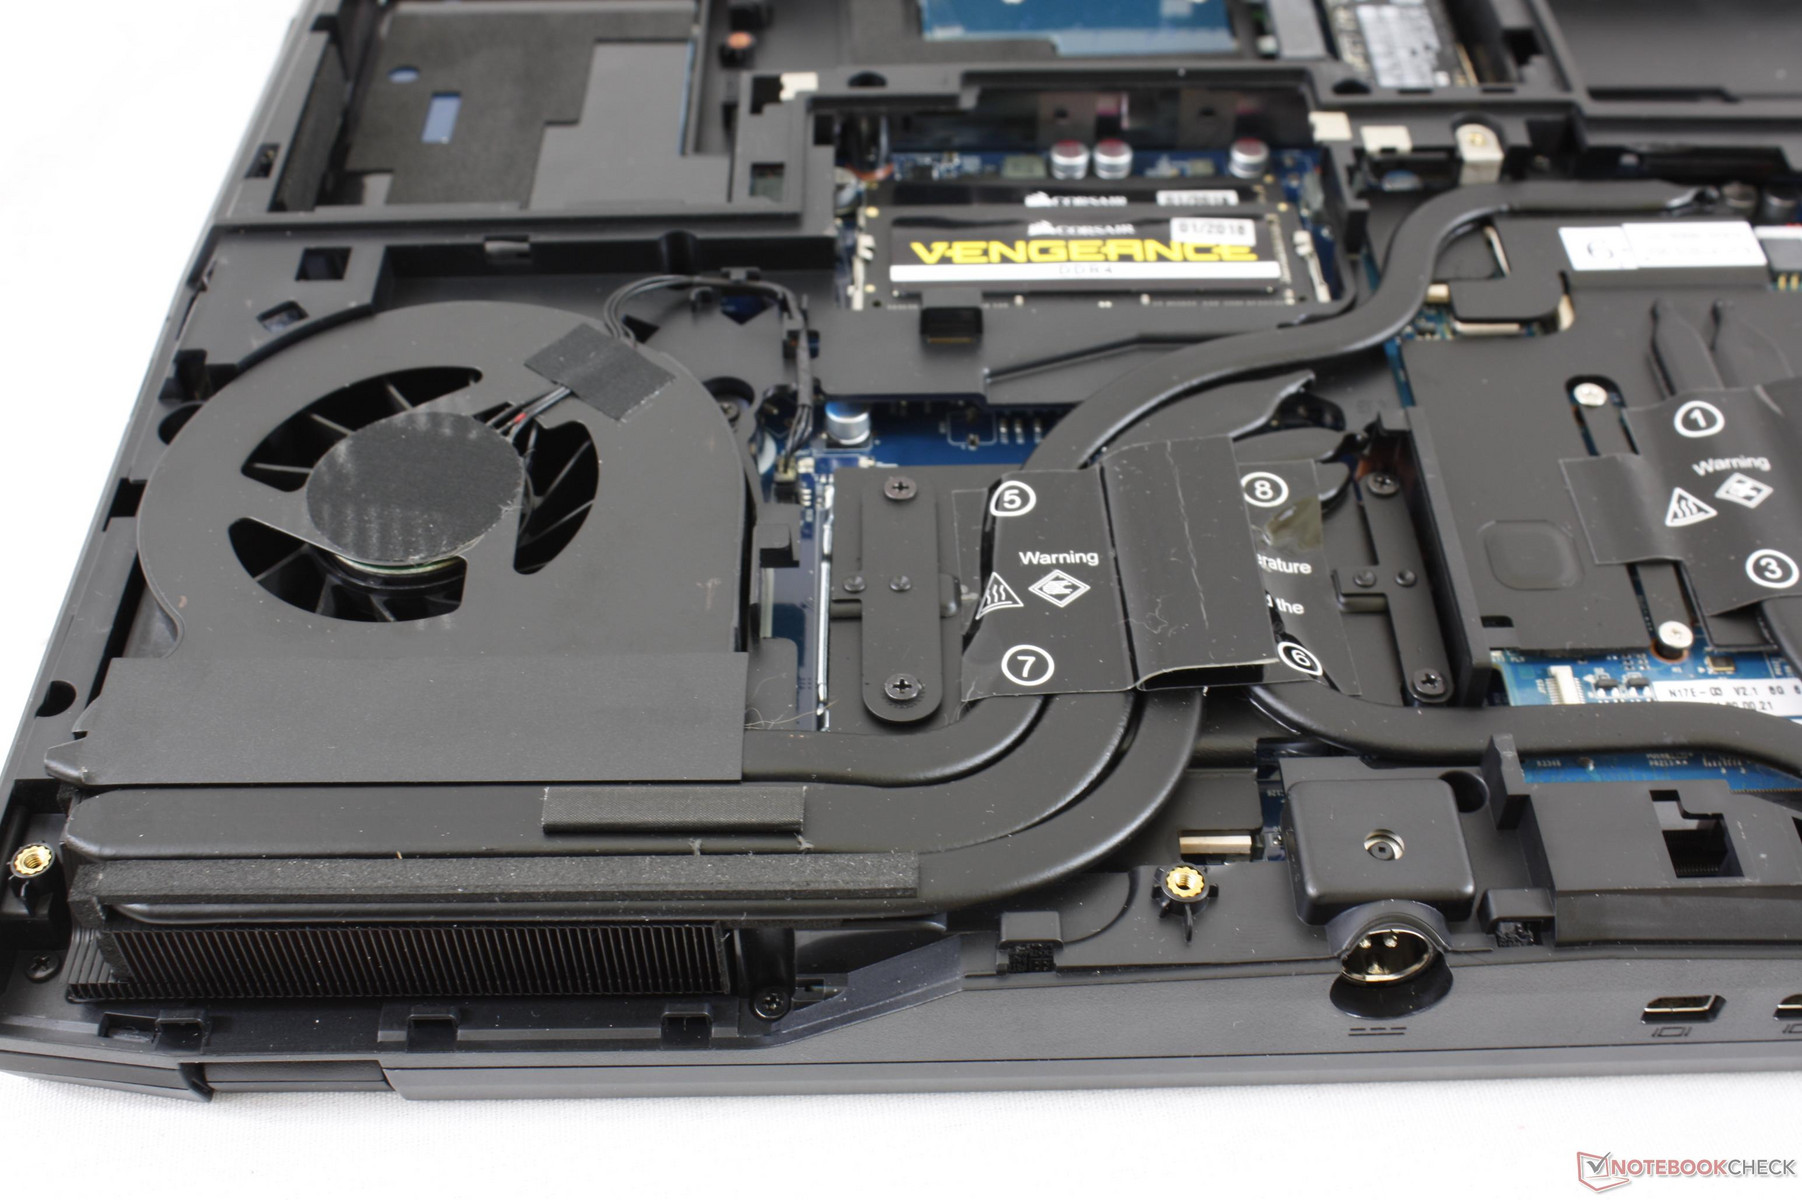
Removal of the two bottom panels require only a standard Philips screwdriver. The smaller panel reveals three of the four storage bays while the larger panel reveals the rest of the motherboard for easy upgrading. Note that additional disassembly is required if needing to access the last M.2 2280 storage bay, the other two DDR4 SODIMM slots, the BIOS battery, and the WLAN card.

Warranty
The standard one-year limited warranty applies with three-year extended options. The delidded CPU is covered under all warranty options from Eurocom.
We'd still like to see a two-year base warranty as competitors like Gigabyte and EVGA have two-year warranty standards for their high-end models.
Input Devices
Keyboard and Touchpad
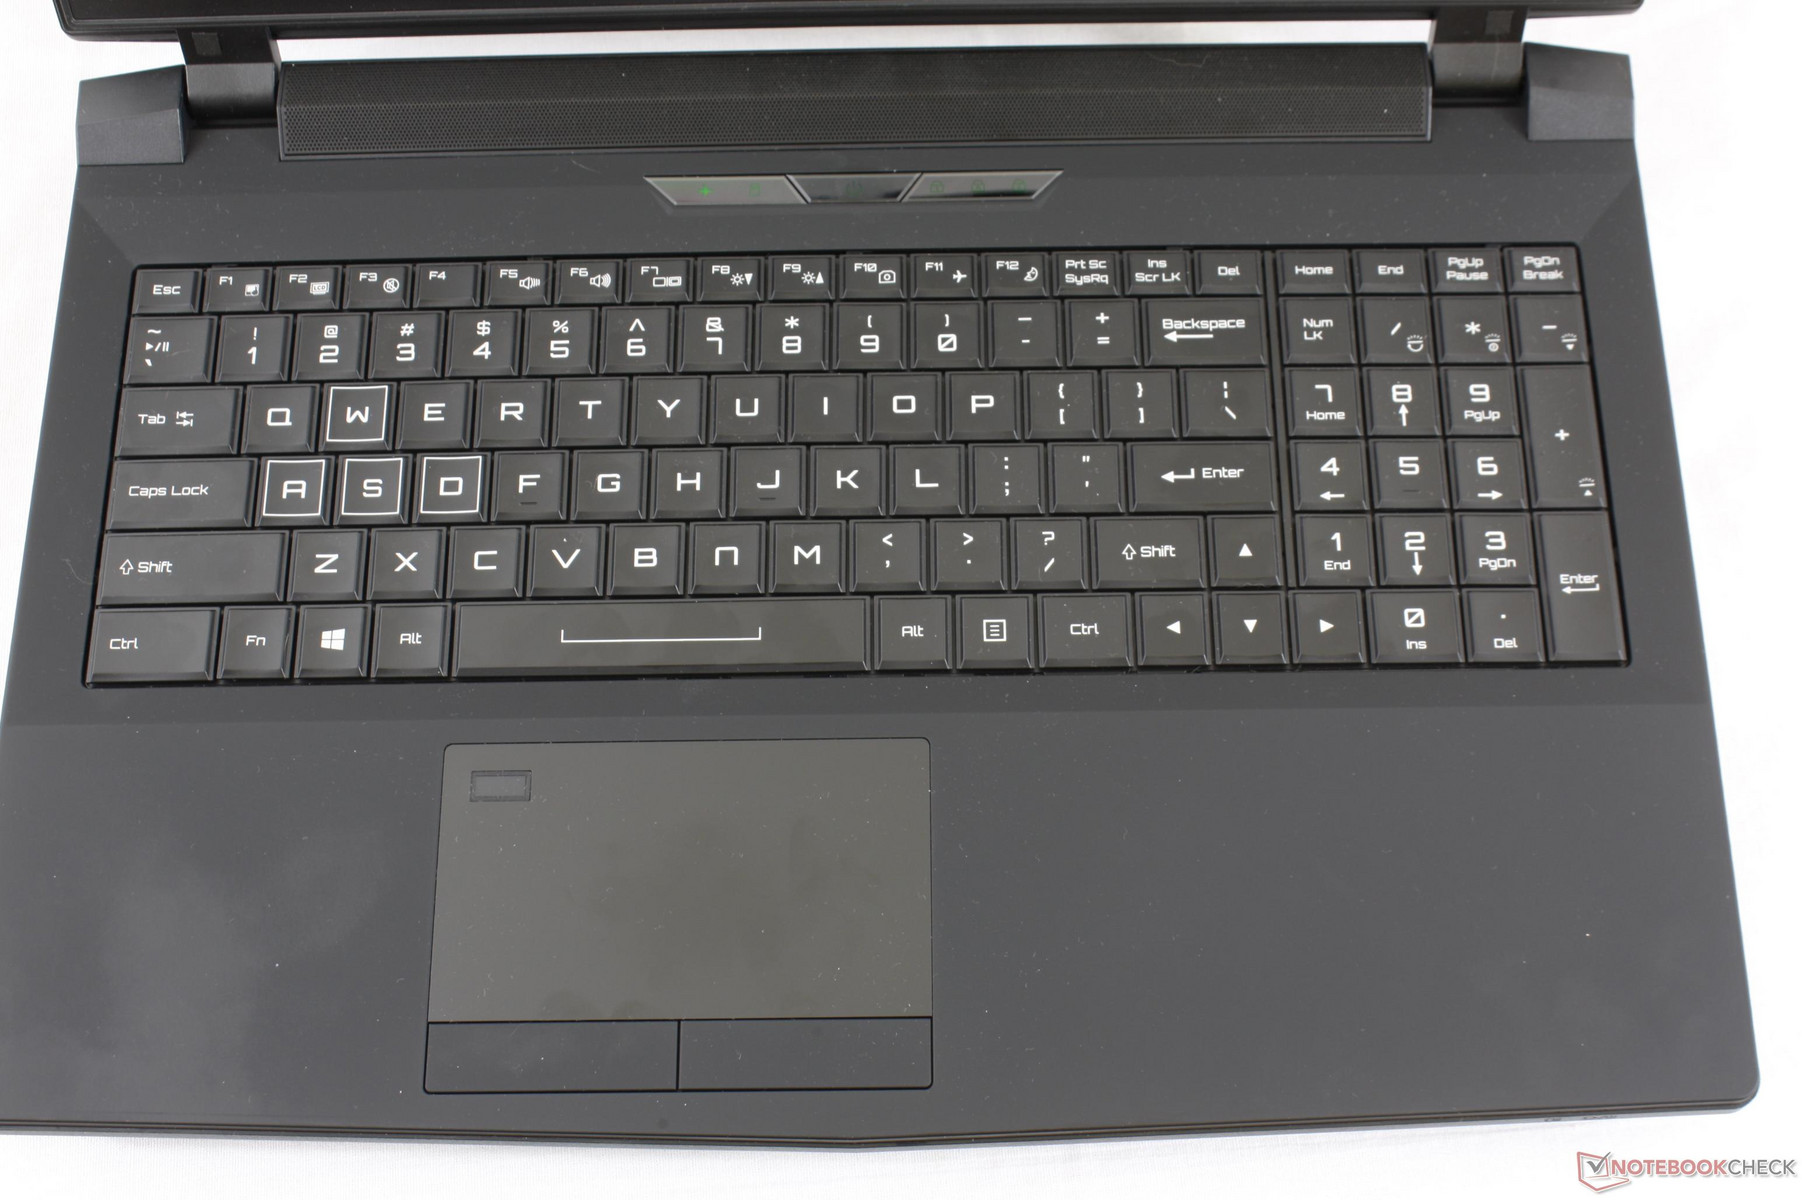
The keyboard (~35 x 11 cm) and trackpad (10.5 x 6.0 cm) remain identical to the ones on the Clevo P751DM2-G and other 15.6-inch Eurocom systems like the Tornado F5. Thus, we recommend checking out these existing reviews for more information. In short, tactile feedback from the keyboard keys can feel soft to veteran desktop users, but clatter is quieter than on most Ultrabooks. Meanwhile, the trackpad offers smooth gliding and works as intended for responsive cursor control. The top left corner is used only as a fingerprint sensor while the dedicated mouse keys are soft in feedback and with deeper travel compared to those on the MSI GT or GE series.
We hope to see individually-lit RGB keys on future Clevo designs instead of the aging tri-zone backligh.
Display
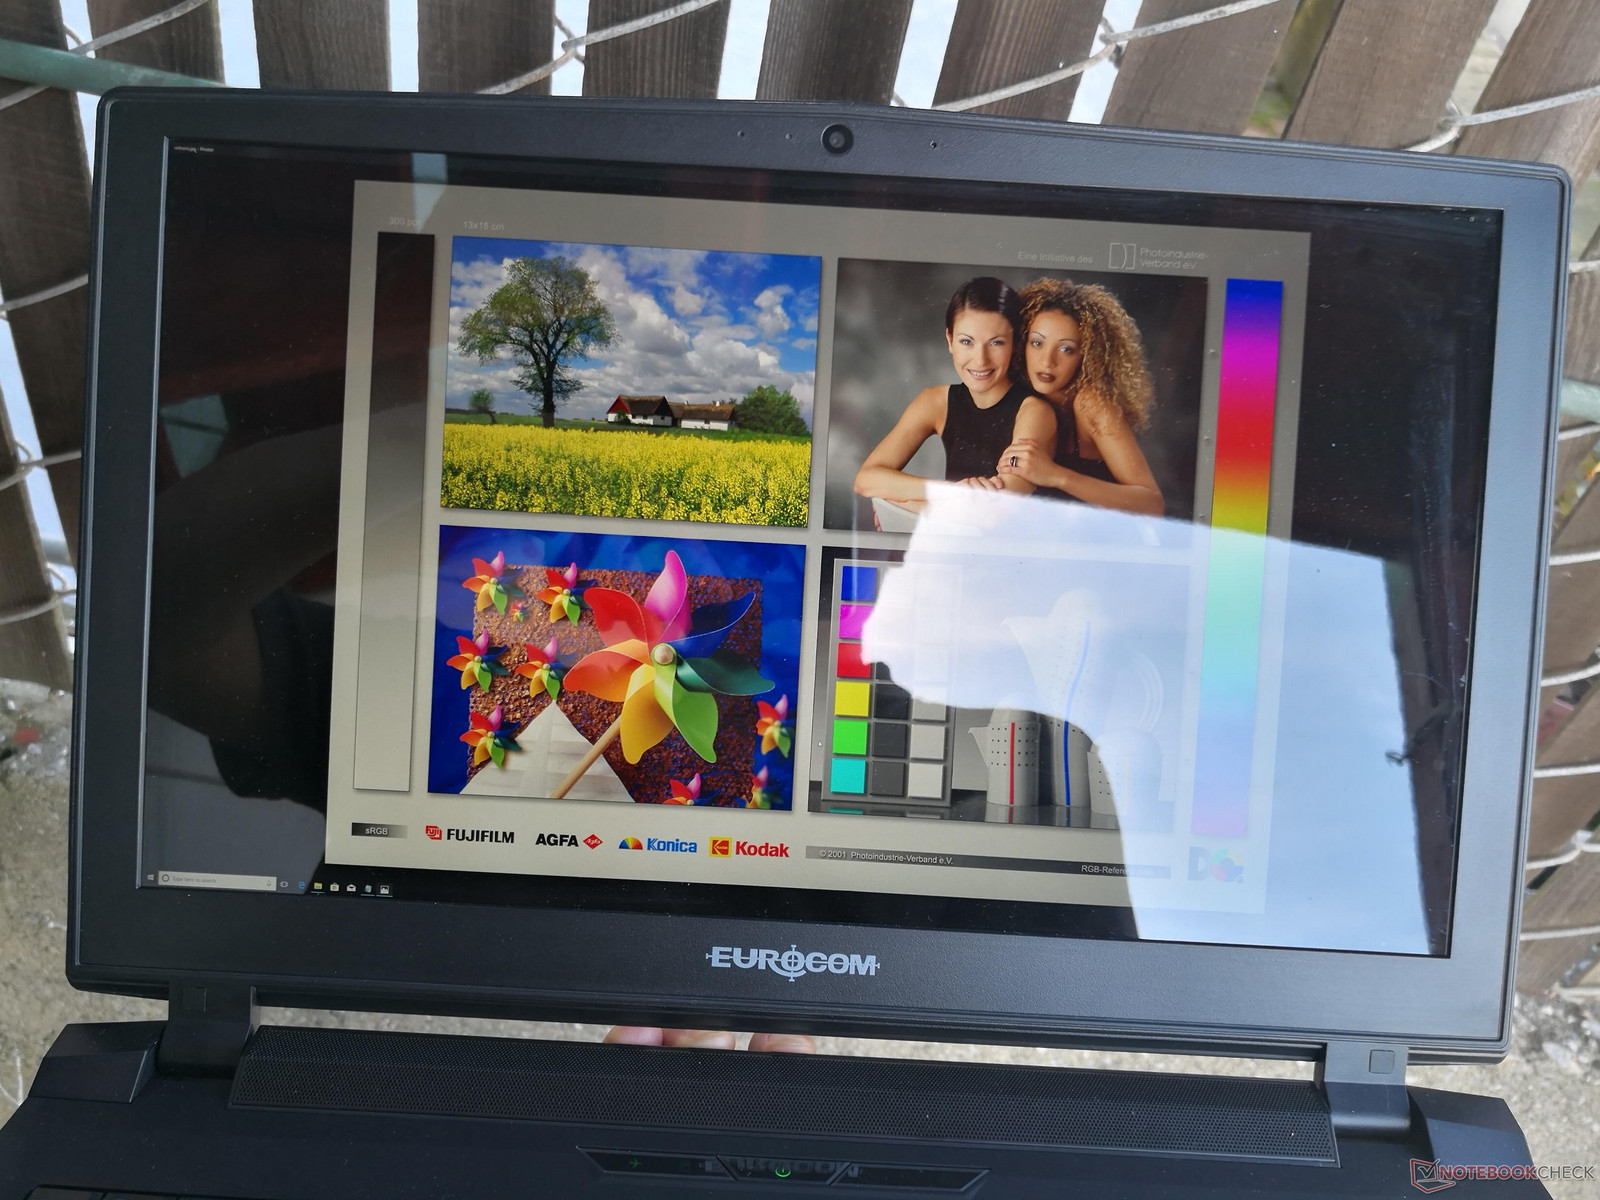
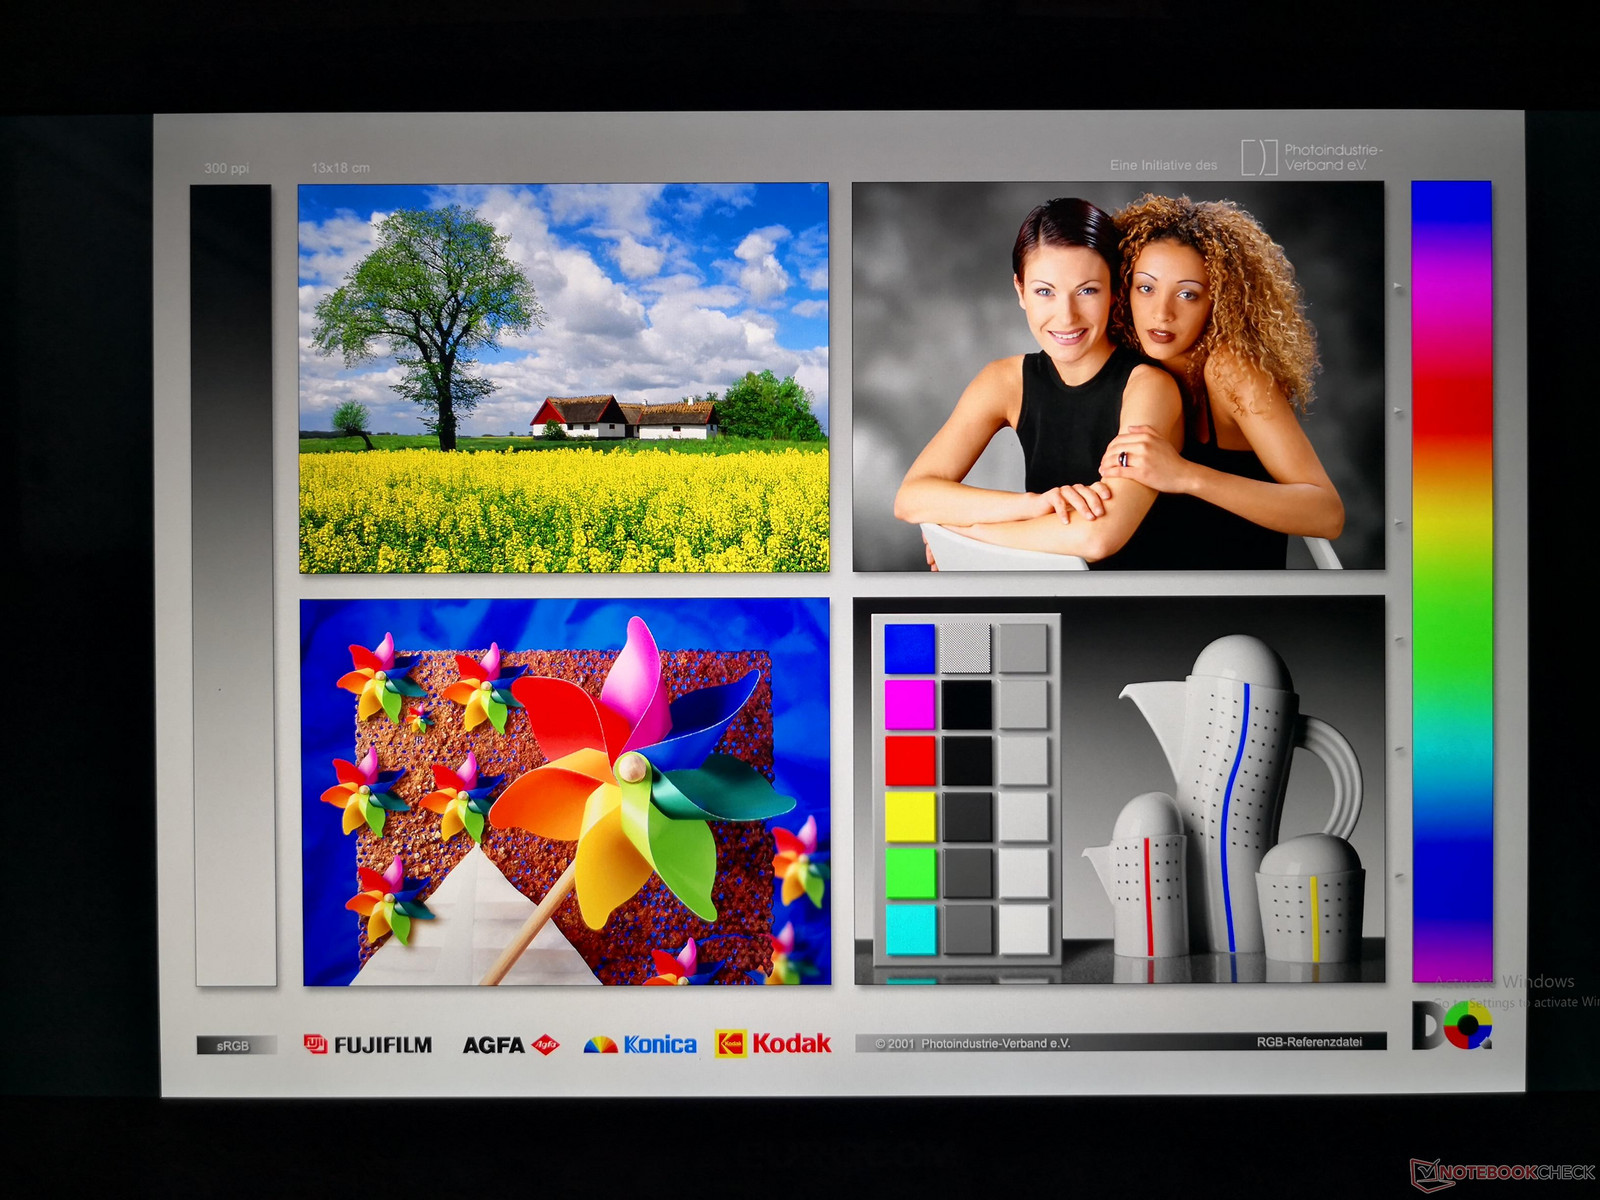
Display options include FHD 60 Hz matte IPS, FHD 5 ms/120 Hz matte TN, 4K UHD 60 Hz matte IPS, and 4K UHD 60 Hz glossy IPS with differing gamuts and contrast ratios between them. Our test unit today is the latter glossy option that promises deeper colors than the matte alternatives. Otherwise, core attributes like brightness, contrast, and response times appear to be run-of-the-mill for a high-end gaming notebook. Users who intend to game extensively on the Sky X4C may want to consider the FHD 5 ms/120 Hz option for fewer ghosting issues. Unfortunately, Eurocom provides no panels with faster 3 ms response times unlike on some newer MSI notebooks.
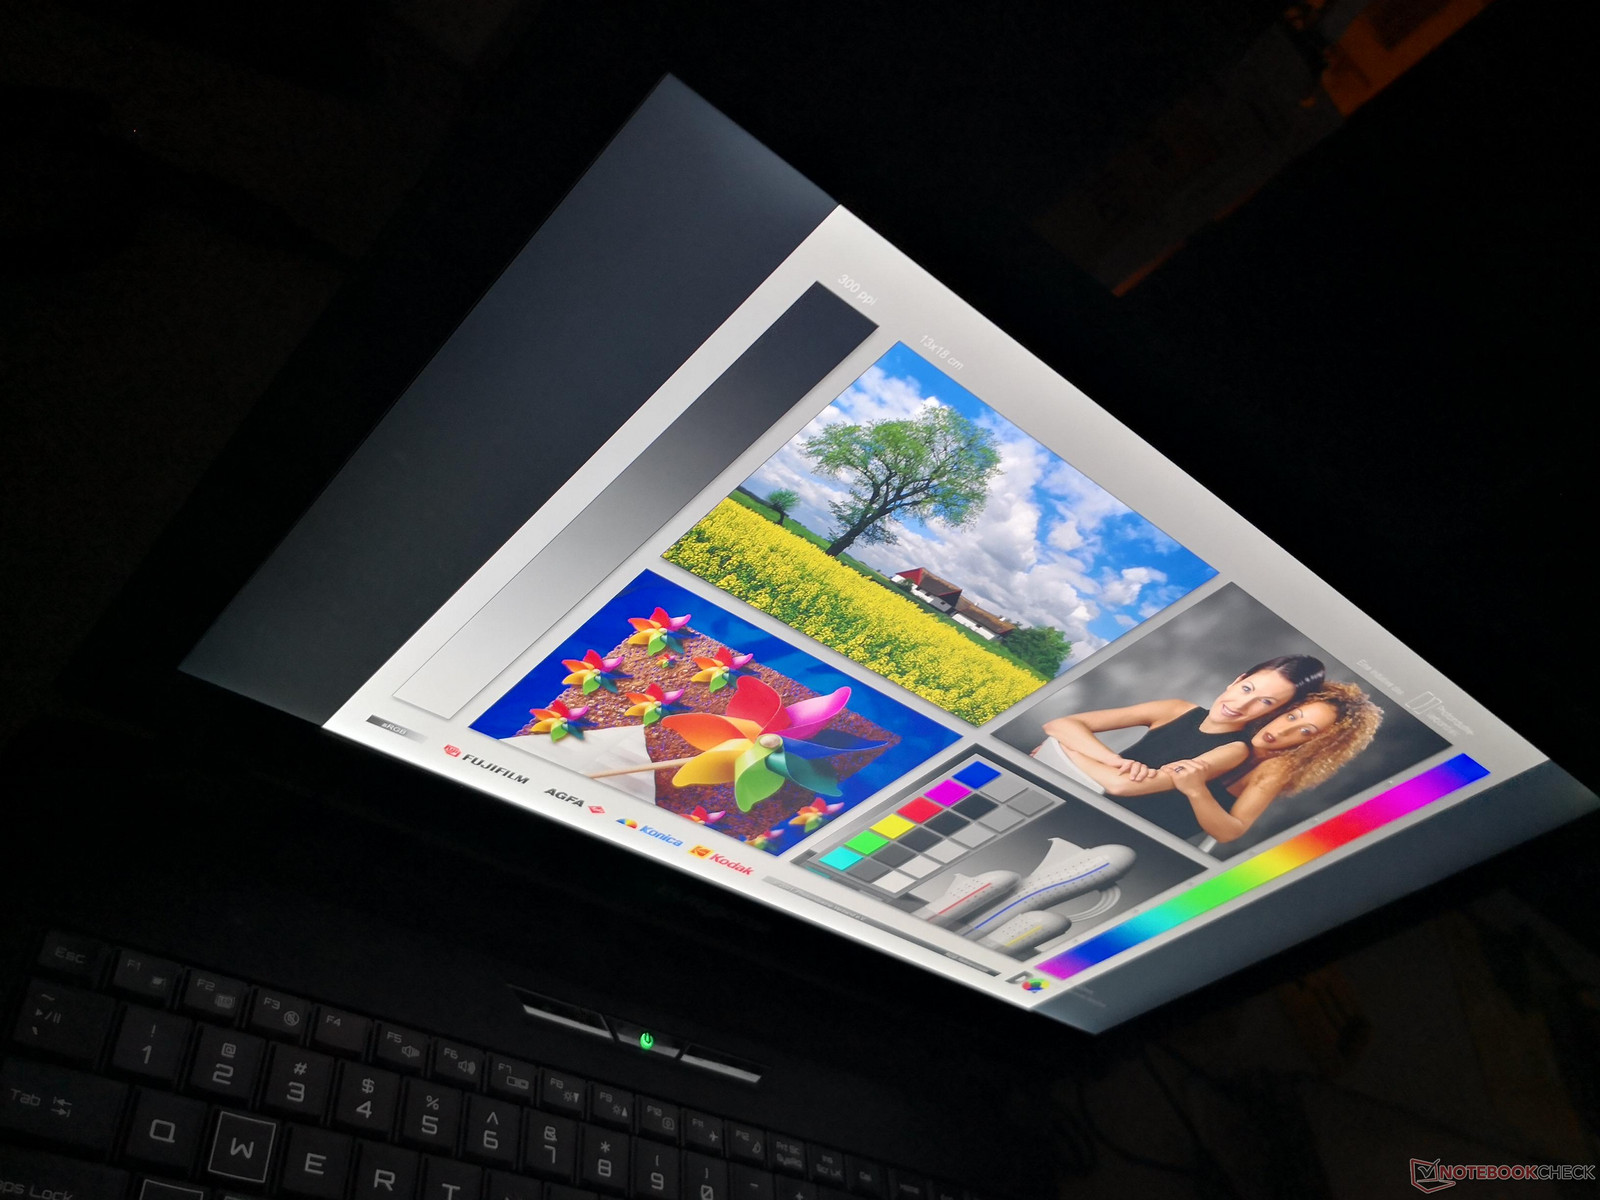
The major benefits of a glossy panel are its potentially sharper texts and colors. On the Sky X4C, however, this does not appear to be the case. Color grains that are normally present on matte panels are still very visible on the glossy X4C. Thus, it's hard to recommend this glossy option knowing that its implementation on the Sky X4C appears to be poorer than on current glossy Ultrabooks.
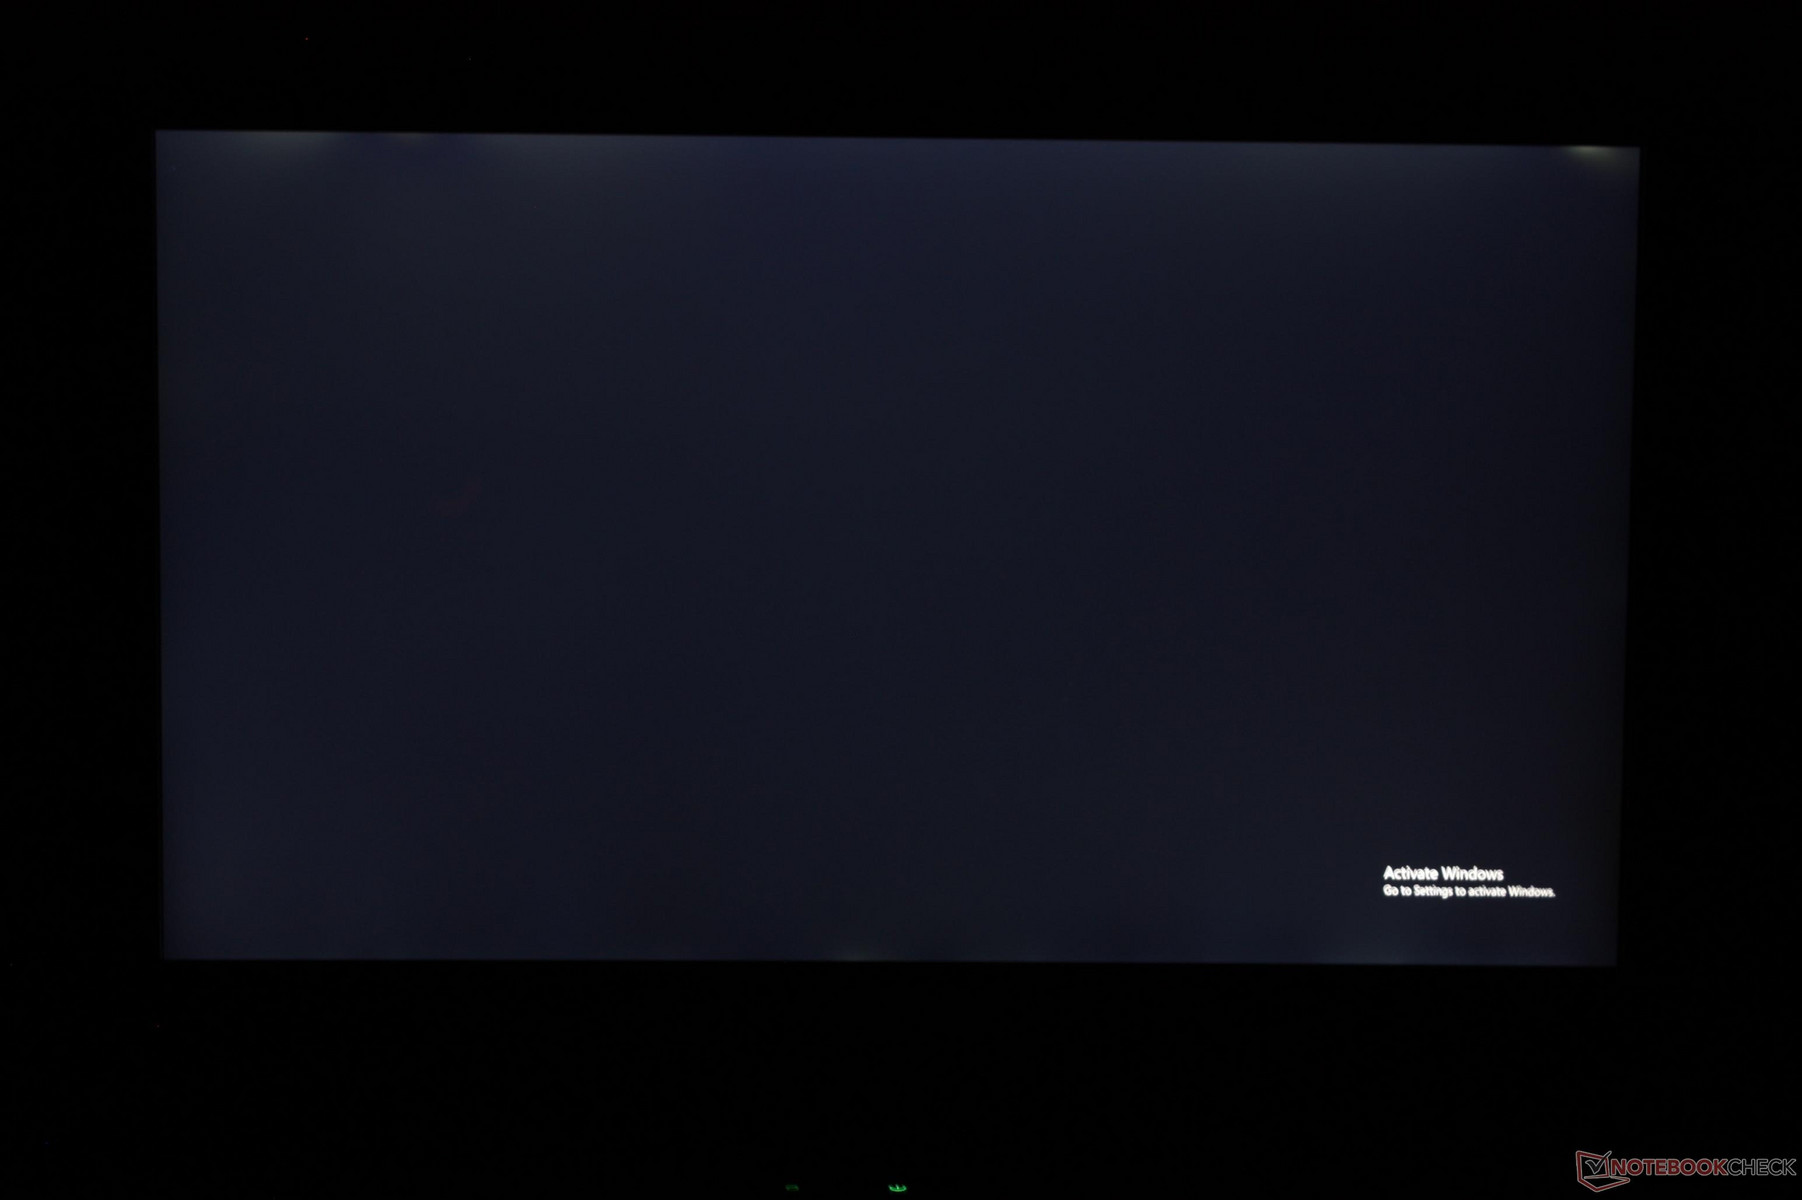
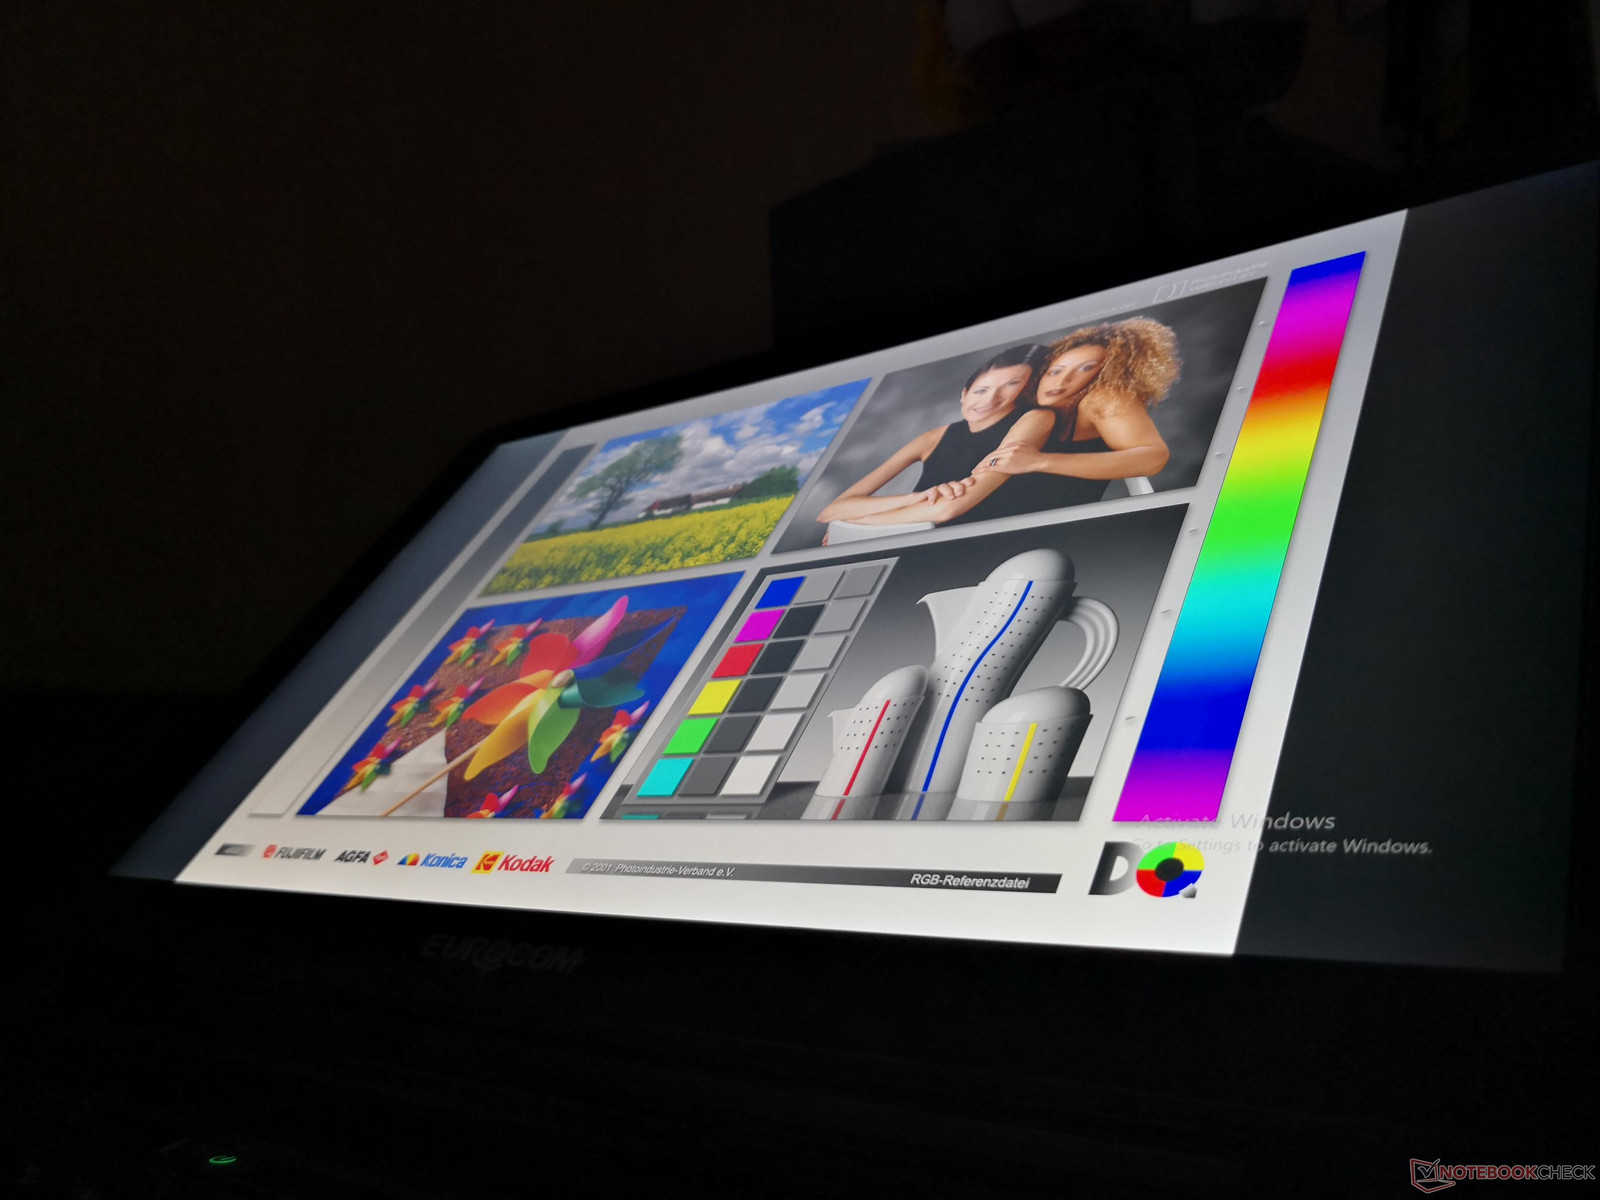
Uneven backlight bleeding is present on our unit along the top edge as shown by our image below. It's not acute enough to be distracting during day-to-day browsing, but it's still noticeable during video playback with black bars.
Note that G-Sync is available but not when paired with the 4K UHD panel or GTX 1080 GPU.

| |||||||||||||||||||||||||
Brightness Distribution: 81 %
Center on Battery: 324.7 cd/m²
Contrast: 1249:1 (Black: 0.26 cd/m²)
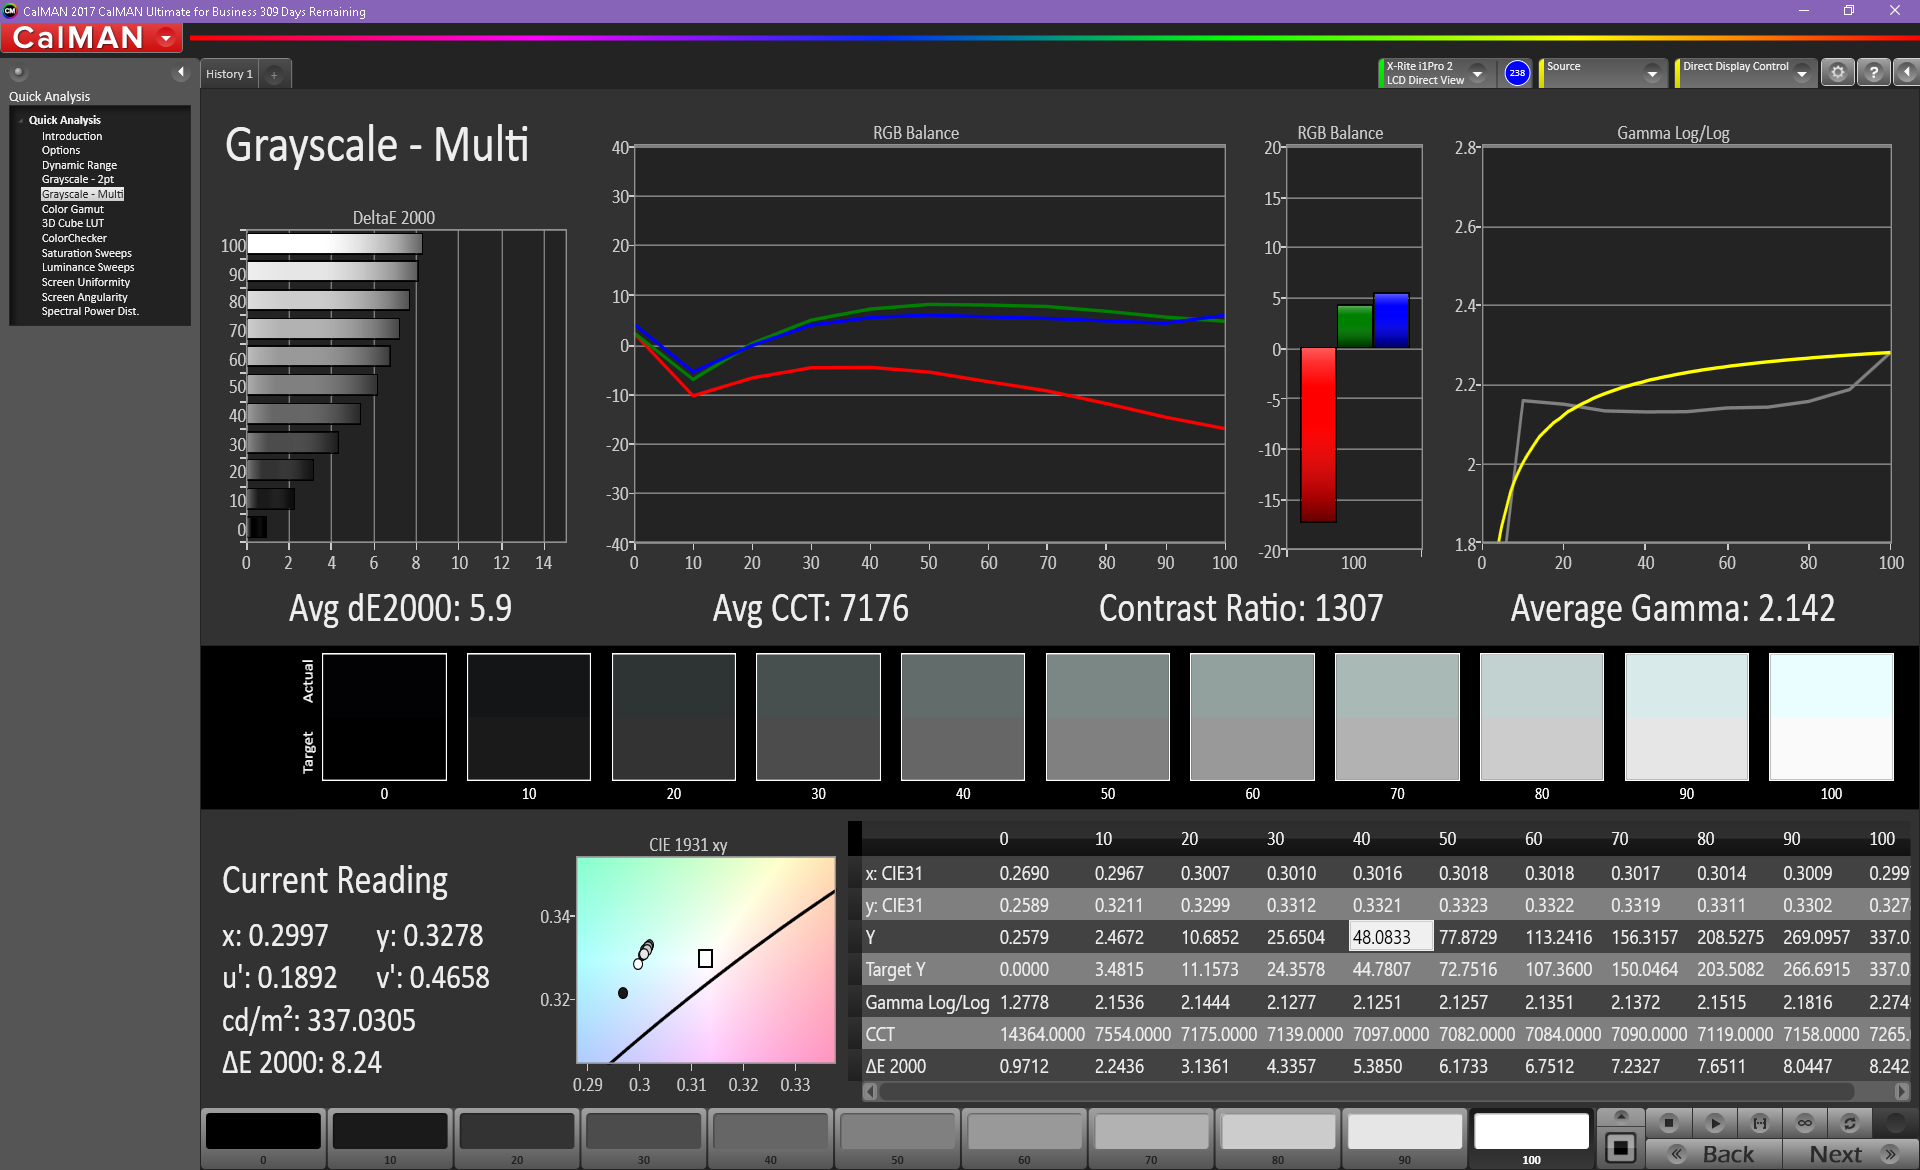
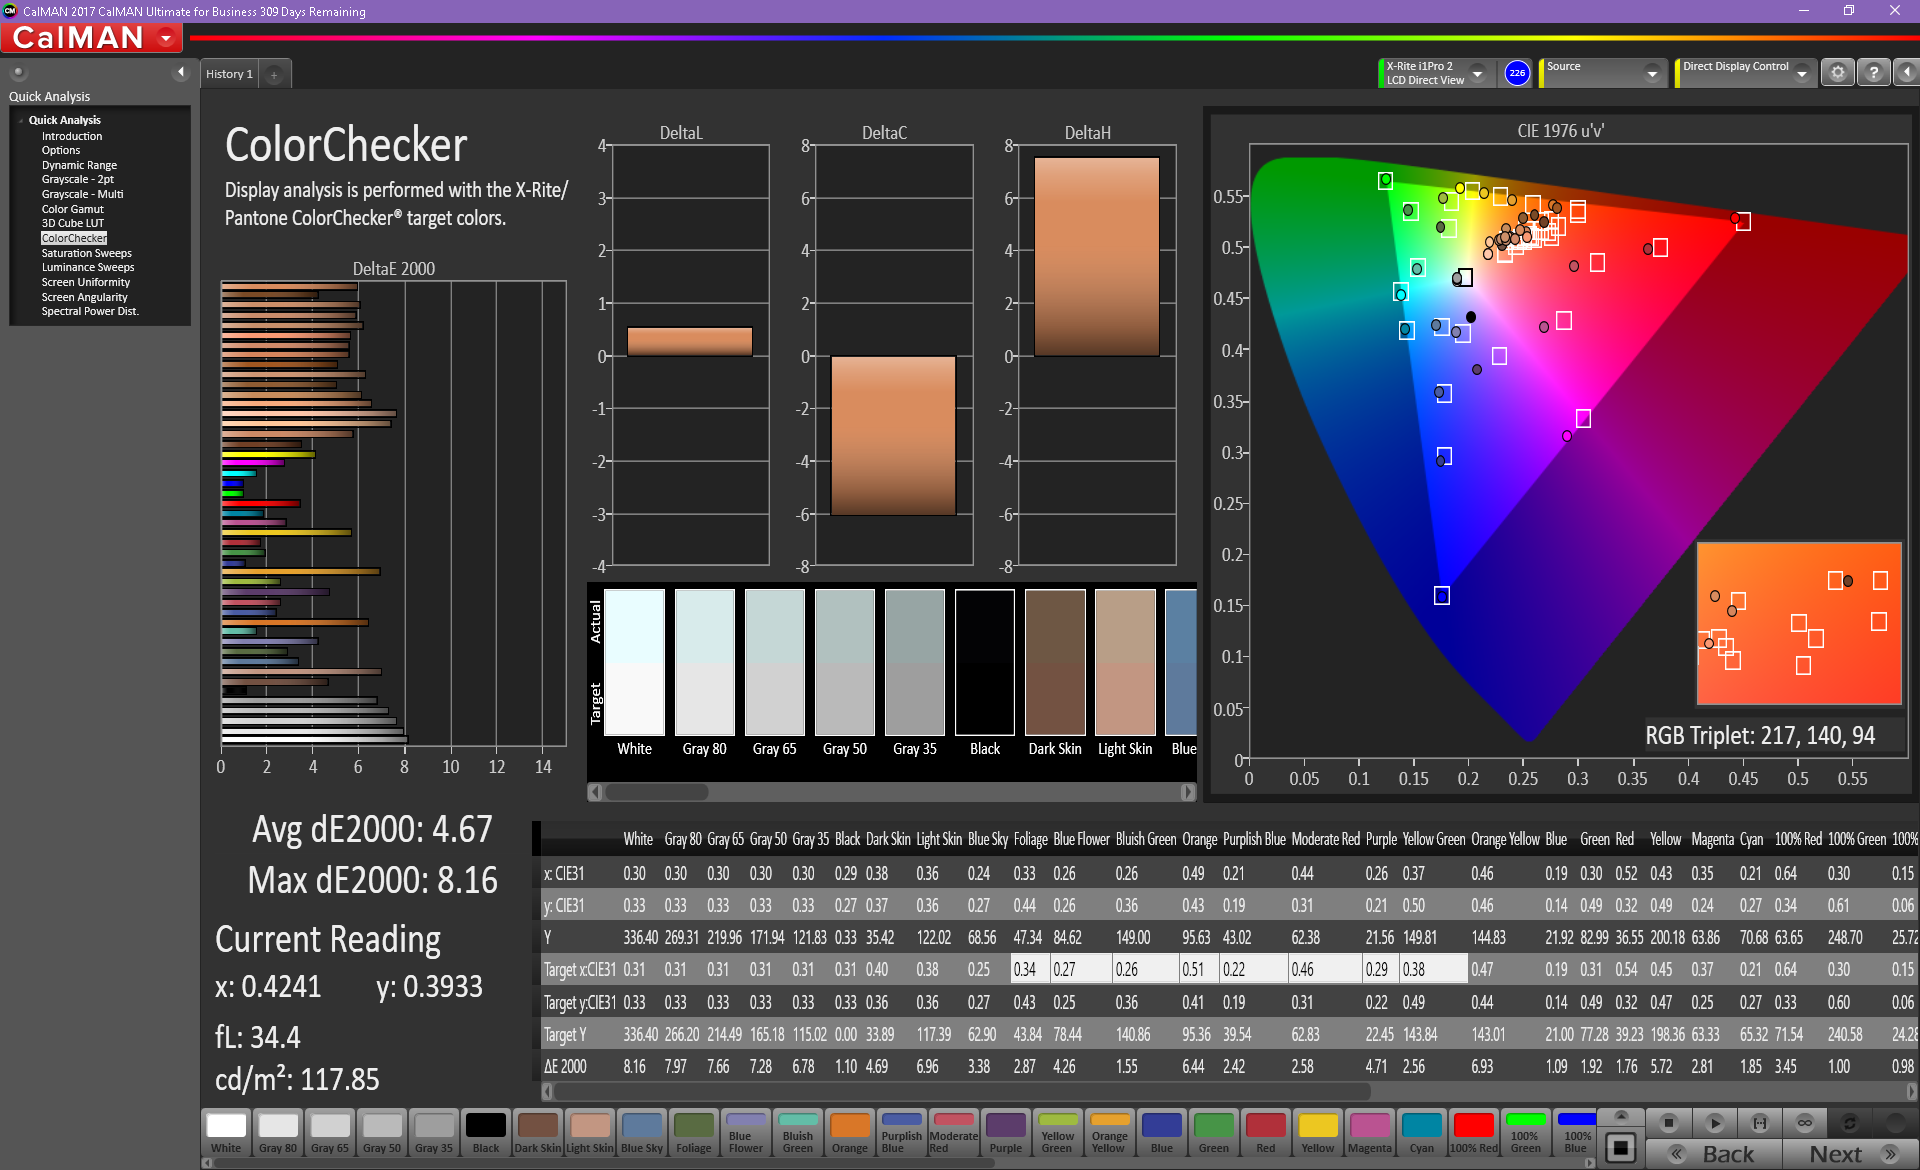
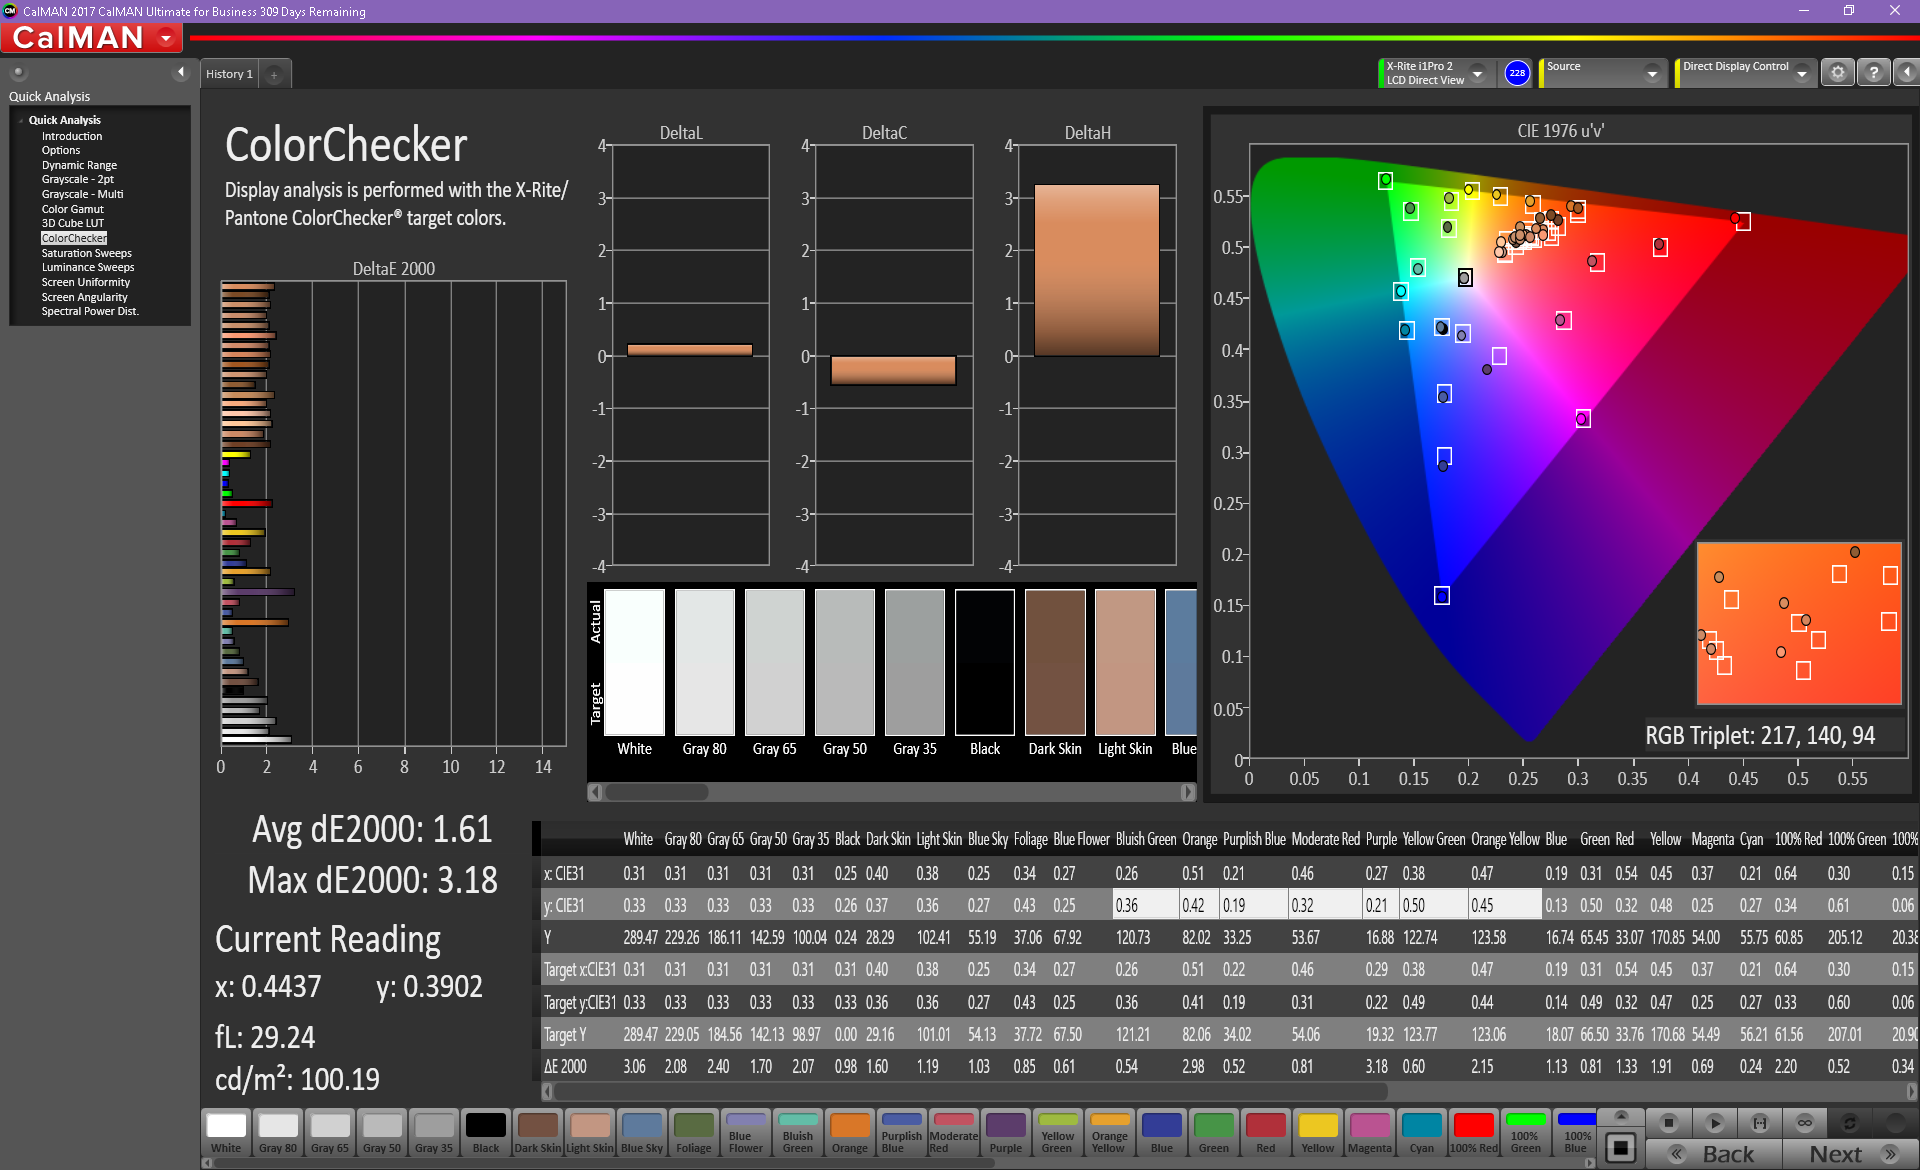
ΔE ColorChecker Calman: 4.67 | ∀{0.5-29.43 Ø4.76}
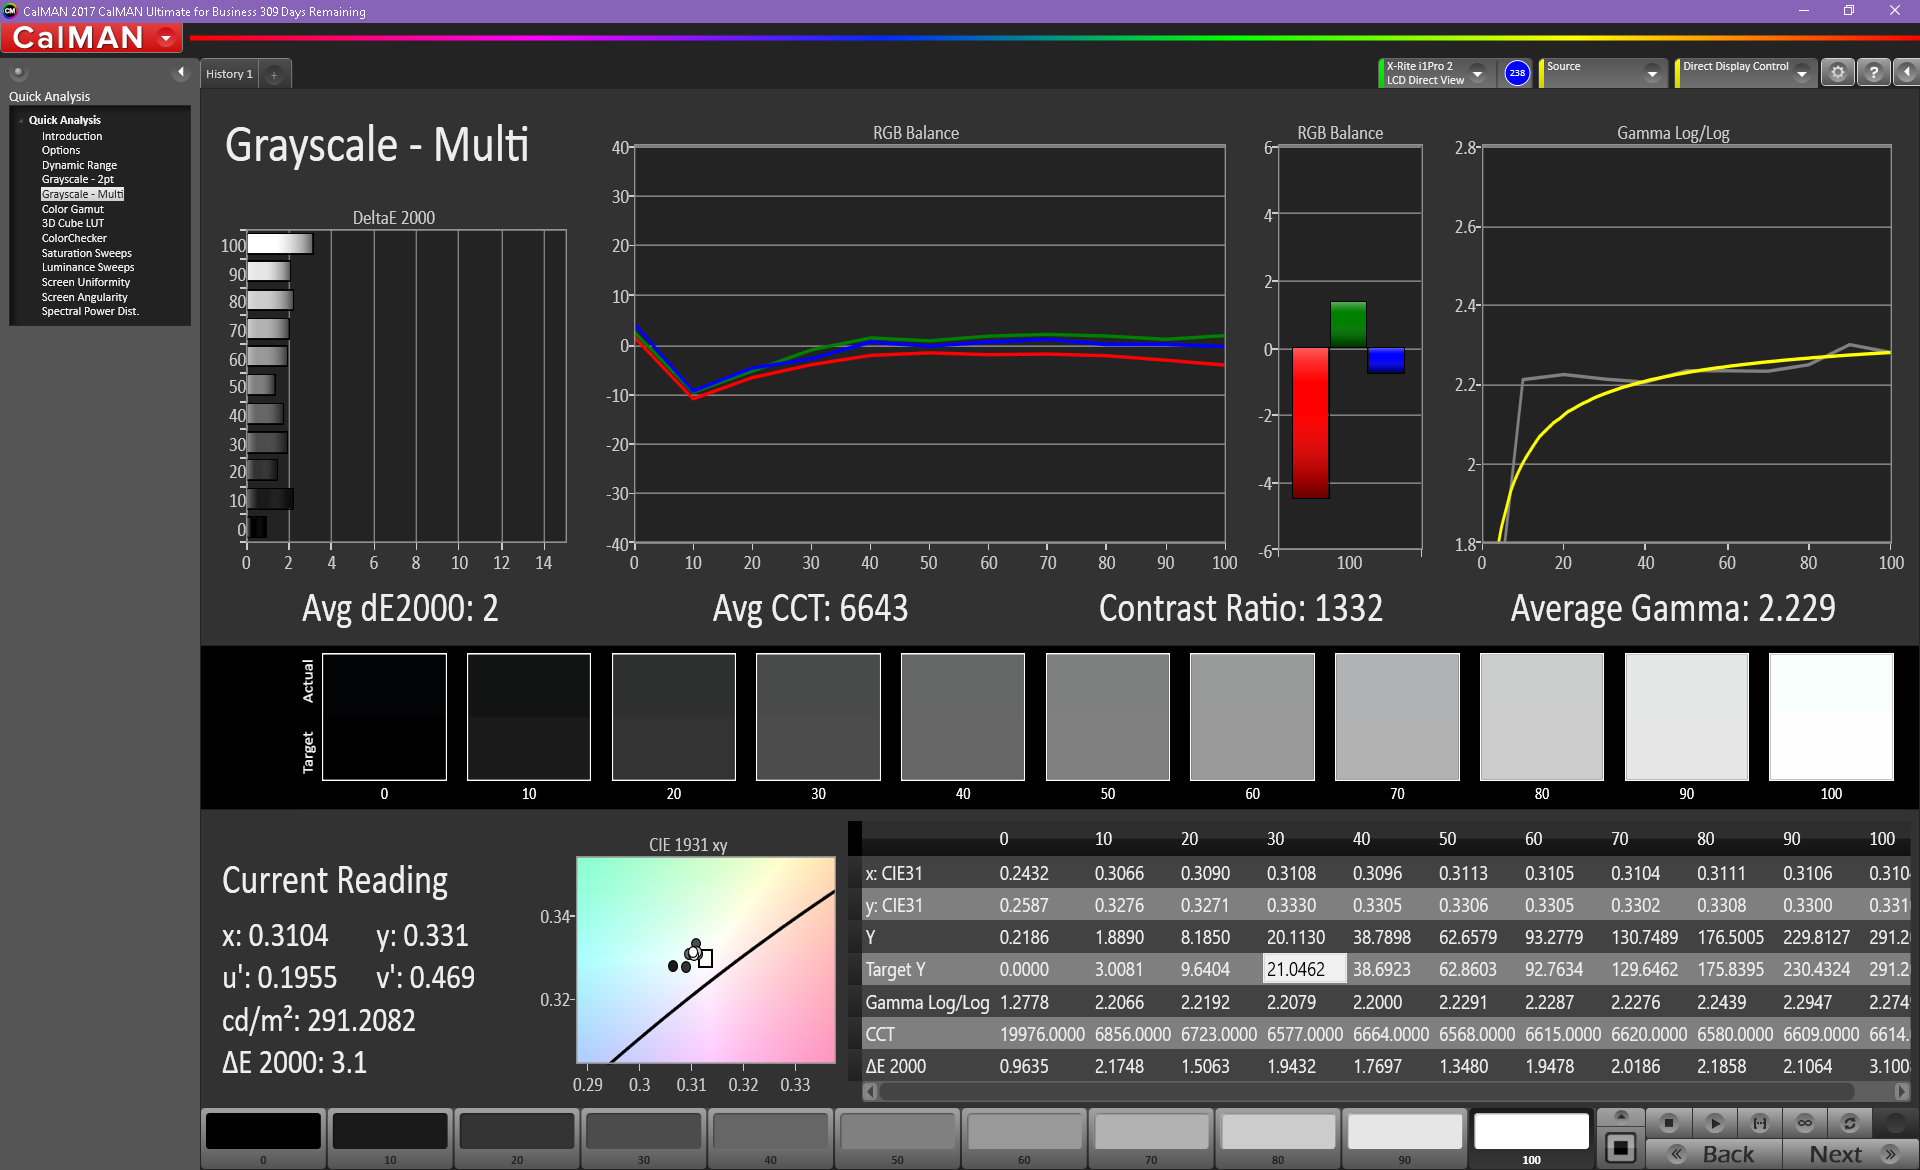
ΔE Greyscale Calman: 5.9 | ∀{0.09-98 Ø5}
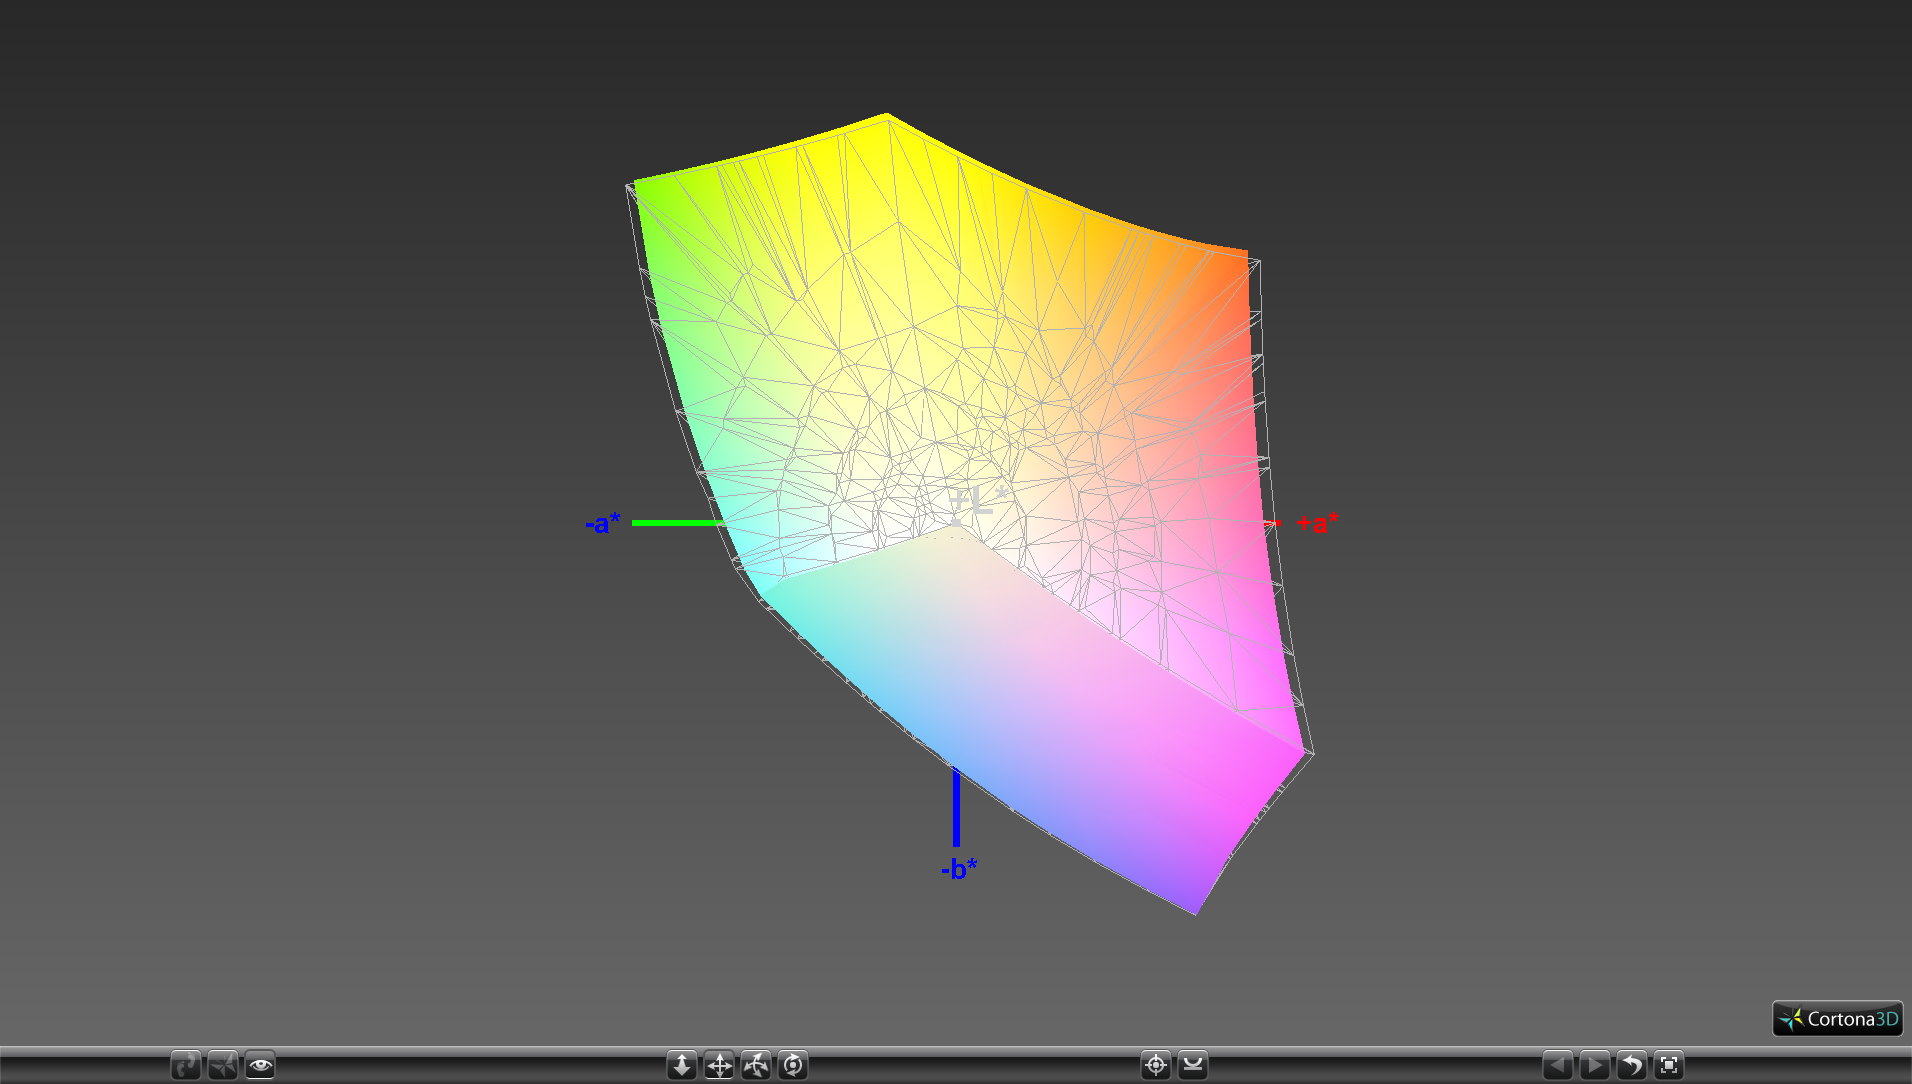
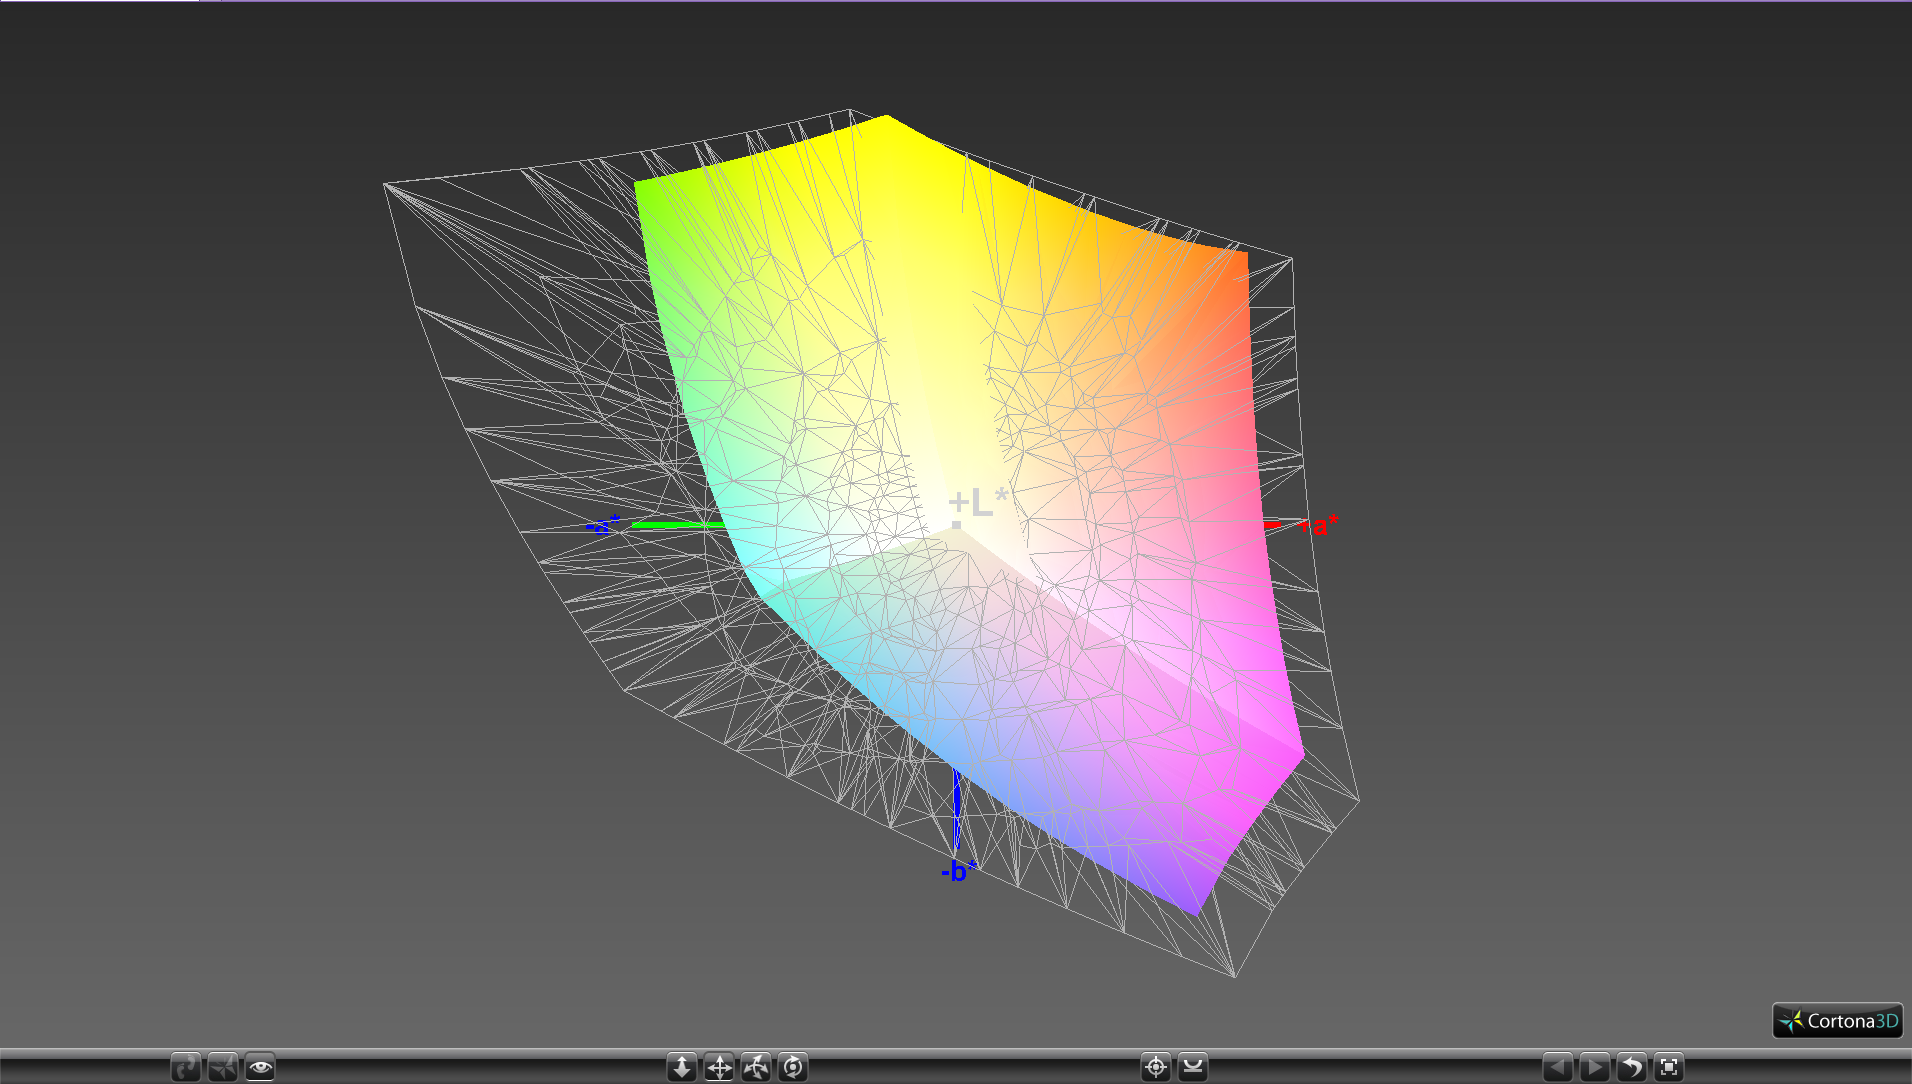
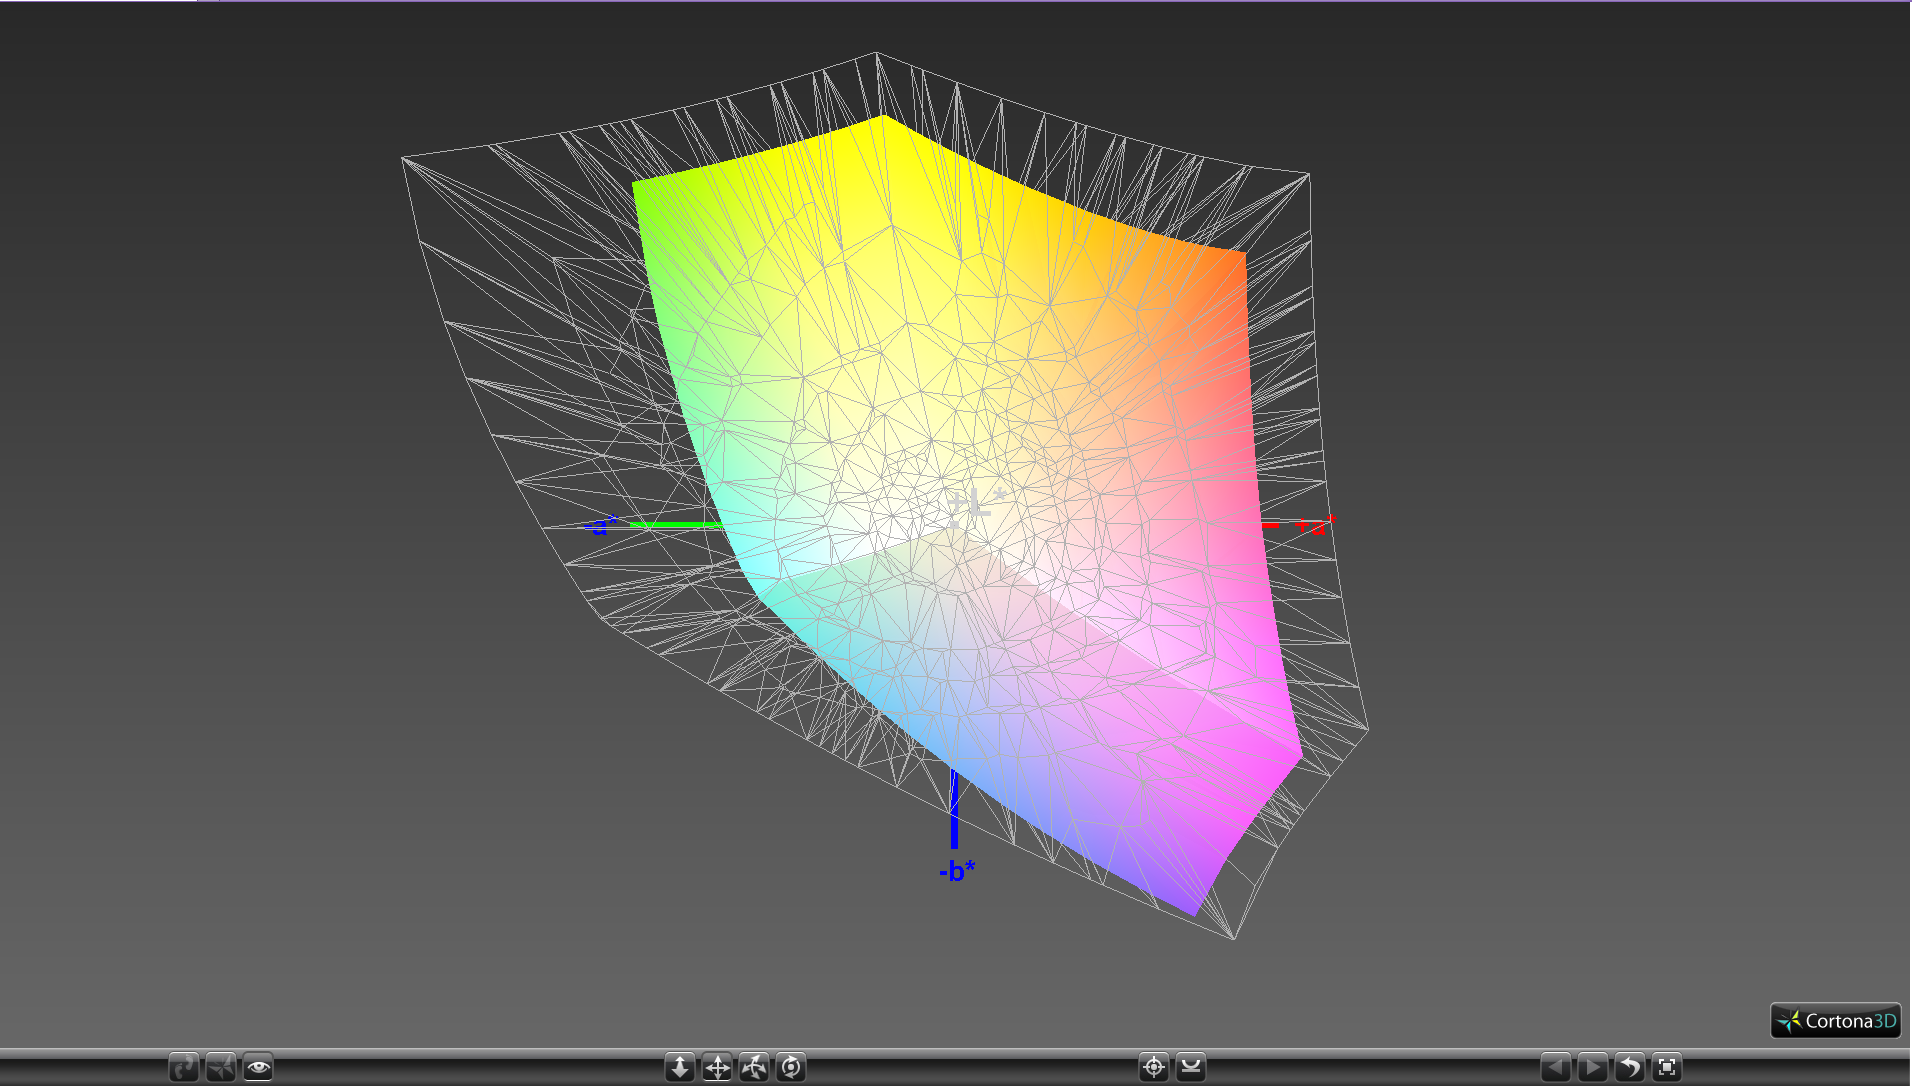
96.1% sRGB (Argyll 1.6.3 3D)
61.1% AdobeRGB 1998 (Argyll 1.6.3 3D)
67.2% AdobeRGB 1998 (Argyll 3D)
96.5% sRGB (Argyll 3D)
65.1% Display P3 (Argyll 3D)
Gamma: 2.14
CCT: 7176 K
| Eurocom Sky X4C ID: SHP142A, Name: LQ156D1JX01B, IPS, 15.6", 3840x2160 | MSI GT62VR 7RE-223 LG Philips LP156WF6 (LGD046F), IPS, 15.6", 1920x1080 | Alienware 15 R3 HPJGK_B156HTN (AUO51ED), TN, 15.6", 1920x1080 | Asus Strix GL502VS-FY032T LG Philips LP156WF6-SPB6 (LGD046F), IPS, 15.6", 1920x1080 | EVGA SC15 ID: AUO42ED, Name: AU Optronics B156HAN04.2, , 15.6", 1920x1080 | Dell XPS 15 9560 (i7-7700HQ, UHD) IGZO IPS, 15.6", 3840x2160 | |
|---|---|---|---|---|---|---|
| Display | -9% | -2% | -8% | -5% | 30% | |
| Display P3 Coverage (%) | 65.1 | 63.9 -2% | 66 1% | 64.5 -1% | 62.3 -4% | 89.7 38% |
| sRGB Coverage (%) | 96.5 | 83.1 -14% | 90.5 -6% | 83.1 -14% | 89.6 -7% | 100 4% |
| AdobeRGB 1998 Coverage (%) | 67.2 | 60.8 -10% | 66.2 -1% | 60.8 -10% | 63.6 -5% | 100 49% |
| Response Times | 8% | 45% | 9% | -9% | -44% | |
| Response Time Grey 50% / Grey 80% * (ms) | 33.6 ? | 37 ? -10% | 25 ? 26% | 38 ? -13% | 41.6 ? -24% | 57.2 ? -70% |
| Response Time Black / White * (ms) | 33.2 ? | 25 ? 25% | 12 ? 64% | 23 ? 31% | 30.8 ? 7% | 39.2 ? -18% |
| PWM Frequency (Hz) | 1000 ? | 962 | ||||
| Screen | -5% | -33% | -6% | -1% | 1% | |
| Brightness middle (cd/m²) | 324.7 | 310 -5% | 386 19% | 315 -3% | 281.5 -13% | 370.1 14% |
| Brightness (cd/m²) | 318 | 311 -2% | 382 20% | 290 -9% | 253 -20% | 356 12% |
| Brightness Distribution (%) | 81 | 85 5% | 93 15% | 85 5% | 73 -10% | 87 7% |
| Black Level * (cd/m²) | 0.26 | 0.3 -15% | 0.39 -50% | 0.32 -23% | 0.27 -4% | 0.37 -42% |
| Contrast (:1) | 1249 | 1033 -17% | 990 -21% | 984 -21% | 1043 -16% | 1000 -20% |
| Colorchecker dE 2000 * | 4.67 | 4.82 -3% | 10.2 -118% | 4.88 -4% | 3.9 16% | 5.3 -13% |
| Colorchecker dE 2000 max. * | 8.16 | 10.14 -24% | 15.81 -94% | 8.88 -9% | 7.1 13% | 9.9 -21% |
| Greyscale dE 2000 * | 5.9 | 3.94 33% | 11.28 -91% | 4.17 29% | 3.8 36% | 4.6 22% |
| Gamma | 2.14 103% | 2.45 90% | 2.23 99% | 2.53 87% | 2.27 97% | 2.31 95% |
| CCT | 7176 91% | 6877 95% | 11383 57% | 6683 97% | 7322 89% | 6284 103% |
| Color Space (Percent of AdobeRGB 1998) (%) | 61.1 | 54 -12% | 59 -3% | 55 -10% | 57.8 -5% | 88.3 45% |
| Color Space (Percent of sRGB) (%) | 96.1 | 83 -14% | 90 -6% | 83 -14% | 89.3 -7% | 100 4% |
| Total Average (Program / Settings) | -2% /
-4% | 3% /
-16% | -2% /
-4% | -5% /
-3% | -4% /
1% |
* ... smaller is better
Color space is approximately 96 percent and 61 percent of the sRGB and AdobeRGB standards, respectively, to be comparable to most high-end gaming notebooks including the Alienware 15 R3 and EVGA SC15. Some 15-inch 4K UHD panels can cover an even wider gamut such as the alternate Sharp IGZO panel on the XPS 15, but response times are slower. Still, most graphics artists should be satisfied with what is available here.
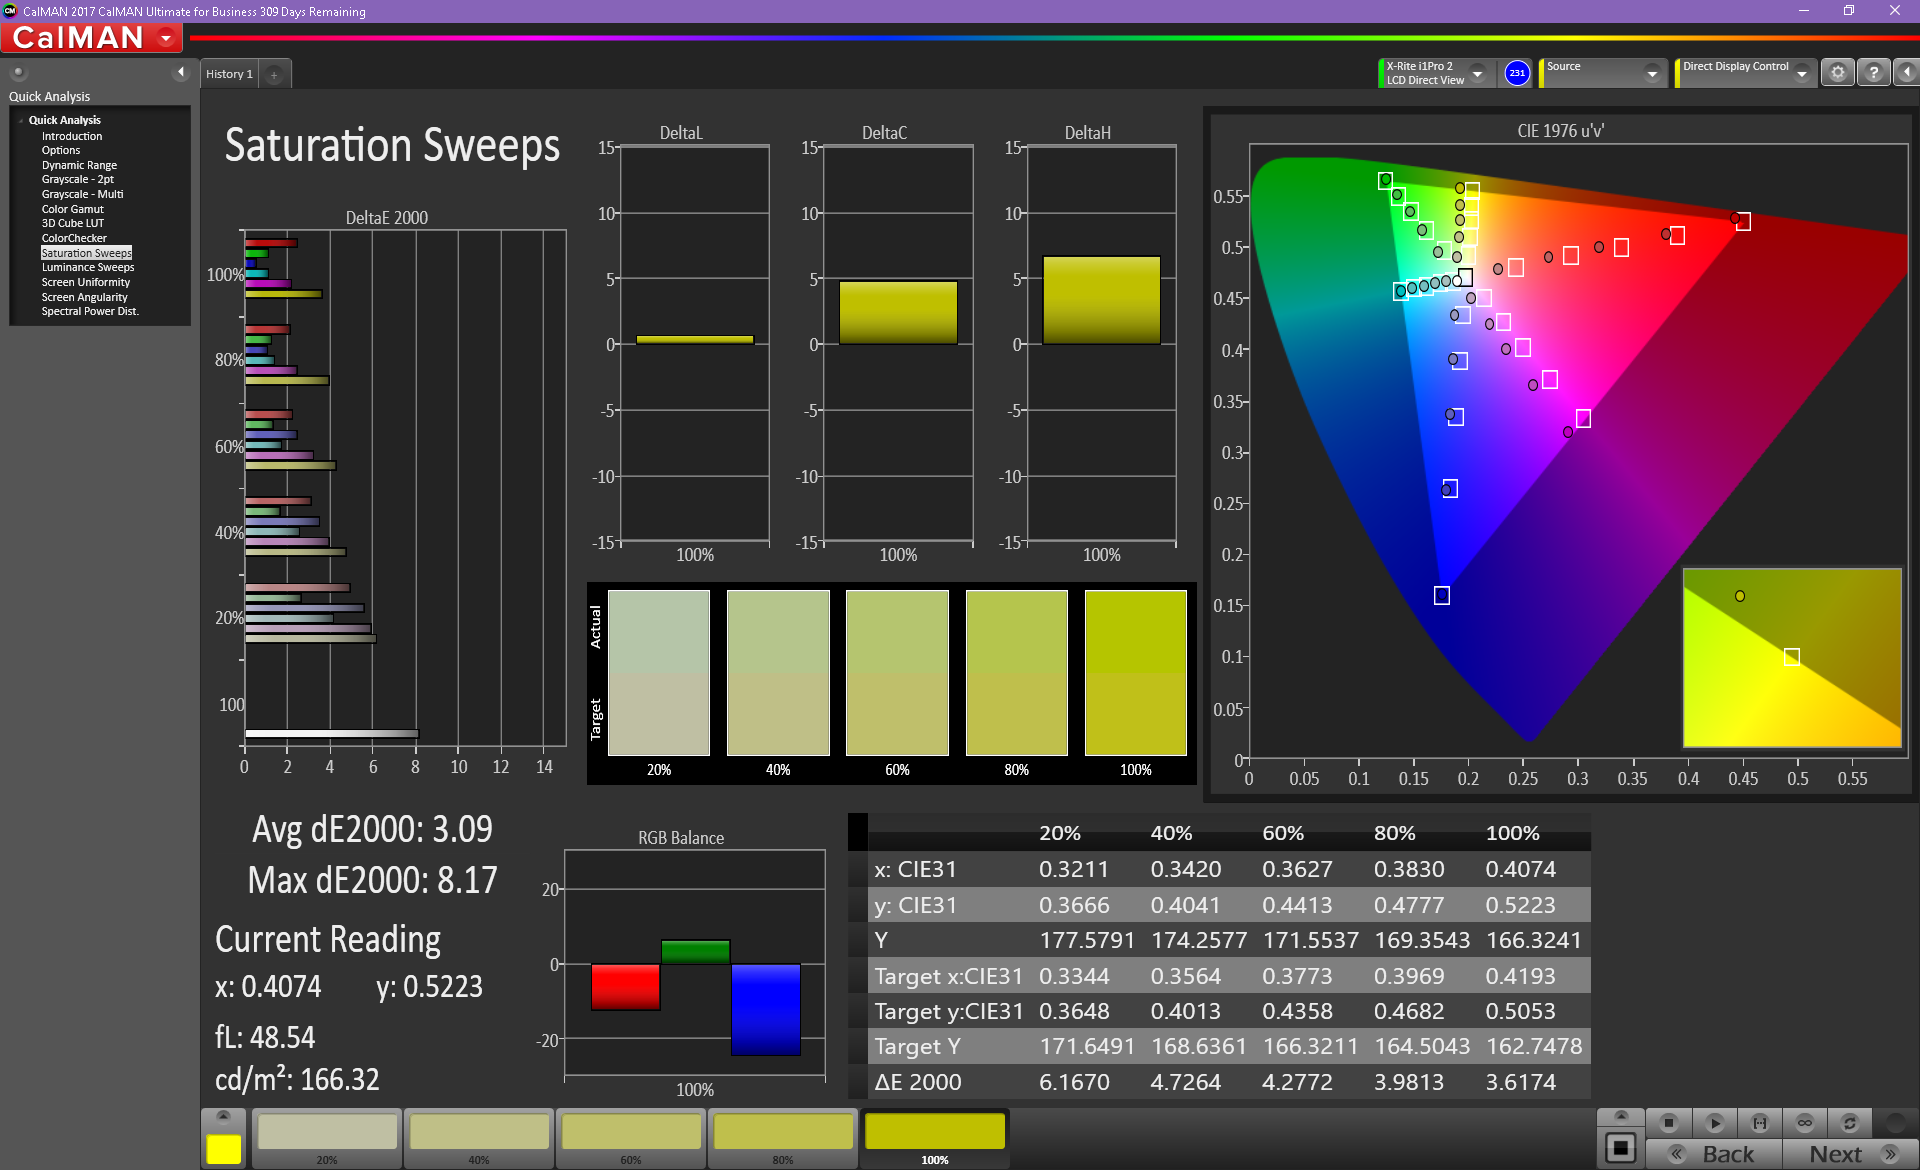
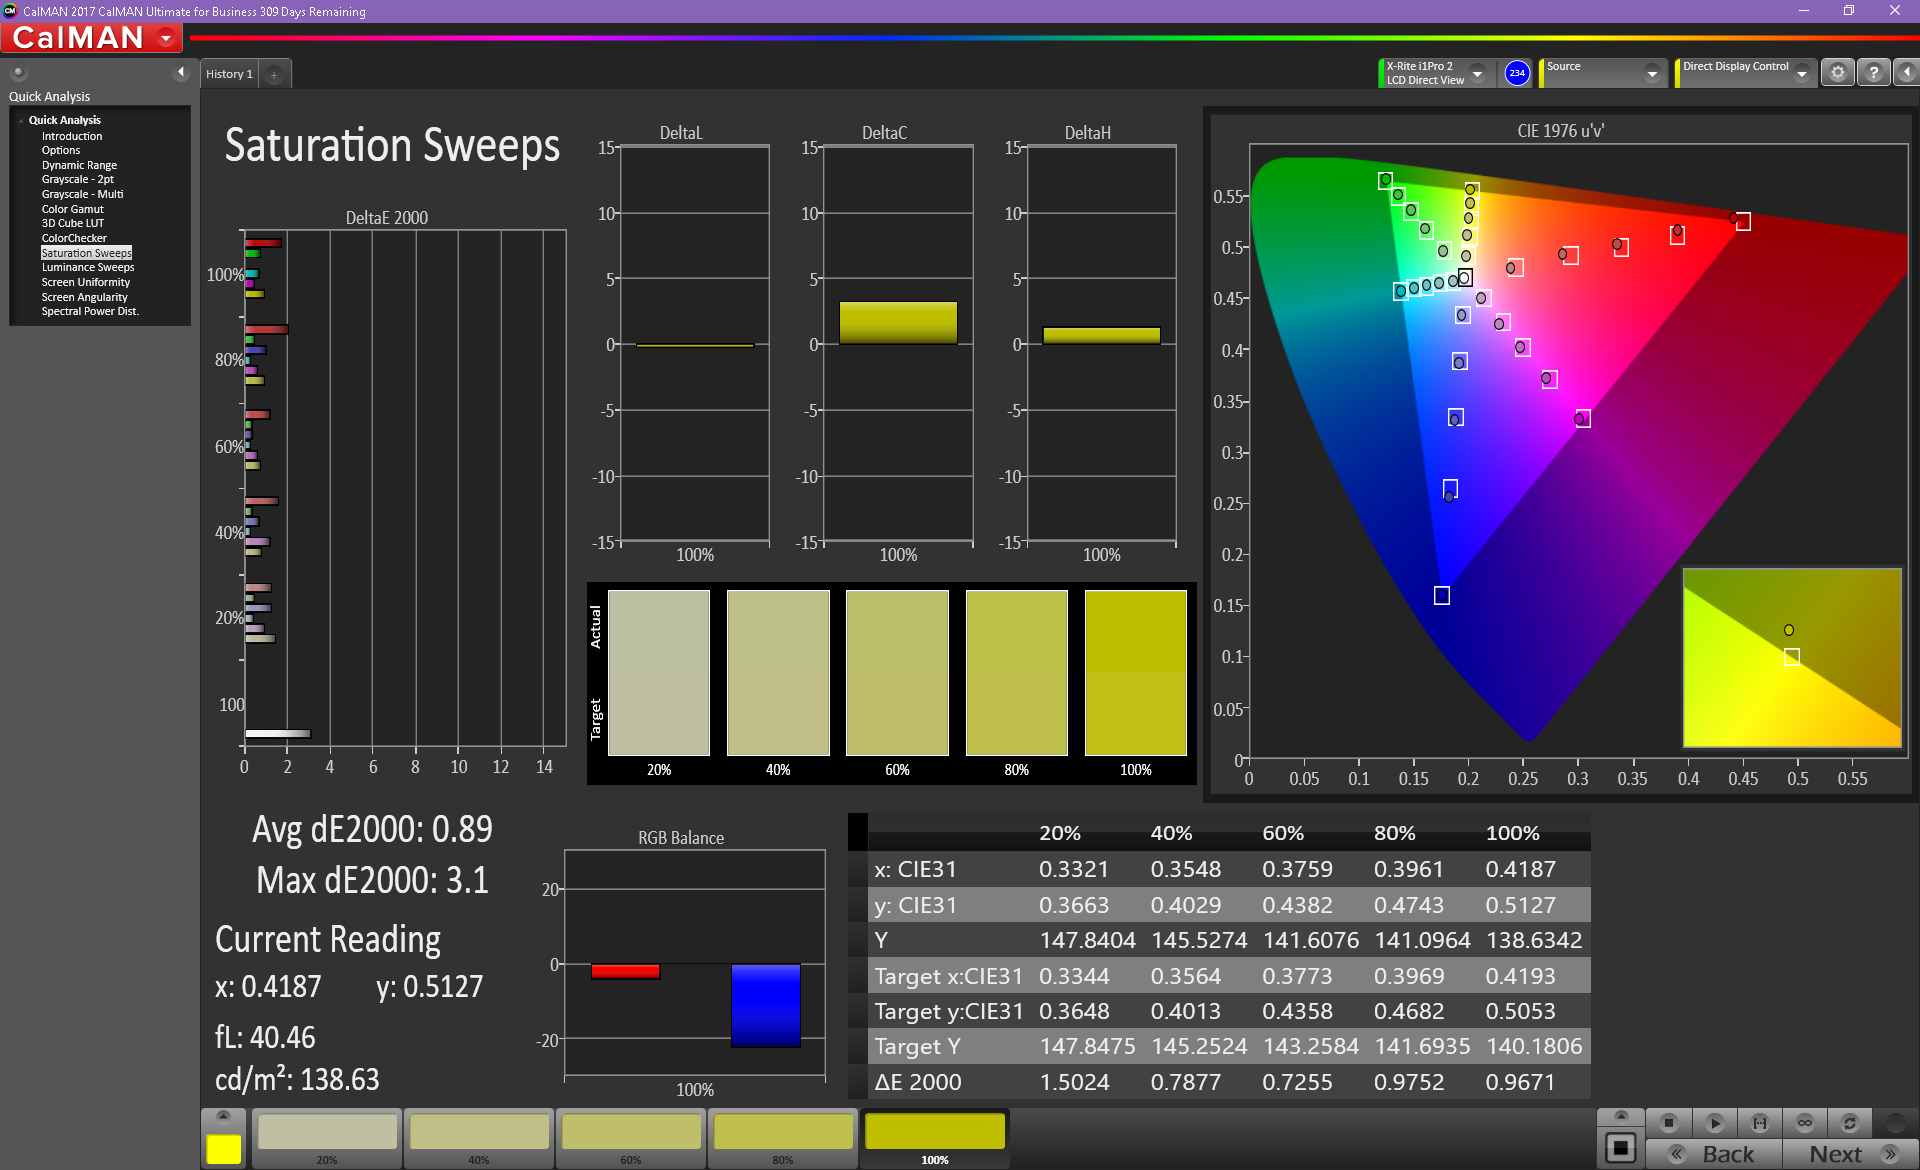
Further analyses with a X-Rite spectrophotometer reveal a generally inaccurate grayscale and an overly cool color temperature out of the box. Our calibration efforts improve both by noticeable margins for more accurate colors on all tested saturation levels. We recommend applying our calibrated ICC profile above for any Sky X4C owners out there with the same Sharp panel in order to get the most out of the display. Otherwise, Eurocom offers a similar service for a small fee.
Display Response Times
| ↔ Response Time Black to White | ||
|---|---|---|
| 33.2 ms ... rise ↗ and fall ↘ combined | ↗ 21.2 ms rise | 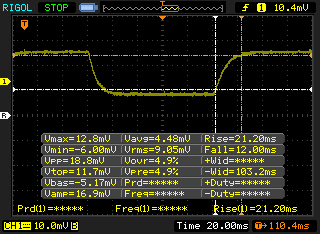 |
| ↘ 12 ms fall | ||
| The screen shows slow response rates in our tests and will be unsatisfactory for gamers. In comparison, all tested devices range from 0.1 (minimum) to 240 (maximum) ms. » 89 % of all devices are better. This means that the measured response time is worse than the average of all tested devices (20.1 ms). | ||
| ↔ Response Time 50% Grey to 80% Grey | ||
| 33.6 ms ... rise ↗ and fall ↘ combined | ↗ 19.6 ms rise | 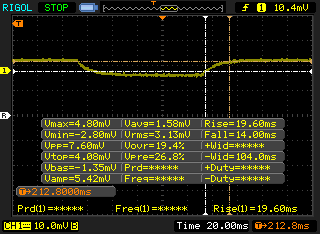 |
| ↘ 14 ms fall | ||
| The screen shows slow response rates in our tests and will be unsatisfactory for gamers. In comparison, all tested devices range from 0.165 (minimum) to 636 (maximum) ms. » 45 % of all devices are better. This means that the measured response time is similar to the average of all tested devices (31.5 ms). | ||
Screen Flickering / PWM (Pulse-Width Modulation)
| Screen flickering / PWM detected | 1000 Hz | ≤ 20 % brightness setting | 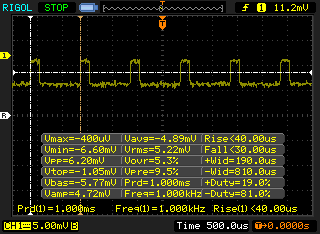 |
The display backlight flickers at 1000 Hz (worst case, e.g., utilizing PWM) Flickering detected at a brightness setting of 20 % and below. There should be no flickering or PWM above this brightness setting. The frequency of 1000 Hz is quite high, so most users sensitive to PWM should not notice any flickering. In comparison: 53 % of all tested devices do not use PWM to dim the display. If PWM was detected, an average of 8033 (minimum: 5 - maximum: 343500) Hz was measured. | |||
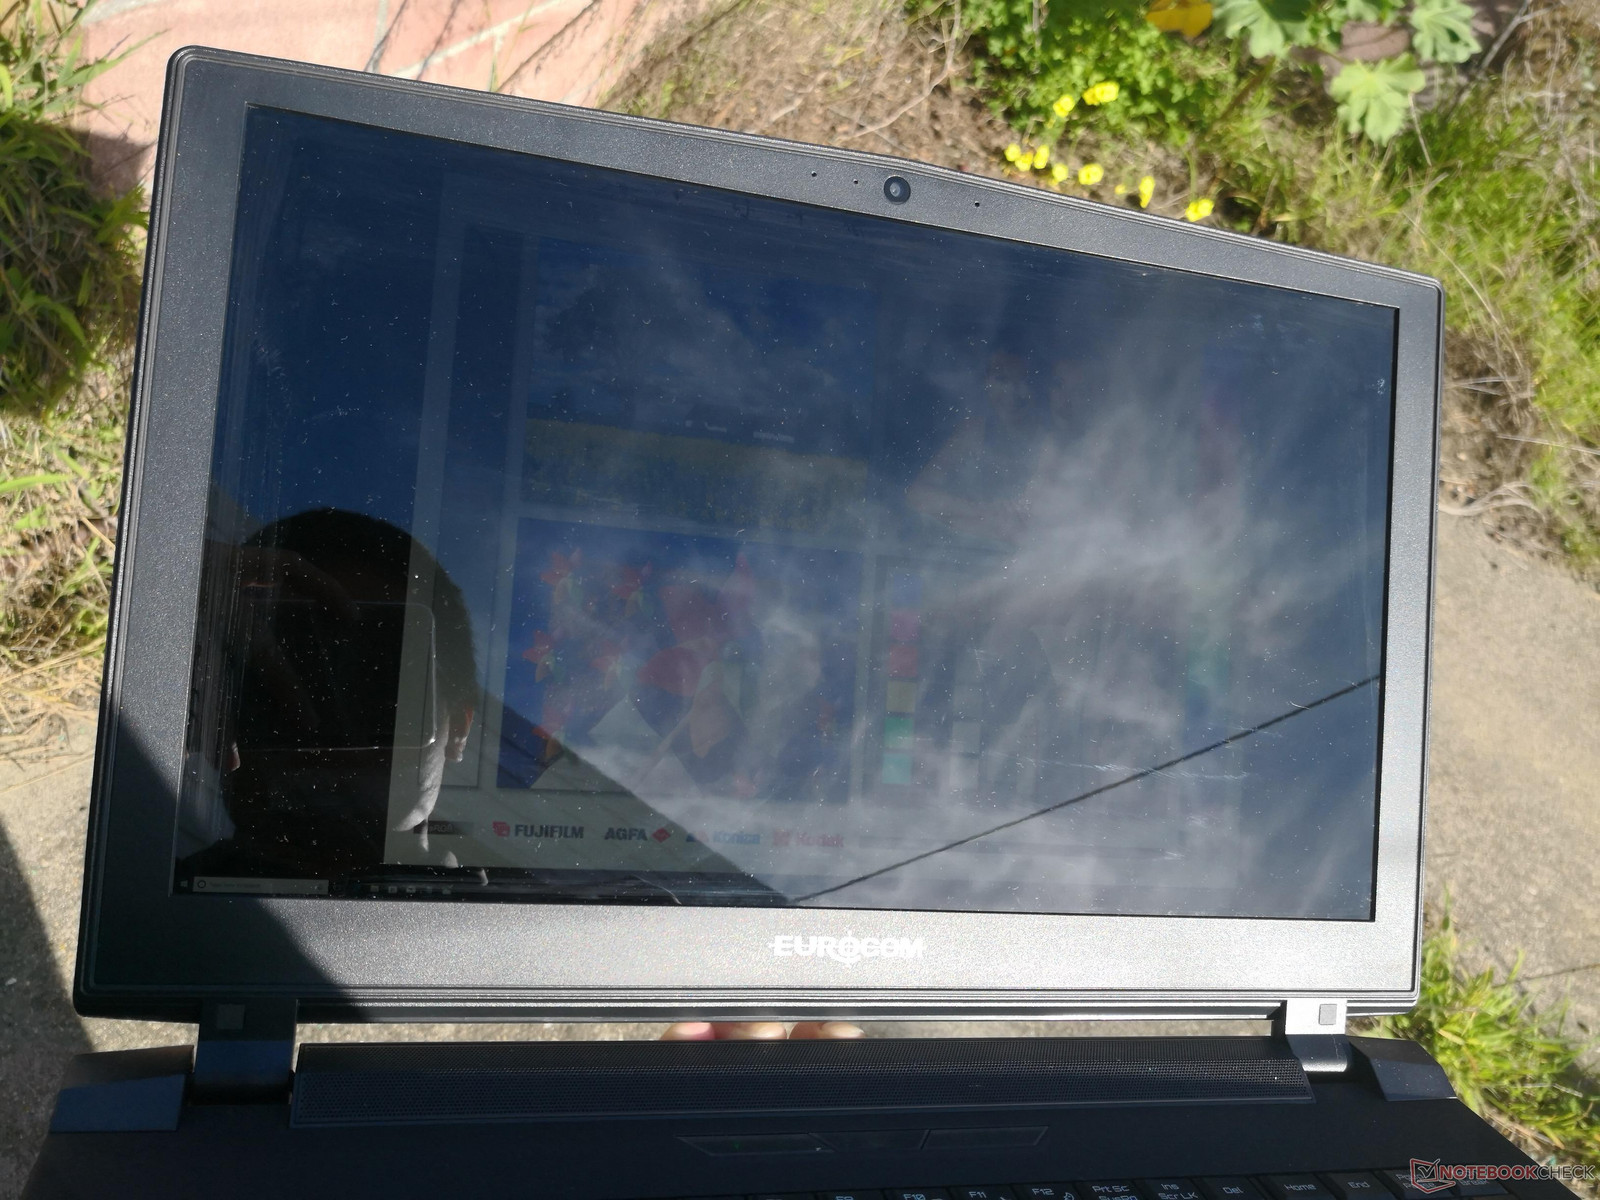
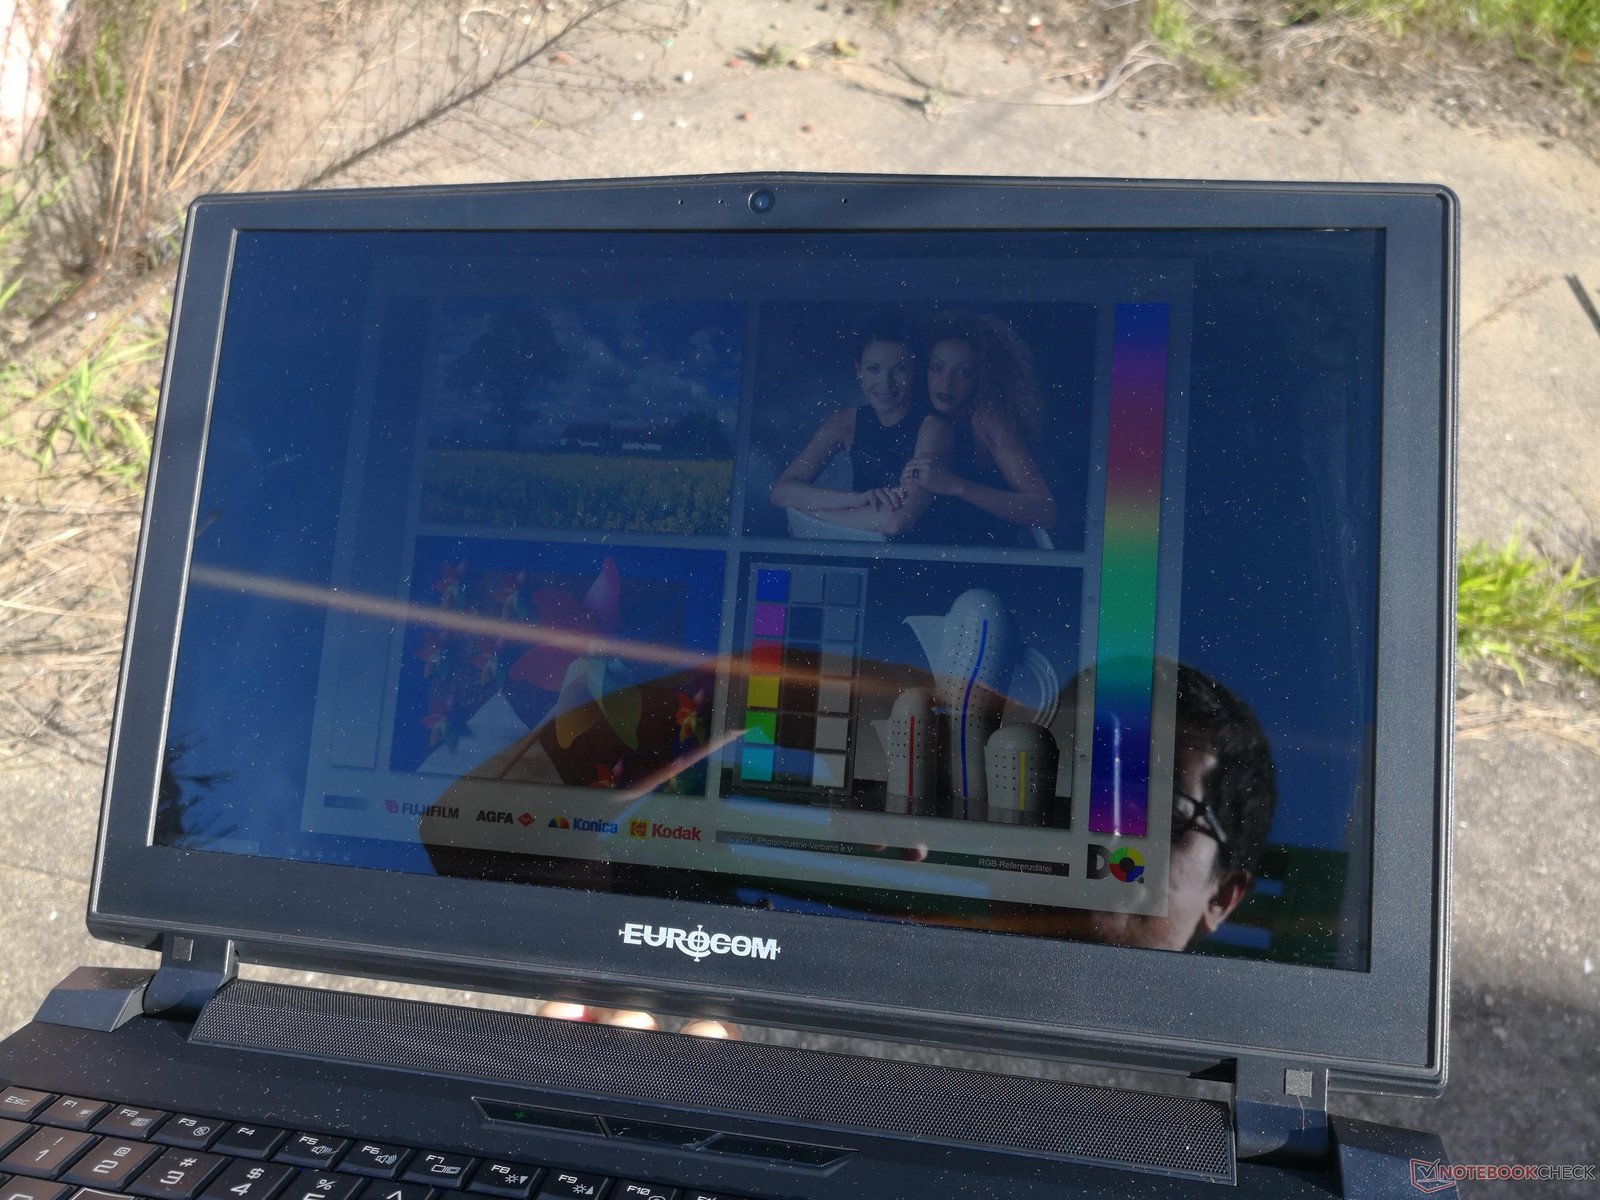
Outdoor visibility is average at best. The display backlights on tested Eurocom notebooks have never been significantly brighter or dimmer than other gaming notebooks of its class and the glossy panel only accentuates glare and reflections. A high DPI scaling is recommended for larger and more easily readable text.
Performance
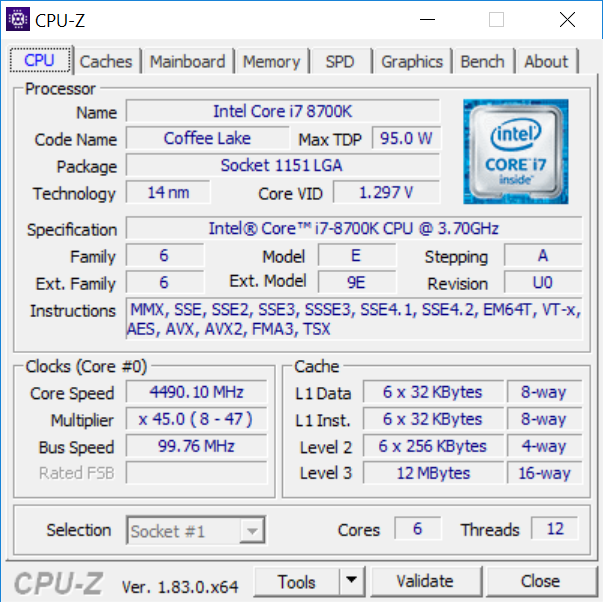
CPU options are limited to desktop Coffee Lake processors as the LGA 1151 socket is incompatible with previous generations. Although Eurocom only configures between the unlocked i7-8700K, i7-8700, and unlocked i5-8600K, users can swap the processor for any other within the family up to a TDP of 95 W. Similarly, the MXM 3.0 slot can be outfitted with either a GeForce or Quadro GPU of up to 190 W for the ability to adapt to gaming or workstation conditions. The removable desktop CPU and MXM-based GPU are a very uncommon pair in consumer notebooks and they offer some of the highest raw performance levels in the market.
Processor
CPU performance is essentially identical to the Sky X9C equipped with the same delidded Core i7-8700K CPU and about 50 to 55 percent faster in multi-threaded workloads than both the Eurocom Tornado F5 and Sky X7E2 equipped with the last generation Kaby Lake i7-7700K and Skylake i7-6700K, respectively. Of course, much of this advantage can be attributed to the hexa-core i7-8700K having 50 percent more physical cores than the quad-core i7-7700K or i7-6700K. Jumping to the Sky X4C from more traditional gaming laptops with HQ-class CPUs, like the Alienware 15 R3 or Asus GL503VD, will see a performance boost of about 75 to 85 percent. The AMD Ryzen 7 series is comparable to the i7-8700K in multi-threaded workloads since its slower clock rates are balanced out by having more physical cores and parallel threads.
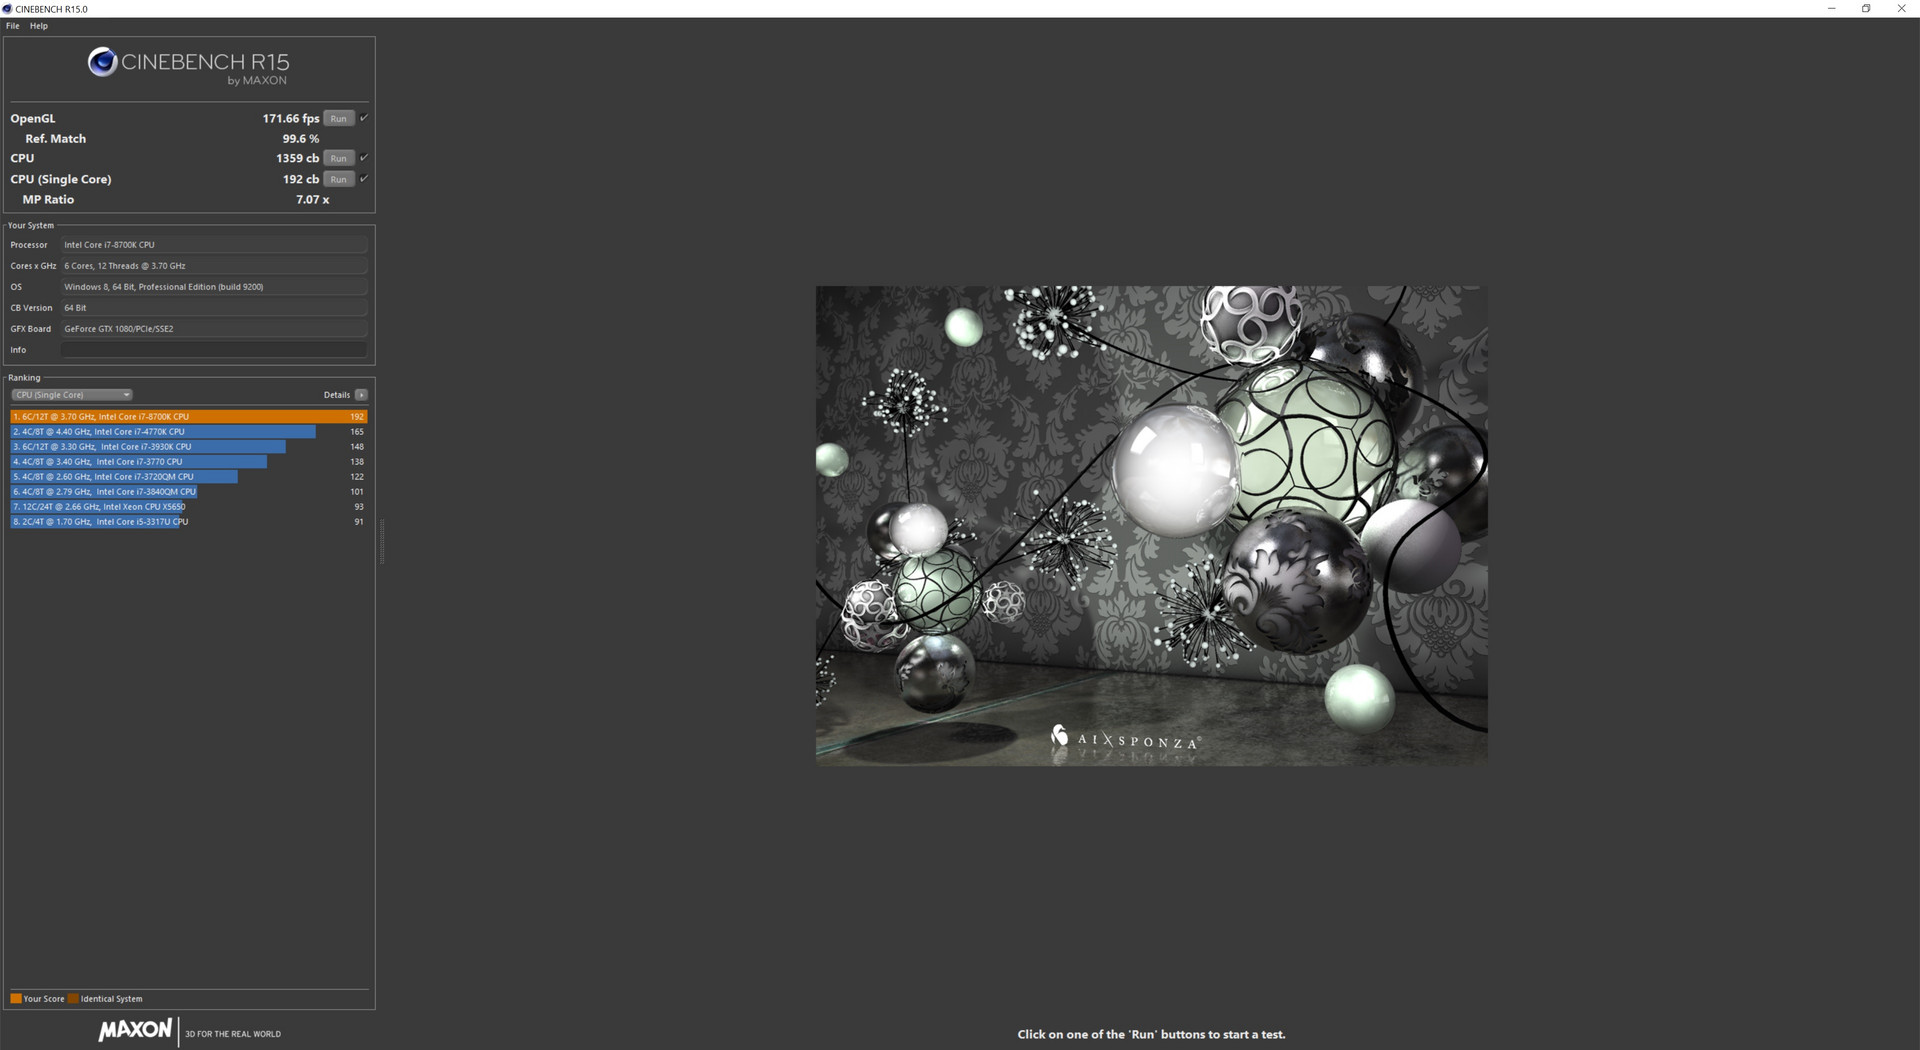
Single-core performance from the i7-8700K is less impressive as core clock rates are not significantly different than those of the i7-7700K or even the i7-6700K. As a result, the deltas between these processors are much narrower as shown by our comparison chart below. The i7-6700HQ and i7-7700HQ, on the other hand, are limited to slower clock rates because of their lower 45 W TDP and they are subsequently about 30 percent behind the i7-8700K in CineBench Single-Threaded tests.
Running CineBench Multi-Thread in a loop results in very stable scores over time. Thus, clock rates remain relatively stable throughout the duration of the test which is impressive considering that this particular processor is meant for desktop platforms. Of course, overclocking capabilities are limited by the high running temperatures as detailed in our Stress Test section below. Note that the score for our second run in the loop test was unusually lower at 1221 points, but the result was fortunately short-lived.
See our dedicated CPU page on the Core i7-8700K for more technical information and benchmark comparisons.
| Cinebench R15 | |
| CPU Single 64Bit | |
| Eurocom Sky X4C | |
| Eurocom Tornado F5 | |
| Eurocom Sky X9C | |
| Smart7 Karme GX17E G2 | |
| Eurocom Tornado F5 Killer Edition | |
| Alienware 15 R3 Max-Q | |
| Eurocom Sky X7E2 | |
| AMD Ryzen 1800X - Asus Crosshair VI Hero | |
| Asus GL702ZC-GC104T | |
| Apple MacBook Pro 15 2016 (2.6 GHz, 450) | |
| Asus GL503VD-DB74 | |
| Dell Inspiron 15 7000 7577 | |
| CPU Multi 64Bit | |
| AMD Ryzen 1800X - Asus Crosshair VI Hero | |
| Asus GL702ZC-GC104T | |
| Eurocom Sky X9C | |
| Eurocom Sky X4C | |
| Smart7 Karme GX17E G2 | |
| Eurocom Tornado F5 | |
| Eurocom Sky X7E2 | |
| Alienware 15 R3 Max-Q | |
| Asus GL503VD-DB74 | |
| Apple MacBook Pro 15 2016 (2.6 GHz, 450) | |
| Eurocom Tornado F5 Killer Edition | |
| Dell Inspiron 15 7000 7577 | |
| Cinebench R11.5 | |
| CPU Single 64Bit | |
| Eurocom Sky X9C | |
| Eurocom Tornado F5 | |
| Eurocom Sky X4C | |
| Eurocom Tornado F5 Killer Edition | |
| Alienware 15 R3 Max-Q | |
| Asus GL503VD-DB74 | |
| AMD Ryzen 1800X - Asus Crosshair VI Hero | |
| Eurocom Sky X7E2 | |
| Asus GL702ZC-GC104T | |
| Apple MacBook Pro 15 2016 (2.6 GHz, 450) | |
| Dell Inspiron 15 7000 7577 | |
| CPU Multi 64Bit | |
| AMD Ryzen 1800X - Asus Crosshair VI Hero | |
| Asus GL702ZC-GC104T | |
| Eurocom Sky X9C | |
| Eurocom Sky X4C | |
| Eurocom Tornado F5 | |
| Eurocom Sky X7E2 | |
| Alienware 15 R3 Max-Q | |
| Asus GL503VD-DB74 | |
| Eurocom Tornado F5 Killer Edition | |
| Apple MacBook Pro 15 2016 (2.6 GHz, 450) | |
| Dell Inspiron 15 7000 7577 | |
| Cinebench R10 | |
| Rendering Multiple CPUs 32Bit | |
| Eurocom Sky X9C | |
| Eurocom Sky X4C | |
| AMD Ryzen 1800X - Asus Crosshair VI Hero | |
| Asus GL702ZC-GC104T | |
| Eurocom Tornado F5 | |
| Eurocom Sky X7E2 | |
| Eurocom Tornado F5 Killer Edition | |
| Alienware 15 R3 Max-Q | |
| Asus GL503VD-DB74 | |
| Dell Inspiron 15 7000 7577 | |
| Rendering Single 32Bit | |
| Eurocom Sky X9C | |
| Eurocom Sky X4C | |
| Eurocom Tornado F5 | |
| Eurocom Tornado F5 Killer Edition | |
| Eurocom Sky X7E2 | |
| Alienware 15 R3 Max-Q | |
| Asus GL503VD-DB74 | |
| Dell Inspiron 15 7000 7577 | |
| AMD Ryzen 1800X - Asus Crosshair VI Hero | |
| Asus GL702ZC-GC104T | |
| wPrime 2.10 - 1024m | |
| Dell Inspiron 15 7000 7577 | |
| Eurocom Tornado F5 Killer Edition | |
| Asus GL503VD-DB74 | |
| Eurocom Sky X7E2 | |
| Smart7 Karme GX17E G2 | |
| Eurocom Tornado F5 | |
| Eurocom Sky X4C | |
| Eurocom Sky X9C | |
| AMD Ryzen 1800X - Asus Crosshair VI Hero | |
* ... smaller is better
System Performance
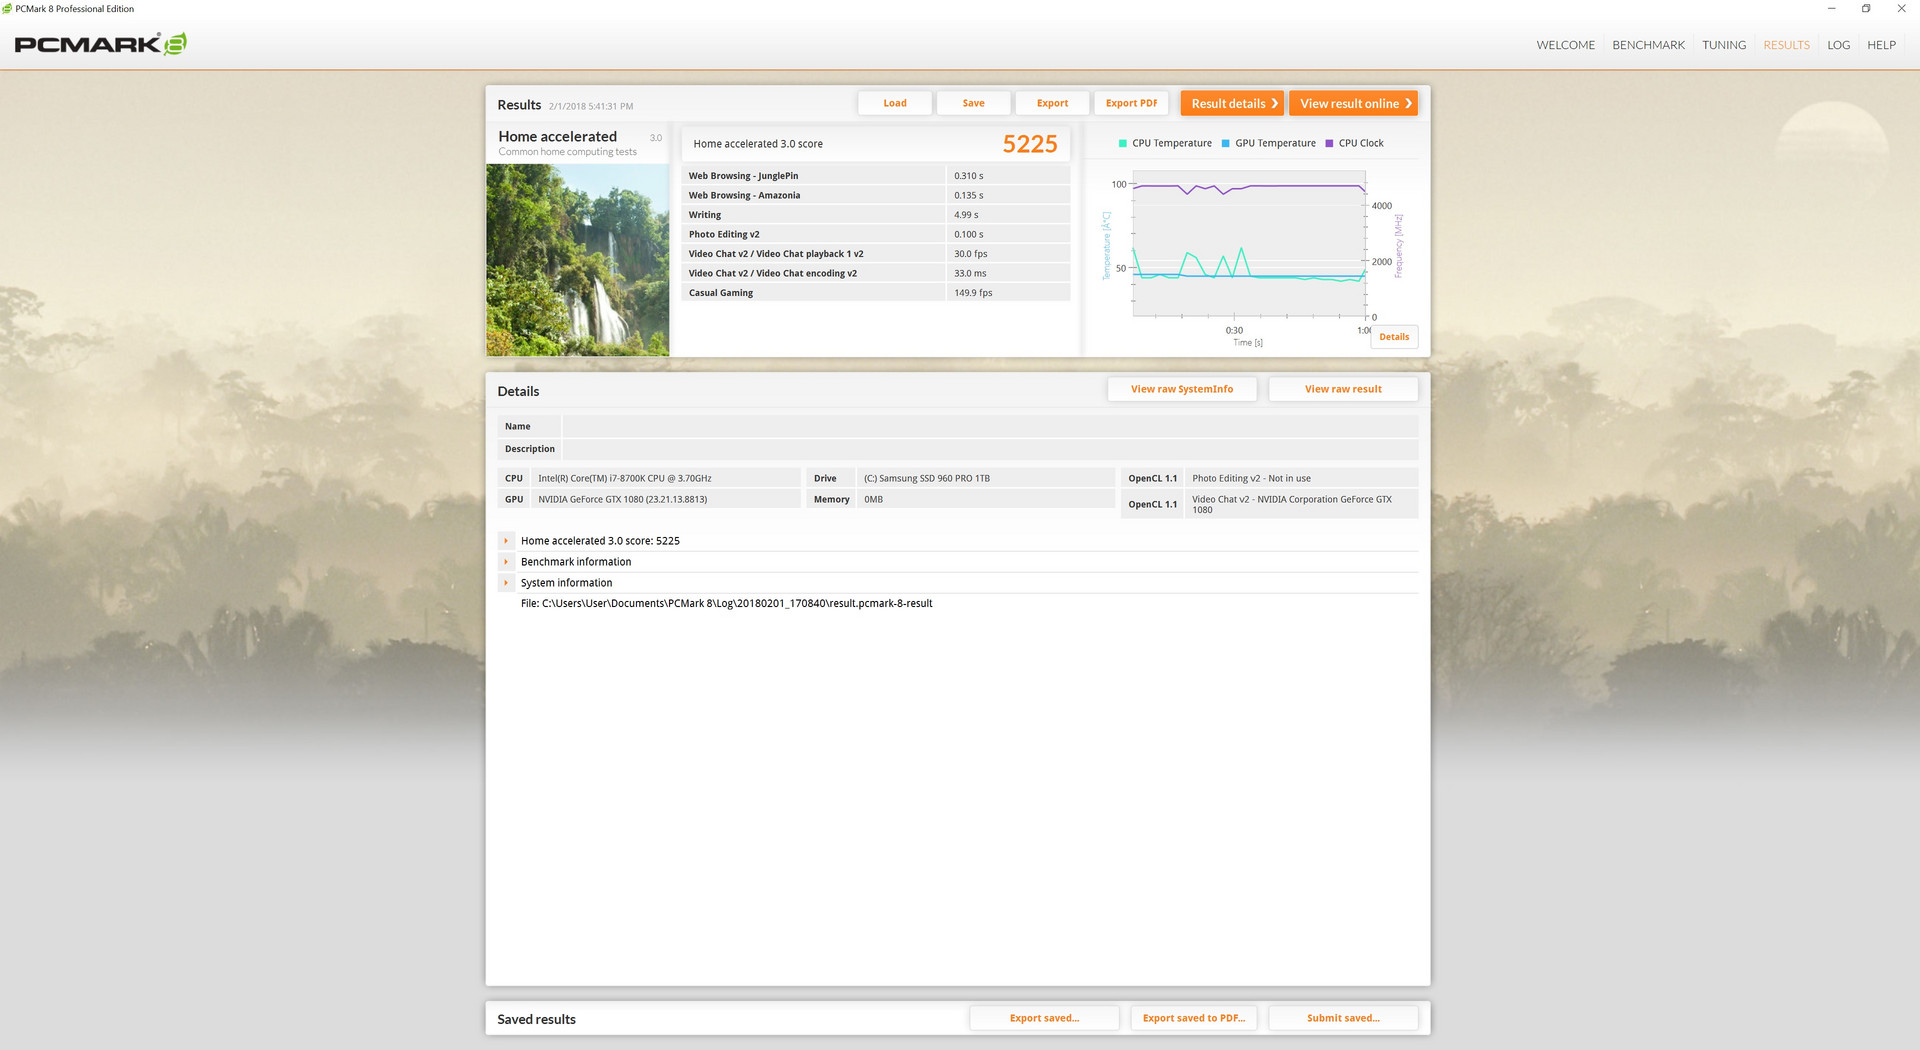
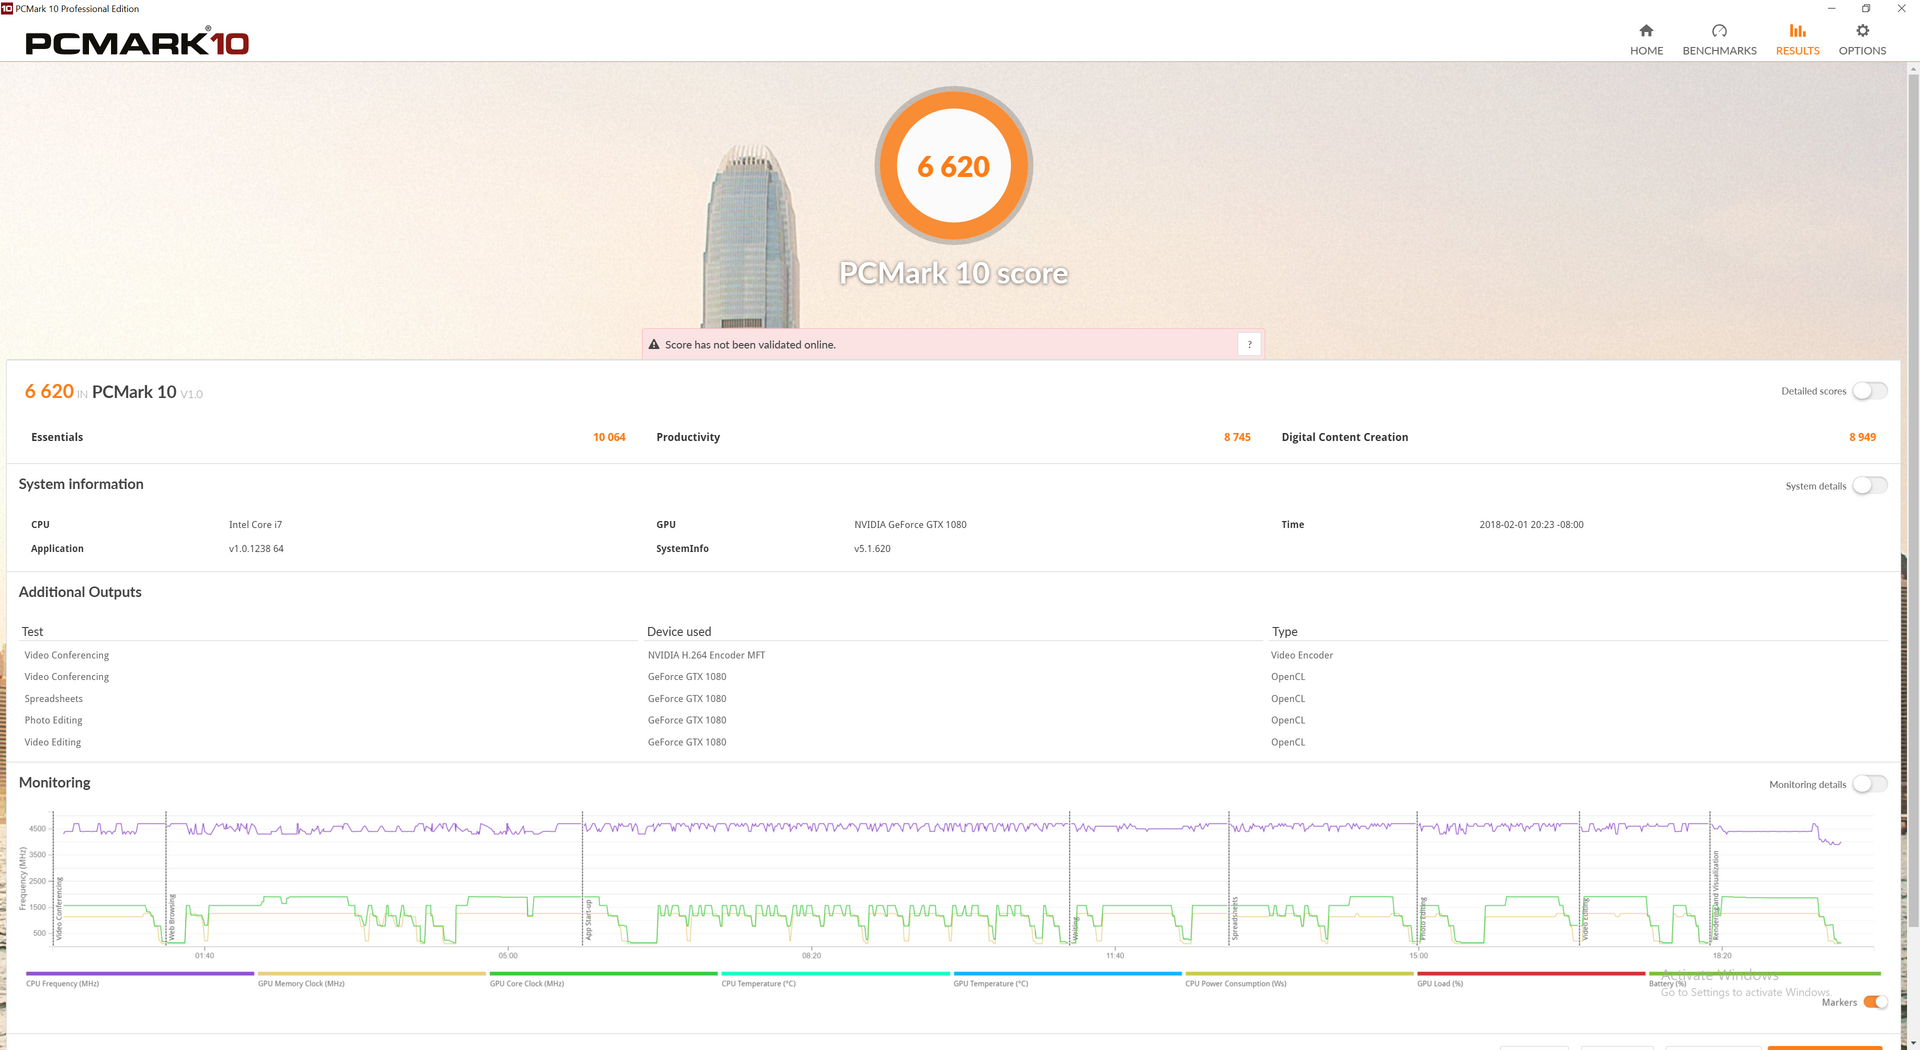
The Sky X4C returns the highest PCMark 10 score in our database at 6620 points beating out the Sky X9C and HP Omen X 17 with 6495 points and 5290 points, respectively. Nonetheless, the final scores are not all that higher than other gaming notebooks equipped with less powerful hardware including the Alienware 15 R3 and Acer Predator 15. Users will not notice any speed boosts when browsing or during other light tasks if that is the main intention of owning the SKy X4C.
Subjectively, we ran into no notable software or hardware issues on our test unit. Wake from sleep, however, takes abnormally long at about 6 to 10 seconds each and every time.
| PCMark 8 | |
| Home Score Accelerated v2 | |
| Eurocom Sky X4C | |
| Acer Predator 15 G9-593-751X | |
| EVGA SC15 | |
| MSI GT62VR 7RE-223 | |
| Eurocom Sky X9C | |
| Alienware 15 R3 | |
| Asus Strix GL502VS-FY032T | |
| Work Score Accelerated v2 | |
| Acer Predator 15 G9-593-751X | |
| MSI GT62VR 7RE-223 | |
| EVGA SC15 | |
| Alienware 15 R3 | |
| Eurocom Sky X4C | |
| Eurocom Sky X9C | |
| Asus Strix GL502VS-FY032T | |
| Creative Score Accelerated v2 | |
| Eurocom Sky X9C | |
| Eurocom Sky X4C | |
| Acer Predator 15 G9-593-751X | |
| MSI GT62VR 7RE-223 | |
| Alienware 15 R3 | |
| EVGA SC15 | |
| PCMark 10 - Score | |
| Eurocom Sky X4C | |
| Eurocom Sky X9C | |
| PCMark 8 Home Score Accelerated v2 | 5225 points | |
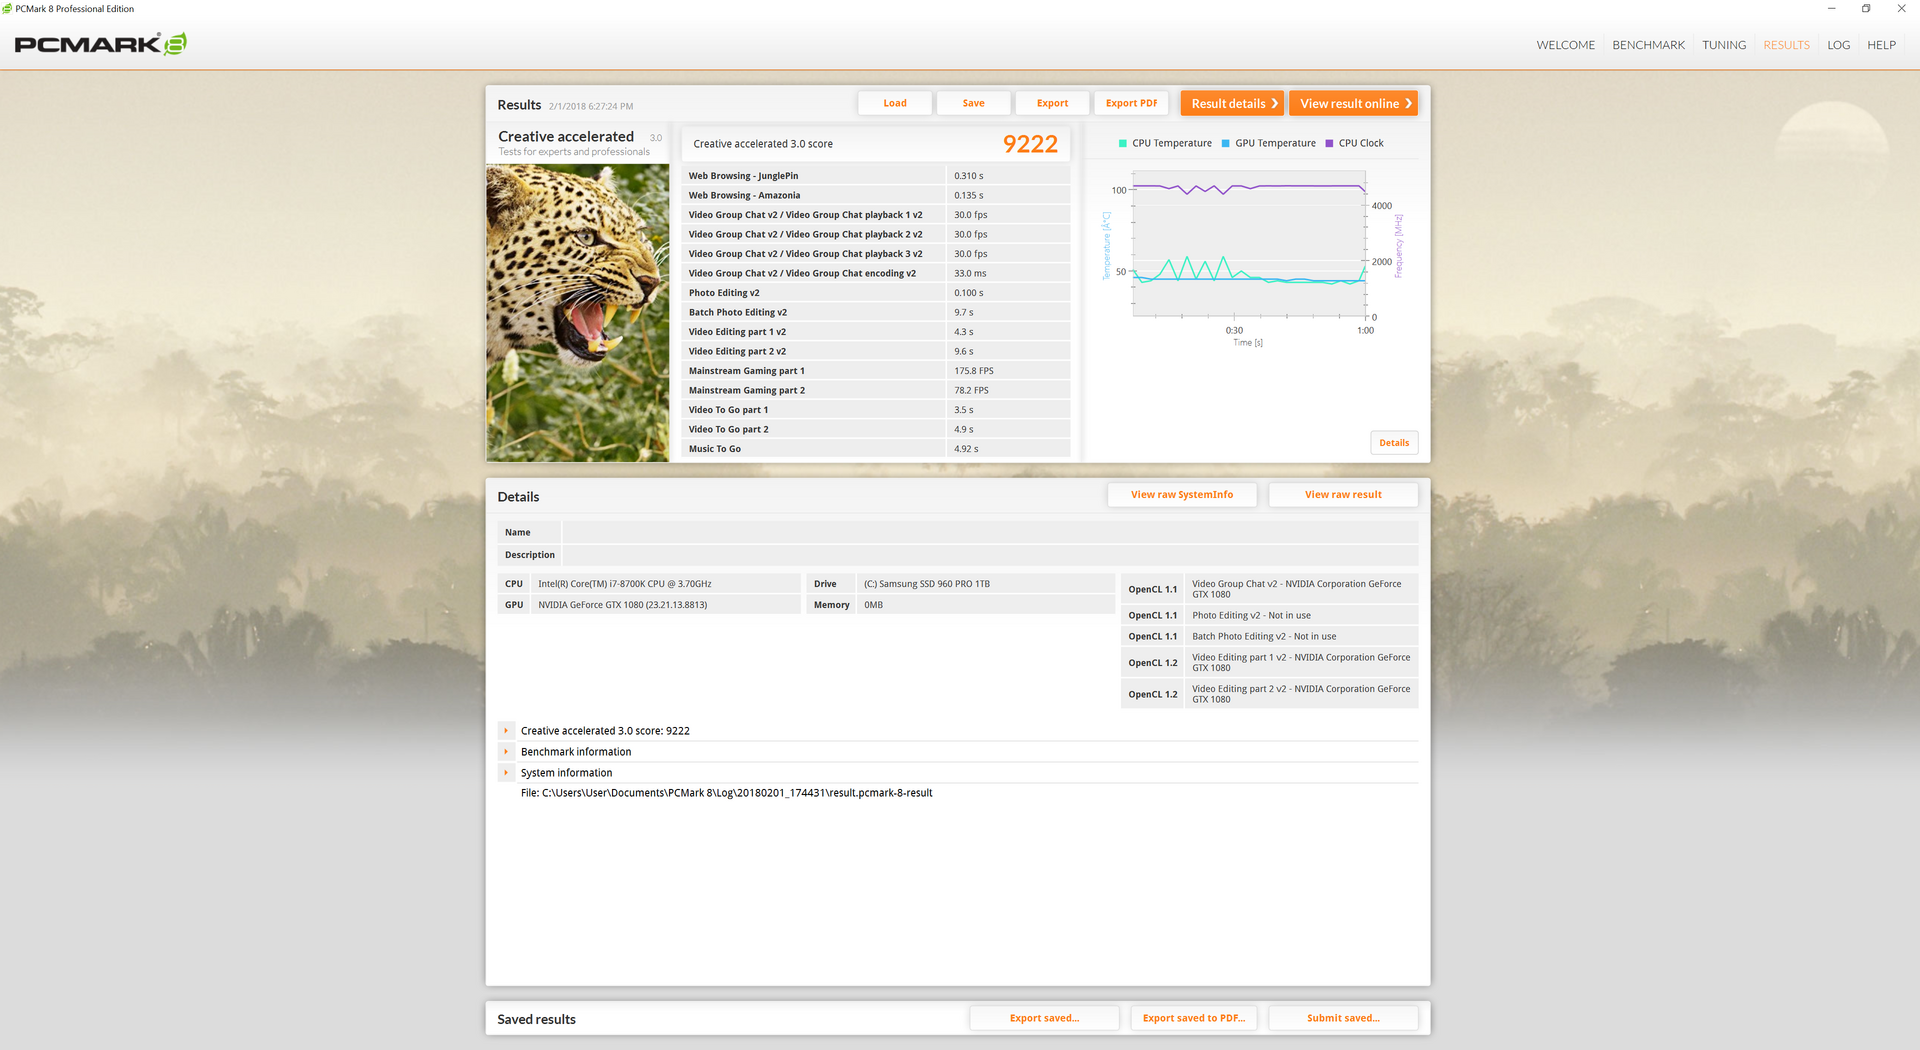
| PCMark 8 Creative Score Accelerated v2 | 9222 points | |
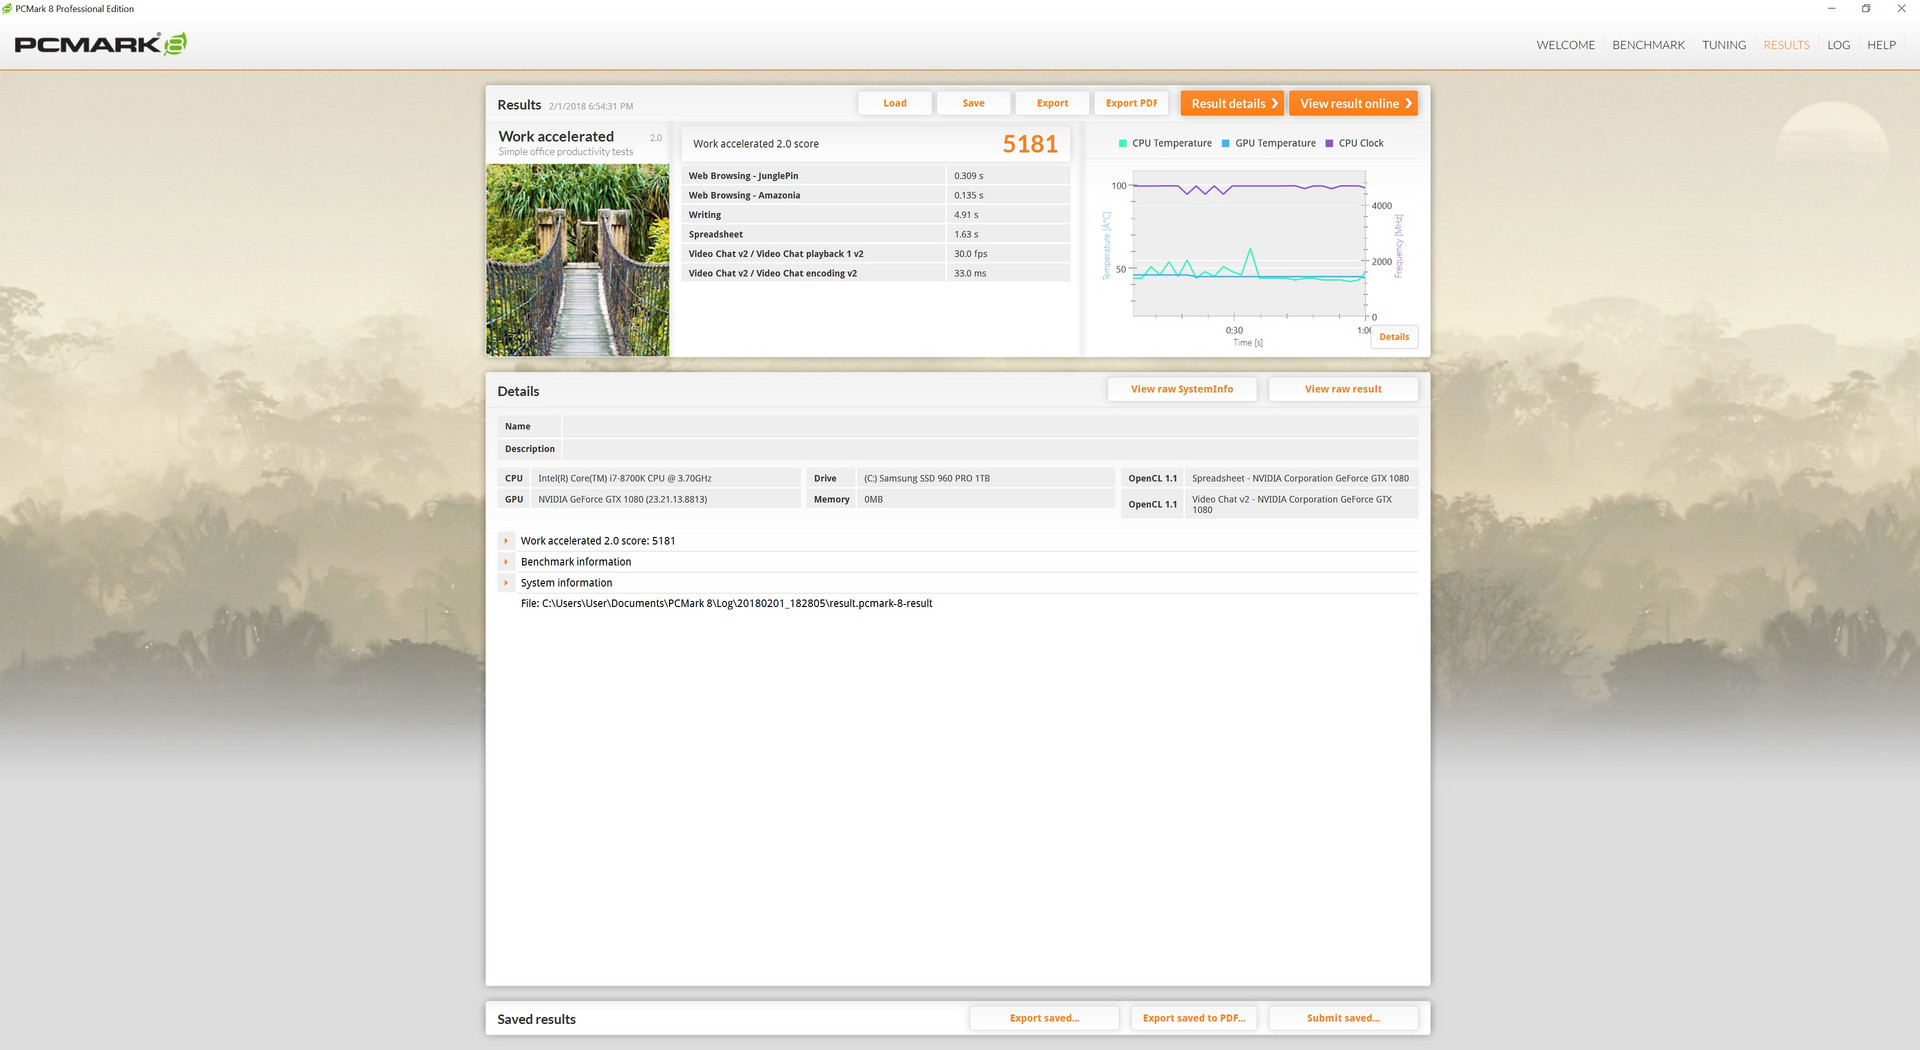
| PCMark 8 Work Score Accelerated v2 | 5181 points | |
| PCMark 10 Score | 6620 points | |
Help | ||
Storage Devices
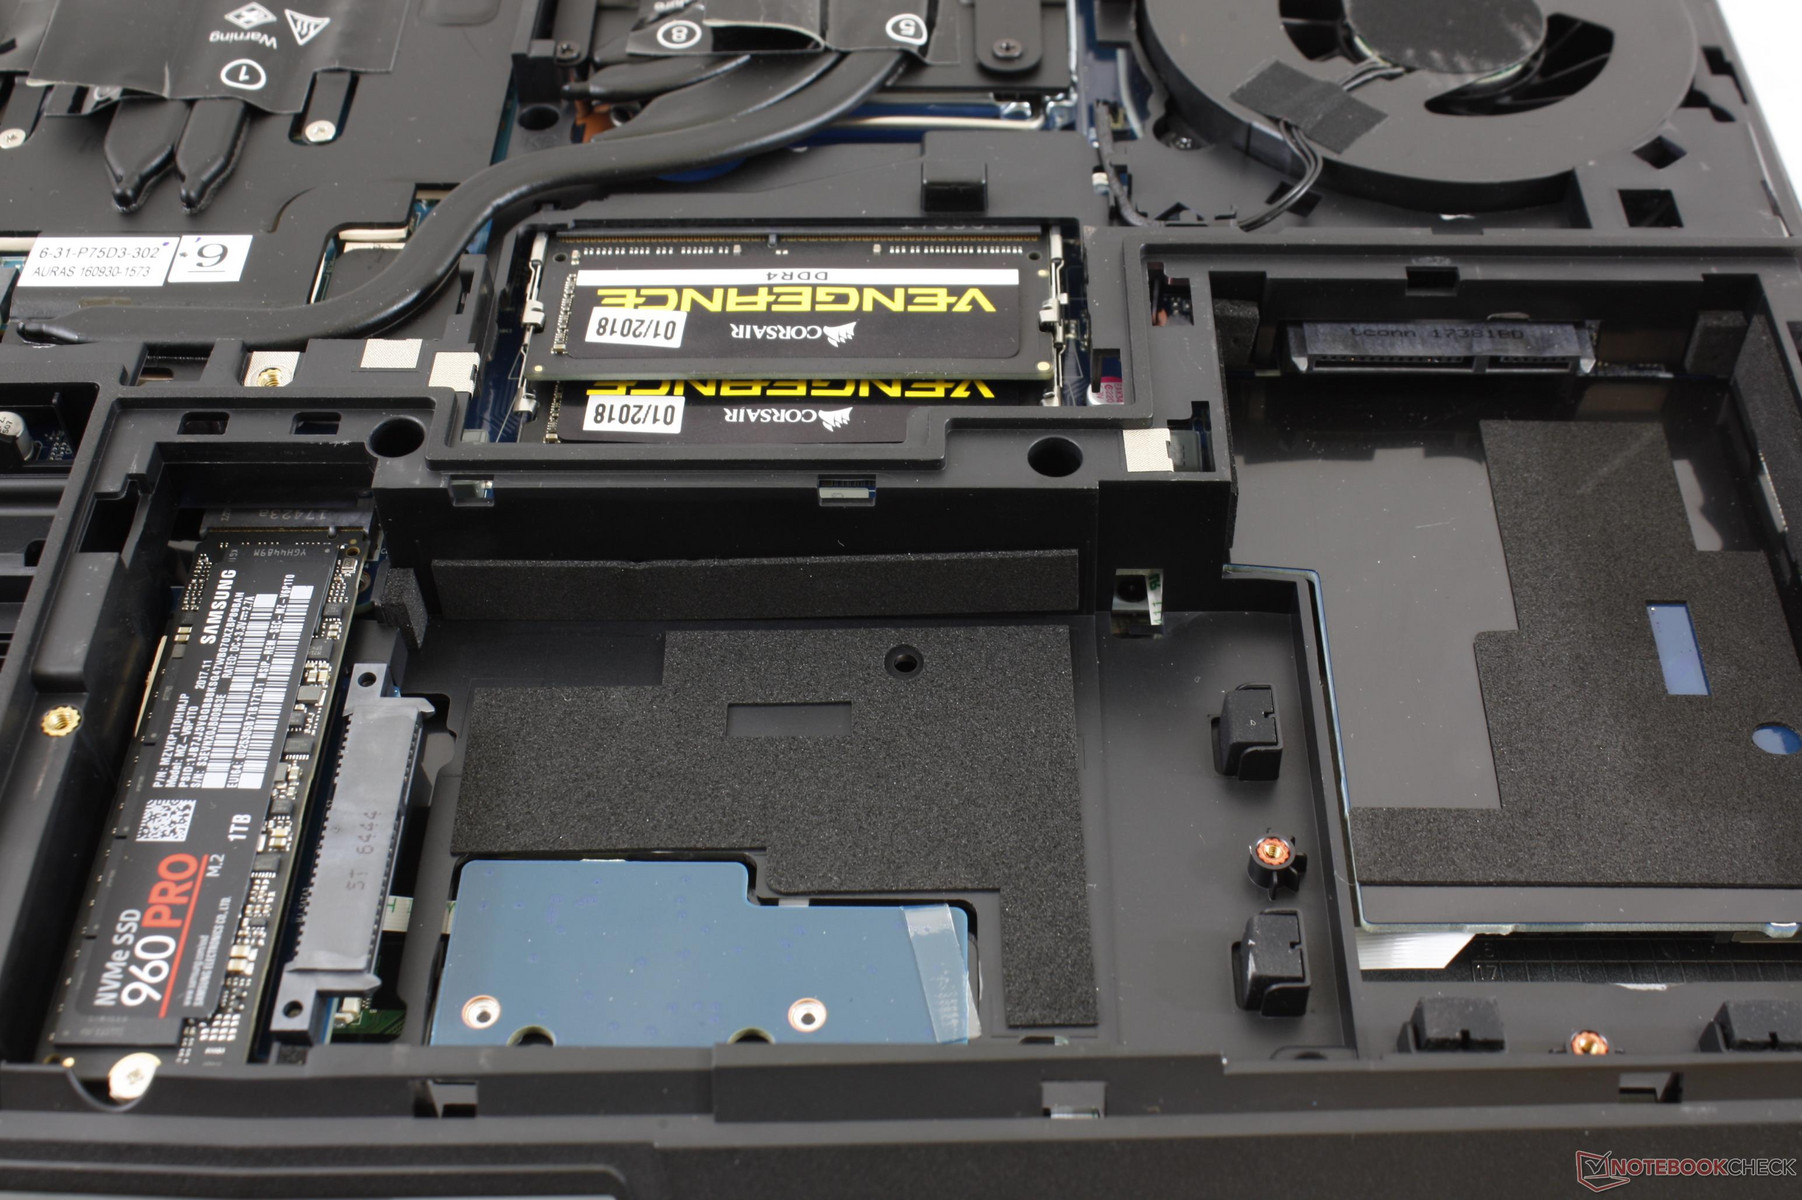
A total of four internal storage bays are available in the form of two M.2 2280 PCIe x4 slots and two 2.5-inch SATA III bays. Three of the four are easily accessible via a hatch on the bottom of the system while the last M.2 bay requires further disassembly. Optane, RAID 0/1, and thick 9.5 mm HDDs are all supported on this model for a plethora of storage combinations.
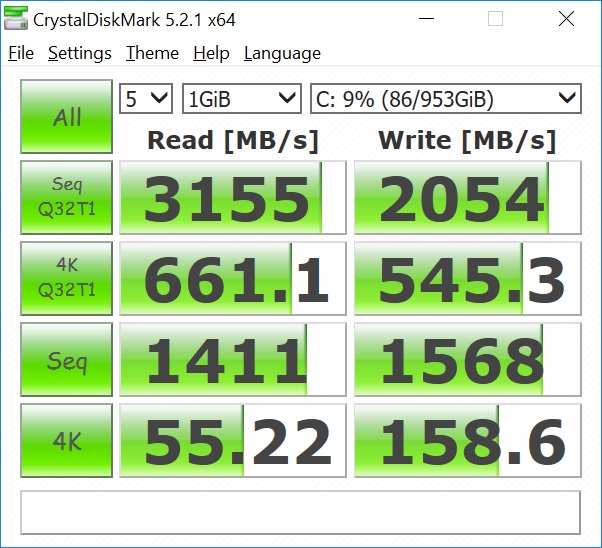
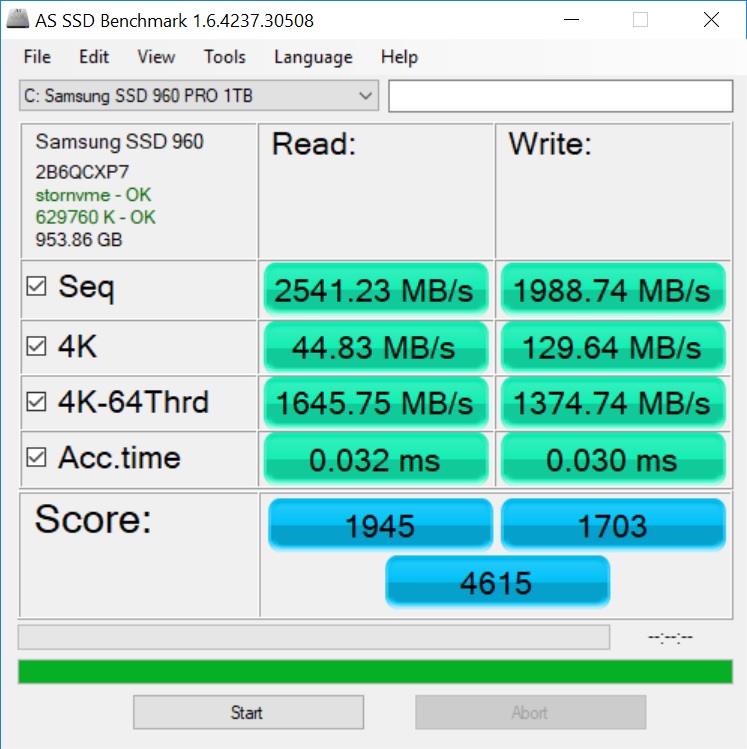
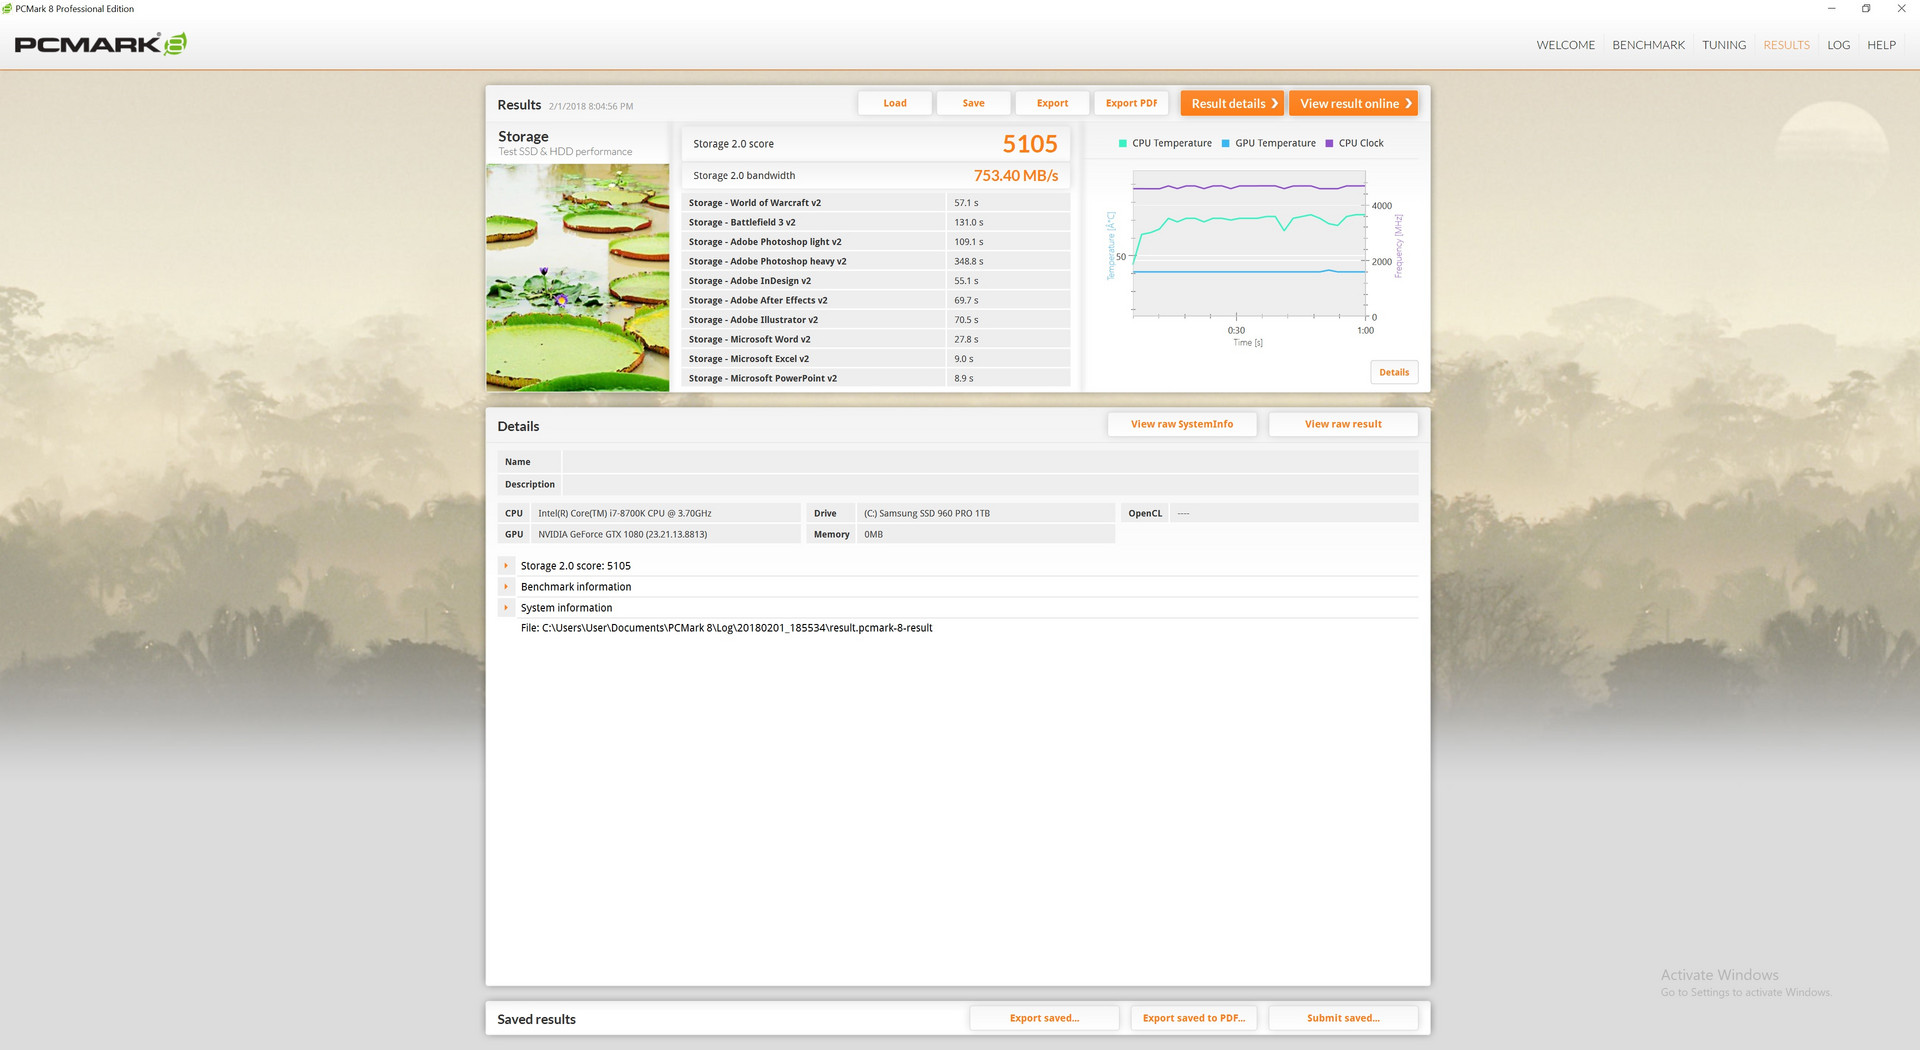
Our particular test unit is equipped with a single 1 TB NVMe Samsung SSD 960 Pro offering sequential read and write speeds approaching 2600 MB/s and 2000 MB/s, respectively. In comparison, the Samsung SM951 or Toshiba XG3 THNSN5256GPU7 offer about half the write speed each.
See our table of SSDs and HDDs for more benchmark comparisons.
| Eurocom Sky X4C Samsung SSD 960 Pro 1TB m.2 NVMe | Acer Predator 15 G9-593-751X Samsung SM951 MZVPV256HDGL m.2 PCI-e | MSI GT62VR 7RE-223 Samsung SSD PM871a MZNLN256HMHQ | Asus Strix GL502VS-FY032T SanDisk SD8SNAT256G1002 | EVGA SC15 Toshiba NVMe THNSN5256GPU7 | |
|---|---|---|---|---|---|
| AS SSD | -30% | -74% | -123% | -35% | |
| Copy Game MB/s (MB/s) | 1055 | 1091 3% | 377.8 -64% | 977 -7% | |
| Copy Program MB/s (MB/s) | 467.2 | 488.6 5% | 199 -57% | 442.3 -5% | |
| Copy ISO MB/s (MB/s) | 1908 | 1575 -17% | 354.7 -81% | 1071 -44% | |
| Score Total (Points) | 4615 | 2574 -44% | 1019 -78% | 598 -87% | 2474 -46% |
| Score Write (Points) | 1703 | 570 -67% | 304 -82% | 288 -83% | 896 -47% |
| Score Read (Points) | 1945 | 1350 -31% | 472 -76% | 207 -89% | 1081 -44% |
| Access Time Write * (ms) | 0.03 | 0.032 -7% | 0.037 -23% | 0.161 -437% | 0.035 -17% |
| Access Time Read * (ms) | 0.032 | 0.059 -84% | 0.1 -213% | 0.097 -203% | 0.054 -69% |
| 4K-64 Write (MB/s) | 1375 | 346 -75% | 171.6 -88% | 191.8 -86% | 706 -49% |
| 4K-64 Read (MB/s) | 1646 | 1109 -33% | 383.4 -77% | 140.7 -91% | 822 -50% |
| 4K Write (MB/s) | 129.6 | 117.3 -9% | 104 -20% | 65.5 -49% | 95.5 -26% |
| 4K Read (MB/s) | 44.83 | 46.35 3% | 37.2 -17% | 16.31 -64% | 39.13 -13% |
| Seq Write (MB/s) | 1989 | 1067 -46% | 288.2 -86% | 309.9 -84% | 943 -53% |
| Seq Read (MB/s) | 2541 | 1941 -24% | 510 -80% | 504 -80% | 2203 -13% |
* ... smaller is better

GPU Performance
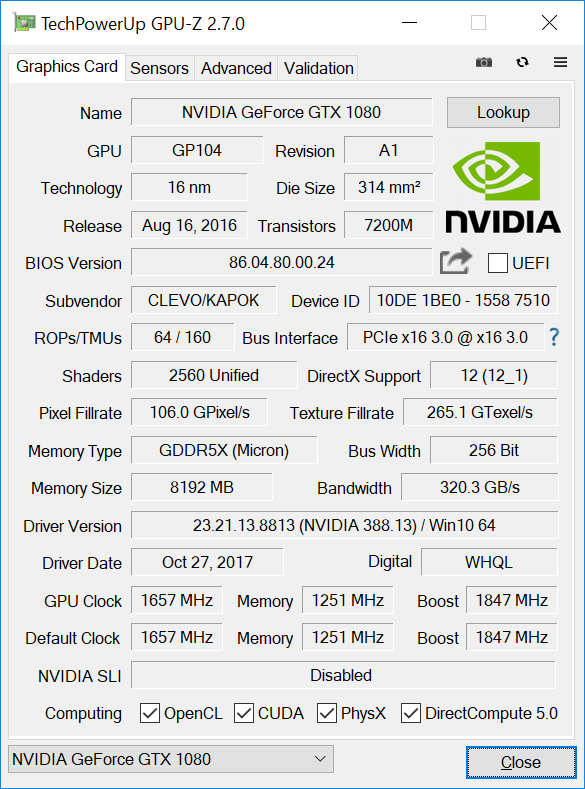
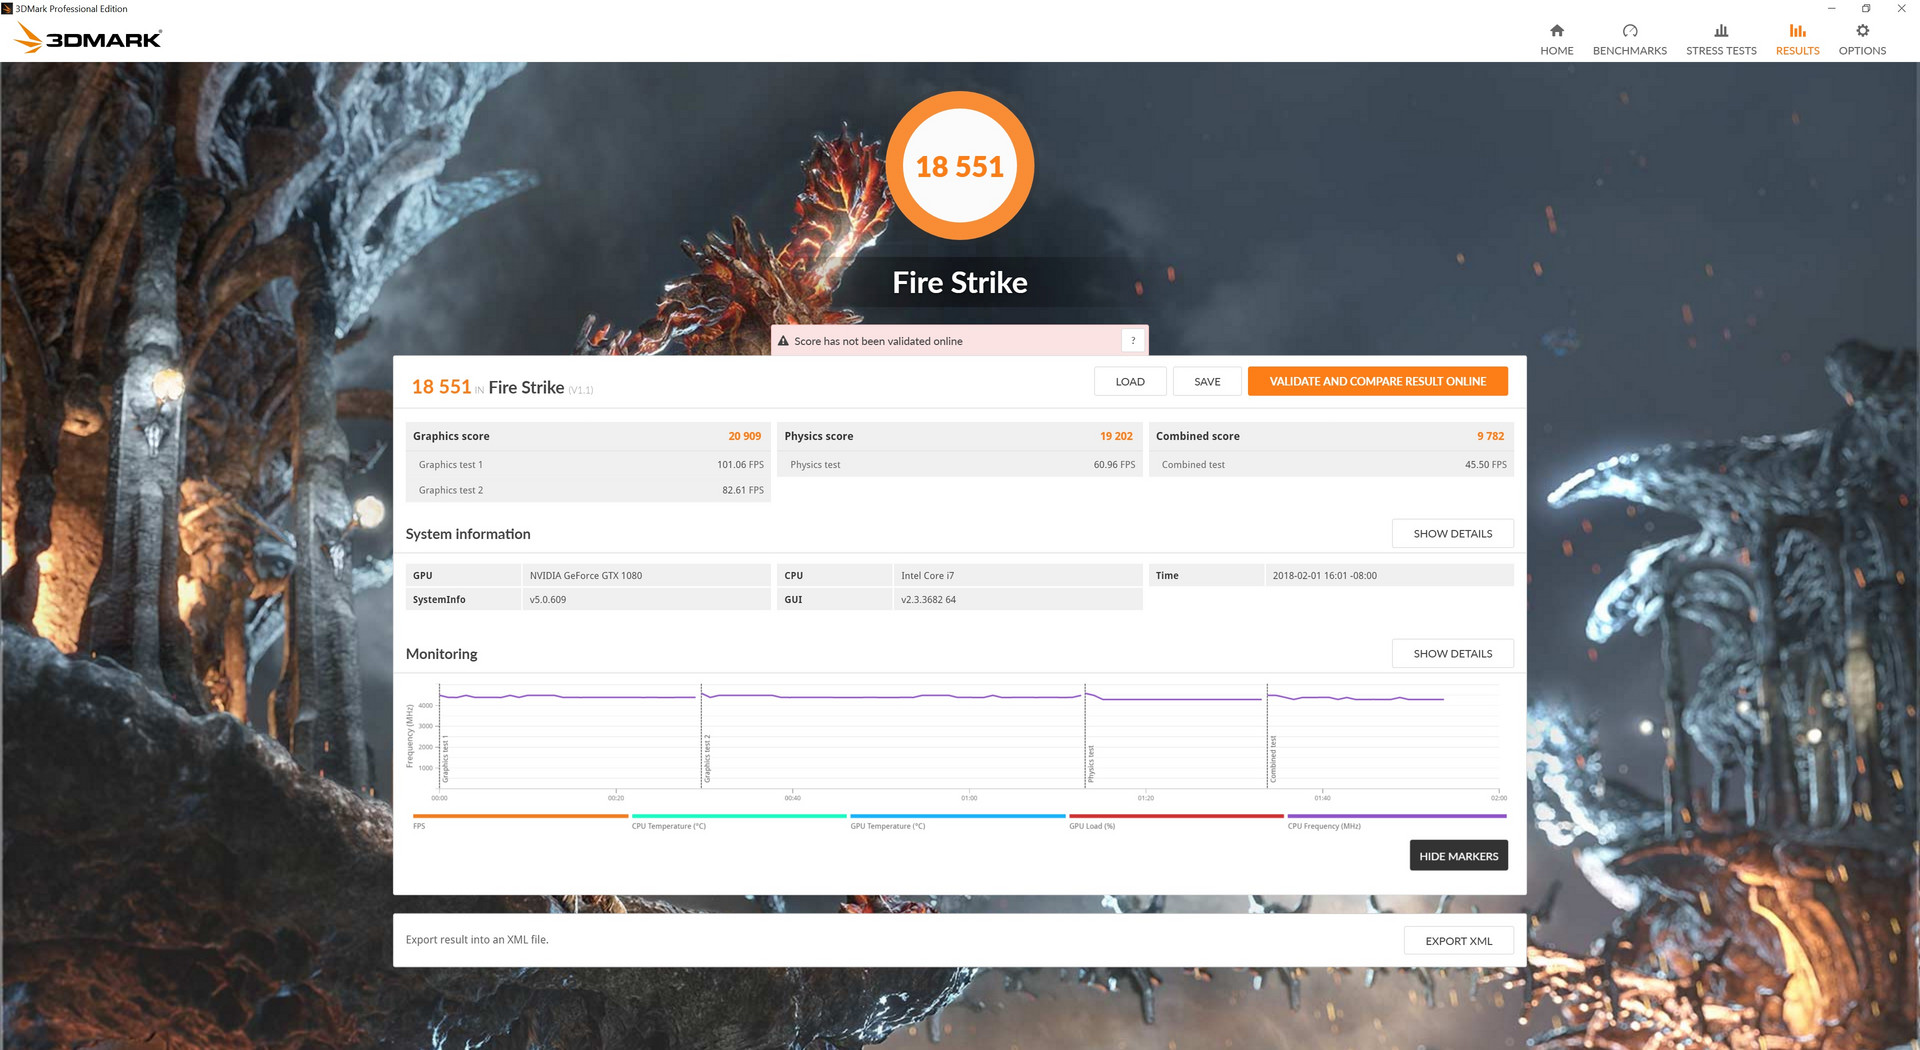
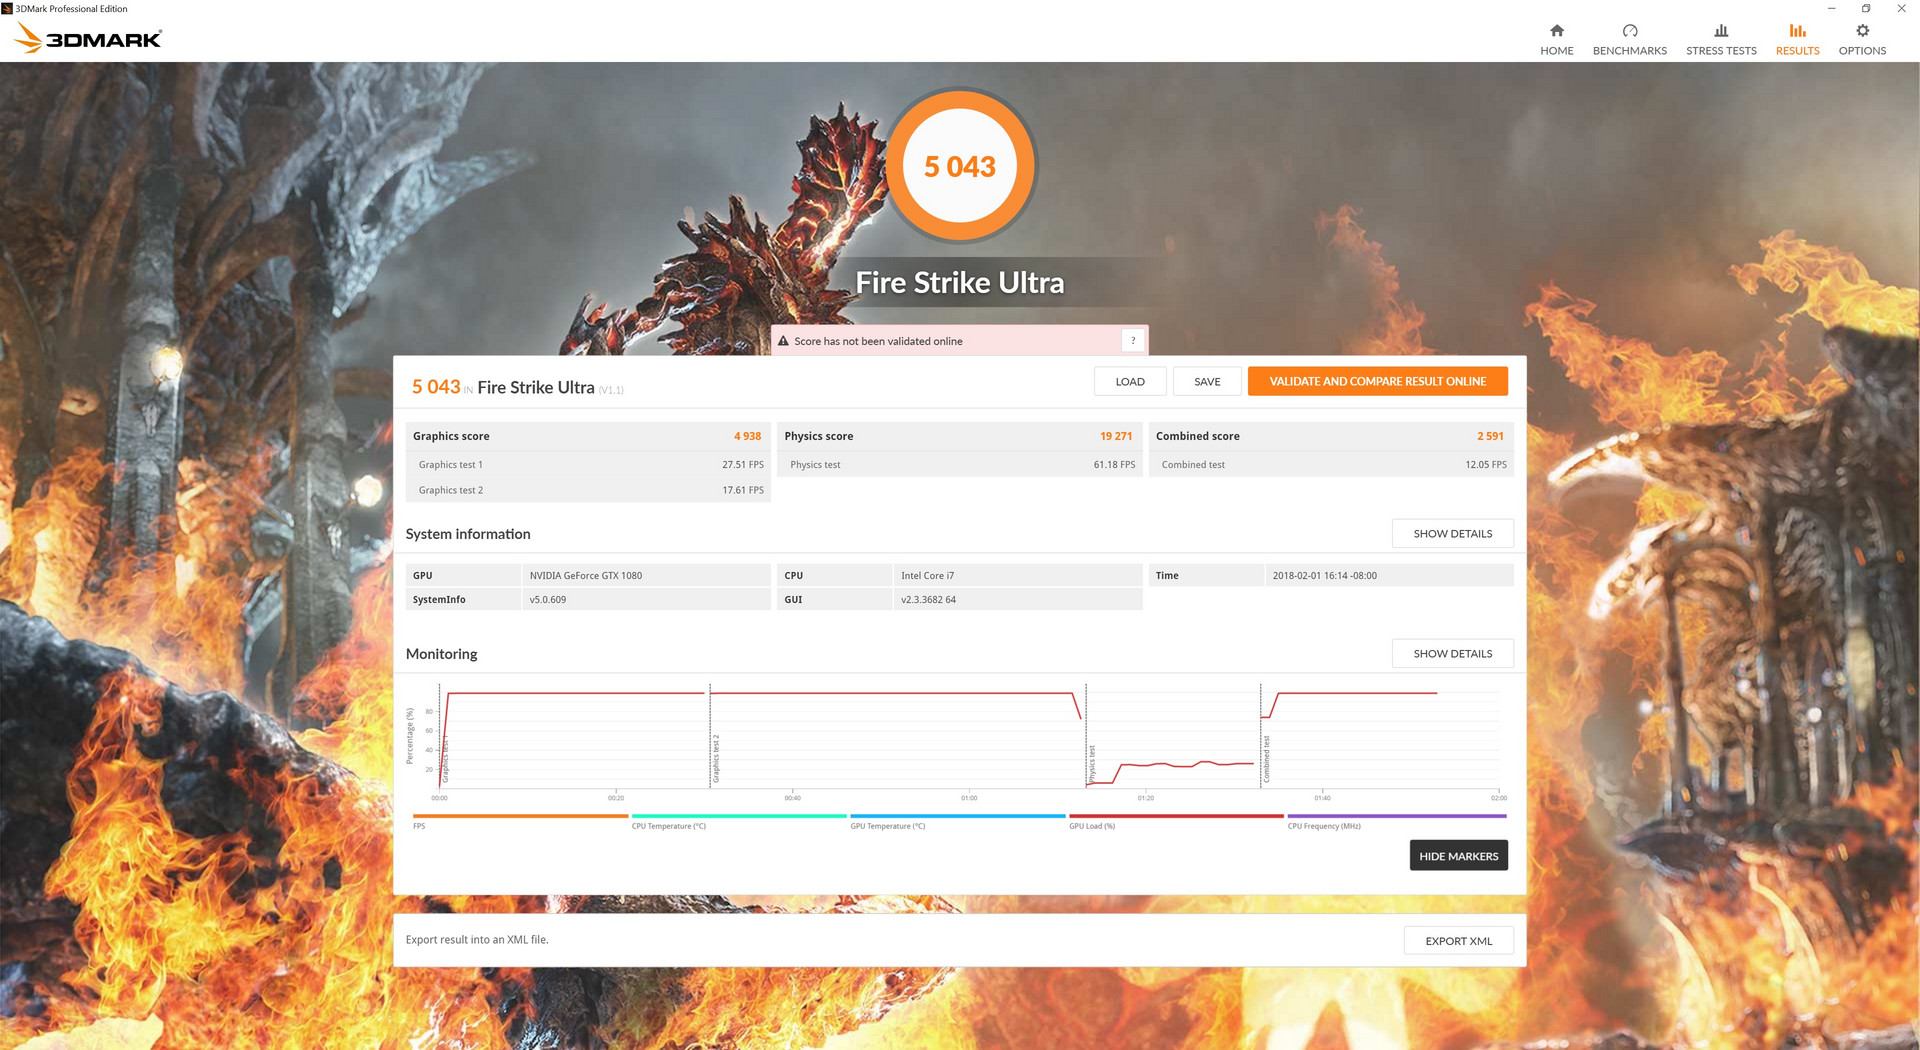
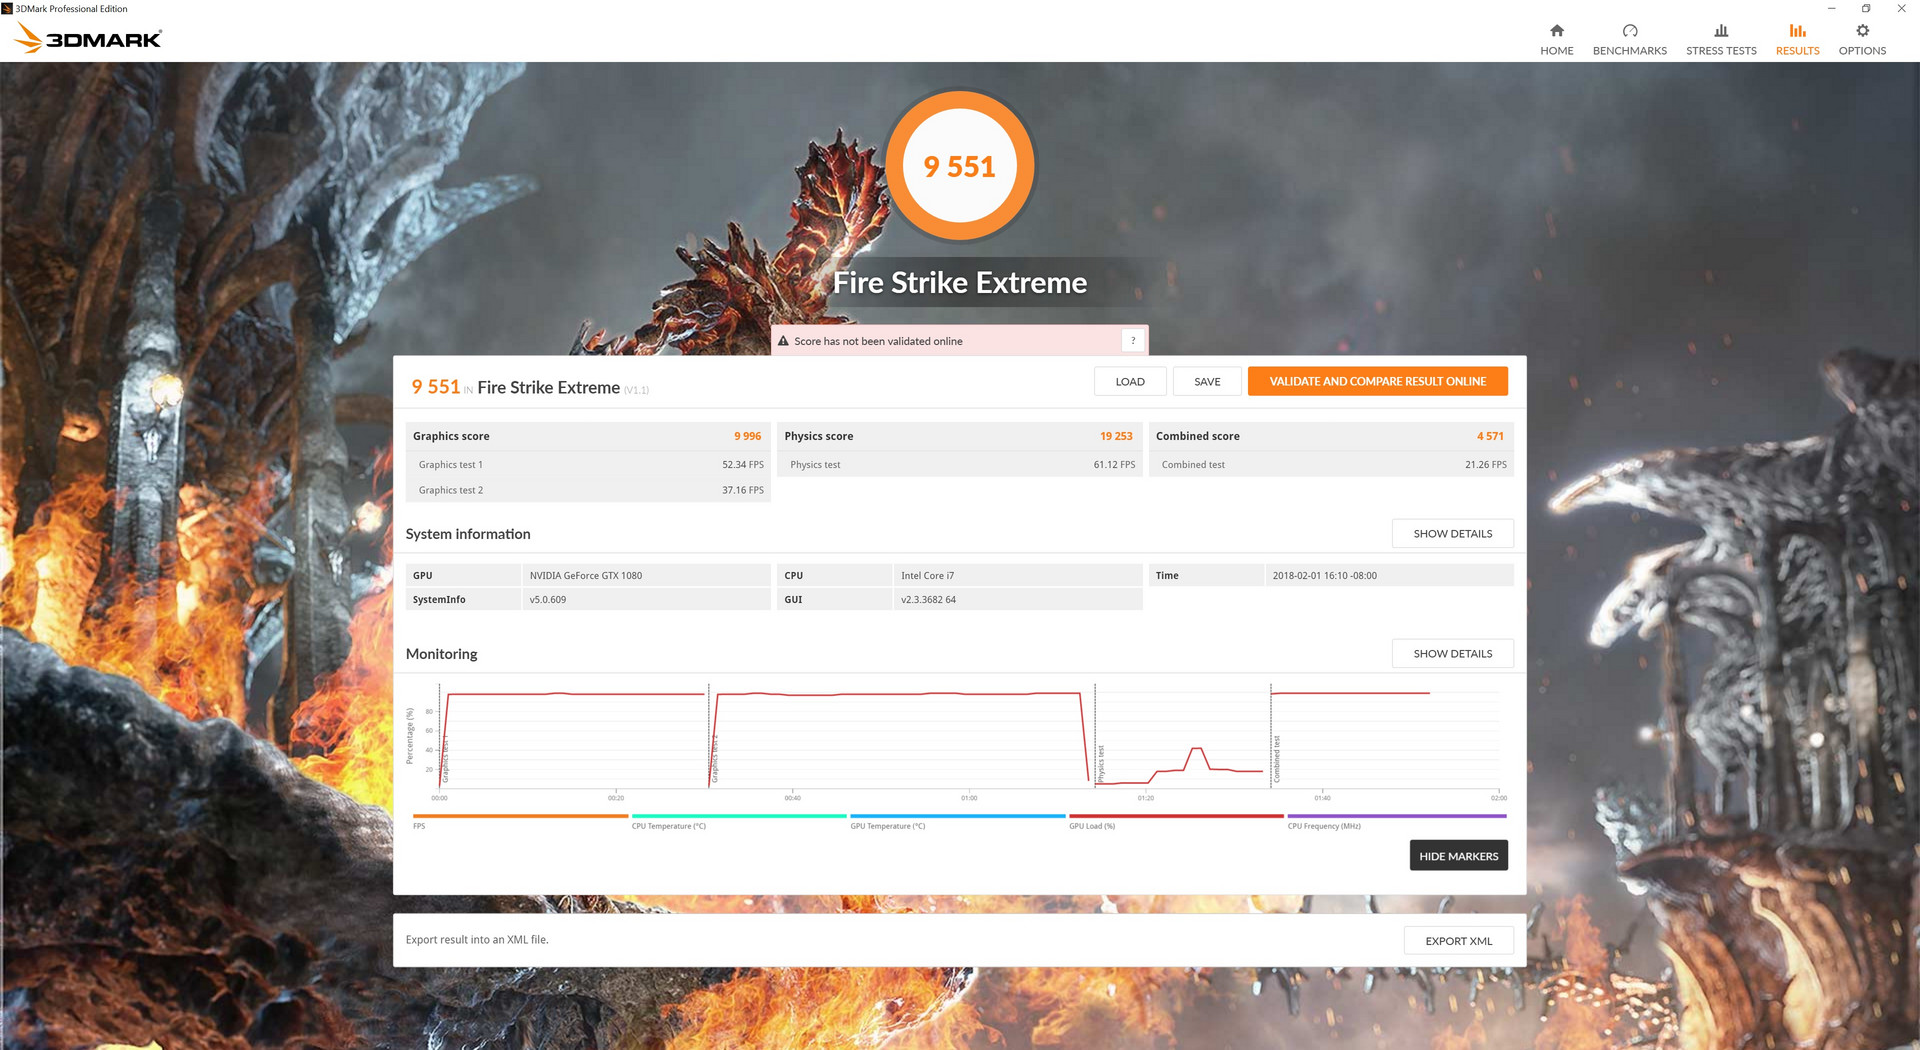
The GTX 1080 in the Sky X4C is within just a few percentage points from our desktop GTX 1080 reference according to 3DMark benchmarks. Note that the Alienware 15 R3 with GTX 1080 Max-Q and the Razer Blade Pro are each about 10 percent slower than our Eurocom because of slower clock rates and more limited GPU Boost potential. Even the GTX 1070 Ti scores about 10 percent lower while the GTX 1080 Ti is 36 percent faster. There is still no GTX 1080 Ti option for notebooks, so the GTX 1080 continues to be the fastest uncontested single GPU solution.
When under gaming loads, the system is able to play most titles at 1080p and at 120 FPS on High to Maximum detail settings. Thus, there is a strong case for paring the GTX 1080 with the 5 ms/120 Hz 1080p panel option if fast frame times are priority. On the other hand, gamers who prioritize resolution will be able to play most games at 4K UHD and at 60 FPS assuming Medium to High details. Newer titles like Middle-earth: Shadow of War and Destiny 2 will need additional tweaking to maintain 60 FPS.
See our review on the GTX 1080 here and more benchmark comparisons here.
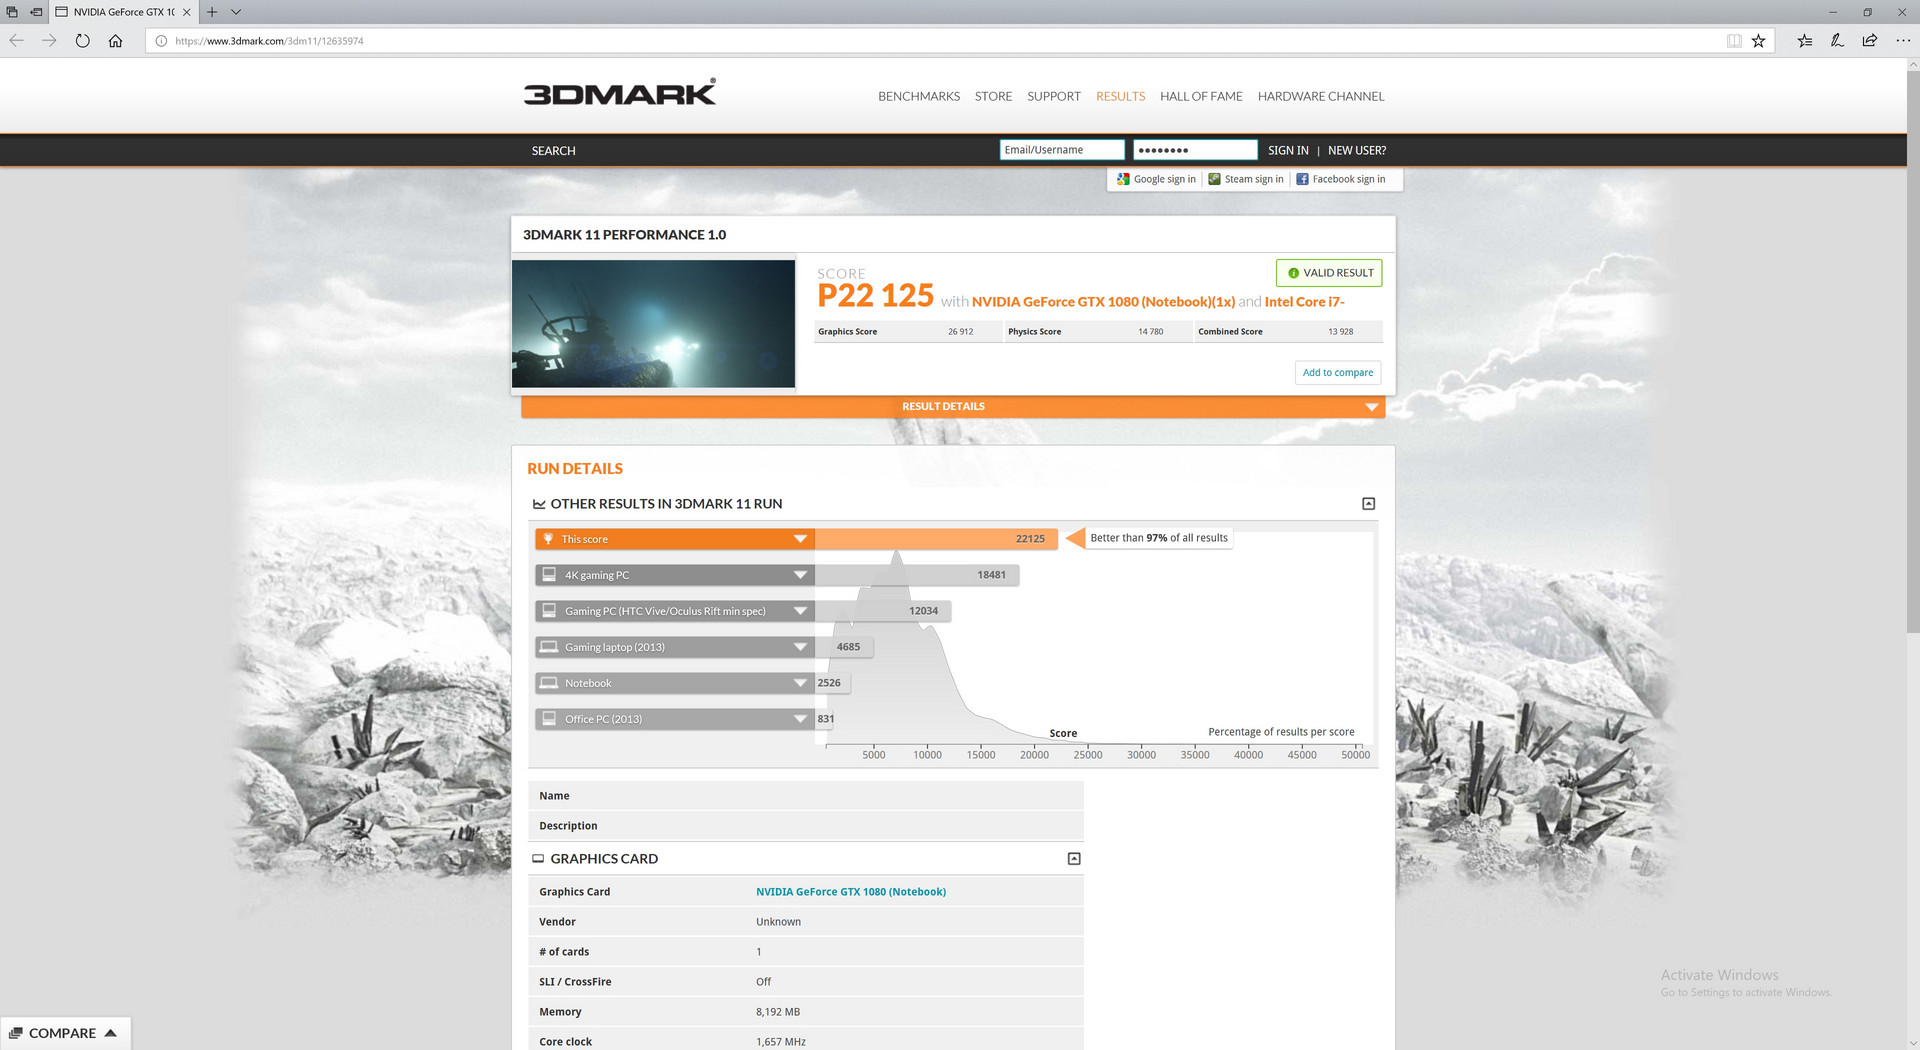
| 3DMark 11 Performance | 22125 points | |
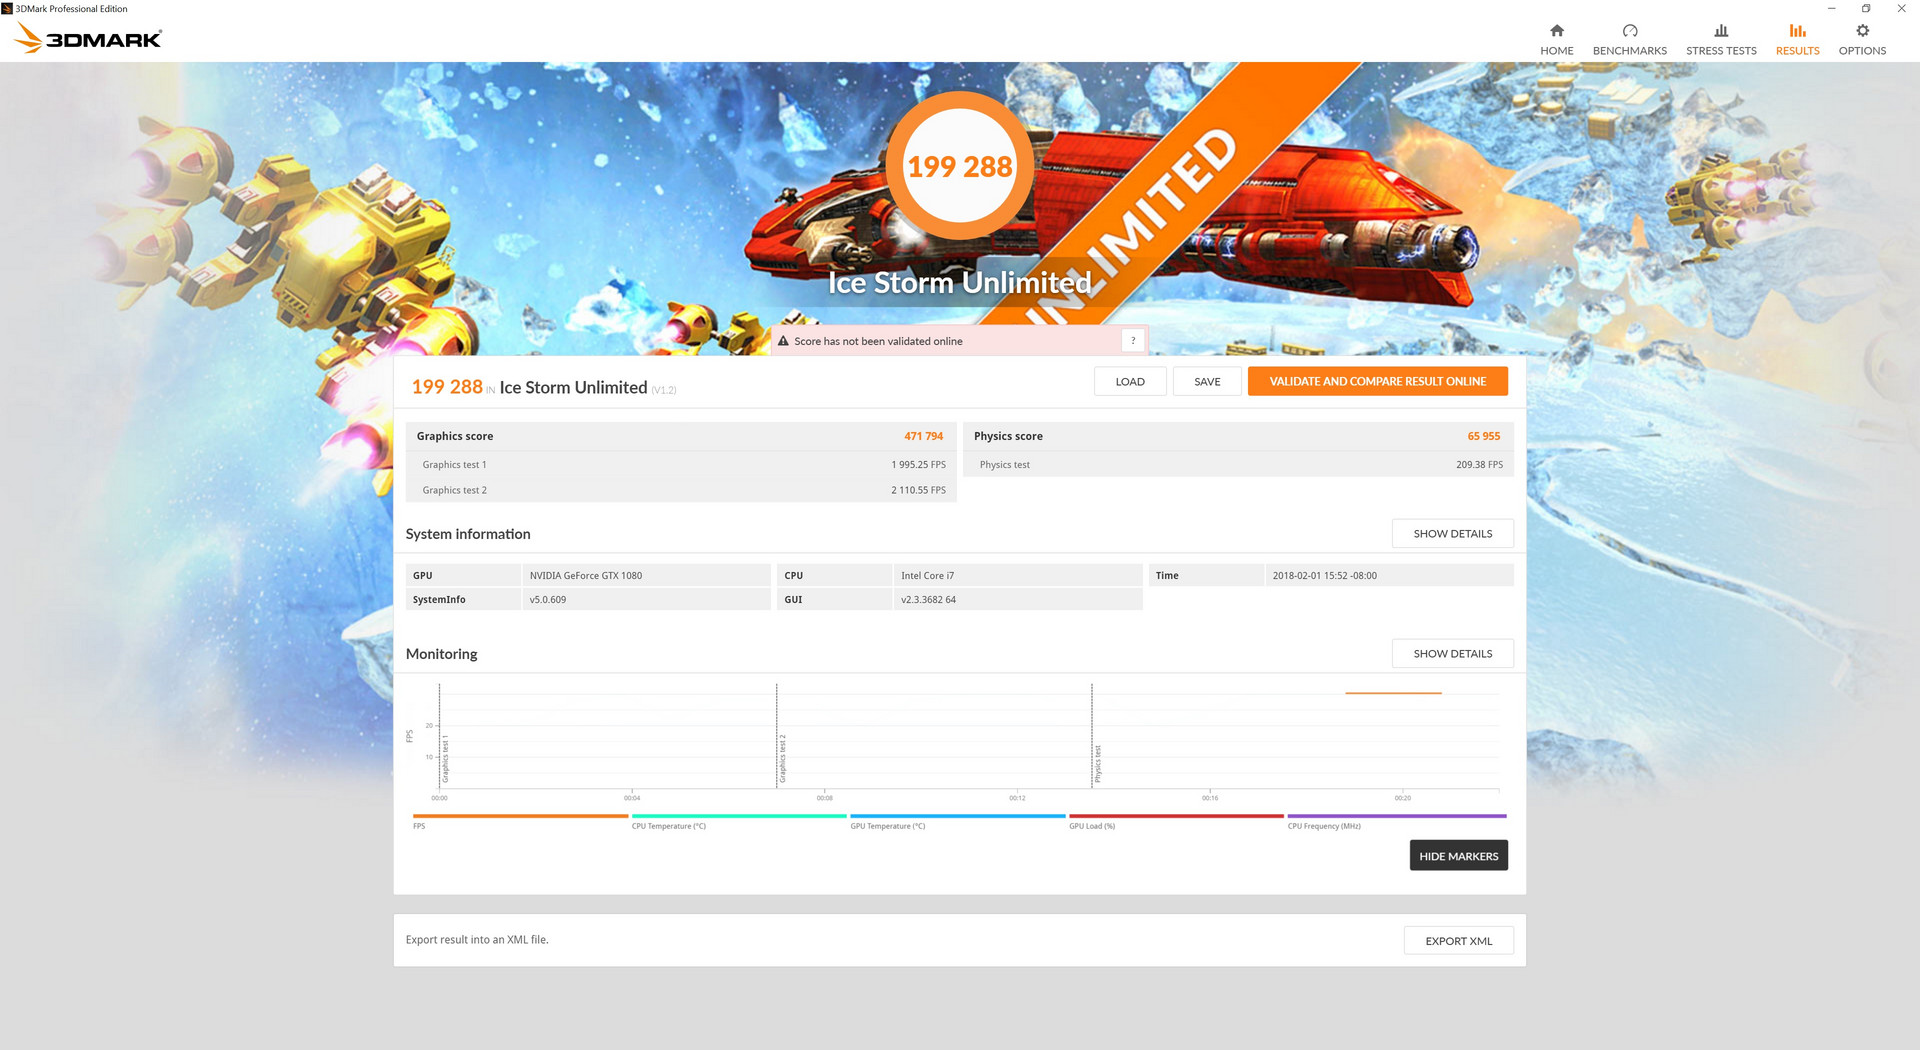
| 3DMark Ice Storm Standard Score | 194644 points | |
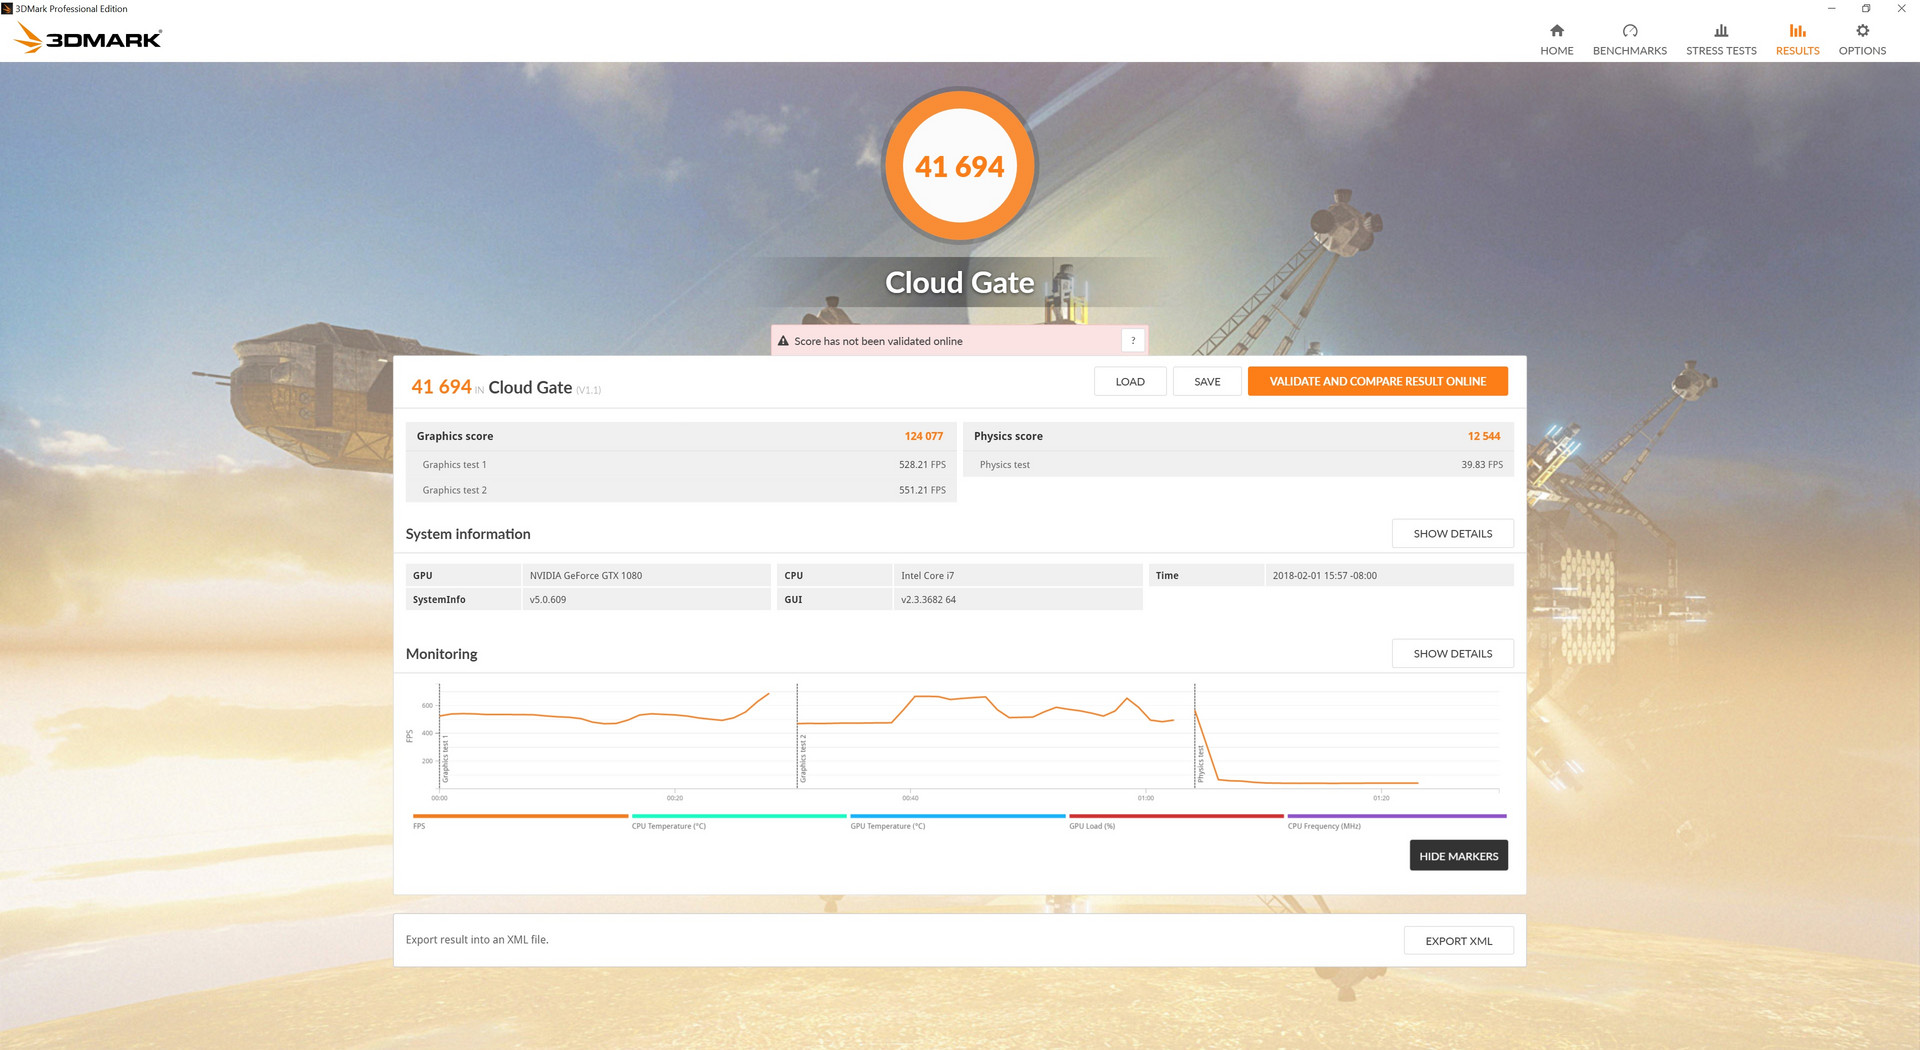
| 3DMark Cloud Gate Standard Score | 41694 points | |
| 3DMark Fire Strike Score | 18551 points | |
| 3DMark Fire Strike Extreme Score | 9551 points | |
Help | ||
| Fallout 4 - 3840x2160 High Preset AA:T AF:16x | |
| Eurocom Sky X9C | |
| Nvidia GeForce GTX 1080 Ti Founders Edition | |
| Nvidia GeForce GTX 1080 Founders Edition | |
| Eurocom Sky X4C | |
| Eurocom Q5 | |
| low | med. | high | ultra | 4K | |
|---|---|---|---|---|---|
| BioShock Infinite (2013) | 181.2 | ||||
| Metro: Last Light (2013) | 141.1 | ||||
| Thief (2014) | 127.6 | ||||
| The Witcher 3 (2015) | 75.3 | 53.4 | |||
| Batman: Arkham Knight (2015) | 101 | 55 | |||
| Metal Gear Solid V (2015) | 60 | 60 | |||
| Fallout 4 (2015) | 123.4 | 53.4 | |||
| Rise of the Tomb Raider (2016) | 111.7 | 50.6 | |||
| Overwatch (2016) | 195.6 | 92.1 | |||
| Mafia 3 (2016) | 81.2 | 32.5 | |||
| Prey (2017) | 143 | 70.9 | |||
| Middle-earth: Shadow of War (2017) | 94 | 37 | |||
| Destiny 2 (2017) | 139.1 | 38.4 |
Stress Test
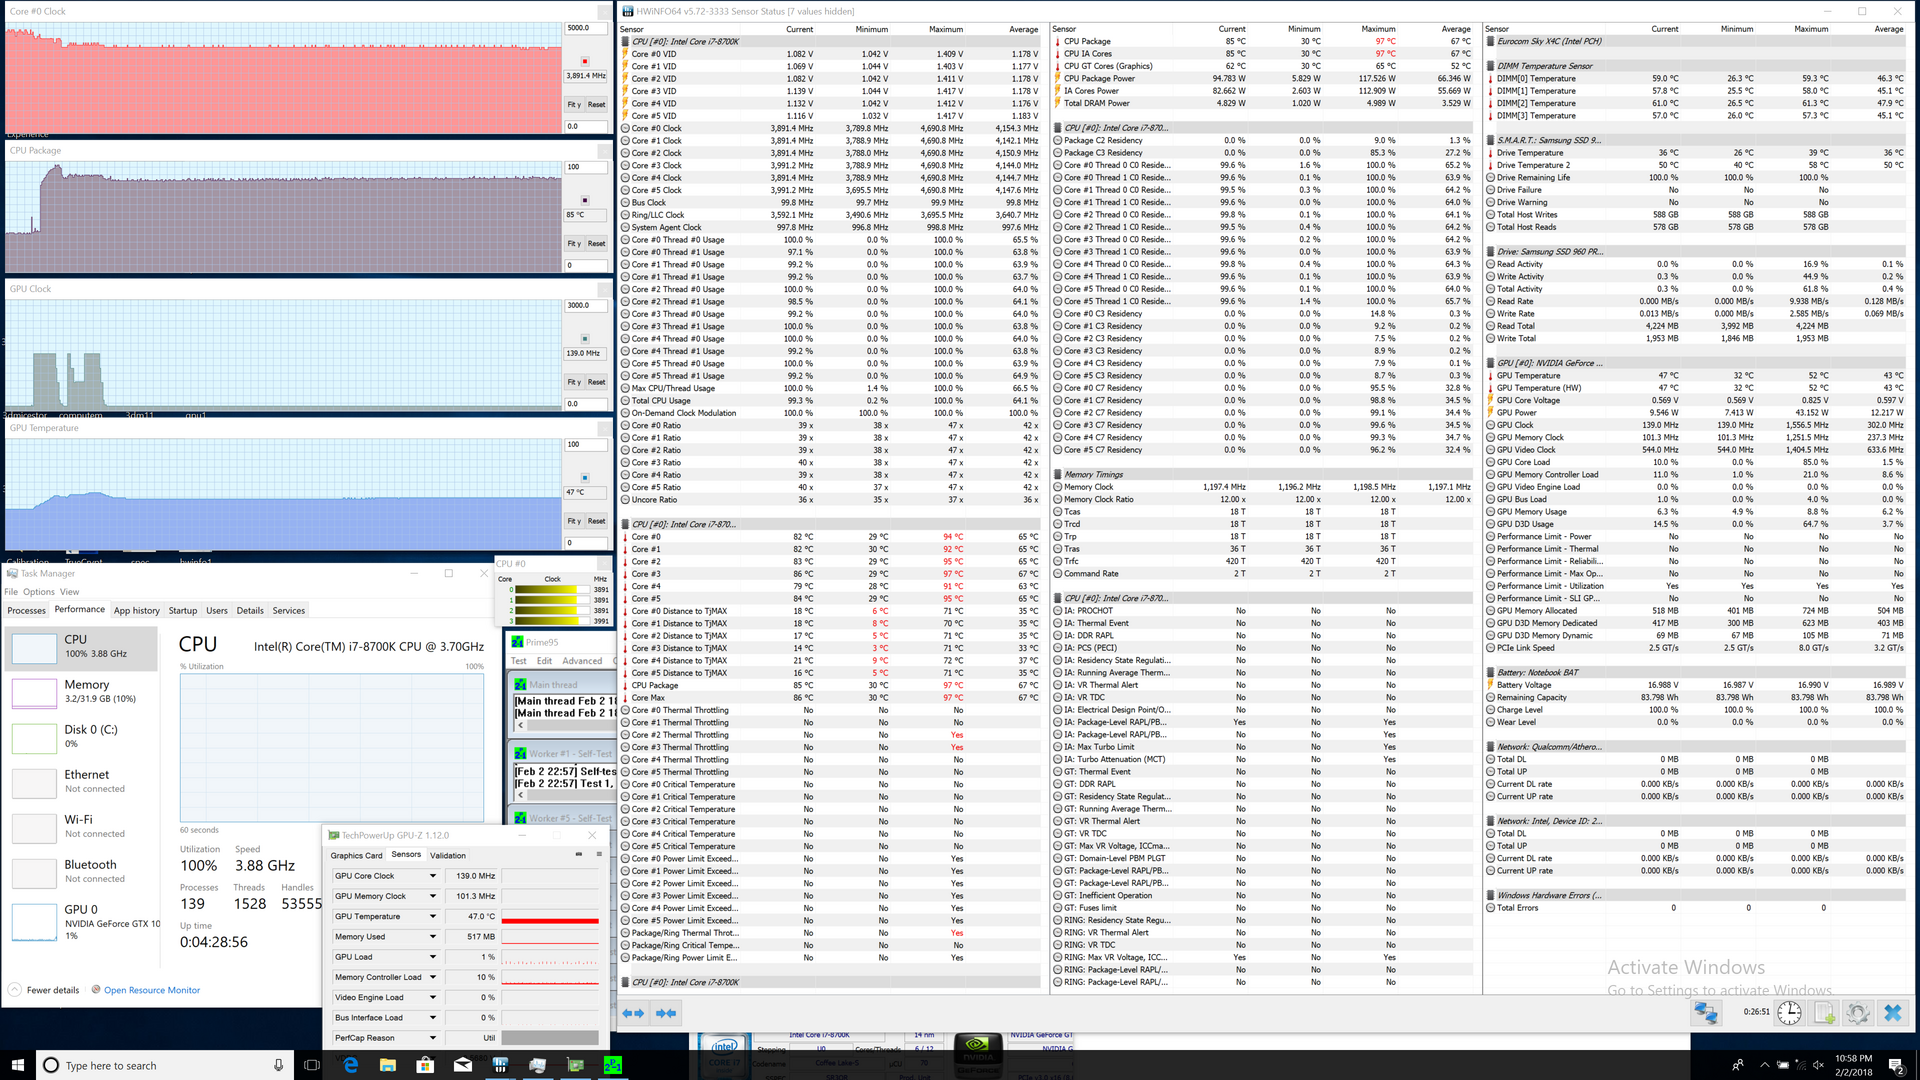
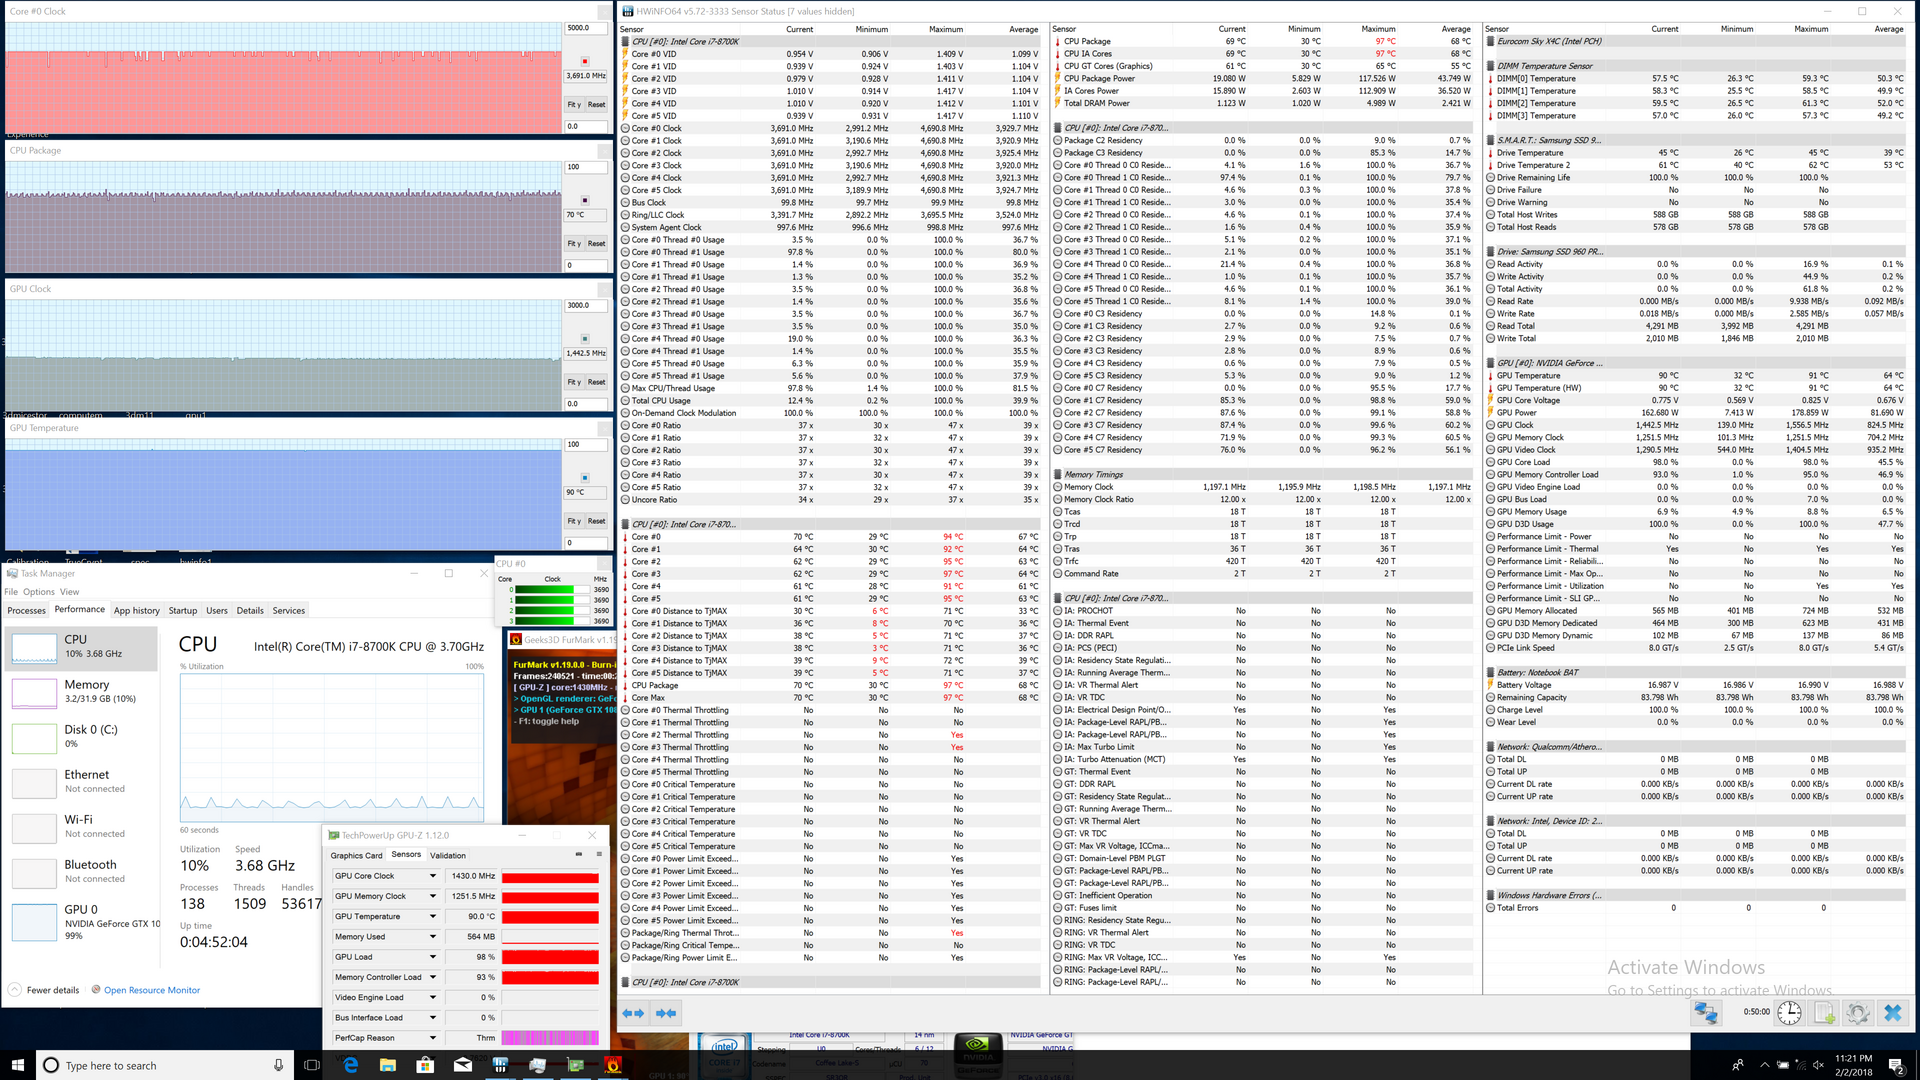
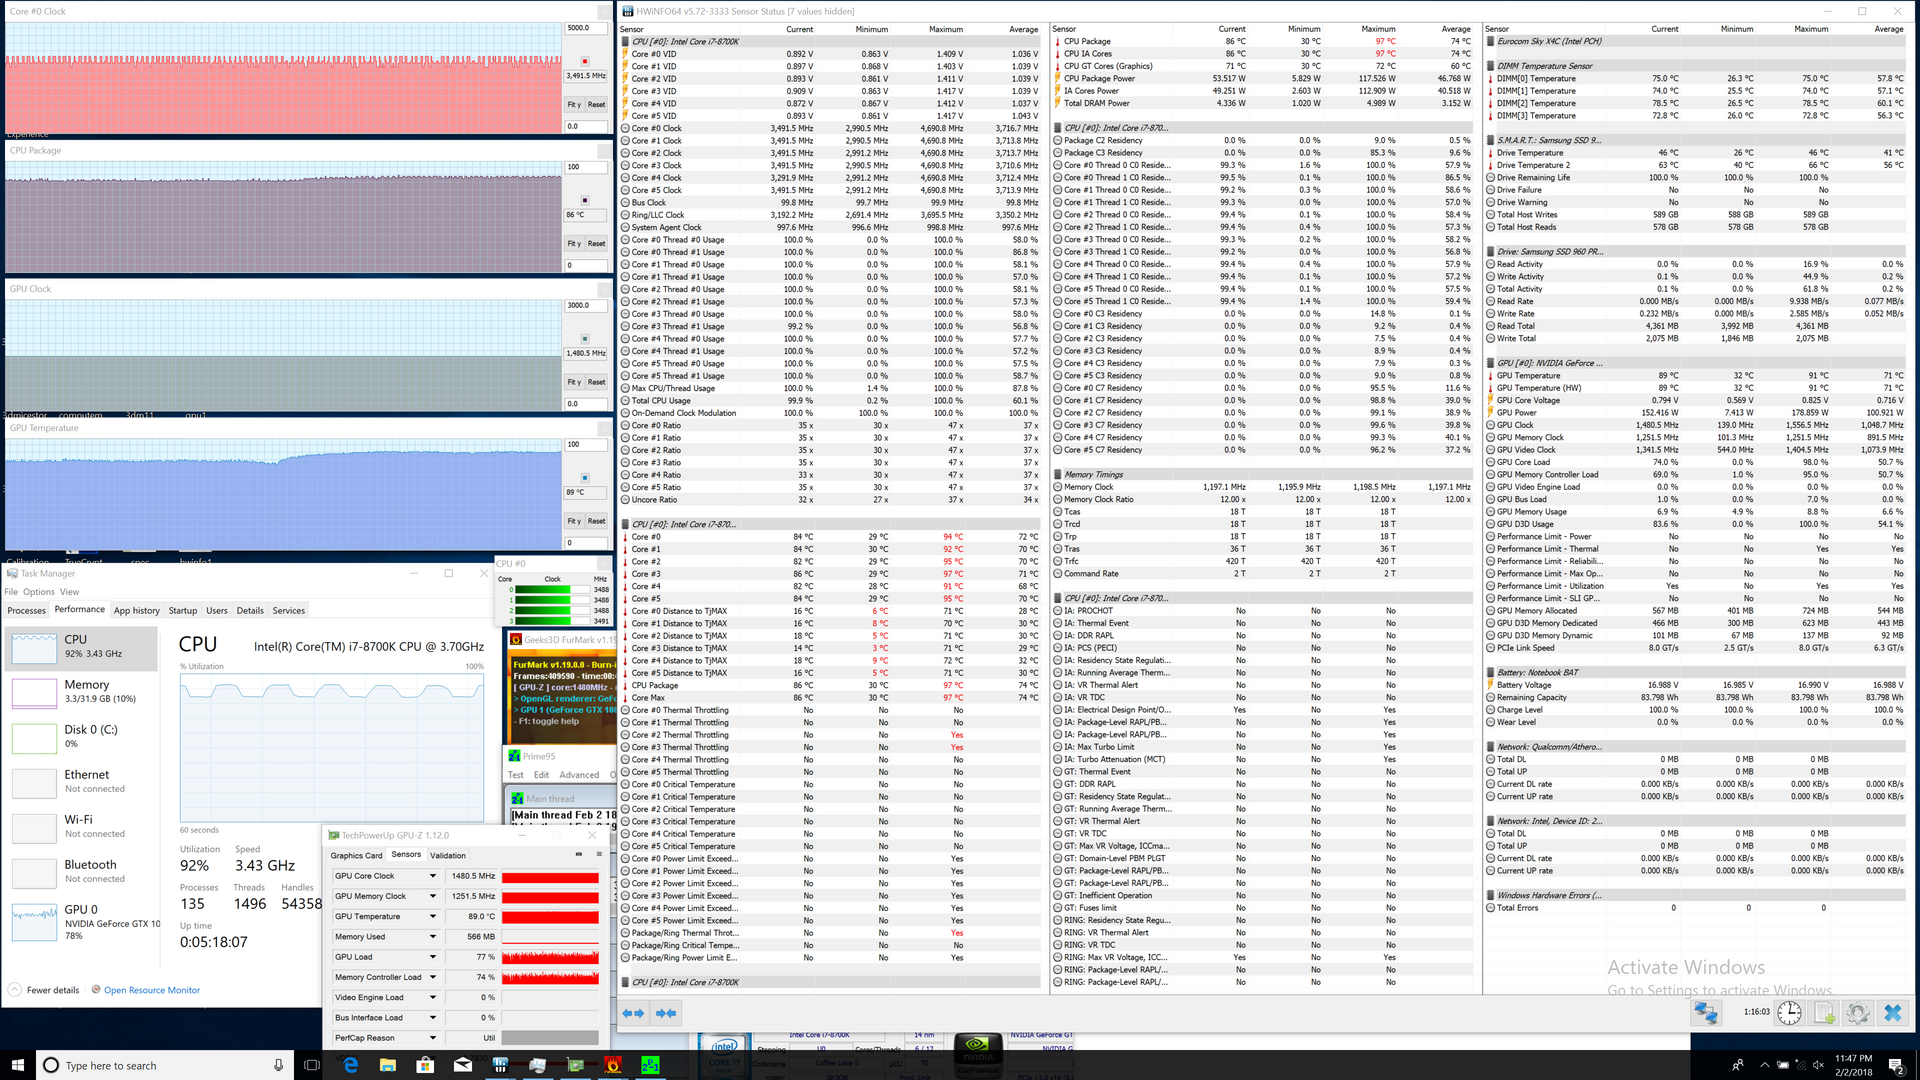
We stress the notebook to identify for any potential throttling or stability issues. When running Prime95, the CPU can be observed jumping from an idling temperature of about 35 C to 97 C in a matter of seconds with clock rates reaching up to 4.2 GHz. After this short period, however, clock rates drop to about 3.9 GHz in order to maintain a core temperature of 85 C. When both Prime95 and FurMark are active simultaneously, the CPU and GPU will stabilize at 86 C and 90 C, respectively, to be significantly warmer than the same Core i7-8700K CPU and GTX 1080 GPU on a desktop form factor. In comparison, the GTX 1080 GPUs in the Razer Blade Pro and Acer Predator Triton 700 settle at slightly cooler temperatures in the low 80 C range due in part to slower clock rates on these competing systems.
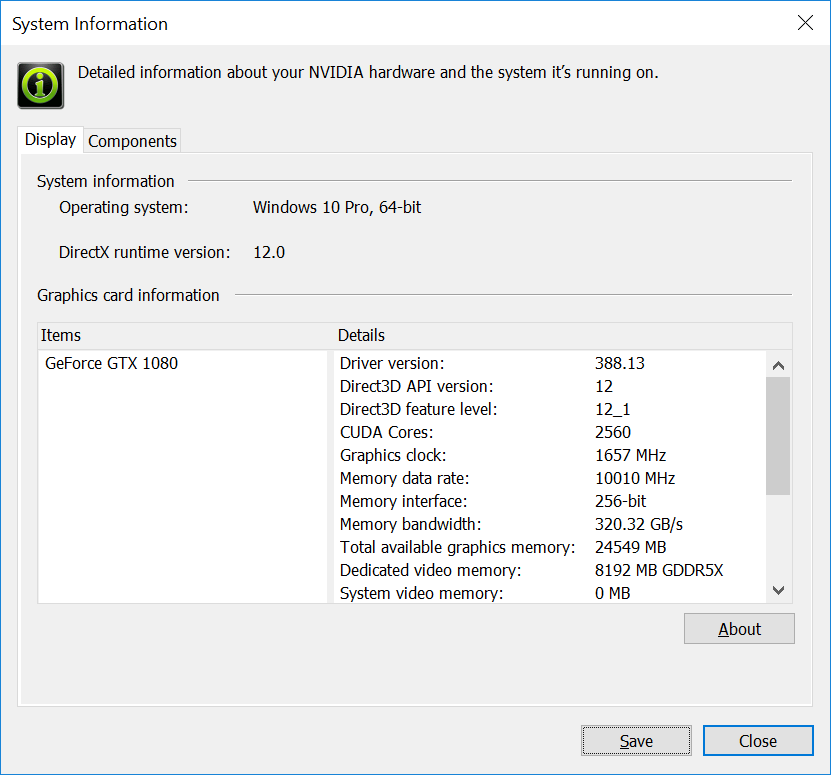
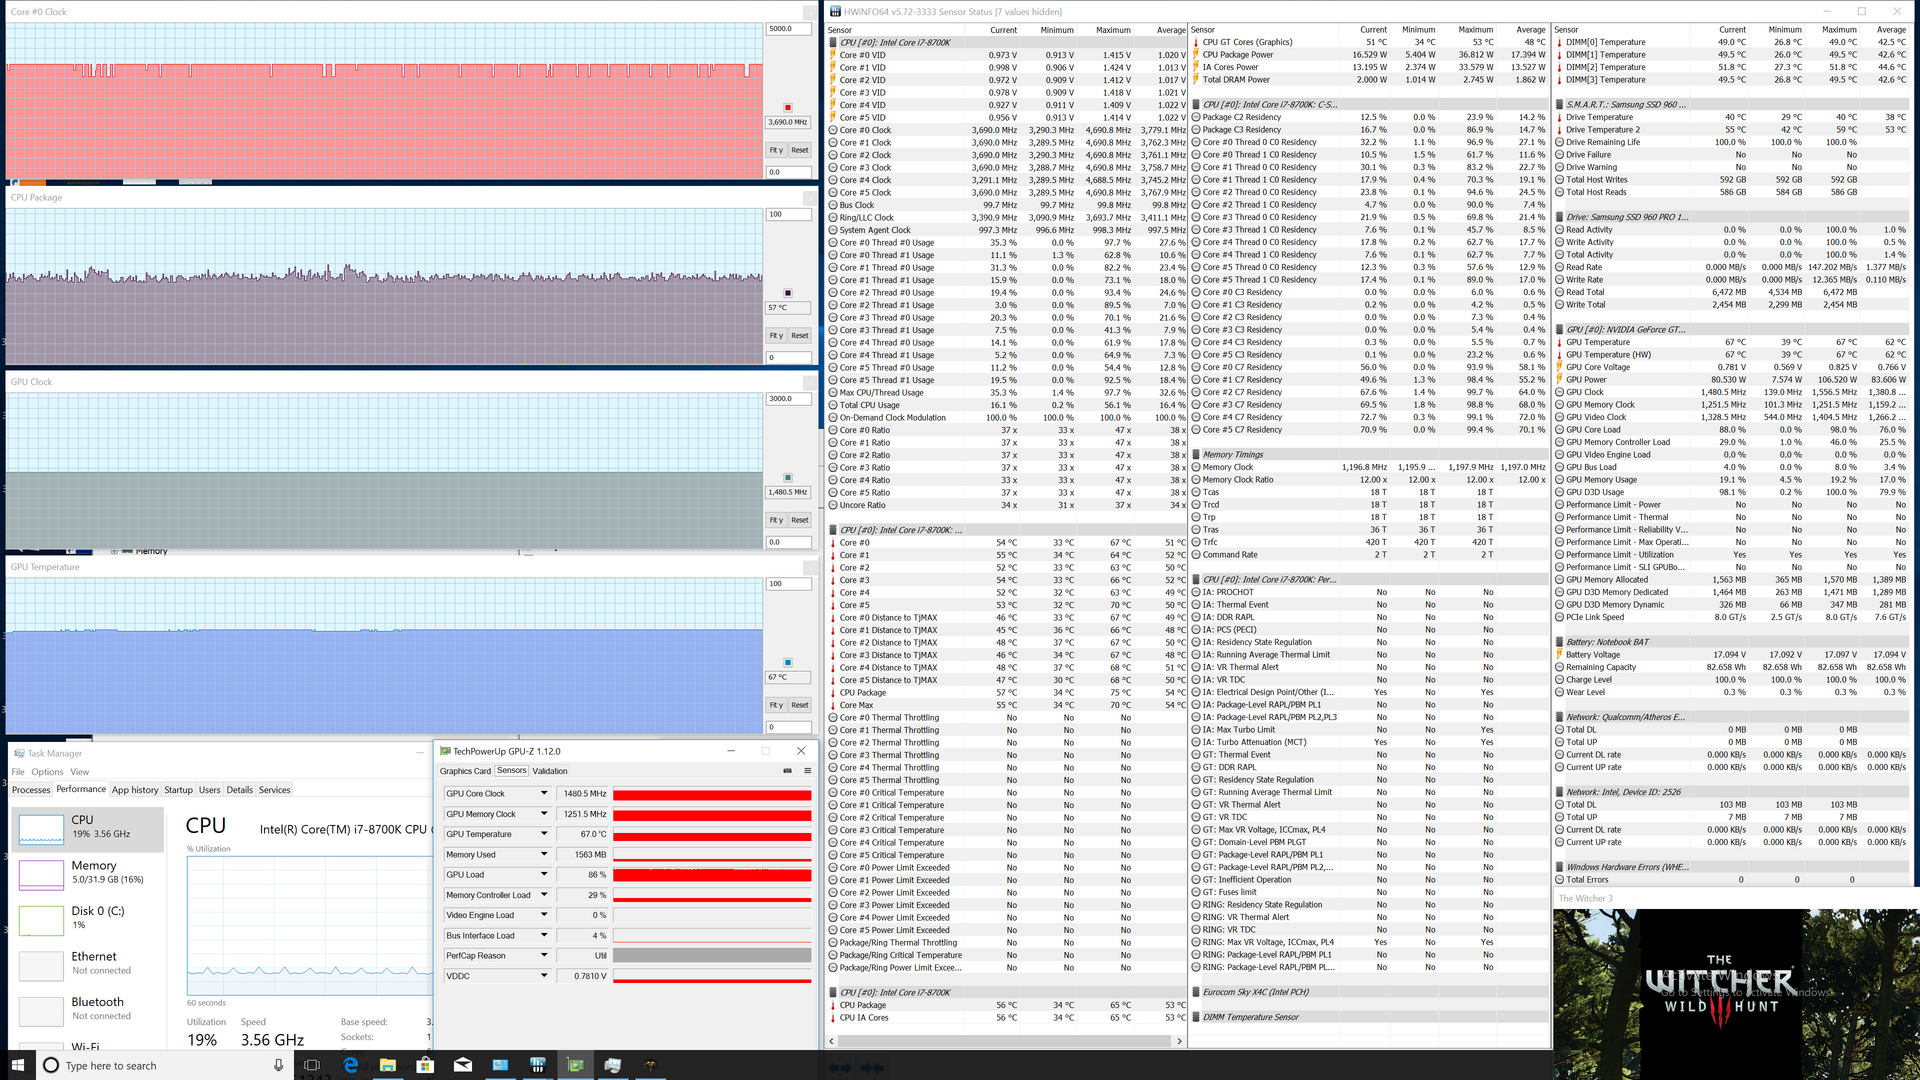
Running Witcher 3 is more representative of real-world gaming loads. The CPU and GPU can be observed stabilizing at 57 C and 67 C, respectively, for cooler surface temperatures as shown in our Temperature section below. It's worth noting that the GPU never reaches the 1657 MHz clock rate as listed on the Nvidia System Information window unless if manually overclocked by the pre-installed overclocking utility.
Running on batteries will throttle both the CPU and GPU. A 3DMark Fire Strike run on battery power results in Physics and Graphics scores of 10375 and 6881, respectively, compared to 19202 and 20909 points when on mains.
| CPU Clock (GHz) | GPU Clock (MHz) | Average CPU Temperature (°C) | Average GPU Temperature (°C) | |
| Prime95 Stress | 3.9 - 4.0 | -- | 85 | 47 |
| FurMark Stress | -- | 1443 | 70 | 90 |
| Prime95 + FurMark Stress | 3.0 - 3.5 | 1481 | 86 | 89 |
| Witcher 3 Stress | 3.7 | 1491 | 57 | 67 |
Emissions
System Noise
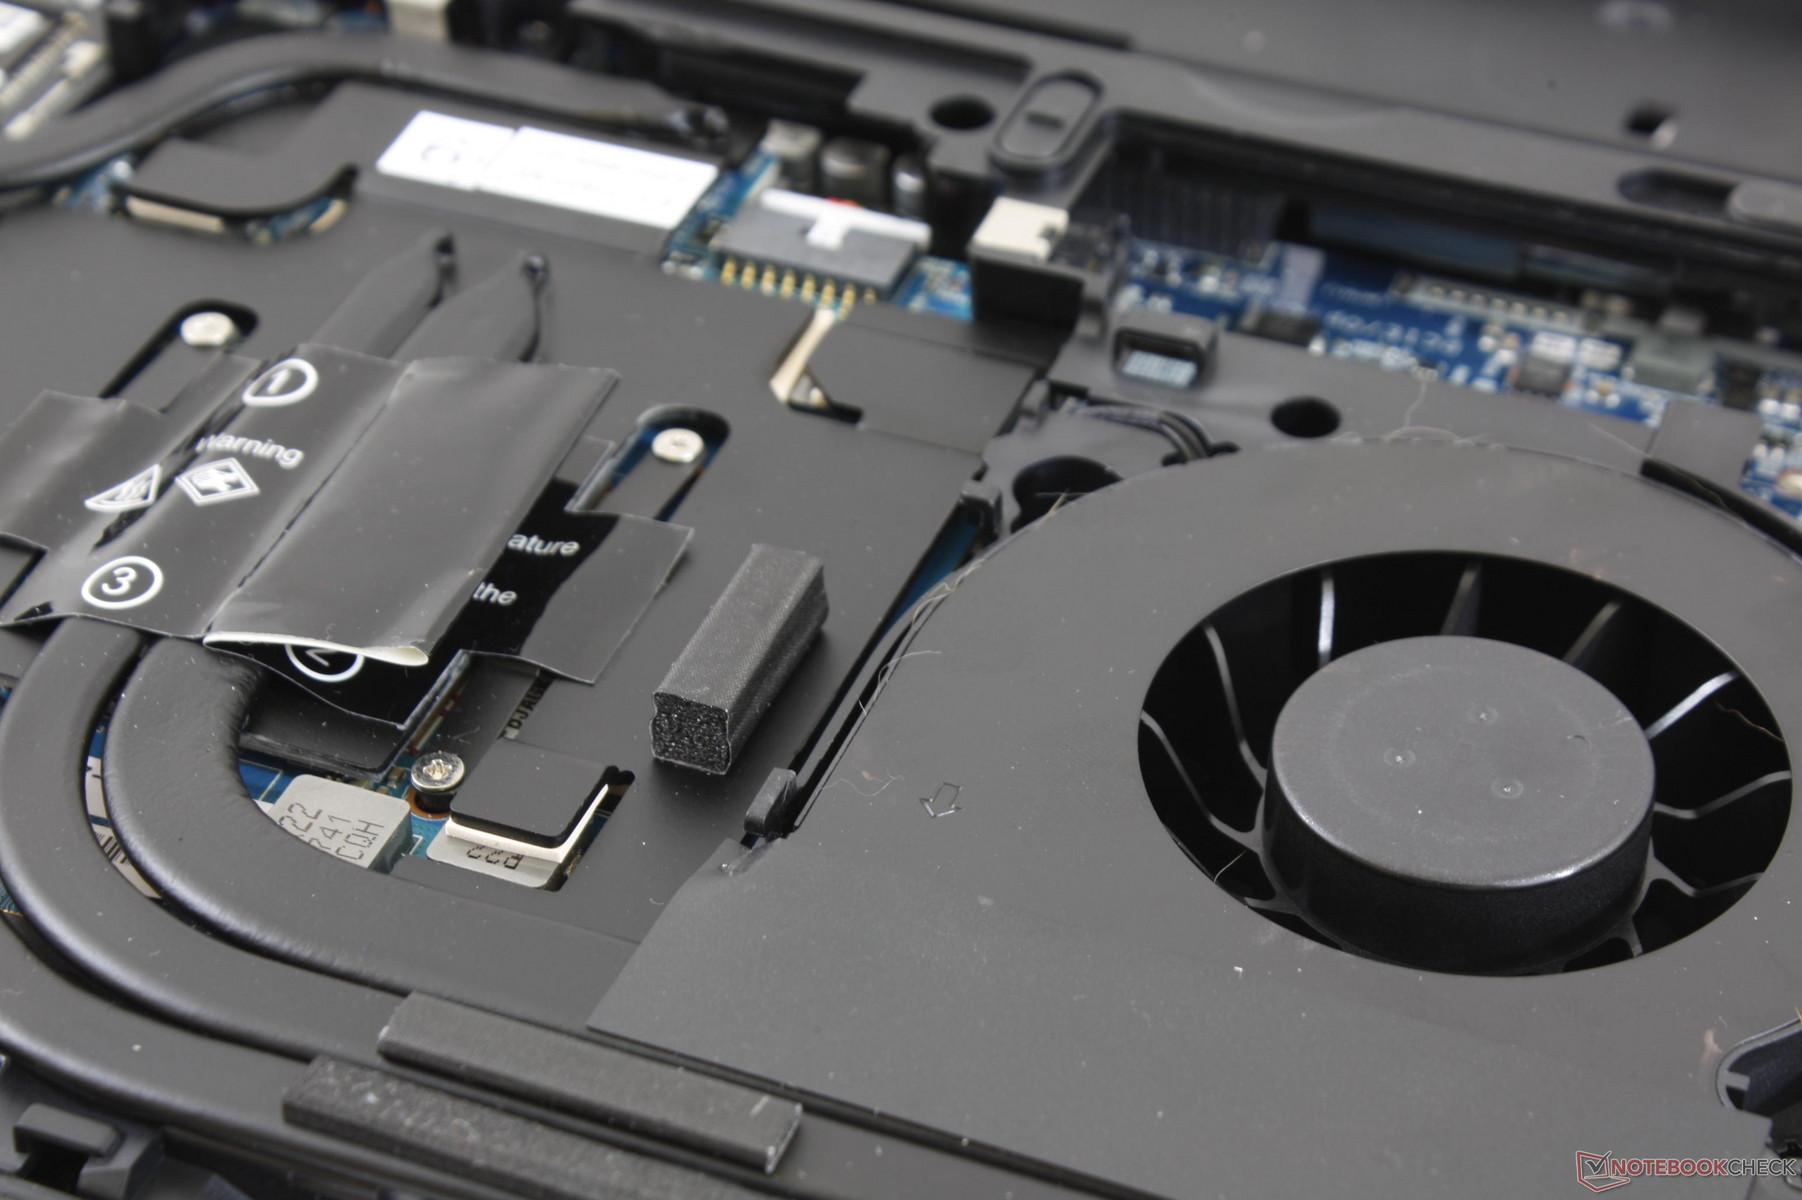
The cooling solution consists of six heat pipes and dual fans with a delidded CPU to improve cooling potential. The fans will idle if the notebook is simply sitting on desktop, but even small loads like browsing will initiate a low whir of about 31 dB(A). Medium loads (as represented by 3DMark 06) will bump fan noise to 42 dB(A) while gaming loads will be even louder at 53 dB(A). We recommend headphones for a better gaming experience.
Fan noise is quieter during maximum load (Prime95 + FurMark) compared to gaming load to suggest throttling when both the CPU and GPU are subjected to unusually extreme processing loads.
Fan pulsing will occur when on the default High Performance Automatic mode and so the Power Saver mode is recommended for video playback, word processing, or browsing. Coil whine or electronic noise is not present on our unit.
Noise level
| Idle |
| 28.6 / 28.6 / 31.1 dB(A) |
| HDD |
| 0 dB(A) |
| Load |
| 42.2 / 50 dB(A) |
 | ||
30 dB silent 40 dB(A) audible 50 dB(A) loud |
||
min: | ||
| Eurocom Sky X4C GeForce GTX 1080 Mobile, i7-8700K, Samsung SSD 960 Pro 1TB m.2 NVMe | Alienware 15 R3 Max-Q GeForce GTX 1080 Max-Q, i7-7820HK, LiteOn CX2-8B256 | MSI GT62VR 7RE-223 GeForce GTX 1070 Mobile, i7-7700HQ, Samsung SSD PM871a MZNLN256HMHQ | Asus Strix GL502VS-FY032T GeForce GTX 1070 Mobile, 6700HQ, SanDisk SD8SNAT256G1002 | EVGA SC15 GeForce GTX 1060 Mobile, i7-7700HQ, Toshiba NVMe THNSN5256GPU7 | Alienware 15 R3 GeForce GTX 1070 Mobile, i7-7700HQ | |
|---|---|---|---|---|---|---|
| Noise | -6% | -8% | -6% | 1% | -13% | |
| off / environment * (dB) | 28.6 | 29 -1% | 30 -5% | 30 -5% | 28 2% | 30 -5% |
| Idle Minimum * (dB) | 28.6 | 32 -12% | 34 -19% | 32 -12% | 31.9 -12% | 31 -8% |
| Idle Average * (dB) | 28.6 | 33 -15% | 35 -22% | 33 -15% | 32 -12% | 32 -12% |
| Idle Maximum * (dB) | 31.1 | 35 -13% | 36 -16% | 34 -9% | 32 -3% | 42 -35% |
| Load Average * (dB) | 42.2 | 46 -9% | 40 5% | 39 8% | 36.5 14% | 49 -16% |
| Witcher 3 ultra * (dB) | 53.8 | 48 11% | 40.3 25% | |||
| Load Maximum * (dB) | 50 | 50 -0% | 46 8% | 51 -2% | 53.4 -7% | 50 -0% |
* ... smaller is better
Temperature
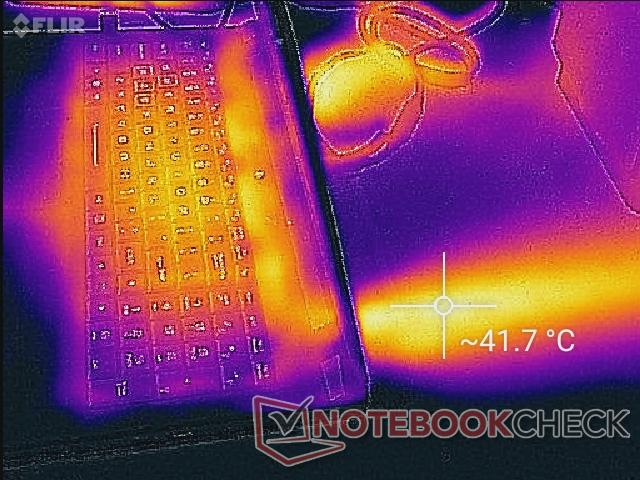
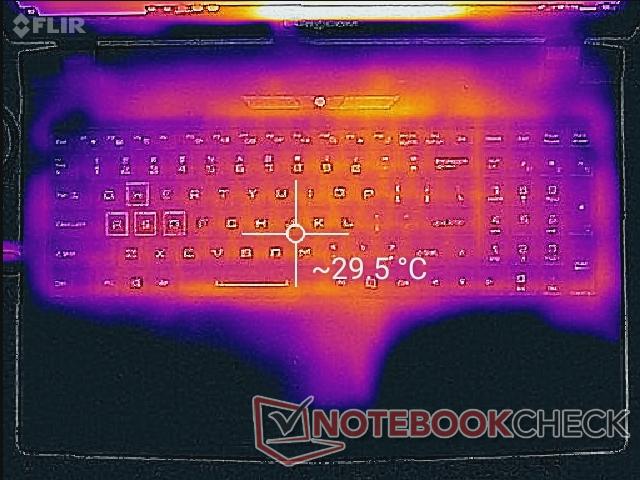
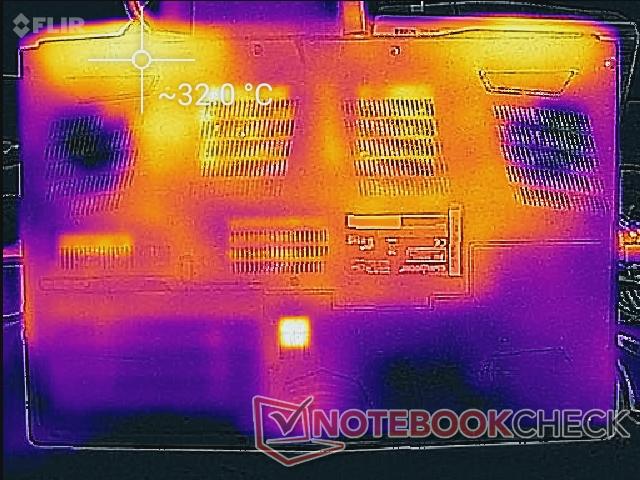
When idling, surface temperatures are slightly warm around the keyboard area at just under 30 C while the trackpad and palm rests are a few degrees cooler. The hot spot at the center of the keyboard can be as warm as 42 C when under extreme processing loads despite having almost no temperature changes to the trackpad or palm rests. The temperature gradient is generally steeper on the Eurocom compared to the MSI GT62 when under similar loads. The tighter cooling solution of the EVGA SC15 means an even wider surface temperature range than our Eurocom.
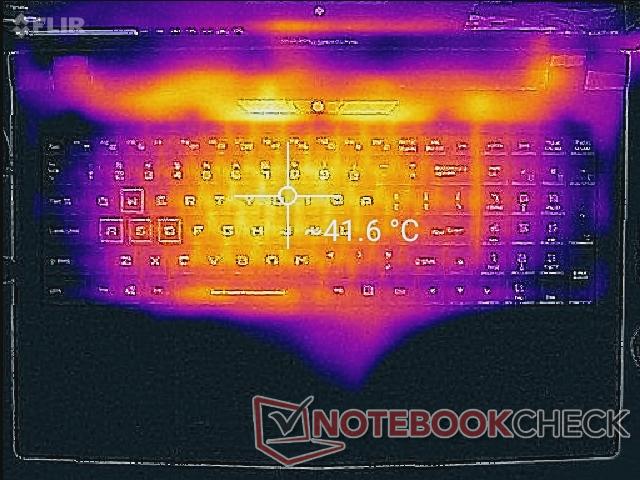

(±) The maximum temperature on the upper side is 43.8 °C / 111 F, compared to the average of 40.4 °C / 105 F, ranging from 21.2 to 68.8 °C for the class Gaming.
(-) The bottom heats up to a maximum of 49.6 °C / 121 F, compared to the average of 43.3 °C / 110 F
(+) In idle usage, the average temperature for the upper side is 26.4 °C / 80 F, compared to the device average of 33.9 °C / 93 F.
(+) Playing The Witcher 3, the average temperature for the upper side is 30 °C / 86 F, compared to the device average of 33.9 °C / 93 F.
(+) The palmrests and touchpad are cooler than skin temperature with a maximum of 27.6 °C / 81.7 F and are therefore cool to the touch.
(±) The average temperature of the palmrest area of similar devices was 28.8 °C / 83.8 F (+1.2 °C / 2.1 F).
Energy Management
Power Consumption
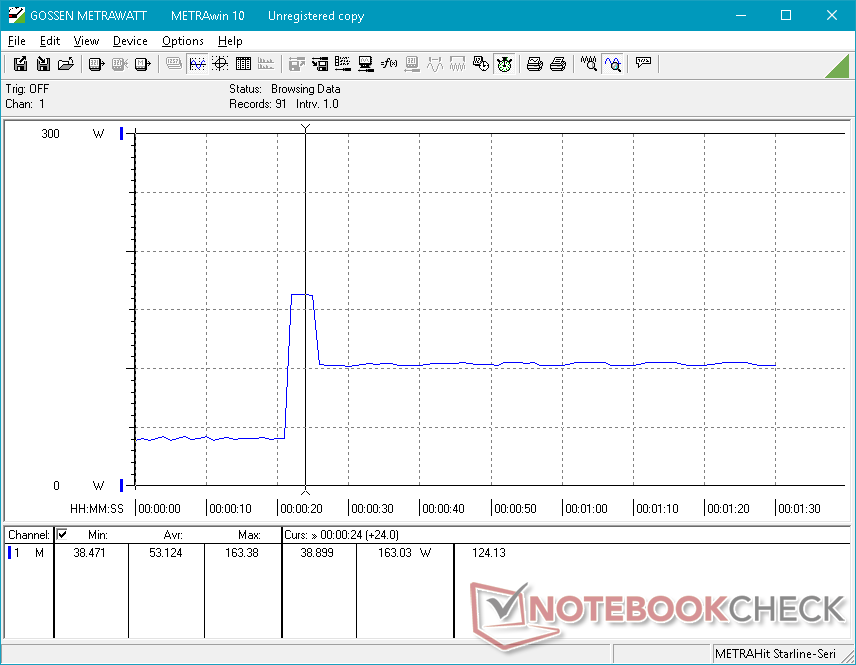
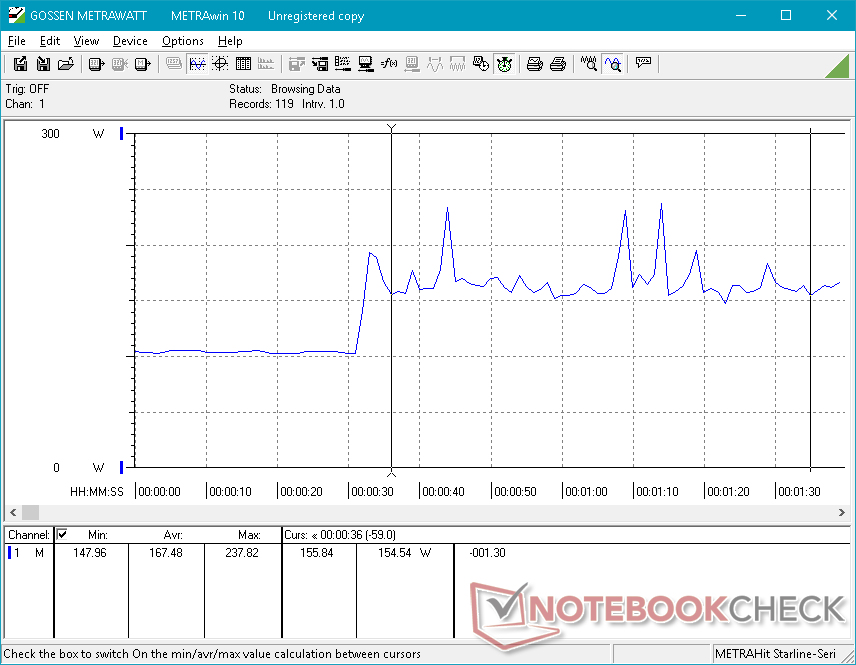
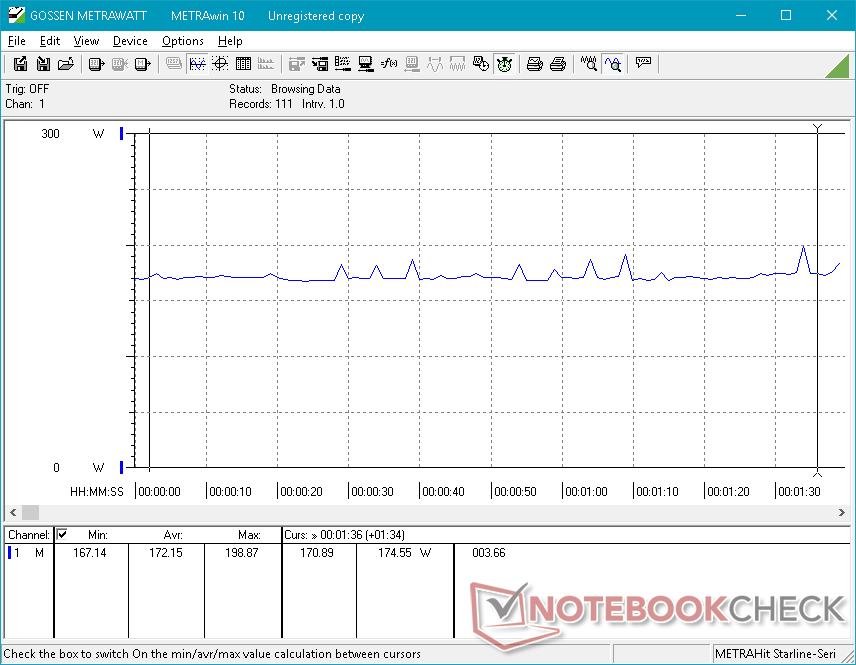
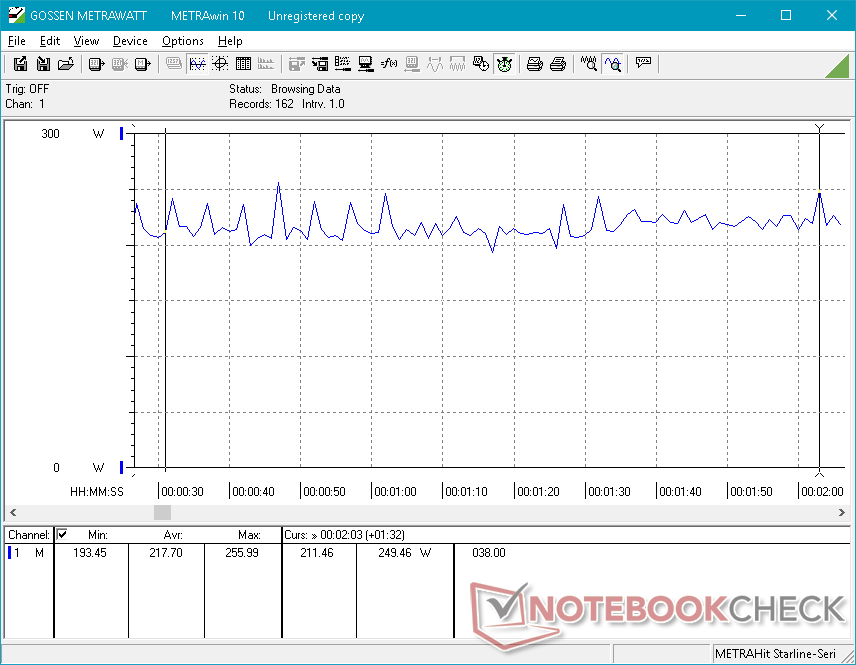
The system will draw anywhere between 30 W and 38 W when idling on desktop depending on the power profile and screen brightness setting. More demanding conditions like gaming will draw about 172 W. Strangely, we cannot record anything higher than about 256 W even when under extreme (Prime95+FurMark) processing load. The system fluctuates between 193 W and 256 W when under extreme loads despite setting the OS and GPU to High Performance mode. We are unsure why the notebook is unable to maintain a stable power consumption when under extreme loads. Fortunately, real-world gaming performance appears to be unaffected.
The large (~20.0 x 10.0 x 4.5 cm) Lite-On external AC adapter is rated for 330 W.
| Off / Standby | |
| Idle | |
| Load |
|
Key:
min: | |
| Eurocom Sky X4C i7-8700K, GeForce GTX 1080 Mobile, Samsung SSD 960 Pro 1TB m.2 NVMe, IPS, 3840x2160, 15.6" | Alienware 15 R3 Max-Q i7-7820HK, GeForce GTX 1080 Max-Q, LiteOn CX2-8B256, IPS, 1920x1080, 15.6" | MSI GT62VR 7RE-223 i7-7700HQ, GeForce GTX 1070 Mobile, Samsung SSD PM871a MZNLN256HMHQ, IPS, 1920x1080, 15.6" | EVGA SC15 i7-7700HQ, GeForce GTX 1060 Mobile, Toshiba NVMe THNSN5256GPU7, , 1920x1080, 15.6" | Alienware 15 R3 i7-7700HQ, GeForce GTX 1070 Mobile, , TN, 1920x1080, 15.6" | Eurocom Tornado F5 Killer Edition i5-7600K, GeForce GTX 1080 Mobile, Samsung SSD 960 Evo 250GB m.2 NVMe, IPS, 3840x2160, 15.6" | |
|---|---|---|---|---|---|---|
| Power Consumption | 18% | 27% | 27% | 28% | -8% | |
| Idle Minimum * (Watt) | 30.2 | 22 27% | 20 34% | 25.8 15% | 19 37% | 28.4 6% |
| Idle Average * (Watt) | 34.7 | 26 25% | 24 31% | 26.6 23% | 23 34% | 32 8% |
| Idle Maximum * (Watt) | 37.8 | 33 13% | 29 23% | 26.7 29% | 29 23% | 33.5 11% |
| Load Average * (Watt) | 130.3 | 86 34% | 82 37% | 80.3 38% | 85 35% | 190.9 -47% |
| Witcher 3 ultra * (Watt) | 172.2 | 159 8% | 121.2 30% | |||
| Load Maximum * (Watt) | 217.7 | 215 1% | 193 11% | 159.3 27% | 192 12% | 259.4 -19% |
* ... smaller is better
Battery Life
Runtimes are poor as expected from a notebook with such powerful components. Users will get just 2.5 hours of real-world WLAN use before automatic shutdown. Gaming notebooks with the more common HQ-class of Intel CPUs and/or Optimus tend to run an hour or two longer than our Eurocom. Unlike most competitors, however, the 82 Wh battery is removable and easily replaceable.
Charging from near empty to full capacity takes about 2 to 2.5 hours with the included AC adapter.
| Eurocom Sky X4C i7-8700K, GeForce GTX 1080 Mobile, 82 Wh | Alienware 15 R3 Max-Q i7-7820HK, GeForce GTX 1080 Max-Q, 99 Wh | MSI GT62VR 7RE-223 i7-7700HQ, GeForce GTX 1070 Mobile, 75 Wh | Asus Strix GL502VS-FY032T 6700HQ, GeForce GTX 1070 Mobile, 62 Wh | EVGA SC15 i7-7700HQ, GeForce GTX 1060 Mobile, 62 Wh | Acer Predator 15 G9-593-751X i7-7700HQ, GeForce GTX 1070 Mobile, 90 Wh | |
|---|---|---|---|---|---|---|
| Battery runtime | 94% | 61% | 12% | 10% | 112% | |
| Reader / Idle (h) | 3 | 7.1 137% | 6.3 110% | 4.1 37% | 3.7 23% | 8.4 180% |
| WiFi v1.3 (h) | 2.6 | 5.4 108% | 4.1 58% | 3.3 27% | 2.8 8% | 5.5 112% |
| Load (h) | 1.4 | 1.9 36% | 1.6 14% | 1 -29% | 1.4 0% | 2 43% |
Pros
Cons
Verdict
The Sky X4C is the most powerful and versatile 15.6-inch notebook available because of its desktop-like upgradeability. Its dual-purpose capabilities for both gamers and professional workstation users and integrated SIM options make it one-of-a-kind in a sea of consumer gaming notebooks. There's no way a major manufacturer like Lenovo, HP, or Dell would ever allow end-users the level of serviceability and customization encouraged by Eurocom and Clevo notebooks in general. This is a notebook for enthusiasts, after all.
As powerful as the Eurocom may be, the Clevo chassis is beginning to show its age in terms of features. G-Sync is limited to certain GPUs and there are no options for 3 ms/144 Hz panels, no touchscreen features, no 10 Gbps RJ-45, and no per-key RGB lighting or dedicated auxiliary keys. Some users may find these missing options to be superfluous, but we expect the kitchen sink and more to be available considering the price of the notebook.
The hardware itself has a few oddities worth mentioning. The rubberized outer lid is a mixed bag because of its attraction to grease and dust while the uneven backlight bleeding is inexcusable for an enthusiast notebook. The glossy-but-grainy 4K UHD panel makes it an unappealing configuration and the power consumption fluctuations when under extreme processing loads has us a bit concerned about the performance of the unit whilst running at 100 percent CPU and GPU utilization for extended periods.
This is the notebook to beat from a pure serviceability and performance perspective. However, there is still a lot of room for improvement regarding features and fan noise.
Eurocom Sky X4C
- 02/11/2018 v6 (old)
Allen Ngo
Price comparison
