AMD Ryzen 7 1700, 1700X & 1800X Review
Introduction
For the original German article, see here.
AMD definitely created the biggest hype of the new year: After years of a niche existence on the market, the new Ryzen CPUs are supposed to be the big deal. Our review shows that the first three processors are actually impressive pieces of hardware, even though we cannot give a blind recommendation for them.
Before we dive into the review, we want to note one thing: Ryzen is a brand-new CPU generation, so both general drivers as well as dedicated software and games in particular still have to be optimized. A couple of weeks after the launch, there should at least be updated BIOS versions by now, but we cannot rule out further performance improvements – AMD already talked about it and individual developers mentioned corresponding patches as well.
Ryzen Overview
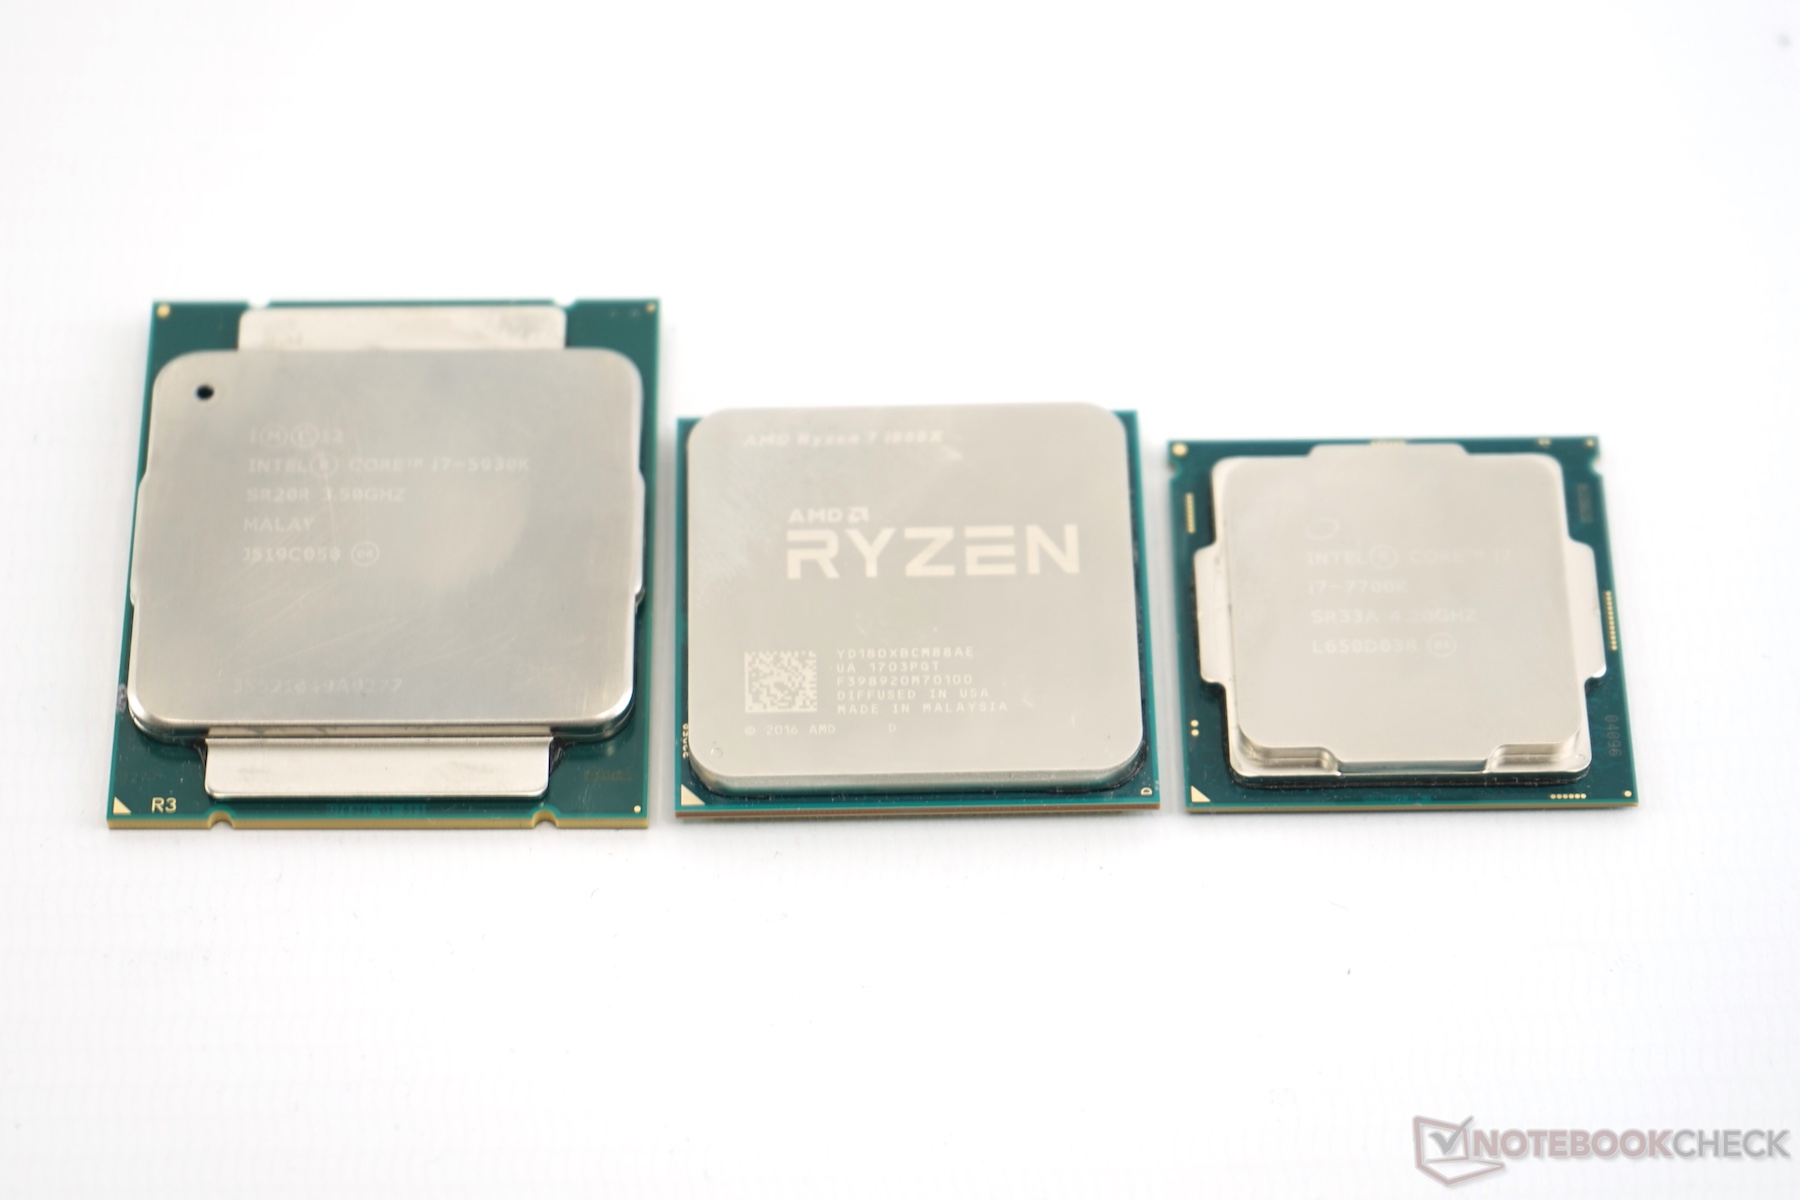
Ryzen is nothing less than a quantum leap for AMD. While the previous generation was still based on outdated 32-nm and 24-nm technology, respectively, the Ryzen CPUs are manufactured in the modern 14-nm-FinFET process. Despite the slightly inferior manufacturing, there is a size advantage of around 10%, which is mainly a result of the physically smaller cache (not in terms of capacity!).
The very challenging decrease of the structural size offers more advantages: You can put more transistors into the same space, both theoretically and in practice, and the efficiency benefits as well.
Zen: AMD's new micro architecture
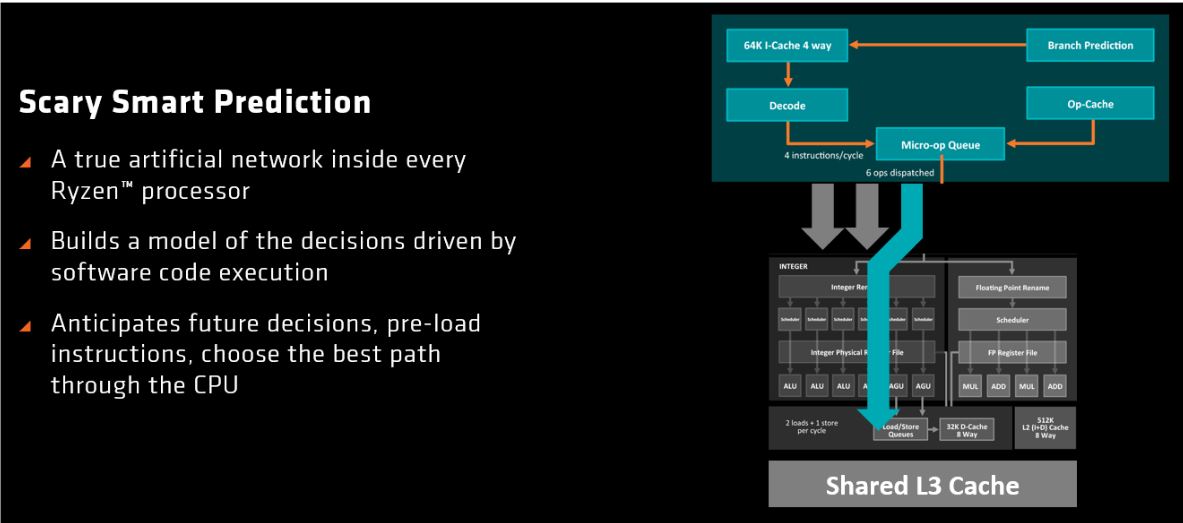
The Ryzen CPUs are the first products from AMD based on the Zen architecture. Zen is the designation of the micro architecture, which describes the basic structure of the individual chip. AMD integrated some typical improvements, but also some real new features. All of this is supposed to result in an IPC (instruction per cycle) improvement of more than 52 percent.
The rather conventional measures to improve the performance include the size increase of several buffers by at least 50%, and some buffer sizes were even doubled compared to the previous generation.
One of the bigger new features is the Micro-op cache, which can store up to 2000 already decodes micro-ops. Besides performance gains, such a cache will also improve efficiency. The competitor Intel already uses this type of cache since Sandy Bridge, which shows that AMD must catch up.
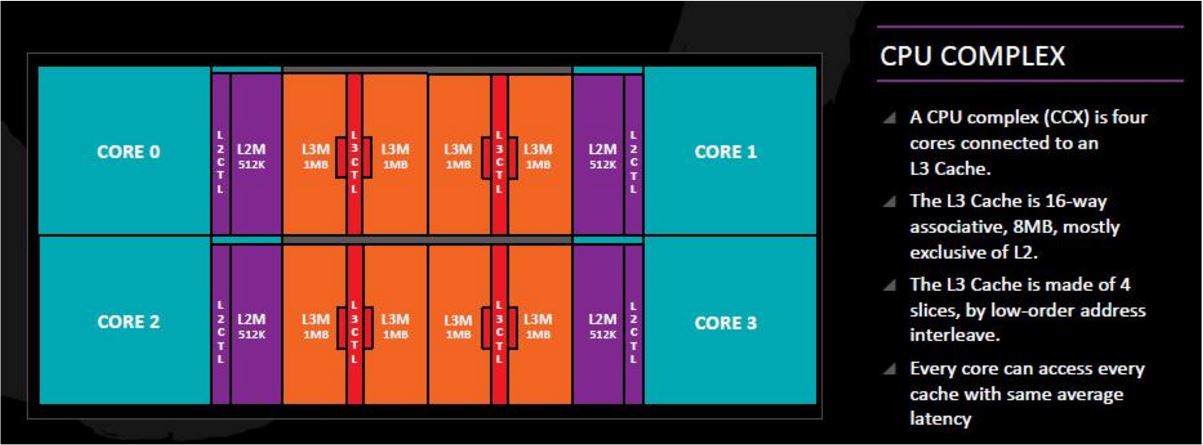
Four individual cores are combined in a so-called CPU Complex, which share 8 MB L3 cache. Despite the internal cache allocation in so called slices, every core is supposed to access every individual cache area with the same latency. The whole buffer is also supposed to run in sync with the highest clocked core.
Ryzen is also AMD first architecture with simultaneous multi-threading. The basic principle is similar to Intel's Hyper Threading: Thanks to a comparatively small number of additional transistors, every core gets a second virtual core, so two threads can be executed simultaneously.
Every logical core gets both exclusive as well as shared units. The resources of the latter are allocated based on special demand-oriented algorithms, which can result in higher single-core performance in single-thread applications compared to a fixed allocation (like 50/50, for example).
Media reports say that according to AMD, about five percent additional transistors can increase the performance in synthetic benchmarks by up to 41%. However, it is also a fact that SMT does not have any advantages when an application cannot really benefit from the high number of eight cores.
AMD also uses the so called "Infinity Fabric" to connect individual functional units on an architectural level, which is supposed to increase the performance. This is also the end of the module design, where the shared floating point unit could become the bottleneck in certain situations.
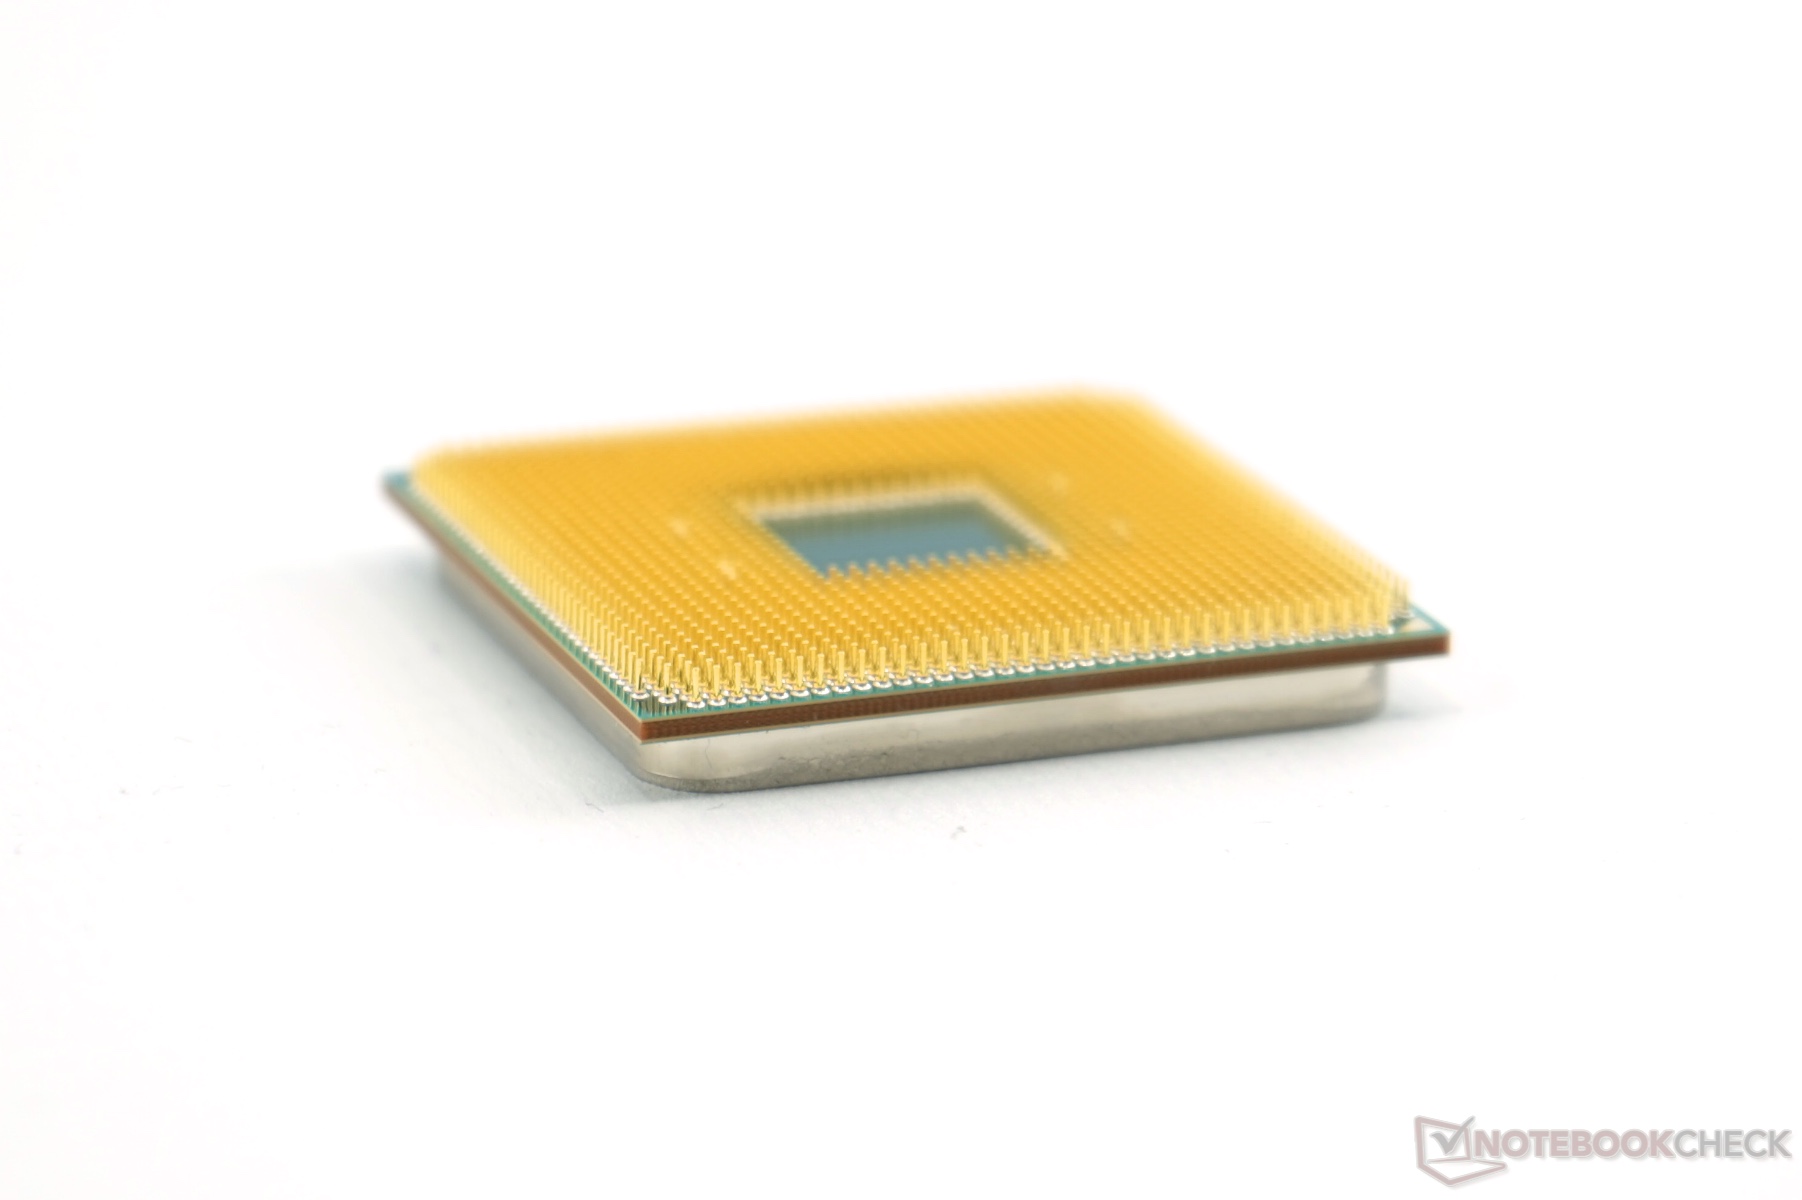
AM4
Ryzen also marks the premiere of the new AM4 mainboards. We will cover them comprehensively in a separate article and only want to focus on the most relevant points here.
Of particular interest is the port situation, because a substantial part of them is provided directly by the processor. You basically get 24 PCIe 3.0 lanes with 16 of them for the graphics card. Four more can be used for fast NVMe-SSDs or two SATA-III ports and one NVMe-SSD with two lanes. These two PCIe lanes from the latter configuration can also be used for something else.
The four remaining lanes are used for the X370, B350 or A320 chipset. This means four lanes can be used for something else on X300 and A300 chipsets, because they are not "real" chipsets in terms of I/O platform, but only accommodates functions like the Trusted Platform Module.
The 1800X provides four USB 3.1 Gen1 ports, the "real" A4 chipsets provide two (X370 and B350) or one (A320) native second generation USB 3.1 port. More information on the port situation is available in the slide from AMD below.
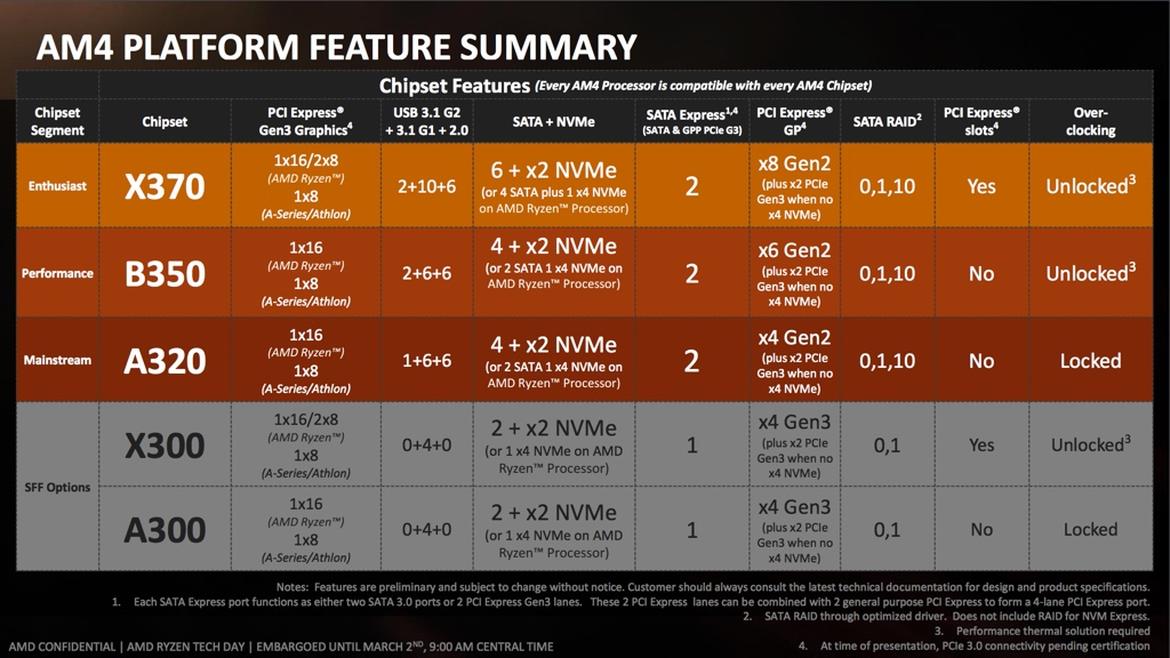
AMD decided to equip all Ryzen CPUs with a free multiplier, so overclocking is easy. However, it is only supported by X370, B350, and X300 – so these are the interesting chipsets for enthusiasts. Multi GPU setups are only supported by the X370 and X300 according to the manufacturer; the B350 is only supposed to support CrossFire, but not SLI.
Another new feature: The AM4 platform uses DDR4, which was introduced in the end of 2015 with Intel's Skylake generation. Advantages are higher (theoretical) clocks and reduced power consumption. Ryzen has some limitations regarding the memory where the internal organization (single/dual rank) has a big influence – but you can only see it in the spec sheet of the RAM module.
Four dual rank modules (up to 64 GB) can reach 1866 MHz, single rank modules 2133 MHz. Two RAM modules on the other hand reach clocks of up to 2400 or 2667 MHz, respectively, so you basically have to choose between capacity and performance – even though 32 GB should not even limit prosumers over the next couple of years, especially since the use of RAM Disk is not as attractive anymore thanks to fast PCIe-SSDs. The potential performance deficit by slower RAM modules is also countered by a larger L3 cache to a certain extent.
We also want to mention that the listed frequencies are the official specifications, all other settings are overclocking and there is no guarantee it will work properly.
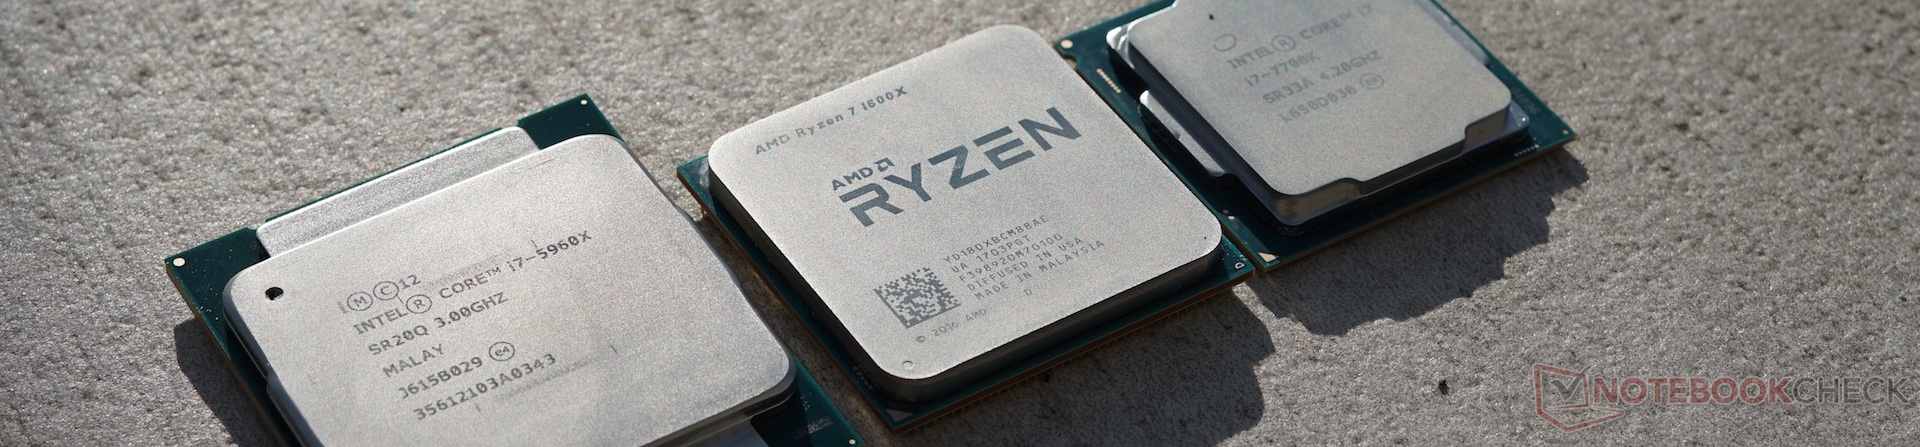
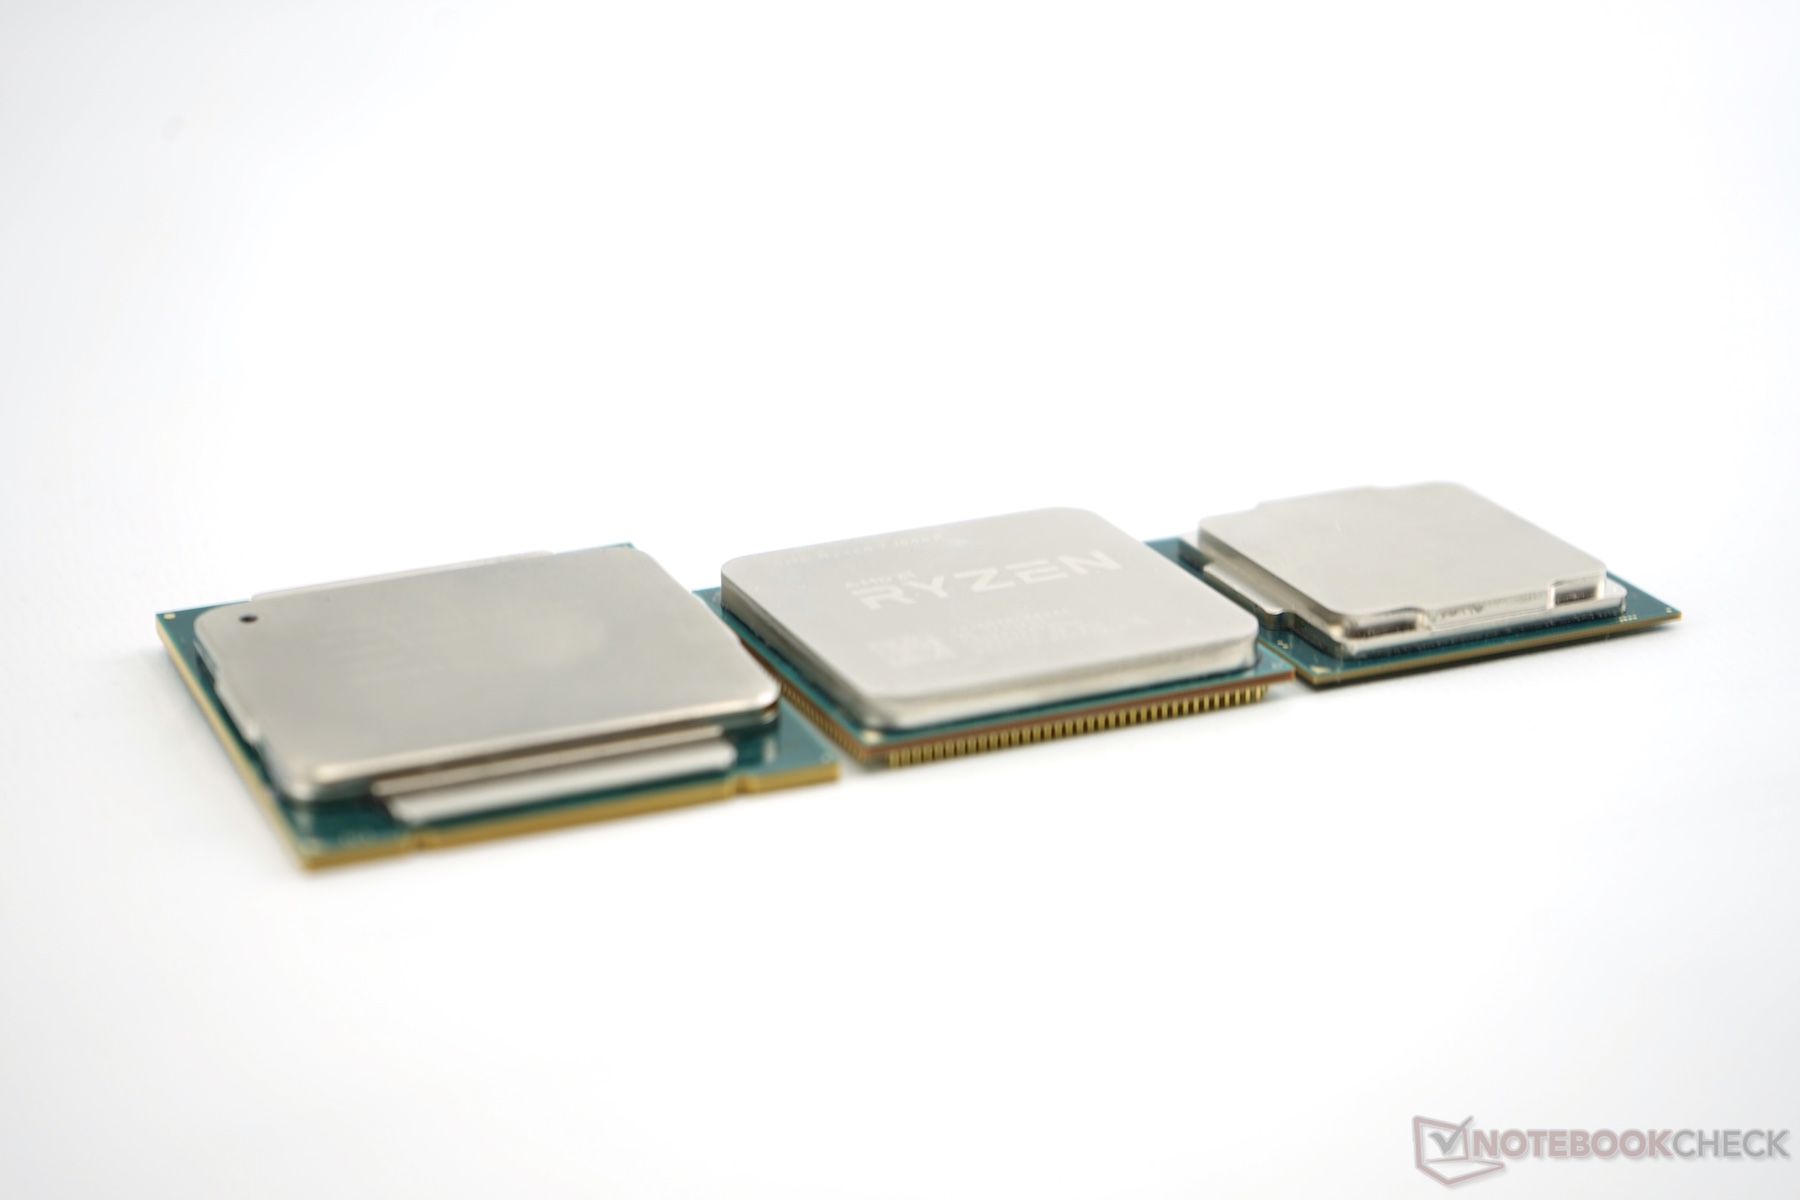
Ryzen 7 1800X, 1700X, and 1700
We had the chance to review all three available Ryzen CPUs very thoroughly. The three models basically only differ in terms of clock and the TDP (thermal design power). We already mentioned that the model without the "X" in the designation only reaches a higher clock of 50 MHz instead of 100 MHz via Extended Frequency Range when the situation requires and the consumption allows it. All models feature eight cores, SMT, and 16 MB L3 cache.
| Model | Cores - Threads | Base frequency | Turbo (1-2 cores) | Turbo (3 and more cores) | XFR overclocking | L3-Cache | TDP | RRP |
| Ryzen R7 1800X | 8 - 16 | 3.6 GHz | 4.0 GHz | 3.7 GHz | 100 MHz | 16 MB | 95 Watts | $499 |
| Ryzen R7 1700X | 8 - 16 | 3.4 GHz | 3.8 GHz | 3.5 GHz | 100 MHz | 16 MB | 95 Watts | $399 |
| Ryzen R7 1700 | 8 - 16 | 3.0 GHz | 3.7 GHz | 3.2 GHz | 50 MHz | 16 MB | 65 Watts | $329 |
Synthetic Benchmarks
Cinebench R15
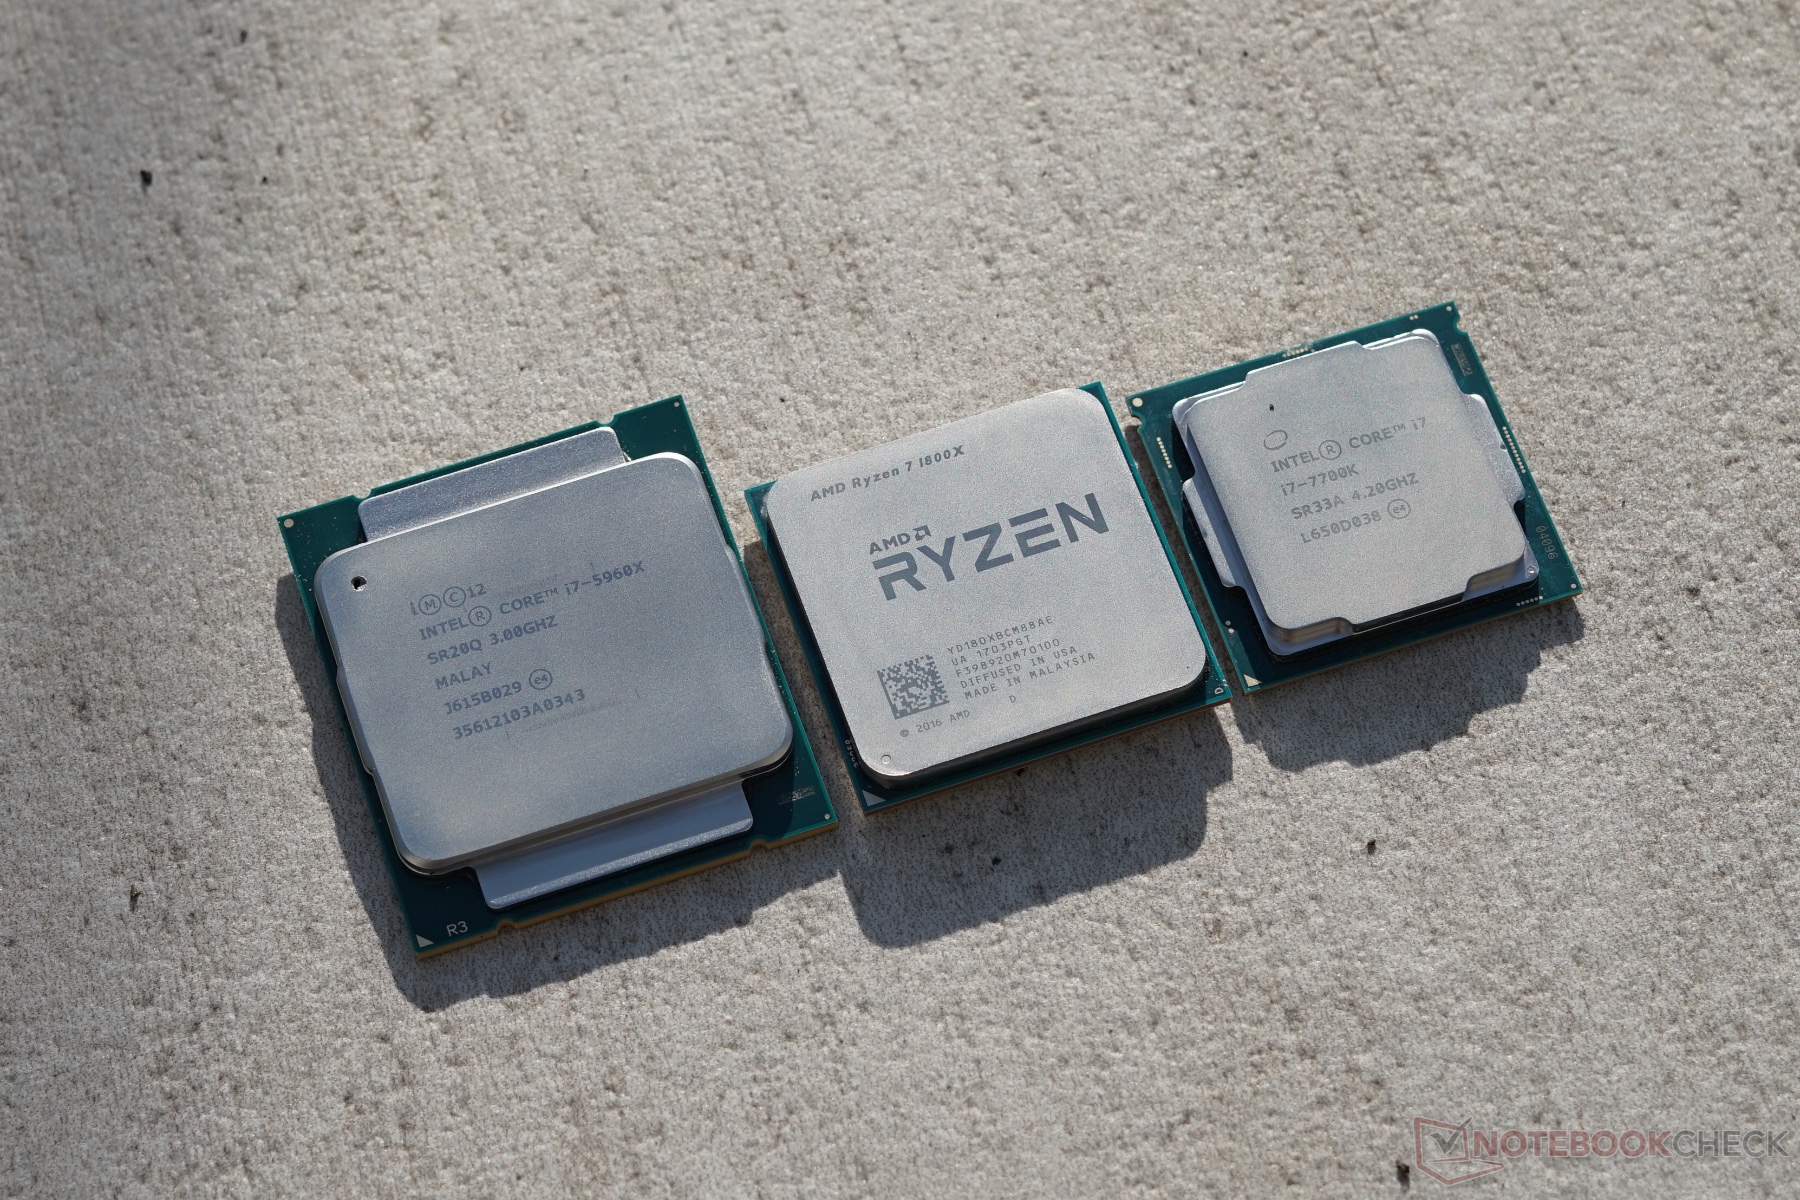
We compare the three AMD CPUs with multiple Intel processors. Cinebench tests both the single-core as well as multi-core performance and benefits from SMT or Hyper Threading, respectively, in multi-threaded applications.
We start with the multi-core performance, where all three Ryzen CPUs clearly beat the desktop competition from Intel we use for the comparisons – the 1800X is more than 50% faster than the Intel Core i7-7700K. Only the extremely expensive server CPUs like the Xeon E5-2697 v2 and E5-2680 v2 can beat Ryzen in this benchmark – but the difference is small.
The single-core performance on the other hand is less convincing: Both the i7-7700T as well as the i7-7700 and i7-7700K are much faster than the current Ryzen models, which can be an issue for Ryzen users in applications that hardly benefit from multiple cores.
The comparison between the single and multi-core performance is also an indicator for the advertised multi-threading: All three processors heavily benefit from SMT; the actual multi-core performance is at least 20% higher than the expected performance for eight cores. At least the Intel rival i7-7700 reaches a lower advantage below 20%. The Ryzen CPUs did not have a problem to sustain the high performance over long periods.
| Cinebench R15 | |
| CPU Single 64Bit | |
| Intel Core i7-7700K | |
| Intel Core i5-7600K | |
| Intel Core i7-6950X | |
| Intel Core i7-6950X | |
| AMD Ryzen 7 1800X | |
| AMD Ryzen 7 1700X | |
| Intel Core i7-7700HQ | |
| AMD Ryzen 7 1700 | |
| Intel Core i7-5960X | |
| Intel Xeon E5-2697 v2 | |
| Intel Xeon E5-2680 v4 | |
| AMD FX-8350 | |
| CPU Multi 64Bit | |
| Intel Core i7-6950X | |
| Intel Xeon E5-2680 v4 | |
| AMD Ryzen 7 1800X | |
| Intel Xeon E5-2697 v2 | |
| AMD Ryzen 7 1700X | |
| AMD Ryzen 7 1700 | |
| Intel Core i7-5960X | |
| Intel Core i7-7700K | |
| Intel Core i7-7700HQ | |
| Intel Core i5-7600K | |
| AMD FX-8350 | |
Truecrypt
This benchmark, which is not completely synthetic, determines the encryption performance of the CPU with the AES, Twofish and Serpent protocol. The 1800X is almost twice as fast as the Core i7-7700K, and the other Ryzen CPUs scale based on the clocks – not a surprise considering the otherwise similar specs. The Core i5-7600K is far behind and the encryption performance is not even 50% of the smallest Ryzen R7 1700.
| Performance rating - Percent | |
| Intel Core i7-6950X | |
| AMD Ryzen 7 1800X -1! | |
| Intel Xeon E5-2697 v2 | |
| Intel Xeon E5-2680 v4 | |
| AMD Ryzen 7 1700X | |
| AMD Ryzen 7 1700 | |
| Intel Core i7-5960X | |
| Intel Core i7-7700K | |
| Intel Core i5-7600K | |
| TrueCrypt | |
| Serpent Mean 100MB | |
| Intel Core i7-6950X | |
| Intel Xeon E5-2697 v2 | |
| AMD Ryzen 7 1700X | |
| Intel Xeon E5-2680 v4 | |
| AMD Ryzen 7 1700 | |
| Intel Core i7-5960X | |
| Intel Core i7-7700K | |
| Intel Core i5-7600K | |
| Twofish Mean 100MB | |
| Intel Core i7-6950X | |
| Intel Xeon E5-2697 v2 | |
| AMD Ryzen 7 1800X | |
| Intel Xeon E5-2680 v4 | |
| AMD Ryzen 7 1700X | |
| AMD Ryzen 7 1700 | |
| Intel Core i7-5960X | |
| Intel Core i7-7700K | |
| Intel Core i5-7600K | |
| AES Mean 100MB | |
| Intel Core i7-6950X | |
| AMD Ryzen 7 1800X | |
| Intel Xeon E5-2680 v4 | |
| Intel Xeon E5-2697 v2 | |
| AMD Ryzen 7 1700X | |
| AMD Ryzen 7 1700 | |
| Intel Core i7-5960X | |
| Intel Core i7-7700K | |
| Intel Core i5-7600K | |
wPrime
wPrime calculates square roots based on the Newton method, so it executes mathematical operations and benefits from multi-threading. The three Ryzen chips once again scale as expected, which can also be said about the difference compared to the Intel competitors i7-7700K and i5-7600K.
| wPrime 2.10 | |
| 1024m | |
| Intel Xeon E5-2697 v2 | |
| Intel Core i5-7600K | |
| Intel Core i7-7700K | |
| AMD Ryzen 7 1700 | |
| Intel Core i7-5960X | |
| AMD Ryzen 7 1700X | |
| AMD Ryzen 7 1800X | |
| Intel Core i7-6950X | |
| 32m | |
| Intel Xeon E5-2697 v2 | |
| Intel Core i5-7600K | |
| AMD Ryzen 7 1700 | |
| AMD Ryzen 7 1700X | |
| Intel Core i7-7700K | |
| AMD Ryzen 7 1800X | |
| Intel Core i7-5960X | |
| Intel Core i7-6950X | |
* ... smaller is better
Other synthetic benchmarks
The older versions of WinRAR and x264 (Avisynth) did not show results that correspond with the performance, so we did evaluate them. At least colleagues that used newer versions of x264 determined good results for Ryzen.
| Geekbench 4.0 | |
| 64 Bit Single-Core Score | |
| Intel Core i7-7700K | |
| Intel Core i5-7600K | |
| AMD Ryzen 7 1800X | |
| Intel Core i7-7700HQ | |
| AMD Ryzen 7 1700 | |
| Intel Core i7-6950X | |
| AMD Ryzen 7 1700X | |
| Intel Core i7-5960X | |
| Intel Xeon E5-2680 v4 | |
| 64 Bit Multi-Core Score | |
| Intel Core i7-6950X | |
| Intel Core i7-5960X | |
| Intel Xeon E5-2680 v4 | |
| AMD Ryzen 7 1800X | |
| AMD Ryzen 7 1700X | |
| AMD Ryzen 7 1700 | |
| Intel Core i7-7700K | |
| Intel Core i5-7600K | |
| Intel Core i7-7700HQ | |
| WinRAR - Result | |
| Intel Core i7-6950X | |
| Intel Xeon E5-2697 v2 | |
| Intel Core i7-5960X | |
| Intel Xeon E5-2680 v4 | |
| Intel Core i7-7700K | |
| AMD Ryzen 7 1800X | |
| Intel Core i5-7600K | |
| AMD Ryzen 7 1700 | |
| AMD Ryzen 7 1700X | |
| X264 HD Benchmark 4.0 | |
| Pass 1 | |
| Intel Core i7-7700K | |
| Intel Core i5-7600K | |
| Intel Core i7-6950X | |
| Intel Core i7-5960X | |
| AMD Ryzen 7 1700X | |
| Intel Xeon E5-2697 v2 | |
| AMD Ryzen 7 1800X | |
| AMD Ryzen 7 1700 | |
| Intel Xeon E5-2680 v4 | |
| Pass 2 | |
| Intel Core i7-6950X | |
| AMD Ryzen 7 1700X | |
| Intel Xeon E5-2697 v2 | |
| Intel Core i7-5960X | |
| Intel Xeon E5-2680 v4 | |
| AMD Ryzen 7 1800X | |
| AMD Ryzen 7 1700 | |
| Intel Core i7-7700K | |
| Intel Core i5-7600K | |
| PCMark 8 | |
| Home Score Accelerated v2 | |
| Intel Core i7-7700K | |
| Intel Core i5-7600K | |
| Intel Core i7-4790K | |
| AMD Ryzen 7 1800X | |
| AMD Ryzen 7 1700X | |
| Intel Core i7-6950X | |
| Intel Core i7-5960X | |
| Intel Core i7-7700HQ | |
| AMD Ryzen 7 1700 | |
| Intel Xeon E5-2697 v2 | |
| Work Score Accelerated v2 | |
| Intel Core i7-7700HQ | |
| Intel Core i7-7700K | |
| AMD Ryzen 7 1800X | |
| Intel Xeon E5-2697 v2 | |
| Intel Core i7-6950X | |
| Intel Core i7-5960X | |
| AMD Ryzen 7 1700 | |
| AMD Ryzen 7 1700X | |
| 3DMark | |
| 1920x1080 Fire Strike Physics | |
| Intel Core i7-6950X | |
| Intel Core i7-5960X | |
| AMD Ryzen 7 1700 | |
| Intel Xeon E5-2697 v2 | |
| Intel Xeon E5-2680 v4 | |
| Intel Core i7-7700K | |
| Intel Core i7-4790K | |
| Intel Core i7-7700HQ | |
| Intel Core i5-7600K | |
| 2560x1440 Time Spy CPU | |
| Intel Core i7-6950X | |
| Intel Xeon E5-2680 v4 | |
| Intel Core i7-5960X | |
| AMD Ryzen 7 1700 | |
| Intel Core i7-7700K | |
| Intel Core i7-4790K | |
| Intel Core i7-7700HQ | |
| Intel Core i5-7600K | |
| 3DMark 11 - 1280x720 Performance Physics | |
| Intel Core i7-6950X | |
| Intel Core i7-5960X | |
| Intel Xeon E5-2697 v2 | |
| Intel Xeon E5-2680 v4 | |
| AMD Ryzen 7 1700 | |
| Intel Core i7-7700K | |
| Intel Core i7-4790K | |
| Intel Core i7-7700HQ | |
| 3DMark 06 - CPU - CPU Score | |
| Intel Core i7-6950X | |
| Intel Core i7-7700K | |
| Intel Core i7-5960X | |
| AMD Ryzen 7 1700X | |
| Intel Xeon E5-2697 v2 | |
| Intel Core i5-7600K | |
| AMD Ryzen 7 1800X | |
| Intel Xeon E5-2680 v4 | |
| Intel Core i7-7700HQ | |
| AMD Ryzen 7 1700 | |
Gaming Benchmarks
Test system
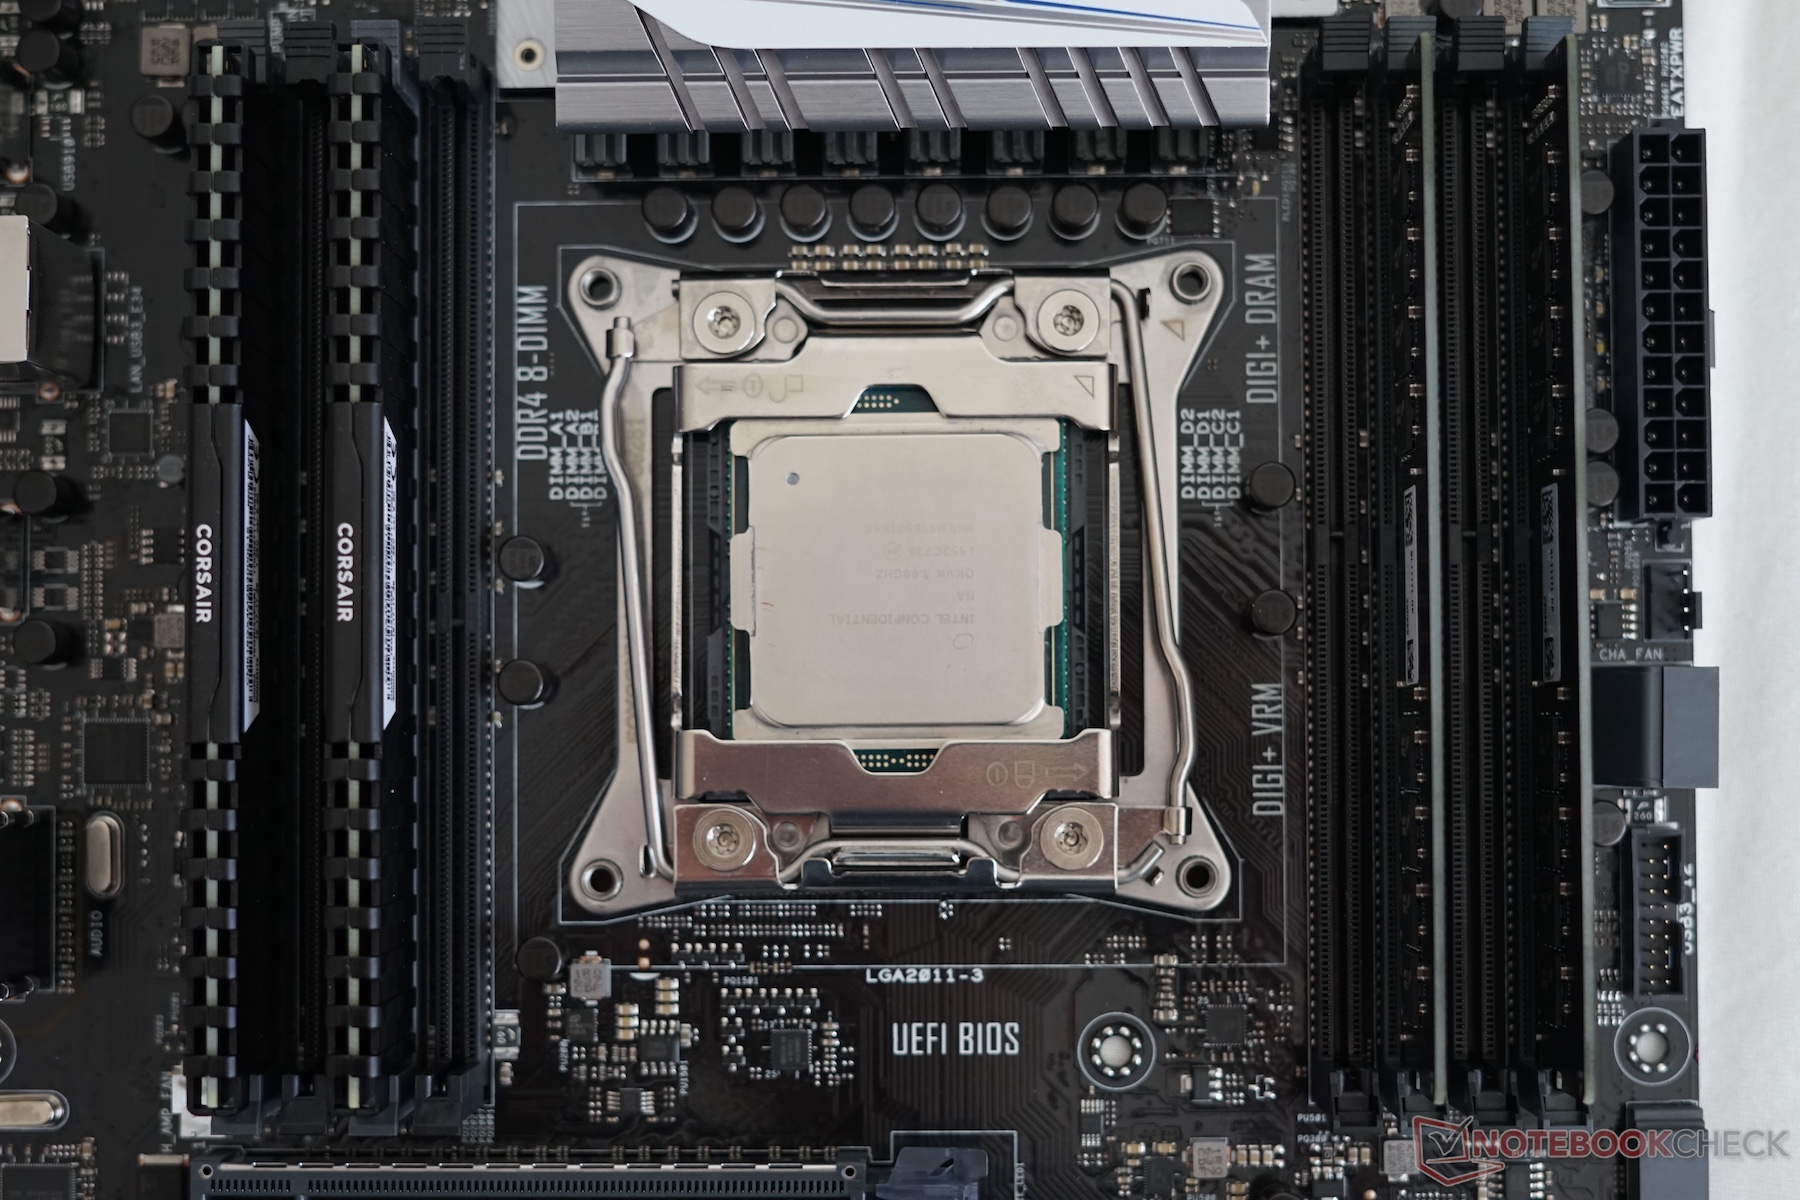
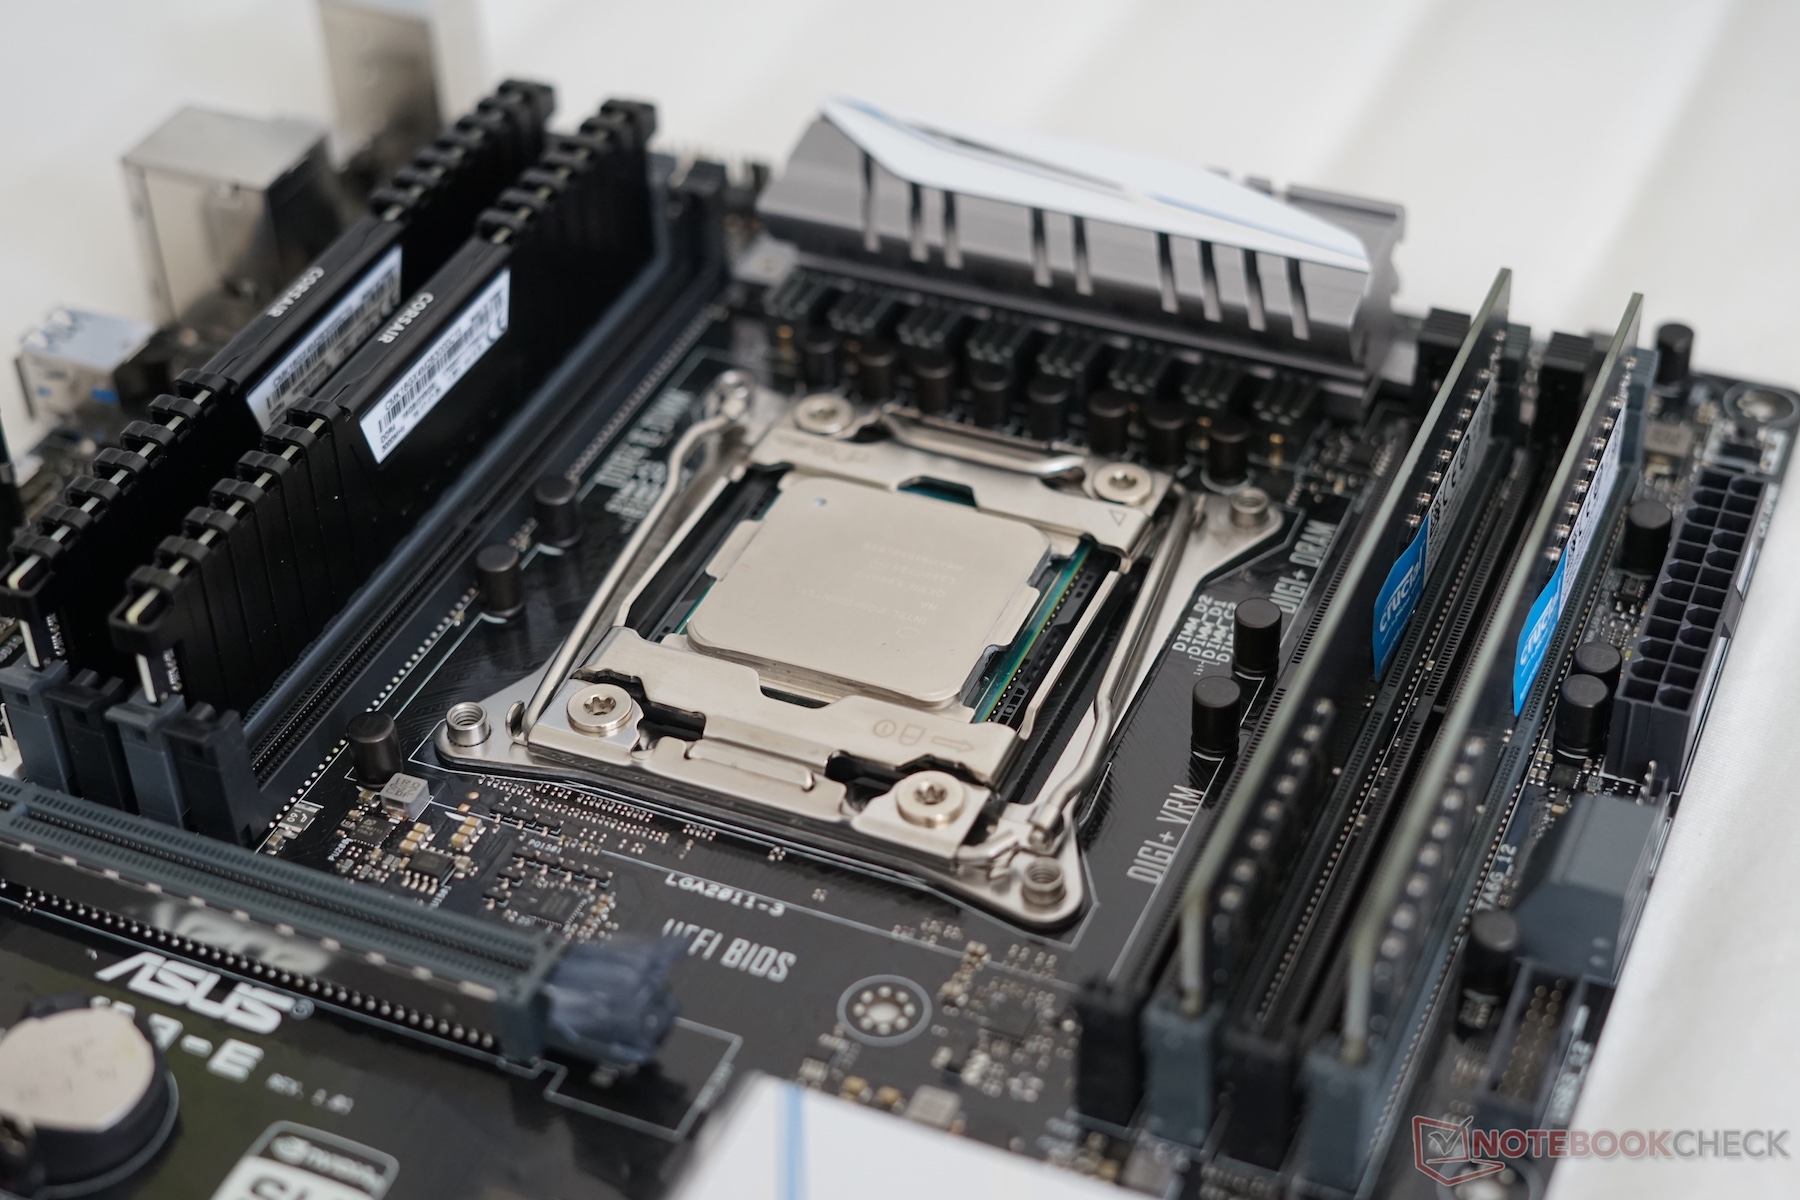
All the three tested CPUs are high-end models, so a powerful graphics card is required for good test results. We use the Nvidia GeForce GTX 1080 Ti, which is currently the fastest GPU and test different resolution as well as settings to show the raw CPU performance as well as the practical performance. We use the mainboards Asus Crosshair VI Hero for the Ryzen CPUs, the Asus Z97-Deluxe for the i7-4970K, the Asus X99-E for the socket 2011 CPUs and the Gigabyte Z270-Gaming K3 for the Kaby Lake desktop processors. 2x 8 GB DDR4-3000 RAM modules are provided by Corsair (Intel at 2133 MHz) or Crucial, respectively (also all four for the 2011 mainboard). The operating system is stored on a Samsung 840 Pro 250 GB; games on a Toshiba OCZ SSD.
Frame Rates
The 1800X, 1700X, and 1700 are competing with the i7-7700K and i5-7600K, which provide a significantly higher single-core performance compared to their AMD counterparts. We also recorded the frame time while playing The Witcher 3, where we compared the results with the Core i7-4790K and the i7-7700K.
The first and at the same time most important result: SMT cannot always improve the performance. Deus Ex: Mankind Divided, For Honor, and Farming Simulator 2017 run at a lower FPS number when we activate the Hyper Threading counterpart. This might sound like a small issue, but it is actually a problem: You can only deactivate SMT in the BIOS, which will be annoying for enthusiasts.
It is possible that the SMT performance will be improved by patches, but you should not take that as granted. New titles should probably benefit from SMT, so Ryzen can be seen as an investment for the future. Whether the performance decrease with active SMT is actually relevant in practice will also depend on the graphics card. Deus Ex: Mankind Divided, for example, is already limited by the extremely powerful 1080 Ti with the Ultra preset and Full-HD resolution.
We are not always impressed by the three Ryzen CPUs in the direct comparison with the Intel Core i7-7700K. Even the R7 1800X (without SMT) is clearly beaten (25%) by the much less expensive Intel competitor in Deus Ex: Mankind Divided.
The performances start to level off in the highest settings or the 4K resolution, respectively, due to the GPU limitation. The difference between the three Ryzen models is almost negligible in this benchmark; we can only see up to 5% between the 1800X and 1700.
However, the results are poor with active SMT, where the Intel i7-7700K can be up to 59% faster than the AMD 1800X.
We can see similar results in For Honor and Farming Simulator 2017: The Intel CPU can clearly beat the R7 1800X, even though the difference (8%) is much smaller compared to For Honor – where we can see 30% (without SMT) at low settings. Those settings are mostly irrelevant for practice, but show the CPU performance. The performance deficit caused by SMT is the smallest in Farming Simulator 2017, but it is still significant. The situation is similar for the i5-7600K, which can already beat the AMD competition in every single benchmark, although the differences are smaller. The gaming benchmarks completely reverse the advertised performance ratio by AMD: The Kaby Lake processor beats the Ryzen competition, which is twice as expensive.
| Farming Simulator 17 - 3840x2160 High Preset AA:2xMS AF:2x | |
| Intel Core i7-6950X | |
| Intel Core i5-7600K | |
| Intel Core i7-4790K | |
| Intel Core i7-7700K | |
| Intel Core i7-5960X | |
| AMD Ryzen 7 1800X | |
| AMD Ryzen 7 1800X | |
| Intel Xeon E5-2680 v4 | |
| AMD Ryzen 7 1700 | |
| AMD Ryzen 7 1700 | |
| AMD Ryzen 7 1700X | |
| The Witcher 3 | |
| 1920x1080 Ultra Graphics & Postprocessing (HBAO+) | |
| Intel Core i7-7700K | |
| AMD Ryzen 7 1800X | |
| Intel Core i7-6950X | |
| Intel Core i7-4790K | |
| AMD Ryzen 7 1700 | |
| AMD Ryzen 7 1700X | |
| Intel Xeon E5-2680 v4 | |
| 1024x768 Low Graphics & Postprocessing | |
| Intel Core i7-4790K | |
| Intel Core i7-6950X | |
| Intel Core i7-7700K | |
| AMD Ryzen 7 1800X | |
| Intel Xeon E5-2680 v4 | |
| AMD Ryzen 7 1700 | |
| AMD Ryzen 7 1700X | |
| For Honor | |
| 3840x2160 High Preset AA:T AF:8x | |
| Intel Xeon E5-2680 v4 | |
| Intel Core i7-7700K | |
| AMD Ryzen 7 1700X | |
| AMD Ryzen 7 1800X | |
| Intel Core i7-6950X | |
| Intel Core i5-7600K | |
| AMD Ryzen 7 1700 | |
| Intel Core i7-4790K | |
| Intel Core i7-5960X | |
| 1280x720 Low Preset | |
| Intel Core i7-7700K | |
| Intel Core i7-4790K | |
| Intel Core i5-7600K | |
| AMD Ryzen 7 1800X | |
| AMD Ryzen 7 1800X | |
| Intel Xeon E5-2680 v4 | |
| Intel Core i7-5960X | |
| AMD Ryzen 7 1700 | |
| AMD Ryzen 7 1700X | |
| Intel Core i7-6950X | |
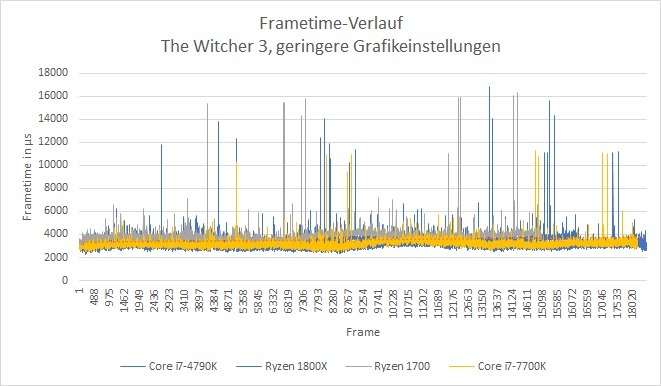
Frame Times
The evaluation of the actual gaming performance definitely requires information about the course of the frame rate. While the number of minimum, maximum, and average FPS already indicates the performance, only an accurate frame time graph gives data about the consistency.
Because: A heavily fluctuating can be perceived as jerky. Such micro stutters can affect the gaming experience compared to a lower, but also more stable frame rate, although the variation always has to be put in perspective compared to the frame rate of the outlier. Example: A drop from 100 to 50 FPS is not as bad as the drop from 50 to 25 FPS, for example.
To eliminate a GPU limitation, we use a benchmark with low graphics settings (The Witcher 3). We have a look at the number of "outliers", which deviate from the median by a certain percentage.
The two Intel processors perform significantly better when we look at the variation: The deviation is around 330% (Core i7-4790K)) or 280% (Core i7-7700K), respectively. The high-end Ryzen CPU has a variation of 400%; the R7 1700 performs much better at 280%. The R7 1700, however, has much more outliers at Ultra settings, but we cannot rule out a limitation by the graphics card.
All four tested CPUs are sometimes on par in terms of outliers, but the Intel CPUs eventually have an advantage. especially compared to the R7 1700, where 0.053% of all frames are at least 300% slower than the average, which is also clearly visible in the diagram. This means the AMD chips provide a less "smooth" experience in this benchmark. However, we once again want to mention the GPU limitation, which is much more common in practice.
| Model | Core i7-4790K | Ryzen R7 1800X | Ryzen R7 1700 | Core i7-7700K |
| Frame times (median, in µs) | 3084 | 3525 | 3823 | 3169 |
| Deviating by at least 20% | 2.711% | 0.473% | 1.129% | 1.555% |
| Deviating by at least 50% | 0.276% | 0.141% | 0.213% | 0.187% |
| Deviating by at least 100% | 0.049% | 0.068% | 0.066% | 0.049% |
| Deviating by at least 300% | 0.005% | 0.018% | 0.053% | 0.000% |
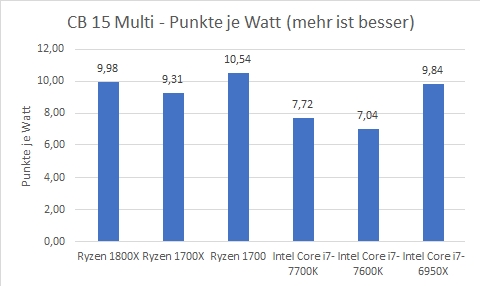
Efficiency
We use The Witcher 3 and Cinebench R15 to check the efficiency of the processors compared to Intel's Core i7-7700K and i5-7600K.
The Ryzen CPUs are much more efficient in Cinebench R15 (Multi) and manage disproportionately higher performance scores based on the lower power consumption. The advantage over the i7-7700K is at least 20%. The most efficient chip is the Ryzen 7, closely followed by the 1800X.
The situation is not as drastic in The Witcher 3 with the Ultra preset and Full HD, but the i7-7700K is actually 6% more efficient than the Ryzen competition. The order between the R7 processor is identical to the Cinebench run.
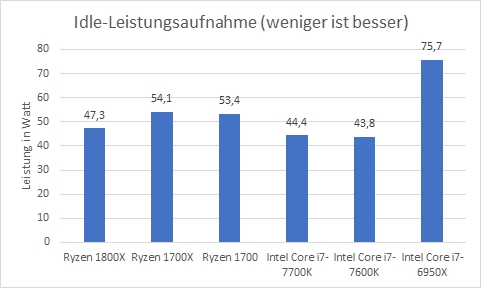
Both the i7-7700K as well as the i5-7600K are more efficient while idling, but the measuring uncertainty is significantly higher in this case due to different mainboards and the test method – it is therefore hard to quantify how much of the advantage (up to 30%) you will actually see in practice. One noticeable aspect is the sometimes much higher idle consumption when SMT is turned off.
Overclocking
We reached a stable frequency of 3.9 GHz for the 1700X (without voltage increase) in a short overclocking attempt. The Cinebench R15 Multi score of 1680 points is 9.4% better. Another 100 MHz resulted in an 11.3% higher score, but the processor was not running properly with a voltage increase.
Verdict
It is certainly not an easy task to classify the Ryzen CPUs. The octa-core chips convince with dream results in the synthetic benchmarks and even beat much more expensive rivals with ease.
However, we cannot give a full recommendation, because the CPUs cannot utilize their full potential in applications. This might be a result of missing optimizations, but potential buyers are interested in the actual performance, which is often sobering – and the 1800X is a CPU for more than 500 Euros. You could actually get a mainboard including gaming-capable CPU and GPU for this price.
Based on our experiences with the quad-core processors, it might not be the best idea to wait for optimizations, either: It usually takes a couple of years until the majority of applications is optimized for a higher number of cores. The small R7 1700 is quite powerful though when this is the case.
The three Ryzen CPUs are therefore more of an investment for the future than the best option right now. We cannot say when the investment will pay off; the i7-7700K, for example, is simply the significantly better processor for gaming.
Users that need multi-core performance for specifically optimized software will probably decide based on specific benchmarks – but the Ryzen CPUs should be quite convincing in professional environments.
Gamers that are currently looking for a fast CPU for their very powerful graphics cards, are better off with Intel chips right now. If you just want something "new", you should still wait and see how the current Ryzen problem (Core Parking) and the driver situation will develop.
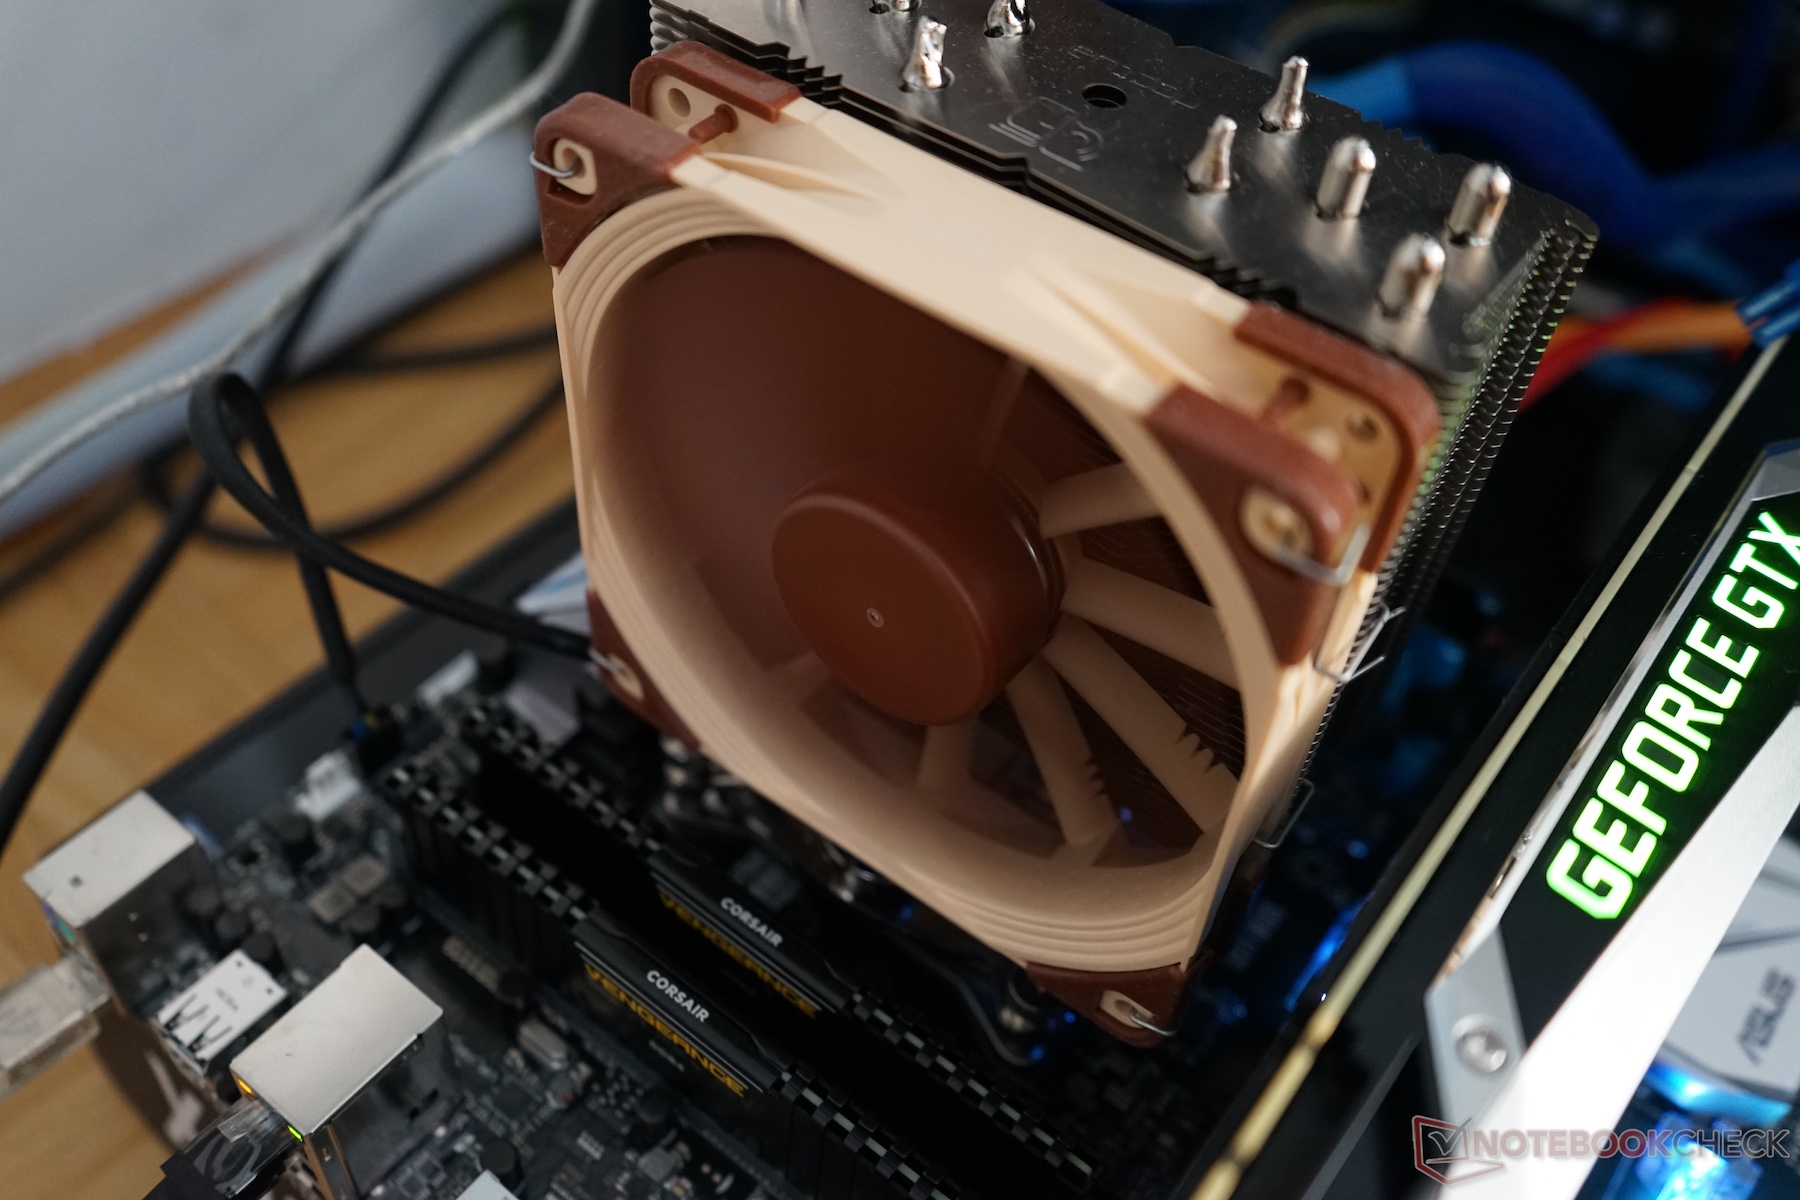
The Ryzen R7 1700 leaves the best impression from the three new CPUs. It is also pretty easy to overclock based on our experiences and user reports thanks to the free multiplier. If you invest a small part of the saved money for a powerful cooler, the 1700 can easily keep up with the R7 1800X.
Test Samples
Most of the test samples for this review were provided by AMD (Ryzen CPUs, Asus mainboard, memory kit, Noctua cooler). Intel provided the Core i7-6950X and i7-5960X, while the X99-E Mainboard was a courtesy of Asus. Noctua provided the NH-U12S cooler for AMD AM4 and the X99 mainboard. We also want to thank the company PCO Computer-Handels-GmbH, which provided Core i7-7700K, 7600K, memory kit, and Gigabyte mainboard (available in the online shop).