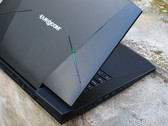
Intel Core i7-8700K
The Intel Core i7-8700K is a high-end desktop processor with six cores based on the Coffee Lake architecture and was announced in September 2017. The processor clocks at between 3.7 and 4.7 GHz and can execute up to twelve threads simultaneously thanks to Hyper-Threading. According to Intel, the CPU is manufactured in an improved 14nm (14nm++) process. The i7-8700K is comparatively easy to overclock thanks to the unlocked multiplier.
Performance
Due to the two additional cores, performance has increased by almost 50% compared to the Core i7-7700K when all cores are in use. Single-core performance has not improved since its Kaby Lake predecessor. As a high-end model, the i7-8700K is suitable for the most demanding applications and games.
Graphics
The integrated Intel UHD Graphics 630 iGPU is supposed to offer higher performance as its clock rate has been increased by 50 MHz. The build is identical to that of the Intel HD Graphics 630 . We do expect a performance improvement, but as a low-end solution it will probably only display current games smoothly at reduced details - if at all.
Power Consumption
Intel specifies the TDP with 95 watts. Therefore, well-dimensioned cooling systems should easily manage to deal with the created heat. We expect increased efficiency due to the higher performance.
Series Intel Coffee Lake Codename Coffee Lake-S Series: Coffee Lake Coffee Lake-S Clock Rate 3700 - 4700 MHz Level 1 Cache 384 KB Level 2 Cache 1.5 MB Level 3 Cache 12 MB Number of Cores / Threads 6 / 12 Power Consumption (TDP = Thermal Design Power) 95 Watt Manufacturing Technology 14 nm Socket FCLGA1151 Features Dual-Channel DDR3(L)-1600/DDR4-2666 Memory Controller, HyperThreading, AVX, AVX2, AES-NI, TSX-NI, Quick Sync, Virtualization, vPro GPU Intel UHD Graphics 630 (350 - 1200 MHz)64 Bit 64 Bit support Architecture x86 Starting Price $359 U.S. Announcement Date 01/05/2017 Product Link (external) Intel Coffee Lake i7-8700K
Benchmarks Cinebench R15 - Cinebench R15 CPU Multi 64 Bit
min: 1323 avg: 1374 median: 1362 (30%) max: 1422 Points
...
...
0 10 20 30 40 50 60 70 80 90 100 110 120 130 140 150 160 170 180 190 200 210 220 230 240 250 260 270 280 290 300 310 320 330 340 350 360 370 380 390 400 410 420 430 440 450 460 470 480 490 500 510 520 530 540 550 560 570 580 590 600 610 620 630 640 650 660 670 680 690 700 710 720 730 740 750 760 770 780 790 800 810 820 830 840 850 860 870 880 890 900 910 920 930 940 950 960 970 980 990 1000 1010 1020 1030 1040 1050 1060 1070 1080 1090 1100 1110 1120 1130 1140 1150 1160 1170 1180 1190 1200 1210 1220 1230 1240 1250 1260 1270 1280 1290 1300 1310 1320 1330 1340 1350 1360 1370 1380 1390 1400 1410 Tooltip Intel Core i7-8700K, AMD Radeon RX Vega 64 : Ø1334 (1317.87-1347.85)
no name : Ø1392 (1375.04-1405.28)
Cinebench R15 - Cinebench R15 CPU Single 64 Bit
min: 187 avg: 192 median: 192 (71%) max: 199 Points
...
...
Cinebench R11.5 - Cinebench R11.5 CPU Multi 64 Bit
min: 13.61 avg: 14.8 median: 15 (30%) max: 15.64 Points
...
...
Cinebench R11.5 - Cinebench R11.5 CPU Single 64 Bit
min: 2.11 avg: 2.2 median: 2.2 (70%) max: 2.27 Points
...
...
Cinebench R10 - Cinebench R10 Rend. Single (32bit)
min: 7130 avg: 7302 median: 7328 (65%) max: 7423 points
...
...
Cinebench R10 - Cinebench R10 Rend. Multi (32bit)
min: 36392 avg: 38552 median: 39096 (66%) max: 39624 points
...
...
Cinebench R10 - Cinebench R10 Rend. Multi (64bit)
46535 Points (44%)
Intel Core i7-8700K, AMD Radeon RX Vega 64 RX Vega 64 16384 MB 1630 / MHz 8192MB 46535
...
...
Cinebench R10 - Cinebench R10 Rend. Single (64bit)
9303 Points (70%)
Intel Core i7-8700K, AMD Radeon RX Vega 64 RX Vega 64 16384 MB 1630 / MHz 8192MB 9303
...
...
wPrime 2.10 - wPrime 2.0 1024m *
min: 116.591 avg: 121 median: 118.9 (1%) max: 129.095 s
...
...
VIA C3-M C3-M-1200 6892%
wPrime 2.10 - wPrime 2.0 32m *
min: 4 avg: 4.5 median: 4.2 (1%) max: 5.341 s
...
...
min: 7032 avg: 7196 median: 7120 (46%) max: 7435 points
...
...
X264 HD Benchmark 4.0 - x264 Pass 2
min: 82.1 avg: 85.6 median: 87.2 (39%) max: 87.4 fps
Intel Pentium 4 2.4 GHz -98%
...
...
X264 HD Benchmark 4.0 - x264 Pass 1
min: 230 avg: 232 median: 232 (68%) max: 233 fps
...
...
HWBOT x265 Benchmark v2.2 - HWBOT x265 4k Preset
10.8 fps (34%)
Intel Core i7-8700K, AMD Radeon RX Vega 64 RX Vega 64 16384 MB 1630 / MHz 8192MB 10.8
...
...
0 10 20 Tooltip Intel Core i7-8700K, AMD Radeon RX Vega 64 : Ø11.2 (1.09-18.5)
TrueCrypt - TrueCrypt Serpent
min: 0.668 avg: 0.8 median: 0.8 (33%) max: 0.796 GB/s
...
...
TrueCrypt - TrueCrypt Twofish
min: 1 avg: 1.3 median: 1.4 (38%) max: 1.4 GB/s
...
...
TrueCrypt - TrueCrypt AES
min: 4.9 avg: 7.3 median: 8 (30%) max: 8 GB/s
...
...
Blender 2.79 - Blender 2.79 BMW27 CPU *
min: 312 avg: 333 median: 332.8 (2%) max: 353.5 Seconds
...
...
3DMark 06 - CPU - 3DMark 06 - CPU
min: 11599 avg: 11729 median: 11701 (65%) max: 11886 Points
...
...
Super Pi mod 1.5 XS 1M - Super Pi mod 1.5 XS 1M *
min: 7.545 avg: 8 median: 8 (2%) max: 8.329 s
...
...
VIA C3-M C3-M-1200 5695%
Super Pi mod 1.5 XS 2M - Super Pi mod 1.5 XS 2M *
min: 16.73 avg: 17.8 median: 17.8 (1%) max: 18.768 s
...
...
Super Pi Mod 1.5 XS 32M - Super Pi mod 1.5 XS 32M *
min: 413.791 avg: 443 median: 442.8 (2%) max: 465.128 s
...
...
VIA C3-M C3-M-1200 4982%
3DMark 11 - 3DM11 Performance Physics
min: 13293 avg: 14460 median: 14766 (54%) max: 15013 Points
...
...
3DMark - 3DMark Ice Storm Physics
min: 63878 avg: 64781 median: 64445 (41%) max: 66020 Points
...
...
3DMark - 3DMark Ice Storm Extreme Physics
min: 63734 avg: 64731 median: 64316 (68%) max: 66143 Points
...
...
3DMark - 3DMark Ice Storm Unlimited Physics
min: 63328 avg: 65156 median: 65451.5 (68%) max: 66393 Points
...
...
3DMark - 3DMark Cloud Gate Physics
min: 12363 avg: 12530 median: 12521 (32%) max: 12713 Points
...
...
3DMark - 3DMark Fire Strike Standard Physics
min: 18221 avg: 18728 median: 18574 (47%) max: 19358 Points
...
...
3DMark - 3DMark Time Spy CPU
min: 6578 avg: 7256 median: 7255.5 (50%) max: 7933 Points
...
...
Geekbench 3 - Geekbench 3 64 Bit Multi-Core
25920 points (41%)
...
Geekbench 3 - Geekbench 3 64 Bit Single-Core
4914 points (100%)
...
Geekbench 4.0 - Geekbench 4.0 64 Bit Single-Core
min: 5738 avg: 5754 median: 5754 (89%) max: 5770 points
...
Geekbench 4.0 - Geekbench 4.0 64 Bit Multi-Core
min: 23187 avg: 23209 median: 23208.5 (57%) max: 23230 points
...
...
Geekbench 4.1 - 4.4 - Geekbench 4.1 - 4.4 64 Bit Single-Core
min: 5760 avg: 5827 median: 5783 (79%) max: 5937 points
...
...
Geekbench 4.1 - 4.4 - Geekbench 4.1 - 4.4 64 Bit Multi-Core
min: 24546 avg: 24938 median: 25045 (40%) max: 25223 points
...
...
Mozilla Kraken 1.1 - Kraken 1.1 Total Score *
753 ms (1%)
...
...
Sunspider - Sunspider 1.0 Total Score *
min: 52.2 avg: 55.8 median: 55.8 (1%) max: 59.3 ms
...
Octane V2 - Octane V2 Total Score
min: 45565 avg: 47064 median: 47063.5 (70%) max: 48562 Points
...
...
Power Consumption - Prime95 Power Consumption - external Monitor *
min: 142.7 avg: 149 median: 149.4 (40%) max: 156 Watt
...
...
Power Consumption - Cinebench R15 Multi Power Consumption - external Monitor *
min: 134.3 avg: 143 median: 143.2 (38%) max: 152 Watt
...
...
- Range of benchmark values for this graphics card
- Average benchmark values for this graphics card
* Smaller numbers mean a higher performance