Reviews for the Intel Core i5-9300H processor
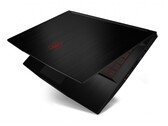
MSI GF63 Thin 9SC Laptop Review: Lightweight gamer for just under $1000
While budget gaming notebooks often have difficulties displaying current games at maximum details, the price-to-performance ratio is good in most cases. MSI's GF63 Thin 9SC is a fairly affordable representative of this species.
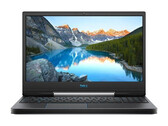
Intel Core i5-9300H, NVIDIA GeForce GTX 1650 Max-Q, 15.6", 1.8 kgDell G5 15 5590 Laptop Review: Price/Performance King and Problem Child
With the G5 15 5590-PCNJJ, Dell has a gaming laptop with a Core i5-9300H CPU and a GeForce GTX 1650 GPU on offer at a very attractive price point. In this review, we are going to take a closer look at the strengths and weaknesses of the 15-inch device.
Intel Core i5-9300H, NVIDIA GeForce GTX 1650 Mobile, 15.6", 2.7 kgDell G3 15 3590 Laptop Review: Inexpensive with Easy Upgrades
The G3 series is home to Dell's most affordable lineup of entry-level gaming laptops. This latest iteration gets the job done well for the price even if it doesn't do very much to buck the trend commonly associated with budget gaming machines.
Intel Core i5-9300H, NVIDIA GeForce GTX 1650 Mobile, 15.6", 2.5 kgLenovo IdeaPad L340 Gaming laptop review: Stiff ClickPad impacts gaming fun
Lenovo has polished the chassis of the V155 a bit and put cheap, but also game-ready hardware into the 15-inch case. The result is the IdeaPad L340 Gaming, which has a price of less than 800 Euros (~$872). Of course, there is no high-end gaming here. In our review, we will show exactly where compromises need to be made.
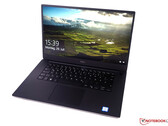
Intel Core i5-9300H, NVIDIA GeForce GTX 1650 Mobile, 15.6", 2.1 kgDell XPS 15 7590 Laptop Review: Is the base model with Core i5 and FHD panel sufficient?
Dell is one of the few manufacturers that also offers its 15-inch premium notebook without a dedicated graphics card. Is the version with the integrated GPU perhaps even the better choice if you don't want to use your laptop for gaming?
Intel Core i5-9300H, UHD Graphics 630, 15.6", 1.9 kgAcer Aspire 7 A715-74G-50U5: NVIDIA GeForce GTX 1650 Mobile, 15.60", 2.4 kg
Review » Aspire 7 A715 Laptop Review: Acer's upgrade giant with gaming potential and long battery life
Lenovo Ideapad L340-17IRH 81LL001YGE: NVIDIA GeForce GTX 1650 Mobile, 17.30", 2.5 kg
Review » Lenovo IdeaPad L340-17IRH Review: The well-rounded mid-range gaming notebook is unable to reach its full performance potential
Lenovo Legion Y540-17IRH: NVIDIA GeForce GTX 1660 Ti Mobile, 17.30", 2.8 kg
Review » Lenovo Legion Y540-17IRH in Review: Mid-Range Gamer Makes Full Use of its Core i5
HP Omen 15-dc1020ng: NVIDIA GeForce GTX 1650 Mobile, 15.60", 2.3 kg
Review » HP Omen 15 Review: affordable entry-level gamer with decent battery life
Acer Aspire Nitro 5 AN515-54-53Z2: NVIDIA GeForce GTX 1650 Mobile, 15.60", 2.2 kg
Review » Acer Nitro 5 (Core i5-9300H, GeForce GTX 1650) Laptop Review
Acer Aspire 7 A715-75G-57H8: NVIDIA GeForce GTX 1650 Ti Mobile, 15.60", 2.2 kg
External Review » Acer Aspire 7 A715-75G-57H8
Lenovo Ideapad L340-17IRH 81LL001YGE: NVIDIA GeForce GTX 1650 Mobile, 17.30", 2.5 kg
External Review » Lenovo Ideapad L340-17IRH 81LL001YGE
MSI GF65 Thin 9SEXR-687XES: NVIDIA GeForce RTX 2060 Mobile, 14.00", 1.5 kg
External Review » MSI GF65 Thin 9SEXR-687XES
Lenovo Legion Y540-15IRH-81SX014NSP: NVIDIA GeForce RTX 2060 Mobile, 15.60", 2.3 kg
External Review » Lenovo Legion Y540-15IRH-81SX014NSP
MSI GF65 Thin 9SEXR-249: NVIDIA GeForce RTX 2060 Mobile, 15.60", 1.9 kg
External Review » MSI GF65 Thin 9SEXR-249
Acer Aspire Nitro 5 AN515-54-53CU: NVIDIA GeForce GTX 1660 Ti Mobile, 15.60", 2.5 kg
External Review » Acer Aspire Nitro 5 AN515-54-53CU
Asus TUF FX505GT-BQ108: NVIDIA GeForce GTX 1650 Mobile, 15.60", 2.2 kg
External Review » Asus TUF FX505GT-BQ108
HP Gaming Pavilion 15-dk0025ns: NVIDIA GeForce GTX 1650 Mobile, 15.60", 2.2 kg
External Review » HP Gaming Pavilion 15-dk0025ns
MSI GF65 Thin 9SEXR-441RU: NVIDIA GeForce RTX 2060 Mobile, 15.60", 1.9 kg
External Review » MSI GF65 Thin 9SEXR-441RU
HP Omen 15-dc1049ns: NVIDIA GeForce GTX 1650 Mobile, 15.60", 2.3 kg
External Review » HP Omen 15-dc1049ns
HP Gaming Pavilion 15-dk0030ns: NVIDIA GeForce GTX 1050 Mobile, 15.60", 2.3 kg
External Review » HP Gaming Pavilion 15-dk0030ns
Acer Aspire Nitro 5 AN515-54-52G3: NVIDIA GeForce GTX 1050 Mobile, 15.60", 2.5 kg
External Review » Acer Aspire Nitro 5 AN515-54-52G3
Asus TUF FX505GT-BQ025: NVIDIA GeForce GTX 1650 Mobile, 15.60", 2.2 kg
External Review » Asus TUF FX505GT-BQ025
Lenovo Legion Y540-15IRH-81SX004UGE: NVIDIA GeForce GTX 1660 Ti Mobile, 15.60", 2.3 kg
External Review » Lenovo Legion Y540-15IRH-81SX004UGE
Acer Nitro 5 AN517-51-55ML: NVIDIA GeForce GTX 1650 Mobile, 17.30", 2.7 kg
External Review » Acer Nitro 5 AN517-51-55ML
Acer Aspire Nitro 5 AN515-54-56MH: NVIDIA GeForce GTX 1660 Ti Mobile, 15.60", 2.5 kg
External Review » Acer Aspire Nitro 5 AN515-54-56MH
Acer Aspire Nitro 5 AN515-54-57M8: NVIDIA GeForce GTX 1660 Ti Mobile, 15.60", 2.5 kg
External Review » Acer Aspire Nitro 5 AN515-54-57M8
HP Pavilion Gaming 15-dk0002ns: NVIDIA GeForce GTX 1650 Mobile, 15.60", 2.3 kg
External Review » HP Pavilion Gaming 15-dk0002ns
HP Pavilion Gaming 15-dk0020ns: NVIDIA GeForce GTX 1050 Mobile, 15.60", 2.3 kg
External Review » HP Pavilion Gaming 15-dk0020ns
MSI GF65 Thin 9SEXR-237XES: NVIDIA GeForce RTX 2060 Mobile, 15.60", 1.9 kg
External Review » MSI GF65 Thin 9SEXR-237XES
Lenovo Legion Y540-17IRH-81Q4002DGE: NVIDIA GeForce GTX 1660 Ti Mobile, 17.30", 2.8 kg
External Review » Lenovo Legion Y540-17IRH-81Q4002DGE
Samsung Odyssey 2 NP850XBD-XG1BR: NVIDIA GeForce GTX 1650 Mobile, 15.60", 2.4 kg
External Review » Samsung Odyssey 2 NP850XBD-XG1BR
HP Pavilion 15-BC523NS: NVIDIA GeForce GTX 1050 Mobile, 15.60", 2.2 kg
External Review » HP Pavilion 15-BC523NS
Acer Predator Triton 300 PT315-51-58BG: NVIDIA GeForce GTX 1650 Mobile, 15.60", 2.5 kg
External Review » Acer Predator Triton 300 PT315-51-58BG
Lenovo Legion Y540-15IRH-81SY00A2SP: NVIDIA GeForce GTX 1650 Mobile, 15.60", 2.3 kg
External Review » Lenovo Legion Y540-15IRH-81SY00A2SP
HP Pavilion 15-bc521ns: NVIDIA GeForce GTX 1650 Mobile, 15.60", 2.1 kg
External Review » HP Pavilion 15-bc521ns
HP Pavilion 15-BC519NS: NVIDIA GeForce GTX 1050 Mobile, 15.60", 2.1 kg
External Review » HP Pavilion 15-BC519NS
Dell G3 3590: NVIDIA GeForce GTX 1650 Mobile, 15.60", 2.5 kg
External Review » Dell G3 3590
Lenovo ThinkPad X1 Extreme G2-20QV000UGE: NVIDIA GeForce GTX 1650 Max-Q, 15.60", 1.7 kg
External Review » Lenovo ThinkPad X1 Extreme G2-20QV000UGE
MSI GL65 9SC-004: NVIDIA GeForce GTX 1650 Mobile, 15.60", 2.3 kg
External Review » MSI GL65 9SC-004
MSI GF63 9SC-621: NVIDIA GeForce GTX 1650 Mobile, 15.60", 1.9 kg
External Review » MSI GF63 9SC-621
Lenovo IdeaPad L340-15IRH 81LK00BMGE: NVIDIA GeForce GTX 1650 Mobile, 15.60", 2.1 kg
External Review » Lenovo IdeaPad L340-15IRH 81LK00BMGE
MSI GL65 9SD-043IT: NVIDIA GeForce GTX 1660 Ti Mobile, 15.60", 3 kg
External Review » MSI GL65 9SD-043IT
Acer Predator Helios 300 PH315-52-52ZM: NVIDIA GeForce GTX 1660 Ti Mobile, 15.60", 2.4 kg
External Review » Acer Predator Helios 300 PH315-52-52ZM
HP Pavilion 15-BC500NS: NVIDIA GeForce GTX 1050 Mobile, 15.60", 2.2 kg
External Review » HP Pavilion 15-BC500NS
Acer Predator Helios 300 PH315-52-NH.Q53EA.007: NVIDIA GeForce GTX 1660 Ti Mobile, 15.60", 2.5 kg
External Review » Acer Predator Helios 300 PH315-52-NH.Q53EA.007
Dell G3 15 3590-cn35907: NVIDIA GeForce GTX 1660 Ti Mobile, 15.60", 2.4 kg
External Review » Dell G3 15 3590-cn35907
HP Gaming Pavilion 17-cd0222ng: NVIDIA GeForce GTX 1650 Mobile, 17.30", 2.8 kg
External Review » HP Gaming Pavilion 17-cd0222ng
HP Pavilion 15-dk0010ns: Intel UHD Graphics 630, 15.60", 2.3 kg
External Review » HP Pavilion 15-dk0010ns
Acer Aspire 7 A715-74G-53YM: NVIDIA GeForce GTX 1650 Mobile, 15.60", 2.4 kg
External Review » Acer Aspire 7 A715-74G-53YM
MSI GF63 9SC-662: NVIDIA GeForce GTX 1650 Max-Q, 15.60", 1.9 kg
External Review » MSI GF63 9SC-662
Acer Nitro 5 AN517-51-56YW: NVIDIA GeForce GTX 1650 Mobile, 17.30", 2.7 kg
External Review » Acer Nitro 5 AN517-51-56YW
Lenovo Ideapad L340-17IRH-81LL004SGE: NVIDIA GeForce GTX 1050 Mobile, 17.30", 2.8 kg
External Review » Lenovo Ideapad L340-17IRH-81LL004SGE
Lenovo Ideapad L340-15IRH-81LK00CKGE: NVIDIA GeForce GTX 1050 Mobile, 15.60", 2.2 kg
External Review » Lenovo Ideapad L340-15IRH-81LK00CKGE
Dell Inspiron 15 7591, i5-9300H: NVIDIA GeForce GTX 1050 Mobile, 15.60", 1.9 kg
External Review » Dell Inspiron 15 7591, i5-9300H
MSI GF63 9RC: NVIDIA GeForce GTX 1050 Mobile, 15.60", 1.9 kg
External Review » MSI GF63 9RC
Dell G3 15 3590-cn35917: NVIDIA GeForce GTX 1650 Mobile, 15.60", 2.4 kg
External Review » Dell G3 15 3590-cn35917
Asus ROG Strix G531GT-BQ005: NVIDIA GeForce GTX 1650 Mobile, 15.60", 2.4 kg
External Review » Asus ROG Strix G531GT-BQ005
Dell G5 15 5590-PCNJJ: NVIDIA GeForce GTX 1650 Mobile, 15.60", 2.7 kg
External Review » Dell G5 15 5590-PCNJJ
Lenovo Legion Y540-15IRH-81SX00B2GE: NVIDIA GeForce GTX 1660 Ti Mobile, 15.60", 2.3 kg
External Review » Lenovo Legion Y540-15IRH-81SX00B2GE
Lenovo Ideapad L340-17IRH-81LL001YGE: NVIDIA GeForce GTX 1650 Mobile, 17.30", 2.5 kg
External Review » Lenovo Ideapad L340-17IRH-81LL001YGE
Lenovo Ideapad L340-15IRH-81LK0001UK: NVIDIA GeForce GTX 1650 Mobile, 15.60", 2.2 kg
External Review » Lenovo Ideapad L340-15IRH-81LK0001UK
Acer Aspire Nitro 5 AN515-54-53Z2: NVIDIA GeForce GTX 1650 Mobile, 15.60", 2.2 kg
External Review » Acer Aspire Nitro 5 AN515-54-53Z2
Lenovo IdeaPad L340-15IRH 81LK00BMGE: NVIDIA GeForce GTX 1650 Mobile, 15.60", 2.1 kg
» Gaming doesn't have to be expensive: Low-priced entry with Lenovo's IdeaPad L340 and GeForce GTX graphics