Lenovo Legion Y540-17IRH in Review: Mid-Range Gamer Makes Full Use of its Core i5

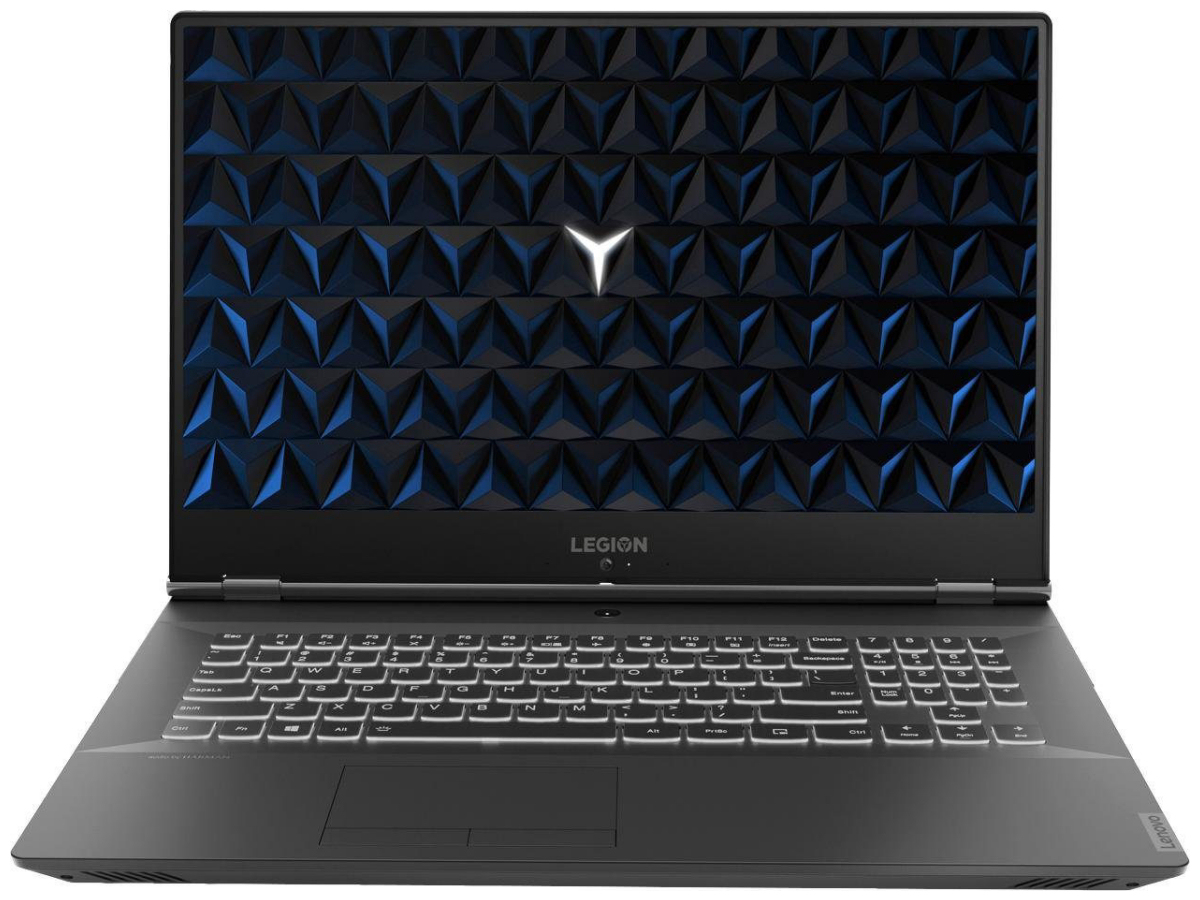
The Lenovo Legion Y540-17IRH is a mid-range 17.3-inch gaming notebook. While its appearance is very similar to that of the Legion Y740-17ICH, there are physical differences between the two laptops. Lenovo chose an inconspicuous, neutral exterior, in order to make the notebook fit better into an office setting. Our test model is powered by a Core i5-9300H processor and a GeForce GTX 1660 Ti GPU. Alternative models with a GeForce GTX 1650 or a GeForce RTX 2060 are available as well. Its competitors include devices such as the Schenker XMG Core 17, MSI GP75 Leopard 9SD, Dell G7 17 7790 and the Gigabyte Sabre 17-W8.
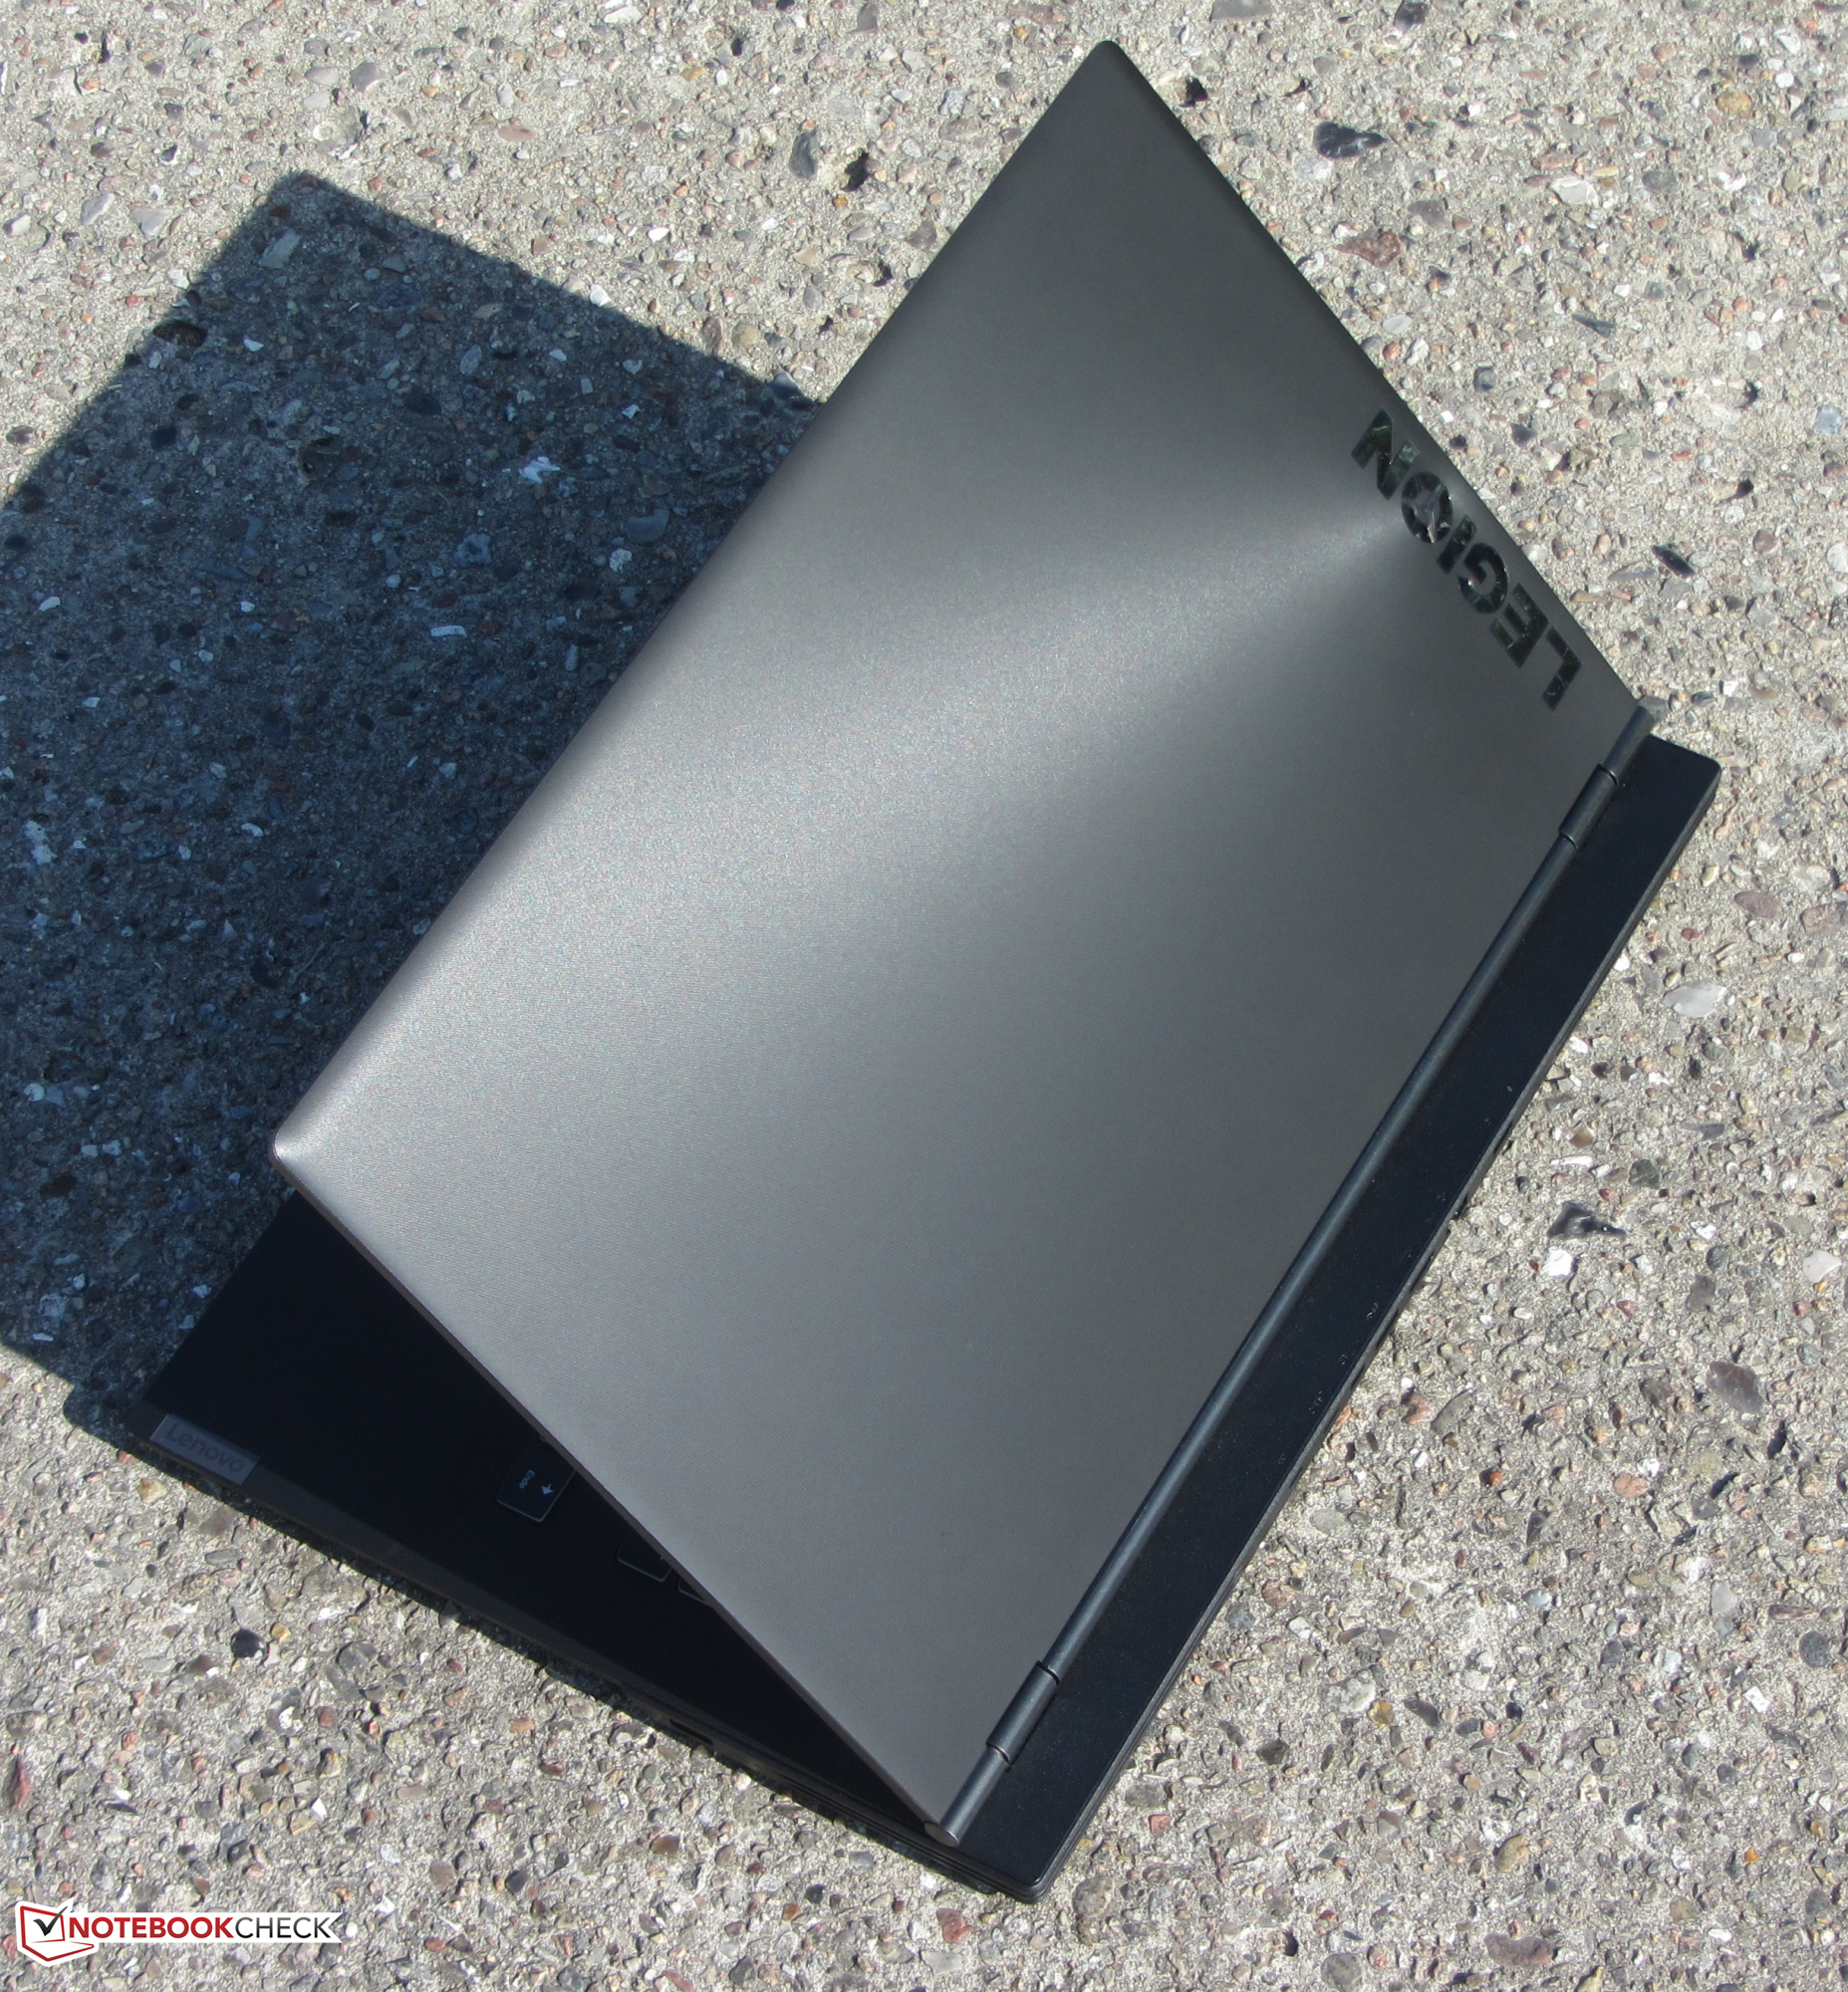
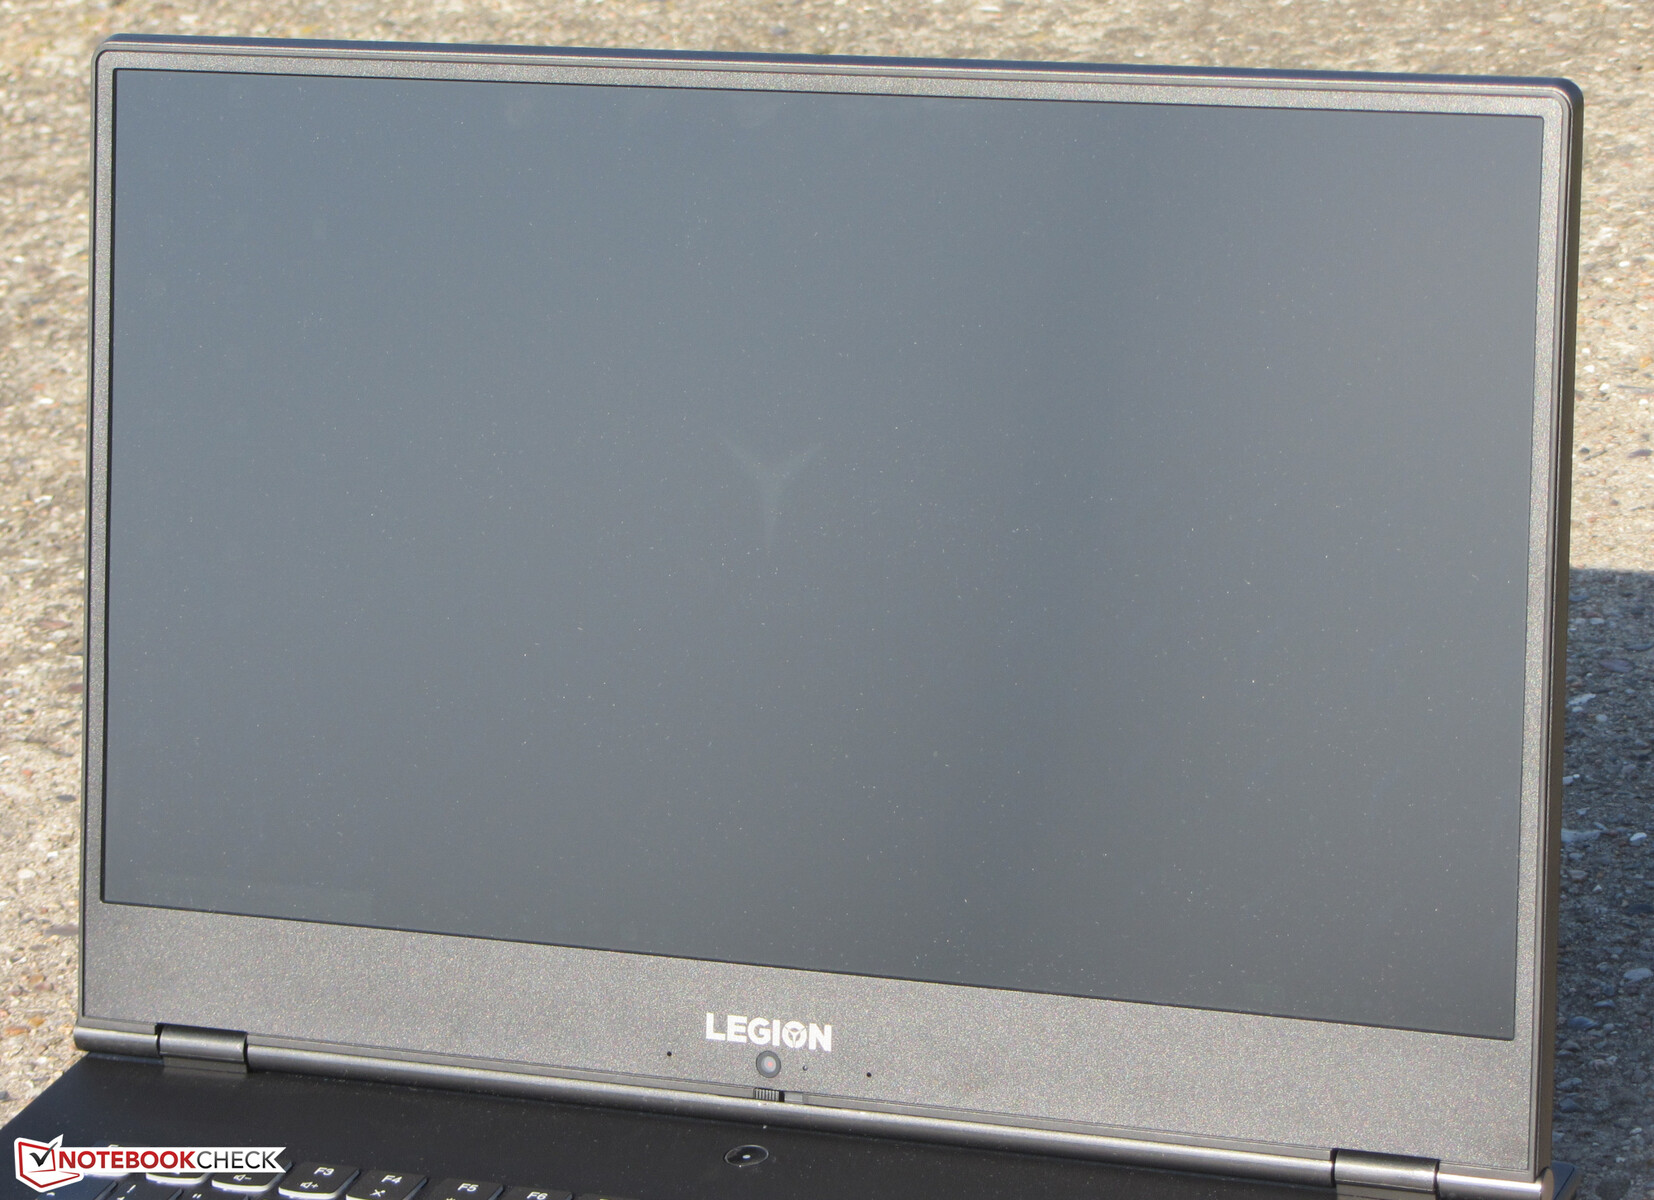
Case - Lenovo Relies on Plastic
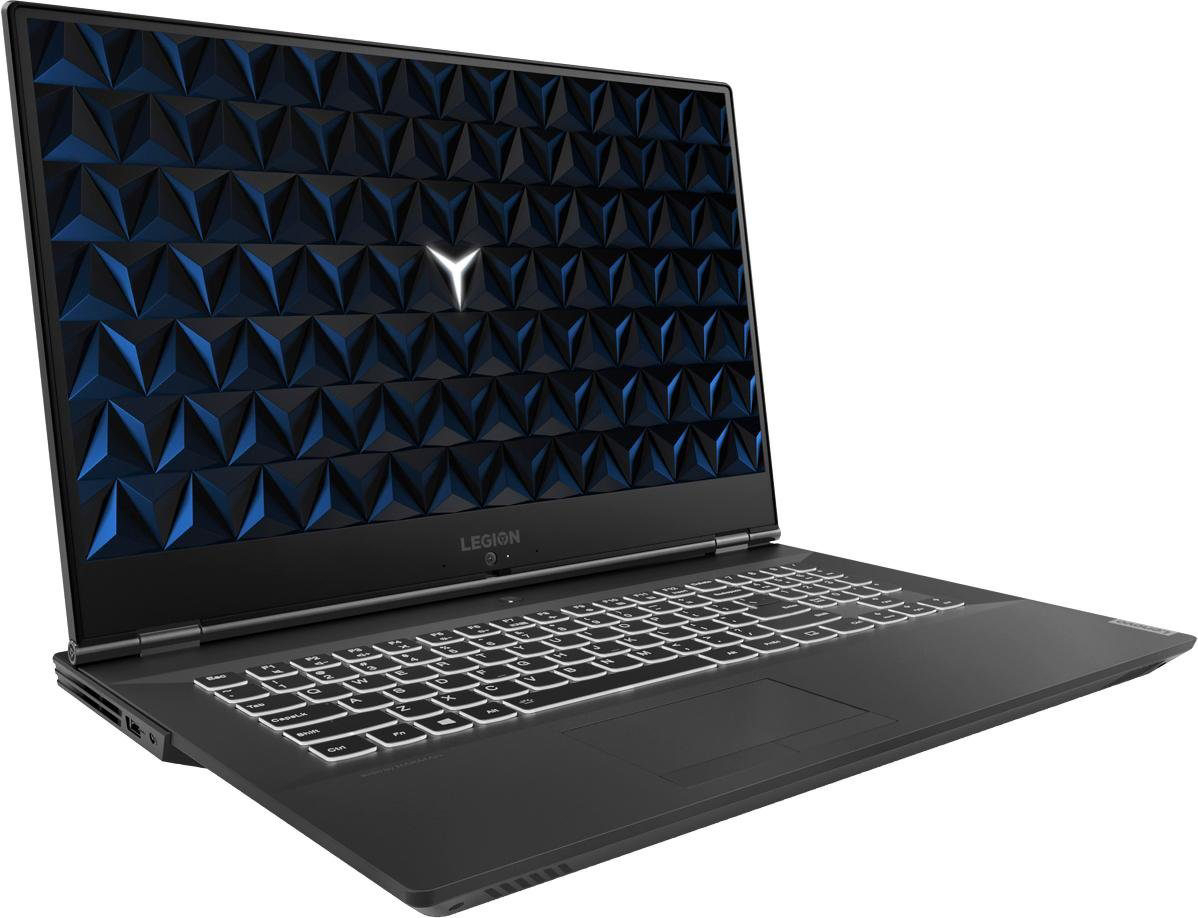
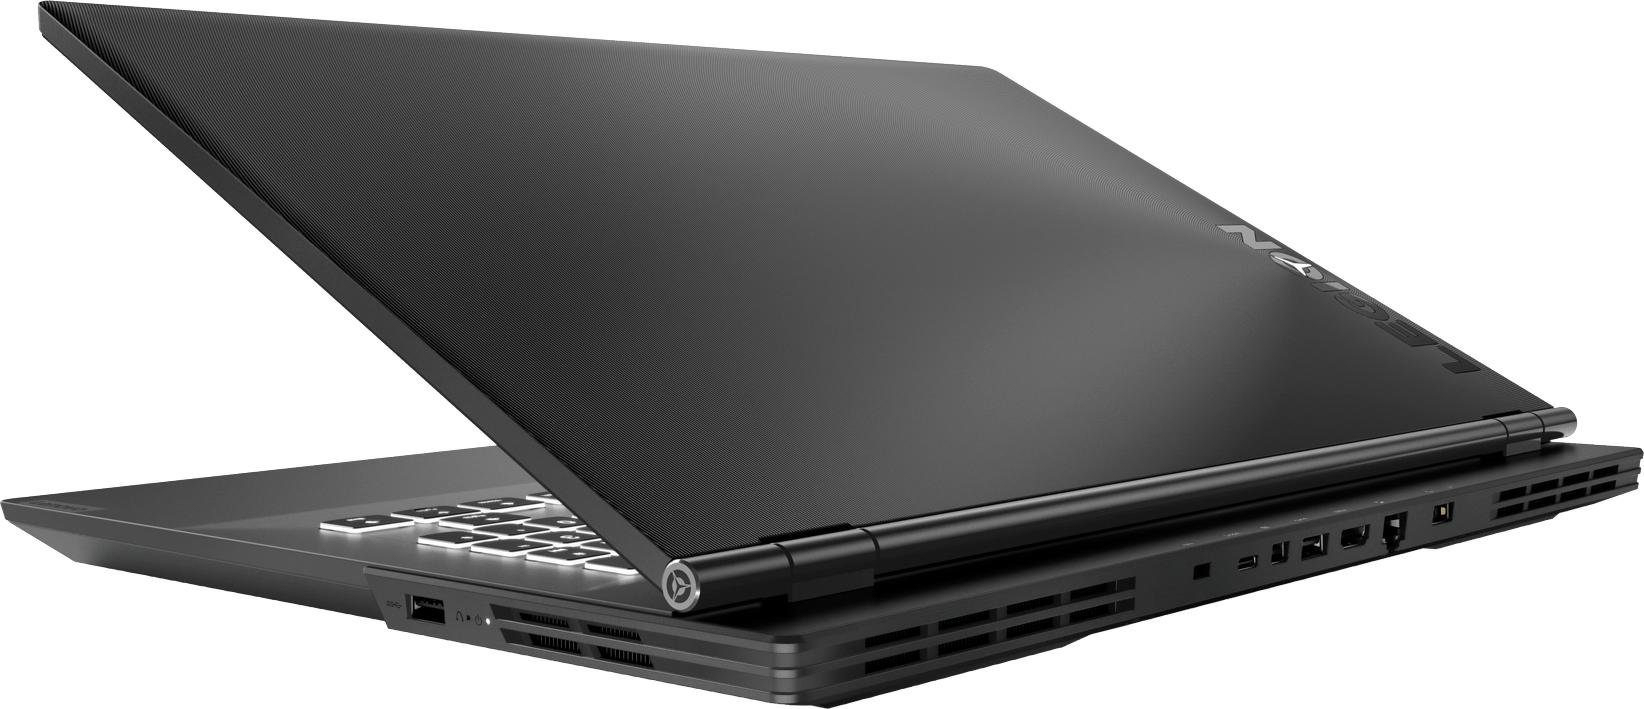
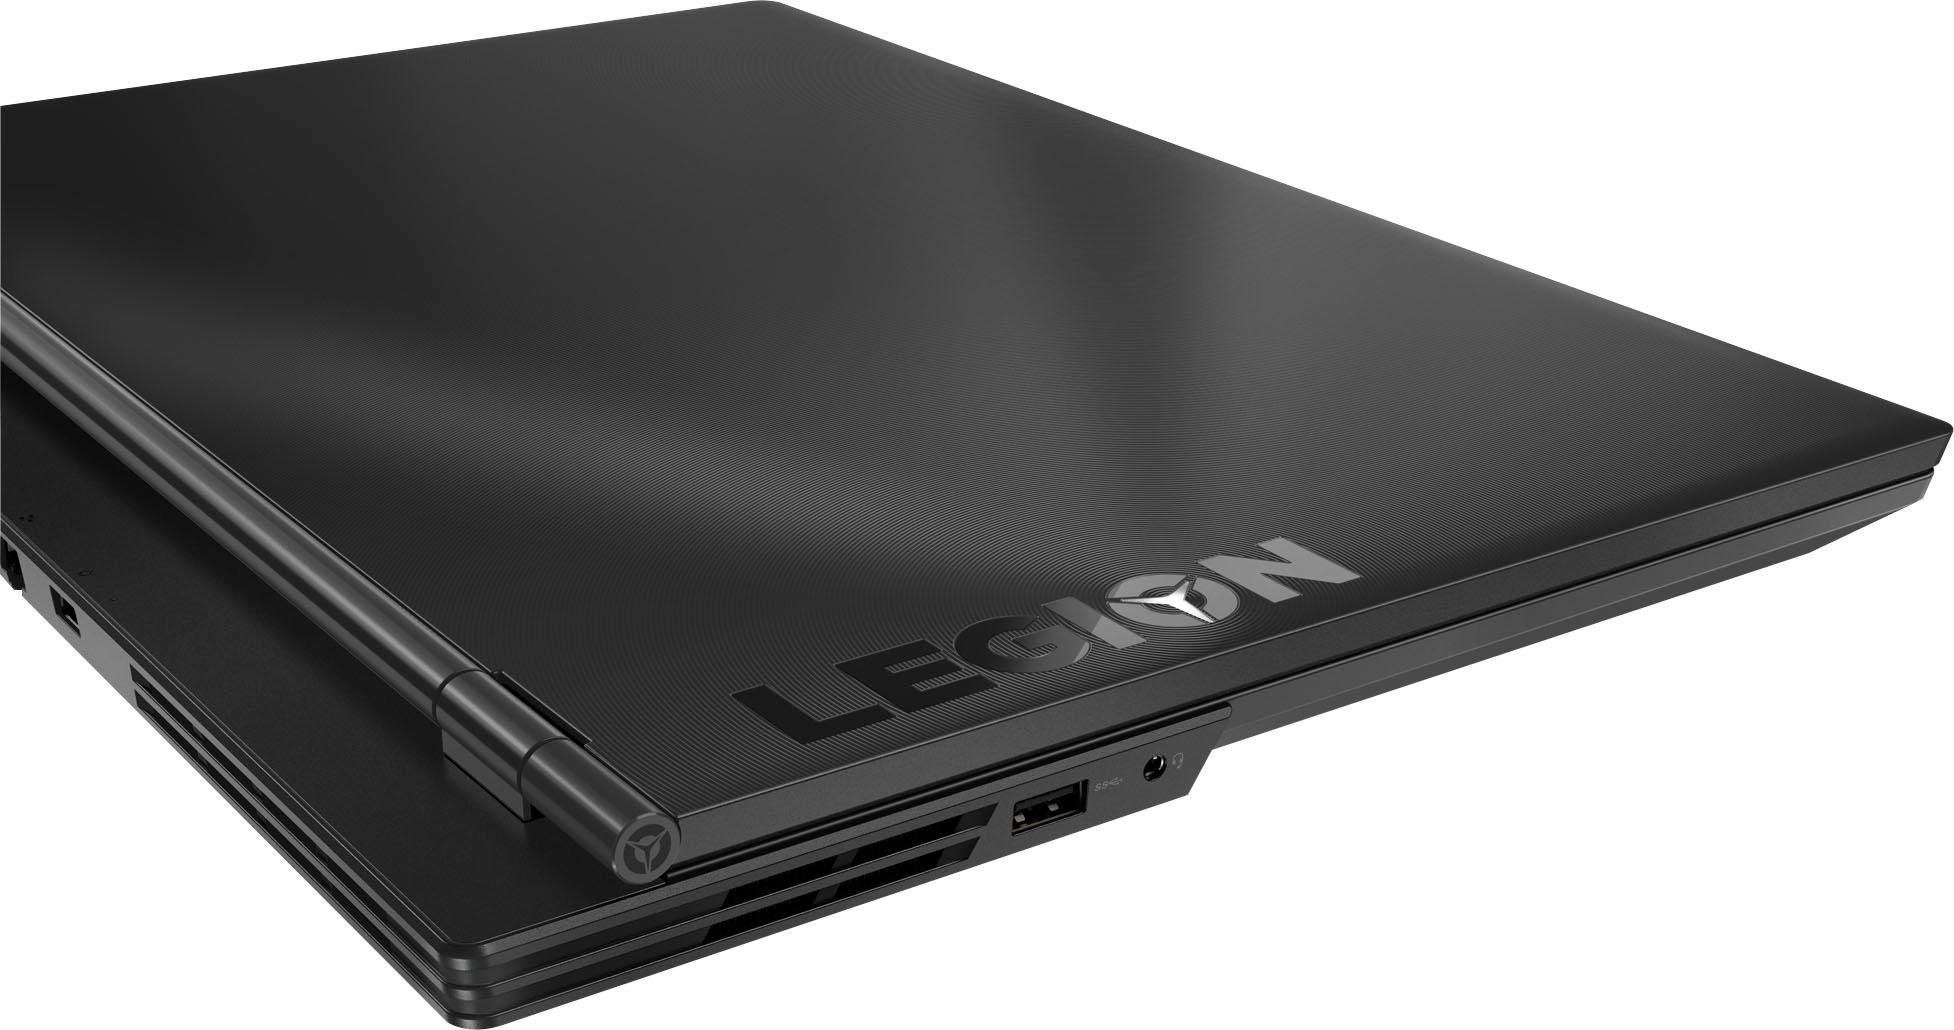
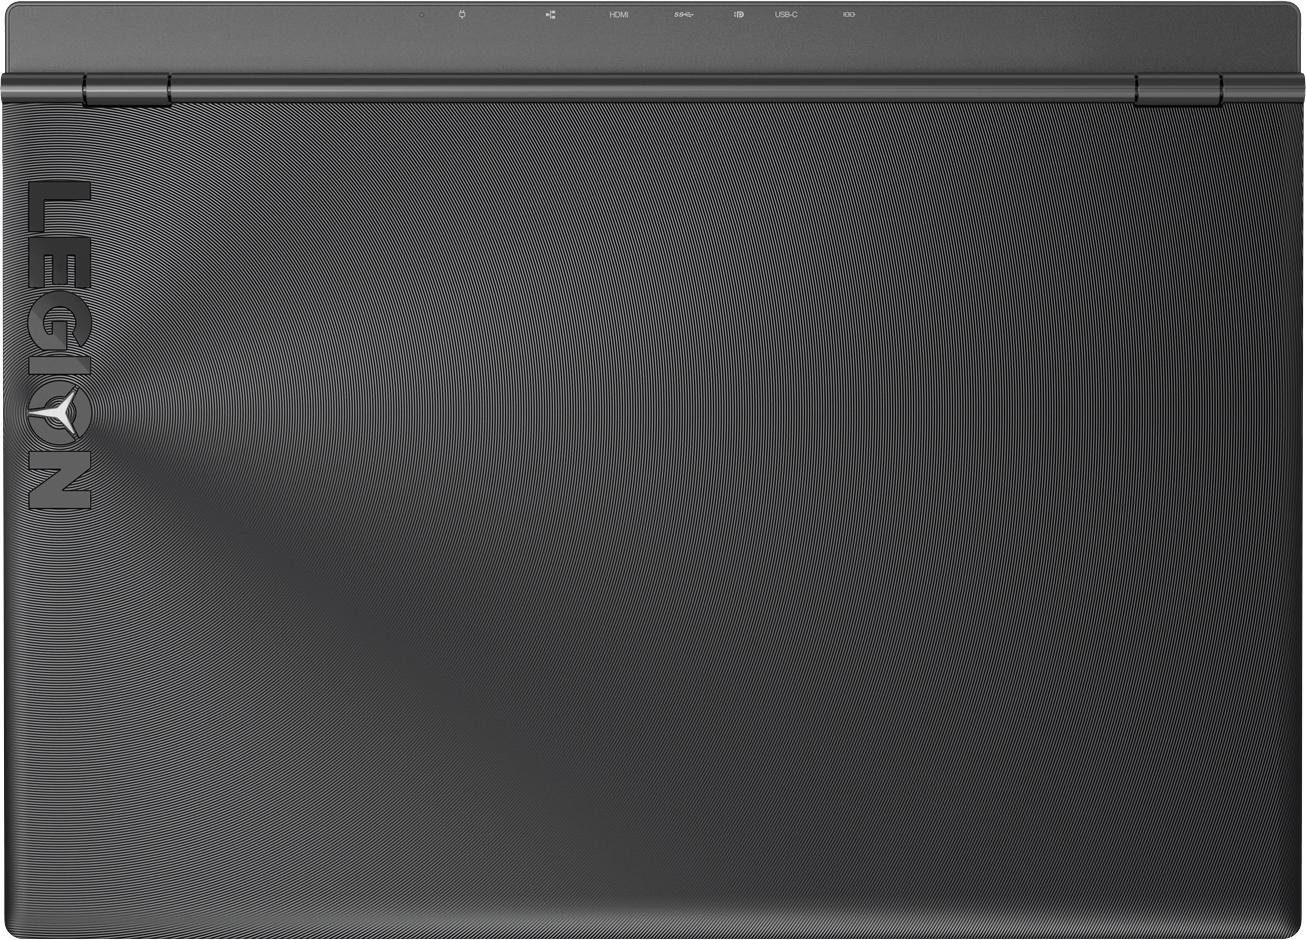
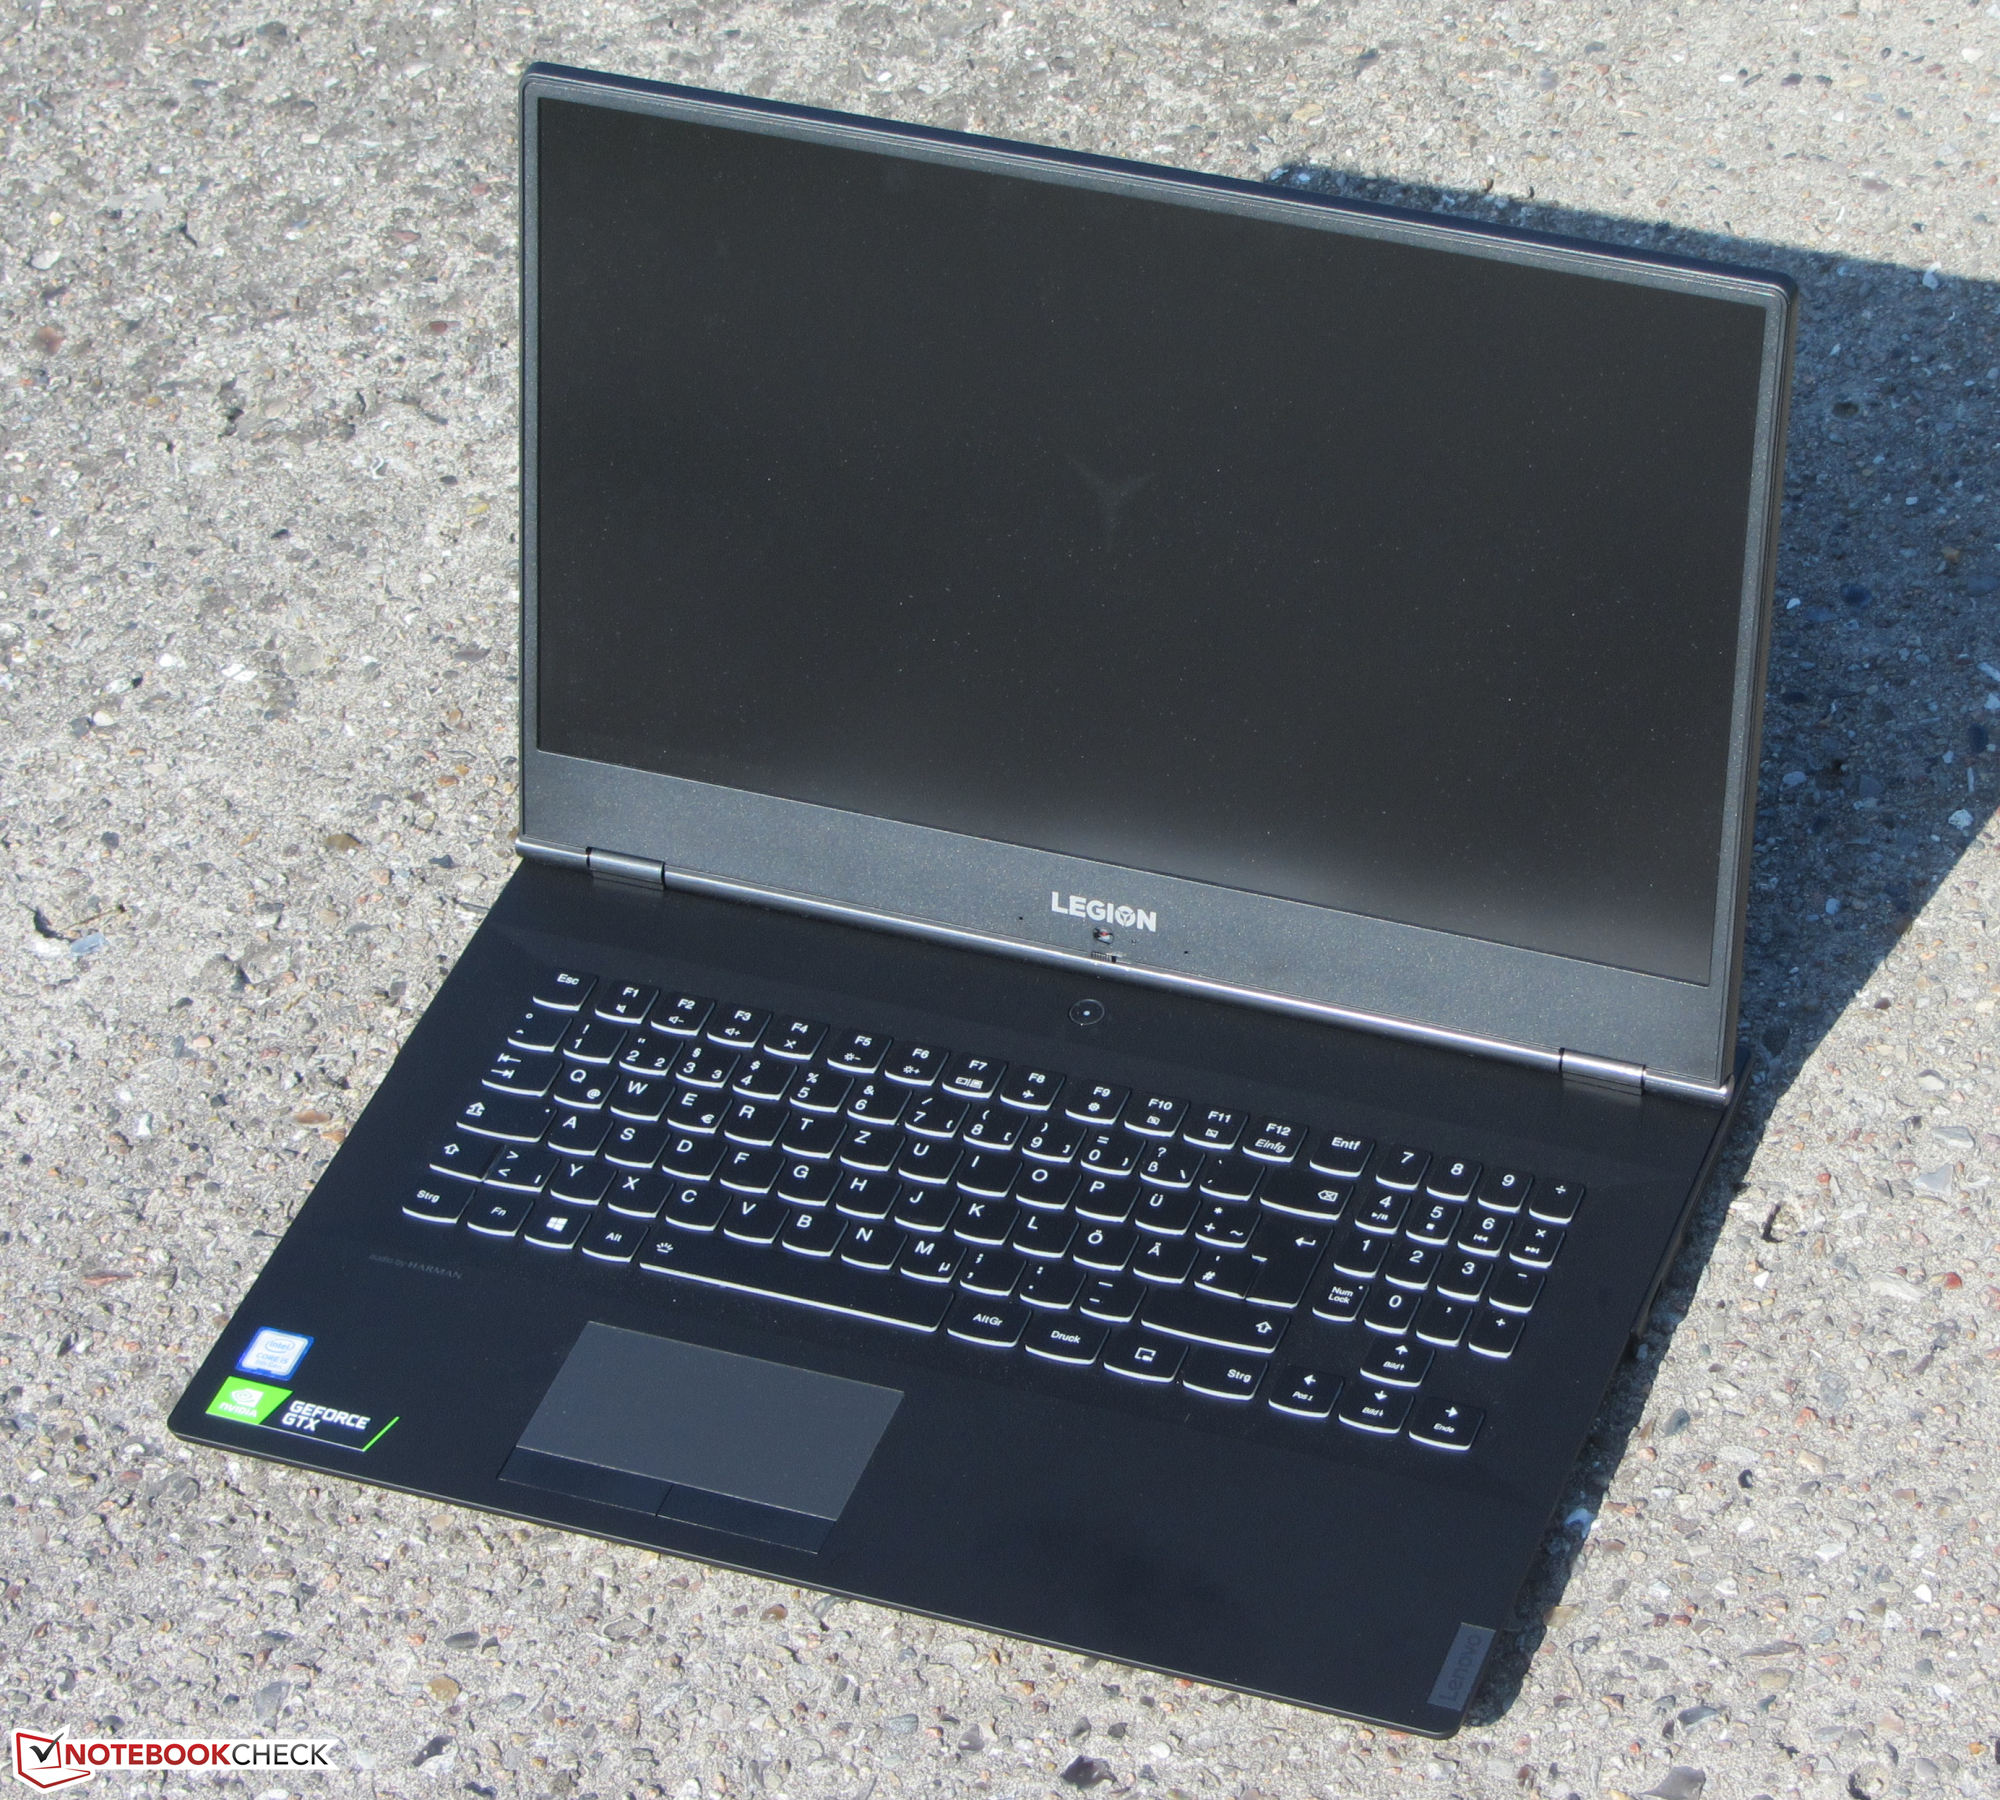
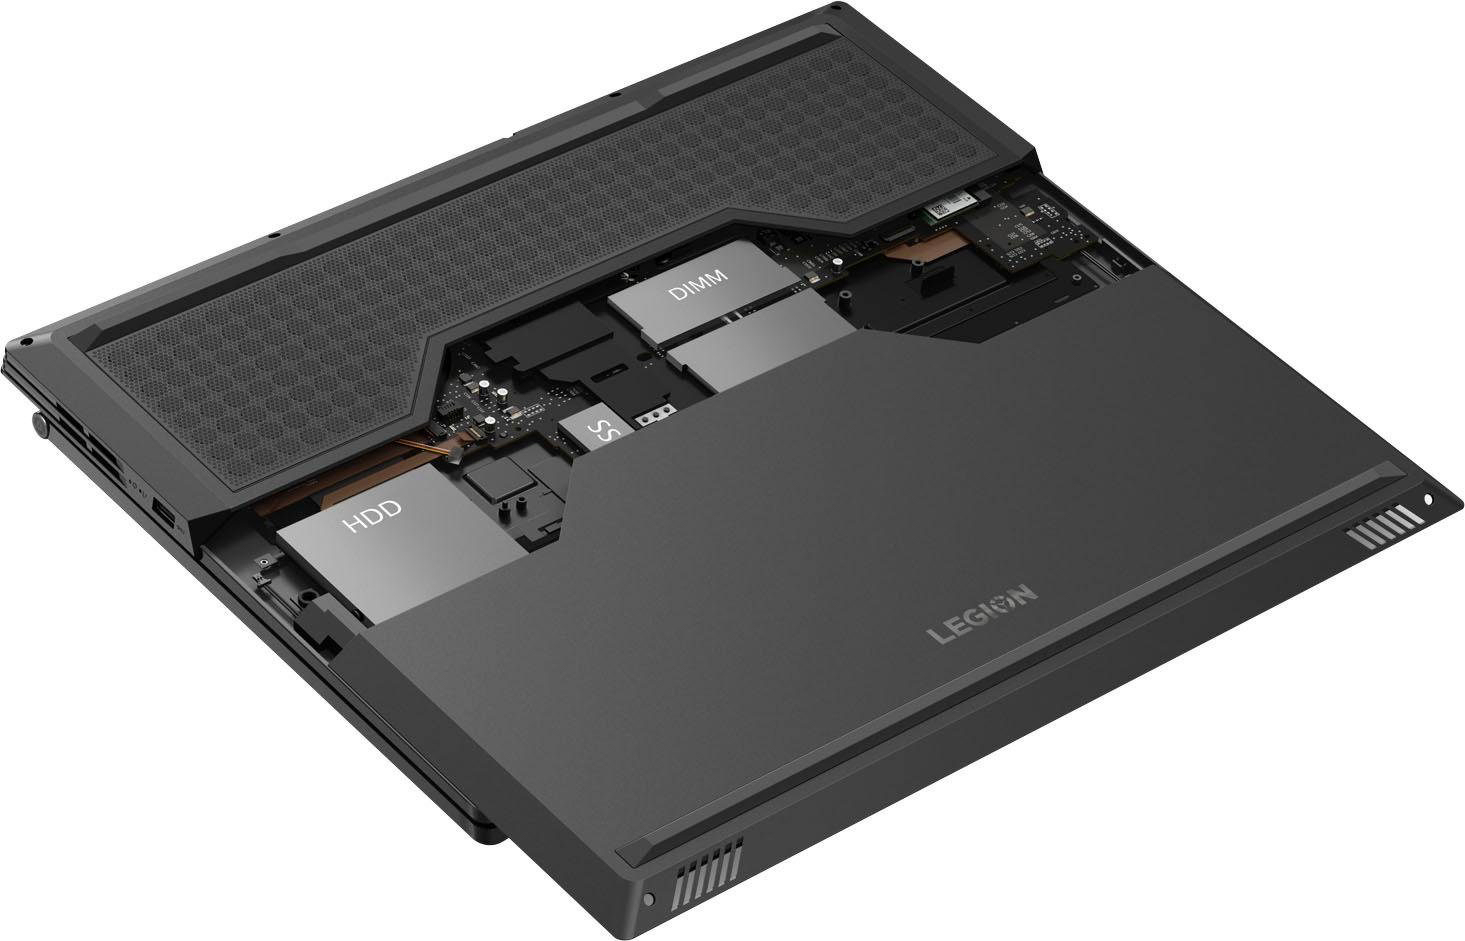
Lenovo hides the Legion's hardware behind a fully black (raven black) case made of plastic. Since Lenovo omits any visual highlights, the device blends well into an office setting. The offset lid is the most prominent design element. It does not close level with the back of the device but rather protrudes by a good 25 mm (~0.98 in). The top of the base unit is rubberized. The texture on the back of the lid features grooves. Good: There is a maintenance hatch on the Legion, which allows for easy access to the SSD, the HDD bay and the RAM. In order to reach the battery, the entire bottom shell has to be removed. More on that topic later.
The Y540-17IRH cannot deny its similarity to the Legion Y740-17ICH with regards to the case - they look very much alike. The chassis is not identical, however. The Y540-17IRH's case is, for example, slightly more compact. At the same time, it is thicker by a few millimeters. That being said, the cases of both devices are low in depth, while having relatively large footprints. In the case of competitors such as the Schenker XMG Core 17 and the MSI GP75 Leopard 9SD, the relationship between these dimensions is reversed.
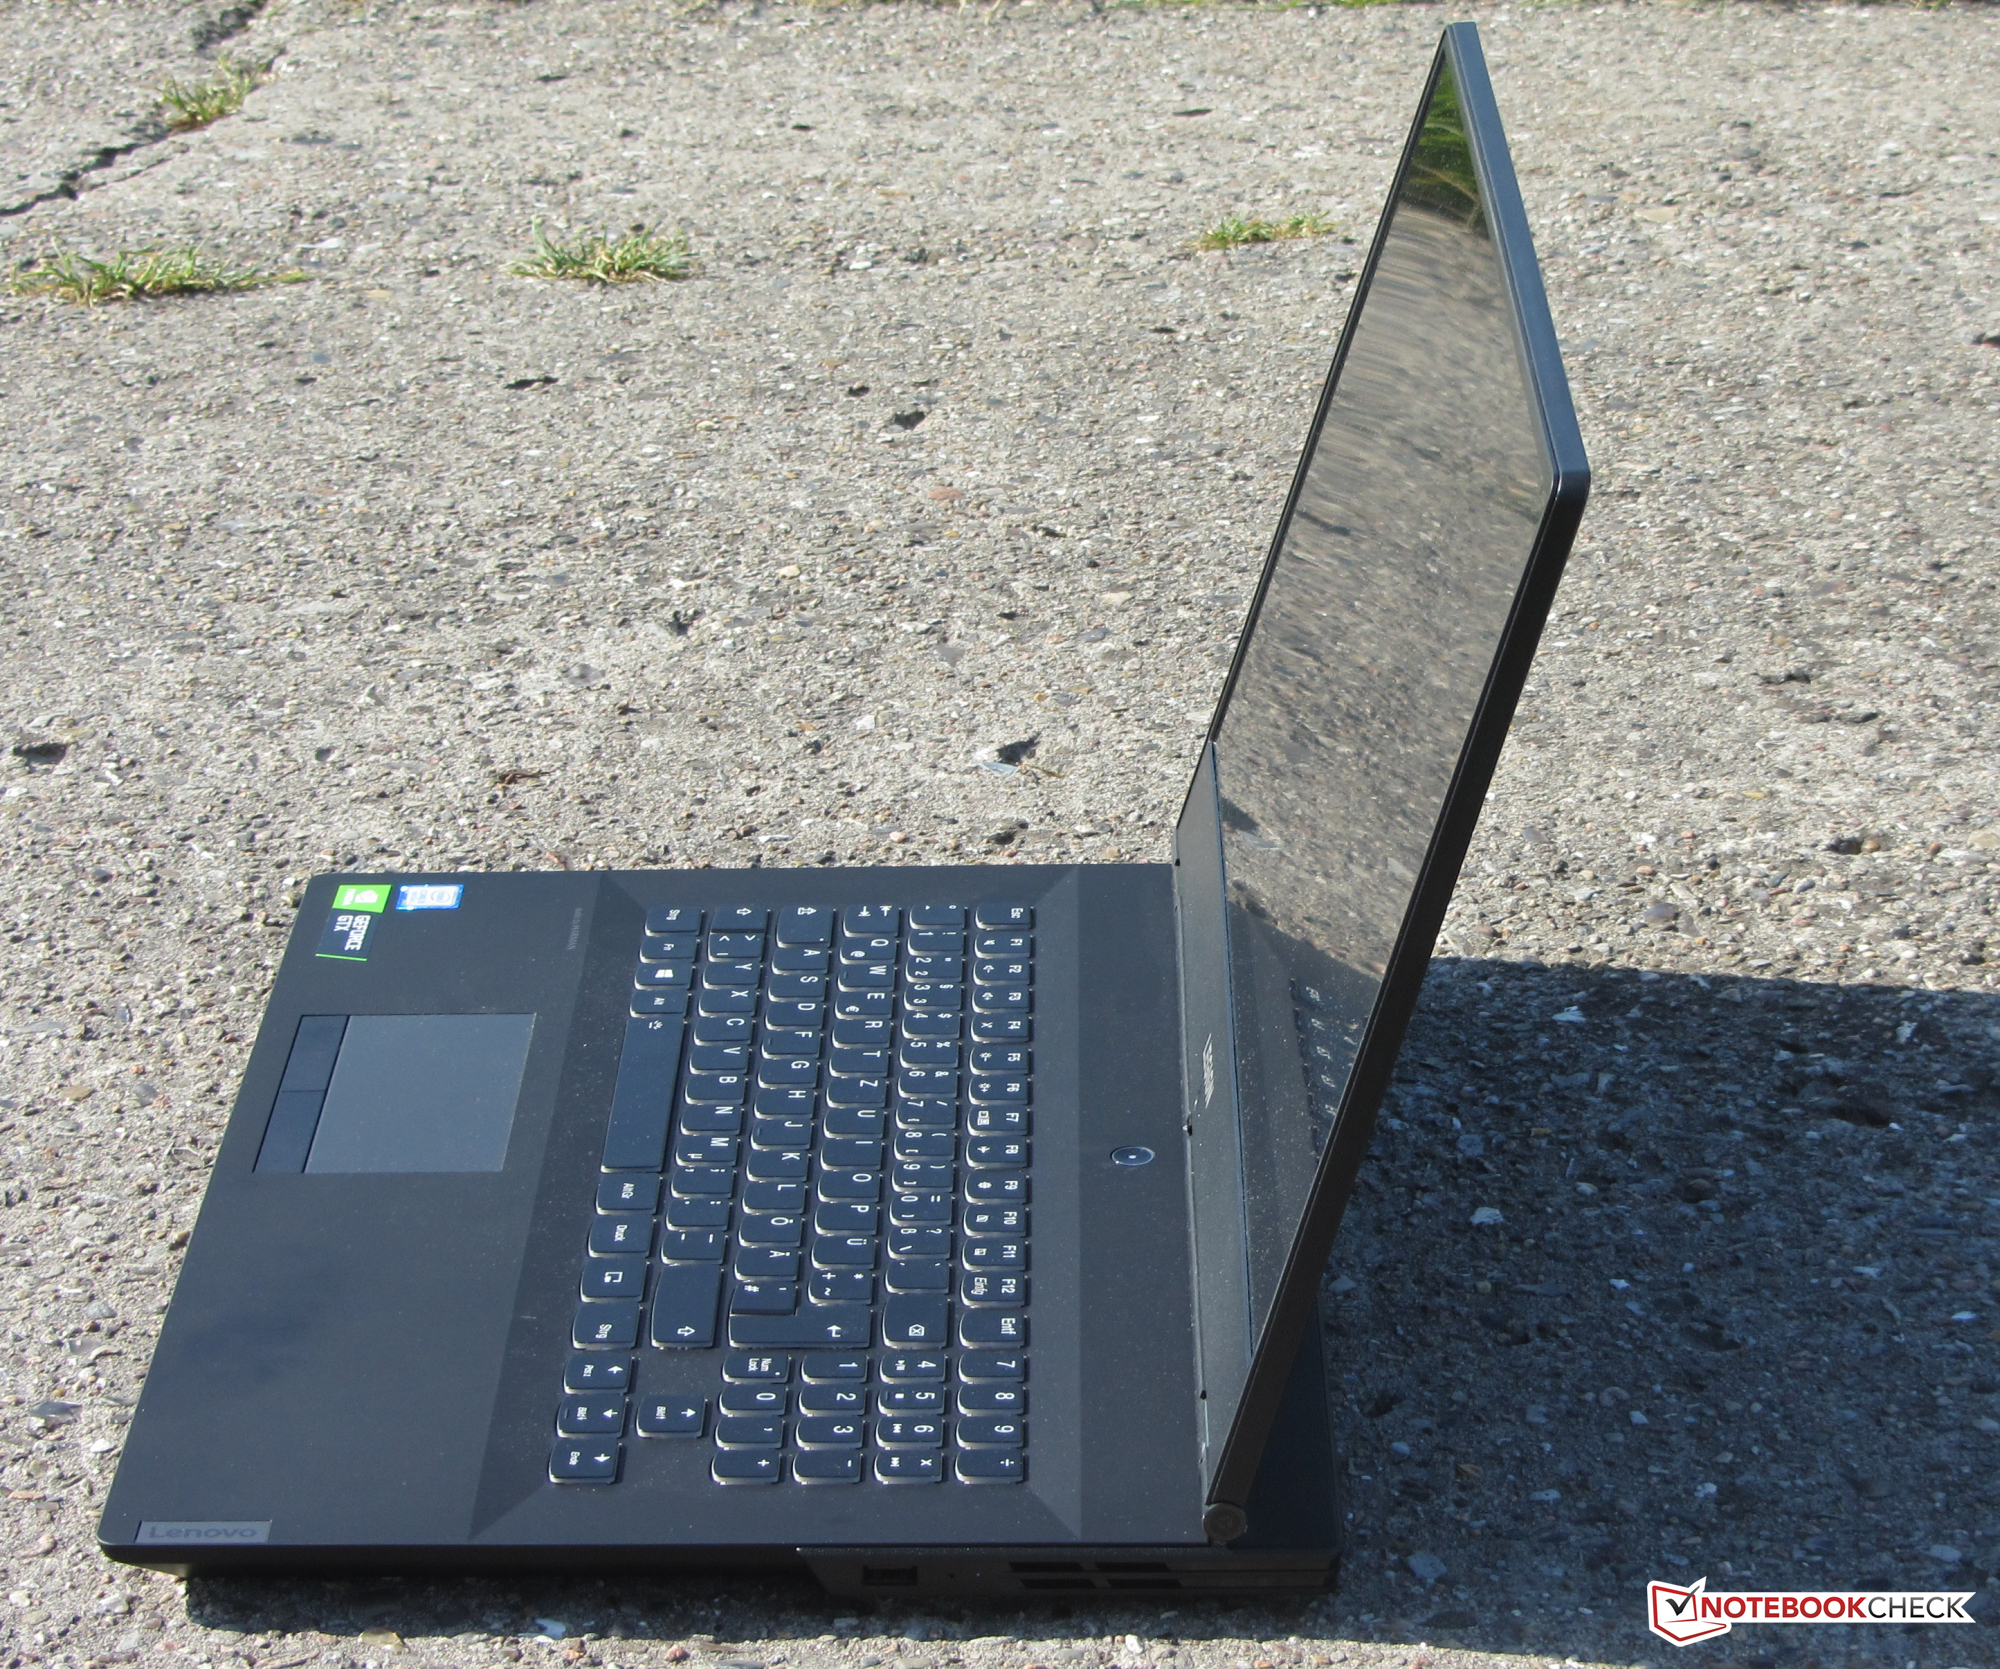
The laptop does not exhibit flaws in terms of build quality. Clearances are as they should be and there are no material protrusions. That being said, we expected more in terms of rigidity. The base unit yields under pressure on the surfaces next to the keyboard - this affects the left side more strongly than the right side. The base unit is also not as resistant to twisting as we would like it to be. This is particularly true for the lid. Thankfully, pressure on the lid does not lead to image distortions. The hinges hold it firmly in place, even though they tend to teeter somewhat. The lid can be opened with one hand. The maximum opening angle of the lid is 180 degrees.

Connectivity - No Thunderbolt 3
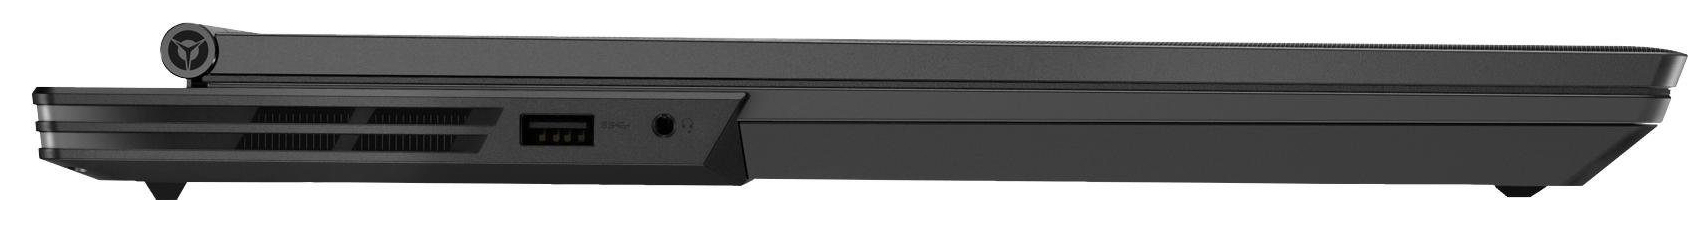
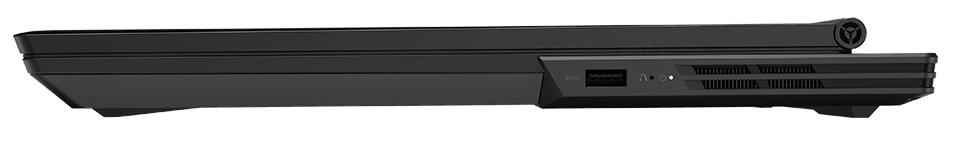
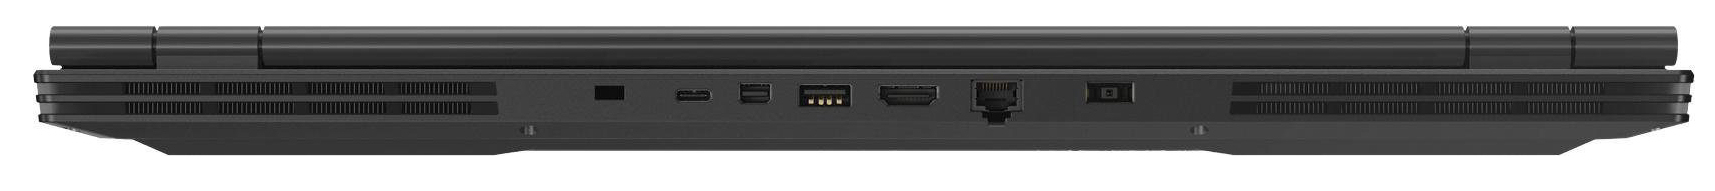
There are no surprises when it comes to the port selection of the Legion. The three available USB Type-A ports and the single USB Type-C port all adhere to the USB 3.2 Gen 1 standard. Additionally, the Type-C model features DisplayPort-via-USB Type-C (the appropriate adapter is sold separately). Combined with the HDMI 2.0 port and the Mini DisplayPort, there are three video outputs in total. There is also a combined audio jack, a Gigabit Ethernet port, and a cable lock slot. The Legion does not have a card reader at its disposal.
We are particularly unhappy with the lack of a Thunderbolt 3 port, which should come standard on a gaming laptop at this price. It could have been used for a more powerful, external GPU for example. Unlike the Y540-17IRH, the Legion Y740-17ICH does offer Thunderbolt 3.
The ports have been distributed across all three sides. Good: There is at least one USB port on each side. The ports on the right and left of the device have been placed farther towards the back. Thanks to this, it is unlikely for cables to interfere with mouse movements.
Communication
The Wi-Fi module of the Y540 contains an Intel chip (Wireless-AC 9560). Aside from 802.11a/b/g/n, it also supports the faster Wi-Fi standard ac. Furthermore, it is responsible for providing Bluetooth 5 functionality. Under optimal conditions (no other Wi-Fi devices in close proximity, small distance between laptop and server PC), we measured good data transfer rates. A Gigabit Ethernet connection from Realtek's well-known RTL8168/8111 family handles wired networking. There were no issues with it during our testing.
Accessories
The Legion's packaging contains the usual paperwork: A quick-start guide and warranty information. There is also a short SATA flat ribbon cable, which is required for the installation of a 2.5-inch drive.
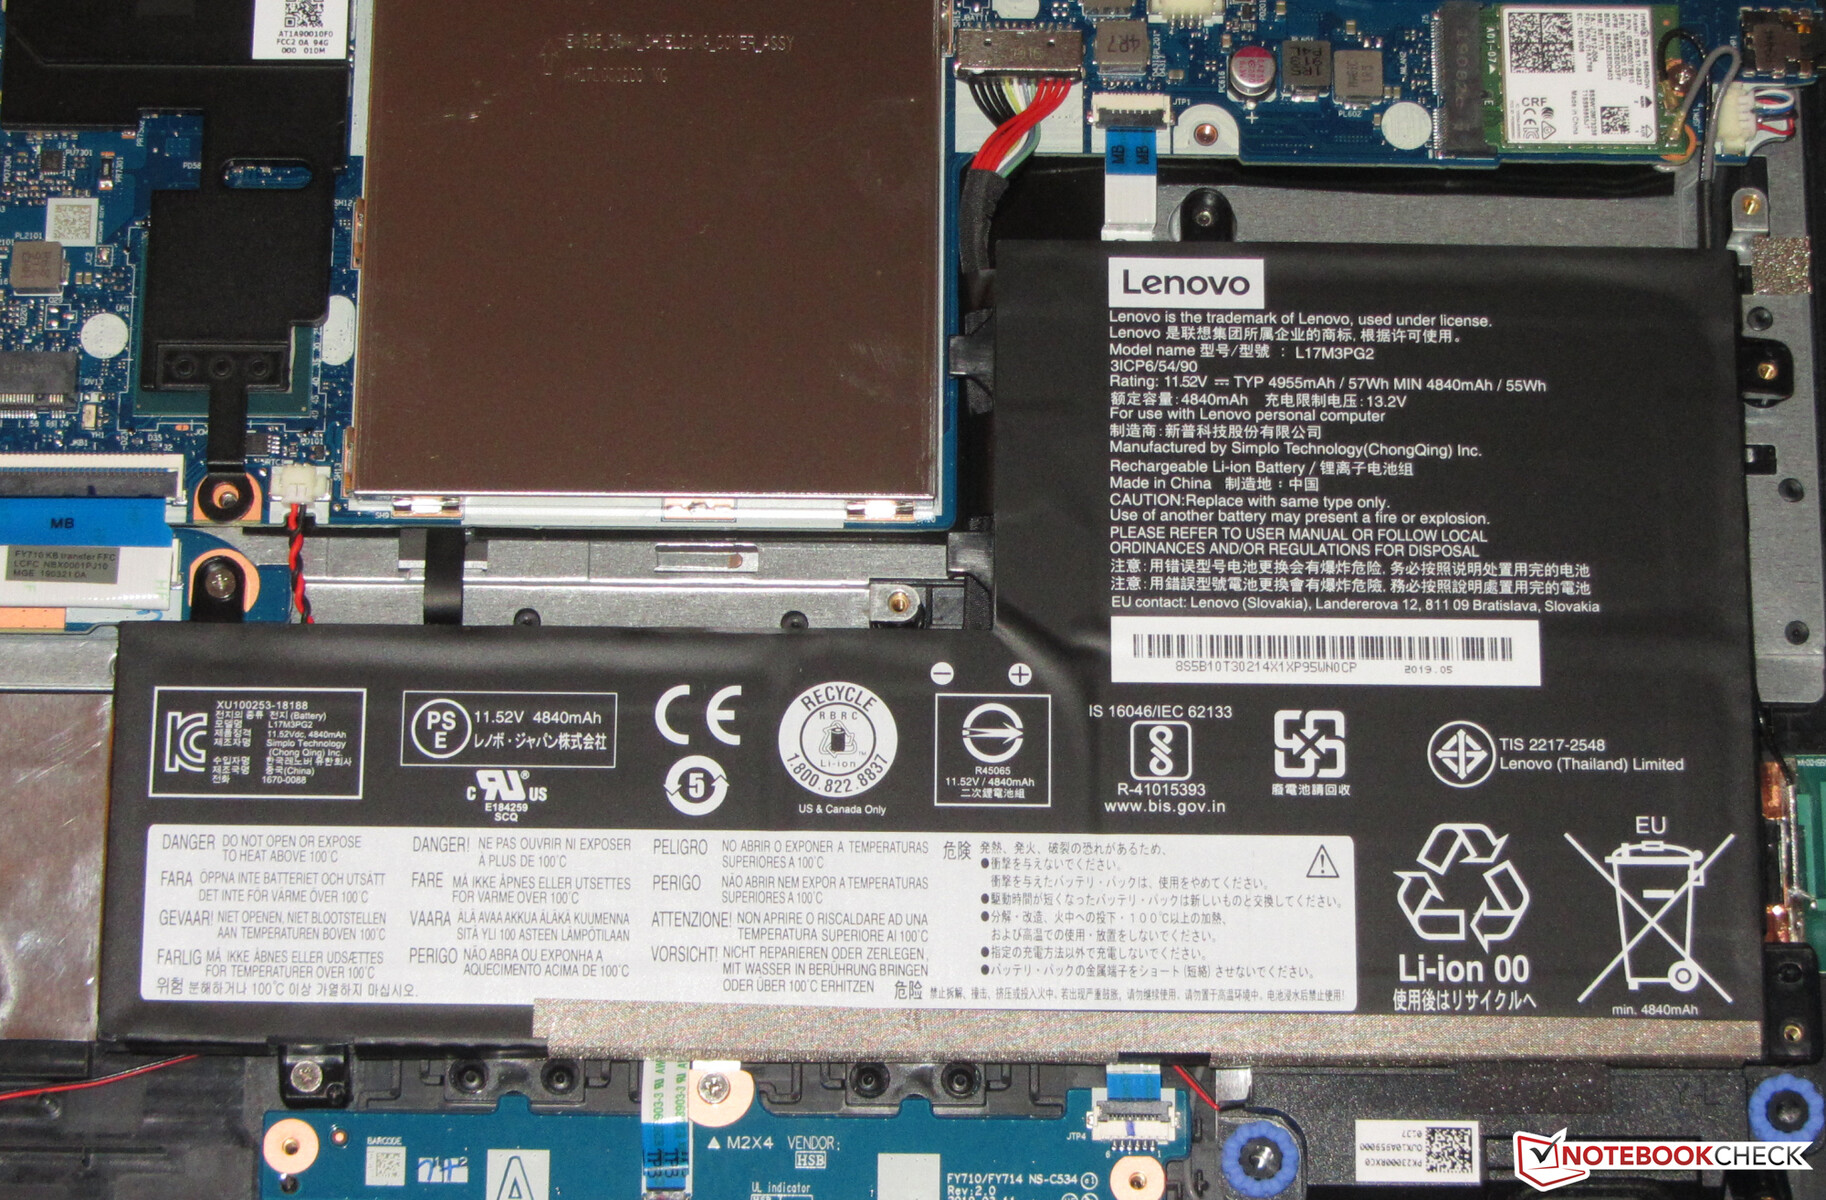
Maintenance
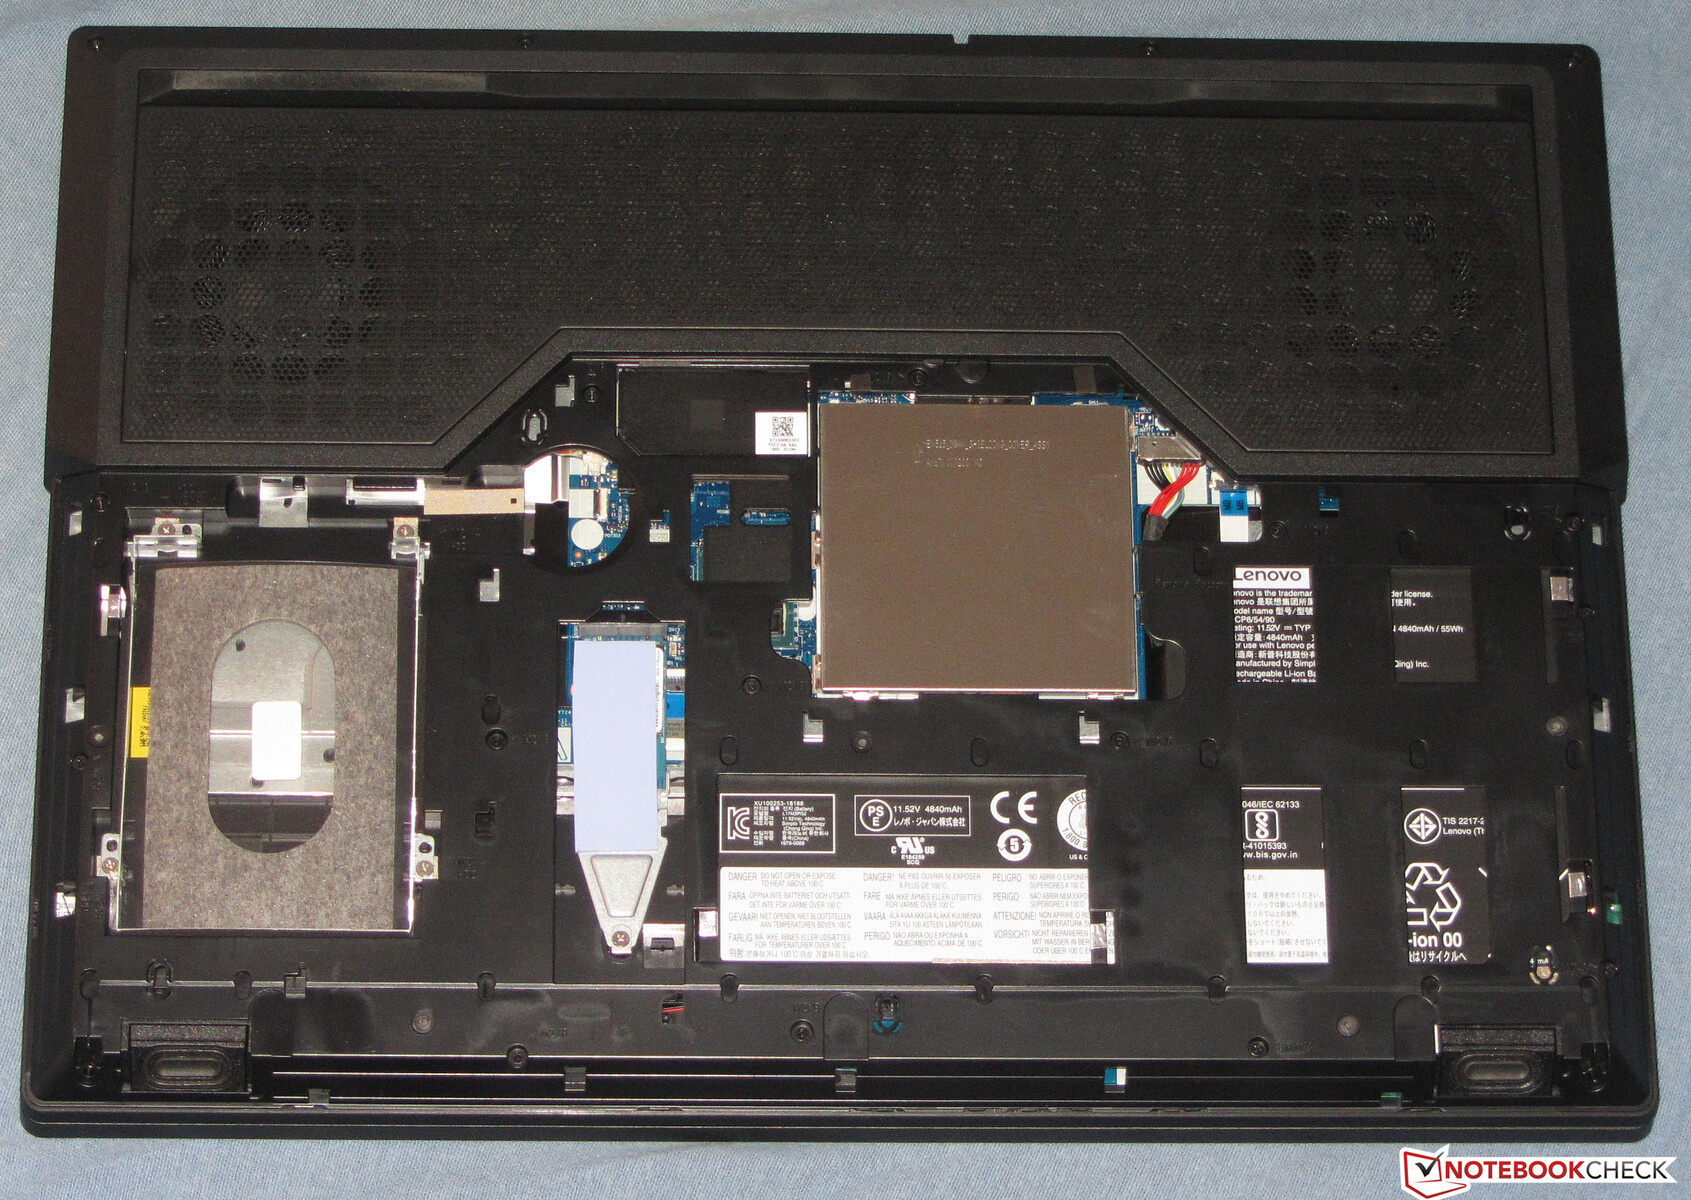
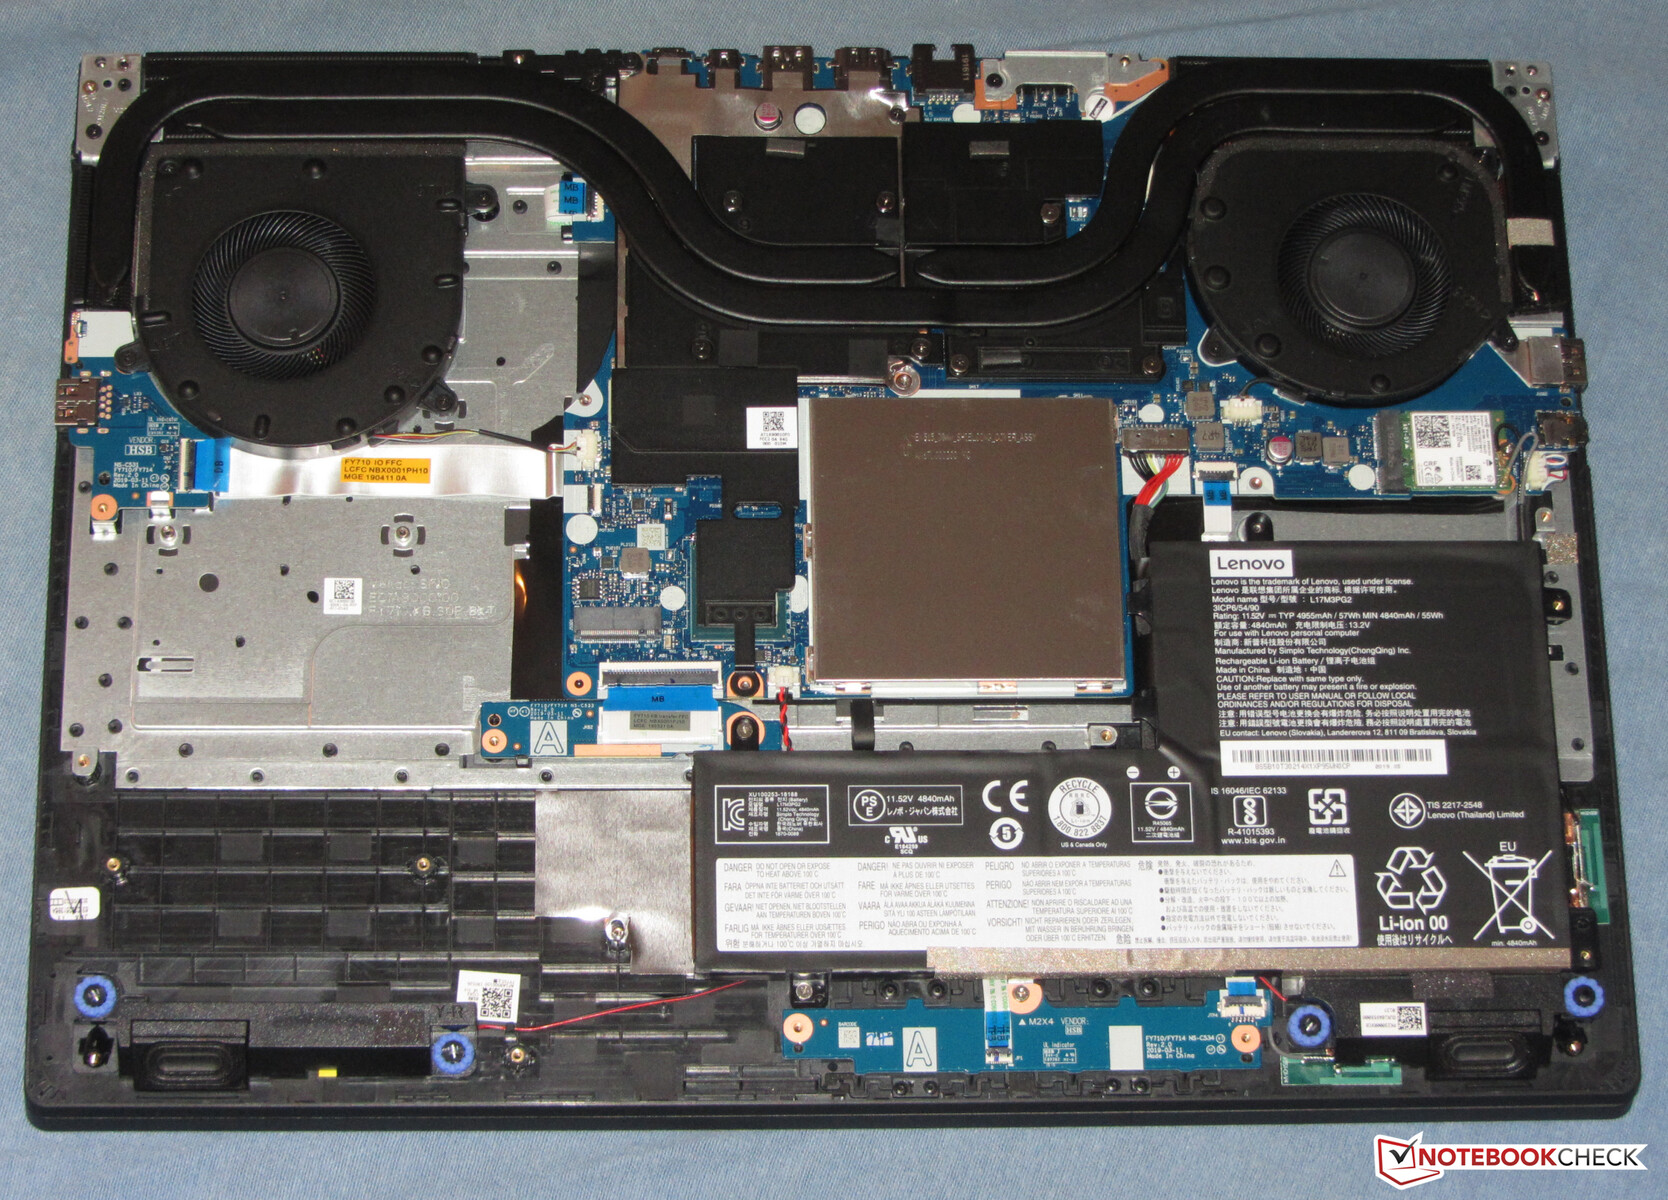
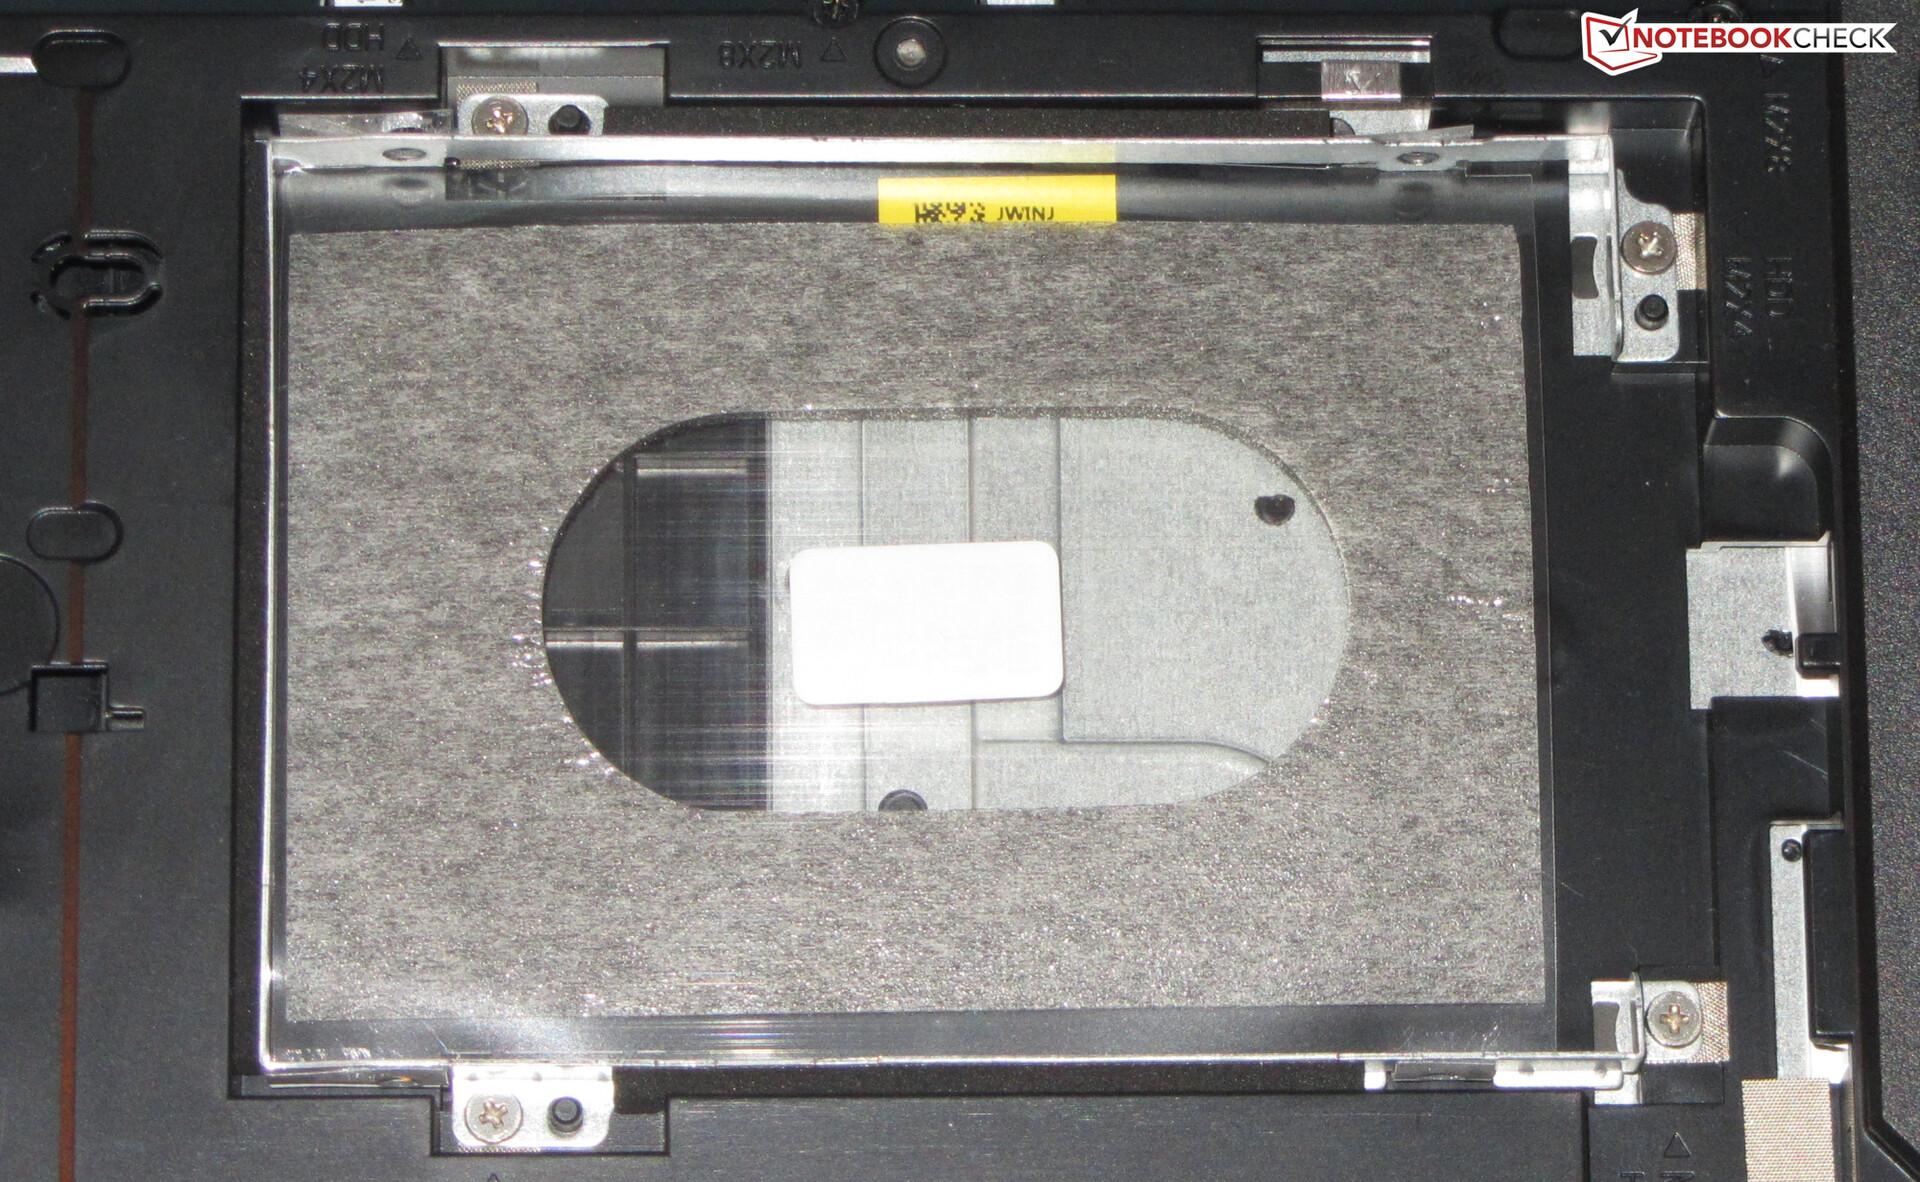
The Y540 provides users with a maintenance hatch, which allows for easy access to the SSD, 2.5-inch bay as well as the RAM. The system memory is covered by an additional metal plate. The hatch can only be opened after unscrewing two screws. Afterwards, it can be removed. In order to access the fans, Wi-Fi module and battery, the entire bottom shell has to be removed. Although this is not very difficult in and of itself, a lot of screws have to be removed in the process. Afterwards, the bottom plates can be dislodged with the help of a sharp edge.
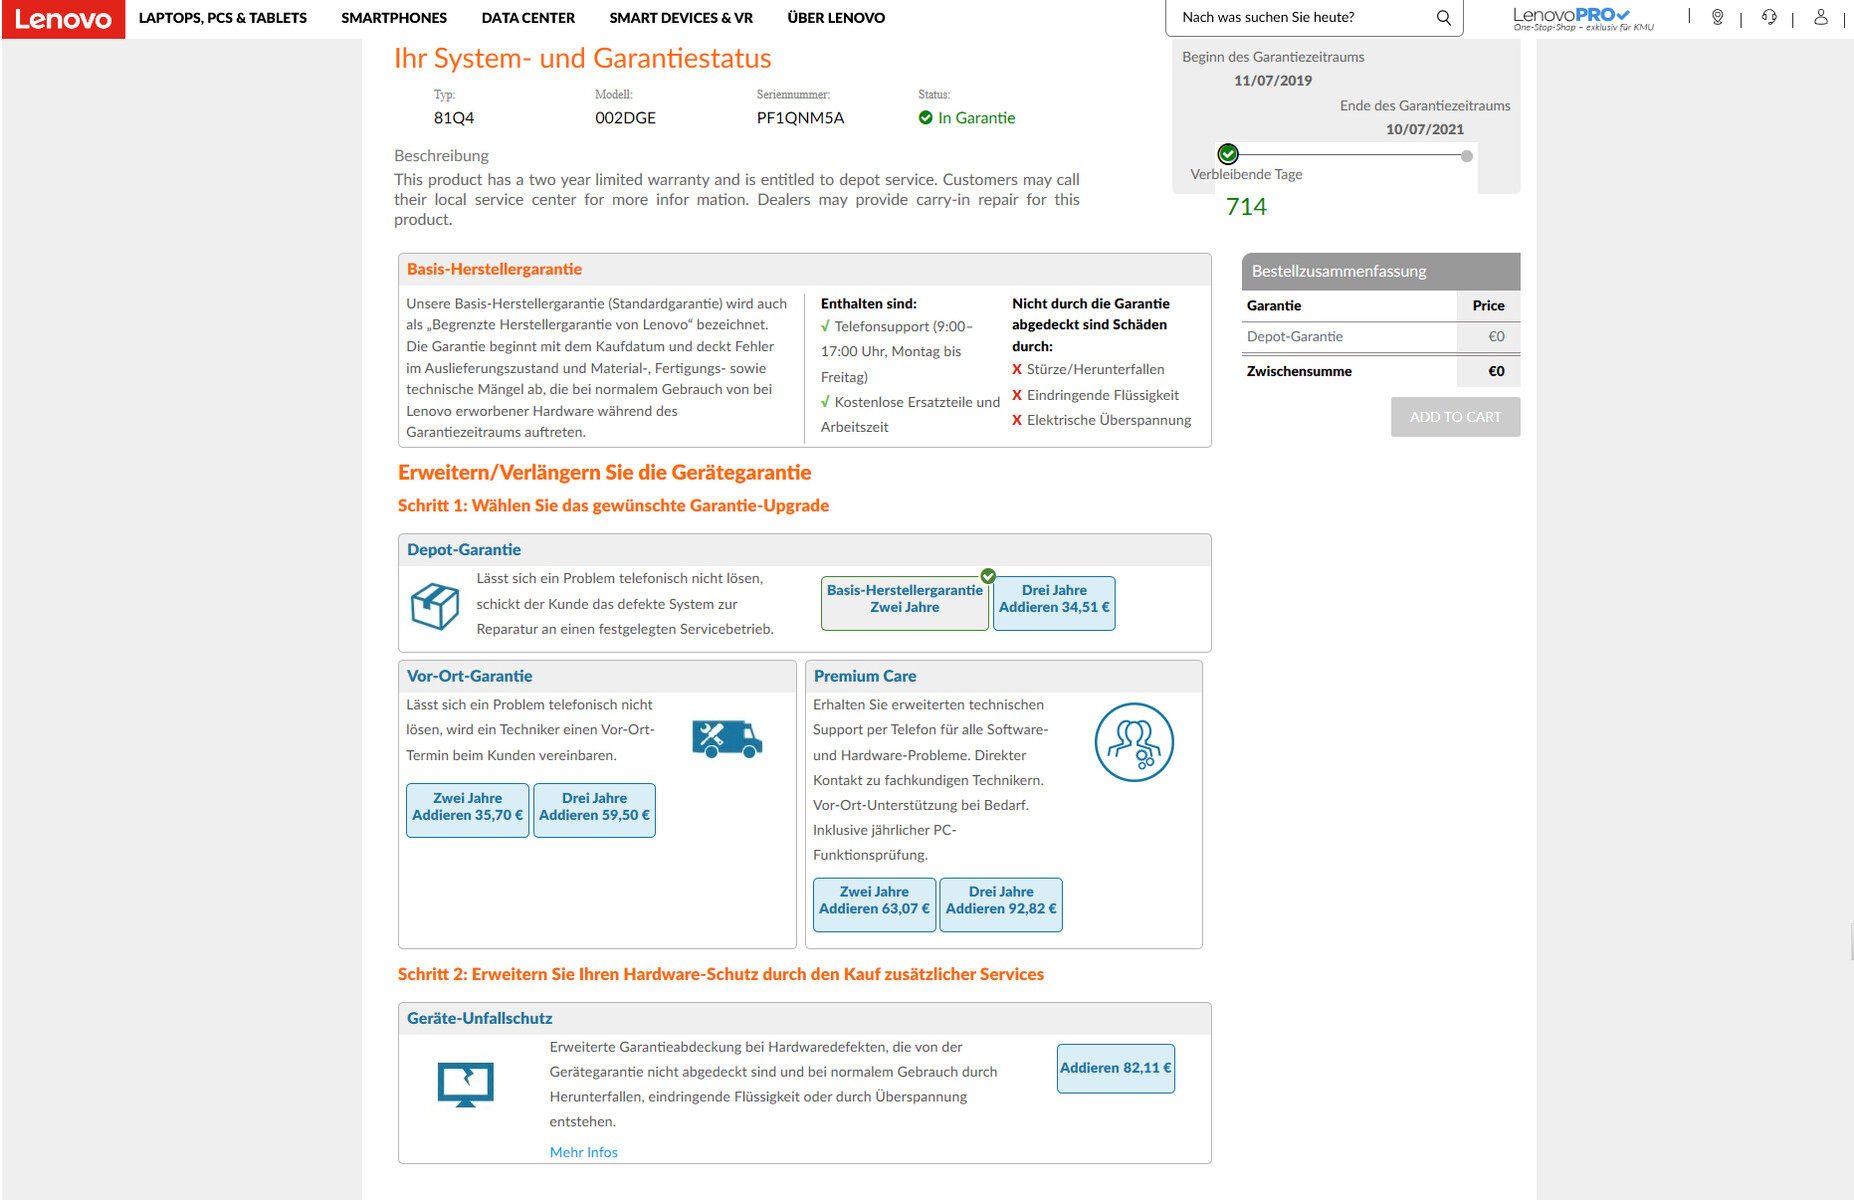
Warranty
Lenovo offers its customers a warranty period of two years. There are options to increase the scope and the length of the warranty. Three years of on-site warranty can be purchased for just below 60 Euros (~$67), for example.
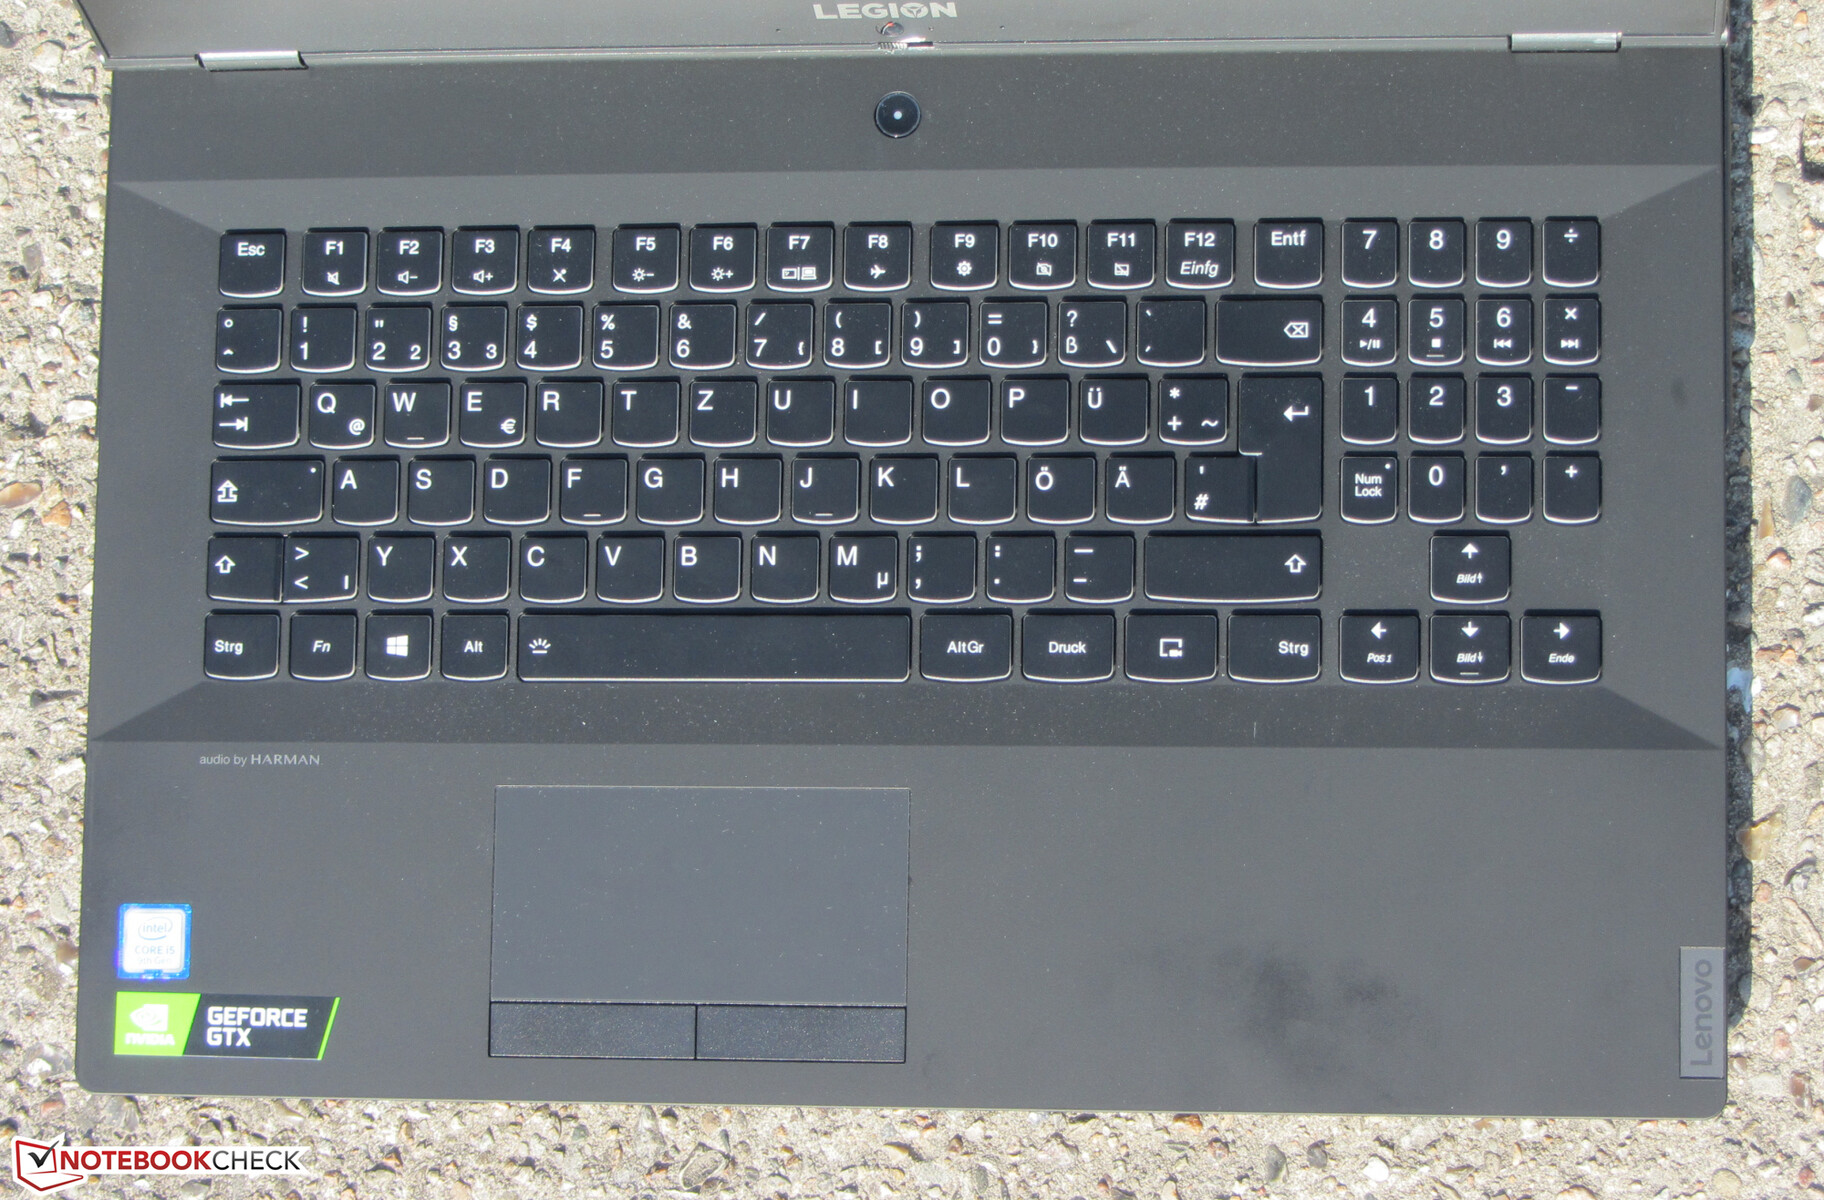
Input Devices - Backlit Keyboard
Keyboard
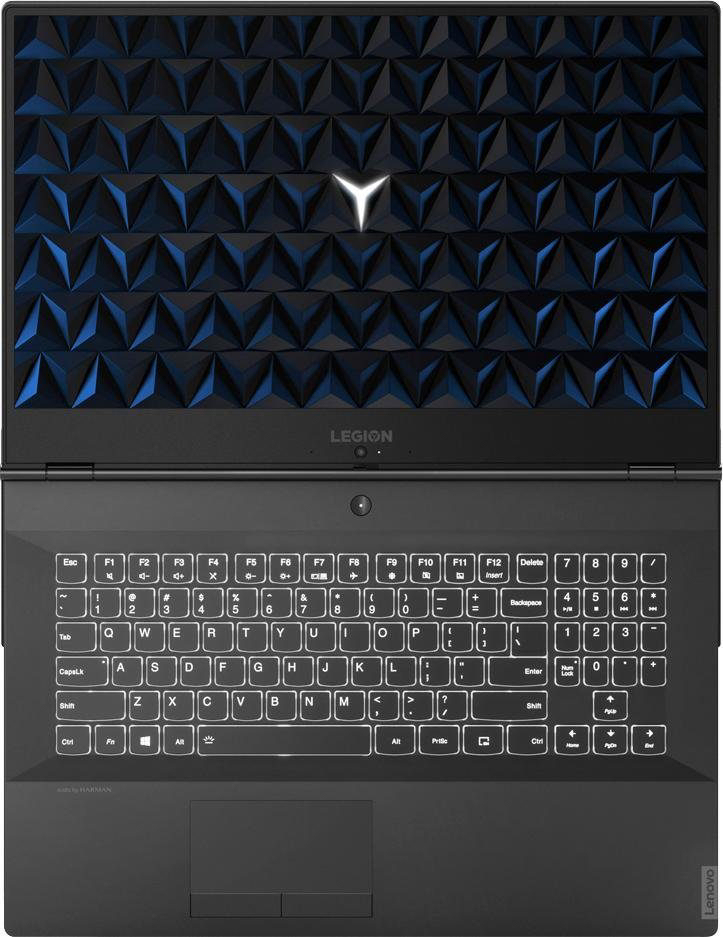
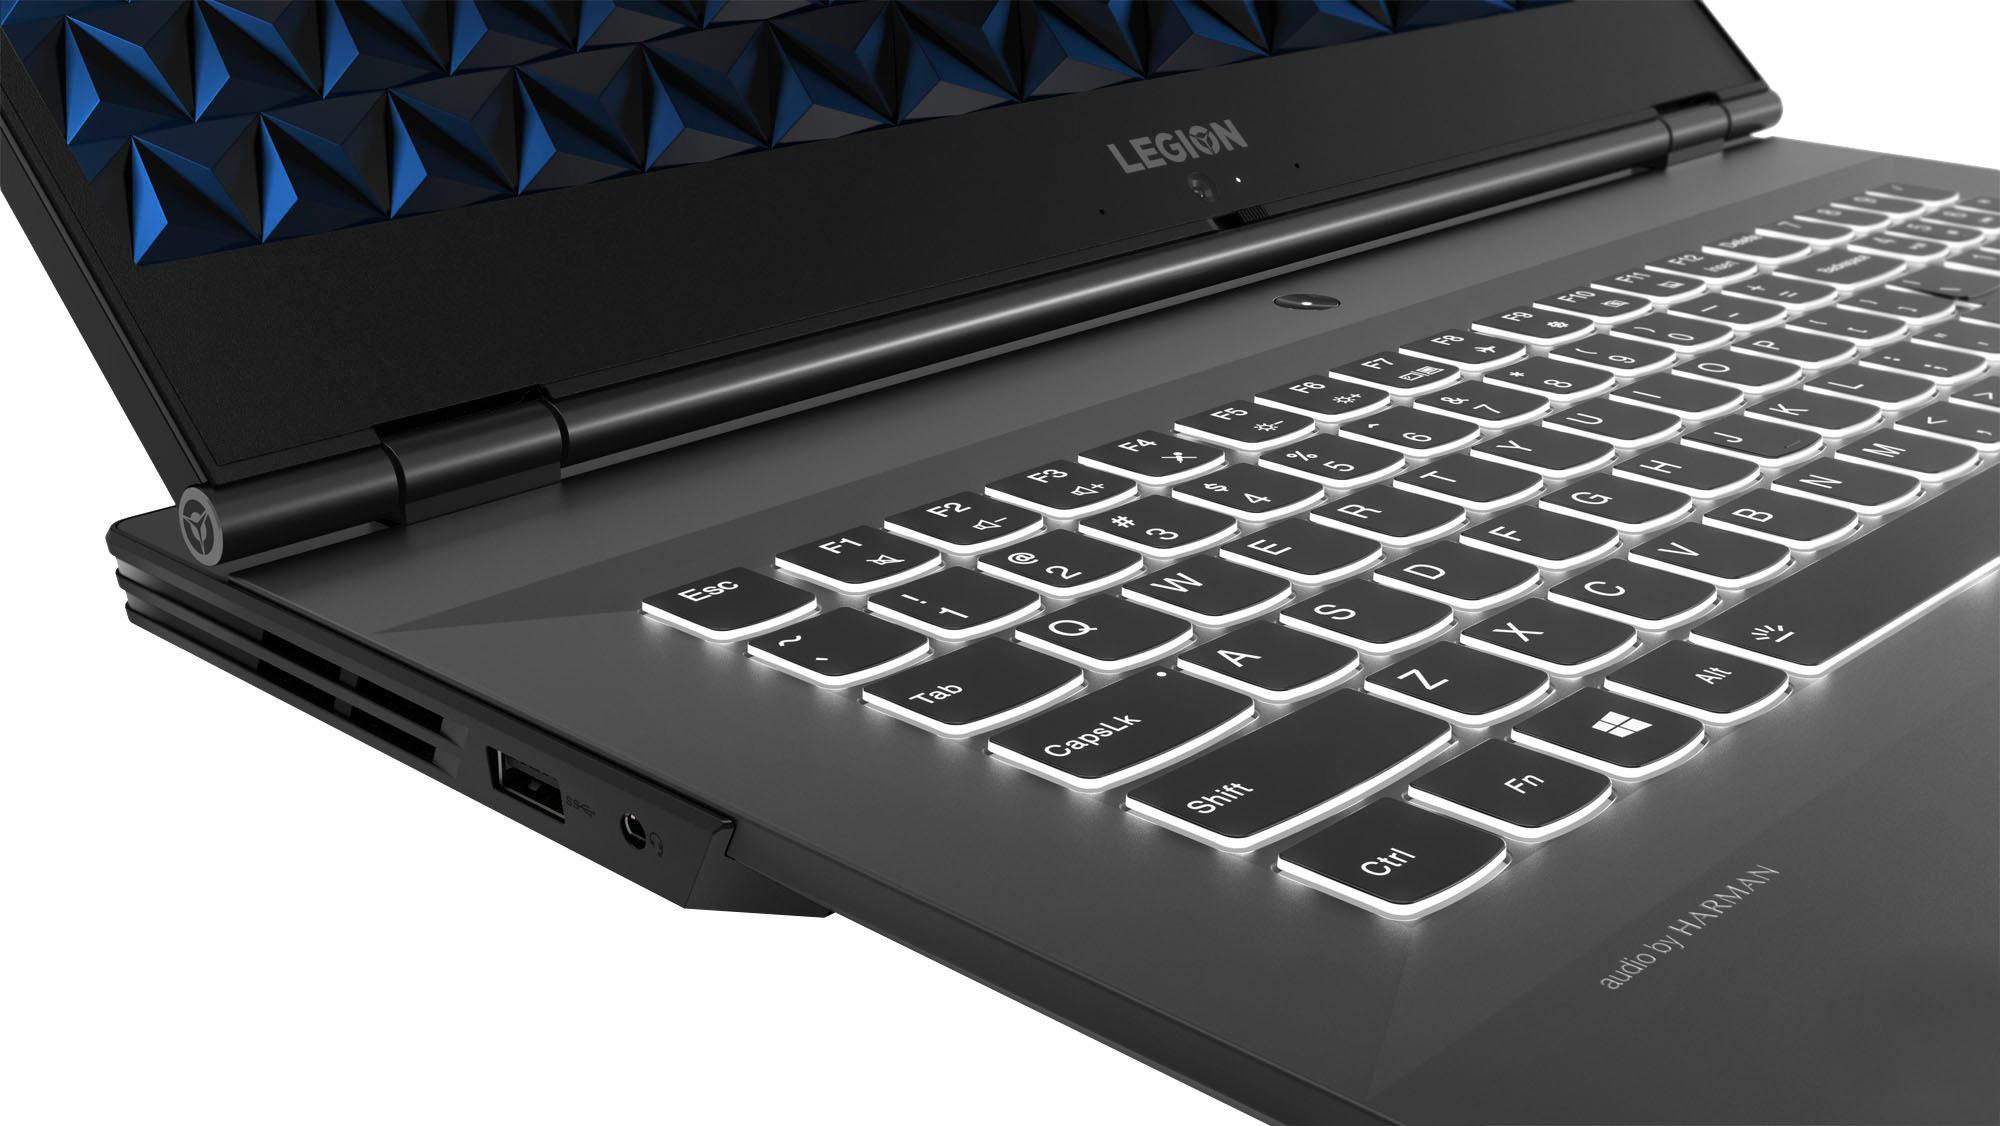
The Y540 is equipped with a chiclet keyboard. The keys have been designed in typical Lenovo fashion: The user-facing sides of the keys are not straight but are curved. The keys offer medium travel and a distinct feedback. We liked the key resistance as well - although this is a matter of personal preference. Typing depresses the keyboard slightly; this did not end up interfering with the workflow however. As opposed to the Y740-17ICH (RGB lighting), the Y540-17IRH's keyboard backlight is monochromatic and white. There are two brightness levels which can be controlled via a function key. All in all, this is a solid keyboard from Lenovo that works well during daily use.
Touchpad
The multi-touch enabled touchpad extends itself over an area of about 10.2 x 5.2 cm (4.02 x 2.05 in). Thus, there is more than enough space for gestures. The smooth surface has good gliding properties. The pad responds precisely to inputs all the way to the edges. Below the touchpad, there are two dedicated mouse buttons. They offer short travel and a distinct haptic, as well as audible feedback.
Display - 144-Hz IPS
The 17.3-inch display of the Legion has a native resolution of 1920x1080 pixels. While the contrast ratio is good (1.505:1), the brightness is somewhat low (282 nits). For the latter, a value of 300 nits and above is considered good. Within our comparison, the MSI GP75 Leopard 9SD's display was able to clearly set itself apart from the competition with a brightness level of almost 400 nits.
The 144-Hz panel inside of the Y540 has fast response times overall. However, this discipline once again favors the display of the MSI GP75 Leopard 9SD - and in this case also that of the Gigabyte Sabre 17-W8. The competing 144-Hz models are able to achieve even lower response times. Good: The display of the Legion does not exhibit PWM flickering.
| |||||||||||||||||||||||||
Brightness Distribution: 87 %
Center on Battery: 286 cd/m²
Contrast: 1505:1 (Black: 0.19 cd/m²)
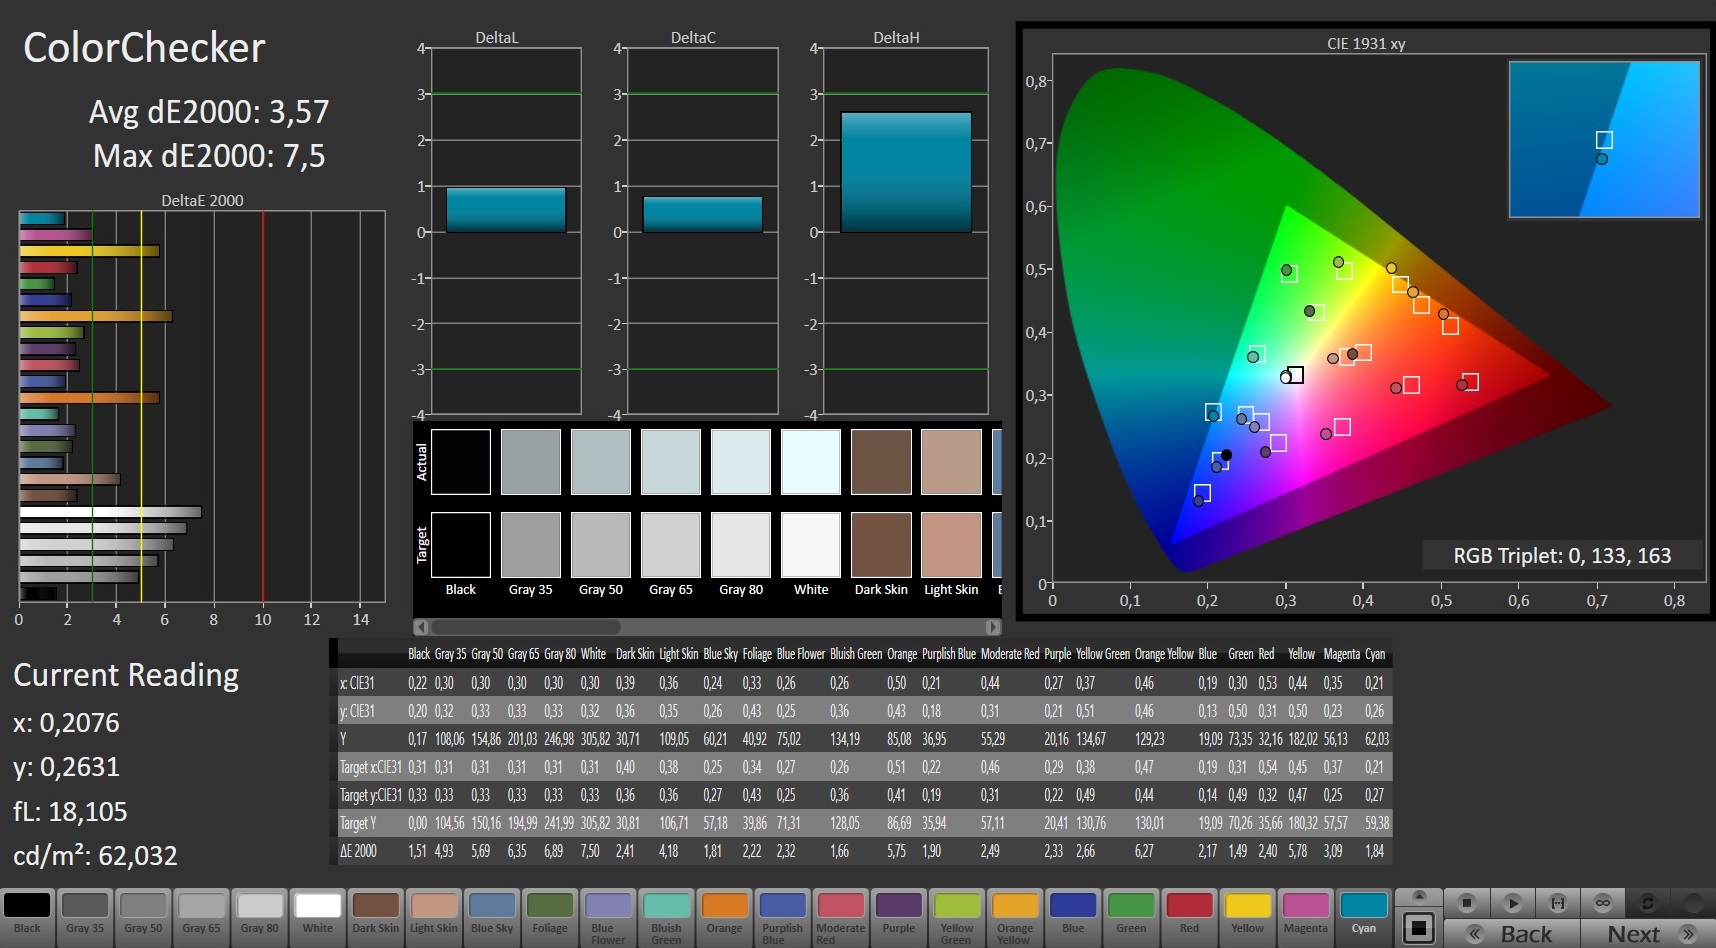
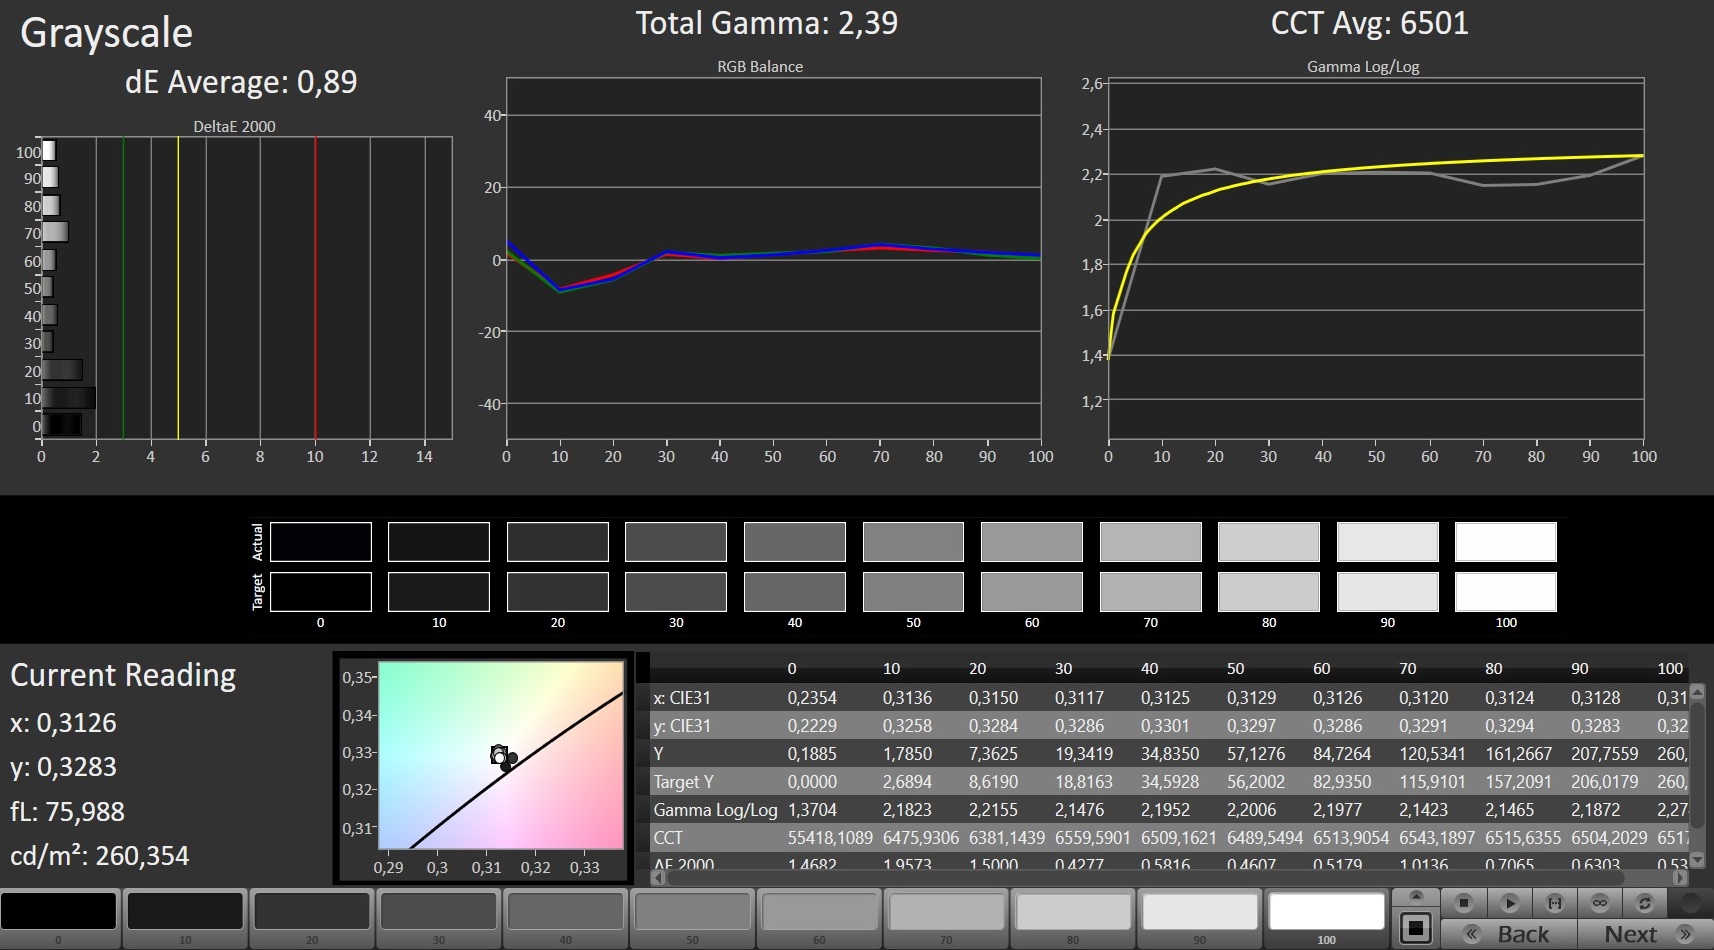
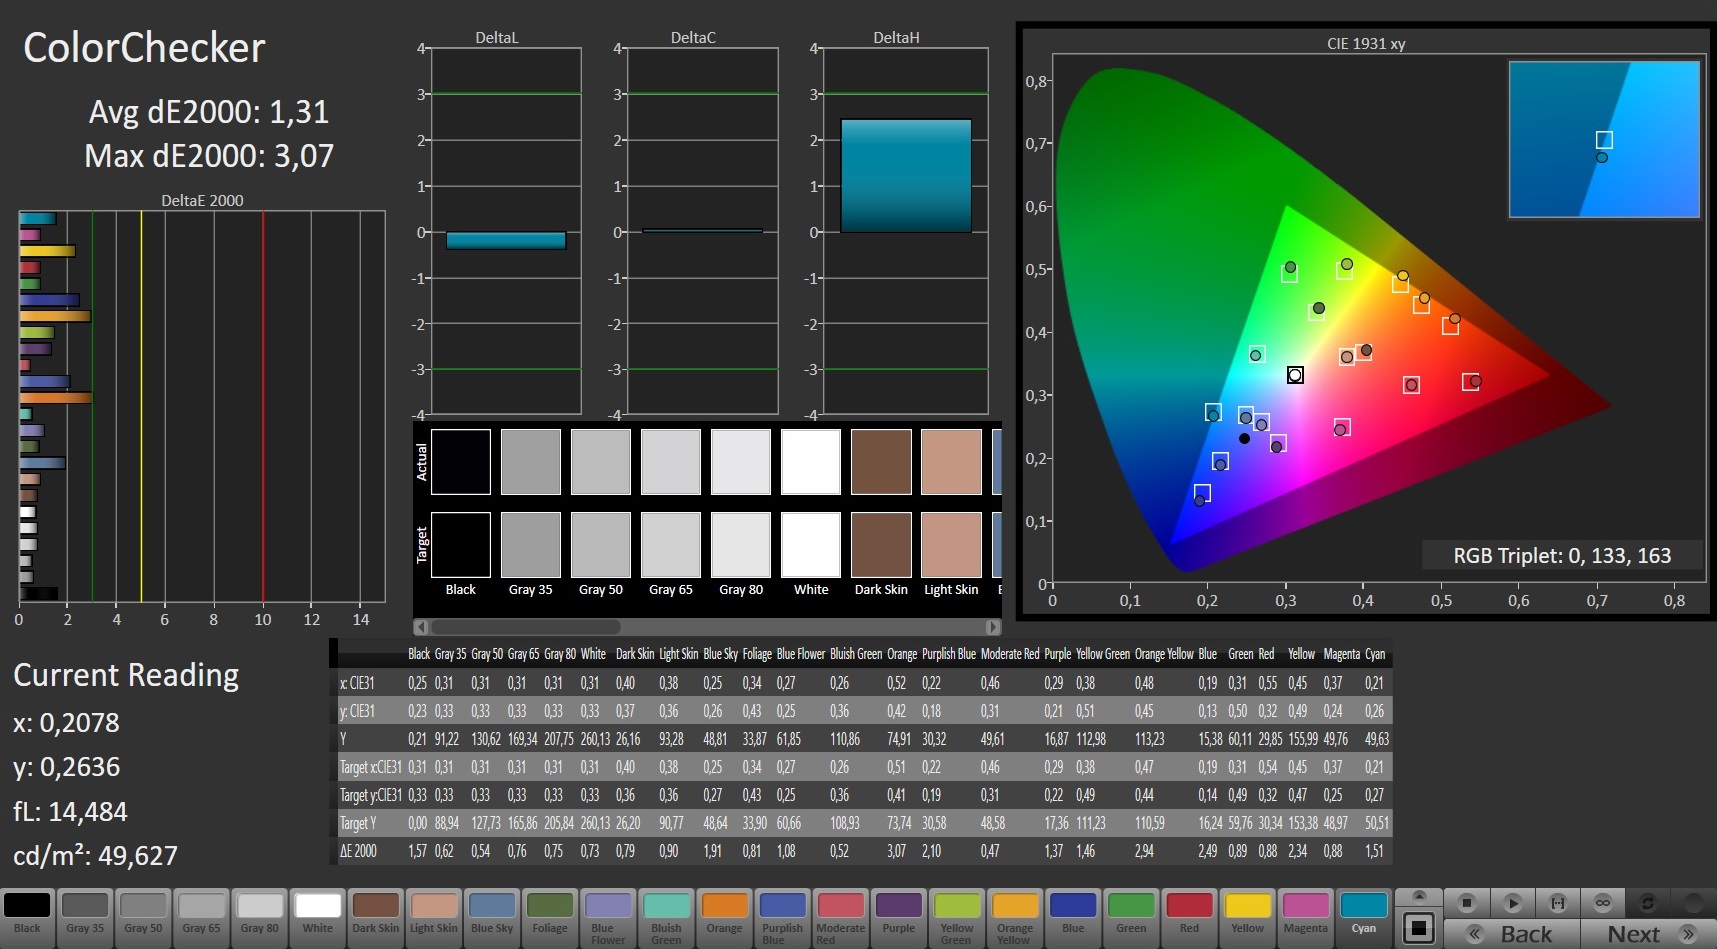
ΔE ColorChecker Calman: 3.57 | ∀{0.5-29.43 Ø4.73}
calibrated: 1.31
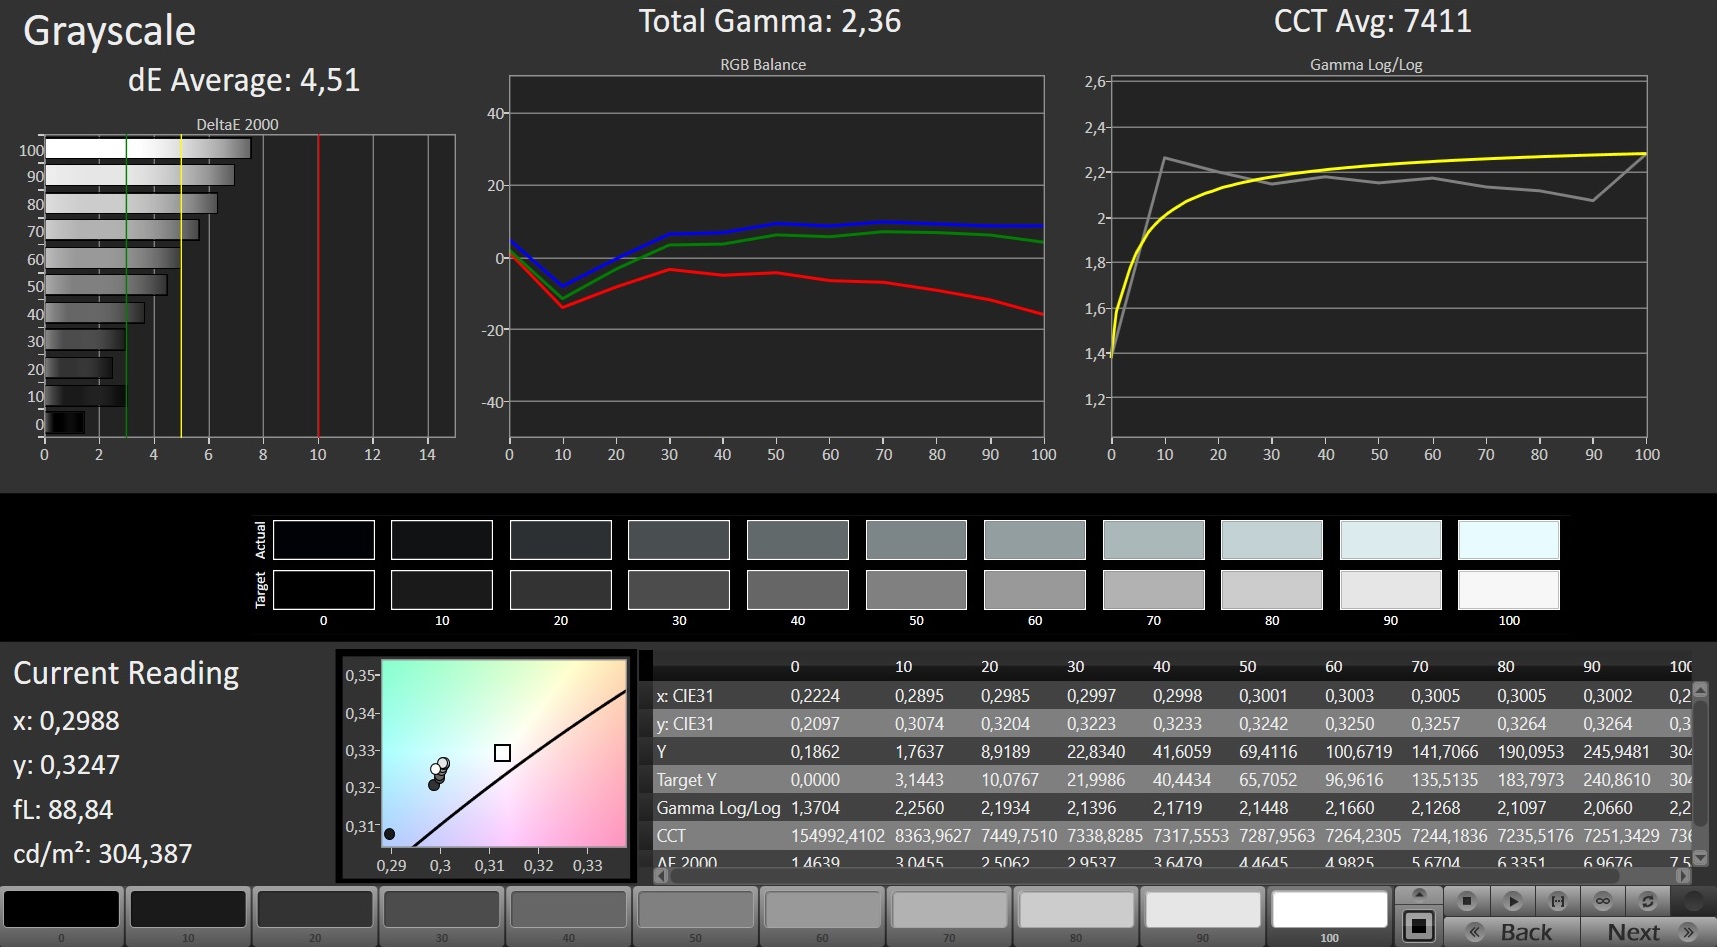
ΔE Greyscale Calman: 4.51 | ∀{0.09-98 Ø4.97}
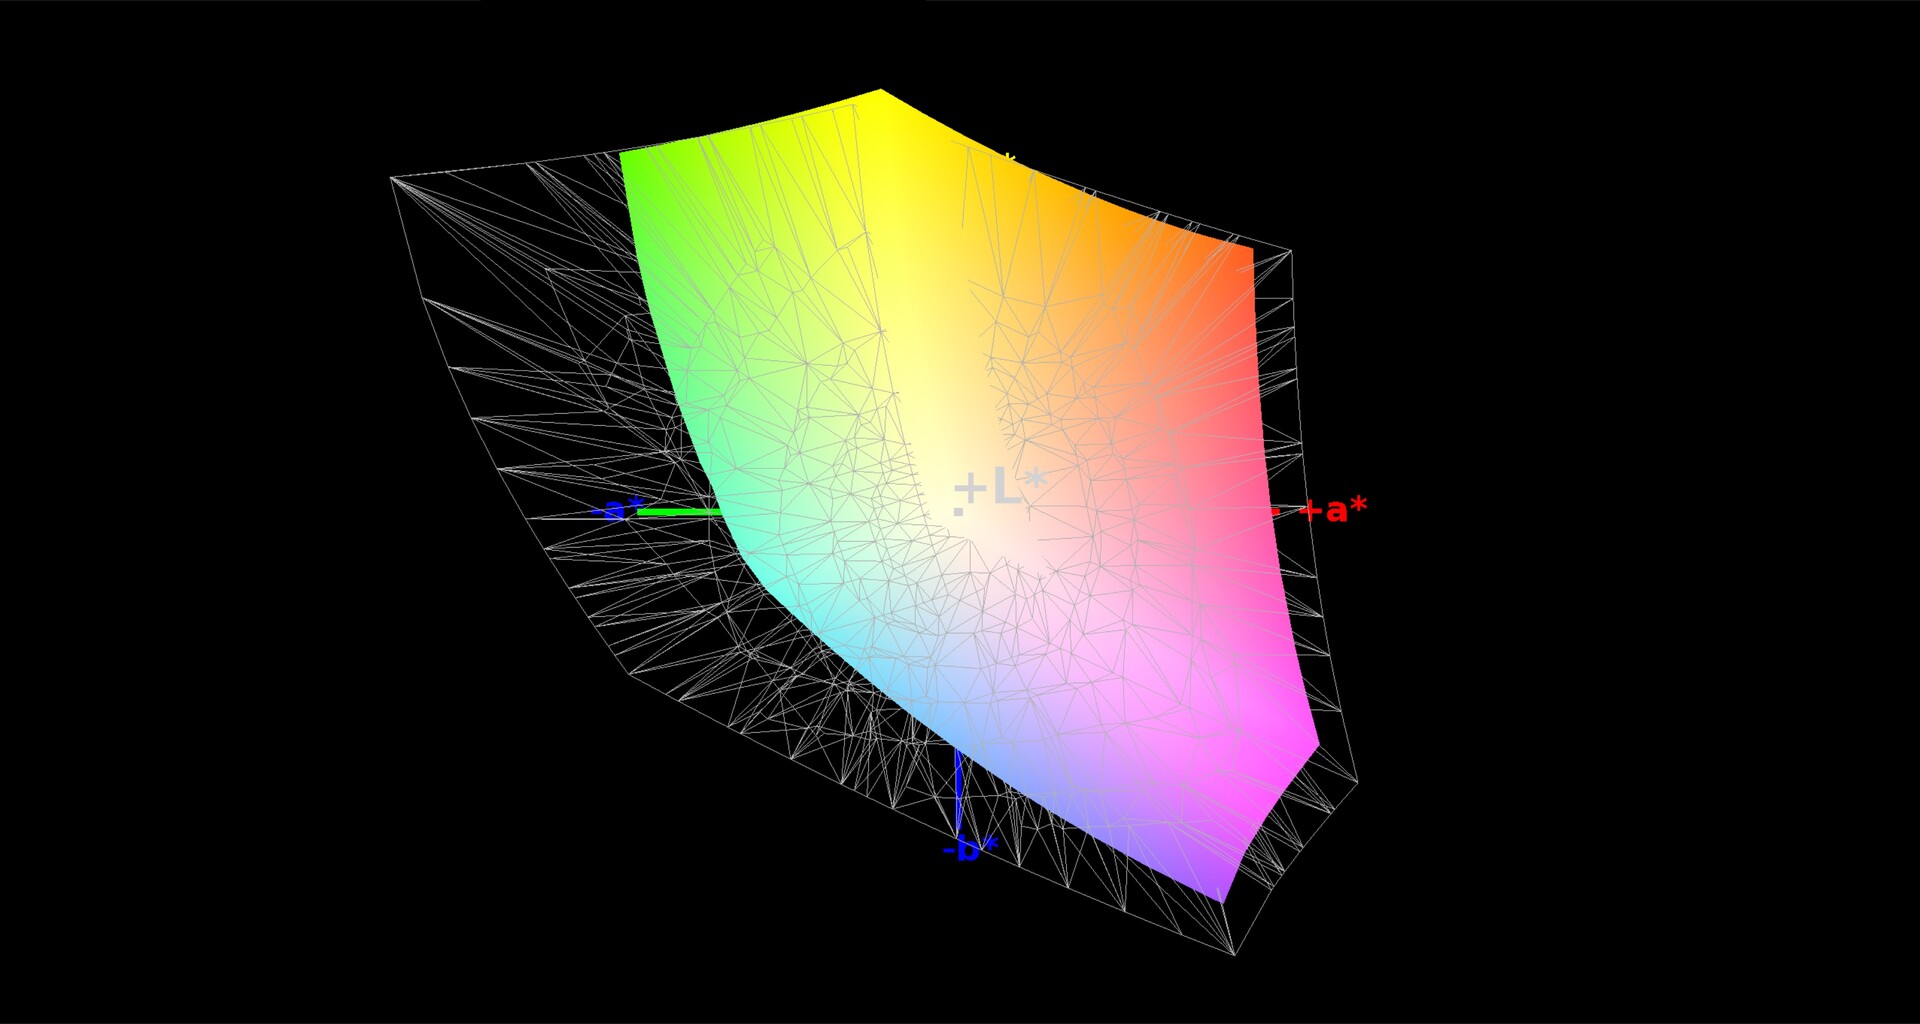
98% sRGB (Argyll 1.6.3 3D)
64% AdobeRGB 1998 (Argyll 1.6.3 3D)
70.7% AdobeRGB 1998 (Argyll 3D)
98.3% sRGB (Argyll 3D)
69% Display P3 (Argyll 3D)
Gamma: 2.36
CCT: 7411 K
| Lenovo Legion Y540-17IRH AU Optronics B173HAN04.4 (AUO449D), IPS, 1920x1080 | Schenker XMG Core 17 LG Philips LP173WFG-SPB1 (LGD0615), IPS, 1920x1080 | Lenovo Legion Y740-17ICH AU Optronics B173HAN03.2, IPS, 1920x1080 | MSI GP75 Leopard 9SD Chi Mei N173HCE-G33 (CMN175C), IPS, 1920x1080 | Dell G7 17 7790 AU Optronics AUO409D, B173HAN, IPS, 1920x1080 | Gigabyte Sabre 17-W8 Chi Mei CMN1747, TN, 1920x1080 | |
|---|---|---|---|---|---|---|
| Display | -6% | -8% | -6% | -10% | 17% | |
| Display P3 Coverage (%) | 69 | 64.4 -7% | 64 -7% | 63.4 -8% | 61.9 -10% | 89.9 30% |
| sRGB Coverage (%) | 98.3 | 95.6 -3% | 90.4 -8% | 94.9 -3% | 89.6 -9% | 100 2% |
| AdobeRGB 1998 Coverage (%) | 70.7 | 65.6 -7% | 64.8 -8% | 65.1 -8% | 63.2 -11% | 85.1 20% |
| Response Times | 23% | 7% | 44% | 5% | 44% | |
| Response Time Grey 50% / Grey 80% * (ms) | 18 ? | 14.4 ? 20% | 15.6 ? 13% | 8 ? 56% | 17.2 ? 4% | 9 ? 50% |
| Response Time Black / White * (ms) | 12.8 ? | 9.6 ? 25% | 12.8 ? -0% | 8.8 ? 31% | 12 ? 6% | 8 ? 37% |
| PWM Frequency (Hz) | 25510 ? | 25000 ? | ||||
| Screen | -1% | -34% | 6% | -22% | -47% | |
| Brightness middle (cd/m²) | 286 | 329 15% | 299.1 5% | 420 47% | 308.6 8% | 326 14% |
| Brightness (cd/m²) | 282 | 286 1% | 273 -3% | 393 39% | 299 6% | 309 10% |
| Brightness Distribution (%) | 87 | 79 -9% | 81 -7% | 91 5% | 92 6% | 82 -6% |
| Black Level * (cd/m²) | 0.19 | 0.3 -58% | 0.27 -42% | 0.32 -68% | 0.29 -53% | 0.27 -42% |
| Contrast (:1) | 1505 | 1097 -27% | 1108 -26% | 1313 -13% | 1064 -29% | 1207 -20% |
| Colorchecker dE 2000 * | 3.57 | 2.52 29% | 5.07 -42% | 3.04 15% | 4.26 -19% | 9.11 -155% |
| Colorchecker dE 2000 max. * | 7.5 | 6.9 8% | 10.55 -41% | 7.22 4% | 7.83 -4% | 14.14 -89% |
| Colorchecker dE 2000 calibrated * | 1.31 | 1.31 -0% | 3.31 -153% | 0.89 32% | 2.93 -124% | 2.62 -100% |
| Greyscale dE 2000 * | 4.51 | 2.98 34% | 6.8 -51% | 3.91 13% | 5 -11% | 11.17 -148% |
| Gamma | 2.36 93% | 2.38 92% | 2.46 89% | 2.26 97% | 2.07 106% | 2.28 96% |
| CCT | 7411 88% | 6738 96% | 7805 83% | 7138 91% | 7488 87% | 12475 52% |
| Color Space (Percent of AdobeRGB 1998) (%) | 64 | 60 -6% | 58.5 -9% | 60 -6% | 57.8 -10% | 76 19% |
| Color Space (Percent of sRGB) (%) | 98 | 95 -3% | 89.9 -8% | 95 -3% | 89.2 -9% | 100 2% |
| Total Average (Program / Settings) | 5% /
1% | -12% /
-24% | 15% /
8% | -9% /
-16% | 5% /
-24% |
* ... smaller is better
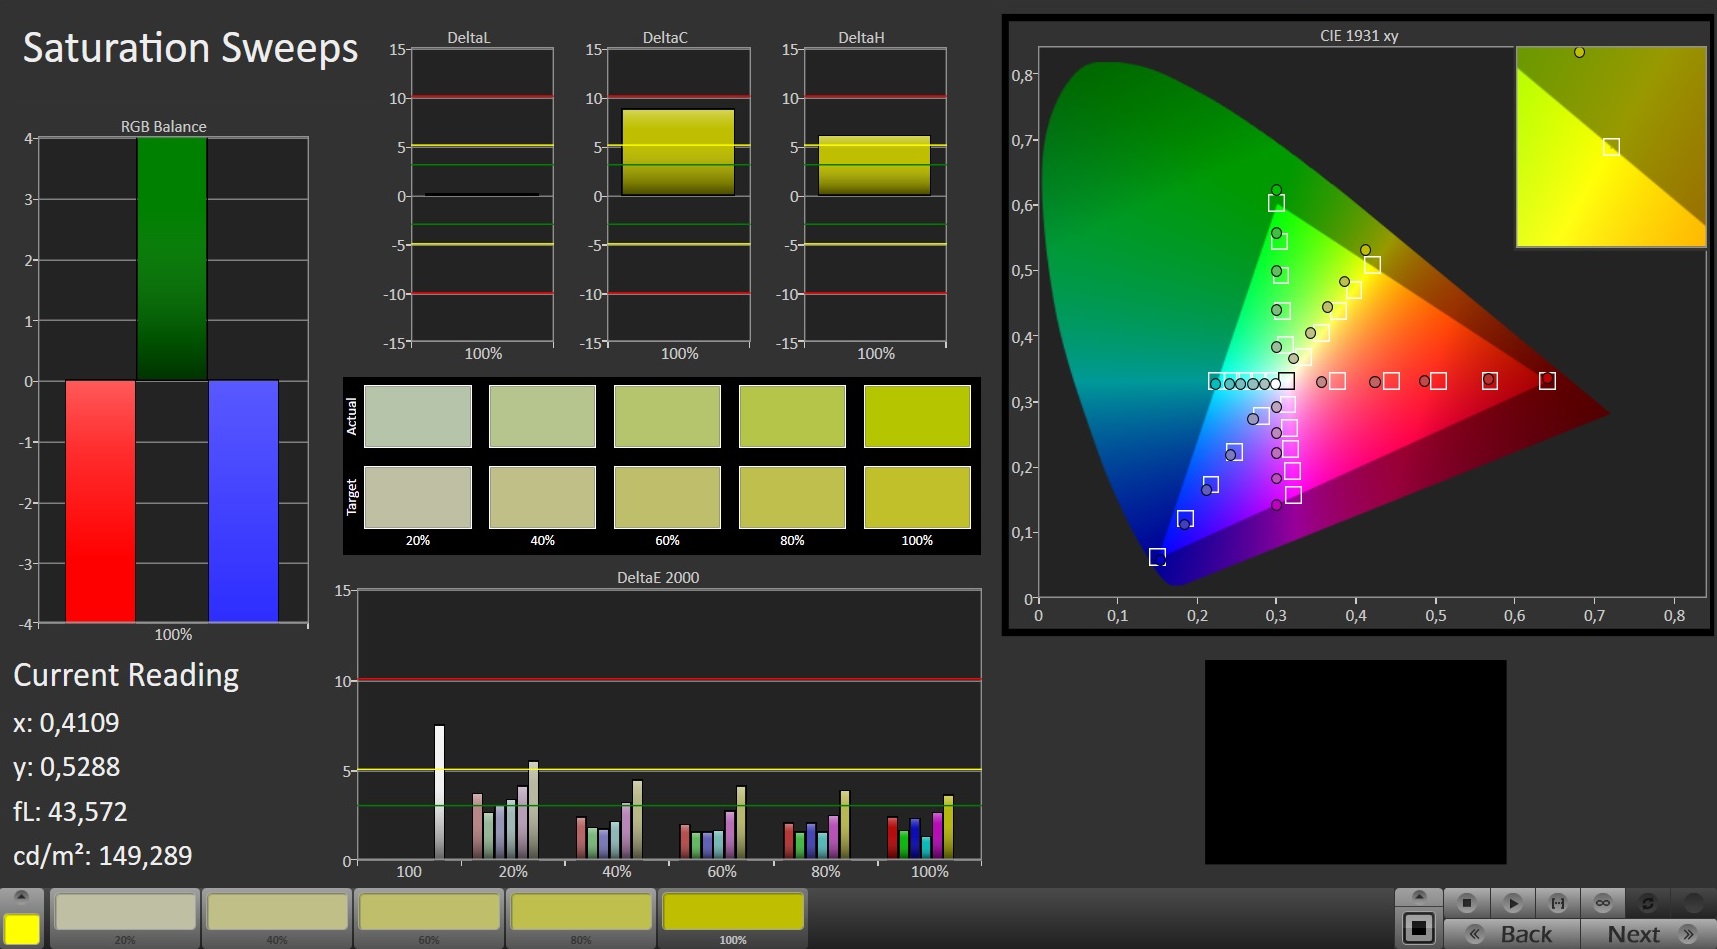
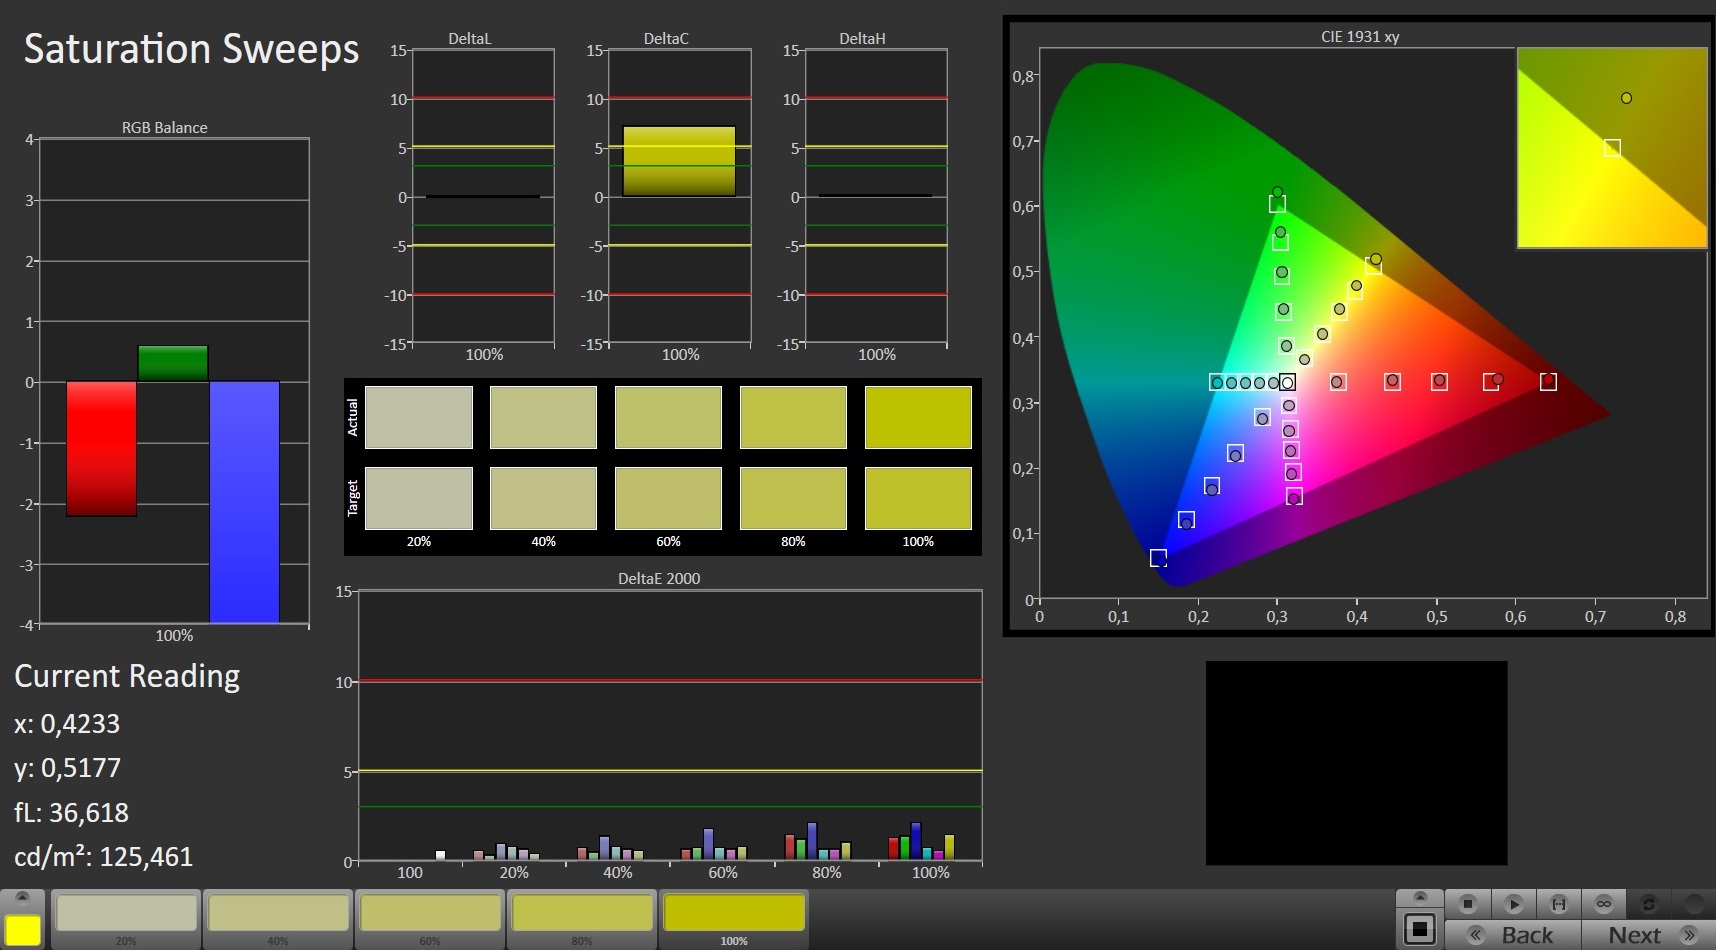
Ex-factory, the Legion's screen already represents colors rather well. At 3.57, its DeltaE-2000 only narrowly misses the ideal threshold (DeltaE of 3 or less). That being said, the display exhibits a faint blue tint. With calibration, the color representation can be improved. We have tried it and achieved the following results: The color deviation was lowered to 1.31, the blue tint disappeared and the grayscale is represented much more accurately as well. The Legion is unable to achieve full color-space coverage of either AdobeRGB or sRGB. The achieved color-space coverage relative to the standards is 64% (AdobeRGB) and 98% (sRGB).
The color representation of the screen can be improved with the help of our color profile, which stems from our calibration. It is important to determine in advance whether the installed display (manufacturer + model number) matches that of our test device. Otherwise, the color accuracy may decrease instead of increase. Frequently, OEMs use displays from a few different screen manufacturers within one laptop line.


Display Response Times
| ↔ Response Time Black to White | ||
|---|---|---|
| 12.8 ms ... rise ↗ and fall ↘ combined | ↗ 7.6 ms rise | 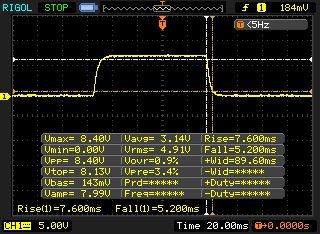 |
| ↘ 5.2 ms fall | ||
| The screen shows good response rates in our tests, but may be too slow for competitive gamers. In comparison, all tested devices range from 0.1 (minimum) to 240 (maximum) ms. » 33 % of all devices are better. This means that the measured response time is better than the average of all tested devices (19.9 ms). | ||
| ↔ Response Time 50% Grey to 80% Grey | ||
| 18 ms ... rise ↗ and fall ↘ combined | ↗ 8.4 ms rise | 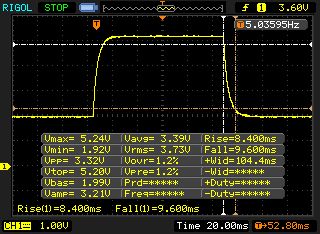 |
| ↘ 9.6 ms fall | ||
| The screen shows good response rates in our tests, but may be too slow for competitive gamers. In comparison, all tested devices range from 0.165 (minimum) to 636 (maximum) ms. » 32 % of all devices are better. This means that the measured response time is better than the average of all tested devices (31.1 ms). | ||
Screen Flickering / PWM (Pulse-Width Modulation)
| Screen flickering / PWM not detected | 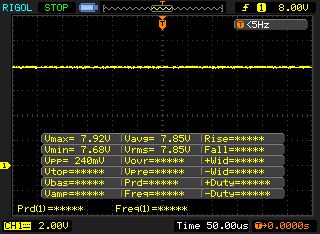 | ||
In comparison: 52 % of all tested devices do not use PWM to dim the display. If PWM was detected, an average of 7791 (minimum: 5 - maximum: 343500) Hz was measured. | |||
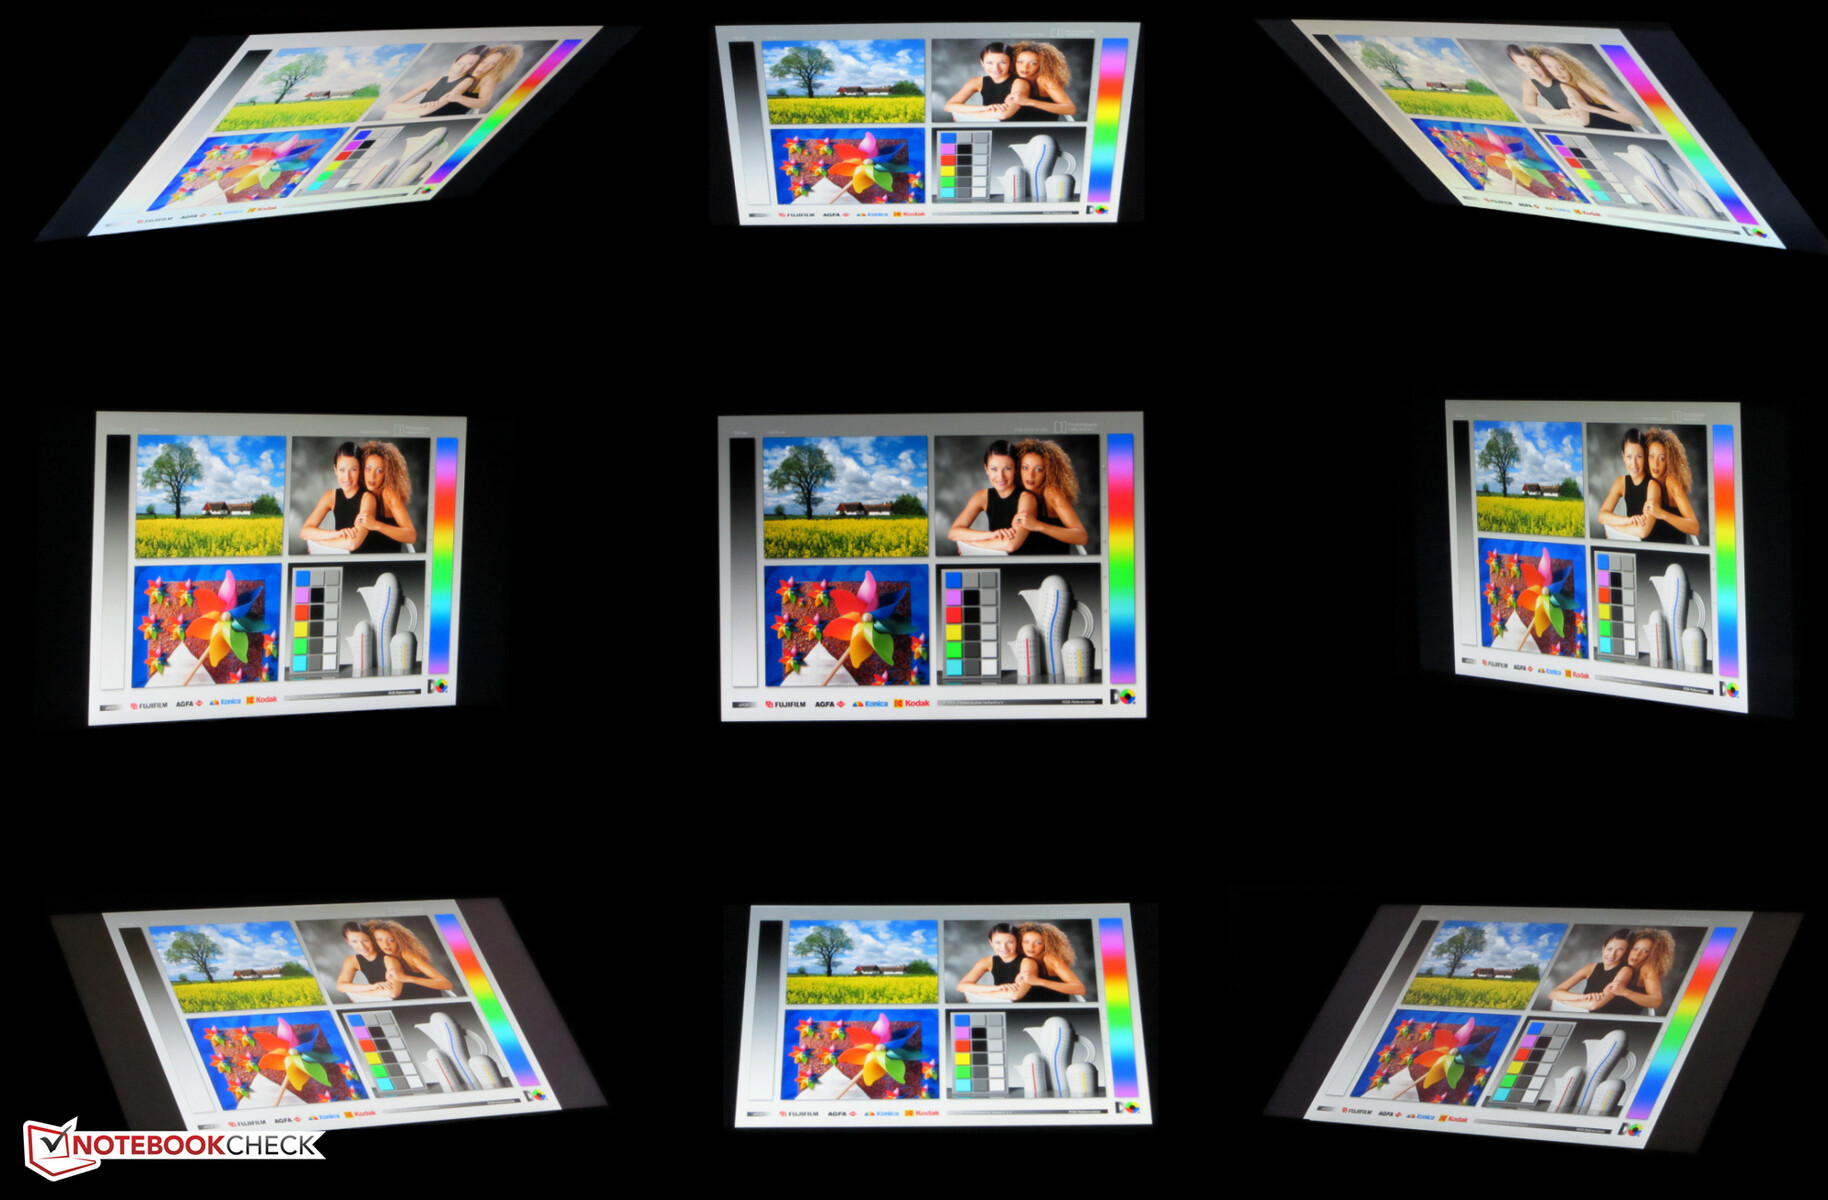
The Lenovo laptop is equipped with an IPS panel with wide viewing angles. Due to this, the screen can be read from every position. Outdoors, screen content is only recognizable if the sun does not shine too brightly.
Performance - Core i5 in Full Force
With the Y540-17IRH, Lenovo has a 17.3-inch gaming laptop in store. It runs all current titles smoothly and does well in terms of other usage scenarios as well. The configuration of our test device can be purchased for around 1,400 Euros (~$1,561). Various other configurations are also available. The cheapest model currently costs just below 1,100 Euros (~$1,226) and comes with a GeForce GTX 1650 GPU. By contrast, more expensive models are fitted with a GeForce RTX 2060 graphics unit.

Testing Conditions
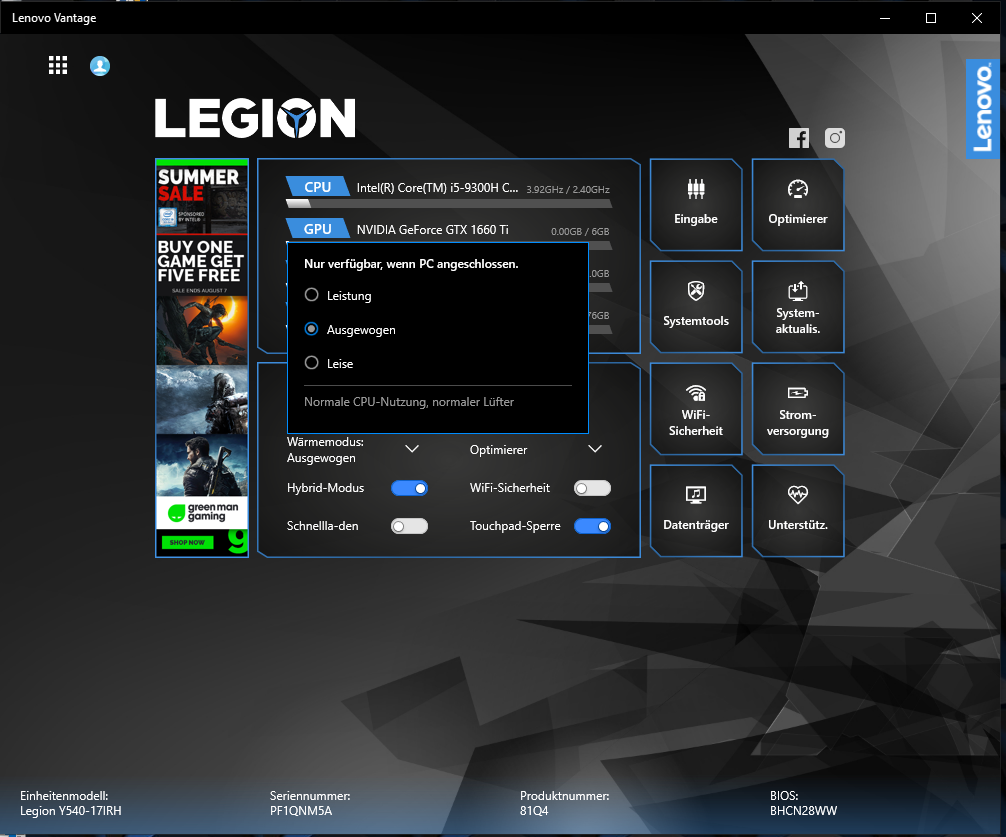
The preinstalled software Lenovo Vantage offers multiple settings, including a temperature-based mode. It controls fan usage and the performance level of the CPU. The available modes are "quiet", "balanced" and "performance". We performed our tests using the "balanced" mode. The profile "performance" did not cause a boost in performance. In "balanced" mode, the CPU's capabilities are already fully exhausted. This may not be the case for Legion models with six-core processors.
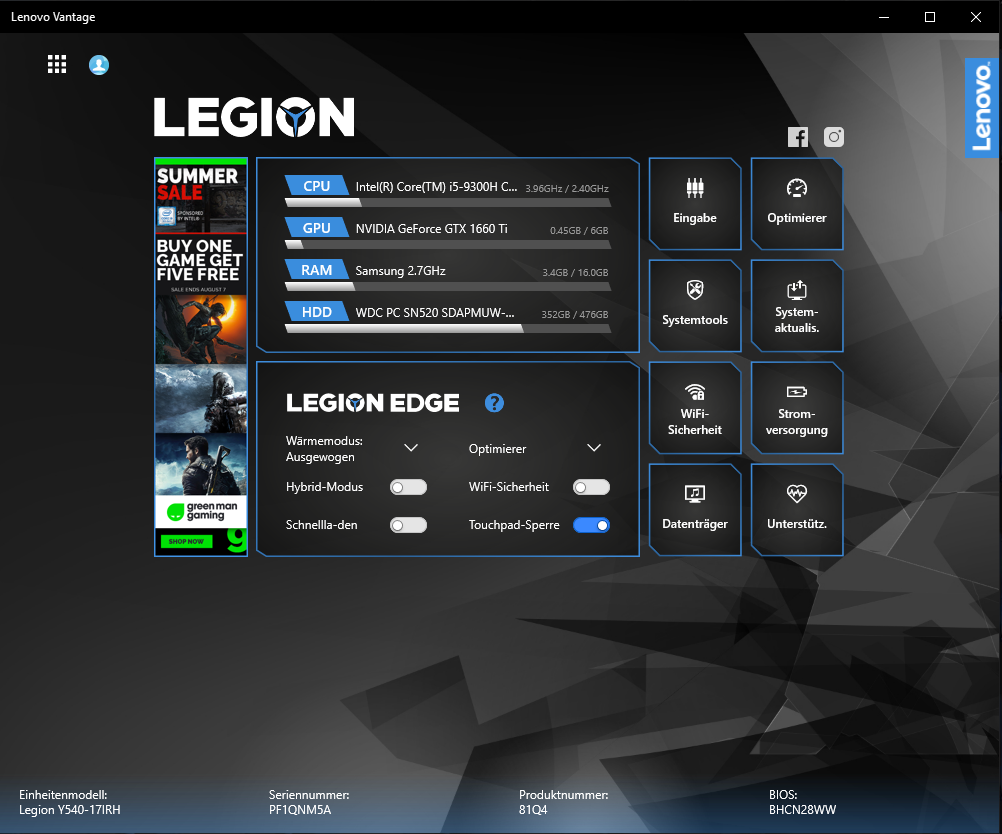

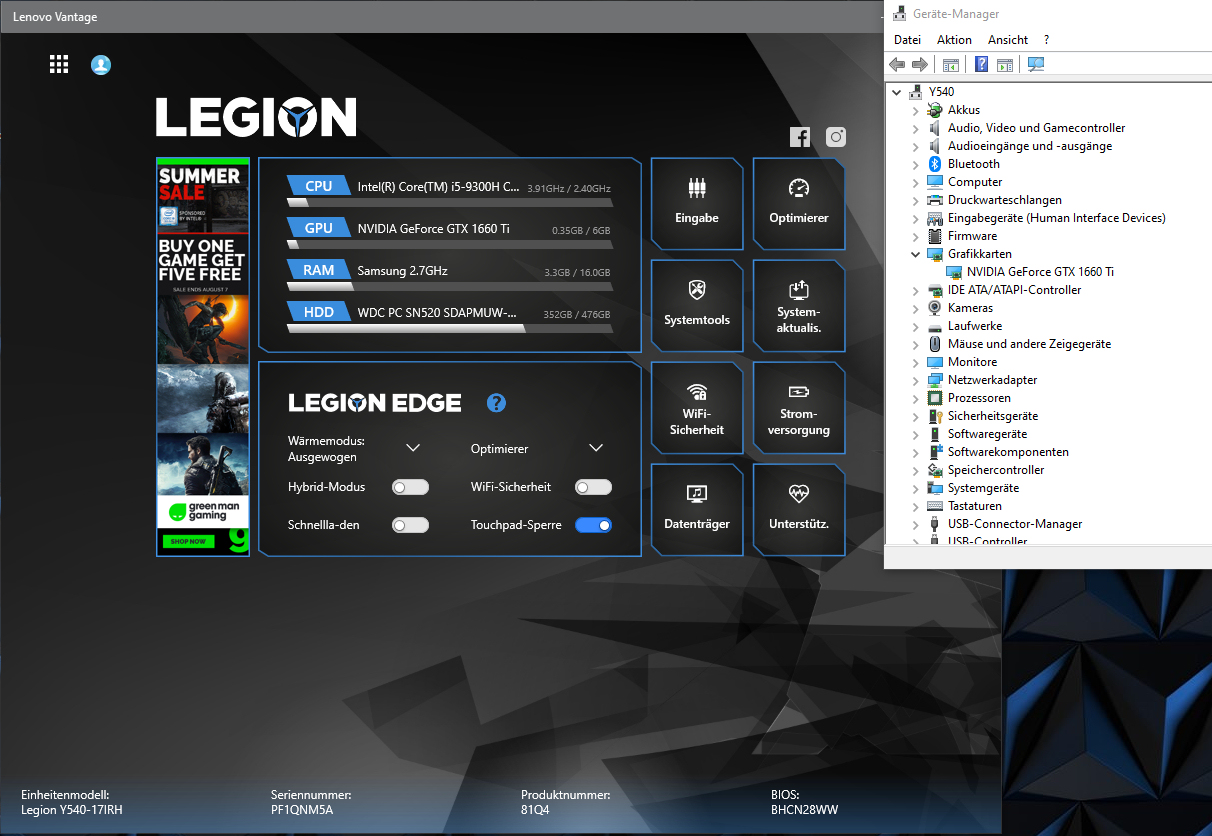
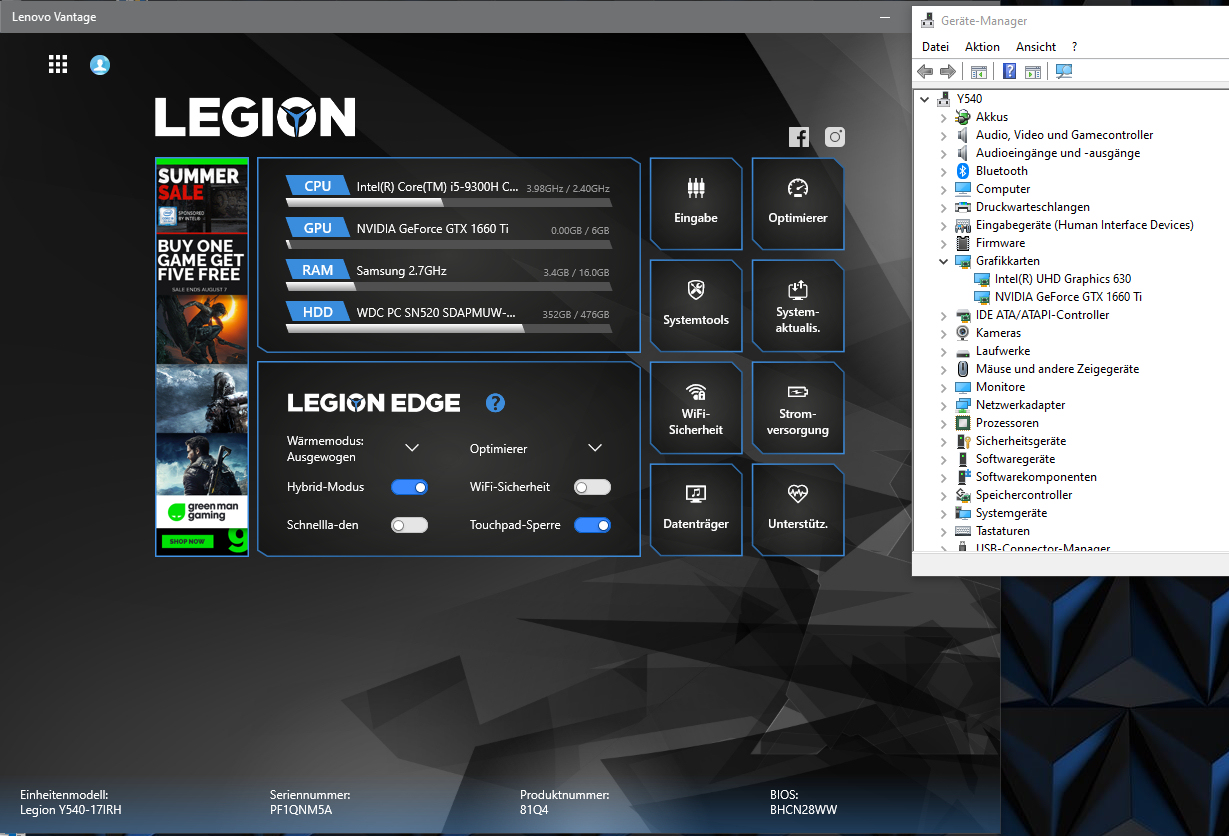
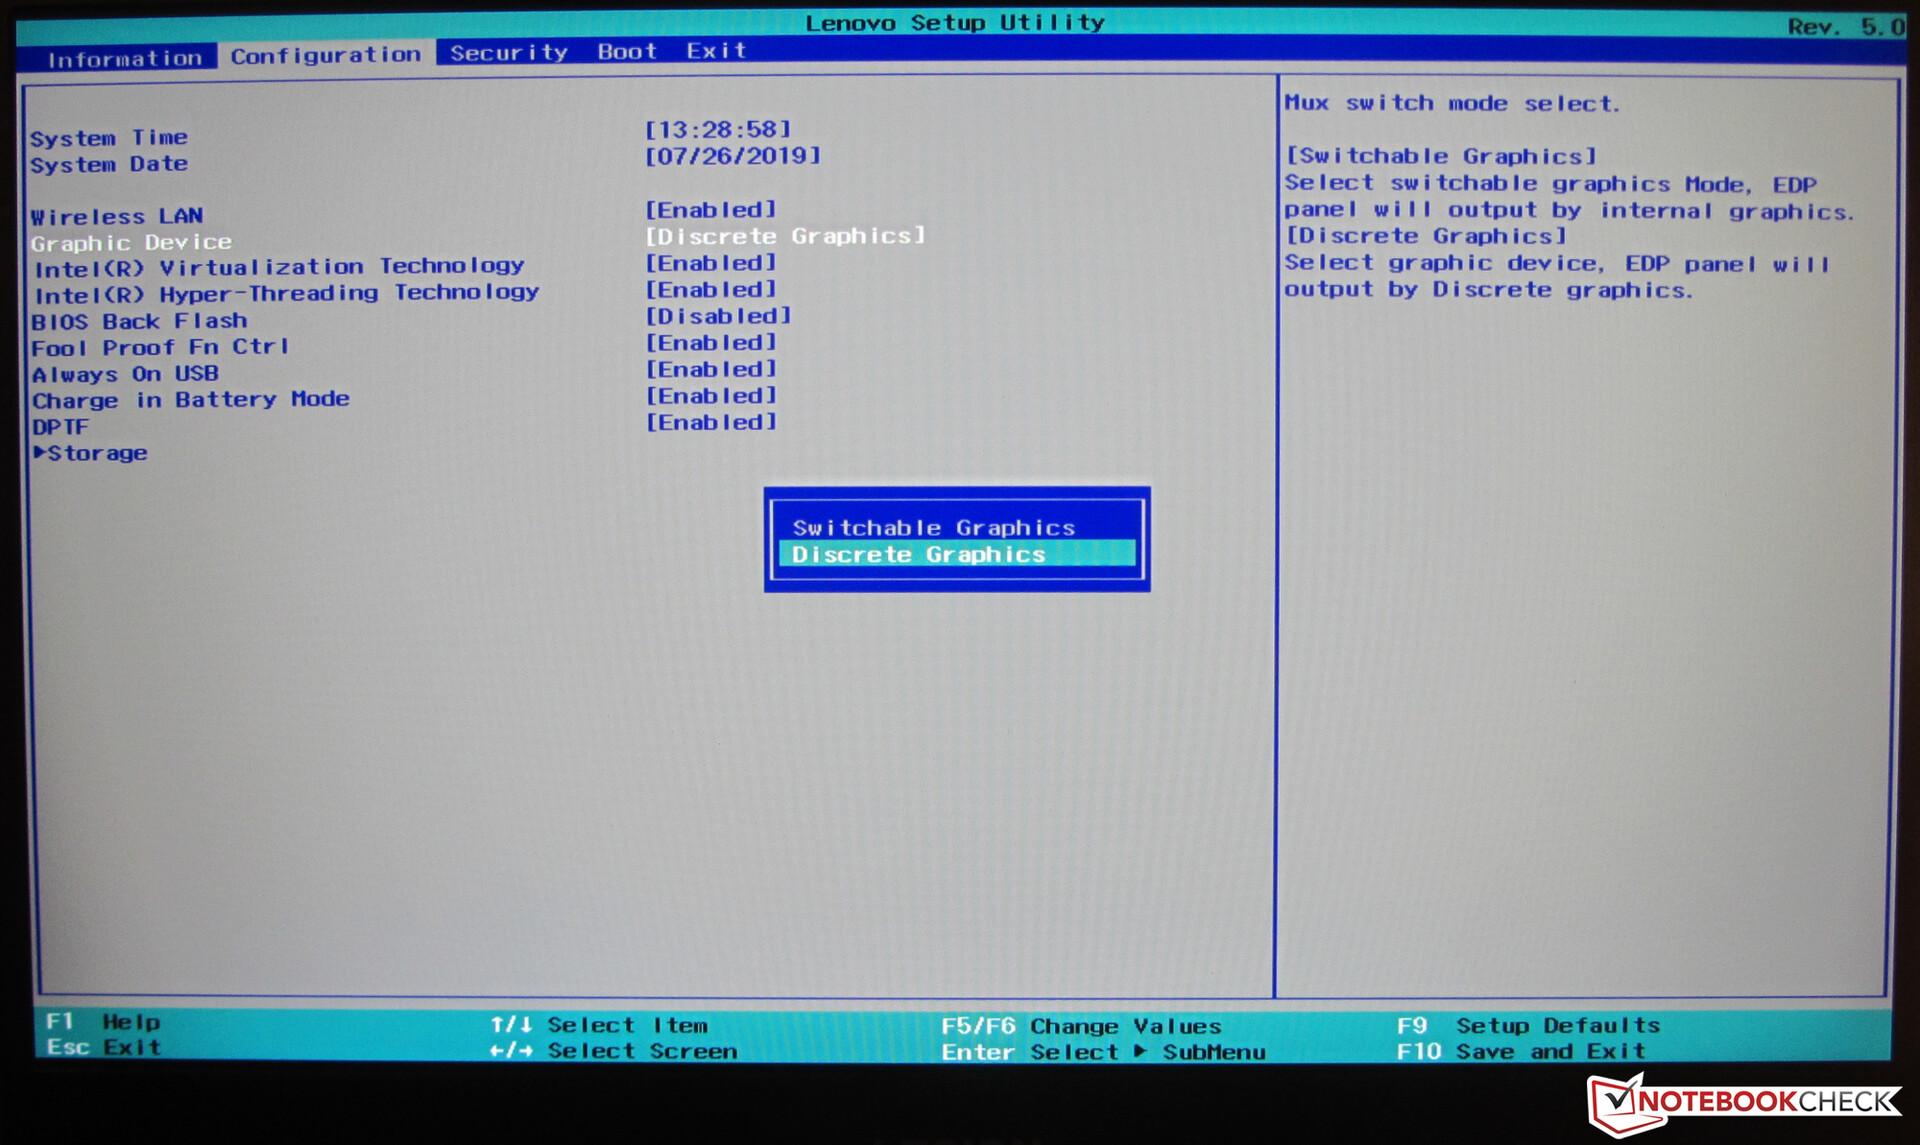
Since the UHD Graphics 630 GPU, which is integrated into the processor, is disabled ex-factory, we left it disabled during our tests as well. This leads to the GeForce GPU being permanently active. However, the iGPU can be enabled via the BIOS or the Lenovo Vantage software. Thereafter, the laptop uses Nvidia's graphics-switching technology, Optimus - this becomes particularly apparent when it comes to the battery life, which we will show at a later stage in this test.
Note: After first enabling the hybrid mode, a graphics driver has to be installed via Windows Update following a reboot of the laptop.
Processor
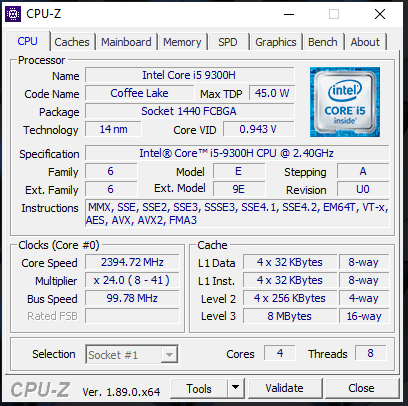
The Legion Y540 is powered by the four-core processor Core i5-9300H (Coffee Lake). Thus, the Legion lacks two CPU cores compared to the other devices in our comparison. In turn, our configuration of the Legion is more than 200 Euros (~$223) cheaper. The 9300H processor has a base clock of 2.4 GHz. The clock rate can be turbo boosted to up to 4 GHz (four cores) or 4.1 GHz (one core).
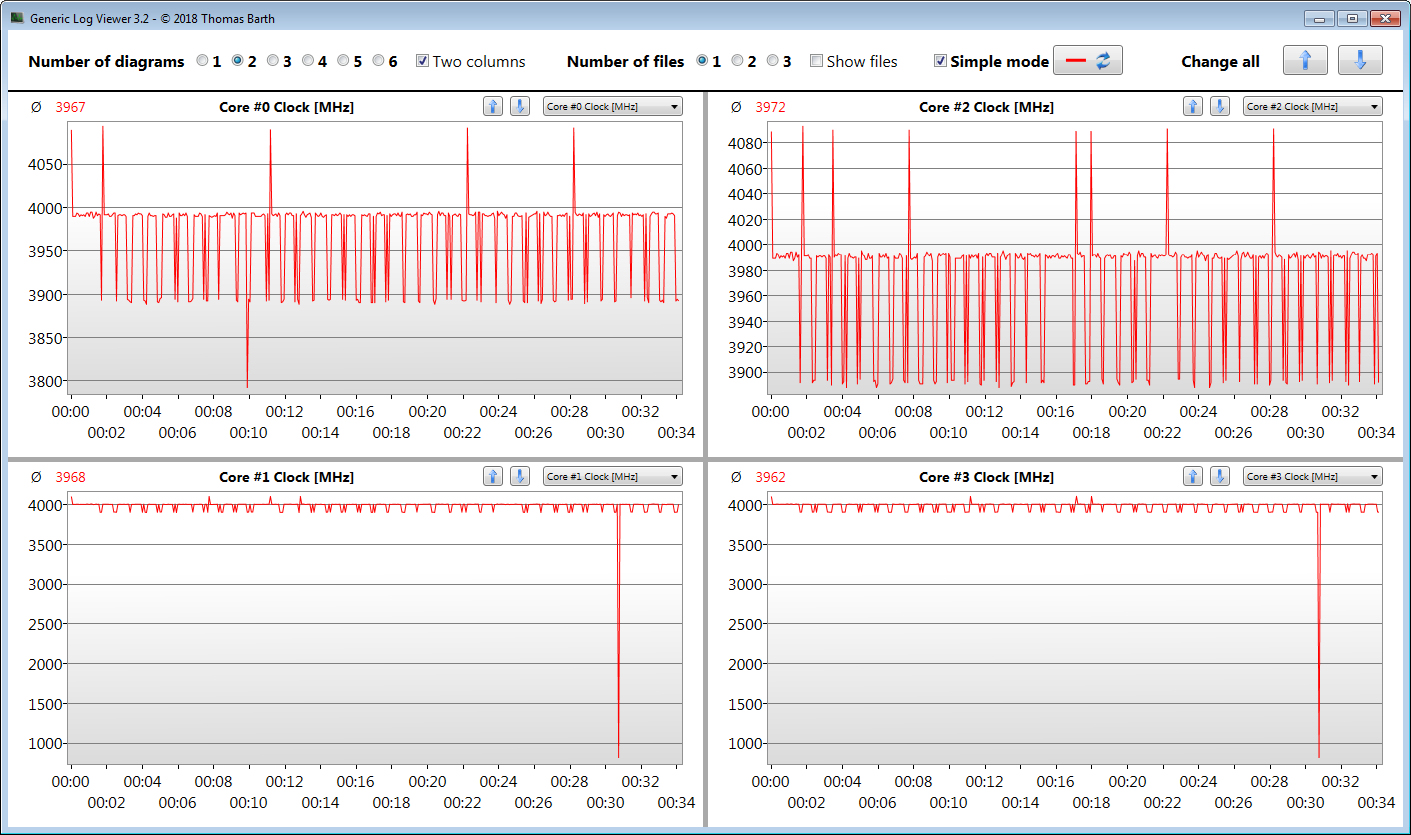
The processor completes the multithread tests of the CineBench benchmarks at 4 GHz and the single-thread tests at 4 to 4.1 GHz. Both values correspond to tests while on mains. In battery mode, the CPU frequency reaches 2.4 GHz (multithread) or between 3.5 and 4.1 GHz (single-thread).
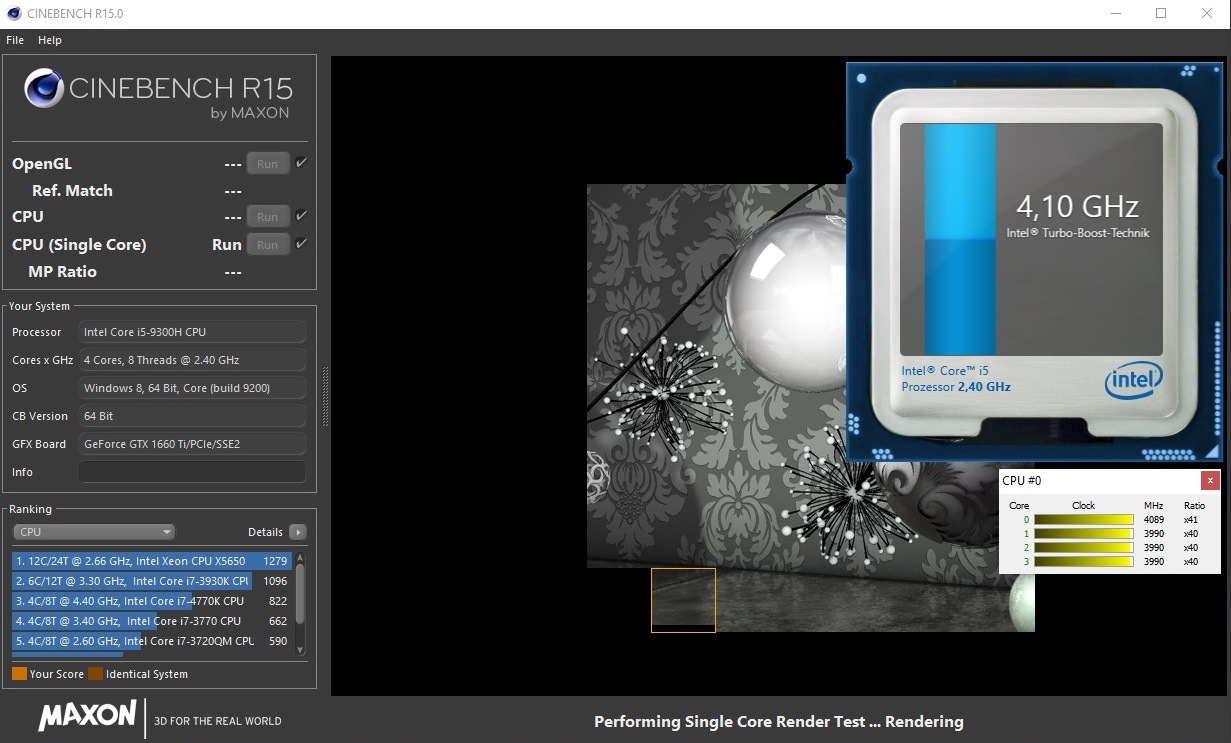
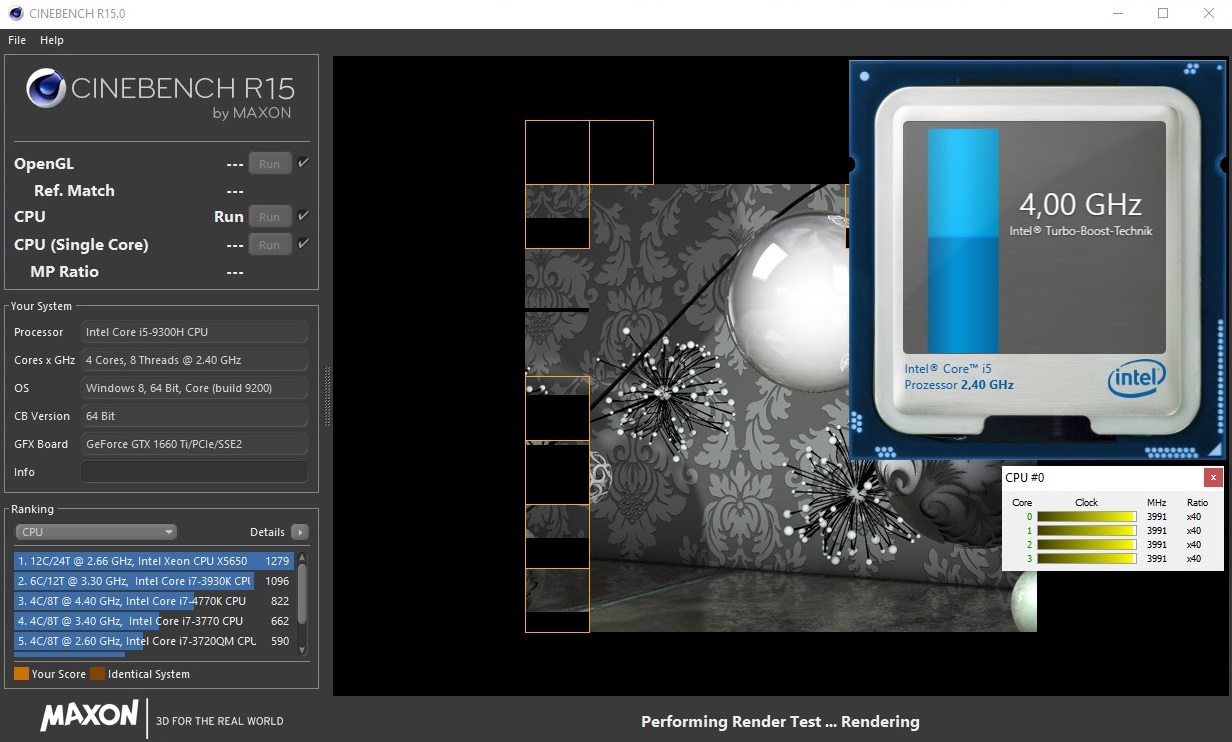
By running the CineBench R15 multithread benchmarks in a loop for at least 30 minutes, we determine whether the CPU turbo is consistently active while on mains. The results were on a consistently steady level. Here, the turbo boost is in full force - this is not a standard result by any means.
Due to the lower core count, it is unsurprising for the Legion to fall far behind its competition. On the other hand, the Legion achieves the best result by far among the Core i5-9300H laptops we have tested to date. We have included the results of two 9300H laptops in the following graph.
| Cinebench R10 | |
| Rendering Single 32Bit | |
| Average of class Gaming (7457 - 11779, n=8, last 2 years) | |
| Schenker XMG Core 17 | |
| Lenovo Legion Y540-17IRH | |
| Rendering Multiple CPUs 32Bit | |
| Average of class Gaming (42932 - 81339, n=8, last 2 years) | |
| Schenker XMG Core 17 | |
| Lenovo Legion Y540-17IRH | |
| Cinebench R20 | |
| CPU (Single Core) | |
| Average of class Gaming (442 - 895, n=109, last 2 years) | |
| Schenker XMG Core 17 | |
| Lenovo Legion Y540-17IRH | |
| CPU (Multi Core) | |
| Average of class Gaming (4029 - 16108, n=109, last 2 years) | |
| Schenker XMG Core 17 | |
| Lenovo Legion Y540-17IRH | |
| Geekbench 3 | |
| 32 Bit Multi-Core Score | |
| Schenker XMG Core 17 | |
| Lenovo Legion Y540-17IRH | |
| 32 Bit Single-Core Score | |
| Schenker XMG Core 17 | |
| Lenovo Legion Y540-17IRH | |
| Geekbench 4.4 | |
| 64 Bit Multi-Core Score | |
| Average of class Gaming (89200 - 97490, n=2, last 2 years) | |
| Schenker XMG Core 17 | |
| Lenovo Legion Y540-17IRH | |
| 64 Bit Single-Core Score | |
| Average of class Gaming (9335 - 9492, n=2, last 2 years) | |
| Schenker XMG Core 17 | |
| Lenovo Legion Y540-17IRH | |
| Mozilla Kraken 1.1 - Total | |
| Lenovo Legion Y540-17IRH (Edge 44) | |
| Gigabyte Sabre 17-W8 | |
| Lenovo Legion Y740-17ICH (Edge 44.17763.1.0) | |
| MSI GP75 Leopard 9SD | |
| Schenker XMG Core 17 (Edge 44) | |
| Average of class Gaming (391 - 590, n=104, last 2 years) | |
| Octane V2 - Total Score | |
| Average of class Gaming (89353 - 139447, n=29, last 2 years) | |
| MSI GP75 Leopard 9SD | |
| Schenker XMG Core 17 (Edge 44) | |
| Lenovo Legion Y740-17ICH (Edge 44.17763.1.0) | |
| Gigabyte Sabre 17-W8 | |
| Lenovo Legion Y540-17IRH (Edge 44) | |
| JetStream 1.1 - 1.1 Total | |
| Average of class Gaming (533 - 647, n=4, last 2 years) | |
| Schenker XMG Core 17 (Edge 44) | |
| MSI GP75 Leopard 9SD | |
| Lenovo Legion Y740-17ICH (Edge 44.17763.1.0) | |
| Gigabyte Sabre 17-W8 | |
| Lenovo Legion Y540-17IRH (Edge 44) | |
* ... smaller is better
System Performance
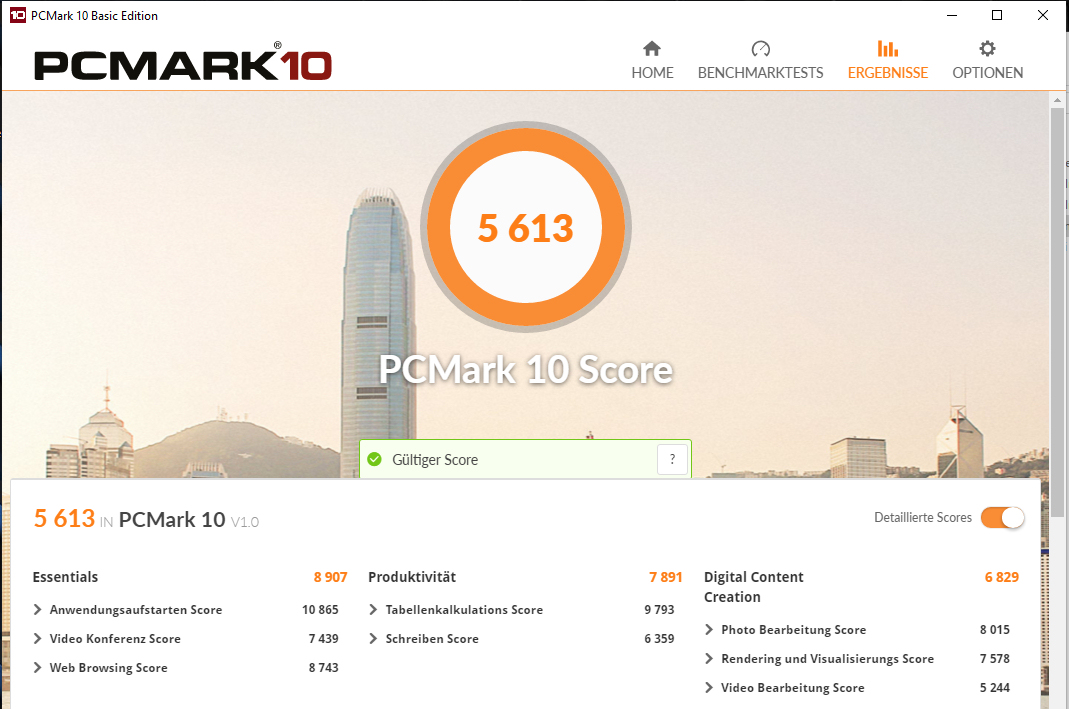
A quick glance at the PCMark results illustrates quickly that the Legion does not lack computation power. Thanks to the four-core processor, dual-channel memory and the fast NVMe SSD, the system runs smoothly and swiftly. An upper mid-range GPU compliments the ensemble and runs all current PC games smoothly.
| PCMark 7 Score | 7284 points | |
| PCMark 8 Home Score Accelerated v2 | 4818 points | |
| PCMark 8 Creative Score Accelerated v2 | 5506 points | |
| PCMark 8 Work Score Accelerated v2 | 5138 points | |
| PCMark 10 Score | 5613 points | |
Help | ||
| PCMark 10 - Score | |
| Average of class Gaming (5828 - 11574, n=94, last 2 years) | |
| Lenovo Legion Y740-17ICH | |
| Schenker XMG Core 17 | |
| Lenovo Legion Y540-17IRH | |
| MSI GP75 Leopard 9SD | |
| Dell G7 17 7790 | |
| Gigabyte Sabre 17-W8 | |
Storage Solution
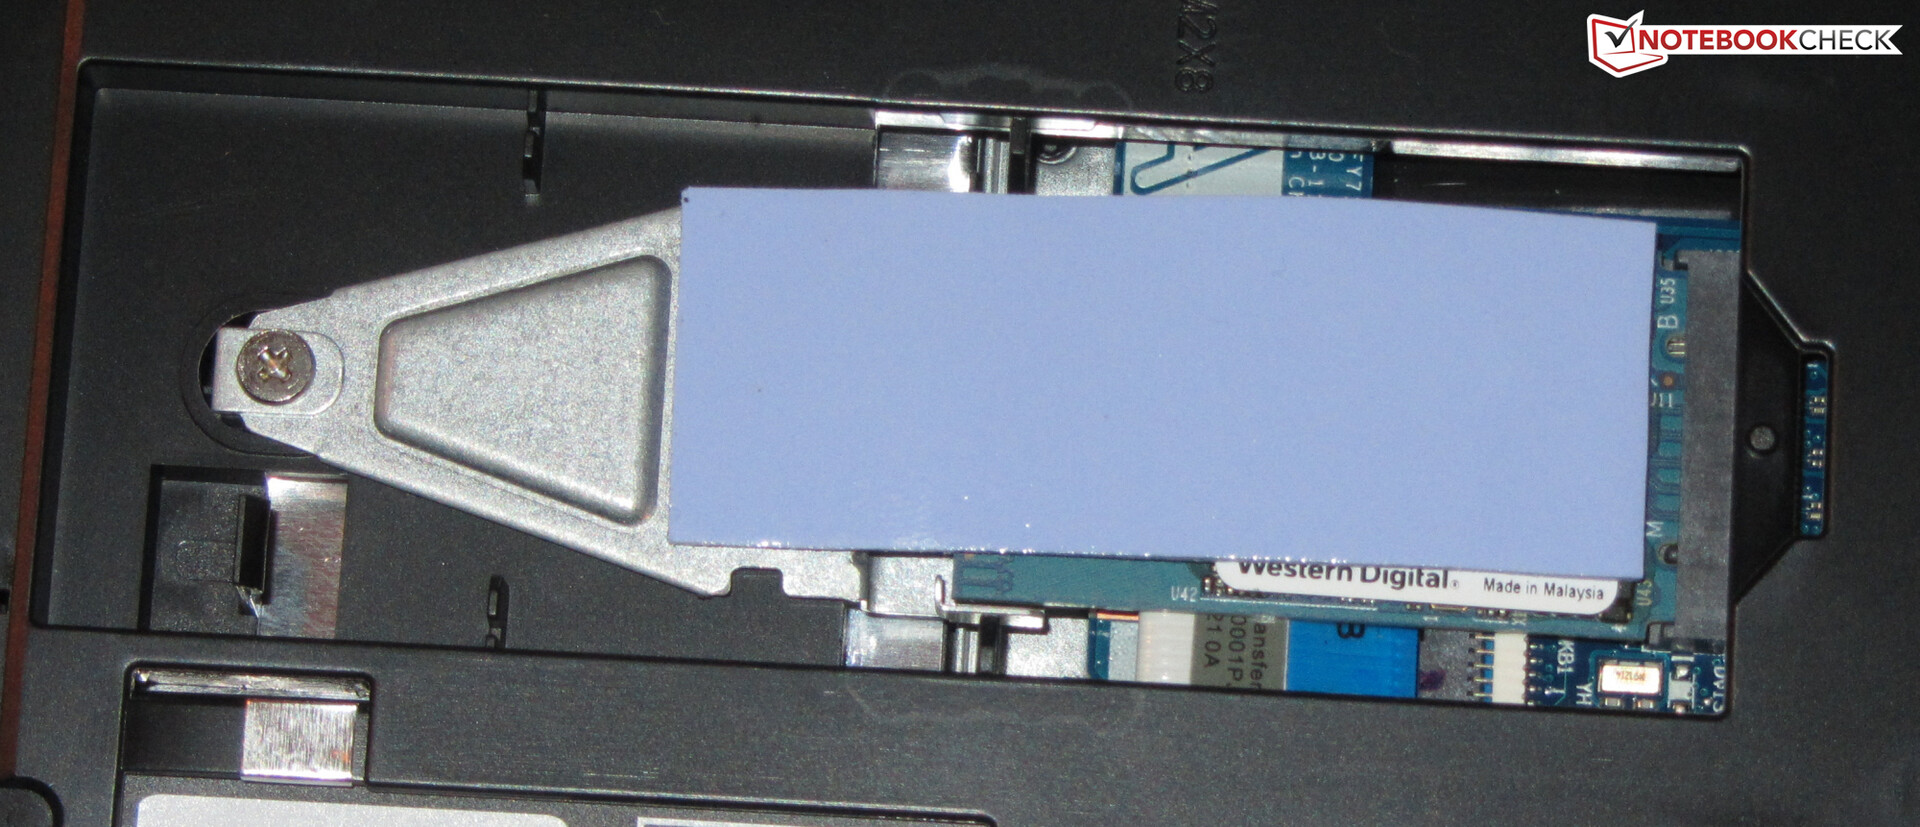
Lenovo has opted for a Western Digital NVMe SSD for the Y540. It is an M.2 2242 model with 512 GB of storage space. Ex-factory, about 440 GB is available to users. The remaining space is occupied by a recovery partition and the windows installation. While the transfer rates are relatively fast, the installed model is not one of the top SSDs on the market. It is evident that the SSD is only connected through two PCI Express lanes. That being said, the Legion supports SSDs, which are connected via four lanes, as well. The achieved transfer rates of these models are consequently higher.
Moreover, users have the option to install an additional 2.5-inch storage medium (SSD/HDD). The required SATA cable is included in the original packaging and the installation frame is located on the inside of the device.

| Lenovo Legion Y540-17IRH WDC PC SN520 SDAPNUW-512G | Schenker XMG Core 17 Samsung SSD 970 EVO Plus 500GB | Lenovo Legion Y740-17ICH Samsung SSD PM981 MZVLB256HAHQ | MSI GP75 Leopard 9SD Kingston RBUSNS8154P3256GJ1 | Dell G7 17 7790 Toshiba BG3 KBG30ZMS256G | Gigabyte Sabre 17-W8 Toshiba NVMe THNSN5256GPU7 | |
|---|---|---|---|---|---|---|
| CrystalDiskMark 5.2 / 6 | 42% | 39% | -22% | -32% | 4% | |
| Write 4K (MB/s) | 105.1 | 99.3 -6% | 99.8 -5% | 105.8 1% | 78.6 -25% | 104.7 0% |
| Read 4K (MB/s) | 34.41 | 38.47 12% | 40.81 19% | 27.89 -19% | 31.89 -7% | 37.39 9% |
| Write Seq (MB/s) | 1298 | 1449 12% | 1385 7% | 270.8 -79% | 230.4 -82% | 866 -33% |
| Read Seq (MB/s) | 1099 | 1237 13% | 2089 90% | 879 -20% | 925 -16% | 944 -14% |
| Write 4K Q32T1 (MB/s) | 335.7 | 364.4 9% | 380 13% | 273.3 -19% | 159.1 -53% | 293.3 -13% |
| Read 4K Q32T1 (MB/s) | 231.4 | 421.9 82% | 445.5 93% | 361.2 56% | 315.6 36% | 374.3 62% |
| Write Seq Q32T1 (MB/s) | 1454 | 3276 125% | 1380 -5% | 253 -83% | 230.7 -84% | 1064 -27% |
| Read Seq Q32T1 (MB/s) | 1740 | 3338 92% | 3471 99% | 1505 -14% | 1323 -24% | 2616 50% |
GPU Performance
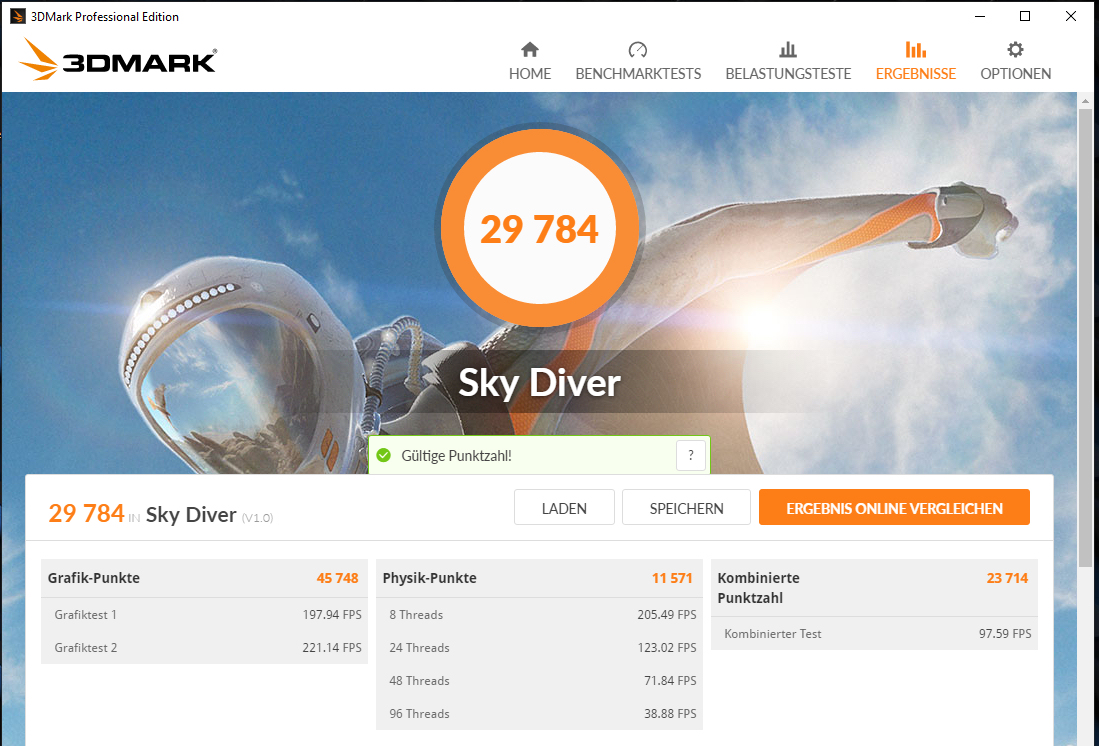
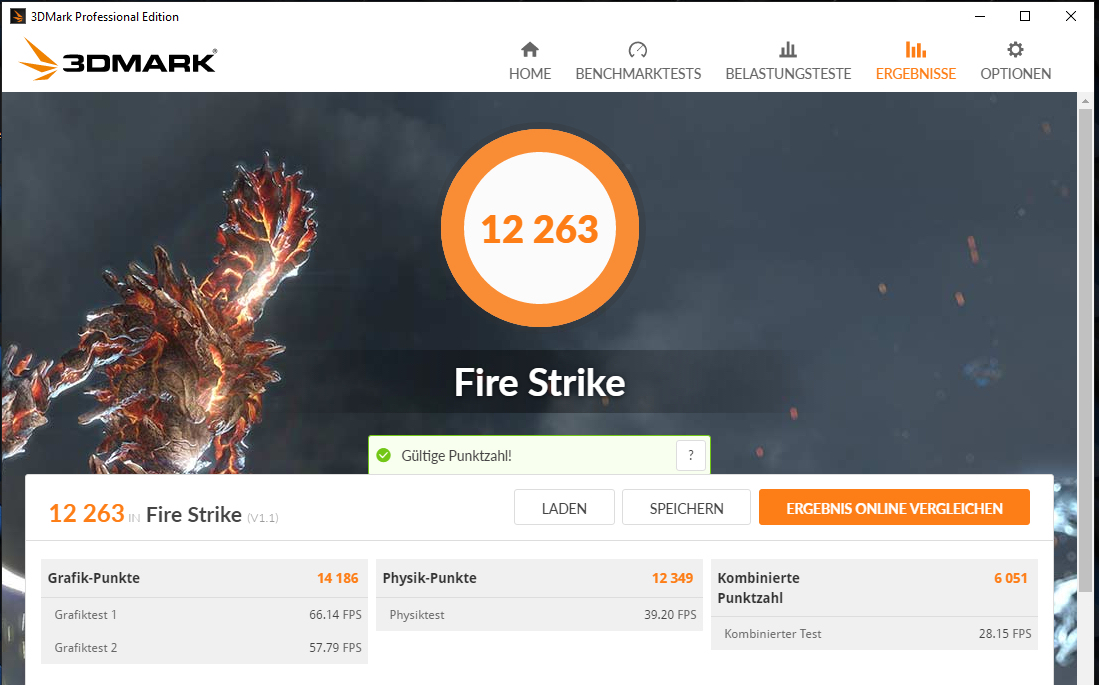
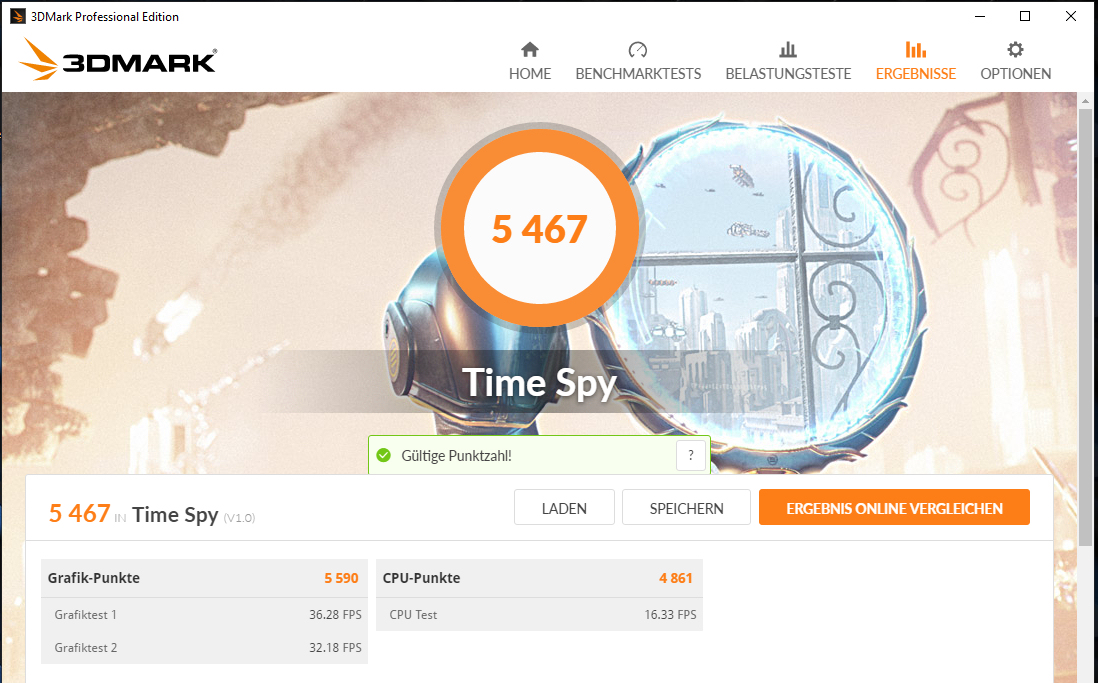
Lenovo's 17.3-inch device is equipped with a GeForce GTX 1660 Ti GPU from Nvidia. While it is based on the Turing architecture - and as opposed to the RTX 2000 series Turing GPUs - it does not offer ray-tracing capabilities or tensor cores. In the 3DMark benchmarks, the GPU achieved results that can be considered normal. Here, the GTX 1660 Ti scores higher than the GTX 1060 and not too far below the GTX 1070. In battery mode, around one third of the graphics power is accessible.
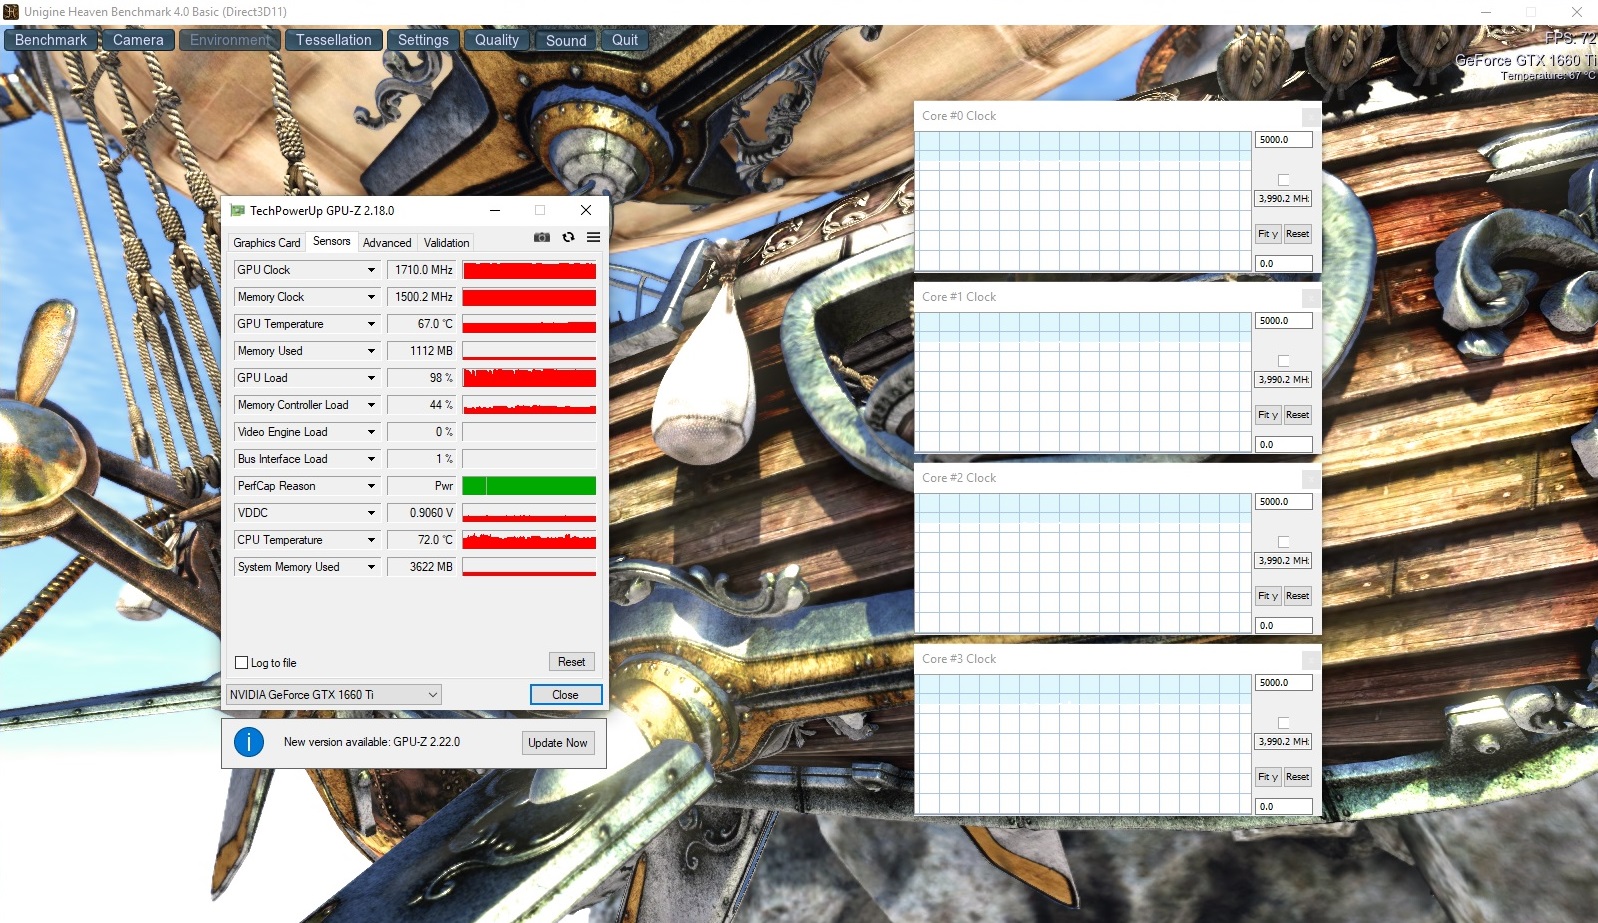
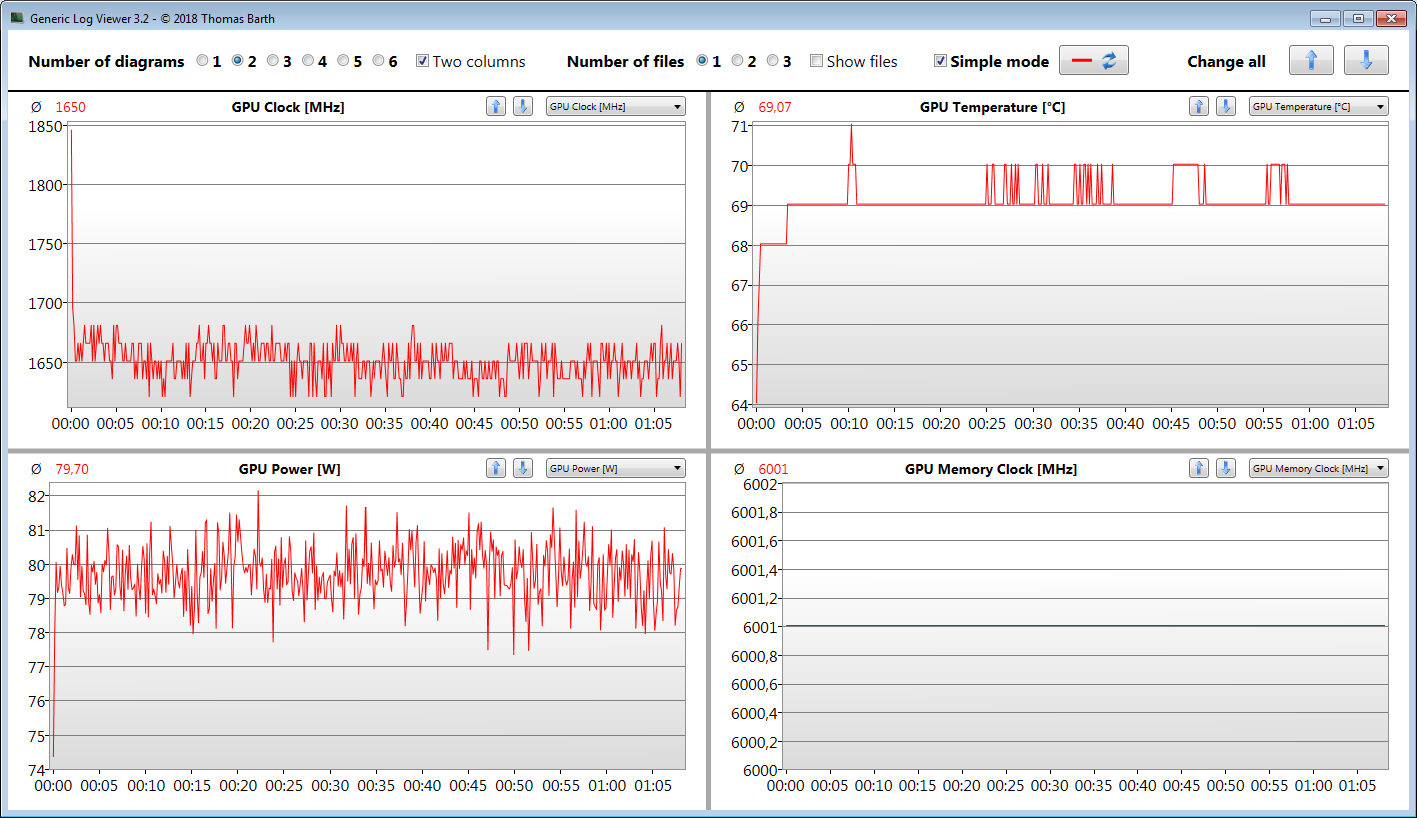
The GPU supports DirectX 12 and has a base clock of 1,455 MHz. If needed, this frequency can be boosted to up to 1,590 MHz. As long as the GPU stays below a certain temperature and/or energy consumption threshold, the performance can be increased even further. We registered a maximum of 1,845 MHz, for example, although this frequency was only maintained for a short period of time. During our benchmarks, we observed an average operating speed of 1,710 MHz. Our The Witcher 3 test was completed at 1,650 MHz. Meanwhile, the GPU has access to fast GDDR6 graphics memory (6.144 GB).
The UHD Graphics 630, which is integrated into the processor, is not active. Thus, the laptop does not use Nvidia's graphics-switching technology, Optimus, ex-factory. As mentioned earlier however, the iGPU can be enabled through the BIOS or the Lenovo Vantage software.
| 3DMark 06 Standard Score | 36563 points | |
| 3DMark 11 Performance | 16162 points | |
| 3DMark Ice Storm Standard Score | 139756 points | |
| 3DMark Cloud Gate Standard Score | 29390 points | |
| 3DMark Fire Strike Score | 12263 points | |
| 3DMark Time Spy Score | 5467 points | |
Help | ||
Gaming Performance
The CPU-GPU combination of the Y540-17IRH is able to run all of the games in our database smoothly. In the overwhelming majority of cases, the full native resolution (Full HD) can be selected. A lot is possible in terms of the quality settings as well. Typically, high to maximum detail settings can be used. The GPU is only suitable for resolutions above Full HD (for which an external display is necessary) in a limited capacity. At these respective resolutions, the quality settings consequently have to be adjusted downwards.
| The Witcher 3 - 1920x1080 Ultra Graphics & Postprocessing (HBAO+) | |
| Average of class Gaming (95 - 240, n=8, last 2 years) | |
| Lenovo Legion Y740-17ICH | |
| Dell G7 17 7790 | |
| MSI GP75 Leopard 9SD | |
| Lenovo Legion Y540-17IRH | |
| Schenker XMG Core 17 | |
| Gigabyte Sabre 17-W8 | |
| BioShock Infinite - 1920x1080 Ultra Preset, DX11 (DDOF) | |
| Lenovo Legion Y740-17ICH | |
| MSI GP75 Leopard 9SD | |
| Lenovo Legion Y540-17IRH | |
| Schenker XMG Core 17 | |
| Dell G7 17 7790 | |
| For Honor - 1920x1080 Extreme Preset AA:T AF:16x | |
| Schenker XMG Core 17 | |
| Lenovo Legion Y540-17IRH | |
| Far Cry New Dawn - 1920x1080 Ultra Preset | |
| Schenker XMG Core 17 | |
| Lenovo Legion Y540-17IRH | |
| F1 2019 - 1920x1080 Ultra High Preset AA:T AF:16x | |
| Schenker XMG Core 17 | |
| Lenovo Legion Y540-17IRH | |
| Total War: Three Kingdoms - 1920x1080 Ultra (incl textures) | |
| Lenovo Legion Y540-17IRH | |
In order to determine whether the frame rates stay largely consistent over a longer period of time, we ran The Witcher 3 at Full HD and at the highest quality settings for about 60 minutes. During the entire time, the main playable character is not moved. We did not experience a sudden drop in terms of frame rates.
| low | med. | high | ultra | |
|---|---|---|---|---|
| BioShock Infinite (2013) | 313.9 | 284.2 | 265.6 | 138 |
| The Witcher 3 (2015) | 264 | 185 | 109.6 | 55.1 |
| For Honor (2017) | 245.1 | 126.1 | 120.4 | 92.6 |
| Ghost Recon Wildlands (2017) | 150.6 | 88.7 | 82.6 | 47.8 |
| Final Fantasy XV Benchmark (2018) | 129 | 78.1 | 55.4 | |
| X-Plane 11.11 (2018) | 91.5 | 83.6 | 71 | |
| Far Cry 5 (2018) | 117 | 90 | 84 | 83 |
| Far Cry New Dawn (2019) | 106 | 86 | 83 | 75 |
| Total War: Three Kingdoms (2019) | 202.9 | 101.5 | 63.9 | 46.1 |
| F1 2019 (2019) | 210 | 154 | 131 | 91 |
Emissions - A Lot of Noise under Load
System Noise
The two installed fans do not spin up to very high speeds during idle and under lighter loads. We registered a sound pressure level of between 32 and 34 dB(A). Ideally, fans are switched off under these conditions for completely silent operation. Under medium and high loads, fan noise ramps up very noticeably. During our stress test, for example, we were able to record a sound pressure level of 52 dB(A). During gaming, it is only marginally quieter: During our The Witcher 3 test, this value drops to 50 dB(A). Due to this, gaming is no fun without a headset.
Noise level
| Idle |
| 30 / 32 / 34 dB(A) |
| Load |
| 44 / 52 dB(A) |
 | ||
30 dB silent 40 dB(A) audible 50 dB(A) loud |
||
min: | ||
| Lenovo Legion Y540-17IRH i5-9300H, GeForce GTX 1660 Ti Mobile | Schenker XMG Core 17 i7-9750H, GeForce GTX 1660 Ti Mobile | Lenovo Legion Y740-17ICH i7-8750H, GeForce RTX 2080 Max-Q | MSI GP75 Leopard 9SD i7-9750H, GeForce GTX 1660 Ti Mobile | Dell G7 17 7790 i7-8750H, GeForce RTX 2070 Max-Q | Gigabyte Sabre 17-W8 i7-8750H, GeForce GTX 1060 Mobile | Average of class Gaming | |
|---|---|---|---|---|---|---|---|
| Noise | -1% | 9% | -5% | 10% | 1% | 10% | |
| off / environment * (dB) | 30 | 30 -0% | 28.3 6% | 29 3% | 28.2 6% | 30.5 -2% | 24.1 ? 20% |
| Idle Minimum * (dB) | 30 | 30 -0% | 31.5 -5% | 29 3% | 28.6 5% | 32.1 -7% | 25.8 ? 14% |
| Idle Average * (dB) | 32 | 32 -0% | 31.6 1% | 34 -6% | 28.6 11% | 32.1 -0% | 27.4 ? 14% |
| Idle Maximum * (dB) | 34 | 35 -3% | 31.6 7% | 37 -9% | 28.6 16% | 32.3 5% | 29.9 ? 12% |
| Load Average * (dB) | 44 | 47 -7% | 32.3 27% | 53 -20% | 31.8 28% | 42.9 2% | 43 ? 2% |
| Witcher 3 ultra * (dB) | 50 | 48 4% | 43 14% | 51 -2% | 50.6 -1% | ||
| Load Maximum * (dB) | 52 | 51 2% | 45.5 12% | 55 -6% | 50.8 2% | 48.8 6% | 54 ? -4% |
* ... smaller is better
Temperature
The Legion performs differently in our stress test (Prime95 and FurMark ran for at least an hour) depending on whether it runs in battery mode or on mains. On mains, the processor runs at 2.9 to 3 GHz, while the graphics chip runs at 1,395 MHz. In battery mode, these values drop to 1.7 to 1.8 GHz (CPU) or 1,500 to 1,800 MHz (GPU). The stress test is an extreme case that does not occur during daily use. We use this test to determine whether the system is stable under full load.
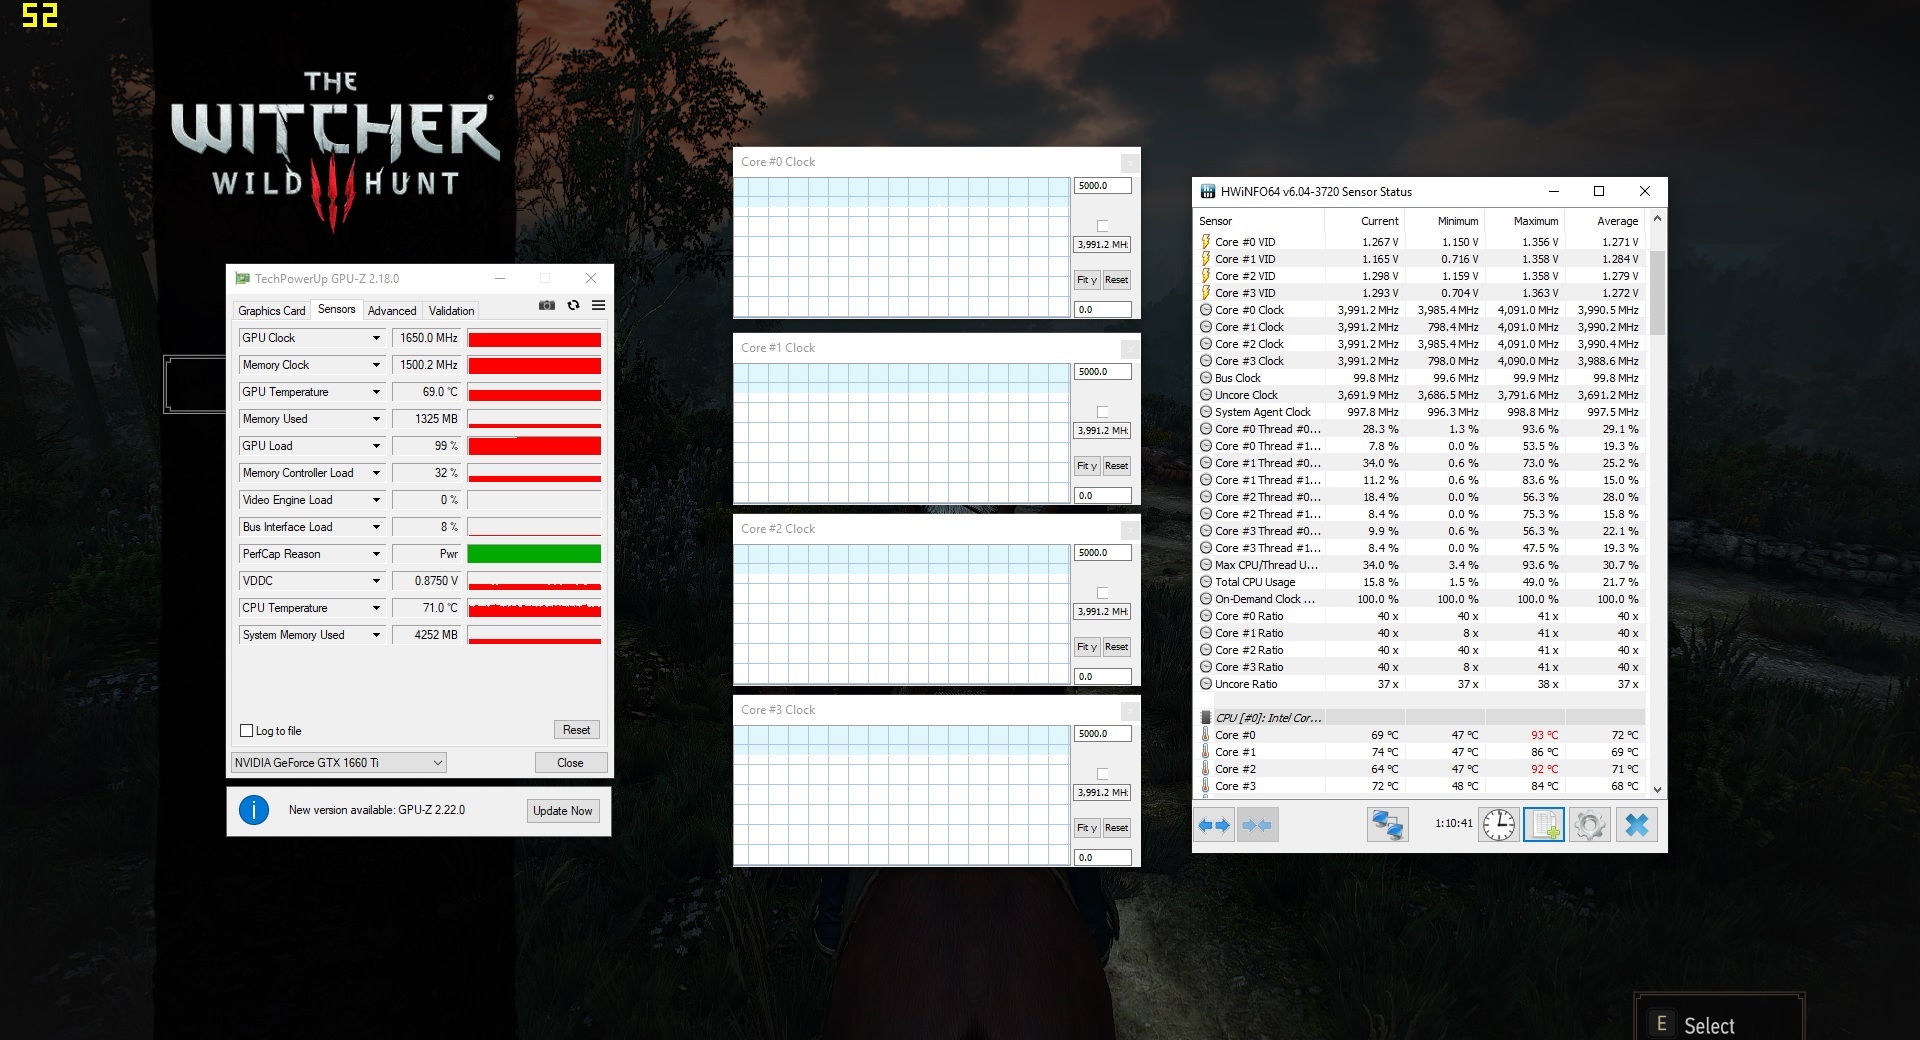
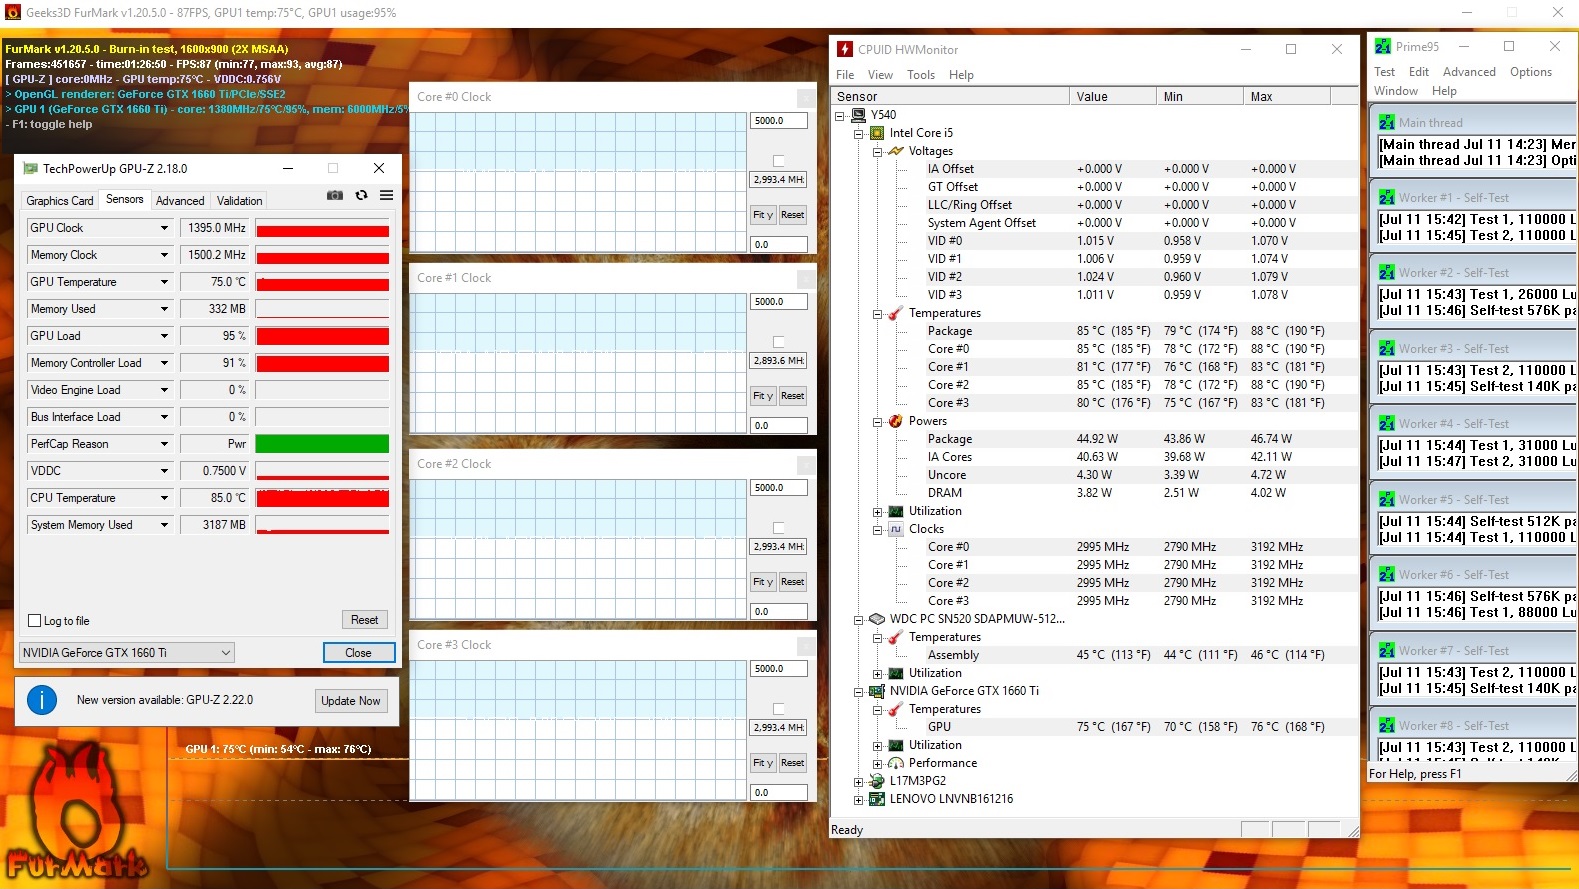
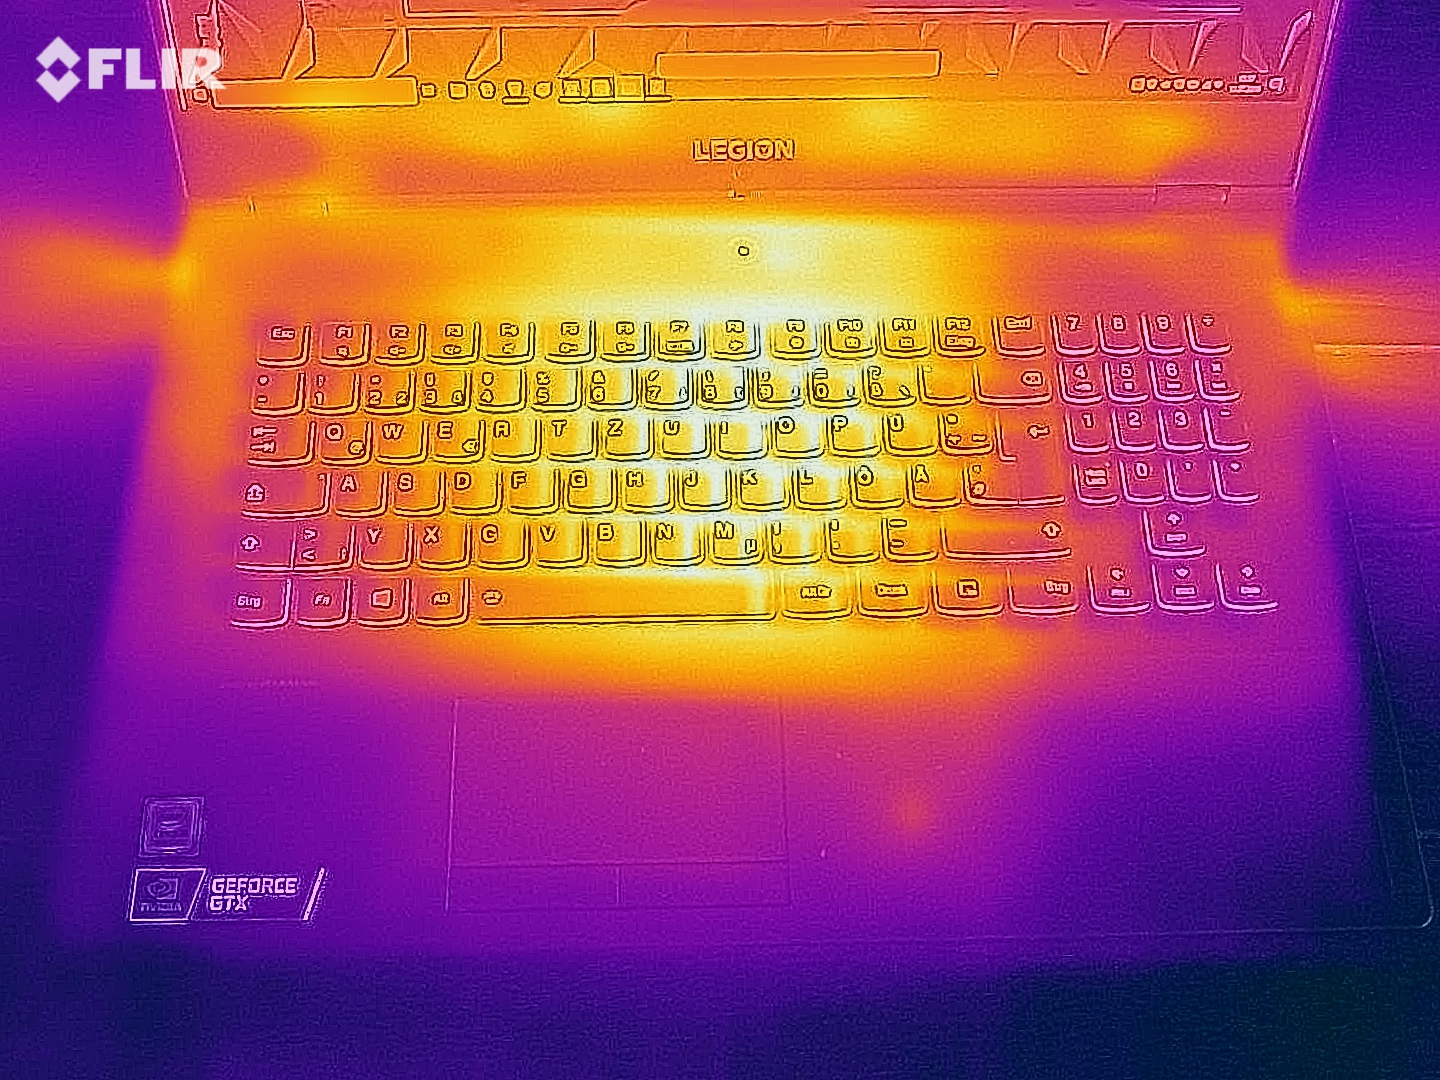
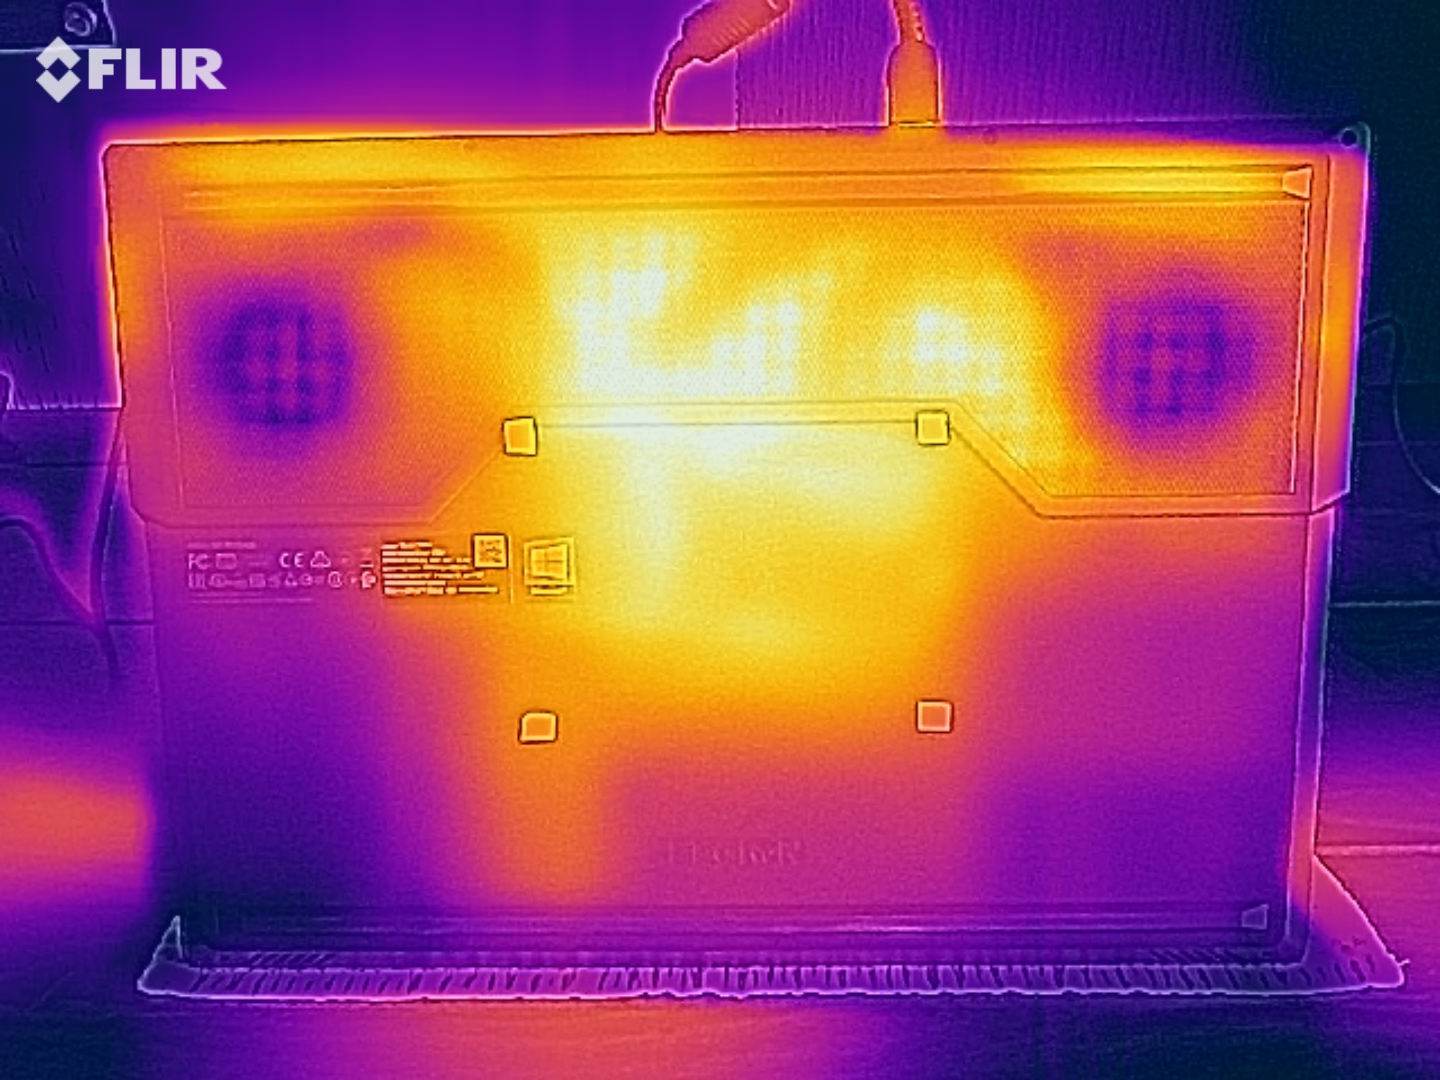
The bottom becomes particularly warm during stress. During the stress tests, we recorded temperatures in excess of 50 °C (122° F) in multiple spots. During our The Witcher 3 test, the temperatures remained slightly lower (we ran the game at Full HD resolution and maximum quality settings). In either case, using the laptop in the literal sense (on your lap) would be ill-advised. During idle, we recorded temperatures above 30 °C (86 °F) in multiple locations. This can be attributed to the GeForce GPU, which is permanently active. Idle temperatures are lower when the integrated GPU is enabled.
(-) The maximum temperature on the upper side is 48 °C / 118 F, compared to the average of 40.4 °C / 105 F, ranging from 21.2 to 68.8 °C for the class Gaming.
(-) The bottom heats up to a maximum of 56 °C / 133 F, compared to the average of 43.2 °C / 110 F
(+) In idle usage, the average temperature for the upper side is 31.6 °C / 89 F, compared to the device average of 33.9 °C / 93 F.
(-) Playing The Witcher 3, the average temperature for the upper side is 39.8 °C / 104 F, compared to the device average of 33.9 °C / 93 F.
(-) The palmrests and touchpad can get very hot to the touch with a maximum of 40 °C / 104 F.
(-) The average temperature of the palmrest area of similar devices was 28.8 °C / 83.8 F (-11.2 °C / -20.2 F).
| Lenovo Legion Y540-17IRH i5-9300H, GeForce GTX 1660 Ti Mobile | Schenker XMG Core 17 i7-9750H, GeForce GTX 1660 Ti Mobile | Lenovo Legion Y740-17ICH i7-8750H, GeForce RTX 2080 Max-Q | MSI GP75 Leopard 9SD i7-9750H, GeForce GTX 1660 Ti Mobile | Dell G7 17 7790 i7-8750H, GeForce RTX 2070 Max-Q | Gigabyte Sabre 17-W8 i7-8750H, GeForce GTX 1060 Mobile | Average of class Gaming | |
|---|---|---|---|---|---|---|---|
| Heat | 9% | 17% | 16% | 4% | 26% | 11% | |
| Maximum Upper Side * (°C) | 48 | 47 2% | 38.6 20% | 45 6% | 46.6 3% | 35 27% | 45.2 ? 6% |
| Maximum Bottom * (°C) | 56 | 50 11% | 43.6 22% | 42 25% | 57 -2% | 34.3 39% | 47.9 ? 14% |
| Idle Upper Side * (°C) | 36 | 34 6% | 30.2 16% | 30 17% | 34.4 4% | 30.1 16% | 31.1 ? 14% |
| Idle Bottom * (°C) | 38 | 32 16% | 35 8% | 32 16% | 34.6 9% | 30.5 20% | 34.2 ? 10% |
* ... smaller is better
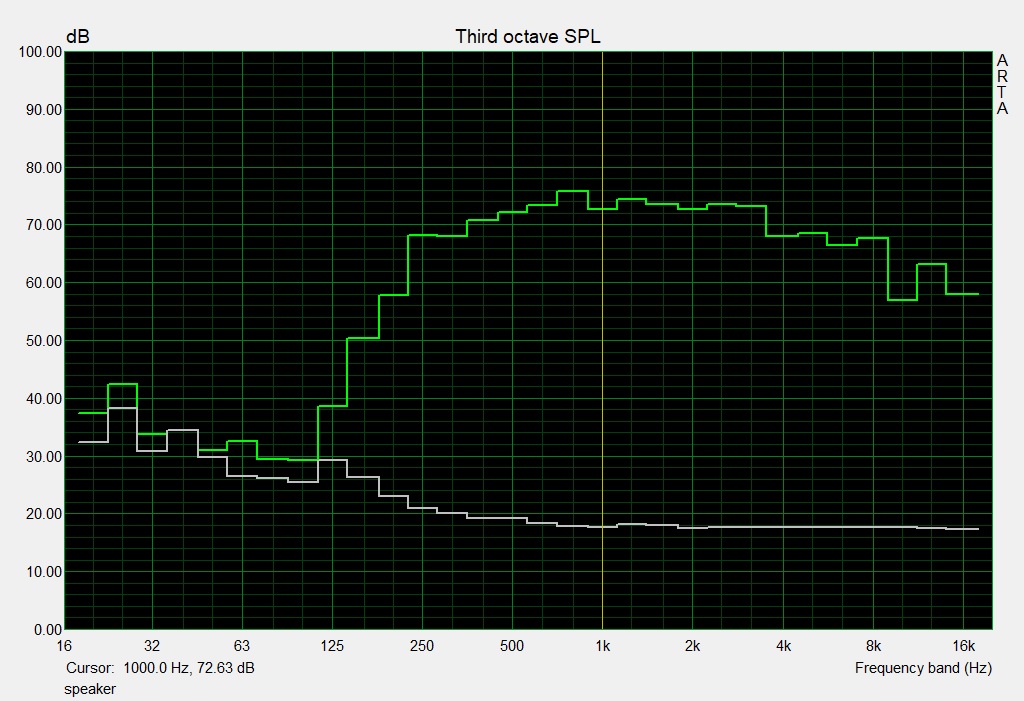
Speakers
The stereo speakers of the Legion are located on the user-facing side of the base unit. As opposed to the Y740-17IRH, the Y540-17IRH is not equipped with a subwoofer. The sound from the speakers is more than satisfactory, although they lack bass. For a better audio experience, external speakers or headphones have to be used.
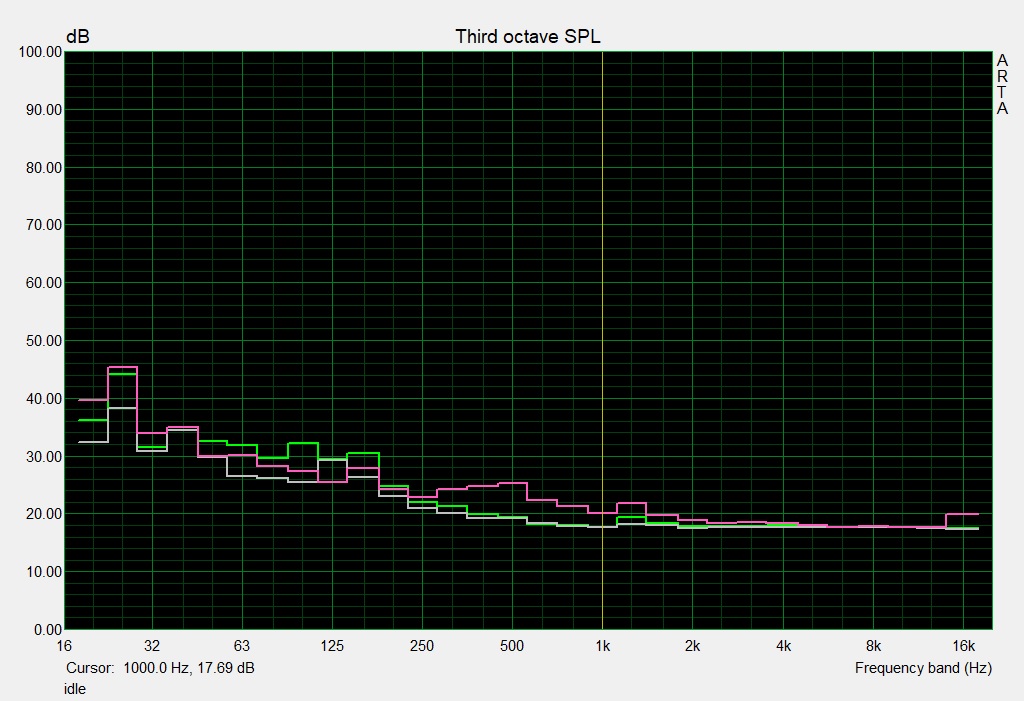
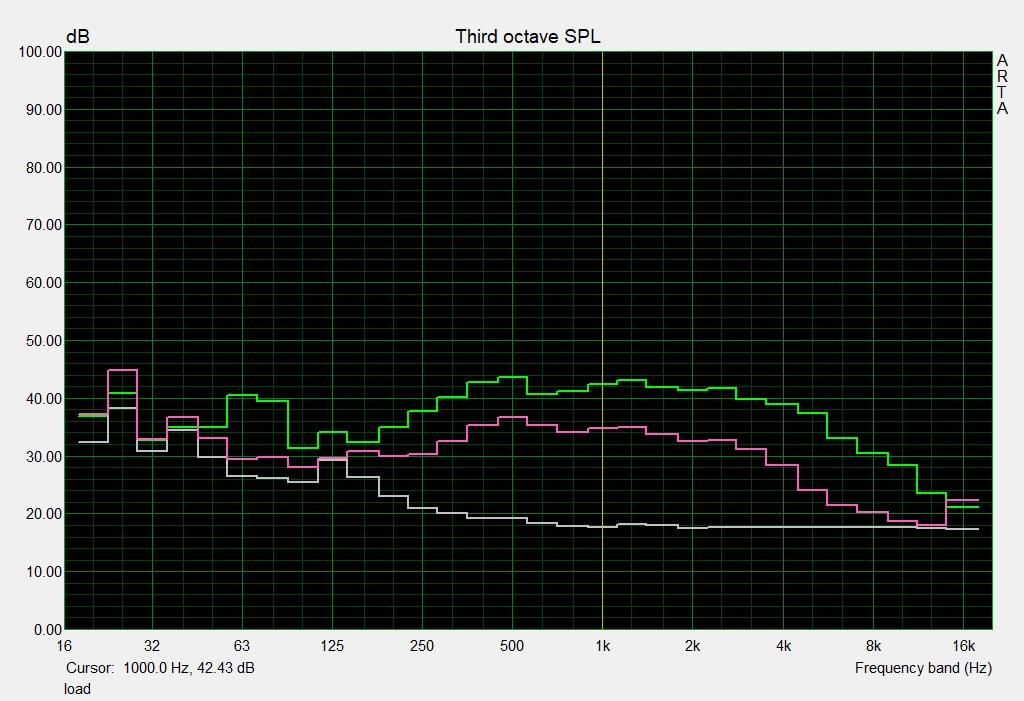
Lenovo Legion Y540-17IRH audio analysis
(+) | speakers can play relatively loud (84 dB)
Bass 100 - 315 Hz
(-) | nearly no bass - on average 16.1% lower than median
(±) | linearity of bass is average (13% delta to prev. frequency)
Mids 400 - 2000 Hz
(±) | higher mids - on average 5% higher than median
(+) | mids are linear (3.6% delta to prev. frequency)
Highs 2 - 16 kHz
(+) | balanced highs - only 3.5% away from median
(+) | highs are linear (5.9% delta to prev. frequency)
Overall 100 - 16.000 Hz
(±) | linearity of overall sound is average (15.7% difference to median)
Compared to same class
» 36% of all tested devices in this class were better, 7% similar, 57% worse
» The best had a delta of 6%, average was 18%, worst was 132%
Compared to all devices tested
» 24% of all tested devices were better, 5% similar, 71% worse
» The best had a delta of 4%, average was 24%, worst was 134%
Lenovo Legion Y740-17ICH audio analysis
(±) | speaker loudness is average but good (74.3 dB)
Bass 100 - 315 Hz
(-) | nearly no bass - on average 21.1% lower than median
(-) | bass is not linear (16.5% delta to prev. frequency)
Mids 400 - 2000 Hz
(+) | balanced mids - only 3.3% away from median
(±) | linearity of mids is average (9.7% delta to prev. frequency)
Highs 2 - 16 kHz
(+) | balanced highs - only 1.7% away from median
(+) | highs are linear (4.6% delta to prev. frequency)
Overall 100 - 16.000 Hz
(±) | linearity of overall sound is average (23.4% difference to median)
Compared to same class
» 85% of all tested devices in this class were better, 5% similar, 11% worse
» The best had a delta of 6%, average was 18%, worst was 132%
Compared to all devices tested
» 70% of all tested devices were better, 6% similar, 24% worse
» The best had a delta of 4%, average was 24%, worst was 134%
Energy Management - Enabling the iGPU Increases Runtimes
Energy Consumption
During idle, the Legion reveals itself to be very demanding with an energy consumption of 30 watts. This, again, can be traced back to the permanently active GeForce GPU. The consumption can be reduced substantially by activating the integrated GPU (the steps for which we detailed above). From our experience, this could realistically reduce the aforementioned values by 5 to 10 watts. During the stress tests, the energy consumption can reach up to 201 watts. During gaming, the consumption reaches more modest levels: While running our The Witcher 3 test, we recorded a value of 134 watts. The power adapter is rated for 230 watts.
| Off / Standby | |
| Idle | |
| Load |
|
Key:
min: | |
| Lenovo Legion Y540-17IRH i5-9300H, GeForce GTX 1660 Ti Mobile | Schenker XMG Core 17 i7-9750H, GeForce GTX 1660 Ti Mobile | Lenovo Legion Y740-17ICH i7-8750H, GeForce RTX 2080 Max-Q | MSI GP75 Leopard 9SD i7-9750H, GeForce GTX 1660 Ti Mobile | Dell G7 17 7790 i7-8750H, GeForce RTX 2070 Max-Q | Gigabyte Sabre 17-W8 i7-8750H, GeForce GTX 1060 Mobile | Average of class Gaming | |
|---|---|---|---|---|---|---|---|
| Power Consumption | 20% | -6% | 12% | 11% | 28% | 0% | |
| Idle Minimum * (Watt) | 19 | 10 47% | 20.2 -6% | 10 47% | 9.5 50% | 9.3 51% | 13.2 ? 31% |
| Idle Average * (Watt) | 22 | 13 41% | 27.2 -24% | 15 32% | 16.2 26% | 14.8 33% | 18.9 ? 14% |
| Idle Maximum * (Watt) | 30 | 21 30% | 28.7 4% | 22 27% | 23.8 21% | 22 27% | 24.3 ? 19% |
| Load Average * (Watt) | 79 | 89 -13% | 90.8 -15% | 92 -16% | 101.7 -29% | 63 20% | 108.3 ? -37% |
| Witcher 3 ultra * (Watt) | 134 | 128 4% | 152.1 -14% | 153 -14% | 155 -16% | ||
| Load Maximum * (Watt) | 201 | 177 12% | 165.4 18% | 216 -7% | 172.2 14% | 187 7% | 254 ? -26% |
* ... smaller is better
Battery Life
In our Wi-Fi test, which aims to mirror real-world conditions, the Legion reached a runtime of 3:40 h. In this test, we simulate stress in a web-browsing scenario. The "balanced" profile is set to active and the display brightness to about 150 nits. The 17.3-inch laptop completed our video test after 3:22 h. The video test consists of a loop of the short film Big Buck Bunny (H.264 encoding, 1920x1080 pixels). Here, the profile "energy saver" is active, the wireless module disabled and the display brightness adjusted to 150 nits.
By activating the integrated GPU, runtimes can be increased. After doing so, the Legion ran for 5:22 h in our Wi-Fi test and for 5:34 h in our video test.
| Lenovo Legion Y540-17IRH i5-9300H, GeForce GTX 1660 Ti Mobile, 57 Wh | Schenker XMG Core 17 i7-9750H, GeForce GTX 1660 Ti Mobile, 46.74 Wh | Lenovo Legion Y740-17ICH i7-8750H, GeForce RTX 2080 Max-Q, 76 Wh | MSI GP75 Leopard 9SD i7-9750H, GeForce GTX 1660 Ti Mobile, 51 Wh | Dell G7 17 7790 i7-8750H, GeForce RTX 2070 Max-Q, 60 Wh | Gigabyte Sabre 17-W8 i7-8750H, GeForce GTX 1060 Mobile, 62 Wh | Average of class Gaming | |
|---|---|---|---|---|---|---|---|
| Battery runtime | 39% | -14% | -22% | 50% | 41% | 84% | |
| Reader / Idle (h) | 5.2 | 8.1 56% | 4.8 -8% | 8.5 63% | 6.9 33% | 8.71 ? 68% | |
| H.264 (h) | 3.4 | 5.3 56% | 5.3 56% | 8.26 ? 143% | |||
| WiFi v1.3 (h) | 3.7 | 4.7 27% | 3.2 -14% | 3.2 -14% | 3.9 5% | 5.4 46% | 7.04 ? 90% |
| Load (h) | 1.1 | 1.3 18% | 0.6 -45% | 2 82% | 1.4 27% | 1.47 ? 34% |
Pros
Cons
Verdict
With the Legion Y540-17IRH, Lenovo delivers a mid-range 17.3-inch gaming laptop. The installed combination of Core i5-9300H CPU and GeForce GTX 1660 Ti GPU is more than capable of displaying current titles smoothly. In most games, Full HD resolution and high to maxed-out settings can be selected. The processor is particularly impressive, since it is able to maintain its full Turbo Boost indefinitely.
Thanks to the installed NVMe SSD, the system runs quickly and smoothly. However, it is not one of the fastest models due to its PCI Express x2 interface. Since the laptop has an easy-to-use maintenance hatch, exchanging the SSD for a faster model is no problem. Furthermore, users have the option to install an additional 2.5-inch drive.
Handy: The integrated GPU can be enabled and disabled with just one click.
The 144-Hz IPS screen shines in our tests thanks to its short response times, wide viewing angles, good contrast and good color representation. While the luminosity of the display is still decent, it could be better in light of the laptop's pricing. The chiclet keyboard is well-suited to daily use. Good: The keyboard is backlit, although there is no RGB lighting. The port selection is fairly large. We regret the absence of a Thunderbolt 3 port, however.
Battery life is nothing special ex-factory. However, it can be increased substantially by enabling the more economical, integrated GPU. This can be done via Lenovo's preinstalled Vantage software or through the BIOS. In our Wi-Fi test, we were able to increase the runtime from 3:40 h to 5:22 h.
Lenovo Legion Y540-17IRH
- 05/14/2020 v7 (old)
Sascha Mölck
Price comparison

