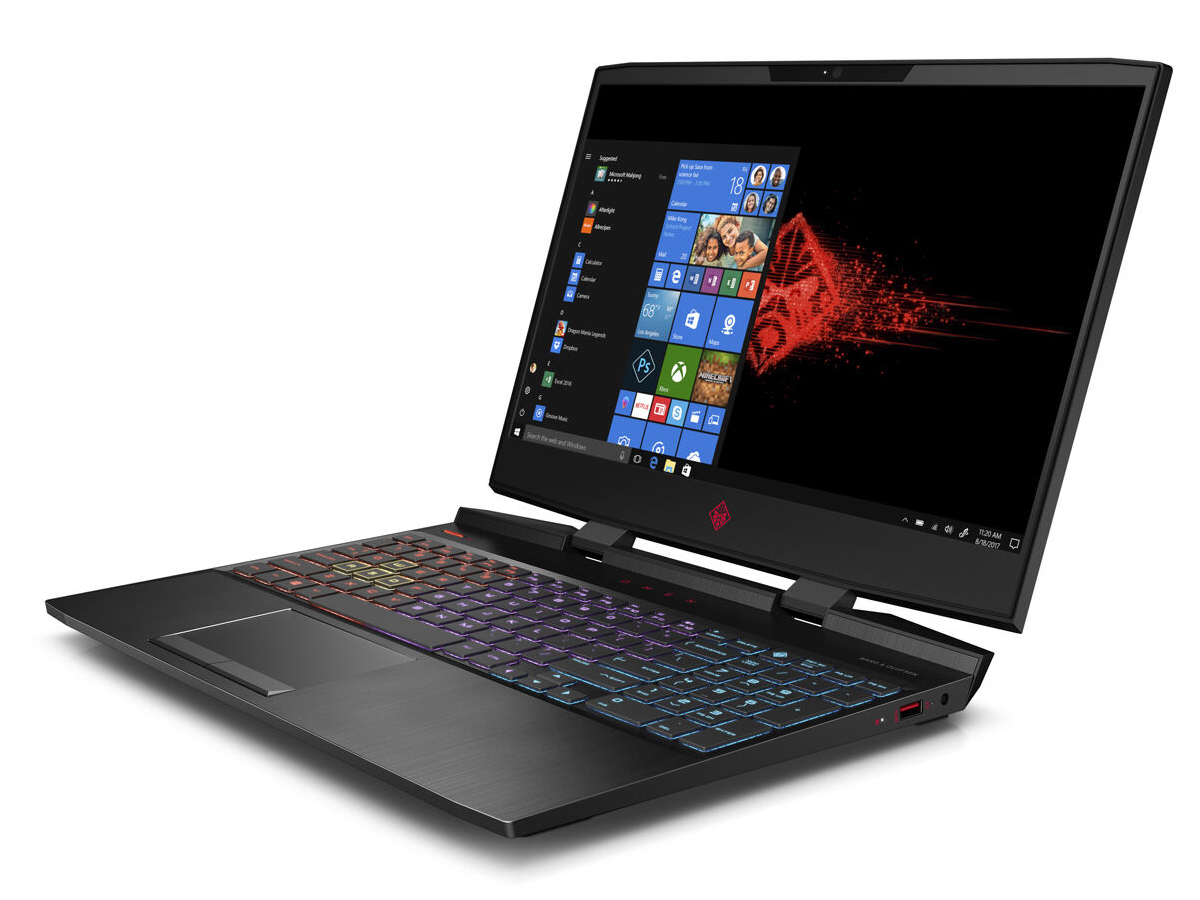
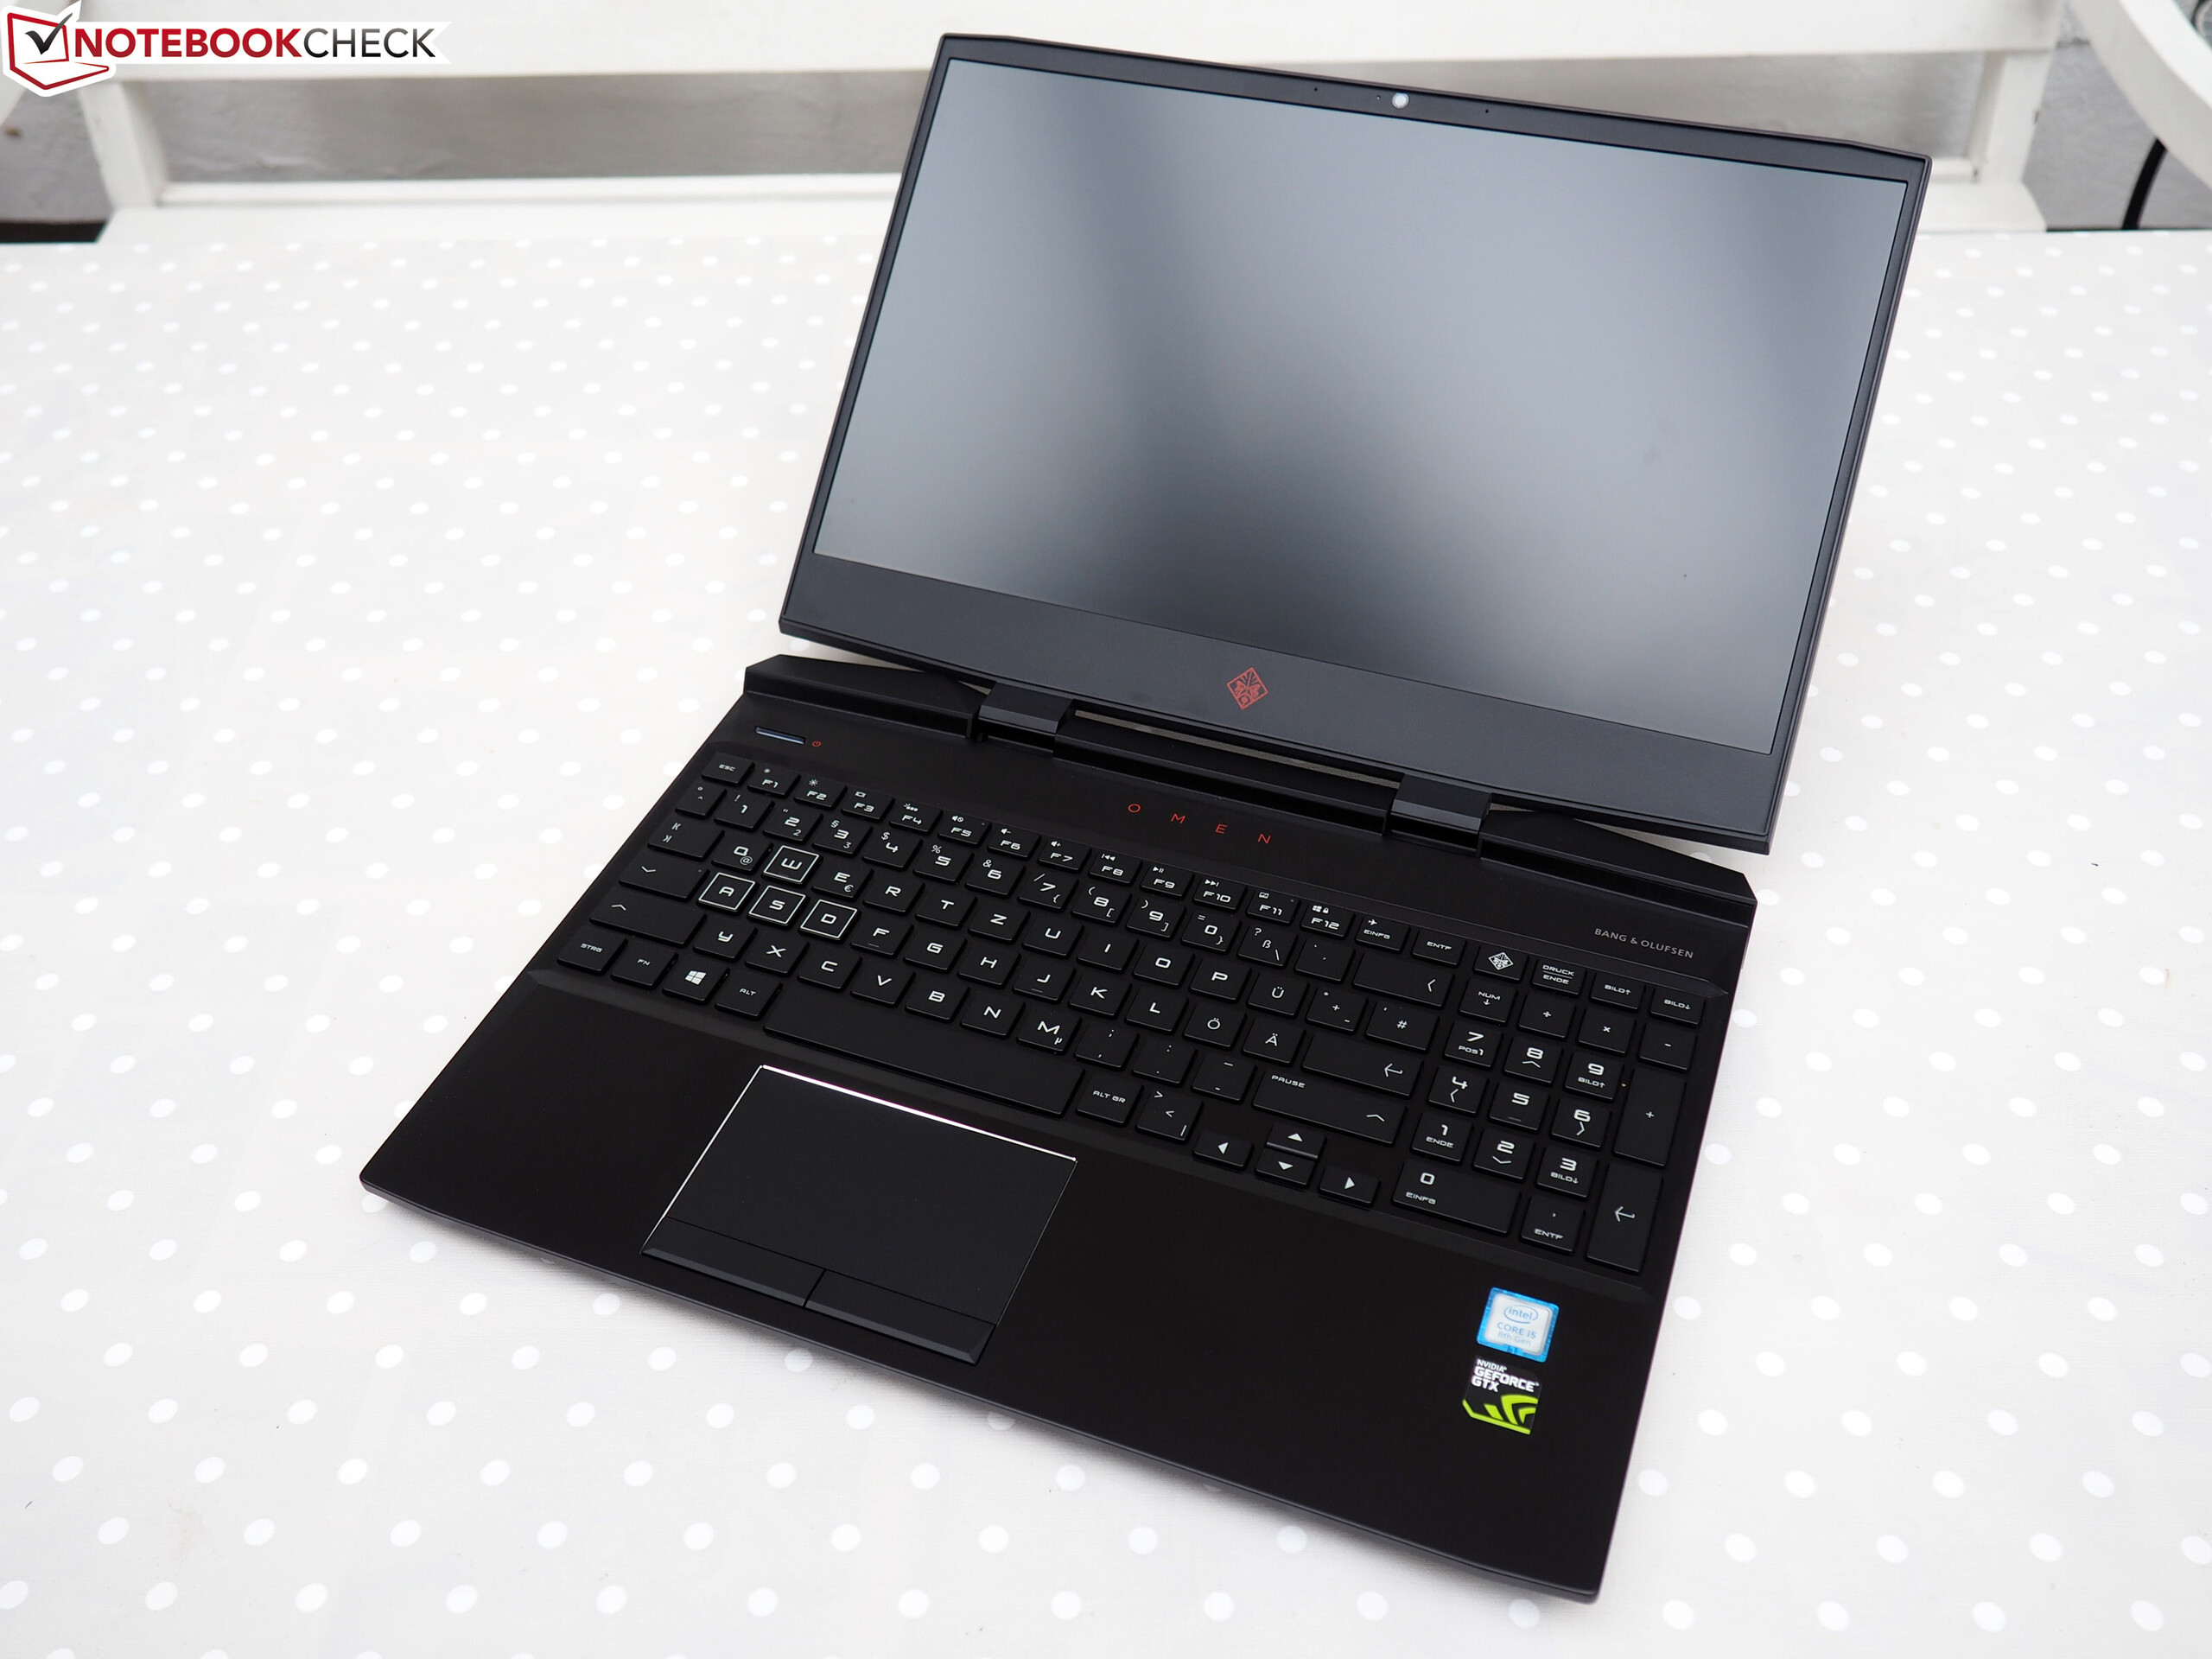
HP Omen 15 Review: affordable entry-level gamer with decent battery life

Omen is HP’s brand for 15.6 and 17.3-inch gaming notebooks, many of which we have already had in review in the past. Today’s Omen 15-dc1020ng is HP’s current 15.6-inch entry-level Omen device powered by a Core i5-9300H and a GeForce GTX 1650. A few weeks ago we had the more powerful Omen 15-dc1303ng SKU in review. Its main competitors are the Acer Nitro 5 AN515-54, Asus TUF FX505DT, Dell G5 15 5590, and Asus ROG GA502DU.
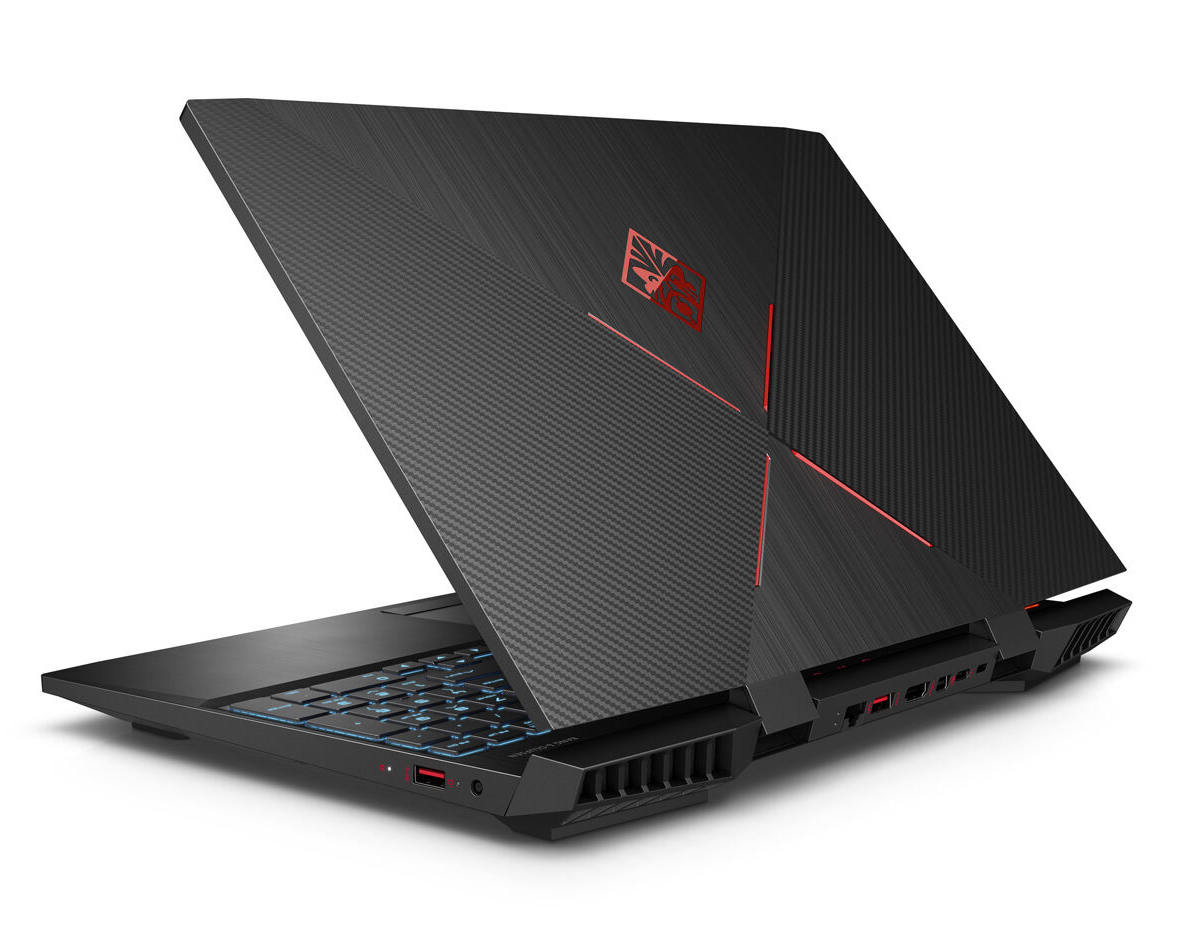
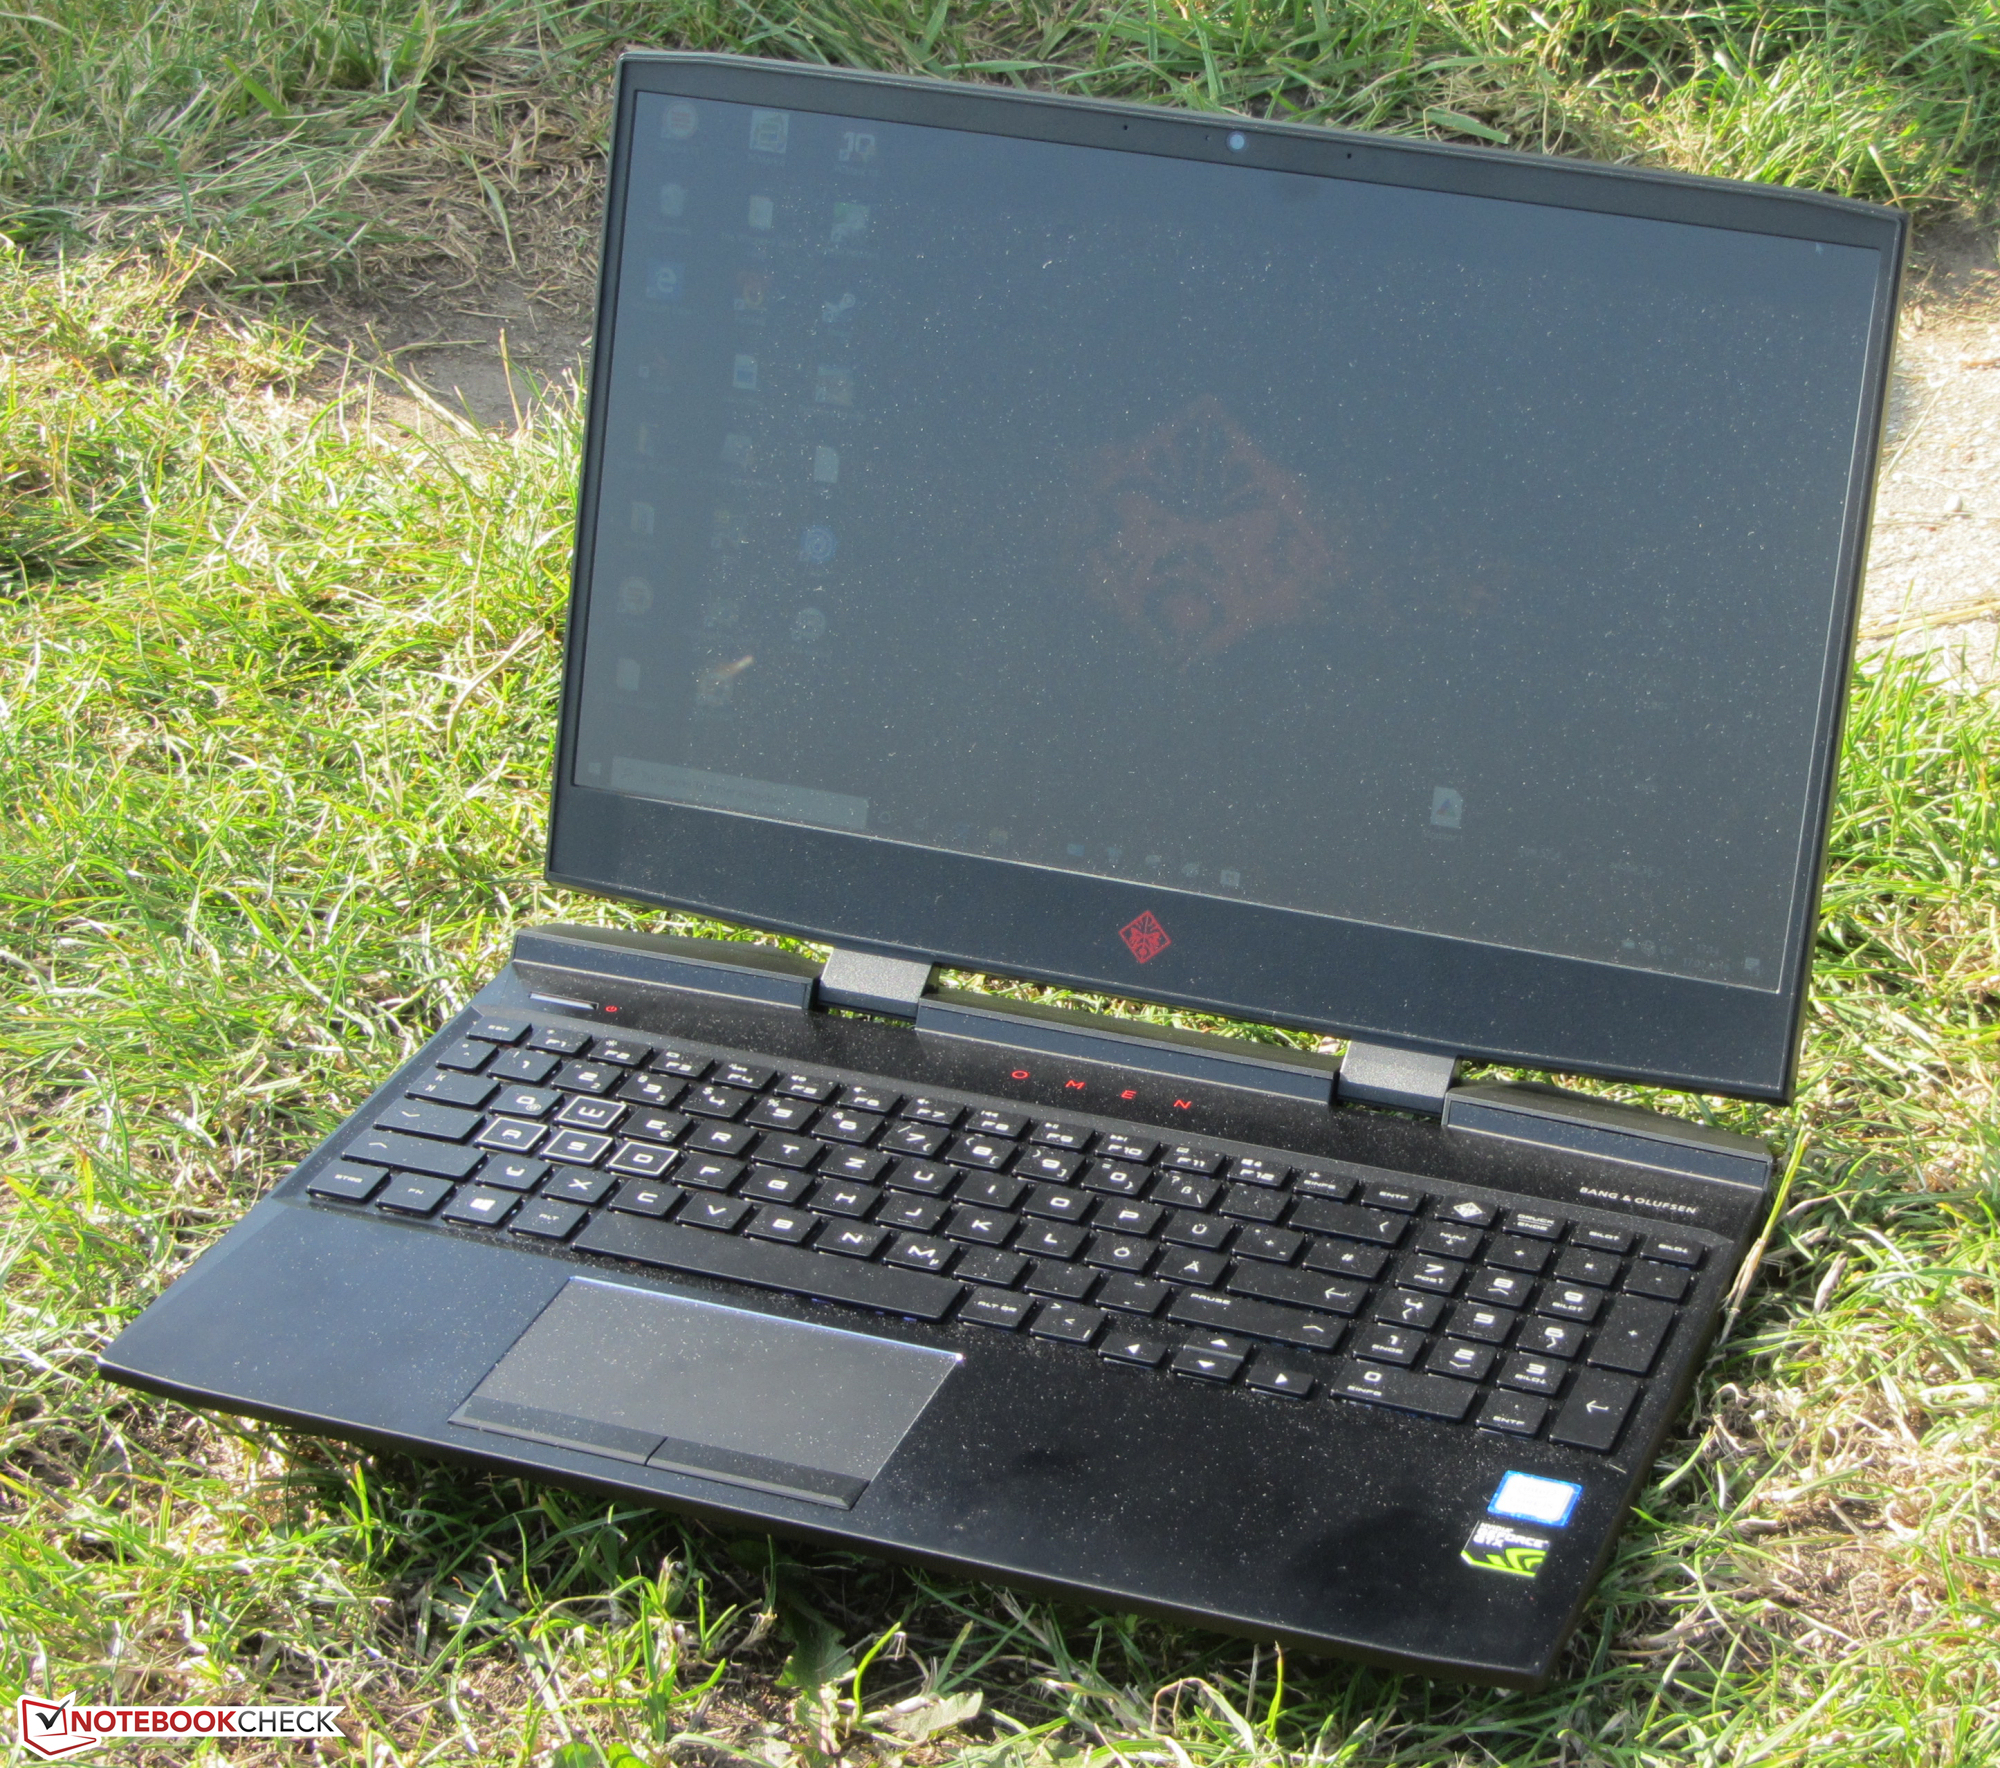
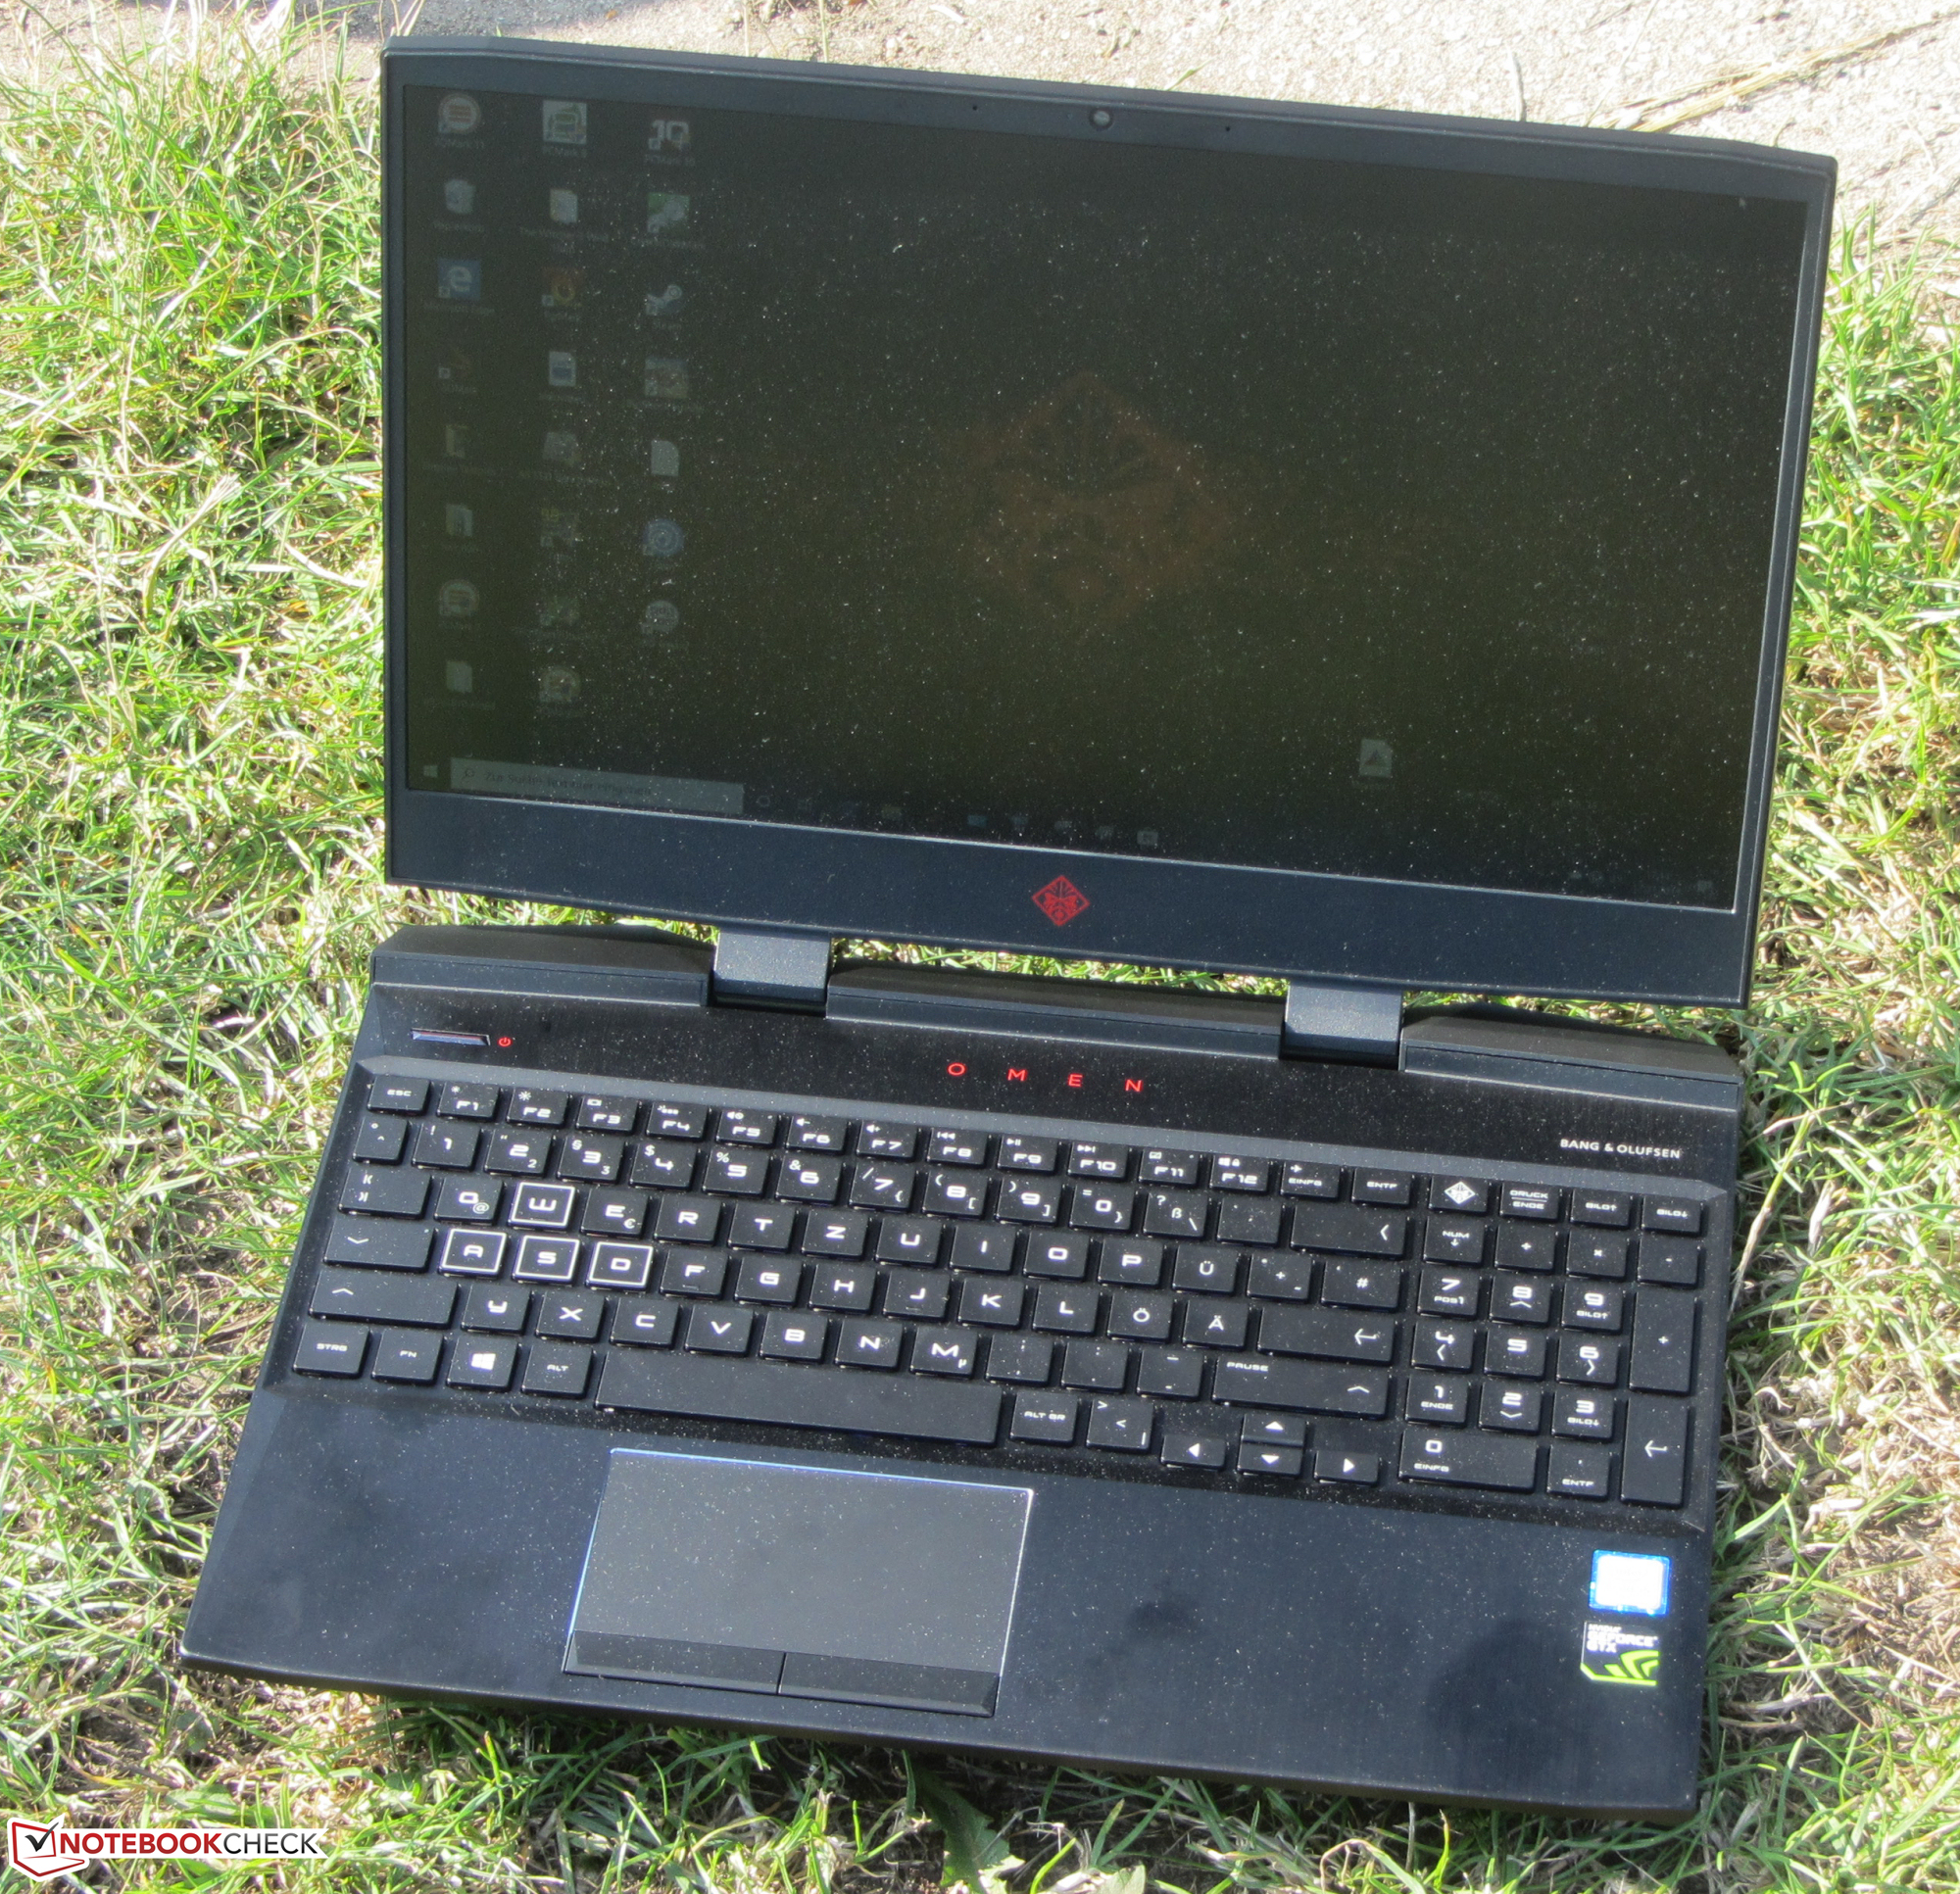
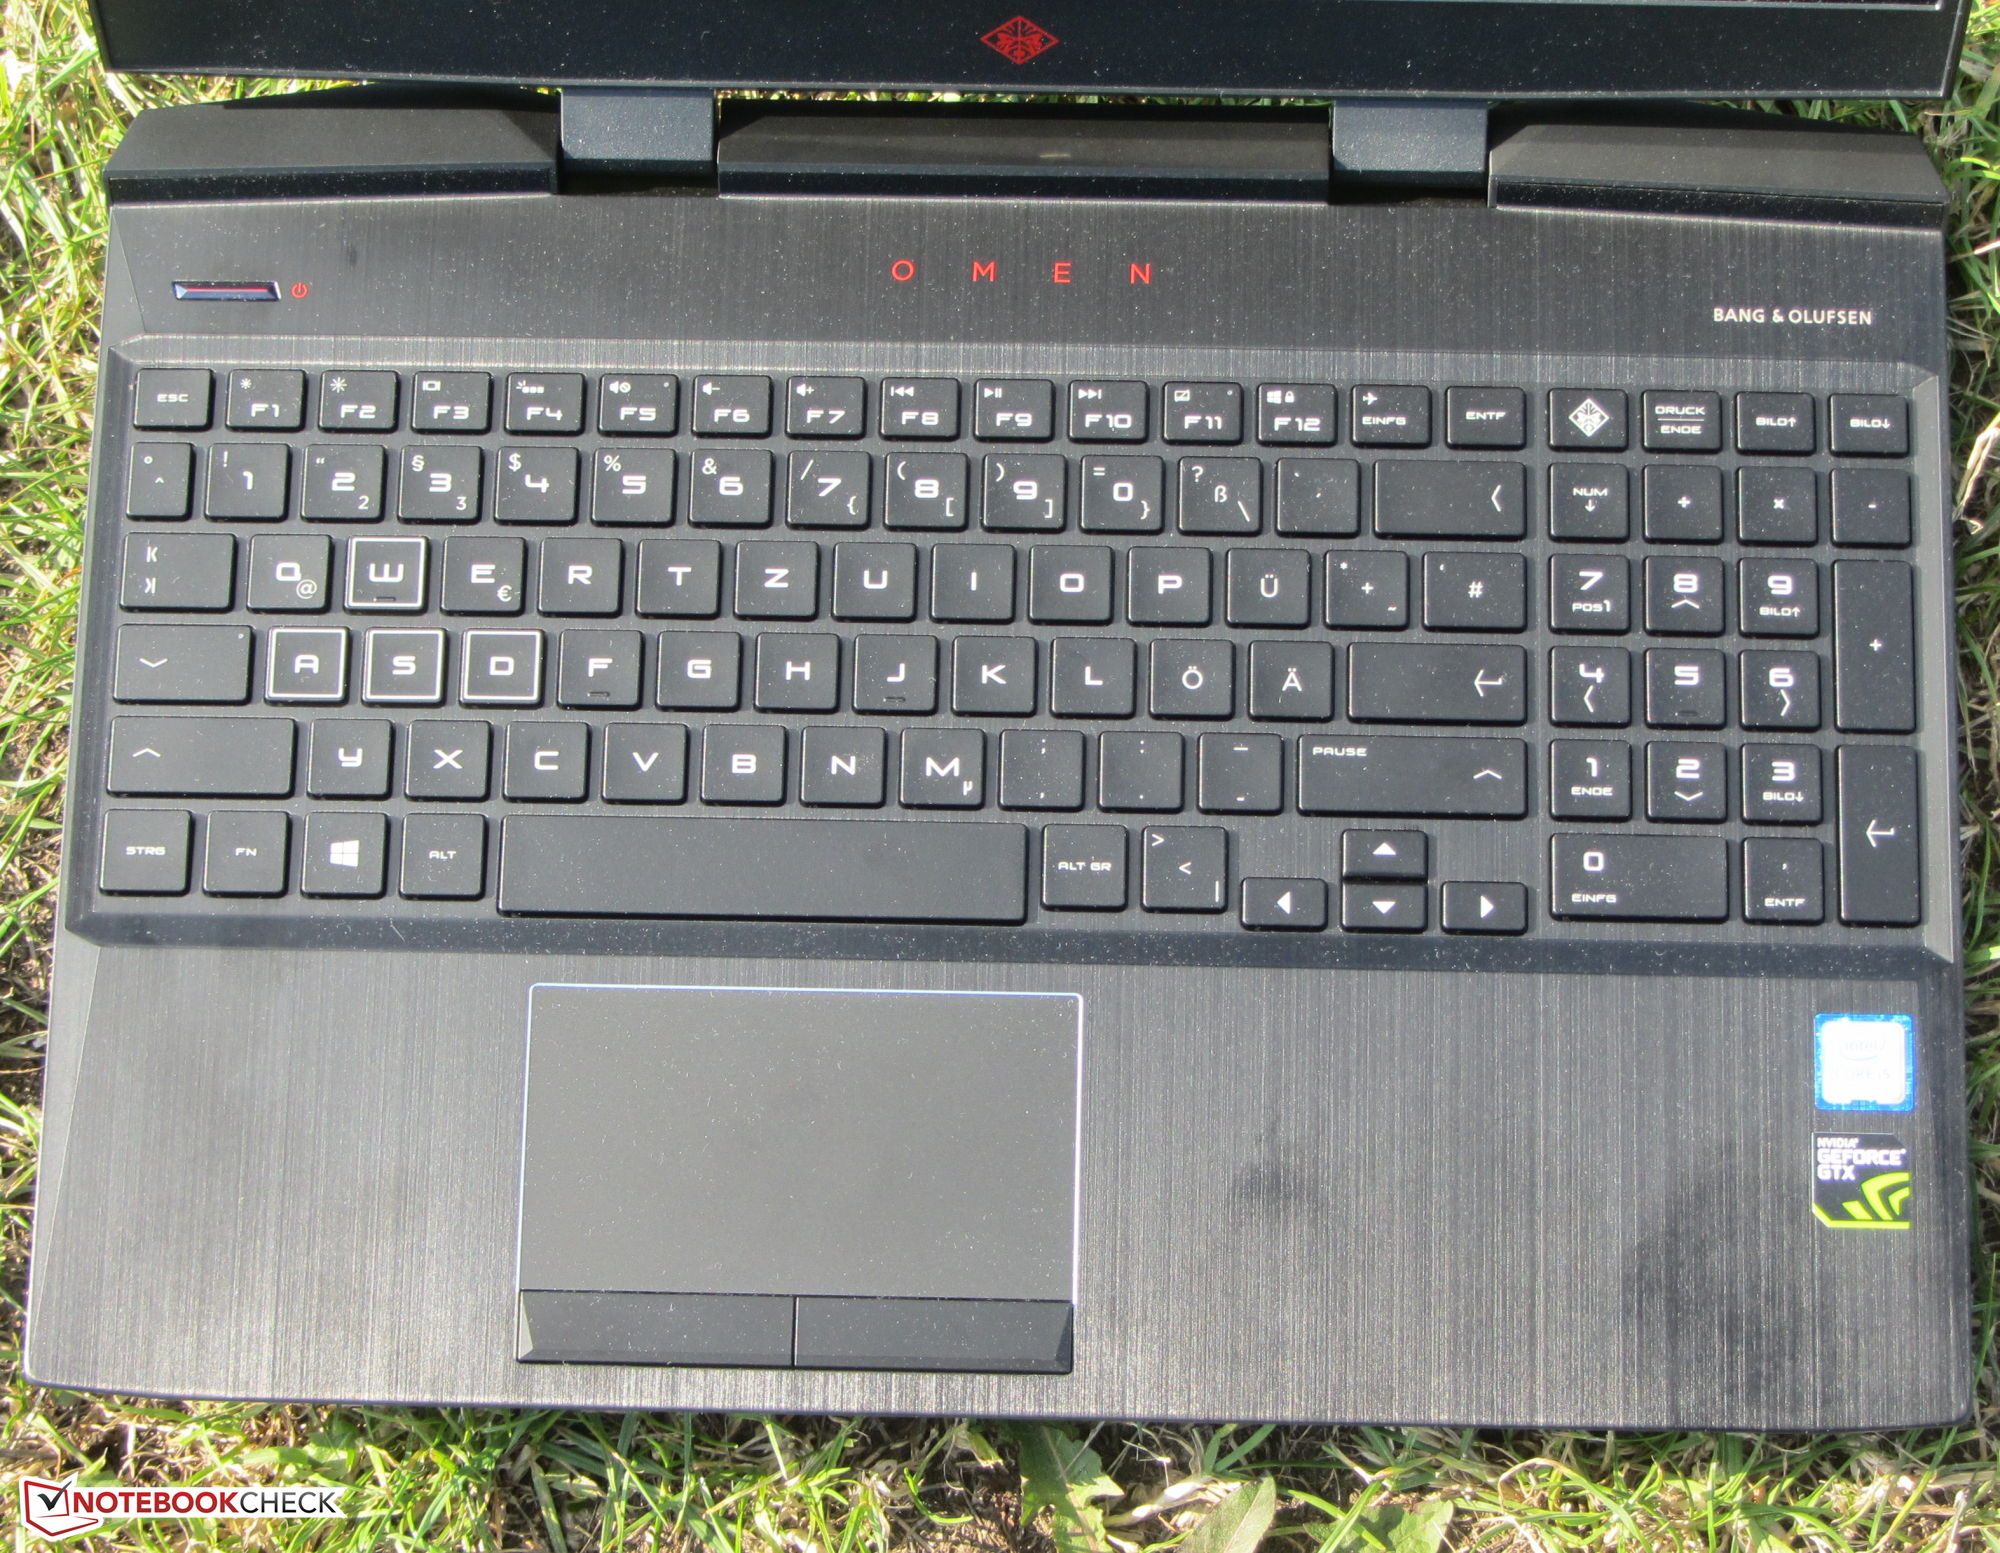
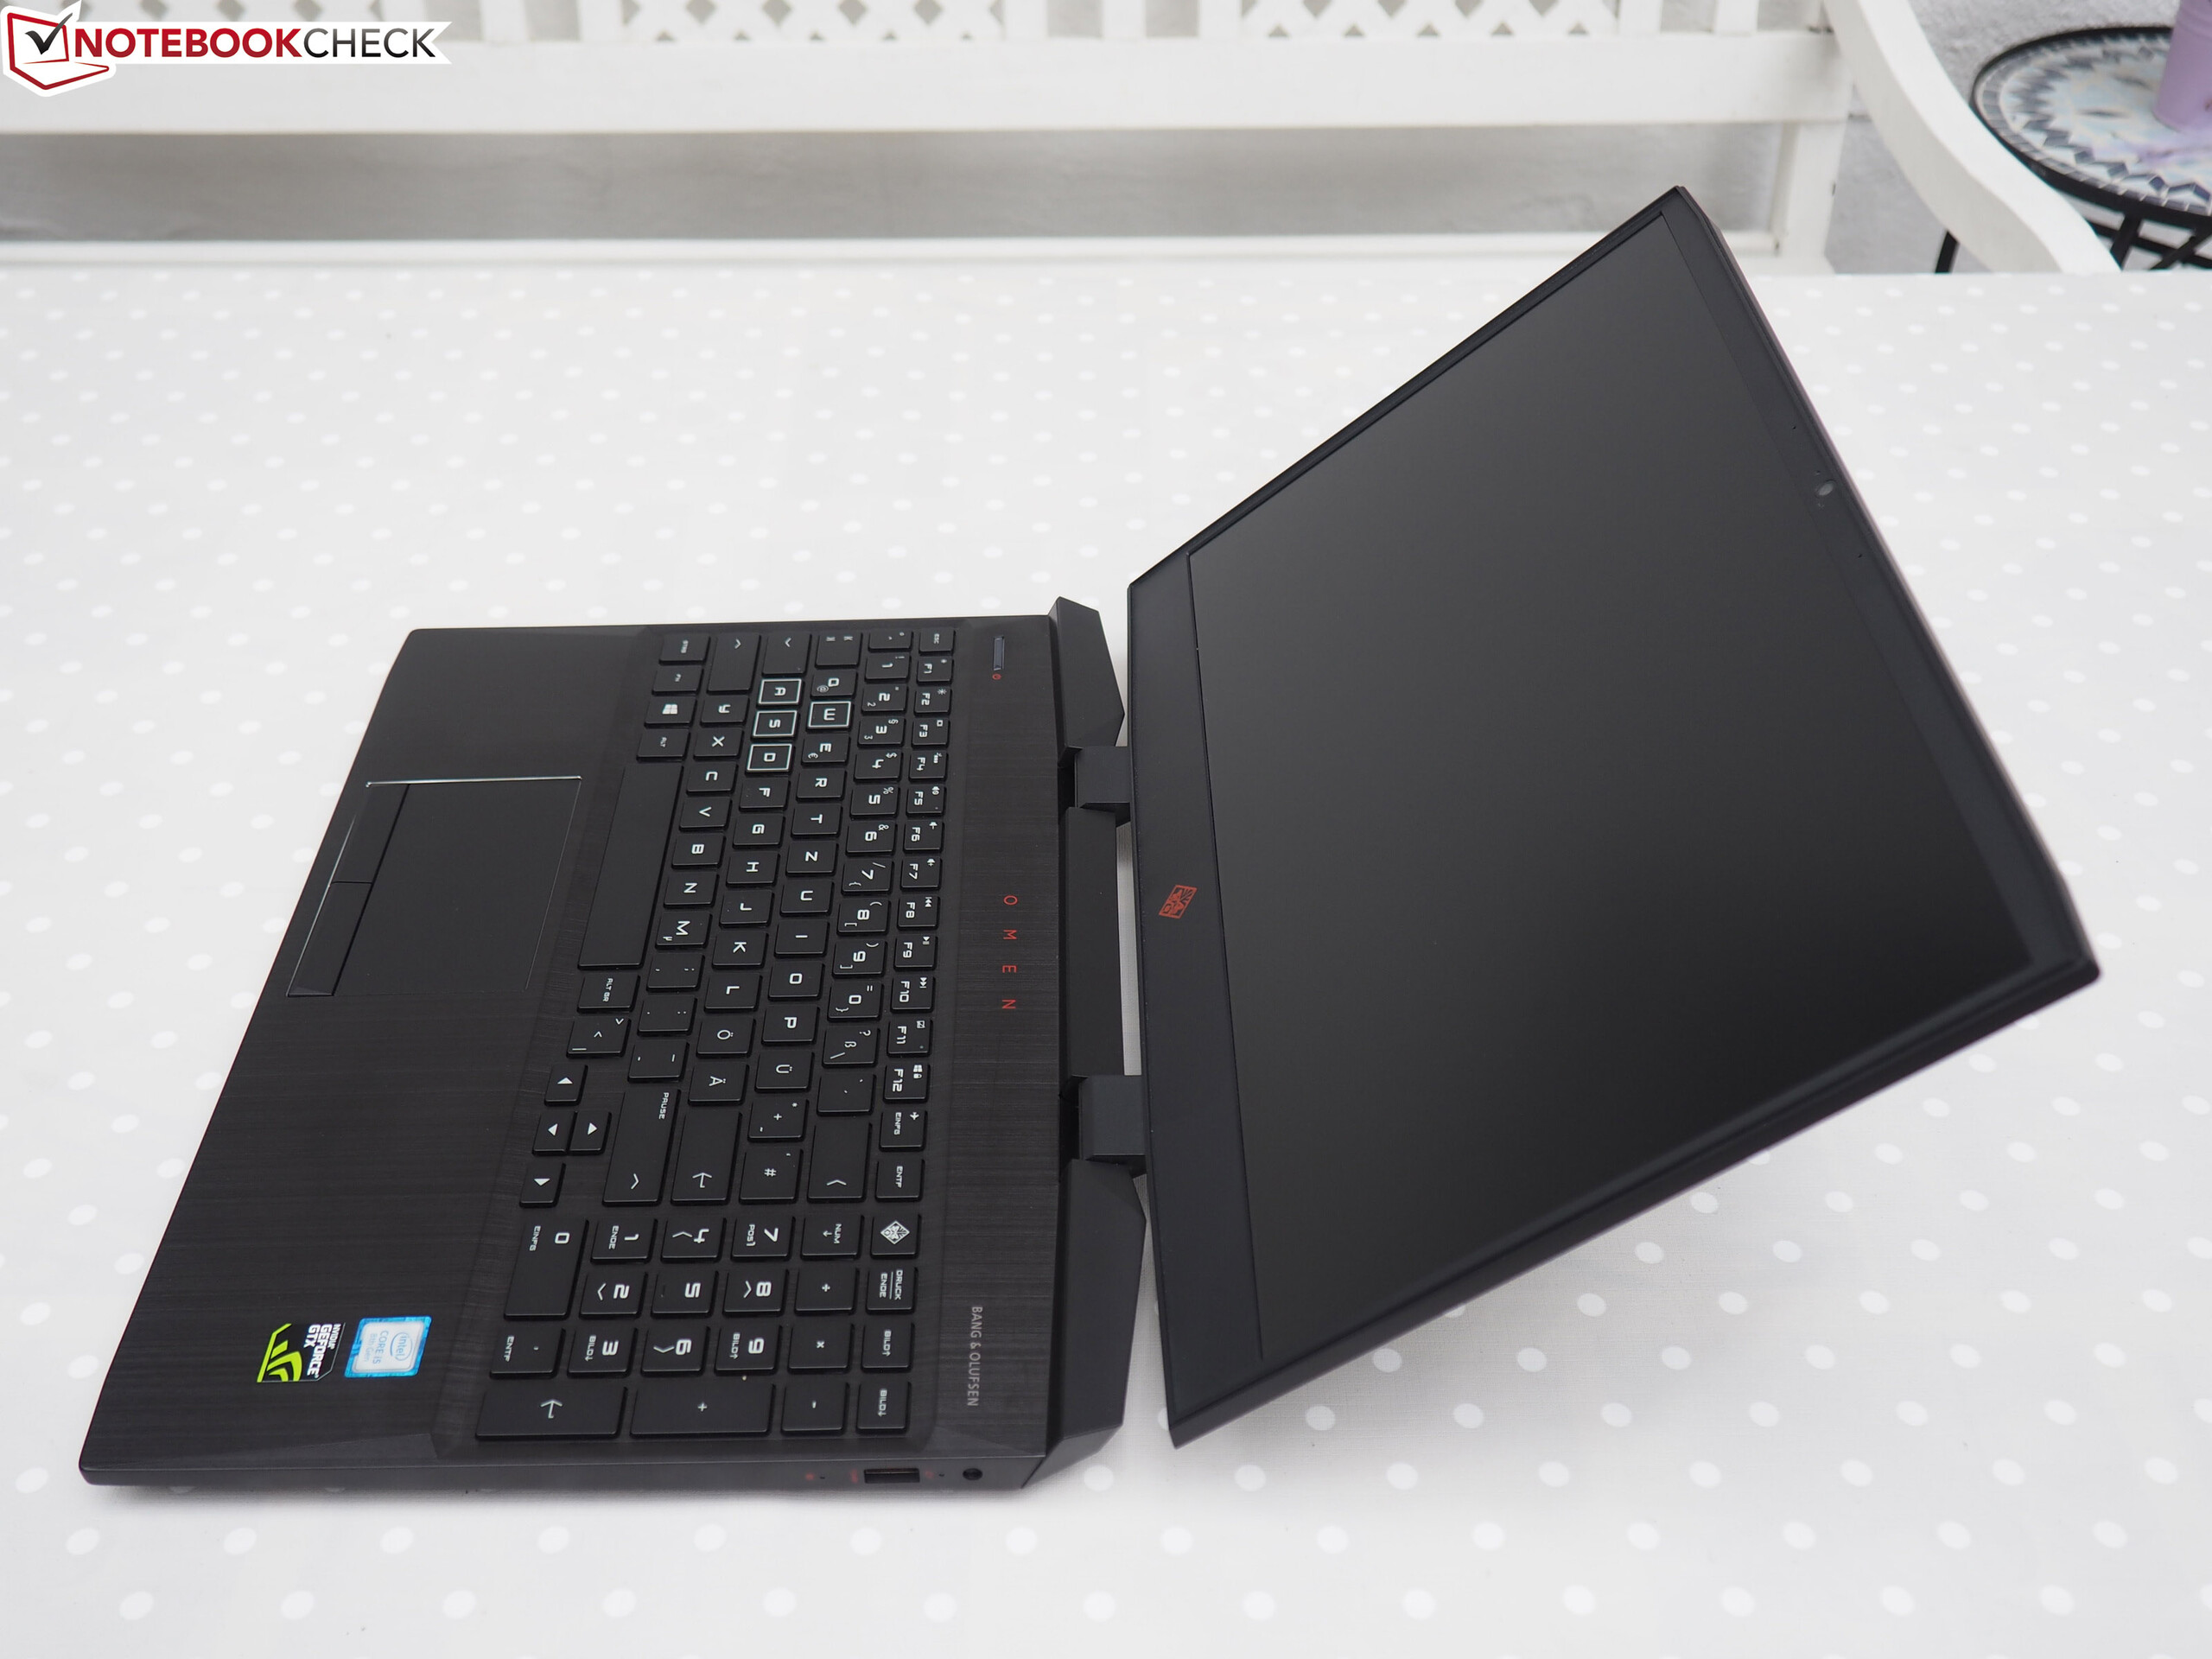
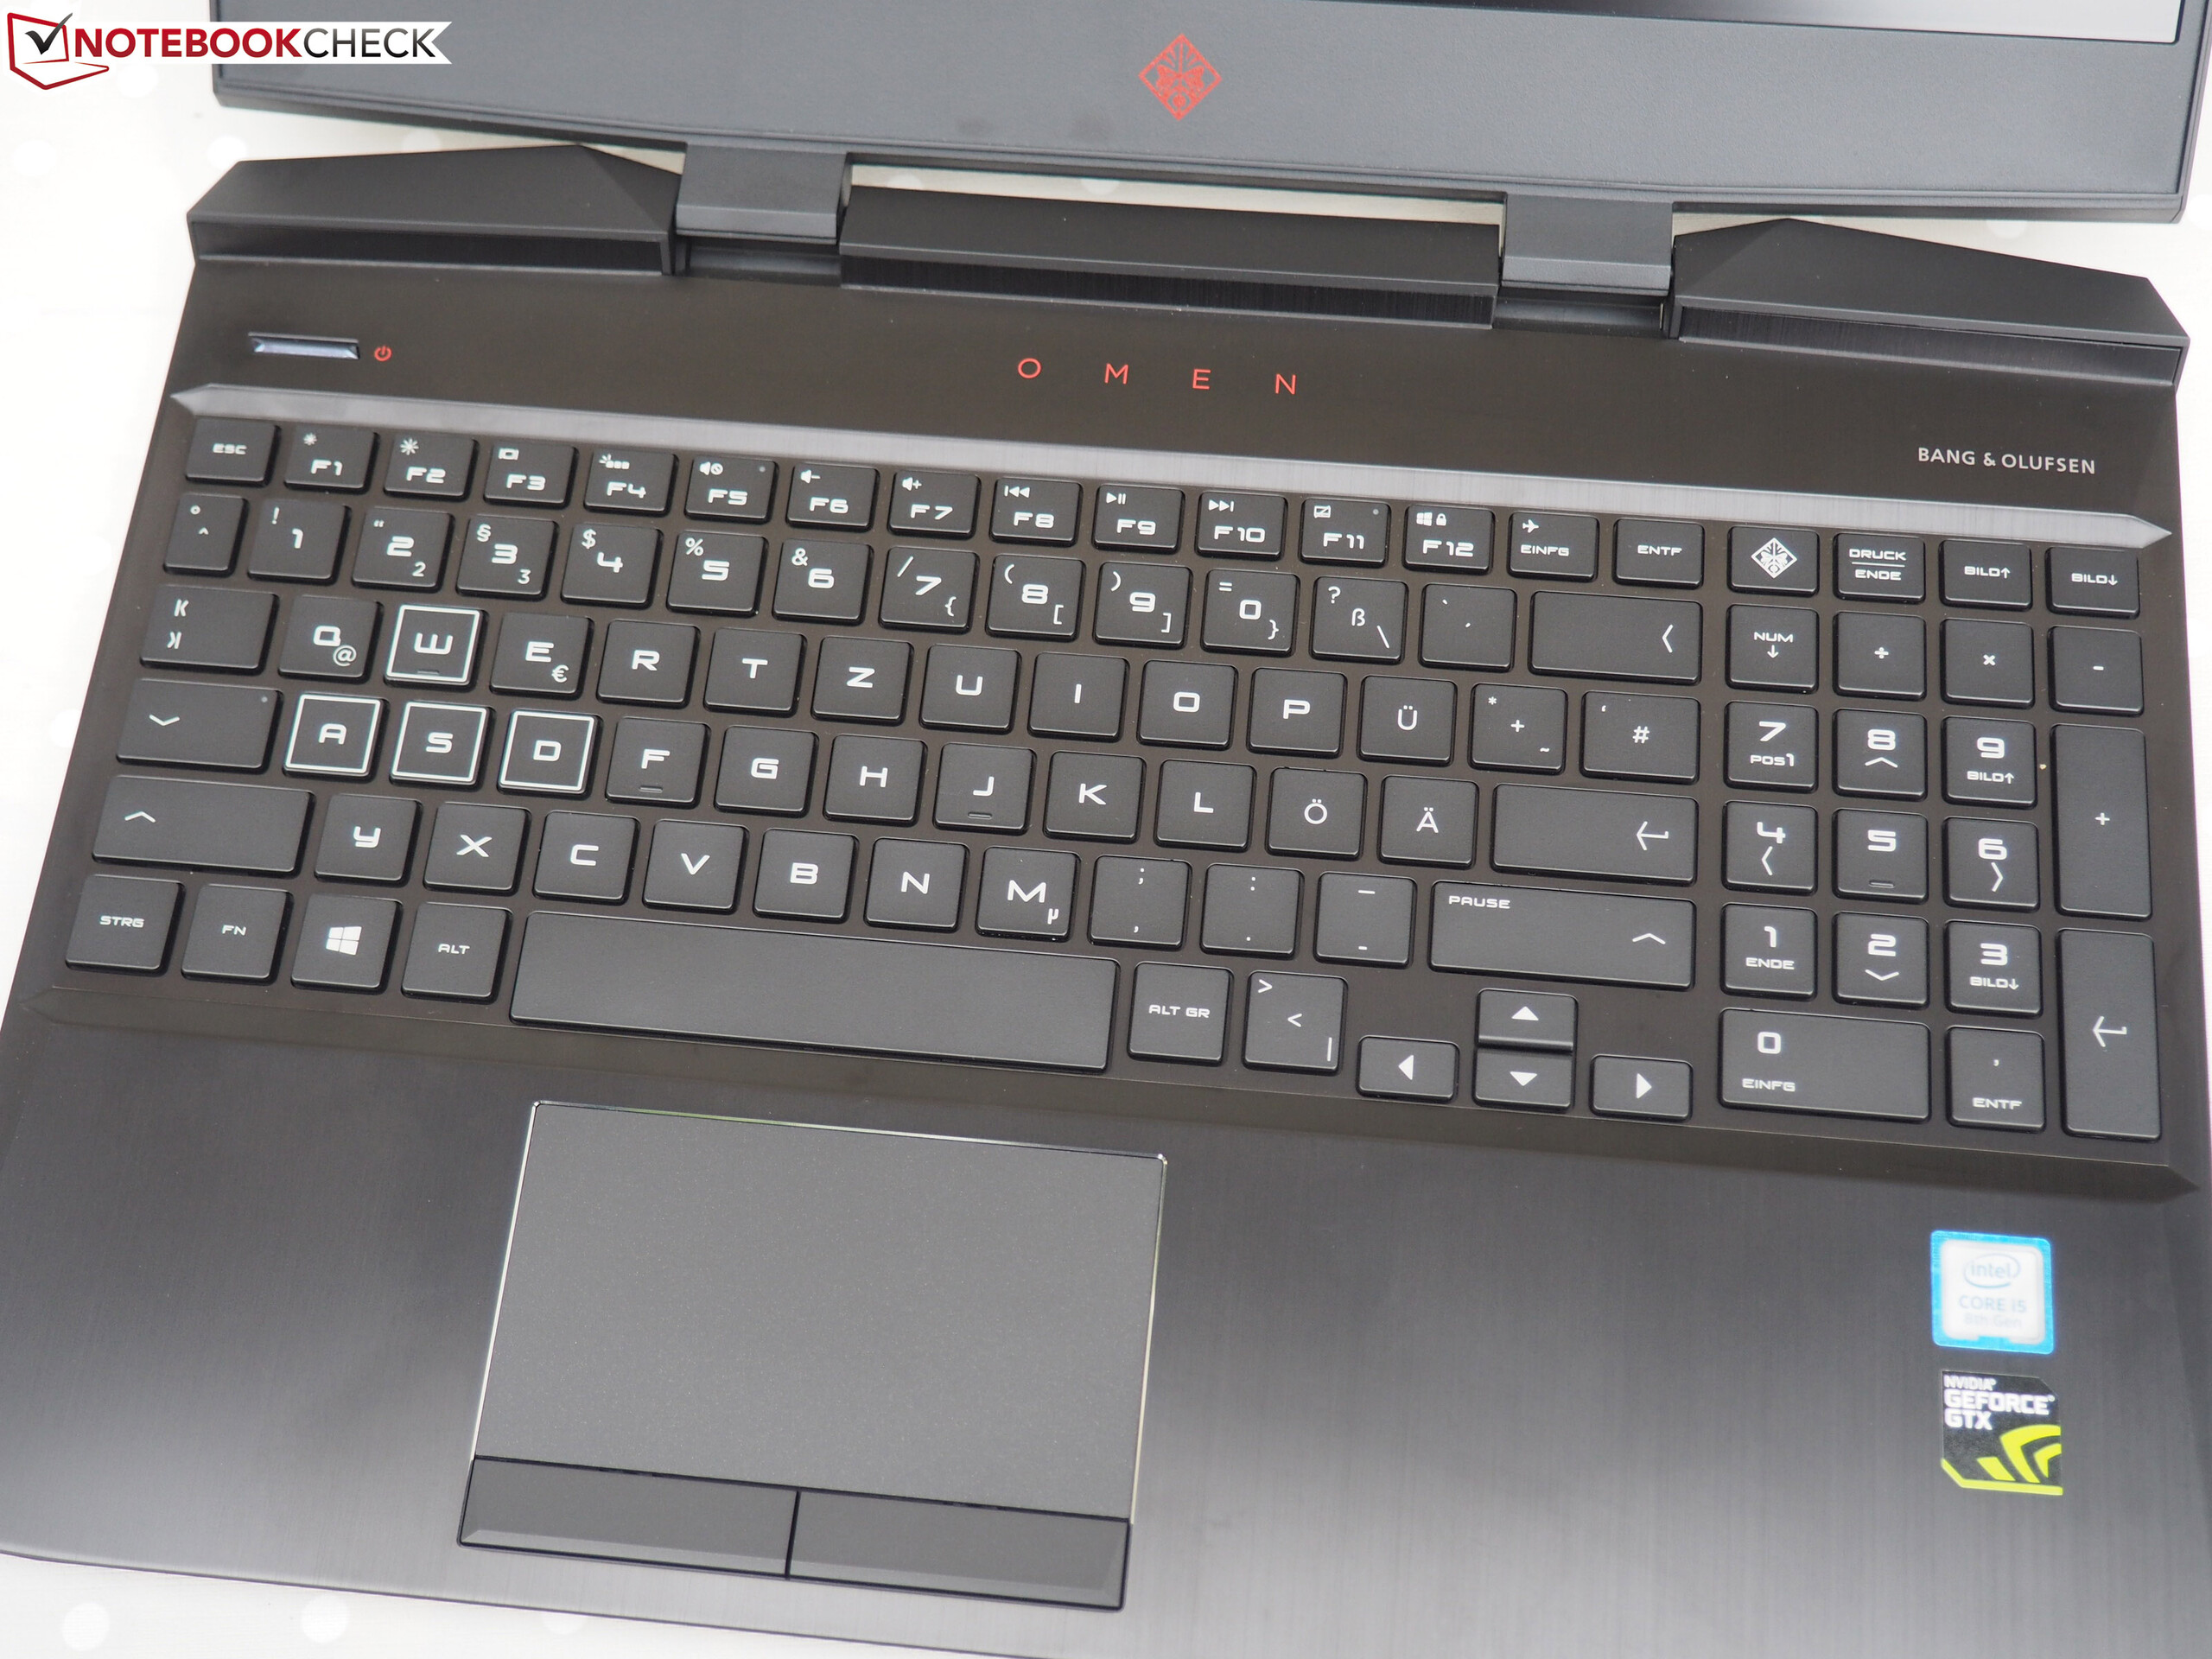
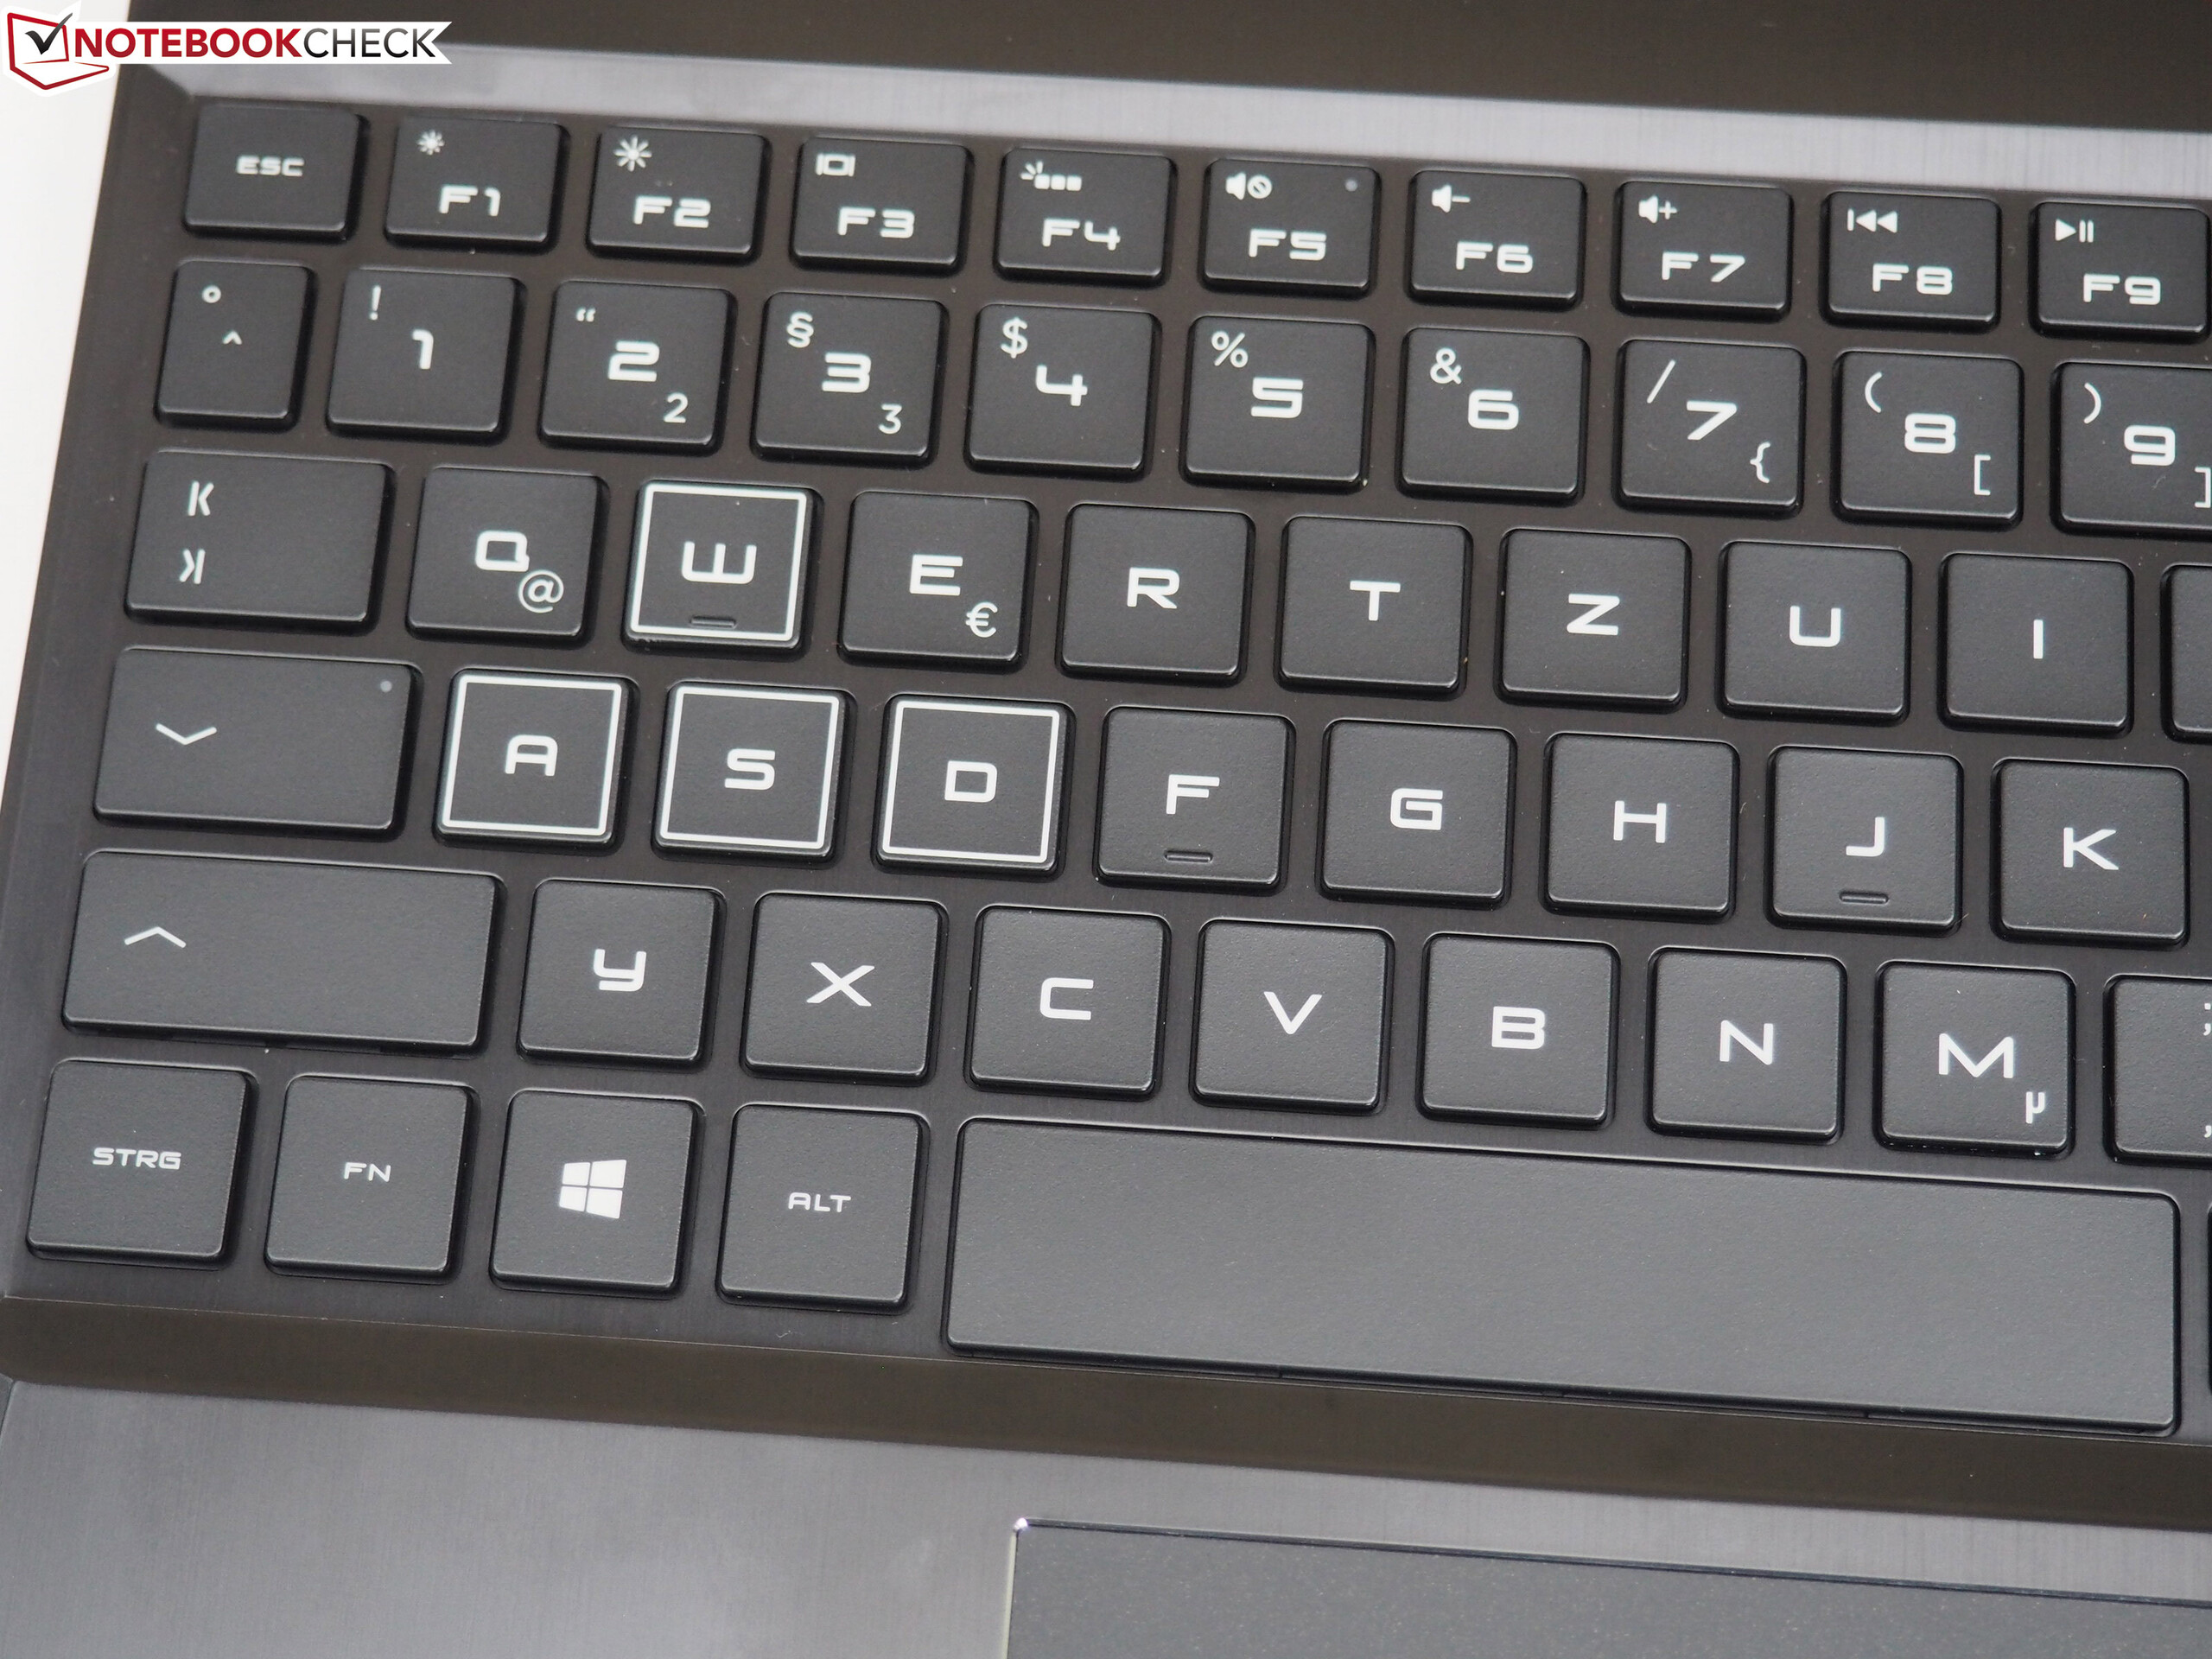
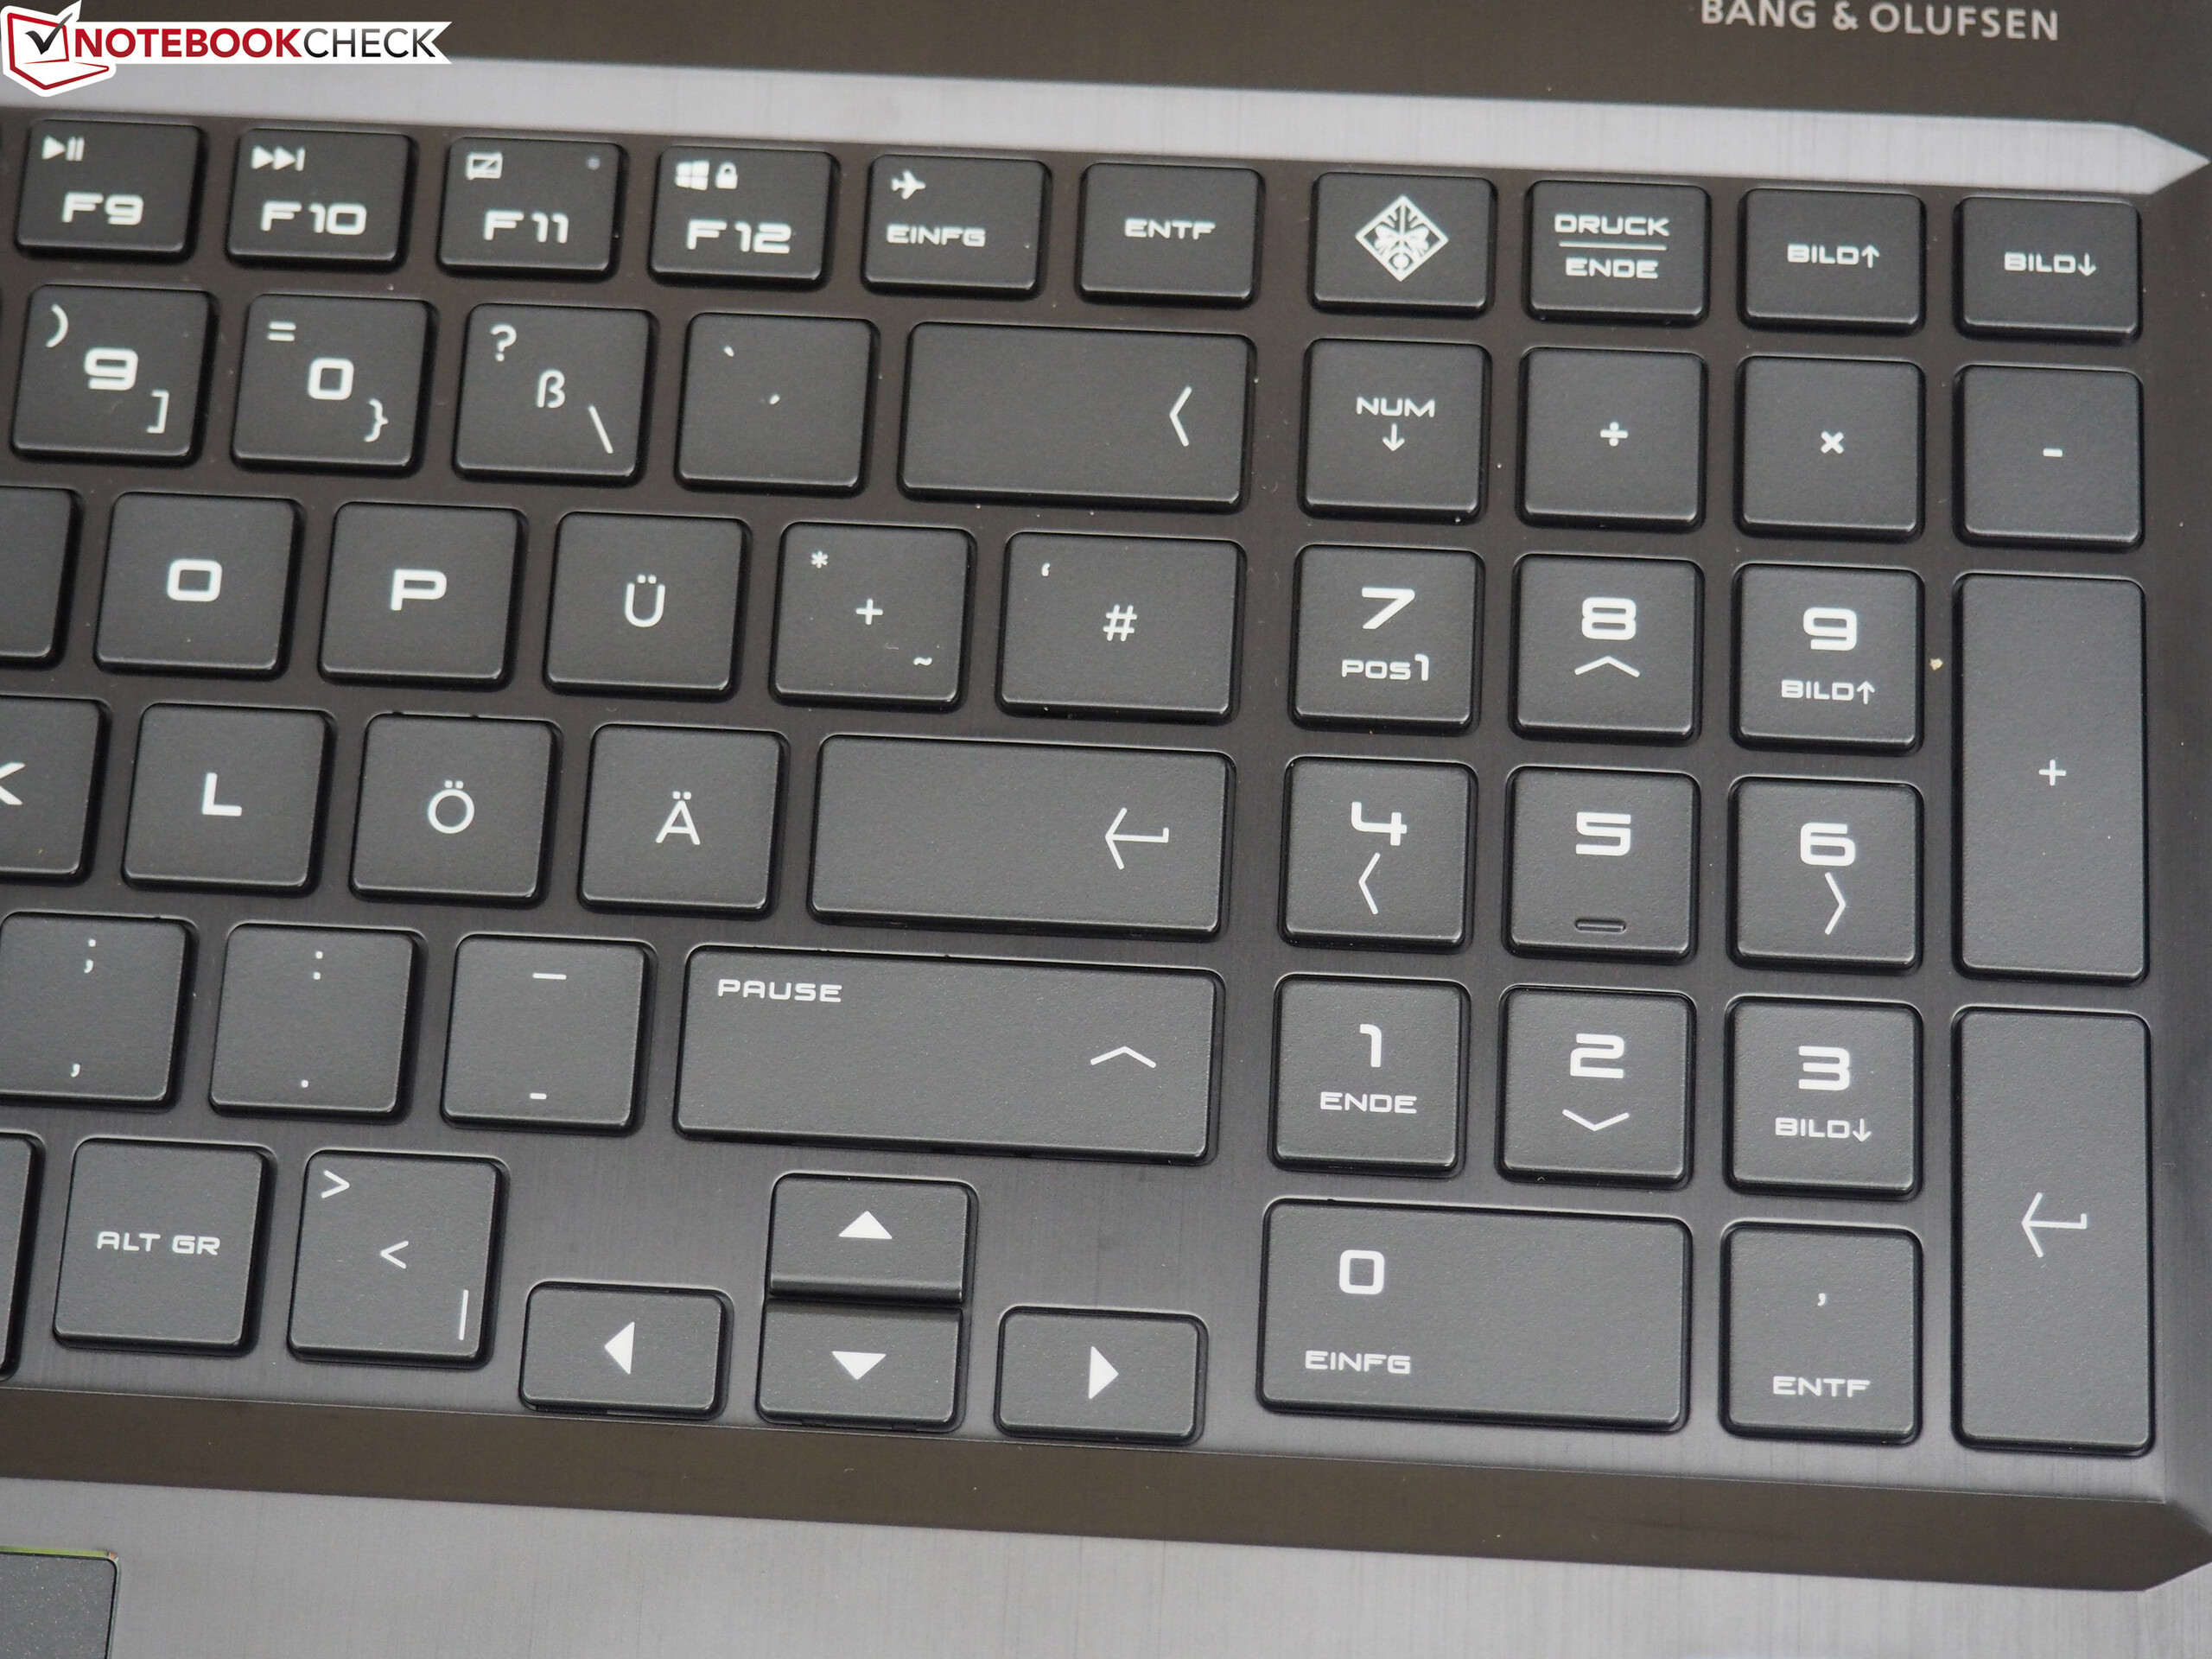
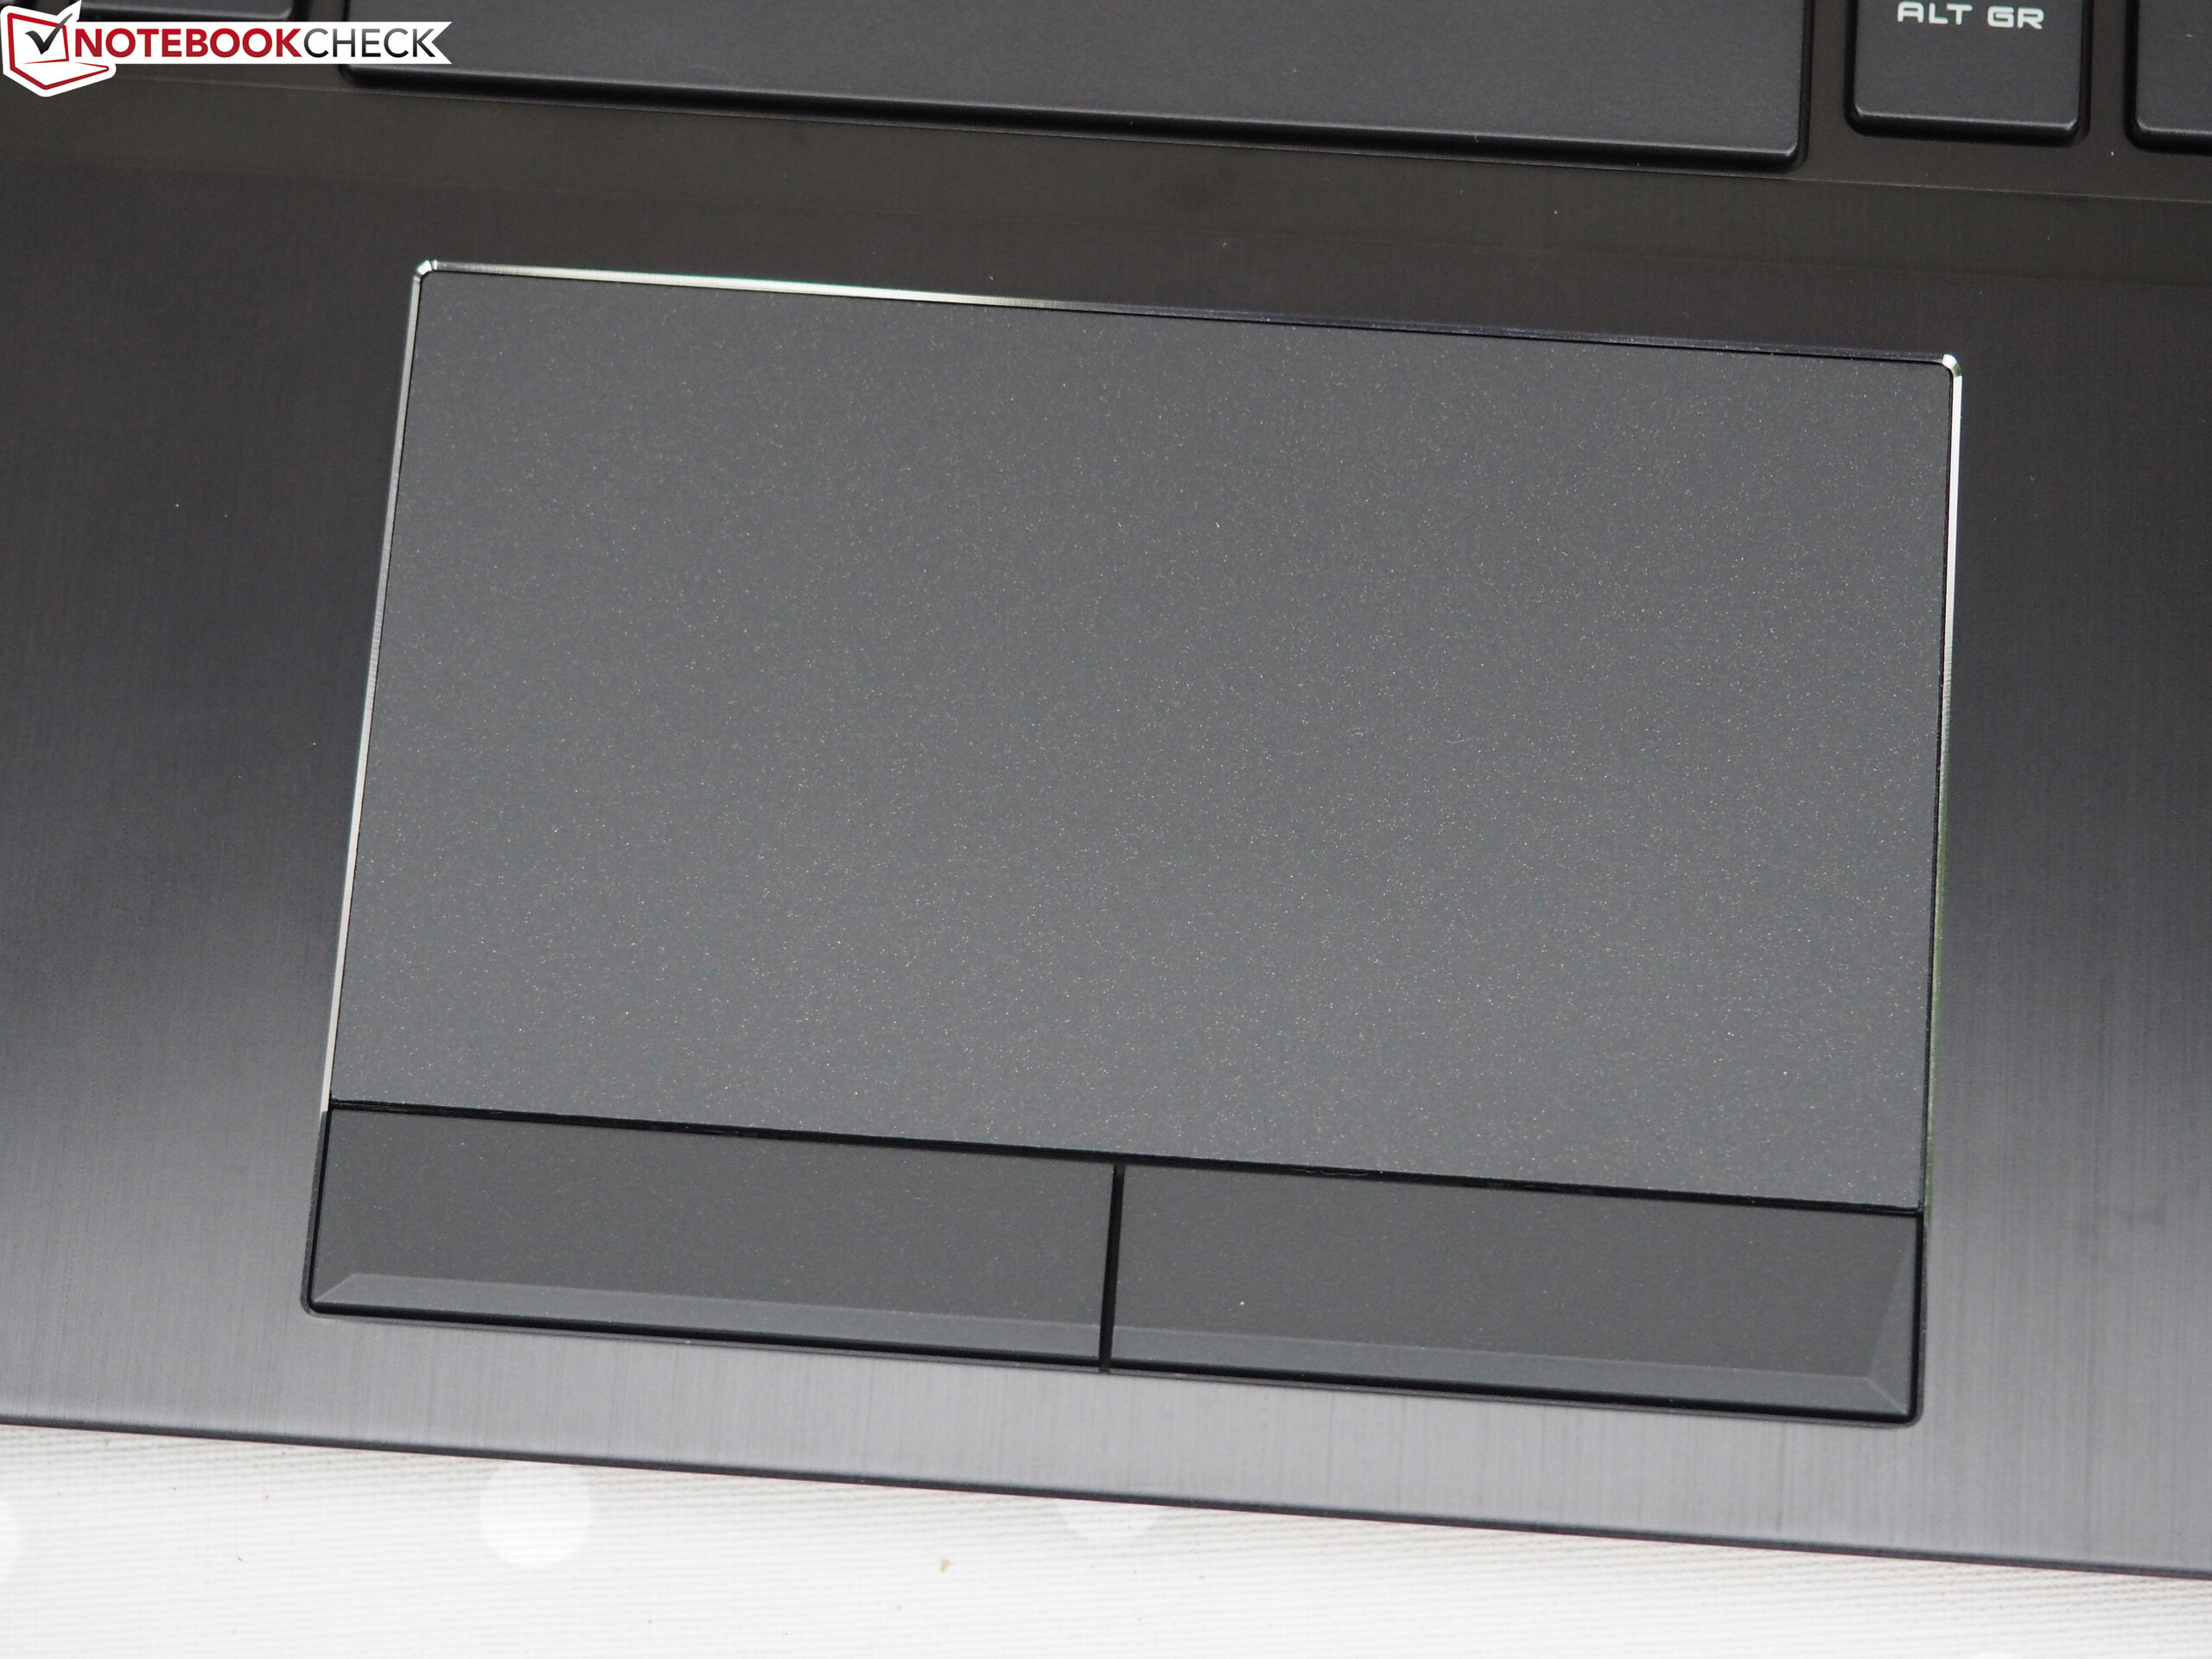
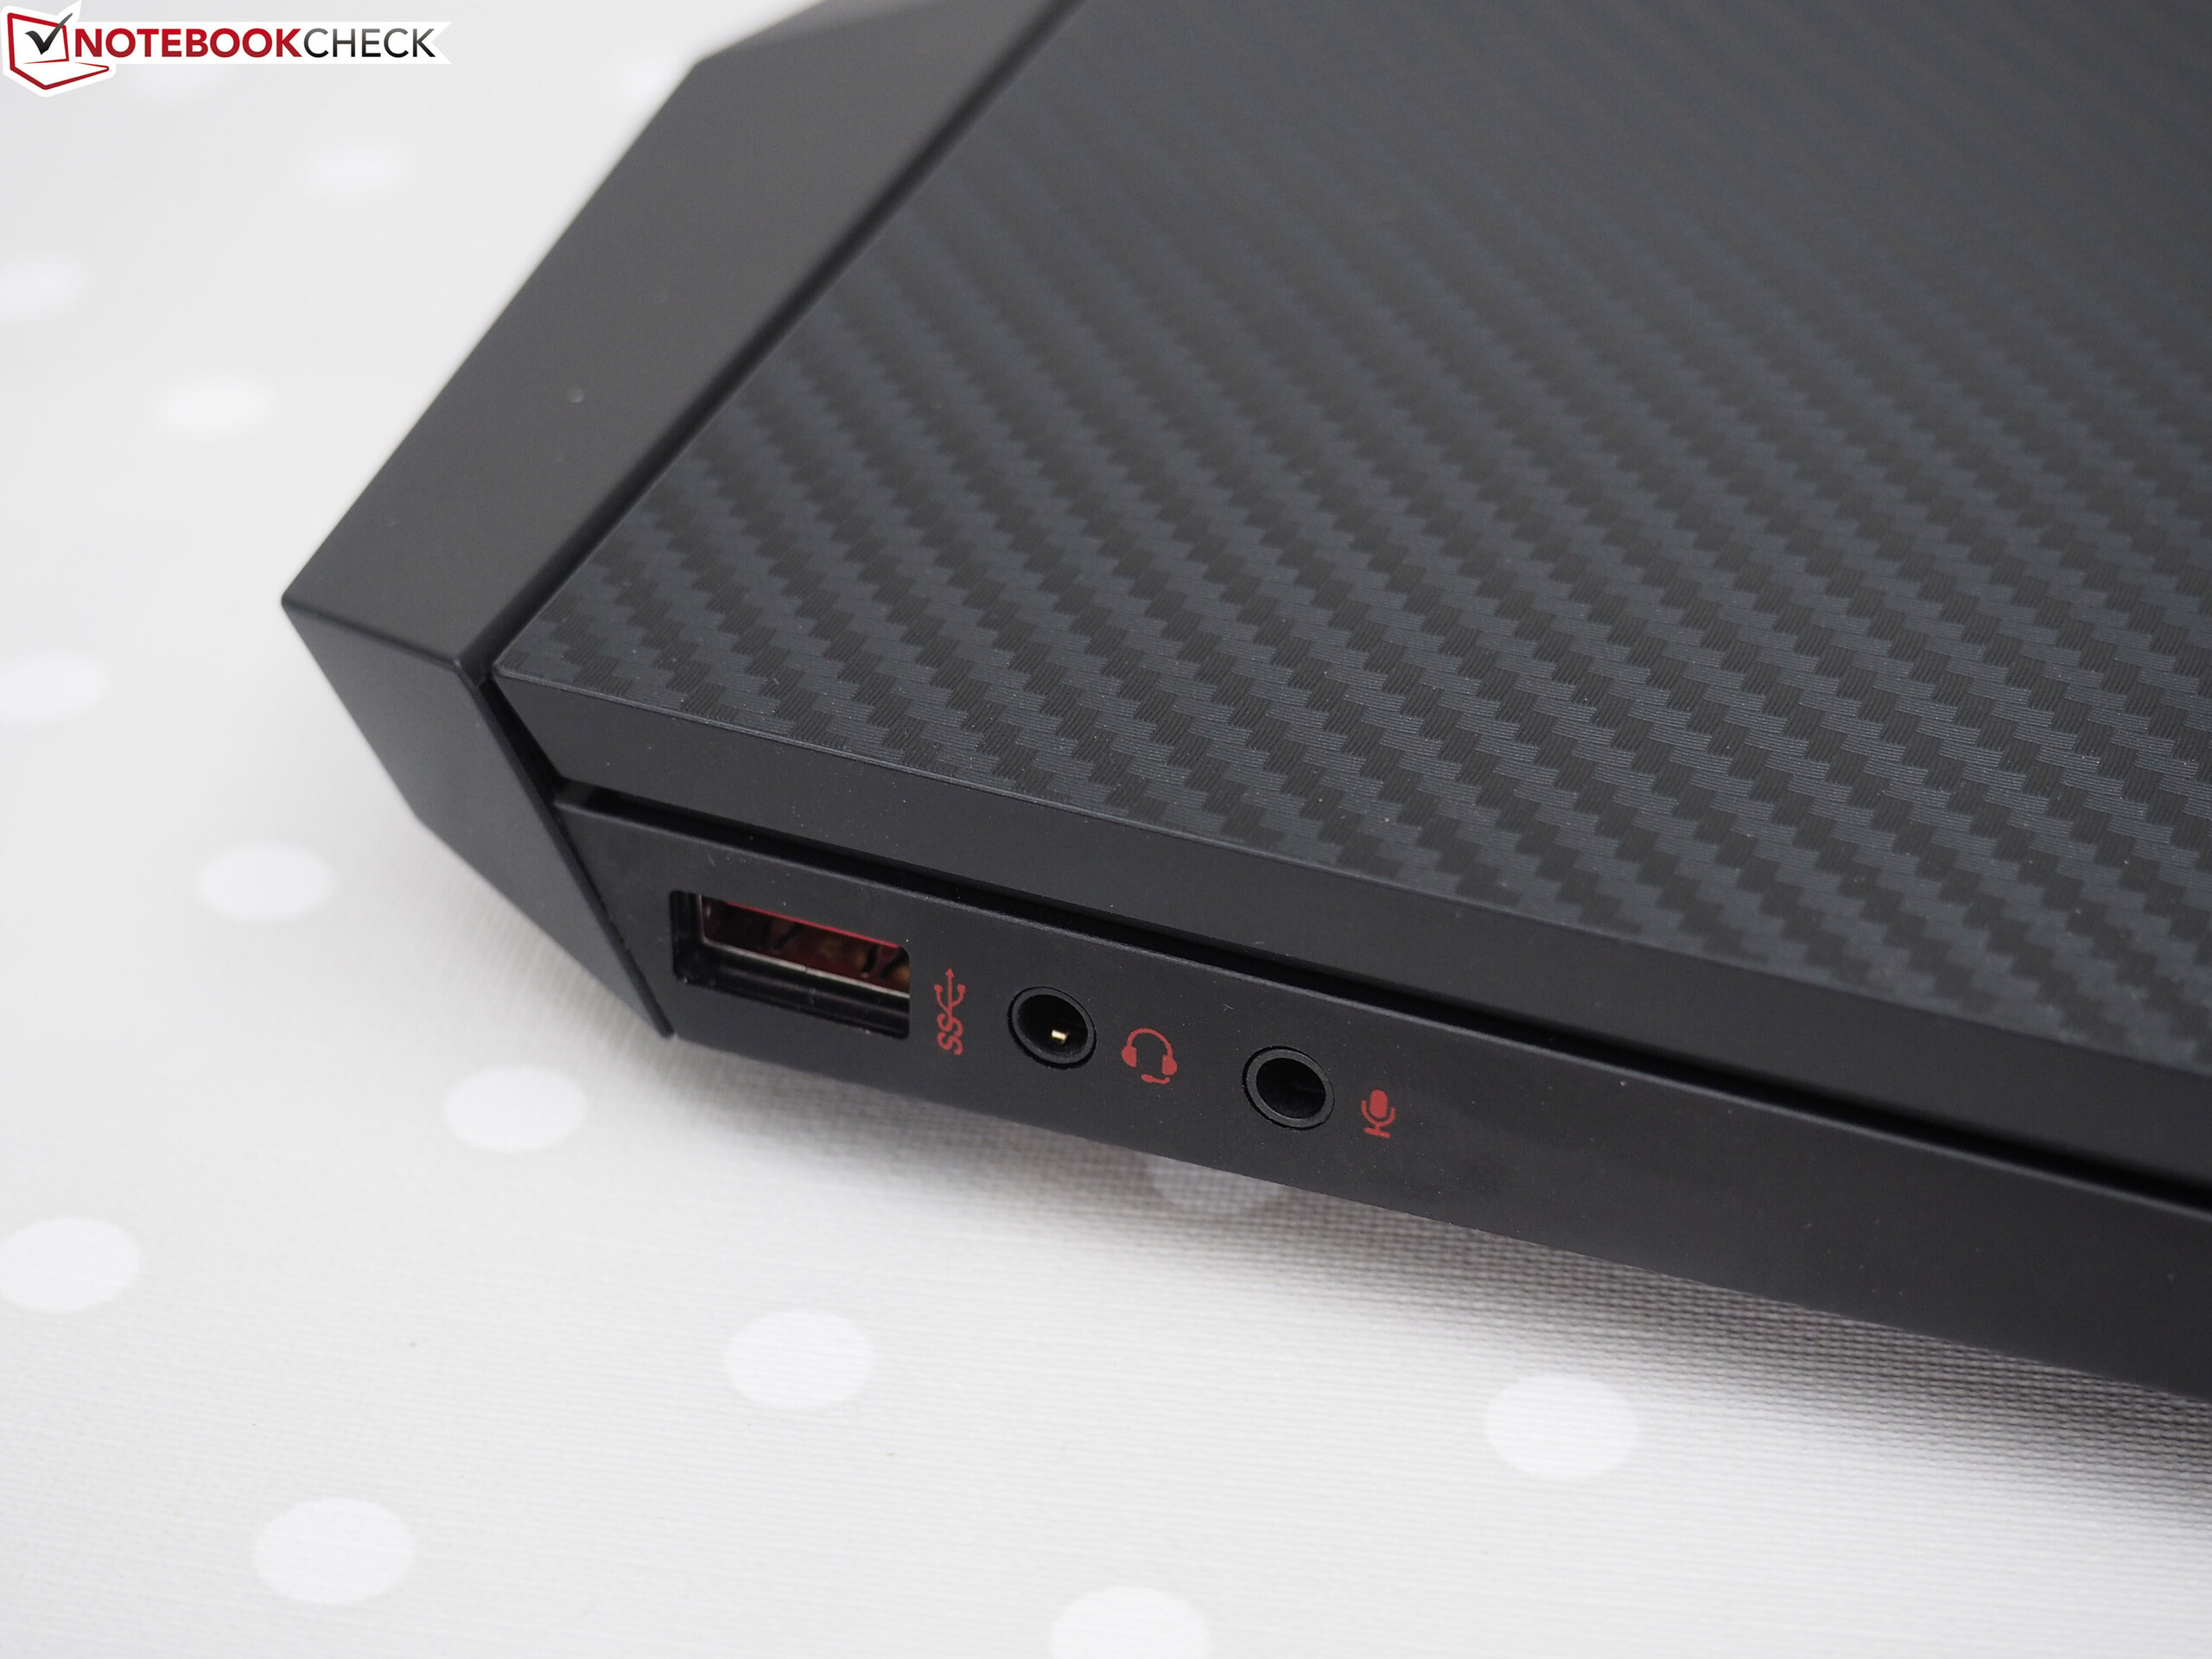
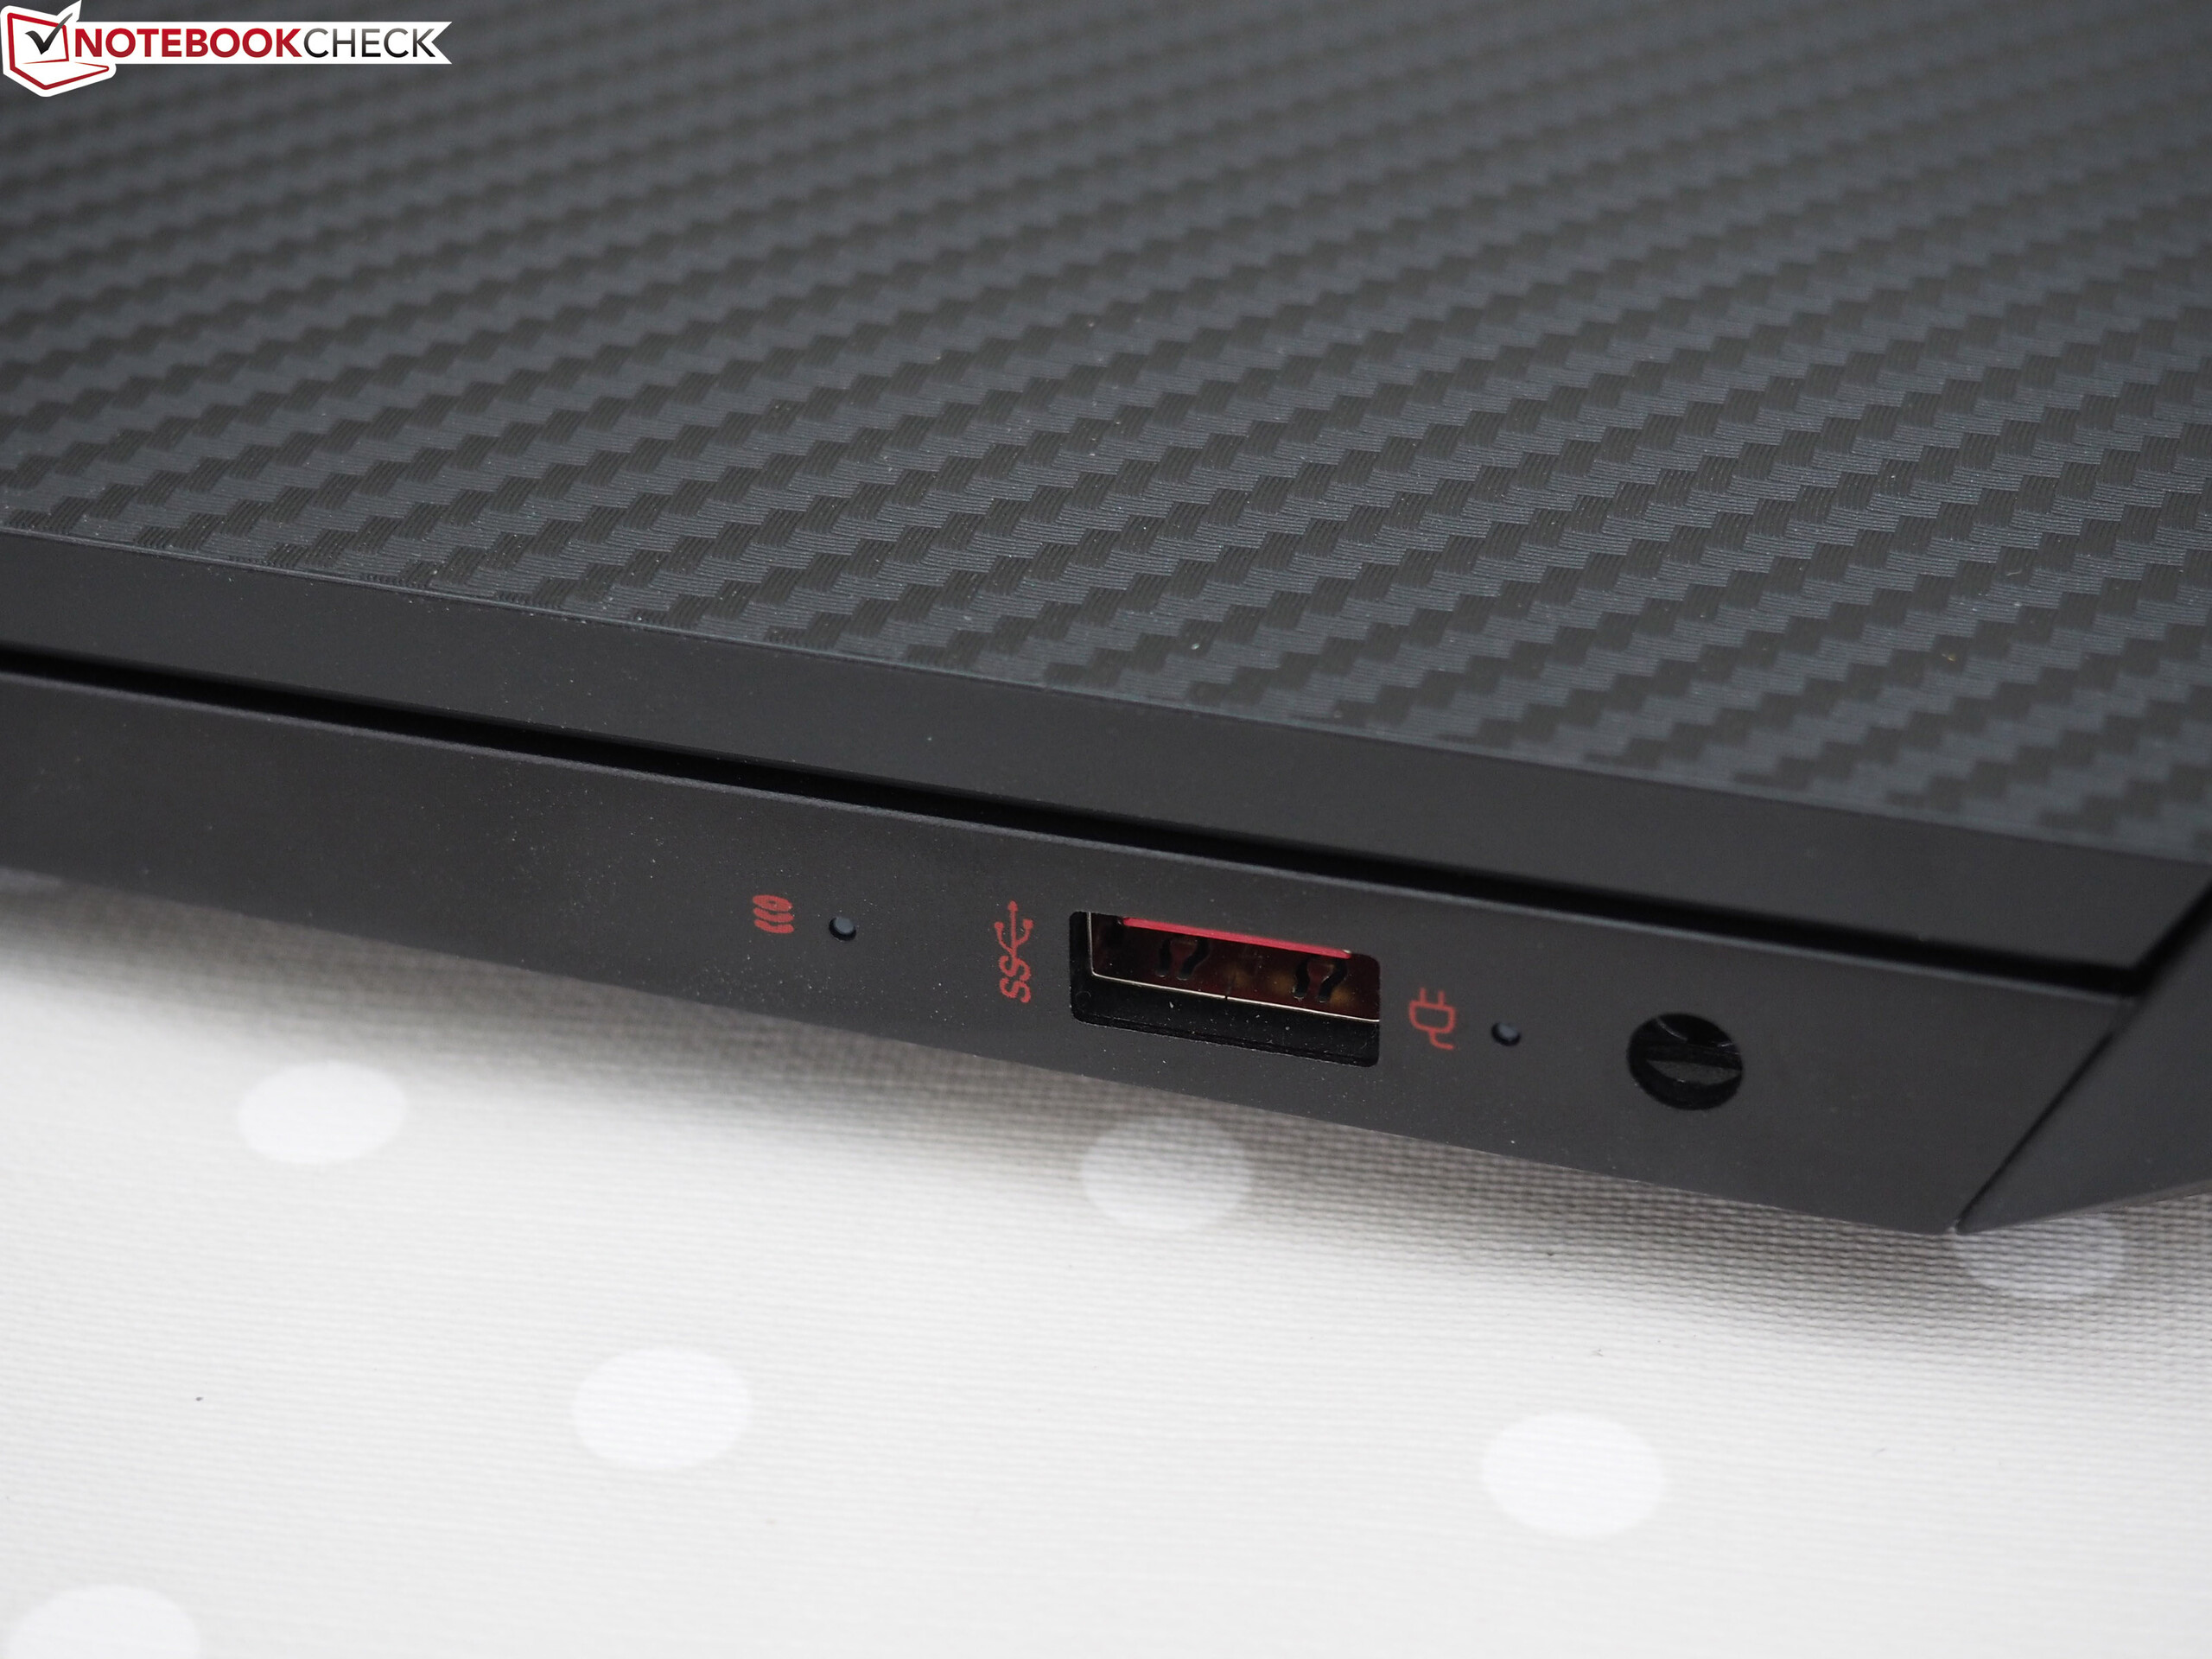
Given the similarities between today’s review unit and the recently reviewed Omen 15 laptop we are not going to cover case, connectivity, input devices, and speakers in this review. Those interested in these aspects can find further information in our extensive Omen 15-dc0001ng review.
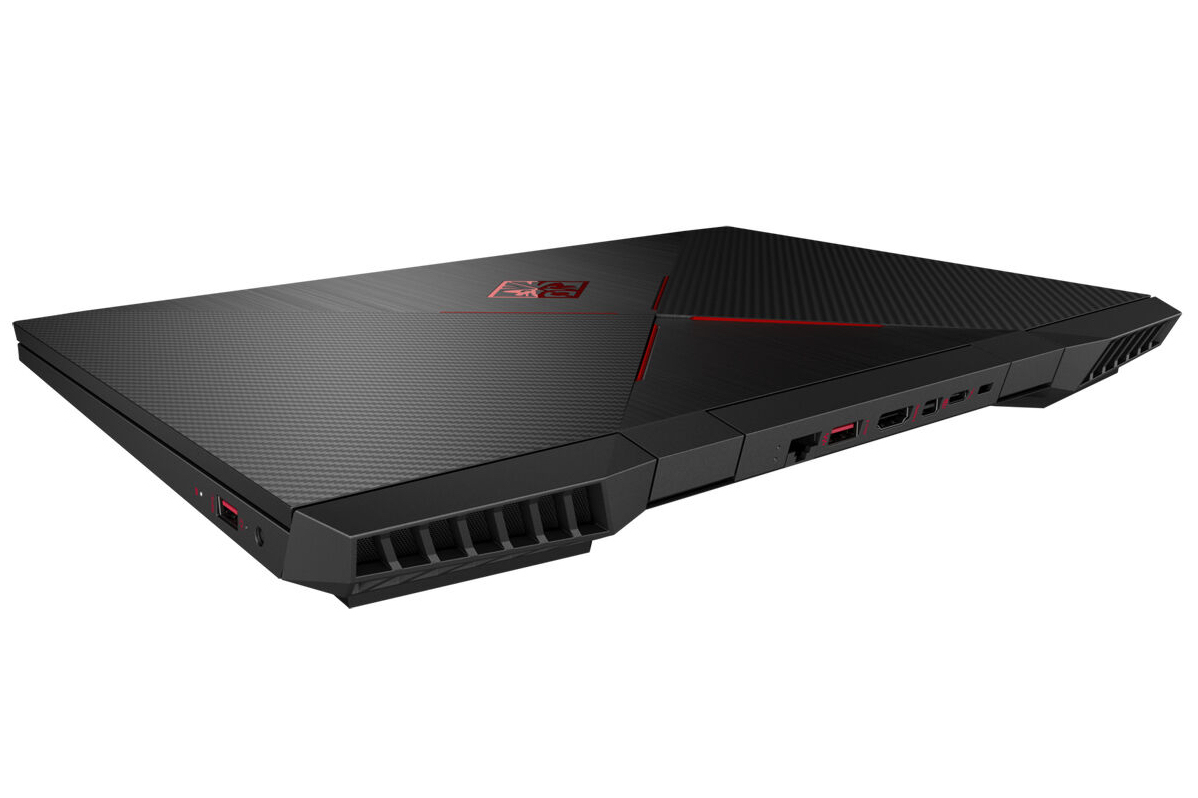


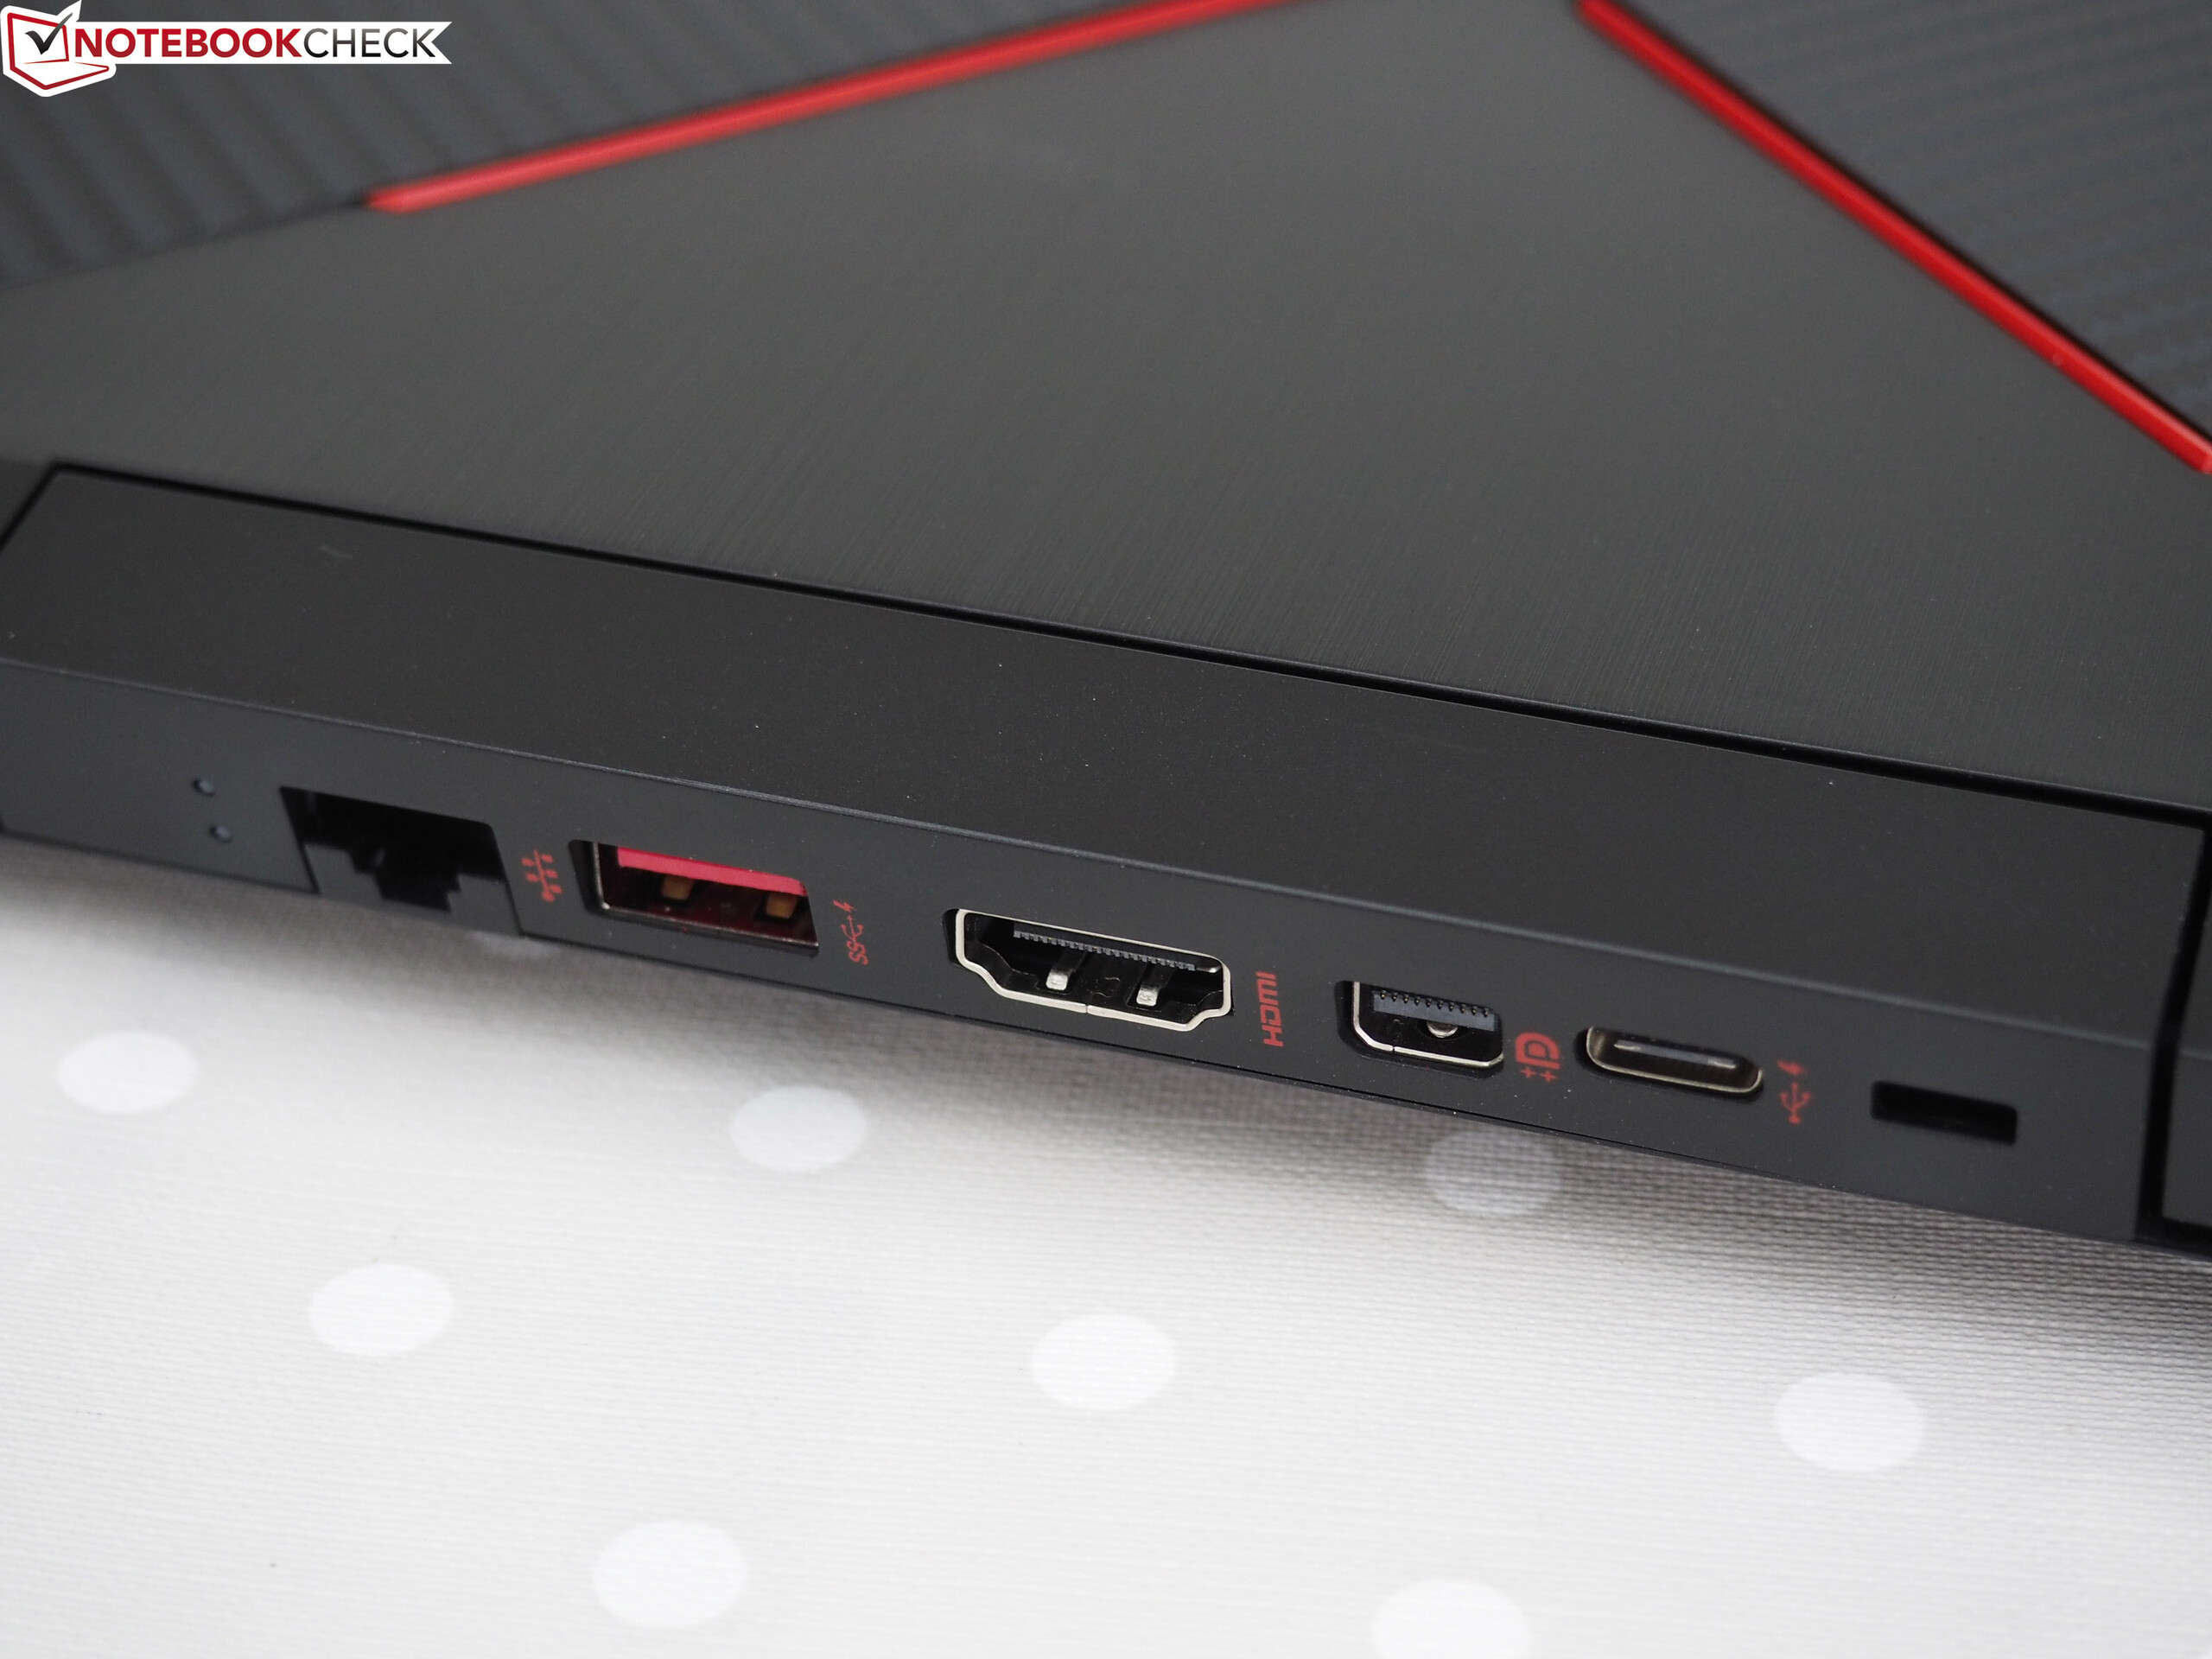
Connectivity Inconsistencies
Various retailers list our review model as G-Sync compatible, a claim that is further corroborated by HP’s maintenance manual according to which our particular SKU is supposed to support G-Sync on both internal and external displays. Imagine our surprise when we discovered that our review unit’s display did in fact not support G-Sync at all.
Another inconsistency surrounds the device’s Thunderbolt 3 support, which is listed on HP’s official spec sheet. However, we have to once again disagree. According to the icon next to the USB Type-C port it only supports USB 3.2 Gen 1 but not Thunderbolt 3. This information can also be found in the Omen’s user manual, according to which the USB Type-C supports charging devices such as smartphones with the notebook turned off and is supposed to carry a DisplayPort signal (which requires a separate not included dongle).

| SD Card Reader | |
| average JPG Copy Test (av. of 3 runs) | |
| Average of class Gaming (20.9 - 210, n=54, last 2 years) | |
| HP Omen 15-dc1020ng (Toshiba Exceria Pro SDXC 64 GB UHS-II) | |
| HP Omen 15-dc1303ng (Toshiba Exceria Pro SDXC 64 GB UHS-II) | |
| Dell G5 15 5590 (Toshiba Exceria Pro SDXC 64 GB UHS-II) | |
| maximum AS SSD Seq Read Test (1GB) | |
| Average of class Gaming (25.5 - 261, n=51, last 2 years) | |
| HP Omen 15-dc1020ng (Toshiba Exceria Pro SDXC 64 GB UHS-II) | |
| HP Omen 15-dc1303ng (Toshiba Exceria Pro SDXC 64 GB UHS-II) | |
| Dell G5 15 5590 (Toshiba Exceria Pro SDXC 64 GB UHS-II) | |
Display
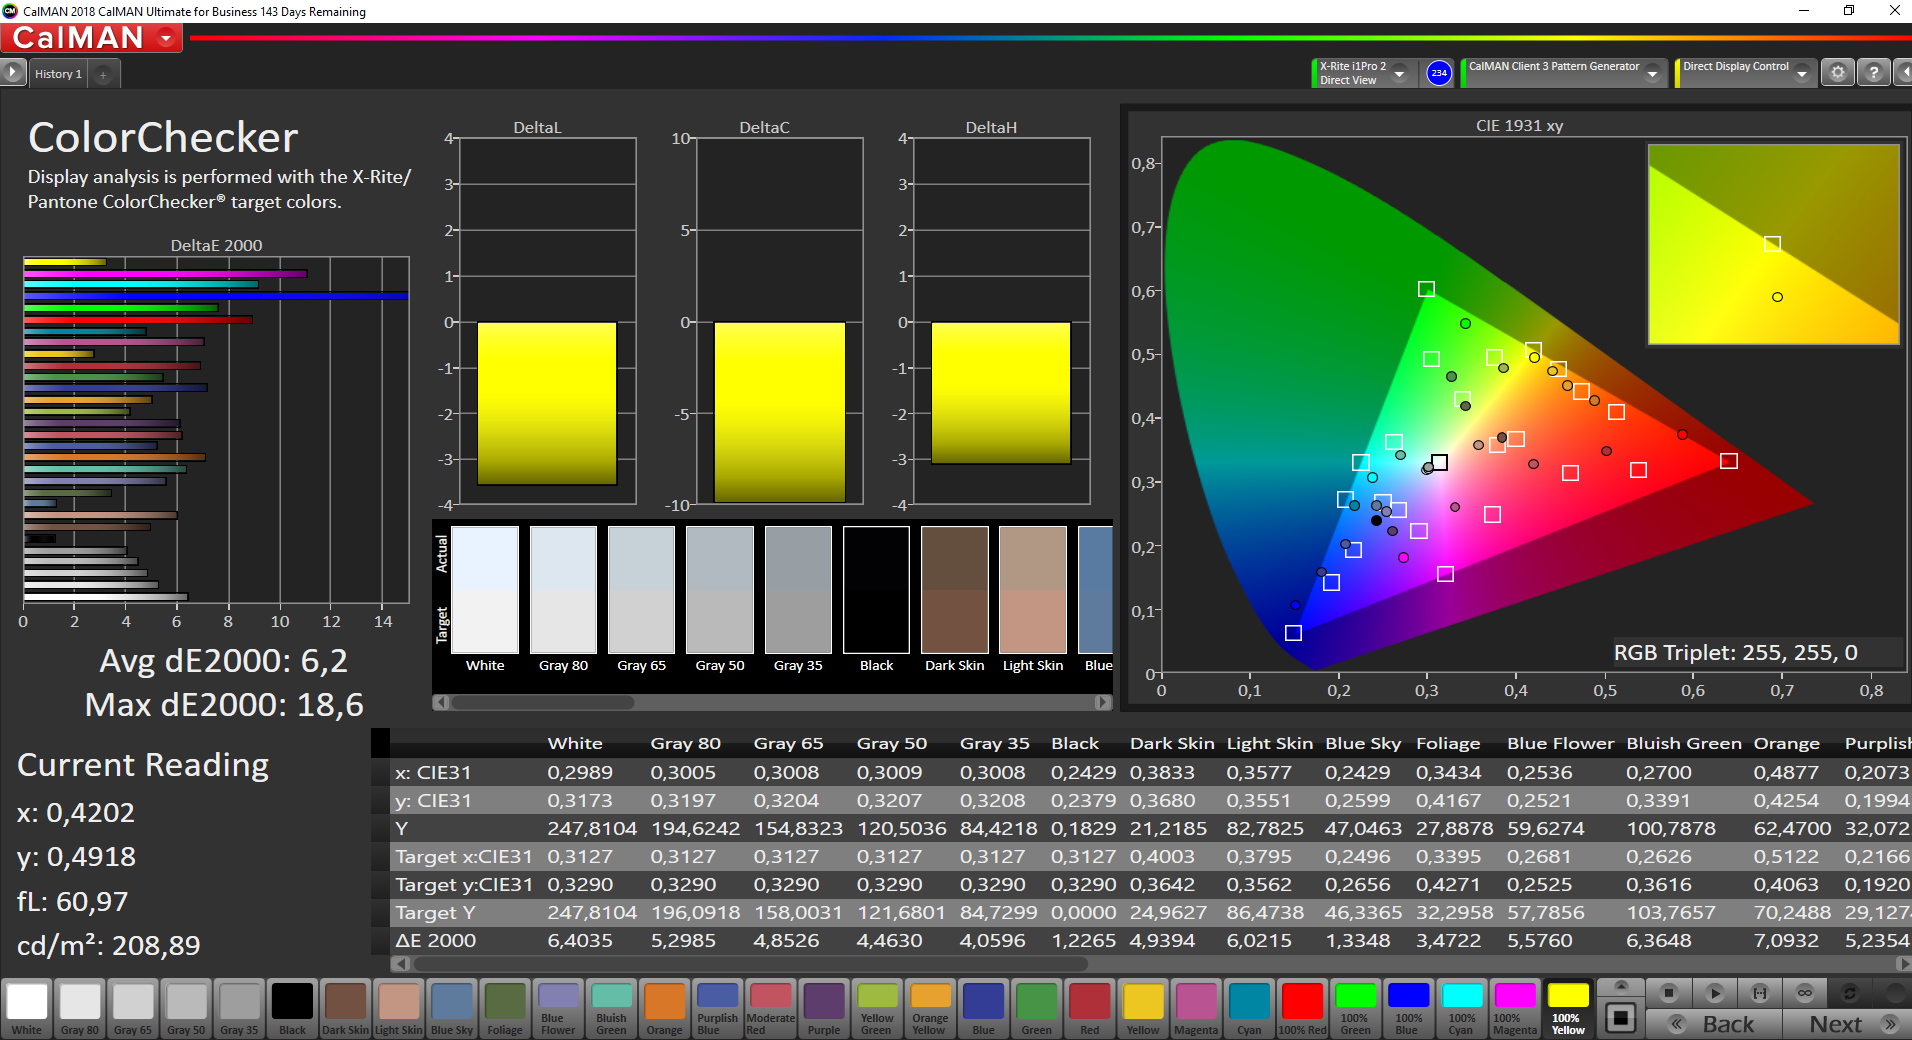
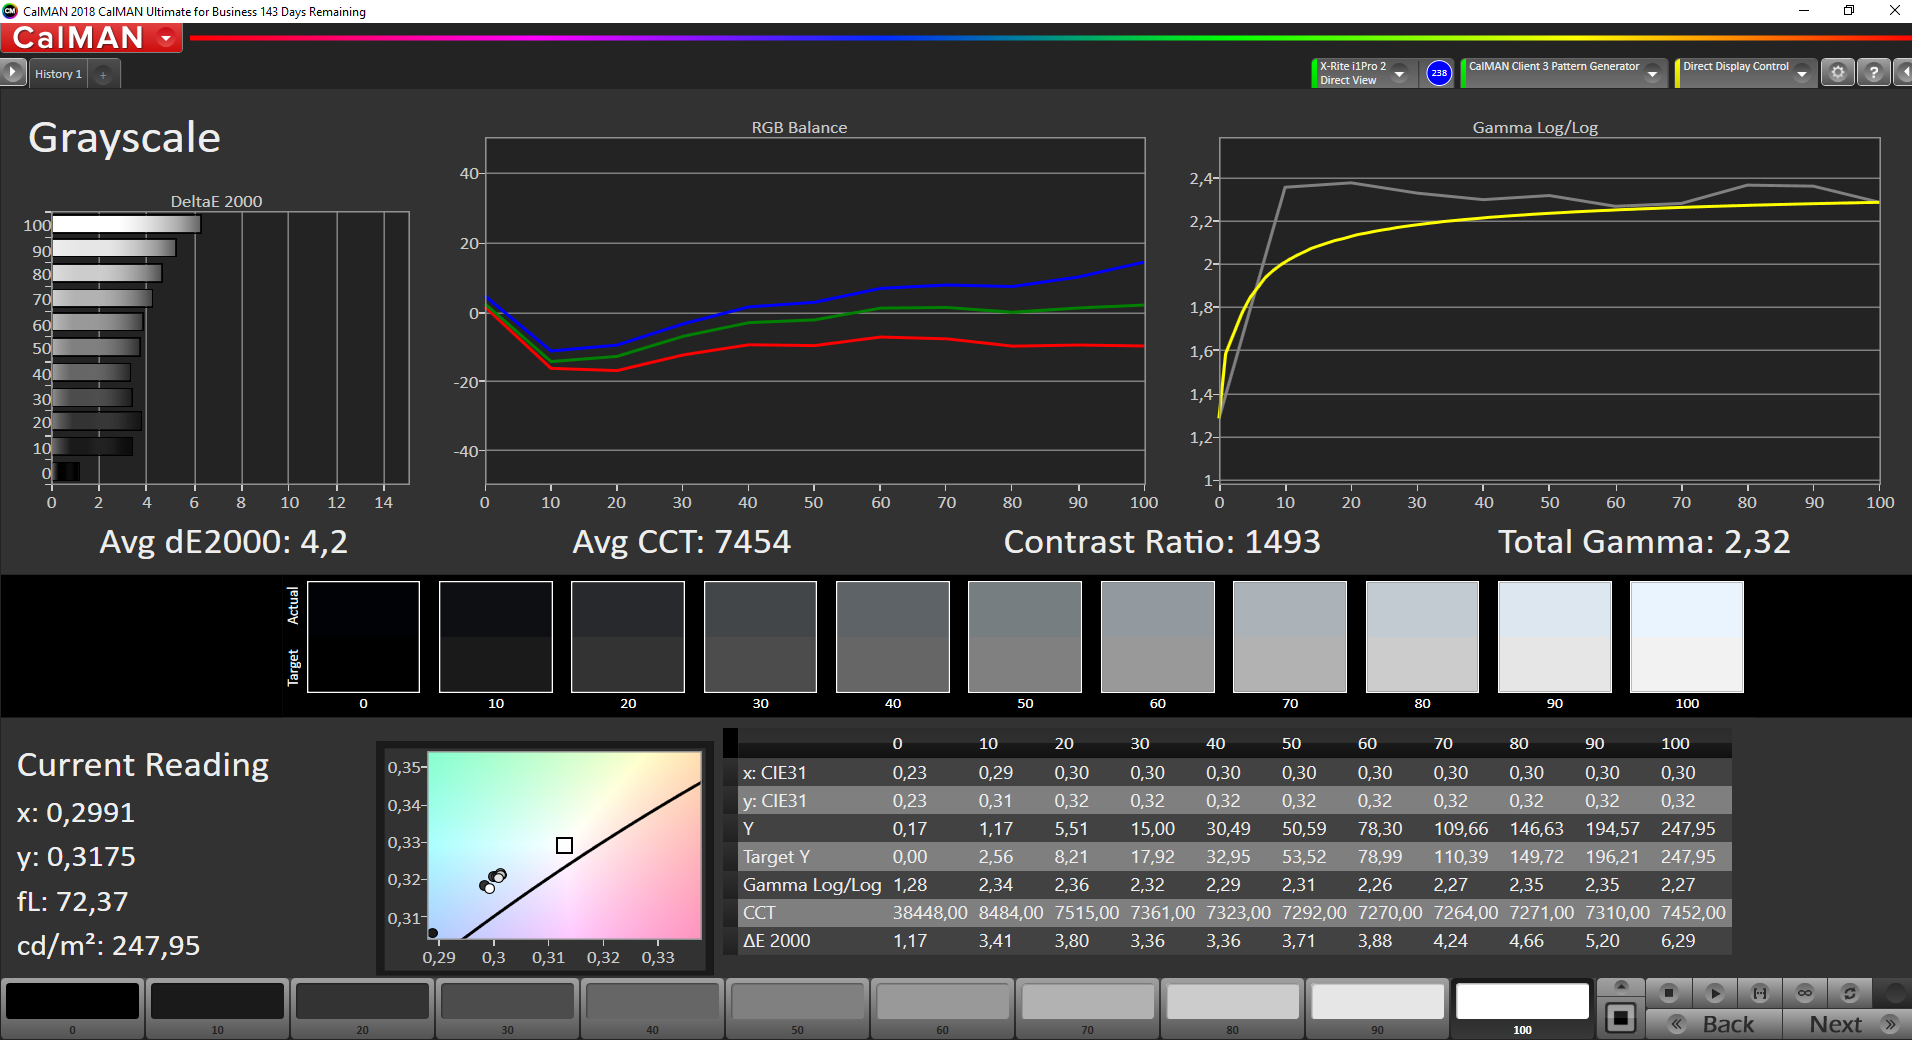
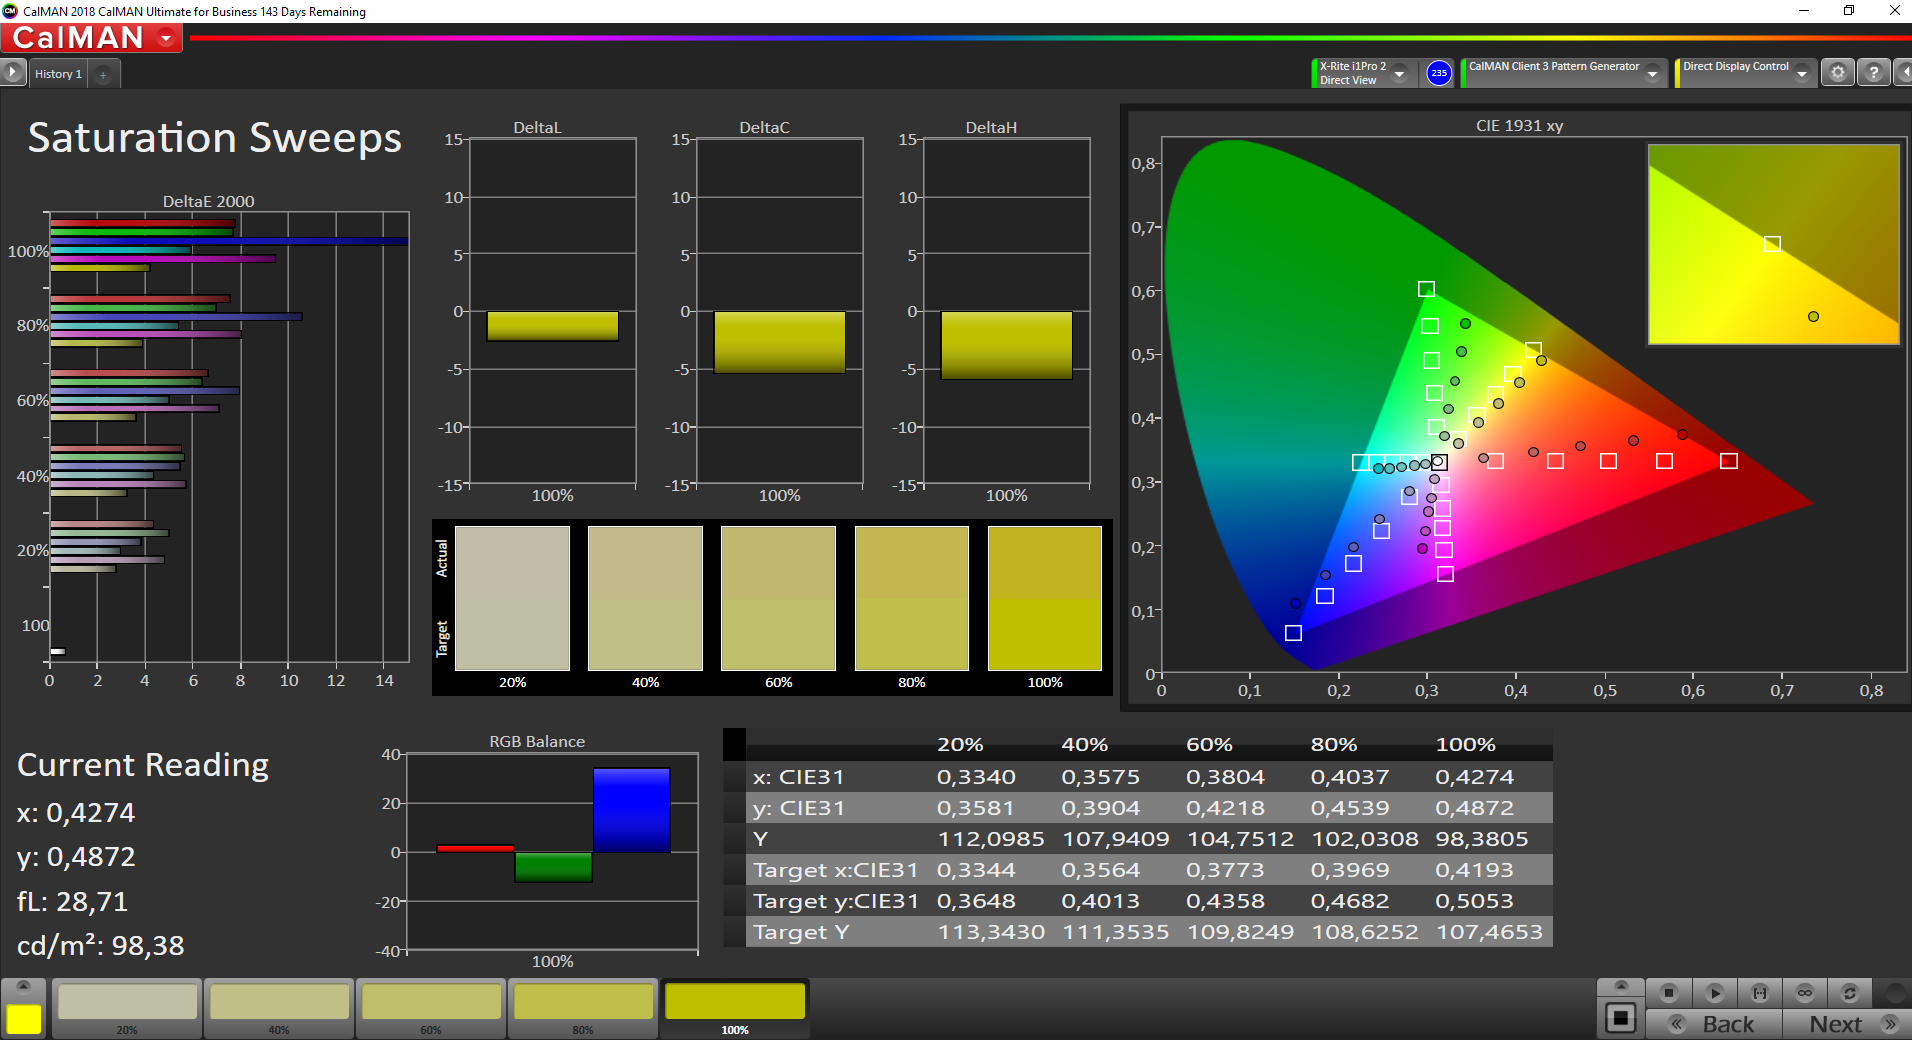
The Omen’s 15.6-inch display runs at a native resolution of 1920x1080. While its contrast ratio of 1,476:1 is quite decent, its maximum brightness of just 231.7 nits is anything but. In addition, the display was even dimmer on battery and topped out at no more than 216 nits. We expect a brightness of more than 300 nits. That said, not a single one of the devices in our test group managed to meet our expectations in this regard. At 76% brightness distribution was also very poor, and we would have expected much more.
While the high-end RTX 2070 Max-Q SKU featured a 144 Hz display our review unit was equipped with a 60 Hz panel. Accordingly, its response times were slower. On a positive note we would like to commend this display for its lack of PWM.


| |||||||||||||||||||||||||
Brightness Distribution: 76 %
Center on Battery: 216 cd/m²
Contrast: 1476:1 (Black: 0.17 cd/m²)
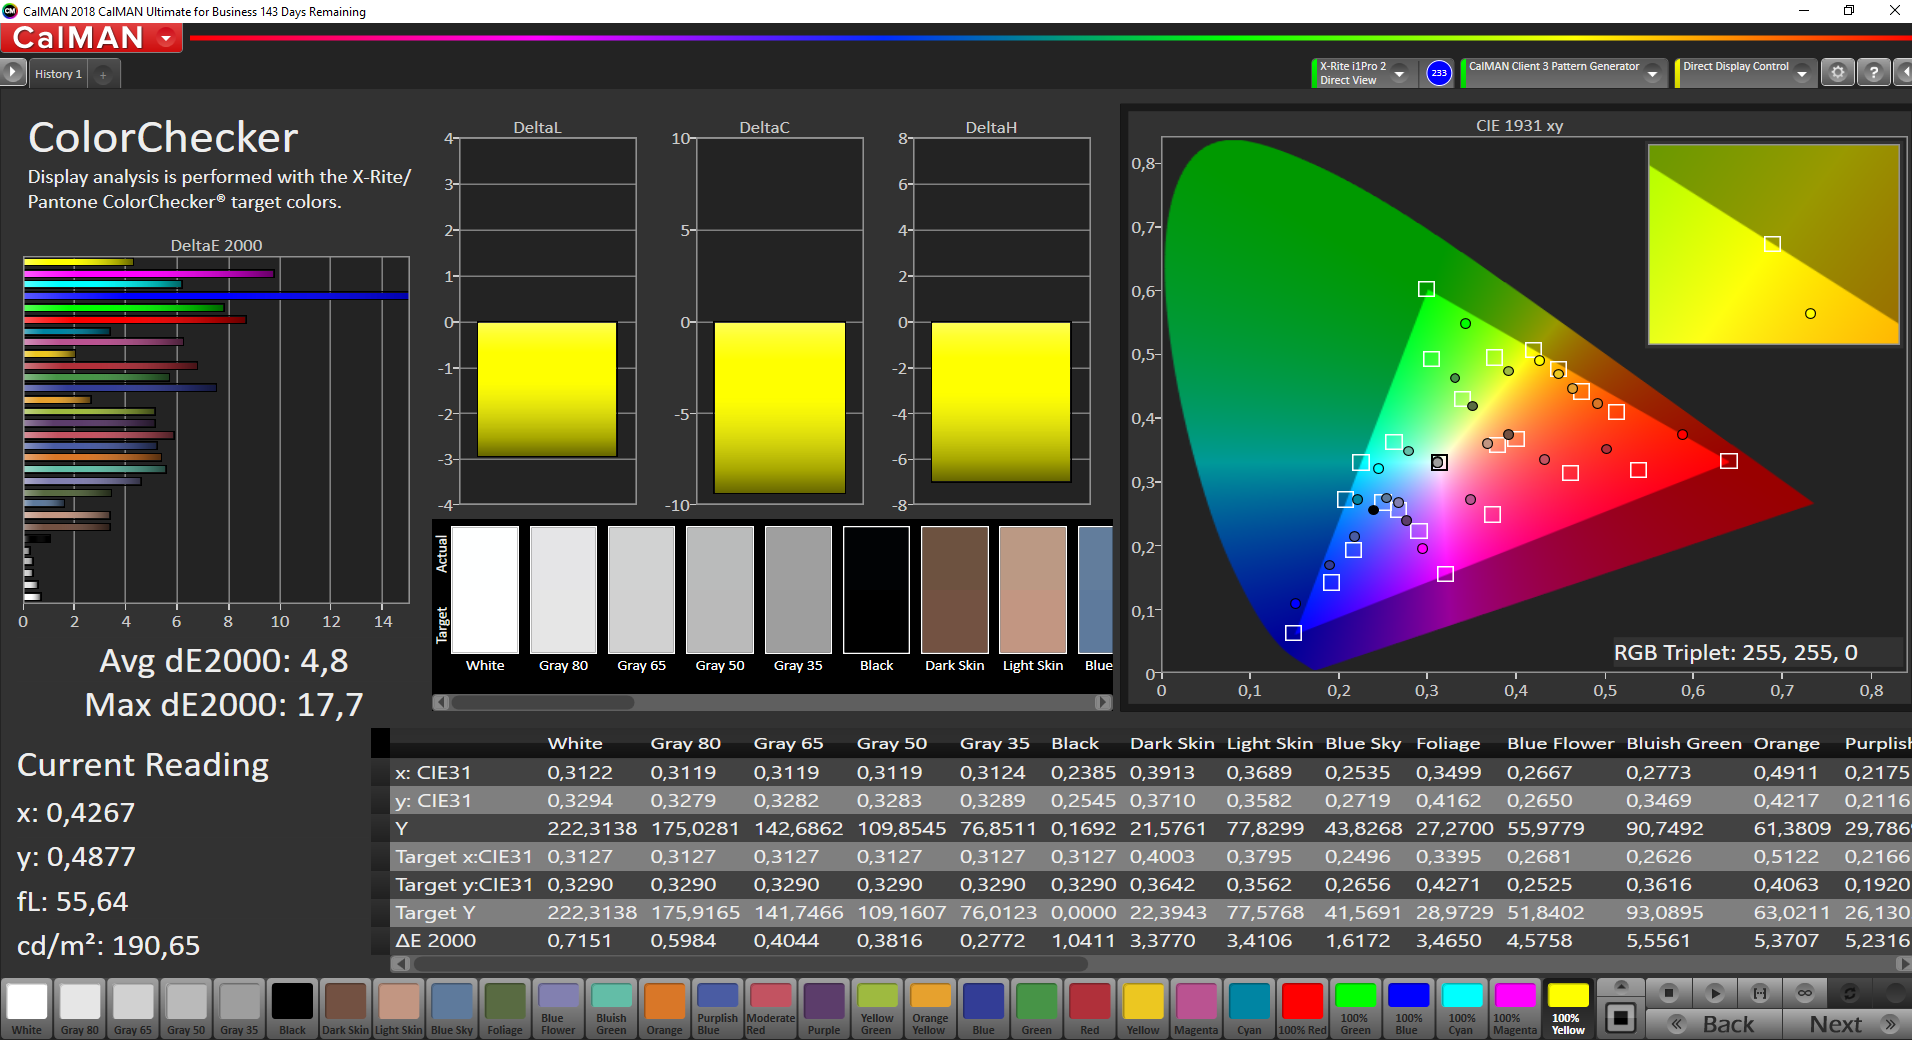
ΔE ColorChecker Calman: 6.2 | ∀{0.5-29.43 Ø4.71}
calibrated: 4.8
ΔE Greyscale Calman: 4.2 | ∀{0.09-98 Ø4.96}
57.4% sRGB (Argyll 1.6.3 3D)
36.5% AdobeRGB 1998 (Argyll 1.6.3 3D)
39.69% AdobeRGB 1998 (Argyll 3D)
57.6% sRGB (Argyll 3D)
38.37% Display P3 (Argyll 3D)
Gamma: 2.32
CCT: 7454 K
| HP Omen 15-dc1020ng IPS, 1920x1080, 15.6" | HP Omen 15-dc1303ng IPS, 1920x1080, 15.6" | Asus TUF FX505DT-EB73 IPS, 1920x1080, 15.6" | Asus ROG Zephyrus G15 GA502DU IPS, 1920x1080, 15.6" | Acer Aspire Nitro 5 AN515-54-53Z2 IPS, 1920x1080, 15.6" | Dell G5 15 5590 IPS, 1920x1080, 15.6" | Asus TUF FX505DY IPS, 1920x1080, 15.6" | |
|---|---|---|---|---|---|---|---|
| Display | 64% | 3% | 5% | -1% | 2% | 4% | |
| Display P3 Coverage (%) | 38.37 | 63.8 66% | 39.56 3% | 40.33 5% | 37.97 -1% | 39.26 2% | 40.04 4% |
| sRGB Coverage (%) | 57.6 | 93.4 62% | 59.5 3% | 60.6 5% | 57 -1% | 59.1 3% | 60.2 5% |
| AdobeRGB 1998 Coverage (%) | 39.69 | 65 64% | 40.91 3% | 41.69 5% | 39.23 -1% | 40.56 2% | 41.4 4% |
| Response Times | 64% | 16% | 10% | 2% | -7% | -8% | |
| Response Time Grey 50% / Grey 80% * (ms) | 40 ? | 14 ? 65% | 30.4 ? 24% | 34 ? 15% | 42 ? -5% | 45 ? -13% | 44.8 ? -12% |
| Response Time Black / White * (ms) | 29.6 ? | 11 ? 63% | 27.6 ? 7% | 28 ? 5% | 26.8 ? 9% | 30 ? -1% | 30.8 ? -4% |
| PWM Frequency (Hz) | 21280 ? | 20830 ? | |||||
| Screen | 21% | -8% | -5% | 7% | -12% | -0% | |
| Brightness middle (cd/m²) | 251 | 316 26% | 286.2 14% | 240.1 -4% | 238 -5% | 234 -7% | 211.5 -16% |
| Brightness (cd/m²) | 232 | 295 27% | 267 15% | 231 0% | 226 -3% | 219 -6% | 200 -14% |
| Brightness Distribution (%) | 76 | 84 11% | 84 11% | 85 12% | 83 9% | 82 8% | 82 8% |
| Black Level * (cd/m²) | 0.17 | 0.42 -147% | 0.33 -94% | 0.34 -100% | 0.27 -59% | 0.17 -0% | 0.23 -35% |
| Contrast (:1) | 1476 | 752 -49% | 867 -41% | 706 -52% | 881 -40% | 1376 -7% | 920 -38% |
| Colorchecker dE 2000 * | 6.2 | 2.7 56% | 5.45 12% | 4.2 32% | 4.11 34% | 8.6 -39% | 3.92 37% |
| Colorchecker dE 2000 max. * | 18.6 | 5.65 70% | 18.08 3% | 17.8 4% | 6.89 63% | 17.49 6% | 17.63 5% |
| Colorchecker dE 2000 calibrated * | 4.8 | 1.58 67% | 4.47 7% | 4.09 15% | 3.76 22% | 4.06 15% | 4.16 13% |
| Greyscale dE 2000 * | 4.2 | 2.35 44% | 5.3 -26% | 2.8 33% | 1.78 58% | 8.55 -104% | 3.1 26% |
| Gamma | 2.32 95% | 2.41 91% | 2.1 105% | 2.2 100% | 2.41 91% | 3.02 73% | 2.23 99% |
| CCT | 7454 87% | 6904 94% | 7679 85% | 6925 94% | 6311 103% | 7802 83% | 6578 99% |
| Color Space (Percent of AdobeRGB 1998) (%) | 36.5 | 60 64% | 37.6 3% | 38.4 5% | 36 -1% | 37 1% | 38.1 4% |
| Color Space (Percent of sRGB) (%) | 57.4 | 93 62% | 59.1 3% | 60.4 5% | 57 -1% | 59 3% | 60 5% |
| Total Average (Program / Settings) | 50% /
34% | 4% /
-3% | 3% /
-1% | 3% /
5% | -6% /
-9% | -1% /
-1% |
* ... smaller is better
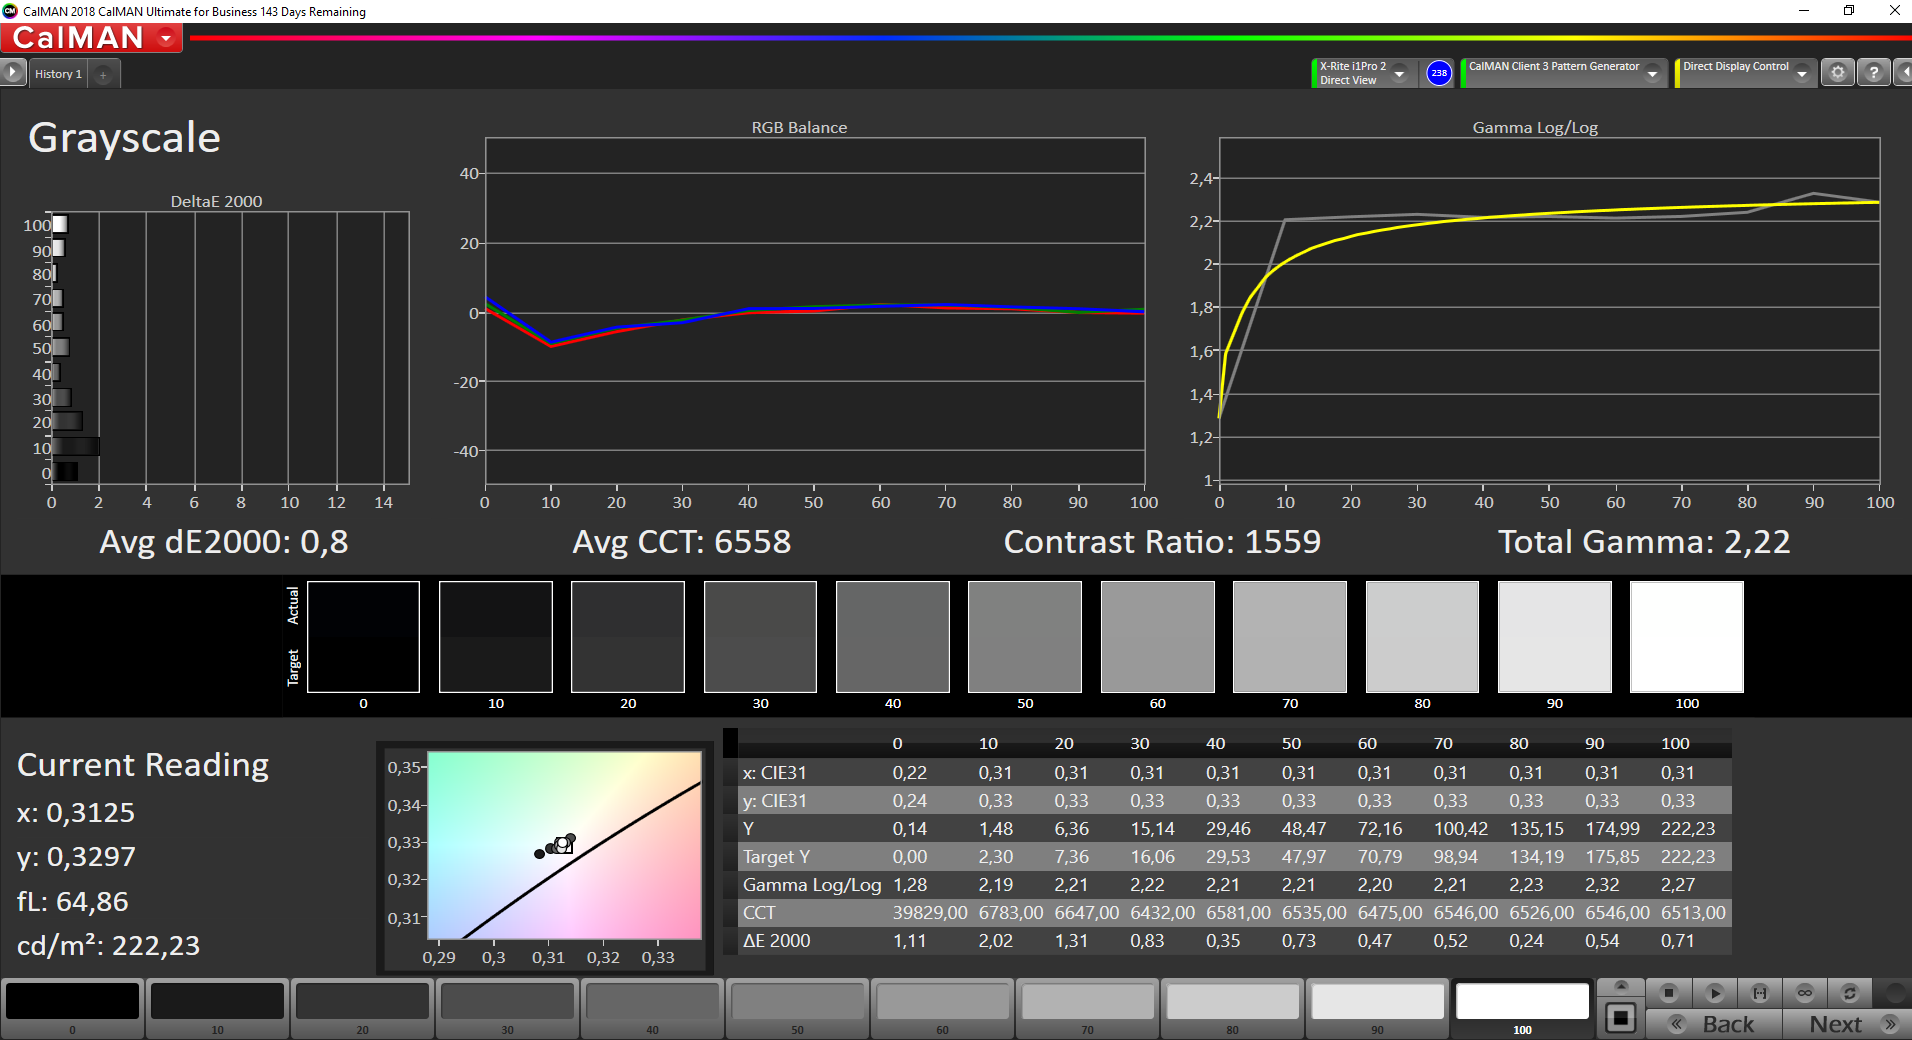
Out of the box we detected a DeltaE 2000 color deviation of 6.2. Ideally, you want this to be less than 3. The display also suffered from a very minor blue tint. We were able to improve upon both characteristics through calibration, and not only managed to lower DeltaE to 4.8 and all but eliminate the blue tint, but also improve upon grayscale balance. As it only managed to cover 36.5 and 57.4% of AdobeRGB and sRGB, respectively, neither of these is fully covered by this display.
As always, the resulting ICC profile can be found for download in the box above. Make sure that your device is equipped with the exact same panel as ours (manufacturer and model number) as OEMs are known to source their displays from various manufacturers even within a single series. Otherwise, you might end up decreasing instead of improving color accuracy.
Display Response Times
| ↔ Response Time Black to White | ||
|---|---|---|
| 29.6 ms ... rise ↗ and fall ↘ combined | ↗ 17.2 ms rise | 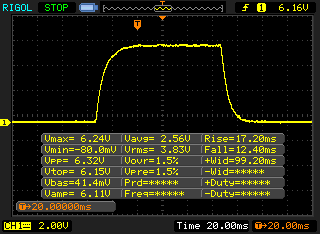 |
| ↘ 12.4 ms fall | ||
| The screen shows relatively slow response rates in our tests and may be too slow for gamers. In comparison, all tested devices range from 0.1 (minimum) to 240 (maximum) ms. » 79 % of all devices are better. This means that the measured response time is worse than the average of all tested devices (19.8 ms). | ||
| ↔ Response Time 50% Grey to 80% Grey | ||
| 40 ms ... rise ↗ and fall ↘ combined | ↗ 21.2 ms rise | 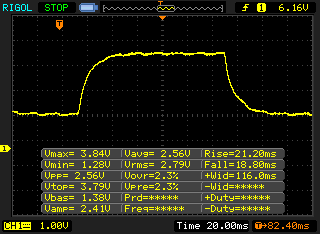 |
| ↘ 18.8 ms fall | ||
| The screen shows slow response rates in our tests and will be unsatisfactory for gamers. In comparison, all tested devices range from 0.165 (minimum) to 636 (maximum) ms. » 61 % of all devices are better. This means that the measured response time is worse than the average of all tested devices (31 ms). | ||
Screen Flickering / PWM (Pulse-Width Modulation)
| Screen flickering / PWM not detected | 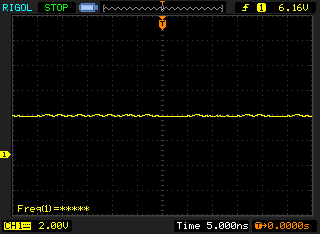 | ||
In comparison: 52 % of all tested devices do not use PWM to dim the display. If PWM was detected, an average of 7747 (minimum: 5 - maximum: 343500) Hz was measured. | |||
The panel is based on IPS technology and thus offers viewing angles wide enough to render the display usable and readable from all angles and positions. Due to its low maximum brightness the display was practically unusable outdoors.

Performance
HP’s Omen 15 is a 15.6-inch gaming notebook capable of running all current games smoothly on its internal display. Our particular review unit is the series’ entry-level SKU and starts at around $1,000. Other SKUs are also available.


Test Conditions
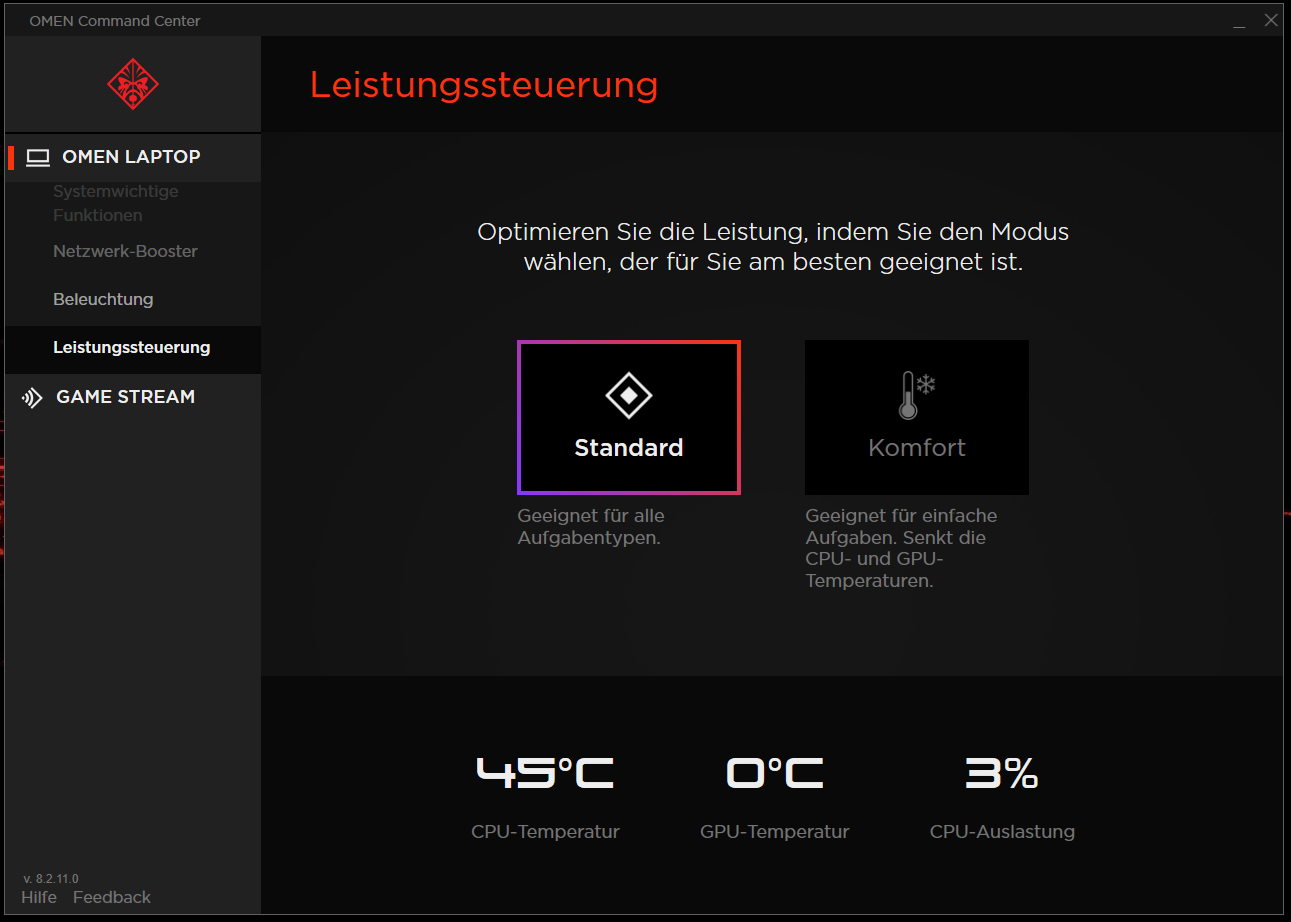
The Omen 15 comes with a software named “Omen Command Center” preloaded ex factory. In addition to monitoring the system and adjusting the keyboard backlight, this application also contains tuning and system optimization features. Two profiles are available, “Standard” and “Comfort”, and we ran all of our tests and benchmarks in “Standard”. According to the documentation the “Comfort” profile is supposed to decrease CPU and GPU core temperatures. We were, however, unable to detect any differences in performance between the two profiles on our particular review model. Keep in mind that the experience may differ on other SKUs.

Processor
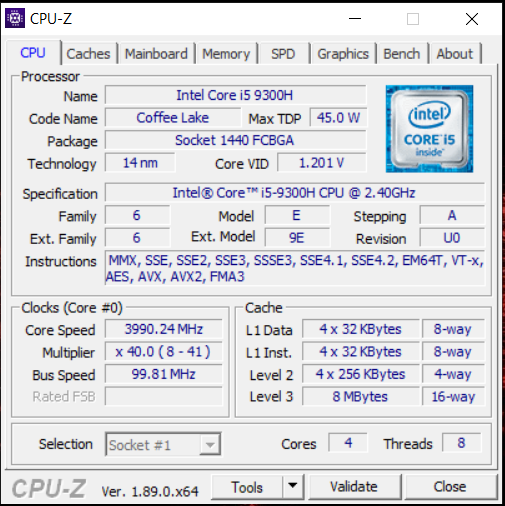
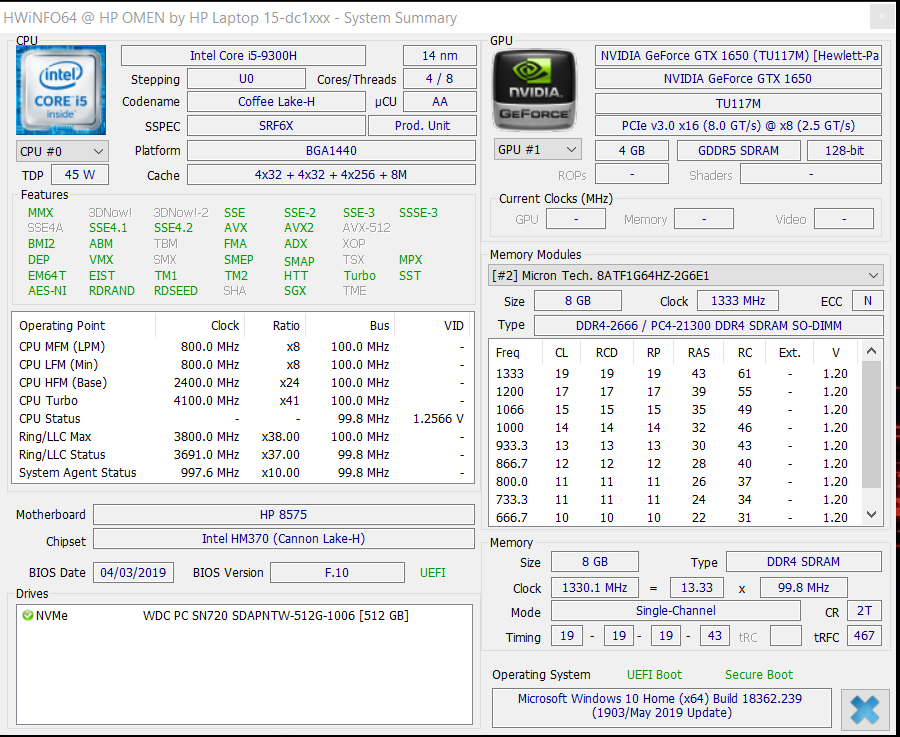
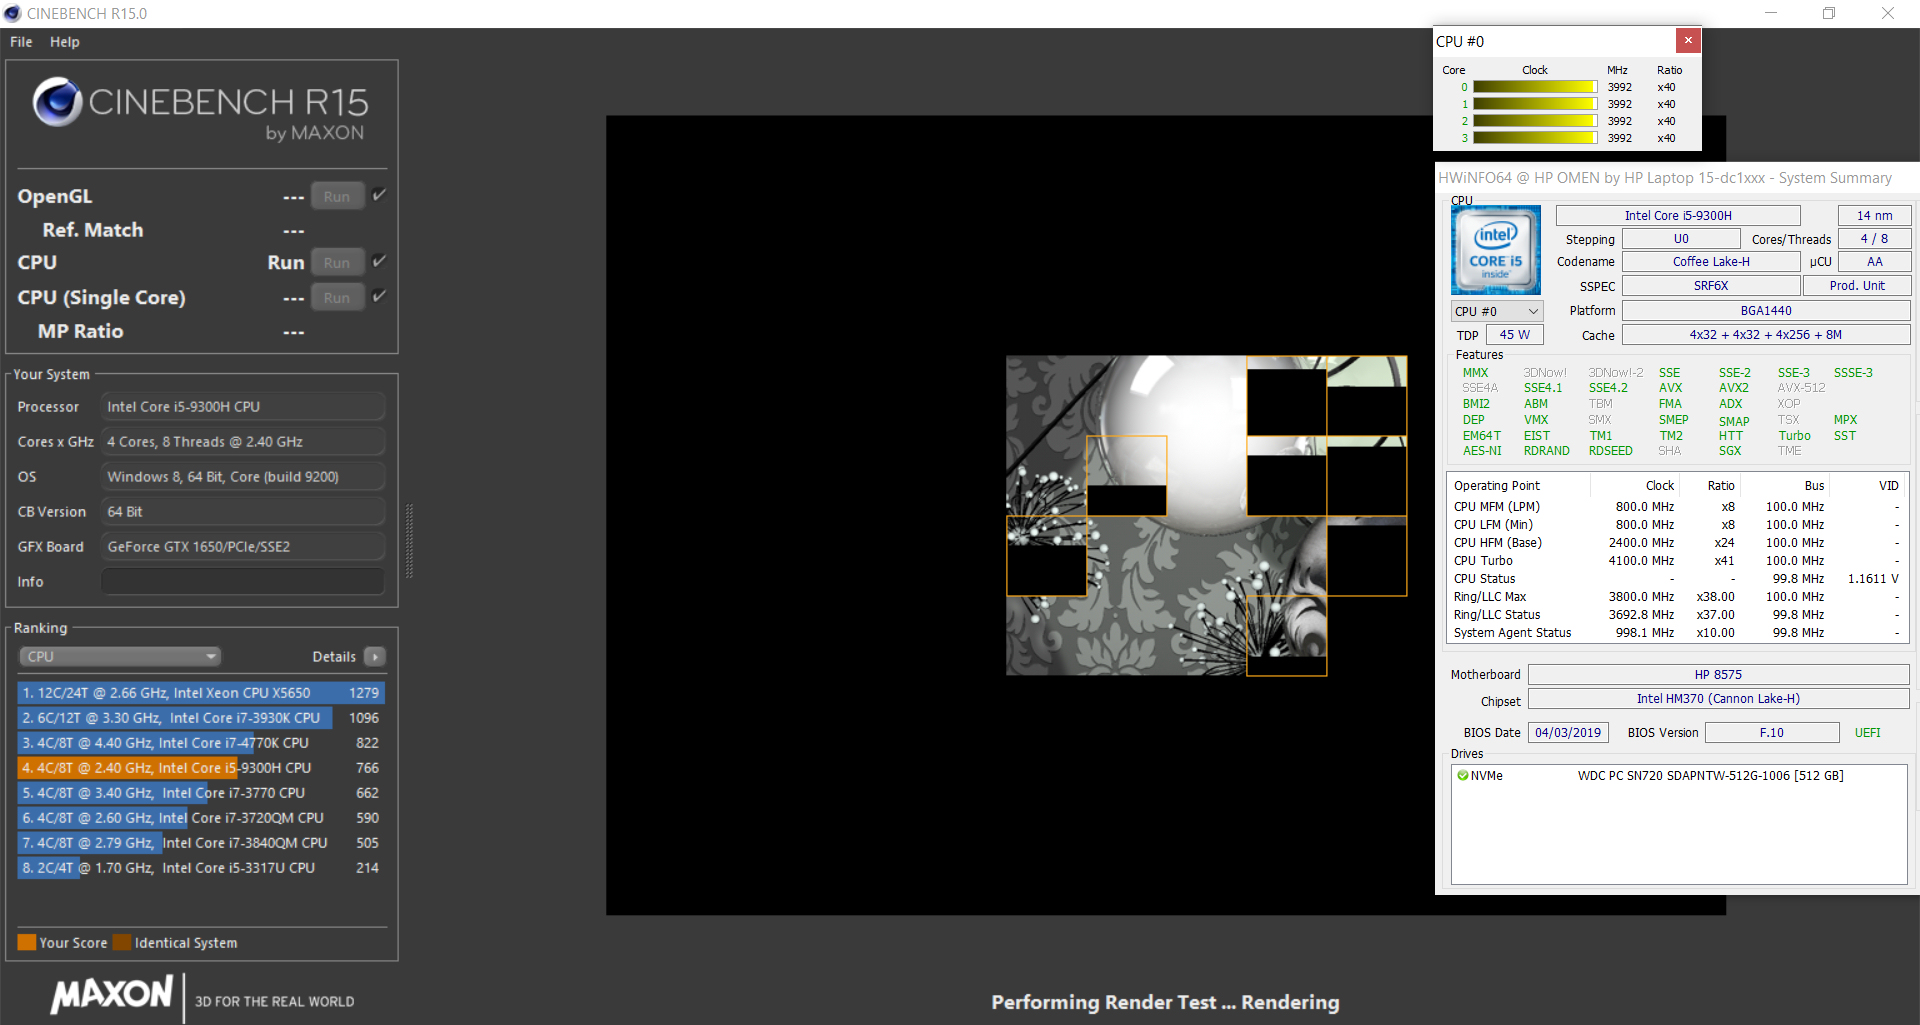
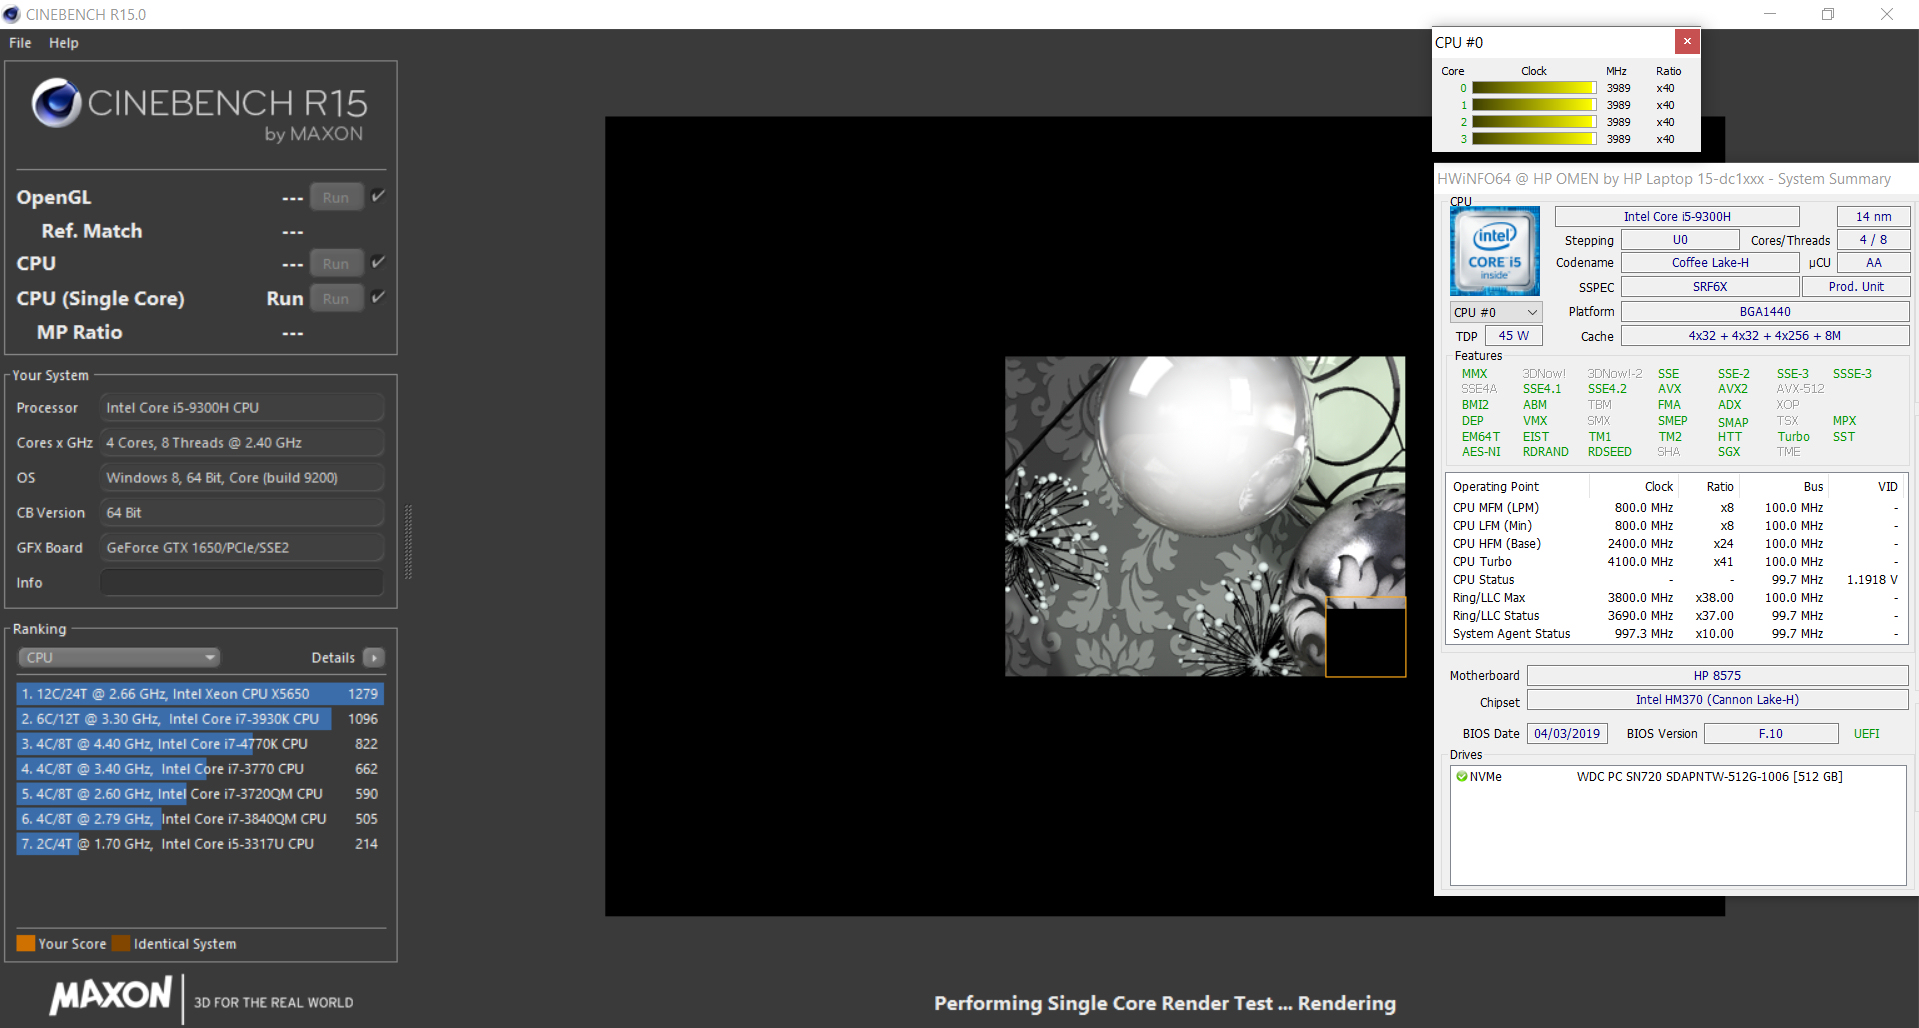
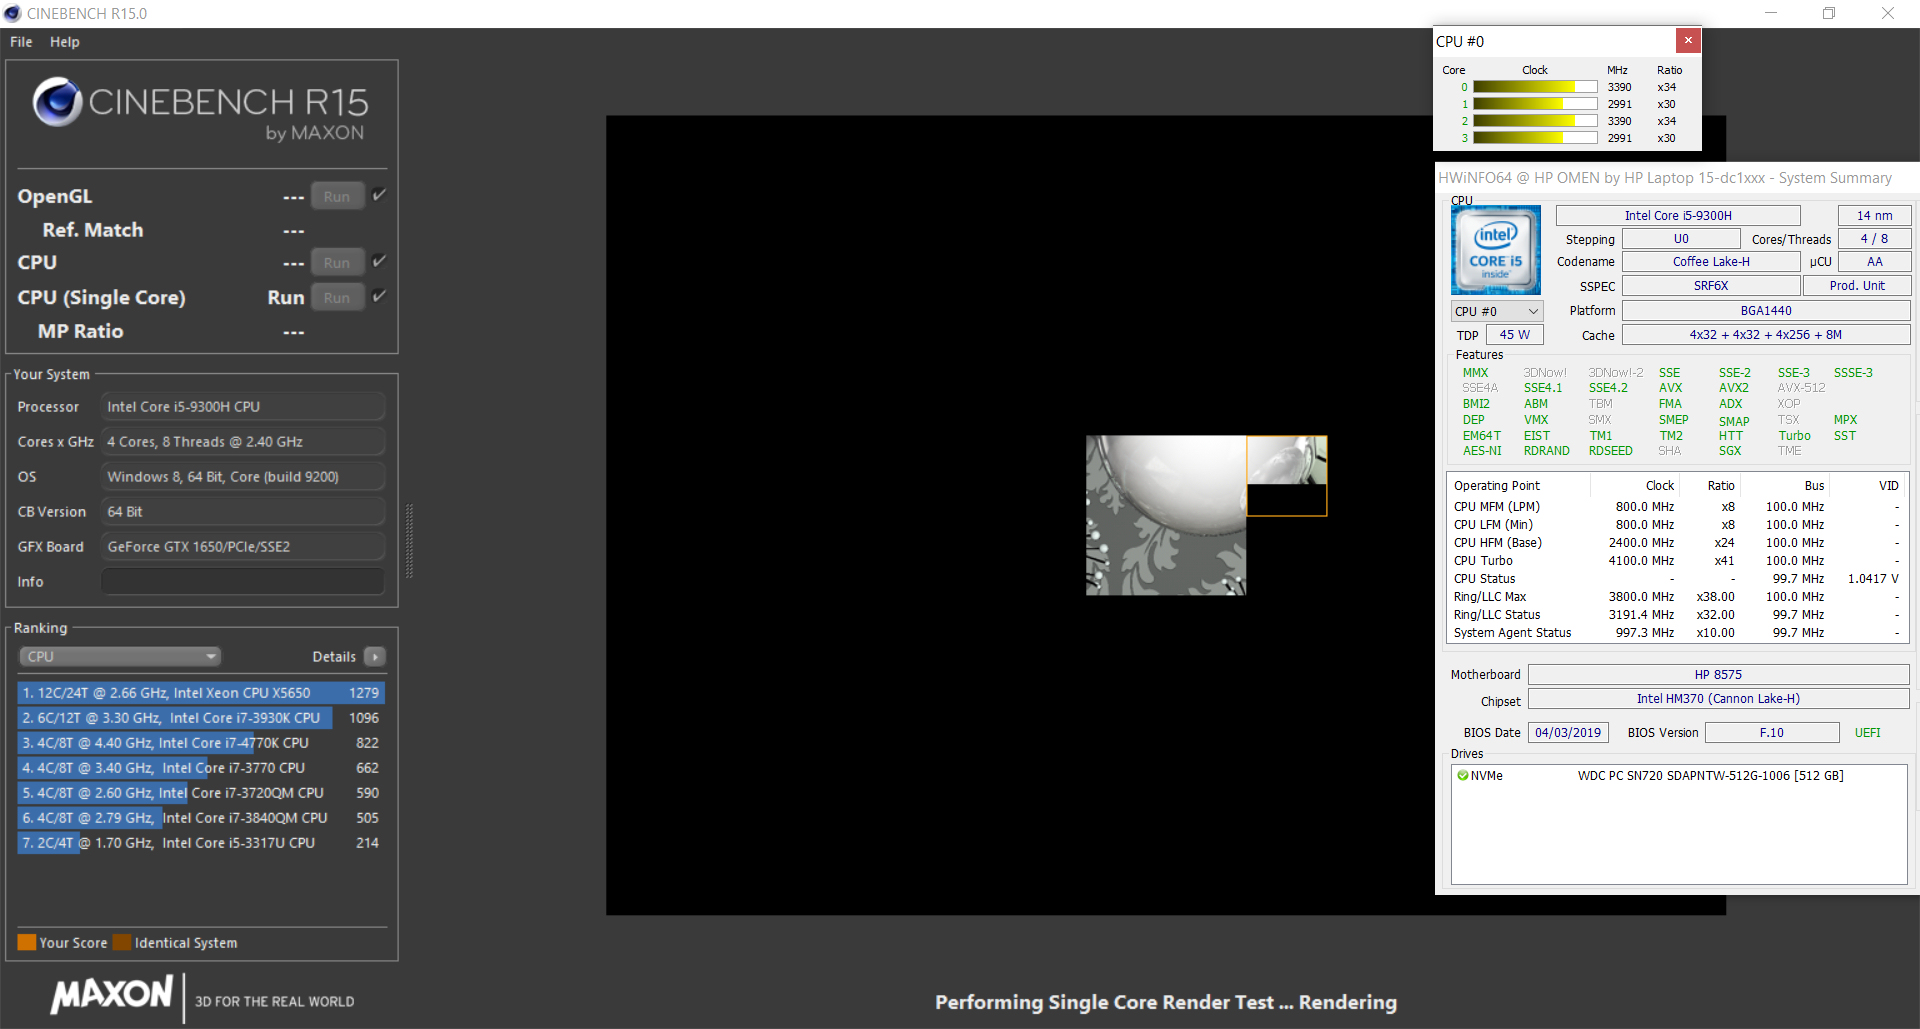
Given its entry-level designation, our review united featured a quad-core i5 instead of a hexa-core Core i7 CPU. The Core i5-9300H is based on Intel’s Coffee Lake architecture, runs at a base clock speed of 2.4 GHz, and is capable of turbo-boosting up to 4 GHz on all four cores simultaneously or 4.1 GHz on a single core.
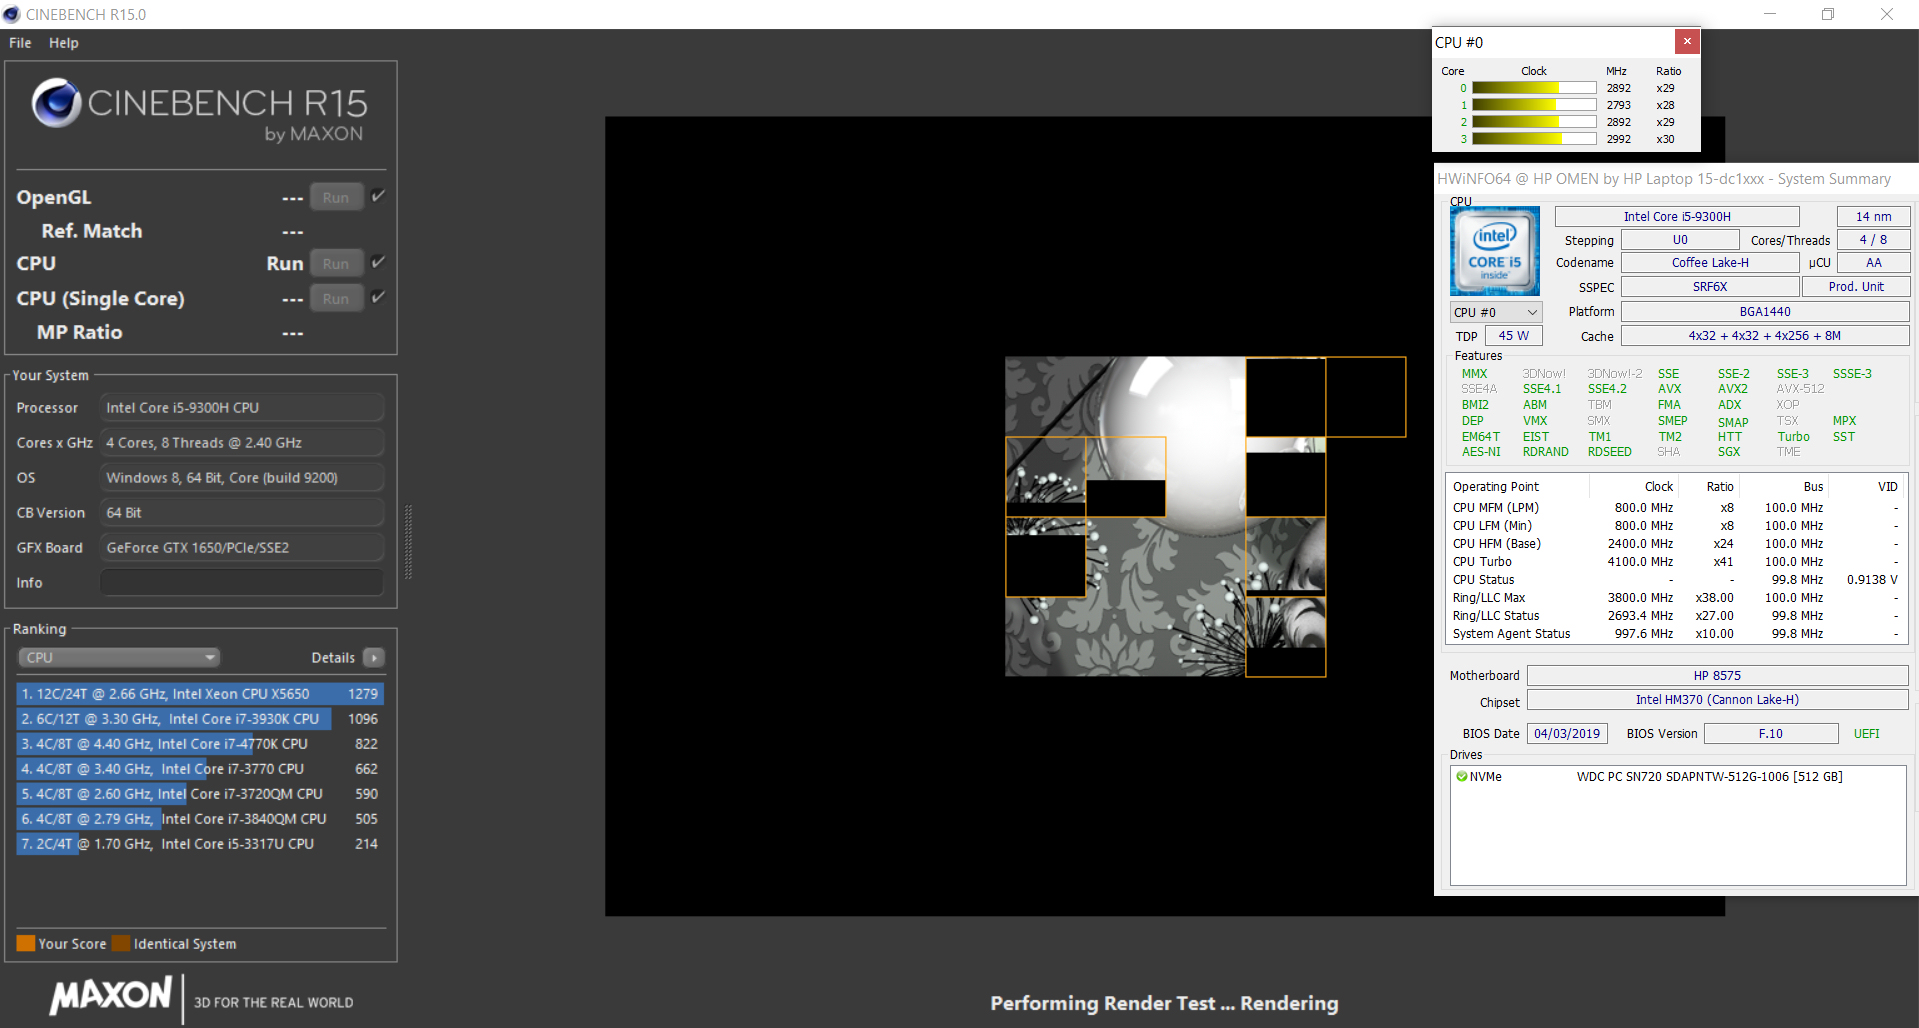
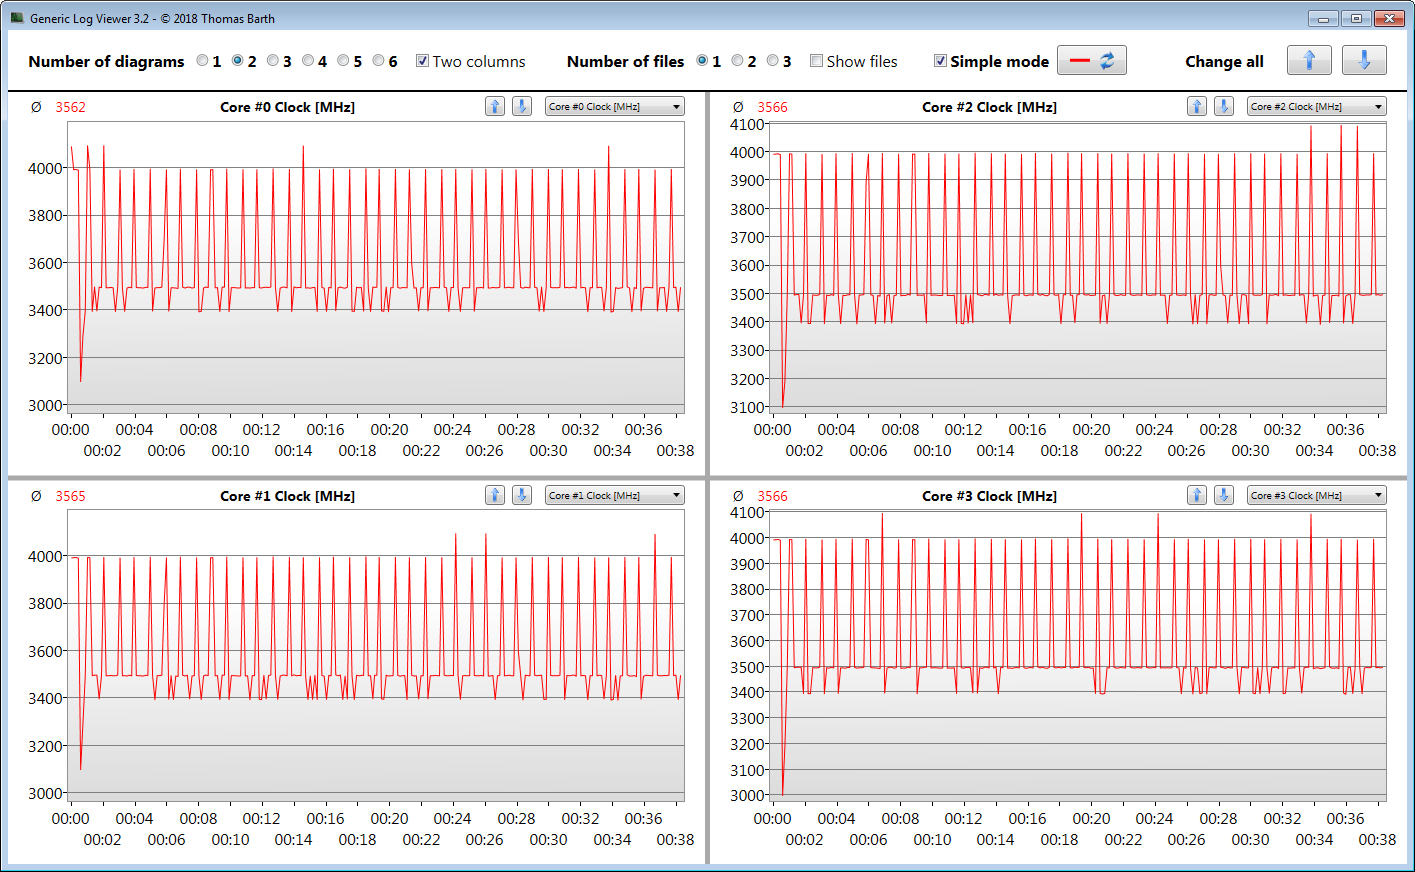
In the Cinebench R15 multi-thread test the CPU ran at 4 GHz for a short period of time before reducing its clock frequency to between 3 and 3.5 GHz. The single-thread tests were performed running at 4-4.1 GHz. When running on battery the clock speeds were reduced to 2.8 to 3 GHz (multi-thread) and 2.5 to 4 GHz (single-thread), respectively.
We run Cinebench R15 multi-thread in a 30-minute loop on each device in order to determine whether or not the CPU is capable of applying turbo boost for long periods of time. The scores dropped between the first and second iteration, but remained consistent afterwards. Turbo boost is applied throughout the test, albeit not at its full potential.
| Geekbench 3 | |
| 32 Bit Multi-Core Score | |
| Dell G5 15 5590 | |
| Average Intel Core i5-9300H (14195 - 16101, n=4) | |
| HP Omen 15-dc1020ng | |
| 32 Bit Single-Core Score | |
| Dell G5 15 5590 | |
| Average Intel Core i5-9300H (3596 - 4109, n=4) | |
| HP Omen 15-dc1020ng | |
| Geekbench 4.4 | |
| 64 Bit Multi-Core Score | |
| Average of class Gaming (89200 - 101054, n=3, last 2 years) | |
| Dell G5 15 5590 | |
| HP Omen 15-dc1020ng (Dual-Channel-Modus) | |
| Average Intel Core i5-9300H (14853 - 17684, n=7) | |
| HP Omen 15-dc1020ng | |
| Asus ROG Zephyrus G15 GA502DU | |
| 64 Bit Single-Core Score | |
| Average of class Gaming (9335 - 9775, n=3, last 2 years) | |
| HP Omen 15-dc1020ng (Dual-Channel-Modus) | |
| Average Intel Core i5-9300H (4704 - 5089, n=7) | |
| HP Omen 15-dc1020ng | |
| Dell G5 15 5590 | |
| Asus ROG Zephyrus G15 GA502DU | |
| Mozilla Kraken 1.1 - Total | |
| Asus TUF FX505DT-EB73 (Edge 44.17763.1.0) | |
| Average Intel Core i5-9300H (1079 - 1349, n=8) | |
| Dell G5 15 5590 (Edge 44) | |
| HP Omen 15-dc1020ng (Edge 44) | |
| HP Omen 15-dc1303ng | |
| Average of class Gaming (391 - 590, n=100, last 2 years) | |
| Octane V2 - Total Score | |
| Average of class Gaming (93292 - 139447, n=27, last 2 years) | |
| HP Omen 15-dc1303ng | |
| HP Omen 15-dc1020ng (Edge 44) | |
| Dell G5 15 5590 (Edge 44) | |
| Average Intel Core i5-9300H (22225 - 34957, n=7) | |
| Asus TUF FX505DT-EB73 (Edge 44.17763.1.0) | |
| Asus ROG Zephyrus G15 GA502DU (Edge 44.17763.1.0) | |
| JetStream 1.1 - 1.1 Total | |
| Average of class Gaming (549 - 647, n=3, last 2 years) | |
| Dell G5 15 5590 (Edge 44) | |
| HP Omen 15-dc1020ng (Edge 44) | |
| Average Intel Core i5-9300H (150.3 - 254, n=7) | |
| Asus TUF FX505DT-EB73 (Edge 44.17763.1.0) | |
| HP Omen 15-dc1303ng | |
| Asus ROG Zephyrus G15 GA502DU (Edge 44.17763.1.0) | |
* ... smaller is better
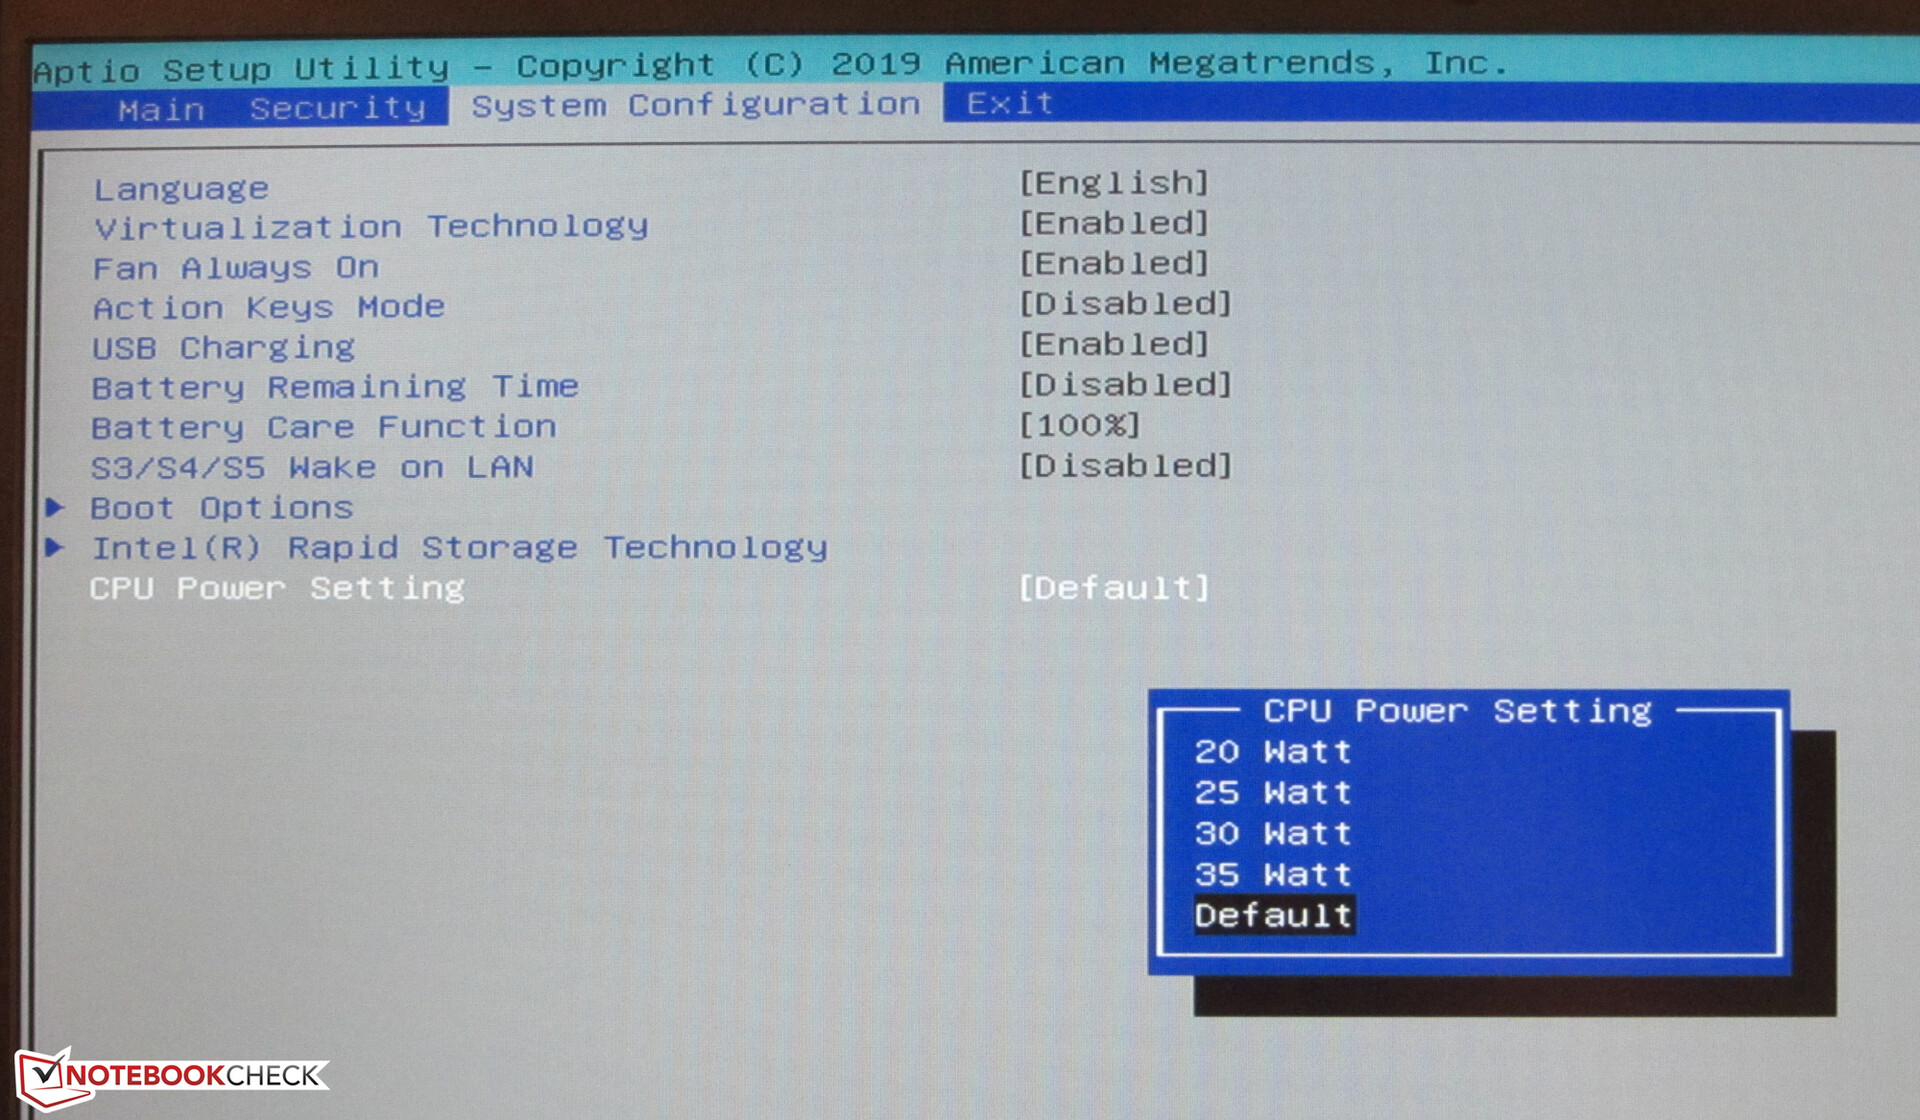
Lowering TDP in BIOS
The Omen’s BIOS setup contains a so-called “CPU Power Setting” feature which allows customization of the CPU’s TDP. Out of the box this option is set to “Default”, which means the CPU operates with the settings and within the thermal limits preconfigured by HP. After lowering the configurable TDP to 20 W and running some of our benchmarks anew, we noticed reduced clock speeds of 2 GHz and 3 to 3.7 GHz in Cinebench R15 resulting in 432 and 154 points in multi and single, respectively. According to our tests this setting had no tangible effect on real-world battery life.
System Performance
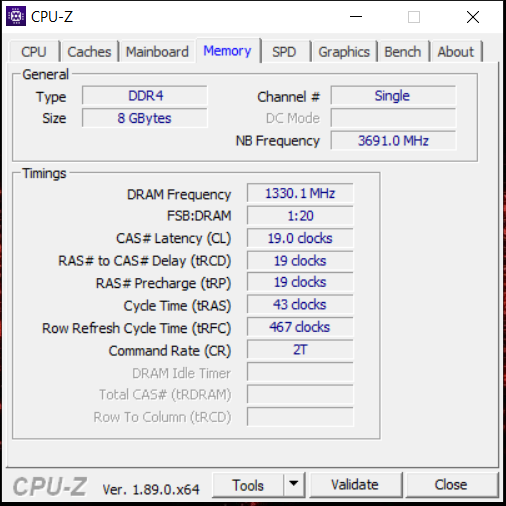
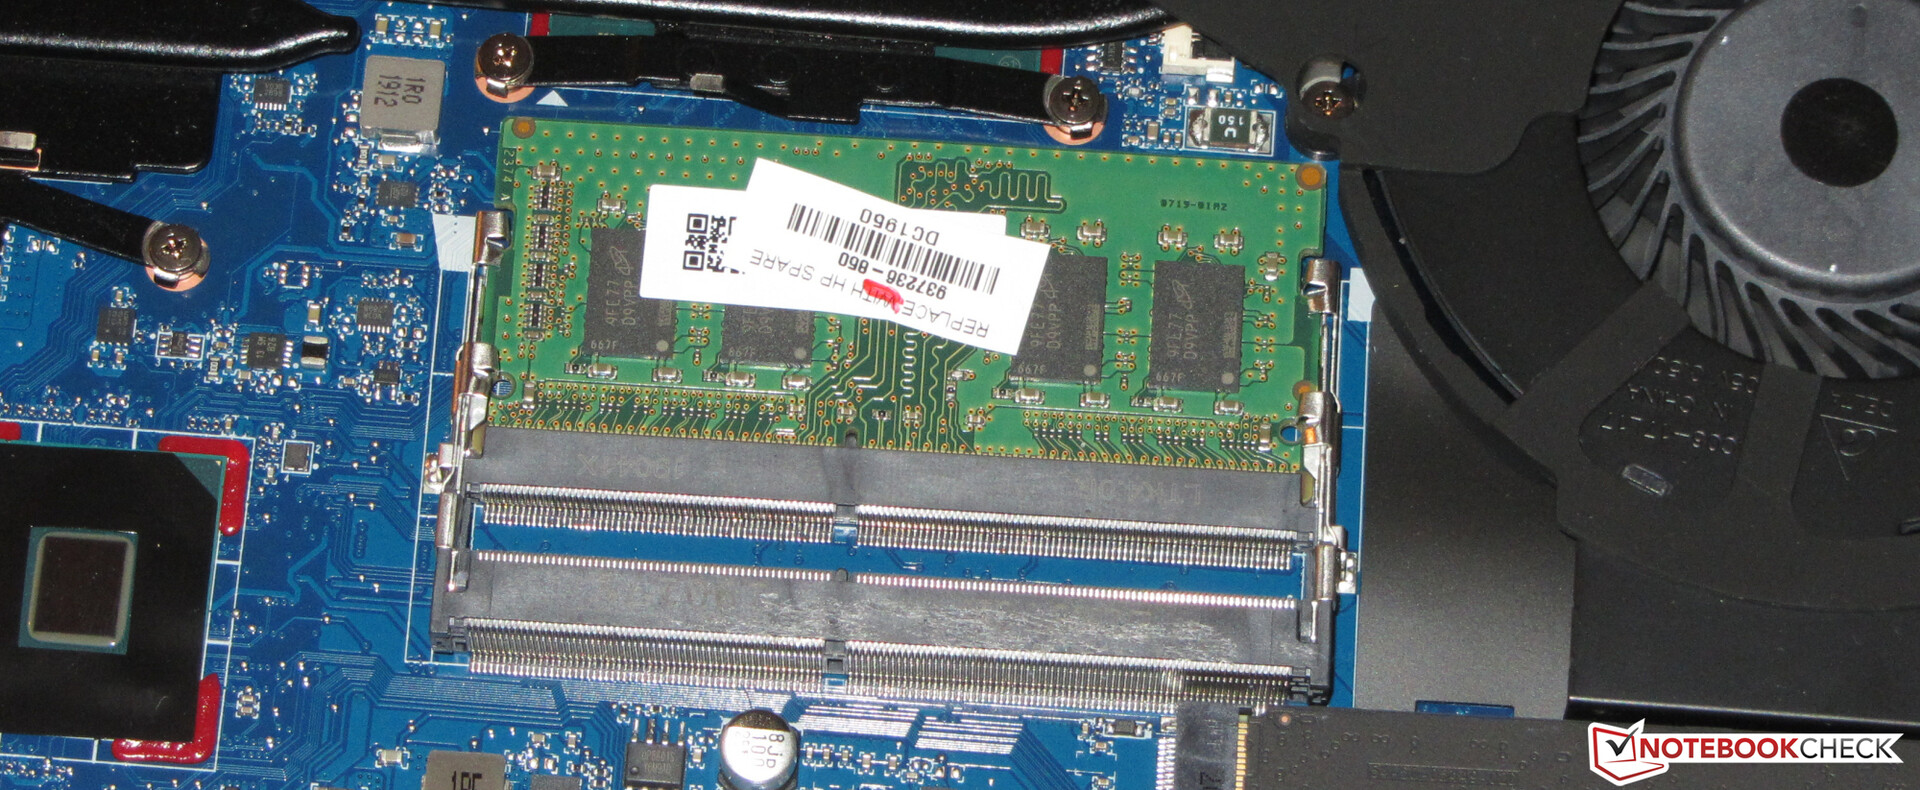
The Omen is certainly more than powerful enough for everyday use thanks to its powerful CPU, a fast NVMe SSD, and a solid mid-range GPU thanks to which it is capable of running all current games smoothly on its internal display. Unsurprisingly, its PC Mark benchmark results were decent as well. A slight boost may be possible by adding a second RAM module, thereby enabling dual-channel mode. By default, the Omen 15 comes equipped with a single memory module and thus a single-channel mode RAM configuration.
| PCMark 7 Score | 6369 points | |
| PCMark 8 Home Score Accelerated v2 | 3691 points | |
| PCMark 8 Creative Score Accelerated v2 | 3609 points | |
| PCMark 8 Work Score Accelerated v2 | 5107 points | |
| PCMark 10 Score | 4873 points | |
Help | ||
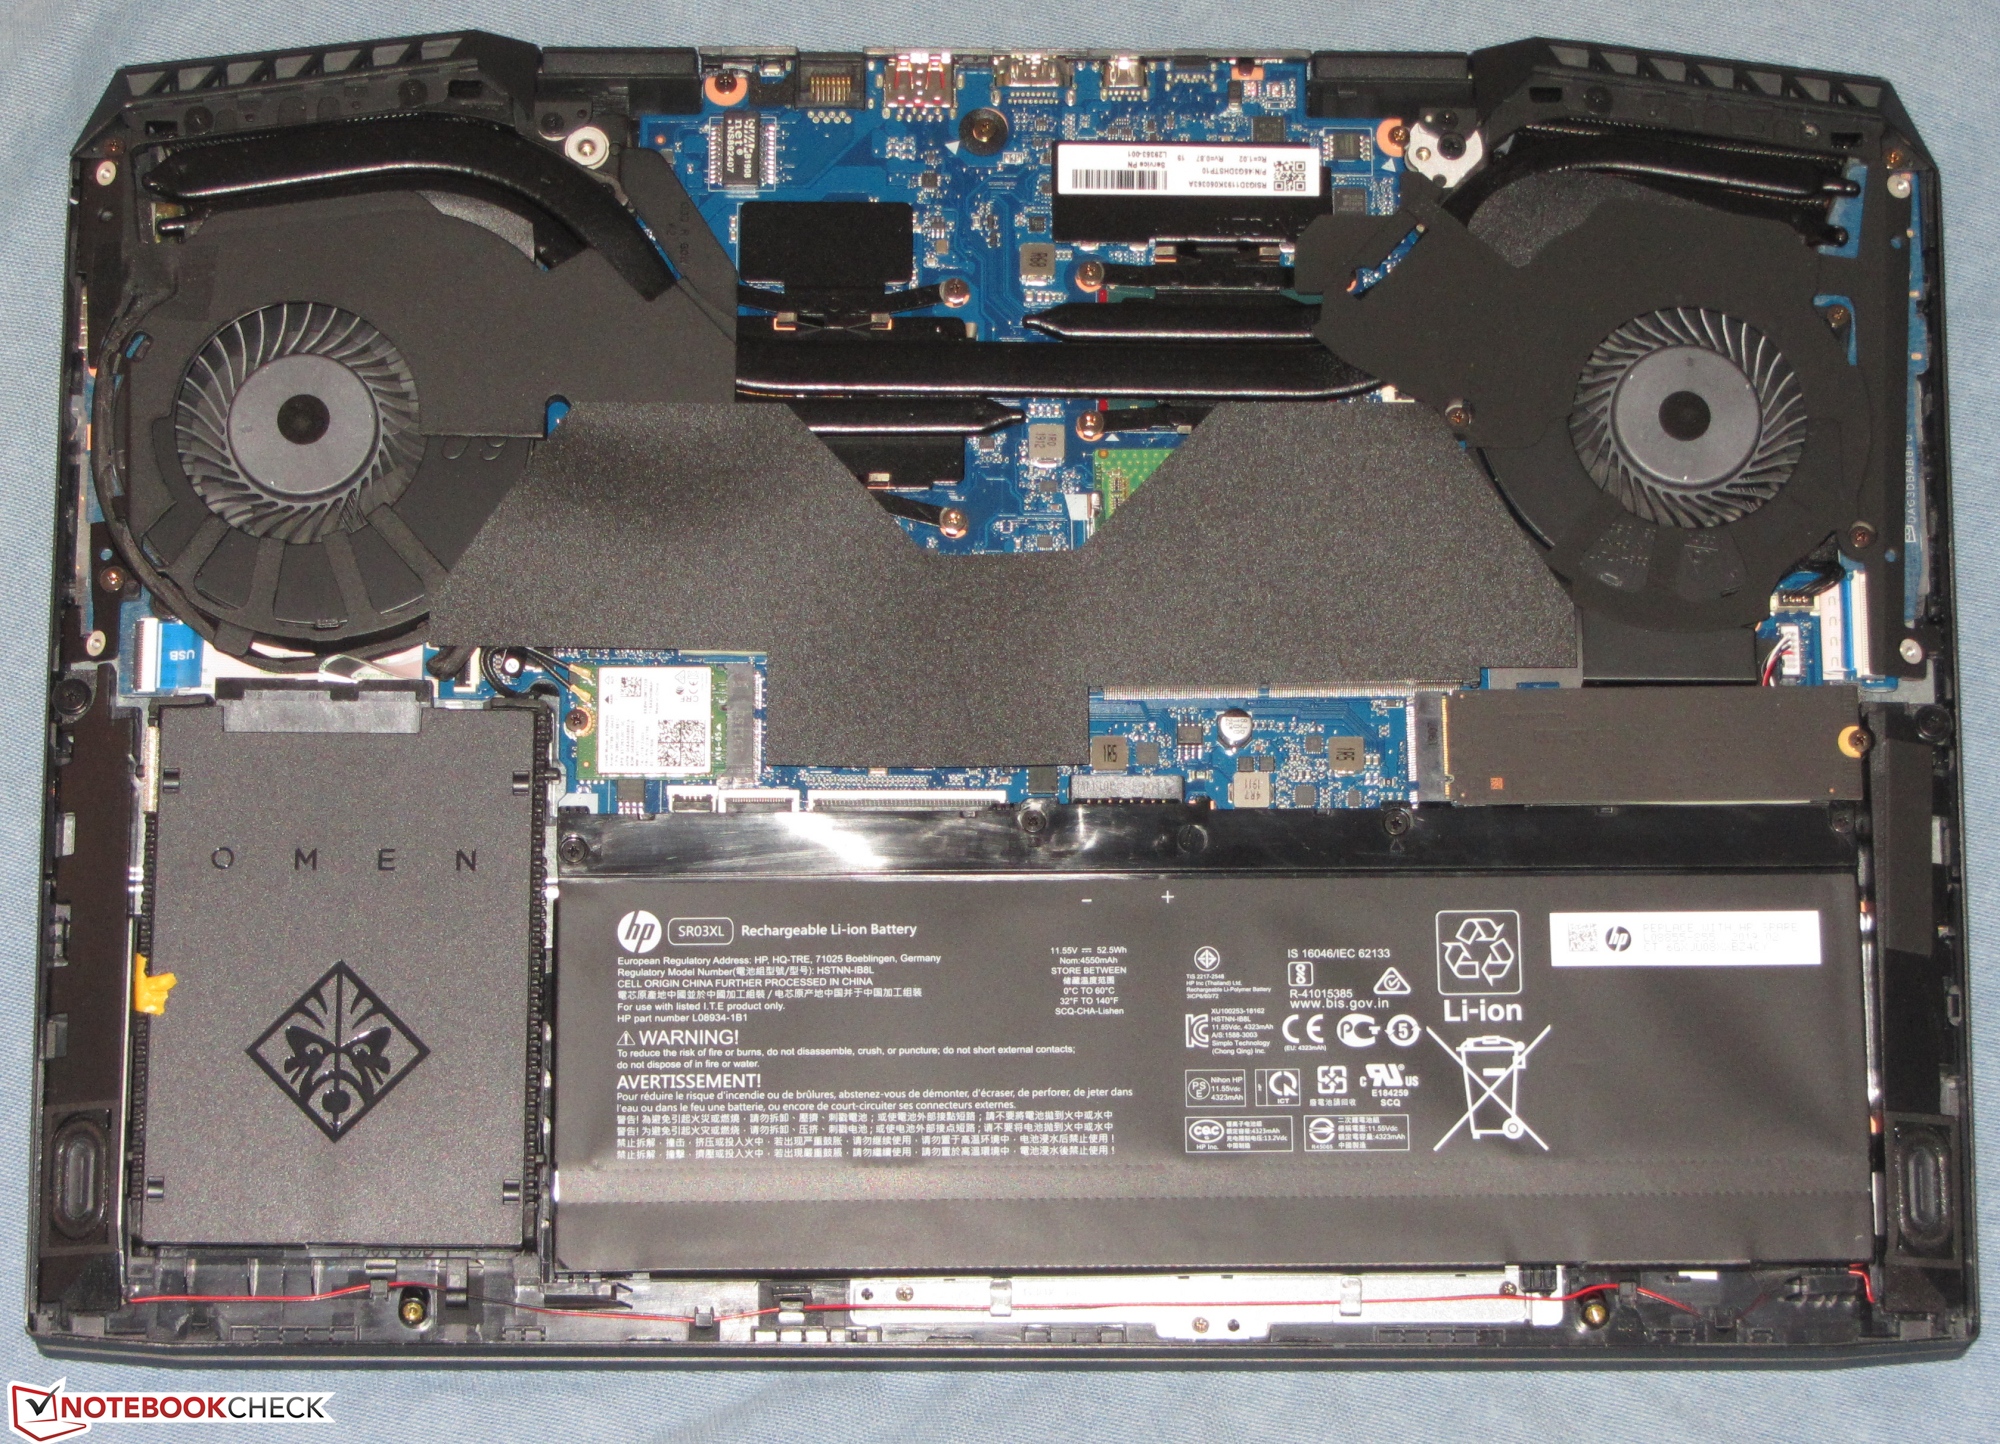
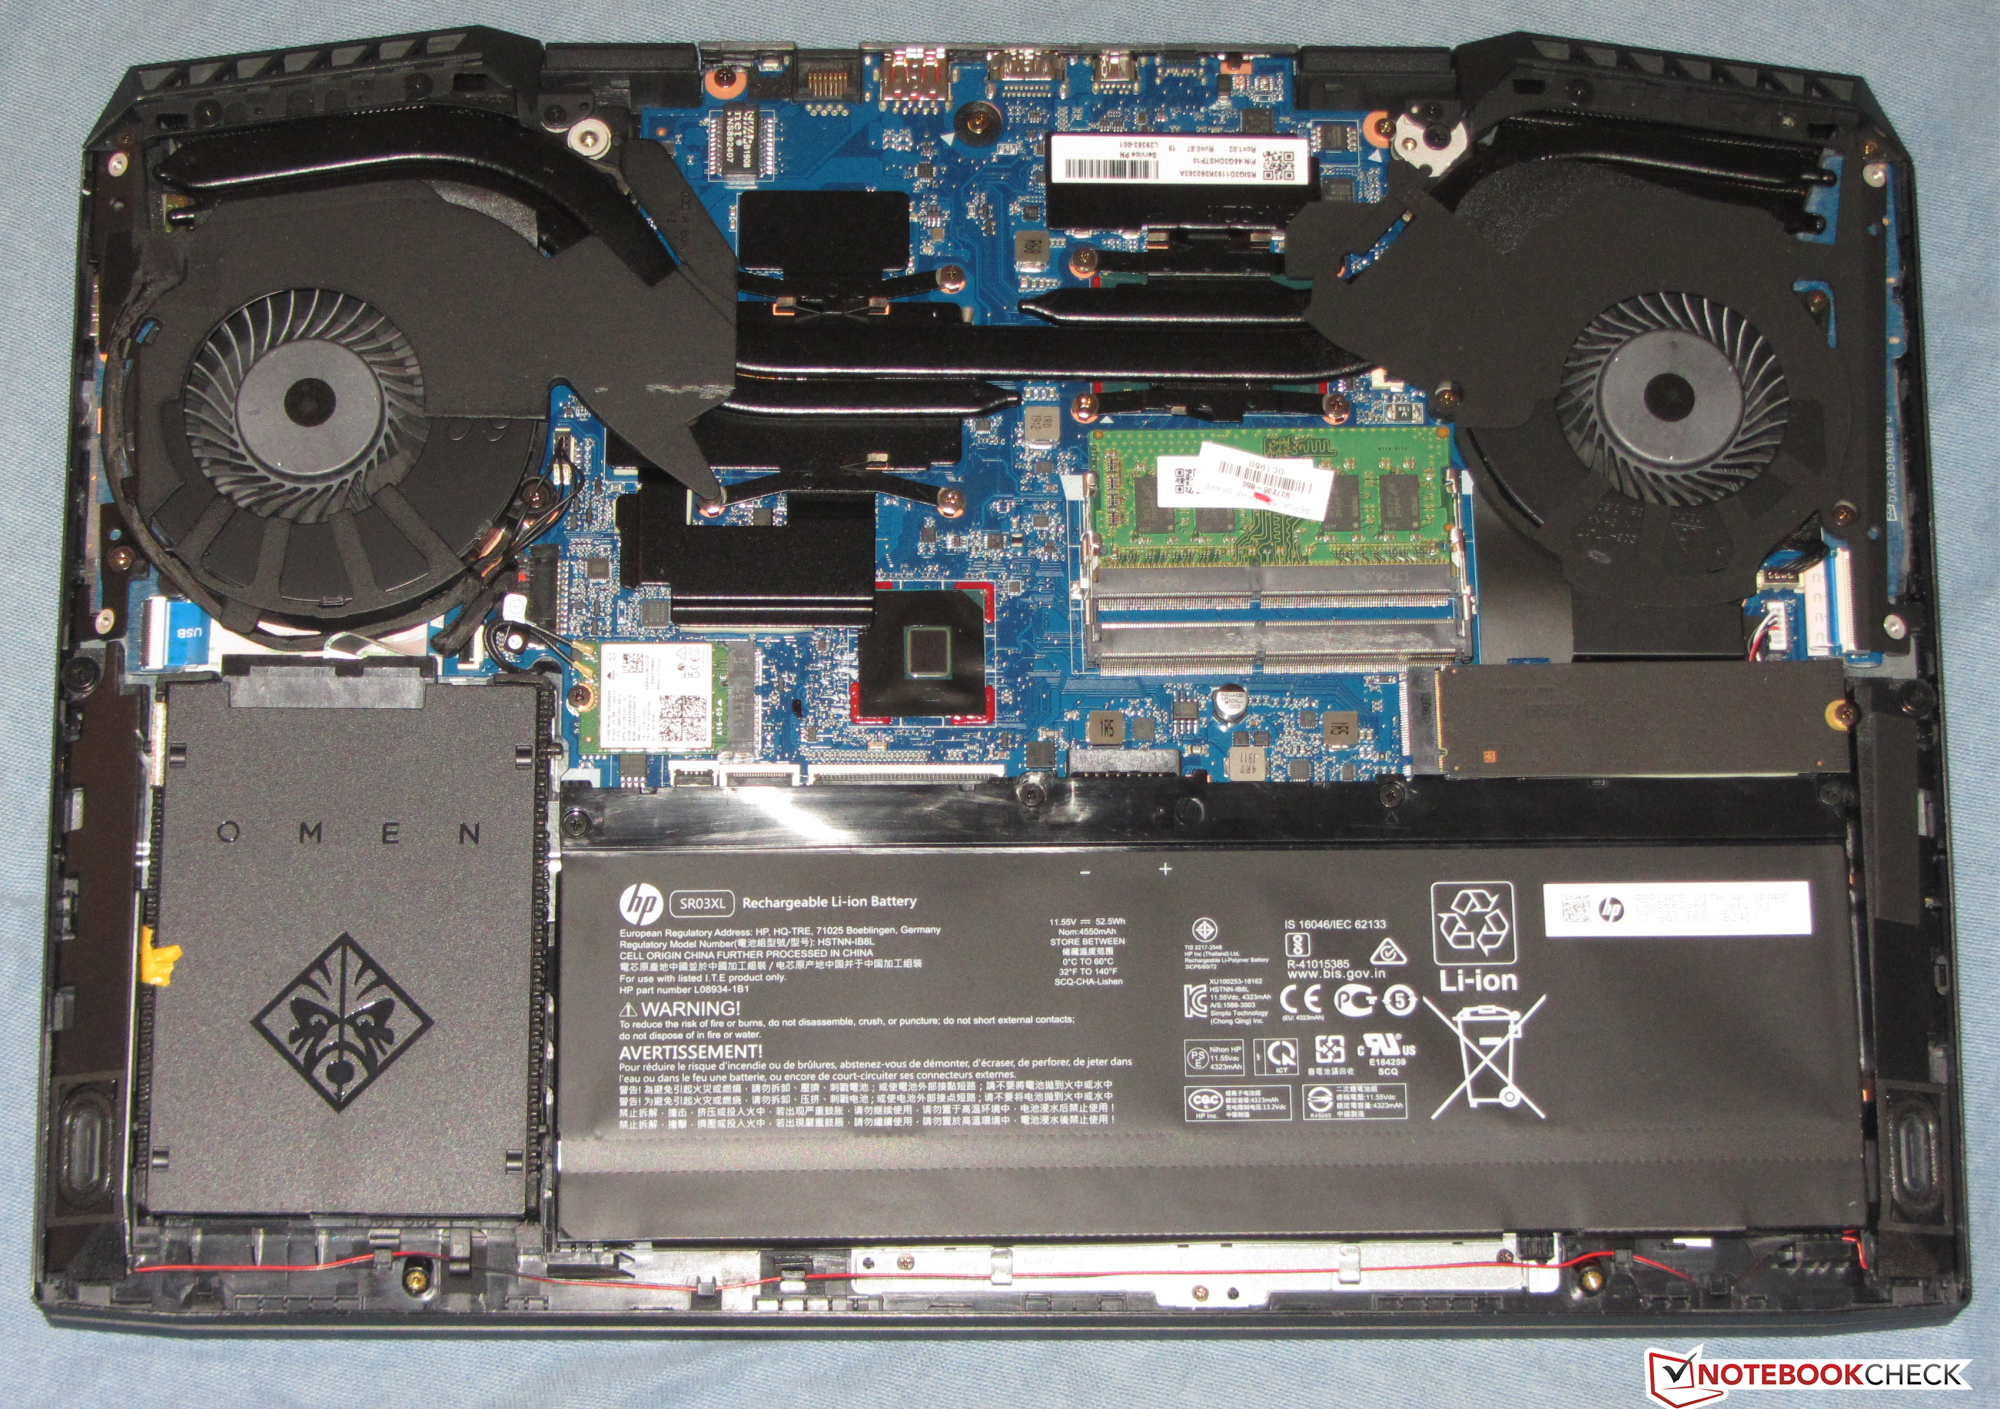
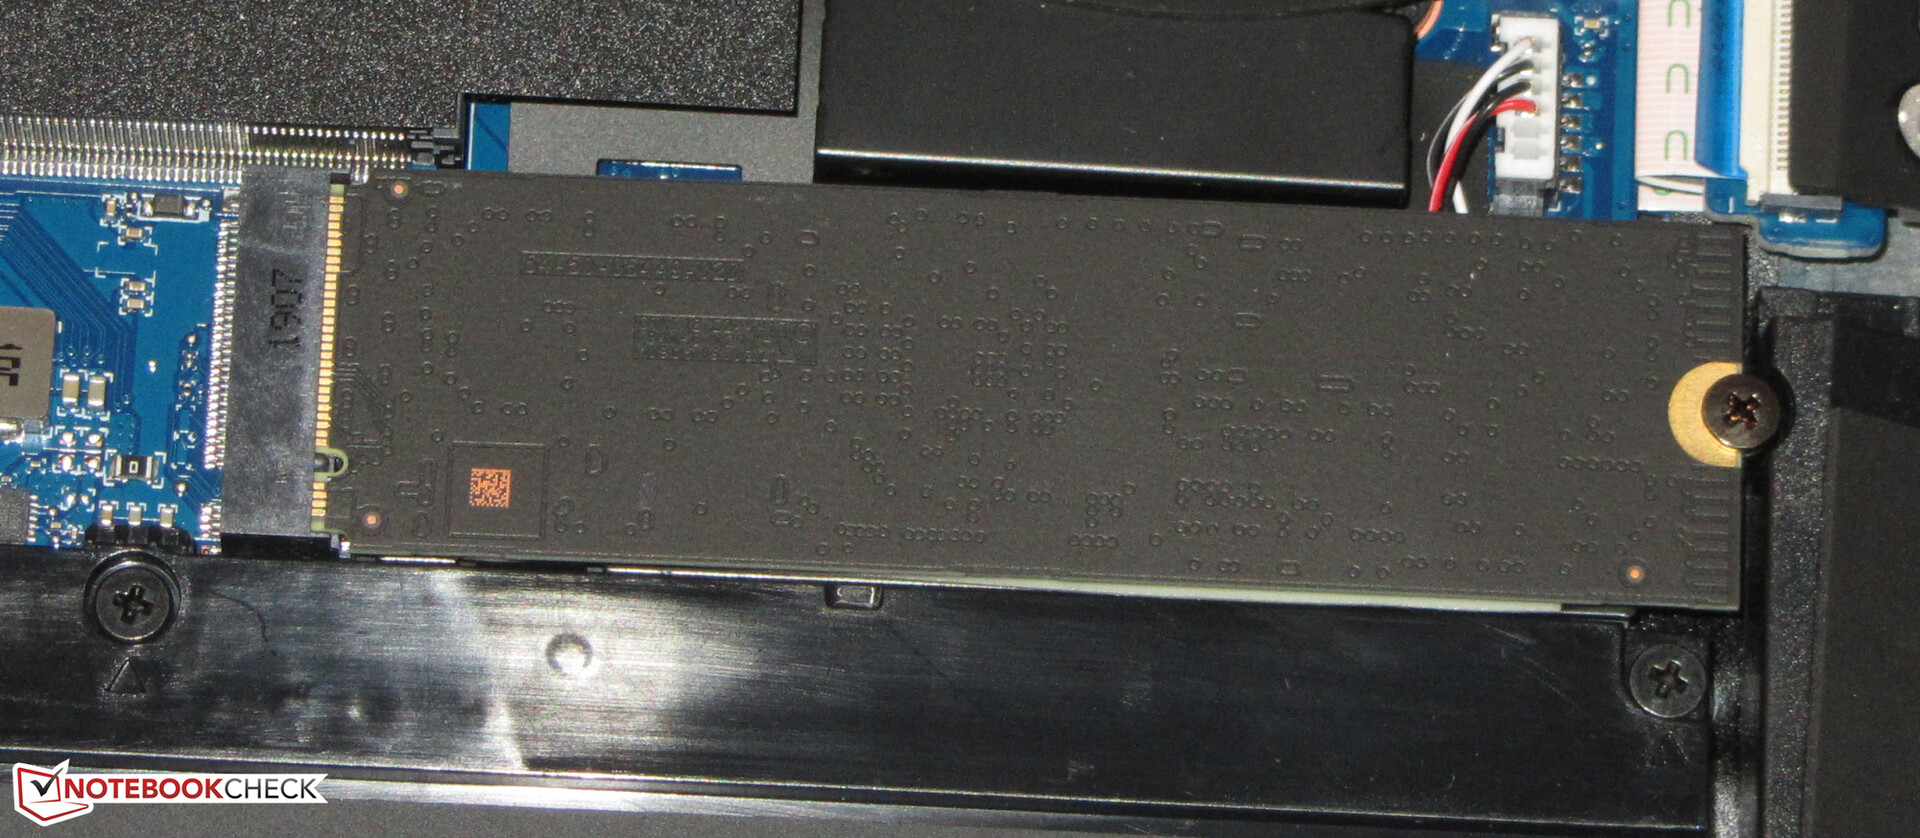
Storage Devices
HP’s entry-level gaming notebook is equipped with a 512 GB M.2-2280 Western Digital NVMe SSD. Around 446 GB are user accessible out of the box, the rest is taken up by the Windows installation and the recovery partition. The SSD performed admirably and offered very fast transfer rates and short loading times in games. Thanks to their PCIe bus support NVMe SSDs tend to offer a much better performance than SATA III SSDs that top out at around 600 MB/s.
Should you run out of storage space on the internal M.2 SSD you can add a secondary 2.5-inch disk drive. The mounting frame required to do so is included.

| HP Omen 15-dc1020ng WDC PC SN720 SDAQNTW-512G | Asus TUF FX505DT-EB73 Intel SSD 660p SSDPEKNW512G8 | Asus ROG Zephyrus G15 GA502DU Intel SSD 660p SSDPEKNW512G8 | Acer Aspire Nitro 5 AN515-54-53Z2 WDC PC SN520 SDAPNUW-512G | Dell G5 15 5590 KBG30ZMS128G | HP Omen 15-dc1303ng Samsung SSD PM981 MZVLB256HAHQ | Average WDC PC SN720 SDAQNTW-512G | |
|---|---|---|---|---|---|---|---|
| CrystalDiskMark 5.2 / 6 | -21% | -26% | -23% | -64% | -14% | 23% | |
| Write 4K (MB/s) | 112.1 | 137.5 23% | 132.2 18% | 109.1 -3% | 64.3 -43% | 50.2 -55% | 183.3 ? 64% |
| Read 4K (MB/s) | 42.01 | 57 36% | 55.5 32% | 42.05 0% | 29.3 -30% | 35.32 -16% | 48.2 ? 15% |
| Write Seq (MB/s) | 1964 | 984 -50% | 986 -50% | 1457 -26% | 131.1 -93% | 991 -50% | 2135 ? 9% |
| Read Seq (MB/s) | 2065 | 1564 -24% | 1318 -36% | 1421 -31% | 776 -62% | 1526 -26% | 2102 ? 2% |
| Write 4K Q32T1 (MB/s) | 318.2 | 237.4 -25% | 220.3 -31% | 287.8 -10% | 96.8 -70% | 445.1 40% | 452 ? 42% |
| Read 4K Q32T1 (MB/s) | 406.7 | 340.7 -16% | 315.5 -22% | 317.9 -22% | 198.6 -51% | 526 29% | 619 ? 52% |
| Write Seq Q32T1 (MB/s) | 2534 | 959 -62% | 987 -61% | 1455 -43% | 127.8 -95% | 1647 -35% | 2537 ? 0% |
| Read Seq Q32T1 (MB/s) | 3438 | 1732 -50% | 1416 -59% | 1739 -49% | 1044 -70% | 3427 0% | 3466 ? 1% |
GPU Performance
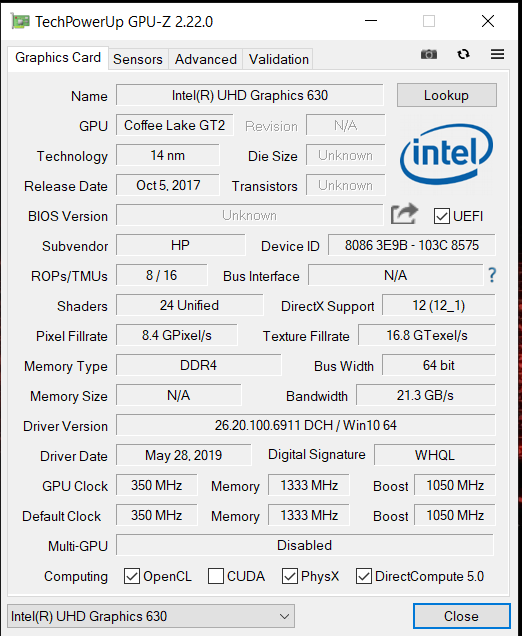
The Omen 15 is equipped with a dedicated GeForce GTX 1650, a mid-range GPU based on Nvidia’s Turing architecture. Unlike its better equipped RTX 2000 series Turing GPUs, the GTX 1650 lacks the Raytracing and Tensor cores. Optimus is supported, and the Omen 15 is capable of on-the-fly on-demand switching between the GTX 1650 and the integrated UHD Graphics 630.
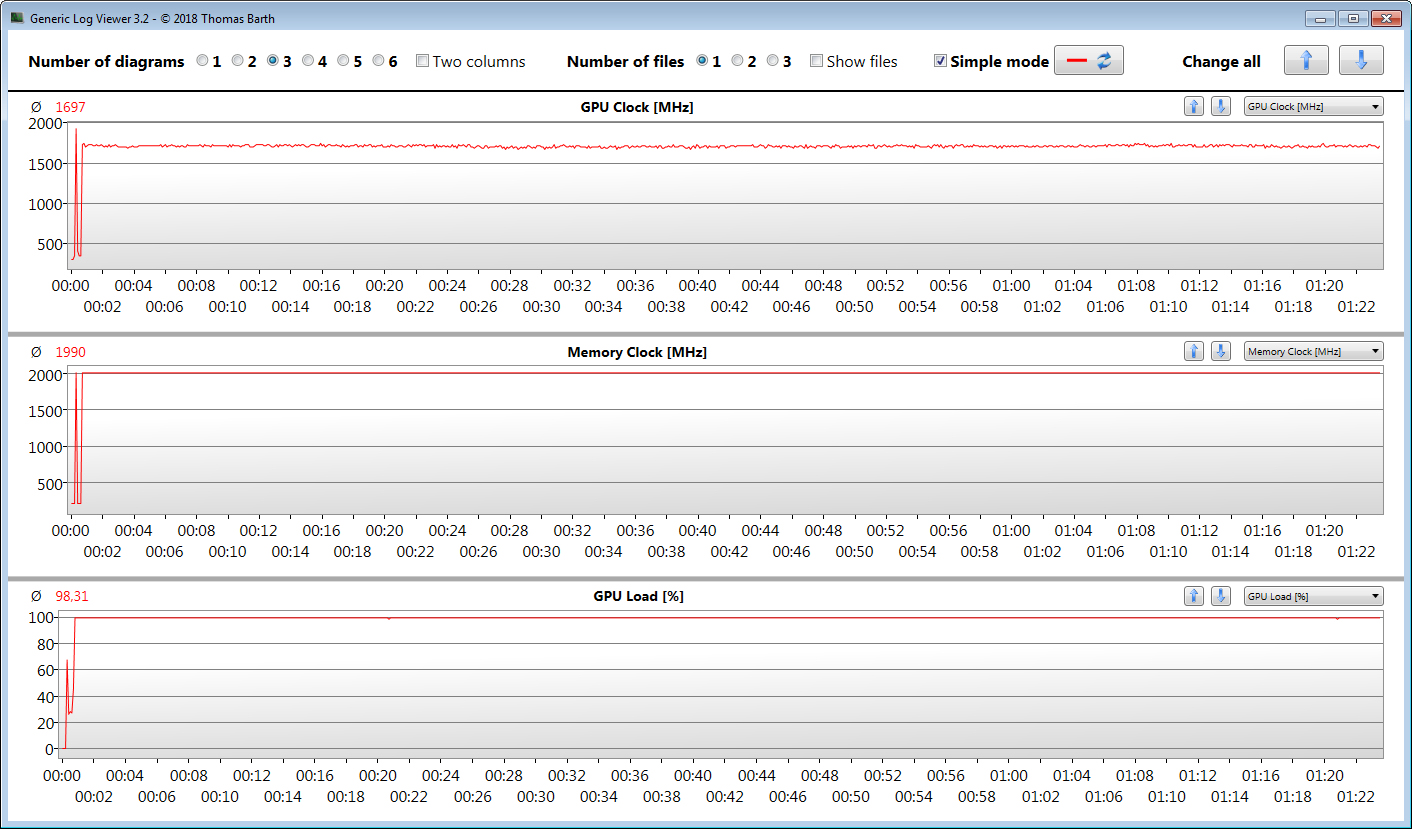
Nvidia’s GTX 1650 supports DirectX 12 and runs at a base clock speed of 1,395 MHz with a turbo boost of up to 1,560 MHz. As long as the GPU remains below a preconfigured temperature and/or energy threshold, it can run even faster, and we measured a short peak of up to 1,935 MHz. In "Witcher 3", the GPU ran with an average clock speed of 1,700 MHz. It has access to 4 GHz of fast GDDR5 video ram.
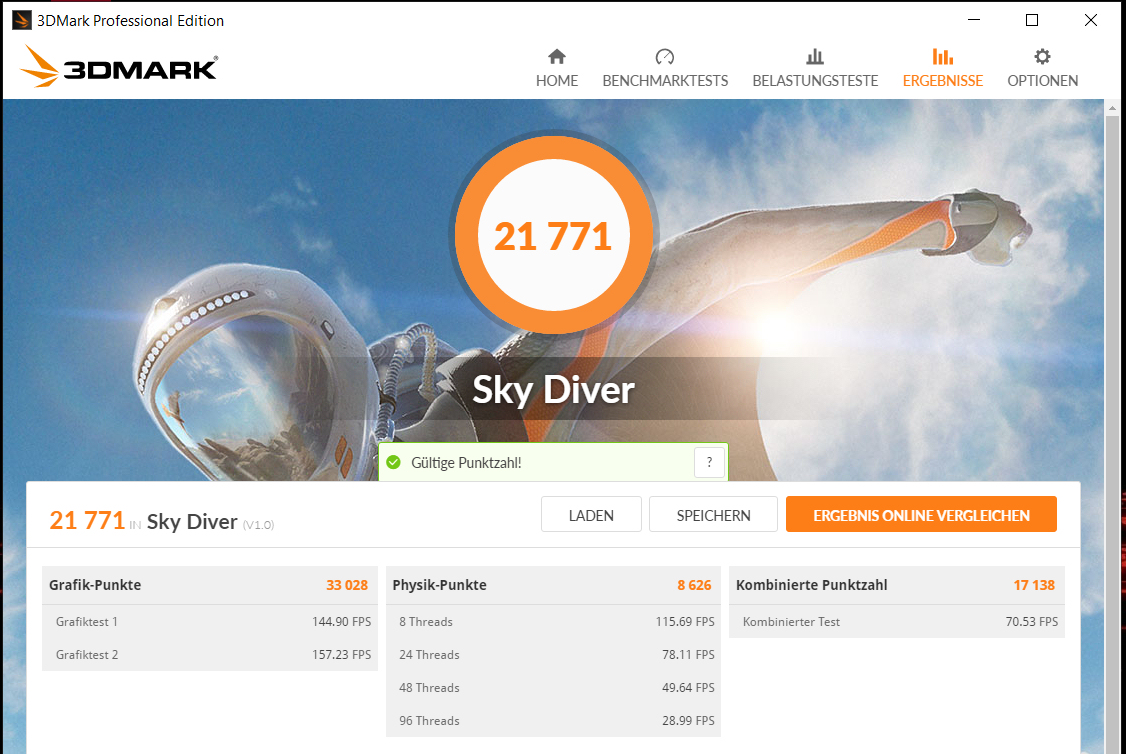
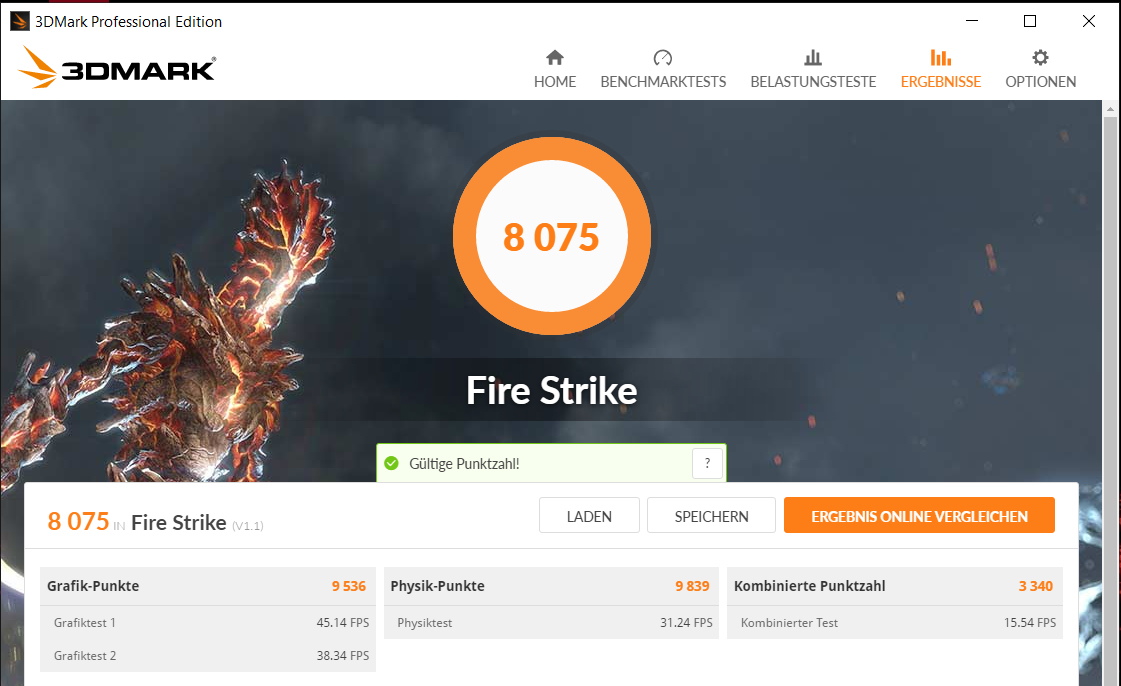
It performed as expected in 3DMark. As the successor to the GTX 1050 and GTX 1050 Ti it had no problems outperforming both. Enabling dual-channel mode by adding a second RAM module resulted in increased 3DMark scores, however, it had no effect on graphics but rather physics performance. On battery, the Omen 15 offered around 80% of its GPU performance on mains.

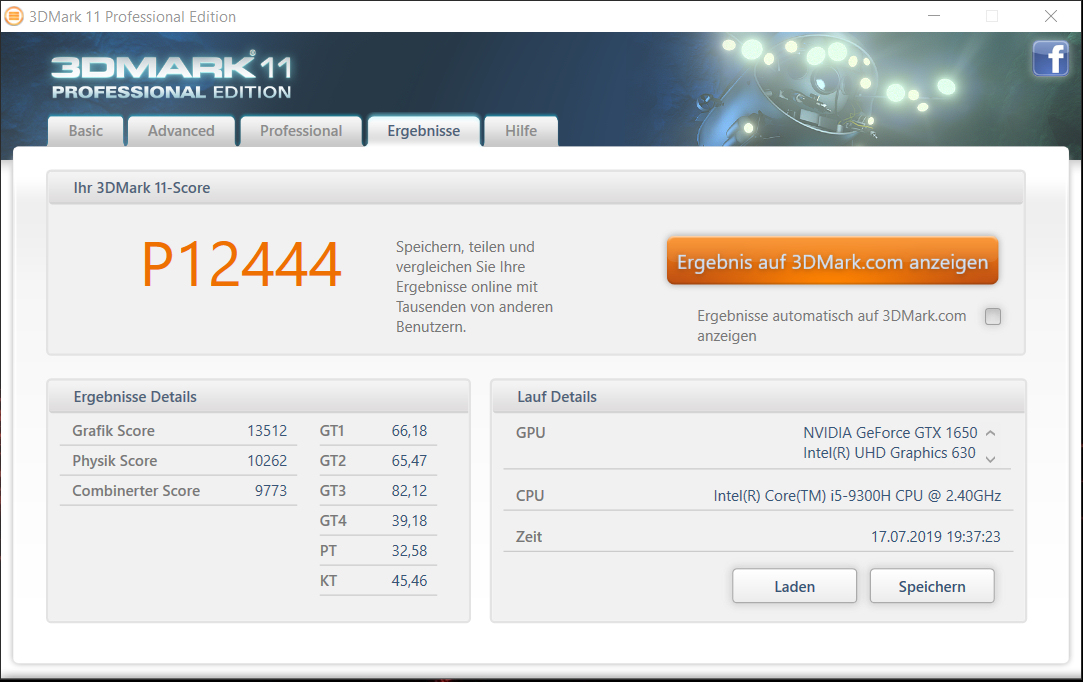
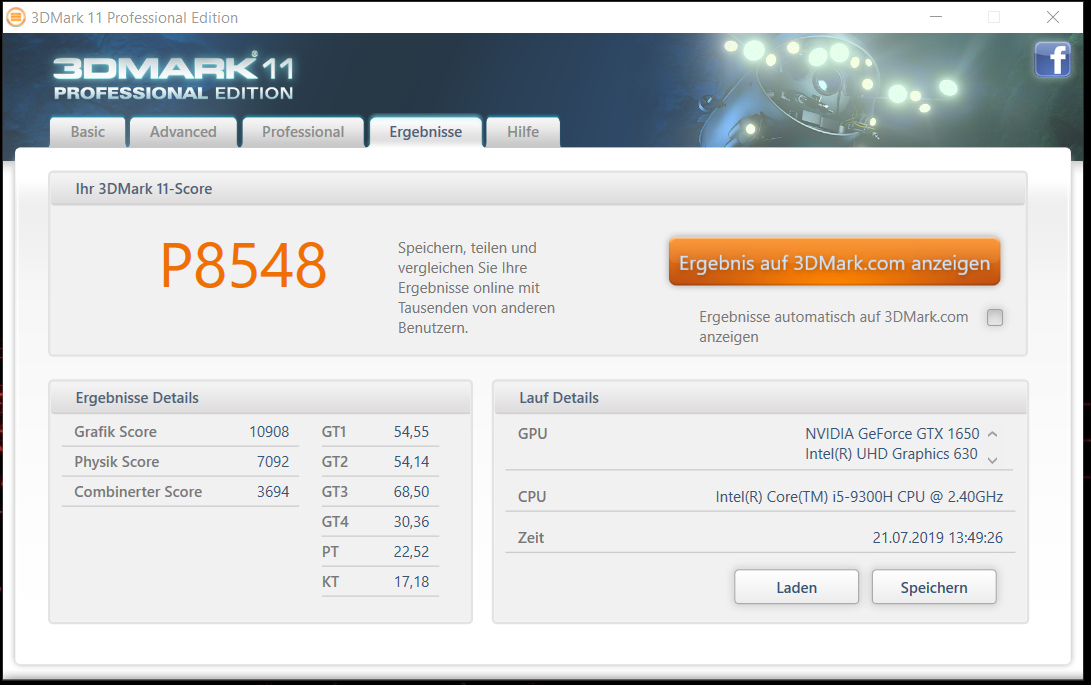
| 3DMark 06 Standard Score | 32694 points | |
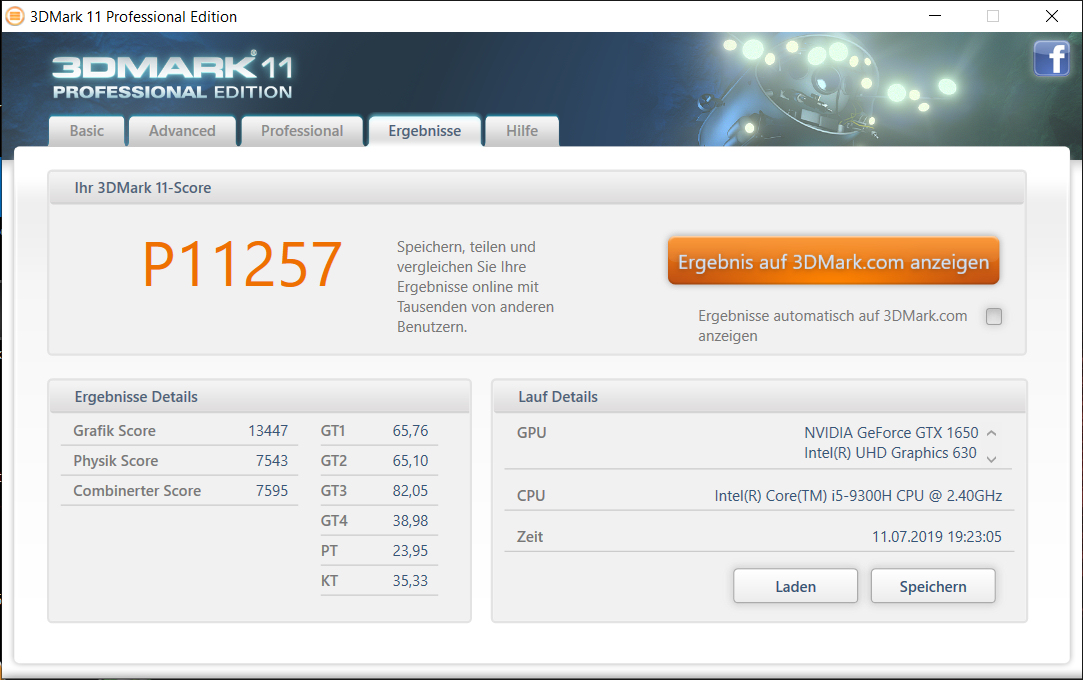
| 3DMark 11 Performance | 11257 points | |
| 3DMark Ice Storm Standard Score | 71342 points | |
| 3DMark Cloud Gate Standard Score | 22167 points | |
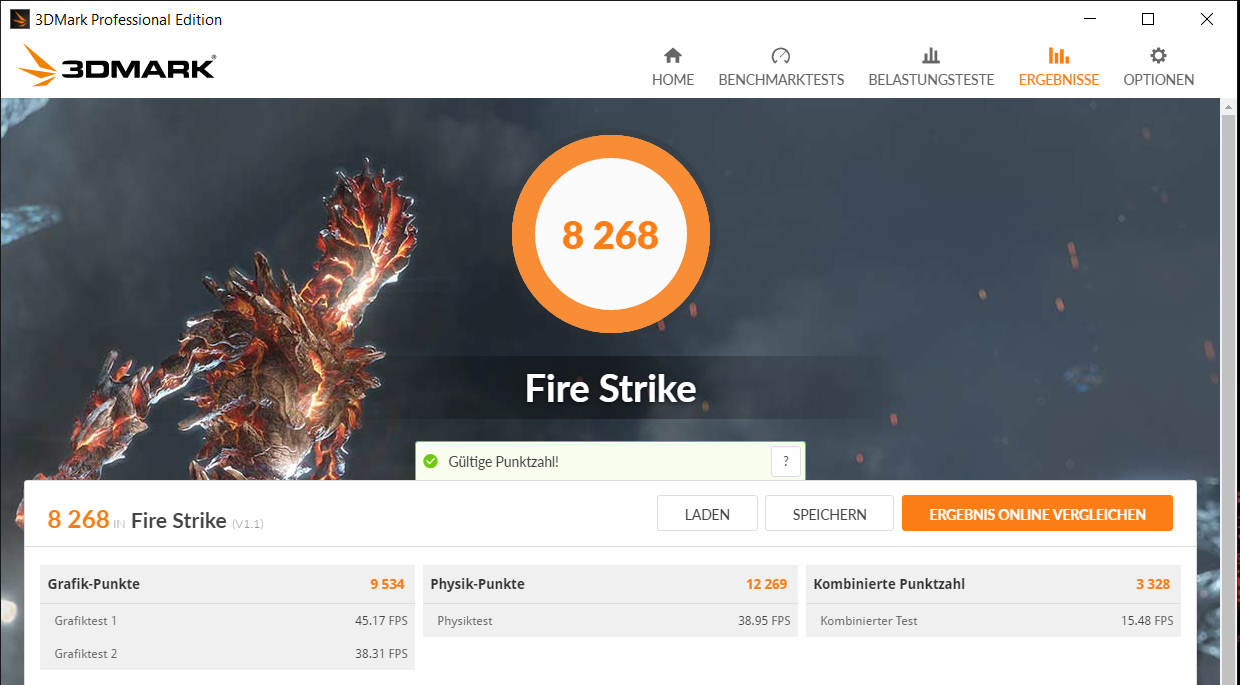
| 3DMark Fire Strike Score | 8075 points | |
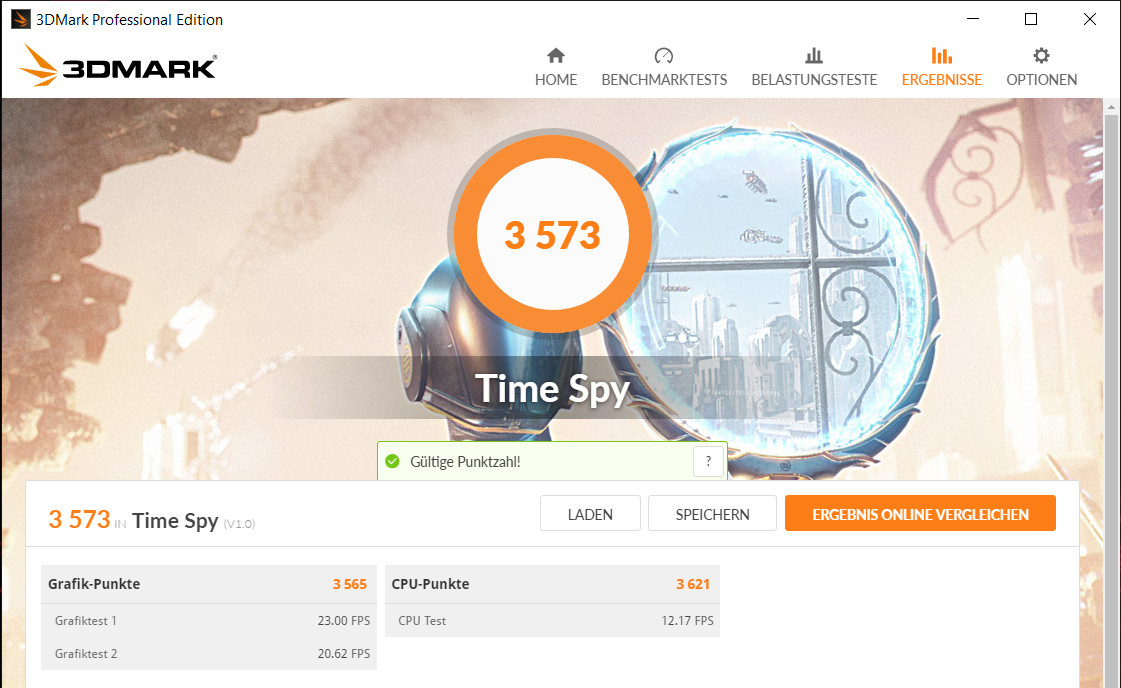
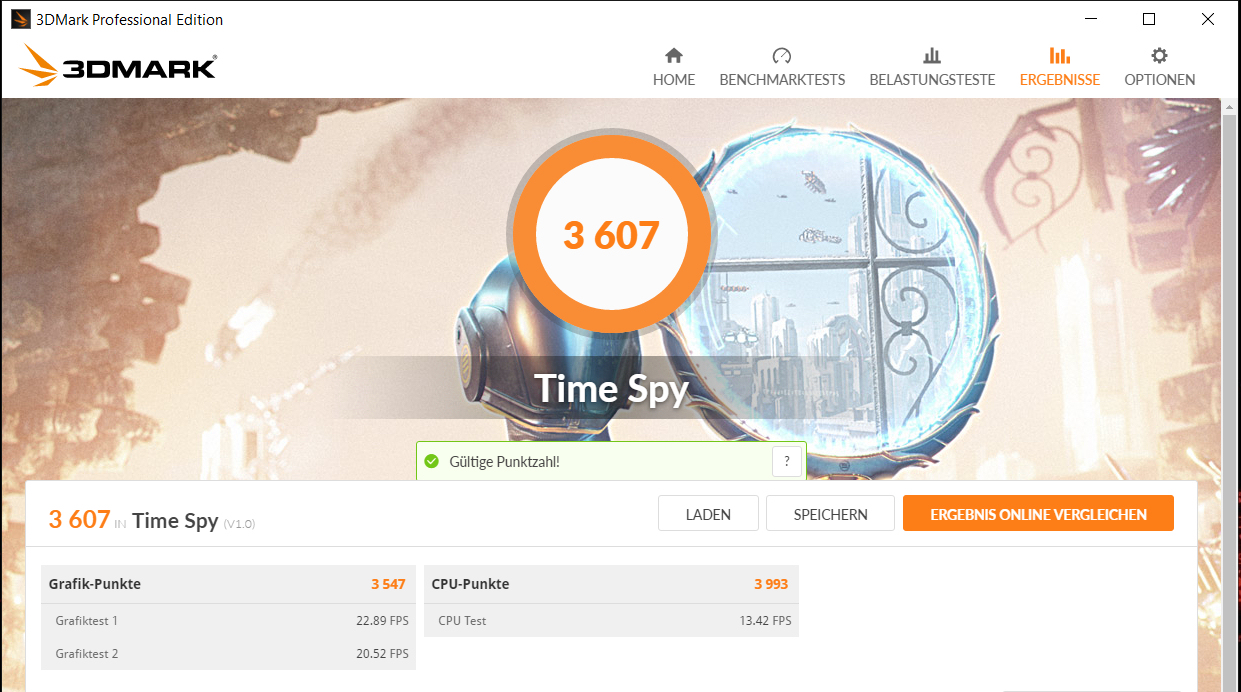
| 3DMark Time Spy Score | 3573 points | |
Help | ||
| 3DMark 11 - 1280x720 Performance GPU | |
| Average of class Gaming (21841 - 80022, n=103, last 2 years) | |
| Dell G5 15 5590 | |
| Asus ROG Zephyrus G15 GA502DU | |
| HP Omen 15-dc1303ng | |
| Asus TUF FX505DT-EB73 | |
| HP Omen 15-dc1020ng (Dual-Channel-Modus) | |
| HP Omen 15-dc1020ng | |
| Acer Aspire Nitro 5 AN515-54-53Z2 | |
| Average NVIDIA GeForce GTX 1650 Mobile (10885 - 13575, n=30) | |
| Asus TUF FX705GE-EW096T | |
| MSI GF75 8RD-001 | |
| Asus TUF FX505DY | |
Gaming Performance
The particular combination of CPU and GPU was capable of running all games in our database smoothly on the Omen 15, most commonly in FHD resolution and with medium to high details. Some games even allowed for more. Resolutions higher than FHD, which would require an external display, can catch the GPU off guard and require reduced details. Less demanding games, such as "FIFA 19" or "Rocket League", will run just fine, though.
We were able to improve upon frame rates by adding a second memory module and enabling dual-channel mode. The individual level of improvement depended on game, resolution, and level of details. We benchmarked some games in both single and dual-channel mode, and the results can be found in the charts below.
| BioShock Infinite - 1920x1080 Ultra Preset, DX11 (DDOF) | |
| Dell G5 15 5590 | |
| HP Omen 15-dc1303ng | |
| Asus ROG Zephyrus G15 GA502DU | |
| HP Omen 15-dc1020ng (Dual-Channel-Modus) | |
| HP Omen 15-dc1020ng | |
| Average NVIDIA GeForce GTX 1650 Mobile (68.5 - 99.4, n=18) | |
| Asus TUF FX505DT-EB73 | |
| Asus TUF FX505DY | |
| The Witcher 3 - 1920x1080 High Graphics & Postprocessing (Nvidia HairWorks Off) | |
| Average of class Gaming (n=1last 2 years) | |
| Dell G5 15 5590 | |
| Asus ROG Zephyrus G15 GA502DU | |
| Asus TUF FX505DT-EB73 | |
| HP Omen 15-dc1020ng | |
| Average NVIDIA GeForce GTX 1650 Mobile (45 - 70.4, n=29) | |
| Acer Aspire Nitro 5 AN515-54-53Z2 | |
| Asus TUF FX505DY | |
| Far Cry New Dawn - 1920x1080 Ultra Preset | |
| Dell G5 15 5590 | |
| HP Omen 15-dc1020ng (Dual-Channel-Modus) | |
| Acer Aspire Nitro 5 AN515-54-53Z2 | |
| Average NVIDIA GeForce GTX 1650 Mobile (40 - 56, n=6) | |
| HP Omen 15-dc1020ng | |
| X-Plane 11.11 - 1920x1080 high (fps_test=3) | |
| Average of class Gaming (55.5 - 143.5, n=109, last 2 years) | |
| HP Omen 15-dc1020ng (Dual-Channel-Modus) | |
| Average NVIDIA GeForce GTX 1650 Mobile (44.5 - 77.3, n=18) | |
| HP Omen 15-dc1020ng | |
| Dota 2 Reborn - 1920x1080 ultra (3/3) best looking | |
| Average of class Gaming (84.8 - 248, n=107, last 2 years) | |
| HP Omen 15-dc1303ng | |
| Average NVIDIA GeForce GTX 1650 Mobile (58.5 - 119, n=20) | |
| HP Omen 15-dc1020ng (Dual-Channel-Modus) | |
| HP Omen 15-dc1020ng | |
In order to determine a notebook’s long-term gaming capabilities we run Witcher 3 in a 60-minute loop in FHD with maximum details. The player remains stationary throughout the entire test. We found no evidence of sudden and unexpected frame rate drops.
| low | med. | high | ultra | |
|---|---|---|---|---|
| BioShock Infinite (2013) | 213.6 | 200.3 | 190.4 | 87.7 |
| The Witcher 3 (2015) | 157.1 | 109.6 | 62.2 | 37 |
| Dota 2 Reborn (2015) | 114 | 103 | 89 | 82 |
| X-Plane 11.11 (2018) | 78 | 62 | 55 | |
| Far Cry New Dawn (2019) | 60 | 53 | 52 | 47 |
| Rage 2 (2019) | 117 | 97 | 74 | 60 |
| F1 2019 (2019) | 128 | 97 | 74 | 60 |
Emissions
Noise Emissions
One of the two fans is always running, even when the device is completely idle. That said at just 31.1 dB(A) it is barely noticeable at all. This can, however, be configured in the device’s BIOS setup by disabling the “Fan always on” setting. The fans remained largely inconspicuous even under load, and peaked at just 41 dB(A) during our stress test - fairly quiet for a gaming notebook. It was even slightly less obtrusive when gaming, and we measured just 35.2 dB(A) during our Witcher 3 test and 38.2 dB(A) when running CPU-intensive games. The Omen’s more powerful sibling was louder regardless of load.
Noise level
| Idle |
| 28.8 / 29.5 / 31.1 dB(A) |
| Load |
| 35.2 / 41 dB(A) |
 | ||
30 dB silent 40 dB(A) audible 50 dB(A) loud |
||
min: | ||
| HP Omen 15-dc1020ng i5-9300H, GeForce GTX 1650 Mobile | HP Omen 15-dc1303ng i7-8750H, GeForce RTX 2070 Max-Q | Asus TUF FX505DT-EB73 R7 3750H, GeForce GTX 1650 Mobile | Asus ROG Zephyrus G15 GA502DU R7 3750H, GeForce GTX 1660 Ti Max-Q | Acer Aspire Nitro 5 AN515-54-53Z2 i5-9300H, GeForce GTX 1650 Mobile | Dell G5 15 5590 i7-8750H, GeForce RTX 2060 Mobile | Average NVIDIA GeForce GTX 1650 Mobile | Average of class Gaming | |
|---|---|---|---|---|---|---|---|---|
| Noise | -12% | -9% | -17% | -14% | -10% | -4% | -3% | |
| off / environment * (dB) | 28.8 | 30.5 -6% | 28.2 2% | 28 3% | 30 -4% | 30.4 -6% | 27.6 ? 4% | 24.1 ? 16% |
| Idle Minimum * (dB) | 28.8 | 32.8 -14% | 28.2 2% | 29.4 -2% | 30 -4% | 30.4 -6% | 28.1 ? 2% | 25.9 ? 10% |
| Idle Average * (dB) | 29.5 | 32.8 -11% | 28.2 4% | 31.9 -8% | 31 -5% | 30.4 -3% | 28.8 ? 2% | 27.4 ? 7% |
| Idle Maximum * (dB) | 31.1 | 32.8 -5% | 31.4 -1% | 33 -6% | 33 -6% | 33.4 -7% | 31 ? -0% | 30.1 ? 3% |
| Load Average * (dB) | 35.2 | 42.5 -21% | 39.8 -13% | 41.2 -17% | 46 -31% | 42 -19% | 41.7 ? -18% | 43.6 ? -24% |
| Witcher 3 ultra * (dB) | 35.2 | 47 -34% | 53.8 -53% | 46 -31% | ||||
| Load Maximum * (dB) | 41 | 47.5 -16% | 50.2 -22% | 55.7 -36% | 49 -20% | 48.7 -19% | 46.4 ? -13% | 54.2 ? -32% |
* ... smaller is better
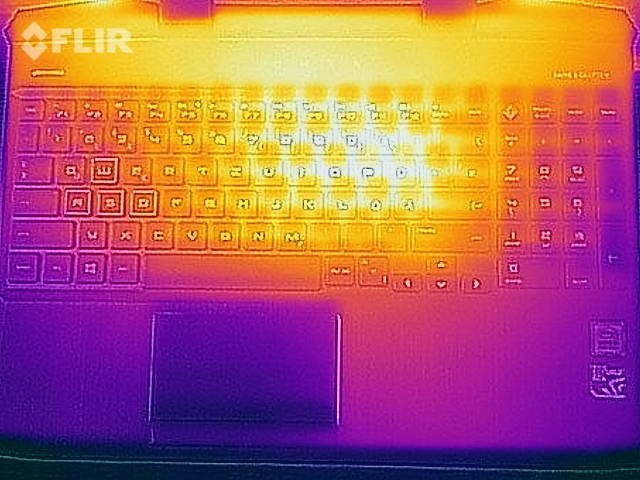
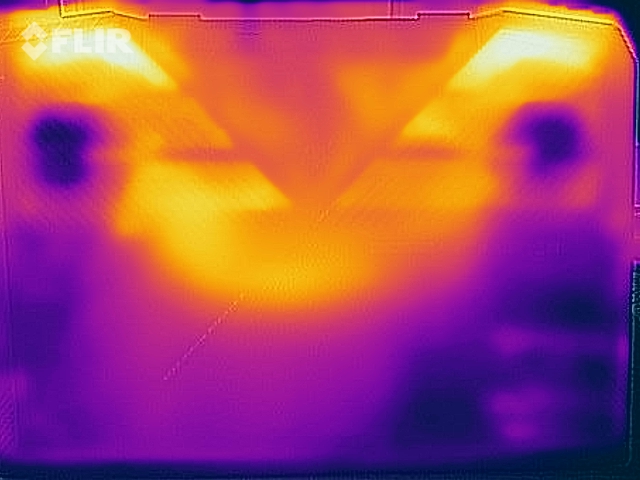
Temperature
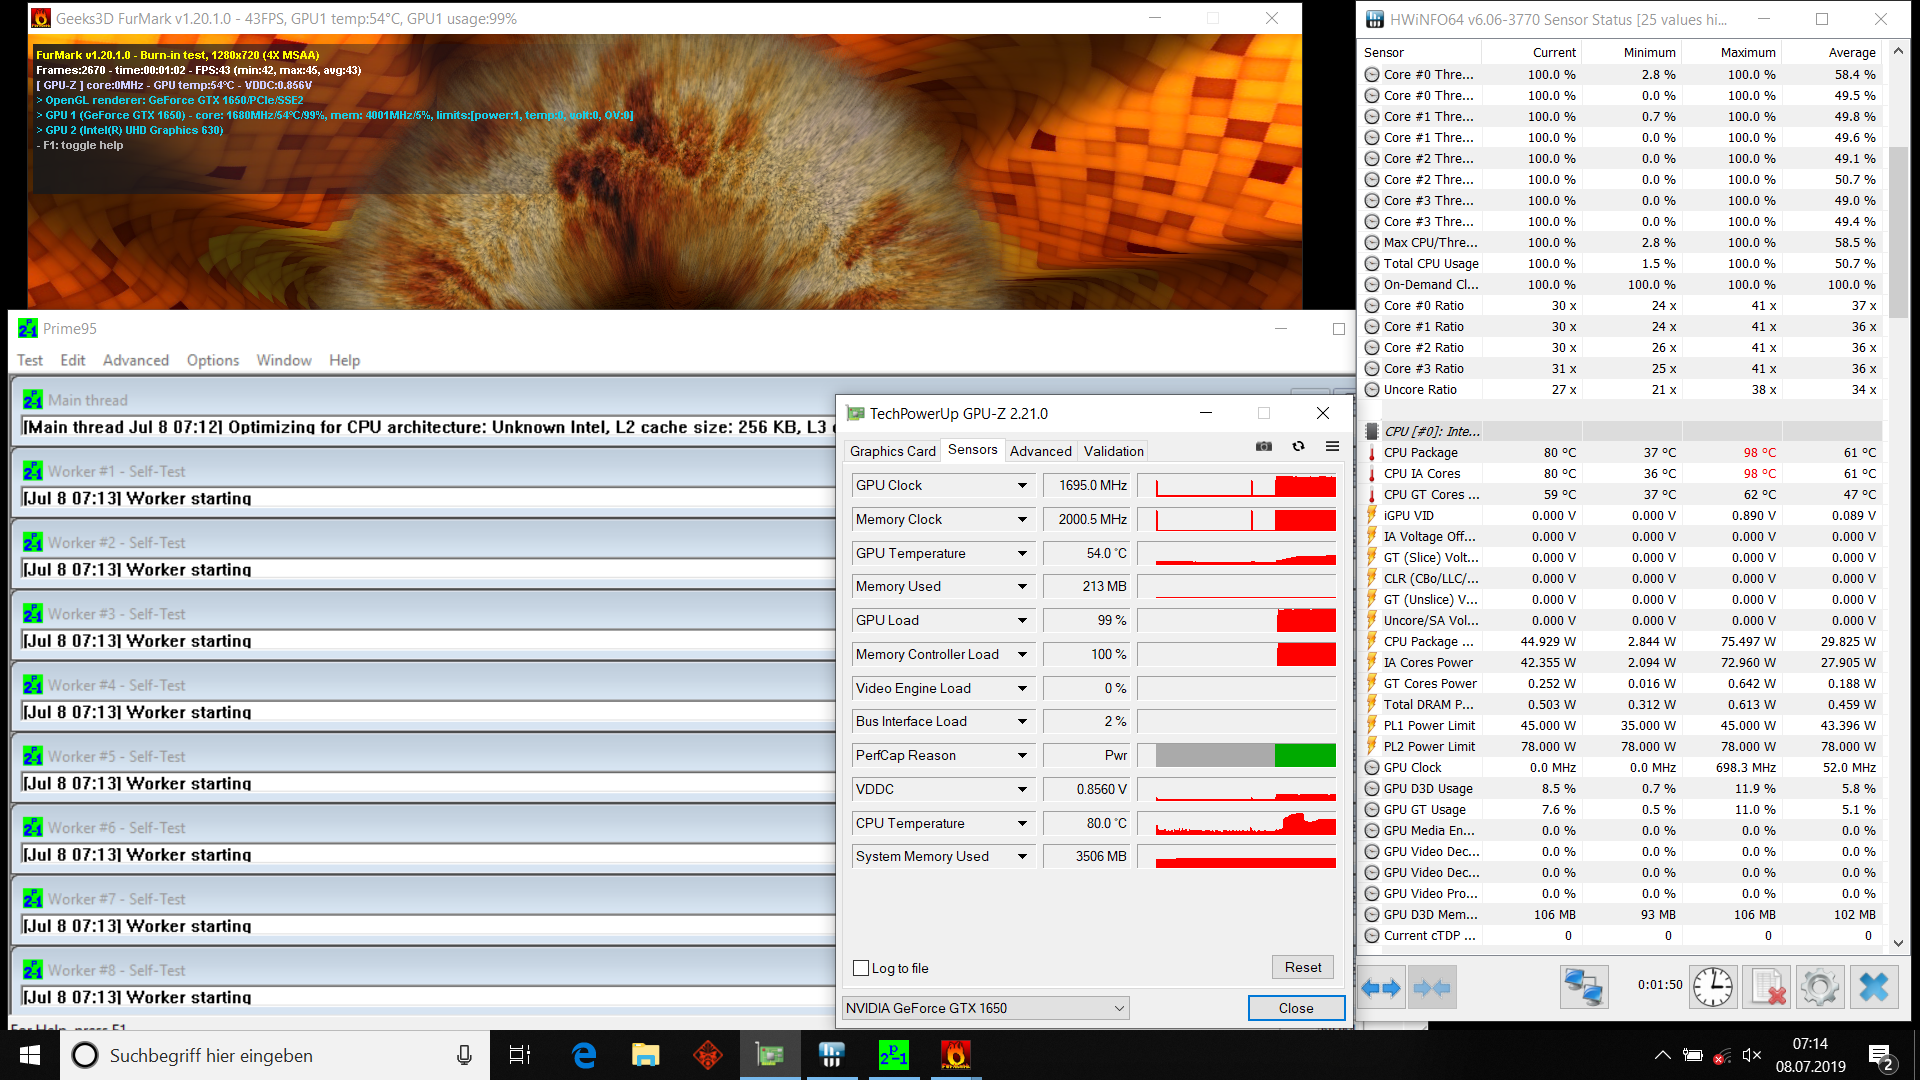
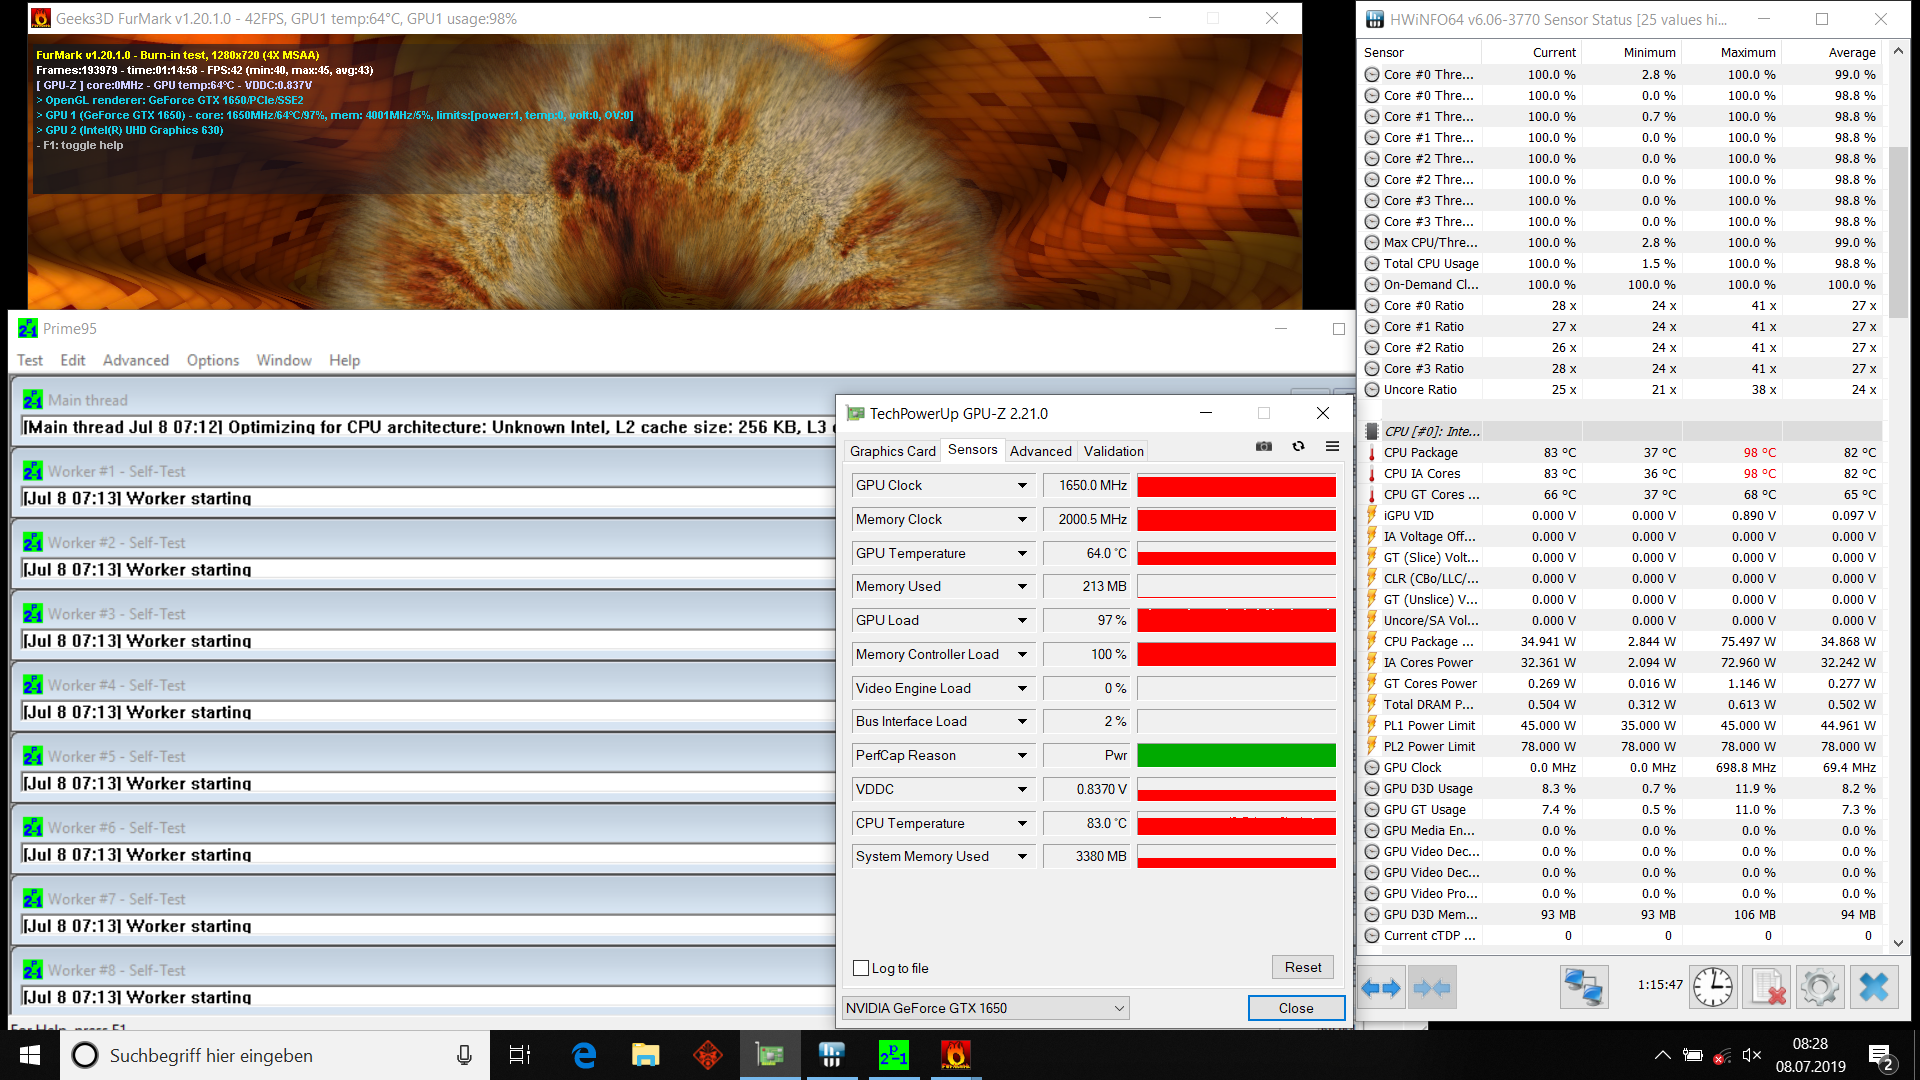
The Omen 15 completed our stress test (Prime95 and FurMark simultaneously for at least one hour) differently on mains and on battery. On mains the CPU ran at 3.8 to 4 GHz for a short while and then reduced its clock speed to around 3 GHz for the remainder of the test. The GPU started out at 1,710 MHz, which was then subsequently reduced to 1,650 MHz. On battery the CPU started out at 2.2 to 2.4 GHz and eventually settled at 1.2 to 2 GHz while the GPU fluctuated between 600 and 1,600 MHz. Keep in mind that this stress test is an extreme load scenario that rarely ever occurs in the real world. We run this test to determine whether or not a system remains stable even at extreme maximum load.
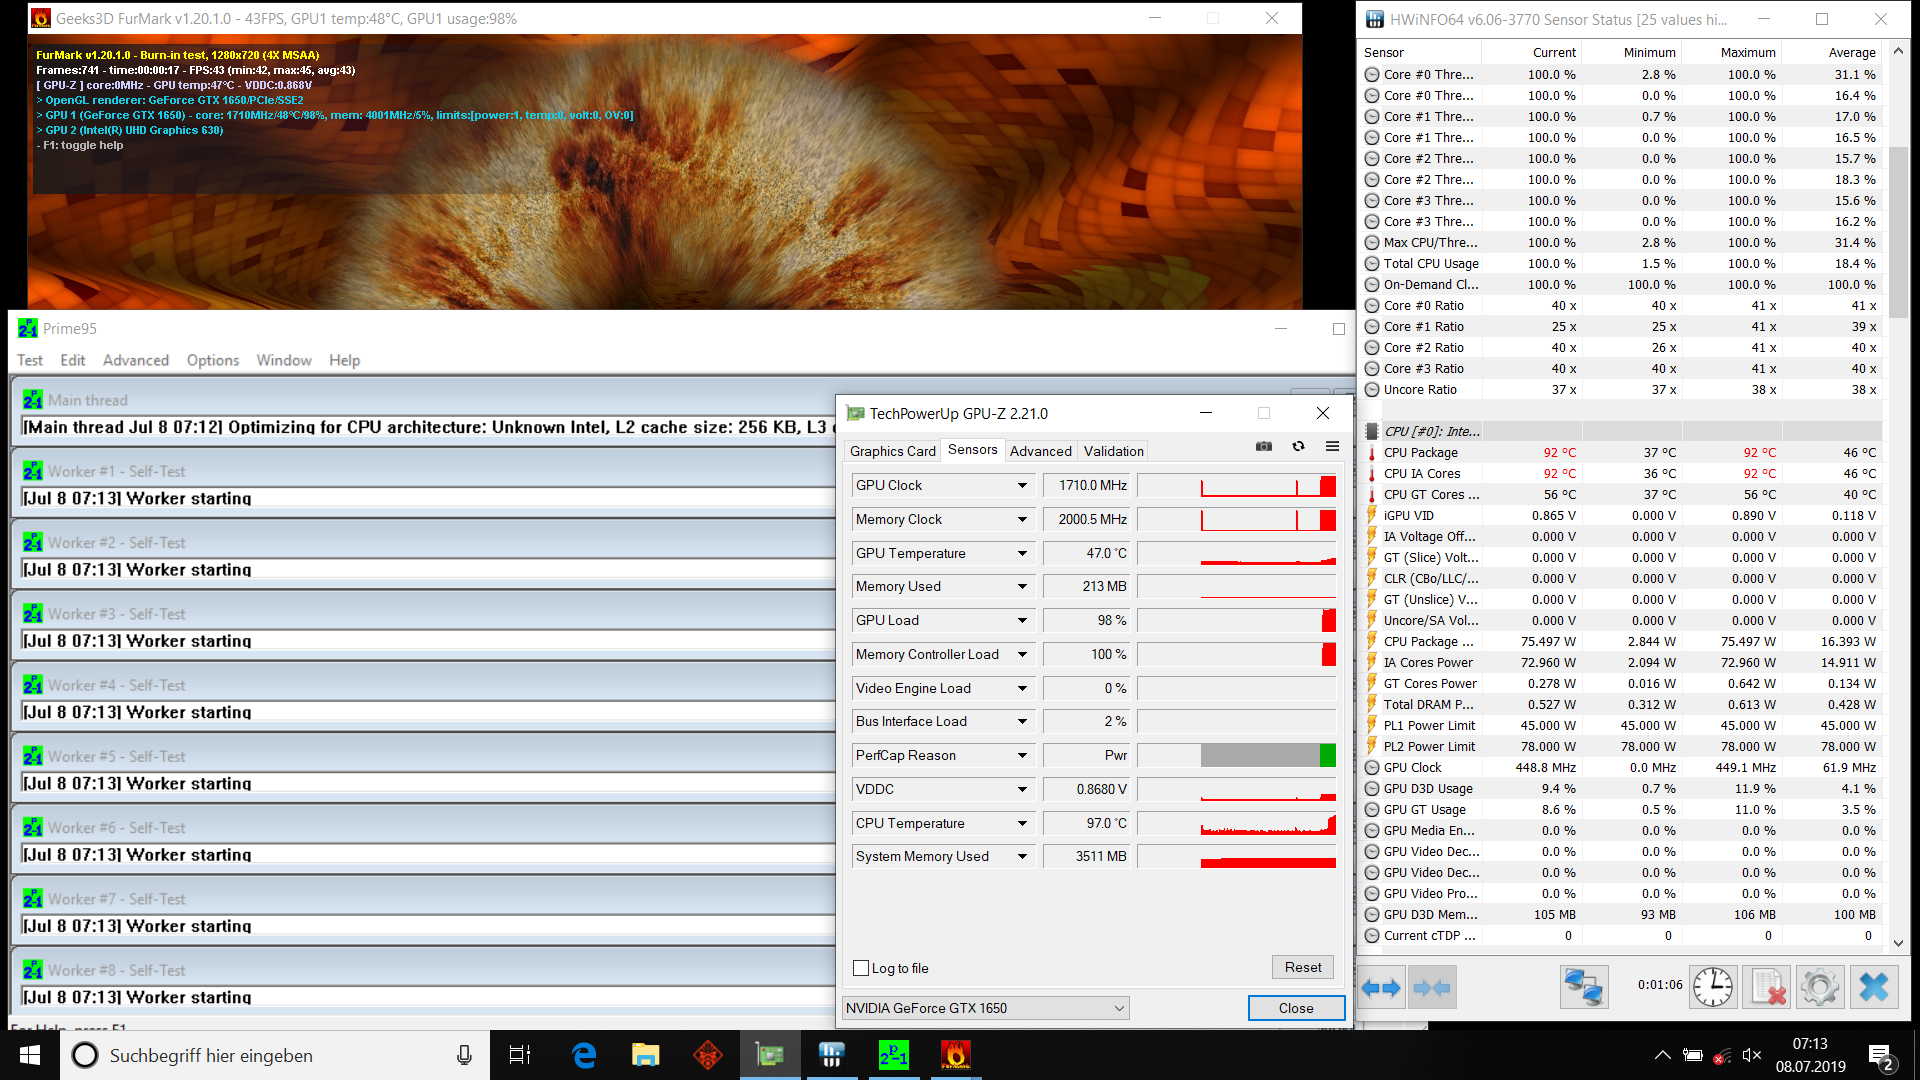
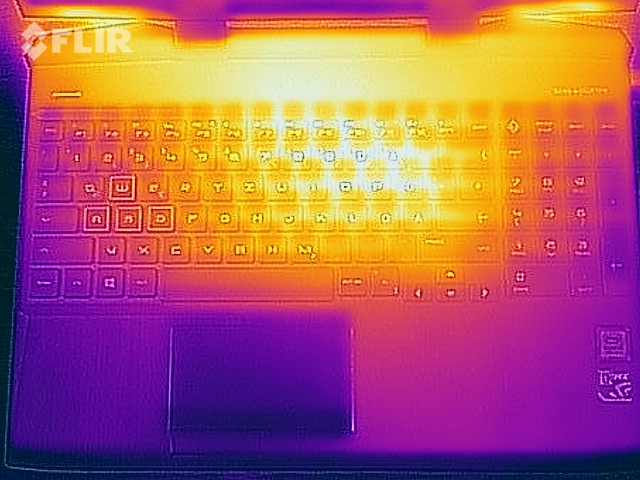
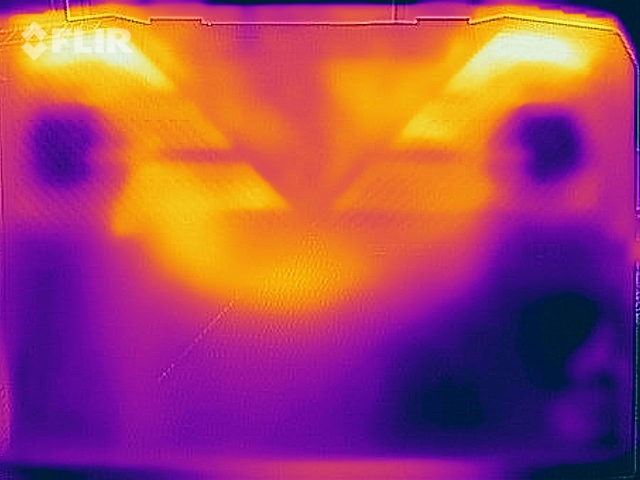
Overall, HP’s gaming notebook remained pleasantly cool. At no time during our stress test did the device cross the 50 °C (122 °F) threshold, and temperatures were similar during our "Witcher 3" test (Witcher 3 for a full hour in FHD and maximum details). The device should thus not be used on your lap when gaming, but will allow for lap usage in low to medium load everyday use cases.
(±) The maximum temperature on the upper side is 40.3 °C / 105 F, compared to the average of 40.4 °C / 105 F, ranging from 21.2 to 68.8 °C for the class Gaming.
(-) The bottom heats up to a maximum of 48.5 °C / 119 F, compared to the average of 43.2 °C / 110 F
(+) In idle usage, the average temperature for the upper side is 23.2 °C / 74 F, compared to the device average of 33.9 °C / 93 F.
(±) Playing The Witcher 3, the average temperature for the upper side is 34.7 °C / 94 F, compared to the device average of 33.9 °C / 93 F.
(+) The palmrests and touchpad are cooler than skin temperature with a maximum of 28.6 °C / 83.5 F and are therefore cool to the touch.
(±) The average temperature of the palmrest area of similar devices was 28.8 °C / 83.8 F (+0.2 °C / 0.3 F).
| HP Omen 15-dc1020ng i5-9300H, GeForce GTX 1650 Mobile | HP Omen 15-dc1303ng i7-8750H, GeForce RTX 2070 Max-Q | Asus TUF FX505DT-EB73 R7 3750H, GeForce GTX 1650 Mobile | Asus ROG Zephyrus G15 GA502DU R7 3750H, GeForce GTX 1660 Ti Max-Q | Acer Aspire Nitro 5 AN515-54-53Z2 i5-9300H, GeForce GTX 1650 Mobile | Dell G5 15 5590 i7-8750H, GeForce RTX 2060 Mobile | Average NVIDIA GeForce GTX 1650 Mobile | Average of class Gaming | |
|---|---|---|---|---|---|---|---|---|
| Heat | -33% | -17% | -34% | -6% | -13% | -13% | -20% | |
| Maximum Upper Side * (°C) | 40.3 | 47.6 -18% | 41.2 -2% | 55.8 -38% | 47 -17% | 51.5 -28% | 46 ? -14% | 45.2 ? -12% |
| Maximum Bottom * (°C) | 48.5 | 59.6 -23% | 40 18% | 58.2 -20% | 50 -3% | 48.3 -0% | 49.2 ? -1% | 48.2 ? 1% |
| Idle Upper Side * (°C) | 23.9 | 33.8 -41% | 34.6 -45% | 33.4 -40% | 24 -0% | 27.2 -14% | 28.3 ? -18% | 31 ? -30% |
| Idle Bottom * (°C) | 24.6 | 36.5 -48% | 34.4 -40% | 33.6 -37% | 25 -2% | 27.4 -11% | 28.9 ? -17% | 34.3 ? -39% |
* ... smaller is better
Speakers
HP Omen 15-dc1020ng audio analysis
(-) | not very loud speakers (71.1 dB)
Bass 100 - 315 Hz
(-) | nearly no bass - on average 21.6% lower than median
(±) | linearity of bass is average (11.3% delta to prev. frequency)
Mids 400 - 2000 Hz
(+) | balanced mids - only 1.8% away from median
(±) | linearity of mids is average (8.8% delta to prev. frequency)
Highs 2 - 16 kHz
(+) | balanced highs - only 3.2% away from median
(+) | highs are linear (5.8% delta to prev. frequency)
Overall 100 - 16.000 Hz
(±) | linearity of overall sound is average (22.2% difference to median)
Compared to same class
» 79% of all tested devices in this class were better, 6% similar, 14% worse
» The best had a delta of 6%, average was 18%, worst was 132%
Compared to all devices tested
» 65% of all tested devices were better, 6% similar, 29% worse
» The best had a delta of 4%, average was 23%, worst was 134%
Acer Aspire Nitro 5 AN515-54-53Z2 audio analysis
(±) | speaker loudness is average but good (79 dB)
Bass 100 - 315 Hz
(±) | reduced bass - on average 14.5% lower than median
(±) | linearity of bass is average (11.9% delta to prev. frequency)
Mids 400 - 2000 Hz
(±) | higher mids - on average 8.5% higher than median
(±) | linearity of mids is average (7.2% delta to prev. frequency)
Highs 2 - 16 kHz
(+) | balanced highs - only 3.4% away from median
(+) | highs are linear (6.7% delta to prev. frequency)
Overall 100 - 16.000 Hz
(±) | linearity of overall sound is average (20.7% difference to median)
Compared to same class
» 74% of all tested devices in this class were better, 4% similar, 21% worse
» The best had a delta of 6%, average was 18%, worst was 132%
Compared to all devices tested
» 56% of all tested devices were better, 8% similar, 36% worse
» The best had a delta of 4%, average was 23%, worst was 134%
Energy Management
Power Consumption
Overall power consumption remained inconspicuous regardless of load. Its maximum consumption when idle was a very decent 11.4 W, and peaked out at 144.5 W during our stress test. When gaming we were able to measure a power consumption of around 93.6 W during our "Witcher 3" test. The power supply is rated at 150 W.
| Off / Standby | |
| Idle | |
| Load |
|
Key:
min: | |
| HP Omen 15-dc1020ng i5-9300H, GeForce GTX 1650 Mobile | HP Omen 15-dc1303ng i7-8750H, GeForce RTX 2070 Max-Q | Asus TUF FX505DT-EB73 R7 3750H, GeForce GTX 1650 Mobile | Asus ROG Zephyrus G15 GA502DU R7 3750H, GeForce GTX 1660 Ti Max-Q | Acer Aspire Nitro 5 AN515-54-53Z2 i5-9300H, GeForce GTX 1650 Mobile | Dell G5 15 5590 i7-8750H, GeForce RTX 2060 Mobile | Average NVIDIA GeForce GTX 1650 Mobile | Average of class Gaming | |
|---|---|---|---|---|---|---|---|---|
| Power Consumption | -103% | -16% | -57% | -2% | -8% | -13% | -122% | |
| Idle Minimum * (Watt) | 4.04 | 14.7 -264% | 7 -73% | 7.4 -83% | 5 -24% | 3.5 13% | 4.96 ? -23% | 13 ? -222% |
| Idle Average * (Watt) | 7.2 | 18.6 -158% | 9.9 -38% | 8.6 -19% | 7 3% | 6.9 4% | 8.61 ? -20% | 18.7 ? -160% |
| Idle Maximum * (Watt) | 11.4 | 22.6 -98% | 12 -5% | 39.1 -243% | 11 4% | 8.5 25% | 14.8 ? -30% | 24.3 ? -113% |
| Load Average * (Watt) | 80.8 | 90 -11% | 68.4 15% | 65.9 18% | 89 -10% | 127 -57% | 81.7 ? -1% | 110.2 ? -36% |
| Witcher 3 ultra * (Watt) | 93.6 | 94.9 -1% | 106.9 -14% | 90 4% | ||||
| Load Maximum * (Watt) | 144.5 | 120 17% | 130.9 9% | 141.3 2% | 132 9% | 179 -24% | 131.9 ? 9% | 258 ? -79% |
* ... smaller is better
Battery Life
In our real-world Wi-Fi test HP’s notebook lasted for 6:25 hours. In this test we simulate browsing the web by loading websites via a script with the energy plan set to “Balanced” and display brightness normalized to 150 nits. In our video test the device ran for 8:02 hours. In this test we run the Big Buck Bunny short film (H.264, 1920x1080) in a loop with the energy plan set to “Power Saver”, all radios disabled, and the display brightness once again normalized to 150 nits.
All things considered the HP Omen 15 offered decent battery life for a gaming notebook, and it ran longer than its more powerful sibling despite a smaller battery (52.5 vs. 70 Wh) mainly for two reasons: its sibling featured more powerful and thus more demanding hardware, and its internal GPU was disabled completely.
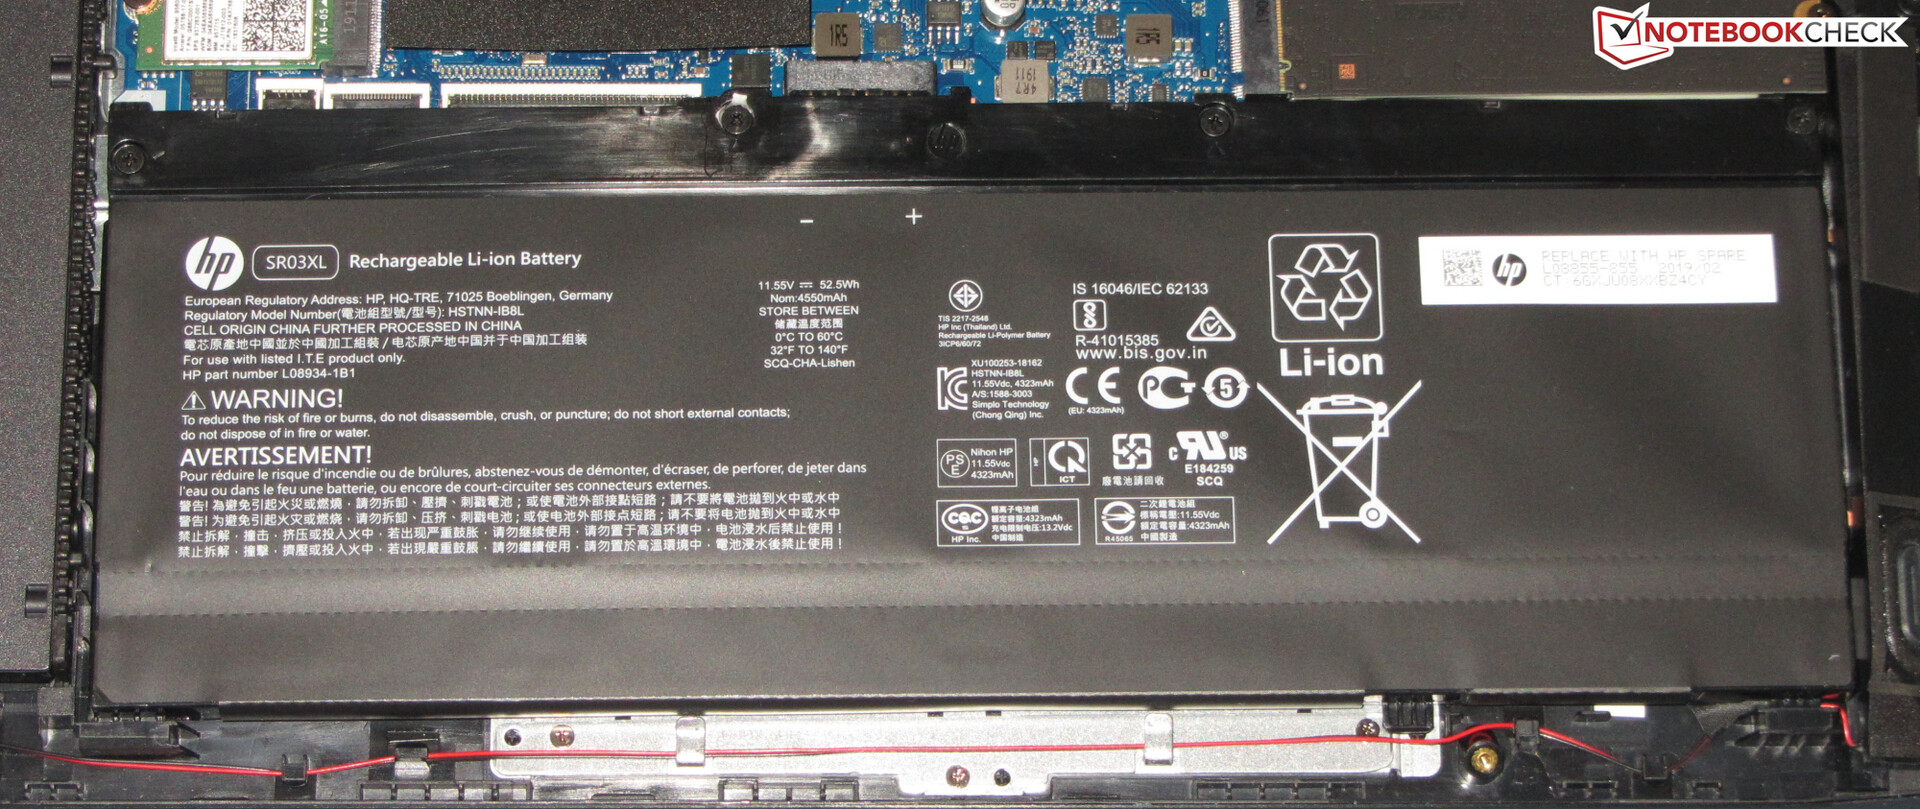
| HP Omen 15-dc1020ng i5-9300H, GeForce GTX 1650 Mobile, 52.5 Wh | Asus TUF FX505DT-EB73 R7 3750H, GeForce GTX 1650 Mobile, 48 Wh | Asus ROG Zephyrus G15 GA502DU R7 3750H, GeForce GTX 1660 Ti Max-Q, 76 Wh | Acer Aspire Nitro 5 AN515-54-53Z2 i5-9300H, GeForce GTX 1650 Mobile, 57 Wh | Dell G5 15 5590 i7-8750H, GeForce RTX 2060 Mobile, 60 Wh | HP Omen 15-dc1303ng i7-8750H, GeForce RTX 2070 Max-Q, 70 Wh | Average of class Gaming | |
|---|---|---|---|---|---|---|---|
| Battery runtime | -17% | 32% | 20% | 38% | -39% | 0% | |
| Reader / Idle (h) | 15.9 | 7.8 -51% | 15.3 -4% | 17.4 9% | 14.8 -7% | 5 -69% | 8.71 ? -45% |
| H.264 (h) | 8 | 8.4 5% | 8.64 ? 8% | ||||
| WiFi v1.3 (h) | 6.4 | 4.8 -25% | 8 25% | 8.1 27% | 7.7 20% | 3.3 -48% | 7.15 ? 12% |
| Witcher 3 ultra (h) | 1 | ||||||
| Load (h) | 1.2 | 1.5 25% | 2.1 75% | 1.5 25% | 2.8 133% | 1.2 0% | 1.502 ? 25% |
Pros
Cons
Verdict
At the time of writing the HP Omen 15-dc1020ng was the most affordable entry-level Omen 15 notebook. Around $1,000 gets you a gaming notebook with Core i5-9300H and GeForce GTX 1650 capable of running all current games smoothly on its display in FHD resolution and medium details. Some games even allowed for higher settings and resolutions. In order to get the most out of the system we advise you to add a second memory module in order to enable dual-channel mode.
The device remains fairly cool and quiet regardless of load, particularly so in idle and low to medium load use cases. It also offers a decent battery life of roughly 6.5 hours when browsing the web or 8 hours when watching movies.
Hewlett Packard’s current Omen 15 entry-level model is a well balanced gaming notebook at a moderate price point.
HP has also opted for a fast 512 GB NVMe SSD, which can be upgraded for a more spacious storage device. In addition, users can add a secondary 2.5-inch SSD or HDD. A storage bay and mounting frame are included by default.
The matte FHD IPS panel offers wide viewing angles and a decent contrast ratio. However, its maximum brightness is too low and further reduced on battery, and the color space coverage was disappointing, to say the least. We expect more of a notebook at the Omen 15’s price point. The keyboard is usable and includes a backlight. Unfortunately, the Omen 15 lacks Thunderbolt 3, which would have allowed for a more powerful external GPU.
HP Omen 15-dc1020ng
- 09/20/2019 v7 (old)
Sascha Mölck
Price comparison

