Asus TUF FX505DY (Ryzen 5 3550H, Radeon RX 560X) Laptop Review
Asus unveiled the TUF FX505DY at CES 2019 alongside the AMD Zen+ family of processors. It has the distinction of being all AMD inside and the first to carry a Zen+ Ryzen 5 3550H CPU that will have a lot to prove in a market dominated by Intel H-class CPUs. Much like how the 2017 Asus Zephyrus GX501 was the premier Nvidia Max-Q laptop, the TUF FX505 is AMD's premier Zen+ laptop with all eyes on performance.
The TUF series is home to Asus' budget-mainstream gaming laptops in contrast to the higher-end ROG series. Since the Ryzen 5 3550H is also targeting budget-mainstream laptops, the TUF FX505DY should be a snug fit to showcase the Zen+ CPU at its best. Asus has chosen to pair AMD's brand new processor with the two-year old Radeon RX 560X Polaris GPU, so this uncommon combination should make some interesting results when compared to the sea of Intel-Nvidia alternatives currently available.
The FX505 is the successor to last year's FX504 with a newer chassis. Nonetheless, we will still be comparing the system to the FX504 as well as some competing budget Intel-Nvidia 15.6-inch alternatives like the Gigabyte Sabre 15, Lenovo Legion Y530-15ICH, MSI GP63, Acer Nitro 5 AN515, Samsung Odyssey 15, and HP Pavilion 15 Gaming. Our Asus has the notable advantage of costing only $700 MSRP compared to the $900+ launch prices of the aforementioned alternatives.
Note that Asus is also planning to launch a 17.3-inch version of the model we have here called the TUF FX705DY.
More Asus gaming reviews:
Case
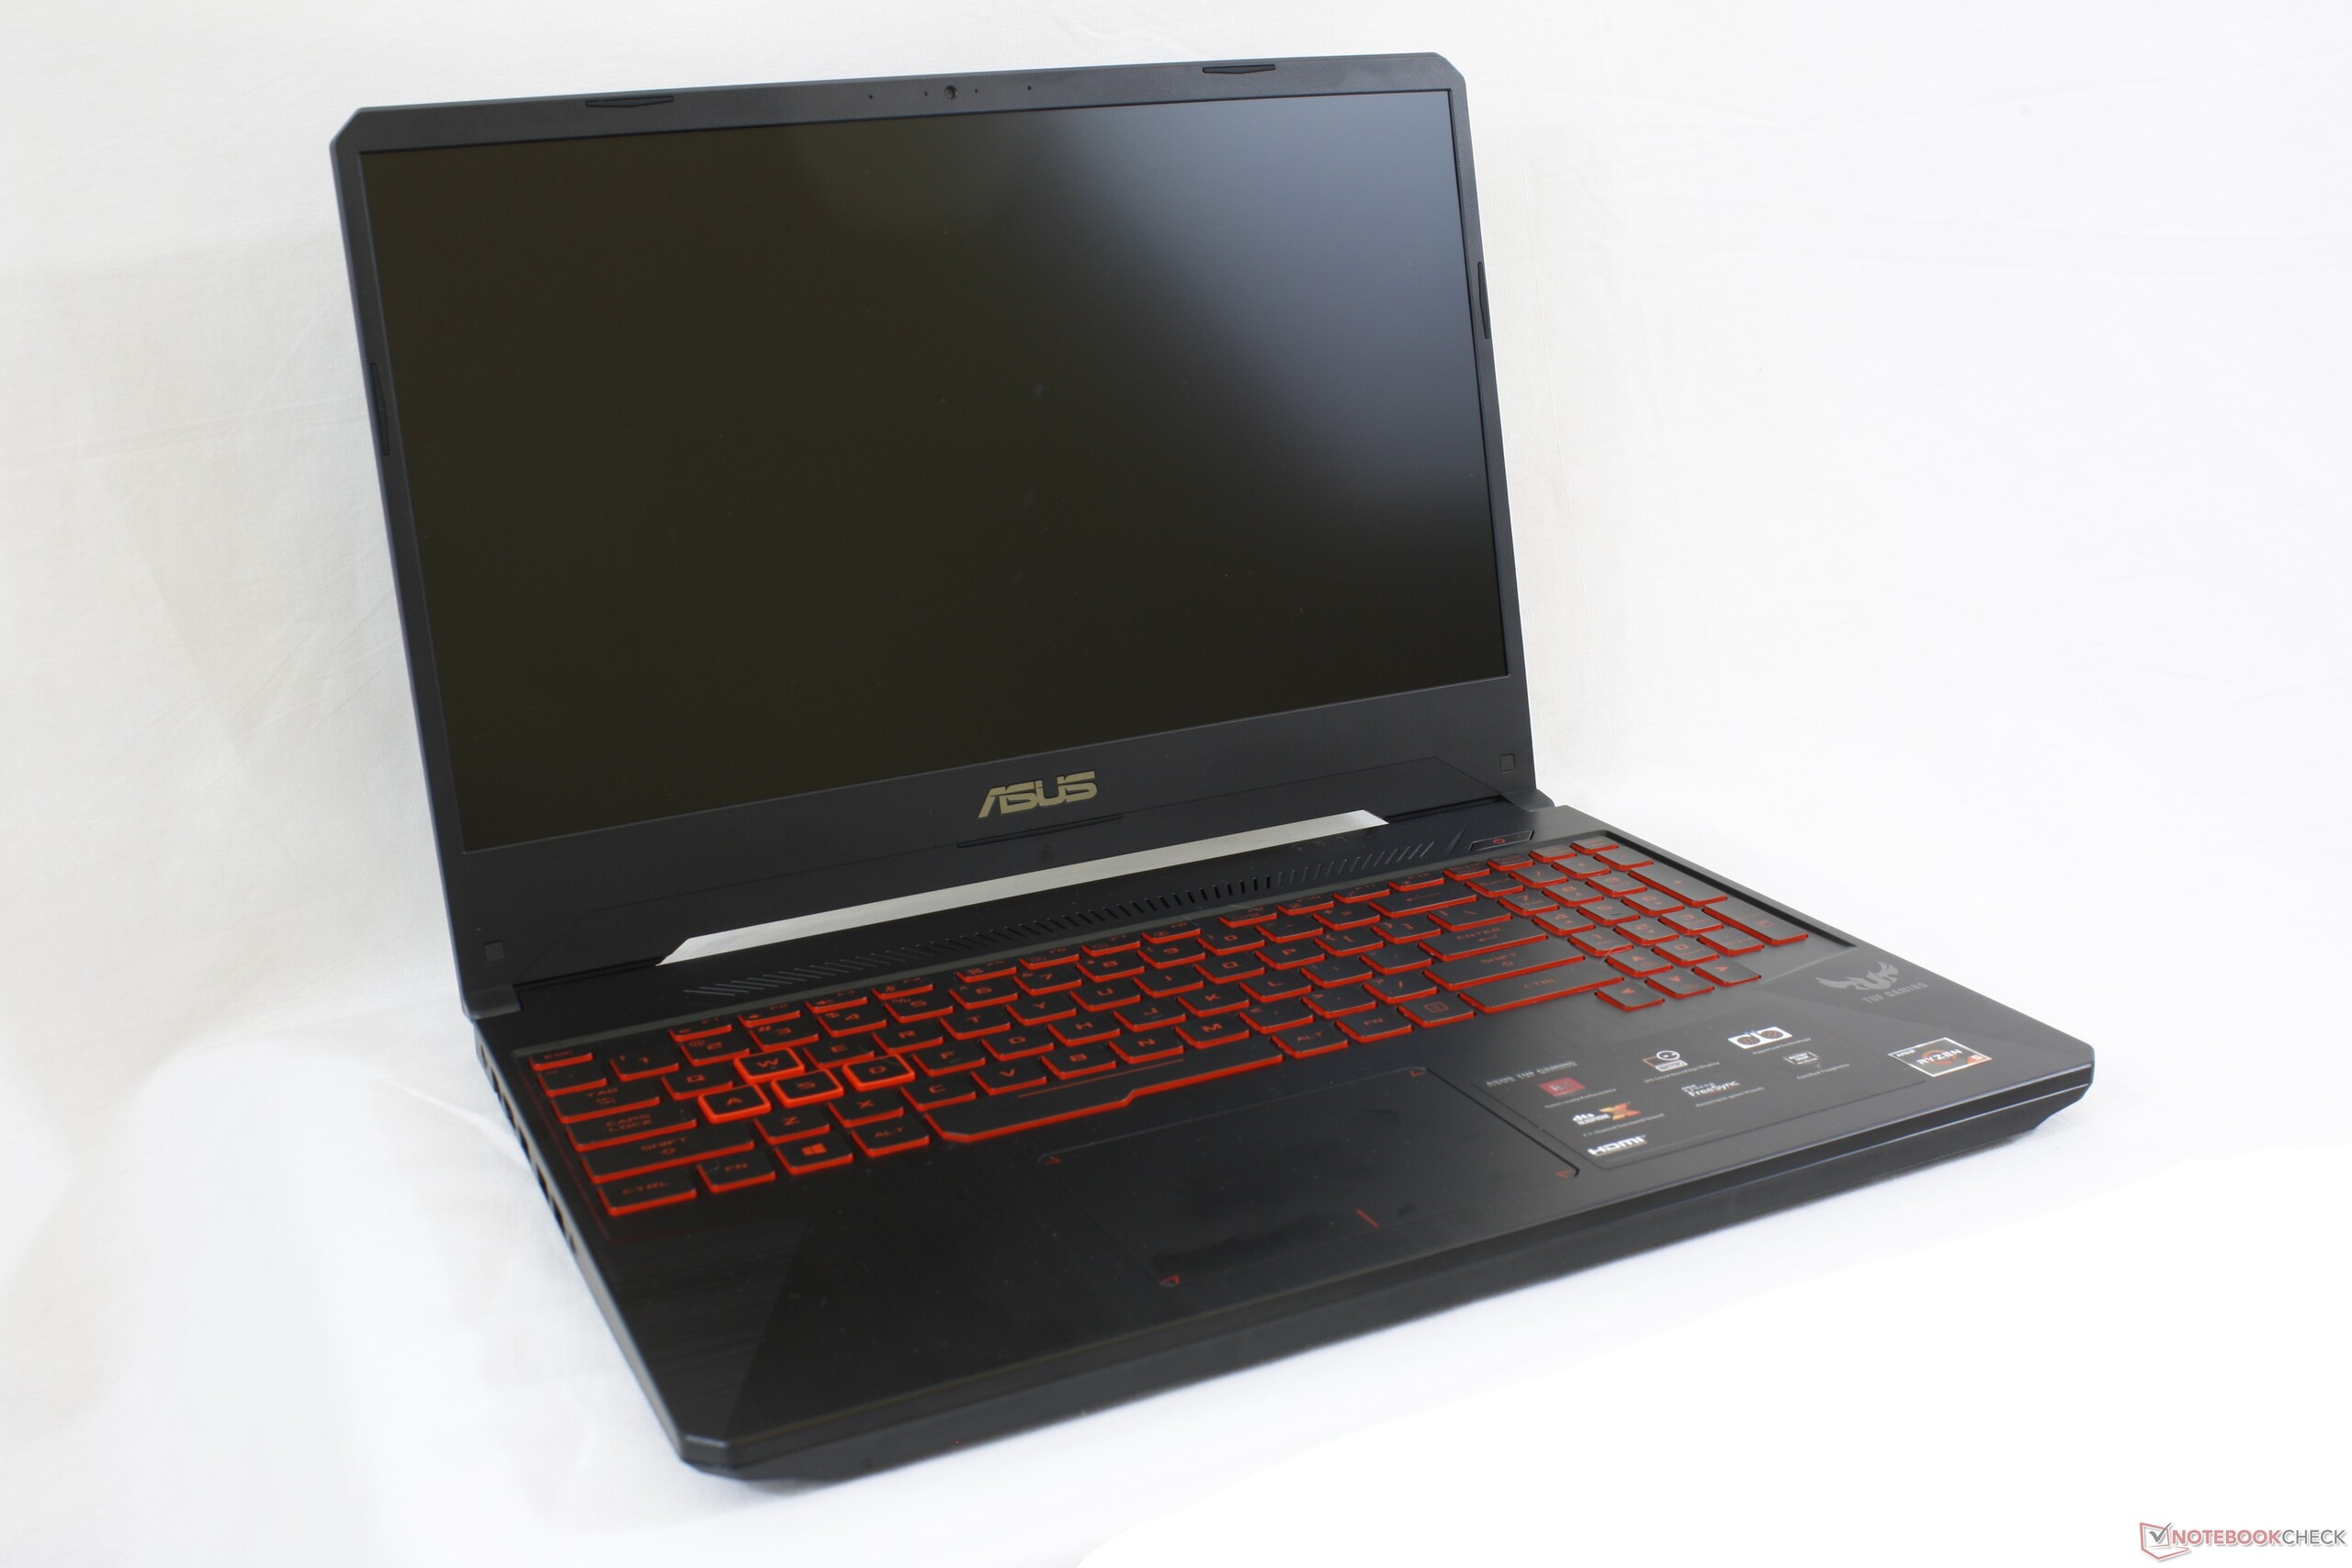
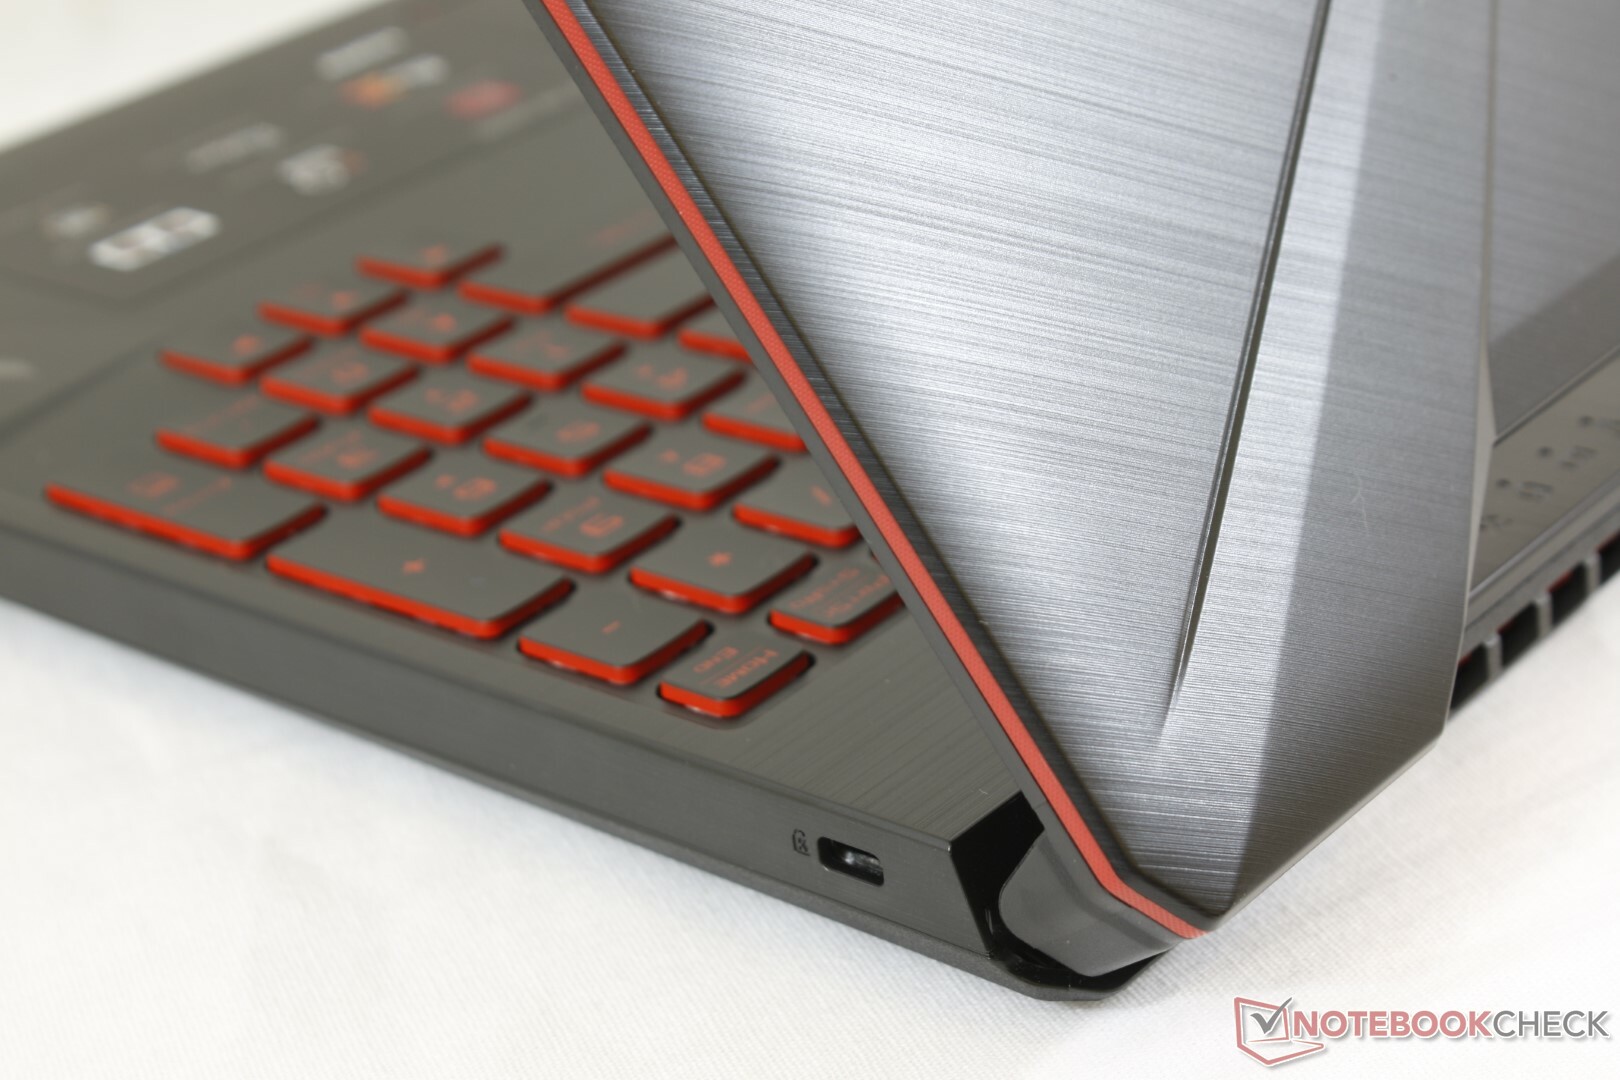
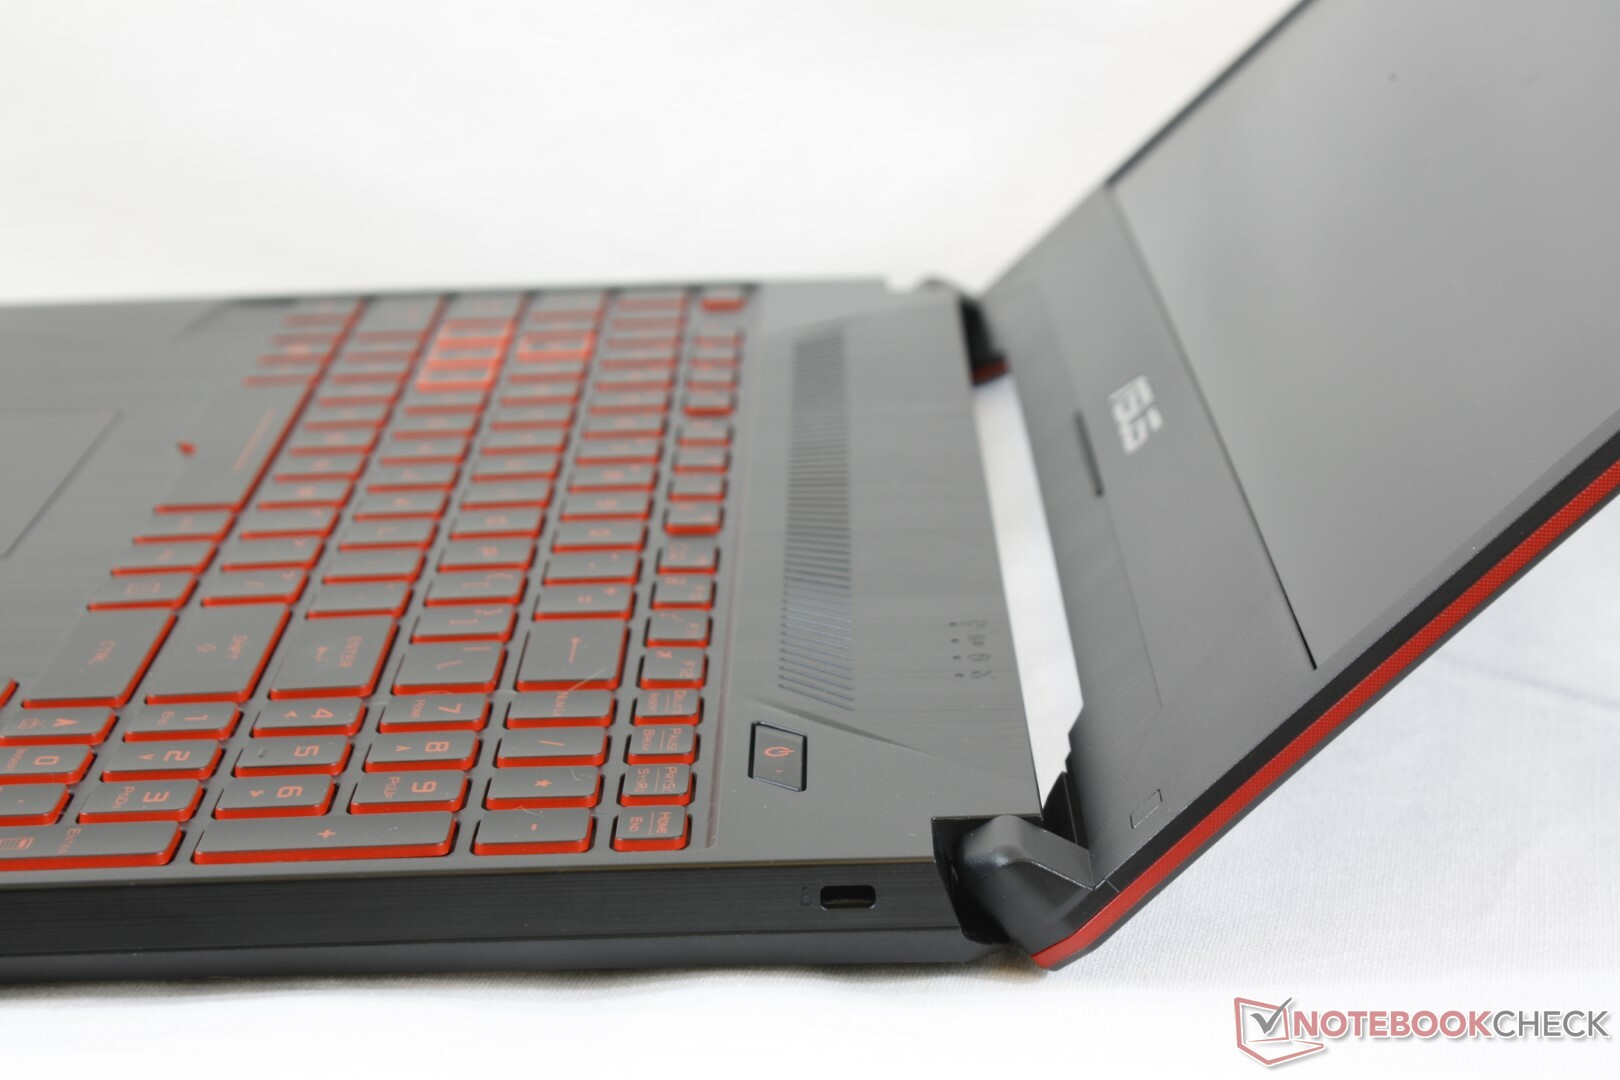
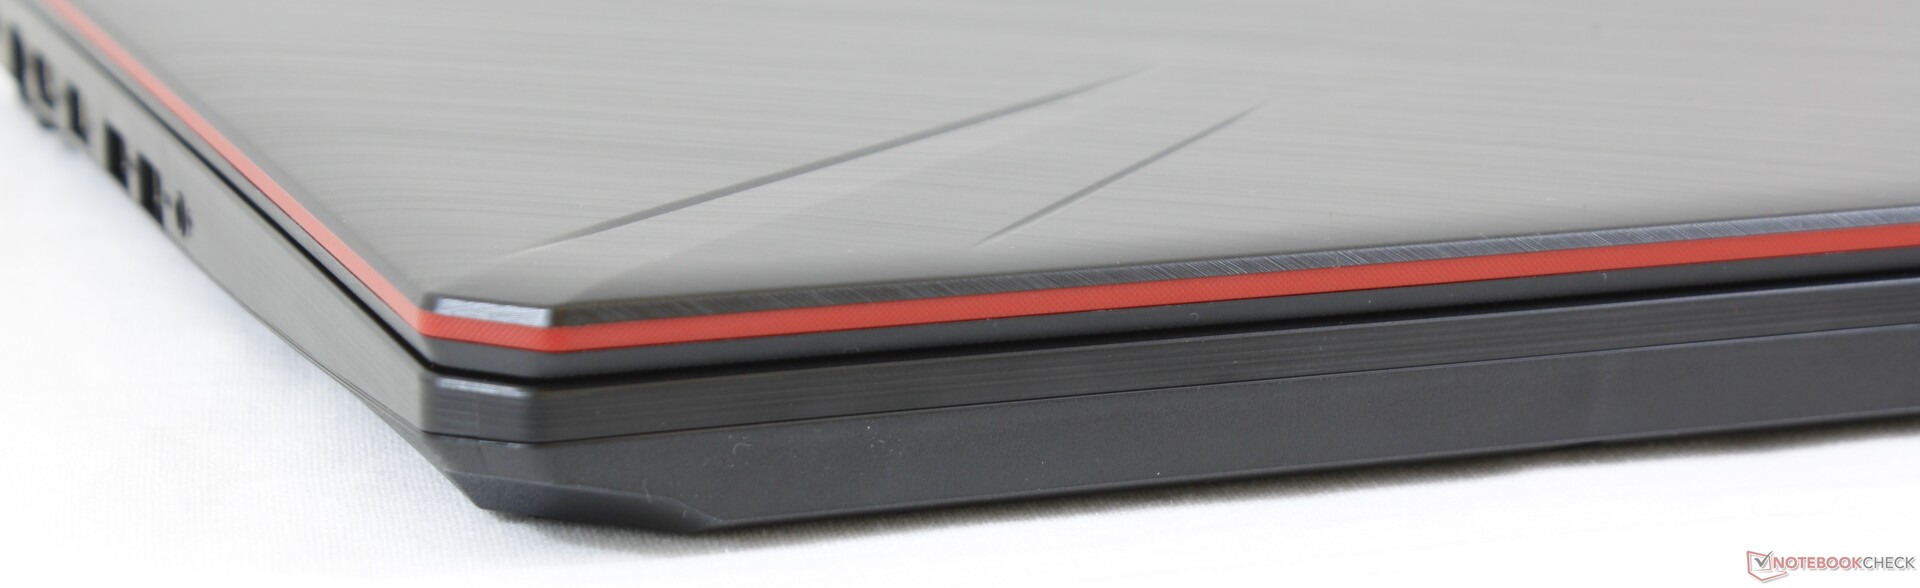
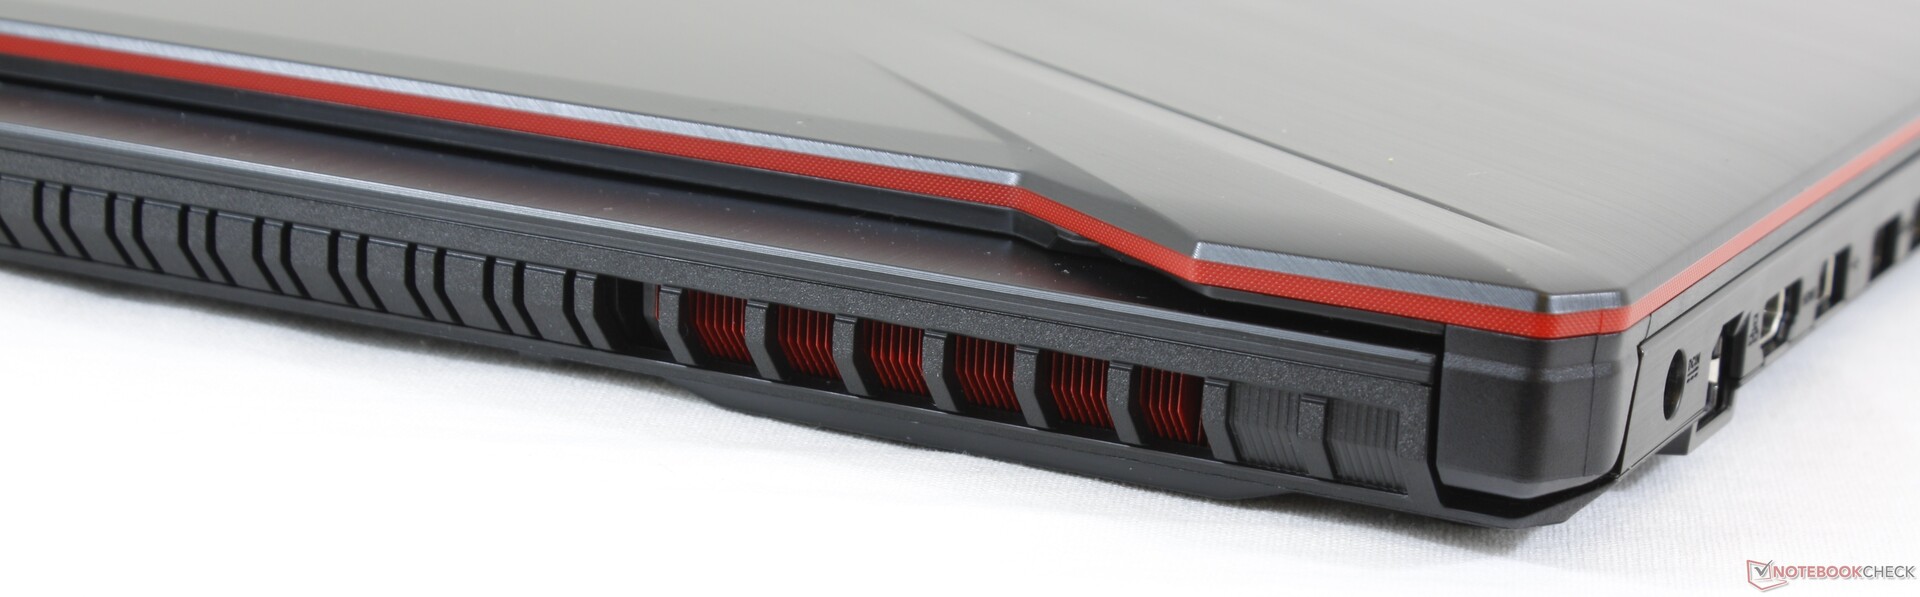
Take the FX504 chassis, cut the side bezels narrower, and you're essentially left with the FX505. The design, chassis material, and overall feel of the system remain the same. Unfortunately, this also means that all the disadvantages of the FX504 are still in effect here including the flexible lid and slight creaking of the hinges and base. The all-plastic build certainly gives a budget impression when compared to the higher-end Zephyrus or Strix series that retail for significantly more. We find it to be run-of-the-mill and not significantly better or worse than many other budget gaming laptops like the Sabre 15 or Acer Nitro 5 AN515.
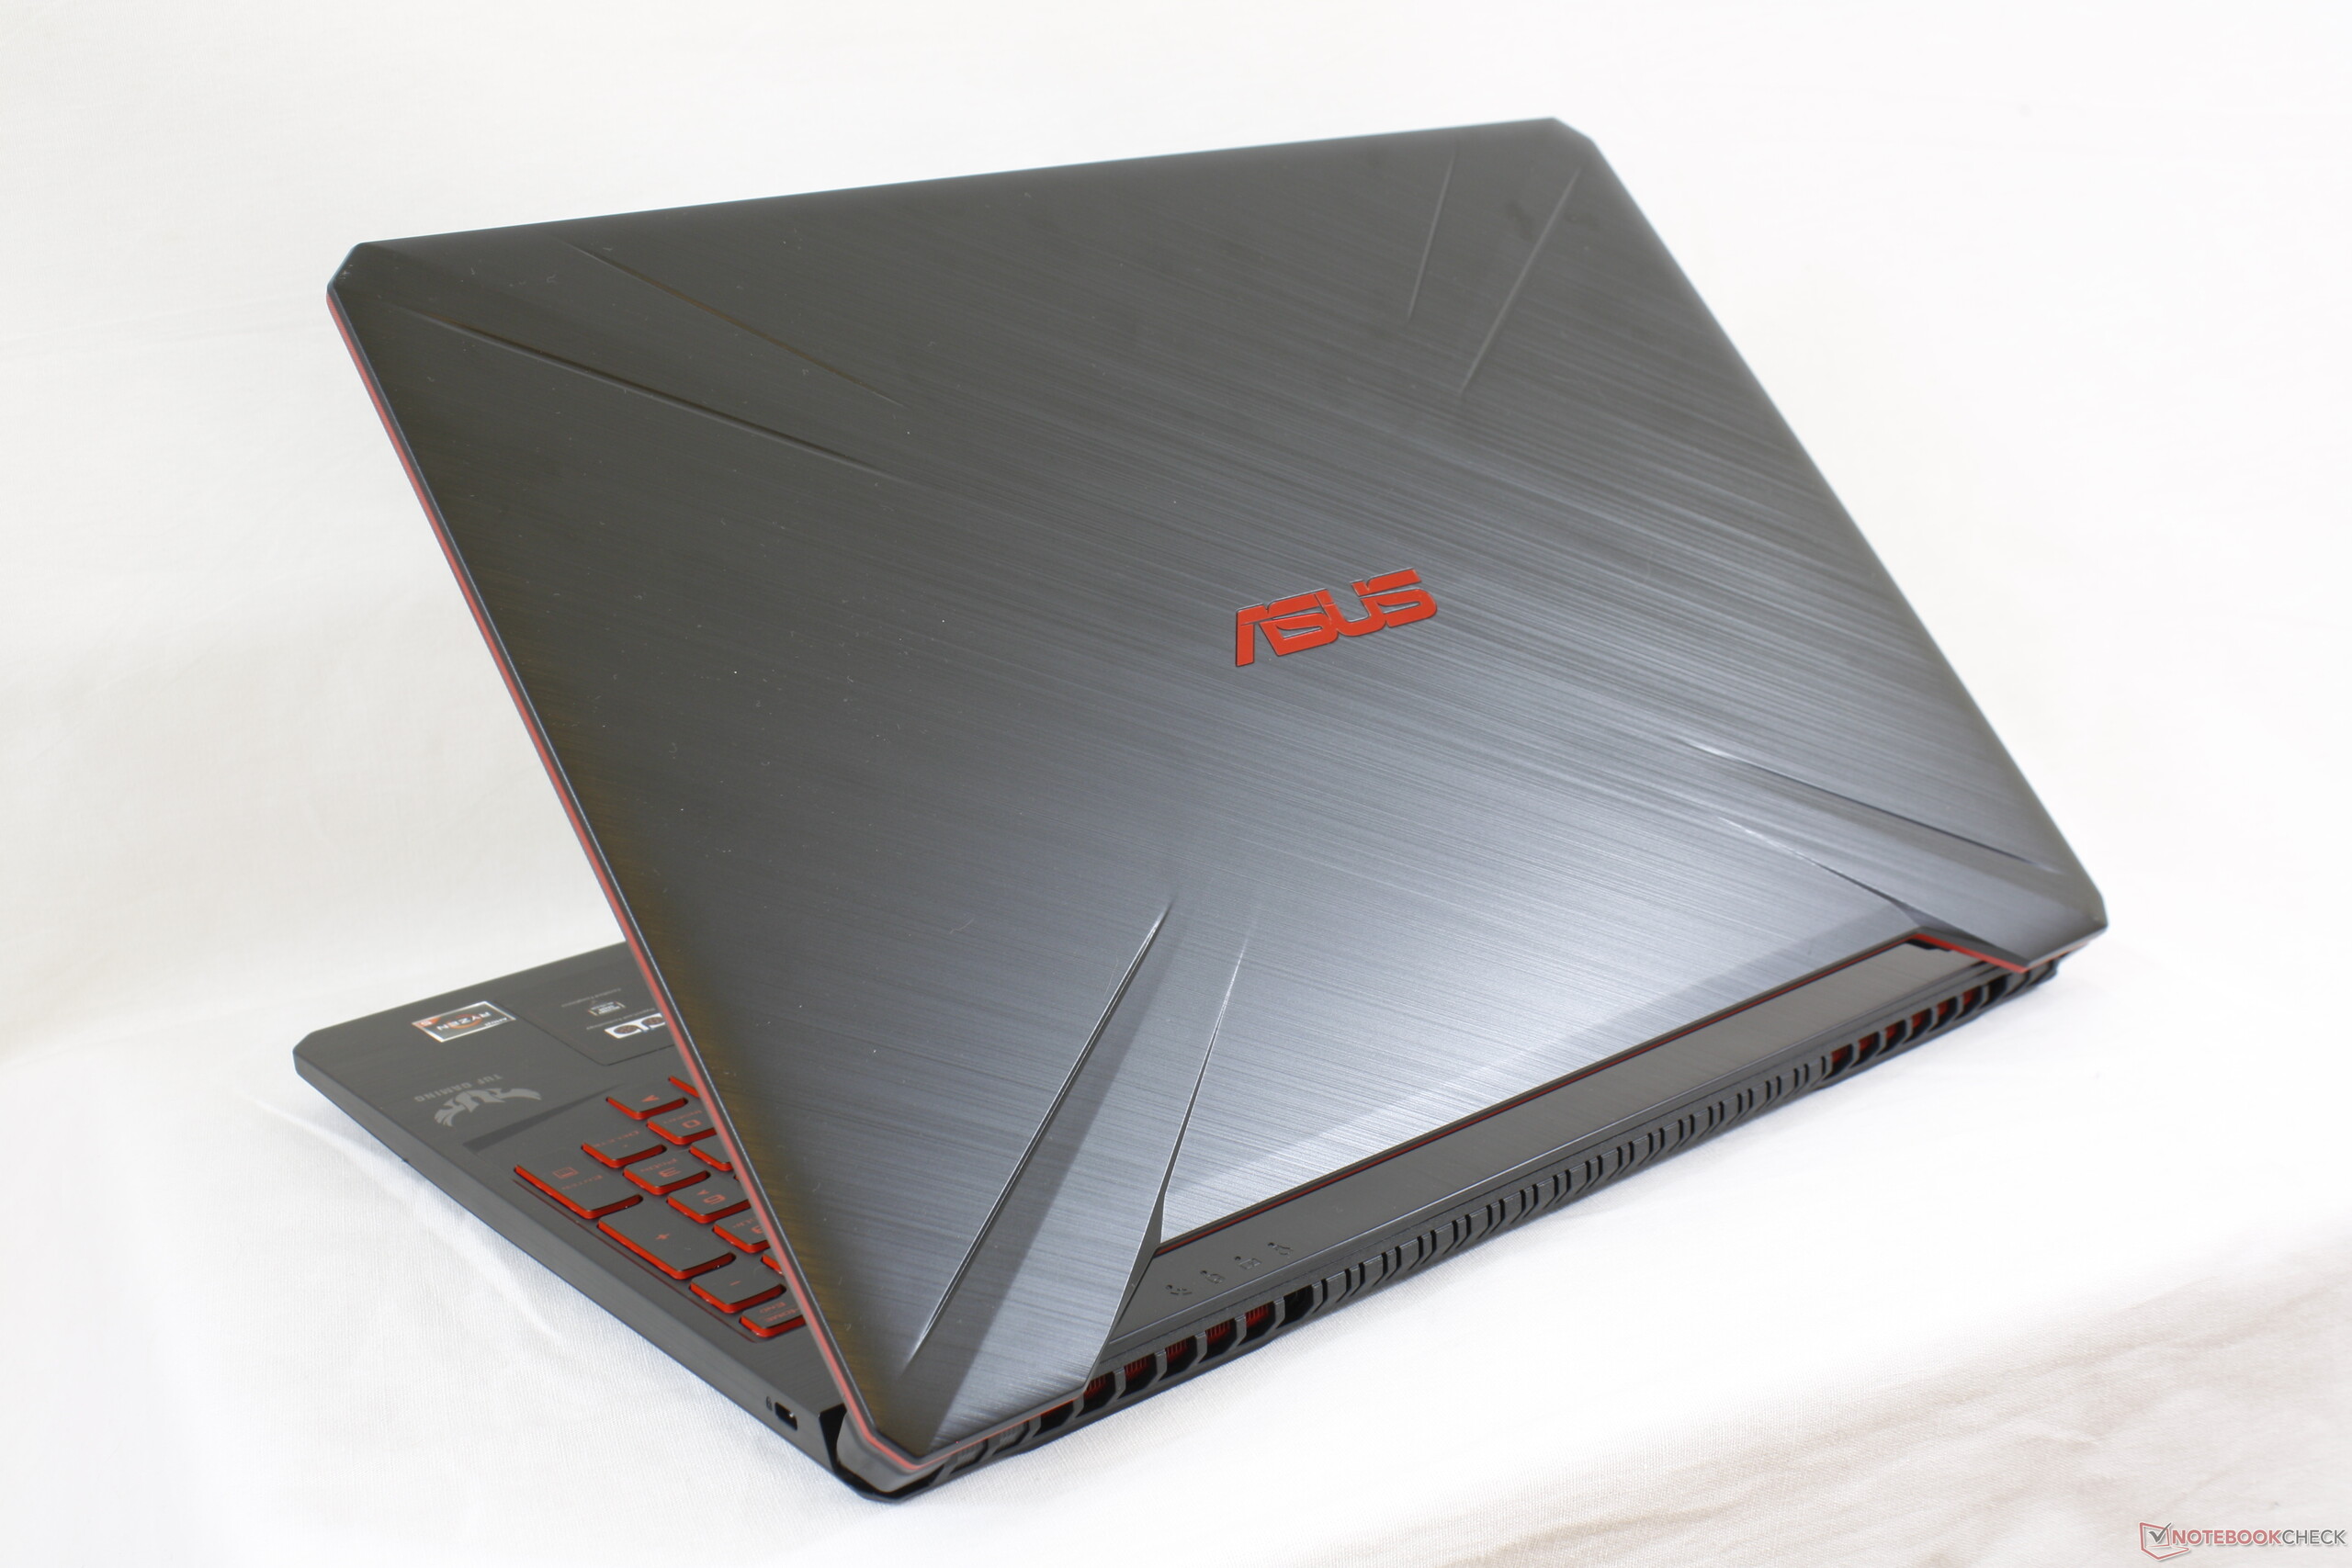
Thickness and length are almost identical to the FX504 series while width has been cut by over 20 mm because of the narrower bezels. It's one of the more compact 15.6-inch gaming laptops available without resorting to higher-end models like the MSI GS65 or Razer Blade 15 that can cost over twice as much.
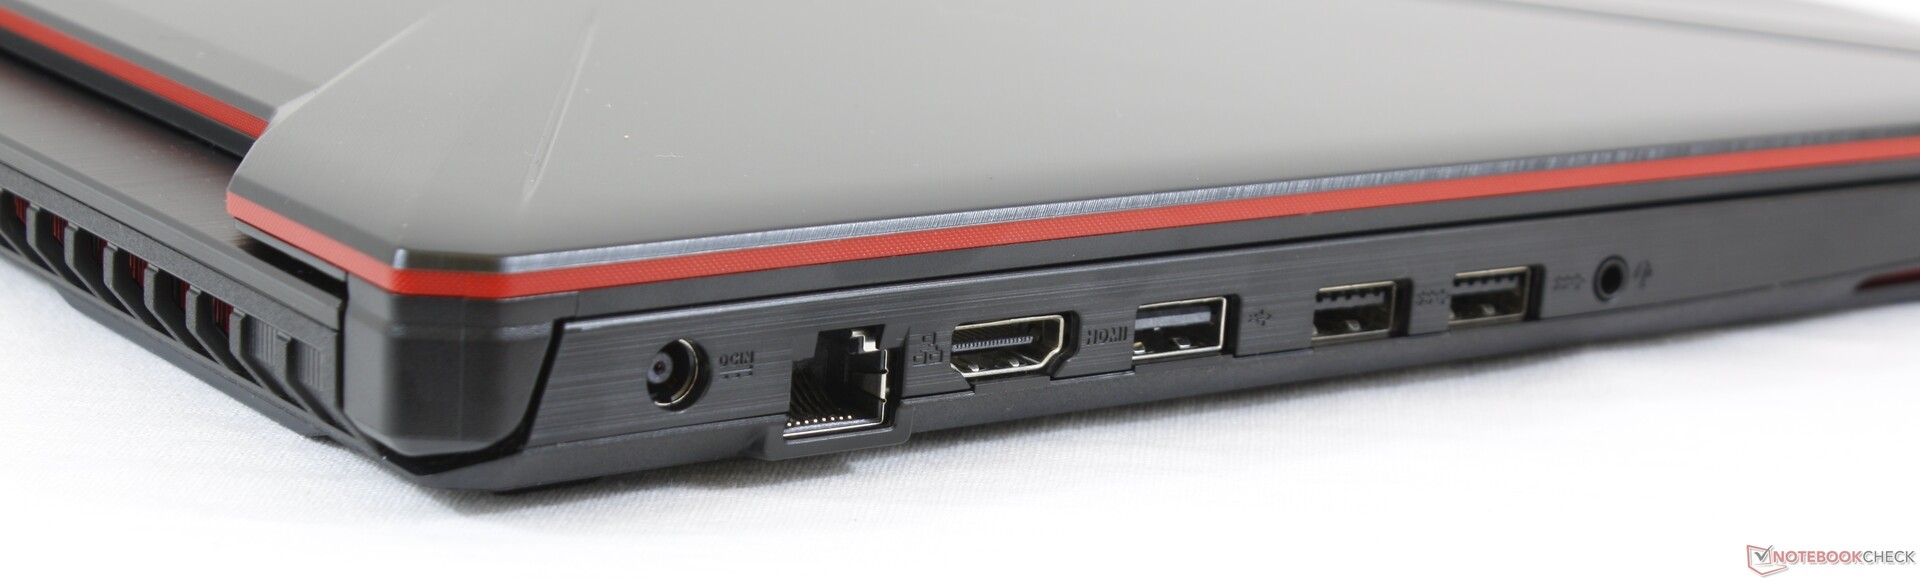
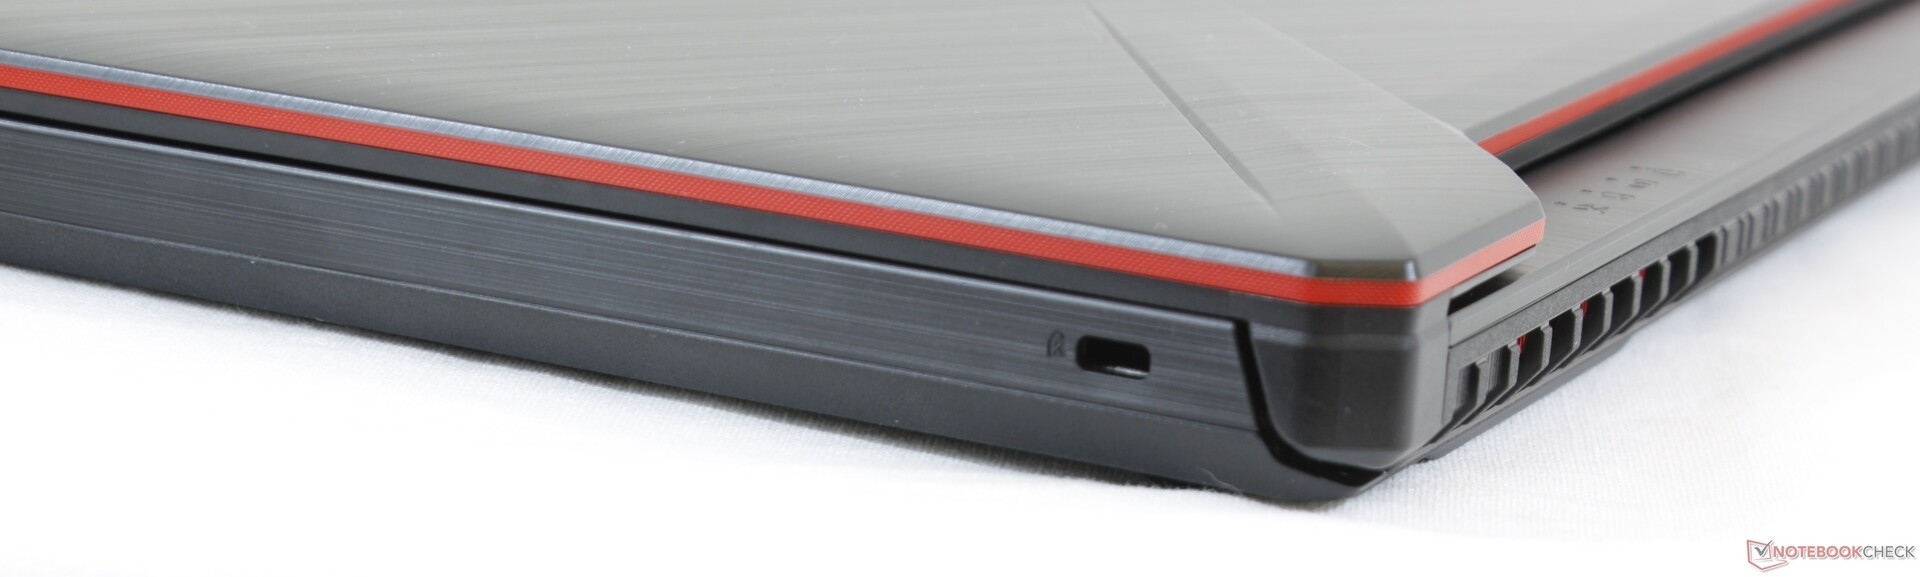
Connectivity
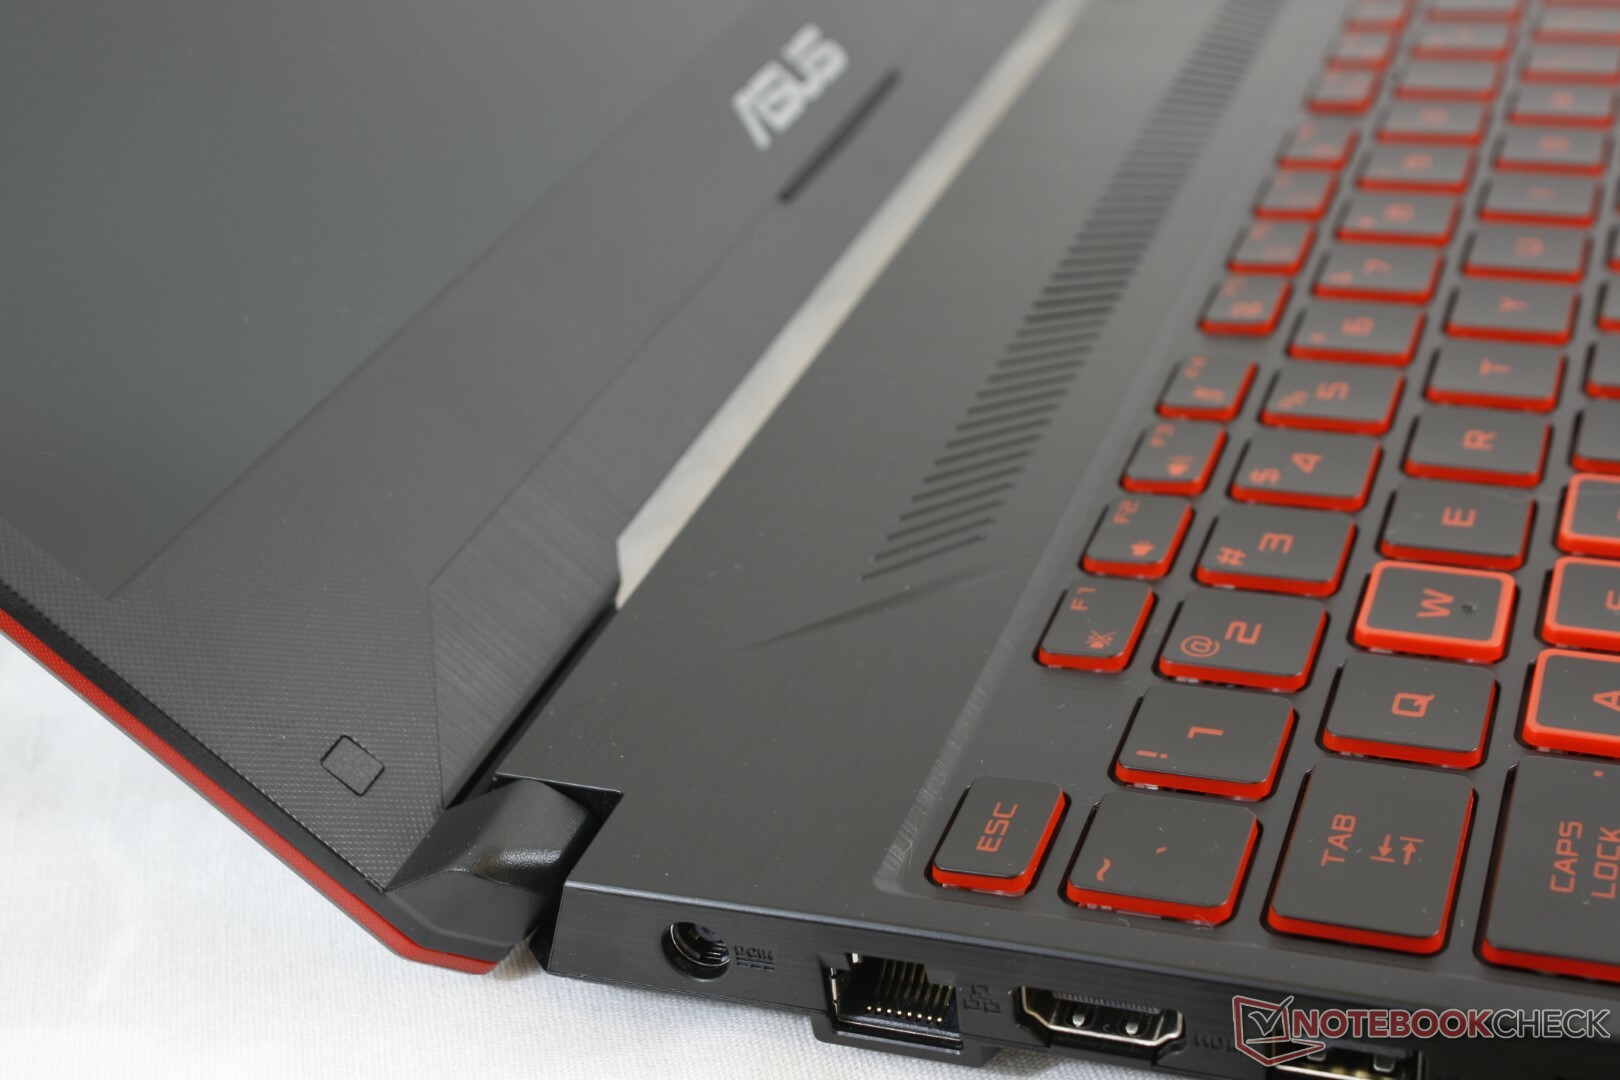
Port options and positioning are identical to the FX504 series except that the HDMI port has now been upgraded from 1.4 to 2.0. We're still disappointed to not see any USB Type-C ports which we believe should be standard across all gaming laptops. Some users may also find it odd that there are no ports along the right edge of the system. An SD reader is excluded yet again much like on the Lenovo Legion series and the Razer Blade 15.
Communication

Unlike most Ultrabooks and pricier gaming laptops where 2x2 wireless is the norm, the FX505DY ships with a 1x1 RealTek WLAN module for theoretical transfer rates of only 433 Mbps. This is likely a cost-saving measure as the usual Intel and Killer solutions are more premium solutions.
We didn't experience any connectivity issues during our time with the test unit despite the slower maximum transfer rates.
| Networking | |
| iperf3 transmit AX12 | |
| MSI GP63 Leopard 8RE-013US | |
| Asus FX504GD | |
| Asus TUF FX505DY | |
| Lenovo Legion Y530-15ICH | |
| iperf3 receive AX12 | |
| Asus FX504GD | |
| MSI GP63 Leopard 8RE-013US | |
| Asus TUF FX505DY | |
| Lenovo Legion Y530-15ICH | |
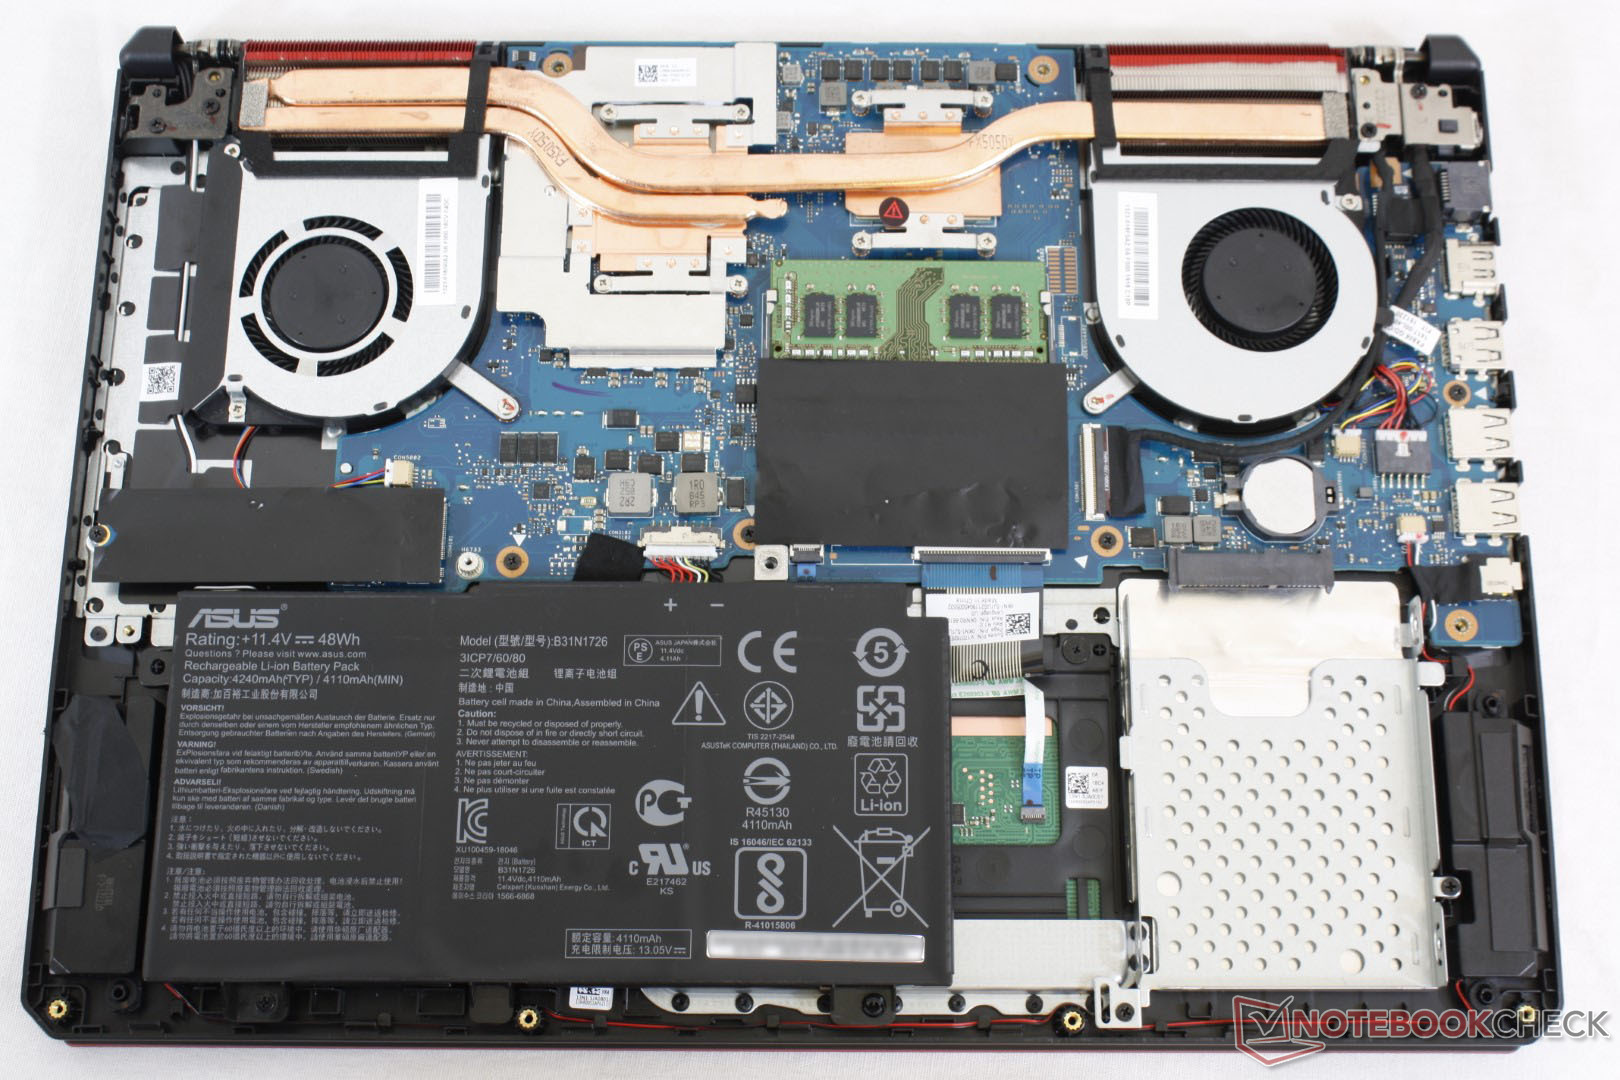
Maintenance
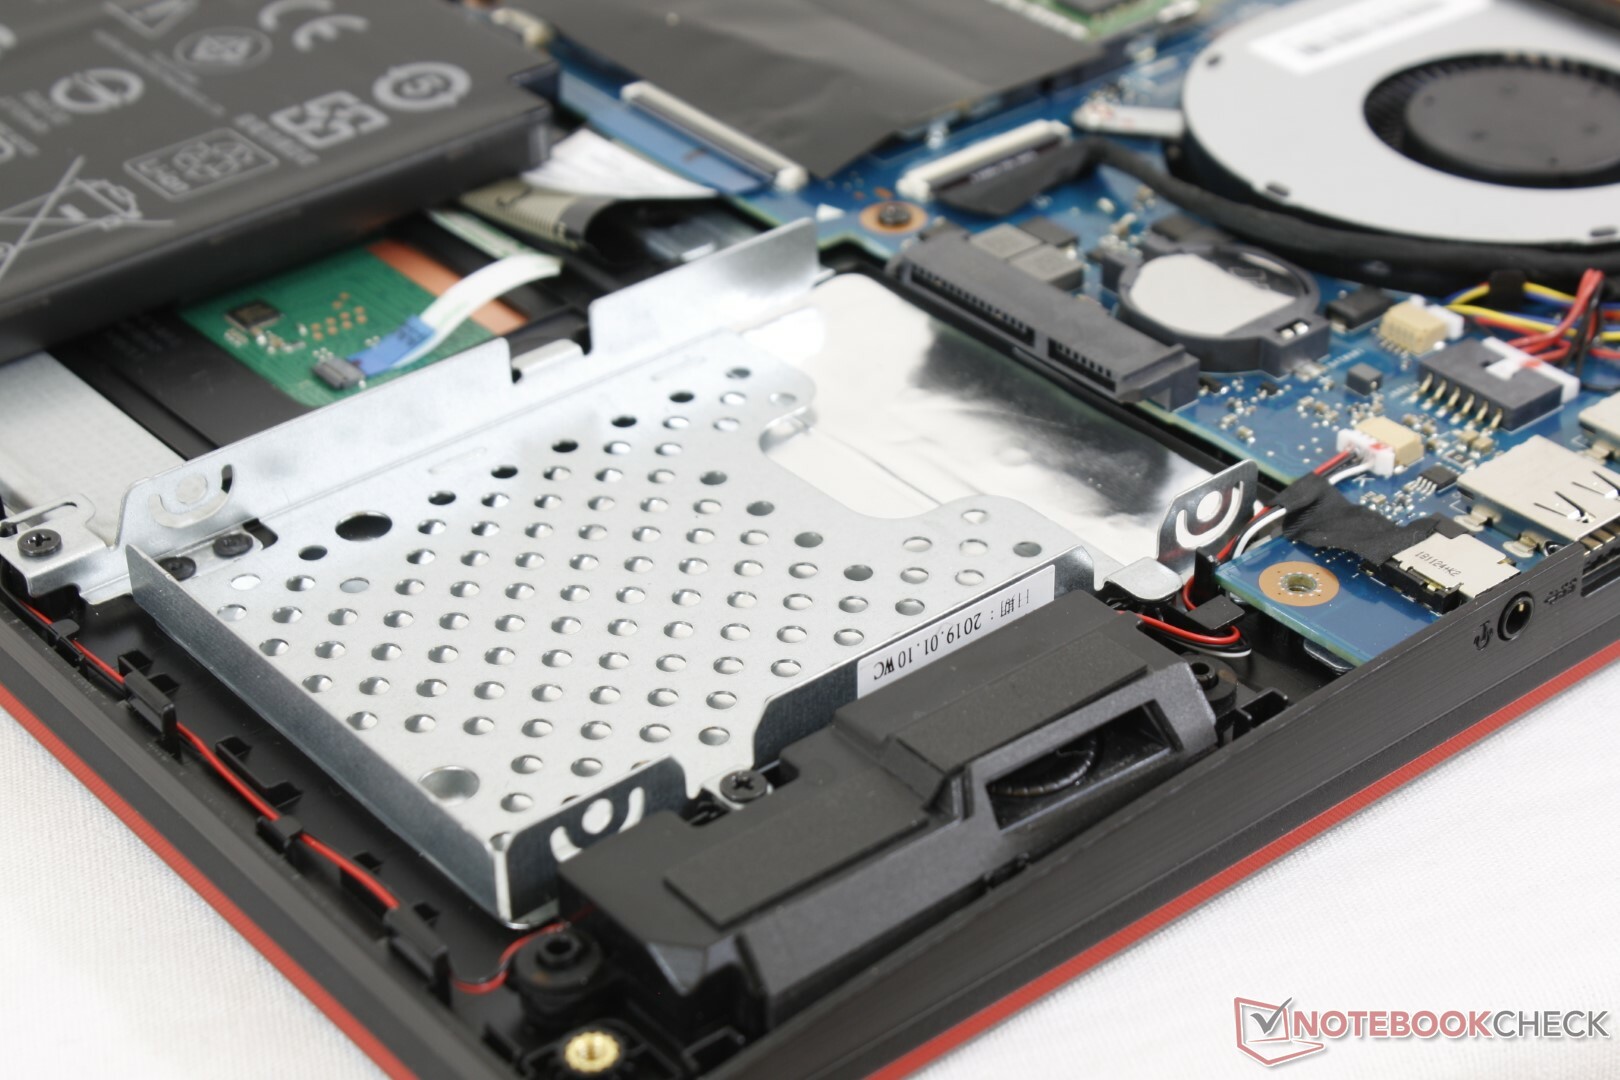
Servicing is easier than expected and requires only a Philips screwdriver. The bottom panel pops out without much effort unlike what we experienced on the MSI GE75. Users have direct access to both storage bays, both SODIMM slots, and the BIOS battery.
Accessories and Warranty
There are no extras in the box outside of the AC adapter.
The standard one-year limited warranty applies. Registering the laptop with Asus will extend the warranty by an extra year.
Input Devices
Keyboard and Touchpad
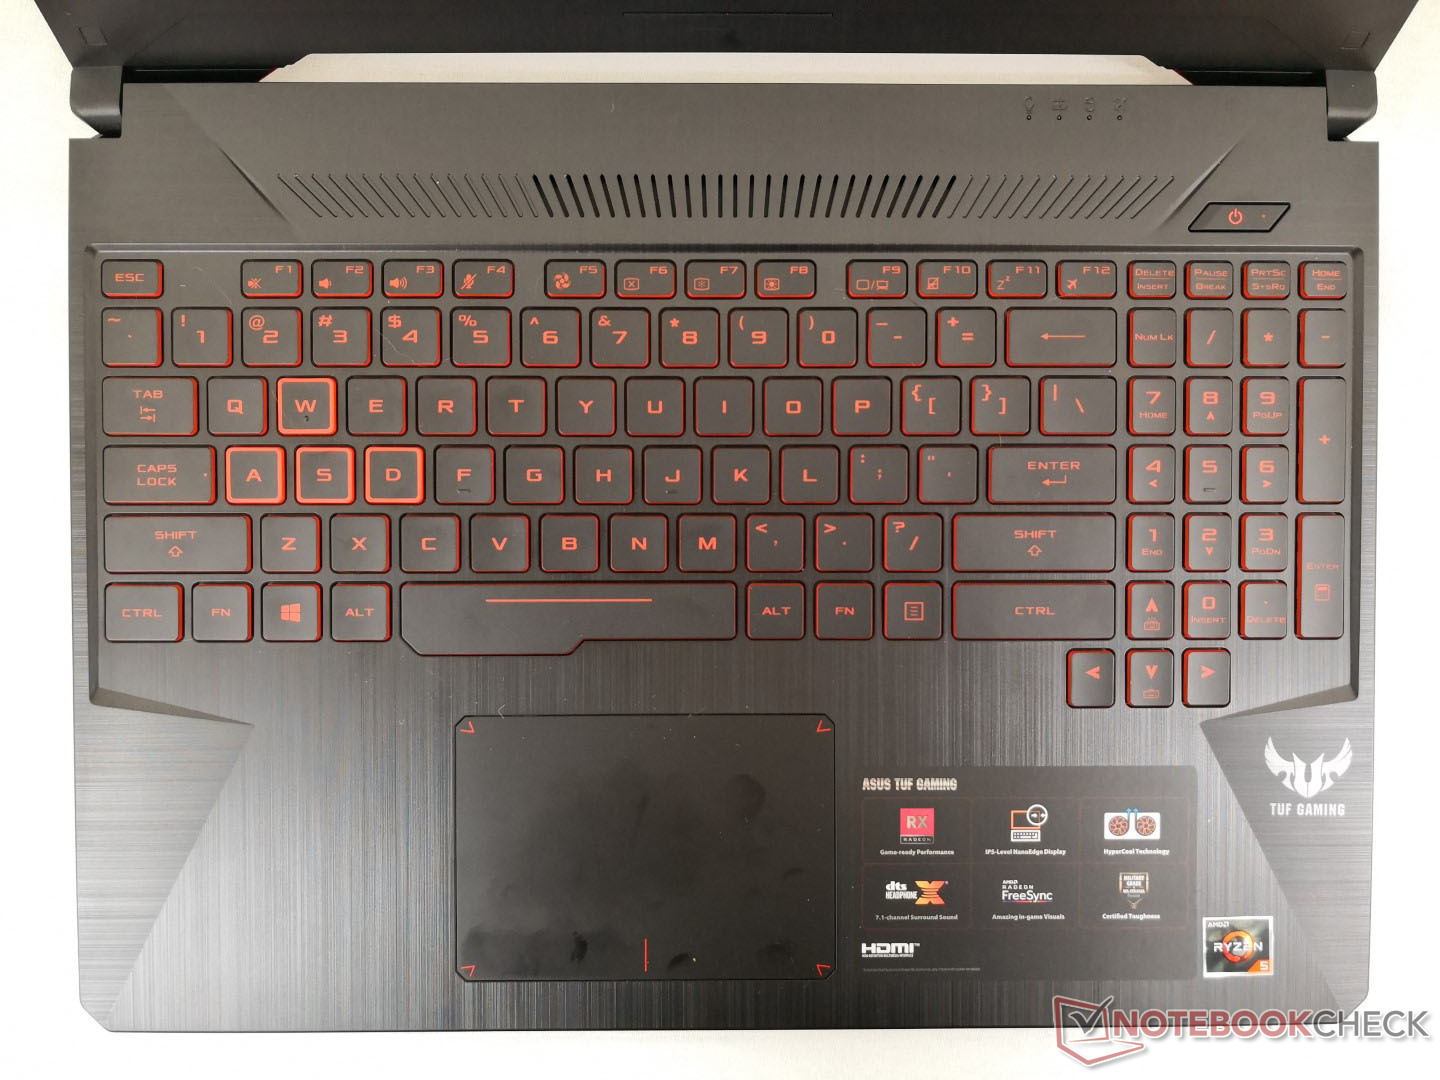
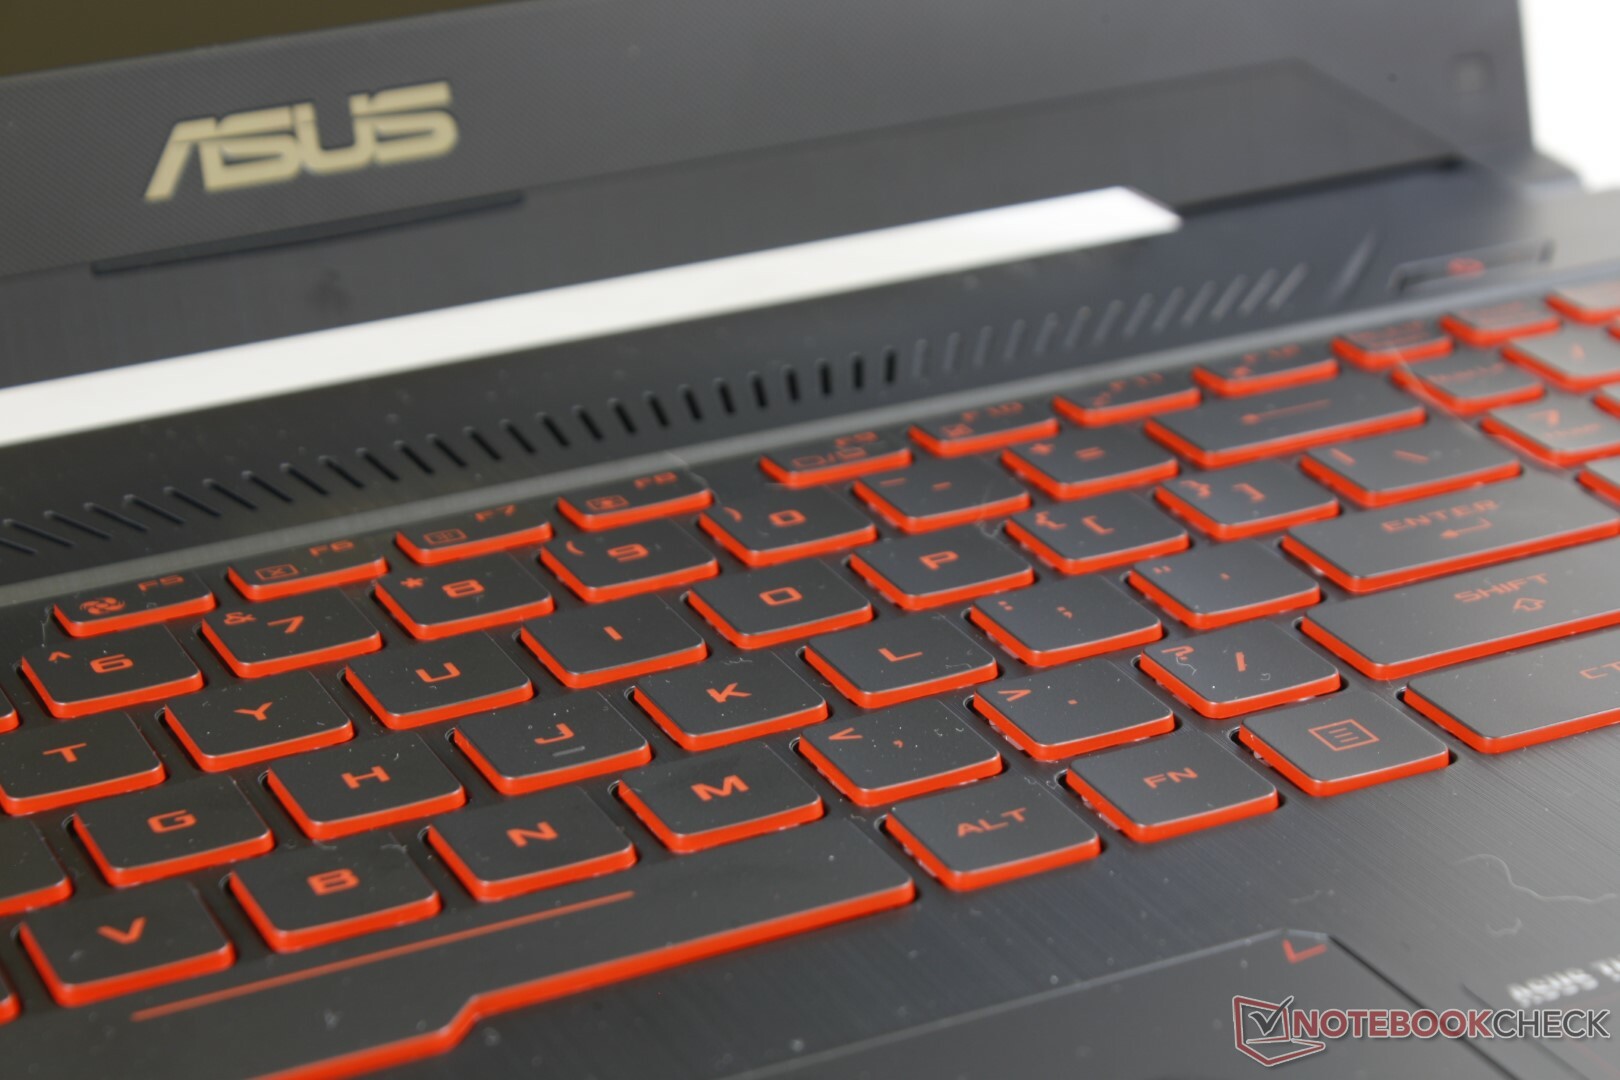
The red backlit keyboard and plastic trackpad (~10.3 cm x 7.3 cm) are essentially identical to last year's FX504 and so our previous comments still apply here. The sides of the keyboard are narrower this time around due to the narrow bezel design of the chassis, but key feedback remains satisfactory with relatively quiet clatter.
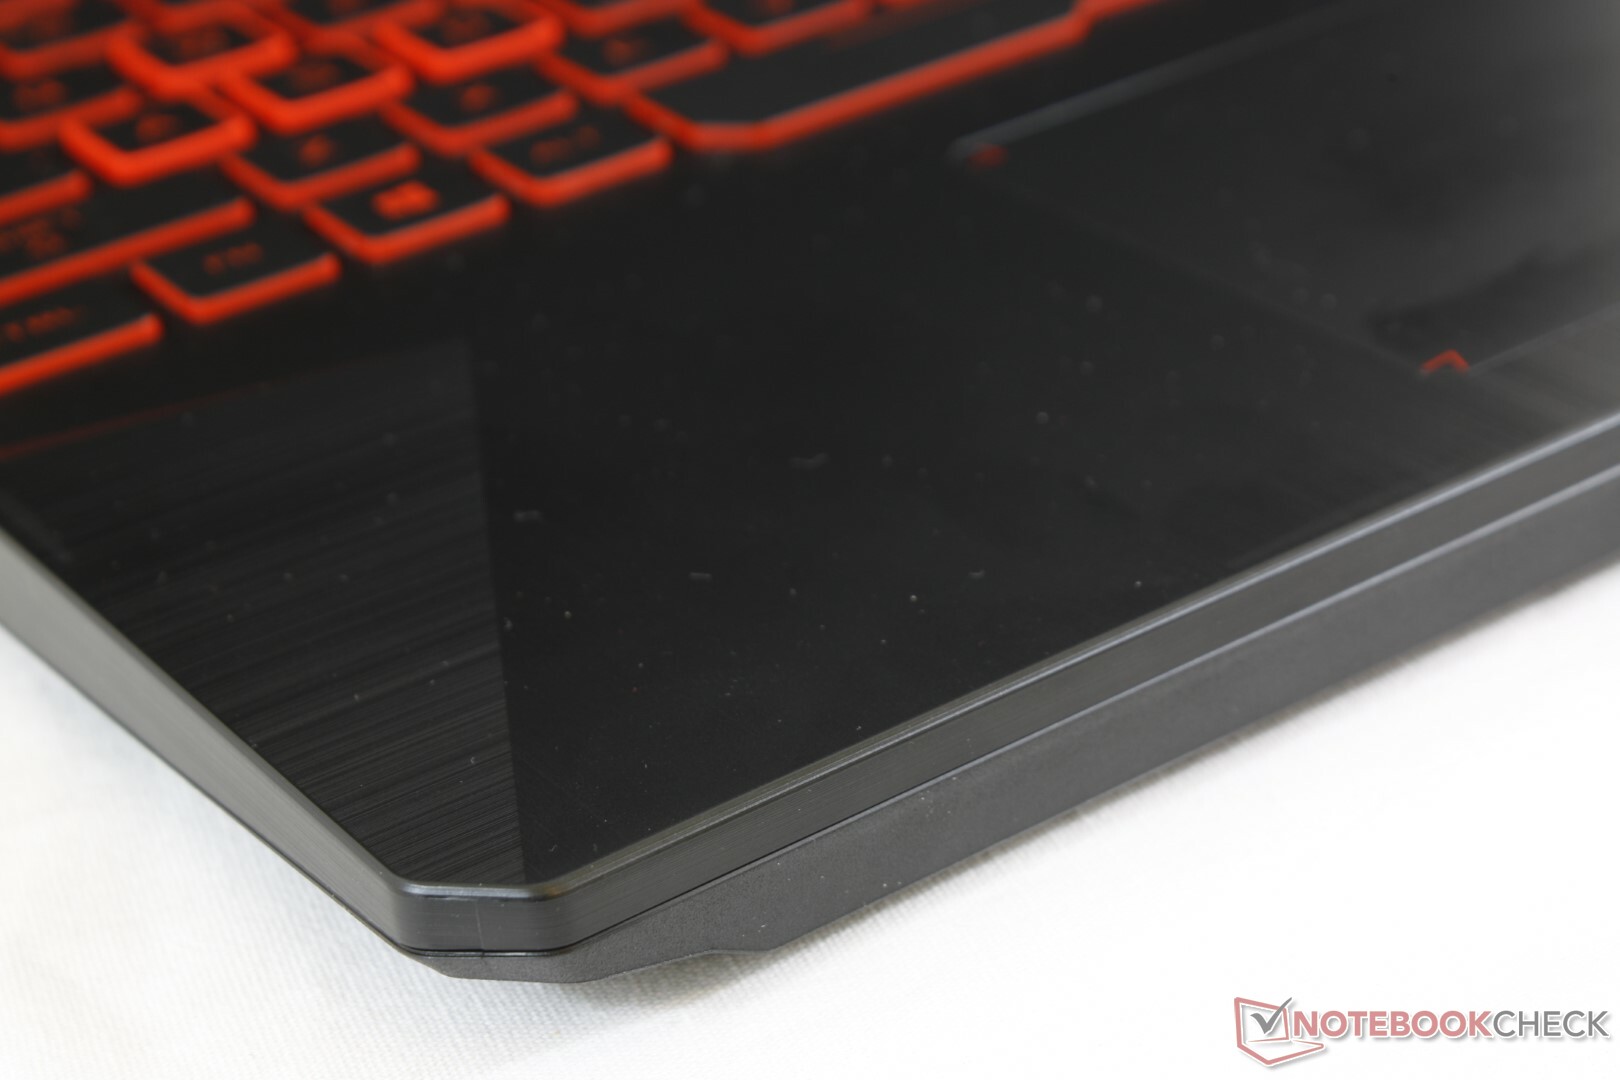
The trackpad is still disappointing and more fit for a cheap $500 laptop. Its integrated click keys are spongy and the plastic surface offers a bumpy glide when moving the cursor slowly. Conspicuous fingerprints will accumulate very quickly as well.
Display
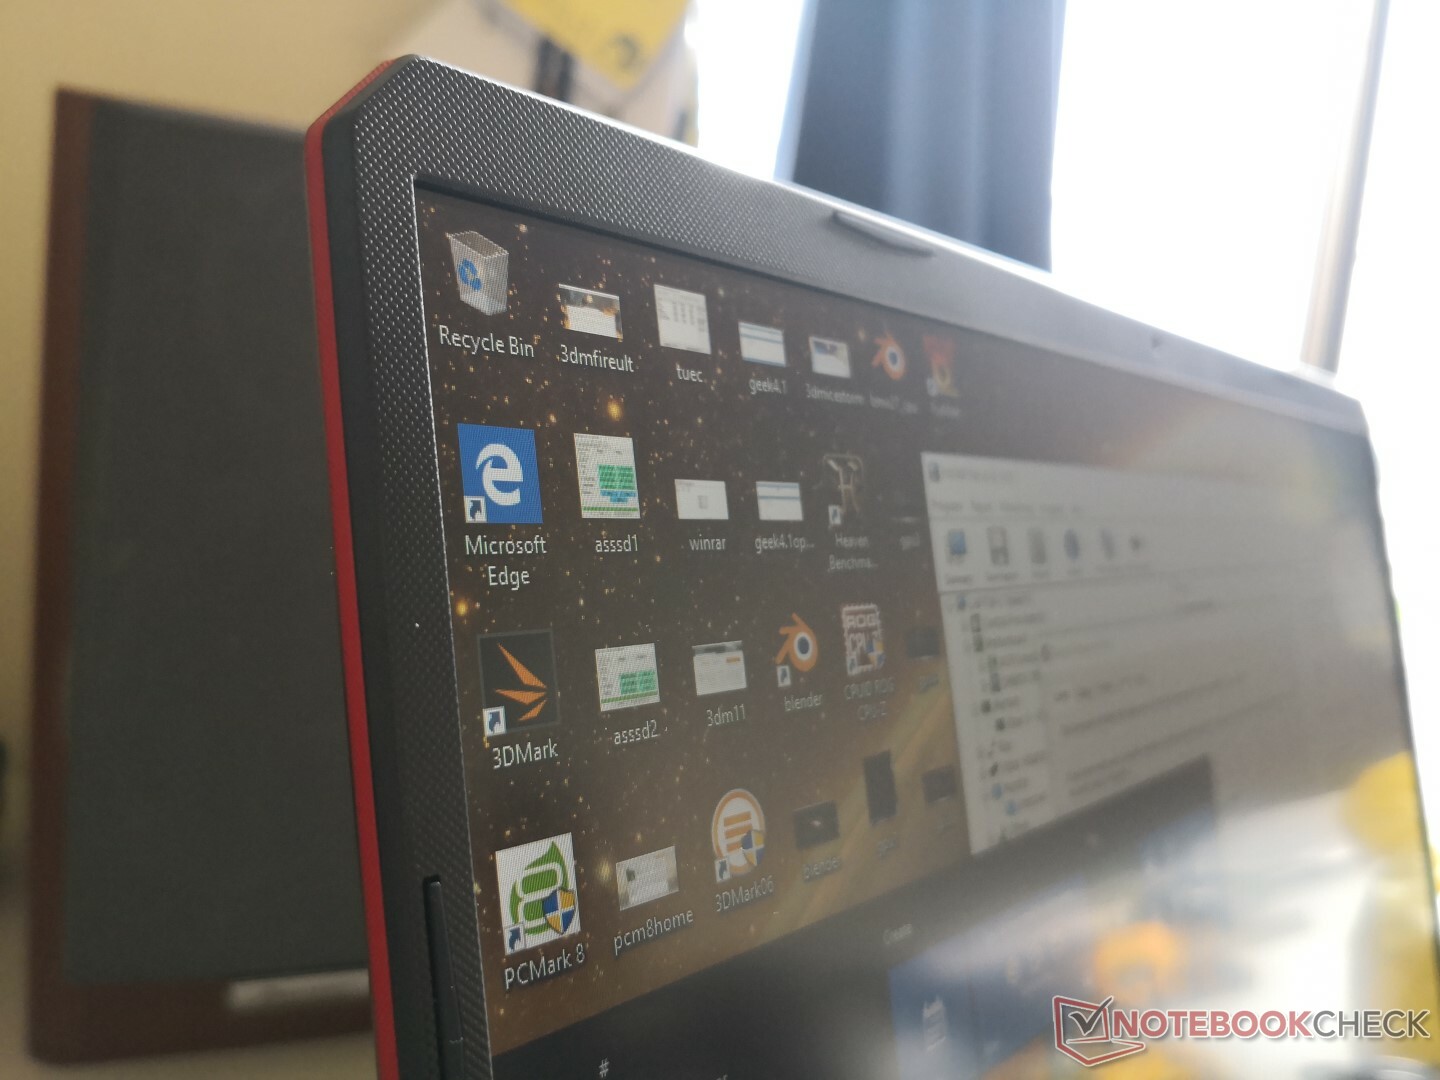
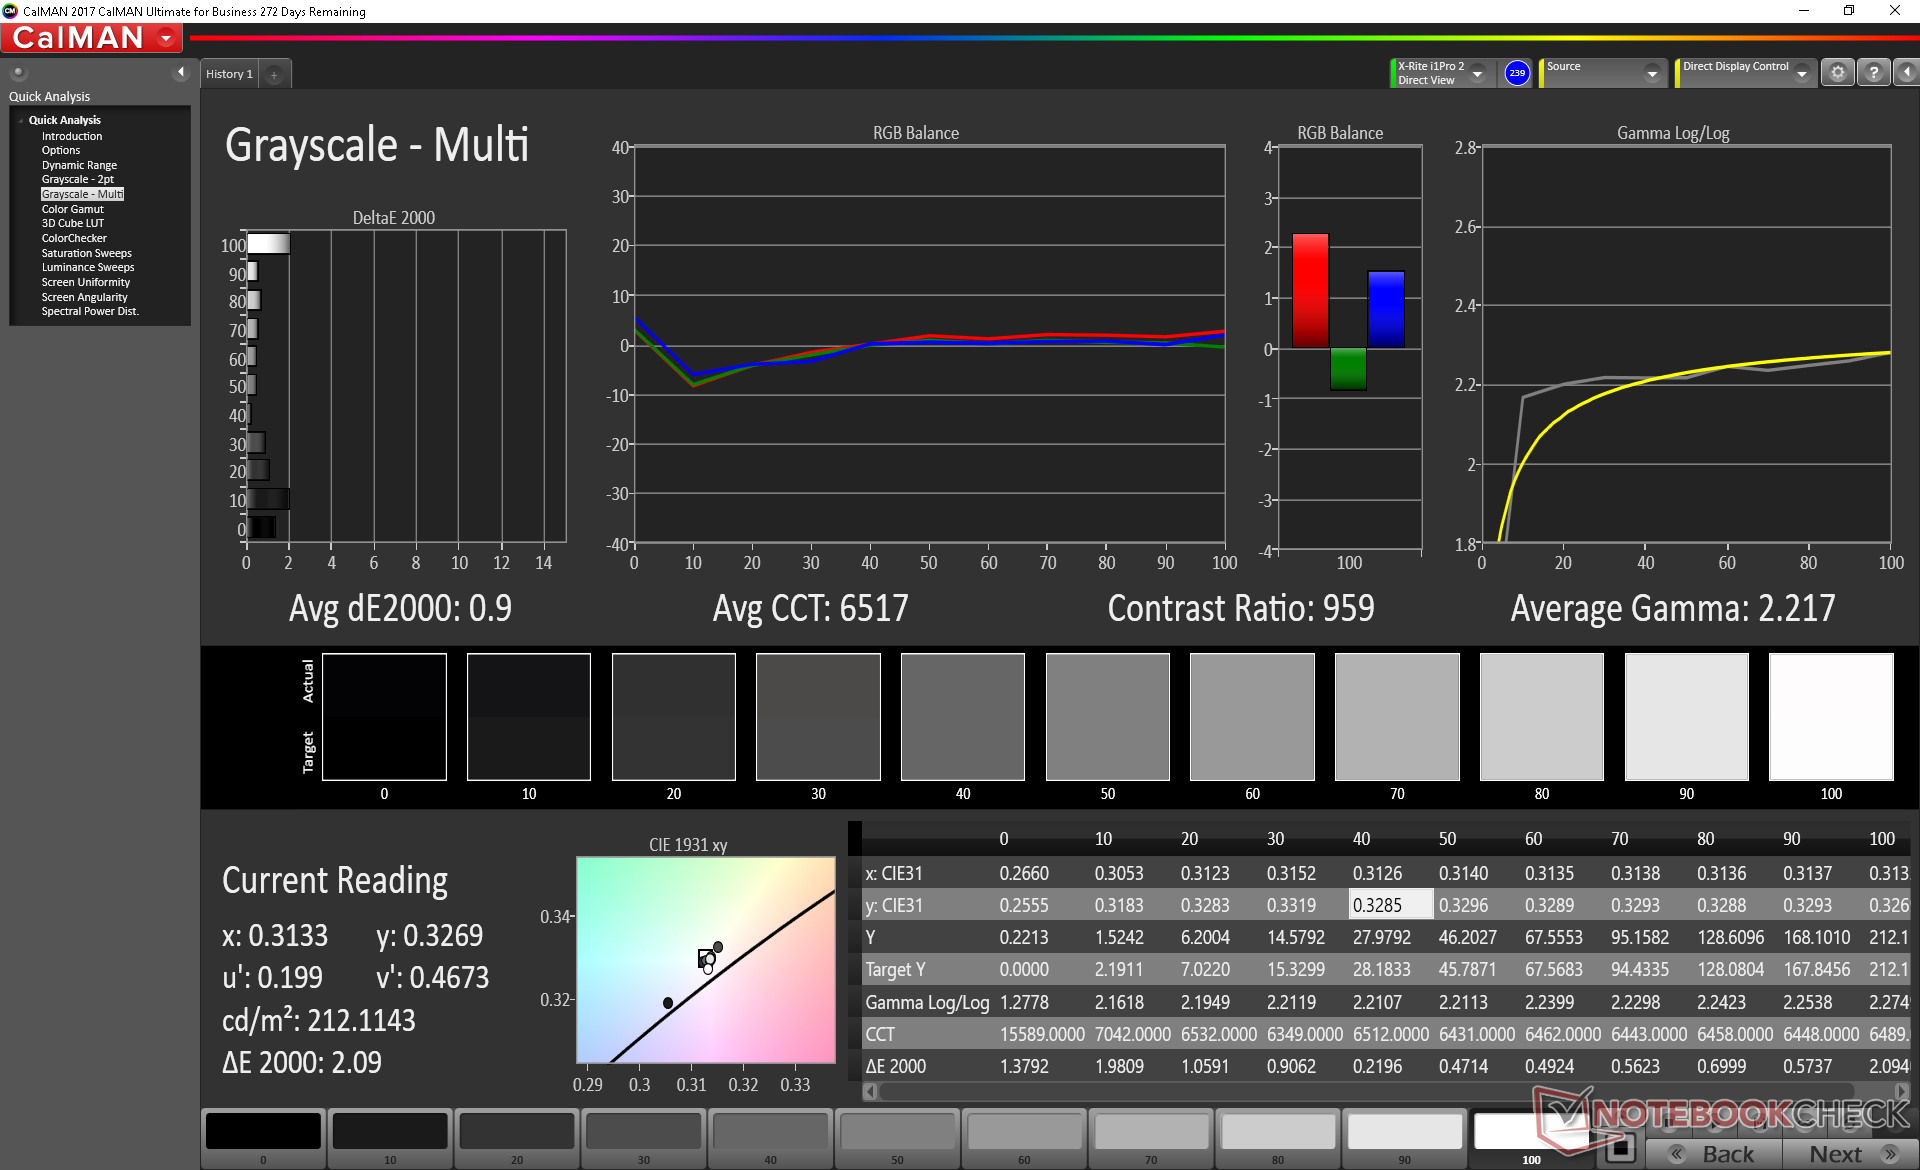
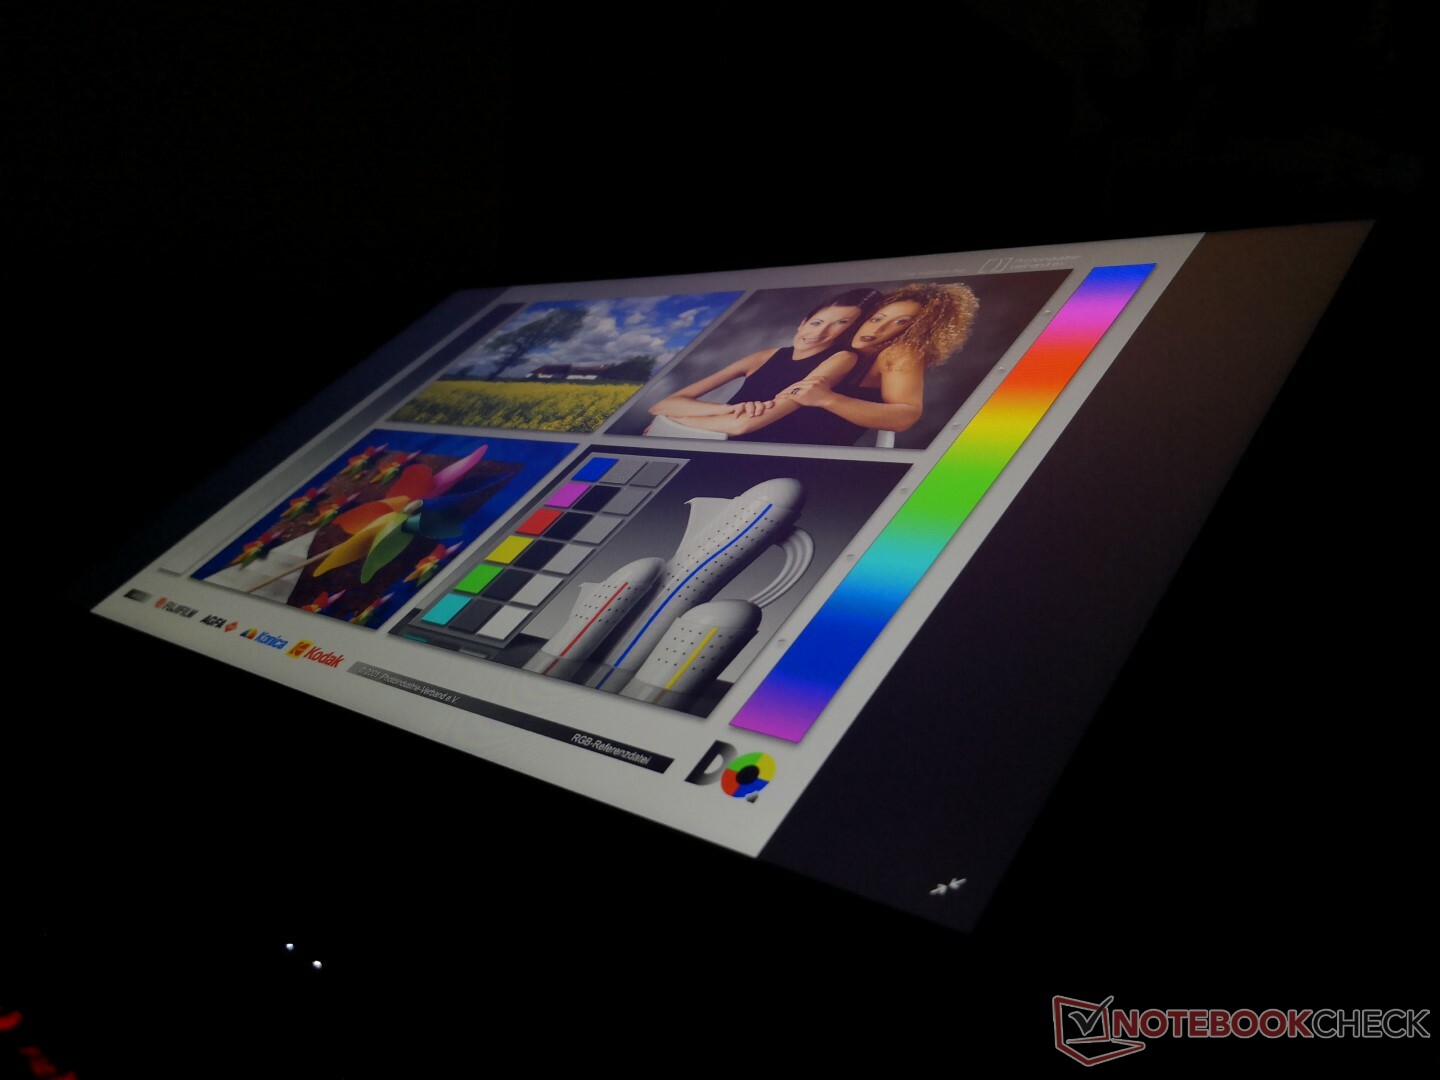
Too many budget laptops are equipped with cheap TN panels that offer poor contrast, shallow colors, and narrow viewing angles. Thankfully, the FX505DY has a 1080p IPS panel without any of these drawbacks. Granted, it's still a budget panel with just average colors, response times, and brightness, but even a cheap IPS panel is leagues ahead of a cheap TN panel. Contrast ratio is surprisingly good at almost 1000:1 compared to half that on the outgoing FX504GD.
Interestingly, Asus has sourced Panda for the matte panel here whereas most other Asus gaming laptops have panels from AU Optronics. Graininess is kept to a minimum for a crisp and almost glossy-like viewing experience without the glare. Some uneven backlight bleeding is present on our test unit that's only noticeable when viewing movies with black borders.
Enthusiast features like G-Sync, 120/144 Hz, 3/5 ms, or 4K UHD are not available here. This is supposed to be a no frills inexpensive gaming laptop, after all.


| |||||||||||||||||||||||||
Brightness Distribution: 82 %
Center on Battery: 211.5 cd/m²
Contrast: 920:1 (Black: 0.23 cd/m²)
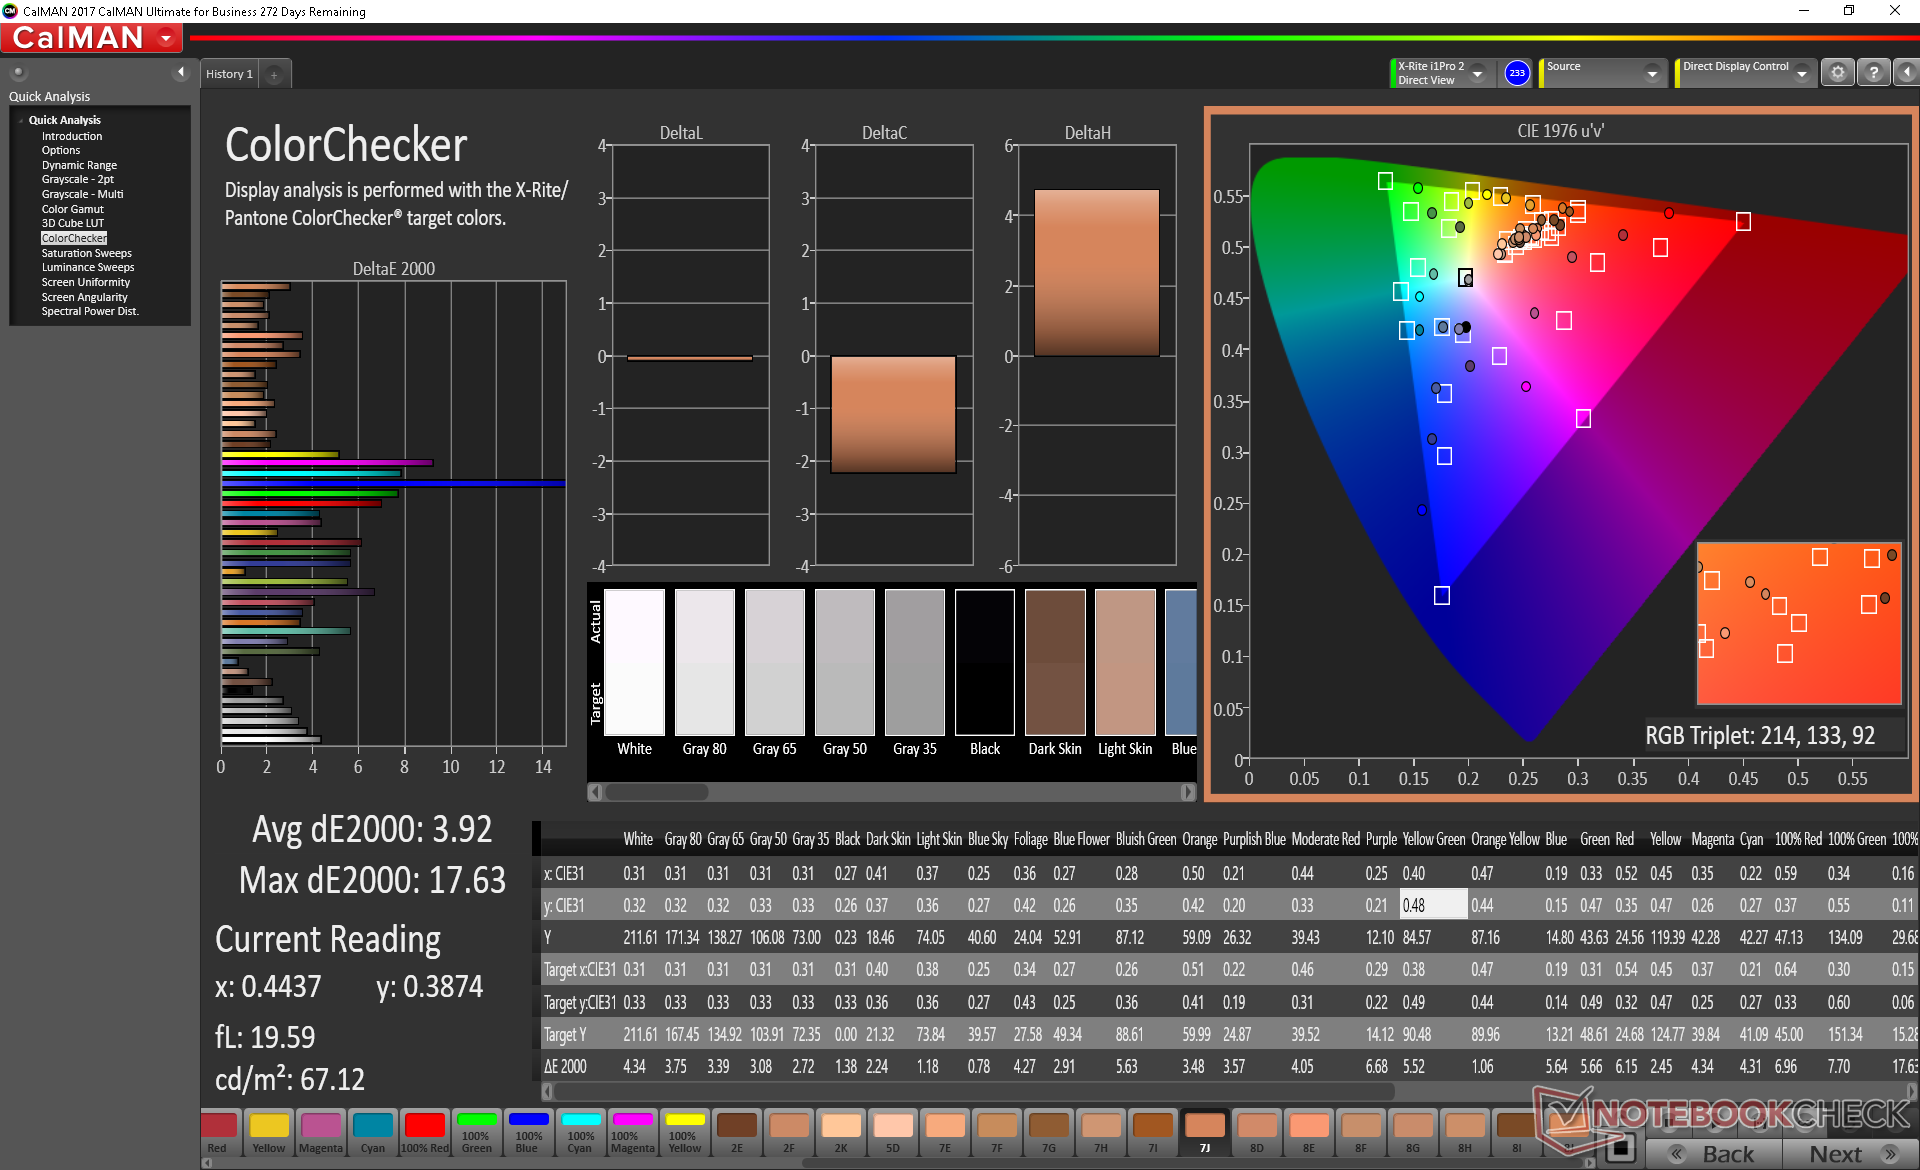
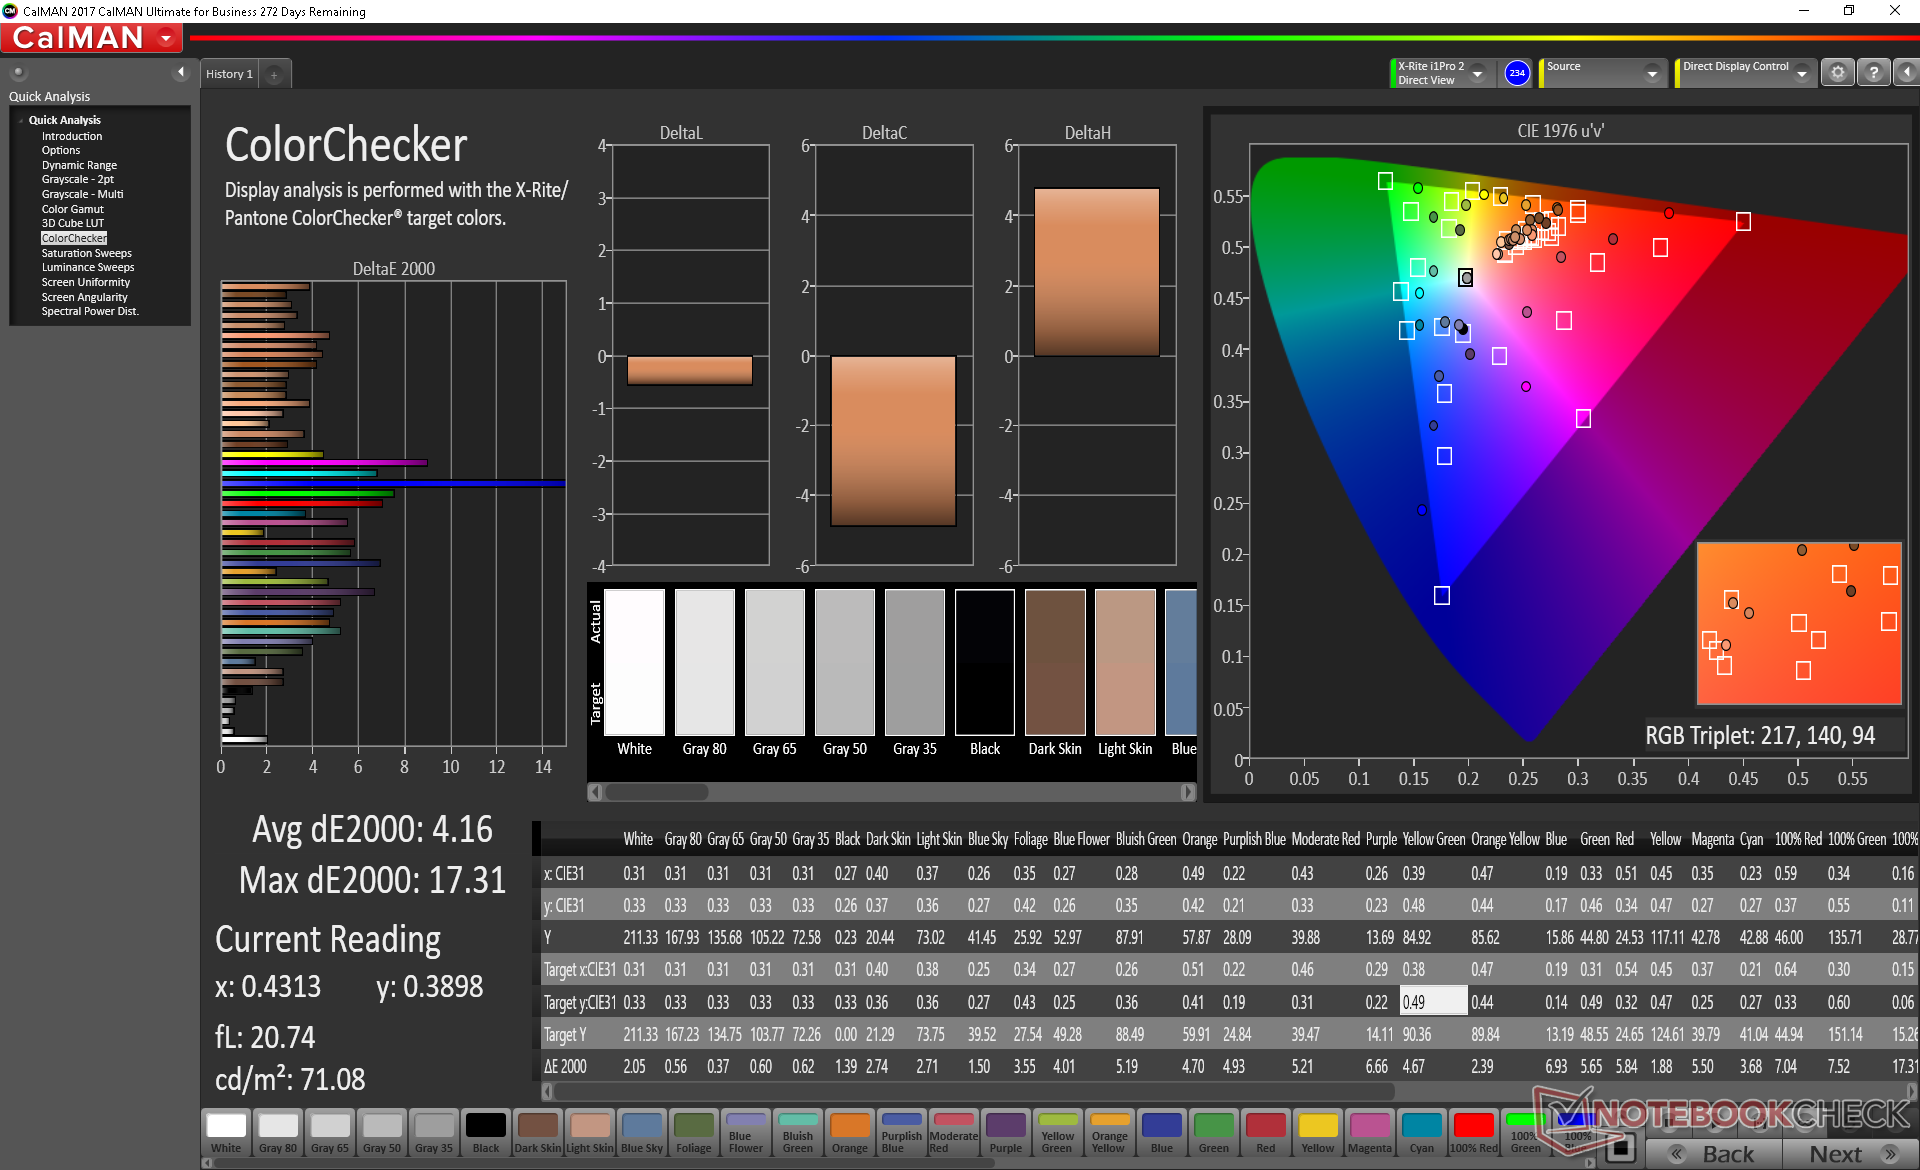
ΔE ColorChecker Calman: 3.92 | ∀{0.5-29.43 Ø4.73}
calibrated: 4.16
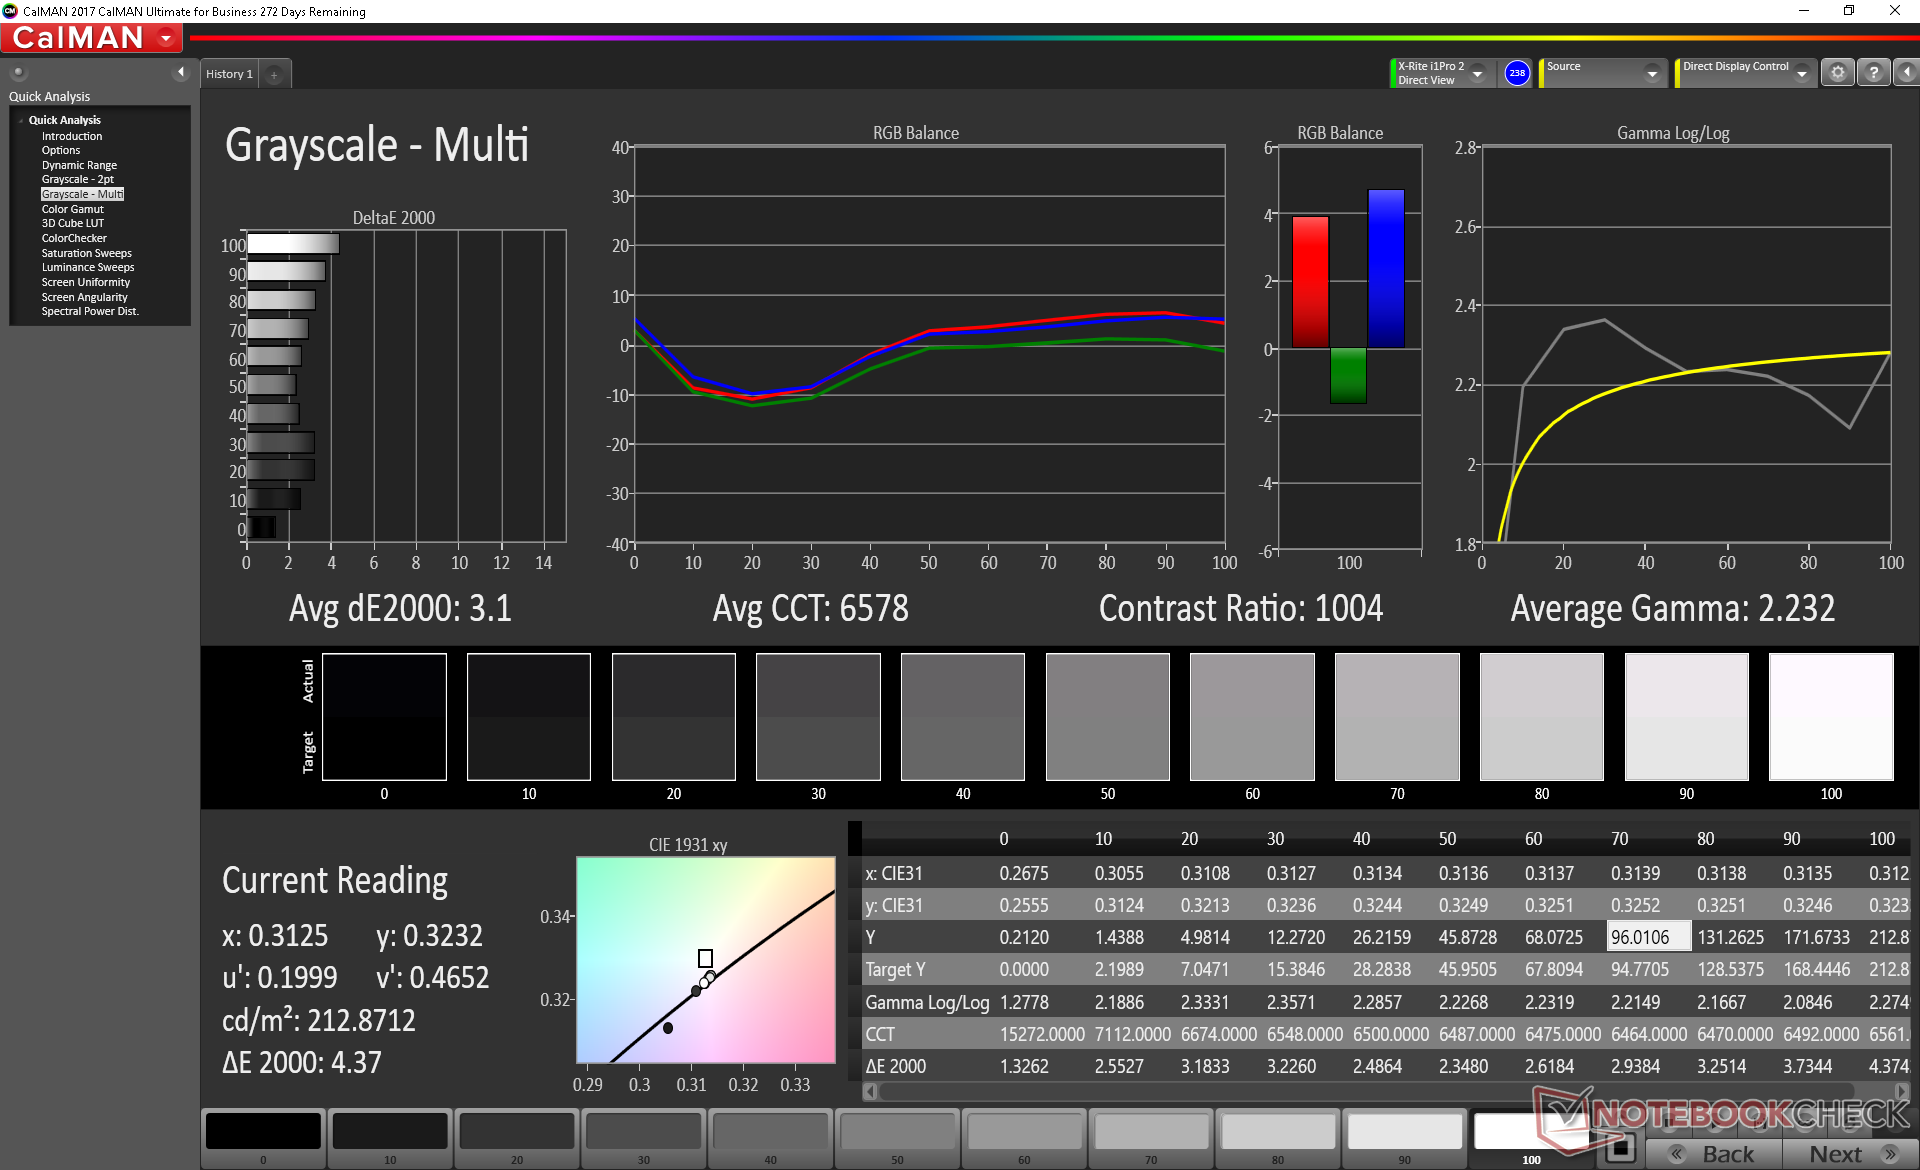
ΔE Greyscale Calman: 3.1 | ∀{0.09-98 Ø4.97}
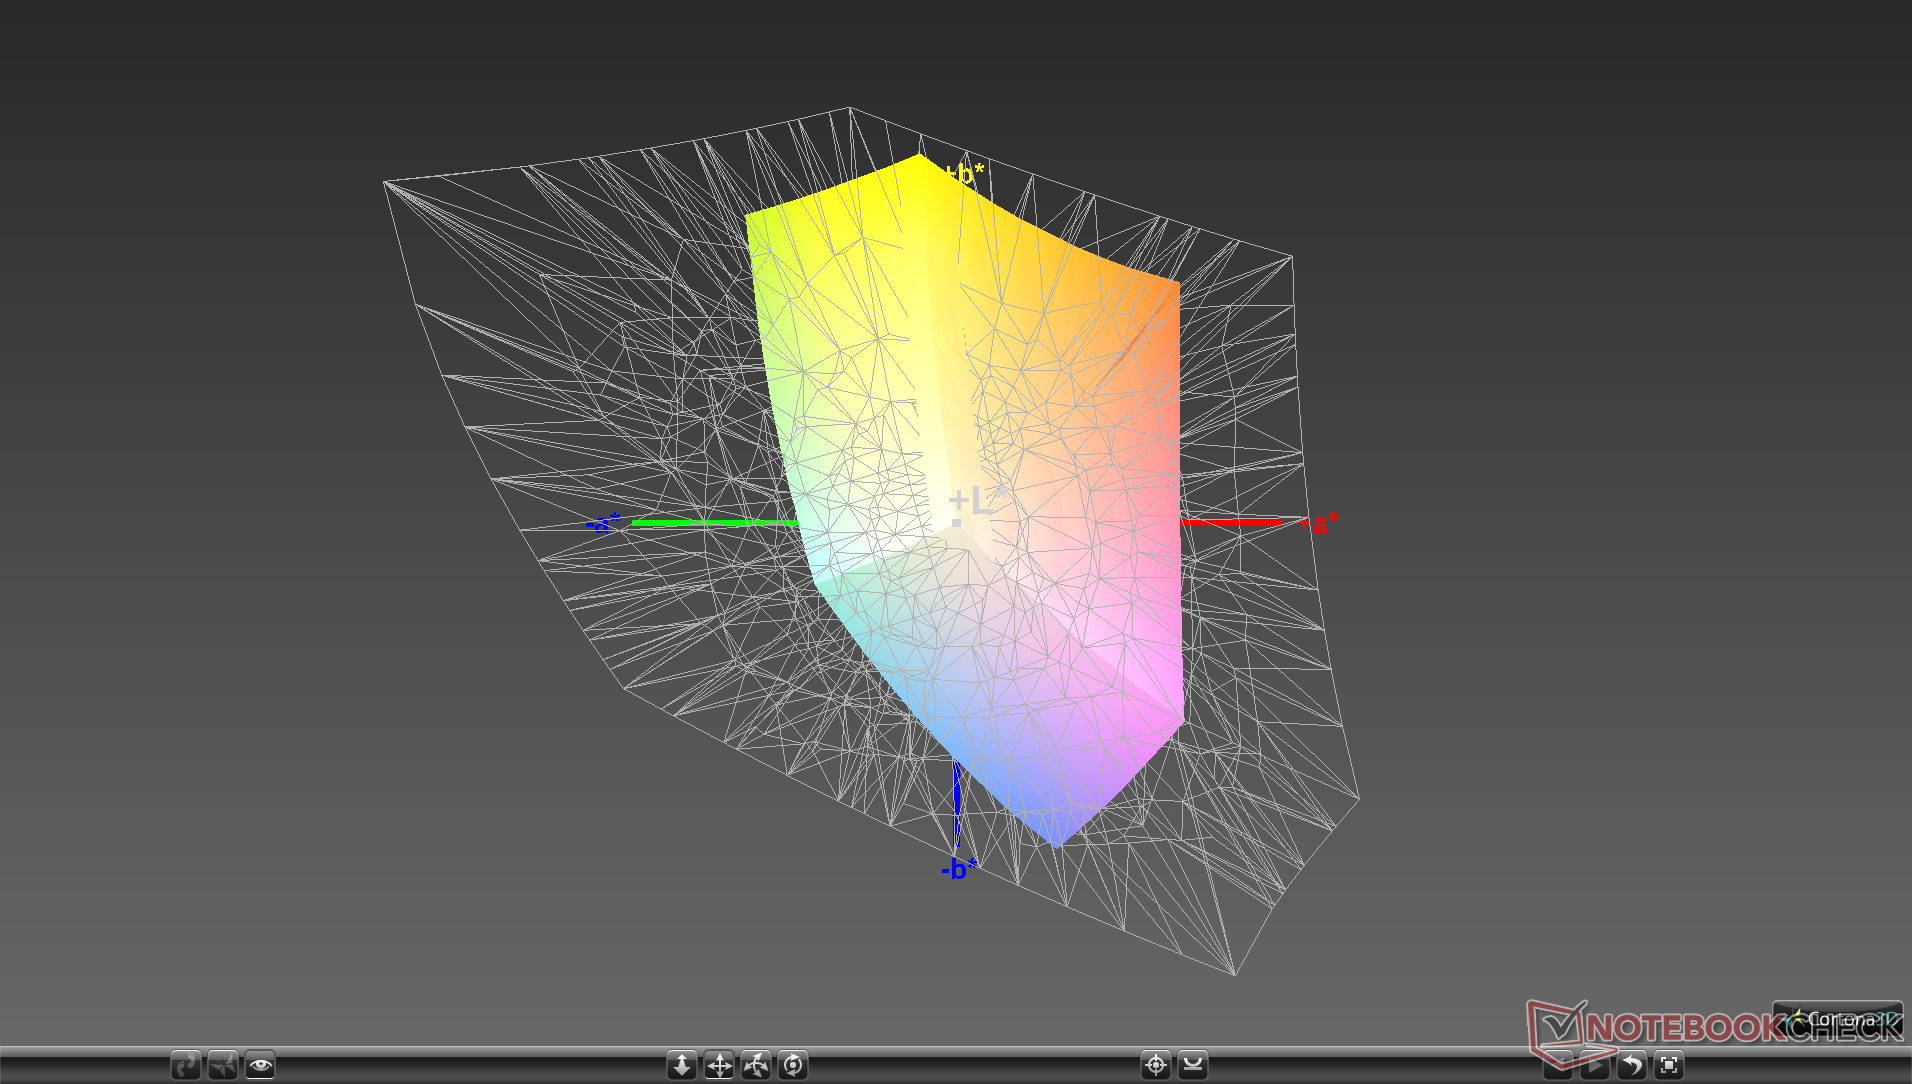
60% sRGB (Argyll 1.6.3 3D)
38.1% AdobeRGB 1998 (Argyll 1.6.3 3D)
41.4% AdobeRGB 1998 (Argyll 3D)
60.2% sRGB (Argyll 3D)
40.04% Display P3 (Argyll 3D)
Gamma: 2.23
CCT: 6578 K
| Asus TUF FX505DY Panda LM156LF-CL03, IPS, 15.6", 1920x1080 | MSI GP63 Leopard 8RE-013US Chi Mei CMN15F4 (N156HHE-GA1 CMN), TN LED, 120 Hz, 15.6", 1920x1080 | Asus FX504GD AU Optronics B156HTN03.8, TN LED, 15.6", 1920x1080 | Lenovo Legion Y530-15ICH LG Display LP156WFG-SPB2, IPS, 15.6", 1920x1080 | Acer Nitro 5 AN515-42-R6V0 AU Optronics B156HAN06.0 (AUO60ED), IPS, 15.6", 1920x1080 | Gigabyte Sabre 15G ID: LGD0533, Name: LG Display LP156WF6-SPK3, IPS, 15.6", 1920x1080 | |
|---|---|---|---|---|---|---|
| Display | 101% | -7% | 55% | 53% | -3% | |
| Display P3 Coverage (%) | 40.04 | 91.5 129% | 37.09 -7% | 62.5 56% | 63.4 58% | 38.97 -3% |
| sRGB Coverage (%) | 60.2 | 100 66% | 55.8 -7% | 93 54% | 87.4 45% | 58.2 -3% |
| AdobeRGB 1998 Coverage (%) | 41.4 | 85.9 107% | 38.34 -7% | 63.8 54% | 64 55% | 40.3 -3% |
| Response Times | 60% | 29% | 66% | -7% | 23% | |
| Response Time Grey 50% / Grey 80% * (ms) | 44.8 ? | 24 ? 46% | 41.6 ? 7% | 15 ? 67% | 48.4 ? -8% | 32 ? 29% |
| Response Time Black / White * (ms) | 30.8 ? | 8.4 ? 73% | 15.2 ? 51% | 11 ? 64% | 32.8 ? -6% | 25.6 ? 17% |
| PWM Frequency (Hz) | 20830 ? | 26040 ? | 20000 ? | |||
| Screen | -5% | -34% | 10% | 19% | -25% | |
| Brightness middle (cd/m²) | 211.5 | 368.5 74% | 260 23% | 305 44% | 299 41% | 248.4 17% |
| Brightness (cd/m²) | 200 | 341 71% | 241 21% | 284 42% | 284 42% | 241 21% |
| Brightness Distribution (%) | 82 | 87 6% | 85 4% | 83 1% | 88 7% | 84 2% |
| Black Level * (cd/m²) | 0.23 | 0.34 -48% | 0.55 -139% | 0.52 -126% | 0.24 -4% | 0.3 -30% |
| Contrast (:1) | 920 | 1084 18% | 473 -49% | 587 -36% | 1246 35% | 828 -10% |
| Colorchecker dE 2000 * | 3.92 | 8.91 -127% | 7 -79% | 3.63 7% | 4.98 -27% | 7.5 -91% |
| Colorchecker dE 2000 max. * | 17.63 | 14.39 18% | 22.52 -28% | 8.18 54% | 7.67 56% | 25.2 -43% |
| Colorchecker dE 2000 calibrated * | 4.16 | 2.87 31% | 5.27 -27% | 1.31 69% | 3.7 11% | |
| Greyscale dE 2000 * | 3.1 | 12 -287% | 6.1 -97% | 4.77 -54% | 4.58 -48% | 6.5 -110% |
| Gamma | 2.23 99% | 1.825 121% | 1.97 112% | 2.54 87% | 2.55 86% | 2.19 100% |
| CCT | 6578 99% | 11519 56% | 7894 82% | 7500 87% | 6397 102% | 7852 83% |
| Color Space (Percent of AdobeRGB 1998) (%) | 38.1 | 85.94 126% | 35.5 -7% | 59 55% | 57 50% | 37 -3% |
| Color Space (Percent of sRGB) (%) | 60 | 99.98 67% | 61 2% | 93 55% | 87 45% | 57.9 -3% |
| Total Average (Program / Settings) | 52% /
23% | -4% /
-21% | 44% /
25% | 22% /
22% | -2% /
-14% |
* ... smaller is better
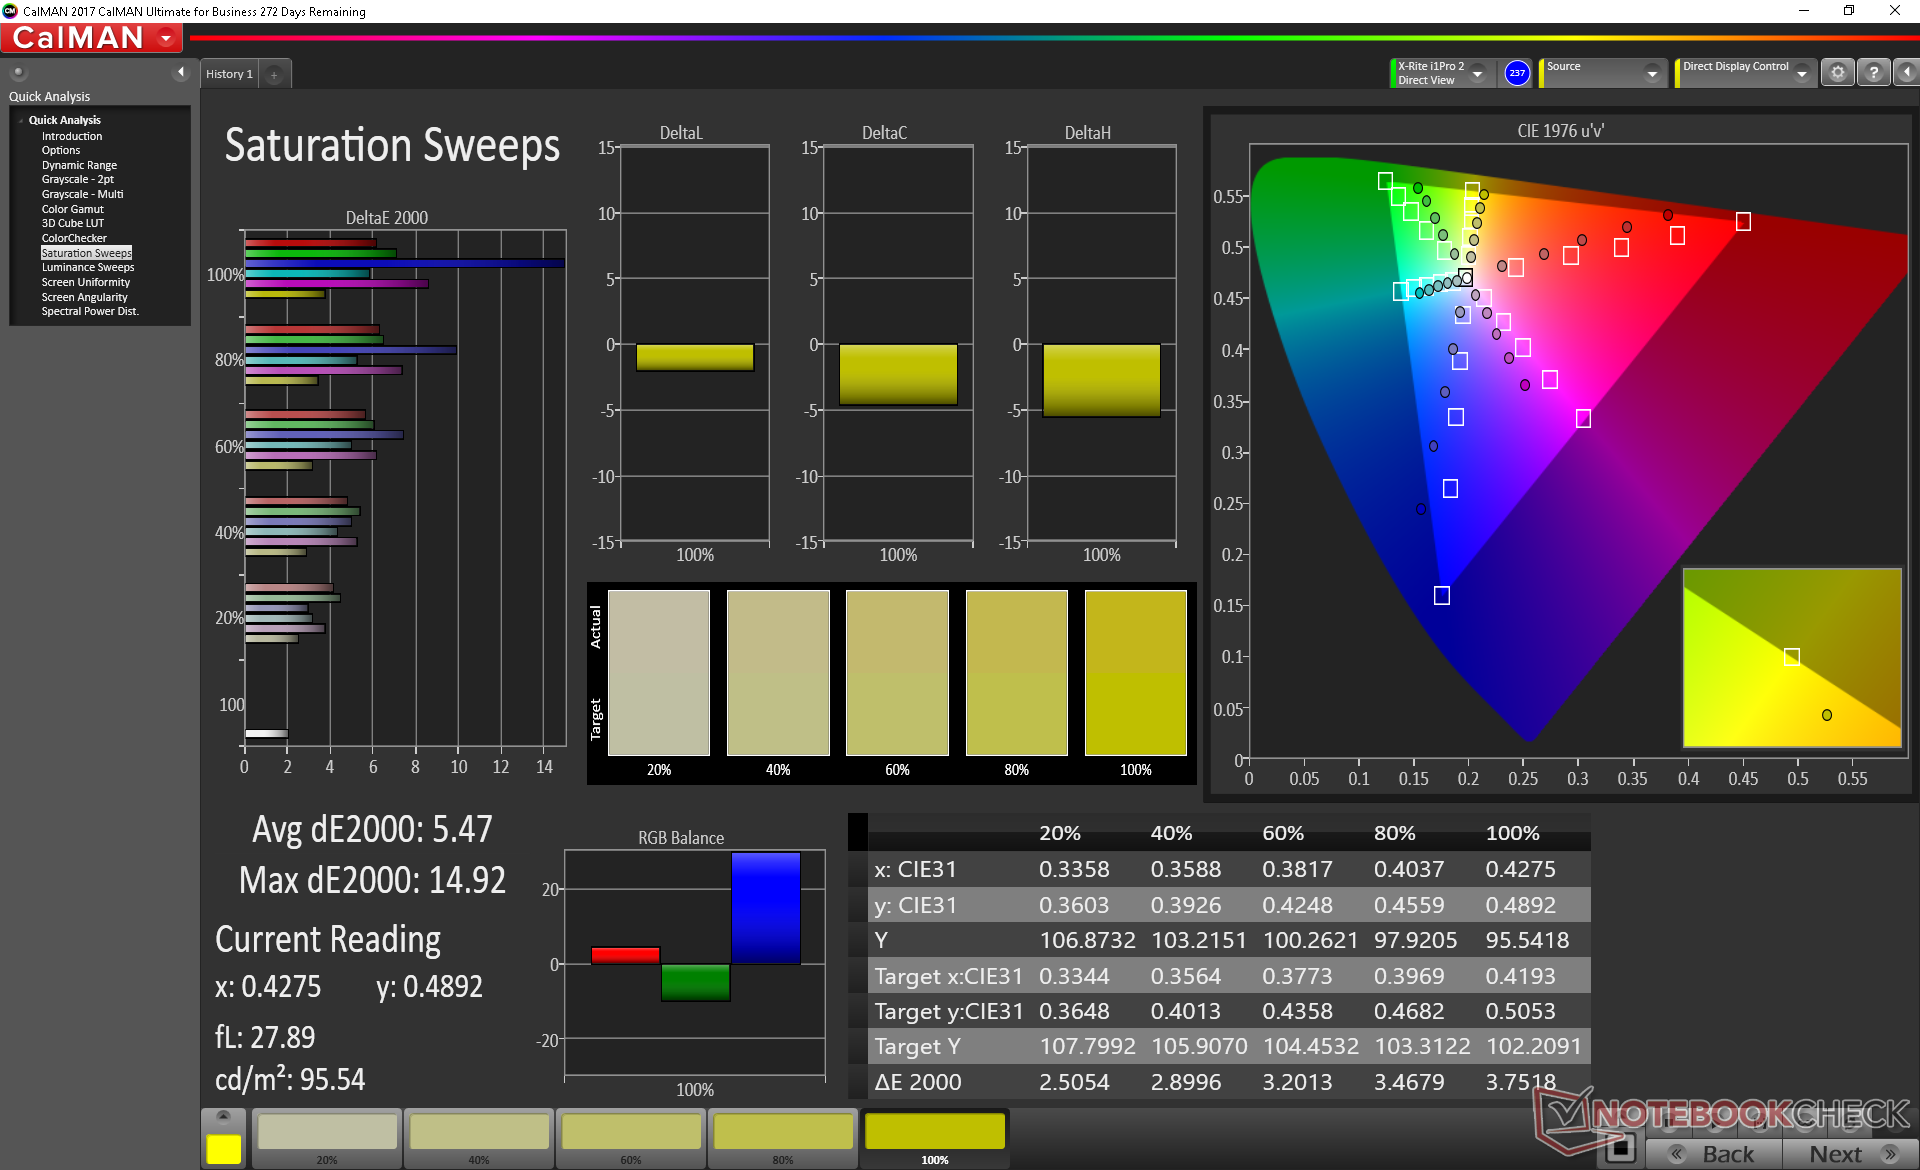
Color space covers only 60 percent of sRGB to indicate a budget panel. Most mainstream gaming laptops cover 90 percent of sRGB or more for deeper and more accurate colors. For gaming purposes, however, the more limited color space will not dramatically impact the experience.
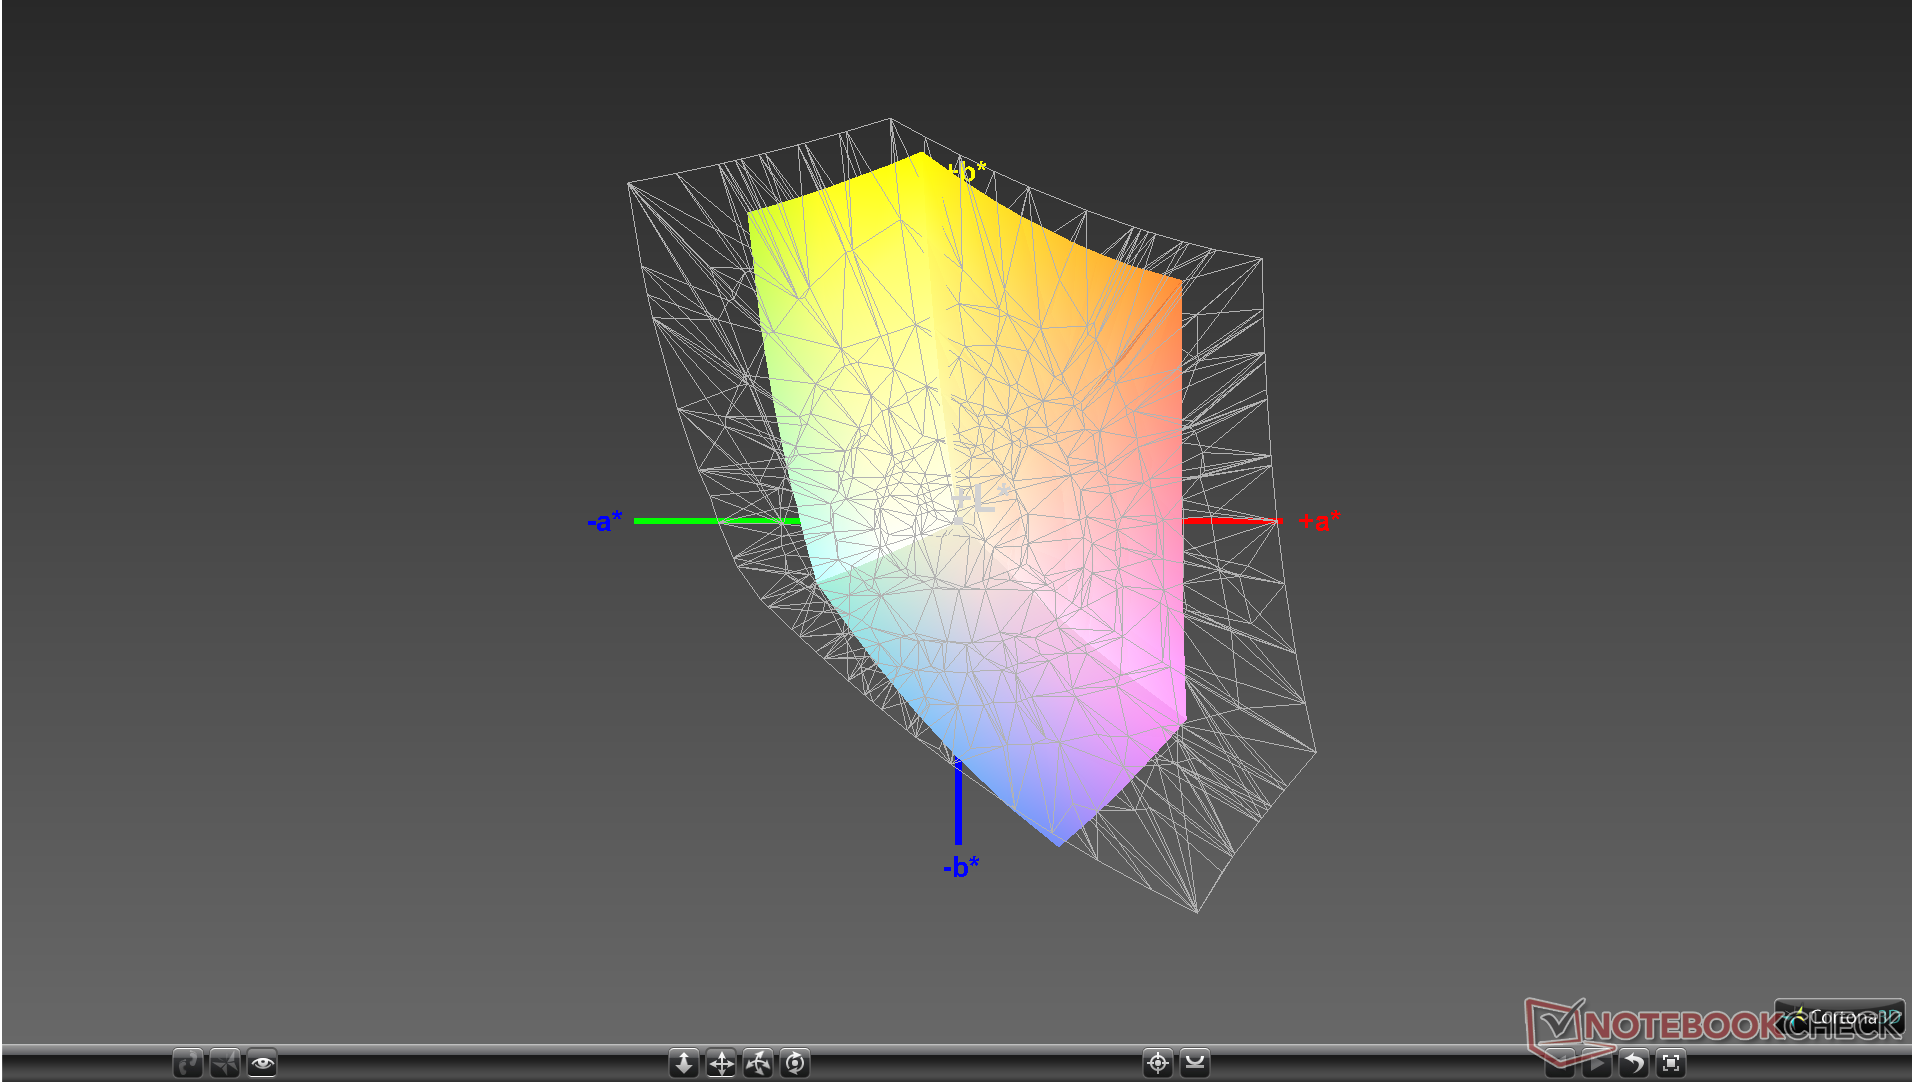
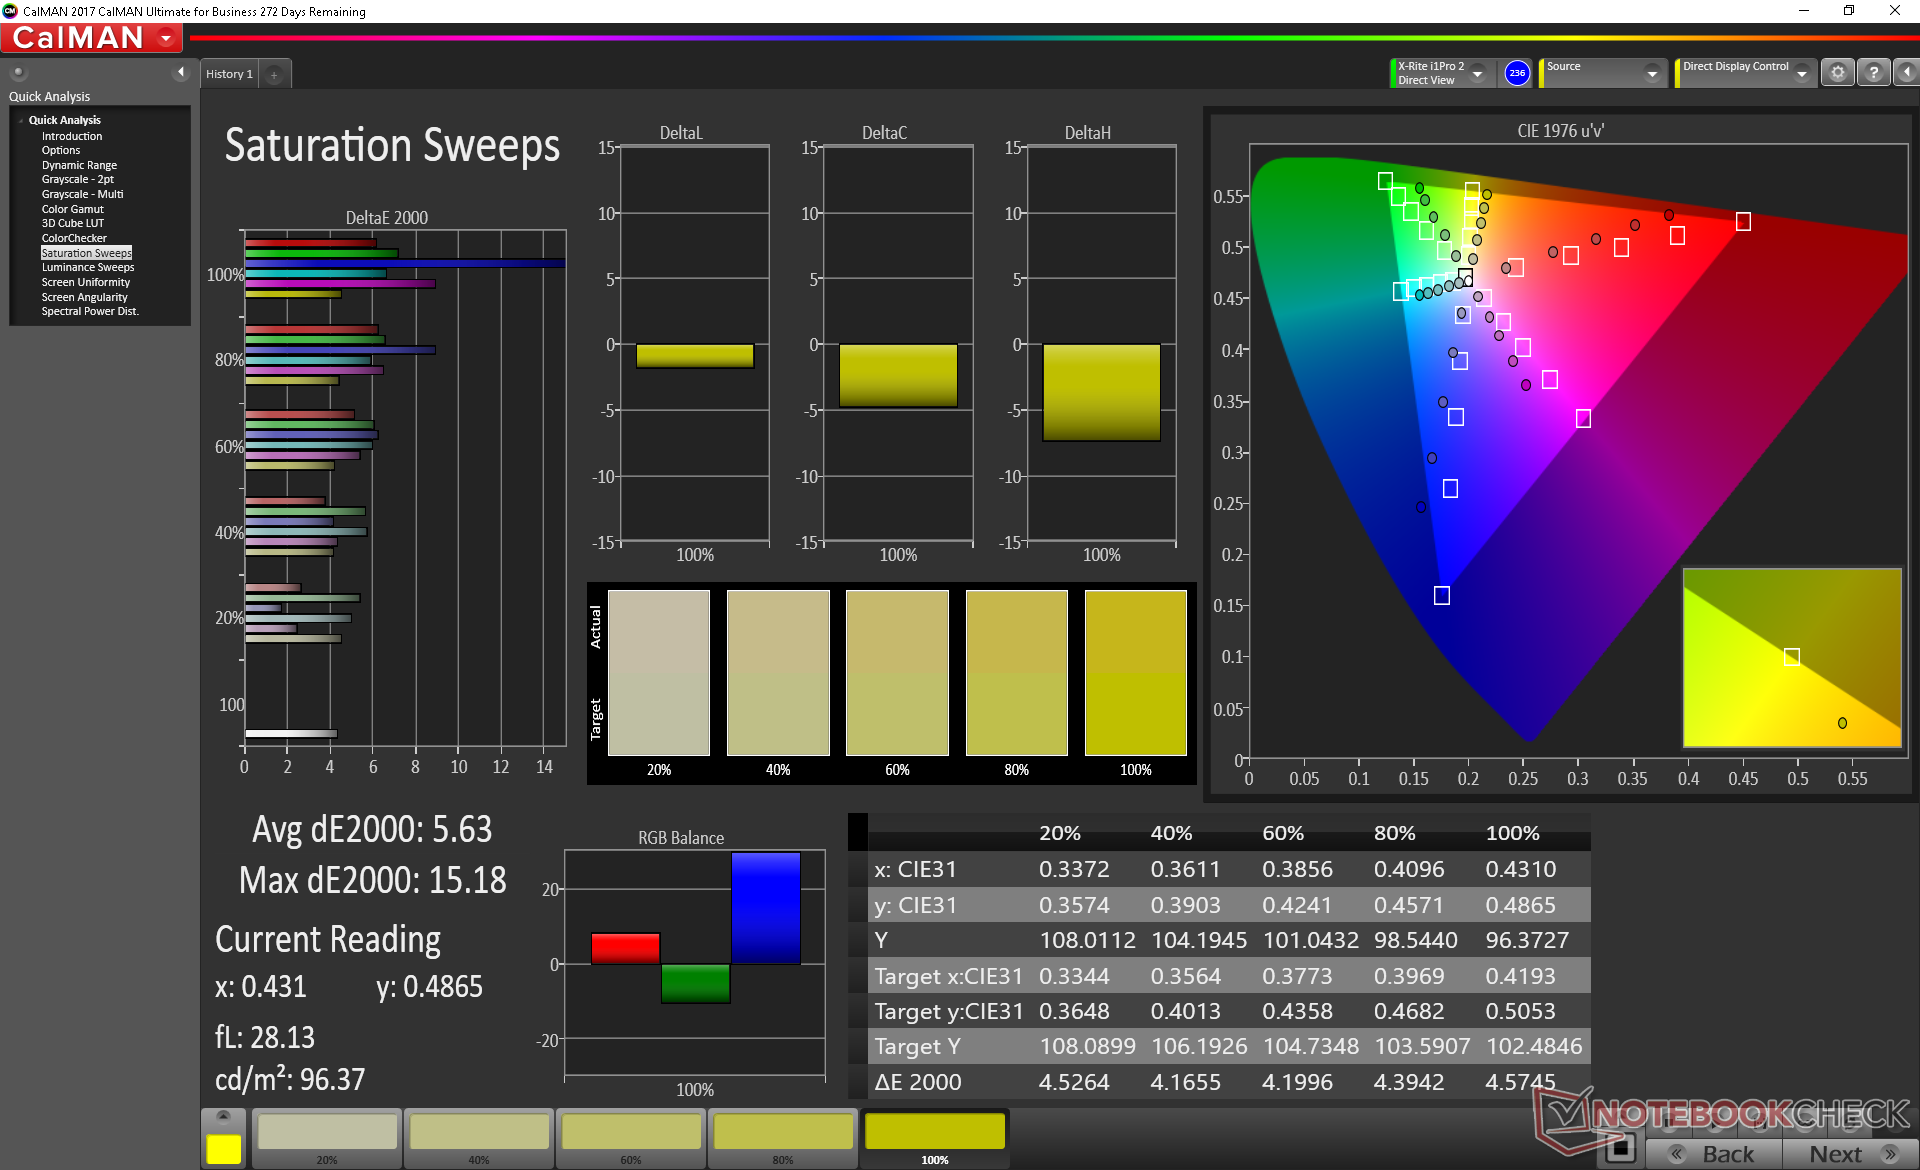
Further measurements with an X-Rite colorimeter reveal generally accurate grayscale before any calibration. Most budget gaming laptops have overly cool color temperatures for poor first impressions, but the FX505 has thankfully broken this trend. Colors still become increasingly inaccurate at higher saturation levels due to the narrow color space mentioned above. Blue in particular is measurably more inaccurate than other colors as it leans towards blue-violet instead.
Display Response Times
| ↔ Response Time Black to White | ||
|---|---|---|
| 30.8 ms ... rise ↗ and fall ↘ combined | ↗ 17.6 ms rise | 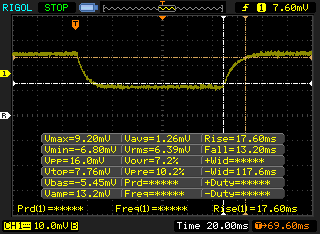 |
| ↘ 13.2 ms fall | ||
| The screen shows slow response rates in our tests and will be unsatisfactory for gamers. In comparison, all tested devices range from 0.1 (minimum) to 240 (maximum) ms. » 83 % of all devices are better. This means that the measured response time is worse than the average of all tested devices (19.9 ms). | ||
| ↔ Response Time 50% Grey to 80% Grey | ||
| 44.8 ms ... rise ↗ and fall ↘ combined | ↗ 18.8 ms rise | 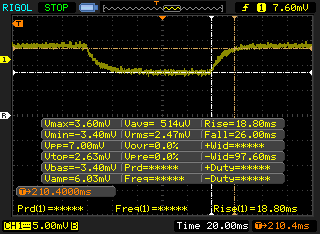 |
| ↘ 26 ms fall | ||
| The screen shows slow response rates in our tests and will be unsatisfactory for gamers. In comparison, all tested devices range from 0.165 (minimum) to 636 (maximum) ms. » 76 % of all devices are better. This means that the measured response time is worse than the average of all tested devices (31.1 ms). | ||
Screen Flickering / PWM (Pulse-Width Modulation)
| Screen flickering / PWM detected | 20830 Hz | ≤ 30 % brightness setting | 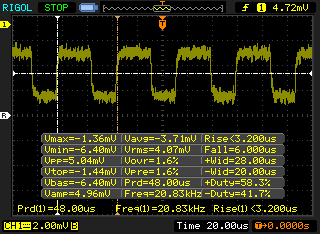 |
The display backlight flickers at 20830 Hz (worst case, e.g., utilizing PWM) Flickering detected at a brightness setting of 30 % and below. There should be no flickering or PWM above this brightness setting. The frequency of 20830 Hz is quite high, so most users sensitive to PWM should not notice any flickering. In comparison: 52 % of all tested devices do not use PWM to dim the display. If PWM was detected, an average of 7794 (minimum: 5 - maximum: 343500) Hz was measured. | |||
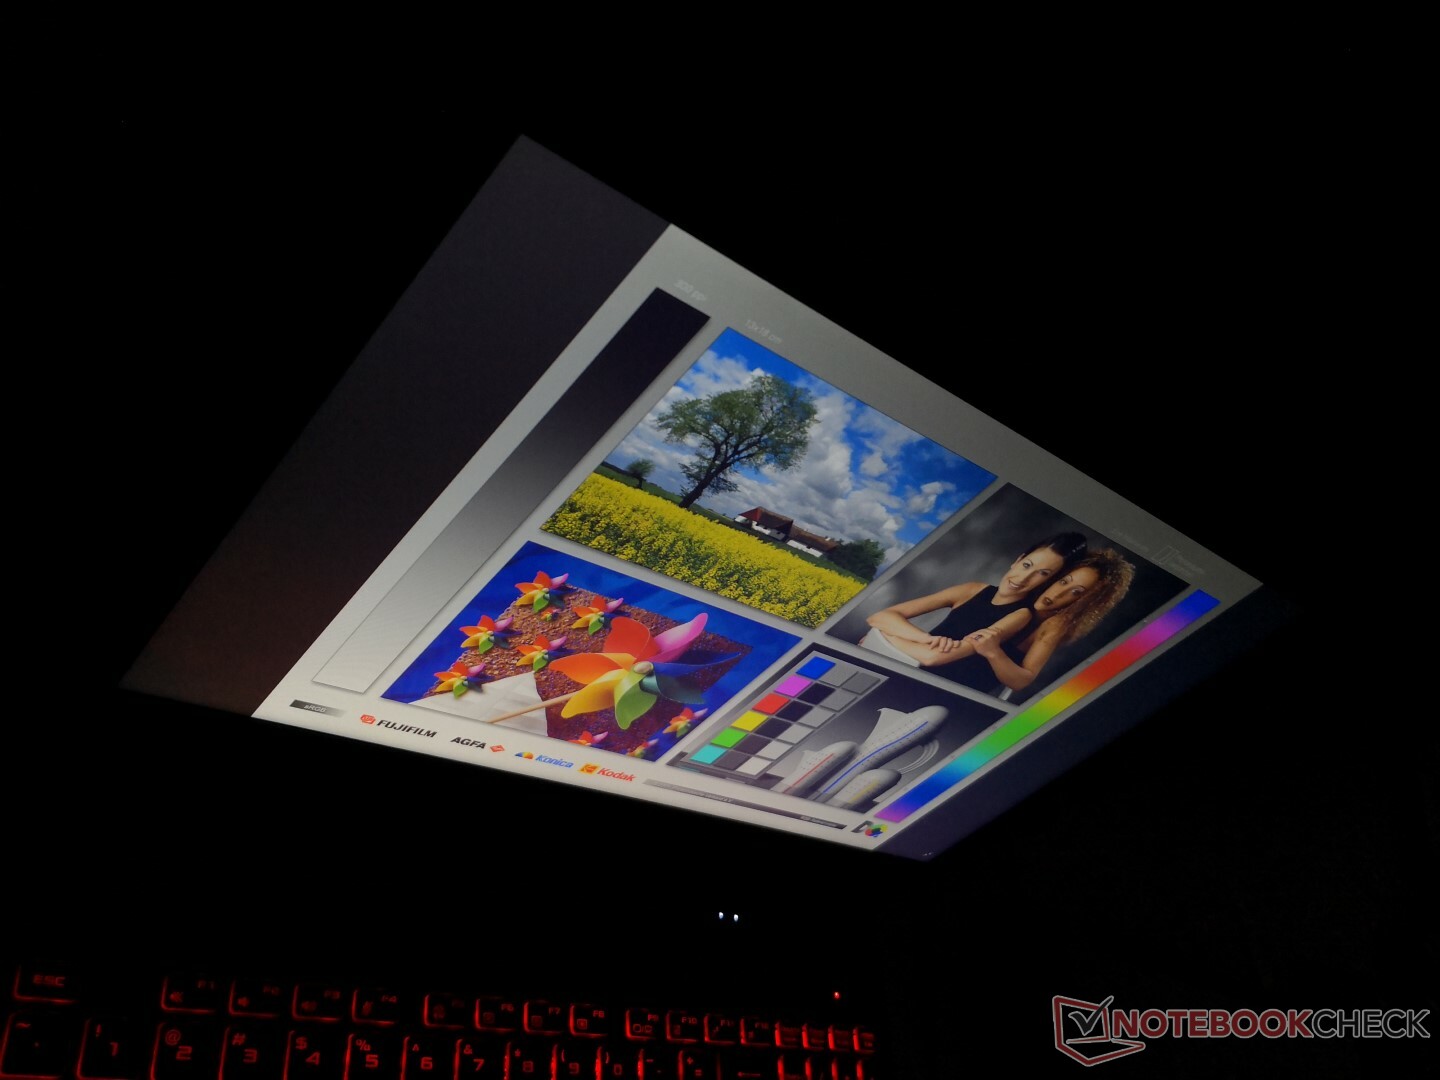
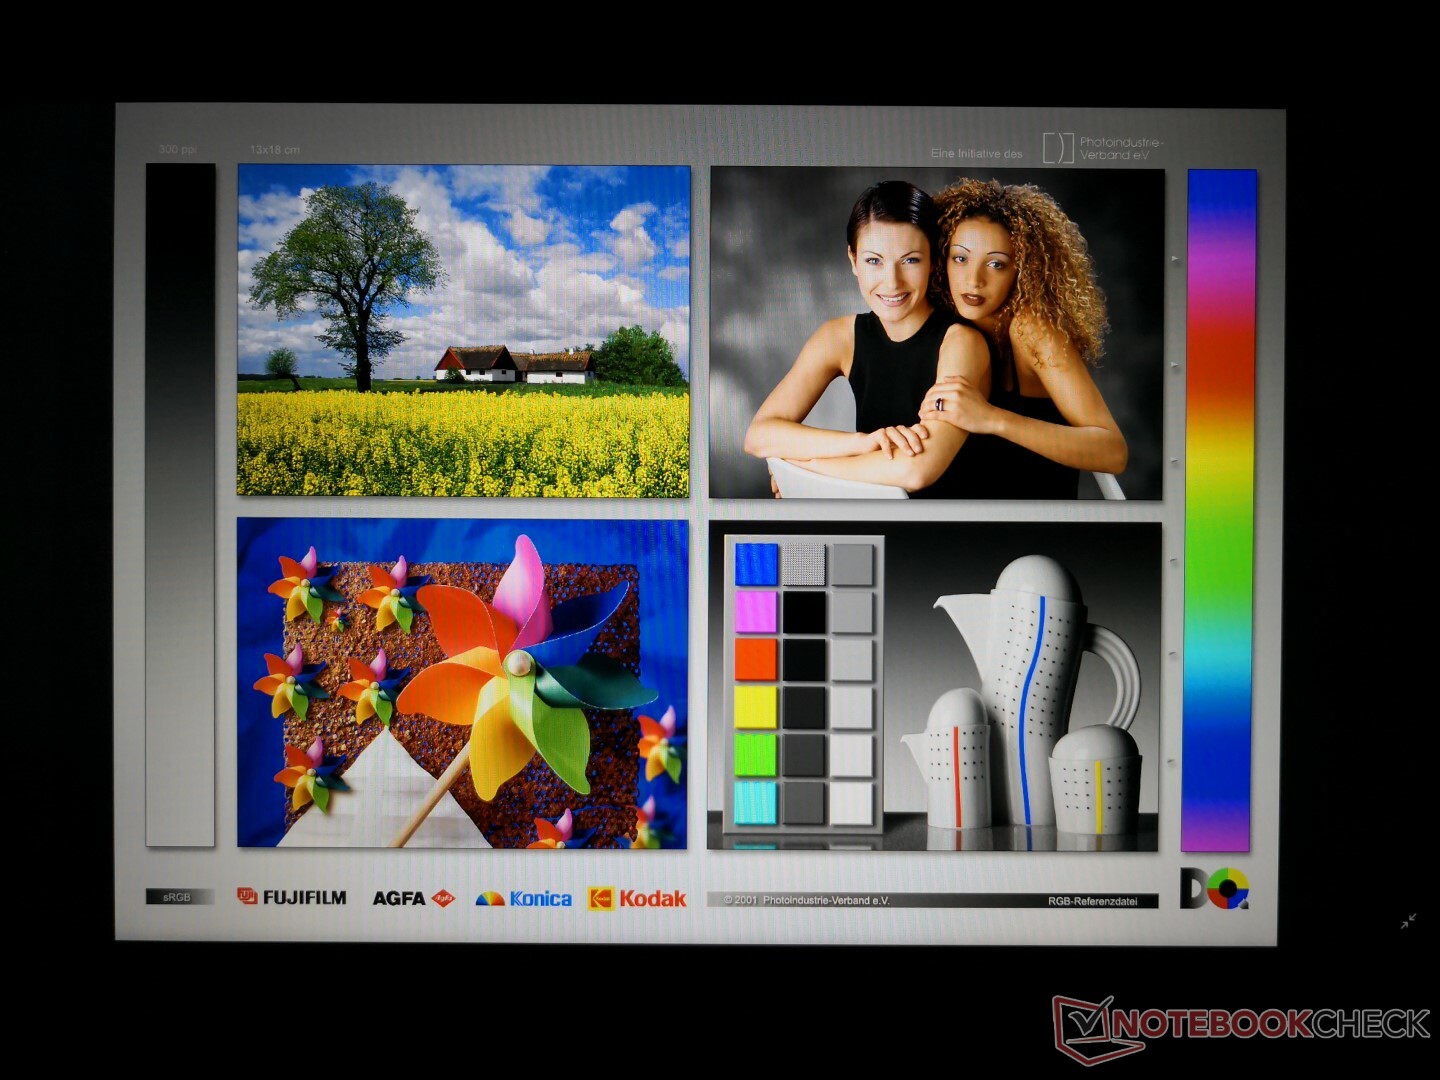
Outdoor visibility is poorer than most gaming laptops as the display is dimmer than average. Even though the matte panel keeps glare at a minimum, ambient lighting will still wash out colors and make it difficult to read text for long periods. Viewing angles are wide as expected from an IPS panel with only slight changes to colors and contrast from extreme angles.
Be sure to disable the display power savings option through the Radeon settings or else maximum brightness will be even lower when running on battery power.
Performance
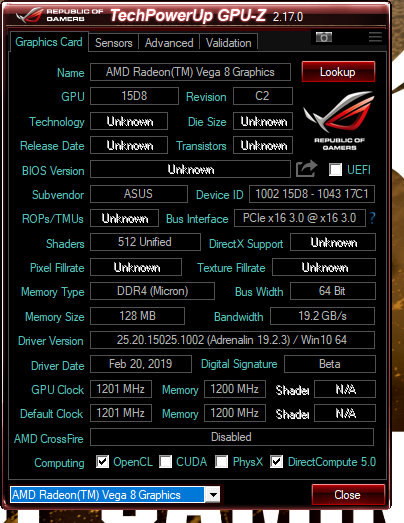
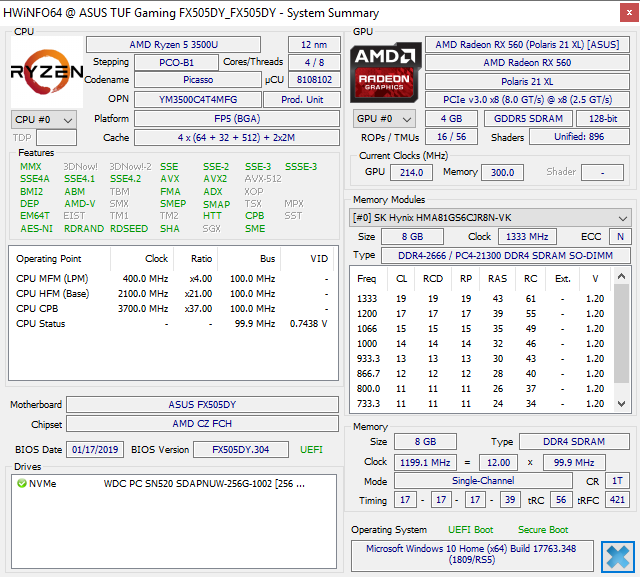
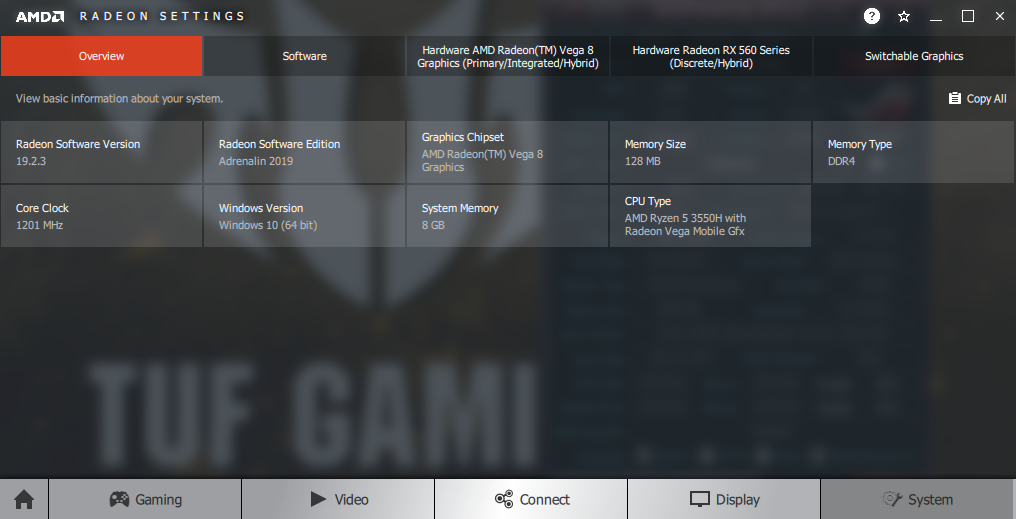
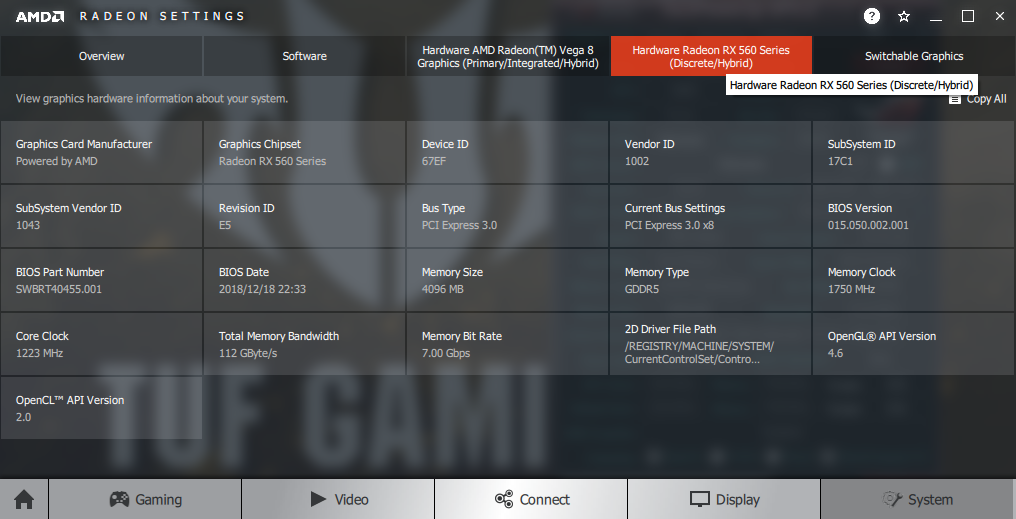
There are no other CPU or GPU options available other than the quad-core Ryzen 5 3550H CPU and Radeon RX 560X GPU. It's possible that Asus will add additional SKUs or introduce different models in the future with the more powerful Ryzen 7 3750H.
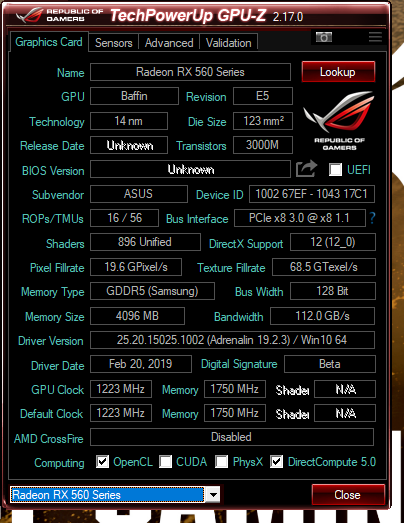
As for the GPU, the Radeon RX 560X is an aging model based on AMD's last generation (and soon-to-be two generations old) Polaris architecture. It's rarely found on PCs since most OEMs would rather use the more common GeForce GTX 1050 Nvidia equivalent.
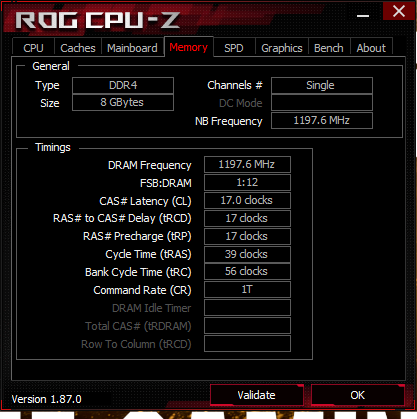
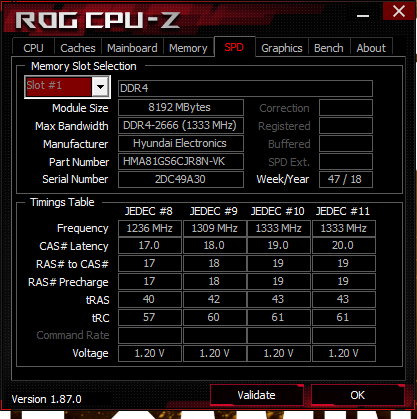
Our specific test unit is equipped with just 8 GB of single-channel DDR4 RAM. Slightly faster results than we've recorded here can be obtained if upgrading to dual-channel memory.
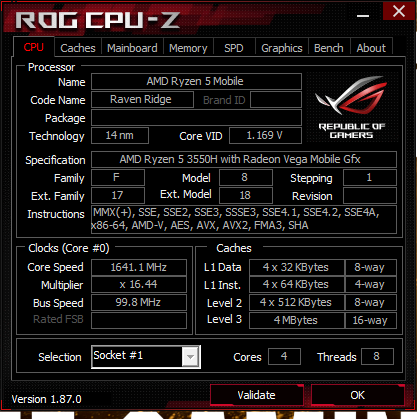
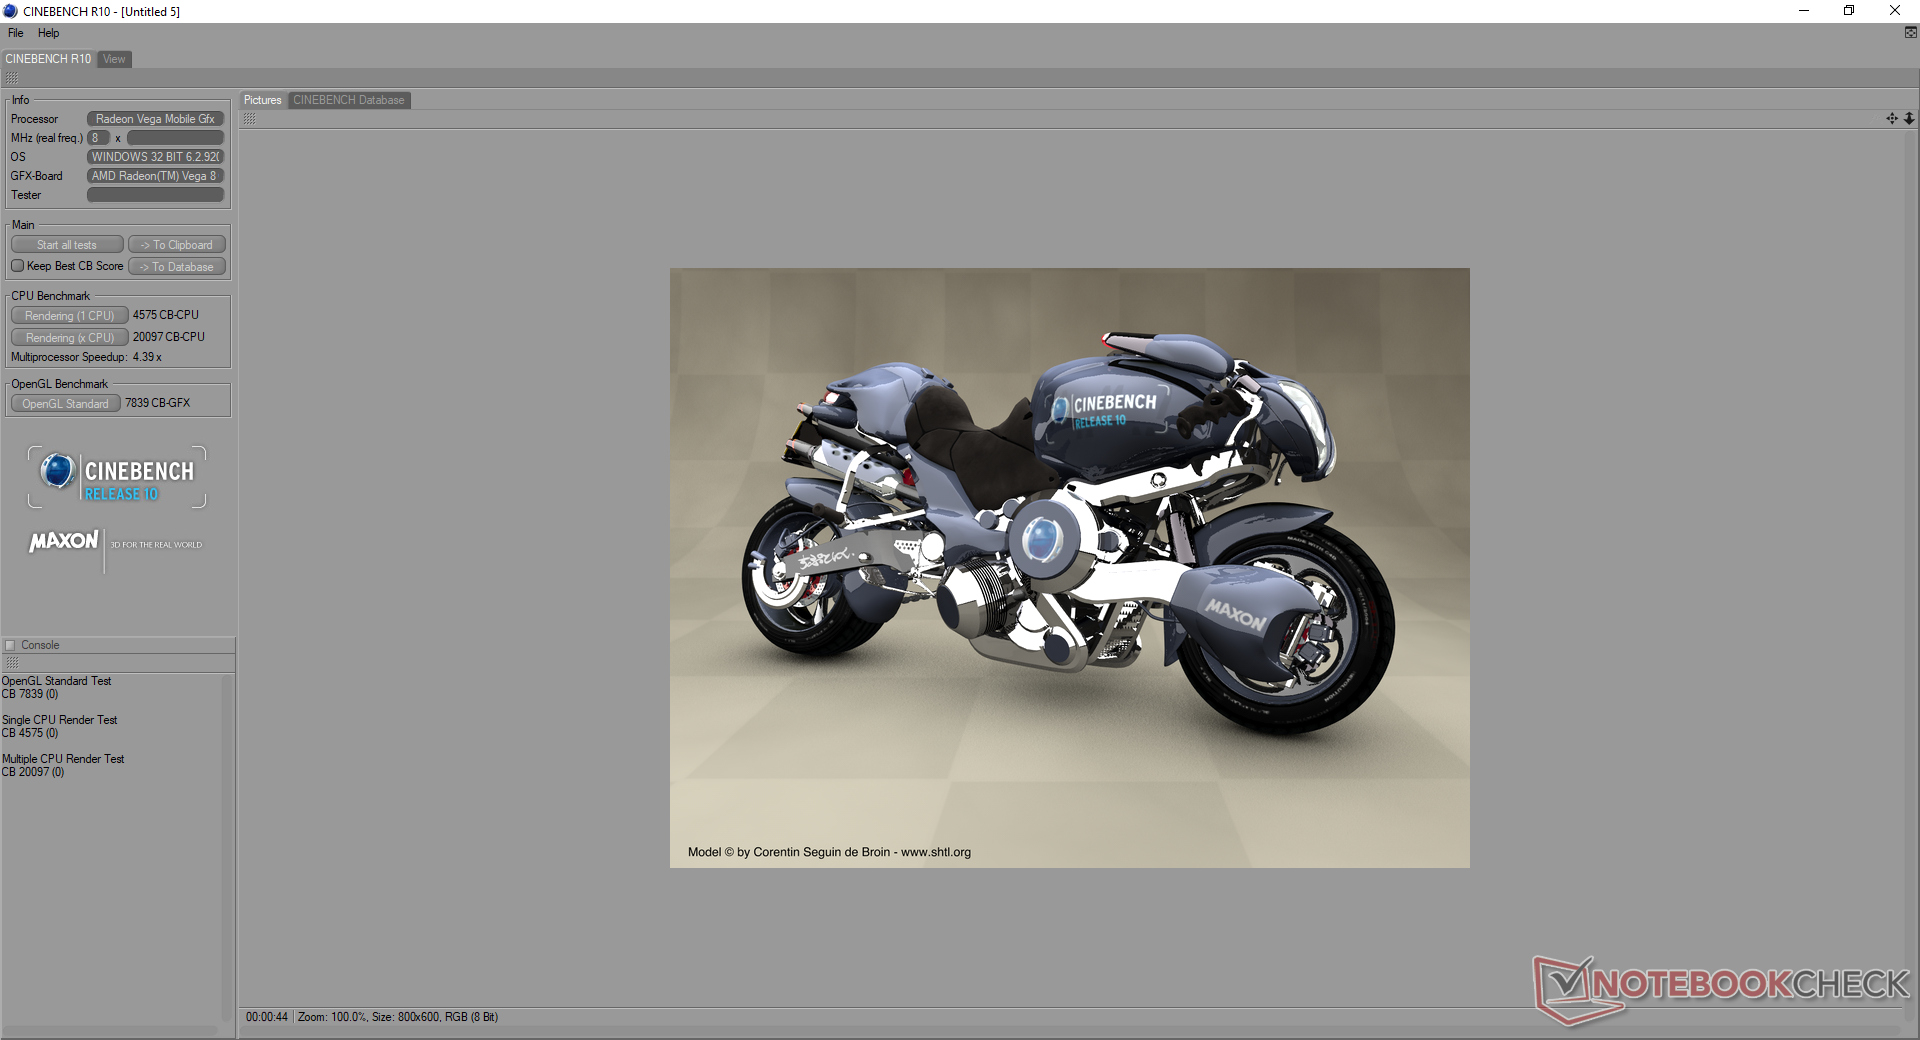
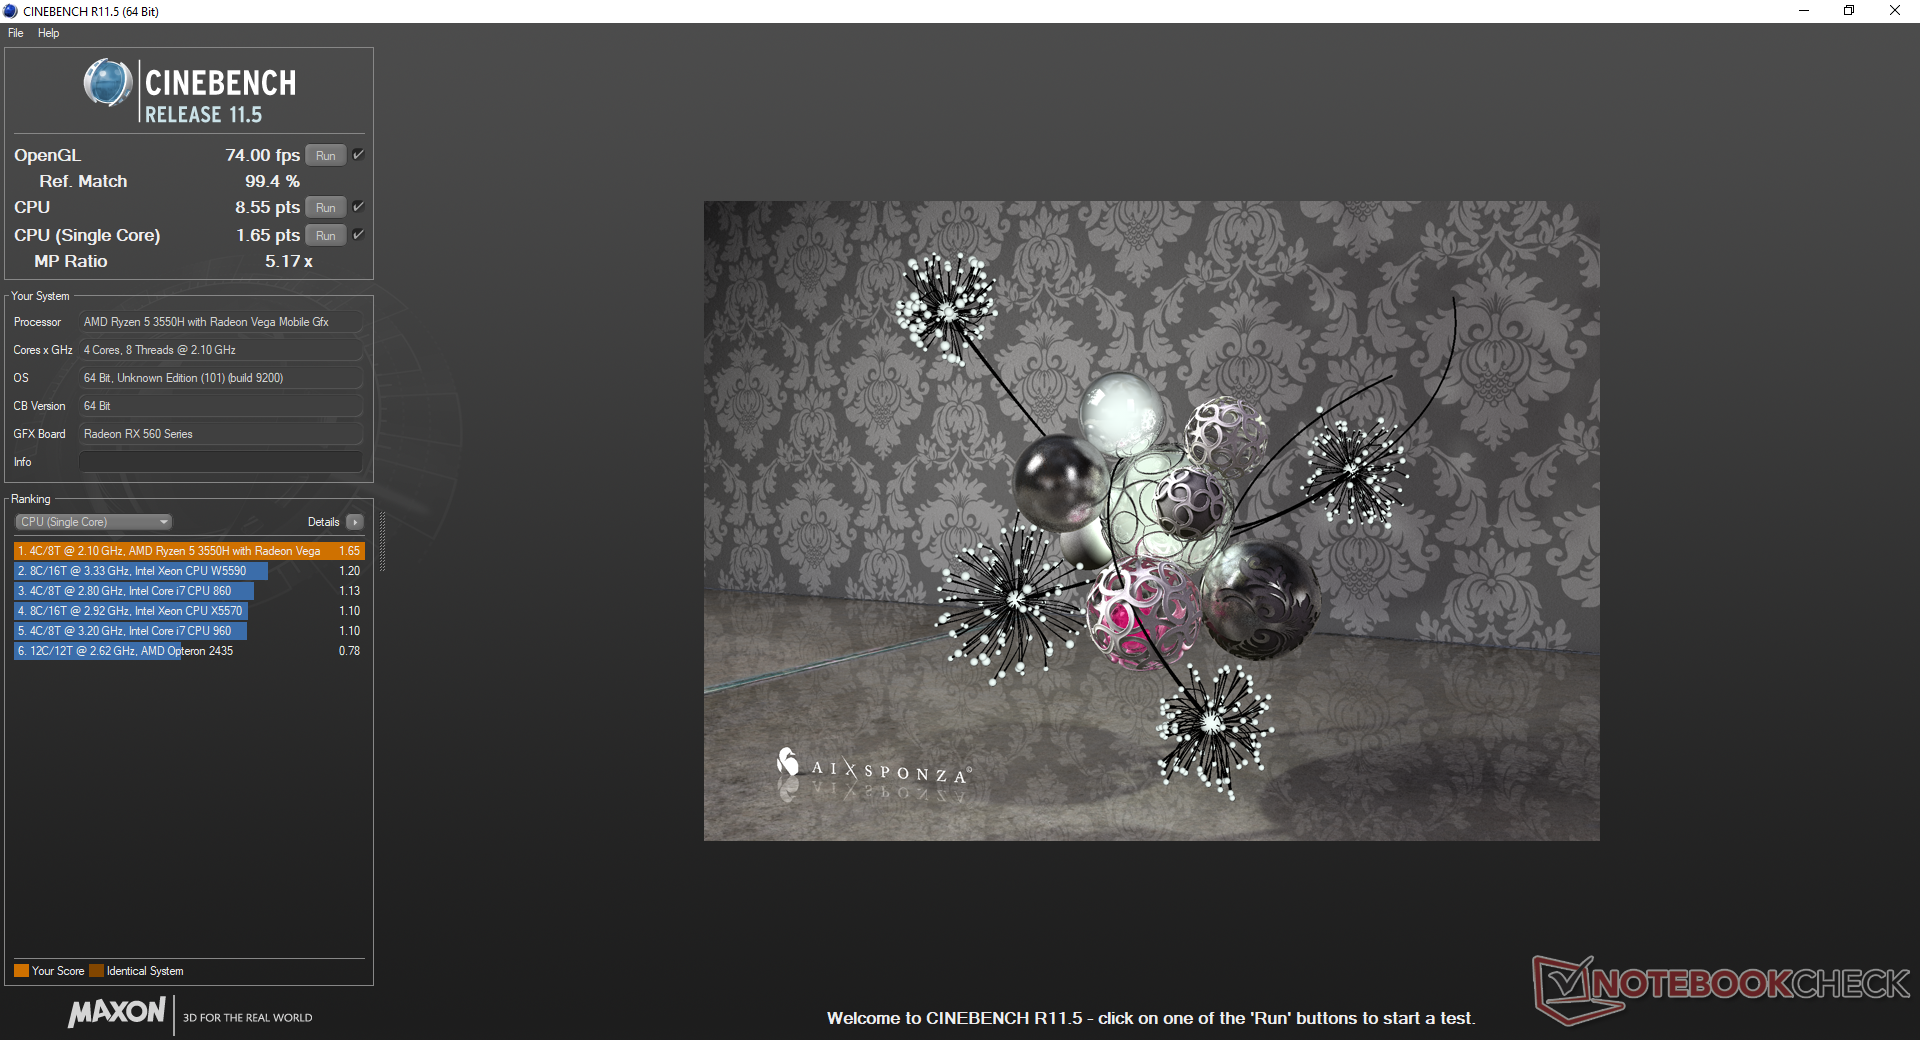
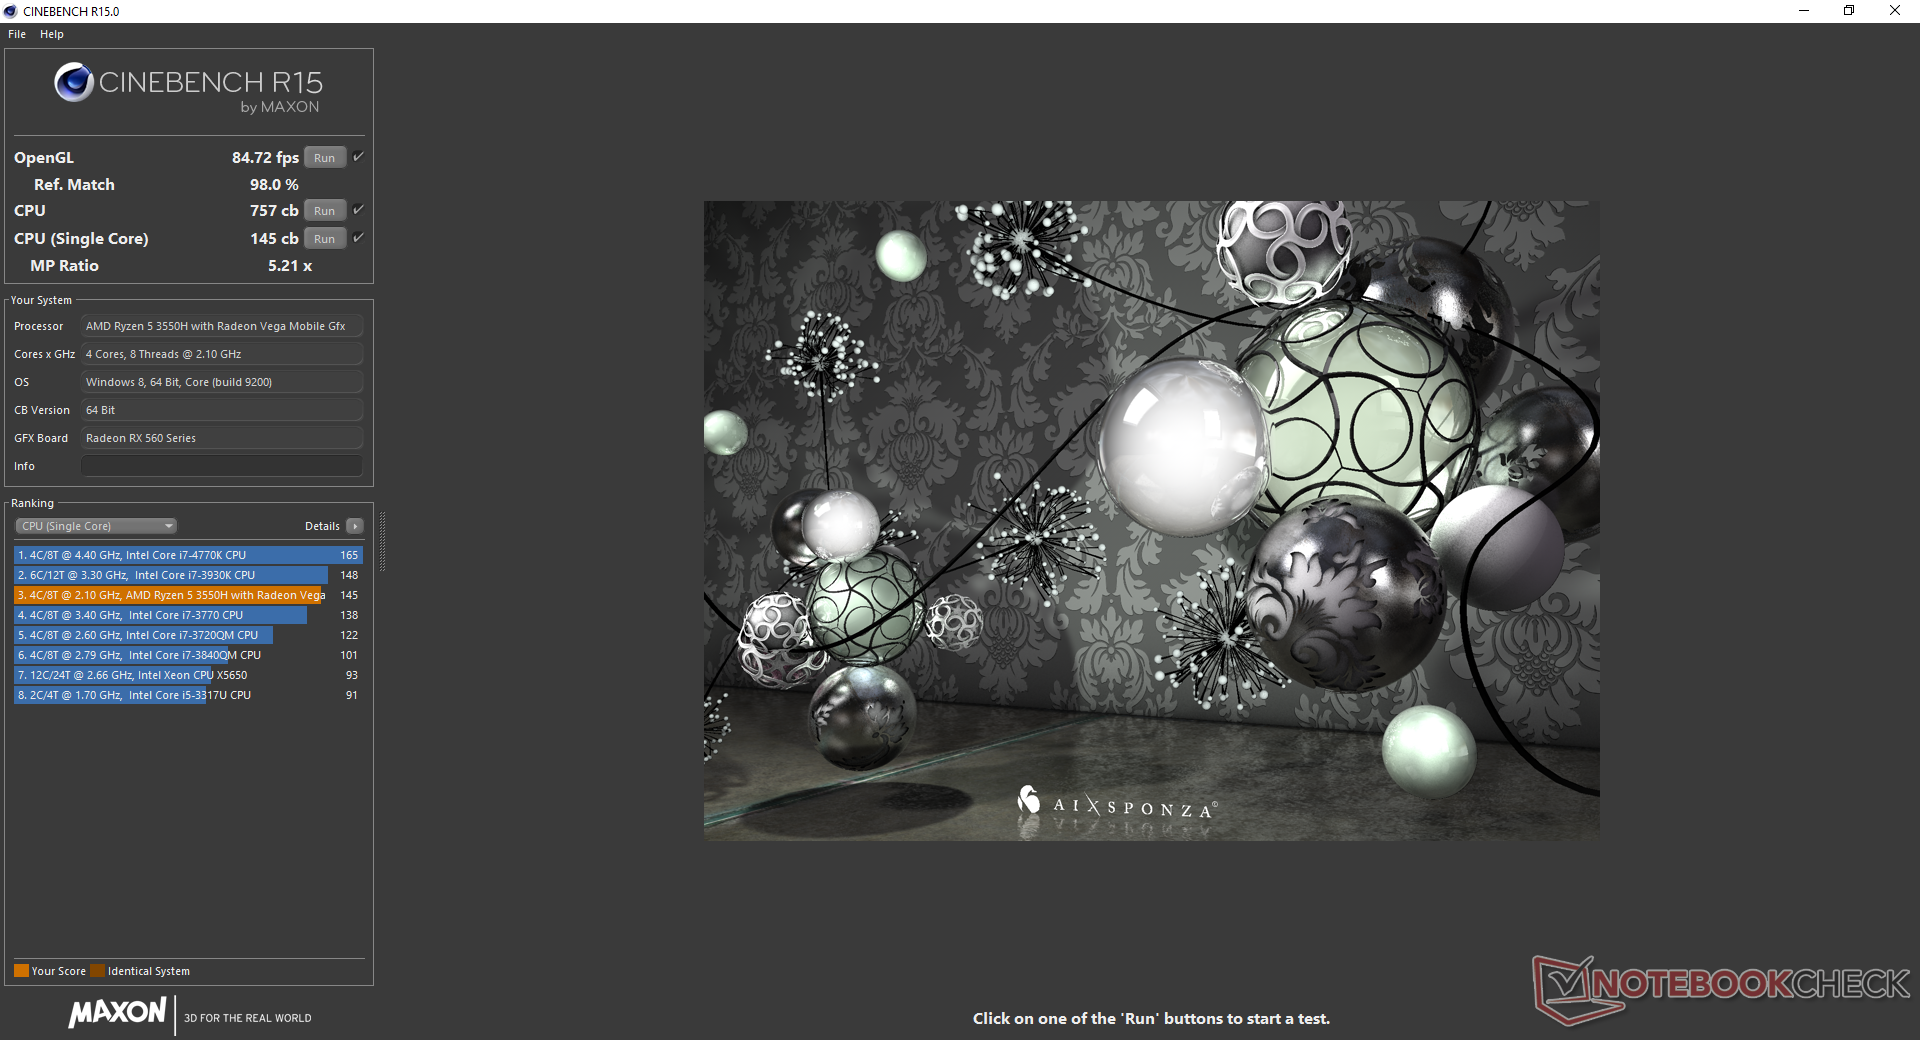
Processor
CPU performance is comparable to the Core i5-8300H and Core i7-7700HQ according to CineBench benchmarks despite the fact that the AMD processor is running at a lower TDP envelope than the Intel (35 W vs. 45 W). Single-thread performance, however, is slower than we were expecting as it's only comparable to the 15 W Ryzen 7 2700U. Meanwhile, the higher-end hexa-core Core i7-8750H will still handily outperform the new Zen+ processor by 30 percent or more depending on the laptop. Even so, AMD's intention was to offer a CPU that's competitive against the Core i5-8300H and the Ryzen 5 3550H is a success in this regard.
Performance sustainability is excellent. When running CineBench R15 Multi-Thread in a loop, the CPU is able to maintain its initial high score of ~755 points for the first few loops before falling just 5 percent as shown by our graph below. This corresponds to an initial clock rate of 3.7 GHz before falling to 3.5 GHz which we will detail in our Stress Test section.
Note that the Core i5-8300H in last year's Asus FX504GD suffered from throttling issues and so its scores are much lower than the average Core i5-8300H in our database. Our FX505DY thankfully exhibits no similar performance issues.
See our dedicated page on the Ryzen 5 3550H for more technical information and benchmark comparisons.
System Performance
PCMark benchmarks rank our FX505 consistently ahead of last year's FX504 equipped with the i5-8300H CPU and GTX 1050 GPU. Part of this is likely due to the fact that our FX504 was running on a slow primary HDD compared to the NVMe SSD of our FX505, but it's a breath of fresh air to see a full-on AMD gaming laptop match and even outscore a competing Intel-Nvidia alternative. Mid-range gaming laptops equipped with the i7-8750H and GTX 1060 will still outperform our Asus by a wide margin.
We didn't experience any software issues during our time with the test unit.
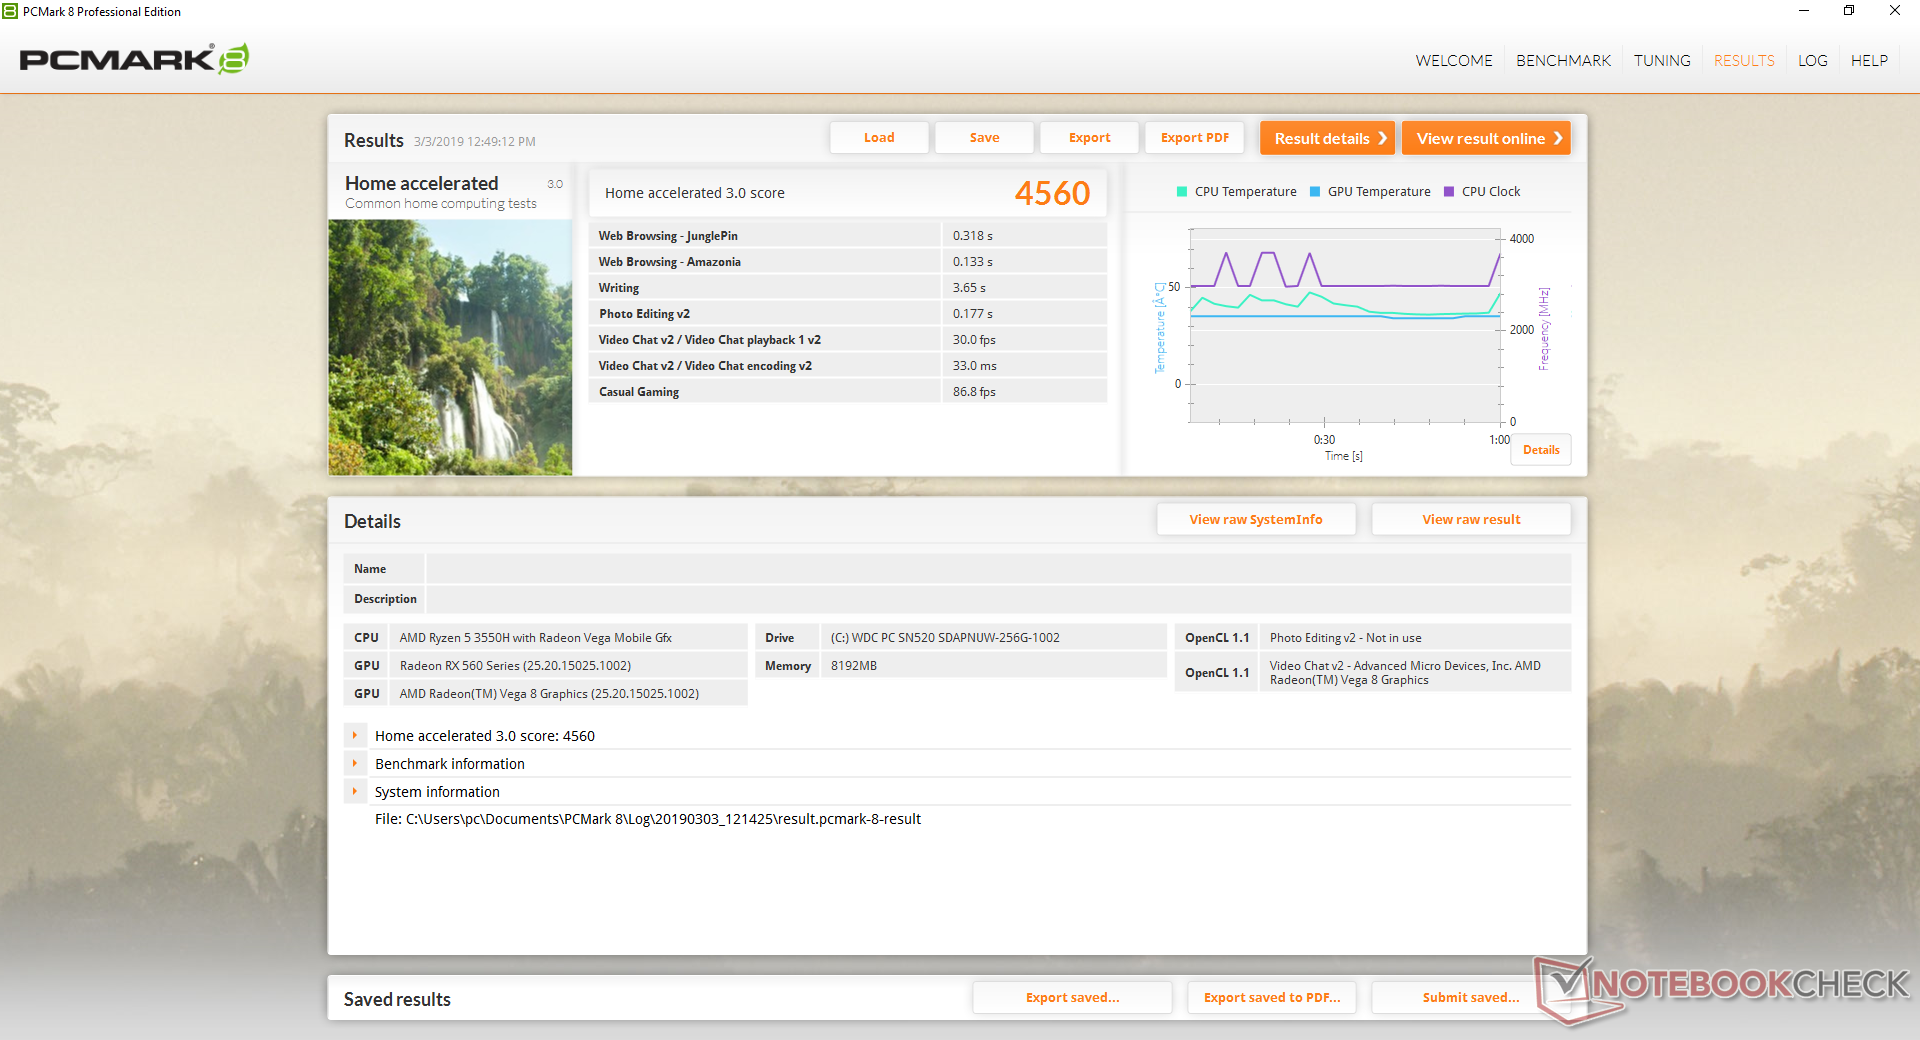
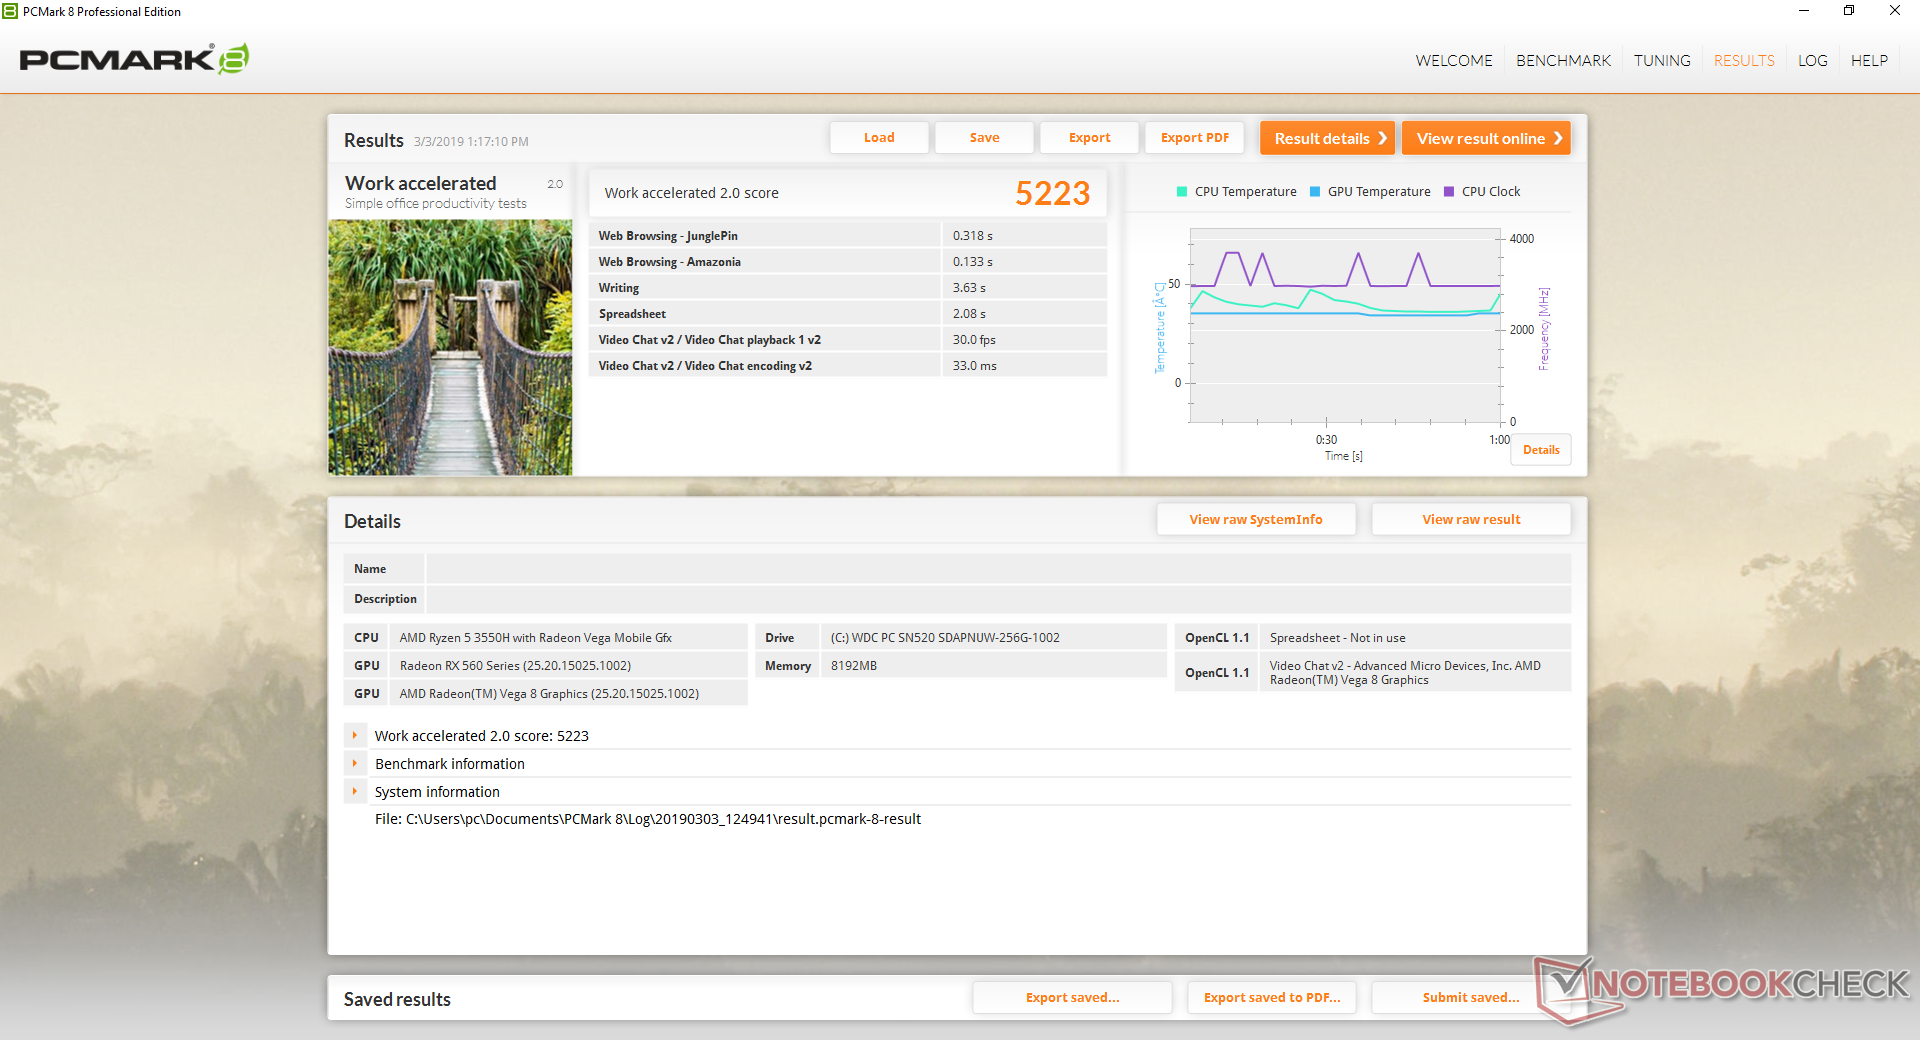
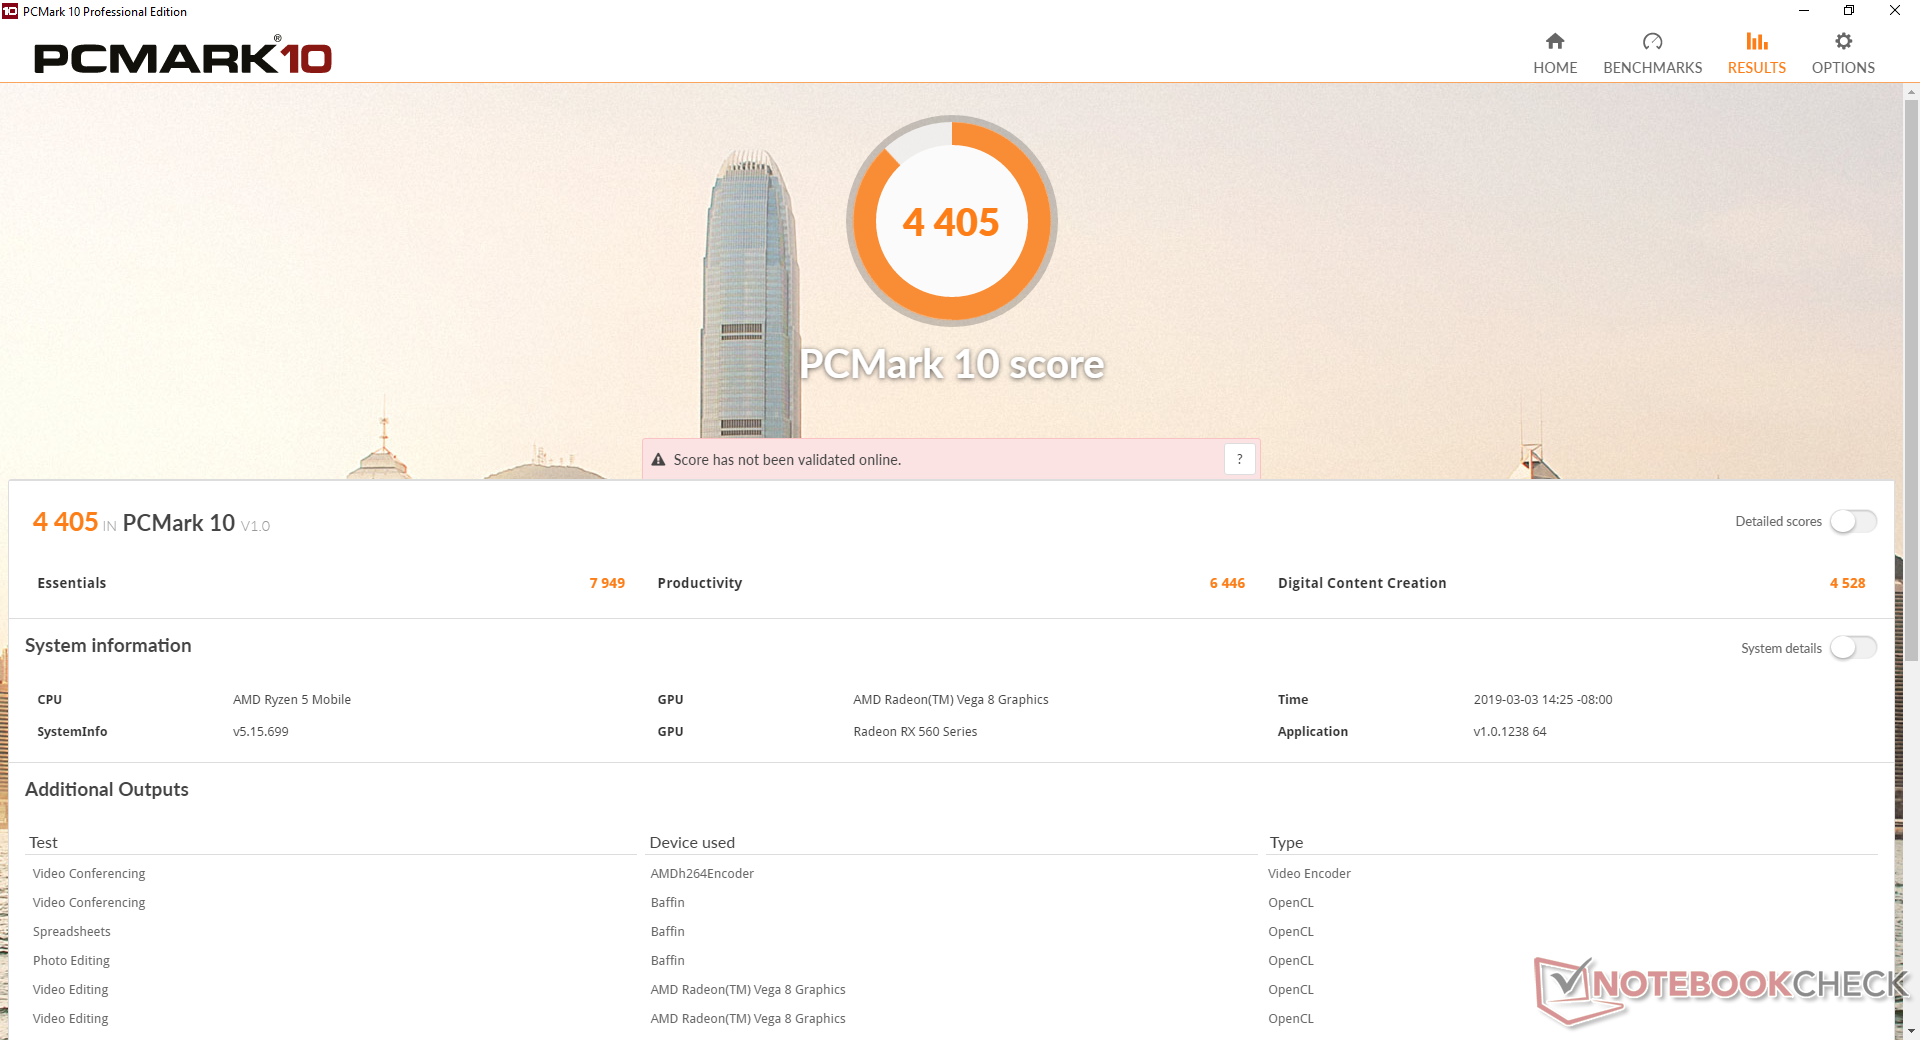
| PCMark 8 Home Score Accelerated v2 | 4560 points | |
| PCMark 8 Work Score Accelerated v2 | 5223 points | |
| PCMark 10 Score | 4405 points | |
Help | ||
Storage Devices
Internal storage options include a single PCIe Gen. 3 M.2 2280 slot and a secondary 2.5-inch SATA III bay. Our specific test unit is configured with only a 256 GB Western Digital M.2 NVMe SSD.
Sequential read and write rates are balanced at just over 1000 MB/s each. While much faster than any SATA III SSD, this is rather average for an NVMe drive. The pricier Samsung SSD PM981 can offer almost twice the read rates as our Kingston drive. In the end, the WD drive a budget NVMe SSD fit for a budget gaming laptop.
Swapping out and upgrading drives will not void any warranties.
See our table of HDDs and SSDs for more benchmark comparisons.
| Asus TUF FX505DY WDC PC SN520 SDAPNUW-256G | MSI GP63 Leopard 8RE-013US Samsung PM871b MZNLN128HAHQ | Lenovo Legion Y530-15ICH Samsung SSD PM981 MZVLB256HAHQ | Acer Nitro 5 AN515-42-R6V0 SK Hynix HFS128G39TND | Gigabyte Sabre 15G Liteonit CV3-8D128 | |
|---|---|---|---|---|---|
| AS SSD | -60% | -1% | -119% | -60% | |
| Seq Read (MB/s) | 1059 | 504 -52% | 1808 71% | 470.8 -56% | 516 -51% |
| Seq Write (MB/s) | 1180 | 462.9 -61% | 1429 21% | 126.8 -89% | 479.8 -59% |
| 4K Read (MB/s) | 37.55 | 21.88 -42% | 46.1 23% | 23.64 -37% | 28.3 -25% |
| 4K Write (MB/s) | 110.6 | 60.8 -45% | 97 -12% | 54.5 -51% | 53.8 -51% |
| 4K-64 Read (MB/s) | 619 | 253 -59% | 536 -13% | 203.1 -67% | 257 -58% |
| 4K-64 Write (MB/s) | 502 | 137.8 -73% | 273.6 -45% | 127.1 -75% | 132.2 -74% |
| Access Time Read * (ms) | 0.087 | 0.155 -78% | 0.085 2% | 0.121 -39% | 0.141 -62% |
| Access Time Write * (ms) | 0.034 | 0.072 -112% | 0.038 -12% | 0.269 -691% | 0.073 -115% |
| Score Read (Points) | 762 | 325 -57% | 763 0% | 274 -64% | 337 -56% |
| Score Write (Points) | 730 | 245 -66% | 514 -30% | 194 -73% | 234 -68% |
| Score Total (Points) | 1899 | 742 -61% | 1663 -12% | 600 -68% | 752 -60% |
| Copy ISO MB/s (MB/s) | 1166 | 690 -41% | 446.8 -62% | ||
| Copy Program MB/s (MB/s) | 507 | 328.1 -35% | 195.3 -61% | ||
| Copy Game MB/s (MB/s) | 480.3 | 220.7 -54% | 323.5 -33% |
* ... smaller is better

GPU Performance
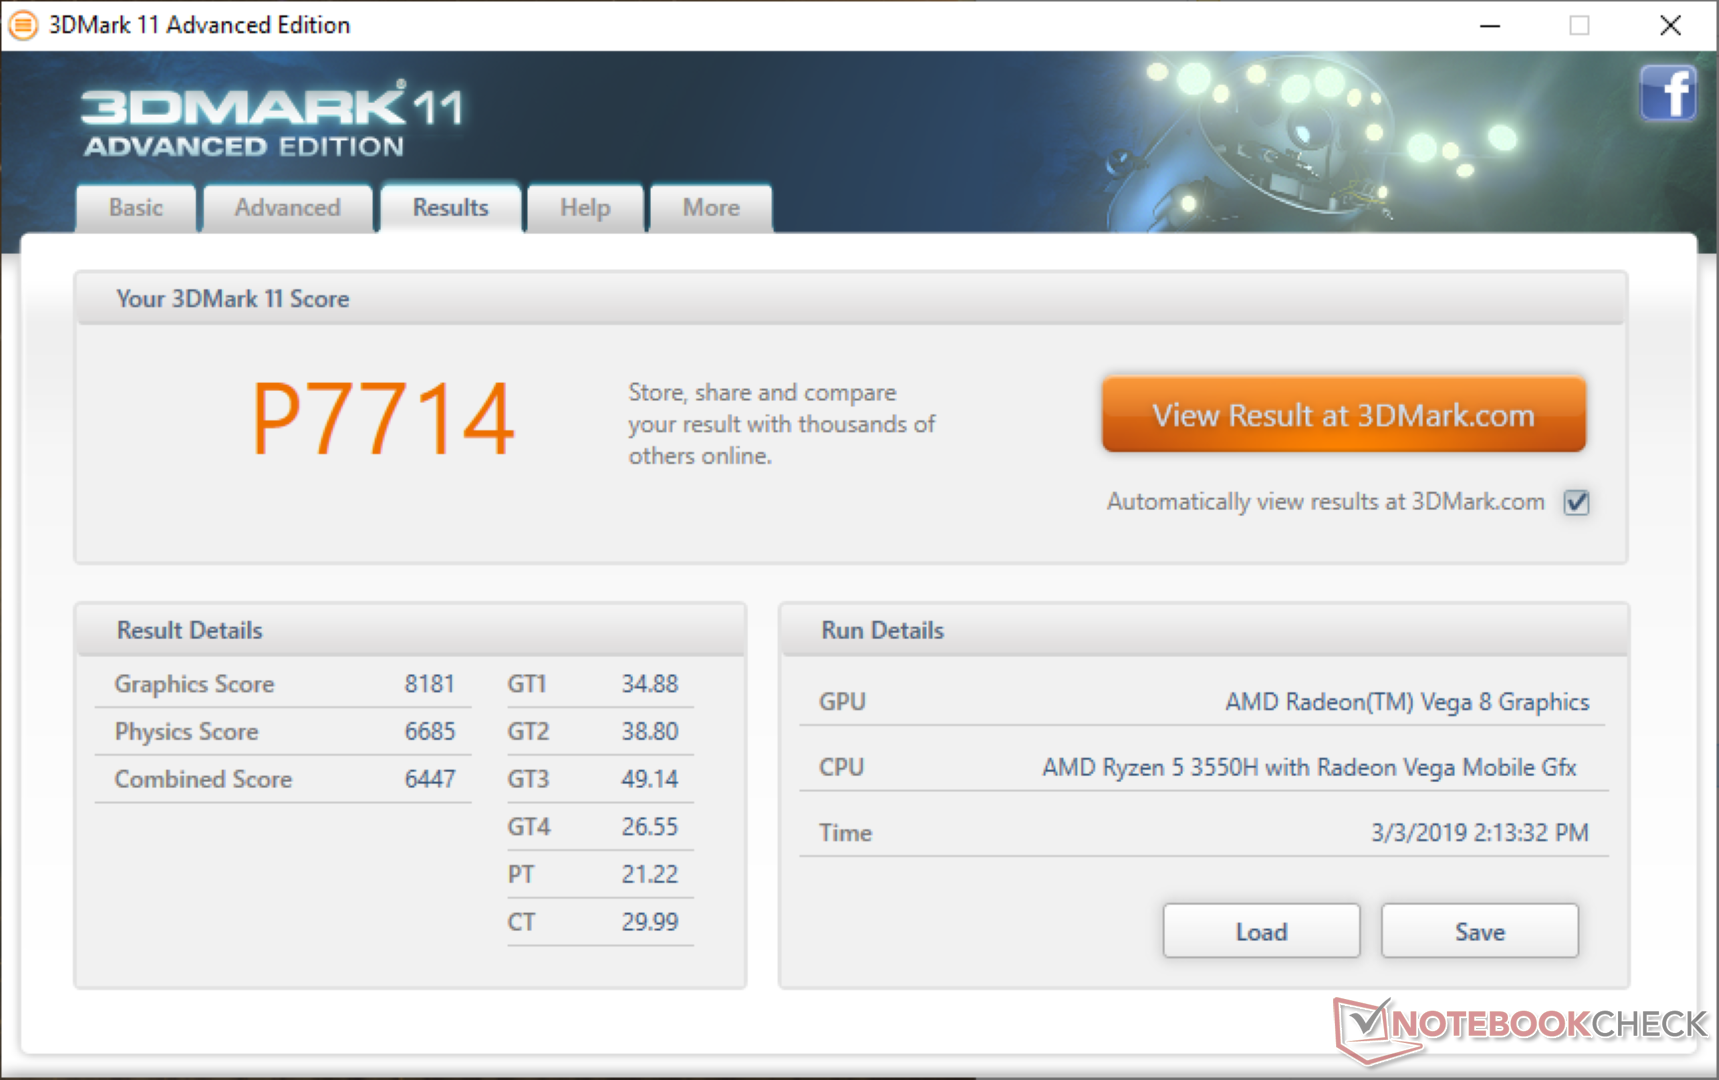
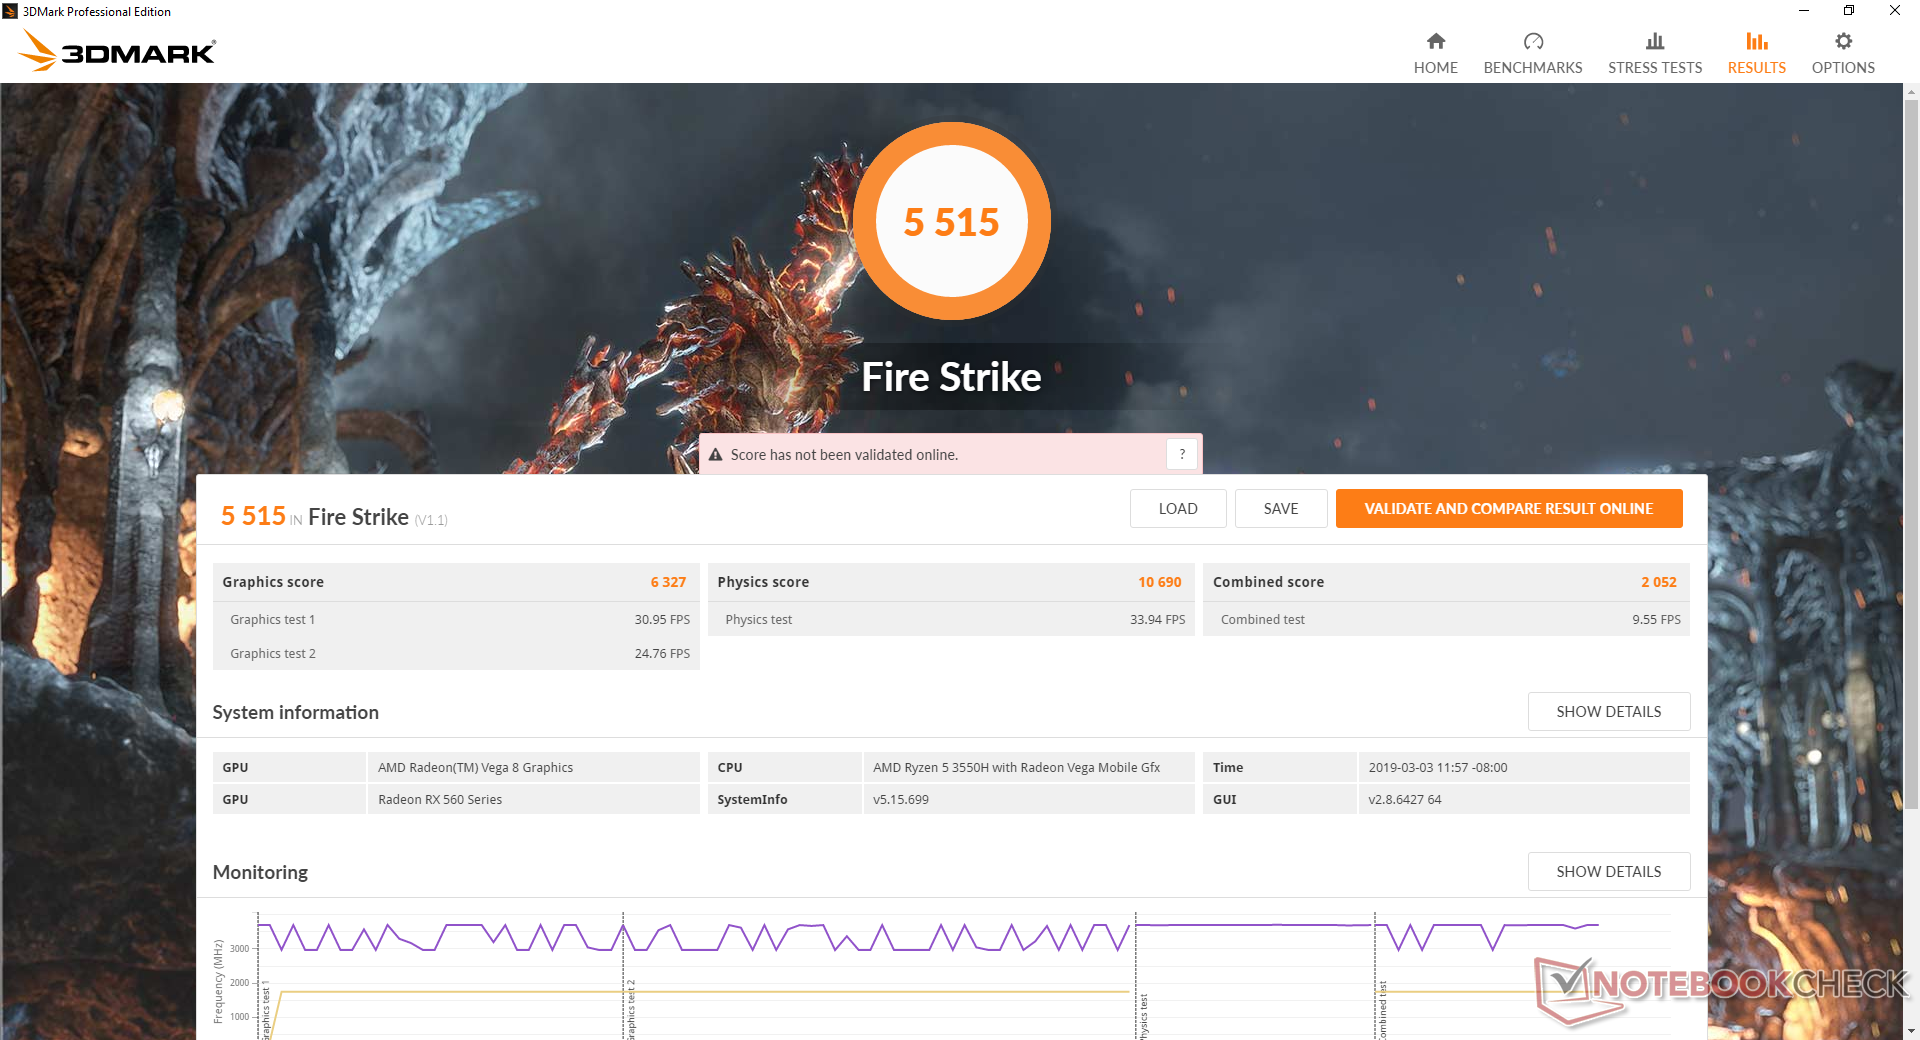
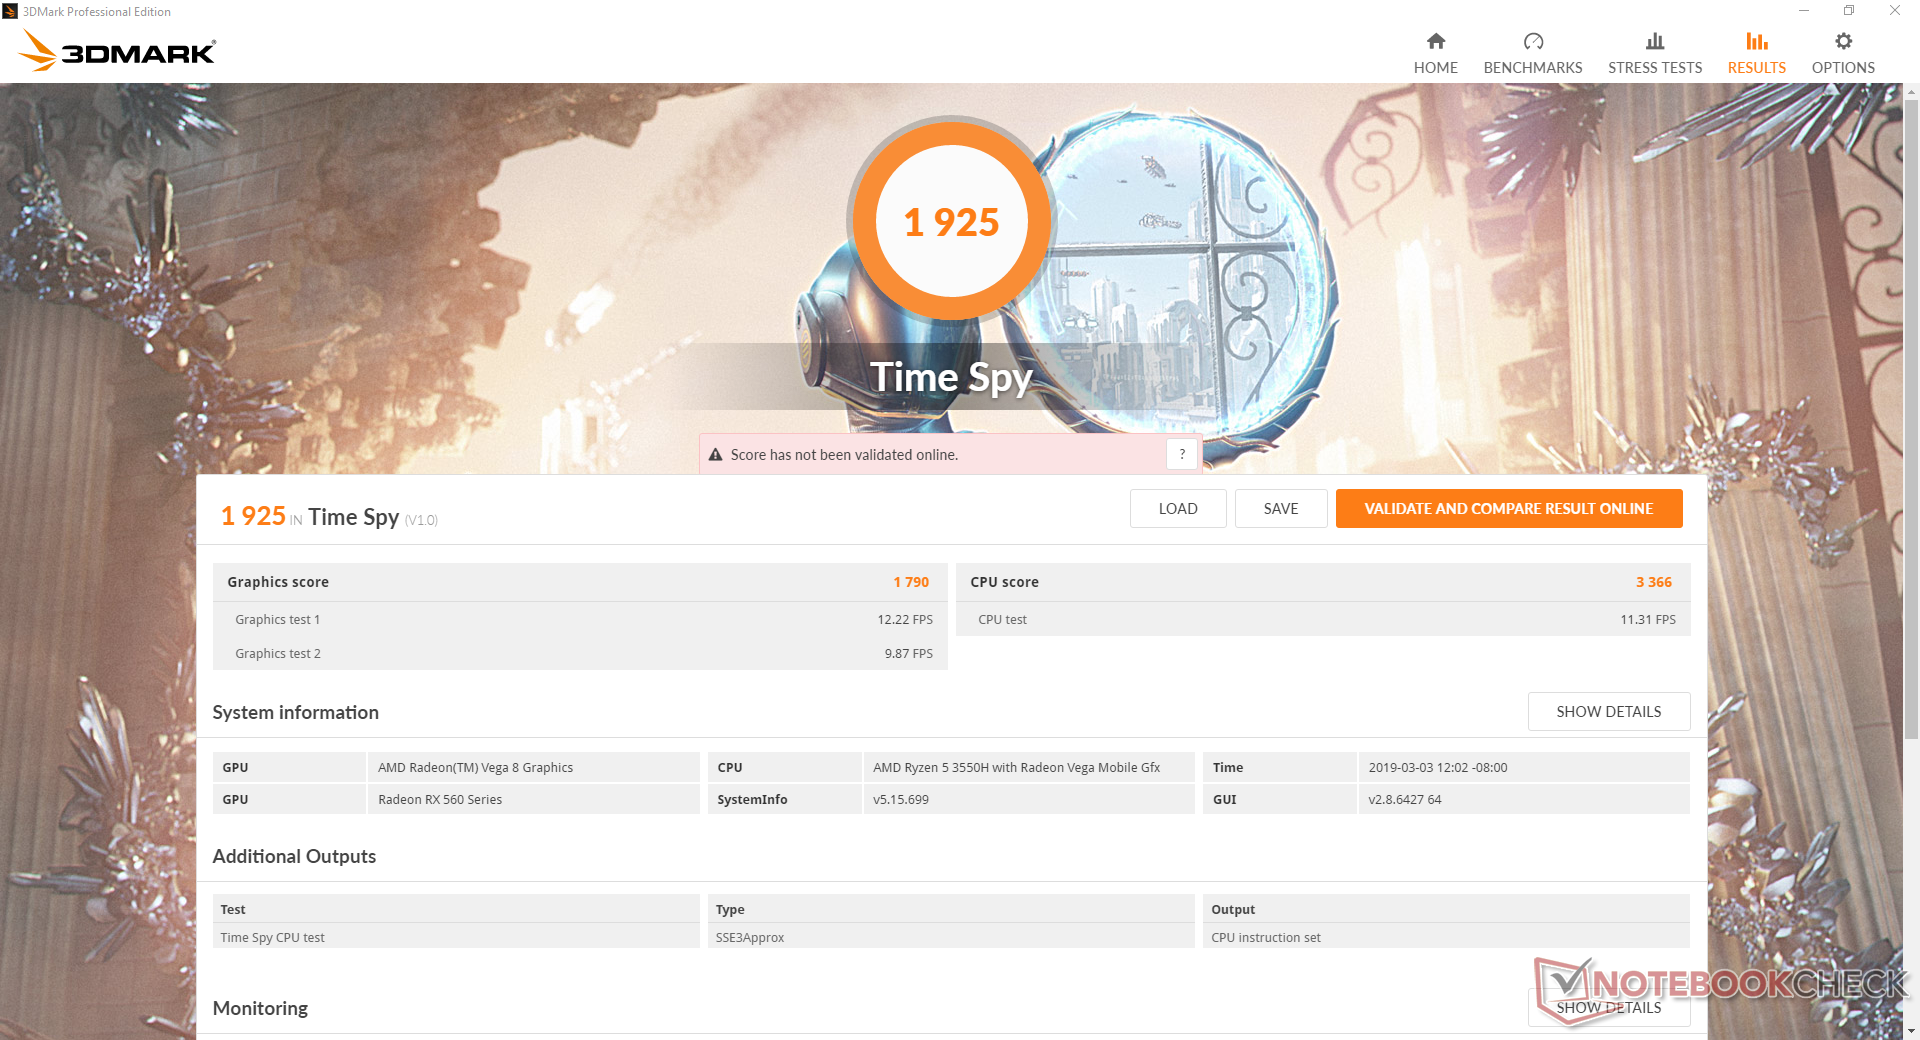
Graphics performance is most similar to the GeForce GTX 1050 or GTX 965M if not just slightly better at DX12 titles according to 3DMark benchmarks. Nonetheless, the GTX 1050 Ti is still the noticeably faster card by about 27 percent. The even rarer Radeon RX 580 as found on the Asus GL702ZC is up to 90 percent faster.
| 3DMark | |
| 1920x1080 Fire Strike Graphics | |
| Asus Zephyrus S GX531GM | |
| Asus GL702ZC-GC104T | |
| Intel Hades Canyon NUC8i7HVK | |
| Lenovo Legion Y730-15ICH i5-8300H | |
| Schenker XMG P506 | |
| Dell XPS 15 9575 i5-8305G | |
| Asus FX504GD | |
| Asus TUF FX505DY | |
| Acer Nitro 5 AN515-42-R6V0 | |
| Lenovo Legion Y520-15IKBA-80WY001VGE | |
| Asus ZenBook 15 UX533FD | |
| Asus GL552VW-DK725T | |
| Honor Magicbook | |
| 2560x1440 Time Spy Graphics | |
| Asus Zephyrus S GX531GM | |
| Asus GL702ZC-GC104T | |
| Intel Hades Canyon NUC8i7HVK | |
| Asus TUF FX505DY | |
| Asus FX504GD | |
| 3DMark 11 | |
| 1280x720 Performance GPU | |
| Asus GL702ZC-GC104T | |
| Intel Hades Canyon NUC8i7HVK | |
| Asus Zephyrus S GX531GM | |
| Schenker XMG P506 | |
| Dell XPS 15 9575 i5-8305G | |
| Lenovo Legion Y730-15ICH i5-8300H | |
| Acer Nitro 5 AN515-42-R6V0 | |
| Lenovo Legion Y520-15IKBA-80WY001VGE | |
| Asus TUF FX505DY | |
| Asus FX504GD | |
| Asus ZenBook 15 UX533FD | |
| Asus GL552VW-DK725T | |
| Honor Magicbook | |
| 1280x720 Performance Combined | |
| Intel Hades Canyon NUC8i7HVK | |
| Asus GL702ZC-GC104T | |
| Schenker XMG P506 | |
| Lenovo Legion Y730-15ICH i5-8300H | |
| Dell XPS 15 9575 i5-8305G | |
| Asus FX504GD | |
| Asus Zephyrus S GX531GM | |
| Asus ZenBook 15 UX533FD | |
| Asus TUF FX505DY | |
| Lenovo Legion Y520-15IKBA-80WY001VGE | |
| Acer Nitro 5 AN515-42-R6V0 | |
| Asus GL552VW-DK725T | |
| Honor Magicbook | |
| 3DMark 06 Standard Score | 25730 points | |
| 3DMark 11 Performance | 7714 points | |
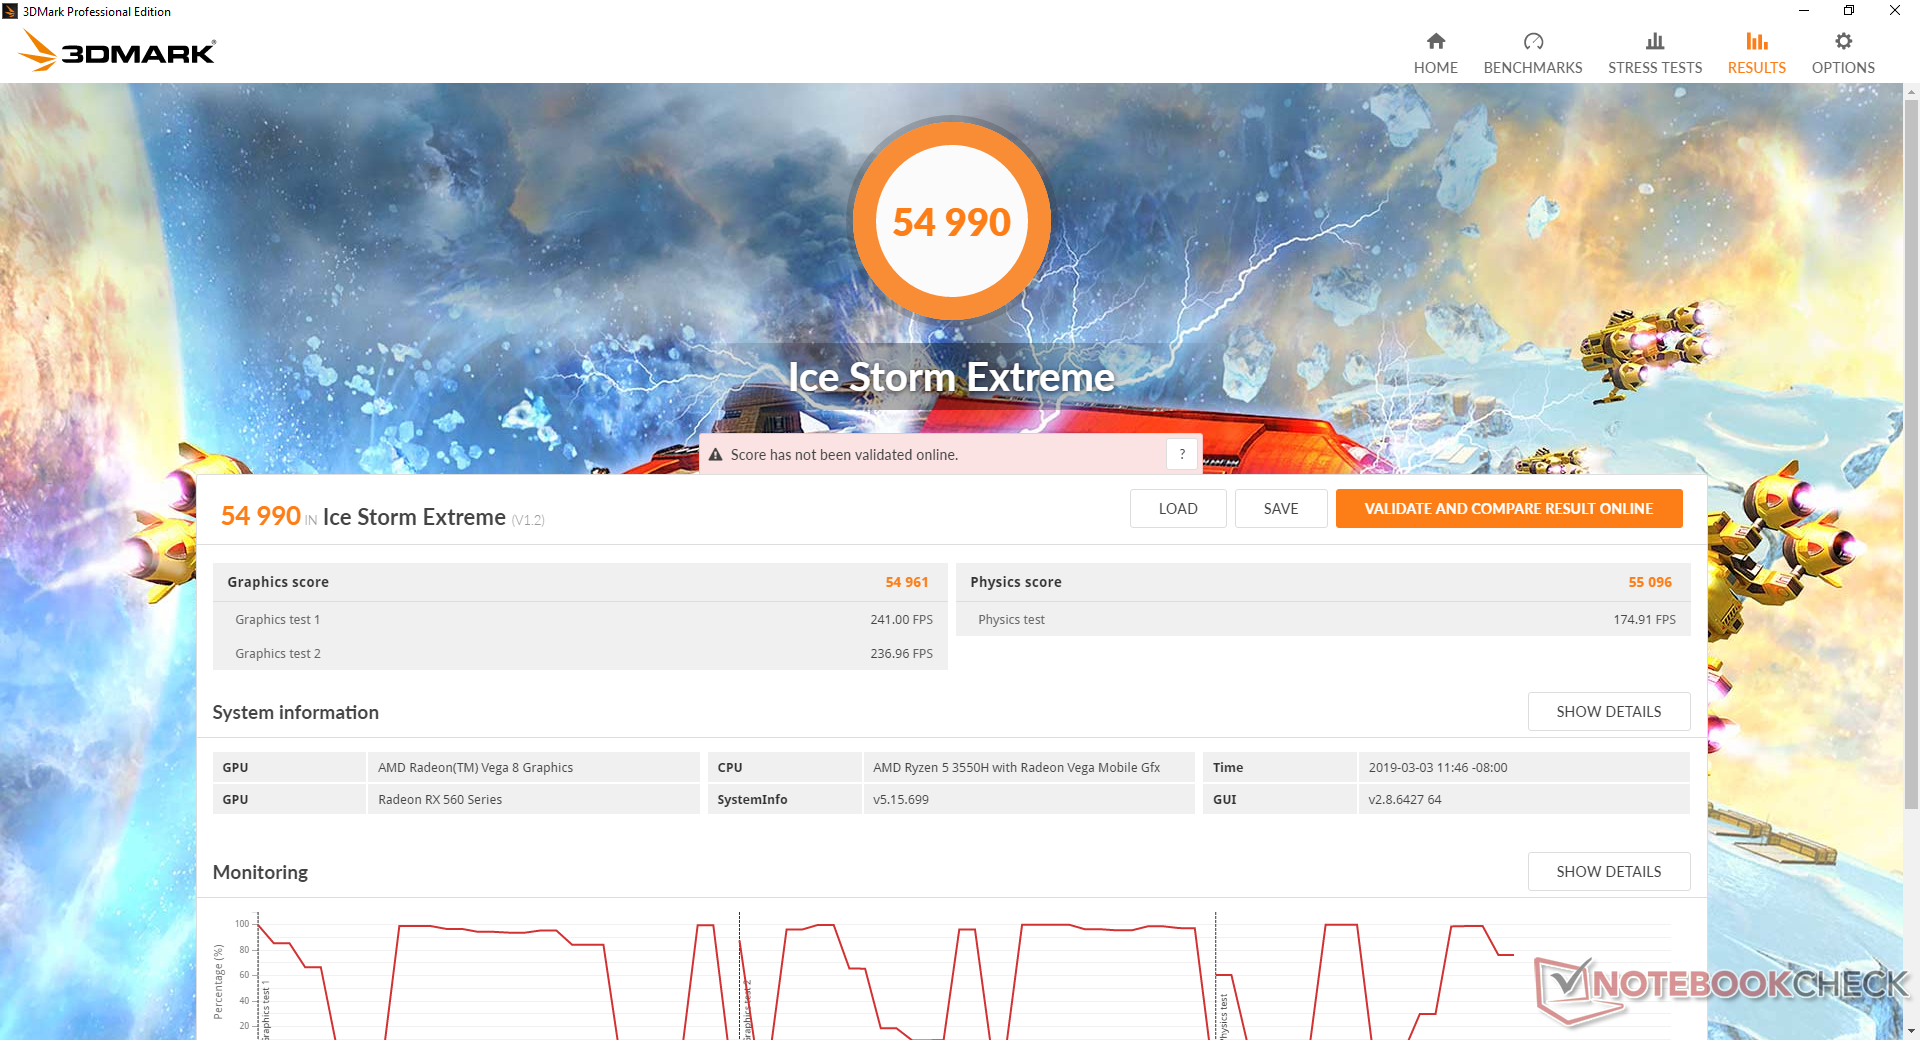
| 3DMark Ice Storm Standard Score | 57356 points | |
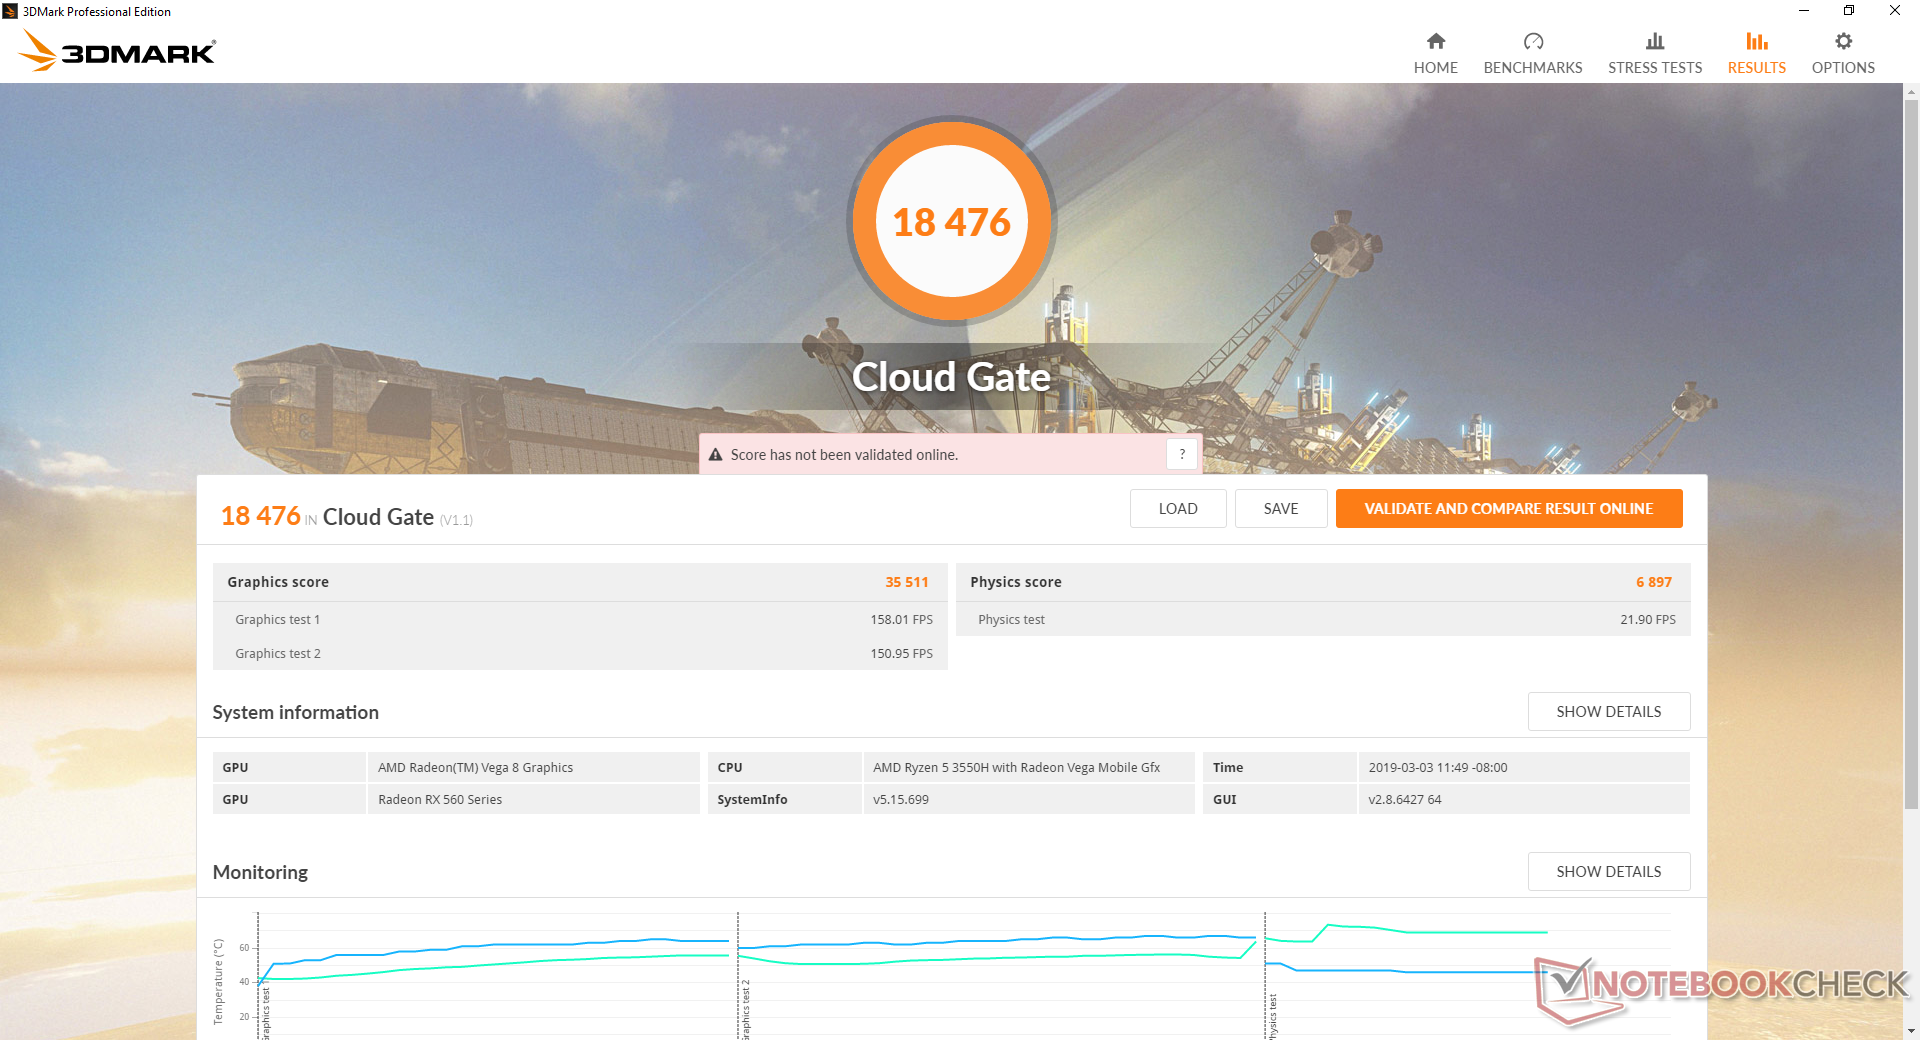
| 3DMark Cloud Gate Standard Score | 18476 points | |
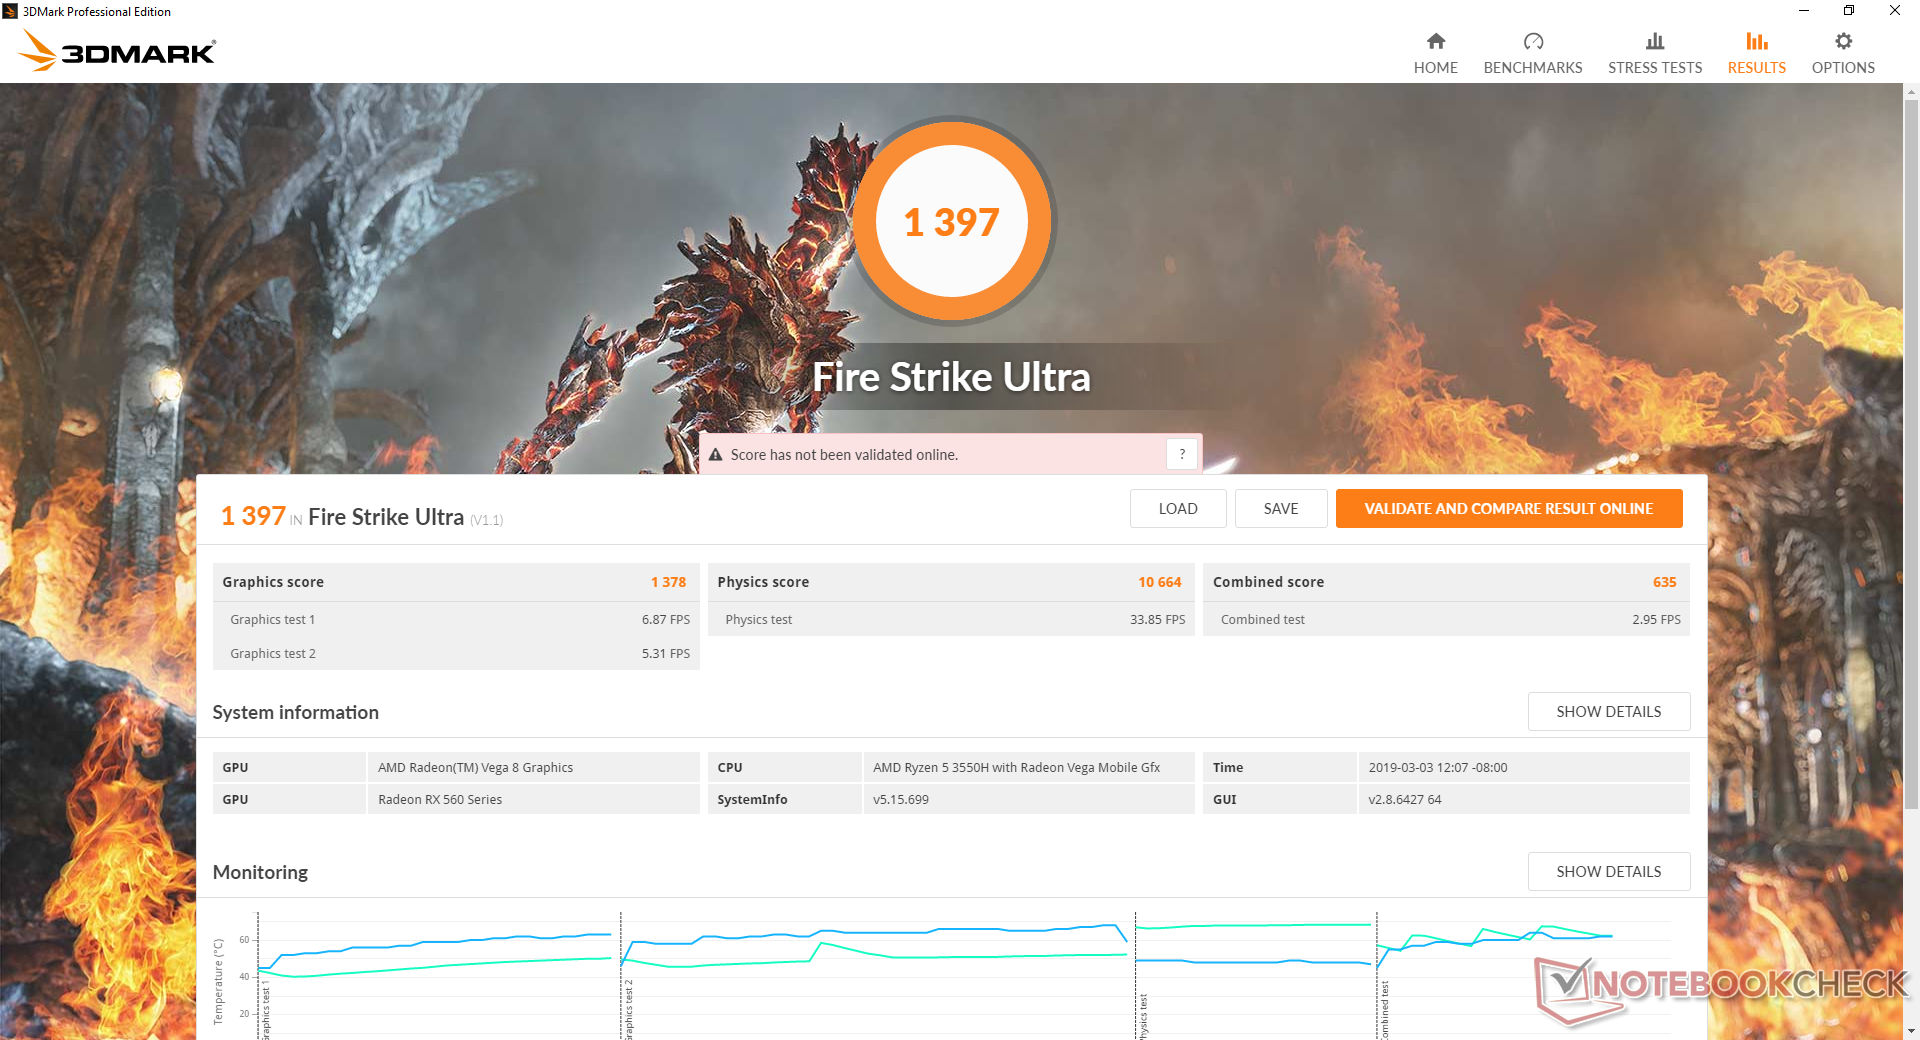
| 3DMark Fire Strike Score | 5515 points | |
| 3DMark Time Spy Score | 1925 points | |
Help | ||
Gaming Performance
Since raw performance is not unlike the GTX 1050, the latest PC titles should have no issues running on this AMD machine. Gaming at 1080p is certainly possible on demanding titles with most settings on Low-Medium or Medium.
Idling on Witcher 3 shows no sudden dips in frame rates to suggest no interrupting background activity or heavy throttling.
See our dedicated page on the Radeon RX 560X for more technical information and benchmark comparisons.
| The Witcher 3 - 1920x1080 Ultra Graphics & Postprocessing (HBAO+) | |
| MSI GP63 Leopard 8RE-013US | |
| Asus GL702ZC-GC104T | |
| Intel Hades Canyon NUC8i7HVK | |
| Asus ZenBook 15 UX533FD | |
| Lenovo Legion Y730-15ICH i5-8300H | |
| Schenker XMG P506 | |
| Dell XPS 15 9575 i5-8305G | |
| Asus TUF FX505DY | |
| Asus FX504GD | |
| Lenovo Legion Y520-15IKBA-80WY001VGE | |
| Acer Nitro 5 AN515-42-R6V0 | |
| Asus GL552VW-DK725T | |
| low | med. | high | ultra | |
|---|---|---|---|---|
| BioShock Infinite (2013) | 134.3 | 118 | 114 | 53.1 |
| The Witcher 3 (2015) | 108.8 | 70.3 | 38.5 | 22.7 |
| Rise of the Tomb Raider (2016) | 108.6 | 65.7 | 35.3 | 26.6 |
Emissions
System Noise
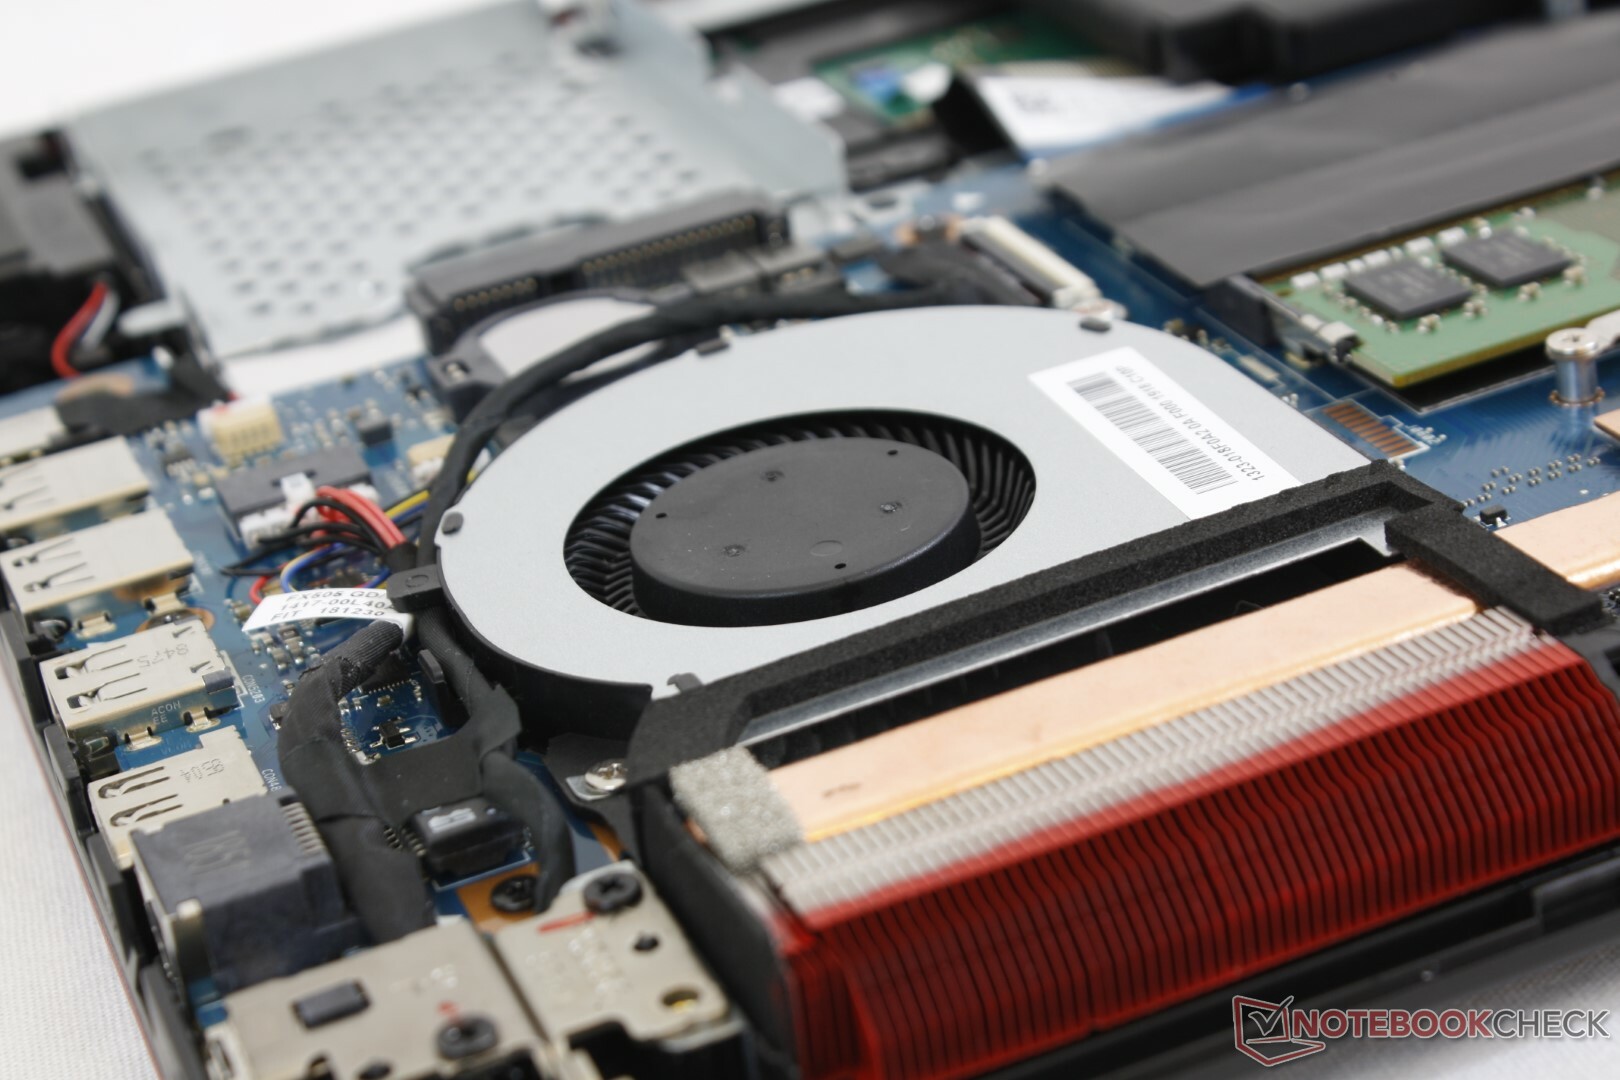
The cooling solution consists of just two fans and two heat pipes. When the system is idling, both fans will idle for a silent experience. This doesn't last long, however, as even light loads like browsing or video streaming will kickstart the fans up to 32 dB(A) against a background of 28.2 dB(A). We recommend running on Power Saver mode if complete silence is priority.
Fan noise when gaming is loud even for a gaming laptop. We're able to record a steady fan noise of 49 dB(A) when playing Witcher 3 compared to 44 dB(A) on the Acer Nitro 5 AN515 equipped with the same Radeon RX 560X GPU. Granted, many mid-range GeForce gaming laptops are just as loud as our FX505 such as the Gigabyte Sabre 15 or MSI GP63, but we think Asus and AMD should be aiming to do better.
We otherwise noticed no coil whine on our test unit.

| Asus TUF FX505DY Radeon RX 560X (Laptop), R5 3550H, WDC PC SN520 SDAPNUW-256G | MSI GP63 Leopard 8RE-013US GeForce GTX 1060 Mobile, i7-8750H, Samsung PM871b MZNLN128HAHQ | Asus FX504GD GeForce GTX 1050 Mobile, i5-8300H, Seagate Mobile HDD 1TB ST1000LX015-1U7172 | Lenovo Legion Y530-15ICH GeForce GTX 1060 Mobile, i7-8750H, Samsung SSD PM981 MZVLB256HAHQ | Acer Nitro 5 AN515-42-R6V0 Radeon RX 560X (Laptop), R7 2700U, SK Hynix HFS128G39TND | Gigabyte Sabre 15G GeForce GTX 1050 Mobile, i7-7700HQ, Liteonit CV3-8D128 | |
|---|---|---|---|---|---|---|
| Noise | -6% | 1% | -2% | 1% | -9% | |
| off / environment * (dB) | 28.2 | 28.4 -1% | 28.1 -0% | 30.2 -7% | 29 -3% | 28.2 -0% |
| Idle Minimum * (dB) | 28.2 | 32.8 -16% | 29 -3% | 30.9 -10% | 29 -3% | 33 -17% |
| Idle Average * (dB) | 28.2 | 32.8 -16% | 29.2 -4% | 30.9 -10% | 31 -10% | 33.3 -18% |
| Idle Maximum * (dB) | 28.2 | 33 -17% | 29.7 -5% | 31.6 -12% | 32 -13% | 34.7 -23% |
| Load Average * (dB) | 43.9 | 35.8 18% | 44.3 -1% | 42.3 4% | 36 18% | 44.5 -1% |
| Witcher 3 ultra * (dB) | 49 | 51 -4% | 40.7 17% | 44 10% | 49.2 -0% | |
| Load Maximum * (dB) | 50.6 | 52.3 -3% | 47.7 6% | 40 21% | 46 9% | 52.8 -4% |
* ... smaller is better
Noise level
| Idle |
| 28.2 / 28.2 / 28.2 dB(A) |
| Load |
| 43.9 / 50.6 dB(A) |
 | ||
30 dB silent 40 dB(A) audible 50 dB(A) loud |
||
min: | ||
Temperature
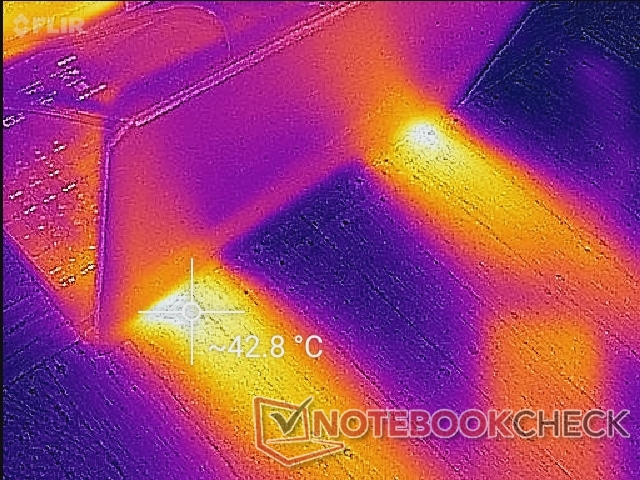
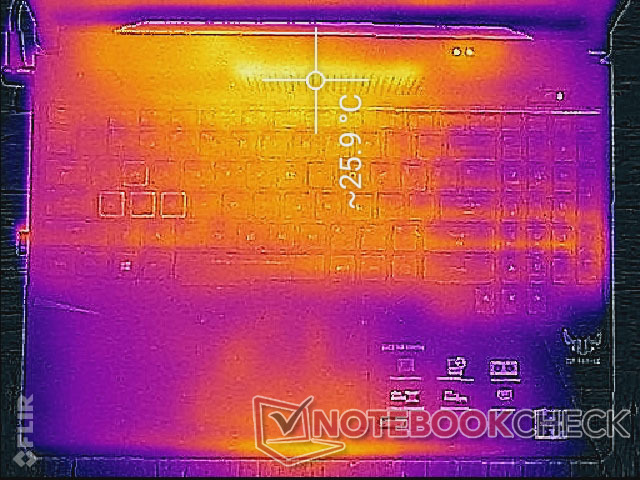
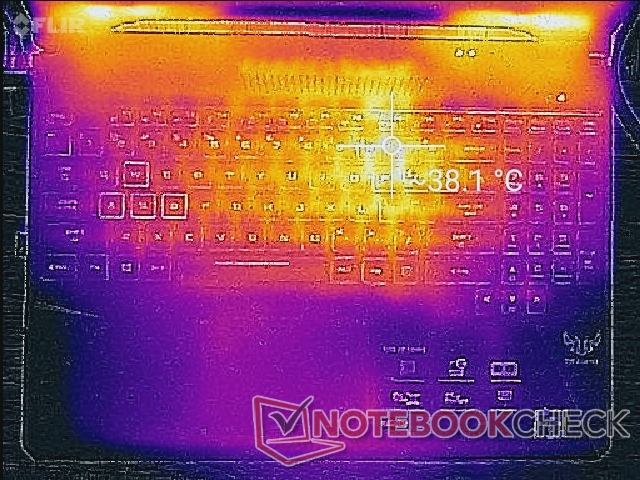
Surface temperatures when idling are generally flat with the rear quadrants being only 2 C to 3 C warmer than the front quadrants. The spot closest to the M.2 drive, however, will be noticeably warmer as shown by our temperature map below since NVMe SSDs are notorious for their temperatures.
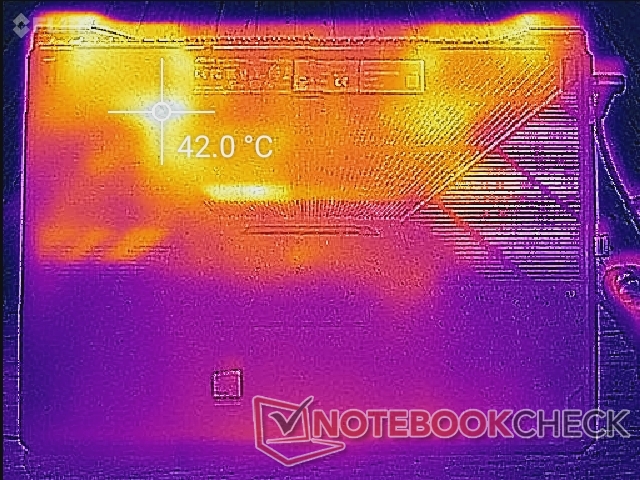
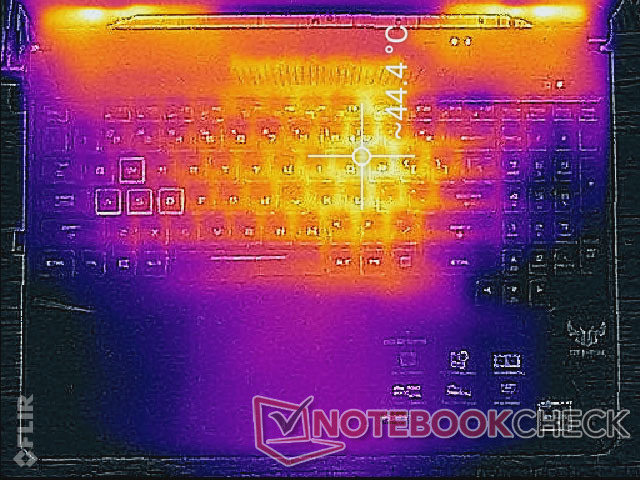
When gaming, the top of the keyboard can become as warm as 39 C compared to 54 C on the FX504GD to represent a significant improvement. As expected, the side with the Radeon GPU runs warmer than the side with the Ryzen CPU. These hot spots are thankfully towards the rear of the unit and away from the palm rests and WASD keys for comfortable use.
Note that the left palm rest will always be warmer than the right if a secondary HDD or SSD is installed. This is not the case for our configuration since it lacks a secondary drive.


Stress Test
We subject the laptop to unrealistically demanding workloads to test for any potential throttling or stability issues. When running Prime95 to stress the CPU, clock rates will be as high as 3.7 GHz for the first few minutes before dropping and stabilizing at 3.5 GHz. Since the base clock rate of the Ryzen 5 3550H is 2.1 GHz, the CPU in the Asus is able to maintain a fairly high level of Boost performance at a relatively low core temperature of 62 C. At worst, we are able to record a core temperature of 83 C to 87 C when running both Prime95 and FurMark simultaneously.
Running Witcher 3 is more representative of real-world gaming loads. The CPU and GPU stabilize at 60 C and 70 C, respectively, compared to 74 C and 66 C on the last generation FX504 with Intel Core i5-8300H and GeForce GTX 1050 graphics. It's clear here that the new AMD CPU is able to run cooler than the Intel equivalent while its Radeon RX 560X GPU is beginning to show its age.
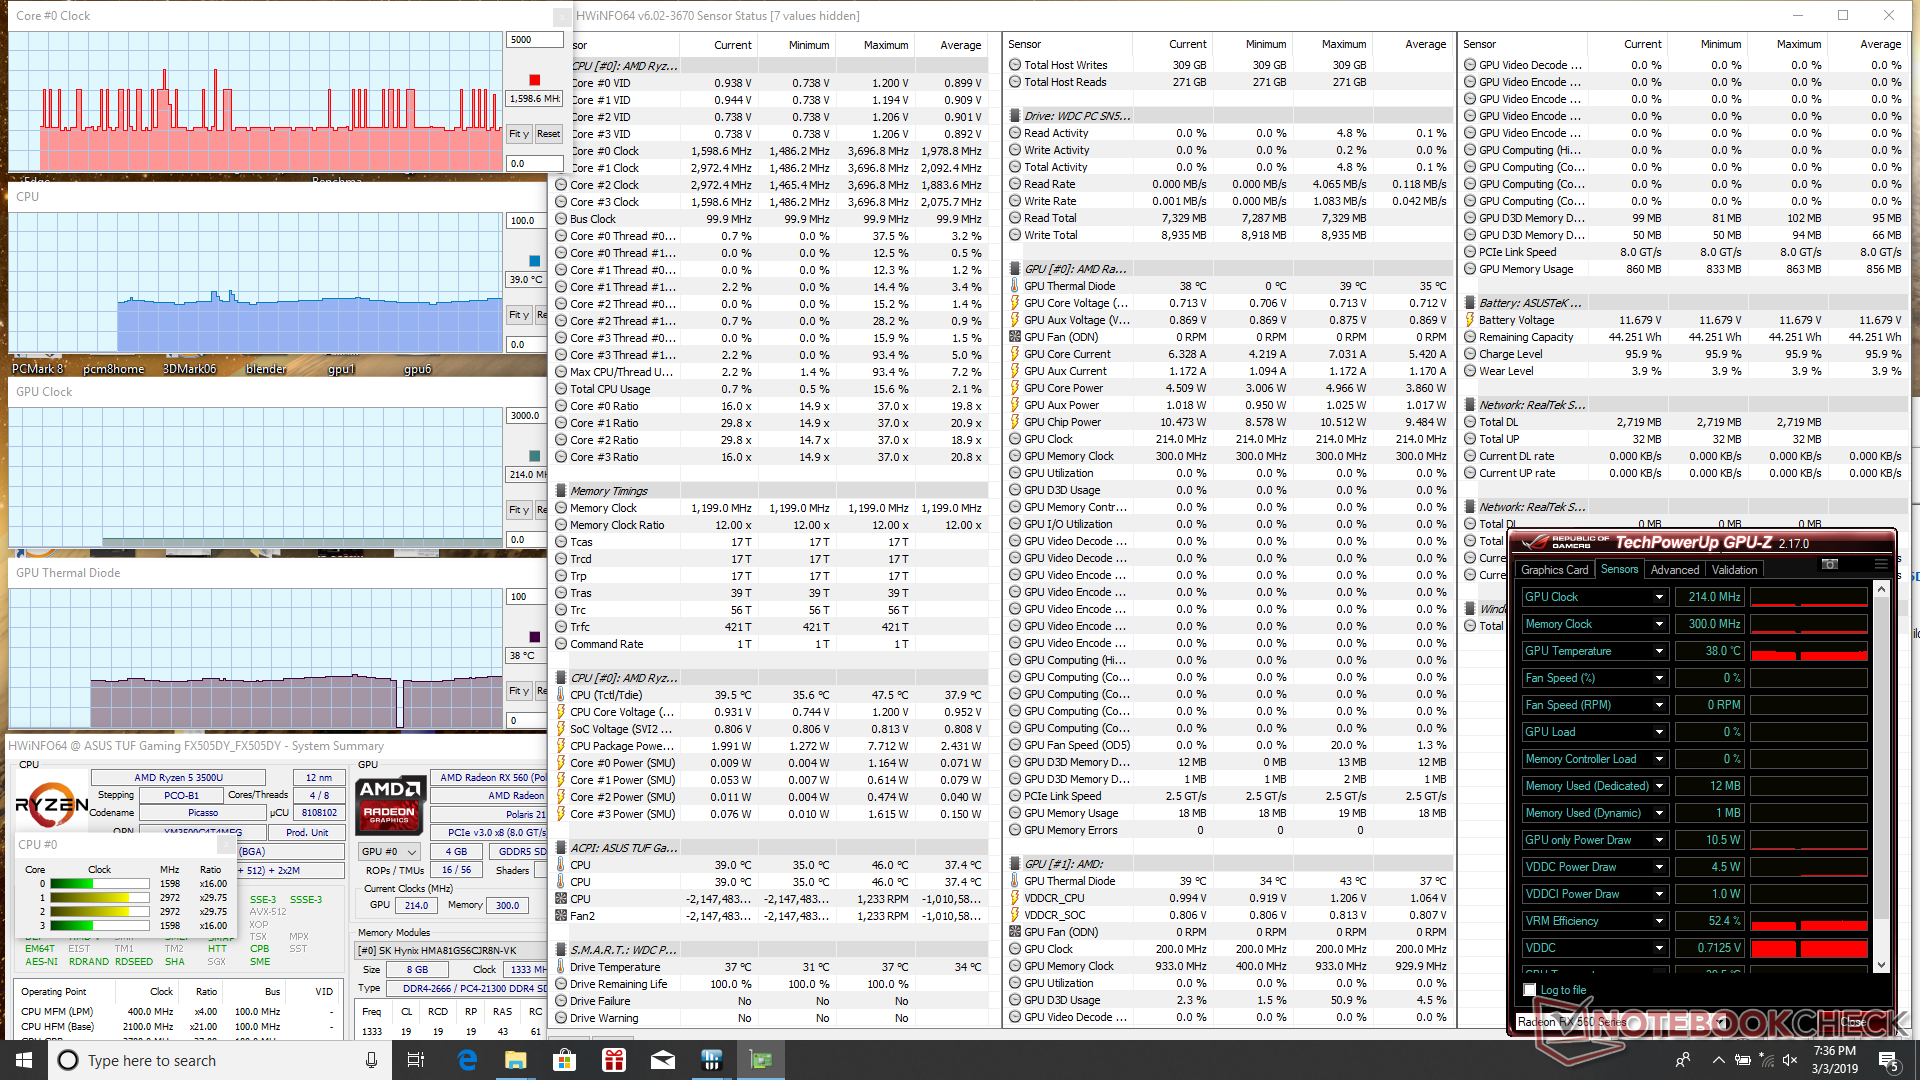
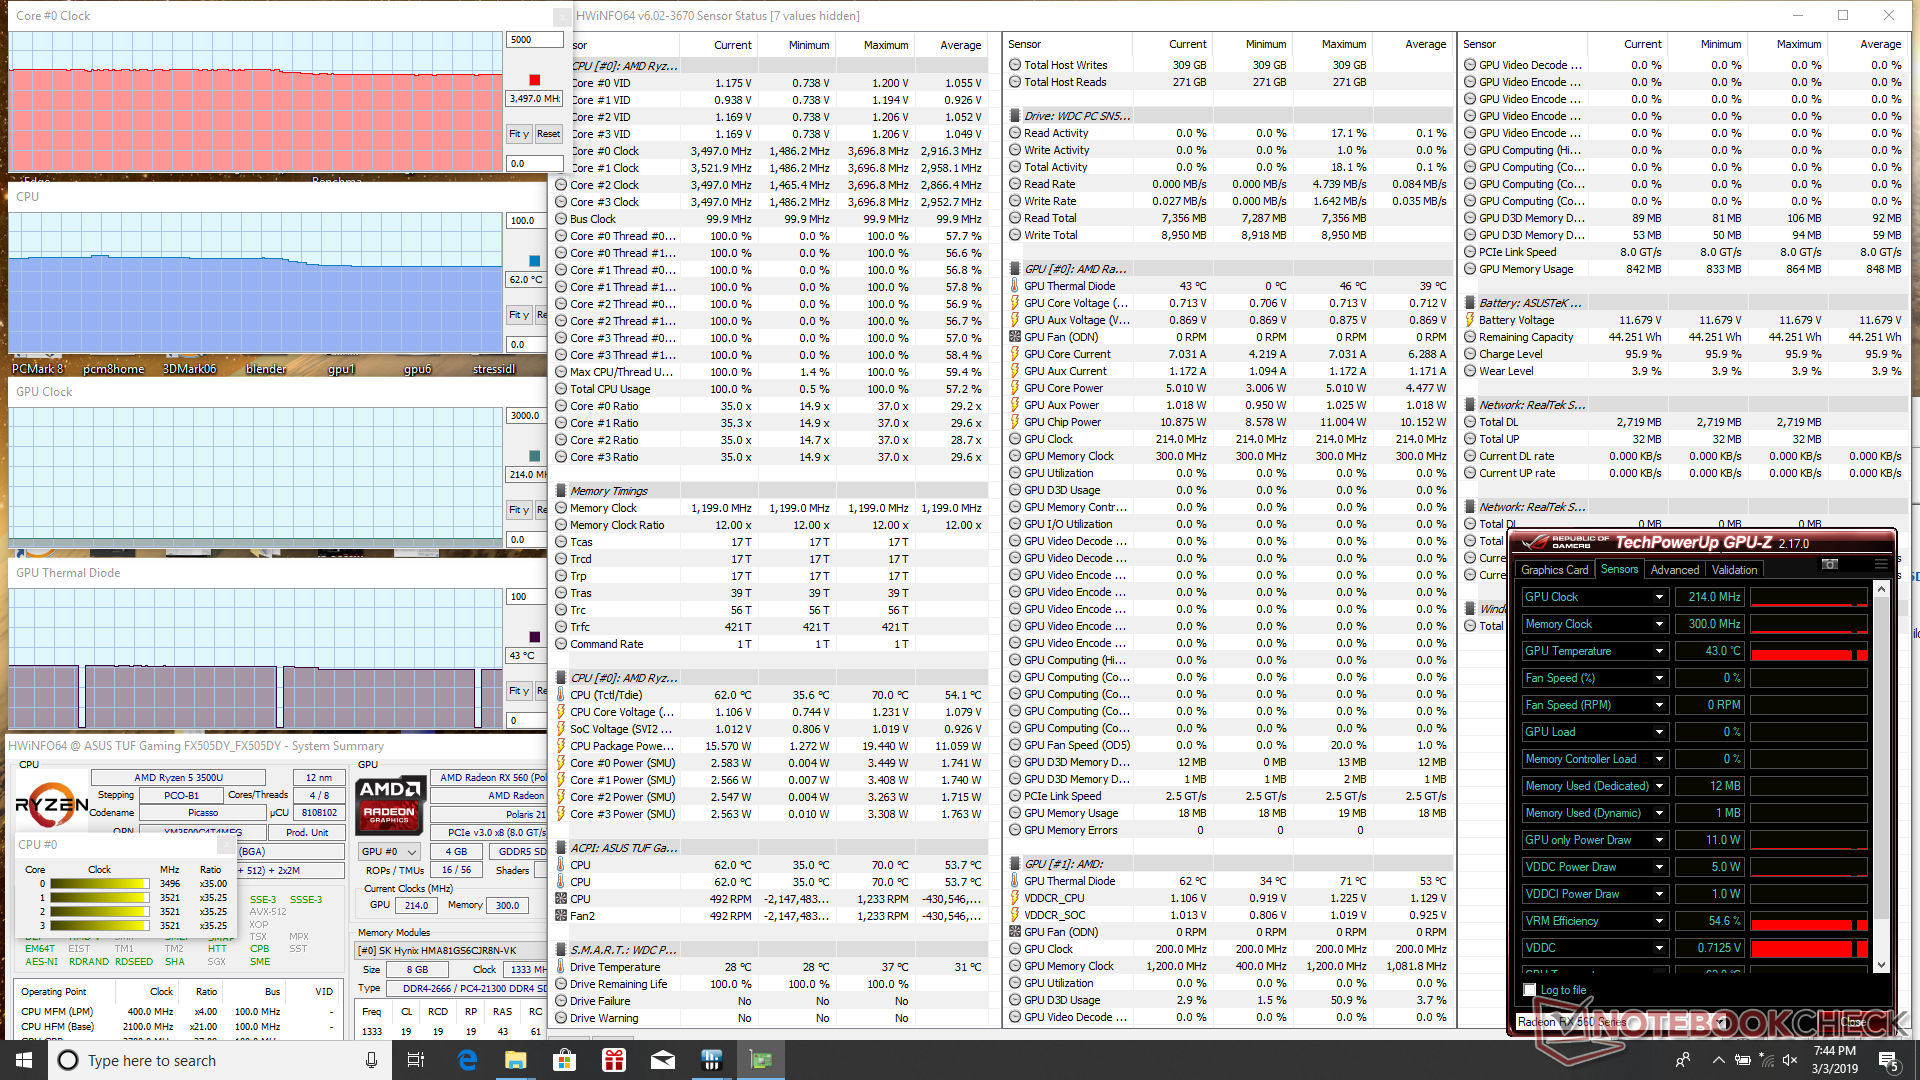
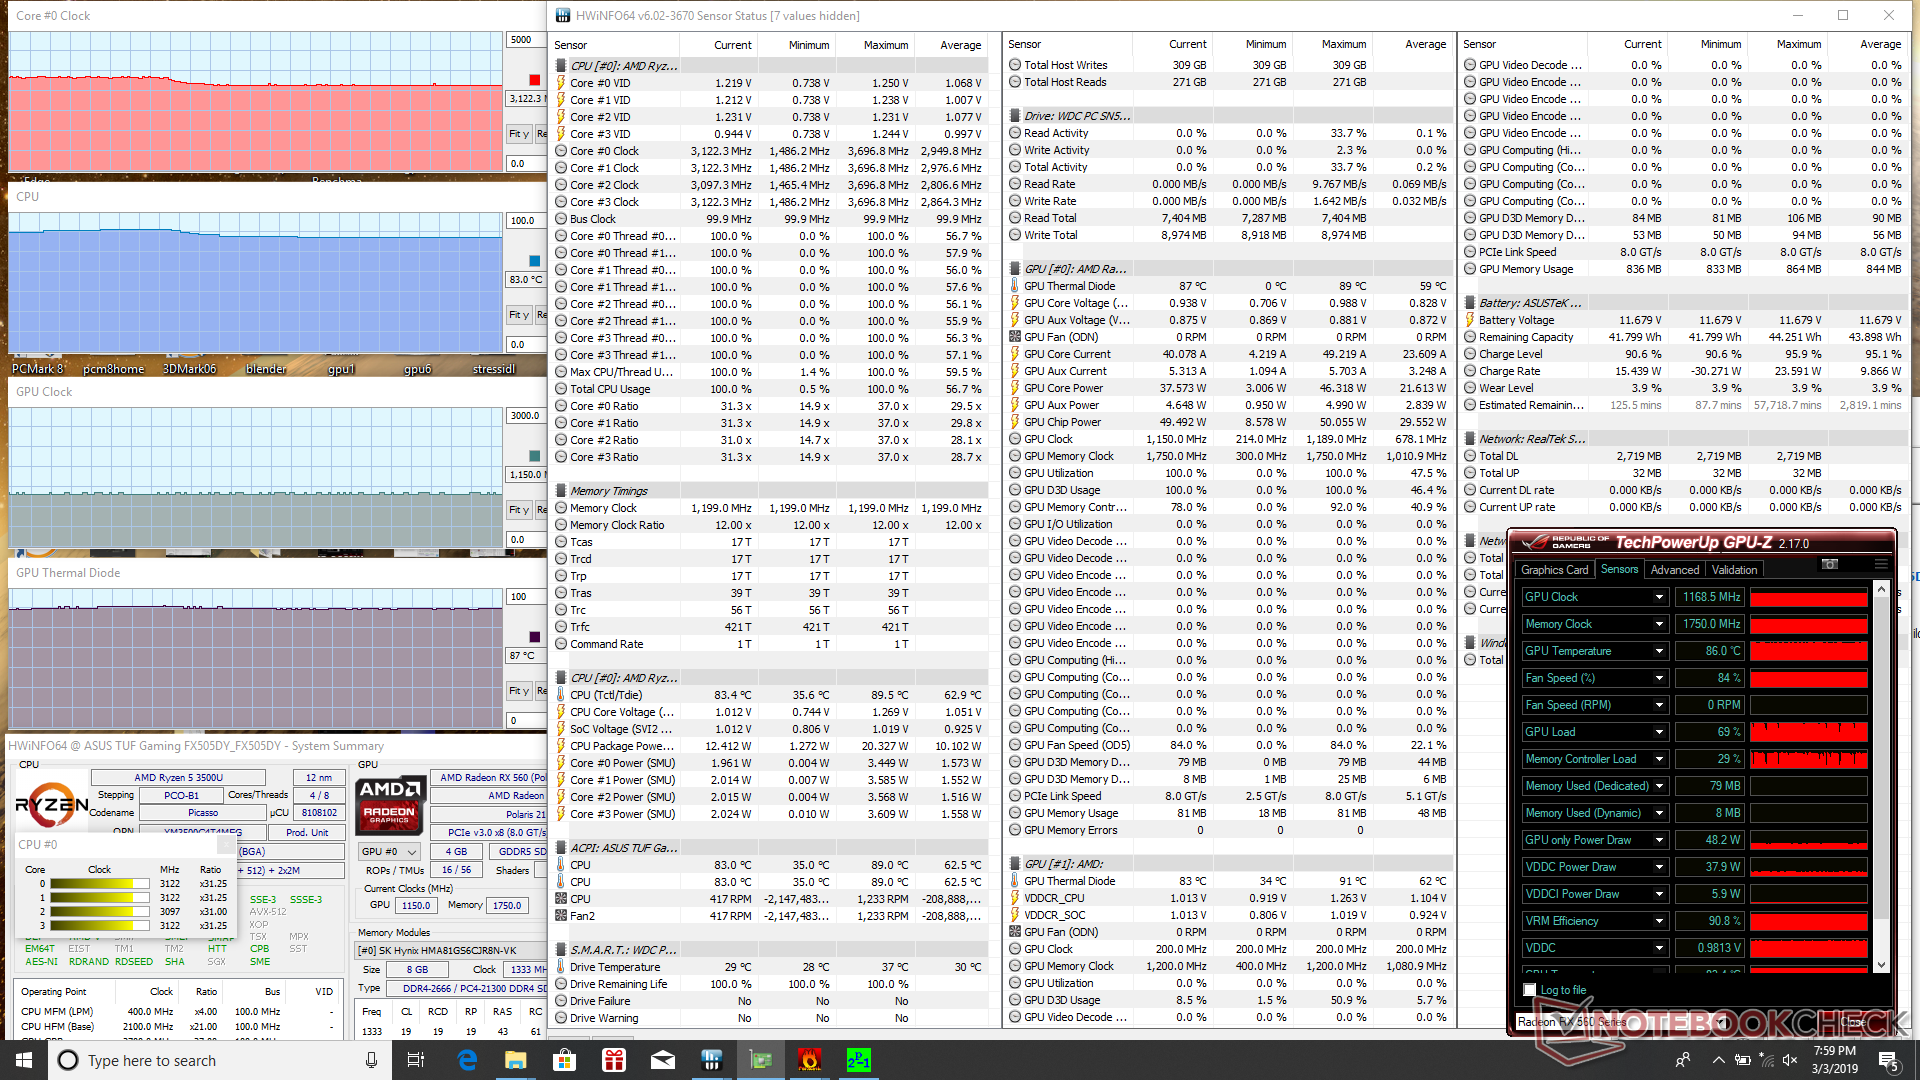
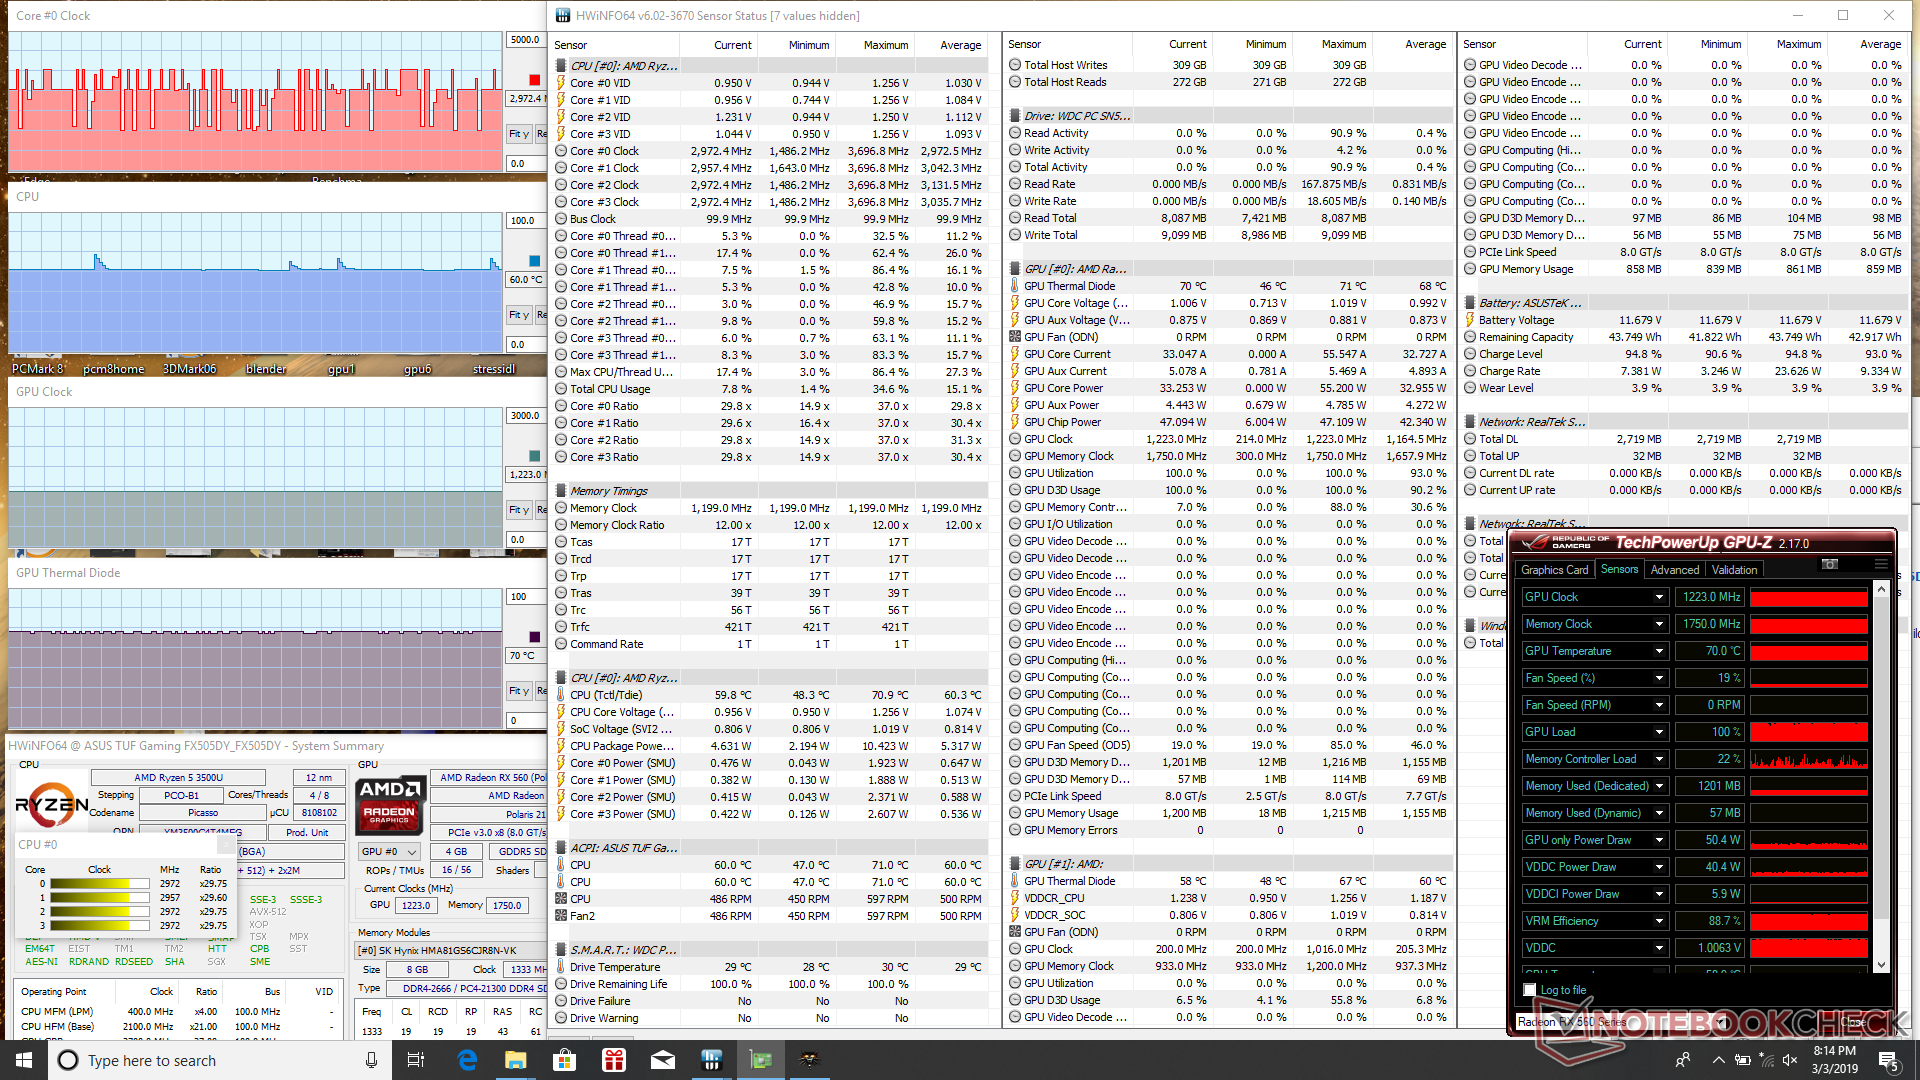
| CPU Clock (GHz) | GPU Clock (MHz) | Average CPU Temperature (°C) | Average GPU Temperature (°C) | |
| System Idle | -- | -- | 39 | 38 |
| Prime95 Stress | 3.5 | -- | 62 | -- |
| Prime95 + FurMark Stress | 3.1 | 1169 | 83 | 87 |
| Witcher 3 Stress | ~3.0 | 1223 | 60 | 70 |
(±) The maximum temperature on the upper side is 44.2 °C / 112 F, compared to the average of 40.4 °C / 105 F, ranging from 21.2 to 68.8 °C for the class Gaming.
(-) The bottom heats up to a maximum of 49.4 °C / 121 F, compared to the average of 43.2 °C / 110 F
(+) In idle usage, the average temperature for the upper side is 24.2 °C / 76 F, compared to the device average of 33.9 °C / 93 F.
(+) Playing The Witcher 3, the average temperature for the upper side is 28.4 °C / 83 F, compared to the device average of 33.9 °C / 93 F.
(+) The palmrests and touchpad are cooler than skin temperature with a maximum of 27.4 °C / 81.3 F and are therefore cool to the touch.
(±) The average temperature of the palmrest area of similar devices was 28.8 °C / 83.8 F (+1.4 °C / 2.5 F).
Speakers
The integrated speakers hold no surprises as they perform about as well as you'd expect from any budget laptop. Bass is very poor for a "tin can"-like experience unfit for multimedia playback or gaming sessions. We recommend earphones if possible for a much better audio experience.
Maximum volume will not vibrate the chassis or introduce any static.


Asus TUF FX505DY audio analysis
(±) | speaker loudness is average but good (74.2 dB)
Bass 100 - 315 Hz
(-) | nearly no bass - on average 19.4% lower than median
(±) | linearity of bass is average (9.9% delta to prev. frequency)
Mids 400 - 2000 Hz
(±) | higher mids - on average 7% higher than median
(±) | linearity of mids is average (8.3% delta to prev. frequency)
Highs 2 - 16 kHz
(±) | higher highs - on average 6.3% higher than median
(±) | linearity of highs is average (7.6% delta to prev. frequency)
Overall 100 - 16.000 Hz
(-) | overall sound is not linear (31.6% difference to median)
Compared to same class
» 97% of all tested devices in this class were better, 1% similar, 2% worse
» The best had a delta of 6%, average was 18%, worst was 132%
Compared to all devices tested
» 90% of all tested devices were better, 2% similar, 8% worse
» The best had a delta of 4%, average was 24%, worst was 134%
Apple MacBook 12 (Early 2016) 1.1 GHz audio analysis
(+) | speakers can play relatively loud (83.6 dB)
Bass 100 - 315 Hz
(±) | reduced bass - on average 11.3% lower than median
(±) | linearity of bass is average (14.2% delta to prev. frequency)
Mids 400 - 2000 Hz
(+) | balanced mids - only 2.4% away from median
(+) | mids are linear (5.5% delta to prev. frequency)
Highs 2 - 16 kHz
(+) | balanced highs - only 2% away from median
(+) | highs are linear (4.5% delta to prev. frequency)
Overall 100 - 16.000 Hz
(+) | overall sound is linear (10.2% difference to median)
Compared to same class
» 7% of all tested devices in this class were better, 2% similar, 91% worse
» The best had a delta of 5%, average was 18%, worst was 53%
Compared to all devices tested
» 5% of all tested devices were better, 1% similar, 94% worse
» The best had a delta of 4%, average was 24%, worst was 134%
Energy Management
Power Consumption
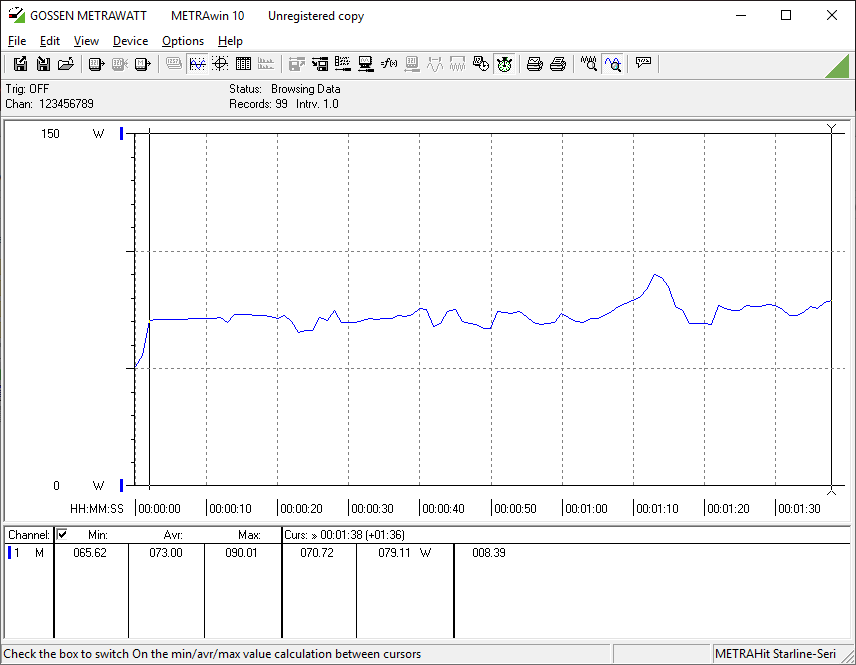
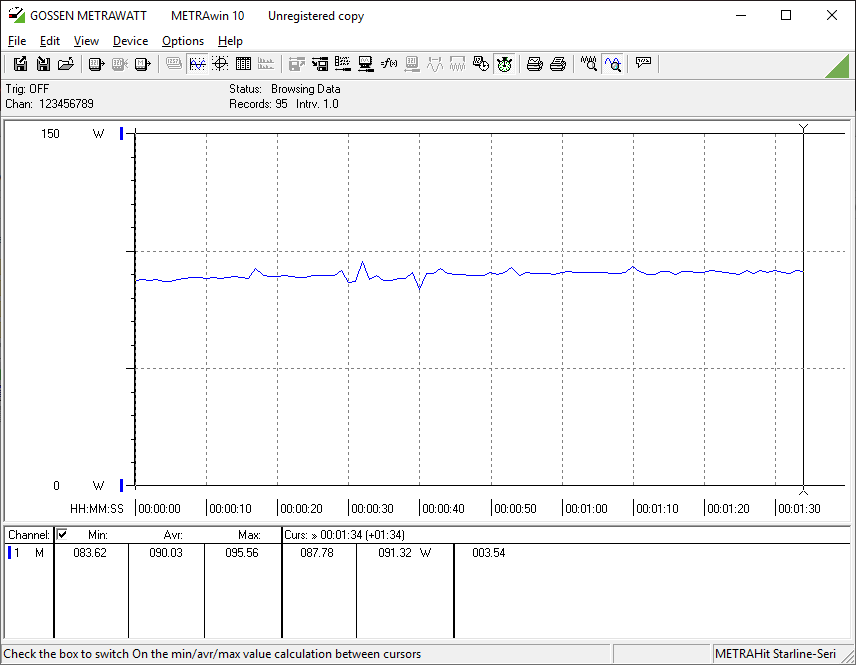
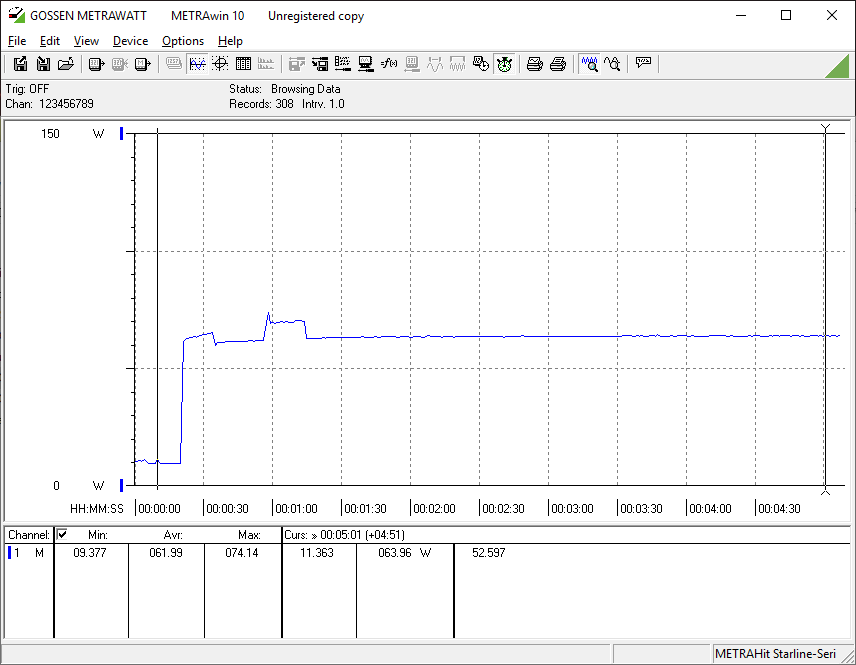
Idling on desktop demands anywhere between 5 W and 10 W depending on the power profile and screen brightness setting to be just slightly more efficient than most 15.6-inch gaming laptops. When gaming, however, power consumption averages about 90 W to be similar to competing laptops equipped with GTX 1050 graphics. The all-AMD Asus offers a similar level of performance-per-Watt to GTX 1050-powered alternatives.
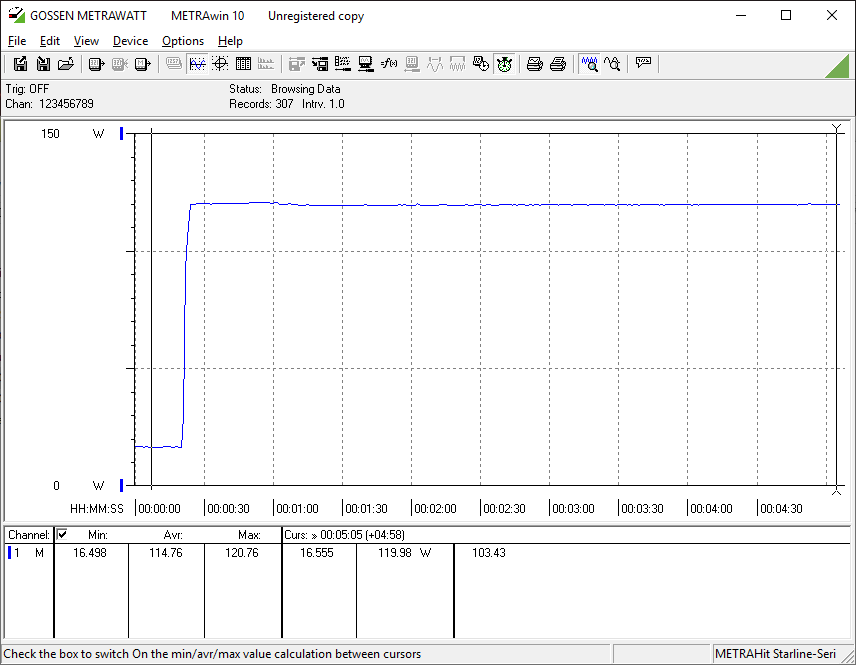
We are able to record a maximum power consumption of 120.7 W from the medium-sized (~16 x 7.5 x 2.7 cm) 120 W AC adapter when running both Prime95 and FurMark simultaneously. Thus, the laptop will recharge very slowly if running at 100 percent CPU and GPU load. Perhaps a higher capacity 150 W adapter would have been more appropriate for the system.
| Off / Standby | |
| Idle | |
| Load |
|
Key:
min: | |
| Asus TUF FX505DY R5 3550H, Radeon RX 560X (Laptop), WDC PC SN520 SDAPNUW-256G, IPS, 1920x1080, 15.6" | MSI GP63 Leopard 8RE-013US i7-8750H, GeForce GTX 1060 Mobile, Samsung PM871b MZNLN128HAHQ, TN LED, 120 Hz, 1920x1080, 15.6" | Asus FX504GD i5-8300H, GeForce GTX 1050 Mobile, Seagate Mobile HDD 1TB ST1000LX015-1U7172, TN LED, 1920x1080, 15.6" | Lenovo Legion Y530-15ICH i7-8750H, GeForce GTX 1060 Mobile, Samsung SSD PM981 MZVLB256HAHQ, IPS, 1920x1080, 15.6" | Acer Nitro 5 AN515-42-R6V0 R7 2700U, Radeon RX 560X (Laptop), SK Hynix HFS128G39TND, IPS, 1920x1080, 15.6" | Gigabyte Sabre 15G i7-7700HQ, GeForce GTX 1050 Mobile, Liteonit CV3-8D128, IPS, 1920x1080, 15.6" | |
|---|---|---|---|---|---|---|
| Power Consumption | -52% | -18% | -42% | -30% | -19% | |
| Idle Minimum * (Watt) | 5.2 | 7.99 -54% | 7.2 -38% | 7.3 -40% | 7 -35% | 8 -54% |
| Idle Average * (Watt) | 7.5 | 12.15 -62% | 10.2 -36% | 11.1 -48% | 10 -33% | 10.9 -45% |
| Idle Maximum * (Watt) | 9.4 | 13.4 -43% | 10.9 -16% | 12.6 -34% | 18 -91% | 11 -17% |
| Load Average * (Watt) | 73 | 103.62 -42% | 93.3 -28% | 109 -49% | 79 -8% | 76.7 -5% |
| Witcher 3 ultra * (Watt) | 90 | 156.1 -73% | 95.8 -6% | 98 -9% | 94.9 -5% | |
| Load Maximum * (Watt) | 120.7 | 164.29 -36% | 102.5 15% | 168 -39% | 128 -6% | 106.4 12% |
* ... smaller is better
Battery Life
Runtimes are longer than the average gaming laptop at almost 5.5 hours of real-world WLAN use. Results are actually quite close to the Acer Nitro 5 AN515 even though our Asus is equipped with a more powerful CPU. Battery capacity is relatively small not unlike other budget gaming laptops, but we're still surprised to see the Asus outlast competitors like the MSI GP63 or Gigabyte Sabre 15 by almost an hour each.
Charging from empty to full capacity takes just under 1.5 hours.
| Asus TUF FX505DY R5 3550H, Radeon RX 560X (Laptop), 48 Wh | MSI GP63 Leopard 8RE-013US i7-8750H, GeForce GTX 1060 Mobile, 51 Wh | Asus FX504GD i5-8300H, GeForce GTX 1050 Mobile, 48 Wh | Lenovo Legion Y530-15ICH i7-8750H, GeForce GTX 1060 Mobile, 52 Wh | Acer Nitro 5 AN515-42-R6V0 R7 2700U, Radeon RX 560X (Laptop), 48 Wh | Gigabyte Sabre 15G i7-7700HQ, GeForce GTX 1050 Mobile, 47 Wh | |
|---|---|---|---|---|---|---|
| Battery runtime | -24% | -30% | -37% | 4% | -15% | |
| Reader / Idle (h) | 8.7 | 7.5 -14% | 7.5 -14% | 8.3 -5% | 8.2 -6% | |
| WiFi v1.3 (h) | 5.5 | 4.8 -13% | 3.7 -33% | 3.8 -31% | 5.7 4% | 4.4 -20% |
| Load (h) | 1.6 | 0.9 -44% | 0.9 -44% | 0.4 -75% | 1.3 -19% |
Pros
Cons
Verdict
The TUF FX505DY is the most balanced AMD gaming laptop we've tested. Whereas the mismatched Strix GL702ZC paired a high-end CPU with a mid-range GPU and the FX550IU paired a low-end CPU with a mid-range GPU, the FX505DY successfully combines a mid-range Ryzen 5 3550H with the mid-range Radeon RX 560X for 1080p gaming on a budget. Overall performance is oftentimes on par with the common budget gaming laptop powered by an Intel Core i5-8300H and GeForce GTX 1050 while selling at a lower MSRP, which is exactly what AMD and Asus are aiming for with this new TUF system.
The main issue here is timing. Laptops with GTX 1050 and even 1050 Ti GPUs have been dropping in price to make room for RTX laptops. It's not difficult to find such systems on sale nowadays for $700 to nullify the performance-per-dollar advantage that AMD systems typically have. Had the FX505DY launched a year earlier when the GTX 1050 was newer and costlier, then it would have made for a more compelling alternative.
Because of the reason above, the FX505DY doesn't have any major advantages over the competition, but it isn't an inferior pick either. It stands toe-to-toe with budget Intel-Nvidia offerings which is saying a lot for an all-AMD laptop. AS the first Zen+ gaming laptop in the market, it shows a lot of promise for what future Ryzen gaming laptops can bring to the table. We're still crossing our fingers for Ryzen-Nvidia laptops to really undercut Intel's dominance.
Strong Ryzen Zen+ debut, but a little late to the party. The Asus TUF FX505DY makes for a good alternative to the usual Intel Core i5-8300H and GTX 1050 alternative. The system will hopefully pave the way for Ryzen-Turing gaming laptops in the near future which will almost certainly undercut Intel-Turing in terms of retail pricing.
Asus TUF FX505DY
- 03/08/2019 v6 (old)
Allen Ngo
Price comparison
