ASUS ROG Strix Scar II GL704GW (Core i7-8750H, RTX 2070) Laptop Review
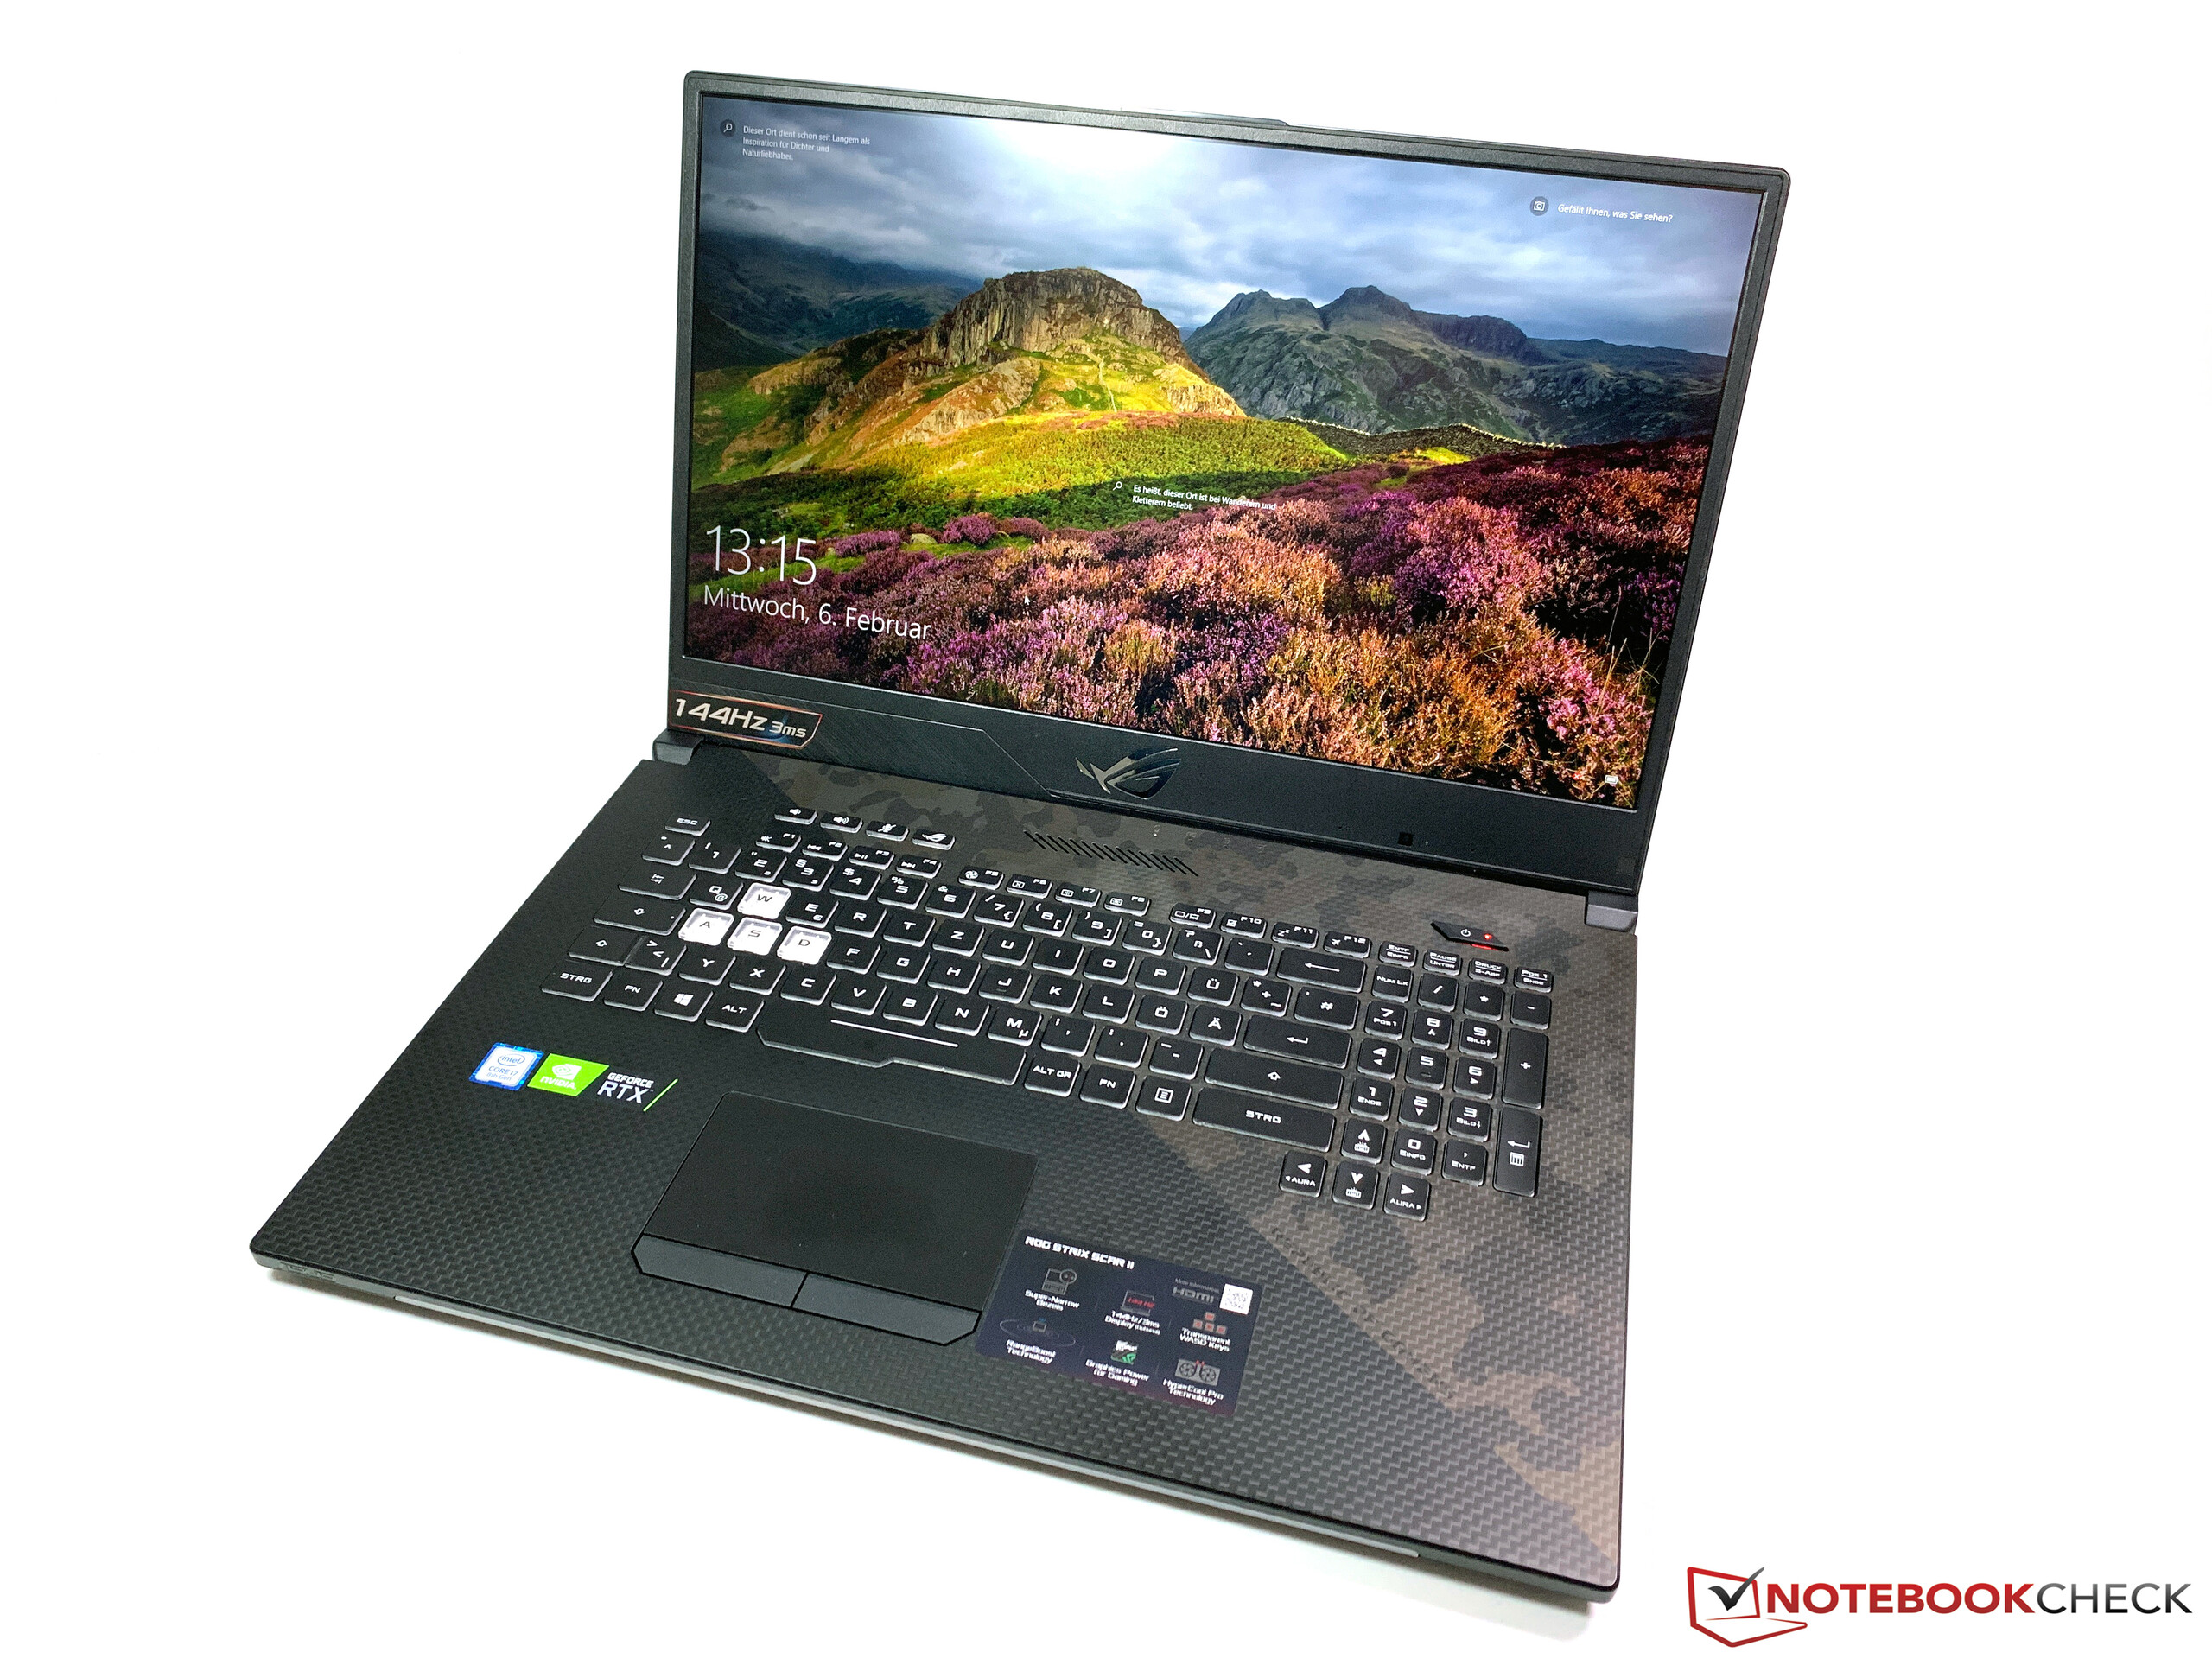
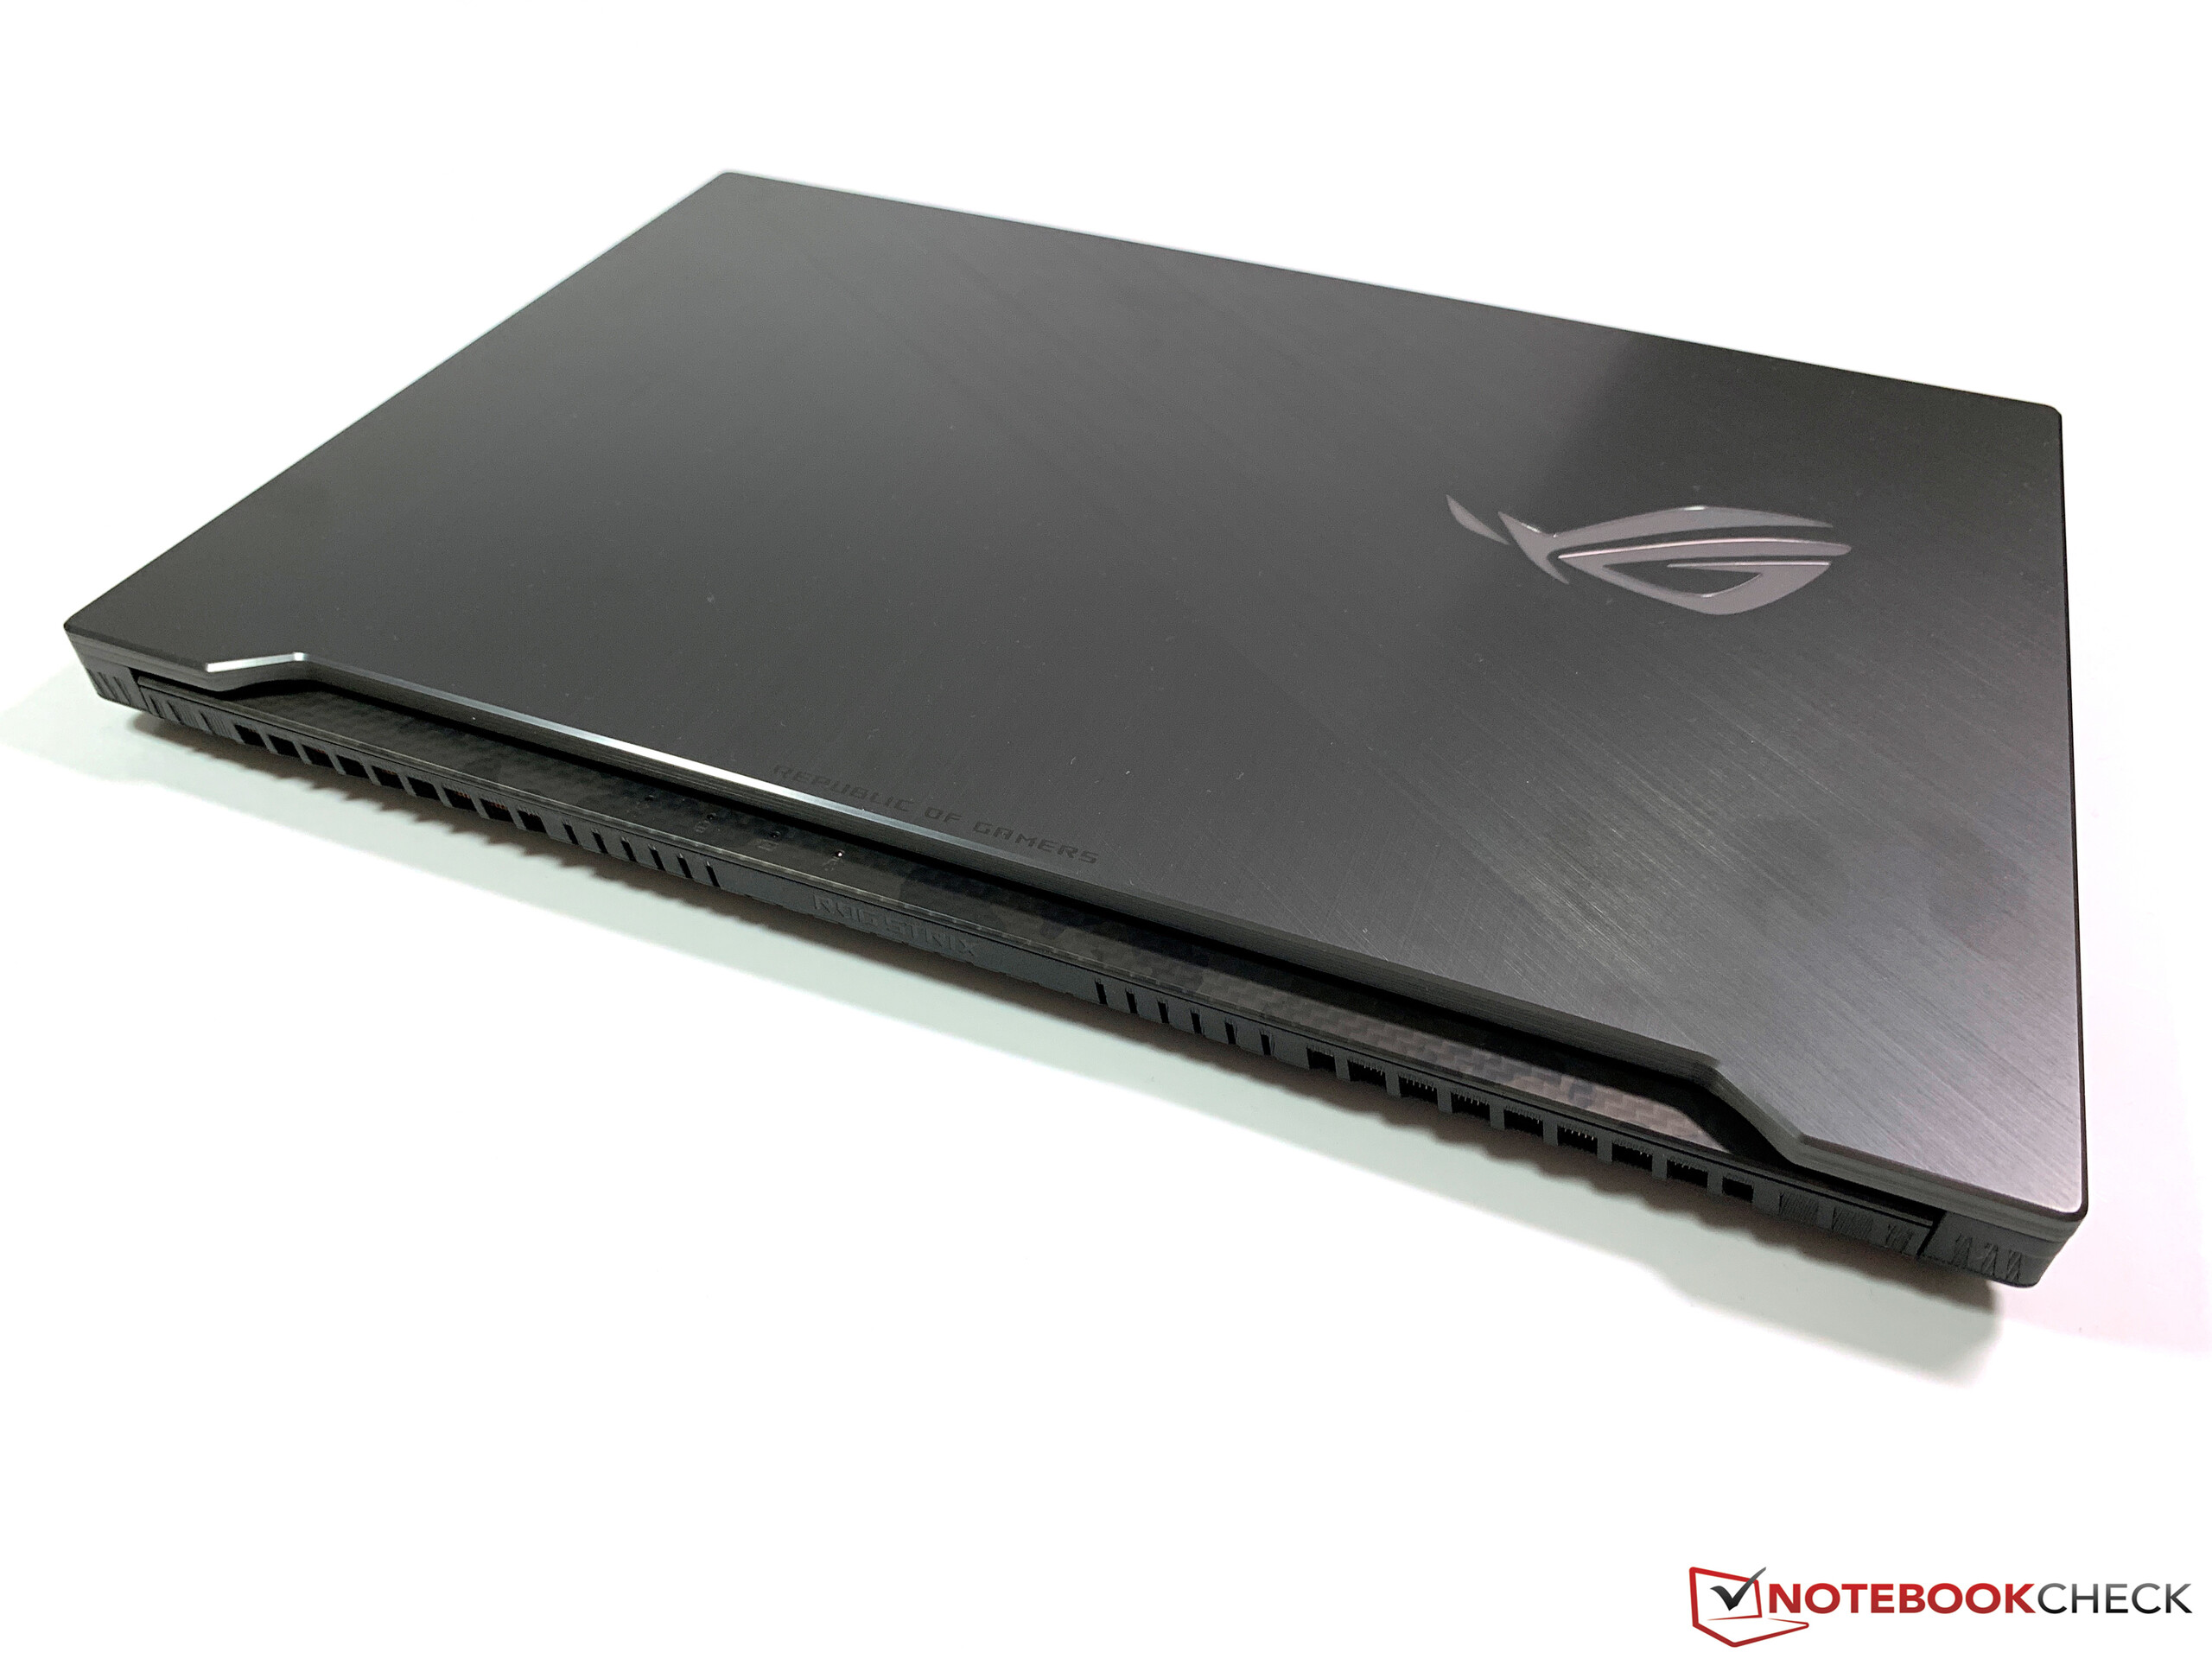
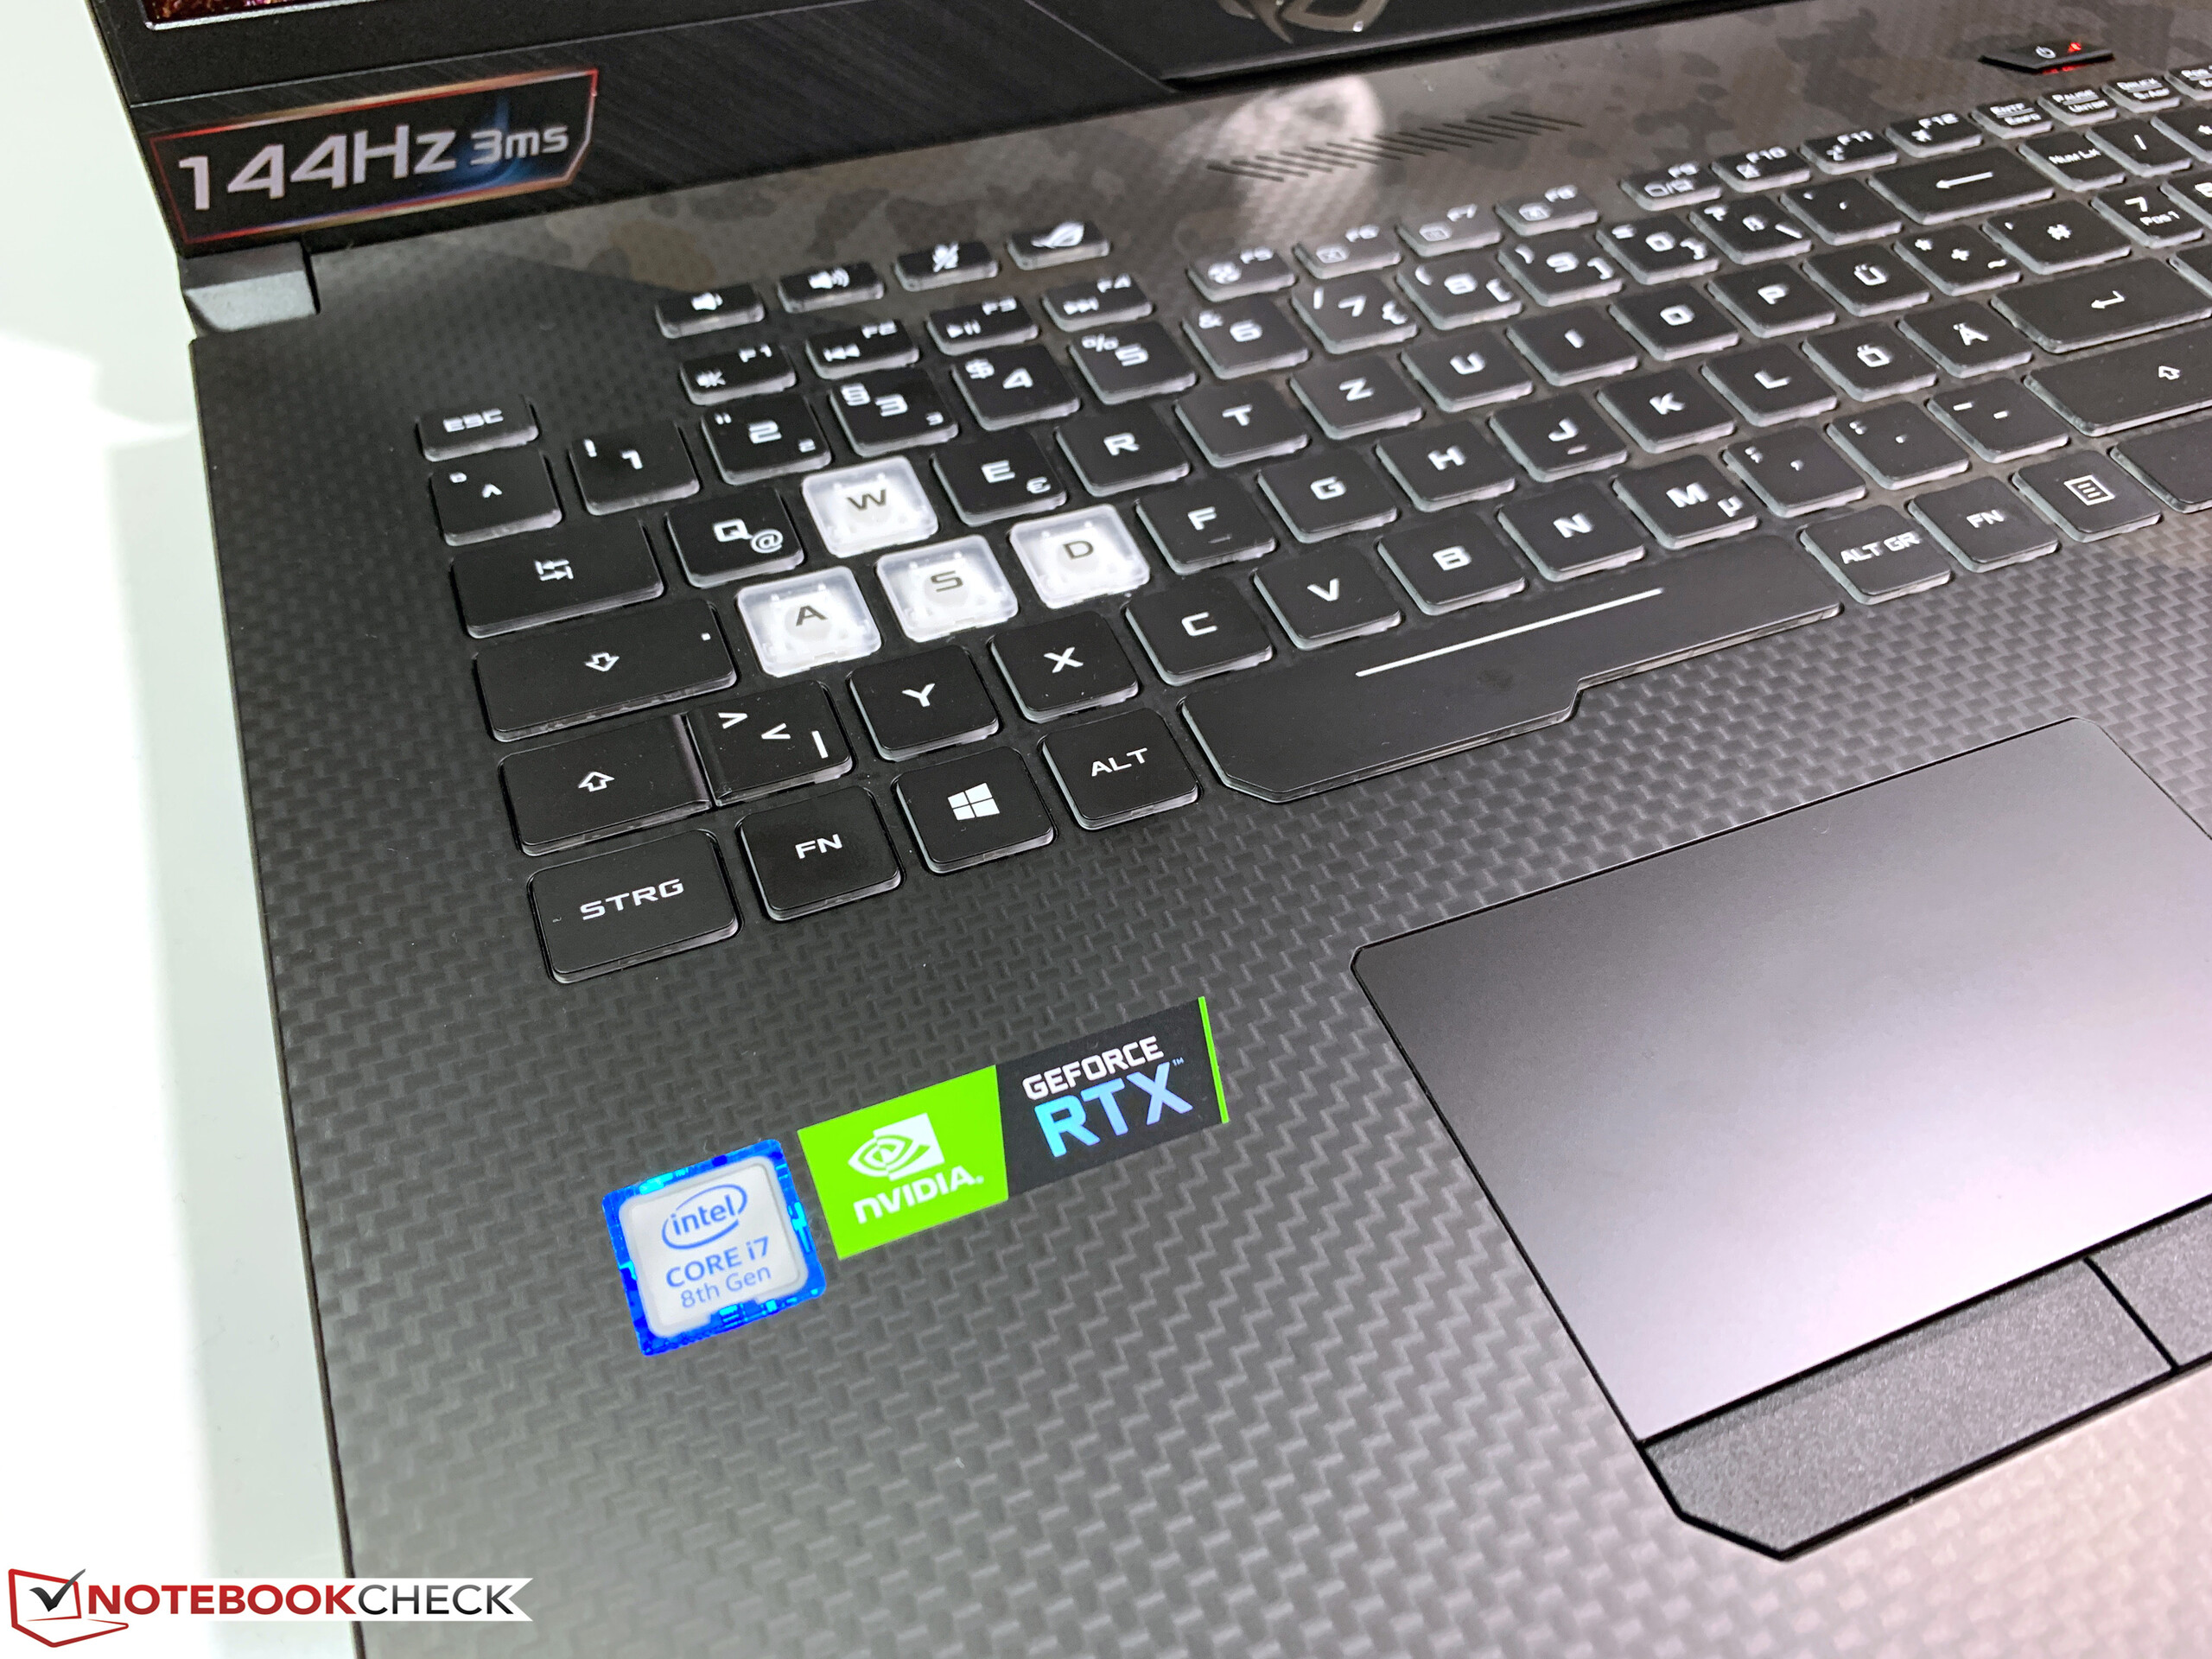
The ASUS ROG Strix Scar II GL704GW may look familiar to those of you who have read our GL704GM review, which we published just over three months ago. The two laptops are broadly identical, except that ASUS has swapped the Nvidia GeForce GTX 1060 out for a GeForce RTX 2070. The company is one of the first manufacturers to ship its RTX 20 series gaming laptops, and the GeForce RTX 2070 should offer a significant performance boost over the GeForce GTX 1060. The other hardware remains unchanged though, as does the Intel Core i7-8750H CPU, so we are interested to see how the cooling system handles the additional power that the RTX 2070 brings.
Our test configuration currently retails for around 2,100 Euros (~$2,374). We have chosen to compare the GL704GW against its predecessor and other 17-inch gaming laptops. Our comparison devices will include the Gigabyte Sabre 17, the HP Omen 17, the MSI GS73VR and the RTX 2060 version of the GL73 8SE. Please keep in mind that these and other laptops, besides the GS73VR, should receive an update to RTX 20 series GPUs in the coming weeks.
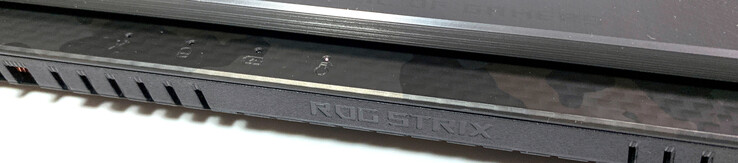
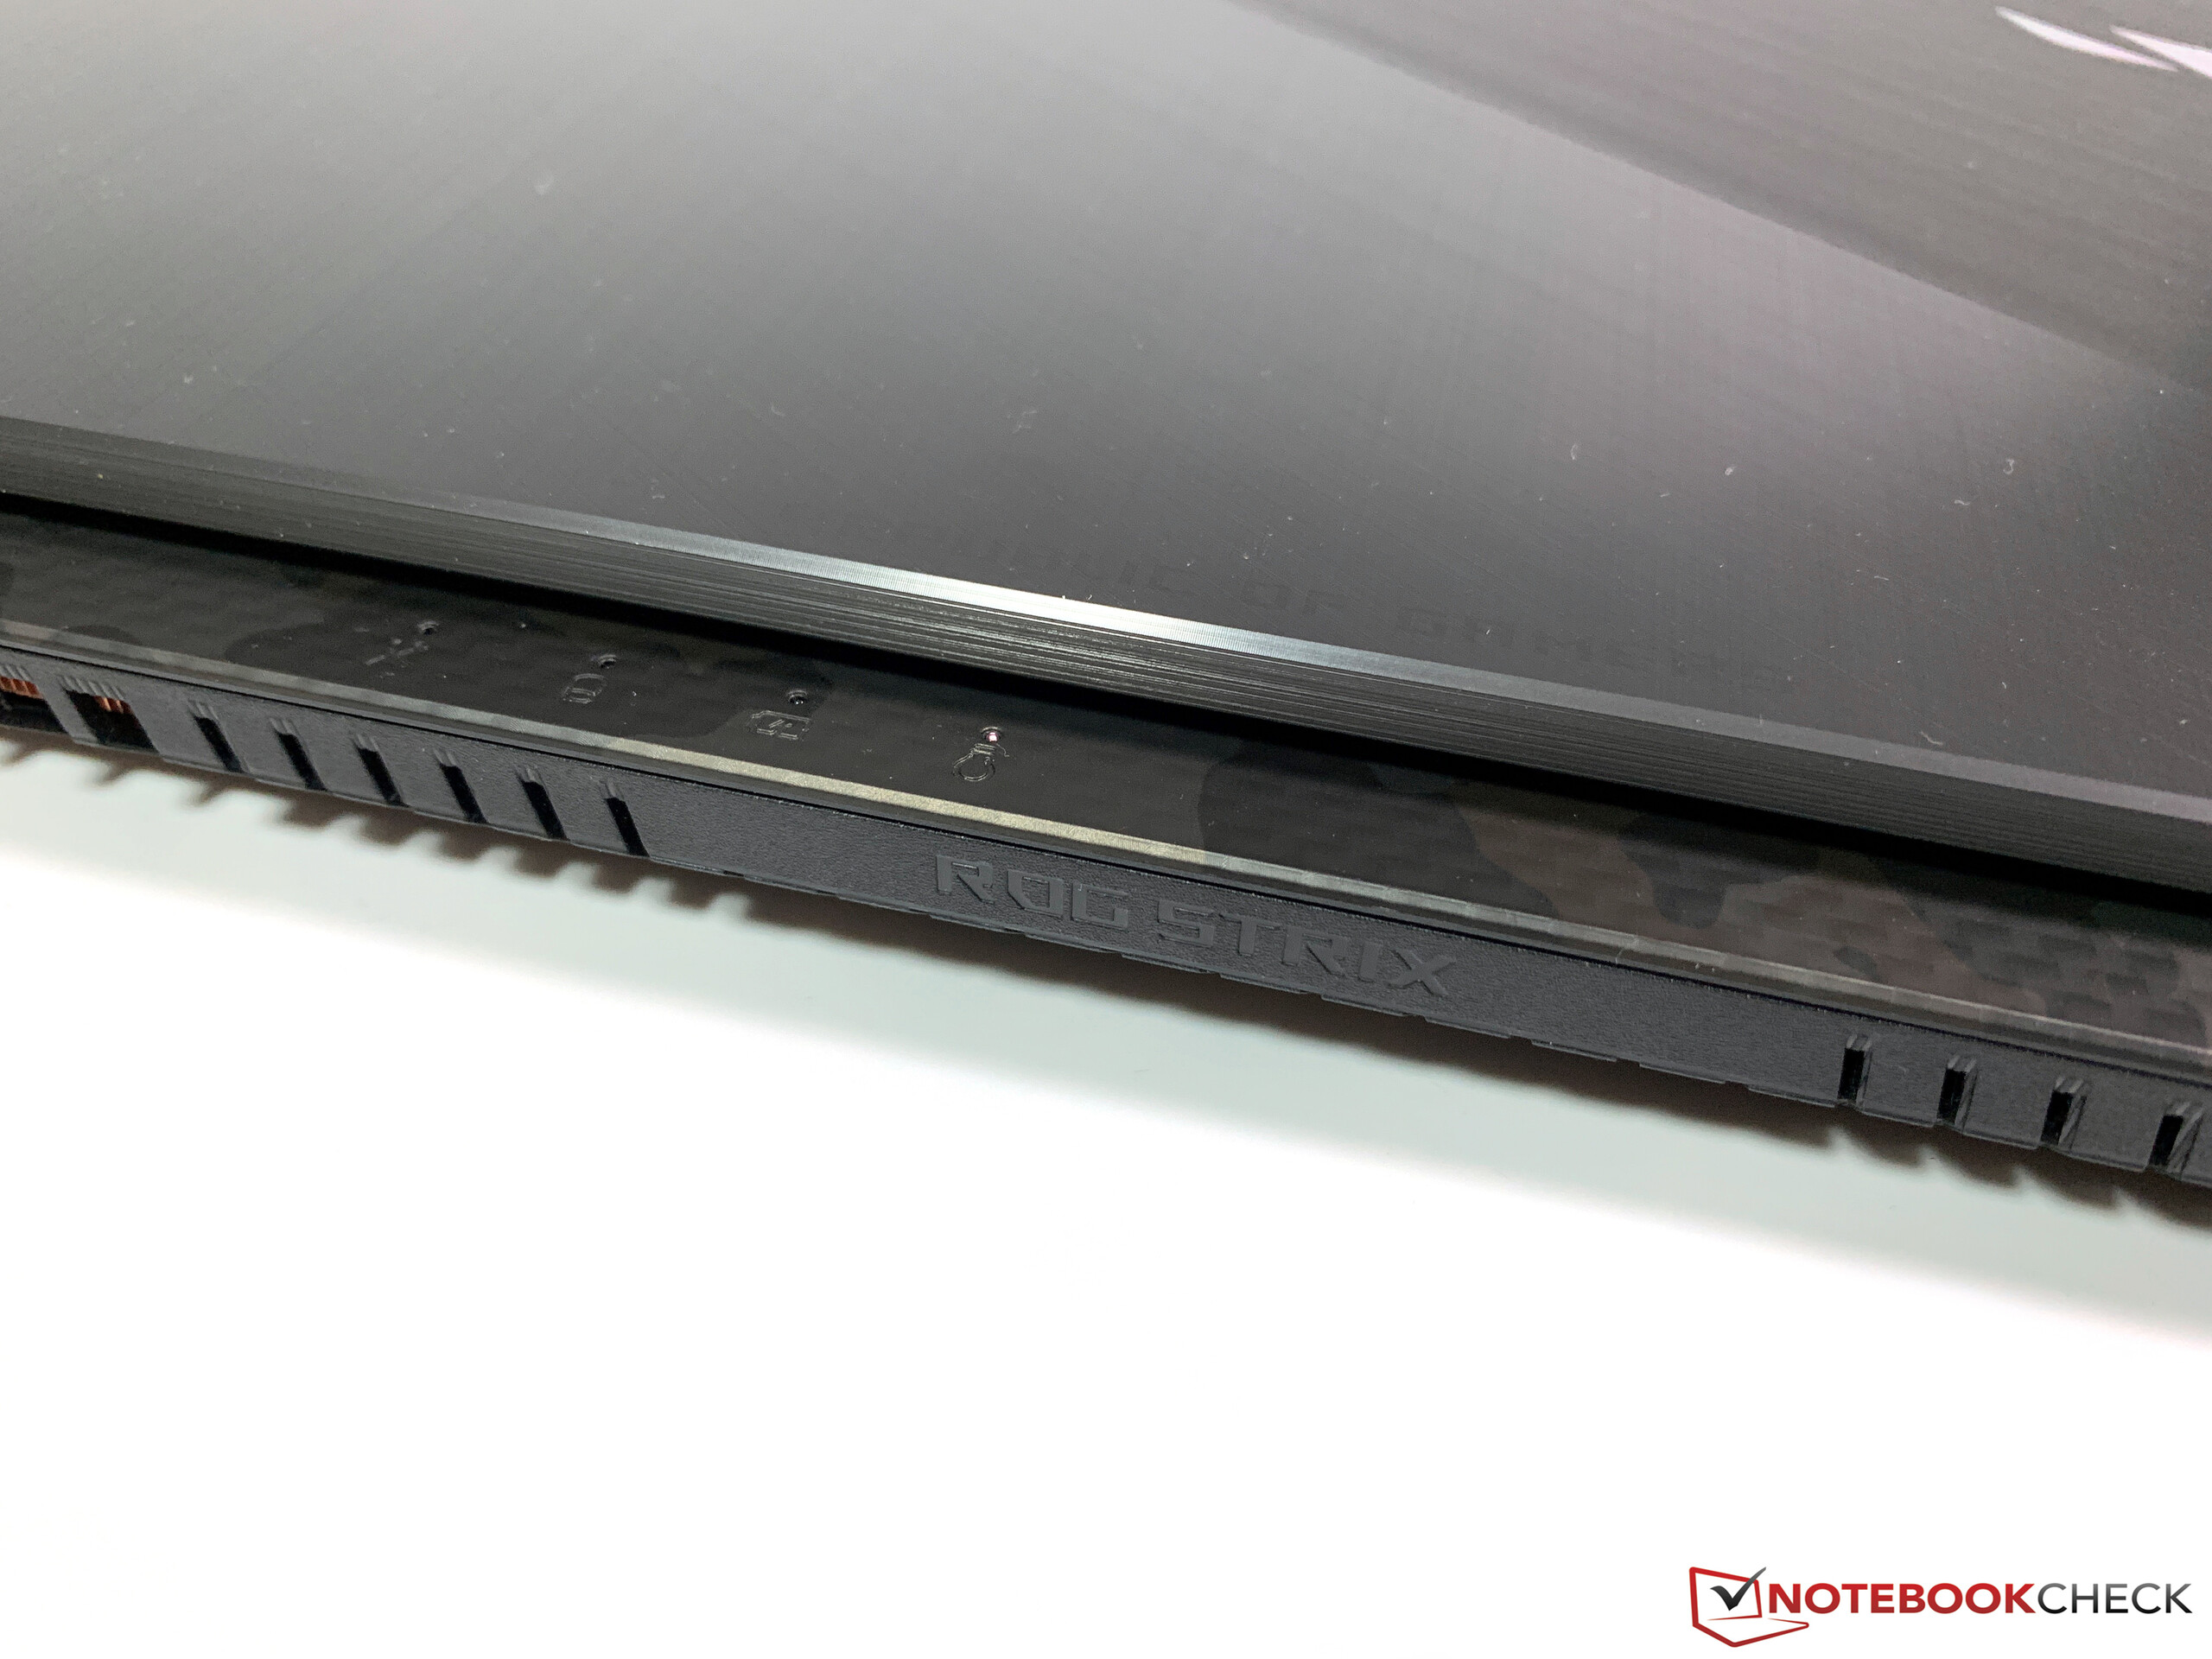
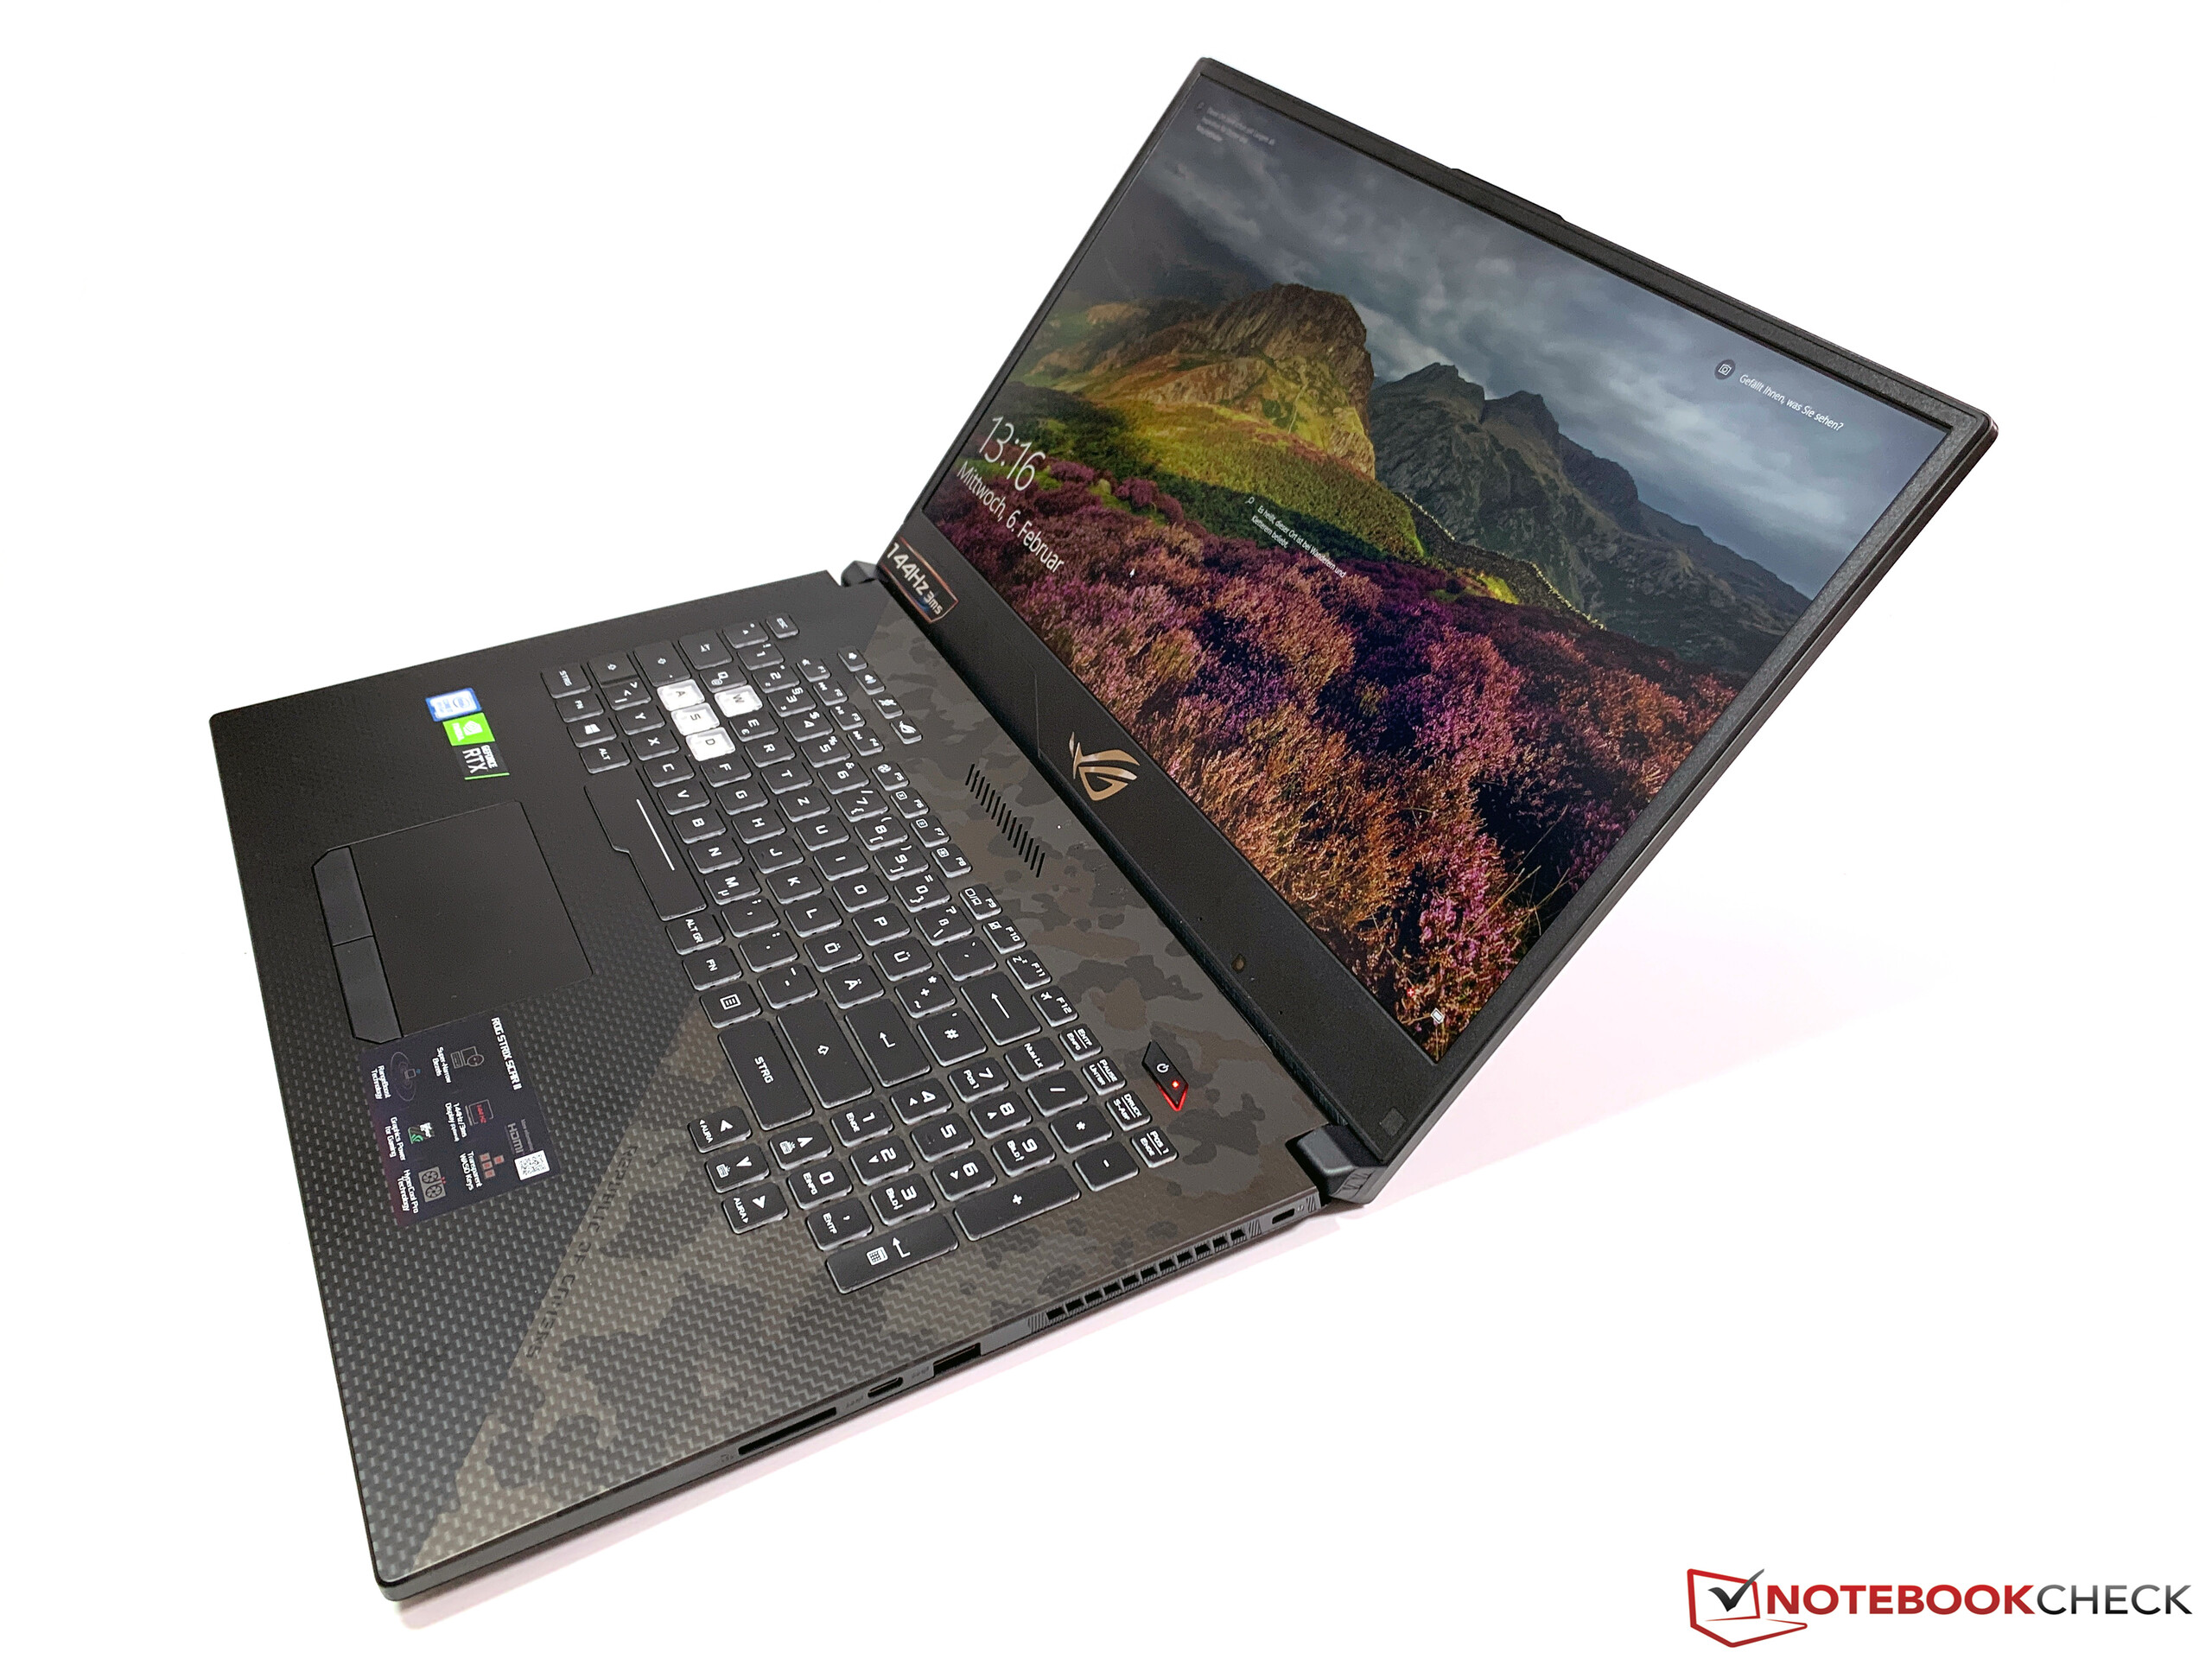
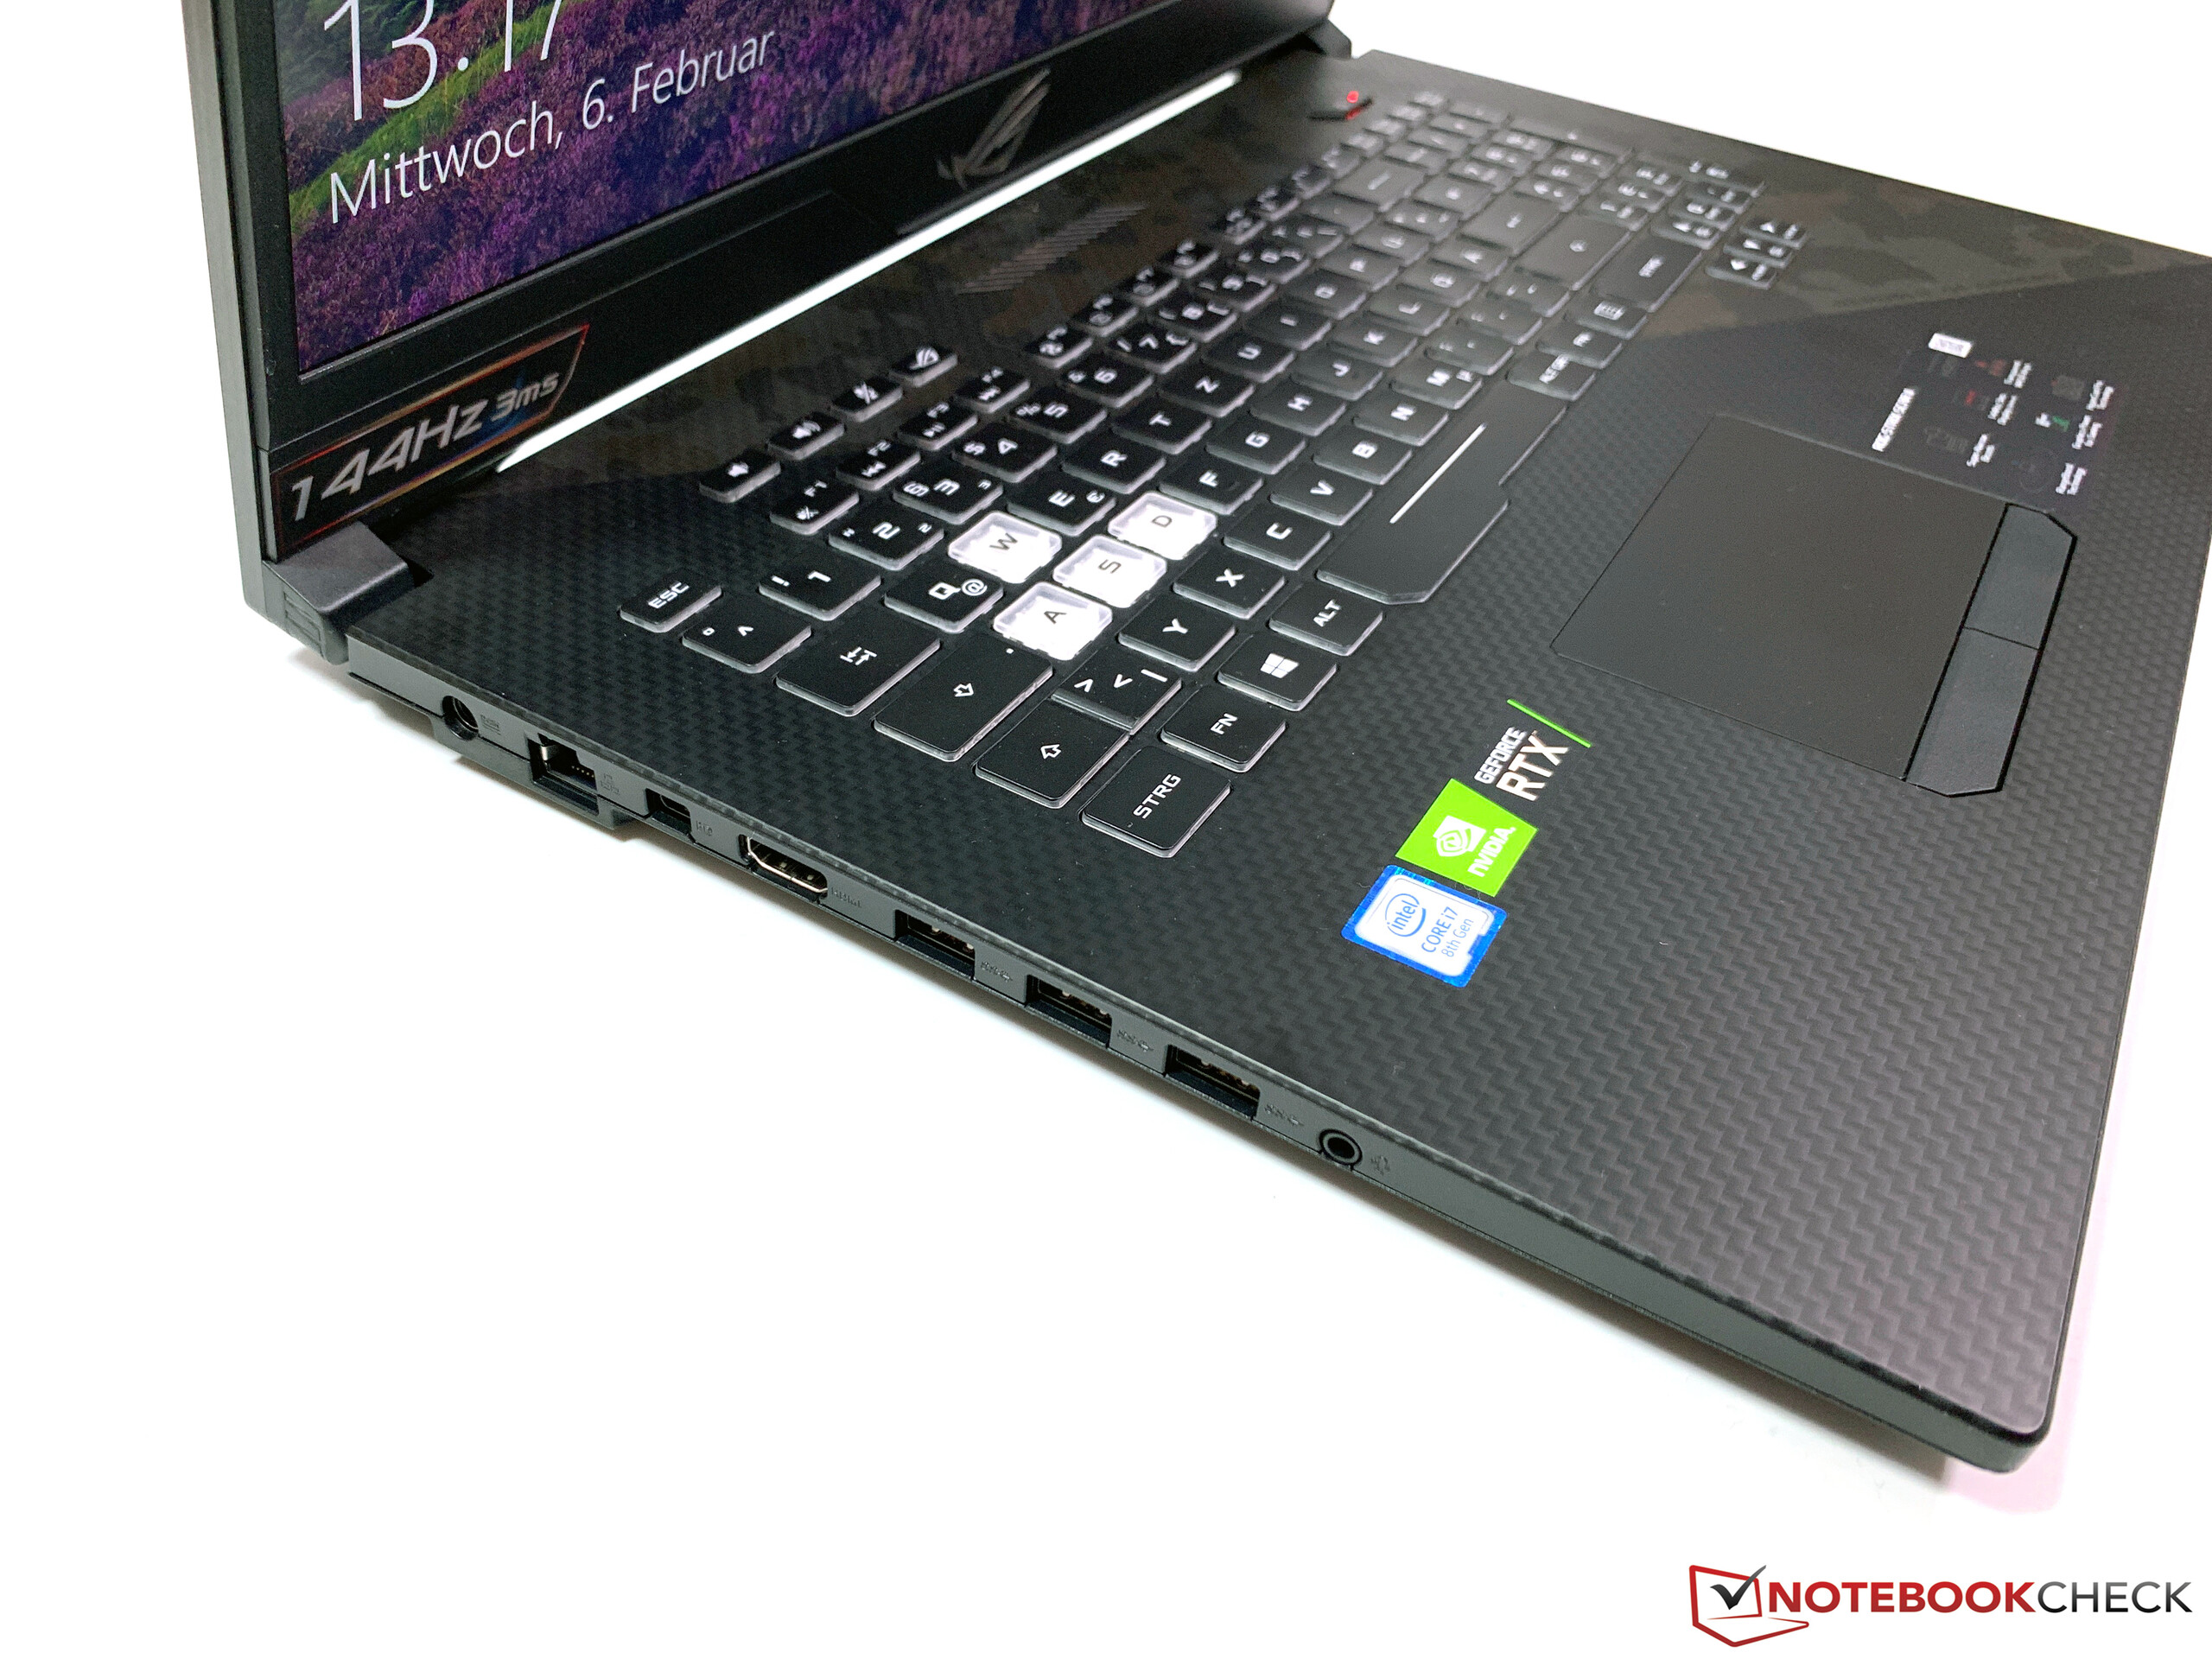
We are most interested in how the RTX 2070 performs and its impact on cooling. We shall jump straight to our review unit’s display though, as the GL704GW shares its case, connectivity, input devices and accessories with its predecessor. Please see our GL704GM review for our thoughts on these areas.

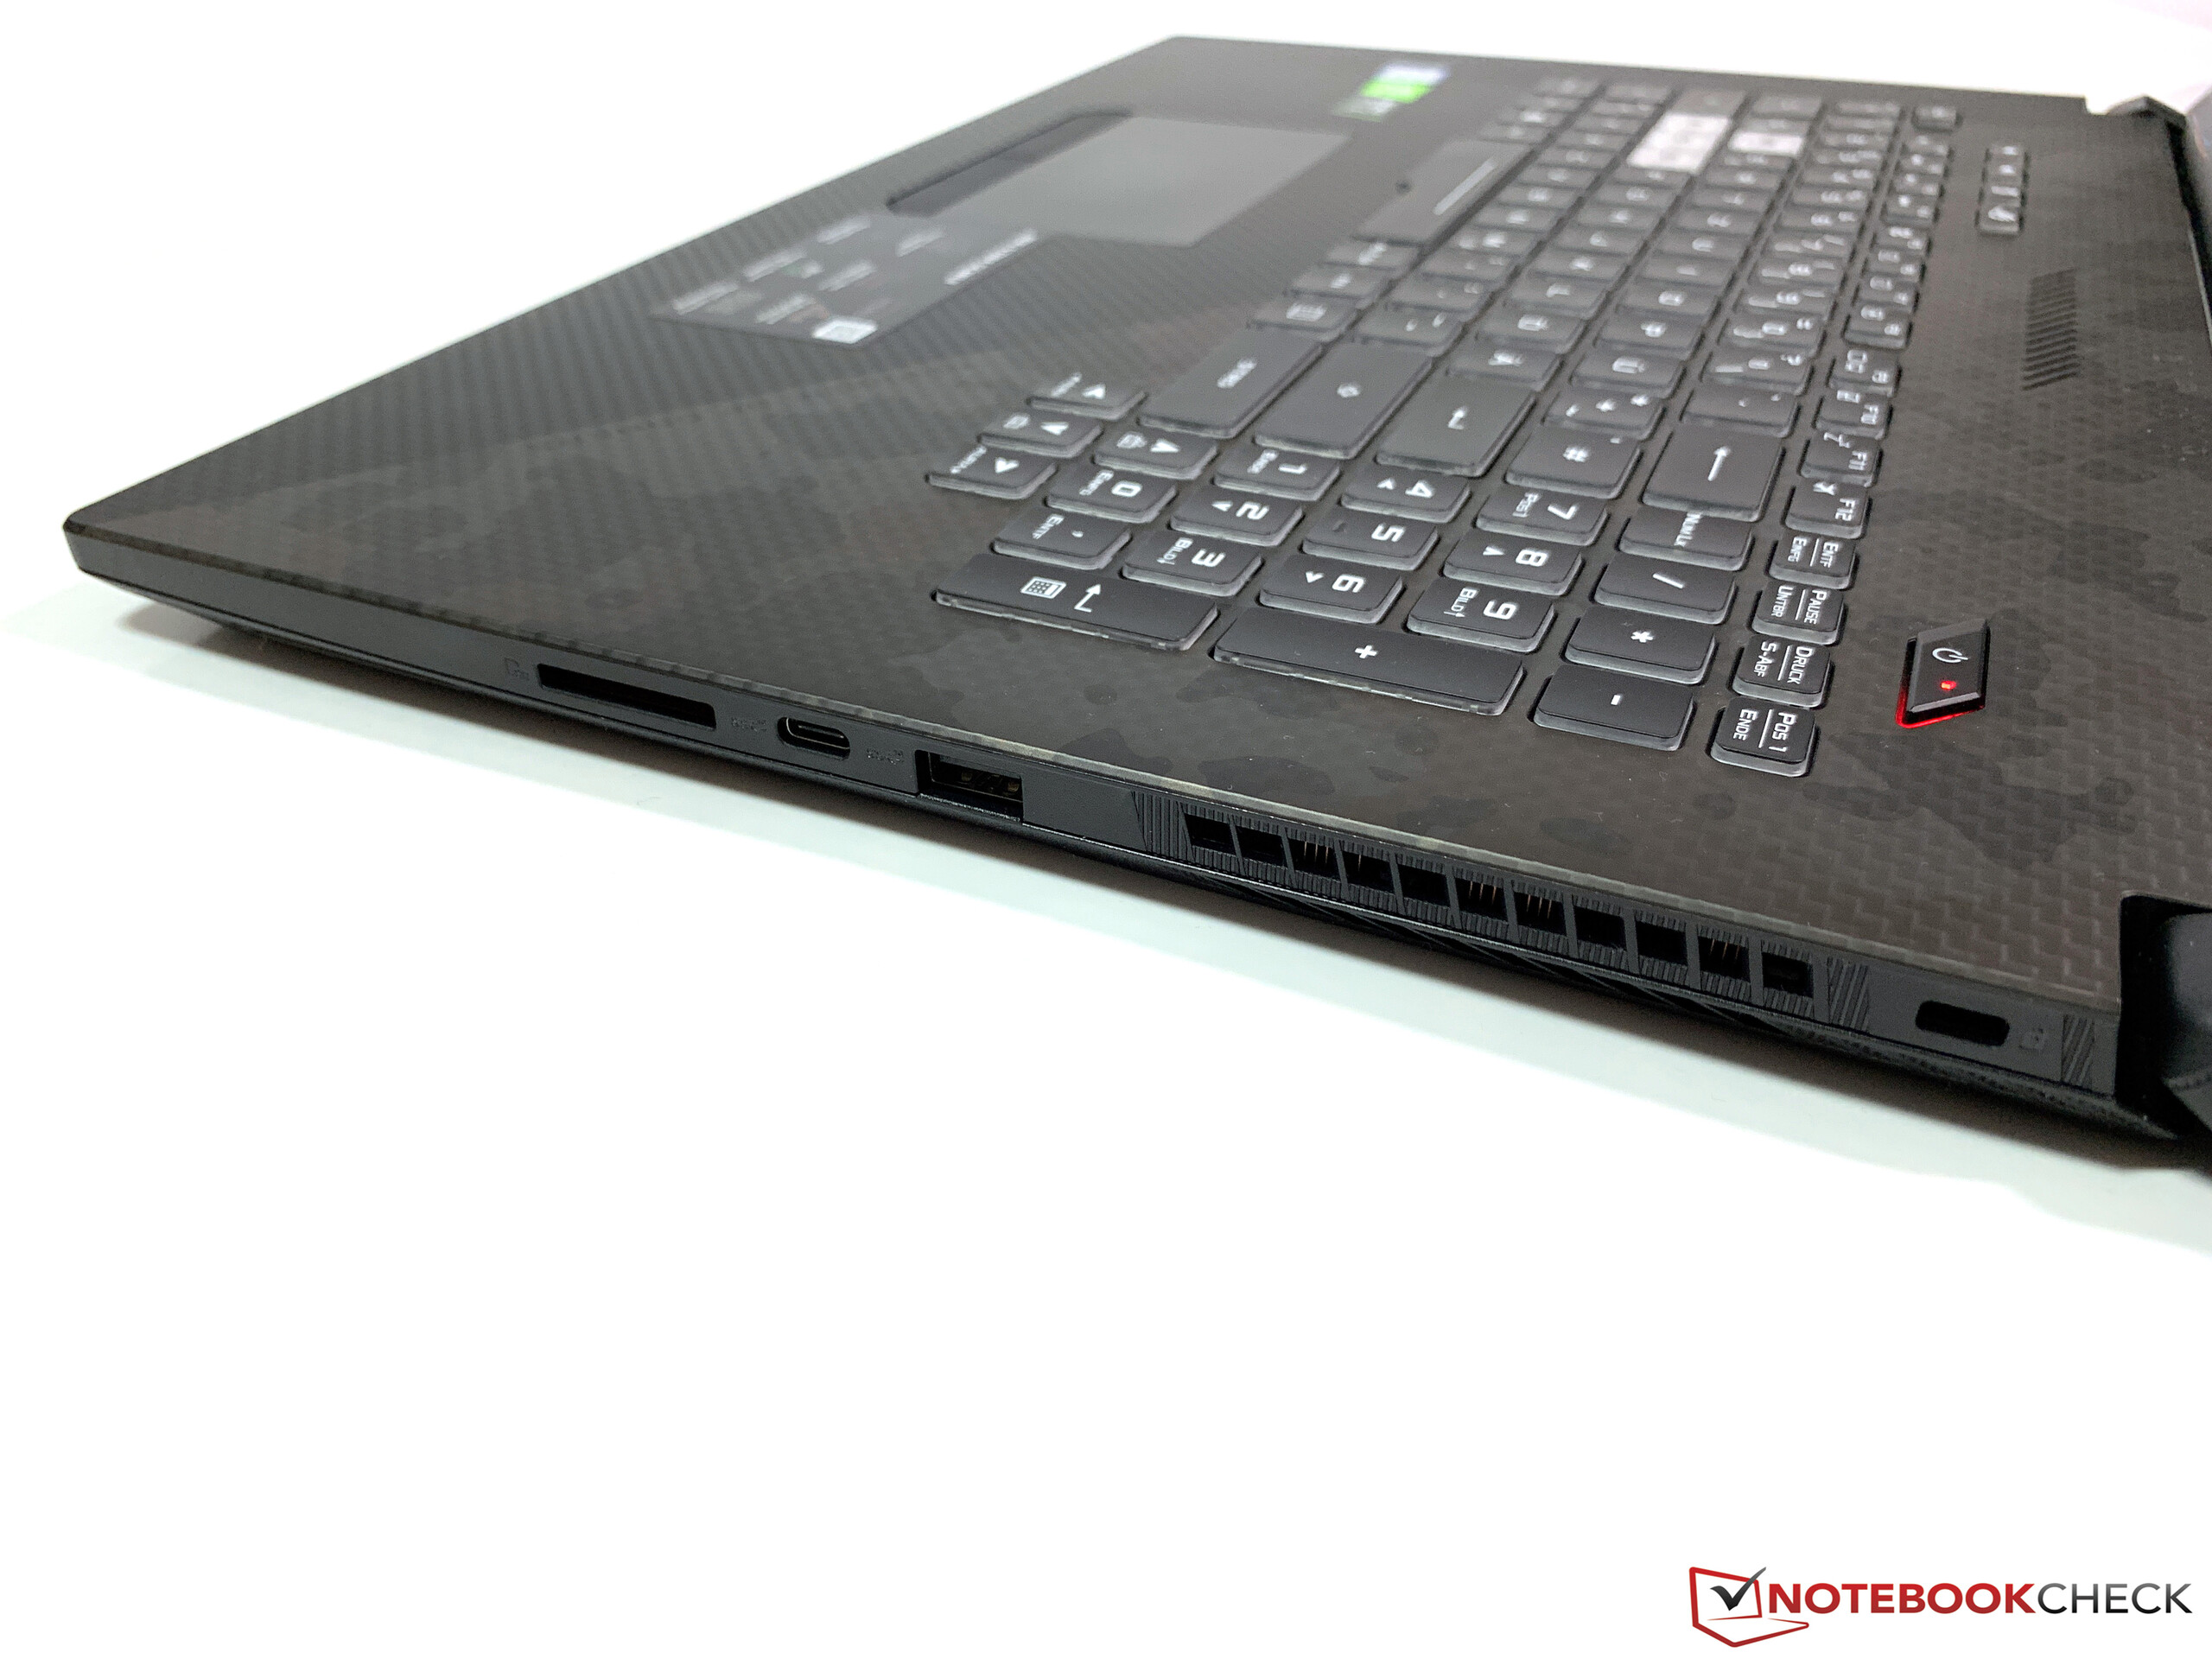
| SD Card Reader | |
| average JPG Copy Test (av. of 3 runs) | |
| MSI GS73VR 7RG (Toshiba Exceria Pro SDXC 64 GB UHS-II) | |
| Average of class Gaming (20.9 - 210, n=54, last 2 years) | |
| HP Omen 17t-3AW55AV_1 (Toshiba Exceria Pro SDXC 64 GB UHS-II) | |
| Asus ROG Strix Scar II GL704GW (Toshiba Exceria Pro SDXC 64 GB UHS-II) | |
| Asus GL704GM-DH74 (Toshiba Exceria Pro SDXC 64 GB UHS-II) | |
| Gigabyte Sabre 17-W8 (Toshiba Exceria Pro SDXC 64 GB UHS-II) | |
| MSI GL73 8SE-010US (Toshiba Exceria Pro SDXC 64 GB UHS-II) | |
| maximum AS SSD Seq Read Test (1GB) | |
| MSI GS73VR 7RG (Toshiba Exceria Pro SDXC 64 GB UHS-II) | |
| Average of class Gaming (25.5 - 261, n=51, last 2 years) | |
| HP Omen 17t-3AW55AV_1 (Toshiba Exceria Pro SDXC 64 GB UHS-II) | |
| Asus ROG Strix Scar II GL704GW (Toshiba Exceria Pro SDXC 64 GB UHS-II) | |
| Gigabyte Sabre 17-W8 (Toshiba Exceria Pro SDXC 64 GB UHS-II) | |
| Asus GL704GM-DH74 (Toshiba Exceria Pro SDXC 64 GB UHS-II) | |
| MSI GL73 8SE-010US (Toshiba Exceria Pro SDXC 64 GB UHS-II) | |
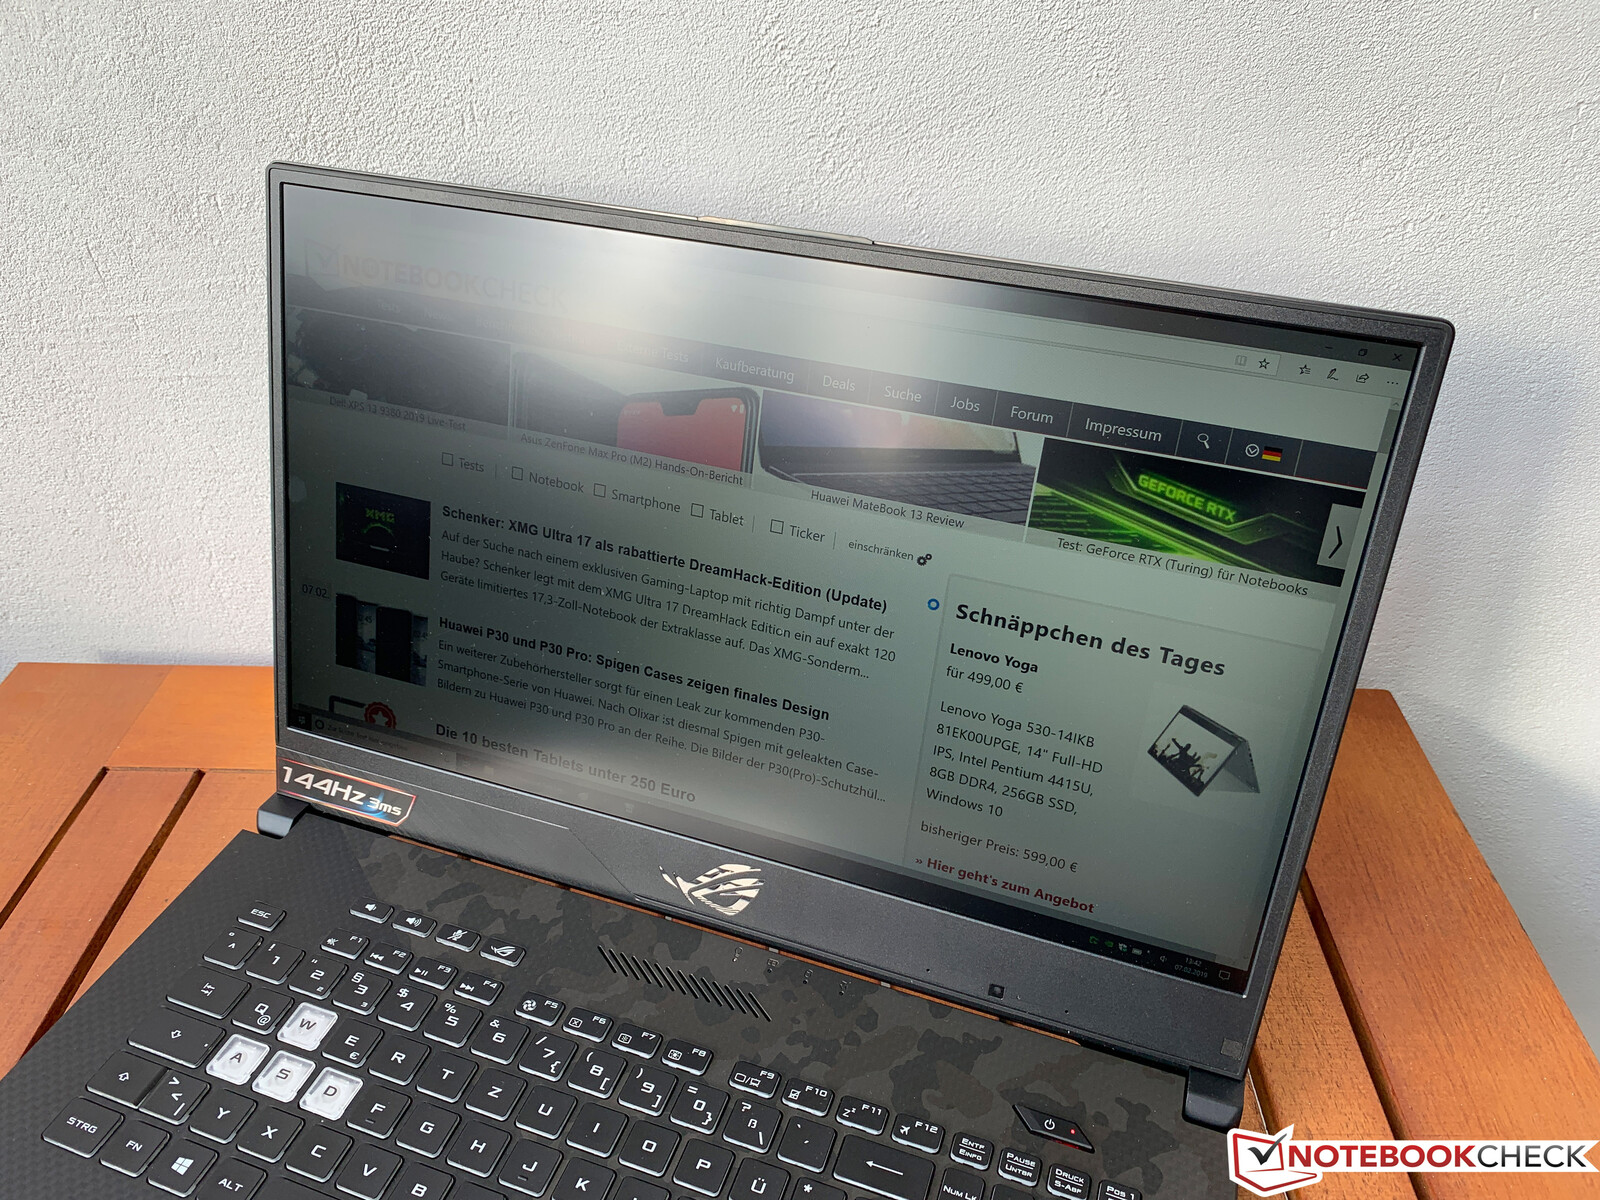
Display
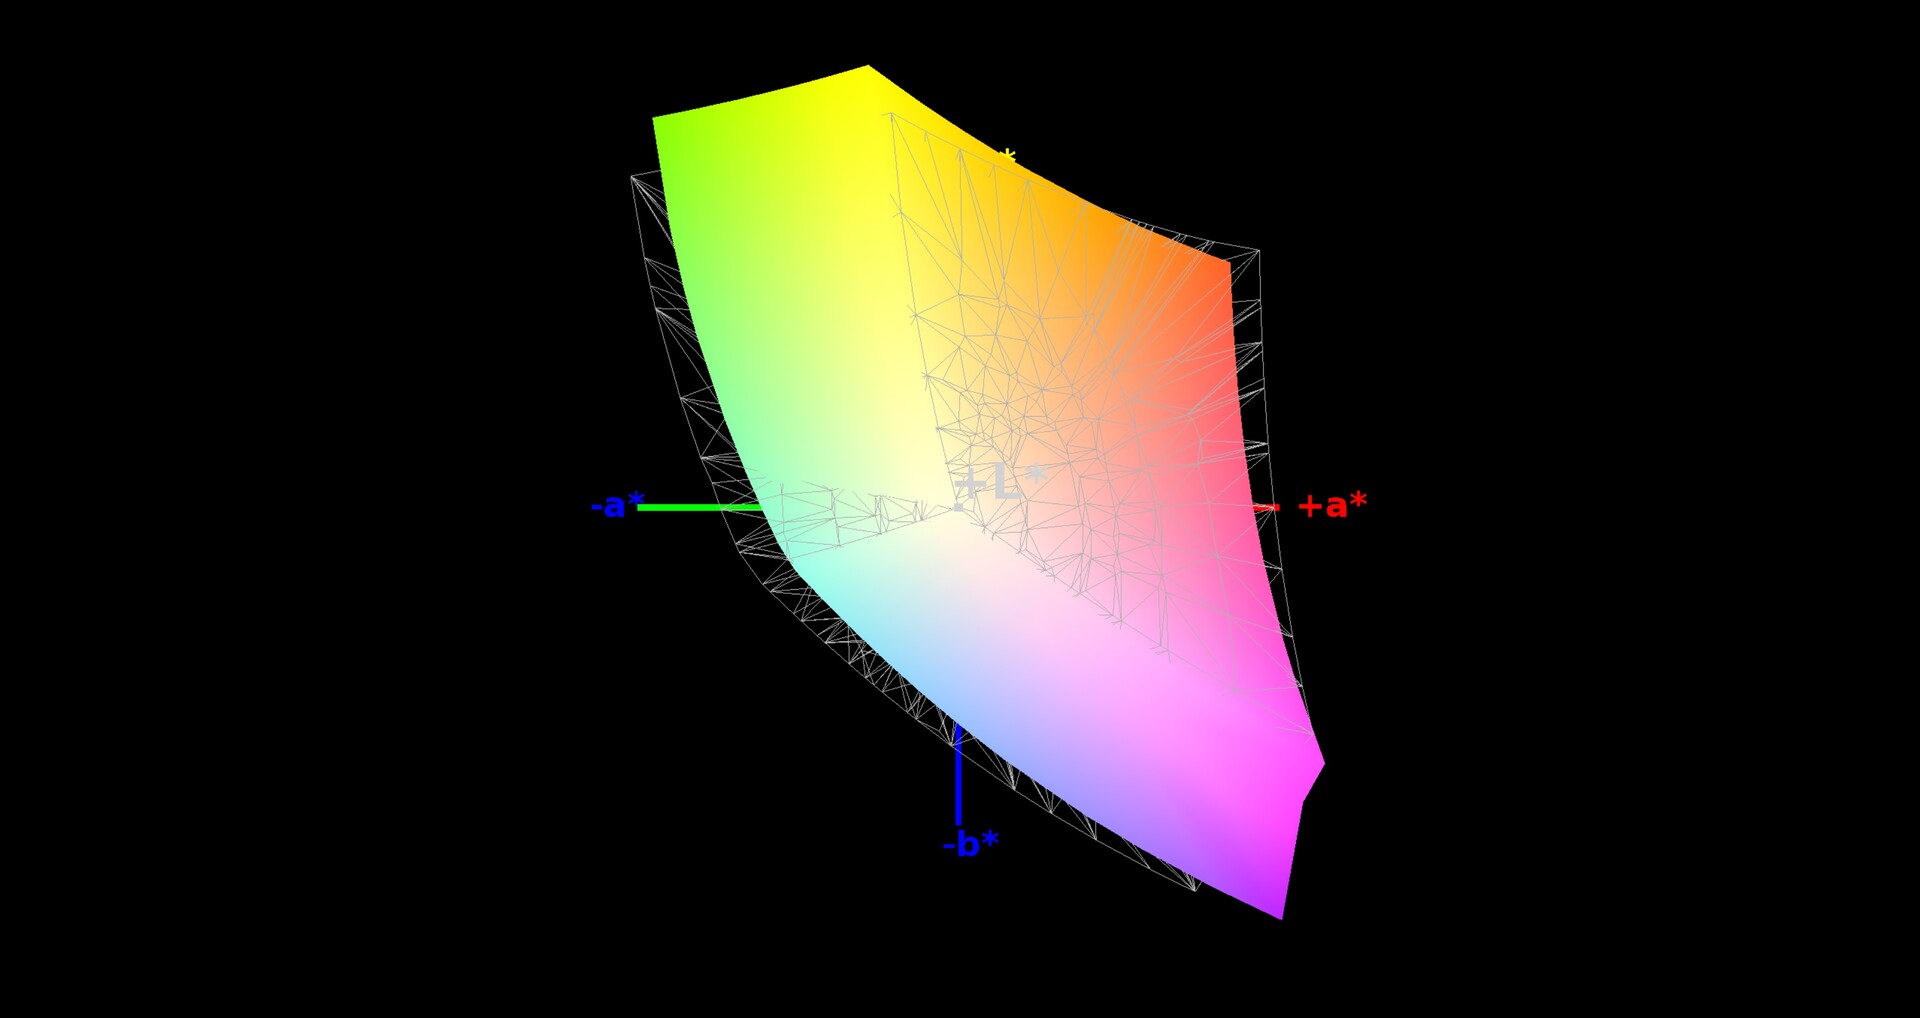
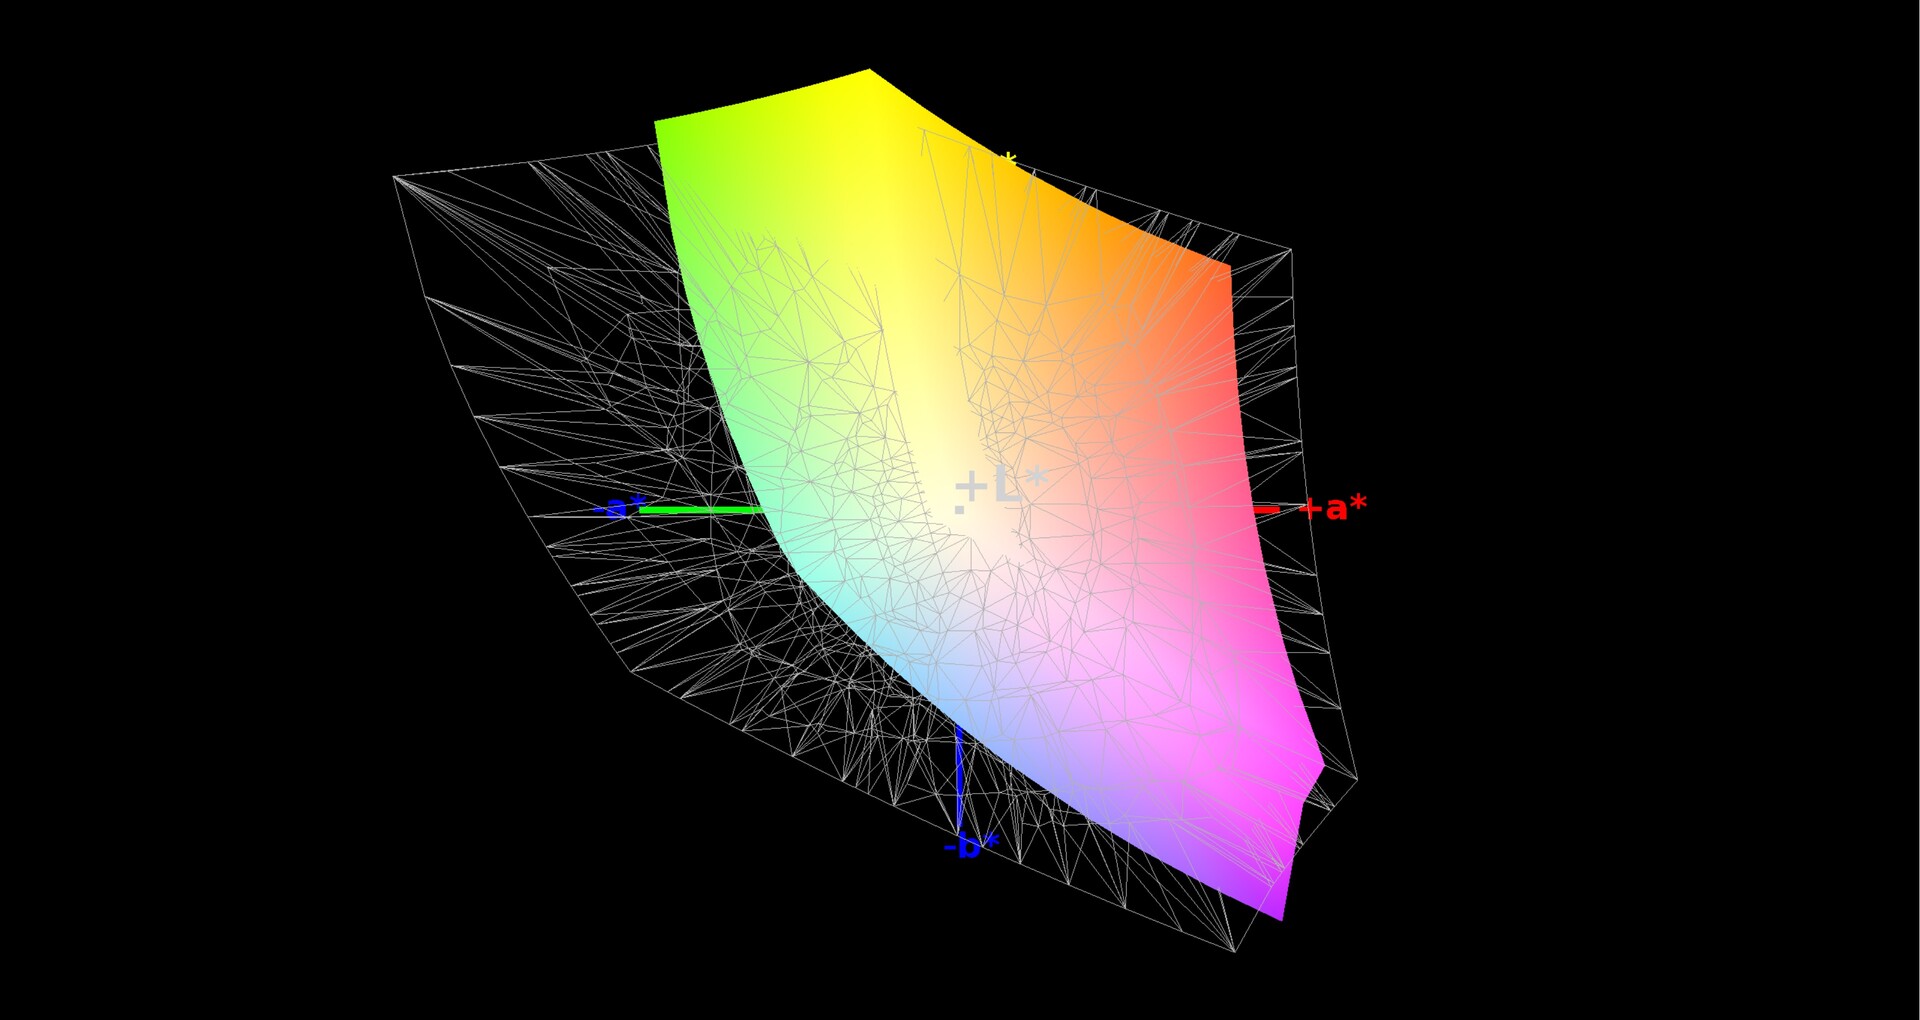
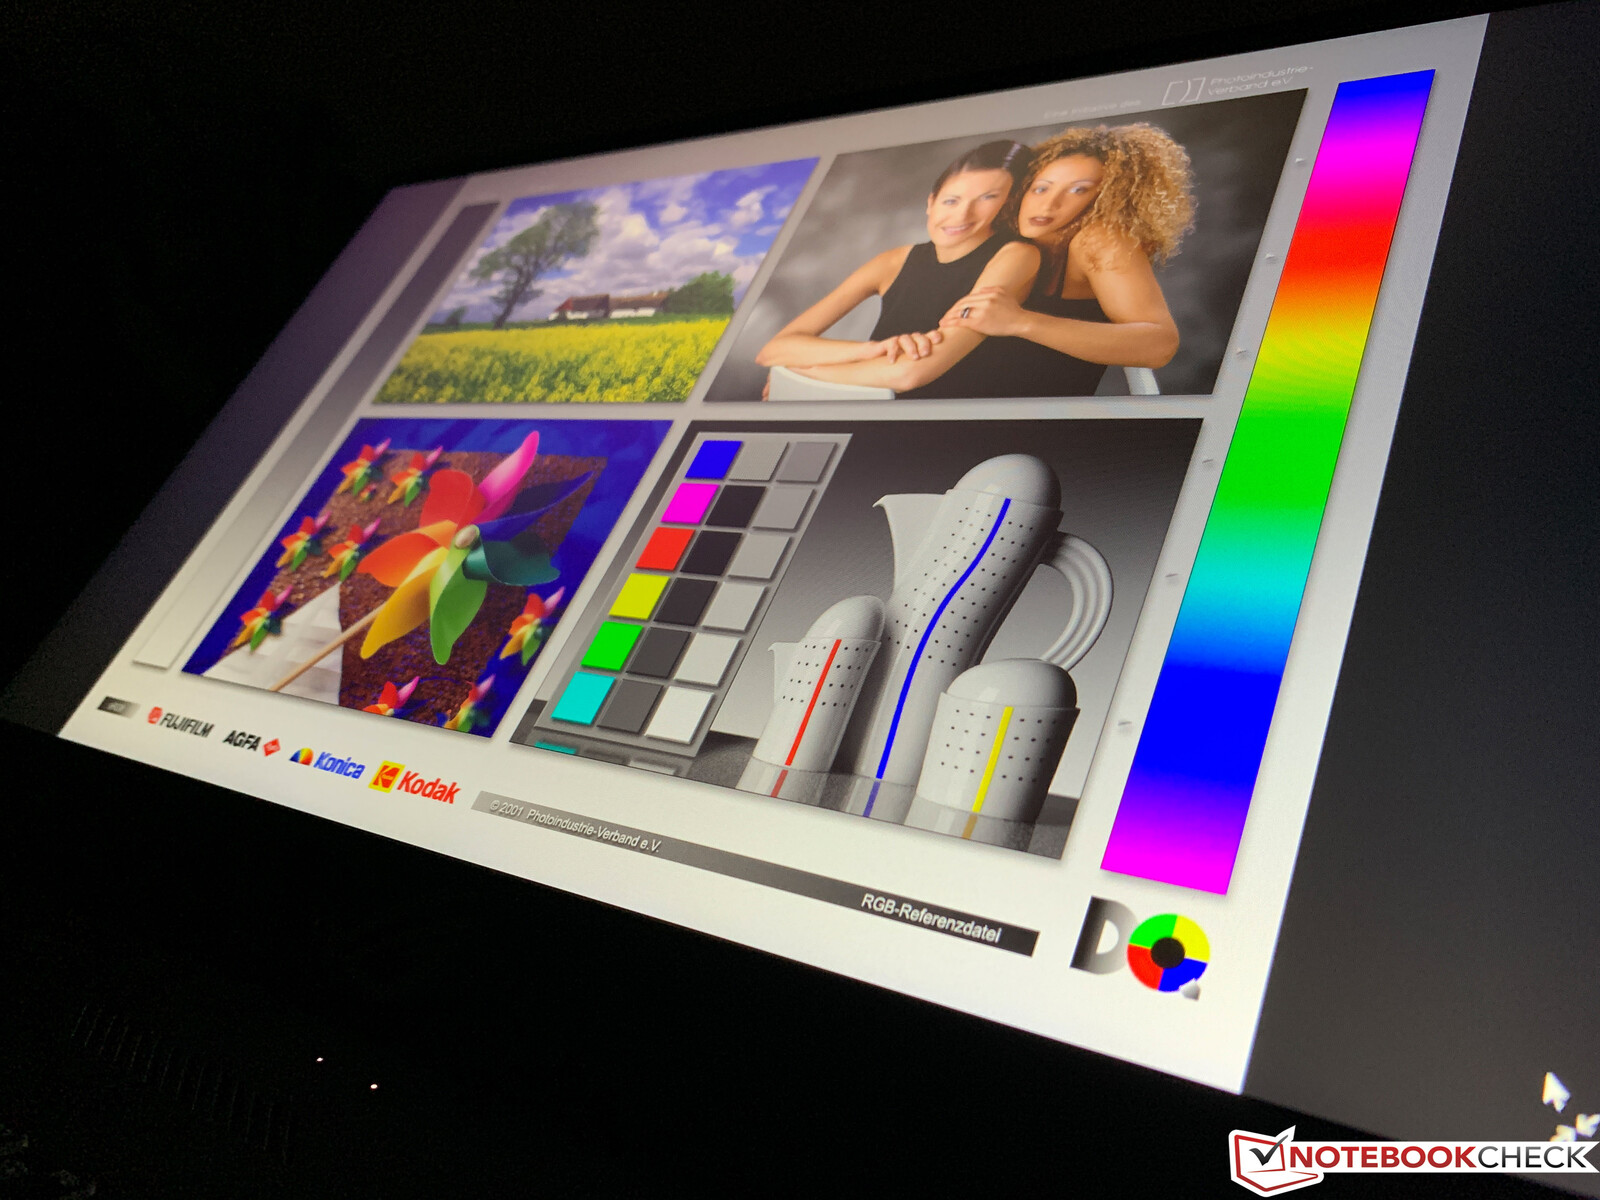
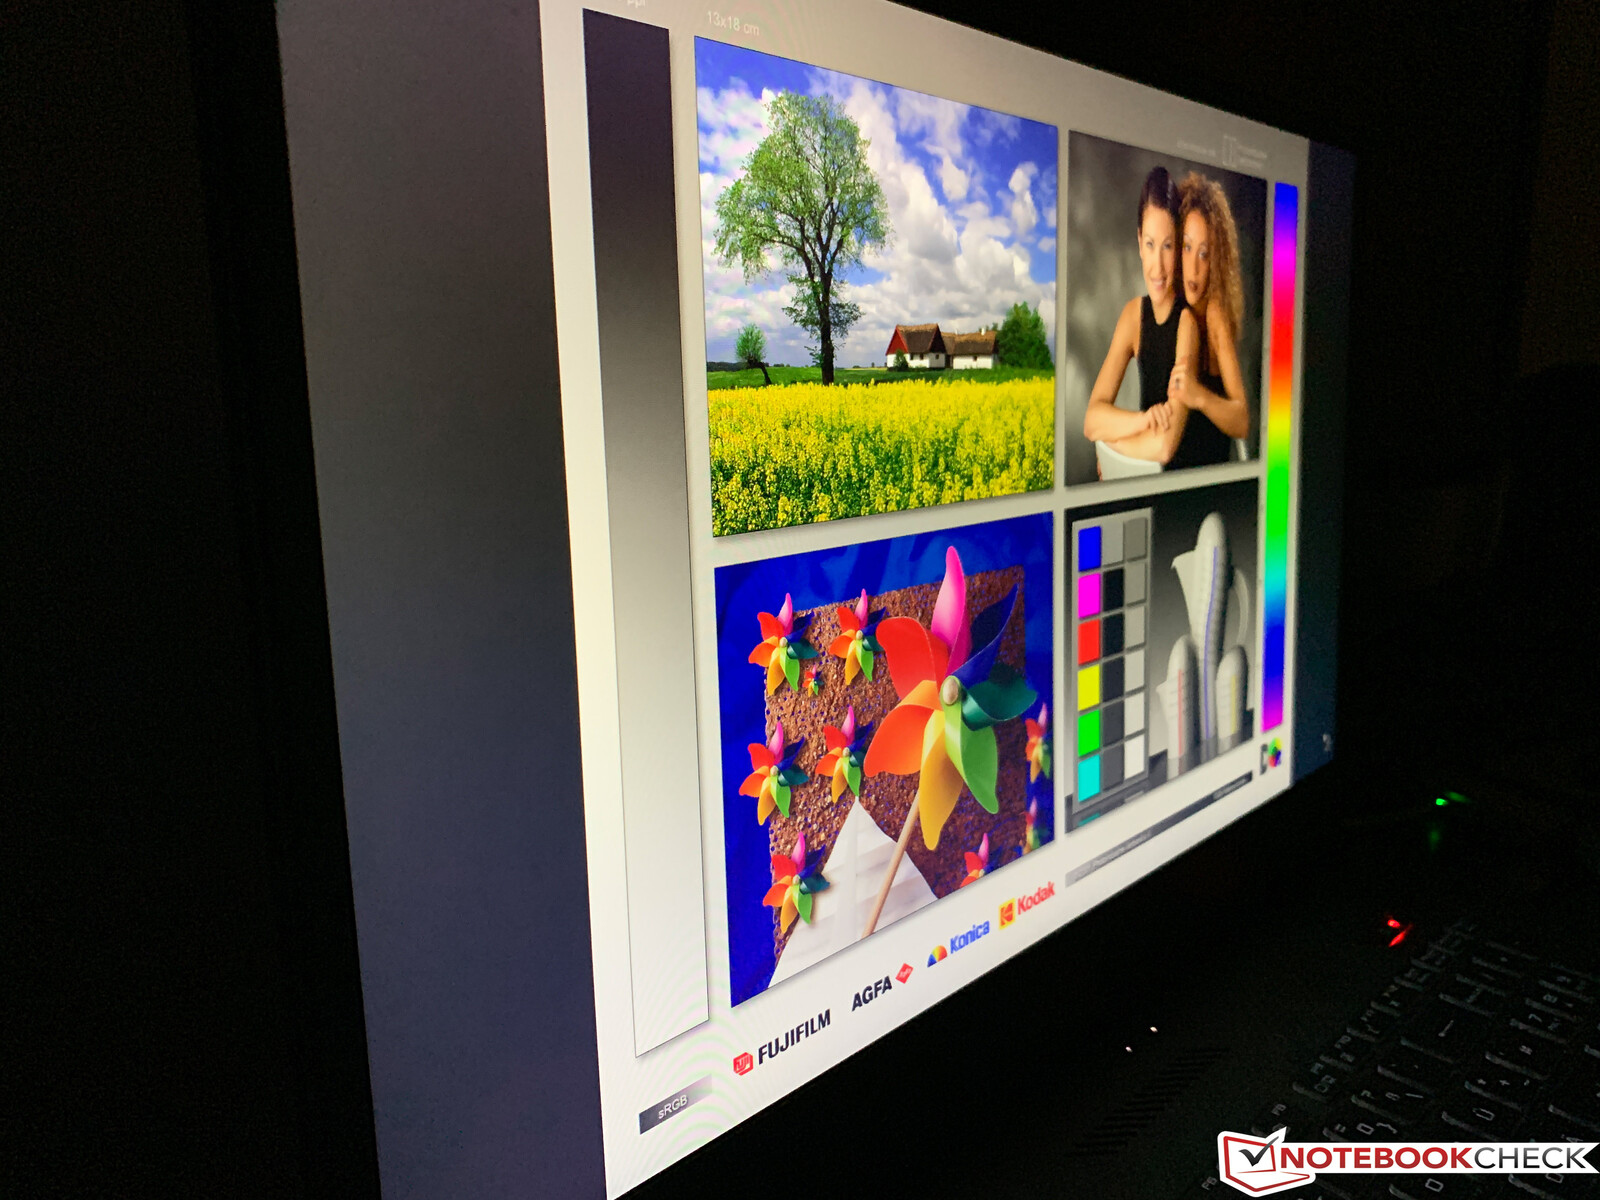
ASUS equips the GL704GW with the same AU Optronics B173HAN04.0 panel also found in the GL704GM that we tested. The matte display operates natively at 1080p and 144 Hz. The response times of our review unit are impressively fast too and deliver a smooth gaming experience. ASUS markets the display as “IPS grade” but it is an Advanced Hyper-Viewing Angles (AHVA) panel. The main difference between the two technologies is that AHVA panels tend to be higher frequency, but IPS panels can cover a slightly larger colour space. Subjectively, images look sharp and are free from any graininess from which dull screens occasionally suffer. Our review unit suffers from some minor backlight bleeding at the bottom of the display, but we can only notice this at maximum brightness with large areas of dark content being displayed onscreen.
Our test device achieves an average maximum brightness of 291 cd/m², which is 8% dimmer than the display in the GL704GM and puts the GL704GW bottom of our comparison table in this regard. The display is 96% evenly lit though, which should deliver noticeably more even backlight distribution than all our comparison devices. The GL704GW also has a better black value and contrast ratio than our comparison devices. Moreover, the device does not use pulse-width modulation (PWM) to regulate display brightness, so no-one should suffer from eye strain or headaches when using the GL704GW.
| |||||||||||||||||||||||||
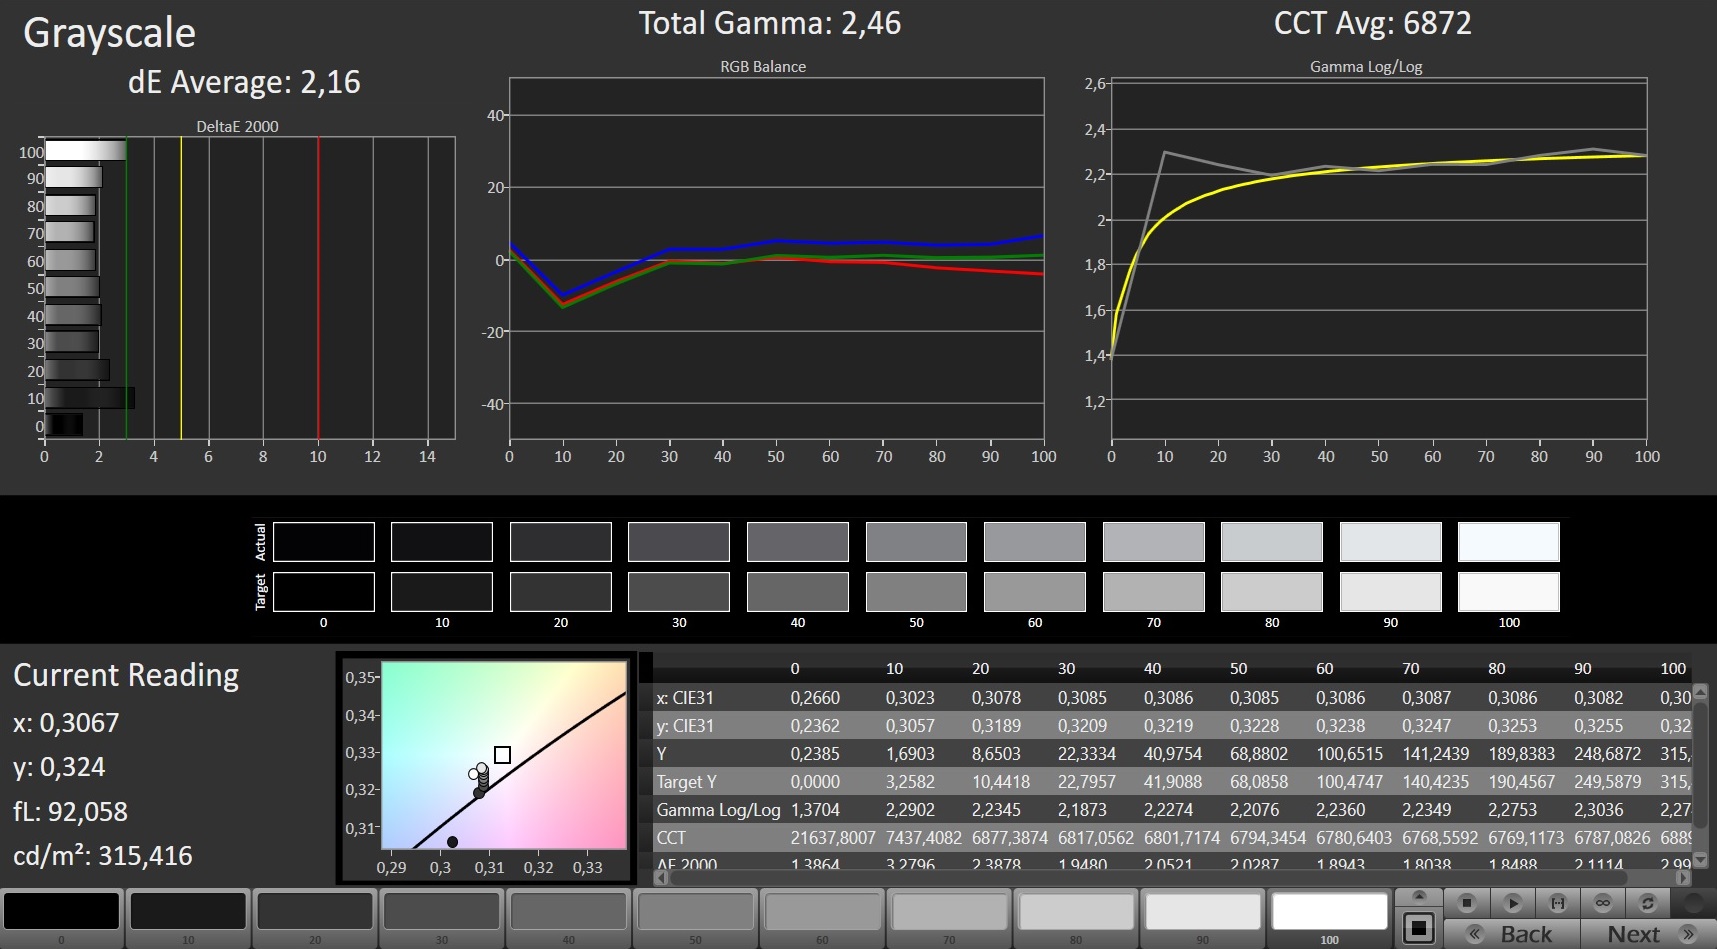
Brightness Distribution: 96 %
Contrast: 1229:1 (Black: 0.24 cd/m²)
ΔE ColorChecker Calman: 3.2 | ∀{0.5-29.43 Ø4.72}
calibrated: 2.52
ΔE Greyscale Calman: 2.16 | ∀{0.09-98 Ø4.97}
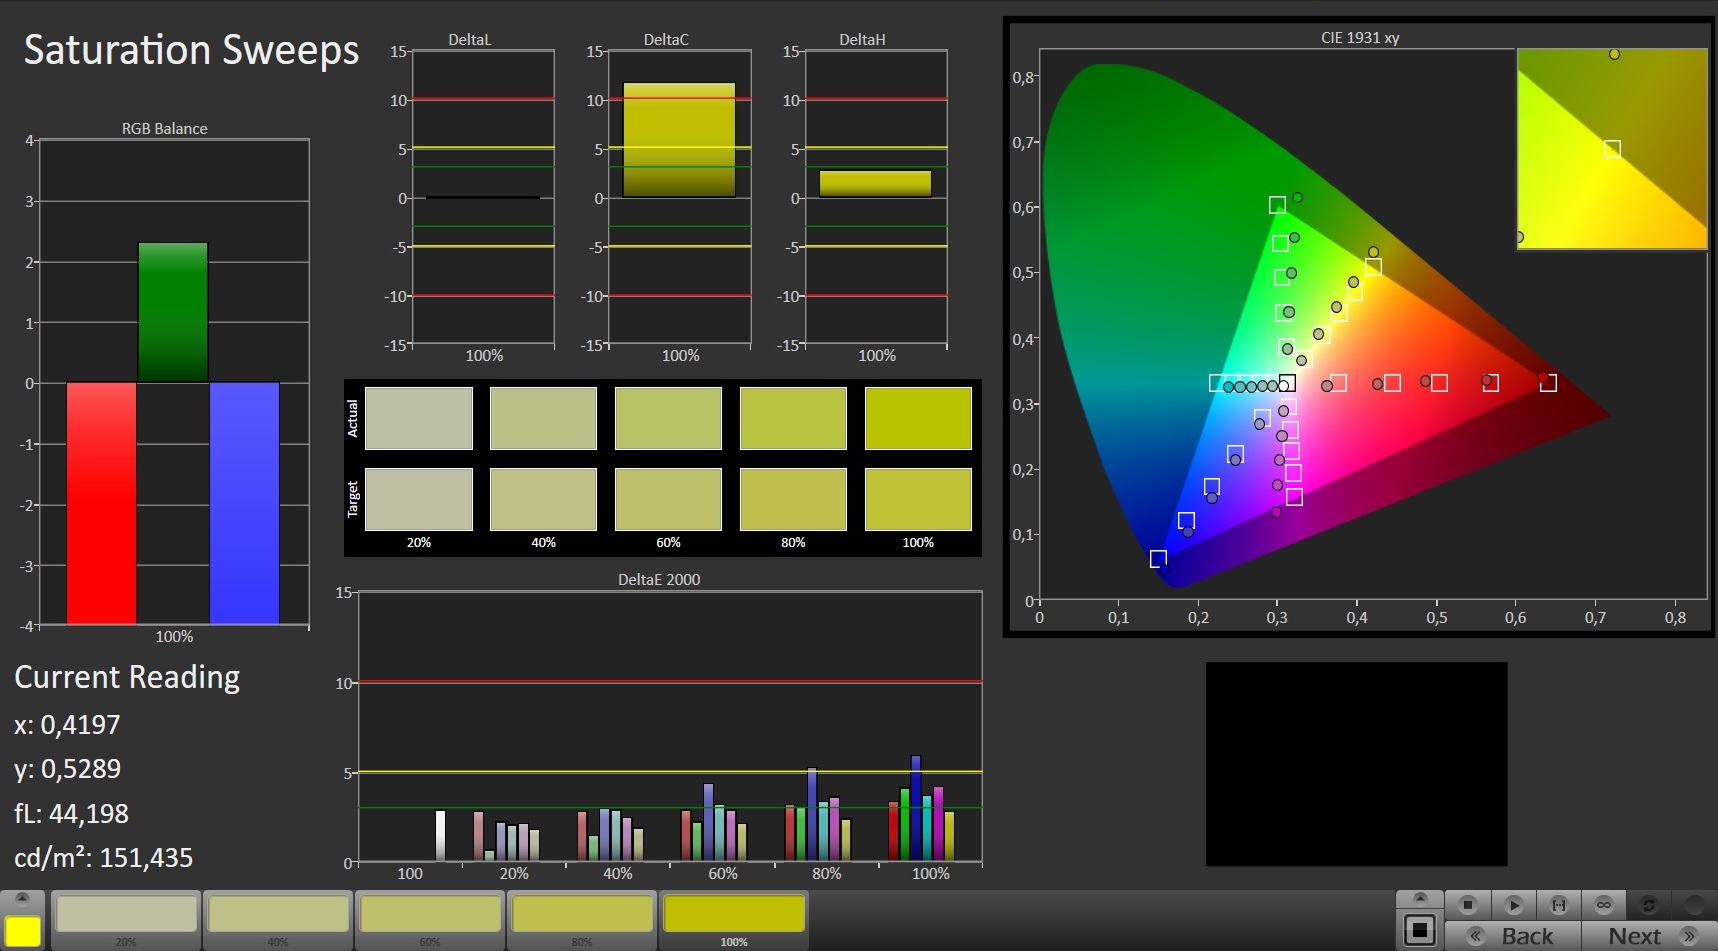
87% sRGB (Argyll 1.6.3 3D)
57% AdobeRGB 1998 (Argyll 1.6.3 3D)
63.7% AdobeRGB 1998 (Argyll 3D)
87.1% sRGB (Argyll 3D)
62.9% Display P3 (Argyll 3D)
Gamma: 2.46
CCT: 6872 K
| Asus ROG Strix Scar II GL704GW B173HAN04.0 (AUO409D), AHVA, 1920x1080 | Asus GL704GM-DH74 AU Optronics B173HAN04.0, IPS, 1920x1080 | MSI GS73VR 7RG ID: CMN1747, Name: Chi Mei N173HHE-G32, TN LED, 1920x1080 | Gigabyte Sabre 17-W8 Chi Mei CMN1747, TN, 1920x1080 | HP Omen 17t-3AW55AV_1 AU Optronics AUO309D, IPS, 1920x1080 | MSI GL73 8SE-010US CMN1747, TN LED, 1920x1080 | |
|---|---|---|---|---|---|---|
| Display | 0% | 31% | 31% | 3% | 31% | |
| Display P3 Coverage (%) | 62.9 | 62 -1% | 89.6 42% | 89.9 43% | 65.4 4% | 91.1 45% |
| sRGB Coverage (%) | 87.1 | 89.2 2% | 100 15% | 100 15% | 90 3% | 100 15% |
| AdobeRGB 1998 Coverage (%) | 63.7 | 63.3 -1% | 86.9 36% | 85.1 34% | 65.8 3% | 85.4 34% |
| Response Times | 31% | -5% | 39% | 6% | 27% | |
| Response Time Grey 50% / Grey 80% * (ms) | 17.6 ? | 6.8 ? 61% | 23.6 ? -34% | 9 ? 49% | 17.6 ? -0% | 12.8 ? 27% |
| Response Time Black / White * (ms) | 11.2 ? | 11.2 ? -0% | 8.4 ? 25% | 8 ? 29% | 10 ? 11% | 8.2 ? 27% |
| PWM Frequency (Hz) | 26040 ? | 25000 ? | 25770 ? | |||
| Screen | -18% | -67% | -62% | -13% | -57% | |
| Brightness middle (cd/m²) | 295 | 324.4 10% | 350.9 19% | 326 11% | 343.6 16% | 326.4 11% |
| Brightness (cd/m²) | 291 | 314 8% | 311 7% | 309 6% | 320 10% | 317 9% |
| Brightness Distribution (%) | 96 | 92 -4% | 79 -18% | 82 -15% | 87 -9% | 90 -6% |
| Black Level * (cd/m²) | 0.24 | 0.35 -46% | 0.33 -38% | 0.27 -13% | 0.34 -42% | 0.28 -17% |
| Contrast (:1) | 1229 | 927 -25% | 1063 -14% | 1207 -2% | 1011 -18% | 1166 -5% |
| Colorchecker dE 2000 * | 3.2 | 3.82 -19% | 7.7 -141% | 9.11 -185% | 3.74 -17% | 7.83 -145% |
| Colorchecker dE 2000 max. * | 6.64 | 6.4 4% | 14.4 -117% | 14.14 -113% | 5.33 20% | 13.36 -101% |
| Colorchecker dE 2000 calibrated * | 2.52 | 3.32 -32% | 2.62 -4% | 3.49 -38% | 2.83 -12% | |
| Greyscale dE 2000 * | 2.16 | 4.3 -99% | 11.1 -414% | 11.17 -417% | 3.7 -71% | 10.9 -405% |
| Gamma | 2.46 89% | 2.2 100% | 2.11 104% | 2.28 96% | 2.36 93% | 1.97 112% |
| CCT | 6872 95% | 7366 88% | 11813 55% | 12475 52% | 6388 102% | 11056 59% |
| Color Space (Percent of AdobeRGB 1998) (%) | 57 | 57.5 1% | 77.74 36% | 76 33% | 58 2% | 75.8 33% |
| Color Space (Percent of sRGB) (%) | 87 | 88.8 2% | 100 15% | 100 15% | 90 3% | 100 15% |
| Total Average (Program / Settings) | 4% /
-9% | -14% /
-39% | 3% /
-32% | -1% /
-8% | 0% /
-30% |
* ... smaller is better
ASUS has done a great job at factory calibrating the display too. Our review unit has better than ideal DeltaE deviations, so games should look colour accurate without any additional calibration. We noticed no annoying colour casts either, which is reinforced by CalMAN. In short, you do not need to calibrate the GL704GW’s display, but you can improve greyscale deviations if you do. Hence, we have included a calibrated ICC profile should you wish to use it. Our test device achieves decent colour-space coverage too, but our two MSI comparison devices and the Gigabyte Sabre 17 achieved better results here, with all three having 100% sRGB coverage.
Display Response Times
| ↔ Response Time Black to White | ||
|---|---|---|
| 11.2 ms ... rise ↗ and fall ↘ combined | ↗ 6.8 ms rise | 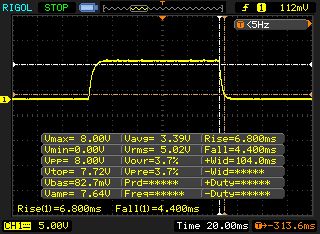 |
| ↘ 4.4 ms fall | ||
| The screen shows good response rates in our tests, but may be too slow for competitive gamers. In comparison, all tested devices range from 0.1 (minimum) to 240 (maximum) ms. » 30 % of all devices are better. This means that the measured response time is better than the average of all tested devices (19.8 ms). | ||
| ↔ Response Time 50% Grey to 80% Grey | ||
| 17.6 ms ... rise ↗ and fall ↘ combined | ↗ 8.4 ms rise | 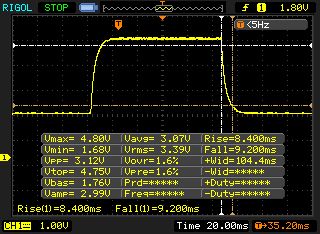 |
| ↘ 9.2 ms fall | ||
| The screen shows good response rates in our tests, but may be too slow for competitive gamers. In comparison, all tested devices range from 0.165 (minimum) to 636 (maximum) ms. » 32 % of all devices are better. This means that the measured response time is better than the average of all tested devices (31 ms). | ||
Screen Flickering / PWM (Pulse-Width Modulation)
| Screen flickering / PWM not detected | 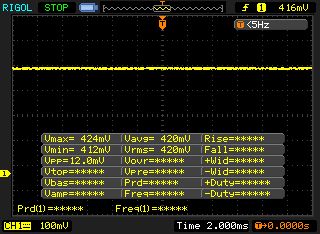 | ||
In comparison: 52 % of all tested devices do not use PWM to dim the display. If PWM was detected, an average of 7747 (minimum: 5 - maximum: 343500) Hz was measured. | |||
The GL704GW is also usable outdoors thanks to its matte display, but we struggle to read it in direct sunlight as the screen looks washed-out. Hence, we would recommend finding a shady spot, where possible. You should have no issues using the GL704GW outside on a cloudy day though.
Equally, our review unit has stable viewing angles. We noticed a slight loss of contrast from acute viewing angles, but this should not prevent you from using the GL704GW at practically any angle.
Performance
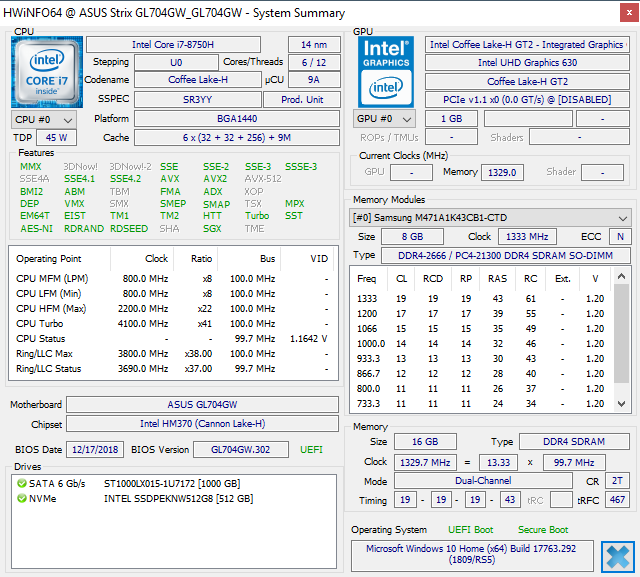
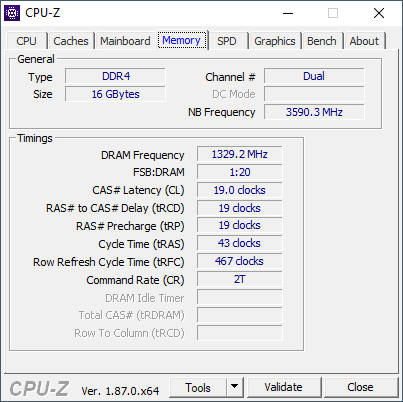
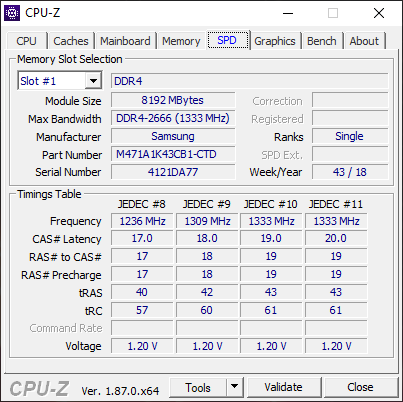
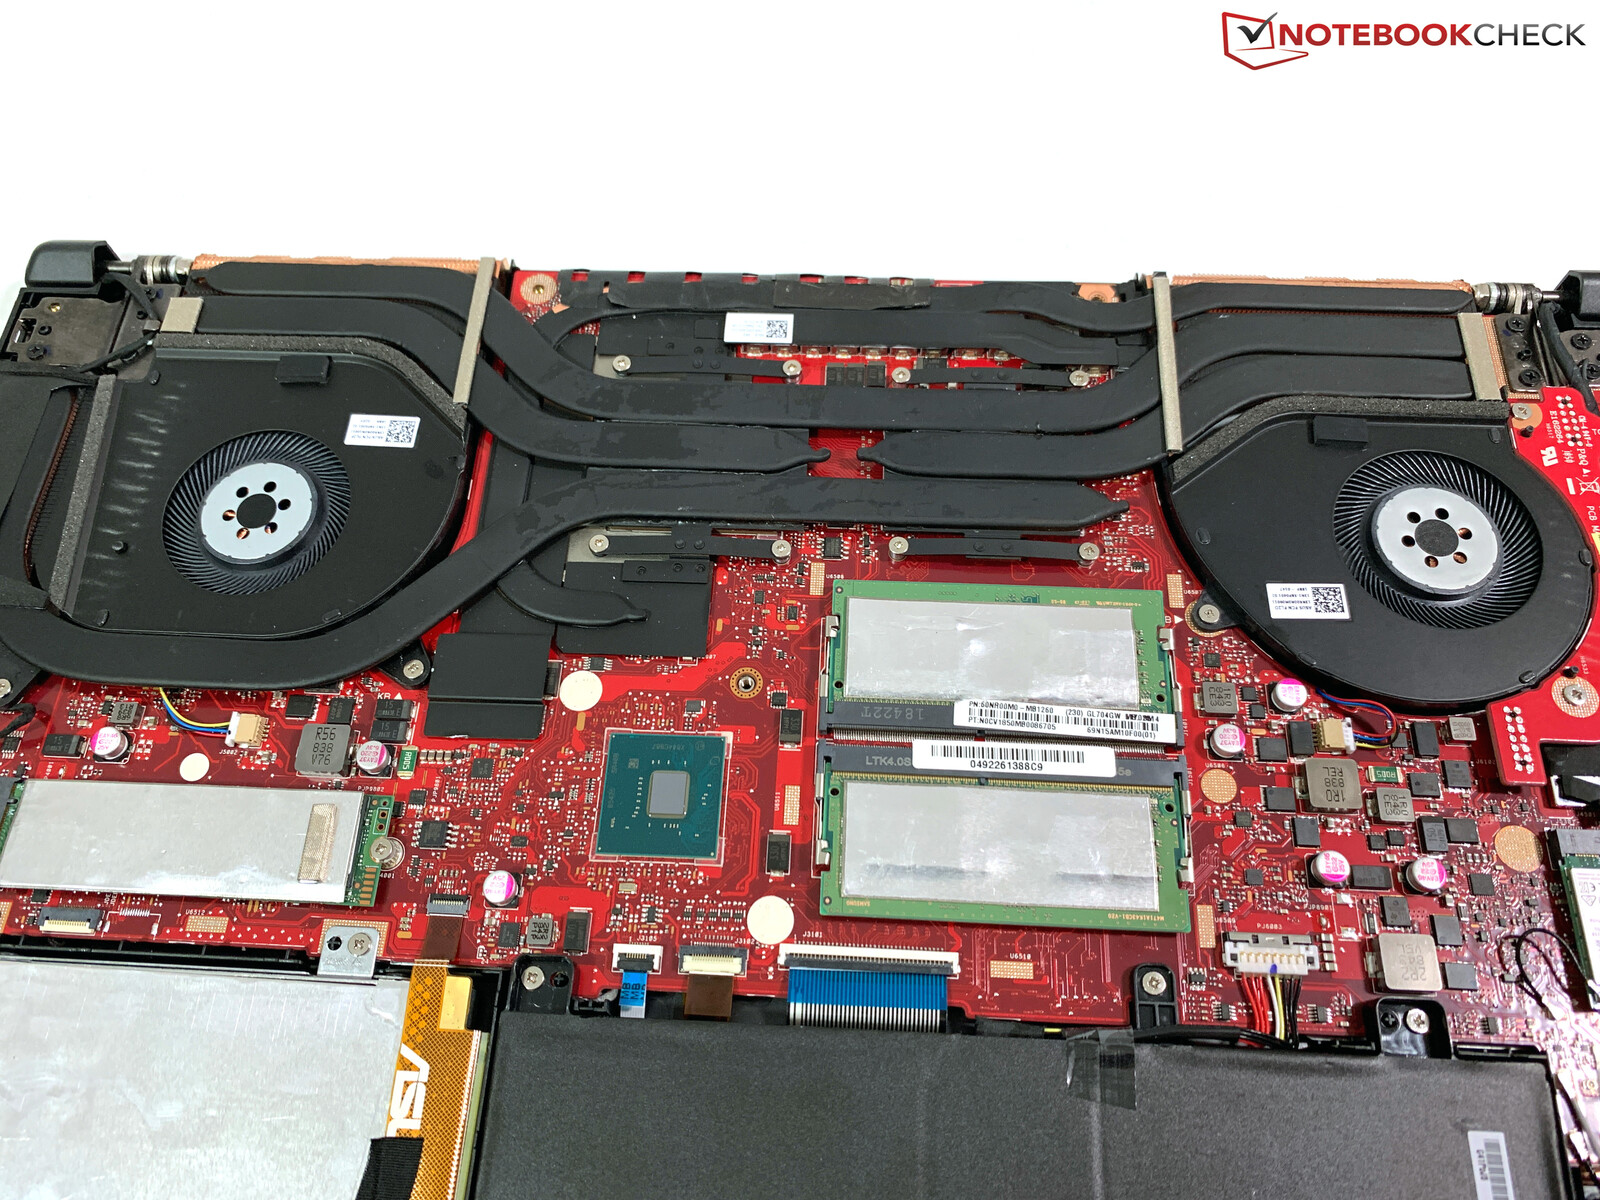
ASUS has equipped the GL704GW with powerful components. In addition to the brand-new GeForce RTX 2070, there is an Intel Core i7-8750H, which is supported by 16 GB of DDR4 RAM that operates in dual-channel mode. Moreover, ASUS includes a 512 GB NVMe SSD and a 1 TB SSHD, which should provide plenty of space for installing many games.

Processor
You may have seen the Core i7-8750H before from not only the GL704GM but also many other gaming and multimedia laptops, including most of our comparison devices. The Core i7-8750H is a hexa-core CPU that has a 2.2 GHz base clock speed that can Turbo Boost up to 3.9 GHz across all cores and 4.1 GHz across four cores. Please see our Core i7-8750H page for more technical information about the CPU and how it compares against other processors.
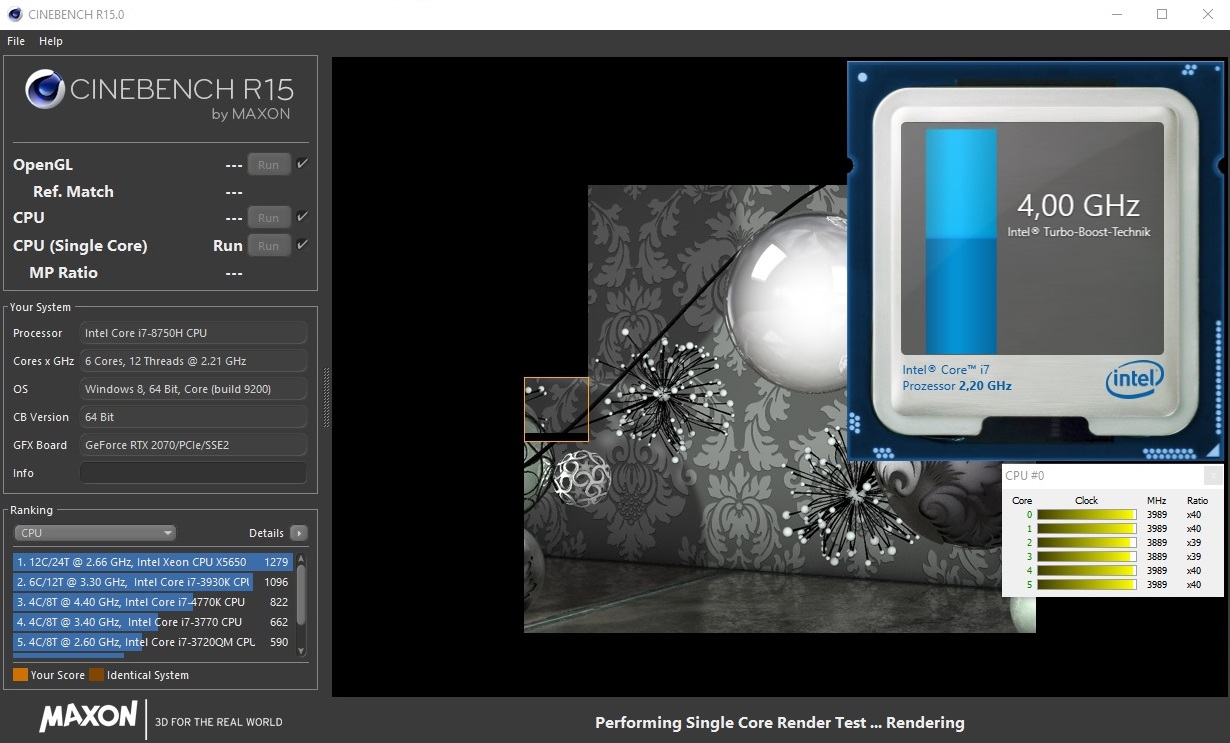
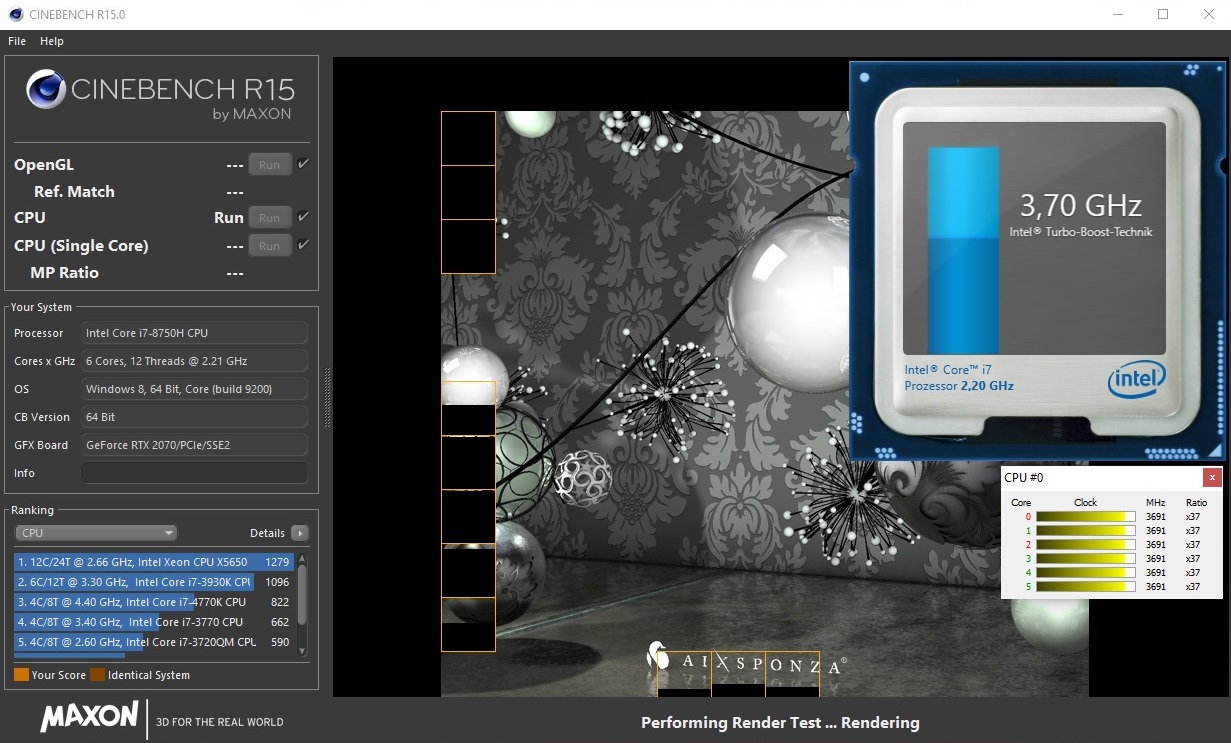
The Core i7-8750H in our test device performs exceptionally, which is underlined by its benchmark results. We subjected the GL704GW to a looped Cinebench R15 Multi 64-bit benchmark to determine how well it manages its performance under sustained load. The chart looks erratic, with some noticeable thermal throttling during the mid-section of our loop, but overall the GL704GW consistently outperformed our comparison devices. The thermal throttling is only temporary too, with performance only dropping by 3% by the end of the benchmark loop.
It is worth keeping in mind that the system downclocks the CPU by almost 50% when running on battery though.
System Performance
Our review unit also performed well in PCMark benchmarks, in which it finished towards the top of our comparison tables and a few percent ahead of its predecessor in PCMark 10. The system also feels responsive in daily use, and we did not detect any problems during our tests.
ASUS preinstalls its ROG tools, as it does with its ROG laptops, which allows you to tweak the fans, lighting and performance. You can also disable the sound effects that play when the system starts using ROG tools.
| PCMark 10 - Score | |
| Average of class Gaming (5828 - 11730, n=92, last 2 years) | |
| HP Omen 17t-3AW55AV_1 | |
| Asus ROG Strix Scar II GL704GW | |
| MSI GL73 8SE-010US | |
| Asus GL704GM-DH74 | |
| Gigabyte Sabre 17-W8 | |
| MSI GS73VR 7RG | |
| PCMark 8 Home Score Accelerated v2 | 4861 points | |
| PCMark 8 Creative Score Accelerated v2 | 7941 points | |
| PCMark 8 Work Score Accelerated v2 | 5663 points | |
| PCMark 10 Score | 5555 points | |
Help | ||
Storage Devices
The GL704GW has two drives, the main one of which is a 512 GB Intel 660p M.2 NVMe SSD. The Intel 660p performed well in the AS SSD and CrystalDiskMark benchmarks, especially in 4K tests. The Samsung PM871 achieves faster sequential transfer speeds though, as demonstrated by the drive in the GS73VR.
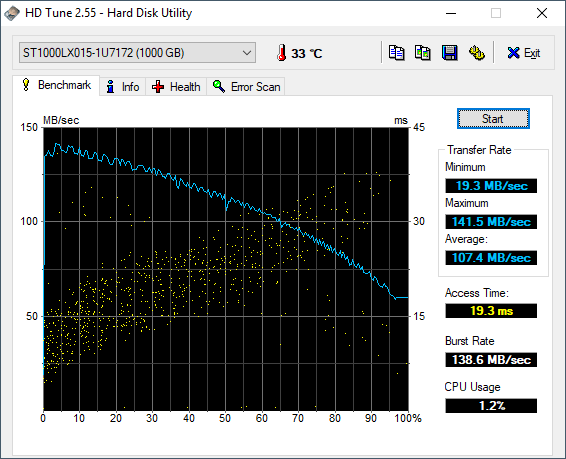
ASUS also includes a 1 TB Seagate FireCuda drive, which is a hybrid SSD and HDD that is commonly referred to as an SSHD. The drive has an 8 GB SSD cache to deliver improved performance compared to traditional HDDs. The drive in our review unit achieves an average transfer speed of 107.4 MB/s, according to HD Tune, which is comparatively fast for a 5,400 RPM drive, but it is much slower than an NVMe SSD.
Please see our HDD/SSD page for more benchmark information and comparisons between drives.
| Asus ROG Strix Scar II GL704GW Intel SSD 660p SSDPEKNW512G8 | Asus GL704GM-DH74 WDC PC SN520 SDAPNUW-256G | MSI GS73VR 7RG Samsung SSD PM871 MZNLN512HMJP | Gigabyte Sabre 17-W8 Toshiba NVMe THNSN5256GPU7 | HP Omen 17t-3AW55AV_1 Samsung SSD PM981 MZVLB512HAJQ | MSI GL73 8SE-010US Kingston RBUSNS8154P3128GJ | |
|---|---|---|---|---|---|---|
| CrystalDiskMark 5.2 / 6 | -1% | -19% | 1% | 29% | -43% | |
| Write 4K (MB/s) | 99.6 | 96.8 -3% | 141.3 42% | 104.7 5% | 110.7 11% | 71.2 -29% |
| Read 4K (MB/s) | 48.99 | 39.82 -19% | 41.02 -16% | 37.39 -24% | 35.49 -28% | 32.7 -33% |
| Write Seq (MB/s) | 972 | 1197 23% | 507 -48% | 866 -11% | 1665 71% | 404.5 -58% |
| Read Seq (MB/s) | 1515 | 1166 -23% | 539 -64% | 944 -38% | 1284 -15% | 8.3 -99% |
| Write 4K Q32T1 (MB/s) | 280.6 | 247.3 -12% | 362.8 29% | 293.3 5% | 340.2 21% | 204 -27% |
| Read 4K Q32T1 (MB/s) | 327.8 | 314.3 -4% | 402.8 23% | 374.3 14% | 407.5 24% | 303.2 -8% |
| Write Seq Q32T1 (MB/s) | 970 | 1302 34% | 524 -46% | 1064 10% | 2038 110% | 386.5 -60% |
| Read Seq Q32T1 (MB/s) | 1757 | 1688 -4% | 553 -69% | 2616 49% | 2367 35% | 1214 -31% |
| AS SSD | 6% | -23% | 14% | 83% | -53% | |
| Seq Read (MB/s) | 1315 | 1102 -16% | 497.9 -62% | 2120 61% | 1473 12% | 794 -40% |
| Seq Write (MB/s) | 927 | 1204 30% | 465.1 -50% | 871 -6% | 1962 112% | 427.6 -54% |
| 4K Read (MB/s) | 52.4 | 28.76 -45% | 33.69 -36% | 20.59 -61% | 31.66 -40% | 21.91 -58% |
| 4K Write (MB/s) | 122.8 | 92.9 -24% | 96.8 -21% | 88.4 -28% | 84.4 -31% | 56.6 -54% |
| 4K-64 Read (MB/s) | 326.5 | 649 99% | 337.7 3% | 848 160% | 1125 245% | 354.3 9% |
| 4K-64 Write (MB/s) | 727 | 593 -18% | 273.6 -62% | 591 -19% | 1866 157% | 285.7 -61% |
| Access Time Read * (ms) | 0.11 | 0.141 -28% | 0.051 54% | 0.191 -74% | 0.071 35% | 0.237 -115% |
| Access Time Write * (ms) | 0.045 | 0.04 11% | 0.032 29% | 0.047 -4% | 0.047 -4% | 0.09 -100% |
| Score Read (Points) | 510 | 788 55% | 421 -17% | 1080 112% | 1304 156% | 456 -11% |
| Score Write (Points) | 942 | 806 -14% | 417 -56% | 767 -19% | 2147 128% | 385 -59% |
| Score Total (Points) | 1715 | 2008 17% | 1064 -38% | 2335 36% | 4142 142% | 1061 -38% |
| Total Average (Program / Settings) | 3% /
3% | -21% /
-21% | 8% /
9% | 56% /
60% | -48% /
-49% |
* ... smaller is better

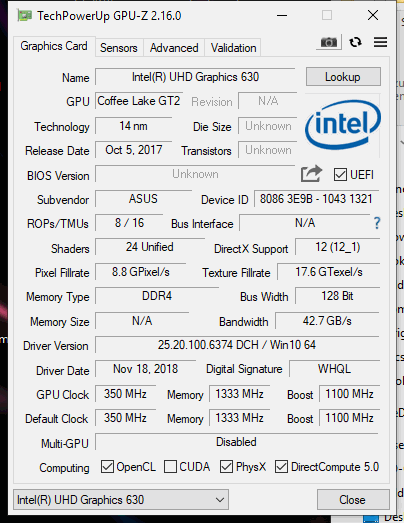
Graphics Card
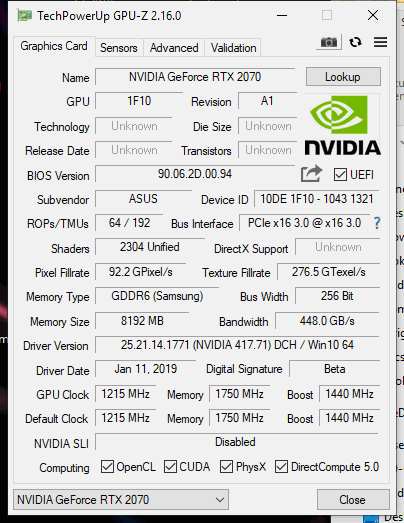
The highlight of the GL704GW is undoubtedly its GeForce RTX 2070 GPU, which succeeds the GTX 1070. The RTX 2070 is based on the 12 nm TU106 chip like its desktop counterpart, but Nvidia sets it at lower clock speeds. Both GPUs have 8 GB of GDDR6 VRAM, which operates at 14 GHz and with a 256-bit bus though.
Our review unit achieved excellent results in 3DMark benchmarks, in which it finished between 6% and 10% ahead of the Razer Blade 15 with its RTX 2070 Max-Q GPU. The RTX 2070 also outscores the GTX 1070 and the RTX 2060, while it scored around 50% more than the GTX 1060 in the GL704GM.
ASUS also preinstalls its Armory Crate software, which has a Turbo Mode that is designed to boost graphics performance. We did not notice any difference while playing games, but our review unit achieved 4% higher scores in 3DMark 11 with Turbo Mode activated. The Turbo Mode is stable too, although our test device only just passed the Time Spy and Fire Strike Ultra stress tests.
Please keep in mind that the system throttles its GPU performance by over 50% when operating on battery. Hence, we would recommend playing games only with the charger connected.
| 3DMark 11 - 1280x720 Performance GPU | |
| Average of class Gaming (21841 - 80022, n=103, last 2 years) | |
| Asus ROG Strix Scar II GL704GW (Turbo Mode) | |
| Asus ROG Strix Scar II GL704GW | |
| Razer Blade 15 RTX 2070 Max-Q | |
| HP Omen 17t-3AW55AV_1 | |
| MSI GL73 8SE-010US | |
| MSI GS73VR 7RG | |
| Asus GL704GM-DH74 | |
| Gigabyte Sabre 17-W8 | |
| 3DMark 11 Performance | 19085 points | |
| 3DMark Fire Strike Score | 16810 points | |
| 3DMark Fire Strike Extreme Score | 8788 points | |
| 3DMark Time Spy Score | 7182 points | |
Help | ||
Gaming Performance
As expected, the GL704GW achieved outstanding framerates in modern triple-A games. Our review unit averaged more than 60 FPS in all our gaming tests and can make use of its 144 Hz panel when games are played at high graphics settings. The RTX 2070 generally outperforms the GeForce GTX 1080 too and is only a few percent behind the RTX 2080 Max-Q. There is not much difference between the RTX 2070 and the RTX 2080 either, with the gap between the GPUs being as small as 4% in games like Darksiders III at maximum graphics. The RTX 2080 achieved 61% higher frame rates in Battlefield V at ultra-graphics though. In short, the GL704GW is even powerful enough for 4K gaming on an external monitor, but just not at maximum settings.
| The Witcher 3 | |
| 1920x1080 High Graphics & Postprocessing (Nvidia HairWorks Off) | |
| Average of class Gaming (n=1last 2 years) | |
| Asus ROG G703GX | |
| Asus ROG Strix Scar II GL704GW | |
| MSI GL73 8SE-010US | |
| MSI GS73VR 7RG | |
| HP Omen 17t-3AW55AV_1 | |
| Asus GL704GM-DH74 | |
| Gigabyte Sabre 17-W8 | |
| 1920x1080 Ultra Graphics & Postprocessing (HBAO+) | |
| Average of class Gaming (104.7 - 240, n=6, last 2 years) | |
| Asus ROG G703GX | |
| MSI GS75 8SG Stealth | |
| Asus ROG Strix Scar II GL704GW | |
| Schenker XMG Ultra 17 Coffee Lake Refresh | |
| HP Omen 17t-3AW55AV_1 | |
| MSI GL73 8SE-010US | |
| MSI GS73VR 7RG | |
| Asus GL704GM-DH74 | |
| Gigabyte Sabre 17-W8 | |
| Shadow of the Tomb Raider | |
| 1920x1080 Highest Preset AA:T | |
| Asus ROG G703GX | |
| Average of class Gaming (96 - 116, n=2, last 2 years) | |
| Asus ROG Strix Scar II GL704GW | |
| Schenker XMG Ultra 17 Coffee Lake Refresh | |
| MSI GS75 8SG Stealth | |
| MSI GL73 8SE-010US | |
| 1920x1080 High Preset AA:SM | |
| Average of class Gaming (107 - 127, n=2, last 2 years) | |
| Asus ROG G703GX | |
| Asus ROG Strix Scar II GL704GW | |
| MSI GL73 8SE-010US | |
| Rise of the Tomb Raider | |
| 1920x1080 High Preset AA:FX AF:4x | |
| Asus ROG Strix Scar II GL704GW | |
| HP Omen 17t-3AW55AV_1 | |
| MSI GS73VR 7RG | |
| Asus GL704GM-DH74 | |
| Gigabyte Sabre 17-W8 | |
| 1920x1080 Very High Preset AA:FX AF:16x | |
| Asus ROG Strix Scar II GL704GW | |
| HP Omen 17t-3AW55AV_1 | |
| MSI GS73VR 7RG | |
| Asus GL704GM-DH74 | |
| Gigabyte Sabre 17-W8 | |
| Battlefield V | |
| 1920x1080 Ultra Preset | |
| Asus ROG G703GX | |
| MSI GS75 8SG Stealth | |
| Asus ROG Strix Scar II GL704GW | |
| 1920x1080 High Preset | |
| Asus ROG G703GX | |
| Asus ROG Strix Scar II GL704GW | |
| Darksiders III | |
| 1920x1080 Epic | |
| Asus ROG G703GX | |
| Asus ROG Strix Scar II GL704GW | |
| 1920x1080 High | |
| Asus ROG G703GX | |
| Asus ROG Strix Scar II GL704GW | |
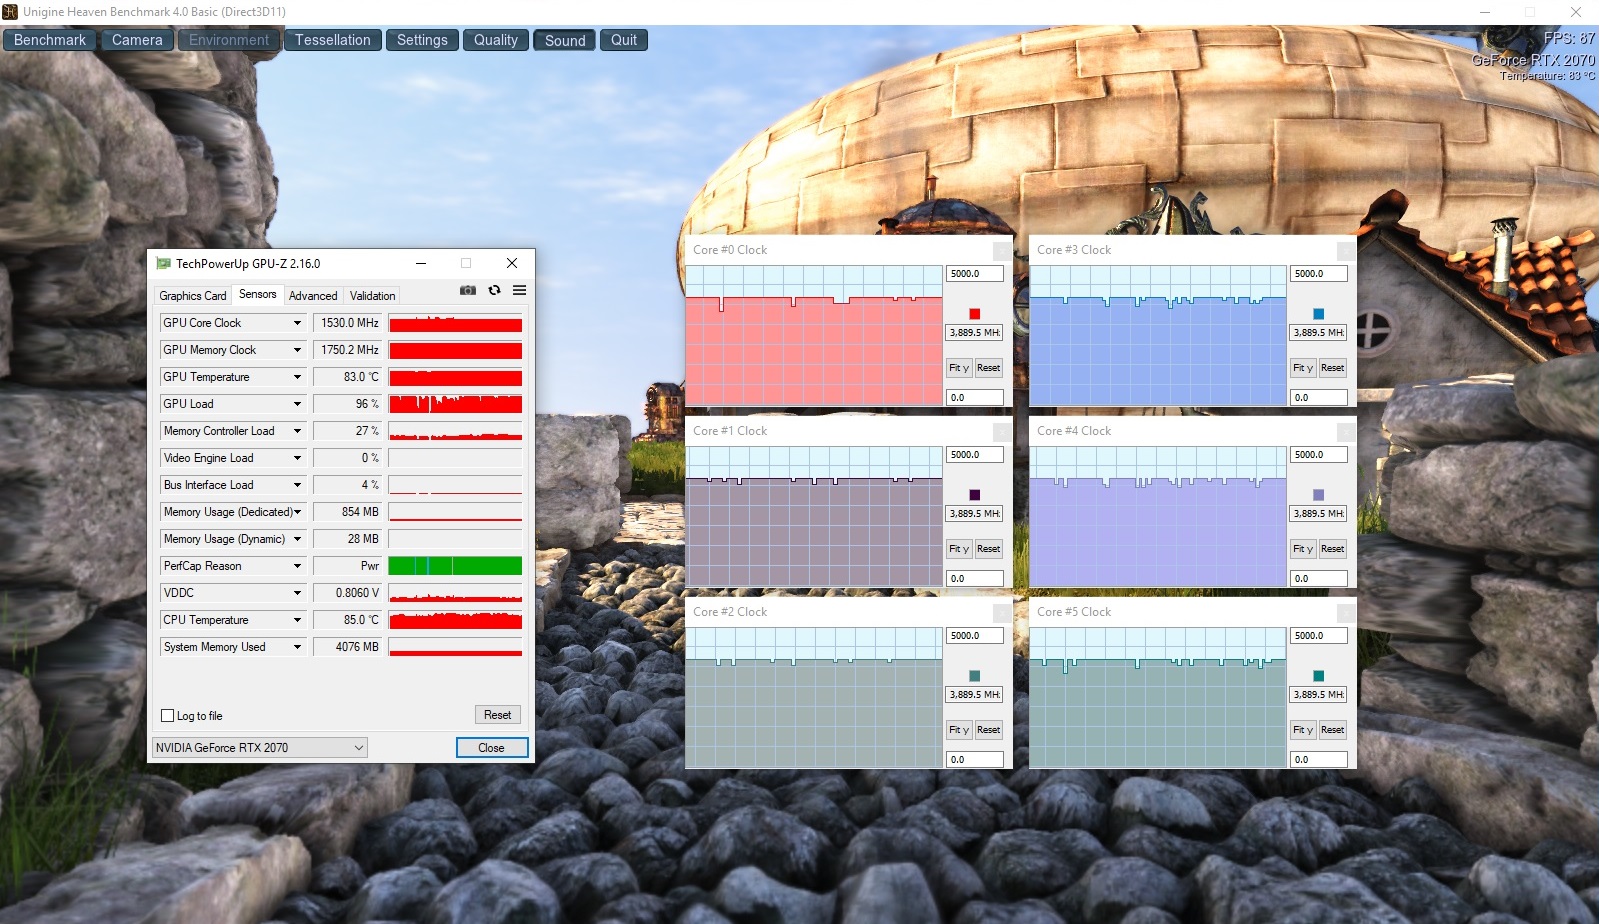
We also subjected our review unit to an hour-long The Witcher 3 play-through to determine how the system manages performance over longer gaming sessions. The GL704GW only briefly dropped to around 60 FPS during the day/night cycle, with frame rates generally remaining around 65/75 FPS. The GPU operated at 1,440 MHz during our The Witcher 3 test, while the CPU maintained a consistent 3.9 GHz boost clock across all cores. Core temperatures exceeded 80 °C on both components, but neither thermal throttled.
However, frame rates dropped to just 24 FPS on battery. We would therefore recommend only gaming when connected to mains power, but you could achieve playable frame rates if you reduce the graphics settings.
Please see our GPU benchmarks page for more information on the GeForce RTX 2070 and how it compares against other GPUs.
| low | med. | high | ultra | |
|---|---|---|---|---|
| GTA V (2015) | 163.4 | 155.7 | 126.6 | 71.4 |
| Dirt Rally (2015) | 254.5 | 160.6 | 199.7 | 113.6 |
| The Witcher 3 (2015) | 255.3 | 204.1 | 133.6 | 71.8 |
| Dota 2 Reborn (2015) | 129.7 | 120.7 | 115 | 109.2 |
| Rise of the Tomb Raider (2016) | 210.5 | 158.6 | 130.7 | 109 |
| Battlefield 1 (2016) | 165.4 | 141.5 | 120.6 | 113.3 |
| Assassin´s Creed Origins (2017) | 84 | 72 | 71 | 64 |
| Shadow of the Tomb Raider (2018) | 119 | 95 | 92 | 91 |
| Forza Horizon 4 (2018) | 137 | 113 | 112 | 94 |
| Battlefield V (2018) | 111.6 | 86 | 77.7 | 73 |
| Darksiders III (2018) | 169.2 | 102.4 | 98.5 | 94.7 |
| Just Cause 4 (2018) | 169.5 | 129.3 | 96.1 | 91.3 |
Emissions
Fan Noise
ASUS equips the GL704GW with two fans just as it does with the GL704GM. The fans are occasionally silent, but they will spin up to 40 dB(A) when performing short tasks like installing programs. The fans in our review unit reached a maximum of 52 dB(A) under sustained load, which is overly loud and drowns sounds while playing games. Moreover, the GPU fan is intrusive and pulsates, which we found annoying. In short, the enthusiastic fans will force you to use a headset while gaming unless you connect the GL704GW to external speakers and turn the volume up.
While we noticed no coil whine, we did hear a quiet electronic noise coming from the area around the mains connection on our review unit. We only heard this when we had the charger connected and with the laptop on standby or switched off though.
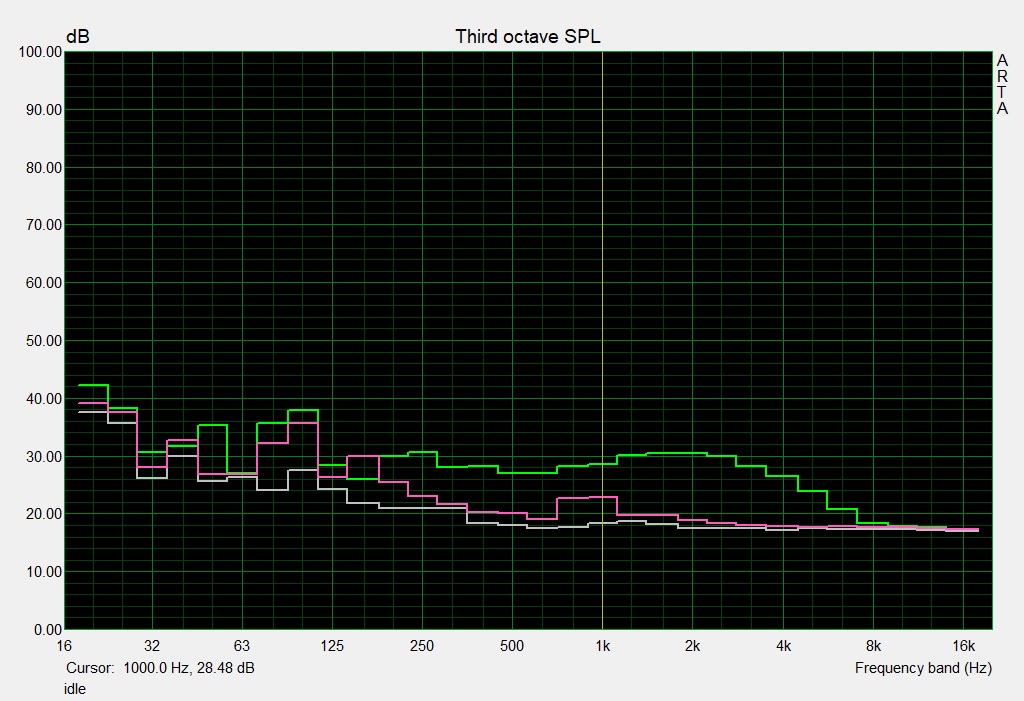
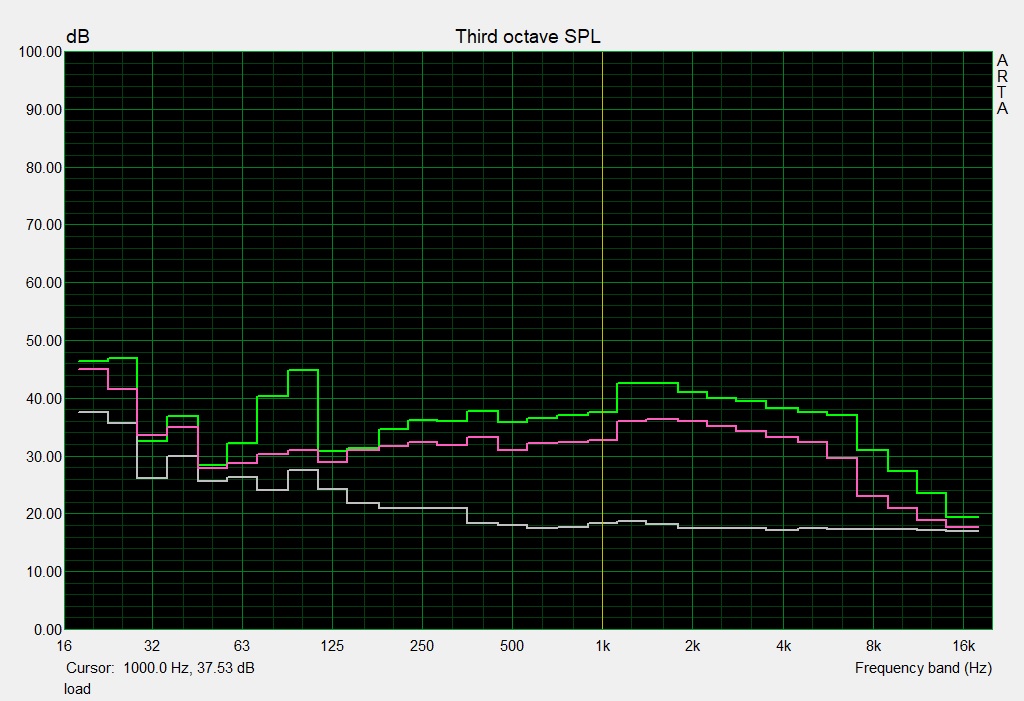
Noise level
| Idle |
| 29 / 32 / 40 dB(A) |
| HDD |
| 32 dB(A) |
| Load |
| 46 / 52 dB(A) |
 | ||
30 dB silent 40 dB(A) audible 50 dB(A) loud |
||
min: | ||
| Asus ROG Strix Scar II GL704GW GeForce RTX 2070 Mobile, i7-8750H | Asus GL704GM-DH74 GeForce GTX 1060 Mobile, i7-8750H | MSI GS73VR 7RG GeForce GTX 1070 Max-Q, i7-7700HQ | Gigabyte Sabre 17-W8 GeForce GTX 1060 Mobile, i7-8750H | HP Omen 17t-3AW55AV_1 GeForce GTX 1070 Mobile, i7-8750H | MSI GL73 8SE-010US GeForce RTX 2060 Mobile, i7-8750H | |
|---|---|---|---|---|---|---|
| Noise | -3% | 7% | 3% | 6% | 3% | |
| off / environment * (dB) | 29 | 28.2 3% | 28 3% | 30.5 -5% | 27.8 4% | 28.6 1% |
| Idle Minimum * (dB) | 29 | 30 -3% | 29.4 -1% | 32.1 -11% | 31.1 -7% | 33.8 -17% |
| Idle Average * (dB) | 32 | 31.8 1% | 30.7 4% | 32.1 -0% | 31.1 3% | 34 -6% |
| Idle Maximum * (dB) | 40 | 34.6 13% | 34 15% | 32.3 19% | 35 12% | 34.1 15% |
| Load Average * (dB) | 46 | 56 -22% | 42 9% | 42.9 7% | 42 9% | 36.5 21% |
| Witcher 3 ultra * (dB) | 51 | 54.2 -6% | 45.8 10% | 44.5 13% | 47.8 6% | |
| Load Maximum * (dB) | 52 | 56.7 -9% | 45.8 12% | 48.8 6% | 46.5 11% | 52.2 -0% |
* ... smaller is better
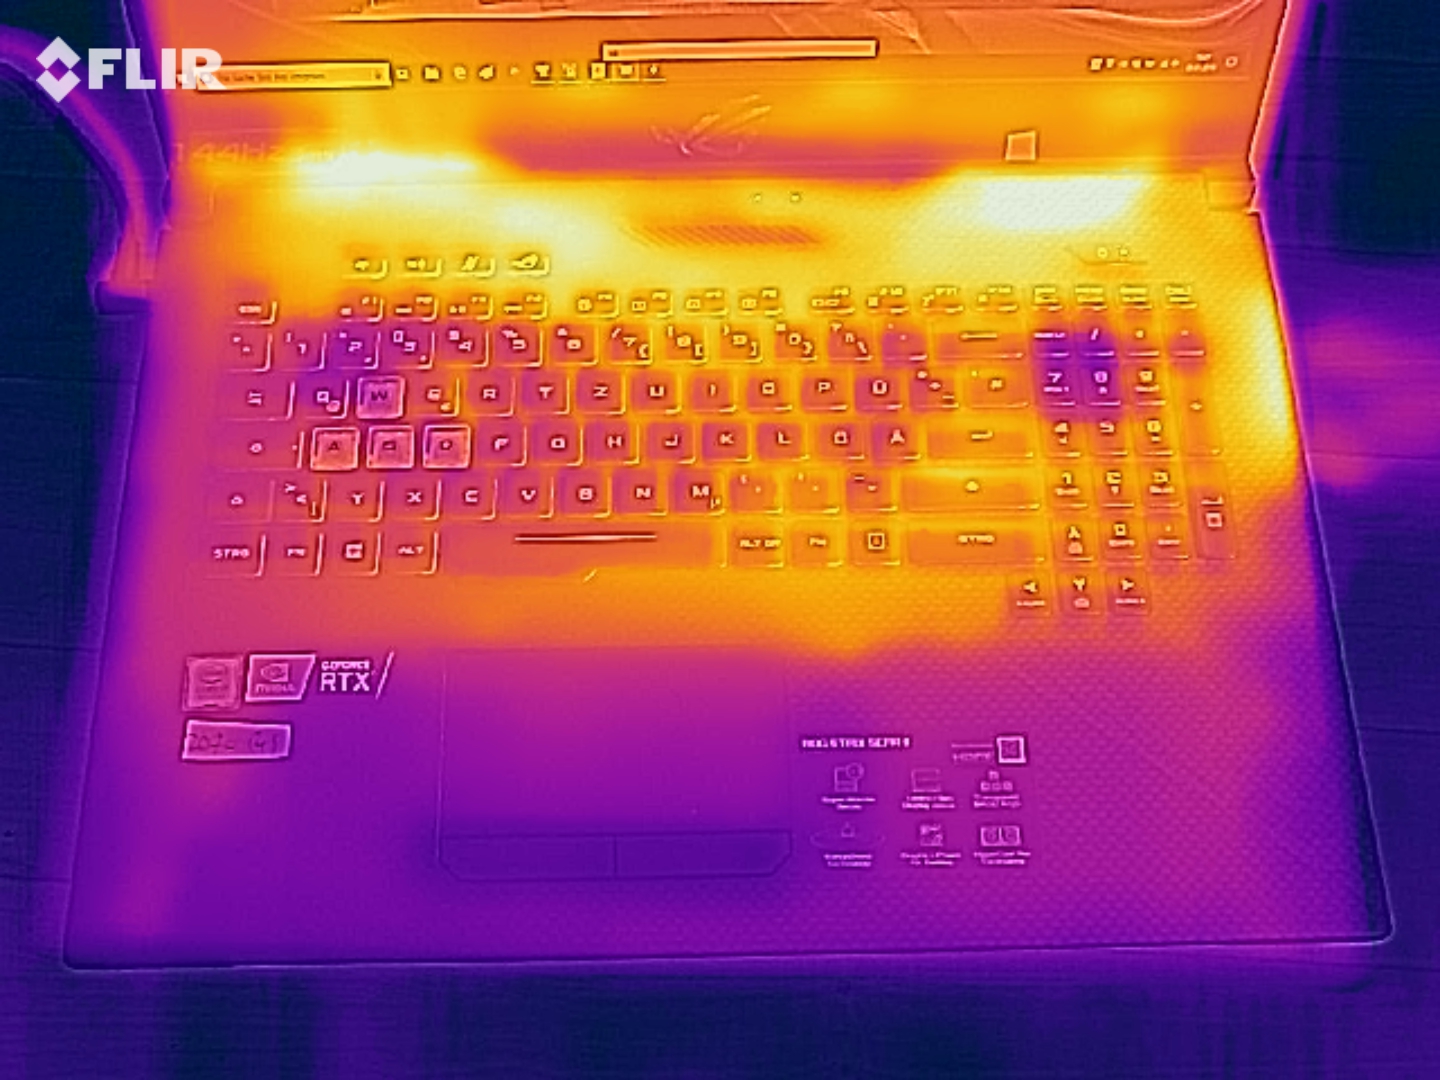
Temperature
The GL704GW also gets hot, which is somewhat predictable as it is difficult to cool powerful components in a thin case. Parts of our review unit average 35 °C at idle, although the palm rest remains pleasantly cool at around 27.3 °C. Surface temperatures peaked at 59 °C during a stress test and 56 °C while gaming, so we would recommend placing the laptop on a well-ventilated surface when you are pushing it hard, and not on your lap. Please keep in mind that we tested the GL704GW in winter, so surface temperatures may exceed 60 °C in the summer.
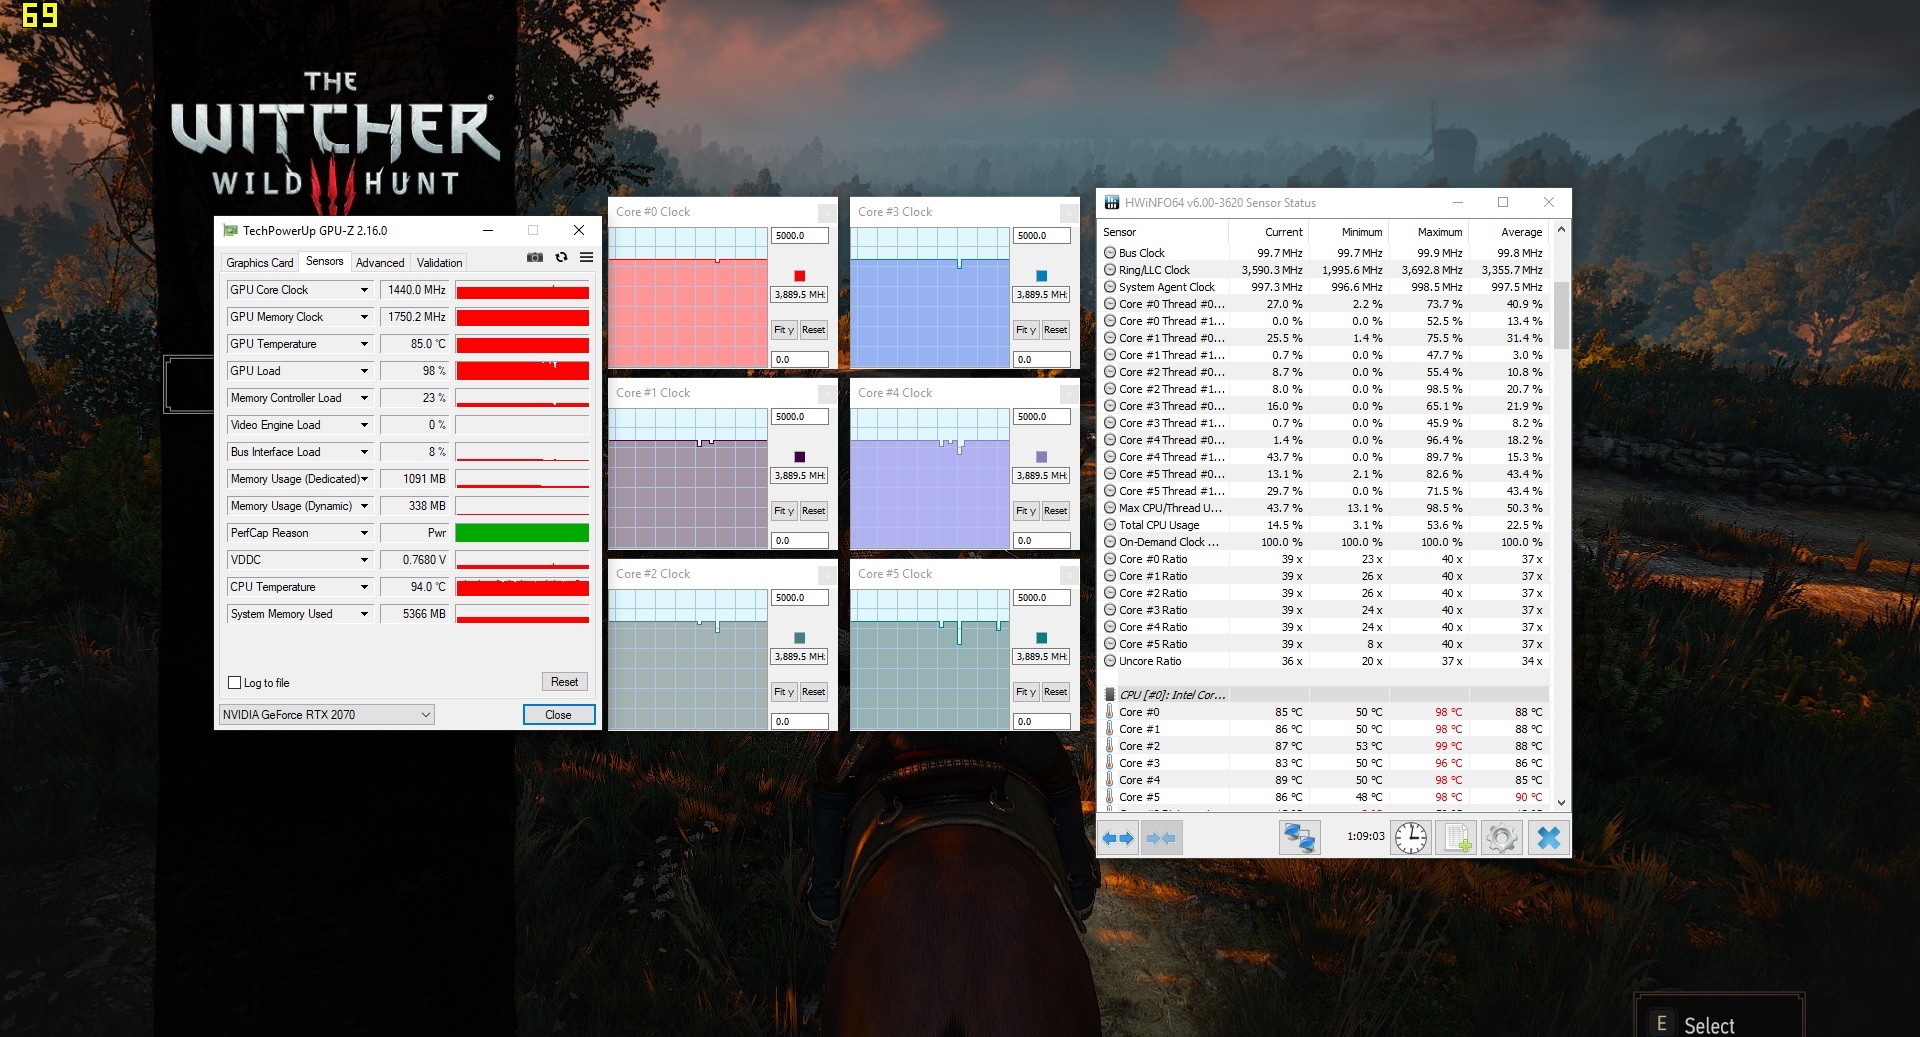
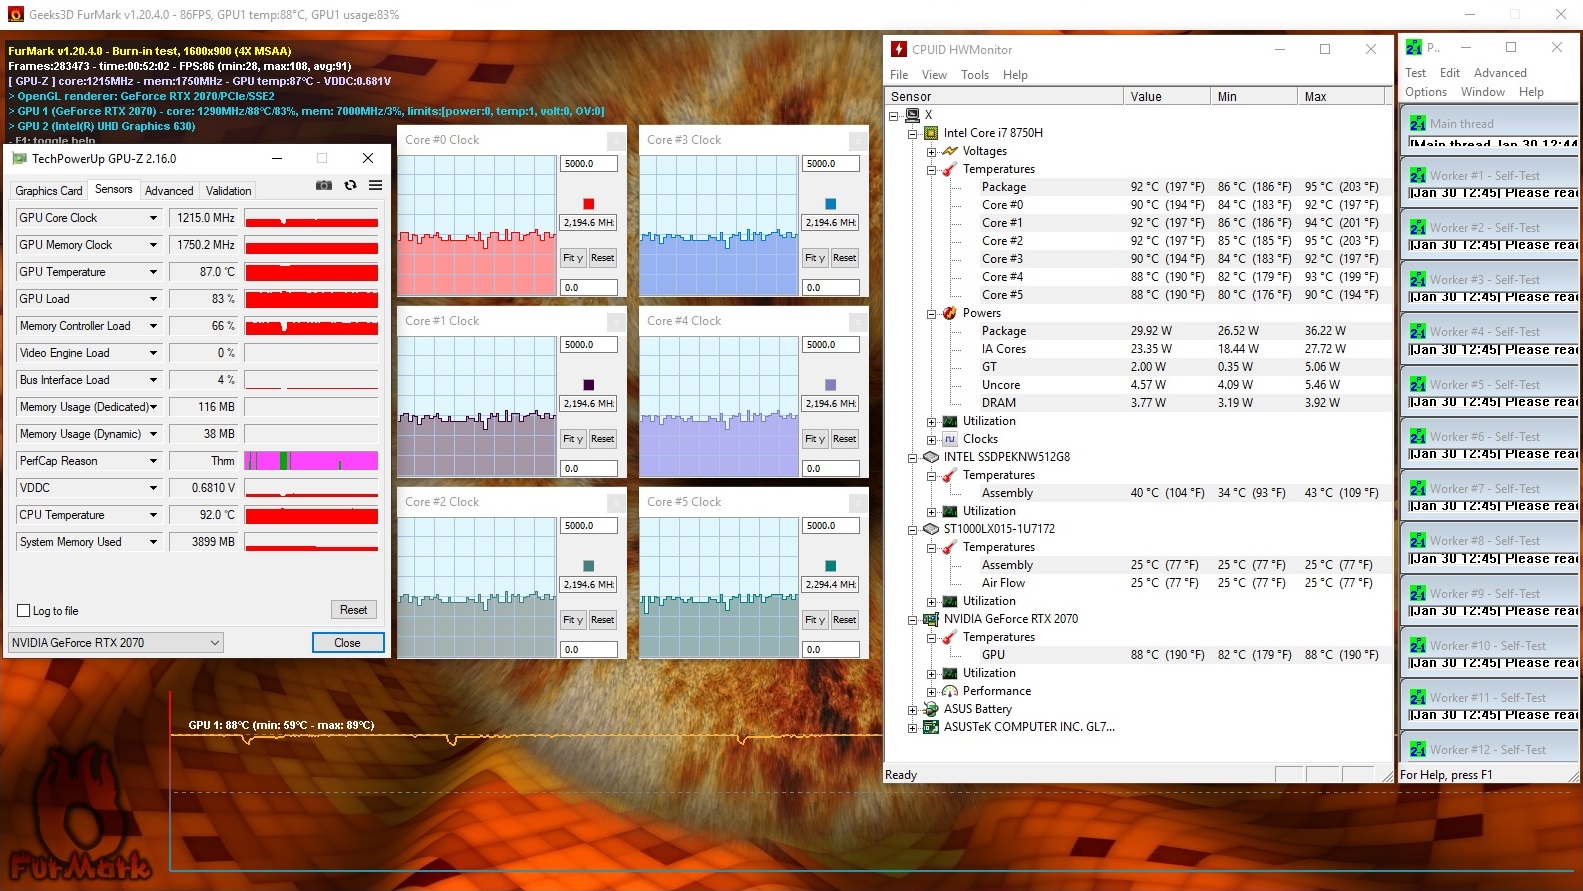
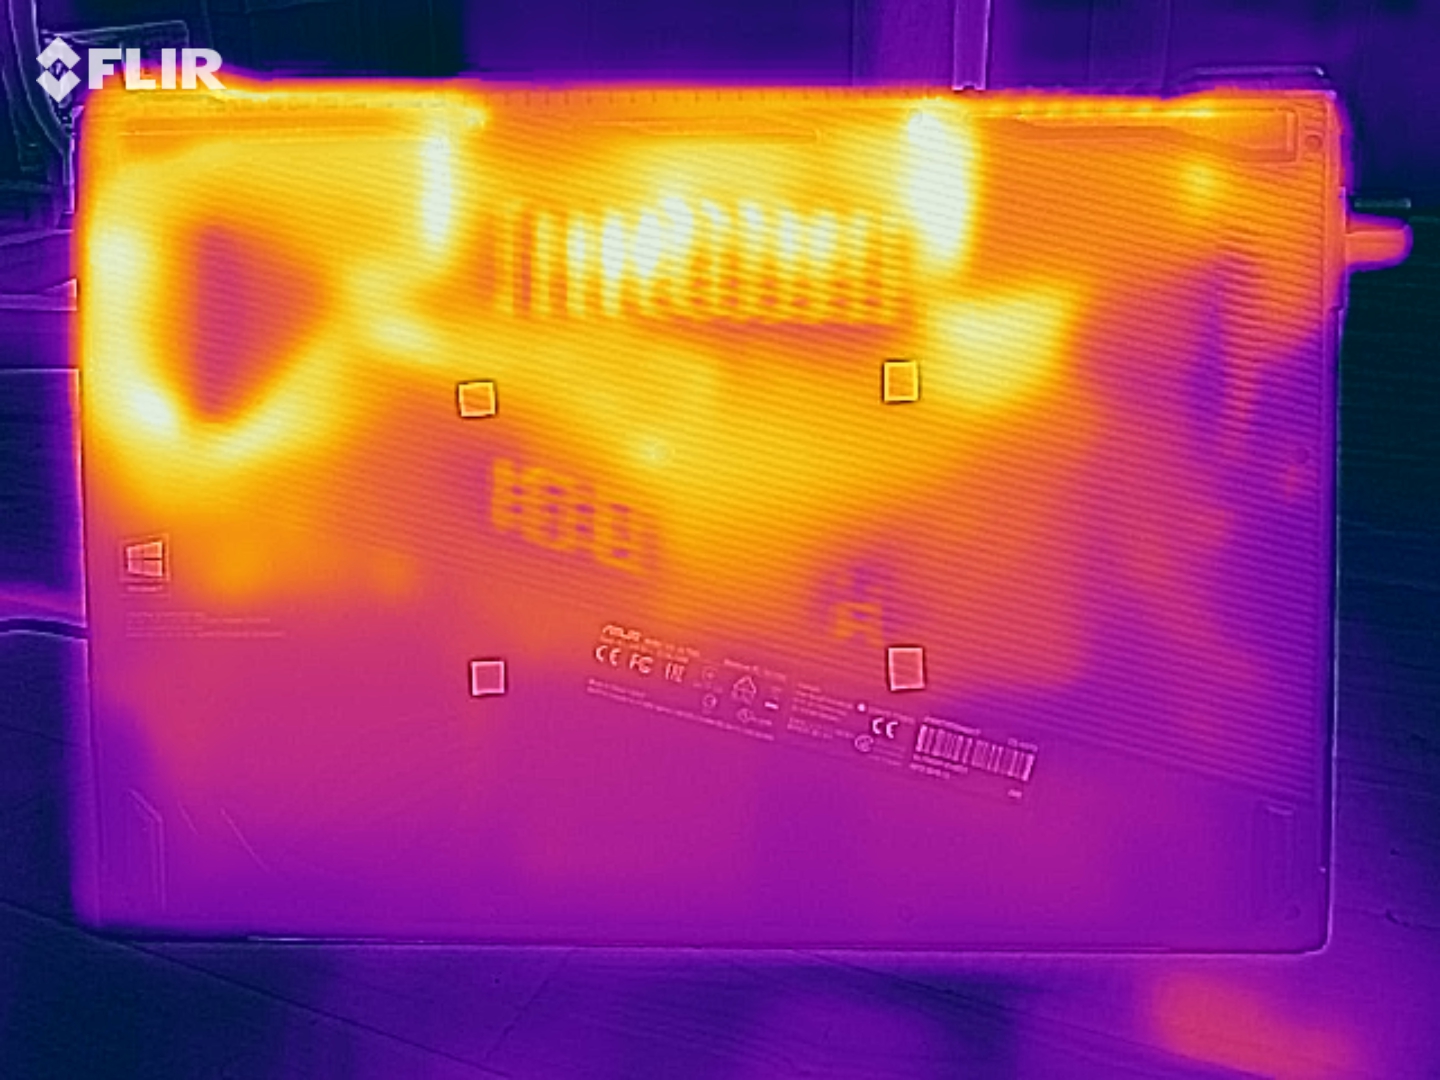
We also subjected our review unit to a combined FurMark and Prime95 stress test to determine how it maintained performance under extreme load conditions. The CPU and GPU core temperatures reached almost 90 °C and both components downclocked slightly. The GPU maintained 1,200 MHz while the CPU dropped to between 2.2 and 2.3 GHz across all cores. You should not experience any throttling when playing games though.
(-) The maximum temperature on the upper side is 59 °C / 138 F, compared to the average of 40.4 °C / 105 F, ranging from 21.2 to 68.8 °C for the class Gaming.
(-) The bottom heats up to a maximum of 54 °C / 129 F, compared to the average of 43.2 °C / 110 F
(+) In idle usage, the average temperature for the upper side is 30.7 °C / 87 F, compared to the device average of 33.9 °C / 93 F.
(-) Playing The Witcher 3, the average temperature for the upper side is 40.4 °C / 105 F, compared to the device average of 33.9 °C / 93 F.
(+) The palmrests and touchpad are cooler than skin temperature with a maximum of 29 °C / 84.2 F and are therefore cool to the touch.
(±) The average temperature of the palmrest area of similar devices was 28.8 °C / 83.8 F (-0.2 °C / -0.4 F).
Speakers
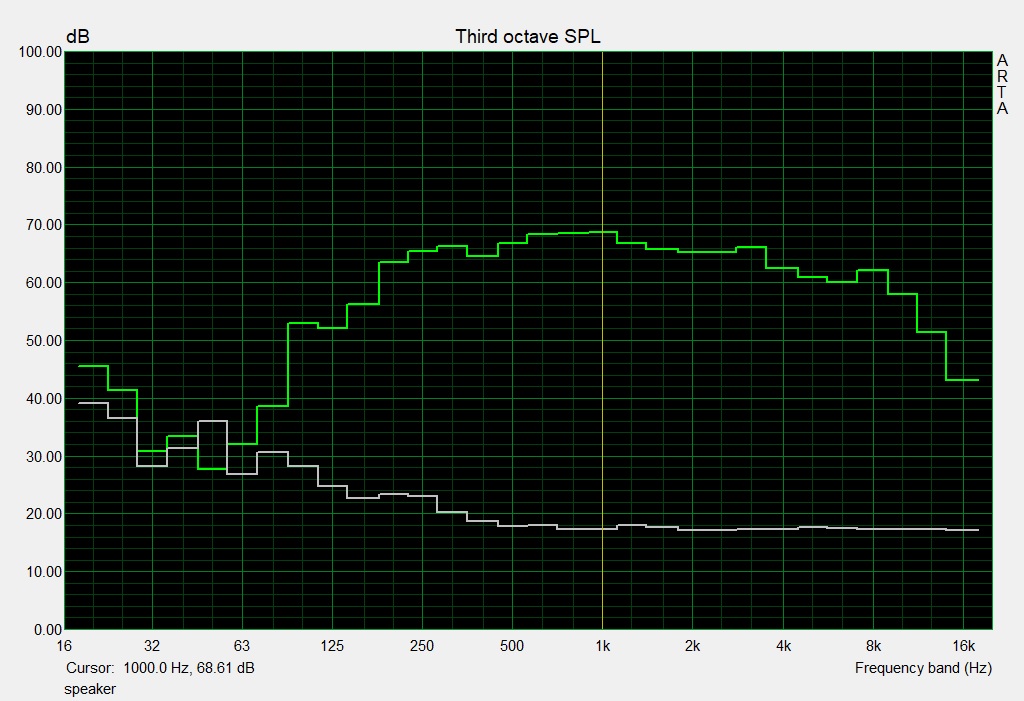
The GL704GW has two 3.5 W speakers, which sound good. However, a subwoofer would have helped deliver a more rounded sound as the stereo speakers lack bass. The speakers get loud though, and audio sounds balanced. Overall, the speakers are best enjoyed when listening to music or watching movies, as they are drowned out by the fans while gaming.
Asus ROG Strix Scar II GL704GW audio analysis
(±) | speaker loudness is average but good (77 dB)
Bass 100 - 315 Hz
(±) | reduced bass - on average 6.1% lower than median
(±) | linearity of bass is average (10.4% delta to prev. frequency)
Mids 400 - 2000 Hz
(+) | balanced mids - only 2.2% away from median
(+) | mids are linear (2.4% delta to prev. frequency)
Highs 2 - 16 kHz
(+) | balanced highs - only 3.1% away from median
(+) | highs are linear (4% delta to prev. frequency)
Overall 100 - 16.000 Hz
(+) | overall sound is linear (12.3% difference to median)
Compared to same class
» 13% of all tested devices in this class were better, 5% similar, 82% worse
» The best had a delta of 6%, average was 18%, worst was 132%
Compared to all devices tested
» 10% of all tested devices were better, 3% similar, 87% worse
» The best had a delta of 4%, average was 23%, worst was 134%
Asus GL704GM-DH74 audio analysis
(-) | not very loud speakers (67.9 dB)
Bass 100 - 315 Hz
(±) | reduced bass - on average 7.7% lower than median
(±) | linearity of bass is average (14.4% delta to prev. frequency)
Mids 400 - 2000 Hz
(+) | balanced mids - only 3% away from median
(+) | mids are linear (5.7% delta to prev. frequency)
Highs 2 - 16 kHz
(+) | balanced highs - only 2.9% away from median
(±) | linearity of highs is average (9% delta to prev. frequency)
Overall 100 - 16.000 Hz
(±) | linearity of overall sound is average (17% difference to median)
Compared to same class
» 45% of all tested devices in this class were better, 12% similar, 43% worse
» The best had a delta of 6%, average was 18%, worst was 132%
Compared to all devices tested
» 30% of all tested devices were better, 8% similar, 62% worse
» The best had a delta of 4%, average was 23%, worst was 134%
Power Management
Power Consumption
The GL704GW consumes more than our comparison devices, but we expected as much considering that it is equipped with a more powerful GPU. The GL704GW averages only 1.6 W more at idle than its predecessor and 6W more than the GL73 8SE with its RTX 2060 GPU.
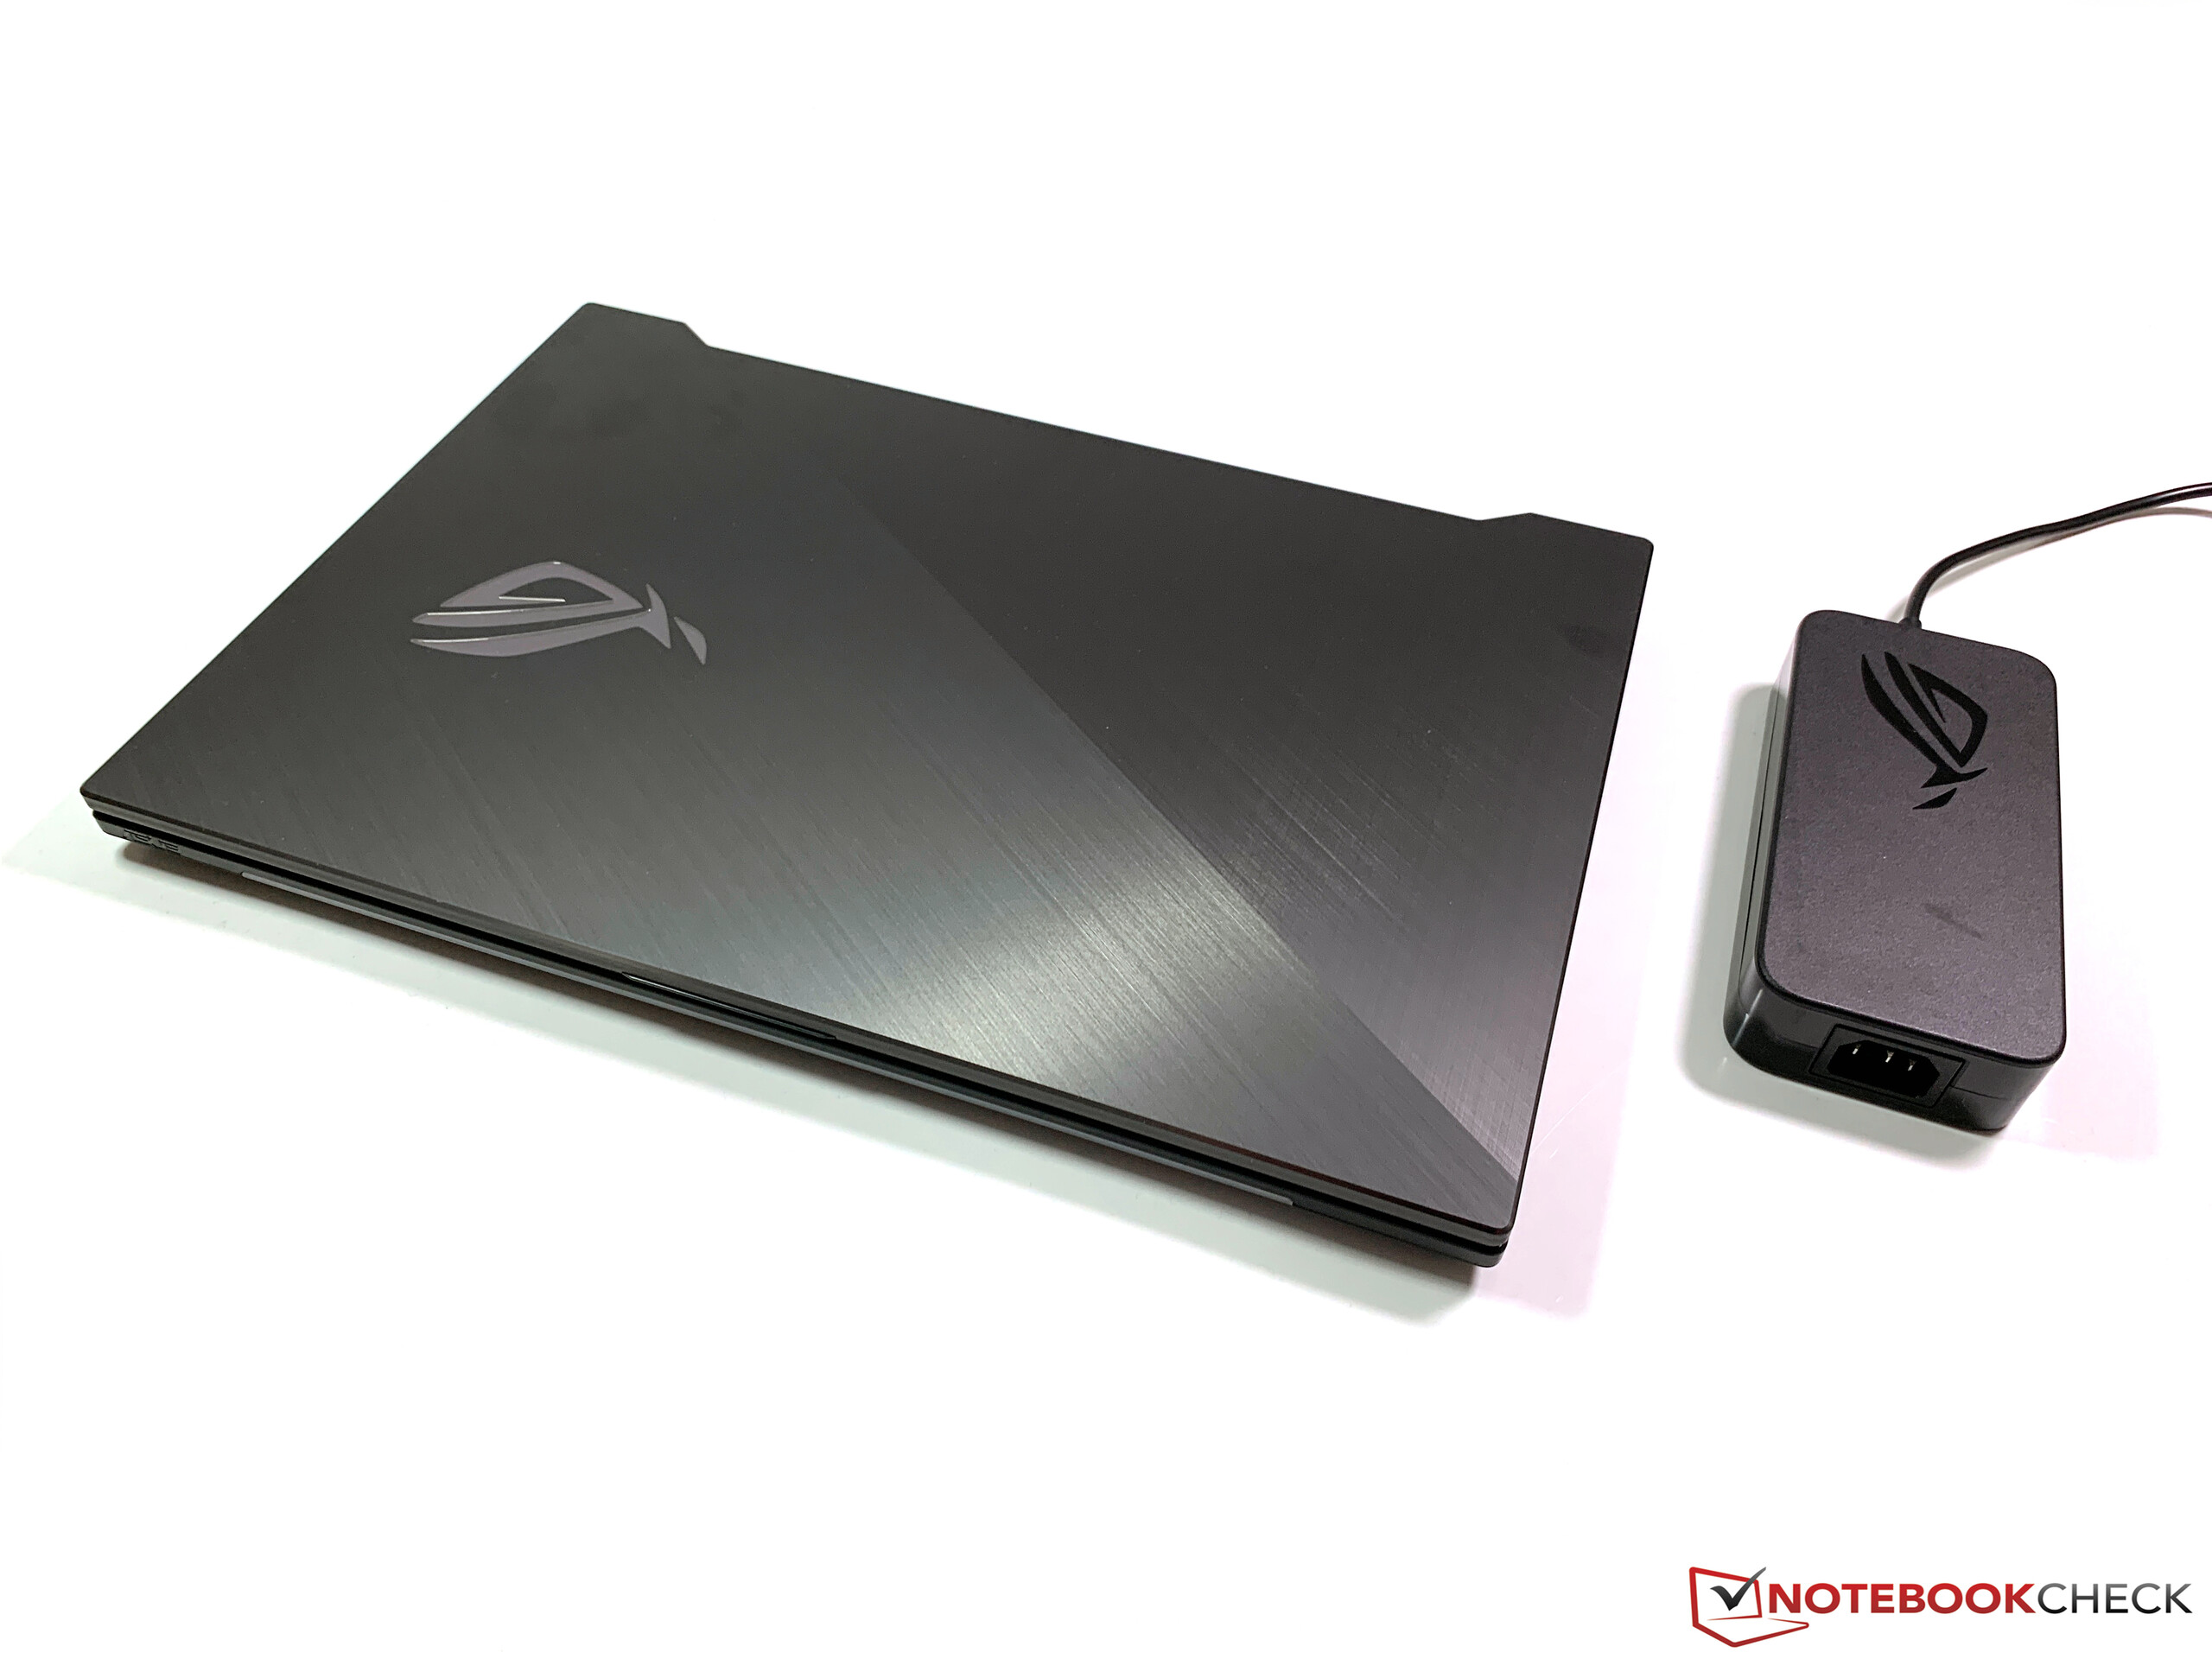
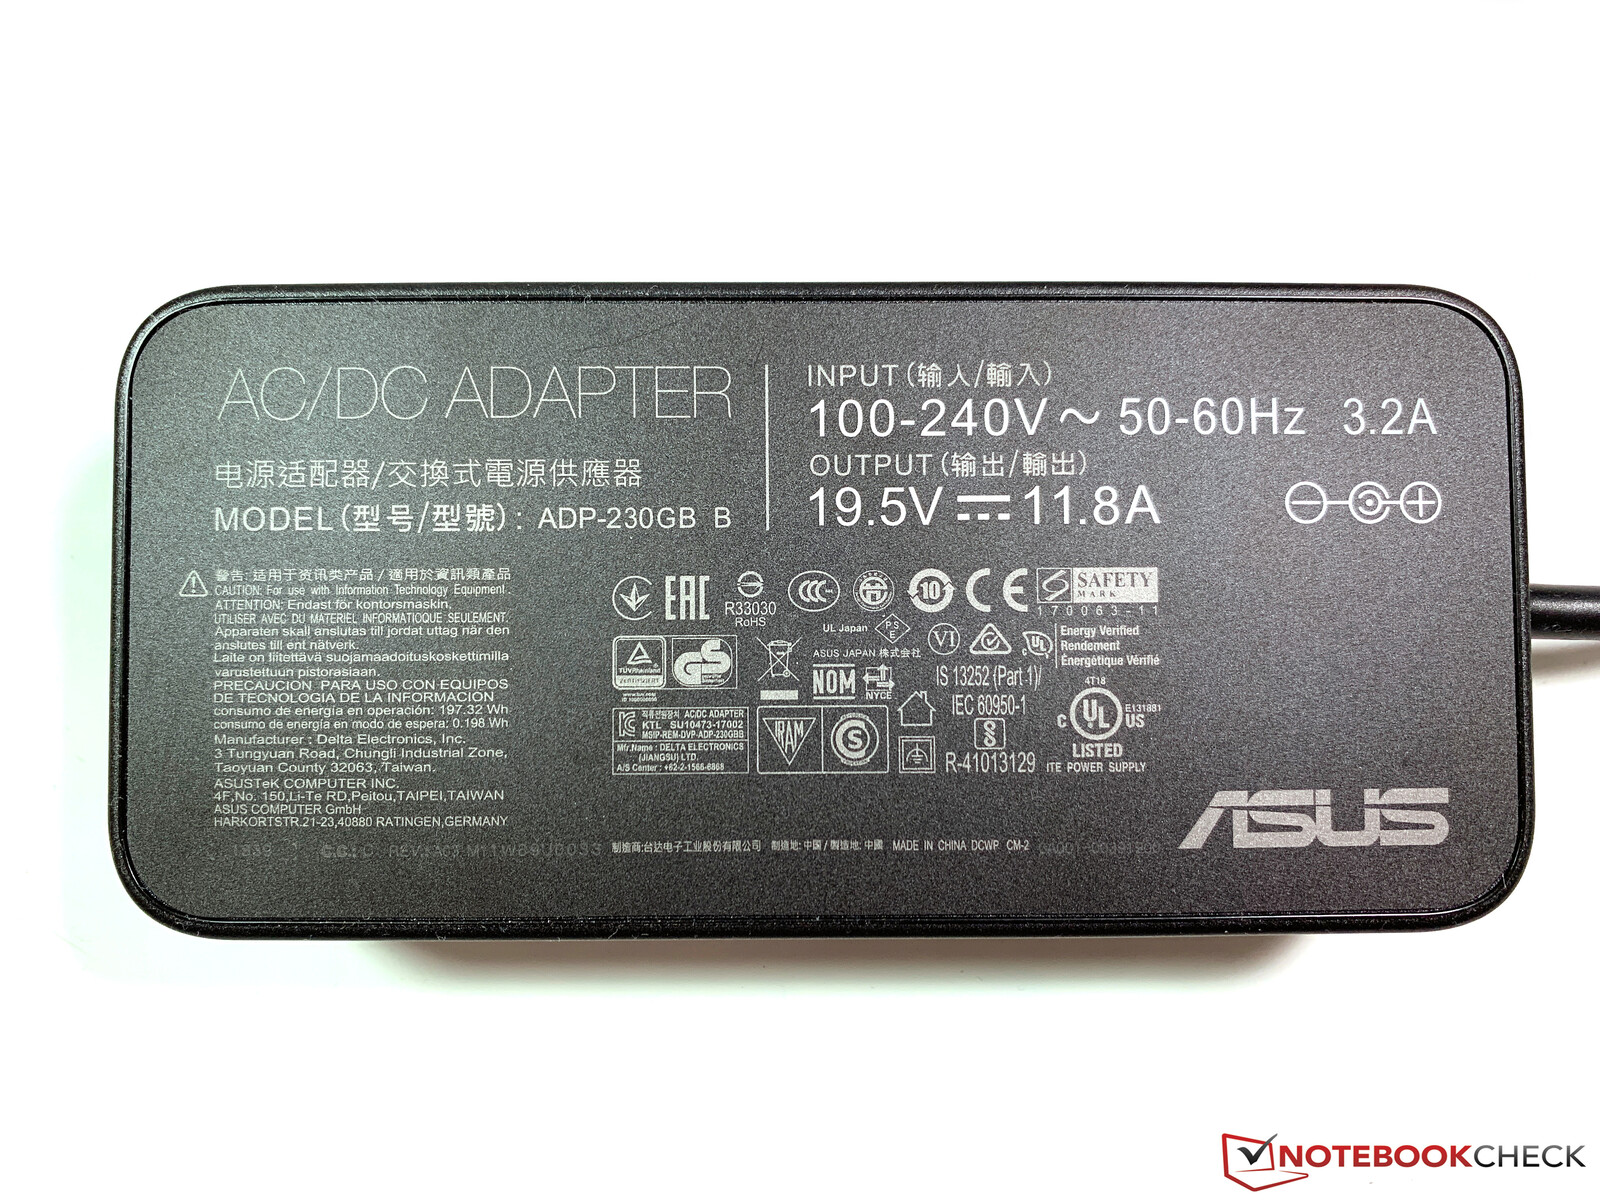
Our review unit consumes almost 50 W more than the GL704GM and the GL73 8SE while playing The Witcher 3. Likewise, the RTX 2070 and Core i7-8750H consume nearly 60 W more than the GTX 1070 Max-Q and the Core i7 7700HQ in the GS73VR. This should not be an issue though as we only achieved these consumption rates with our test device on charge. We measured a peak power consumption of 231 W though, which is 1 W more than for which the included power supply is rated. Correspondingly, the included charger sometimes exceeds 50 °C, so perhaps ASUS should have included a more powerful charger with the GL704GW.
| Off / Standby | |
| Idle | |
| Load |
|
Key:
min: | |
| Asus ROG Strix Scar II GL704GW GeForce RTX 2070 Mobile, i7-8750H | Asus GL704GM-DH74 GeForce GTX 1060 Mobile, i7-8750H | MSI GL73 8SE-010US GeForce RTX 2060 Mobile, i7-8750H | MSI GS73VR 7RG GeForce GTX 1070 Max-Q, i7-7700HQ | Gigabyte Sabre 17-W8 GeForce GTX 1060 Mobile, i7-8750H | HP Omen 17t-3AW55AV_1 GeForce GTX 1070 Mobile, i7-8750H | Average of class Gaming | |
|---|---|---|---|---|---|---|---|
| Power Consumption | 14% | 29% | 28% | 33% | 3% | 9% | |
| Idle Minimum * (Watt) | 19 | 15.2 20% | 8.8 54% | 10.1 47% | 9.3 51% | 17.8 6% | 13 ? 32% |
| Idle Average * (Watt) | 22 | 20.4 7% | 16.2 26% | 18.3 17% | 14.8 33% | 24.7 -12% | 18.7 ? 15% |
| Idle Maximum * (Watt) | 29 | 27.3 6% | 18.3 37% | 19.6 32% | 22 24% | 29.6 -2% | 24.3 ? 16% |
| Load Average * (Watt) | 102 | 92.9 9% | 86.1 16% | 87.6 14% | 63 38% | 110 -8% | 110.2 ? -8% |
| Witcher 3 ultra * (Watt) | 190 | 143 25% | 146.7 23% | 136.3 28% | 167.8 12% | ||
| Load Maximum * (Watt) | 231 | 190.6 17% | 186.4 19% | 160.7 30% | 187 19% | 178.6 23% | 258 ? -12% |
* ... smaller is better
Battery Life
The GL704GW has the same 66 Wh, 4-cell battery as its predecessor. As expected, the GL704GW needs recharging sooner than the GL704GM, but only 20 minutes sooner in our Wi-Fi test. The former even lasted 3 minutes longer under continuous load, but we suspect that few people will game on the go as the GL704GW only lasted 1:07 hours and significantly thermal throttles on battery.
Overall, the GL704GW has acceptable battery life, but the Sabre 17 consistently achieved longer runtimes than our review unit. Likewise, the HP Omen 17t lasted longer under sustained load and in our Wi-Fi battery life test, so there are 17-inch gaming laptops out there that have better battery life than the GL704GW.
The battery recharges impressively quickly though. Our review unit reached 60% charge from flat after just 38 minutes and recharged fully in 107 minutes.
| Asus ROG Strix Scar II GL704GW GeForce RTX 2070 Mobile, i7-8750H, 66 Wh | Asus GL704GM-DH74 GeForce GTX 1060 Mobile, i7-8750H, 66 Wh | MSI GS73VR 7RG GeForce GTX 1070 Max-Q, i7-7700HQ, 51 Wh | Gigabyte Sabre 17-W8 GeForce GTX 1060 Mobile, i7-8750H, 62 Wh | HP Omen 17t-3AW55AV_1 GeForce GTX 1070 Mobile, i7-8750H, 86 Wh | MSI GL73 8SE-010US GeForce RTX 2060 Mobile, i7-8750H, 41 Wh | Average of class Gaming | |
|---|---|---|---|---|---|---|---|
| Battery runtime | 8% | -11% | 25% | 9% | -23% | 53% | |
| Reader / Idle (h) | 6.2 | 7.1 15% | 5.8 -6% | 6.9 11% | 4.5 -27% | 6.5 5% | 8.71 ? 40% |
| WiFi v1.3 (h) | 3.9 | 4.3 10% | 3.2 -18% | 5.4 38% | 4.2 8% | 2.8 -28% | 7.15 ? 83% |
| Witcher 3 ultra (h) | 0.9 | ||||||
| Load (h) | 1.1 | 1.1 0% | 1 -9% | 1.4 27% | 1.6 45% | 0.6 -45% | 1.502 ? 37% |
| H.264 (h) | 5.3 | 8.64 ? |
Verdict
Pros
Cons
The ASUS ROG Strix Scar II GL704GW is a remarkably compact and powerful laptop. Its footprint is only slightly larger than most 15.6-inch gaming laptops, and it is noticeably smaller than all but the MSI GS73VR 7RG of our comparison devices. It is even more impressive that ASUS has squeezed in a GeForce RTX 2070 GPU too and not the Max-Q version.
Our review unit achieved excellent results in our tests and can run all modern triple-A games smoothly in 1080p at maximum graphics. The only downsides are that the device runs hot and loud, so much so that the fans drown out the speakers when gaming. The GL704GW also throttles heavily on battery, but that is a minor gripe as the battery only lasts an hour or so under sustained load. It is a shame that the fans are so loud though as ASUS has equipped the GL704GW with decent speakers.
Sometimes, less is more. The ASUS ROG Strix Scar II GL704GW is an impressive 17.3-inch gaming laptop, but the RTX 2070 version runs so hot and loud that you may be better off with the RTX 2060 model instead.
ASUS has equipped the GL704GW with the same 144 Hz display that it used on the GL704GM, which continues to impress us with its low response times and its excellent colour accuracy. The aggressive and industrial case design will not be for everyone, but you would be hard pressed to find a more compact 17-inch gaming laptop that delivers the same performance as the GL704GW does. In short, the ASUS ROG Strix Scar II GL704GW is an excellent gaming laptop with few drawbacks besides its loud fans and high temperatures.
Asus ROG Strix Scar II GL704GW
- 02/18/2019 v6 (old)
Andreas Osthoff
Price comparison
