Asus Zephyrus S GX531GX (i7-8750H, RTX 2080 Max-Q) Laptop Review
")
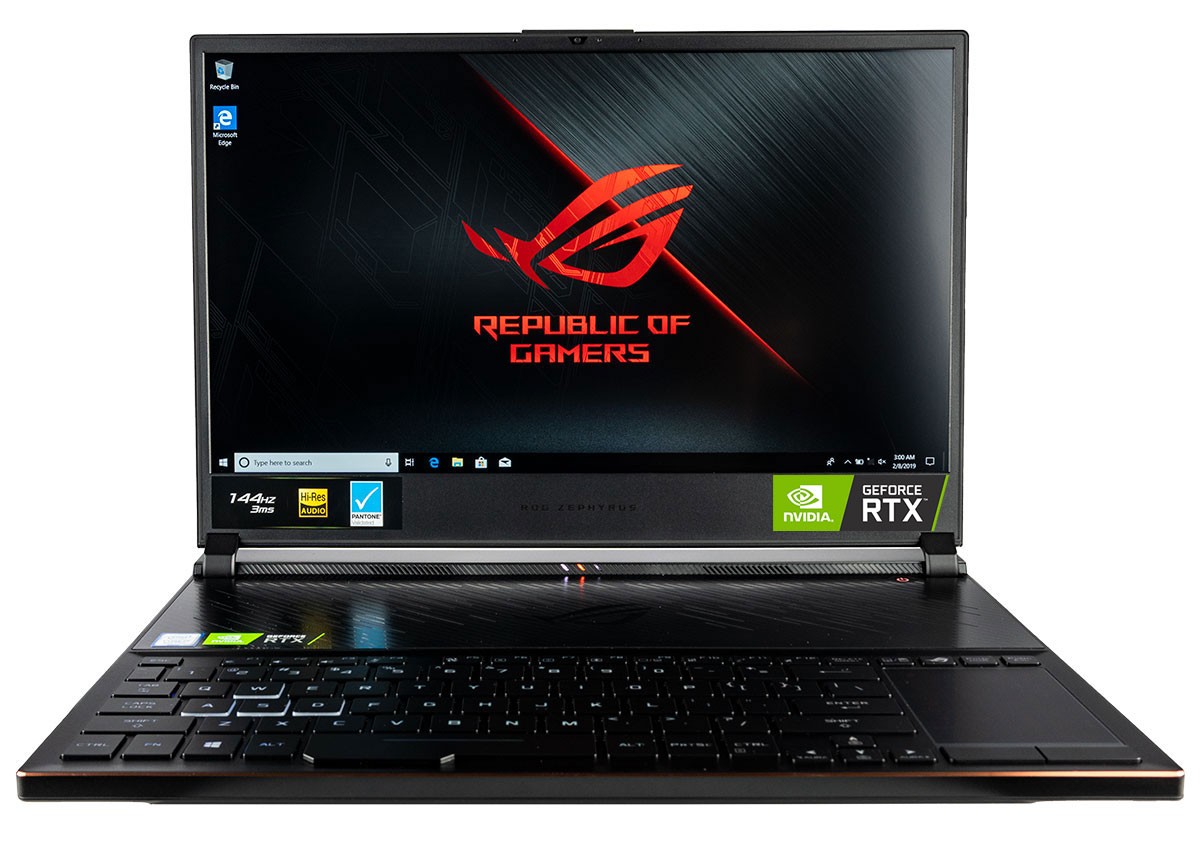
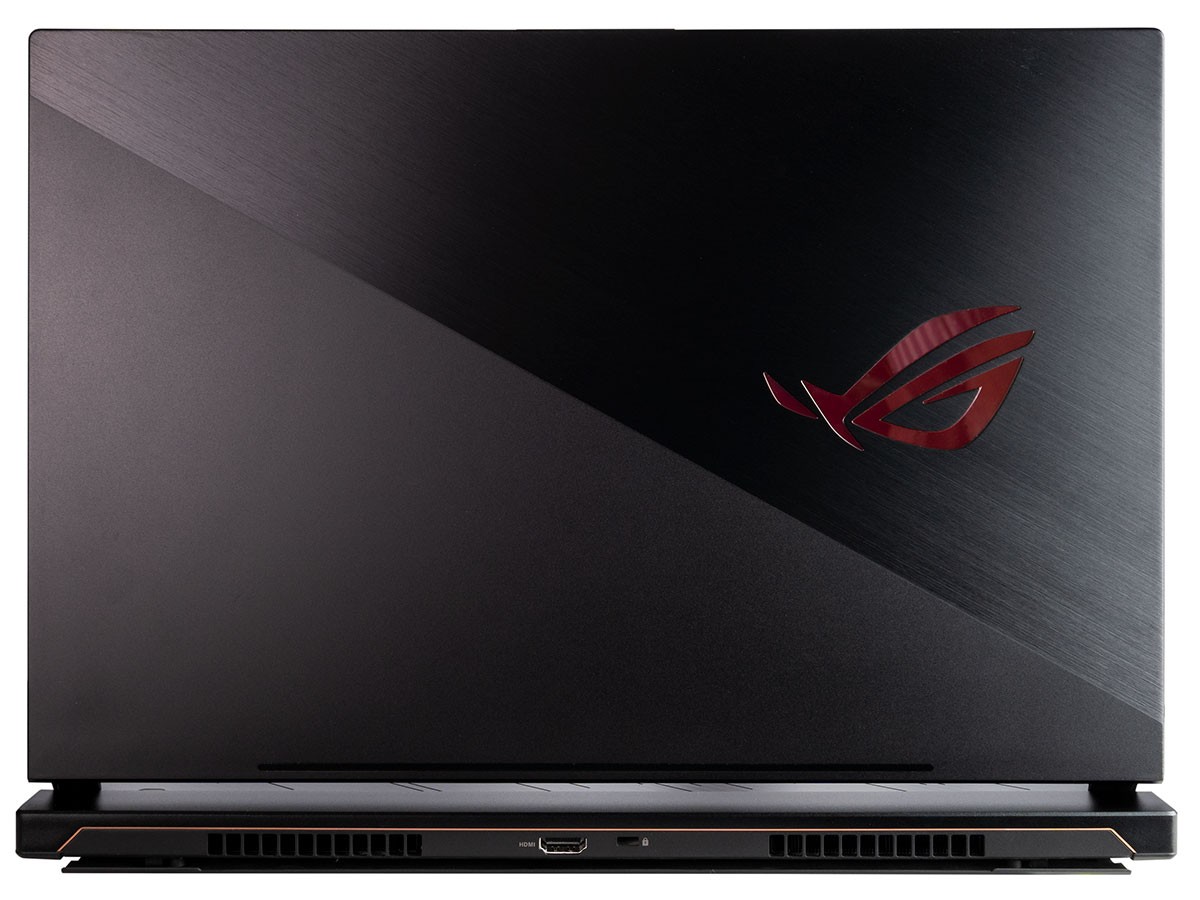
The Zephyrus S GX531 series is a direct successor to the original GX501 series. It carries all the unique features of the GX501 including the scissor-door hinge design, two-stage contrasting anodized surfaces, and forward keyboard position. This time, however, the GX531 incorporates narrower bezels with GeForce RTX Turing graphics to supplant the last generation GTX Pascal series.
Aside from the GPU update, everything else about the GX531GX we have here today is identical to the GX531GS and GX531GM SKUs we already reviewed last year. We therefore recommend checking out our existing reviews on the two other GX531 configurations for more information on the chassis and its features.
Current SKUs of the RTX-equipped GX531 include the GX531GX (RTX 2080 Max-Q), GX531GW (RTX 2070 Max-Q), and GX531GV (RTX 2060). All options otherwise come with the same 1080p 144 Hz 3 ms display and Core i7-8750H CPU.
The Zephyrus S GX531GX competes directly with other 15.6-inch ultra-thin gaming laptops including the MSI GS65, Razer Blade 15, Acer Predator Triton 700, and Alienware m15. Asus is positioning its flagship GX531 series a step above its mid-range Zephyrus M GM501 series and the mid-range GL504/GL704 series.
More Asus ROG Zephyrus reviews:

Communication
| Networking | |
| iperf3 transmit AX12 | |
| Asus Strix GL504GM | |
| Razer Blade 15 RTX 2070 Max-Q | |
| Asus Zephyrus S GX531GX | |
| Aorus 15 X9 | |
| Asus Zephyrus GX501 | |
| iperf3 receive AX12 | |
| Razer Blade 15 RTX 2070 Max-Q | |
| Asus Zephyrus GX501 | |
| Asus Zephyrus S GX531GX | |
| Asus Strix GL504GM | |
| Aorus 15 X9 | |
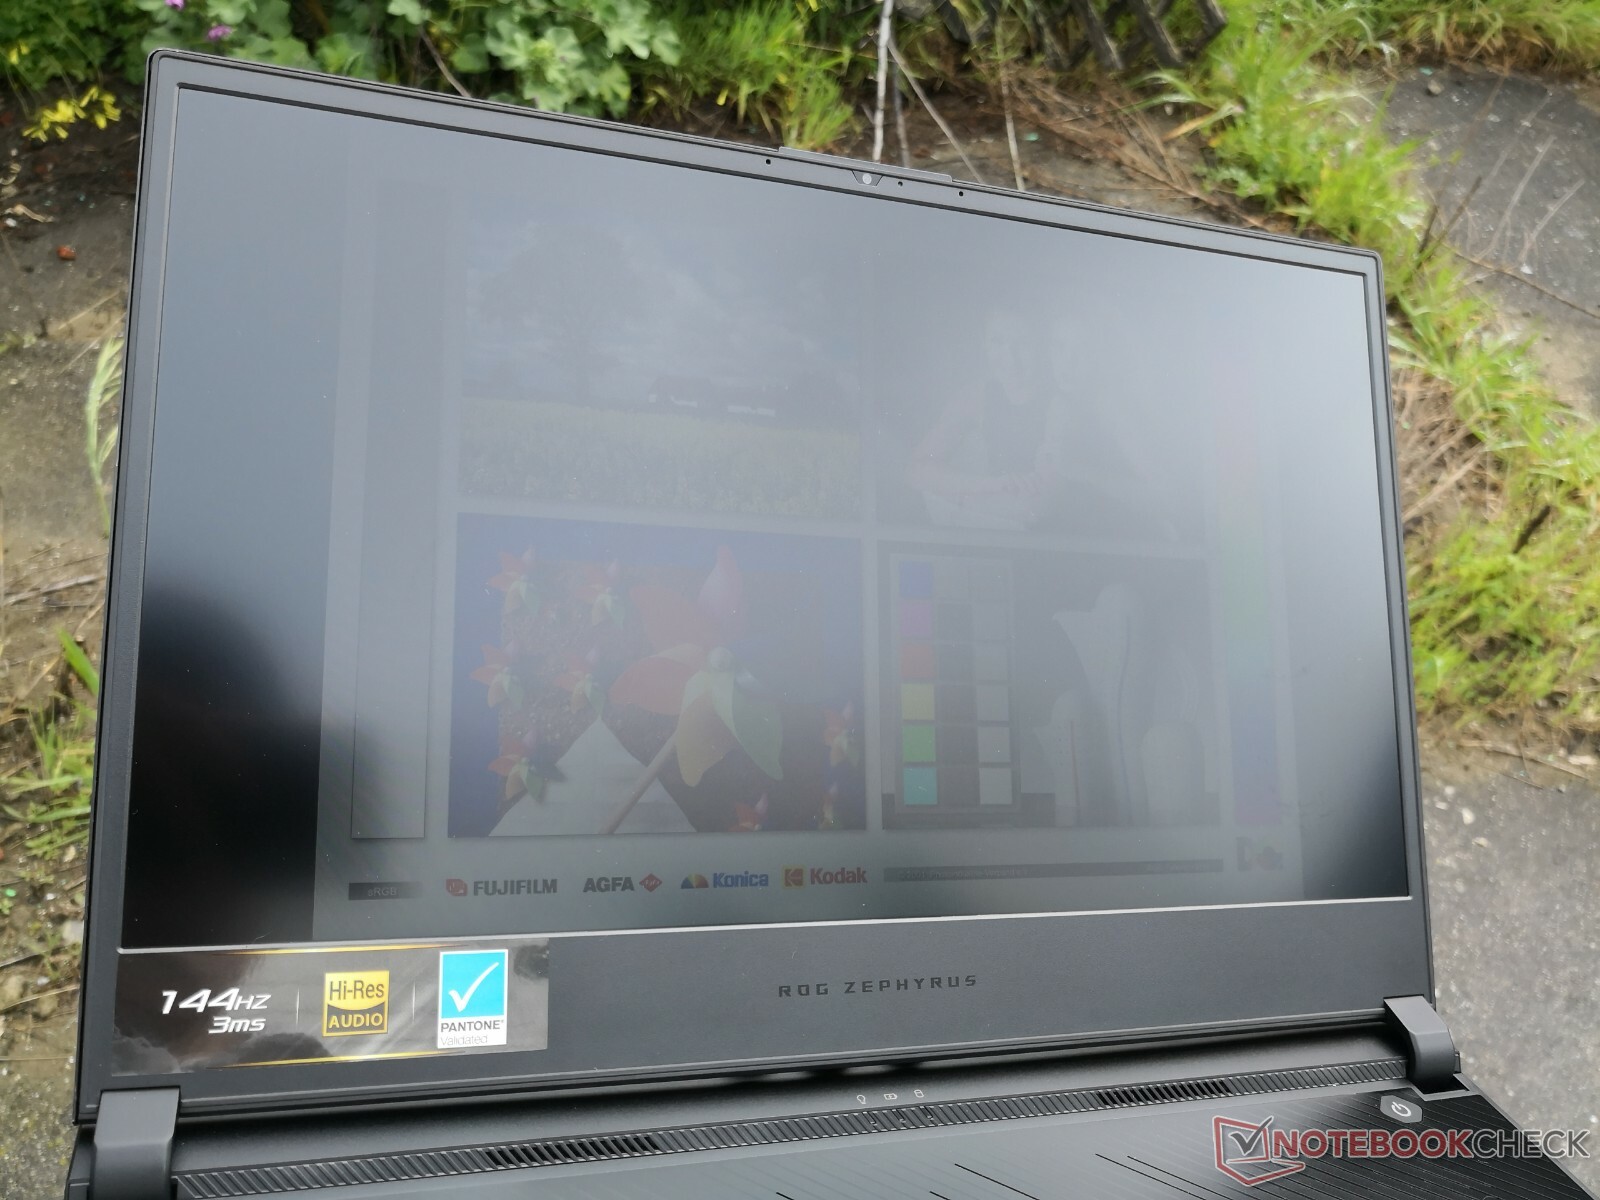
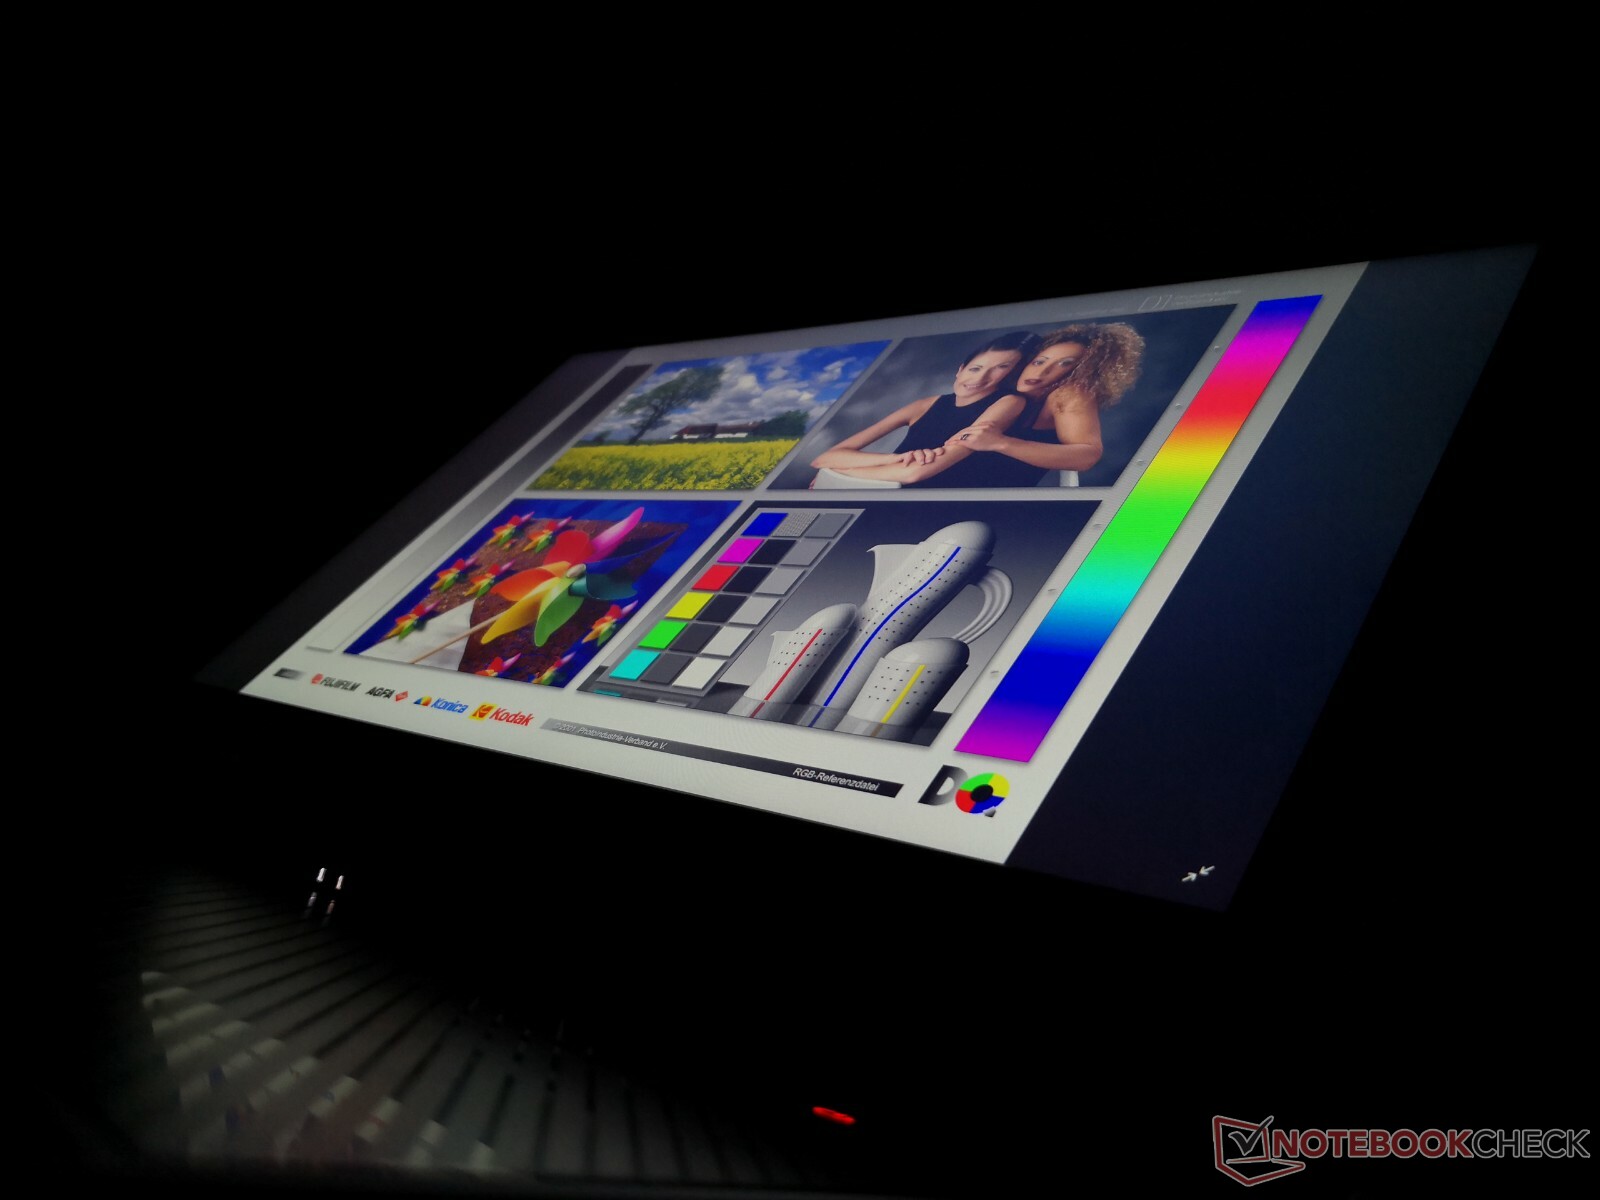
Display
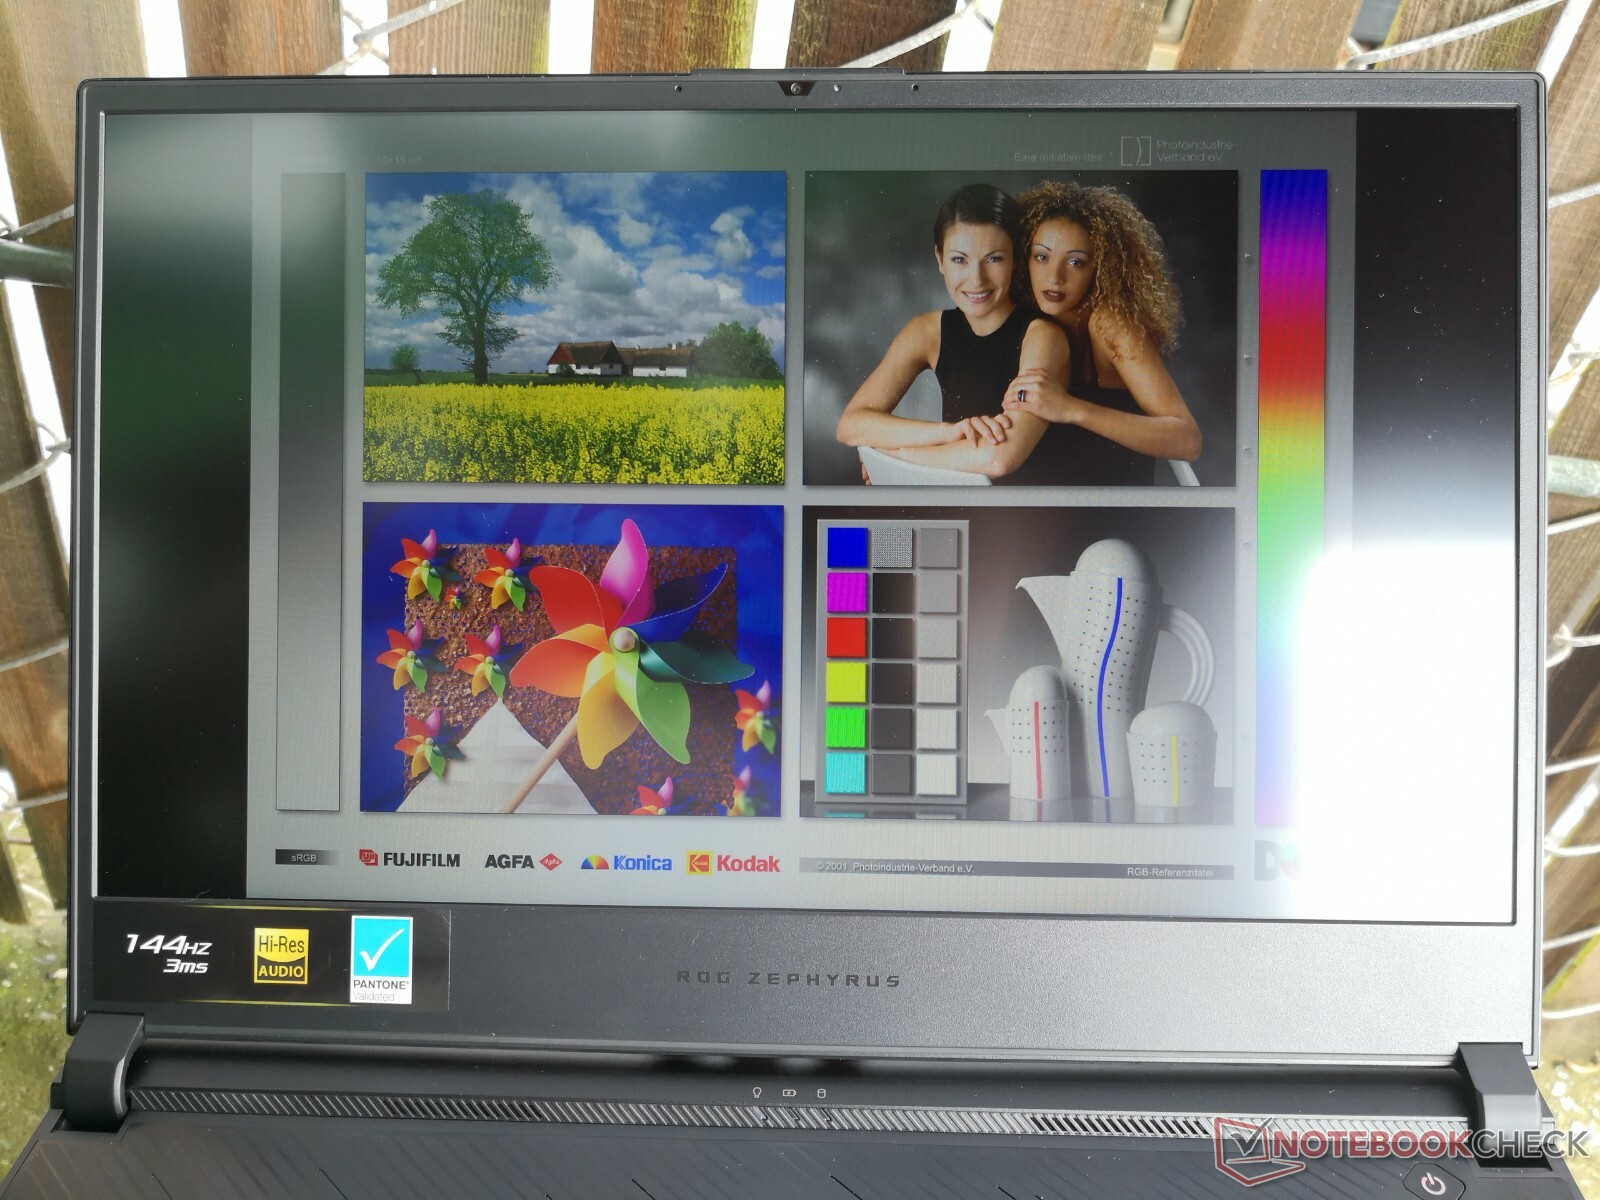
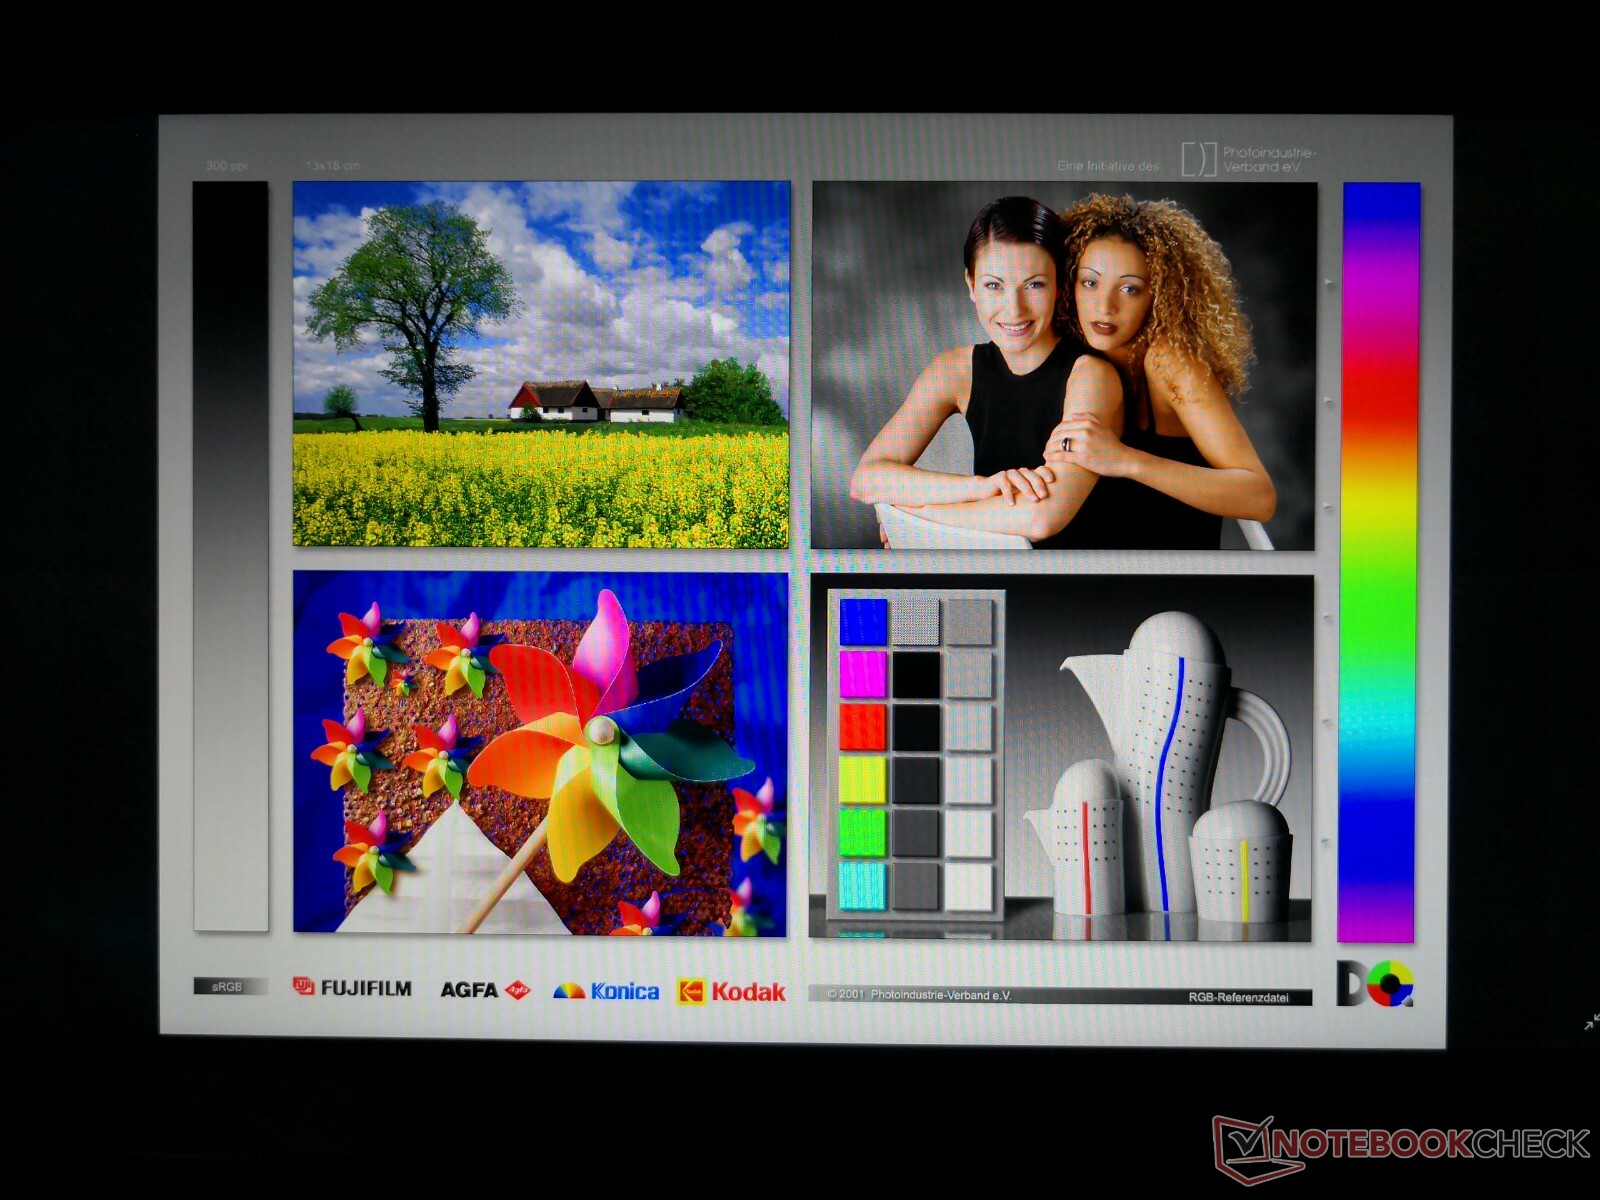
Asus uses the same high quality AU Optronics B156HAN08.2 IPS panel for both the Zephyrus S GX531 and ROG GL504. Last year's GX531GS is equipped with the exact same panel as well. These three laptops subsequently share similar response times, color coverage, 144 Hz refresh rate, and contrast ratios between them. Response times in particular are significantly faster when compared to the older AU Optronics Panel on the GX501 for reduced ghosting when gaming.
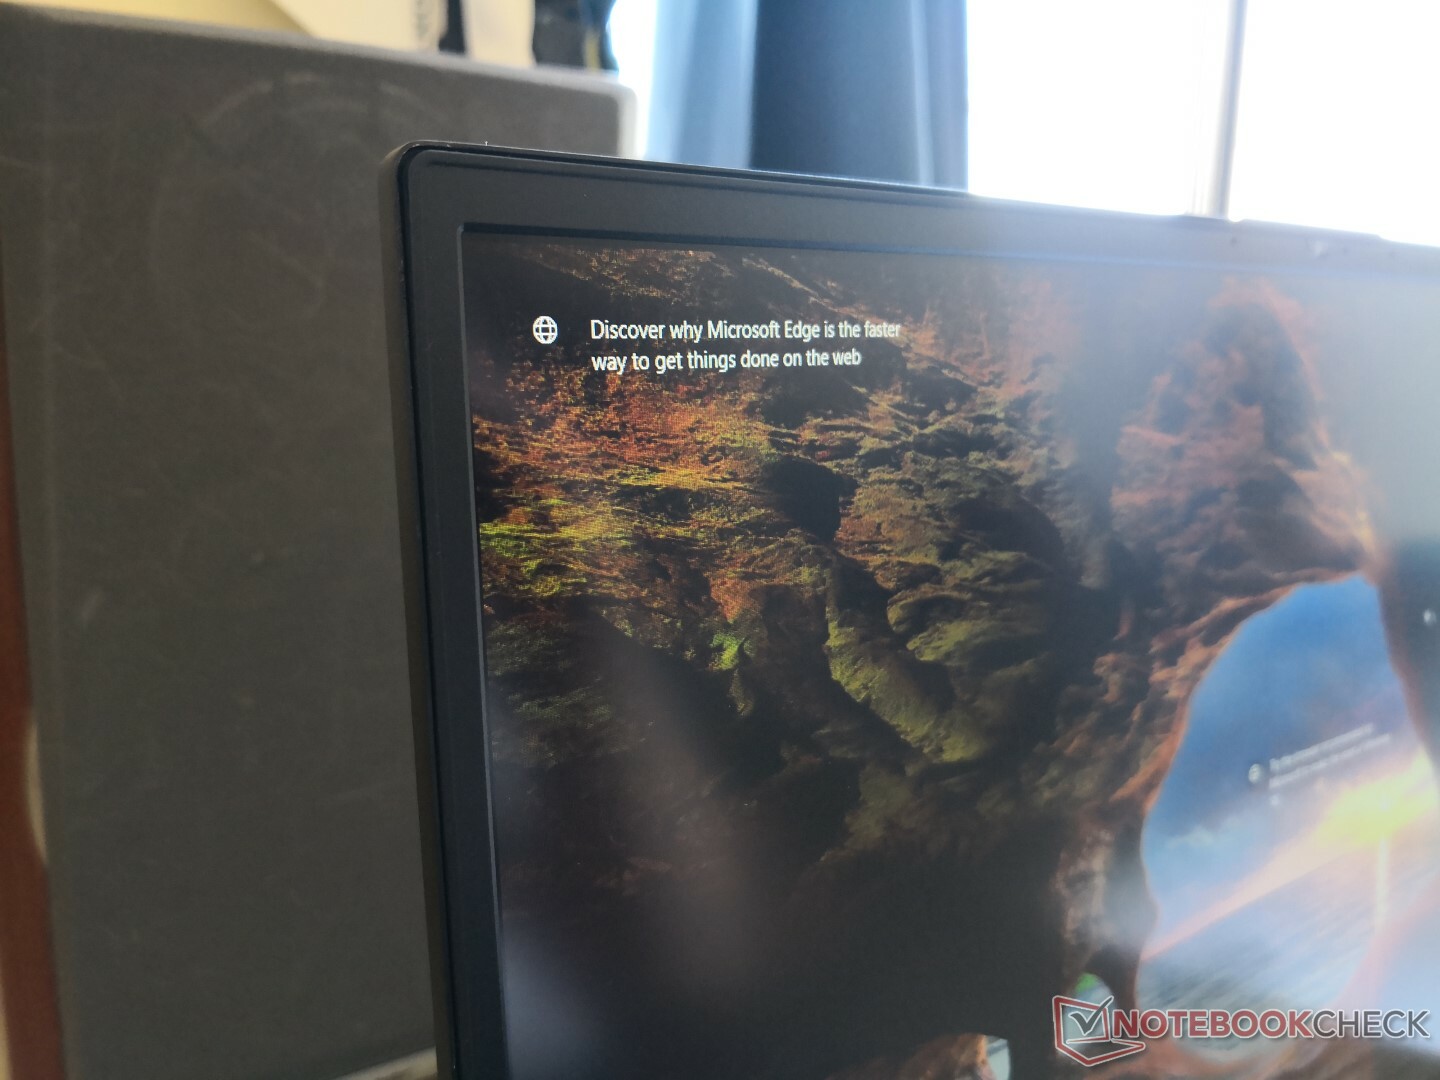
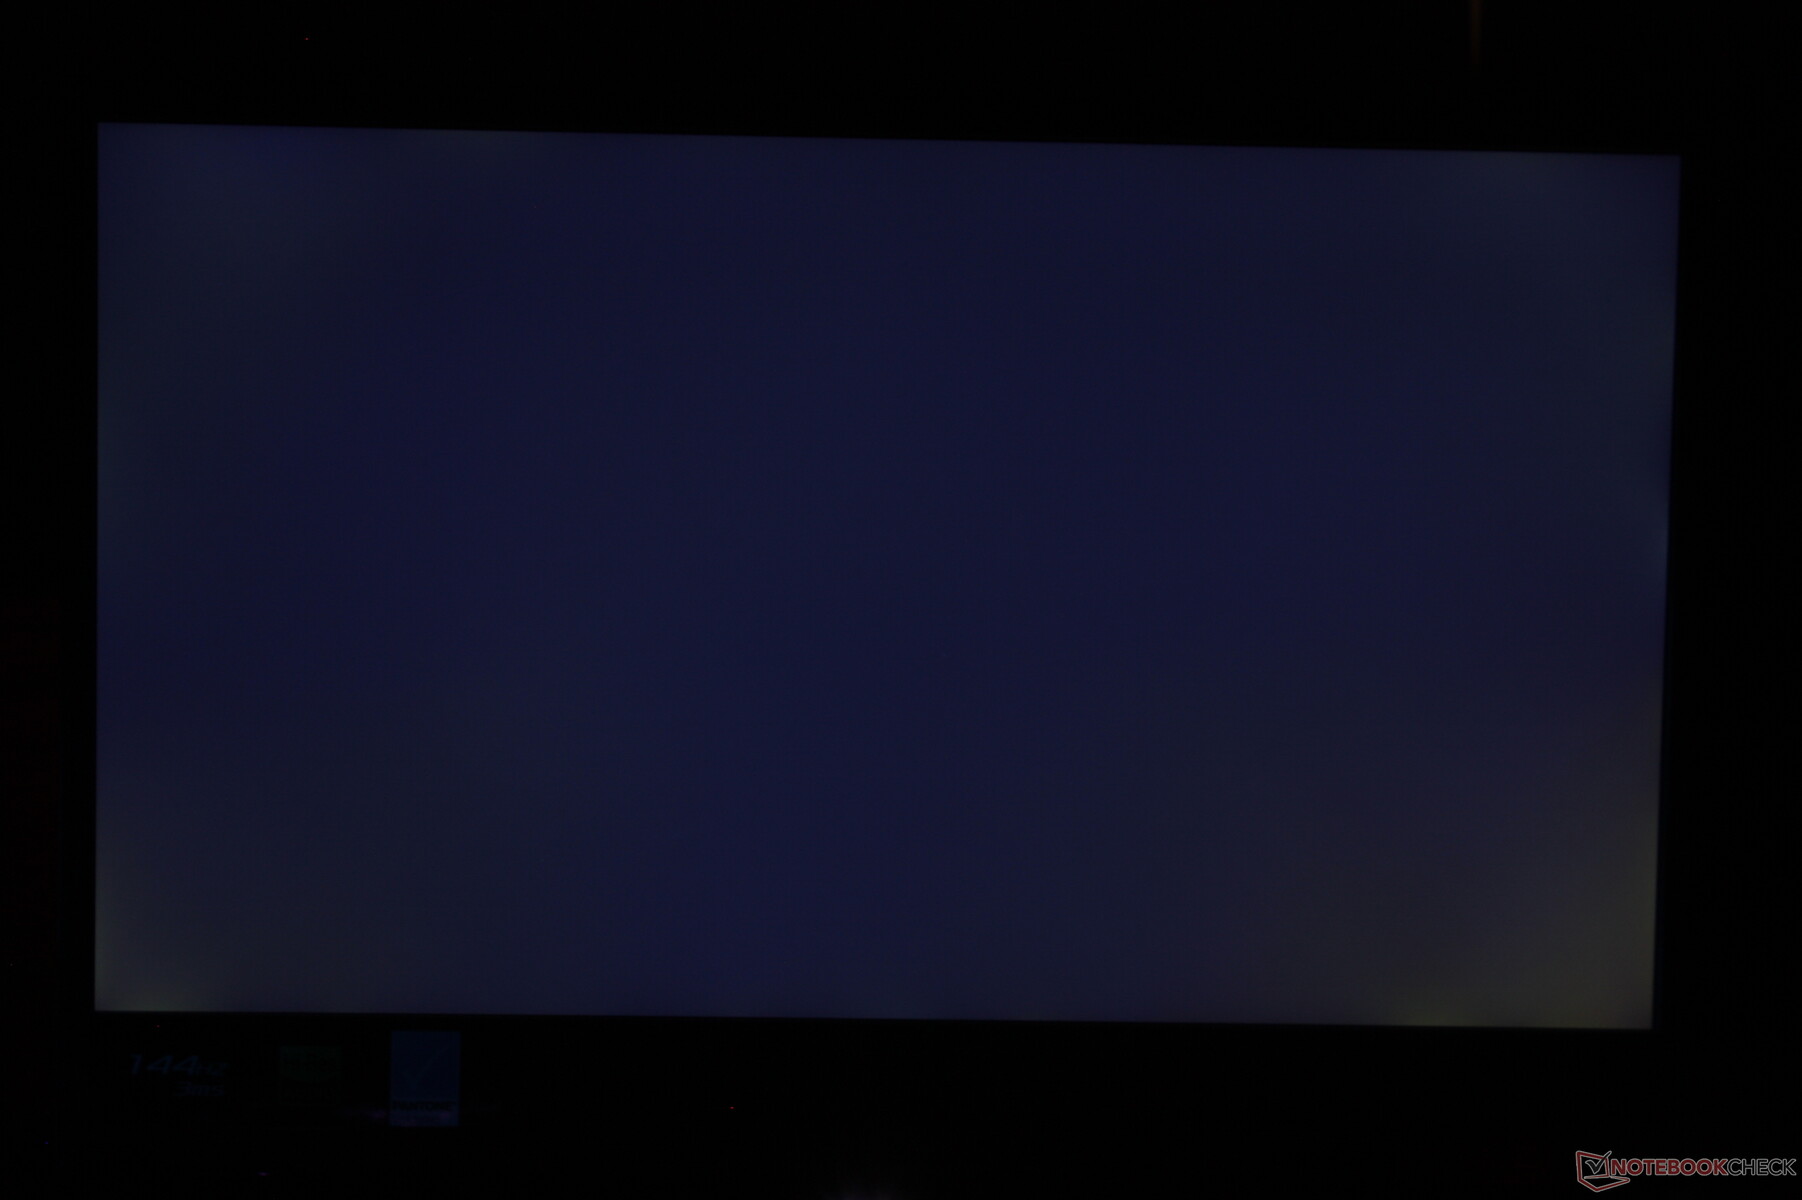
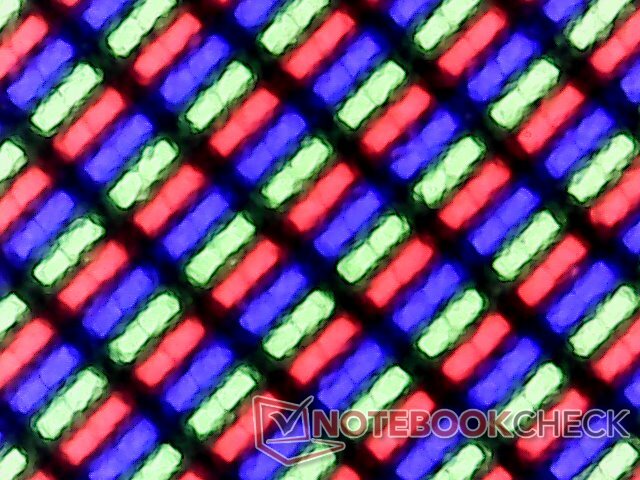
The display is slightly grainy and so it's not as clean or sharp as a glossy alternative. This disadvantage is not uncommon on most matte panels. There is minor backlight bleeding along the bottom edge of our test unit that's mostly unnoticeable.
| |||||||||||||||||||||||||
Brightness Distribution: 91 %
Center on Battery: 323.6 cd/m²
Contrast: 1116:1 (Black: 0.29 cd/m²)
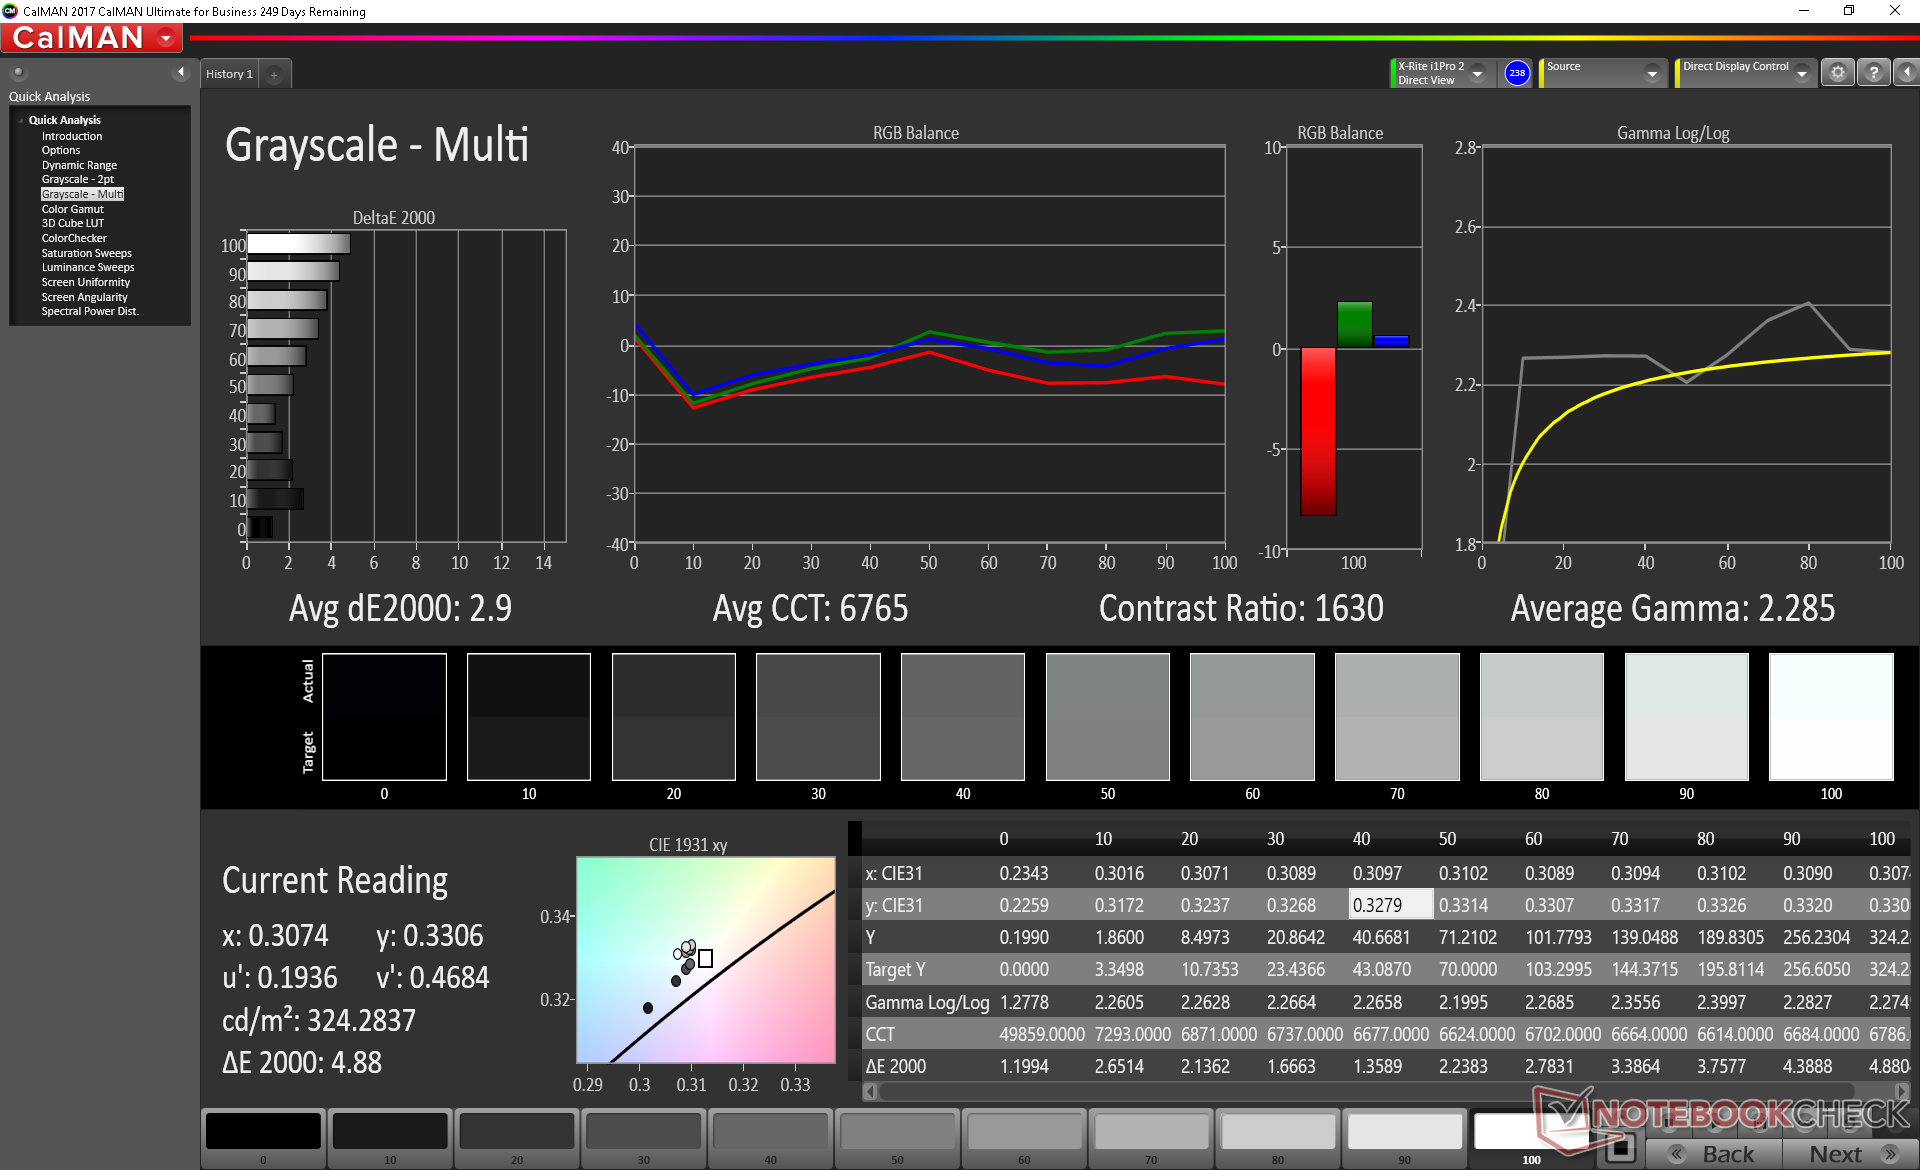
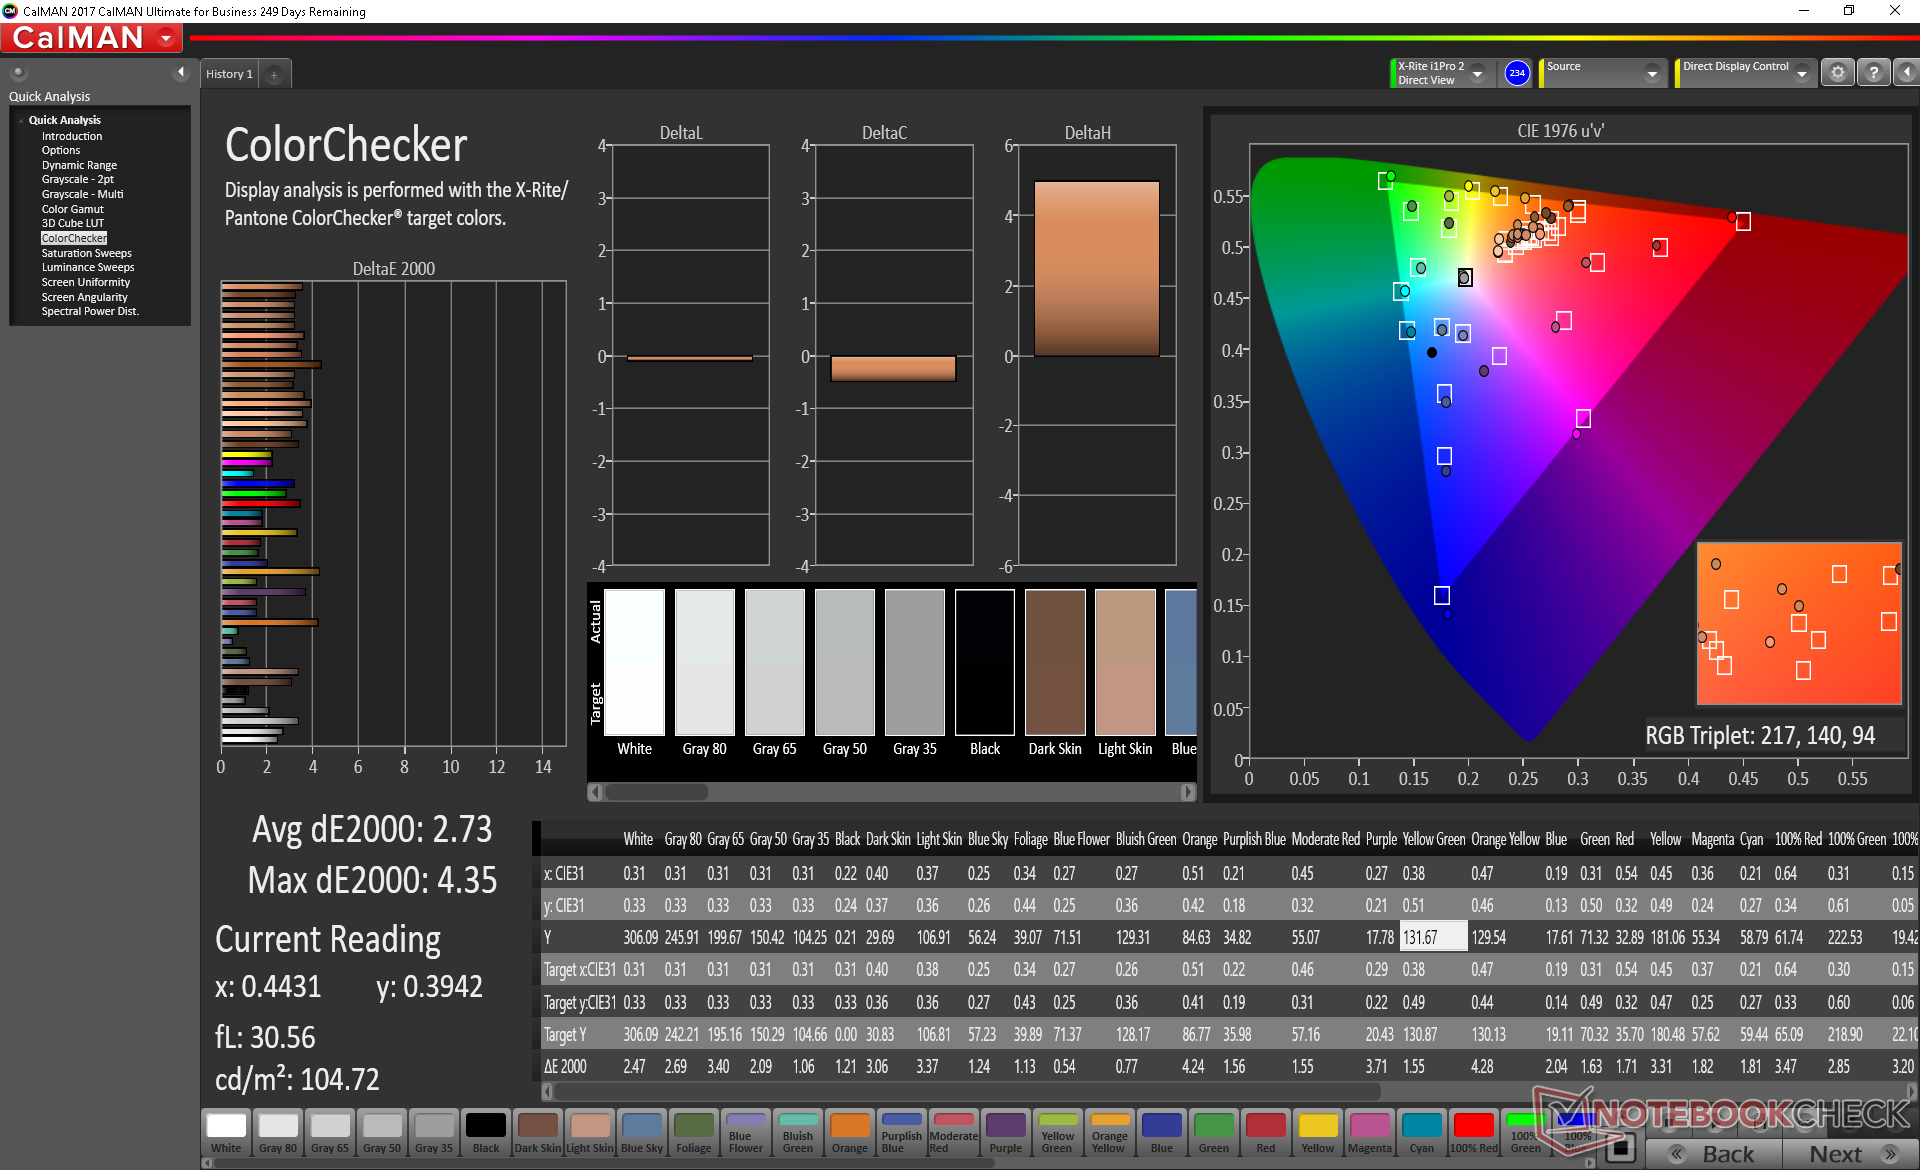
ΔE ColorChecker Calman: 3.31 | ∀{0.5-29.43 Ø4.75}
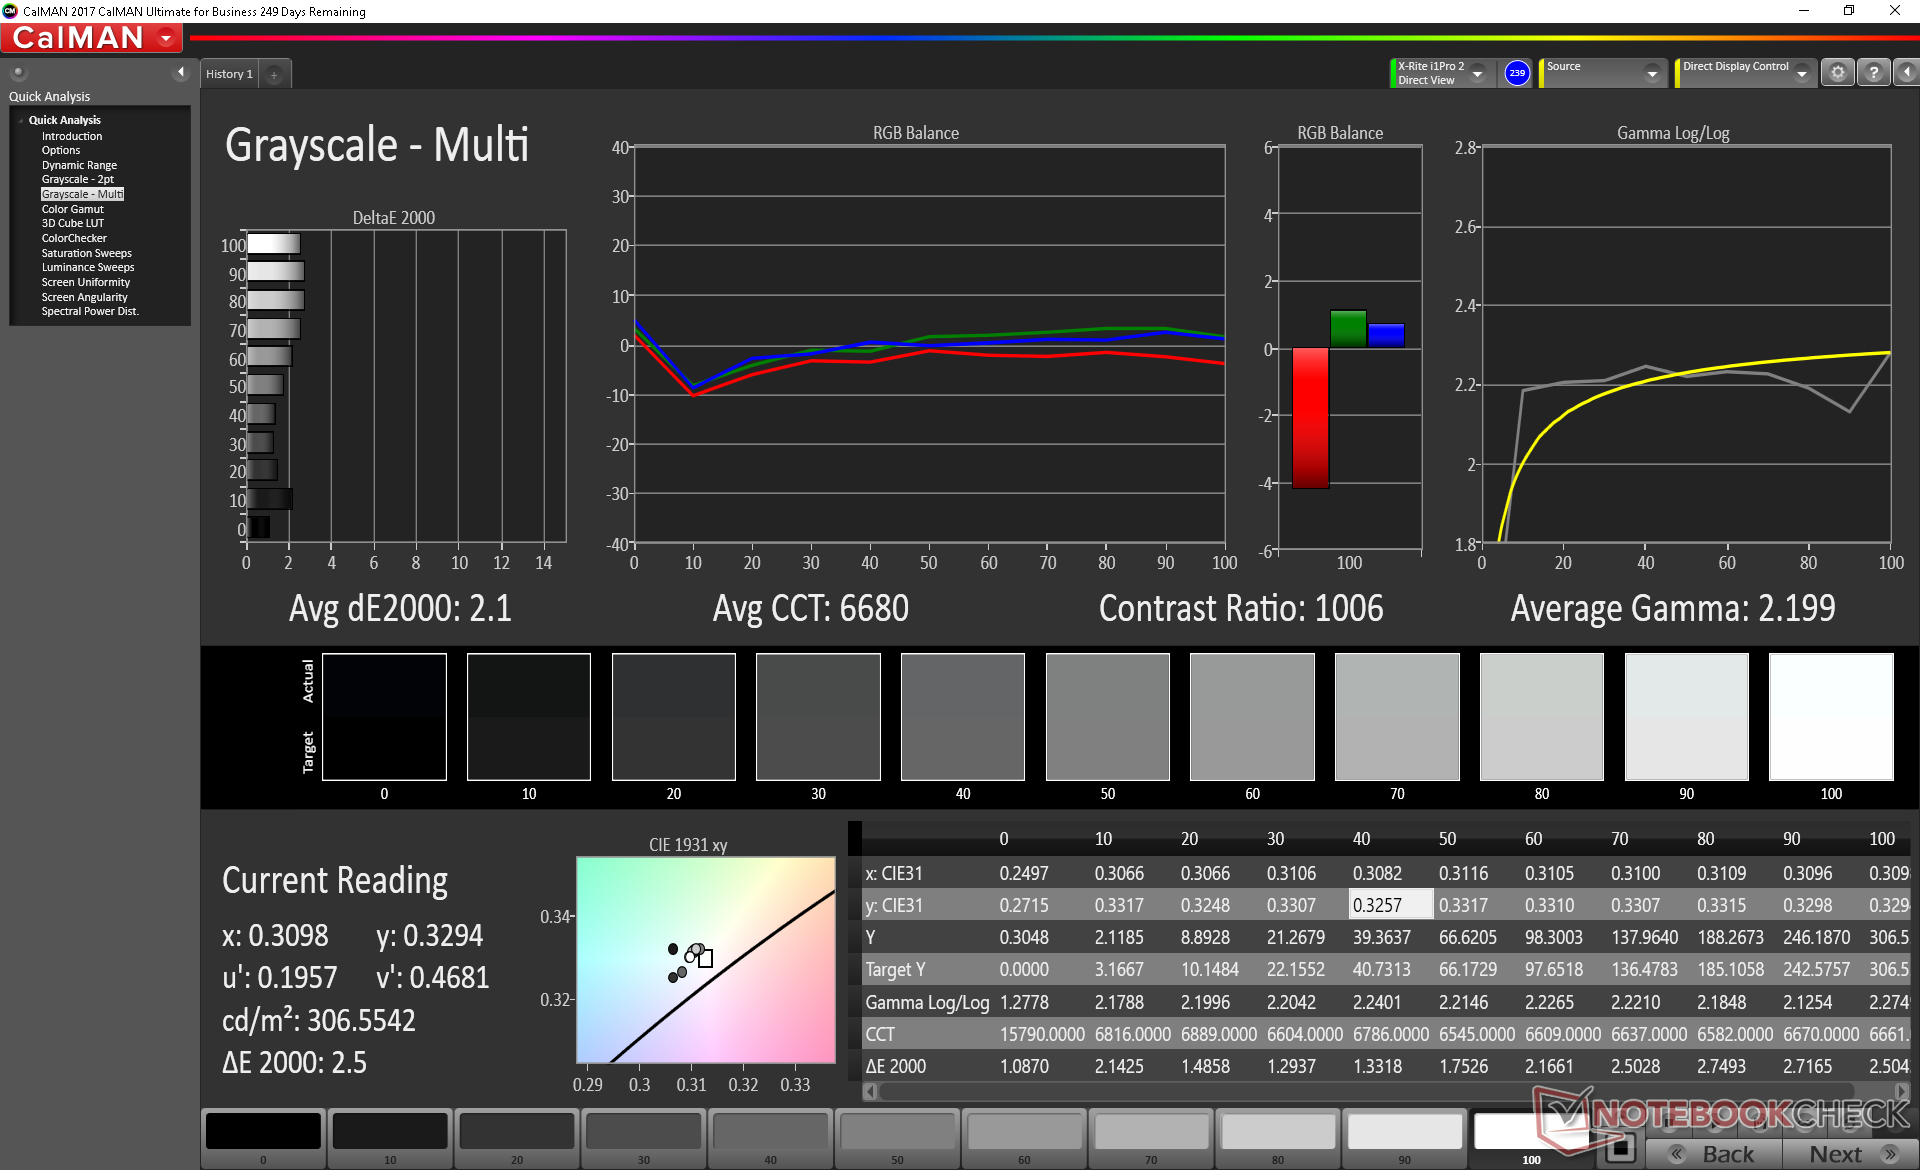
calibrated: 2.73
ΔE Greyscale Calman: 2.9 | ∀{0.09-98 Ø5}
91.8% sRGB (Argyll 1.6.3 3D)
59.7% AdobeRGB 1998 (Argyll 1.6.3 3D)
66.9% AdobeRGB 1998 (Argyll 3D)
92.2% sRGB (Argyll 3D)
65.6% Display P3 (Argyll 3D)
Gamma: 2.29
CCT: 6765 K
| Asus Zephyrus S GX531GX AU Optronics B156HAN08.2, IPS, 15.6", 1920x1080 | Aorus 15 X9 LG Philips LP156WFG-SPB2, IPS, 15.6", 1920x1080 | Alienware m15 GTX 1070 Max-Q AU Optronics B156HAN, IPS, 15.6", 1920x1080 | Razer Blade 15 RTX 2070 Max-Q LG Philips LGD05C0, IPS, 15.6", 1920x1080 | Asus Strix GL504GM AU Optronics B156HAN08.2 (AUO82ED), IPS, 15.6", 1920x1080 | Asus Zephyrus GX501 AUO B156HAN04.2 (AUO42ED), IPS, 15.6", 1920x1080 | |
|---|---|---|---|---|---|---|
| Display | 1% | -3% | 1% | 0% | -1% | |
| Display P3 Coverage (%) | 65.6 | 64.9 -1% | 63.5 -3% | 65.3 0% | 65.3 0% | 64.8 -1% |
| sRGB Coverage (%) | 92.2 | 95.6 4% | 89.4 -3% | 94.9 3% | 92.8 1% | 91.8 0% |
| AdobeRGB 1998 Coverage (%) | 66.9 | 66.3 -1% | 64.5 -4% | 66.3 -1% | 66.7 0% | 65.9 -1% |
| Response Times | -73% | -91% | -81% | -10% | -314% | |
| Response Time Grey 50% / Grey 80% * (ms) | 7 ? | 15.2 ? -117% | 18 ? -157% | 16.8 ? -140% | 7.8 ? -11% | 40.4 ? -477% |
| Response Time Black / White * (ms) | 9.6 ? | 12.4 ? -29% | 12 ? -25% | 11.6 ? -21% | 10.4 ? -8% | 24 ? -150% |
| PWM Frequency (Hz) | ||||||
| Screen | 3% | -12% | 0% | -11% | -26% | |
| Brightness middle (cd/m²) | 323.6 | 305.1 -6% | 353.6 9% | 314.7 -3% | 350 8% | 328 1% |
| Brightness (cd/m²) | 315 | 295 -6% | 346 10% | 312 -1% | 338 7% | 305 -3% |
| Brightness Distribution (%) | 91 | 78 -14% | 86 -5% | 90 -1% | 90 -1% | 83 -9% |
| Black Level * (cd/m²) | 0.29 | 0.33 -14% | 0.3 -3% | 0.38 -31% | 0.33 -14% | 0.25 14% |
| Contrast (:1) | 1116 | 925 -17% | 1179 6% | 828 -26% | 1061 -5% | 1312 18% |
| Colorchecker dE 2000 * | 3.31 | 2.58 22% | 4.55 -37% | 2.56 23% | 4.3 -30% | 6.02 -82% |
| Colorchecker dE 2000 max. * | 5.74 | 4.32 25% | 7.91 -38% | 4.89 15% | 7.78 -36% | 10.14 -77% |
| Colorchecker dE 2000 calibrated * | 2.73 | 1.33 51% | 3.37 -23% | 1.71 37% | 2.83 -4% | |
| Greyscale dE 2000 * | 2.9 | 3.4 -17% | 4.1 -41% | 3.4 -17% | 4.4 -52% | 6.32 -118% |
| Gamma | 2.29 96% | 2.28 96% | 2.27 97% | 2.3 96% | 2.26 97% | 2.28 96% |
| CCT | 6765 96% | 6374 102% | 7434 87% | 6435 101% | 7517 86% | 8194 79% |
| Color Space (Percent of AdobeRGB 1998) (%) | 59.7 | 60.7 2% | 57.9 -3% | 60.7 2% | 60 1% | 60 1% |
| Color Space (Percent of sRGB) (%) | 91.8 | 95.2 4% | 88.9 -3% | 94.6 3% | 92.5 1% | 92 0% |
| Total Average (Program / Settings) | -23% /
-7% | -35% /
-20% | -27% /
-10% | -7% /
-9% | -114% /
-59% |
* ... smaller is better
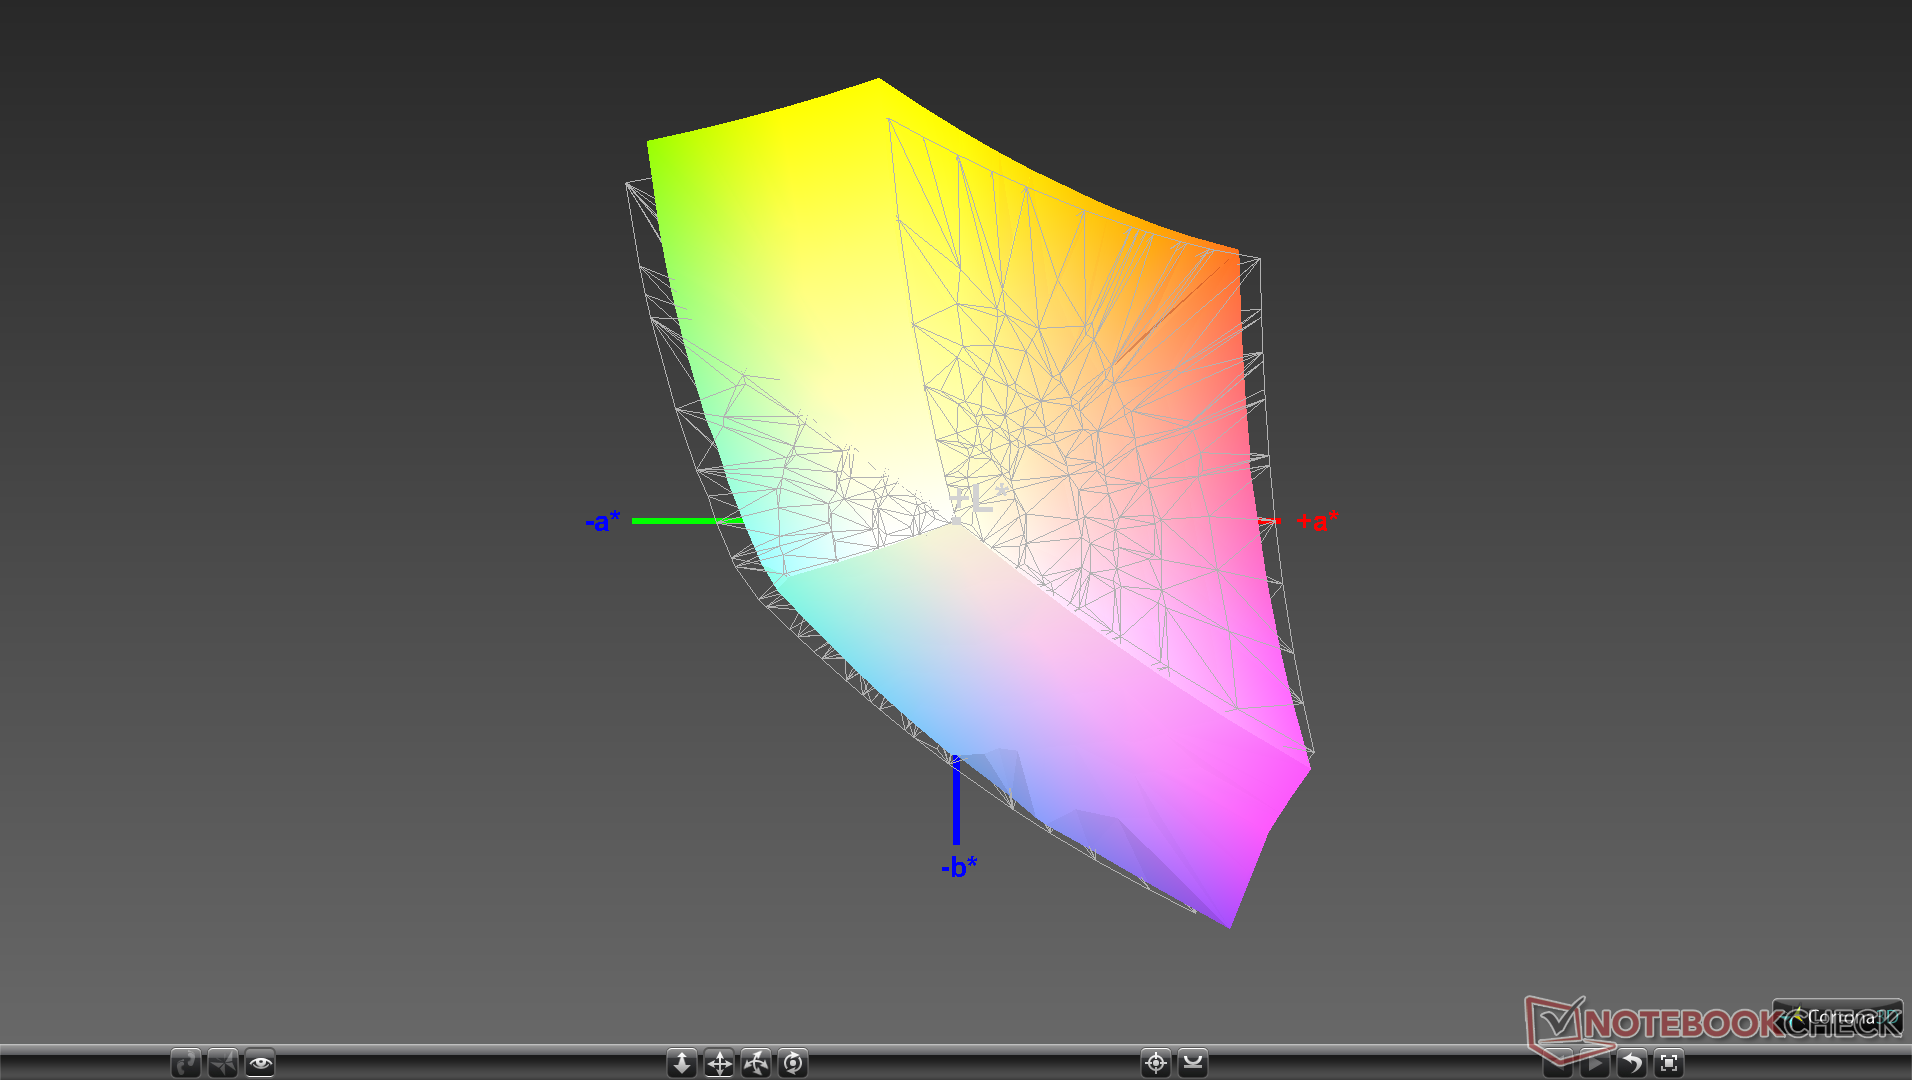
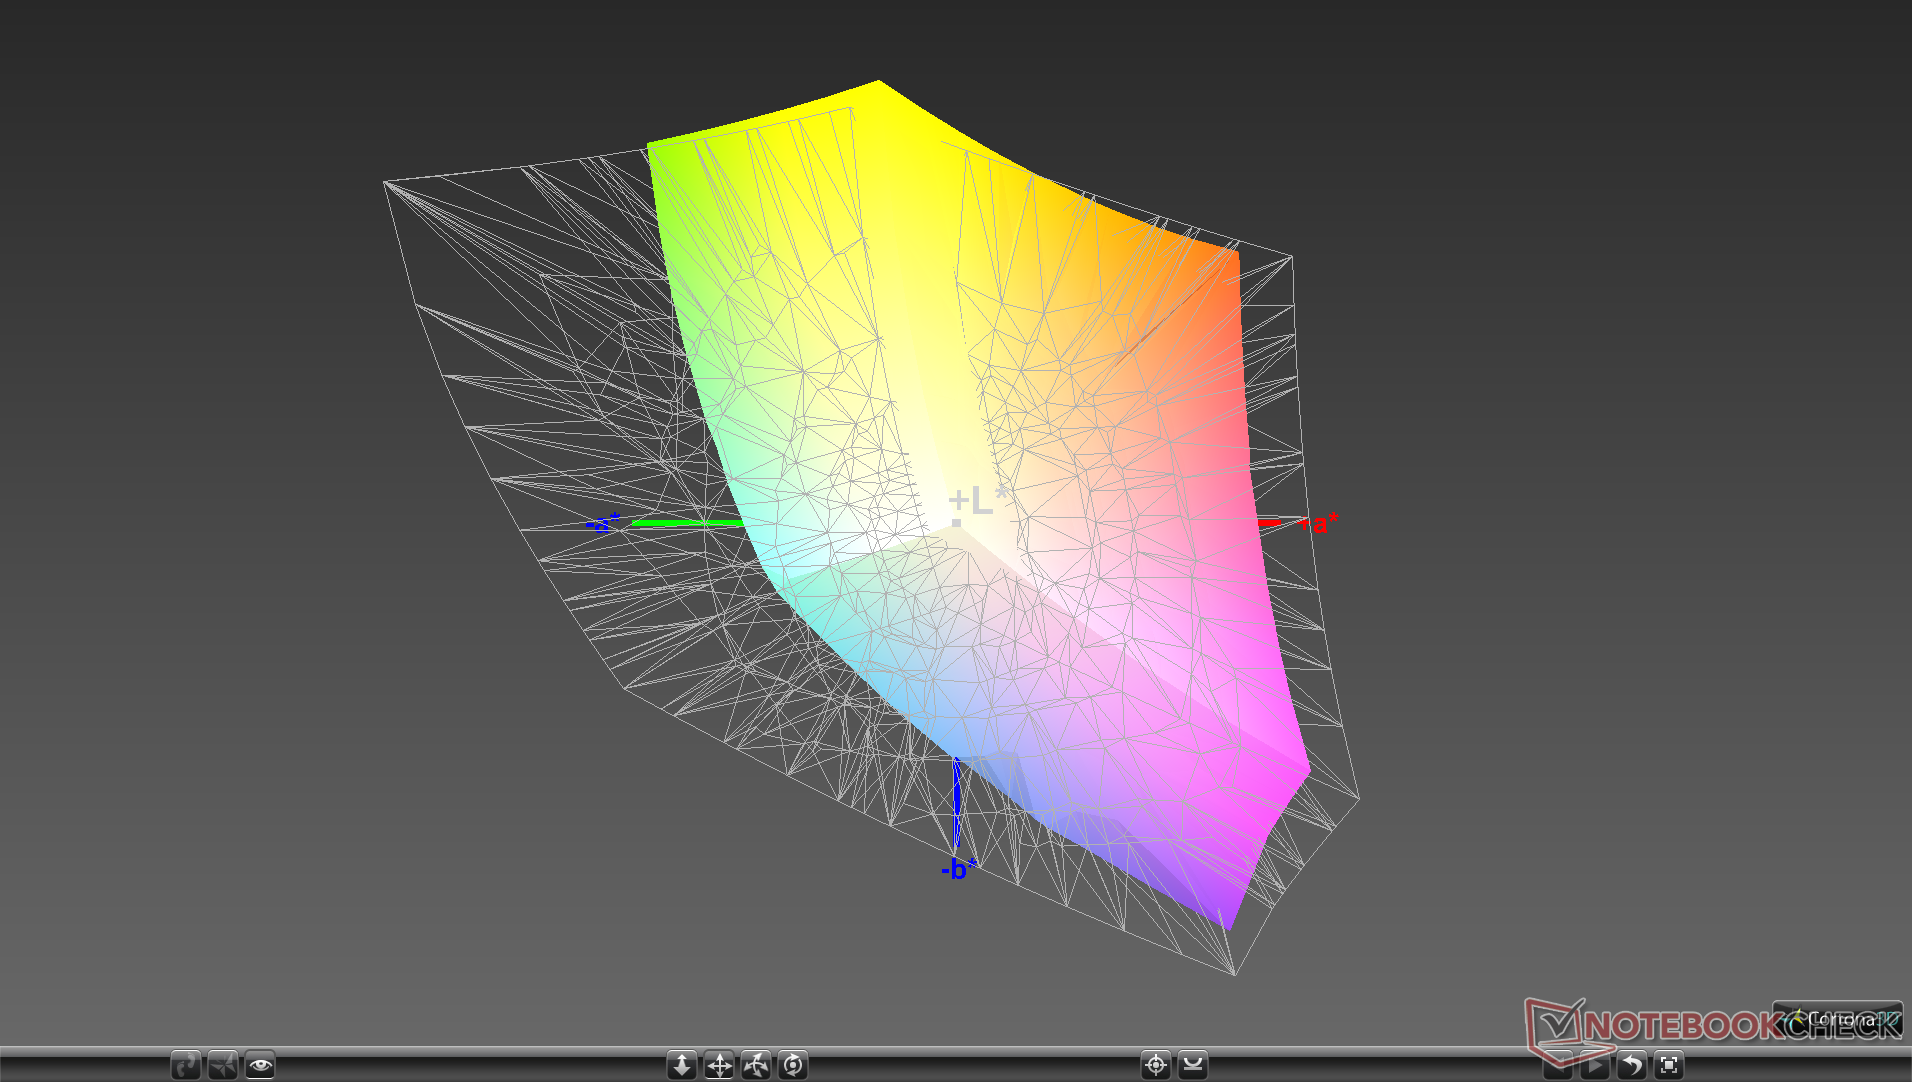
X-Rite colorimeter measurements reveal an accurate display out of the box. Each unit is "Pantone Validated" to suggest at least some level of factory calibration before shipment much like on the Gigabyte Aero 15 series. Our own calibration attempts do improve grayscale and colors even further, albeit just marginally.


Display Response Times
| ↔ Response Time Black to White | ||
|---|---|---|
| 9.6 ms ... rise ↗ and fall ↘ combined | ↗ 4.4 ms rise | 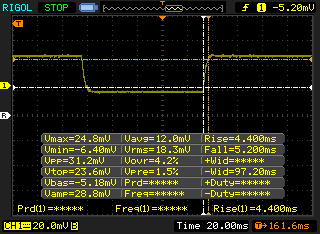 |
| ↘ 5.2 ms fall | ||
| The screen shows fast response rates in our tests and should be suited for gaming. In comparison, all tested devices range from 0.1 (minimum) to 240 (maximum) ms. » 26 % of all devices are better. This means that the measured response time is better than the average of all tested devices (20.1 ms). | ||
| ↔ Response Time 50% Grey to 80% Grey | ||
| 7 ms ... rise ↗ and fall ↘ combined | ↗ 3.6 ms rise | 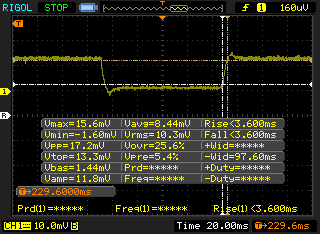 |
| ↘ 3.4 ms fall | ||
| The screen shows very fast response rates in our tests and should be very well suited for fast-paced gaming. In comparison, all tested devices range from 0.165 (minimum) to 636 (maximum) ms. » 19 % of all devices are better. This means that the measured response time is better than the average of all tested devices (31.4 ms). | ||
Screen Flickering / PWM (Pulse-Width Modulation)
| Screen flickering / PWM not detected | 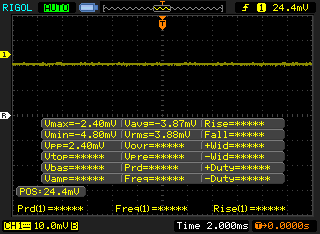 | ||
In comparison: 53 % of all tested devices do not use PWM to dim the display. If PWM was detected, an average of 7986 (minimum: 5 - maximum: 343500) Hz was measured. | |||
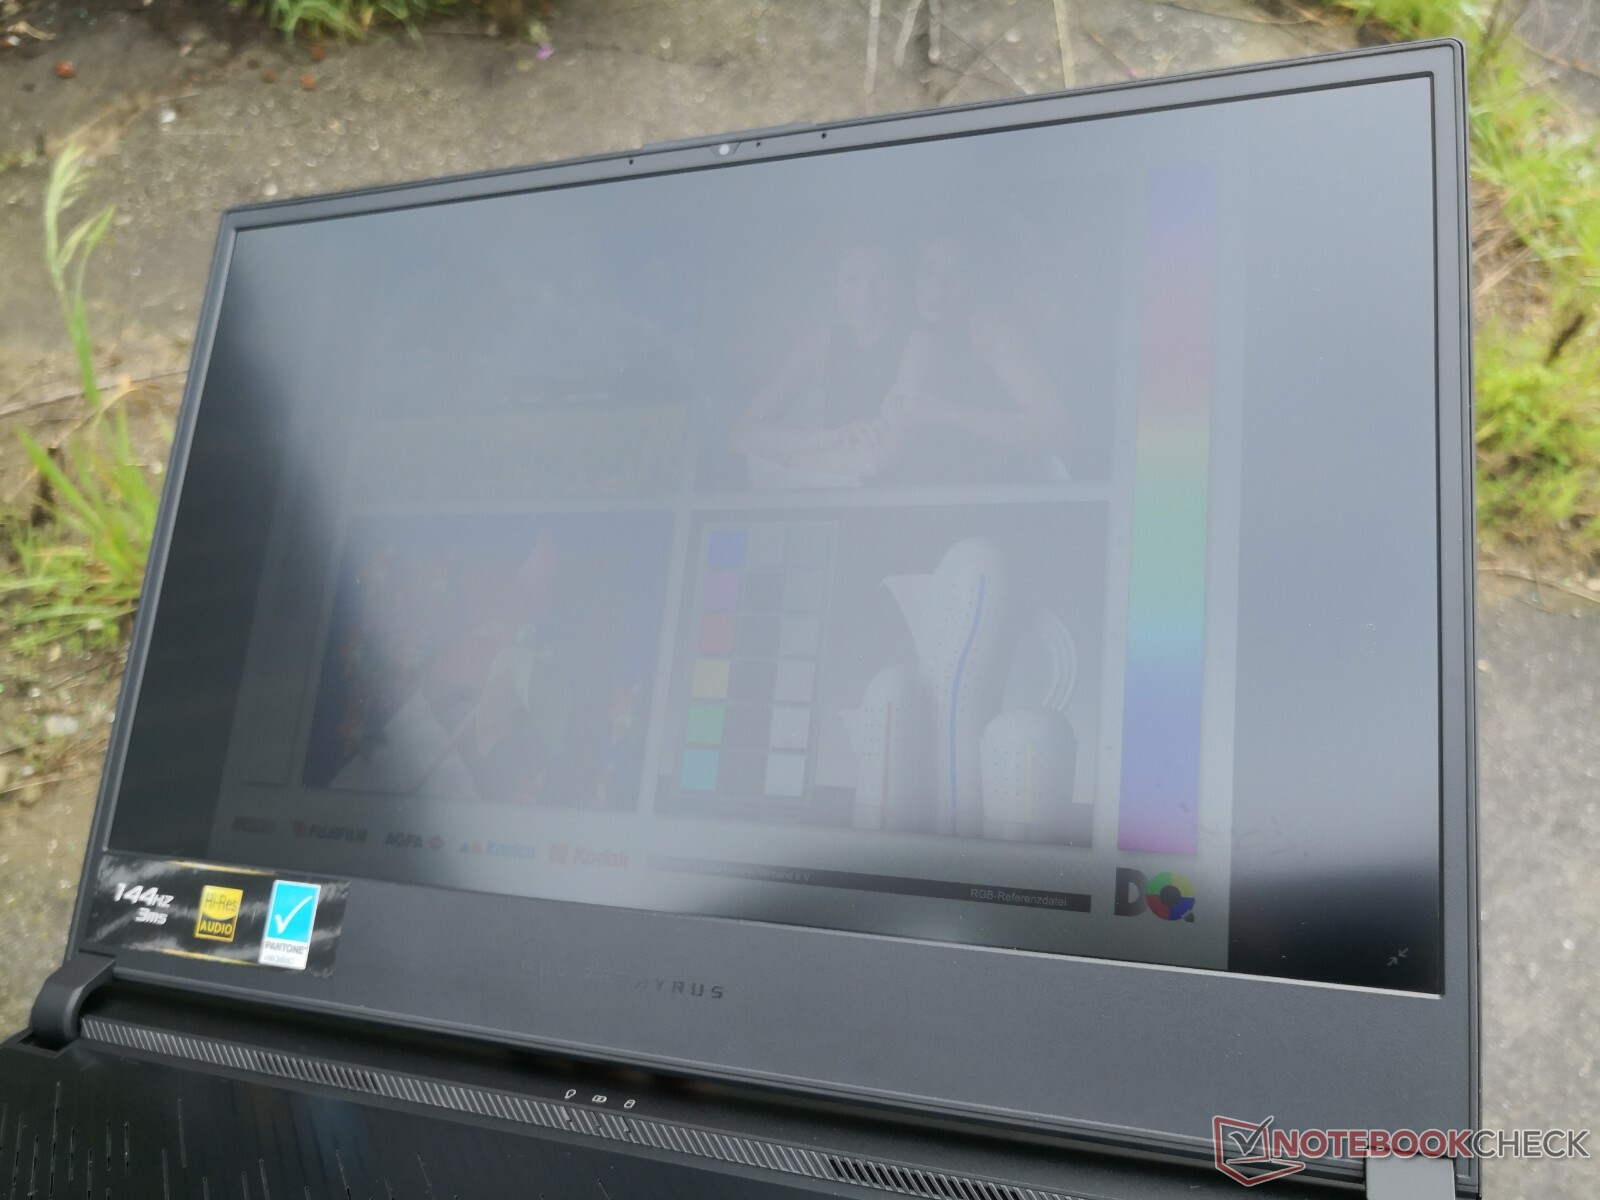
Since the display brightness is about average for a 15.6-inch gaming laptop (~300 nits), outdoor visibility is not any better or worse than the competition. Colors become washed out if not working under shade and glare will still be present despite the matte panel. It's worth noting that the maximum lid angle is quite narrow at just ~120 degrees to limit viewability.
Performance
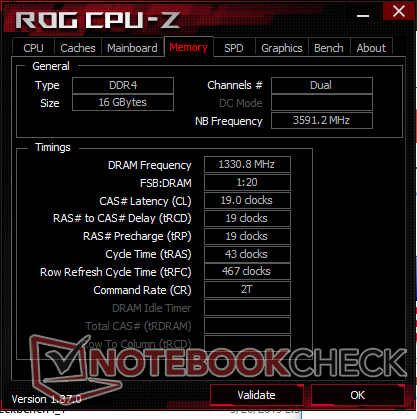
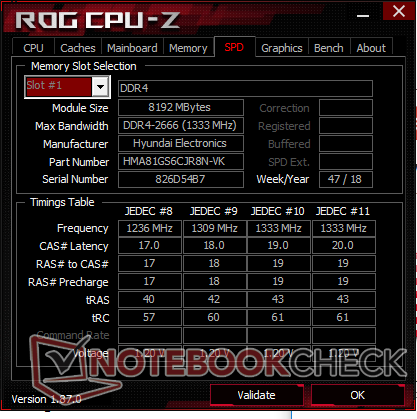
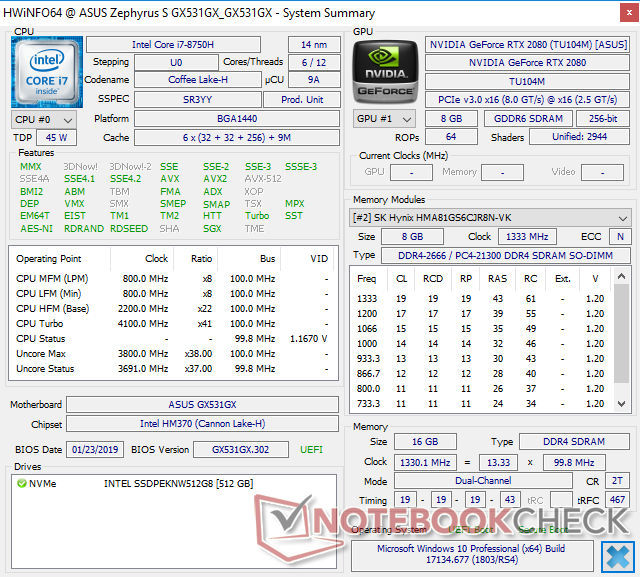
The Core i7-8750H CPU, 8 GB of soldered DDR4 RAM, and 1080p144 matte display are fixed across all current SKUs while the GPU can range from the RTX 2060 to the RTX 2080 Max-Q. Users who want standard non-Max-Q RTX 2080 options should take a look at the thicker Asus ROG G703 series which offers multiple storage bays and Core i9 options.
Optimus is integrated for switching to the Intel iGPU when needed. As a result, G-Sync is not available.
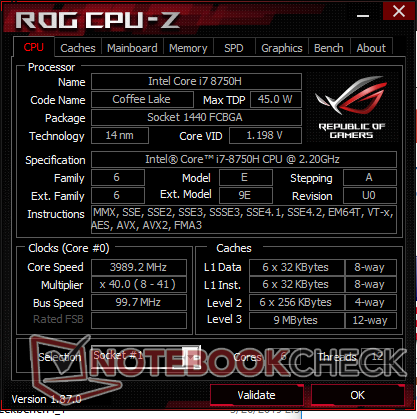
Processor
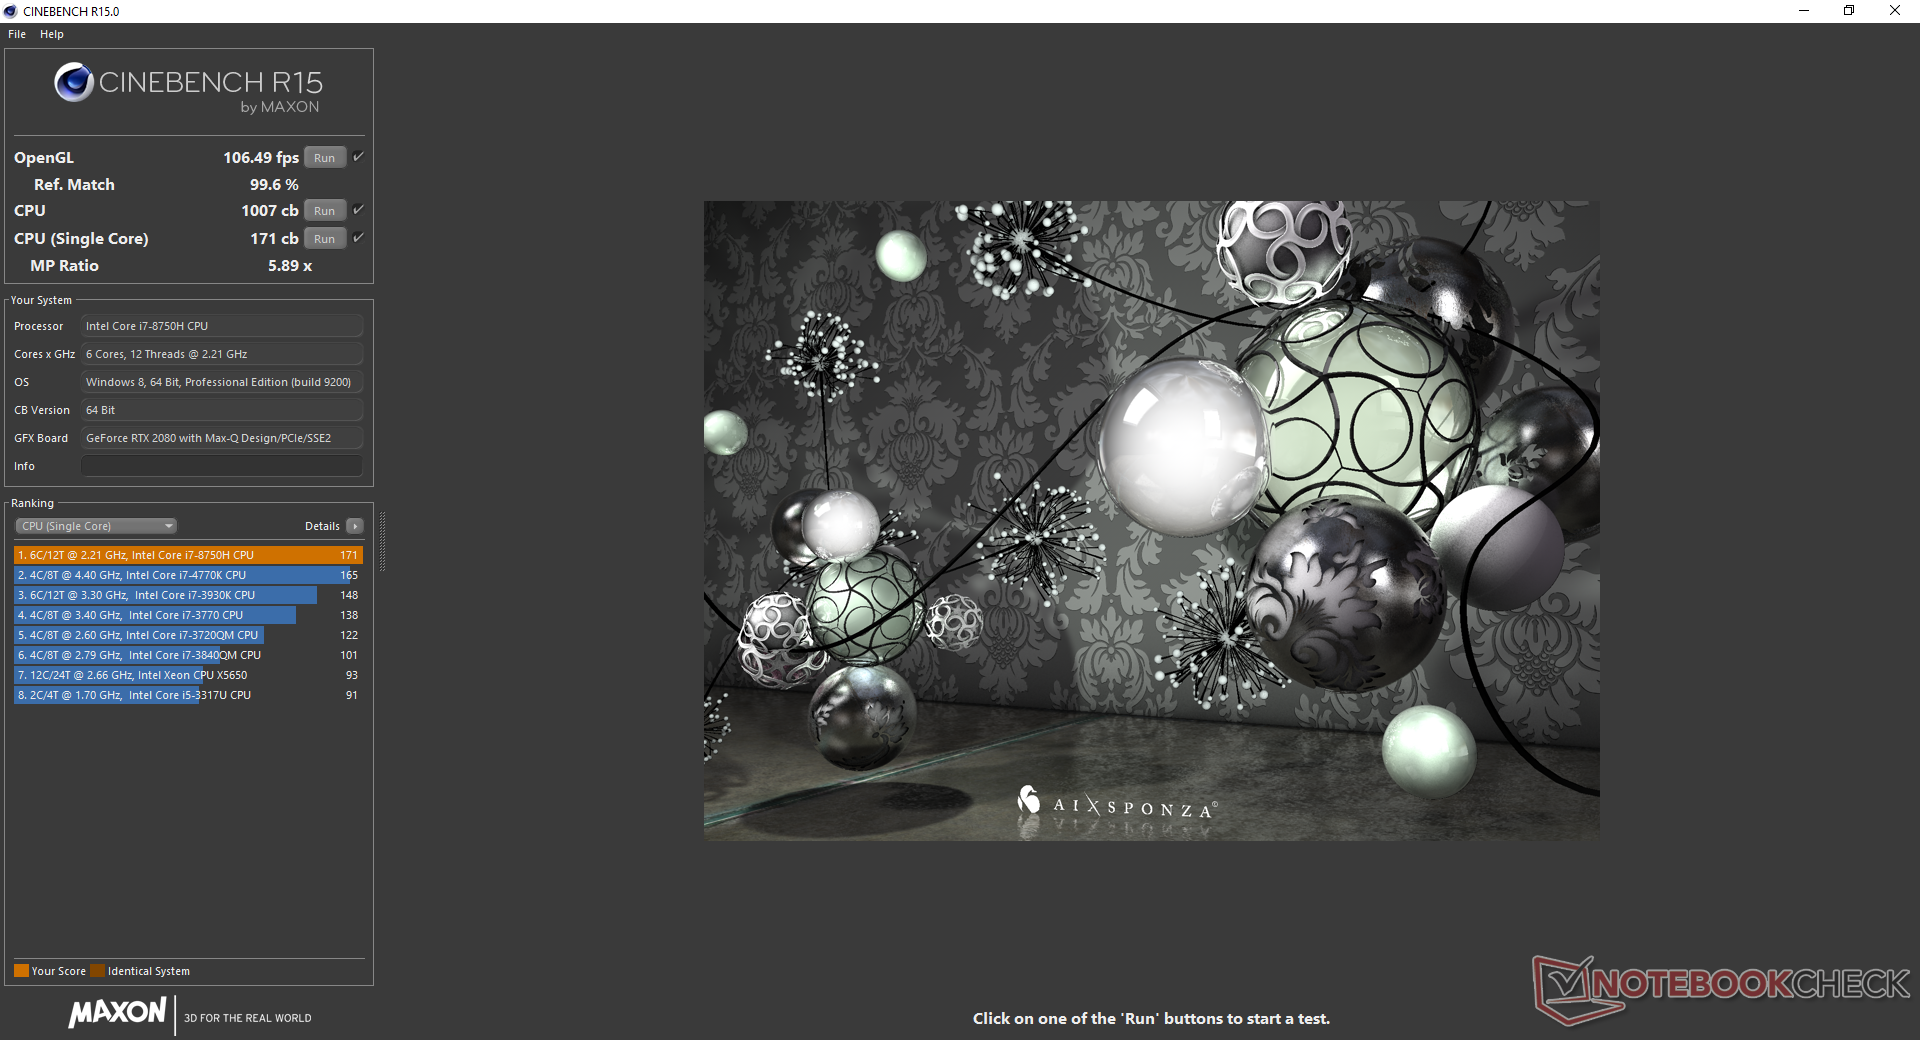
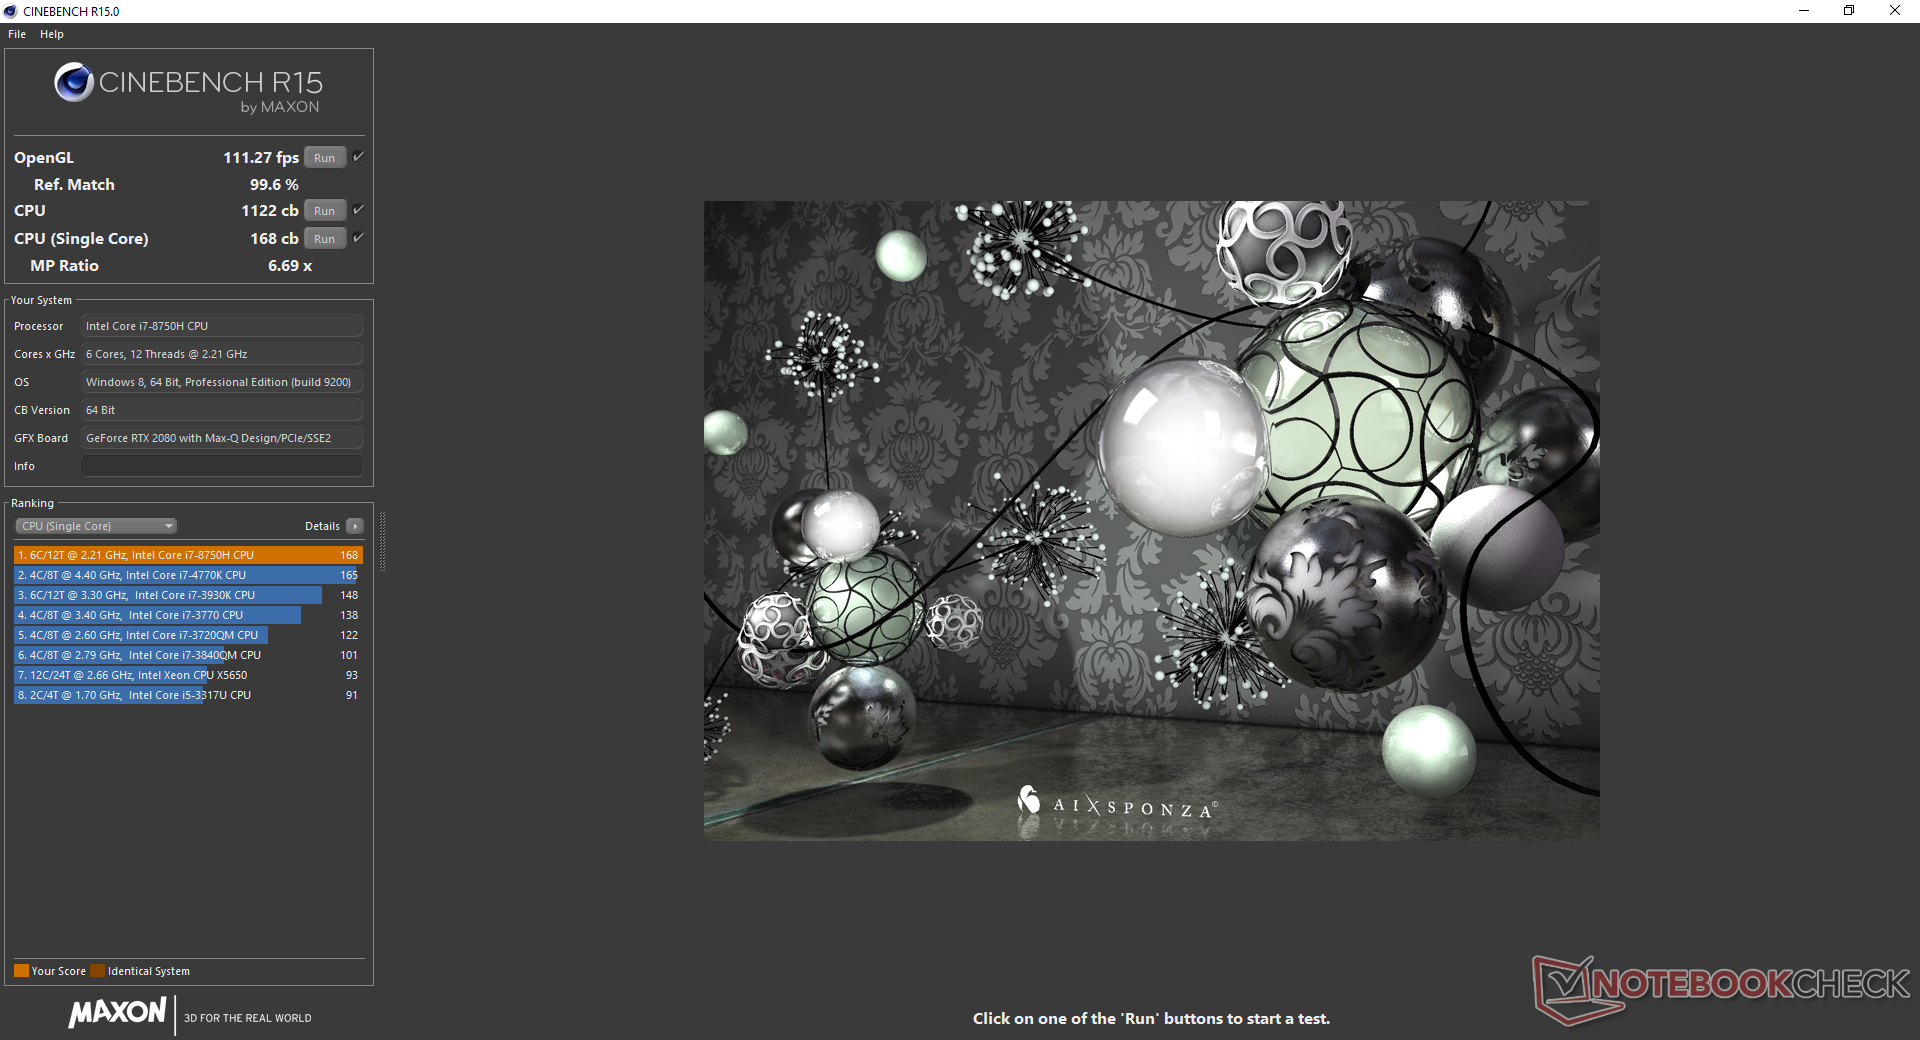
CPU performance is within 1 percent of the average Core i7-8750H CPU in our database taken from 80 other laptops. In other words, the CPU in the GX531 is performing exactly where we expect it to be. Note that the laptop must be set to Turbo Mode through the Asus Armoury Crate software if you want the full performance of the CPU. When running the same CineBench R15 Multi-Thread benchmark on Balanced Mode, for example, the final score is lower compared to Turbo Mode (1007 points vs. 1122 points).
Running CineBench R15 Multi-Thread in a loop reveals better Turbo Boost sustainability than the Razer Blade 15. The CPU performance gap is almost 17 percent after accounting for processor throttling between the two laptops. Even so, the Alienware m15 still has the upper hand at maintaining faster clock rates than both the Asus and Razer with the exact same processor.
See our dedicated page on the Core i7-8750H for more technical information and benchmark comparisons.
System Performance
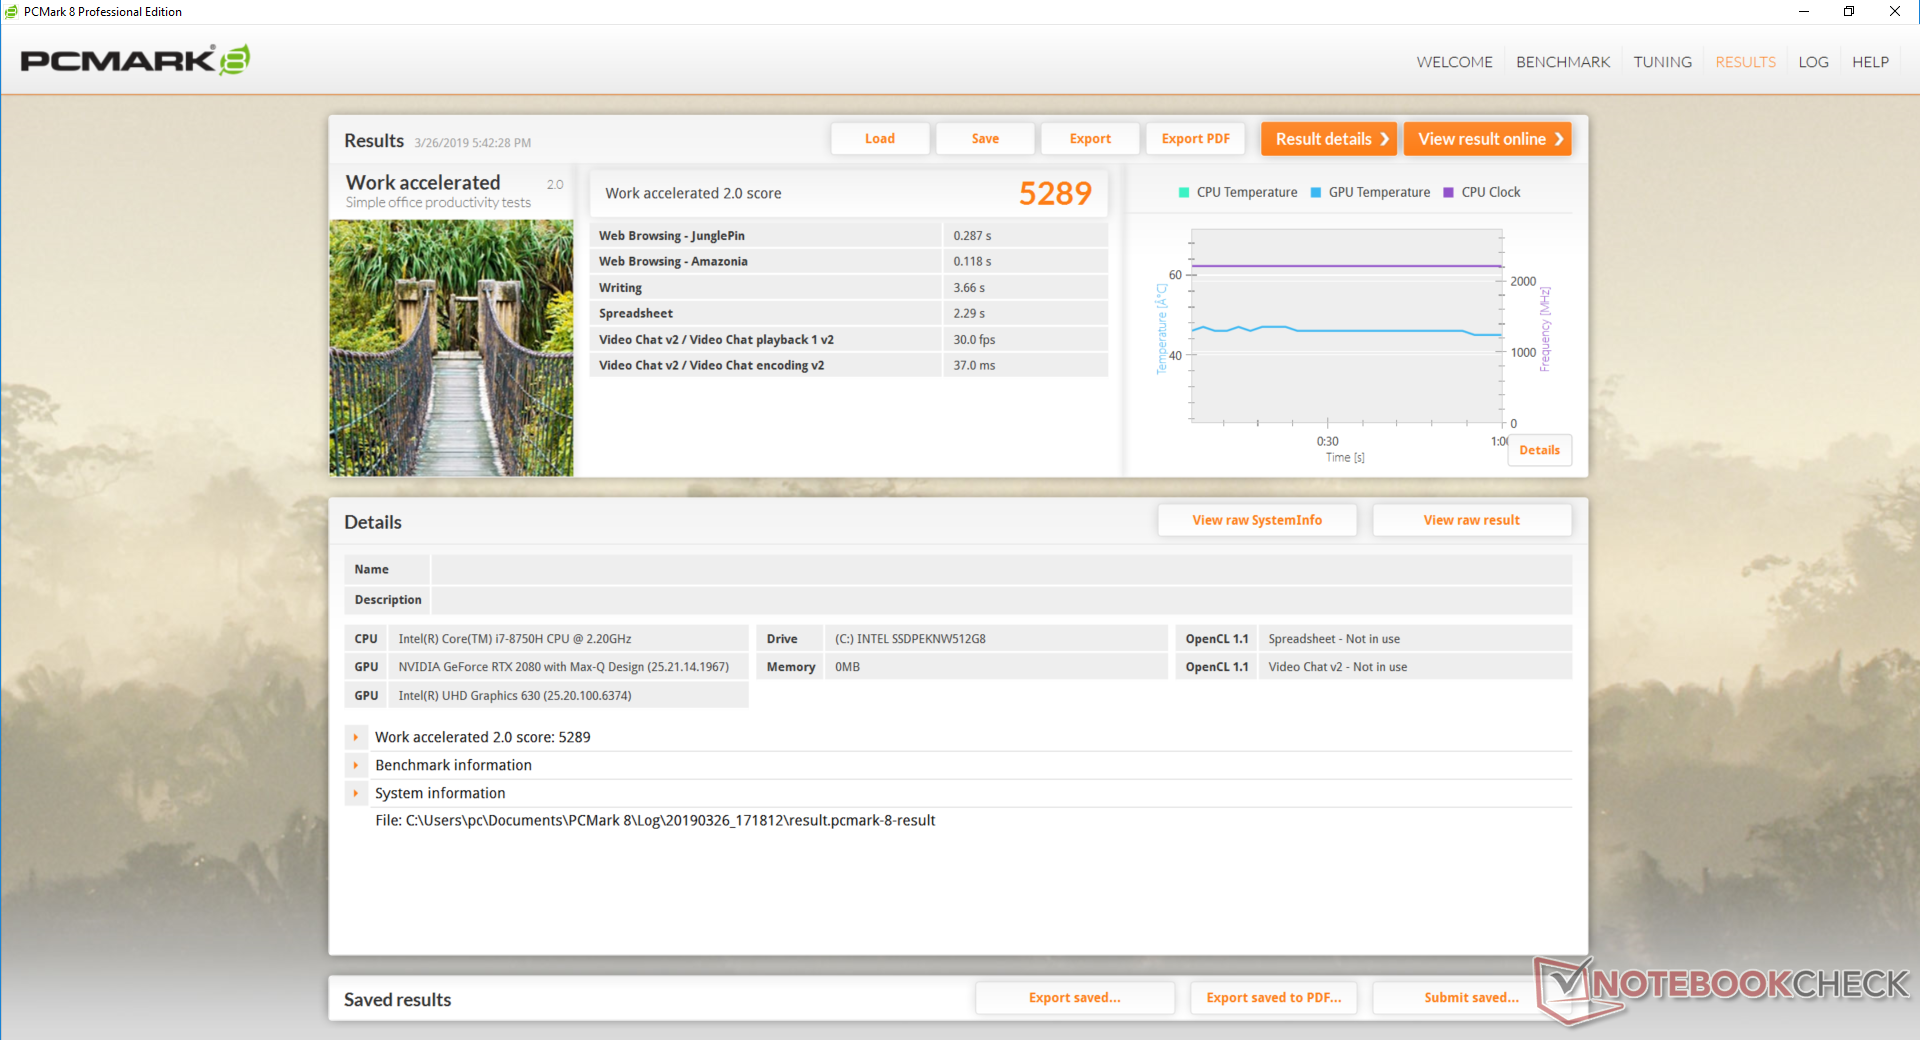
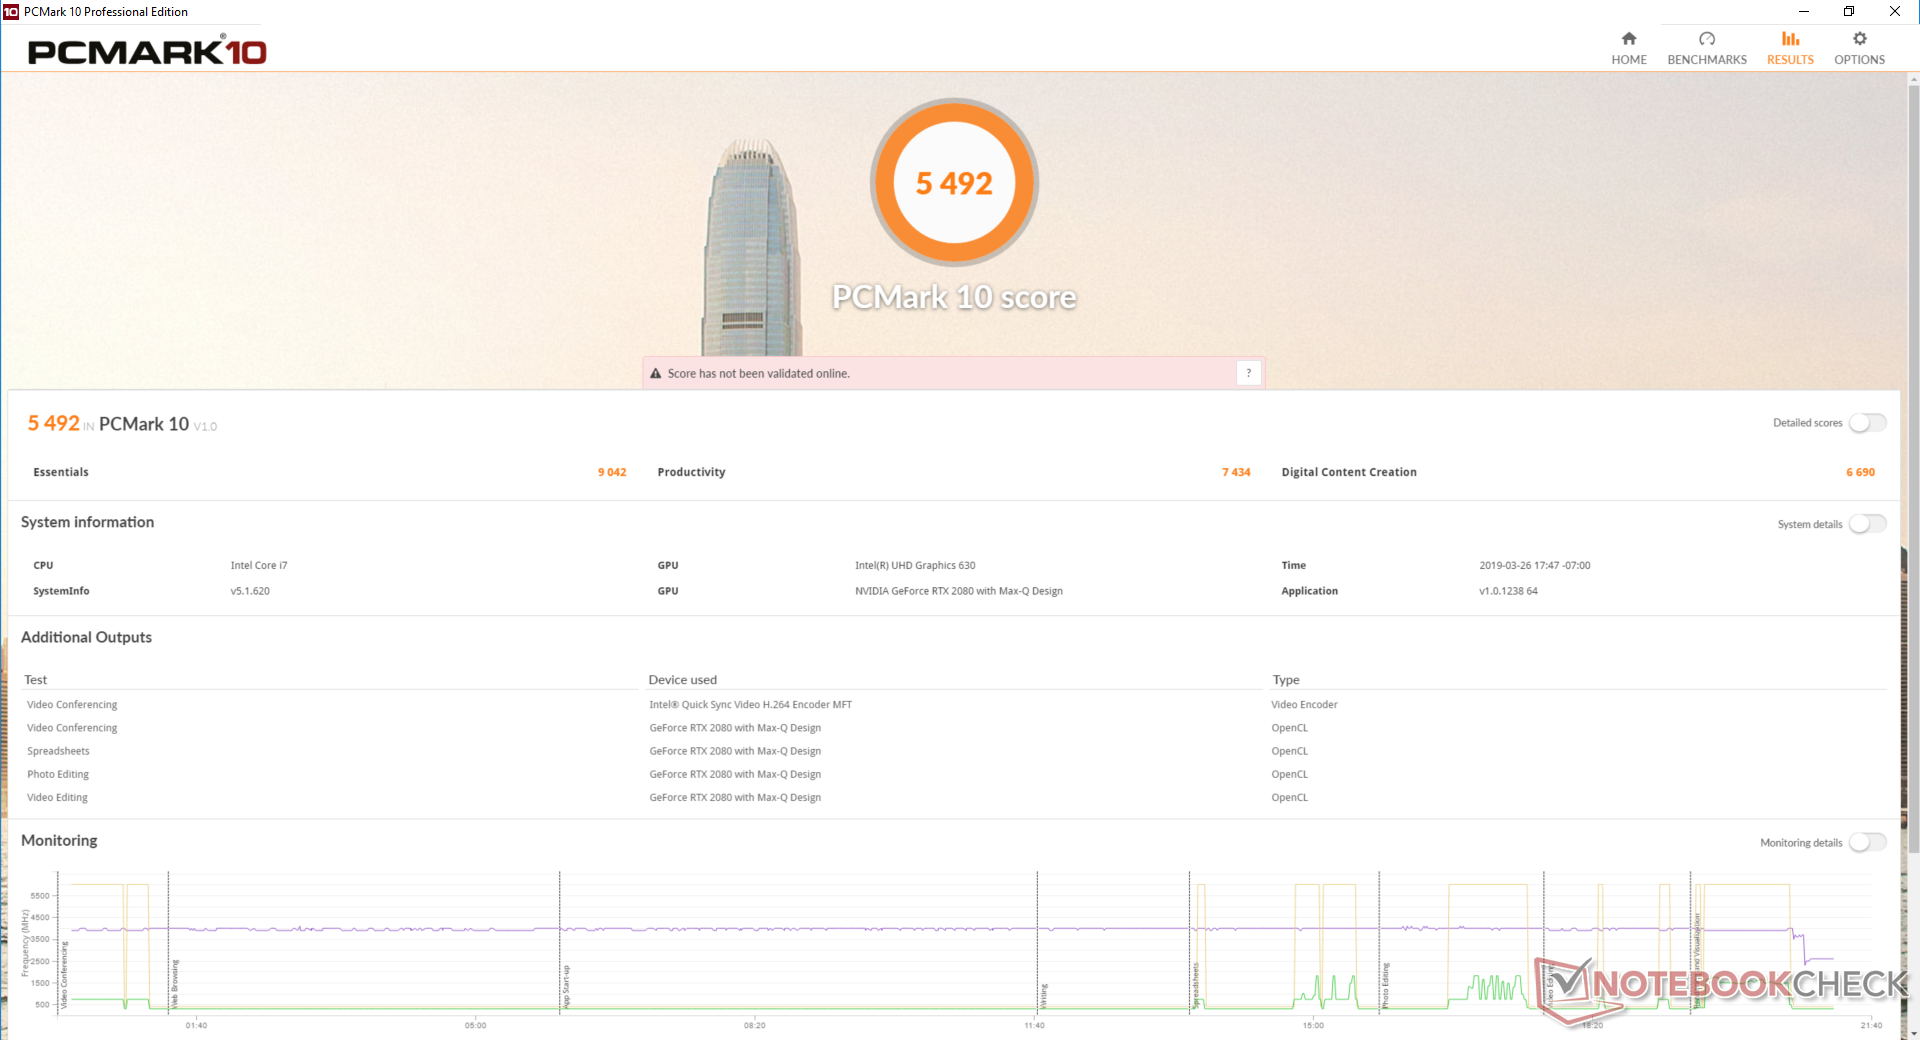
PCMark benchmarks are nearly identical to other high-end gaming laptops including the Blade 15, Alienware m15, and Aorus 15. its Digital Content Creation score, however, is a bit lower than expected. We otherwise did not experience any software or hardware issues on our test unit.
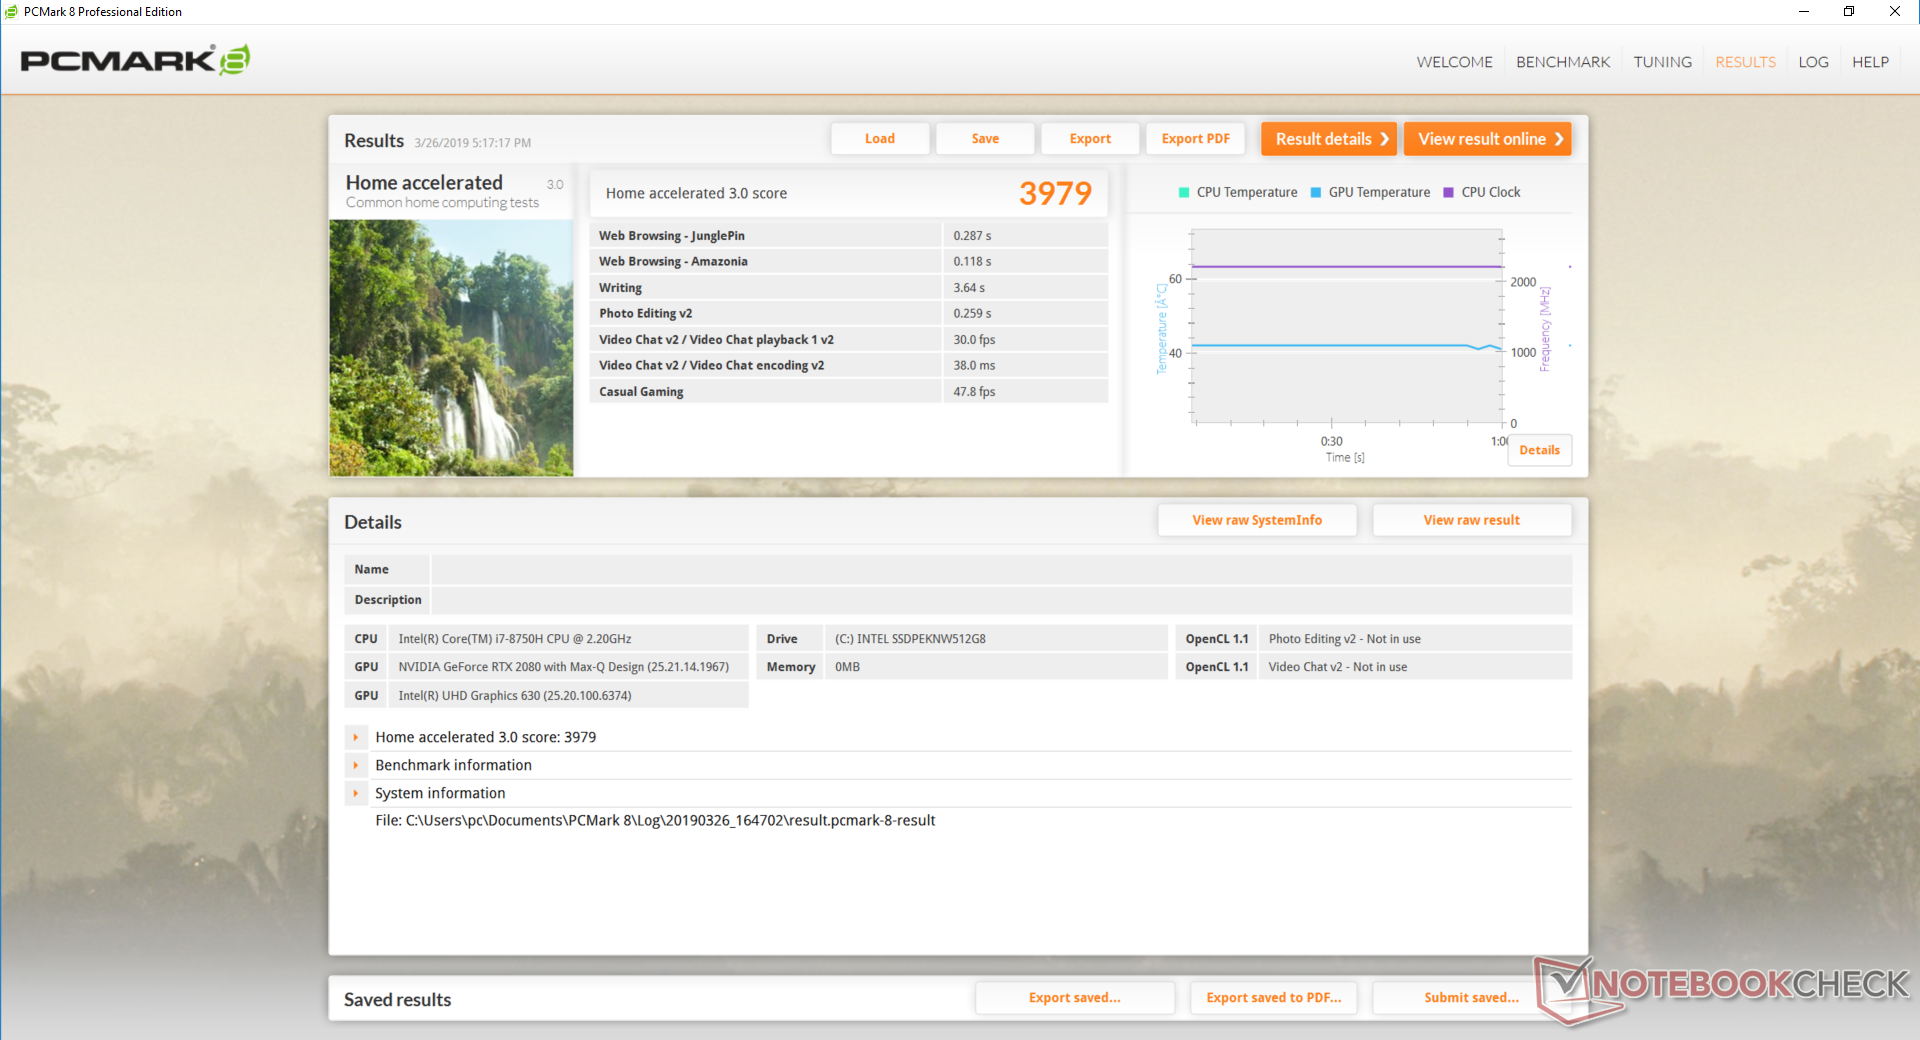
| PCMark 8 Home Score Accelerated v2 | 3979 points | |
| PCMark 8 Work Score Accelerated v2 | 5289 points | |
| PCMark 10 Score | 5492 points | |
Help | ||
Storage Devices
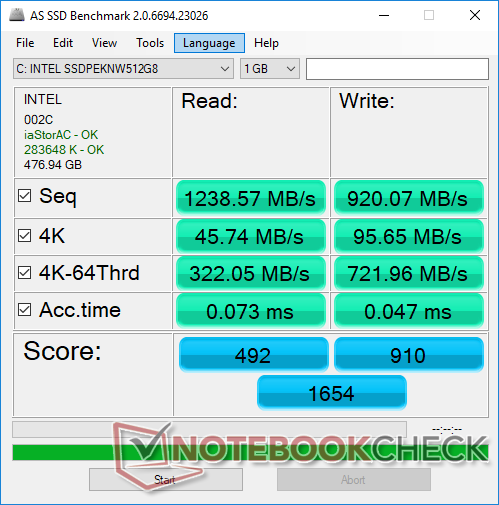
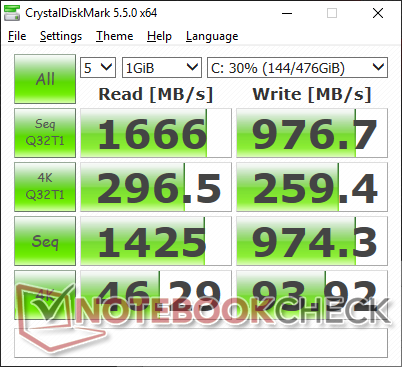
There is only one internal storage slot compared to two or more on most other 15-inch gaming laptops like the Aorus 15 or Asus' own GL504 series. The 512 GB Intel SSD 660p on our unit is a budget NVMe offering in contrast to the pricier Intel SSD 760p. Sequential read and write rates are still at least two times faster than any SATA III SSD but nowhere near the performance of a Samsung SSD PM981.
See our table of HDDs and SSDs for more benchmark comparisons.
| Asus Zephyrus S GX531GX Intel SSD 660p SSDPEKNW512G8 | Aorus 15 X9 Intel SSD 760p SSDPEKKW512G8 | Razer Blade 15 RTX 2070 Max-Q Samsung SSD PM981 MZVLB512HAJQ | Asus Strix GL504GM Toshiba NVMe THNSN5256GPU7 | Asus Zephyrus S GX531GS WDC PC SN520 SDAPNUW-512G | |
|---|---|---|---|---|---|
| AS SSD | 40% | 83% | 20% | 50% | |
| Seq Read (MB/s) | 1239 | 1912 54% | 1840 49% | 1433 16% | 903 -27% |
| Seq Write (MB/s) | 920 | 1553 69% | 1822 98% | 1071 16% | 1261 37% |
| 4K Read (MB/s) | 45.74 | 56.5 24% | 52.3 14% | 32 -30% | 40.02 -13% |
| 4K Write (MB/s) | 95.7 | 119.6 25% | 110.7 16% | 96.5 1% | 103.6 8% |
| 4K-64 Read (MB/s) | 322 | 869 170% | 1126 250% | 832 158% | 1030 220% |
| 4K-64 Write (MB/s) | 722 | 584 -19% | 1717 138% | 520 -28% | 1285 78% |
| Access Time Read * (ms) | 0.073 | 0.049 33% | 0.047 36% | 0.072 1% | 0.129 -77% |
| Access Time Write * (ms) | 0.047 | 0.031 34% | 0.033 30% | 0.045 4% | 0.036 23% |
| Score Read (Points) | 492 | 1116 127% | 1362 177% | 1007 105% | 1161 136% |
| Score Write (Points) | 910 | 859 -6% | 2010 121% | 724 -20% | 1515 66% |
| Score Total (Points) | 1654 | 2544 54% | 4079 147% | 2233 35% | 3294 99% |
| Copy ISO MB/s (MB/s) | 1236 | 1329 8% | 1975 60% | 1006 -19% | |
| Copy Program MB/s (MB/s) | 703 | 404.3 -42% | 526 -25% | 752 7% | |
| Copy Game MB/s (MB/s) | 812 | 1071 32% | 1200 48% | 1088 34% |
* ... smaller is better

GPU Performance
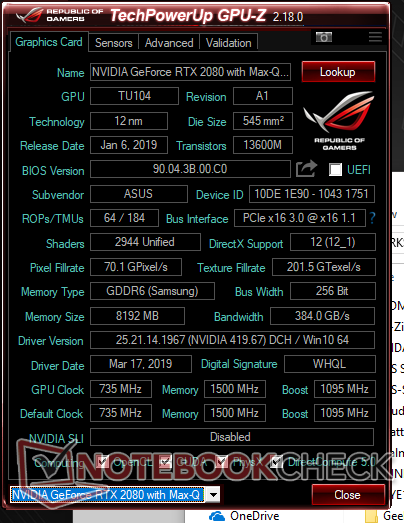
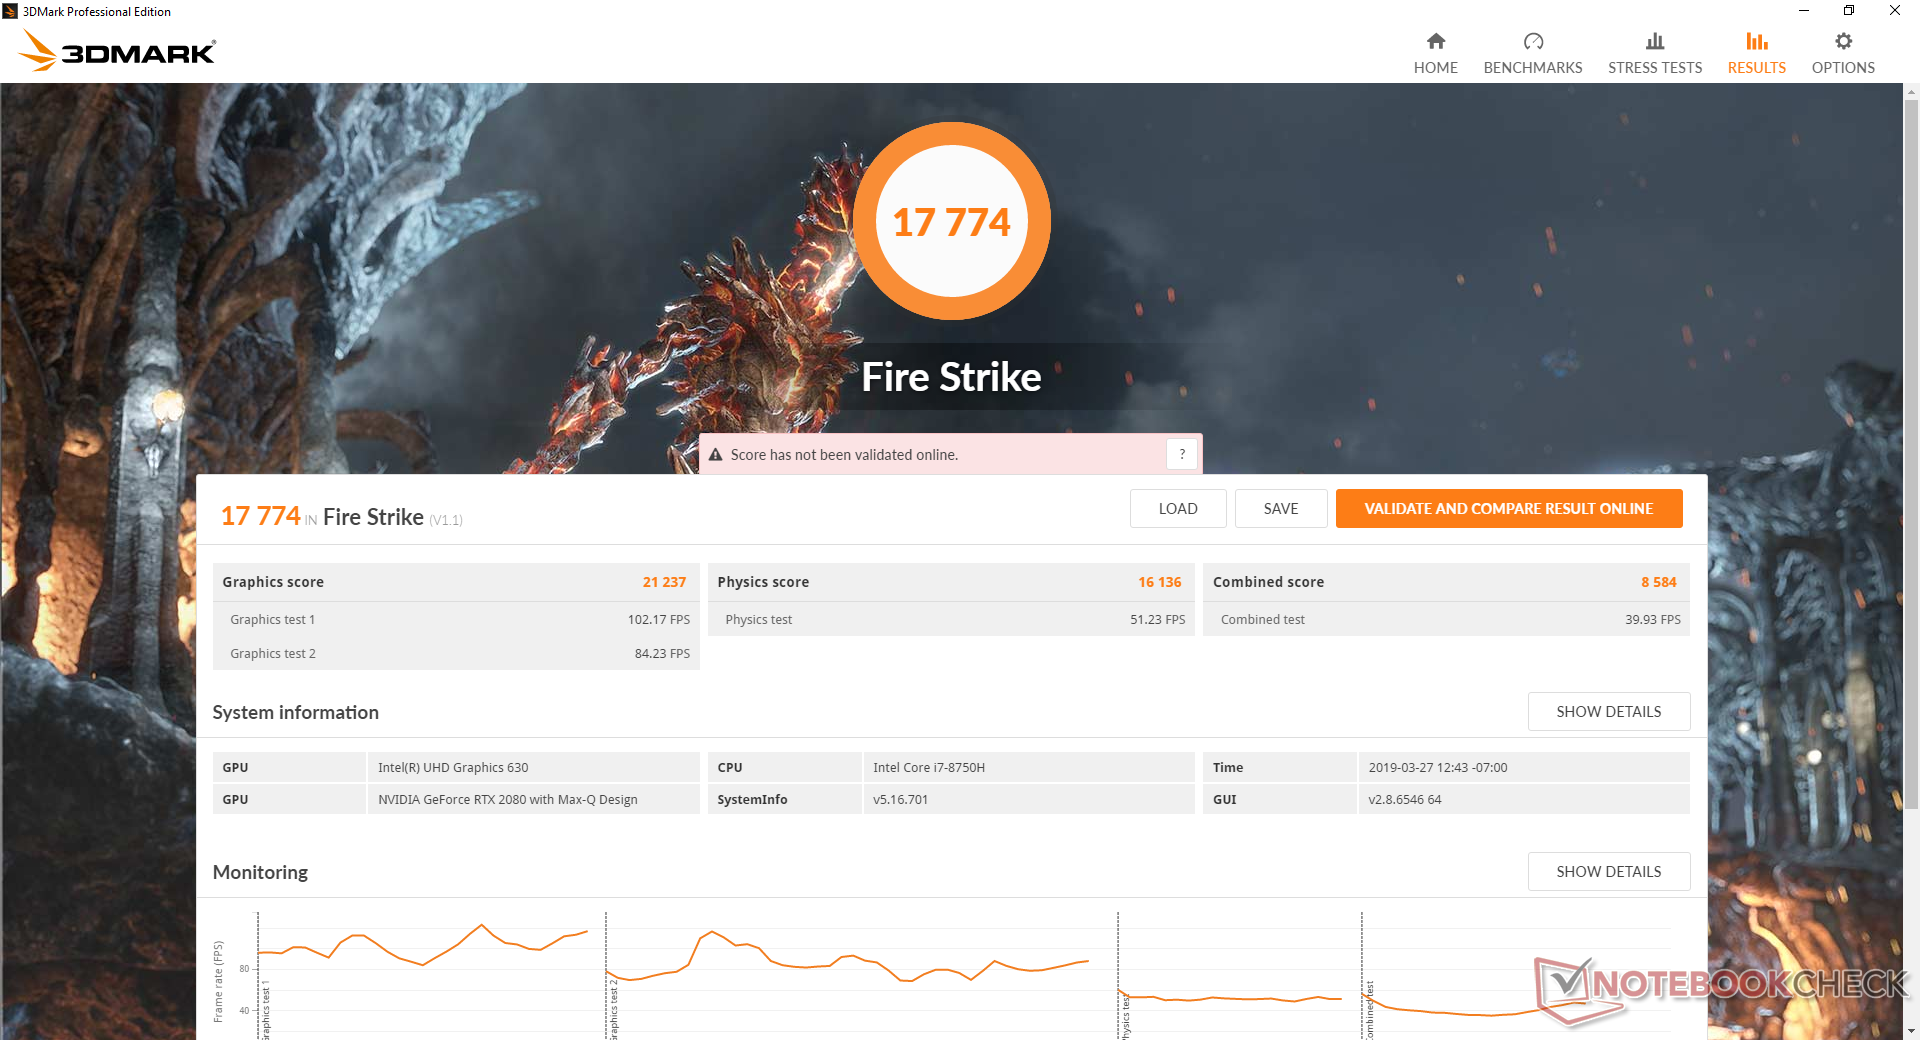
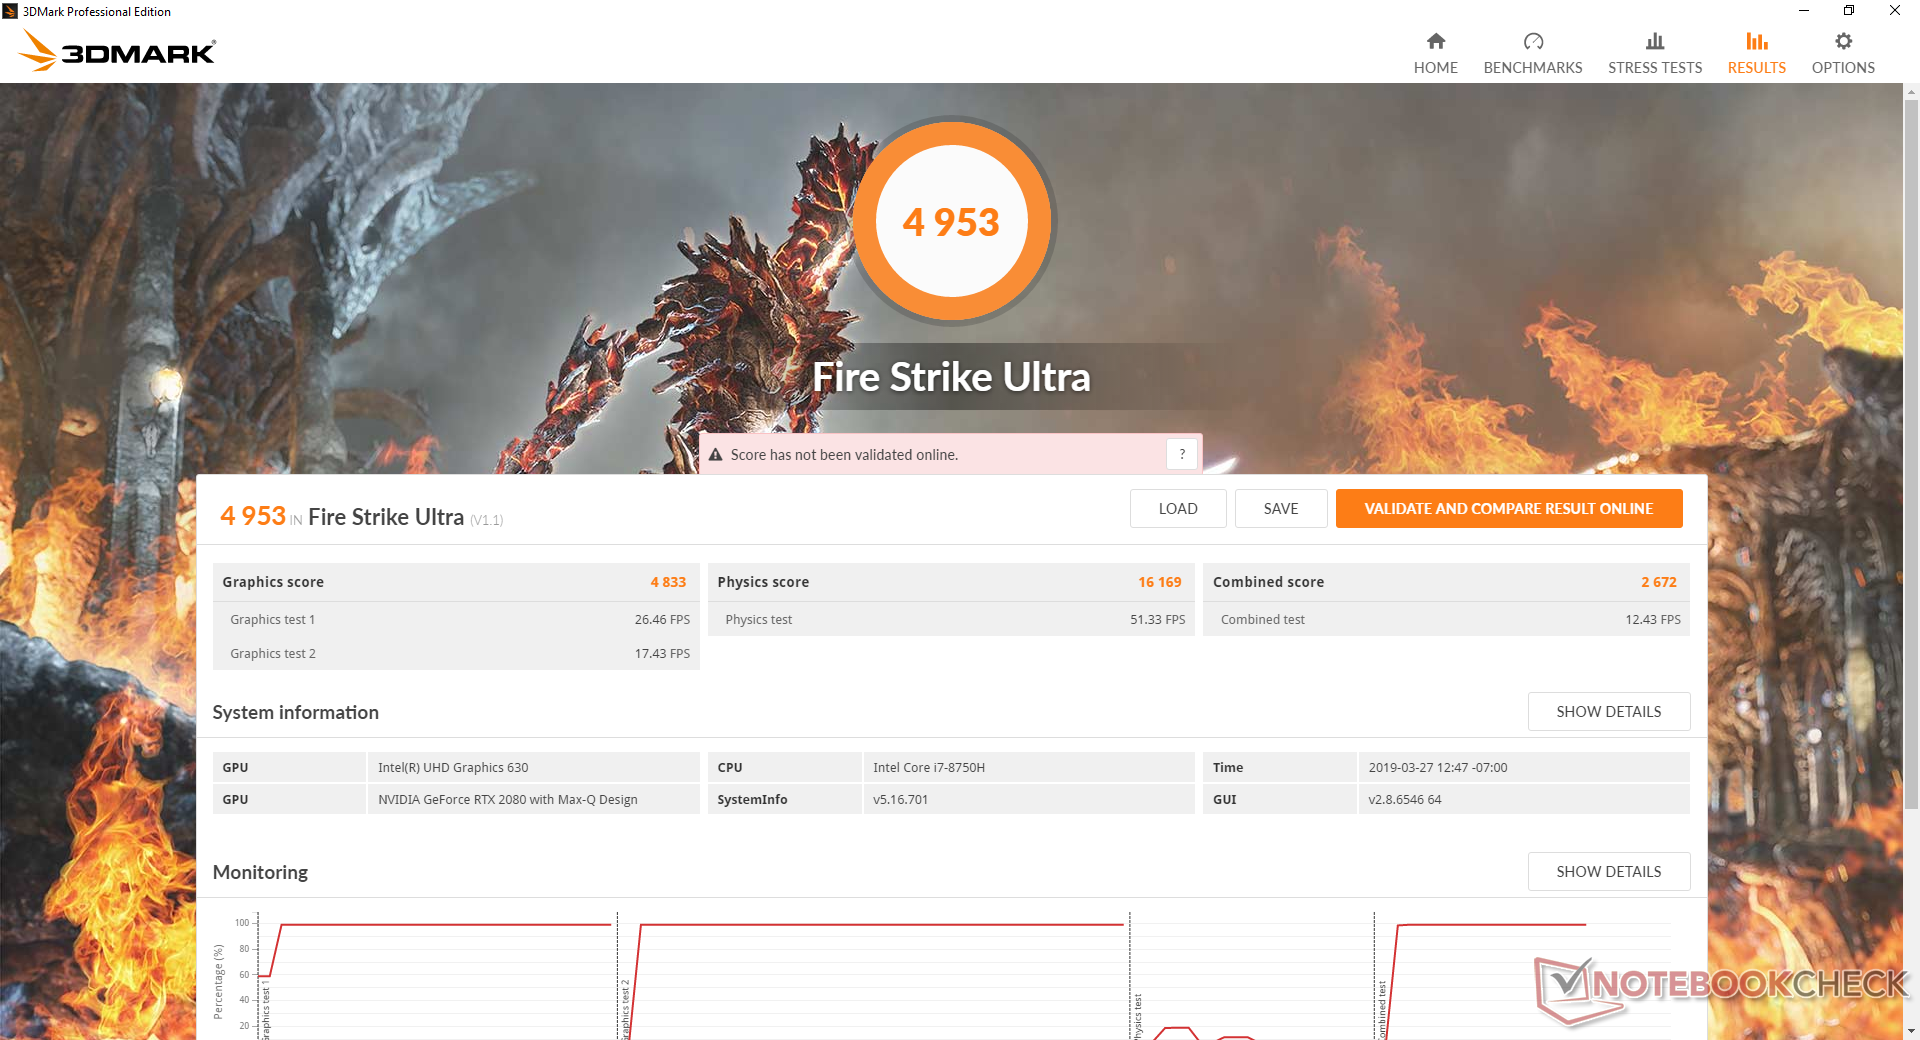
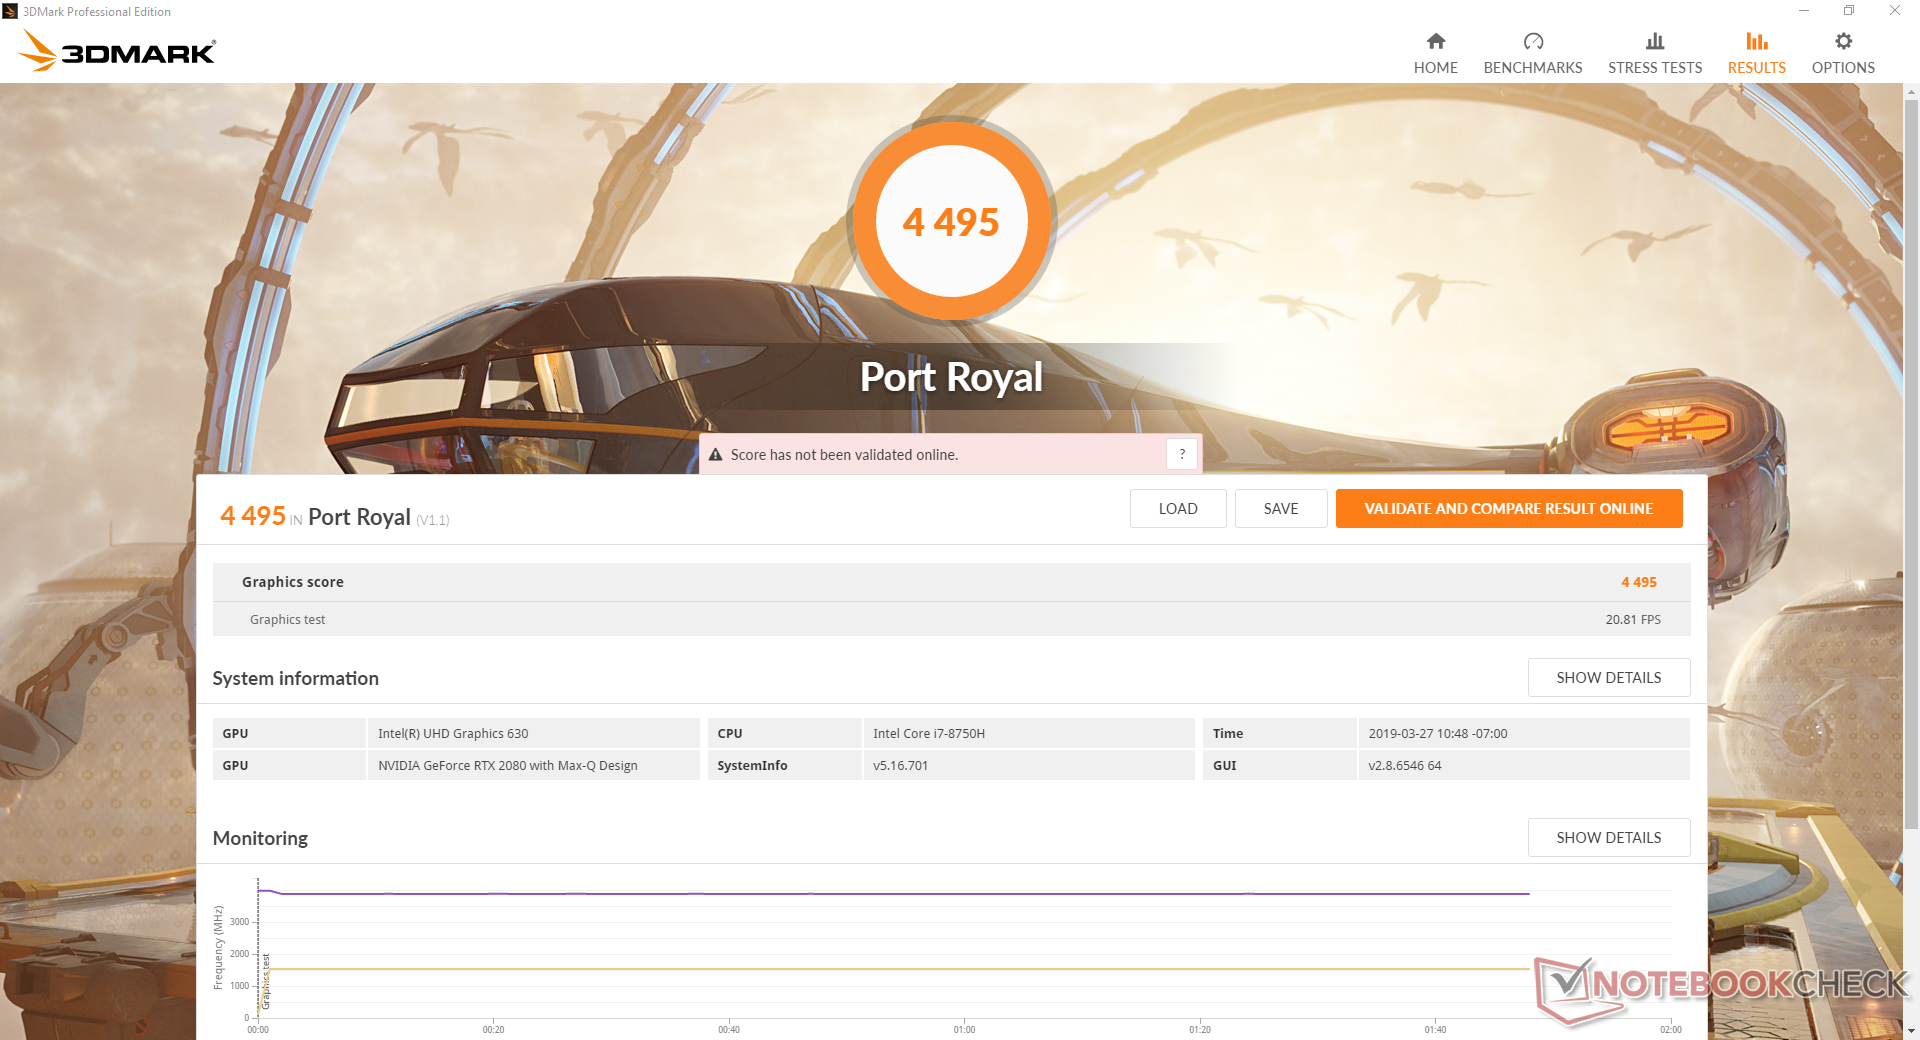
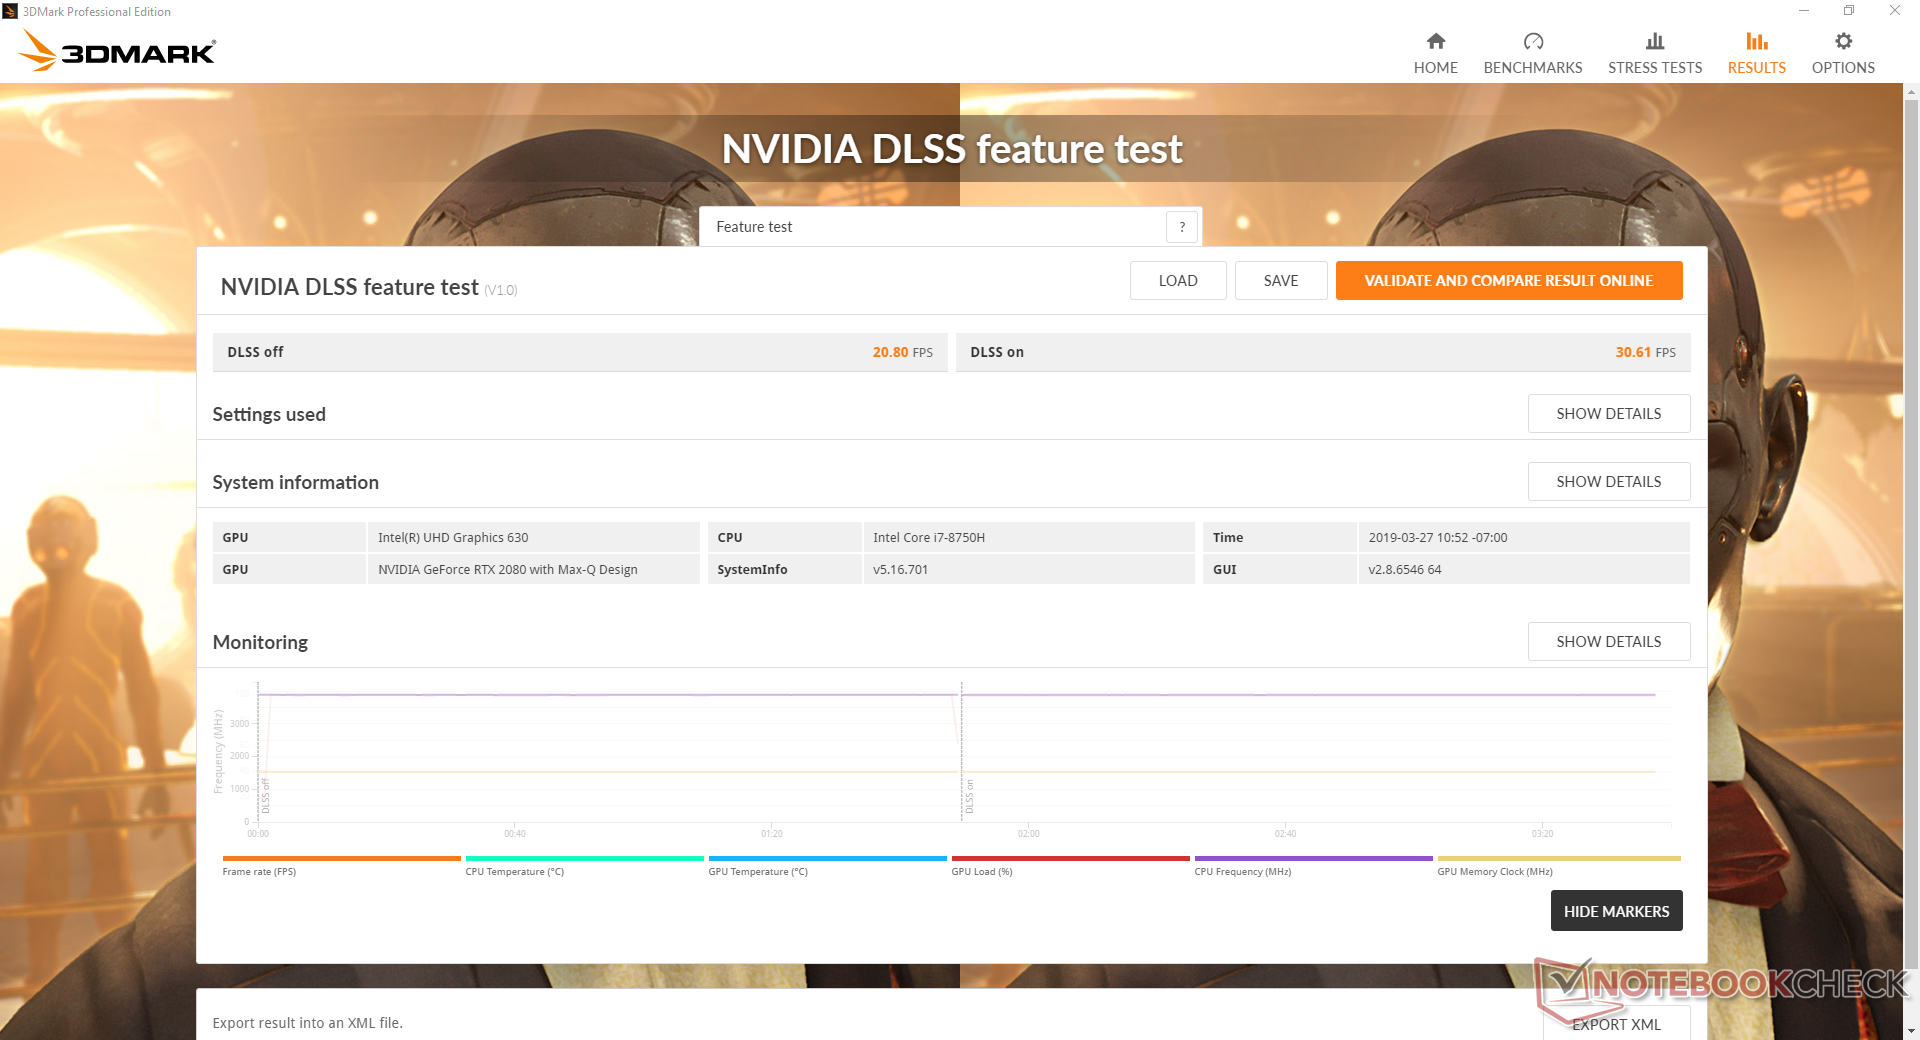
3DMark results are within a few percentage points of the standard GTX 1080 or RTX 2070 for laptops. When compared to the last generation GTX 1080 Max-Q in the older GX501, the RTX 2080 Max-Q can be 17 to 45 percent faster. The performance delta between the two GPUs becomes greater at higher resolutions and when DX12 is enabled.
The standard RTX 2080 for laptops is still about 25 to 30 percent faster than the RTX 2080 Max-Q. We can observe no recurring frame rate dips when running Witcher 3 to suggest no interrupting background activity when gaming.
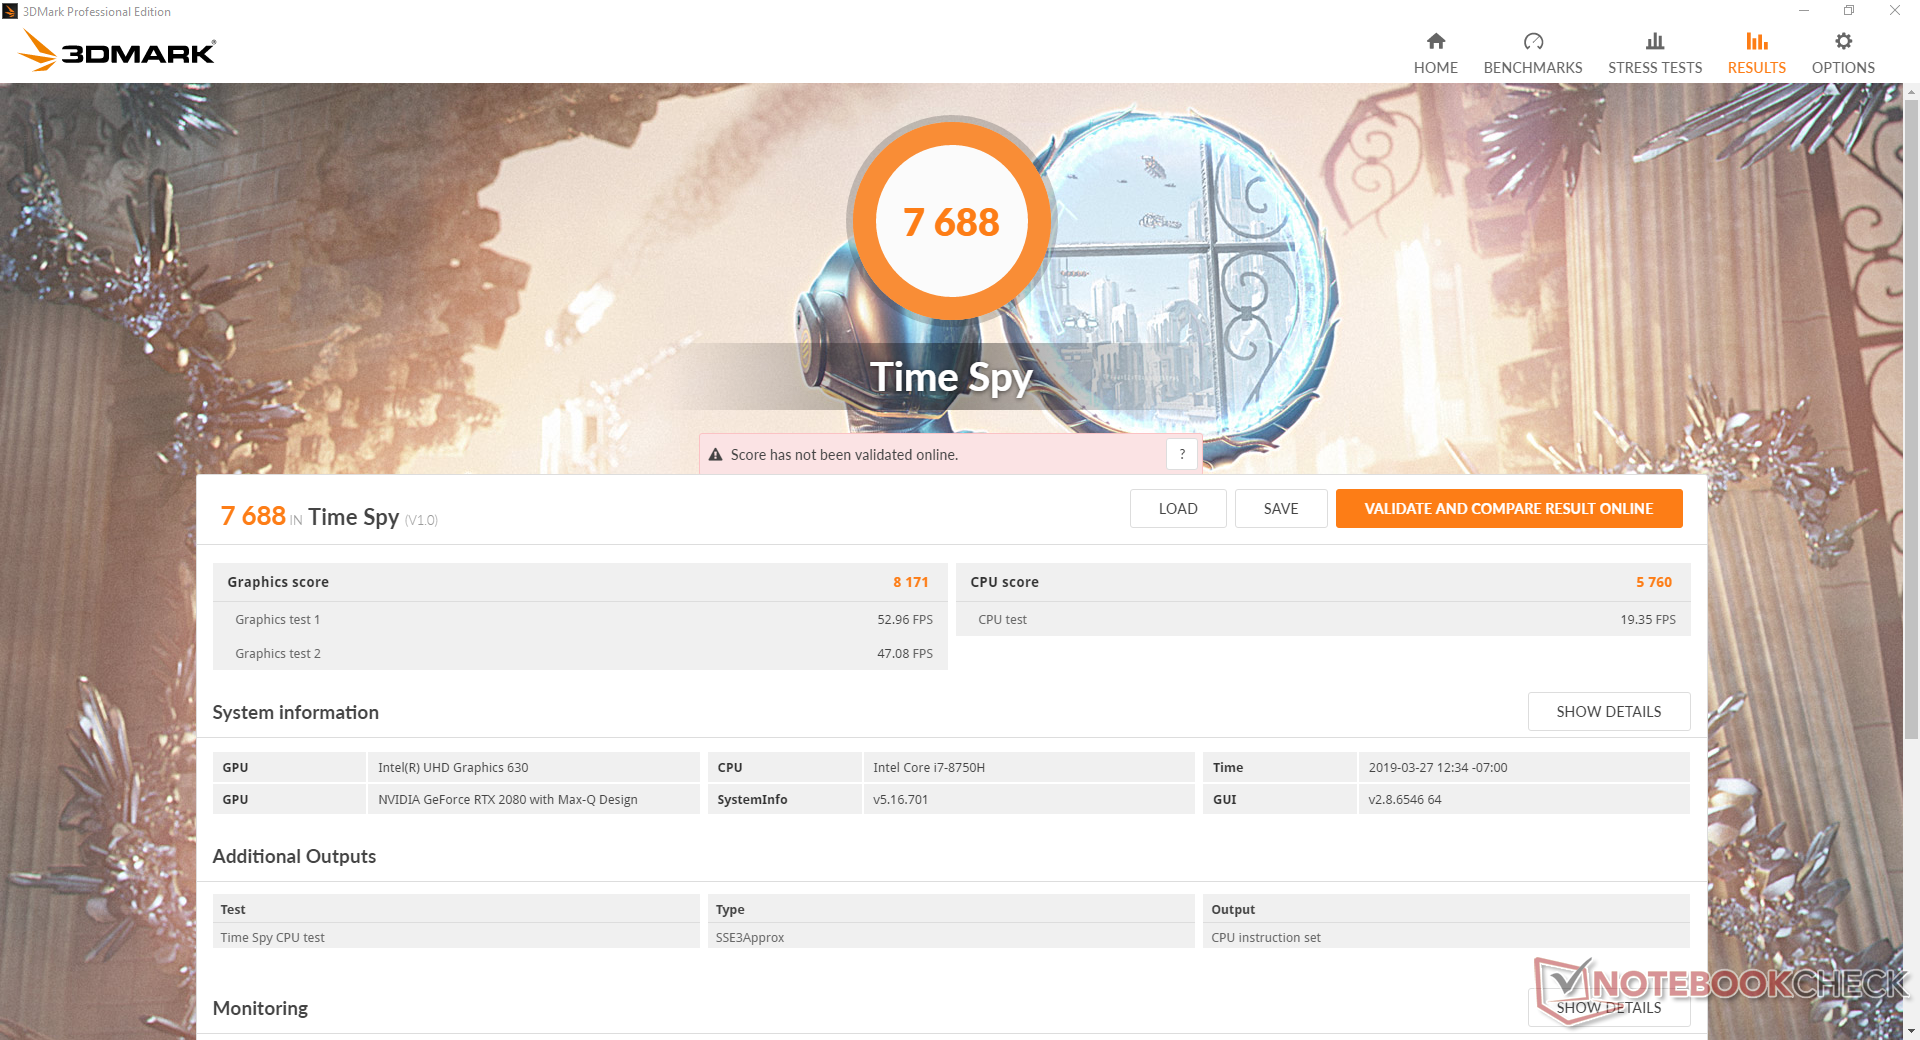
Remember to set the laptop to Turbo Mode through the Armoury Crate software if you want the full performance of the GPU. When running 3DMark Time Spy on Balanced Mode, for example, the GPU score is only 7376 points to represent a performance dip of almost 10 percent.
See our review on the Nvidia Turing series and our dedicated page on the RTX 2080 Max-Q for more benchmark comparisons.
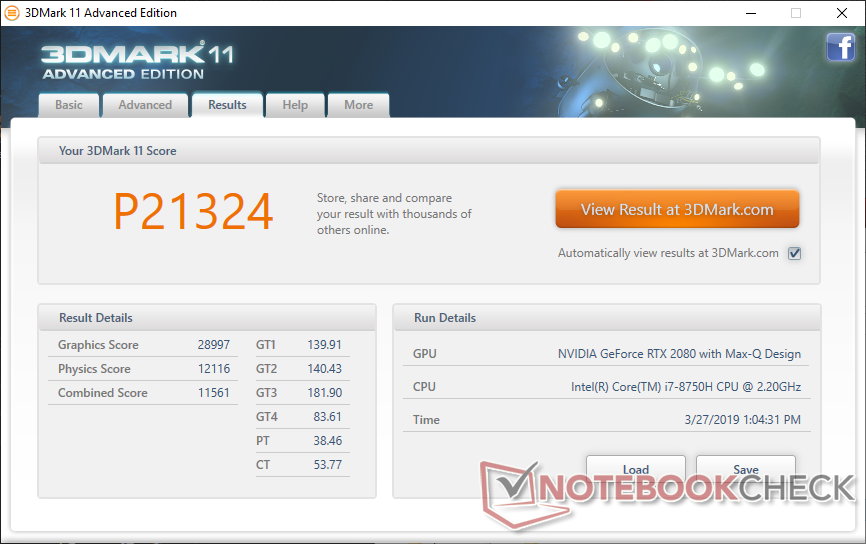
| 3DMark 11 Performance | 21324 points | |
| 3DMark Cloud Gate Standard Score | 32978 points | |
| 3DMark Fire Strike Score | 17774 points | |
| 3DMark Time Spy Score | 7688 points | |
Help | ||
| low | med. | high | ultra | |
|---|---|---|---|---|
| BioShock Infinite (2013) | 276.8 | 246.7 | 232.3 | 166 |
| The Witcher 3 (2015) | 263.4 | 215.2 | 142 | 80.3 |
| Rise of the Tomb Raider (2016) | 215 | 163.6 | 146.5 | 124 |
Emissions
System Noise
The cooling solution consists of two 12 V fans, five heat pipes, and four heat sinks. Fan noise remains the same as on last year's GX531GS. The twin fans are quiet when set to Silent Mode even though they are never truly idle. When set to Turbo Mode, expect a base fan noise of 38 dB(A) even when no applications are running.
Fan noise becomes more complicated when gaming as it depends on the Armoury Crate performance setting. When set to Balanced Mode, for example, fan noise when running Witcher 3 remains steady 51.7 dB(A). In contrast, fan noise when gaming in Turbo Mode is much louder at 56.6 dB(A). Users who want the full performance of the laptop must choose the louder option. Competing laptops like the Blade 15 and MSI GS65 are able to run much quieter.
Fan pulsing behavior still occurs even in Silent Mode, but it is thankfully minor and not often enough to be distracting. We can notice some slight coil whine on our test unit that's also very minor and of no concern during regular use.
| Asus Zephyrus S GX531GX GeForce RTX 2080 Max-Q, i7-8750H, Intel SSD 660p SSDPEKNW512G8 | Aorus 15 X9 GeForce RTX 2070 Mobile, i7-8750H, Intel SSD 760p SSDPEKKW512G8 | Alienware m15 GTX 1070 Max-Q GeForce GTX 1070 Max-Q, i7-8750H, Toshiba XG5 KXG50ZNV512G | Razer Blade 15 RTX 2070 Max-Q GeForce RTX 2070 Max-Q, i7-8750H, Samsung SSD PM981 MZVLB512HAJQ | Asus Strix GL504GM GeForce GTX 1060 Mobile, i7-8750H, Toshiba NVMe THNSN5256GPU7 | Asus Zephyrus GX501 GeForce GTX 1080 Max-Q, i7-7700HQ, Samsung SSD SM961 1TB M.2 MZVKW1T0HMLH | Asus Zephyrus S GX531GS GeForce GTX 1070 Max-Q, i7-8750H, WDC PC SN520 SDAPNUW-512G | |
|---|---|---|---|---|---|---|---|
| Noise | -0% | 8% | 13% | 7% | 5% | -4% | |
| off / environment * (dB) | 28.7 | 28.2 2% | 28.6 -0% | 28.8 -0% | 28.5 1% | 31 -8% | 29 -1% |
| Idle Minimum * (dB) | 29.8 | 32.6 -9% | 28.6 4% | 28.8 3% | 30 -1% | 32 -7% | 33 -11% |
| Idle Average * (dB) | 32.4 | 32.7 -1% | 28.6 12% | 28.8 11% | 30 7% | 33 -2% | 34 -5% |
| Idle Maximum * (dB) | 38 | 32.7 14% | 28.6 25% | 29.4 23% | 30 21% | 34 11% | 40 -5% |
| Load Average * (dB) | 38.2 | 38.9 -2% | 40.8 -7% | 35.7 7% | 41.8 -9% | 39 -2% | 47 -23% |
| Witcher 3 ultra * (dB) | 56.6 | 51.8 8% | 49.6 12% | 42.5 25% | 47.6 16% | 42 26% | 51 10% |
| Load Maximum * (dB) | 56.6 | 64.1 -13% | 49.6 12% | 45 20% | 50 12% | 46 19% | 53 6% |
* ... smaller is better
Noise level
| Idle |
| 29.8 / 32.4 / 38 dB(A) |
| Load |
| 38.2 / 56.6 dB(A) |
 | ||
30 dB silent 40 dB(A) audible 50 dB(A) loud |
||
min: | ||
Temperature
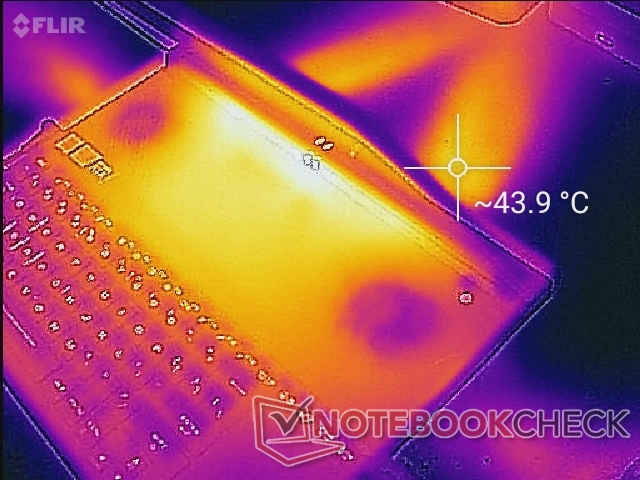
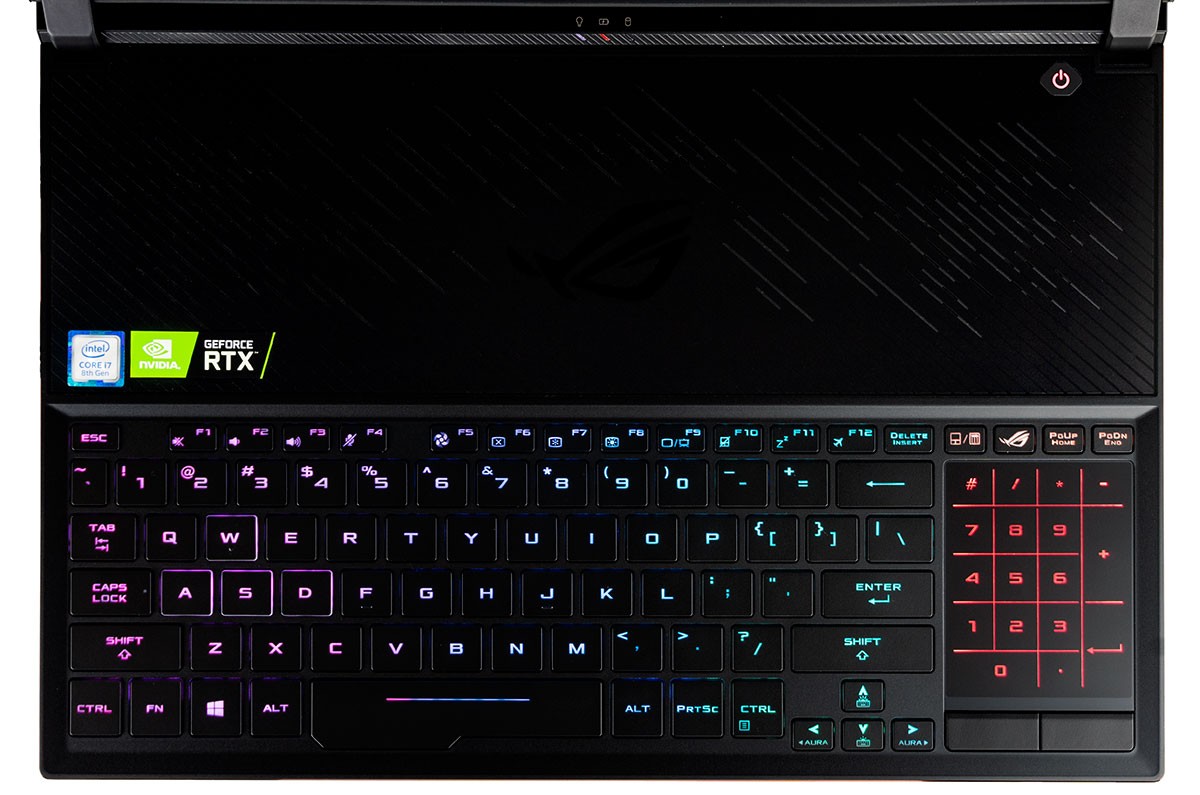
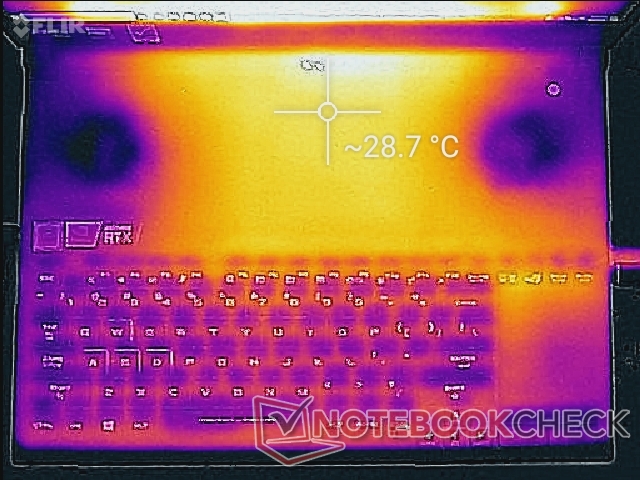
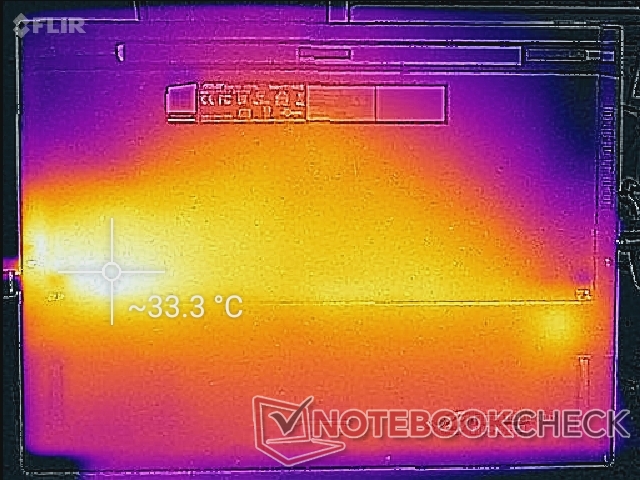
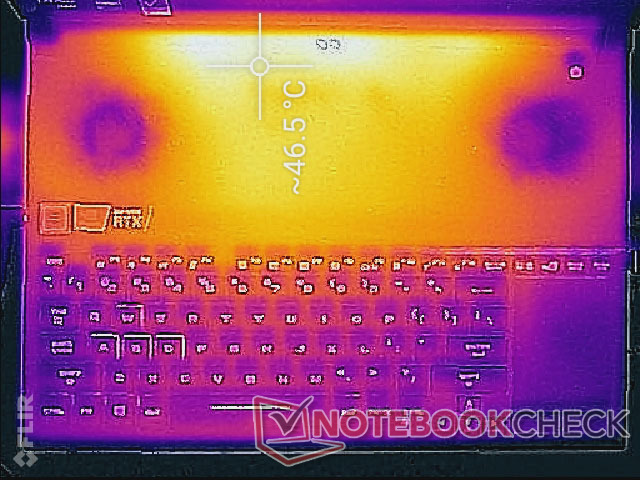
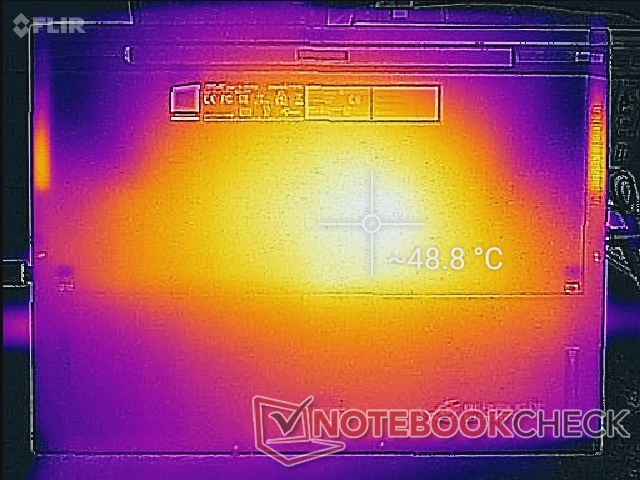
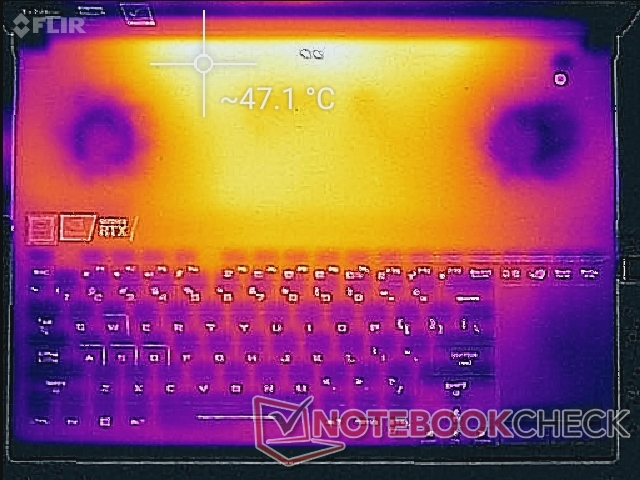
The keyboard will always be cooler than the rest of the laptop because of its unique positioning. On most other laptops, the fans and heat pipes would be directly underneath the keyboard instead for warmer keys when gaming.
When running Witcher 3, surface temperatures can become as warm as 46 C to 49 C. These hot spots are fortunately nowhere near the keyboard keys. In comparison, the keyboard on the Razer Blade 15 can be as warm as 42 C when under high processing stress.
Be sure to not place any books or papers on top of the fans when gaming or airflow will be impeded.
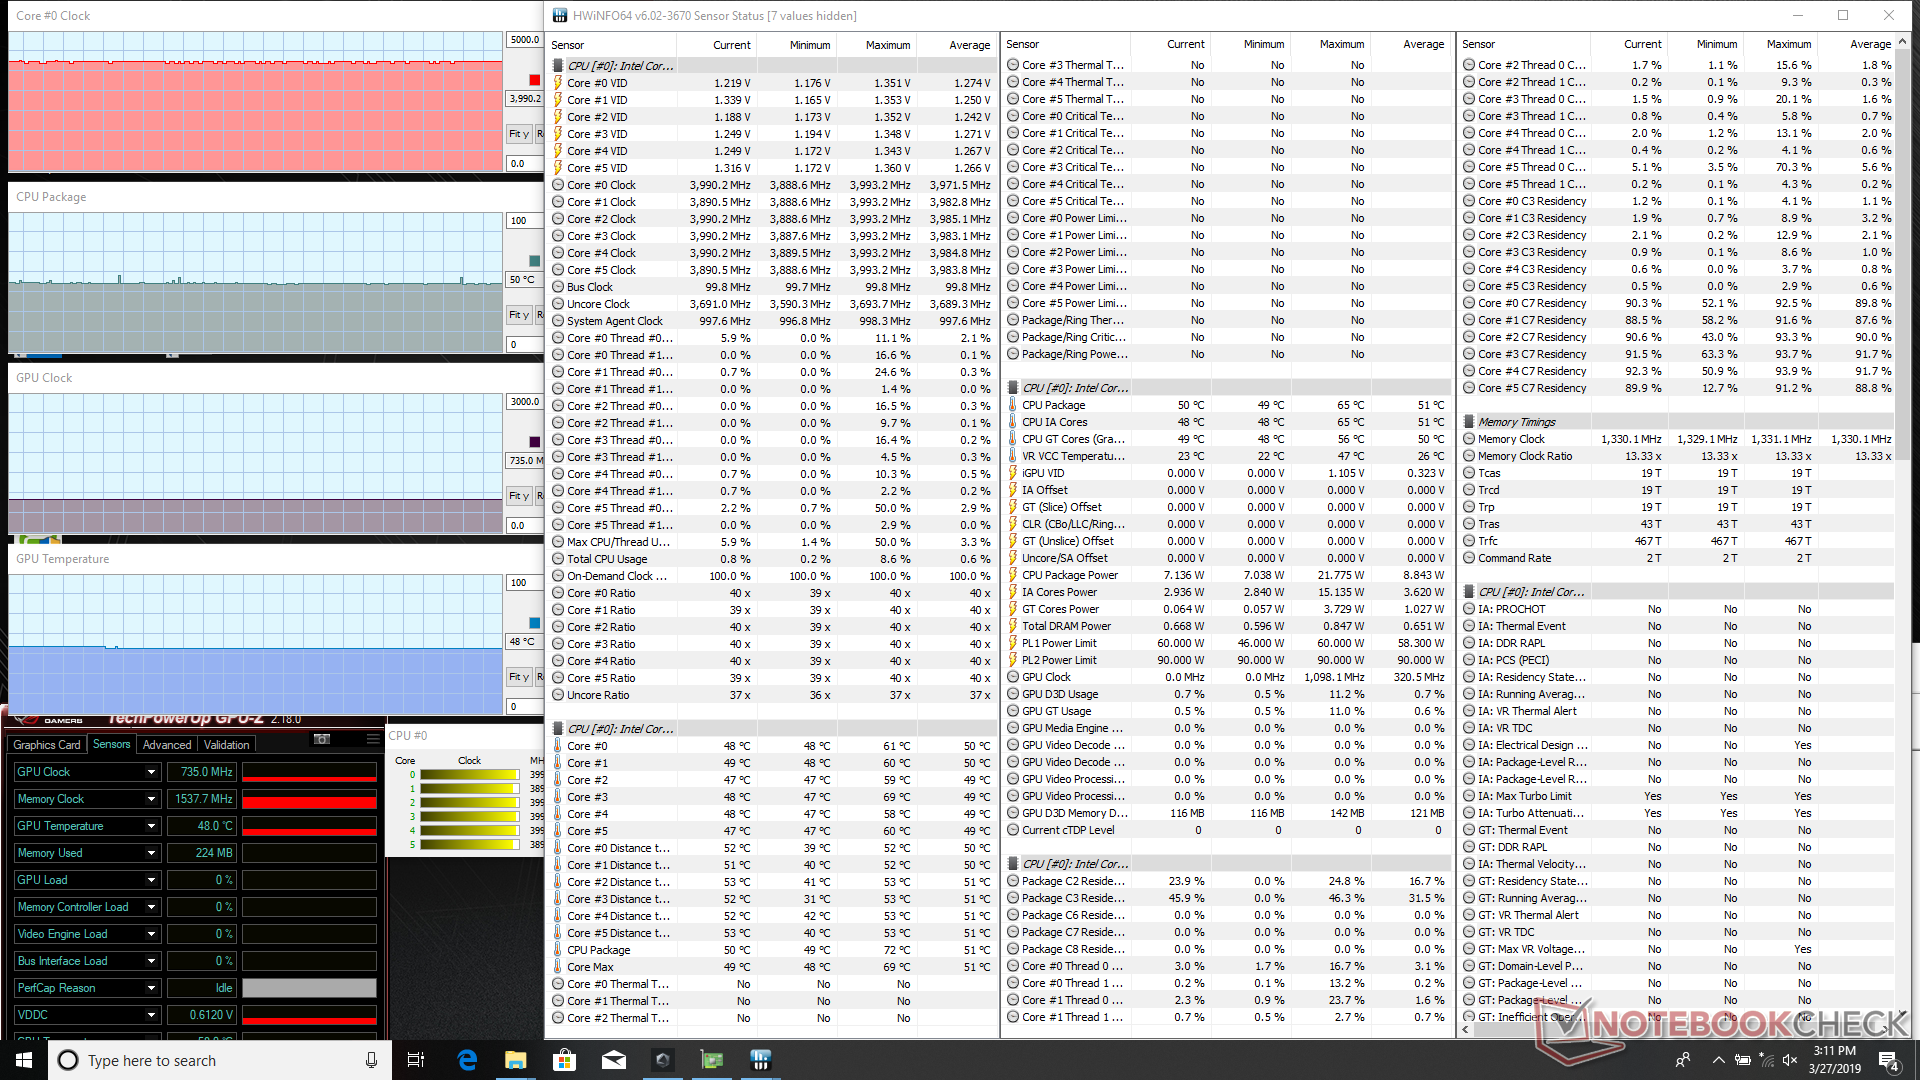
Stress Test
We stress the system with synthetic loads to identify for any potential throttling or stability issues. When running Prime95, CPU clock rates will be as high as 3.9 GHz for the first few seconds before reaching a core temperature of 95 C. Thereafter, clock rates drop to 2.9 GHz before rising again to stabilize at 3.2 to 3.3 GHz. This behavior reflects our CineBench R15 loop test above where the processor is fastest only during the initial loop before dropping and stabilizing in subsequent loops. The laptop is unable to maintain its maximum Turbo Boost clock rate of 3.9 GHz indefinitely, but that is perhaps to be expected from an ultra-thin design.
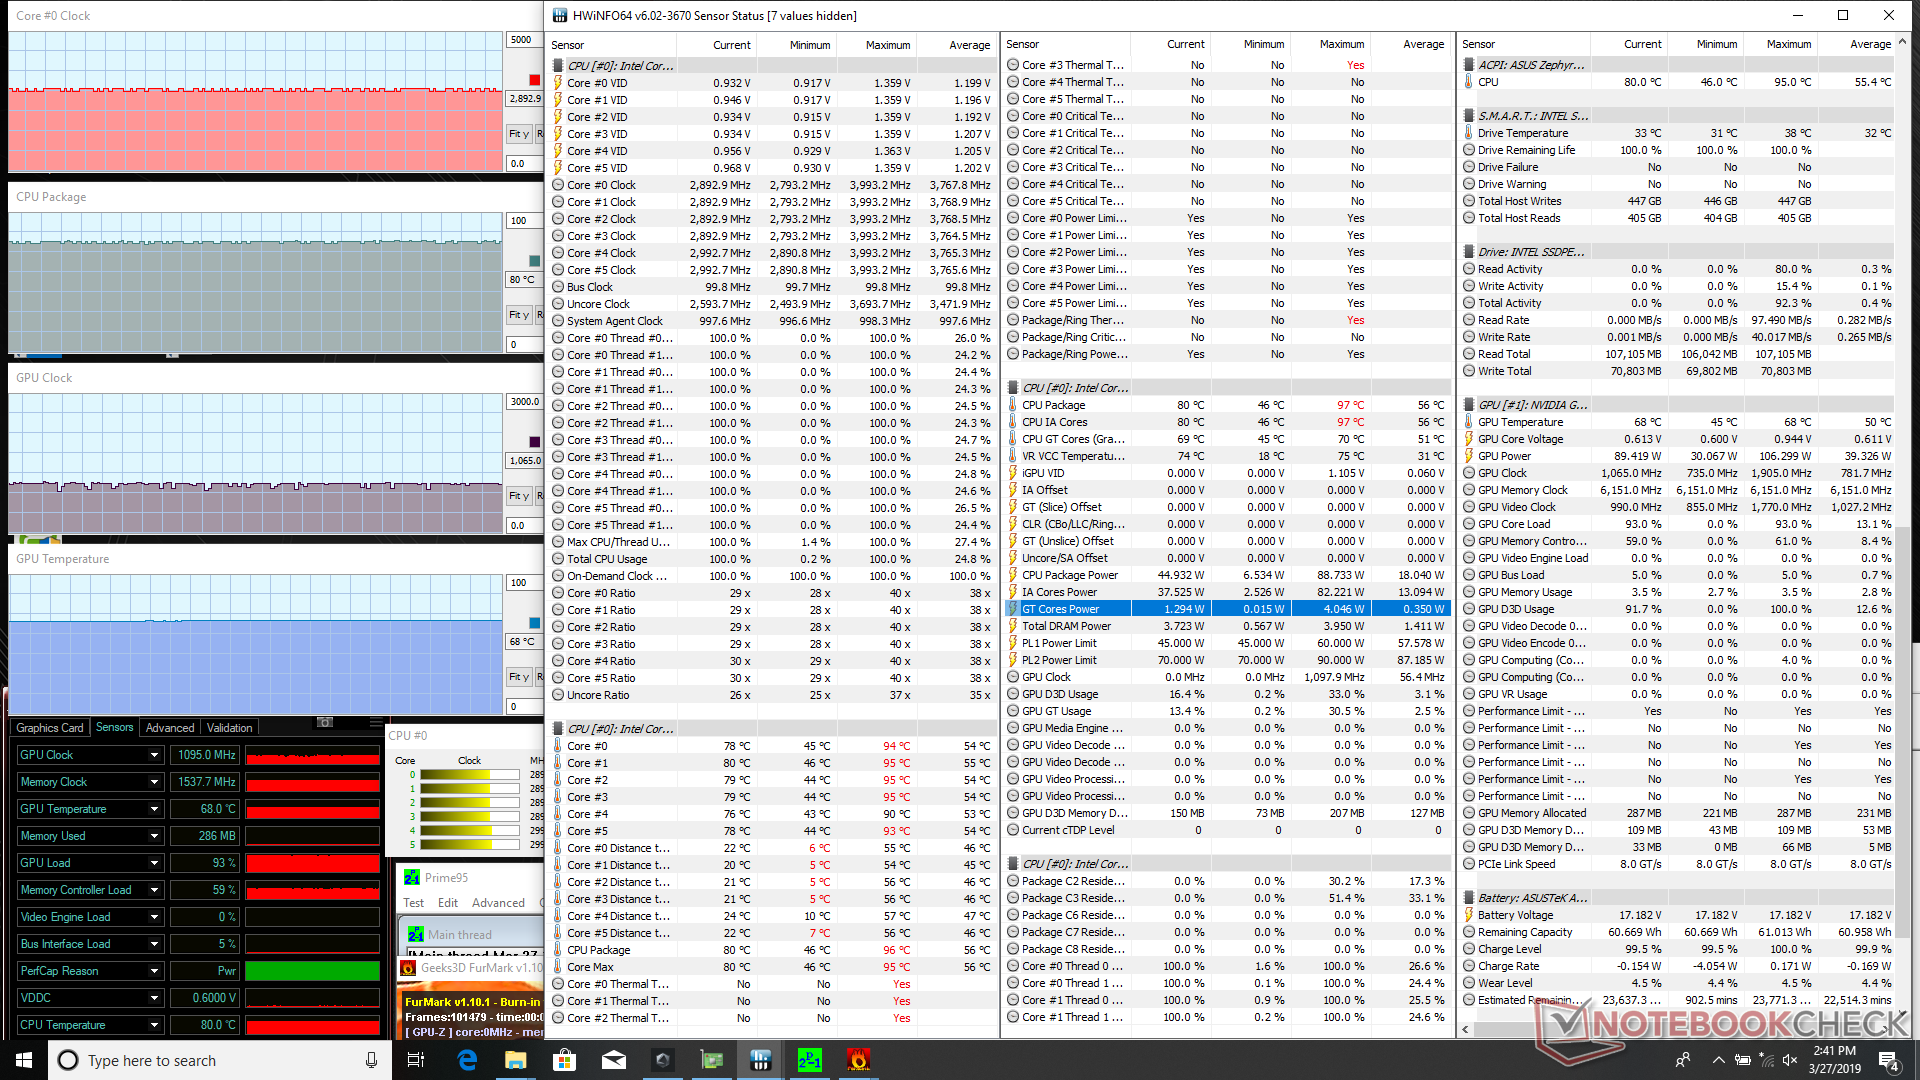
Running Witcher 3 is more representative of real-world gaming loads. The CPU and GPU stabilize at 76 C and 66 C, respectively, which are respectable numbers considering the form factor and demanding processors inside. The Razer Blade 15 with weaker RTX 2070 Max-Q graphics runs warmer at 74 C to 80 C when subjected to the same Witcher 3 load.
Running on batteries will reduce performance. A Fire Strike run on batteries returns Physics and Graphics scores of only 8067 and 6004 points, respectively, compared to 16136 and 21237 points when on mains.
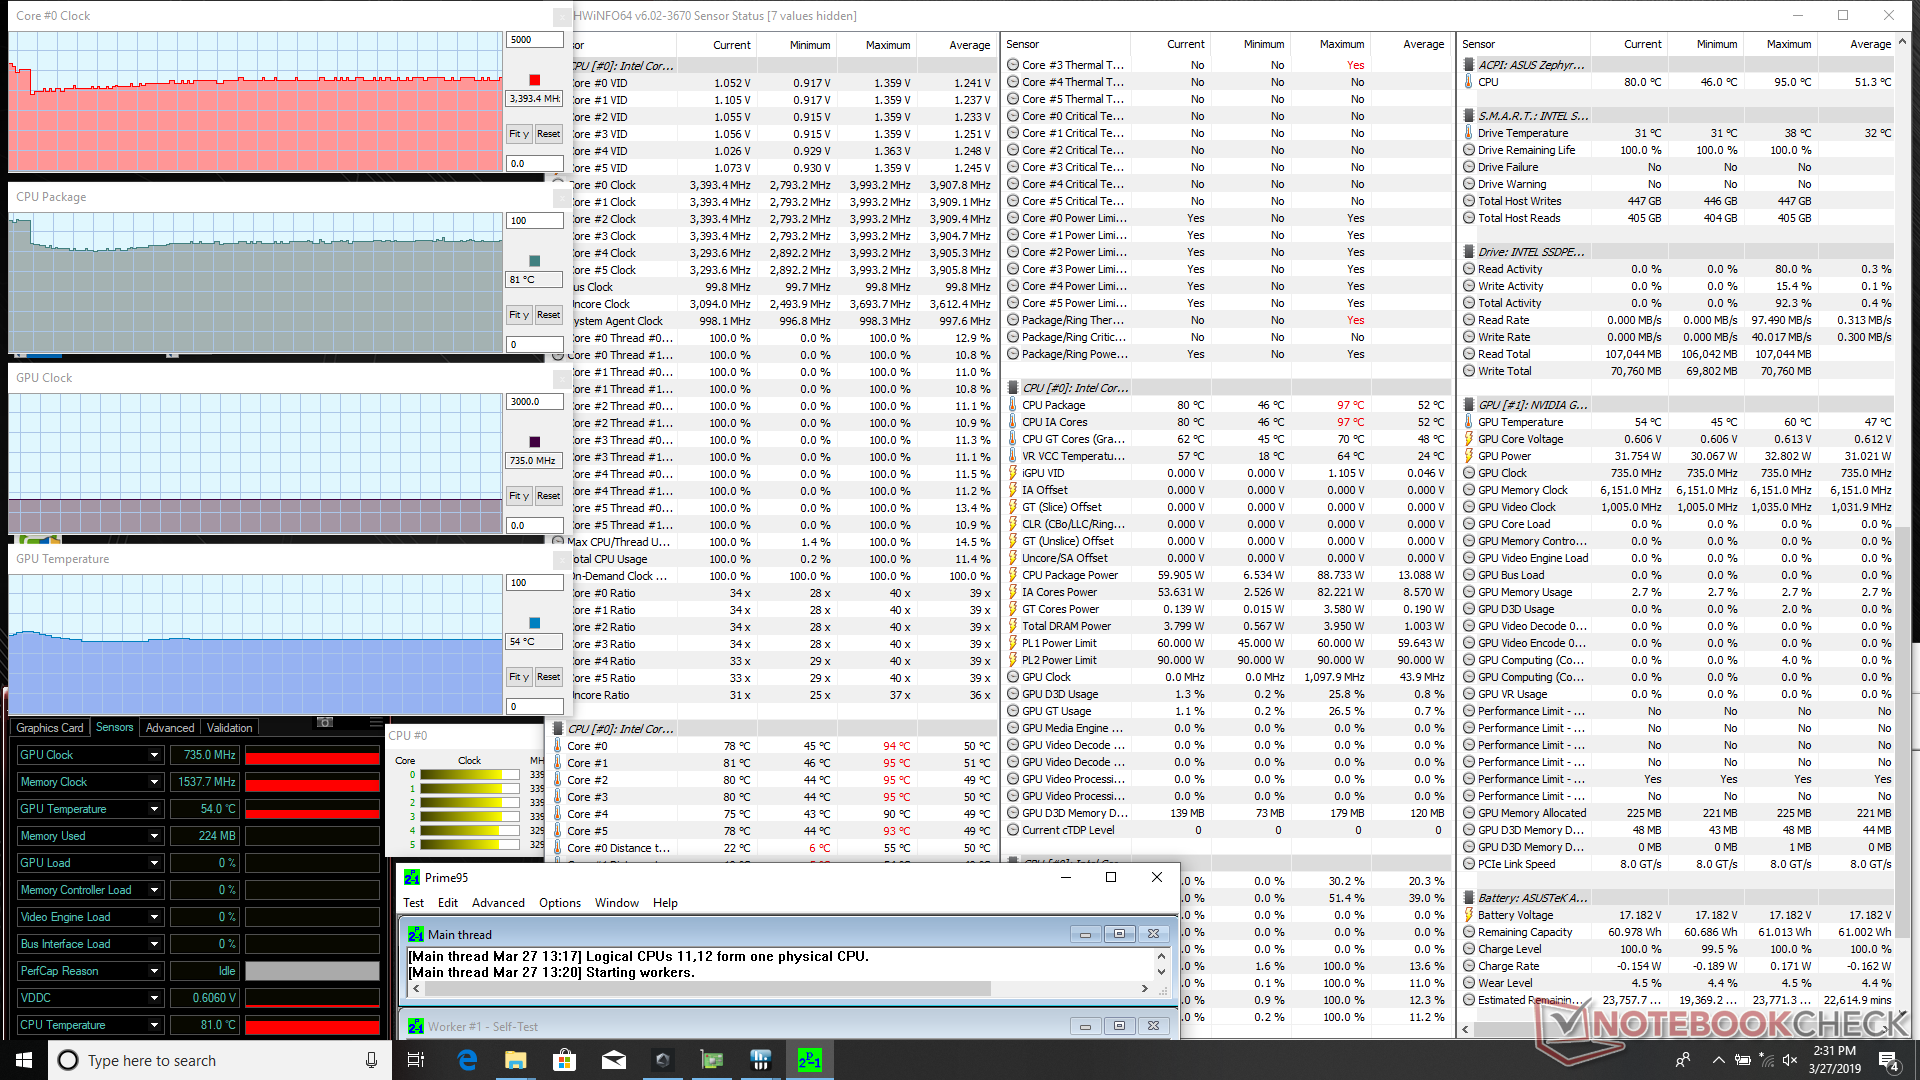
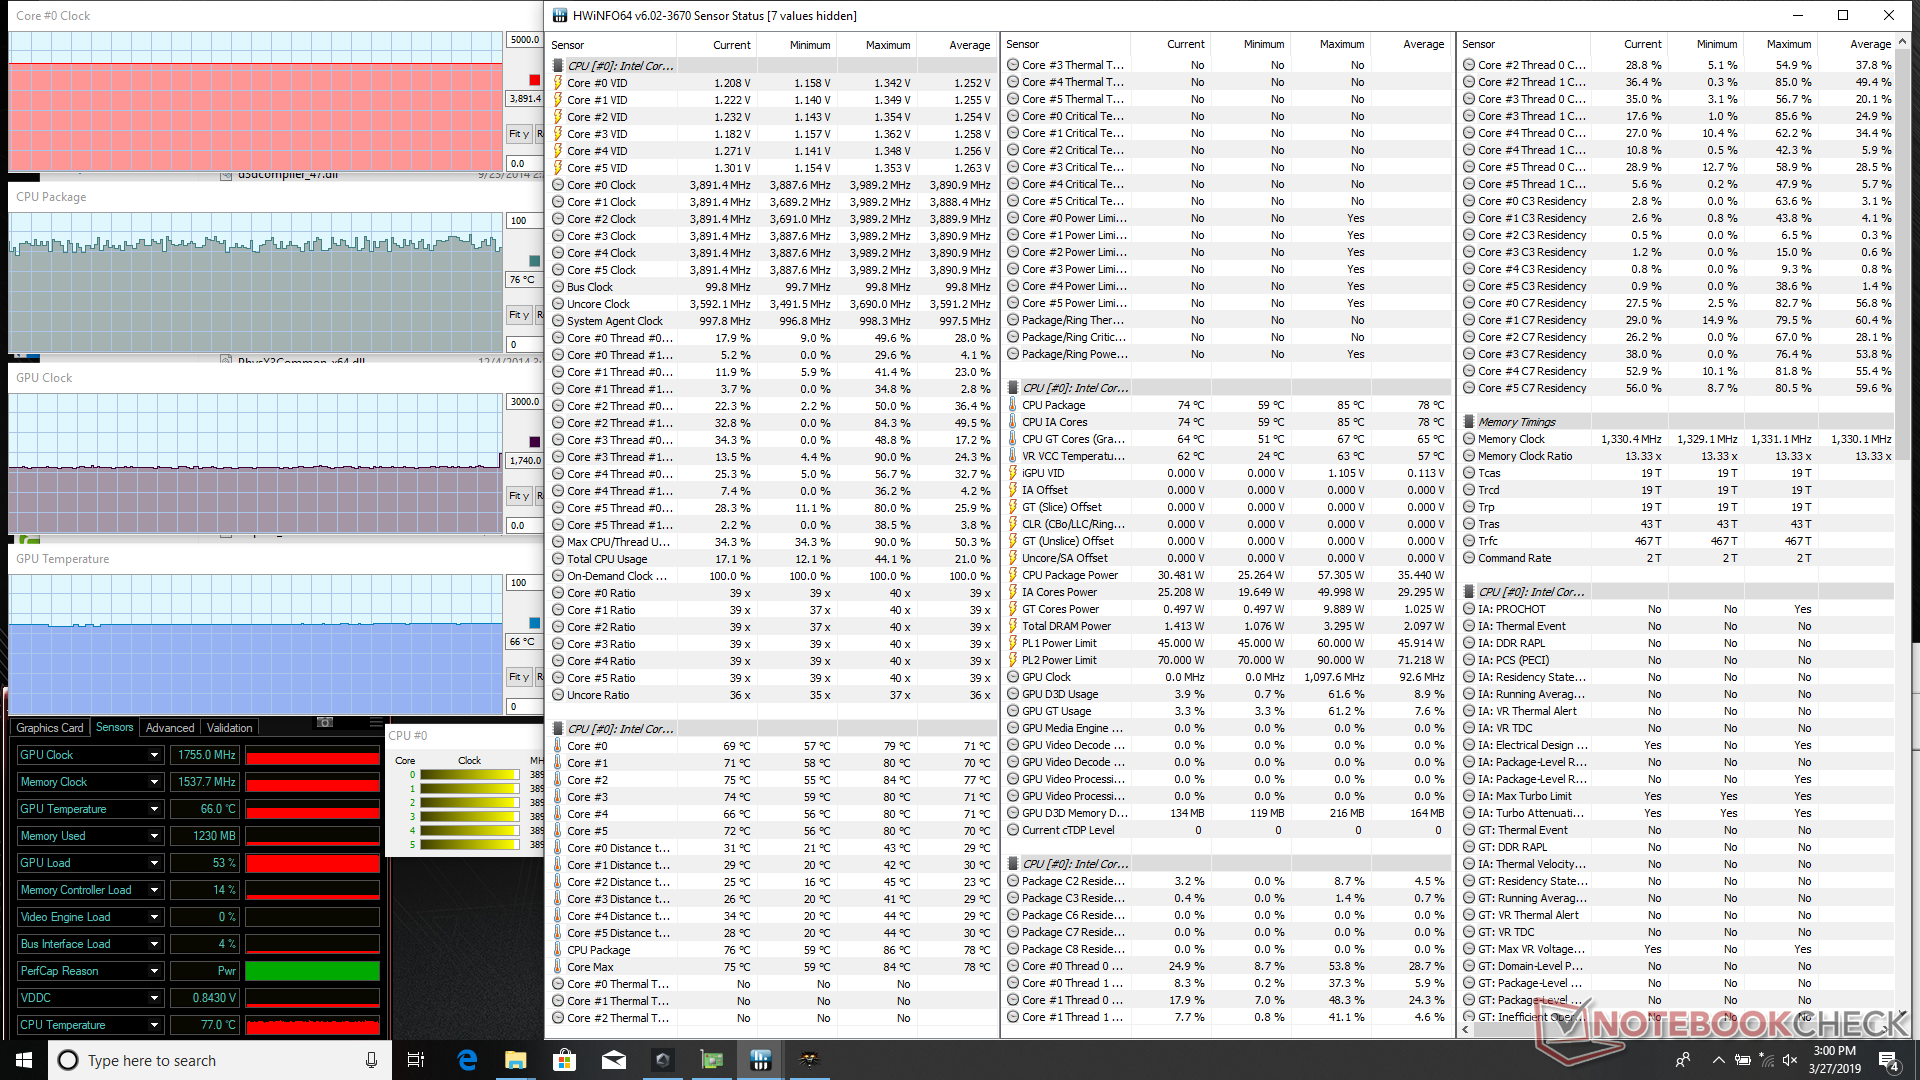
| CPU Clock (GHz) | GPU Clock (MHz) | Average CPU Temperature (°C) | Average GPU Temperature (°C) | |
| System Idle | -- | -- | 50 | 48 |
| Prime95 Stress | 3.3 - 3.4 | -- | 81 | -- |
| Prime95 + FurMark Stress | 2.9 | 1095 | 80 | 68 |
| Witcher 3 Stress | 3.9 | 1315 | 76 | 66 |
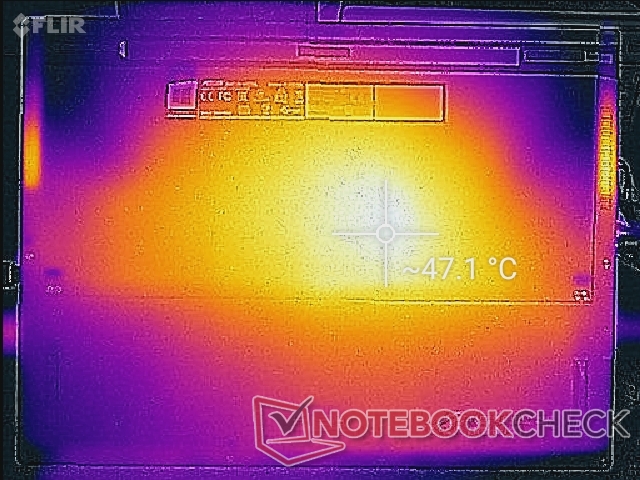
(-) The maximum temperature on the upper side is 47 °C / 117 F, compared to the average of 40.4 °C / 105 F, ranging from 21.2 to 68.8 °C for the class Gaming.
(-) The bottom heats up to a maximum of 48.6 °C / 119 F, compared to the average of 43.3 °C / 110 F
(+) In idle usage, the average temperature for the upper side is 27.1 °C / 81 F, compared to the device average of 33.9 °C / 93 F.
(-) Playing The Witcher 3, the average temperature for the upper side is 38.1 °C / 101 F, compared to the device average of 33.9 °C / 93 F.
(+) The palmrests and touchpad are reaching skin temperature as a maximum (33.4 °C / 92.1 F) and are therefore not hot.
(-) The average temperature of the palmrest area of similar devices was 28.8 °C / 83.8 F (-4.6 °C / -8.3 F).
Speakers

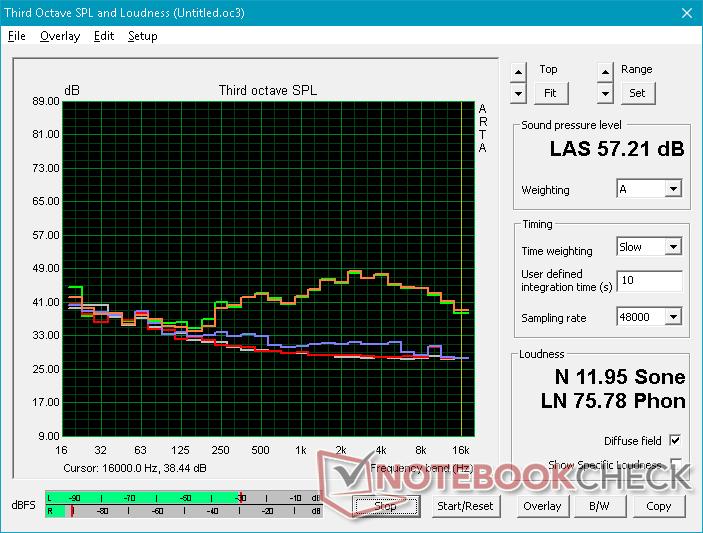
The 2 W stereo speakers are decent with balanced mid and high tones considering the thinness of the chassis. Roll-off occurs at around 250 Hz as is common on most laptops. Perhaps a dedicated subwoofer would have improved bass reproduction.
Asus Zephyrus S GX531GX audio analysis
(±) | speaker loudness is average but good (73 dB)
Bass 100 - 315 Hz
(±) | reduced bass - on average 13.3% lower than median
(±) | linearity of bass is average (14.9% delta to prev. frequency)
Mids 400 - 2000 Hz
(+) | balanced mids - only 1.9% away from median
(+) | mids are linear (5.2% delta to prev. frequency)
Highs 2 - 16 kHz
(±) | higher highs - on average 5.6% higher than median
(±) | linearity of highs is average (10.8% delta to prev. frequency)
Overall 100 - 16.000 Hz
(±) | linearity of overall sound is average (18.3% difference to median)
Compared to same class
» 57% of all tested devices in this class were better, 9% similar, 34% worse
» The best had a delta of 6%, average was 18%, worst was 132%
Compared to all devices tested
» 40% of all tested devices were better, 8% similar, 53% worse
» The best had a delta of 4%, average was 24%, worst was 134%
Apple MacBook 12 (Early 2016) 1.1 GHz audio analysis
(+) | speakers can play relatively loud (83.6 dB)
Bass 100 - 315 Hz
(±) | reduced bass - on average 11.3% lower than median
(±) | linearity of bass is average (14.2% delta to prev. frequency)
Mids 400 - 2000 Hz
(+) | balanced mids - only 2.4% away from median
(+) | mids are linear (5.5% delta to prev. frequency)
Highs 2 - 16 kHz
(+) | balanced highs - only 2% away from median
(+) | highs are linear (4.5% delta to prev. frequency)
Overall 100 - 16.000 Hz
(+) | overall sound is linear (10.2% difference to median)
Compared to same class
» 7% of all tested devices in this class were better, 2% similar, 91% worse
» The best had a delta of 5%, average was 18%, worst was 53%
Compared to all devices tested
» 5% of all tested devices were better, 1% similar, 94% worse
» The best had a delta of 4%, average was 24%, worst was 134%
Energy Management
Power Consumption
When gaming, the GX531GX draws 168 W compared to 148 W on the last generation GX501. This represents a 14 percent increase in power consumption for a 17 to 45 percent increase in graphics performance to suggest higher performance-per-Watt overall.
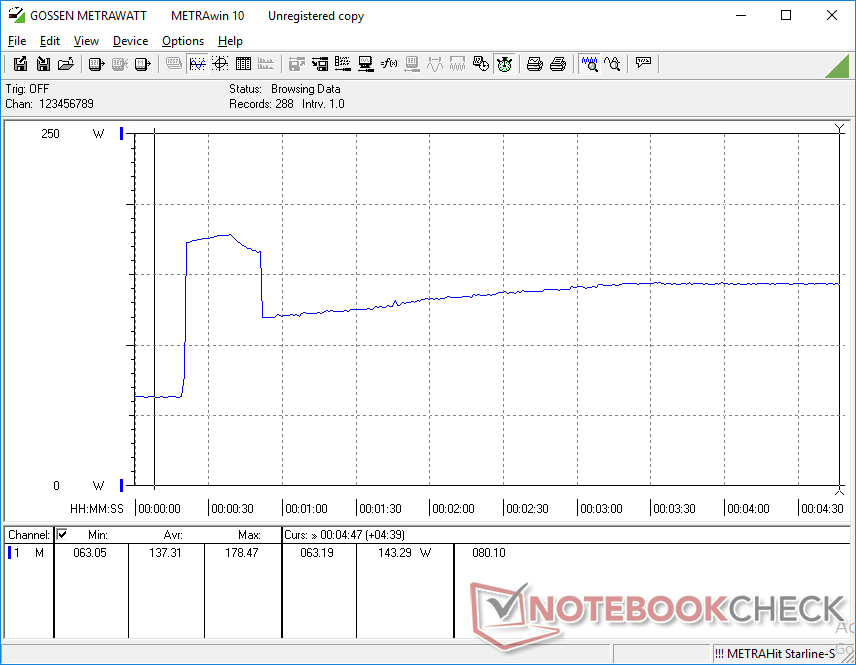
The maximum consumption we're able to record is 215 W from the medium-sized (~16.5 x 7.5 x 3.3 cm) 230 W AC adapter when running both Prime95 and FurMark simultaneously.
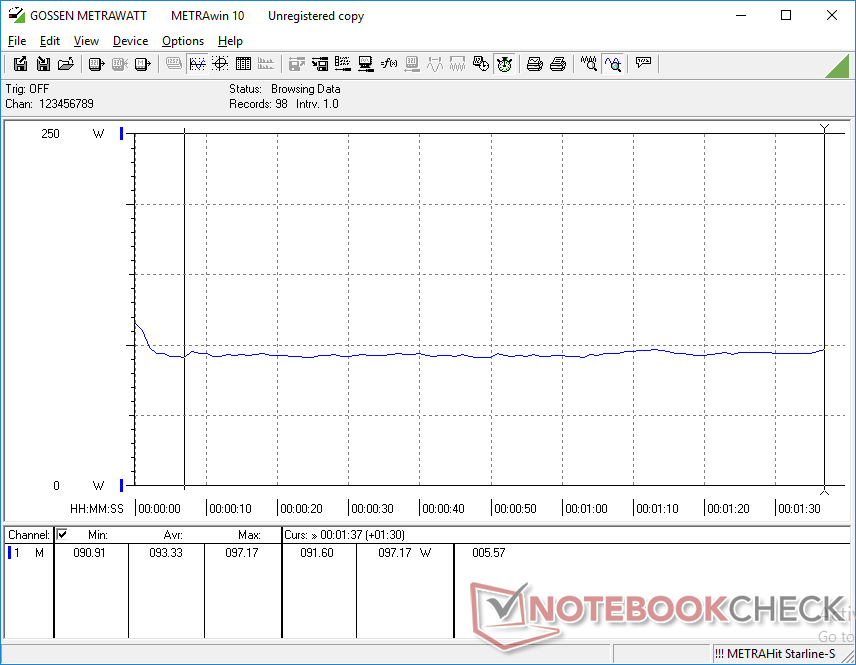
When running only Prime95, power consumption spikes to 178 W for the first few seconds before dropping and stabilizing at about 143 W as shown by our graph below. The results are in line with what we observed on the CineBench R15 loop stress test above regarding clock rates and performance when under high CPU stress.
| Off / Standby | |
| Idle | |
| Load |
|
Key:
min: | |
| Asus Zephyrus S GX531GX i7-8750H, GeForce RTX 2080 Max-Q, Intel SSD 660p SSDPEKNW512G8, IPS, 1920x1080, 15.6" | Aorus 15 X9 i7-8750H, GeForce RTX 2070 Mobile, Intel SSD 760p SSDPEKKW512G8, IPS, 1920x1080, 15.6" | Asus Zephyrus S GX531GS i7-8750H, GeForce GTX 1070 Max-Q, WDC PC SN520 SDAPNUW-512G, IPS, 1920x1080, 15.6" | Razer Blade 15 RTX 2070 Max-Q i7-8750H, GeForce RTX 2070 Max-Q, Samsung SSD PM981 MZVLB512HAJQ, IPS, 1920x1080, 15.6" | Asus Strix GL504GM i7-8750H, GeForce GTX 1060 Mobile, Toshiba NVMe THNSN5256GPU7, IPS, 1920x1080, 15.6" | Asus Zephyrus GX501 i7-7700HQ, GeForce GTX 1080 Max-Q, Samsung SSD SM961 1TB M.2 MZVKW1T0HMLH, IPS, 1920x1080, 15.6" | |
|---|---|---|---|---|---|---|
| Power Consumption | -25% | -3% | 22% | 18% | -0% | |
| Idle Minimum * (Watt) | 16.1 | 26 -61% | 17 -6% | 10.4 35% | 10 38% | 18 -12% |
| Idle Average * (Watt) | 20.9 | 30.8 -47% | 20 4% | 14.6 30% | 16.9 19% | 23 -10% |
| Idle Maximum * (Watt) | 27 | 34.9 -29% | 29 -7% | 16.3 40% | 21.1 22% | 31 -15% |
| Load Average * (Watt) | 93.4 | 90.7 3% | 112 -20% | 88.5 5% | 112.4 -20% | 79 15% |
| Witcher 3 ultra * (Watt) | 168.2 | 175 -4% | 152 10% | 155.4 8% | 135.5 19% | 148 12% |
| Load Maximum * (Watt) | 215.3 | 241.2 -12% | 211 2% | 182.4 15% | 157.3 27% | 196 9% |
* ... smaller is better
Battery Life
Internal battery capacity remains unchanged from the last generation GX501 series at 50 Wh. Competing 15.6-inch gaming laptops tend to have larger battery packs including the MSI GS65 and Razer Blade 15. Battery life is subsequently short on our Asus at only 3 hours of real-world WLAN use. Be sure to set the system to Balanced mode or lower to squeeze out longer runtimes if needed.
Charging from empty to full capacity takes about 1.5 hours.
| Asus Zephyrus S GX531GX i7-8750H, GeForce RTX 2080 Max-Q, 50 Wh | Aorus 15 X9 i7-8750H, GeForce RTX 2070 Mobile, 62 Wh | Alienware m15 GTX 1070 Max-Q i7-8750H, GeForce GTX 1070 Max-Q, 90 Wh | Razer Blade 15 RTX 2070 Max-Q i7-8750H, GeForce RTX 2070 Max-Q, 80 Wh | Asus Strix GL504GM i7-8750H, GeForce GTX 1060 Mobile, 66 Wh | Asus Zephyrus GX501 i7-7700HQ, GeForce GTX 1080 Max-Q, 50 Wh | |
|---|---|---|---|---|---|---|
| Battery runtime | -47% | 157% | 117% | 97% | -27% | |
| WiFi v1.3 (h) | 3 | 1.6 -47% | 7.7 157% | 6.5 117% | 5.9 97% | 2.2 -27% |
| Reader / Idle (h) | 1.8 | 10.5 | 11.4 | 3.1 | ||
| Load (h) | 1 | 1.7 | 1.5 | 0.7 |
Pros
Cons
Verdict
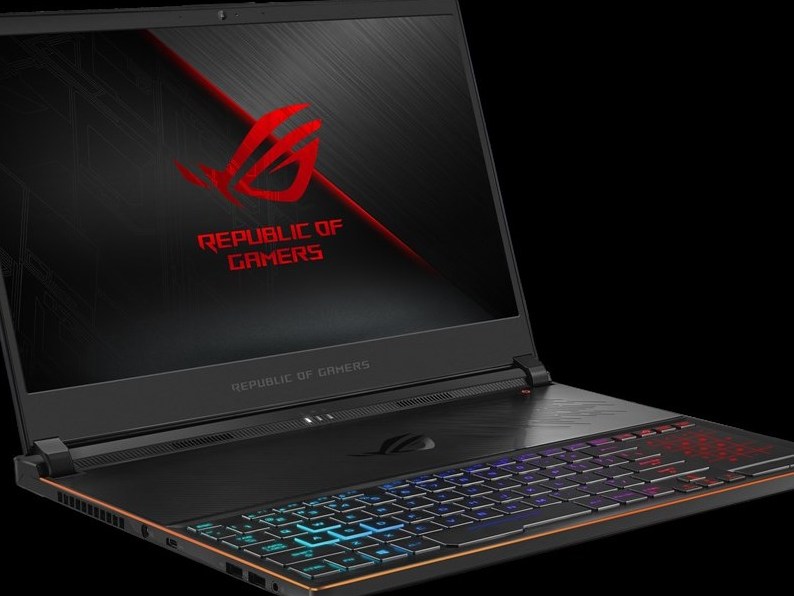

The GX531 excels in a few key areas. Aside from being attractively thin with narrow bezels, core temperatures are cooler than we were anticipating when gaming and the display itself is a huge improvement over the GX501 display where ghosting was very noticeable. Of course, the unique design of the chassis means uncomfortably warm keys will never be an issue. Users can expect 17 to 45 percent better gaming performance from the RTX 2080 Max-Q when compared to the GTX 1080 Max-Q.
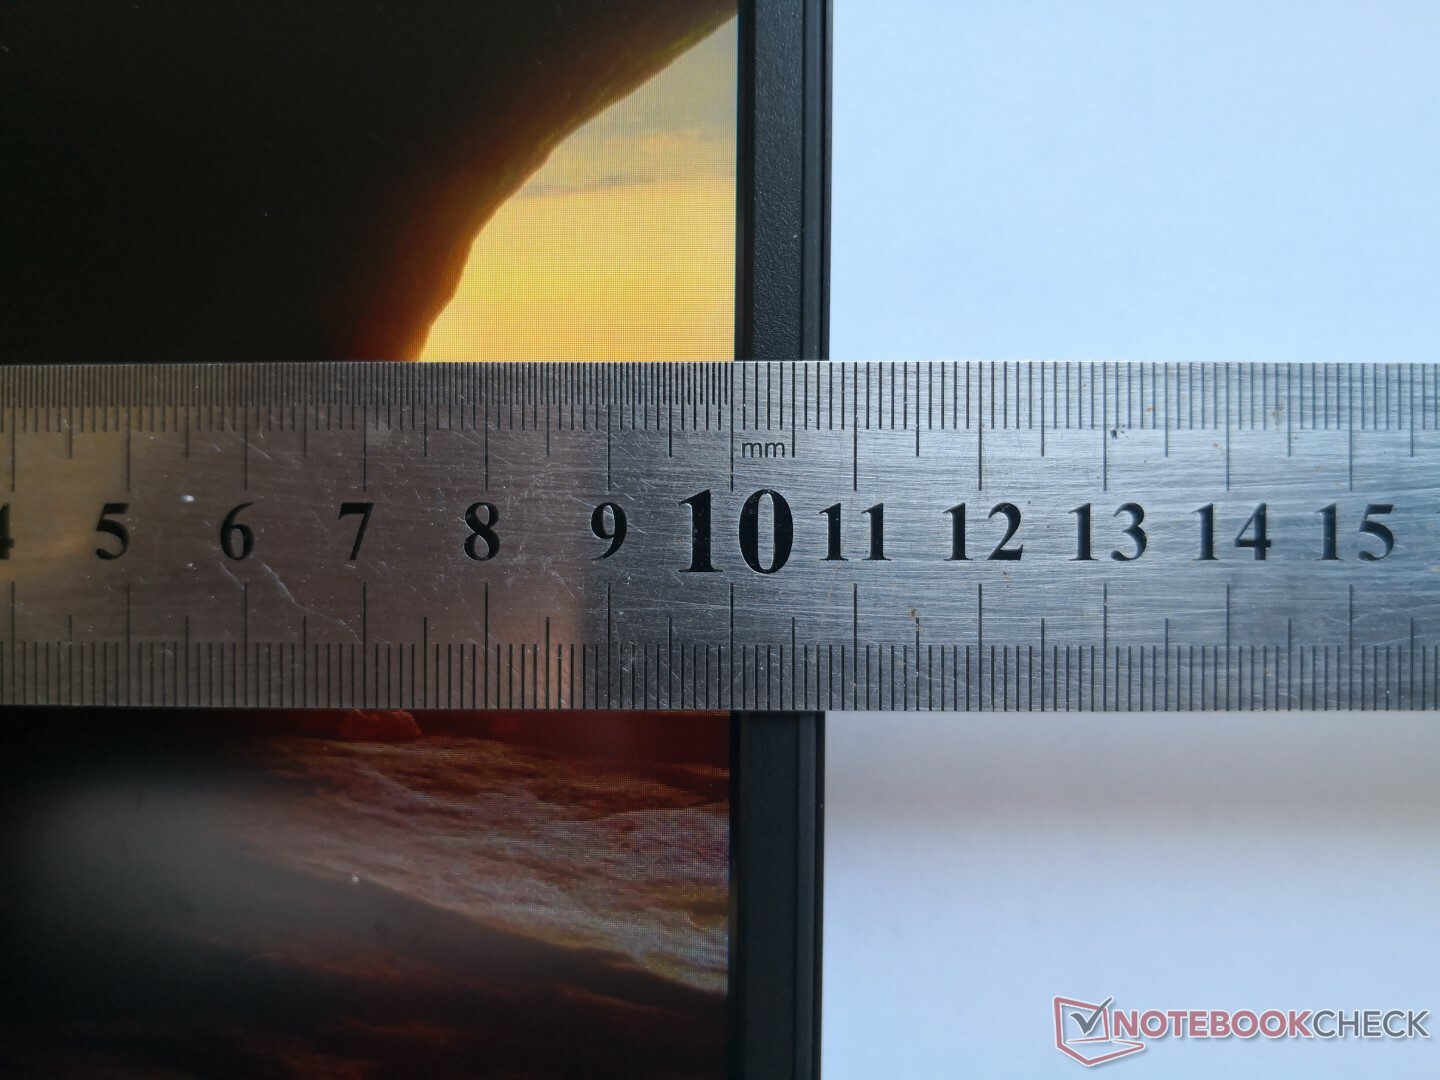
There is still a lot of room for improvement. The display chin is very large and fan noise is louder than on competitors including the MSI GS65 or Razer Blade 15. Running the laptop on Turbo Mode with fans at maximum is required to get the most performance out of the laptop as running it on Balanced Mode will incur a 10 percent performance penalty. These power settings must be toggled via the Armoury Crate app as they operate independently from the standard Windows power profiles.
Other missing features include RJ-45, SD card reader, per-key RGB lighting, and Thunderbolt 3 which we believe should be standard on flagship gaming laptops reaching north of $2500 USD. Gaming enthusiasts may prefer to have G-Sync in lieu of Optimus since battery life here is already average at best even with graphics switching available. The thin profile also excludes any internal secondary storage options which may be a problem for users with large gaming libraries.
Because of the drawbacks of the GX531, we recommend users take a look at the Asus ROG GL504 series instead. We find it to be better balanced with firmer keyboard keys, stronger lid, more storage options, more ports, and a larger trackpad. It even shares the exact same IPS panel as the GX531. It's a thicker alternative, but we find its long list of handy features to be well worth it.
A significant upgrade over the old GX501 in terms of performance, weight, thickness, and appearance. The GX531 is Asus' most visually stunning 15.6-inch gaming laptop to date, but it had to sacrifice some useful features to reach such a thin and light form factor.
Asus Zephyrus S GX531GX
- 09/20/2019 v7 (old)
Allen Ngo
Price comparison
