Asus ROG Strix GL703VM Scar Edition (7700HQ, GTX 1060, FHD 120 Hz) Laptop Review
Back in October, we reviewed Asus' ROG Strix GL703VD, a 17.3-inch thin-and-light gaming laptop from the venerable Taiwanese manufacturer. While that machine performed admirably in our review, we lamented the lack of alternate GPU options and the absence of a high refresh rate display panel.
Ask and ye shall receive: today's review device offers both of these features in the same chassis and throws an Nvidia GeForce GTX 1060 and a 120 Hz screen into the mix. However, as our review will demonstrate, these options come at a cost; while the GL703VM offers more power, it is also louder and hotter.
We'll compare our review unit today against the previously-reviewed GL703VD. We will also look at similarly specced devices to give a broader picture of where our review device sits in the market. There is no shortage of GTX 1060-equipped laptops and thus no shortage of comparative notebooks. We will look at the MSI GS73VR, HP Omen 17, and Acer Aspire V17 Nitro, all of which are relatively thin 17.3-inch devices. We will also compare the GTX 1070-powered Aorus X7 v7 to let readers see how much of an improvement the more powerful hardware brings.
Since the GL703VM is an upgrade of a device we've previously reviewed, we will focus primarily on performance metrics and eschew discussion of the case and input devices. For more detailed information on the case design, keyboard, touchpad, and other exterior facets, please refer to our review of the Asus ROG Strix GL703VD. Let's get started.
SD Card Reader
SD card reader speeds are (unsurprisingly) similar to those of the GL703VD. Using our Toshiba Exceria Pro SDXC 64 GB UHS-II Reference-Card, we measured a copy rate of 67 MB/s, which is on the lower side of average for this category. Readers in need of faster SD card access times should look at the Acer Predator 17.
| SD Card Reader | |
| average JPG Copy Test (av. of 3 runs) | |
| Aorus X7 v7 (Toshiba Exceria Pro SDXC 64 GB UHS-II) | |
| Average of class Gaming (20.9 - 210, n=54, last 2 years) | |
| Acer Predator 17 G9-793-70PJ (Toshiba Exceria Pro SDXC 64 GB UHS-II) | |
| HP Omen 17-w100ng (Toshiba Exceria Pro SDXC 64 GB UHS-II) | |
| Asus ROG Strix GL703VD-DB74 (Toshiba Exceria Pro SDXC 64 GB UHS-II) | |
| Asus Strix GL703VM-DB74 (Toshiba Exceria Pro SDXC 64 GB UHS-II) | |
| MSI GS73VR 7RF (Toshiba Exceria Pro SDXC 64 GB UHS-II) | |
| Acer Aspire V17 Nitro BE VN7-793G-52XN (Toshiba Exceria Pro SDXC 64 GB UHS-II) | |
| maximum AS SSD Seq Read Test (1GB) | |
| Aorus X7 v7 (Toshiba Exceria Pro SDXC 64 GB UHS-II) | |
| Average of class Gaming (25.5 - 261, n=51, last 2 years) | |
| Asus Strix GL703VM-DB74 (Toshiba Exceria Pro SDXC 64 GB UHS-II) | |
| Acer Predator 17 G9-793-70PJ (Toshiba Exceria Pro SDXC 64 GB UHS-II) | |
| HP Omen 17-w100ng (Toshiba Exceria Pro SDXC 64 GB UHS-II) | |
| Asus ROG Strix GL703VD-DB74 (Toshiba Exceria Pro SDXC 64 GB UHS-II) | |
| MSI GS73VR 7RF (Toshiba Exceria Pro SDXC 64 GB UHS-II) | |
| Acer Aspire V17 Nitro BE VN7-793G-52XN (Toshiba Exceria Pro SDXC 64 GB UHS-II) | |
Communication
Wireless speeds leave a mixed impression. Receive speeds are good, hovering around 600 MBit/s, but transmit speeds are relatively low at just under 400 MBit/s. These speeds should be more than adequate for regular use, but those that rely on fast network speeds for online gaming or file transfers should opt for a hardwired connection via the Ethernet jack.
Display
Perhaps the most interesting facet of the GL703VM is the 120 Hz refresh rate of the AU Optronics screen. While the higher refresh rate promises smoother animations and gameplay, the rest of the display experience falls flat. Asus posits the panel as a 5 ms display, but our measurements show significantly slower than advertised response times. The display also doesn't support G-Sync, and there is some very slight screen tearing during gameplay (although only scrupulous gamers will notice this). On the plus side, PWM is non-existent.
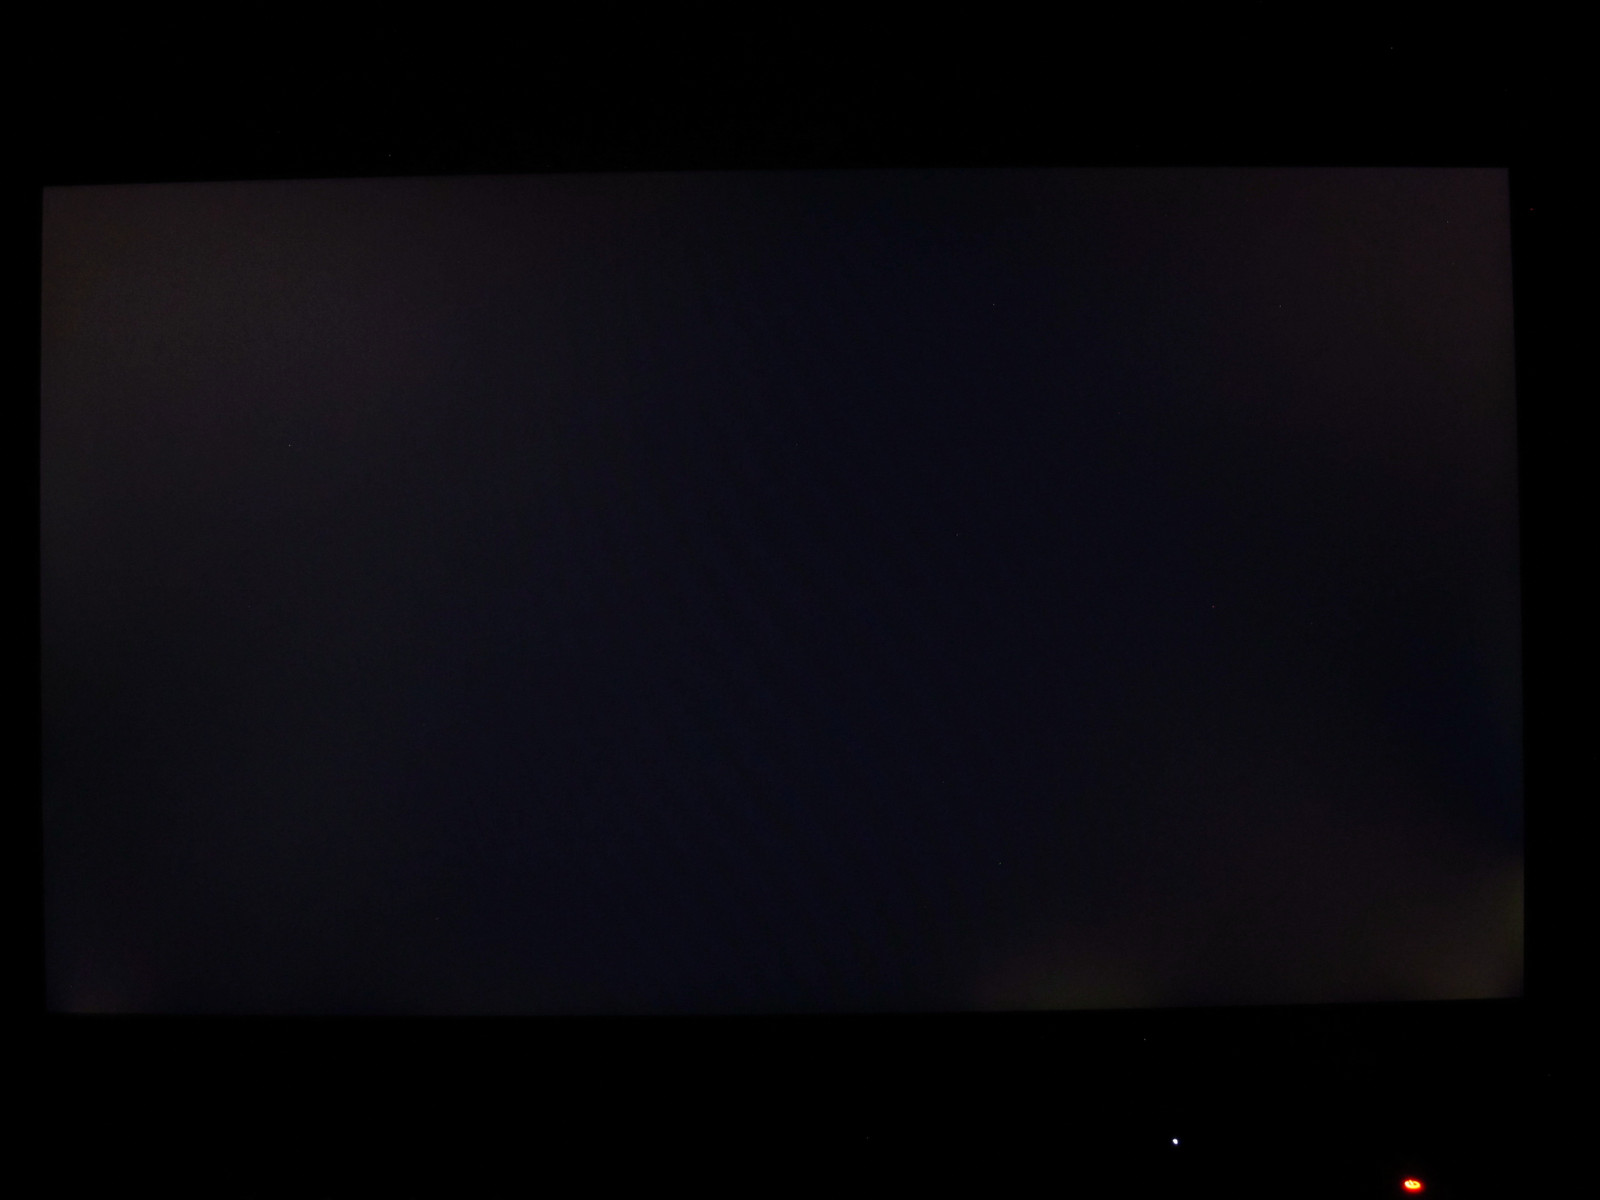
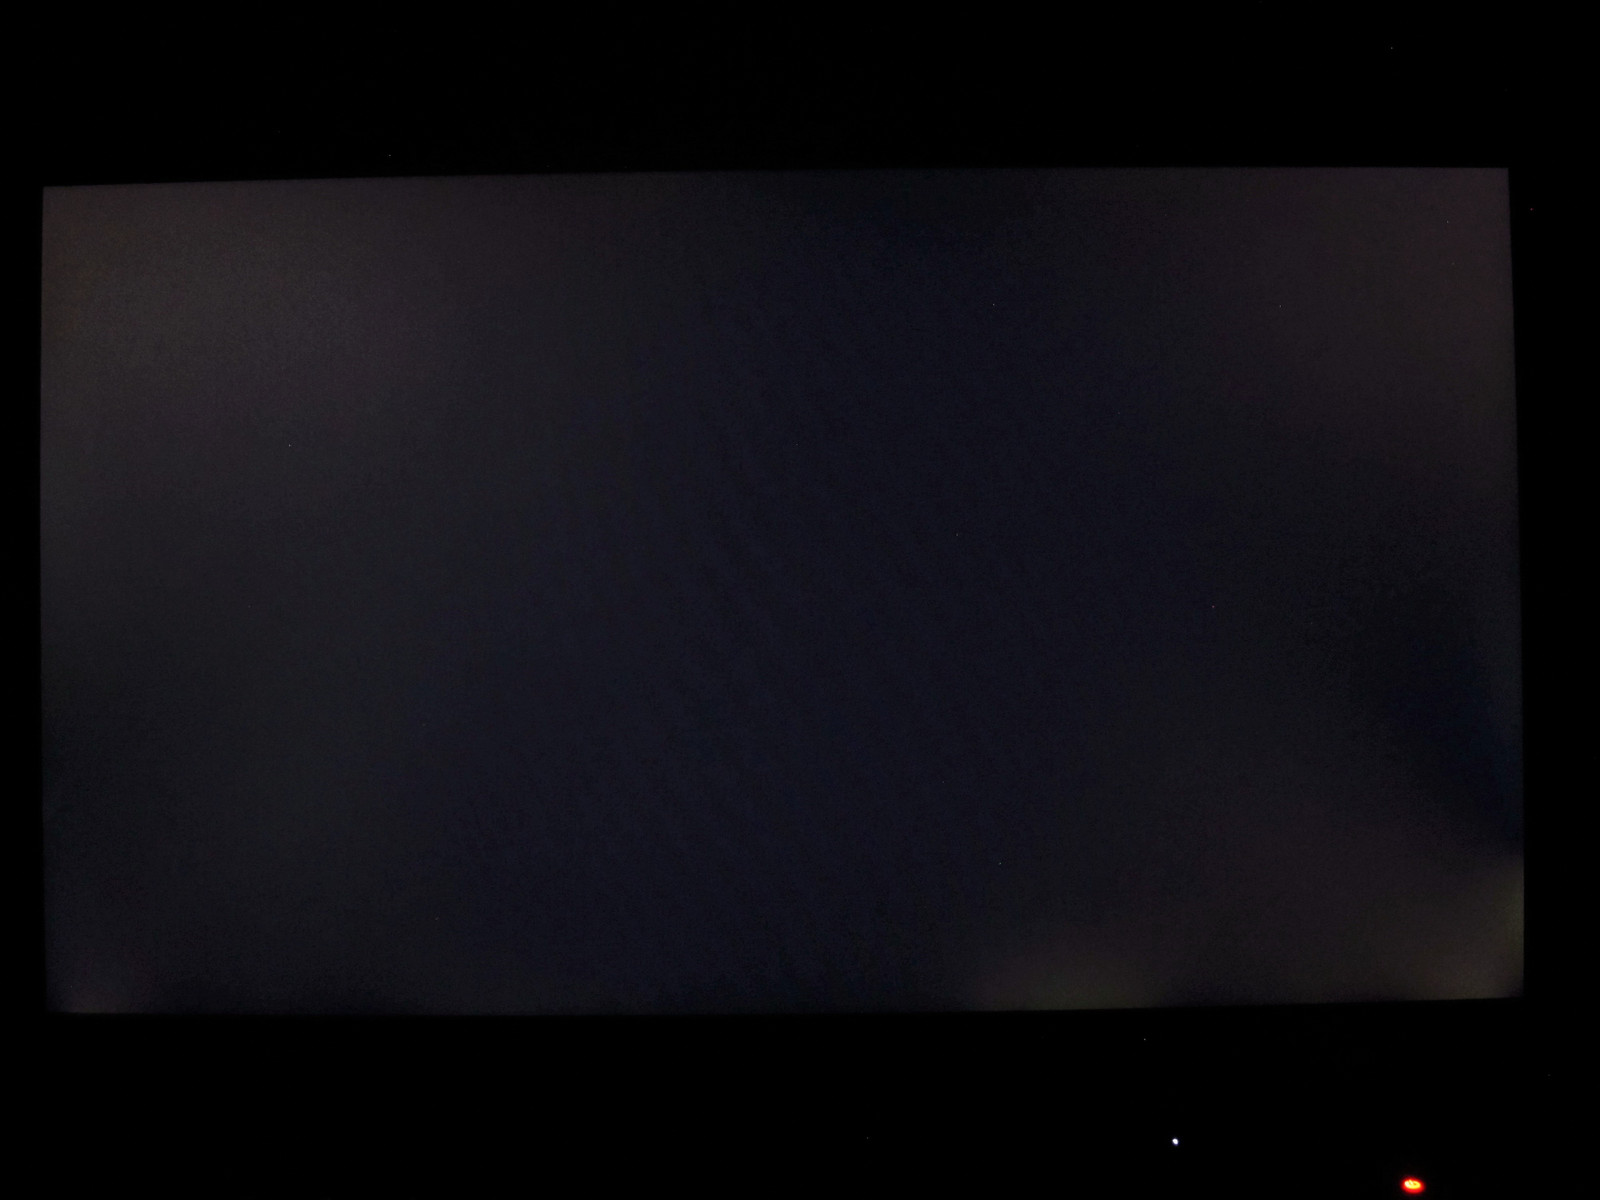
The biggest shortcoming of this display is the disappointing backlight. Brightness distribution is incredibly uneven at 67%, and there is noticeable vertical banding when viewing a pure white screen. The upper right corner is significantly dimmer than the rest of the panel, but this is more subtle in real-world use and shouldn't be terribly distracting. Backlight bleed is particularly offensive; the corners of the panel shine through in dark scenes. Contrast is also very poor, especially for an IPS panel. At less than 500:1, the display sits rock bottom in our comparison and is more akin to cheaper budget notebooks and netbooks than mid-range gaming laptops.
| |||||||||||||||||||||||||
Brightness Distribution: 67 %
Center on Battery: 319.5 cd/m²
Contrast: 492:1 (Black: 0.65 cd/m²)
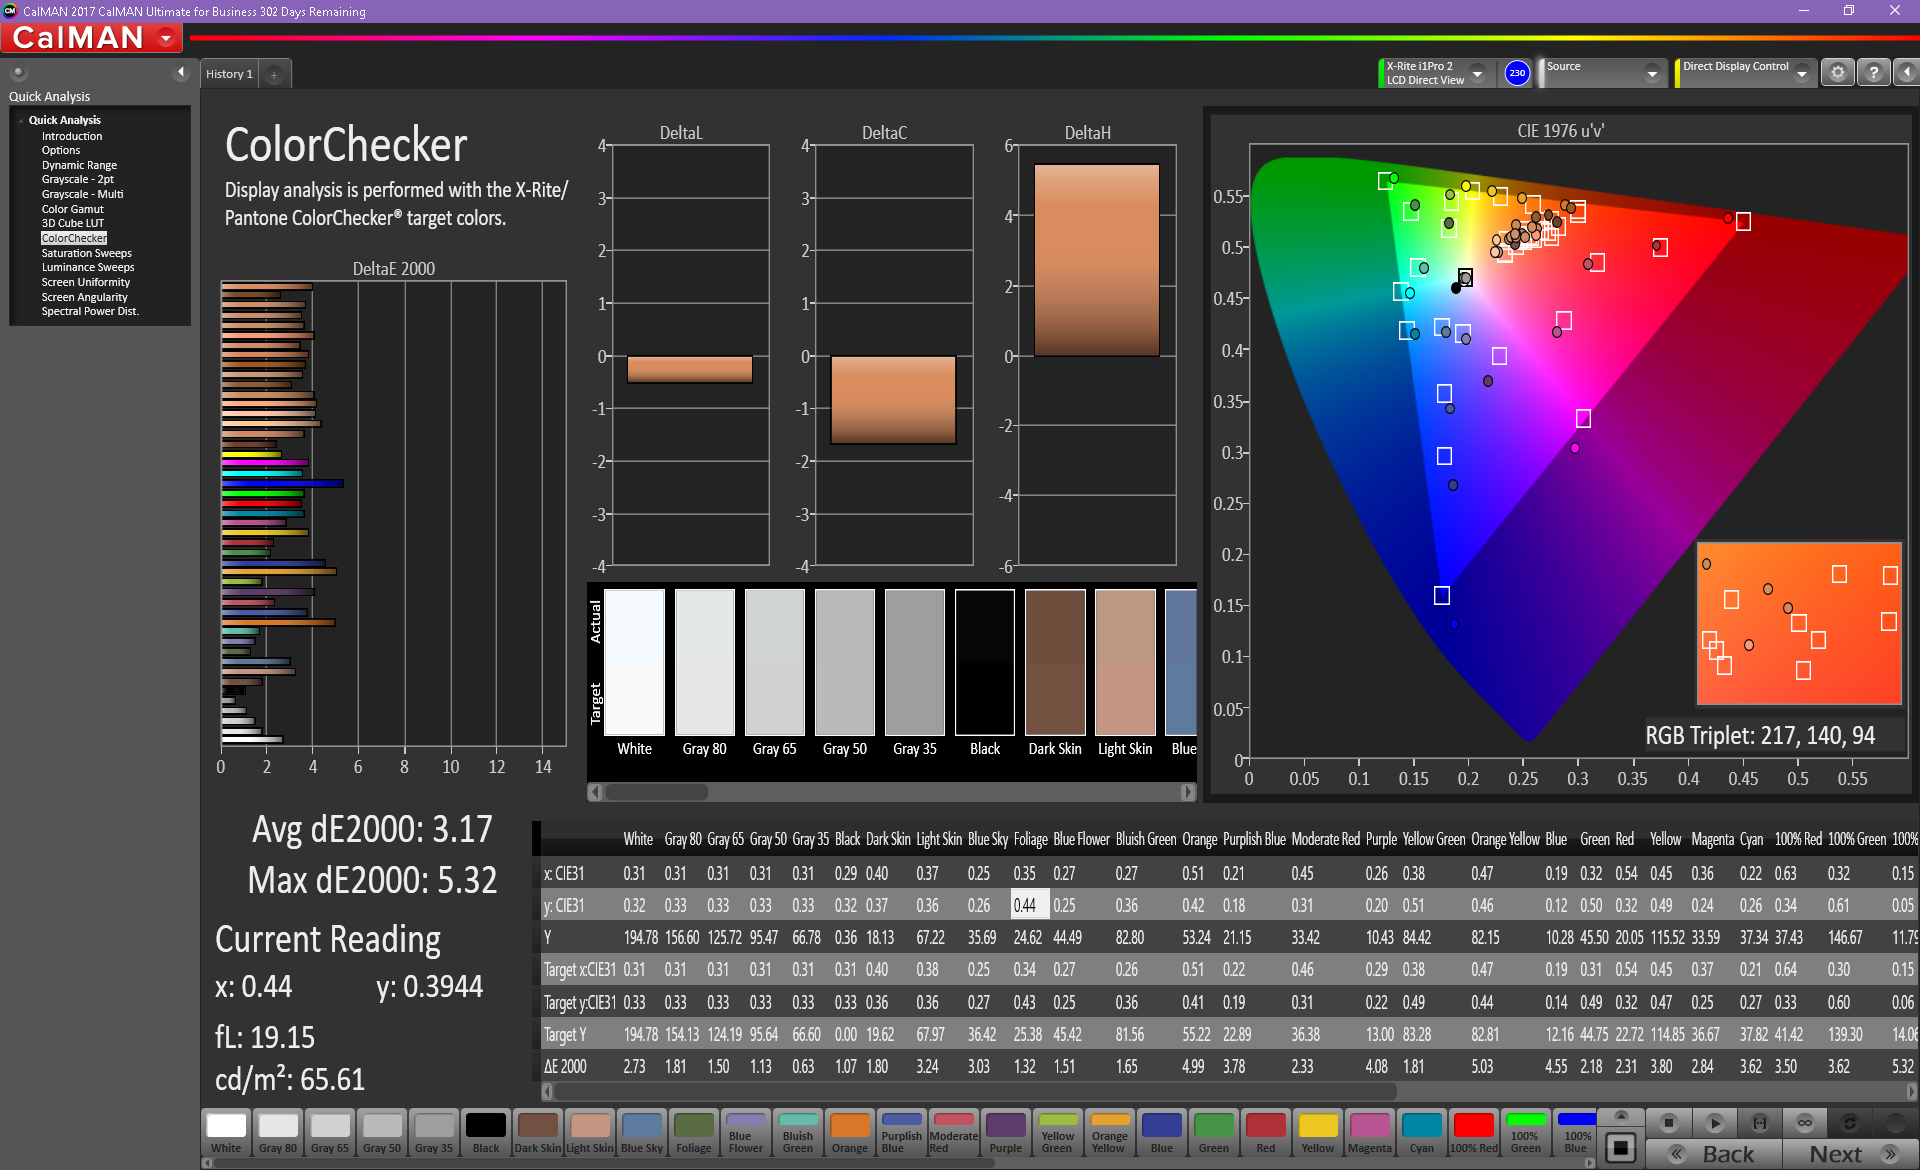
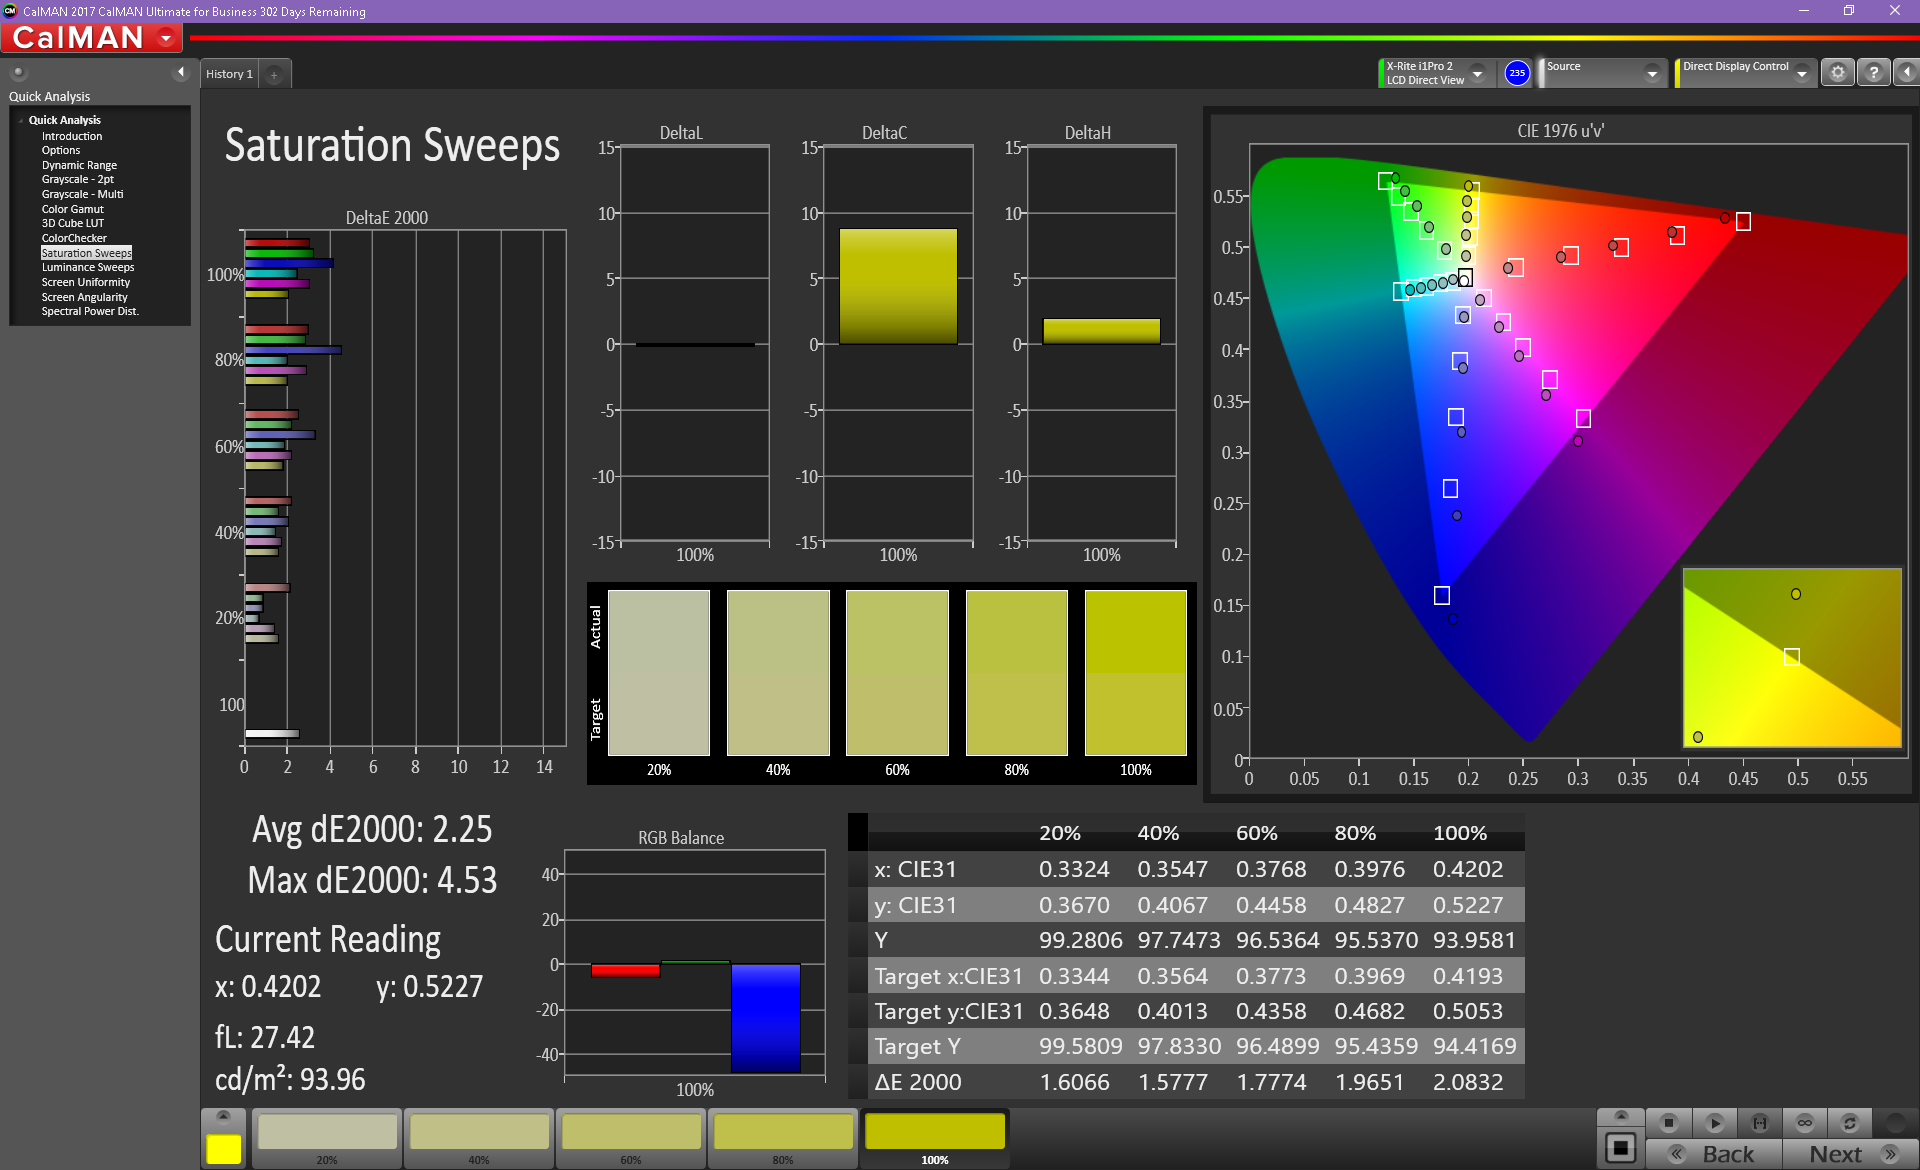
ΔE ColorChecker Calman: 3.17 | ∀{0.5-29.43 Ø4.71}
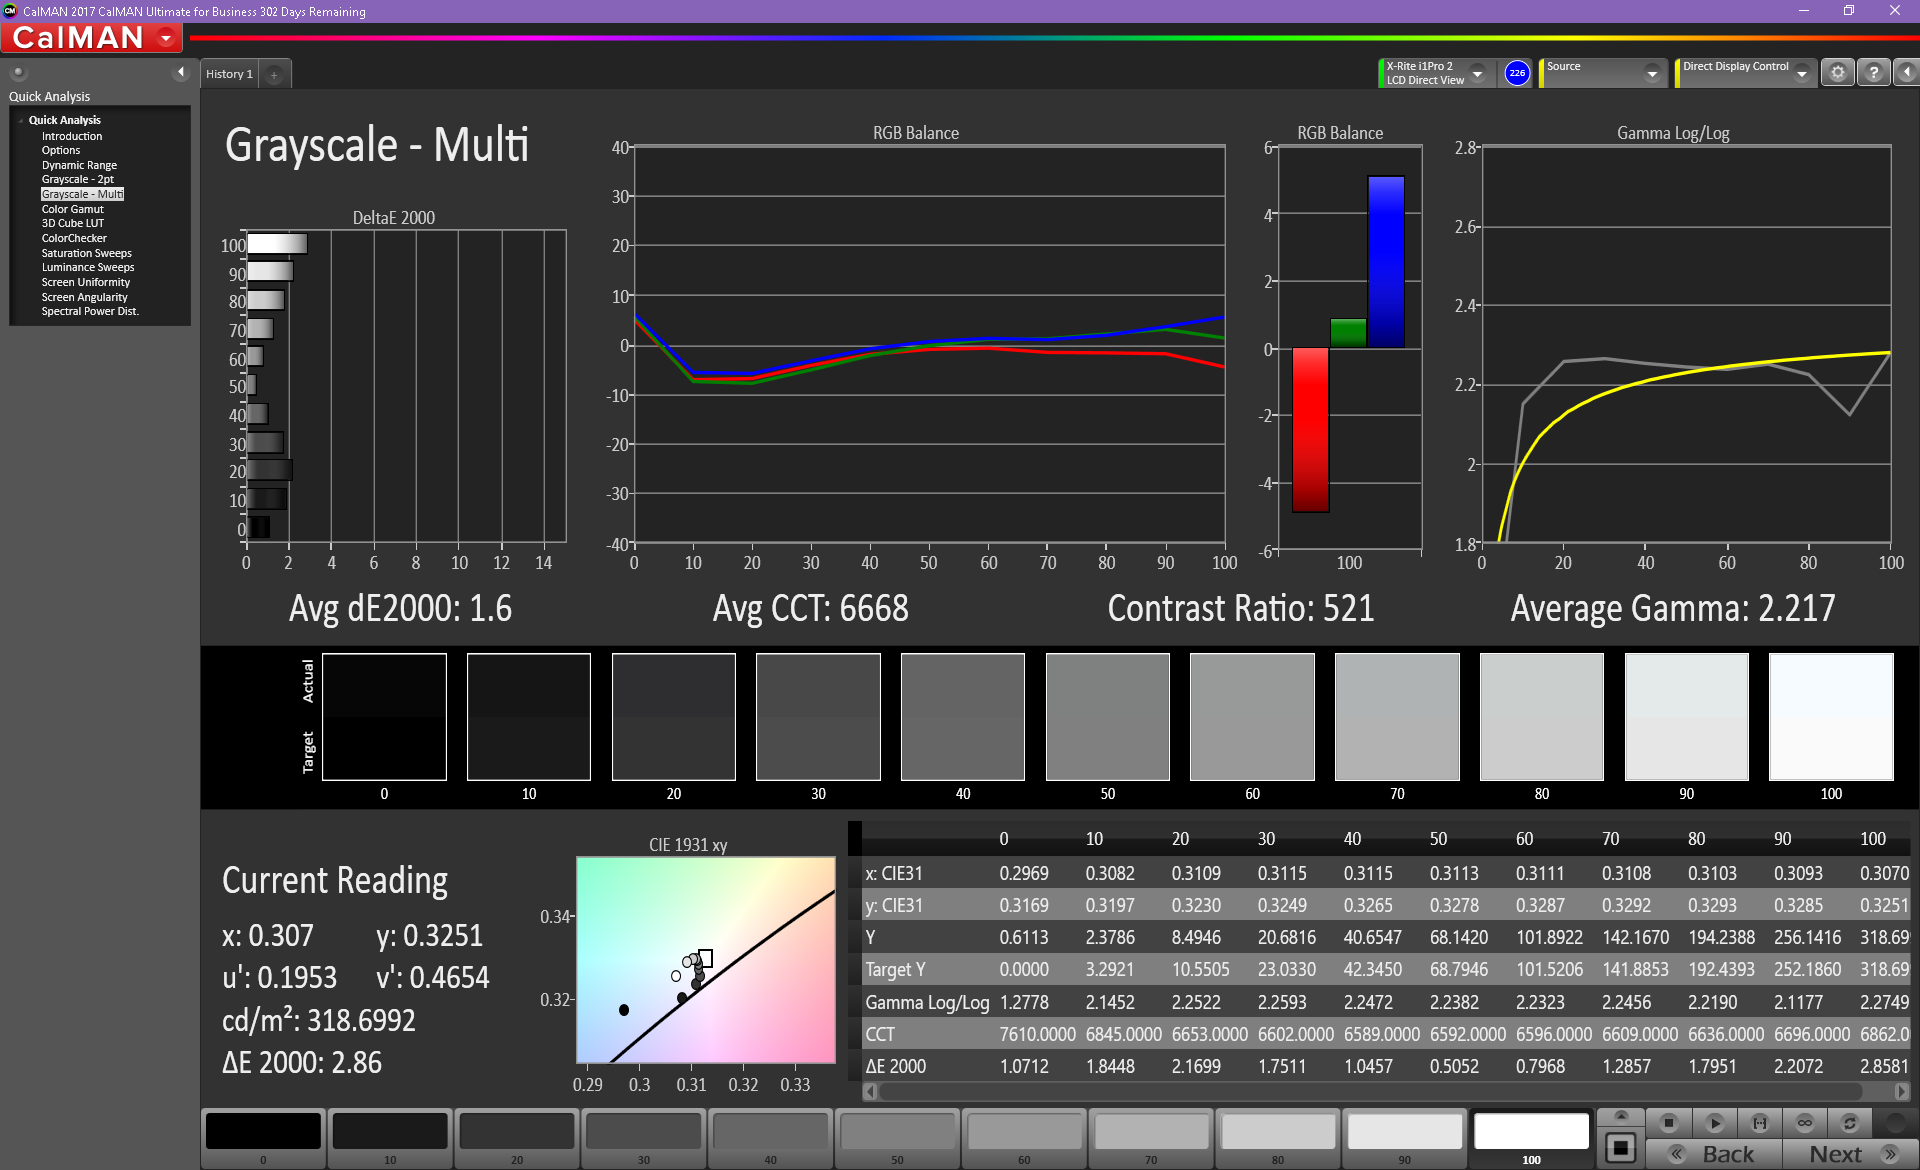
ΔE Greyscale Calman: 1.6 | ∀{0.09-98 Ø4.96}
87% sRGB (Argyll 1.6.3 3D)
56% AdobeRGB 1998 (Argyll 1.6.3 3D)
62.7% AdobeRGB 1998 (Argyll 3D)
87.2% sRGB (Argyll 3D)
61.5% Display P3 (Argyll 3D)
Gamma: 2.22
CCT: 6668 K
| Asus Strix GL703VM-DB74 AU Optronics B173HAN01.1, IPS, 17.3", 1920x1080 | Asus ROG Strix GL703VD-DB74 LG Philips LP173WF4-SPF5, IPS, 17.3", 1920x1080 | MSI GS73VR 7RF AU Optronics AUO109B, IPS, 17.3", 3840x2160 | Acer Aspire V17 Nitro BE VN7-793G-52XN AUO B173HAN01.0, a-Si TFT-LCD, WLED, 17.3", 1920x1080 | HP Omen 17-w100ng LG Philips LGD046E, IPS, 17.3", 1920x1080 | Aorus X7 v7 AU Optronics B173QTN01.4 (AUO1496), TN LED, 17.3", 2560x1440 | Acer Predator 17 G9-793-70PJ AU Optronics B173ZAN01.0 (AUO109B), IPS, 17.3", 3840x2160 | |
|---|---|---|---|---|---|---|---|
| Display | 3% | 7% | 4% | 3% | 1% | 38% | |
| Display P3 Coverage (%) | 61.5 | 67.6 10% | 64.2 4% | 64 4% | 67.2 9% | 63 2% | 86.4 40% |
| sRGB Coverage (%) | 87.2 | 86.1 -1% | 96.8 11% | 90.2 3% | 86.6 -1% | 87.1 0% | 99.9 15% |
| AdobeRGB 1998 Coverage (%) | 62.7 | 62.9 0% | 66.4 6% | 65.4 4% | 63.3 1% | 63.7 2% | 99.1 58% |
| Response Times | 8% | -15% | -12% | -8% | 49% | -34% | |
| Response Time Grey 50% / Grey 80% * (ms) | 30.8 ? | 30.8 ? -0% | 38 ? -23% | 36 ? -17% | 35 ? -14% | 24 ? 22% | 50 ? -62% |
| Response Time Black / White * (ms) | 24.4 ? | 20.4 ? 16% | 26 ? -7% | 26 ? -7% | 25 ? -2% | 6 ? 75% | 25.6 ? -5% |
| PWM Frequency (Hz) | 119000 ? | ||||||
| Screen | -11% | -2% | -7% | -3% | -34% | 8% | |
| Brightness middle (cd/m²) | 319.5 | 421.2 32% | 371.1 16% | 346 8% | 342 7% | 375 17% | 343 7% |
| Brightness (cd/m²) | 293 | 393 34% | 343 17% | 307 5% | 331 13% | 353 20% | 328 12% |
| Brightness Distribution (%) | 67 | 85 27% | 86 28% | 84 25% | 84 25% | 85 27% | 84 25% |
| Black Level * (cd/m²) | 0.65 | 0.44 32% | 0.42 35% | 0.26 60% | 0.32 51% | 0.58 11% | 0.29 55% |
| Contrast (:1) | 492 | 957 95% | 884 80% | 1331 171% | 1069 117% | 647 32% | 1183 140% |
| Colorchecker dE 2000 * | 3.17 | 5 -58% | 4.5 -42% | 4.32 -36% | 4.35 -37% | 6.06 -91% | 4.01 -26% |
| Colorchecker dE 2000 max. * | 5.32 | 8.8 -65% | 9.7 -82% | 8.05 -51% | 9.24 -74% | 10.54 -98% | 6.03 -13% |
| Greyscale dE 2000 * | 1.6 | 5 -213% | 3.1 -94% | 5.76 -260% | 3.73 -133% | 5.68 -255% | 4.7 -194% |
| Gamma | 2.22 99% | 2.18 101% | 2.17 101% | 2.35 94% | 2.23 99% | 2.3 96% | 2.4 92% |
| CCT | 6668 97% | 6882 94% | 7120 91% | 6447 101% | 6801 96% | 7998 81% | 6451 101% |
| Color Space (Percent of AdobeRGB 1998) (%) | 56 | 62.94 12% | 61 9% | 59 5% | 57 2% | 57 2% | 88 57% |
| Color Space (Percent of sRGB) (%) | 87 | 86.1 -1% | 97 11% | 90 3% | 86 -1% | 87 0% | 100 15% |
| Total Average (Program / Settings) | 0% /
-5% | -3% /
-2% | -5% /
-6% | -3% /
-2% | 5% /
-16% | 4% /
8% |
* ... smaller is better
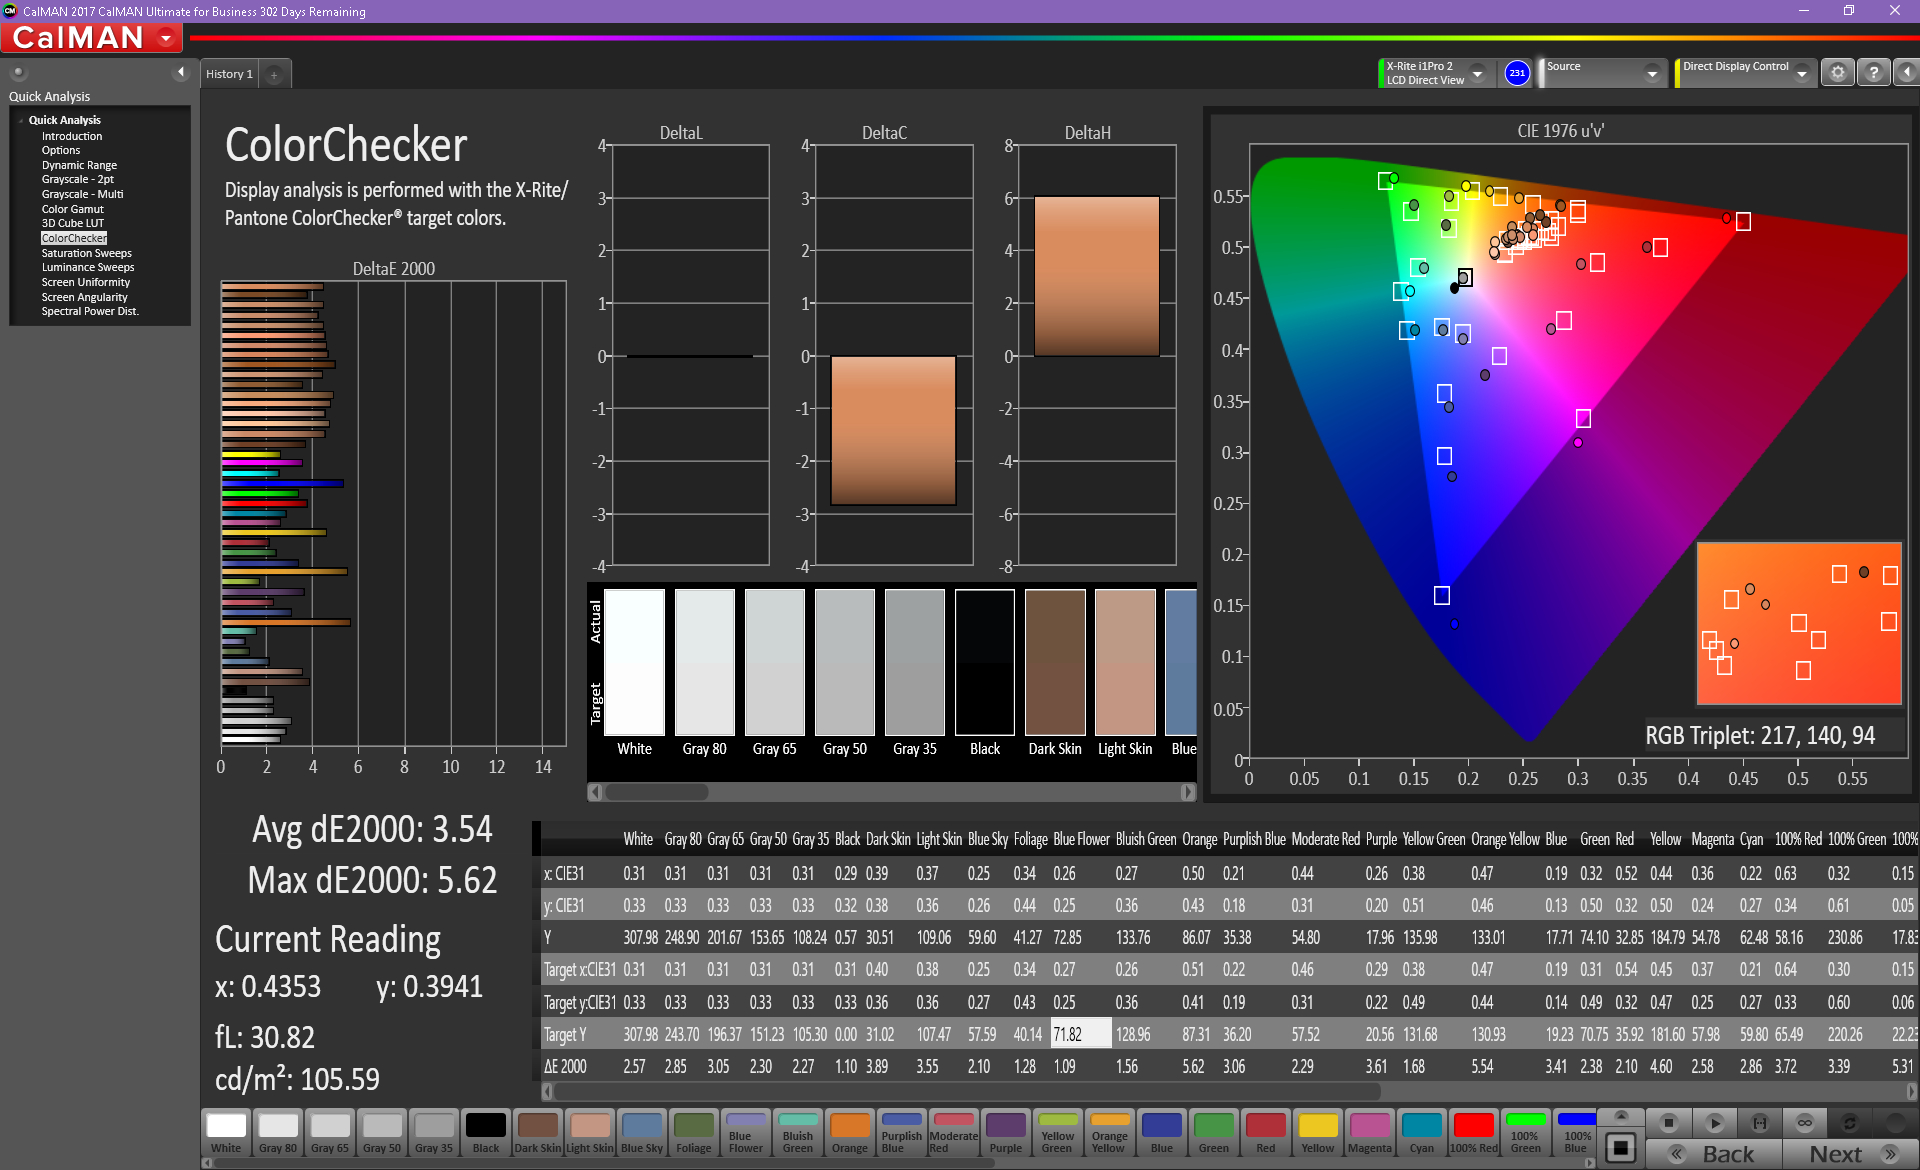
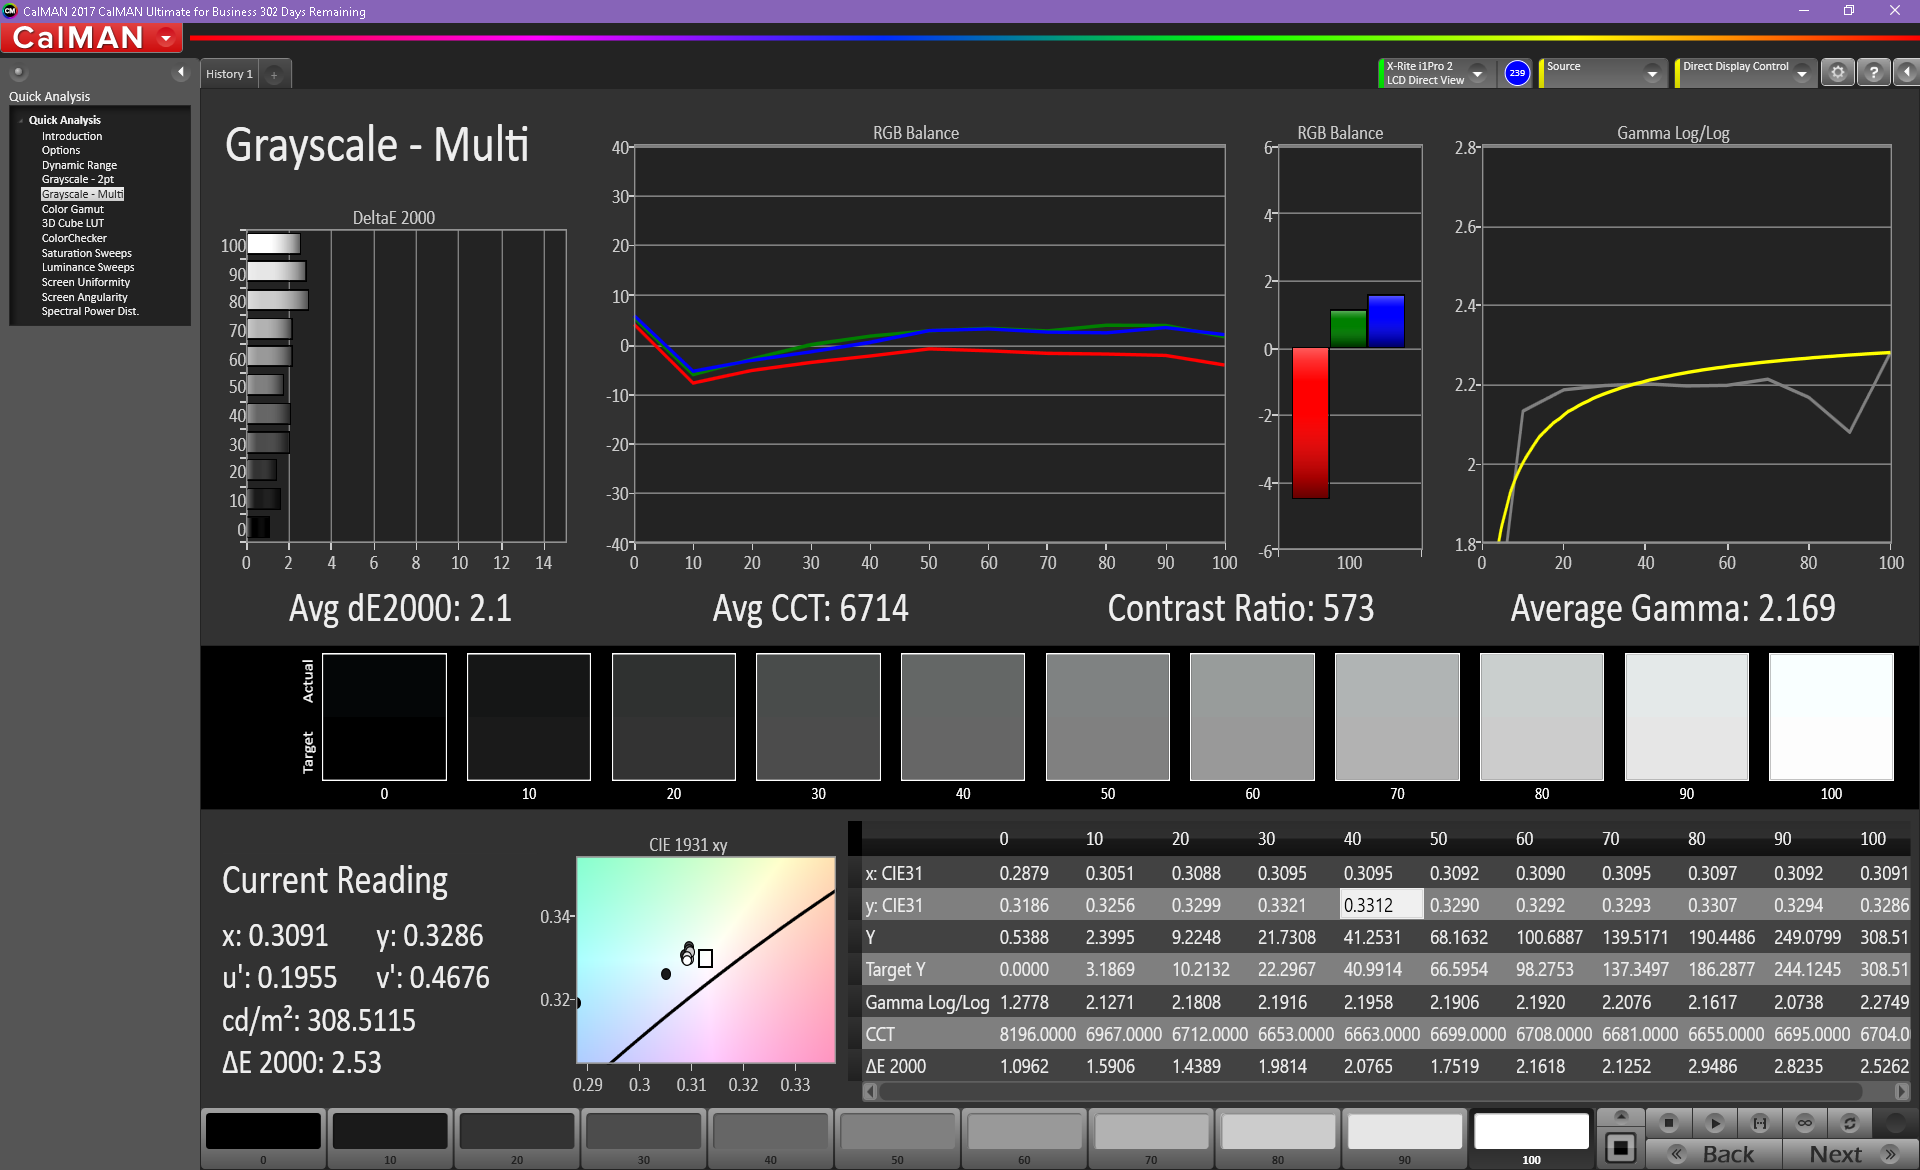
In spite of its bad backlight (which might be a flaw specific to our unit), color accuracy is superb out of the box. The average DeltaE 2000 is 3.17 for colors and 1.6 for grays, which are excellent. (DeltaE 2000 measurements of 3 or less are considered acceptable for most professional color work.) Calibration raises these numbers a bit but balances the overall spectrum and flattens the gamma curve a bit (in the case of grayscale measurements). It should be noted that our unit may have been calibrated before being sent to us as the "before and after" numbers are almost the same.
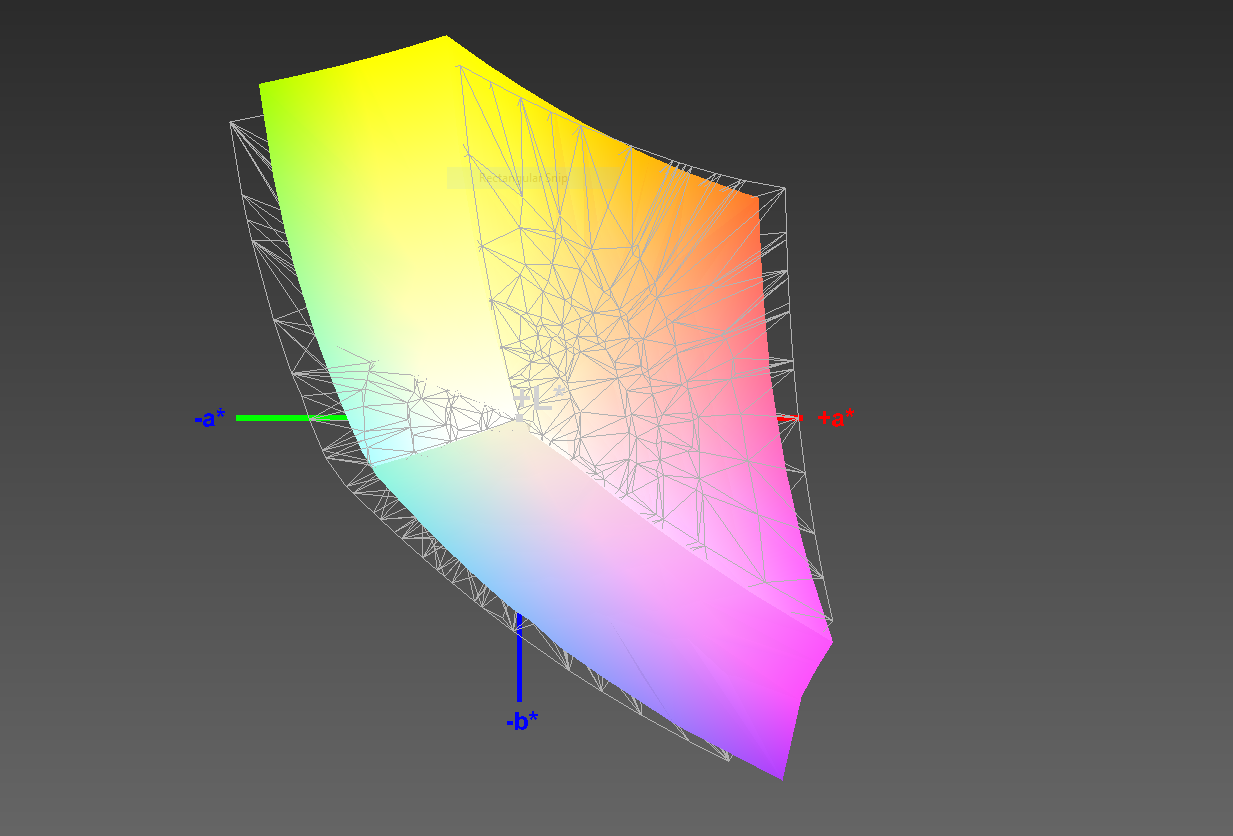
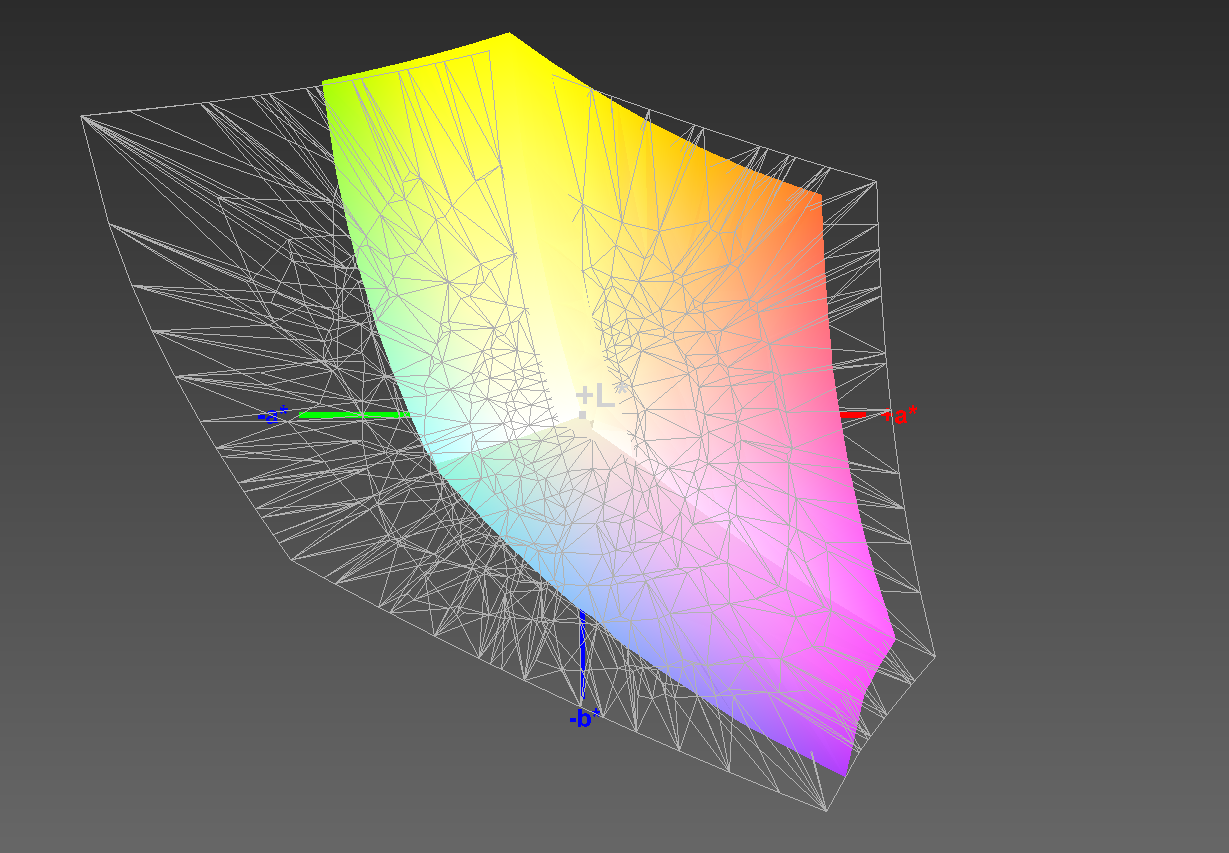
While colors are fairly accurate for a mid-range gaming laptop, color space coverage is only average. The AU Optronics panel covers about 56% and 87% of the AdobeRGB and sRGB color spectrums, respectively. These measurements are good, but they're only average for this category. The MSI GS73VR and Acer Predator 17 both cover nearly 100% of the sRGB gamut. These machines aren't as color accurate as the GL703VM, however.
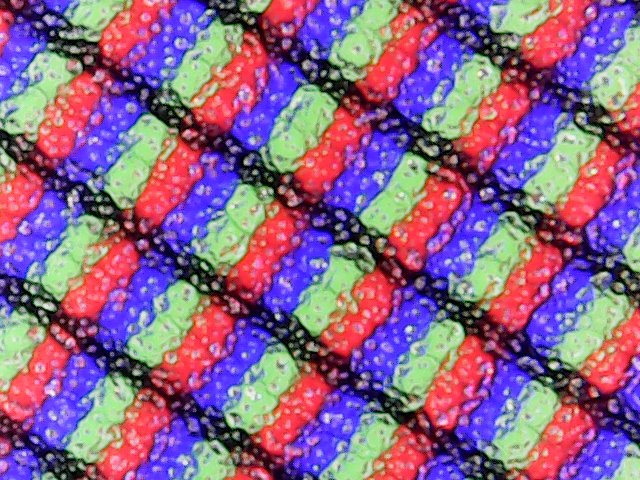
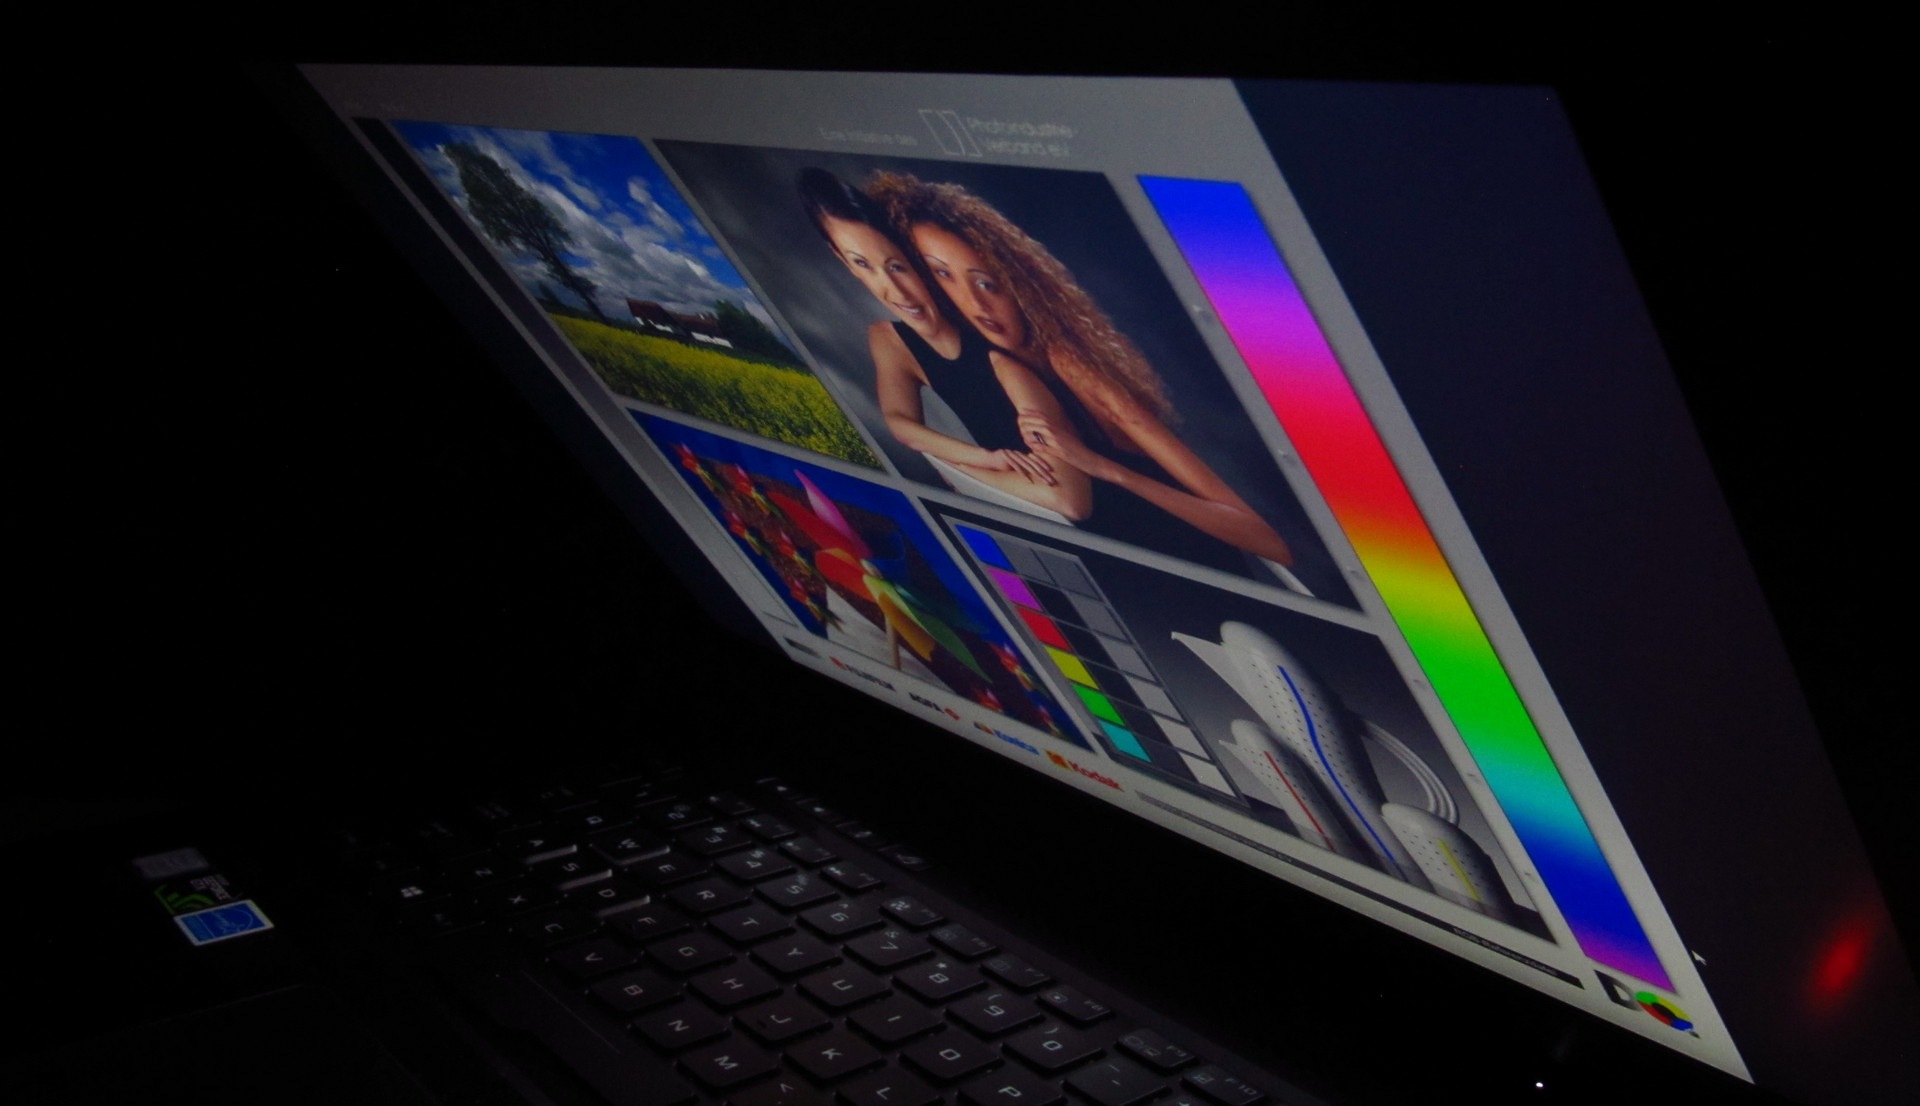
Viewing angles are good, which is to be expected of an IPS display. Colors remain accurate and text legible at angles past 45°. The panel exhibits a "graininess" common to matte displays; when viewing white backgrounds from a close distance, the panel looks noisy and gritty.


Display Response Times
| ↔ Response Time Black to White | ||
|---|---|---|
| 24.4 ms ... rise ↗ and fall ↘ combined | ↗ 13.2 ms rise | 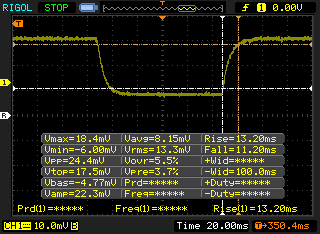 |
| ↘ 11.2 ms fall | ||
| The screen shows good response rates in our tests, but may be too slow for competitive gamers. In comparison, all tested devices range from 0.1 (minimum) to 240 (maximum) ms. » 58 % of all devices are better. This means that the measured response time is worse than the average of all tested devices (19.8 ms). | ||
| ↔ Response Time 50% Grey to 80% Grey | ||
| 30.8 ms ... rise ↗ and fall ↘ combined | ↗ 16.4 ms rise | 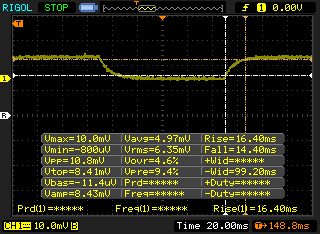 |
| ↘ 14.4 ms fall | ||
| The screen shows slow response rates in our tests and will be unsatisfactory for gamers. In comparison, all tested devices range from 0.165 (minimum) to 636 (maximum) ms. » 41 % of all devices are better. This means that the measured response time is similar to the average of all tested devices (31 ms). | ||
Screen Flickering / PWM (Pulse-Width Modulation)
| Screen flickering / PWM not detected | 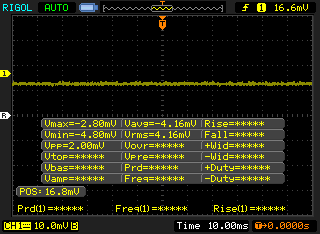 | ||
In comparison: 52 % of all tested devices do not use PWM to dim the display. If PWM was detected, an average of 7754 (minimum: 5 - maximum: 343500) Hz was measured. | |||
Performance
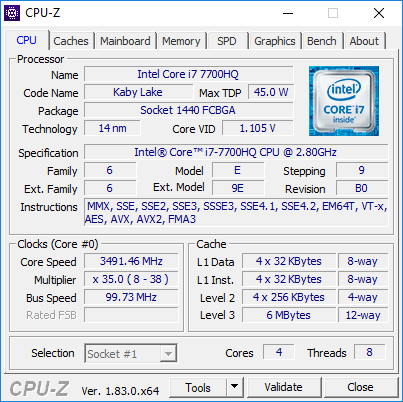
The GL703VM uses the now-classic combination of Intel's Core i7-7700HQ and Nvidia's GeForce GTX 1060. We've seen plenty of devices using this hardware and have a pretty good idea of what we can expect from it; these machines sit at a sweet spot for price/performance when it comes to gaming.
Processor
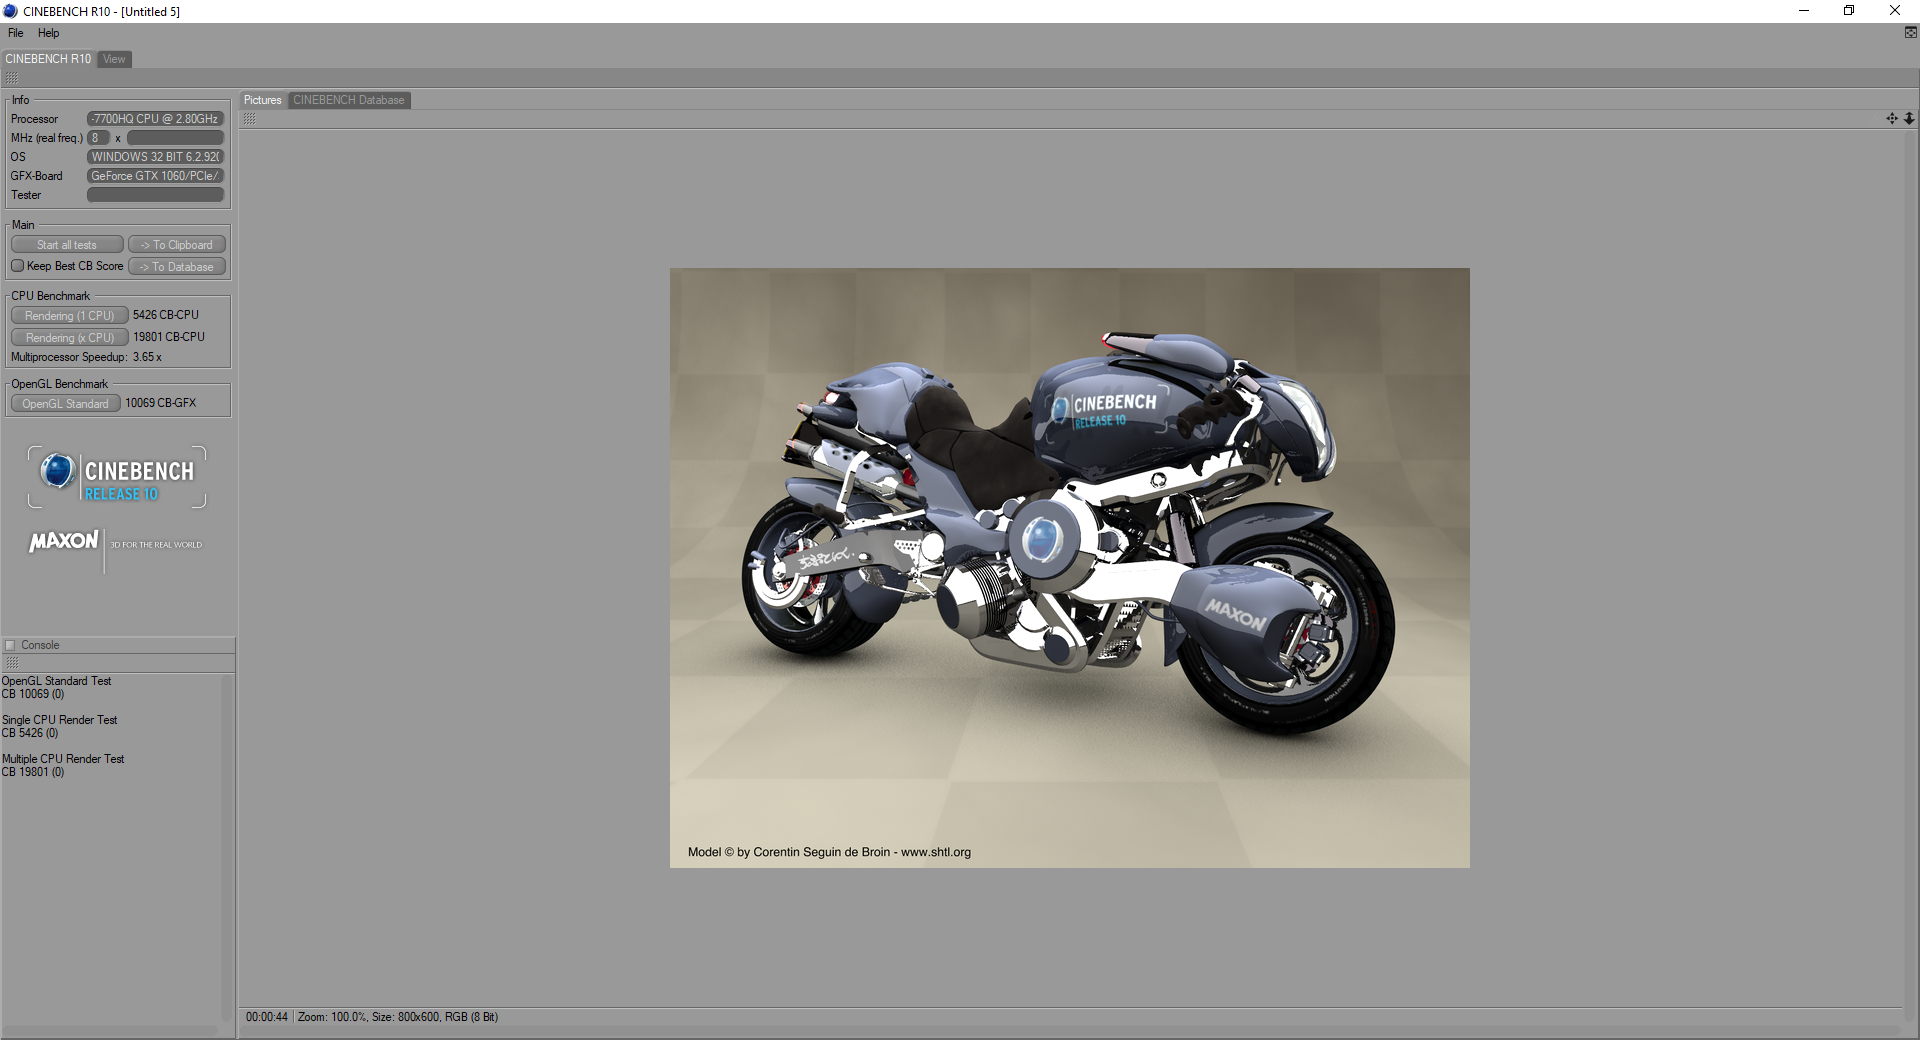
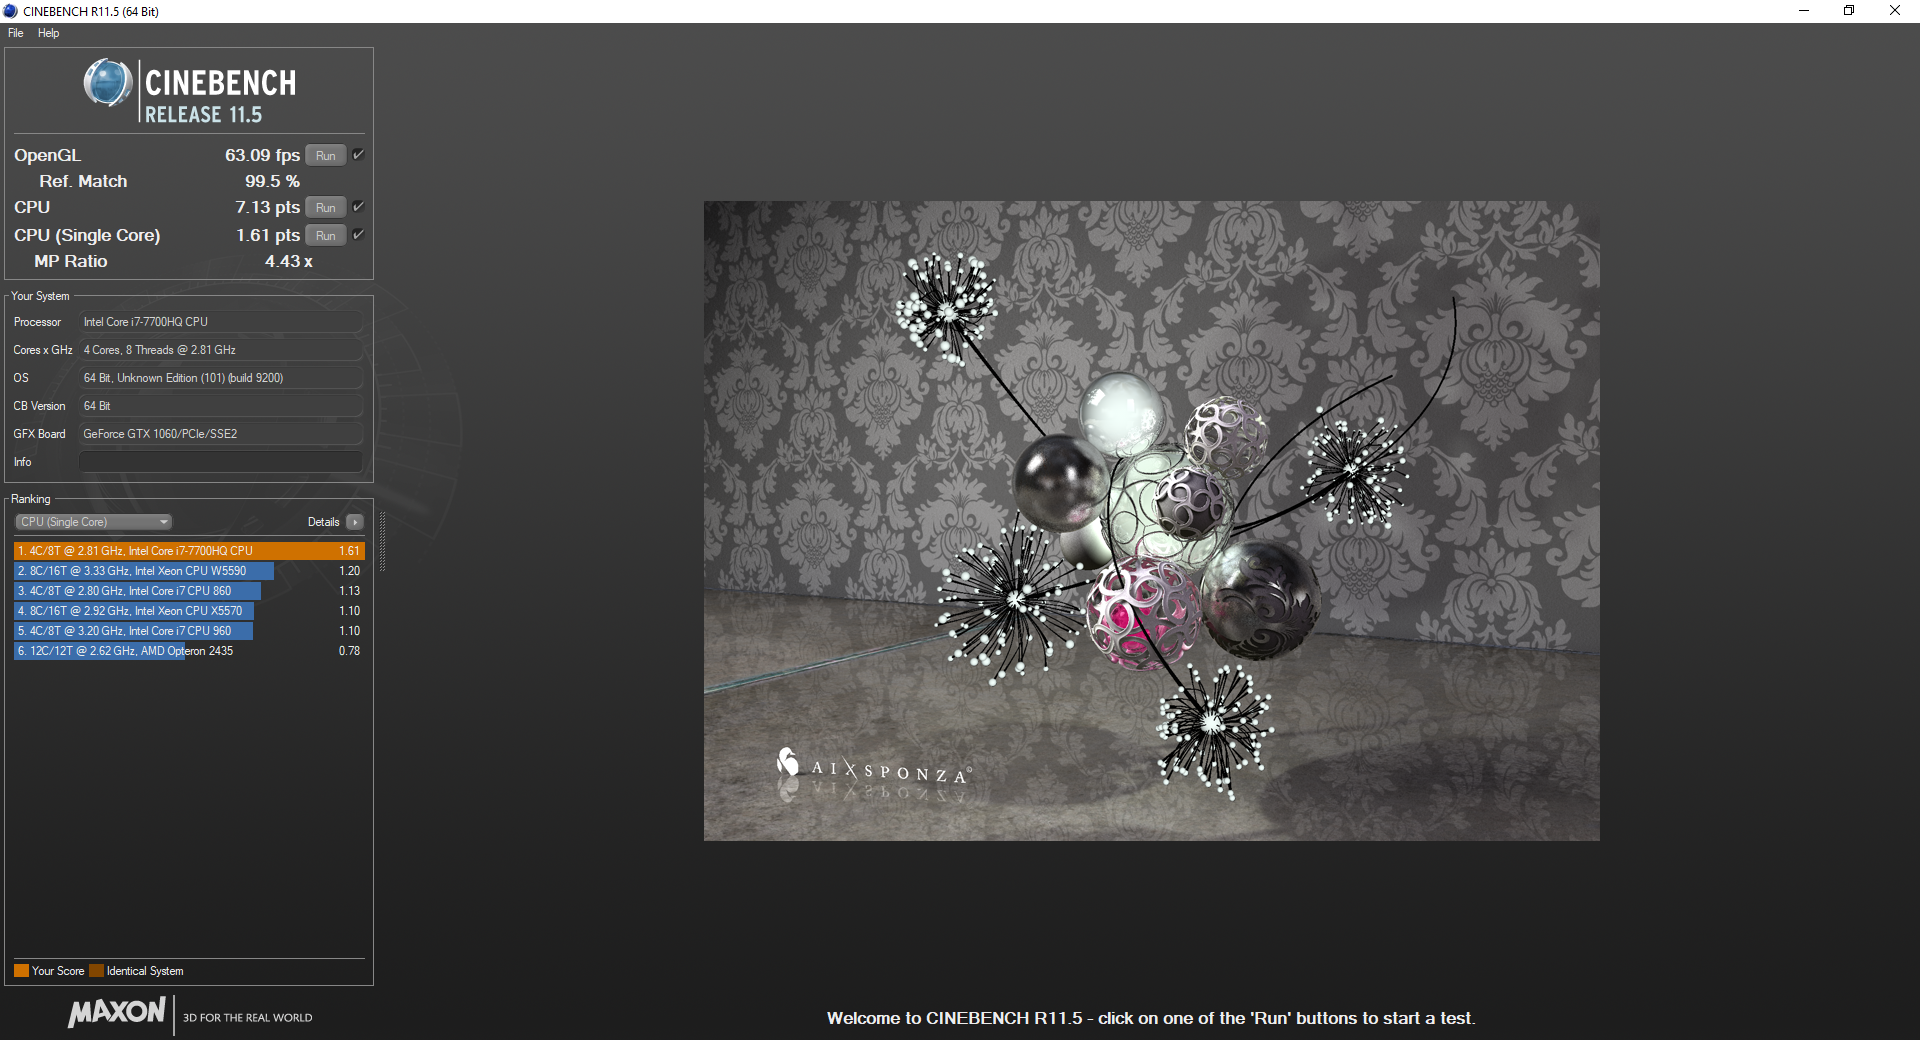
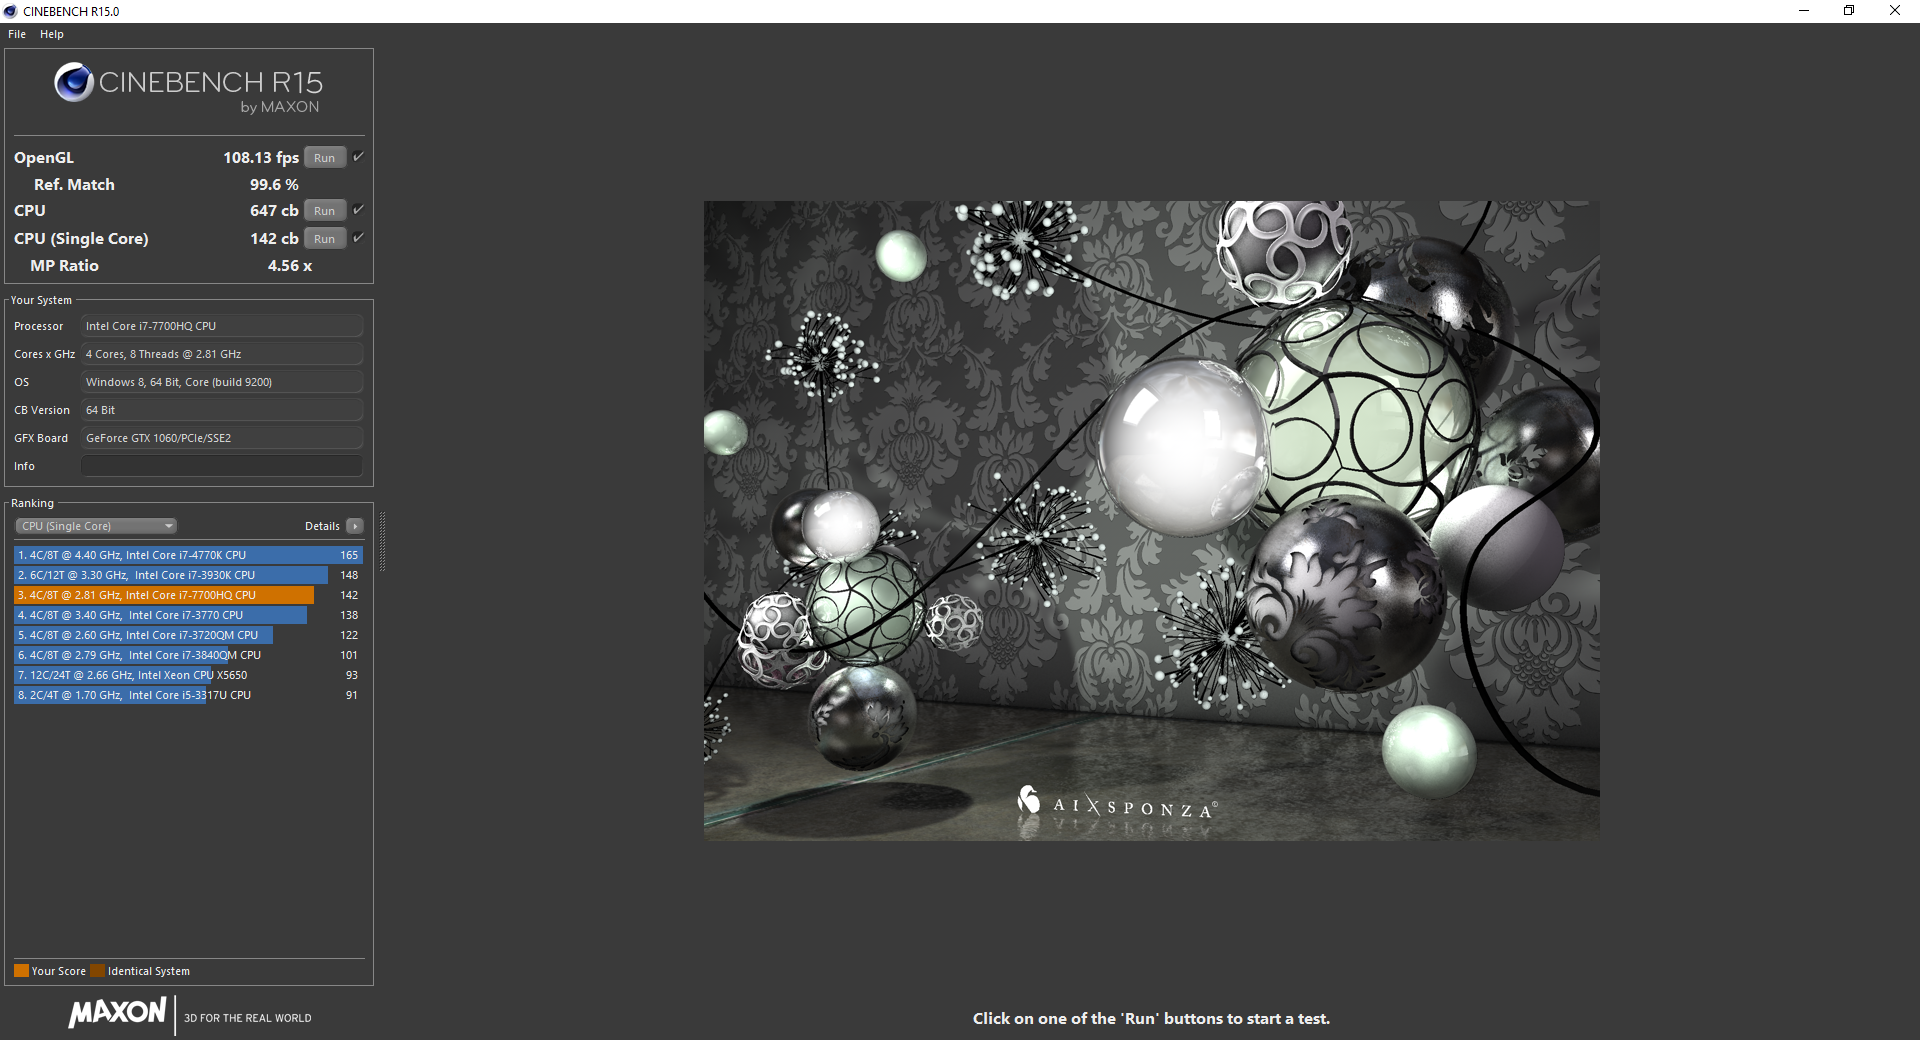
If you've looked at gaming laptops any time over the past year, the Intel Core i7-7700HQ should be familiar to you. The quad-core hyperthreaded CPU has become one of the most common processors in the gaming market, and for good reason. Clocked at 2.9 GHz (with a 3.9 GHz boost), the 45 W CPU packs a punch and should be more than enough for gaming.
In practice (at least with our review unit today), the 7700HQ doesn't quite live up to its full potential. As we'll see in the stress test section below, thermal limits seem to hold it back; Cinebench scores consistently sit below competitors and overall average scores for the CPU. In multi-core testing, the GL703VM lands just behind the competitors in our roundup with a score of 710. While this score is good, there are better iterations of the 7700HQ available.
Looping Cinebench to test the CPU's stability produces consistent results. Scores float around 710 cb, which is what we see in single runs of the test. Over long periods of computationally heavy workloads, the GL703VM should remain consistent. On battery, the GL703VM sees a 10-15% reduction in CPU performance, as measured by an average Cinebench score of around 600 cb.

| wPrime 2.10 - 1024m | |
| Asus ROG Strix GL703VD-DB74 | |
| MSI GS73VR 7RF | |
| Average Intel Core i7-7700HQ (210 - 379, n=48) | |
| Asus Strix GL703VM-DB74 | |
| Average of class Gaming (33 - 210, n=6, last 2 years) | |
* ... smaller is better
System Performance
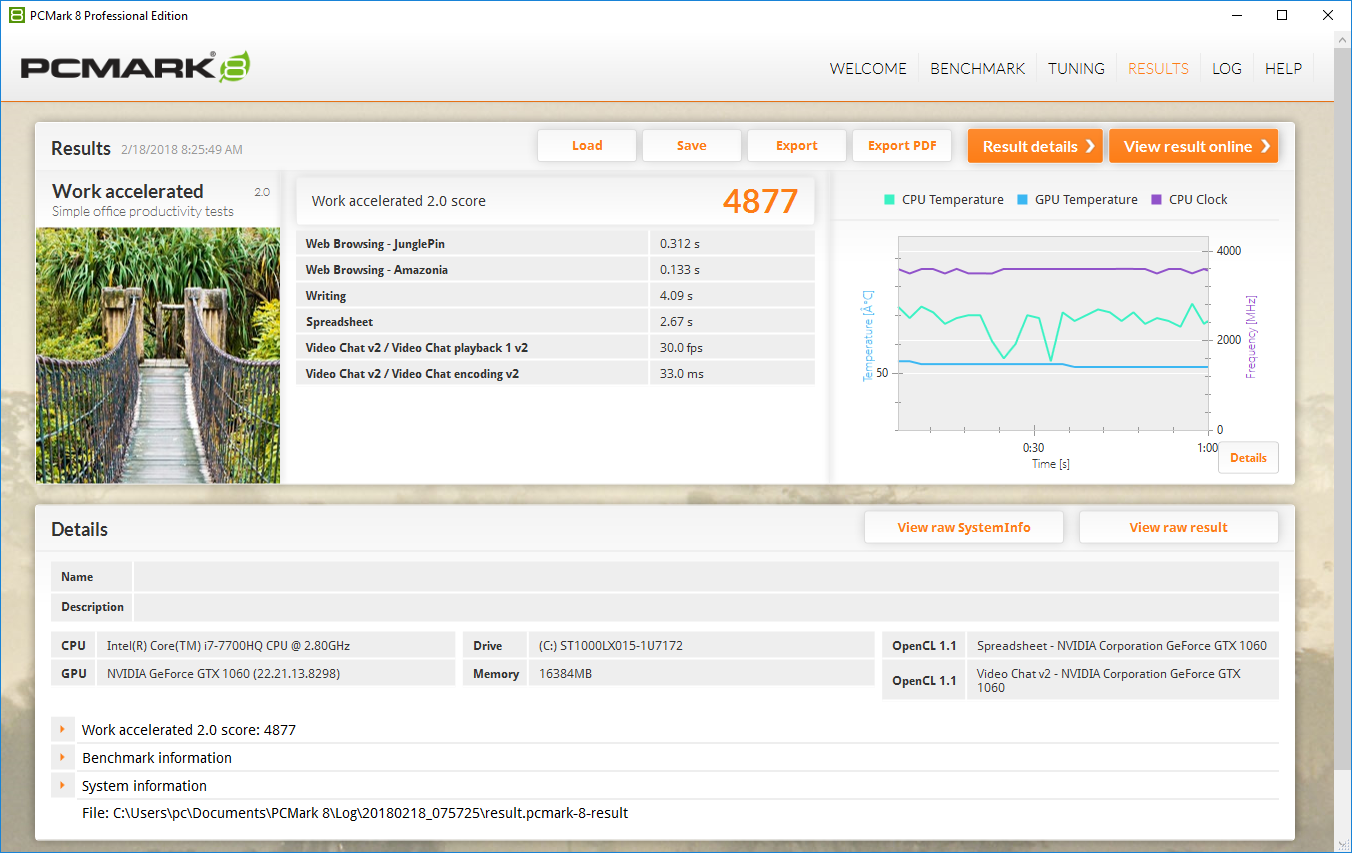
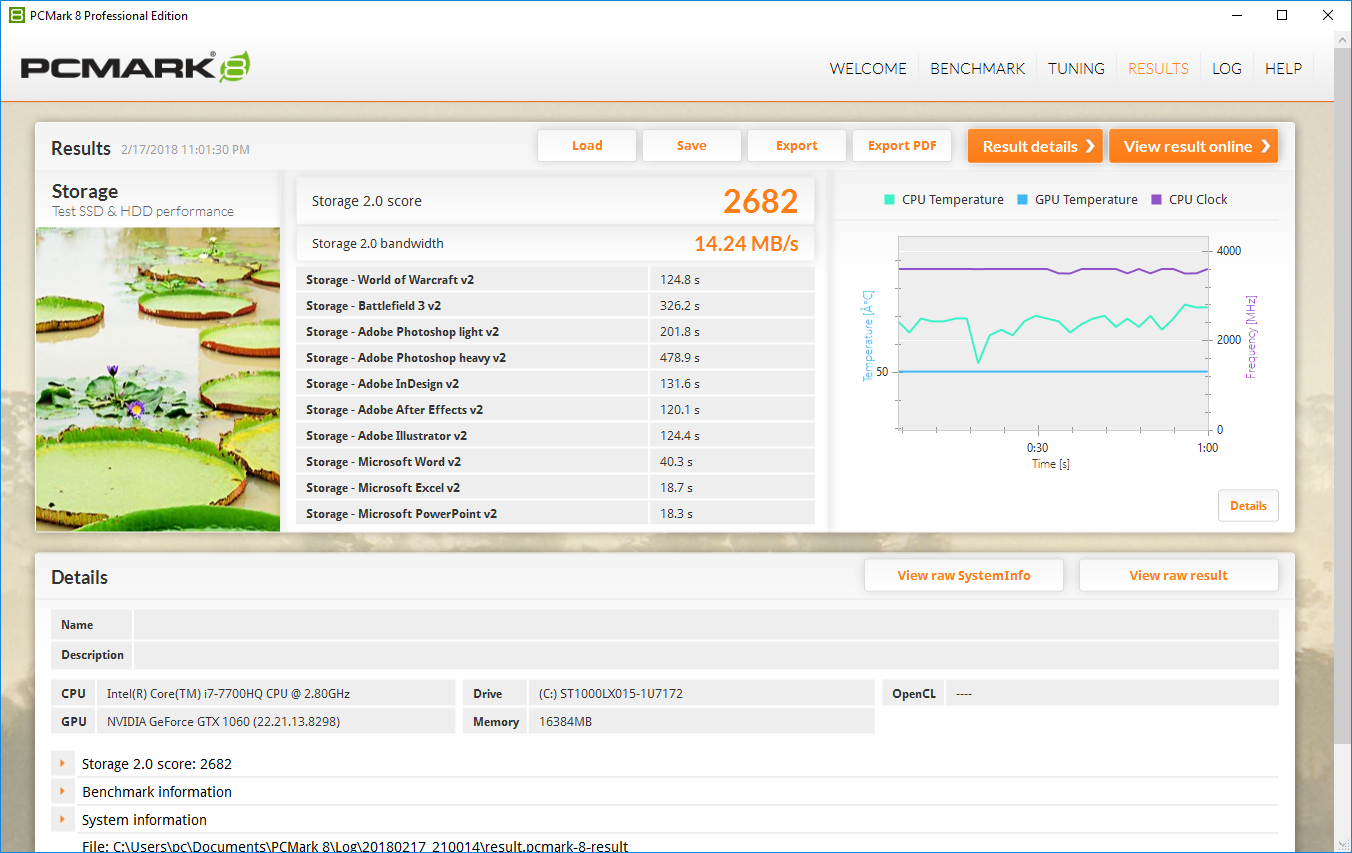
Overall system performance, according to PCMark 8, is average for a mid-range gaming laptop. PCMark scores regularly land in the middle of the pack, so users shouldn't experience any debilitating hiccups in day-to-day use. The biggest limiting factor, which we will explore in the next section, is the slow HDD. While most models of the GL703VM are equipped with an m.2 SSD (SATA or NVMe), our review unit relies solely on a 5400 RPM mechanical drive, which is sluggish in comparison. Apps run fine once they've been opened, but users will stretch their patience when loading files and programs.
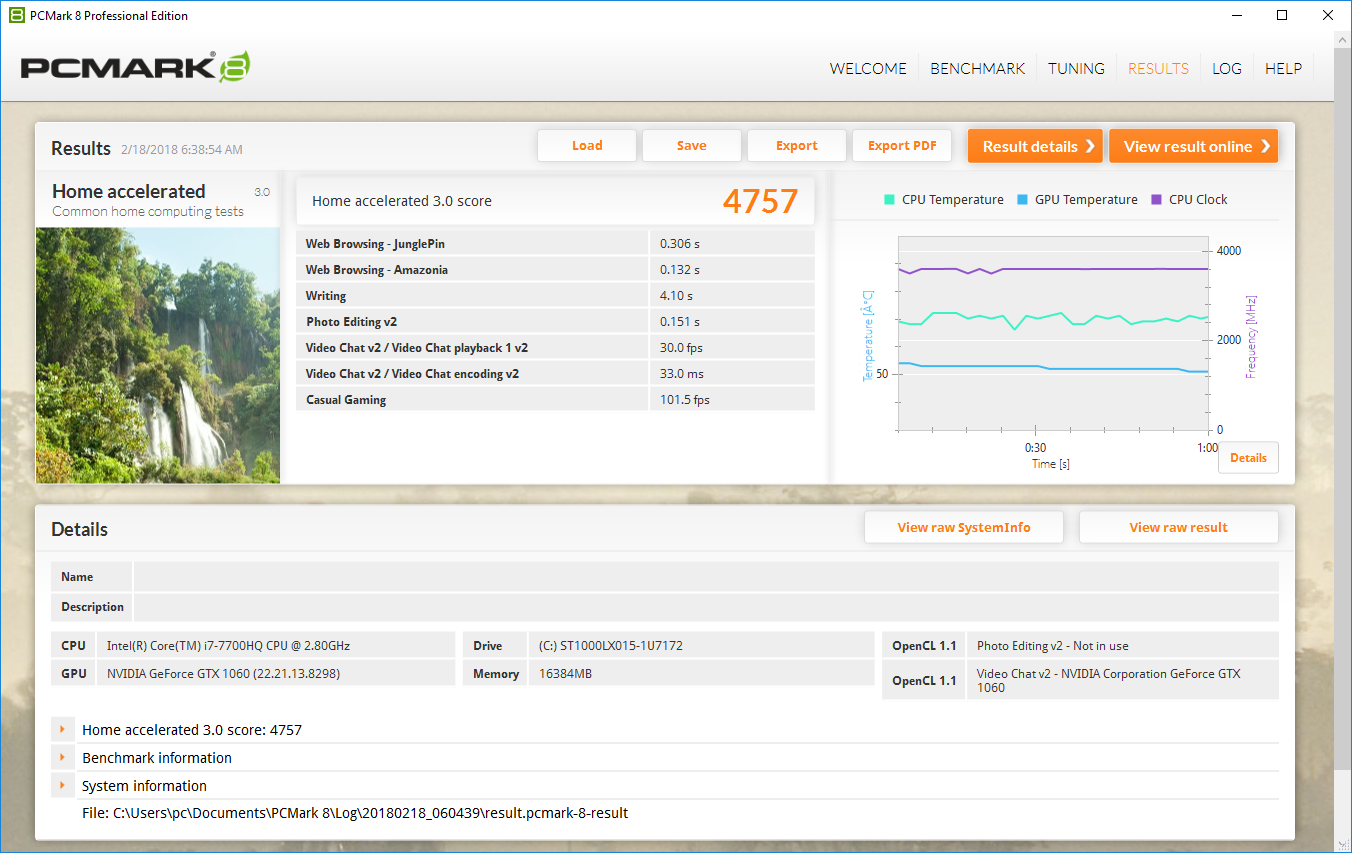
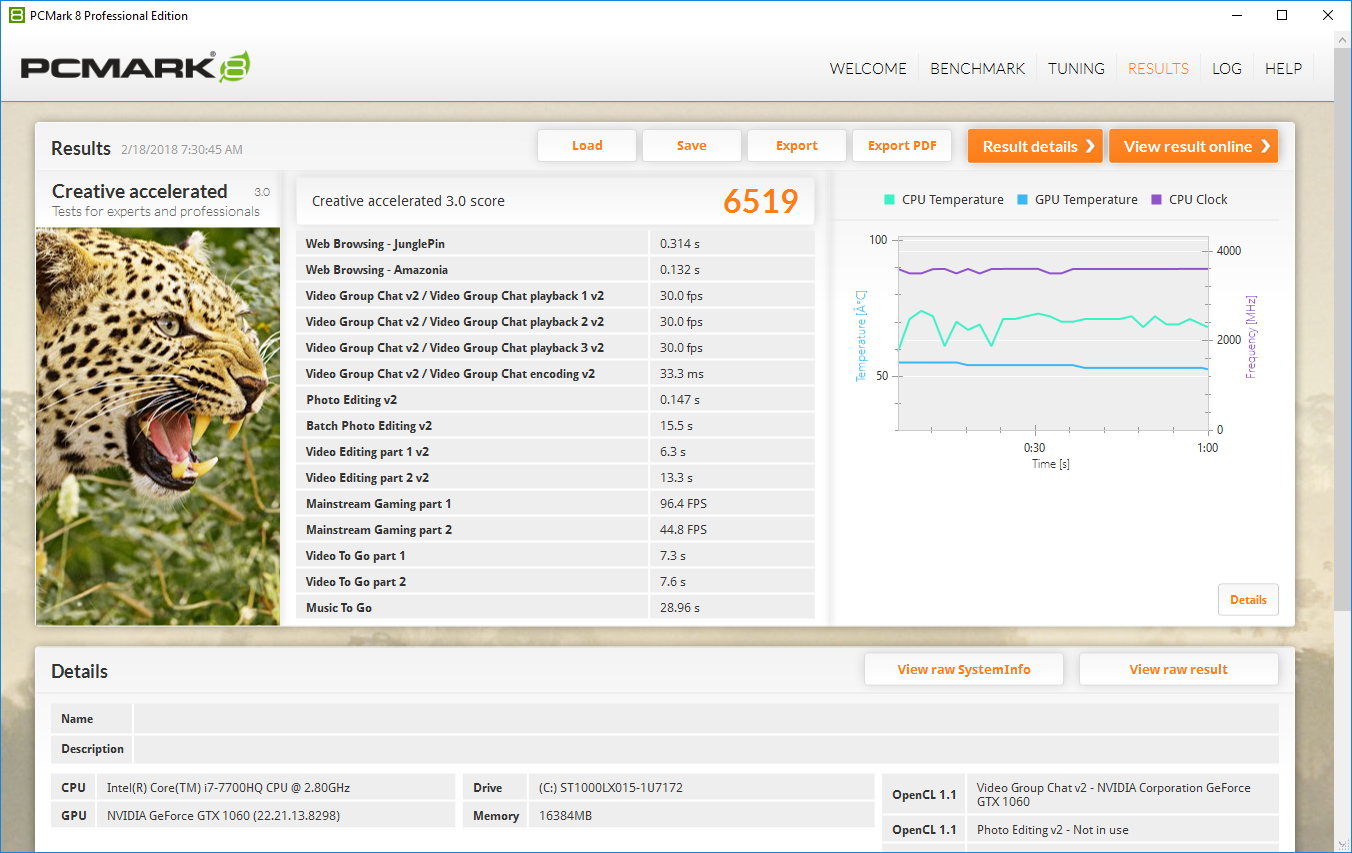

| PCMark 8 Home Score Accelerated v2 | 4757 points | |
| PCMark 8 Creative Score Accelerated v2 | 6519 points | |
| PCMark 8 Work Score Accelerated v2 | 4877 points | |
| PCMark 10 Score | 4352 points | |
Help | ||
Storage Devices
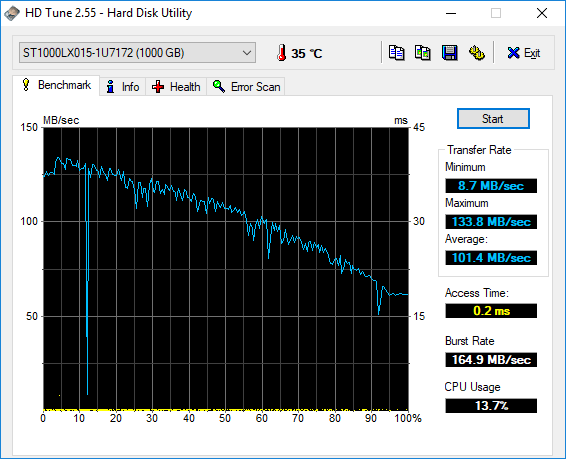
As we mentioned above, the 5400 RPM HDD from Seagate is a sloth. The 1 TB of storage is generous, but users should definitely opt for models equipped with an SSD (either SATA or NVMe) or budget one into their purchase. The drive in our unit also exhibits some strange behavior (as shown in the HD Tune graph below). Transfer rates inexplicably drop for a few seconds at a time, and drive speeds suffer accordingly. These results are sadly common for 5400 RPM mechanical drives.
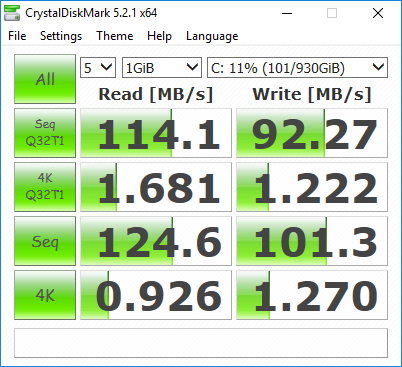
| Asus Strix GL703VM-DB74 Seagate Mobile HDD 1TB ST1000LX015-1U7172 | Asus ROG Strix GL703VD-DB74 SanDisk SD8SN8U256G1002 | HP ProBook 450 G5-2UB53EA SanDisk SD8SN8U256G1006 | Asus VivoBook 17 X705UA-BX022T Seagate Mobile HDD 1TB ST1000LM035 | Asus G703 2x Samsung SM961 MZVKW512HMJP NVMe (RAID 0) | Dell Inspiron 15 7000 7577 4K SK hynix SC311 M.2 | HP Omen 15t-ce000 Samsung PM961 NVMe MZVLW128HEGR | Average Seagate Mobile HDD 1TB ST1000LX015-1U7172 | |
|---|---|---|---|---|---|---|---|---|
| CrystalDiskMark 5.2 / 6 | 5789% | 5824% | -17% | 15239% | 4482% | 8317% | -31% | |
| Write 4K (MB/s) | 1.27 | 53.1 4081% | 51.6 3963% | 1.747 38% | 160.7 12554% | 89 6908% | 145.1 11325% | 0.4682 ? -63% |
| Read 4K (MB/s) | 0.93 | 24.7 2556% | 27.1 2814% | 0.285 -69% | 54.8 5792% | 28.77 2994% | 45.95 4841% | 0.533 ? -43% |
| Write Seq (MB/s) | 101.3 | 445.3 340% | 471.6 366% | 76.8 -24% | 2738 2603% | 246.7 144% | 750 640% | 75.6 ? -25% |
| Read Seq (MB/s) | 124.6 | 478.2 284% | 499.3 301% | 85.6 -31% | 3346 2585% | 480.9 286% | 1250 903% | 116.1 ? -7% |
| Write 4K Q32T1 (MB/s) | 1.22 | 259.2 21146% | 283.2 23113% | 1.727 42% | 612 50064% | 162.2 13195% | 176.1 14334% | 0.643 ? -47% |
| Read 4K Q32T1 (MB/s) | 1.68 | 289.3 17120% | 257.9 15251% | 0.647 -61% | 709 42102% | 199.6 11781% | 524 31090% | 1.067 ? -36% |
| Write Seq Q32T1 (MB/s) | 92.3 | 470.7 410% | 476.6 416% | 89.3 -3% | 3082 3239% | 243.8 164% | 749 711% | 81.9 ? -11% |
| Read Seq Q32T1 (MB/s) | 114.1 | 540 373% | 533 367% | 78.6 -31% | 3505 2972% | 549 381% | 3183 2690% | 97 ? -15% |

GPU Performance
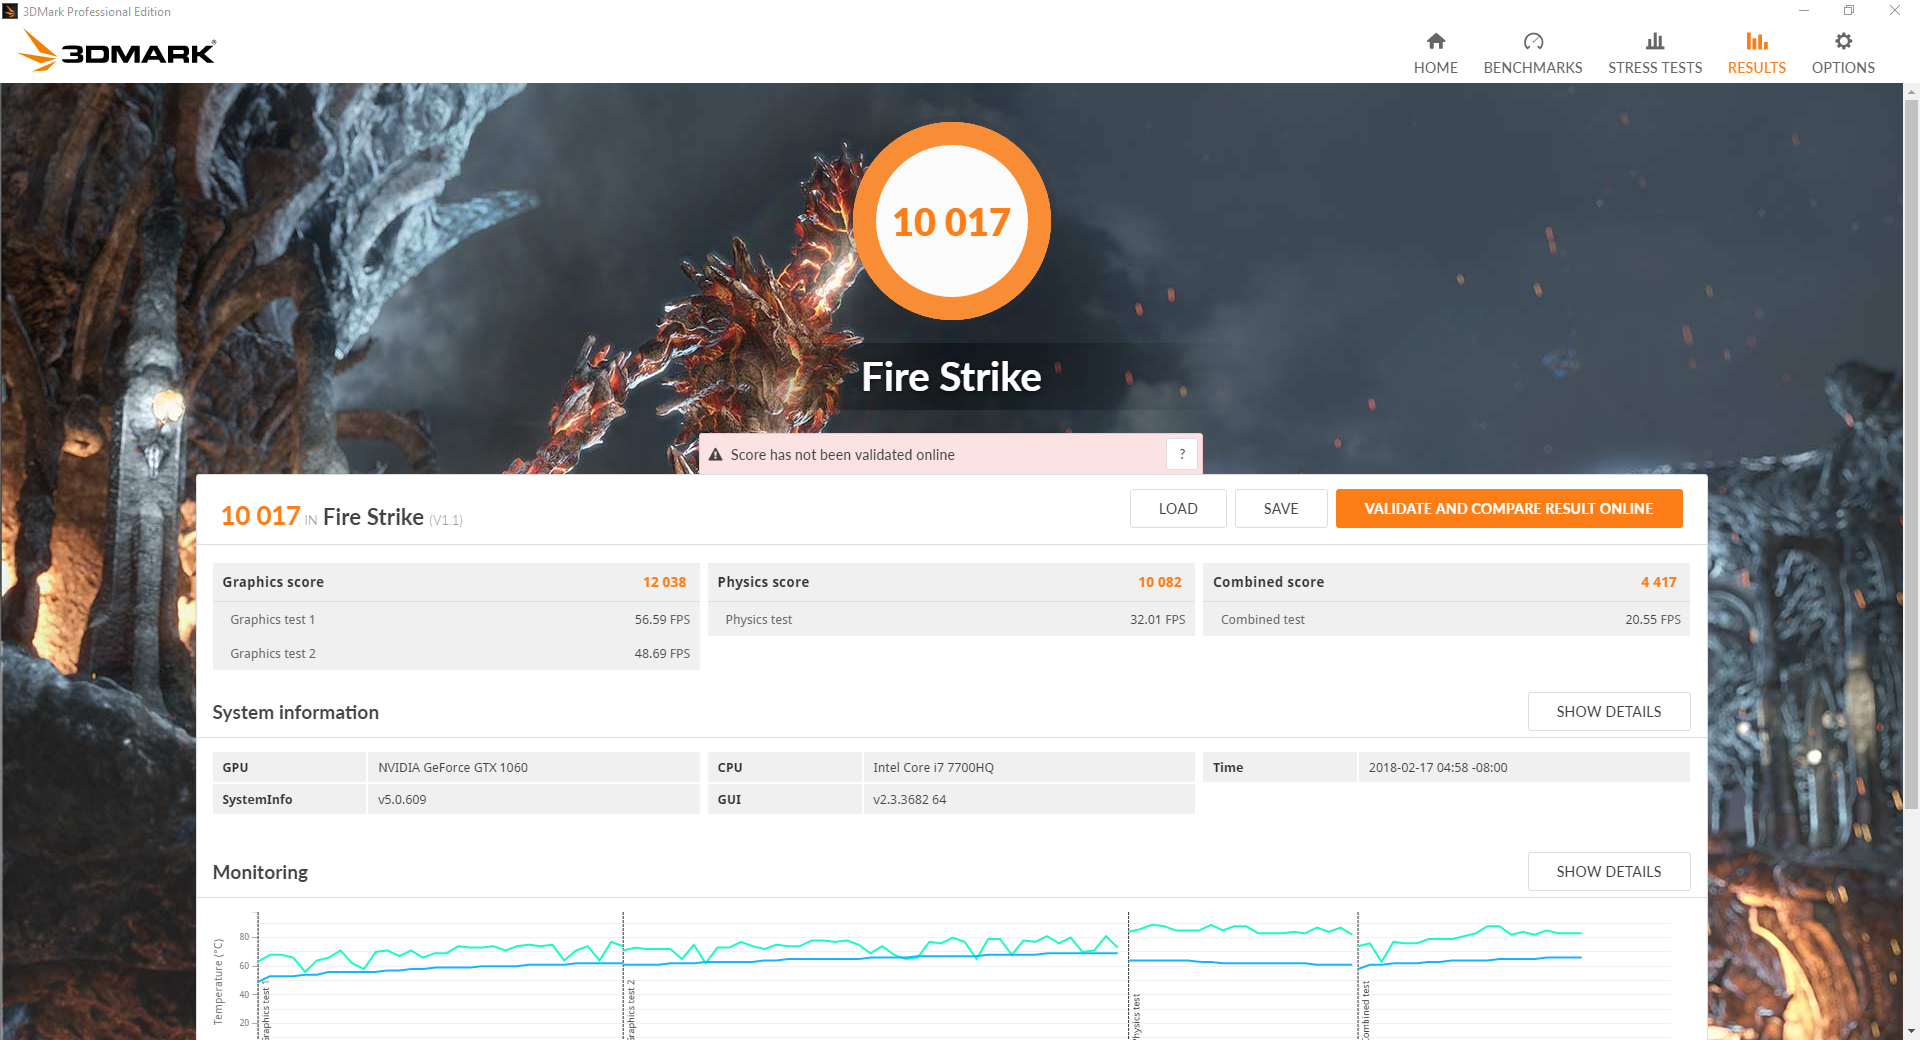
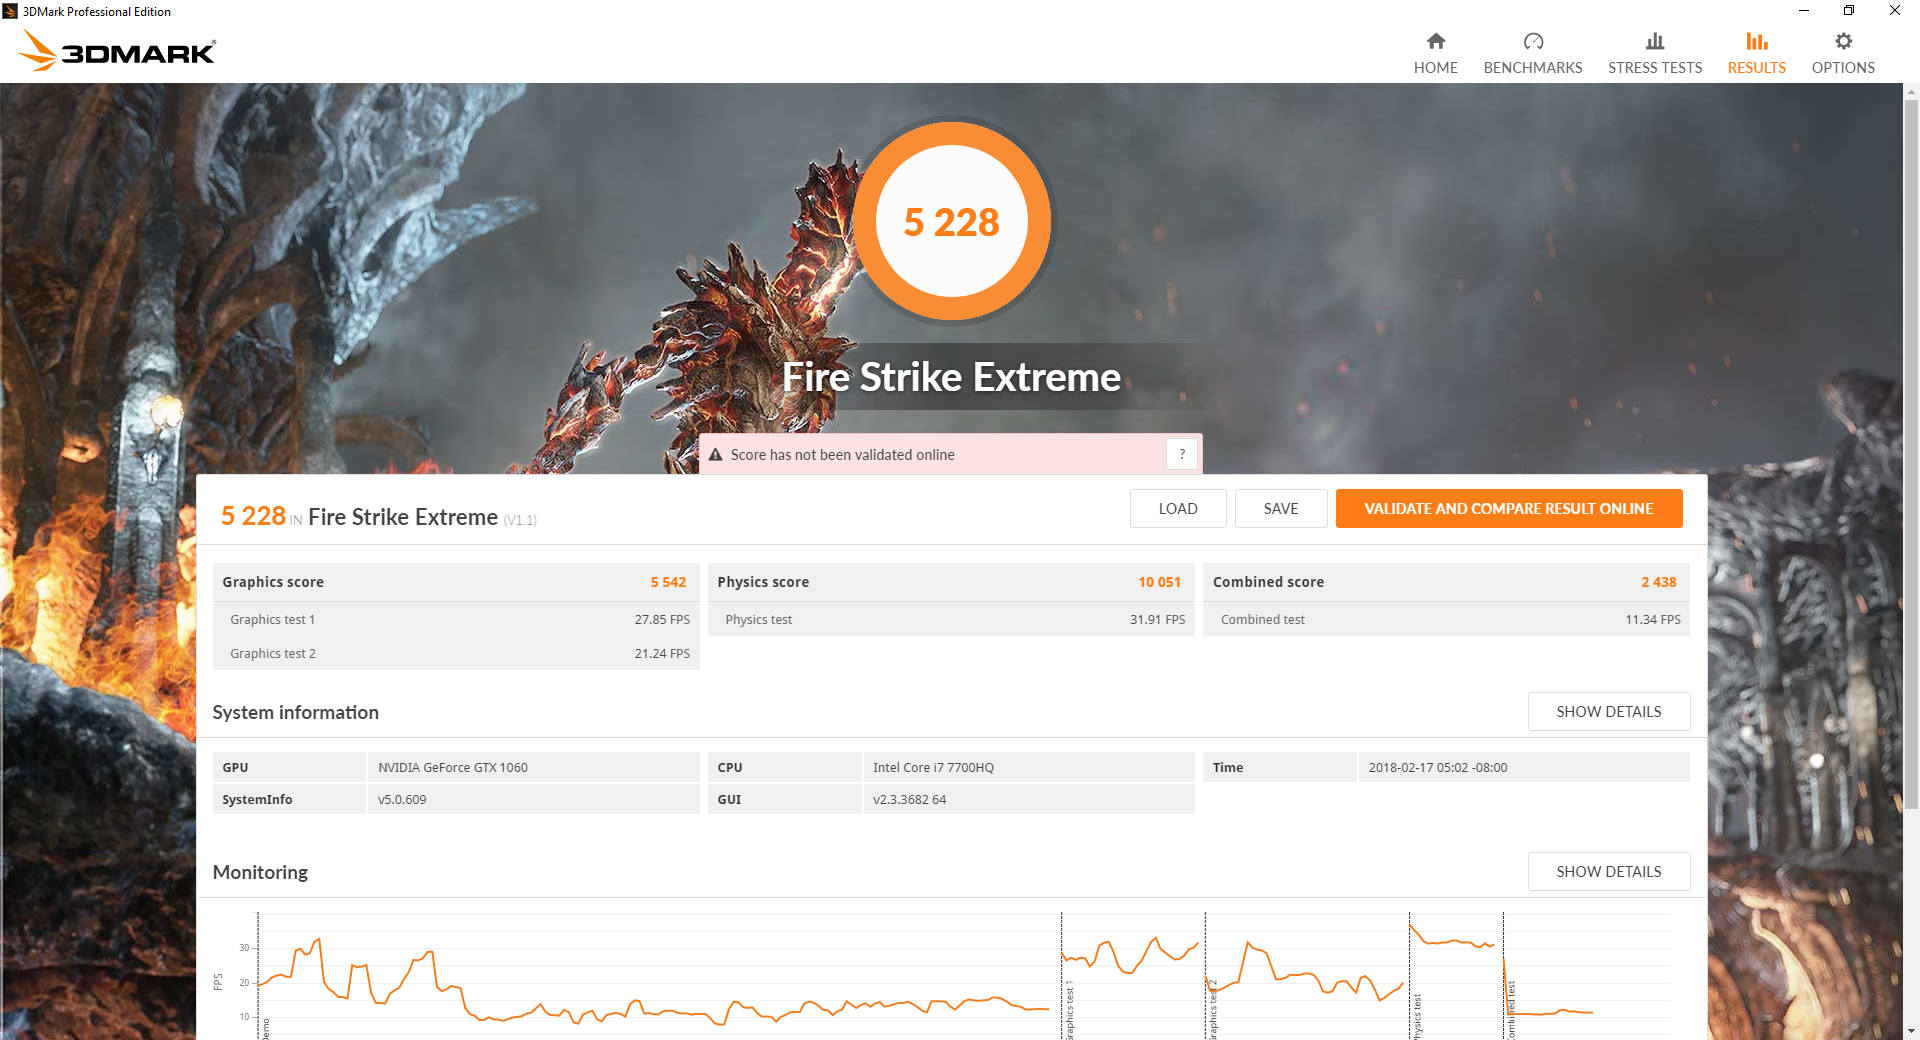
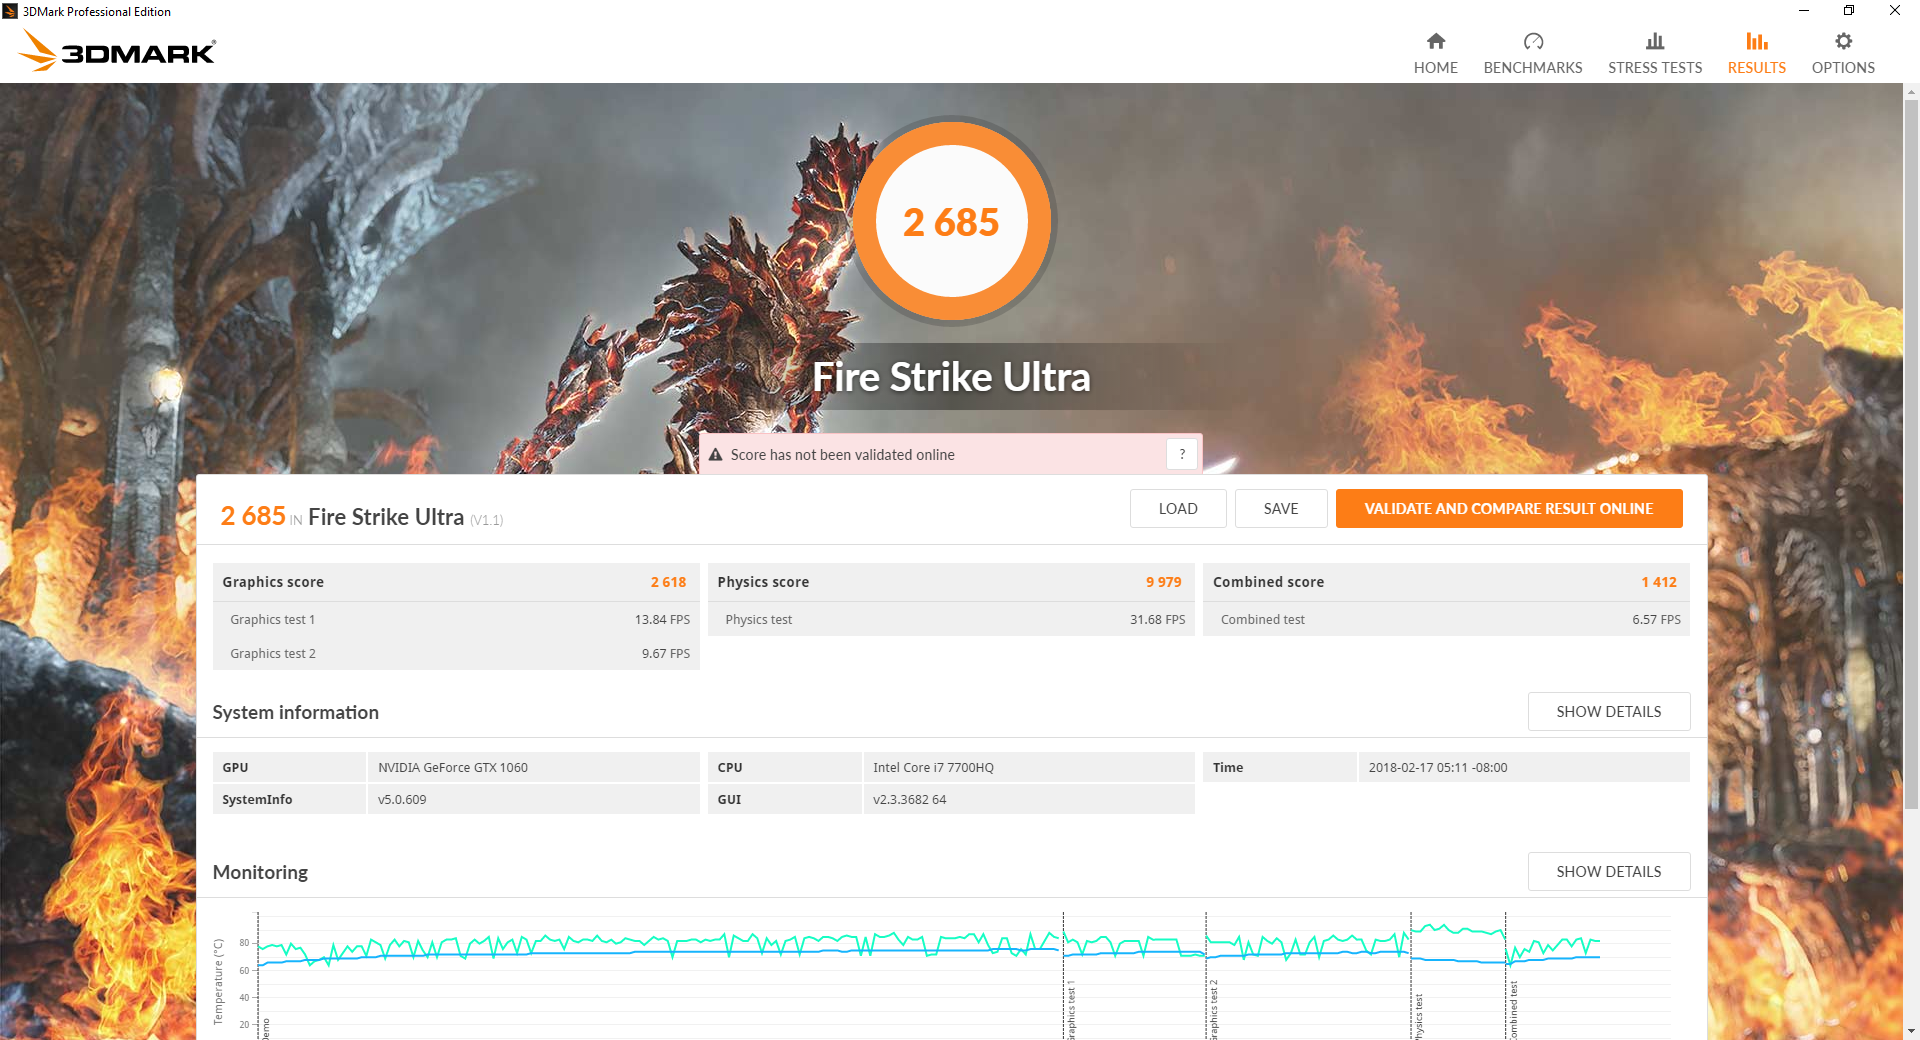
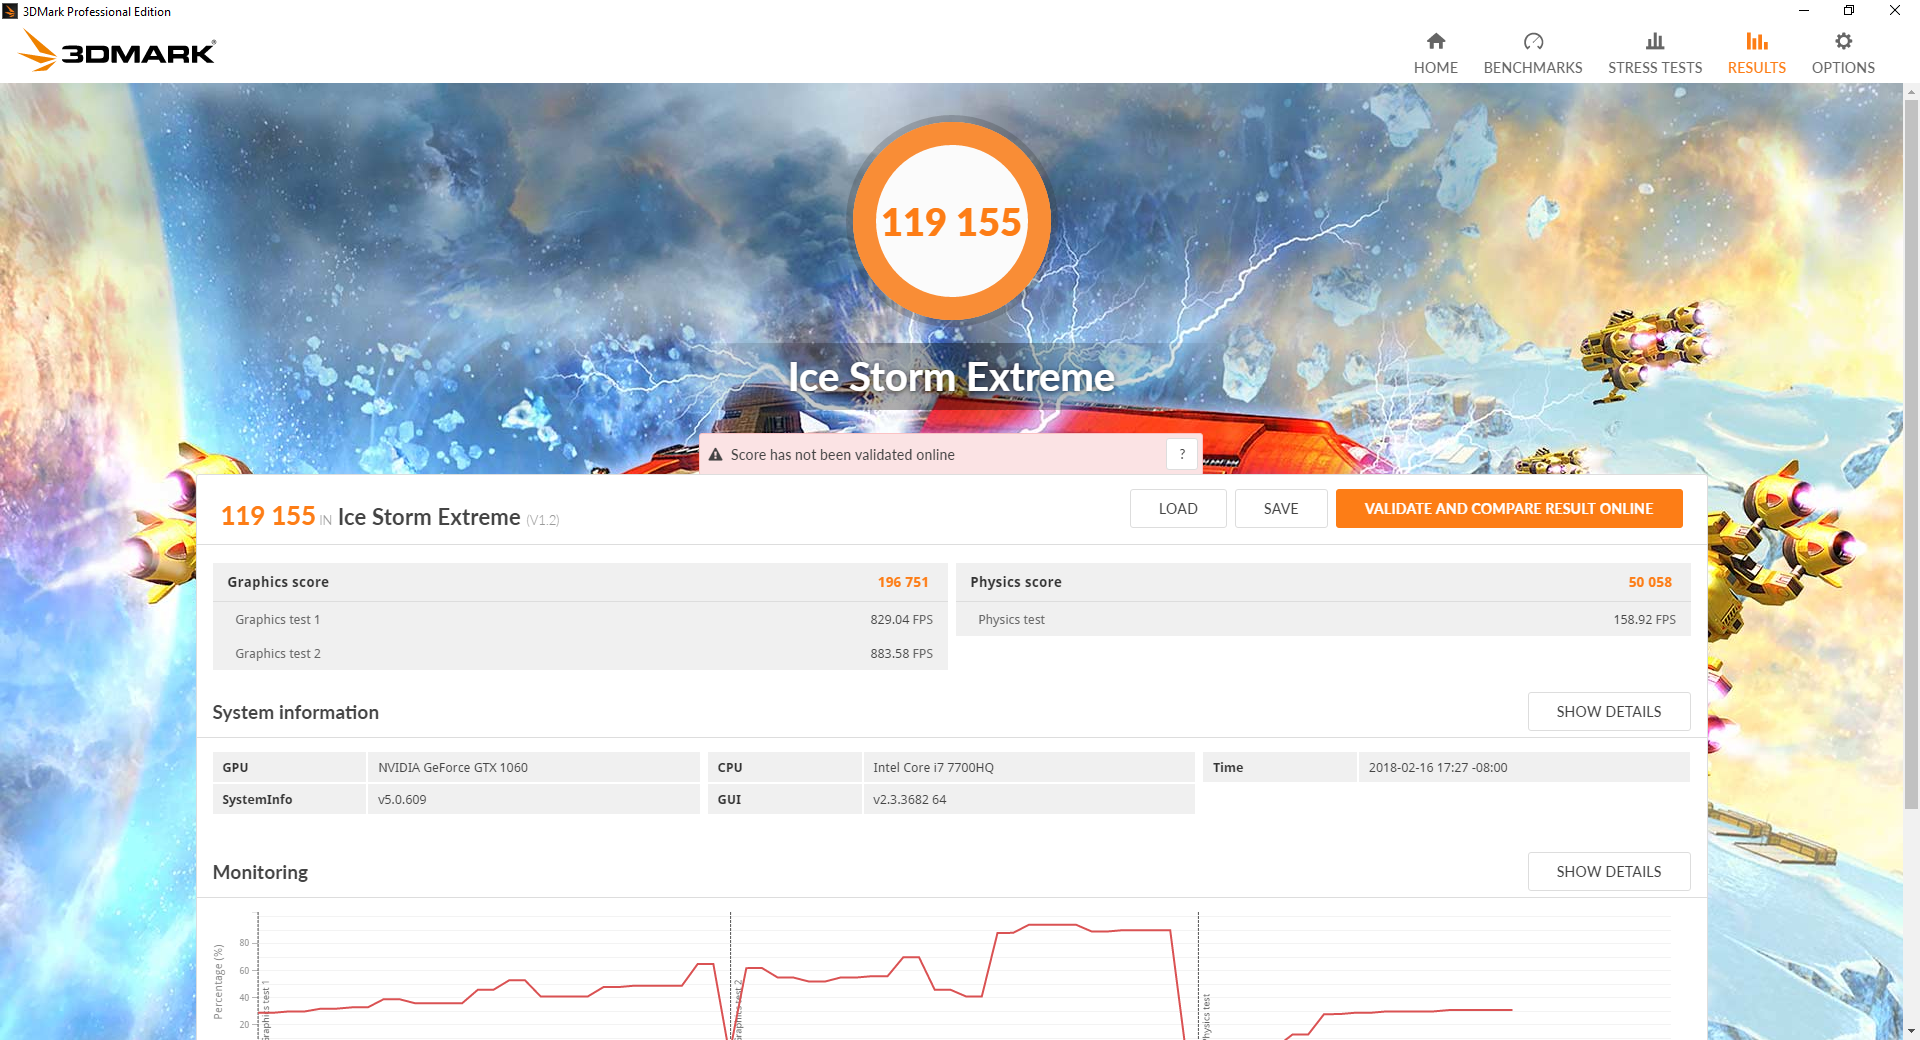
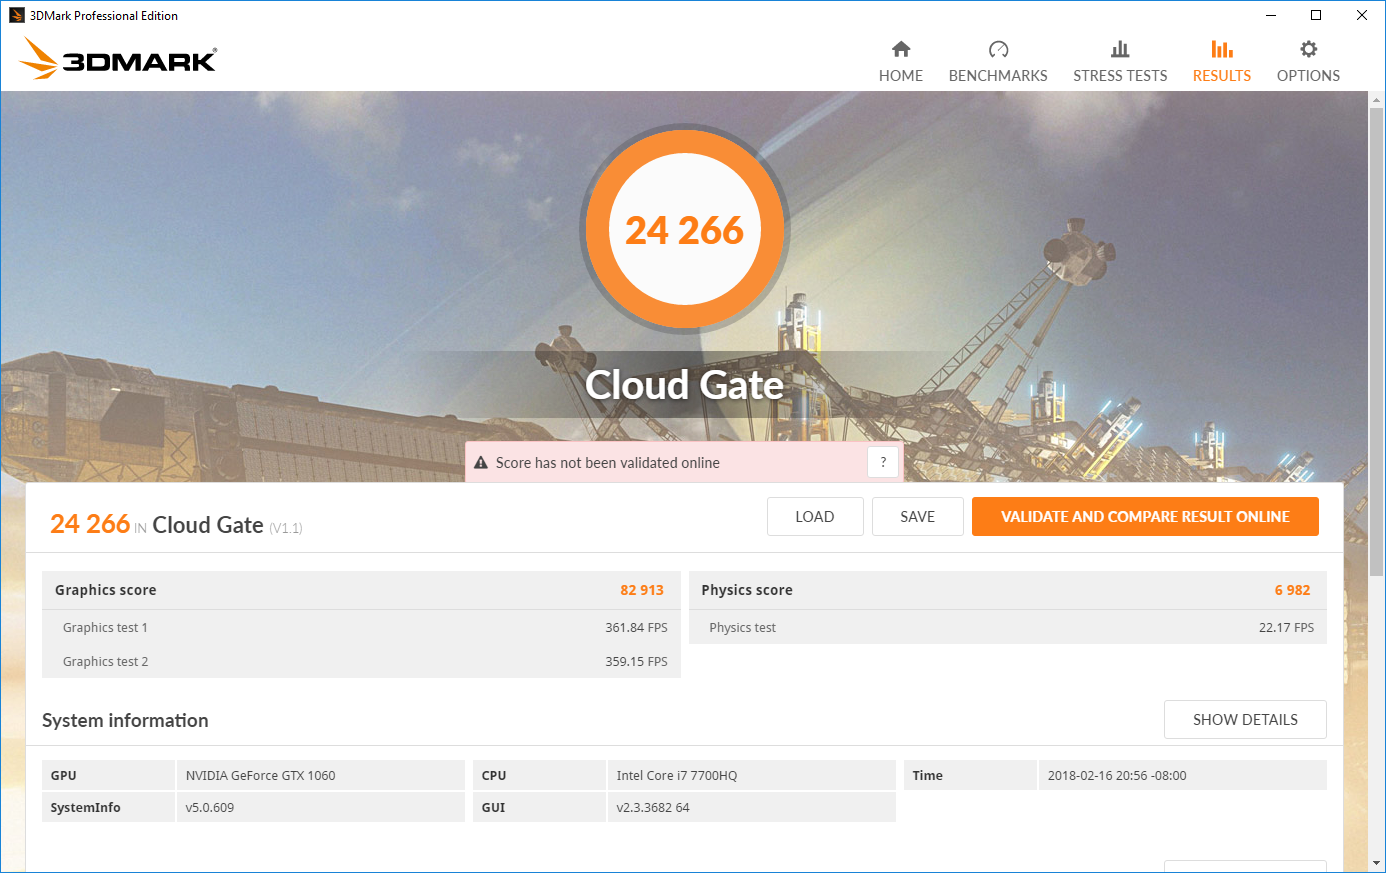
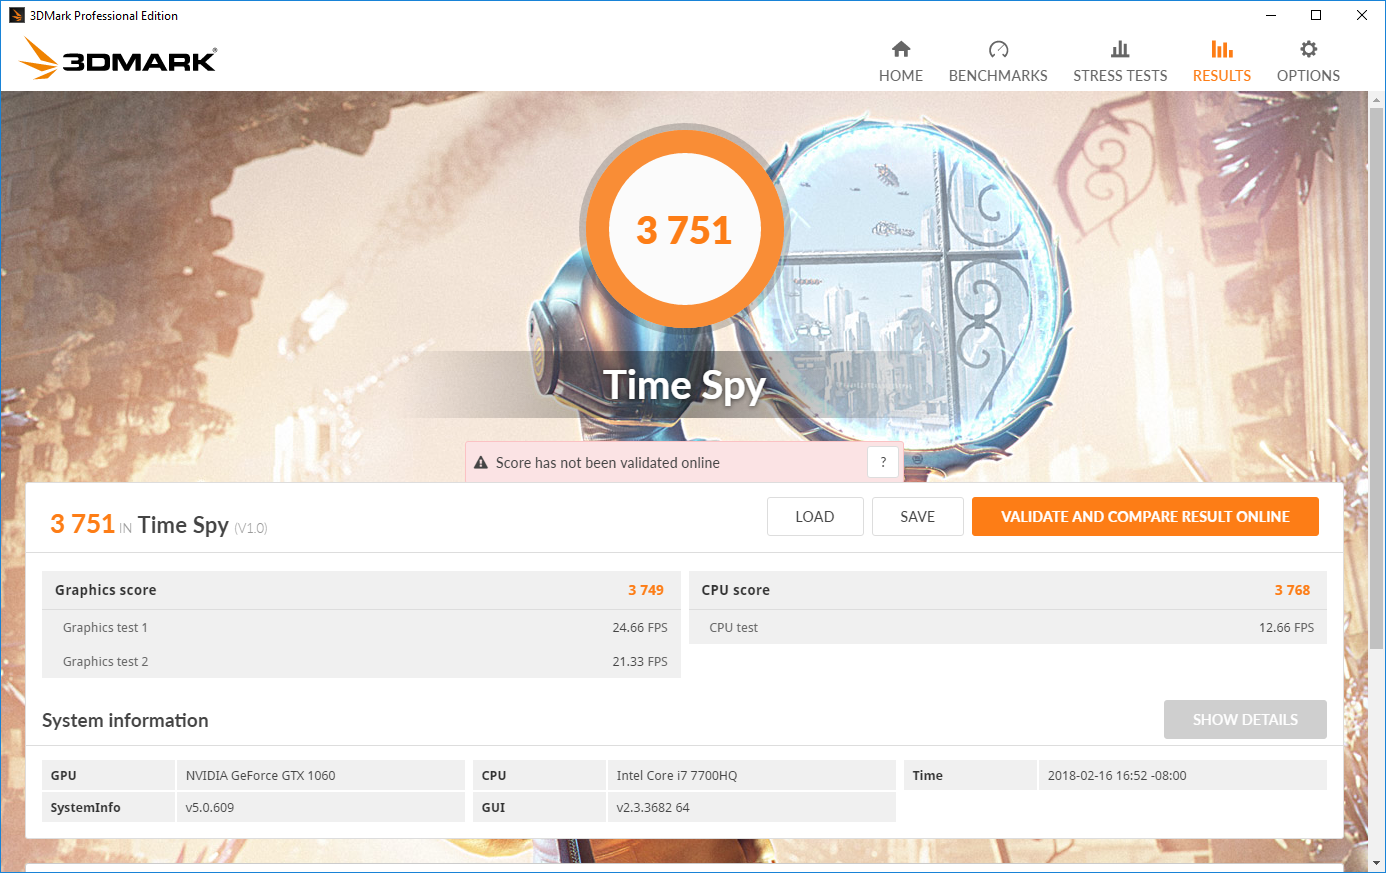
After testing the below average CPU and aggravatingly slow HDD, graphics benchmarks are a breath of fresh air. The Nvidia GeForce GTX 1060 remains an excellent "bang for the buck" GPU choice, and that sentiment rings true here. Our review unit excelled in our 3DMark testing, sitting above competing GTX 1060 notebooks by a healthy margin. Fire Strike scores were particularly impressive, scoring above 12000 in the graphics portion of the benchmark in several passes.
| 3DMark 06 Standard Score | 28862 points | |
| 3DMark 11 Performance | 11774 points | |
| 3DMark Ice Storm Standard Score | 131096 points | |
| 3DMark Cloud Gate Standard Score | 24266 points | |
| 3DMark Fire Strike Score | 10017 points | |
| 3DMark Fire Strike Extreme Score | 5228 points | |
| 3DMark Time Spy Score | 3751 points | |
Help | ||
Gaming Performance
The excellent graphics performance seen in benchmarks translates over to real-world gaming (mostly). Framerates hover around 60 fps at Full HD/Ultra settings for most AAA titles, but more demanding games (like The Witcher 3) will need to be played at lower settings to hit this threshold. Competitive gamers will enjoy the 120 Hz panel; games like DOTA 2 and League of Legends will run buttery smooth and should approach or exceed 120 fps, which makes the 120 Hz display that much more enticing. Older or well-optimized titles (e.g., Bioshock Infinite, Overwatch) can benefit from the faster refresh rate, but modern AAA games won't.
Performance remains stable during extended gameplay. The chart below shows frames per second over an hour-long session of The Witcher 3. Performance follows the expected curve (which is caused by the day/night cycle in the game) without any jarring peaks or troughs.
| BioShock Infinite - 1920x1080 Ultra Preset, DX11 (DDOF) (sort by value) | |
| Asus Strix GL703VM-DB74 | |
| Asus ROG Strix GL703VD-DB74 | |
| MSI GS73VR 7RF | |
| Acer Aspire V17 Nitro BE VN7-793G-52XN | |
| HP Omen 17-w100ng | |
| Aorus X7 v7 | |
| Average NVIDIA GeForce GTX 1060 Mobile (82 - 159, n=48) | |
| Doom - 1920x1080 Ultra Preset AA:SM (sort by value) | |
| Asus Strix GL703VM-DB74 | |
| MSI GS73VR 7RF | |
| Average NVIDIA GeForce GTX 1060 Mobile (66 - 103.3, n=17) | |
| Civilization 6 - 1920x1080 Ultra Preset AA:4xMS (sort by value) | |
| Asus Strix GL703VM-DB74 | |
| MSI GS73VR 7RF | |
| HP Omen 17-w100ng | |
| Average NVIDIA GeForce GTX 1060 Mobile (42.8 - 71, n=5) | |
| Rise of the Tomb Raider - 1920x1080 Very High Preset AA:FX AF:16x (sort by value) | |
| Asus Strix GL703VM-DB74 | |
| Asus ROG Strix GL703VD-DB74 | |
| MSI GS73VR 7RF | |
| Acer Aspire V17 Nitro BE VN7-793G-52XN | |
| Average NVIDIA GeForce GTX 1060 Mobile (51 - 68.8, n=37) | |
| low | med. | high | ultra | |
|---|---|---|---|---|
| The Elder Scrolls V: Skyrim (2011) | 87 | |||
| BioShock Infinite (2013) | 111 | |||
| Thief (2014) | 74 | |||
| The Witcher 3 (2015) | 39 | |||
| Batman: Arkham Knight (2015) | 56 | |||
| Rise of the Tomb Raider (2016) | 56 | |||
| Ashes of the Singularity (2016) | 48 | |||
| Doom (2016) | 98 | |||
| Civilization 6 (2016) | 65 | |||
| Farming Simulator 17 (2016) | 60 |
Stress Test
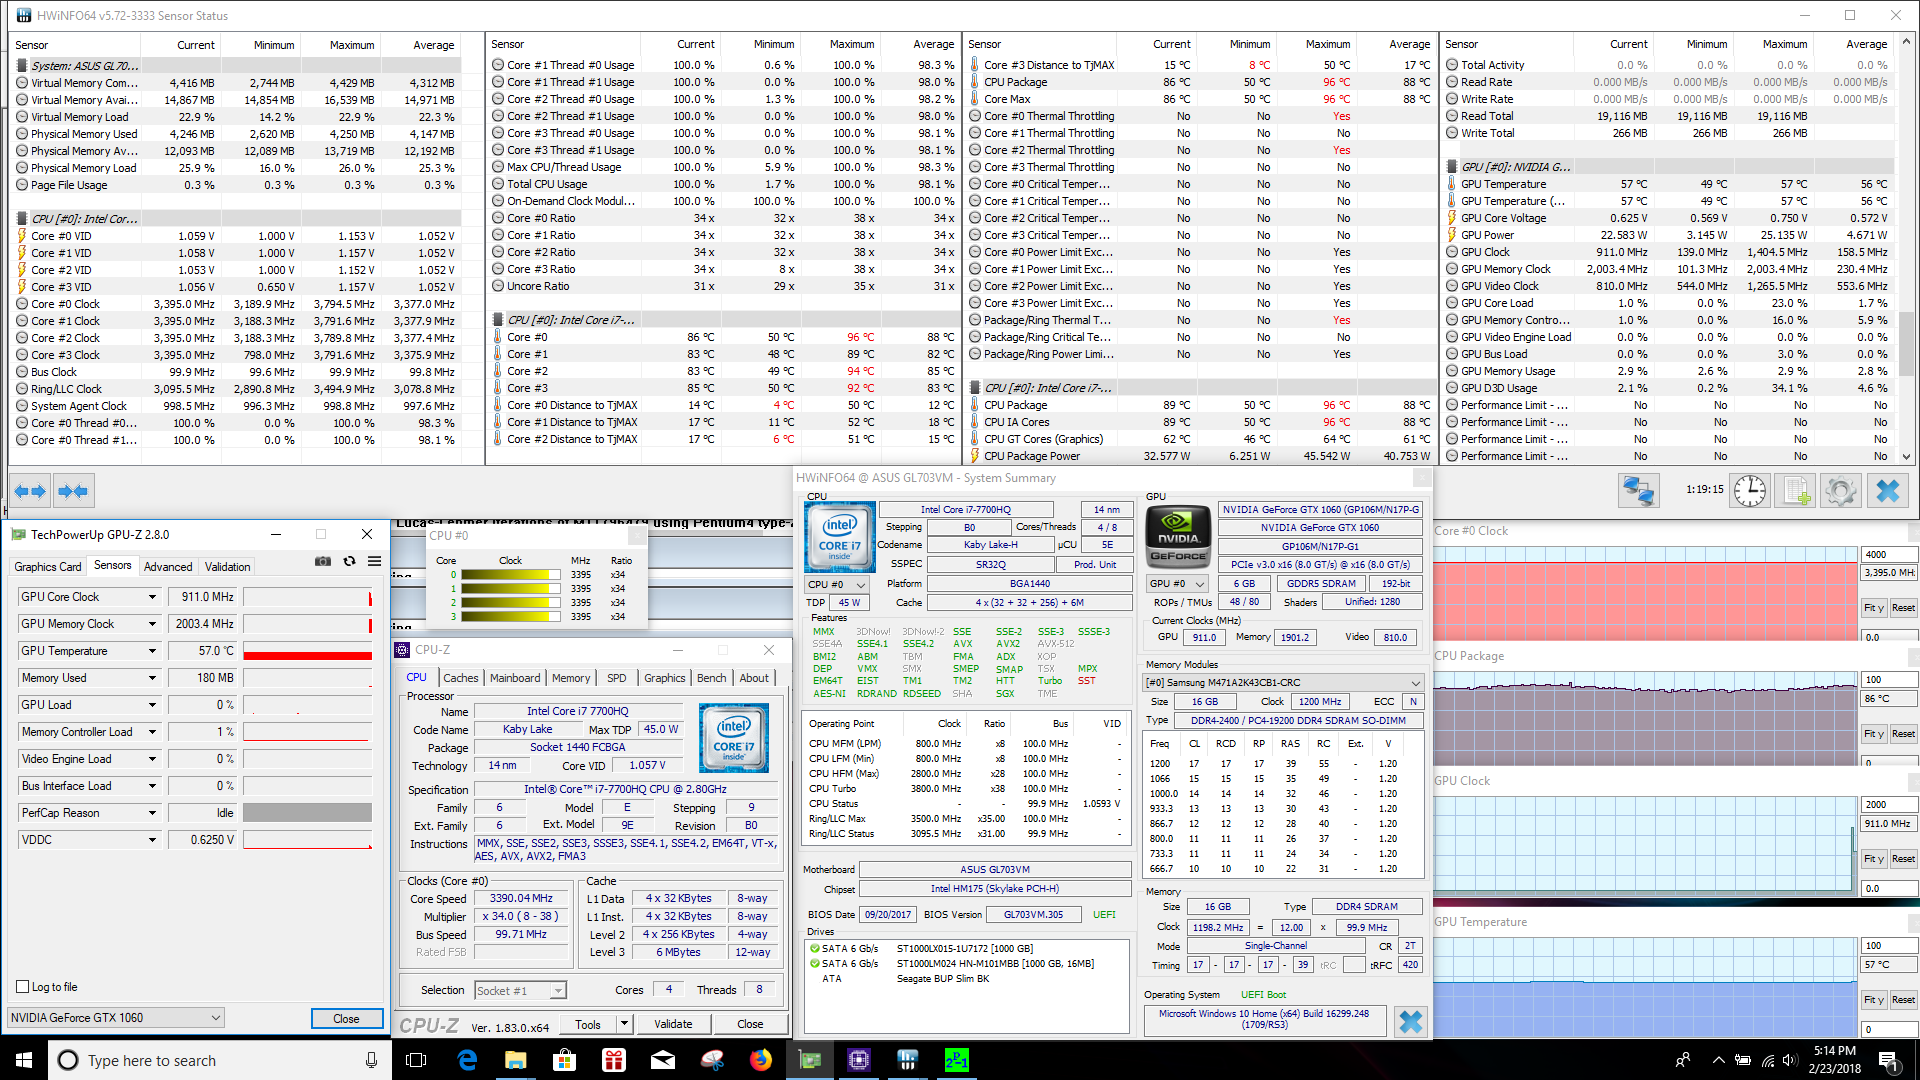
Herein lies the GL703VM's Achilles Heel. When under stress, the machine generates a lot of heat. This shouldn't come as a surprise, considering the powerful components that are crammed into this thin of a chassis. What is surprising is how this heat seems to linger in the system. The CPU by itself performs within expectations; running Prime95 for an hour sees temperatures on the die climb to 88° C while the silicon maintains an average clock of 3.4 GHz across all four cores. FurMark puts a mild strain on the GPU, which holds steady at 1290 MHz and 78° C.
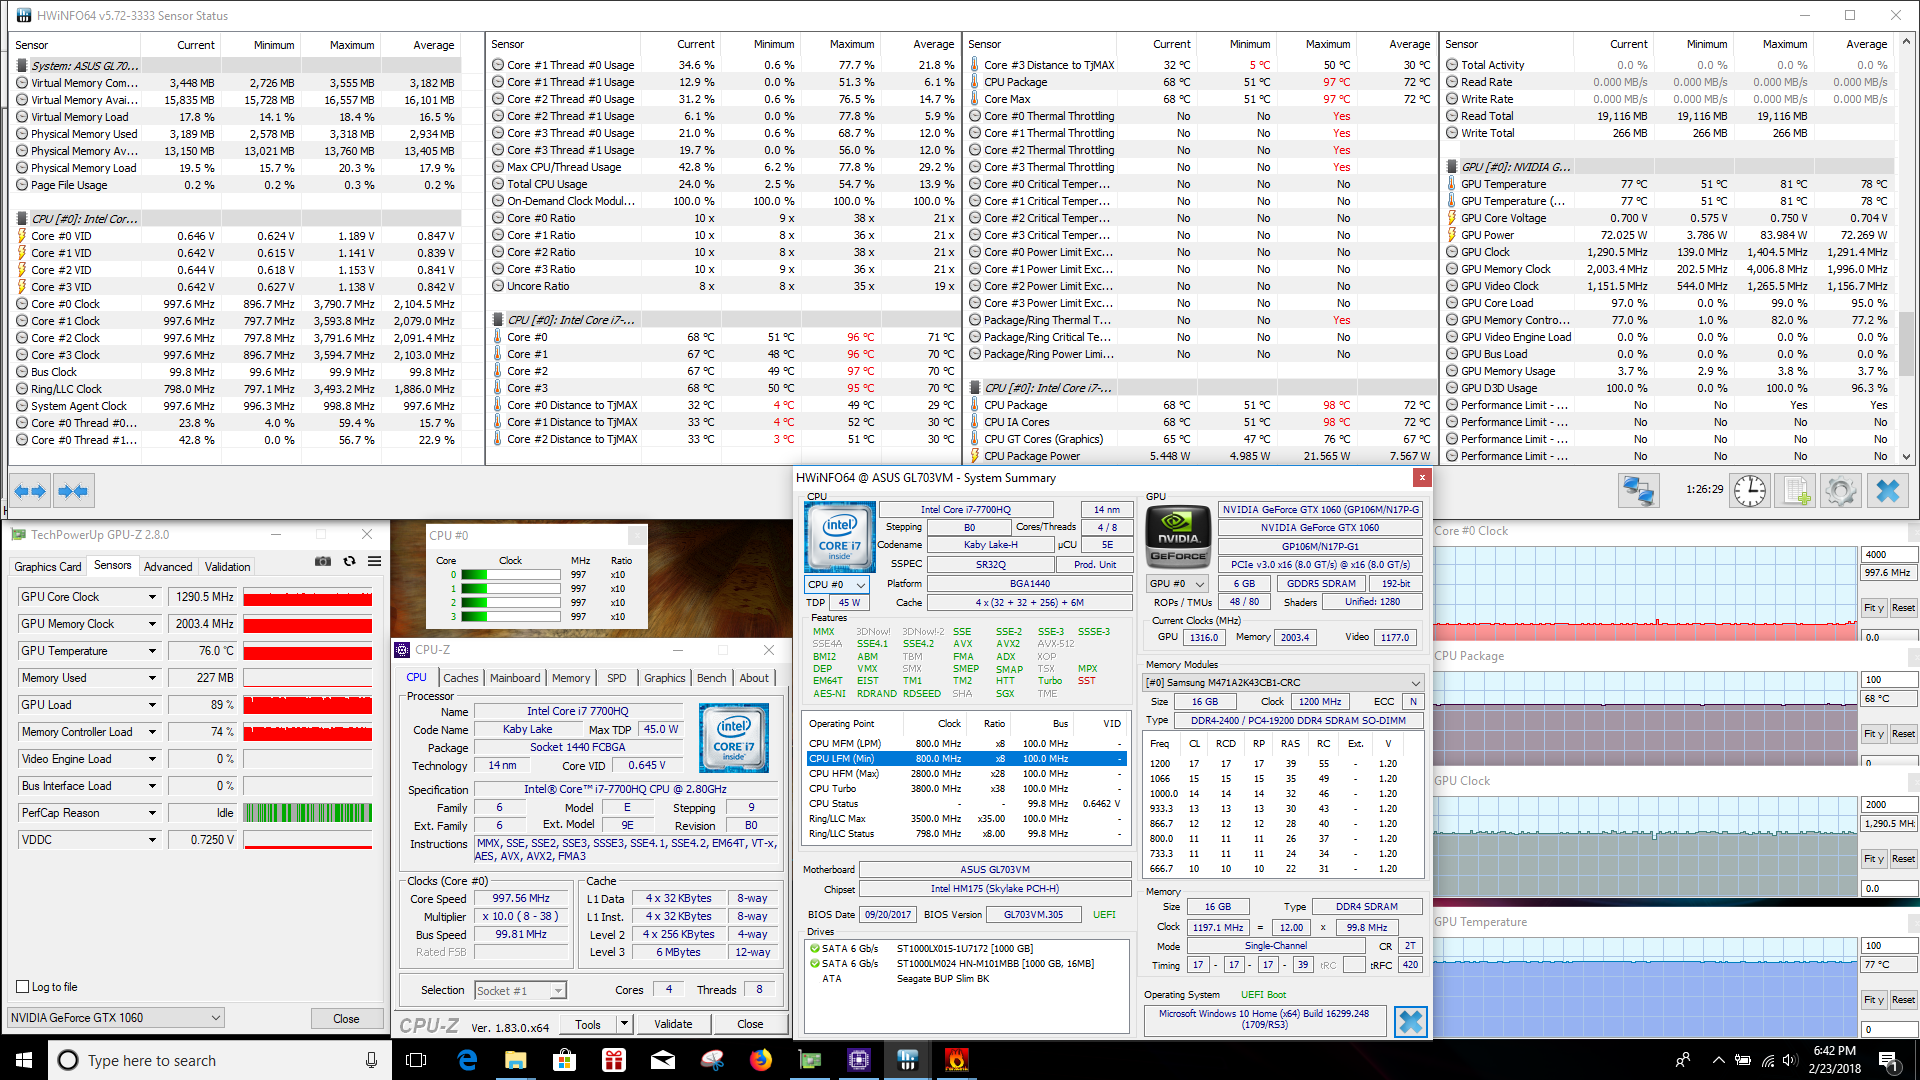
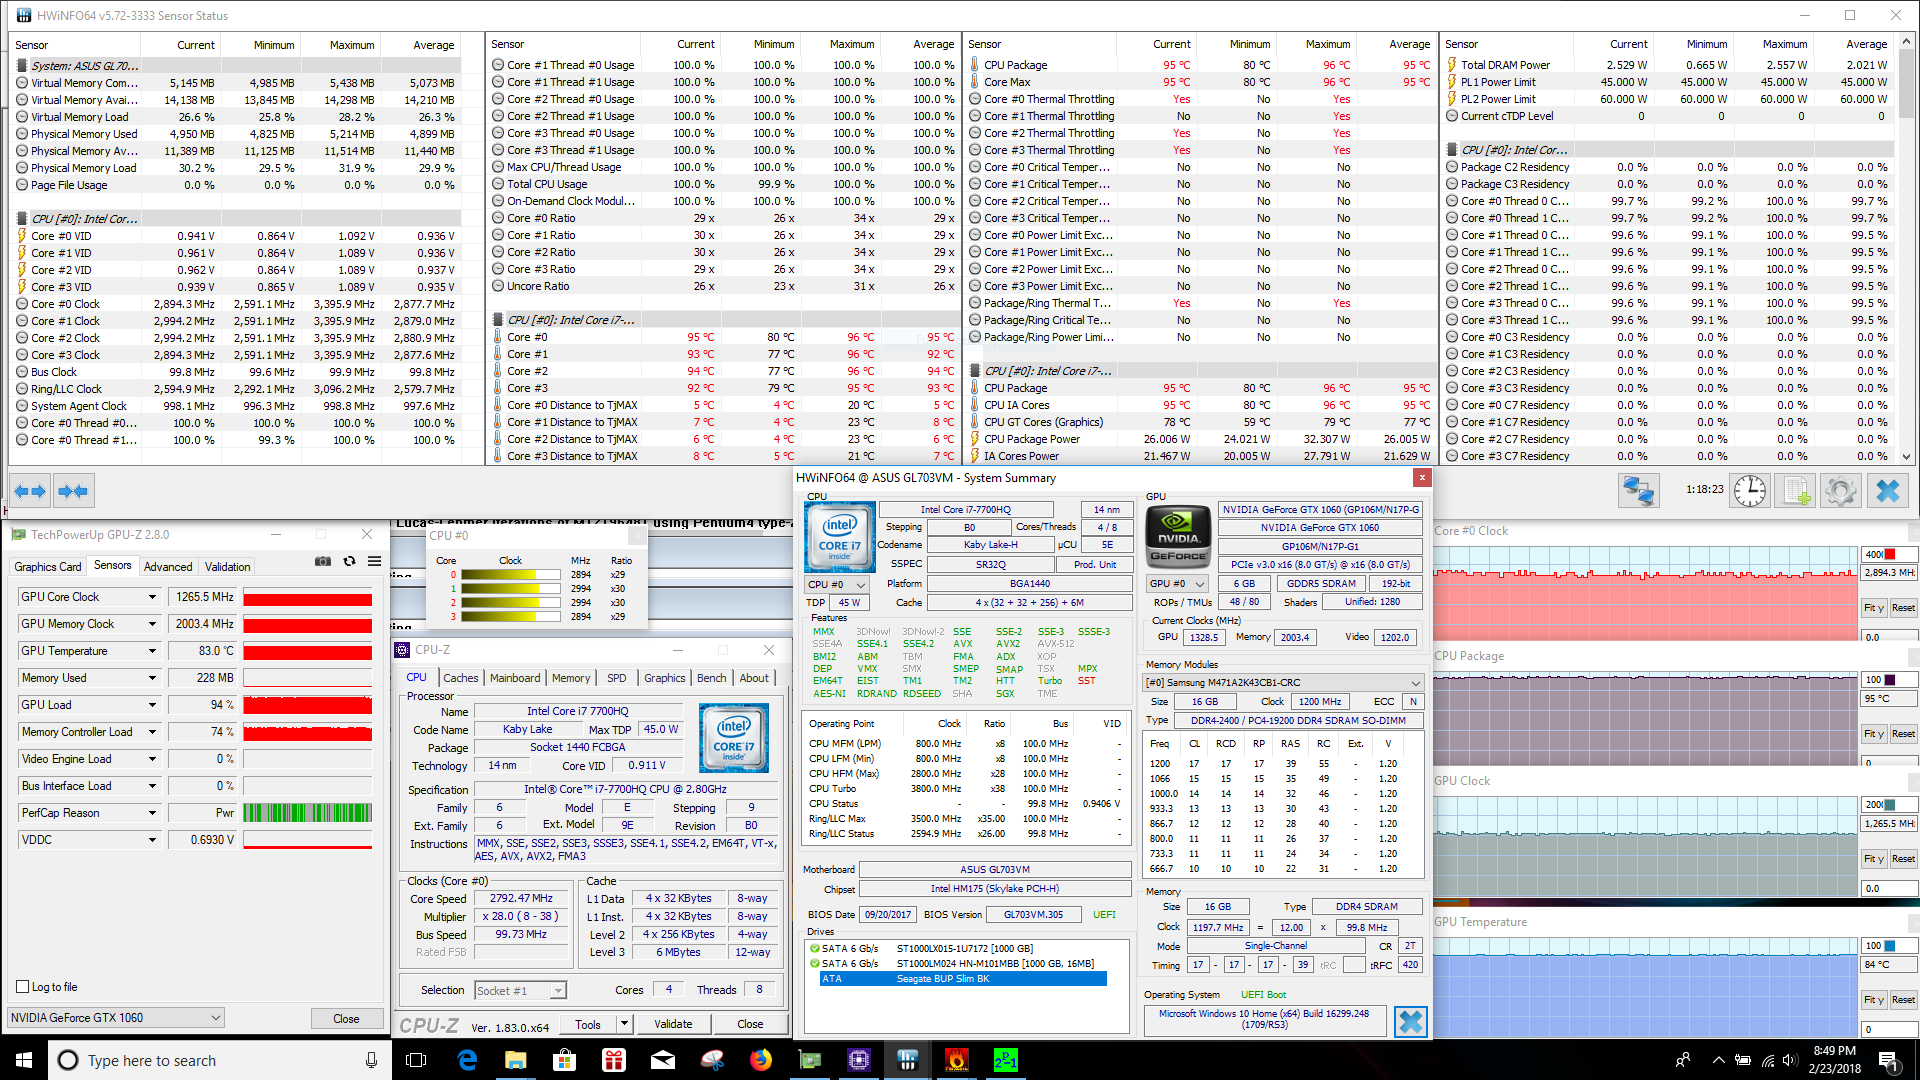
When both the CPU and GPU are stressed concurrently, the processor suffers. Running Prime95 and FurMark together sees the CPU struggle to boost at all. Instead, the Core i7 is held back to its base clock, mainly by thermal limits; temperatures on the CPU package approach 95° C. While this is within Intel's rated limits, it is still very hot, and CPU performance is throttled to keep temperatures from rising any higher. The GPU does well in this test, reaching a steady clock of 1265 MHz at 84° C.
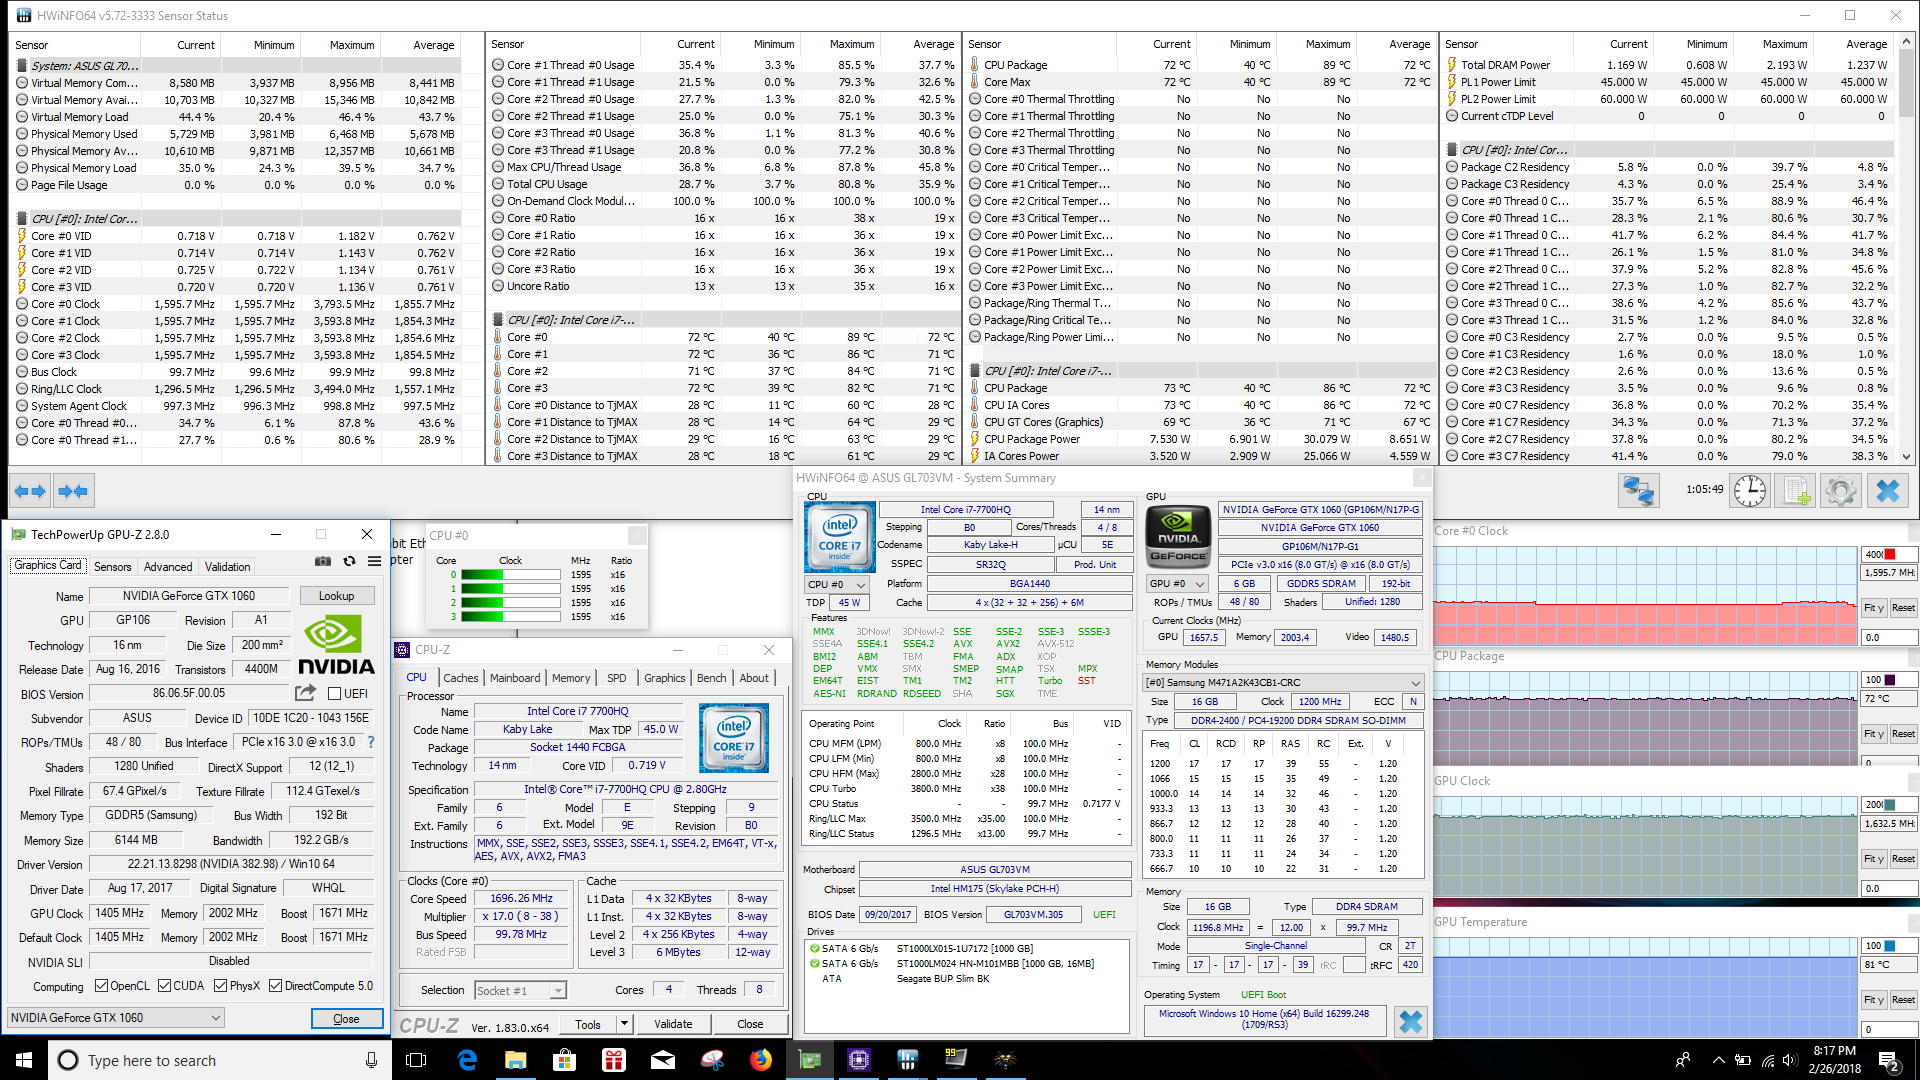
In less CPU-demanding tasks (like gaming), the system does well. Running The Witcher 3 for an hour see temperatures float in the low 70° C range for the CPU and hover at 81° C on the GPU. The GPU is able to fully boost and hold at about 1657 MHz, which is about as far as the GTX 1060 can be pushed. The CPU hangs far back at about 1.85 GHz but is able to remain cool and boost when needed to 3.6-3.7 GHz.
| CPU Clock (GHz) | GPU Clock (MHz) | Average CPU Temperature (°C) | Average GPU Temperature (°C) | |
| Prime95 Stress | 3.4 | - | 88 | - |
| FurMark Stress | 2.1 | 1291 | 72 | 78 |
| Prime95 + FurMark Stress | 2.9 | 1265 | 95 | 84 |
| Witcher 3 Stress | 1.9 | 1657 | 72 | 81 |
Emissions
System Noise
Fan noise is, for the most part, good. Fans remain subtle and low during most workloads (web browsing, office tasks, etc.). Once the system is under load, however, the fans engage aggressively and rapidly climb to high levels of noise. The fan curve for gaming sessions is especially steep; fan noise reaches 50 dB within minutes of starting a game. The experience is further hampered by the high pitched whir of the fans themselves; once they ramp up, it's almost impossible to ignore them. Headphones are highly recommended. There are quieter laptops using the GTX 1060, such as the Acer Aspire V17 Nitro, but users may have to compromise with a slightly thicker device.
There is noticeable coil whine should users put their ear close to the bottom panel, but it isn't audible at a normal sitting distance. The mechanical HDD, on the other hand, can be heard in a quiet room or office. The behavior we mentioned in the Storage section above rears its head here; the irregular drive activity creates an audible noise that users will notice if no other sounds are present.
Noise level
| Idle |
| 30.2 / 30.2 / 30.2 dB(A) |
| HDD |
| 32.2 dB(A) |
| Load |
| 38.4 / 54.5 dB(A) |
 | ||
30 dB silent 40 dB(A) audible 50 dB(A) loud |
||
min: | ||
| Asus Strix GL703VM-DB74 GeForce GTX 1060 Mobile, i7-7700HQ, Seagate Mobile HDD 1TB ST1000LX015-1U7172 | Asus ROG Strix GL703VD-DB74 GeForce GTX 1050 Mobile, i7-7700HQ, SanDisk SD8SN8U256G1002 | MSI GS73VR 7RF GeForce GTX 1060 Mobile, i7-7700HQ, Samsung SM961 MZVKW512HMJP m.2 PCI-e | Acer Aspire V17 Nitro BE VN7-793G-52XN GeForce GTX 1060 Mobile, i5-7300HQ, SK Hynix HFS256G39TND-N210A | HP Omen 17-w100ng GeForce GTX 1060 Mobile, 6300HQ, SanDisk Z400s SD8SNAT-128G | Aorus X7 v7 GeForce GTX 1070 Mobile, i7-7820HK, Samsung SM961 MZVPW256HEGL | |
|---|---|---|---|---|---|---|
| Noise | 2% | 1% | 5% | -14% | -9% | |
| off / environment * (dB) | 28.4 | 27.9 2% | 28.1 1% | 30.7 -8% | 31 -9% | 30 -6% |
| Idle Minimum * (dB) | 30.2 | 30.4 -1% | 30.8 -2% | 30.7 -2% | 35 -16% | 33 -9% |
| Idle Average * (dB) | 30.2 | 30.4 -1% | 30.8 -2% | 30.7 -2% | 36 -19% | 36 -19% |
| Idle Maximum * (dB) | 30.2 | 30.4 -1% | 30.9 -2% | 31.4 -4% | 37 -23% | 41 -36% |
| Load Average * (dB) | 38.4 | 36.4 5% | 42.2 -10% | 32.1 16% | 44 -15% | 41 -7% |
| Witcher 3 ultra * (dB) | 49.7 | 46 7% | 44.4 11% | 42.8 14% | 45 9% | |
| Load Maximum * (dB) | 54.5 | 53 3% | 48.6 11% | 42.8 21% | 54 1% | 52 5% |
* ... smaller is better
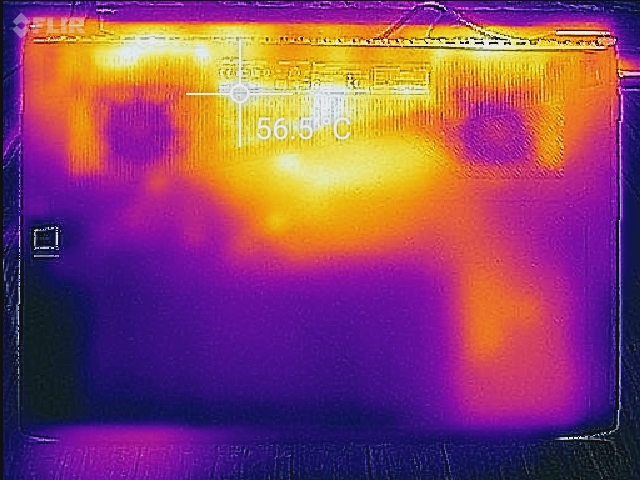
Temperature
With a larger overall footprint and aggressive fans, one would expect external heat to be well managed. Unfortunately, this is not the case. The body of the device gets hot to the touch, especially directly over the GPU and CPU. Heat is directed away from the WASD keys, which is a blessing for gamers, but other parts of the keyboard (especially the middle of the number row) feel warm after only 10 minutes of gameplay. The bottom also grows warm and may feel uncomfortable, so a hard, flat surface is recommended while gaming. Other ROG GLX03 models have this same problem.
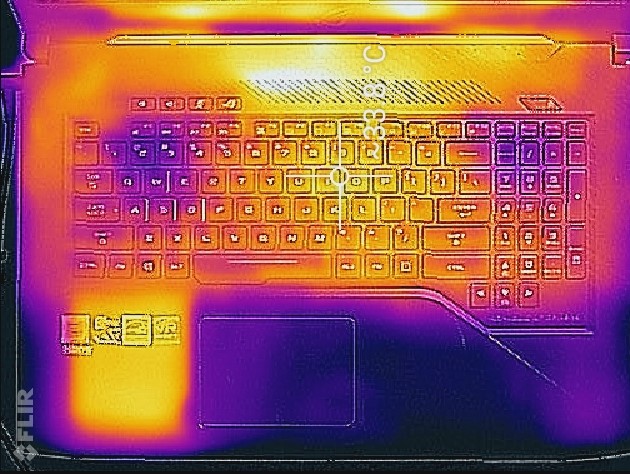
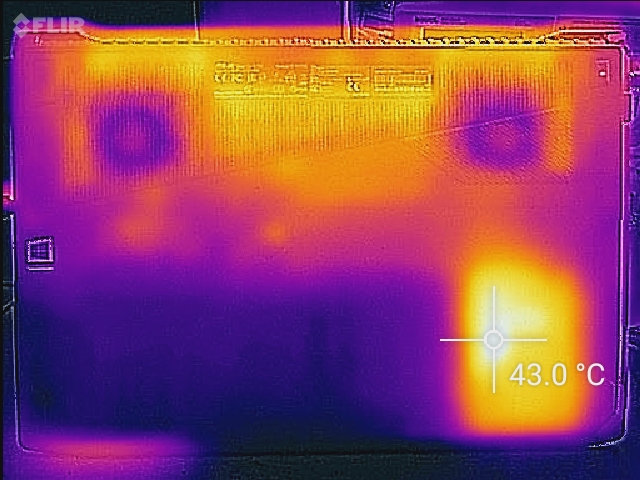
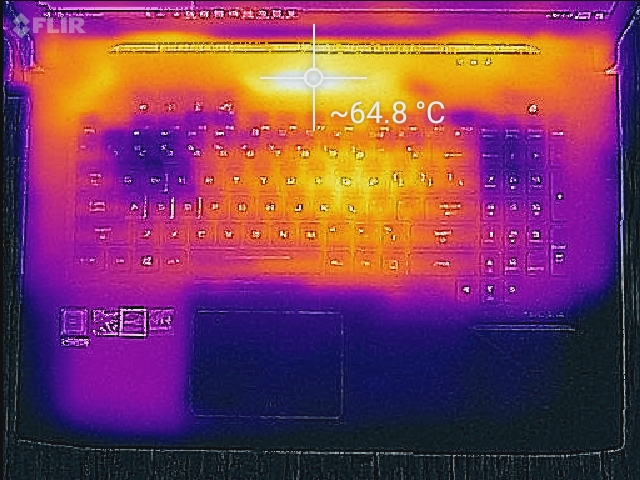
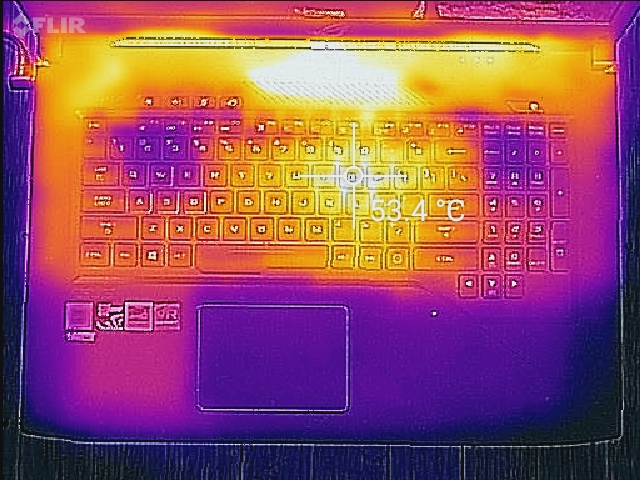
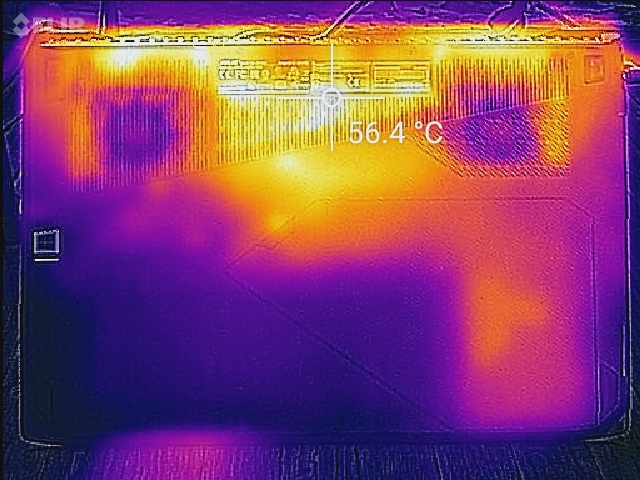
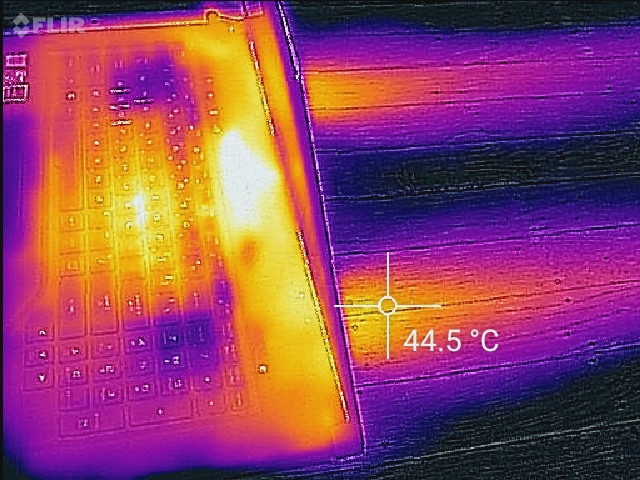
(-) The maximum temperature on the upper side is 64.6 °C / 148 F, compared to the average of 40.4 °C / 105 F, ranging from 21.2 to 68.8 °C for the class Gaming.
(-) The bottom heats up to a maximum of 57.2 °C / 135 F, compared to the average of 43.2 °C / 110 F
(+) In idle usage, the average temperature for the upper side is 31.4 °C / 89 F, compared to the device average of 33.9 °C / 93 F.
(-) Playing The Witcher 3, the average temperature for the upper side is 40.6 °C / 105 F, compared to the device average of 33.9 °C / 93 F.
(+) The palmrests and touchpad are reaching skin temperature as a maximum (34 °C / 93.2 F) and are therefore not hot.
(-) The average temperature of the palmrest area of similar devices was 28.8 °C / 83.8 F (-5.2 °C / -9.4 F).
Speakers

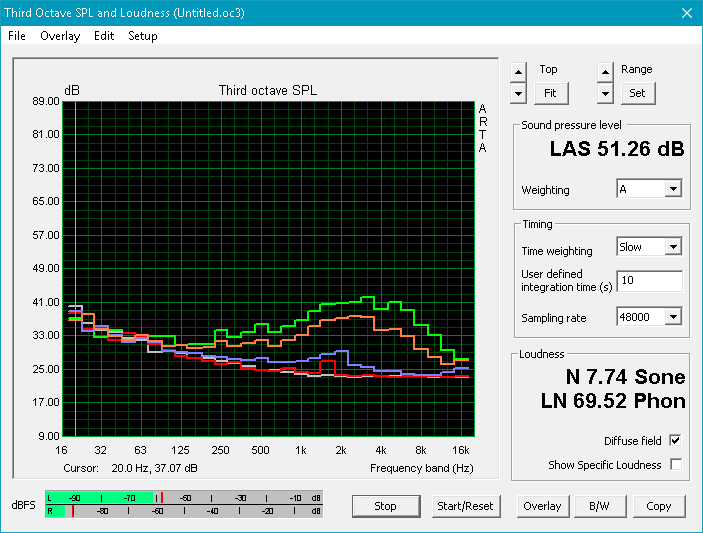
The 3.5 W stereo speakers are average for a thin laptop. The overall noise output is low, peaking at about 62 dB (which isn't much louder than the fans at full load). Bass is almost non-existent, but mids and highs are present and well-balanced. The overall mix is good, but the small speakers fall victim to a problem common among laptops; music sounds thin and tinny and isn't very pleasant on the ears. The speakers will do in a pinch, but headphones are once again recommended for a better aural experience.
Asus Strix GL703VM-DB74 audio analysis
(-) | not very loud speakers (62.3 dB)
Bass 100 - 315 Hz
(±) | reduced bass - on average 9.2% lower than median
(±) | linearity of bass is average (12.1% delta to prev. frequency)
Mids 400 - 2000 Hz
(+) | balanced mids - only 4.4% away from median
(+) | mids are linear (3.3% delta to prev. frequency)
Highs 2 - 16 kHz
(+) | balanced highs - only 1.4% away from median
(+) | highs are linear (6.9% delta to prev. frequency)
Overall 100 - 16.000 Hz
(±) | linearity of overall sound is average (18.5% difference to median)
Compared to same class
» 60% of all tested devices in this class were better, 8% similar, 32% worse
» The best had a delta of 6%, average was 18%, worst was 132%
Compared to all devices tested
» 42% of all tested devices were better, 8% similar, 51% worse
» The best had a delta of 4%, average was 23%, worst was 134%
MSI GS73VR 7RF audio analysis
(+) | speakers can play relatively loud (82 dB)
Bass 100 - 315 Hz
(-) | nearly no bass - on average 18.1% lower than median
(±) | linearity of bass is average (13.2% delta to prev. frequency)
Mids 400 - 2000 Hz
(±) | higher mids - on average 5.2% higher than median
(±) | linearity of mids is average (8.3% delta to prev. frequency)
Highs 2 - 16 kHz
(±) | higher highs - on average 7.9% higher than median
(±) | linearity of highs is average (8.9% delta to prev. frequency)
Overall 100 - 16.000 Hz
(±) | linearity of overall sound is average (26.2% difference to median)
Compared to same class
» 92% of all tested devices in this class were better, 1% similar, 6% worse
» The best had a delta of 6%, average was 18%, worst was 132%
Compared to all devices tested
» 81% of all tested devices were better, 4% similar, 15% worse
» The best had a delta of 4%, average was 23%, worst was 134%
Acer Aspire V17 Nitro BE VN7-793G-52XN audio analysis
(±) | speaker loudness is average but good (72 dB)
Bass 100 - 315 Hz
(±) | reduced bass - on average 5.7% lower than median
(+) | bass is linear (5% delta to prev. frequency)
Mids 400 - 2000 Hz
(+) | balanced mids - only 4.4% away from median
(+) | mids are linear (6% delta to prev. frequency)
Highs 2 - 16 kHz
(+) | balanced highs - only 3% away from median
(±) | linearity of highs is average (7.2% delta to prev. frequency)
Overall 100 - 16.000 Hz
(+) | overall sound is linear (12.5% difference to median)
Compared to same class
» 24% of all tested devices in this class were better, 3% similar, 73% worse
» The best had a delta of 5%, average was 17%, worst was 45%
Compared to all devices tested
» 11% of all tested devices were better, 2% similar, 87% worse
» The best had a delta of 4%, average was 23%, worst was 134%
Frequency Comparison (Checkbox selectable!)
Graph 1: Pink Noise 100% Vol.; Graph 2: Audio off
Energy Management
Power Consumption
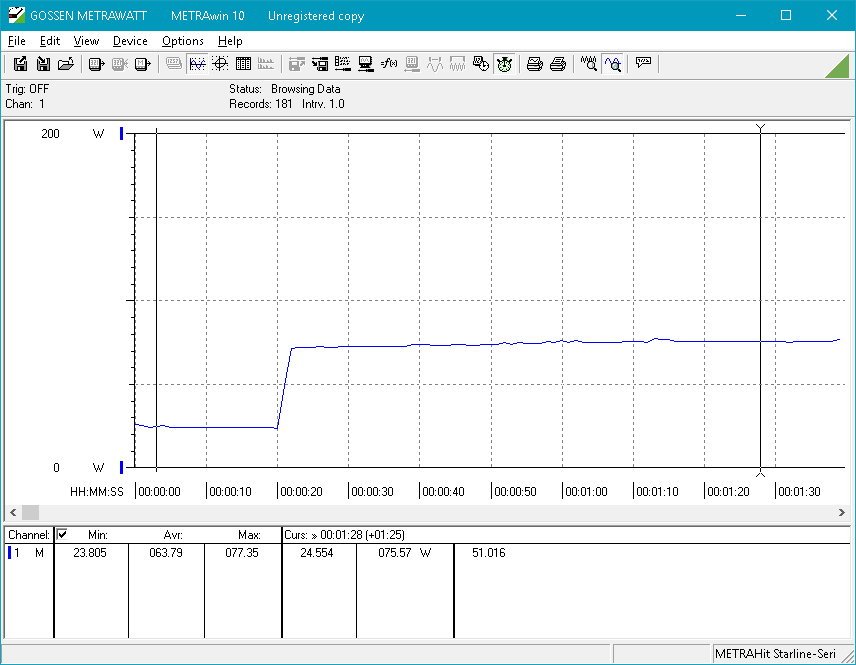
Power consumption is in line with similarly specced devices. Under load, power draw sits around 80 W on average and peaks just under 160 W. While gaming, users can expect the machine to pull 125 Watts, which is on the higher end for a GTX 1060 gaming laptop. This is likely due to the combination of the mechanical drive in our machine and the 120 Hz display, which might use more power than the more common SSDs and 60 Hz displays in other machines.
The 180 W adapter should supply more than enough power for the system. Even at peak usage, the GL703VM only requires 87% of the power supply's rated wattage.
| Off / Standby | |
| Idle | |
| Load |
|
Key:
min: | |
| Asus Strix GL703VM-DB74 i7-7700HQ, GeForce GTX 1060 Mobile, Seagate Mobile HDD 1TB ST1000LX015-1U7172, IPS, 1920x1080, 17.3" | Asus ROG Strix GL703VD-DB74 i7-7700HQ, GeForce GTX 1050 Mobile, SanDisk SD8SN8U256G1002, IPS, 1920x1080, 17.3" | MSI GS73VR 7RF i7-7700HQ, GeForce GTX 1060 Mobile, Samsung SM961 MZVKW512HMJP m.2 PCI-e, IPS, 3840x2160, 17.3" | Acer Aspire V17 Nitro BE VN7-793G-52XN i5-7300HQ, GeForce GTX 1060 Mobile, SK Hynix HFS256G39TND-N210A, a-Si TFT-LCD, WLED, 1920x1080, 17.3" | HP Omen 17-w100ng 6300HQ, GeForce GTX 1060 Mobile, SanDisk Z400s SD8SNAT-128G, IPS, 1920x1080, 17.3" | Aorus X7 v7 i7-7820HK, GeForce GTX 1070 Mobile, Samsung SM961 MZVPW256HEGL, TN LED, 2560x1440, 17.3" | |
|---|---|---|---|---|---|---|
| Power Consumption | 34% | -3% | 28% | -1% | -56% | |
| Idle Minimum * (Watt) | 17.3 | 5.8 66% | 14.2 18% | 7.8 55% | 17 2% | 27 -56% |
| Idle Average * (Watt) | 21.8 | 11.6 47% | 23.5 -8% | 13.3 39% | 22 -1% | 33 -51% |
| Idle Maximum * (Watt) | 23 | 12.3 47% | 23.8 -3% | 16.6 28% | 29 -26% | 40 -74% |
| Load Average * (Watt) | 79.2 | 82.4 -4% | 90.9 -15% | 73 8% | 72 9% | 107 -35% |
| Load Maximum * (Watt) | 158.2 | 135.5 14% | 171.6 -8% | 140 12% | 141 11% | 259 -64% |
| Witcher 3 ultra * (Watt) | 97 | 116 | 118 | 190 |
* ... smaller is better
Battery Life
Battery life is very disappointing. The GPU is always enabled due to the 120 Hz display. As such, the GTX 1060 is always engaged and the system demands quite a bit from the battery, even during our WiFi browsing test. Those in need of a laptop that can last while out and about should look at the GL703VD, which uses a standard 60 Hz display and Nvidia's Optimus technology. Optimus allows the system to switch to the integrated Intel HD Graphics, which is much less taxing on battery life. That feature is absent in today's review device.
| Asus Strix GL703VM-DB74 i7-7700HQ, GeForce GTX 1060 Mobile, 64 Wh | Asus ROG Strix GL703VD-DB74 i7-7700HQ, GeForce GTX 1050 Mobile, 64 Wh | MSI GS73VR 7RF i7-7700HQ, GeForce GTX 1060 Mobile, 65 Wh | Acer Aspire V17 Nitro BE VN7-793G-52XN i5-7300HQ, GeForce GTX 1060 Mobile, 69 Wh | HP Omen 17-w100ng 6300HQ, GeForce GTX 1060 Mobile, 95.8 Wh | Aorus X7 v7 i7-7820HK, GeForce GTX 1070 Mobile, 94 Wh | |
|---|---|---|---|---|---|---|
| Battery runtime | 131% | 3% | 132% | 129% | 14% | |
| Reader / Idle (h) | 4 | 13.4 235% | 5 25% | 10.3 158% | 9.1 128% | 3.7 -7% |
| WiFi v1.3 (h) | 3.2 | 7.2 125% | 2.7 -16% | 6.2 94% | 6.1 91% | 3 -6% |
| Load (h) | 0.9 | 1.2 33% | 0.9 0% | 2.2 144% | 2.4 167% | 1.4 56% |
Pros
Cons
Verdict

The Asus ROG Strix GL703VM is a laptop of compromise. There are some great points to celebrate: the device's gaming performance is excellent for its class, the 120 Hz display is fluid, there is a generous amount of ports, and the chassis is fairly solid (considering its thin profile) and striking.
However, there's a counter for every high point. While gaming performance is great, the CPU is throttled and doesn't reach its potential. The 120 Hz display is smooth, but the panel suffers from terrible backlight bleed and poor contrast. The chassis is compact and beautiful but gets hot to the touch while gaming.
Should you purchase the GL703VM? It really depends on what matters most to you as a gamer. If you want stellar gaming performance and a fast display panel enough to compromise on heat management and a higher quality picture, then the GL703VM may be an option to consider. However, the MSI GS73VR offers a similarly beautiful and slim body, comparable gaming performance, and an excellent keyboard with the added benefit of an optional 4K display and much better thermal management under gaming loads.MSI GS73VR 7RF (7700HQ, GTX 1060, 4K) Laptop Review
In the end, it comes down to value. At its MSRP (about $1600 USD), it's a no-brainer: the GL703VM is simply too expensive considering its shortcomings. There are laptops that excel in the GL703VM's weaknesses while coming close to or matching its strengths at a much lower price. If you can catch the GL703VM on sale, it's worth considering. Otherwise, pass on this one.
Asus Strix GL703VM-DB74
- 03/01/2018 v6 (old)
Sam Medley
Price comparison
