MSI GS73VR 7RF (7700HQ, GTX 1060, 4K) Laptop Review

MSI was among the first notebook manufacturers to bring NVIDIA's Pascal-based GPUs to market. We reviewed the GS73VR 6RF, a redesign of MSI's larger thin-and-light notebook line, almost a year ago in August 2016. That model scored well due to its impressive performance despite the slim chassis. Cooling was also adequate, but the fan noise was loud and ever-present in order to keep the powerful components at bay.
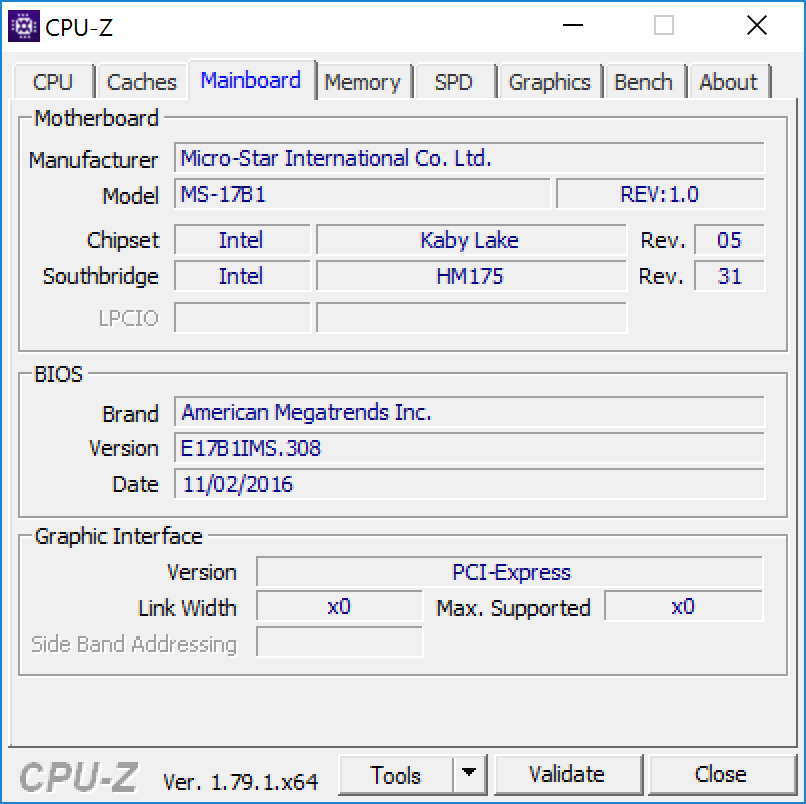
Today, we'll take a look at the next iteration of the GS73VR line, the GS73VR 7RF. This model is almost the exact same as its recent predecessor, save for the inclusion of Intel's 7th generation Kaby Lake CPUs. Everything else has been carried over from the GS73VR 6RF, including the SteelSeries RGB keyboard, the case, and maintenance access. As such, we will skip these sections to focus on the differences between devices and examine the improvements the generational jump makes in system performance.
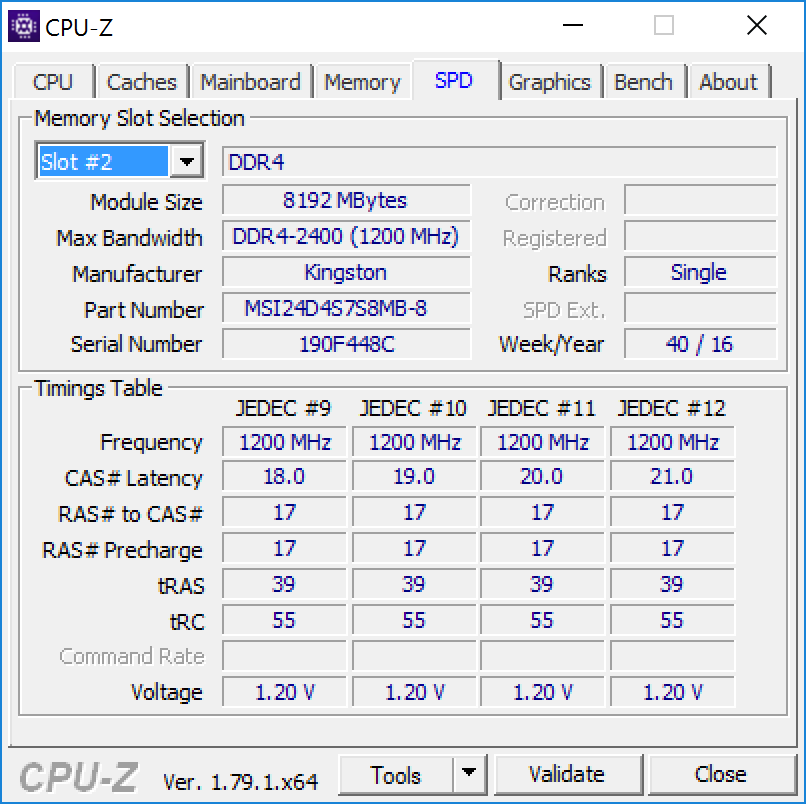
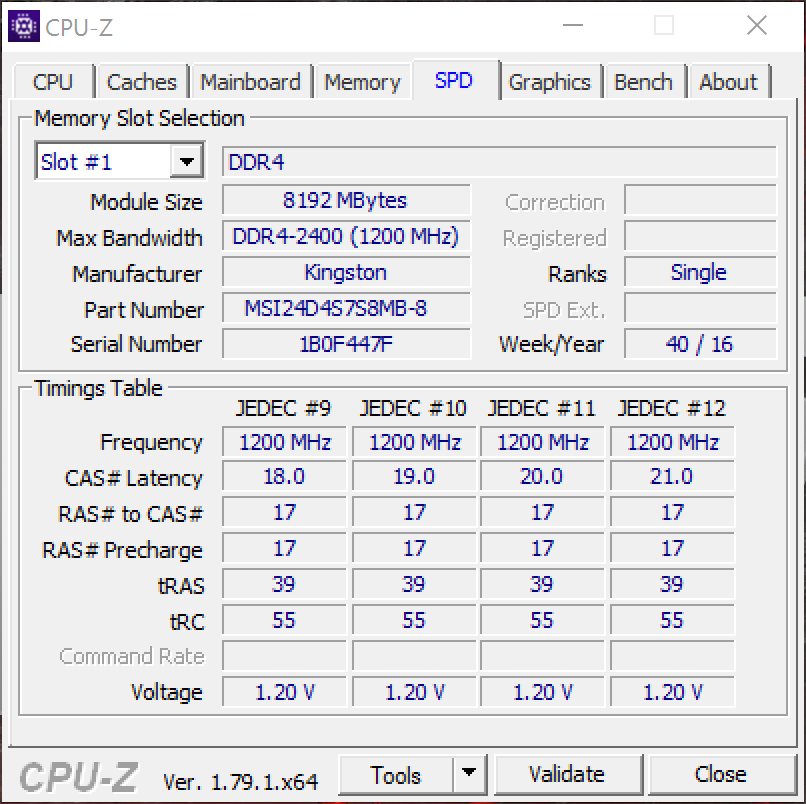
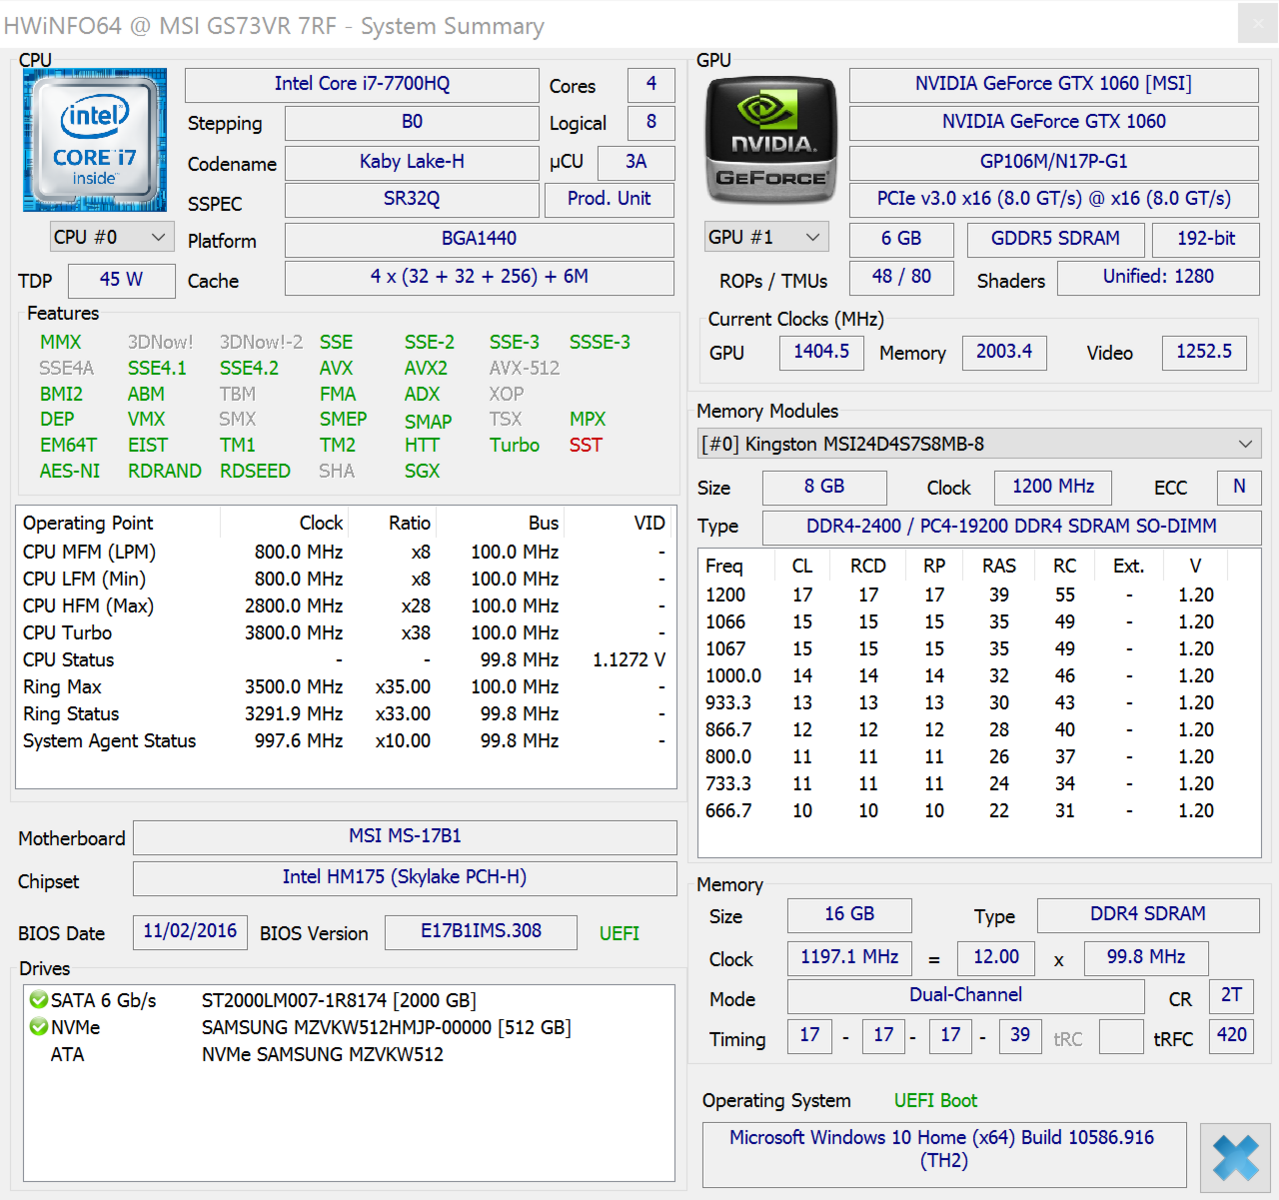
As a quick overview, the GS73VR 7RF is equipped with an Intel Core i7-7700HQ and an NVIDIA GeForce GTX 1060. Other components are configurable from retailers selling the device. Our unit includes 16 GB of DDR4 RAM, a 512 GB PCIe NVMe SSD, a 2 TB 5400 RPM HDD, and a 17.3-inch IPS display with a resolution of 3840x2160. This configuration retails for about $2,300 USD, depending on the seller. There is a SKU available with a Full HD screen for about $400-500 less. We will compare our unit to the GS73VR 6RF to see the improvements Kaby Lake brings. Due to its components and form factor, we will also compare our model to the Gigabyte Aero 15, the Asus GL702VS, the Acer Aspire V17 Nitro, and the Aorus X7 v6 to get a wide view of what the GS73VR brings to the table.
SD Card Reader
Using our Toshiba Exceria Pro SDXC 64 GB UHS-II Reference-Card, we see underwhelming speeds from the SD card slot. At about 26 MB/s, the 7RF has the same disappointing read speeds as its predecessor, falling behind the competition by almost 70%. This is surprising, as both notebooks use the same slow card reader. Professionals that rely on SD cards for image and file transfers will be very disappointed.
| SD Card Reader | |
| average JPG Copy Test (av. of 3 runs) | |
| Aorus X7 v6 | |
| Gigabyte Aero 15 | |
| Asus Strix GL702VSK | |
| MSI GS73VR 7RF | |
| MSI GS73VR 6RF | |
| Acer Aspire V17 Nitro BE VN7-793G-52XN | |
| maximum AS SSD Seq Read Test (1GB) | |
| Gigabyte Aero 15 | |
| Aorus X7 v6 | |
| Asus Strix GL702VSK | |
| MSI GS73VR 6RF | |
| MSI GS73VR 7RF | |
| Acer Aspire V17 Nitro BE VN7-793G-52XN | |
Communication
Wireless connection speeds are excellent. Transmit and receive speeds are quick at 563 Mbit/s and 640 Mbit/s, respectively. This performance is in line with rivals and the category as a whole.
Connections as a whole are somewhat spotty. While solid most of the time, intermittent disconnects severely hinder workflow and lead to frustration. The notebooks would routinely drop connection to a WiFi network despite several other devices maintaining strong signal with no interruption. Again, this may be a flaw with our test unit but is annoying nonetheless and should be mentioned.
| Networking | |
| iperf3 transmit AX12 | |
| Acer Aspire V17 Nitro BE VN7-793G-52XN | |
| MSI GS73VR 7RF | |
| Aorus X7 v6 | |
| Asus Strix GL702VSK | |
| Gigabyte Aero 15 | |
| iperf3 receive AX12 | |
| Gigabyte Aero 15 | |
| Asus Strix GL702VSK | |
| MSI GS73VR 7RF | |
| Acer Aspire V17 Nitro BE VN7-793G-52XN | |
| Aorus X7 v6 | |
Software
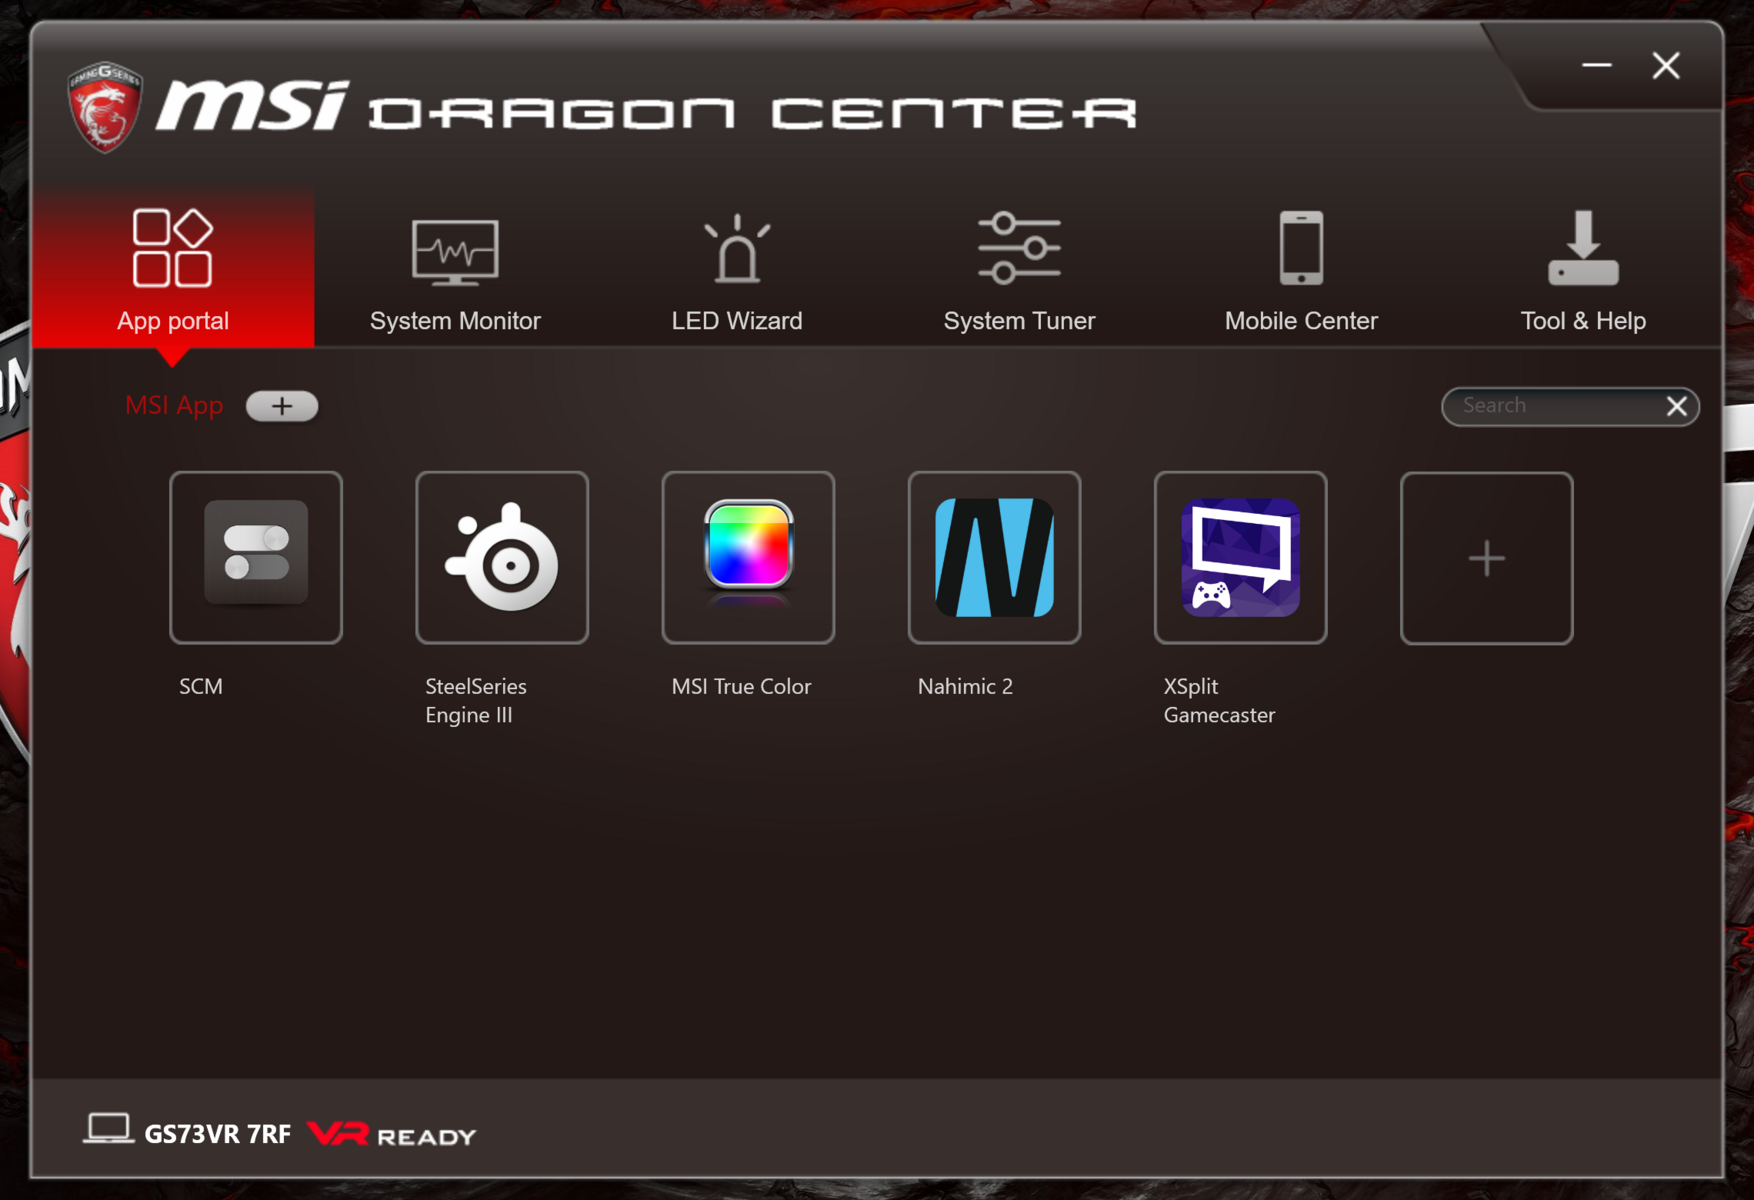
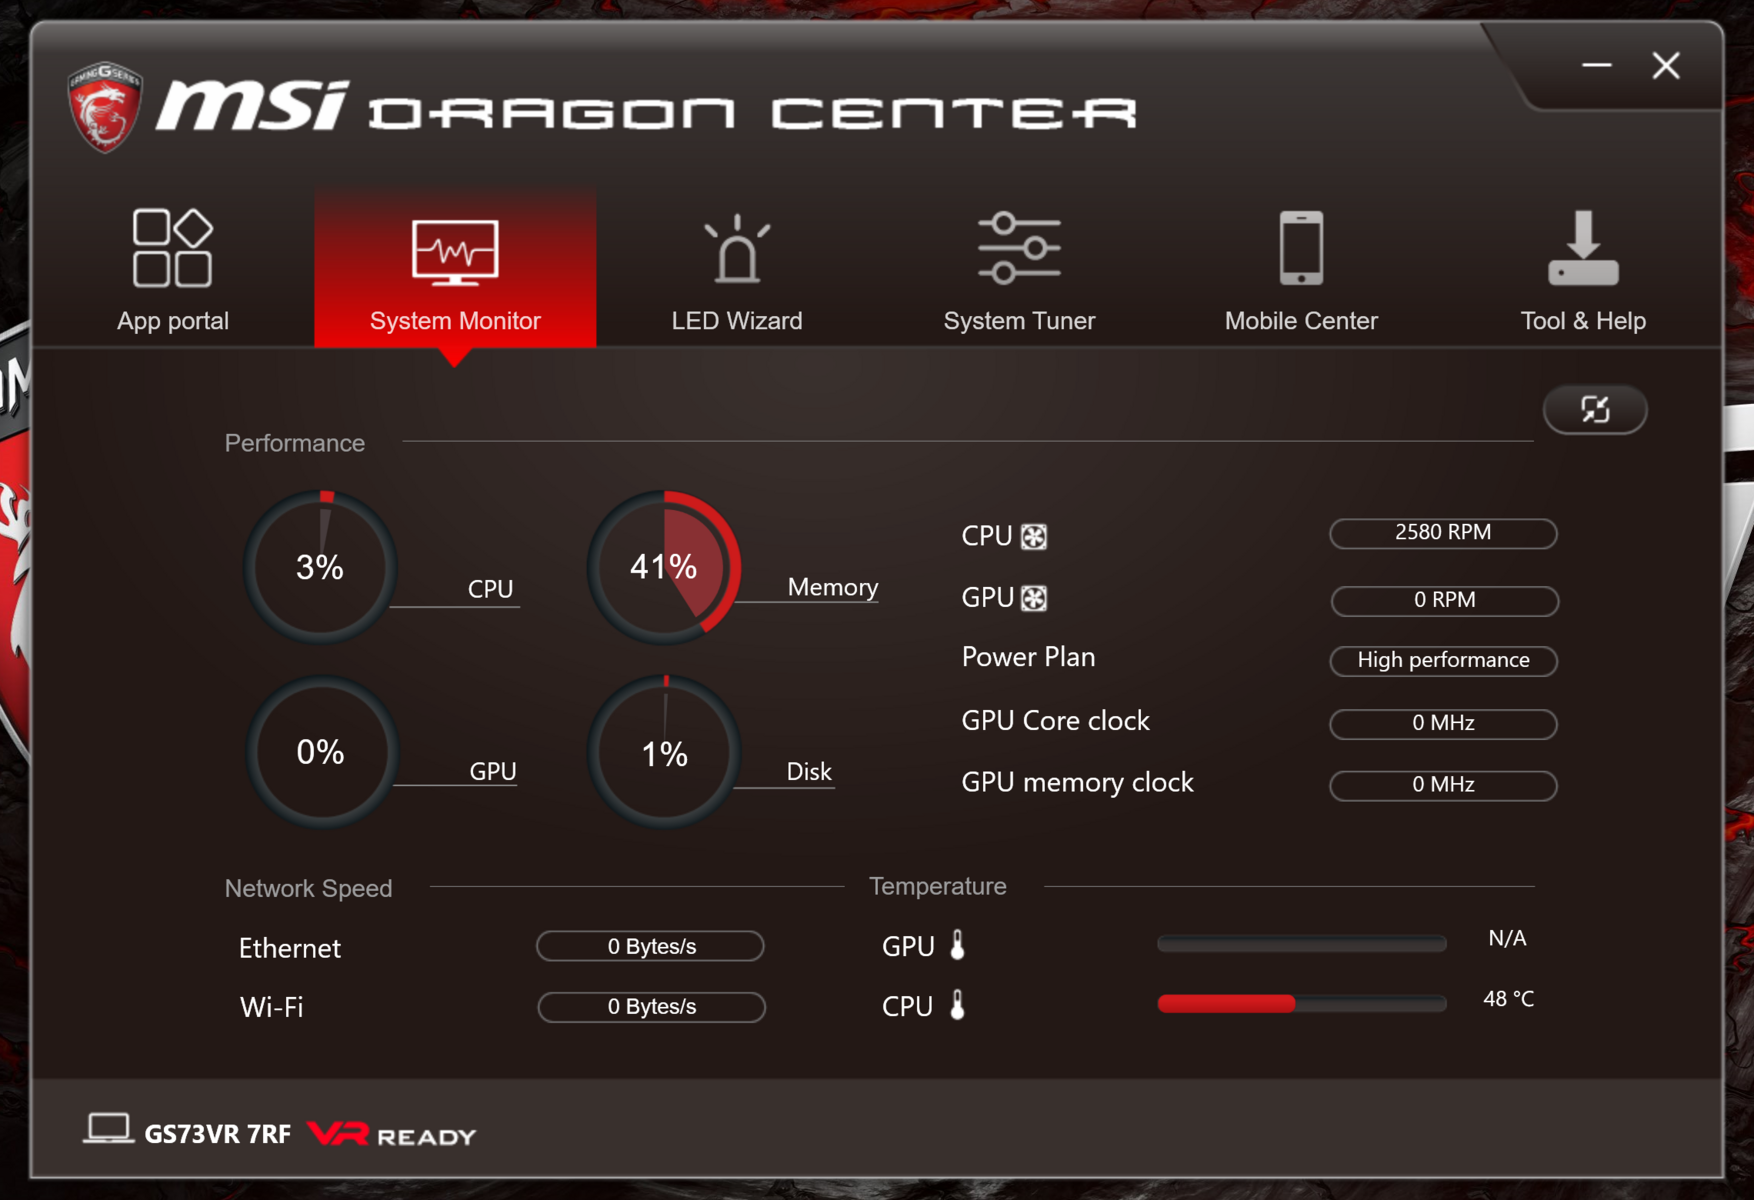
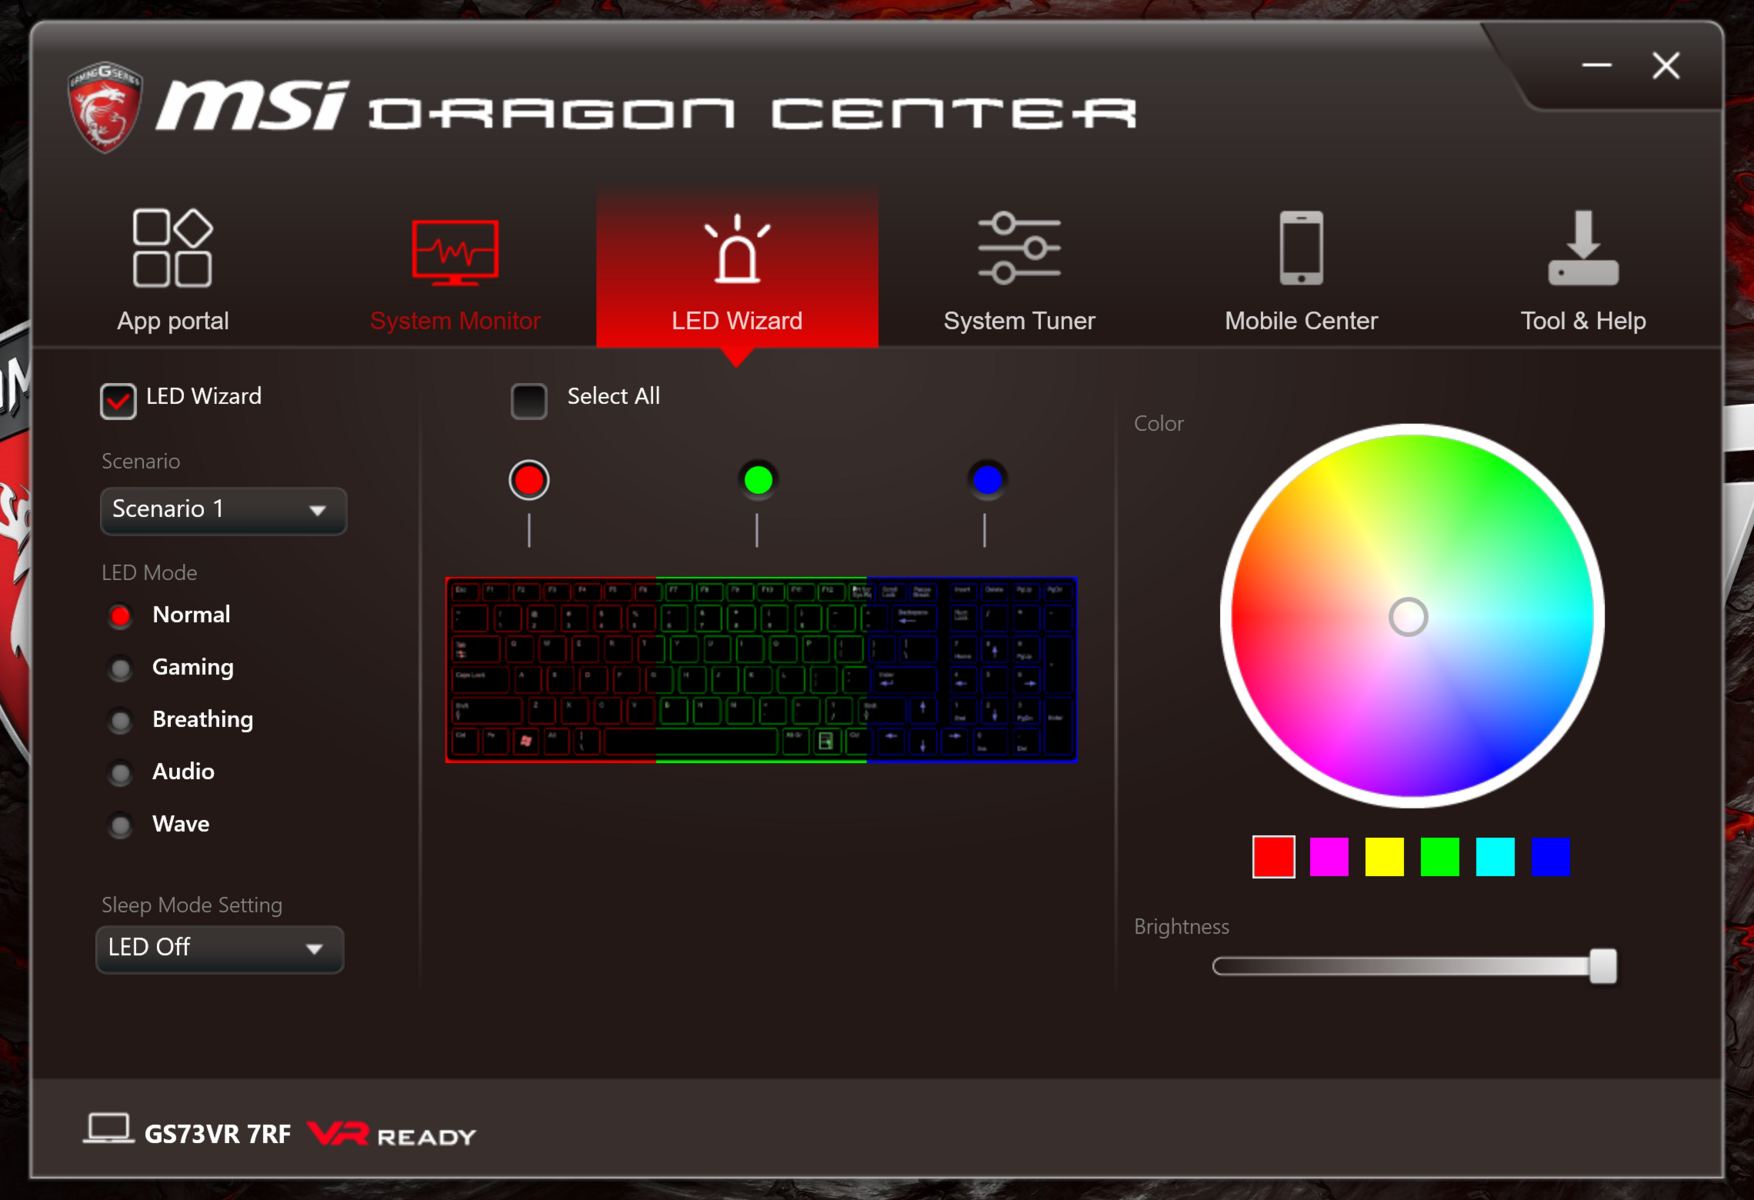
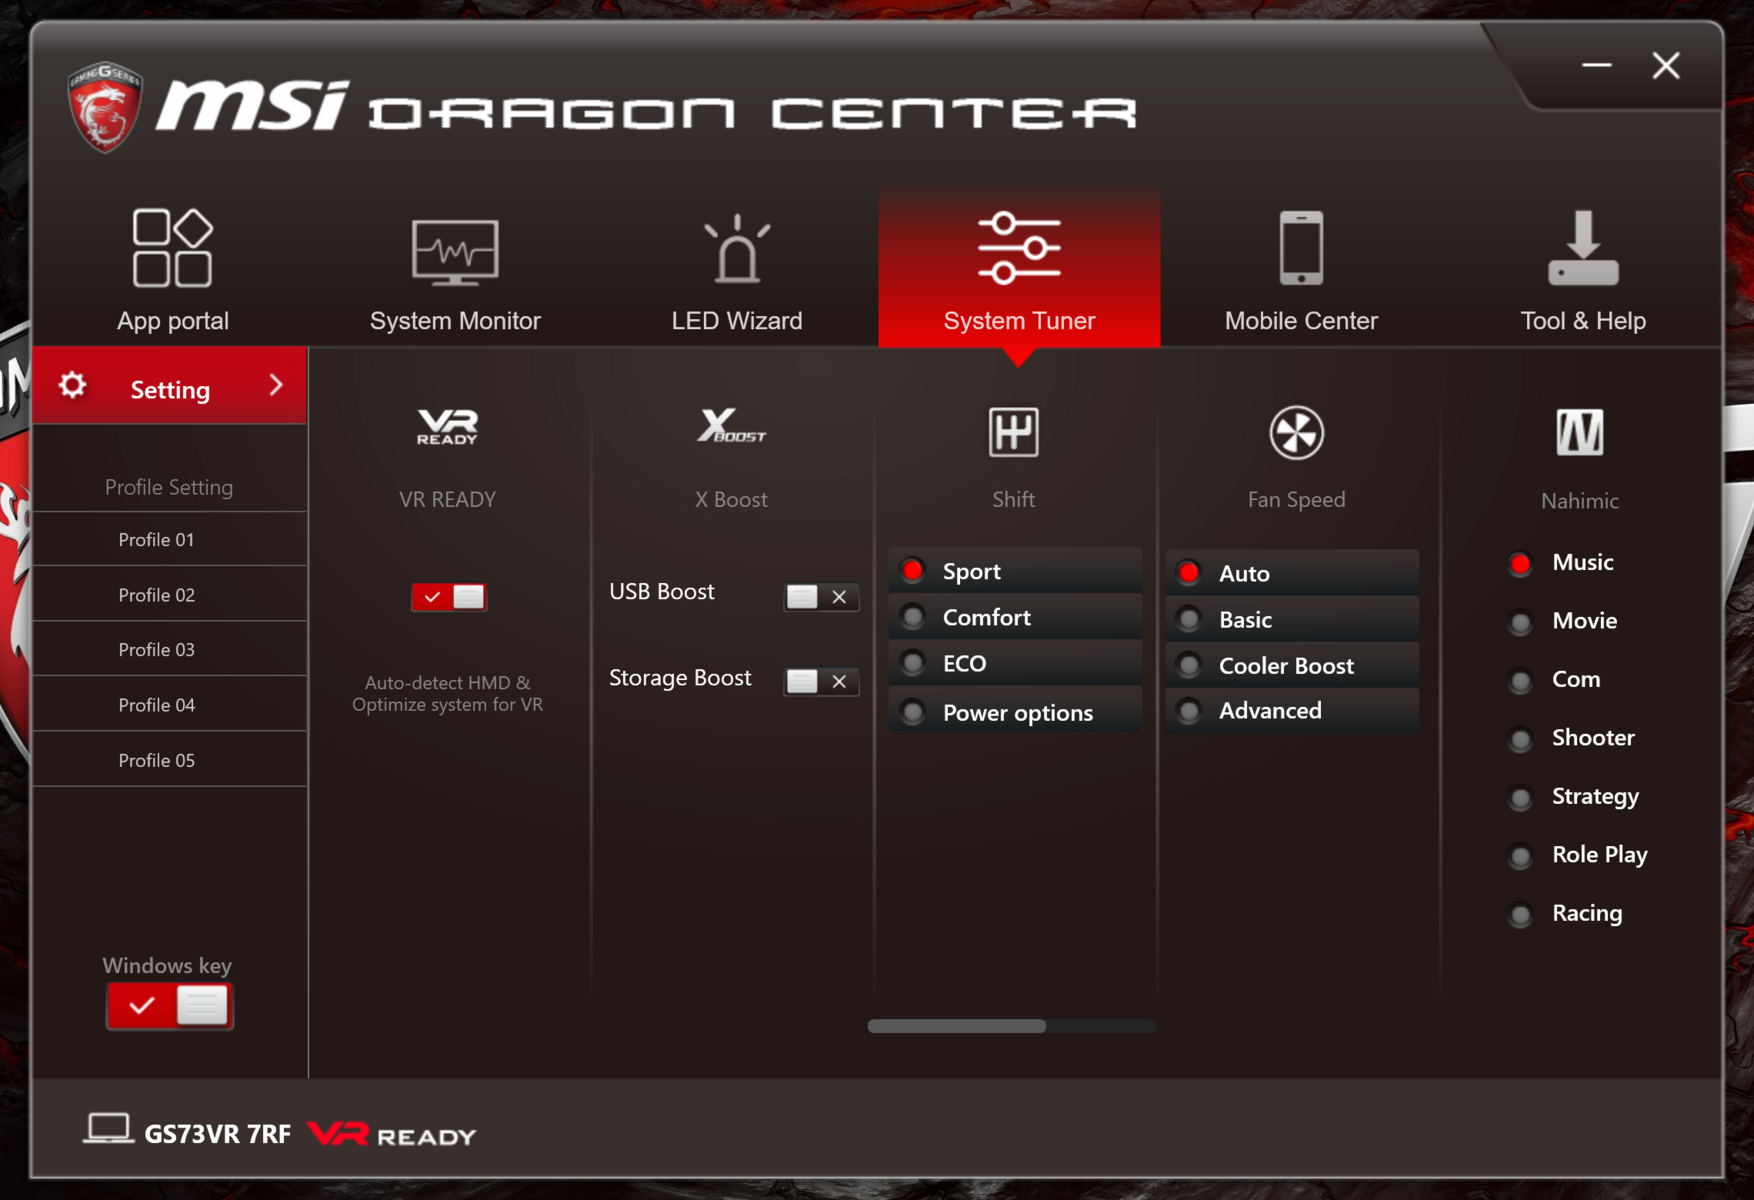
MSI includes their Dragon Center app package. Through Dragon Center, users can access several other included applications, including SteelSeries Engine 3 to control the keyboard and its backlight, Shift to tune system performance, Nahimic 2 for sound profiles, and an app to set fan profiles. Options are the name of the game here, but the number of included applications is staggering. Some of these tools are redundant with apps and settings that are already baked into the operating system. The SCM app, or System Control Manager, acts as a hub for controls available in the Windows system tray (such as volume and WiFi on/off). Even within Dragon Center itself, there are multiple apps for some of the same tasks. Case in point, SteelSeries Engine 3 and the LED Wizard can both be used to tune the RGB keyboard backlight.
While the included package offers an high amount of control over the system, the sheer amount of preloaded software is overwhelming. Some of these apps are also frustrating, such as an overlay used for screen snapping that appears anytime a window is moved. These preloaded applications also might bog down the system, and there have recently been complaints about MSI loading their devices with bloatware that eats up system resources.
Display
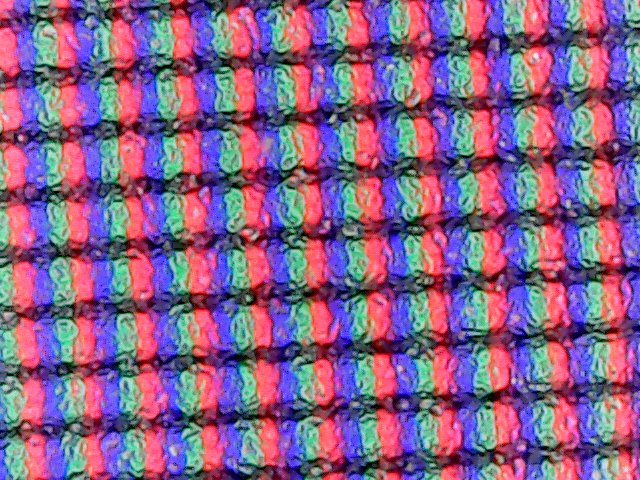
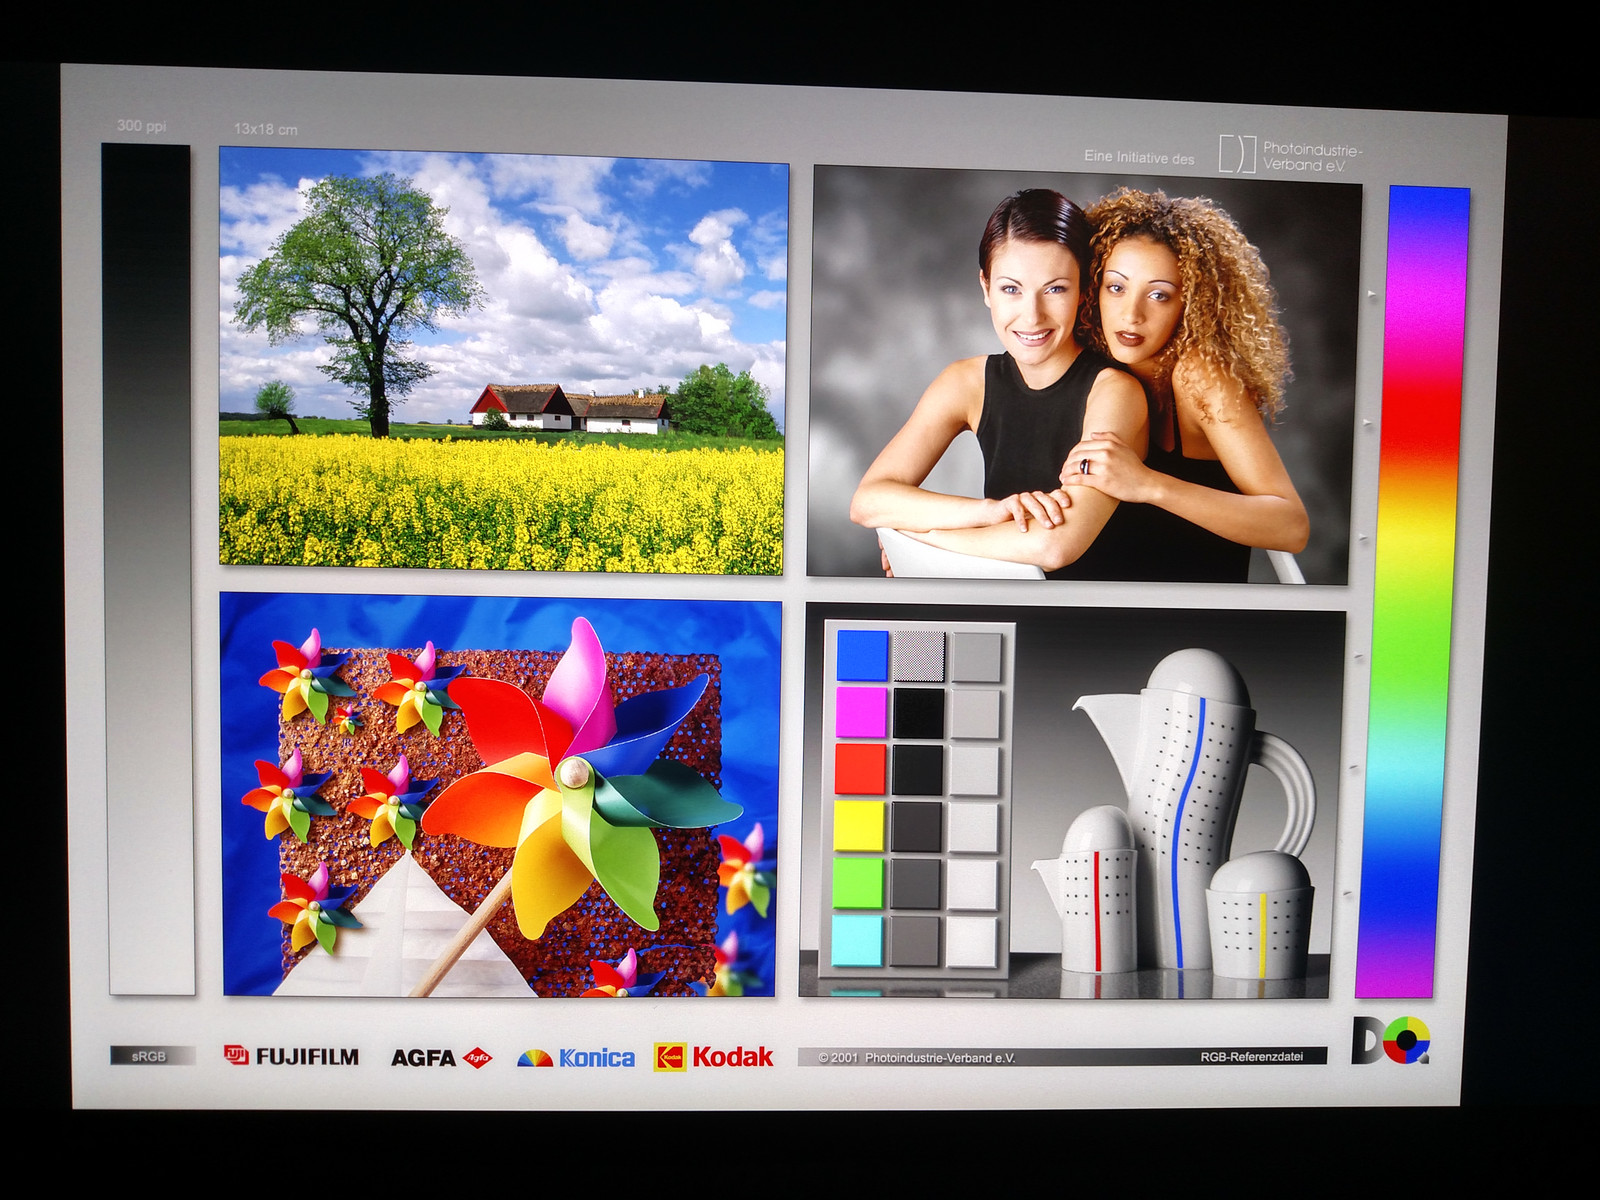
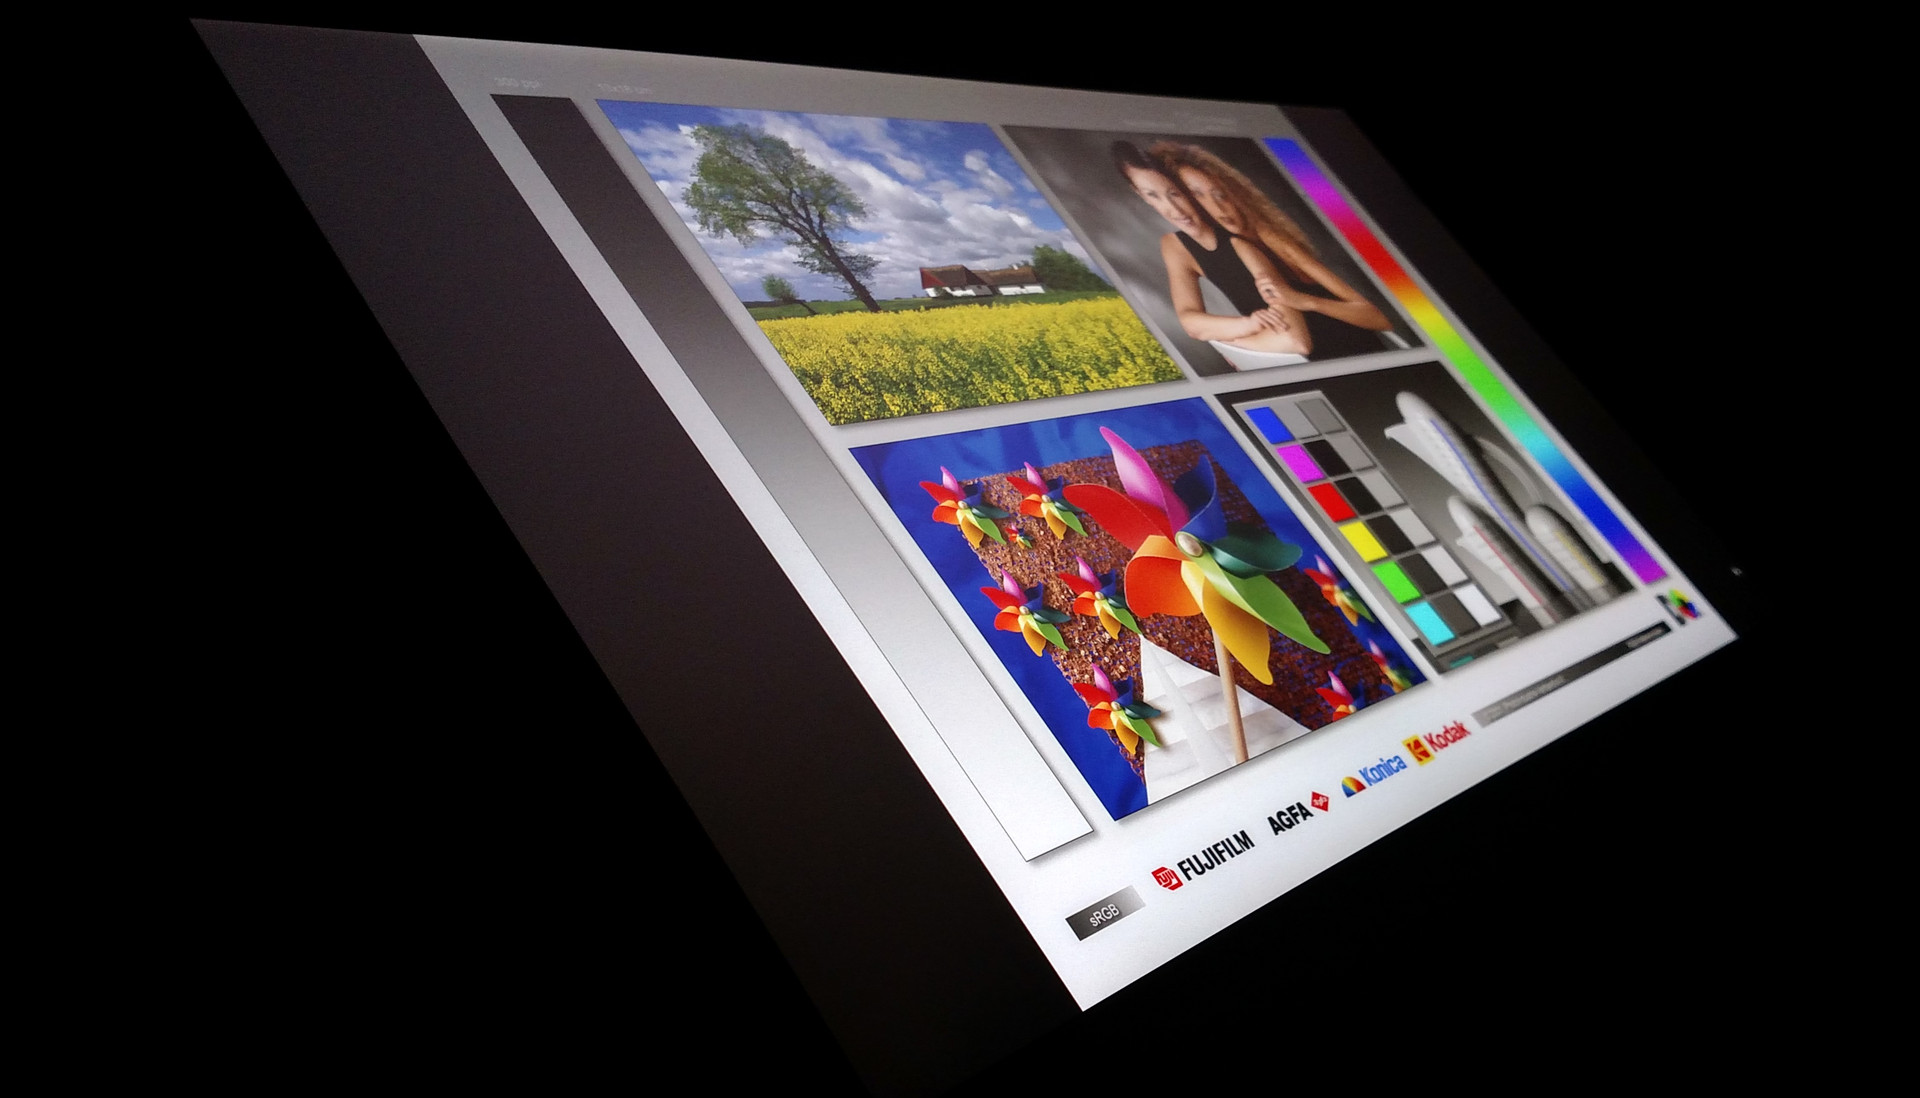
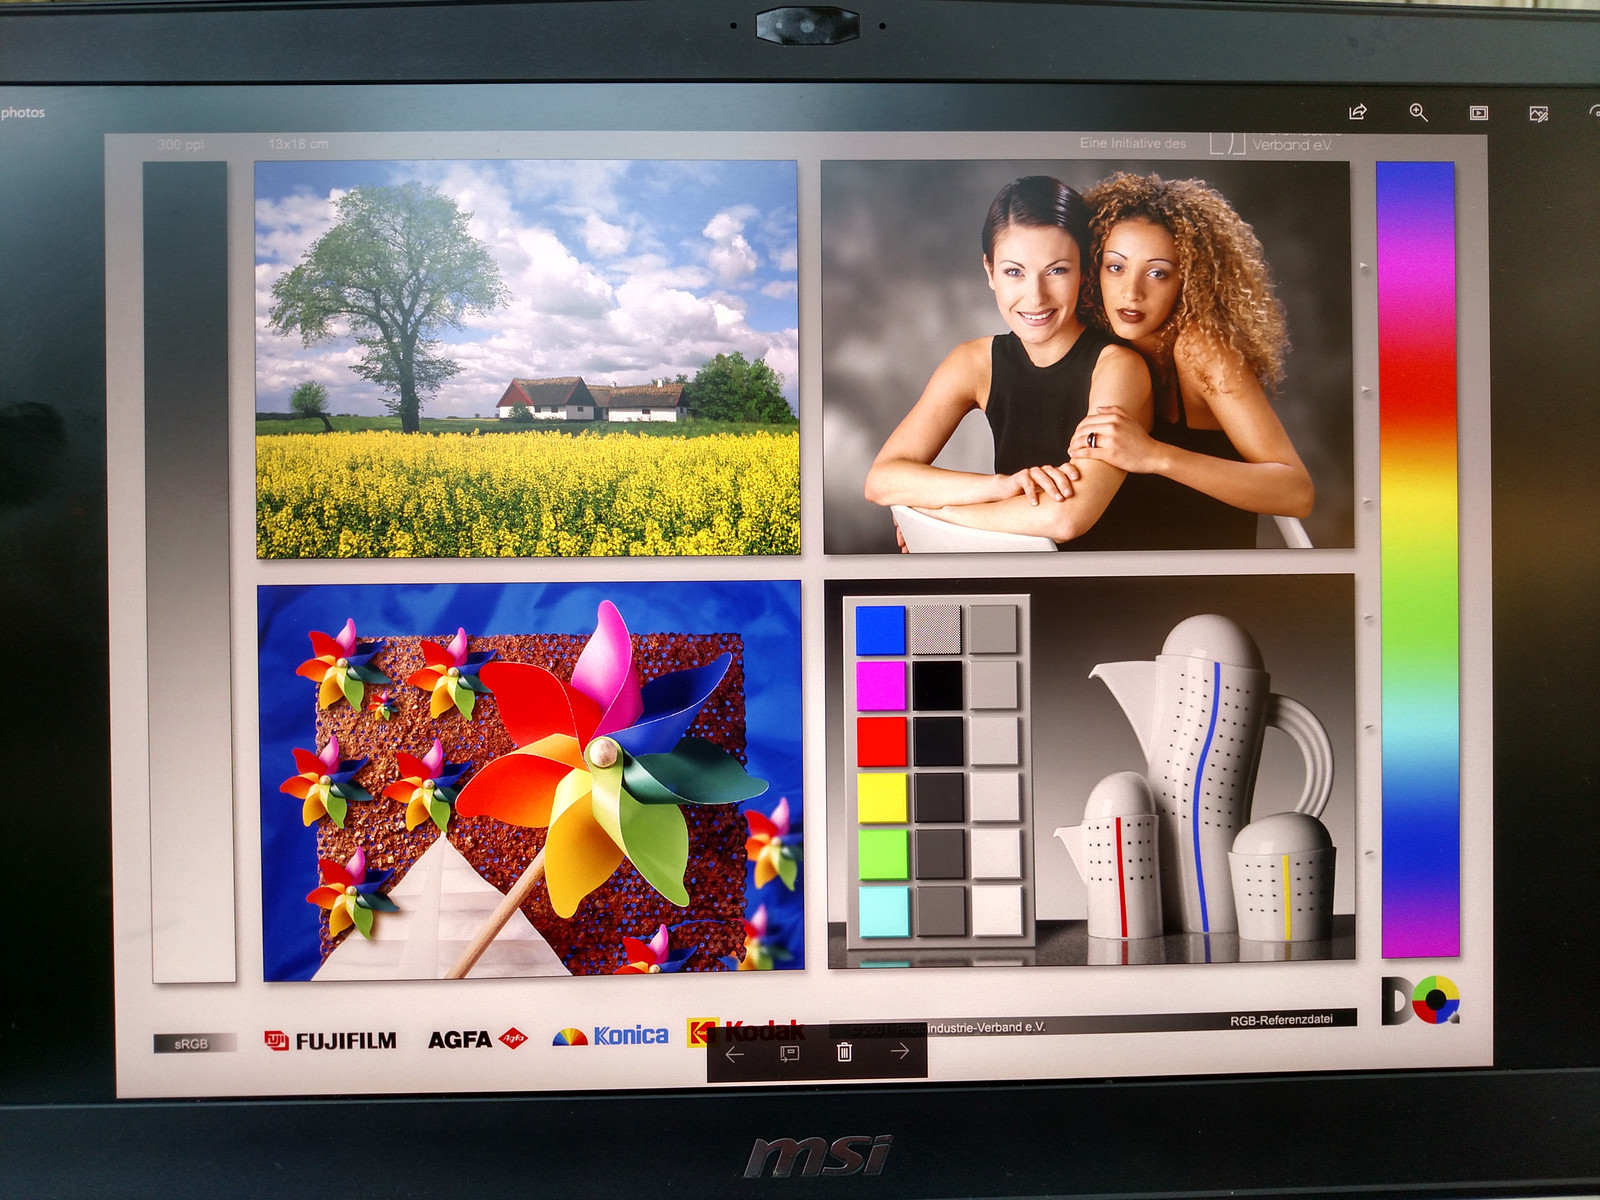
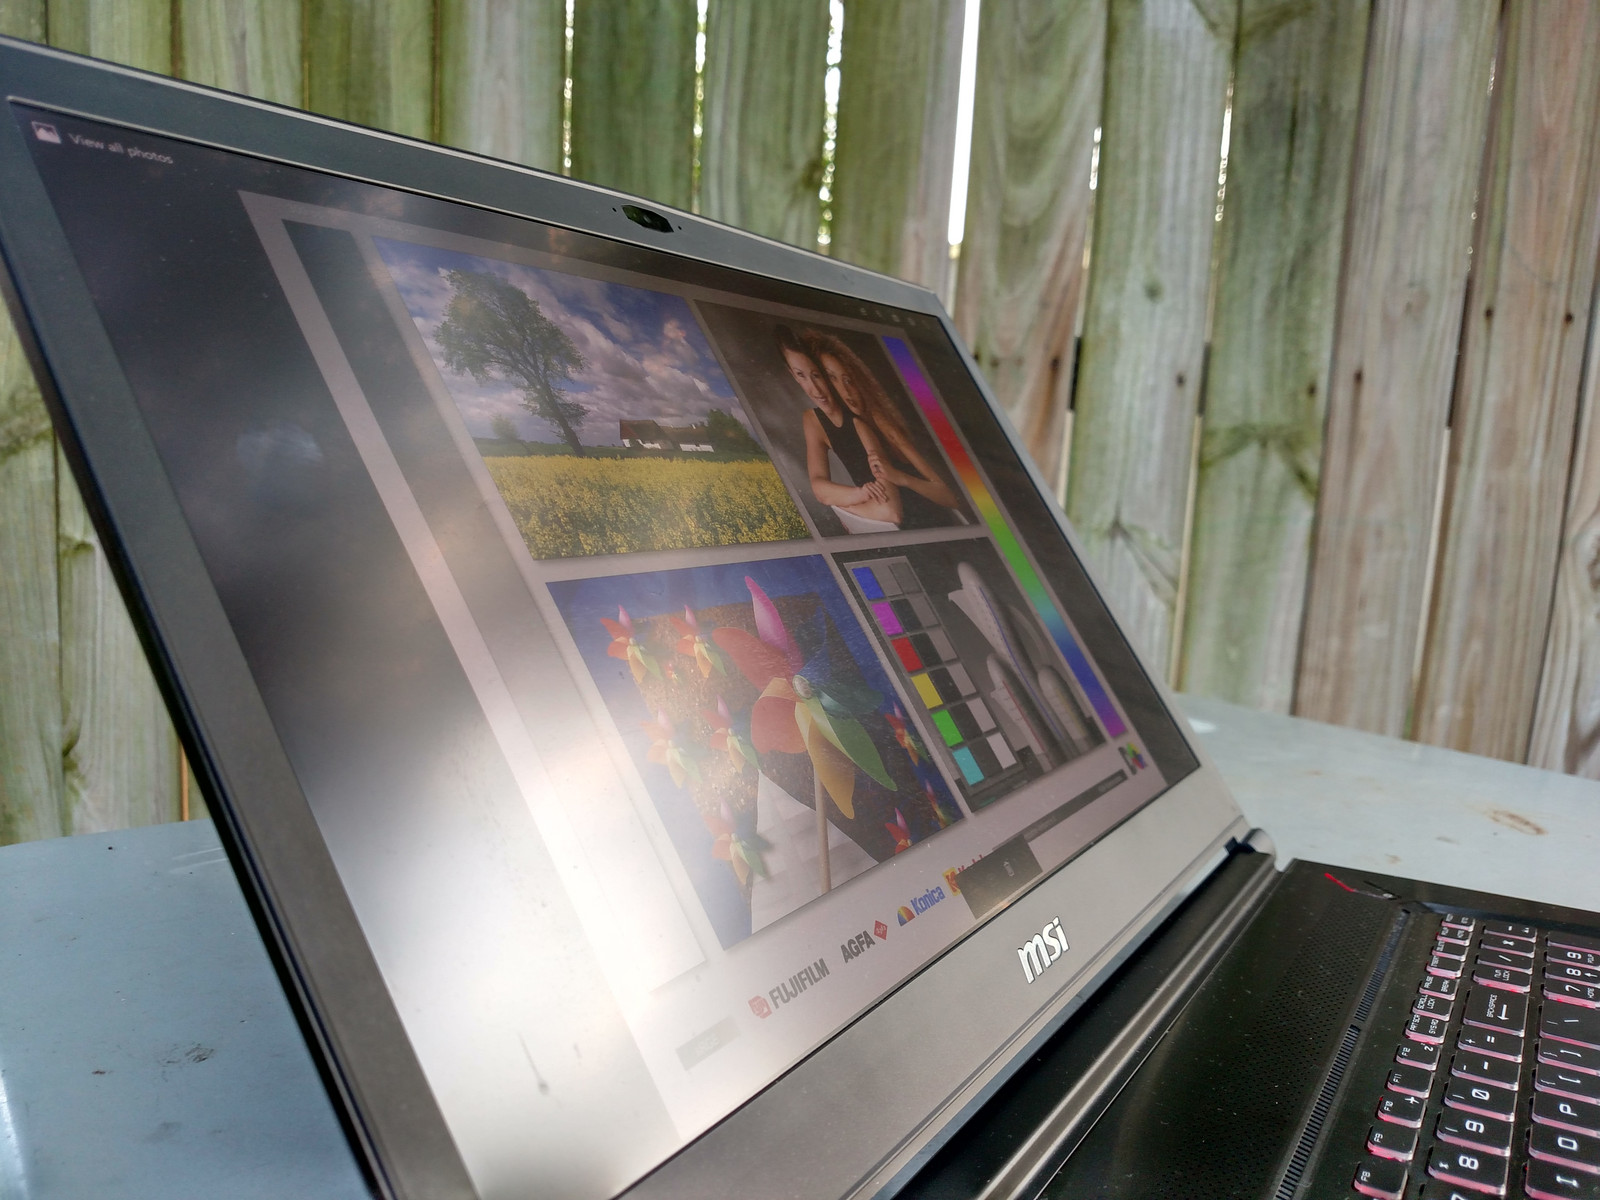
The 17.3-inch IPS display gets bright, averaging at about 343 nits. The brightness and matte finish make this panel easy to view in most lighting conditions, including outdoors. The screen isn't usable in direct sunlight, but finding some shade resolves this problem. In dark environments, the display backlight is even across the entire panel. There is no discernible backlight bleed.
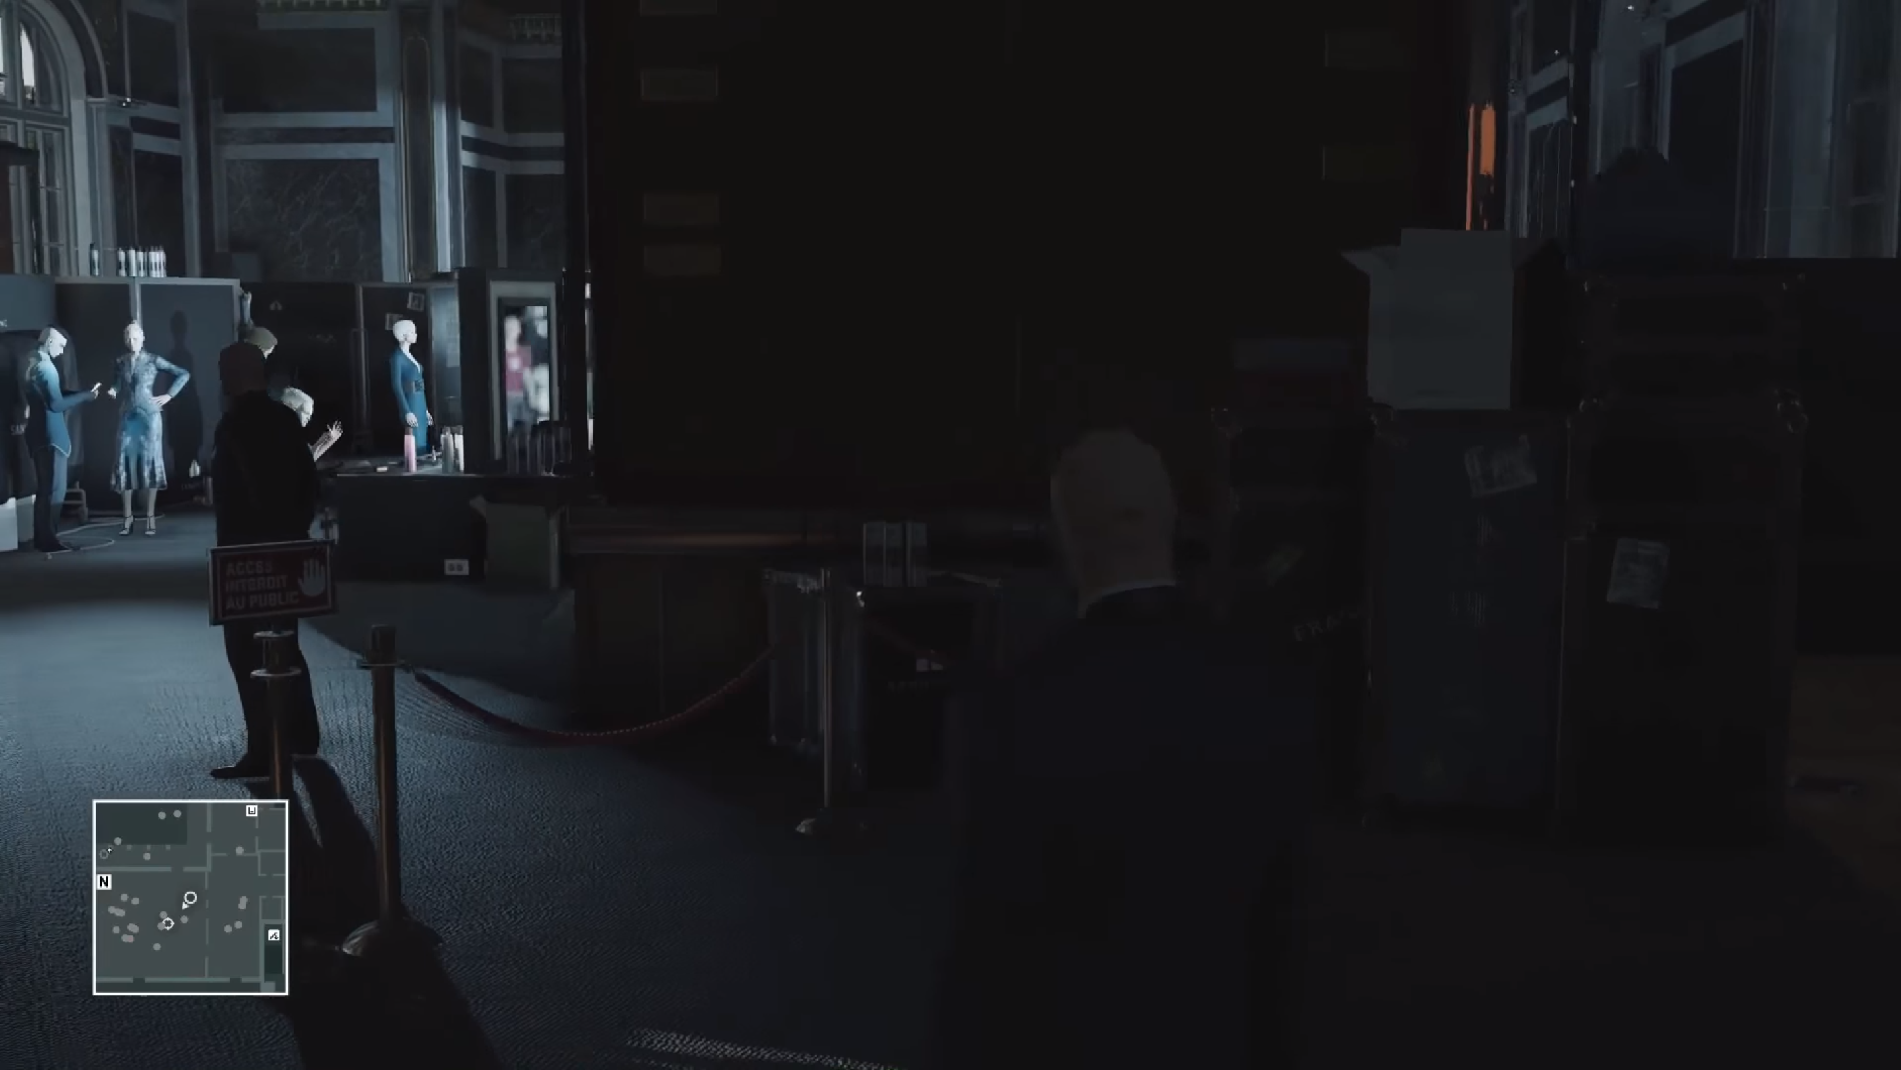
The display has a resolution of 3840x2160, which can be a blessing and a curse. The display has a very high pixel density; as a result, 4K content looks fantastic and crisp. However, the hardware inside isn't able to adequately push these high resolutions in gaming, and the extra pixels are an added drain on battery life. The panel also creates artifacts in 1080p videos; in dark scenes, blacks take on a boxy appearance. We are not sure if the cause is poor Gamma calibration or the occurrence of scaling issues, but the end result is ugly and distracting. This blockiness is not present if the video resolution is bumped to 4K and isn't noticeable in gaming, despite the resolution.
As a prime example, the image below is a screen capture from the 2016 game Hitman. The graphics are set to High settings at 1920x1080, and gameplay footage was recorded via Open Broadcaster Software and saved as an uncompressed video file. Notice the artifacts in the dark parts of the scene. This blockiness is not present during gameplay and only appears in the recording. Other dark scenes in video playback yield similar results.
| |||||||||||||||||||||||||
Brightness Distribution: 86 %
Center on Battery: 371.1 cd/m²
Contrast: 884:1 (Black: 0.42 cd/m²)
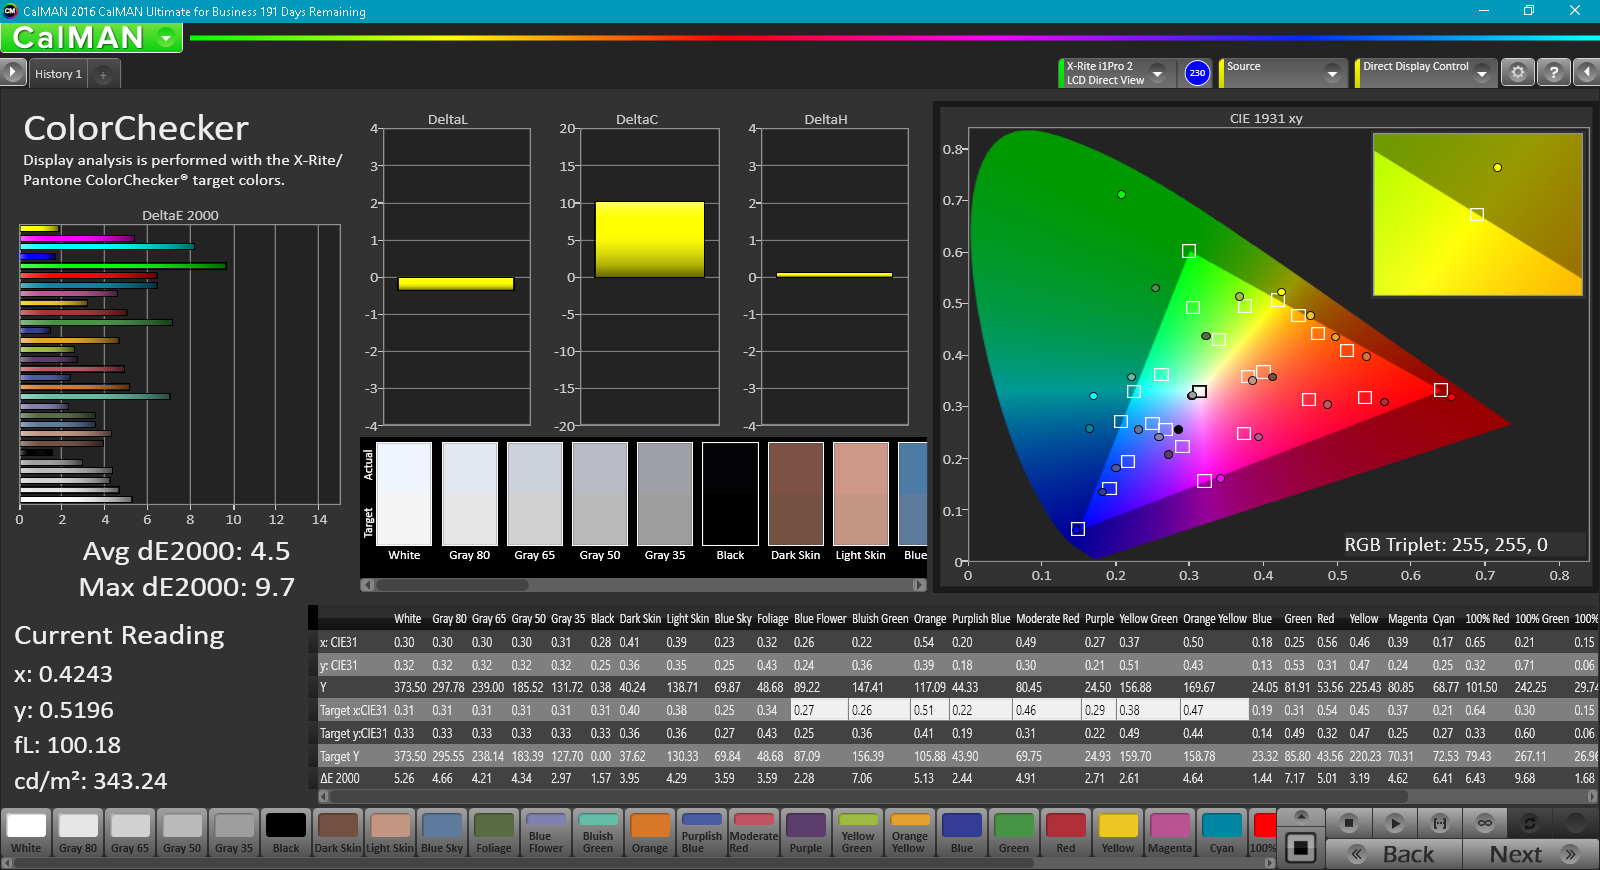
ΔE ColorChecker Calman: 4.5 | ∀{0.5-29.43 Ø4.71}
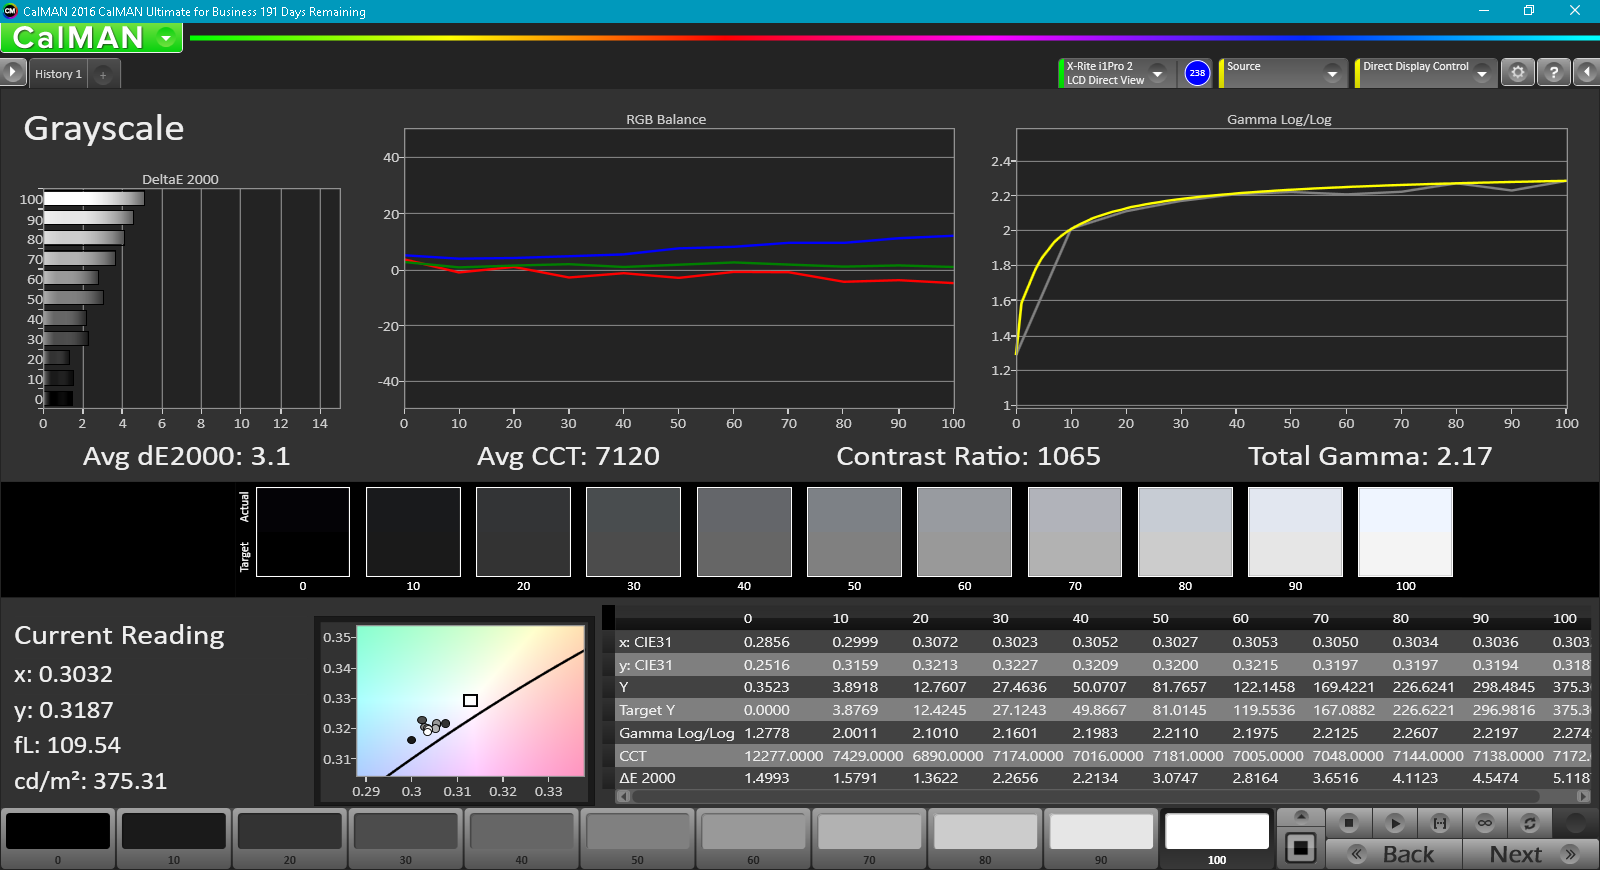
ΔE Greyscale Calman: 3.1 | ∀{0.09-98 Ø4.96}
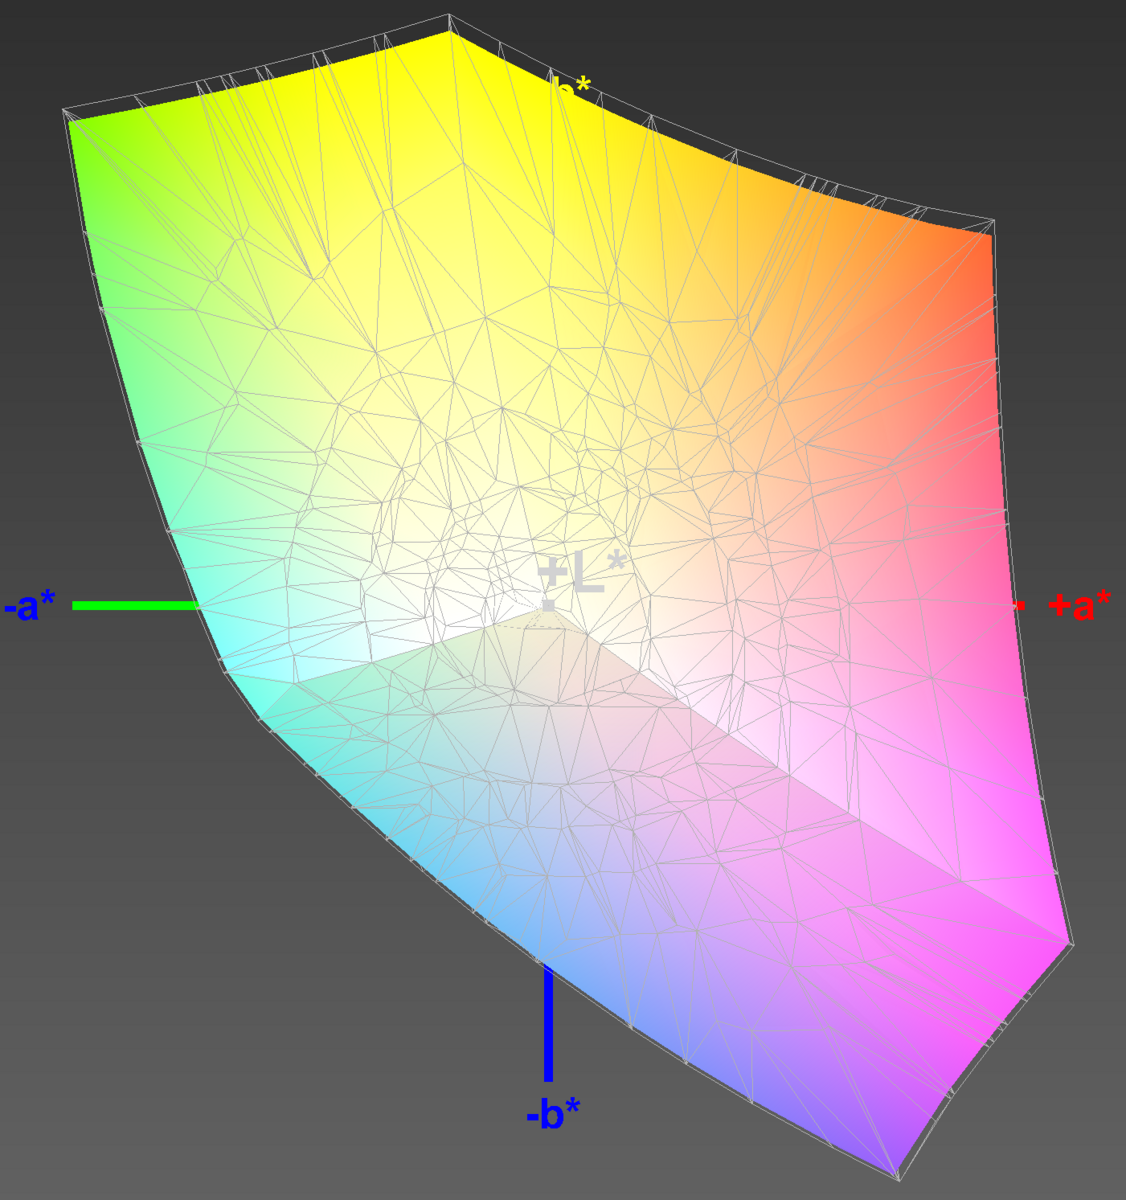
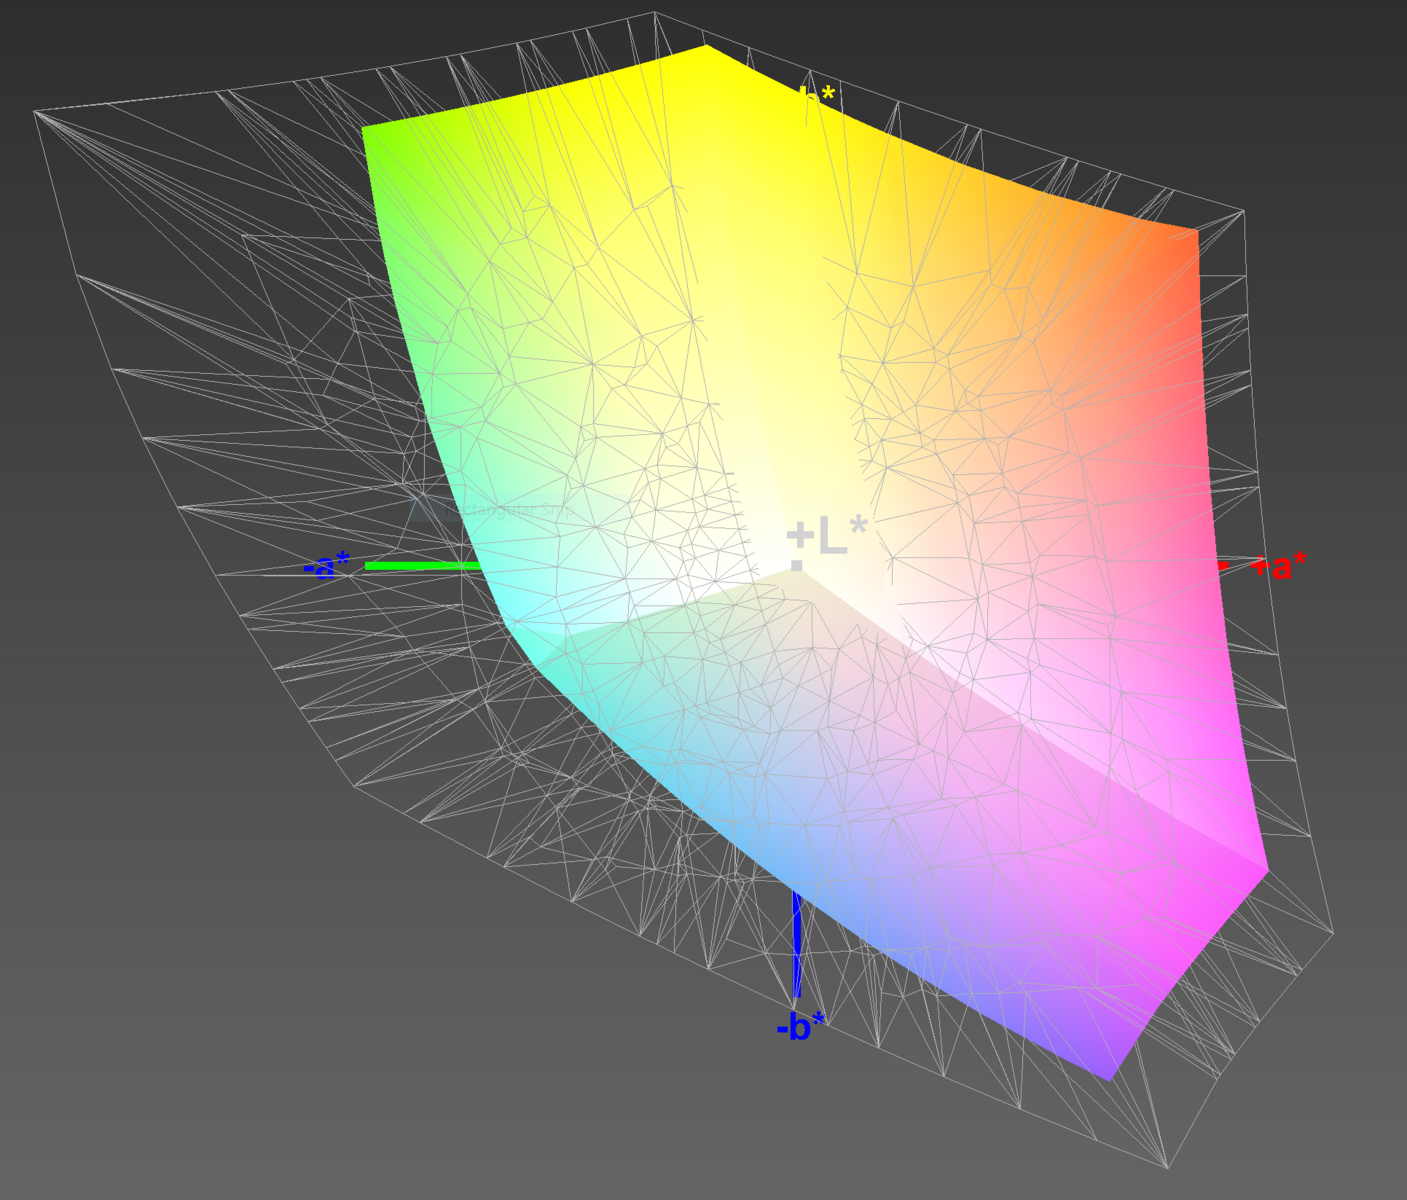
97% sRGB (Argyll 1.6.3 3D)
61% AdobeRGB 1998 (Argyll 1.6.3 3D)
66.4% AdobeRGB 1998 (Argyll 3D)
96.8% sRGB (Argyll 3D)
64.2% Display P3 (Argyll 3D)
Gamma: 2.17
CCT: 7120 K
| MSI GS73VR 7RF AU Optronics AUO109B, IPS, 17.3", 3840x2160 | MSI GS73VR 6RF TN LED, 17.3", 1920x1080 | Asus Strix GL702VSK AU Optronics AUO119D, IPS, 17.3", 1920x1080 | Acer Aspire V17 Nitro BE VN7-793G-52XN AUO B173HAN01.0, a-Si TFT-LCD, WLED, 17.3", 1920x1080 | Aorus X7 v6 B173QTN01.0 (AUO1096), TN LED, 17.3", 2560x1440 | Gigabyte Aero 15 N156HCA-EA1 (CMN15D7), IPS, 15.6", 1920x1080 | |
|---|---|---|---|---|---|---|
| Display | 23% | -7% | -3% | -9% | -1% | |
| Display P3 Coverage (%) | 64.2 | 90 40% | 61.3 -5% | 64 0% | 60.9 -5% | 65.2 2% |
| sRGB Coverage (%) | 96.8 | 99.9 3% | 86.7 -10% | 90.2 -7% | 84.2 -13% | 92.5 -4% |
| AdobeRGB 1998 Coverage (%) | 66.4 | 83.6 26% | 62.3 -6% | 65.4 -2% | 61.2 -8% | 66.5 0% |
| Response Times | 45% | 22% | 3% | 40% | -18% | |
| Response Time Grey 50% / Grey 80% * (ms) | 38 ? | 28 ? 26% | 21.2 ? 44% | 36 ? 5% | 31 ? 18% | 42.8 ? -13% |
| Response Time Black / White * (ms) | 26 ? | 9.6 ? 63% | 26 ? -0% | 26 ? -0% | 10 ? 62% | 32 ? -23% |
| PWM Frequency (Hz) | 26000 ? | |||||
| Screen | 15% | 9% | -1% | -31% | -11% | |
| Brightness middle (cd/m²) | 371.1 | 337.2 -9% | 316.5 -15% | 346 -7% | 343 -8% | 320 -14% |
| Brightness (cd/m²) | 343 | 315 -8% | 306 -11% | 307 -10% | 312 -9% | 316 -8% |
| Brightness Distribution (%) | 86 | 86 0% | 93 8% | 84 -2% | 80 -7% | 90 5% |
| Black Level * (cd/m²) | 0.42 | 0.308 27% | 0.21 50% | 0.26 38% | 0.5 -19% | 0.36 14% |
| Contrast (:1) | 884 | 1095 24% | 1507 70% | 1331 51% | 686 -22% | 889 1% |
| Colorchecker dE 2000 * | 4.5 | 2.96 34% | 4.2 7% | 4.32 4% | 7.33 -63% | 4.62 -3% |
| Colorchecker dE 2000 max. * | 9.7 | 5.45 44% | 7.1 27% | 8.05 17% | 10.79 -11% | 9.75 -1% |
| Greyscale dE 2000 * | 3.1 | 2.57 17% | 3.9 -26% | 5.76 -86% | 7.6 -145% | 6 -94% |
| Gamma | 2.17 101% | 2.25 98% | 2.19 100% | 2.35 94% | 2.19 100% | 2.46 89% |
| CCT | 7120 91% | 7114 91% | 7242 90% | 6447 101% | 9024 72% | 6761 96% |
| Color Space (Percent of AdobeRGB 1998) (%) | 61 | 74.3 22% | 56 -8% | 59 -3% | 55 -10% | 60 -2% |
| Color Space (Percent of sRGB) (%) | 97 | 100 3% | 86 -11% | 90 -7% | 84 -13% | 92 -5% |
| Total Average (Program / Settings) | 28% /
21% | 8% /
8% | -0% /
-1% | 0% /
-17% | -10% /
-10% |
* ... smaller is better
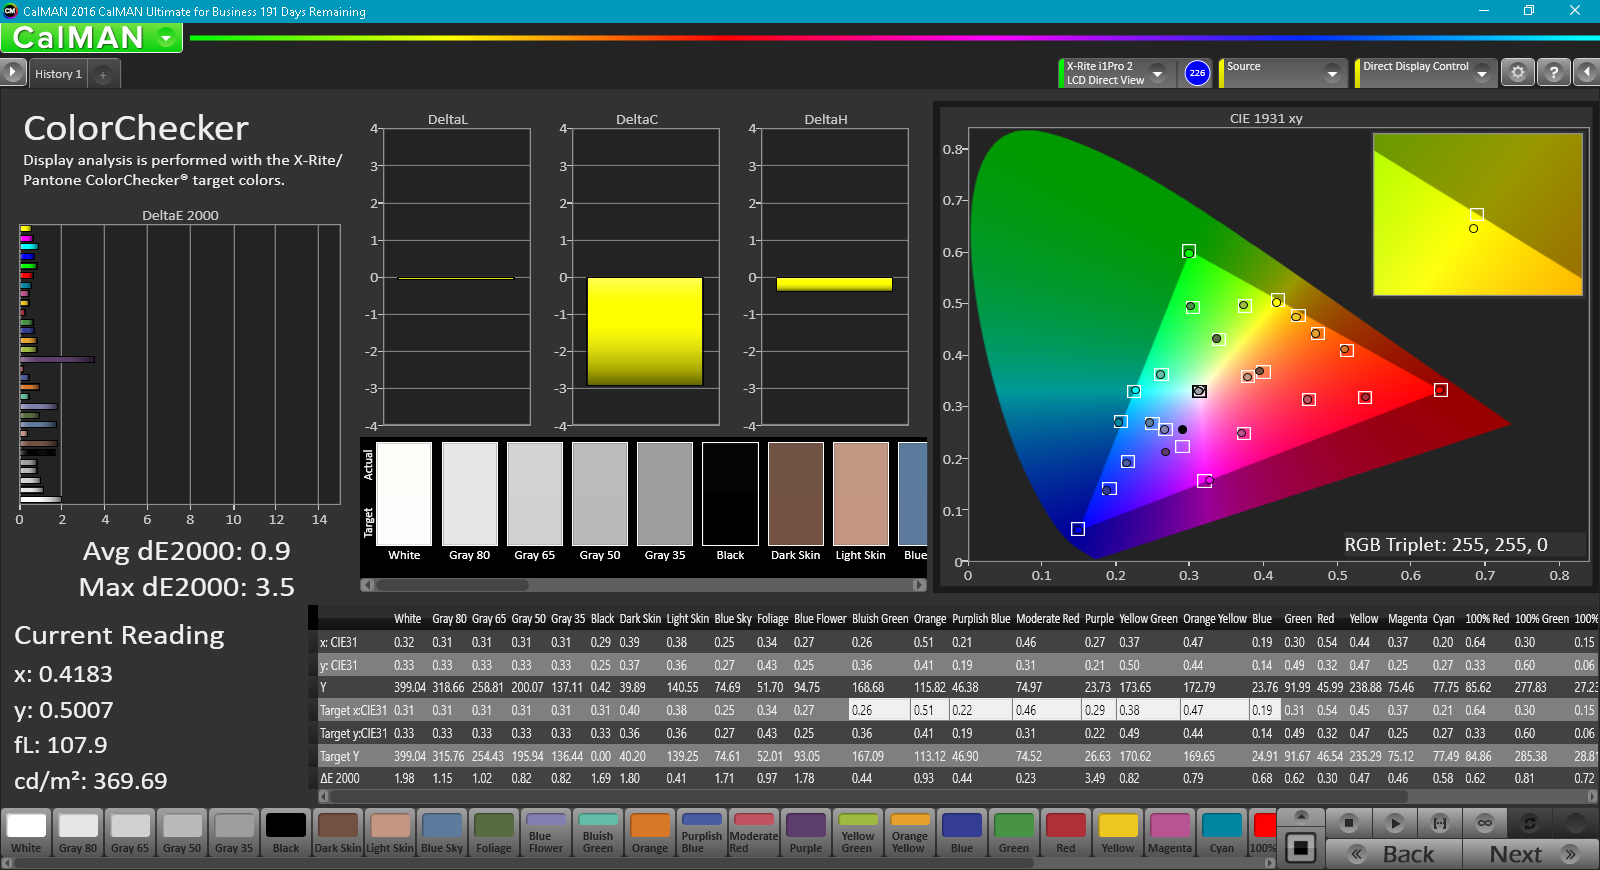
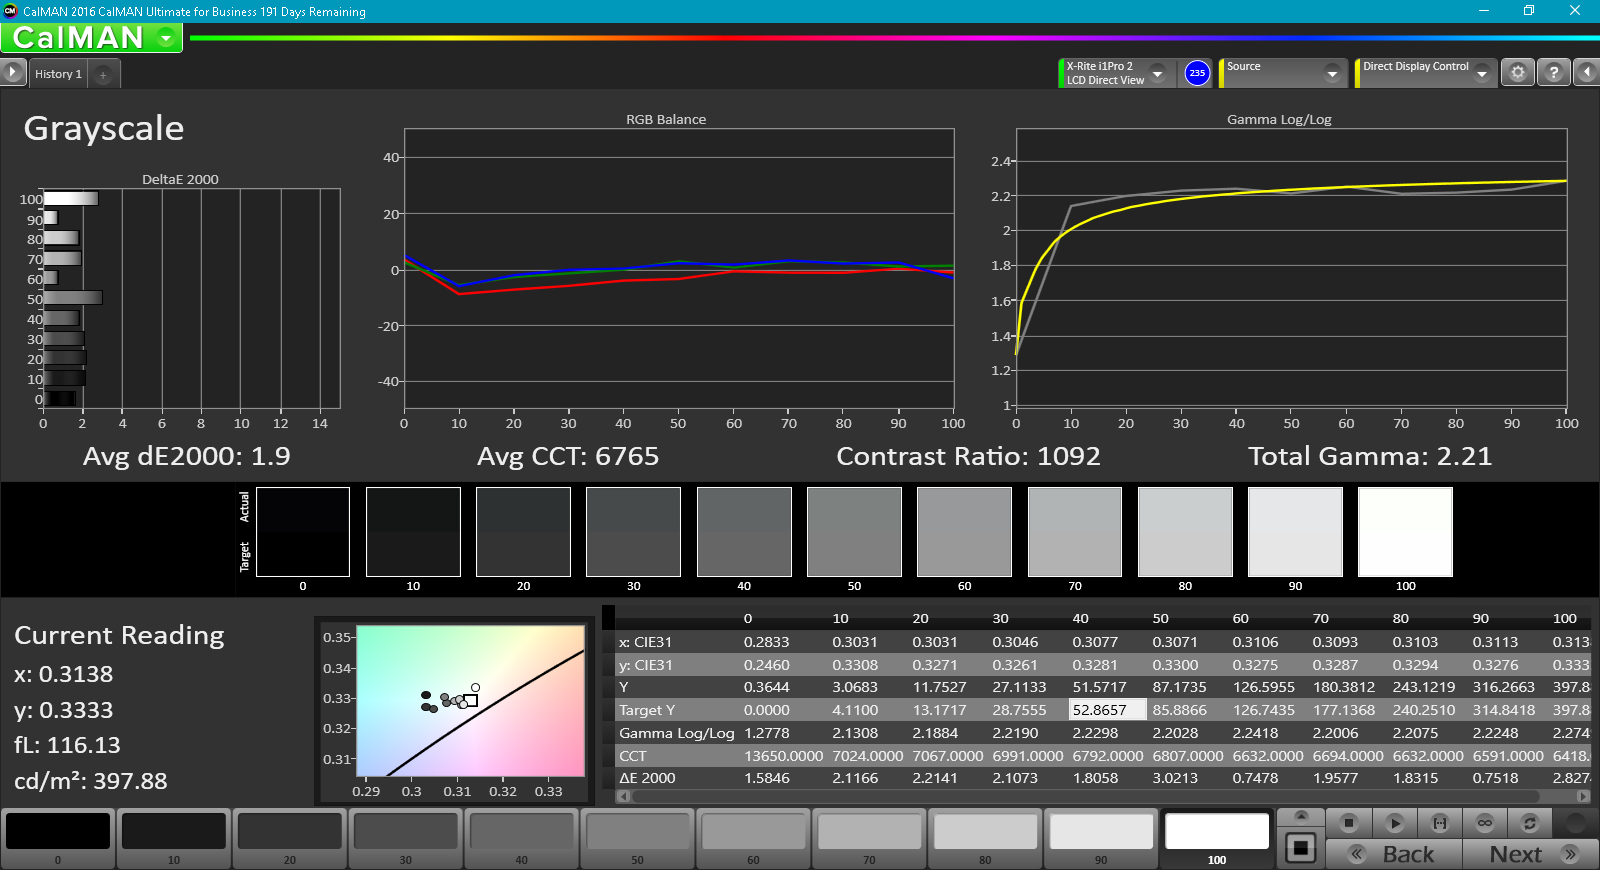
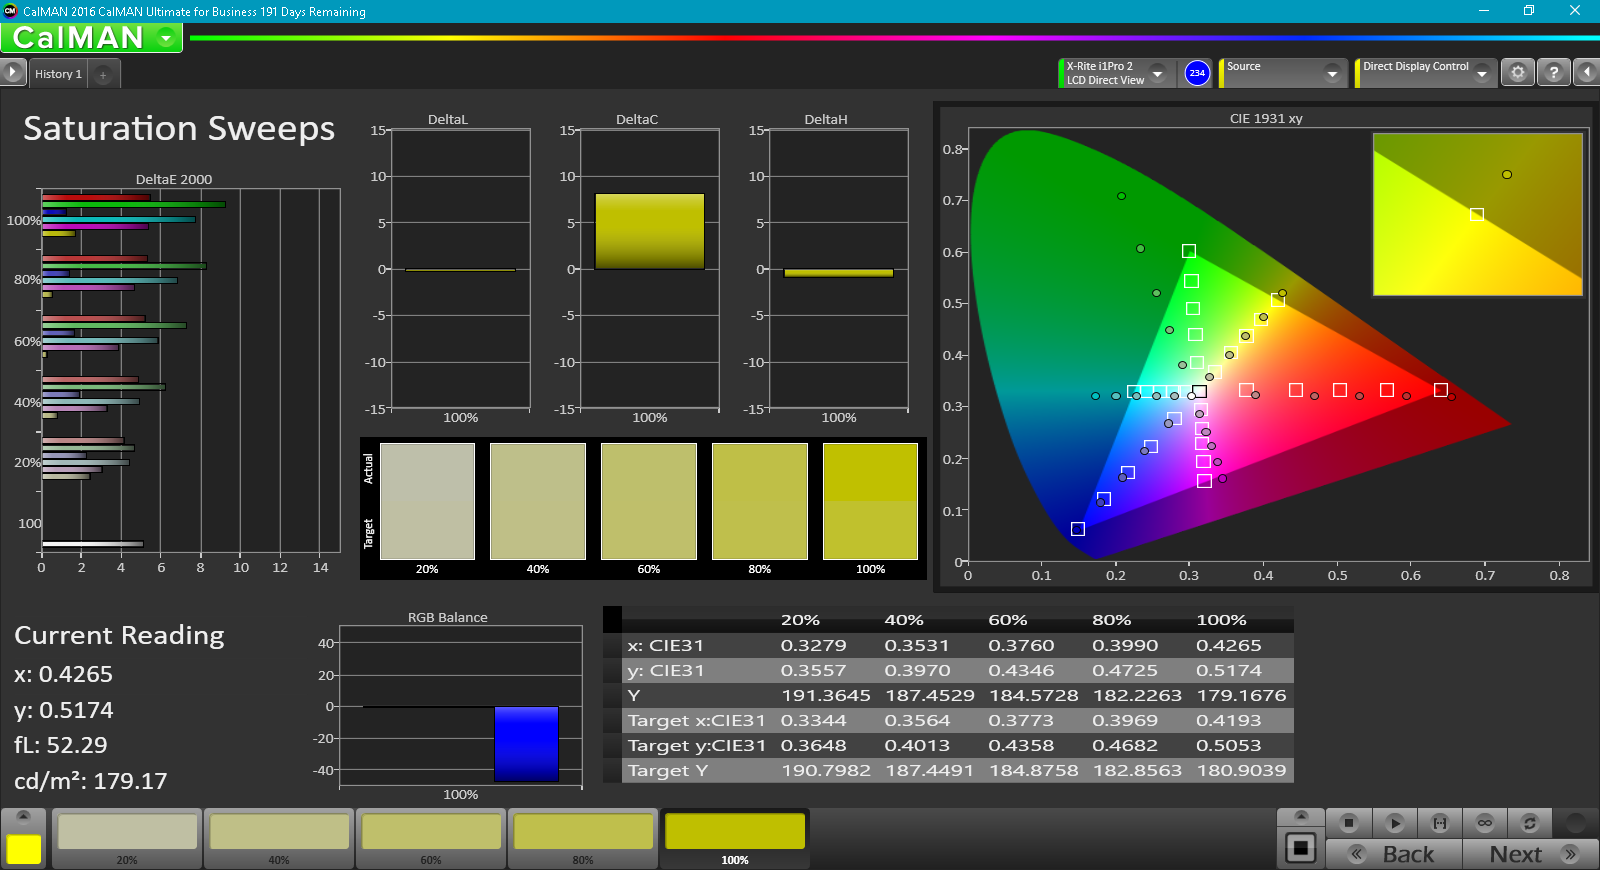
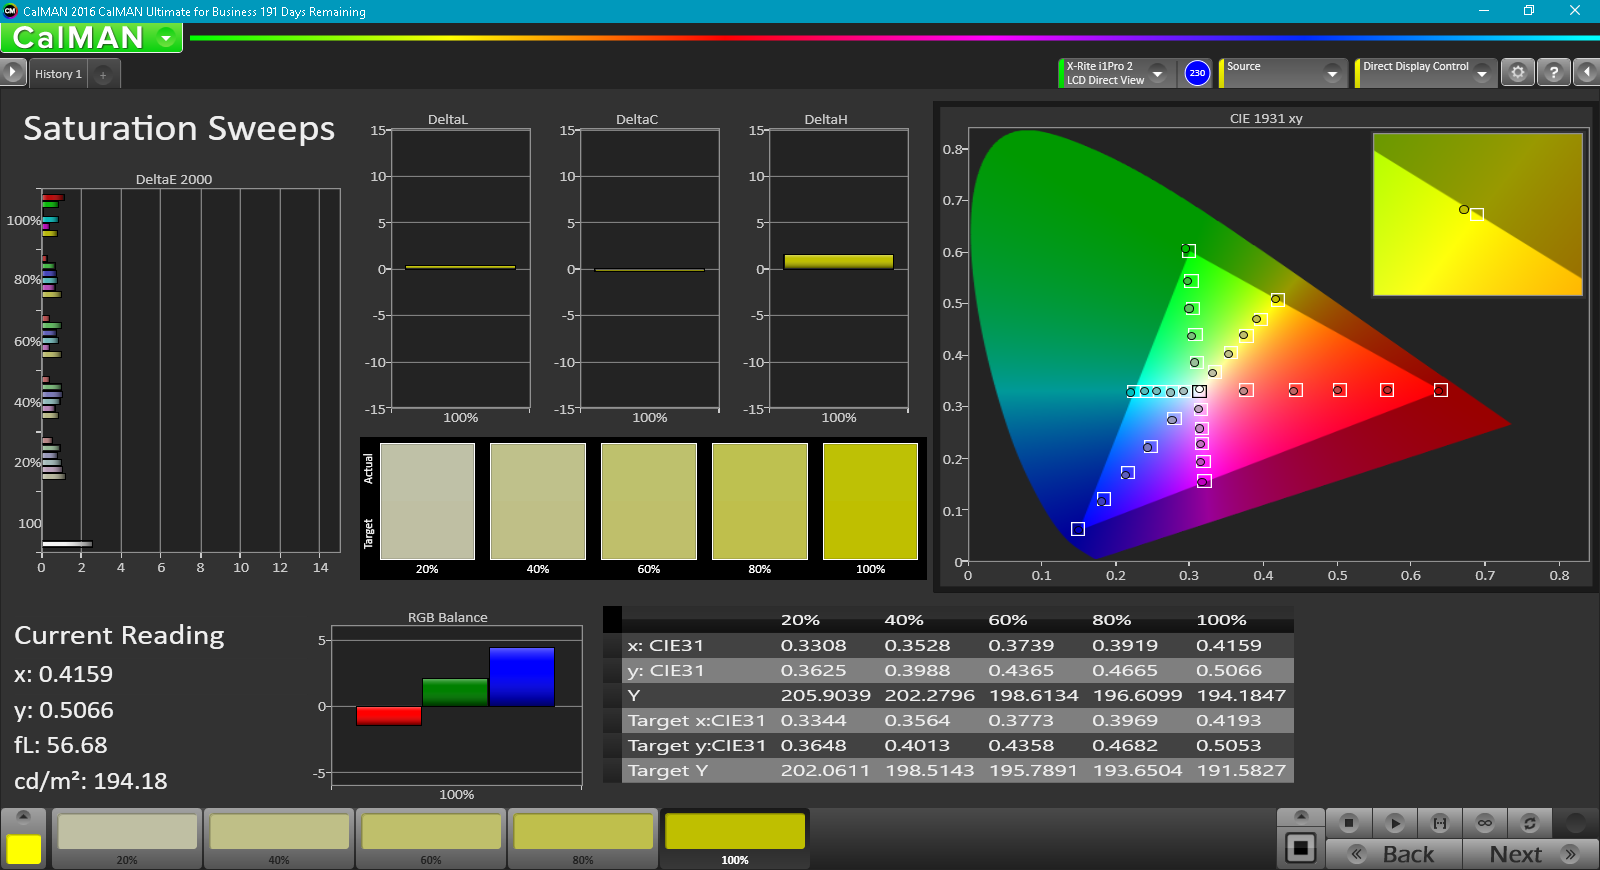
Color accuracy is decent out of the box. Deltas of 4.5 and 3.1 for color and grayscale, respectively, are good enough for gaming but are a bit too high for photo and video editing. Professional use typically demands deltas of 3 or less, so users will want to calibrate the screen. Calibration massively improves the situation, bringing the average delta for colors down to 0.9 and for grays to 1.9. This results in a very color accurate display. Color space is also good; 97% of the sRGB gamut is covered, while 61% of the AdobeRGB color space can be reproduced. The color accuracy and good gamut coverage, coupled with the panel's 4K resolution, make for a beautiful panel and an excellent overall viewing experience.
There are several different monitor profiles available through MSI's True Color application. Should users want a more accurate sRGB profile, there is an "sRGB" mode in this software.
Display Response Times
| ↔ Response Time Black to White | ||
|---|---|---|
| 26 ms ... rise ↗ and fall ↘ combined | ↗ 16 ms rise | 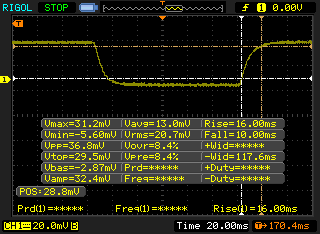 |
| ↘ 10 ms fall | ||
| The screen shows relatively slow response rates in our tests and may be too slow for gamers. In comparison, all tested devices range from 0.1 (minimum) to 240 (maximum) ms. » 63 % of all devices are better. This means that the measured response time is worse than the average of all tested devices (19.8 ms). | ||
| ↔ Response Time 50% Grey to 80% Grey | ||
| 38 ms ... rise ↗ and fall ↘ combined | ↗ 19.6 ms rise | 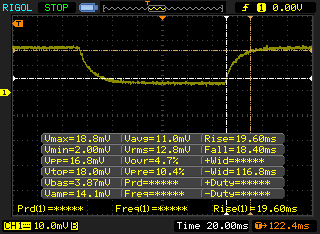 |
| ↘ 18.4 ms fall | ||
| The screen shows slow response rates in our tests and will be unsatisfactory for gamers. In comparison, all tested devices range from 0.165 (minimum) to 636 (maximum) ms. » 55 % of all devices are better. This means that the measured response time is worse than the average of all tested devices (31 ms). | ||
Screen Flickering / PWM (Pulse-Width Modulation)
| Screen flickering / PWM not detected | 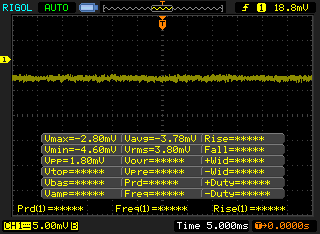 | ||
In comparison: 52 % of all tested devices do not use PWM to dim the display. If PWM was detected, an average of 7754 (minimum: 5 - maximum: 343500) Hz was measured. | |||
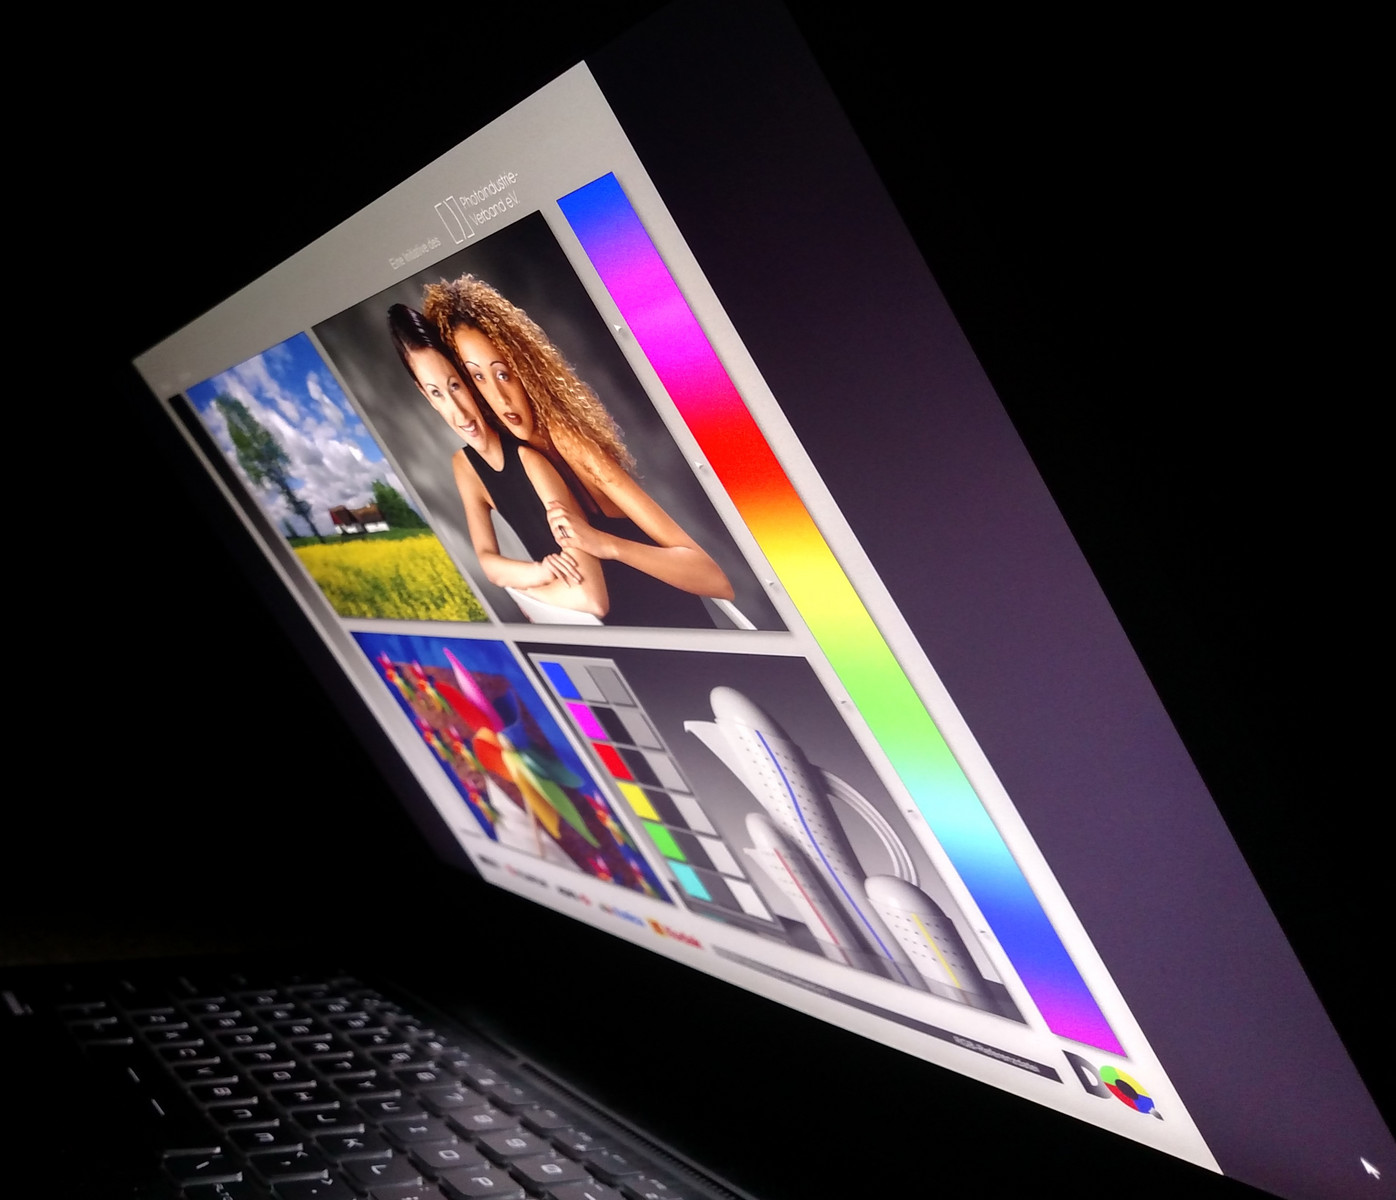
Viewing angles are excellent. The IPS panel can be viewed from extreme angles (greater that 45º) with almost no loss in visual clarity. Colors remain vivid and accurate, and images and text are sharp and crisp.

Performance
The internal components of the GS73VR 7RF are almost identical to the GS73VR 6RF. The only change is the CPU, which has been upgraded from Intel's Skylake Core i7-6700HQ to the latest Kaby Lake Core i7-7700HQ (and, of course, optional changes like storage and RAM). The switch to Kaby Lake brings some marginal changes in performance and power efficiency; while the improvements are noticeable, they are not significant.


Processor
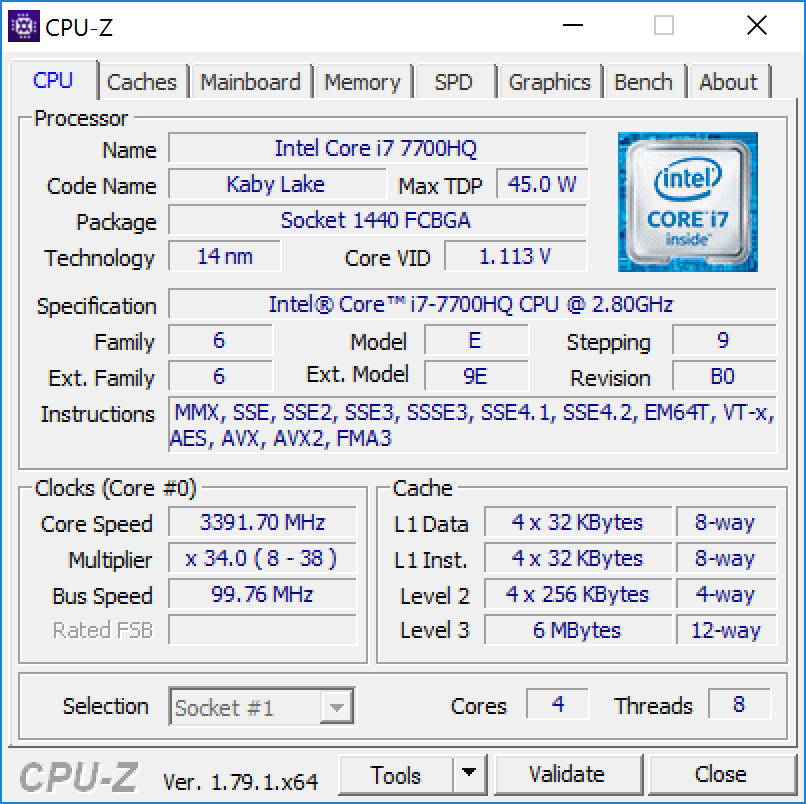
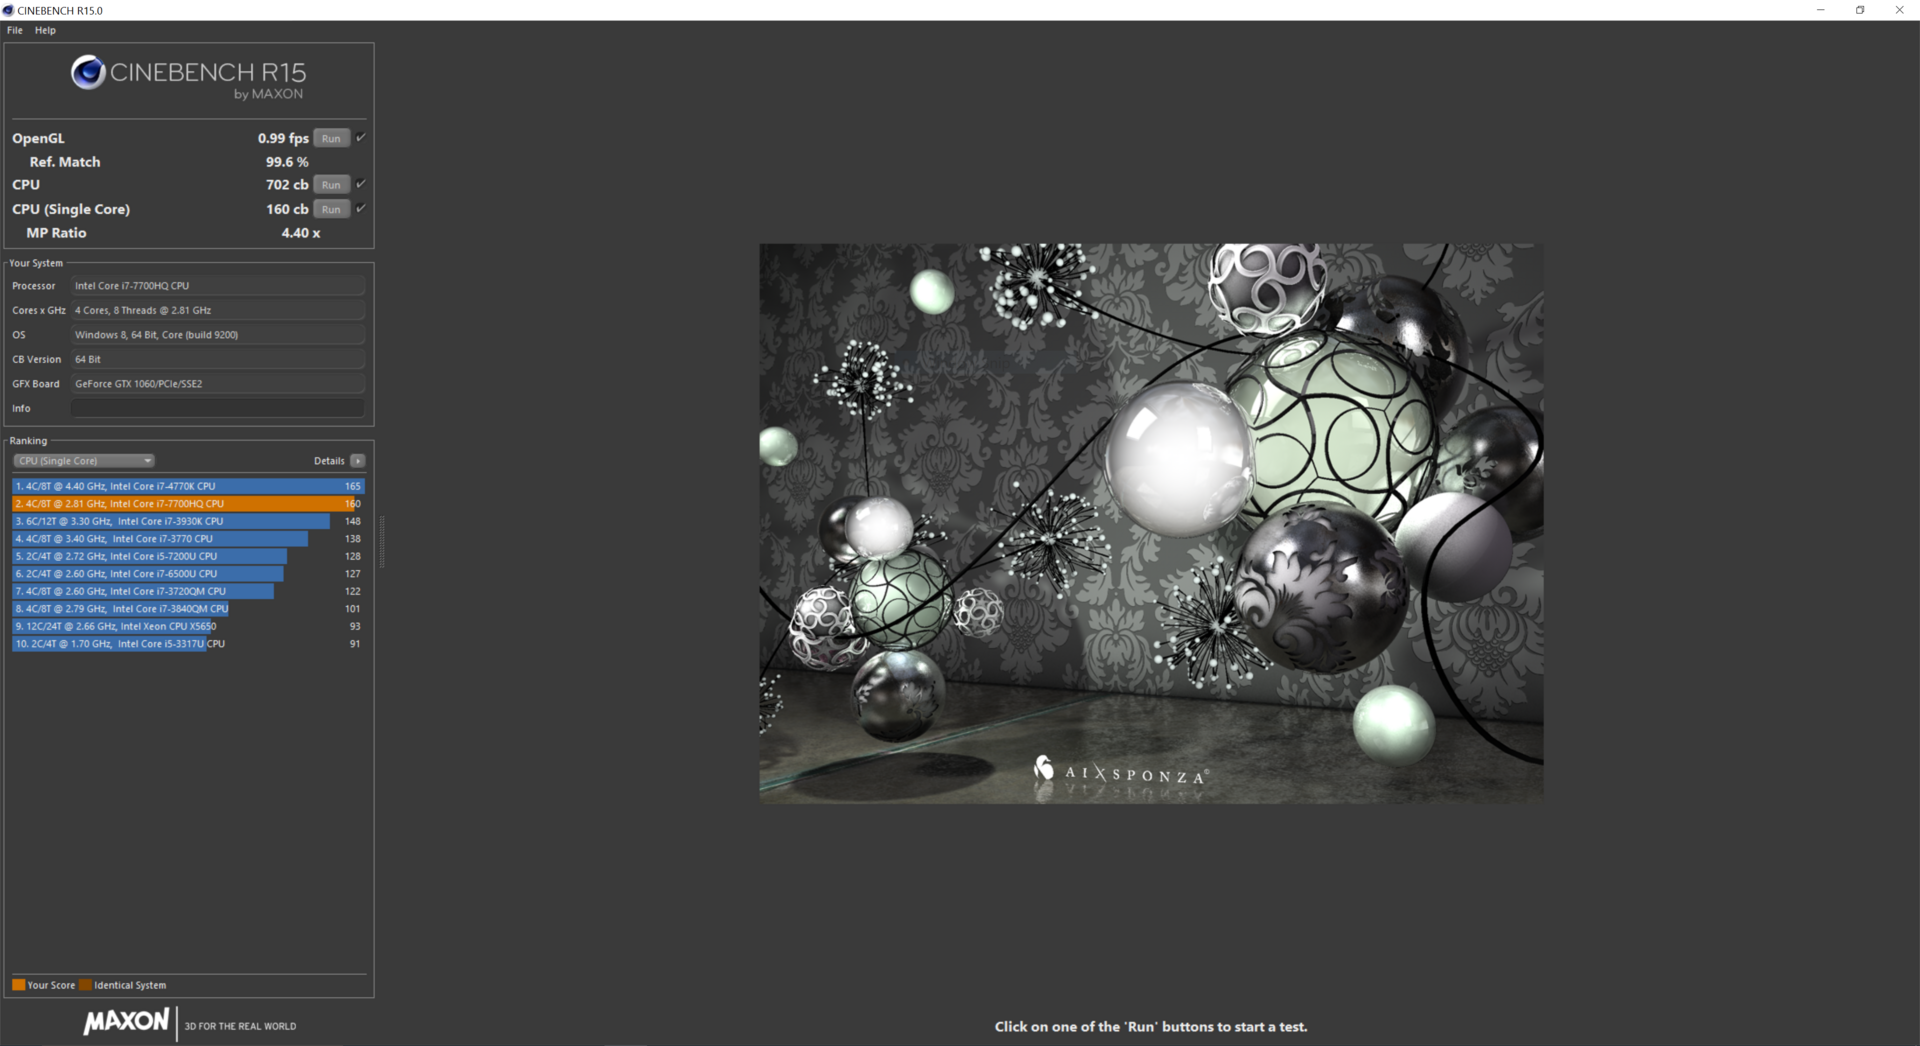
The Intel Core i7-7700HQ (2.8 GHz base, 3.8 GHz Turbo, 6 MB L3 cache) is an incremental upgrade and brings a slight boost in performance. Built on a similar 14 nm process as the i7-6700HQ, the Kaby Lake CPU outperforms its predecessor by about 16% and 8% in single- and multi-threaded workloads. Our review unit also keeps pace with similarly specced gaming notebooks. The Aorus X7 v6, which sports an unlocked Core i7-6820HK, only beats the 7700HQ by about 10%.
Using Cinebench R15 to measure CPU performance, the 7700HQ is easily able to hit its boost clock of 3.8 GHz, although it averages a bit lower at 3.6 GHz. On battery, the CPU performs almost as well. While it does reach it's maximum boost clock when unplugged, overall performance is about 4-5% lower. This won't be noticeable in everyday use.
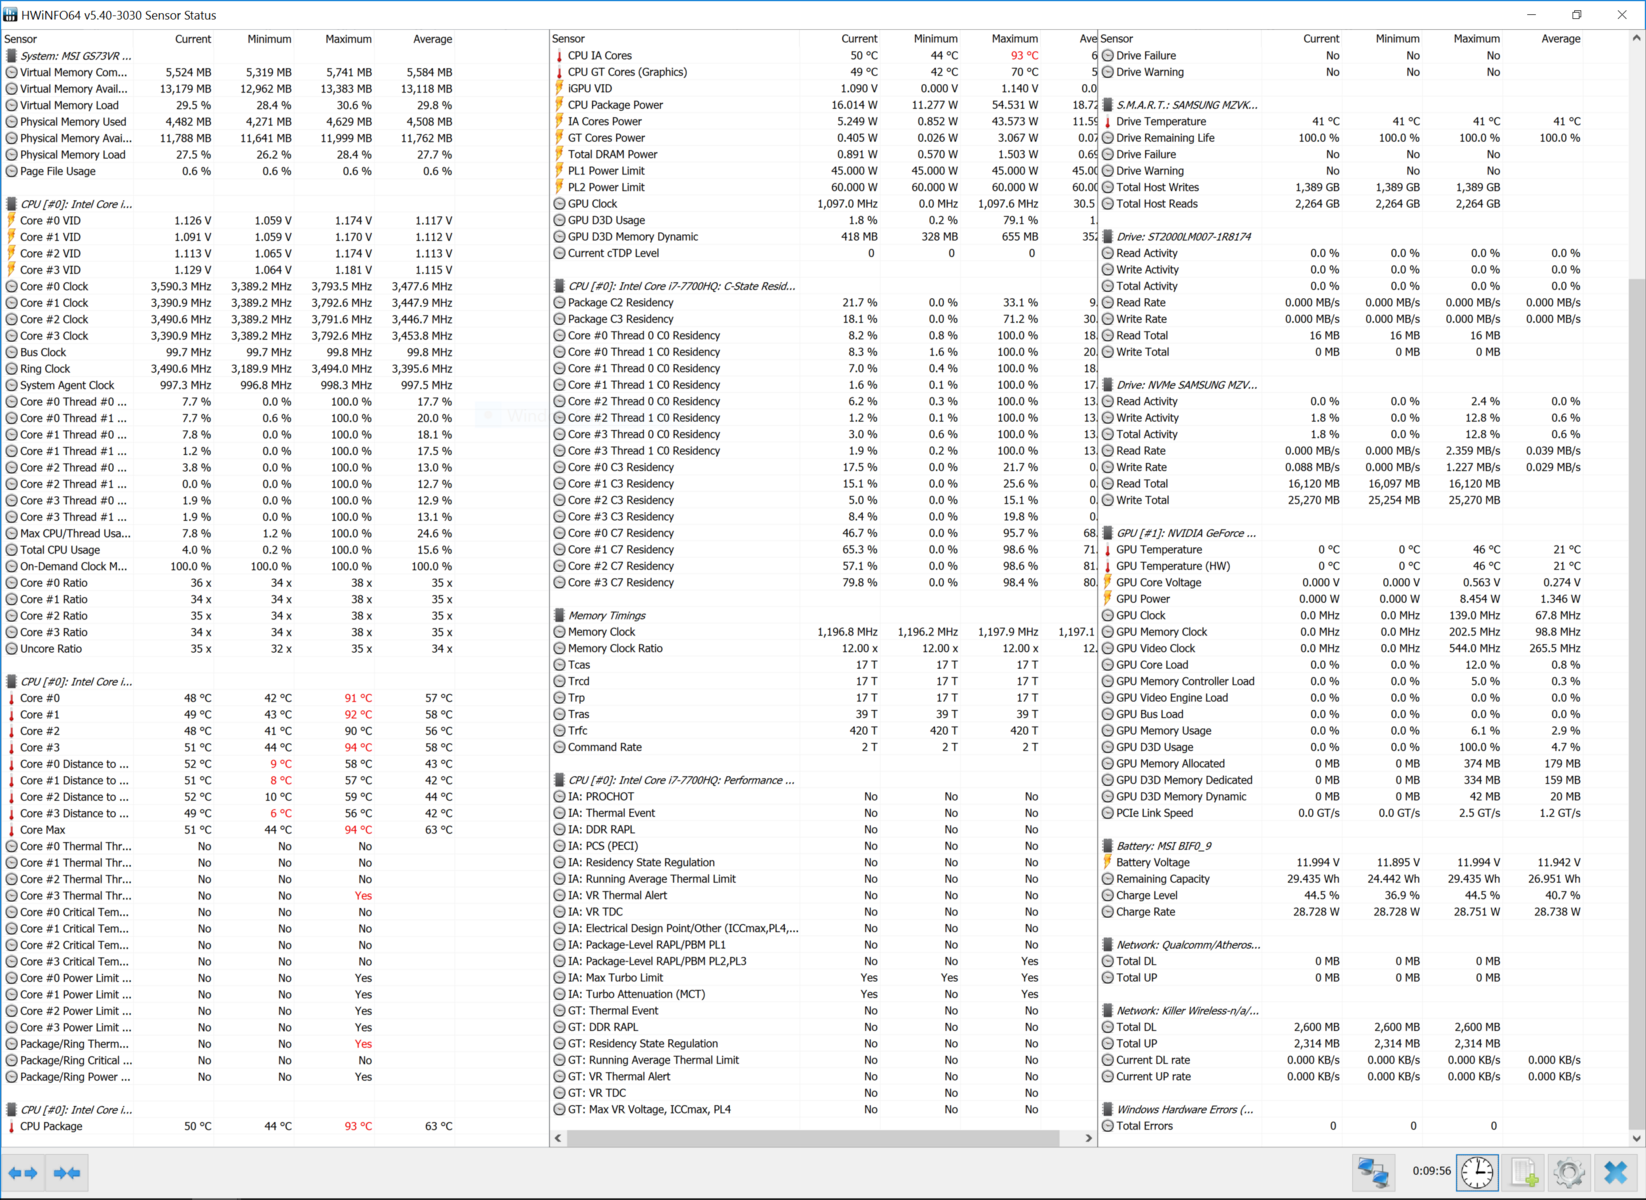
Running Cinebench several times in a row, we can get a good idea of CPU performance over a lengthy period of time. Interestingly, the CPU starts out strong, with some small dips here and there. However, after several runs, performance drops off significantly by about 30%. This result is alarming, but we see the same result in repeats of the test. This may be due to thermal throttling, which we will discuss in the Stress Test section below.
For more information about the Intel Core i7-7700HQ, view our dedicated CPU page here.


| Cinebench R10 | |
| Rendering Multiple CPUs 32Bit | |
| Asus Strix GL702VSK | |
| MSI GS73VR 6RF | |
| Acer Aspire V17 Nitro BE VN7-793G-52XN | |
| Rendering Single 32Bit | |
| Asus Strix GL702VSK | |
| MSI GS73VR 6RF | |
| Acer Aspire V17 Nitro BE VN7-793G-52XN | |
| wPrime 2.10 - 1024m | |
| MSI GS73VR 7RF | |
| MSI GS73VR 6RF | |
| Asus Strix GL702VSK | |
* ... smaller is better
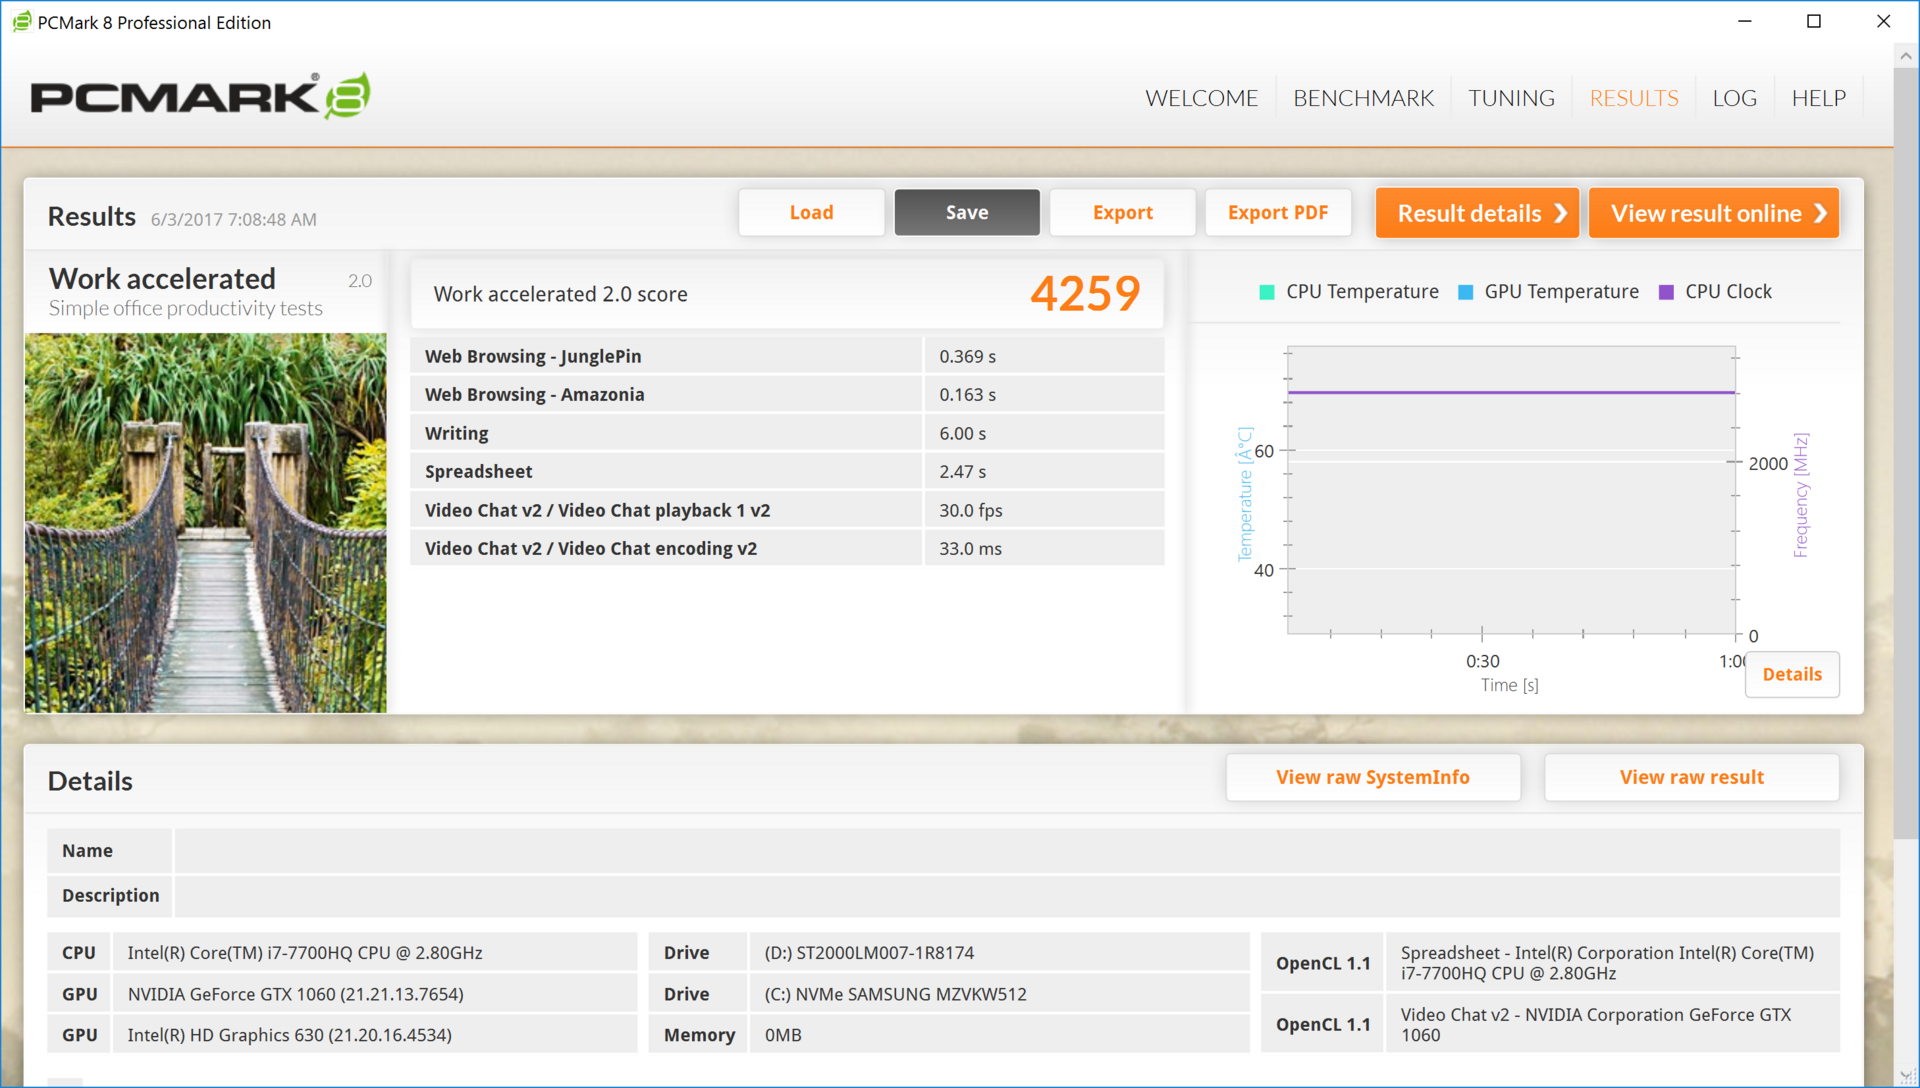
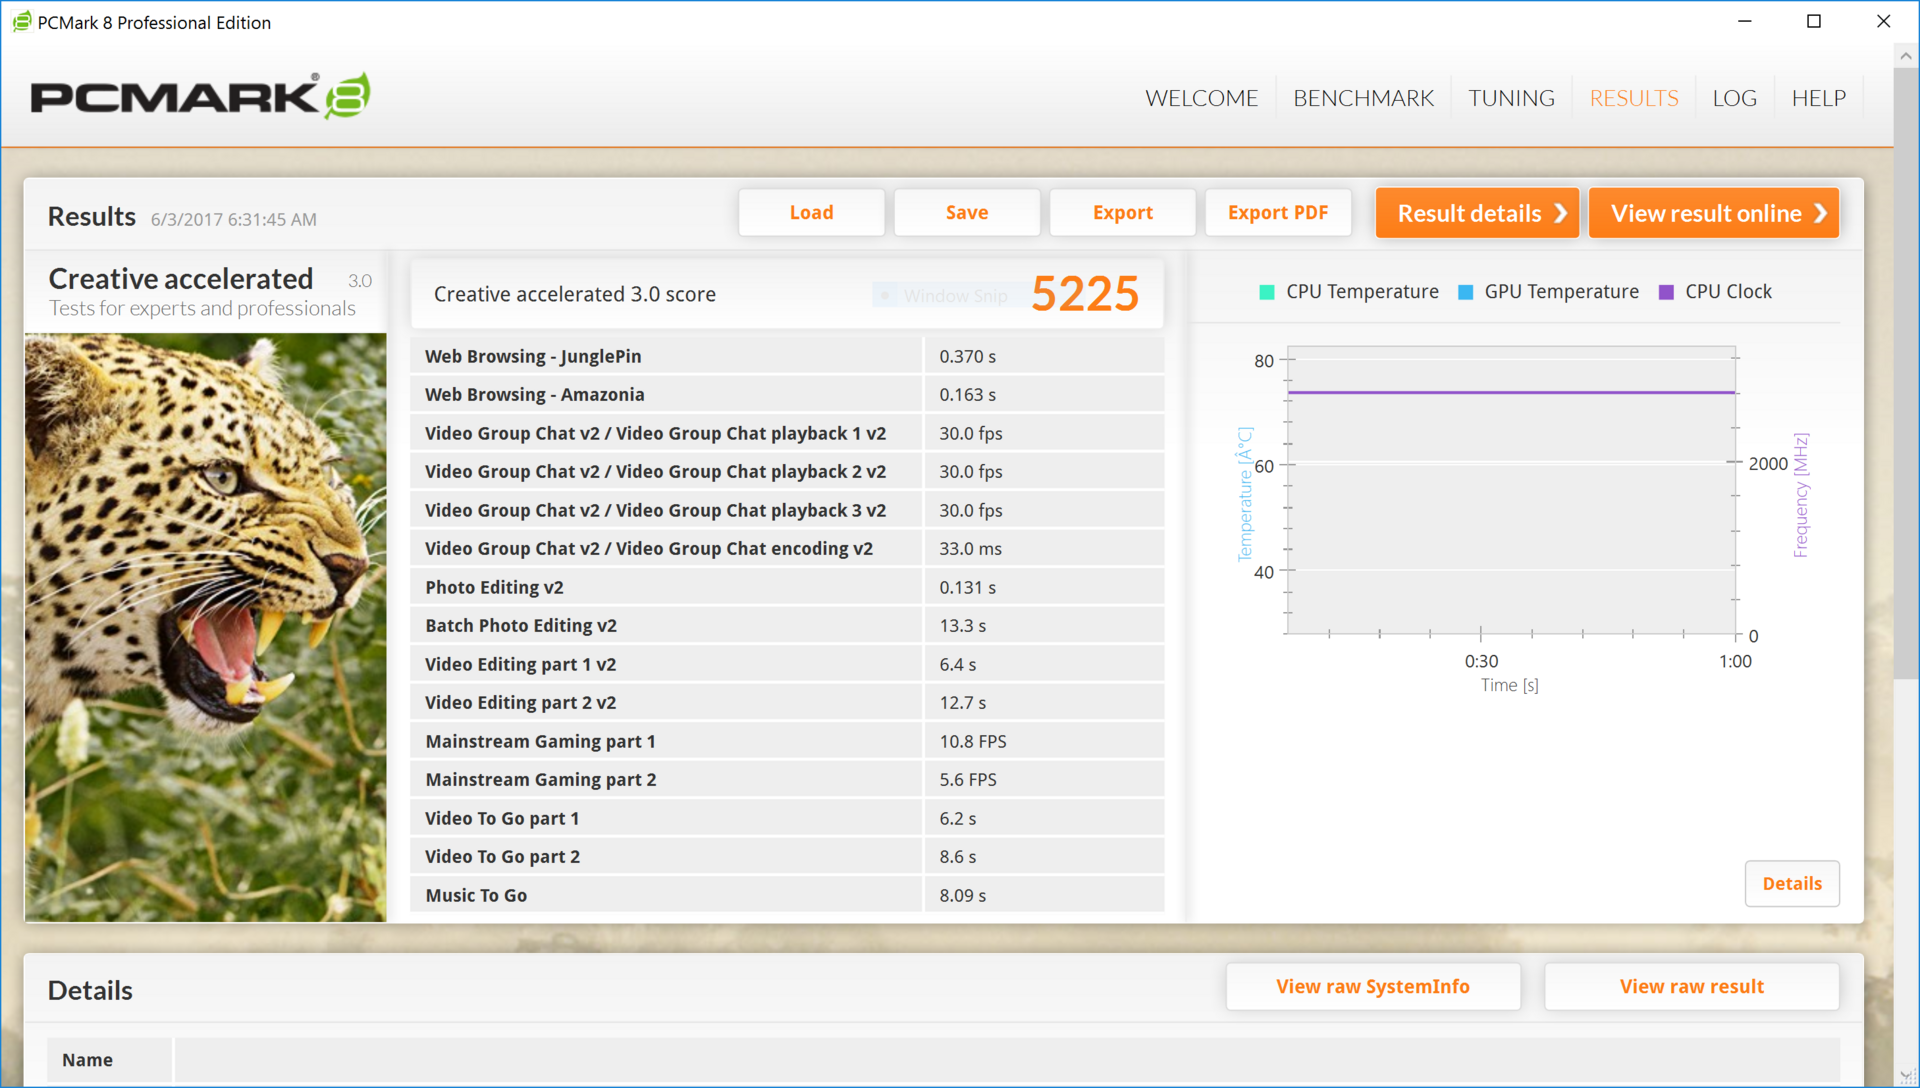
System Performance
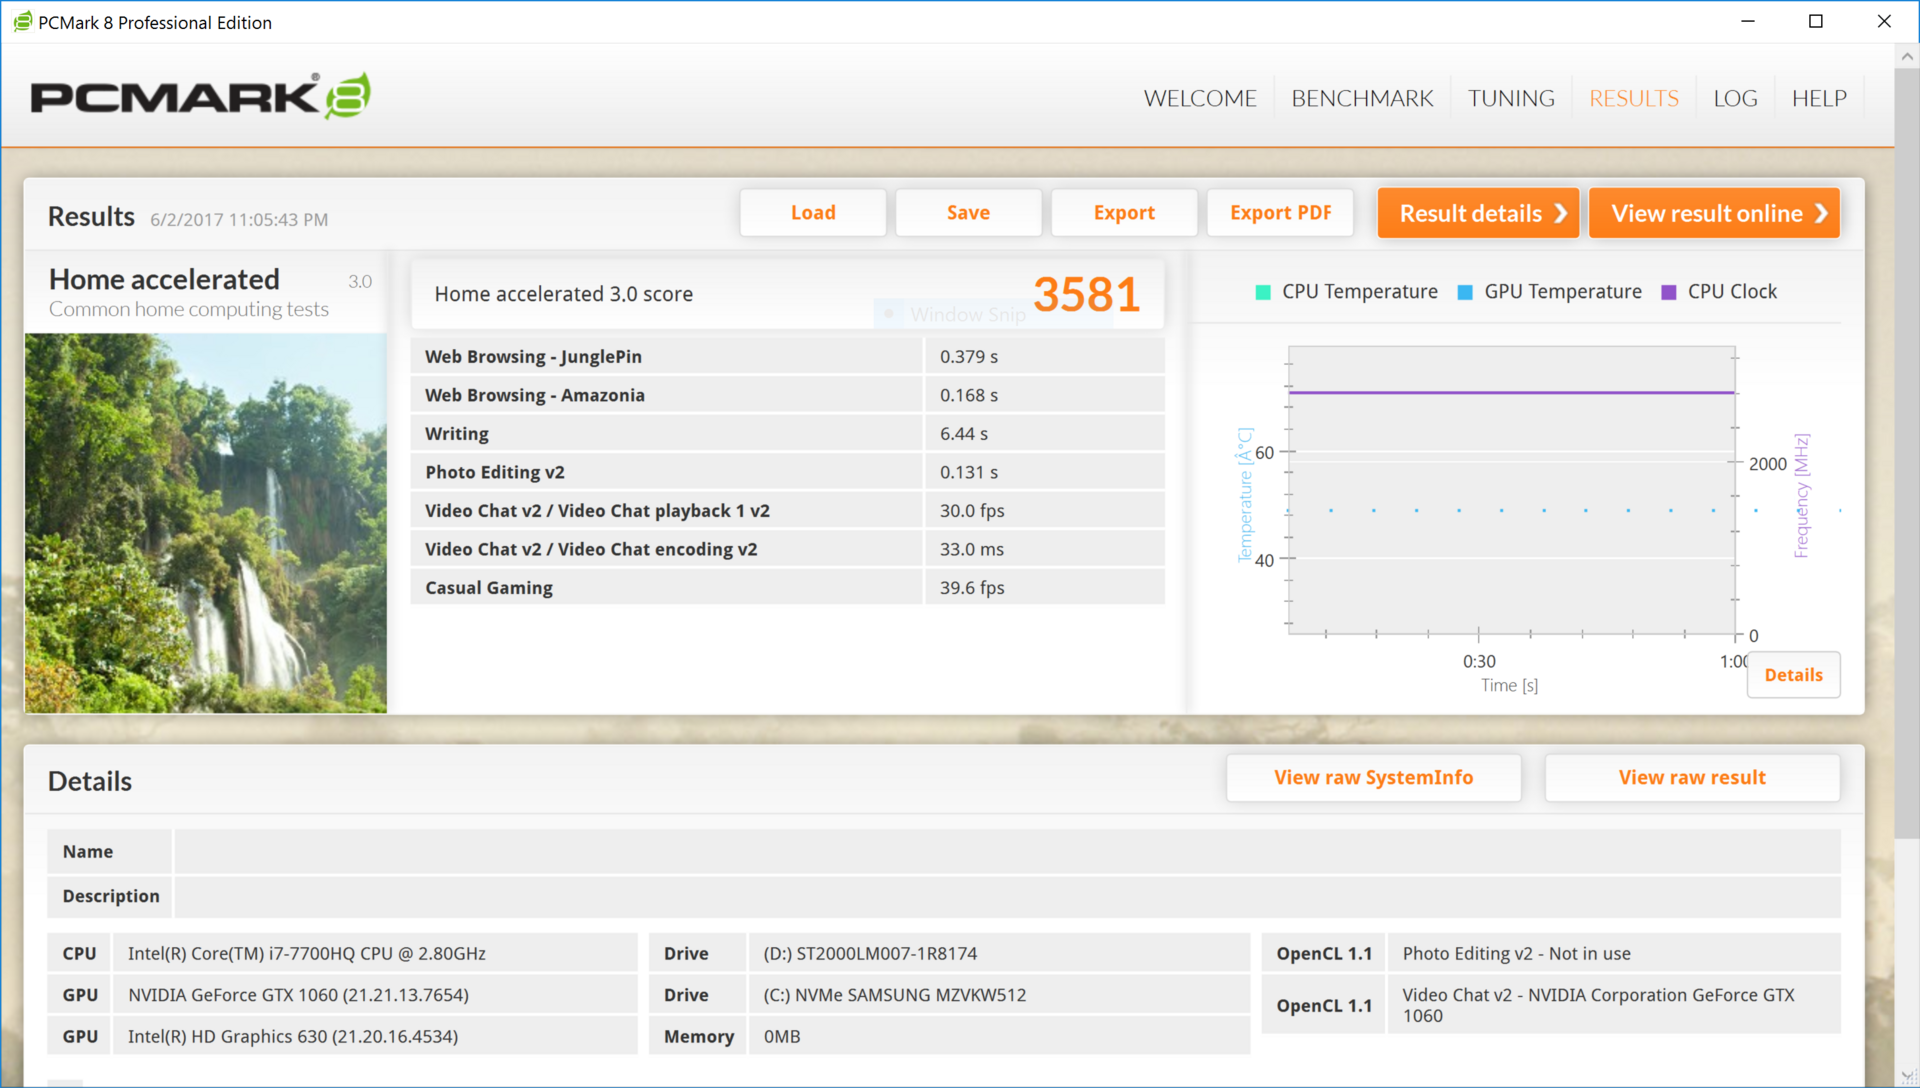
Overall system performance is disappointing. Despite its high-end internals, PCMark 8 pegs our device markedly below the competition in the Work and Home tests. This might be due to the system overhead required of the preinstalled apps, although we could not confirm this during our testing period. Either way, the performance on paper is a letdown.
While PCMark 8 is a reasonably good judge of system performance, it's not always indicative of real-world use. In the case of the GS73VR 7RF, however, the benchmark scores reflect everyday performance. Most apps are smooth, but buggy performance is too commonplace to be written off. Opening the Start menu, for example, is immediate at times and aggravatingly slow at others. Simple tasks, like resizing or moving windows, can induce noticeable lag and be frustrating. Even moving the cursor requires patience as it will freeze or hang every so often. While overall system performance should be quick, it routinely takes a tick too long for things to get going to be comfortable.
| PCMark 8 | |
| Home Score Accelerated v2 | |
| Asus Strix GL702VSK | |
| Gigabyte Aero 15 | |
| MSI GS73VR 6RF | |
| Acer Aspire V17 Nitro BE VN7-793G-52XN | |
| MSI GS73VR 7RF | |
| Work Score Accelerated v2 | |
| Gigabyte Aero 15 | |
| Acer Aspire V17 Nitro BE VN7-793G-52XN | |
| Asus Strix GL702VSK | |
| MSI GS73VR 6RF | |
| MSI GS73VR 7RF | |
| Creative Score Accelerated v2 | |
| MSI GS73VR 7RF | |
| MSI GS73VR 6RF | |
| Acer Aspire V17 Nitro BE VN7-793G-52XN | |
| PCMark 8 Home Score Accelerated v2 | 3581 points | |
| PCMark 8 Creative Score Accelerated v2 | 5225 points | |
| PCMark 8 Work Score Accelerated v2 | 4259 points | |
Help | ||
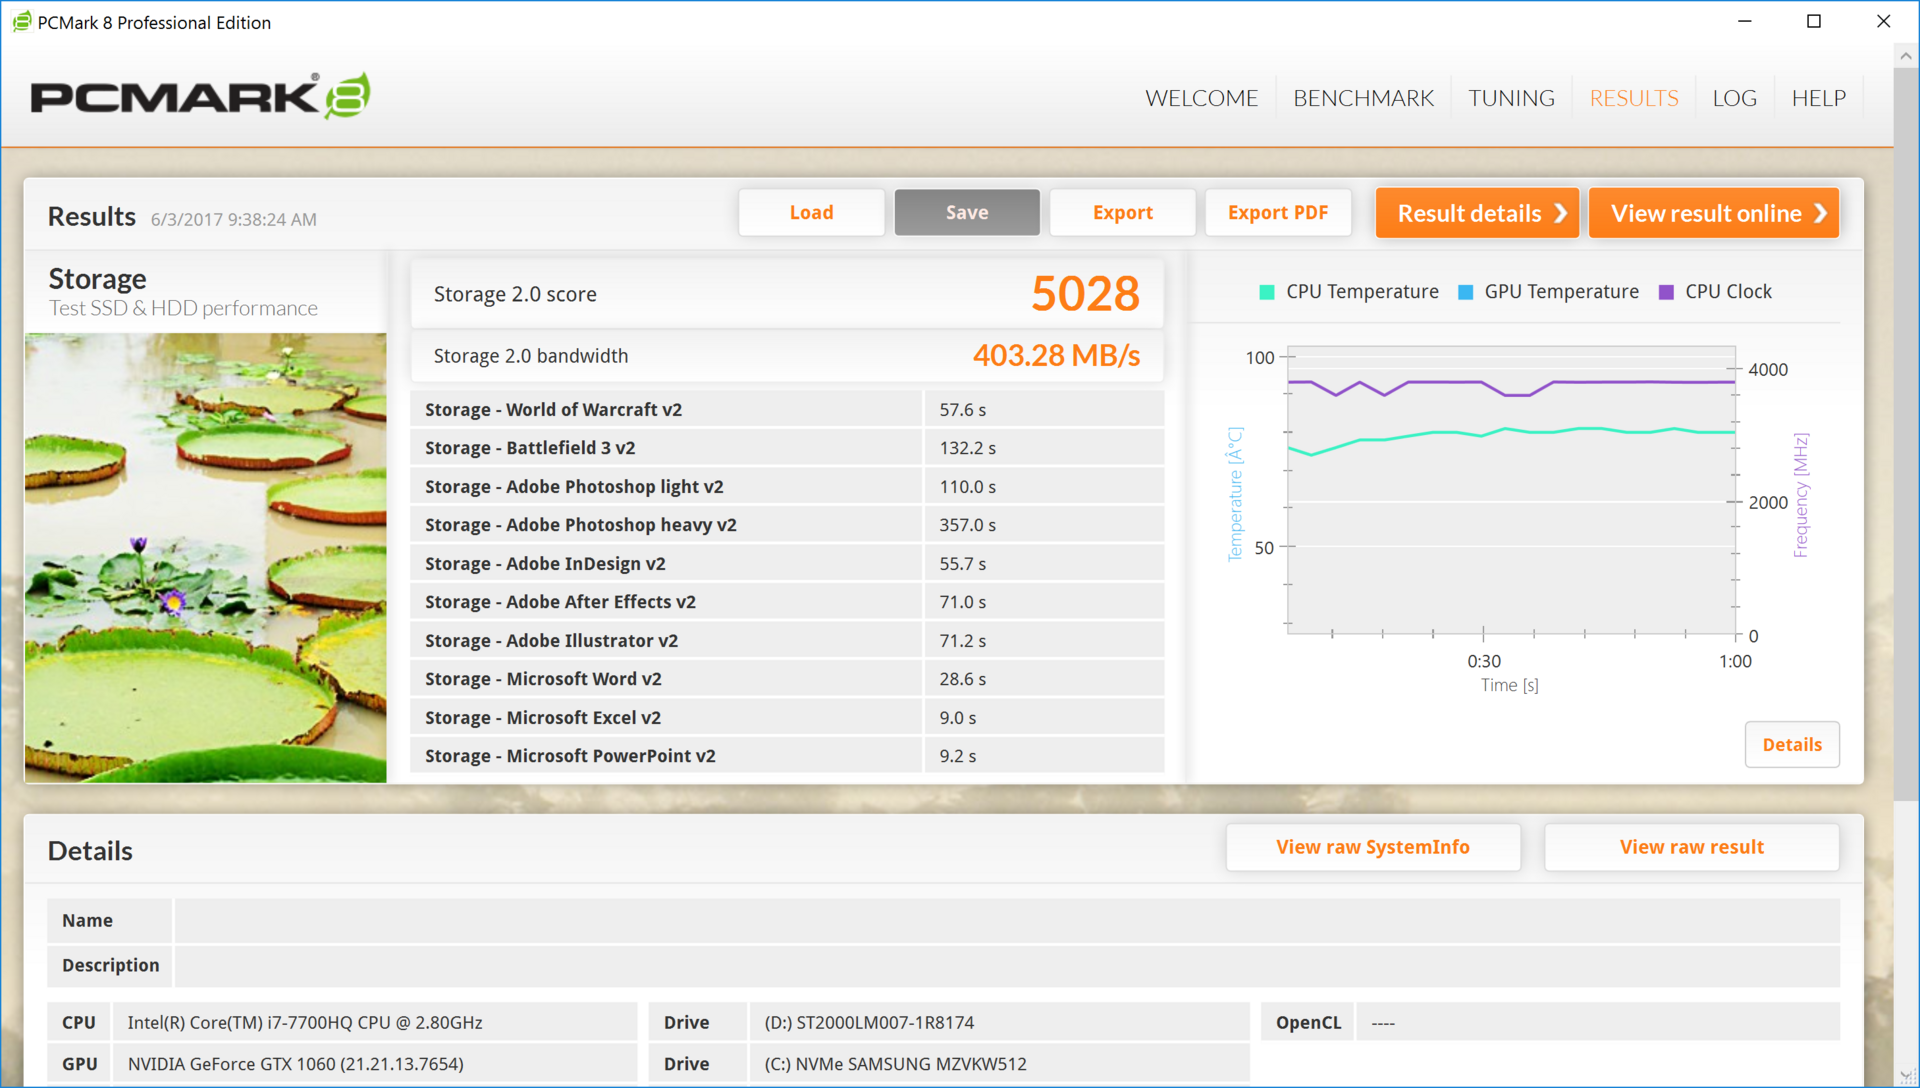
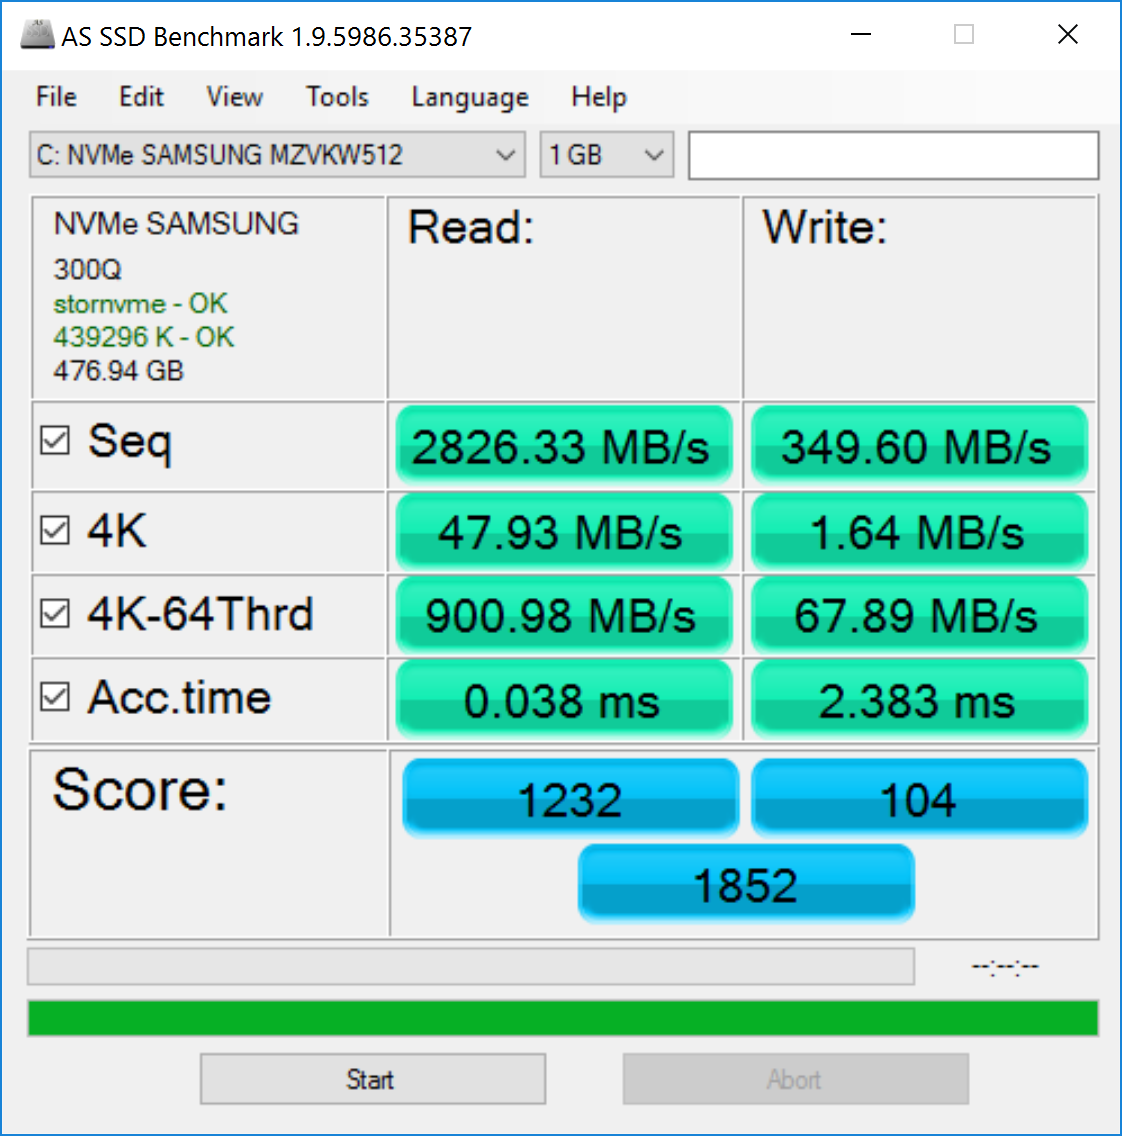
Storage Devices
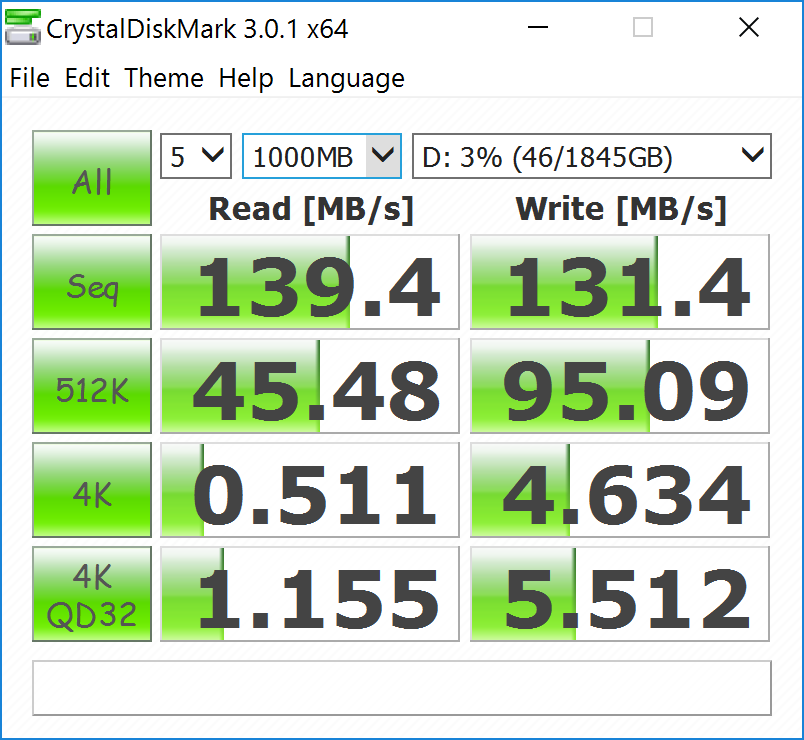
Drive performance is excellent. Our review unit is equipped with a fast 512 GB M.2 Samsung PCIe NVMe SSD and a large 2 TB 5400 RPM HDD. This is a great combo, as recently used apps and games can be loaded onto the speedy SSD, while older or less demanding files and applications can be moved to the mass storage drive.
Using CrystalDiskMark, we see read and write speeds in excess of 2400 MB/s and 1600 MBs, respectively, on the SSD. These are phenomenal speeds and much, much faster than the competition. Load times in games are blazing fast, and we are never left waiting for applications to open or files to load (unless the aforementioned buggy performance occurs). Saving large files also happens at lightning speed, which helps make the system feel responsive in most tasks.
The HDD is slow, but this is to be expected of a 5400 RPM drive. It is best suited for media that doesn't require fast loading times and long-term storage of games and other files. Should users wish to replace it with a faster HDD or SSD, the 2.5-inch drive bay can easily be accessed by removing the bottom panel. Replacing the M.2 SSD, which occupies the only other internal storage slot, requires removing the motherboard.

| MSI GS73VR 7RF Samsung SM961 MZVKW512HMJP m.2 PCI-e | MSI GS73VR 6RF SanDisk SD8SN8U1T001122 | Asus Strix GL702VSK HGST Travelstar 7K1000 HTS721010A9E630 | Acer Aspire V17 Nitro BE VN7-793G-52XN SK Hynix HFS256G39TND-N210A | Aorus X7 v6 Toshiba NVMe THNSN5512GPU7 | Gigabyte Aero 15 Lite-On CX2-8B512-Q11 | |
|---|---|---|---|---|---|---|
| CrystalDiskMark 3.0 | -63% | -97% | -48% | 28% | 19% | |
| Read Seq (MB/s) | 2459 | 334.3 -86% | 78.3 -97% | 493.1 -80% | 1499 -39% | 1769 -28% |
| Write Seq (MB/s) | 1609 | 319 -80% | 75.5 -95% | 270.2 -83% | 1411 -12% | 1133 -30% |
| Read 512 (MB/s) | 445.2 | 242.3 -46% | 34 -92% | 325.8 -27% | 966 117% | 891 100% |
| Write 512 (MB/s) | 748 | 254.4 -66% | 43.9 -94% | 267.8 -64% | 1103 47% | 1069 43% |
| Read 4k (MB/s) | 48.5 | 20.3 -58% | 0.5 -99% | 28.4 -41% | 44.33 -9% | 44.7 -8% |
| Write 4k (MB/s) | 131.5 | 42.51 -68% | 1.1 -99% | 76.2 -42% | 155.5 18% | 123.3 -6% |
| Read 4k QD32 (MB/s) | 454.1 | 251.6 -45% | 1.1 -100% | 344.6 -24% | 696 53% | 645 42% |
| Write 4k QD32 (MB/s) | 355.3 | 167.1 -53% | 1.1 -100% | 267 -25% | 531 49% | 490.5 38% |

GPU Performance
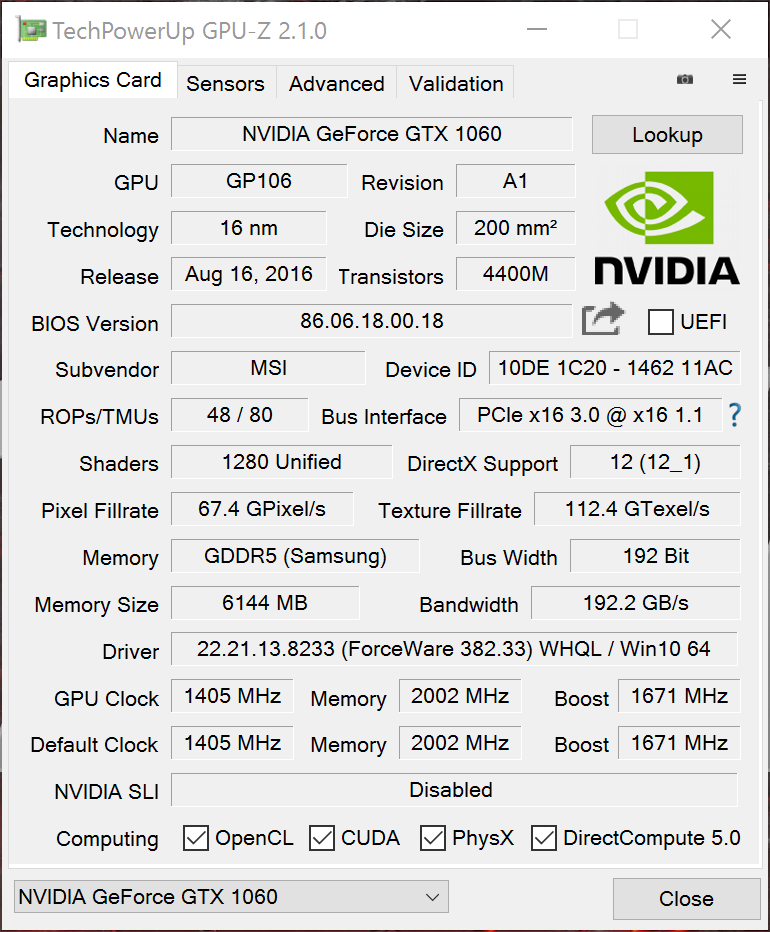
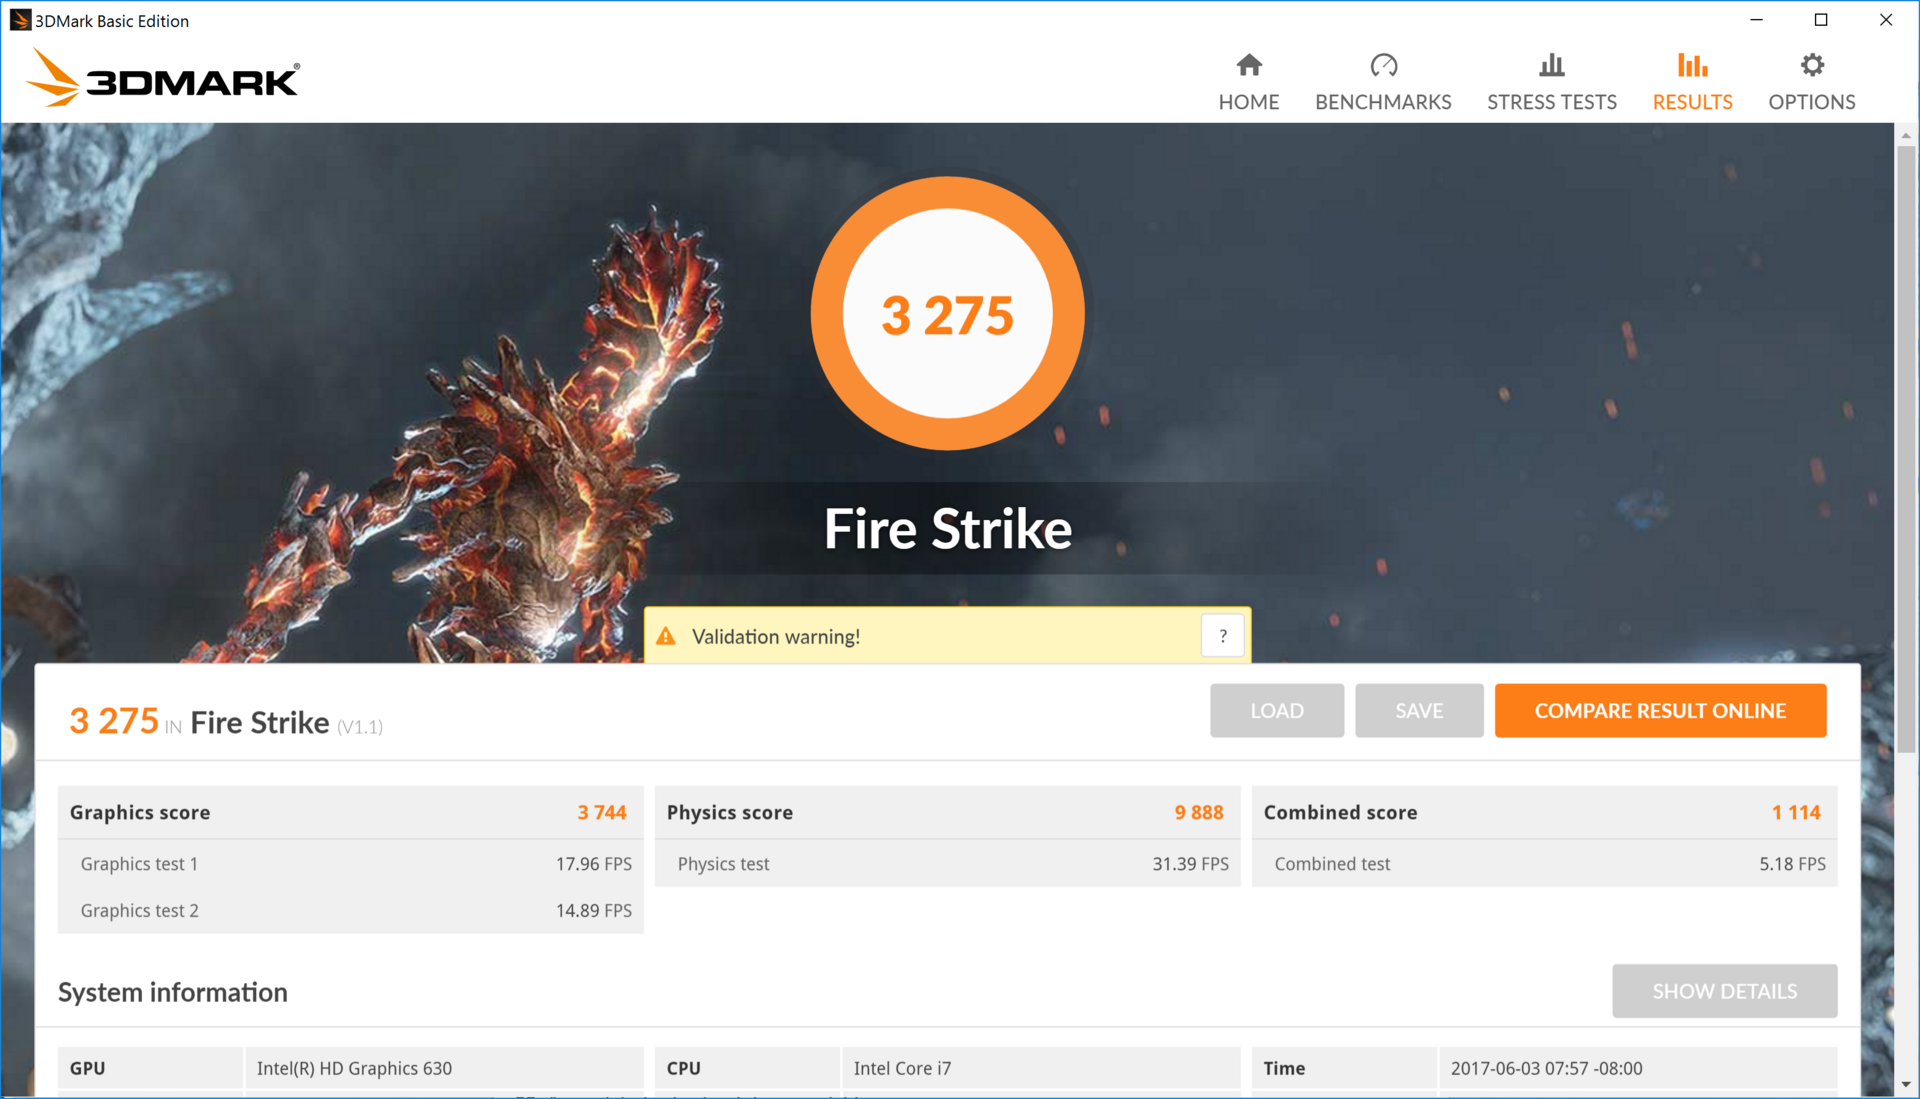
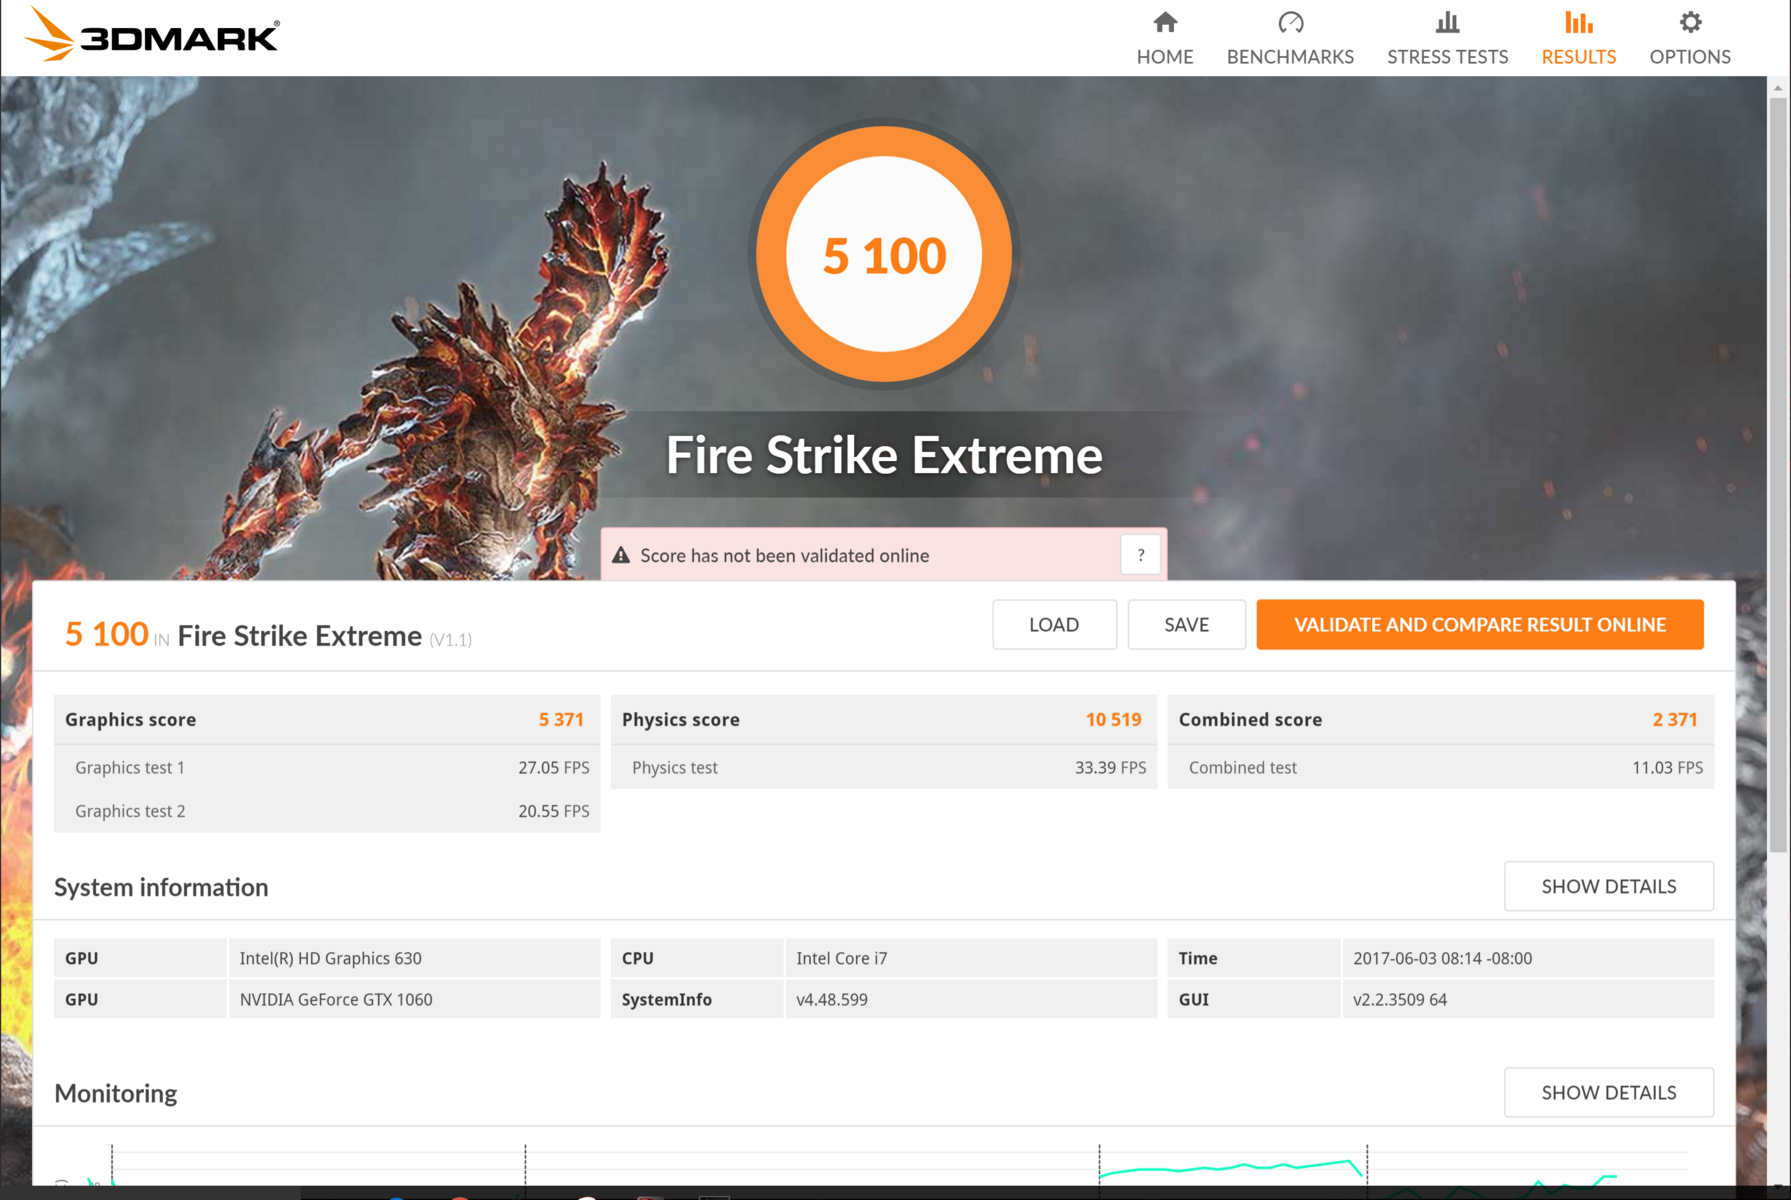
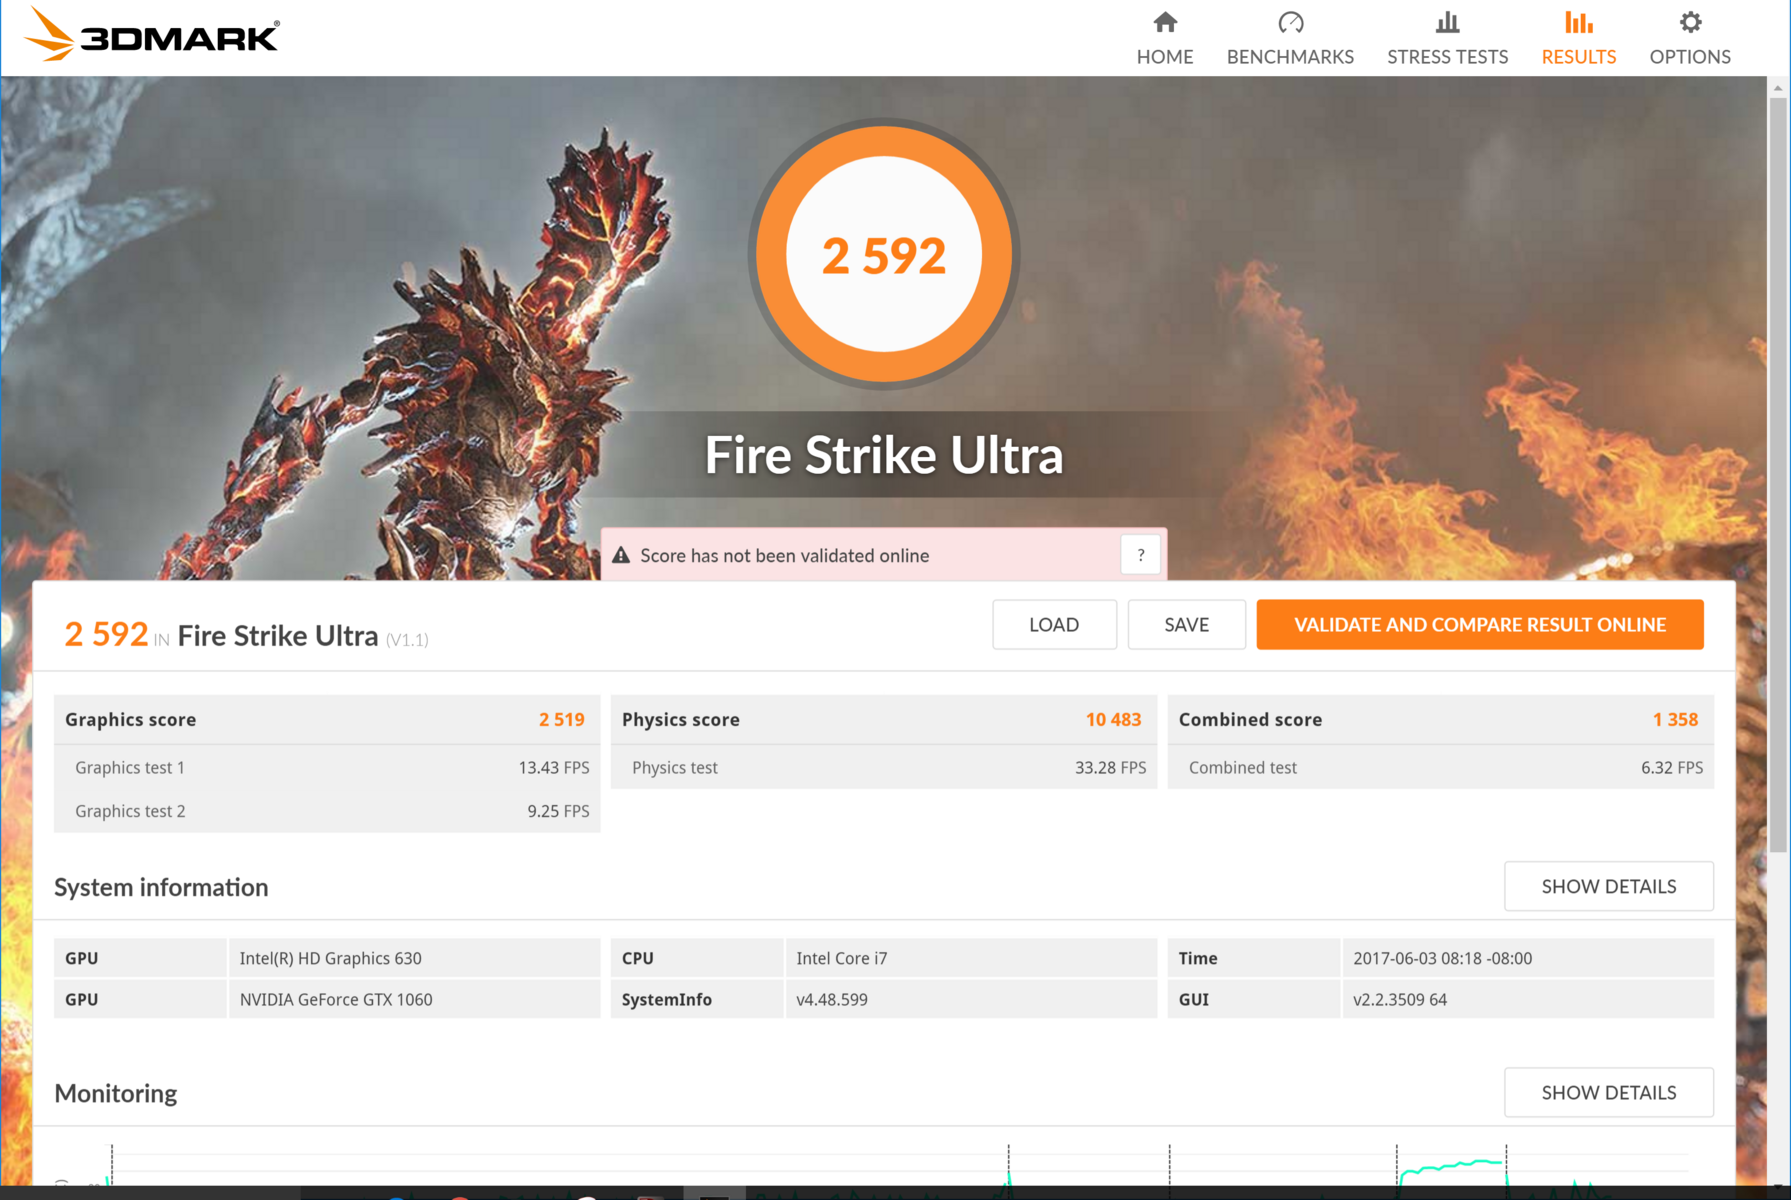
NVIDIA's GeForce GTX 1060 has proven time and time again to be a capable graphics card for moderate workloads. That is evident here; our review unit falls in line with its competition in Fire Strike with an overall score of 9675 and a graphics score of 11384. This translates to very capable rendering performance at 1080p and even 1440p, although 4K is still out of reach. Overall, the GTX 1060 is a steady card and a great balance between price and performance. Users wanting more power should opt for the GTX 1070, which is about 40-50% more powerful than the GTX 1060 (although much more expensive).
On battery, our review unit consistently switched to the internal GPU, even when running Fire Strike. This did not happen during games, however. Gaming while unplugged will fully utilize the GTX 1060. For more details on the GeForce GTX 1060, please visit our dedicated GPU page here.

| 3DMark 11 | |
| 1280x720 Performance GPU | |
| Aorus X7 v6 | |
| Asus Strix GL702VSK | |
| MSI GS73VR 6RF | |
| Acer Aspire V17 Nitro BE VN7-793G-52XN | |
| MSI GS73VR 7RF | |
| Gigabyte Aero 15 | |
| 1280x720 Performance Combined | |
| Aorus X7 v6 | |
| Gigabyte Aero 15 | |
| MSI GS73VR 7RF | |
| MSI GS73VR 6RF | |
| Asus Strix GL702VSK | |
| Acer Aspire V17 Nitro BE VN7-793G-52XN | |
| 3DMark | |
| 1280x720 Cloud Gate Standard Graphics | |
| Aorus X7 v6 | |
| Gigabyte Aero 15 | |
| Asus Strix GL702VSK | |
| MSI GS73VR 6RF | |
| Acer Aspire V17 Nitro BE VN7-793G-52XN | |
| MSI GS73VR 7RF | |
| 1920x1080 Fire Strike Graphics | |
| Asus Strix GL702VSK | |
| Aorus X7 v6 | |
| MSI GS73VR 6RF | |
| MSI GS73VR 7RF | |
| Gigabyte Aero 15 | |
| Acer Aspire V17 Nitro BE VN7-793G-52XN | |
| 1920x1080 Ice Storm Extreme Graphics | |
| Asus Strix GL702VSK | |
| MSI GS73VR 6RF | |
| Acer Aspire V17 Nitro BE VN7-793G-52XN | |
| MSI GS73VR 7RF | |
| 3DMark 11 Performance | 12579 points | |
| 3DMark Ice Storm Standard Score | 28688 points | |
| 3DMark Cloud Gate Standard Score | 20795 points | |
| 3DMark Fire Strike Score | 9675 points | |
| 3DMark Fire Strike Extreme Score | 5100 points | |
Help | ||
Gaming Performance
The GTX 1060 is a capable choice for gaming at 1080p. The card chews through most titles at Ultra settings, routinely hitting between 50-60 frames per second or higher. Poorly optimized titles, such as Deus Ex: Mankind Divided or Mafia 3, are still playable at maximum settings. Even highly demanding games, like The Witcher 3, are fairly smooth with everything turned up. Some settings will need to be set lower to hit 60 fps, but overall game performance on Full HD is smooth and enjoyable.
Despite its 4K screen, the GS73VR 7RF cannot play most games at Ultra HD. Lighter titles like Civilization VI and more casual games run well at 4K, but for the most part, gaming at 3840x2160 is unattainable.
Running The Witcher 3 for an hour shows how stable the GTX 1060 can be. Frame rates stay between 38 and 42 for the entire gameplay session. However, it should be noted that we do experience strange performance during extended gameplay. Games are often randomly minimized in the middle of active play, although the reason is not clear. This completely interrupts the experience and can be incredibly frustrating.
| BioShock Infinite - 1920x1080 Ultra Preset, DX11 (DDOF) (sort by value) | |
| MSI GS73VR 7RF | |
| MSI GS73VR 6RF | |
| Asus Strix GL702VSK | |
| Acer Aspire V17 Nitro BE VN7-793G-52XN | |
| Metro: Last Light - 1920x1080 Very High (DX11) AF:16x (sort by value) | |
| MSI GS73VR 7RF | |
| MSI GS73VR 6RF | |
| Asus Strix GL702VSK | |
| Thief - 1920x1080 Very High Preset AA:FXAA & High SS AF:8x (sort by value) | |
| MSI GS73VR 7RF | |
| MSI GS73VR 6RF | |
| Asus Strix GL702VSK | |
| The Witcher 3 - 1920x1080 Ultra Graphics & Postprocessing (HBAO+) (sort by value) | |
| MSI GS73VR 7RF | |
| Asus Strix GL702VSK | |
| Acer Aspire V17 Nitro BE VN7-793G-52XN | |
| Gigabyte Aero 15 | |
| Fallout 4 - 1920x1080 Ultra Preset AA:T AF:16x (sort by value) | |
| MSI GS73VR 7RF | |
| MSI GS73VR 6RF | |
| Asus Strix GL702VSK | |
| Rise of the Tomb Raider | |
| 1920x1080 Very High Preset AA:FX AF:16x (sort by value) | |
| MSI GS73VR 7RF | |
| MSI GS73VR 6RF | |
| Asus Strix GL702VSK | |
| Acer Aspire V17 Nitro BE VN7-793G-52XN | |
| Aorus X7 v6 | |
| 3840x2160 High Preset AA:FX AF:4x (sort by value) | |
| MSI GS73VR 7RF | |
| Hitman 2016 - 1920x1080 Ultra / On AA:SM AF:16x (sort by value) | |
| MSI GS73VR 7RF | |
| Ashes of the Singularity | |
| 1920x1080 high (sort by value) | |
| MSI GS73VR 7RF | |
| Asus Strix GL702VSK | |
| 3840x2160 crazy (sort by value) | |
| MSI GS73VR 7RF | |
| Doom | |
| 1920x1080 Ultra Preset AA:SM (sort by value) | |
| MSI GS73VR 7RF | |
| MSI GS73VR 6RF | |
| Asus Strix GL702VSK | |
| Aorus X7 v6 | |
| 3840x2160 High Preset AA:FX (sort by value) | |
| MSI GS73VR 7RF | |
| Deus Ex Mankind Divided - 1920x1080 Ultra Preset AA:2xMS AF:8x (sort by value) | |
| MSI GS73VR 7RF | |
| Aorus X7 v6 | |
| Mafia 3 - 1920x1080 High Preset (sort by value) | |
| MSI GS73VR 7RF | |
| Asus Strix GL702VSK | |
| Civilization 6 | |
| 1920x1080 Ultra Preset AA:4xMS (sort by value) | |
| MSI GS73VR 7RF | |
| 3840x2160 High Preset (sort by value) | |
| MSI GS73VR 7RF | |
| low | med. | high | ultra | 4K | |
|---|---|---|---|---|---|
| BioShock Infinite (2013) | 134 | ||||
| Metro: Last Light (2013) | 76 | ||||
| Thief (2014) | 60 | ||||
| The Witcher 3 (2015) | 41 | ||||
| Fallout 4 (2015) | 71 | ||||
| Rise of the Tomb Raider (2016) | 51 | 16 | |||
| Hitman 2016 (2016) | 57 | ||||
| Ashes of the Singularity (2016) | 54 | 24 | |||
| Doom (2016) | 89 | 30 | |||
| Deus Ex Mankind Divided (2016) | 30 | ||||
| Mafia 3 (2016) | 47 | ||||
| Civilization 6 (2016) | 43 | 37 |
Stress Test
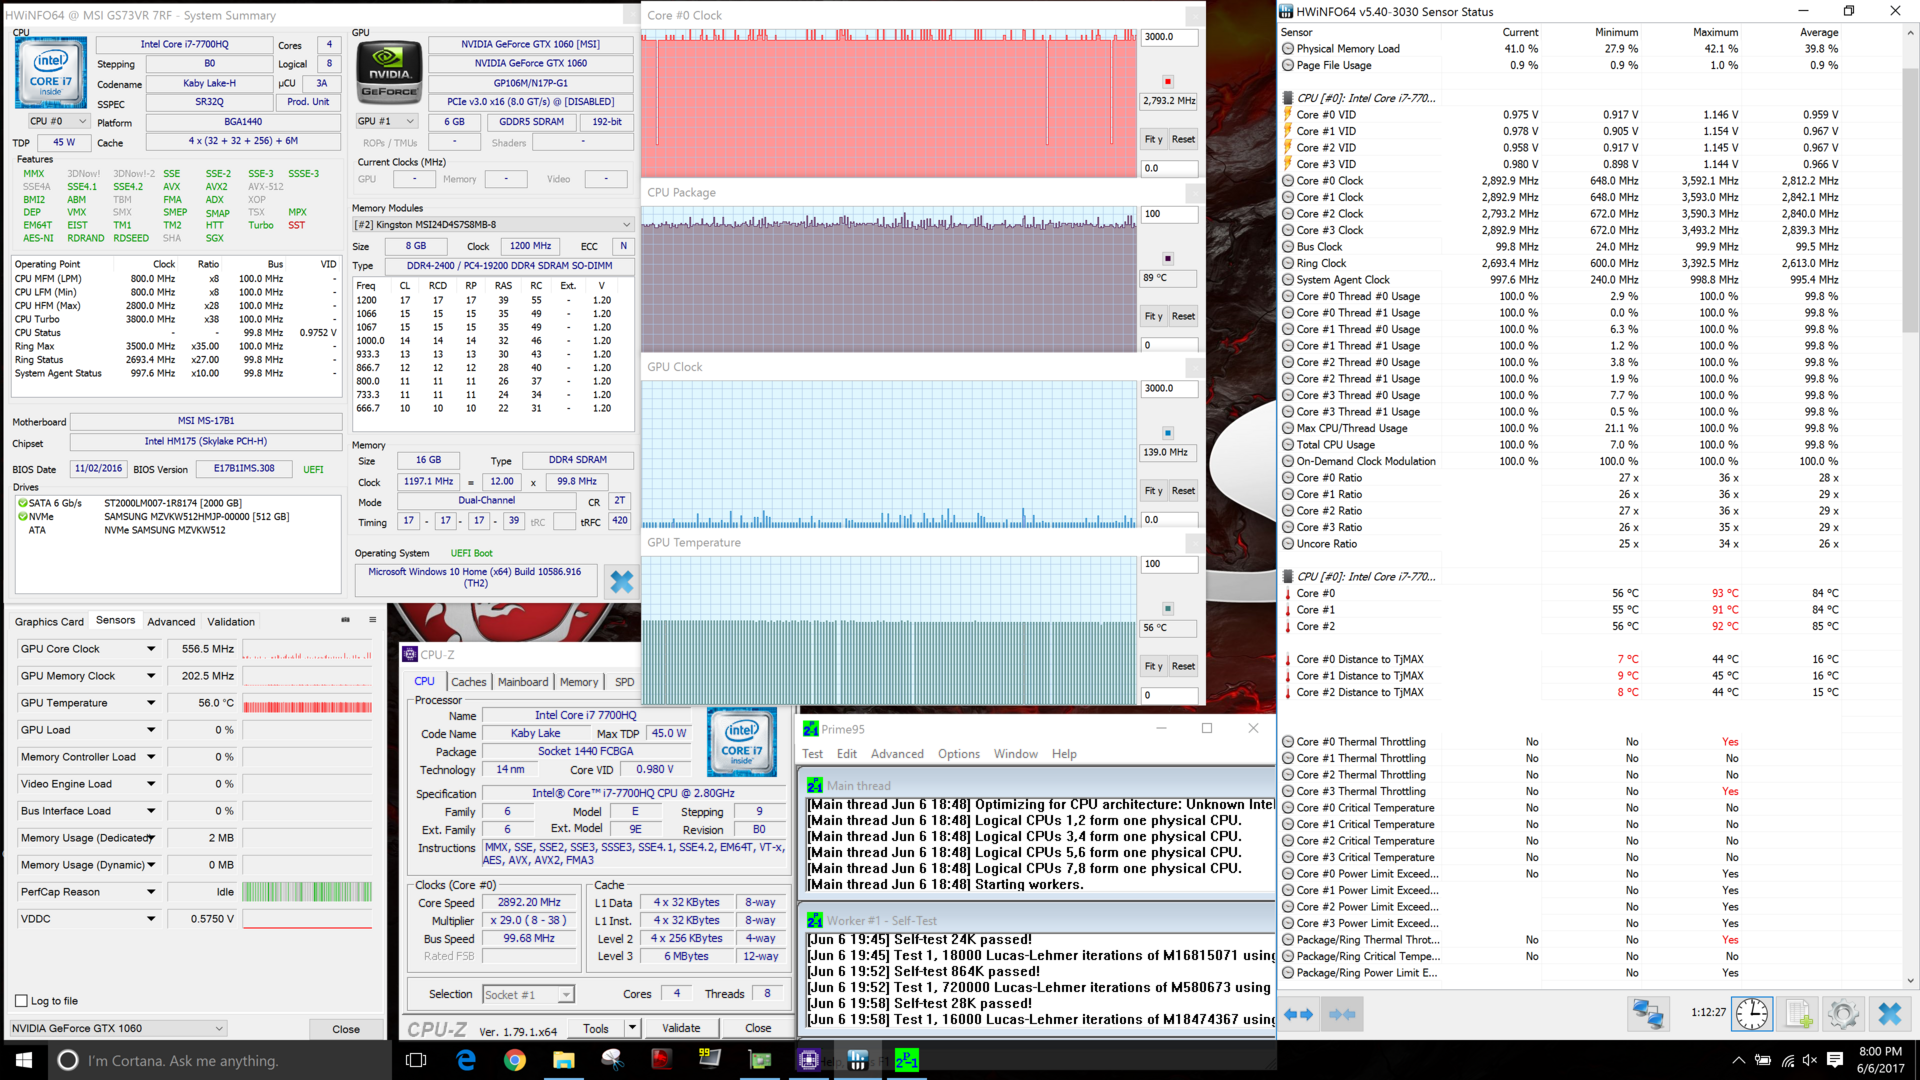
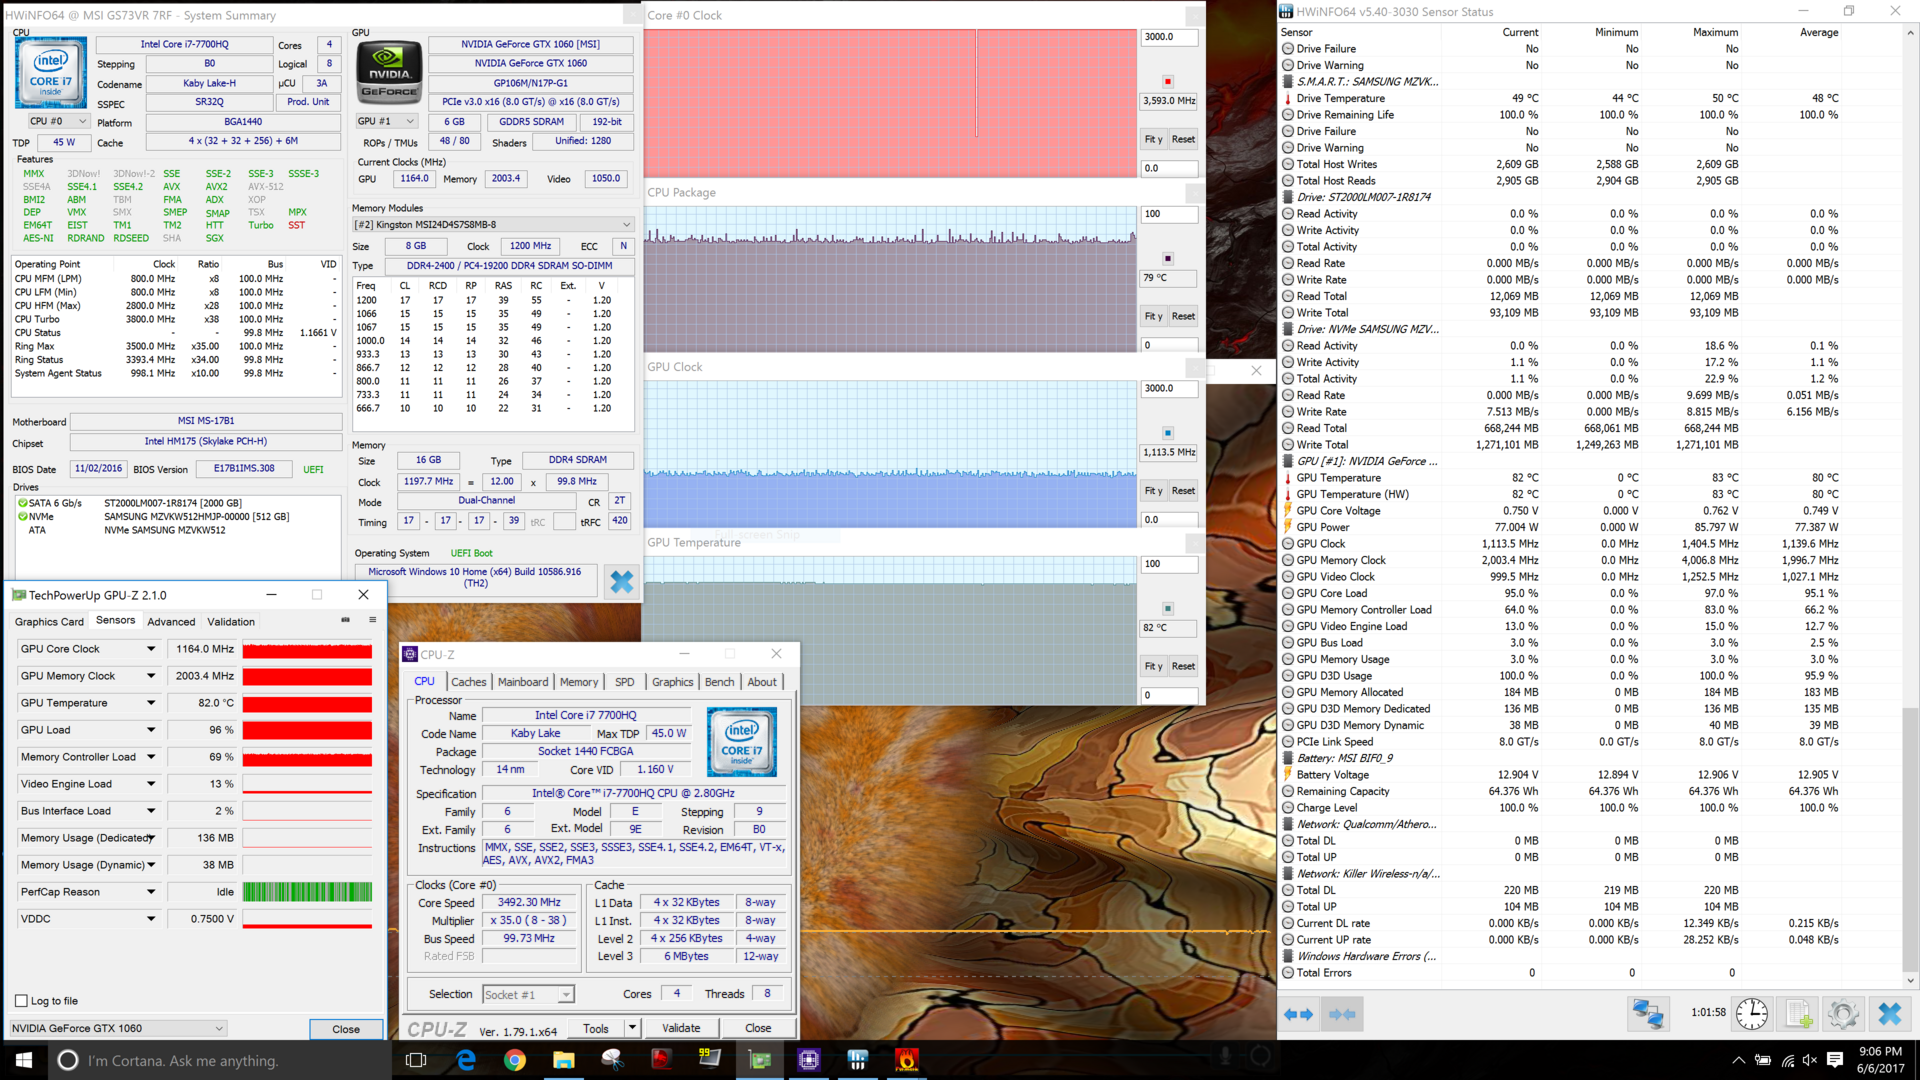
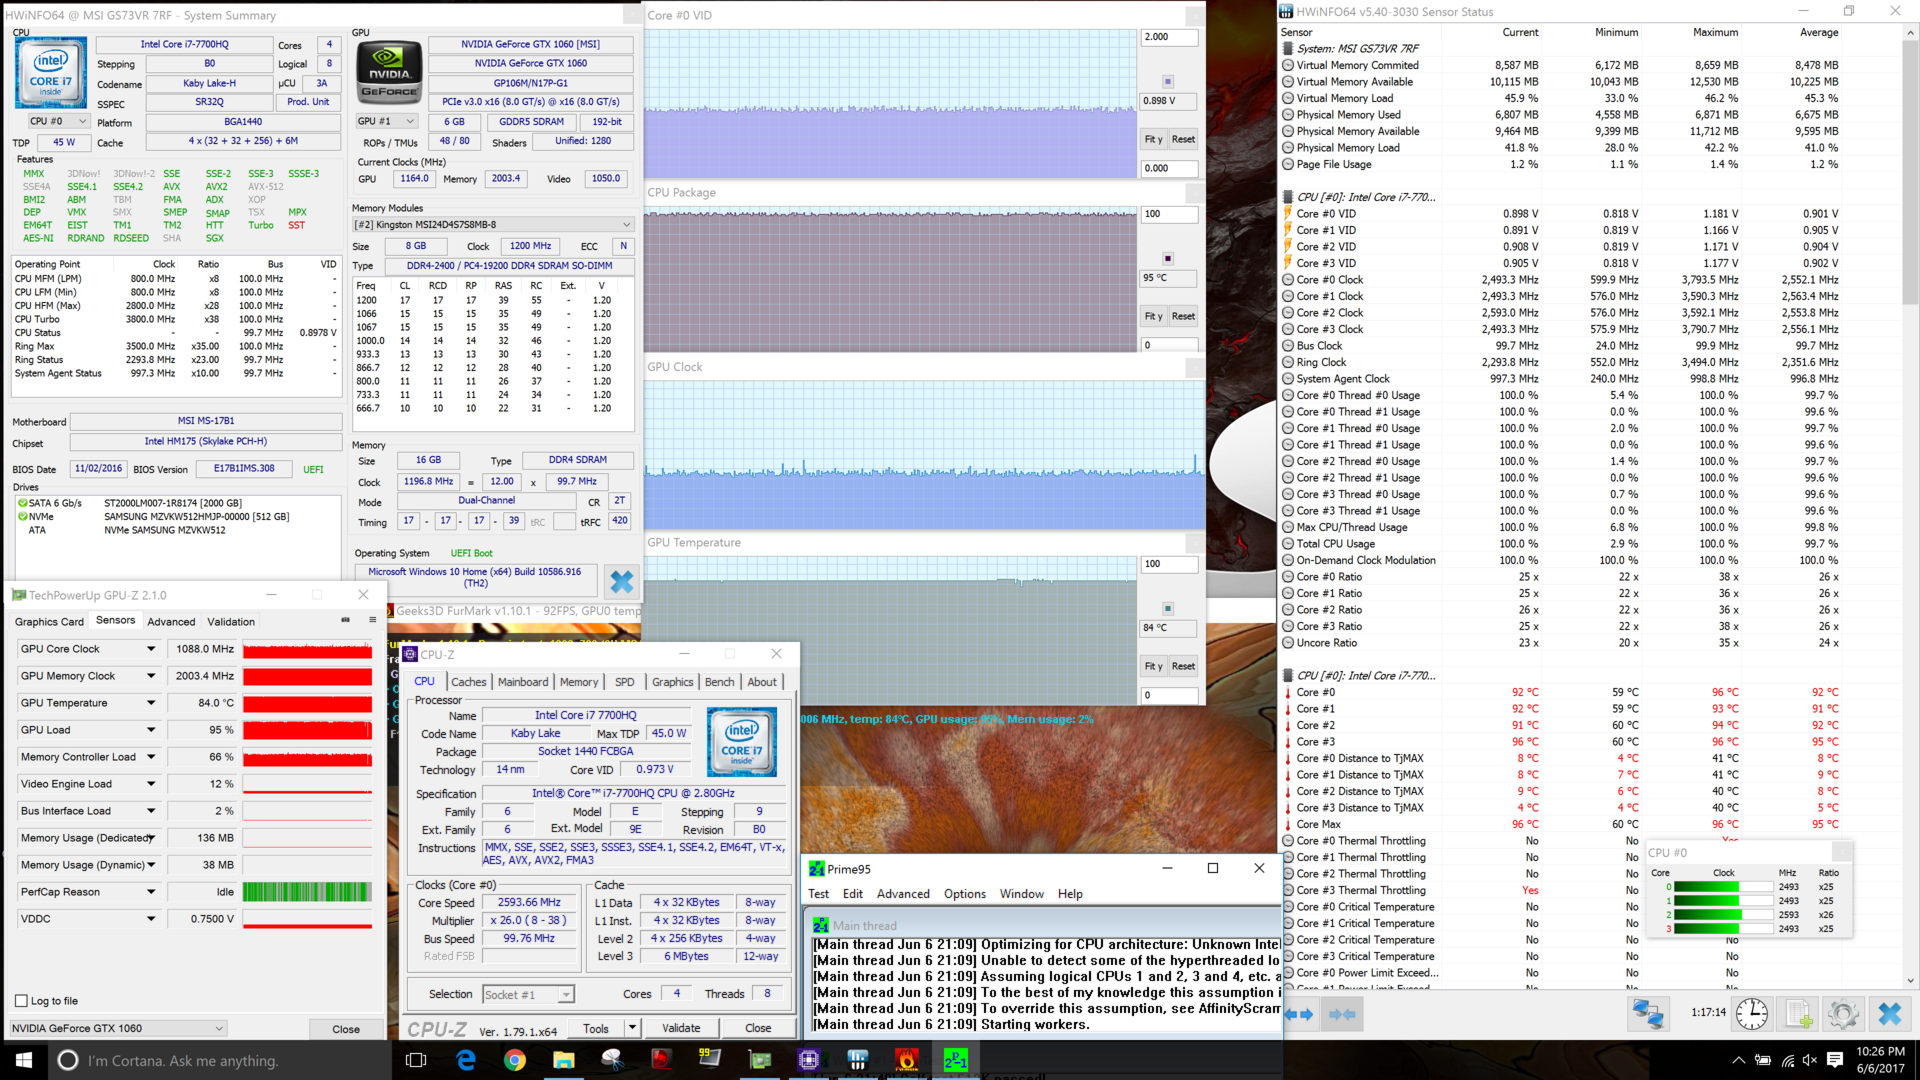
Stress testing our system checks for any potential thermal throttling that could limit CPU or GPU performance. Prime95, which synthetically stresses the processor, shows that the 7700HQ cannot maintain its boost clock for extended periods; the CPU averages 2.8 GHz and 89º C over the hour long test. FurMark is intended to push the GTX 1060 to its limits, and the GPU averages a core clock of about 1,140 MHz while hitting temperatures of 82º C. This is interesting; MSI may be aggressively controlling temperatures on the graphics card. There is some thermal headroom that could allow for higher GPU performance, but the system may be trying to keep temperatures under control at the cost of lowered performance. Running Prime95 and Furmark concurrently taxes the system past its limits. The CPU is pulled back to 2.5 GHz after hitting temperatures in the high 90's when boosting. The GPU also maintains similar clock speeds as before.
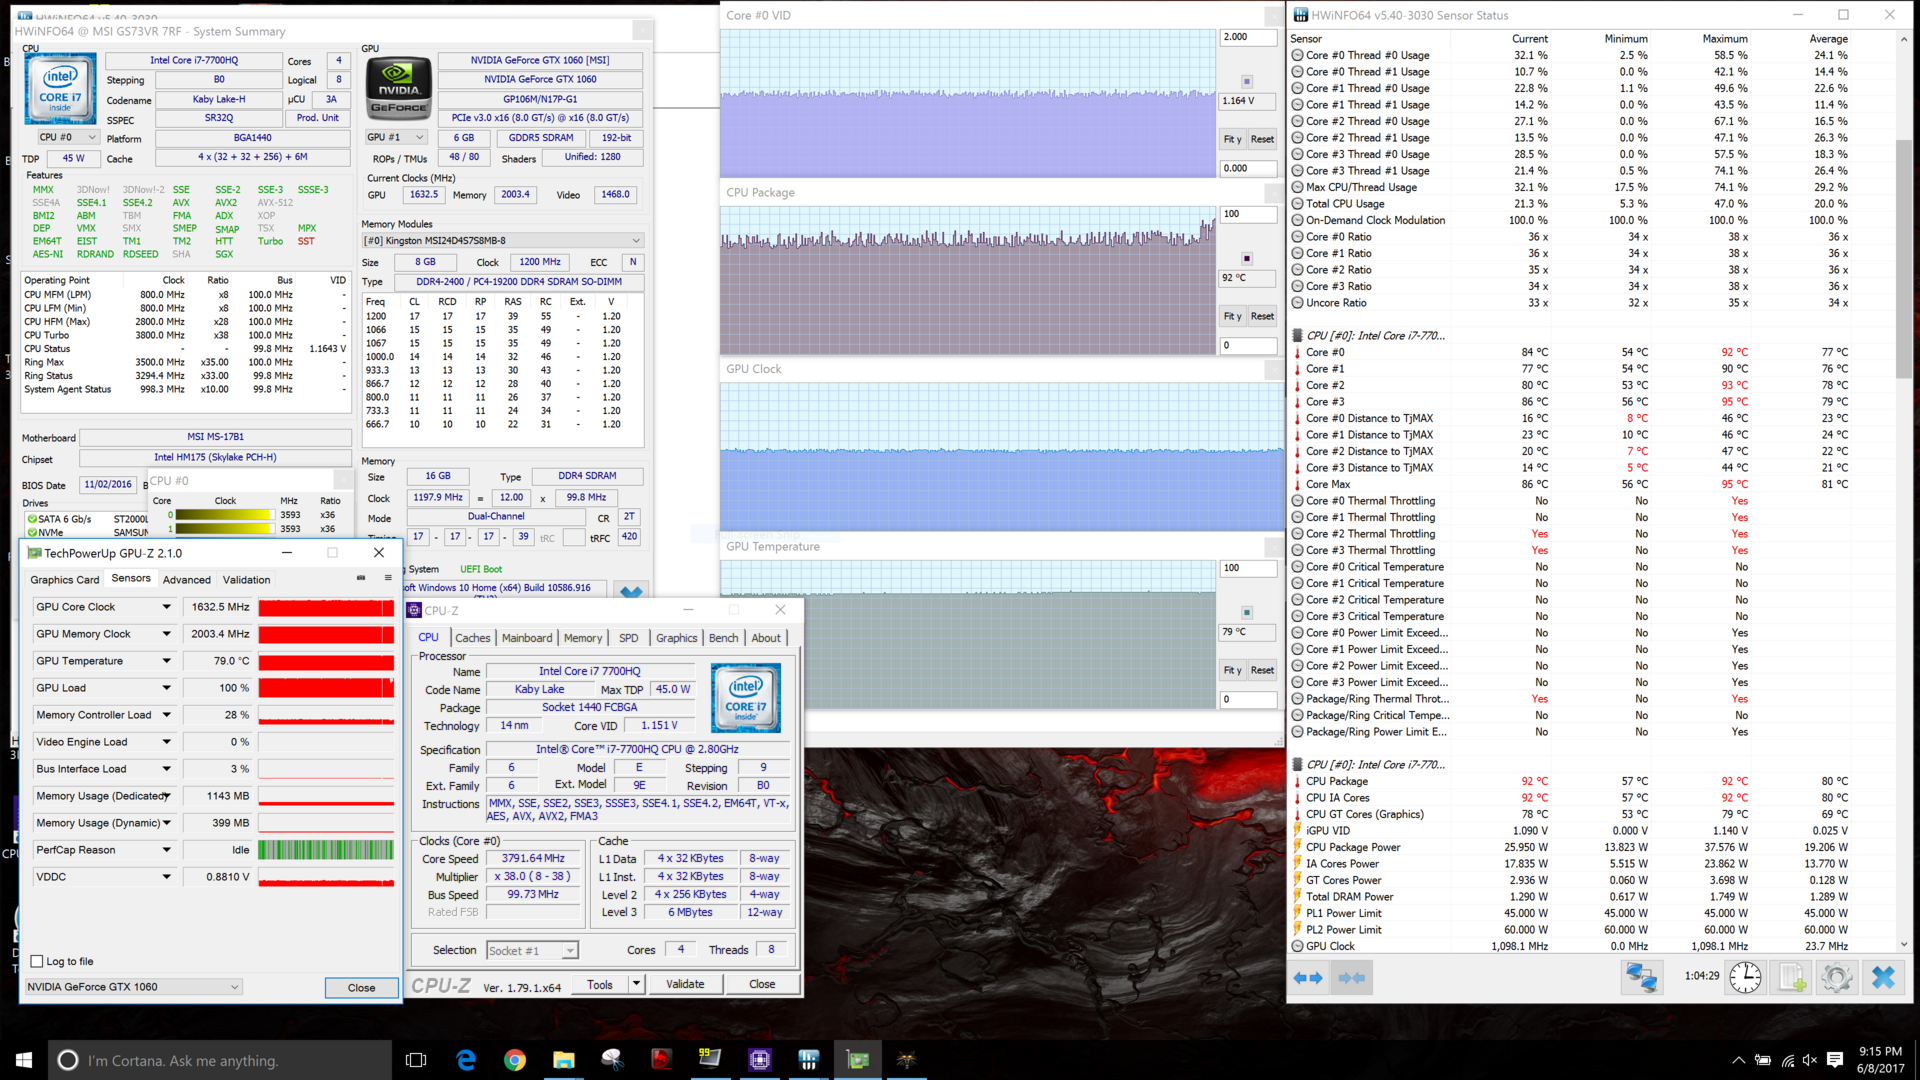
A more applicable measure of stress is our hour-long Witcher 3 gameplay test. Here, we see a real-world example of how well the system works together. The CPU maintains a high clock speed of 3.6 GHz, albeit while averaging at a toasty 92º C. The GPU really shines here, reaching over 1,600 MHz on its core clock and managing a reasonable 79º C. Apart from the buggy behavior we have discussed previously, the GS73VR can maintain excellent performance under long periods of realistic stress.
| CPU Clock (GHz) | GPU Clock (MHz) | Average CPU Temperature (°C) | Average GPU Temperature (°C) | |
| Prime95 Stress | 2.8 | - | 89 | 56 |
| FurMark Stress | 3.6 | 1140 | 79 | 82 |
| Prime95 + FurMark Stress | 2.5 | 1140 | 95 | 84 |
| Witcher 3 Stress | 3.6 | 1633 | 92 | 79 |
Emissions
System Noise
Our test unit uses the same cooling system as the previous model, as well as the same high-pitched fan noise that plagued the earlier model. While system noise on paper isn't terrible, considering the thin chassis and powerful components, the shrill whine of the fans (particularly the smaller 40 mm fan) easily cuts through ambient sounds. The result is ever-present fan noise that can quickly become distracting. The fans always spin, even when the system is idle; thankfully, the noise is much easier on the ears under low load. We understand the difficulty in cooling thin-and-light gaming notebooks, but the noise tradeoff will push users to wear headphones, especially while gaming.
The coil whine we experienced with the 6RF is also present in our 7RF review unit. While not loud, the high-pitched noise is always present and noticeable, especially under light workloads. As we recommended with the previous model, users should check their device at the time of purchase to hear if coil whine is present, as it may detract from the overall experience.
Noise level
| Idle |
| 30.8 / 30.8 / 30.9 dB(A) |
| Load |
| 42.2 / 48.6 dB(A) |
 | ||
30 dB silent 40 dB(A) audible 50 dB(A) loud |
||
min: | ||
| MSI GS73VR 7RF GeForce GTX 1060 Mobile, i7-7700HQ, Samsung SM961 MZVKW512HMJP m.2 PCI-e | MSI GS73VR 6RF GeForce GTX 1060 Mobile, 6700HQ, SanDisk SD8SN8U1T001122 | Asus Strix GL702VSK GeForce GTX 1070 Mobile, i7-7700HQ, HGST Travelstar 7K1000 HTS721010A9E630 | Acer Aspire V17 Nitro BE VN7-793G-52XN GeForce GTX 1060 Mobile, i5-7300HQ, SK Hynix HFS256G39TND-N210A | Aorus X7 v6 GeForce GTX 1070 Mobile, 6820HK, Toshiba NVMe THNSN5512GPU7 | Gigabyte Aero 15 GeForce GTX 1060 Mobile, i7-7700HQ, Lite-On CX2-8B512-Q11 | |
|---|---|---|---|---|---|---|
| Noise | -5% | 1% | 4% | -12% | -3% | |
| off / environment * (dB) | 28.1 | 28.4 -1% | 28.6 -2% | 30.7 -9% | 30 -7% | 31 -10% |
| Idle Minimum * (dB) | 30.8 | 31.9 -4% | 30.6 1% | 30.7 -0% | 33 -7% | 32 -4% |
| Idle Average * (dB) | 30.8 | 32 -4% | 30.6 1% | 30.7 -0% | 35 -14% | 33 -7% |
| Idle Maximum * (dB) | 30.9 | 34 -10% | 30.6 1% | 31.4 -2% | 40 -29% | 34 -10% |
| Load Average * (dB) | 42.2 | 47 -11% | 39.8 6% | 32.1 24% | 43 -2% | 39 8% |
| Witcher 3 ultra * (dB) | 44.4 | 42.8 4% | 43 3% | |||
| Load Maximum * (dB) | 48.6 | 49.4 -2% | 48 1% | 42.8 12% | 54 -11% | 50 -3% |
* ... smaller is better
Temperature
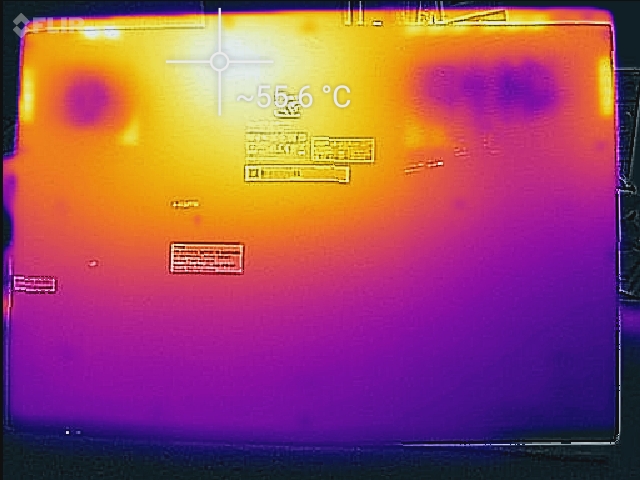
One of the positive results of the aggressive fans is well-managed temperatures. While the device can still get very warm, hitting 55º C on the underside at its hottest, this is a noticeable improvement over the GS73VR 6RF and far cry better than MSI's thin gaming notebooks of old. Under more real-world loads, such as the Witcher 3, temperatures are fantastic in view of how thin this notebook is. The keyboard deck stays very comfortable, especially along the palm rest and WASD keys (where hands will naturally rest during gameplay). Users' palms should stay cool and sweat-free while gaming.
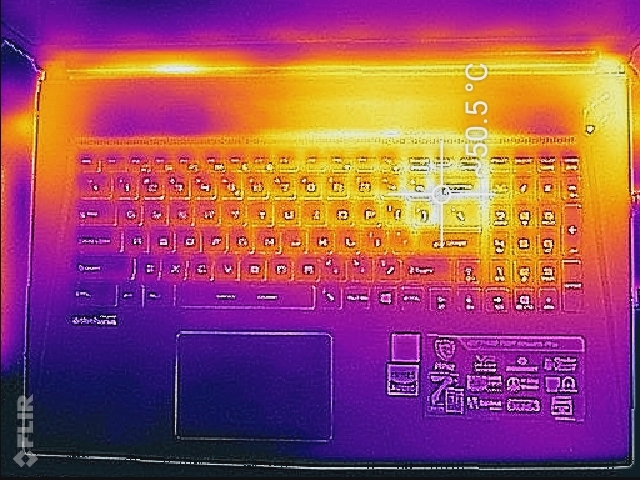
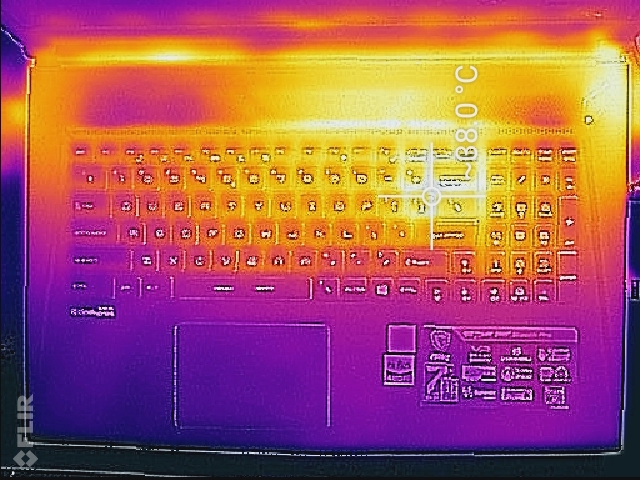
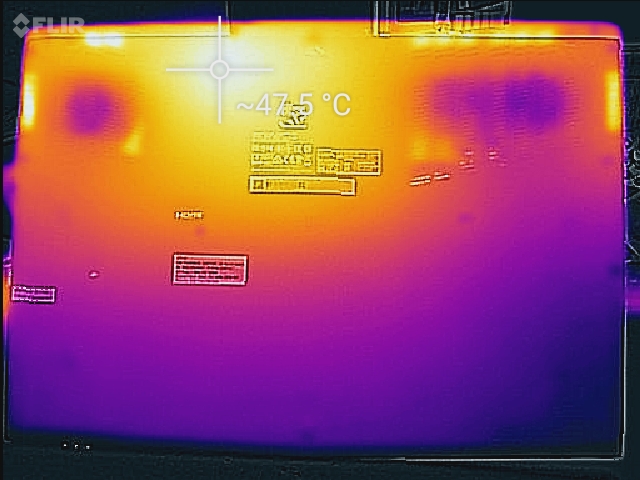
(-) The maximum temperature on the upper side is 50.2 °C / 122 F, compared to the average of 40.4 °C / 105 F, ranging from 21.2 to 68.8 °C for the class Gaming.
(-) The bottom heats up to a maximum of 55.6 °C / 132 F, compared to the average of 43.2 °C / 110 F
(+) In idle usage, the average temperature for the upper side is 25.2 °C / 77 F, compared to the device average of 33.9 °C / 93 F.
(+) Playing The Witcher 3, the average temperature for the upper side is 28.2 °C / 83 F, compared to the device average of 33.9 °C / 93 F.
(+) The palmrests and touchpad are cooler than skin temperature with a maximum of 30.8 °C / 87.4 F and are therefore cool to the touch.
(±) The average temperature of the palmrest area of similar devices was 28.8 °C / 83.8 F (-2 °C / -3.6 F).
Speakers

The speakers are a low point. The down-firing drivers emit a thin, tinny sound, and despite the inclusion of a subwoofer, the noise profile lacks presence. While highs are clear, the sound as a whole is flat and thin. The included Nahimic software greatly improves sound quality over the stock settings but is not a cure-all. Even when tuning the sound profile in the software, bass remains almost non-existent. On the plus side, the speakers can get loud, and the chassis does not rattle at higher volume levels.
The GS73VR includes a dedicated ESS Sabre HiFi DAC that can drive high-quality headphones, which is a very nice addition. Using studio-grade headphones, we can say that sound output via the dedicated HiFi audio jack is superb. High-end headphones are practically a must-have for this notebook.
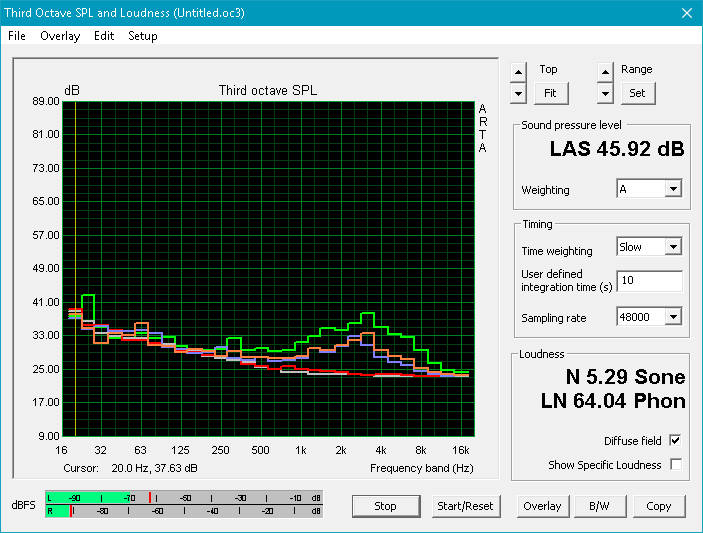
MSI GS73VR 7RF audio analysis
(+) | speakers can play relatively loud (82 dB)
Bass 100 - 315 Hz
(-) | nearly no bass - on average 18.1% lower than median
(±) | linearity of bass is average (13.2% delta to prev. frequency)
Mids 400 - 2000 Hz
(±) | higher mids - on average 5.2% higher than median
(±) | linearity of mids is average (8.3% delta to prev. frequency)
Highs 2 - 16 kHz
(±) | higher highs - on average 7.9% higher than median
(±) | linearity of highs is average (8.9% delta to prev. frequency)
Overall 100 - 16.000 Hz
(±) | linearity of overall sound is average (26.2% difference to median)
Compared to same class
» 92% of all tested devices in this class were better, 1% similar, 6% worse
» The best had a delta of 6%, average was 18%, worst was 132%
Compared to all devices tested
» 81% of all tested devices were better, 4% similar, 15% worse
» The best had a delta of 4%, average was 23%, worst was 134%
Asus Strix GL702VSK audio analysis
(±) | speaker loudness is average but good (78.9 dB)
Bass 100 - 315 Hz
(±) | reduced bass - on average 8.8% lower than median
(±) | linearity of bass is average (14.3% delta to prev. frequency)
Mids 400 - 2000 Hz
(+) | balanced mids - only 1.5% away from median
(+) | mids are linear (5.9% delta to prev. frequency)
Highs 2 - 16 kHz
(±) | higher highs - on average 8.2% higher than median
(±) | linearity of highs is average (14.2% delta to prev. frequency)
Overall 100 - 16.000 Hz
(±) | linearity of overall sound is average (22.3% difference to median)
Compared to same class
» 80% of all tested devices in this class were better, 6% similar, 14% worse
» The best had a delta of 6%, average was 18%, worst was 132%
Compared to all devices tested
» 65% of all tested devices were better, 6% similar, 29% worse
» The best had a delta of 4%, average was 23%, worst was 134%
Frequency Comparison (Checkbox selectable!)
Graph 1: Pink Noise 100% Vol.; Graph 2: Audio off
Energy Management
Power Consumption
The upgrade to Kaby Lake brings with it much better power efficiency. The 7RF consumes about 40% less power at idle and about 25% less under load than the 6RF. Despite this, the 7RF consumes quite a bit more power than either the Acer V17 Nitro or Gigabyte Aero 15 which have similar components; our unit measures 91 W on average under load compared to 73 W for the Nitro and 82 W for the Aero 15. The 4K screen in the 7RF likely contributes to the higher power draw. Maximum consumption approaches the limit of the 180 W power supply and leaves little room to breathe.
| Off / Standby | |
| Idle | |
| Load |
|
Key:
min: | |
| MSI GS73VR 7RF i7-7700HQ, GeForce GTX 1060 Mobile, Samsung SM961 MZVKW512HMJP m.2 PCI-e, IPS, 3840x2160, 17.3" | MSI GS73VR 6RF 6700HQ, GeForce GTX 1060 Mobile, SanDisk SD8SN8U1T001122, TN LED, 1920x1080, 17.3" | Asus Strix GL702VSK i7-7700HQ, GeForce GTX 1070 Mobile, HGST Travelstar 7K1000 HTS721010A9E630, IPS, 1920x1080, 17.3" | Acer Aspire V17 Nitro BE VN7-793G-52XN i5-7300HQ, GeForce GTX 1060 Mobile, SK Hynix HFS256G39TND-N210A, a-Si TFT-LCD, WLED, 1920x1080, 17.3" | Aorus X7 v6 6820HK, GeForce GTX 1070 Mobile, Toshiba NVMe THNSN5512GPU7, TN LED, 2560x1440, 17.3" | Gigabyte Aero 15 i7-7700HQ, GeForce GTX 1060 Mobile, Lite-On CX2-8B512-Q11, IPS, 1920x1080, 15.6" | |
|---|---|---|---|---|---|---|
| Power Consumption | -32% | -23% | 26% | -53% | 15% | |
| Idle Minimum * (Watt) | 14.2 | 22.6 -59% | 20.9 -47% | 7.8 45% | 29 -104% | 12 15% |
| Idle Average * (Watt) | 23.5 | 32.7 -39% | 22.9 3% | 13.3 43% | 31 -32% | 15 36% |
| Idle Maximum * (Watt) | 23.8 | 32.8 -38% | 23.1 3% | 16.6 30% | 38 -60% | 20 16% |
| Load Average * (Watt) | 90.9 | 114.7 -26% | 147.2 -62% | 73 20% | 111 -22% | 82 10% |
| Witcher 3 ultra * (Watt) | 116 | 118 -2% | 111 4% | |||
| Load Maximum * (Watt) | 171.6 | 167.9 2% | 188.1 -10% | 140 18% | 253 -47% | 161 6% |
* ... smaller is better
Battery Life
The 65 Wh battery offers anemic runtimes. While under load, users can expect less than an hour of use, which limits gaming away from an outlet. Using our WiFi v1.3 test to simulate everyday use, the GS73VR 7RF offers about 2 hours 45 minutes. This will barely be enough for a school lecture or brief afternoon meeting. WiFi runtimes are about 45 minutes less than the 6RF and fall well below the competition. Users in need of longer runtimes should look at the offerings from Gigabyte; the Aero 15 lasts about 4.5 hours longer in everyday use.
| MSI GS73VR 7RF i7-7700HQ, GeForce GTX 1060 Mobile, 65 Wh | MSI GS73VR 6RF 6700HQ, GeForce GTX 1060 Mobile, 65 Wh | Asus Strix GL702VSK i7-7700HQ, GeForce GTX 1070 Mobile, 76 Wh | Acer Aspire V17 Nitro BE VN7-793G-52XN i5-7300HQ, GeForce GTX 1060 Mobile, 69 Wh | Aorus X7 v6 6820HK, GeForce GTX 1070 Mobile, 94 Wh | Gigabyte Aero 15 i7-7700HQ, GeForce GTX 1060 Mobile, 94.24 Wh | |
|---|---|---|---|---|---|---|
| Battery runtime | 24% | 28% | 127% | 11% | 127% | |
| Reader / Idle (h) | 5 | 5.9 18% | 5.1 2% | 10.3 106% | 10.6 112% | |
| WiFi v1.3 (h) | 2.7 | 3.6 33% | 3.4 26% | 6.2 130% | 3 11% | 7 159% |
| Load (h) | 0.9 | 1.1 22% | 1.4 56% | 2.2 144% | 1.9 111% |
Pros
Cons
Verdict
The MSI GS73VR 7RF is less an upgrade and more a refinement. Where the 6RF was an overhaul of MSI's 17.3-inch thin-and-light line, the 7RF is the completion of that idea. As such, it improves upon the positives of its predecessor but keeps the cons as well. We still celebrate the excellent keyboard, the premium chassis, and the excellent gaming performance. However, the difficult upgradeability, annoyingly loud fans, and tight port placement continue to be downsides. Add to that consistently buggy behavior during our review time, and we're left feeling mixed about the 7RF.
The screen is a mixed bag. Colors and image quality are great, but the 4K resolution isn't necessary. While it is a nice option, it largely amounts to a party trick. The internal components are more suited to gameplay at Full HD, and the high resolution creates more problems than it solves. Content creators and movie buffs will likely find great use out of the UHD panel, but most other users will likely never notice the difference. The Full HD panel option is the choice we recommend for gamers, as it is less demanding of the system, increases battery life, and reduces cost.
The GS73VR 7RF is a competent notebook that does a lot of things very well. It offers excellent performance in a very thin package. However, the market for thin-and-light gaming notebooks has exploded in recent years. Other companies also offer powerful and portable notebooks, namely Razer, Gigabyte, and Asus. While there isn't yet a perfect compact gaming notebook, there is no shortage of fantastic options from which to choose.
While the GS73VR 7RF offers some tangible improvements over its predecessor, they are marginal at best. The GS73VR 6RF is almost as good and could be found new or used for a much cheaper price. Other options, such as Gigabyte's Aero 15, offer similar performance for the same or less money while improving on aspects that might matter more to gamers.
The MSI GS73VR 7RF is a good machine but is held back by many minor and some major hindrances. While this is a good notebook overall, there are better options avilable.
MSI GS73VR 7RF
- 06/13/2017 v6 (old)
Sam Medley
Price comparison
