Reviews for the Intel Core i7-6820HK processor
Aorus X7 DT v6 Notebook Review
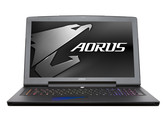
Boundless performance. Gigabyte has taken the design of their AORUS gaming notebook to the next level with the advent of the X7 DT v6. With class-leading GPU and CPU performance, speedy solid-state storage, and powerful networking and display options, can anything slow it down?
Intel Core i7-6820HK, NVIDIA GeForce GTX 1080 Mobile, 17.3", 3.3 kgEVGA SC17 GTX 1070 Notebook Review
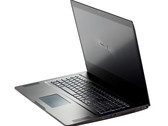
More power, same features. The impressive overclock-ready SC17 is now officially on the Pascal train, but its continuing lack of features puts the notebook at a disadvantage in the 17-inch gaming category.
Intel Core i7-6820HK, NVIDIA GeForce GTX 1070 Mobile, 17.3", 4.1 kgAorus X7 v6 Notebook Review
Soaring High. Gigabyte wants to join the ranks of Acer, Asus, Alienware, Clevo and MSI by producing high-end notebooks. The gaming expert has grown the Aorus brand into a symbol for powerful gaming PCs. We have looked at the X7 v6 and were impressed with what we found.
Intel Core i7-6820HK, NVIDIA GeForce GTX 1070 Mobile, 17.3", 3.2 kgMSI GT73VR 6RF Titan Notebook Review
A souped-up GT72. We checked out the GT73VR last month in its 1080p and GTX 1070 configuration and were blown away by its performance and workmanship. The pricier 4K UHD and 1080 SKU is even better, but it makes some sacrifices regarding contrast and colors.
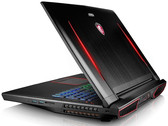
Intel Core i7-6820HK, NVIDIA GeForce GTX 1080 Mobile, 17.3", 4.1 kgMSI GT83VR 6RE Titan SLI Xotic PC Edition Notebook Review
Superlative. If the price is not important and you want the maximum amount of performance, the MSI GT83VR is currently the best solution for fans of desktop replacements. The 18-inch gaming laptop is equipped with two Pascal GPUs in an SLI system. The other components are also state of the art. Our review will show whether the cooling system can handle demanding 3D workloads.
Intel Core i7-6820HK, NVIDIA GeForce GTX 1070 SLI (Laptop), 18.4", 5.5 kgAorus X5 v6: NVIDIA GeForce GTX 1070 Mobile, 15.60", 2.6 kg
Review » Aorus X5 v6 Notebook Review
Lenovo IdeaPad Y900: NVIDIA GeForce GTX 980M, 17.30", 4.4 kg
Review » Lenovo IdeaPad Y900 17ISK Notebook Review
MSI GT73VR-6RE16SR451: NVIDIA GeForce GTX 1070 Mobile, 17.30", 4.1 kg
Review » MSI GT73VR 6RE Titan Notebook Review
Asus G752VS-XB78K: NVIDIA GeForce GTX 1070 Mobile, 17.30", 4.5 kg
Review » Asus ROG G752VS Notebook Review
Asus G800VI Prototype: NVIDIA GeForce GTX 1080 Mobile, 18.40", 5.5 kg
Review » Asus ROG G800VI Notebook Preview
Asus GX800VH Prototype: NVIDIA GeForce GTX 1080 SLI (Laptop), 18.40", 5.7 kg
Review » Asus ROG GX800VH Notebook Preview
Asus G701VO-CS74K: NVIDIA GeForce GTX 980 (Laptop), 17.30", 3.9 kg
Review » Asus ROG G701VO-CS74K Xotic PC Edition Notebook Review
Asus GX800 Prototype: NVIDIA GeForce GTX 980 SLI (Laptop), 18.40", 5.7 kg
Review » Asus ROG GX800 Notebook Preview
EVGA SC17: NVIDIA GeForce GTX 980M, 17.30", 4 kg
Review » EVGA SC17 Xotic PC Edition Notebook Review
Schenker XMG P506 PRO: NVIDIA GeForce GTX 980M, 15.60", 2.8 kg
Review » Schenker XMG P506 PRO (Clevo P651RG) Notebook Review
Aorus X7 Pro v5: NVIDIA GeForce GTX 970M SLI, 17.30", 3.3 kg
Review » Aorus X7 Pro v5 Notebook Review
MSI GT80S 6QF: NVIDIA GeForce GTX 980 SLI (Laptop), 18.40", 5 kg
Review » MSI GT80S 6QF Titan SLI Notebook Review
Asus GX700: NVIDIA GeForce GTX 980 (Laptop), 17.30", 3.9 kg
Review » Asus GX700 Notebook Review
MSI GT72S 6QF: NVIDIA GeForce GTX 980 (Laptop), 17.30", 3.8 kg
Review » Xotic PC MSI GT72S 6QF Dragon Notebook Review
Schenker XMG P706: NVIDIA GeForce GTX 980M, 17.30", 3.3 kg
Review » Schenker XMG P706 (Clevo P671RG) Notebook Review
MSI GT72S-6QEG16SR421BW: NVIDIA GeForce GTX 980M, 17.30", 3.8 kg
Review » MSI GT72S 6QE Dominator Pro G Notebook Review
MSI GT72S-6QF-012BE: NVIDIA GeForce GTX 980M, 17.30", 3.8 kg
External Review » MSI GT72S-6QF-012BE
MSI GT73VR 6RE-053NL: NVIDIA GeForce GTX 1070 Mobile, 17.30", 3.9 kg
External Review » MSI GT73VR 6RE-053NL
EVGA SC17 GTX 1070: NVIDIA GeForce GTX 1070 Mobile, 17.30", 4.1 kg
External Review » EVGA SC17 GTX 1070
Alienware 15 R3 (2016): NVIDIA GeForce GTX 1070 Mobile, 15.60", 3.5 kg
External Review » Alienware 15 R3 (2016)
MSI GT72VR 6RE-266NL: NVIDIA GeForce GTX 1070 Mobile, 17.30", 3.8 kg
External Review » MSI GT72VR 6RE-266NL
MSI GT72S 6QE-827RU Dominator Pro G: NVIDIA GeForce GTX 980M, 17.30", 3.8 kg
External Review » MSI GT72S 6QE-827RU Dominator Pro G
Lenovo IdeaPad Y900-17ISK- 80Q1006GRA: NVIDIA GeForce GTX 980M, 17.30", 4.6 kg
External Review » Lenovo IdeaPad Y900-17ISK- 80Q1006GRA
Asus G701VI-XB72K: NVIDIA GeForce GTX 1080 Mobile, 17.30", 3.6 kg
External Review » Asus G701VI-XB72K
Alienware 17 R4-HID55-AUK2: NVIDIA GeForce GTX 1070 Mobile, 17.30", 4.4 kg
External Review » Alienware 17 R4-HID55-AUK2
MSI GT72S 6QE-1012N: NVIDIA GeForce GTX 980M, 17.30", 3.8 kg
External Review » MSI GT72S 6QE-1012N
MSI GT73VR 6RE-030PL: NVIDIA GeForce GTX 1070 Mobile, 17.30", 4.1 kg
External Review » MSI GT73VR 6RE-030PL
Aorus X3 Plus v6: NVIDIA GeForce GTX 1060 Mobile, 13.90", 1.8 kg
External Review » Aorus X3 Plus v6
Asus GX800VH Prototype: NVIDIA GeForce GTX 1080 SLI (Laptop), 18.40", 5.7 kg
External Review » Asus GX800VH Prototype
Aorus X7 DT v6: NVIDIA GeForce GTX 1080 Mobile, 17.30", 3.3 kg
External Review » Aorus X7 DT v6
Aorus X7 v6: NVIDIA GeForce GTX 1070 Mobile, 17.30", 3.2 kg
External Review » Aorus X7 v6
MSI GT73VR 6RE-022ES TITAN: NVIDIA GeForce GTX 1070 Mobile, 17.30", 3.9 kg
External Review » MSI GT73VR 6RE-022ES TITAN
Asus G752VS-GC026T: NVIDIA GeForce GTX 1070 Mobile, 17.30", 4.4 kg
External Review » Asus G752VS-GC026T
Aorus X5 v6: NVIDIA GeForce GTX 1070 Mobile, 15.60", 2.6 kg
External Review » Aorus X5 v6
MSI GT62VR 6RE-016NL: NVIDIA GeForce GTX 1070 Mobile, 15.60", 4 kg
External Review » MSI GT62VR 6RE-016NL
Acer Predator 17X GX-791-758V: NVIDIA GeForce GTX 980 (Laptop), 17.30", 4.2 kg
External Review » Acer Predator 17X GX-791-758V
MSI GT73VR-6RF-095FR: NVIDIA GeForce GTX 1070 Mobile, 17.30", 3.9 kg
External Review » MSI GT73VR-6RF-095FR
MSI GT83VR-6RE32SR451Titan SLI: NVIDIA GeForce GTX 1070 SLI (Laptop), 18.40", 4.5 kg
External Review » MSI GT83VR-6RE32SR451Titan SLI
MSI GT73VR 6RE Titan 6RESLI4K32SR451: NVIDIA GeForce GTX 1070 SLI (Laptop), 17.30", 3.9 kg
External Review » MSI GT73VR 6RE Titan 6RESLI4K32SR451
Medion Erazer X7843-MD99997: NVIDIA GeForce GTX 980M, 17.30", 3.5 kg
External Review » Medion Erazer X7843-MD99997
Lenovo Ideapad Y910: NVIDIA GeForce GTX 1070 Mobile, 17.30", 4.6 kg
External Review » Lenovo Ideapad Y910
Acer Predator 17X GX-791-74YL: NVIDIA GeForce GTX 980 (Laptop), 17.30", 4.2 kg
External Review » Acer Predator 17X GX-791-74YL
Acer Predator 17X GX-791-78ZP: NVIDIA GeForce GTX 980 (Laptop), 17.30", 4.2 kg
External Review » Acer Predator 17X GX-791-78ZP
MSI GT73VR-6RE16SR451: NVIDIA GeForce GTX 1070 Mobile, 17.30", 4.1 kg
External Review » MSI GT73VR-6RE16SR451
Medion Erazer X7849 MD 60292: NVIDIA GeForce GTX 1070 Mobile, 17.30", 3.6 kg
External Review » Medion Erazer X7849 MD 60292
MSI GT73VR-6RF4K32SR451 Titan Pro: NVIDIA GeForce GTX 1080 Mobile, 17.30", 4.1 kg
External Review » MSI GT73VR-6RF4K32SR451 Titan Pro
Asus G701VO-CS74K: NVIDIA GeForce GTX 980 (Laptop), 17.30", 3.9 kg
External Review » Asus G701VO-CS74K
Asus GX800 Prototype: NVIDIA GeForce GTX 980 SLI (Laptop), 18.40", 5.7 kg
External Review » Asus GX800 Prototype
Asus G752VS-XB72K: NVIDIA GeForce GTX 1070 Mobile, 17.30", 4.3 kg
External Review » Asus G752VS-XB72K
Asus G752VS-XB78K: NVIDIA GeForce GTX 1070 Mobile, 17.30", 4.5 kg
External Review » Asus G752VS-XB78K
Acer Predator 17X GX-791-750T: NVIDIA GeForce GTX 980M, 17.30", 4.2 kg
External Review » Acer Predator 17X GX-791-750T
MSI GT72S 6QE-858FR : NVIDIA GeForce GTX 980M, 17.30", 3.8 kg
External Review » MSI GT72S 6QE-858FR
MSI GT72S-6QE32SR42BW Tobii: NVIDIA GeForce GTX 980M, 17.30", 3.8 kg
External Review » MSI GT72S-6QE32SR42BW Tobii
Alienware 17 R3 A17-9942: NVIDIA GeForce GTX 980M, 17.30", 3.8 kg
External Review » Alienware 17 R3 A17-9942
MSI GT72S 6QE-208CZ: NVIDIA GeForce GTX 980M, 17.30", 3.8 kg
External Review » MSI GT72S 6QE-208CZ
Asus GX700VO-GC009T: NVIDIA GeForce GTX 980M, 17.30", 3.6 kg
External Review » Asus GX700VO-GC009T
EVGA SC17: NVIDIA GeForce GTX 980M, 17.30", 4 kg
External Review » EVGA SC17
Aorus X7 Pro v5: NVIDIA GeForce GTX 970M SLI, 17.30", 3.3 kg
External Review » Aorus X7 Pro v5
Asus G752VY-DH78K: NVIDIA GeForce GTX 980M, 17.30", 4 kg
External Review » Asus G752VY-DH78K
Asus GX700: NVIDIA GeForce GTX 980 (Laptop), 17.30", 3.9 kg
External Review » Asus GX700
Alienware 17-A17-9942: NVIDIA GeForce GTX 980M, 17.30", 3.8 kg
External Review » Alienware 17-A17-9942
MSI GT80S 6QF: NVIDIA GeForce GTX 980 SLI (Laptop), 18.40", 5 kg
External Review » MSI GT80S 6QF
Lenovo IdeaPad Y900: NVIDIA GeForce GTX 980M, 17.30", 4.4 kg
External Review » Lenovo IdeaPad Y900
MSI GT80S-6QE32SR42HOS: NVIDIA GeForce GTX 980M SLI, 18.40", 4.5 kg
External Review » MSI GT80S-6QE32SR42HOS
MSI GT72S 6QF-036FR: NVIDIA GeForce GTX 980M, 17.30", 3.9 kg
External Review » MSI GT72S 6QF-036FR
MSI GT72S-6QE-265UK: NVIDIA GeForce GTX 980M, 17.30", 3.8 kg
External Review » MSI GT72S-6QE-265UK
MSI GT72S 6QE-072RU: NVIDIA GeForce GTX 980M, 17.30", 3.8 kg
External Review » MSI GT72S 6QE-072RU
MSI GT72S 6QF: NVIDIA GeForce GTX 980 (Laptop), 17.30", 3.8 kg
External Review » MSI GT72S 6QF
MSI GT72S 6QD Dominator G-037: NVIDIA GeForce GTX 970M, 17.30", 3.8 kg
External Review » MSI GT72S 6QD Dominator G-037
MSI GT72S-6QEG16SR421BW: NVIDIA GeForce GTX 980M, 17.30", 3.8 kg
External Review » MSI GT72S-6QEG16SR421BW
MSI VR One: NVIDIA GeForce GTX 1070 Mobile, 0.00", 3.6 kg
Article » MSI VR One