MSI GT73VR 6RF Titan Notebook Review
The MSI GT73VR is one of our favorite Pascal gaming notebooks available. Our original review on the GT73VR 6RE praised the overall quality, performance, and accessibility of the notebook and its GTX 1070 GPU and 120 Hz/5 ms FHD display. We recommend checking out the review page for more images and details on the hardware and software.
Our second GT73VR SKU today is the 6RF with the even more powerful GTX 1080 and higher resolution 4K UHD panel. We want to find out how core temperatures and fan noise can keep up with the faster GPU and if the 4K UHD panel is really worth the investment considering that it sacrifices some features from the 1080p option.
Competing 17.3-inch gaming notebooks include the following:
Case
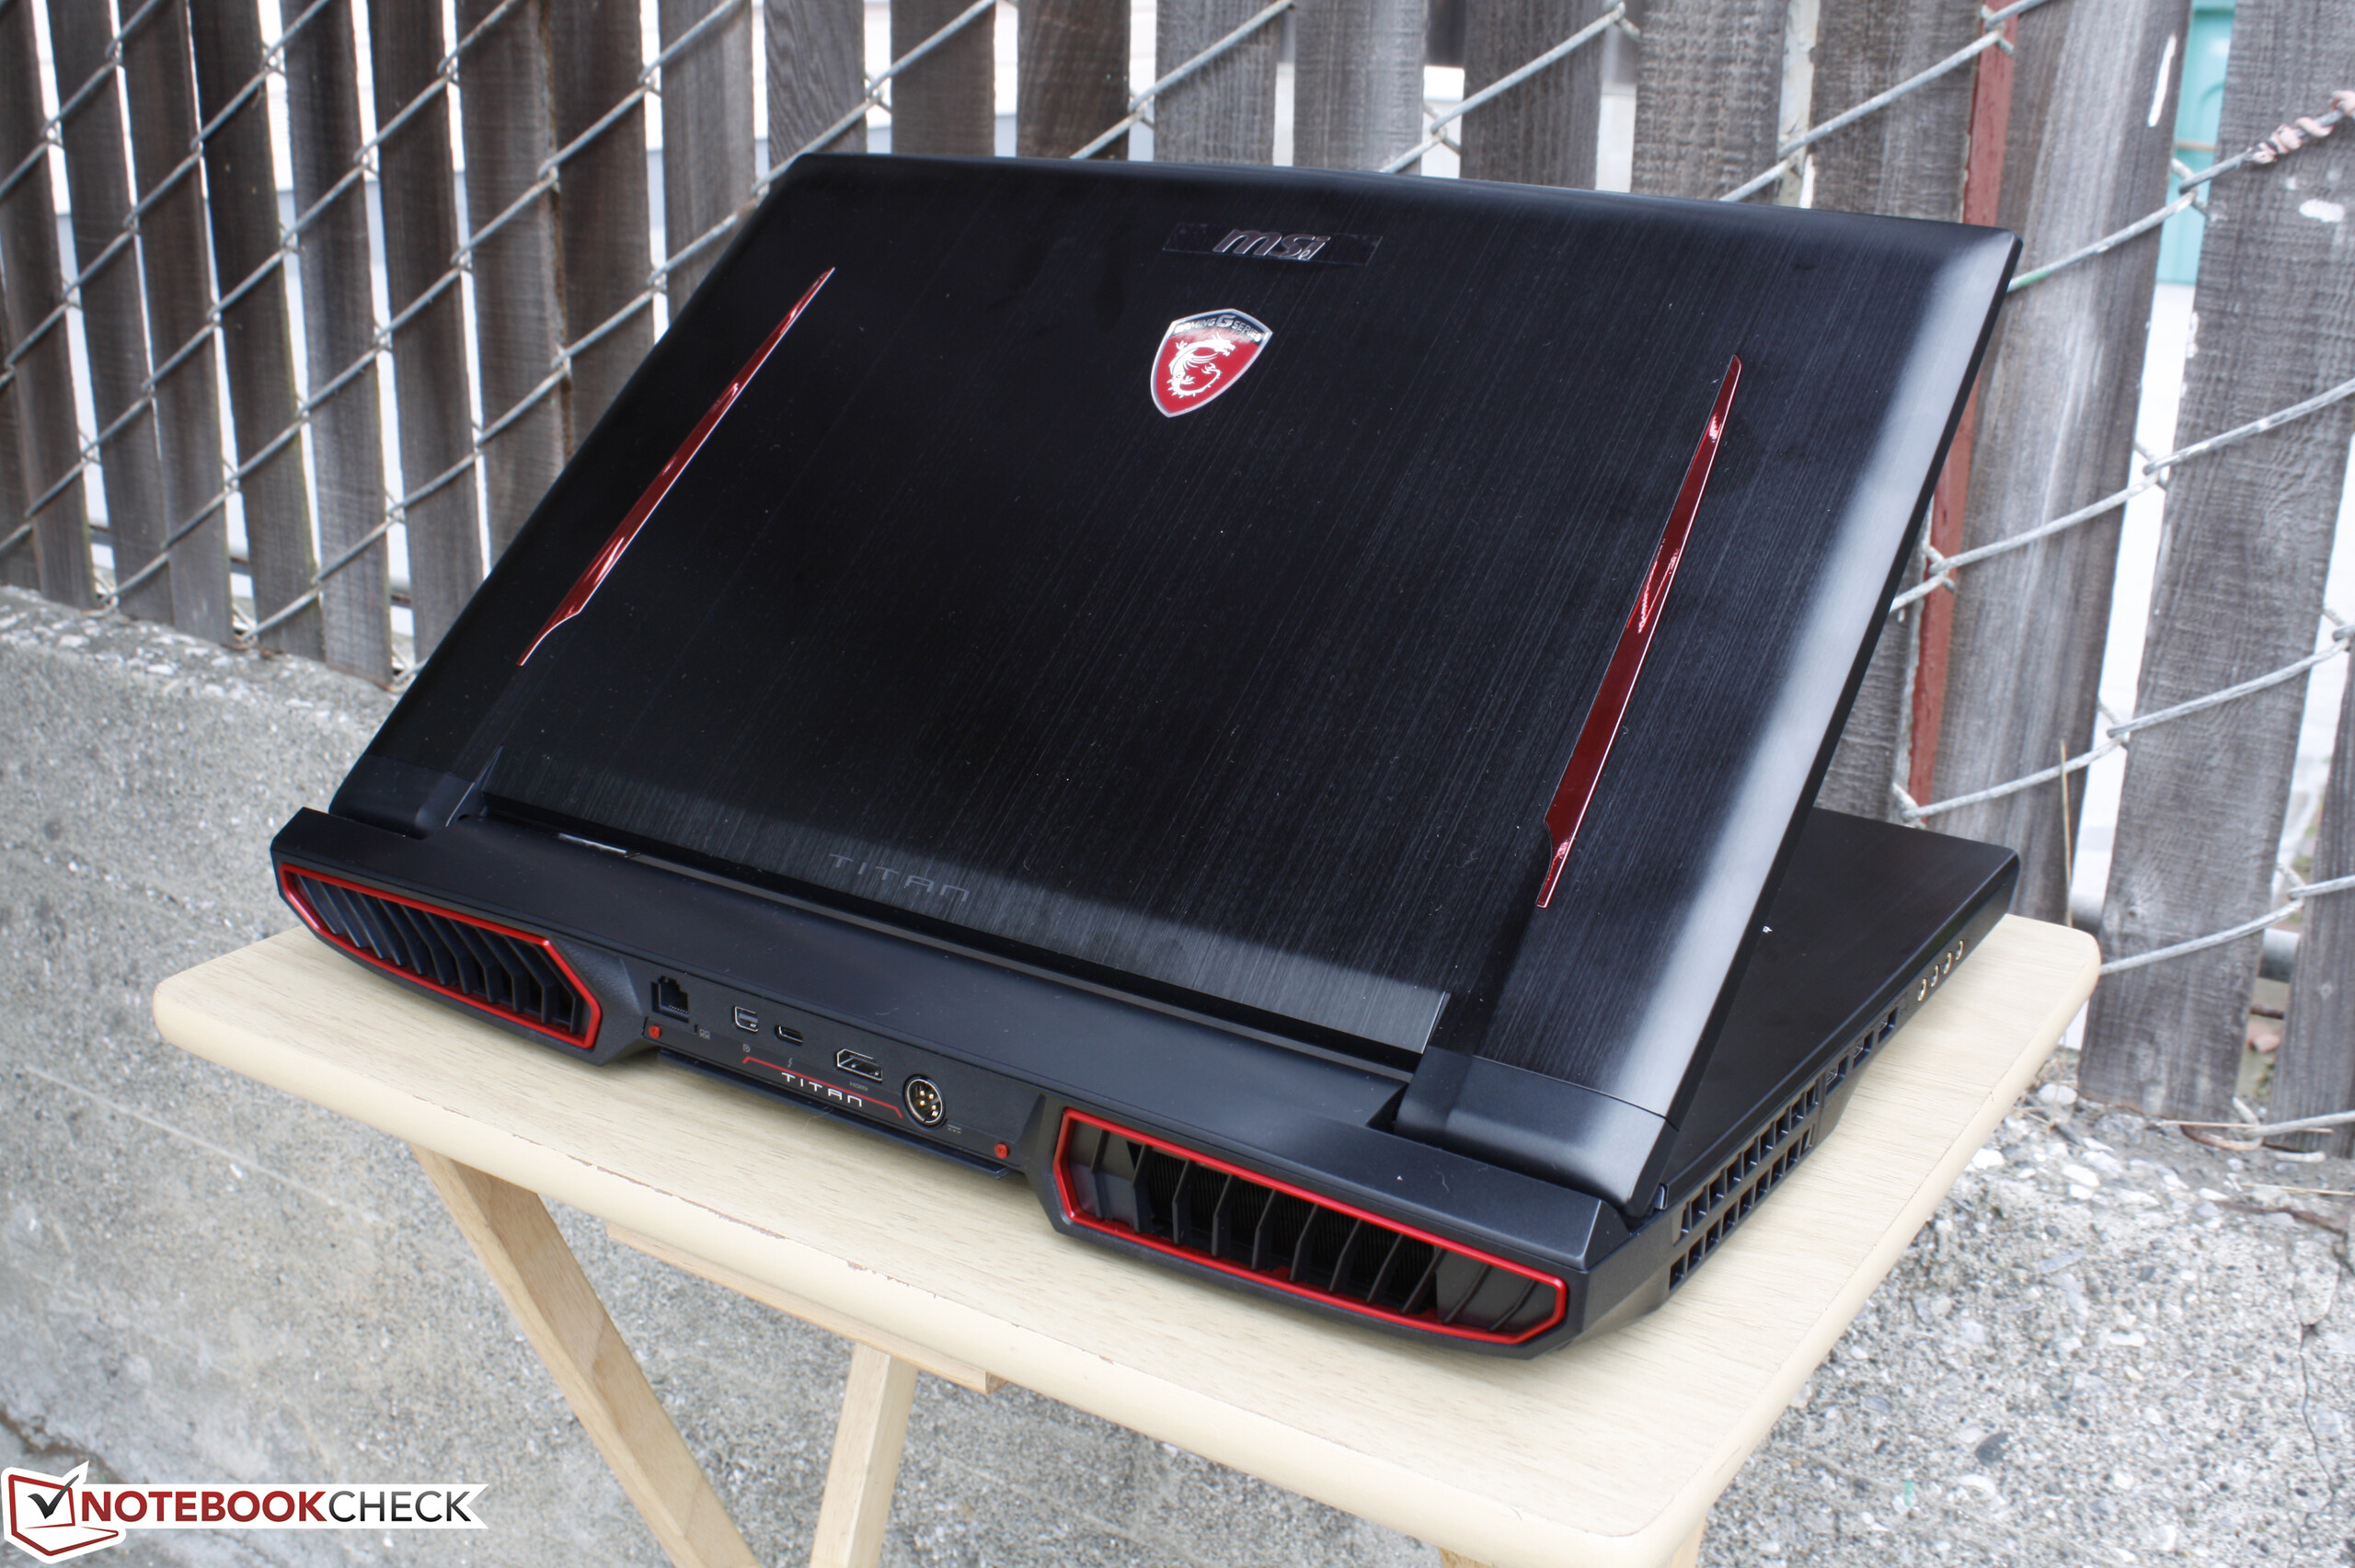
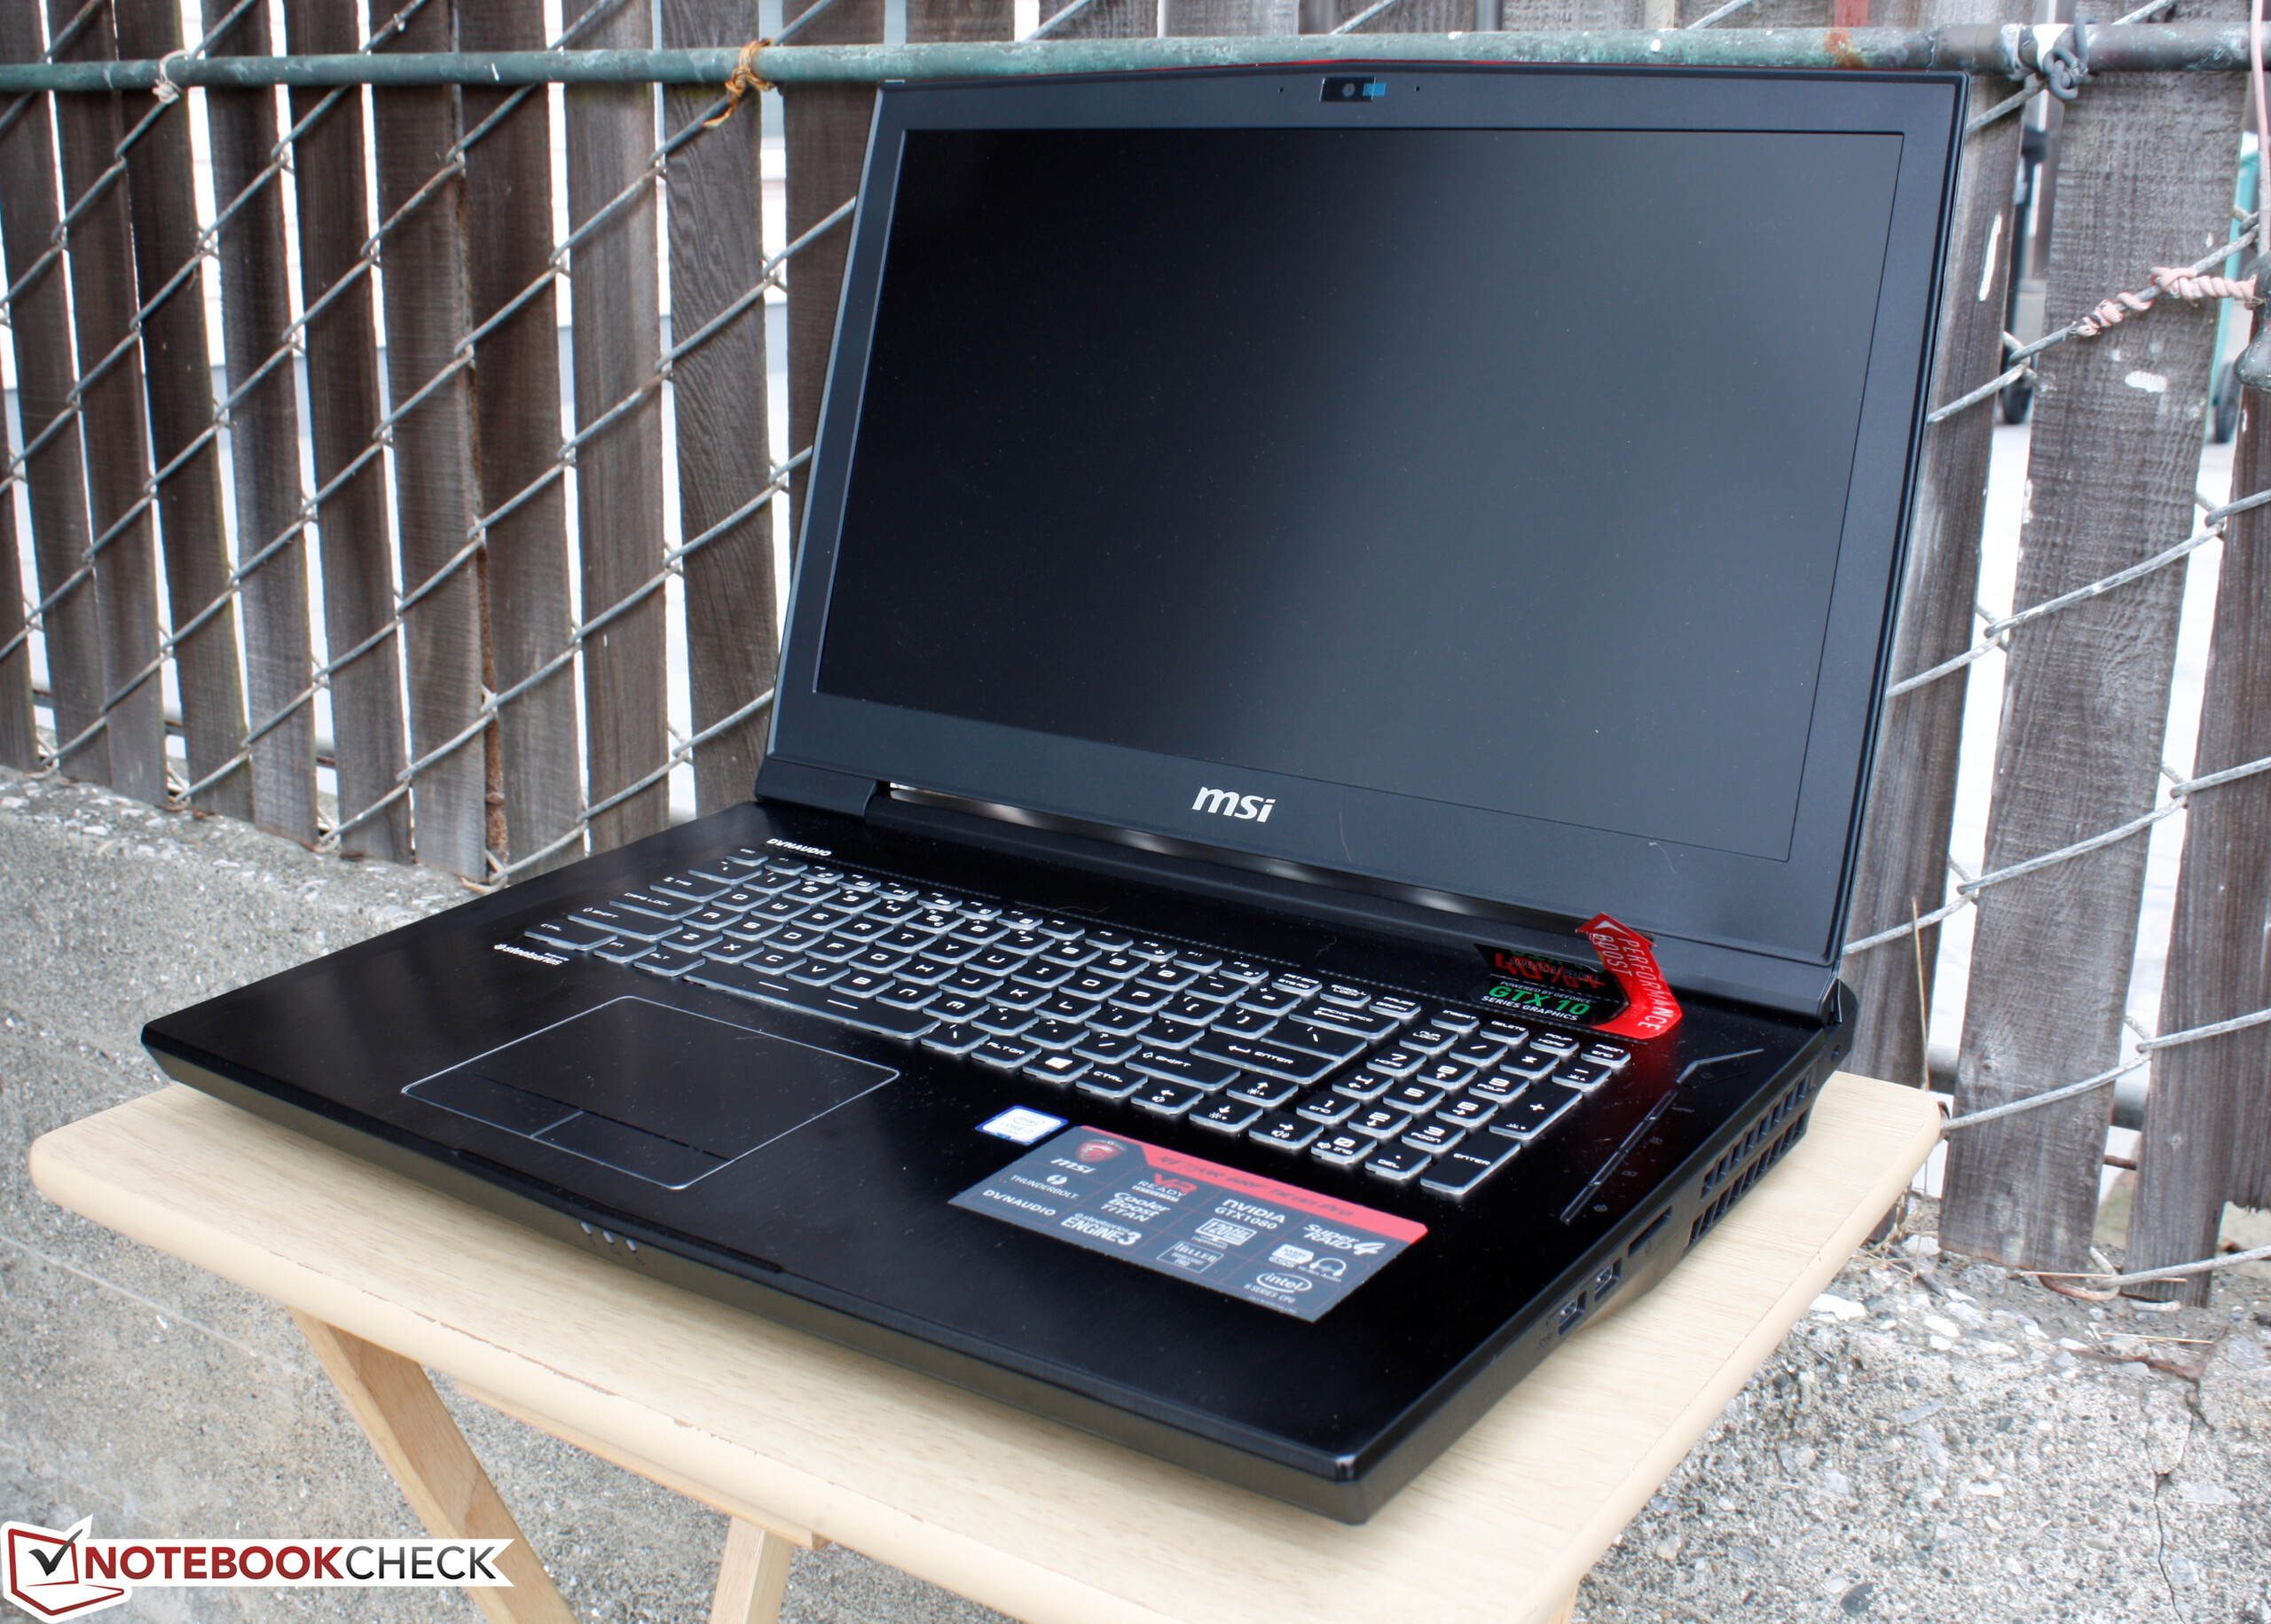
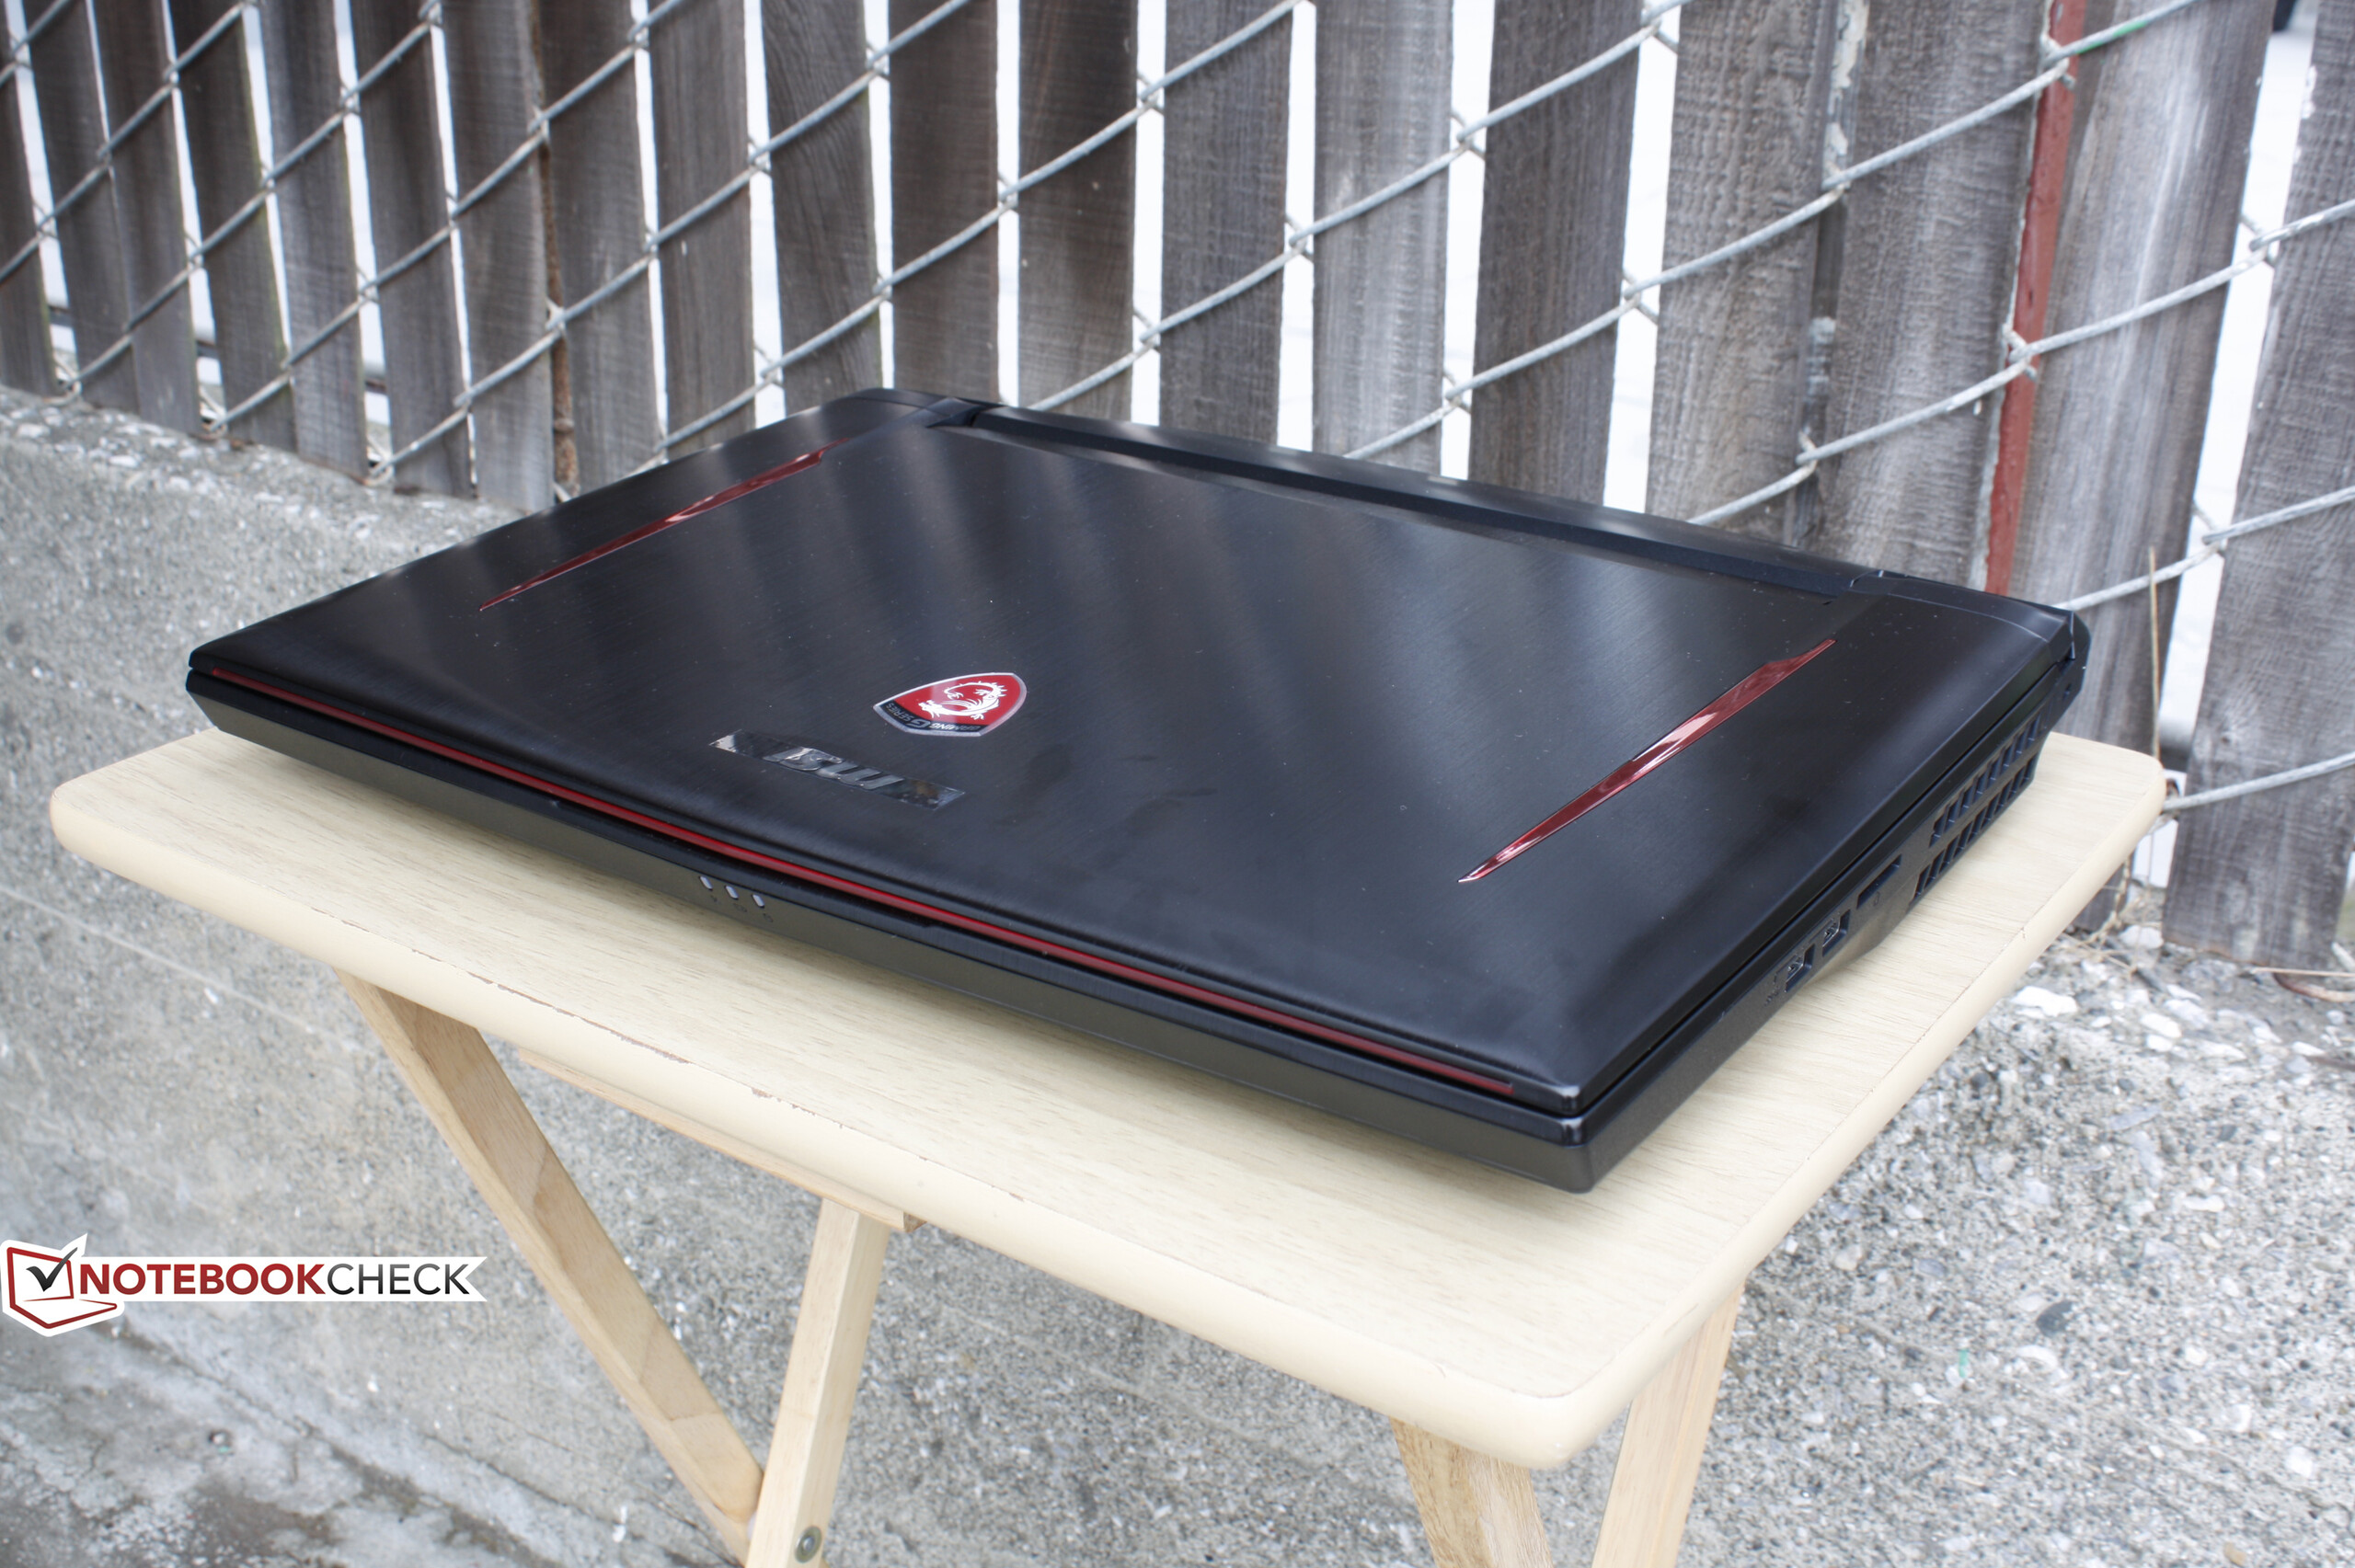
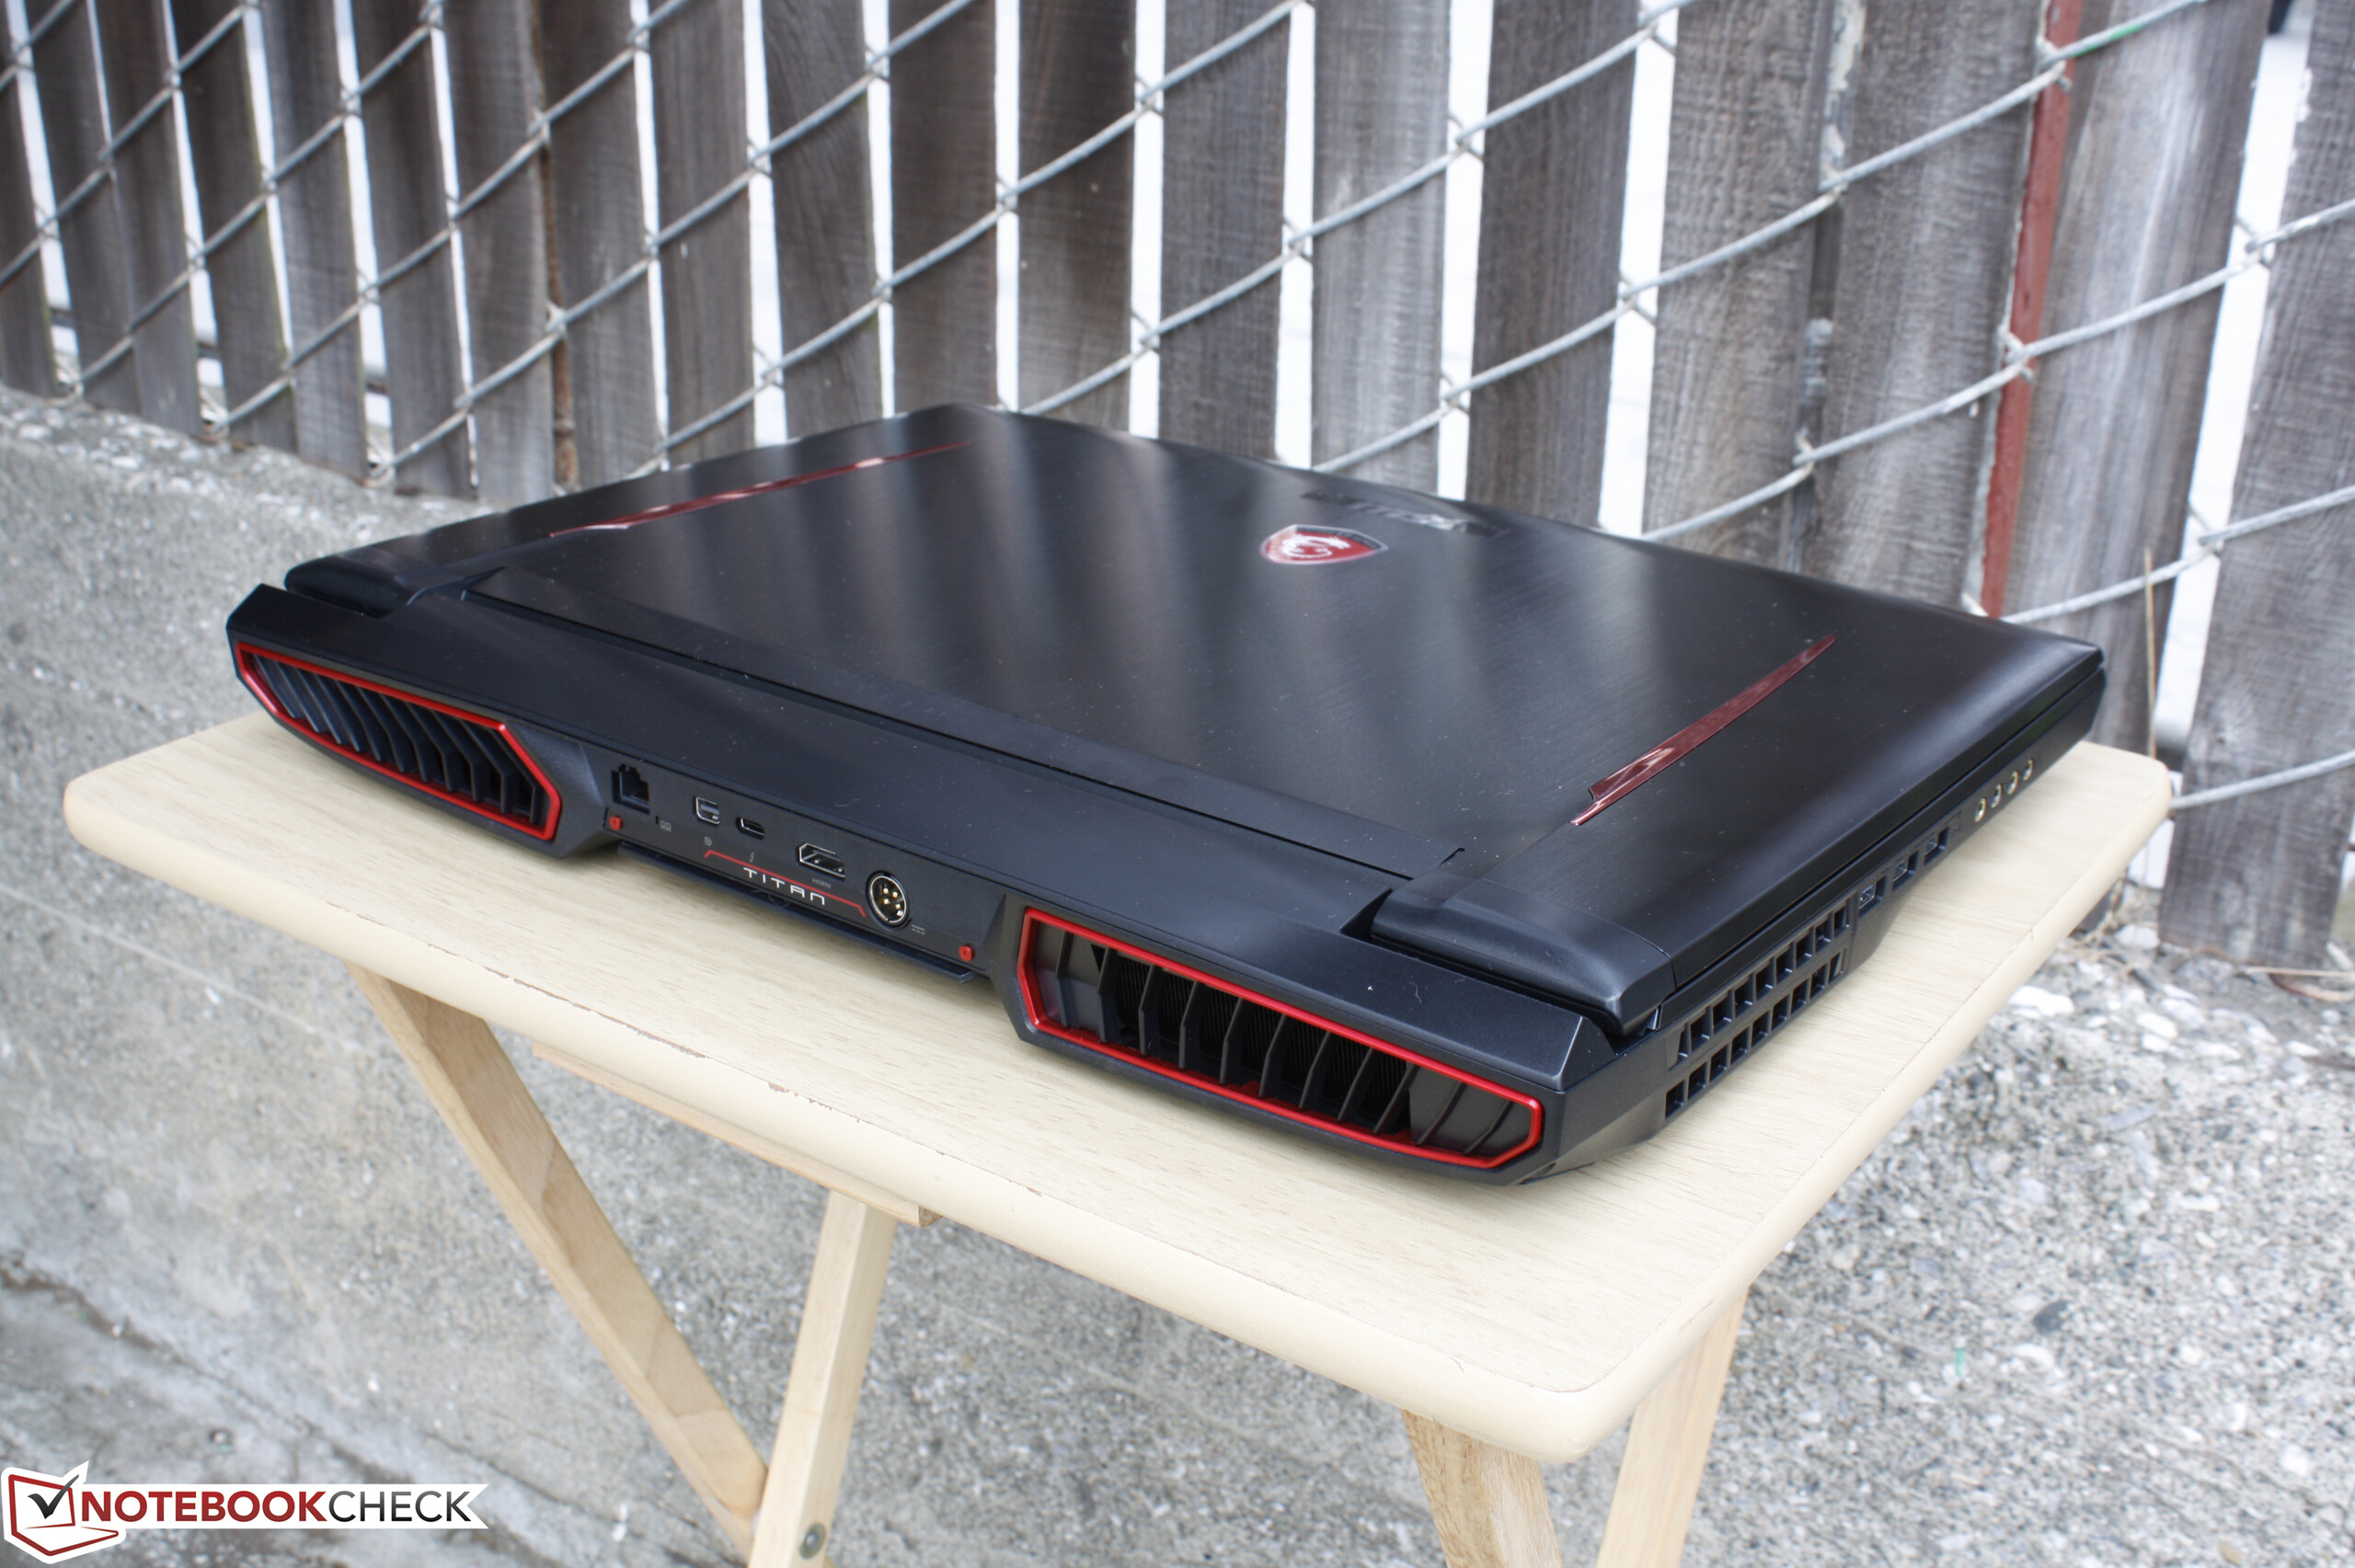
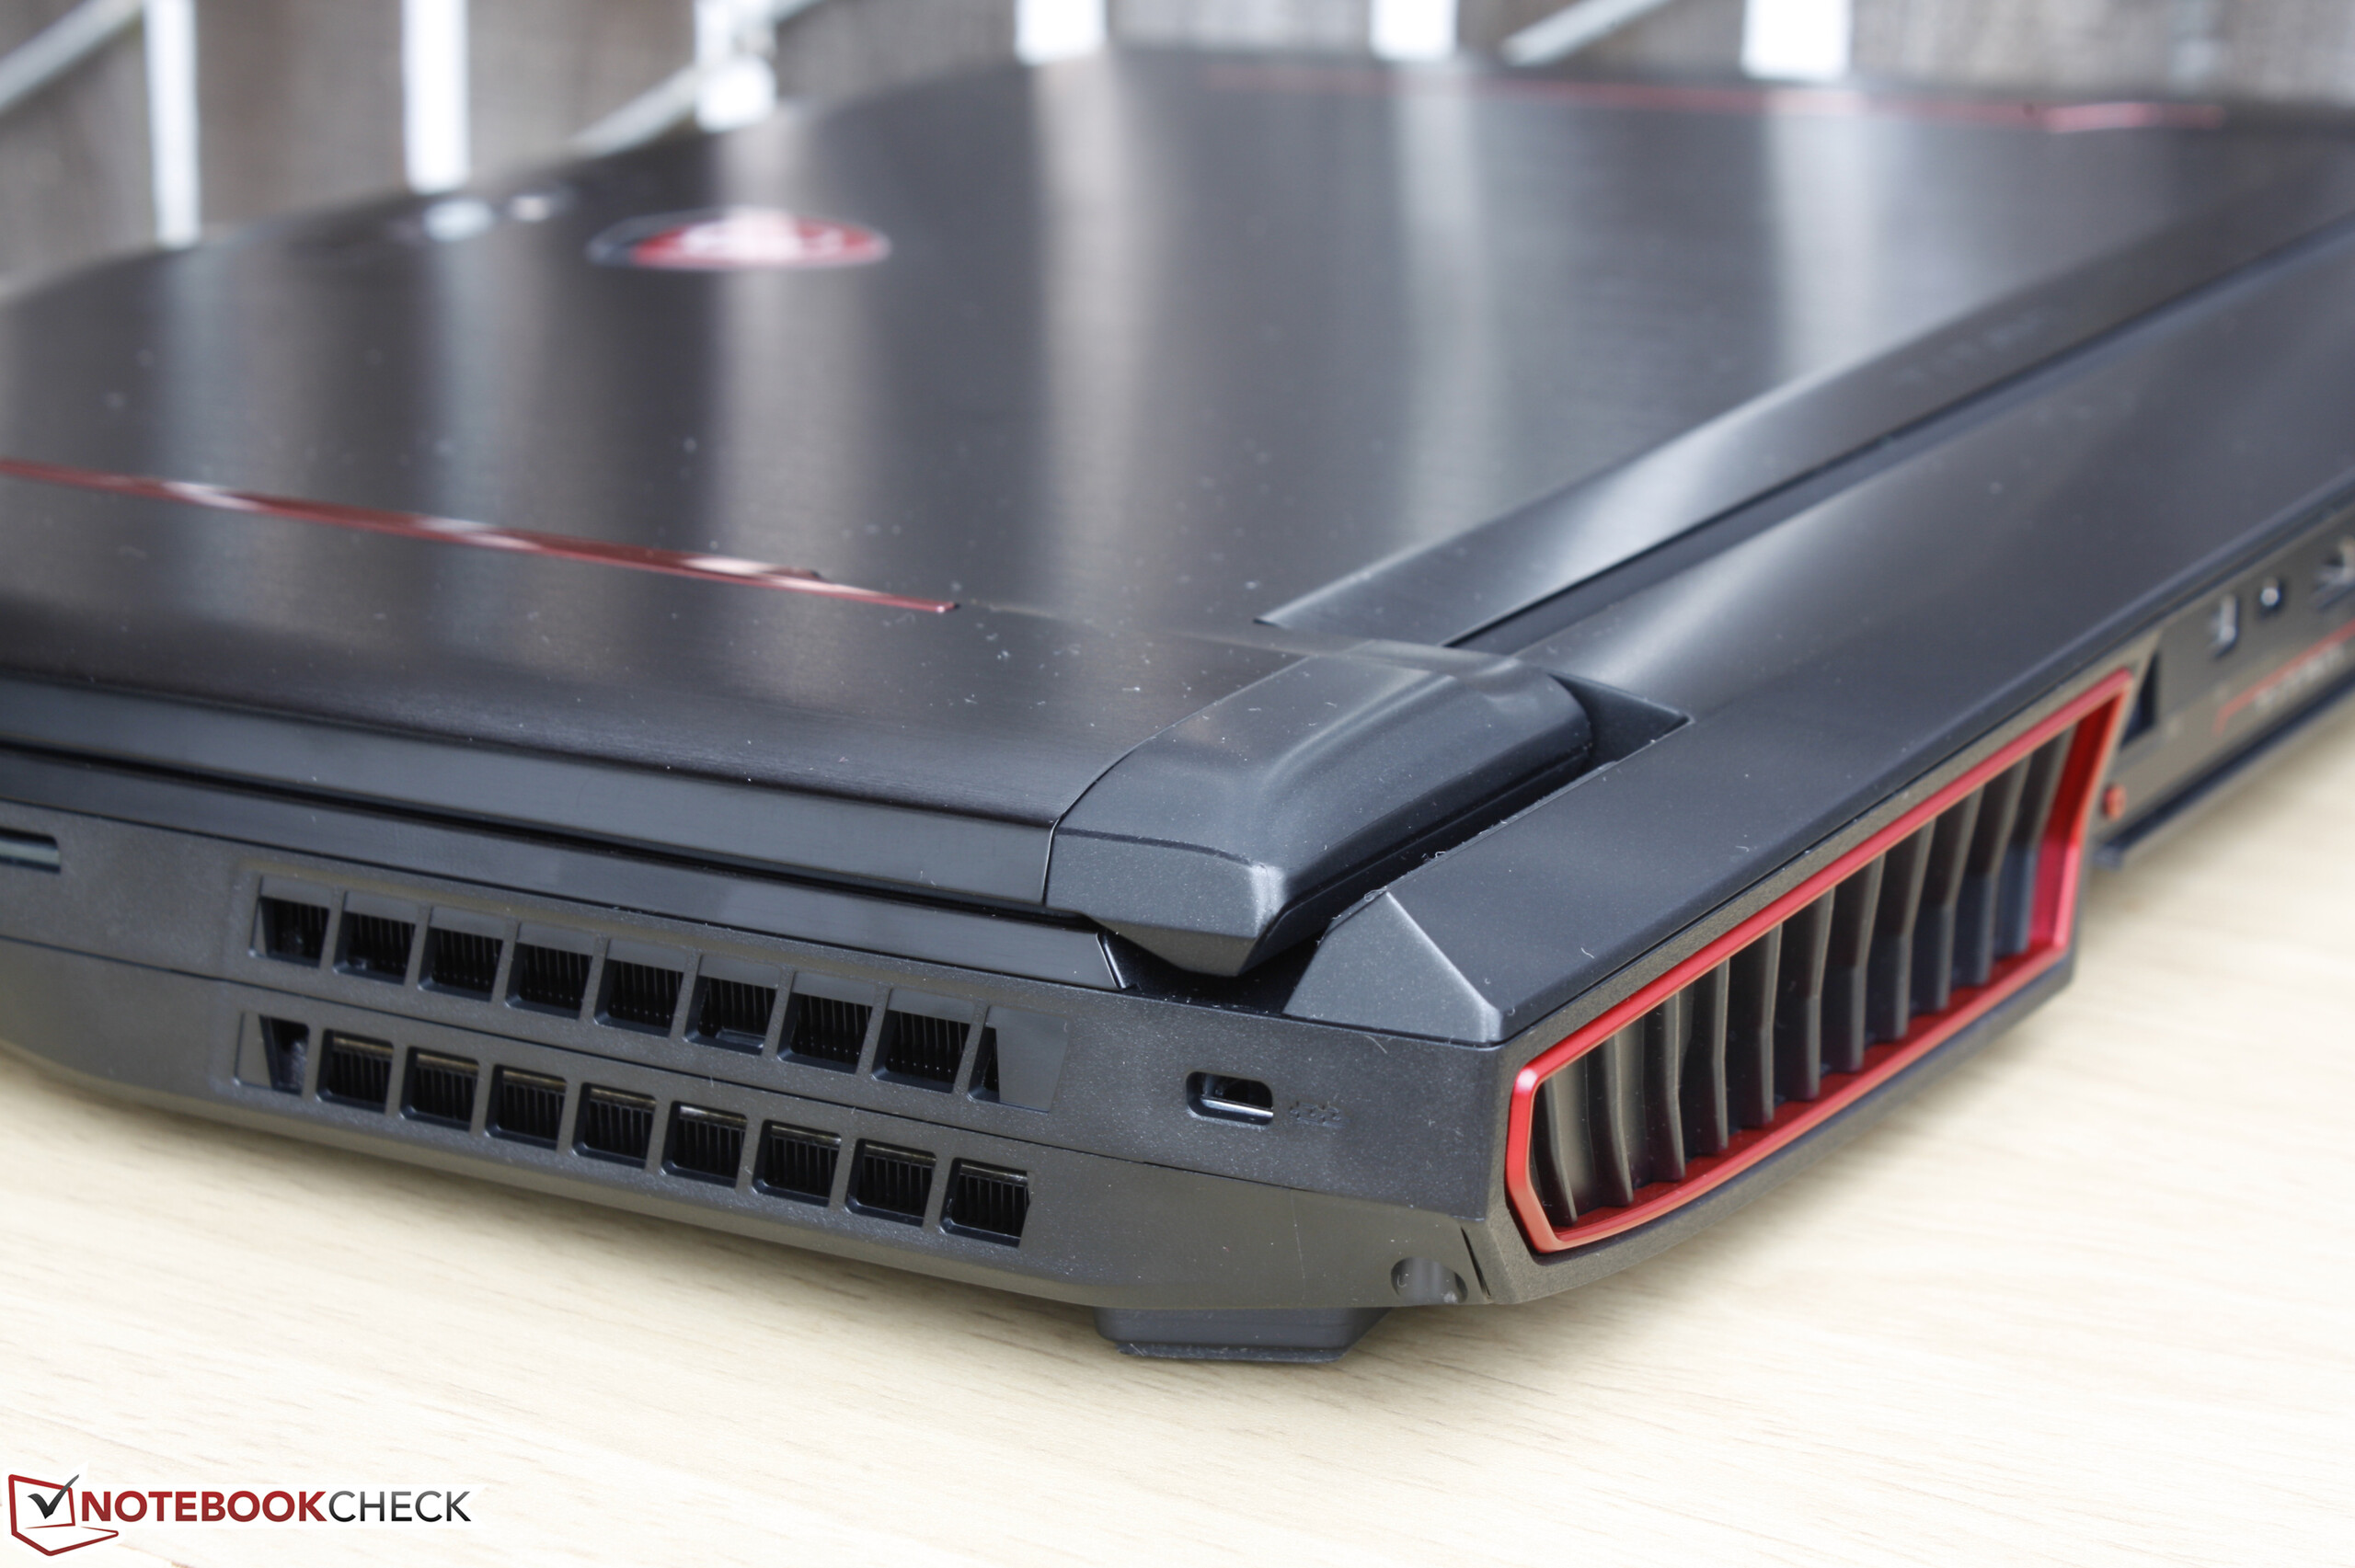
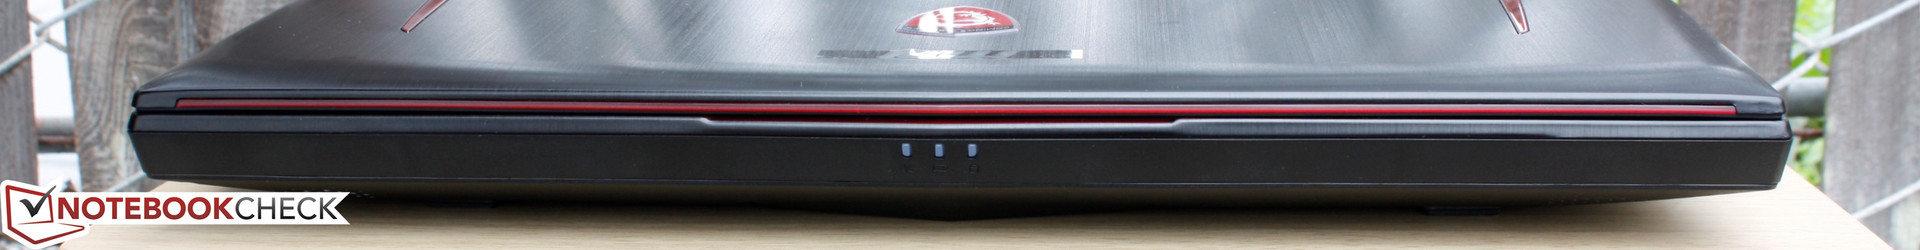
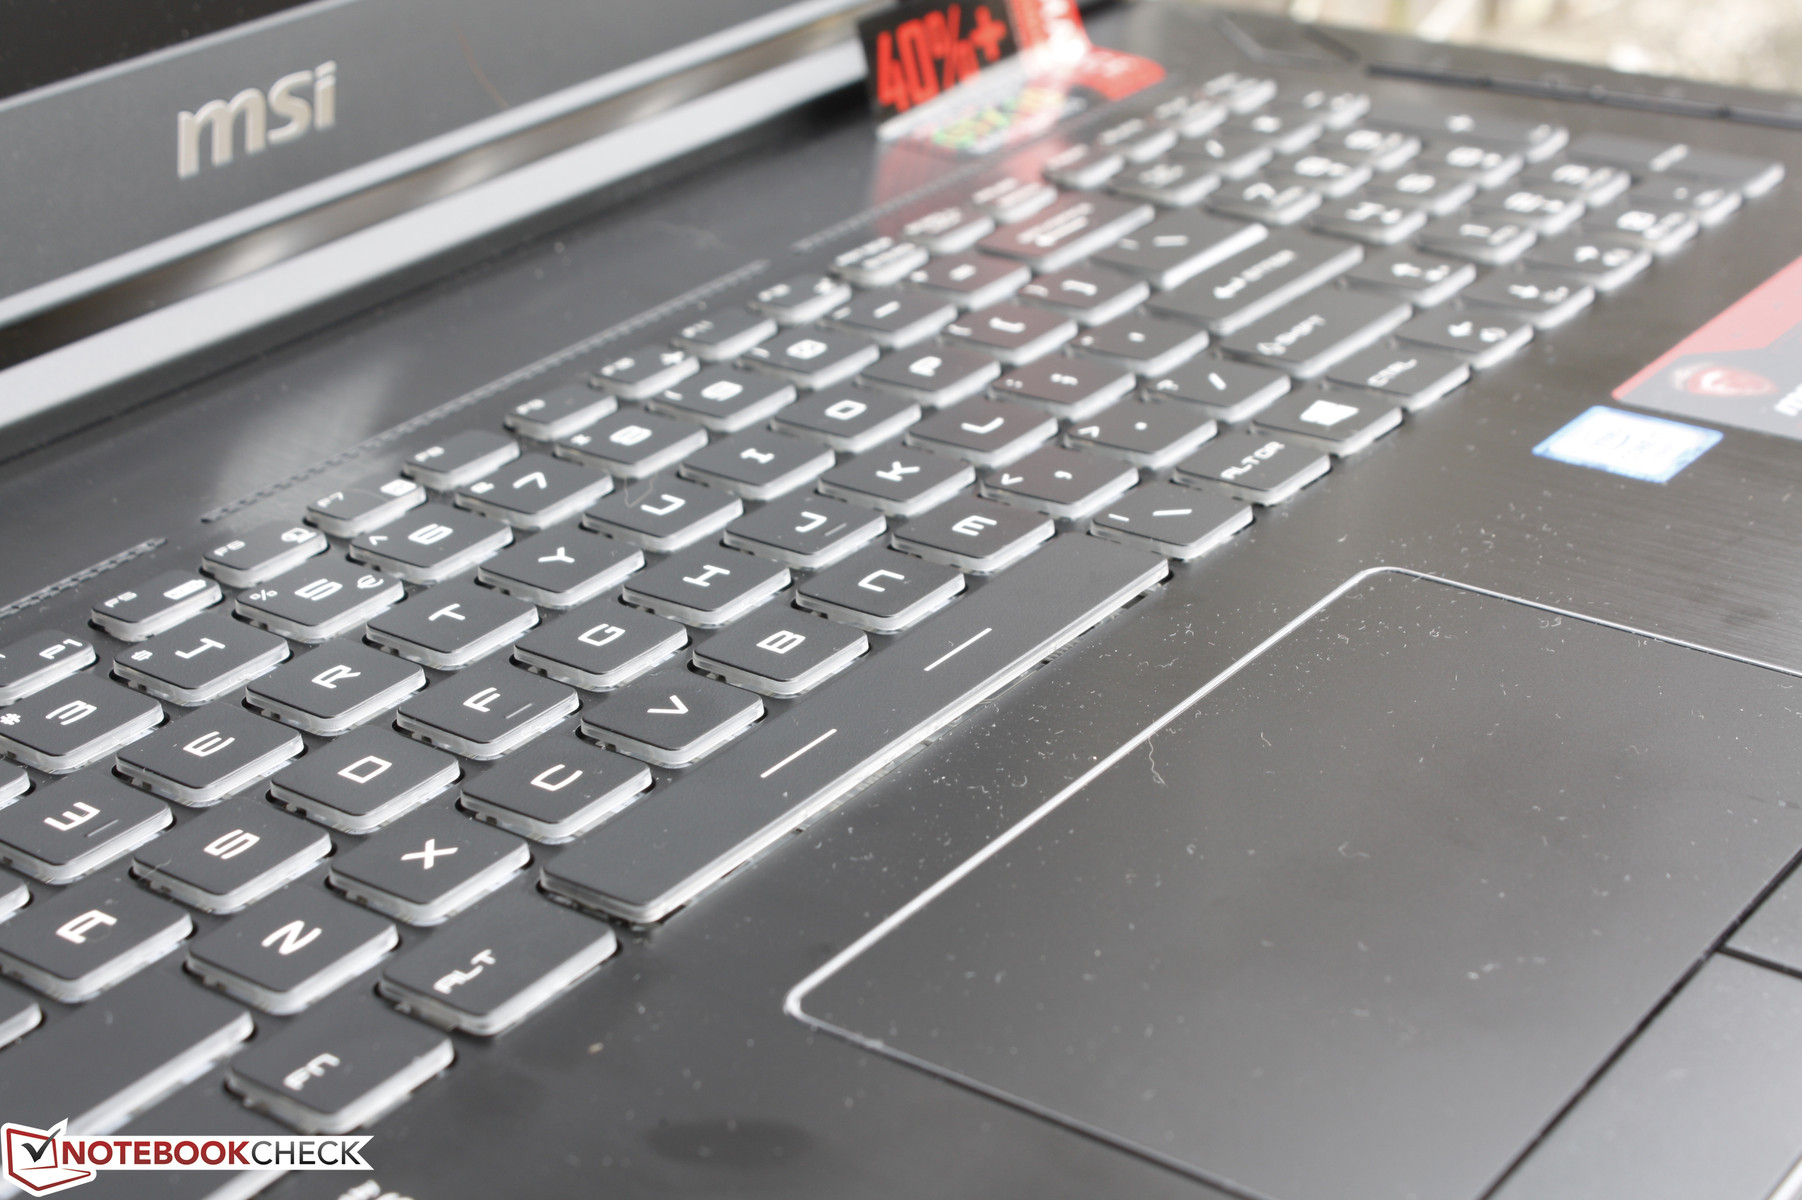
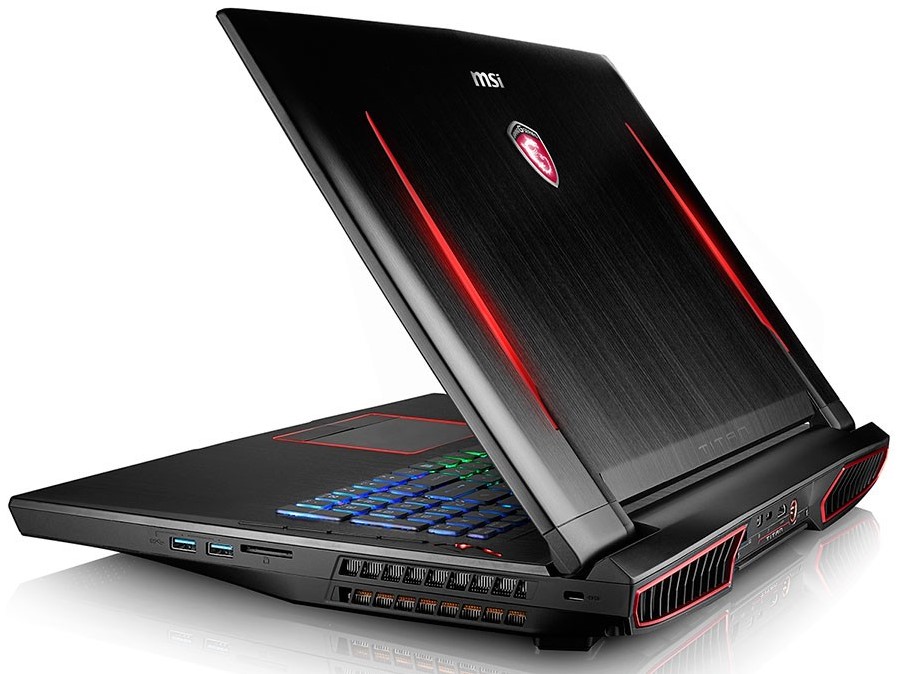
There's little to dislike about the design and chassis of the GT73VR desktop replacement. It's one of the thickest and heaviest 17-inch gaming notebooks available with the notable vapor-cooled Asus G752 series being even larger and heavier. MSI utilizes the ample space inside wisely while still providing excellent rigidity around the base. Teetering and warping of the display are kept to a minimum even down the center of the outer lid where flexing commonly occurs the most.
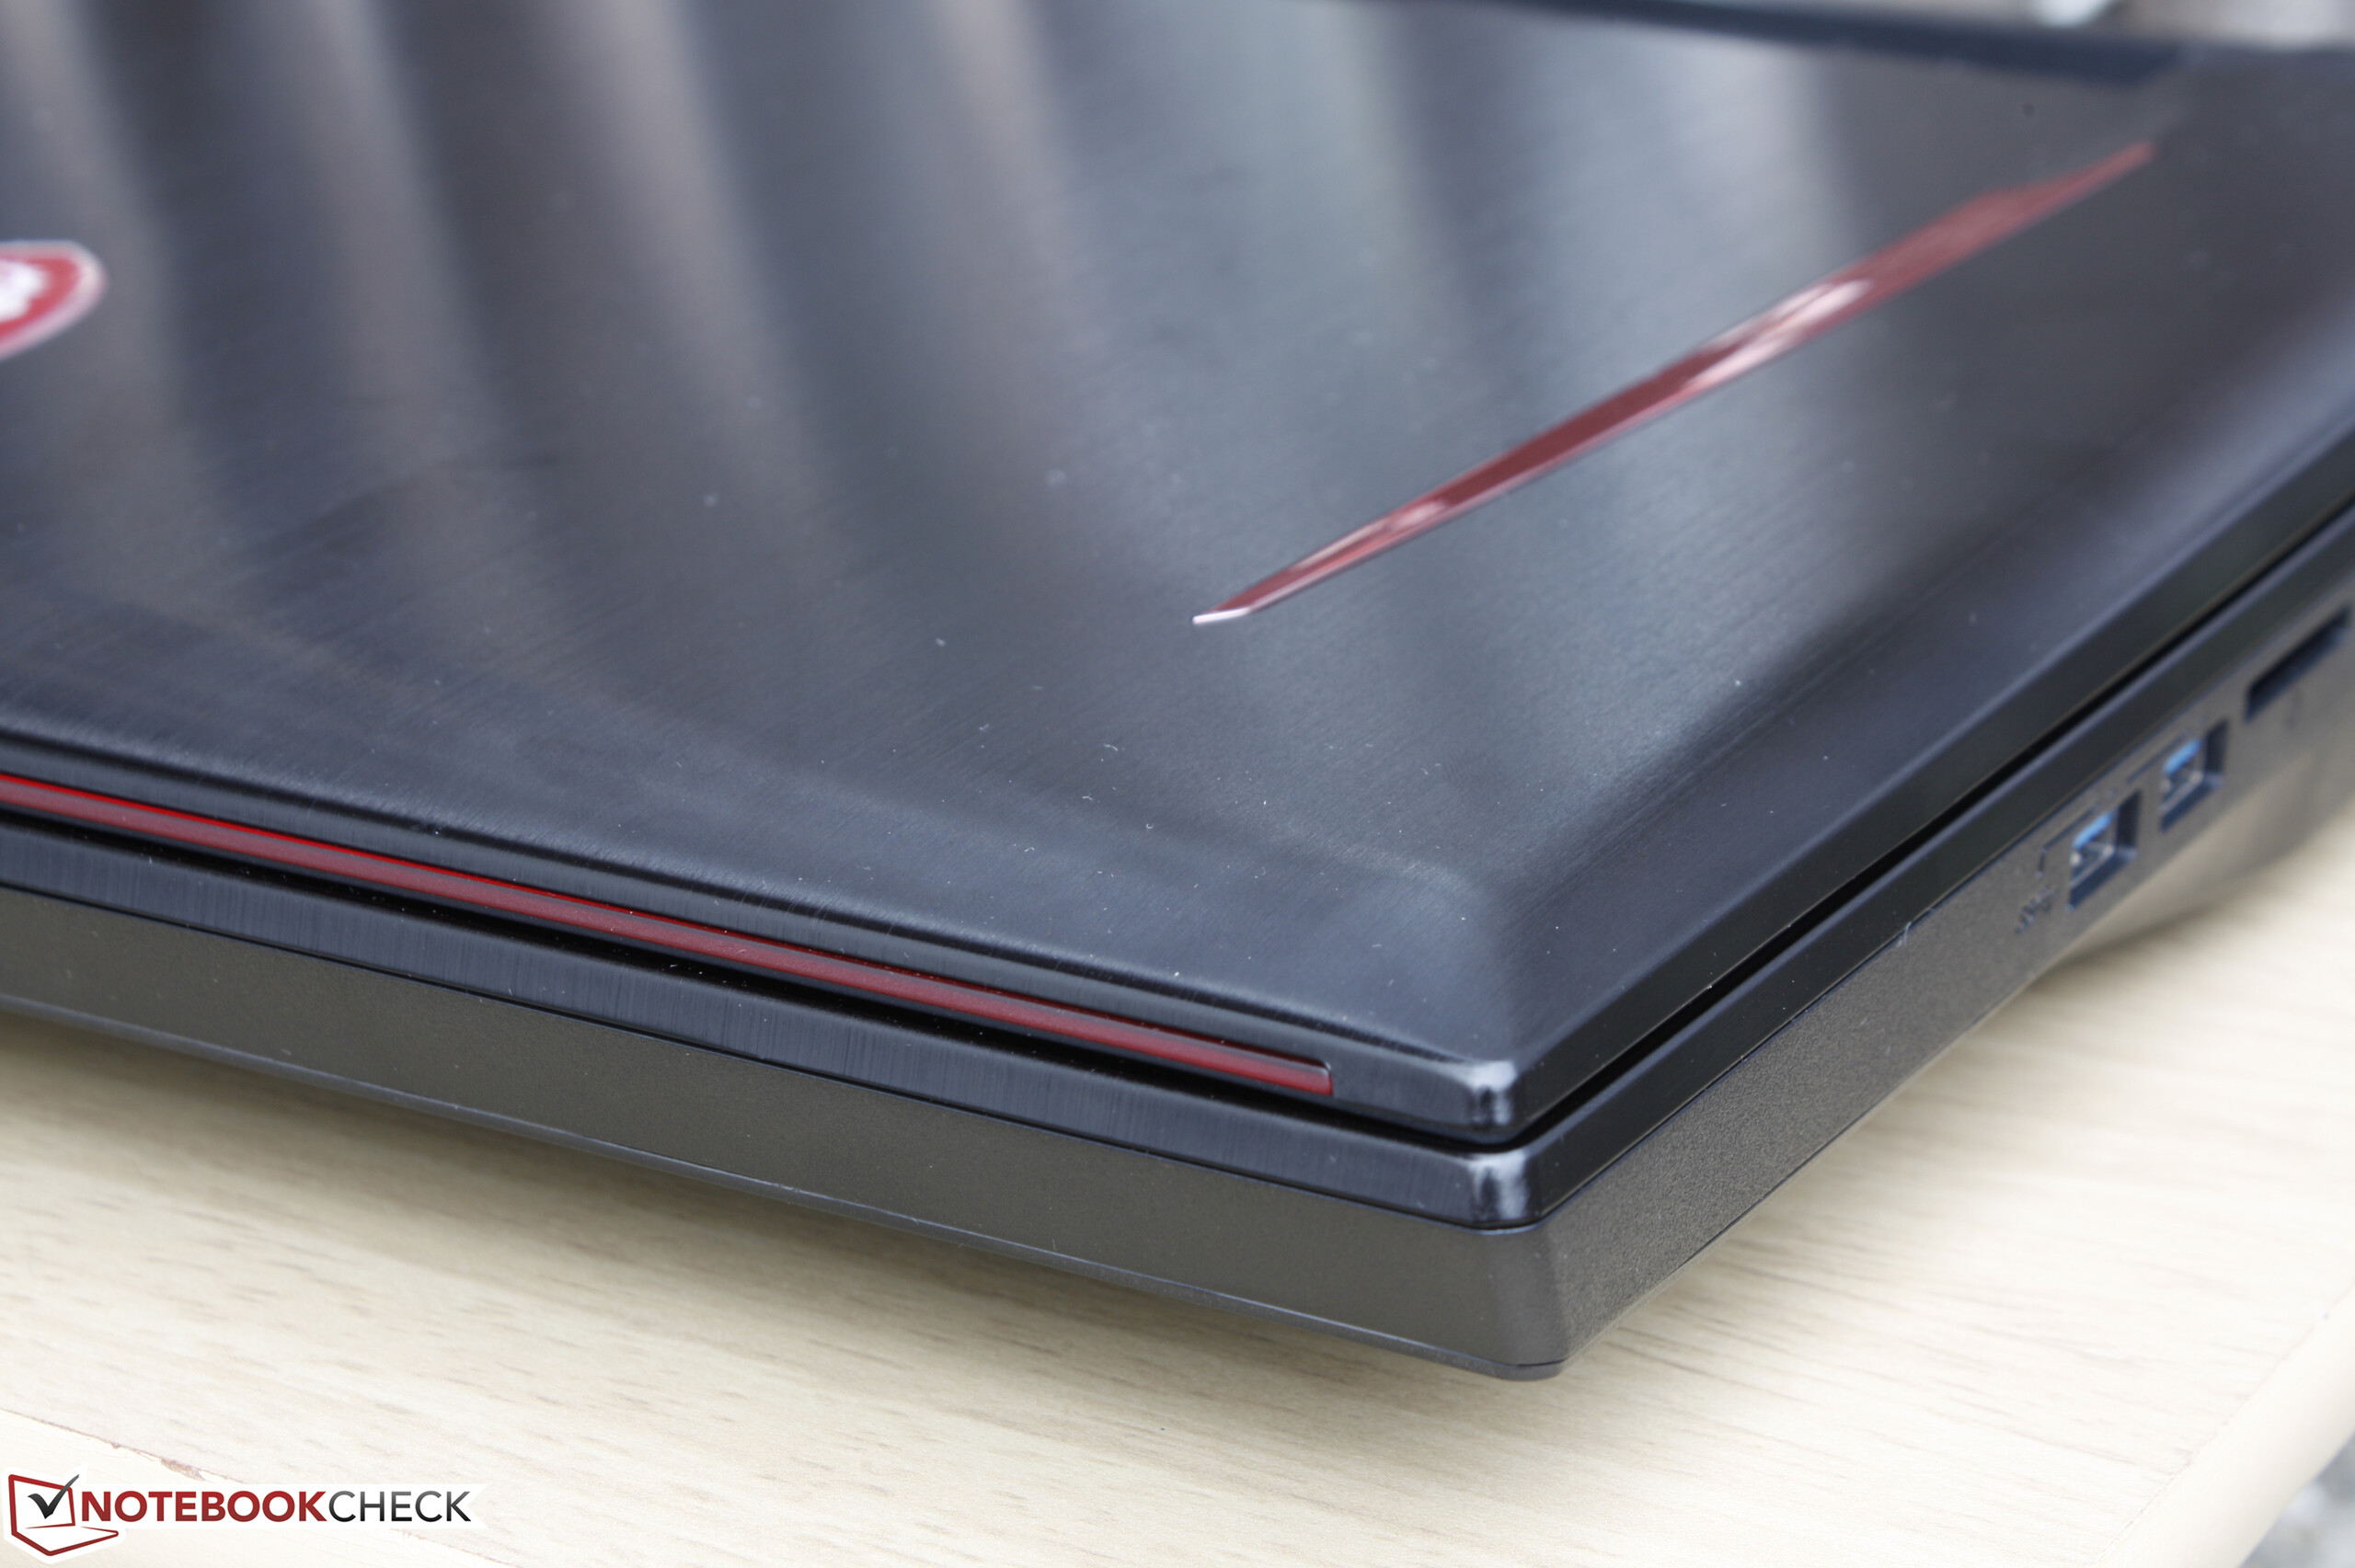
Workmanship is excellent as well with no unintended gaps between the different materials. The rear ventilation grilles are stiff and the edges of the inner bezel sit firmly around the outer screen unlike on the recent Clevo design and the GT72S, respectively. Perhaps a notable weak spot of the notebook is the bottom maintenance panel as it flexes and creaks just slightly due to its numerous ventilation grilles and large empty space between it and the components underneath. In comparison, the bottom panels of the Asus G752 and the Eurocom series are stiffer.
Connectivity
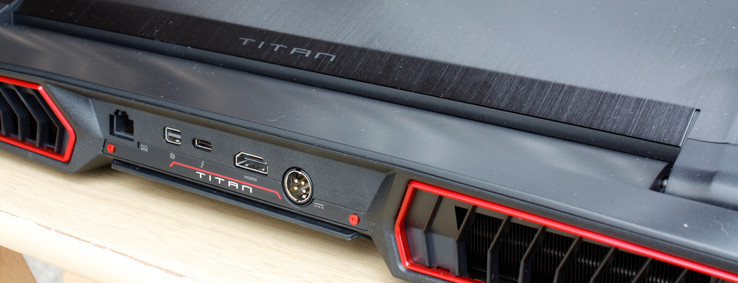
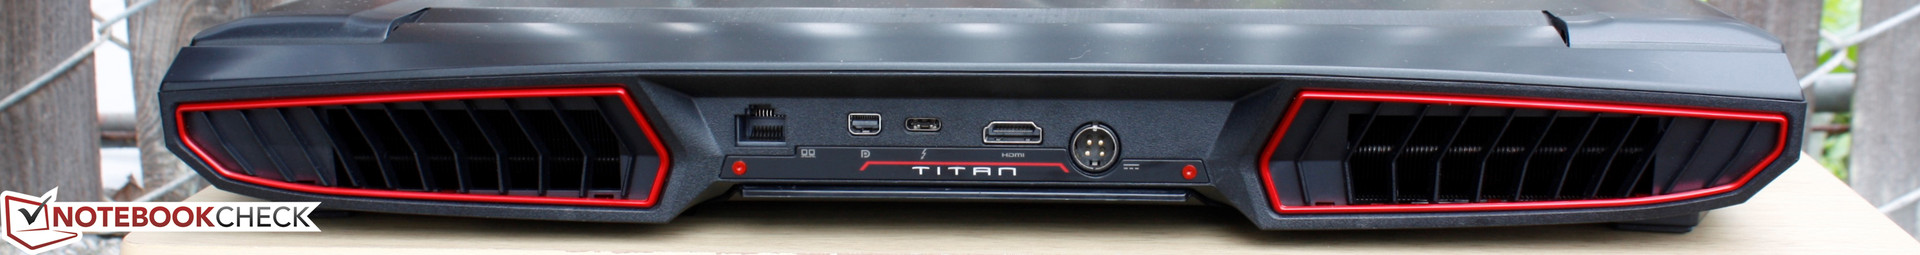
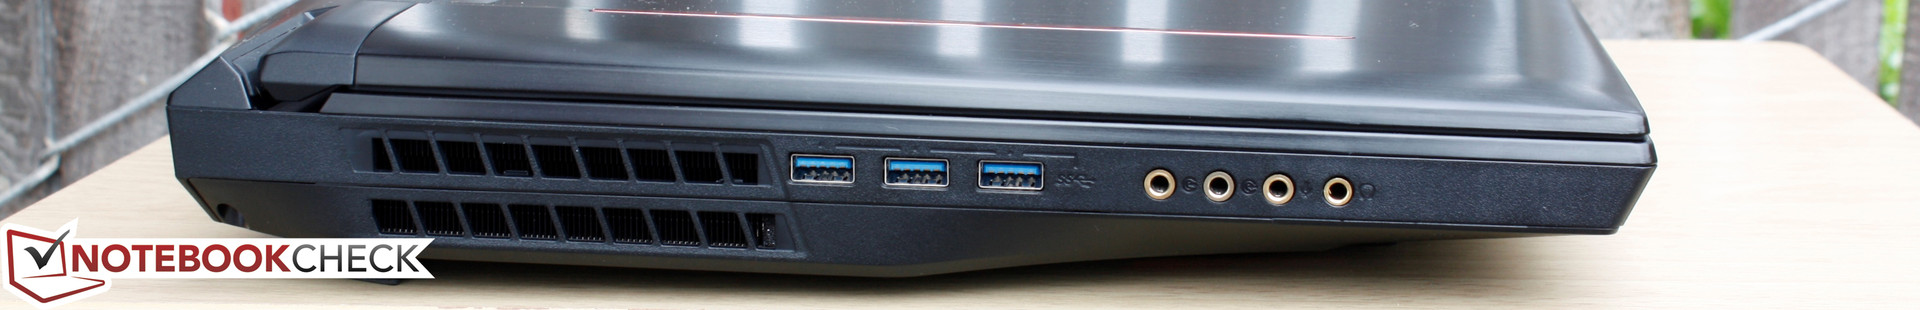
All the core connectivity features are available including HDMI, mDP, Thunderbolt 3, and 4x audio ports. A more irritating issue is the placement of the rear ports as they are more difficult to reach and that the HDMI port itself is upside-down compared to most other notebooks. Unlike on the Asus G701VO and latest Aorus X5 v6 models, the GT73VR utilizes HDMI 1.4 instead of 2.0 for more limited 4K output capabilities.
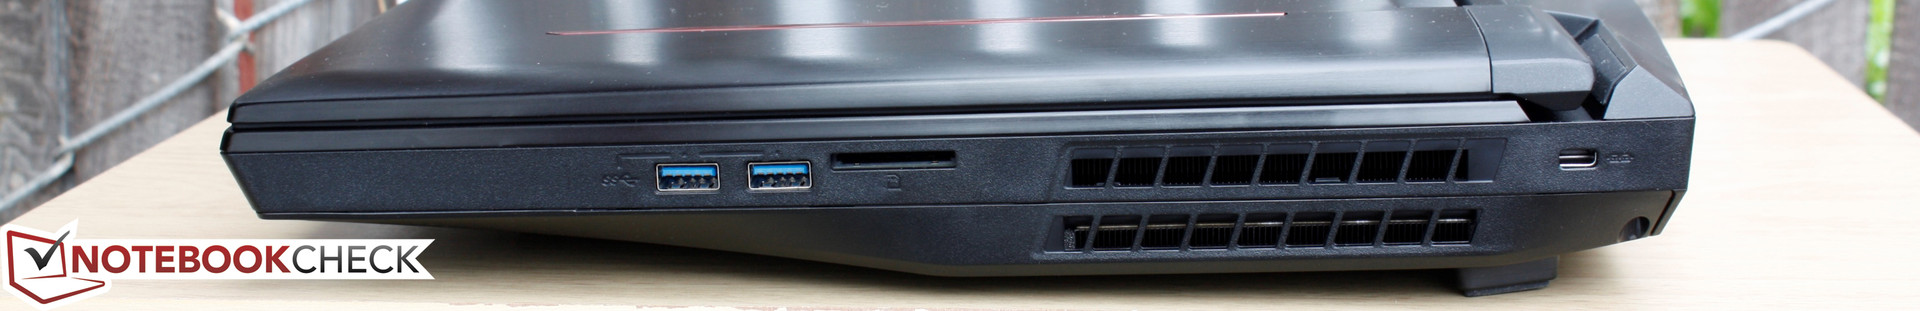
SD Card Reader
Read rates from the SD card reader average about 210 MB/s from our Toshiba Exceria Pro UHS-II test card. This is slightly slower than on the Asus G701VO and the Eurocom Sky X7E2, but still significantly faster than on the MSI GS73VR. Transferring 1 GB of photos from the reader to desktop will take about 6.5 seconds.
| SD Card Reader | |
| average JPG Copy Test (av. of 3 runs) | |
| Asus G701VO-CS74K | |
| MSI GT73VR 6RF | |
| MSI GS73VR 6RF | |
| maximum AS SSD Seq Read Test (1GB) | |
| Asus G701VO-CS74K | |
| MSI GT73VR 6RF | |
| MSI GS73VR 6RF | |
Communication
WLAN is provided by a Killer 1535 M.2 module capable of theoretical transfer rates of up to 867 Mbps. Special features include DoubleShot Pro for utilizing both cabled and WLAN connectivity simultaneously and full MU-MIMO and beamforming for routers that support them. See our dedicated review on the Killer 1535 for more details on performance.
An iPerf3 test standing one meter away from our Linksys EA8500 test router reveals a real-world transfer rate of about 660 Mbps under the -i 1 -t 30 -w 4M -P 10 -O 3 command line.
| Networking | |
| Wi-Fi Client 1m 512KB | |
| Wi-Fi Server 1m 512KB |
Accessories
Included extras are a warranty card, Quick Start guide, Nvidia sticker, cleaning cloth, and a drivers/utilities DVD. The latter, of course, will require an external DVD drive to use. In comparison, Clevo resellers like Eurocom include additional screws, padding, and even thermal paste since they encourage end-user tinkering. MSI sells a host of G series branded accessories such as backpacks, mousepads, and more.
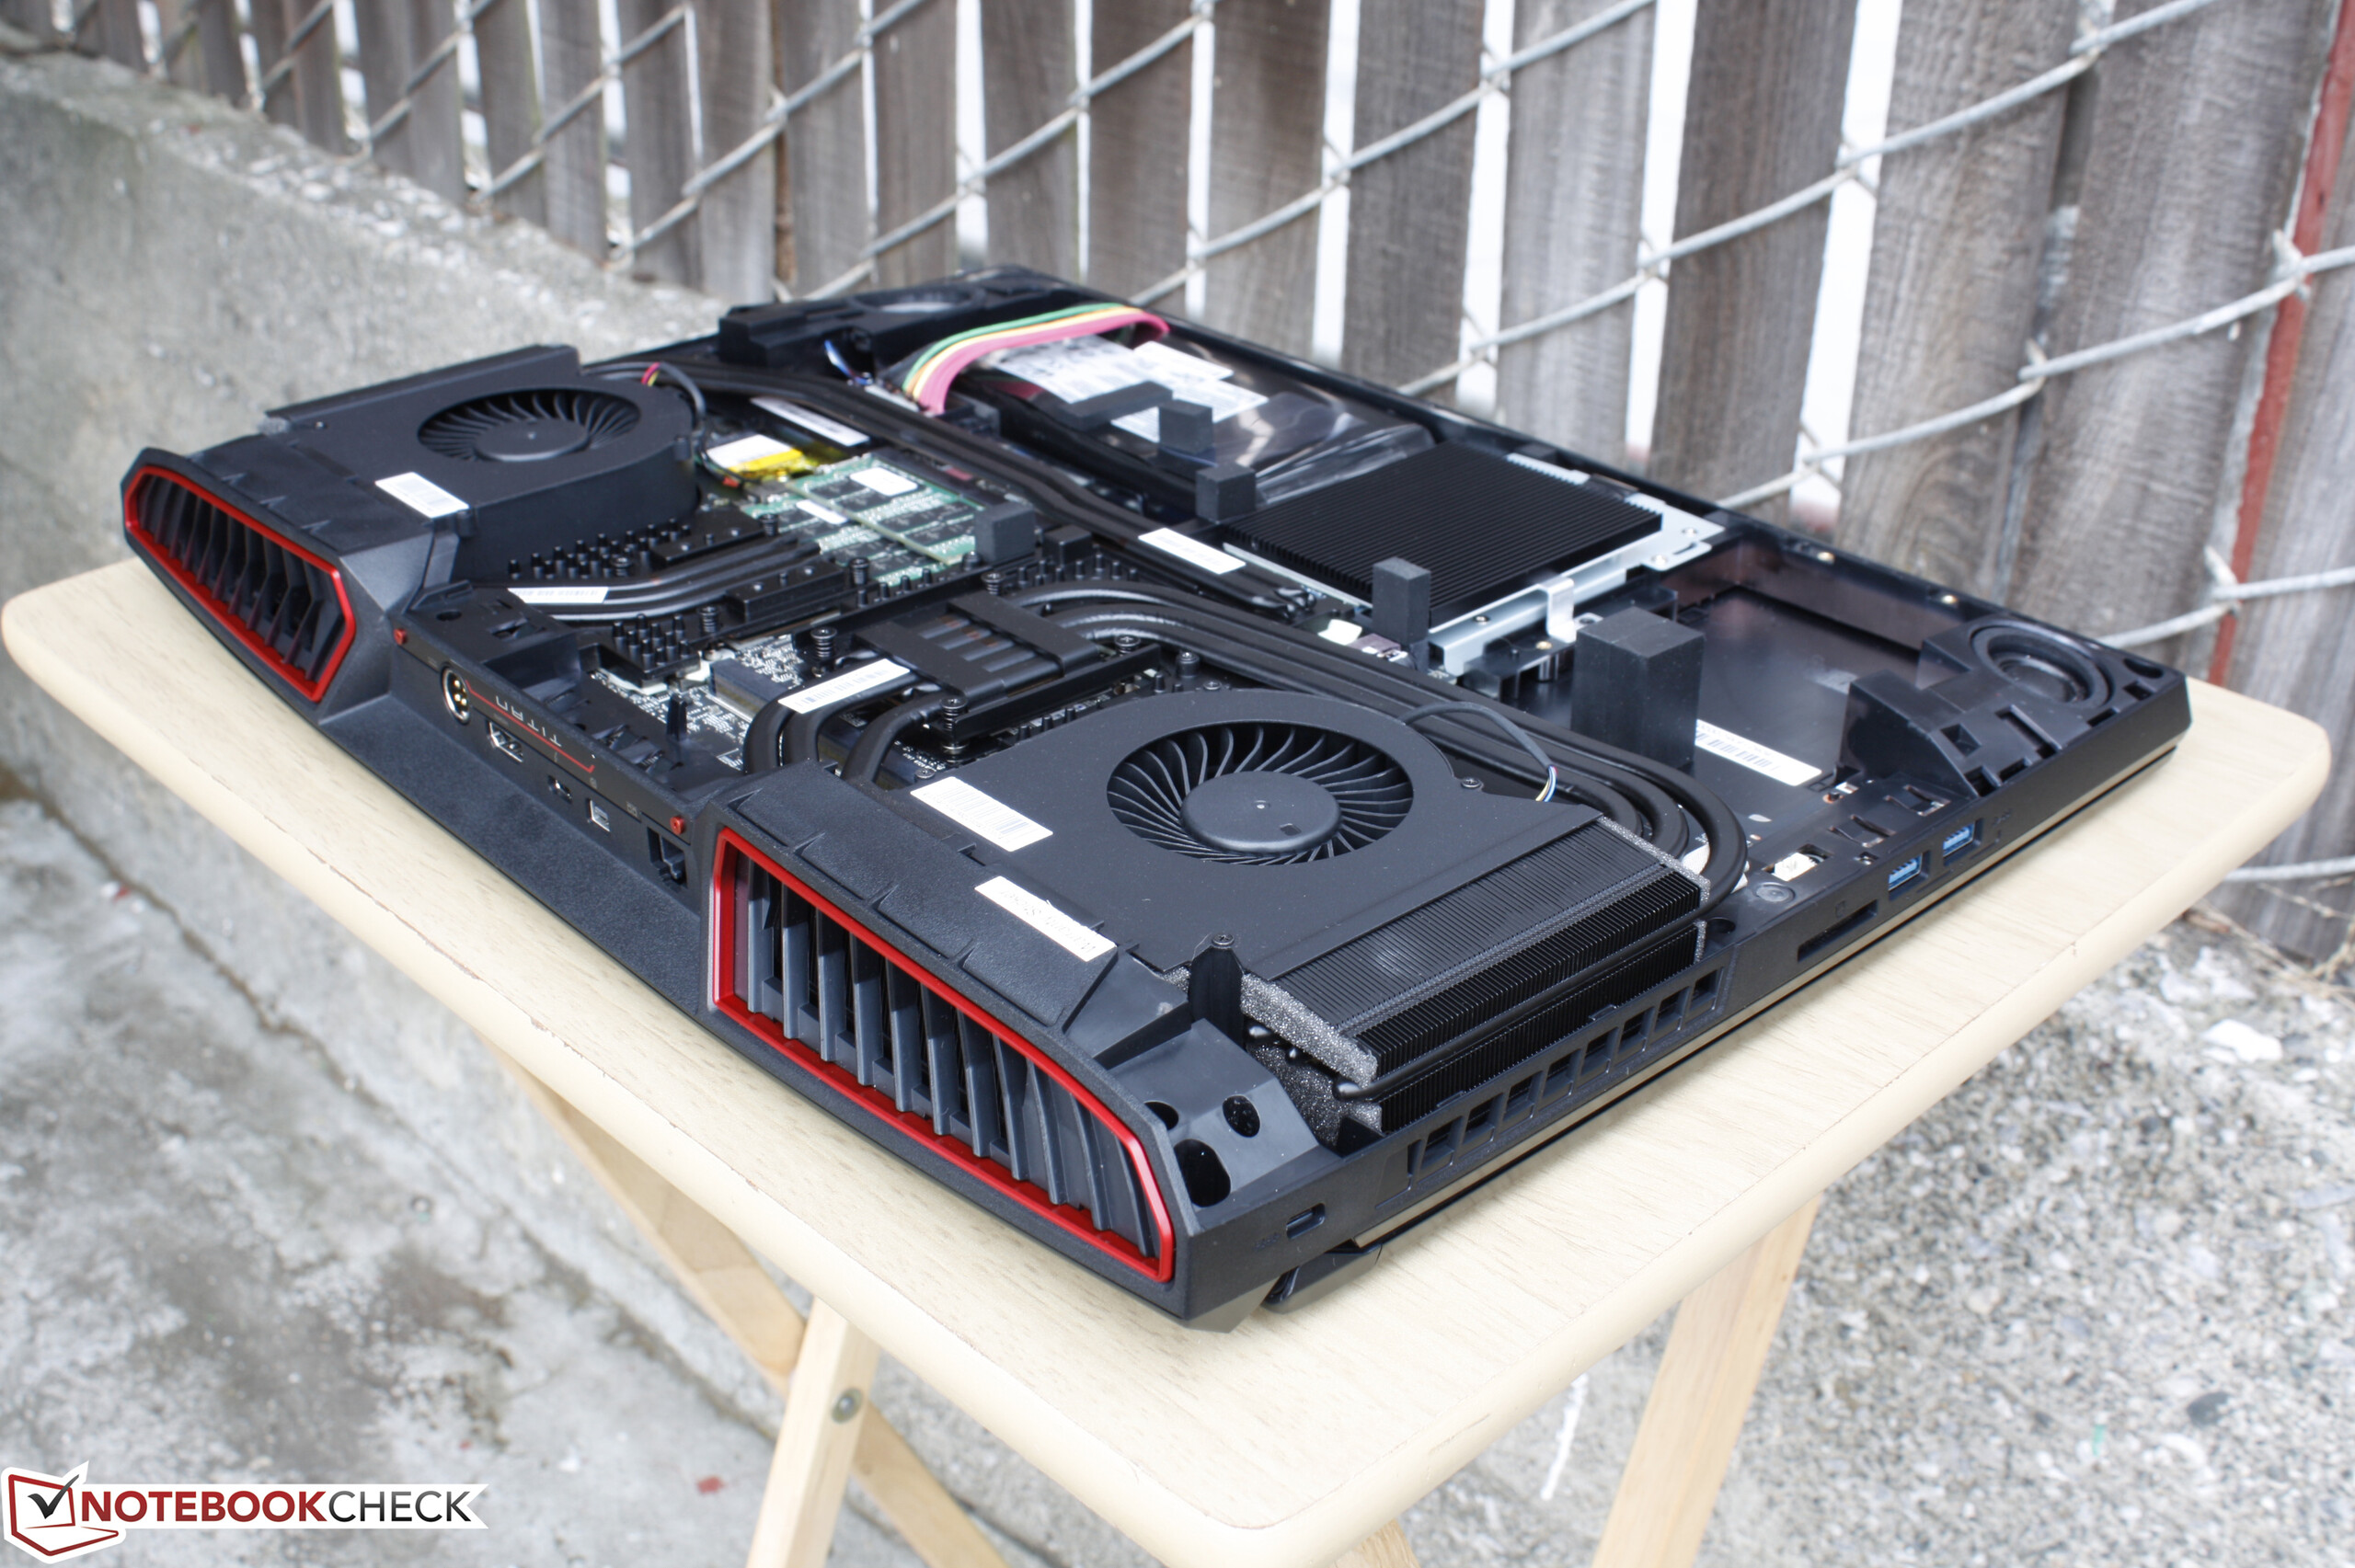
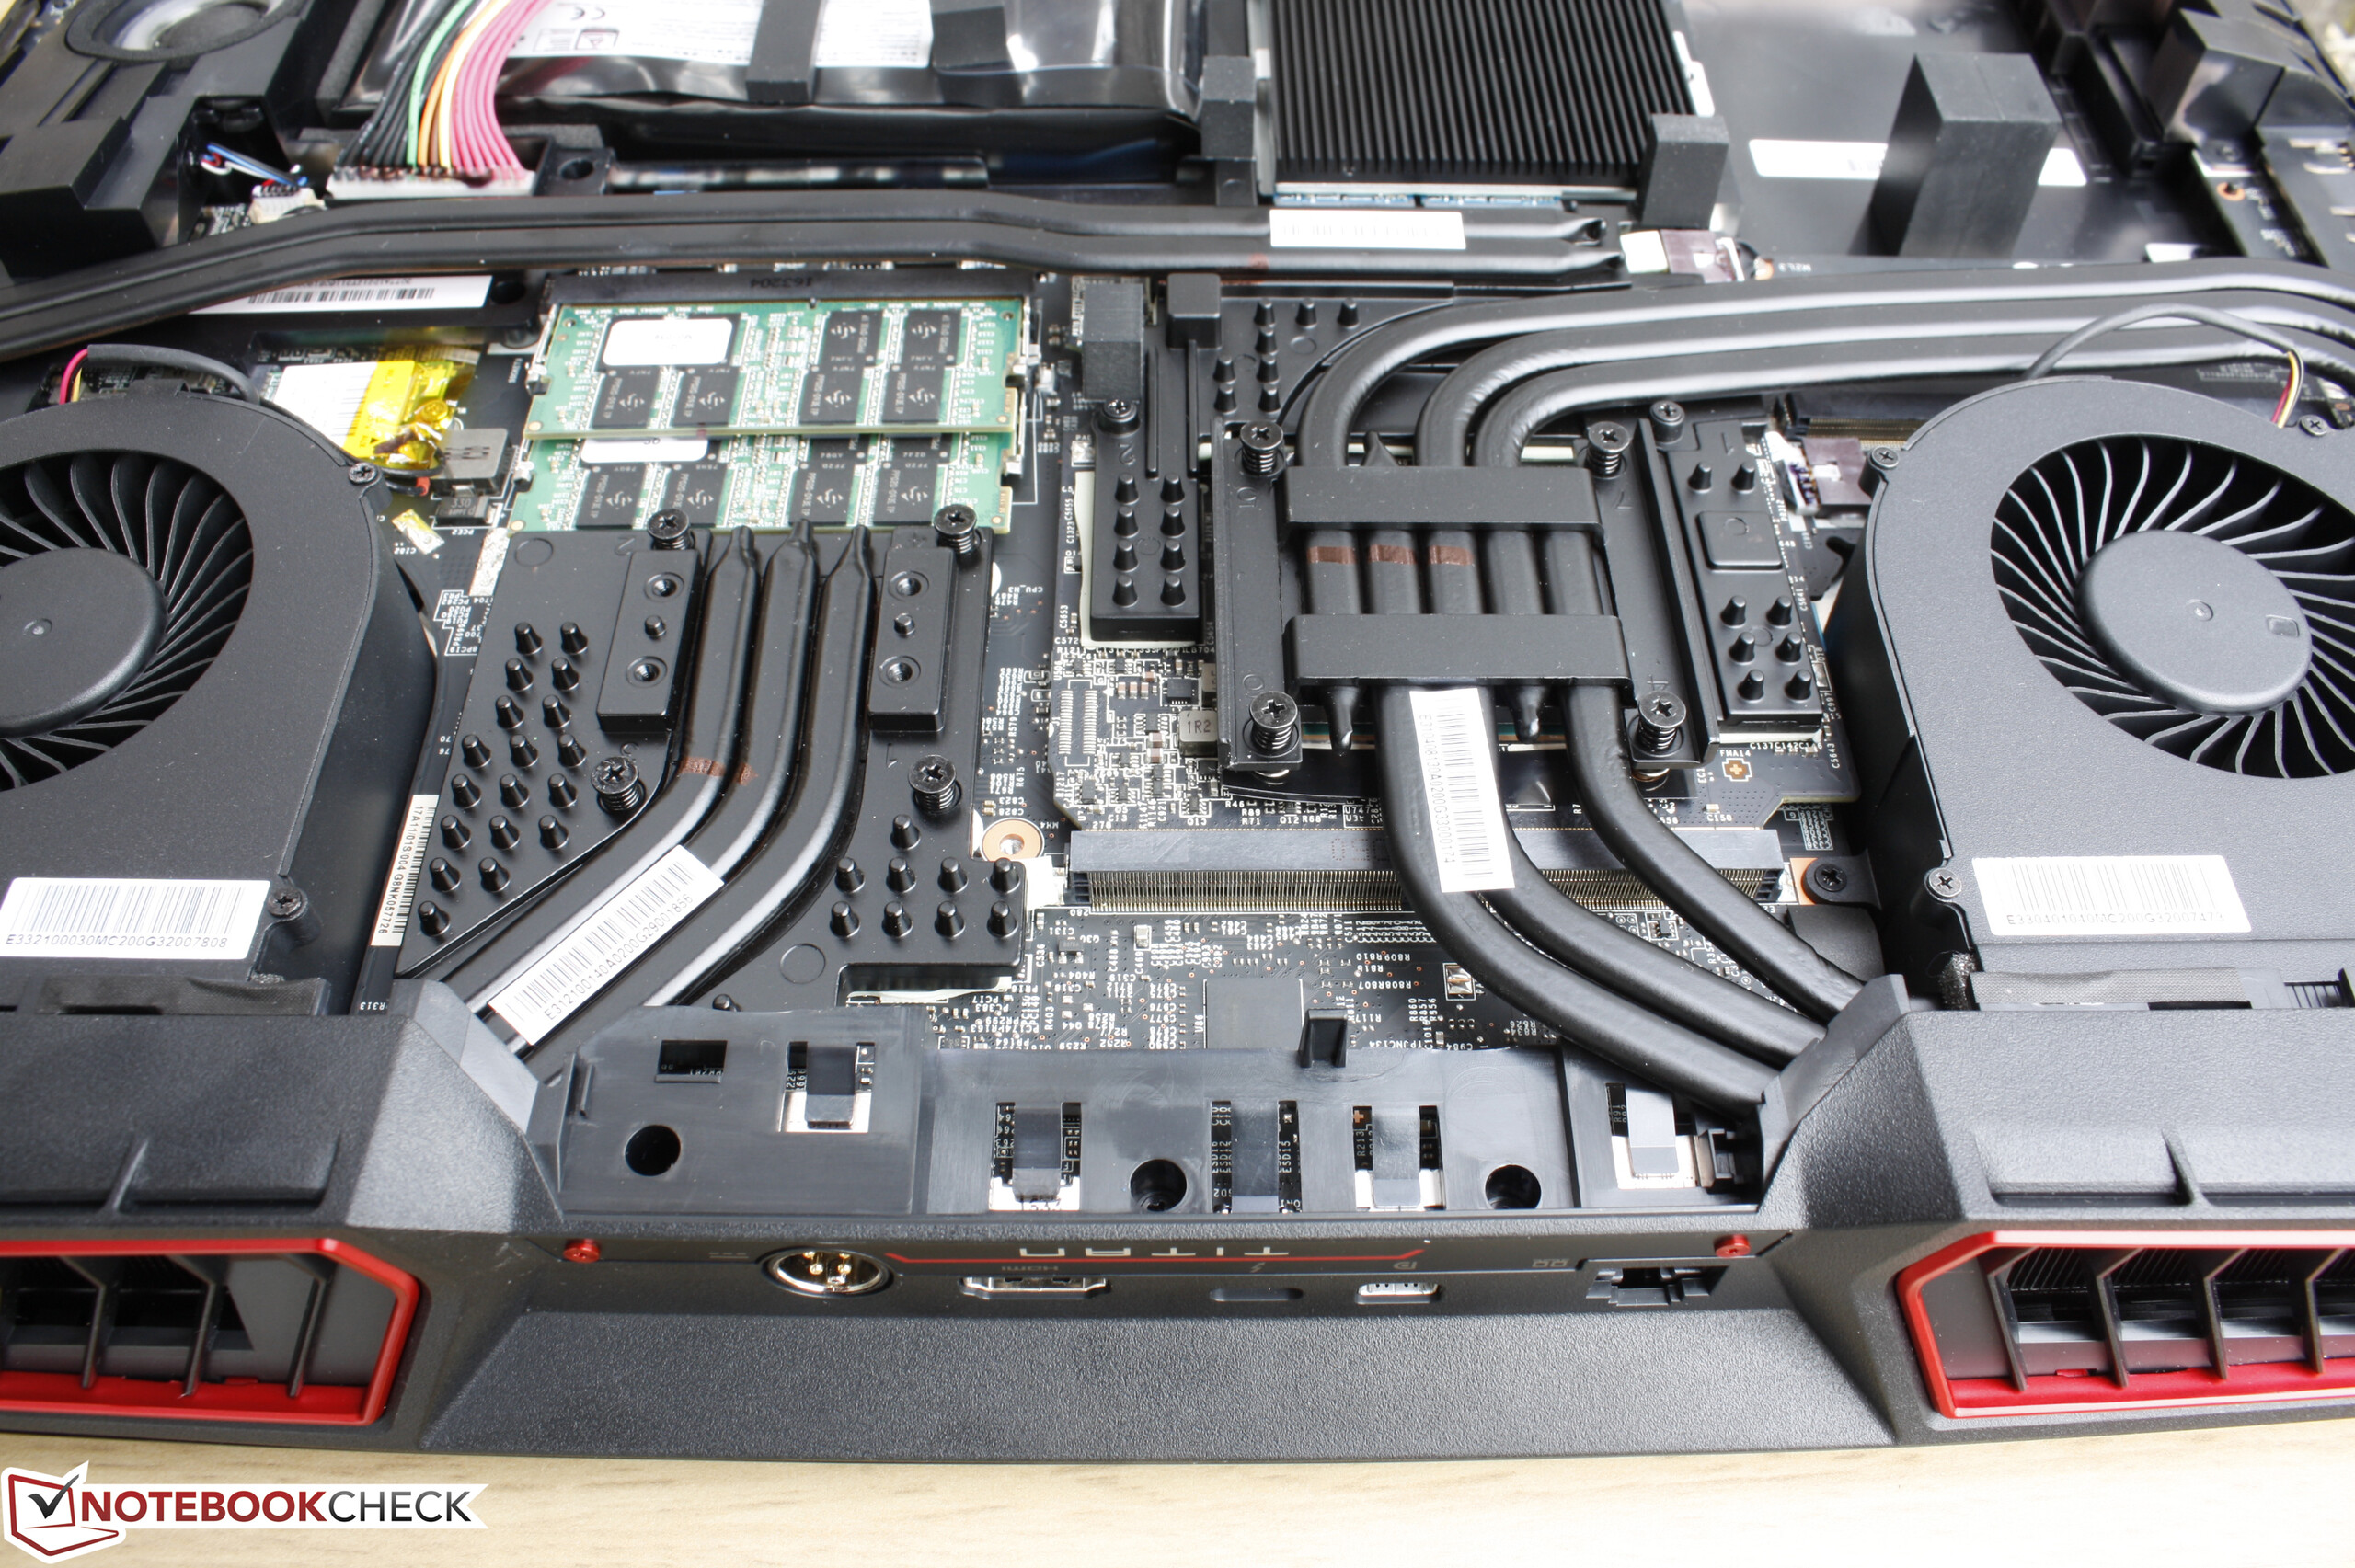
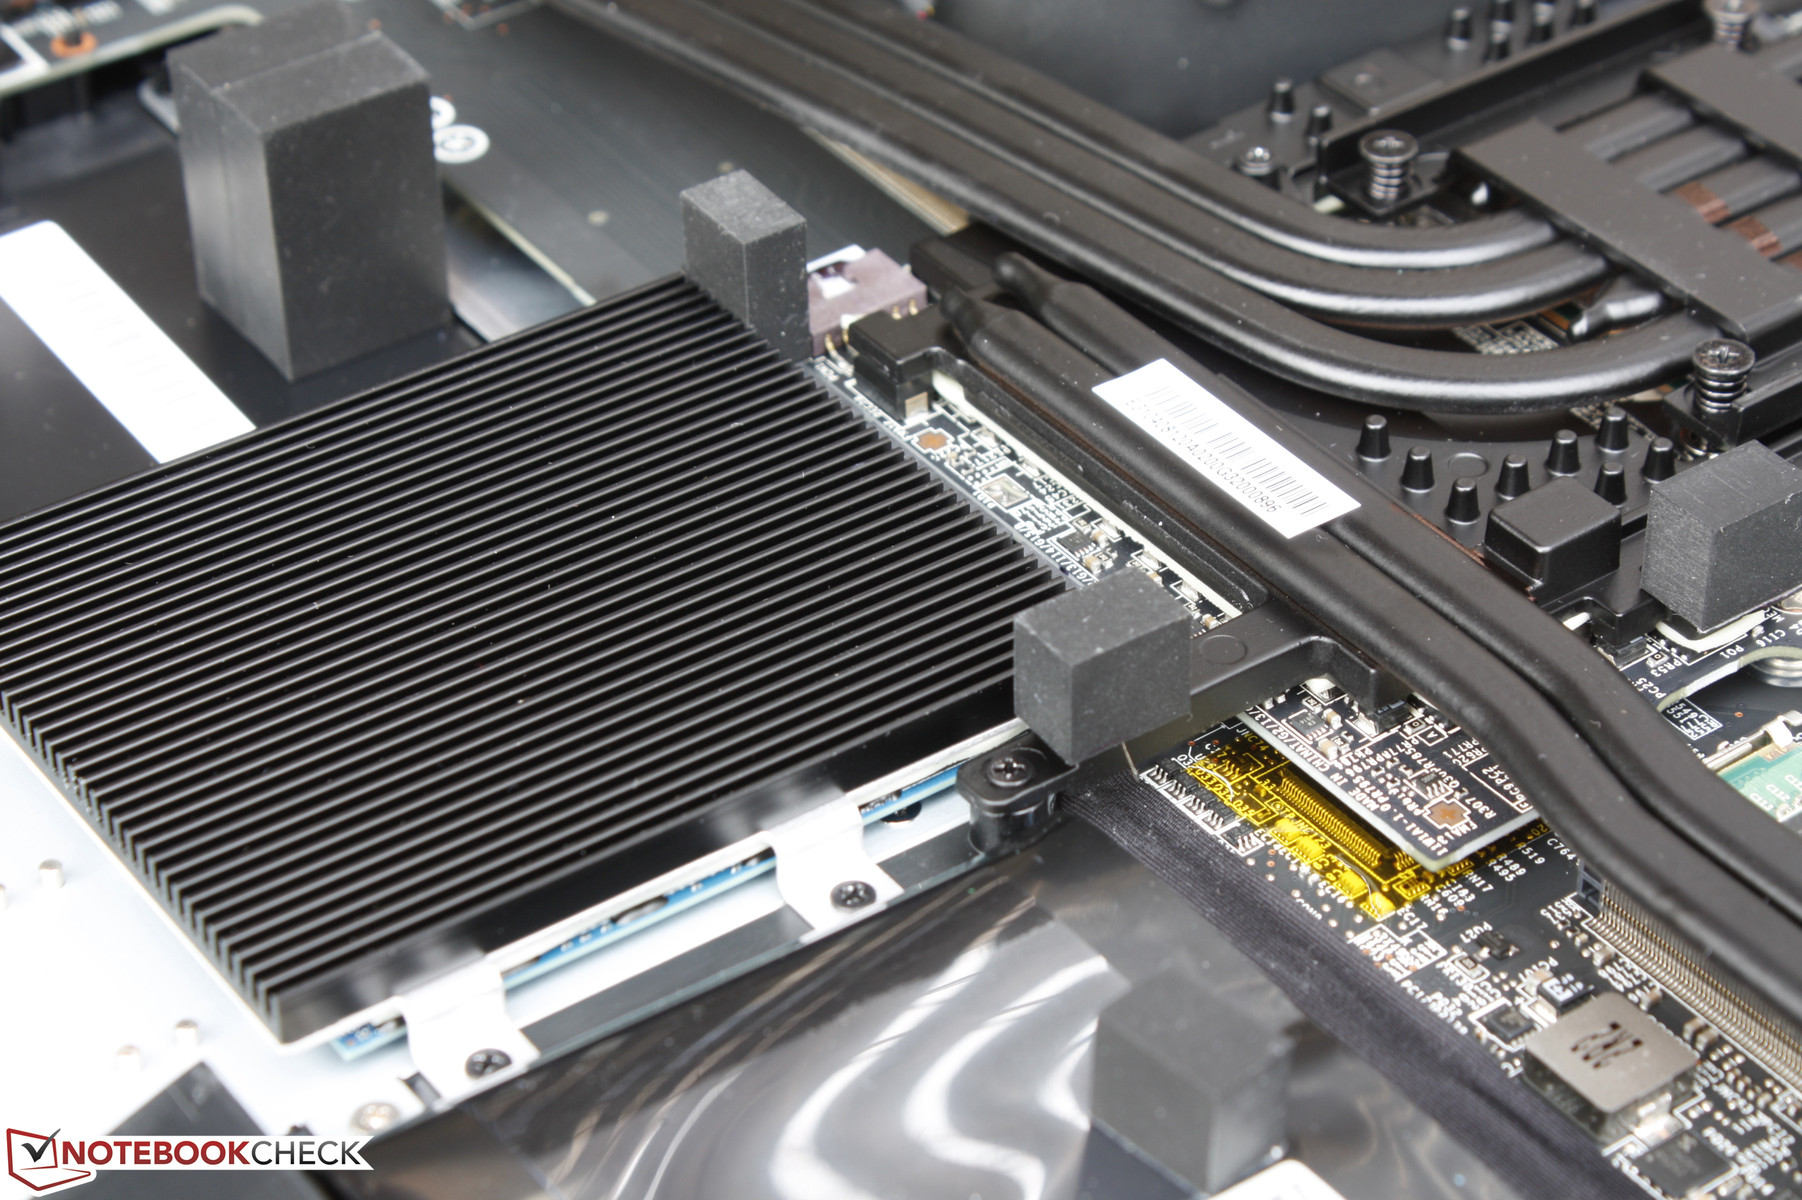
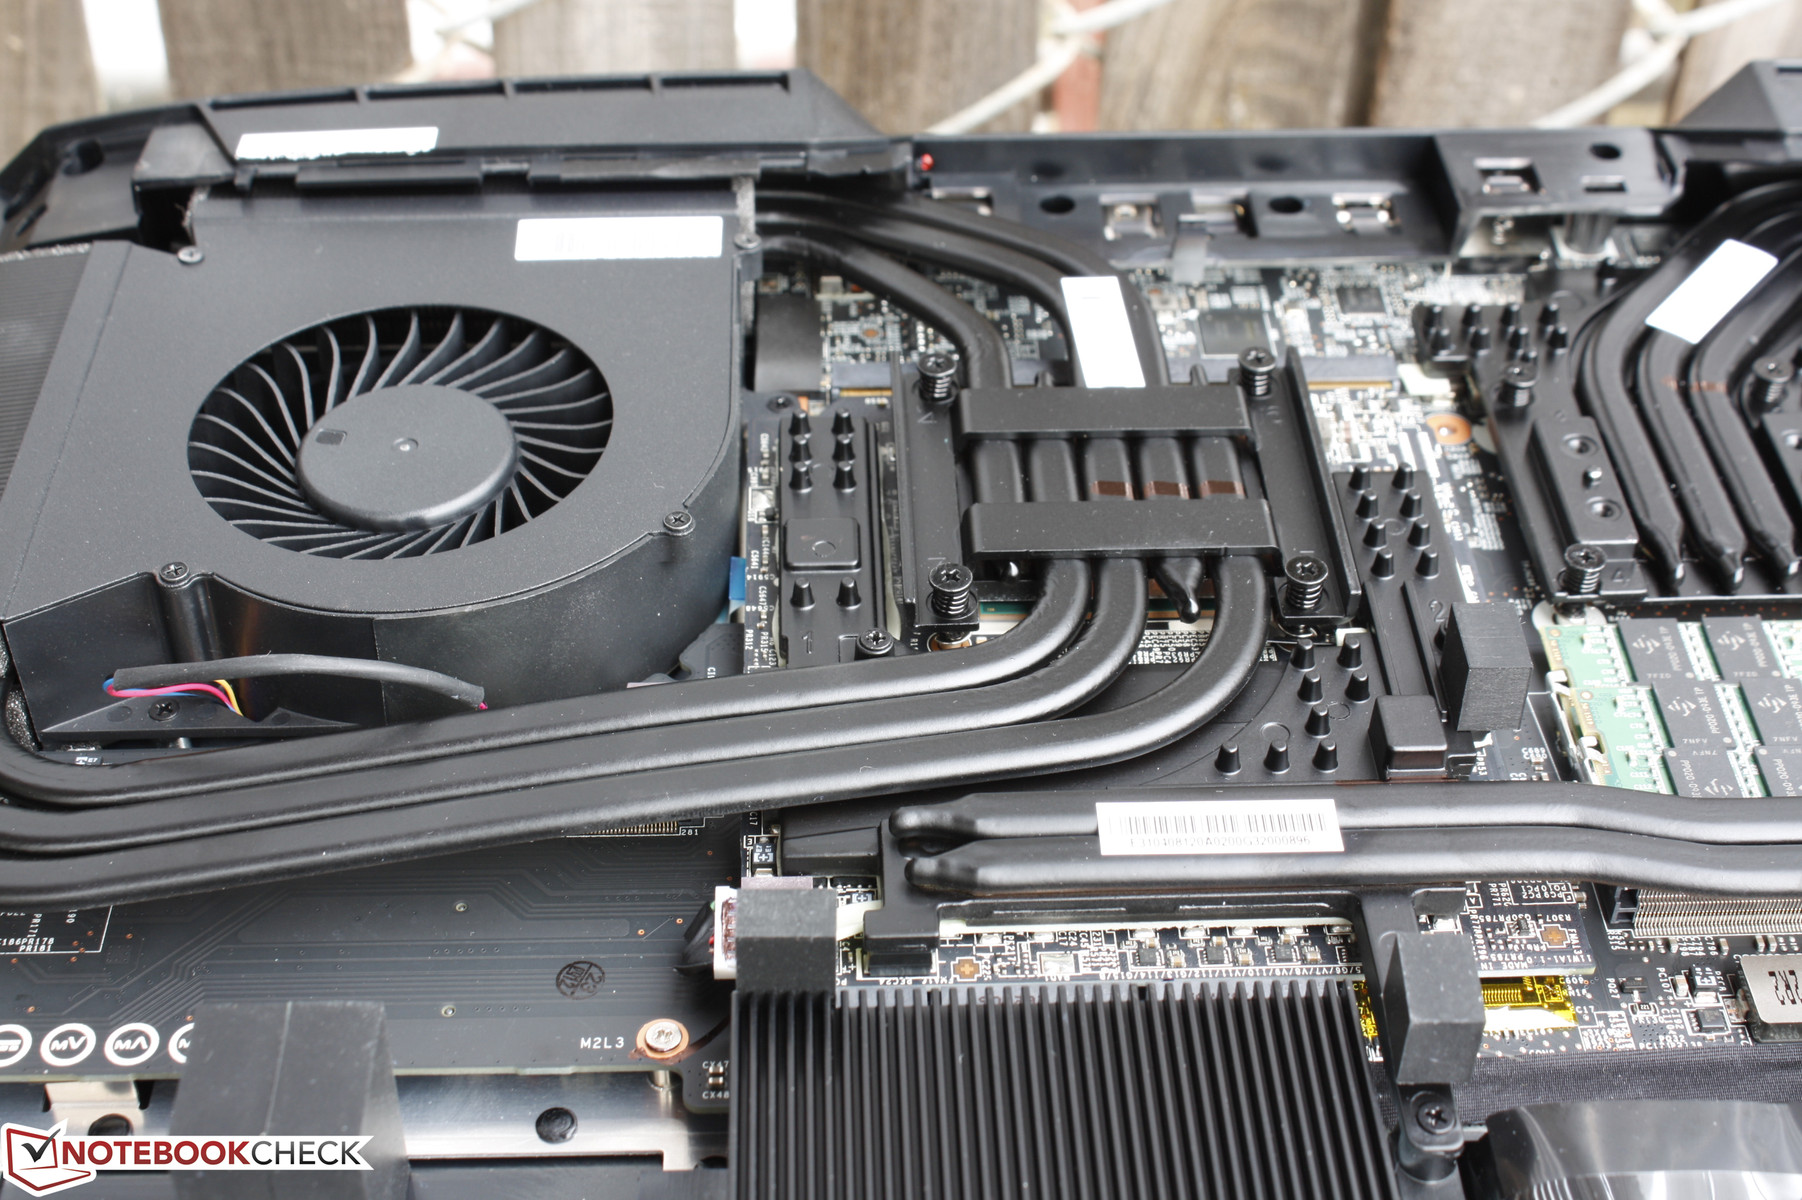
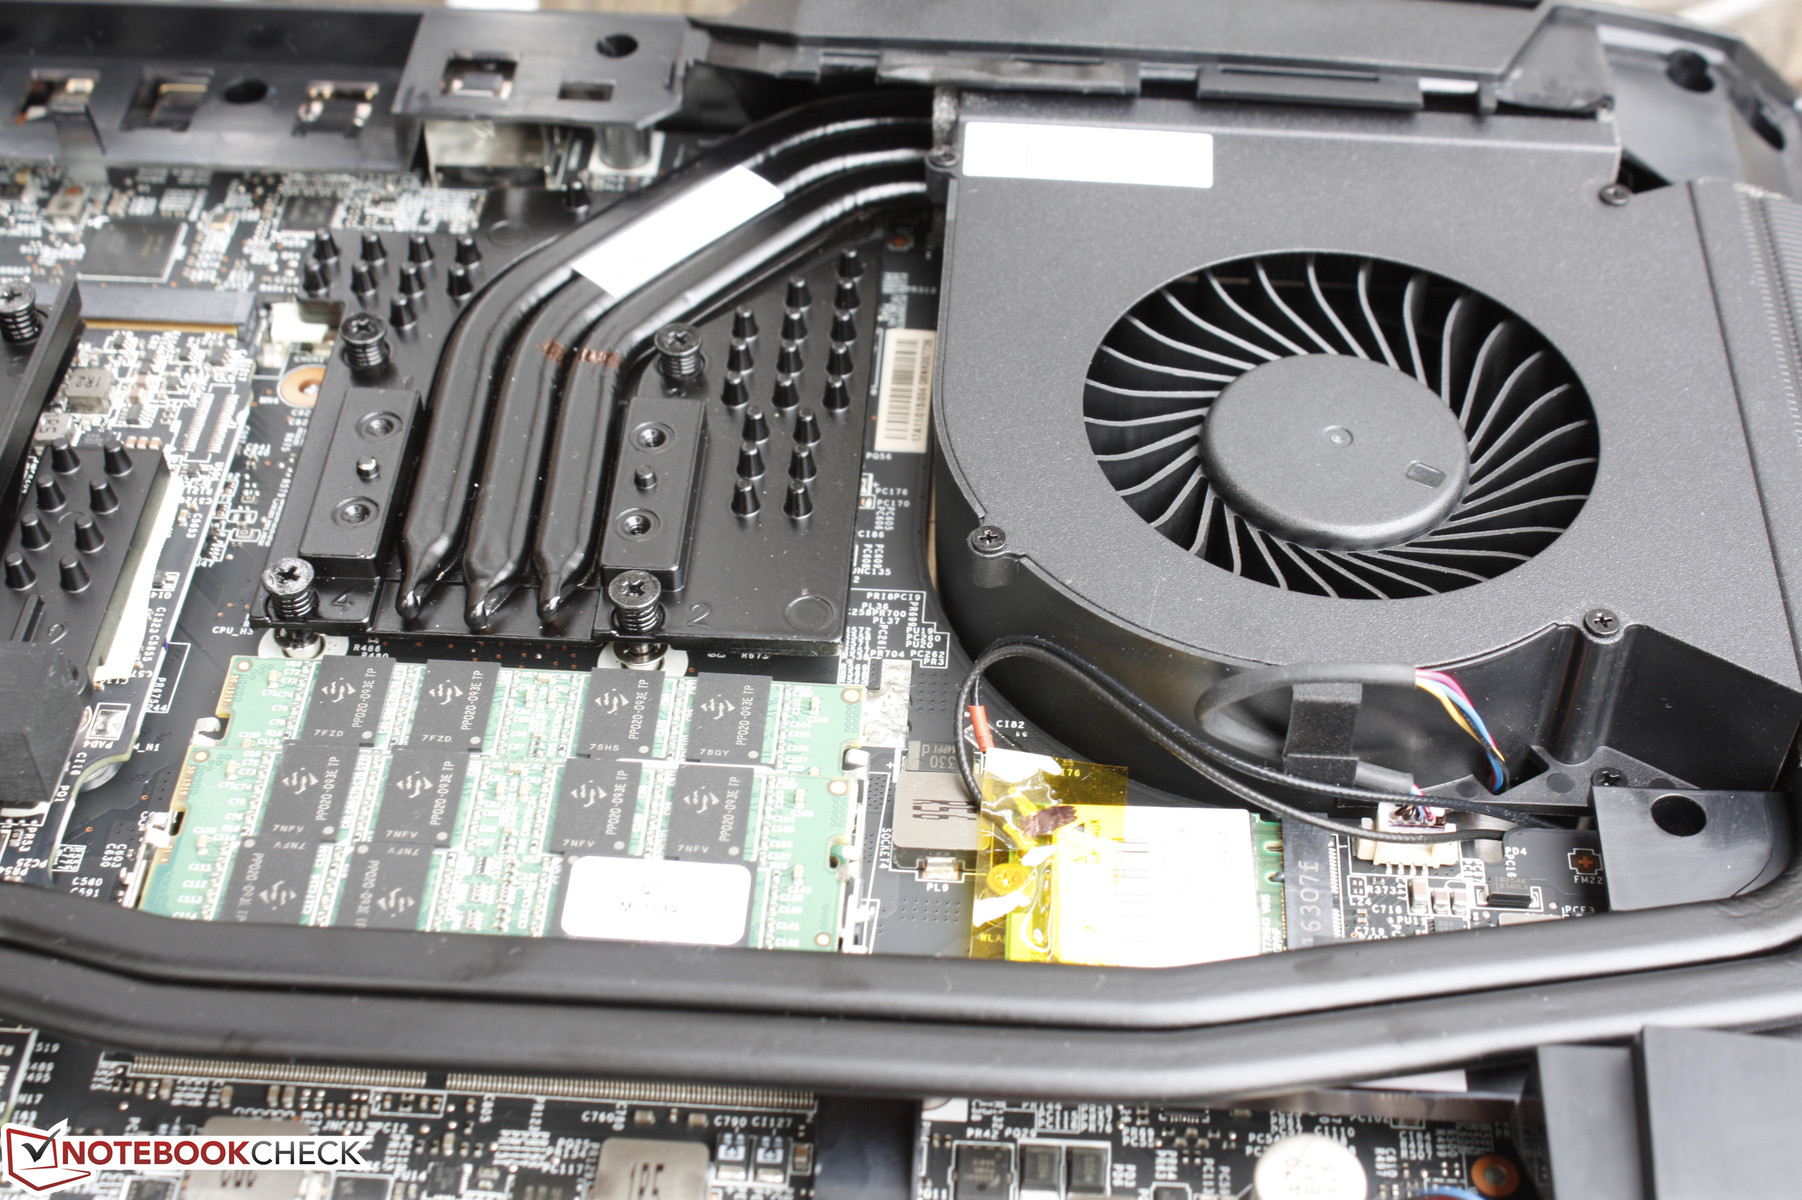
Maintenance
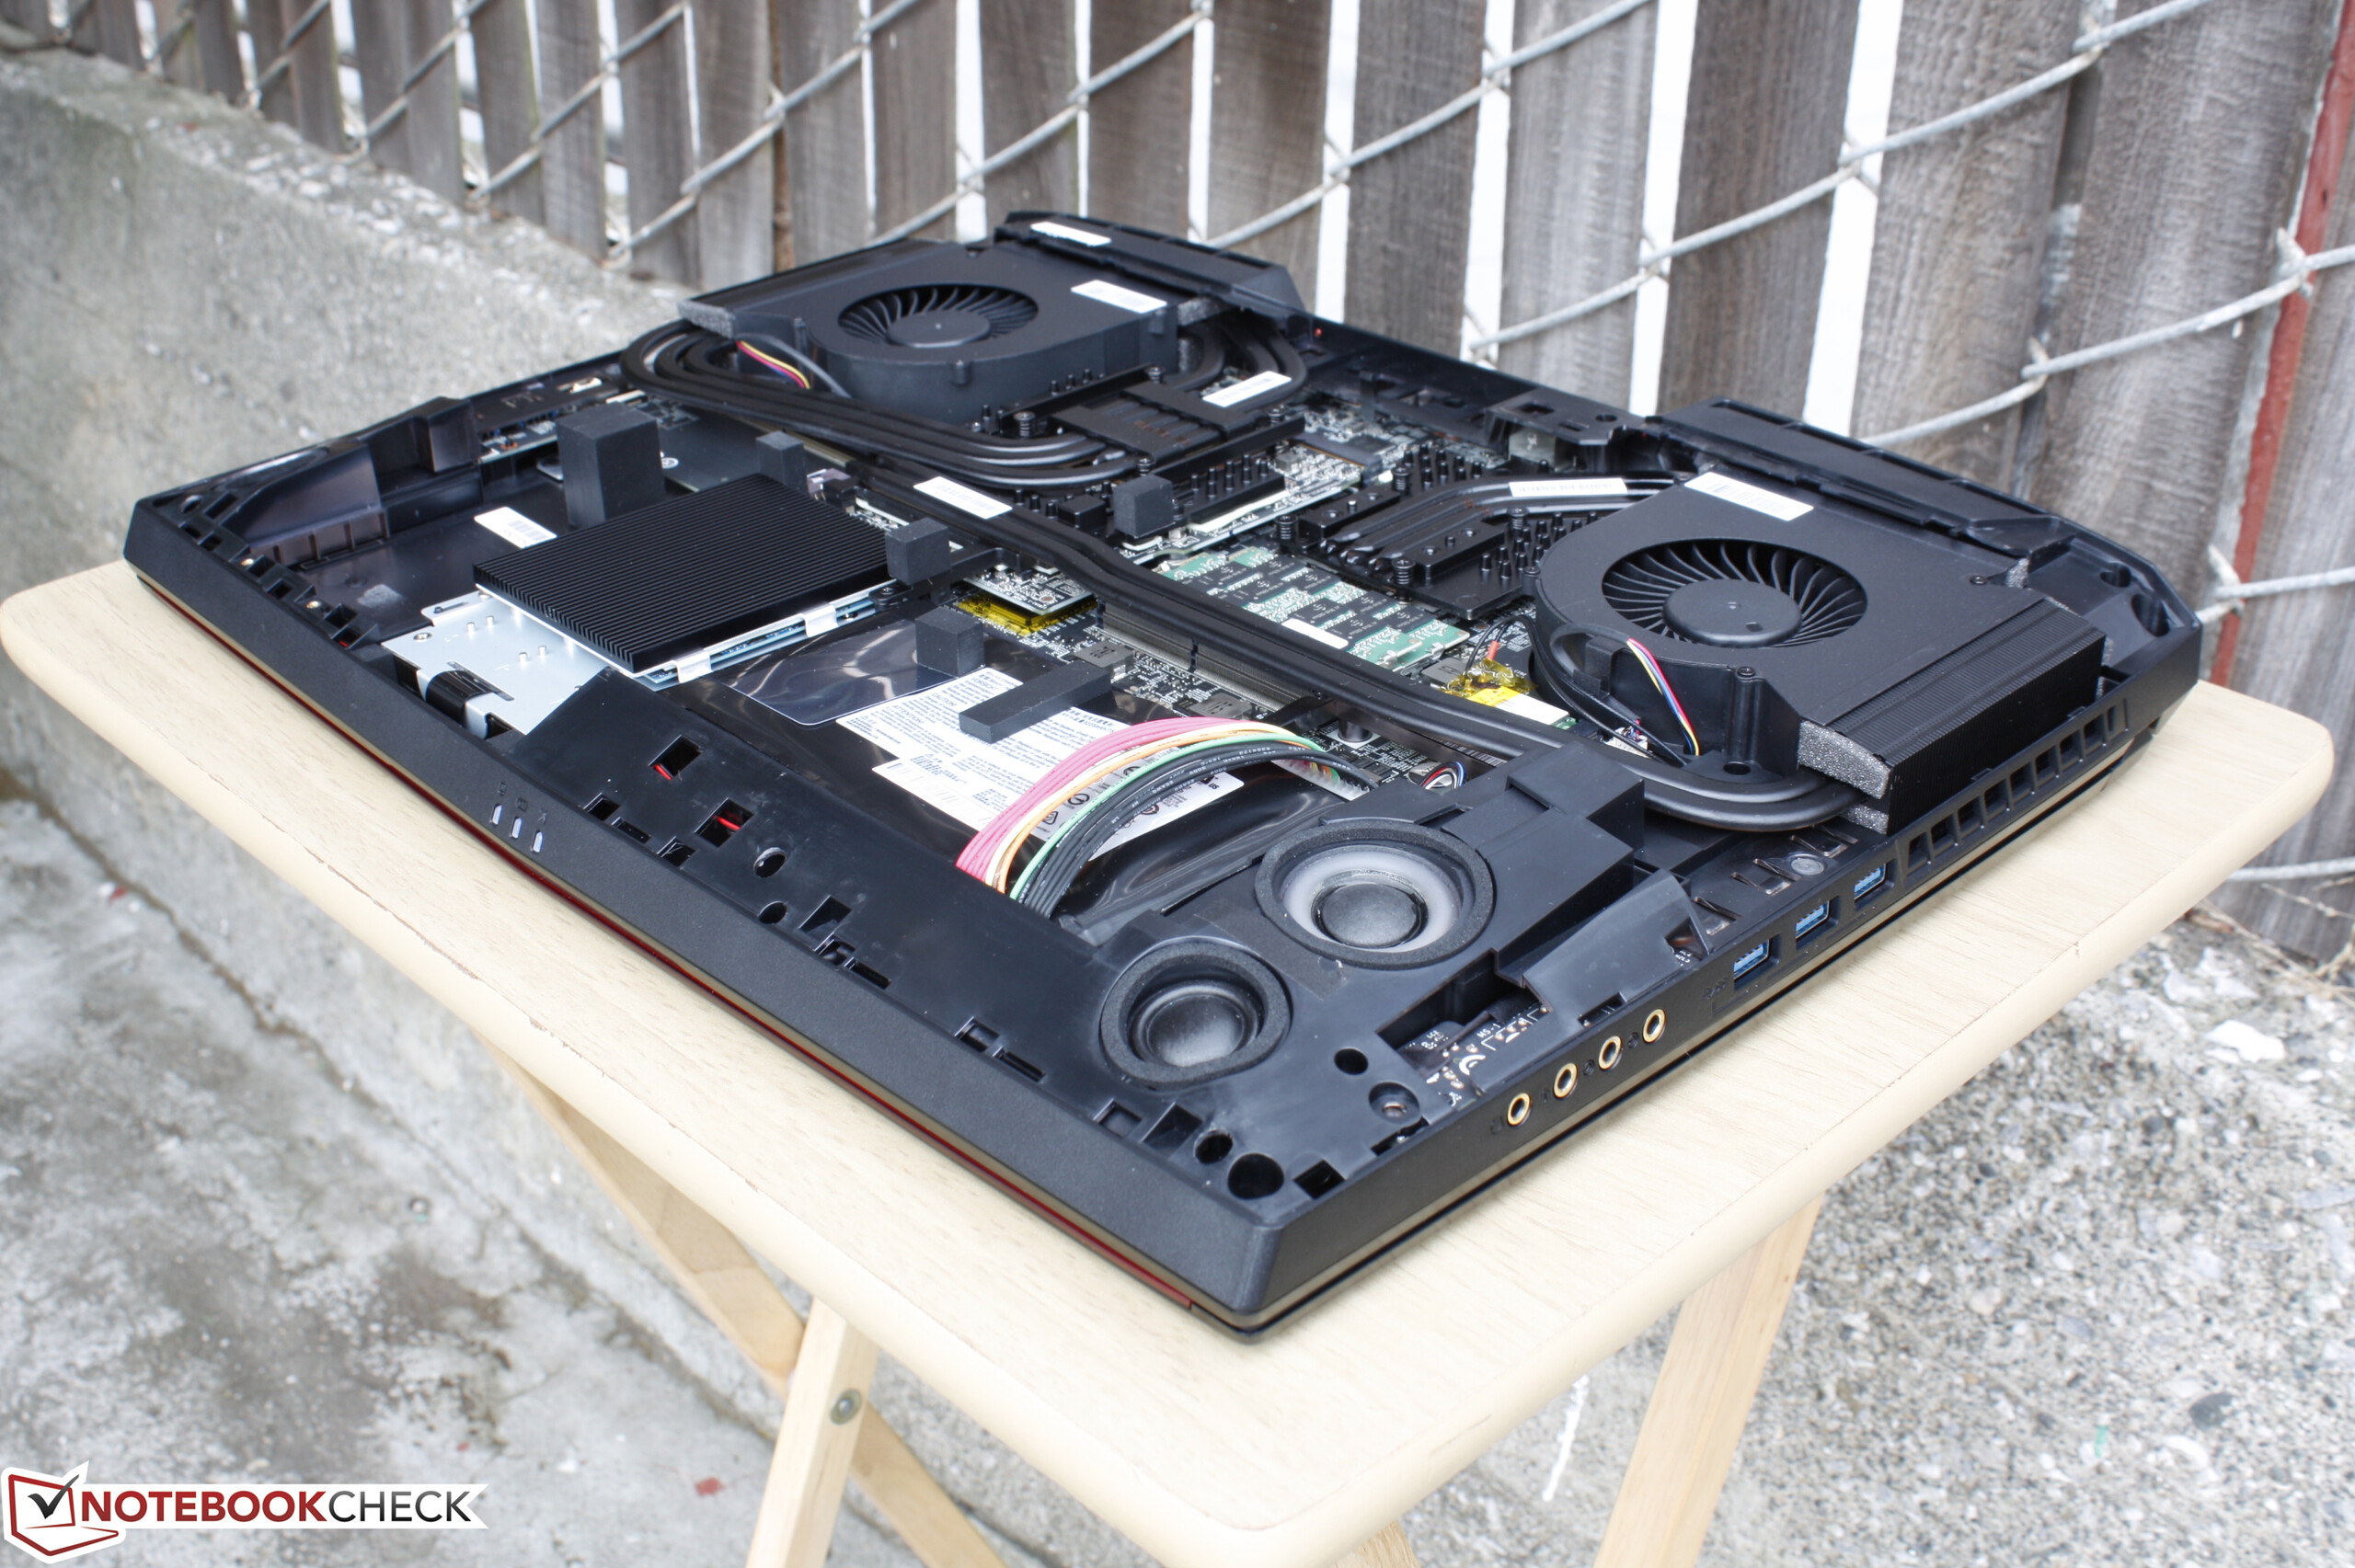
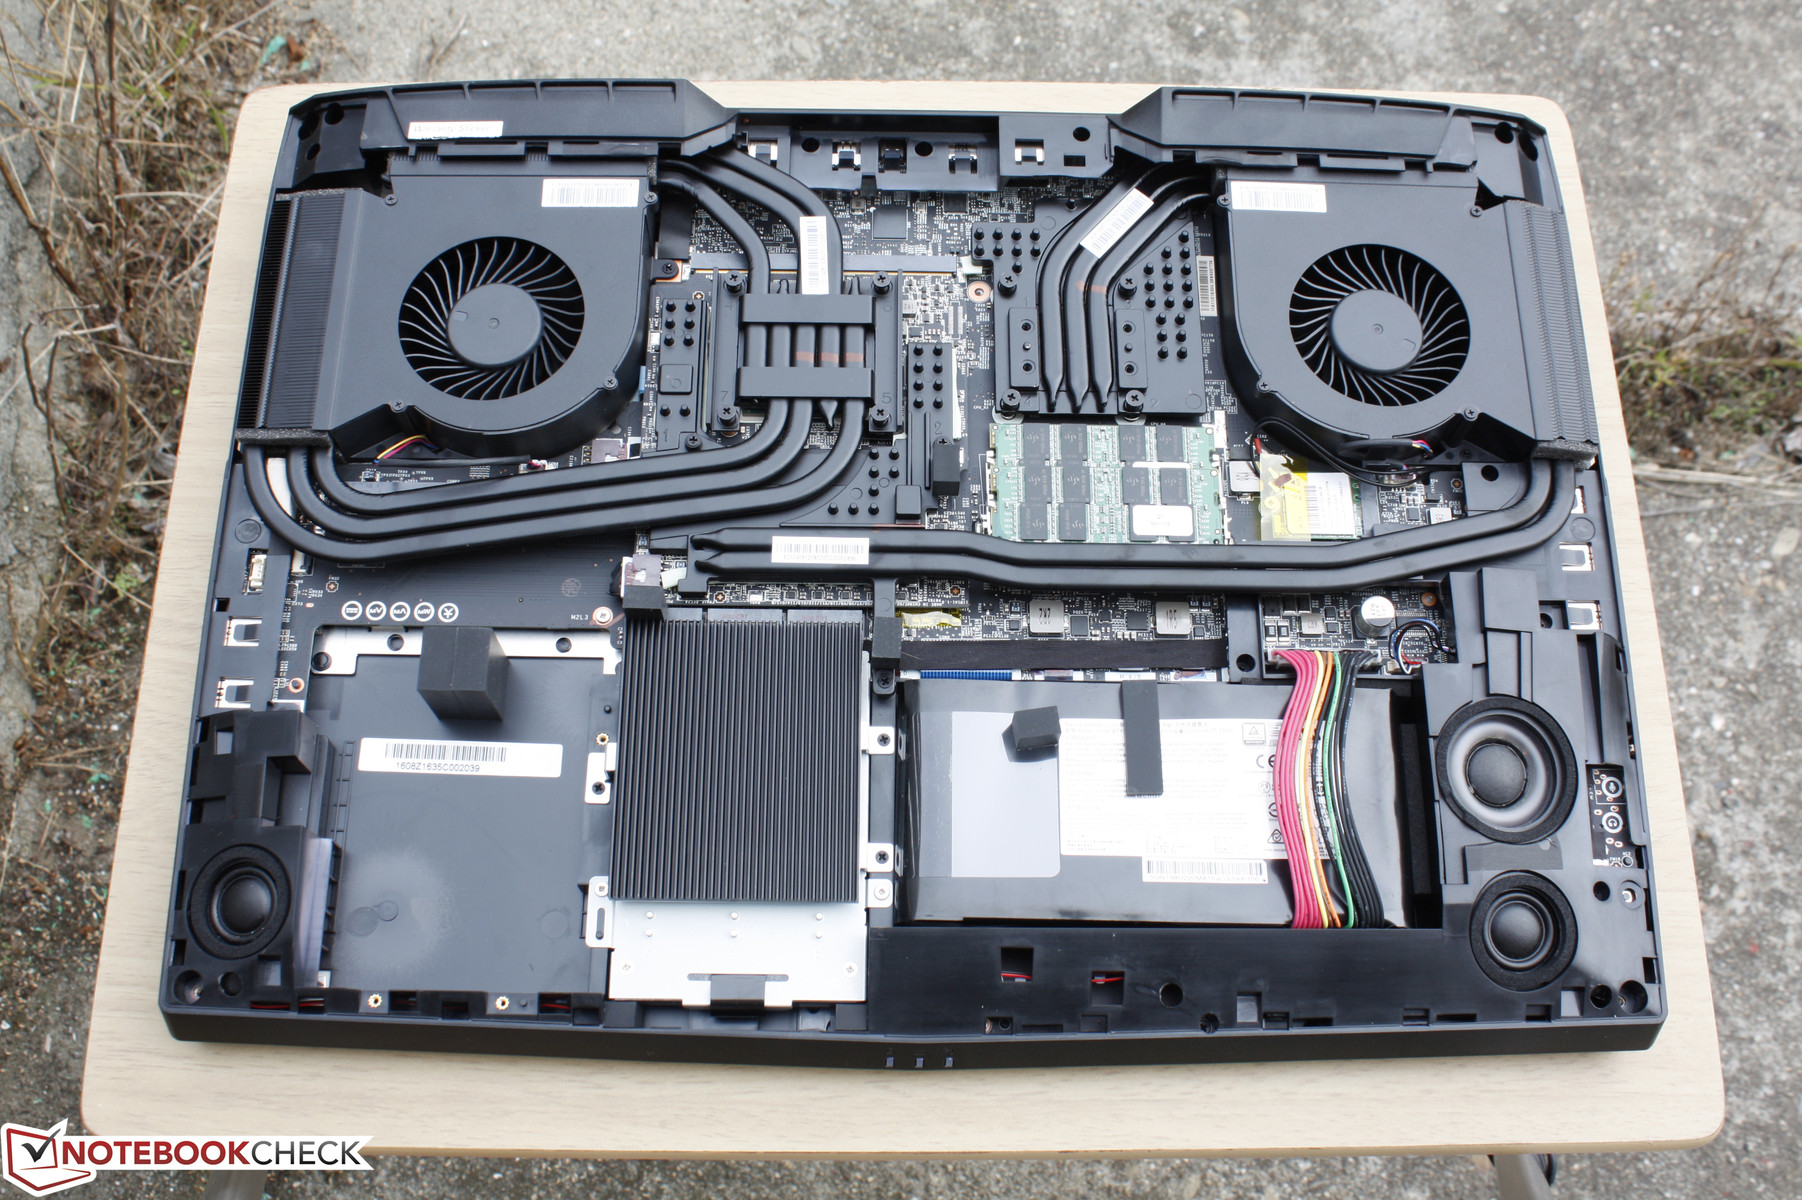
Serviceability is easy on the MSI system with only five Philips screws to loosen. The massive cooling solution takes up most of the space while the battery is surprisingly small considering the power demands of the notebook. The passive heat sink over the 3x M.2 slots is another nice touch as M.2 drives can run very warm with the single 2.5-inch SATA III bay sitting directly below. Access to the last two SODIMM slots underneath the motherboard will require additional disassembly.
Warranty
MSI offers two-year limited warranty as standard on new purchases of their G series notebooks. CUKUSA covers modified components installed by the reseller for up to three years including any SODIMM modules and internal storage drives.
Please see our Guarantees, Return Policies & Warranties FAQ for country-specific information.
Input Devices
Keyboard & Touchpad
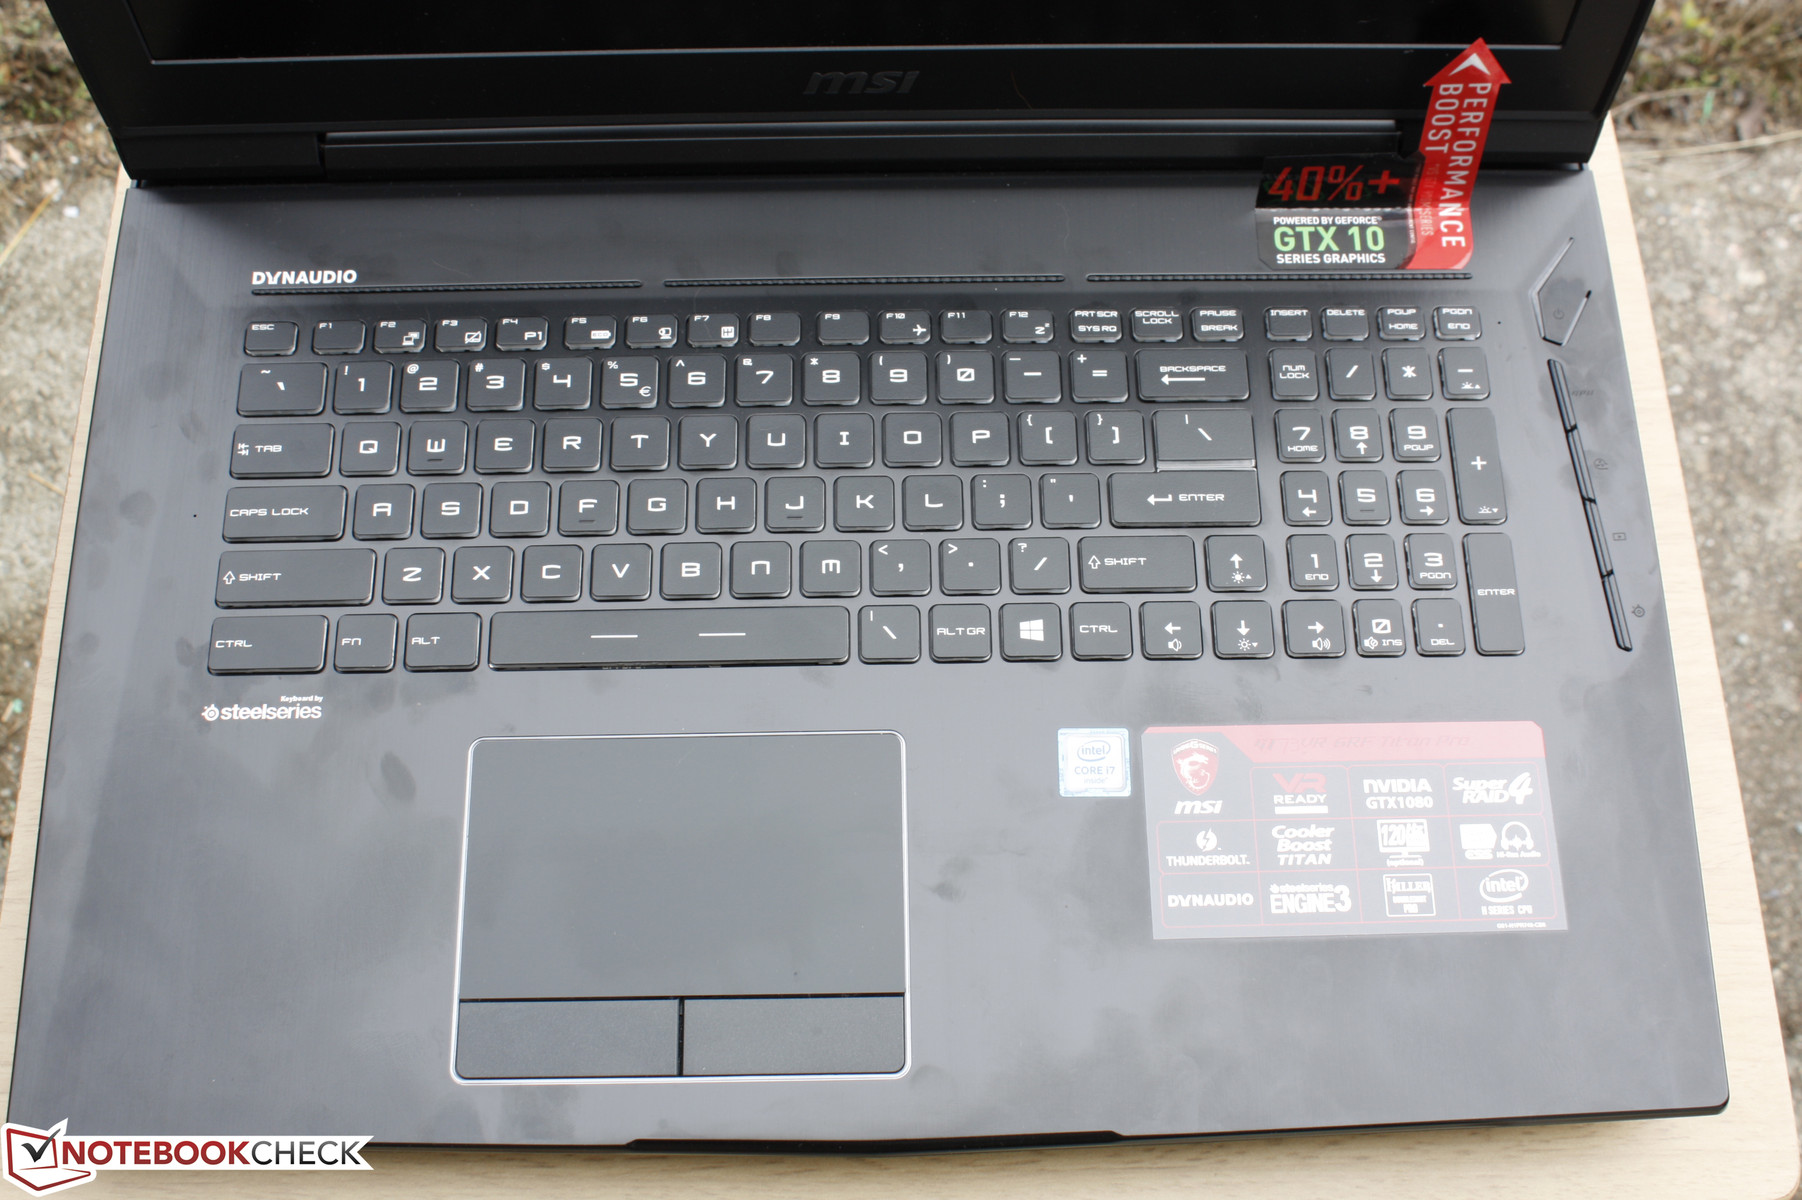
The SteelSeries keyboard provides a consistent experience across the MSI G series similar to how Lenovo implements its AccuType keyboard across a wide range of ThinkPad models. Travel is adequate with firm feedback and surprisingly little clatter for comfortable typing and gaming. Drawbacks include the lack of both dedicated Macro keys and individually lit keys. Furthermore, the labeling of the auxiliary keys on the right side of the notebook can be hard to see since it contrasts poorly with the notebook surface.
The touchpad works reliably for cursor control and multi-touch gestures regardless if gliding slowly or quickly. The dedicated mouse keys are shallow in travel with solid feedback and a loud auditory click. The force required to push on a key is not too high or low, so using the touchpad is comfortable for longer periods if a mouse is not available.
Display
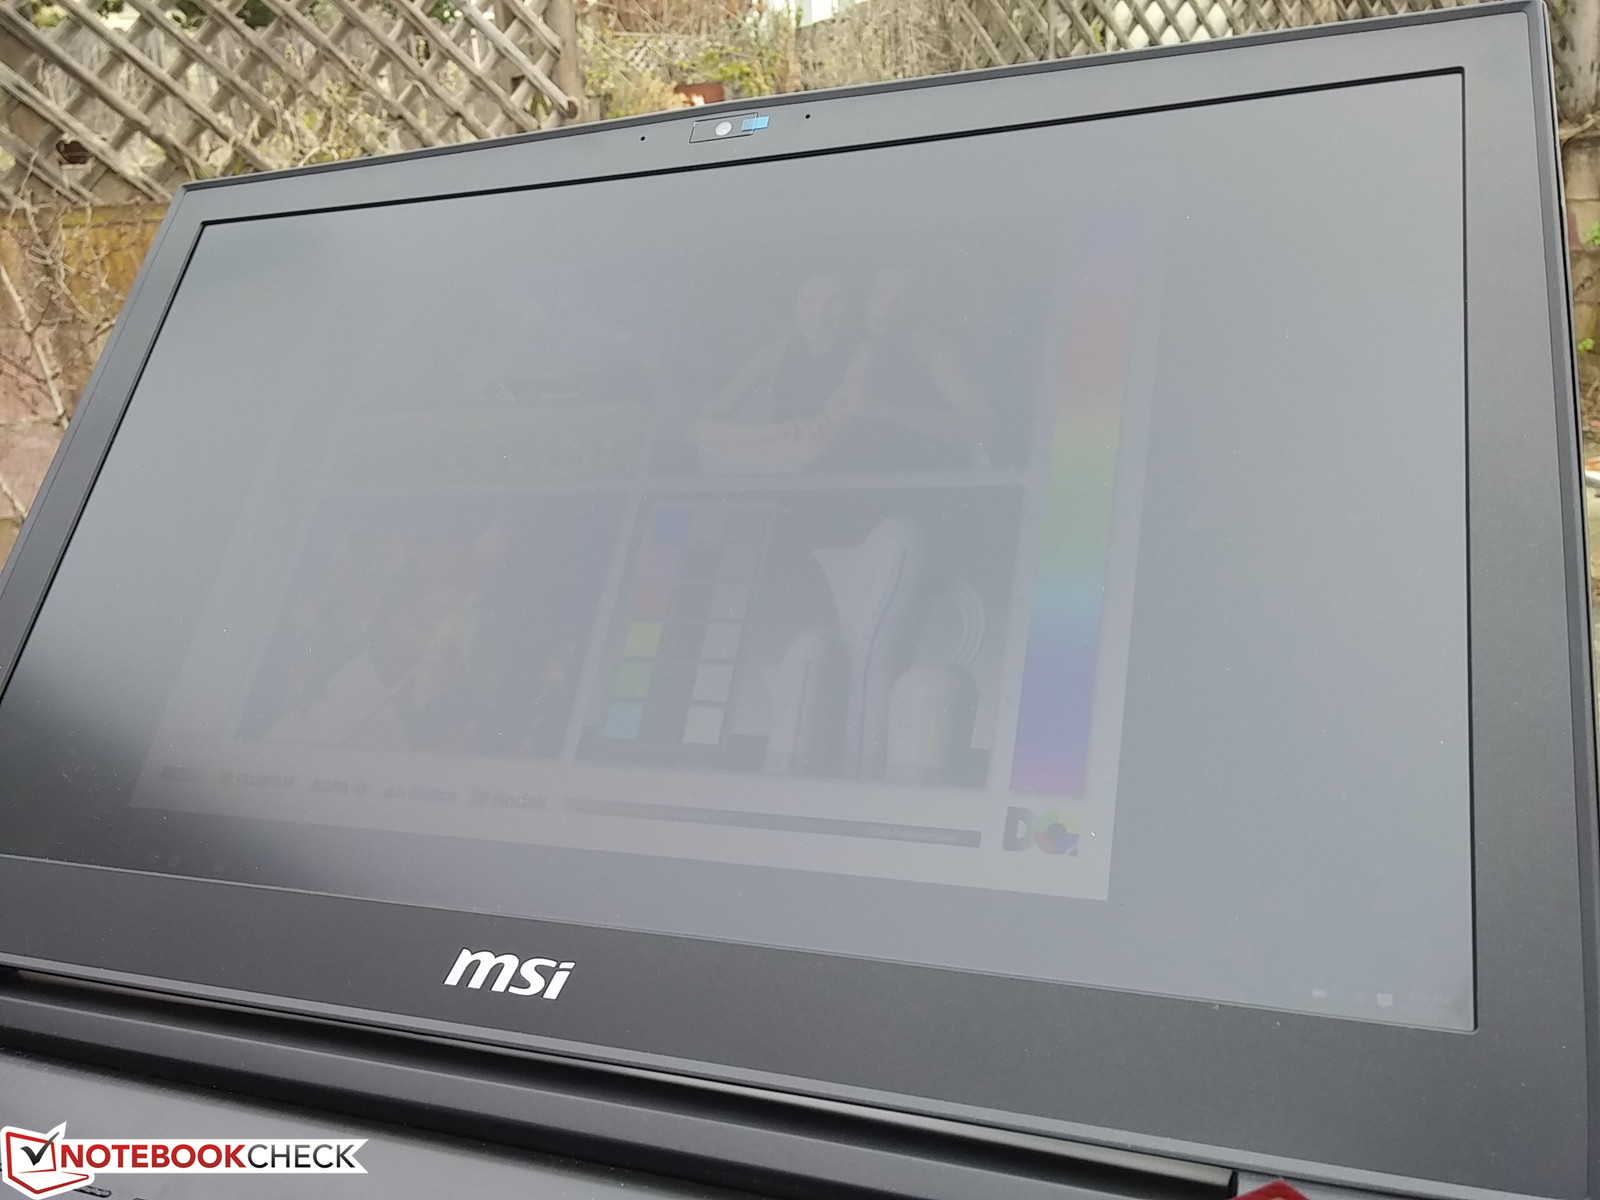
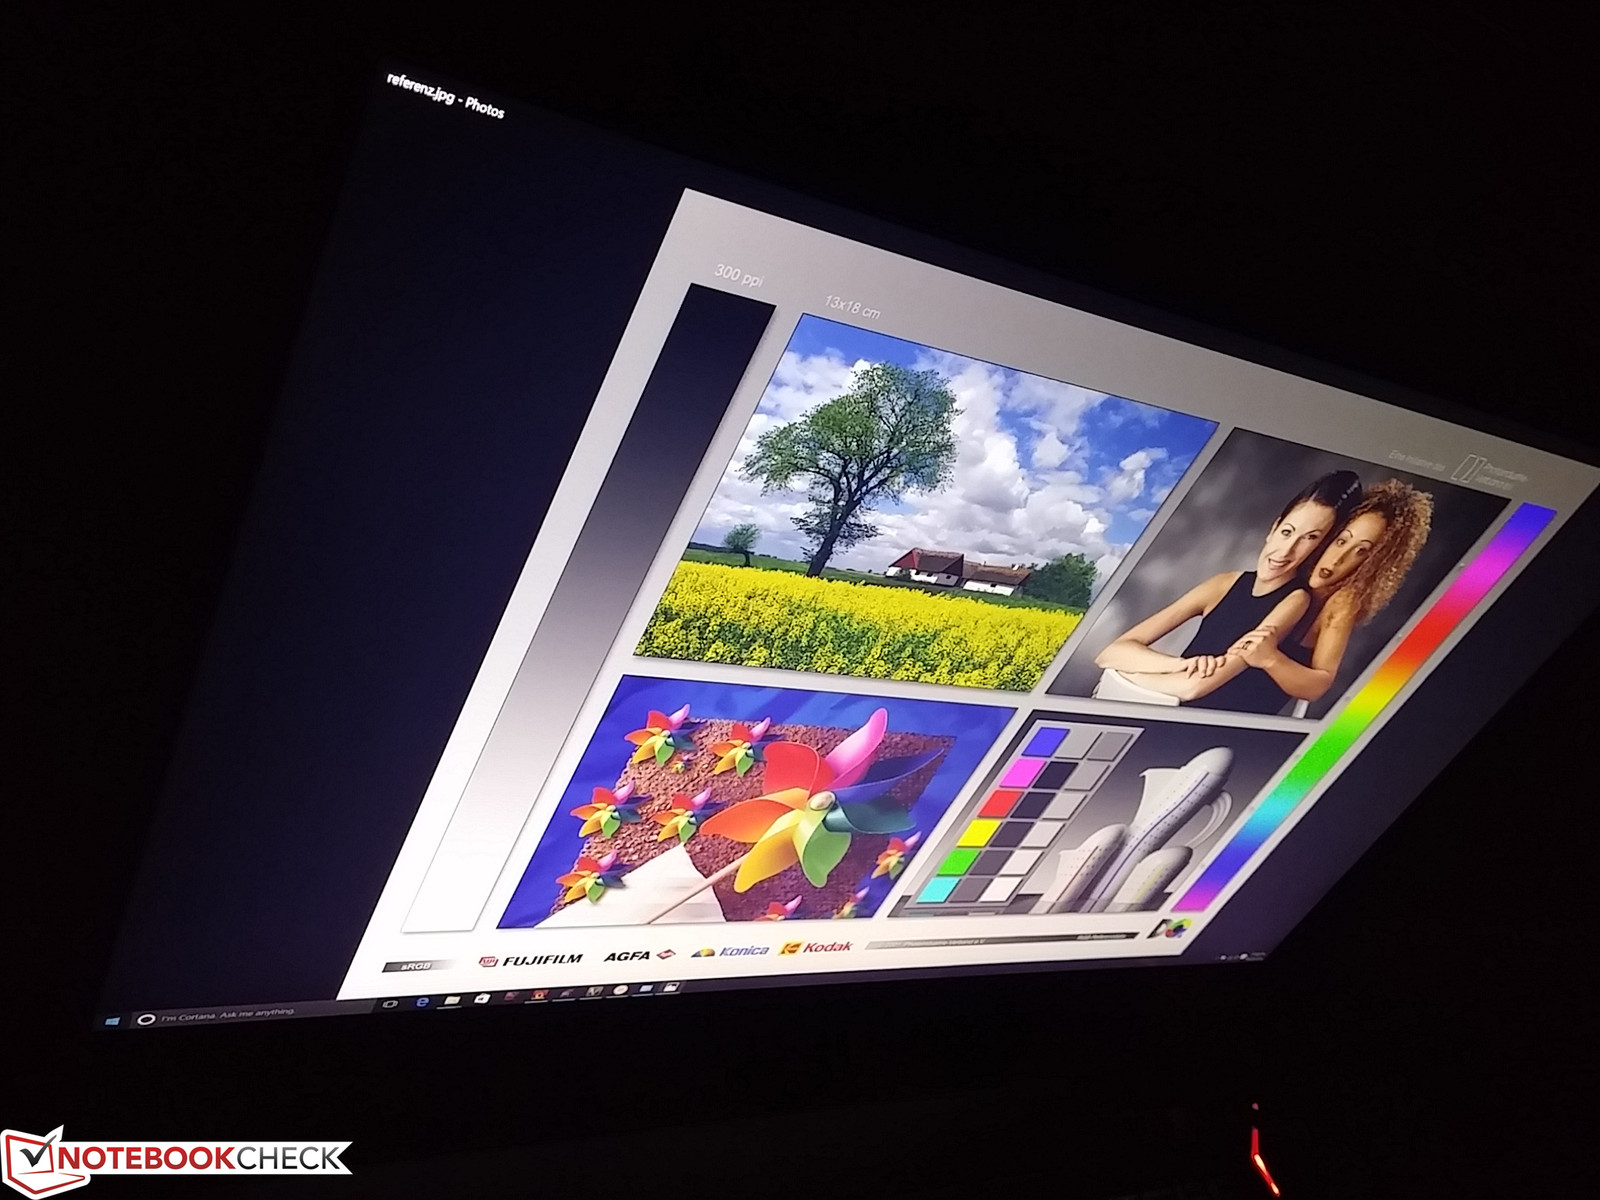
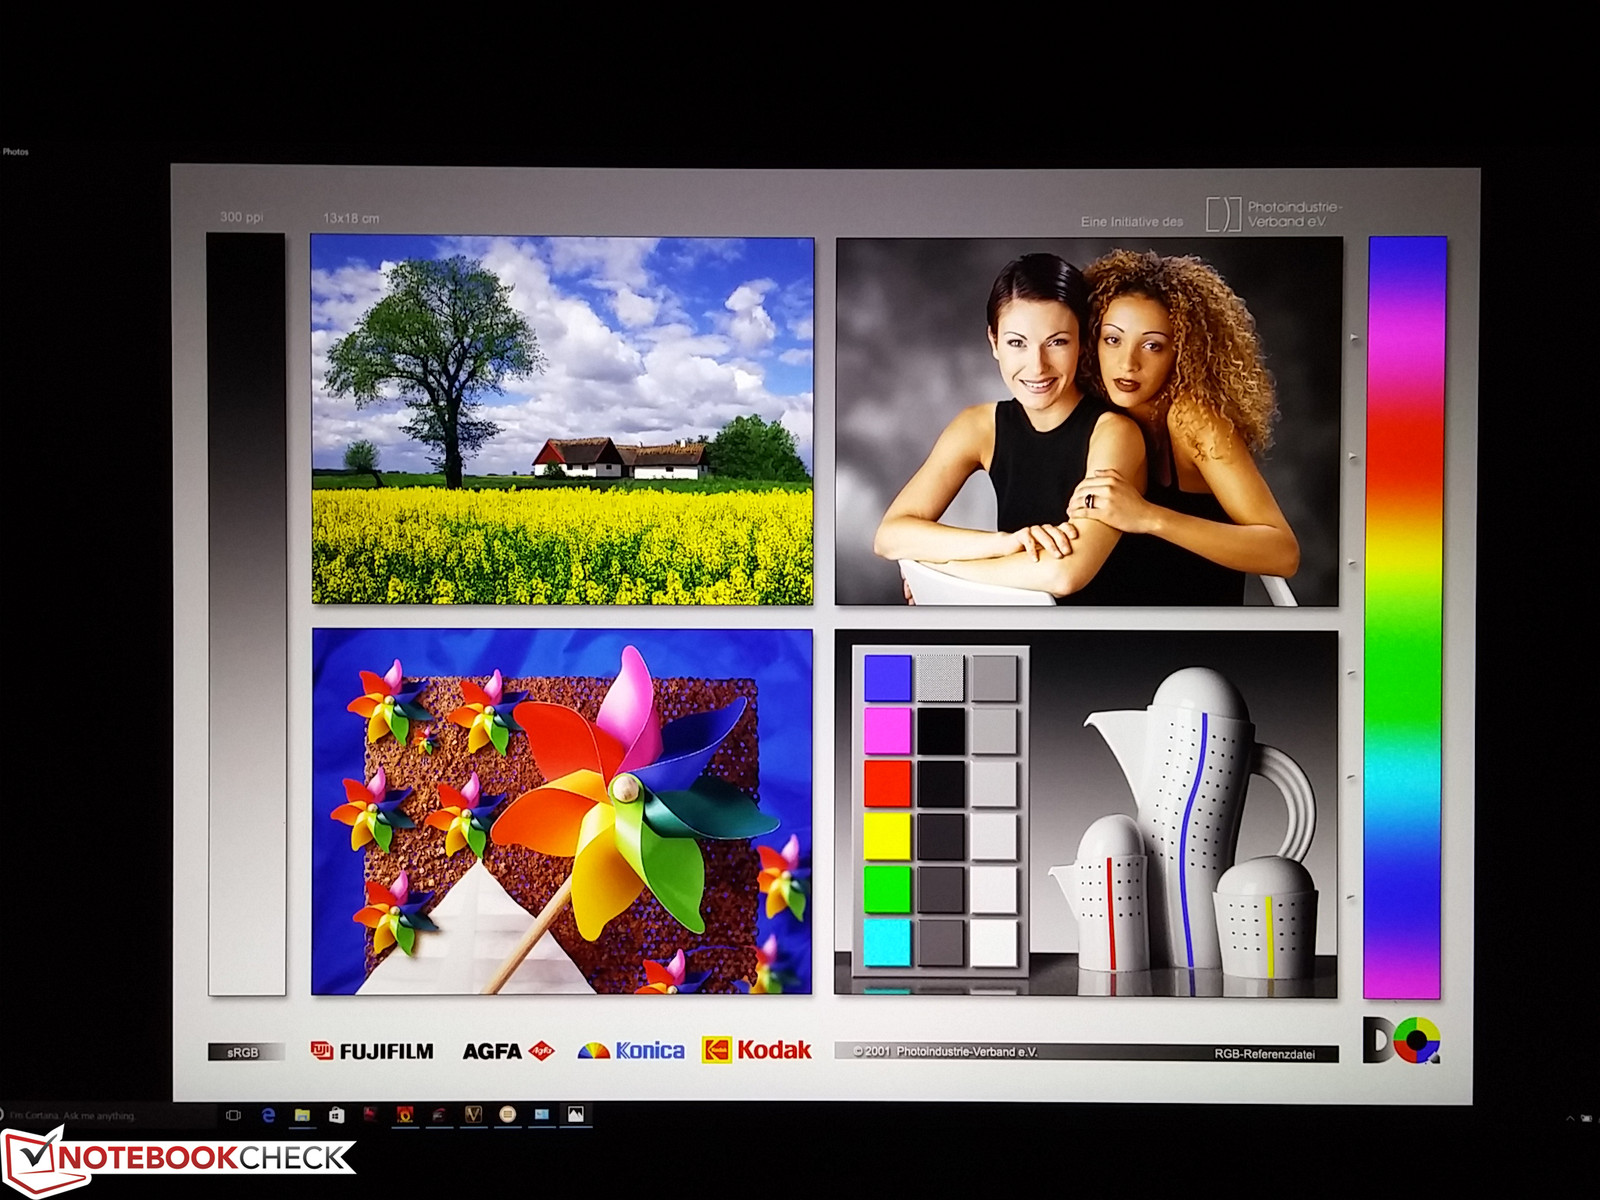
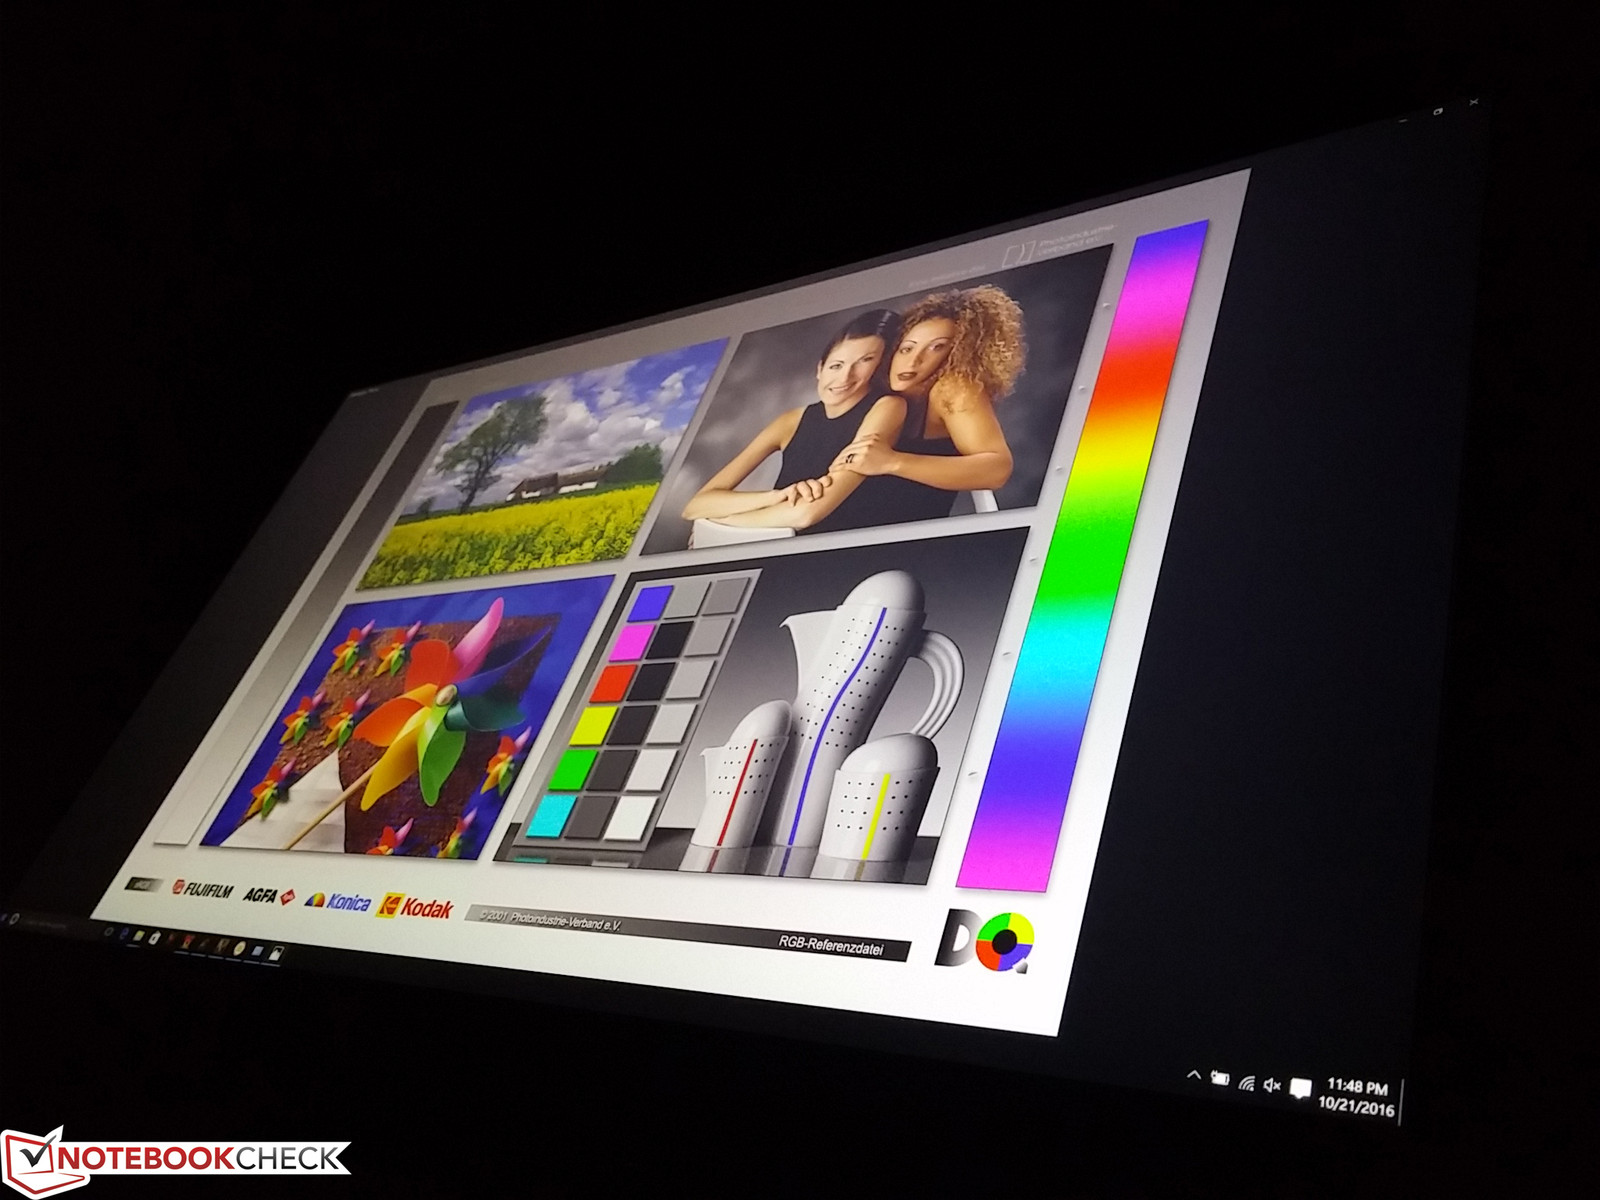
How different is the 4K UHD IPS screen compared to the FHD TN option? There are actually a handful aside from their obvious pixel densities and many of them favor the 120 Hz/5 ms FHD panel. According to our measurements, the 4K UHD panel has lower contrast and measurably slower response times. Colors are more accurate than the FHD panel before calibration, but gamut is narrower overall. A quick search for its AUO B173ZAN01.0 panel name shows that similar panels are also used on the GT80S and a number of Clevo barebonee including the Eurocom Sky DLX7 and Schenker XMG U727. Backlight brightness is otherwise nearly identical between the GT73VR 6RF and GT73VR 6RE SKUs.
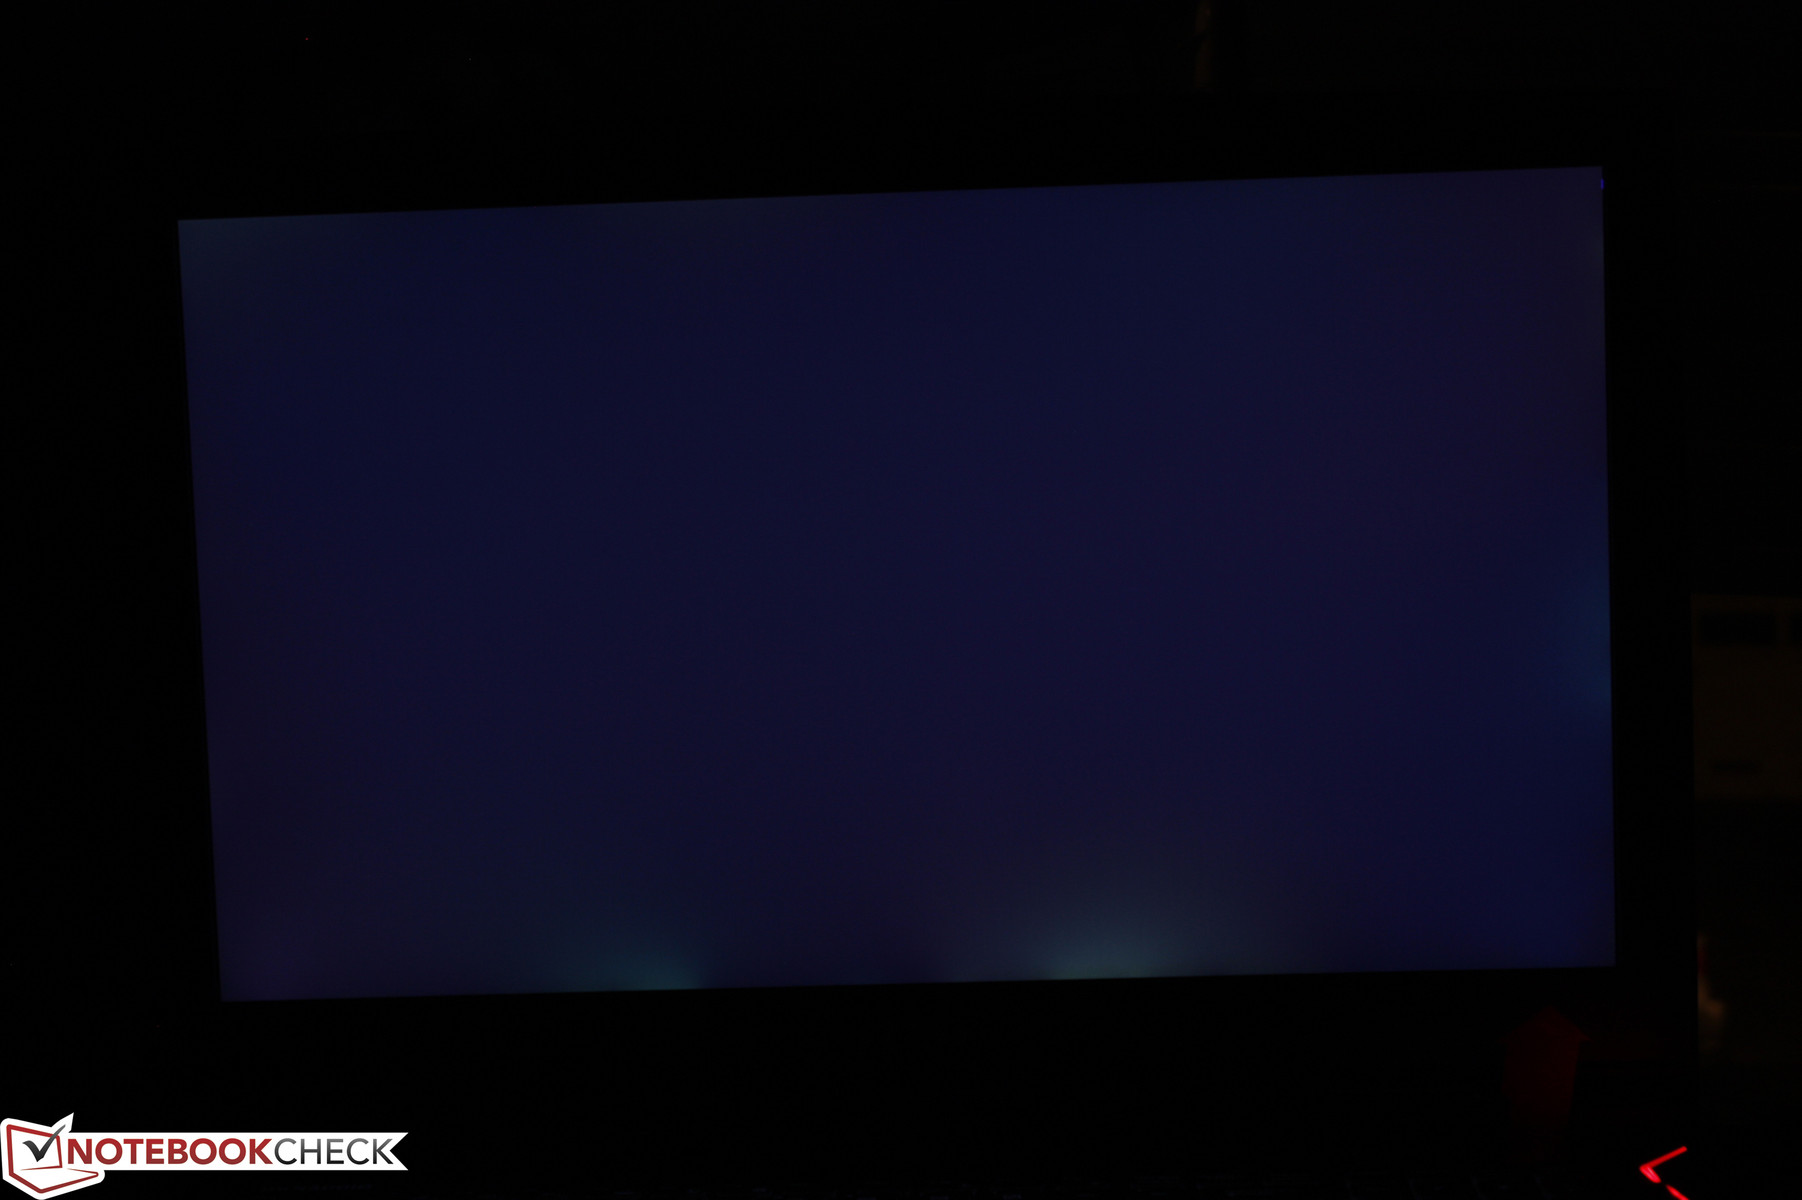
Subjectively, the matte 4K UHD screen suffers from moderate graininess that becomes very noticeable when viewing a bright white image such as a File Explorer window. Moderate backlight bleeding along the bottom edge is also noticeable during movie playback when black bars are present.

| |||||||||||||||||||||||||
Brightness Distribution: 87 %
Center on Battery: 334.8 cd/m²
Contrast: 793:1 (Black: 0.422 cd/m²)
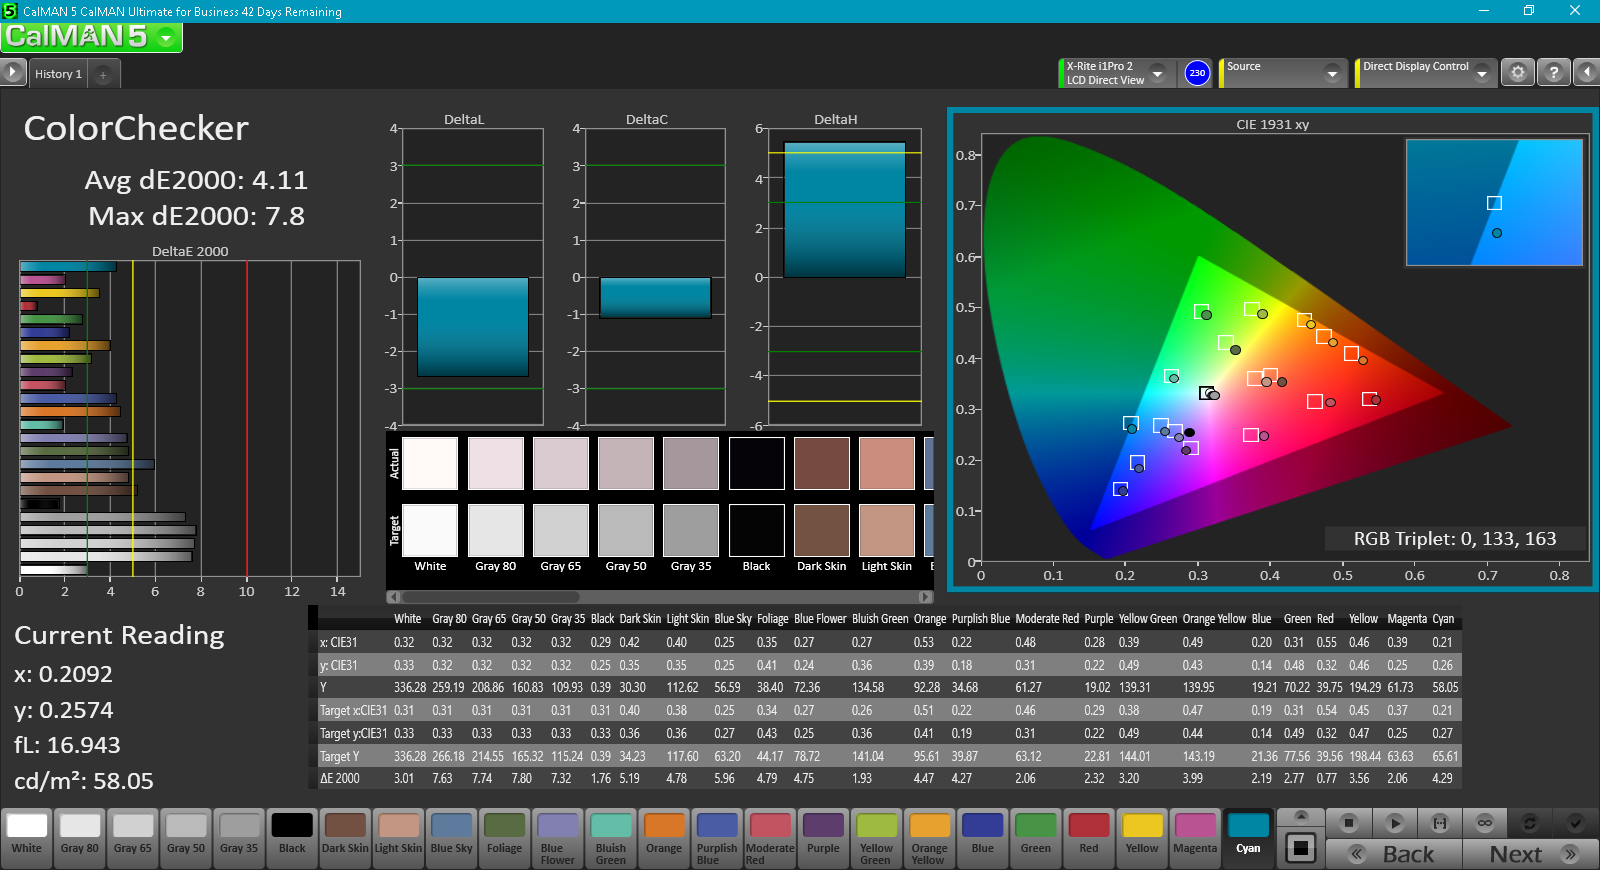
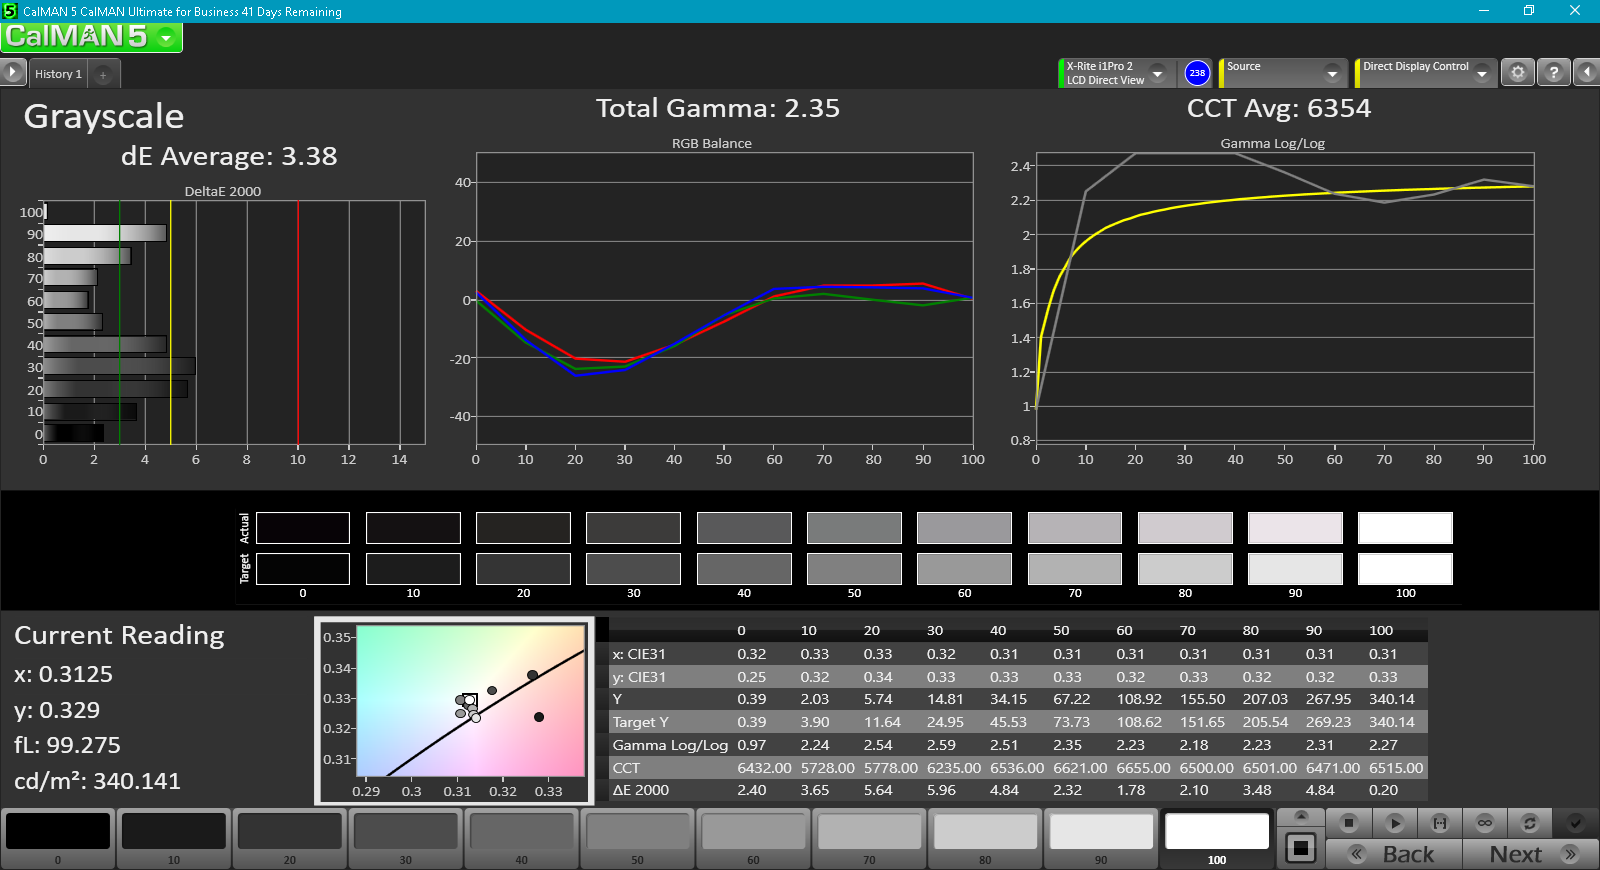
ΔE ColorChecker Calman: 4.11 | ∀{0.5-29.43 Ø4.71}
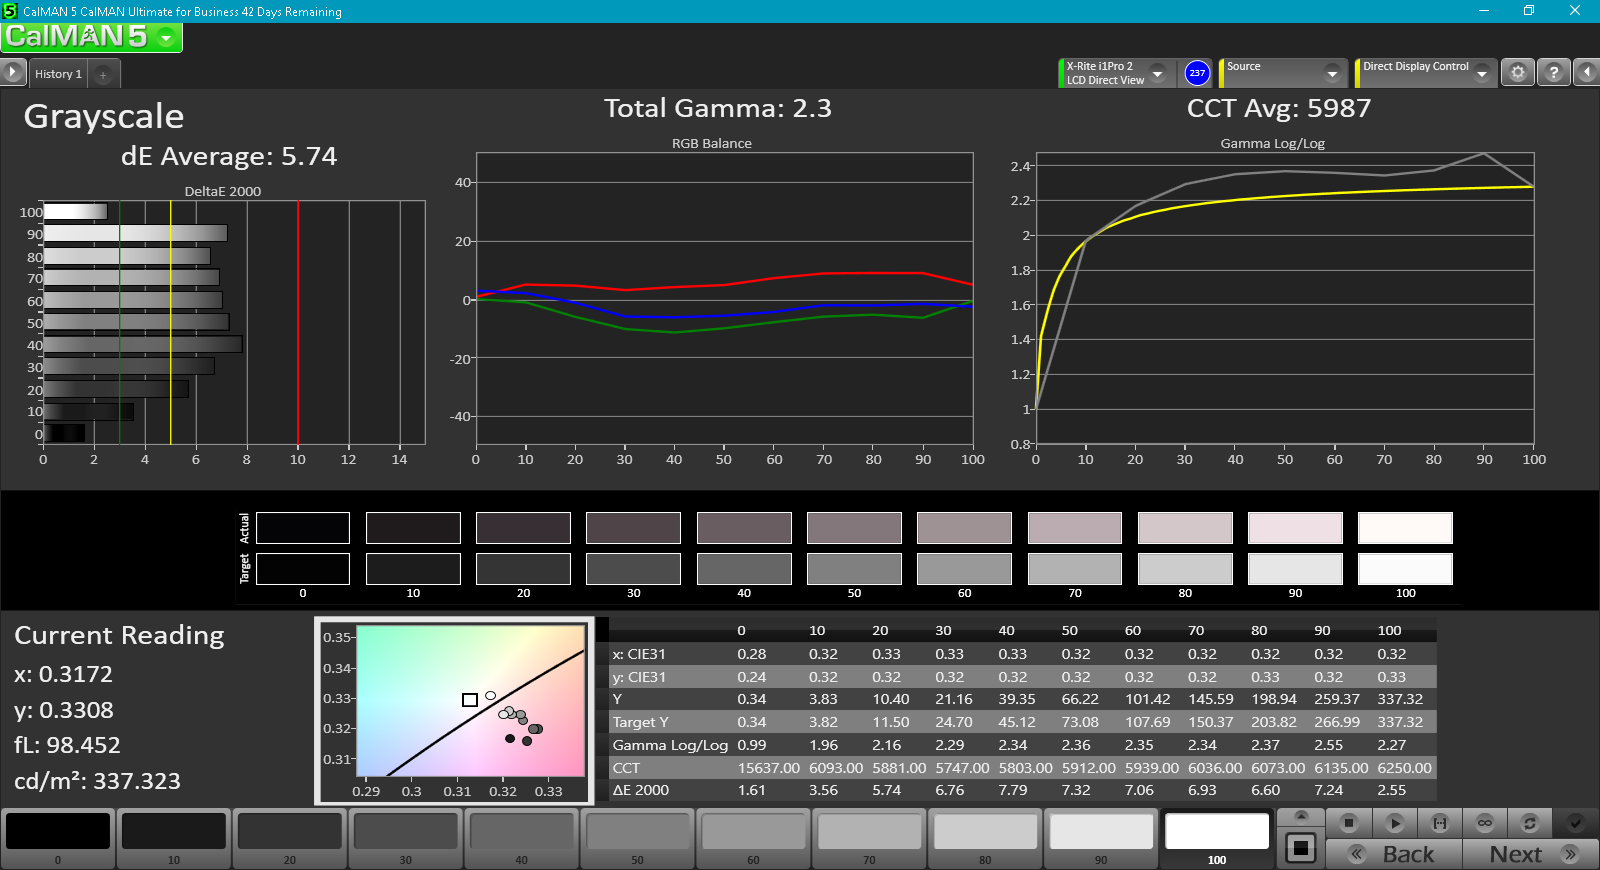
ΔE Greyscale Calman: 5.74 | ∀{0.09-98 Ø4.96}
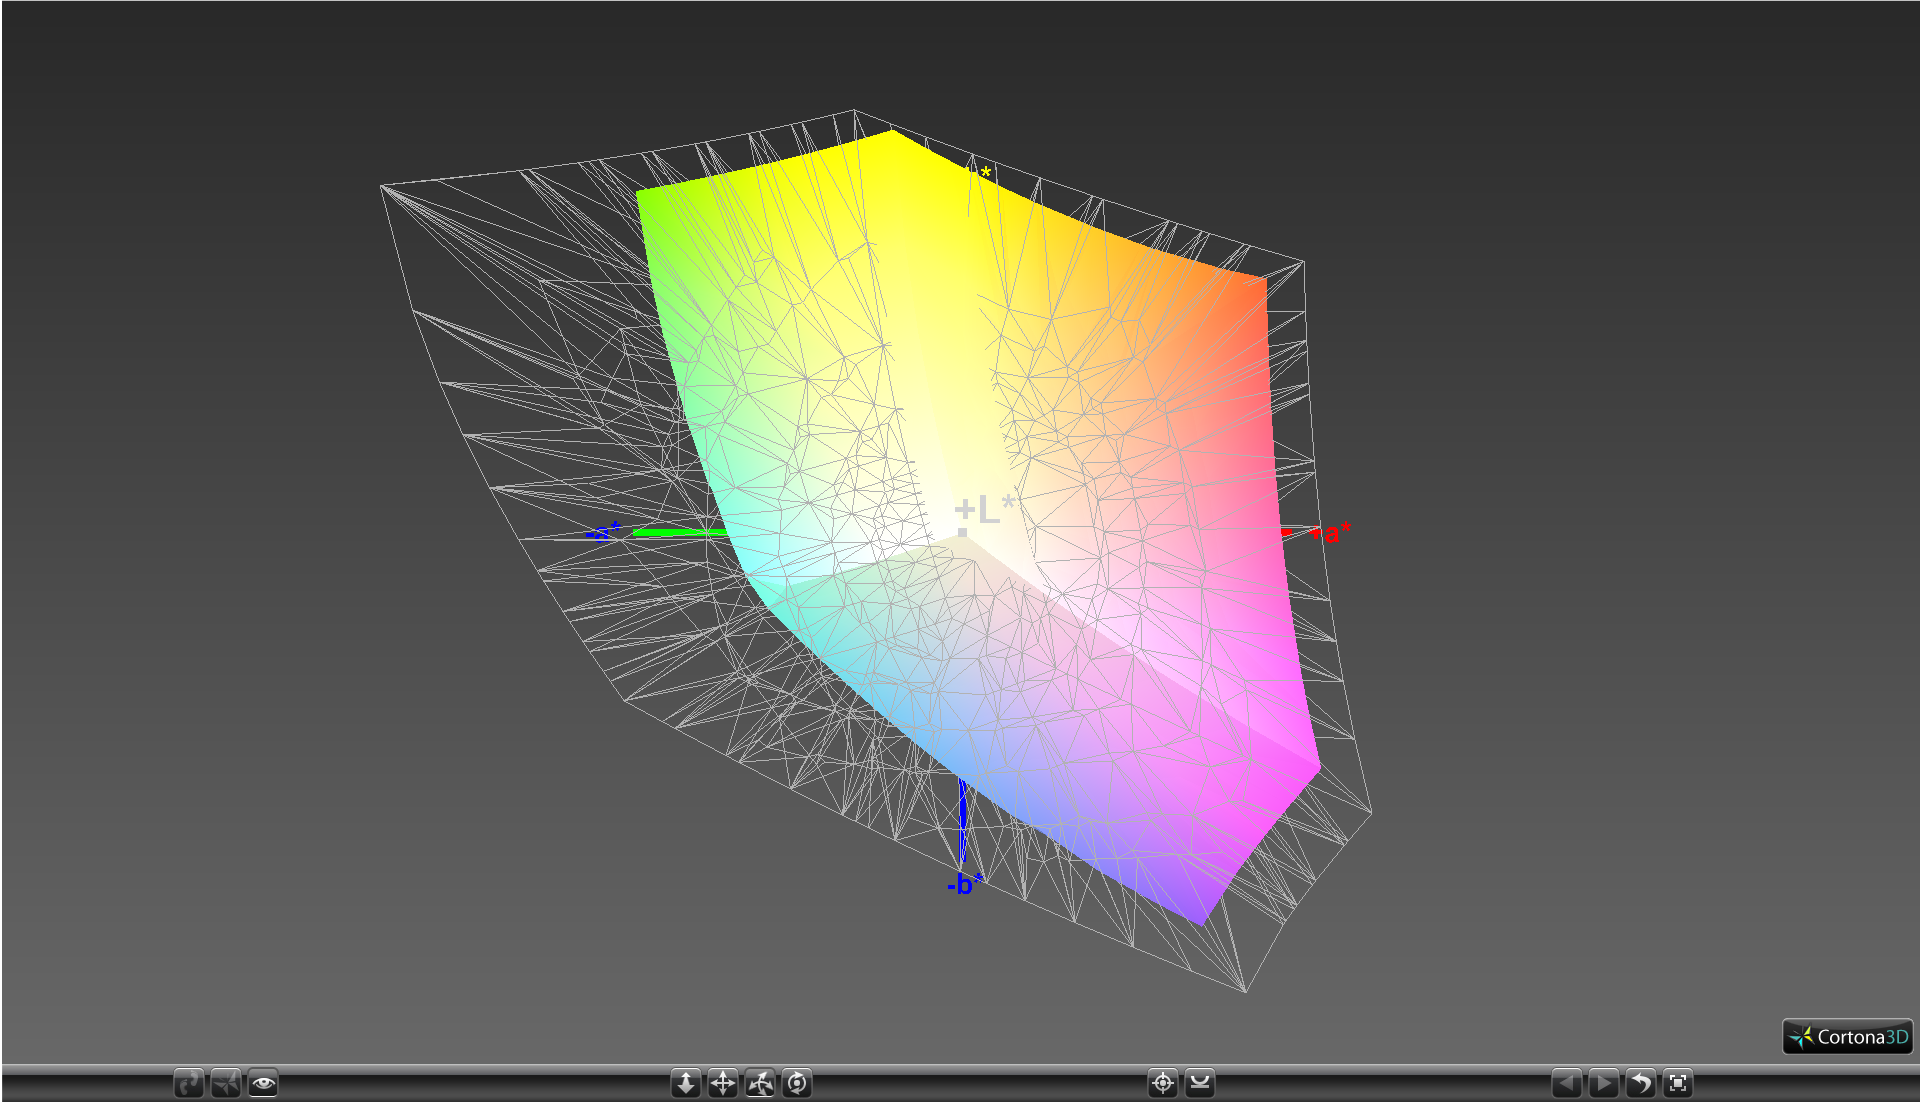
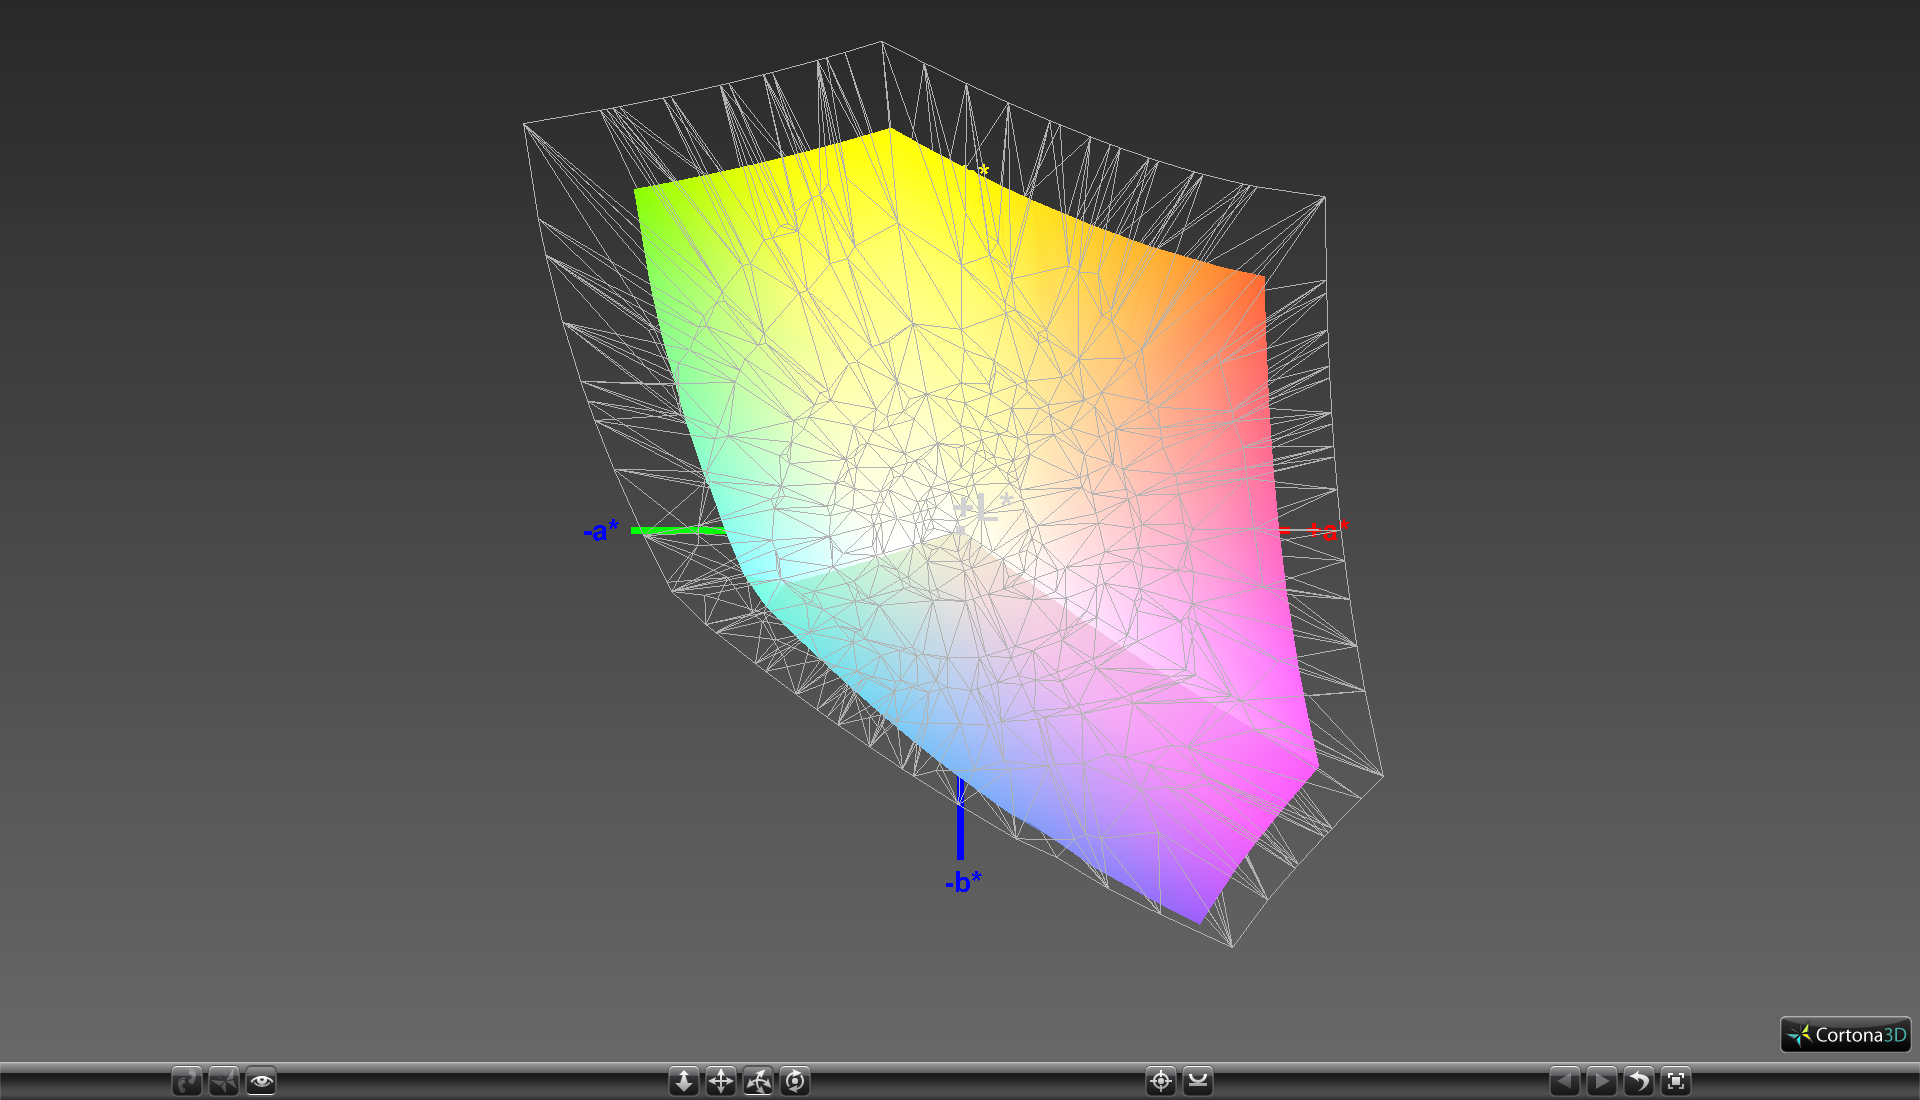
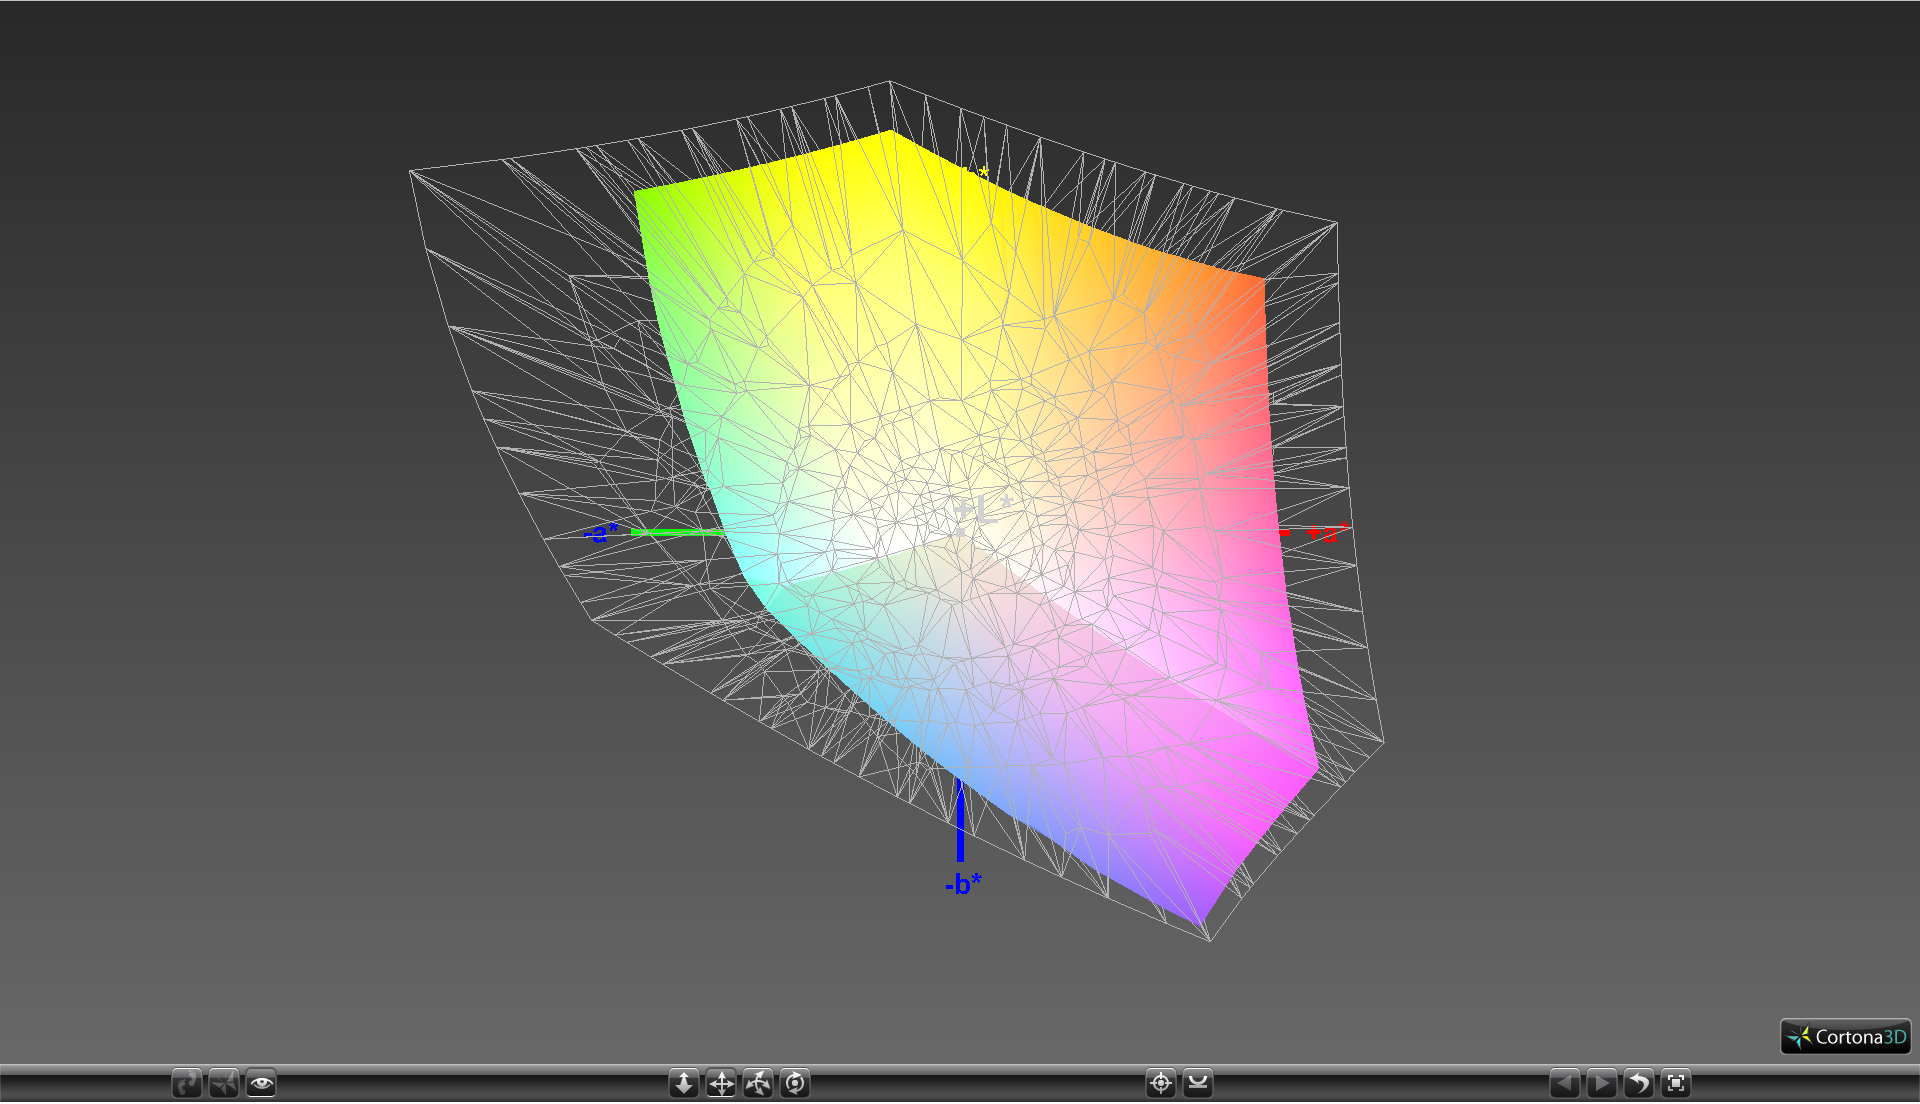
96% sRGB (Argyll 1.6.3 3D)
60.5% AdobeRGB 1998 (Argyll 1.6.3 3D)
65.7% AdobeRGB 1998 (Argyll 3D)
95.8% sRGB (Argyll 3D)
63.6% Display P3 (Argyll 3D)
Gamma: 2.3
CCT: 5987 K
| MSI GT73VR 6RF IPS, 17.3", 3840x2160 | MSI GT73VR-6RE16SR451 N173HHE-G32 (CMN1747), TN, 17.3", 1920x1080 | Acer Predator 17 G9-793-77LG AU Optronics B173ZAN01.0 (AUO109B), IPS, 17.3", 3840x2160 | Asus G701VO-CS74K IPS, 17.3", 1920x1080 | MSI GS73VR 6RF TN LED, 17.3", 1920x1080 | |
|---|---|---|---|---|---|
| Display | 25% | 31% | -1% | 24% | |
| Display P3 Coverage (%) | 63.6 | 91.2 43% | 86.9 37% | 68.8 8% | 90 42% |
| sRGB Coverage (%) | 95.8 | 100 4% | 100 4% | 87.7 -8% | 99.9 4% |
| AdobeRGB 1998 Coverage (%) | 65.7 | 84.9 29% | 99.4 51% | 64.1 -2% | 83.6 27% |
| Response Times | 50% | 5% | 13% | 43% | |
| Response Time Grey 50% / Grey 80% * (ms) | 33.6 ? | 26 ? 23% | 37 ? -10% | 29.2 ? 13% | 28 ? 17% |
| Response Time Black / White * (ms) | 30 ? | 6.8 ? 77% | 24 ? 20% | 26.4 ? 12% | 9.6 ? 68% |
| PWM Frequency (Hz) | |||||
| Screen | -17% | 21% | 7% | 21% | |
| Brightness middle (cd/m²) | 334.8 | 314 -6% | 336 0% | 368.1 10% | 337.2 1% |
| Brightness (cd/m²) | 316 | 294 -7% | 320 1% | 349 10% | 315 0% |
| Brightness Distribution (%) | 87 | 89 2% | 88 1% | 86 -1% | 86 -1% |
| Black Level * (cd/m²) | 0.422 | 0.23 45% | 0.25 41% | 0.365 14% | 0.308 27% |
| Contrast (:1) | 793 | 1365 72% | 1344 69% | 1008 27% | 1095 38% |
| Colorchecker dE 2000 * | 4.11 | 9.74 -137% | 3.61 12% | 4.16 -1% | 2.96 28% |
| Colorchecker dE 2000 max. * | 7.8 | 15.71 -101% | 6.02 23% | 8.7 -12% | 5.45 30% |
| Greyscale dE 2000 * | 5.74 | 9.58 -67% | 4.78 17% | 3.86 33% | 2.57 55% |
| Gamma | 2.3 96% | 2.5 88% | 2.32 95% | 2.19 100% | 2.25 98% |
| CCT | 5987 109% | 11854 55% | 6185 105% | 6892 94% | 7114 91% |
| Color Space (Percent of AdobeRGB 1998) (%) | 60.5 | 76 26% | 88 45% | 57.6 -5% | 74.3 23% |
| Color Space (Percent of sRGB) (%) | 96 | 100 4% | 100 4% | 87.6 -9% | 100 4% |
| Total Average (Program / Settings) | 19% /
0% | 19% /
21% | 6% /
6% | 29% /
24% |
* ... smaller is better
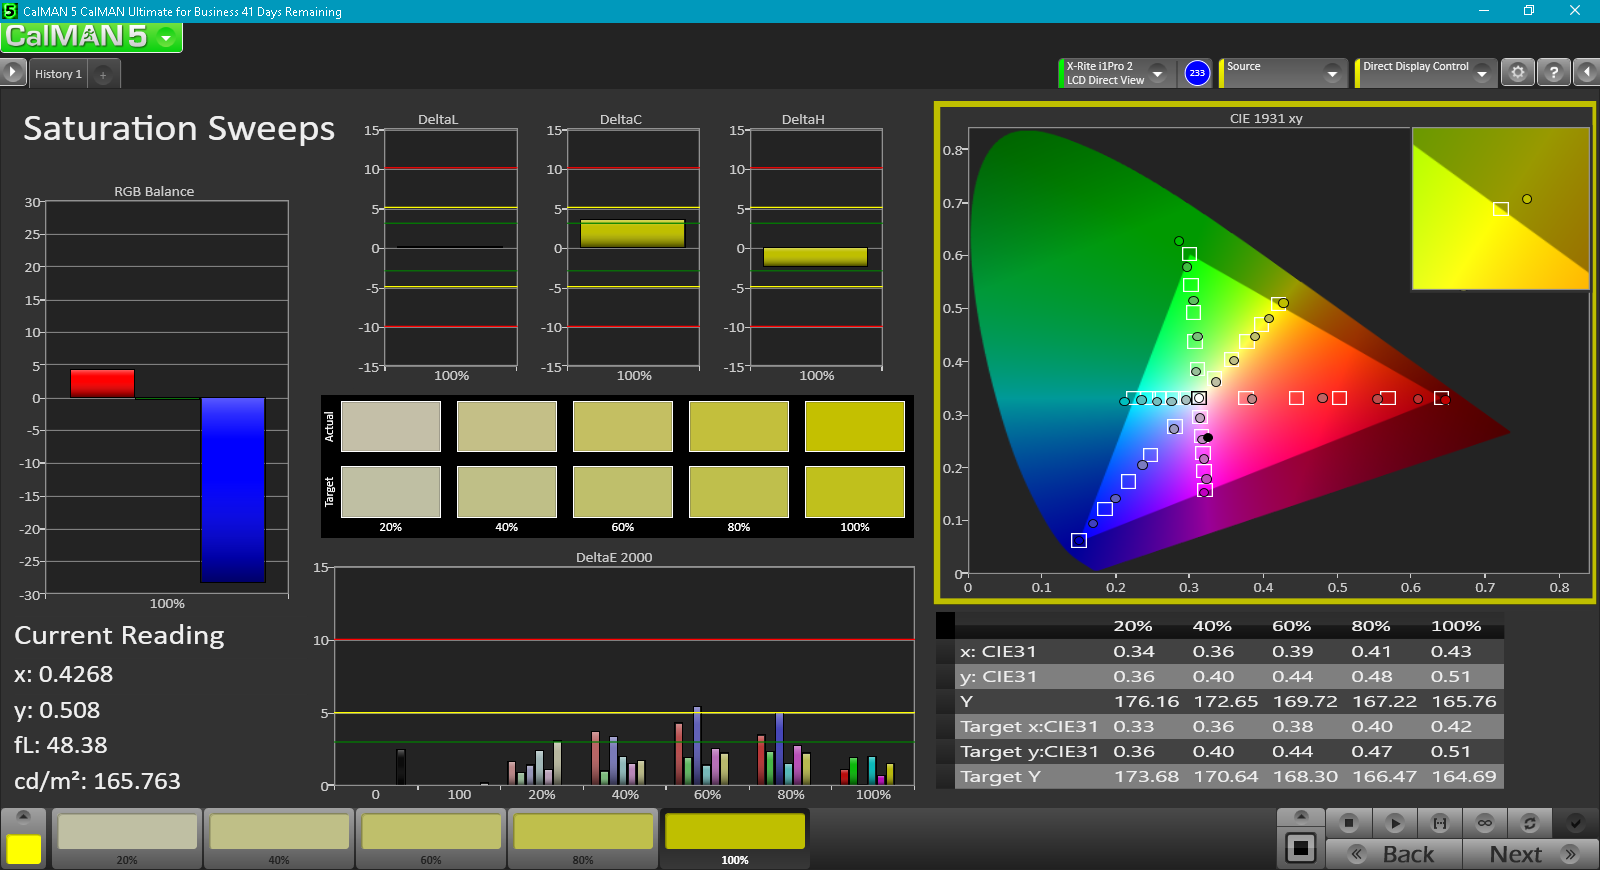
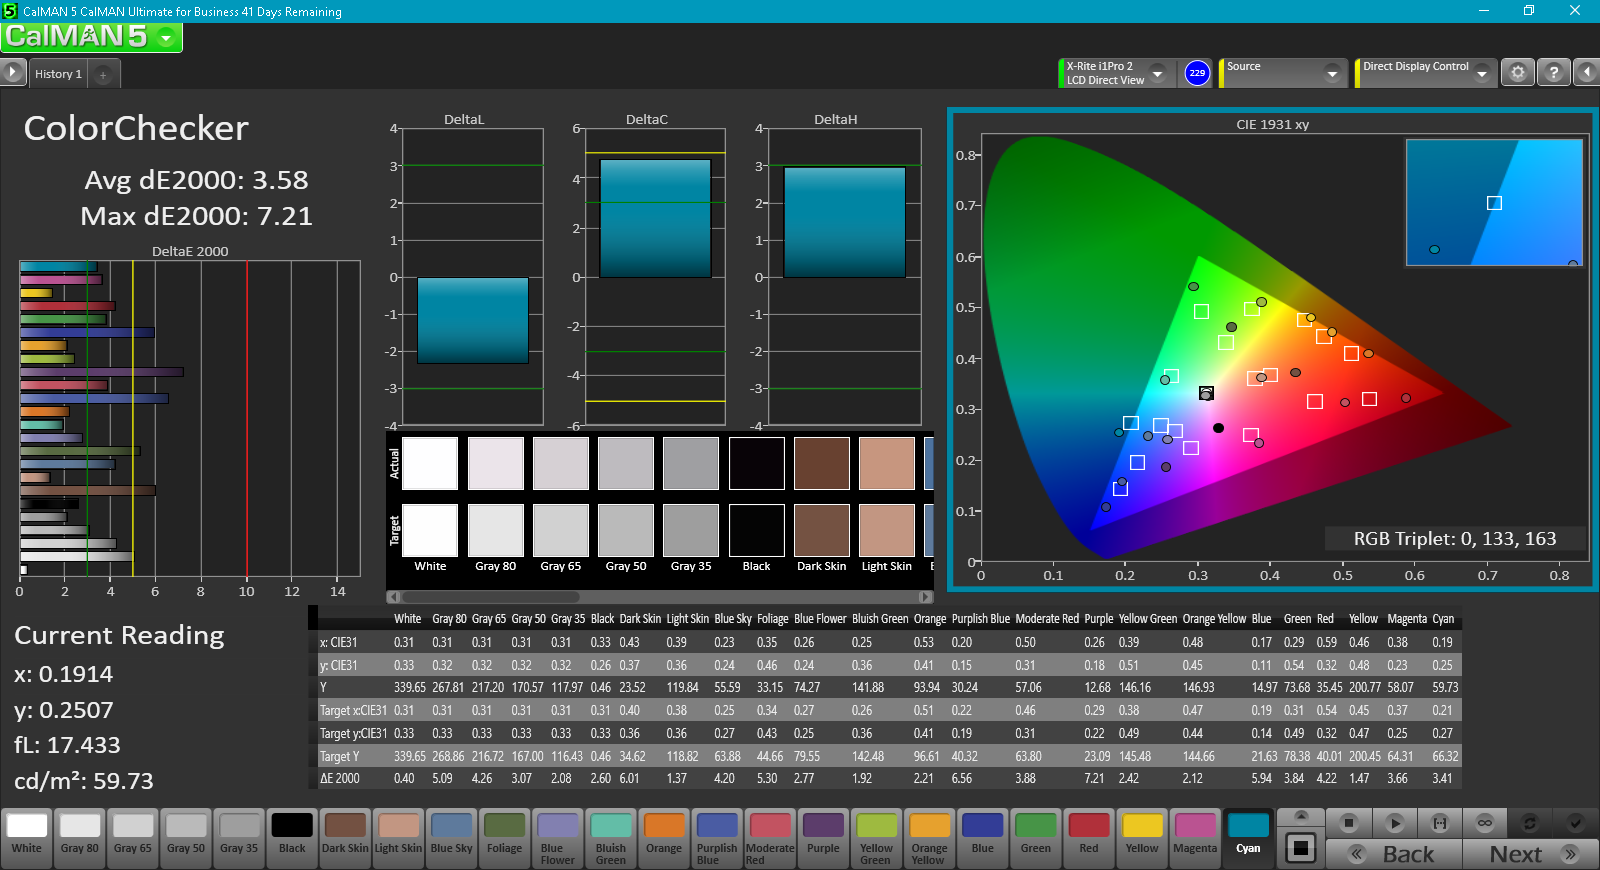
Color coverage is approximately 96 percent and 60 percent of the sRGB and AdobeRGB standards, respectively. This is noticeably narrower than both the 1080p panel of the GT73VR 6RE and the 4K UHD panel of the Acer Predator 17. Gamers will more than likely not notice or care, but professional graphic artists may prefer the 1080p SKU for the slightly deeper colors.

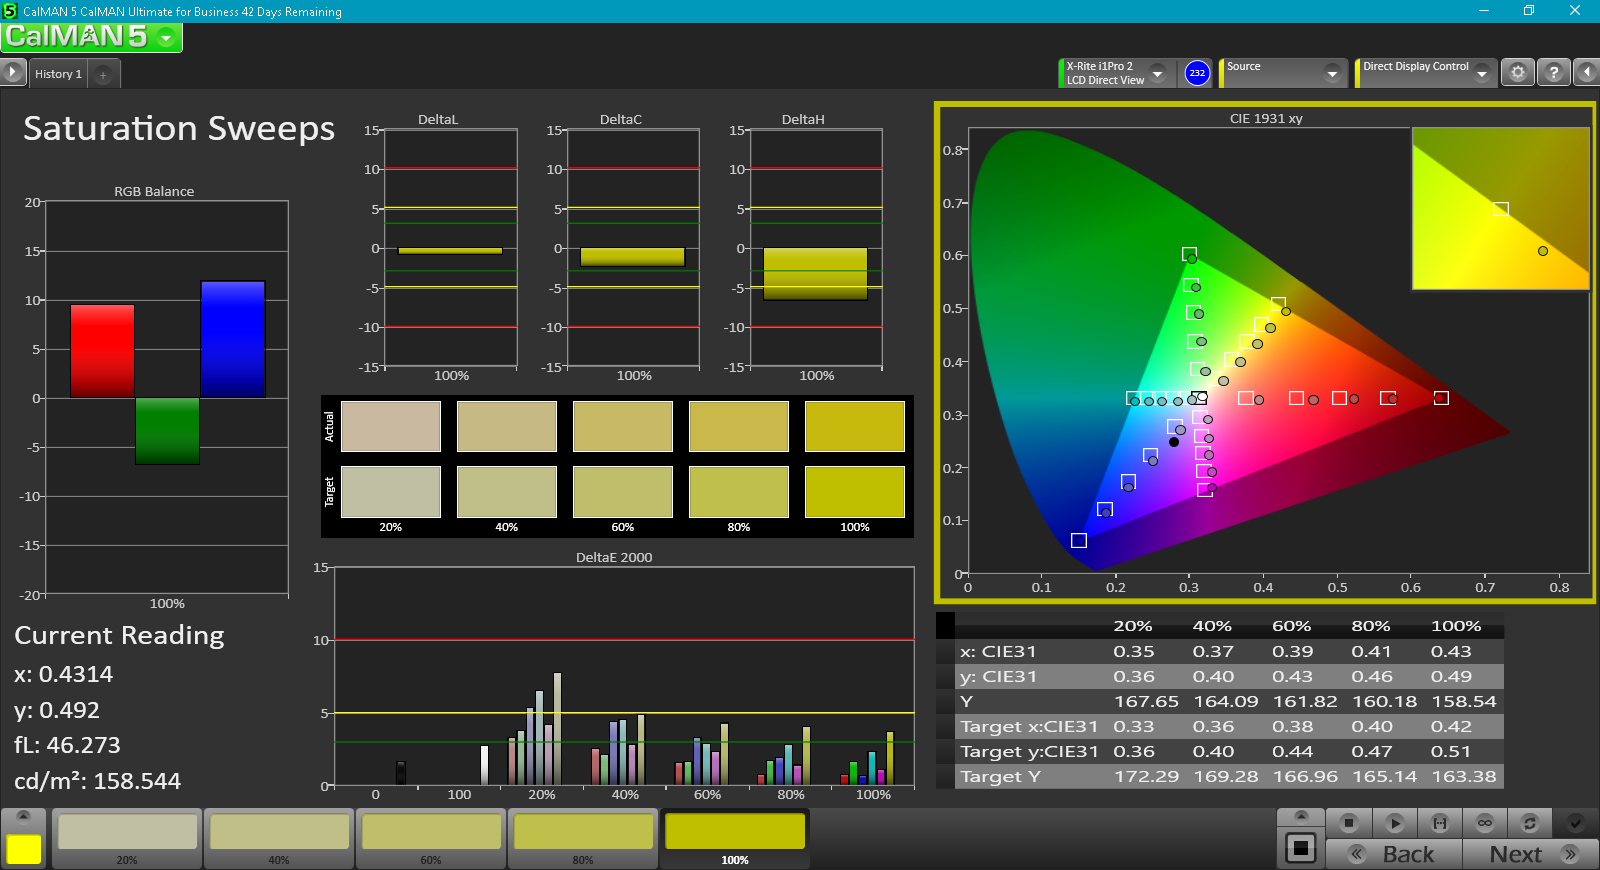
Color temperature is slightly on the warm side out of the box. A quick calibration improves colors and grayscale, though RGB balance is oddly off and will likely require additional manual calibration for more precise colors and grayscale at medium saturation levels. The display was set to sRGB through the Dragon Center software before our spectrophotometer measurements were taken. MSI True Color includes preset modes for gaming, movie, and office applications with adjustable sliders for color temperature, gamma, blue intensity, and more.
Display Response Times
| ↔ Response Time Black to White | ||
|---|---|---|
| 30 ms ... rise ↗ and fall ↘ combined | ↗ 5.2 ms rise | 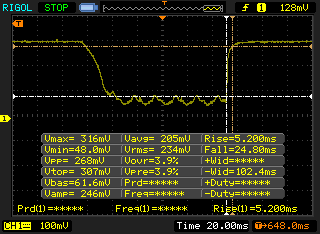 |
| ↘ 24.8 ms fall | ||
| The screen shows slow response rates in our tests and will be unsatisfactory for gamers. In comparison, all tested devices range from 0.1 (minimum) to 240 (maximum) ms. » 80 % of all devices are better. This means that the measured response time is worse than the average of all tested devices (19.8 ms). | ||
| ↔ Response Time 50% Grey to 80% Grey | ||
| 33.6 ms ... rise ↗ and fall ↘ combined | ↗ 13.2 ms rise | 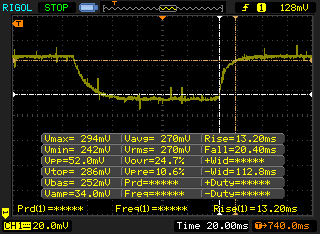 |
| ↘ 20.4 ms fall | ||
| The screen shows slow response rates in our tests and will be unsatisfactory for gamers. In comparison, all tested devices range from 0.165 (minimum) to 636 (maximum) ms. » 46 % of all devices are better. This means that the measured response time is similar to the average of all tested devices (30.9 ms). | ||
Screen Flickering / PWM (Pulse-Width Modulation)
| Screen flickering / PWM not detected | 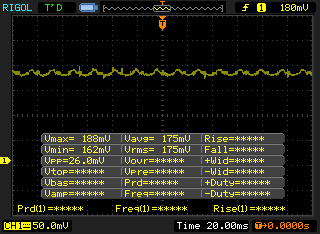 | ||
In comparison: 52 % of all tested devices do not use PWM to dim the display. If PWM was detected, an average of 7741 (minimum: 5 - maximum: 343500) Hz was measured. | |||
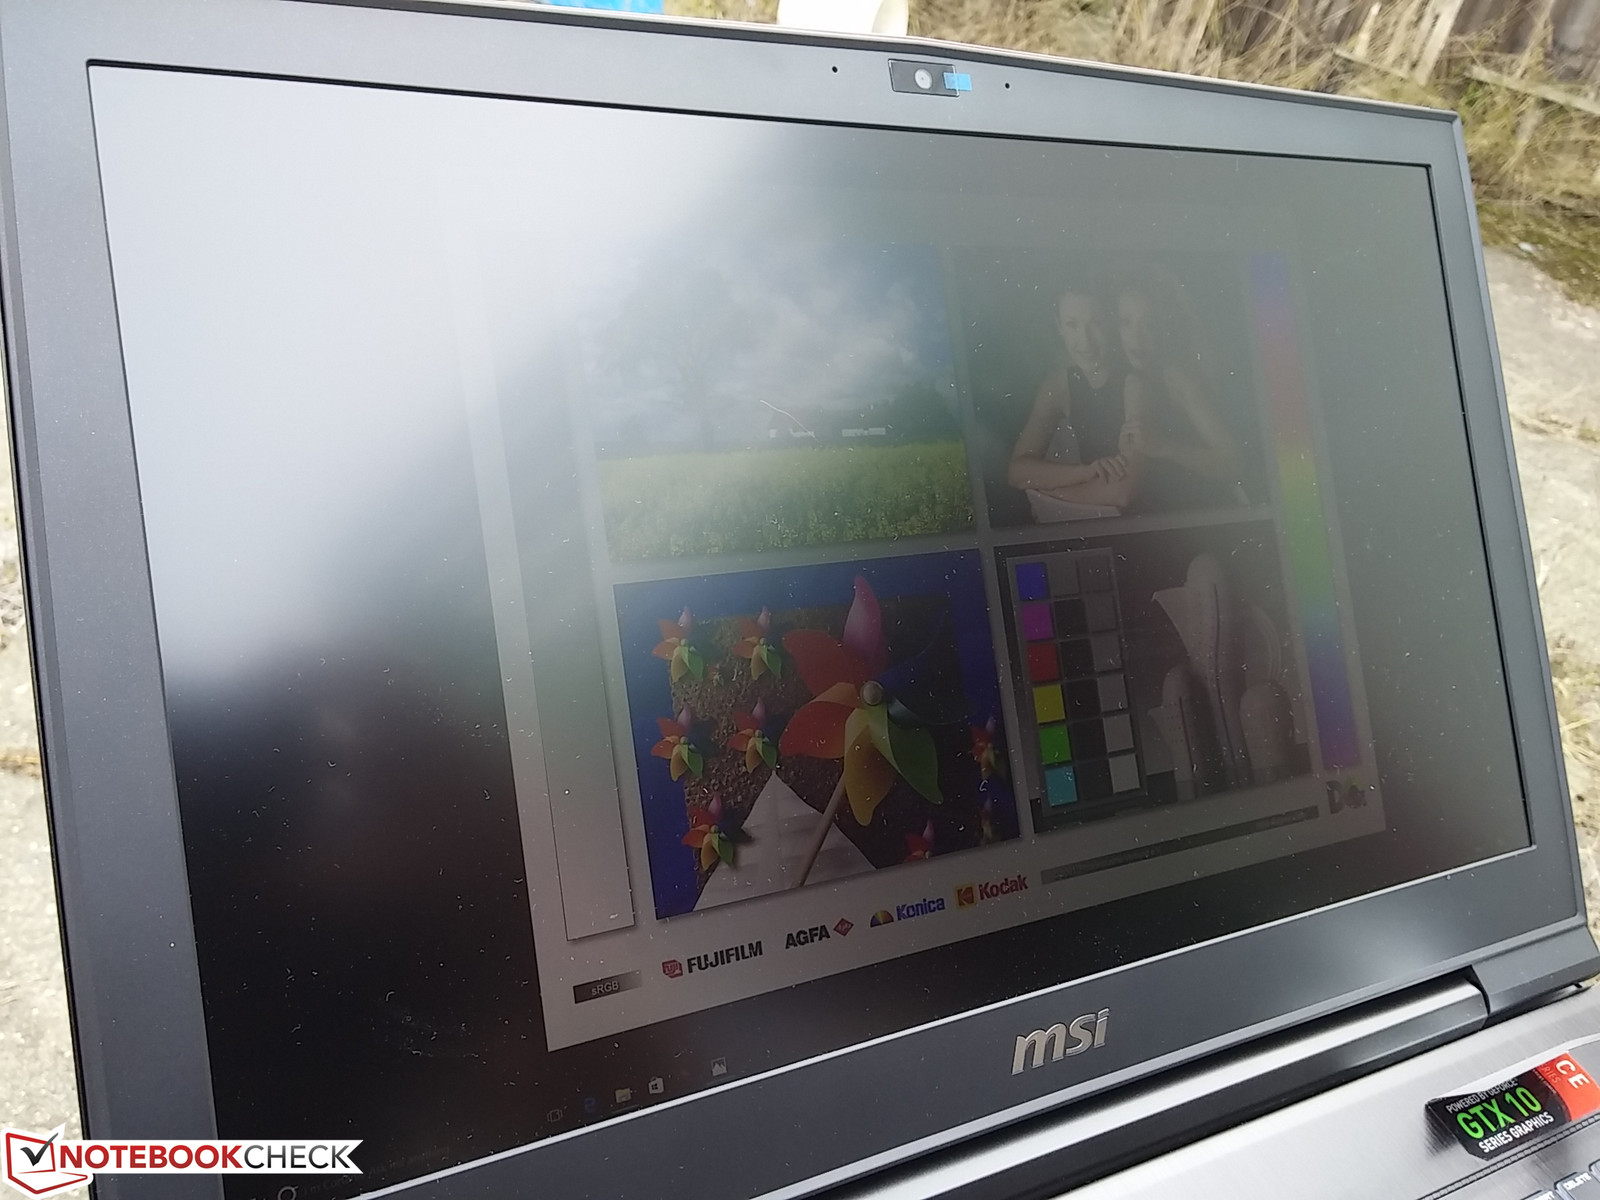
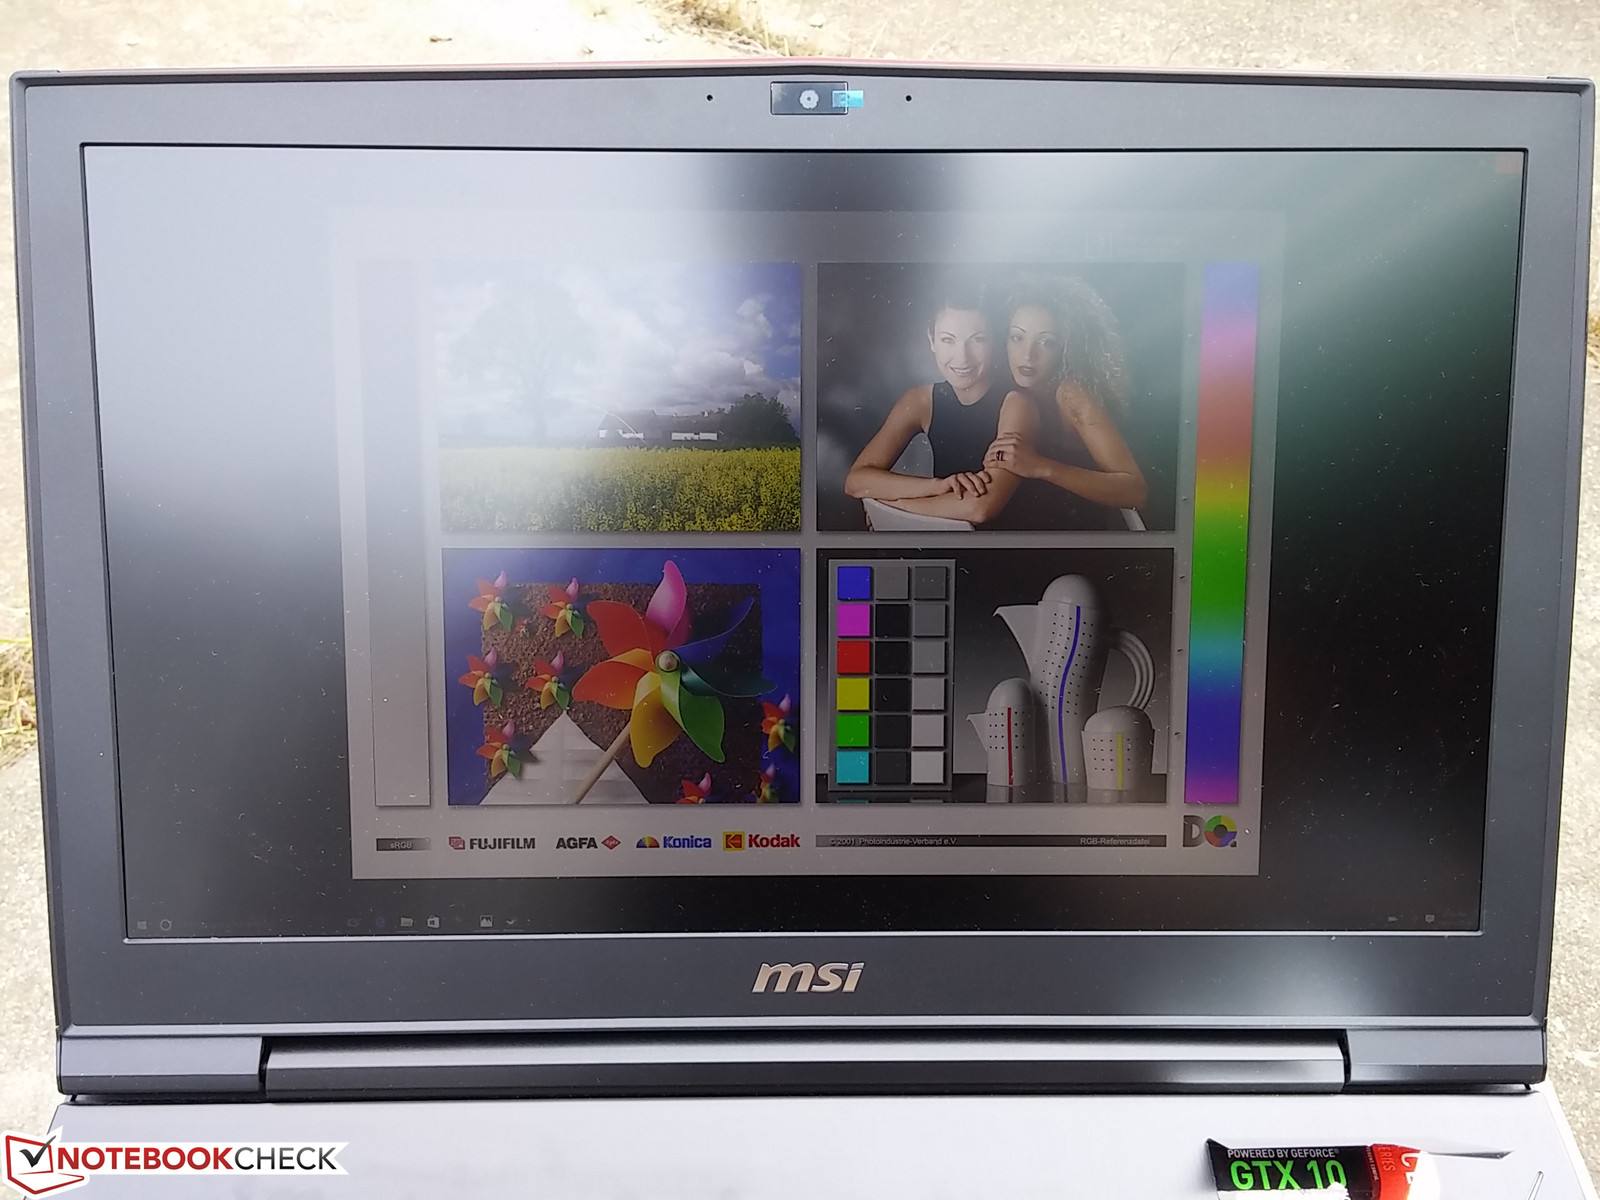
Outdoor visibility is slightly worse than the GT73VR 6RE as texts are smaller and contrast levels are not as deep. The panel benefits from wider IPS viewing angles but the backlight will need to be much brighter to overcome sunlight or bright ambient lighting. Visibility is otherwise not an issue when indoors.
Performance
The GT73VR is available in at least three SKUs with a choice of either the GTX 1070 or the GTX 1080 and a FHD or 4K UHD display. SKUs with GTX 1070 SLI options are also in the works for a future release. The FHD SKU (6RE) promises 120 Hz refresh rates and 5 ms response times whereas the 4K UHD option is limited to 60 Hz and slower response times. The display and GPU are the two largest differences between our 6RF and 6RE configurations.
Manual GPU switching is available to make use of the integrated HD Graphics 530 for power-saving purposes. Optimus is not an option in order to preserve G-Sync capabilities. Most other gaming notebooks with G-Sync do not have any graphics switching capabilities at all.
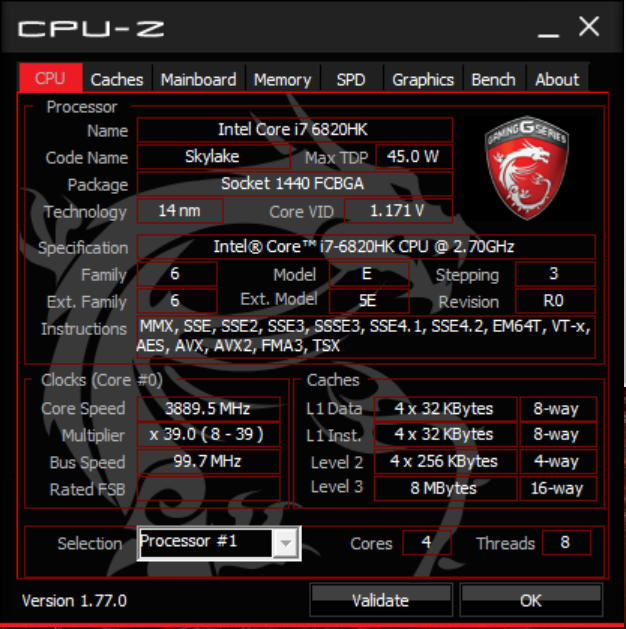
Processor
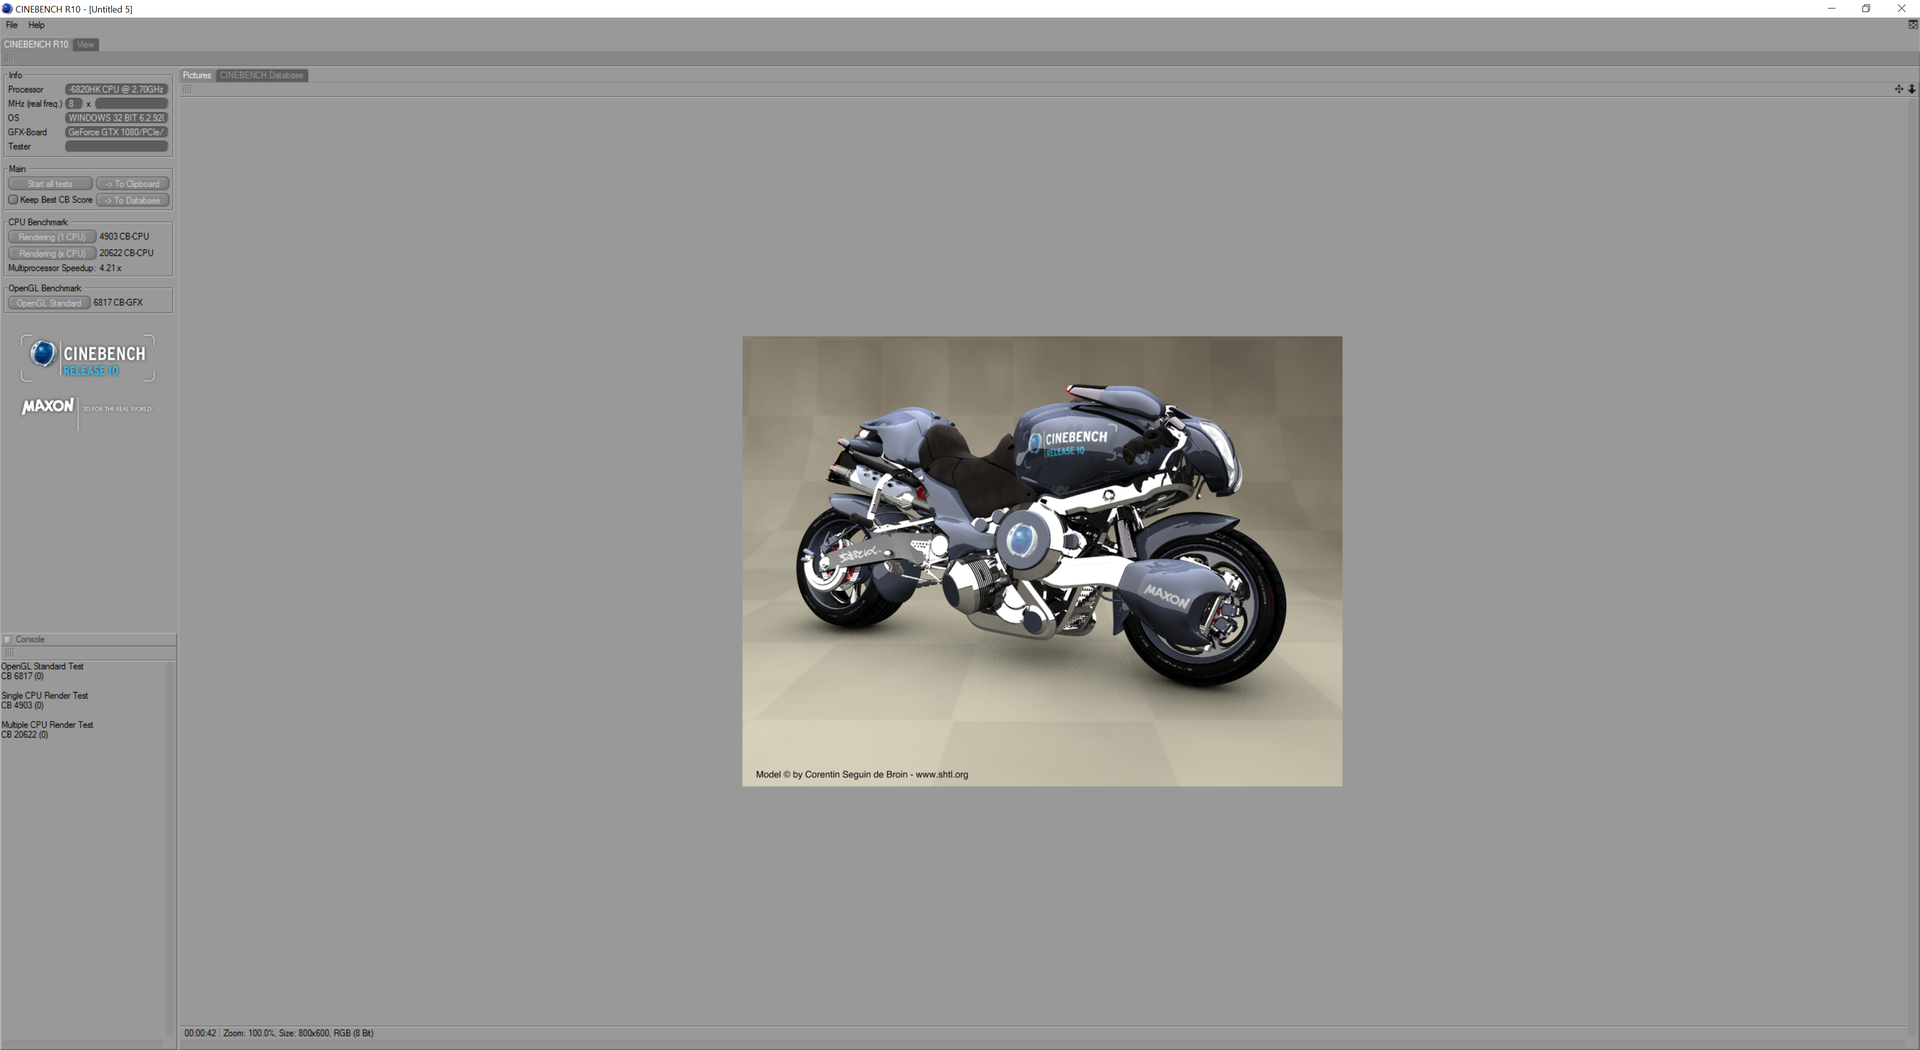
Raw CPU performance from the i7-6820HK on stock speeds is not significantly different from the Broadwell i7-5700HQ or even the Haswell i7-4700HQ according to CineBench benchmarks. The more demanding desktop-class i7-6700K is about 30 percent faster than the i7-6820HK in multi-threaded operations while single-threaded operations are almost the same. When we set the system to Turbo Performance mode, however, the CPU will maintain a clock rate of 4 GHz for both single-threaded and multi-threaded workloads compared to 3.2 GHz to 3.6 GHz when on stock High Performance settings. We've provided CineBench results below for both High Performance and Turbo Performance modes to illustrate the differences in scores. The i7-6820HK in Turbo Mode is almost neck-to-neck with the much more demanding desktop-class Core i7-6700K in stock speeds.
See our dedicated CPU page on the Core i7-6820HK and our review on the processor for more technical information and benchmark comparisons.
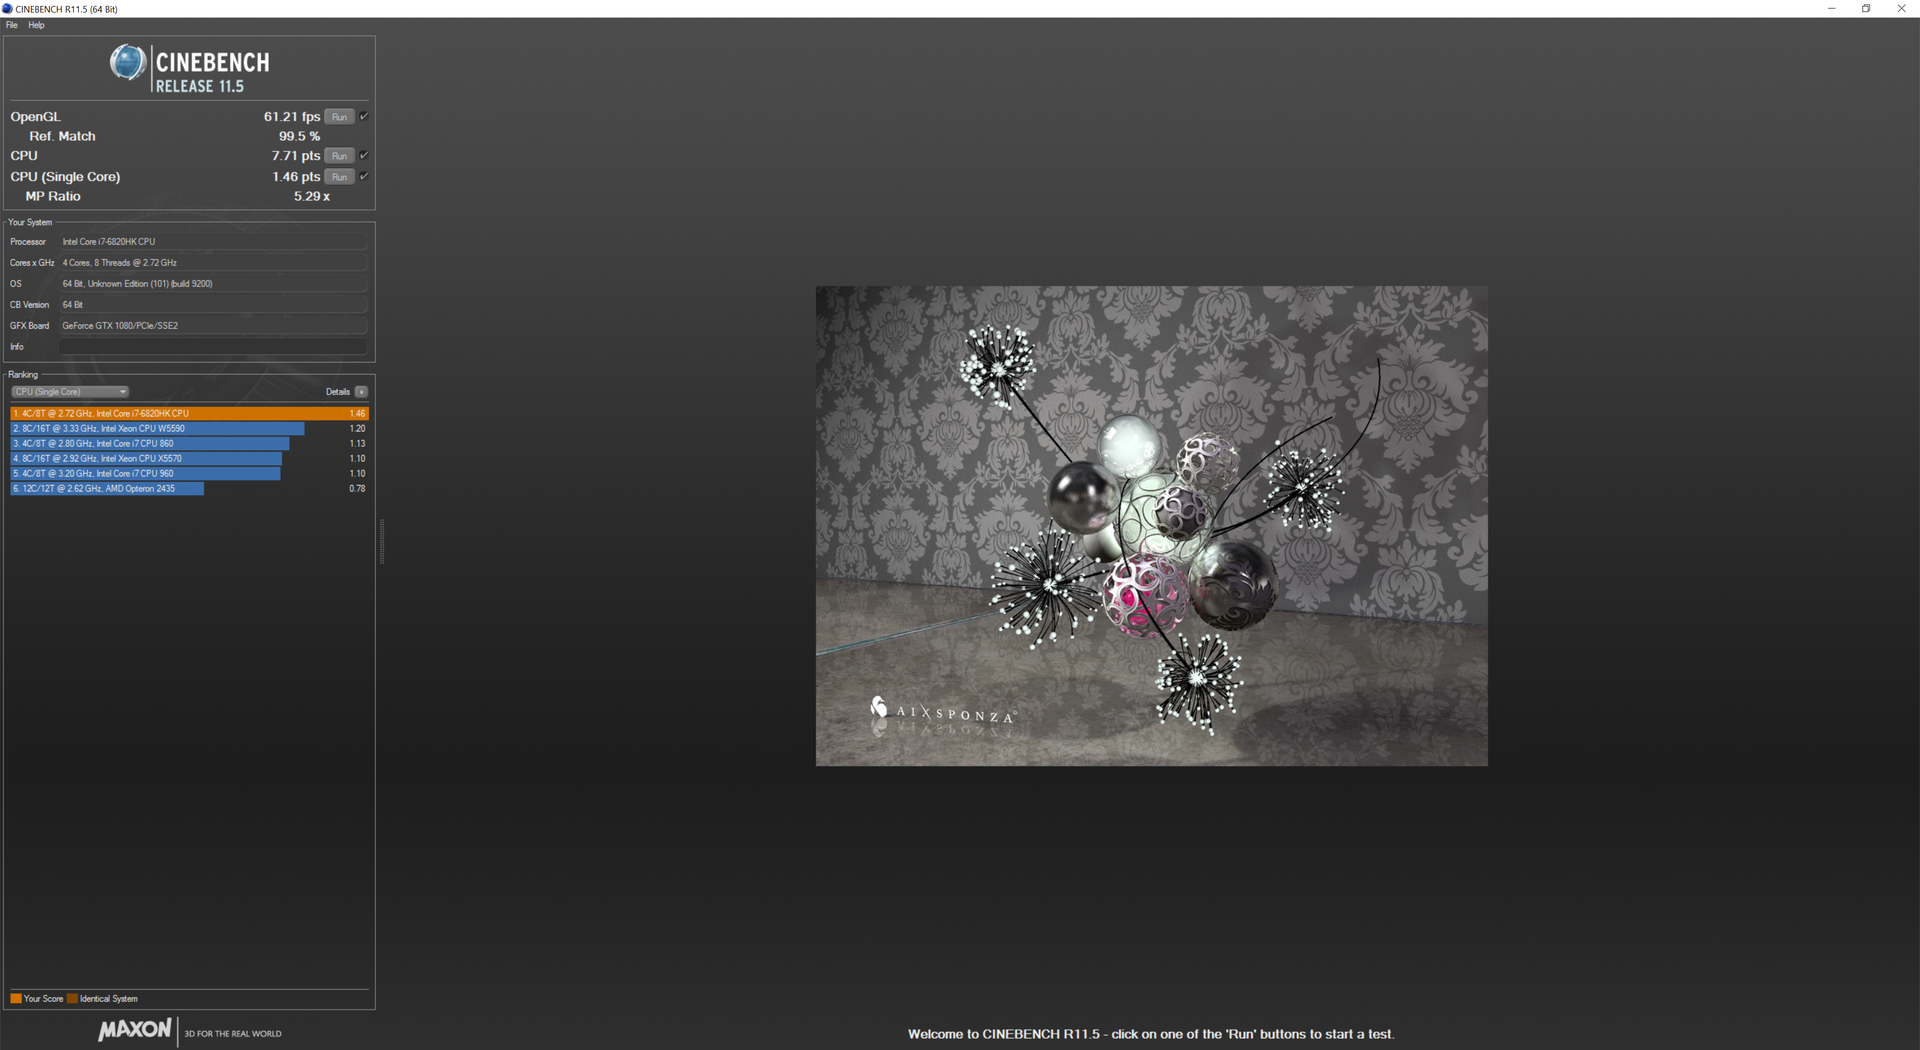
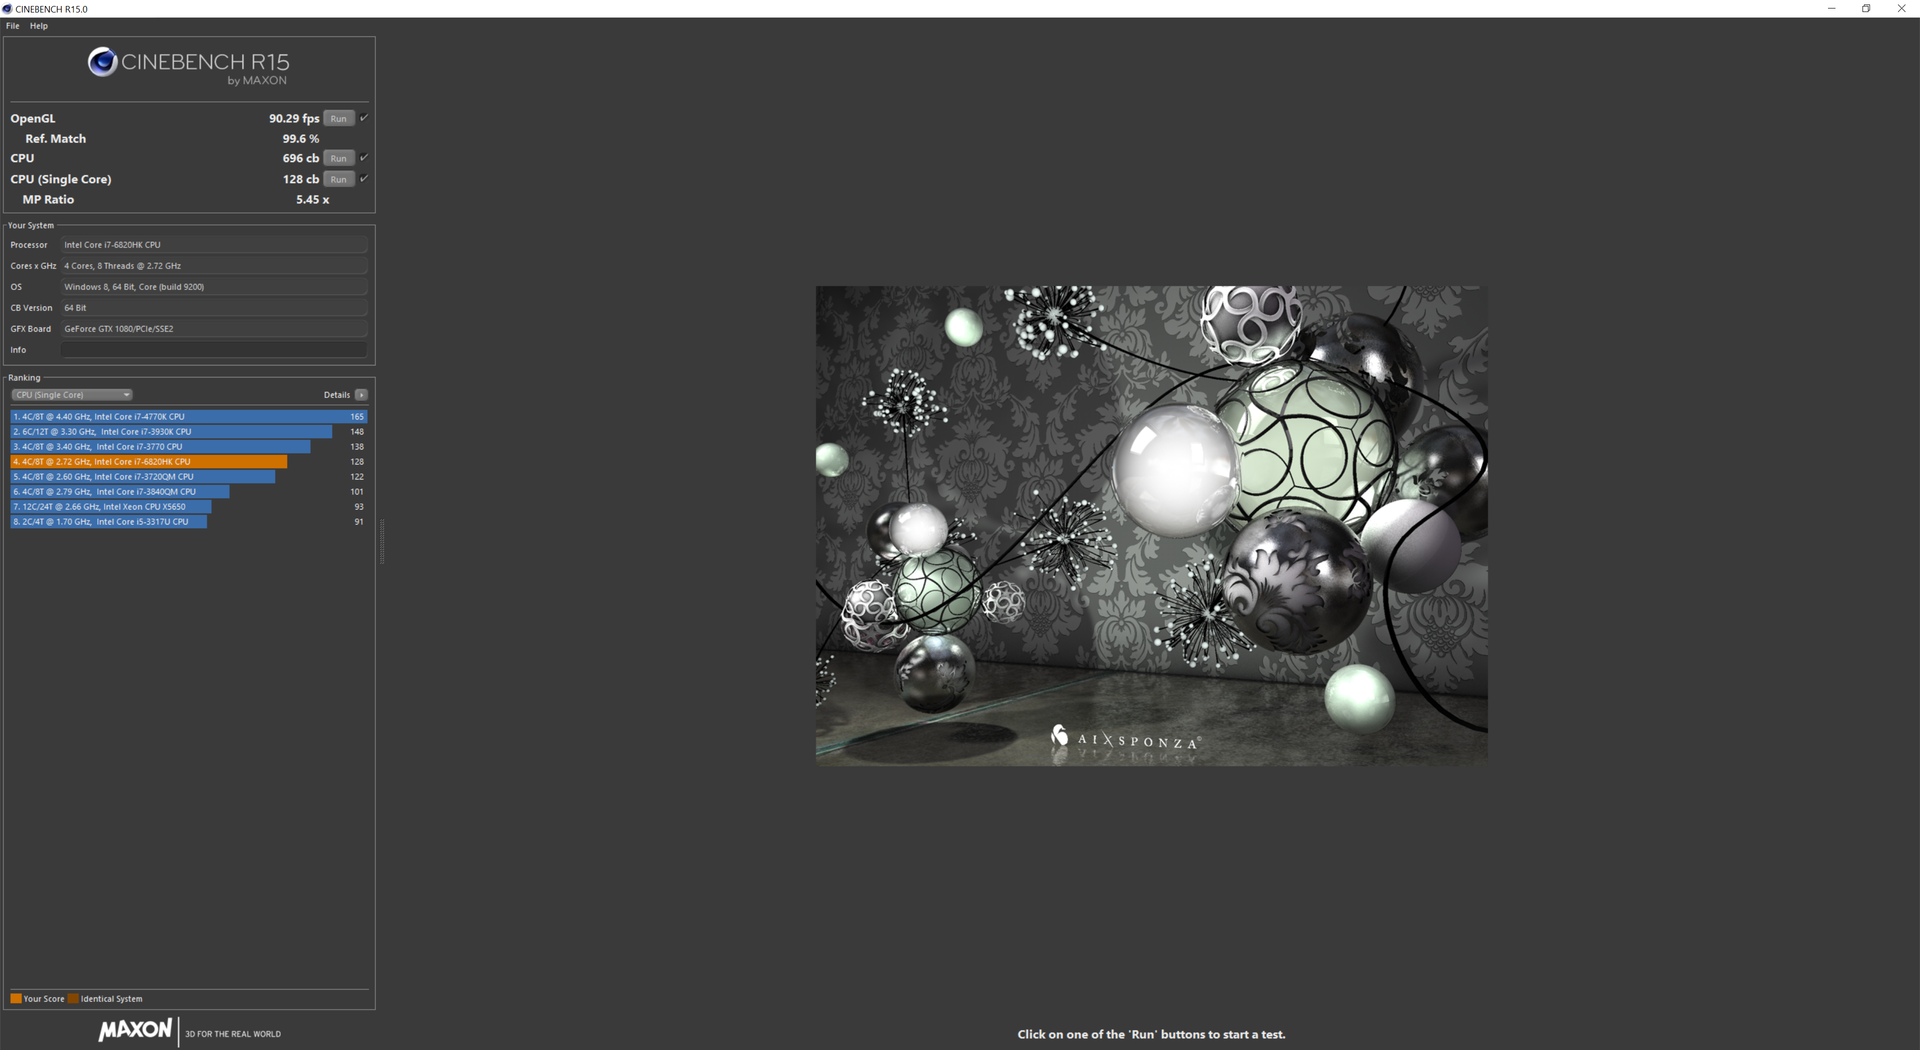

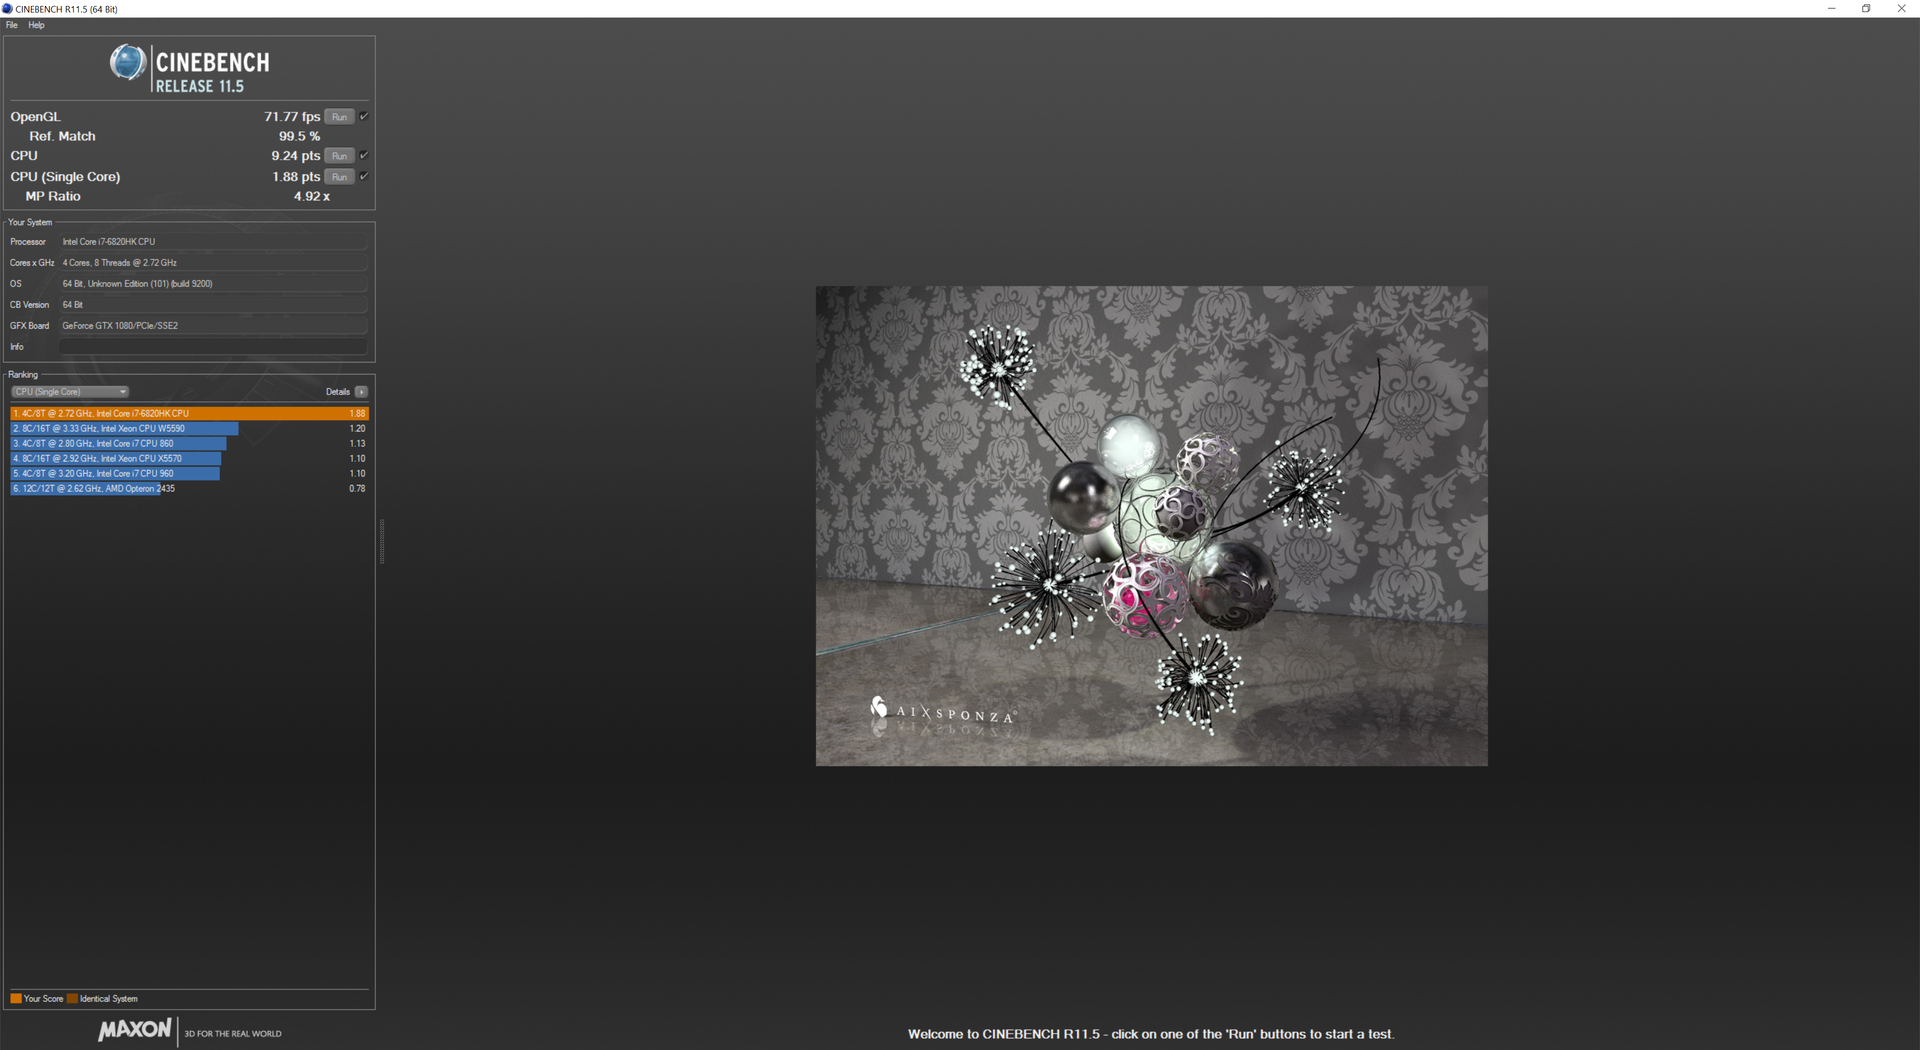

| Cinebench R11.5 | |
| CPU Single 64Bit | |
| MSI GT73VR 6RF | |
| Eurocom Sky X7E2 | |
| MSI GP62-2QEi781FD | |
| MSI GT72VR 6RD-063US | |
| Toshiba Satellite S70-B-106 | |
| CPU Multi 64Bit | |
| MSI GT73VR 6RF | |
| Eurocom Sky X7E2 | |
| MSI GP62-2QEi781FD | |
| MSI GT72VR 6RD-063US | |
| Toshiba Satellite S70-B-106 | |
| Cinebench R10 | |
| Rendering Multiple CPUs 32Bit | |
| MSI GT73VR 6RF | |
| Eurocom Sky X7E2 | |
| MSI GT72VR 6RD-063US | |
| MSI GP62-2QEi781FD | |
| Rendering Single 32Bit | |
| Eurocom Sky X7E2 | |
| MSI GT73VR 6RF | |
| MSI GP62-2QEi781FD | |
| MSI GT72VR 6RD-063US | |
System Performance
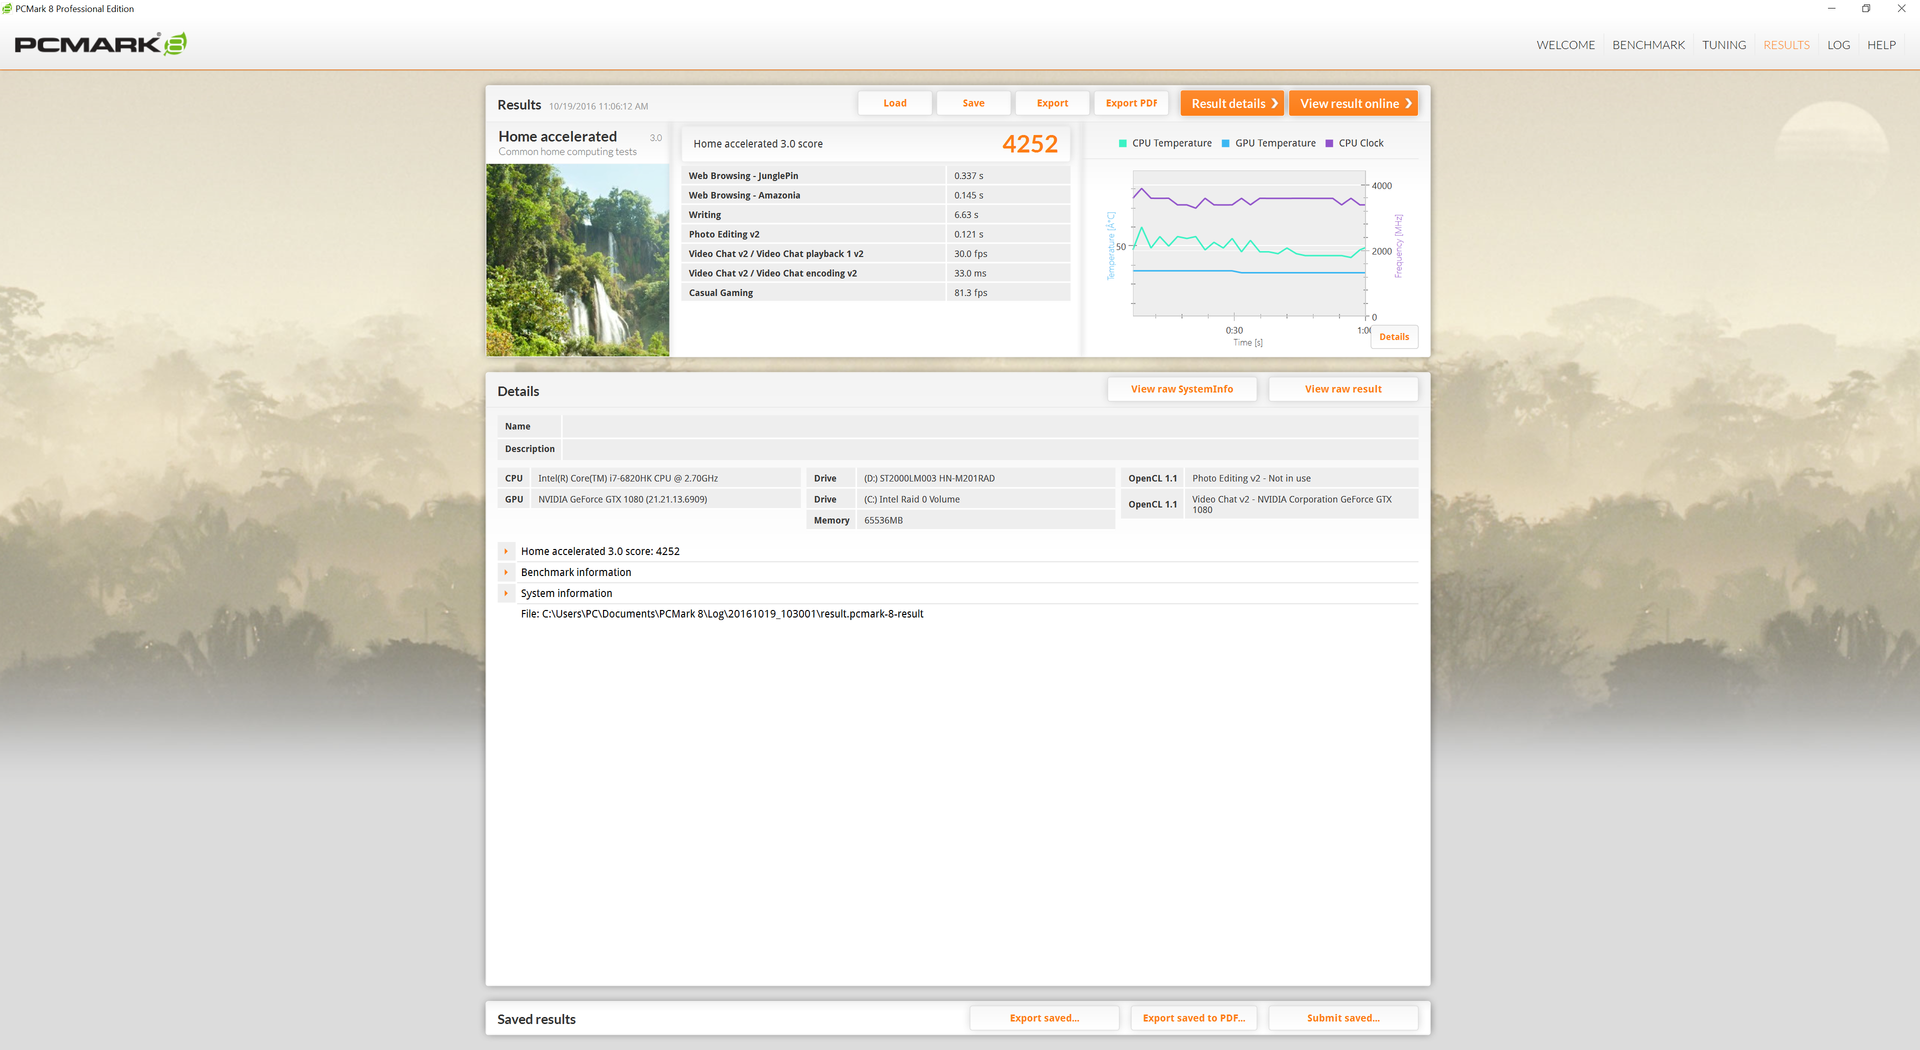
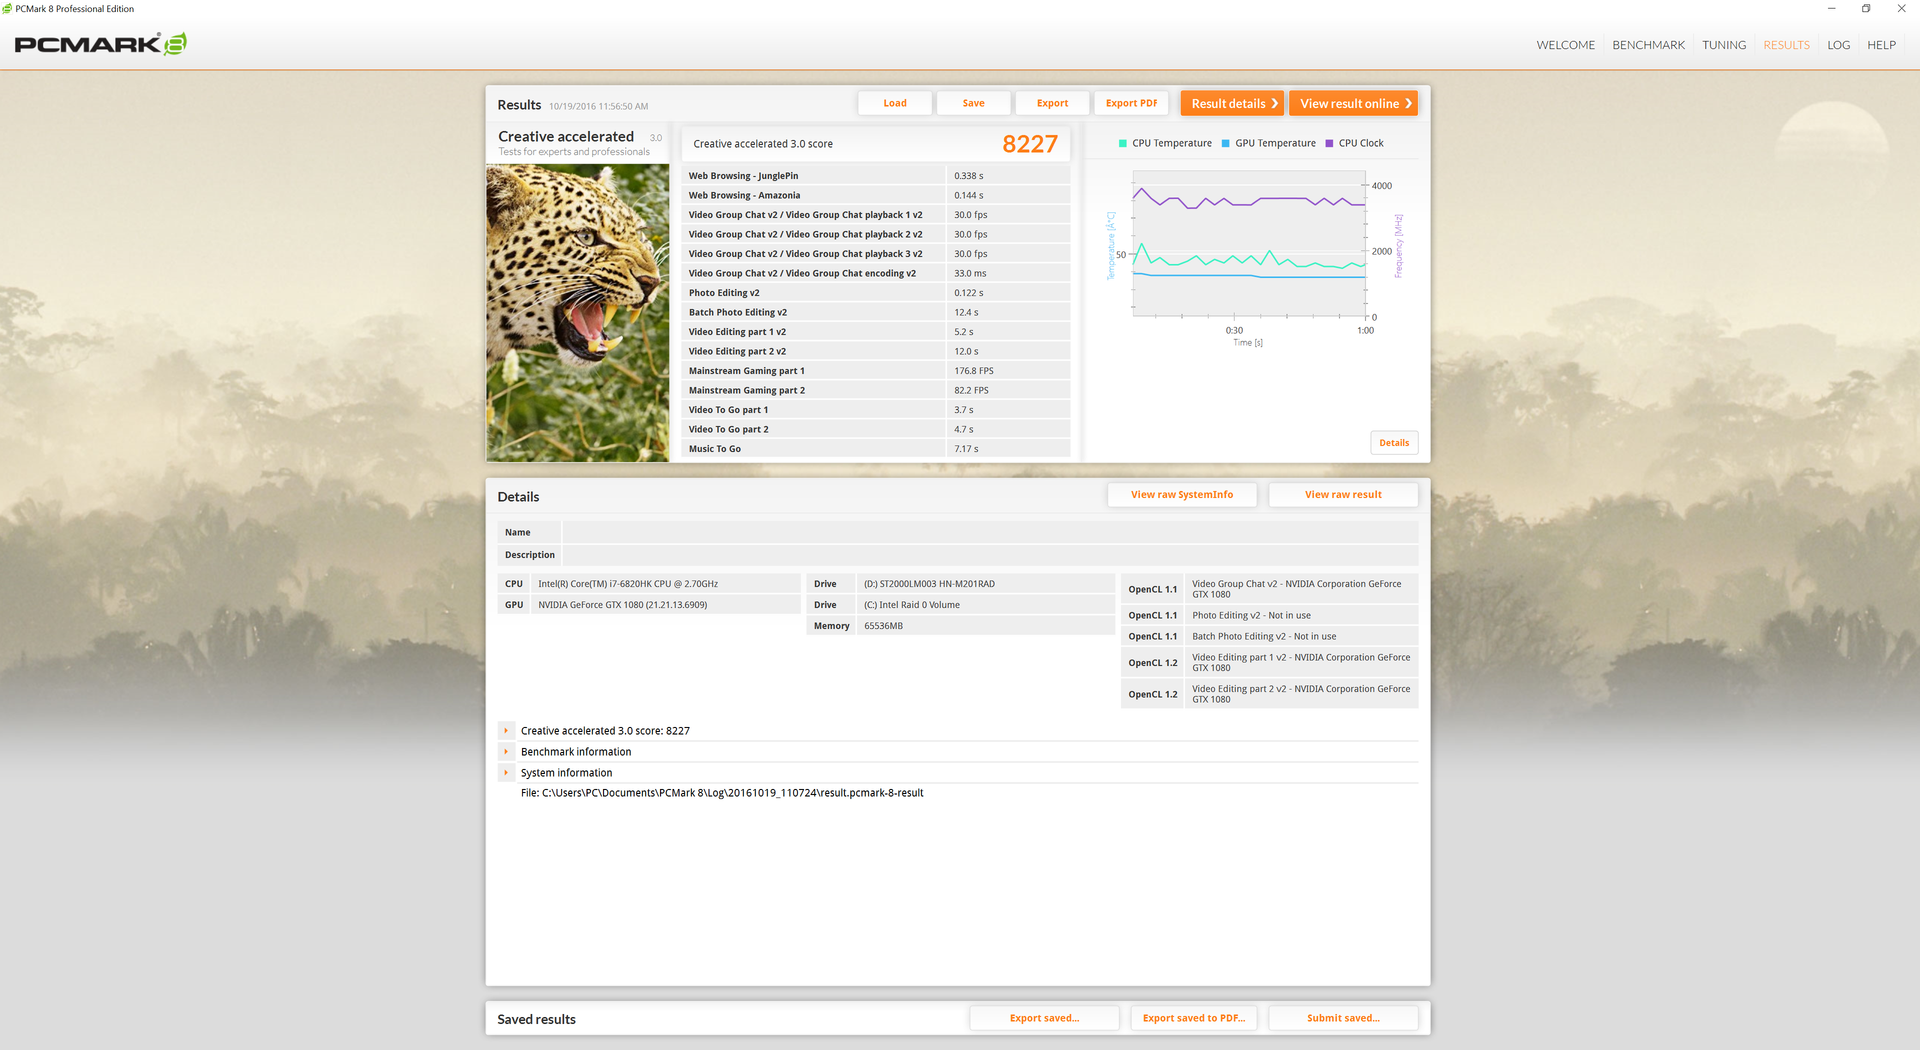
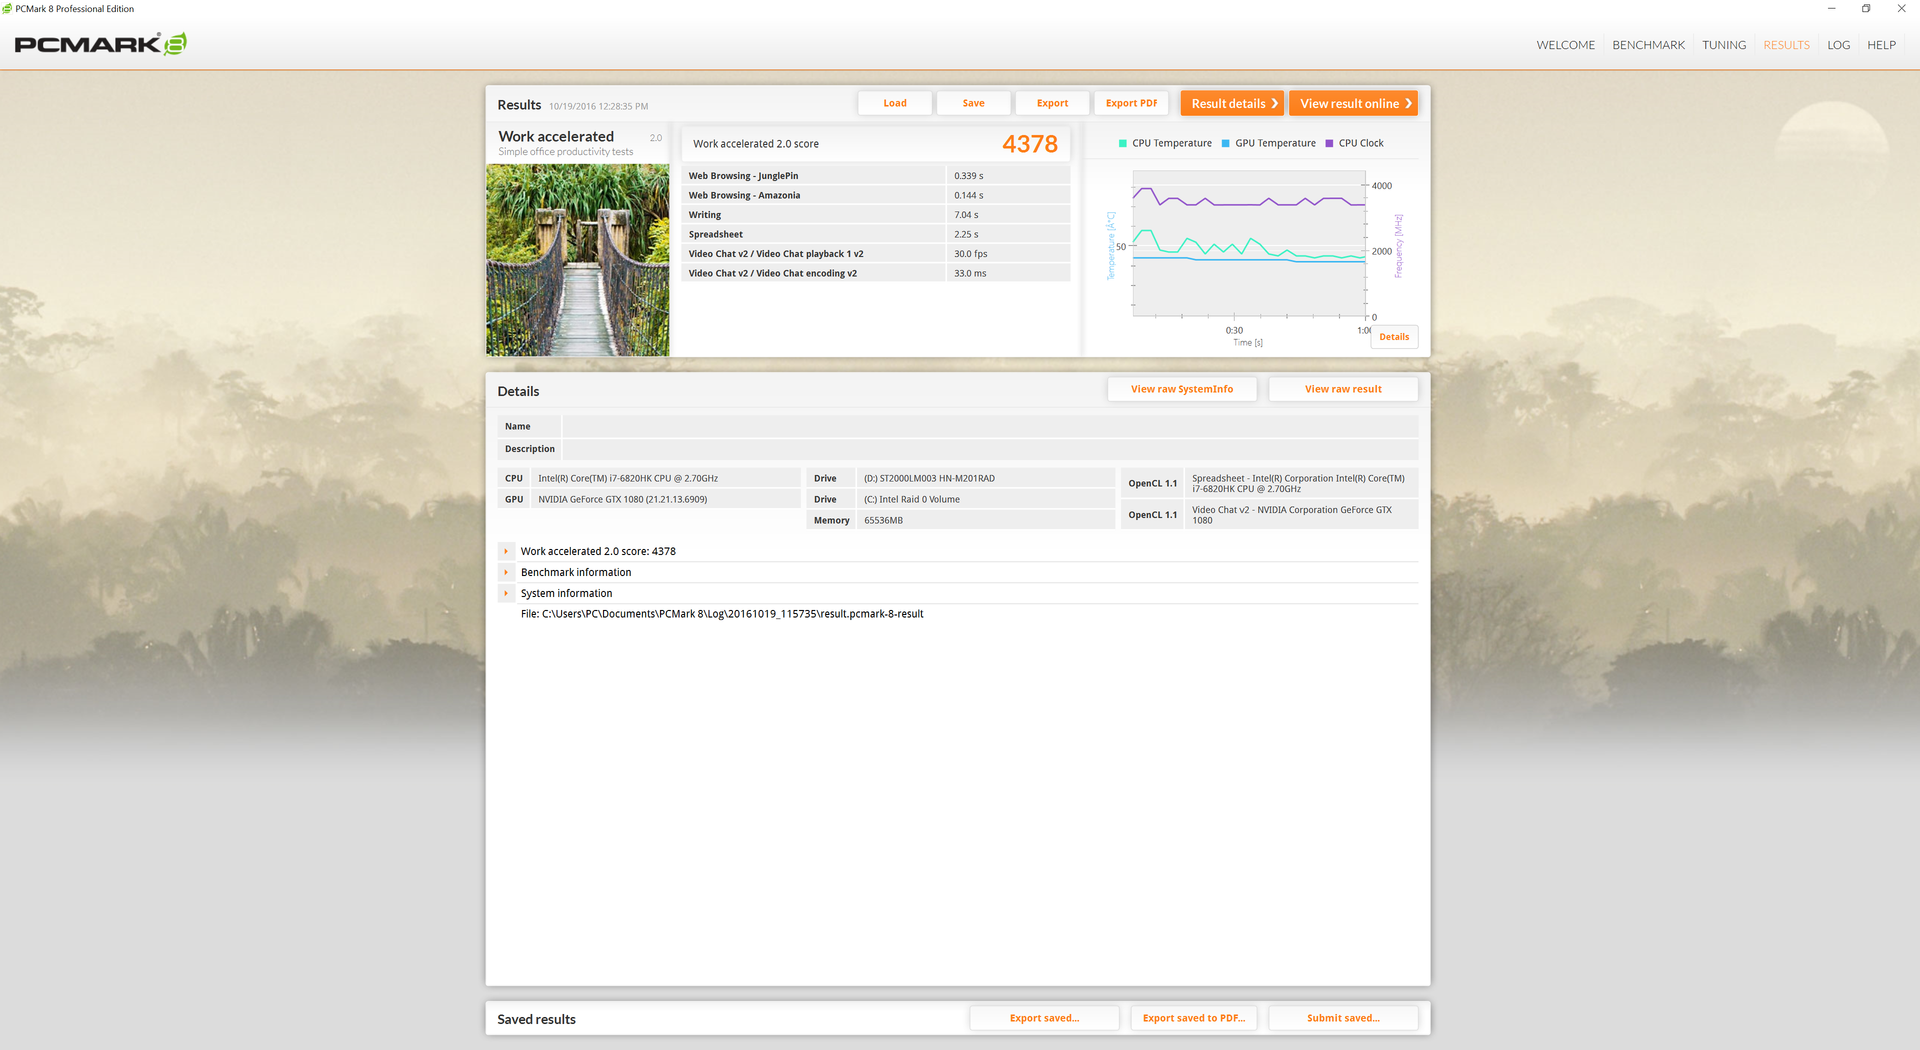
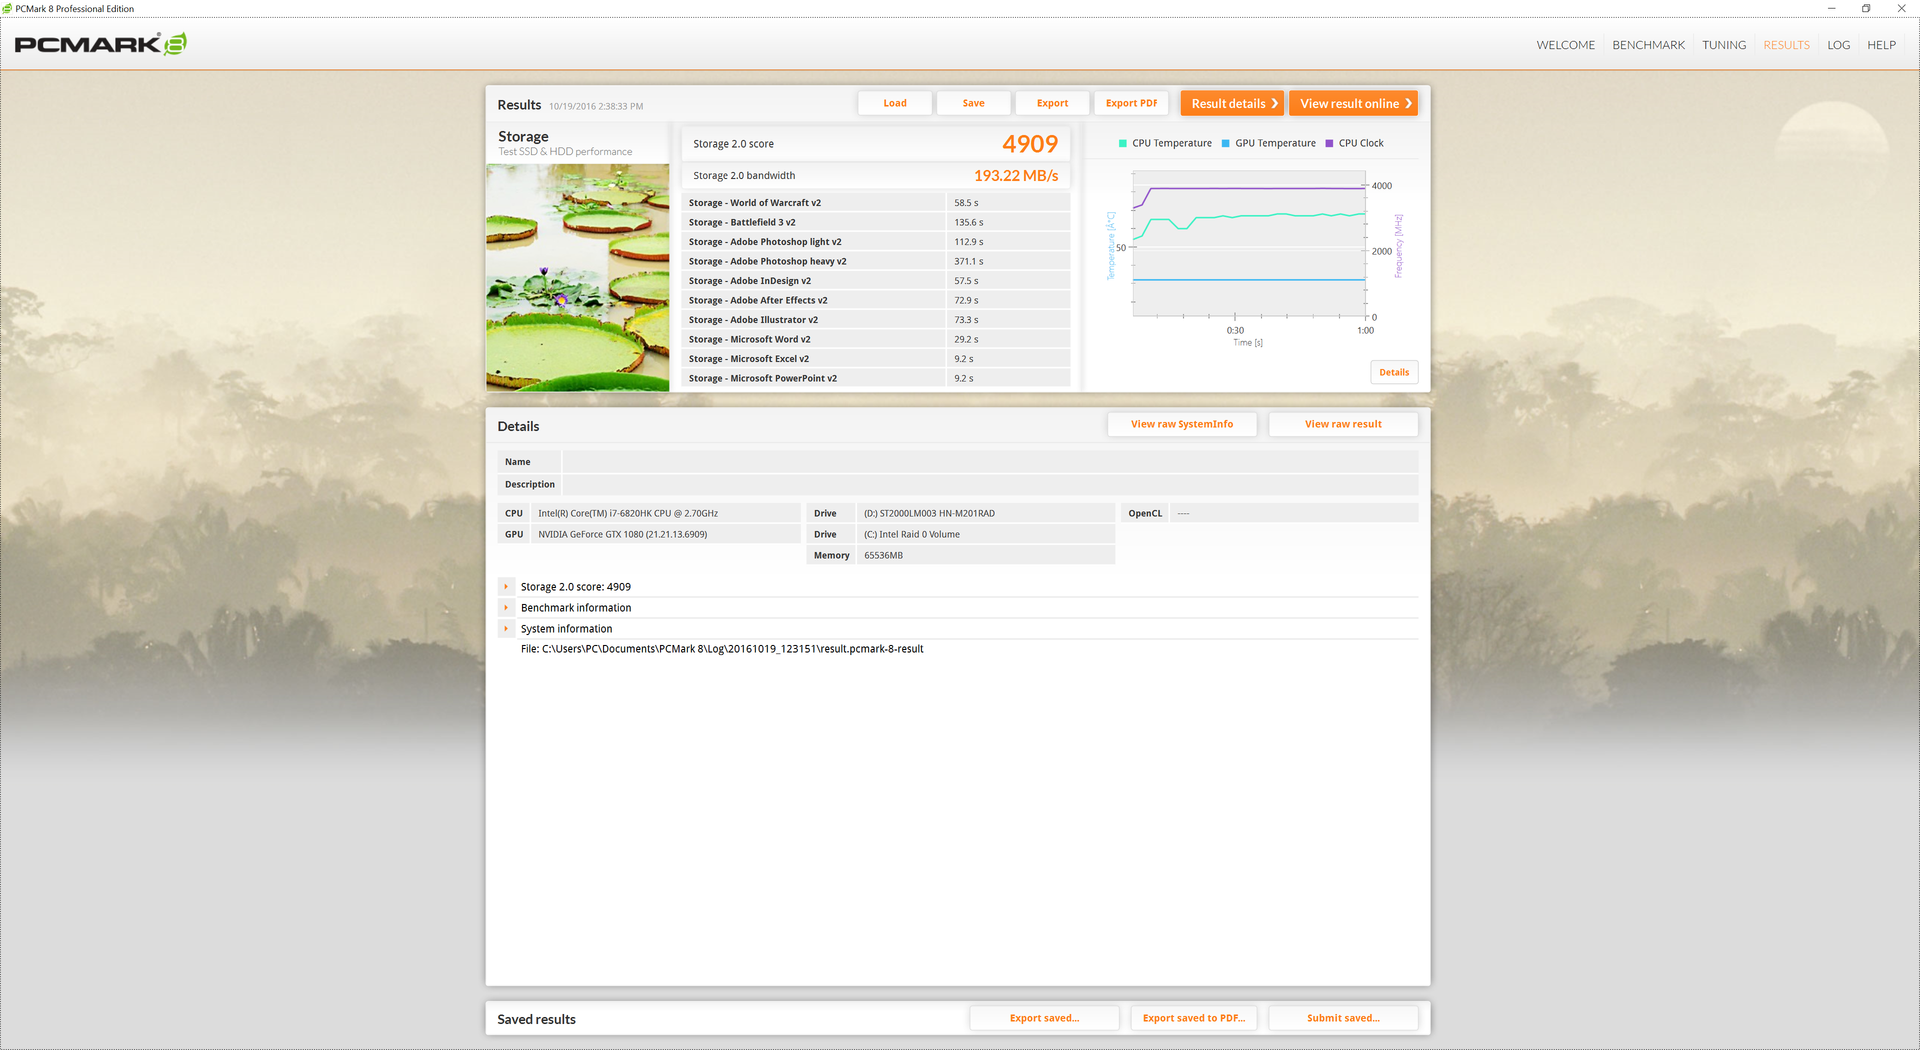
PCMark benchmarks rank the GT73VR in the same ballpark as many of its competitors if not slightly lower since our configuration is not equipped with NVMe SSDs. Subjectively, system responsiveness is very fast as expected from a primary solid-state drive. Our display panel would infrequently flicker at random, so there may be some hardware or software bugs related to the screen.
| PCMark 8 | |
| Home Score Accelerated v2 | |
| Asus G752VS-XB78K | |
| Asus G701VO-CS74K | |
| MSI GT73VR 6RF | |
| MSI GS73VR 6RF | |
| EVGA SC17 | |
| Work Score Accelerated v2 | |
| Asus G752VS-XB78K | |
| Asus G701VO-CS74K | |
| MSI GS73VR 6RF | |
| MSI GT73VR 6RF | |
| EVGA SC17 | |
| Creative Score Accelerated v2 | |
| Asus G752VS-XB78K | |
| MSI GT73VR 6RF | |
| Asus G701VO-CS74K | |
| MSI GS73VR 6RF | |
| EVGA SC17 | |
| PCMark 8 Home Score Accelerated v2 | 4252 points | |
| PCMark 8 Creative Score Accelerated v2 | 8227 points | |
| PCMark 8 Work Score Accelerated v2 | 4378 points | |
Help | ||
Storage Devices
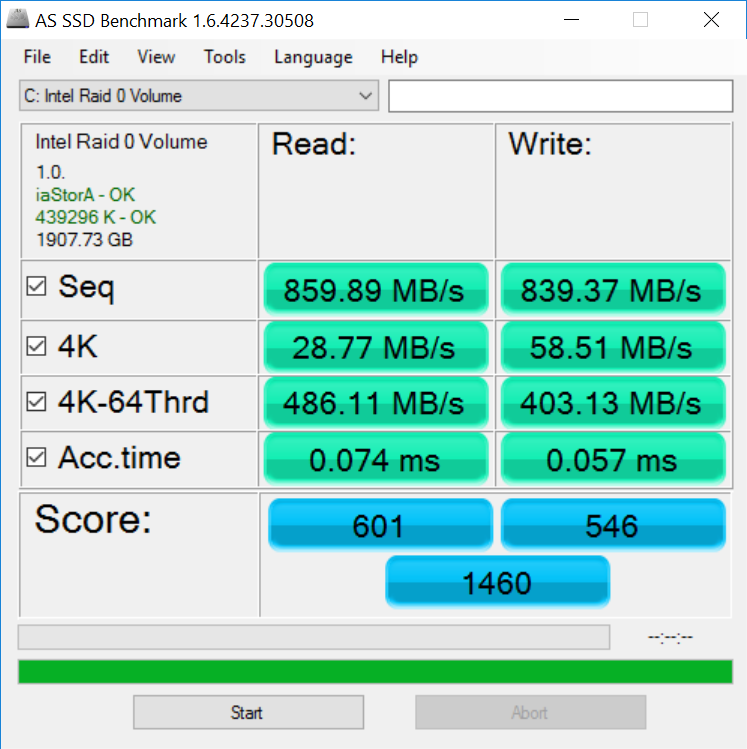
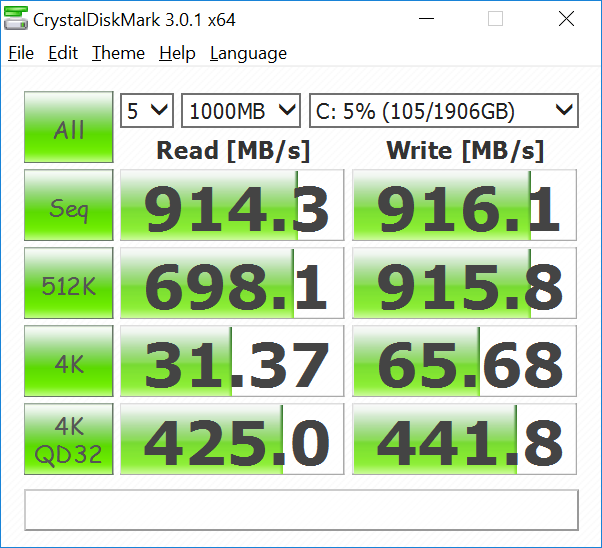
The chassis supports NVMe SSDs, but our particular configuration is equipped with two 1 TB SanDisk X400 SD8SN8U1T001122 SATA M.2 SSDs in RAID 0 for slower speeds and a more affordable price. Average read and write rates are just over 900 MB/s each compared to about 1600 MB/s with the Samsung SM951 NVMe SSD or over 3000 MB/s on the Samsung SM951 NVMe in RAID 0.
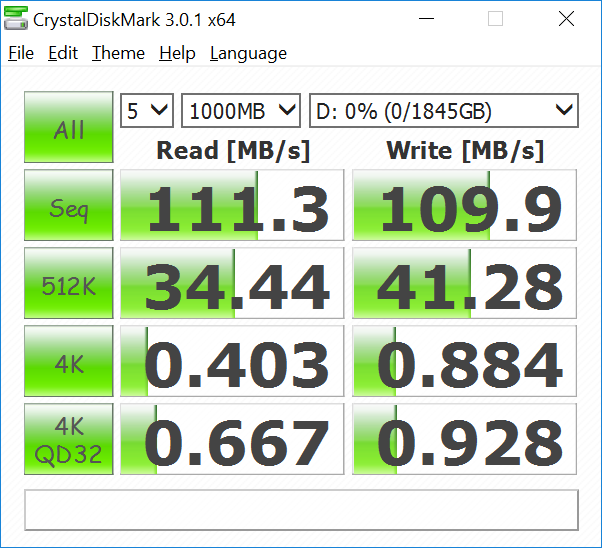
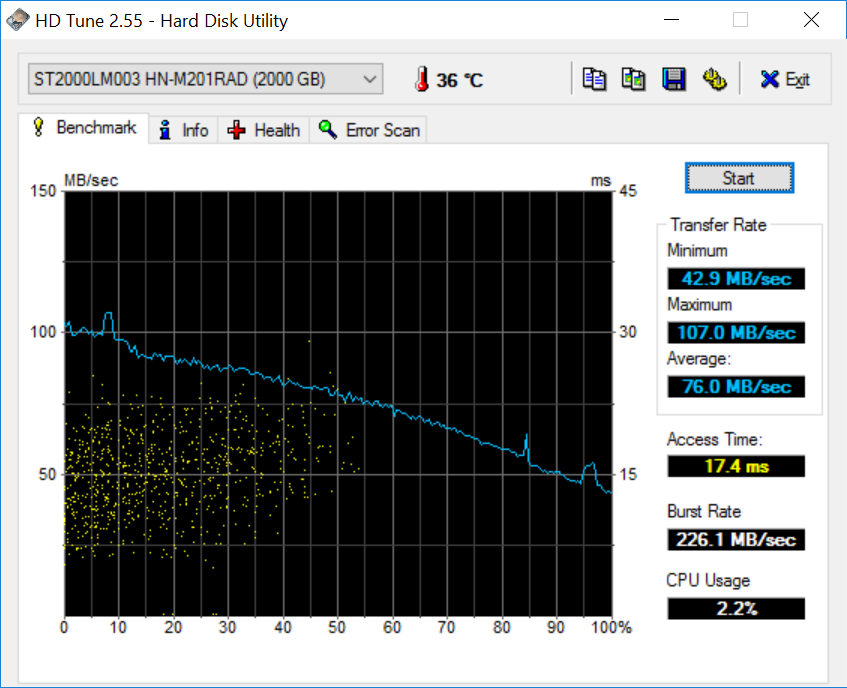
Our secondary 5400 RPM 2 TB Seagate HDD is rather slow with its 76 MB/s transfer rate according to HD Tune. 7200 RPM drives from Hitachi tend to clock in over 90 MB/s. See our table of HDDs and SSDs for more comparisons and benchmarks.
| MSI GT73VR 6RF 2x SanDisk X400 1TB M.2 SD8SN8U1T001122 (RAID 0) | MSI GT73VR-6RE16SR451 2x Samsung SM951 MZVPV256HDGL (RAID 0) | Asus G701VO-CS74K 2x Samsung SM951 MZVPV512HDGL (RAID 0) | Eurocom Sky X7E2 Samsung SM951 MZVPV512HDGL m.2 PCI-e | MSI GS73VR 6RF SanDisk SD8SN8U1T001122 | |
|---|---|---|---|---|---|
| CrystalDiskMark 3.0 | 127% | 105% | 67% | -55% | |
| Read Seq (MB/s) | 914 | 3285 259% | 3067 236% | 1673 83% | 334.3 -63% |
| Write Seq (MB/s) | 916 | 2560 179% | 2434 166% | 1576 72% | 319 -65% |
| Read 512 (MB/s) | 698 | 1775 154% | 1582 127% | 1180 69% | 242.3 -65% |
| Write 512 (MB/s) | 916 | 2327 154% | 2255 146% | 1561 70% | 254.4 -72% |
| Read 4k (MB/s) | 31.37 | 52.2 66% | 47.25 51% | 51.5 64% | 20.3 -35% |
| Write 4k (MB/s) | 65.7 | 153.1 133% | 110.7 68% | 144 119% | 42.51 -35% |
| Read 4k QD32 (MB/s) | 425 | 627 48% | 584 37% | 694 63% | 251.6 -41% |
| Write 4k QD32 (MB/s) | 441.8 | 527 19% | 463.3 5% | 422.1 -4% | 167.1 -62% |

GPU Performance
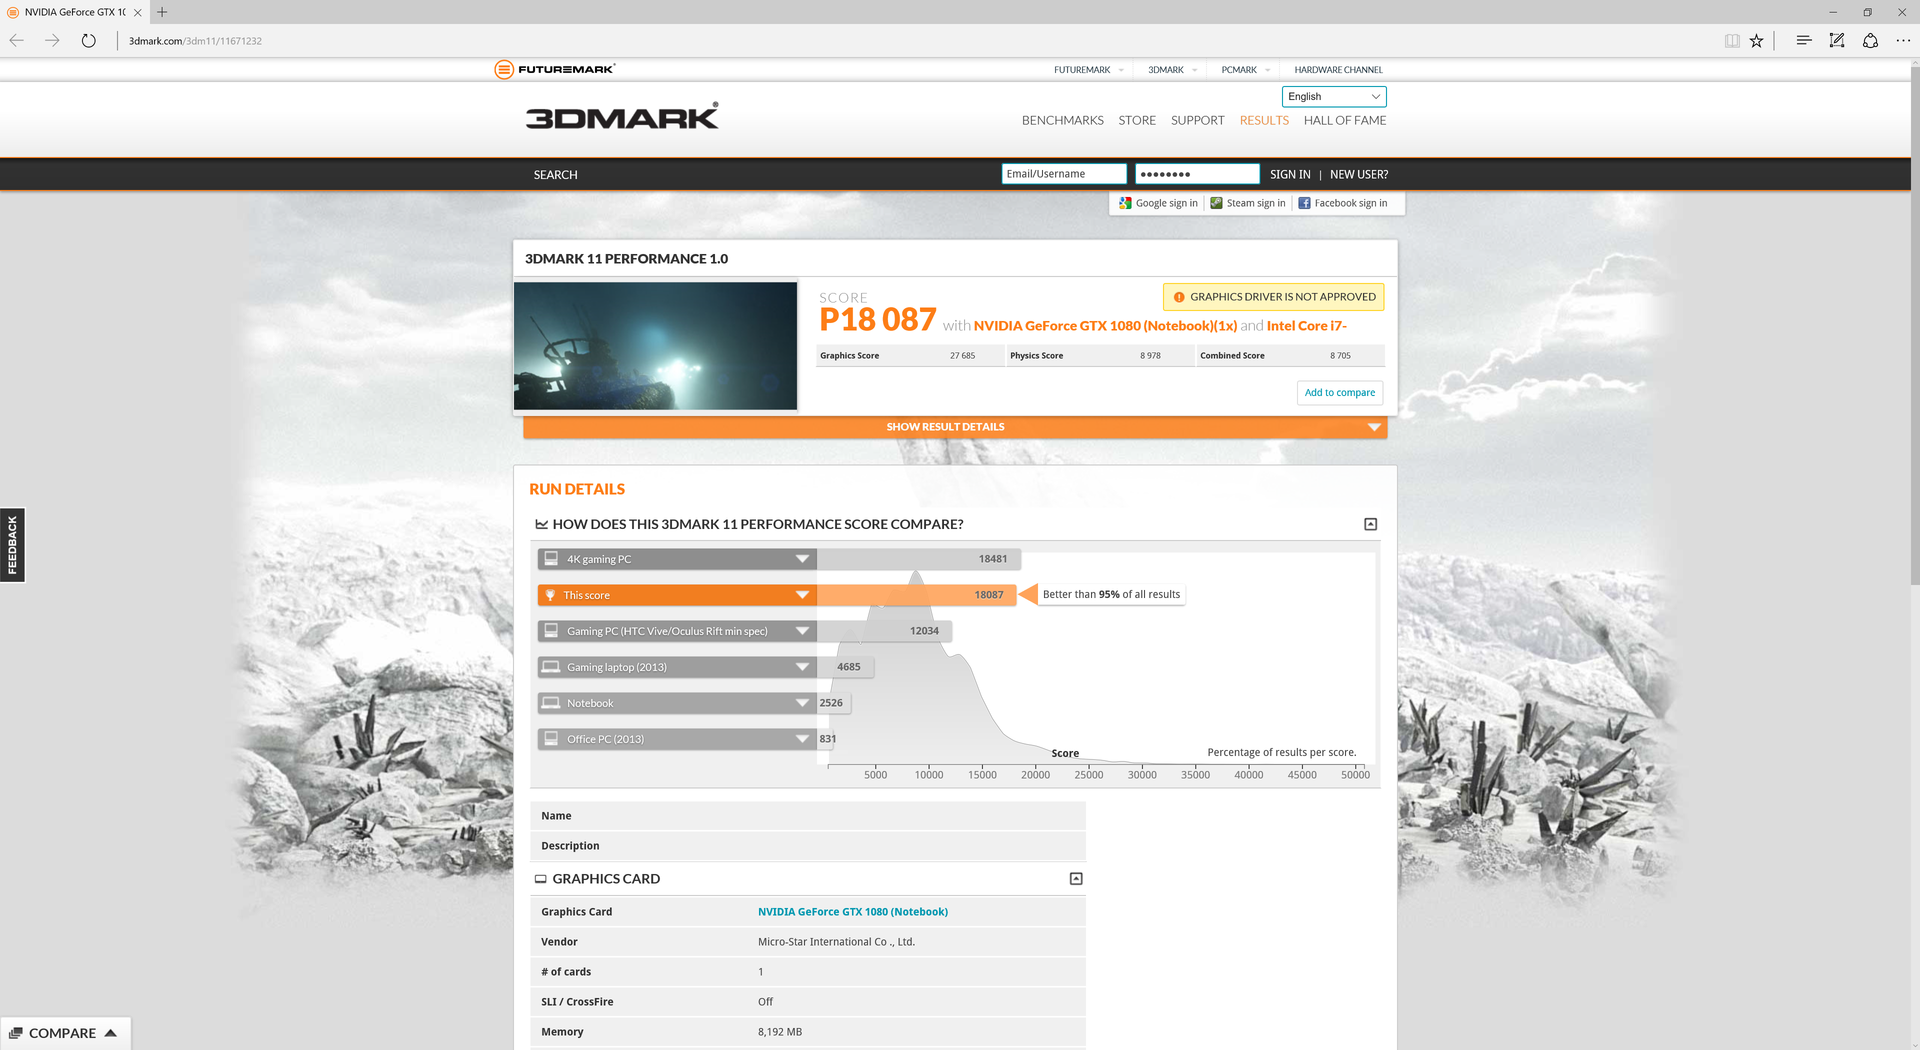
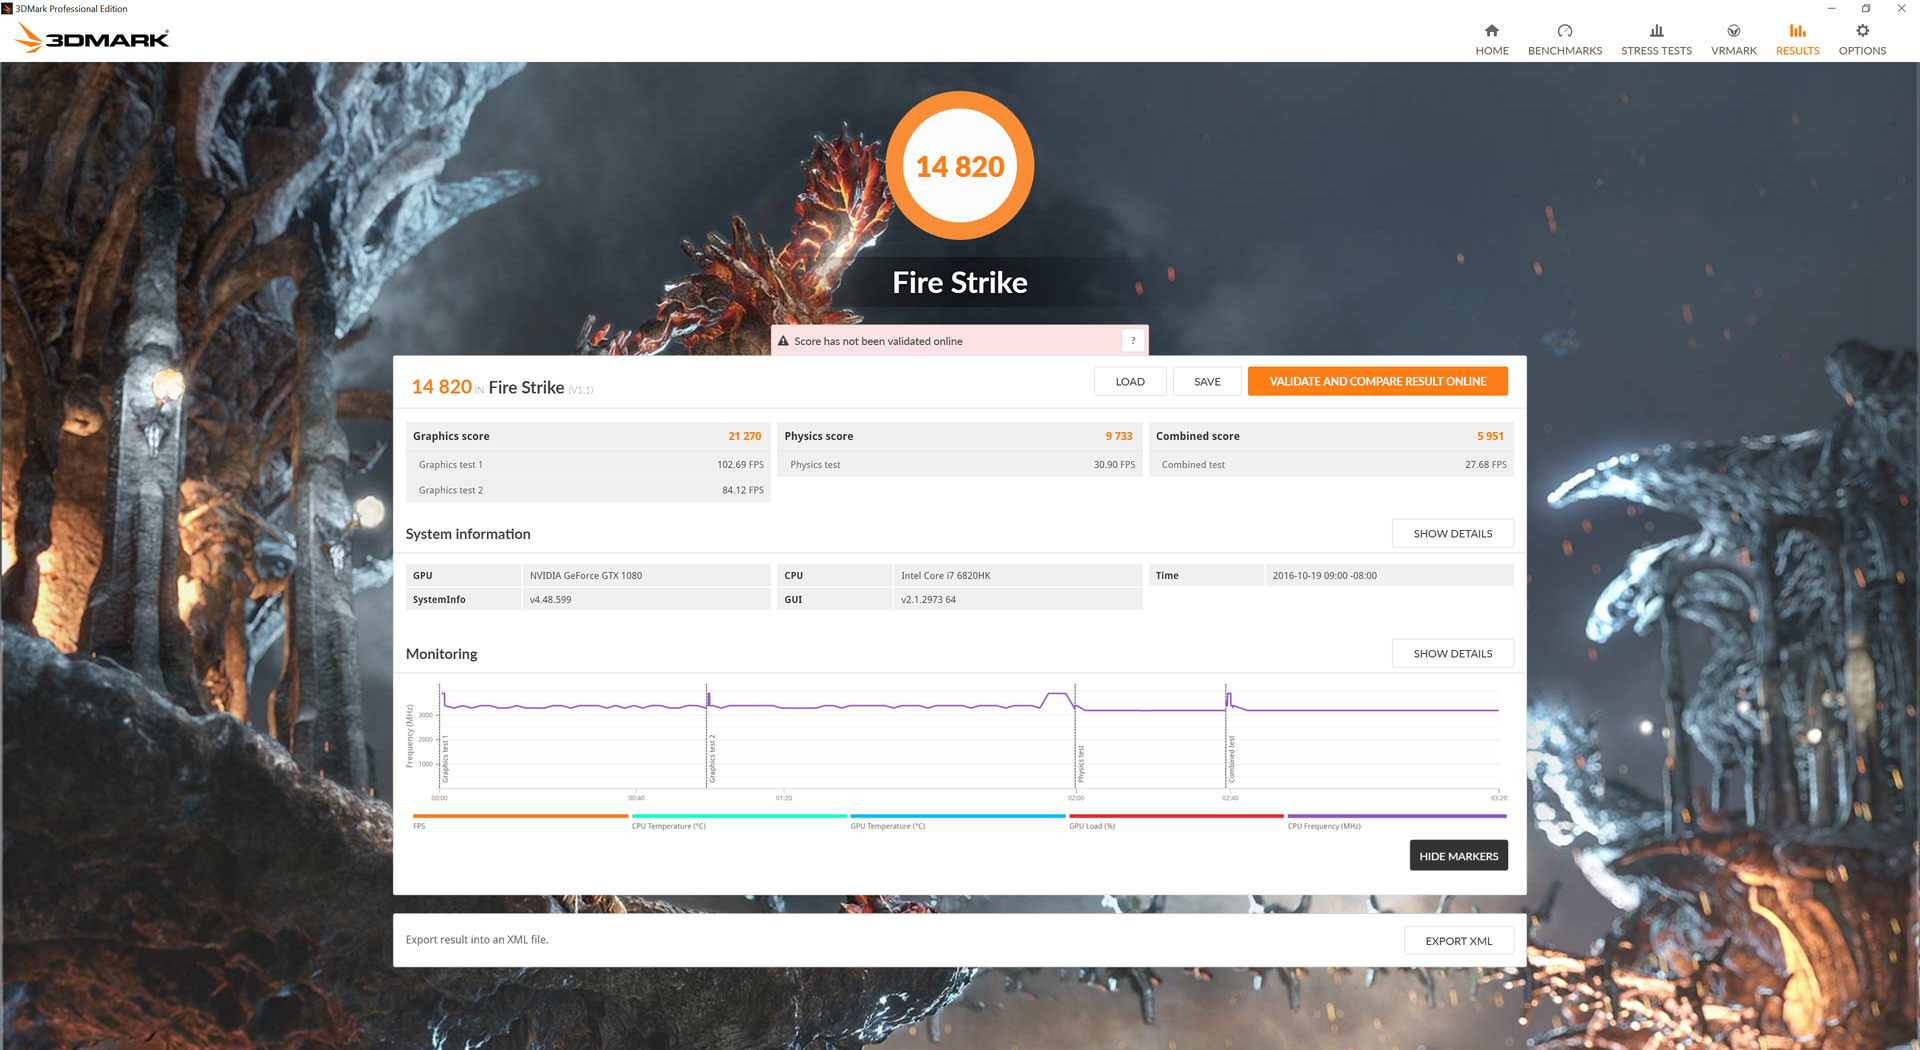
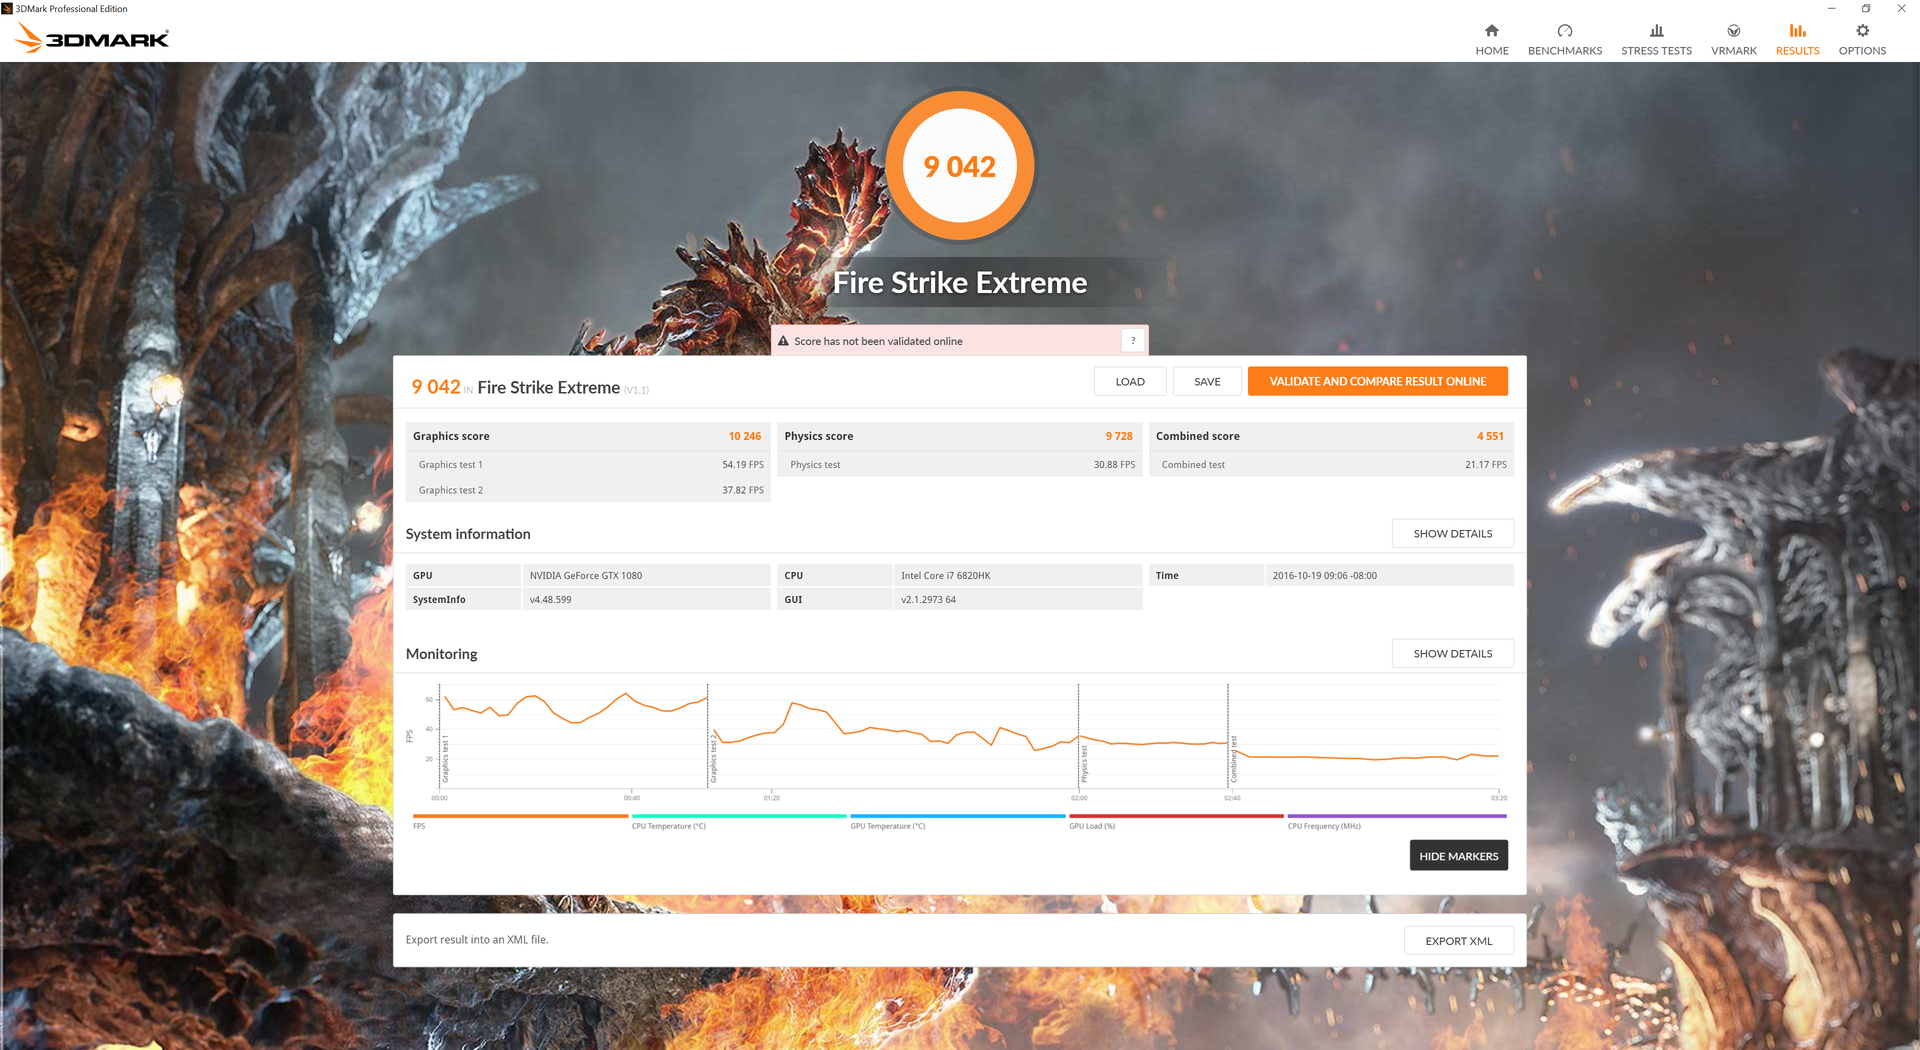
3DMark reveals no significant performance differences between the GTX 1080 in our MSI notebook and our reference desktop GTX 1080. Our configuration is about 20 percent faster than the Eurocom X8 with GTX 980M SLI and about 70 percent faster than the laptop version of the GTX 980.
See our dedicated GPU page on the GTX 1080 and our review on the Pascal series for more technical information and benchmark comparisons.
| 3DMark | |
| 1920x1080 Fire Strike Graphics | |
| MSI GT73VR 6RF | |
| Nvidia GeForce GTX 1080 Founders Edition | |
| Eurocom X8 | |
| MSI GT73VR-6RE16SR451 | |
| Asus G701VO-CS74K | |
| MSI GT72VR 6RD-063US | |
| Asus Strix GL502VY-DS71 | |
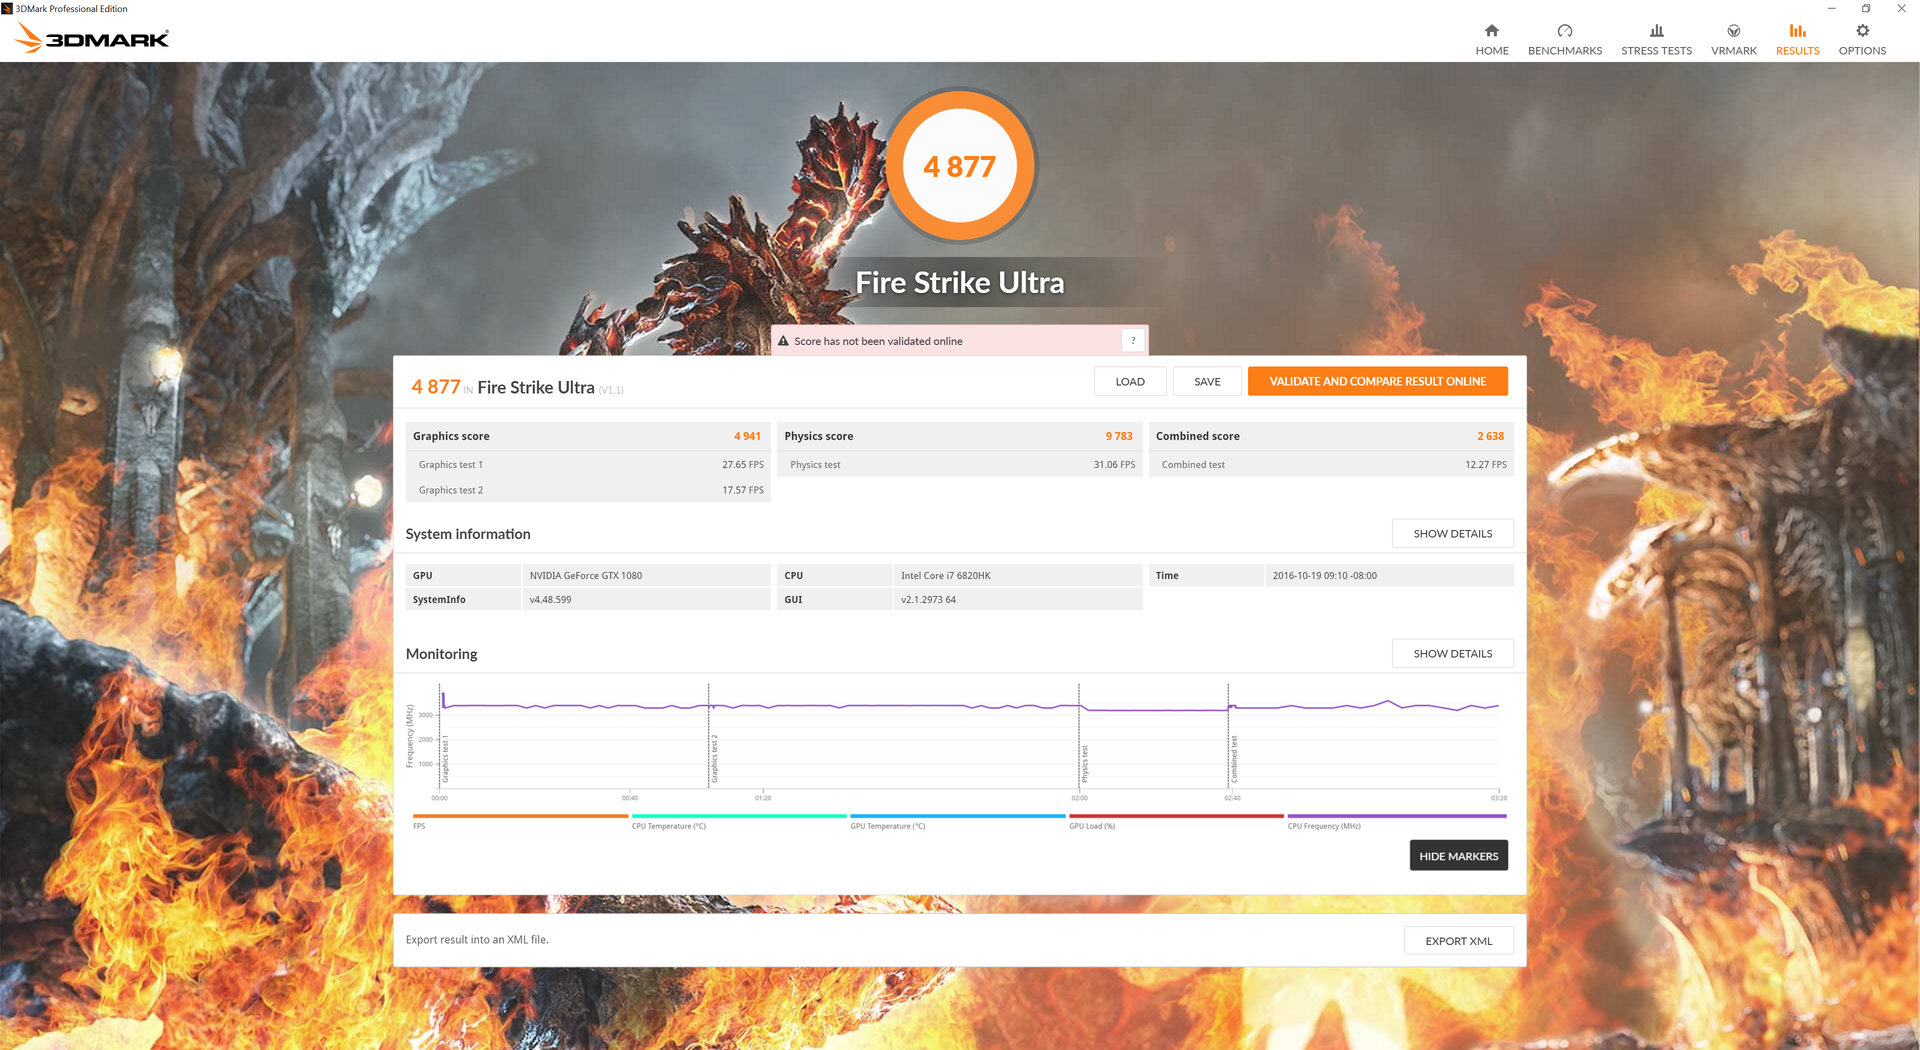
| 3840x2160 Fire Strike Ultra Graphics | |
| MSI GT73VR 6RF | |
| Nvidia GeForce GTX 1080 Founders Edition | |
| MSI GT73VR-6RE16SR451 | |
| Asus G701VO-CS74K | |
| MSI GT72VR 6RD-063US | |
| Asus Strix GL502VY-DS71 | |
| Fire Strike Extreme Graphics | |
| MSI GT73VR 6RF | |
| Nvidia GeForce GTX 1080 Founders Edition | |
| Eurocom X8 | |
| Asus G701VO-CS74K | |
| MSI GT72VR 6RD-063US | |
| Asus Strix GL502VY-DS71 | |
| 3DMark 11 Performance | 18087 points | |
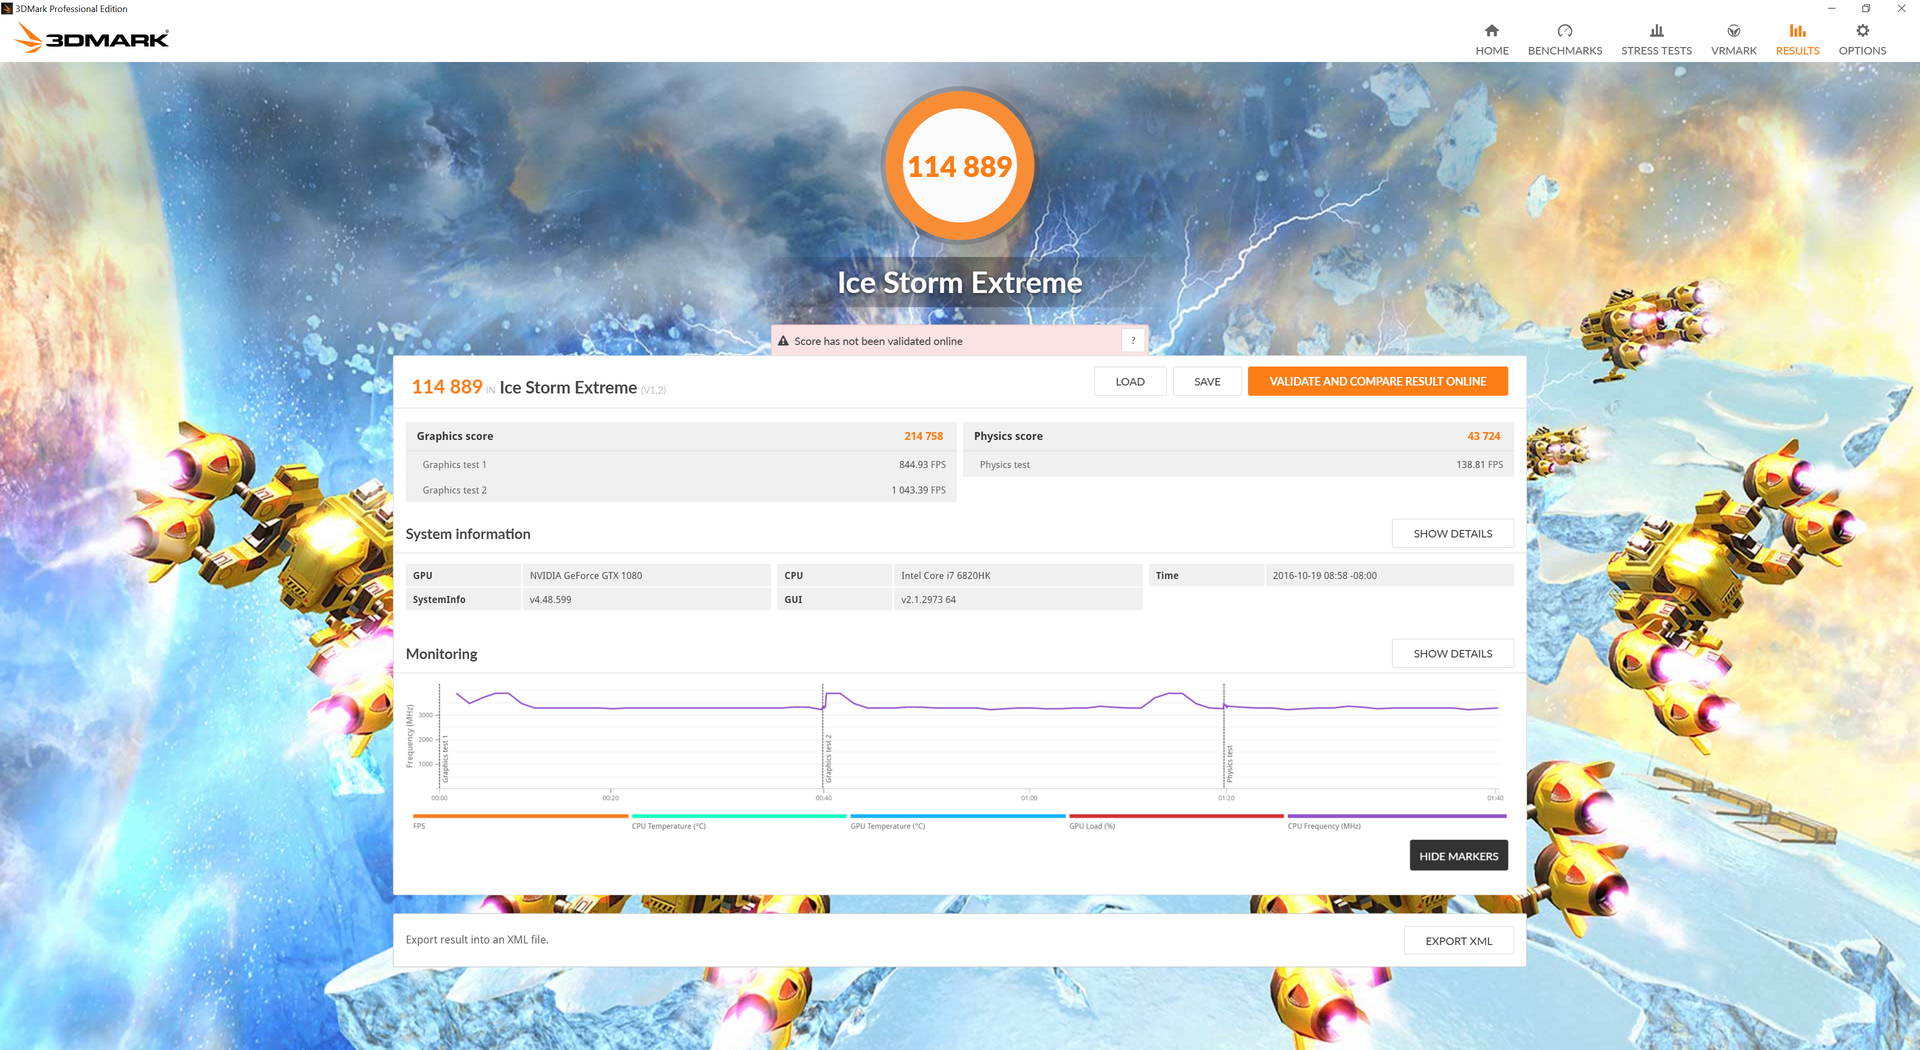
| 3DMark Ice Storm Standard Score | 124187 points | |
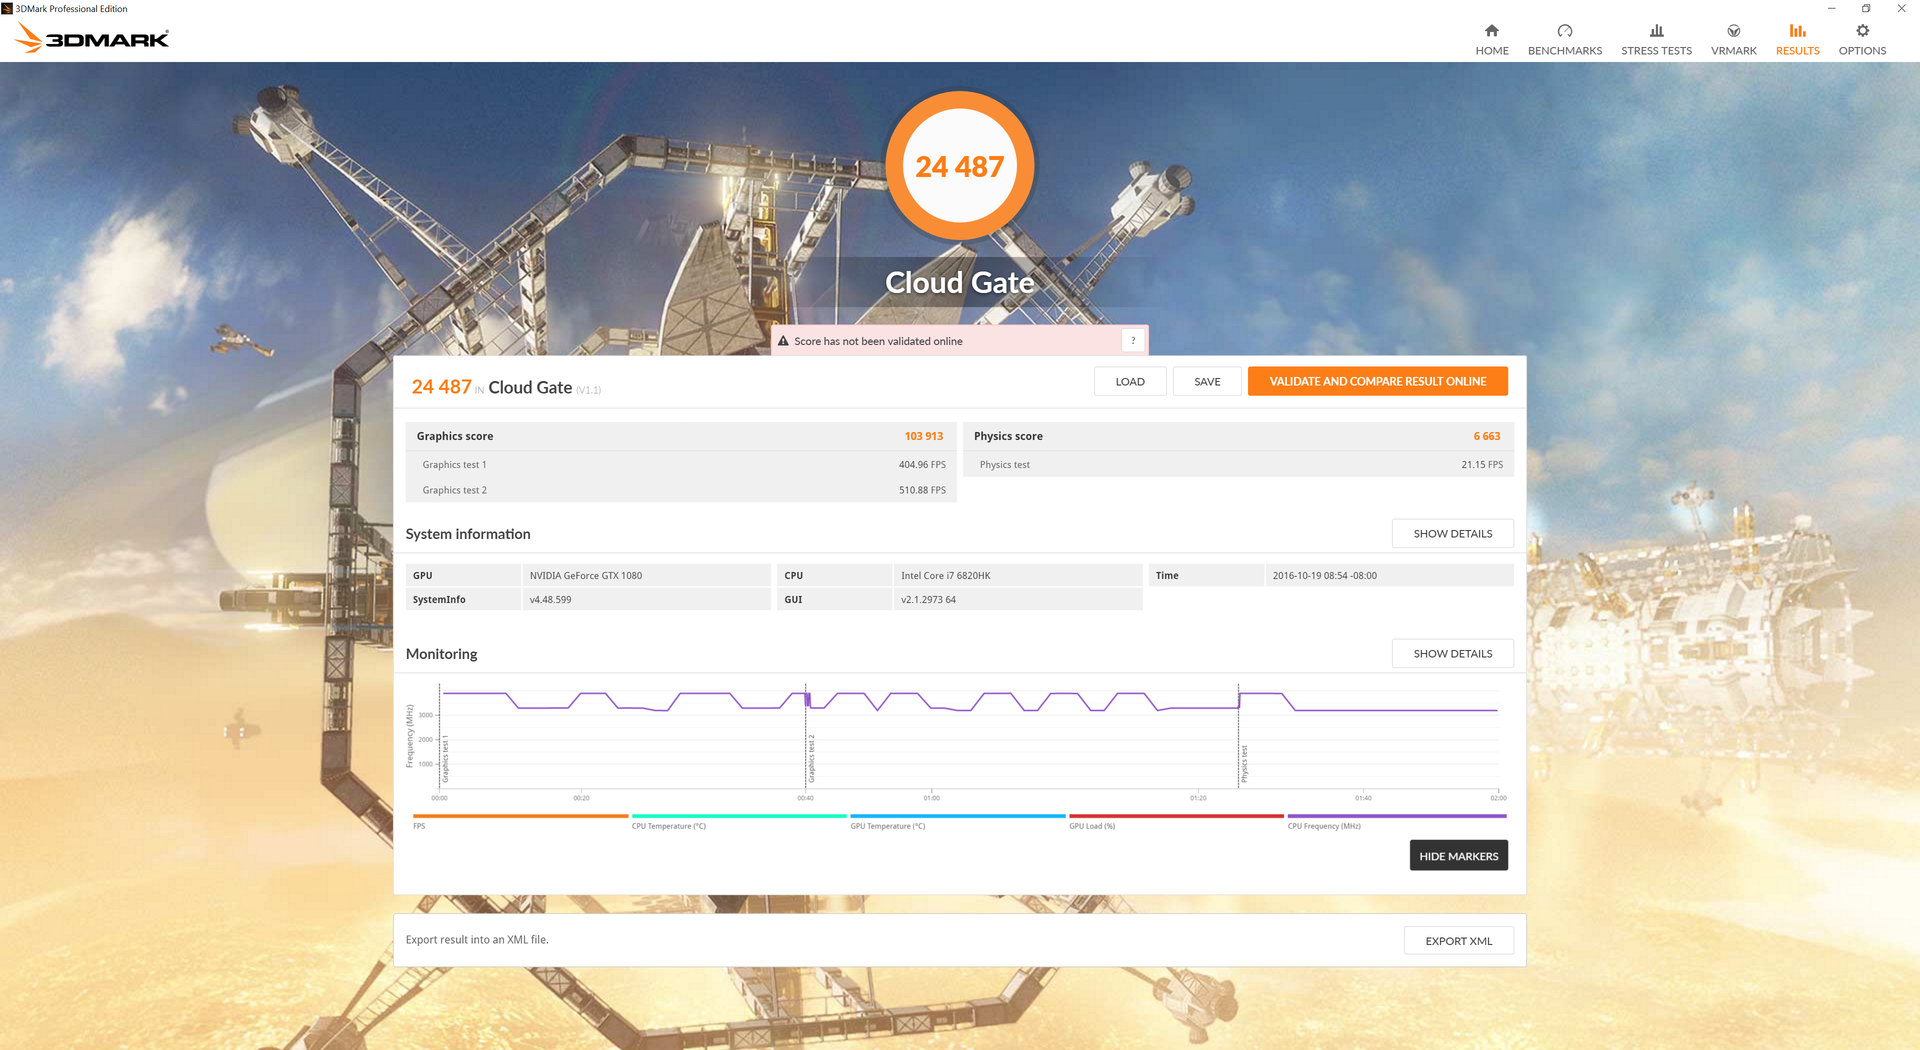
| 3DMark Cloud Gate Standard Score | 24487 points | |
| 3DMark Fire Strike Score | 14820 points | |
| 3DMark Fire Strike Extreme Score | 9042 points | |
Help | ||
Gaming Performance
The GTX 1080 has been heavily benchmarked and tested around the web. According to our own benchmarks, our GT73VR SKU will be able to play most (if not all) current titles at 4K UHD resolution on High settings or better. Average frame rates do not quite reach 60 FPS on most titles, however, so 4K60 on Ultra settings is unrealistic even for the GTX 1080. G-Sync is fortunately an option and pairs well with this particular GPU and resolution.
| Fallout 4 - 3840x2160 High Preset AA:T AF:16x | |
| Nvidia GeForce GTX 1080 Founders Edition | |
| MSI GT73VR 6RF | |
| Nvidia GeForce GTX 1070 Founders Edition | |
| Nvidia GeForce GTX 1060 Founders Edition 6 GB | |
| Batman: Arkham Knight - 3840x2160 High / On (Interactive Smoke & Paper Debris Off) AA:SM AF:8x | |
| MSI GT73VR 6RF | |
| Nvidia GeForce GTX 1060 Founders Edition 6 GB | |
| Rise of the Tomb Raider - 3840x2160 High Preset AA:FX AF:4x | |
| Nvidia GeForce GTX 1080 Founders Edition | |
| Nvidia GeForce GTX 1080 Founders Edition | |
| MSI GT73VR 6RF | |
| Nvidia GeForce GTX 1070 Founders Edition | |
| Nvidia GeForce GTX 1060 Founders Edition 6 GB | |
| Nvidia GeForce GTX 1060 Founders Edition 6 GB | |
| Doom - 3840x2160 High Preset AA:FX | |
| MSI GT73VR 6RF | |
| Nvidia GeForce GTX 1080 Founders Edition | |
| Nvidia GeForce GTX 1070 Founders Edition | |
| Nvidia GeForce GTX 1060 Founders Edition 6 GB | |
| Overwatch - 3840x2160 High (Render Scale 100 %) AA:SM AF:4x | |
| Nvidia GeForce GTX 1080 Founders Edition | |
| MSI GT73VR 6RF | |
| Nvidia GeForce GTX 1070 Founders Edition | |
| Nvidia GeForce GTX 1060 Founders Edition 6 GB | |
| Mafia 3 - 3840x2160 High Preset | |
| Nvidia GeForce GTX 1080 Founders Edition | |
| low | med. | high | ultra | 4K | |
|---|---|---|---|---|---|
| Batman: Arkham Knight (2015) | 52 | ||||
| Metal Gear Solid V (2015) | 60 | ||||
| Fallout 4 (2015) | 51.7 | ||||
| Rise of the Tomb Raider (2016) | 49.8 | ||||
| Doom (2016) | 64.1 | ||||
| Overwatch (2016) | 103.1 | ||||
| Mafia 3 (2016) | 73.6 |
| Title | 3840 x 2160 Ultra Settings (FPS) |
| Metro: Last Light | 53.6 |
| Thief | 46 |
| Guild Wars 2 | 63.7 |
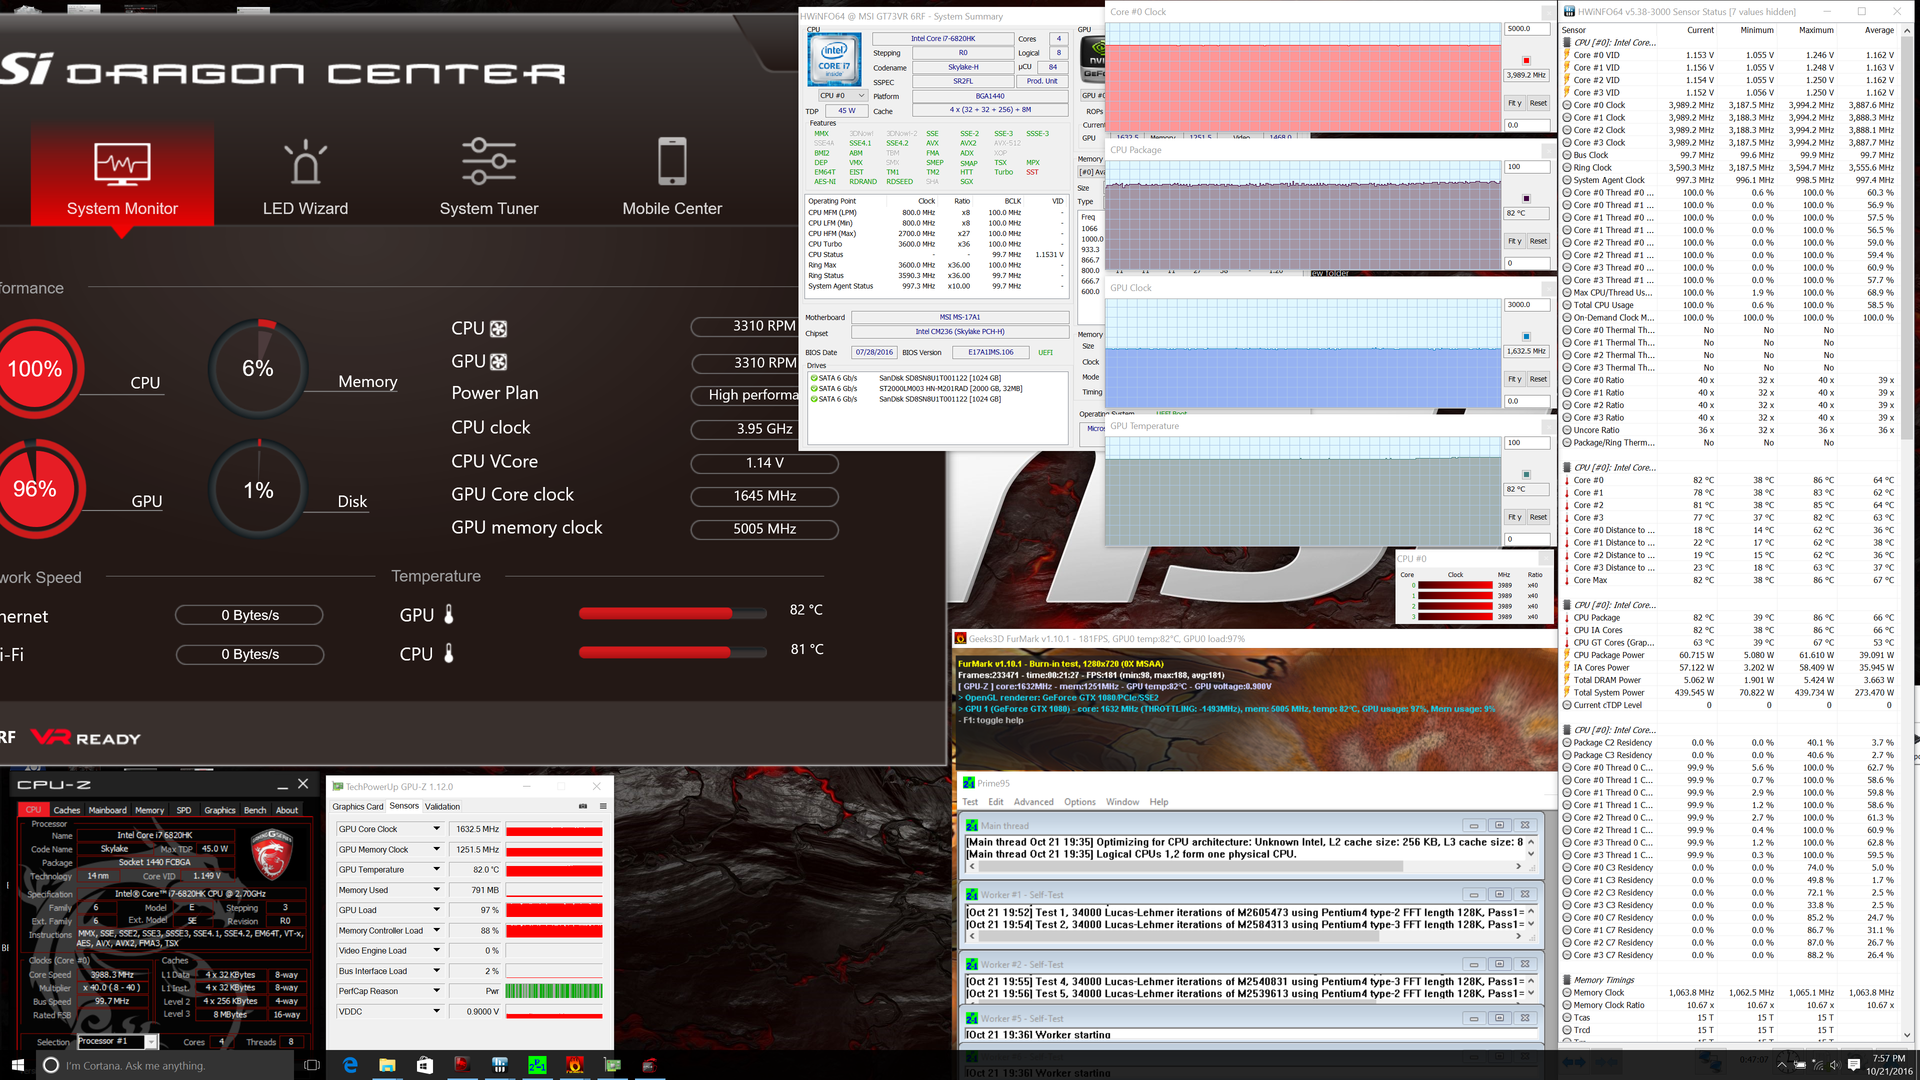
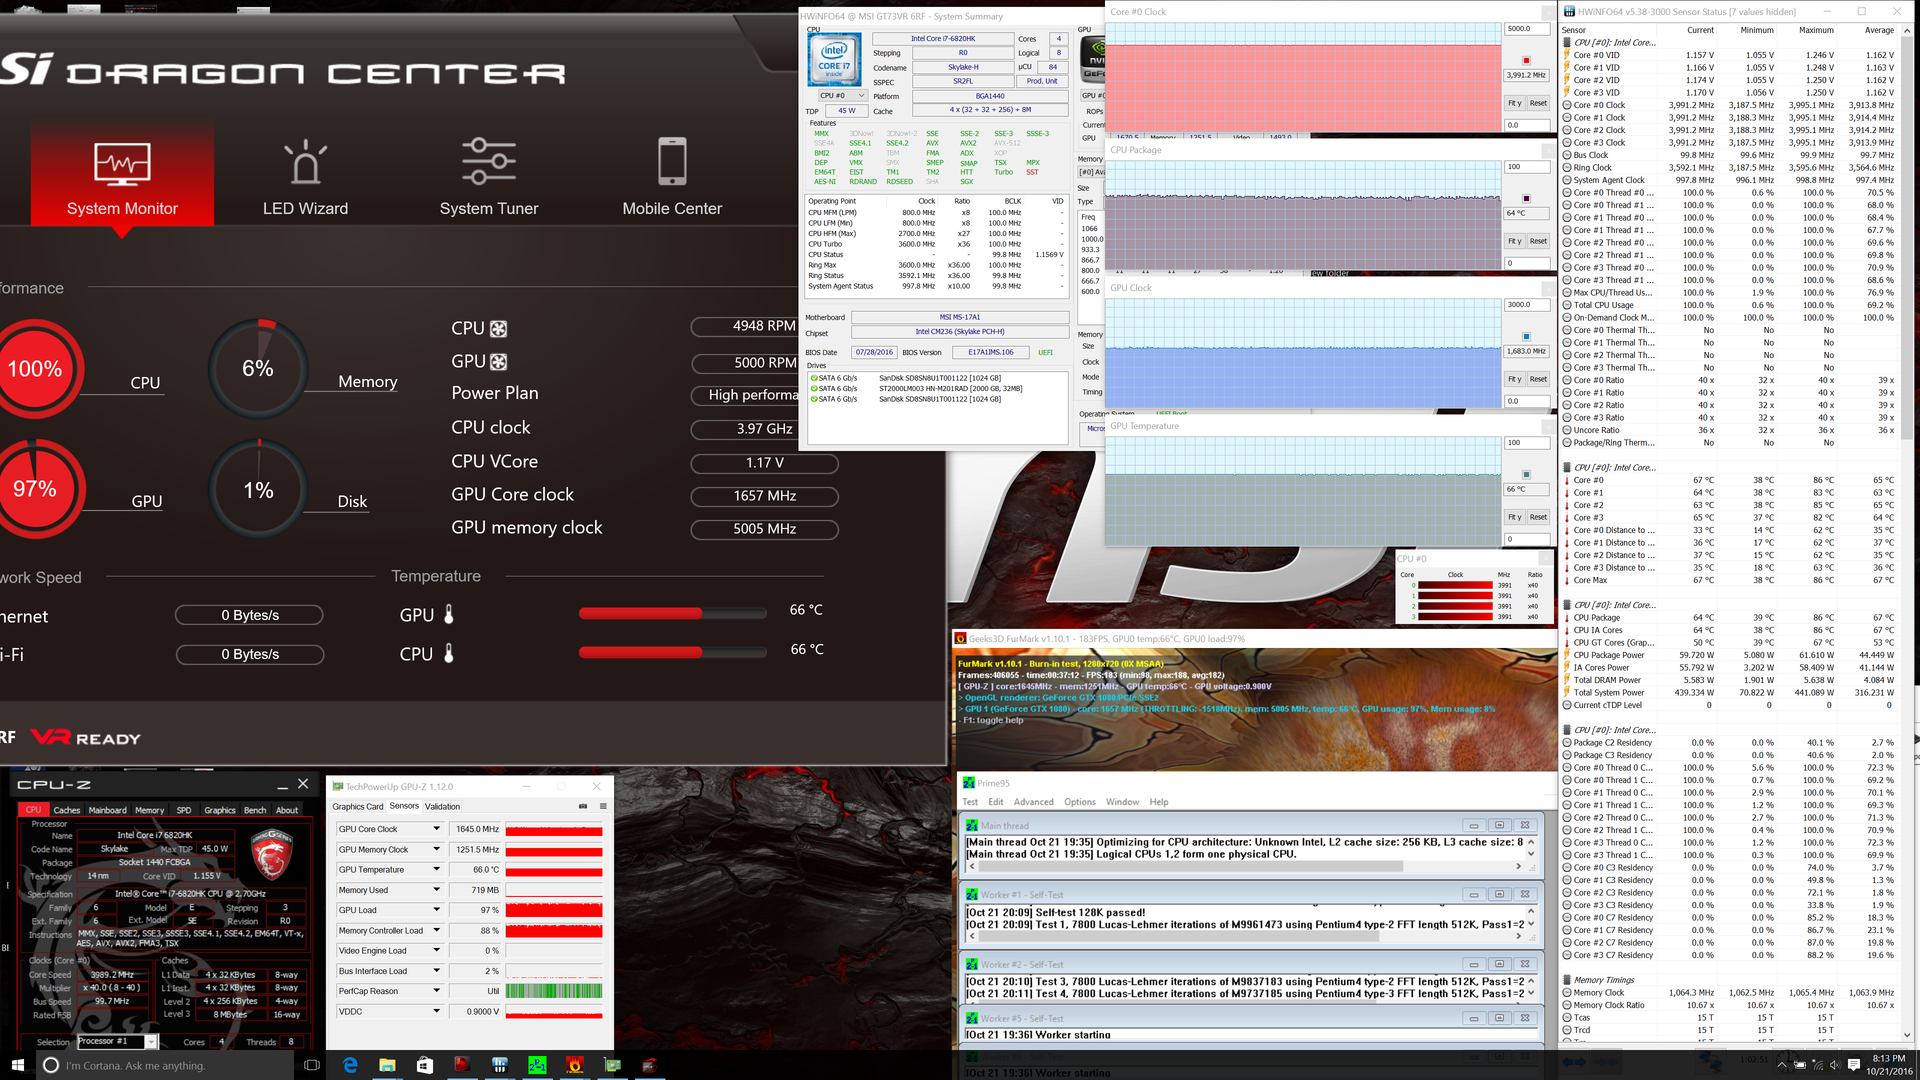
Stress Test
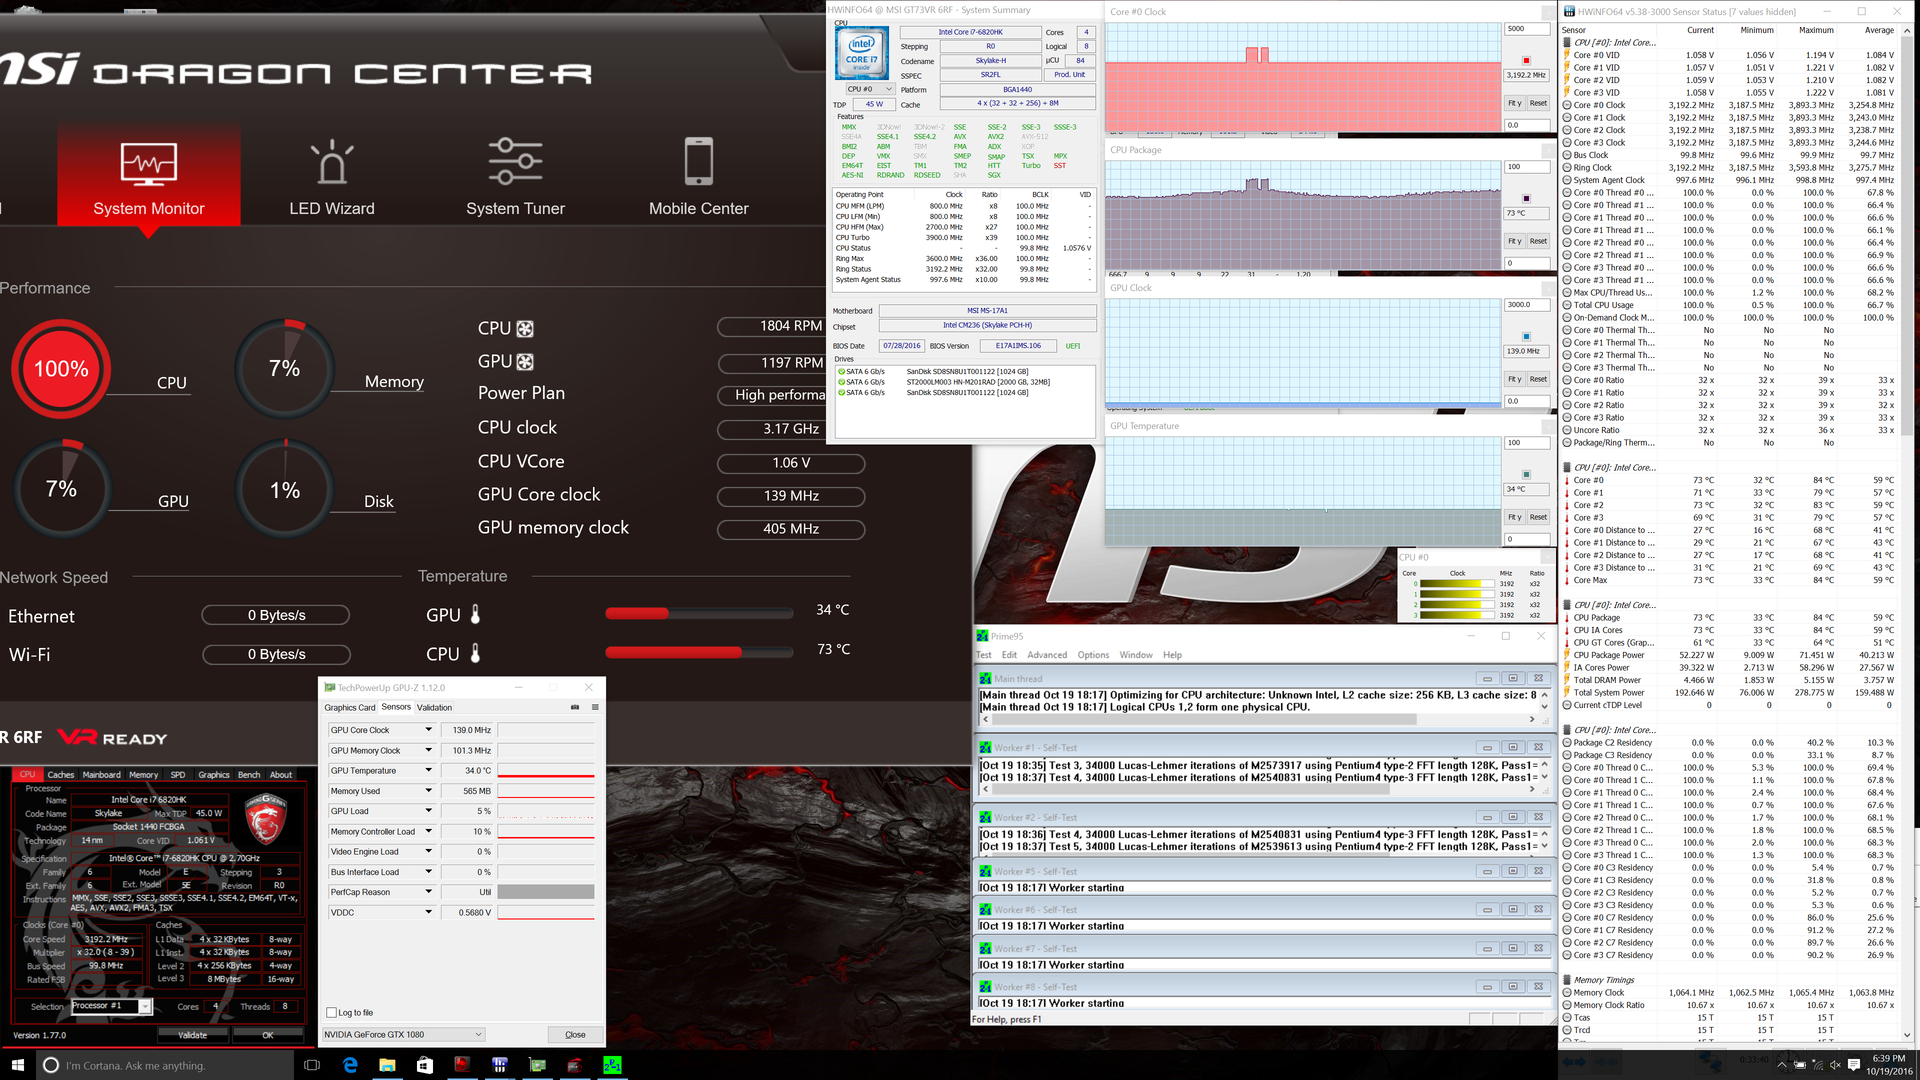
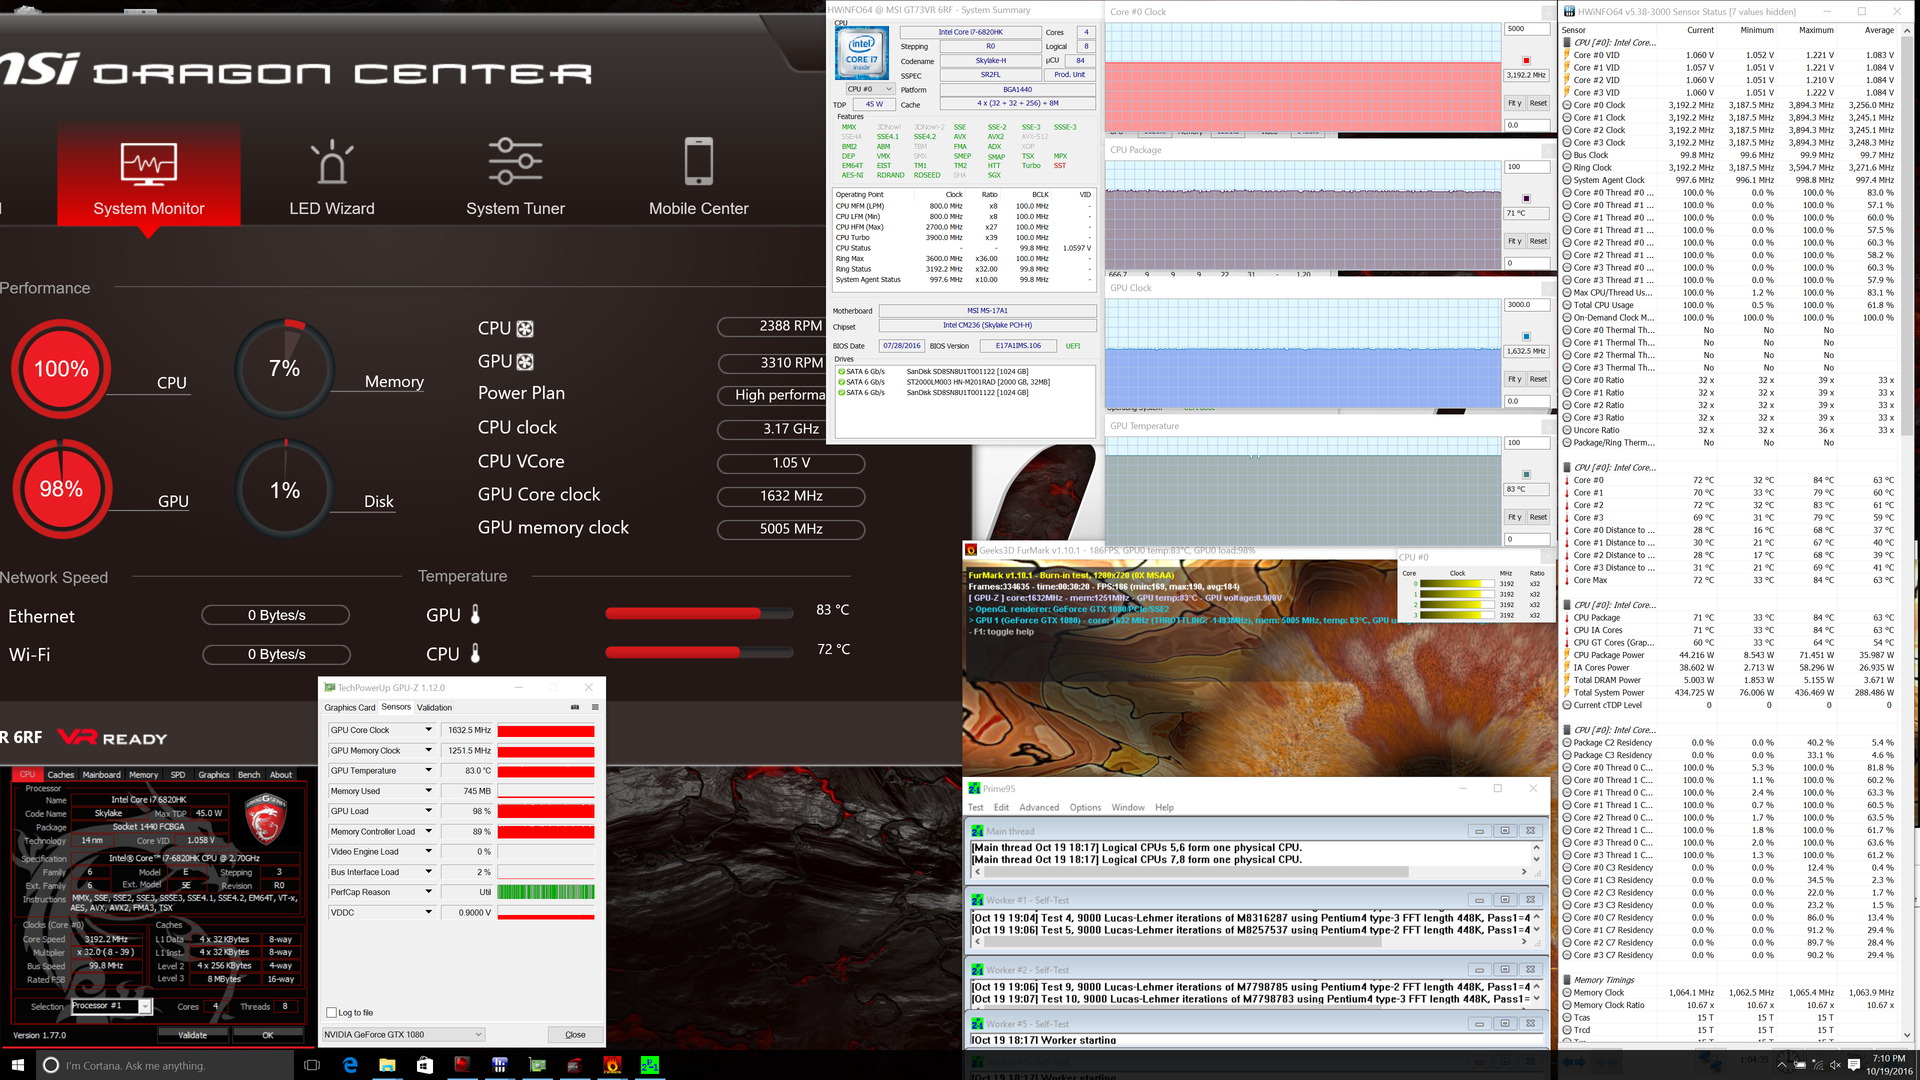
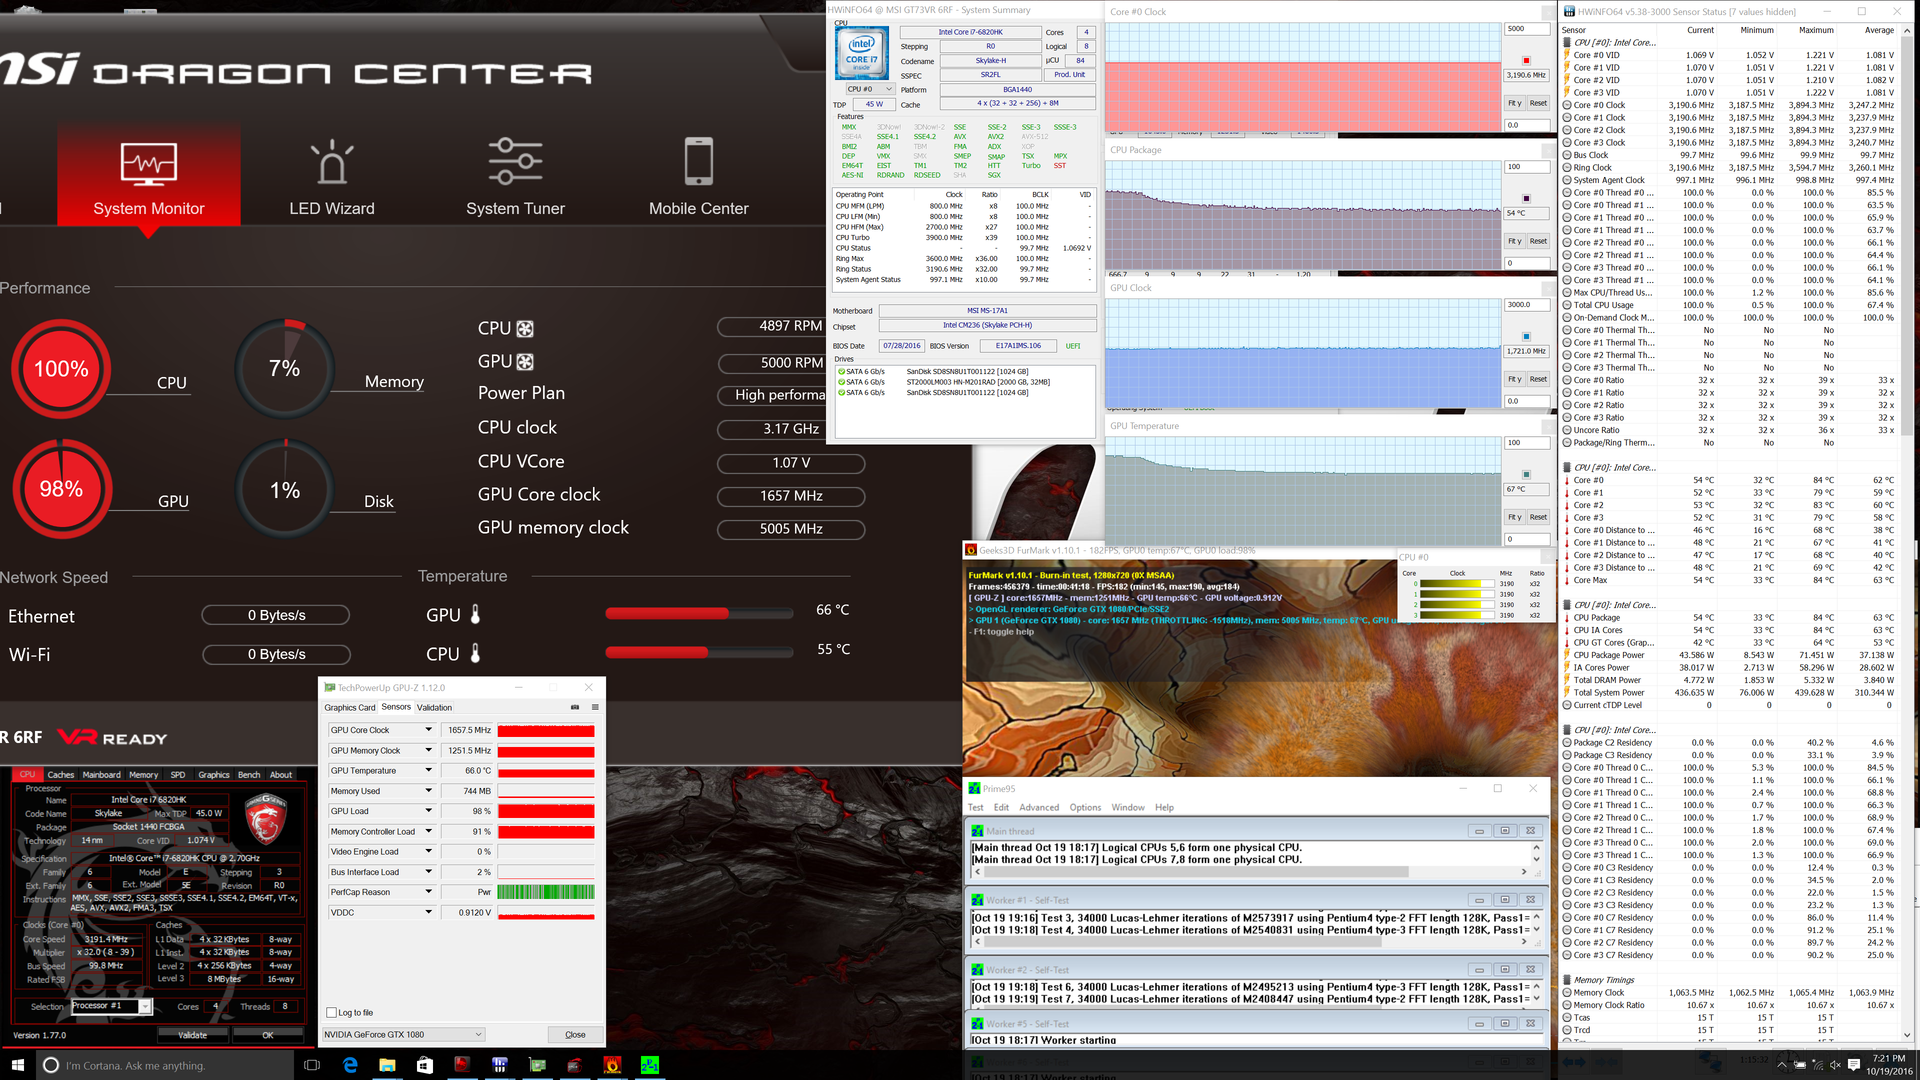
We stress the notebook with Prime95 and FurMark in order to identify for any potential throttling issues. Running both simultaneously with Turbo Performance and Turbo Fan modes off will result in core CPU and GPU temperatures of about 70 C and 80 C, respectively. Turning on Turbo Performance will boost core clock rate to 4.0 GHz and CPU temperature to a warmer but steady 82 C. The Nvidia GPU gets a small clock rate boost as well to the 1800 MHz to 1900 MHz range from its base 1556 MHz. Turbo Fan mode will set both system fans to maximum speed (~5000 RPM) to reduce CPU and GPU temperatures even further by about 15 C each. No matter the mode, the system never throttles and core temperatures never reach 90 C or warmer even when under extreme stress.
Running on batteries will limit CPU and GPU power. A 3DMark 11 run on batteries returns Physics and Graphics scores of 7038 and 2542 points, respectively, compared to 8978 and 27685 points when on mains.

| CPU Clock (GHz) | GPU Clock (MHz) | Average CPU Temperature (°C) | Average GPU Temperature (°C) | |
| Prime95 Stress | 3.2 | -- | 73 | 34 |
| FurMark Stress | -- | 1633 | 58 | 84 |
| Prime95 + FurMark Stress | 3.2 | 1633 | 71 | 83 |
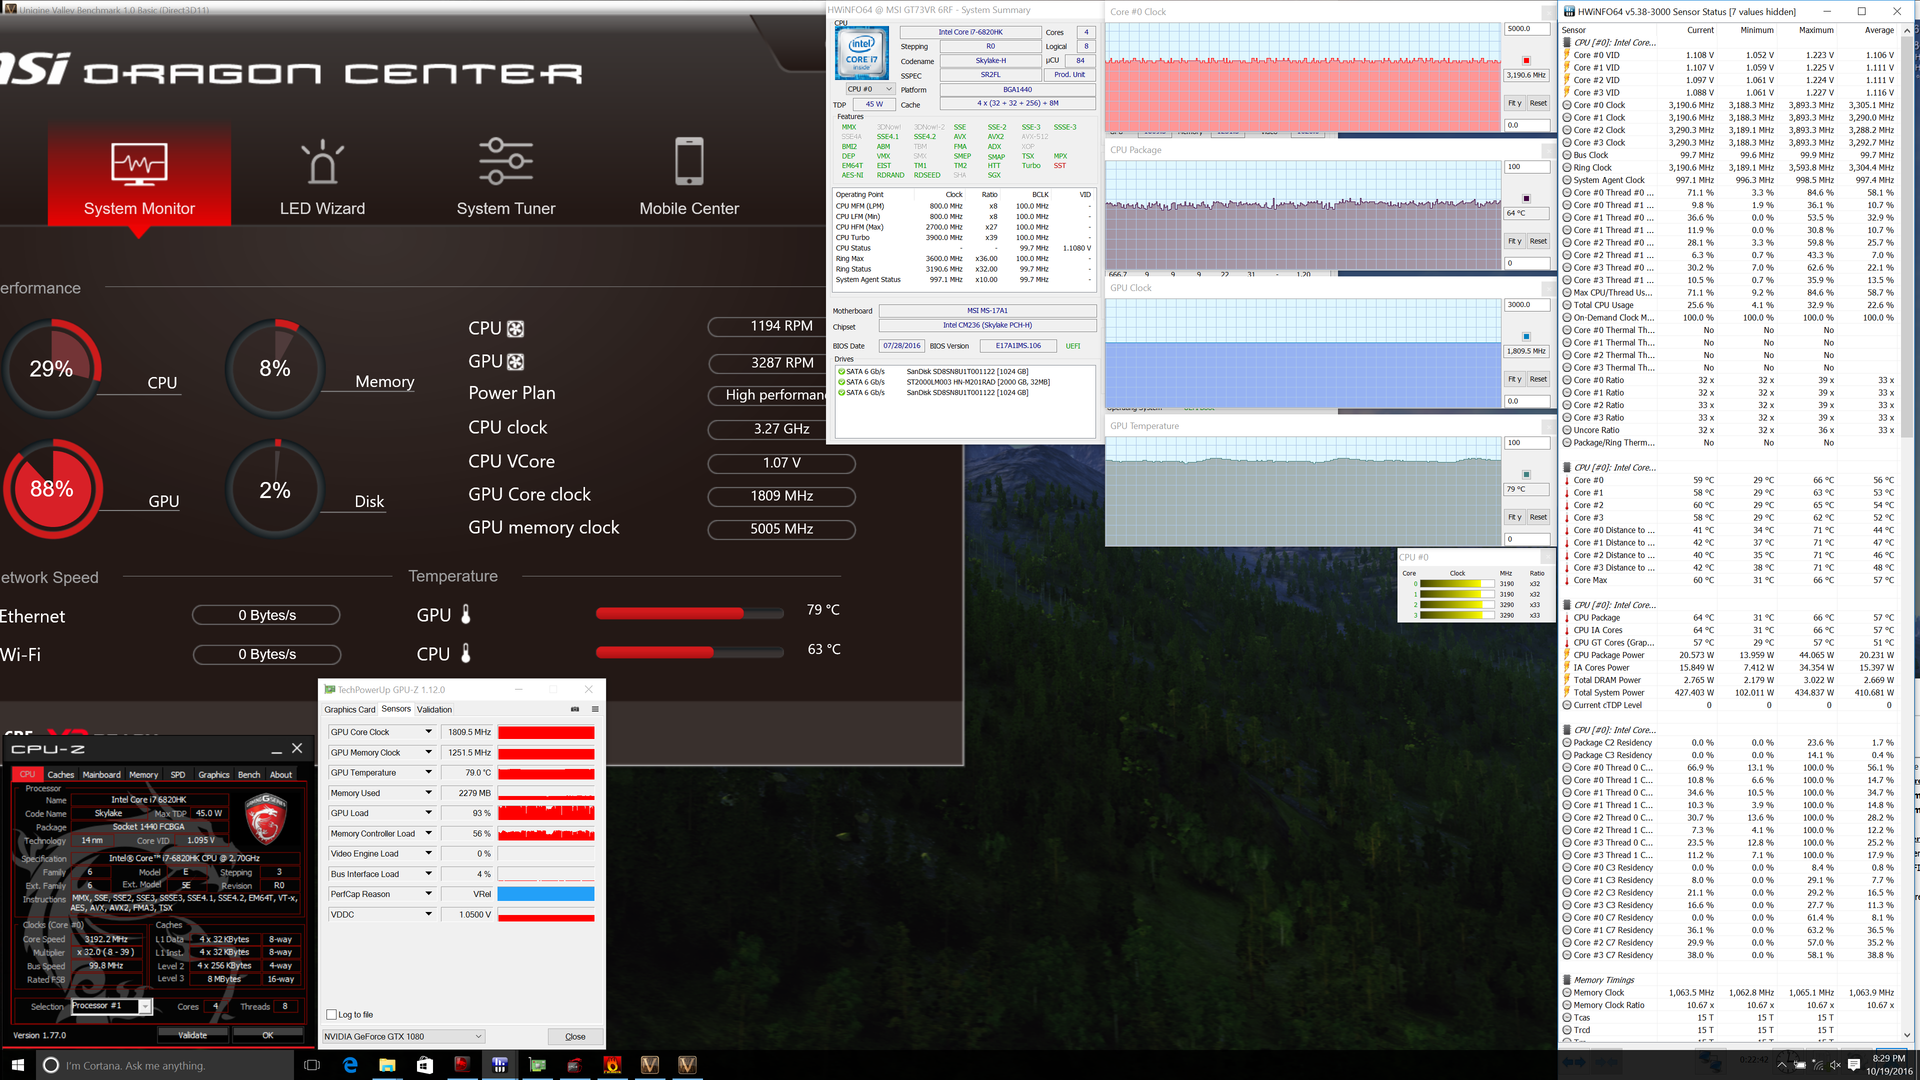
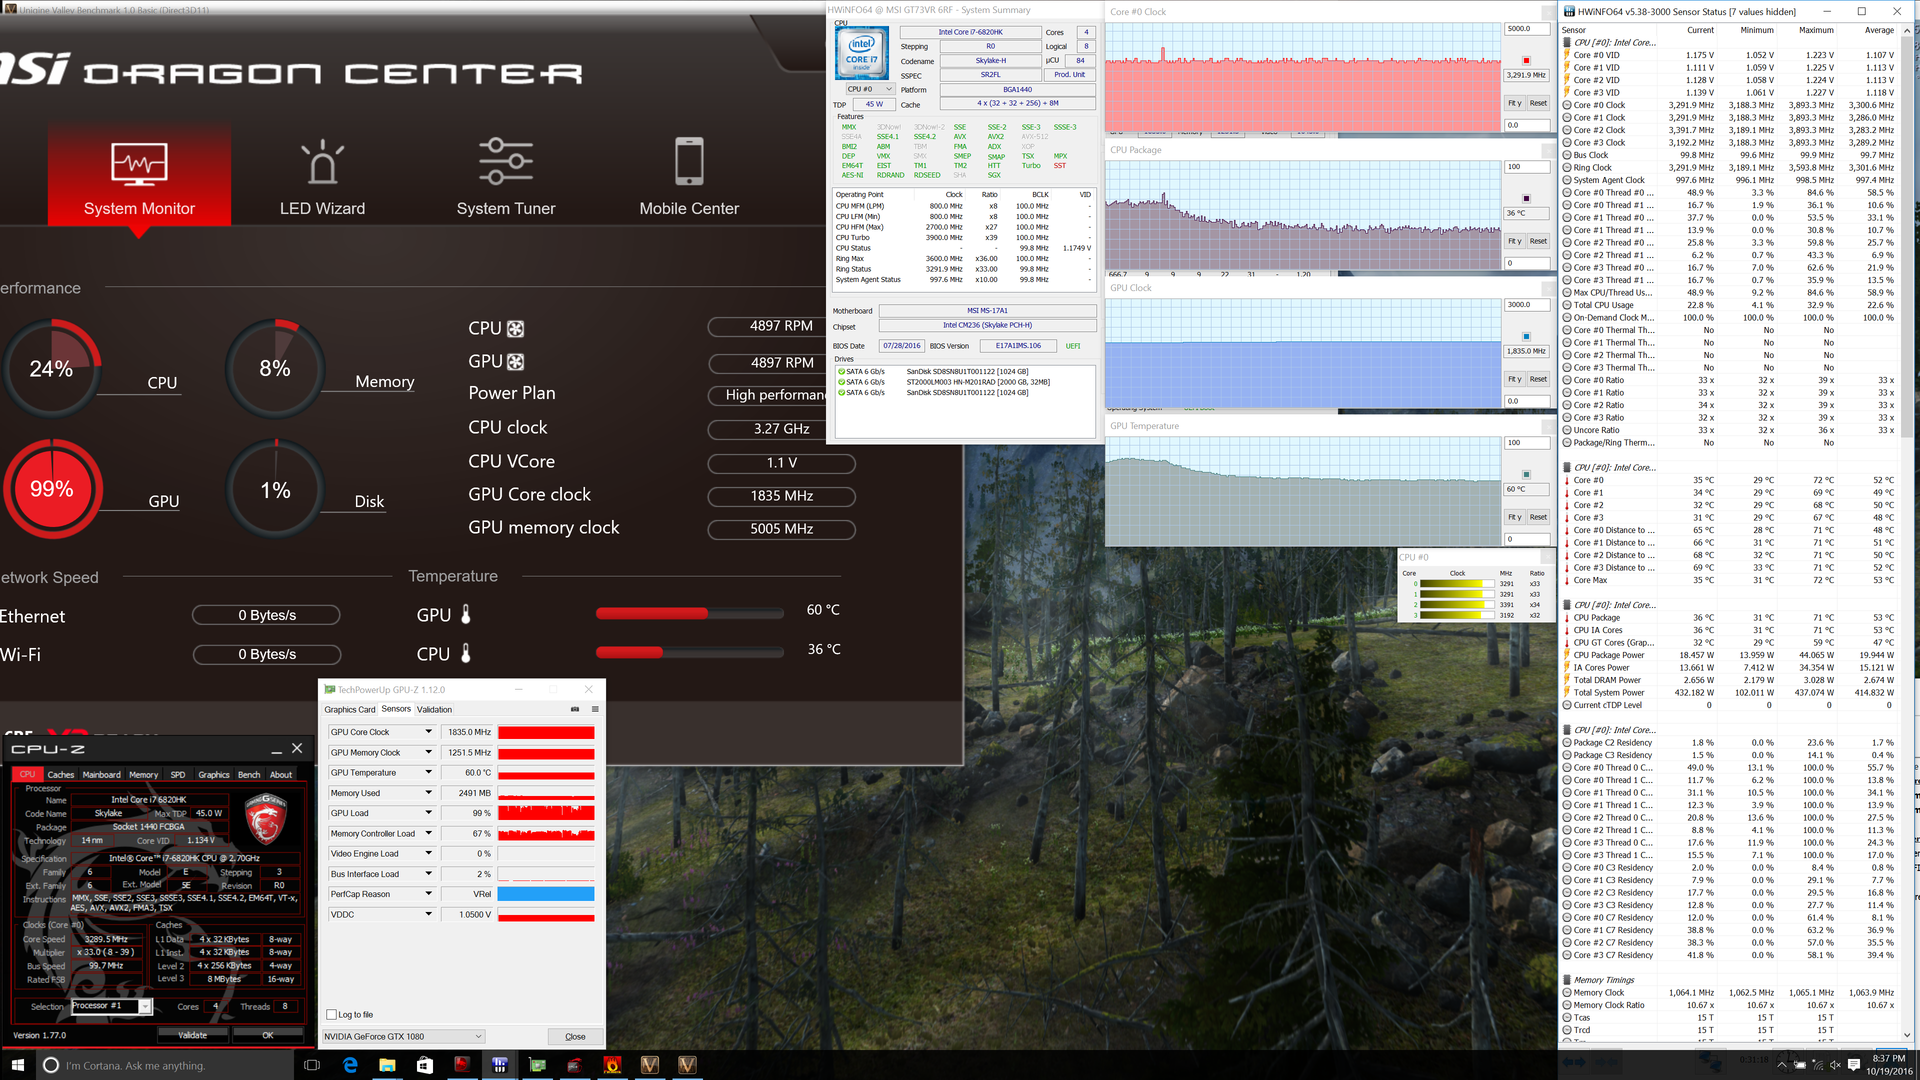
| Unigine Valley Stress | 3.2 | 1810 | 64 | 79 |
| Prime95 + FurMark Stress (Turbo Fan mode) | 3.2 | 1721 | 54 | 67 |
| Unigine Valley Stress (Turbo Fan mode) | 3.2 - 3.3 | 1835 | 36 | 60 |
| Prime95 + FurMark Stress (Turbo Performance) | 4.0 | 1633 | 82 | 82 |
| Prime95 + FurMark Stress (Turbo Performance + Turbo Fan mode) | 4.0 | 1683 | 64 | 66 |
Emissions
System Noise
The cooling solution consists of twin ~65 mm fans and ten heat pipes of which seven are dedicated to the GPU. The system is very large especially when compared to thinner gaming notebooks where as few as two or three heat pipes are common.
The system fans are always active no matter the workload or setting at about 32 dB(A). Fortunately, fan speed is largely apathetic to low loads like browsing and web surfing with only the rare occasional pulsing to 35 dB(A).
When gaming, however, expect fan noise to be noisier than on the GT73VR 6RE and its GTX 1070. Fan noise pulsates between 42 dB(A) and 50 dB(A), so it is not even steady under gaming conditions when set to automatic mode. This range is louder than on many competing systems including some thinner ones like the GS73VR.
Activating Turbo Fan mode will bump fan noise to a steady 64 dB(A) to be one of the loudest notebooks we've tested. Otherwise, fan noise is will max out at about 50 dB(A) when Turbo Fan is off. Fortunately, the mode is not necessary when gaming on stock speeds or even on Turbo Performance mode.
Noise level
| Idle |
| 32 / 32 / 35 dB(A) |
| Load |
| 50 / 64 dB(A) |
 | ||
30 dB silent 40 dB(A) audible 50 dB(A) loud |
||
min: | ||
| MSI GT73VR 6RF GeForce GTX 1080 Mobile, 6820HK, 2x SanDisk X400 1TB M.2 SD8SN8U1T001122 (RAID 0) | MSI GT73VR-6RE16SR451 GeForce GTX 1070 Mobile, 6820HK, 2x Samsung SM951 MZVPV256HDGL (RAID 0) | Acer Predator 17 G9-793-77LG GeForce GTX 1070 Mobile, 6700HQ, Toshiba NVMe THNSN5256GPU7 | Asus G701VO-CS74K GeForce GTX 980 (Laptop), 6820HK, 2x Samsung SM951 MZVPV512HDGL (RAID 0) | MSI GS73VR 6RF GeForce GTX 1060 Mobile, 6700HQ, SanDisk SD8SN8U1T001122 | |
|---|---|---|---|---|---|
| Noise | 8% | 1% | 9% | 6% | |
| off / environment * (dB) | 29.2 | 30 -3% | 31 -6% | 29.1 -0% | 28.4 3% |
| Idle Minimum * (dB) | 32 | 32 -0% | 33 -3% | 29.1 9% | 31.9 -0% |
| Idle Average * (dB) | 32 | 33 -3% | 34 -6% | 31.9 -0% | 32 -0% |
| Idle Maximum * (dB) | 35 | 35 -0% | 40 -14% | 31.9 9% | 34 3% |
| Load Average * (dB) | 50 | 35 30% | 44 12% | 46 8% | 47 6% |
| Load Maximum * (dB) | 64 | 49 23% | 50 22% | 47.5 26% | 49.4 23% |
* ... smaller is better
Temperature
Surface temperatures on the MSI GT series are generally low for a gaming notebook due to the thick chassis designs and large cooling solutions. The keyboard and palm rests of the GT73VR never become uncomfortably warm even when under the most demanding of tasks. Hot spots are concentrated above the top row of keyboard keys where fingers and palms less likely to touch. Temperature differences between the GT73VR GTX 1080 SKU and the GT73VR GTX 1070 SKU are minimal when compared to thinner gaming systems like the GS73VR or the Aorus X5 v6.
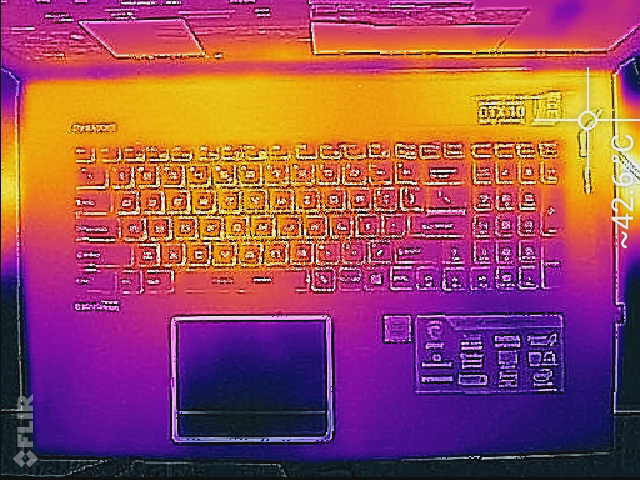
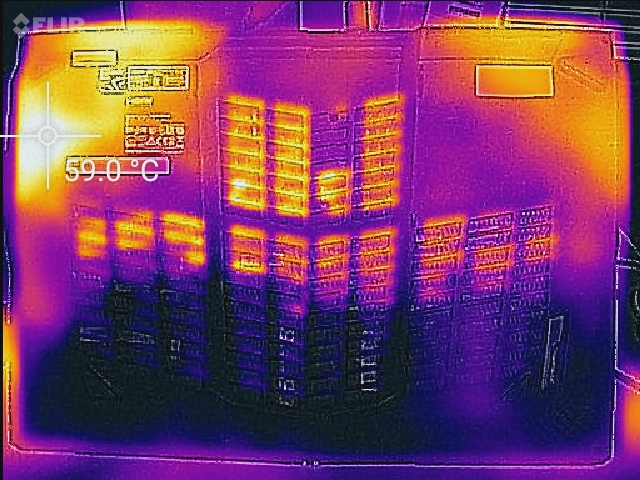
(±) The maximum temperature on the upper side is 41.4 °C / 107 F, compared to the average of 40.4 °C / 105 F, ranging from 21.2 to 68.8 °C for the class Gaming.
(-) The bottom heats up to a maximum of 59 °C / 138 F, compared to the average of 43.2 °C / 110 F
(+) In idle usage, the average temperature for the upper side is 26.8 °C / 80 F, compared to the device average of 33.9 °C / 93 F.
(+) The palmrests and touchpad are cooler than skin temperature with a maximum of 30.4 °C / 86.7 F and are therefore cool to the touch.
(±) The average temperature of the palmrest area of similar devices was 28.8 °C / 83.8 F (-1.6 °C / -2.9 F).
Speakers

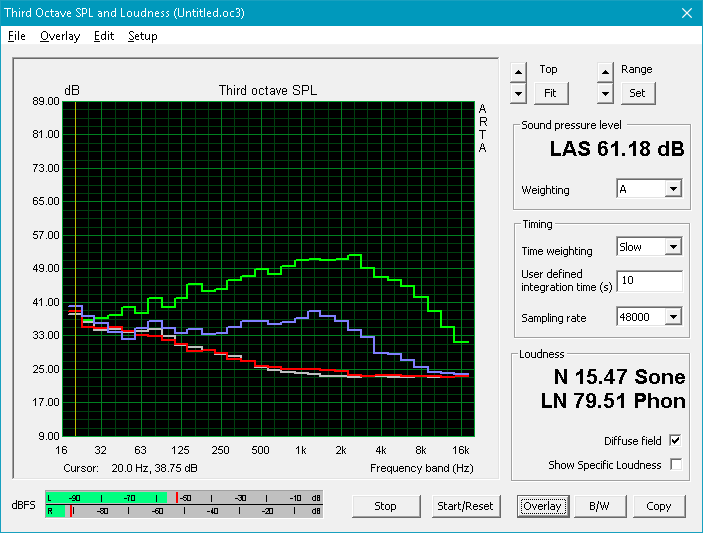
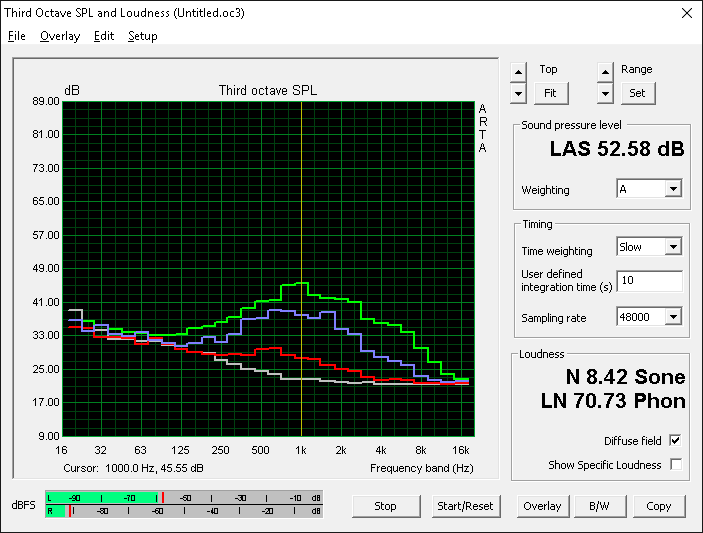
The integrated 2.1 Dynaudio speakers provide great sound quality for a gaming notebook. The subwoofer itself is quite large at about 35 mm in diameter and our microphone measurements show slightly better bass reproduction than the Eurocom X7E2 and the much thinner MSI GS73VR. Higher tones are unfortunately more imbalanced and may require some adjustments with the Nahimic 2 software for better quality. Our measurements were performed at maximum volume and at the default settings.
Unlike most gaming notebooks, the higher-end G series models are equipped with ESS Sabre Hi-Fi DAC for supporting studio-grade headphones of up to 122 DNR and 600 ohms.
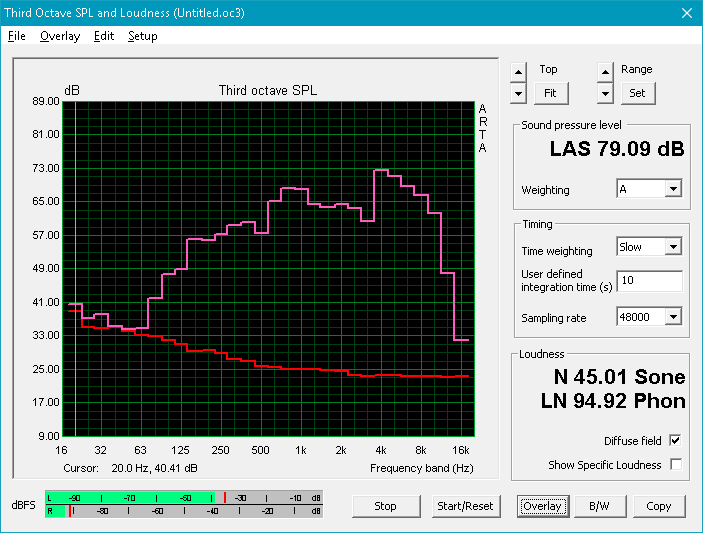
MSI GT73VR 6RF audio analysis
(±) | speaker loudness is average but good (79.1 dB)
Bass 100 - 315 Hz
(±) | reduced bass - on average 8.2% lower than median
(±) | linearity of bass is average (8% delta to prev. frequency)
Mids 400 - 2000 Hz
(+) | balanced mids - only 3.3% away from median
(+) | mids are linear (6.4% delta to prev. frequency)
Highs 2 - 16 kHz
(+) | balanced highs - only 4.6% away from median
(±) | linearity of highs is average (9.9% delta to prev. frequency)
Overall 100 - 16.000 Hz
(±) | linearity of overall sound is average (19.9% difference to median)
Compared to same class
» 70% of all tested devices in this class were better, 6% similar, 24% worse
» The best had a delta of 6%, average was 18%, worst was 132%
Compared to all devices tested
» 51% of all tested devices were better, 7% similar, 42% worse
» The best had a delta of 4%, average was 23%, worst was 134%
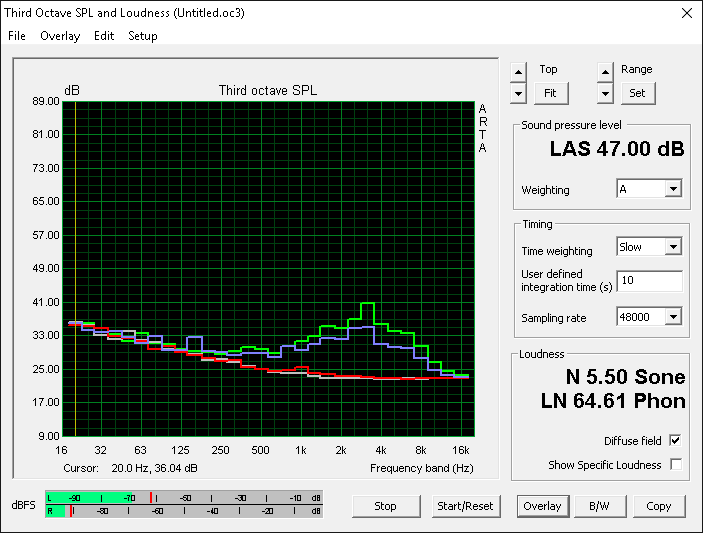
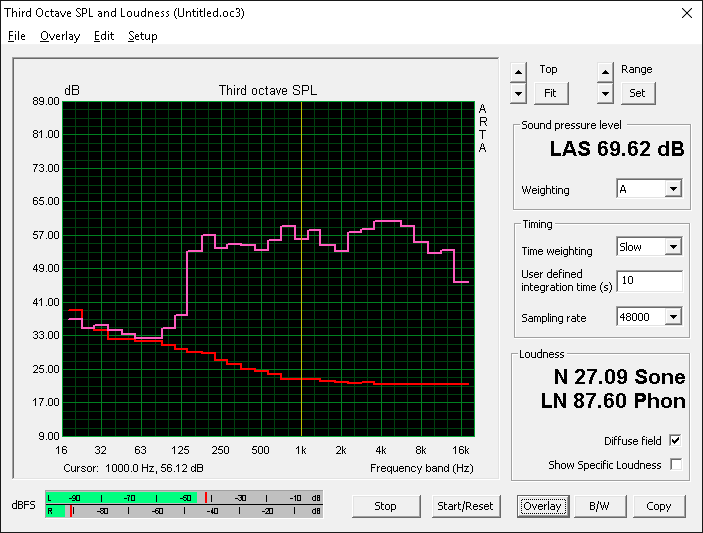
Apple MacBook 12 (Early 2016) 1.1 GHz audio analysis
(+) | speakers can play relatively loud (83.6 dB)
Bass 100 - 315 Hz
(±) | reduced bass - on average 11.3% lower than median
(±) | linearity of bass is average (14.2% delta to prev. frequency)
Mids 400 - 2000 Hz
(+) | balanced mids - only 2.4% away from median
(+) | mids are linear (5.5% delta to prev. frequency)
Highs 2 - 16 kHz
(+) | balanced highs - only 2% away from median
(+) | highs are linear (4.5% delta to prev. frequency)
Overall 100 - 16.000 Hz
(+) | overall sound is linear (10.2% difference to median)
Compared to same class
» 7% of all tested devices in this class were better, 2% similar, 90% worse
» The best had a delta of 5%, average was 18%, worst was 53%
Compared to all devices tested
» 5% of all tested devices were better, 1% similar, 94% worse
» The best had a delta of 4%, average was 23%, worst was 134%
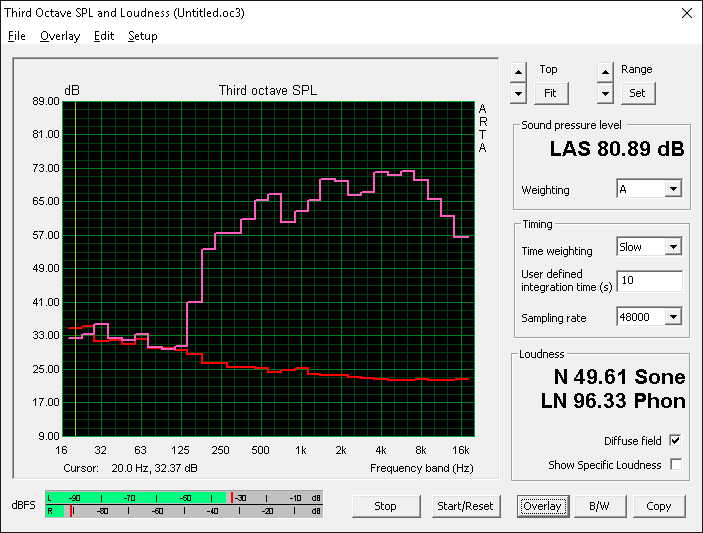
Frequency Comparison (Checkbox selectable!)
Graph 1: Pink Noise 100% Vol.; Graph 2: Audio off
Energy Management
Power Consumption
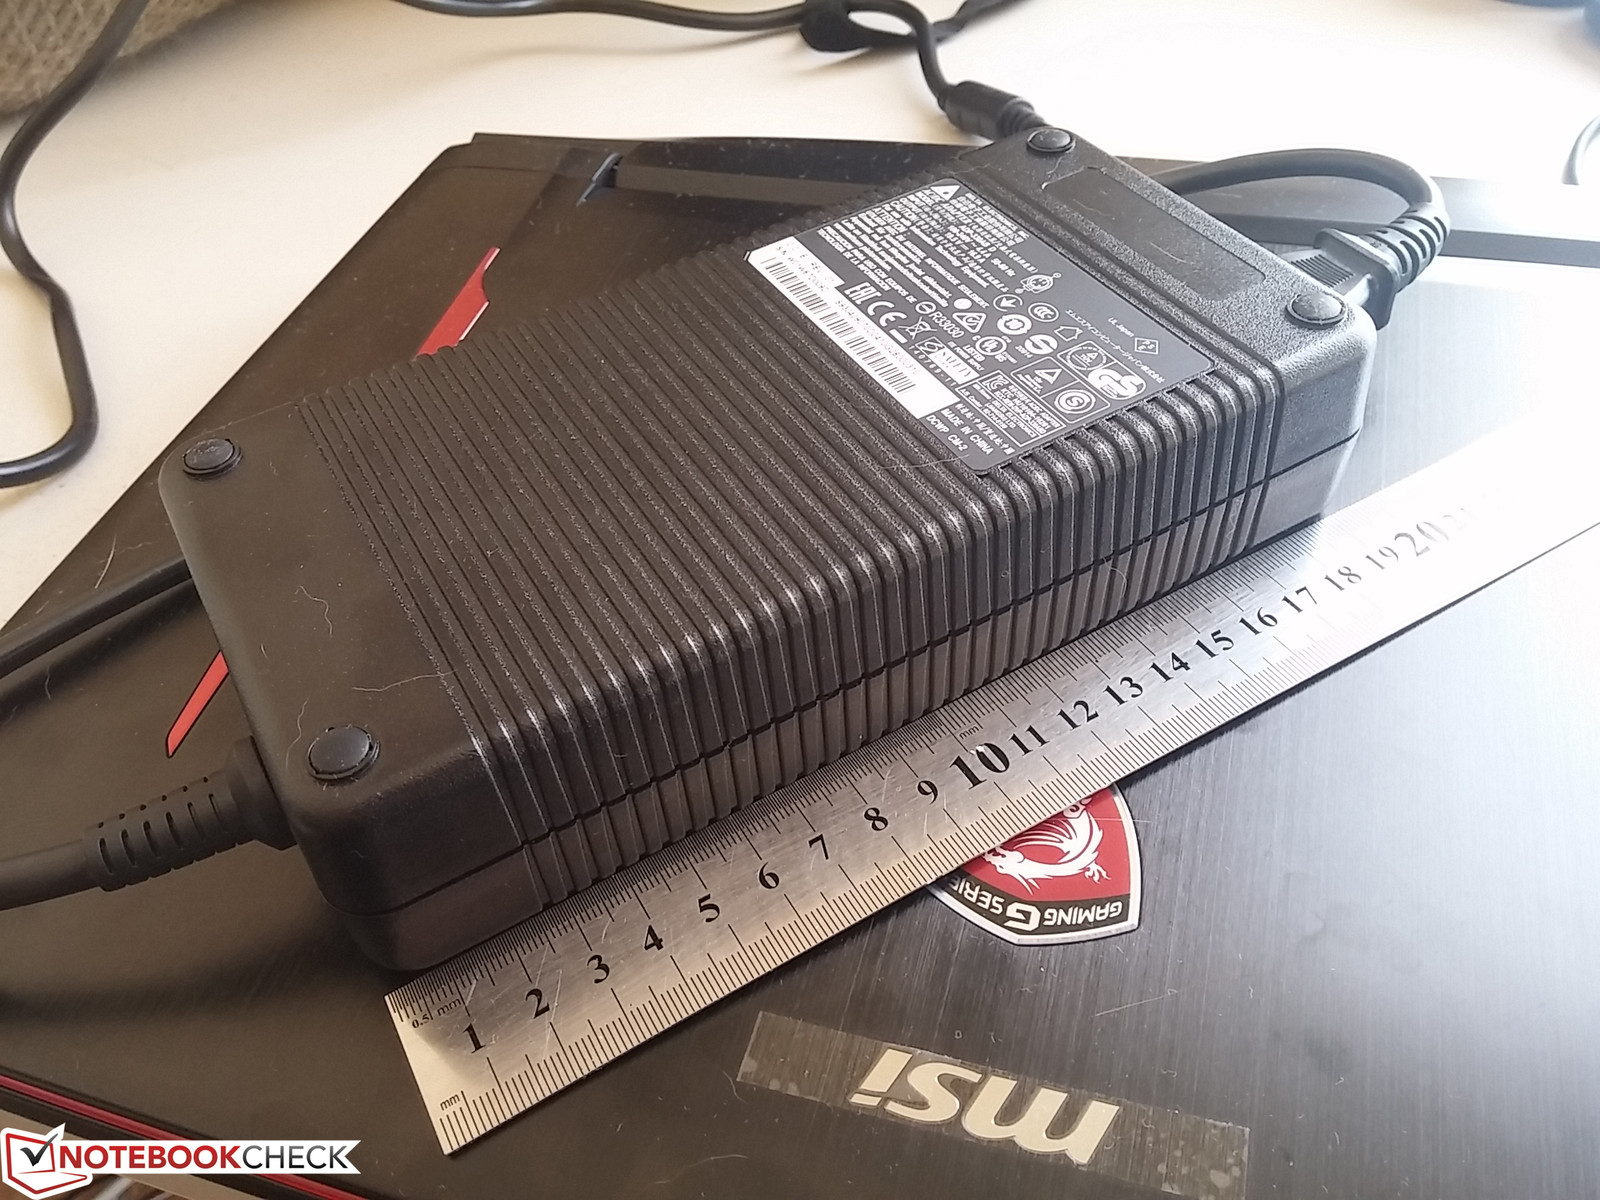
Power consumption when idling with the integrated GPU active will draw about 29 W to 33 W depending on screen brightness and wireless activity. When gaming, however, expect this configuration to draw about 224 W to be over 100 W more than the GT73VR 6RE GTX 1070 SKU under similar conditions. Maximum load with both Prime95 and FurMark running simultaneously on High Performance (not Turbo Performance) will draw about 303 W.
The power adapter is rated for up to 330 W, so there is slight headroom available for overclocking and other connected components or hardware. Note that the PSU included with the GT73VR GTX 1080 SKU is larger (~20 x 10 x 4.5 cm) and more capable than the PSU included with the GT73VR GTX 1070 SKU (330 W vs. 230 W).
| Off / Standby | |
| Idle | |
| Load |
|
Key:
min: | |
| MSI GT73VR 6RF 6820HK, GeForce GTX 1080 Mobile, 2x SanDisk X400 1TB M.2 SD8SN8U1T001122 (RAID 0), IPS, 3840x2160, 17.3" | MSI GT73VR-6RE16SR451 6820HK, GeForce GTX 1070 Mobile, 2x Samsung SM951 MZVPV256HDGL (RAID 0), TN, 1920x1080, 17.3" | Acer Predator 17 G9-793-77LG 6700HQ, GeForce GTX 1070 Mobile, Toshiba NVMe THNSN5256GPU7, IPS, 3840x2160, 17.3" | Asus G701VO-CS74K 6820HK, GeForce GTX 980 (Laptop), 2x Samsung SM951 MZVPV512HDGL (RAID 0), IPS, 1920x1080, 17.3" | MSI GS73VR 6RF 6700HQ, GeForce GTX 1060 Mobile, SanDisk SD8SN8U1T001122, TN LED, 1920x1080, 17.3" | |
|---|---|---|---|---|---|
| Power Consumption | 8% | 8% | 14% | 22% | |
| Idle Minimum * (Watt) | 28.9 | 31 -7% | 25 13% | 28.2 2% | 22.6 22% |
| Idle Average * (Watt) | 30.6 | 35 -14% | 35 -14% | 32 -5% | 32.7 -7% |
| Idle Maximum * (Watt) | 33.1 | 40 -21% | 46 -39% | 32.6 2% | 32.8 1% |
| Load Average * (Watt) | 224.4 | 106 53% | 103 54% | 162.2 28% | 114.7 49% |
| Load Maximum * (Watt) | 302.6 | 218 28% | 223 26% | 173.5 43% | 167.9 45% |
* ... smaller is better
Battery Life
Runtimes are very similar to other high-end 17-inch gaming notebooks at just over three hours of real-world WLAN use. Gaming will drop battery life to only one hour while idling on Power Saver with the integrated GPU active will last around five hours.
Charging from near empty to full capacity will take about 2.5 hours.
| MSI GT73VR 6RF 6820HK, GeForce GTX 1080 Mobile, 75.2 Wh | MSI GT73VR-6RE16SR451 6820HK, GeForce GTX 1070 Mobile, 75.2 Wh | Acer Predator 17 G9-793-77LG 6700HQ, GeForce GTX 1070 Mobile, 88 Wh | Asus G701VO-CS74K 6820HK, GeForce GTX 980 (Laptop), 93 Wh | MSI GS73VR 6RF 6700HQ, GeForce GTX 1060 Mobile, 65 Wh | |
|---|---|---|---|---|---|
| Battery runtime | 2% | 9% | 6% | 8% | |
| Reader / Idle (h) | 5.1 | 4.8 -6% | 4.6 -10% | 4 -22% | 5.9 16% |
| WiFi v1.3 (h) | 3.3 | 3.4 3% | 3.3 0% | 3.4 3% | 3.6 9% |
| Load (h) | 1.1 | 1.2 9% | 1.5 36% | 1.5 36% | 1.1 0% |
Pros
Cons
Verdict

The 4K UHD screen and GTX 1080 GPU combination is the "ultimate" single GPU configuration for the current GT73VR. Performance is ludicrous and its features are numerous, though the drawbacks compared to the lower-cost FHD and GTX 1070 SKU are hard to ignore for enthusiasts.
First, the 4K UHD screen is limited to 60 Hz and suffers from more ghosting than the 120 Hz/5 ms FHD option. Its contrast and color gamut are both inferior to the FHD panel as well. Secondly, the GTX 1080 GPU runs tangibly warmer and louder than the GTX 1070, so the increase in graphics power comes at a cost other than the obvious price difference.
The GT73VR chassis is still one of the best notebooks for running the GTX 1080 due to its versatile features and very capable cooling solution. Very thin 17-inch notebooks with the same GPU will become available before the end of this year including the Aorus X7 v6 and the Razer Blade Pro, but it's unlikely that these more portable alternatives will run any cooler and quieter than the MSI.
The GT73VR is a step in the right direction for the GT series and is superior to the GT72 in almost every way. It's thicker and heavier, but the extra weight and girth are utilized wisely for a much improved gaming experience.
MSI GT73VR 6RF
- 11/04/2016 v5.1 (old)
Allen Ngo
Price comparison
