MSI GS73VR 6RF Notebook Review
MSI is the leader in gaming notebooks worldwide and Nvidia's recent Pascal announcement for notebooks marks the perfect occasion to refresh its lineup of G Series models. While the latest GT73VR will be the more "complete" and full-featured 17.3-inch solution, the GS series has grabbed headlines for its super-thin design that doesn't compromise on performance. The results are models that have become both famous for their thinness and notorious for their high surface temperatures and fan noise as evident by the GS60 and GS70 series.
Despite these drawbacks, MSI is promising that its new GS63/73 series will be even thinner, lighter, cooler, and quieter than its predecessors - extreme claims for a series that is already pushing thermal limits. The manufacturer has nonetheless overhauled the design with Pascal in tow, so we're eager to check out how the new GS73VR stacks up against the current competition and its immediate GS70 Stealth predecessor.
Aside from Pascal, the GS73VR also carries 120 Hz/5 ms display options that are new to the series and shares the same Nahimic 2 and Dragon Center software as its updated G series peers. This super-thin enthusiast category has grown more competitive over the last couple of years with Aorus and Asus both stepping up their game, so it's unsurprising that MSI is going all out with the GS73VR. We recommend checking out our reviews on previous GS70 SKUs as we will be comparing them frequently to this 2016 update.
Case
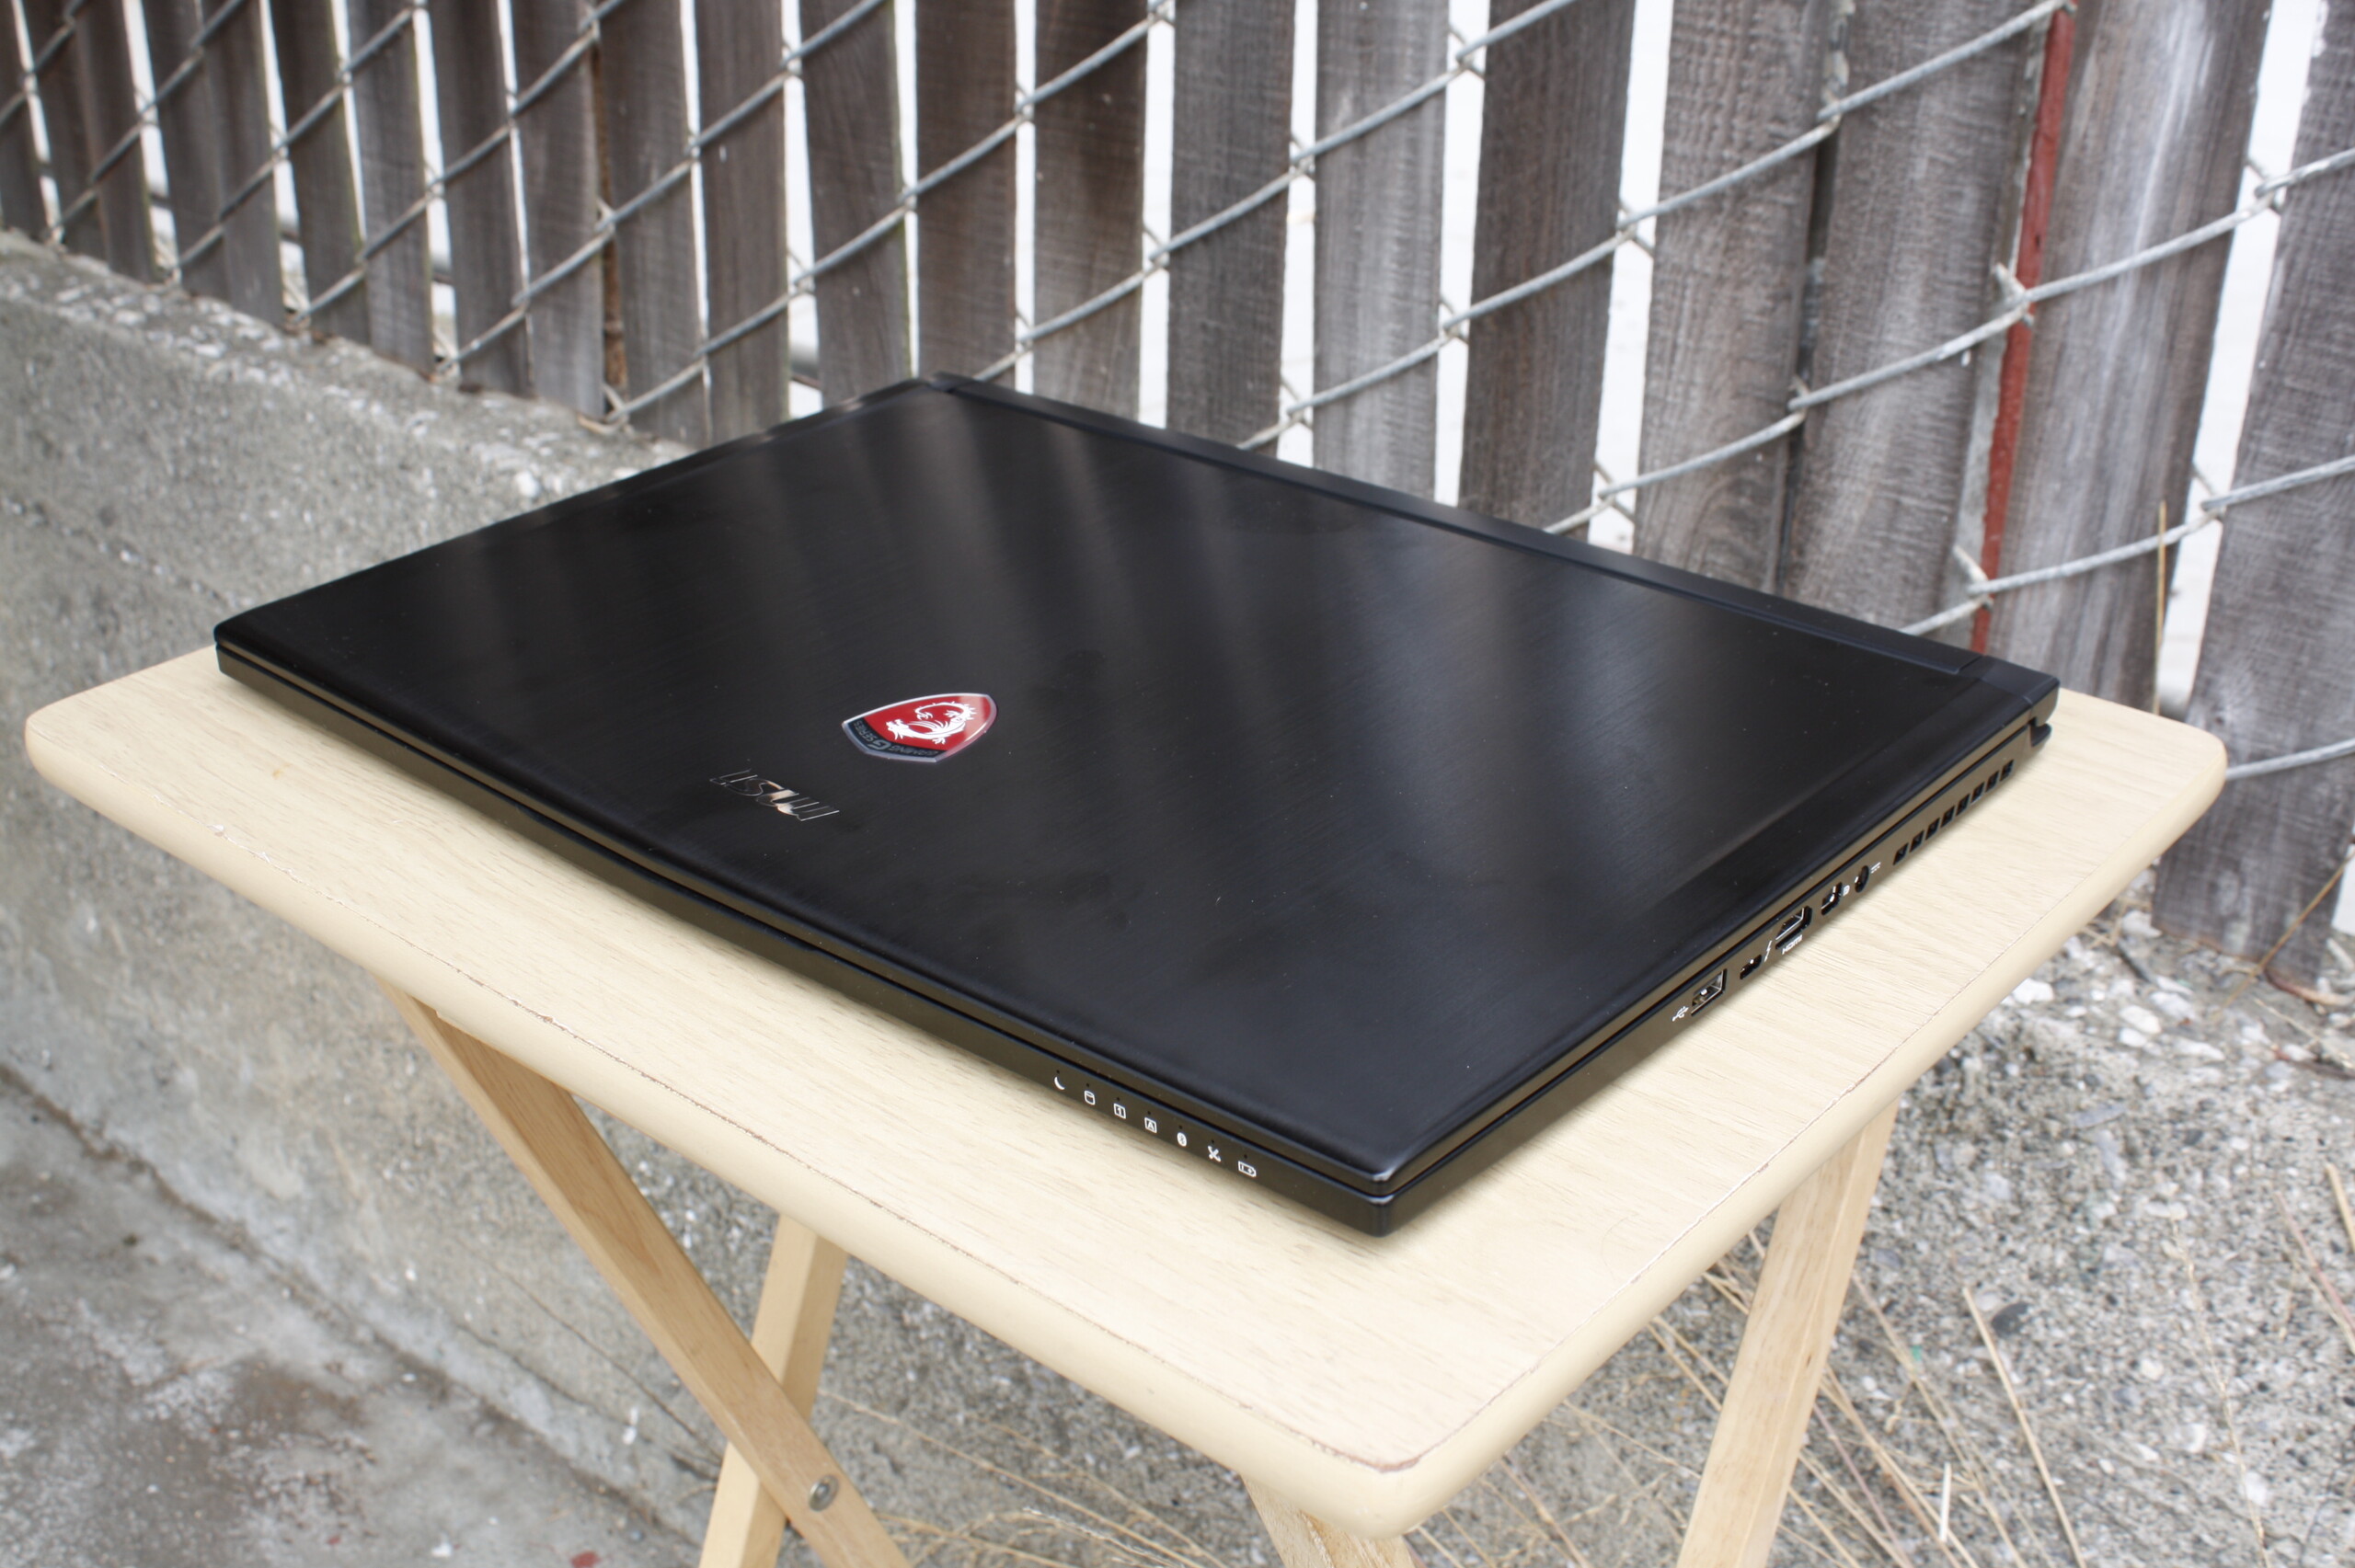
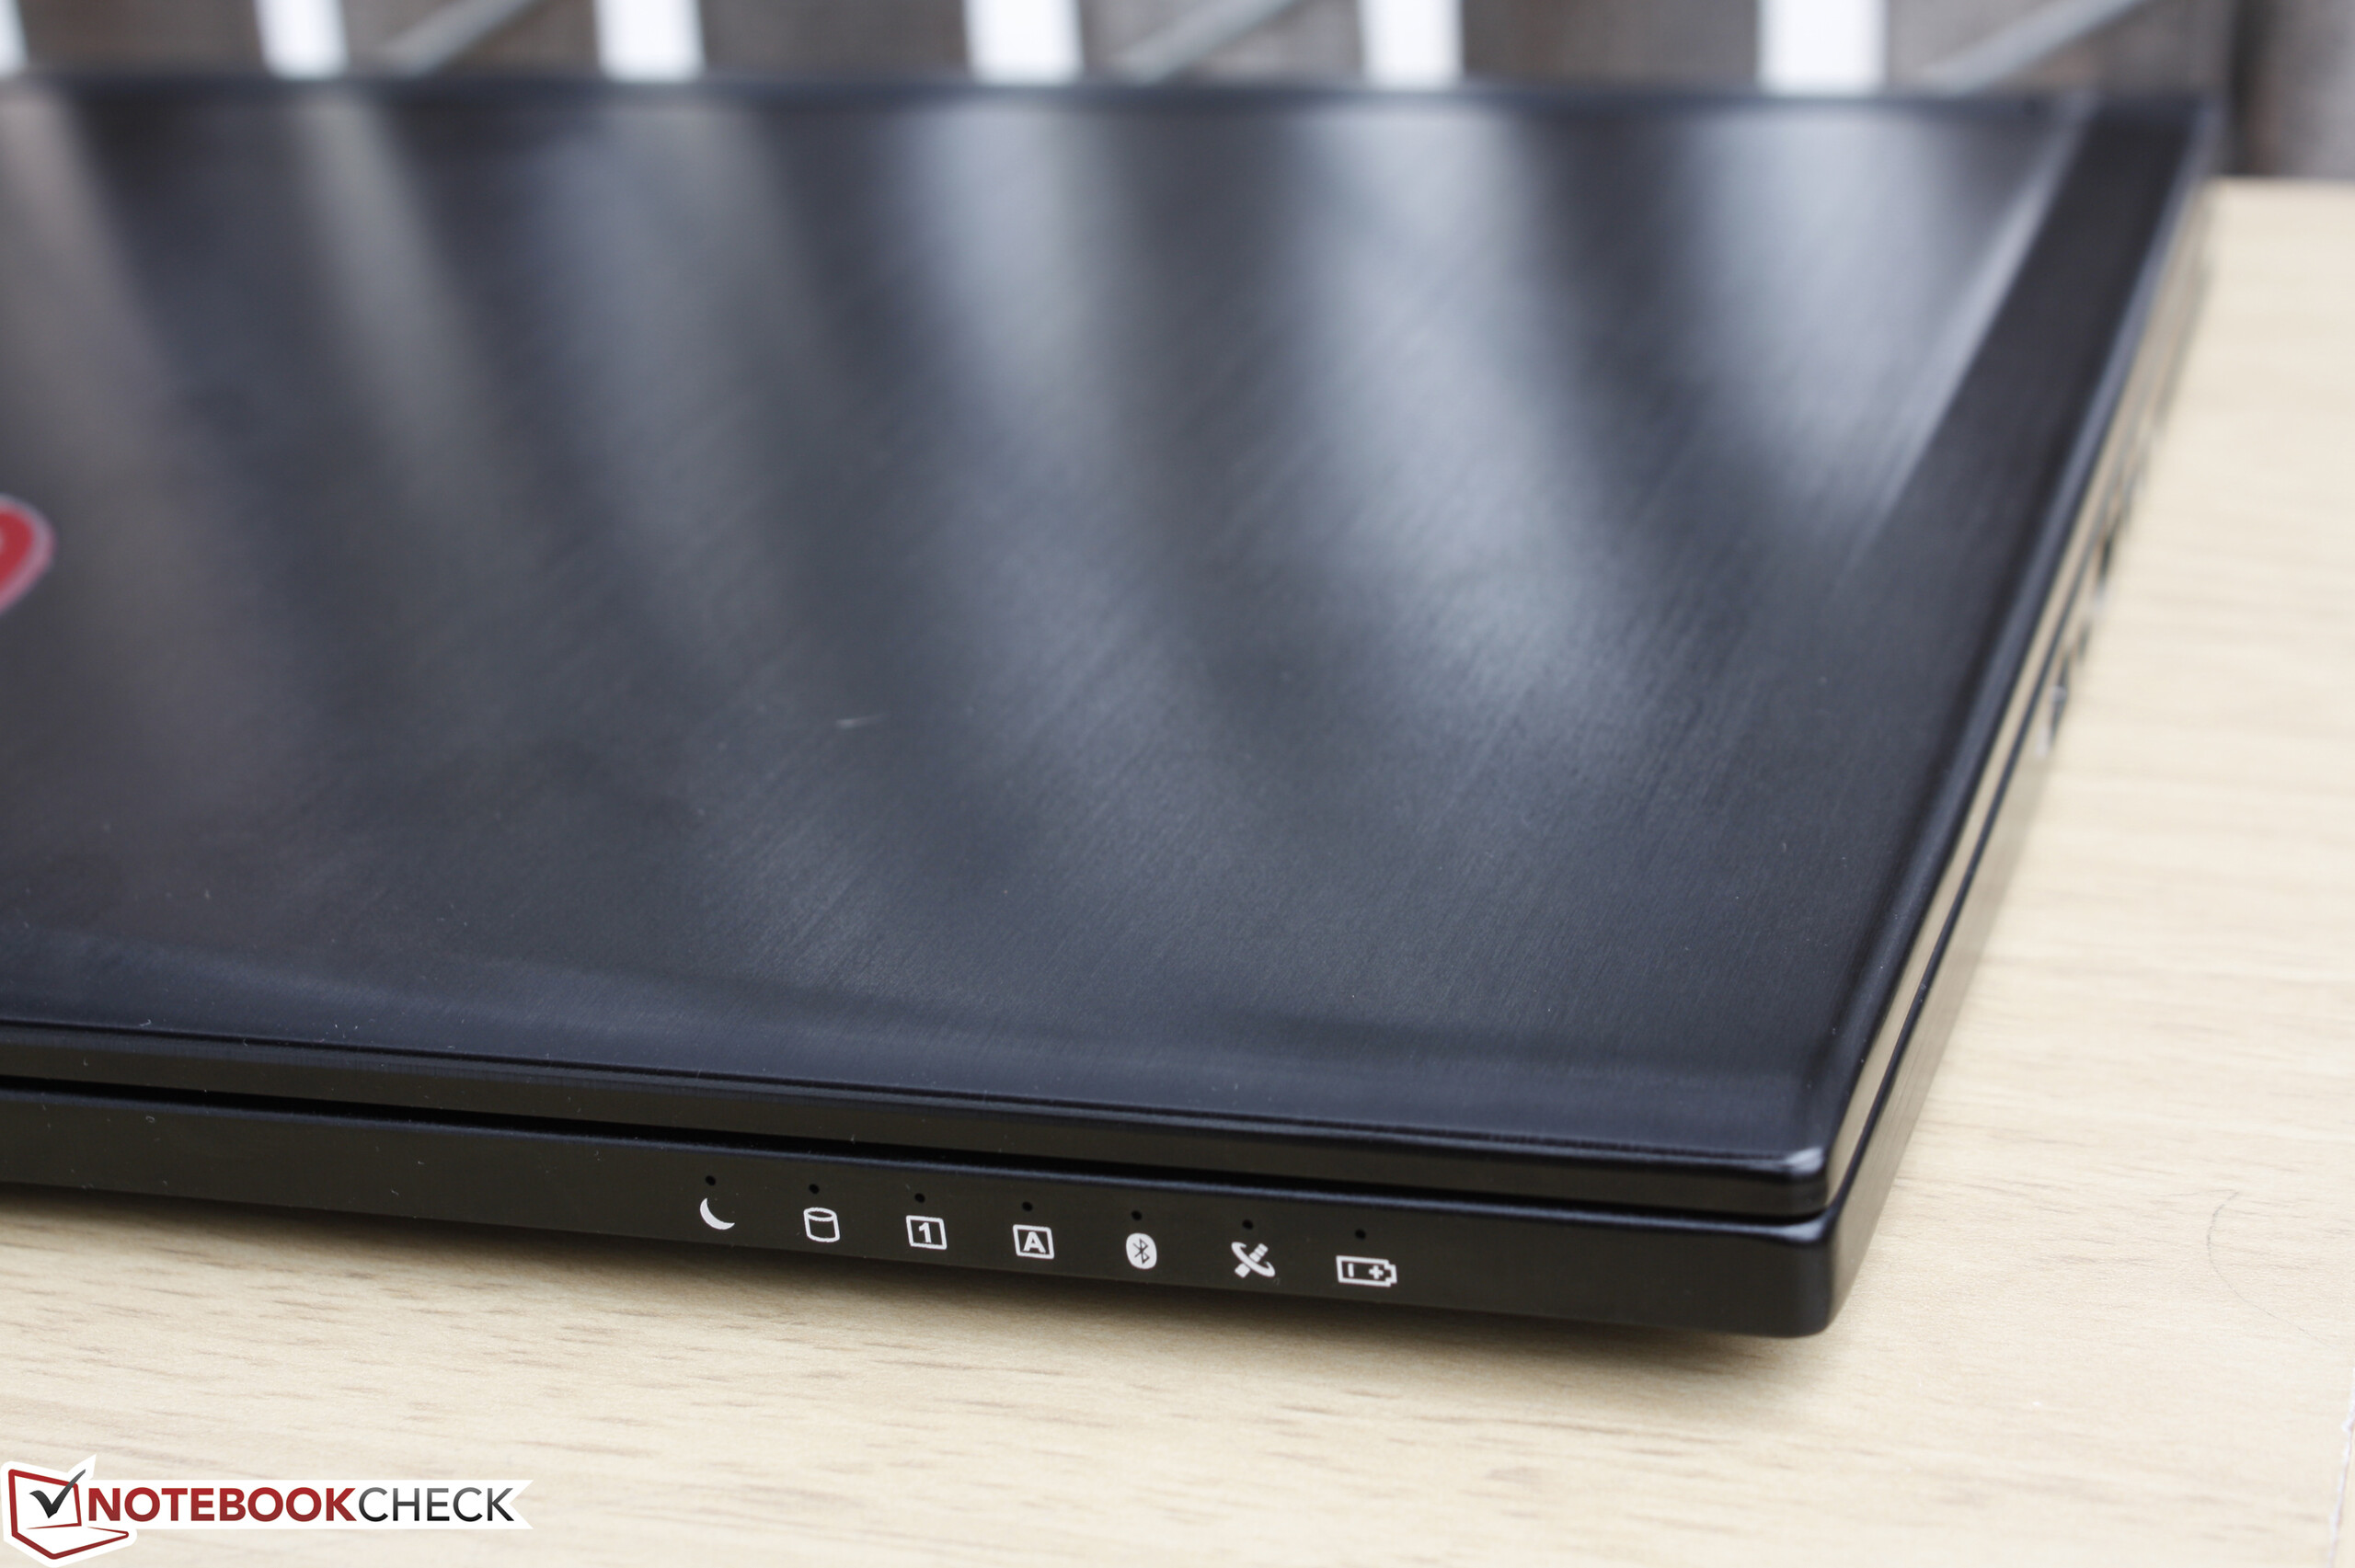
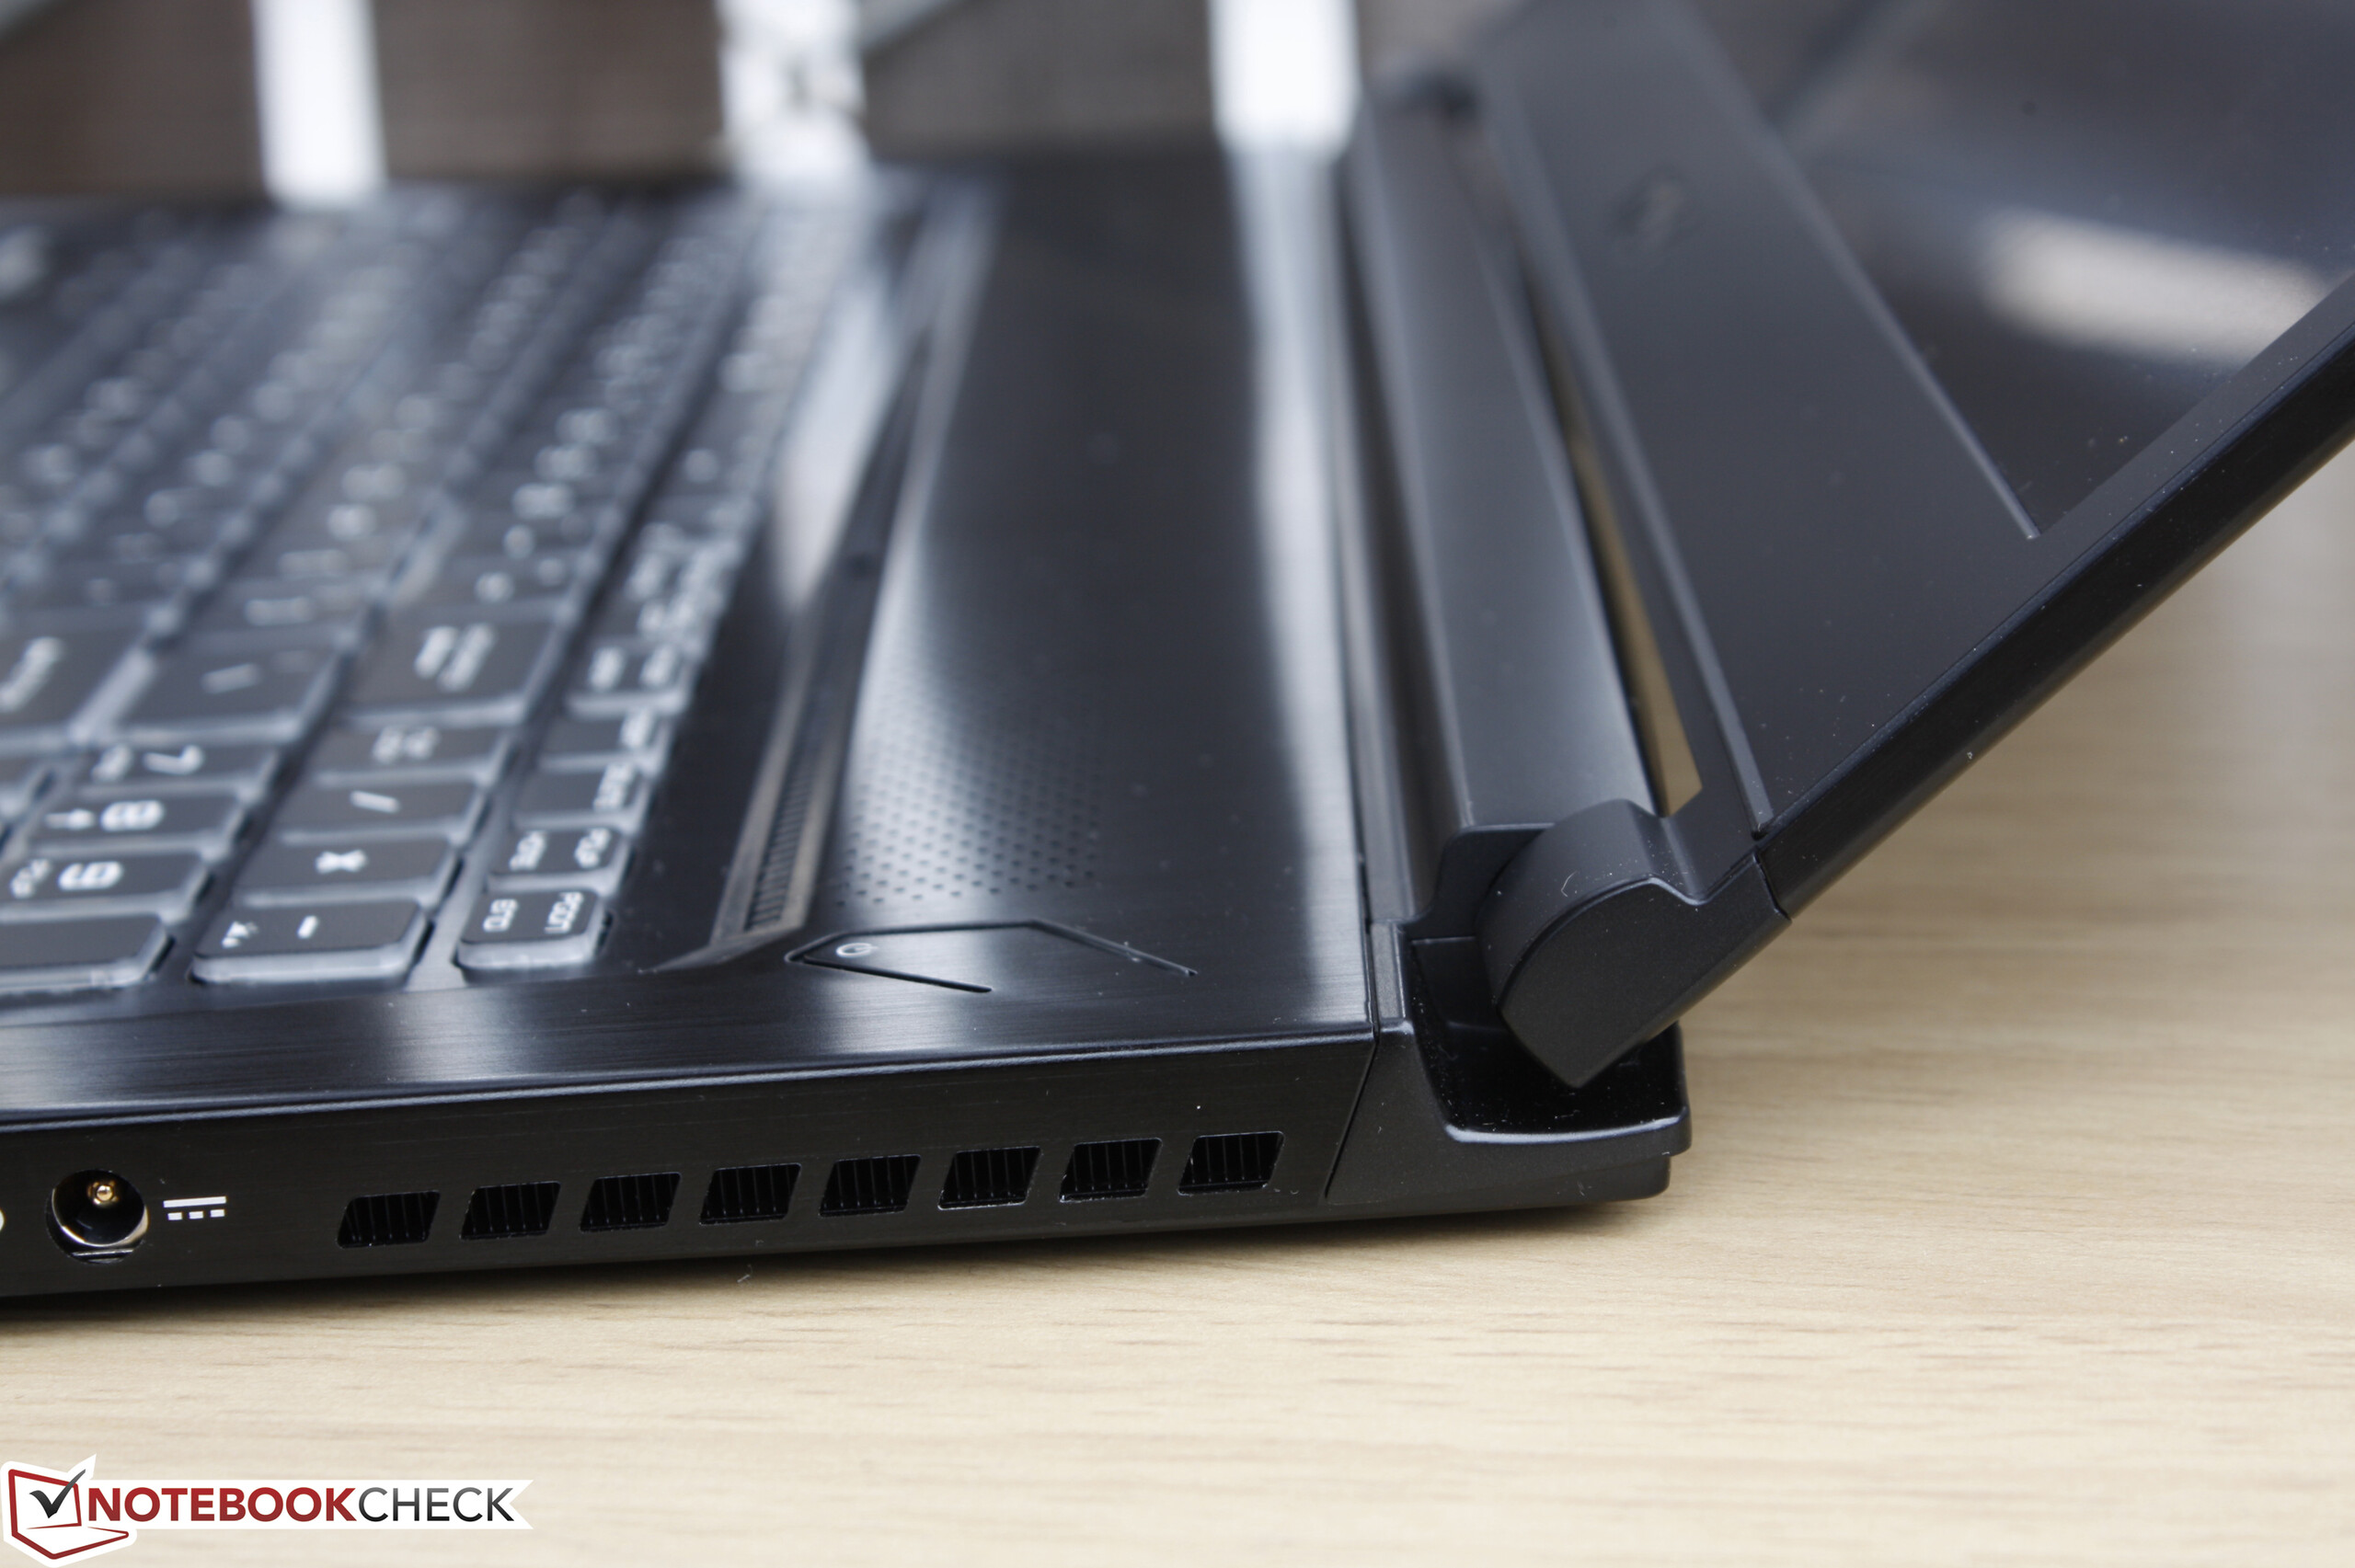
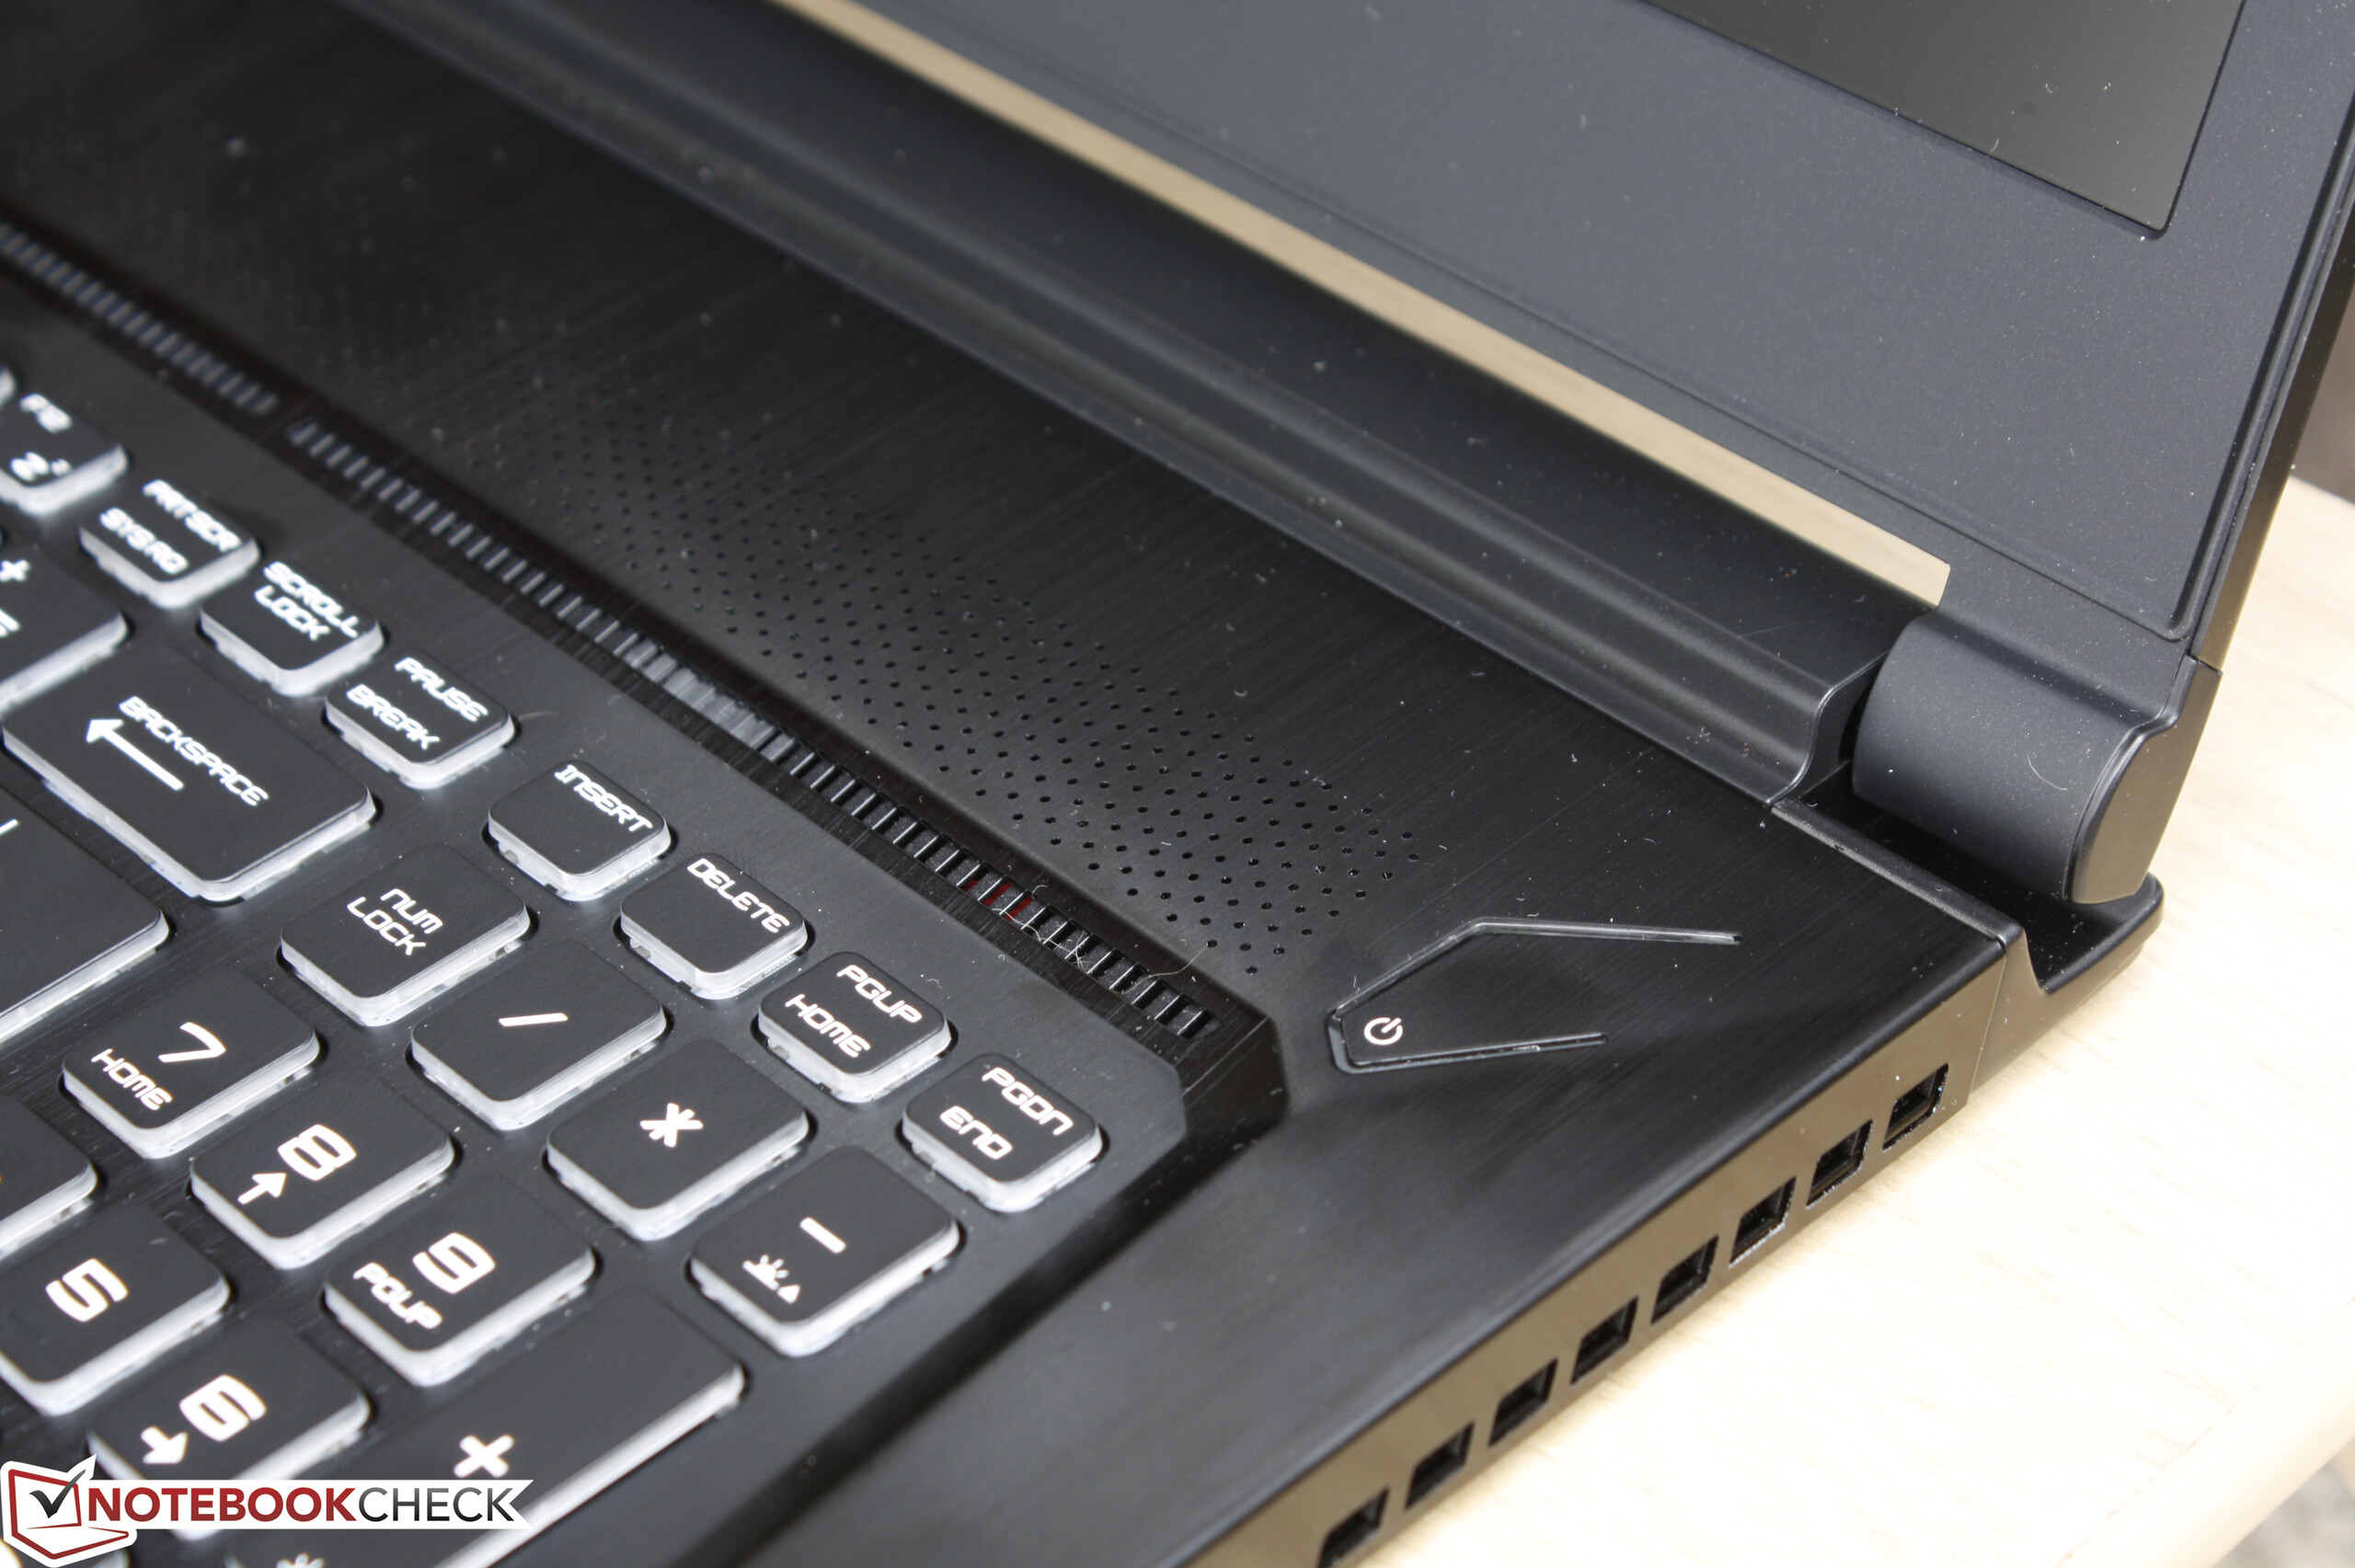
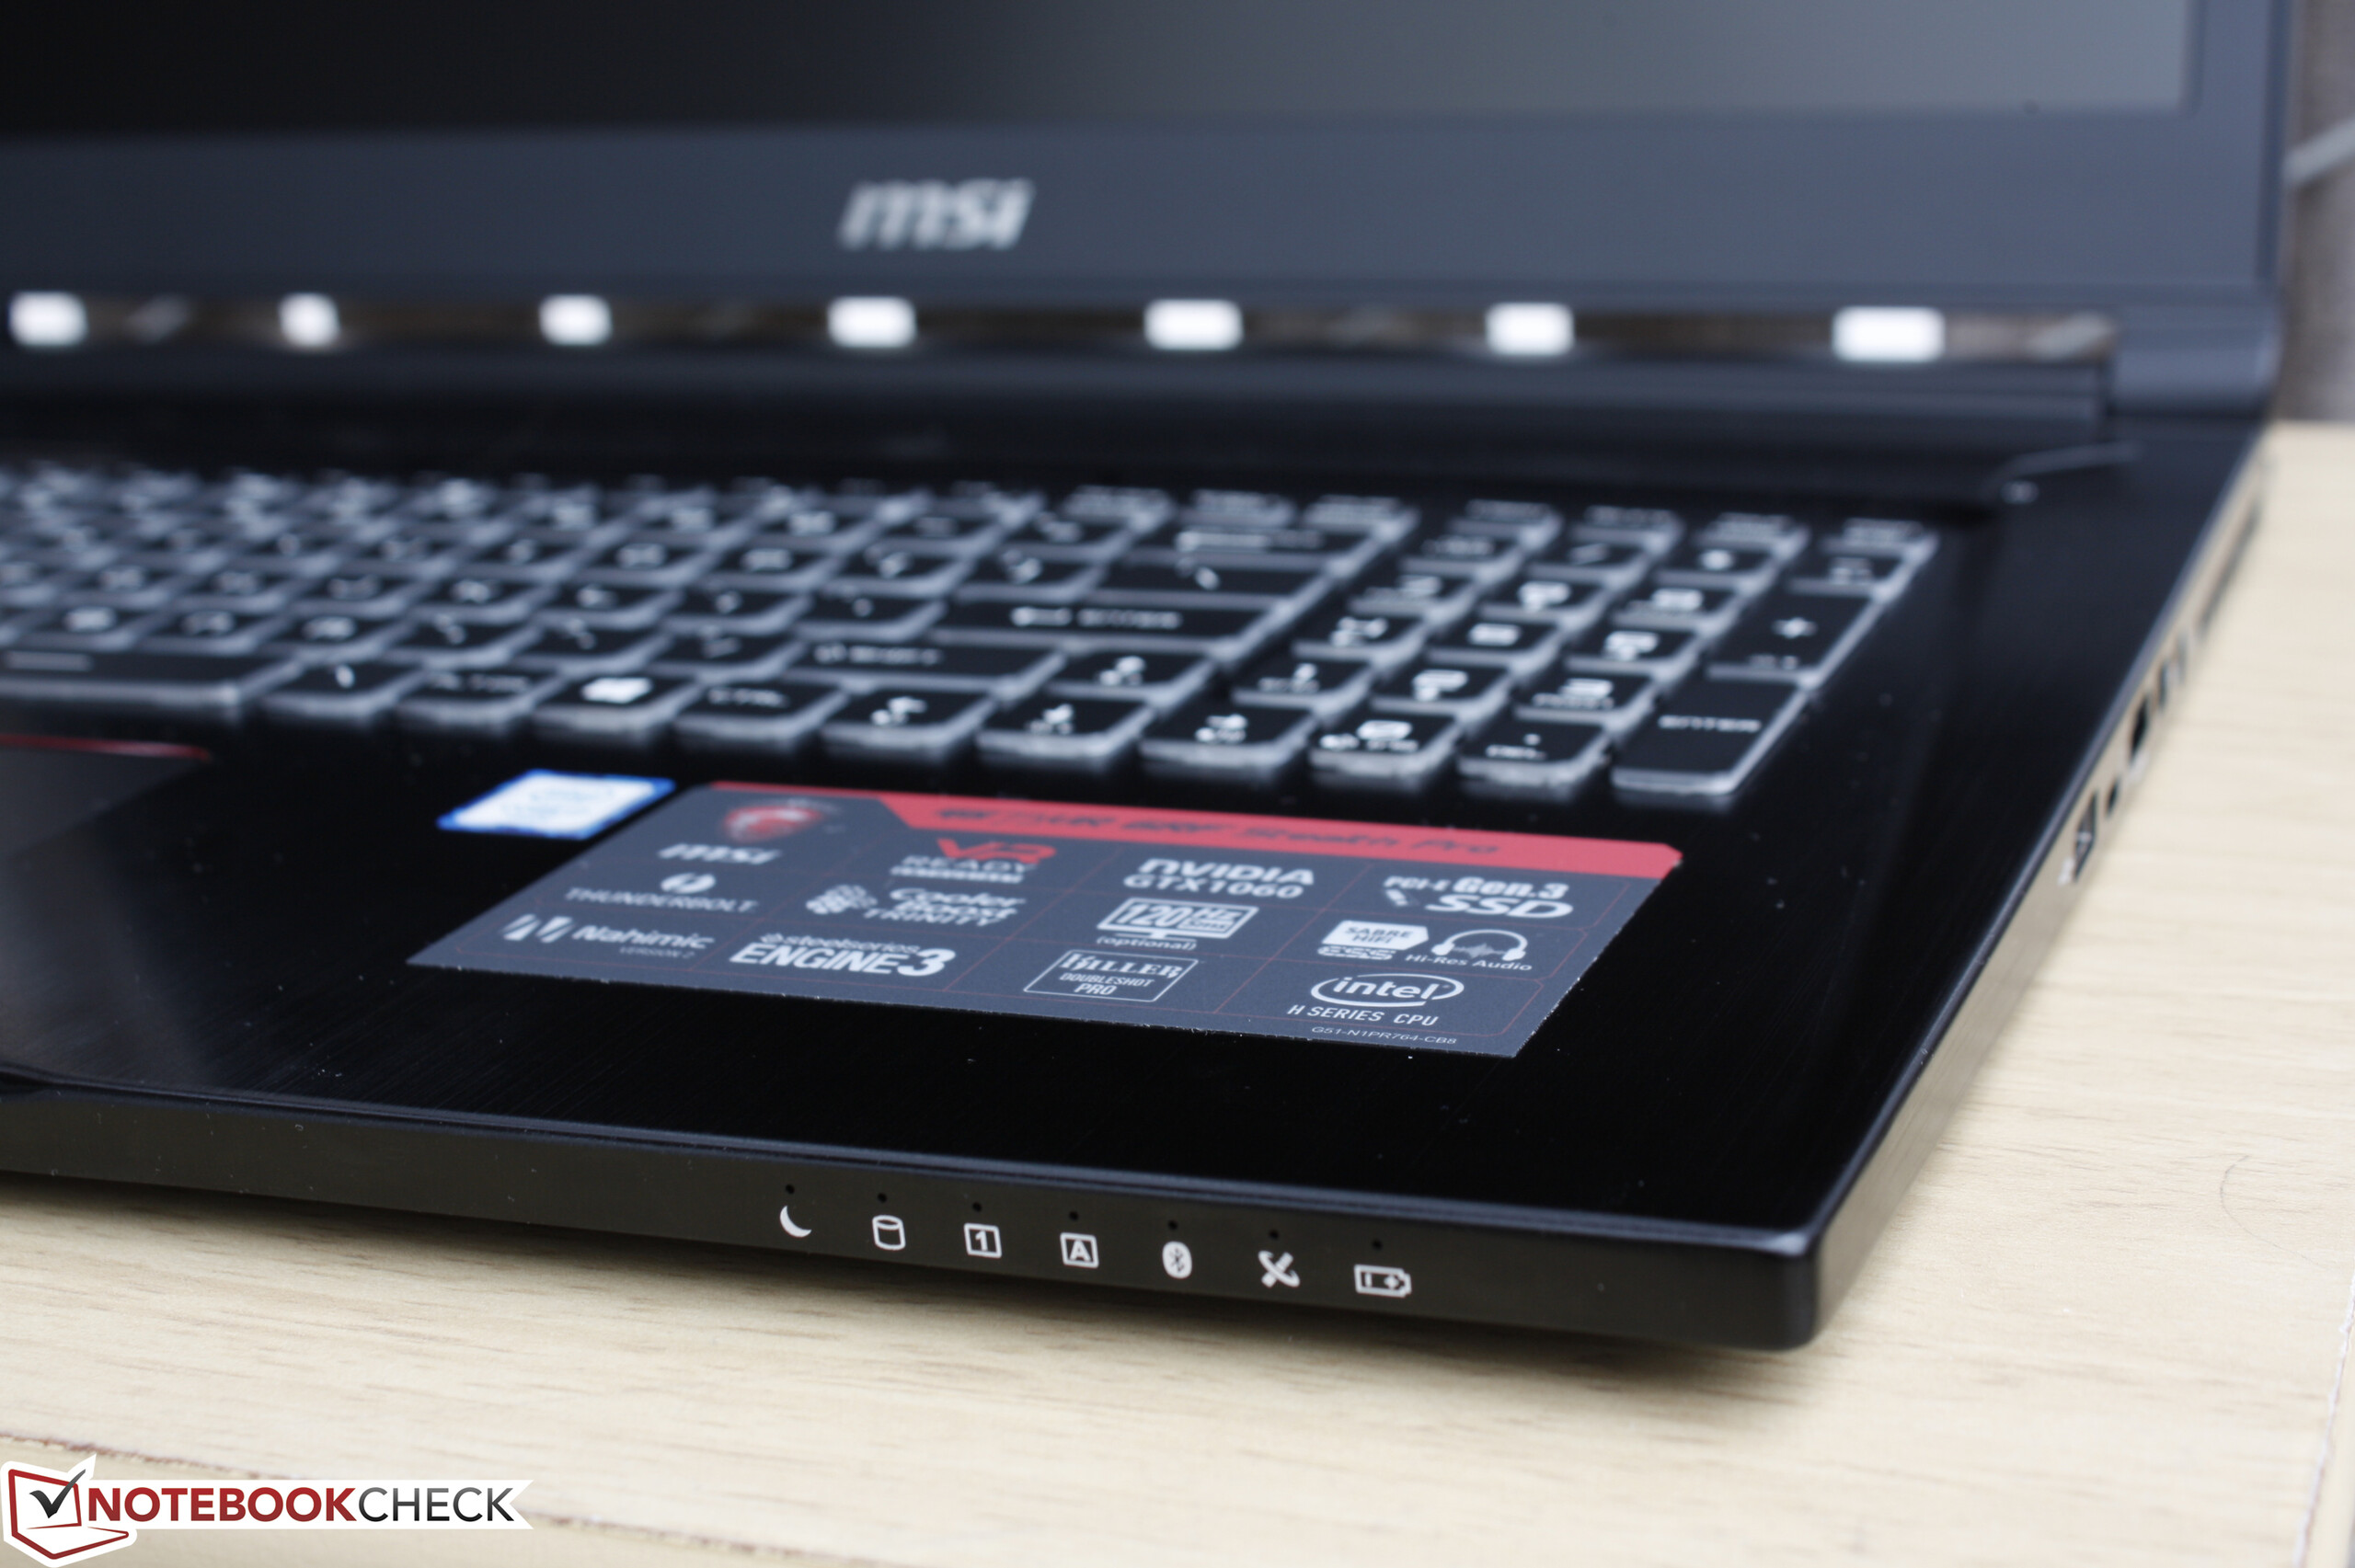
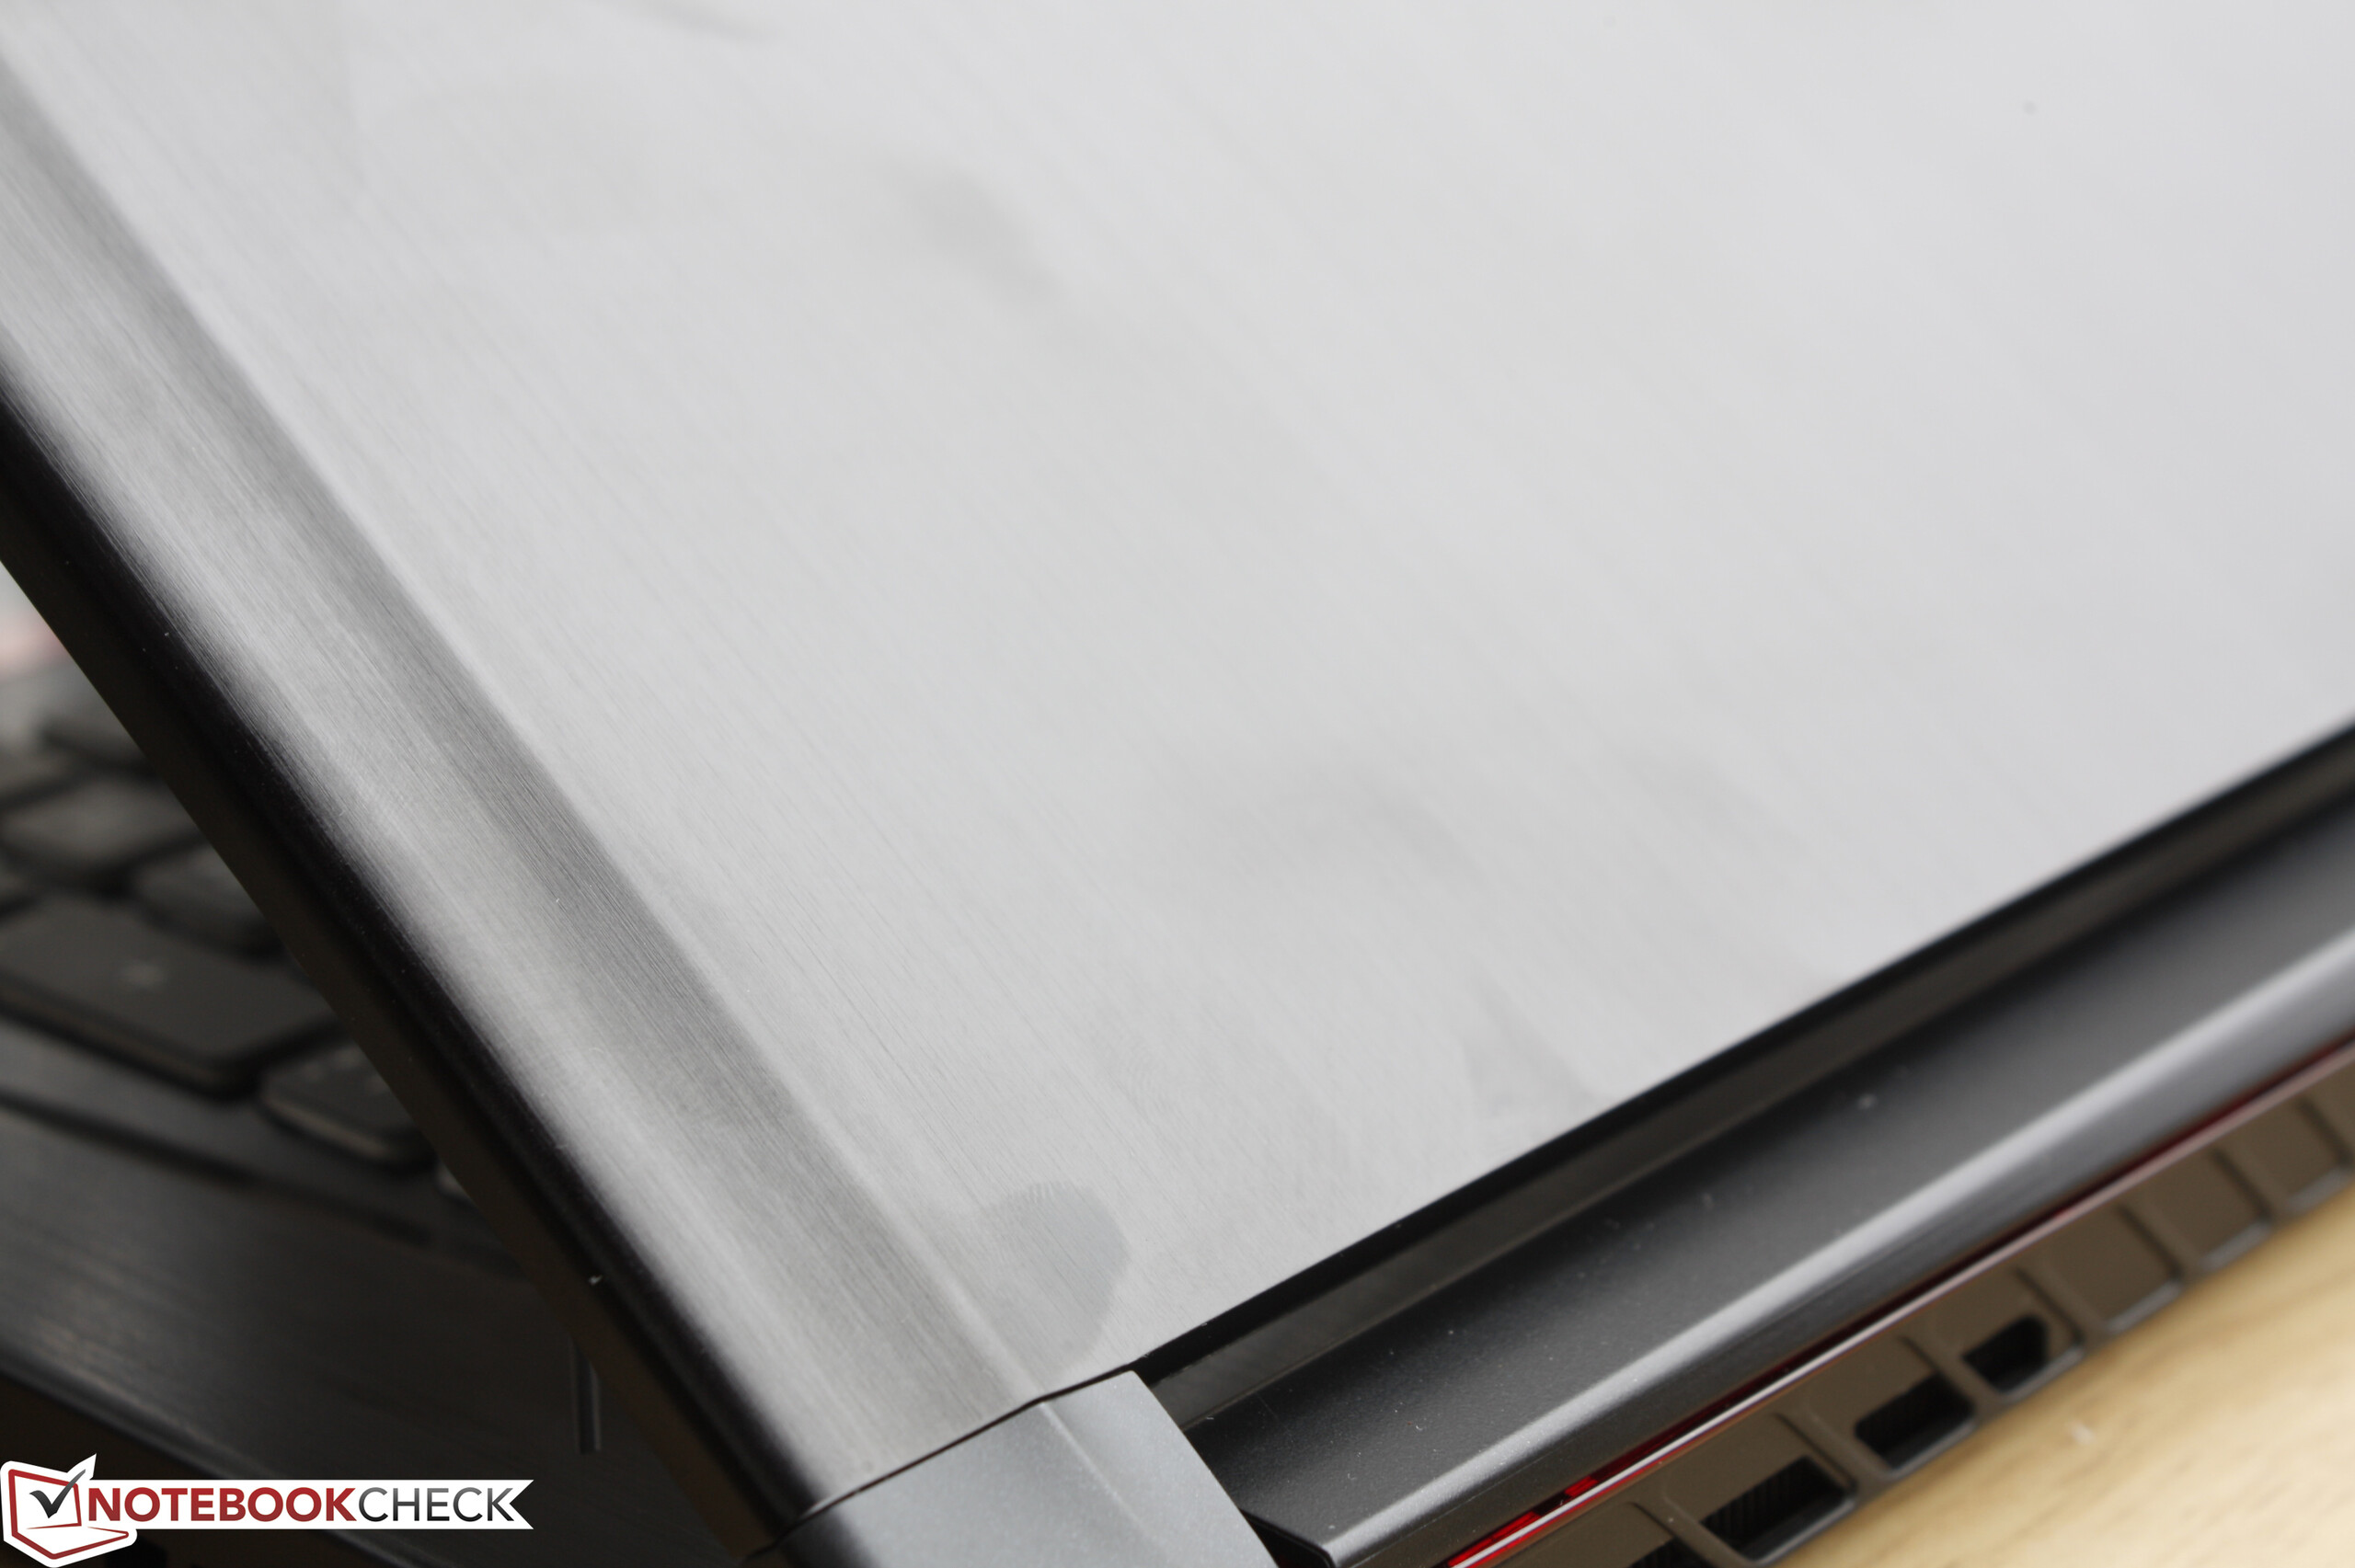
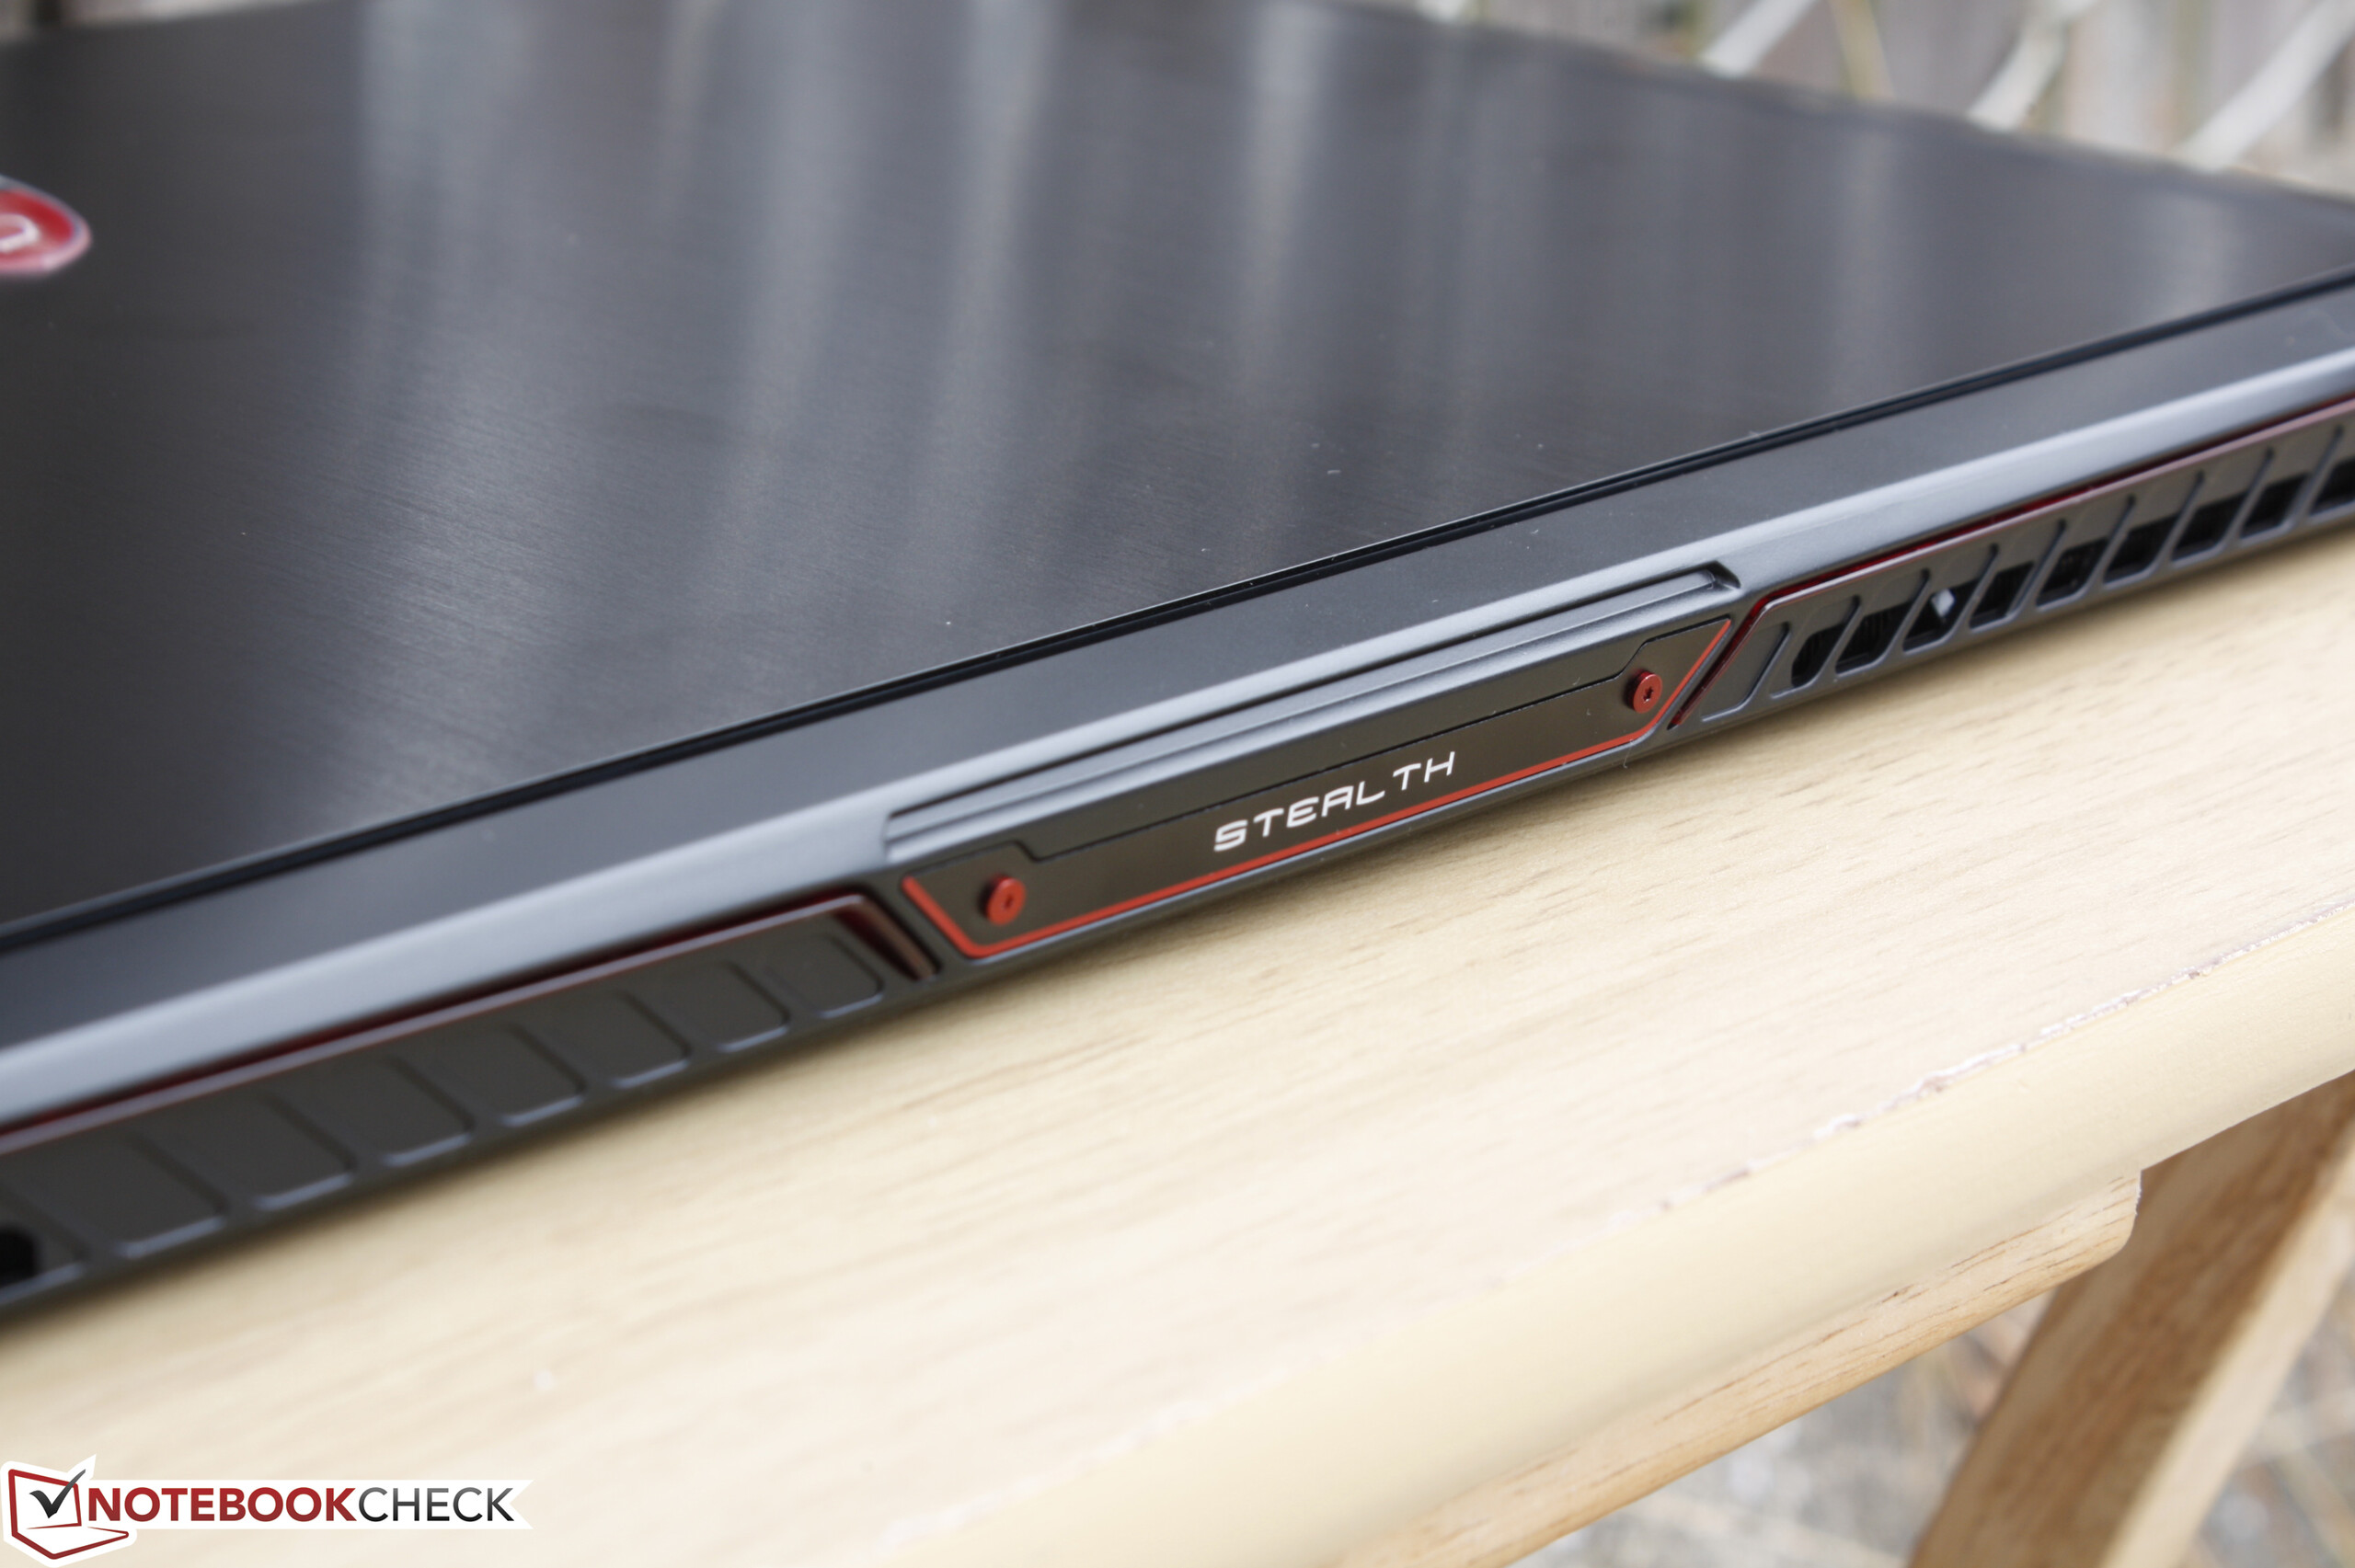
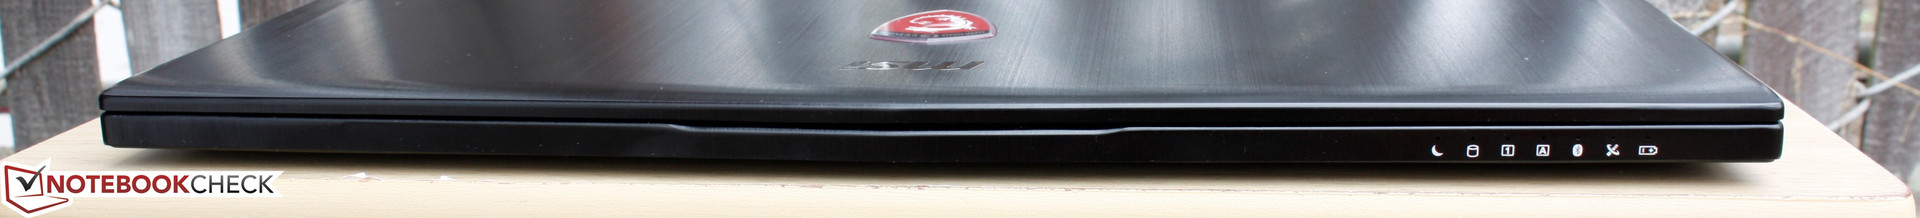
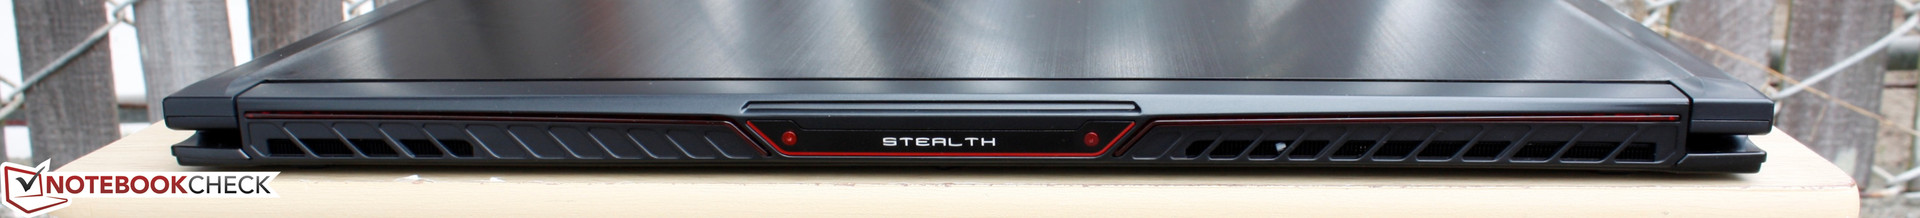
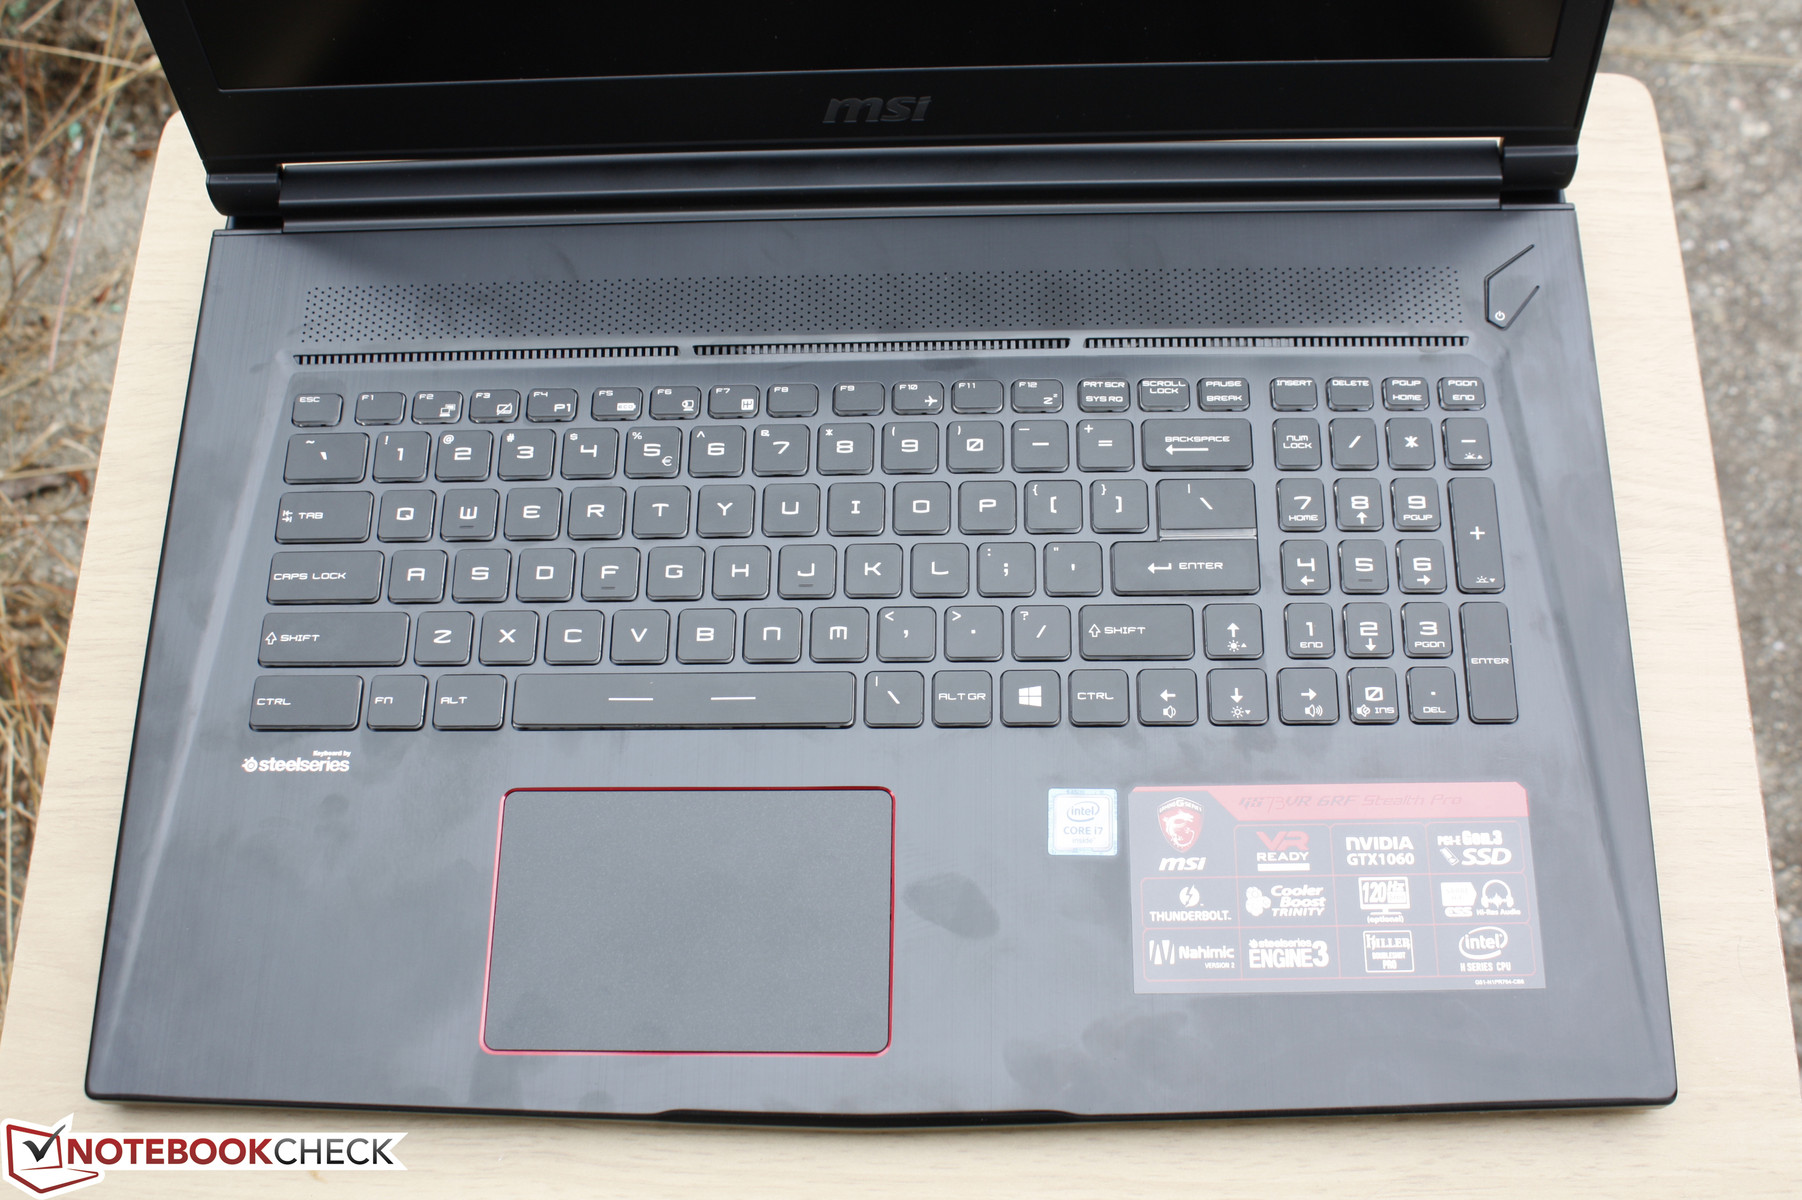
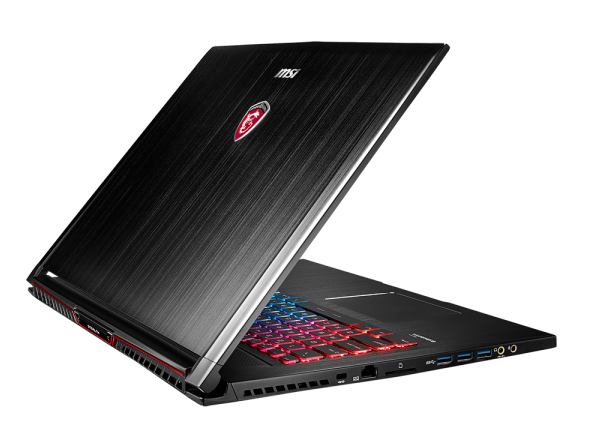
Visually, the new chassis is an upgrade over the GS70 in every way. The brushed aluminum outer lid extends to the base and palm rests with new, sharper accents around the edges. Its darker coat of paint works alongside the hints of red around both the touchpad and rear edge while the single-bar hinge on the previous generation is now a more standard dual hinge design. Though a fingerprint magnet, the design is undeniable eye candy from top to bottom without being minimalist or too eccentric.
The actual build quality of the unit is also very good with a few weak spots. Plastic is used for both the inner bezel and in between the dual hinges while the lid is slightly more susceptible to side-to-side twisting and warping down its center than many of its thicker 17-inch peers. The brushed aluminum base itself and the center of the keyboard will visibly depress with moderate applied force likely due to the thin materials necessary for such a design. The base is otherwise resistant to twists with only very slight audible creaking and the hinges are sufficiently rigid to prevent teetering whilst typing or gaming.
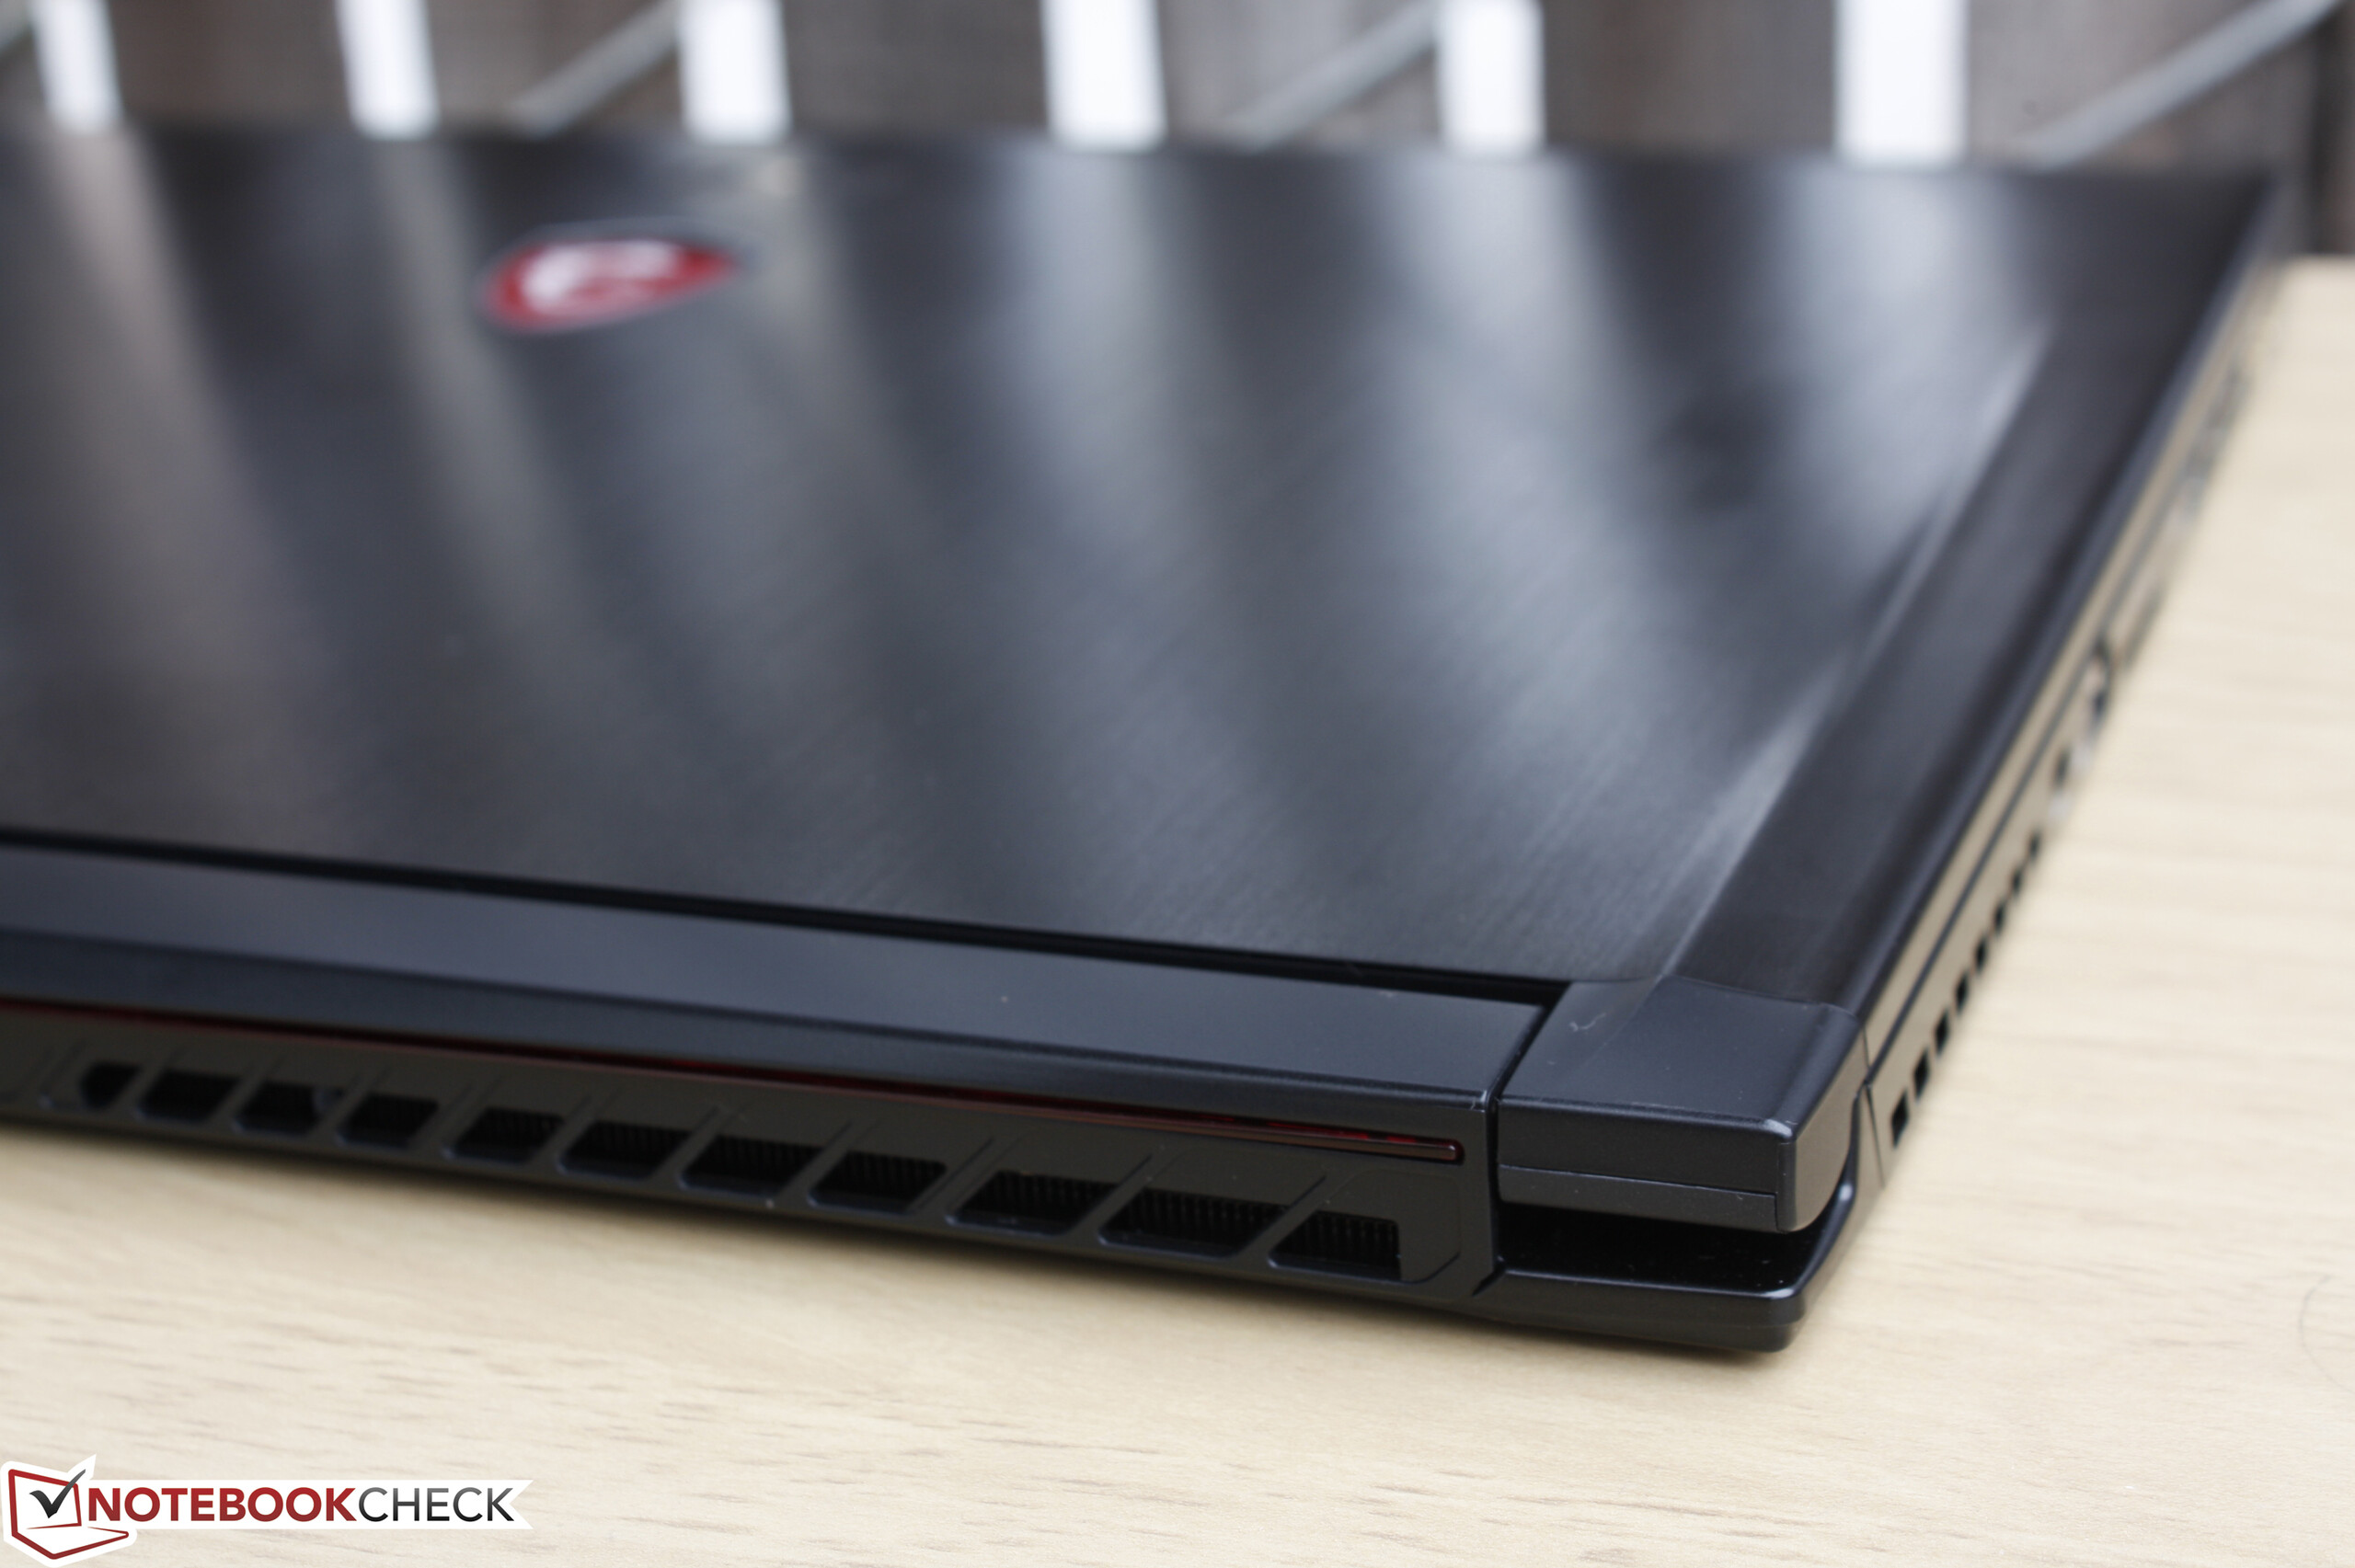
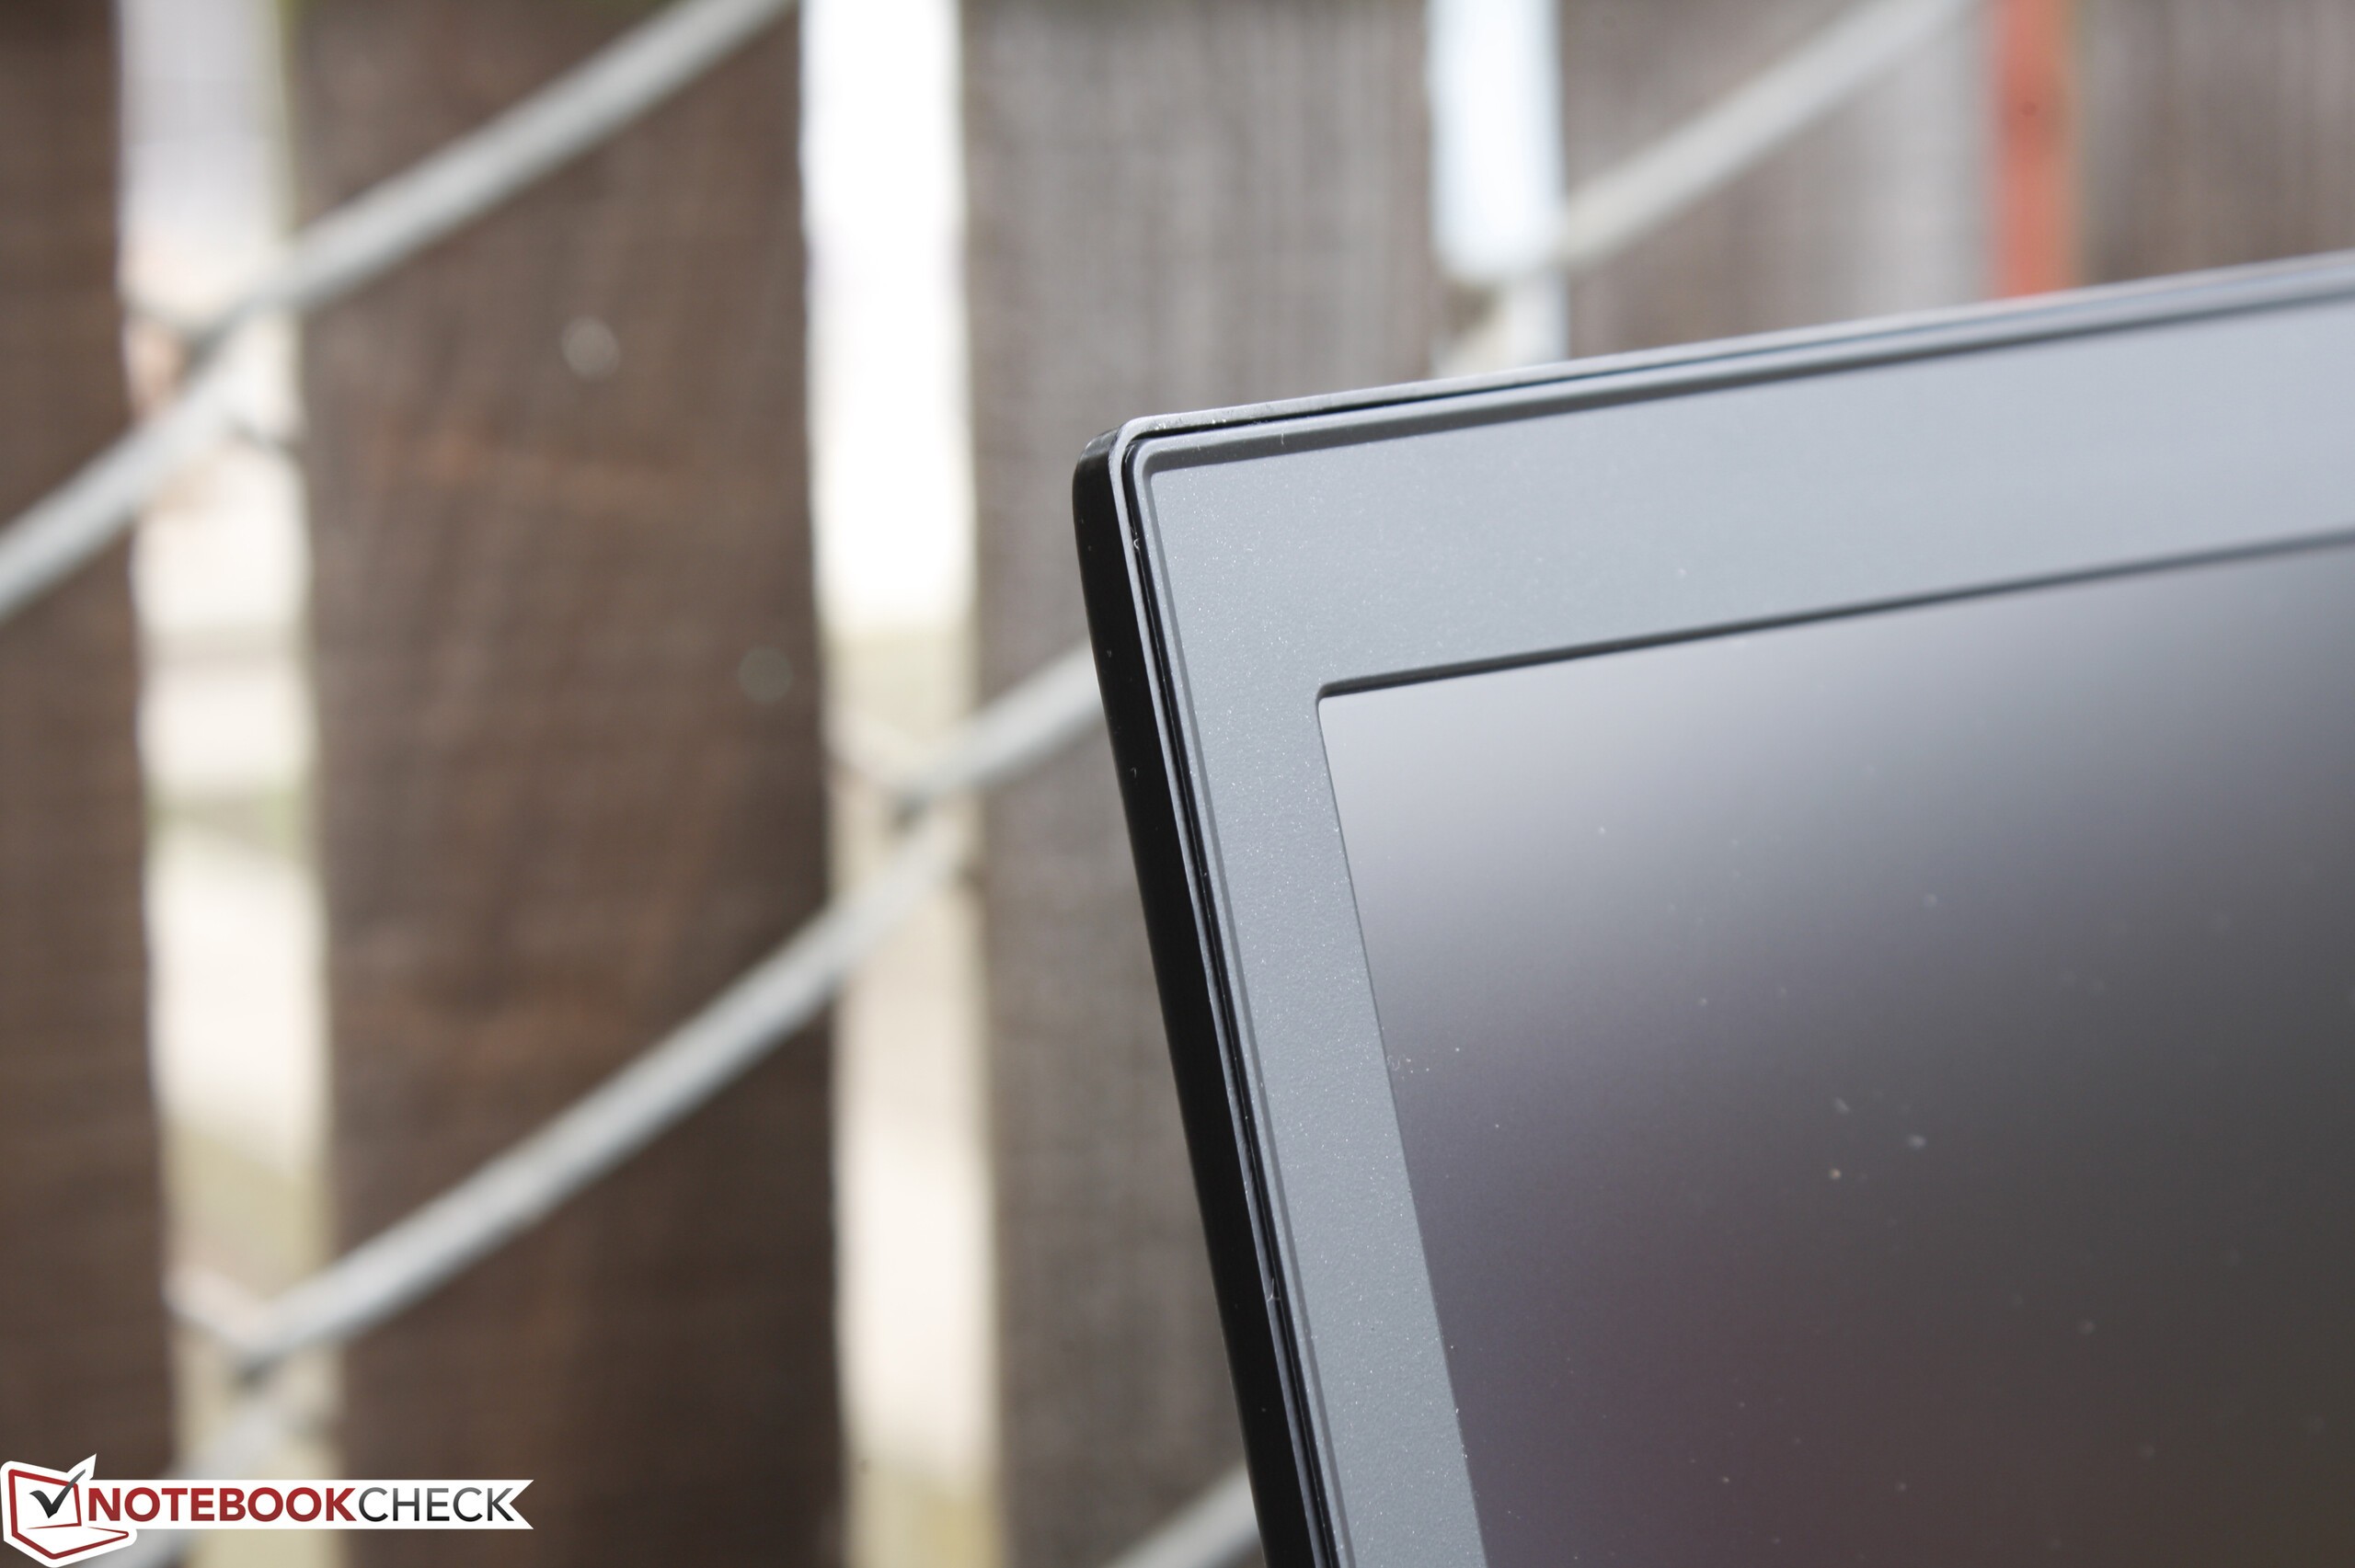
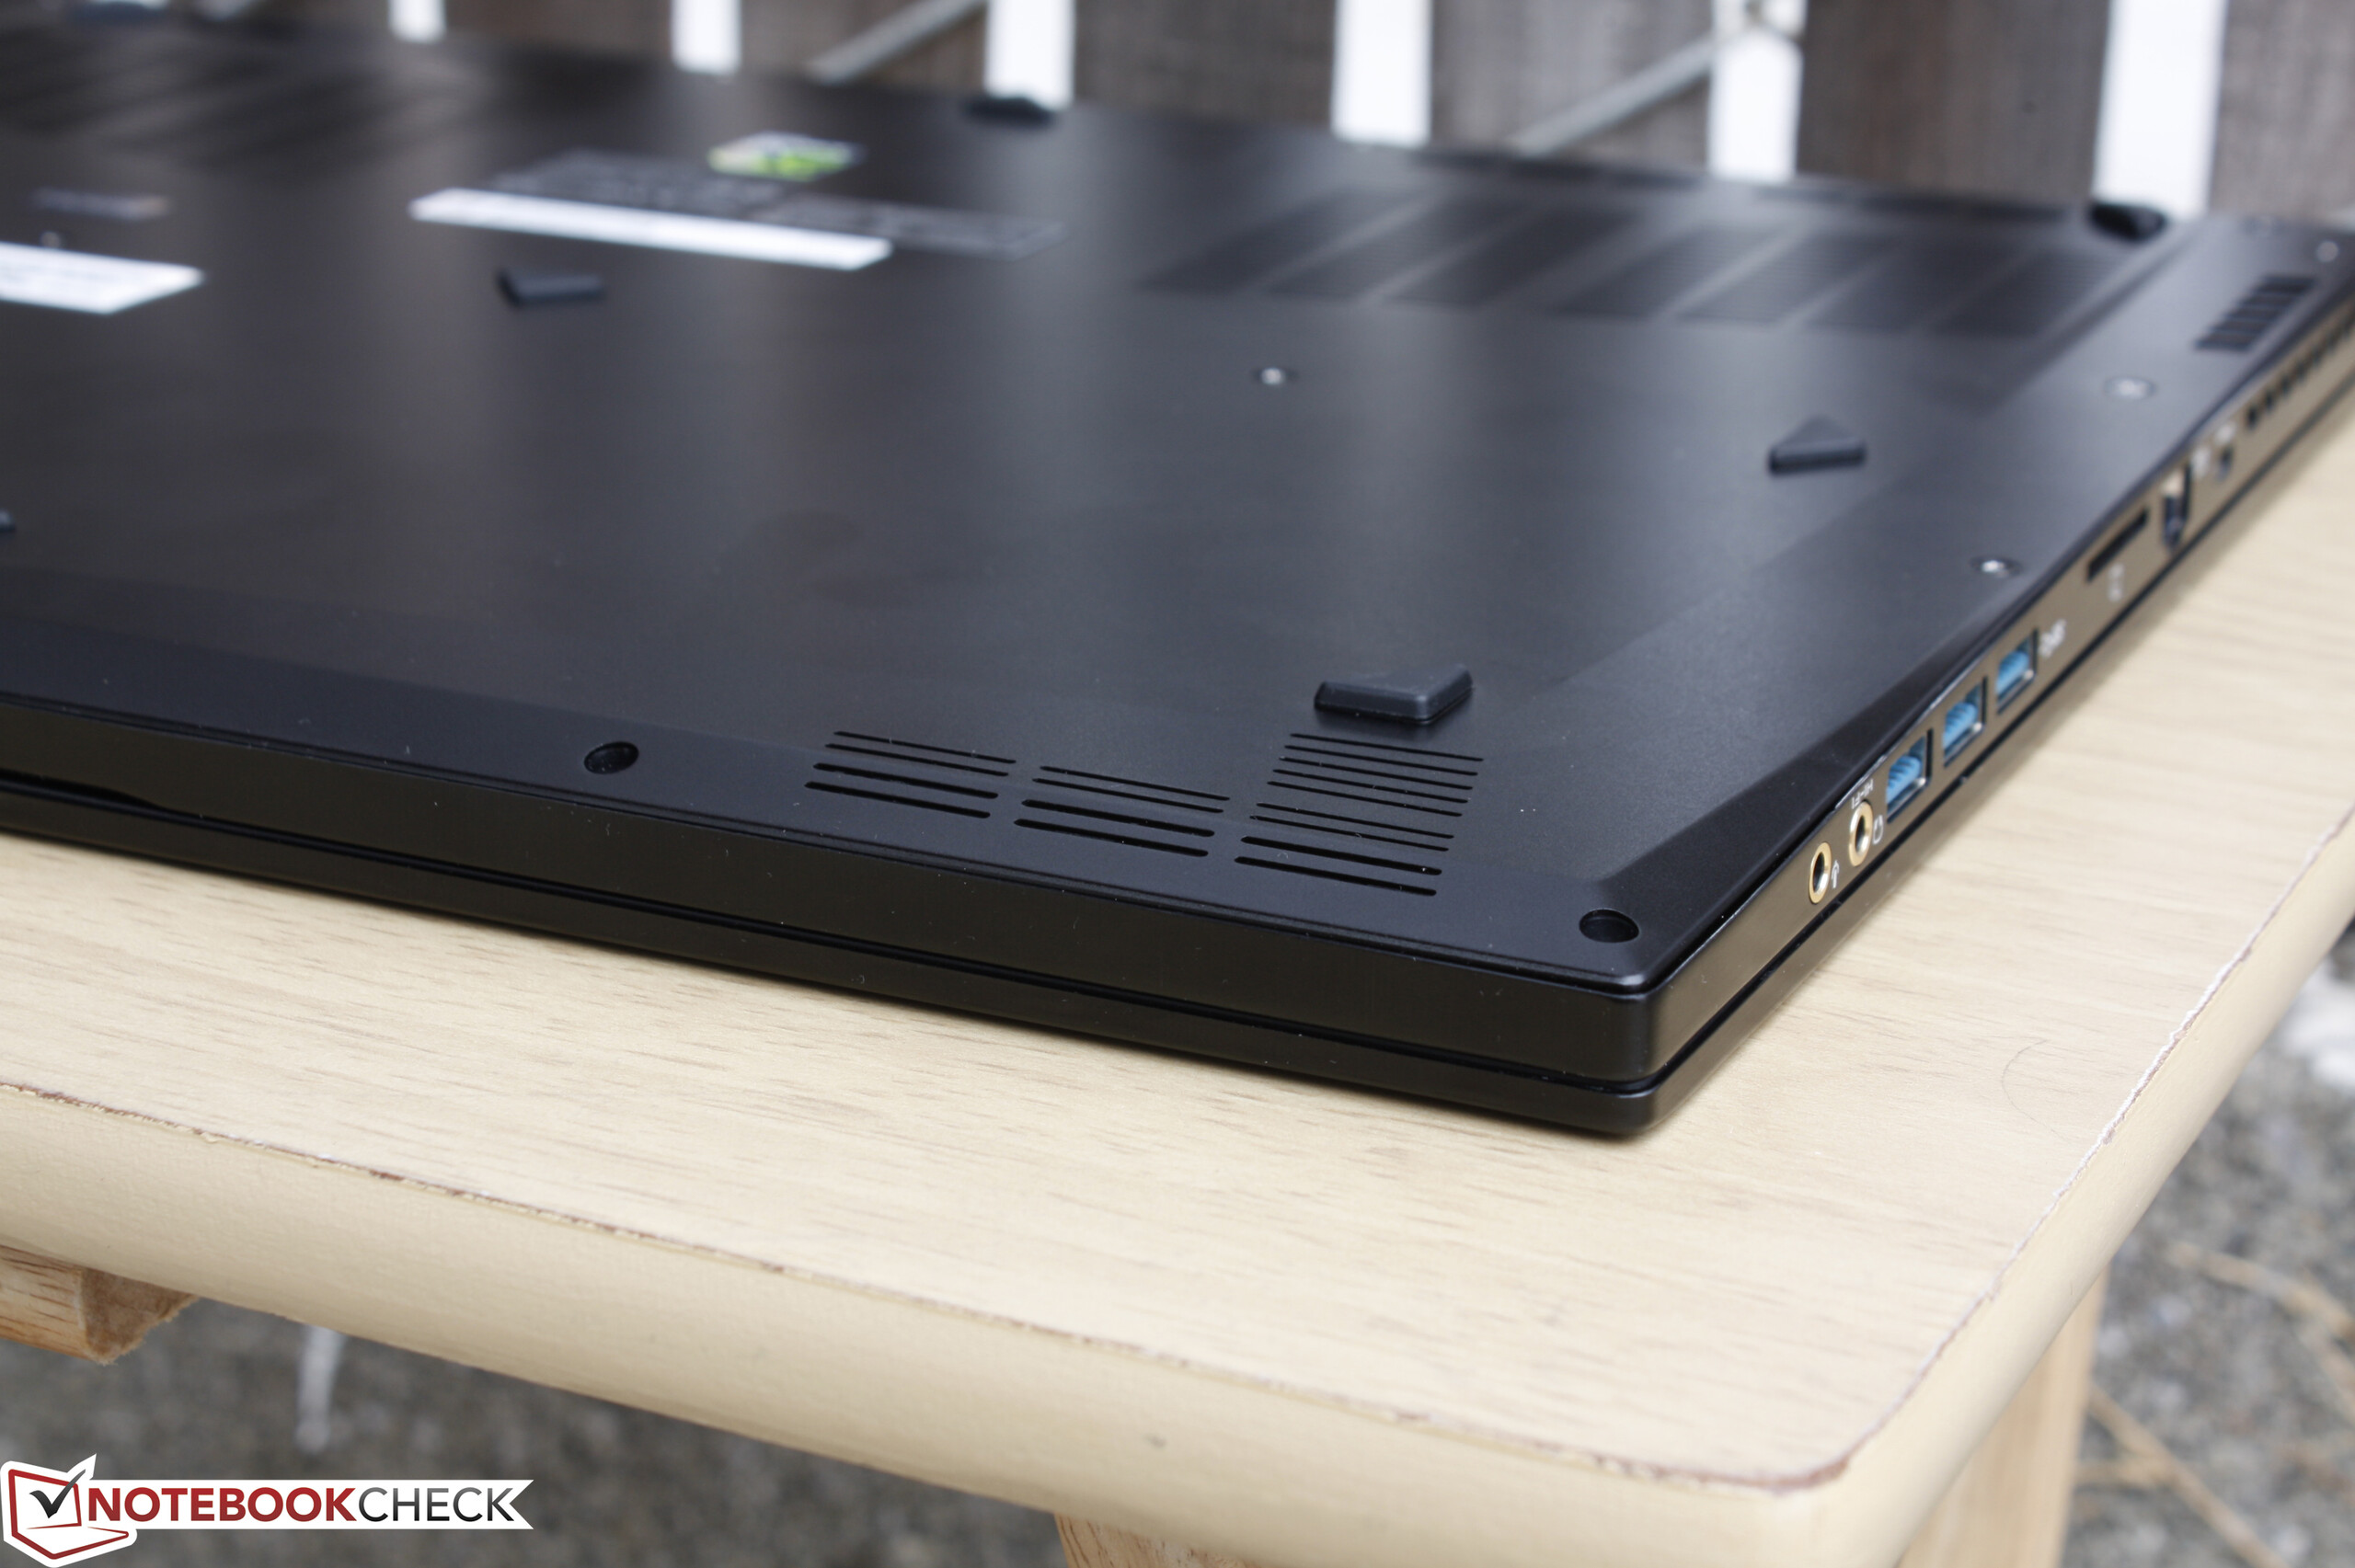
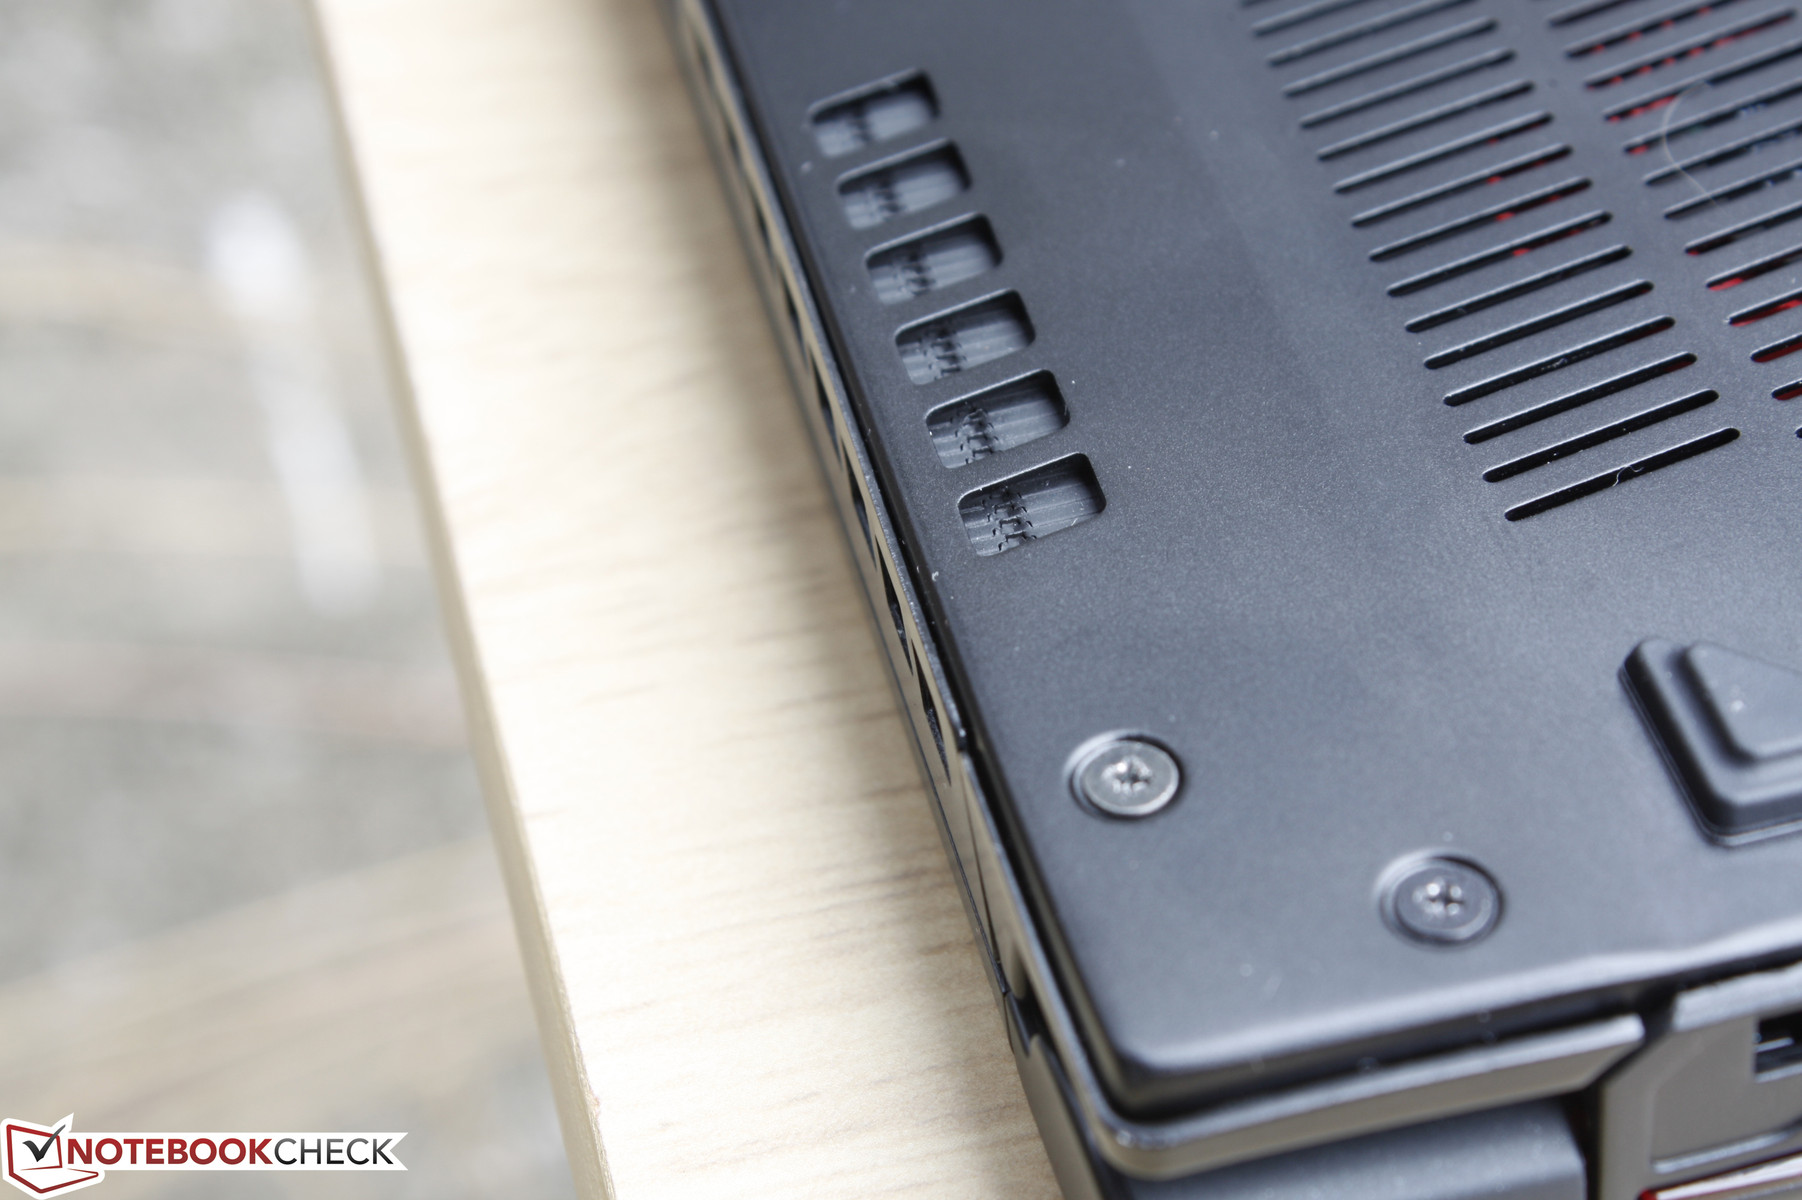
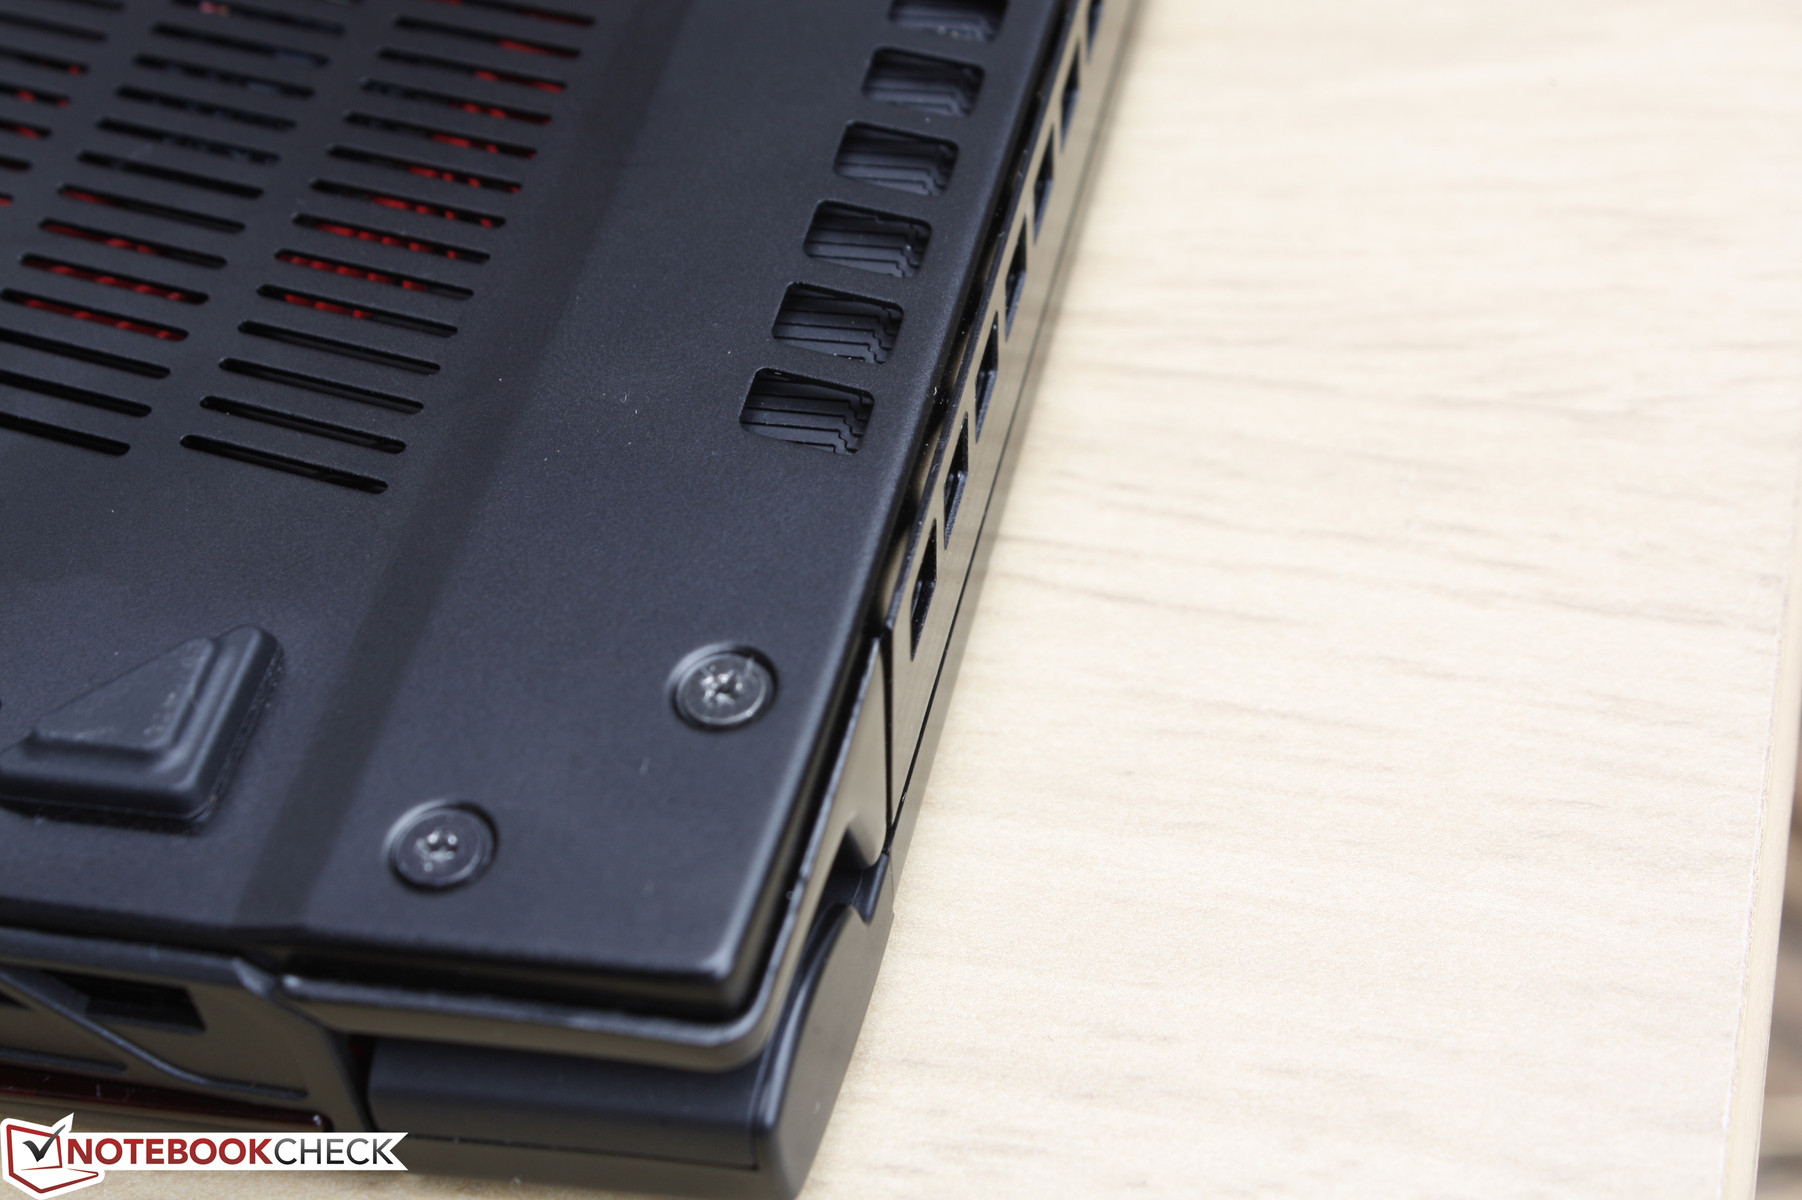
Workmanship is again very good, but not perfect on our test unit. As shown in our two pictures below, the thin plate for the right edge of the notebook is protruding a bit from the chassis. Meanwhile, the opposite edge is completely flushed in comparison, so the disadvantages of not having a unibody chassis are apparent.
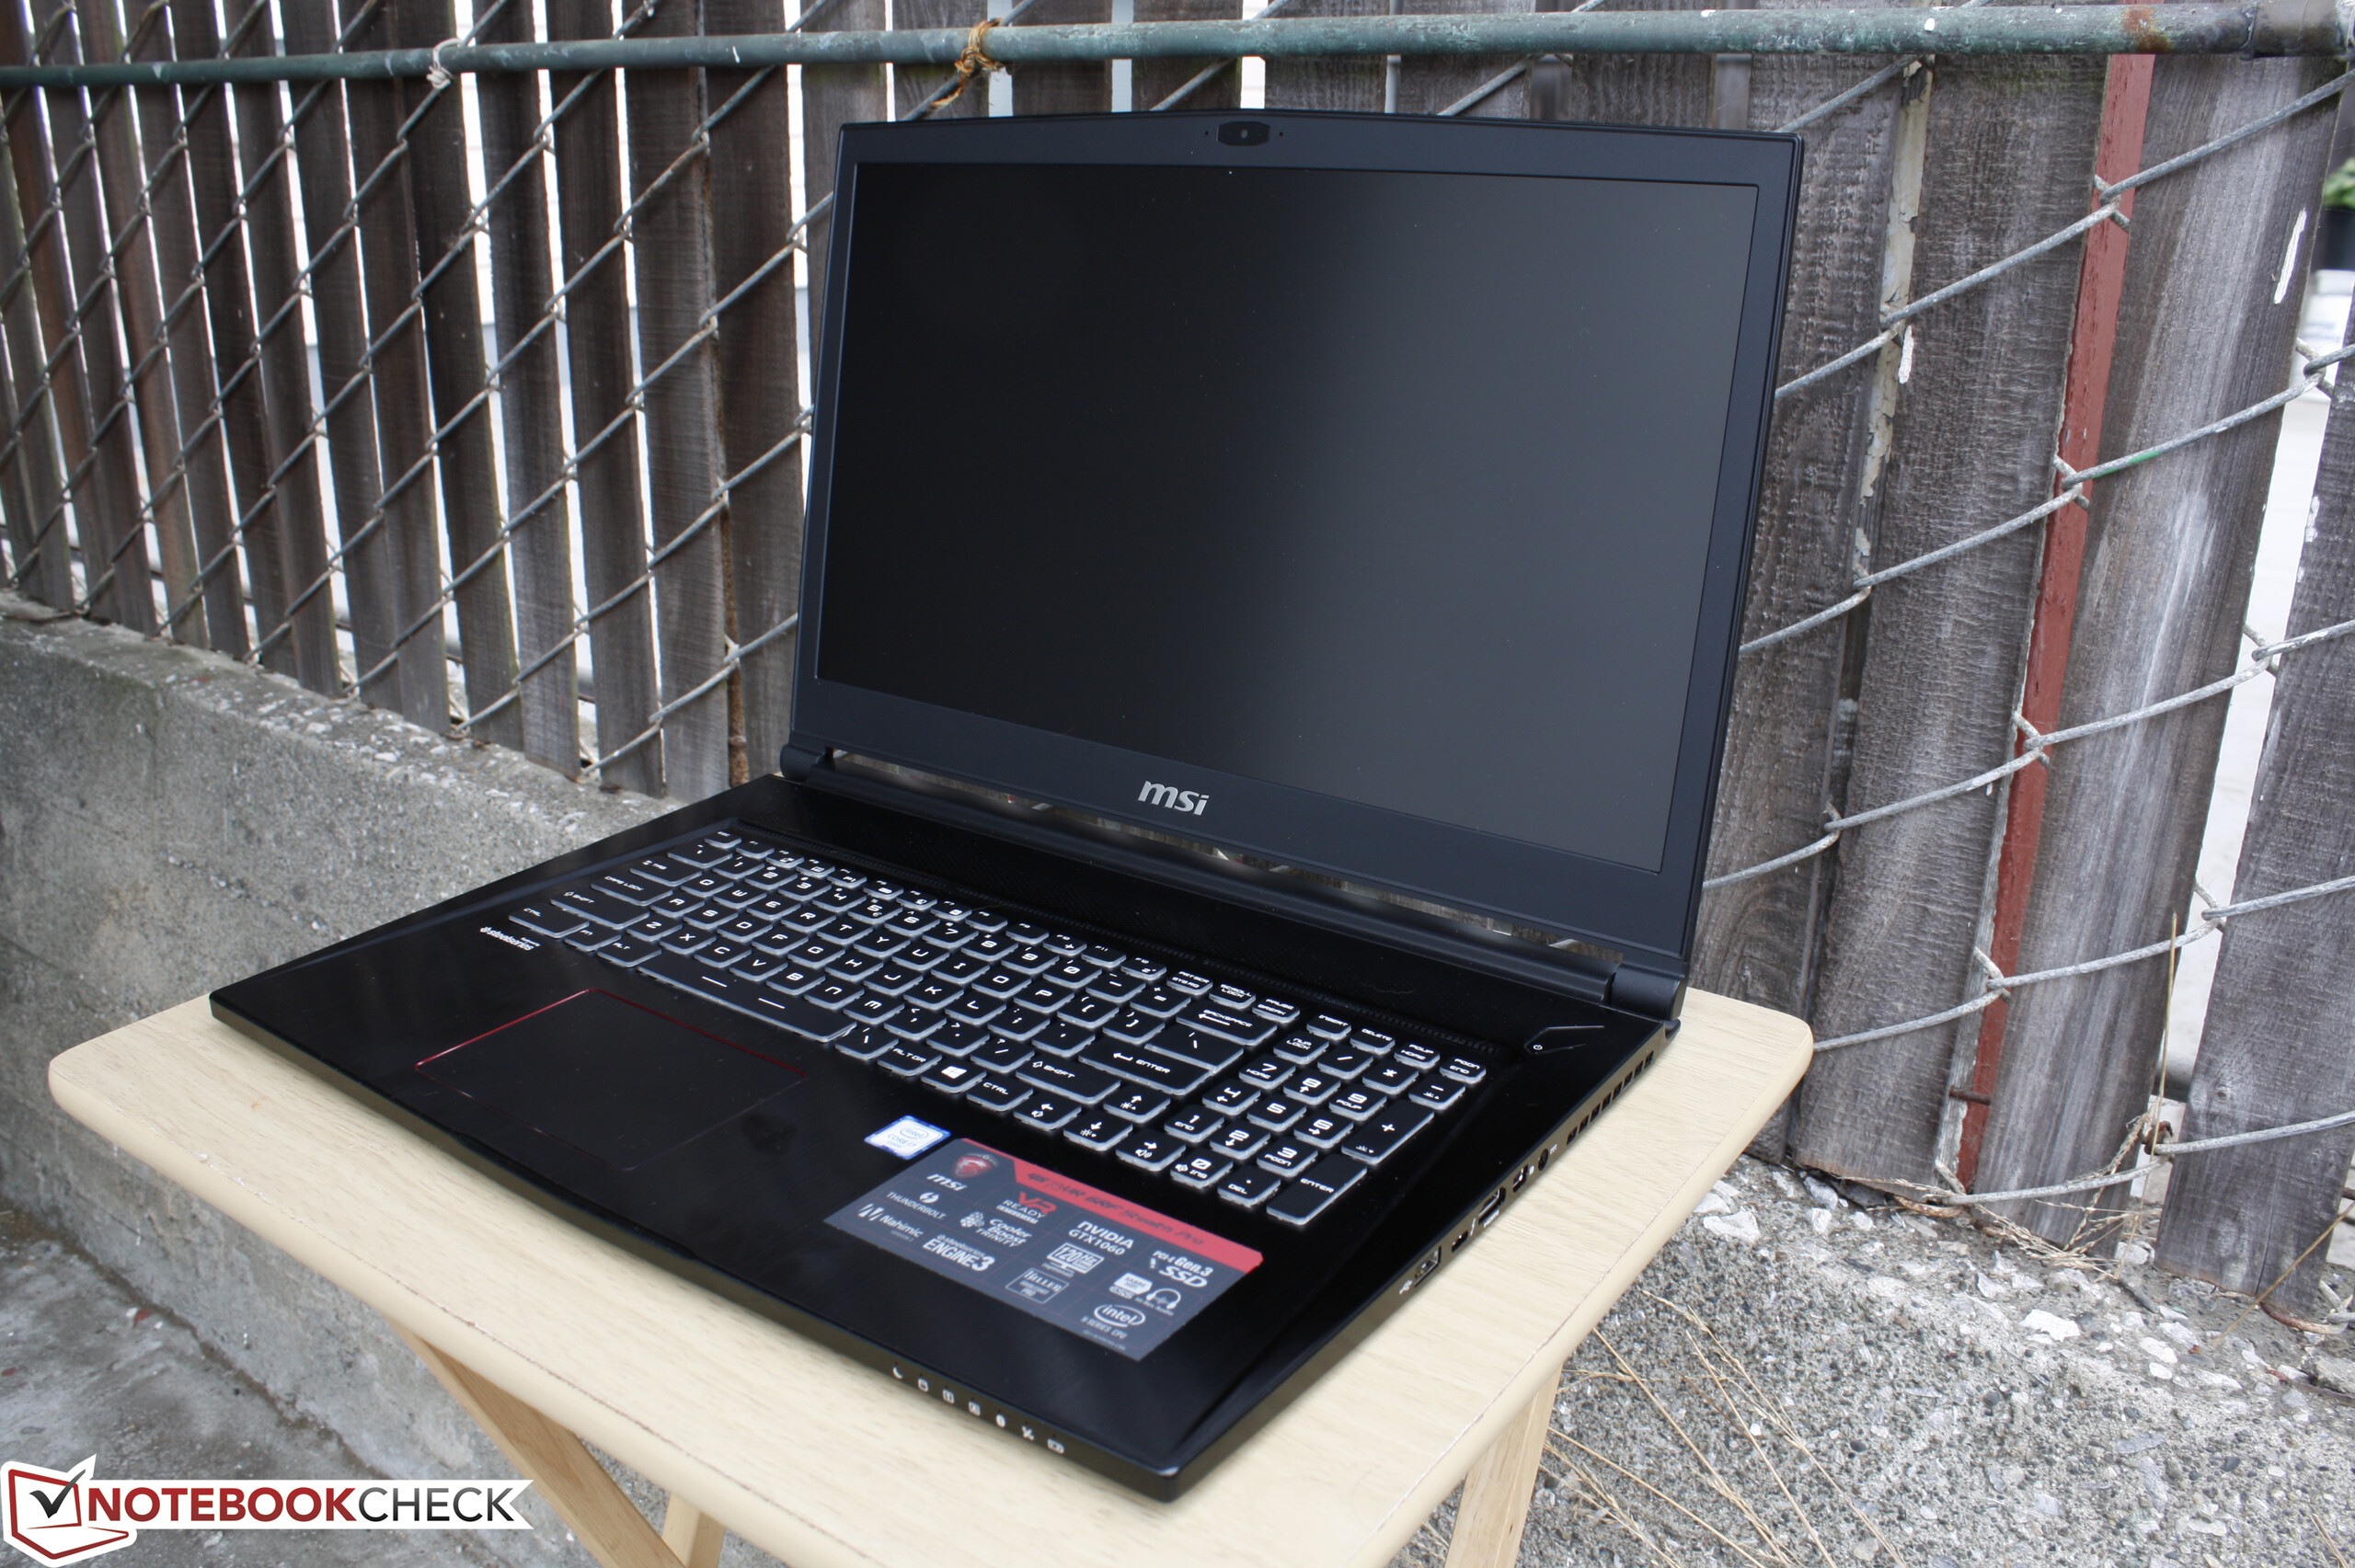
As for size and weight, the MSI refresh is surprisingly light for a 17.3-inch notebook at just 2.4 kg or about 300 g lighter than the outgoing GS70. Margins and bezels are smaller as well, so its footprint and overall dimensions are noticeably more compact. Combine this with its <20 mm thickness and you have one of the most portable gaming notebooks around in its size category.
Connectivity
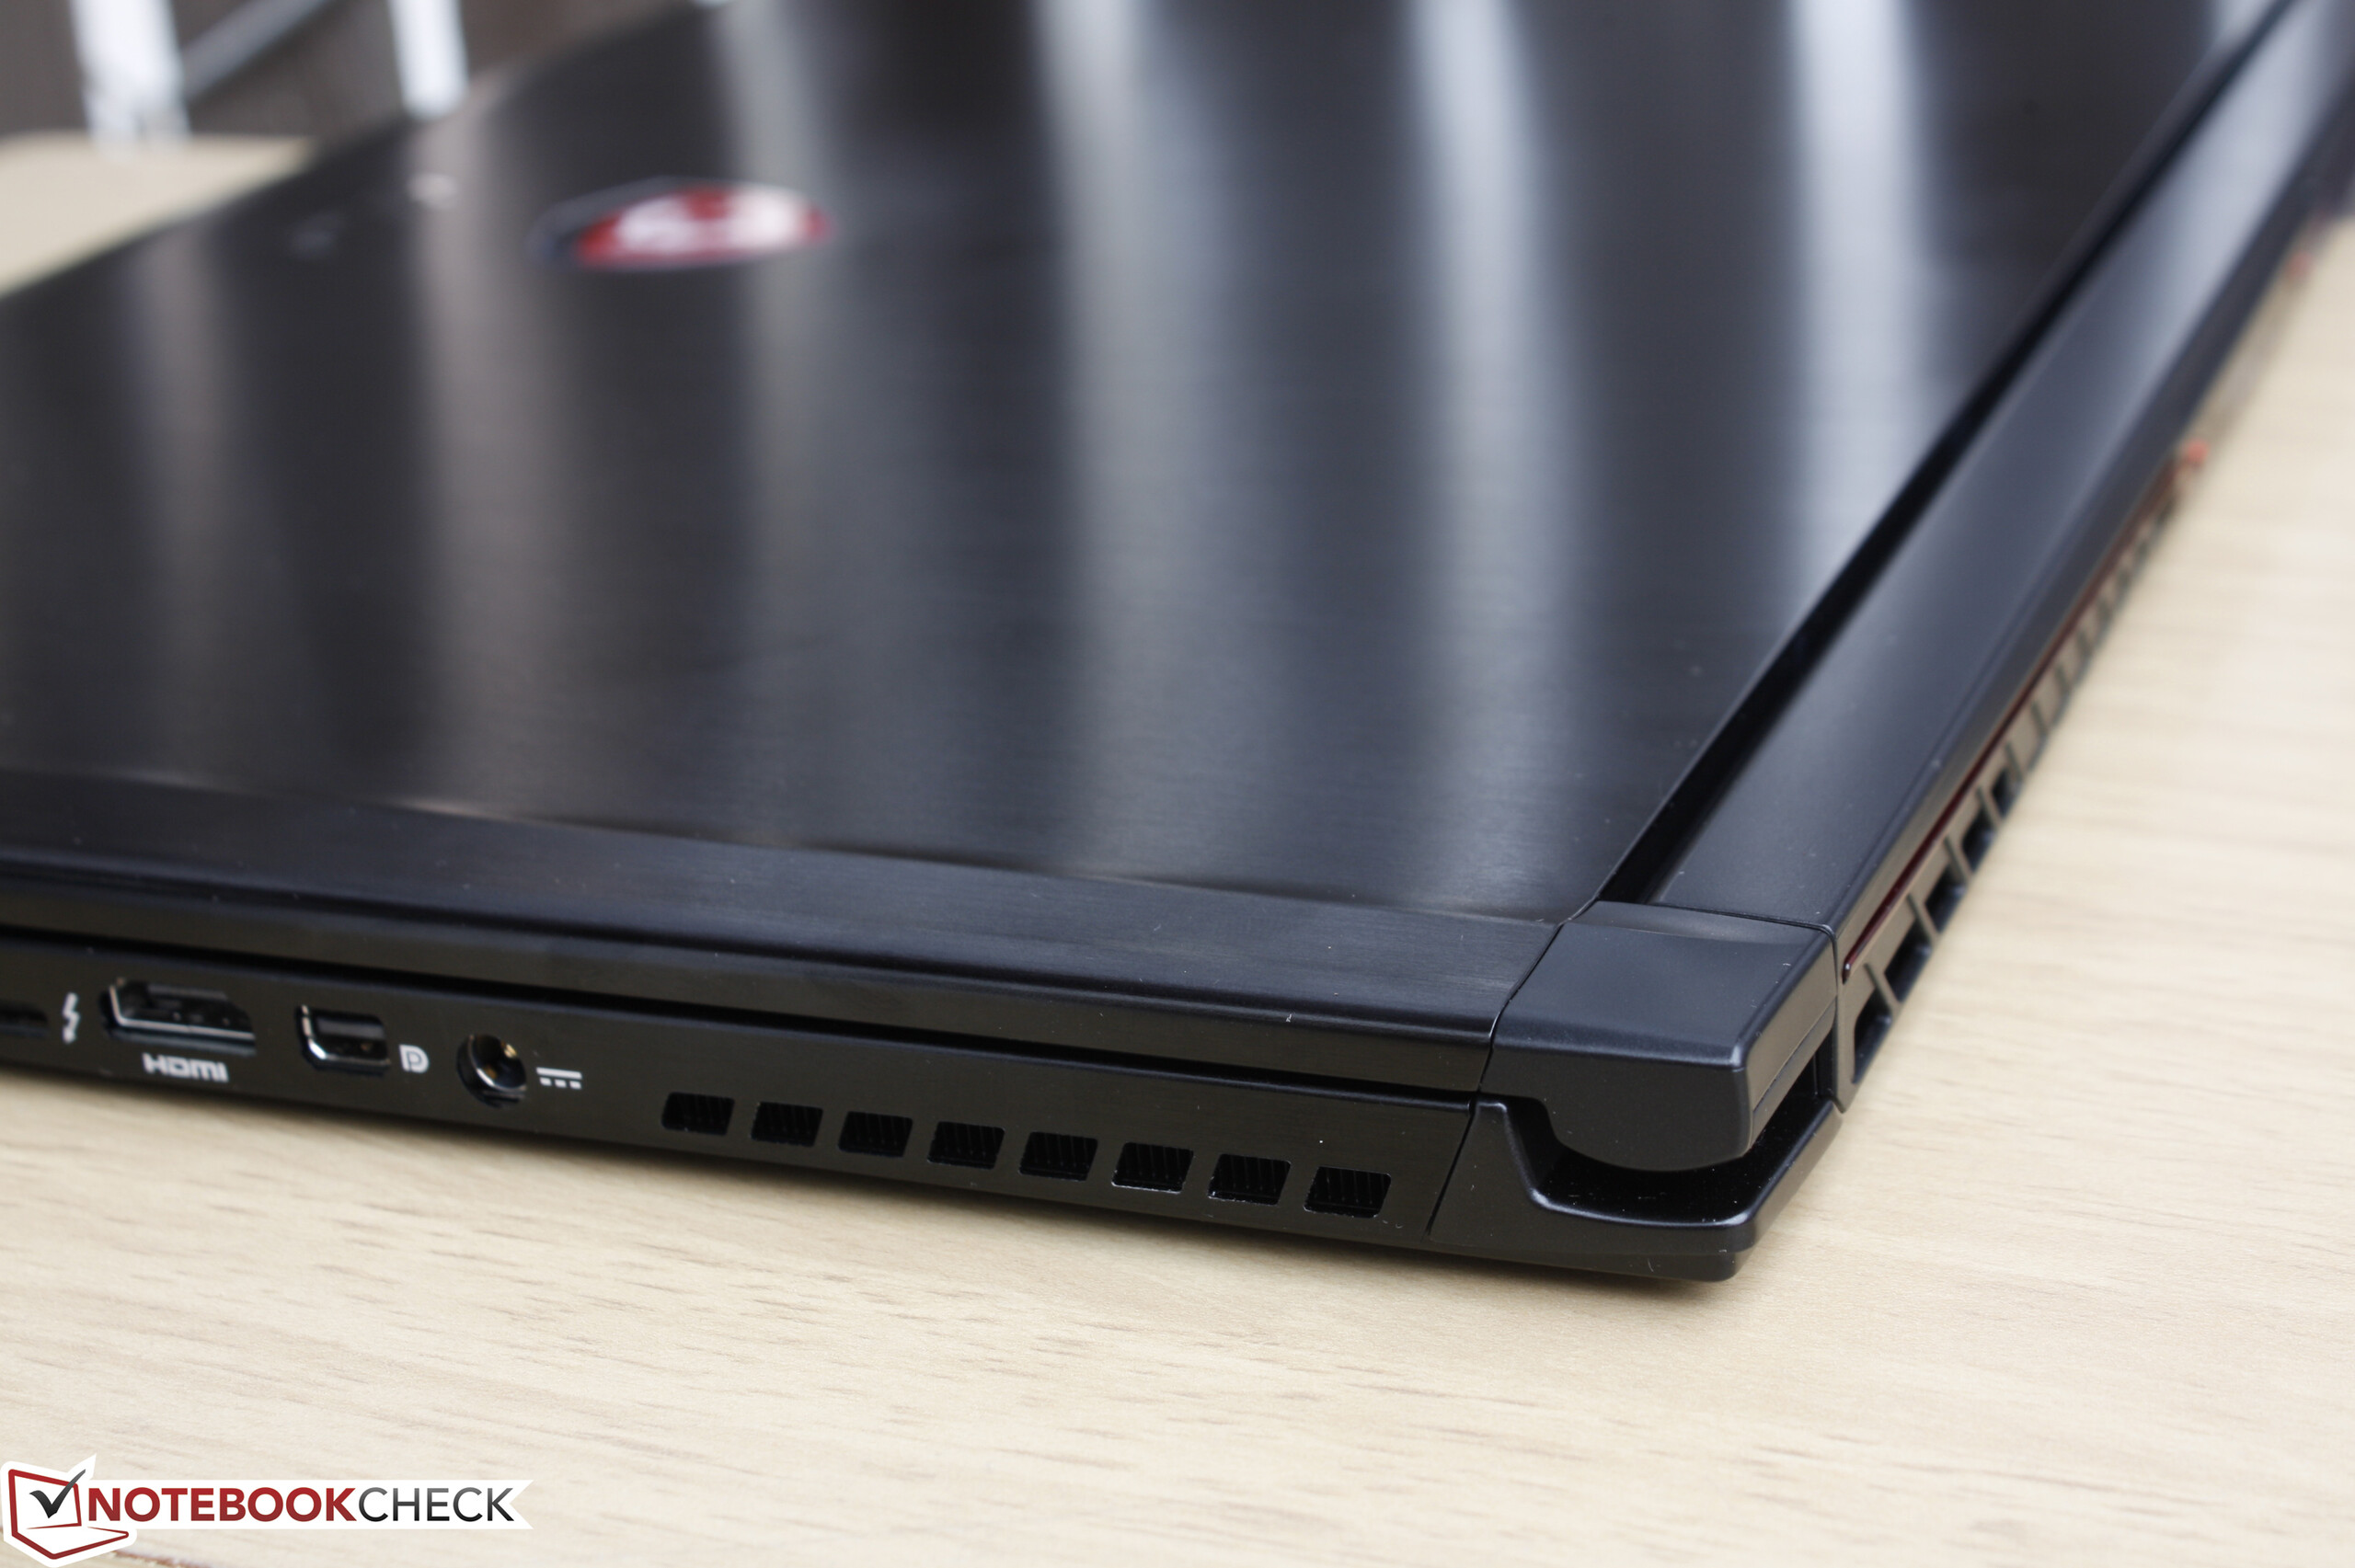
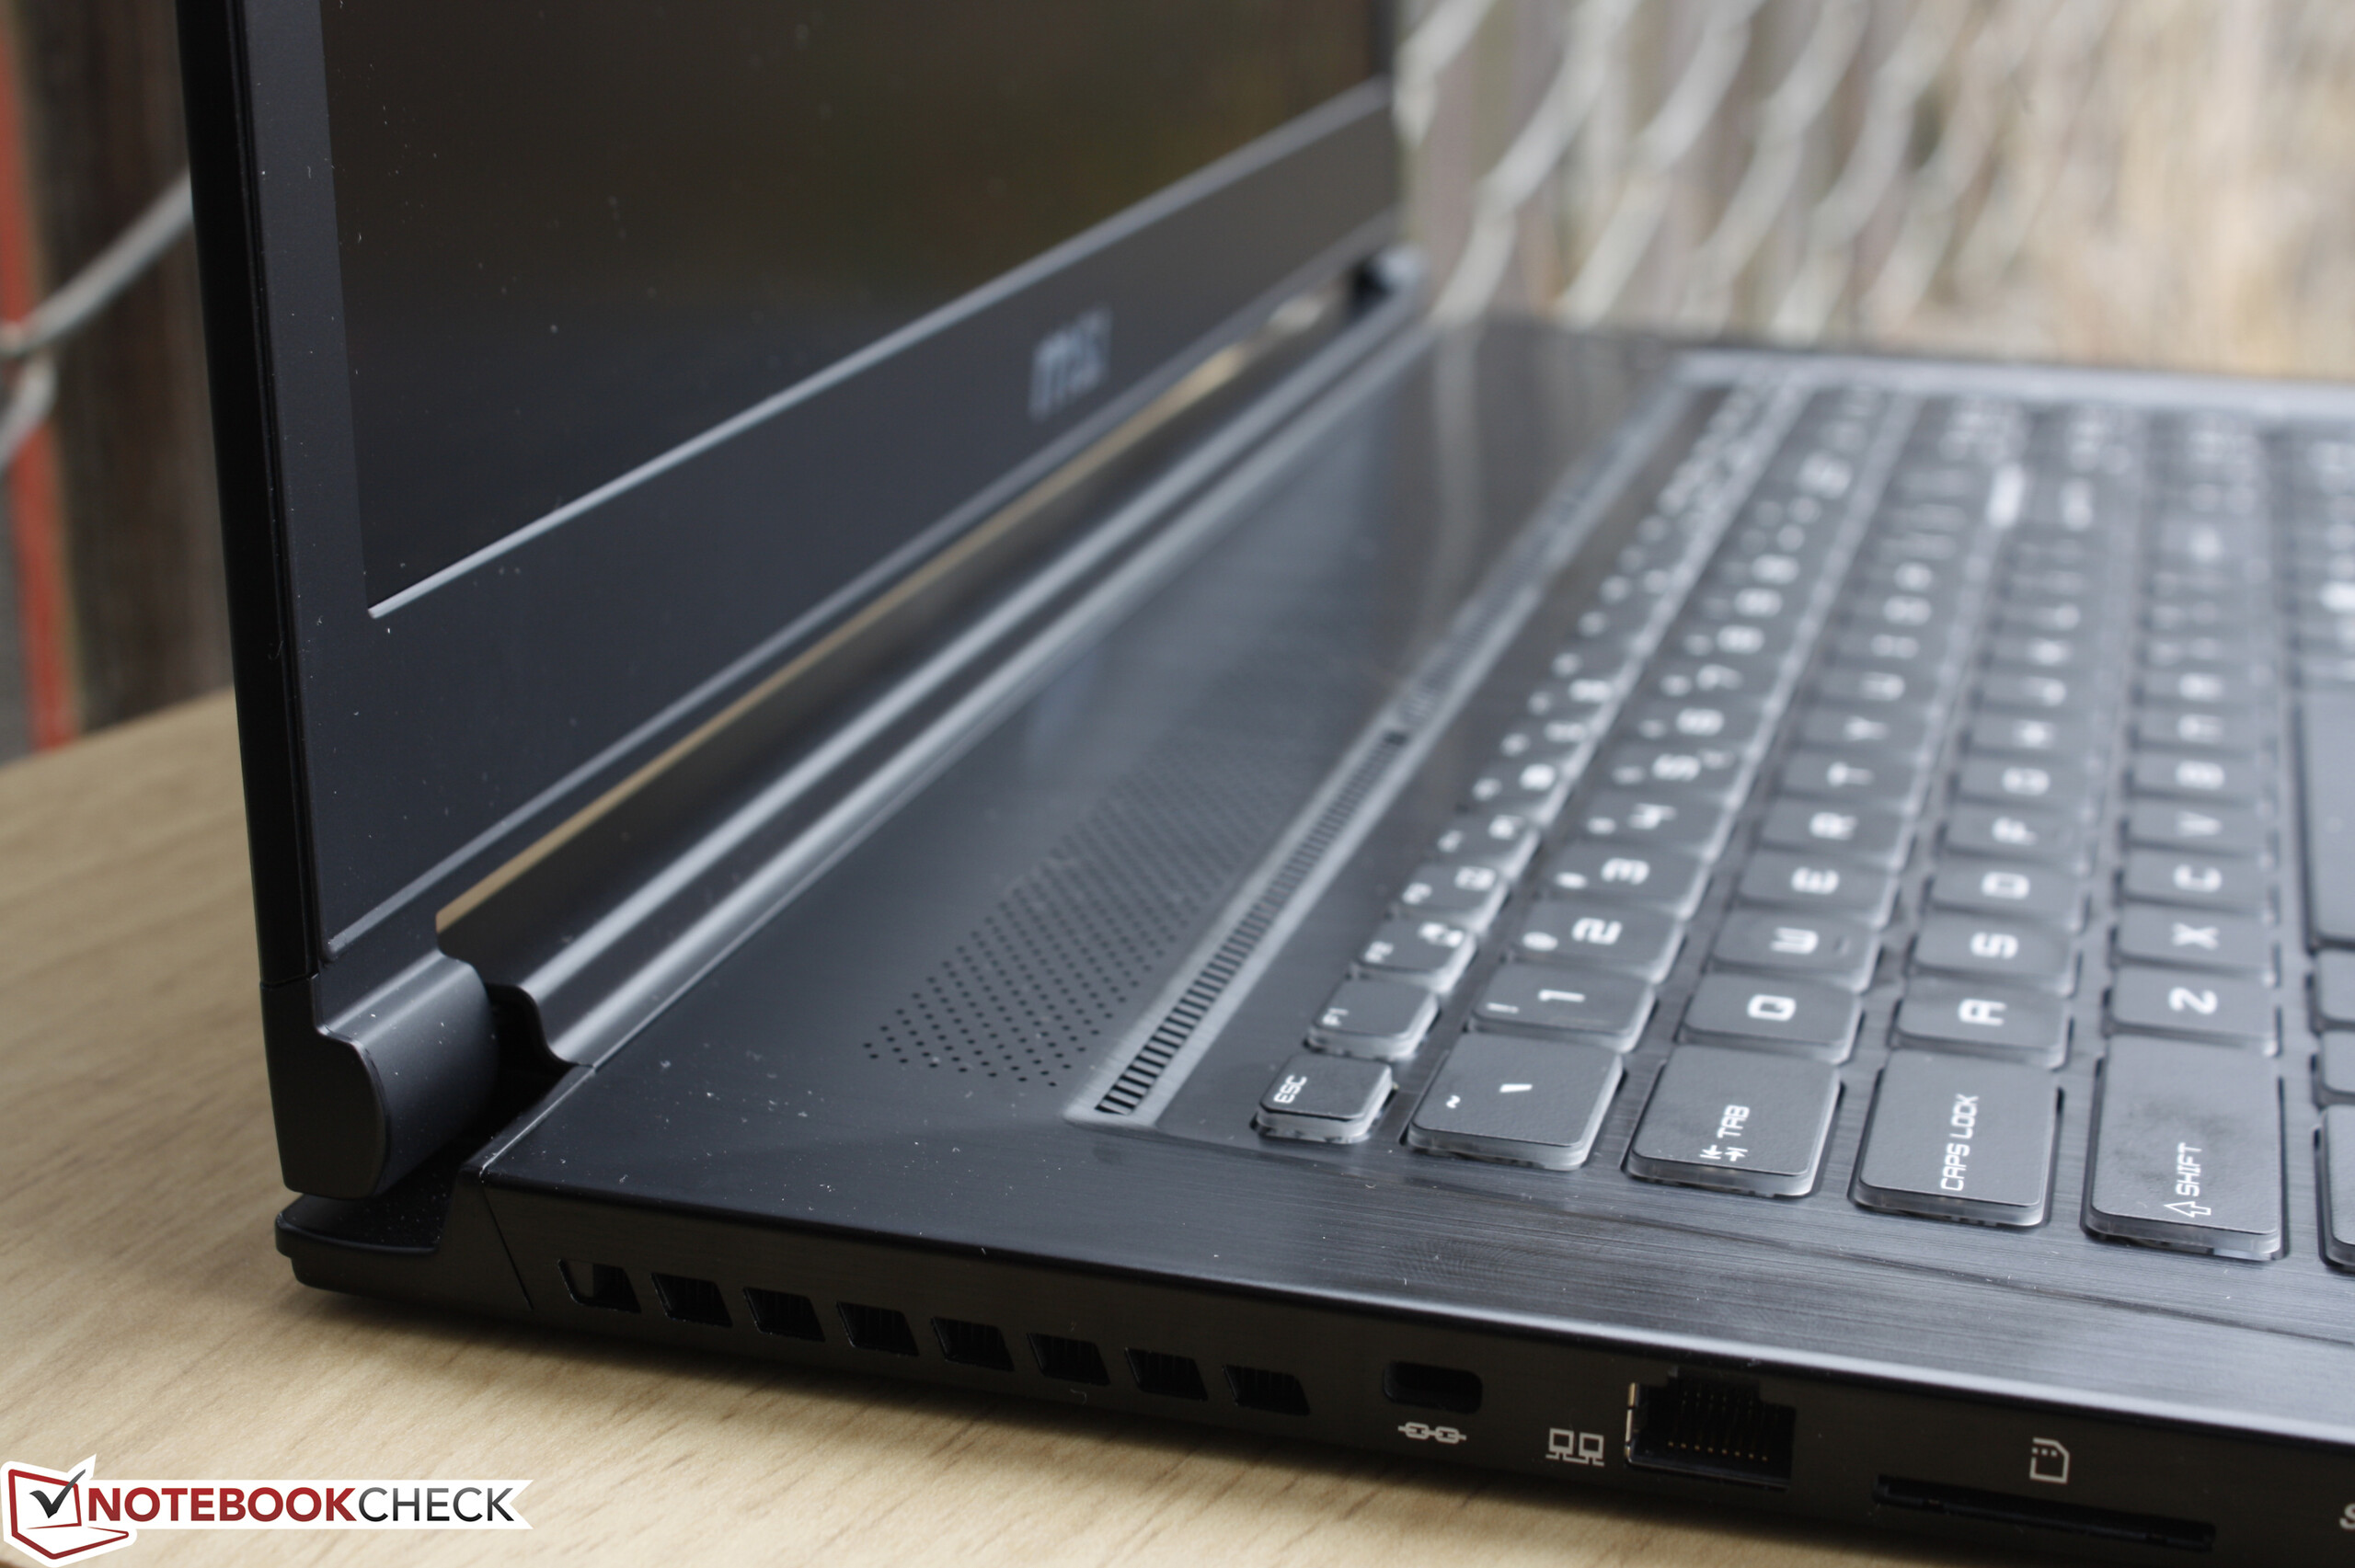
All core interfaces are available and easy to reach on the side edges including the versatile Thunderbolt 3 port. The placement of these ports is a bit too close to the front due to the ventilation grilles and limited surface area available, so thicker cables are more likely to take up valuable desk space. It's also worth noting that the GS73VR has dropped one mDP port (in favor of a USB Type-C/mDP 1.2 combo) and the line-in port from the GS70 and does not include VGA options as found on competing Gigabyte and Aorus units.


SD Card Reader
The SDXC card reader is extraordinarily slow compared to other gaming and multimedia notebooks. AS SSD records a sequential read rate of just over 27 MB/s compared to nearly 200 MB/s on the GT72VR and XPS 13 9350 with our Toshiba Exceria Pro SDXC 64 GB UHS-II test card. Transferring 1 GB of photos from our SD card to desktop takes about 43 seconds.
MSI has since confirmed with us that the card reader in the GS73VR is limited to USB 2.0 speeds.
| SD Card Reader | |
| average JPG Copy Test (av. of 3 runs) | |
| MSI GT72VR 6RE-015US | |
| Dell XPS 13 2016 9350 (FHD, i7-6560U) | |
| Alienware 17 R3 (A17-9935) | |
| MSI GS73VR 6RF | |
| maximum AS SSD Seq Read Test (1GB) | |
| Dell XPS 13 2016 9350 (FHD, i7-6560U) | |
| MSI GT72VR 6RE-015US | |
| Alienware 17 R3 (A17-9935) | |
| MSI GS73VR 6RF | |
Communication
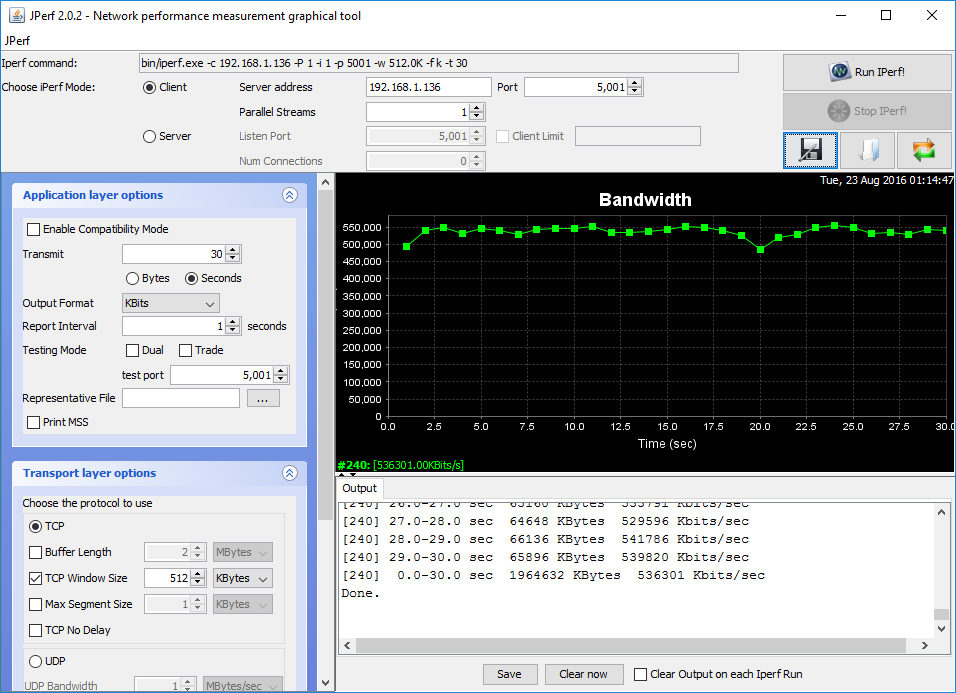
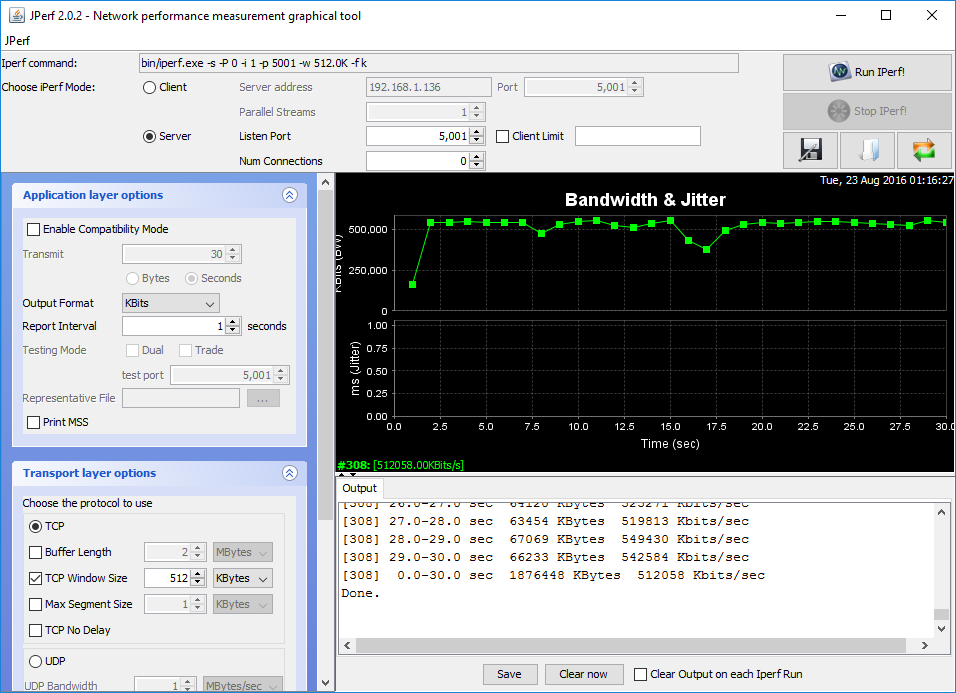
WLAN is provided by a Killer 1535 M.2 module capable of theoretical transfer rates of up to 867 Mbps. Other features include Bluetooth 4.1, MU-MIMO and DoubleShot Pro for utilizing both wireless and Gigabit RJ45 data streams simultaneously. Our Jperf tests with settings as shown below show a real-world transfer rate of about 536 mbps when standing one meter away from our Linksys EA8500 802.11ac test router.
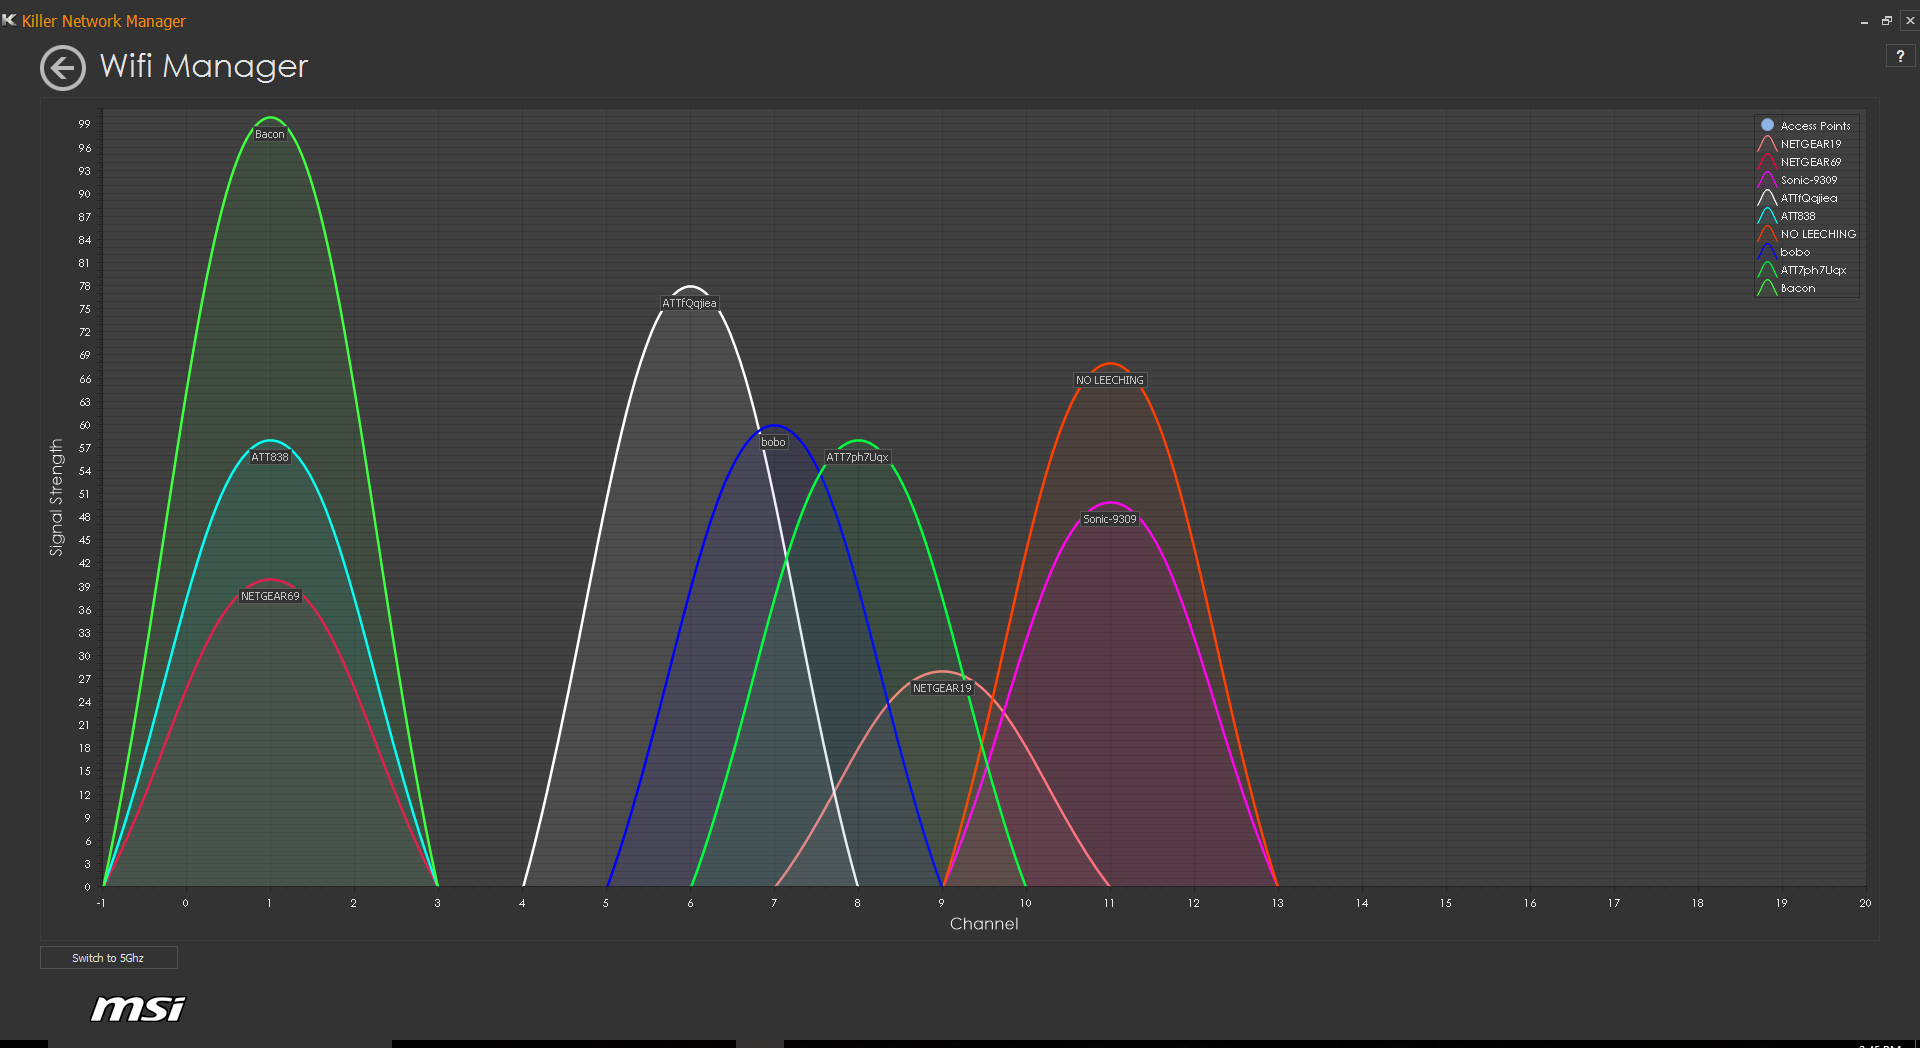
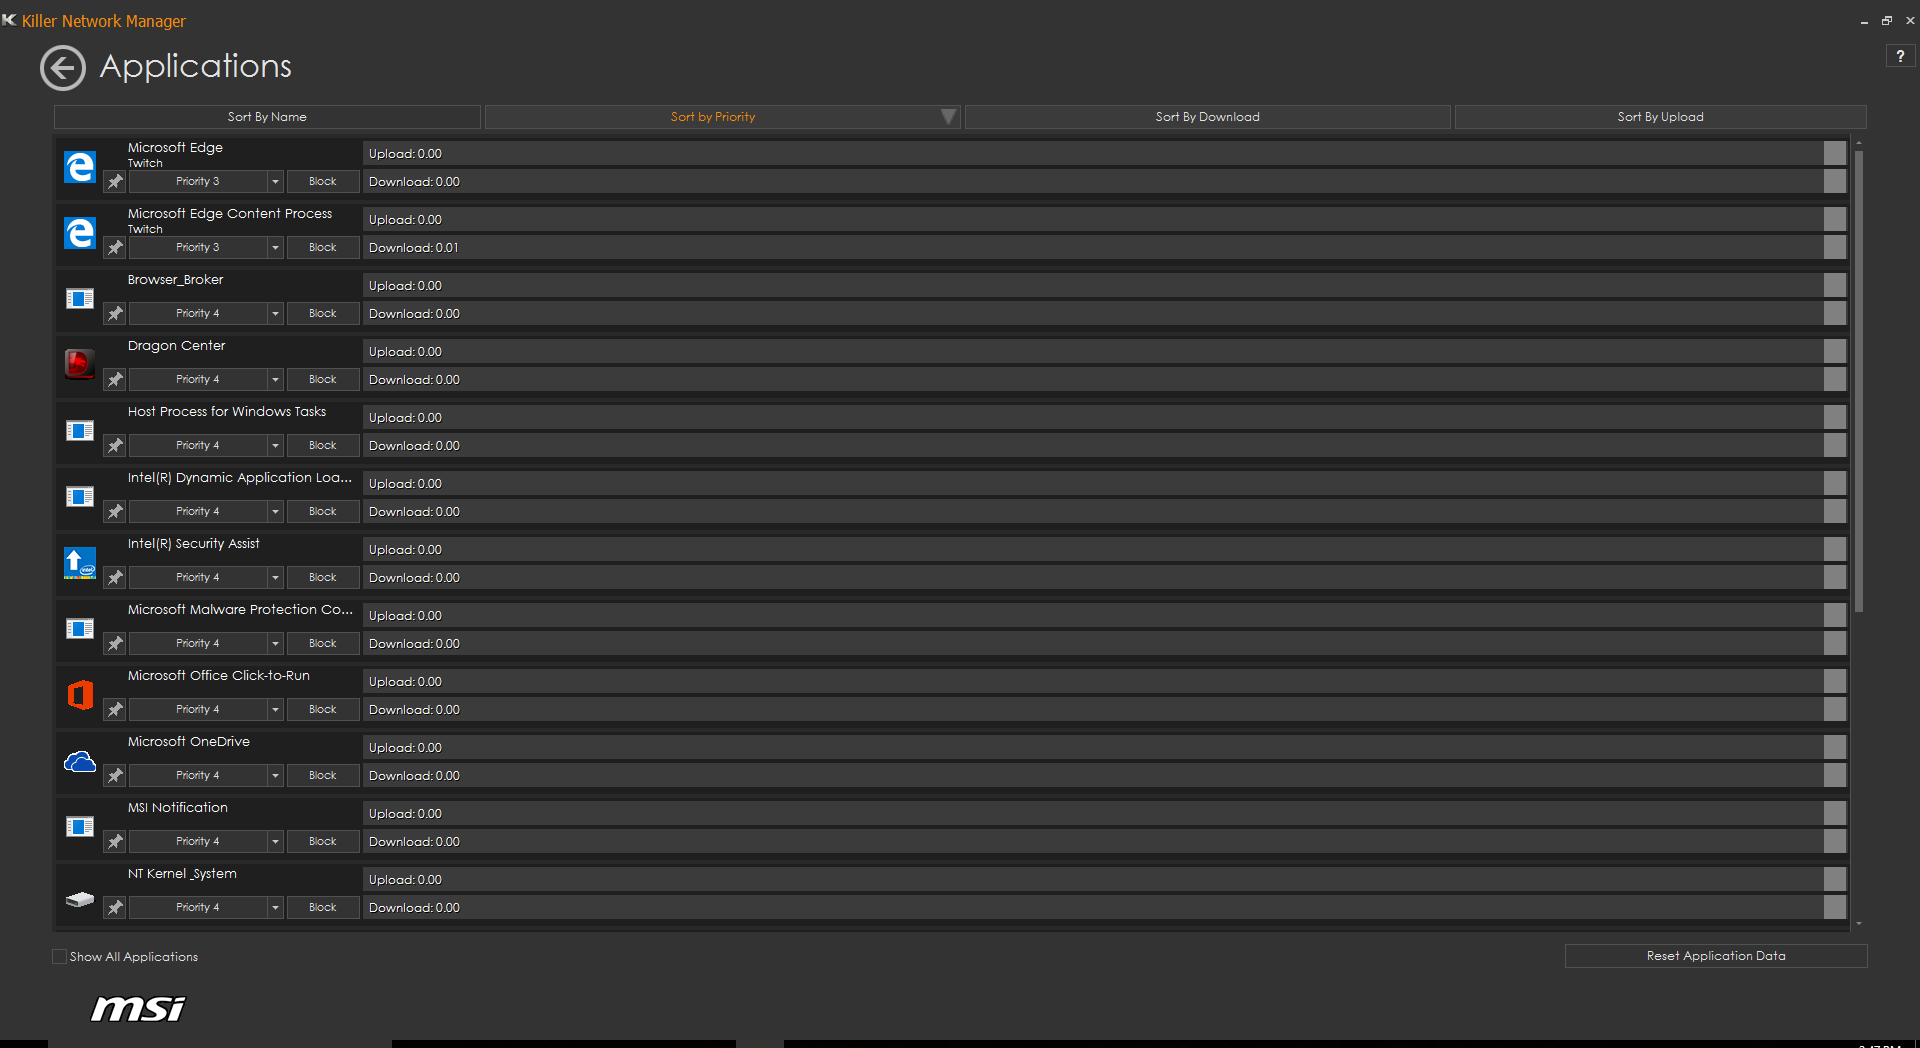
Also unique to systems with Killer WLAN cards is the Killer Network Manager for easy toggling of settings and application priorities. It's not particularly in-depth, but it's nonetheless a handy and easy-to-use tool for checking on wireless connectivity status.
| Networking | |
| iperf Server (receive) TCP 1 m | |
| Dell XPS 13 2016 9350 (FHD, i7-6560U) | |
| MSI GS73VR 6RF | |
| iperf Client (transmit) TCP 1 m | |
| MSI GS73VR 6RF | |
| Dell XPS 13 2016 9350 (FHD, i7-6560U) | |
Accessories
Included extras are light with a simple cleaning cloth, Quick Start guide, and warranty card. MSI offers G Series branded accessories as well and we recommend taking advantage of the Thunderbolt 3 port for docking stations and extra functionality.
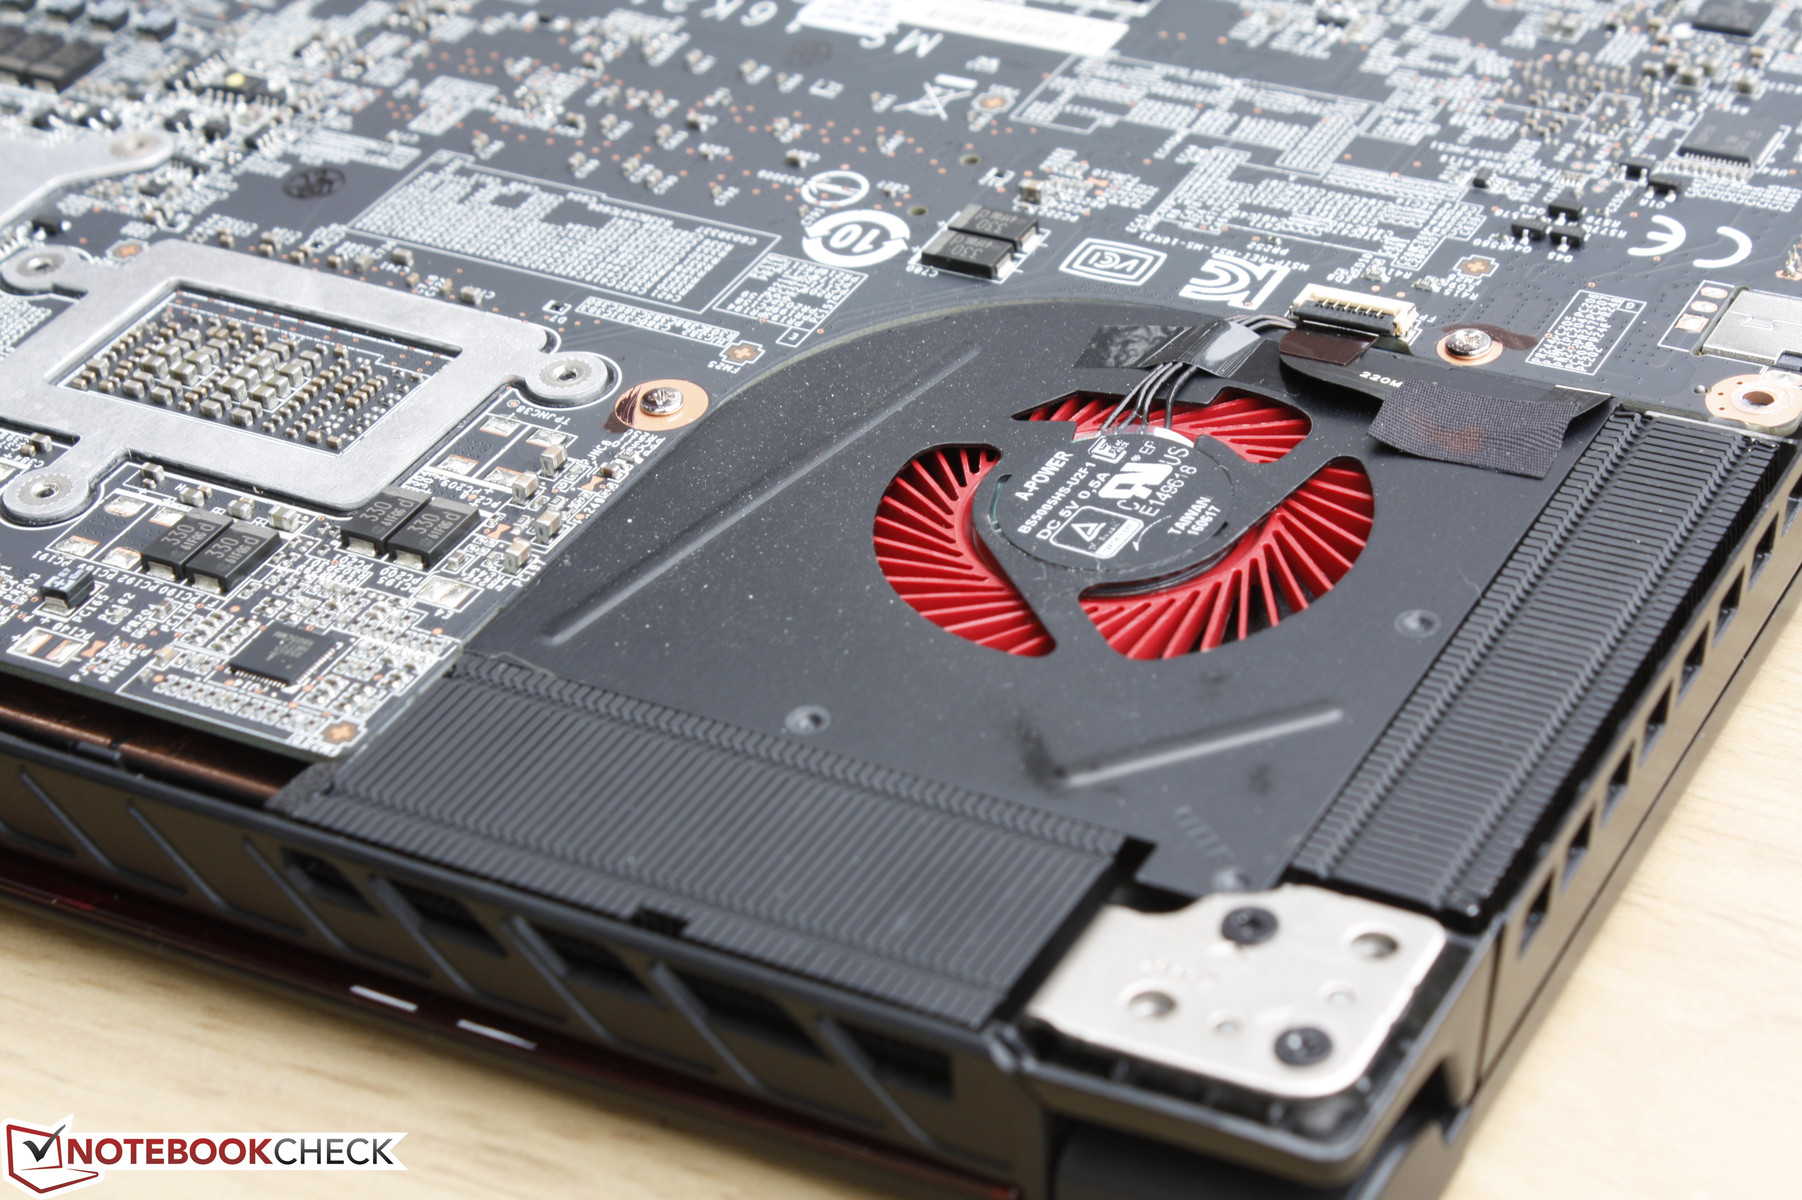
Maintenance
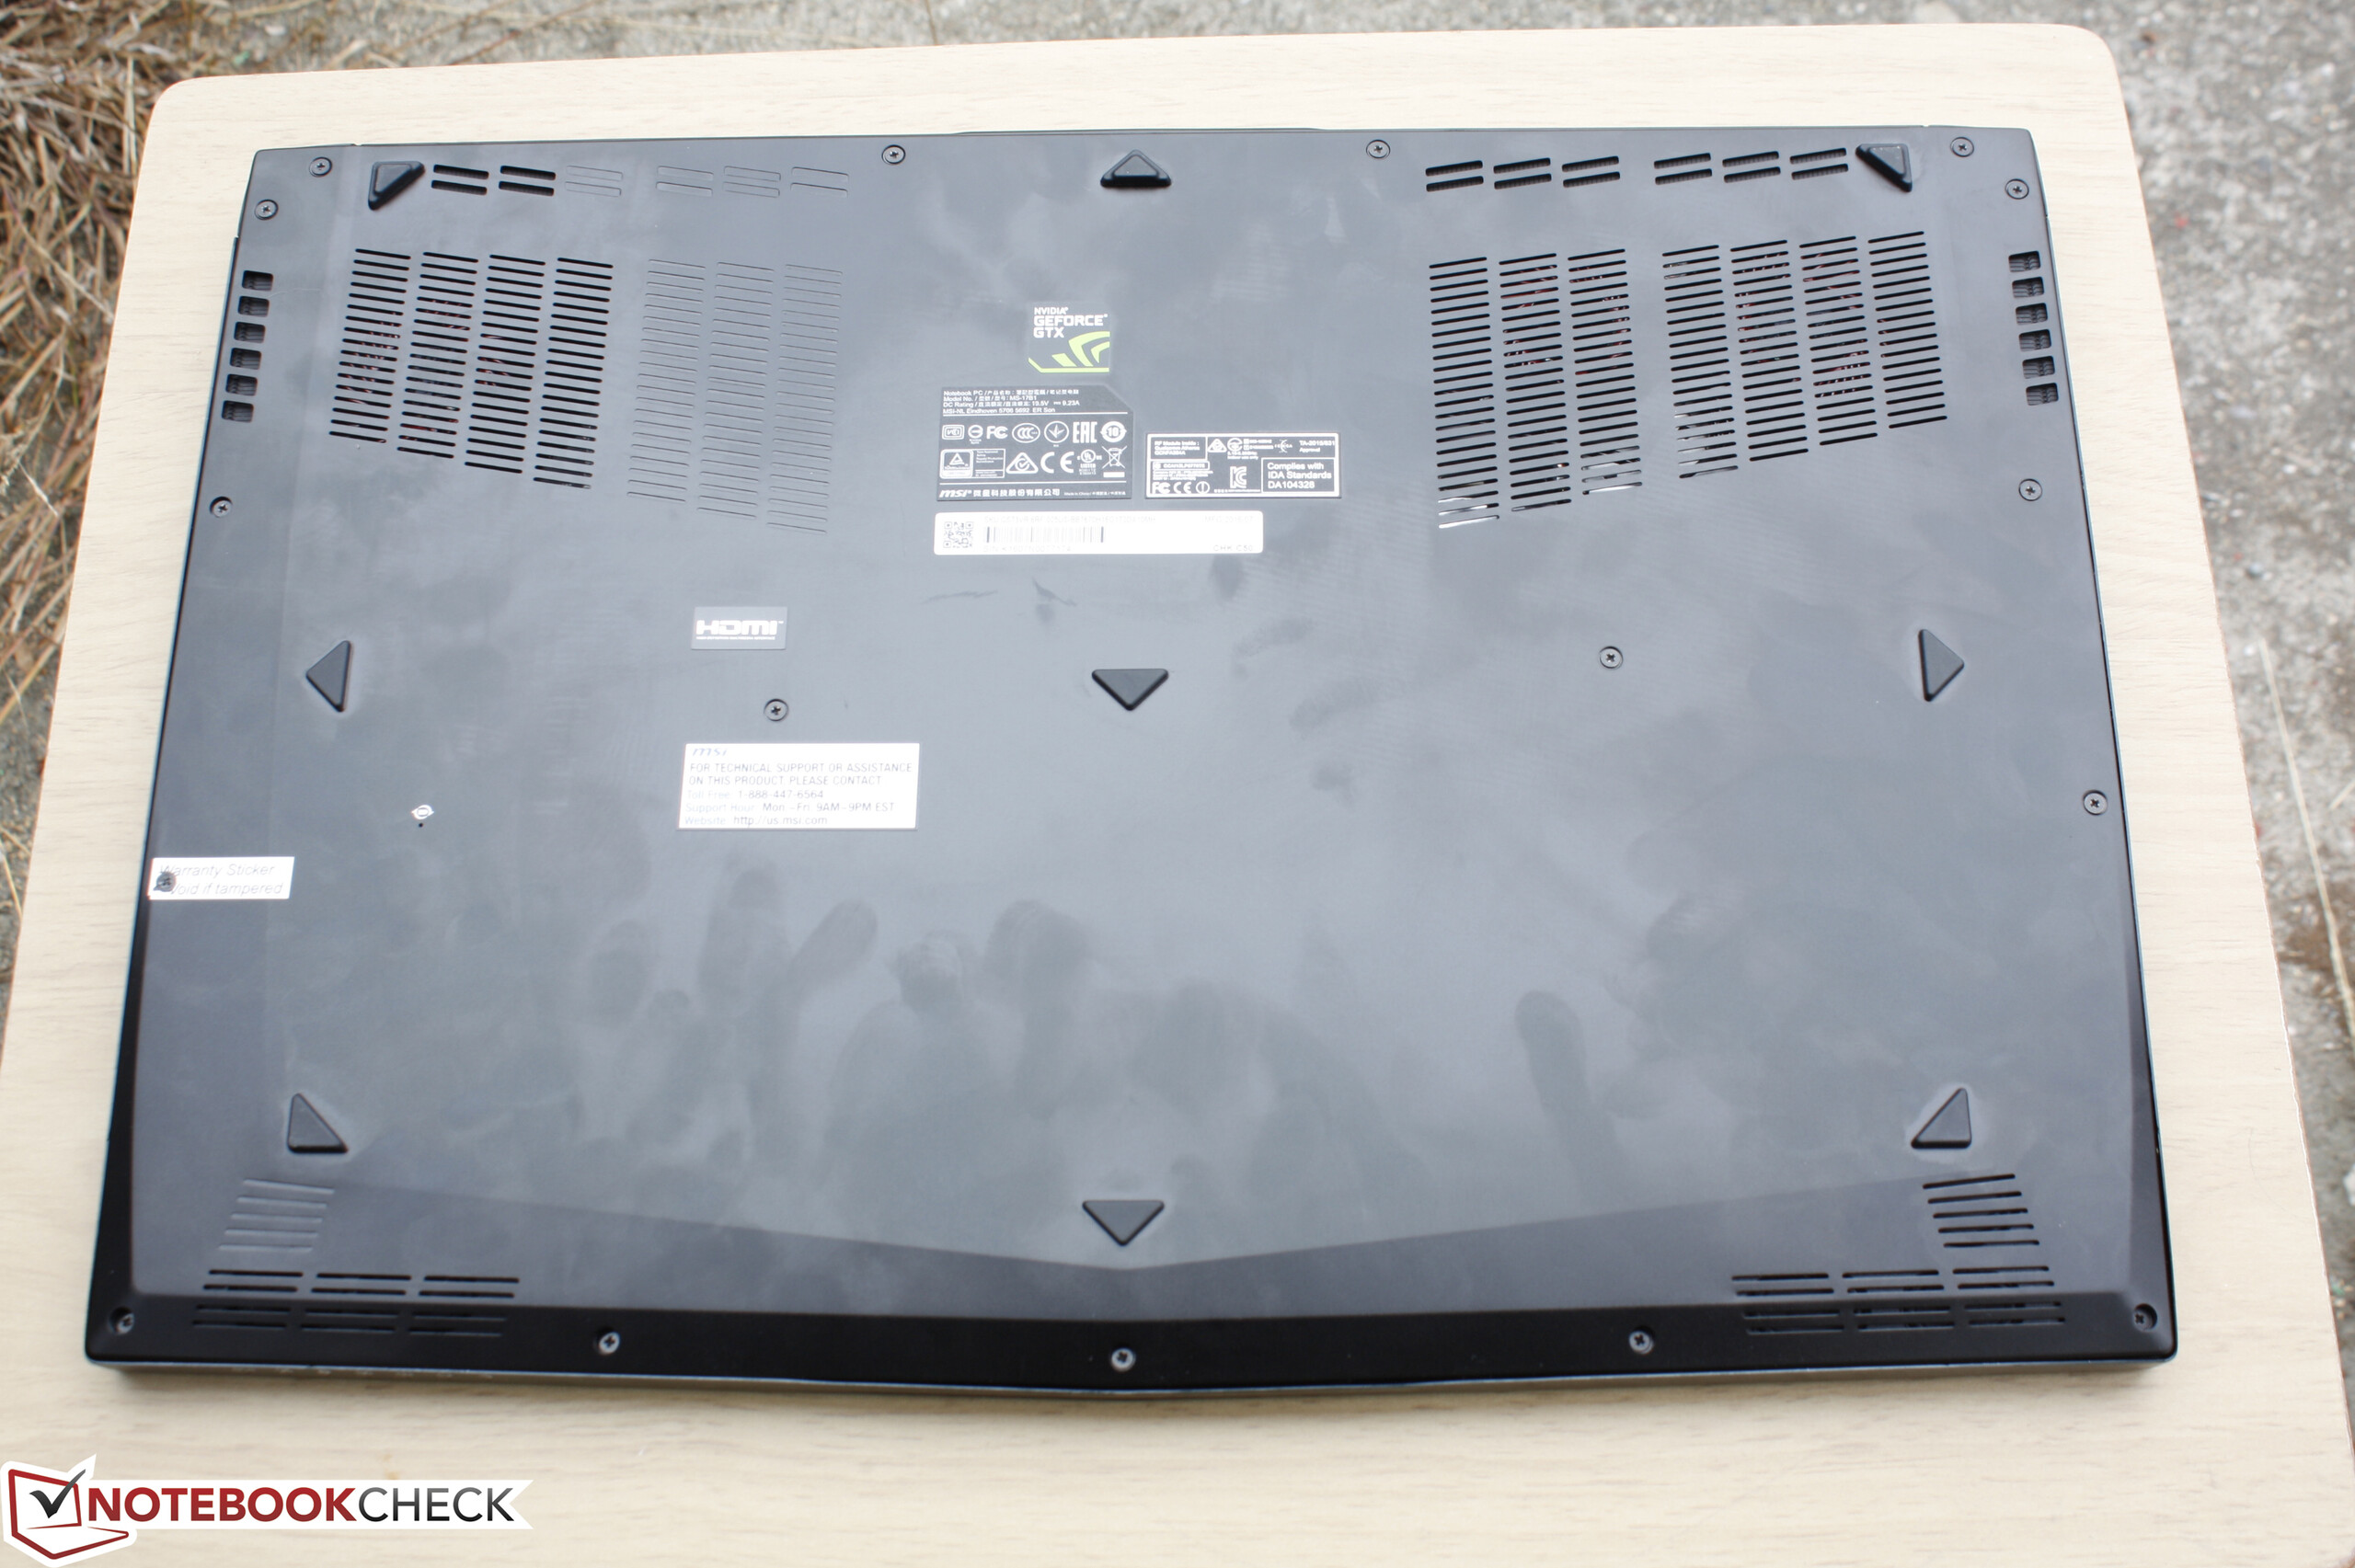
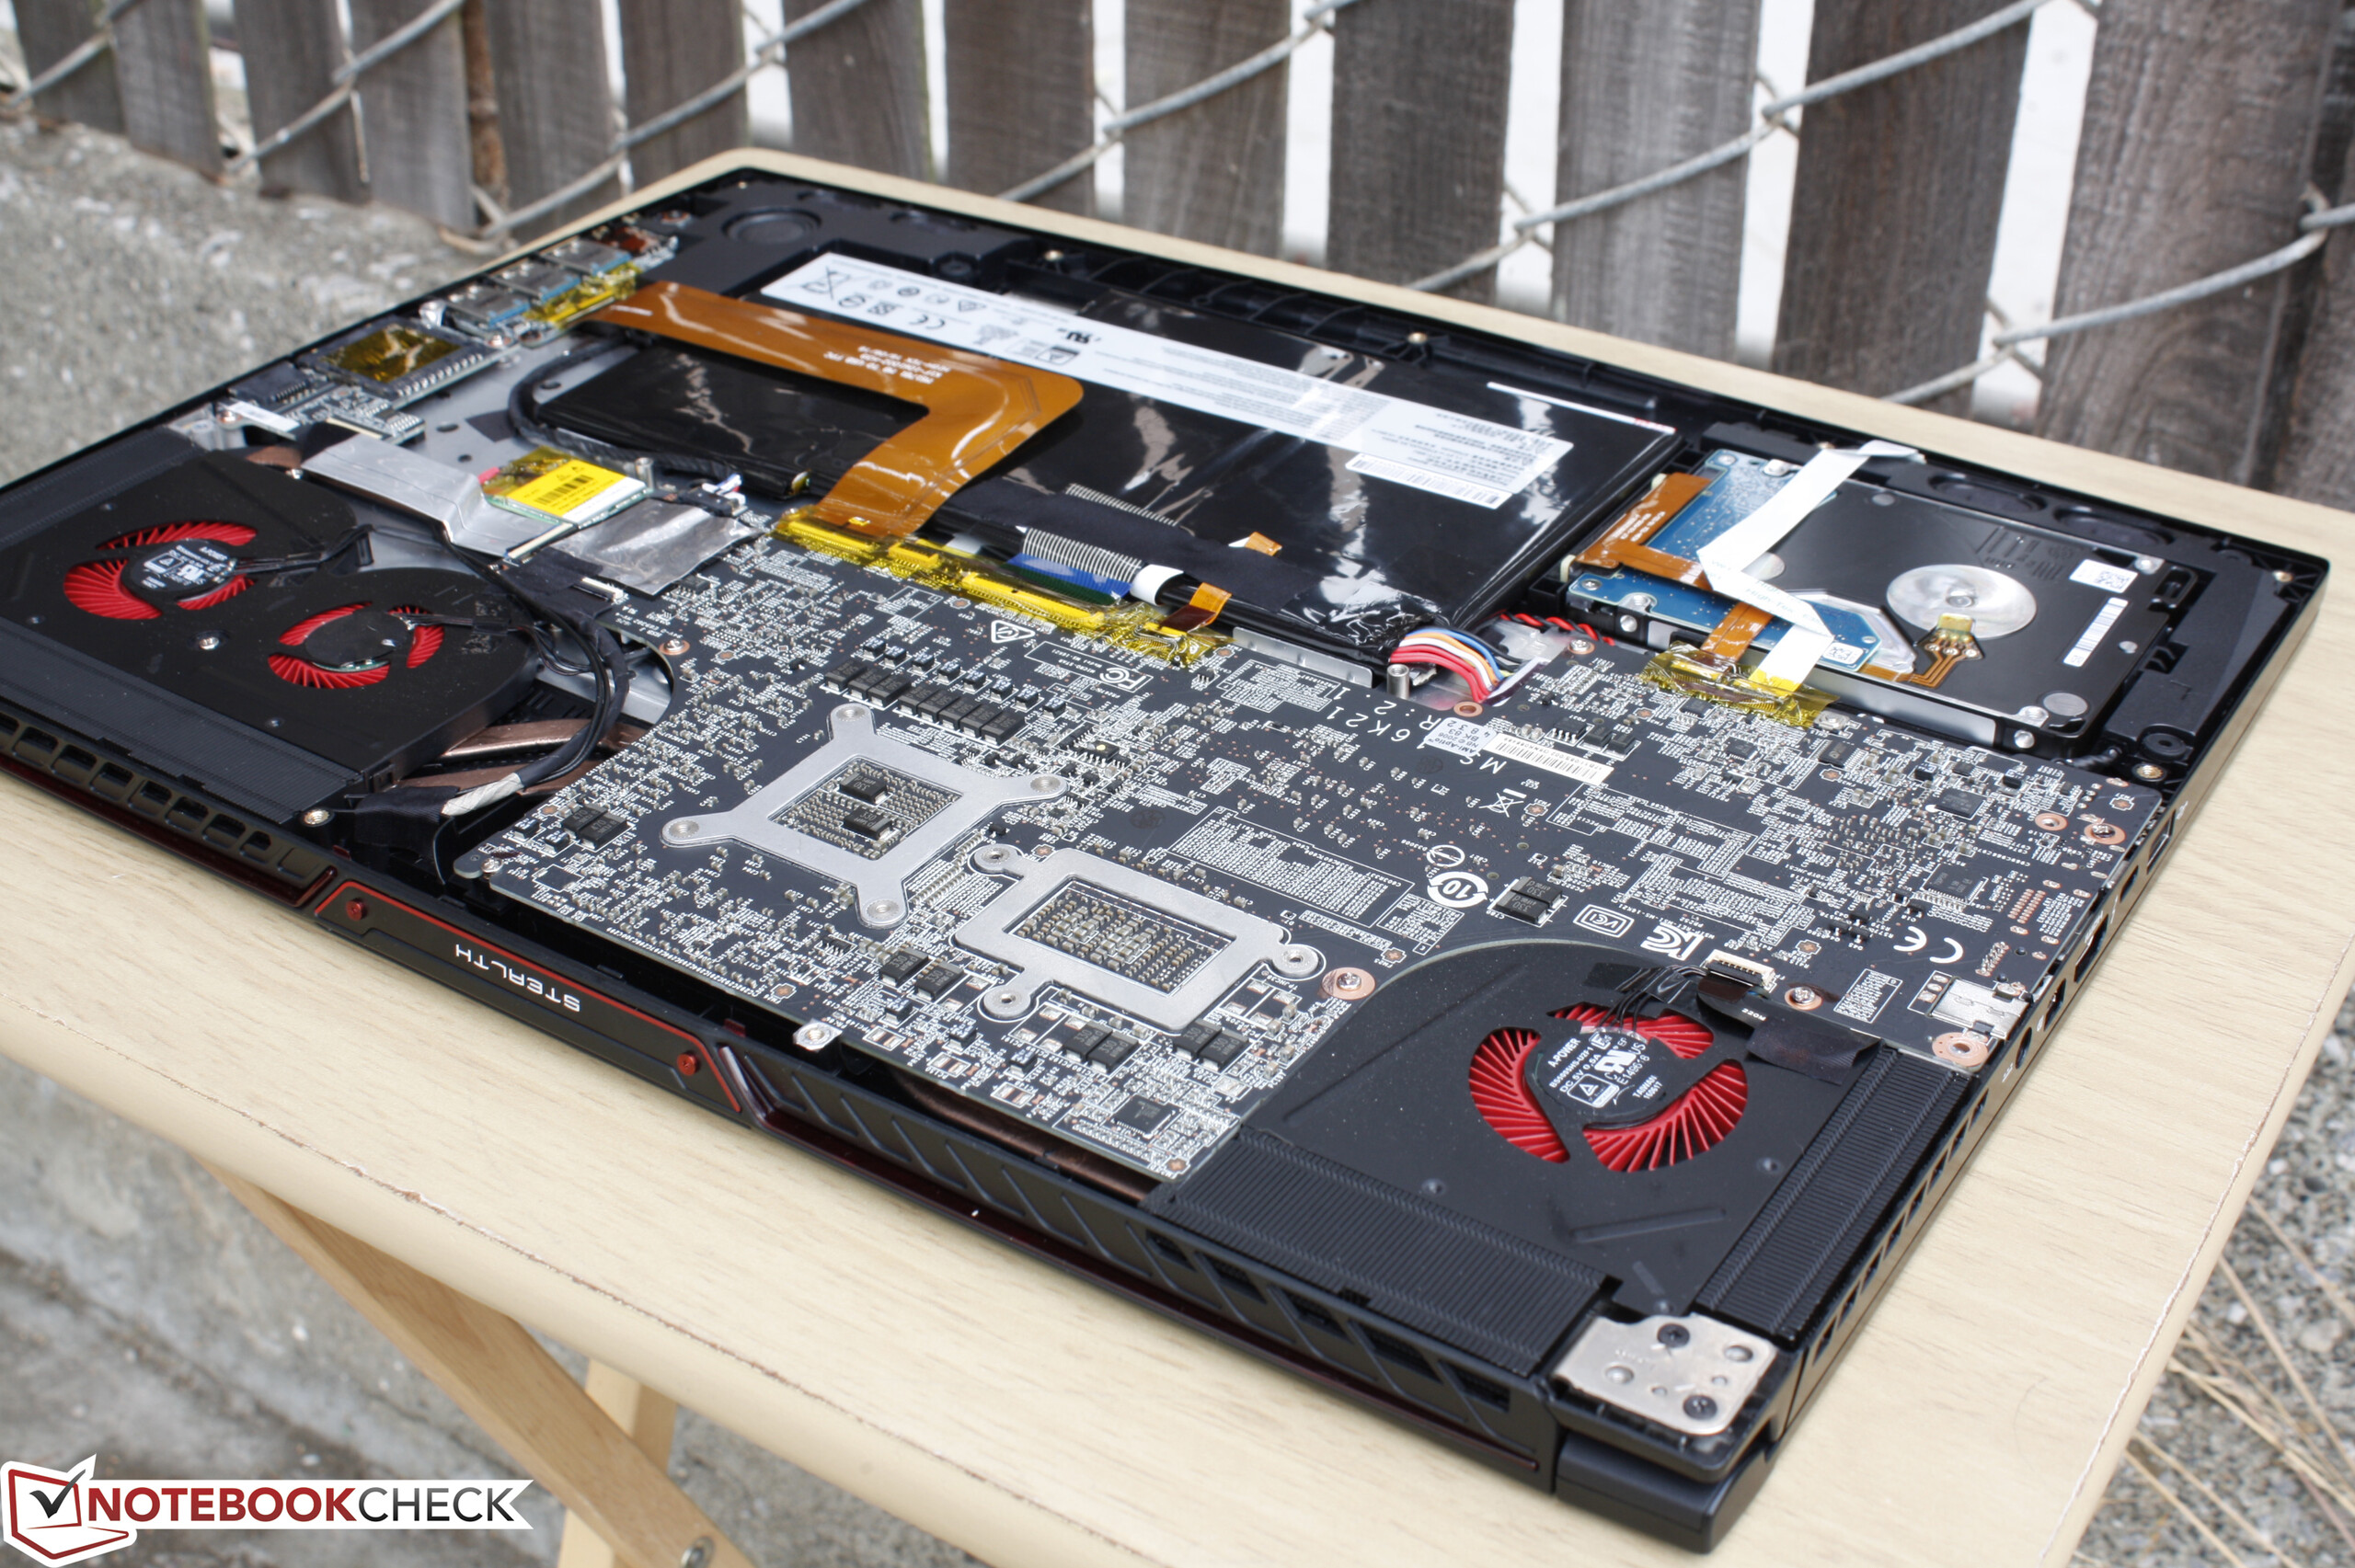
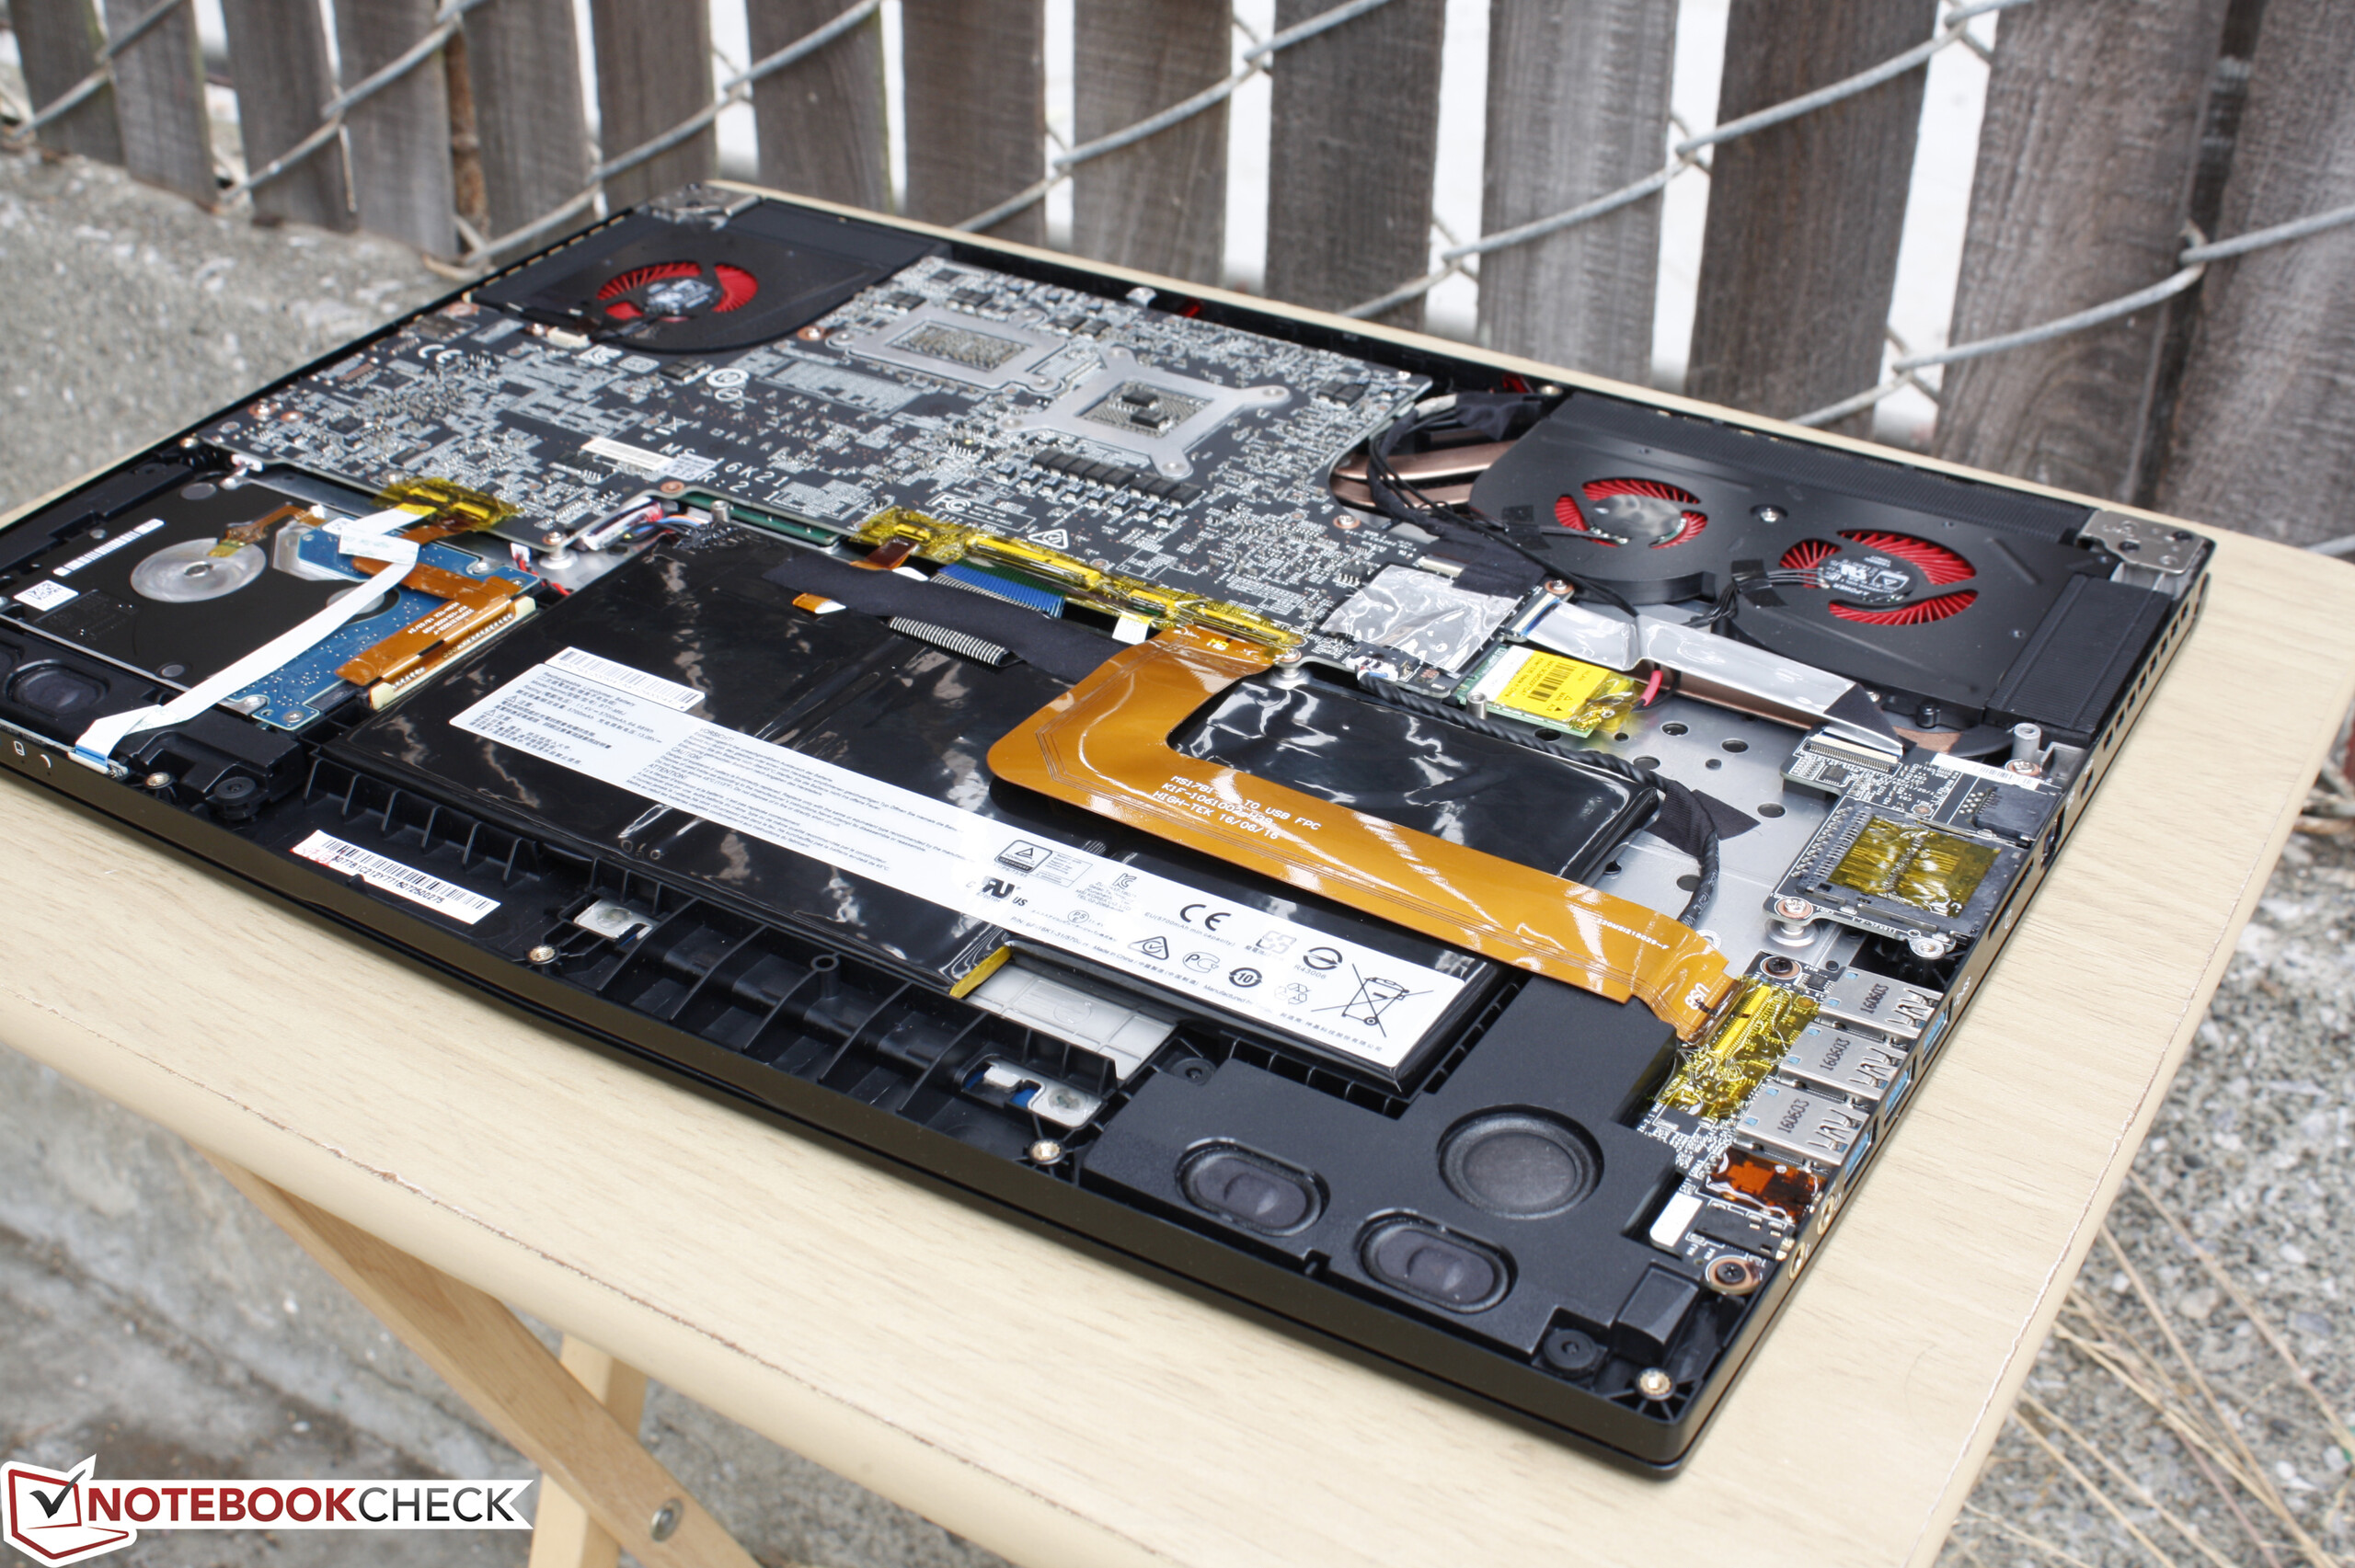
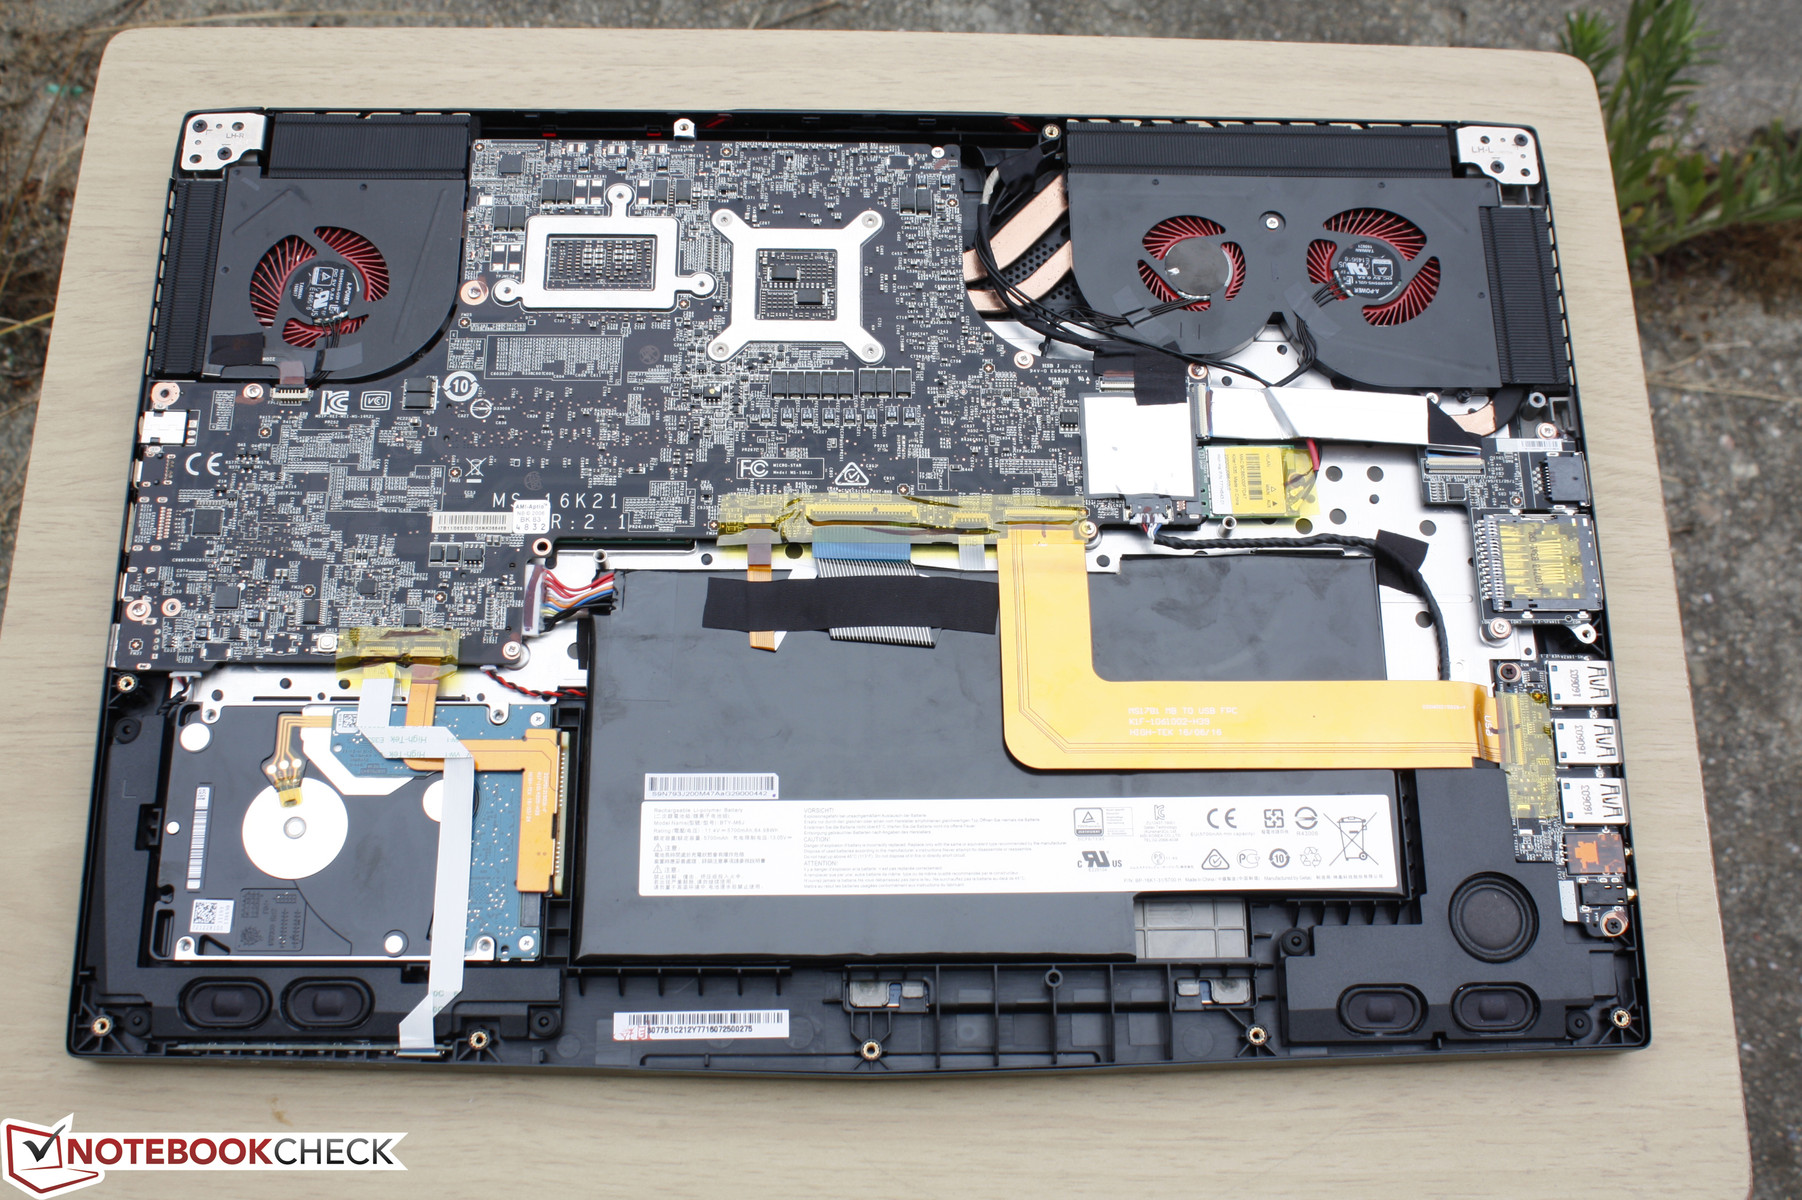
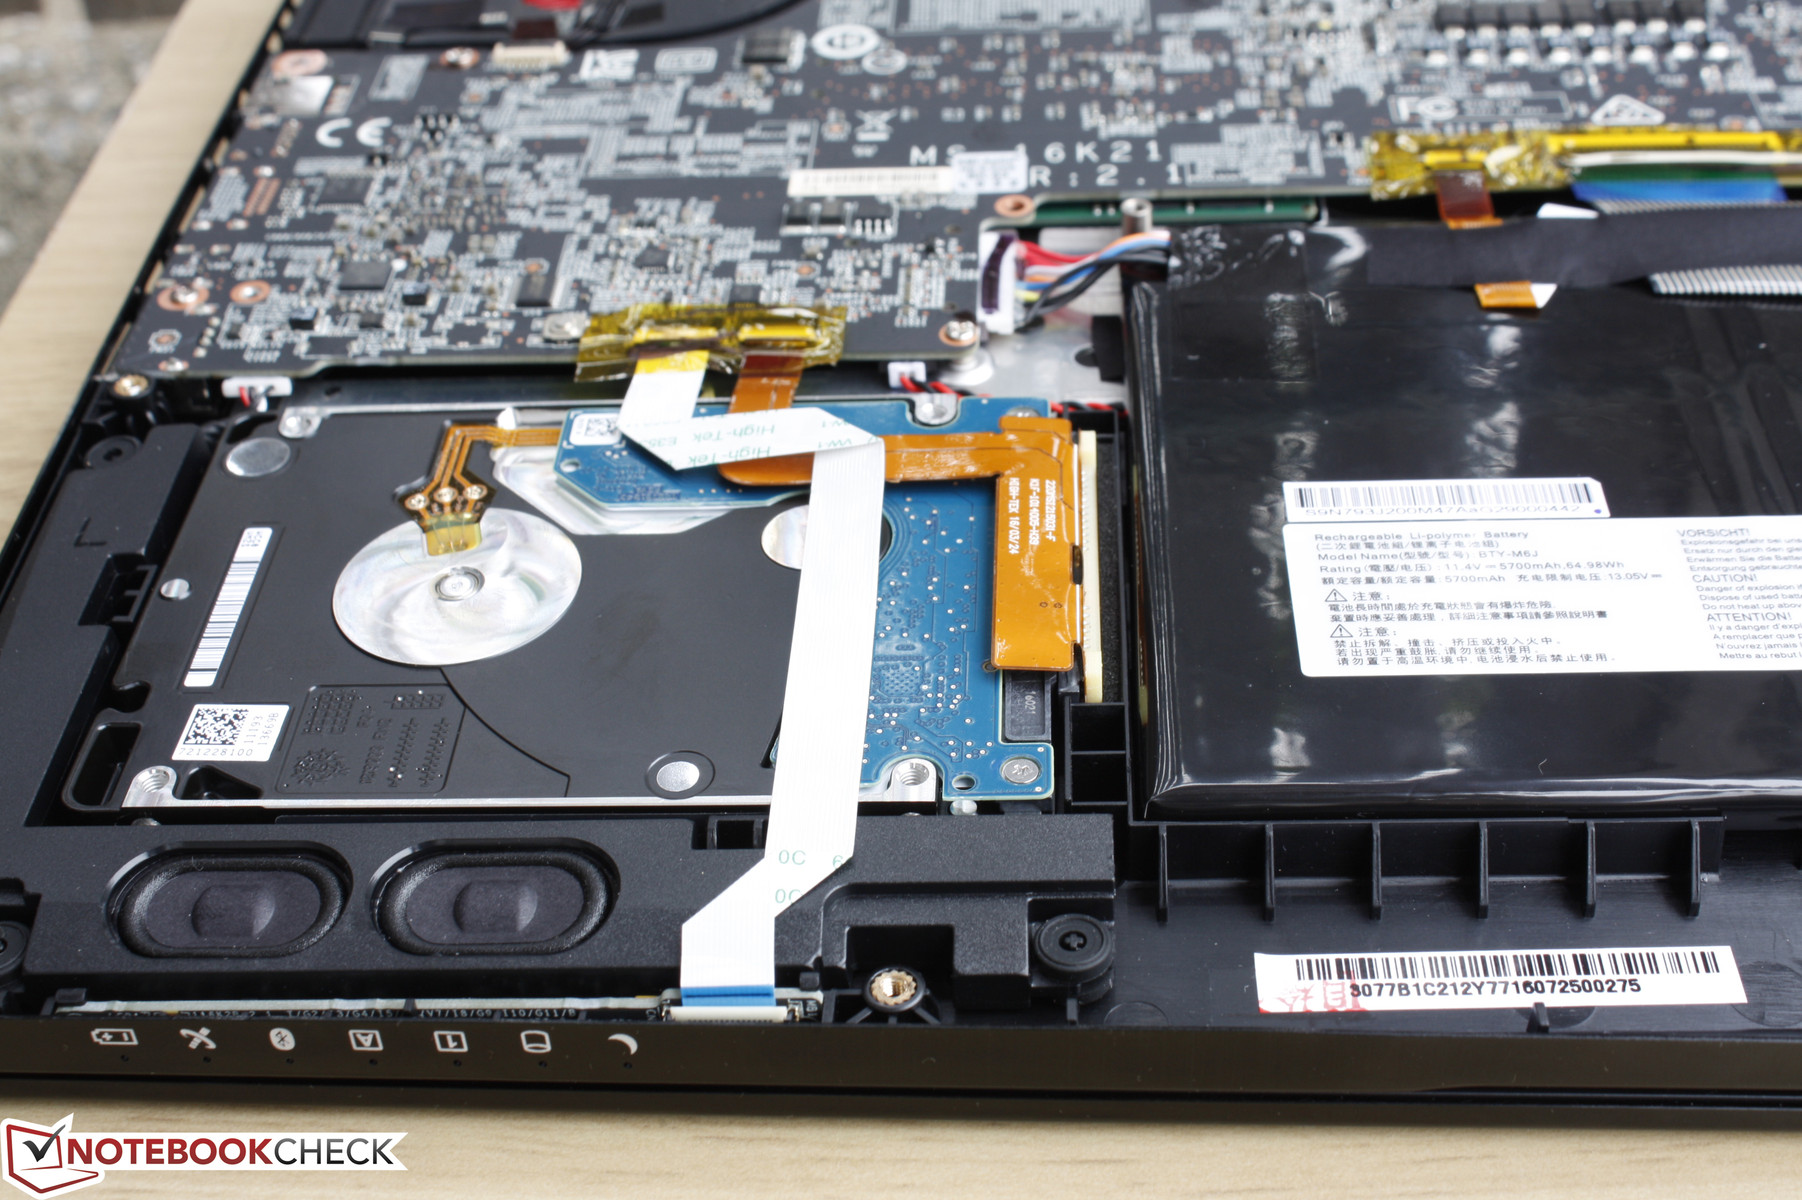
The bottom panel can be easily removed with just a single Philips screwdriver. Unfortunately, it's not a fast process since there are a total of 17 screws securing the panel and just removing the panel itself will automatically void the warranty.
Users have direct access to the 2.5-inch SATA III bay, M.2 WLAN module, and internal battery. The primary M.2 SSD, 2x SODIMM slots, and soldered processors are underneath the motherboard and require further disassembly.
Warranty
MSI offers 24-month warranty for its notebooks, 12-month warranty for its batteries, and 6-month warranty for its AC adapters. There is no "zero dead pixel" policy in place by the manufacturer as its support website instead specifies the minimum number of dead pixels allowed before the limited warranty can take effect. CUKUSA covers any aftermarket components installed by the retailer including RAM and SSD/HDD components for up to three years.
Input Devices
Keyboard
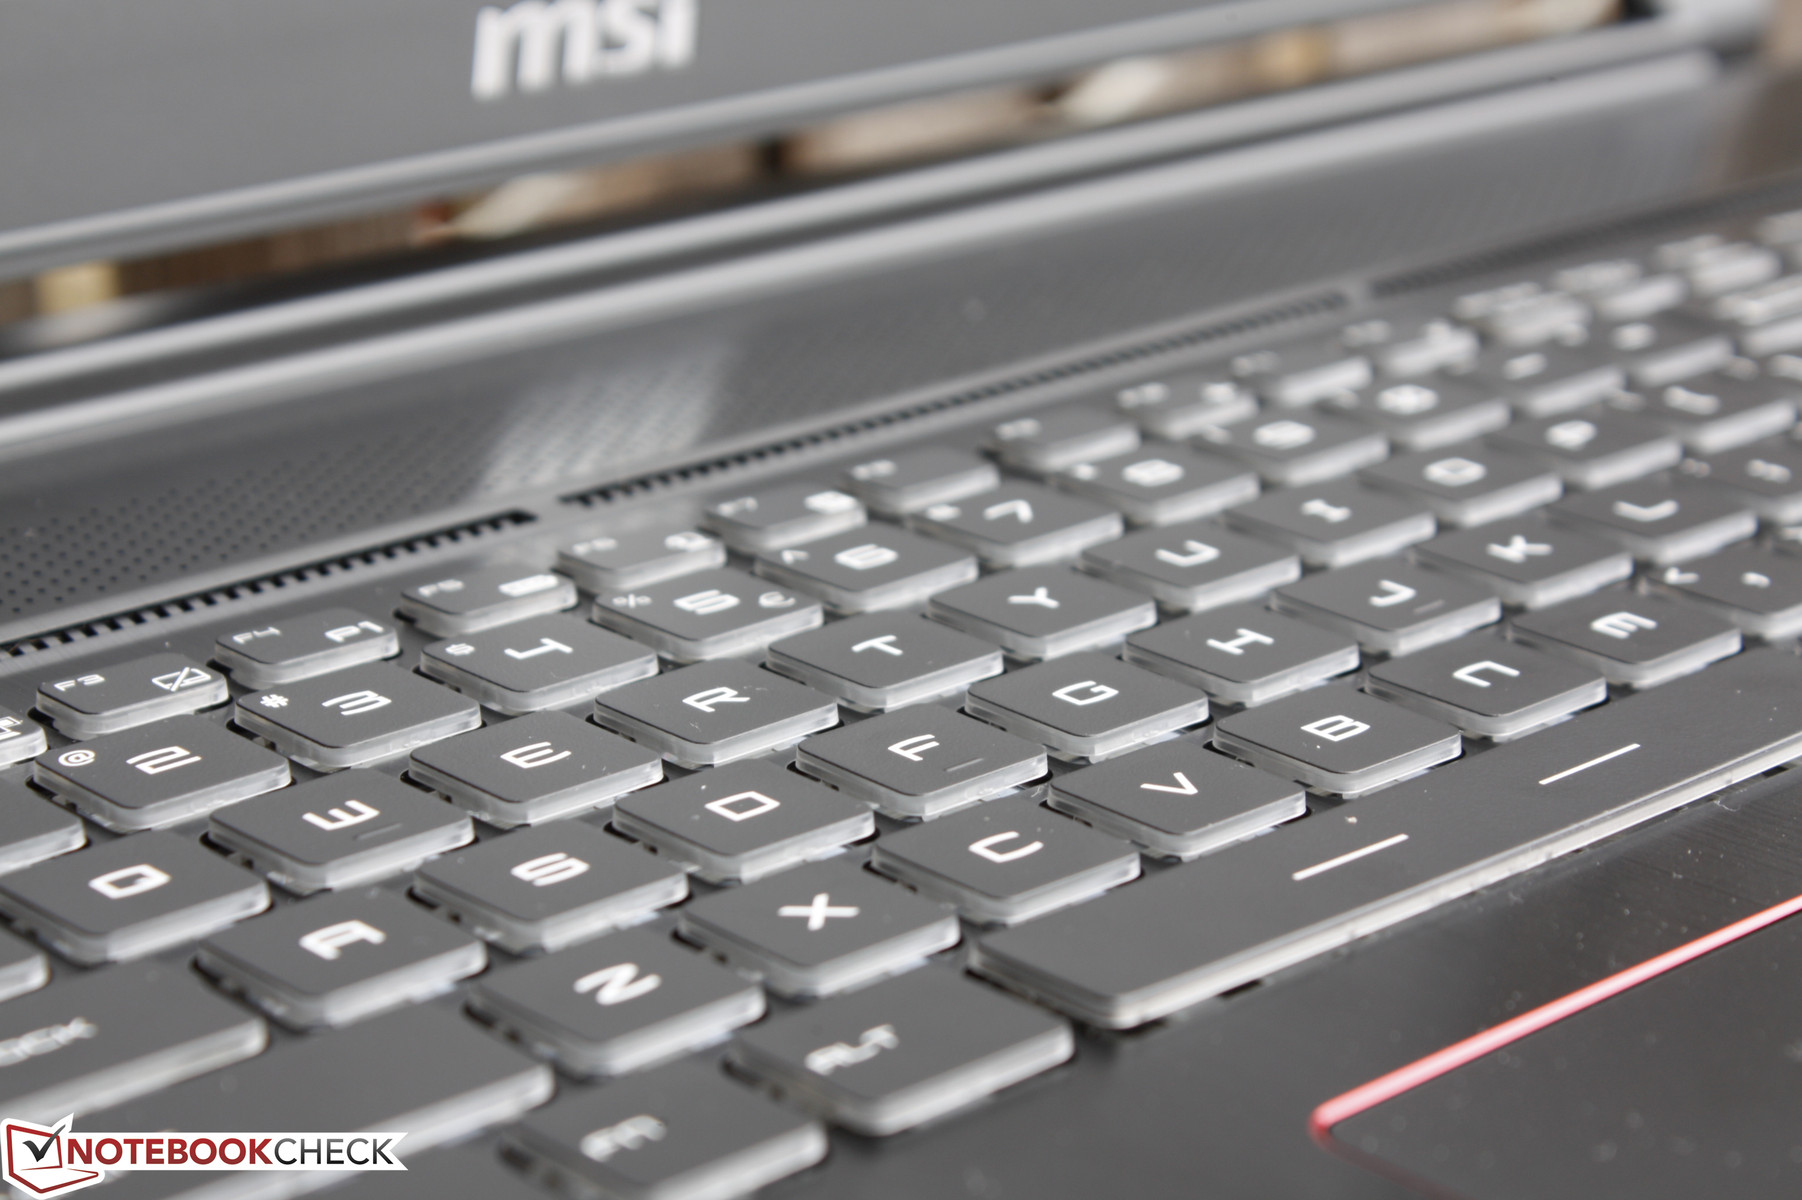
The same SteelSeries keyboard from the GT72VR can be found here on the GS73VR down to its RGB backlight and identical dimensions (34.5 x 10.5 cm). Key feedback is also nearly identical, which is already very good considering that the chassis here is so much thinner. We have to say "nearly identical" because the keyboard surface of the GS73VR is less rigid than on the GT72VR, so each key press feels slightly softer than on the firmer chassis of the GT72VR despite having the same travel depth.
Missing from the GS series continues to be dedicated macro or auxiliary keys. Aorus and Asus, for example, include a column or row of customizable Macro keys that dedicated gamers may appreciate. More manufacturers are incorporating individually backlit RGB keys including the Lenovo Y900 series, Razer Blade Stealth, and the Aorus X5/X7 refresh.
Touchpad
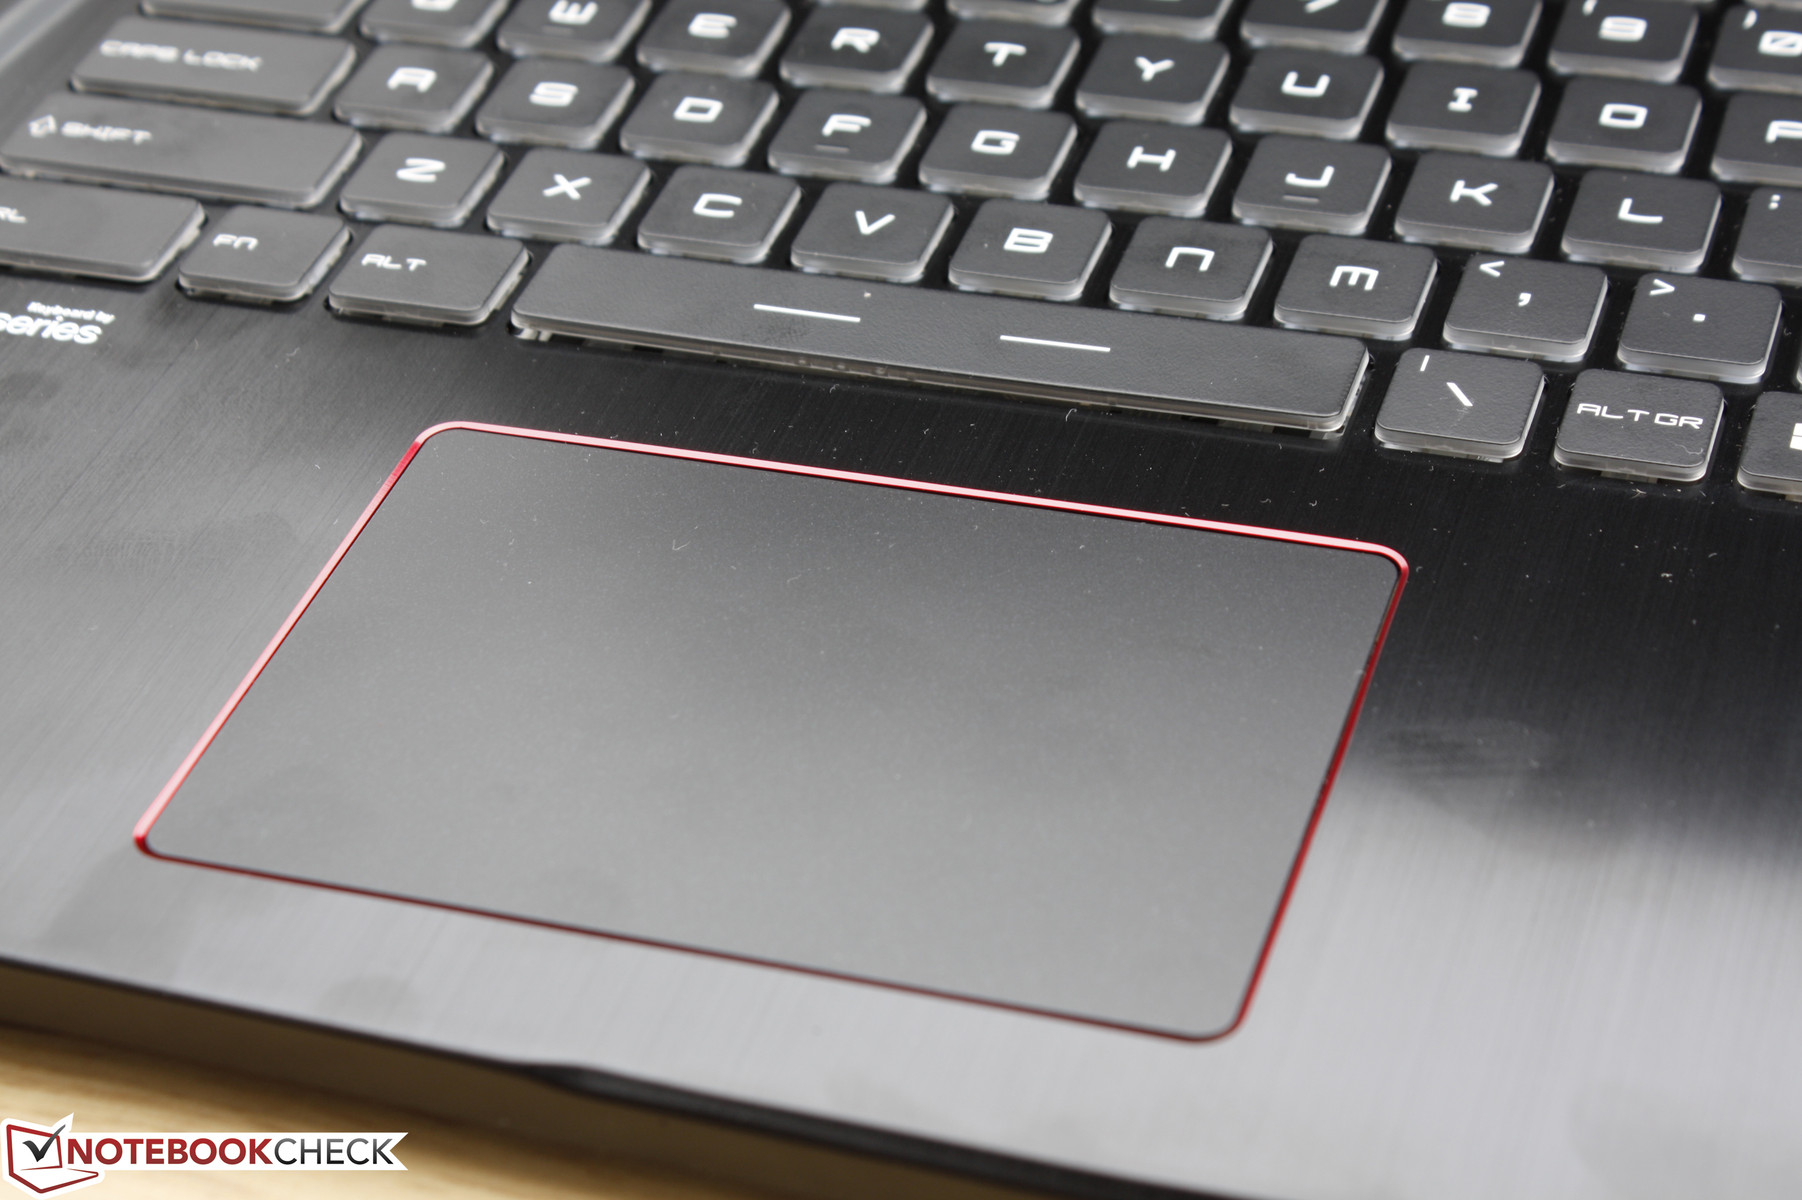
The clickpad is of adequate size (10.5 x 7.0 cm) and its smooth plastic surface is responsive to simple cursor movements without any notable issues. The Elan software can recognize up to three-finger inputs, but we find it to be overly sensitive to multi-touch inputs. For example, attempting to pinch-to-zoom would frequently result in the browser window scrolling up or down instead.
The integrated mouse clicks are slightly spongy as the corners can be visibly depressed without the system registering a click. Quite a bit of force is required to push down on the surface, so fast clicks in succession can be tiresome. The input itself is otherwise shallow with an audible feedback when pressed.
Display
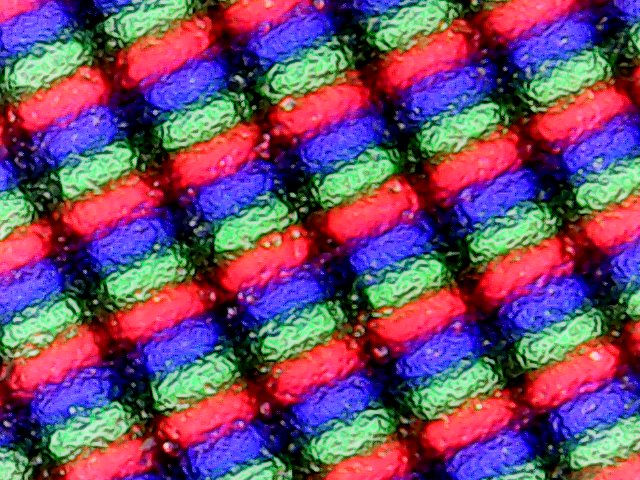
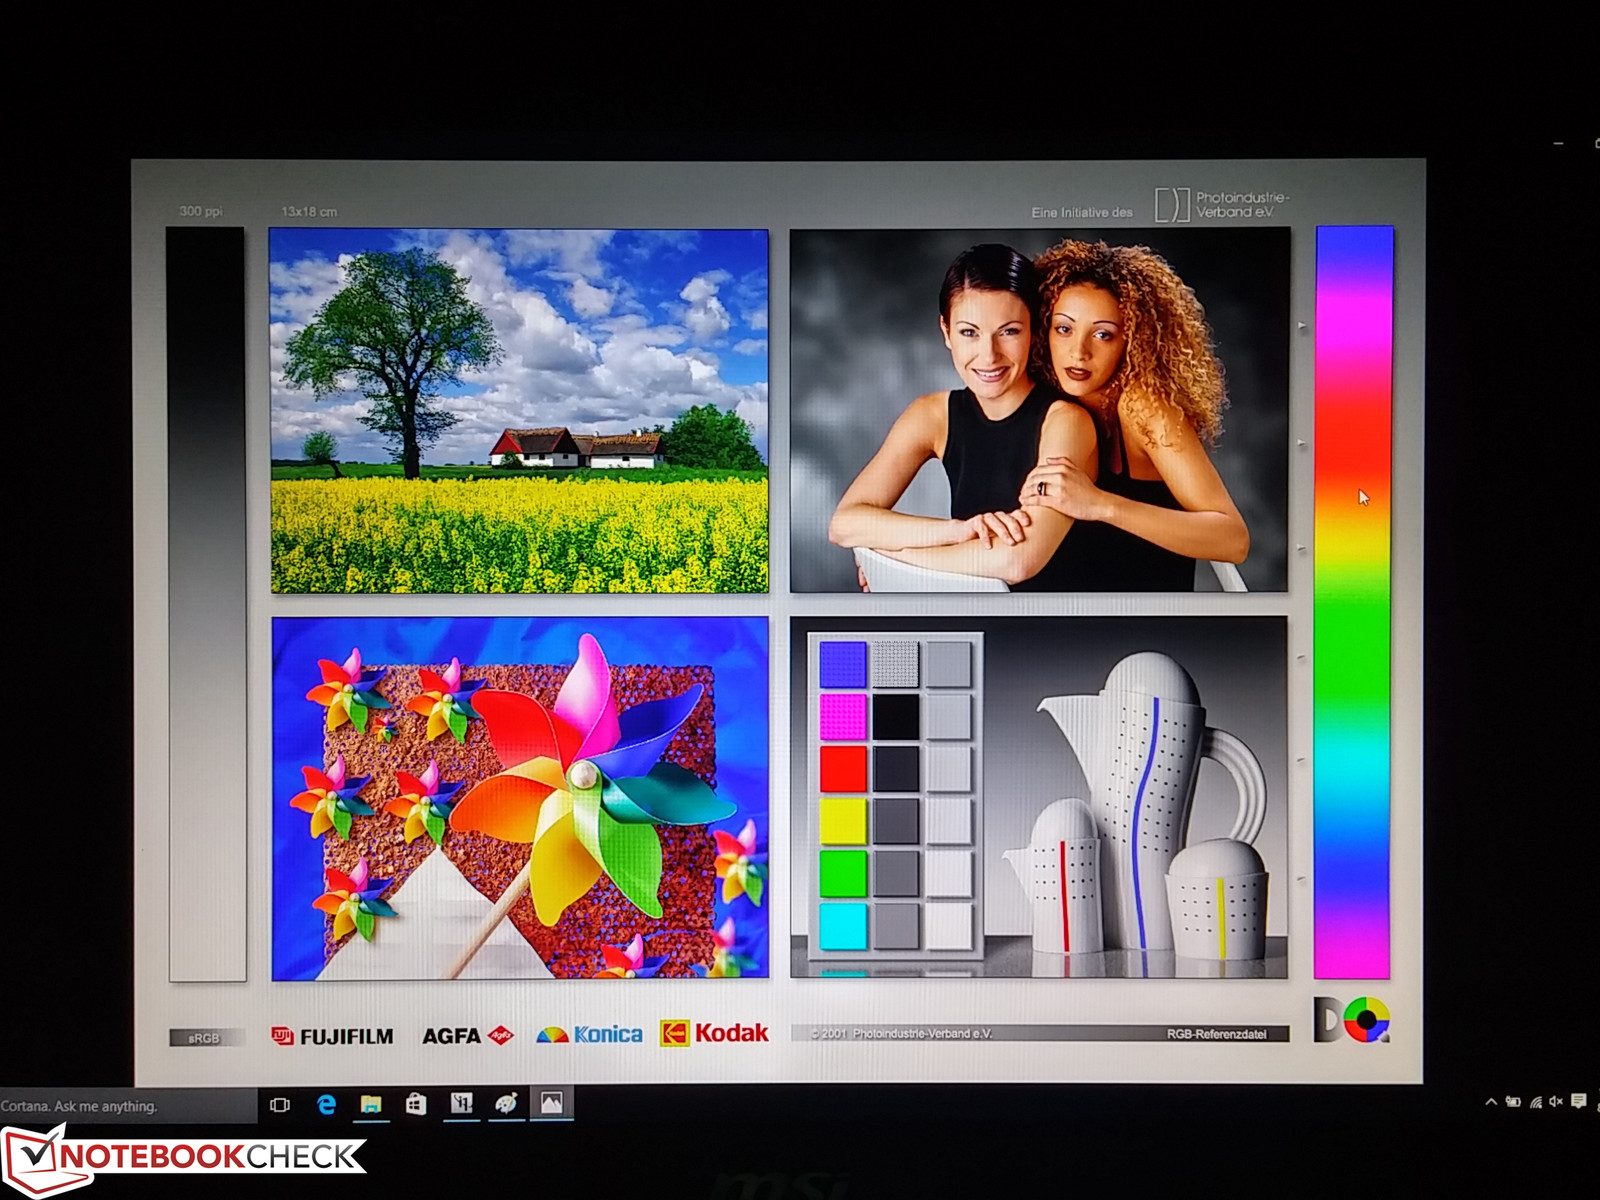
Our test unit is equipped with a 1080p matte panel capable of 120 Hz refresh rates and 5 ms response times. Note that the 120 Hz/5 ms option must be a TN panel, so users will be sacrificing some benefits from an IPS panel. Additional display options include the more standard 1080p IPS screen and a 4K UHD (3840 x 2160) IPS screen that promises 100 percent AdobeRGB coverage to satisfy users who want a better balance between gaming and digital graphics work. Our measurements below speak only of our configuration on hand as these separate IPS options would very likely carry different panels, response times, and even brightness and contrast levels.
The GS73VR uses a quality TN panel with a maximum brightness not unlike most enthusiast gaming notebooks at just over 300 nits and a contrast ratio of just over 1000:1. This is significantly better than the TN panel used on the previous GS70, which we found to be poor considering the high asking price. Subjectively, we can notice only minimal graininess when displaying a white background as is common on matte displays. The GS73VR is also the first notebook in our database to carry the Chi Mei N173HHE-G32 panel since MSI is one of the first to offer 120 Hz/5 ms options on notebooks. Certain titles do indeed recognize the 120 Hz panel including Rise of the Tomb Raider and our own measurements confirm black-white and gray-gray response times to be much faster than competing gaming notebooks with the likely exception of the Alienware 13 OLED.
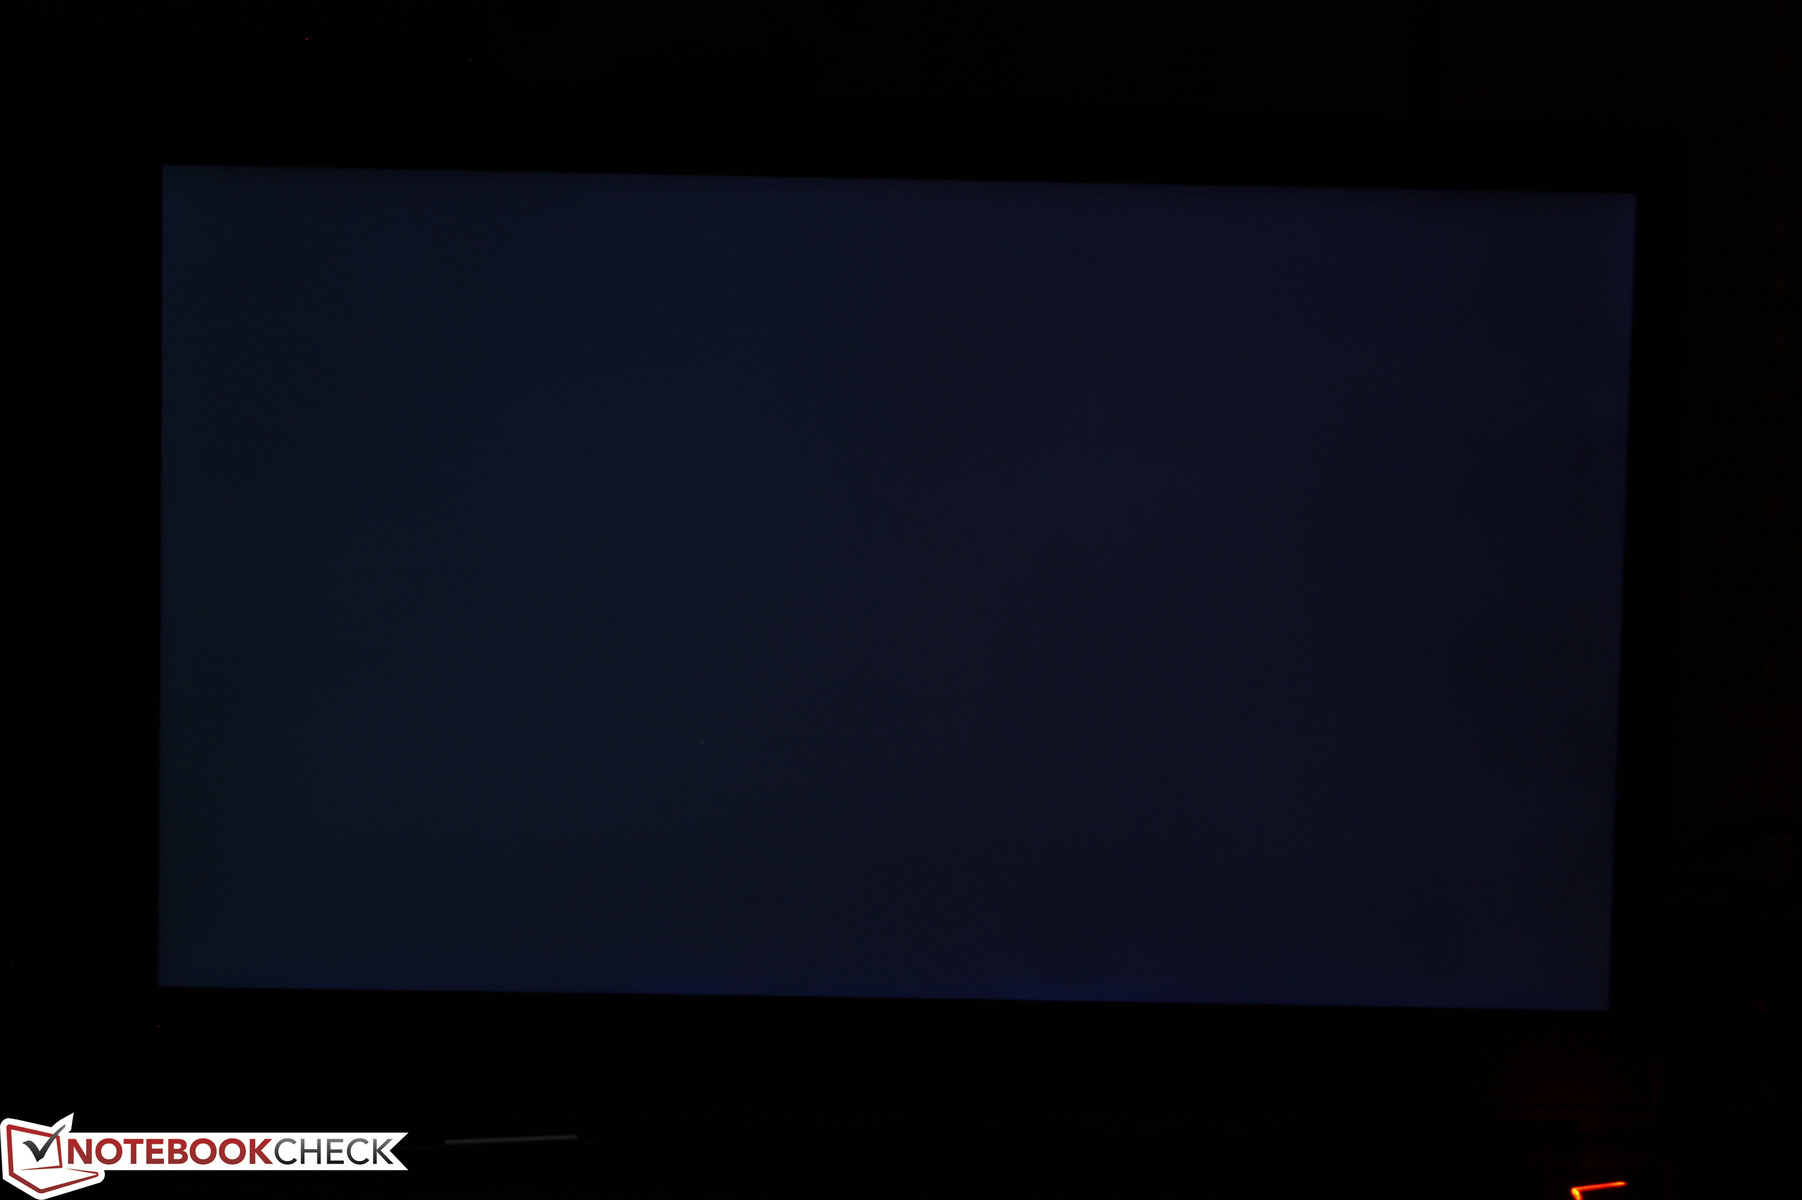
There is almost no uneven backlight bleeding around the edges or corners of the display.
| |||||||||||||||||||||||||
Brightness Distribution: 86 %
Center on Battery: 337.2 cd/m²
Contrast: 1095:1 (Black: 0.308 cd/m²)
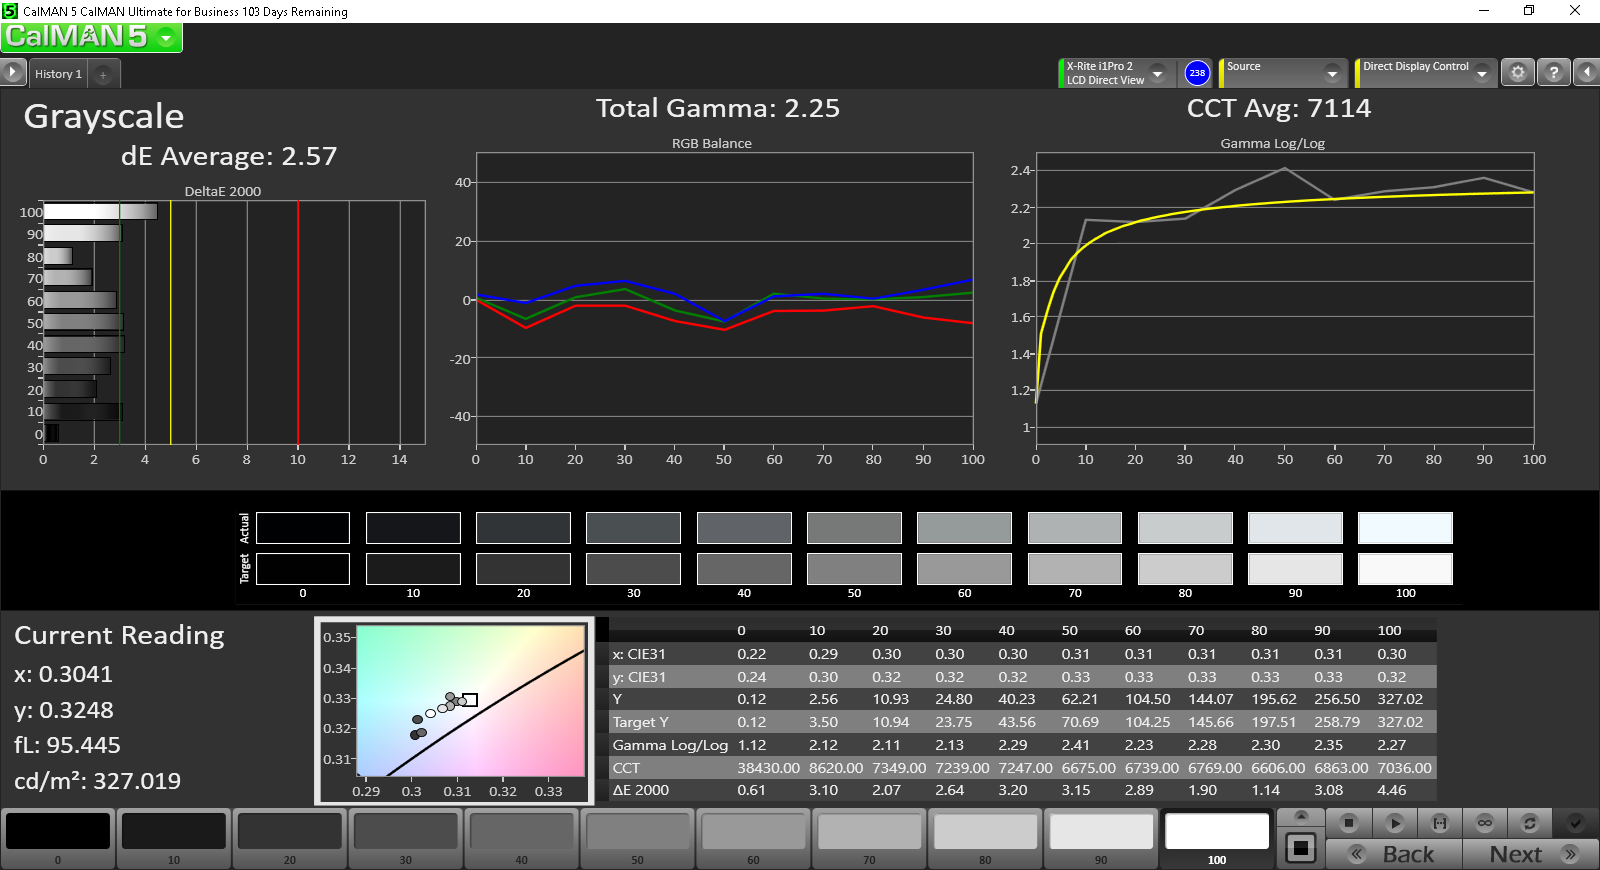
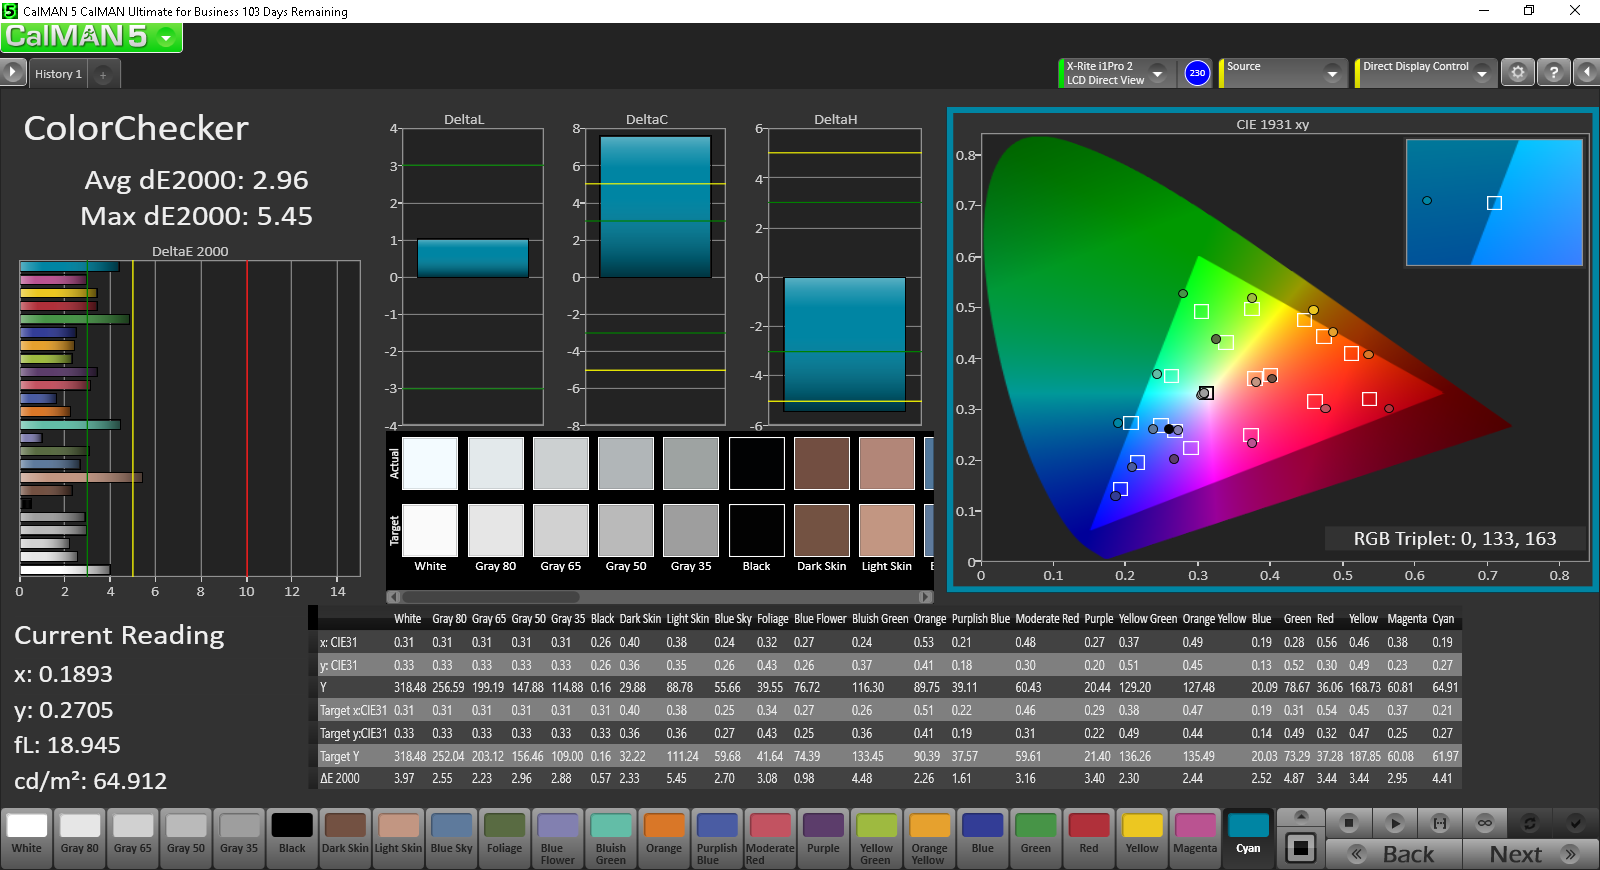
ΔE ColorChecker Calman: 2.96 | ∀{0.5-29.43 Ø4.72}
ΔE Greyscale Calman: 2.57 | ∀{0.09-98 Ø4.97}
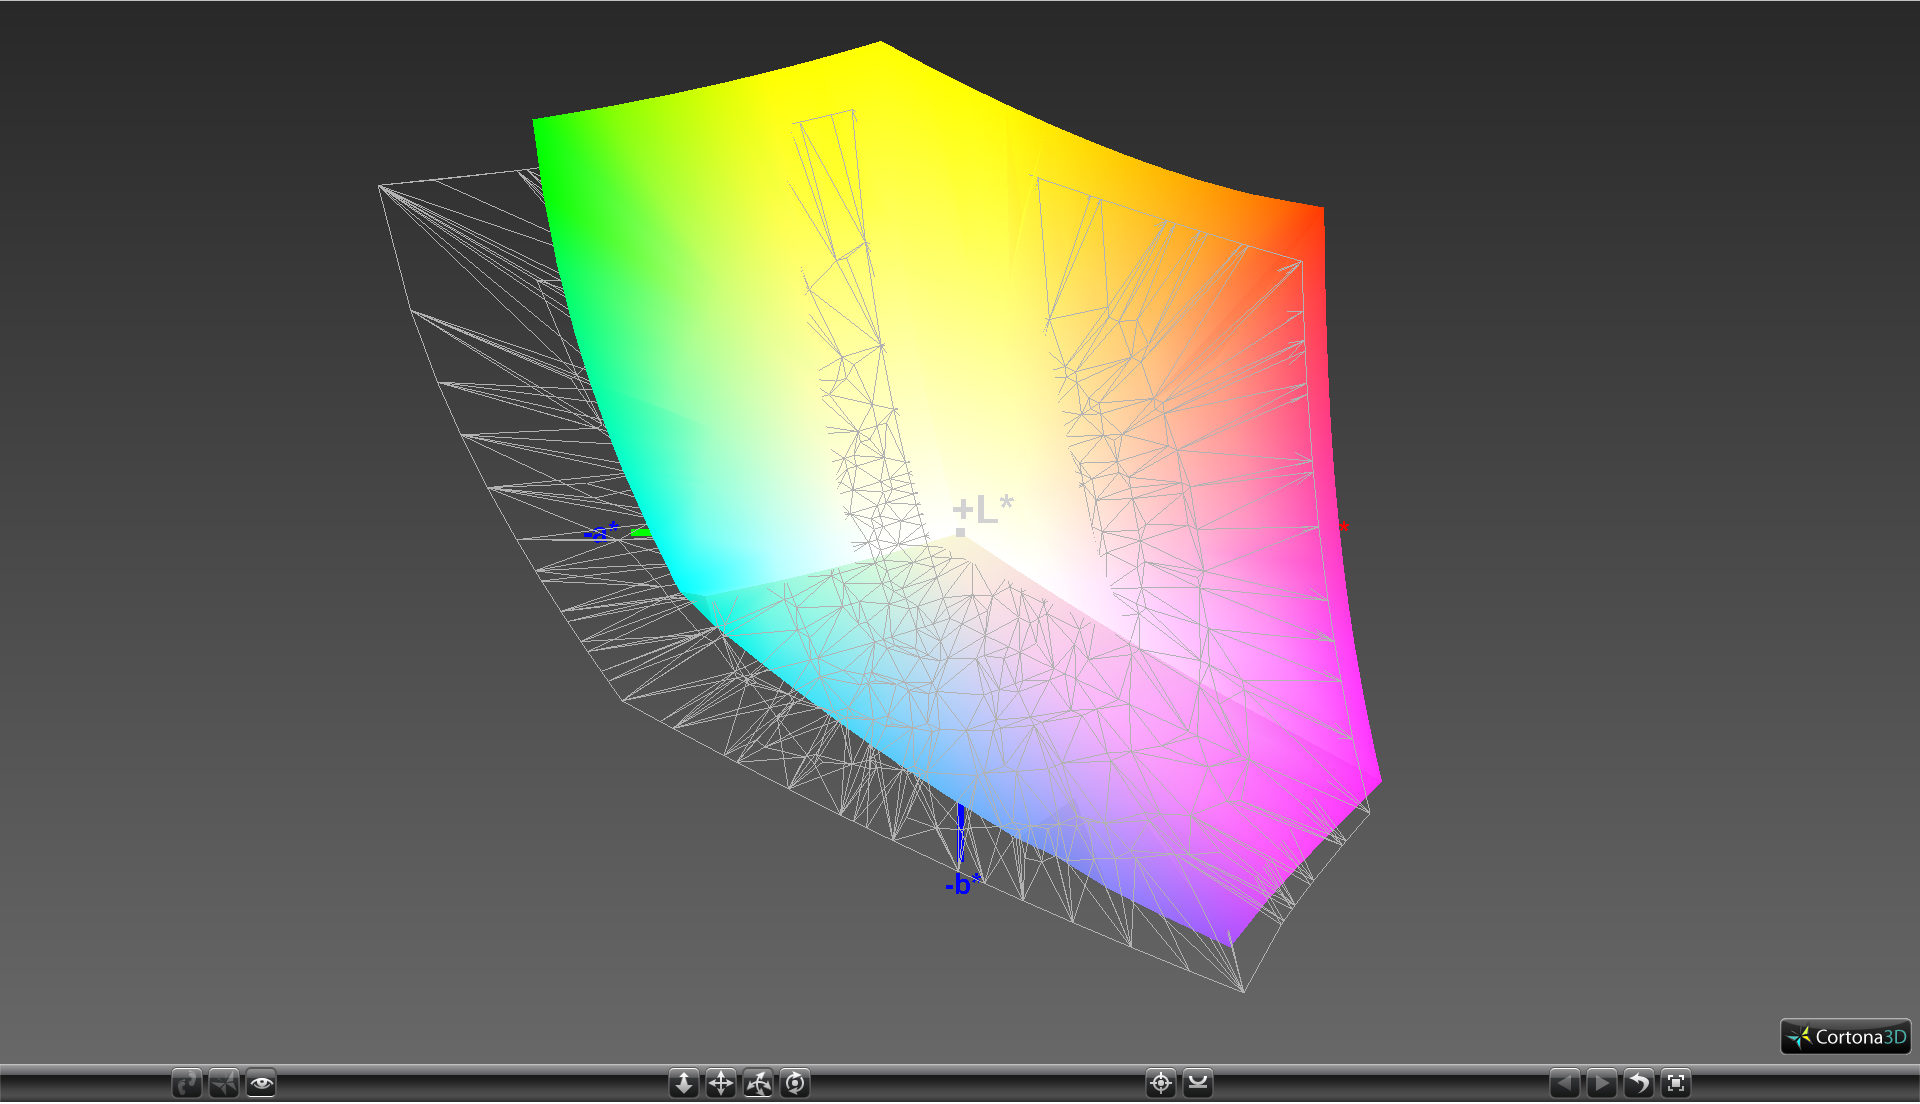
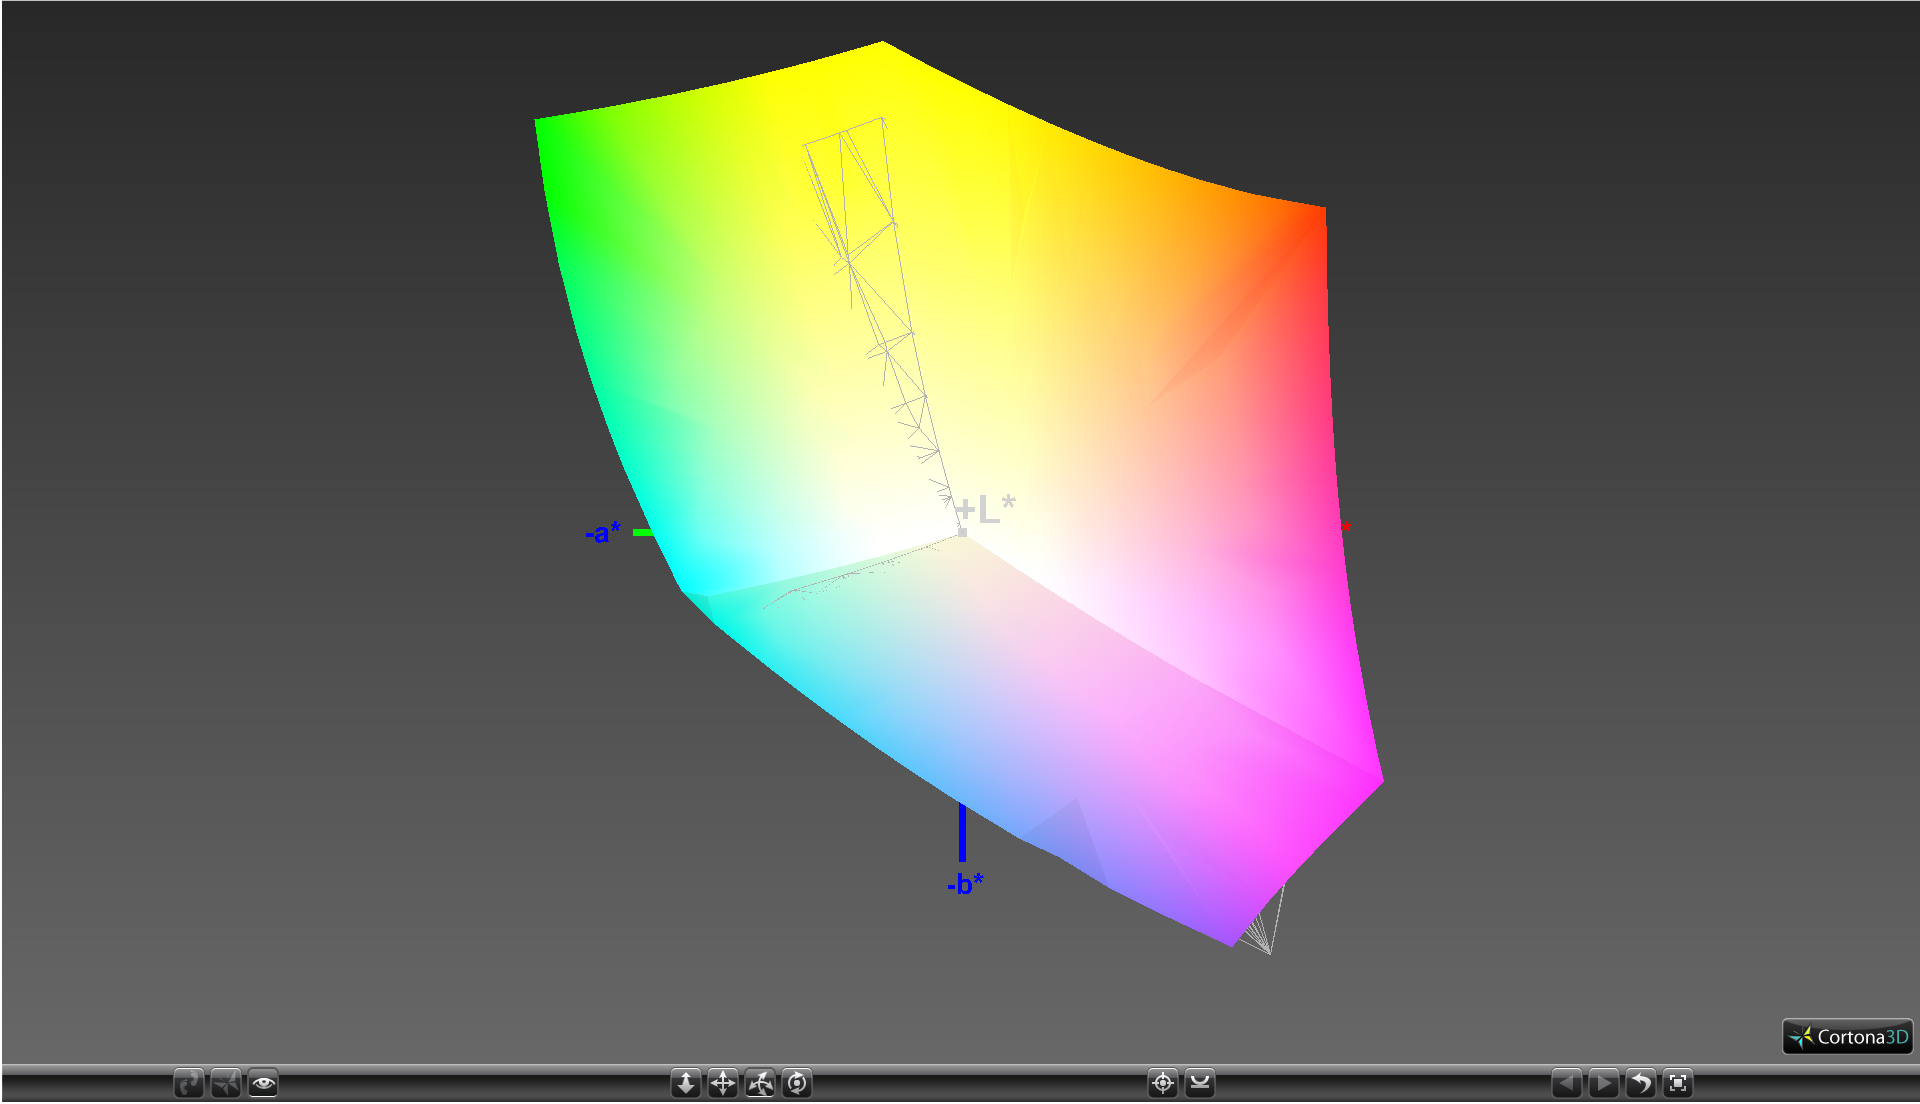
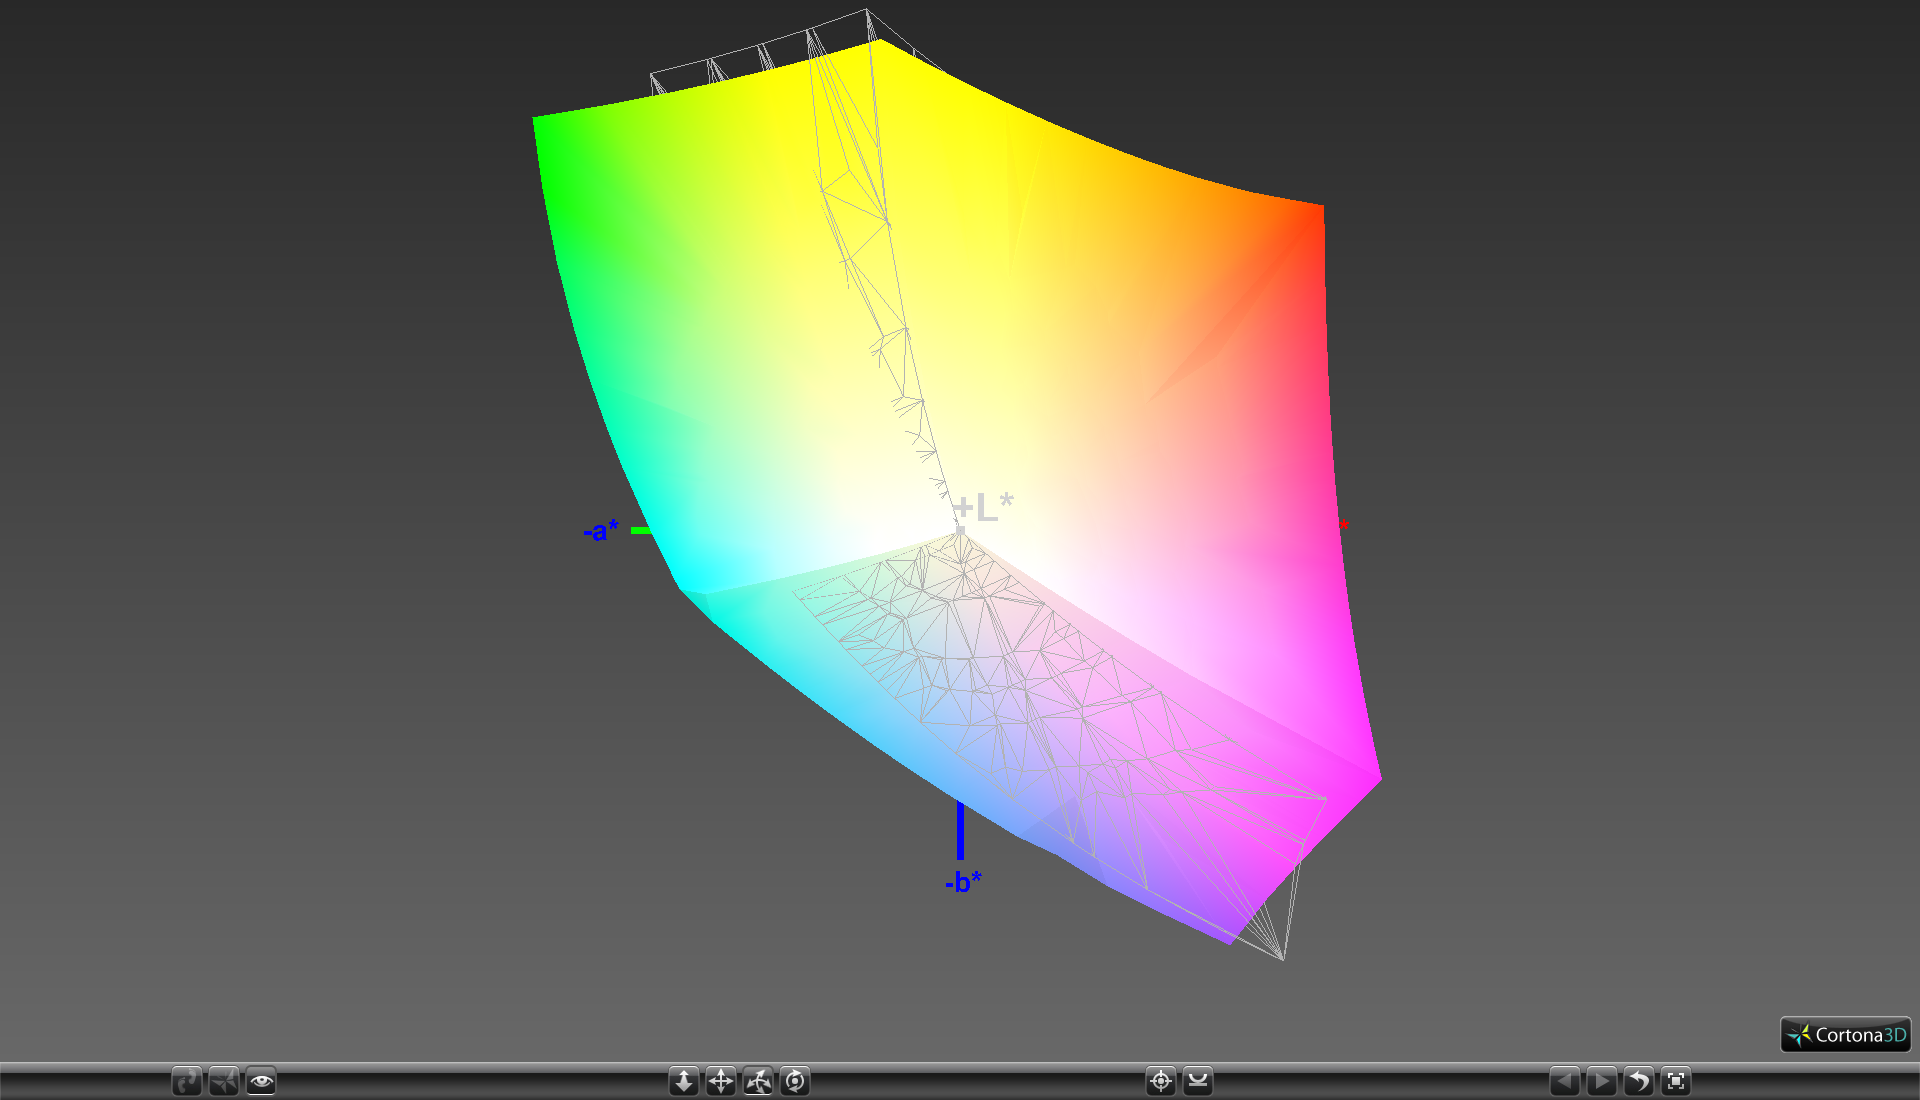
100% sRGB (Argyll 1.6.3 3D)
74.3% AdobeRGB 1998 (Argyll 1.6.3 3D)
83.6% AdobeRGB 1998 (Argyll 3D)
99.9% sRGB (Argyll 3D)
90% Display P3 (Argyll 3D)
Gamma: 2.25
CCT: 7114 K
| MSI GS73VR 6RF TN LED, 17.3", 1920x1080 | Aorus X7 Pro v5 LG Philips LP173WF4-SPD1 (LGD046C), IPS, 17.3", 1920x1080 | MSI GS70-6QE16H21 Chi Mei N173HGE-E11 (CMN1735), TN LED, 17.3", 1920x1080 | Asus G752VS-XB78K LG Philips LP173WF4-SPF3 (LGD04E8), IPS, 17.3", 1920x1080 | Alienware 17 R3 (A17-9935) CV69H_173WF4 (LGD0459), IPS, 17.3", 1920x1080 | |
|---|---|---|---|---|---|
| Display | -24% | -16% | -22% | -23% | |
| Display P3 Coverage (%) | 90 | 66 -27% | 67 -26% | 66.9 -26% | 66.9 -26% |
| sRGB Coverage (%) | 99.9 | 83.4 -17% | 97.3 -3% | 85.2 -15% | 83.9 -16% |
| AdobeRGB 1998 Coverage (%) | 83.6 | 61 -27% | 67.6 -19% | 62.3 -25% | 61.4 -27% |
| Response Times | -77% | -83% | -79% | ||
| Response Time Grey 50% / Grey 80% * (ms) | 28 ? | 35 ? -25% | 38 ? -36% | 33 ? -18% | |
| Response Time Black / White * (ms) | 9.6 ? | 22 ? -129% | 22 ? -129% | 23 ? -140% | |
| PWM Frequency (Hz) | |||||
| Screen | -19% | -12% | -13% | -29% | |
| Brightness middle (cd/m²) | 337.2 | 271 -20% | 172 -49% | 328 -3% | 360 7% |
| Brightness (cd/m²) | 315 | 257 -18% | 161 -49% | 317 1% | 336 7% |
| Brightness Distribution (%) | 86 | 91 6% | 85 -1% | 88 2% | 90 5% |
| Black Level * (cd/m²) | 0.308 | 0.23 25% | 0.26 16% | 0.3 3% | 0.44 -43% |
| Contrast (:1) | 1095 | 1178 8% | 662 -40% | 1093 0% | 818 -25% |
| Colorchecker dE 2000 * | 2.96 | 4.14 -40% | 2.06 30% | 3.74 -26% | 4.76 -61% |
| Colorchecker dE 2000 max. * | 5.45 | 8.11 -49% | 8.97 -65% | 10.8 -98% | |
| Greyscale dE 2000 * | 2.57 | 4 -56% | 2.42 6% | 2.67 -4% | 3.69 -44% |
| Gamma | 2.25 98% | 2.43 91% | 2.45 90% | 2.41 91% | 2.24 98% |
| CCT | 7114 91% | 6558 99% | 6855 95% | 6861 95% | 6091 107% |
| Color Space (Percent of AdobeRGB 1998) (%) | 74.3 | 55 -26% | 62 -17% | 56 -25% | 55 -26% |
| Color Space (Percent of sRGB) (%) | 100 | 83 -17% | 97 -3% | 85 -15% | 84 -16% |
| Total Average (Program / Settings) | -40% /
-27% | -14% /
-13% | -39% /
-24% | -44% /
-35% |
* ... smaller is better
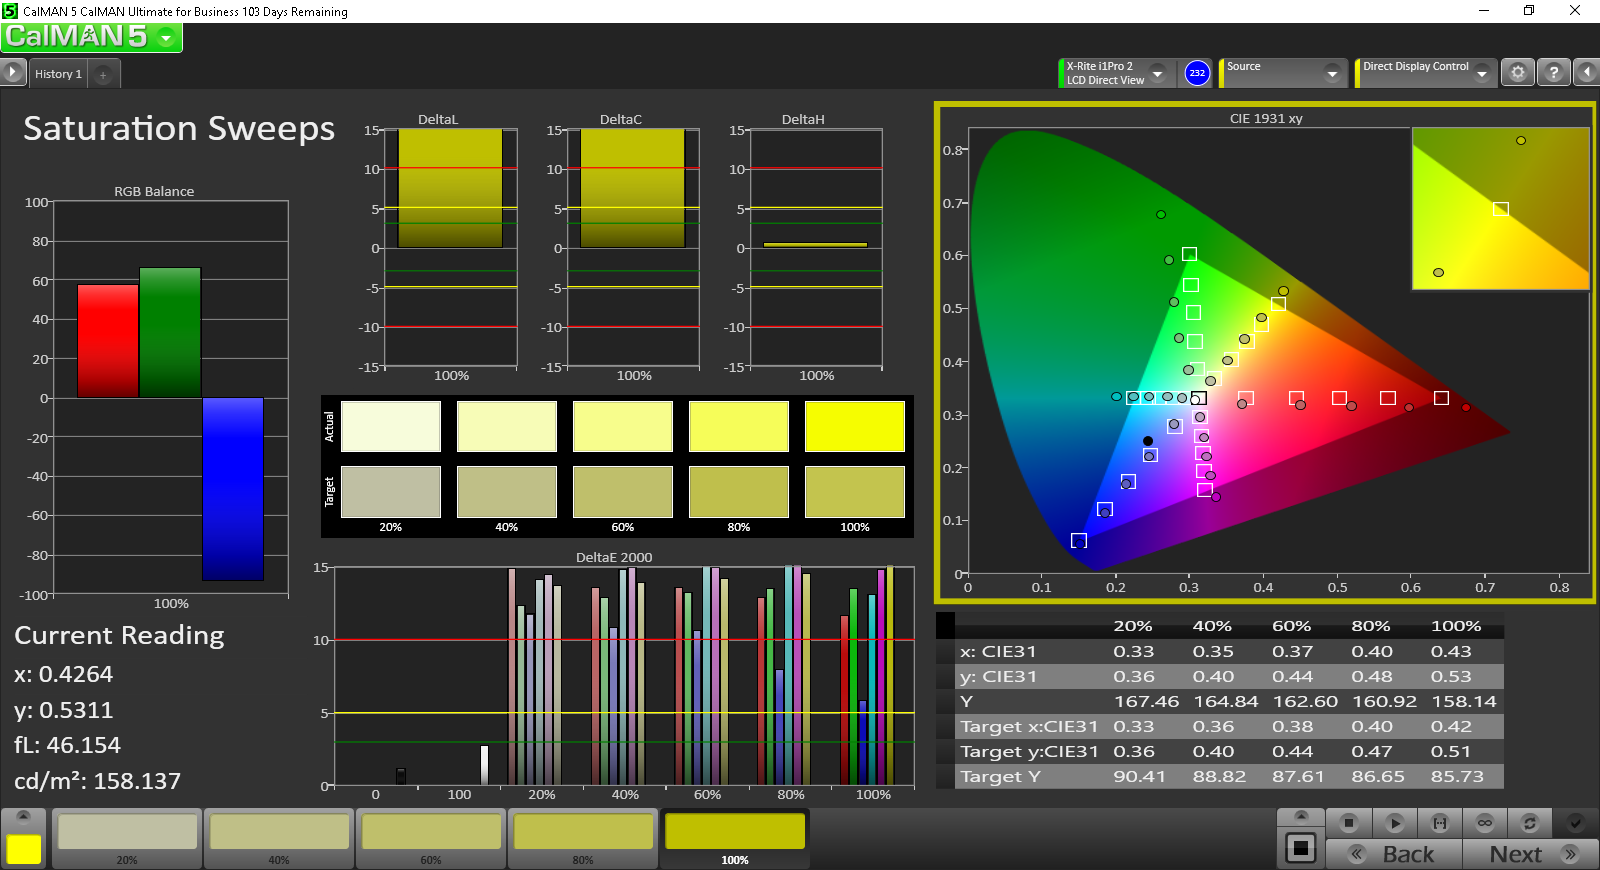
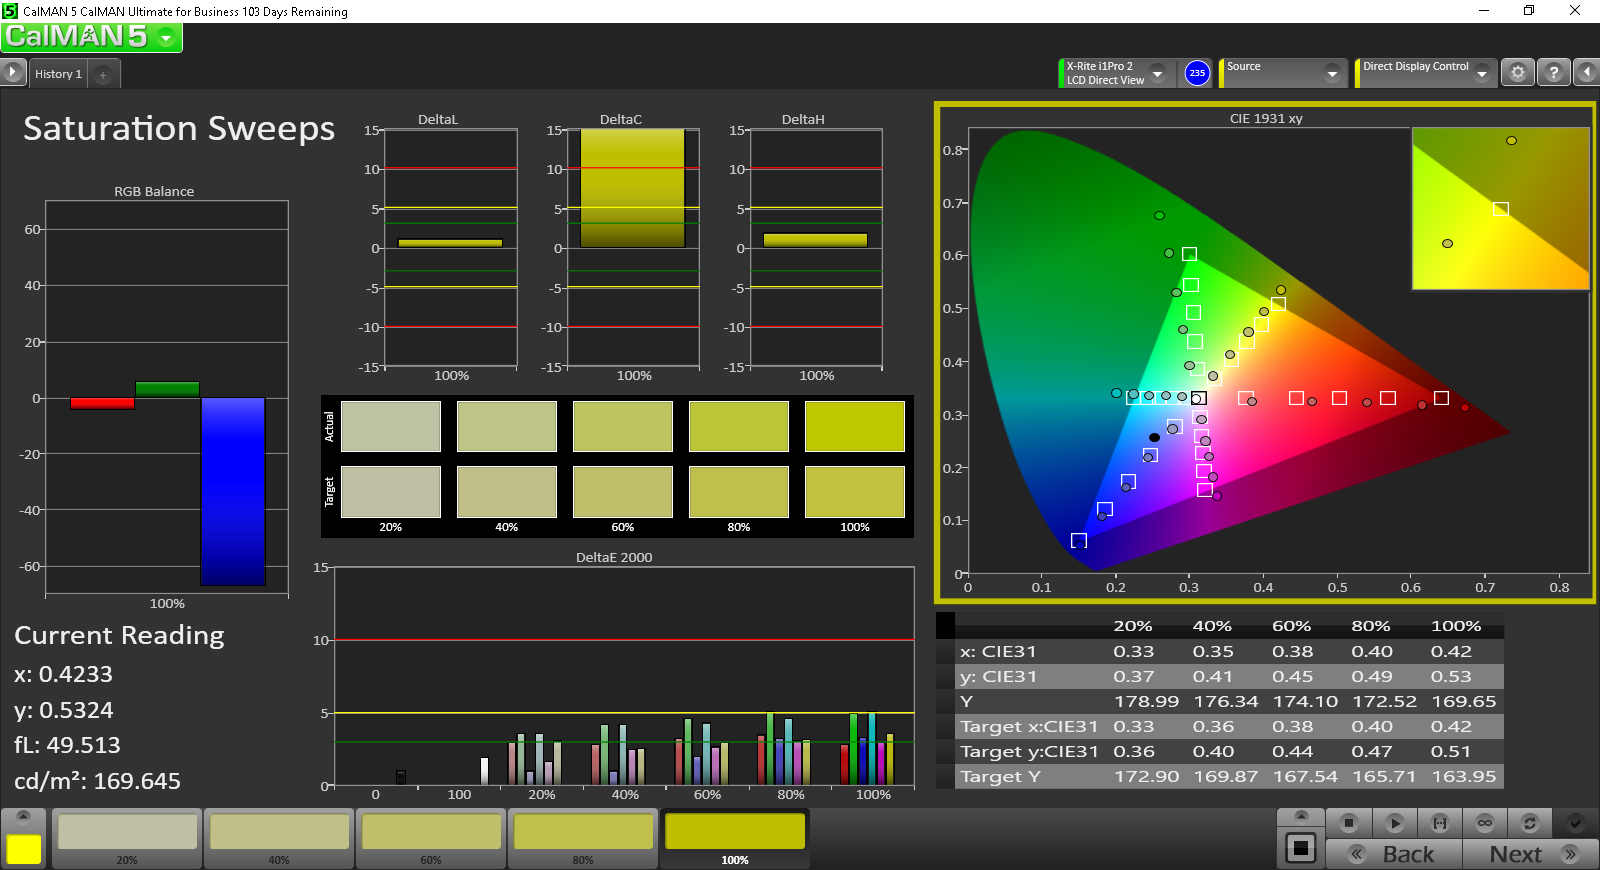
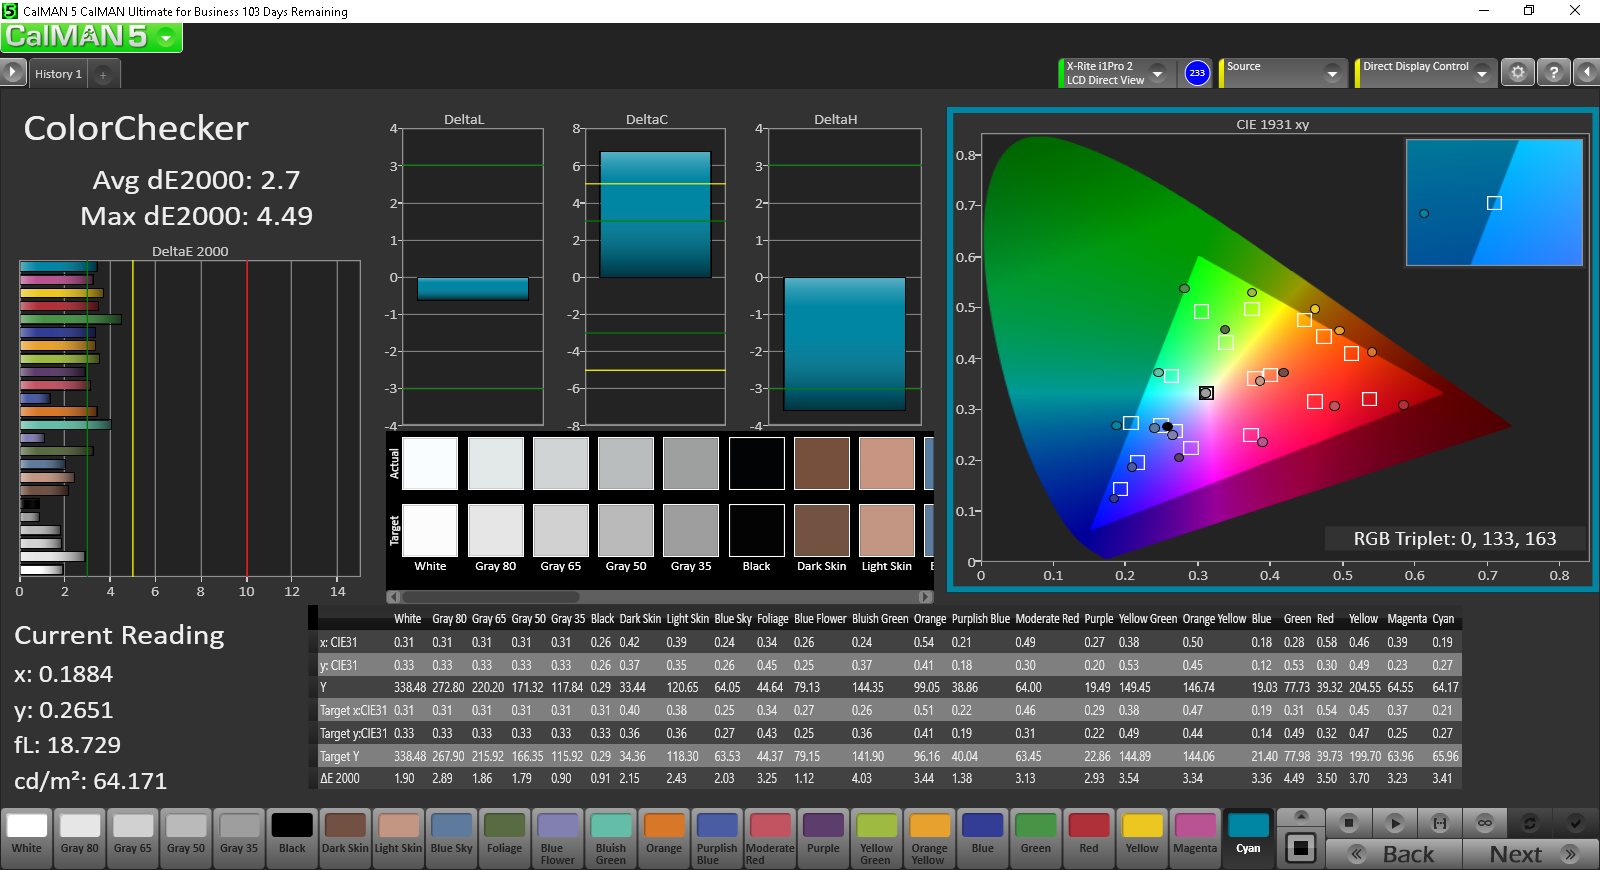
MSI advertises 100 percent sRGB coverage on this particular panel and our own measurements can confirm the claim. Subsequently, AdobeRGB coverage is approximately 74 percent and is wider than the displays on most competing gaming notebooks. Only a small handful of gaming notebooks offer complete AdobeRGB coverage including certain Clevo barebones. Color accuracy is not important to the core gaming experience, so the wider gamut is only a bonus.

Further display measurements with an X-Rite spectrophotometer reveal good grayscale out-of-the-box, but colors are inaccurate at every tested saturation level even after setting the MSI True Color utility to sRGB mode. A quick calibration flattens RGB Balance and lowers color temperature with much more accurate colors across the board. Colors still become increasingly inaccurate the higher the saturation level despite the panel's complete sRGB coverage, so additional manual calibration may be needed.

Display Response Times
| ↔ Response Time Black to White | ||
|---|---|---|
| 9.6 ms ... rise ↗ and fall ↘ combined | ↗ 5.2 ms rise | 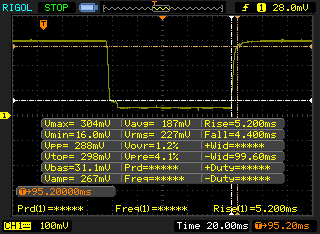 |
| ↘ 4.4 ms fall | ||
| The screen shows fast response rates in our tests and should be suited for gaming. In comparison, all tested devices range from 0.1 (minimum) to 240 (maximum) ms. » 26 % of all devices are better. This means that the measured response time is better than the average of all tested devices (19.8 ms). | ||
| ↔ Response Time 50% Grey to 80% Grey | ||
| 28 ms ... rise ↗ and fall ↘ combined | ↗ 13.2 ms rise | 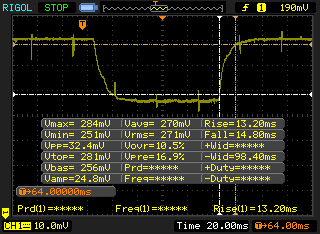 |
| ↘ 14.8 ms fall | ||
| The screen shows relatively slow response rates in our tests and may be too slow for gamers. In comparison, all tested devices range from 0.165 (minimum) to 636 (maximum) ms. » 38 % of all devices are better. This means that the measured response time is similar to the average of all tested devices (31 ms). | ||
Screen Flickering / PWM (Pulse-Width Modulation)
| Screen flickering / PWM not detected | 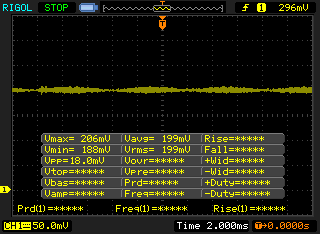 | ||
In comparison: 52 % of all tested devices do not use PWM to dim the display. If PWM was detected, an average of 7778 (minimum: 5 - maximum: 343500) Hz was measured. | |||
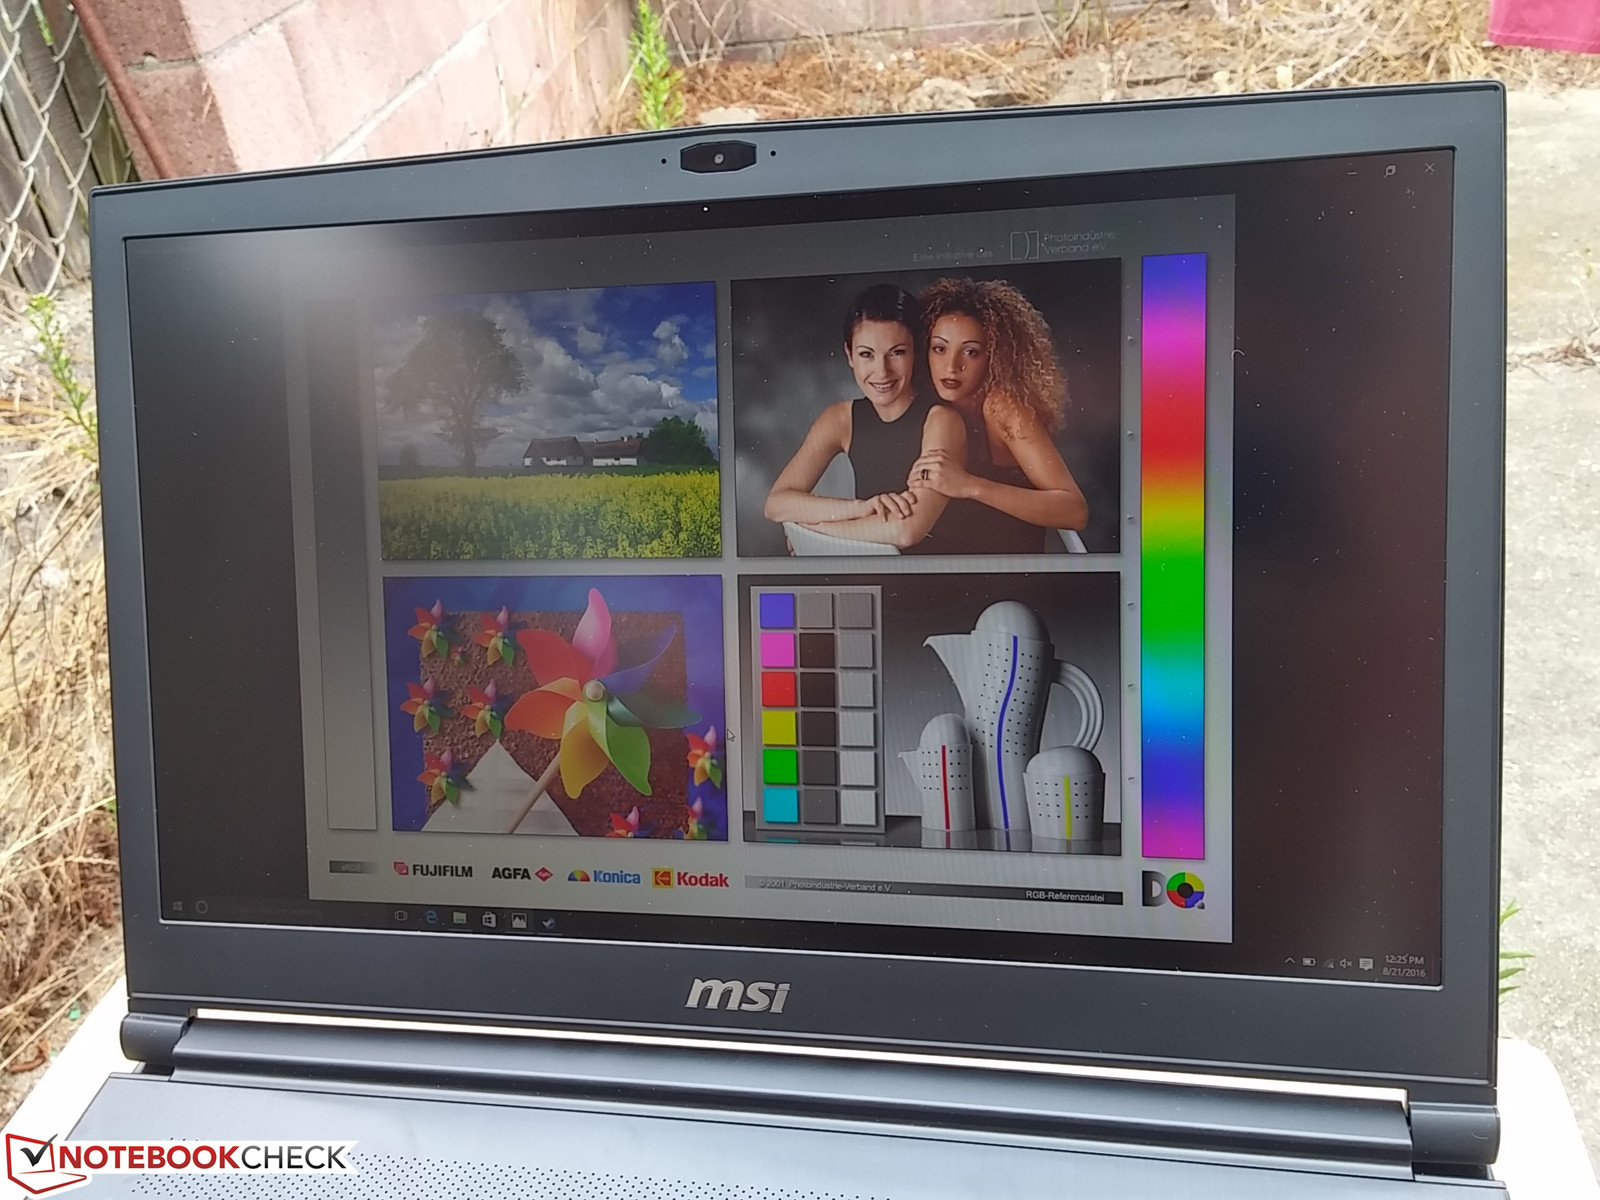
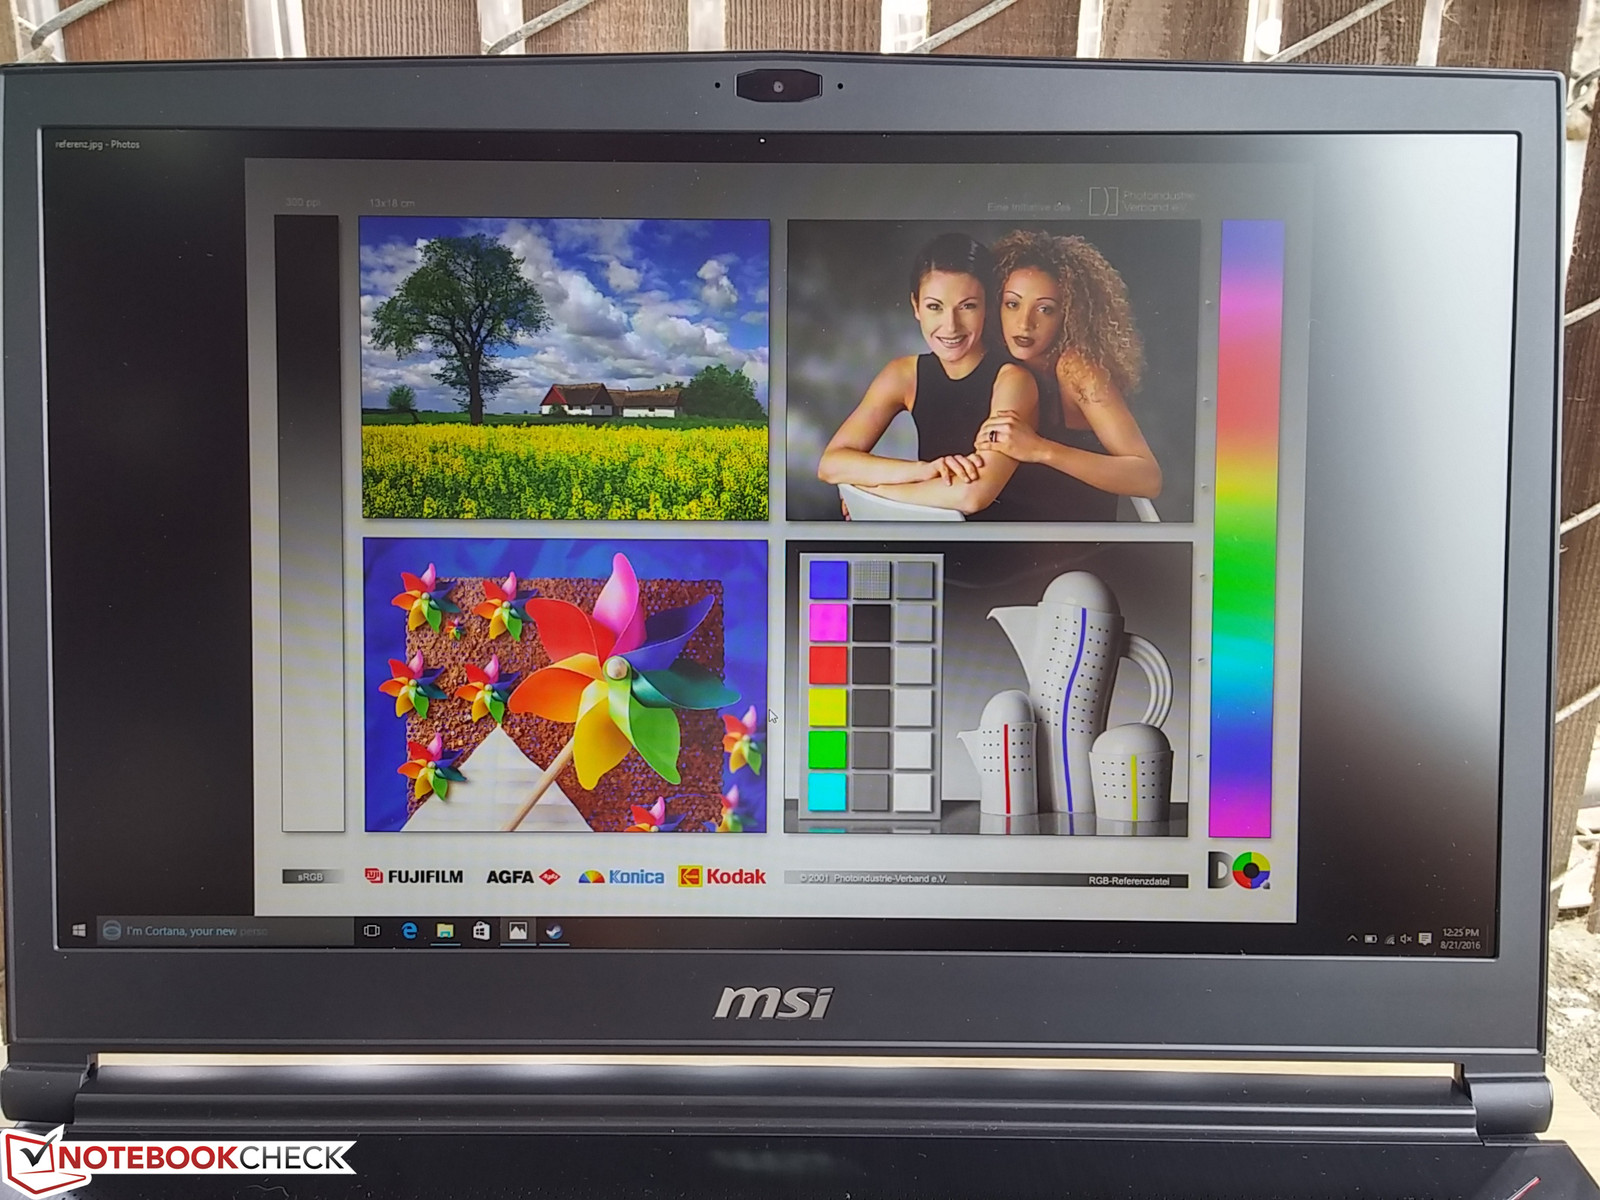
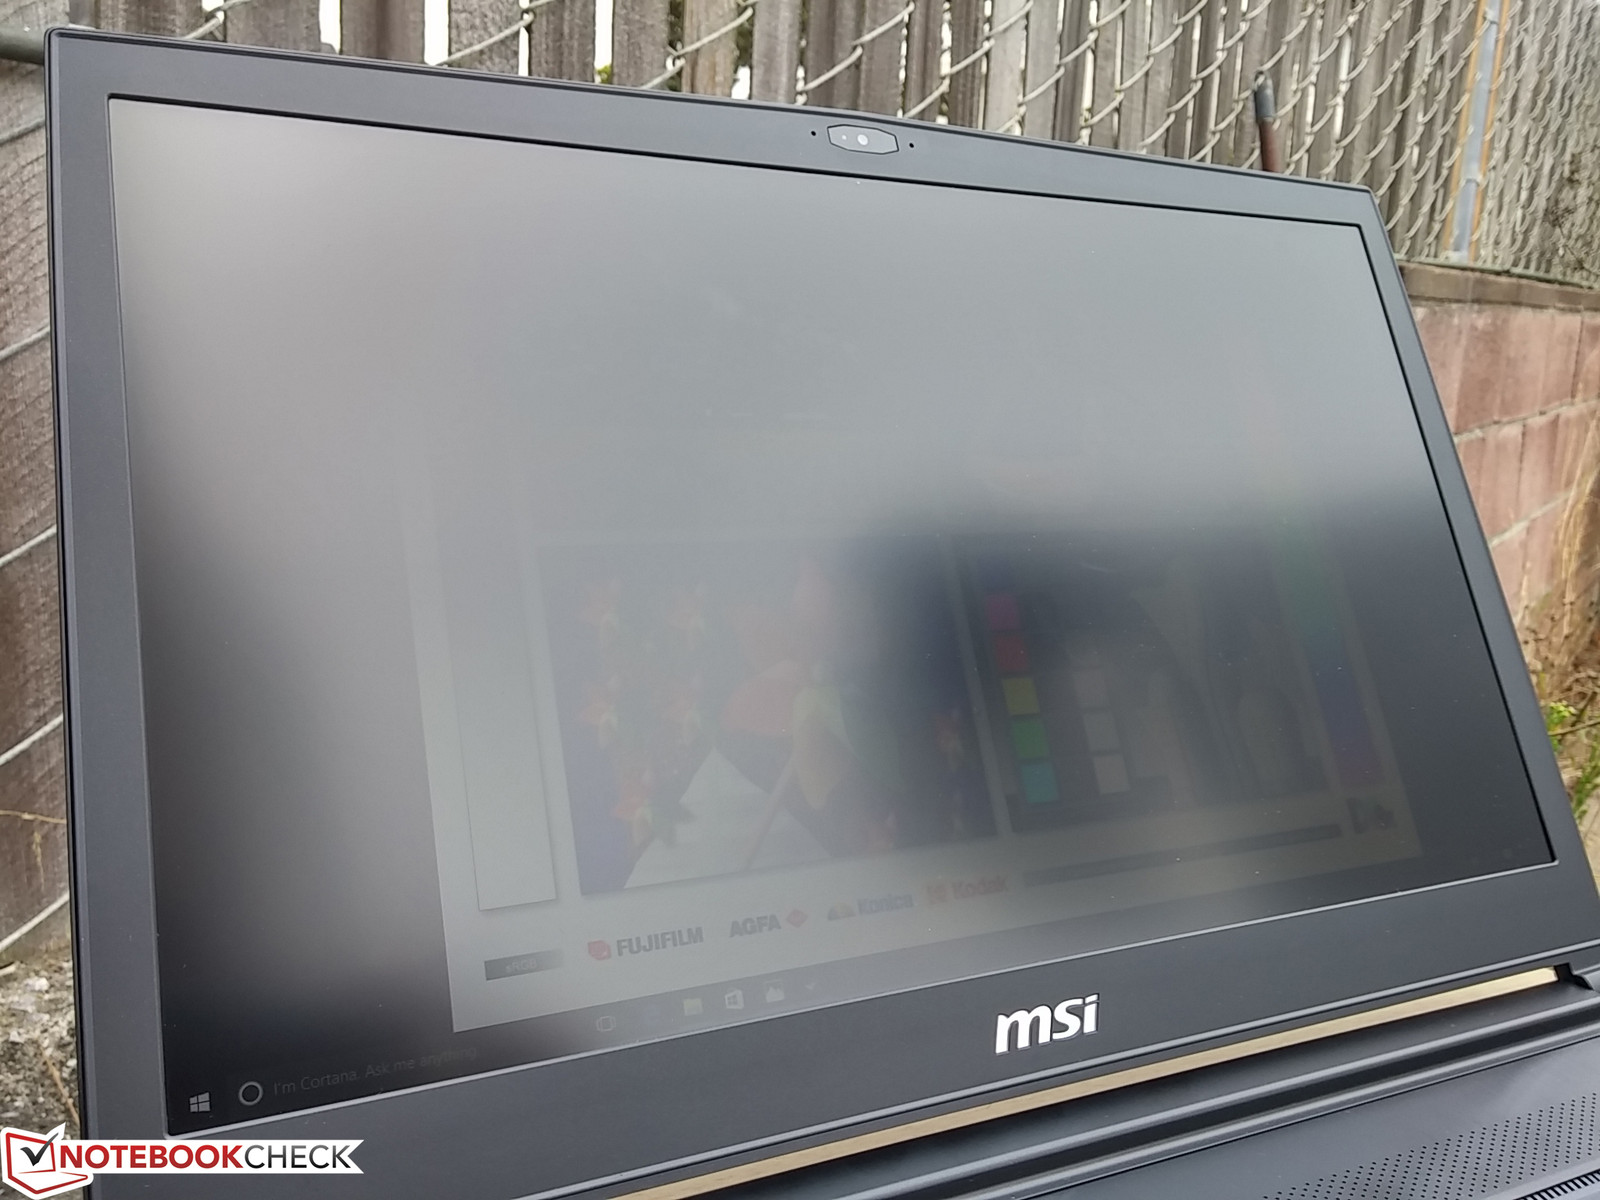
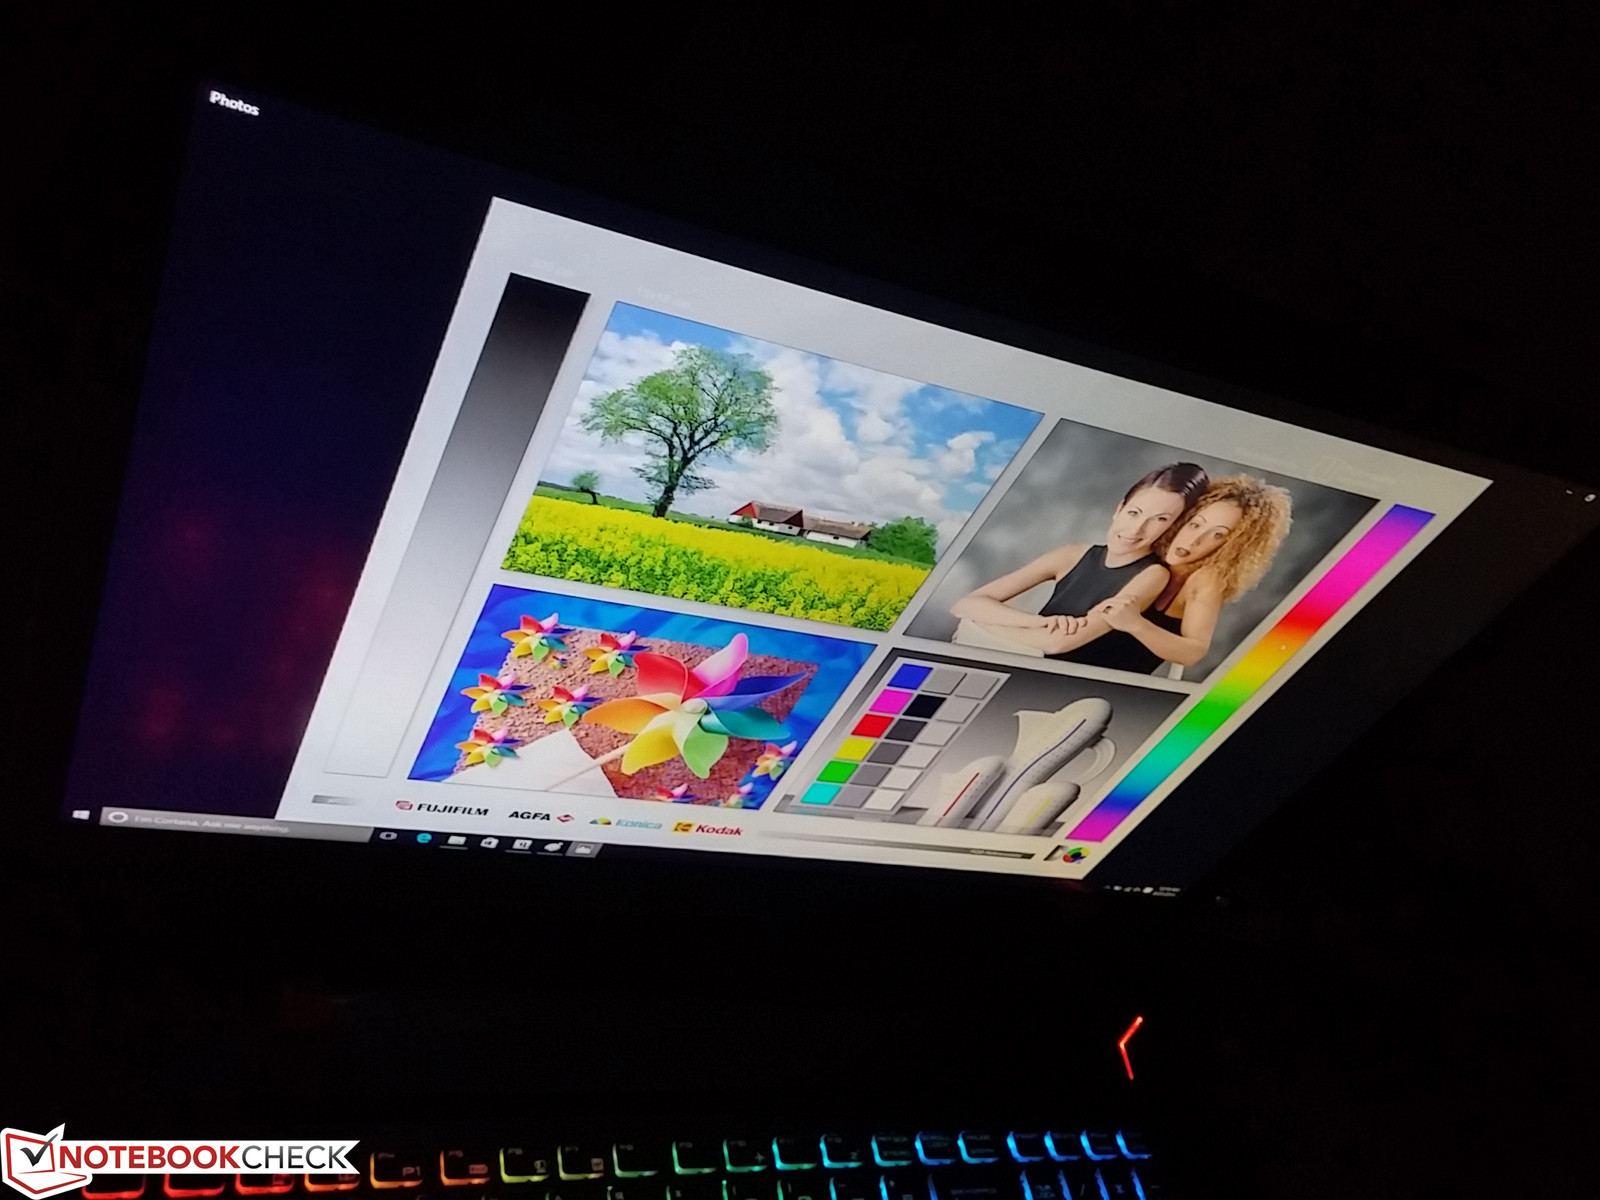
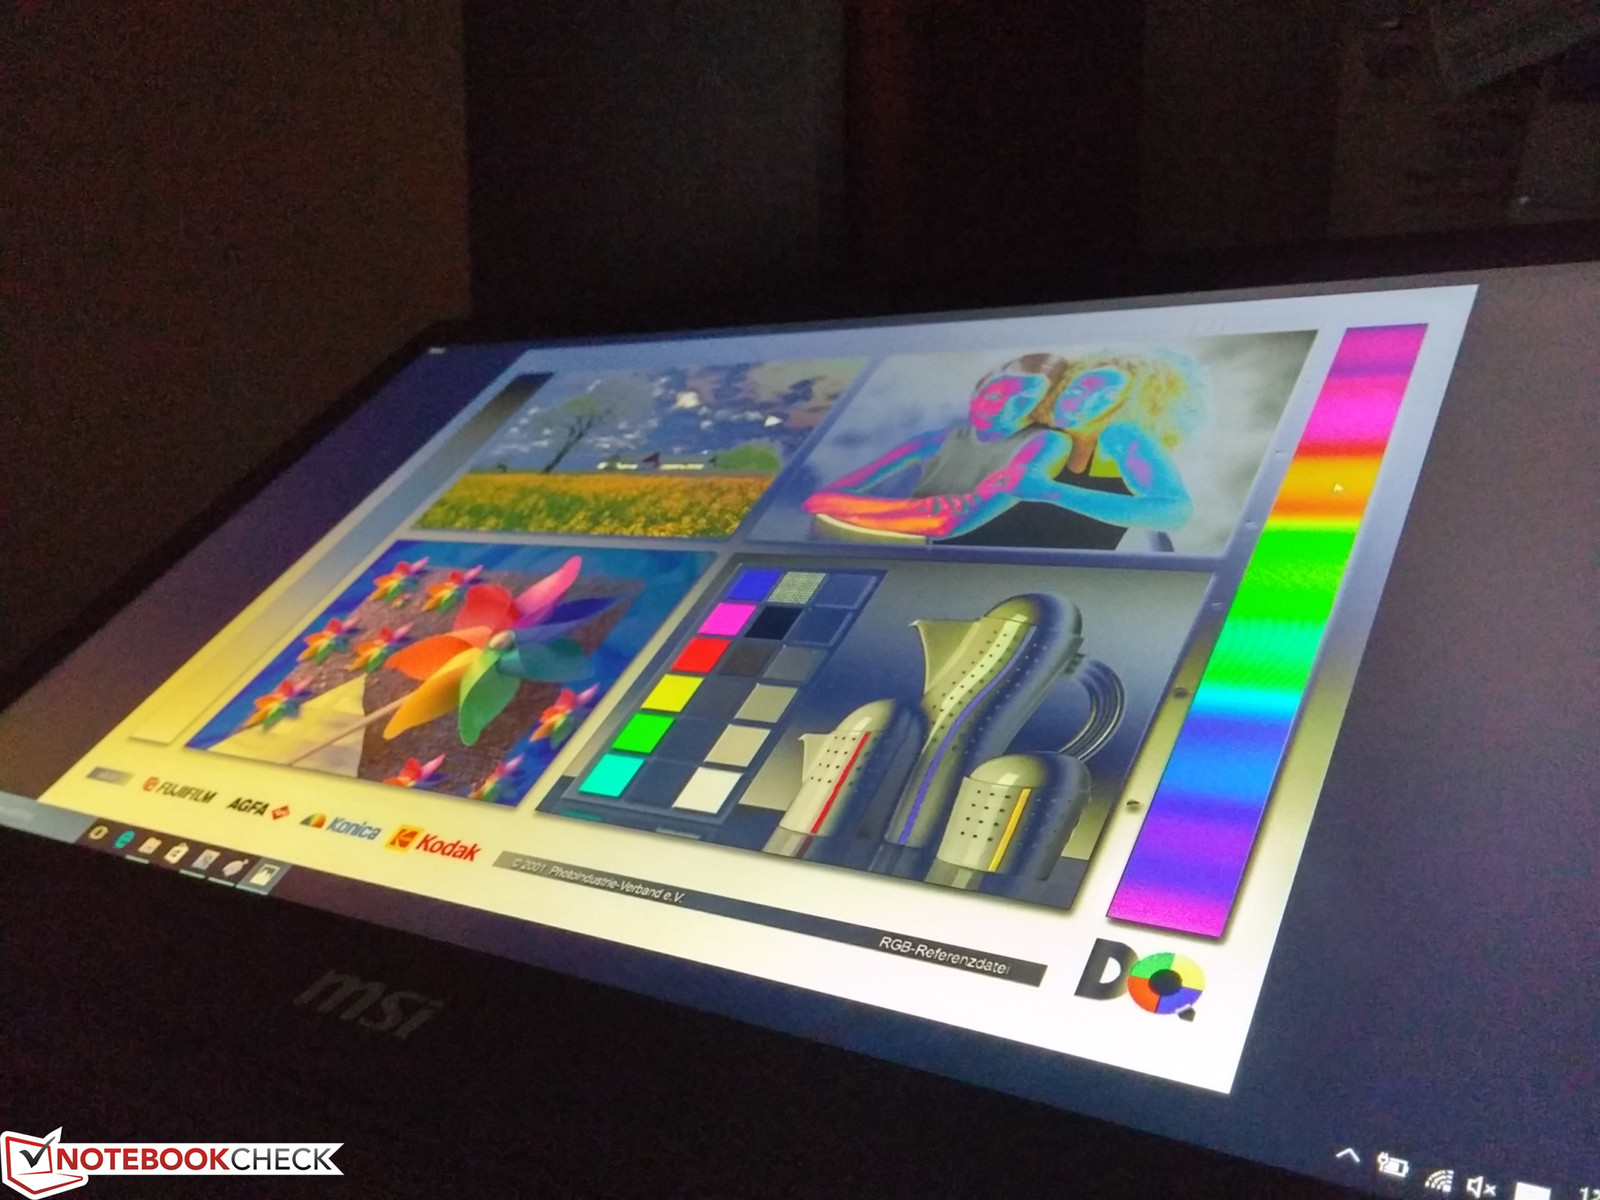
Outdoor visibility is average if working under shade and the TN panel doesn't pair well with the maximum hinge angle of about 150 degrees. The matte panel reduces glare, but the screen washes out easily from sunlight or on an overcast day. The viewing angle limitation of TN has little impact on the sole user when gaming under indoor ambient lighting conditions. Note that apparent brightness will also drop noticeably if not viewing directly at the display, so bumping up the brightness setting is recommended when sharing the screen with others nearby.
Performance
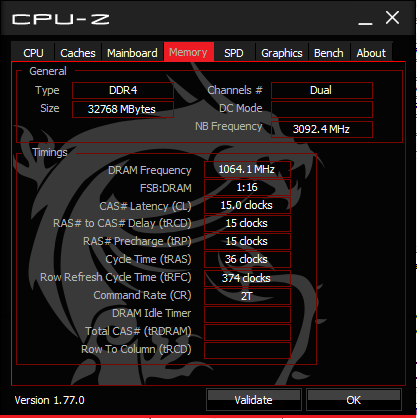
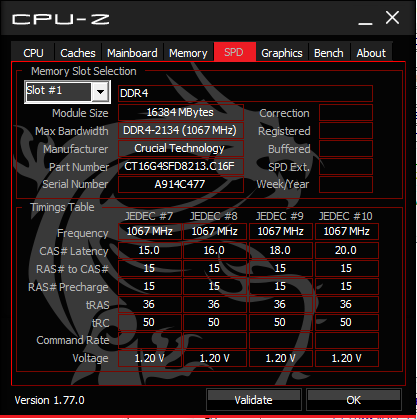
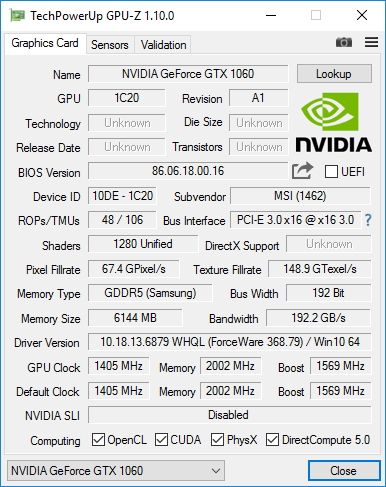
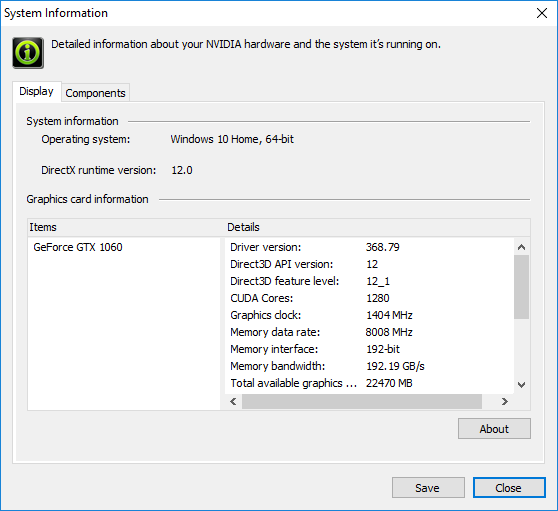
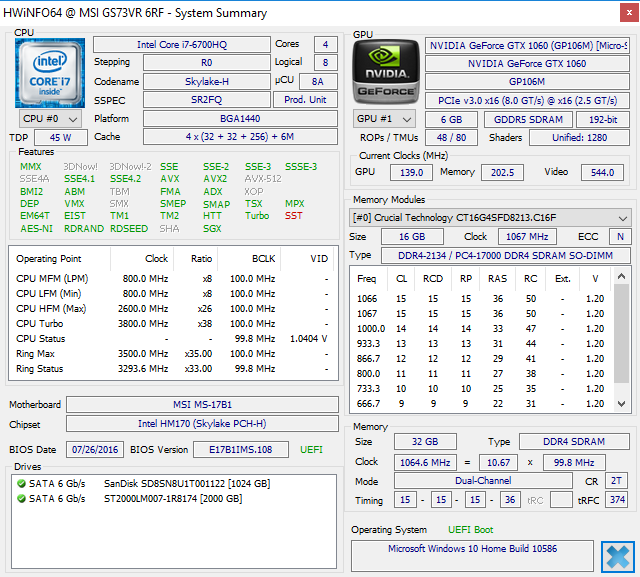
While there are multiple display and storage options available, all GS73VR SKUs thus far ship with the same Core i7-6700HQ CPU and GeForce GTX 1060 GPU. Optimus is supported for switching to the integrated HD Graphics 530 when desired, but there are no G-Sync options across the series. DDR4 RAM at 2400 MHz can be configured up to 32 GB across two SODIMM slots not unlike its GS70 predecessor. Thus, the core performance differences between the GS73VR and the GS70 lie almost exclusively on the GPU update.
Processor
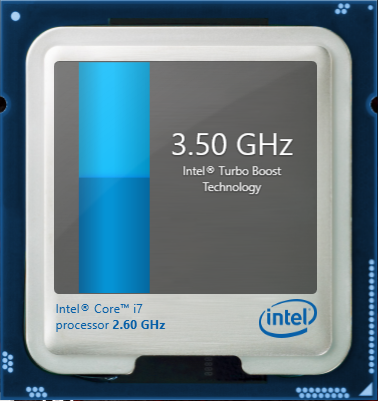
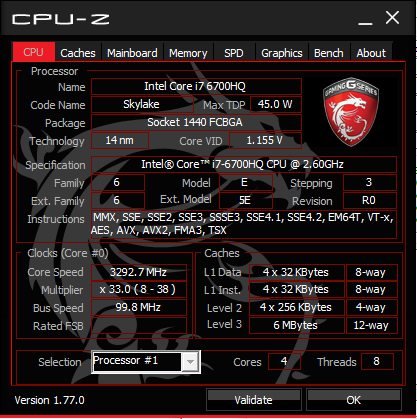
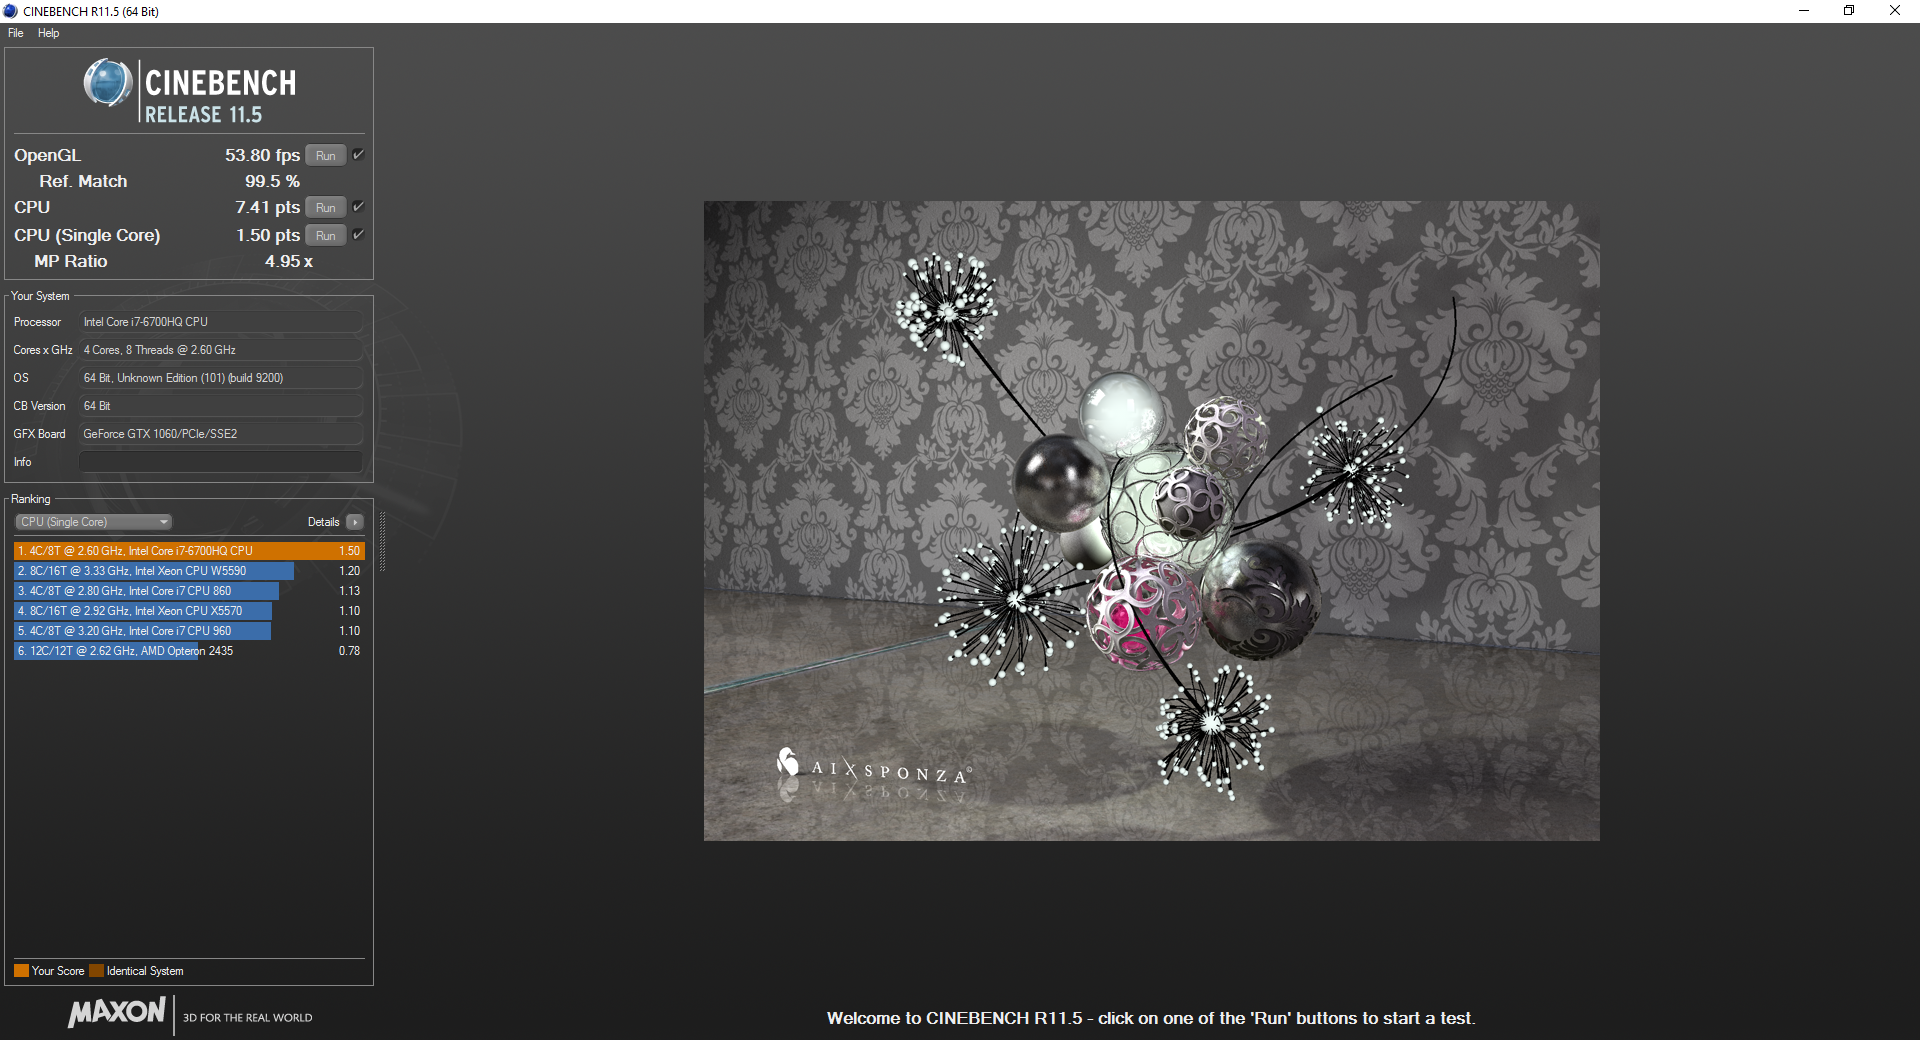
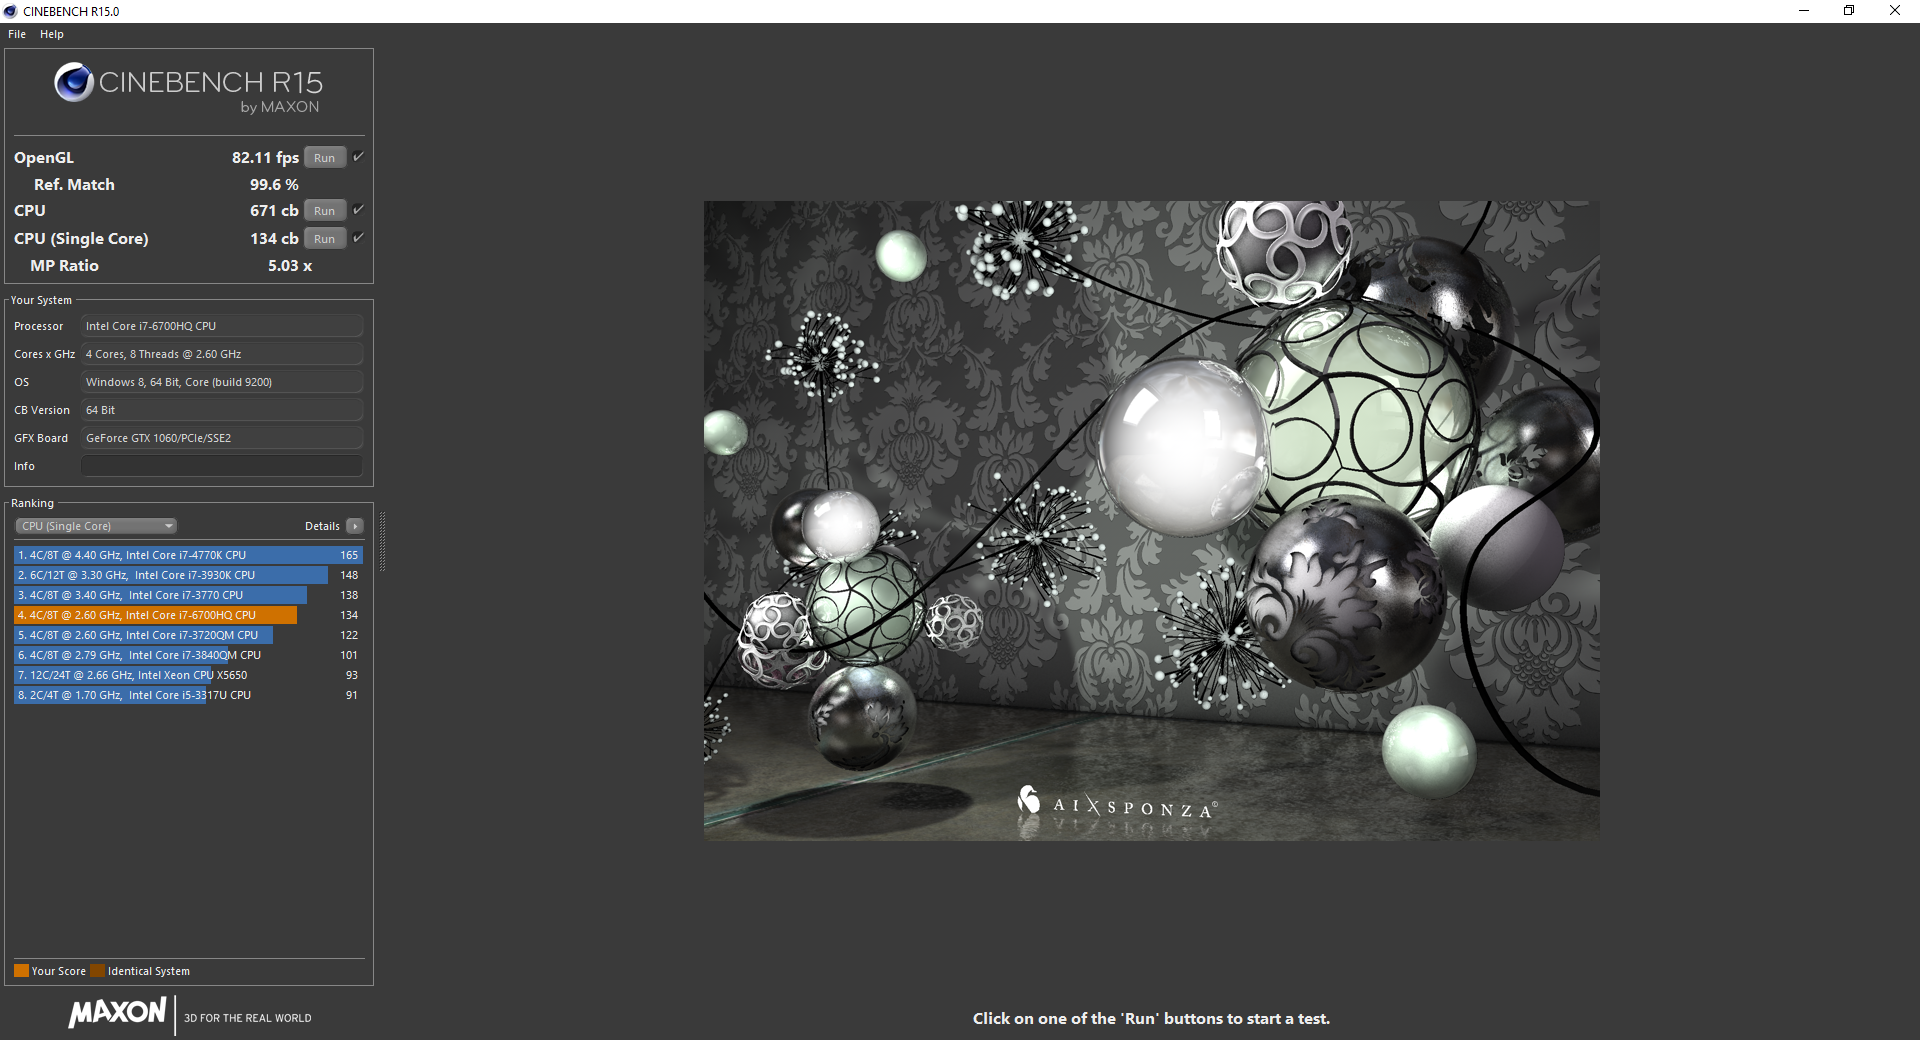
The i7-6700HQ is a common find on gaming notebooks and high-end multimedia machines including the XPS 15 9550. Thus, its performance has been well documented in our database and it carries no surprises here on the GS73VR. Users can expect the processor to perform just as fast as the Broadwell i7-5700HQ and only a tad faster than the Haswell i7-4700HQ as the Skylake generation focuses more on performance-per-Watt and integrated GPU power than any significant boosts to CPU performance. The desktop-class Core i7-6700K is about 30 percent faster than the i7-6700HQ according to CineBench benchmarks.
See our dedicated CPU page on the Core i7-6700HQ for more technical information and benchmark comparisons.
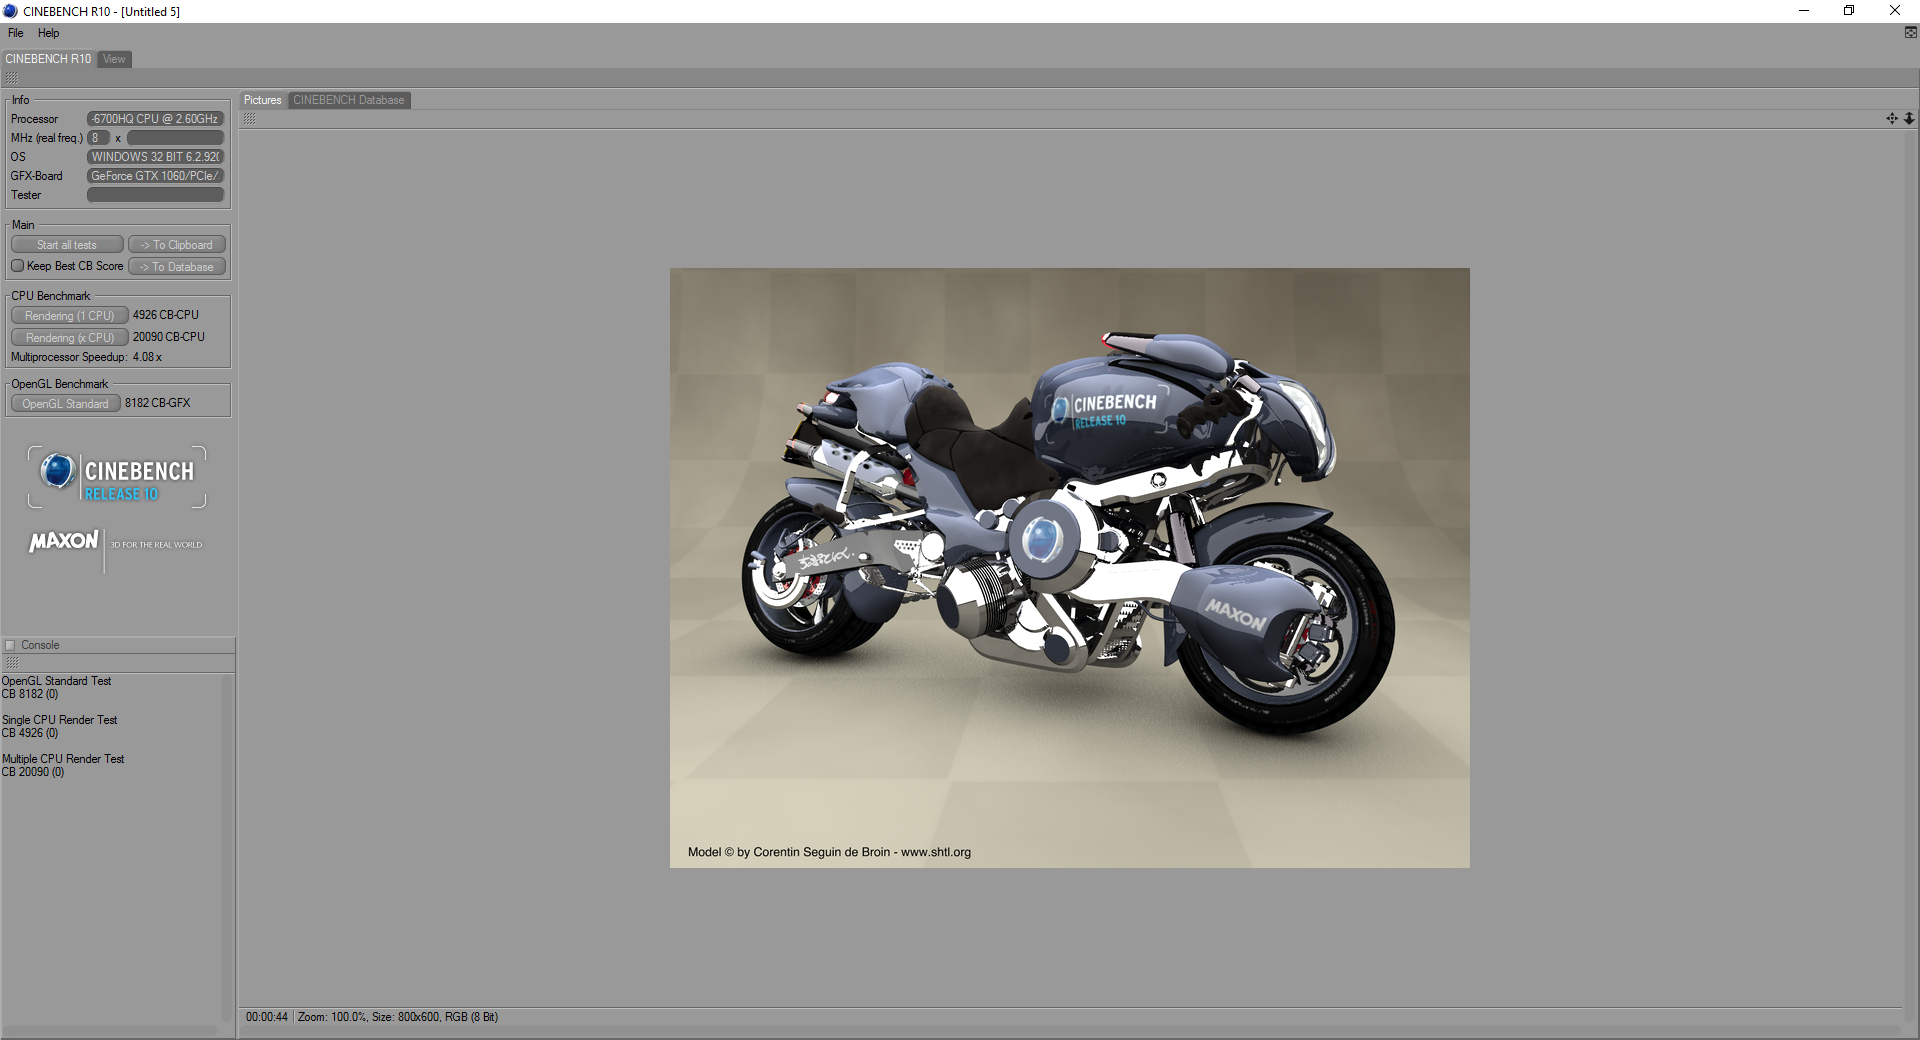
| Cinebench R10 | |
| Rendering Multiple CPUs 32Bit | |
| Eurocom Sky DLX7 | |
| MSI PX60 QD-034US | |
| MSI GS73VR 6RF | |
| Lenovo ThinkPad P40 Yoga 20GQ-000EUS | |
| Rendering Single 32Bit | |
| Eurocom Sky DLX7 | |
| MSI PX60 QD-034US | |
| Lenovo ThinkPad P40 Yoga 20GQ-000EUS | |
| MSI GS73VR 6RF | |
| wPrime 2.10 - 1024m | |
| Lenovo ThinkPad P40 Yoga 20GQ-000EUS | |
| MSI GS73VR 6RF | |
| MSI PX60 QD-034US | |
| Eurocom Sky DLX7 | |
| Super Pi Mod 1.5 XS 32M - 32M | |
| MSI GS73VR 6RF | |
| Lenovo ThinkPad P40 Yoga 20GQ-000EUS | |
| MSI PX60 QD-034US | |
| Eurocom Sky DLX7 | |
* ... smaller is better
System Performance
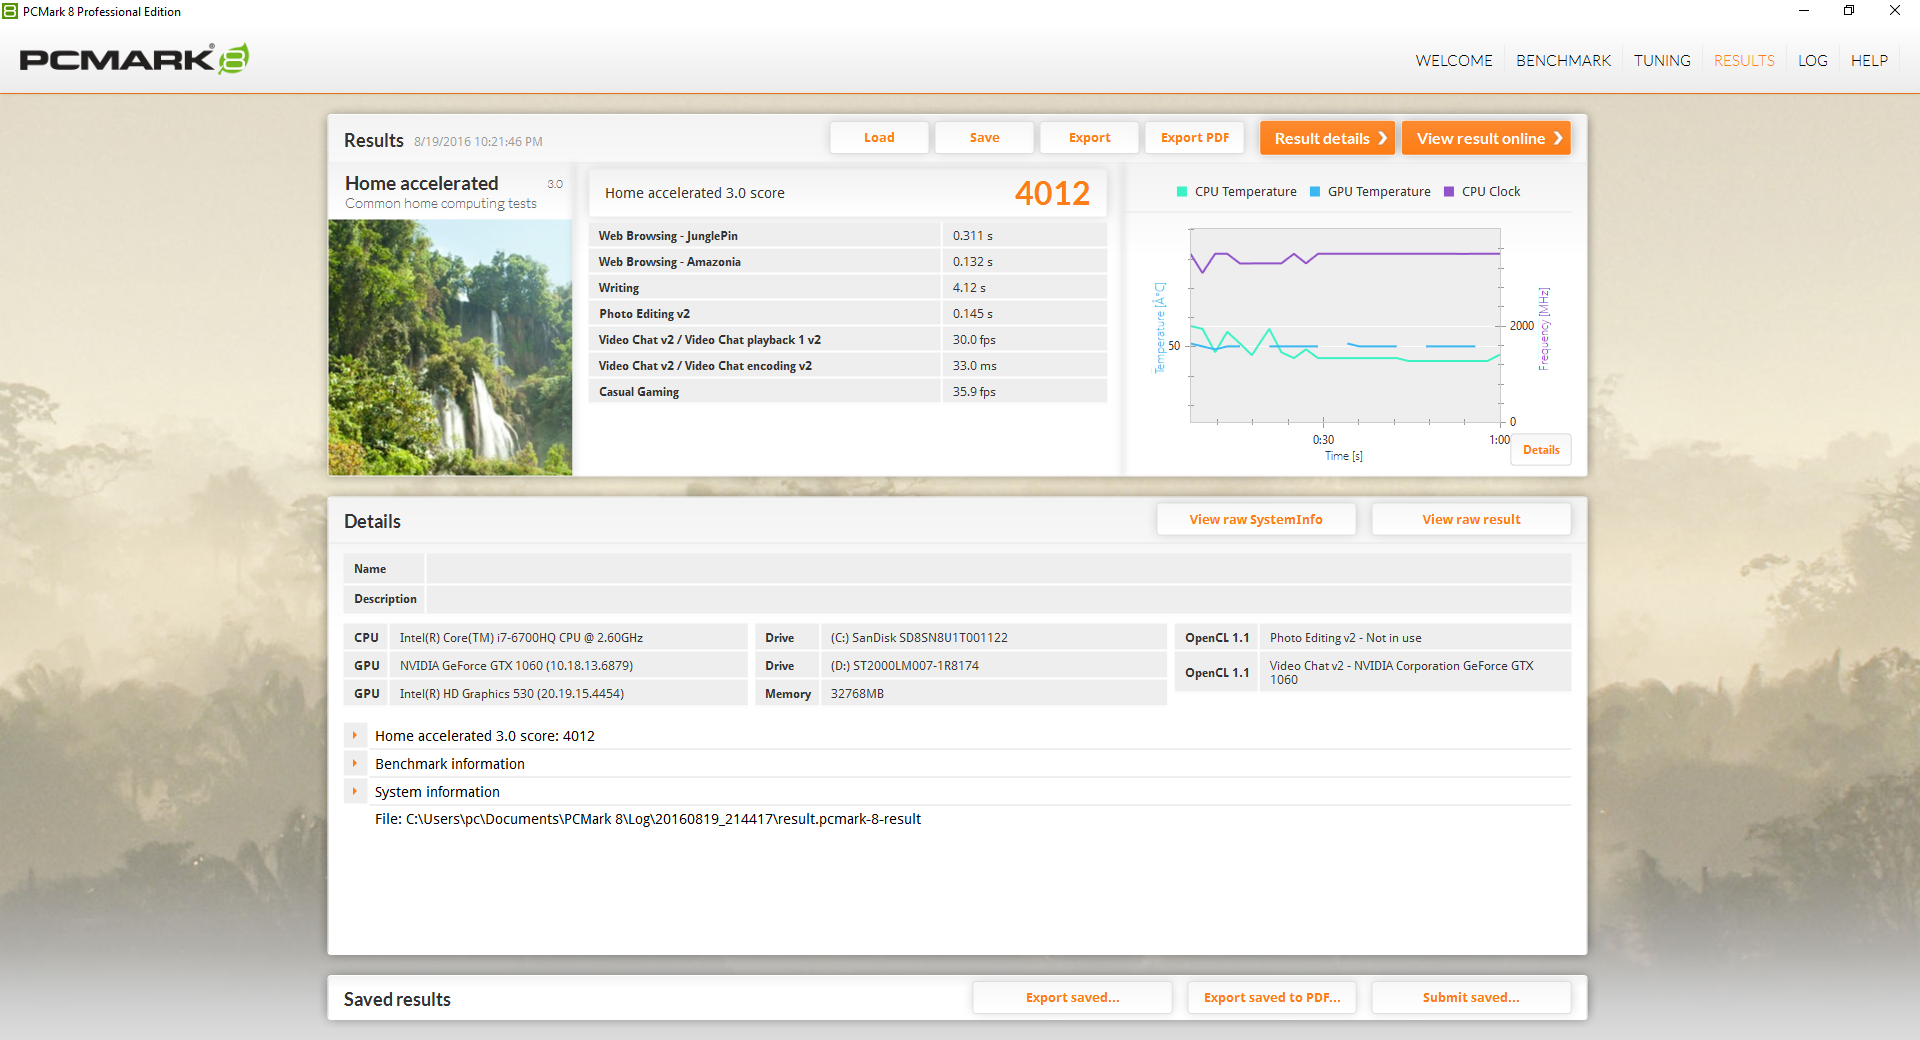
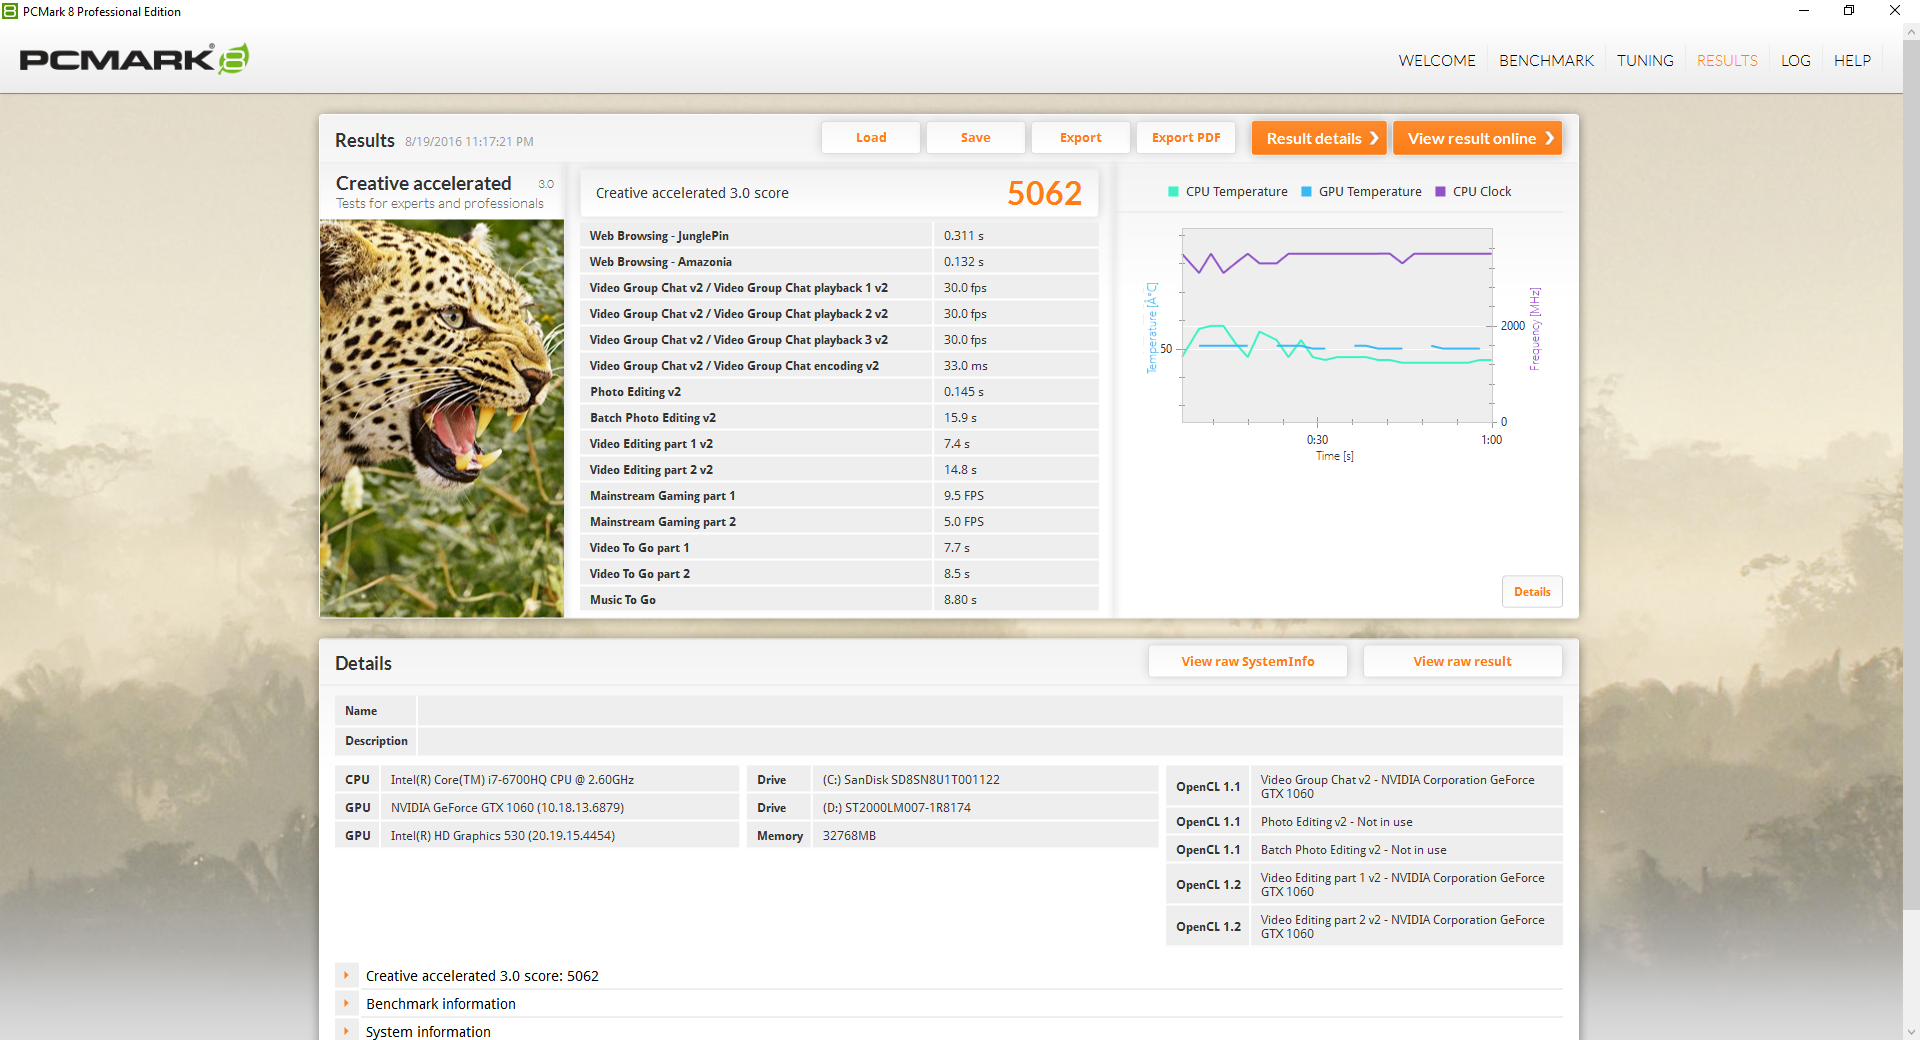
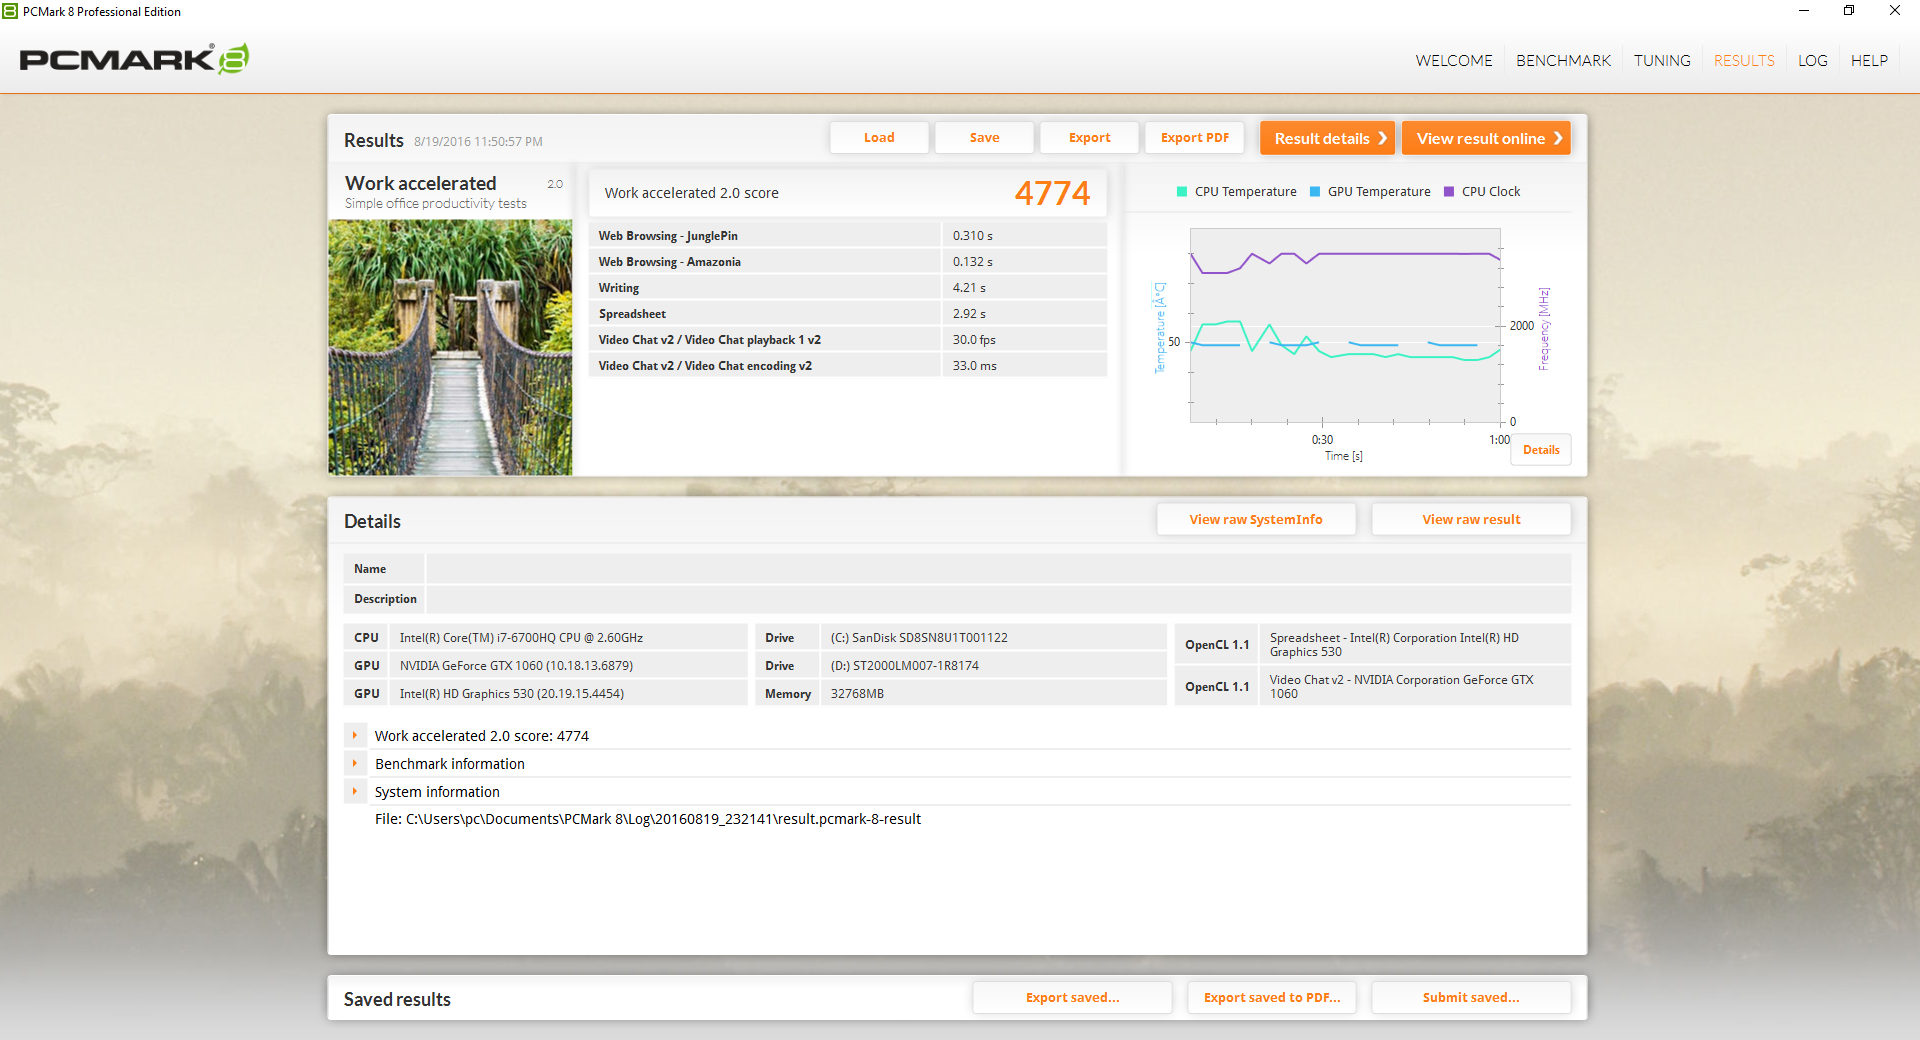
PCMark 8 ranks our system in the same ballpark as previous generation gaming machines including the GS70 and Aorus X5S. Larger gaming systems like the GT72S, Asus G752VY, and Eurocom DLX7 score noticeably higher than the GS73. System responsiveness is still fast due to the primary SSD and we experienced no abnormal software or hardware issues during our time with the unit.
| PCMark 8 | |
| Home Score Accelerated v2 | |
| Asus G752VY-RH71 | |
| MSI GS73VR 6RF | |
| MSI GS70-6QE16H21 | |
| Razer Blade Pro 17 inch 2015 | |
| Aorus X5S v5 | |
| Work Score Accelerated v2 | |
| Asus G752VY-RH71 | |
| MSI GS70-6QE16H21 | |
| MSI GS73VR 6RF | |
| Razer Blade Pro 17 inch 2015 | |
| Aorus X5S v5 | |
| Creative Score Accelerated v2 | |
| Asus G752VY-RH71 | |
| MSI GS73VR 6RF | |
| MSI GS70-6QE16H21 | |
| Aorus X5S v5 | |
| Razer Blade Pro 17 inch 2015 | |
| PCMark 8 Home Score Accelerated v2 | 4012 points | |
| PCMark 8 Creative Score Accelerated v2 | 5062 points | |
| PCMark 8 Work Score Accelerated v2 | 4774 points | |
Help | ||
Storage Devices
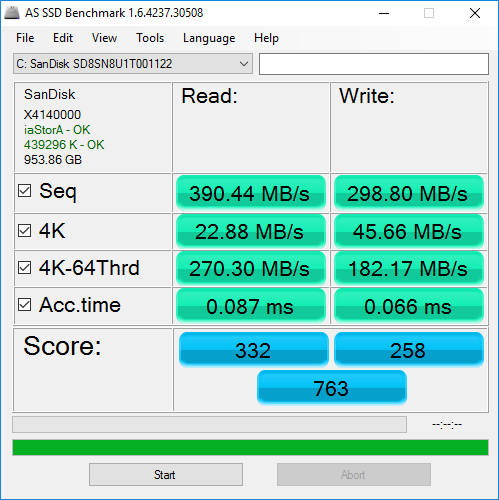
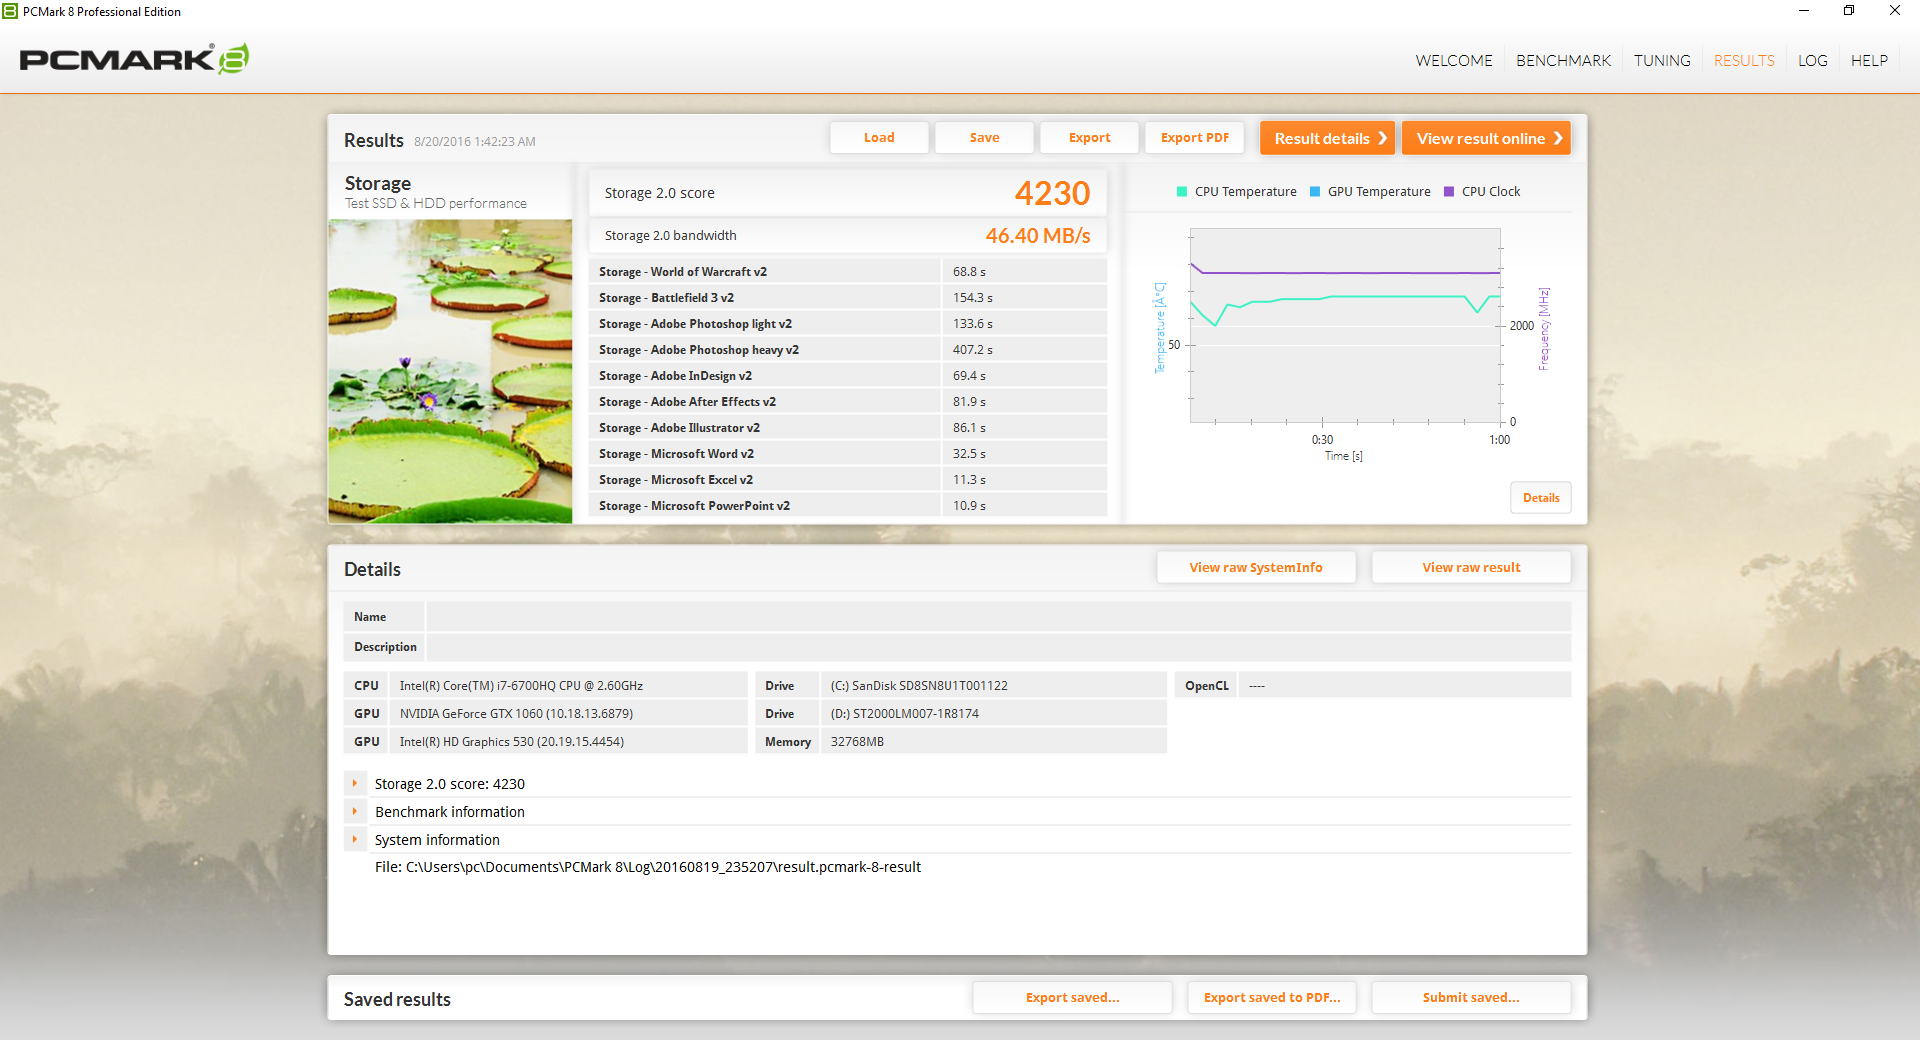
The GS70 series has jumped from mSATA RAID 0 in the original GS70 2QE to optional NVMe M.2 in the GS70 6QE and the GS73VR. While RAID capabilities have been dropped, its necessity is arguable here considering the form factor and already fast speeds of the NVMe controller. Our test model utilizes a 1 TB SanDisk SD8SN8U1T001122 M.2 SSD on a SATA III controller and a secondary 5400 RPM 2 TB Seagate HDD. Only 7 mm HDDs and SSDs will fit in this slot due to the thinness of the chassis.
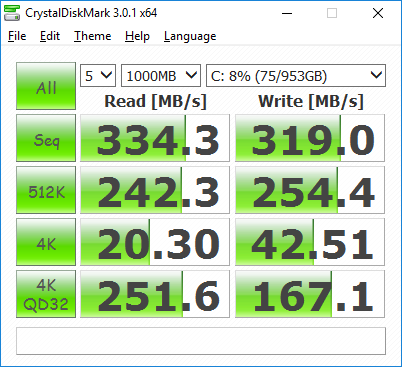
Transfer rates from the primary M.2 SSD are average at best even for a drive limited by the SATA III interface. The older Samsung PM851 Series MZMTE256HMHP in our Razer Blade 17, for example, outperforms the SanDisk in our MSI by wide margins according to CrystalDiskMark. Sequential read and write rates both average in the low 300 MB/s range while NVMe-enabled systems reach four digit transfer rates with ease.
See our growing table of HDDs and SSDs for more benchmark comparisons.
| MSI GS73VR 6RF SanDisk SD8SN8U1T001122 | Aorus X5S v5 Samsung SM951 MZVPV256 m.2 | MSI GT72S-6QEG16SR421BW Toshiba NVMe THNSN5256GPU7 | Asus G752VY-RH71 Samsung SSD 950 Pro 512GB m.2 NVMe | Razer Blade Pro 17 inch 2015 Samsung PM851 Series MZMTE256HMHP | |
|---|---|---|---|---|---|
| CrystalDiskMark 3.0 | 263% | 256% | 298% | 62% | |
| Read Seq (MB/s) | 334.3 | 1748 423% | 1602 379% | 2007 500% | 527 58% |
| Write Seq (MB/s) | 319 | 1272 299% | 1062 233% | 1536 382% | 265.9 -17% |
| Read 512 (MB/s) | 242.3 | 993 310% | 1110 358% | 1022 322% | 445.9 84% |
| Write 512 (MB/s) | 254.4 | 1263 396% | 1095 330% | 1510 494% | 265.9 5% |
| Read 4k (MB/s) | 20.3 | 51.9 156% | 44.74 120% | 51.6 154% | 36.83 81% |
| Write 4k (MB/s) | 42.51 | 146.5 245% | 162.3 282% | 150.2 253% | 116 173% |
| Read 4k QD32 (MB/s) | 251.6 | 628 150% | 682 171% | 576 129% | 389 55% |
| Write 4k QD32 (MB/s) | 167.1 | 370.4 122% | 459.5 175% | 413.7 148% | 266.5 59% |

GPU Performance
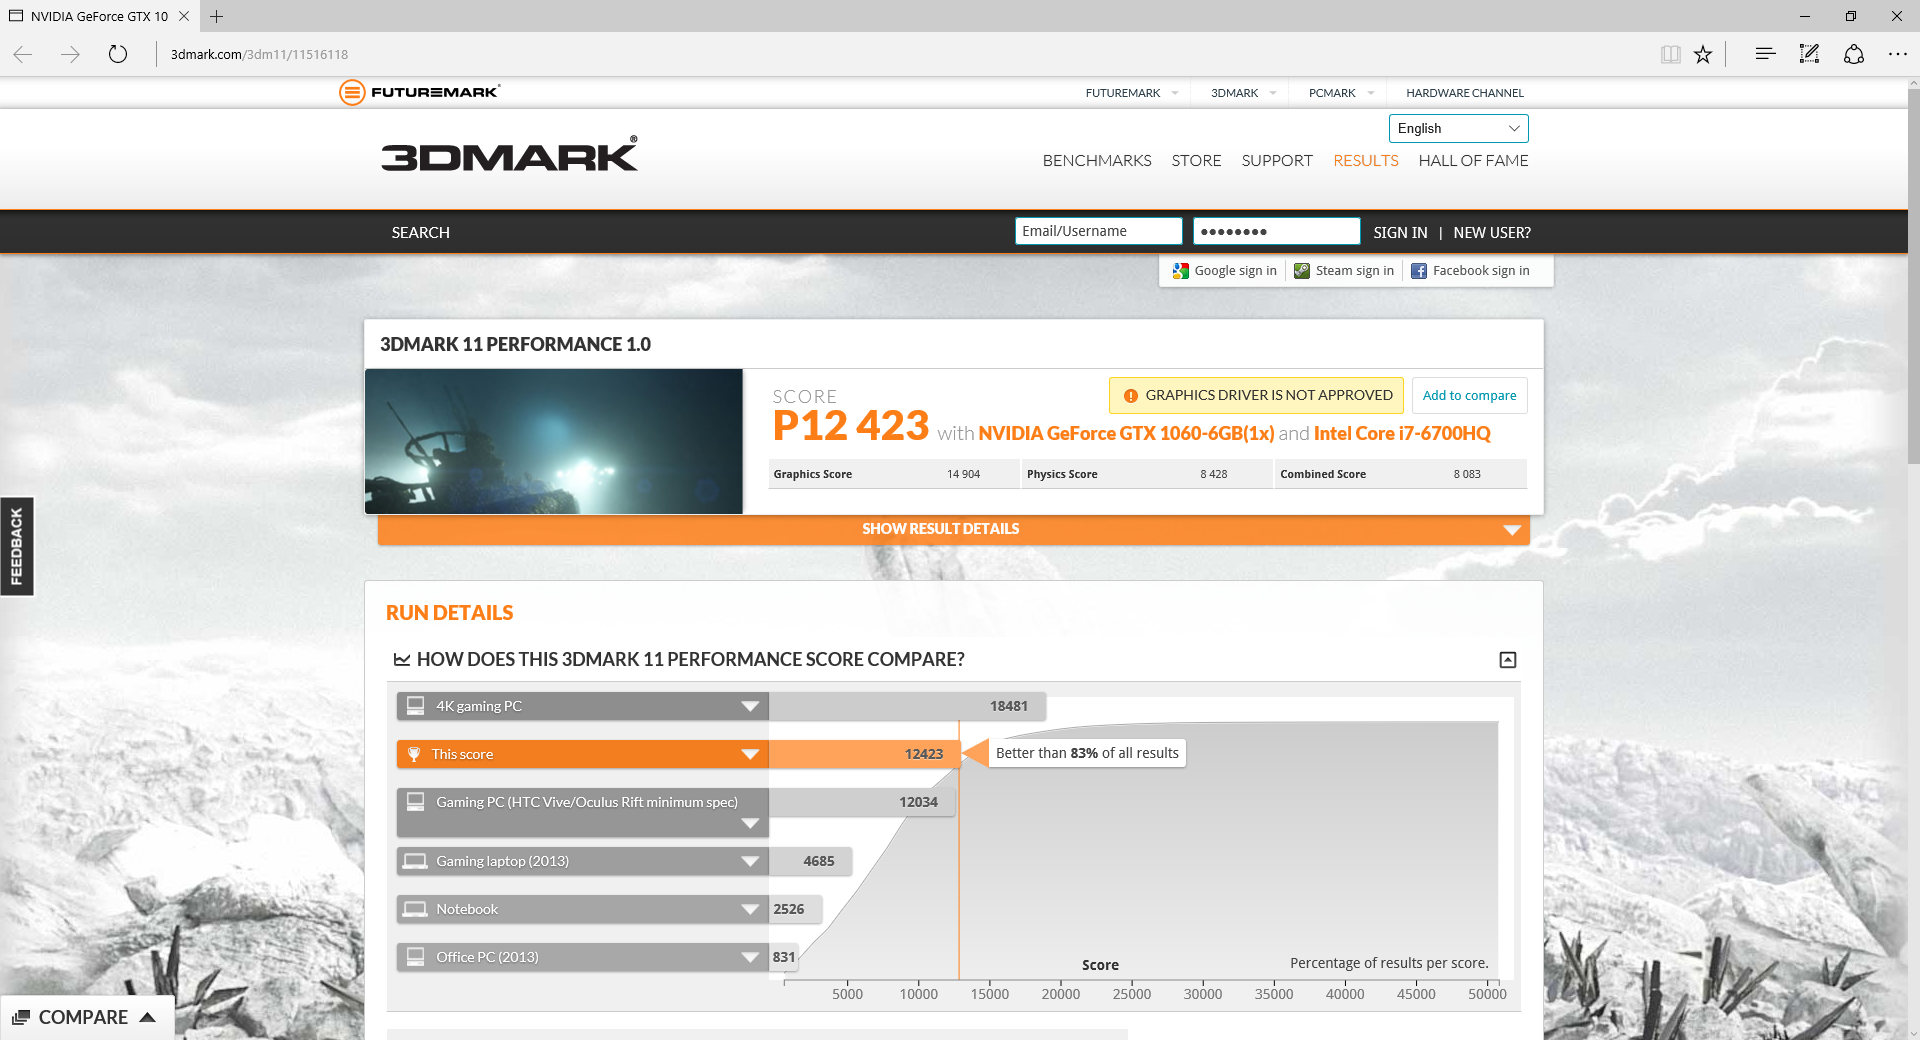
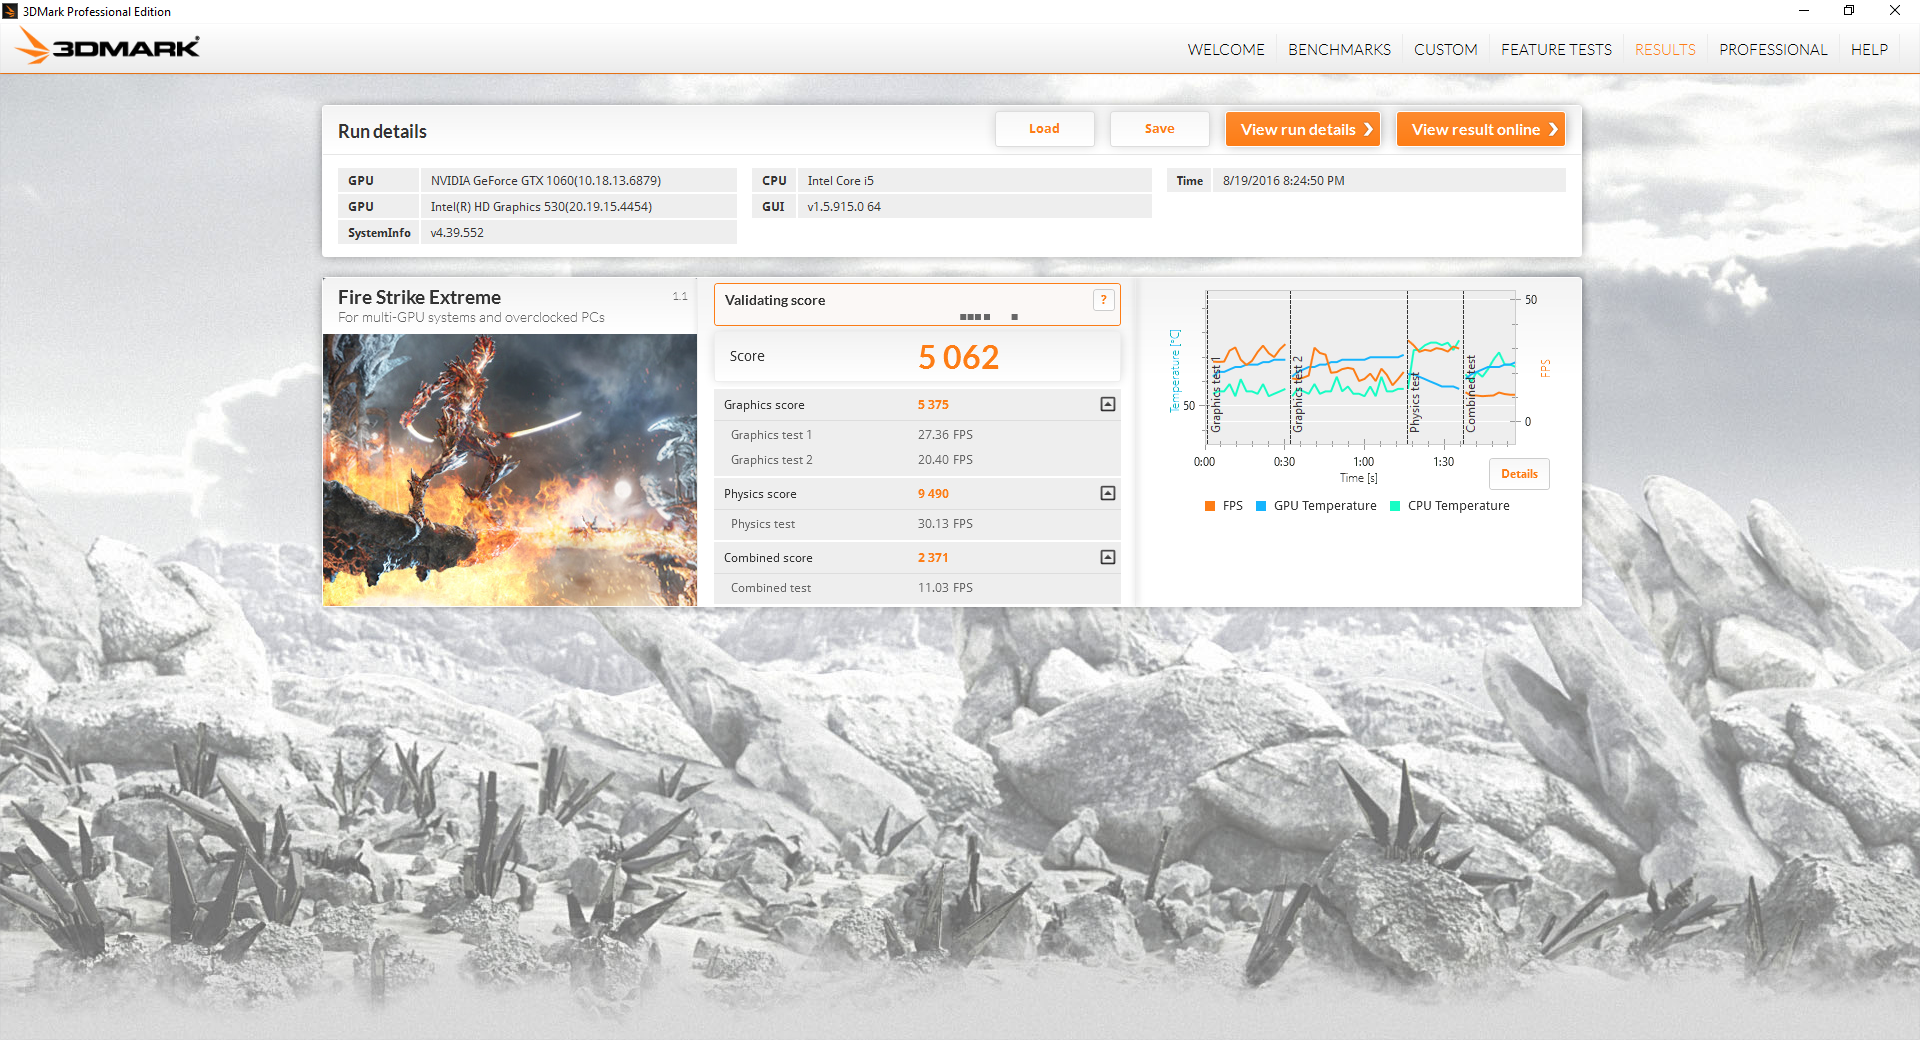
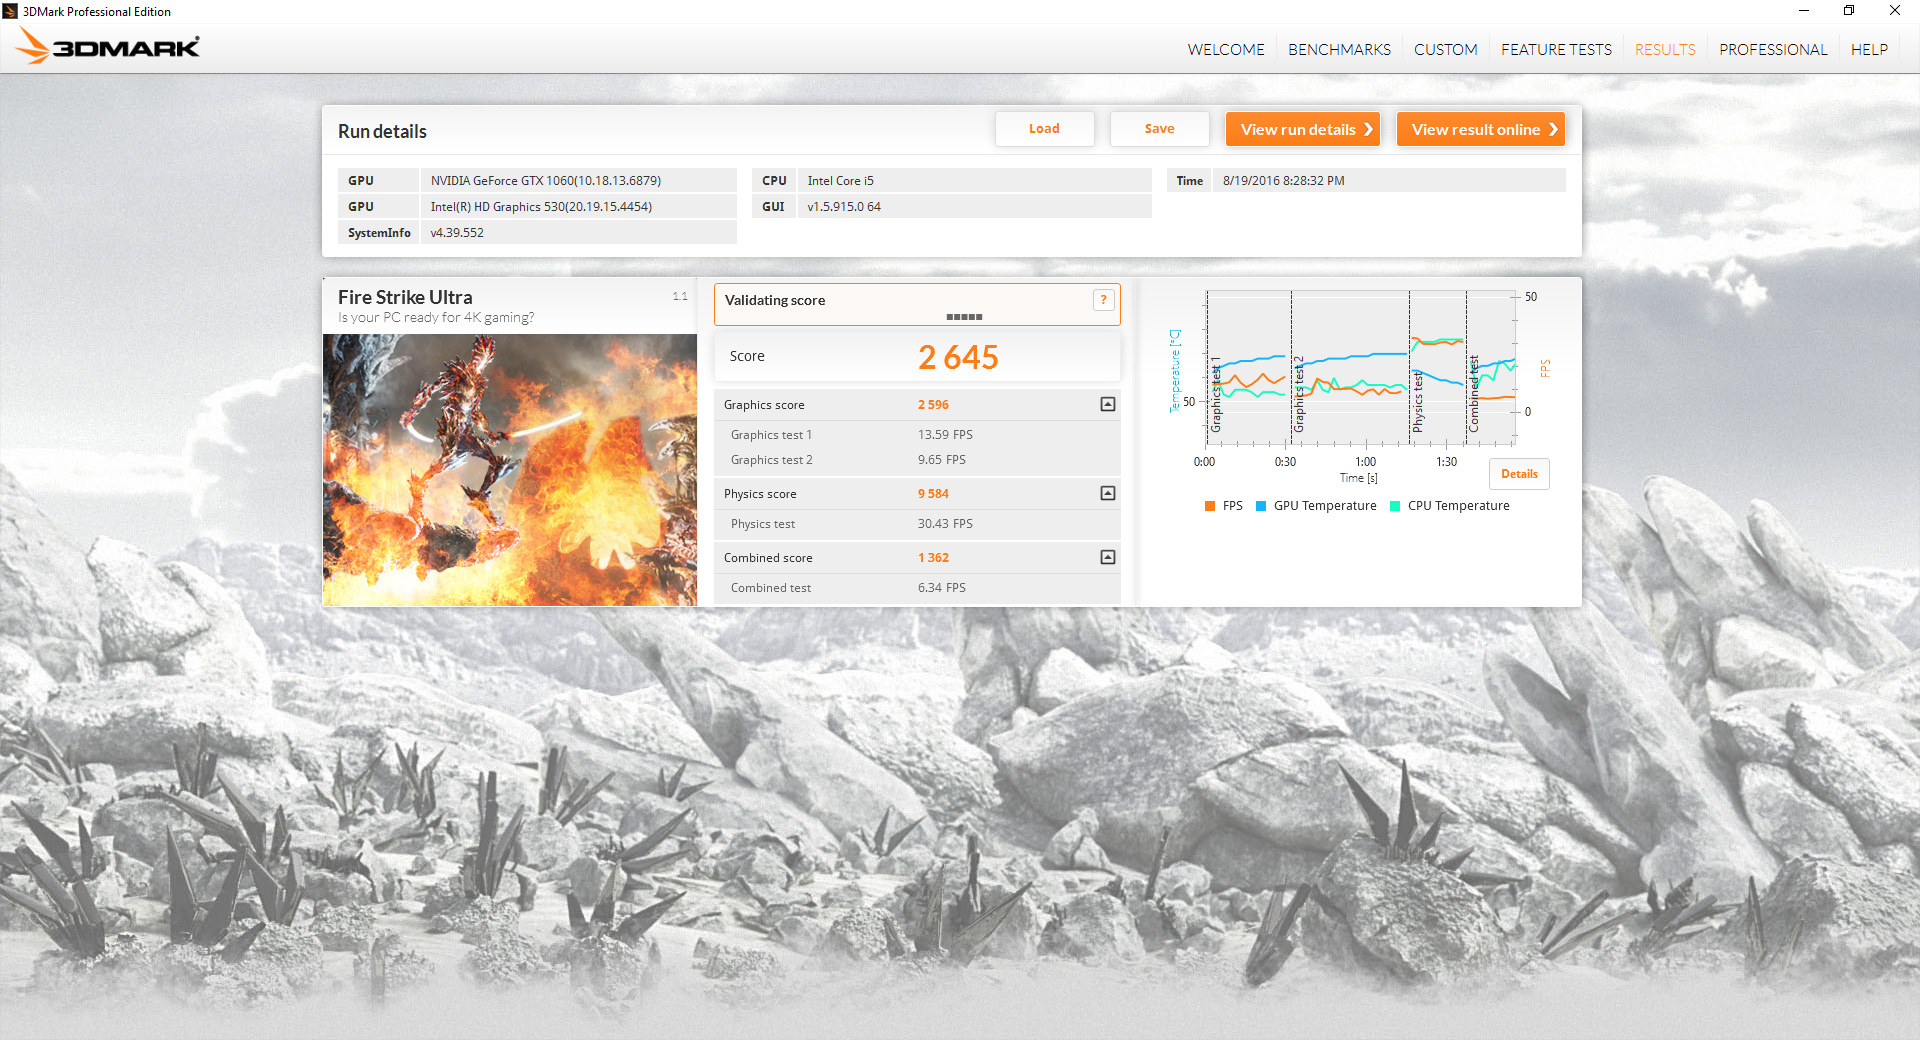
The GTX 1060 was designed to compete directly against the AMD RX 480. As a result, it aims to be the perfect solution for 1080p60 gaming and our raw benchmark scores on 3DMark show it to be just as impressive as its faster Pascal siblings. Fire Strike scores are about 20 percent higher than the GTX 980M and about 15 percent slower than the notebook version of the GTX 980. An entry-level GTX GPU outperforming the mobile GTX leader of the previous generation is a noteworthy feat. Jumping to the GTX 1070 will provide a very large raw GPU performance boost of about 50 percent since the 1070 and 1080 series cater to native 4K gaming.

| 3DMark | |
| 1920x1080 Fire Strike Graphics | |
| Asus G752VS-XB78K | |
| Aorus X7 Pro v5 | |
| Asus G701VO-CS74K | |
| MSI GS73VR 6RF | |
| Aorus X5S v5 | |
| HP Pavilion 15 UHD T9Y85AV | |
| Fire Strike Extreme Graphics | |
| Asus G752VS-XB78K | |
| Asus G701VO-CS74K | |
| MSI GS73VR 6RF | |
| Aorus X5S v5 | |
| HP Pavilion 15 UHD T9Y85AV | |
| 3840x2160 Fire Strike Ultra Graphics | |
| Asus G752VS-XB78K | |
| Asus G701VO-CS74K | |
| MSI GS73VR 6RF | |
| Aorus X5S v5 | |
| HP Pavilion 15 UHD T9Y85AV | |
| 3DMark 11 | |
| 1280x720 Performance GPU | |
| Asus G752VS-XB78K | |
| Aorus X7 Pro v5 | |
| Asus G701VO-CS74K | |
| MSI GS73VR 6RF | |
| Aorus X5S v5 | |
| HP Pavilion 15 UHD T9Y85AV | |
| 1280x720 Performance Combined | |
| Asus G752VS-XB78K | |
| Asus G701VO-CS74K | |
| Aorus X7 Pro v5 | |
| MSI GS73VR 6RF | |
| Aorus X5S v5 | |
| HP Pavilion 15 UHD T9Y85AV | |
| 3DMark 11 Performance | 12423 points | |
| 3DMark Ice Storm Standard Score | 88271 points | |
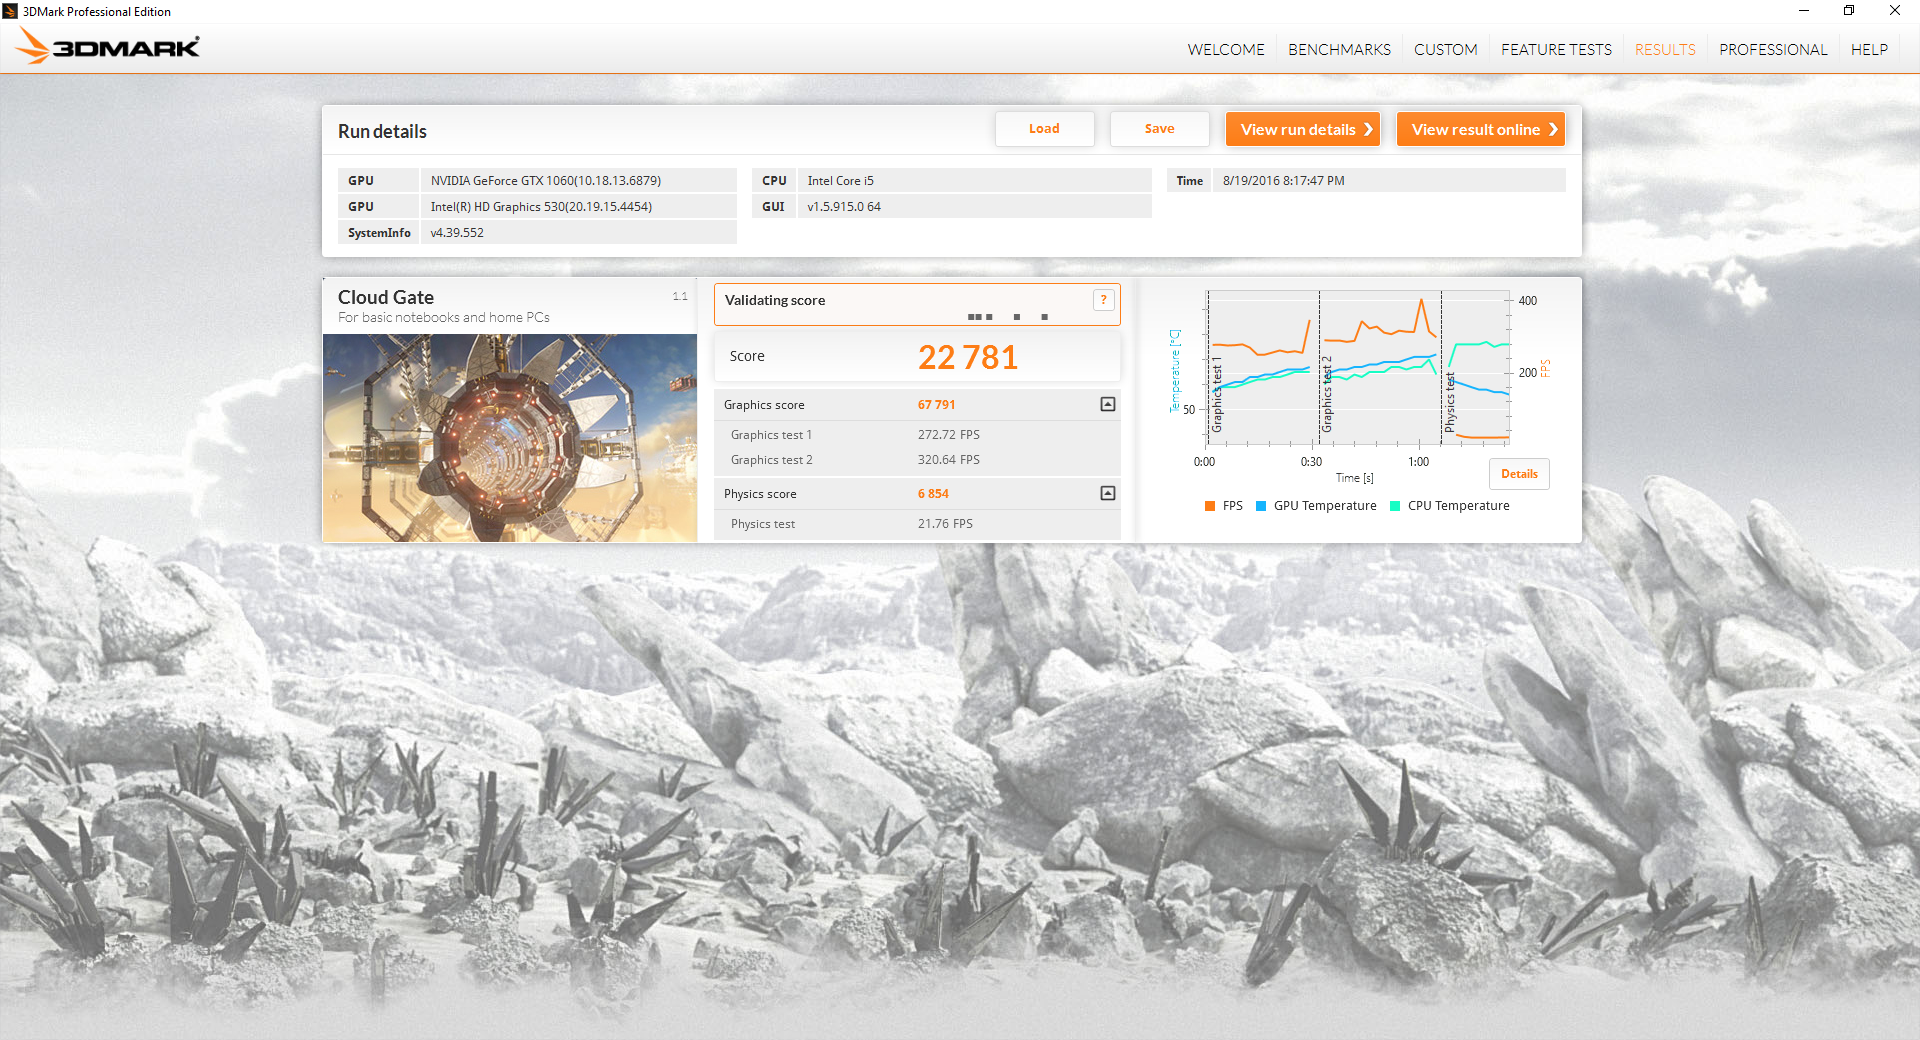
| 3DMark Cloud Gate Standard Score | 22781 points | |
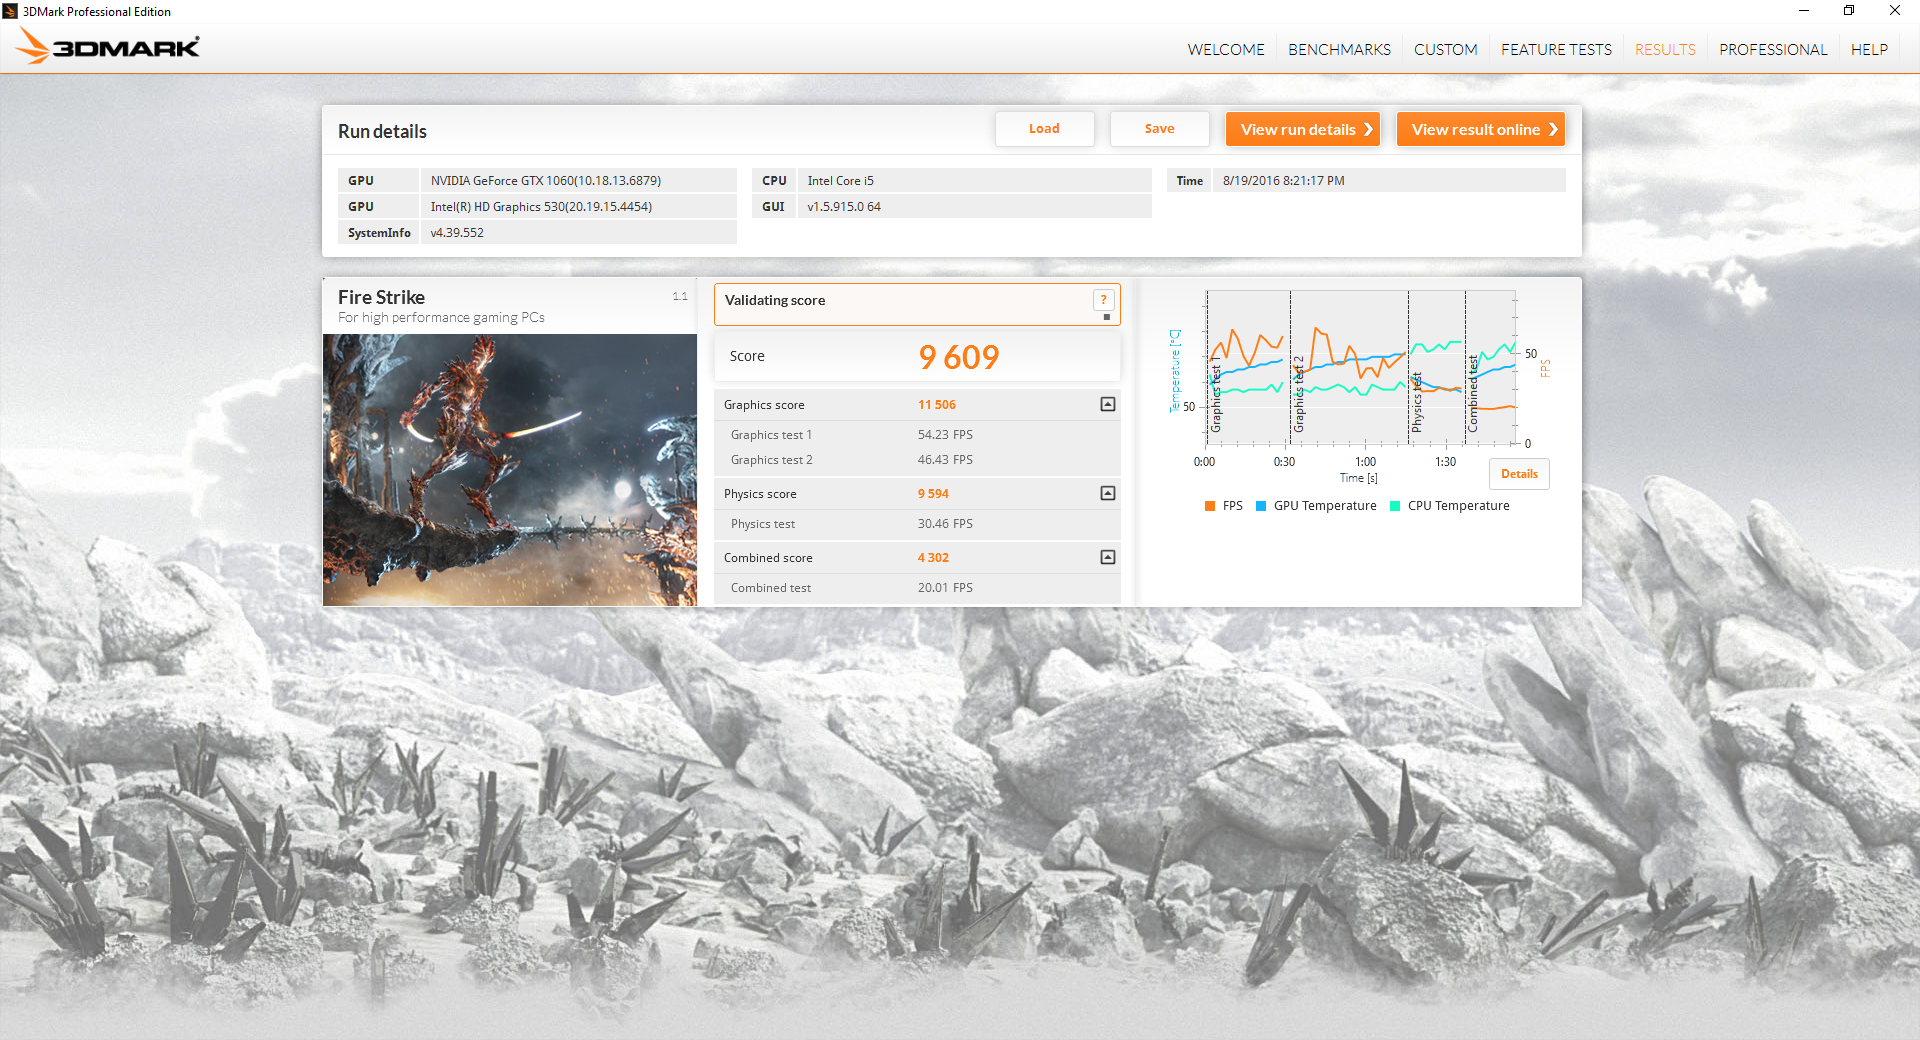
| 3DMark Fire Strike Score | 9609 points | |
| 3DMark Fire Strike Extreme Score | 5062 points | |
Help | ||
Gaming Performance
Nearly all tested titles play at a steady 1080p60 on maximum settings. There are a couple of exceptions including Batman: Arkham Knight, Fallout 4, and Guild Wars 2 (with Super Sampling enabled), but even these demanding titles average in the 50s. Performance matches or exceeds the GTX 980M and falls right below the notebook version of the GTX 980 as predicted by the 3DMark results above. When compared to the GTX 960M that it replaces, the GTX 1060 offers significantly higher frames by triple-digit percentage points.
See our dedicated GPU page on the GTX 1060 for more technical information and benchmark comparisons.
| Batman: Arkham Knight - 1920x1080 High / On AA:SM AF:16x | |
| Asus G752VS-XB78K | |
| Asus G701VO-CS74K | |
| MSI GS73VR 6RF | |
| Aorus X5S v5 | |
| HP Pavilion 15 UHD T9Y85AV | |
| BioShock Infinite - 1920x1080 Ultra Preset, DX11 (DDOF) | |
| Asus G752VS-XB78K | |
| Asus G701VO-CS74K | |
| MSI GS73VR 6RF | |
| Aorus X5S v5 | |
| Aorus X3 Plus v5 | |
| HP Pavilion 15 UHD T9Y85AV | |
| Metro: Last Light - 1920x1080 Very High (DX11) AF:16x | |
| Asus G701VO-CS74K | |
| MSI GS73VR 6RF | |
| Aorus X5S v5 | |
| Aorus X3 Plus v5 | |
| HP Pavilion 15 UHD T9Y85AV | |
| Thief - 1920x1080 Very High Preset AA:FXAA & High SS AF:8x | |
| Asus G752VS-XB78K | |
| Asus G701VO-CS74K | |
| MSI GS73VR 6RF | |
| Aorus X5S v5 | |
| Aorus X3 Plus v5 | |
| HP Pavilion 15 UHD T9Y85AV | |
| Metal Gear Solid V - 1920x1080 Extra High / On | |
| Aorus X5S v5 | |
| Asus G701VO-CS74K | |
| MSI GS73VR 6RF | |
| Aorus X3 Plus v5 | |
| HP Pavilion 15 UHD T9Y85AV | |
| Fallout 4 - 1920x1080 Ultra Preset AA:T AF:16x | |
| Asus G701VO-CS74K | |
| MSI GS73VR 6RF | |
| Aorus X5S v5 | |
| Aorus X3 Plus v5 | |
| HP Pavilion 15 UHD T9Y85AV | |
| Rise of the Tomb Raider - 1920x1080 Very High Preset AA:FX AF:16x | |
| Asus G752VS-XB78K | |
| MSI GS73VR 6RF | |
| Asus G701VO-CS74K | |
| Aorus X5S v5 | |
| HP Pavilion 15 UHD T9Y85AV | |
| Doom - 1920x1080 Ultra Preset AA:SM | |
| Asus G701VO-CS74K | |
| MSI GS73VR 6RF | |
| Overwatch - 1920x1080 Epic (Render Scale 100 %) AA:SM AF:16x | |
| Asus G701VO-CS74K | |
| MSI GS73VR 6RF | |
| HP Pavilion 15 UHD T9Y85AV | |
| low | med. | high | ultra | |
|---|---|---|---|---|
| Guild Wars 2 (2012) | 51.4 | |||
| BioShock Infinite (2013) | 156.9 | 100 | ||
| Metro: Last Light (2013) | 116 | 77.4 | ||
| Thief (2014) | 77.5 | 65.7 | ||
| Batman: Arkham Knight (2015) | 78 | 57 | ||
| Metal Gear Solid V (2015) | 60 | |||
| Fallout 4 (2015) | 57.1 | |||
| Rise of the Tomb Raider (2016) | 72.4 | 61.4 | ||
| Doom (2016) | 84.1 | 76.3 | ||
| Overwatch (2016) | 102.1 |
Stress Test
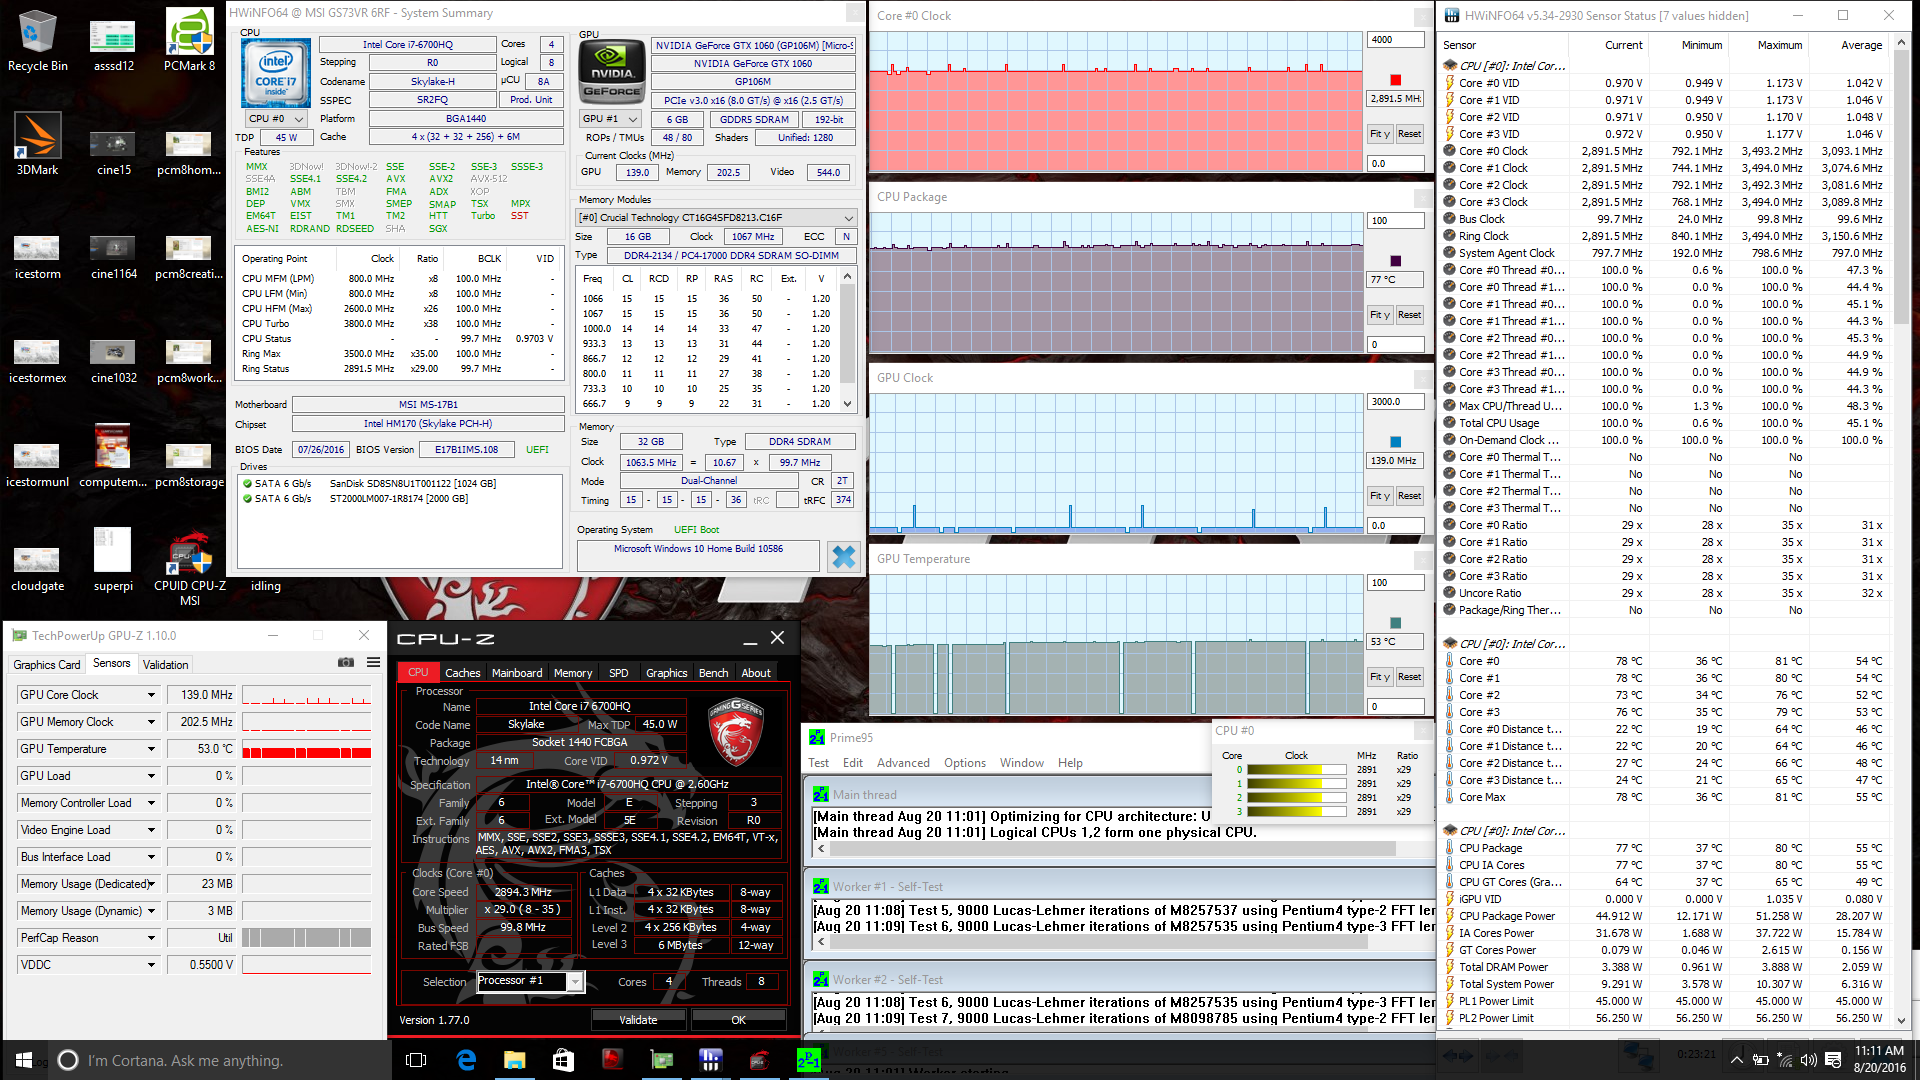
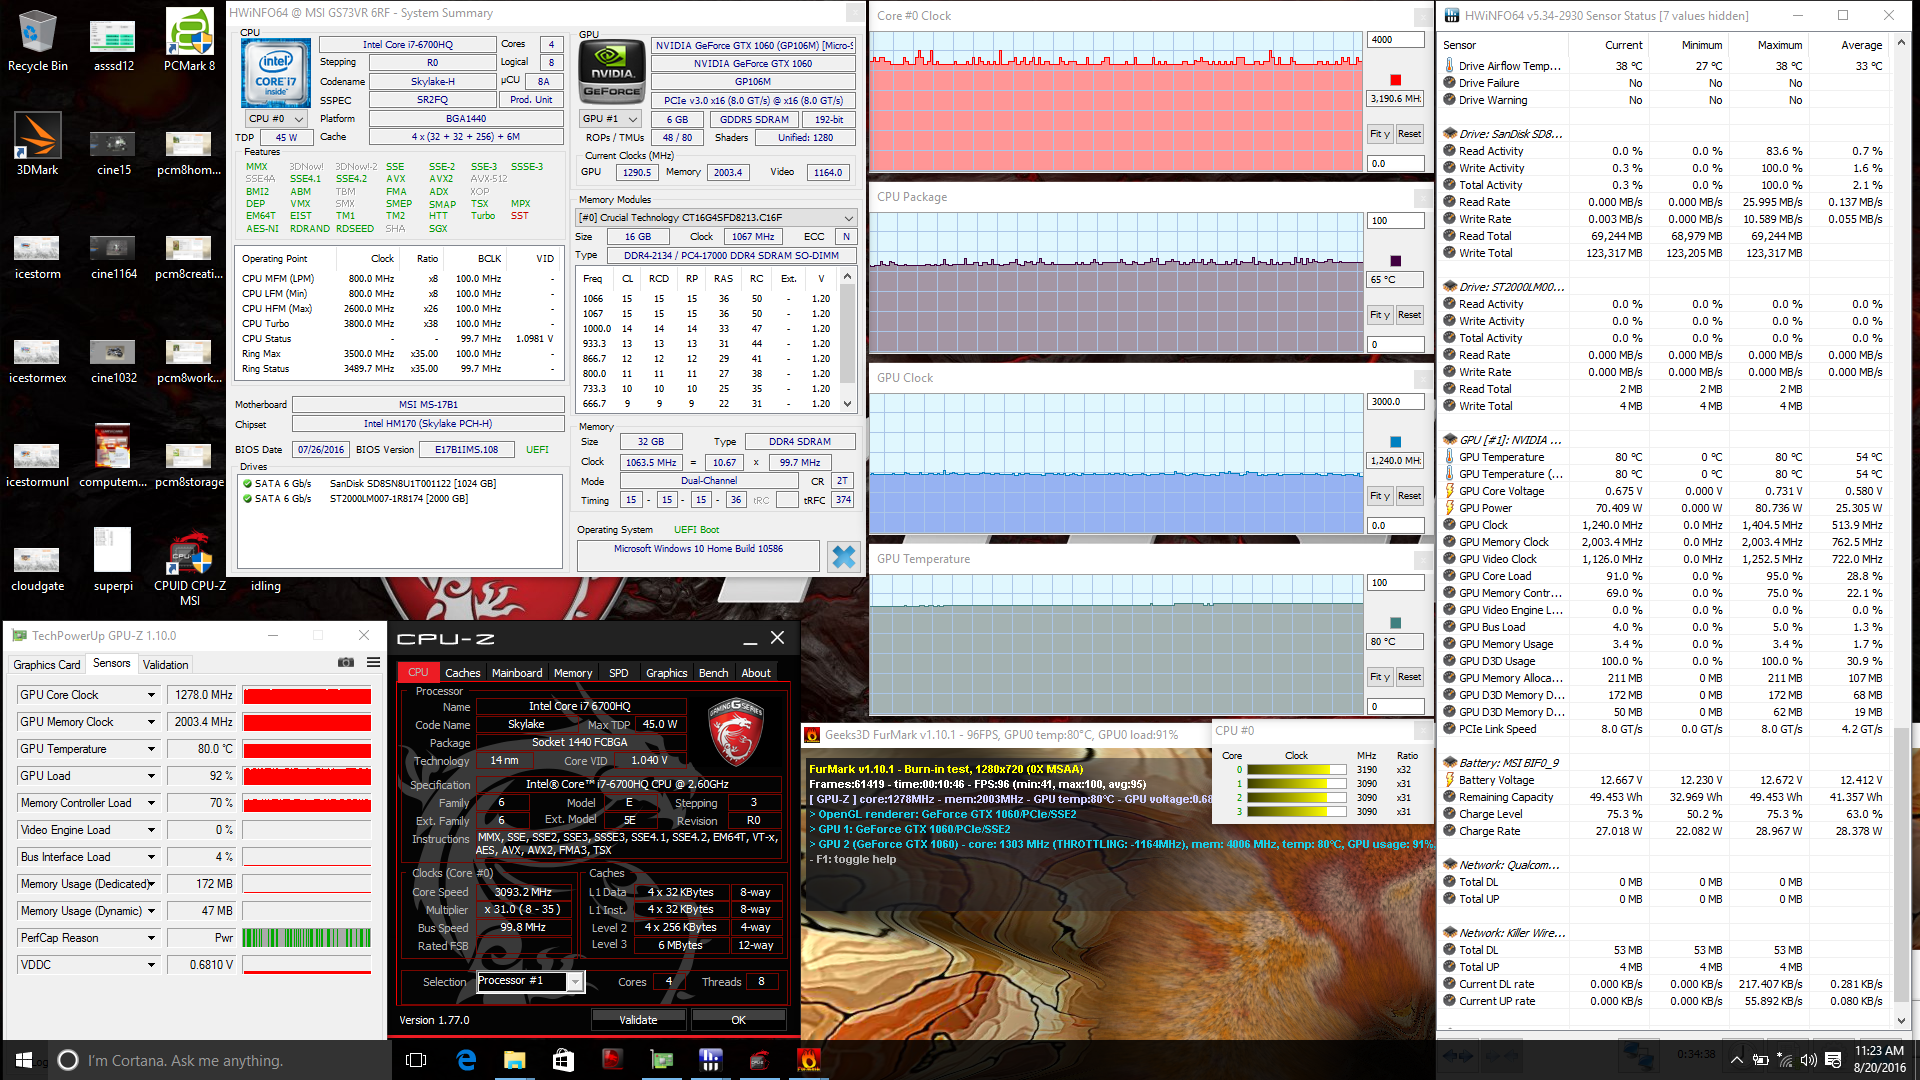
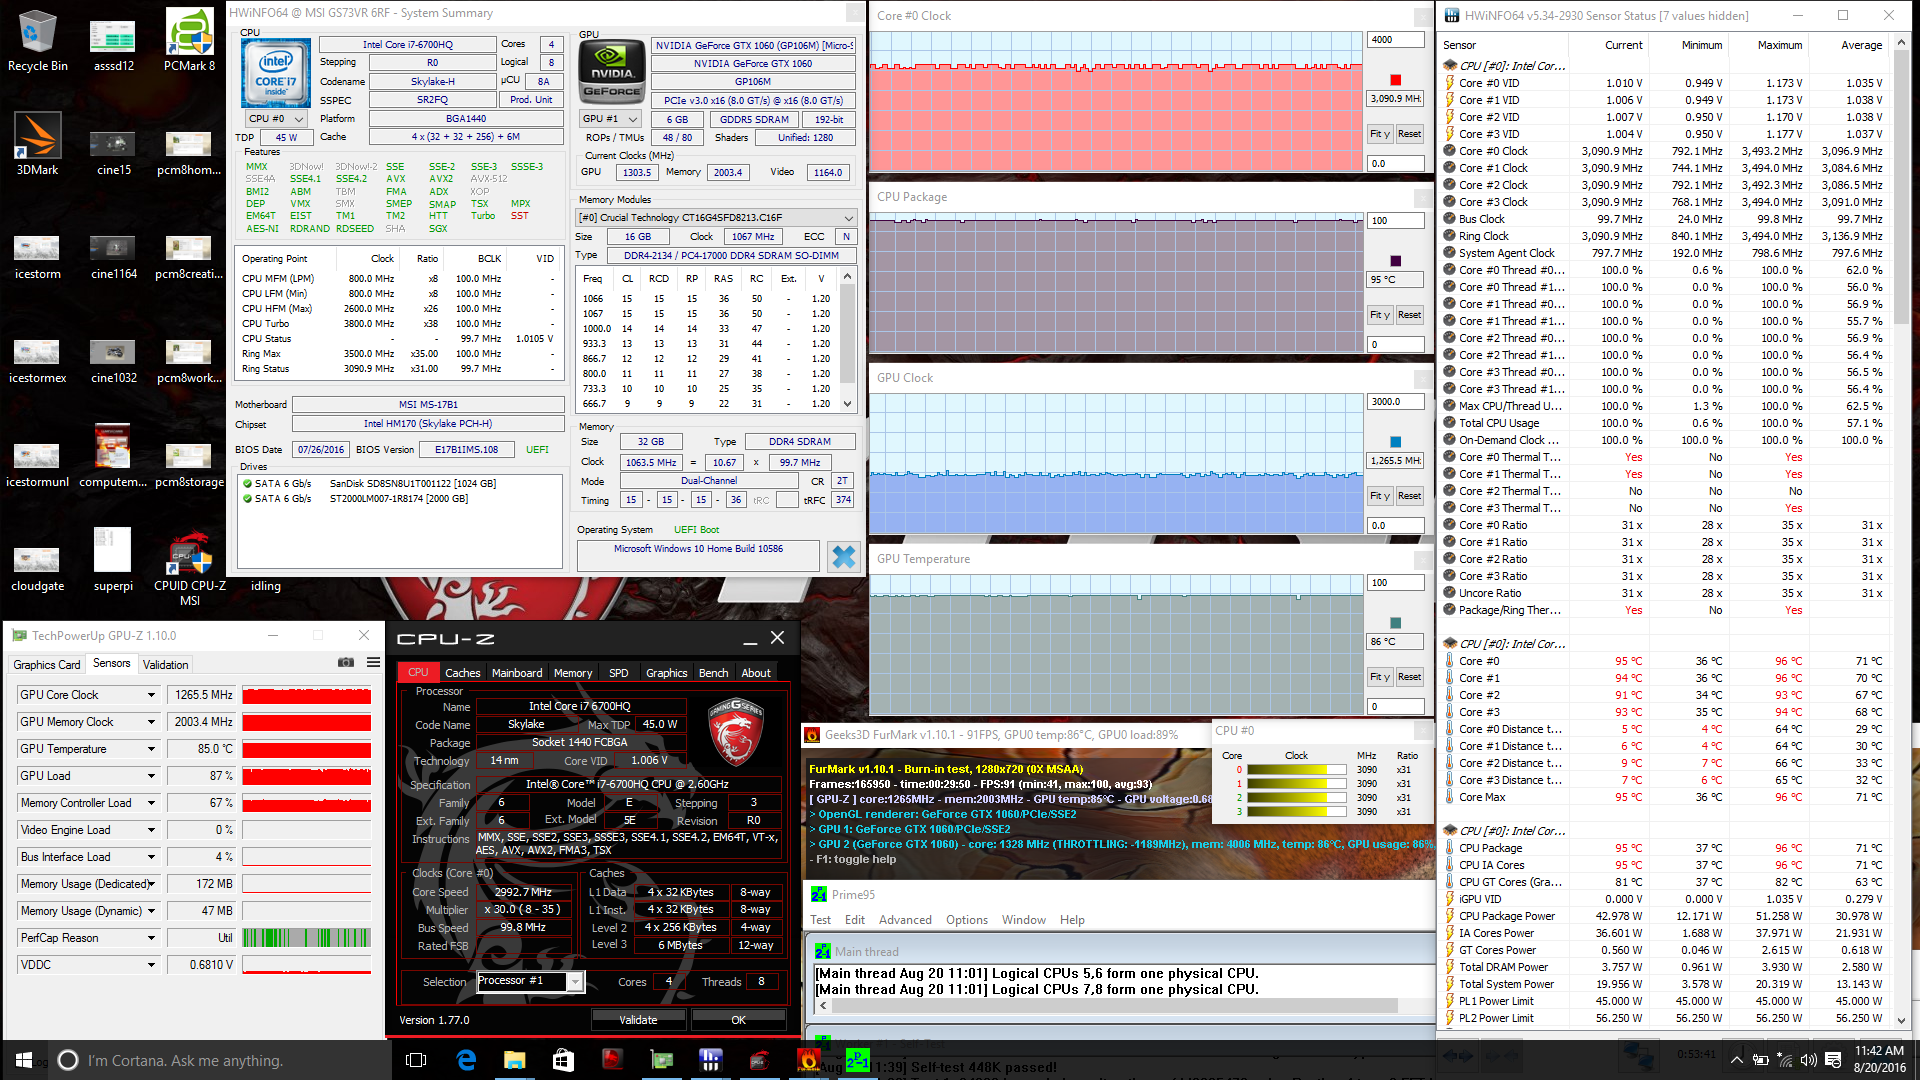
We stress the notebook with benchmarks to identify for any potential throttling or stability issues. Maximum CPU load with Prime95 results in a stable core clock of 2.9 GHz and core temperature of 77 C. Interestingly, core clock is bumped up slightly to its advertised multi-thread maximum of 3.1 GHz when running both Prime95 and FurMark. CPU and GPU temperatures reach very warm levels when subjected to maximum load at up to a recorded 95 C and 86 C, respectively. While there may be no throttling, this permanent Turbo Boost performance takes its toll on very high core temperatures.
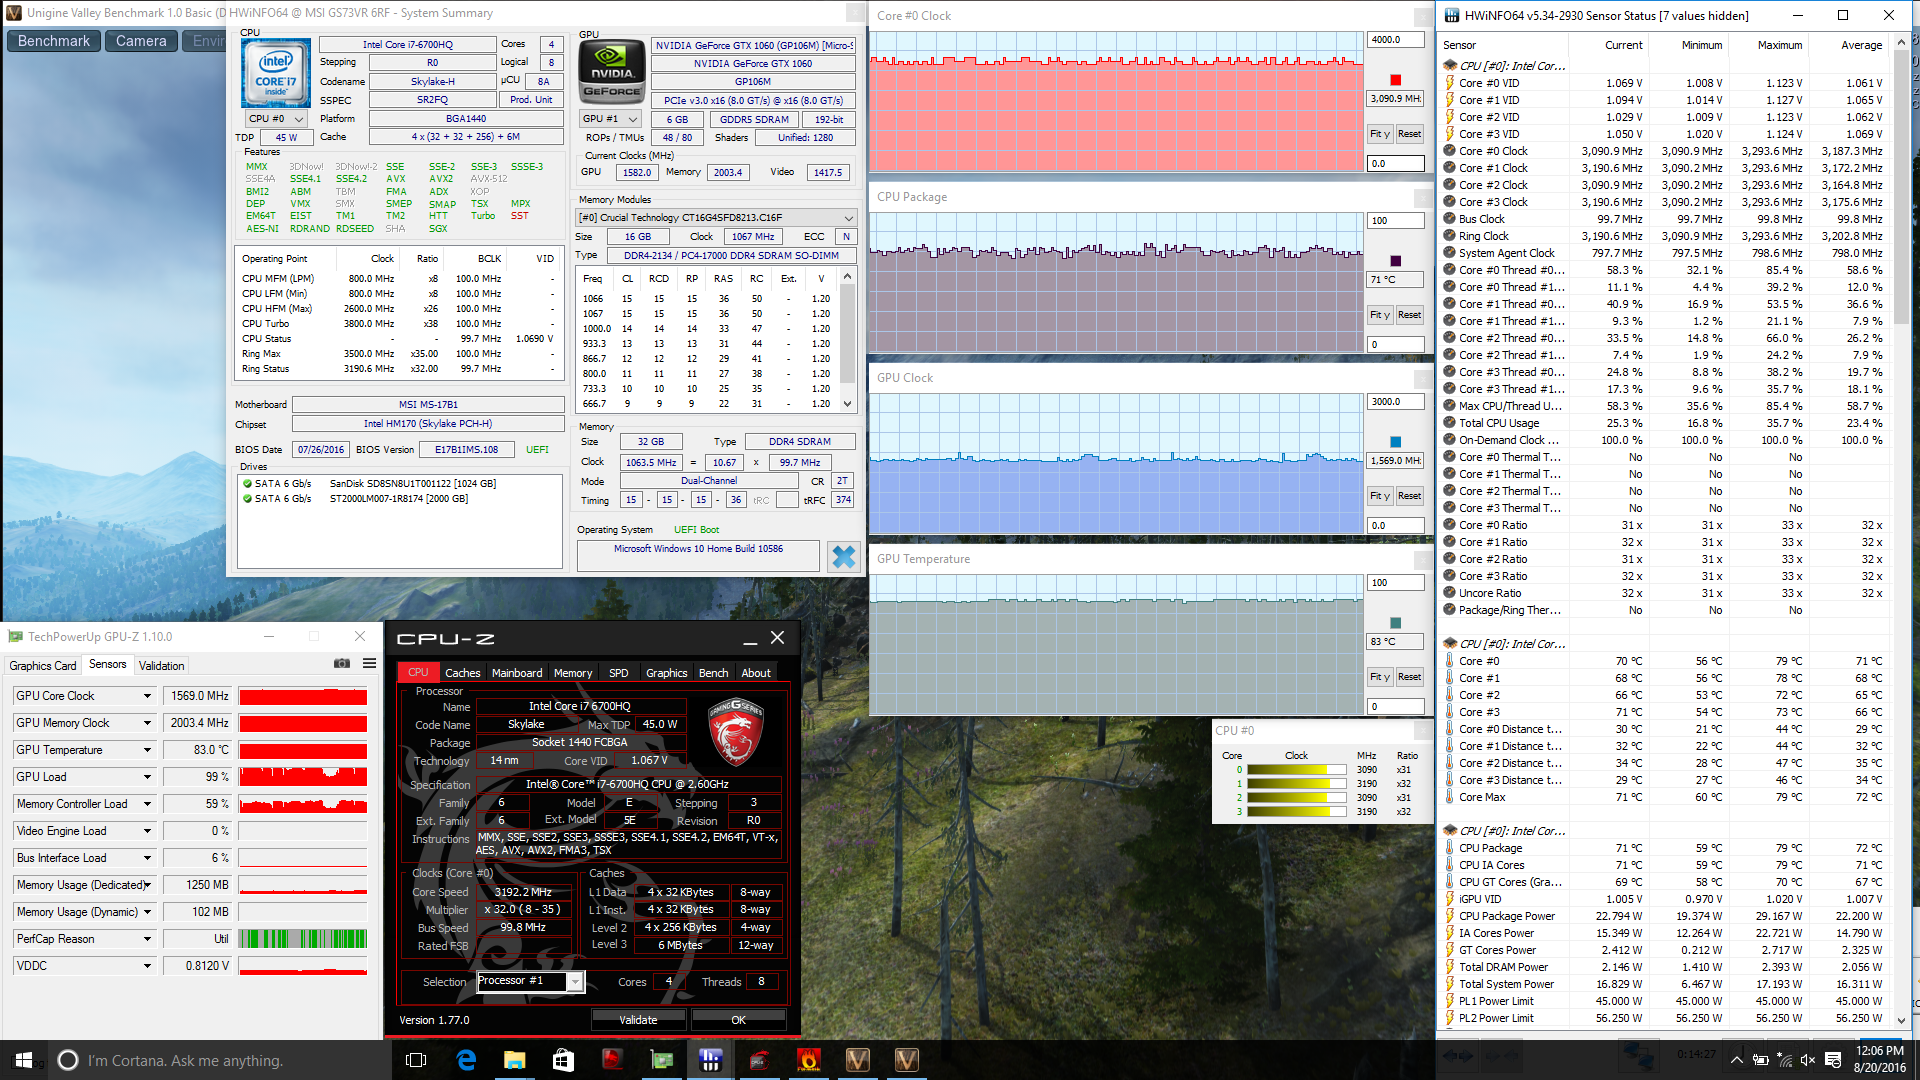
Running Unigine Valley is more representative of gaming loads compared to Prime95 and FurMark. Both the CPU and GPU plateau at higher core clock rates each and at lower temperatures in the 70 C and 80 C range, respectively. We would have liked the GPU to run a little cooler, but the high temperature is the expected compromise for such a thin design.
Running on battery power will throttle the GPU while the CPU is unaffected. A 3DMark 11 run on batteries returns Physics and Graphics scores of 8456 points and 5625 points, respectively, compared to 8428 points and 14904 points when on mains.
| CPU Clock (GHz) | GPU Clock (MHz) | Average CPU Temperature (°C) | Average GPU Temperature (°C) | |
| Prime95 Stress | 2.9 | -- | 77 | 53 |
| FurMark Stress | -- | 1278 | 65 | 80 |
| Prime95 + FurMark Stress | 3.1 | 1266 | 95 | 86 |
| Unigine Valley Stress | 3.1+ | 1569 | 71 | 83 |
Emissions
System Noise
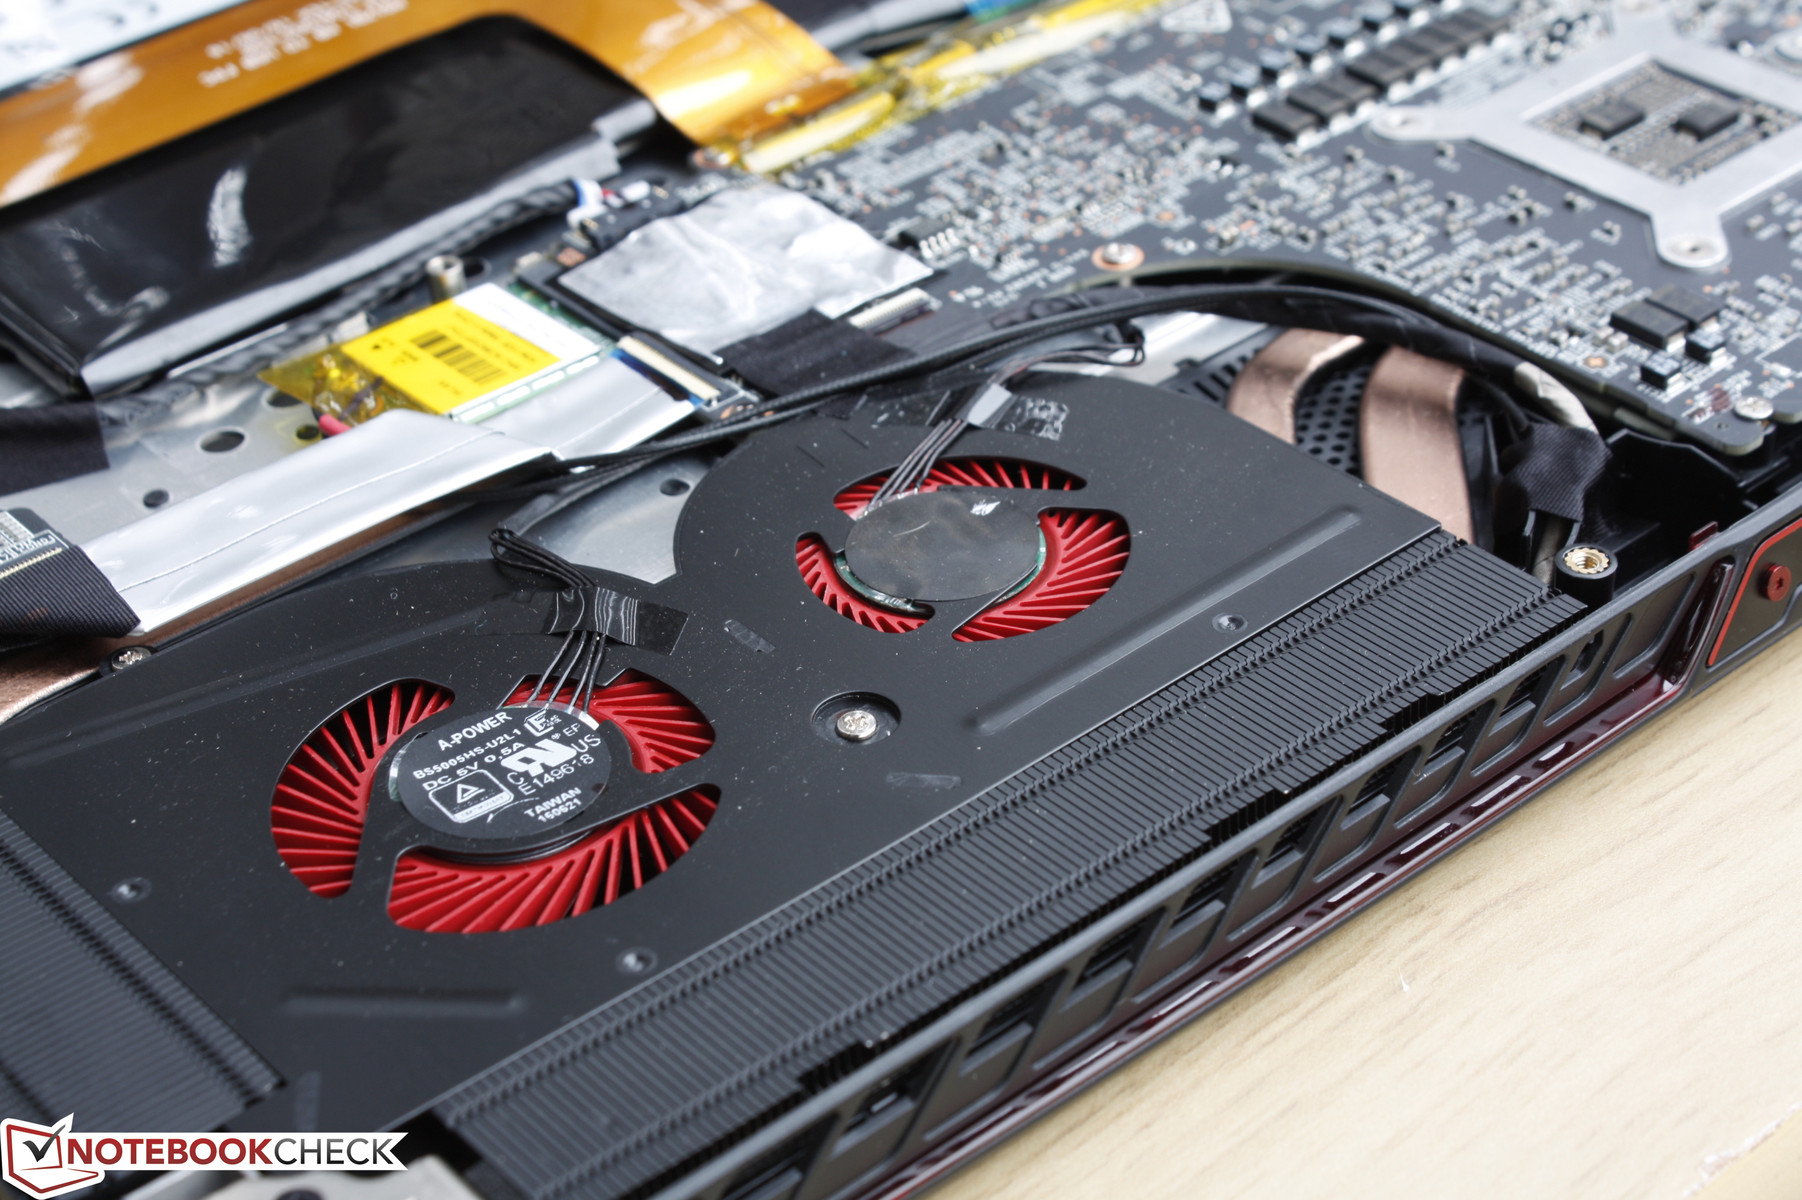
Fan noise is one of the more interesting characteristics to test especially on super-thin gaming notebooks. MSI, of course, is well aware of the challenges of cramming high-end hardware onto thin form factors and has outfitted the GS73 with a third fan in an attempt to curb operating temperatures. Called Cooler Boost Trinity, this revised cooling solution utilizes twin fans just under 50 mm each and a smaller 40 mm fan with five heat pipes total spread across both processors and VRAM modules.
So, is fan noise any quieter than on the GS70? The answer is yes, but not by significant margins. The GS73VR stabilizes in the 46 to 47 dB(A) range when under gaming loads compared to just over 50 dB(A) on the GS70. While an improvement, we should note that thicker gaming notebooks like the GT72 are still much quieter and will typically stabilize in the lower 40 dB(A) range when gaming. The mid 40 dB(A) range is loud enough to be distracting when gaming without headphones.
The triple fans are always active no matter the workload and we recommend setting the system to Power Saver mode to prevent the fans from pulsing between 32 and 34 dB(A) during low workloads. In other words, the system is relatively quiet when browsing, but definitely not silent. Fan controls are identical to the GT72VR as they use the same Dragon Center software, but its default and preset minimums are as low as the utility will allow the user to go.
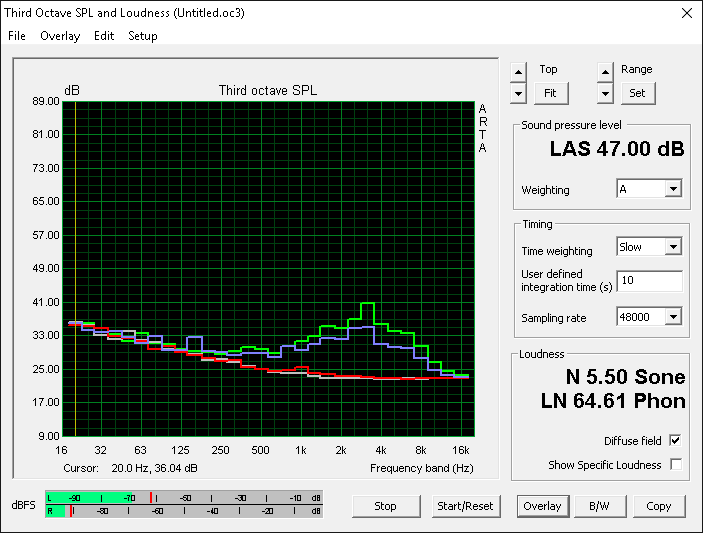
The addition of a third and smaller fan has another consequence to system noise worth mentioning as its small size means higher audio frequencies when active. Thus, fan noise is unfortunately higher-pitched on the GS73. As shown by our microphone measurements below, the fan noise peak is sharper at just under 4000 Hz compared to the broader peak of the thicker Asus G752VS at under 2000 Hz.
Lastly, our test unit exhibited a bit of coil whine that is noticeable during low loads. While we can't speak for all units out there, we recommend checking immediately after or before purchasing as the sound can be annoying to some.
Noise level
| Idle |
| 31.9 / 32 / 34 dB(A) |
| Load |
| 47 / 49.4 dB(A) |
 | ||
30 dB silent 40 dB(A) audible 50 dB(A) loud |
||
min: | ||
| MSI GS73VR 6RF GeForce GTX 1060 Mobile, 6700HQ, SanDisk SD8SN8U1T001122 | Aorus X7 Pro v5 GeForce GTX 970M SLI, 6820HK, Samsung SM951 MZVPV512 m.2 PCI-e | MSI GT72S 6QF GeForce GTX 980 (Laptop), 6820HK, 2x Micron M600 MTFDDAV128MBF NVMe (RAID 0) | MSI GS70 6QE-036XPL GeForce GTX 970M, 6700HQ, Toshiba HG6 THNSNJ128G8NU | Razer Blade Pro 17 inch 2015 GeForce GTX 960M, 4720HQ, Samsung PM851 Series MZMTE256HMHP | |
|---|---|---|---|---|---|
| Noise | -5% | -1% | -6% | 7% | |
| off / environment * (dB) | 28.4 | 30 -6% | |||
| Idle Minimum * (dB) | 31.9 | 34 -7% | 33.1 -4% | 32.5 -2% | 30.6 4% |
| Idle Average * (dB) | 32 | 35 -9% | 33.3 -4% | 34.2 -7% | 30.7 4% |
| Idle Maximum * (dB) | 34 | 39 -15% | 37 -9% | 36.1 -6% | 32.6 4% |
| Load Average * (dB) | 47 | 39 17% | 39 17% | 50.3 -7% | 38.8 17% |
| Load Maximum * (dB) | 49.4 | 54 -9% | 52.2 -6% | 54.5 -10% | 46.2 6% |
* ... smaller is better
Temperature
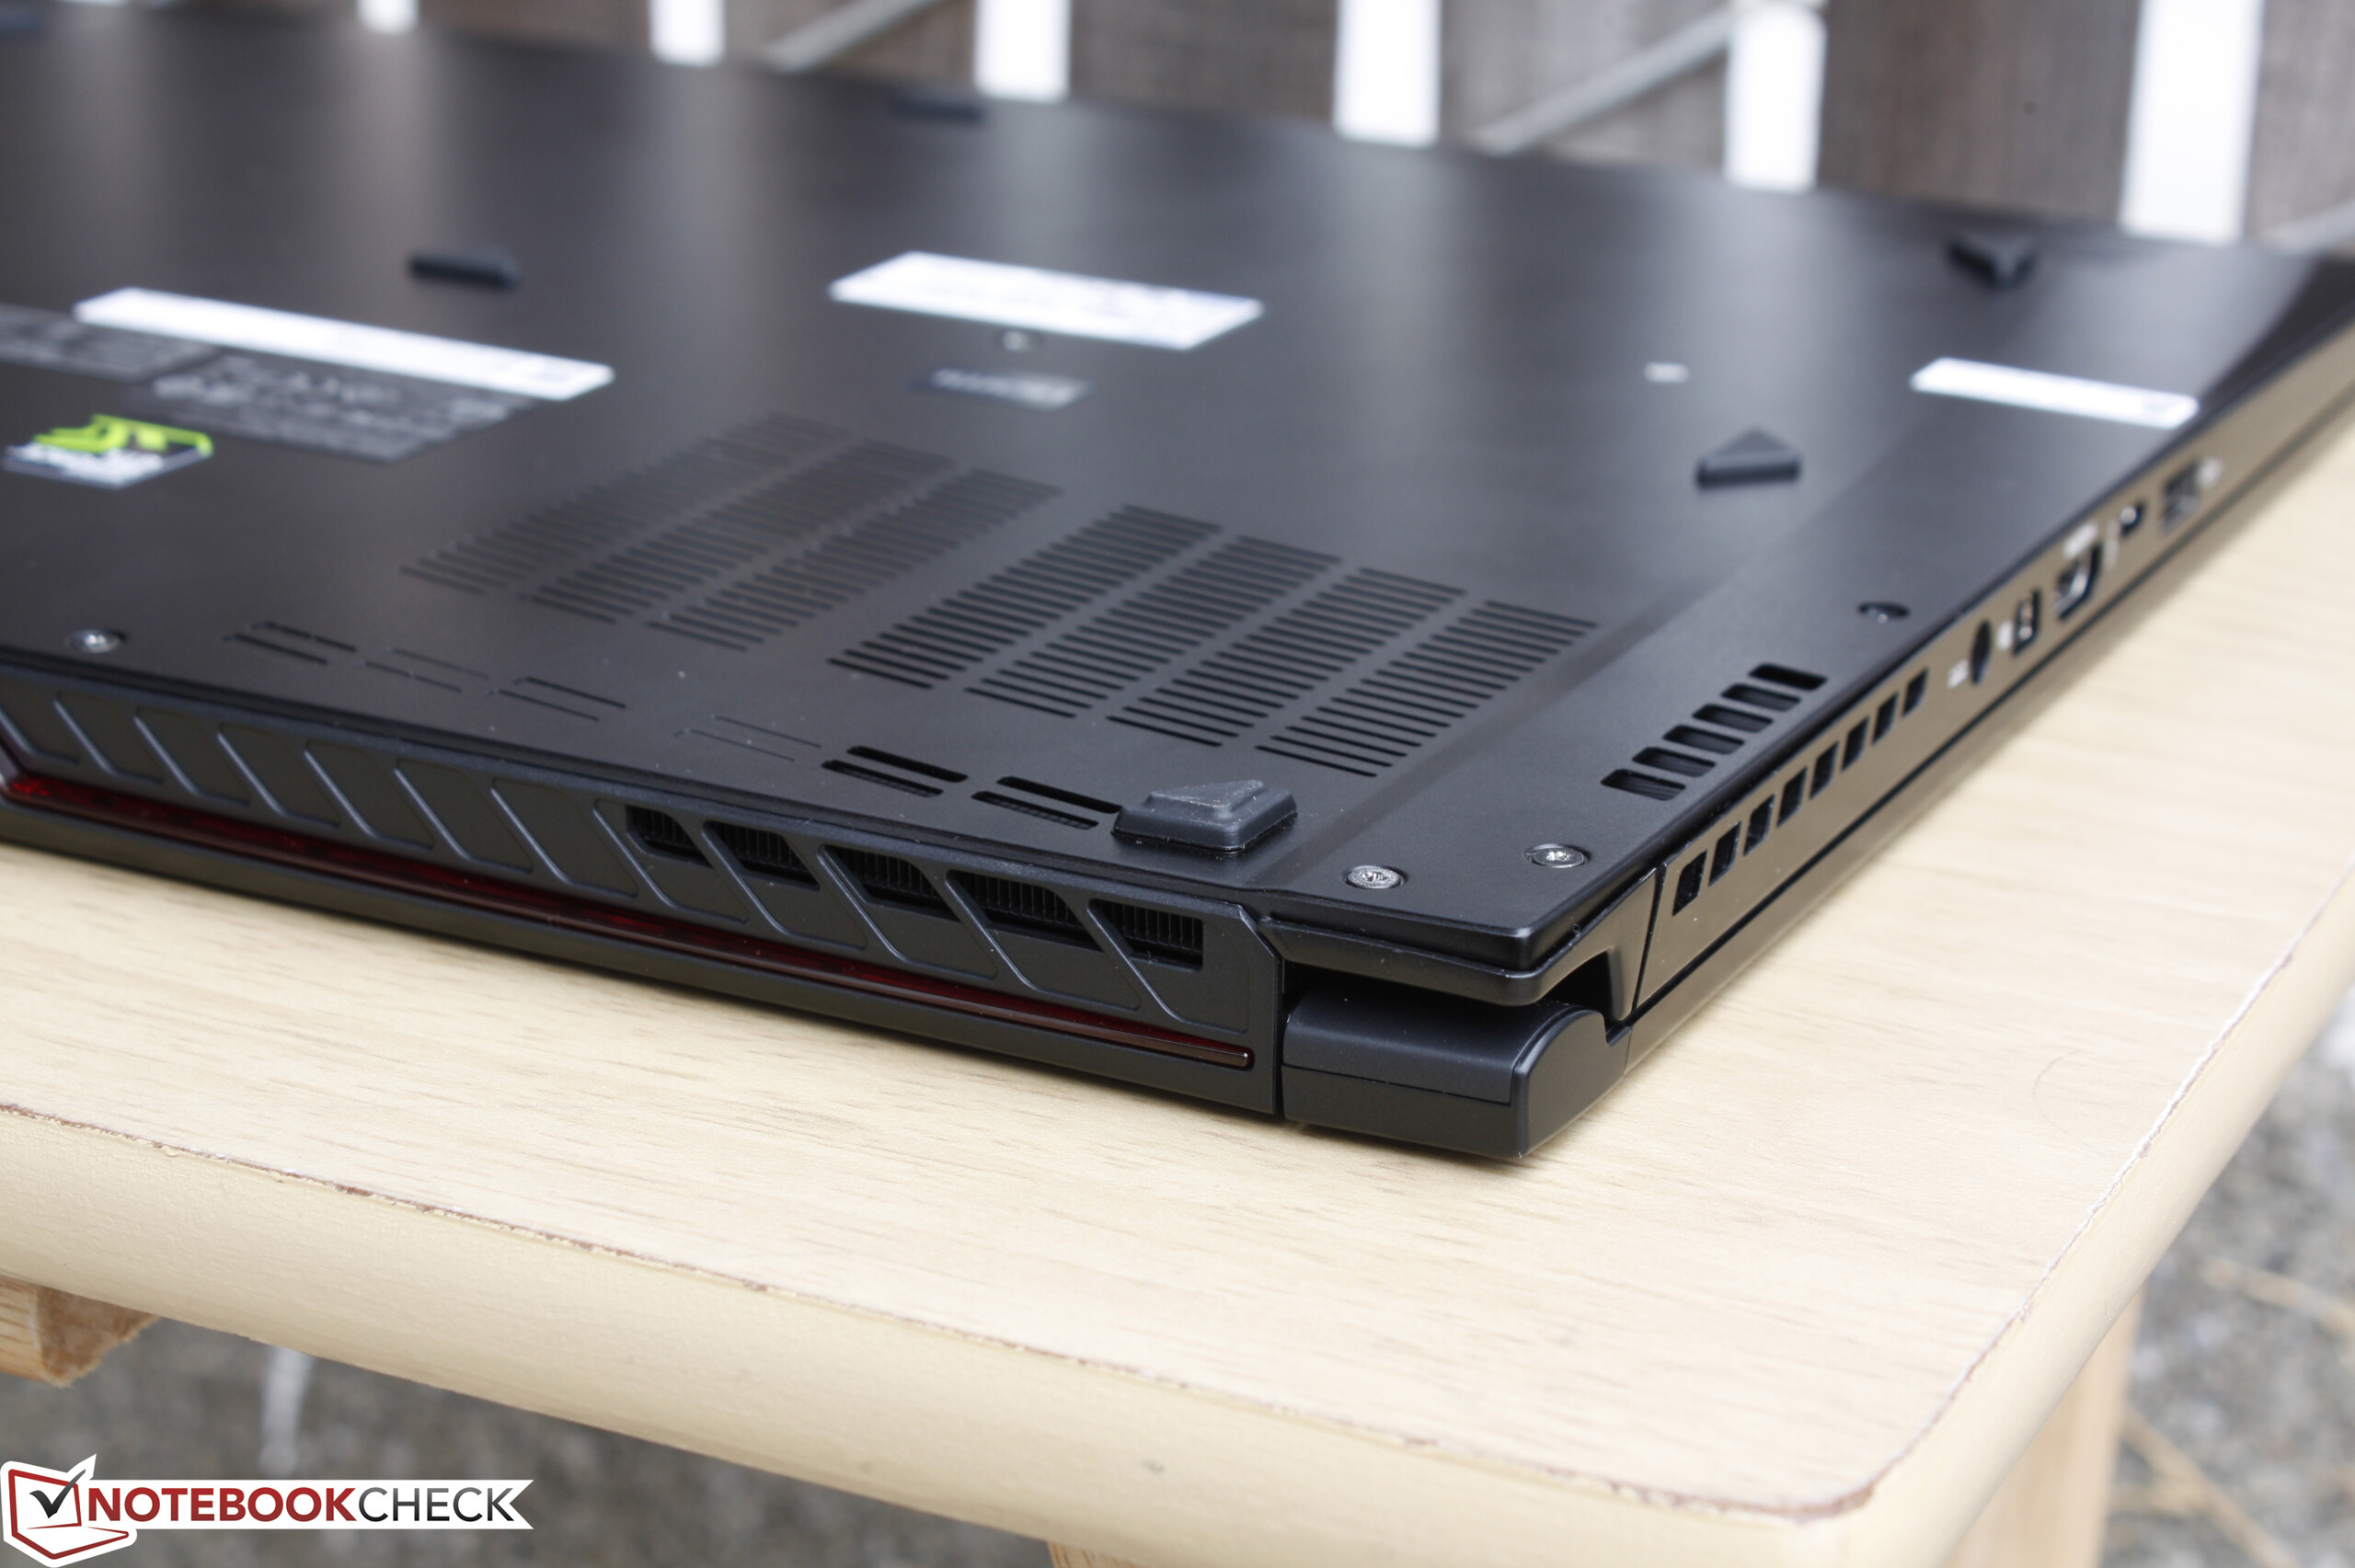
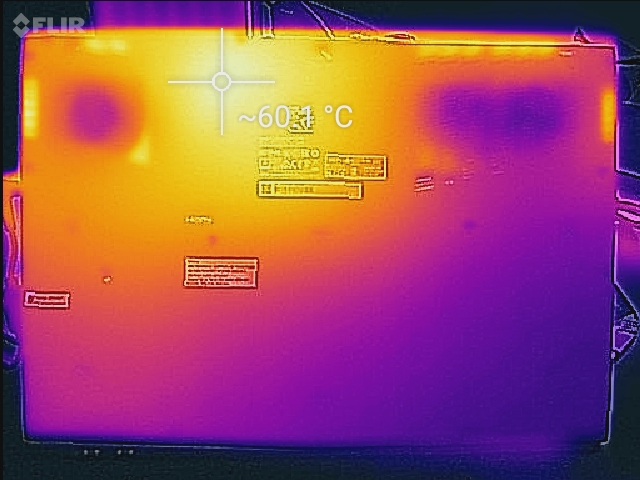
There's no denying that surface temperatures on the GS70 were some of the highest even when considering its super-thin design. Fortunately, the GS73VR is indeed comparatively cooler on average than its predecessor when under load as the system includes more ventilation grilles both on the rear edge and immediately above the top row of keyboard keys for improved airflow. Surface temperatures here are now more in line with other super-thin gaming notebooks like the Aorus X7 or Gigabyte P57, so the MSI is not significantly warmer or cooler than its immediate competitors regardless of what they may advertise. We were able to record a maximum of 60 C on the rear quadrant when running Prime95 and FurMark whereas the front quadrants and WASD keys are much cooler. Thicker gaming notebooks are predictably cooler under the same conditions.
Surface temperatures when idling are flat across the board with no obvious hot spots. Still, it doesn't take much for temperatures to go up as low loads like browsing, email, or even idling on High Performance will be enough to warm up the notebook. The temperature rise is acceptable during day-to-day workloads for comfortable use on the lap.
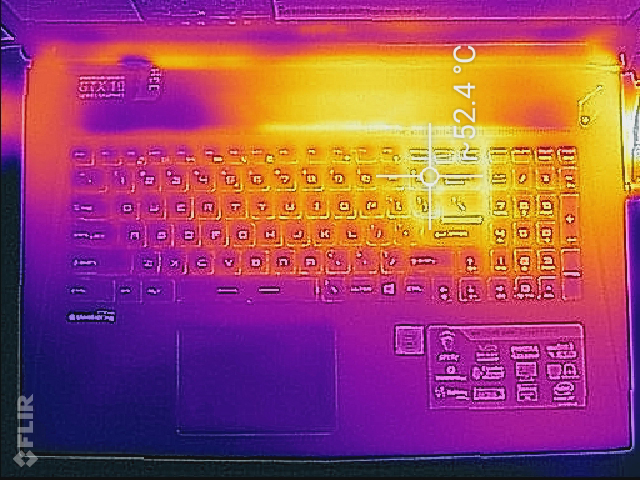
(-) The maximum temperature on the upper side is 50.8 °C / 123 F, compared to the average of 40.4 °C / 105 F, ranging from 21.2 to 68.8 °C for the class Gaming.
(-) The bottom heats up to a maximum of 60 °C / 140 F, compared to the average of 43.2 °C / 110 F
(+) In idle usage, the average temperature for the upper side is 26.4 °C / 80 F, compared to the device average of 33.9 °C / 93 F.
(+) The palmrests and touchpad are reaching skin temperature as a maximum (34.4 °C / 93.9 F) and are therefore not hot.
(-) The average temperature of the palmrest area of similar devices was 28.8 °C / 83.8 F (-5.6 °C / -10.1 F).
Speakers
The internal speakers have been revised to a 4.1 setup (4x 2 W speakers + 3 W subwoofer). Sound quality is actually poor on its default settings, but tinkering with the Nahimic 2 software will boost bass and sample rate playback for a noticeably better experience. Microphone measurements show a more gradual decline at the 500 Hz range whereas most notebooks with poorer speakers and bass reproduction tend to drop off sharply in this range. Maximum volume is sufficiently loud with slight chassis vibrations from the reverberation.
Both the MSI GS and GT series come standard with dedicated ESS Sabre HiFi DAC components to support 600 ohm studio-grade headphones - an uncommon feature on notebooks.

")
MSI GS73VR 6RF audio analysis
(-) | not very loud speakers (68.5 dB)
Bass 100 - 315 Hz
(-) | nearly no bass - on average 20.4% lower than median
(±) | linearity of bass is average (11.4% delta to prev. frequency)
Mids 400 - 2000 Hz
(+) | balanced mids - only 3% away from median
(±) | linearity of mids is average (8.2% delta to prev. frequency)
Highs 2 - 16 kHz
(+) | balanced highs - only 4% away from median
(+) | highs are linear (5.9% delta to prev. frequency)
Overall 100 - 16.000 Hz
(±) | linearity of overall sound is average (21% difference to median)
Compared to same class
» 76% of all tested devices in this class were better, 4% similar, 20% worse
» The best had a delta of 6%, average was 18%, worst was 132%
Compared to all devices tested
» 57% of all tested devices were better, 7% similar, 35% worse
» The best had a delta of 4%, average was 24%, worst was 134%
Apple MacBook 12 (Early 2016) 1.1 GHz audio analysis
(+) | speakers can play relatively loud (83.6 dB)
Bass 100 - 315 Hz
(±) | reduced bass - on average 11.3% lower than median
(±) | linearity of bass is average (14.2% delta to prev. frequency)
Mids 400 - 2000 Hz
(+) | balanced mids - only 2.4% away from median
(+) | mids are linear (5.5% delta to prev. frequency)
Highs 2 - 16 kHz
(+) | balanced highs - only 2% away from median
(+) | highs are linear (4.5% delta to prev. frequency)
Overall 100 - 16.000 Hz
(+) | overall sound is linear (10.2% difference to median)
Compared to same class
» 7% of all tested devices in this class were better, 2% similar, 91% worse
» The best had a delta of 5%, average was 18%, worst was 53%
Compared to all devices tested
» 5% of all tested devices were better, 1% similar, 94% worse
» The best had a delta of 4%, average was 24%, worst was 134%
Schenker F516 Flex audio analysis
(-) | not very loud speakers (69 dB)
Analysis not possible as minimum curve is missing or too high
Frequency Comparison (Checkbox select/deselectable!)
Graph 1: Pink Noise 100% Vol.; Graph 2: Audio off
Energy Management
Power Consumption
The Pascal series shines when it comes to performance-per-Watt. When idling, the MSI system isn't any more or less power efficient than competing 17-inch gaming notebooks. This changes when subjected to gaming loads as the GS73 draws about 115 W compared to 143 W on the Maxwell GS70. It also demands less power than the Asus GL502VY and its GTX 980M while simultaneously outperforming it in benchmarks and games as shown in our benchmarks above.
We were able to record a maximum power demand of about 168 W when subjected to both Prime95 and FurMark stress against a power adapter (15.5 x 7.5 x 3.0 cm) rated for up to 180 W. The margin here is extremely small and we would have preferred a slightly more capable adapter.
| Off / Standby | |
| Idle | |
| Load |
|
Key:
min: | |
| MSI GS73VR 6RF 6700HQ, GeForce GTX 1060 Mobile, SanDisk SD8SN8U1T001122, TN LED, 1920x1080, 17.3" | Asus Strix GL502VY-DS71 6700HQ, GeForce GTX 980M, SanDisk SD8SN8U1T001122, IPS, 1920x1080, 15.6" | Asus G701VO-CS74K 6820HK, GeForce GTX 980 (Laptop), 2x Samsung SM951 MZVPV512HDGL (RAID 0), IPS, 1920x1080, 17.3" | MSI GS70 6QE-036XPL 6700HQ, GeForce GTX 970M, Toshiba HG6 THNSNJ128G8NU, , 1920x1080, 17.3" | MSI GT72VR 6RE-015US 6700HQ, GeForce GTX 1070 Mobile, SanDisk SD8SNAT256G1122, IPS, 1920x1080, 17.3" | |
|---|---|---|---|---|---|
| Power Consumption | 10% | -13% | 12% | -6% | |
| Idle Minimum * (Watt) | 22.6 | 20.6 9% | 28.2 -25% | 14.1 38% | 22.3 1% |
| Idle Average * (Watt) | 32.7 | 22.1 32% | 32 2% | 22.6 31% | 27.3 17% |
| Idle Maximum * (Watt) | 32.8 | 22.5 31% | 32.6 1% | 30.5 7% | 30 9% |
| Load Average * (Watt) | 114.7 | 130.6 -14% | 162.2 -41% | 143.1 -25% | 152.2 -33% |
| Load Maximum * (Watt) | 167.9 | 177.2 -6% | 173.5 -3% | 150 11% | 204.2 -22% |
* ... smaller is better
Battery Life
MSI has upped the battery capacity from 56 Wh on the outgoing GS70 to 65 Wh on the GS73 redesign. Runtimes are subsequently longer in comparison, though not by significant margins as battery life is still average overall at about 3.5 hours. We were able to clock in about 30 minutes of longer battery life on the GS73 compared to its immediate predecessor under similar WLAN conditions. Runtimes when idling are much longer on this latest model, however, so users who are more conservative on power settings will be able to squeeze out more from the GS73.
Charging from near empty to full capacity will take between 2.5 to 3 hours.
| MSI GS73VR 6RF 6700HQ, GeForce GTX 1060 Mobile, 65 Wh | Asus Strix GL502VY-DS71 6700HQ, GeForce GTX 980M, 64 Wh | Asus G701VO-CS74K 6820HK, GeForce GTX 980 (Laptop), 93 Wh | MSI GS70-6QE16H21 6700HQ, GeForce GTX 970M, 56 Wh | MSI GT72VR 6RE-015US 6700HQ, GeForce GTX 1070 Mobile, 83 Wh | |
|---|---|---|---|---|---|
| Battery runtime | -6% | -1% | -16% | 7% | |
| Reader / Idle (h) | 5.9 | 4.6 -22% | 4 -32% | 4 -32% | 5.4 -8% |
| WiFi v1.3 (h) | 3.6 | 3.1 -14% | 3.4 -6% | 3 -17% | 3.7 3% |
| Load (h) | 1.1 | 1.3 18% | 1.5 36% | 1.1 0% | 1.4 27% |
Pros
Cons
Verdict

The GS73VR is the big refresh the GS Stealth series needed. The GS70 had been largely the same since its inception in 2013 and its minor updates ever since have done very little in alleviating its biggest problems. The GS73VR is finally thinner, better built, quieter, cooler, and much more powerful with more localized temperature development. Pascal continues to impress on all fronts as the GTX 1060 offers slightly better performance than the GTX 980M in a chassis that is a fraction of the size compared to Maxwell flagships like the MSI GT72S, Asus G752VY, Alienware 17, and Acer Predator 17.
Performance is clearly not an issue for the series, but its main drawbacks continue to be high-pitched fan noise and short battery life. It's quieter, yes, but just slightly from the already extreme GS70 and battery life is not a significant improvement. Smaller complaints include ports that are a bit too close upfront and some inaccessible internal components including the primary M.2 SSD and SODIMM slots. It's also a shame that removing the bottom panel automatically voids the warranty as owners may want to swap out the secondary drive at will. The slow SDXC card reader is another scratch on the head with read rates that are several times slower than on the GT72VR. Some dedicated Macro keys or 4K with G-Sync would have made the system a more "complete" gaming experience.
The system is a significant leap forward for the series as a whole with Pascal and 120 Hz/5 ms display options being the two game-changers in the category. Users in the market for thicker Maxwell notebooks should seriously consider the GS73 series as it doesn't sacrifice performance despite what its very slim design and low weight may otherwise suggest. Fan noise and more limited expandability and serviceability options are still the two biggest reasons for considering larger and heavier notebooks.
MSI GS73VR 6RF
- 09/13/2016 v5.1 (old)
Allen Ngo
Price comparison
