Dell XPS 15 9550 (Core i7, FHD) Notebook Review

It's no secret that we love the latest XPS 15 from Dell. It currently takes up two spots in our Top 10 Multimedia Notebooks list and this will be our third page dedicated to another SKU of the series. Still, the notebook launched with one too many issues that should have absolutely been fixed before availability. Throttling, short battery life, and faulty fan controls were just some of the problems we noticed on our test model.
Dell has promised us that this latest unit has been properly updated to resolve many of the aforementioned problems. How does this Core i7 FHD configuration compare to its i7 UHD and i5 FHD peers? We'll take a close look at its display, performance, and battery life to find out.
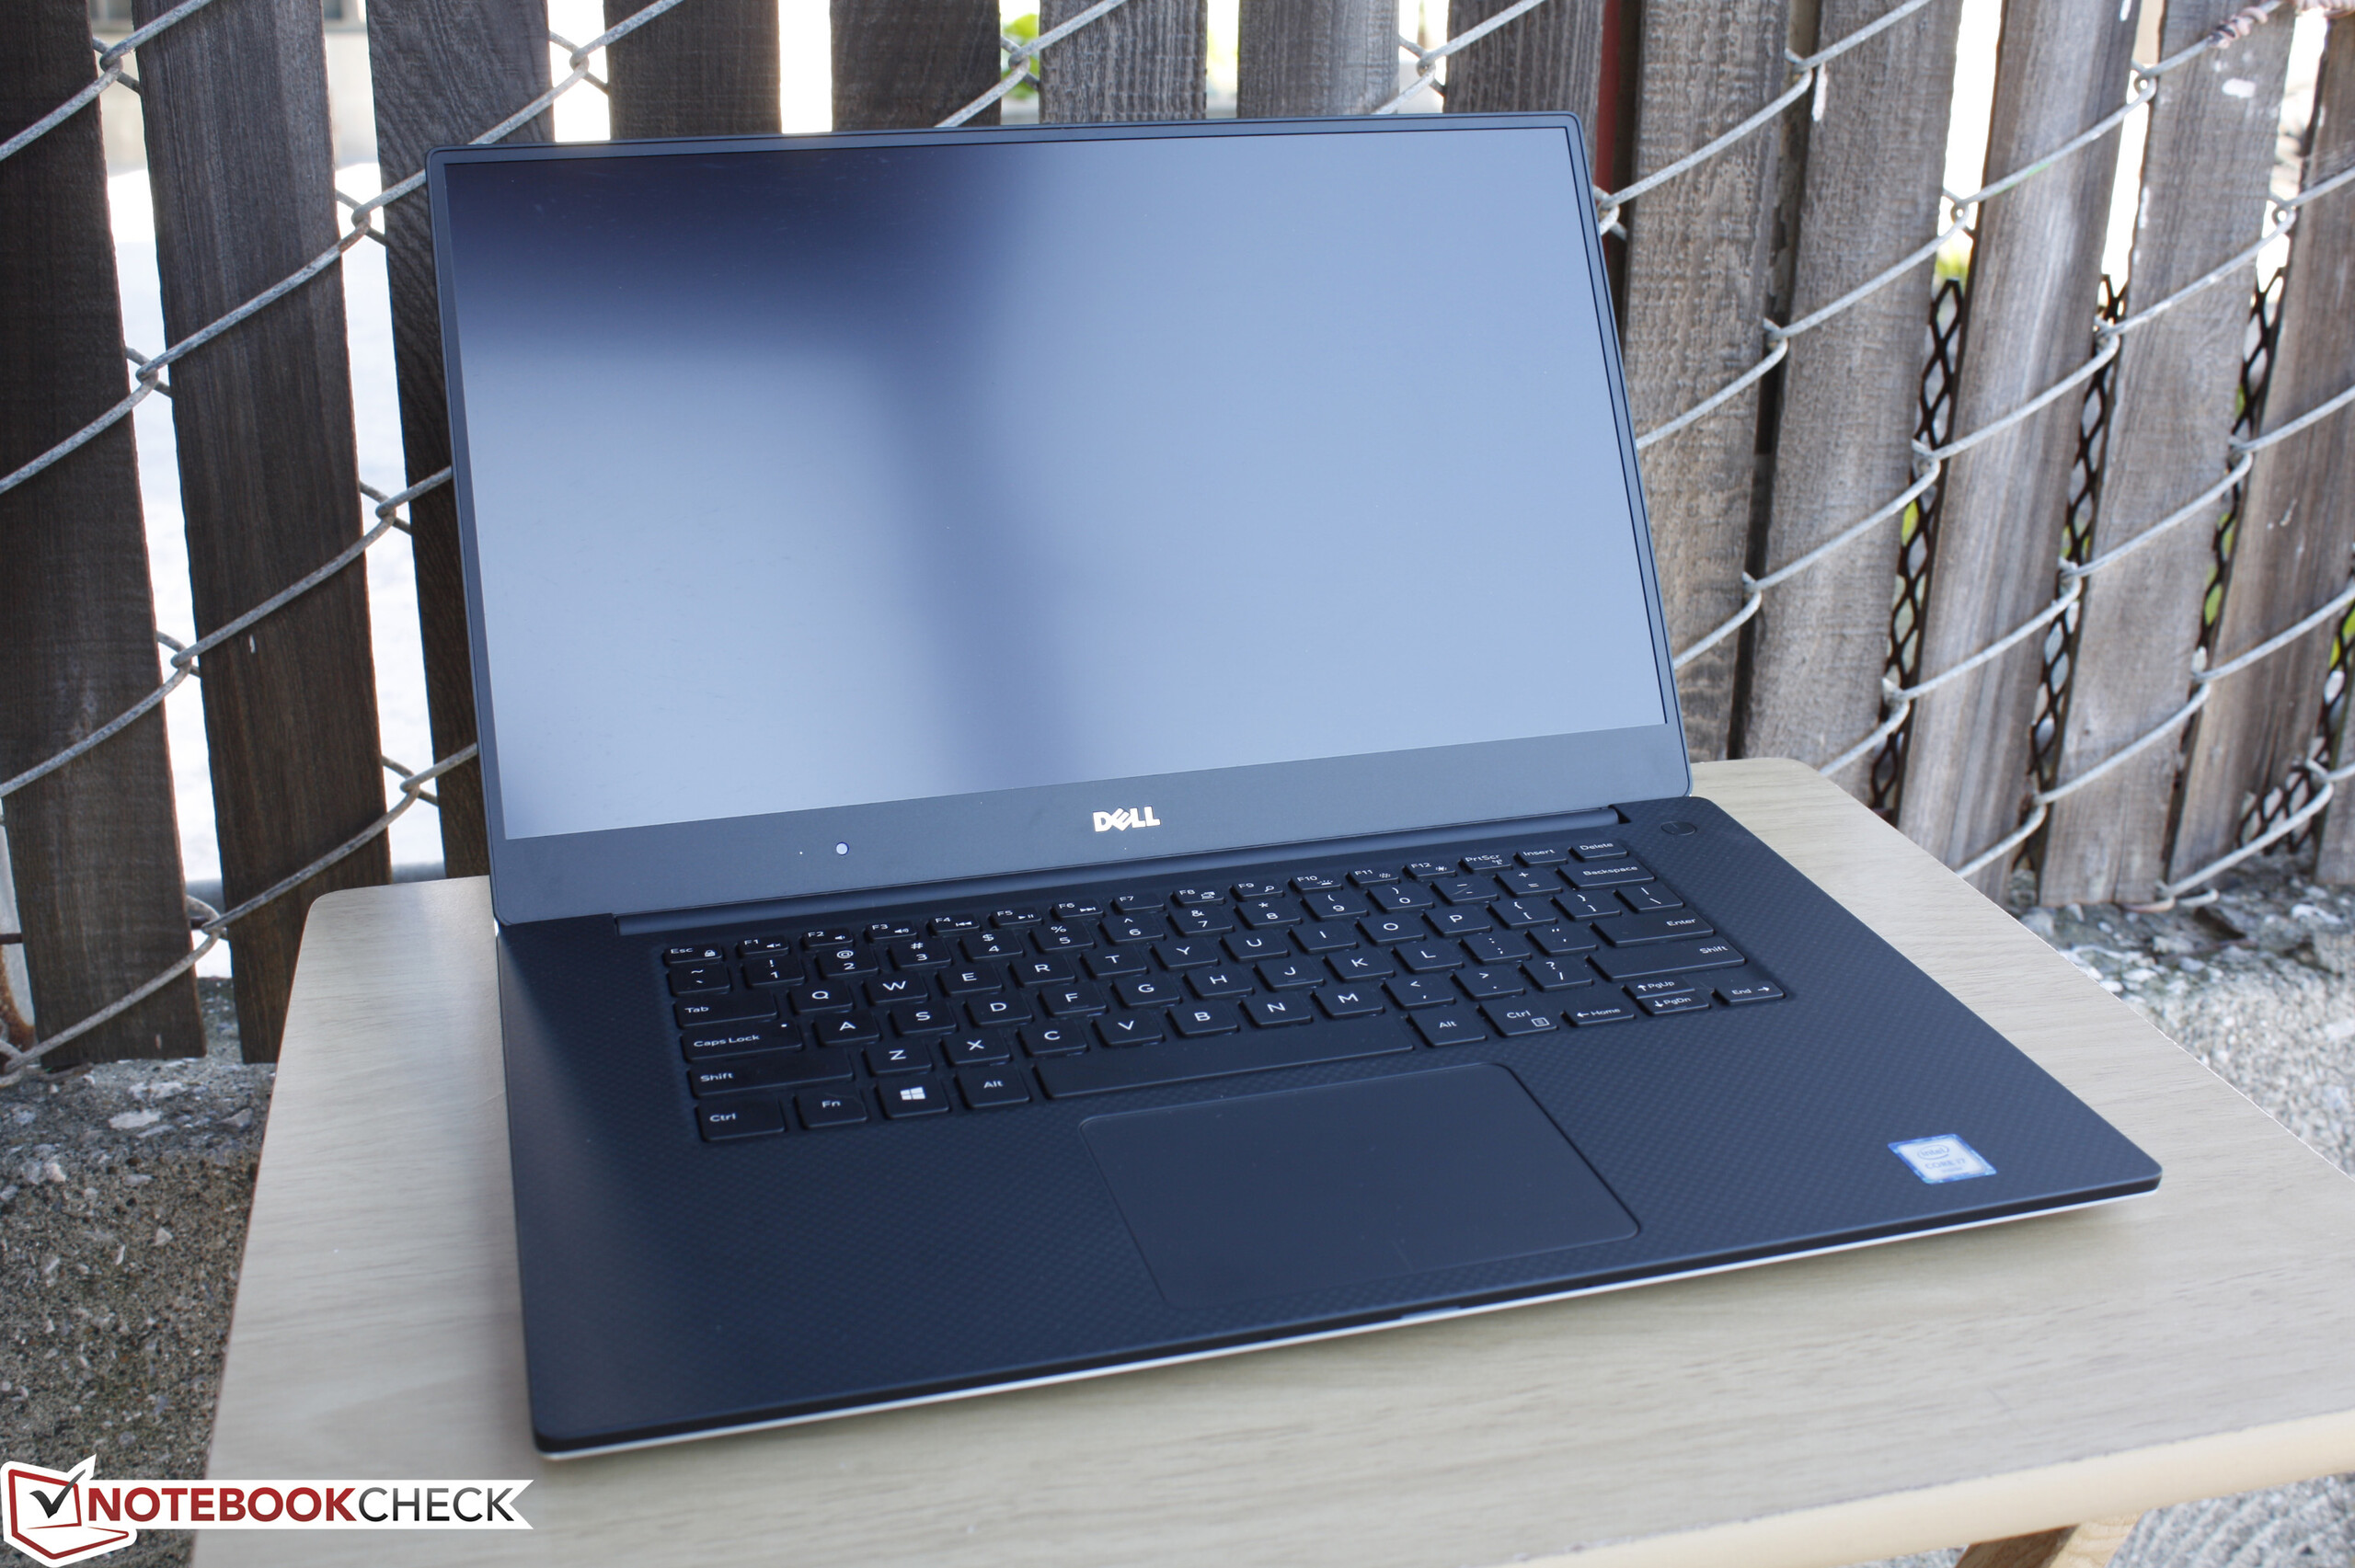
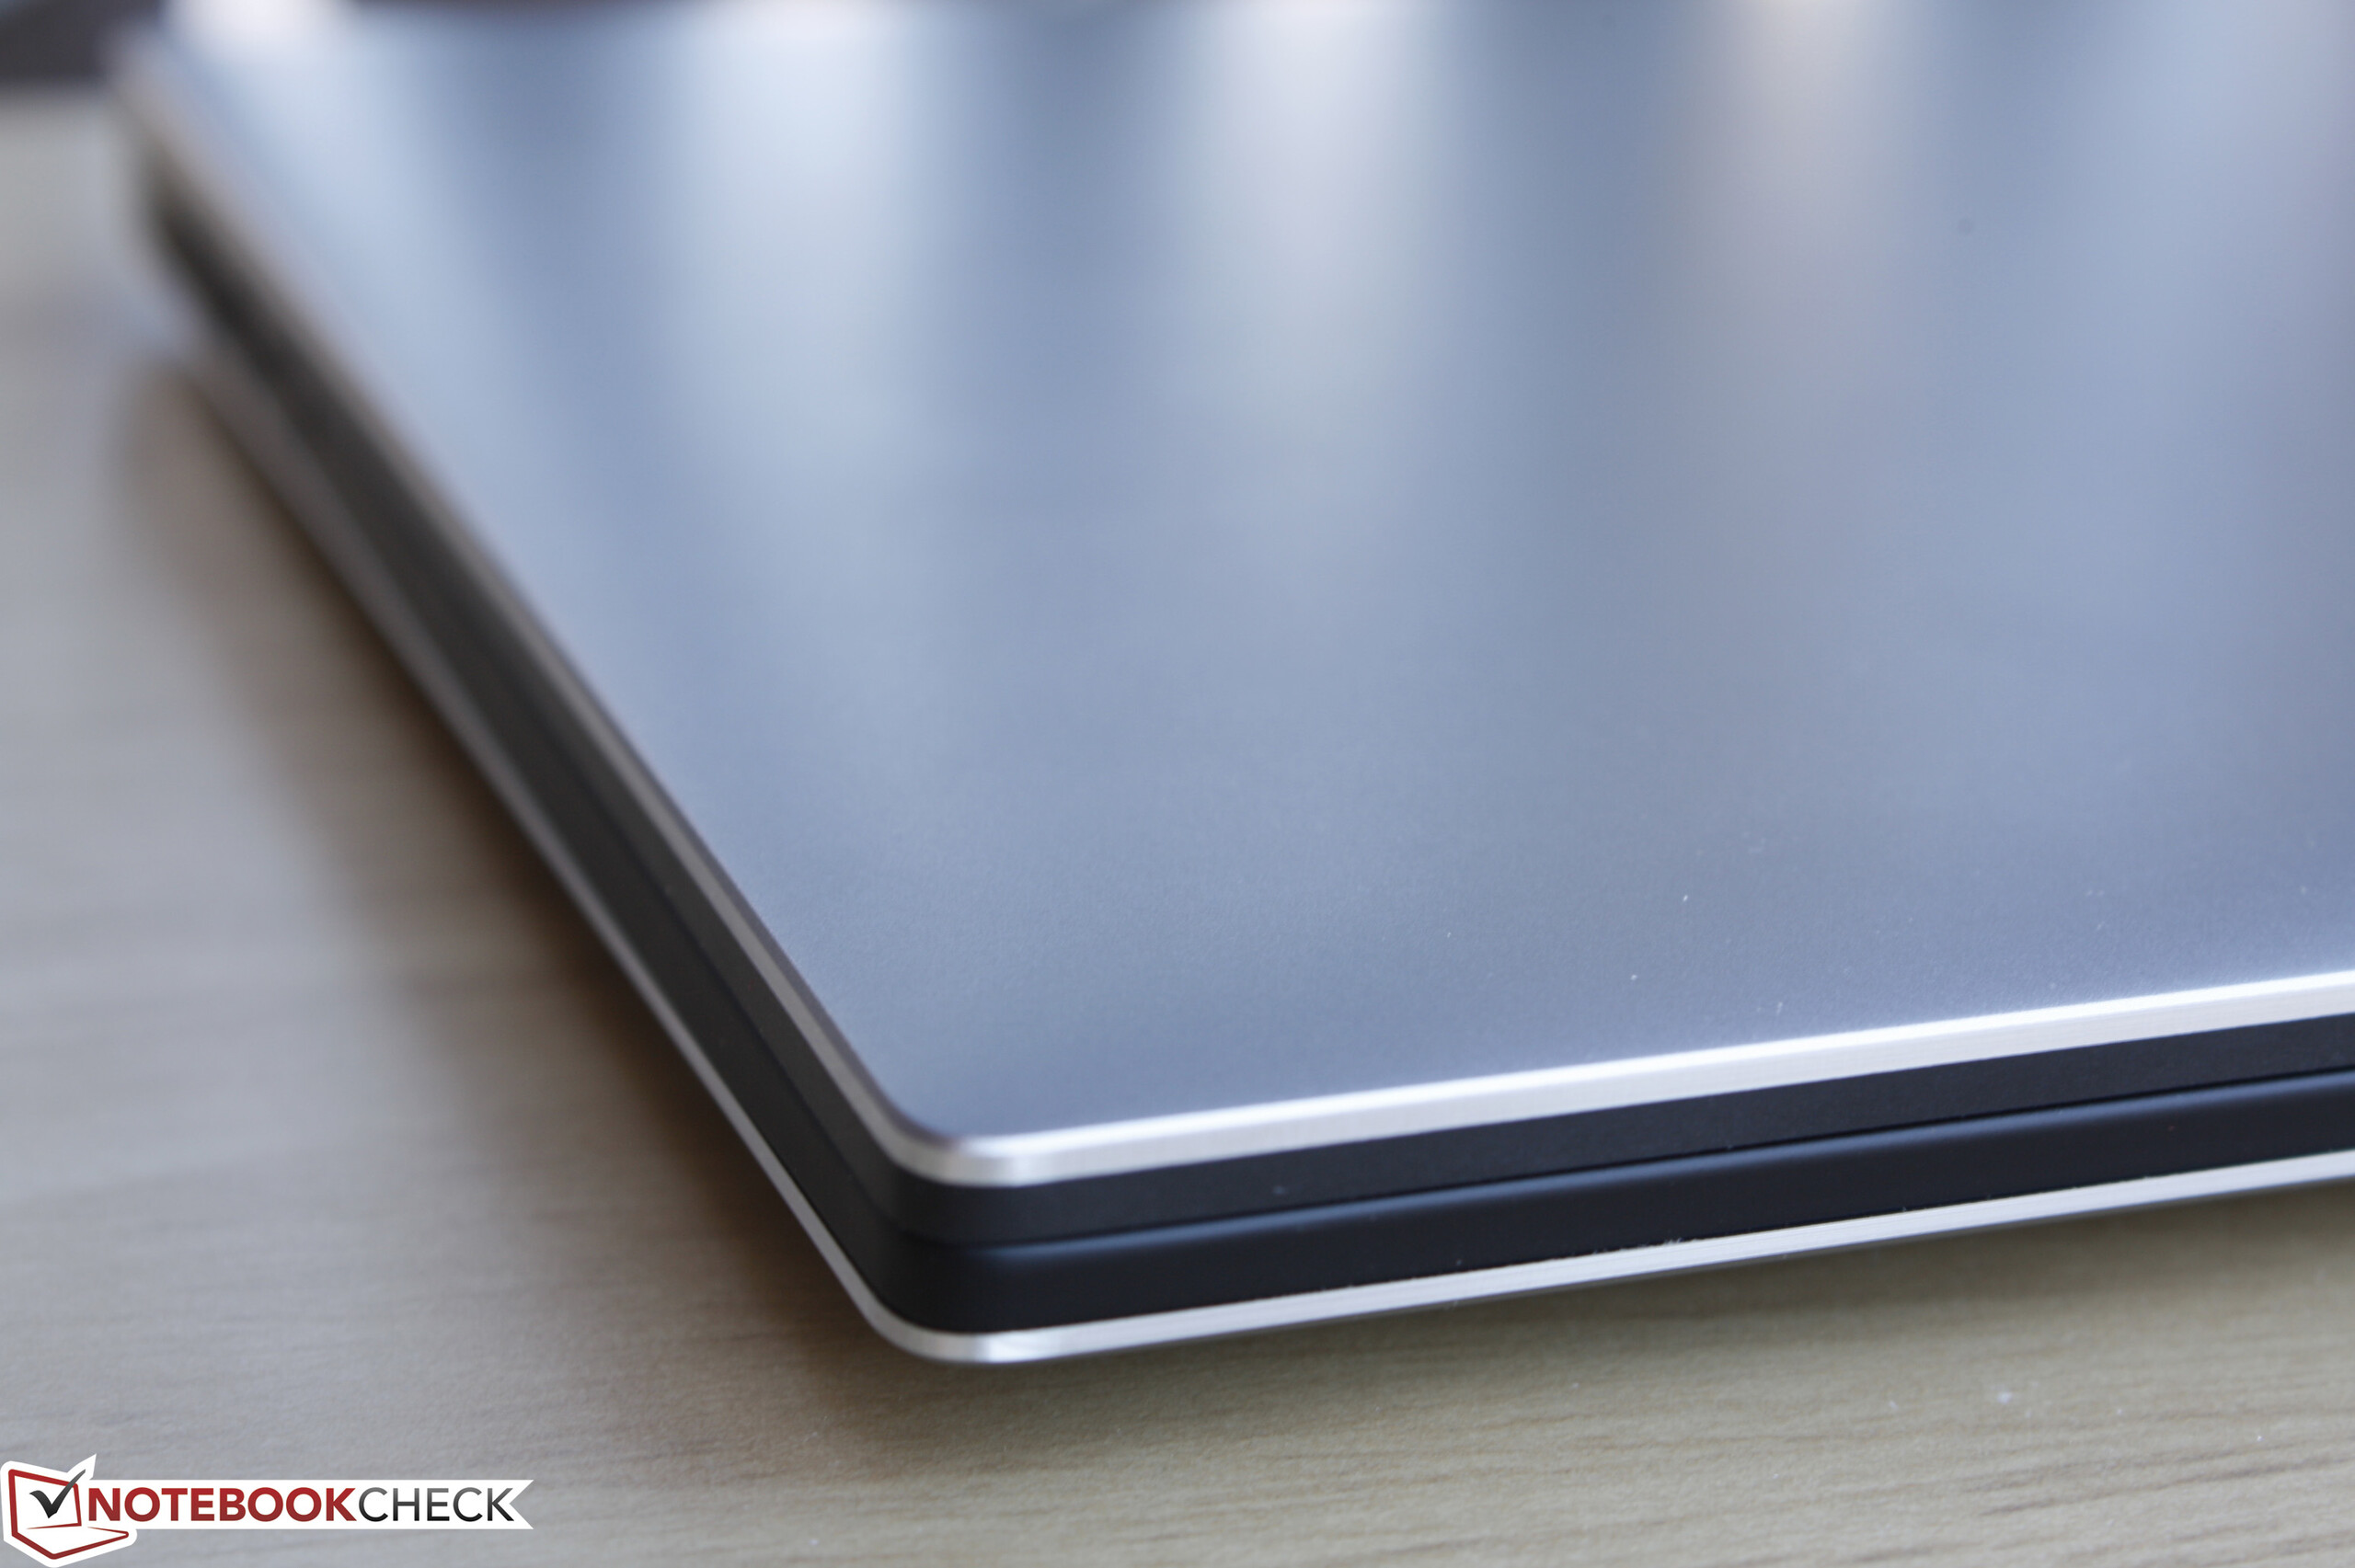
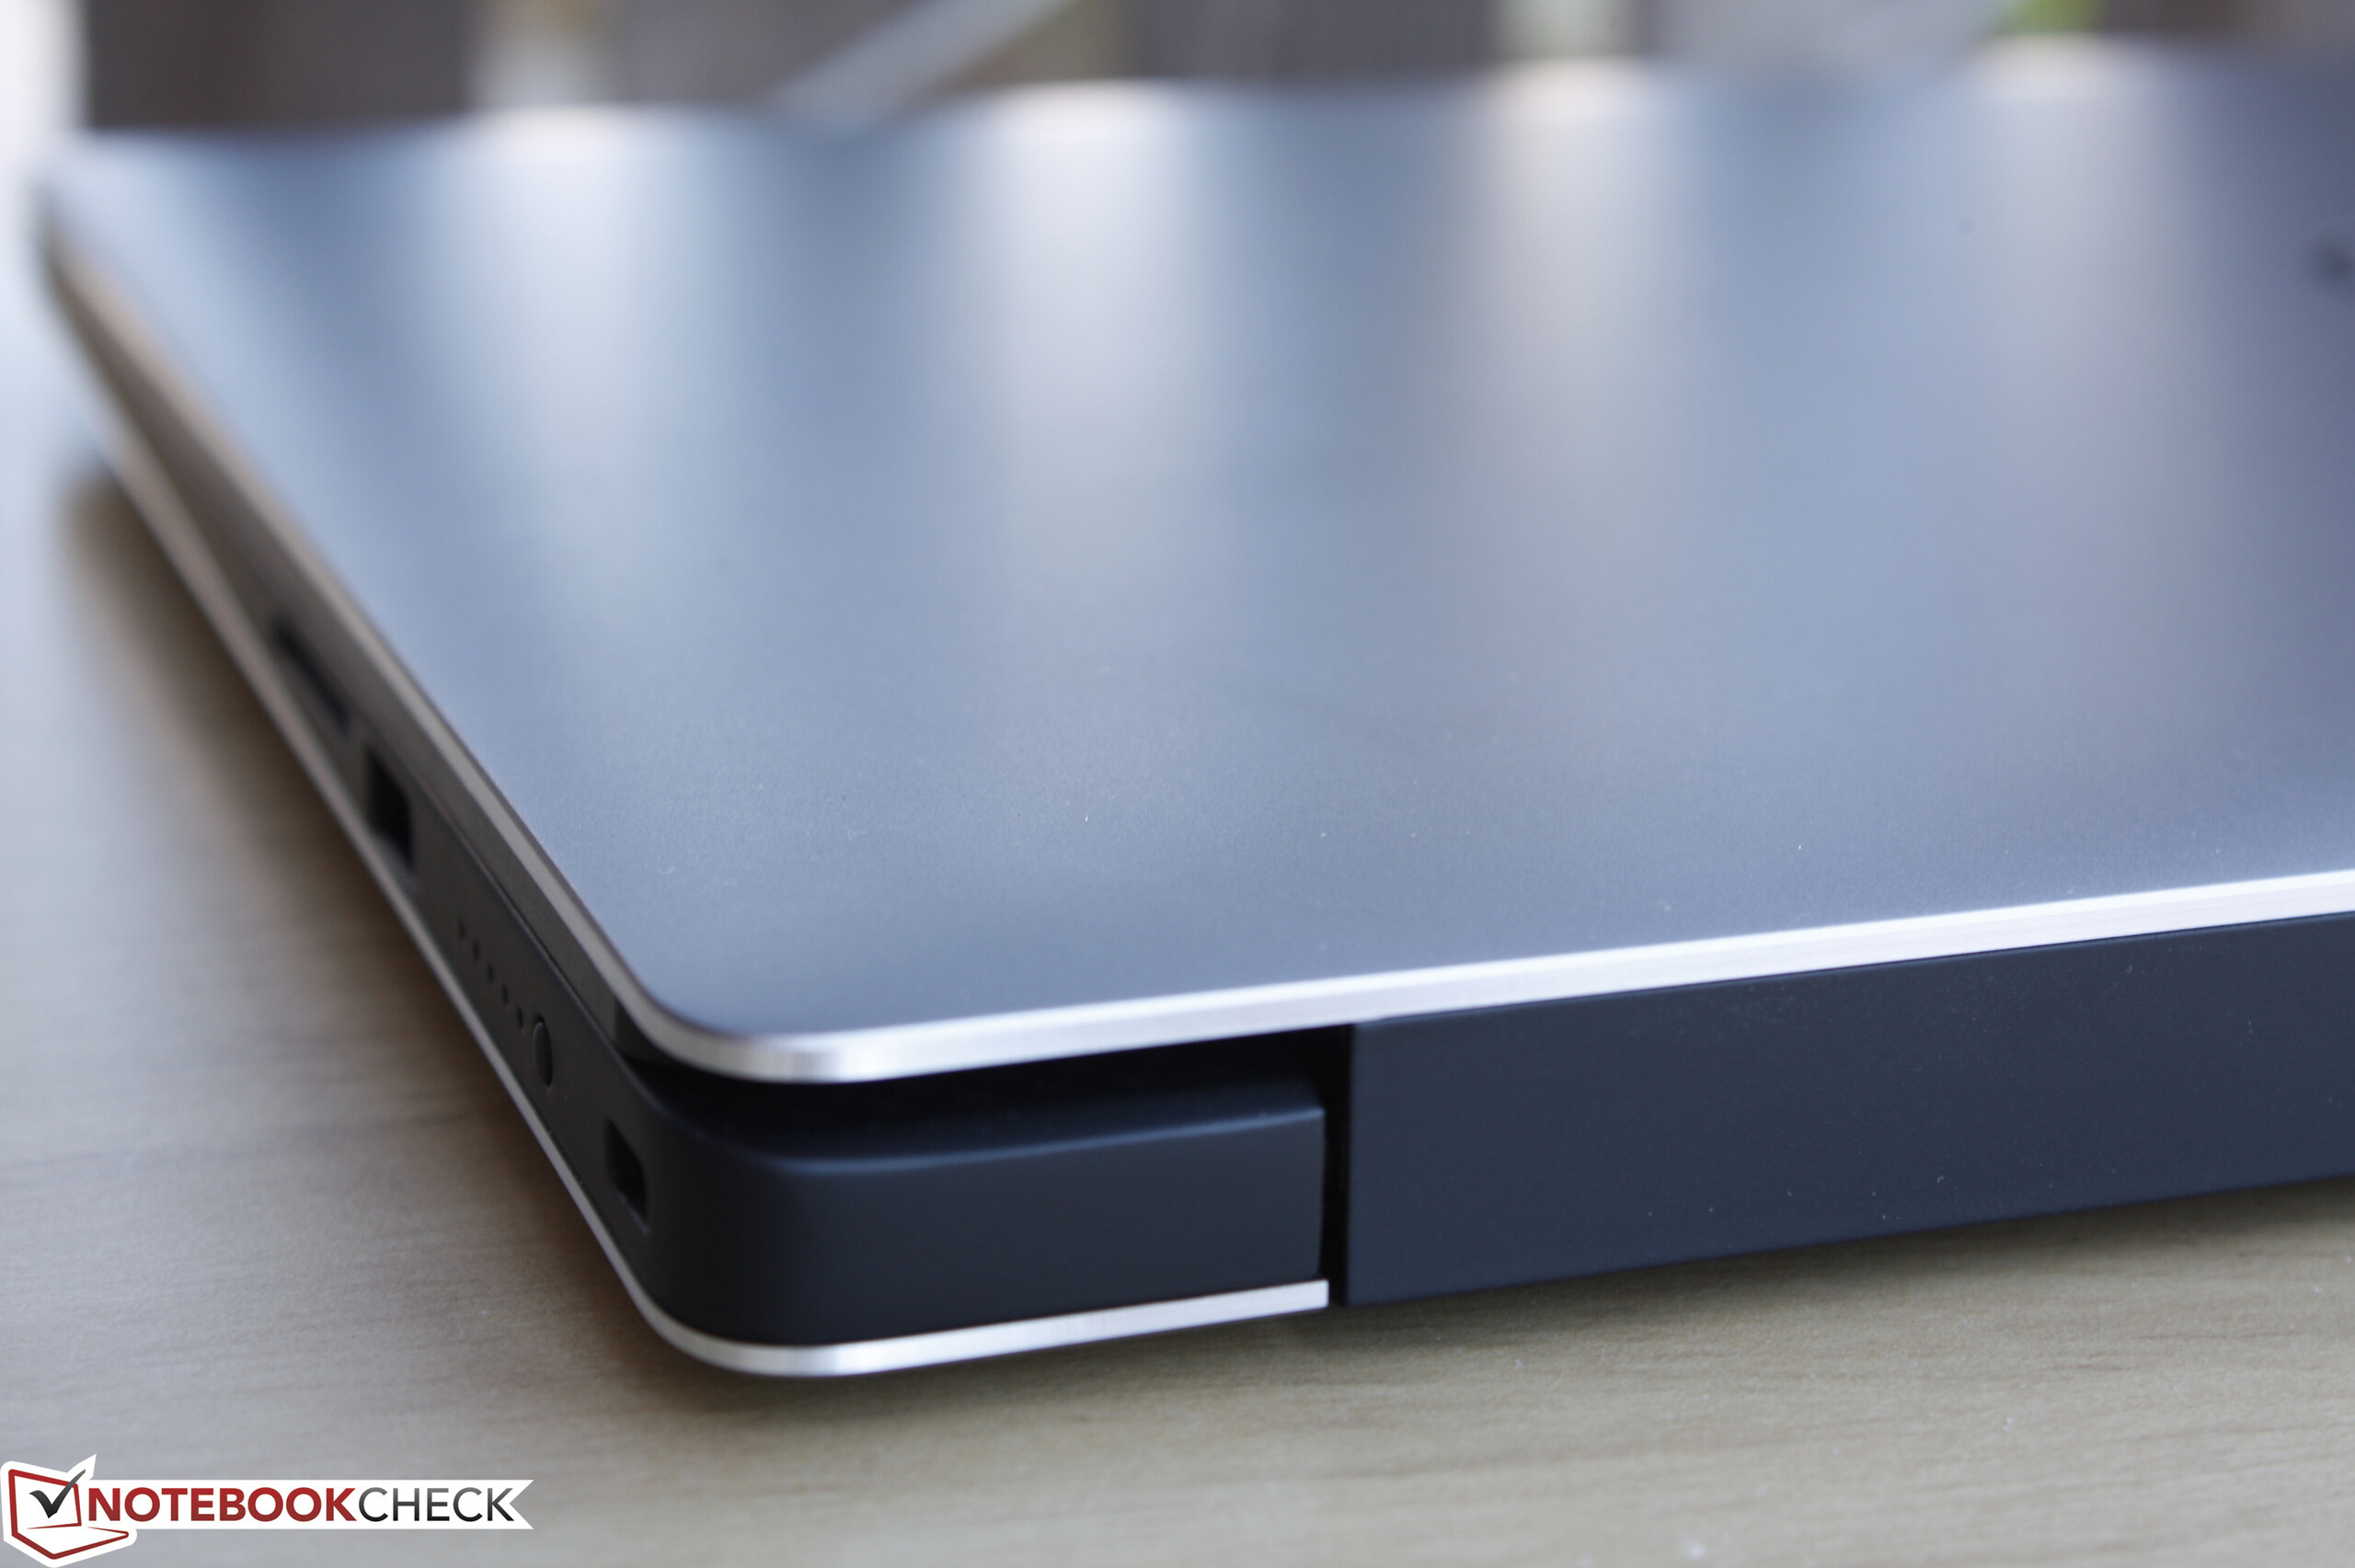
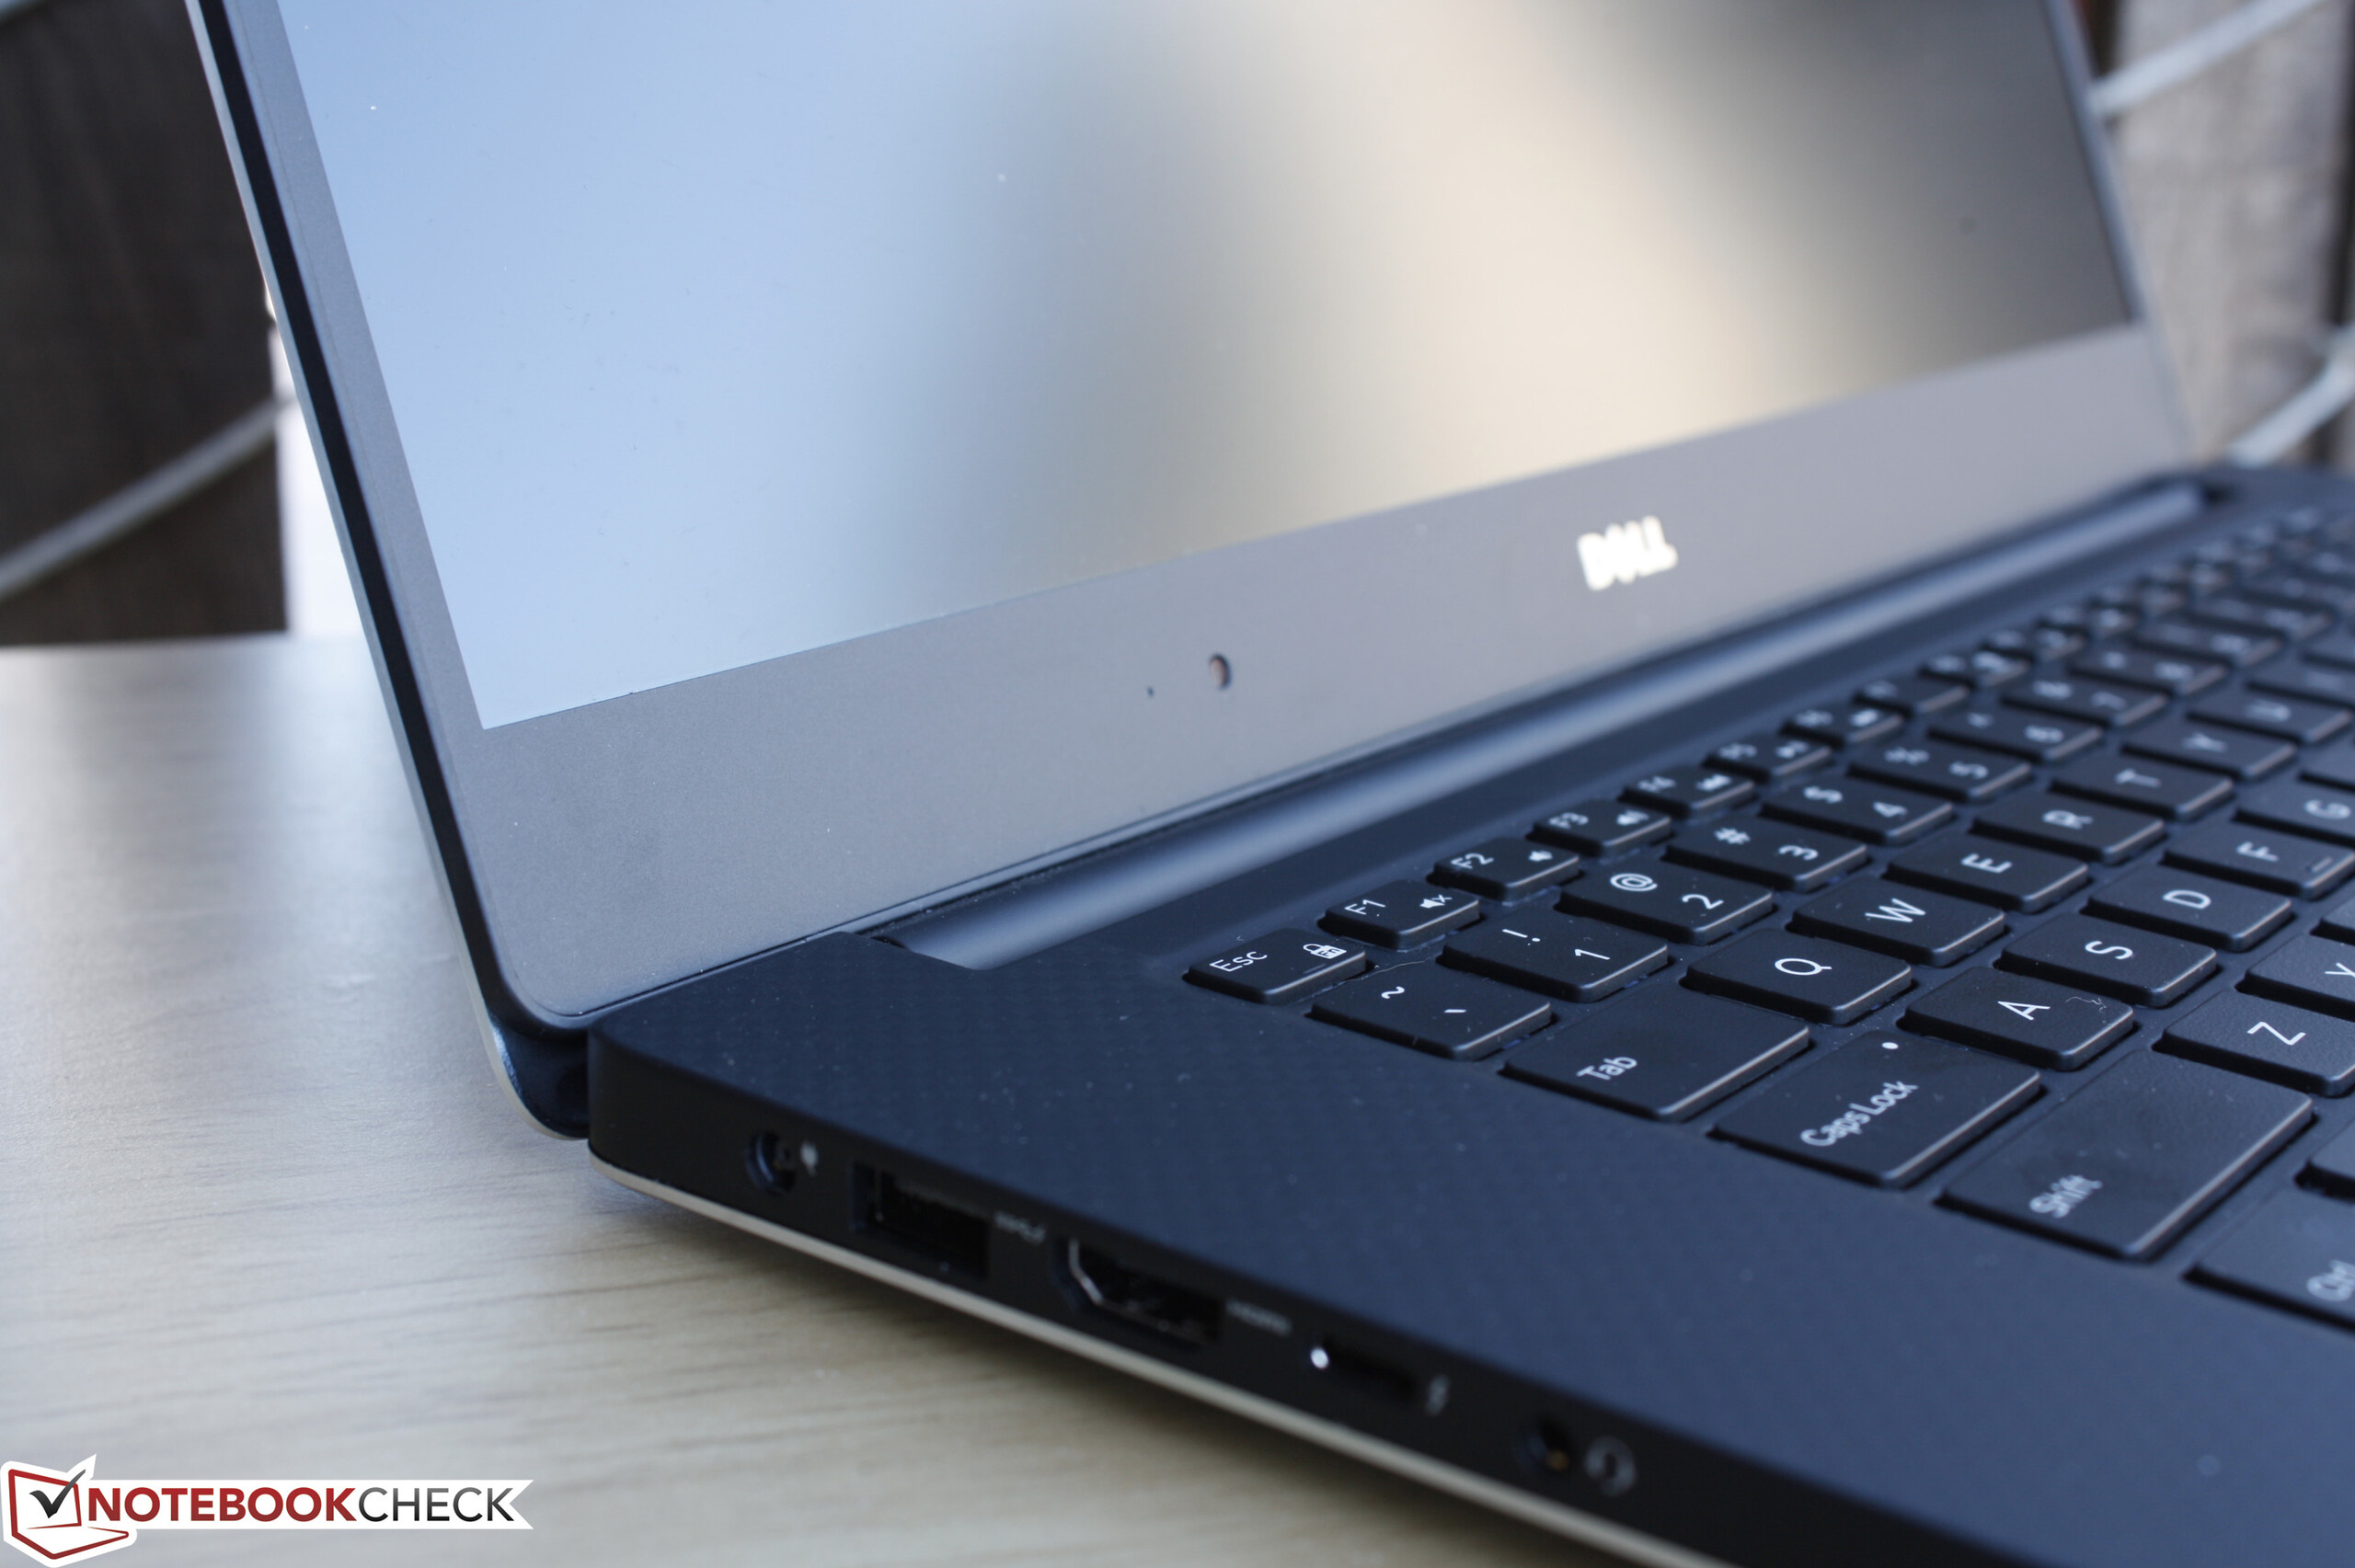
We recommend checking out our previous reviews on the XPS 15 for more pictures and information on the chassis, input devices, and connectivity features.
Display
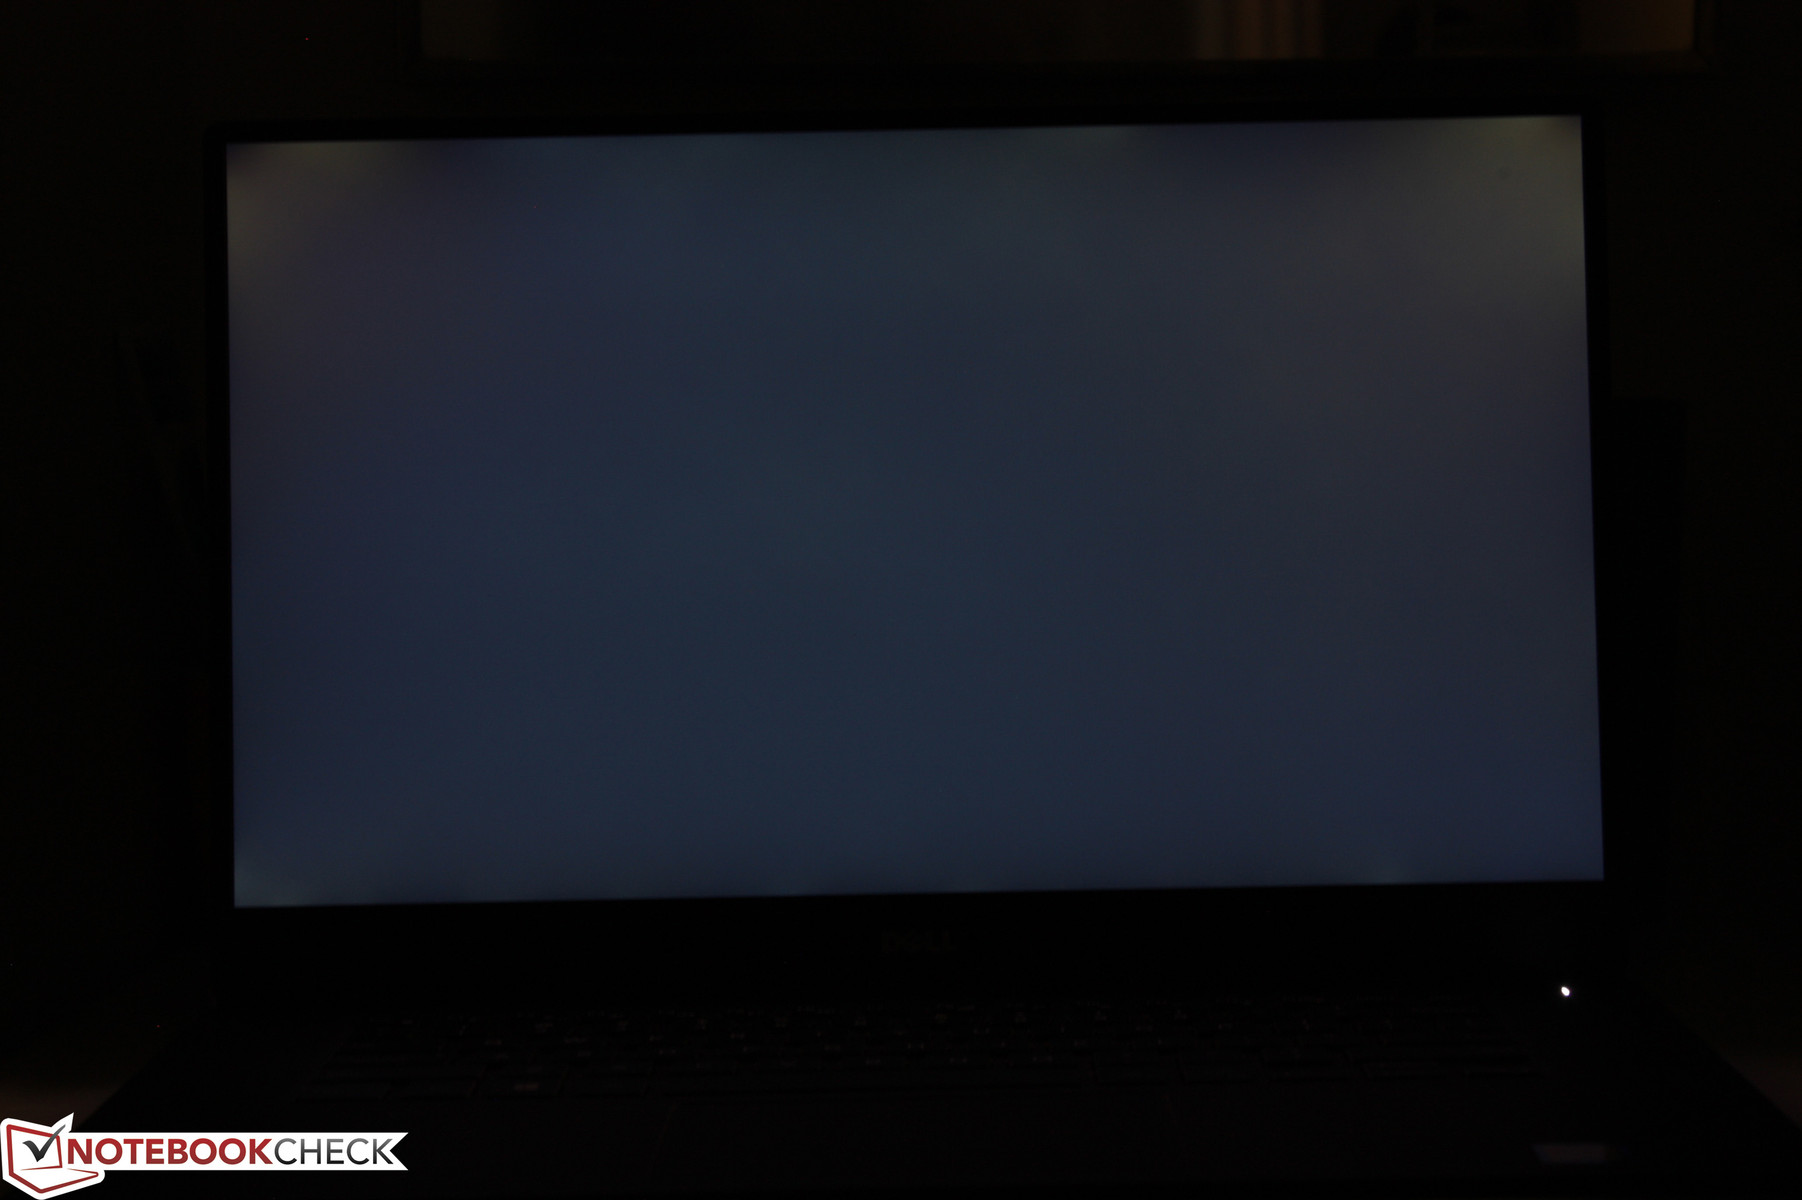
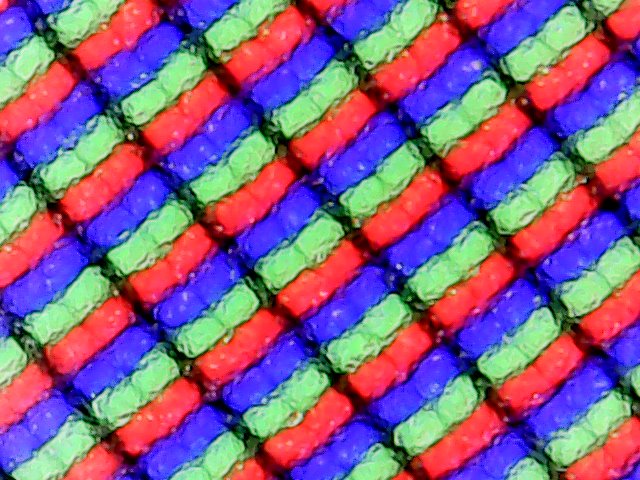
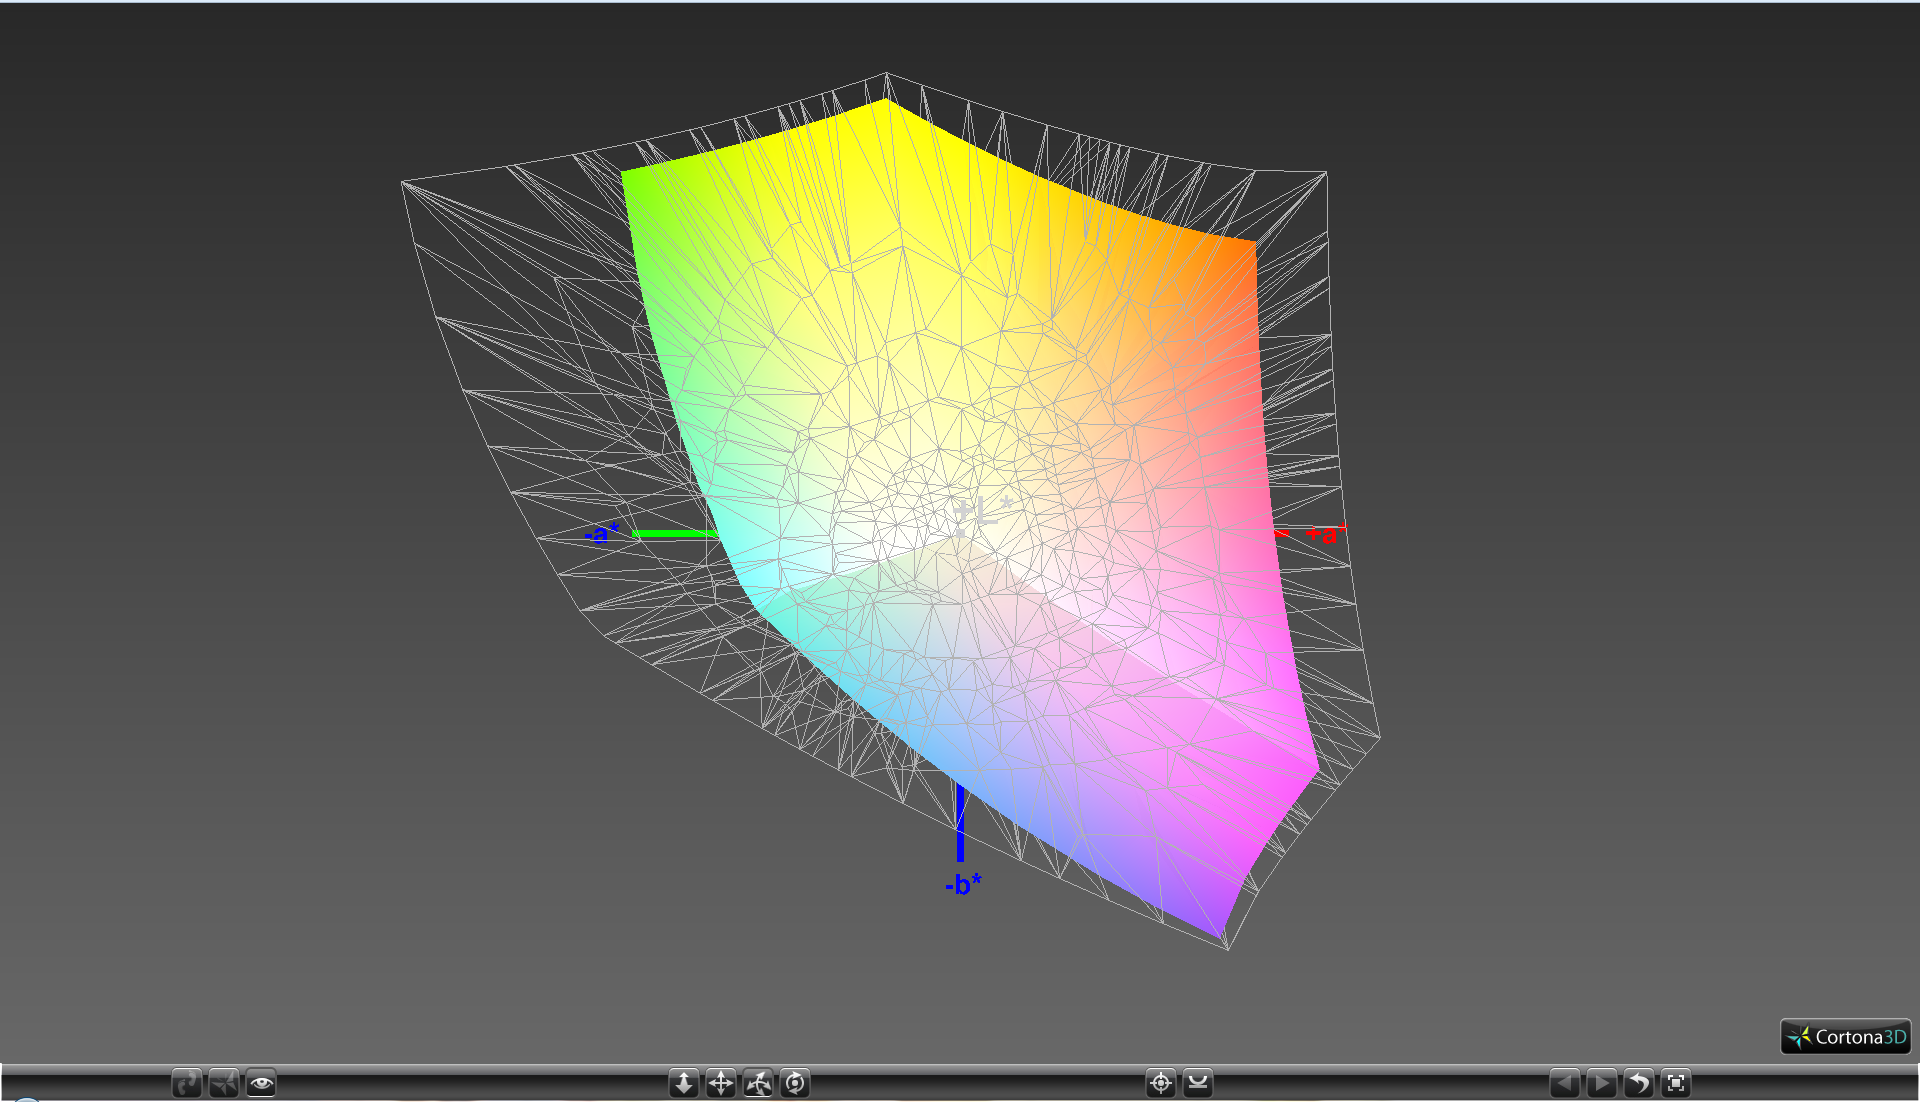
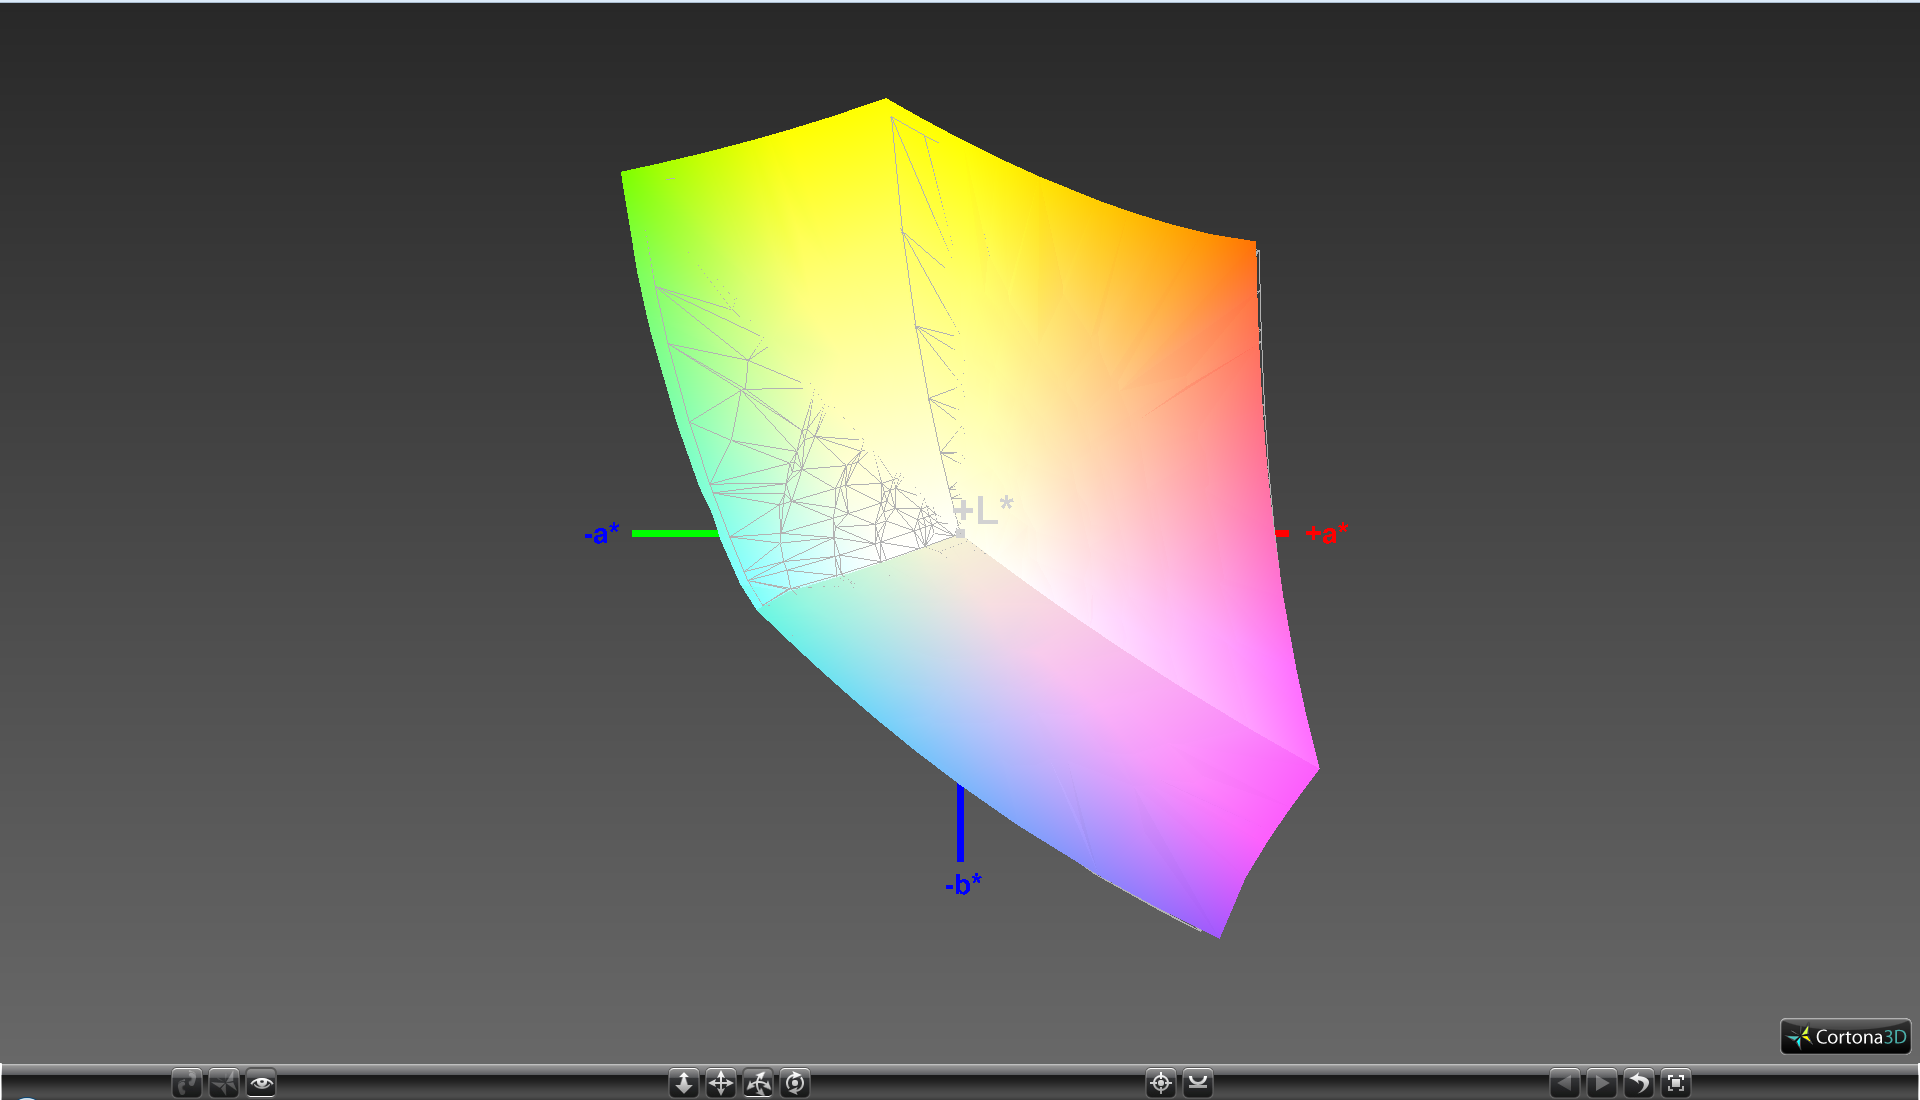
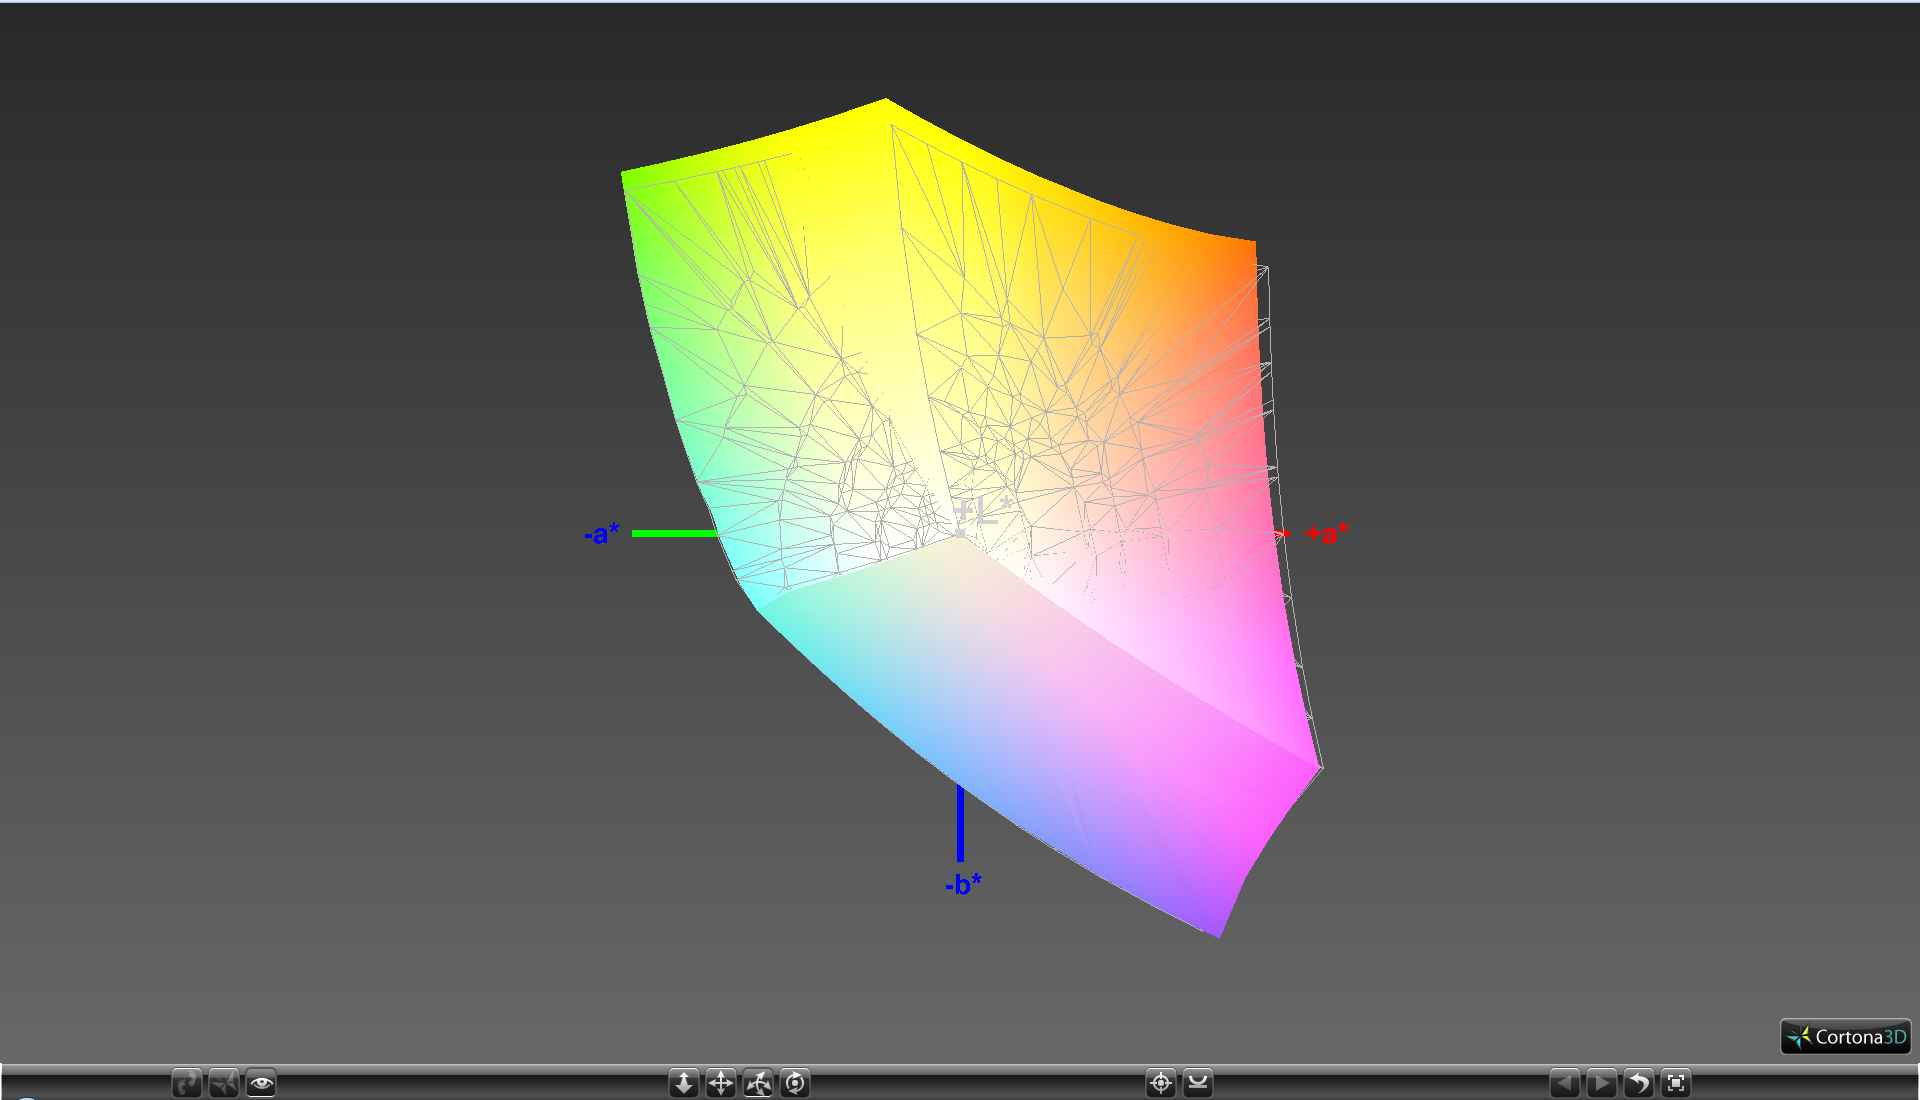
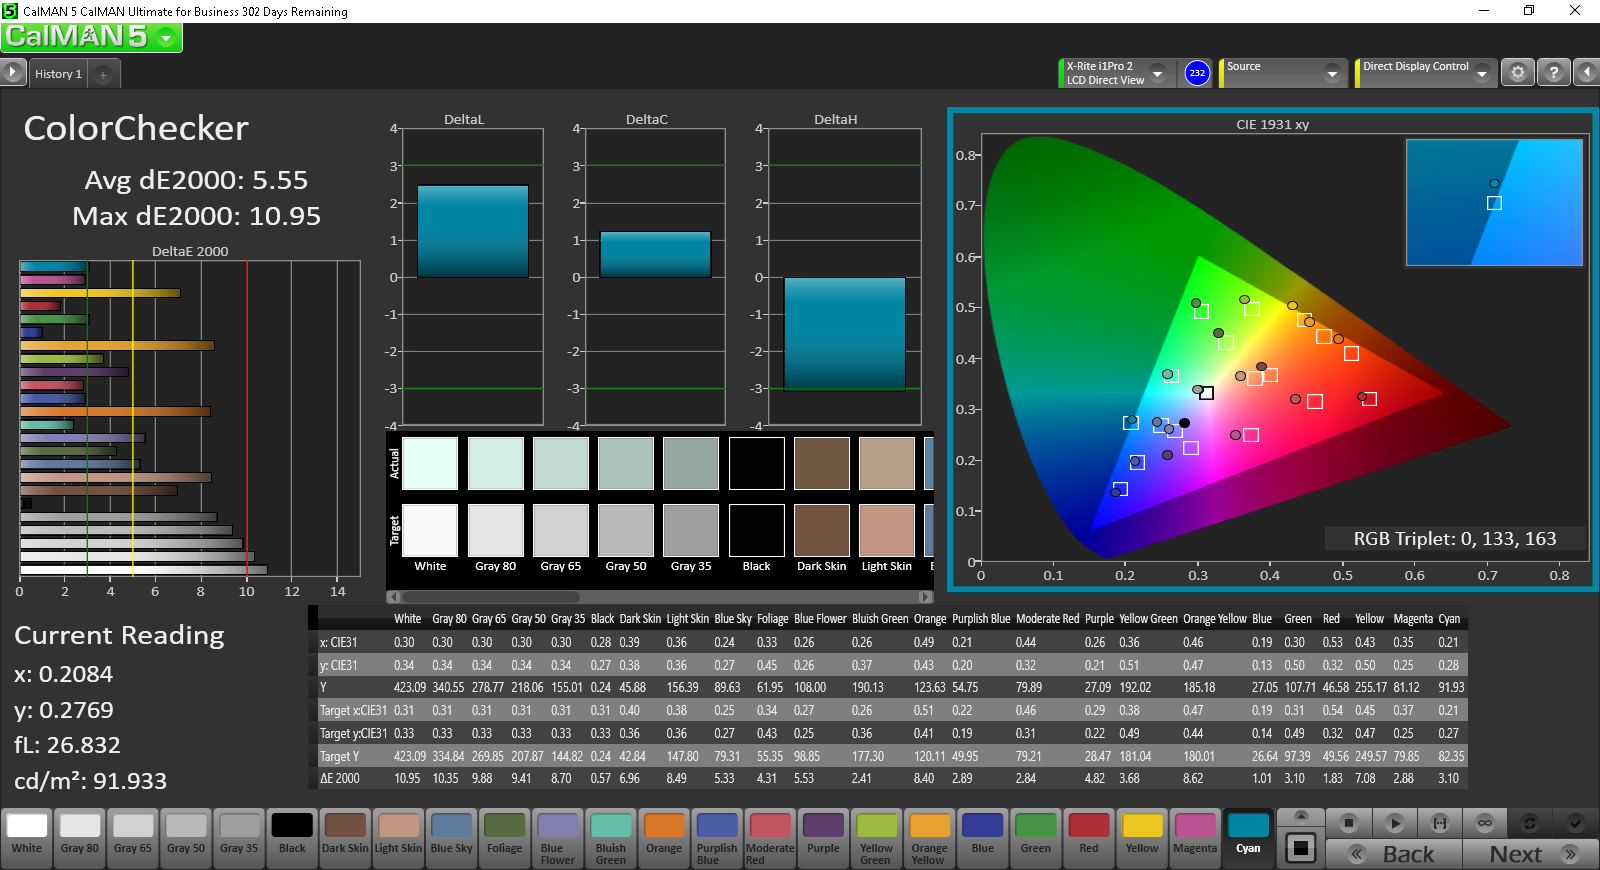
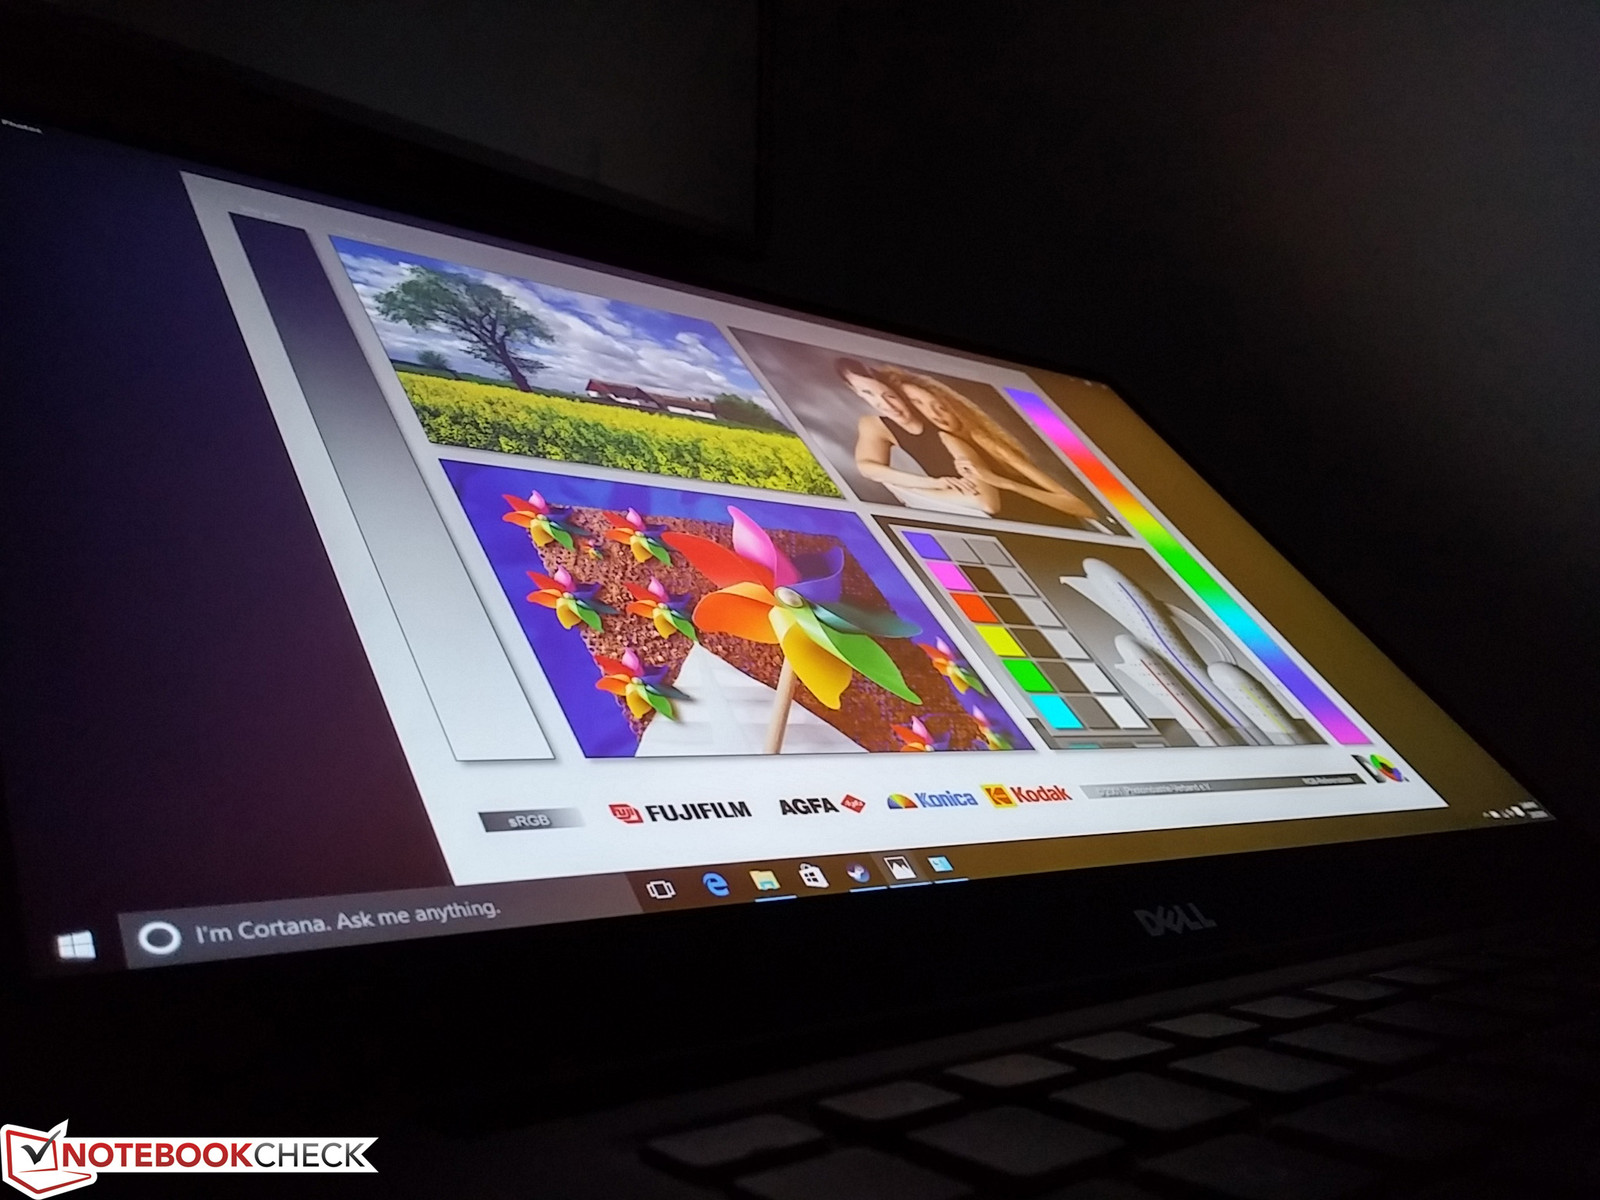
Our test model uses the same Sharp LQ156M1 IPS panel as our previous XPS 15 2016 FHD unit. Thus, our retested brightness, contrast, and color space measurements are very close between the two. It's worth noting that the FHD SKU covers 98 percent of sRGB according to our measurements while the UHD SKU covers an even wider gamut at 89 percent of AdobeRGB. Backlight bleeding occurs near the two top corners of the display, though it is minor enough to be unnoticeable during everyday use and only barely noticeable when watching movies with black borders.
Display flickering continues to be prevalent when at very low brightness levels of 20 percent or dimmer. Users who may be sensitive to PWM should maintain a brightness level of at least 30 or 50 percent where flickering is no longer noticeable or detectable. This backlight behavior is unique to the FHD SKUs as the UHD SKUs function without the use of PWM on all brightness levels.
| |||||||||||||||||||||||||
Brightness Distribution: 92 %
Center on Battery: 371.5 cd/m²
Contrast: 1474:1 (Black: 0.252 cd/m²)
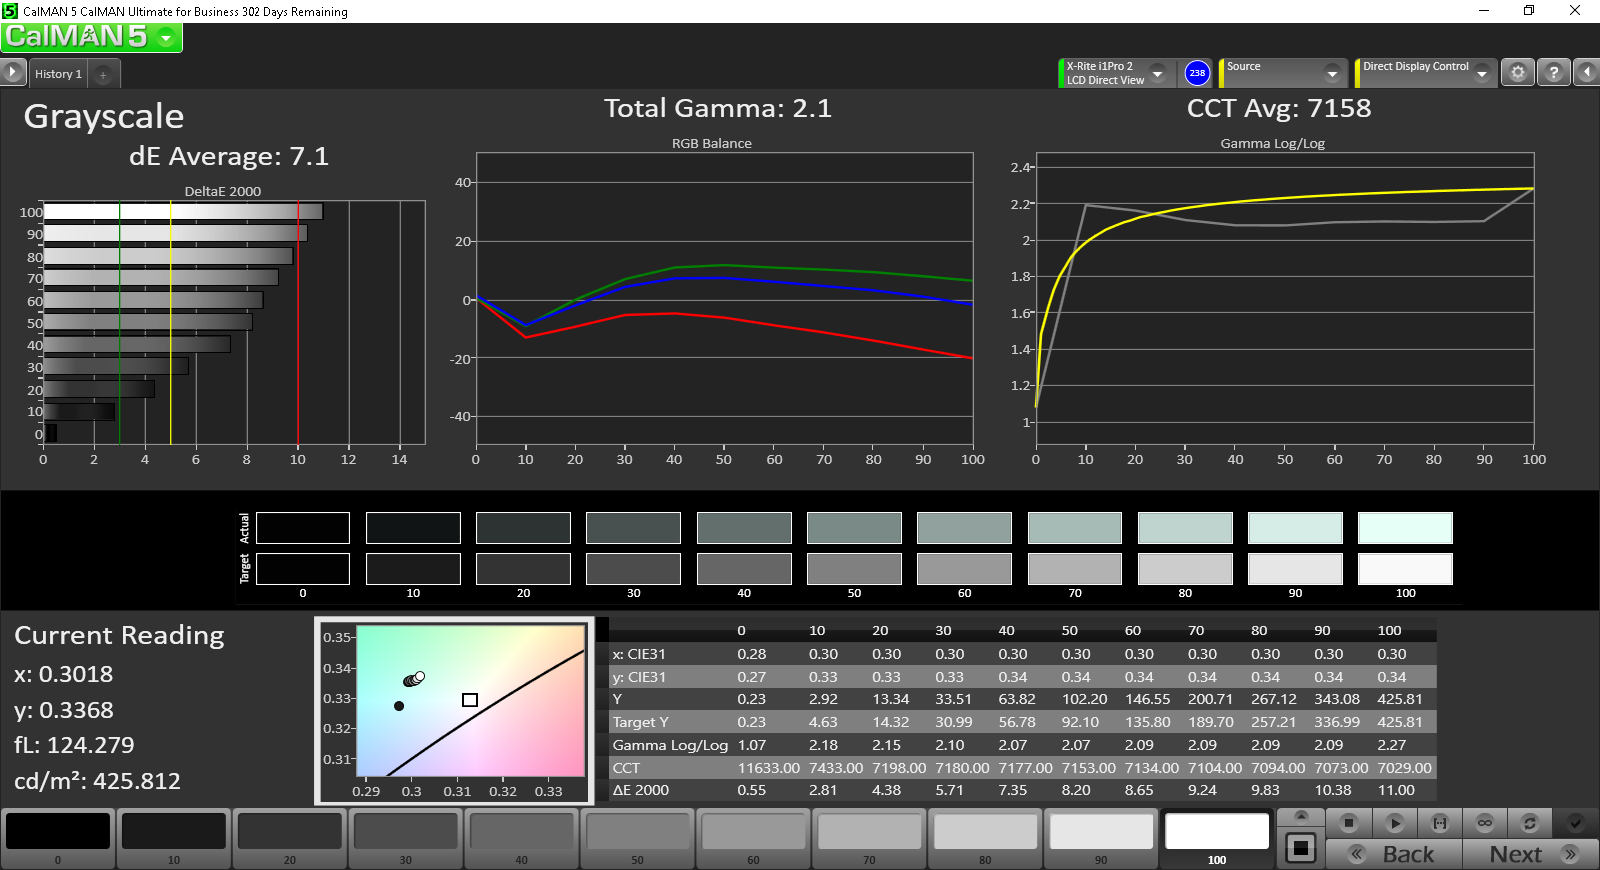
ΔE ColorChecker Calman: 5.55 | ∀{0.5-29.43 Ø4.74}
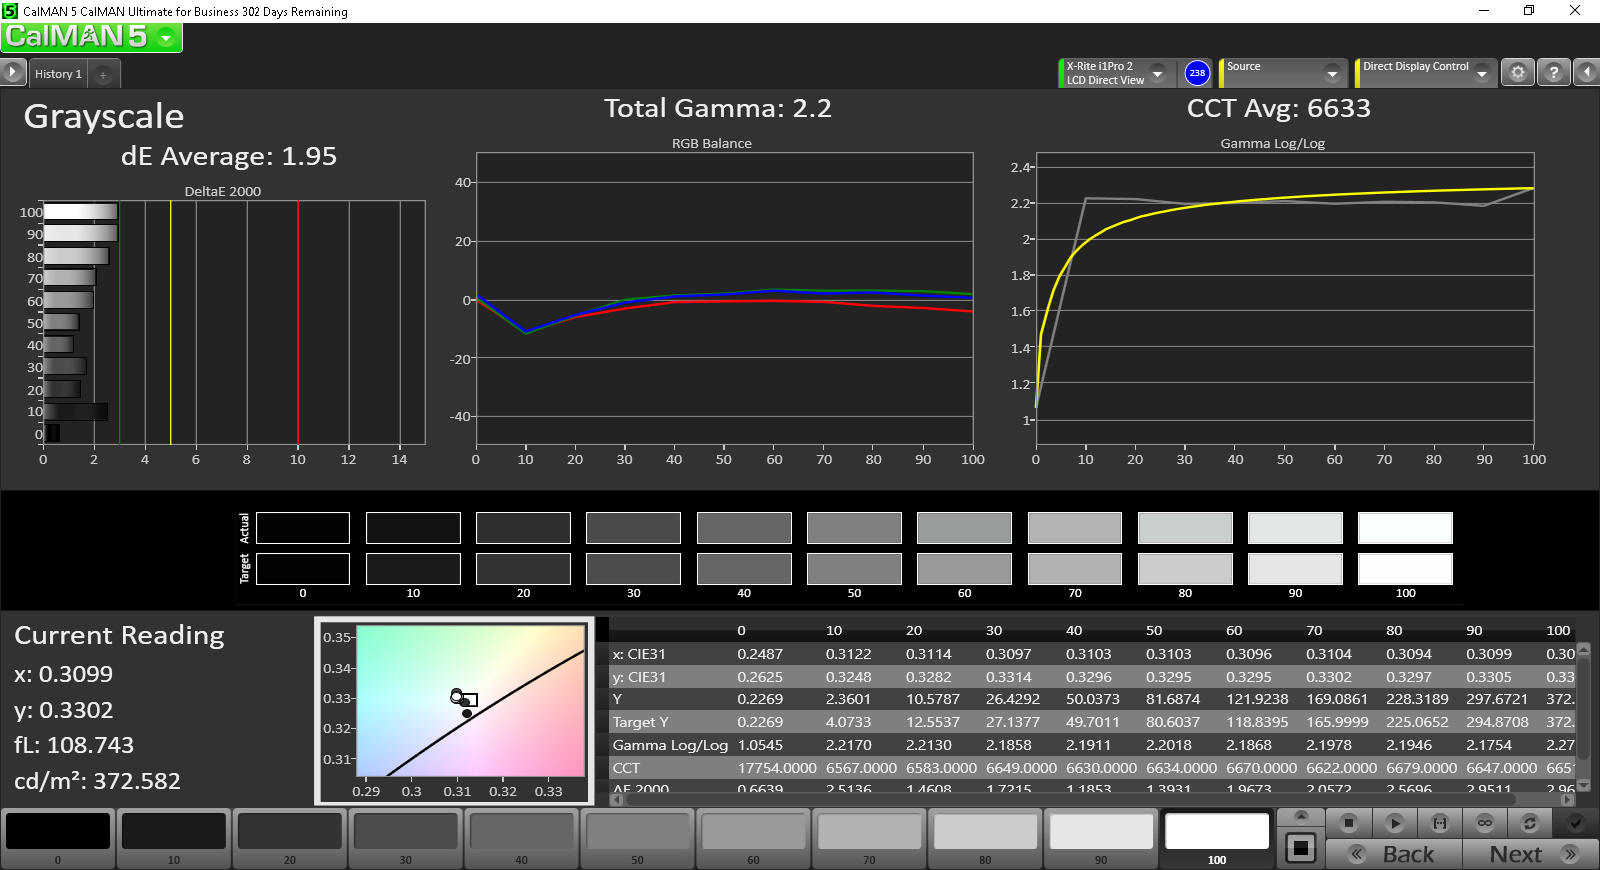
ΔE Greyscale Calman: 7.1 | ∀{0.09-98 Ø4.99}
97.9% sRGB (Argyll 1.6.3 3D)
63.4% AdobeRGB 1998 (Argyll 1.6.3 3D)
70.4% AdobeRGB 1998 (Argyll 3D)
97.2% sRGB (Argyll 3D)
68.5% Display P3 (Argyll 3D)
Gamma: 2.1
| Dell XPS 15 9550 i7 FHD 15.6", 1920x1080 | Dell XPS 15-9550 i7 15.6", 3840x2160 | Dell XPS 15 2016 9550 15.6", 1920x1080 | Dell XPS 15 (9530-0538) 15.6", 3840x2160 | Dell XPS 15 (Late 2013) 15.6", 3200x1800 | Dell XPS 13 2016 i7 256GB QHD 13.3", 3200x1800 | |
|---|---|---|---|---|---|---|
| Display | 24% | 0% | -4% | 3% | -6% | |
| Display P3 Coverage (%) | 68.5 | 87.8 28% | 68.8 0% | 64.9 -5% | 72.6 6% | 63.6 -7% |
| sRGB Coverage (%) | 97.2 | 100 3% | 97.9 1% | 96.1 -1% | 96.1 -1% | 93.6 -4% |
| AdobeRGB 1998 Coverage (%) | 70.4 | 99.4 41% | 70.7 0% | 66.9 -5% | 72.9 4% | 65.5 -7% |
| Response Times | 20% | 12% | 39% | |||
| Response Time Grey 50% / Grey 80% * (ms) | 64 ? | 58 ? 9% | 62 ? 3% | 40 ? 37% | ||
| Response Time Black / White * (ms) | 50 ? | 35 ? 30% | 40 ? 20% | 30 ? 40% | ||
| PWM Frequency (Hz) | 362 ? | 4900 ? | ||||
| Screen | -2% | 1% | 6% | -6% | 2% | |
| Brightness middle (cd/m²) | 371.5 | 361 -3% | 399 7% | 349 -6% | 349 -6% | 285 -23% |
| Brightness (cd/m²) | 356 | 344 -3% | 394 11% | 365 3% | 322 -10% | 281 -21% |
| Brightness Distribution (%) | 92 | 90 -2% | 89 -3% | 87 -5% | 83 -10% | 90 -2% |
| Black Level * (cd/m²) | 0.252 | 0.38 -51% | 0.24 5% | 0.282 -12% | 0.21 17% | 0.18 29% |
| Contrast (:1) | 1474 | 950 -36% | 1663 13% | 1238 -16% | 1662 13% | 1583 7% |
| Colorchecker dE 2000 * | 5.55 | 5.34 4% | 5.95 -7% | 2.65 52% | 8.27 -49% | 4.89 12% |
| Colorchecker dE 2000 max. * | 10.95 | |||||
| Greyscale dE 2000 * | 7.1 | 4.84 32% | 8.41 -18% | 3.77 47% | 7.99 -13% | 5.16 27% |
| Gamma | 2.1 105% | 2.21 100% | 2.35 94% | 2.41 91% | 3.42 64% | 2.15 102% |
| Color Space (Percent of AdobeRGB 1998) (%) | 63.4 | 89 40% | 64 1% | 61.02 -4% | 69.08 9% | 59 -7% |
| Color Space (Percent of sRGB) (%) | 97.9 | 100 2% | 98 0% | 96.1 -2% | 93 -5% | |
| CCT | 7395 88% | 7010 93% | 6786 96% | 8117 80% | 7106 91% | |
| Total Average (Program / Settings) | 14% /
7% | 4% /
2% | 1% /
4% | -2% /
-4% | 12% /
5% |
* ... smaller is better


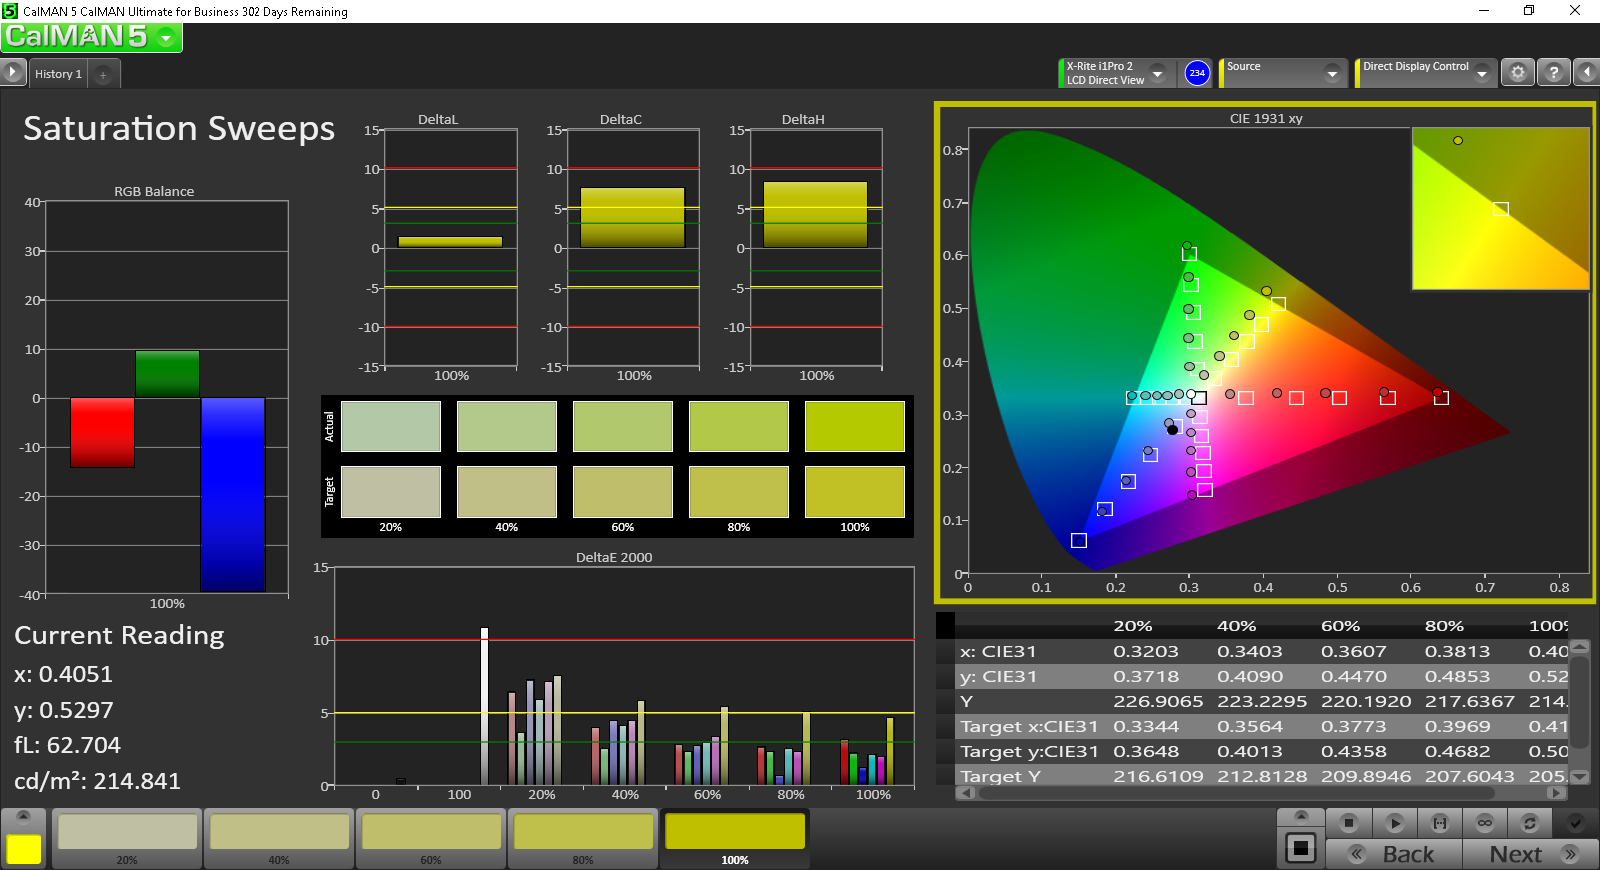
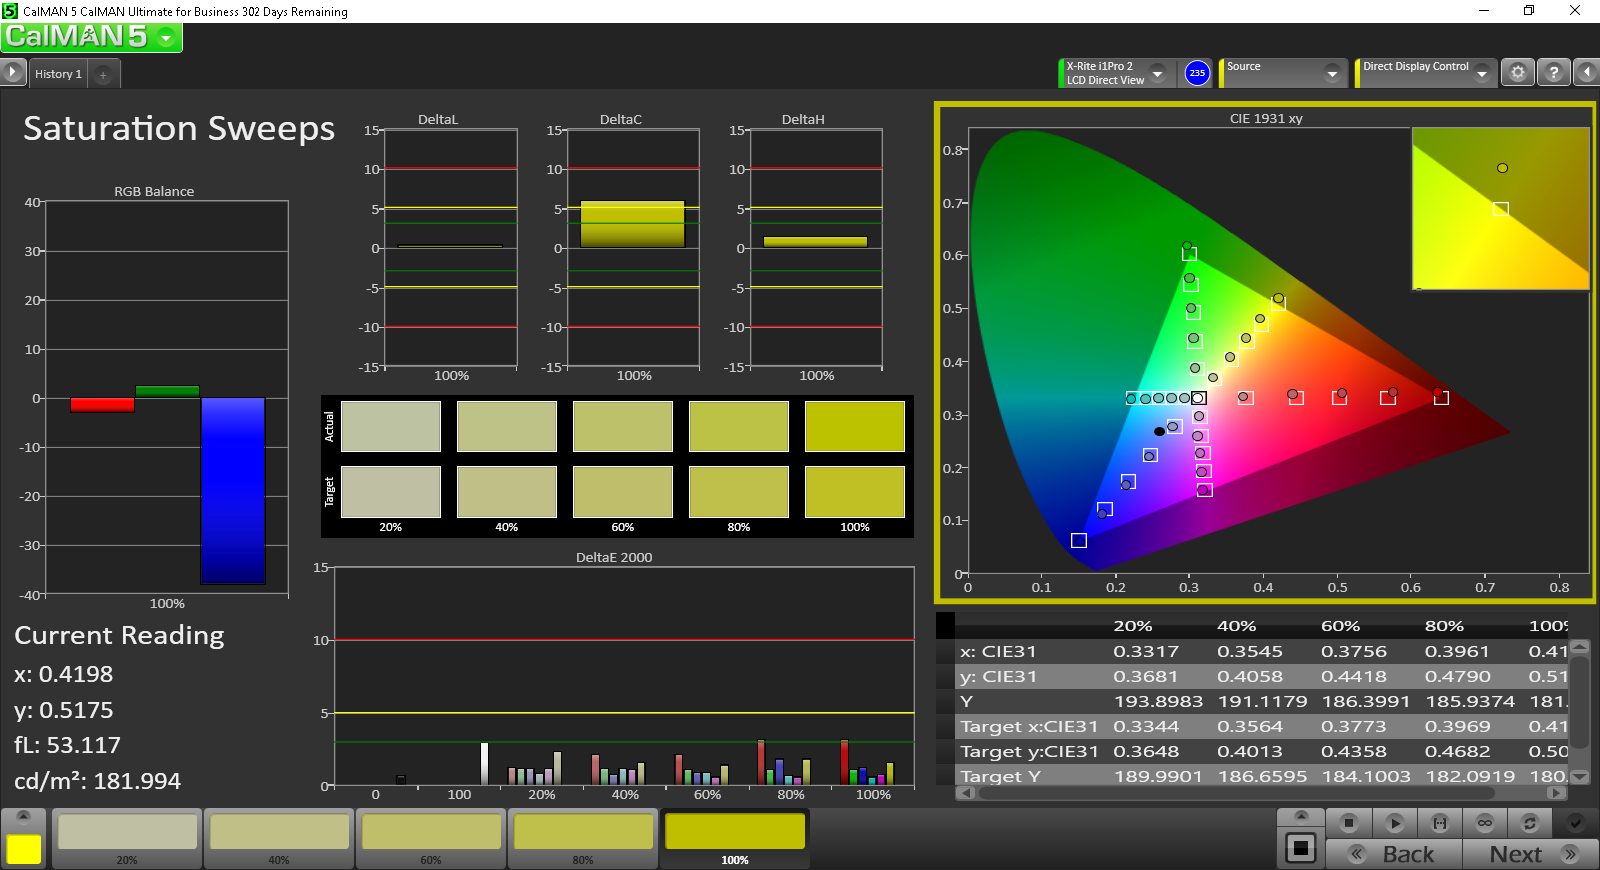
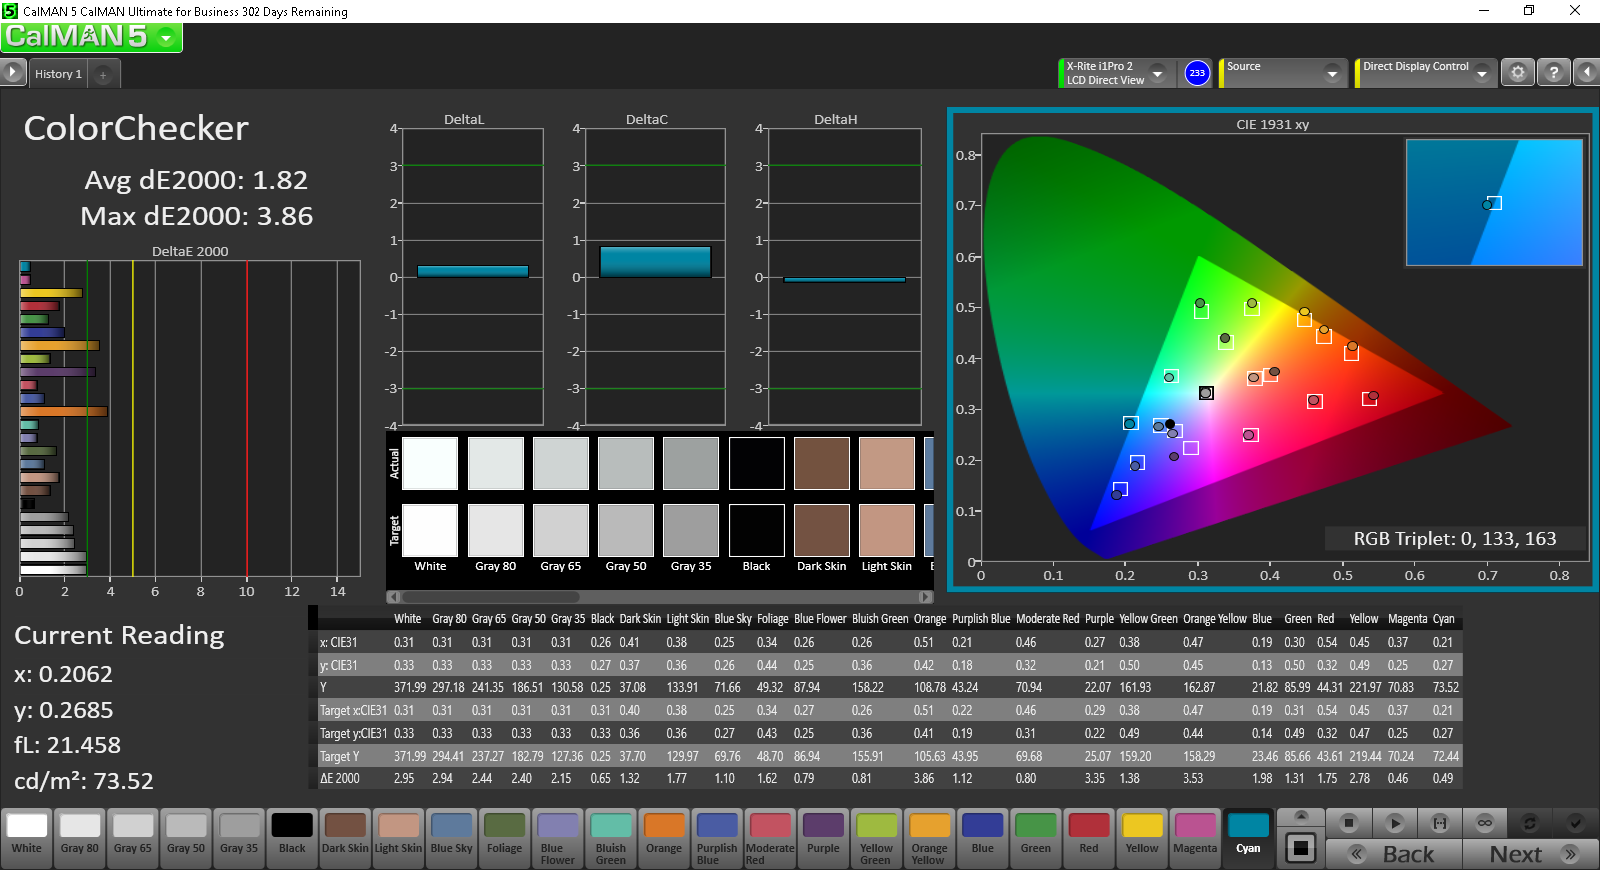
Colors and grayscale are good out-of-the-box, but both could benefit noticeably from a calibration. Colors are very accurate across all tested saturation levels due to the near perfect sRGB coverage. Orange and Red colors appear to be slightly less accurate than others.
Display Response Times
| ↔ Response Time Black to White | ||
|---|---|---|
| 50 ms ... rise ↗ and fall ↘ combined | ↗ 12 ms rise | 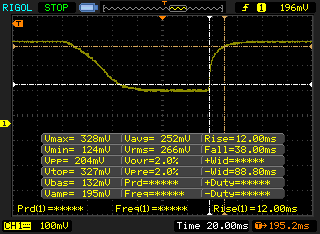 |
| ↘ 38 ms fall | ||
| The screen shows slow response rates in our tests and will be unsatisfactory for gamers. In comparison, all tested devices range from 0.1 (minimum) to 240 (maximum) ms. » 99 % of all devices are better. This means that the measured response time is worse than the average of all tested devices (20 ms). | ||
| ↔ Response Time 50% Grey to 80% Grey | ||
| 64 ms ... rise ↗ and fall ↘ combined | ↗ 27 ms rise | 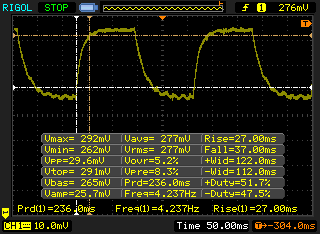 |
| ↘ 37 ms fall | ||
| The screen shows slow response rates in our tests and will be unsatisfactory for gamers. In comparison, all tested devices range from 0.165 (minimum) to 636 (maximum) ms. » 97 % of all devices are better. This means that the measured response time is worse than the average of all tested devices (31.3 ms). | ||
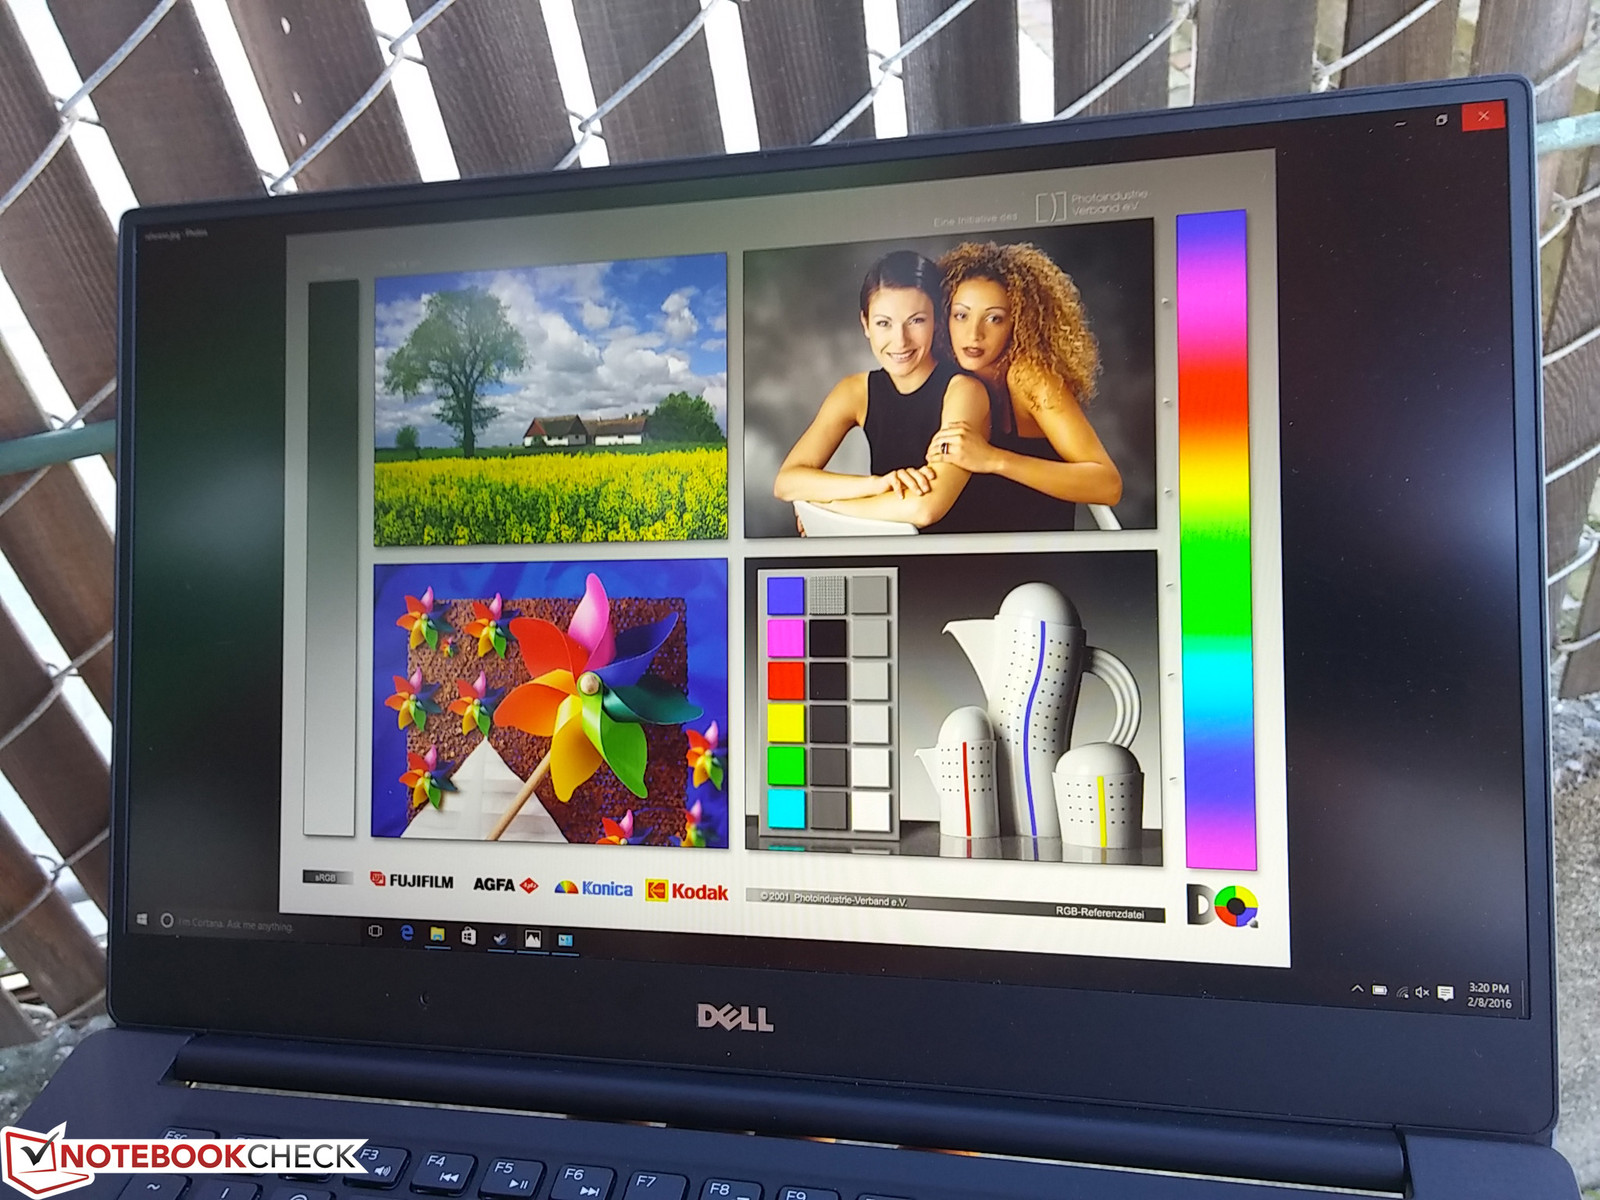
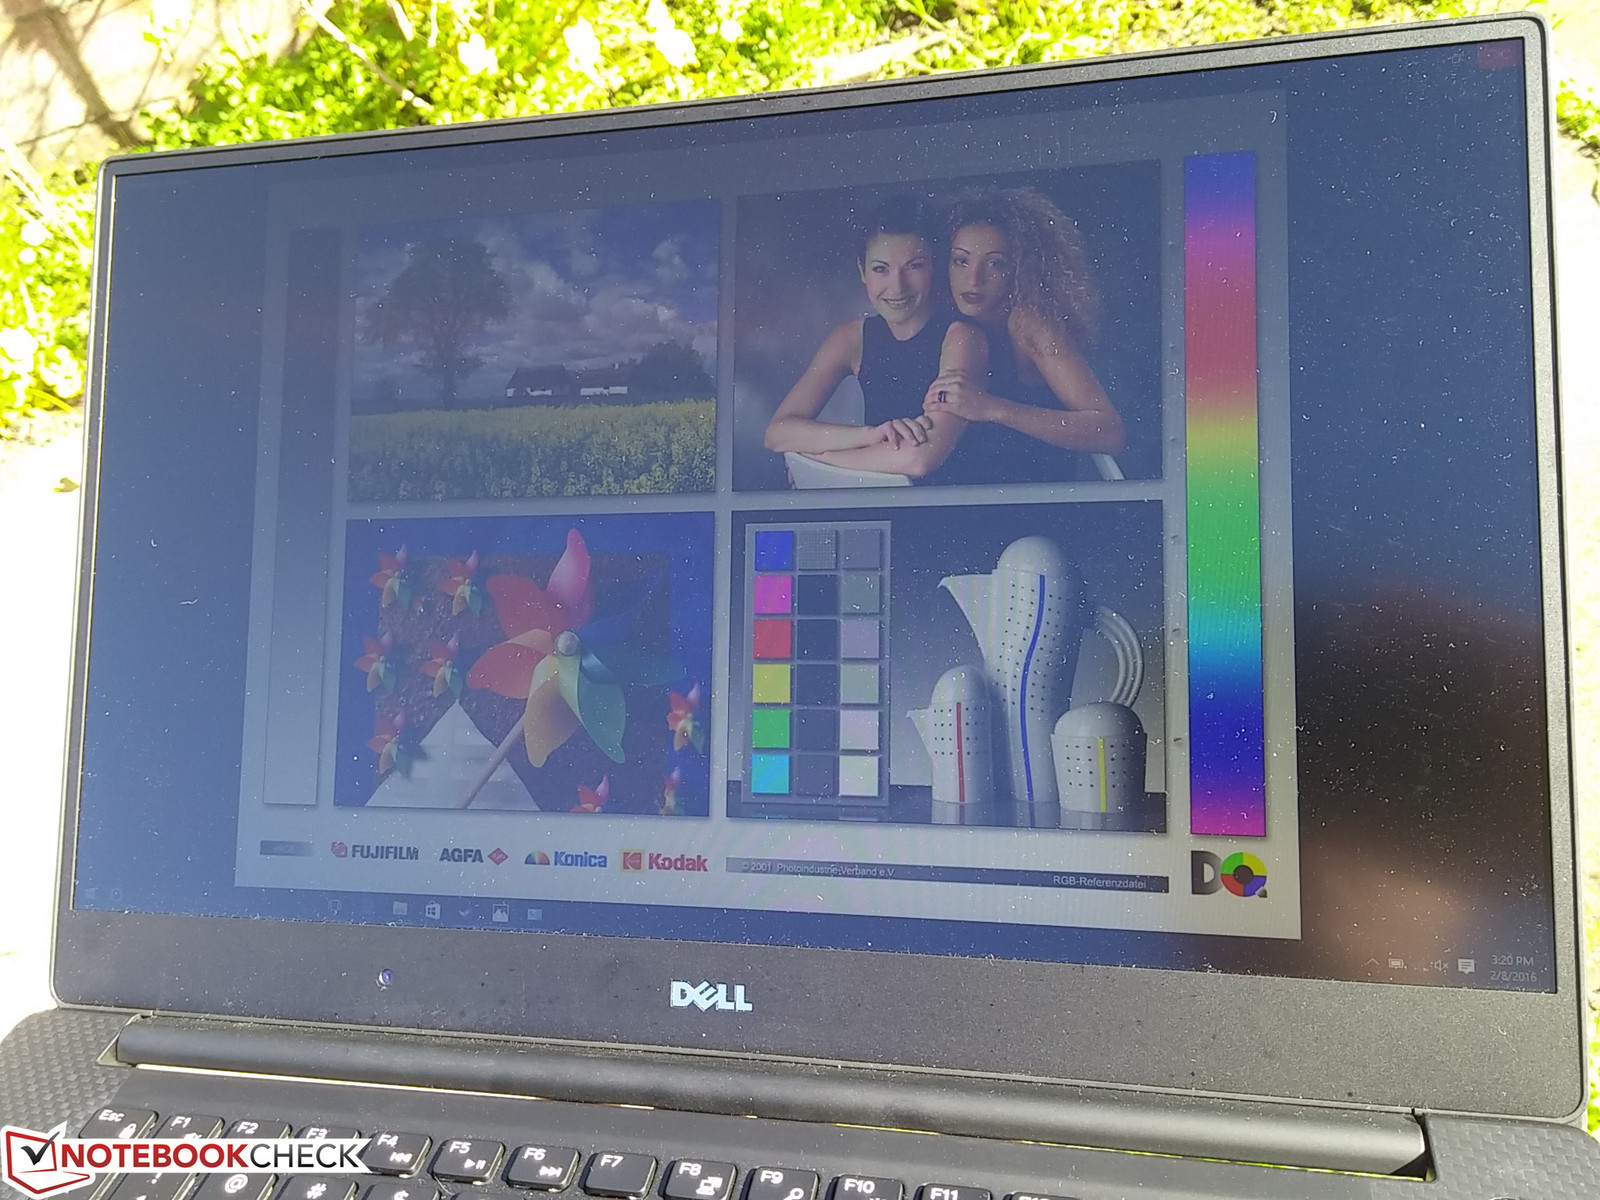
Outdoor usability is above average due to the relatively bright backlight, deep contrast, matte display, and IPS panel for wide viewing angles. We had no issues viewing content comfortably under shade while direct sunlight will easily wash out the display. Viewing from very obtuse angles will have a Yellowing effect on apparent contrast and colors.
Performance
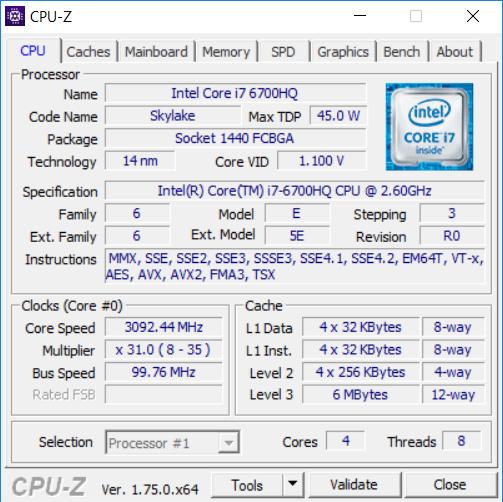
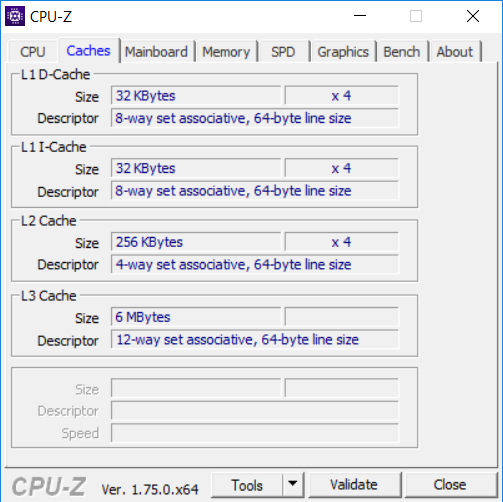
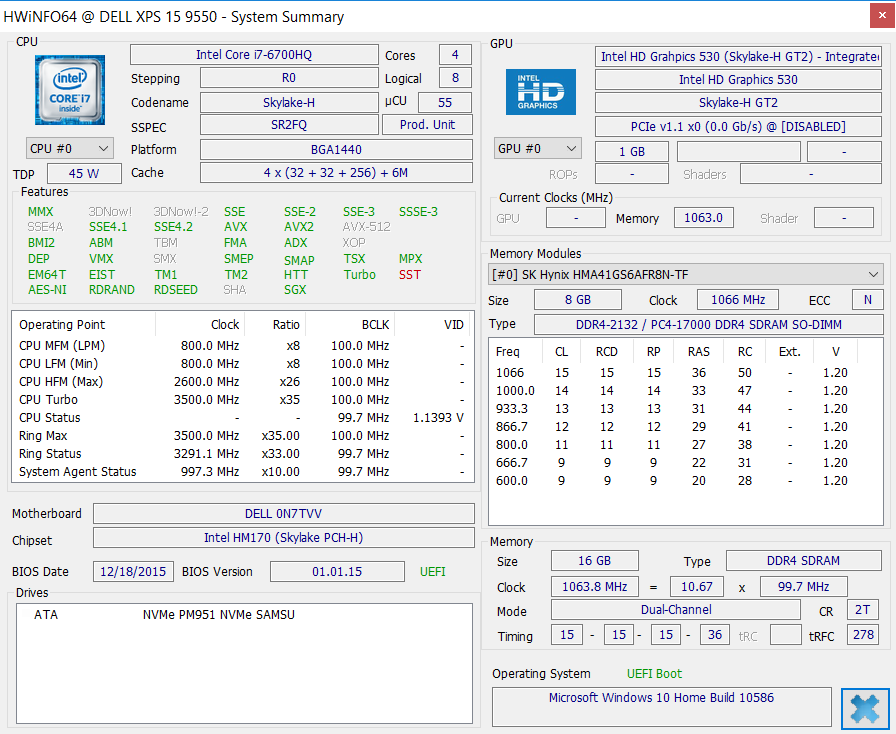
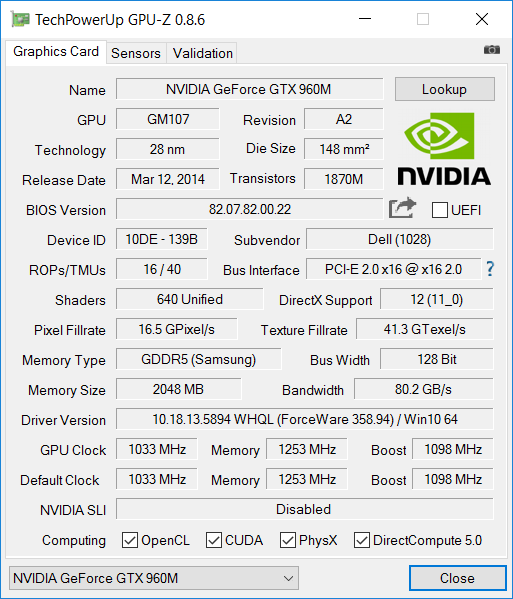
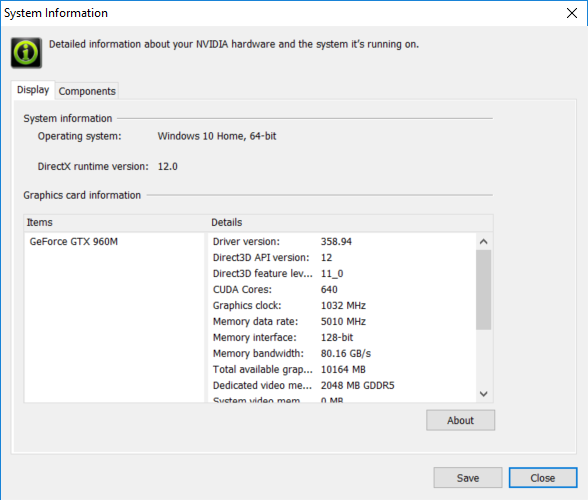
Our test model is equipped with the same Core i7-6700HQ CPU, GTX 960M GPU, and NVMe Samsung SSD as our UHD SKU. If idling, the CPU and GPU can run at just 800 MHz and 135/405 MHz core/memory, respectively, to preserve power. Optimus is available with the integrated HD 530 for even longer battery life.
Processor
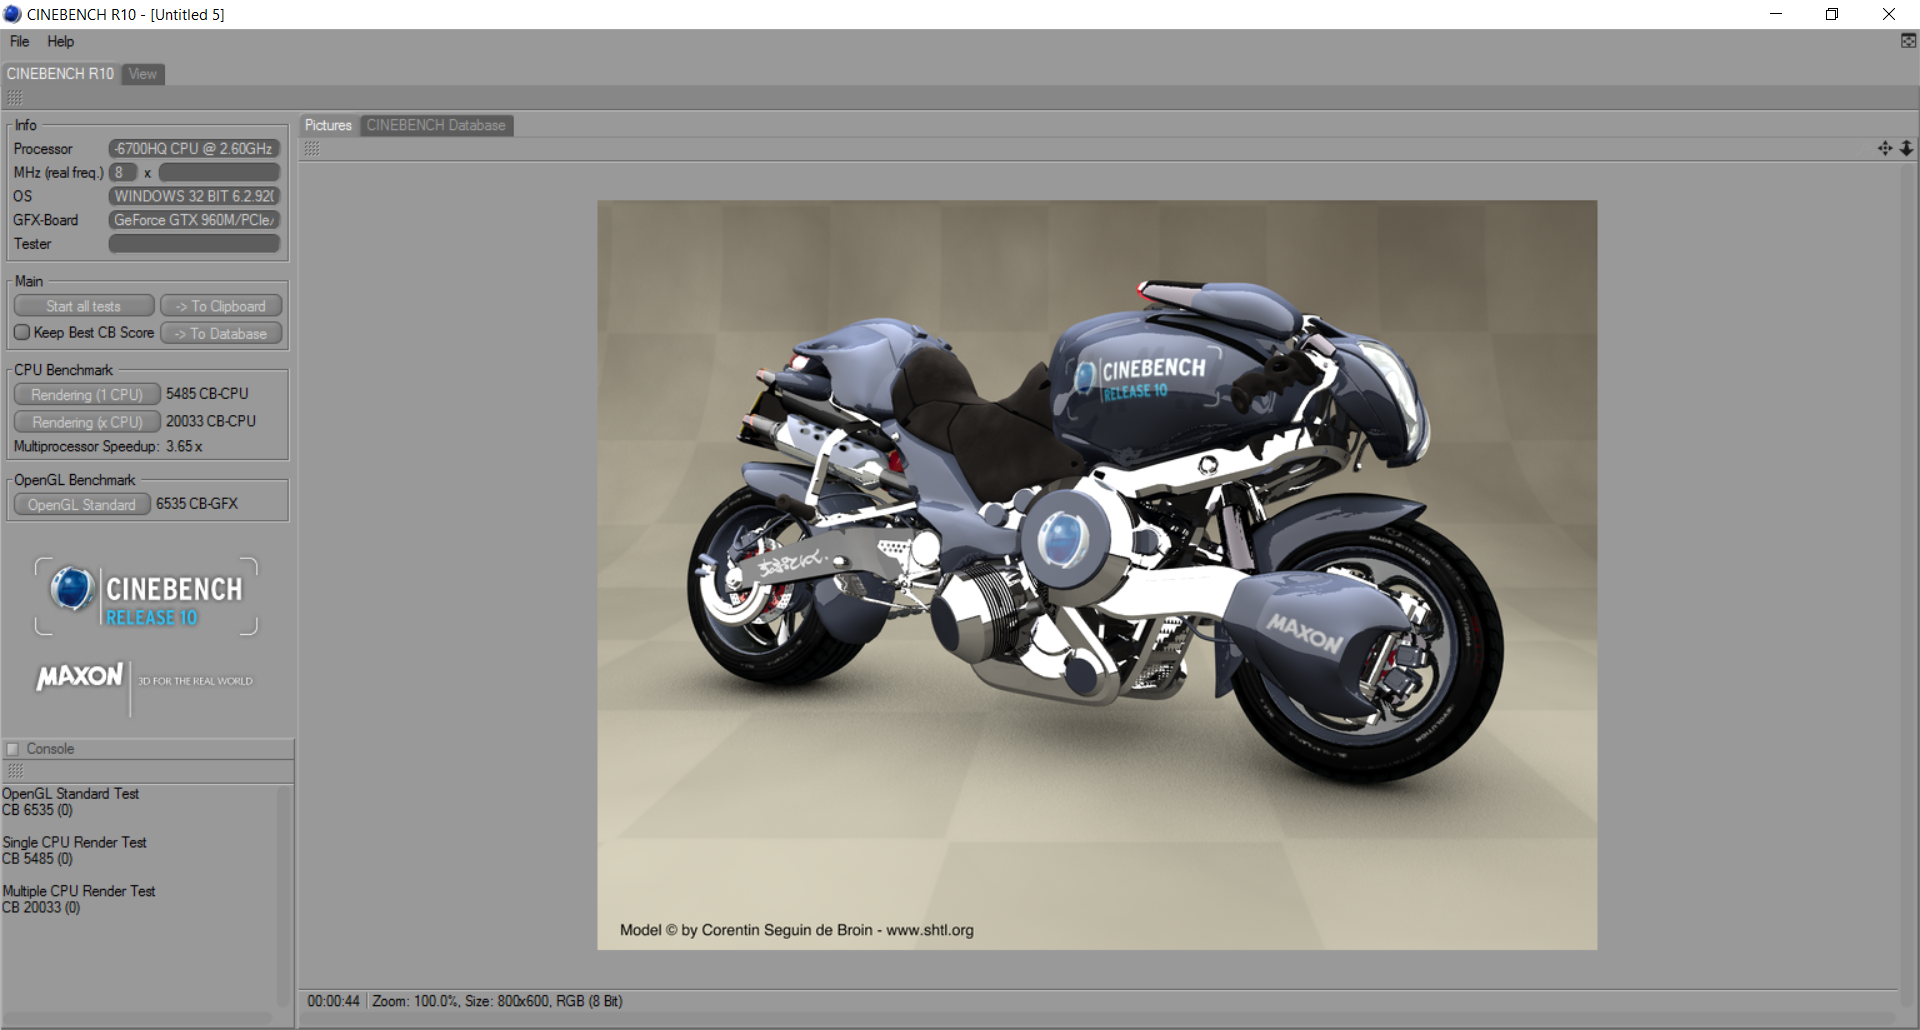
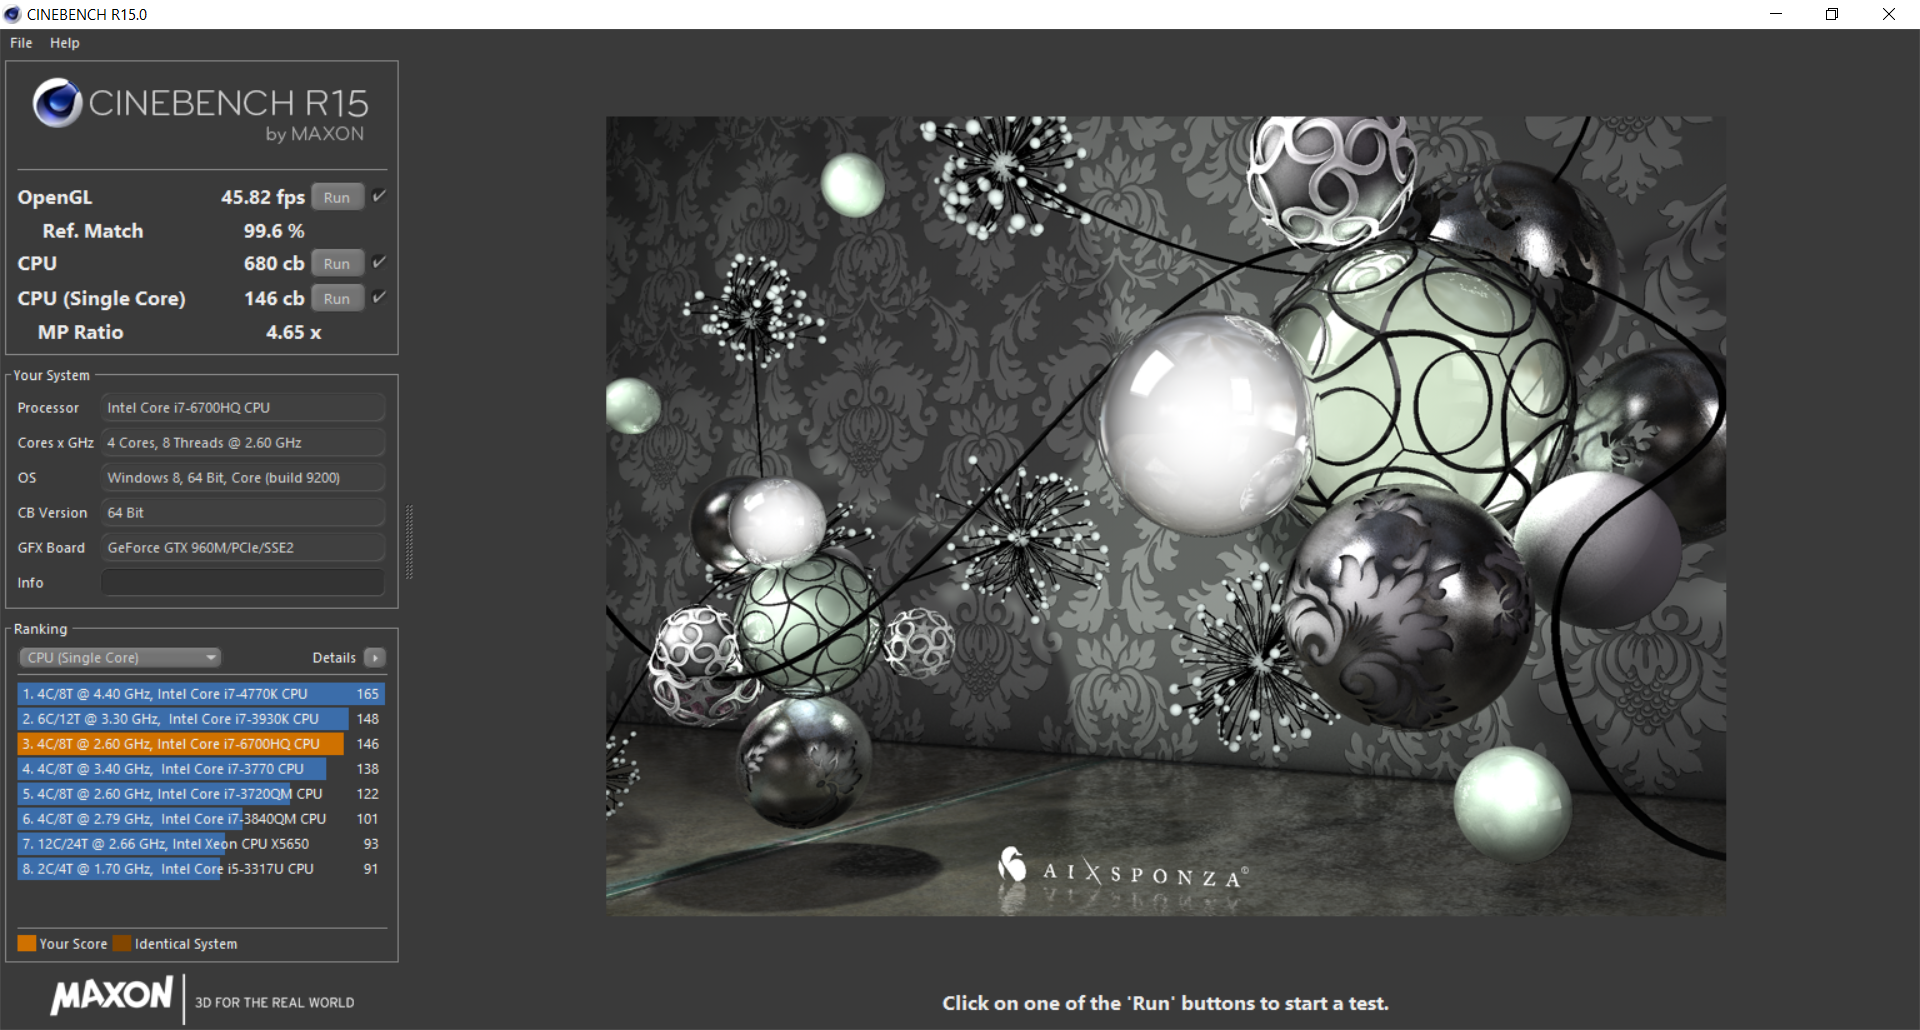
CineBench benchmarks rank our i7-6700HQ roughly 15 percent ahead of the Haswell i7-4712HQ and 25 percent ahead of the Ivy Bridge i7-3612QM in multi-threaded benchmarks. Note that the newer Skylake i5-6300HQ in the base configuration of the XPS 15 2016 performs at about the same level as the faster i7-6700HQ in single-threaded operations, but falls behind even the much older i7-3612QM in multi-threaded operations.
See our dedicated CPU page on the i7-6700HQ for more technical information and benchmark comparisons.
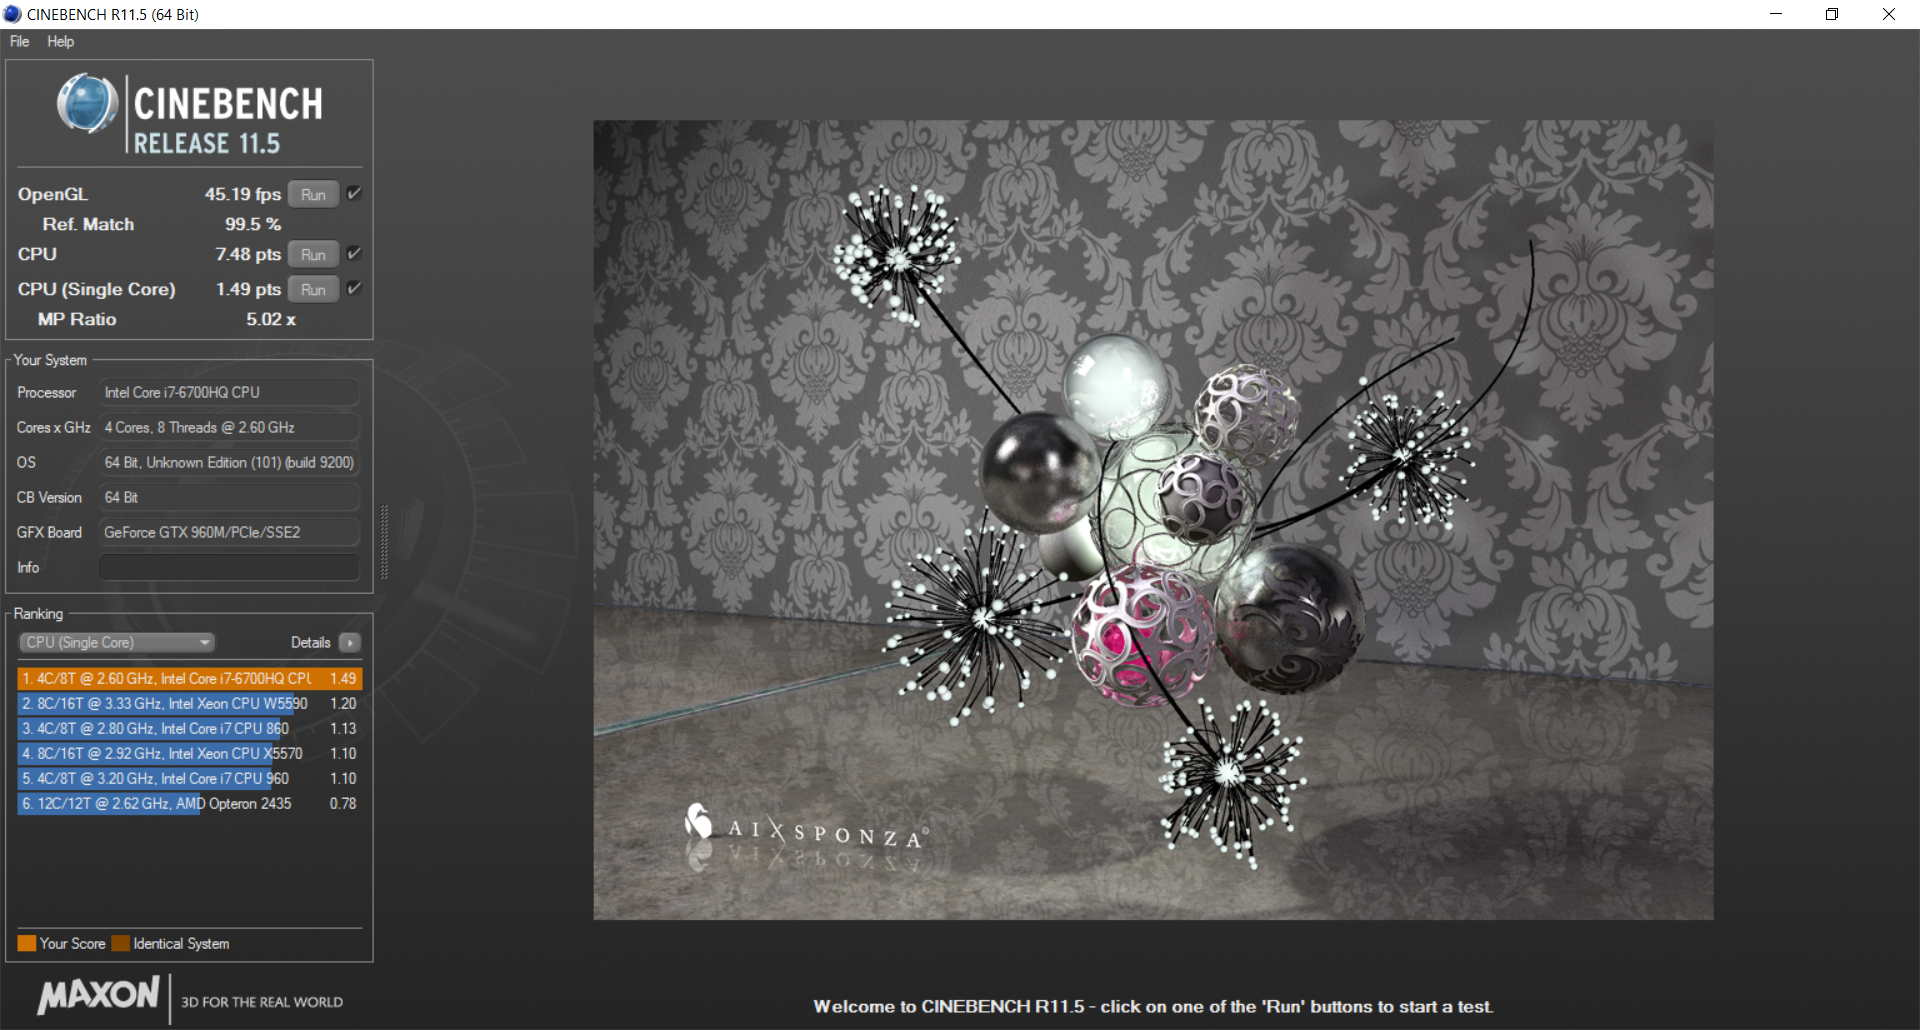
| Cinebench R11.5 | |
| CPU Single 64Bit (sort by value) | |
| Dell XPS 15 9550 i7 FHD | |
| Dell XPS 15-9550 i7 | |
| Dell XPS 15 (9530-0538) | |
| Dell XPS 15 (L521x) PL | |
| Dell XPS 15 2016 9550 | |
| CPU Multi 64Bit (sort by value) | |
| Dell XPS 15 9550 i7 FHD | |
| Dell XPS 15-9550 i7 | |
| Dell XPS 15 (9530-0538) | |
| Dell XPS 15 (L521x) PL | |
| Dell XPS 15 2016 9550 | |
| Cinebench R10 | |
| Rendering Single CPUs 64Bit (sort by value) | |
| Dell XPS 15-9550 i7 | |
| Dell XPS 15 (9530-0538) | |
| Dell XPS 15 (L521x) PL | |
| Dell XPS 15 2016 9550 | |
| Rendering Multiple CPUs 64Bit (sort by value) | |
| Dell XPS 15-9550 i7 | |
| Dell XPS 15 (9530-0538) | |
| Dell XPS 15 (L521x) PL | |
| Dell XPS 15 2016 9550 | |
| Super Pi Mod 1.5 XS 32M - 32M (sort by value) | |
| Dell XPS 15 9550 i7 FHD | |
| Dell XPS 15 (L521x) PL | |
| wPrime 2.10 - 1024m (sort by value) | |
| Dell XPS 15 9550 i7 FHD | |
* ... smaller is better
System Performance
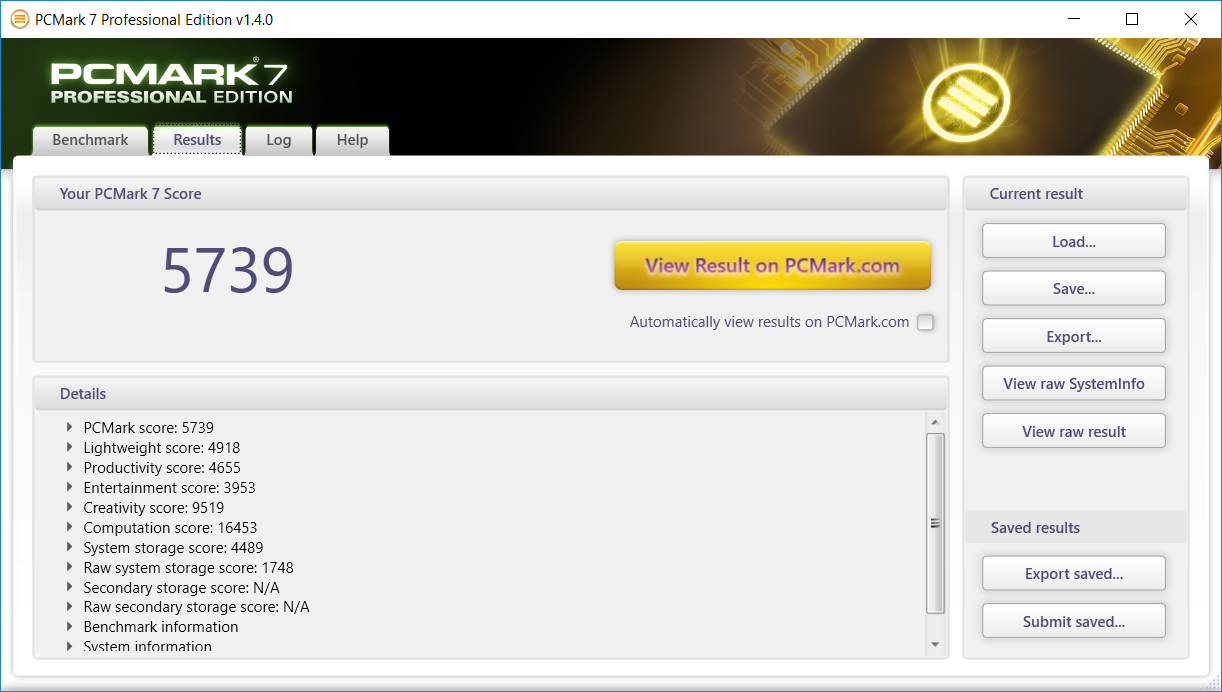
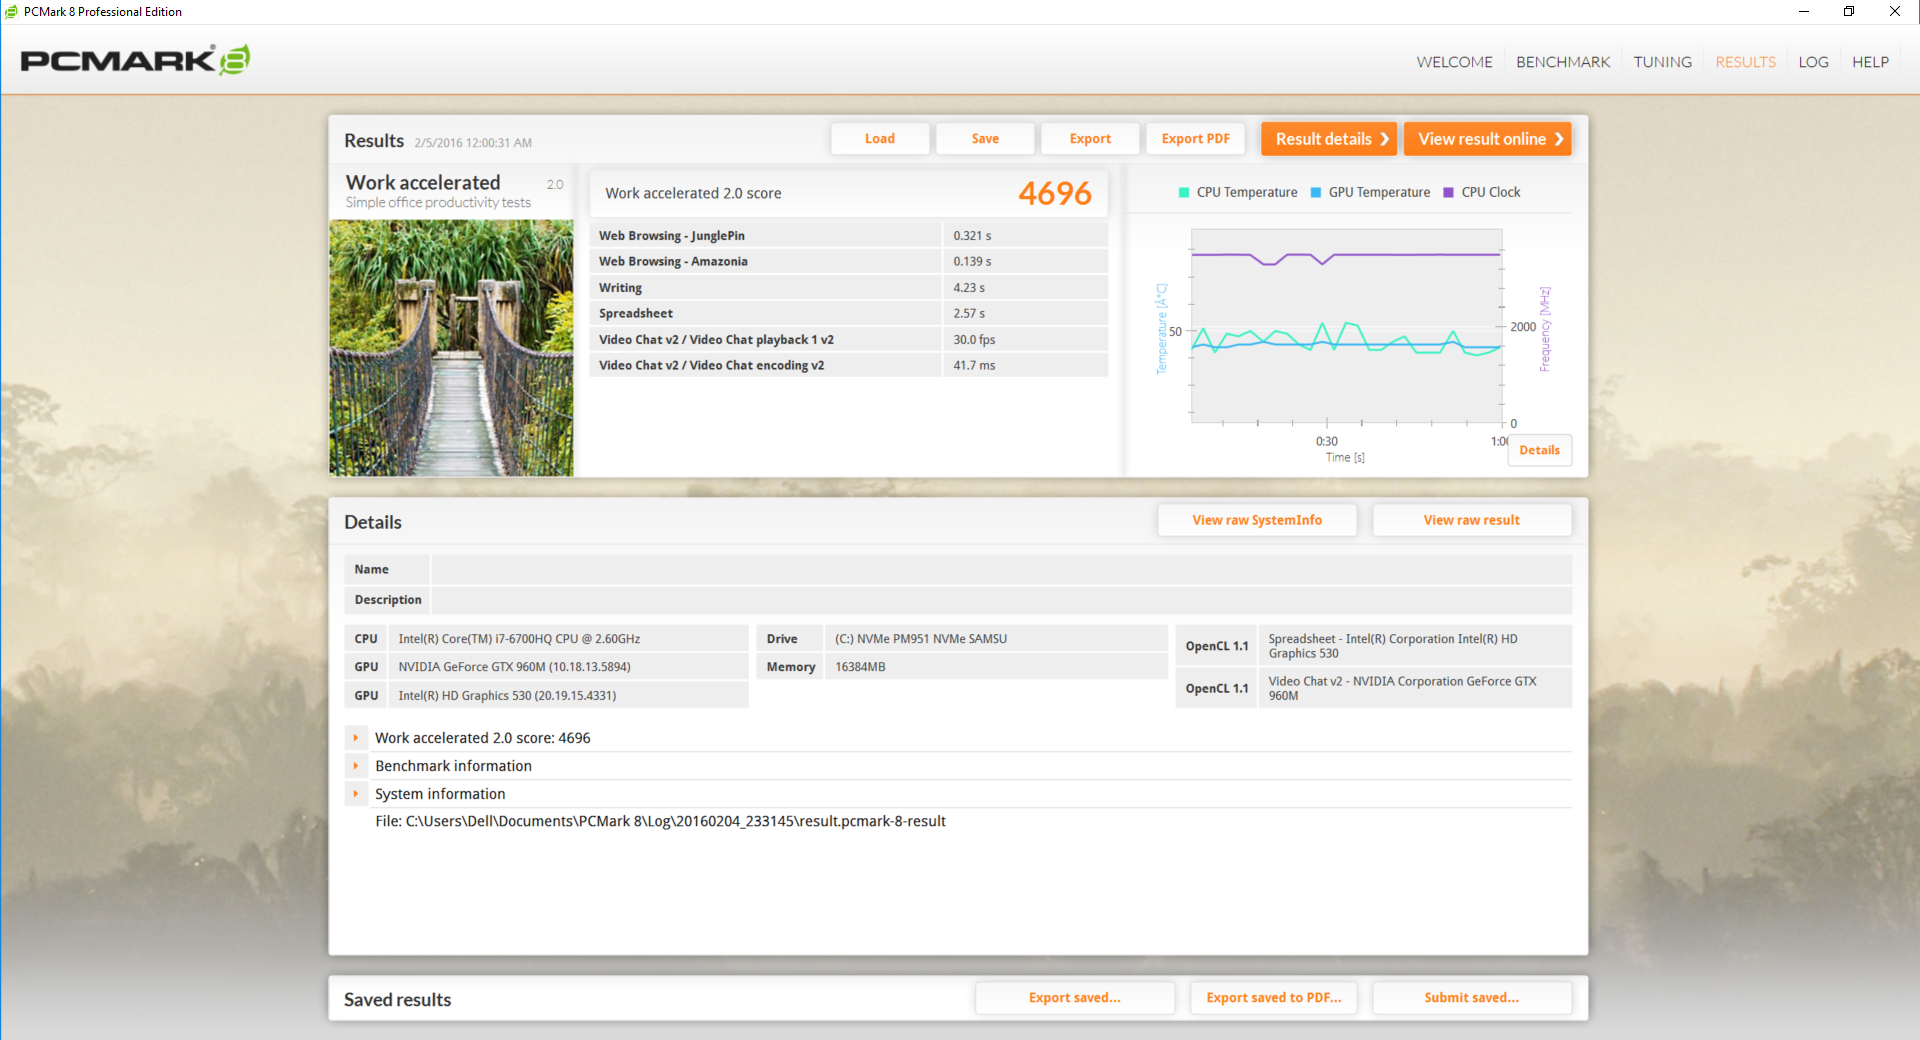
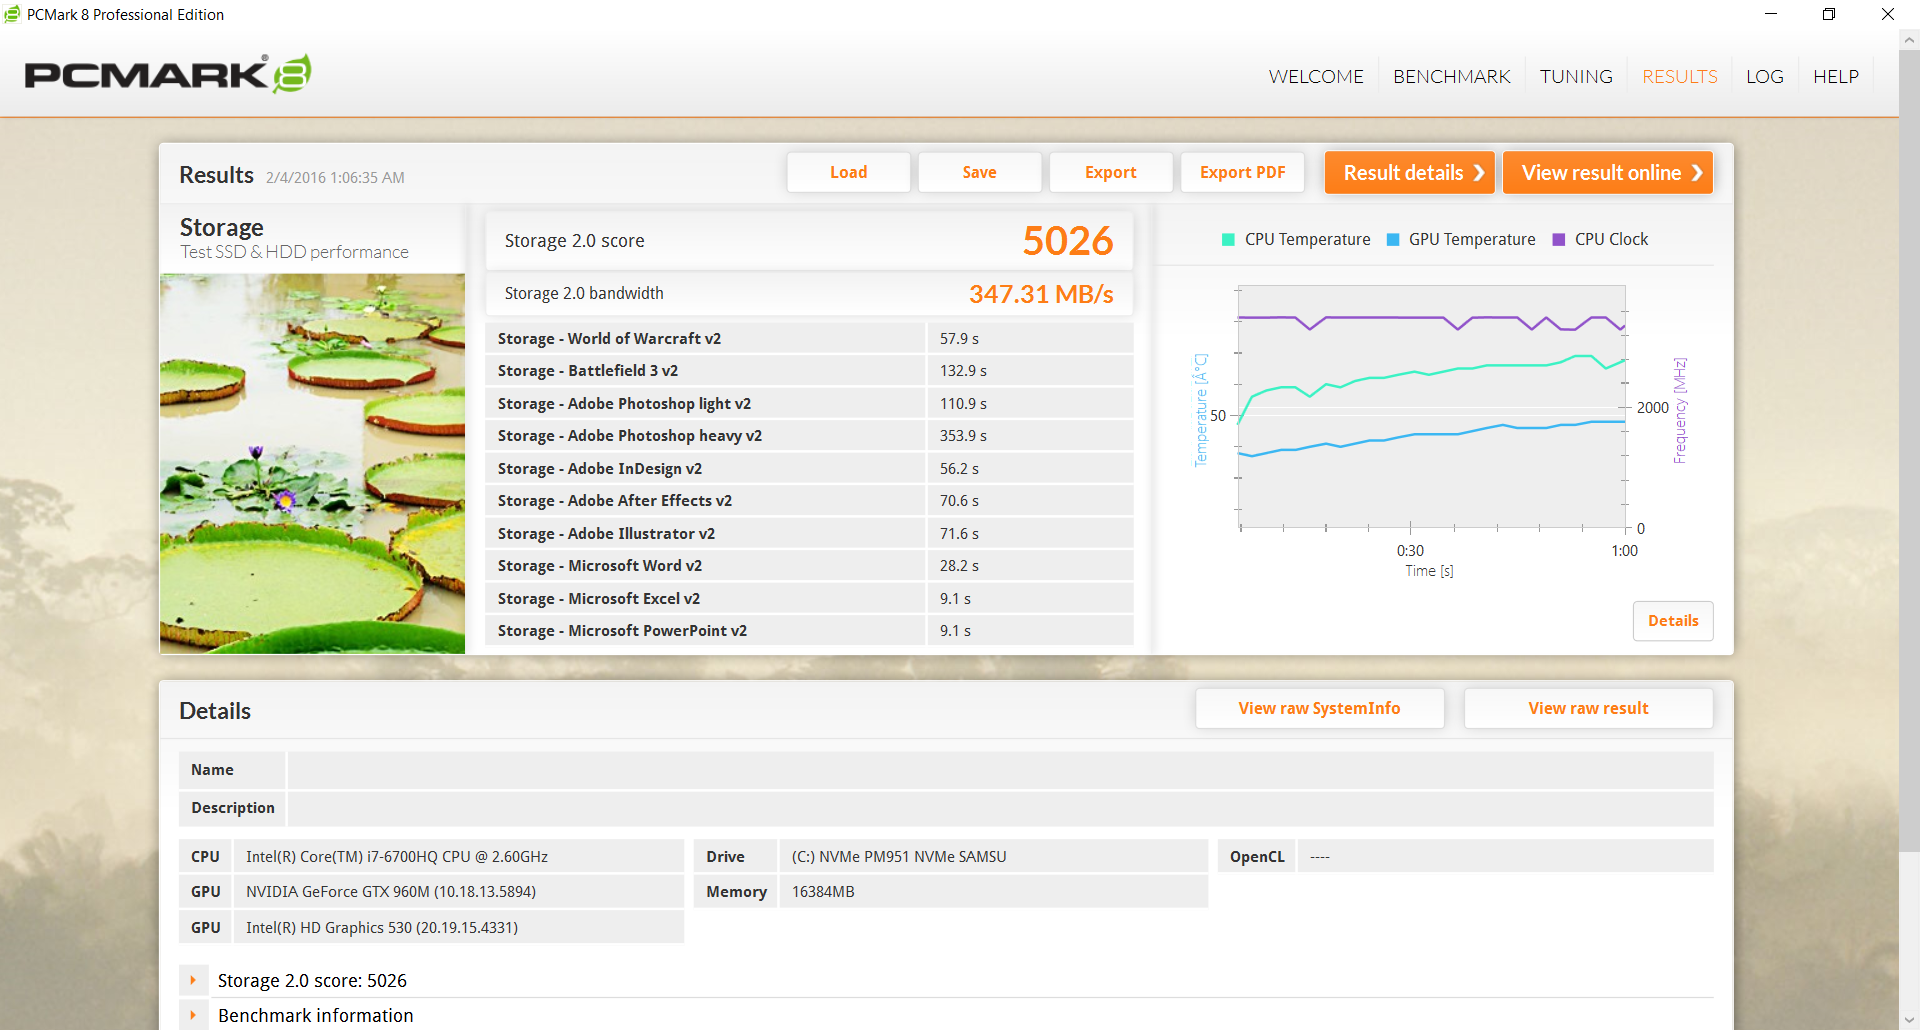
PCMark benchmarks rank our system in the same ballpark as its other SKUs from within the same XPS series. The entry-level XPS 15 2016 configuration falls slightly more behind due to its cheaper primary HDD with SSD cache instead of a full-fledged SSD.
| PCMark 7 - Score (sort by value) | |
| Dell XPS 15 9550 i7 FHD | |
| Dell XPS 15 (9530-0538) | |
| Dell XPS 15-9550 i7 | |
| Dell XPS 15 2016 9550 | |
| PCMark 8 | |
| Home Score Accelerated v2 (sort by value) | |
| Dell XPS 15 9550 i7 FHD | |
| Dell XPS 15-9550 i7 | |
| Dell XPS 15 2016 9550 | |
| Work Score Accelerated v2 (sort by value) | |
| Dell XPS 15 9550 i7 FHD | |
| Dell XPS 15-9550 i7 | |
| Creative Score Accelerated v2 (sort by value) | |
| Dell XPS 15 9550 i7 FHD | |
| Dell XPS 15-9550 i7 | |
| Dell XPS 15 2016 9550 | |
| PCMark 7 Score | 5739 points | |
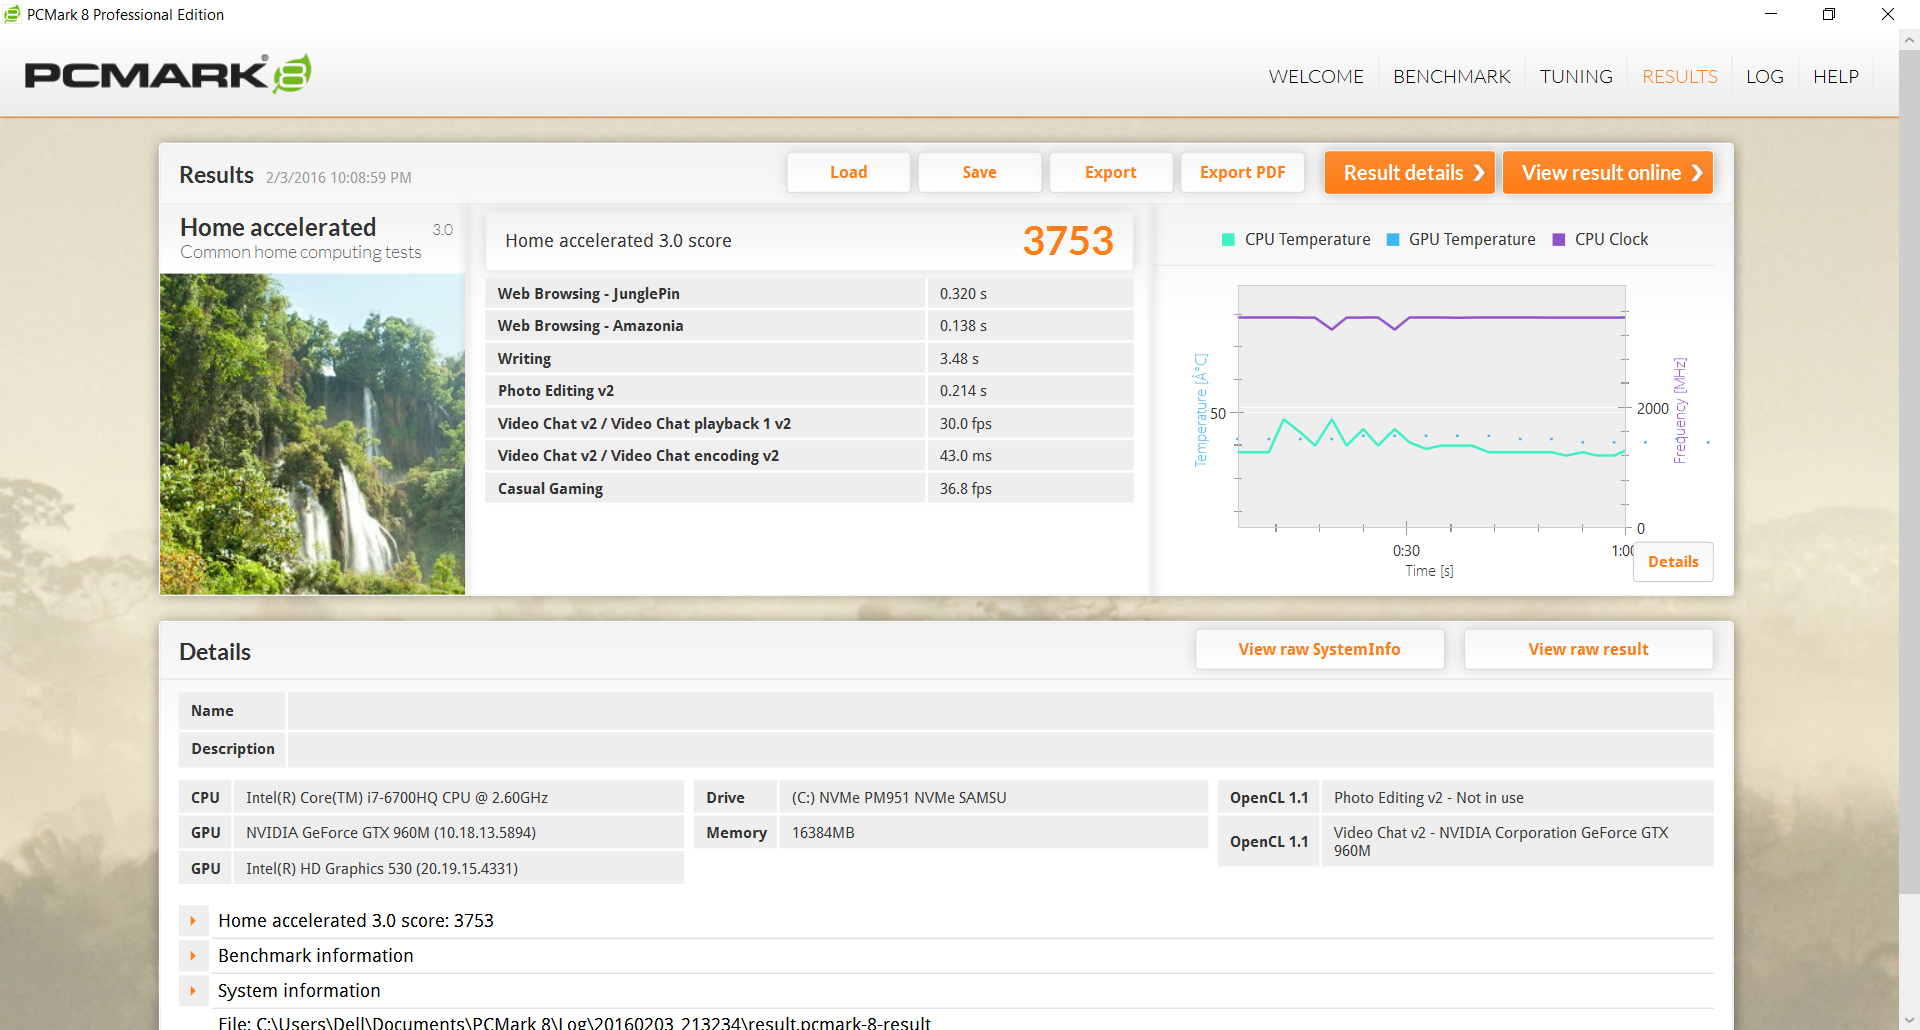
| PCMark 8 Home Score Accelerated v2 | 3753 points | |
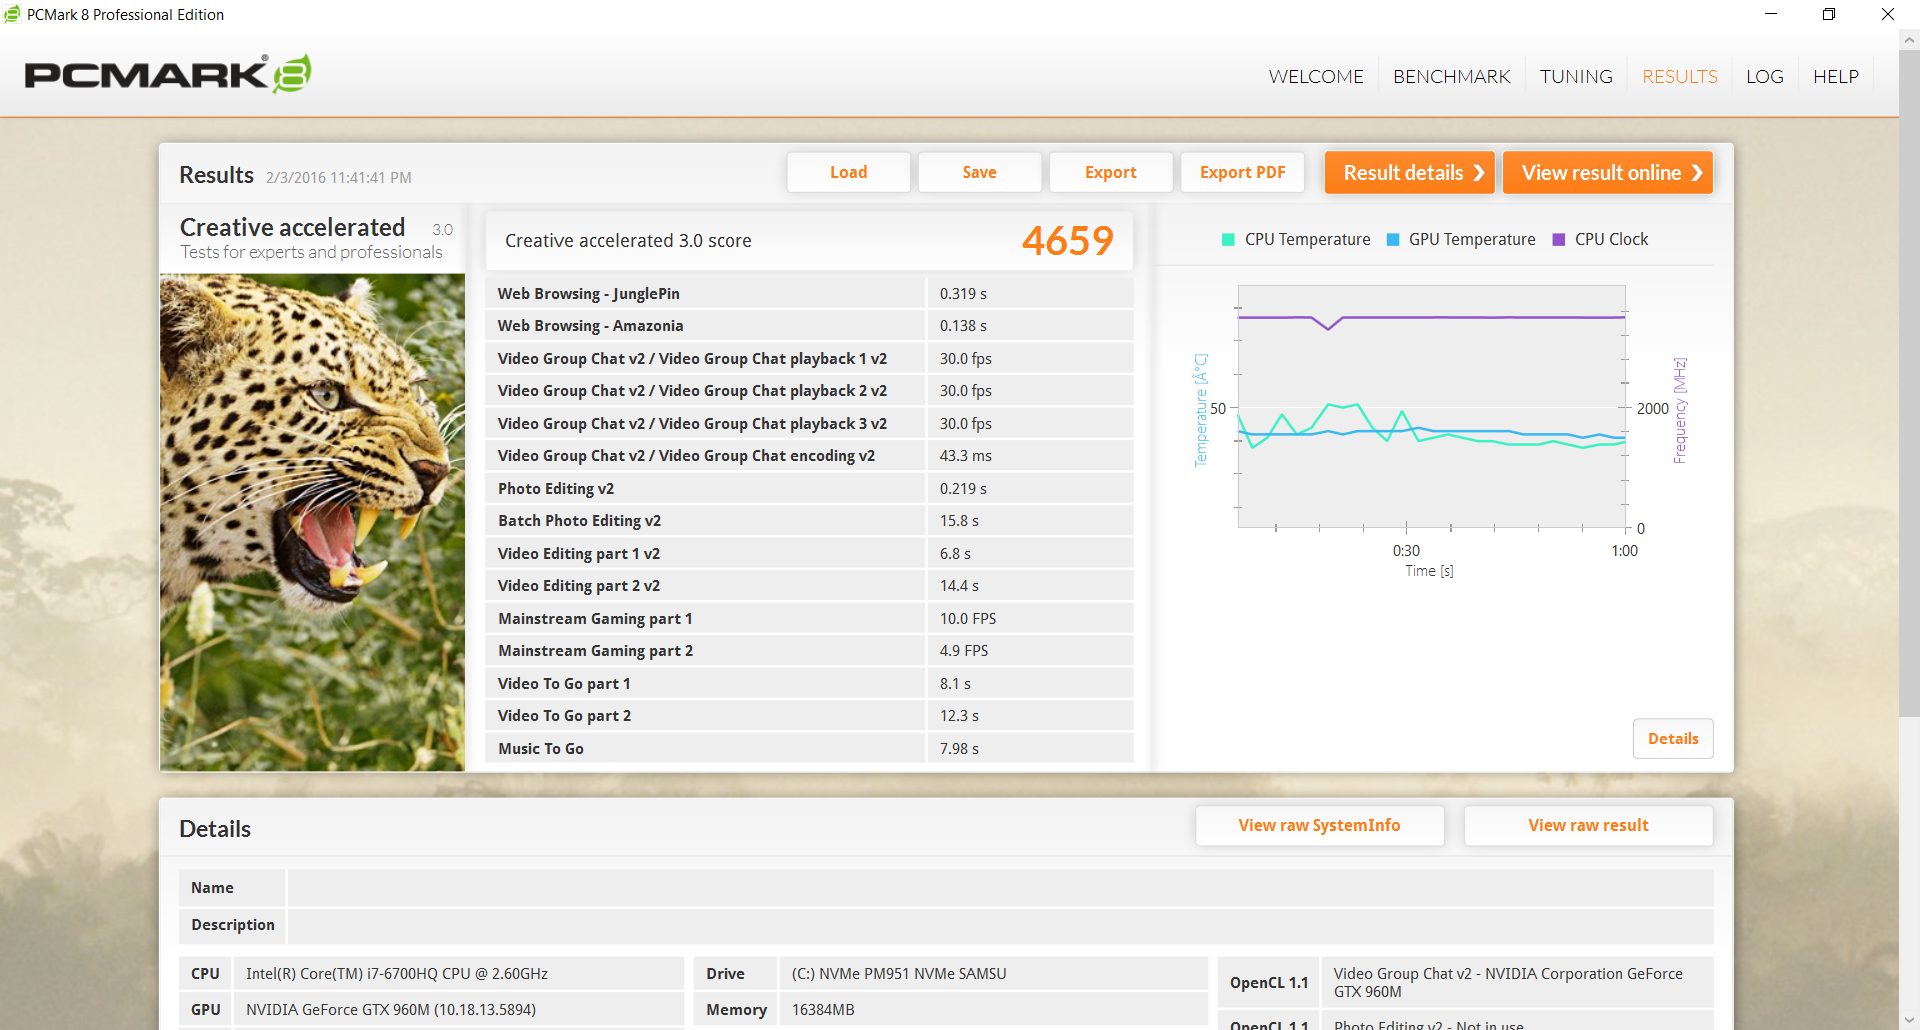
| PCMark 8 Creative Score Accelerated v2 | 4659 points | |
| PCMark 8 Work Score Accelerated v2 | 4696 points | |
Help | ||
Storage Devices
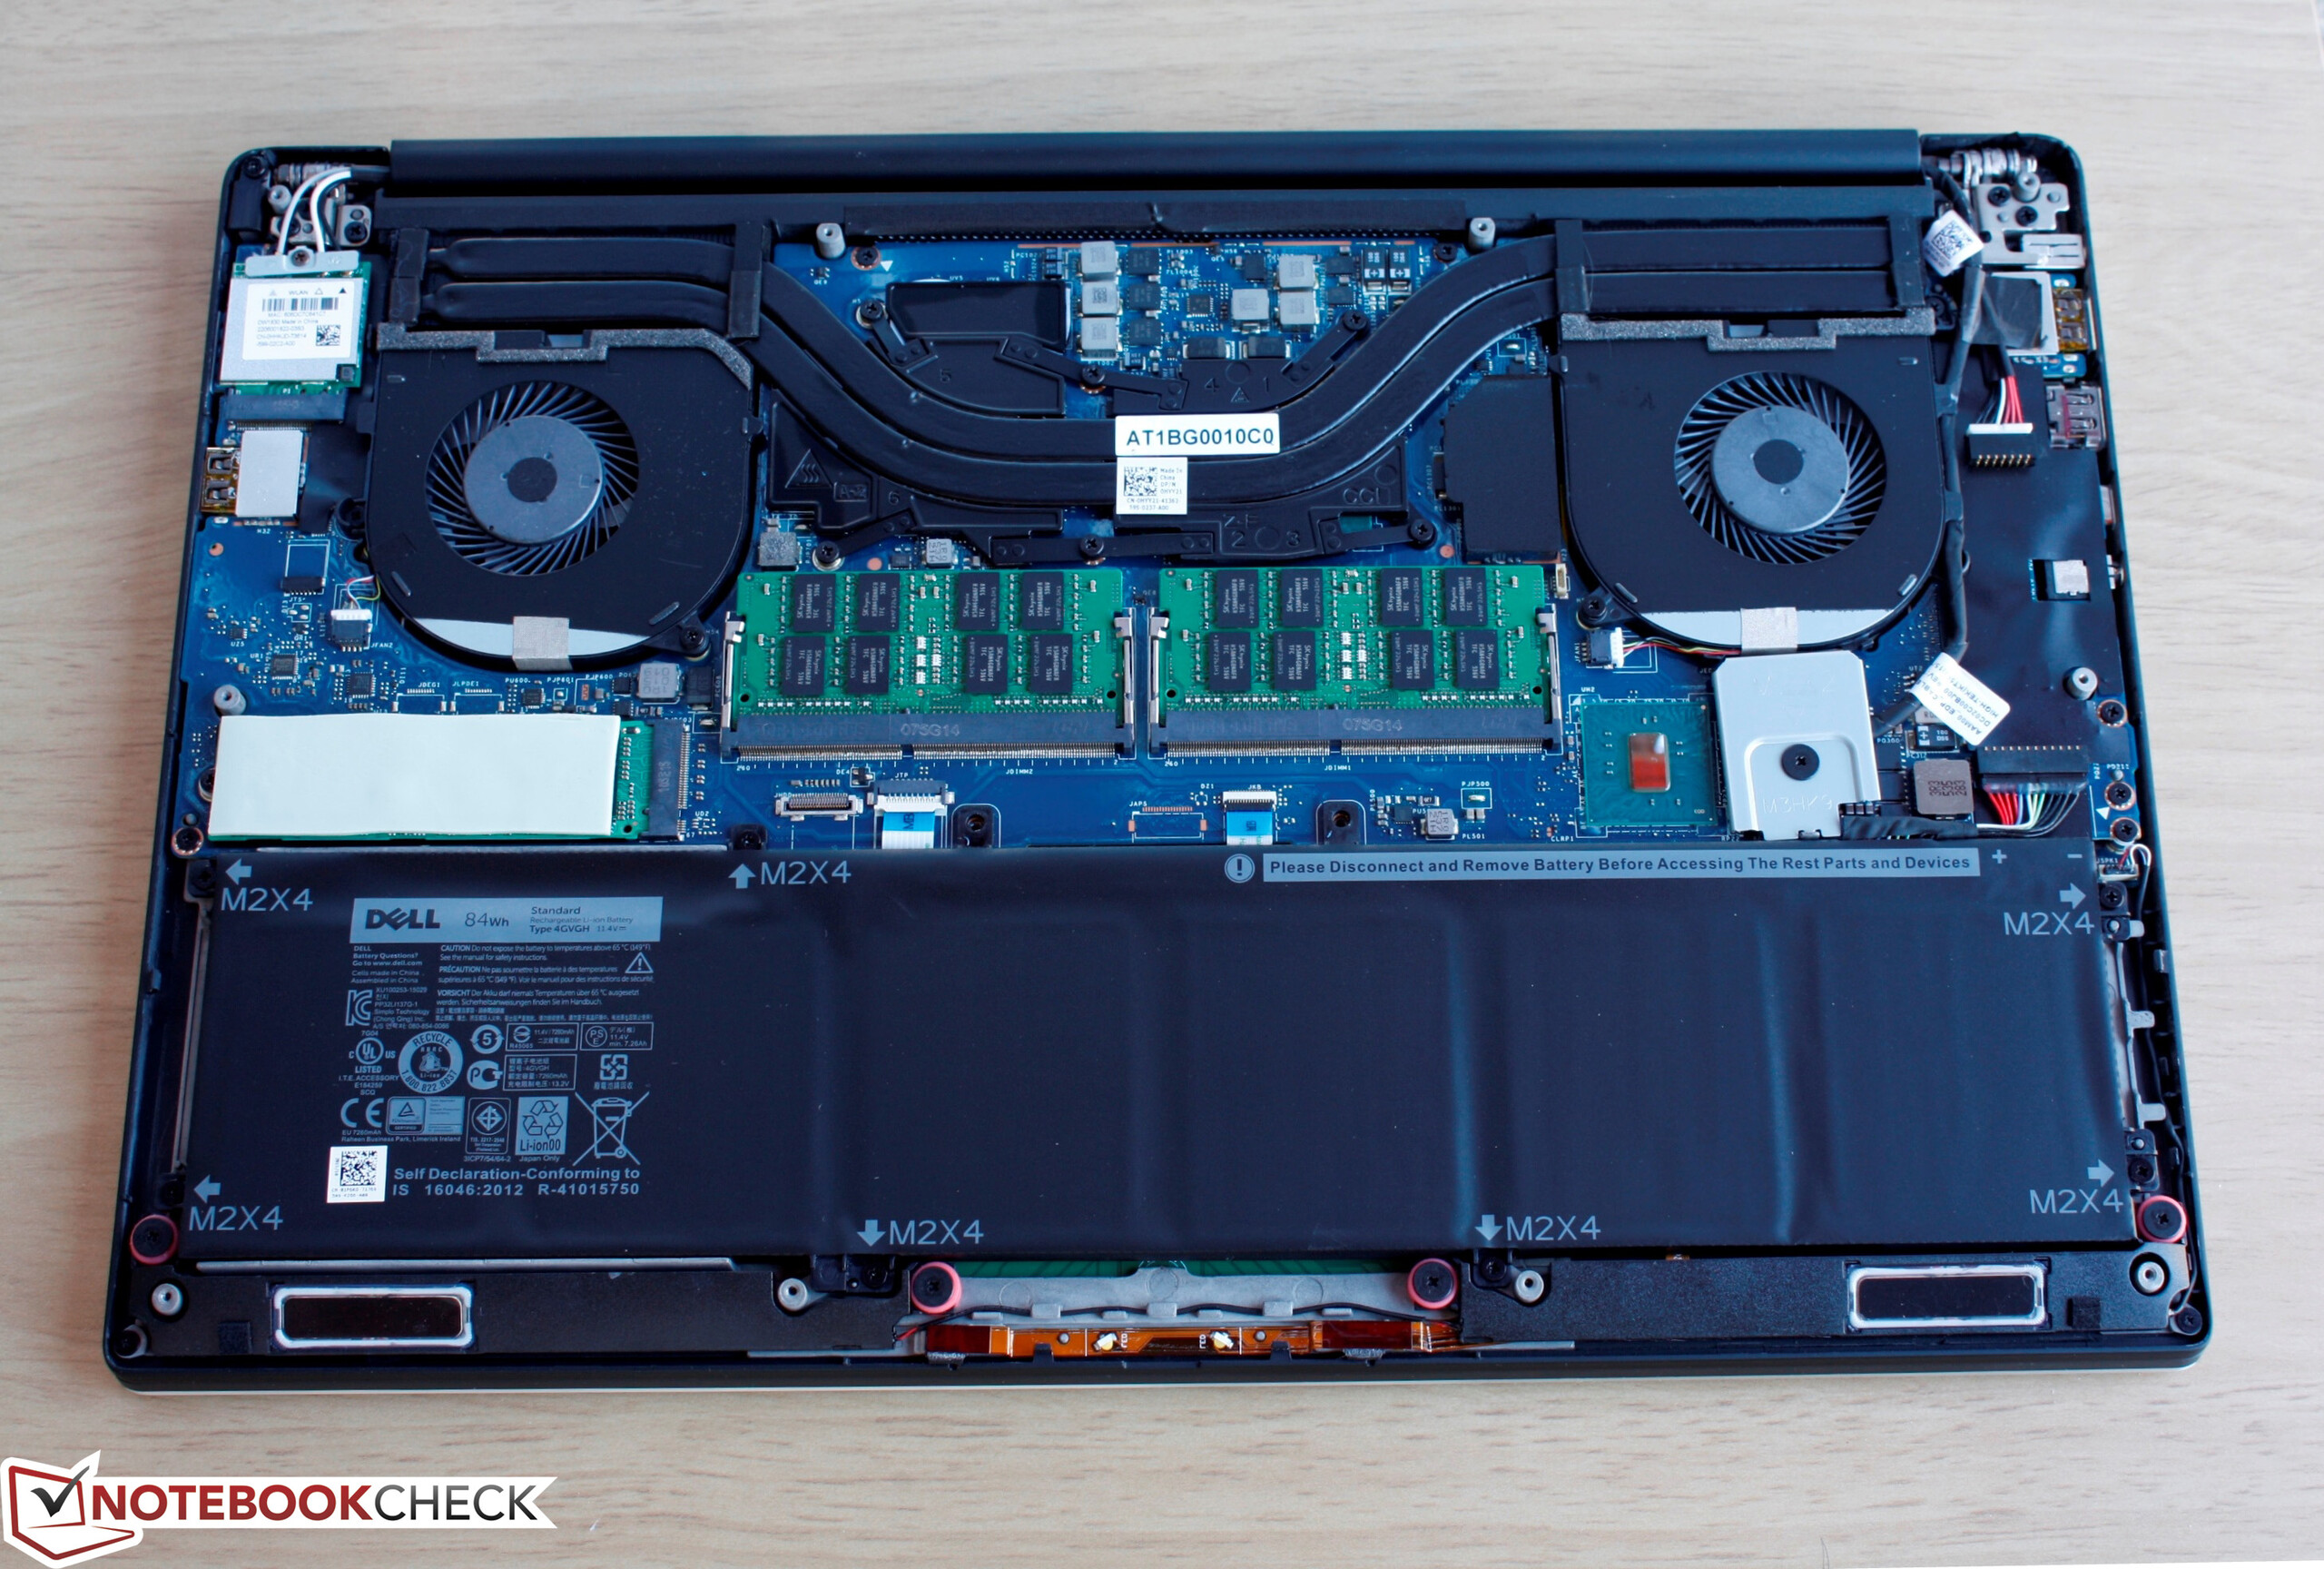
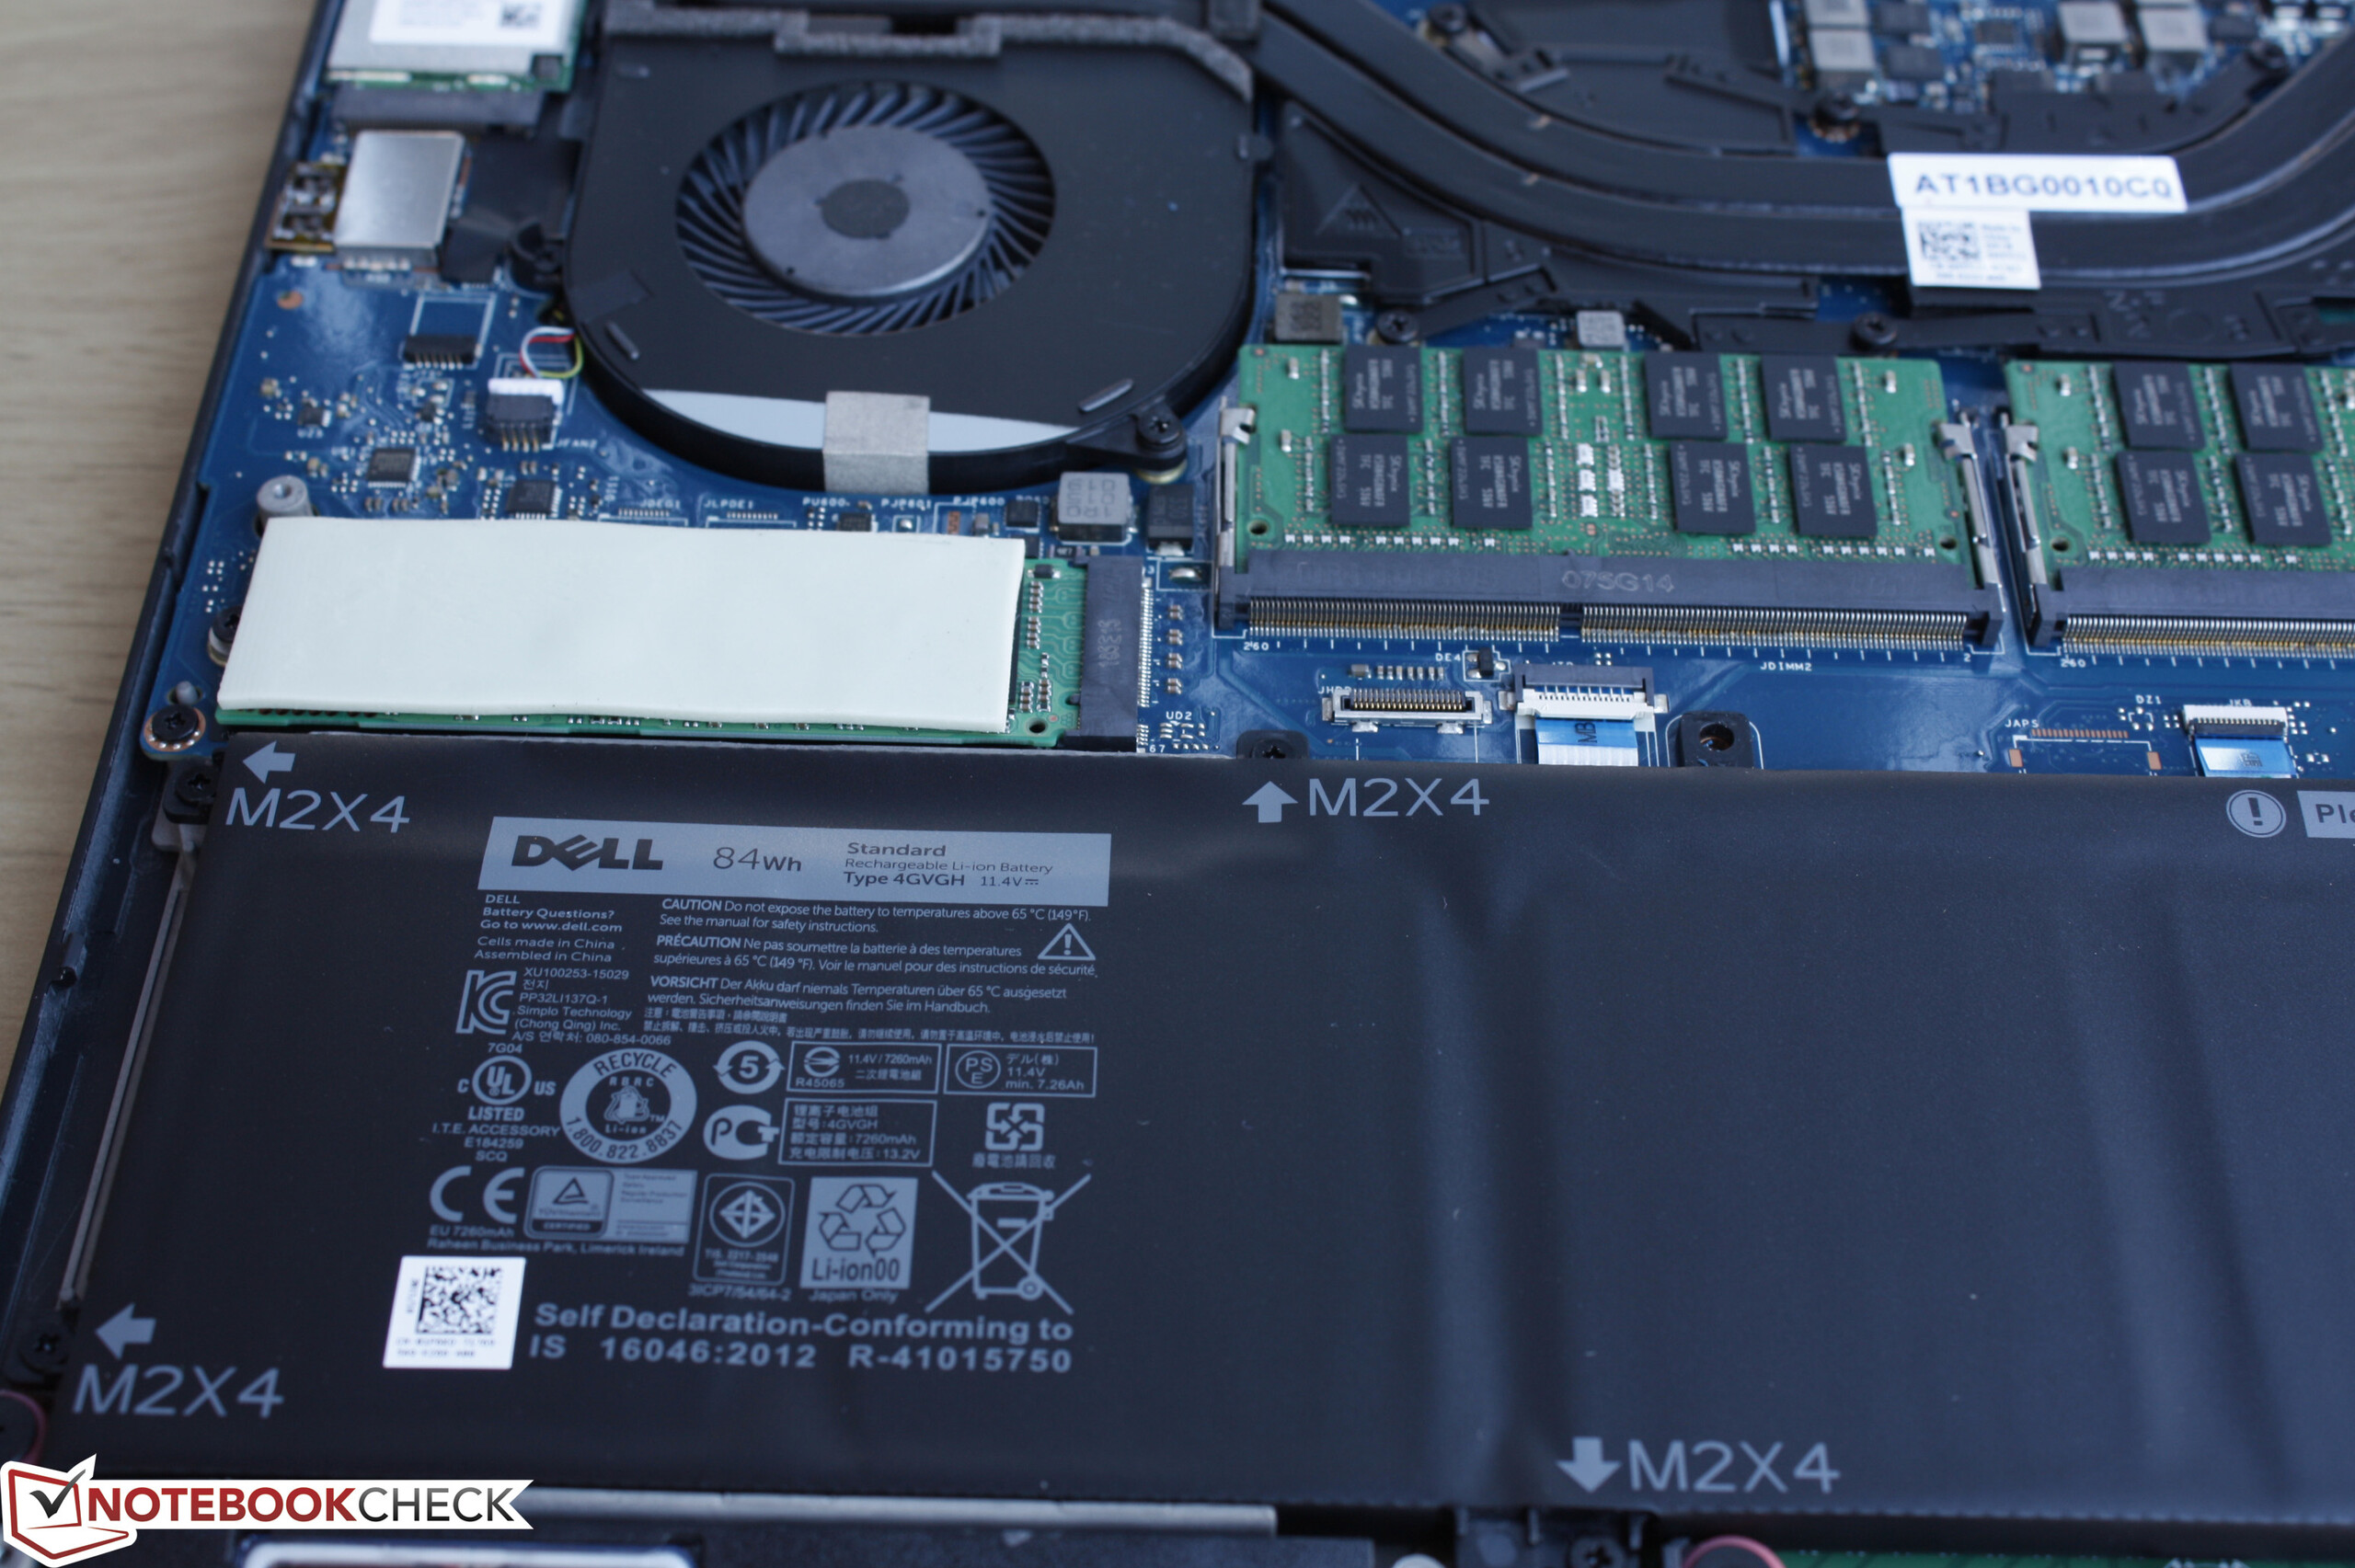
Depending on the SKU, users may only have one storage option (1x M.2 2280/2242) or two (1x M.2 2280/2242, 1x 2.5-inch SATA III). The former carries a larger battery pack (84 Wh) in place of the secondary storage slot while the latter carries a smaller battery pack (56 Wh) in favor of the secondary storage slot. The concept isn't very common, though Asus also utilizes it in its popular UX501 and G501 series of notebooks.
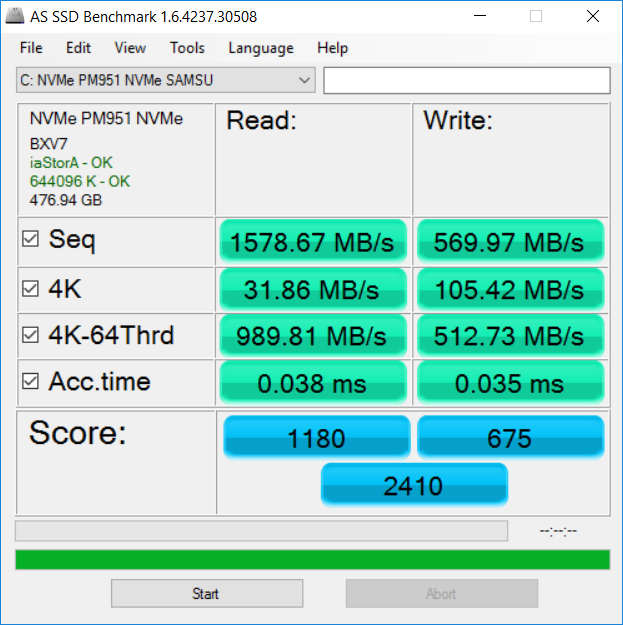
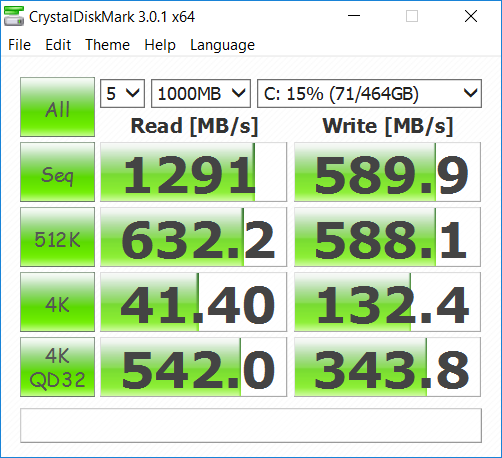
Raw performance from the 512 GB Samsung PM951 NVMe is unsurprisingly nearly identical to the same SSD on our XPS 15 i7 UHD configuration. The jump from SATA III to NVMe gives a massive boost to raw transfer rates that is only now beginning to trickle down from high-end gaming notebooks to more mainstream offerings like the XPS series.
| Dell XPS 15 9550 i7 FHD GeForce GTX 960M, 6700HQ, Samsung PM951 NVMe 512 GB | Dell XPS 15-9550 i7 GeForce GTX 960M, 6700HQ, Samsung PM951 NVMe 512 GB | Dell XPS 15 2016 9550 GeForce GTX 960M, 6300HQ, WDC WD10SPCX-75KHST0 + LiteON CS1-SP32-11 M.2 2242 32GB | Dell XPS 15 (9530-0538) GeForce GT 750M, 4712HQ, Lite-On LMT-512L9M | Dell XPS 15 (Late 2013) GeForce GT 750M, 4702HQ, Samsung SSD SM841 512GB | Dell XPS 13 2016 i7 256GB QHD HD Graphics 520, 6500U, Samsung PM951 NVMe MZ-VLV256D | |
|---|---|---|---|---|---|---|
| AS SSD | -5% | -7397% | -51% | -67% | -32% | |
| Copy Game MB/s (MB/s) | 805 | 785 -2% | 66.4 -92% | 292.6 -64% | 148.9 -82% | |
| Copy Program MB/s (MB/s) | 325.3 | 318.4 -2% | 42.24 -87% | 238.5 -27% | 46.64 -86% | |
| Copy ISO MB/s (MB/s) | 1127 | 716 -36% | 15.75 -99% | 468.2 -58% | 397.7 -65% | |
| Score Total (Points) | 2410 | 2410 0% | 44 -98% | 1021 -58% | 1070 -56% | 1603 -33% |
| Score Write (Points) | 675 | 694 3% | 10 -99% | 352 -48% | 391 -42% | 391 -42% |
| Score Read (Points) | 1180 | 1166 -1% | 24 -98% | 440 -63% | 448 -62% | 809 -31% |
| Access Time Write * (ms) | 0.035 | 0.036 -3% | 17.31 -49357% | 0.058 -66% | 0.061 -74% | 0.034 3% |
| Access Time Read * (ms) | 0.038 | 0.053 -39% | 20.2 -53058% | 0.065 -71% | 0.114 -200% | 0.071 -87% |
| 4K-64 Write (MB/s) | 513 | 532 4% | 0.91 -100% | 253.1 -51% | 290.5 -43% | 263.7 -49% |
| 4K-64 Read (MB/s) | 990 | 975 -2% | 10.11 -99% | 361.5 -63% | 374.5 -62% | 698 -29% |
| 4K Write (MB/s) | 105.4 | 105.6 0% | 0.98 -99% | 62 -41% | 59.6 -43% | 97.6 -7% |
| 4K Read (MB/s) | 31.86 | 34.63 9% | 1.53 -95% | 29.65 -7% | 23.83 -25% | 38.21 20% |
| Seq Write (MB/s) | 570 | 562 -1% | 77.6 -86% | 373.5 -34% | 404.9 -29% | 301.2 -47% |
| Seq Read (MB/s) | 1579 | 1569 -1% | 122.2 -92% | 486.2 -69% | 498.5 -68% | 735 -53% |
* ... smaller is better
GPU Performance
Raw graphics performance according to 3DMark benchmarks is a significant improvement over the outdated GT 750M in last year's XPS 15. Users can expect a roughly twofold graphics boost for smoother gaming and editing.
See our dedicated GPU page on the GTX 960M for more technical information and benchmark comparisons.
| 3DMark 11 | |
| 1280x720 Performance (sort by value) | |
| Dell XPS 15-9550 i7 | |
| Dell XPS 15 2016 9550 | |
| Dell XPS 15 (9530-0538) | |
| Dell XPS 15 (Late 2013) | |
| Dell XPS 15 (L521x) PL | |
| 1280x720 Performance GPU (sort by value) | |
| Dell XPS 15-9550 i7 | |
| Dell XPS 15 2016 9550 | |
| Dell XPS 15 (9530-0538) | |
| Dell XPS 15 (Late 2013) | |
| Dell XPS 15 (L521x) PL | |
| 1280x720 Performance Physics (sort by value) | |
| Dell XPS 15-9550 i7 | |
| Dell XPS 15 2016 9550 | |
| Dell XPS 15 (9530-0538) | |
| Dell XPS 15 (Late 2013) | |
| Dell XPS 15 (L521x) PL | |
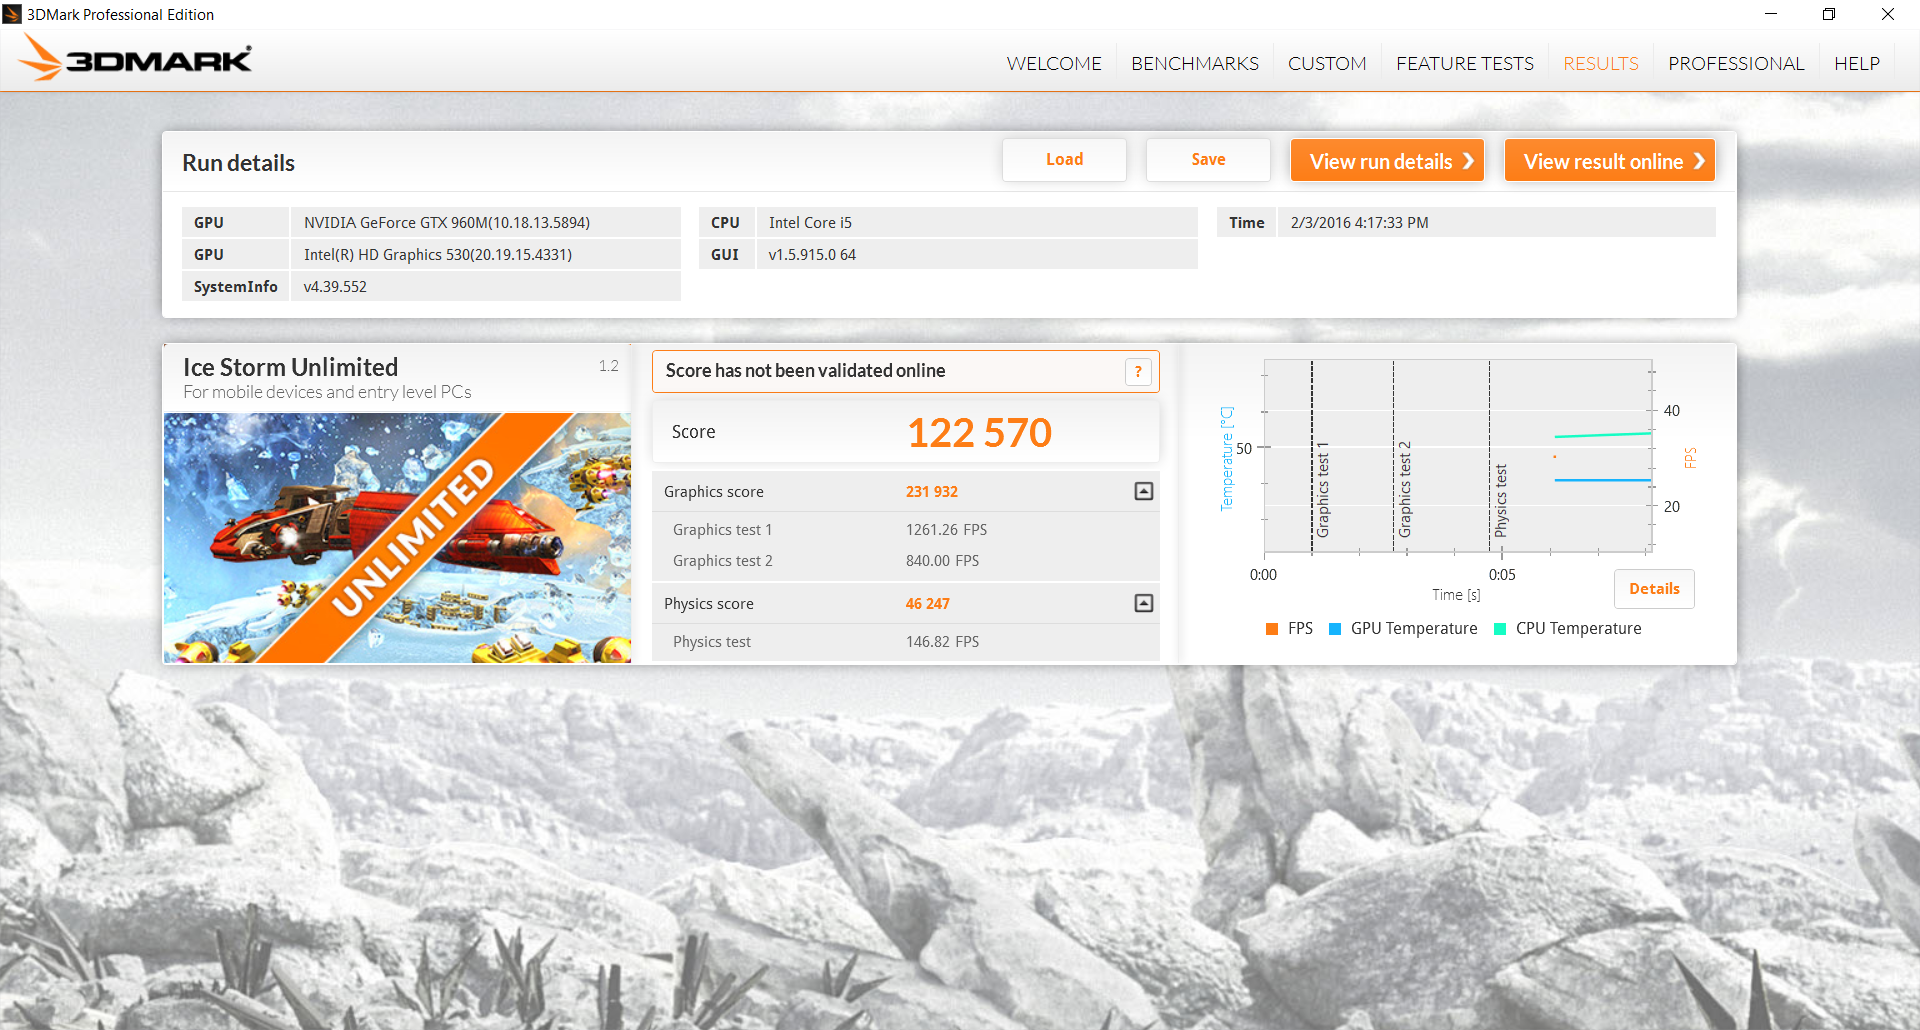
| 3DMark Ice Storm Standard Score | 77565 points | |
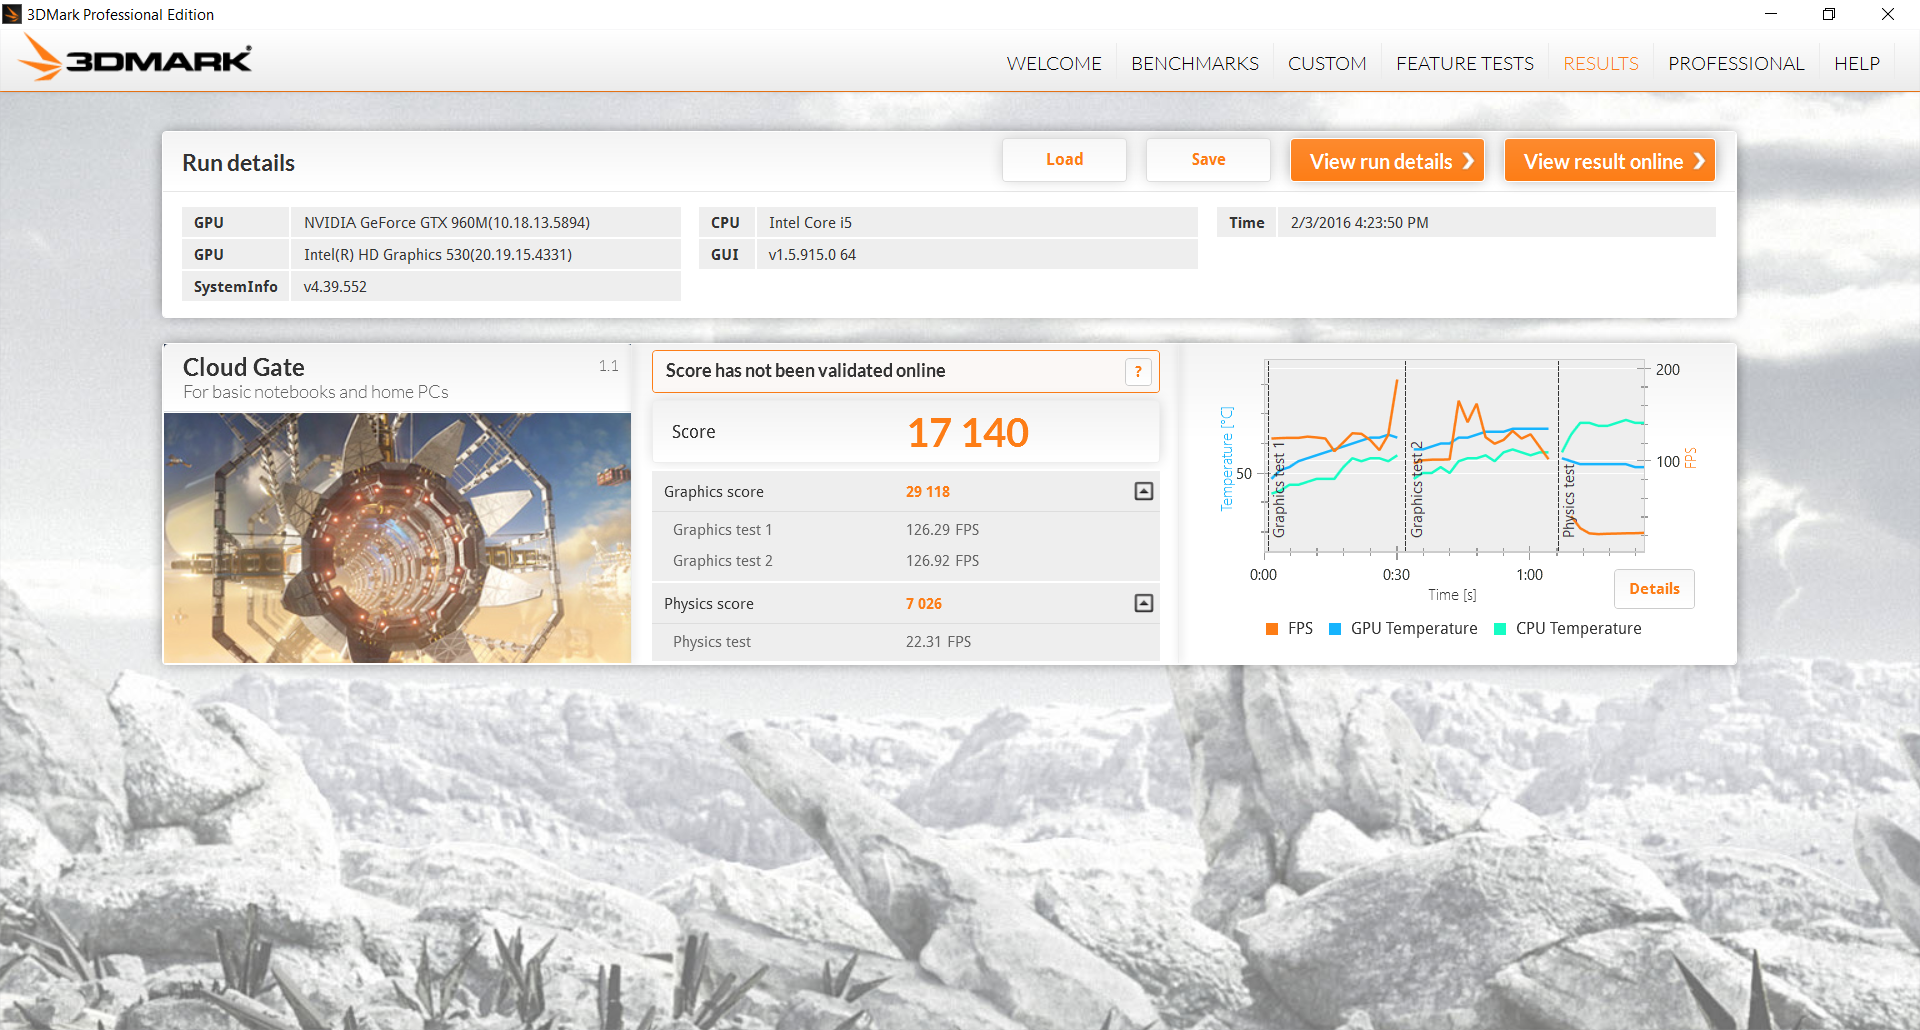
| 3DMark Cloud Gate Standard Score | 17140 points | |
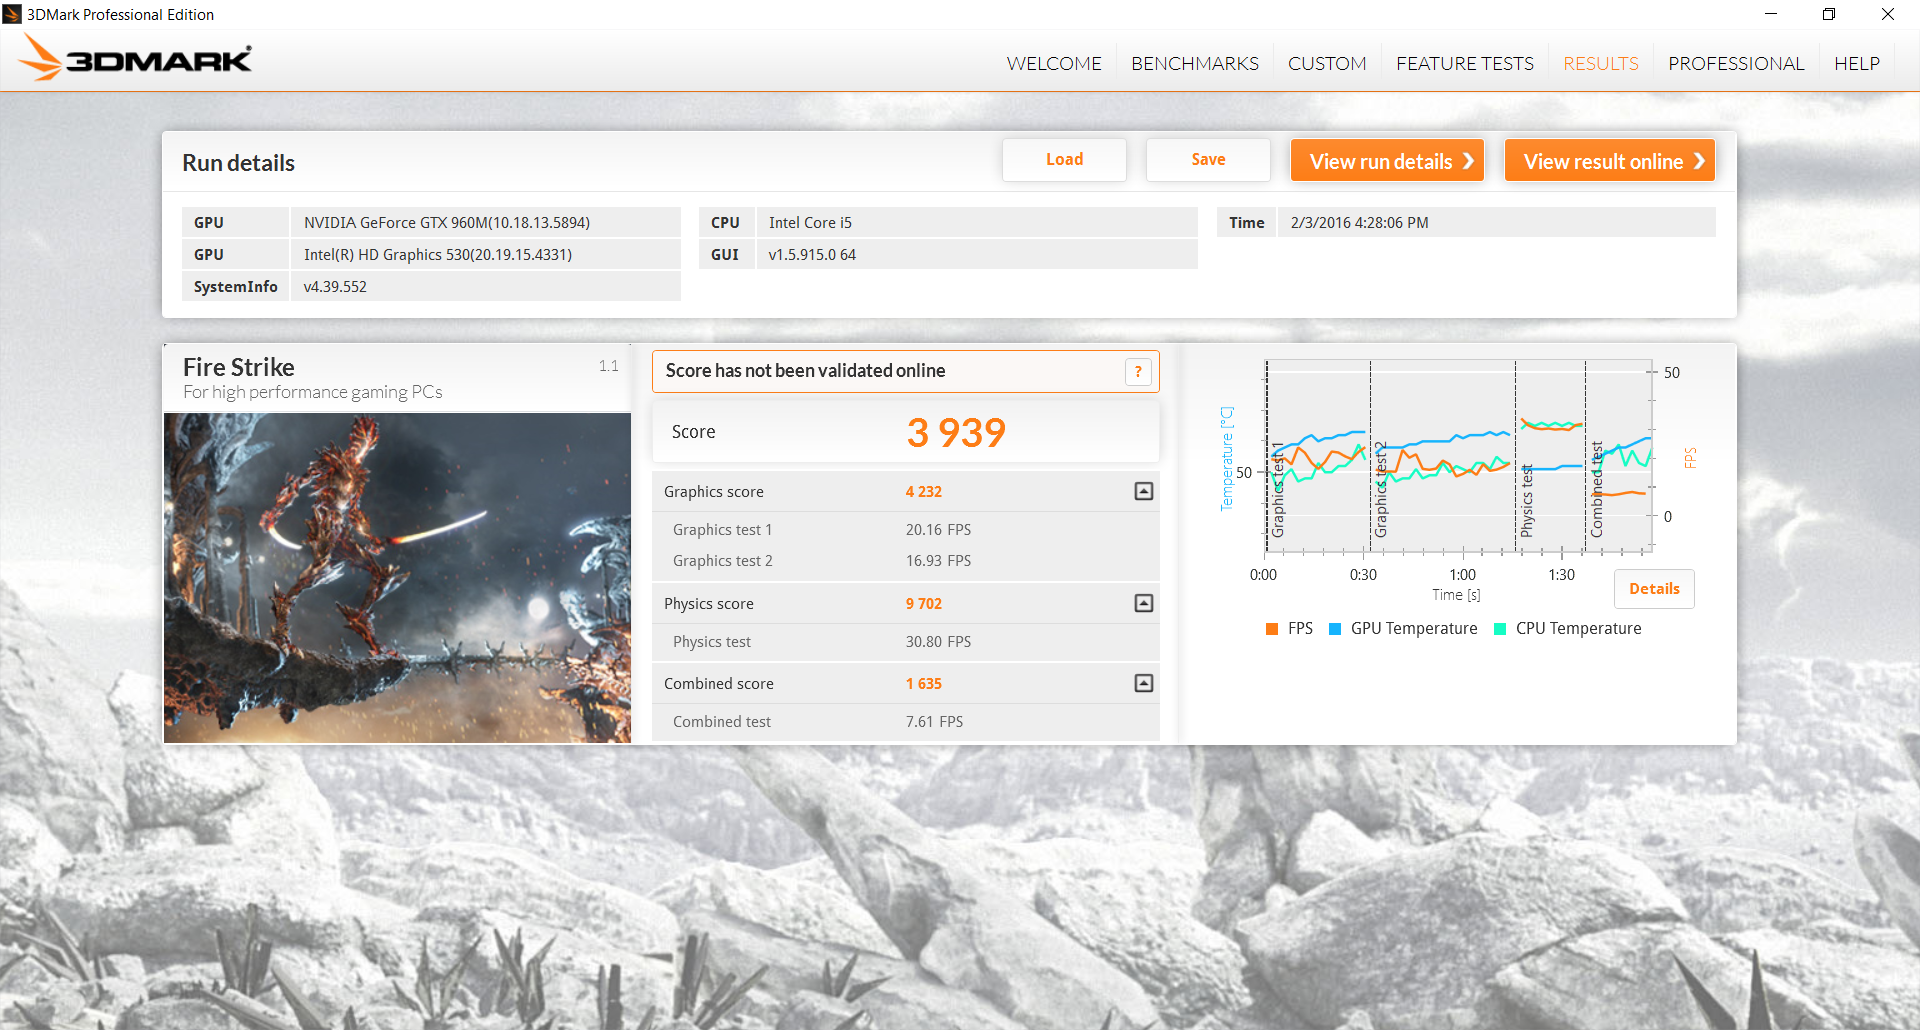
| 3DMark Fire Strike Score | 3939 points | |
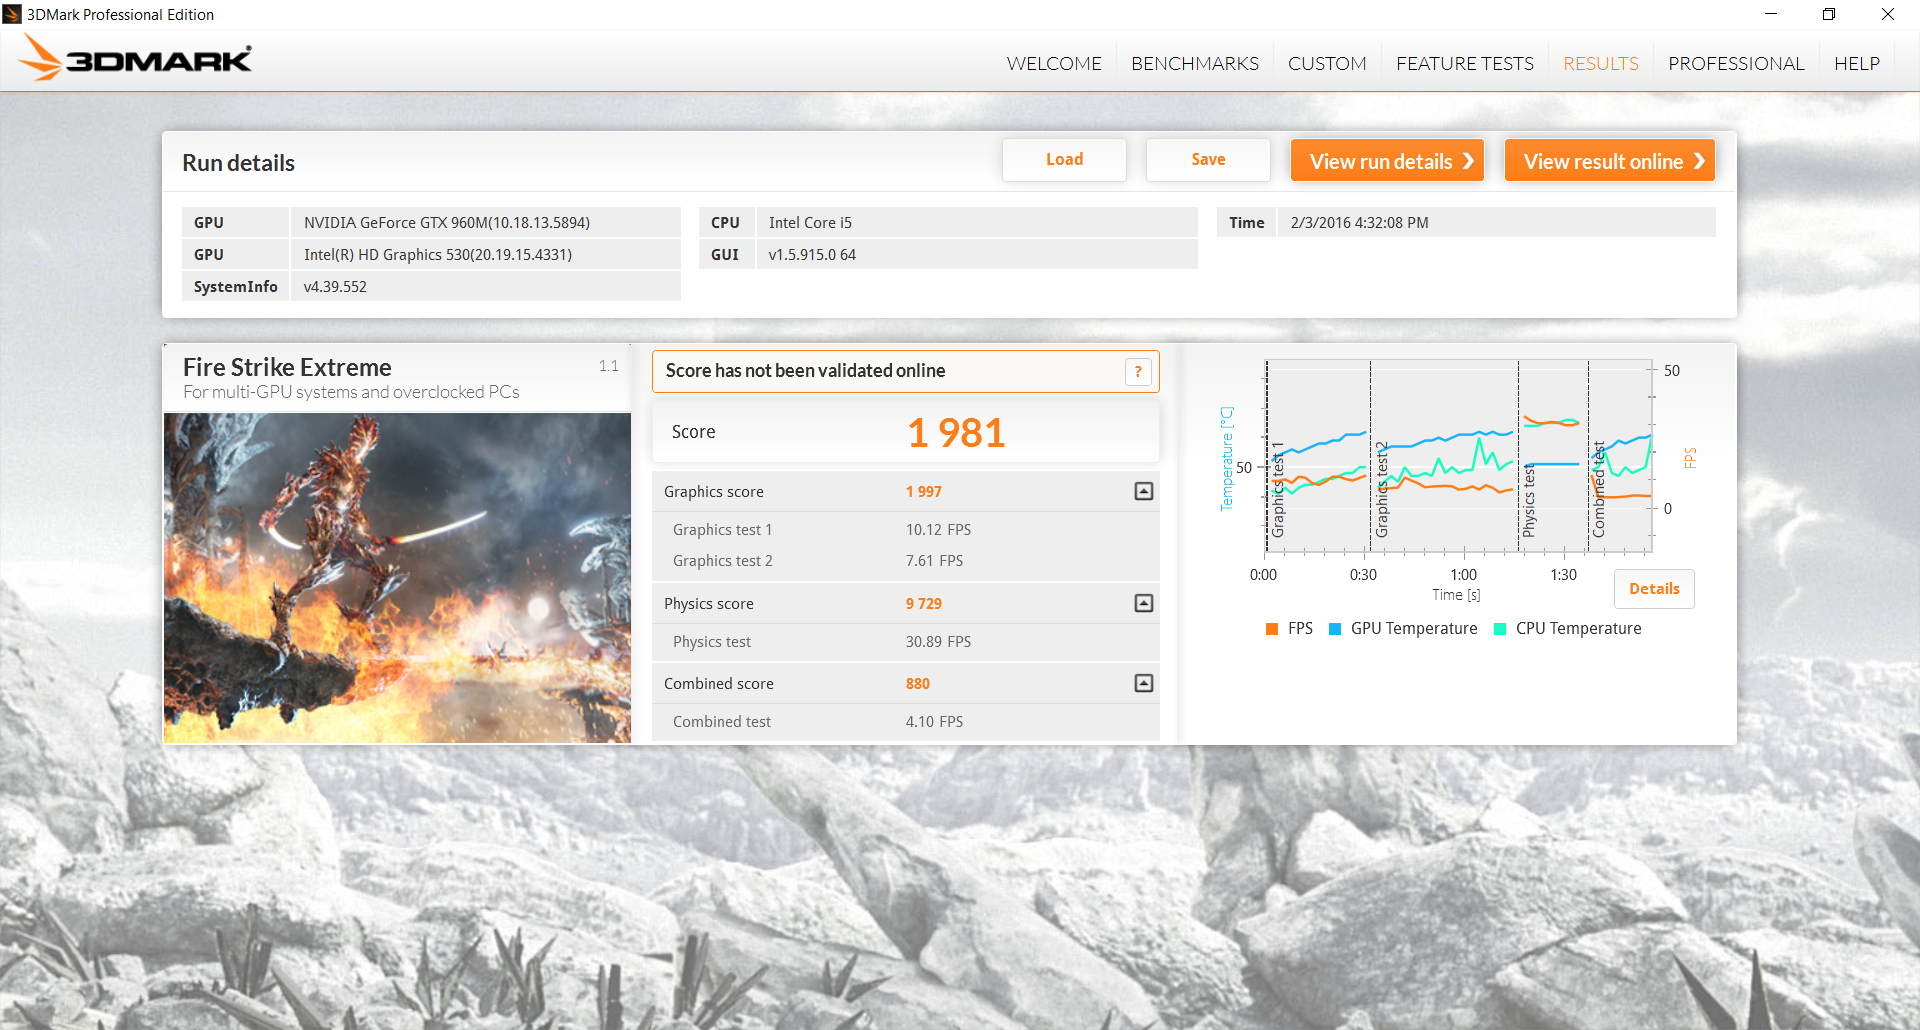
| 3DMark Fire Strike Extreme Score | 1981 points | |
Help | ||
Gaming Performance
The synthetic 3DMark results above translate well into real-world gaming performance. Users can again expect almost double the frame rates compared to older XPS 15 SKUs with GT 750M graphics. The integrated HD 520 in the latest XPS 13 is even further behind.
Modern 3D titles are more than playable on the native resolution of 1080p. Newer and more demanding titles like Fallout 4 and Rise of the Tomb Raider will require Medium settings for more stable frame rates.
| BioShock Infinite | |
| 1366x768 High Preset (sort by value) | |
| Dell XPS 15 9550 i7 FHD | |
| Dell XPS 15 2016 9550 | |
| Dell XPS 15 (9530-0538) | |
| Dell XPS 15 (Late 2013) | |
| Dell XPS 13 2016 i7 256GB QHD | |
| 1920x1080 Ultra Preset, DX11 (DDOF) (sort by value) | |
| Dell XPS 15 9550 i7 FHD | |
| Dell XPS 15-9550 i7 | |
| Dell XPS 15 2016 9550 | |
| Dell XPS 15 (9530-0538) | |
| Dell XPS 15 (Late 2013) | |
| Dell XPS 13 2016 i7 256GB QHD | |
| low | med. | high | ultra | |
|---|---|---|---|---|
| Sleeping Dogs (2012) | 89.2 | 23.4 | ||
| Guild Wars 2 (2012) | 52.5 | 28.6 | ||
| Tomb Raider (2013) | 112 | 52.4 | ||
| StarCraft II: Heart of the Swarm (2013) | 140.3 | 71.1 | ||
| BioShock Infinite (2013) | 106.9 | 44.1 | ||
| Metro: Last Light (2013) | 55.7 | 30.9 | ||
| Thief (2014) | 51.2 | 26.6 | ||
| Middle-earth: Shadow of Mordor (2014) | 39.9 | 30.5 | ||
| Batman: Arkham Knight (2015) | 39 | 19 | ||
| Metal Gear Solid V (2015) | 55 | 37.5 | ||
| Fallout 4 (2015) | 31 | 24.2 | ||
| Rise of the Tomb Raider (2016) | 23.8 | 21.2 |
Stress Test
Our test unit performs very well when under stressful processing conditions. The system is able to maintain the maximum 3.1 GHz Turbo Boost for the CPU when under Prime95 stress while keeping core temperatures in the low 70 C range. The GPU will also never drop below 1111 MHz when under FurMark stress, which means that GPU Boost will always be active under high loads since its base clock rate is 1032 MHz in comparison. The downside is a higher stable GPU temperature of 86 C. Note that the CPU can be as warm as 95 C when subjected to both Prime95 and FurMark stress simultaneously, but the system will automatically throttle down to 2.1 GHz or slower to prevent damage and maintain a stable temperature in the low 80 C range.
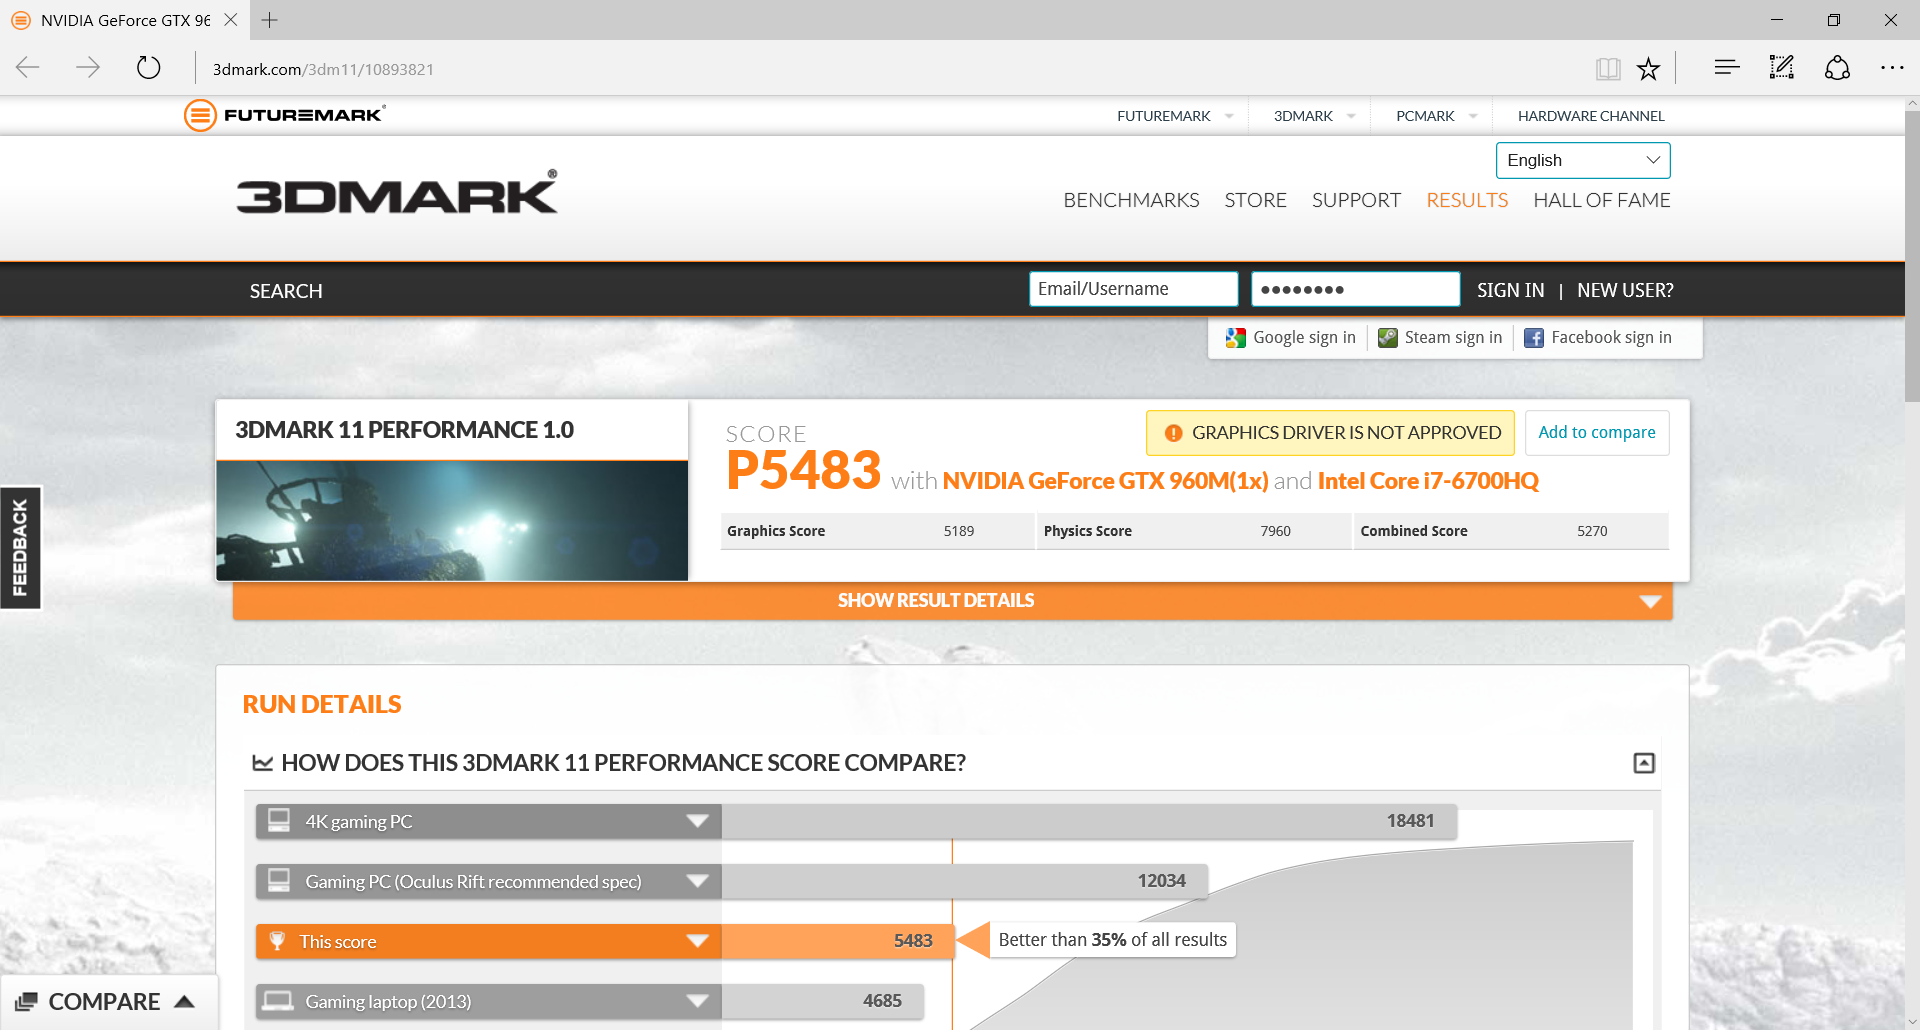
Performance under Unigine Heaven is more representative of gaming loads. Both the CPU and GPU will run at higher clock rates and at lower core temperatures. Running on battery power will not substantially limit CPU or GPU performance. A 3DMark 11 run on batteries returns Physics and Graphics scores of 7959 and 5070 points, respectively, compared to 7960 and 5189 points when on mains.
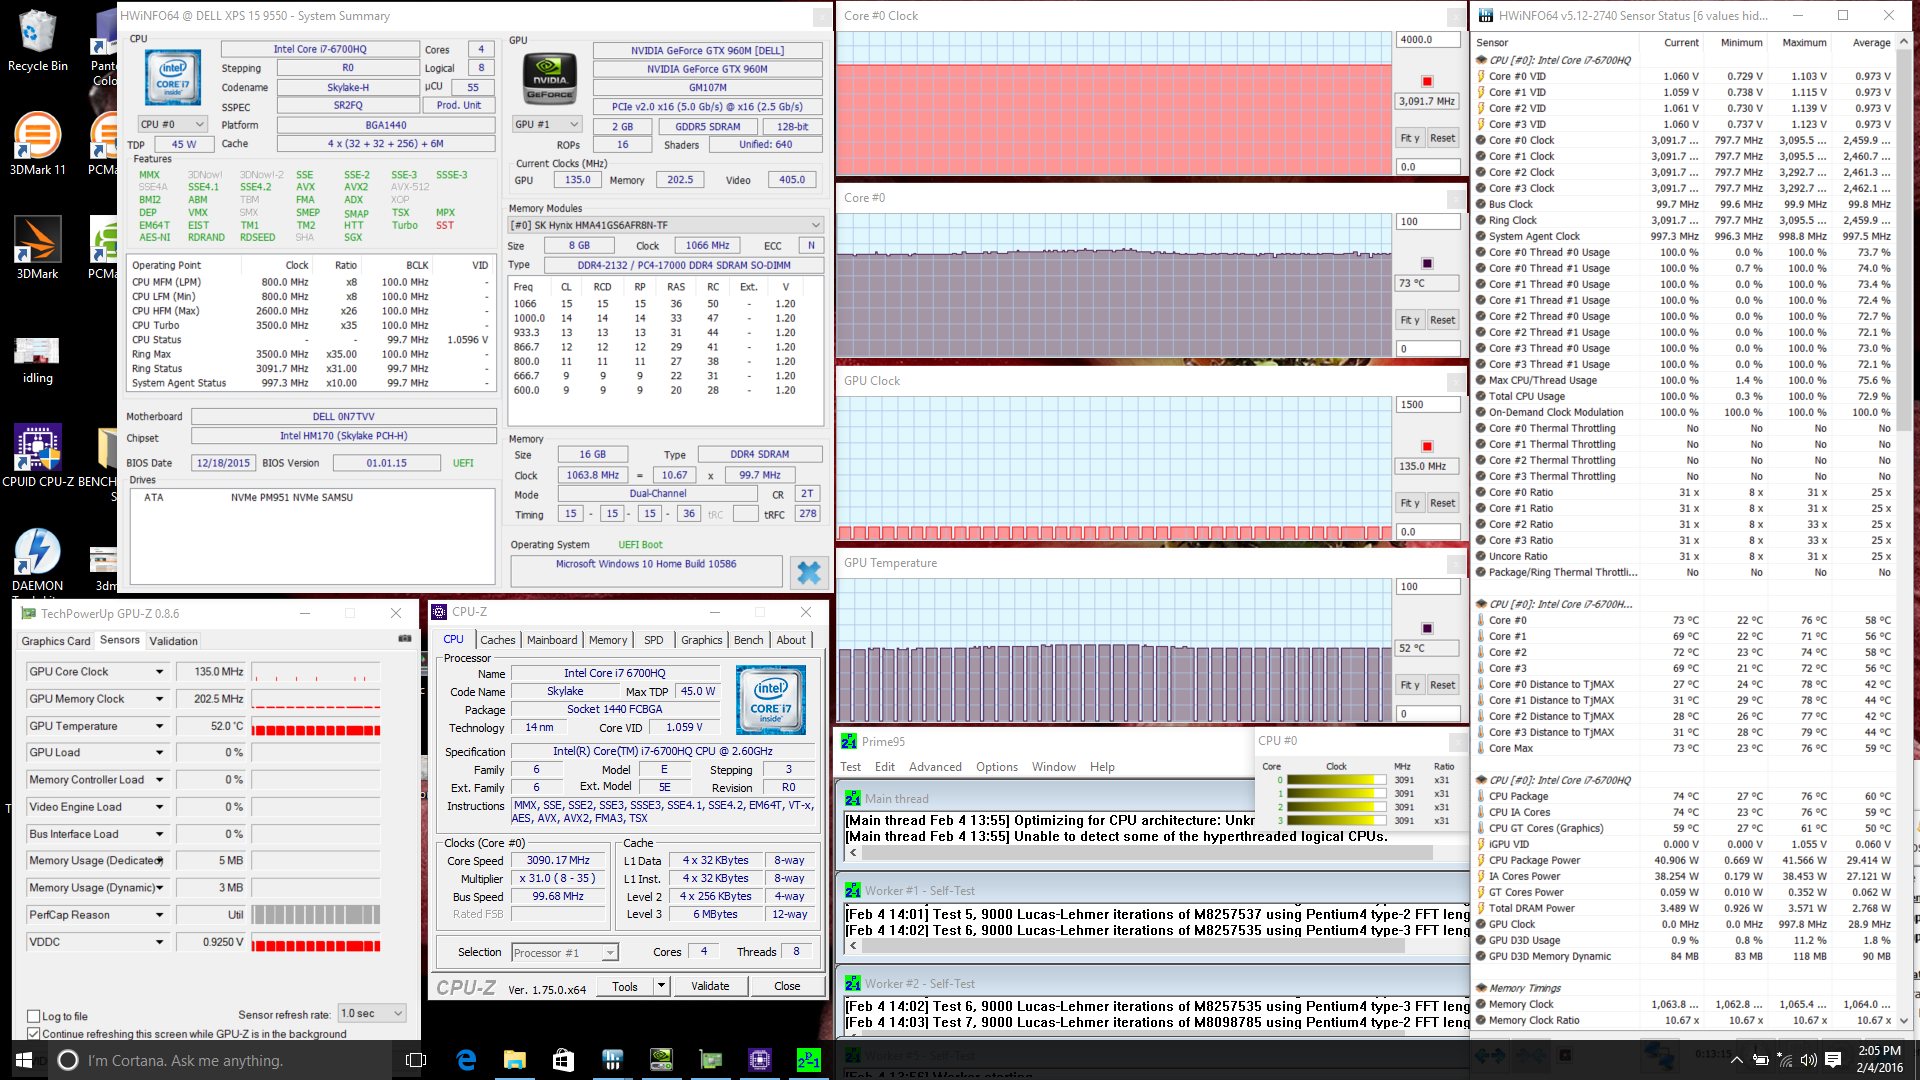
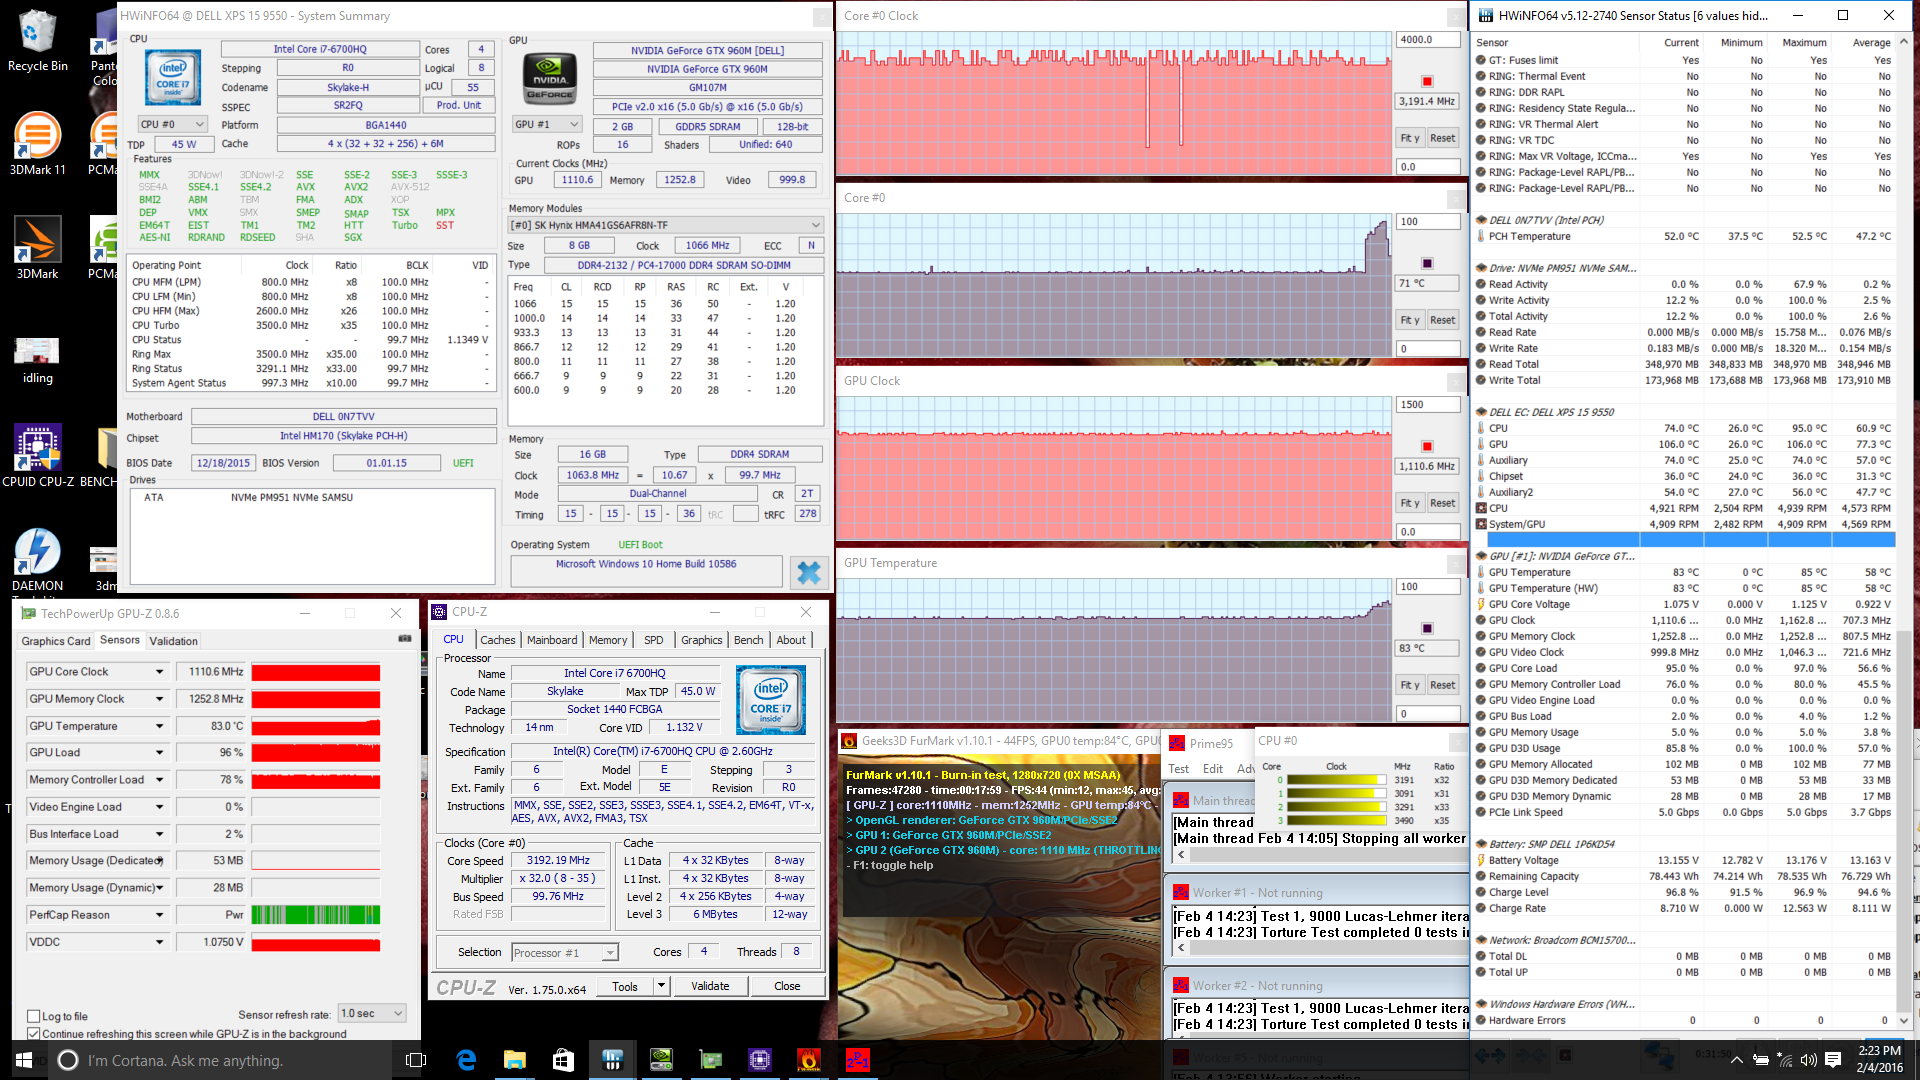
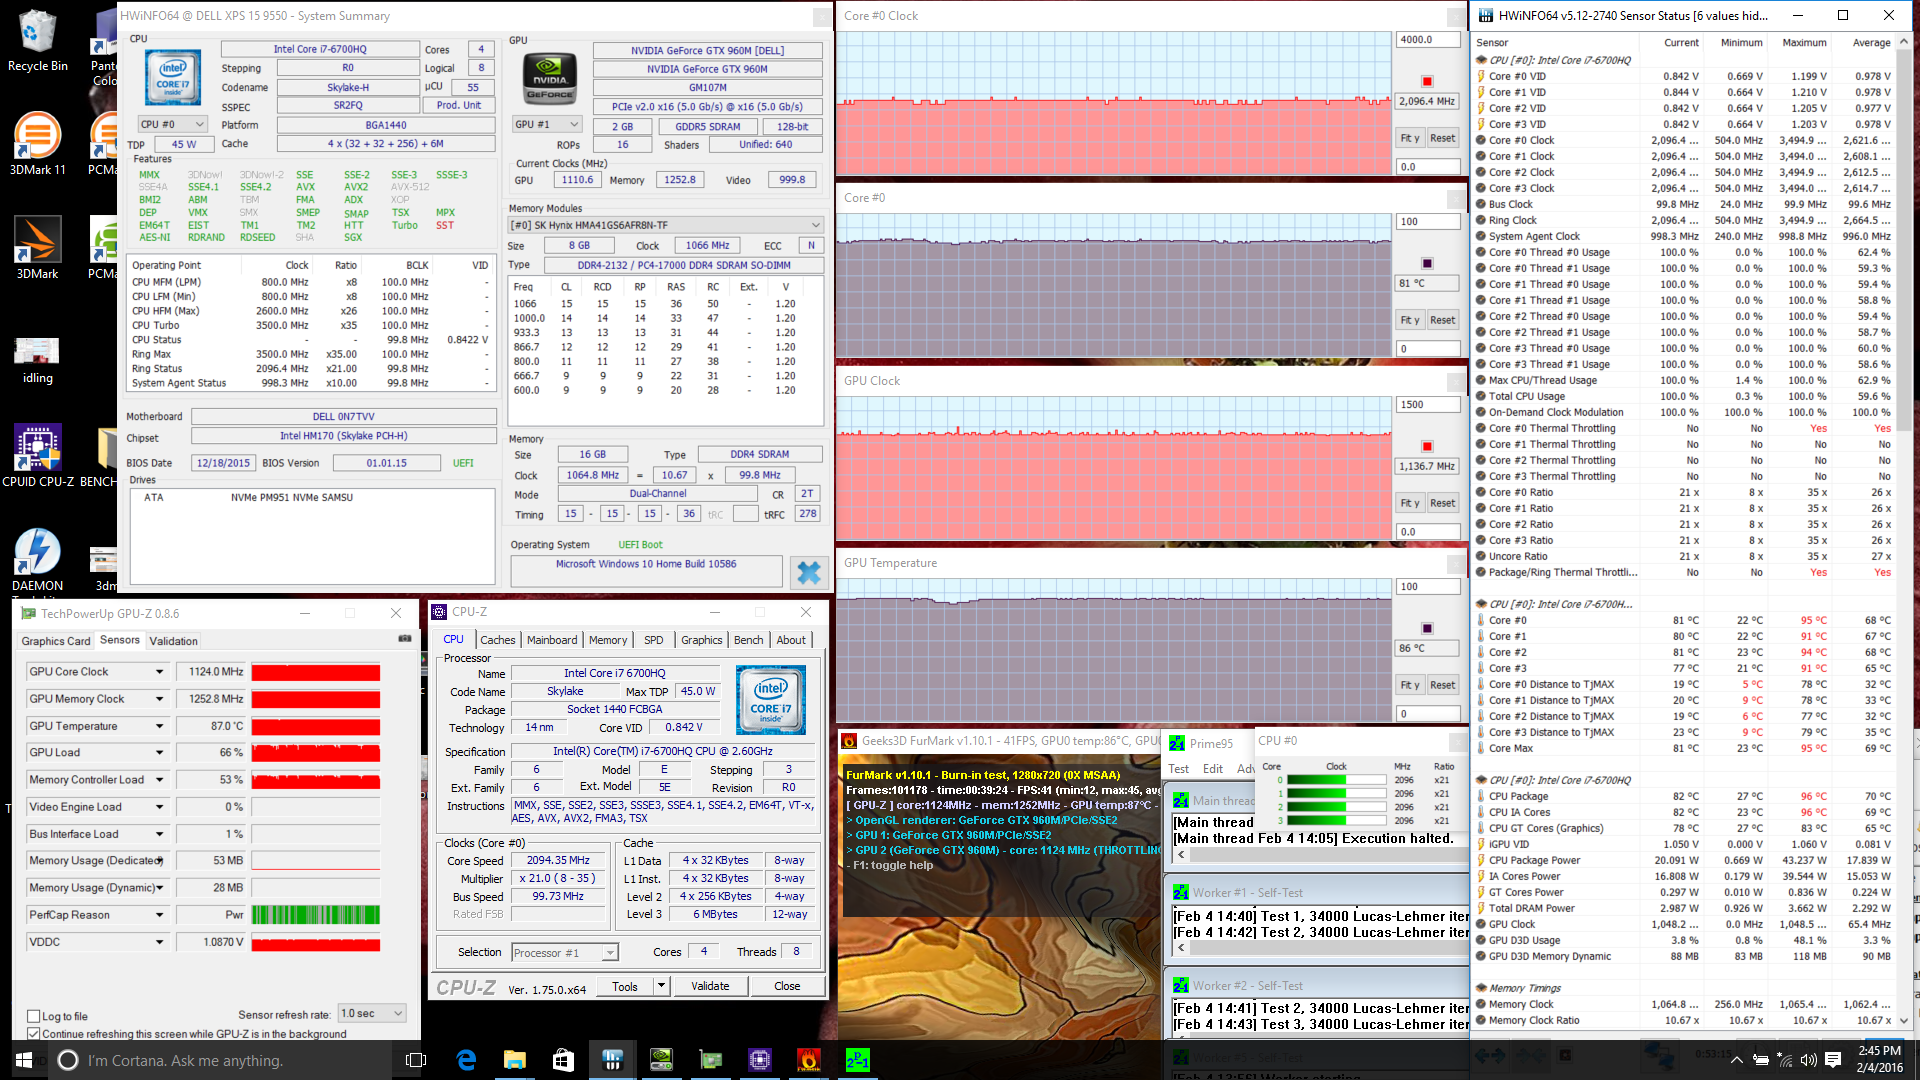
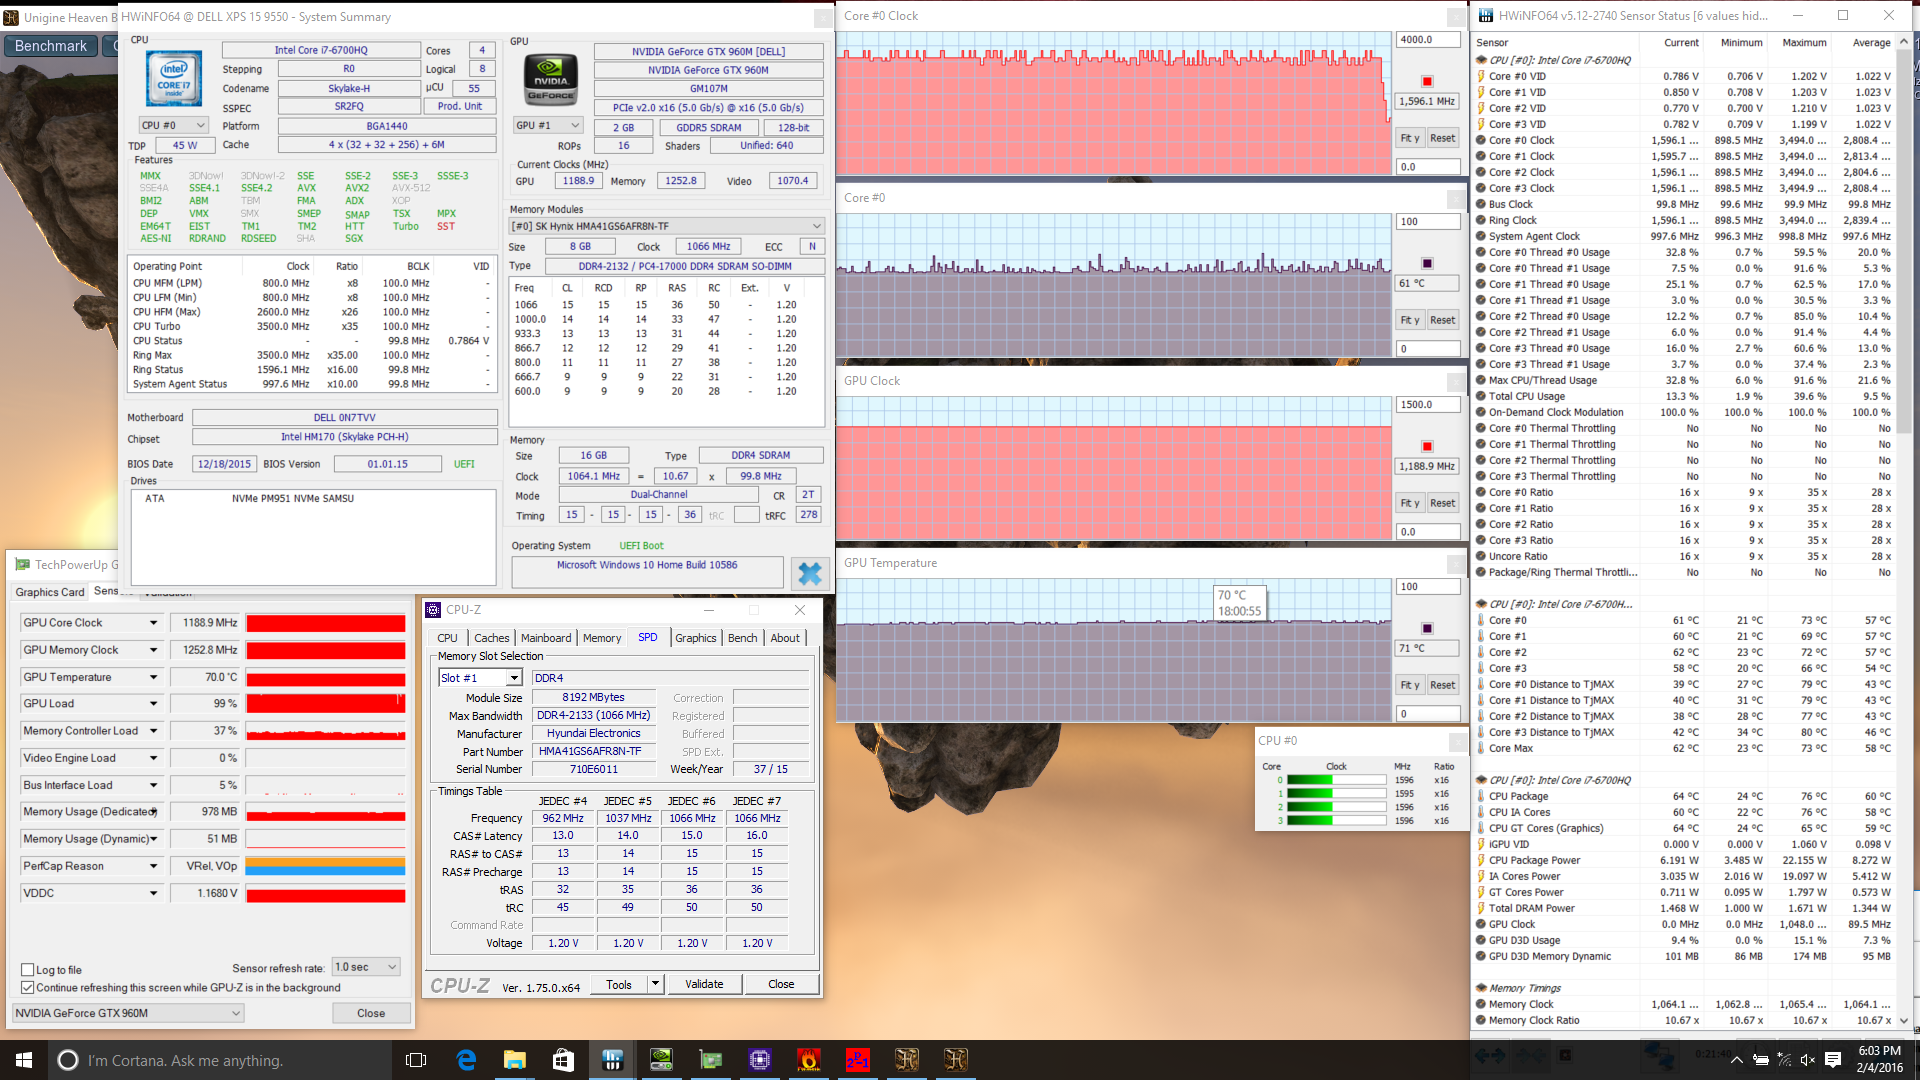
| CPU Clock (GHz) | GPU Clock (MHz) | Average CPU Temperature (C) | Average GPU Temperature (C) | |
| Prime95 Stress | 3.1 | -- | 69 - 73 | -- |
| FurMark Stress | -- | 1111 - 1136 | -- | 80 |
| Prime95 + FurMark Stress | 2.1 | 1111 - 1136 | 80 - 81 | 86 |
| Unigine Heaven Stress | 3.1+ | 1189 | 58 - 62 | 70 - 71 |
Emissions
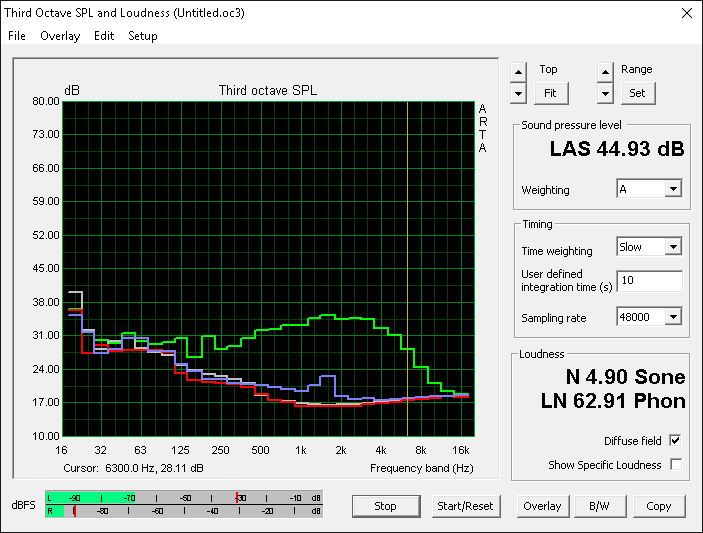
System Noise
The XPS 15 is completely silent when idling or during low loads on the Power Saver profile. More moderate loads with the dGPU active may bump fan noise up to 33 dB(A) for short periods, which is still on the low-end and not at all distracting. Gaming will cause fan noise to cycle from 33 dB(A) to 36.5 dB(A). Most of the time, however, the system will remain stable at 36.5 dB(A) under heavy load.
Extreme loads will bump fan noise in a step-wise manner from 36.5 dB(A) to 40 dB(A), 42.6 dB(A), and finally to 47.7 dB(A). While this maximum is louder than on last year's XPS 15, it should be very uncommon (if not impossible) under gaming and everyday loads. The new XPS model is overall quieter than the outgoing one when under medium loads.
| Dell XPS 15 9550 i7 FHD GeForce GTX 960M, 6700HQ, Samsung PM951 NVMe 512 GB | Dell XPS 15 2016 9550 GeForce GTX 960M, 6300HQ, WDC WD10SPCX-75KHST0 + LiteON CS1-SP32-11 M.2 2242 32GB | Dell XPS 15 (9530-0538) GeForce GT 750M, 4712HQ, Lite-On LMT-512L9M | Dell XPS 13 2016 i7 256GB QHD HD Graphics 520, 6500U, Samsung PM951 NVMe MZ-VLV256D | Asus ZenBook Pro UX501VW-DS71T GeForce GTX 960M, 6700HQ, Samsung SM951 MZVPV512HDGL m.2 PCI-e | Lenovo Ideapad Y700 15ISK 80NW GeForce GTX 960M, 6700HQ, Samsung MZNLN128HCGR-000L2 | |
|---|---|---|---|---|---|---|
| Noise | -9% | -7% | -1% | -1% | -7% | |
| Idle Minimum * (dB) | 29.2 | 32.6 -12% | 29.6 -1% | 31.8 -9% | 28.9 1% | 30.4 -4% |
| Idle Average * (dB) | 29.3 | 33.6 -15% | 31.6 -8% | 31.8 -9% | 28.9 1% | 30.5 -4% |
| Idle Maximum * (dB) | 29.5 | 33.6 -14% | 31.6 -7% | 34.8 -18% | 30.2 -2% | 33.3 -13% |
| Load Average * (dB) | 36.5 | 37.1 -2% | 45.4 -24% | 34.8 5% | 41.8 -15% | 41.4 -13% |
| Load Maximum * (dB) | 47.7 | 47.5 -0% | 45.4 5% | 34.8 27% | 43.9 8% | 47 1% |
* ... smaller is better
Noise level
| Idle |
| 29.2 / 29.3 / 29.5 dB(A) |
| Load |
| 36.5 / 47.7 dB(A) |
 | ||
30 dB silent 40 dB(A) audible 50 dB(A) loud |
||
min: | ||
Temperature
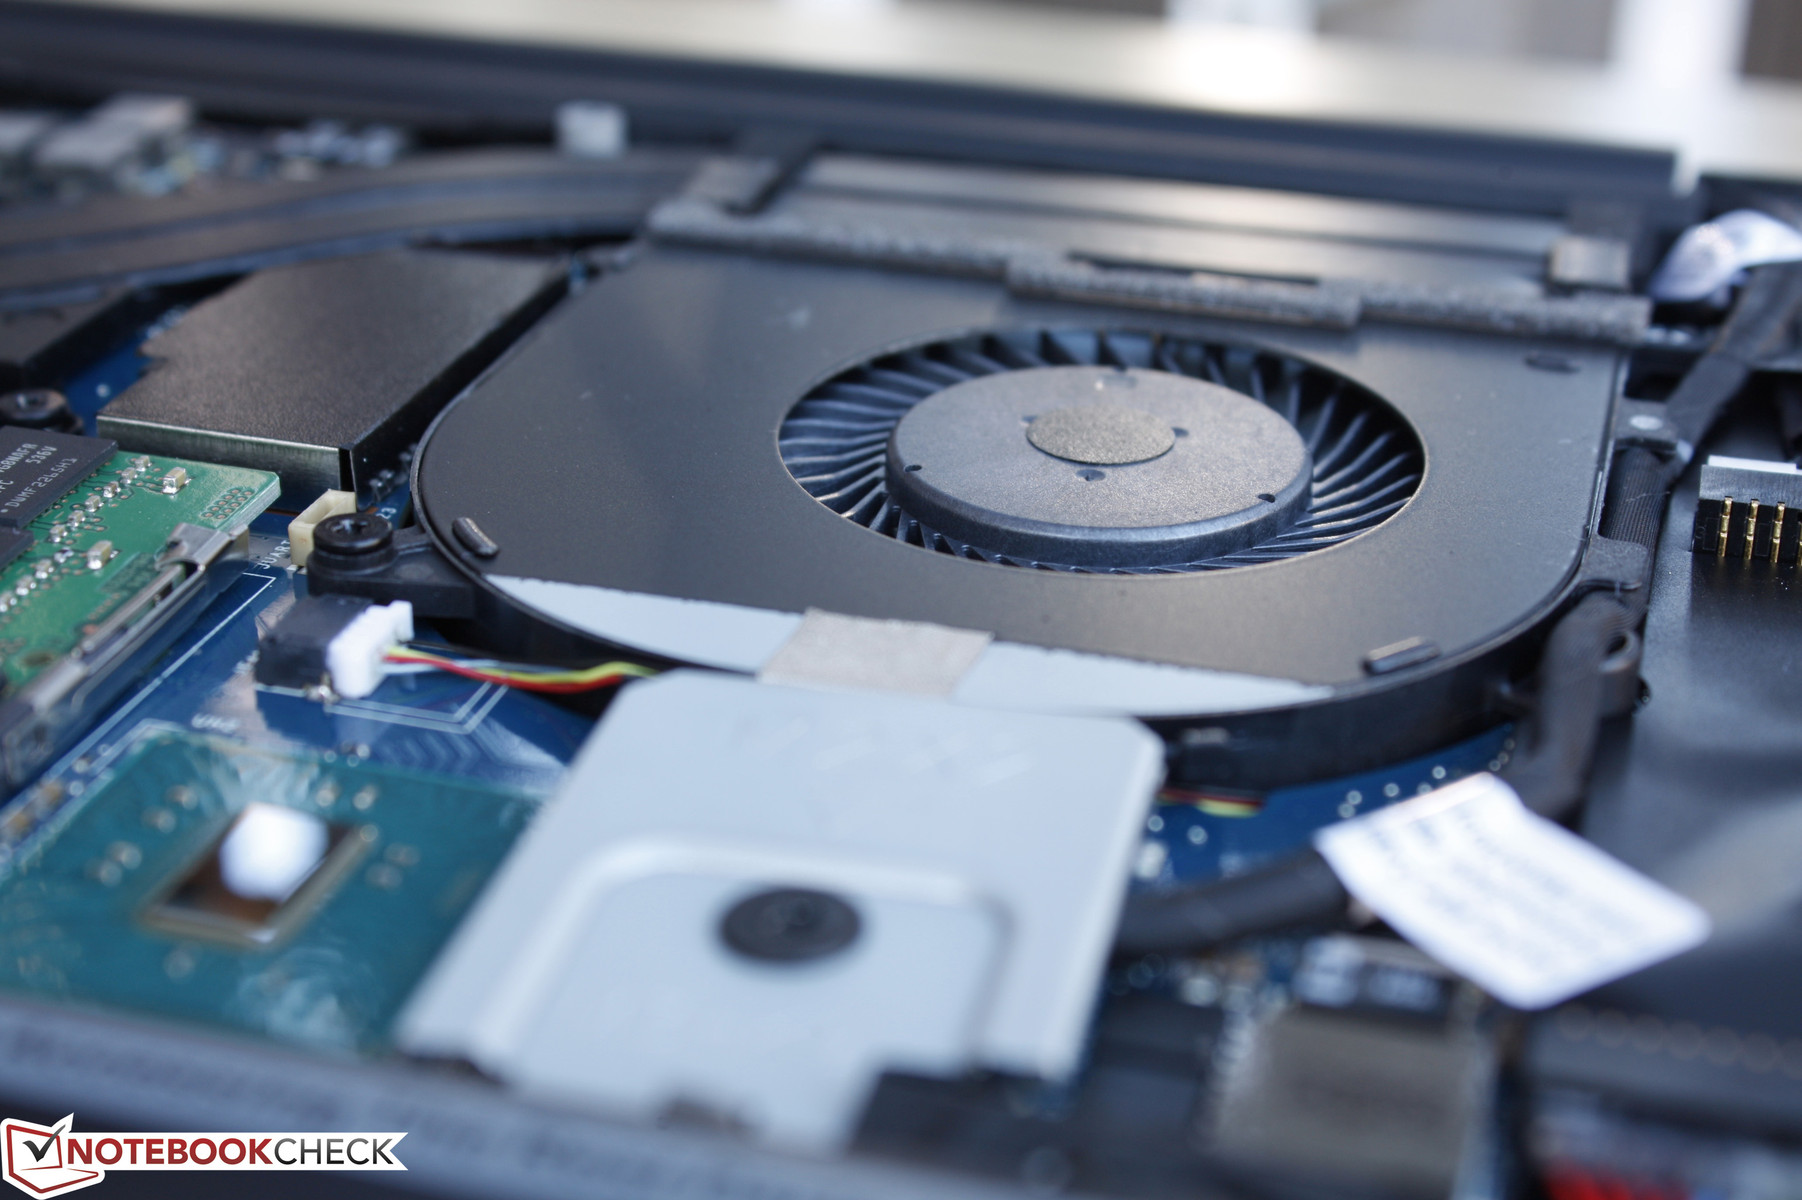
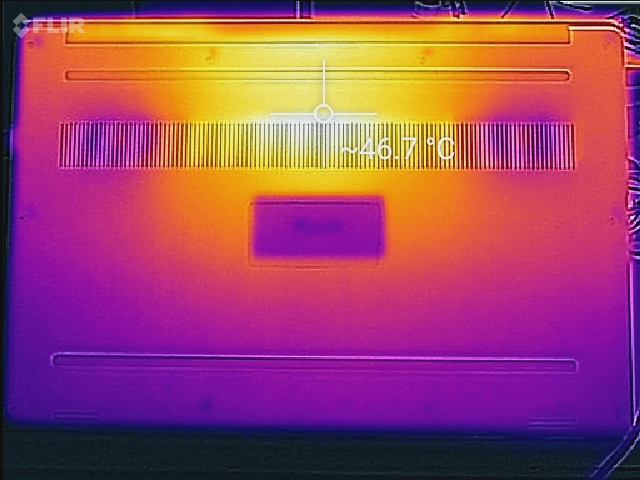
Surface temperatures are generally cool when idling or during low loads. Nonetheless, the center rear of the notebook will always be noticeably warmer at all times. Running on the High Performance profile with the dGPU active will accentuate the warmer regions.
The palm rests remain cool and so do the outer edges of the keyboard, but users will quickly notice that the center of the keyboard will become much warmer over time especially when gaming. Fortunately, the bottom surface of the notebook will not grow uncomfortably warm if the system is simply being used for word processing, browsing, or movie playback.
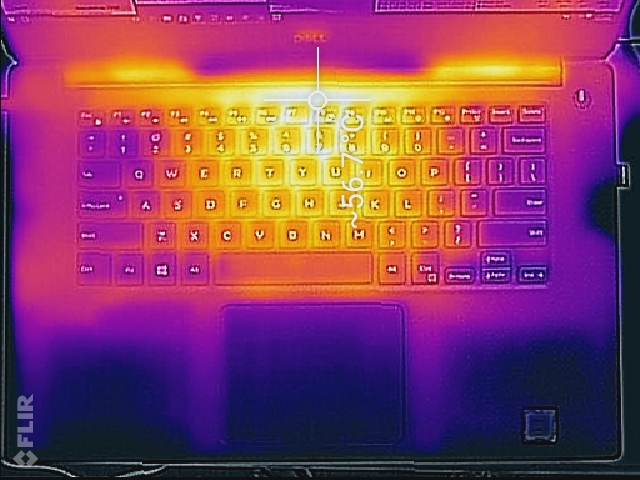
(-) The maximum temperature on the upper side is 56.6 °C / 134 F, compared to the average of 36.9 °C / 98 F, ranging from 21 to 71 °C for the class Multimedia.
(-) The bottom heats up to a maximum of 46.9 °C / 116 F, compared to the average of 39.1 °C / 102 F
(+) In idle usage, the average temperature for the upper side is 23.9 °C / 75 F, compared to the device average of 31.3 °C / 88 F.
(+) The palmrests and touchpad are cooler than skin temperature with a maximum of 26.6 °C / 79.9 F and are therefore cool to the touch.
(+) The average temperature of the palmrest area of similar devices was 28.7 °C / 83.7 F (+2.1 °C / 3.8 F).
Speakers
")
The stereo speakers are of above average quality and with a loud maximum volume. They are better able to reproduce lower frequency sounds than on the Gigabyte P34W v5, so bass is more prevalent. Still, the lack of a dedicated subwoofer puts the XPS 15 at a disadvantage compared to larger dedicated gaming machines.
Battery Life
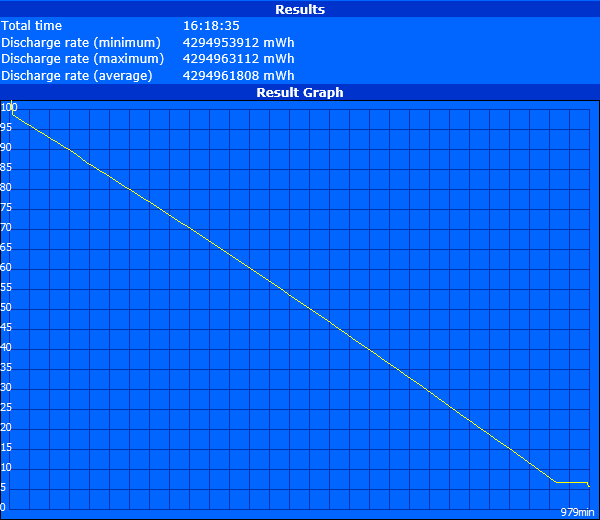
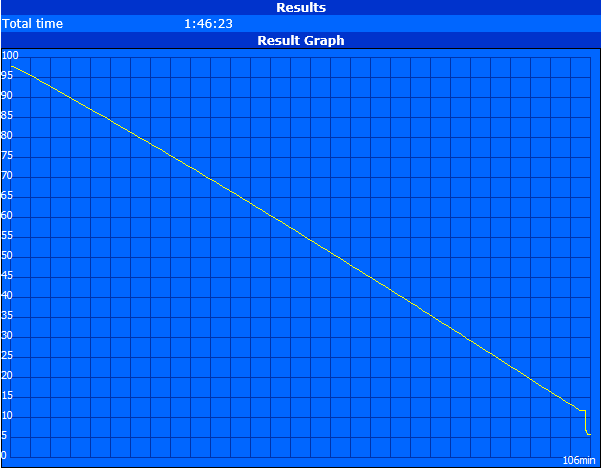
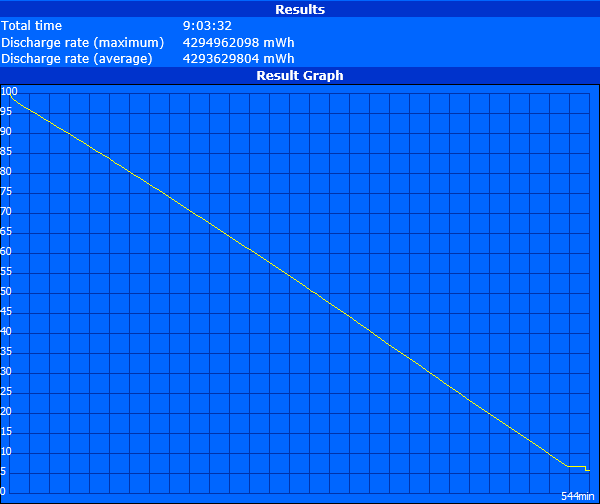
Runtimes have been vastly improved over previous iterations of the XPS 15 including our recent XPS 15 2016 UHD SKU. Part of this can be attributed to the battery capacity that is already larger than on most competing 15.6-inch notebooks and to key updates from Dell that improve battery life directly. At over 9 hours of constant WLAN use, this is probably one of the longest lasting 15.6-inch notebooks with a GTX 960M GPU. Users who don't mind running on the Power Saver profile and with a dimmer display brightness can squeeze out even more from the battery, though too low of a brightness is not recommended due to the aforementioned use of PWM.
Charging from empty to full will take roughly 2 to 2.5 hours with the included AC adapter. Unlike on Dell's business-centric Precision and Latitude series, the internal battery for the XPS 15 is more difficult to access and replace.
| Dell XPS 15 9550 i7 FHD 84 Wh | Dell XPS 15-9550 i7 84 Wh | Dell XPS 15 2016 9550 56 Wh | Dell XPS 15 (9530-0538) 88 Wh | Dell XPS 13-9350 56 Wh | |
|---|---|---|---|---|---|
| Battery runtime | -24% | -19% | -43% | 0% | |
| Reader / Idle (h) | 16.3 | 8.8 -46% | 9.1 -44% | 13 -20% | |
| WiFi v1.3 (h) | 9.1 | 5.2 -43% | 5.5 -40% | 5.2 -43% | 7.5 -18% |
| Load (h) | 1.8 | 2.1 17% | 2.3 28% | 2.5 39% |
Pros
Cons
Verdict
Though it launched with some headache-inducing issues, the XPS 15 2016 refresh is an improvement over the outgoing design in almost every way, especially in terms of graphics, size, and weight. Battery life is incredible with our 84 Wh test unit and the system is able to maintain stable temperatures with no more major throttling issues.
The pulsating backlight at very low brightness levels is still an issue with the FHD SKUs and can be avoided by keeping the backlight above 30 or 40 percent. Additionally, the FHD SKUs have nearly full coverage of sRGB while the 4K UHD SKUs cover an even wider gamut of nearly the entire AdobeRGB standard. These two reasons alone may be enough to persuade digital artists into purchasing a 4K UHD configuration over any FHD options even if the higher resolution is of no interest.
The larger battery capacity will come at the cost of secondary storage and such configurations may not be available in all regions. Models with the smaller battery pack may be preferable for those who intend to use the XPS 15 primarily as a multimedia and gaming machine.
The large display, small size, and graphical power make the latest XPS 15 an excellent solution for traveling, gaming, and schoolwork. It's a very focused system as it lacks business-centric features and connectivity options suited for professional use despite the deep color options.
Dell XPS 15 9550 i7 FHD
- 02/08/2016 v4.1 (old)
Allen Ngo
Price comparison
