Notebook reviews with NVIDIA GeForce GTX 960M graphics card
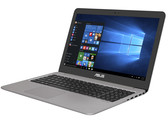
Asus Zenbook UX510UW-CN044T Notebook Review
All-rounder with gaming qualities. With the Zenbook UX510UW, Asus has created a successful compromise of a good gaming laptop and all-rounder for everyday use. The slim laptop pleases with a good configuration and good rates. However, the laptop has its shortcomings.
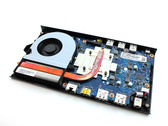
Intel Core i7-6500U, NVIDIA GeForce GTX 960M, 15.6", 2 kgAcer Graphics Dock with Nvidia GTX 960M Review
Surprise! A graphics card in an external case - familiar. In the past, this technology has not worked as intended. In this review, we put all that aside and take a look at what the GPU is capable of. Update 10-15-2016: Aspire Switch 12S does not turn into a gamer.
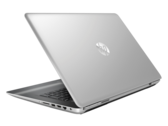
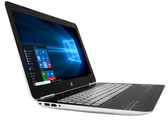
Intel Core i5-6200U, NVIDIA GeForce GTX 960M, 15.6"HP Pavilion 17 FHD V3A33AV Notebook Review
Loud gamer. It's got the looks of a multimedia notebook and the GPU of a gaming machine. While versatile, the system runs much louder than your standard Ultrabook even during low loads.
Intel Core i7-6700HQ, NVIDIA GeForce GTX 960M, 17.3", 3 kgHP Pavilion 15 UHD T9Y85AV Notebook Review
No frills gaming. The Pavilion 15 is a great blend of multimedia and performance gaming in a modest and portable multimedia chassis. Its connectivity options and serviceability, however, leave a lot to be desired.
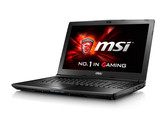
Intel Core i7-6700HQ, NVIDIA GeForce GTX 960M, 15.6", 2.2 kgMSI GL62 6QF Notebook Review
Problems with the competition. The MSI GL62 is supposed to be an attractively priced entry-level gaming device. Customers get a quad-core processor and a decent Nvidia GPU for 1100 Euros (~$1218). The 15-inch notebook still has a hard time against the rivals due to some money-saving measures. We will find out if you should buy the device.
Intel Core i7-6700HQ, NVIDIA GeForce GTX 960M, 15.6", 2.3 kgMSI Prestige PE70 6QE-055XUS: Intel Core i7-6700HQ, 17.30", 2.4 kg
Review » MSI PE70 6QE Prestige iBuyPower Edition Notebook Review
MSI PE60 6QE-056XUS: Intel Core i7-6700HQ, 15.60", 2.4 kg
Review » MSI PE60 6QE Prestige iBuyPower Edition Notebook Review
Asus G501VW-FY081T: Intel Core i7-6700HQ, 15.60", 2.1 kg
Review » Asus G501VW-FY081T Notebook Review
Asus GL552VW-DH74: Intel Core i7-6700HQ, 15.60", 2.6 kg
Review » Asus GL552VW Xotic PC Edition Notebook Review
Asus GL752VW-T4168T: Intel Core i7-6700HQ, 17.30", 3 kg
Review » Asus GL752VW Notebook Review
Acer Aspire V15 Nitro BE VN7-592G-79DV: Intel Core i7-6700HQ, 15.60", 2.3 kg
Review » Acer Aspire V15 Nitro BE VN7-592G-79DV Notebook Review
MSI GL72 6QF: Intel Core i7-6700HQ, 17.30", 2.8 kg
Review » MSI GL72 6QF Xotic PC Edition Notebook Review
Dell XPS 15 9550 i7 FHD: Intel Core i7-6700HQ, 15.60", 2 kg
Review » Dell XPS 15 9550 (Core i7, FHD) Notebook Review
Asus ZenBook Pro UX501VW-DS71T: Intel Core i7-6700HQ, 15.60", 2.3 kg
Review » Asus ZenBook Pro UX501VW Notebook Review
Lenovo Ideapad Y700 17ISK 80Q0: Intel Core i7-6700HQ, 17.30", 3.6 kg
Review » Lenovo Ideapad Y700 17ISK 80Q0 Notebook Review
MSI GE62-6QD16H11: Intel Core i7-6700HQ, 15.60", 2.4 kg
Review » MSI GE62 6QD Apache Pro Notebook Review
Dell XPS 15-9550 i7: Intel Core i7-6700HQ, 15.60", 2.1 kg
Review » Dell XPS 15 9550 (i7, 512GB, UHD) InfinityEdge Notebook Review
Dell XPS 15 2016 9550: Intel Core i5-6300HQ, 15.60", 2 kg
Review » Dell XPS 15 2016 (9550) InfinityEdge Notebook Review
Lenovo Ideapad Y700 15ISK 80NW: Intel Core i7-6700HQ, 15.60", 2.9 kg
Review » Lenovo Ideapad Y700 15ISK 80NW Notebook Review
Dell Inspiron 15 7559: Intel Core i7-6700HQ, 15.60", 2.7 kg
Review » Dell Inspiron 15 7559 Notebook Review
Acer Aspire V Nitro Black Edition VN7-792G-74Q4: Intel Core i7-6700HQ, 17.30", 3.1 kg
Review » Acer Aspire V Nitro Black Edition VN7-792G-74Q4 Notebook Review
Nexoc G515 II: Intel Core i7-6700HQ, 15.60", 2.5 kg
Review » Nexoc G515 II (Clevo N150RD) Notebook Review
Schenker XMG A706: Intel Core i7-6700HQ, 17.30", 3.1 kg
Review » Schenker XMG A706 (Clevo N170RD) Notebook Review
Eurocom Shark 4: Intel Core i7-4720HQ, 15.60", 2.5 kg
Review » Eurocom Shark 4 (Clevo N150SD) Notebook Review
Asus Zenbook Pro UX501JW-FI218H: Intel Core i7-4720HQ, 15.60", 2 kg
Review » Asus ZenBook Pro UX501JW-FI218H Notebook Review
MSI PE70-2QEi581: Intel Core i5-4210H, 17.30", 2.6 kg
Review » MSI PE70 2QE Notebook Review
Lenovo IdeaPad Y50-70-59441229: Intel Core i7-4710HQ, 15.60", 2.4 kg
Review » Lenovo IdeaPad Y50-70 (GTX 960M, FHD) Notebook Review
Asus N551JW-CN094H: Intel Core i7-4720HQ, 15.60", 2.6 kg
Review » Asus N551JW (GTX 960M) Notebook Review
MSI PE60-2QEi581: Intel Core i5-4210H, 15.60", 2.3 kg
Review » MSI PE60 2QE Prestige Notebook Review
Asus G501JW-CN168H: Intel Core i7-4720HQ, 15.60", 2 kg
Review » Asus G501JW (FHD) Notebook Review
Lenovo IdeaPad Y50-70-59441231: Intel Core i7-4710HQ, 15.60", 2.4 kg
Review » Lenovo Y50-70 (GTX 960M, 4K) Notebook Review
MSI GE72-2QDi716H11: Intel Core i7-4720HQ, 17.30", 2.9 kg
Review » MSI GE72 (GTX 960M) Notebook Review
Alienware 13 (GTX 960M): Intel Core i7-5500U, 13.30", 2 kg
Review » Alienware 13 (GTX 960M) Notebook Review
MSI GE60-2QEWi781: Intel Core i7-4720HQ, 15.60", 2.6 kg
Review » MSI GE60 (GTX 960M) Notebook Review
Asus GL771JW-T7082H: Intel Core i7-4720HQ, 17.30", 3.3 kg
Review » Asus GL771JW Notebook Review
Asus UX501JW-DS71T: Intel Core i7-4720HQ, 15.60", 2.3 kg
Review » Asus ZenBook Pro UX501JW Notebook Review
Razer Blade Pro 17 inch 2015: Intel Core i7-4720HQ, 17.30", 3.1 kg
Review » Razer Blade Pro 2015 Notebook Review
Asus G501JW: Intel Core i7-4720HQ, 15.60", 2.1 kg
Review » Asus G501JW Notebook Review
MSI PE70-2QEi716H21BW: Intel Core i7-4720HQ, 17.30"
Review » MSI PE70 Multimedia Notebook Preview
Acer Aspire V Nitro 7-791G-70TW: Intel Core i7-4720HQ, 17.30", 3 kg
Review » Acer Aspire V Nitro 7-791G Notebook Review
Acer Aspire VN7-591G-727P: Intel Core i7-4720HQ, 15.60", 2.4 kg
Review » Acer Aspire V15 Nitro Black Edition VN7-591G Notebook Review
Schenker XMG A305: Intel Core i7-4710MQ, 13.30", 2.1 kg
Review » Schenker XMG A305 (Clevo W230SD) Notebook Review
Schenker XMG A705: Intel Core i7-4720HQ, 17.30", 3.1 kg
Review » Schenker XMG A705 (Clevo N170SD) Notebook Review
Schenker XMG A505: Intel Core i7-4720HQ, 15.60", 2.5 kg
Review » Nvidia GeForce GTX 960M Review
MSI GE62 2QD: Intel Core i7-4720HQ, 15.60", 2.4 kg
Review » iBuyPower MSI GE62 Notebook Review
Schenker XMG A505: Intel Core i7-4720HQ, 15.60", 2.5 kg
Review » Schenker XMG A505 (Clevo N150SD) Notebook Review
MSI GE62 6QC-018NL: Intel Core i7-6700HQ, 15.60", 2.4 kg
External Review » MSI GE62 6QC-018NL
Asus GL552VW-CN471T: Intel Core i7-6700HQ, 15.60", 2.6 kg
External Review » Asus GL552VW-CN471T
MSI GP72 6QF-823NL: Intel Core i7-6700HQ, 17.30", 2.6 kg
External Review » MSI GP72 6QF-823NL
Lenovo Ideapad Y700-15ISK-80NV00XSSP: Intel Core i7-6700HQ, 15.60", 2.6 kg
External Review » Lenovo Ideapad Y700-15ISK-80NV00XSSP
Lenovo Ideapad Y700-15ISK-80NV00XVSP: Intel Core i7-6700HQ, 15.60", 2.6 kg
External Review » Lenovo Ideapad Y700-15ISK-80NV00XVSP
Asus X756UW-T4081T: Intel Core i7-7500U, 17.30", 2.7 kg
External Review » Asus X756UW-T4081T
Asus GL552VW-DM594T: Intel Core i7-6700HQ, 15.60", 2.6 kg
External Review » Asus GL552VW-DM594T
HP Omen 17-w000ns: Intel Core i7-6700HQ, 17.30", 2.9 kg
External Review » HP Omen 17-w000ns
MSI GP72 6QF-690NL Leopard Pro: Intel Core i7-6700HQ, 17.30", 2.6 kg
External Review » MSI GP72 6QF-690NL Leopard Pro
MSI GP62 7QF-1692 Leopard Pro: Intel Core i5-7300HQ, 15.60", 2.4 kg
External Review » MSI GP62 7QF-1692 Leopard Pro
Dell XPS 15 9550-3628: Intel Core i7-6700HQ, 15.60", 2 kg
External Review » Dell XPS 15 9550-3628
MSI GL72 6QF-407NL: Intel Core i7-6700HQ, 17.30", 2.8 kg
External Review » MSI GL72 6QF-407NL
MSI GL72 7QF-1044XRU: Intel Core i5-7300HQ, 17.30", 2.7 kg
External Review » MSI GL72 7QF-1044XRU
MSI GL62 7QF-1660: Intel Core i7-7700HQ, 15.60", 2.4 kg
External Review » MSI GL62 7QF-1660
Dell Inspiron 15-7566-1821: Intel Core i5-6300HQ, 15.60", 2.6 kg
External Review » Dell Inspiron 15-7566-1821
Lenovo IdeaPad Y700-15ISK 80NV00V1MH: Intel Core i7-6700HQ, 15.60", 2.6 kg
External Review » Lenovo IdeaPad Y700-15ISK 80NV00V1MH
Asus G501VW-FI135T: Intel Core i7-6700HQ, 15.60", 2 kg
External Review » Asus G501VW-FI135T
Asus VivoBook Pro N552VW-FY217T: Intel Core i7-6700HQ, 15.60", 2.5 kg
External Review » Asus VivoBook Pro N552VW-FY217T
Asus GL553VW-FY079T: Intel Core i7-6700HQ, 15.60", 2.5 kg
External Review » Asus GL553VW-FY079T
Asus GL552VW-DM141T: Intel Core i7-6700HQ, 15.60", 2.6 kg
External Review » Asus GL552VW-DM141T
HP Pavilion 15-bc004ns: Intel Core i7-6700HQ, 15.60", 2.2 kg
External Review » HP Pavilion 15-bc004ns
Lenovo Ideapad Y700-15ISK-80NV009BSP: Intel Core i7-6700HQ, 15.60", 2.6 kg
External Review » Lenovo Ideapad Y700-15ISK-80NV009BSP
Asus Zenbook UX510UW-CN058T: Intel Core i5-7200U, 15.60", 2 kg
External Review » Asus Zenbook UX510UW-CN058T
Lenovo Y700-15ISK-80NV0143GE: Intel Core i7-6700HQ, 15.60", 2.6 kg
External Review » Lenovo Y700-15ISK-80NV0143GE
MSI GL62 7QF-1668XES: Intel Core i5-7300HQ, 15.60", 2.4 kg
External Review » MSI GL62 7QF-1668XES
HP Pavilion 17-AB006NS: Intel Core i7-6700HQ, 17.30", 2.9 kg
External Review » HP Pavilion 17-AB006NS
Dell Inspiron 7566-0435: Intel Core i7-6700HQ, 15.60", 2.6 kg
External Review » Dell Inspiron 7566-0435
HP Omen 17-w001ns: Intel Core i7-6700HQ, 17.30", 2.9 kg
External Review » HP Omen 17-w001ns
Dell XPS 15 9550-3813: Intel Core i7-6700HQ, 15.60", 1.8 kg
External Review » Dell XPS 15 9550-3813
Asus ZenBook Pro UX501VW-FY075T: Intel Core i7-6700HQ, 15.60", 2.1 kg
External Review » Asus ZenBook Pro UX501VW-FY075T
MSI PX60 6QE-254NL: Intel Core i7-6700HQ, 15.60", 2.1 kg
External Review » MSI PX60 6QE-254NL
HP Pavilion 17-ab004ns: Intel Core i7-6700HQ, 17.30", 2.9 kg
External Review » HP Pavilion 17-ab004ns
MSI GL72 6QF-410NL: Intel Core i7-6700HQ, 17.30", 2.8 kg
External Review » MSI GL72 6QF-410NL
HP Pavilion 15-bc012ng: Intel Core i7-6700HQ, 15.60", 2.3 kg
External Review » HP Pavilion 15-bc012ng
HP Omen 17-w025nf: Intel Core i5-6300HQ, 17.30", 2.9 kg
External Review » HP Omen 17-w025nf
Asus GL752VW-T4064T: Intel Core i7-6700HQ, 17.30", 2.8 kg
External Review » Asus GL752VW-T4064T
HP Pavilion 15-bc008tx: Intel Core i7-6700HQ, 15.60", 2.2 kg
External Review » HP Pavilion 15-bc008tx
Asus GL552VW-DM748T: Intel Core i7-6700HQ, 15.60", 2.6 kg
External Review » Asus GL552VW-DM748T
Acer Aspire V Nitro VN7-792G-520R: Intel Core i5-6300HQ, 17.30", 3 kg
External Review » Acer Aspire V Nitro VN7-792G-520R
Acer Aspire VN7-592G-77BU: Intel Core i7-6700HQ, 15.60", 2.3 kg
External Review » Acer Aspire VN7-592G-77BU
MSI GE62 6QD-006NL: Intel Core i7-6700HQ, 15.60", 2.4 kg
External Review » MSI GE62 6QD-006NL
Dell Inspiron i7559-2512BLK: Intel Core i7-6700HQ, 15.60", 2.6 kg
External Review » Dell Inspiron i7559-2512BLK
HP Omen 15-ax001ns: Intel Core i7-6700HQ, 15.60", 2.2 kg
External Review » HP Omen 15-ax001ns
HP Pavilion 15-bc006ns: Intel Core i5-6300HQ, 15.60", 2.2 kg
External Review » HP Pavilion 15-bc006ns
Asus N552VW-FI202T: Intel Core i7-6700HQ, 15.60", 2.5 kg
External Review » Asus N552VW-FI202T
HP Omen 15-ax009ng: Intel Core i7-6700HQ, 15.60", 2.3 kg
External Review » HP Omen 15-ax009ng
HP Omen 17-w014ur: Intel Core i5-6300HQ, 17.30", 2.9 kg
External Review » HP Omen 17-w014ur
Lenovo IdeaPad Y700-15ISK-80NV010NMH: Intel Core i7-6700HQ, 15.60", 2.6 kg
External Review » Lenovo IdeaPad Y700-15ISK-80NV010NMH
Asus GL552VW-DM149: Intel Core i5-6300HQ, 15.60", 2.6 kg
External Review » Asus GL552VW-DM149
Acer Aspire VN7-592G-77Q4: Intel Core i7-6700HQ, 15.60", 3 kg
External Review » Acer Aspire VN7-592G-77Q4
Asus GL752VW-T4065D: Intel Core i7-6700HQ, 17.30", 2.8 kg
External Review » Asus GL752VW-T4065D
Asus GL752VW-T4016T: Intel Core i7-6700HQ, 17.30", 4.3 kg
External Review » Asus GL752VW-T4016T
MSI GP72 6QF Leopard Pro-614IT: Intel Core i7-6700HQ, 17.30", 2.6 kg
External Review » MSI GP72 6QF Leopard Pro-614IT
HP Omen 15-ax002no: Intel Core i7-6700HQ, 15.60", 2.2 kg
External Review » HP Omen 15-ax002no
Asus UX501VW-F1020T: Intel Core i7-6700HQ, 15.60", 2.1 kg
External Review » Asus UX501VW-F1020T
HP Pavilion 15-bc001nu: Intel Core i7-6700HQ, 15.60", 2.2 kg
External Review » HP Pavilion 15-bc001nu
HP Pavilion 17-ab006ur: Intel Core i7-6700HQ, 17.30", 3 kg
External Review » HP Pavilion 17-ab006ur
Asus GL552VW-CN470T: Intel Core i7-6700HQ, 15.60", 2.6 kg
External Review » Asus GL552VW-CN470T
HP Omen 15-ax010nd: Intel Core i5-6300HQ, 15.60", 2.2 kg
External Review » HP Omen 15-ax010nd
MSI GL62-6QFi58S2FD: Intel Core i5-6300HQ, 15.60", 2.4 kg
External Review » MSI GL62-6QFi58S2FD
MSI GL72-6QFi781FD: Intel Core i7-6700HQ, 17.30", 2.8 kg
External Review » MSI GL72-6QFi781FD
Lenovo Ideapad Y700-17ISK-80Q0002GGE: Intel Core i7-6700HQ, 17.30", 3.6 kg
External Review » Lenovo Ideapad Y700-17ISK-80Q0002GGE
Lenovo Ideapad Y700-15ISK-80NV006QGE: Intel Core i7-6700HQ, 15.60", 2.9 kg
External Review » Lenovo Ideapad Y700-15ISK-80NV006QGE
Asus VivoBook Pro N552VW-FY094T: Intel Core i7-6700HQ, 15.60", 2.5 kg
External Review » Asus VivoBook Pro N552VW-FY094T
HP Omen 15-ax006ng: Intel Core i7-6700HQ, 15.60", 2.2 kg
External Review » HP Omen 15-ax006ng
Asus GL752VW-T4287T: Intel Core i7-6700HQ, 17.30", 3 kg
External Review » Asus GL752VW-T4287T
Asus GL752VW-T4113T: Intel Core i7-6700HQ, 17.30", 3 kg
External Review » Asus GL752VW-T4113T
Asus UX501VW-FY145T: Intel Core i7-6700HQ, 15.60", 2.3 kg
External Review » Asus UX501VW-FY145T
Asus UX501VW-FY144T: Intel Core i7-6700HQ, 15.60", 2.3 kg
External Review » Asus UX501VW-FY144T
Acer Aspire V17 Nitro BE VN7-792G-70JV: Intel Core i7-6700HQ, 17.30", 3.1 kg
External Review » Acer Aspire V17 Nitro BE VN7-792G-70JV
Acer Aspire V17 Nitro BE VN7-792G-59CL: Intel Core i5-6300HQ, 17.30", 3.1 kg
External Review » Acer Aspire V17 Nitro BE VN7-792G-59CL
Acer Aspire V17 Nitro BE VN7-792G-726L: Intel Core i7-6700HQ, 17.30", 3.1 kg
External Review » Acer Aspire V17 Nitro BE VN7-792G-726L
Acer Aspire V15 Nitro BE VN7-592G-79U3: Intel Core i7-6700HQ, 15.60", 2.3 kg
External Review » Acer Aspire V15 Nitro BE VN7-592G-79U3
Acer Aspire V15 Nitro BE VN7-592G-74FP: Intel Core i7-6700HQ, 15.60", 2.3 kg
External Review » Acer Aspire V15 Nitro BE VN7-592G-74FP
MSI GL72 6QF: Intel Core i7-6700HQ, 17.30", 2.8 kg
External Review » MSI GL72 6QF
Asus GL752VW-T4168T: Intel Core i7-6700HQ, 17.30", 3 kg
External Review » Asus GL752VW-T4168T
HP Pavilion 17-ab000ng: Intel Core i5-6300HQ, 17.30", 3.1 kg
External Review » HP Pavilion 17-ab000ng
HP Omen 15-ax005ng: Intel Core i7-6700HQ, 15.60", 2.2 kg
External Review » HP Omen 15-ax005ng
Lenovo Ideapad Y700 15ISK 80NV006NGE: Intel Core i5-6300HQ, 15.60", 2.6 kg
External Review » Lenovo Ideapad Y700 15ISK 80NV006NGE
Dell XPS 15 9550-1370: Intel Core i7-6700HQ, 15.60", 2 kg
External Review » Dell XPS 15 9550-1370
Dell XPS 15 9550 i7 FHD: Intel Core i7-6700HQ, 15.60", 2 kg
External Review » Dell XPS 15 9550 i7 FHD
Asus N552VW-FY083T: Intel Core i7-6700HQ, 15.60", 2.5 kg
External Review » Asus N552VW-FY083T
Lenovo Ideapad Y700 15ISK 80NV: Intel Core i5-6300HQ, 0.00"
External Review » Lenovo Ideapad Y700 15ISK 80NV
Lenovo IdeaPad Y700-17ISK 80Q0002EGE: Intel Core i7-6700HQ, 17.30", 3.5 kg
External Review » Lenovo IdeaPad Y700-17ISK 80Q0002EGE
Asus Zenbook Pro UX501VW-FJ098T: Intel Core i7-6700HQ, 15.60", 2.1 kg
External Review » Asus Zenbook Pro UX501VW-FJ098T
Asus Zenbook Pro UX501VW-FJ044T: Intel Core i7-6700HQ, 15.60", 2.3 kg
External Review » Asus Zenbook Pro UX501VW-FJ044T
Acer Aspire V 17 Nitro VN7-792G-78VL: Intel Core i7-6700HQ, 15.60", 2.4 kg
External Review » Acer Aspire V 17 Nitro VN7-792G-78VL
Asus G501VW-BSI7N25: Intel Core i7-6700HQ, 15.60", 2.1 kg
External Review » Asus G501VW-BSI7N25
Asus G552VW-CN287D: Intel Core i7-6700HQ, 15.60", 2.6 kg
External Review » Asus G552VW-CN287D
Asus GL752VW-T4255D: Intel Core i7-6700HQ, 17.30", 3 kg
External Review » Asus GL752VW-T4255D
Acer Aspire VN7-592 N15W7: Intel Core i7-6700HQ, 15.60", 2.2 kg
External Review » Acer Aspire VN7-592 N15W7
Asus G551VW: Intel Core i7-6700HQ, 15.60", 2.7 kg
External Review » Asus G551VW
Asus N552VW-FI043T: Intel Core i7-6600U, 15.60", 2.5 kg
External Review » Asus N552VW-FI043T
Lenovo Ideapad Y700-15-80NW0010US: Intel Core i7-6700HQ, 15.60", 2.9 kg
External Review » Lenovo Ideapad Y700-15-80NW0010US
Dell XPS 15 9550-4938: Intel Core i5-6300HQ, 15.60", 1.8 kg
External Review » Dell XPS 15 9550-4938
Dell Inspiron 15 7559-1363: Intel Core i7-6700HQ, 15.60", 3.2 kg
External Review » Dell Inspiron 15 7559-1363
Acer Aspire V Nitro Black Edition VN7-792G-74Q4: Intel Core i7-6700HQ, 17.30", 3.1 kg
External Review » Acer Aspire V Nitro Black Edition VN7-792G-74Q4
Asus FZ50VW-NS51: Intel Core i5-6300HQ, 15.60", 2.6 kg
External Review » Asus FZ50VW-NS51
Acer Aspire V15 Nitro BE VN7-592G-79DV: Intel Core i7-6700HQ, 15.60", 2.3 kg
External Review » Acer Aspire V15 Nitro BE VN7-592G-79DV
Asus GL752VW-DH71: Intel Core i7-6700HQ, 17.30", 2.8 kg
External Review » Asus GL752VW-DH71
Asus ZenBook Pro UX501JW-FI204H: Intel Core i7-4720HQ, 15.60", 2.1 kg
External Review » Asus ZenBook Pro UX501JW-FI204H
Asus ZenBook Pro UX501VW-DS71T: Intel Core i7-6700HQ, 15.60", 2.3 kg
External Review » Asus ZenBook Pro UX501VW-DS71T
MSI GE62 6QD-6QD161: , 15.60", 2.4 kg
External Review » MSI GE62 6QD-6QD161
Asus ZenBook Pro UX501-FJ221H: Intel Core i7-4720HQ, 15.60", 2.3 kg
External Review » Asus ZenBook Pro UX501-FJ221H
Asus N551VW-FY196T: Intel Core i7-6700HQ, 15.60", 2.7 kg
External Review » Asus N551VW-FY196T
Lenovo IdeaPad Y700-17ISK-80Q00068GE: Intel Core i5-6300HQ, 17.30", 3.5 kg
External Review » Lenovo IdeaPad Y700-17ISK-80Q00068GE
MSI GE72-6QD161: Intel Core i7-6700HQ, 17.30", 2.9 kg
External Review » MSI GE72-6QD161
Lenovo Ideapad Y700 17ISK 80Q0: Intel Core i7-6700HQ, 17.30", 3.6 kg
External Review » Lenovo Ideapad Y700 17ISK 80Q0
Lenovo Ideapad Y700 15ISK 80NW: Intel Core i7-6700HQ, 15.60", 2.9 kg
External Review » Lenovo Ideapad Y700 15ISK 80NW
Dell XPS 15 2016 9550: Intel Core i5-6300HQ, 15.60", 2 kg
External Review » Dell XPS 15 2016 9550
MSI PE60-6QEi781: Intel Core i7-6700HQ, 15.60", 2.3 kg
External Review » MSI PE60-6QEi781
Dell XPS 15-9550 i7: Intel Core i7-6700HQ, 15.60", 2.1 kg
External Review » Dell XPS 15-9550, Core i7
Acer Aspire VN7-592G-71ZL: Intel Core i7-6700HQ, 15.60", 2.3 kg
External Review » Acer Aspire VN7-592G-71ZL
Alienware 13 R2: Intel Core i7-6500U, 13.30", 2.1 kg
External Review » Alienware 13 R2
MSI GE62-2QFi716SR21BW: Intel Core i7-5700HQ, 15.60", 2.4 kg
External Review » MSI GE62-2QFi716SR21BW
MSI PE70 2QE-075RU: Intel Core i7-4720HQ, 17.30", 2.6 kg
External Review » MSI PE70 2QE-075RU
Dell Inspiron 15 7559: Intel Core i7-6700HQ, 15.60", 2.7 kg
External Review » Dell Inspiron 15 7559
Asus GL552VW-DH71: Intel Core i7-6700HQ, 15.60", 2.6 kg
External Review » Asus GL552VW-DH71
Acer Aspire V Nitro Black Edition VN7-792G-79KE: Intel Core i7-6700HQ, 17.30", 3 kg
External Review » Acer Aspire V Nitro Black Edition VN7-792G-79KE
MSI GE72 2QD-037UK: Intel Core i7-4720HQ, 17.30", 2.7 kg
External Review » MSI GE72 2QD-037UK
Acer Aspire V15 Nitro VN7-591G-727P: Intel Core i7-4720HQ, 15.60", 2.4 kg
External Review » Acer Aspire V15 Nitro VN7-591G-727P
Asus UX501J-DS71T: Intel Core i7-4720HQ, 15.60", 2.3 kg
External Review » Asus UX501J-DS71T
MSI PE60 2QE-051NL: Intel Core i7-4720HQ, 15.60", 2.3 kg
External Review » MSI PE60 2QE-051NL
Asus G501JW-CN039H: Intel Core i7-4720HQ, 15.60", 2.1 kg
External Review » Asus G501JW-CN039H
MSI PE60-2QE-9S7-16J214-204: Intel Core i7-5700HQ, 15.60", 2.3 kg
External Review » MSI PE60-2QE-9S7-16J214-204
HP Omen 15-5110nr: Intel Core i7-4720HQ, 15.60", 2.1 kg
External Review » HP Omen 15-5110nr
Alienware 13 (GTX 960M): Intel Core i7-5500U, 13.30", 2 kg
External Review » Alienware 13 (GTX 960M)
MSI Prestige PE70 2QE: Intel Core i7-4720HQ, 17.30", 2.6 kg
External Review » MSI Prestige PE70 2QE
MSI GE62 2QD-027RU: Intel Core i7-4720HQ, 15.60", 2.4 kg
External Review » MSI GE62 2QD-027RU
MSI PE60-2QEi716H11BW: Intel Core i7-4720HQ, 15.60", 2.3 kg
External Review » MSI PE60-2QEi716H11BW
Acer Aspire V Nitro 7-791G-70TW: Intel Core i7-4720HQ, 17.30", 3 kg
External Review » Acer Aspire V Nitro 7-791G-70TW
Asus G551JW-CN080H: Intel Core i7-4720HQ, 15.60", 2.7 kg
External Review » Asus G551JW-CN080H
Ibuypower Battalion 101 W230SD: Intel Core i7-4710MQ, 13.30", 2.1 kg
External Review » Ibuypower Battalion 101 W230SD
MSI GS70-2QC: Intel Core i7-4720HQ, 17.30", 2.7 kg
External Review » MSI GS70-2QC
Schenker XMG A705: Intel Core i7-4720HQ, 17.30", 3.1 kg
External Review » Schenker XMG A705
Asus UX501JW-DS71T: Intel Core i7-4720HQ, 15.60", 2.3 kg
External Review » Asus UX501JW-DS71T
Asus UX501JW-CN209H: Intel Core i7-4720HQ, 15.60", 2 kg
External Review » Asus UX501JW-CN209H
MSI PE70-2QEi78H11: Intel Core i7-4720HQ, 17.30", 2.7 kg
External Review » MSI PE70-2QEi78H11
Lenovo IdeaPad Y50-70-59442843: Intel Core i7-4720HQ, 15.60", 2.4 kg
External Review » Lenovo IdeaPad Y50-70-59442843
Asus G501JW: Intel Core i7-4720HQ, 15.60", 2.1 kg
External Review » Asus G501JW
Razer Blade Pro 17 inch 2015: Intel Core i7-4720HQ, 17.30", 3.1 kg
External Review » Razer Blade Pro 17 inch 2015
MSI GE62 2QD-029UK: Intel Core i7-4720HQ, 15.60", 2.4 kg
External Review » MSI GE62 2QD-029UK
Lenovo IdeaPad Y50-70-59441231: Intel Core i7-4710HQ, 15.60", 2.4 kg
External Review » Lenovo IdeaPad Y50-70-59441231
Acer Aspire V17 Nitro VN7-791G-70TW: Intel Core i7-4720HQ, 17.40", 3.1 kg
External Review » Acer Aspire V17 Nitro VN7-791G-70TW
Acer Aspire V Nitro VN7-791G-77SW: Intel Core i7-4720HQ, 17.30", 3 kg
External Review » Acer Aspire V Nitro VN7-791G-77SW
Schenker XMG A305: Intel Core i7-4710MQ, 13.30", 2.1 kg
External Review » Schenker XMG A305
MSI GE62 2QD: Intel Core i7-4720HQ, 15.60", 2.4 kg
External Review » MSI GE62 2QD
Asus UX501JW-FI177H: Intel Core i7-4720HQ, 15.60", 2.3 kg
External Review » Asus UX501JW-FI177H
Acer Aspire V15 Nitro VN7-591G-767P: Intel Core i7-4720HQ, 15.60", 2.4 kg
External Review » Acer Aspire V15 Nitro VN7-591G-767P
Schenker XMG A505: Intel Core i7-4720HQ, 15.60", 2.5 kg
External Review » Schenker XMG A505
MSI GE72-2QDi716H11: Intel Core i7-4720HQ, 17.30", 2.9 kg
External Review » MSI GE72-2QD
Dell XPS 15 2016 9550: Intel Core i5-6300HQ, 15.60", 2 kg
Article » Why Pulse-Width Modulation (PWM) is such a headache