MSI PE60 6QE Prestige iBuyPower Edition Notebook Review
The last time we checked out the PE60 series was June of last year with the uncommon Haswell Core i5-4210U CPU. Now a year later, not much has changed in the visuals department as most of the upgrades on the newer PE60 6QE are more internal than external. The latest model has been updated with Skylake, DDR4, and USB Type-C. Has there been any other sly changes to the latest SKU in the process?
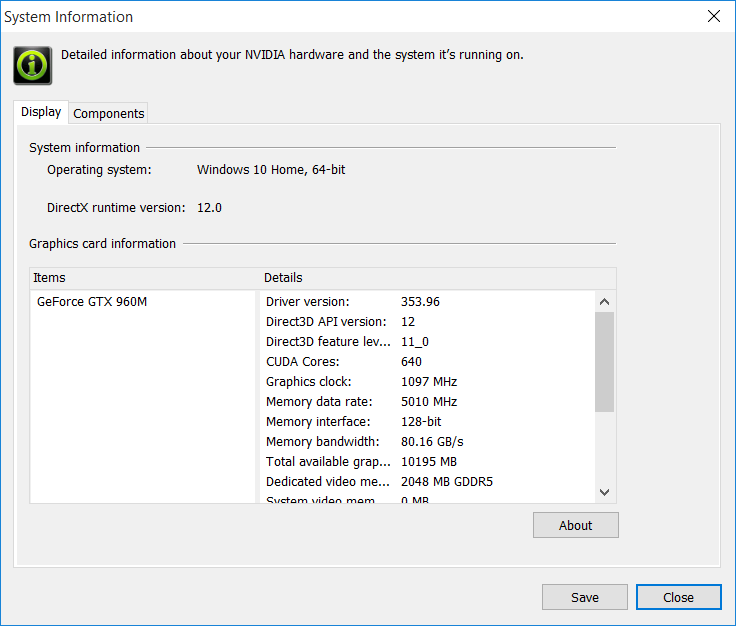
We recommend checking out our previous review page on the PE60 2QE for more pictures and details on chassis quality, input devices, and features as they essentially the same as on the PE60 6QE. The system can also be considered a rebranded GE62 series notebook, so most of the hardware information provided by our GE62/GE72 review pages also apply to the PE60.
Case
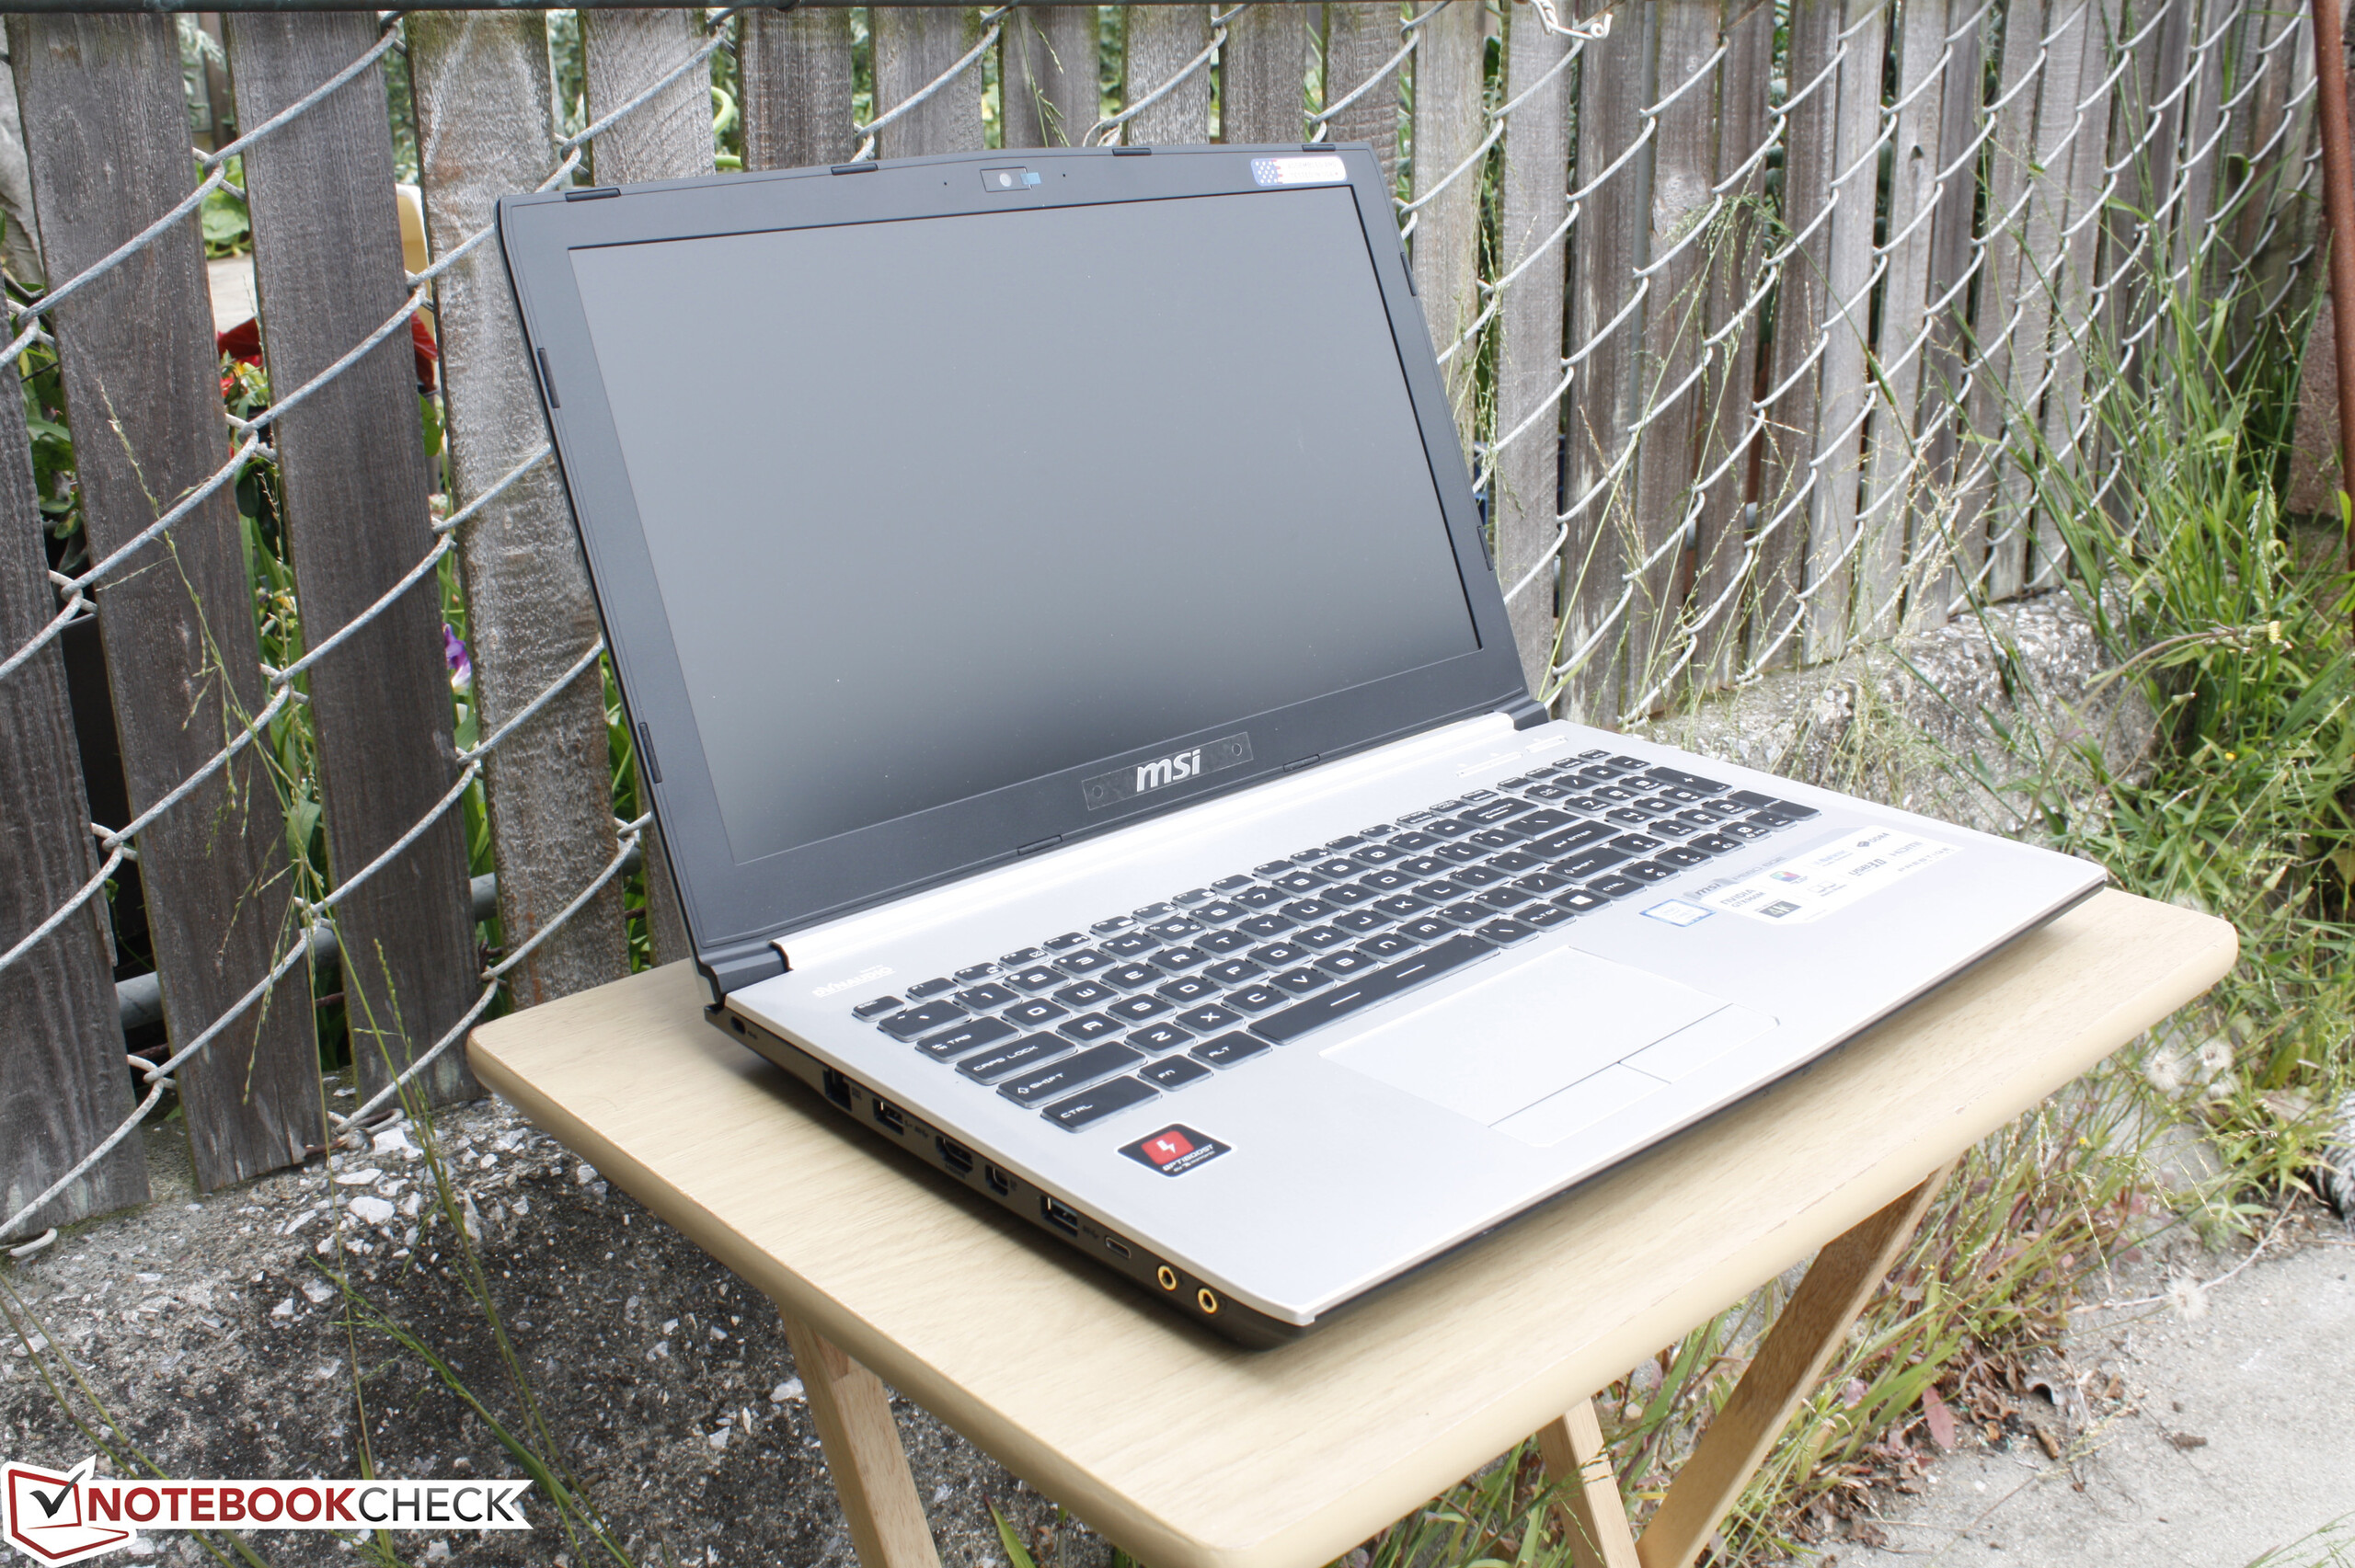
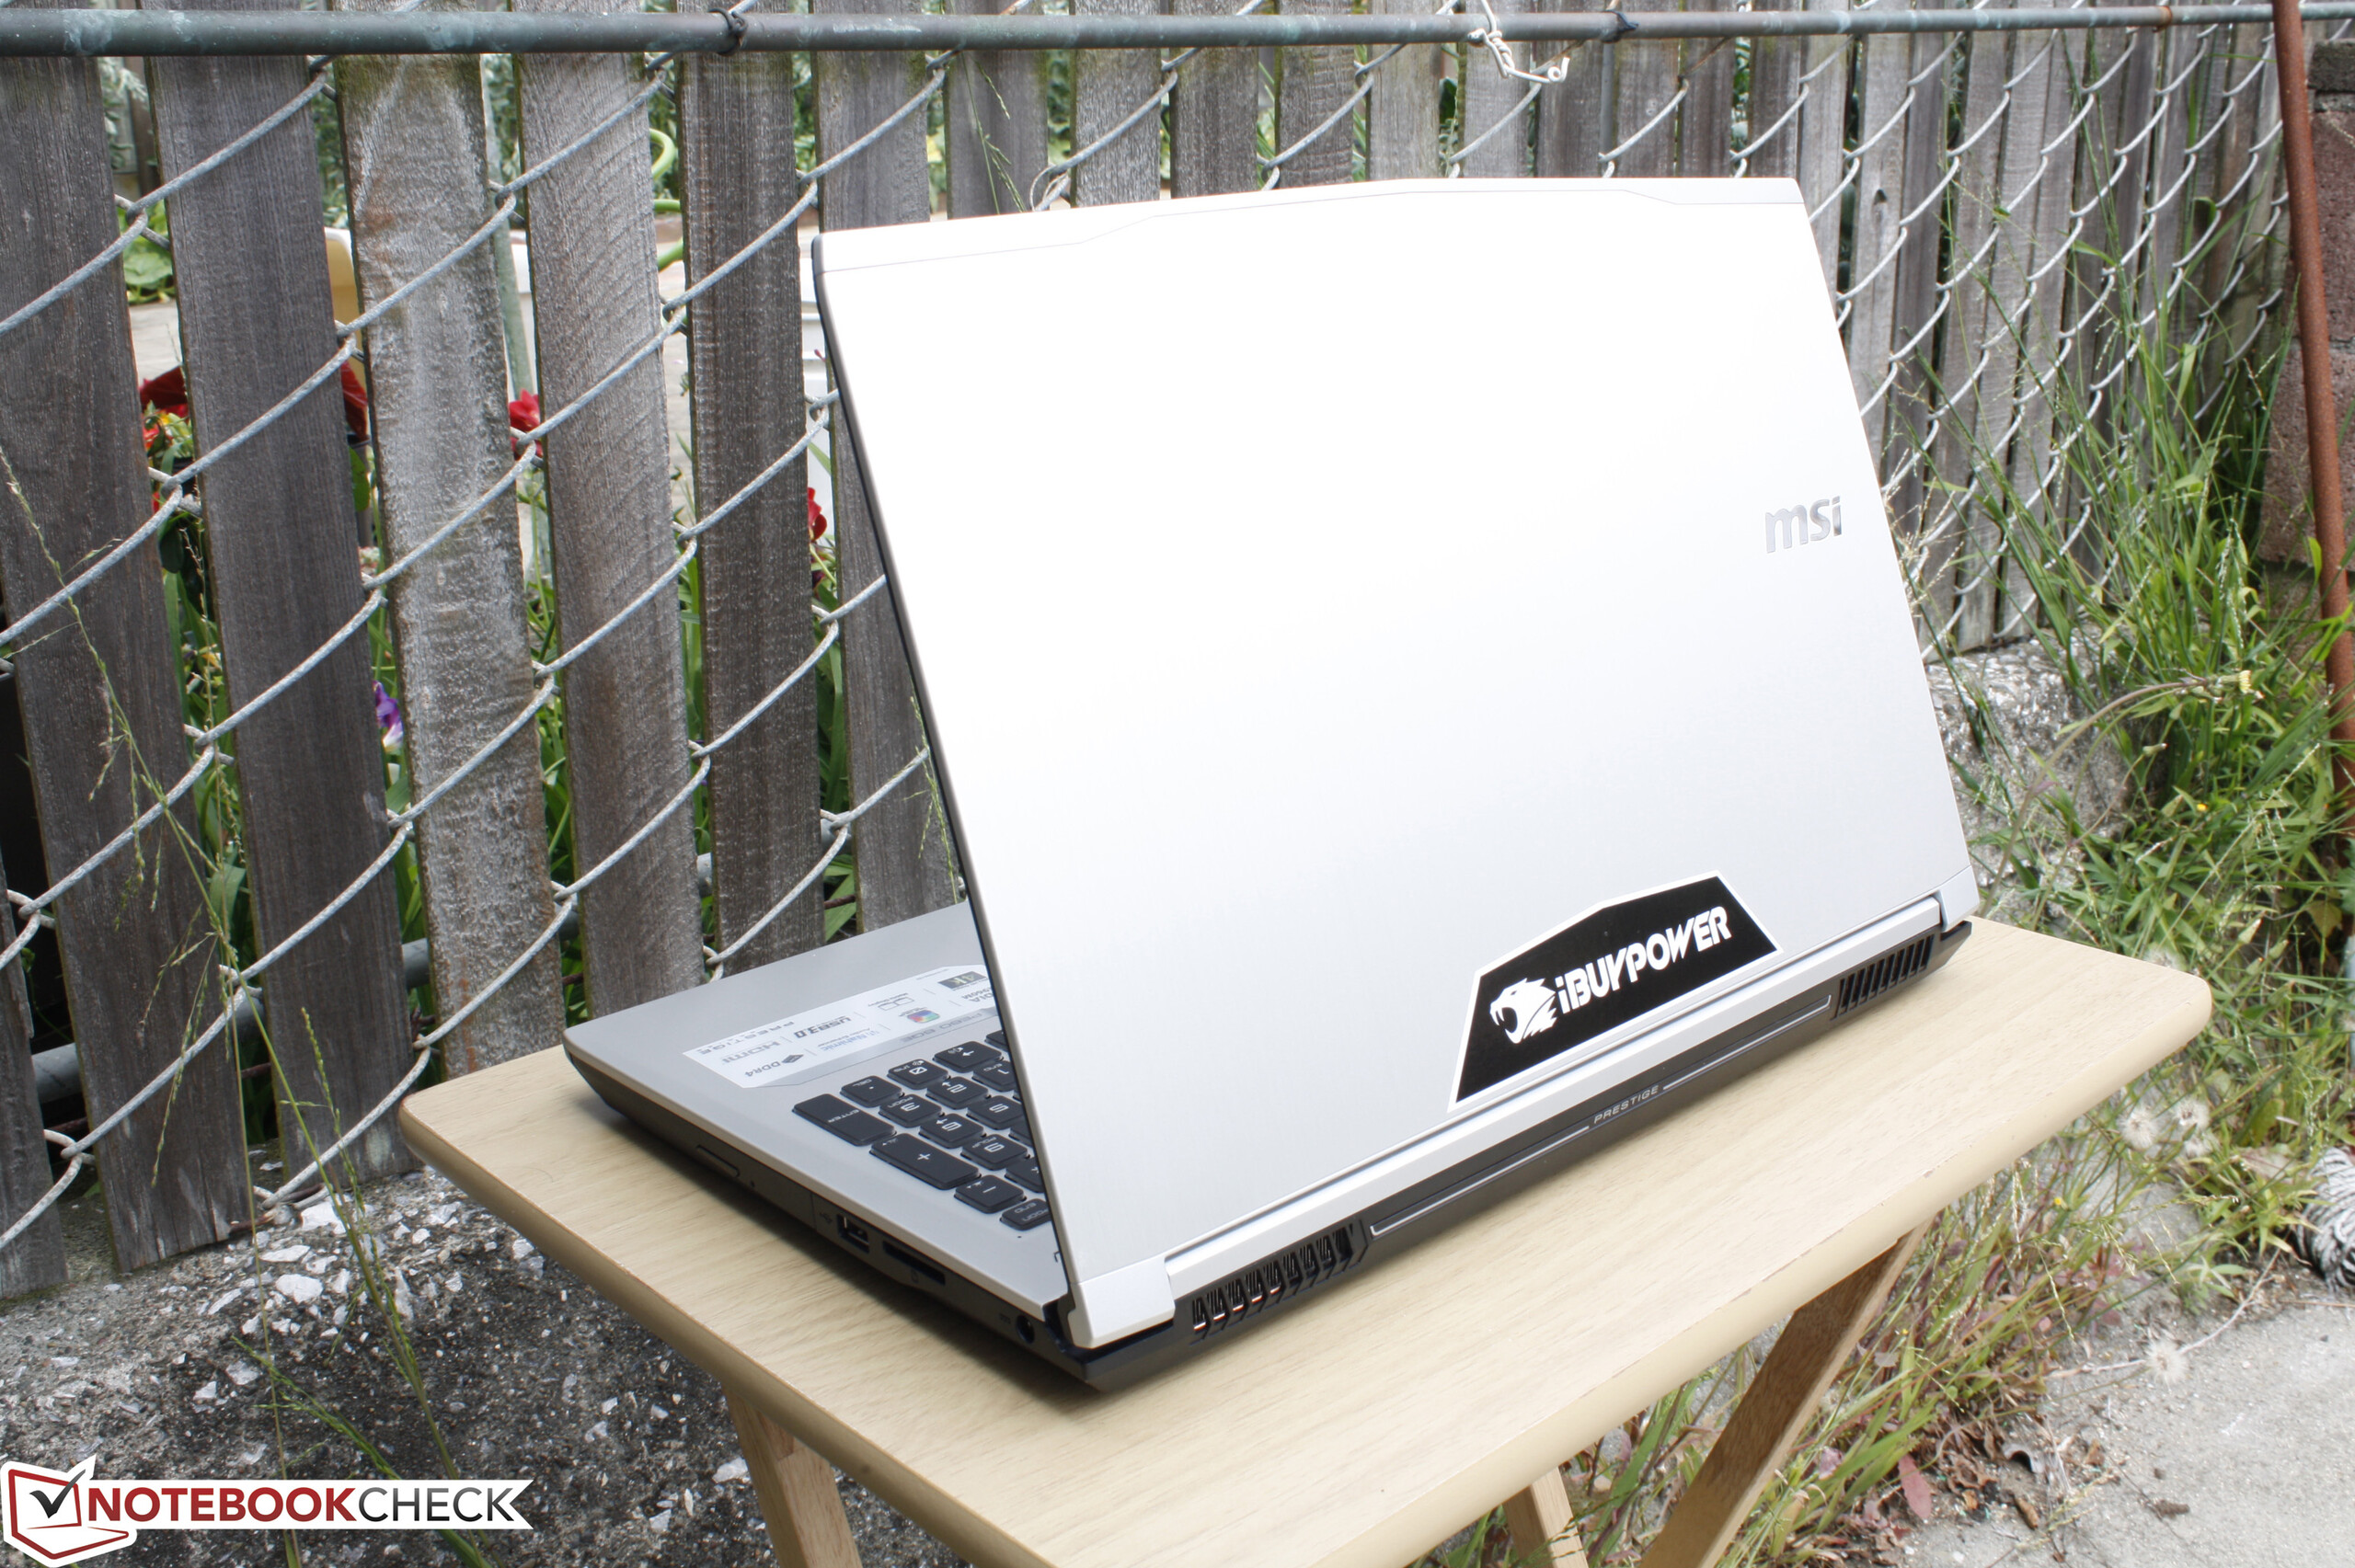
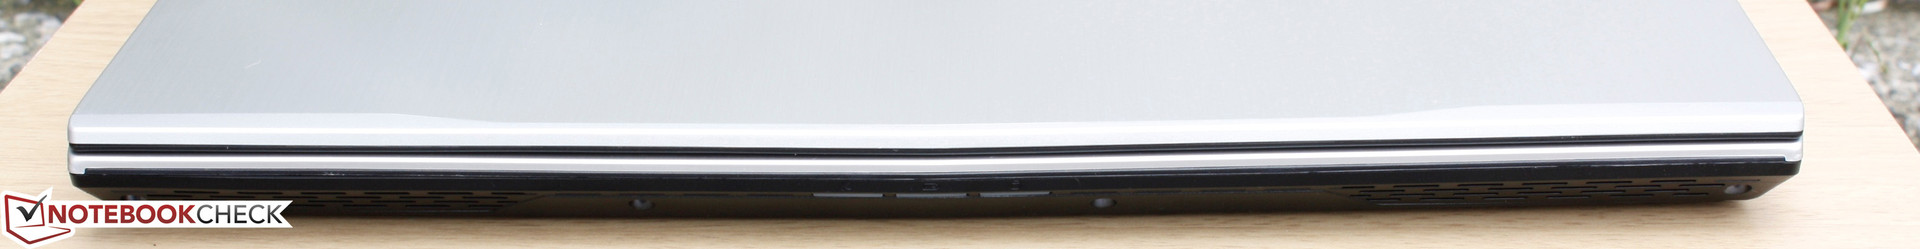
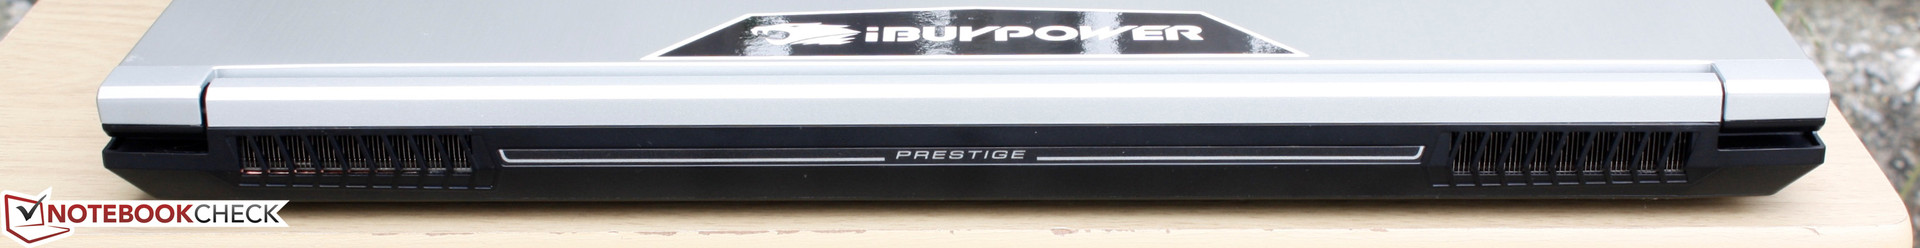
The Prestige series was designed to have more "appropriate" looks for a business setting while having interior features commonly found on gaming notebooks. From this perspective, the PE60 achieves that professional design with its silver brushed aluminum surfaces that appear almost matte against the light. Black plastic is still used for the display bezel and bottom base of the unit. Both the lid and base show above average resistance to twisting. The center of the outer lid, however, is more susceptible to downward pressure and attempting to twist the base can result in a bit of creaking. The small hinges could have been more taut as they feel weaker the wider the lid is opened. Quality is overall a step below the XPS 15 and more in line with the Asus N series or even the mainstream HP Pavilion series. We can observe no unintended gaps or defects on our particular test unit.
In terms of size and weight, the PE60 is not significantly different than many of its competitors. Notable exceptions include the latest XPS 15 and Lenovo Y700 at 2 kg and 2.9 kg, respectively, compared to the 2.4 kg MSI notebook.

Connectivity
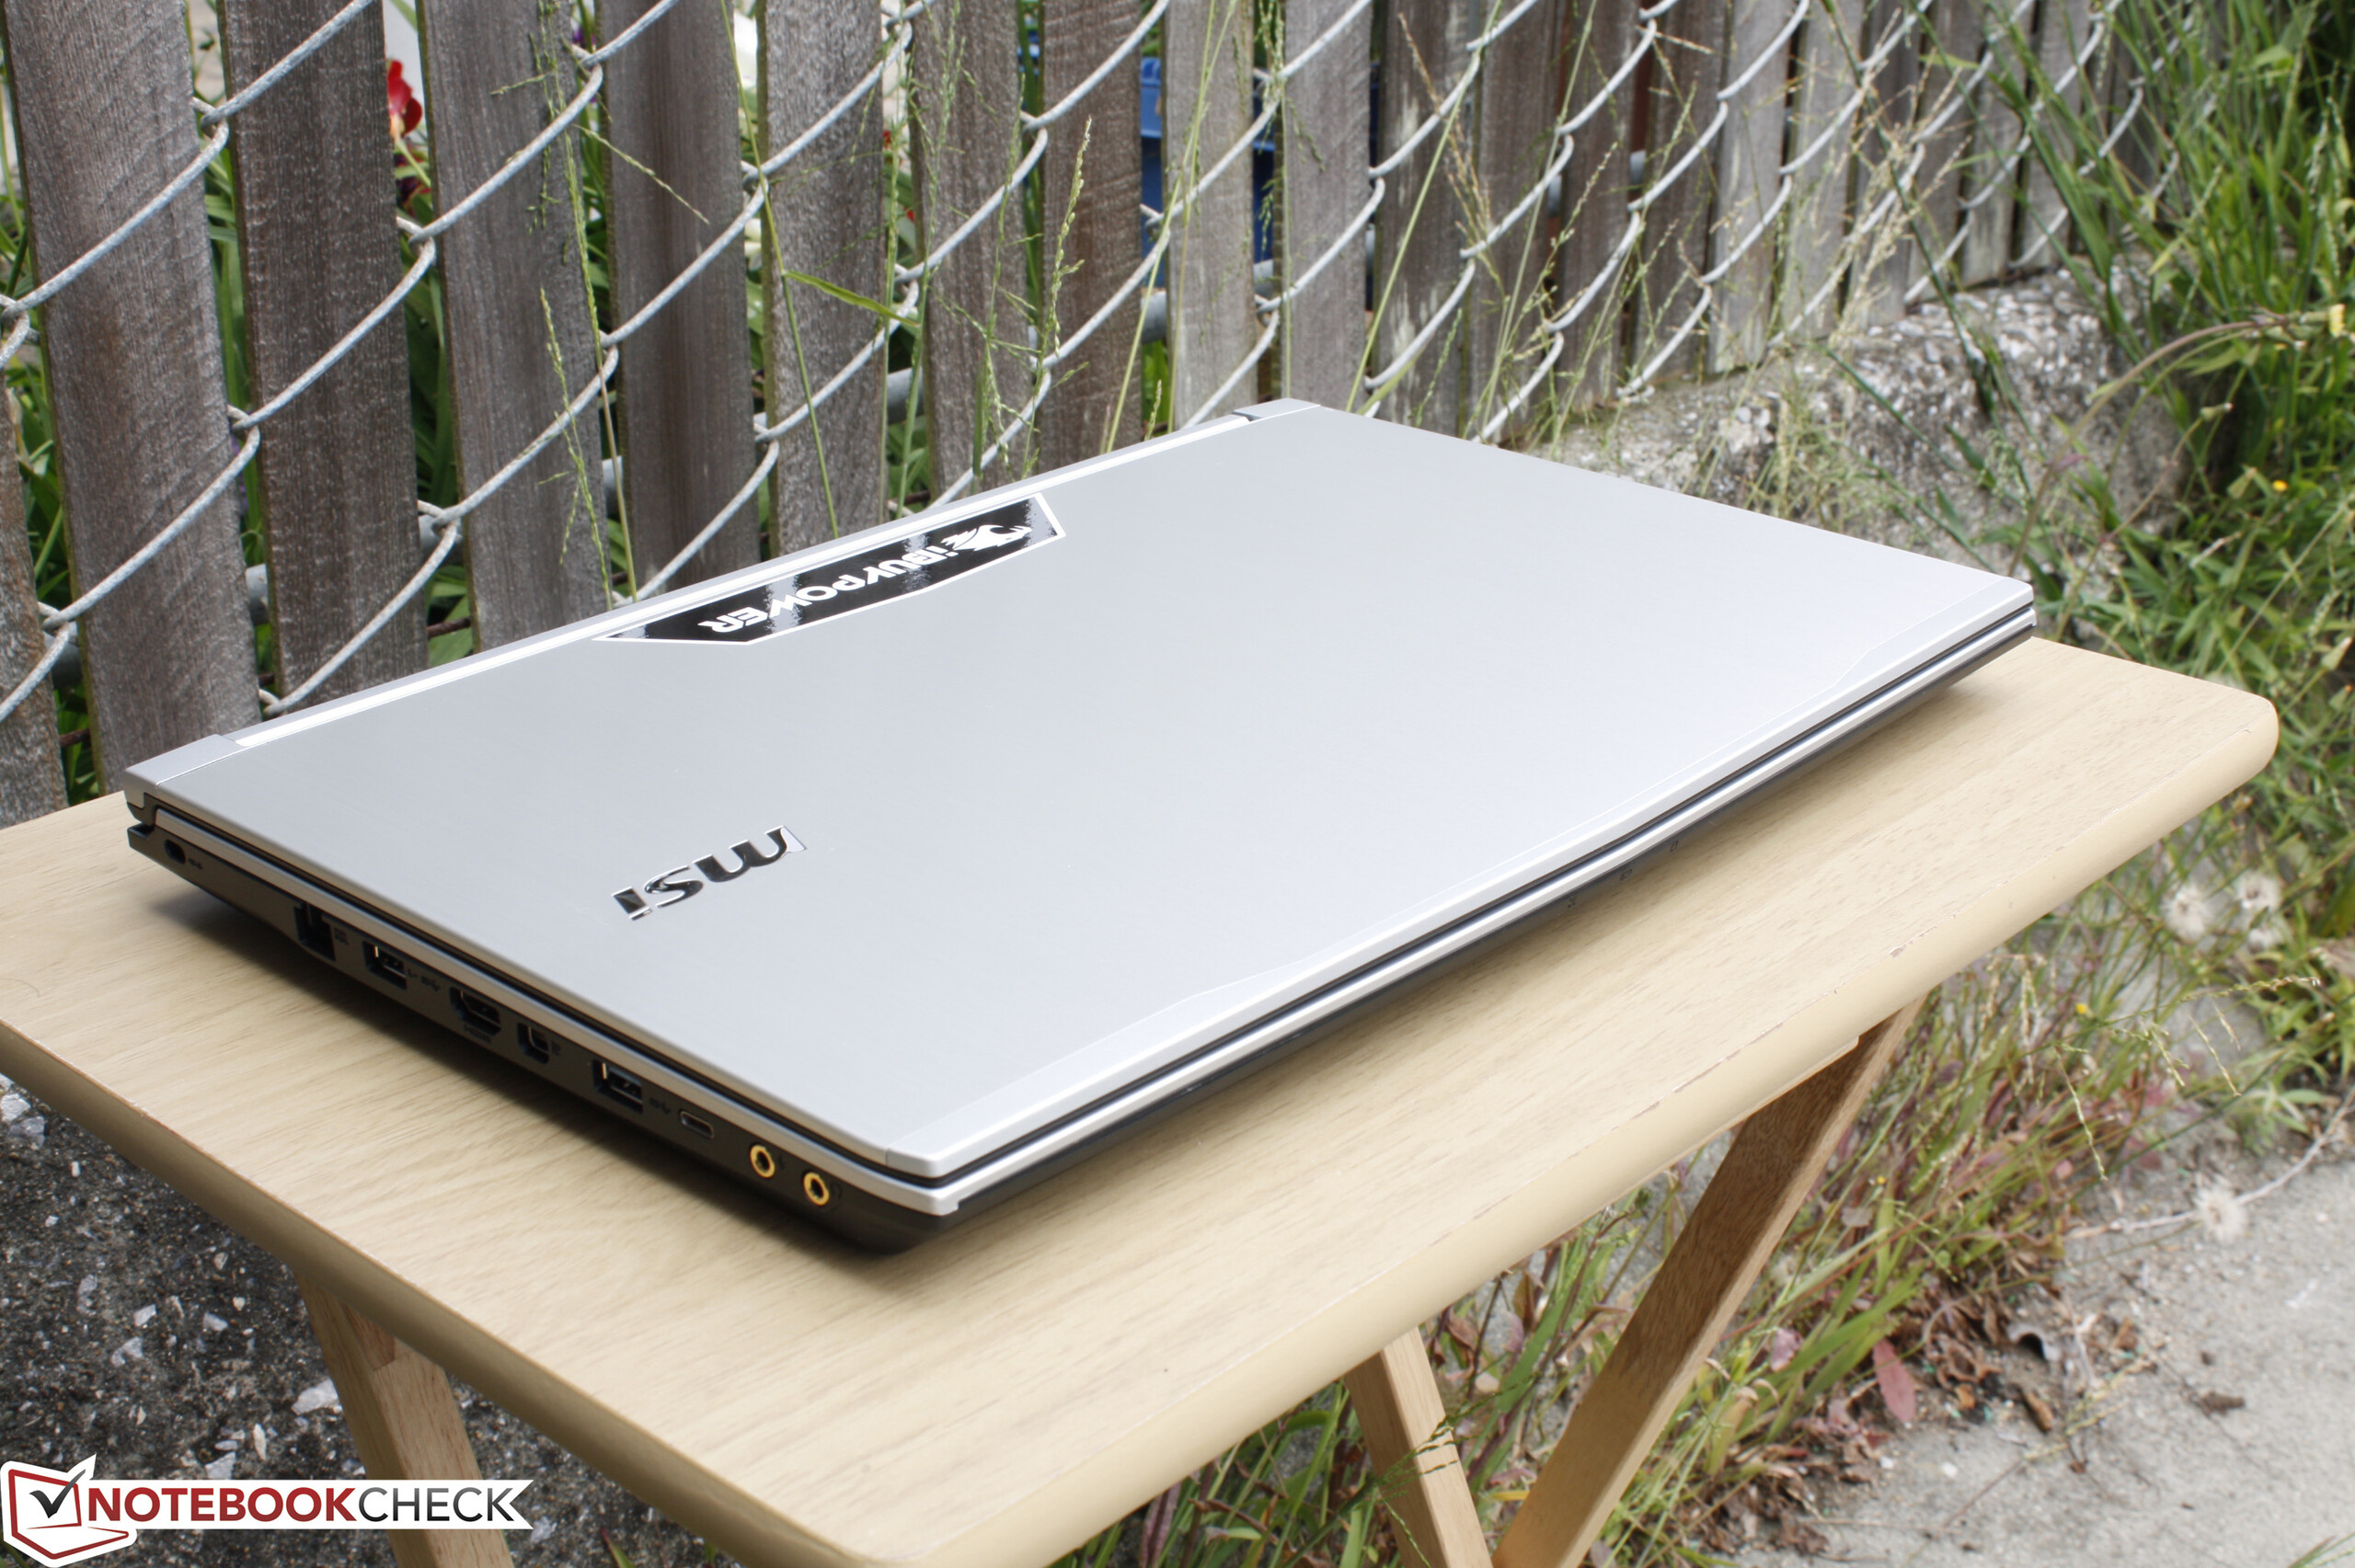
Available ports are identical to that of the PSI PE60 2QE except that one USB 3.0 Type-A port has been replaced with a USB Type-C Gen. 2 port. Unlike on the pricier gaming-centric MSI GS/GT series refresh, this USB Type-C port does not support Thunderbolt 3. Strangely, the USB port of the right side holds a tighter grip onto a connected plug compared to the left USB ports.


Communication
WLAN is provided by an Intel Wireless-AC 3165 module for theoretical transfer rates of up to 433 Mbps. More options exist for faster 2x2 cards including the Killer N1525 and Intel Wireless-AC 7265. In either case, Bluetooth and WiDi come standard and we experienced no dropout issues when connected to our Linksys EA8500 test router.
WWAN and GPS options are unfortunately unavailable.
Accessories
Included extras are a Windows 10 Pro recovery DVD, Drivers and Utilities DVD, Warranty card, and Quick Start guide. There are no proprietary docking stations or special extras for the PE60, though users can now take advantage of newer USB Type-C docking stations.
Maintenance
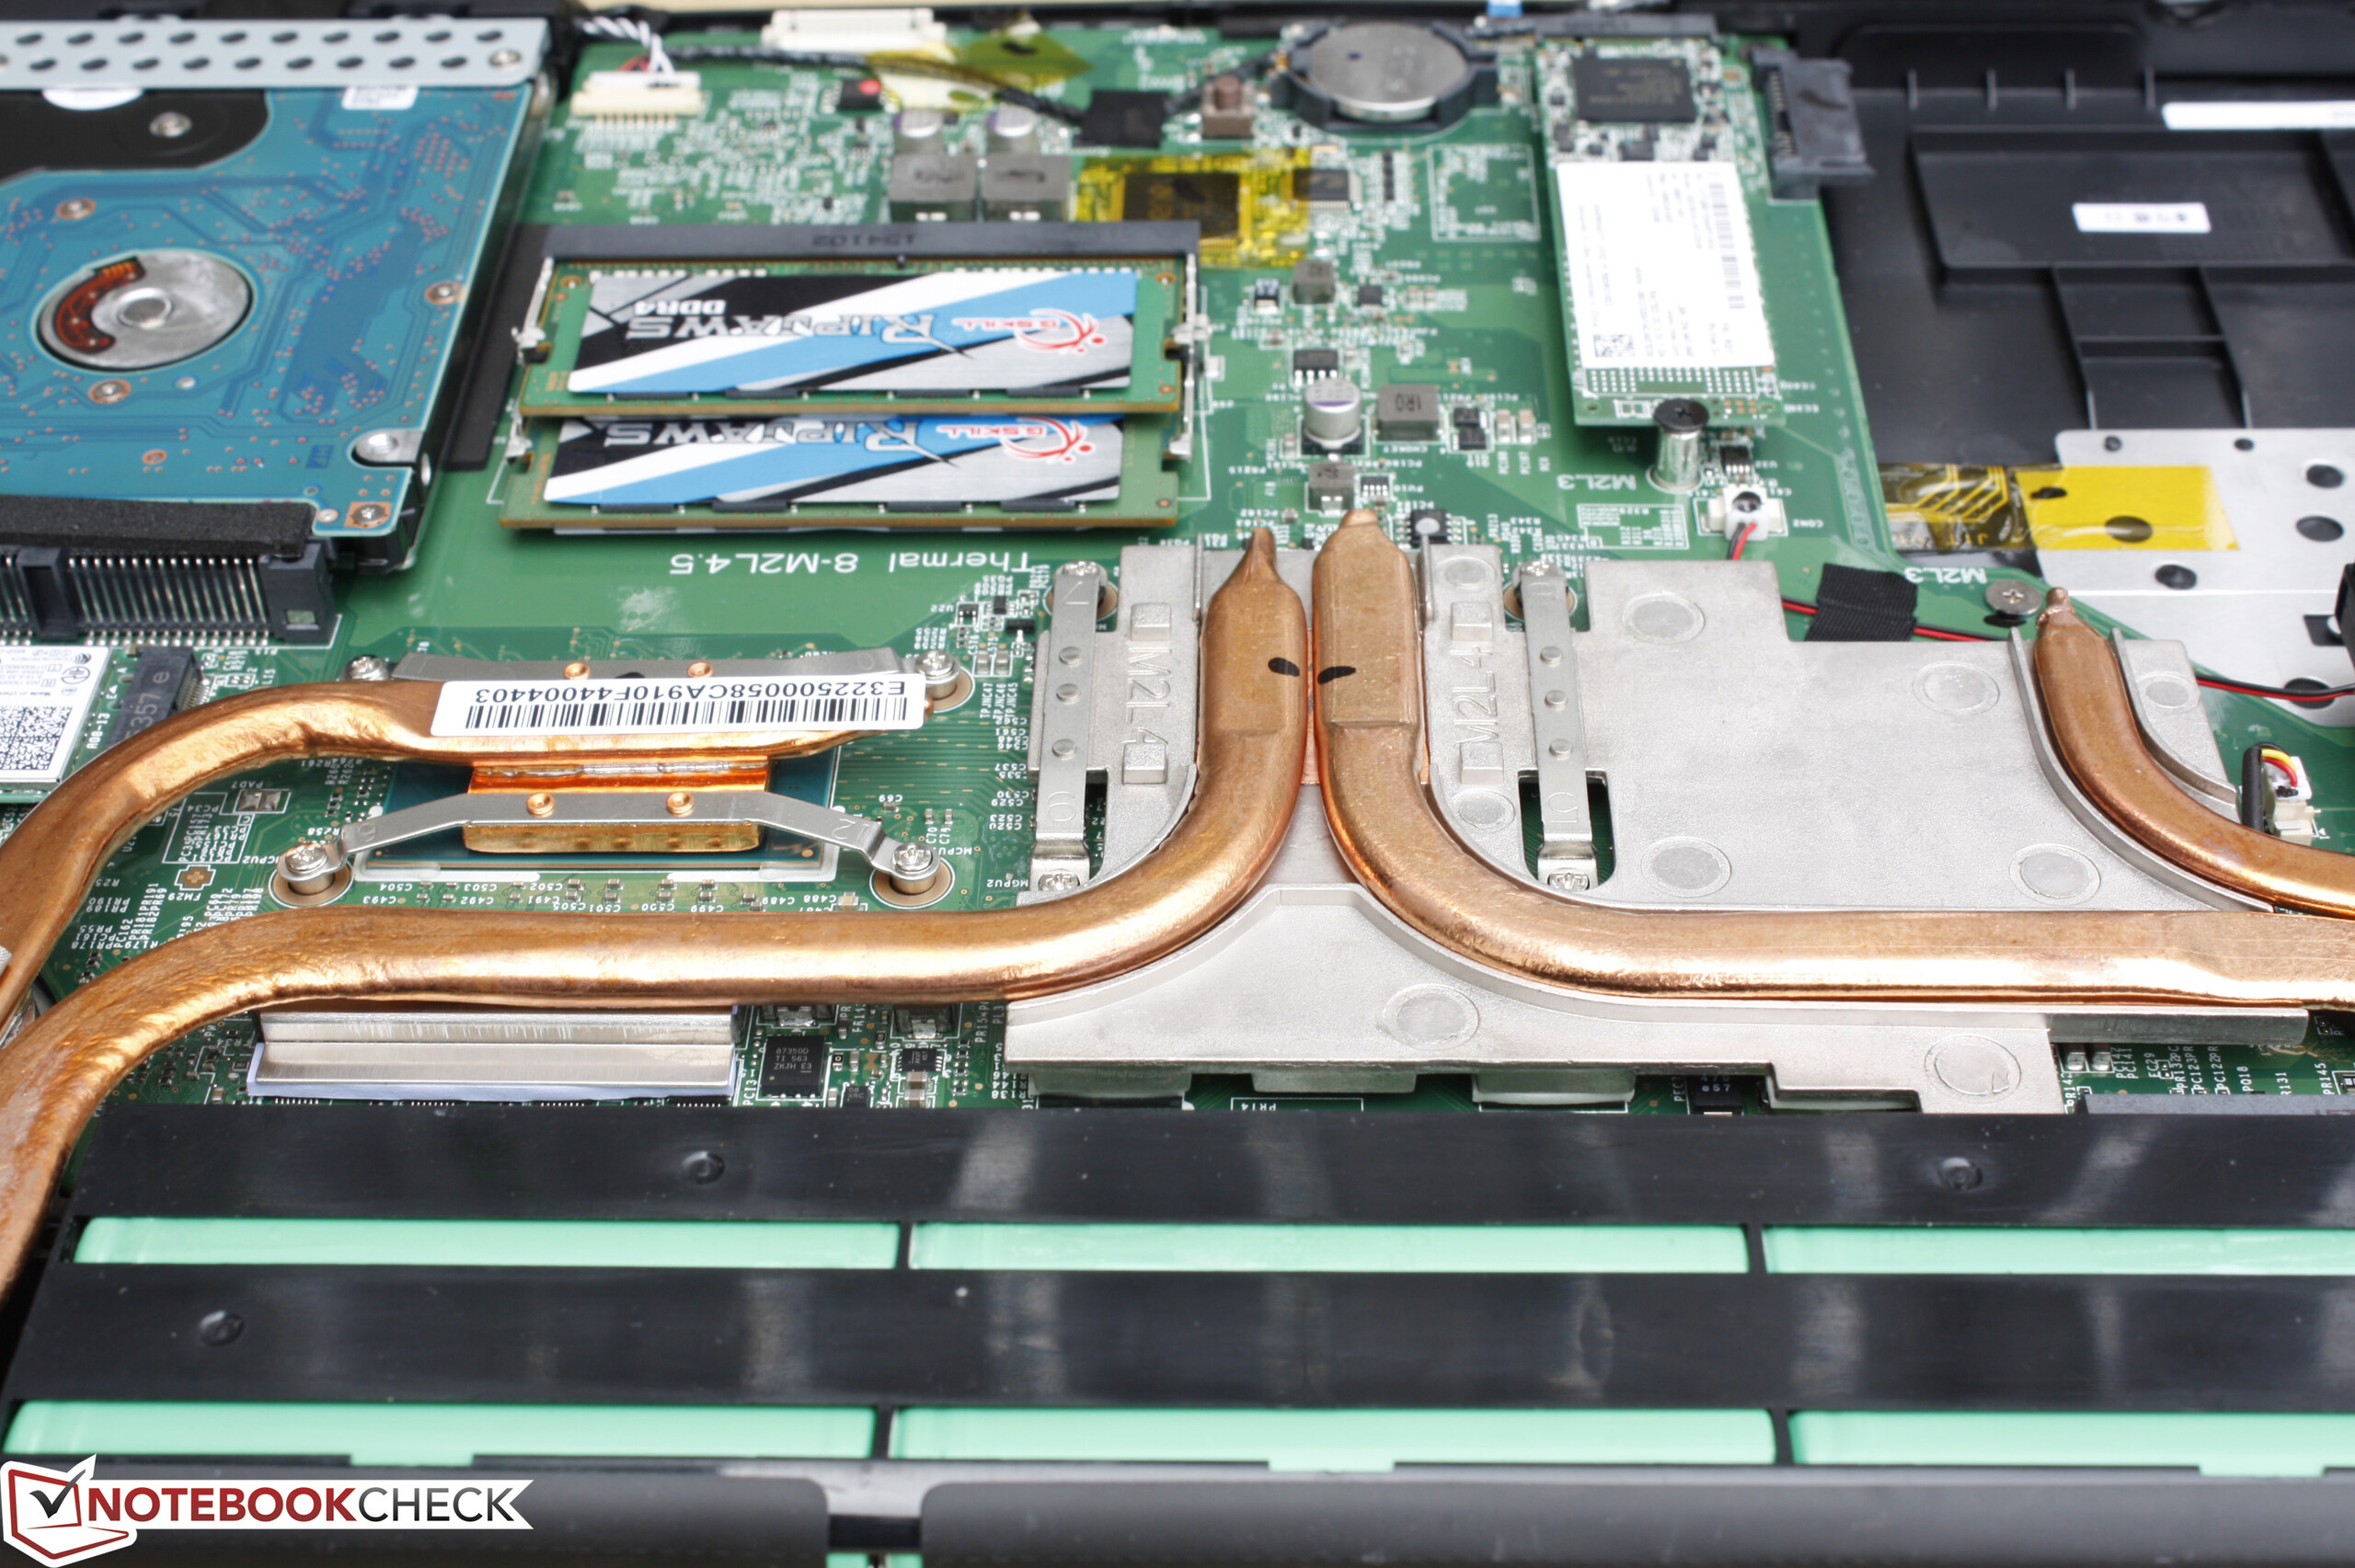
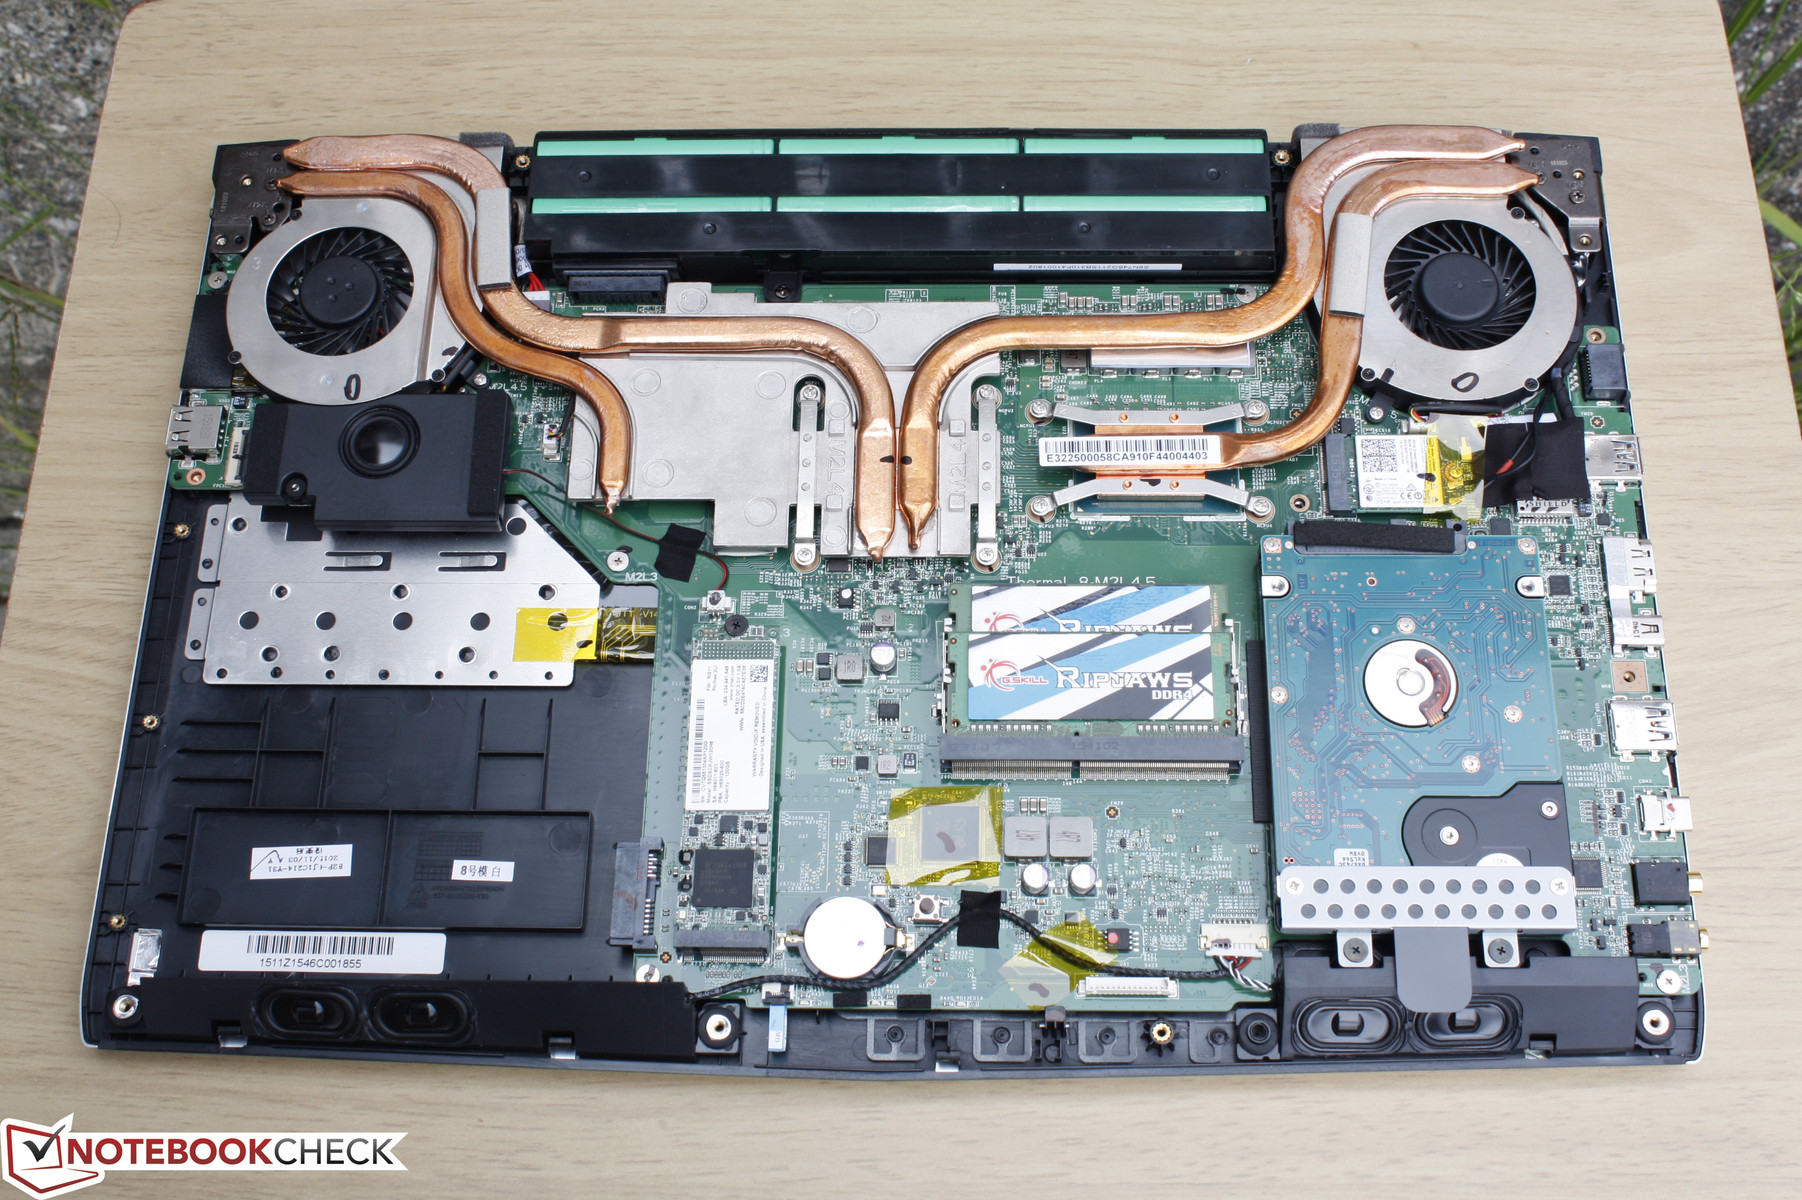
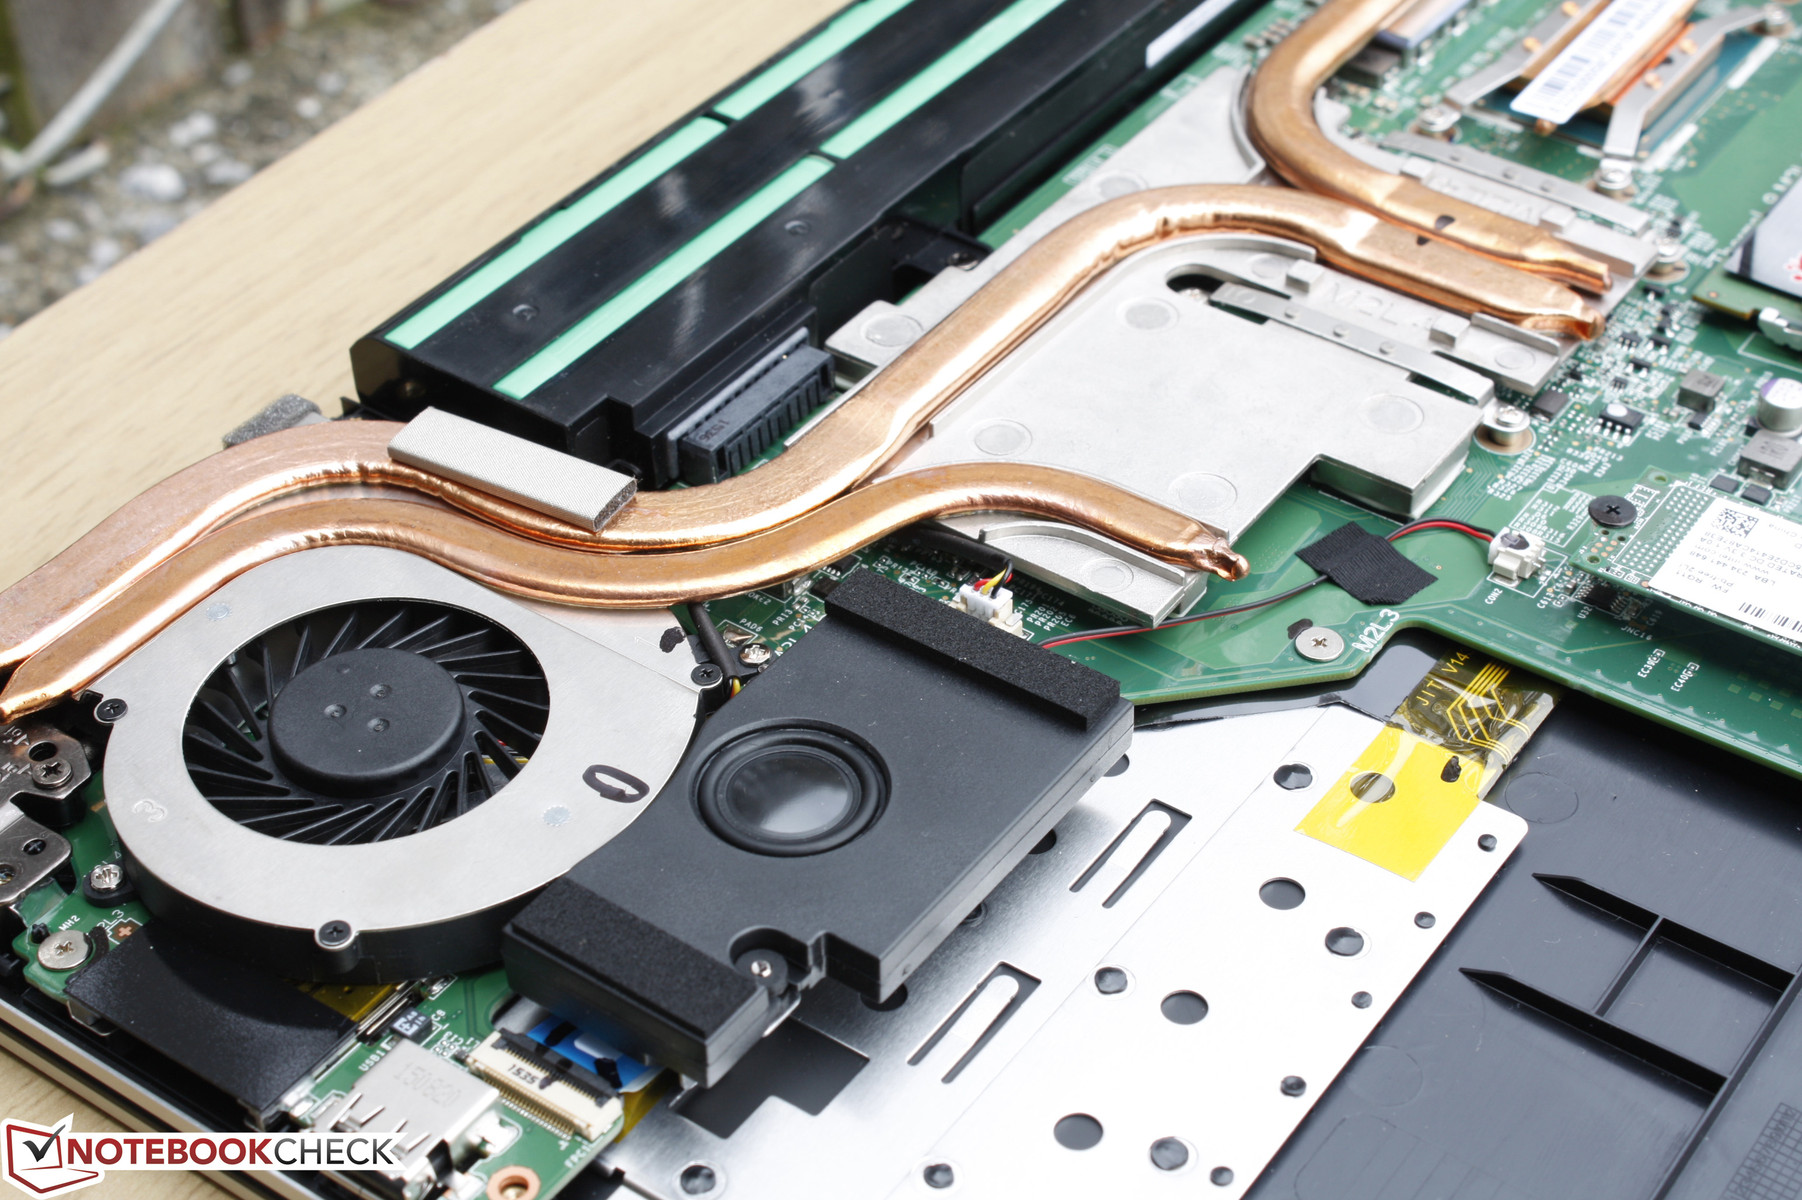
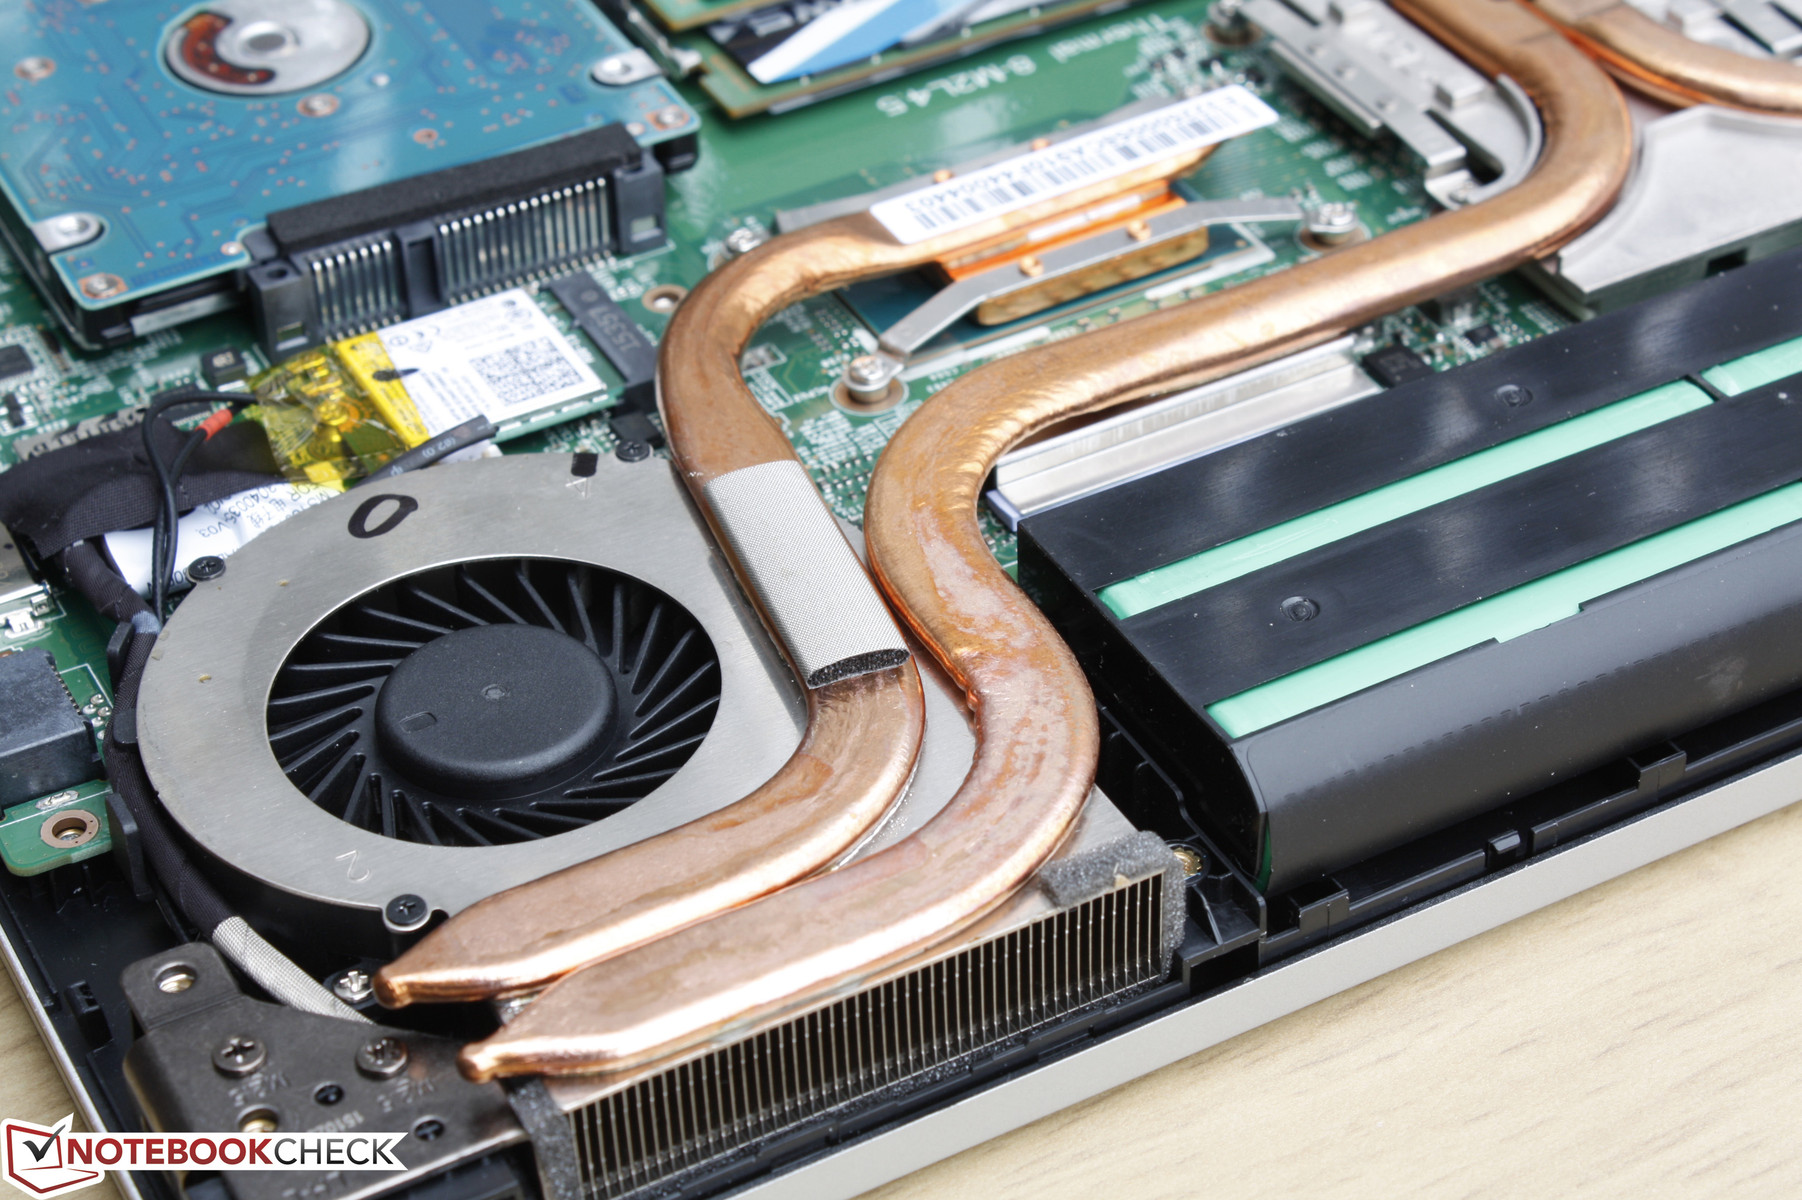
Serviceability is the same as on the GE62 and previous PE60. It's relatively easy as the entire bottom panel can be removed as one piece, but it's also a bit of a hassle as a total of 18 Philips screws must first be removed. Users get direct access to core components such as the 2x SODIMM slots, M.2 2280 slot, WLAN module, battery, and 2.5-inch SATA III slot. Unlike on the larger MSI GT72 series, the CPU and GPU for the PE60 are soldered onto the motherboard and cannot be upgraded.
Warranty
MSI notebooks purchased new from iBuyPower receive the standard one-year limited warranty. A few manufacturers like Gigabyte offer two-year limited warranty as standard instead.
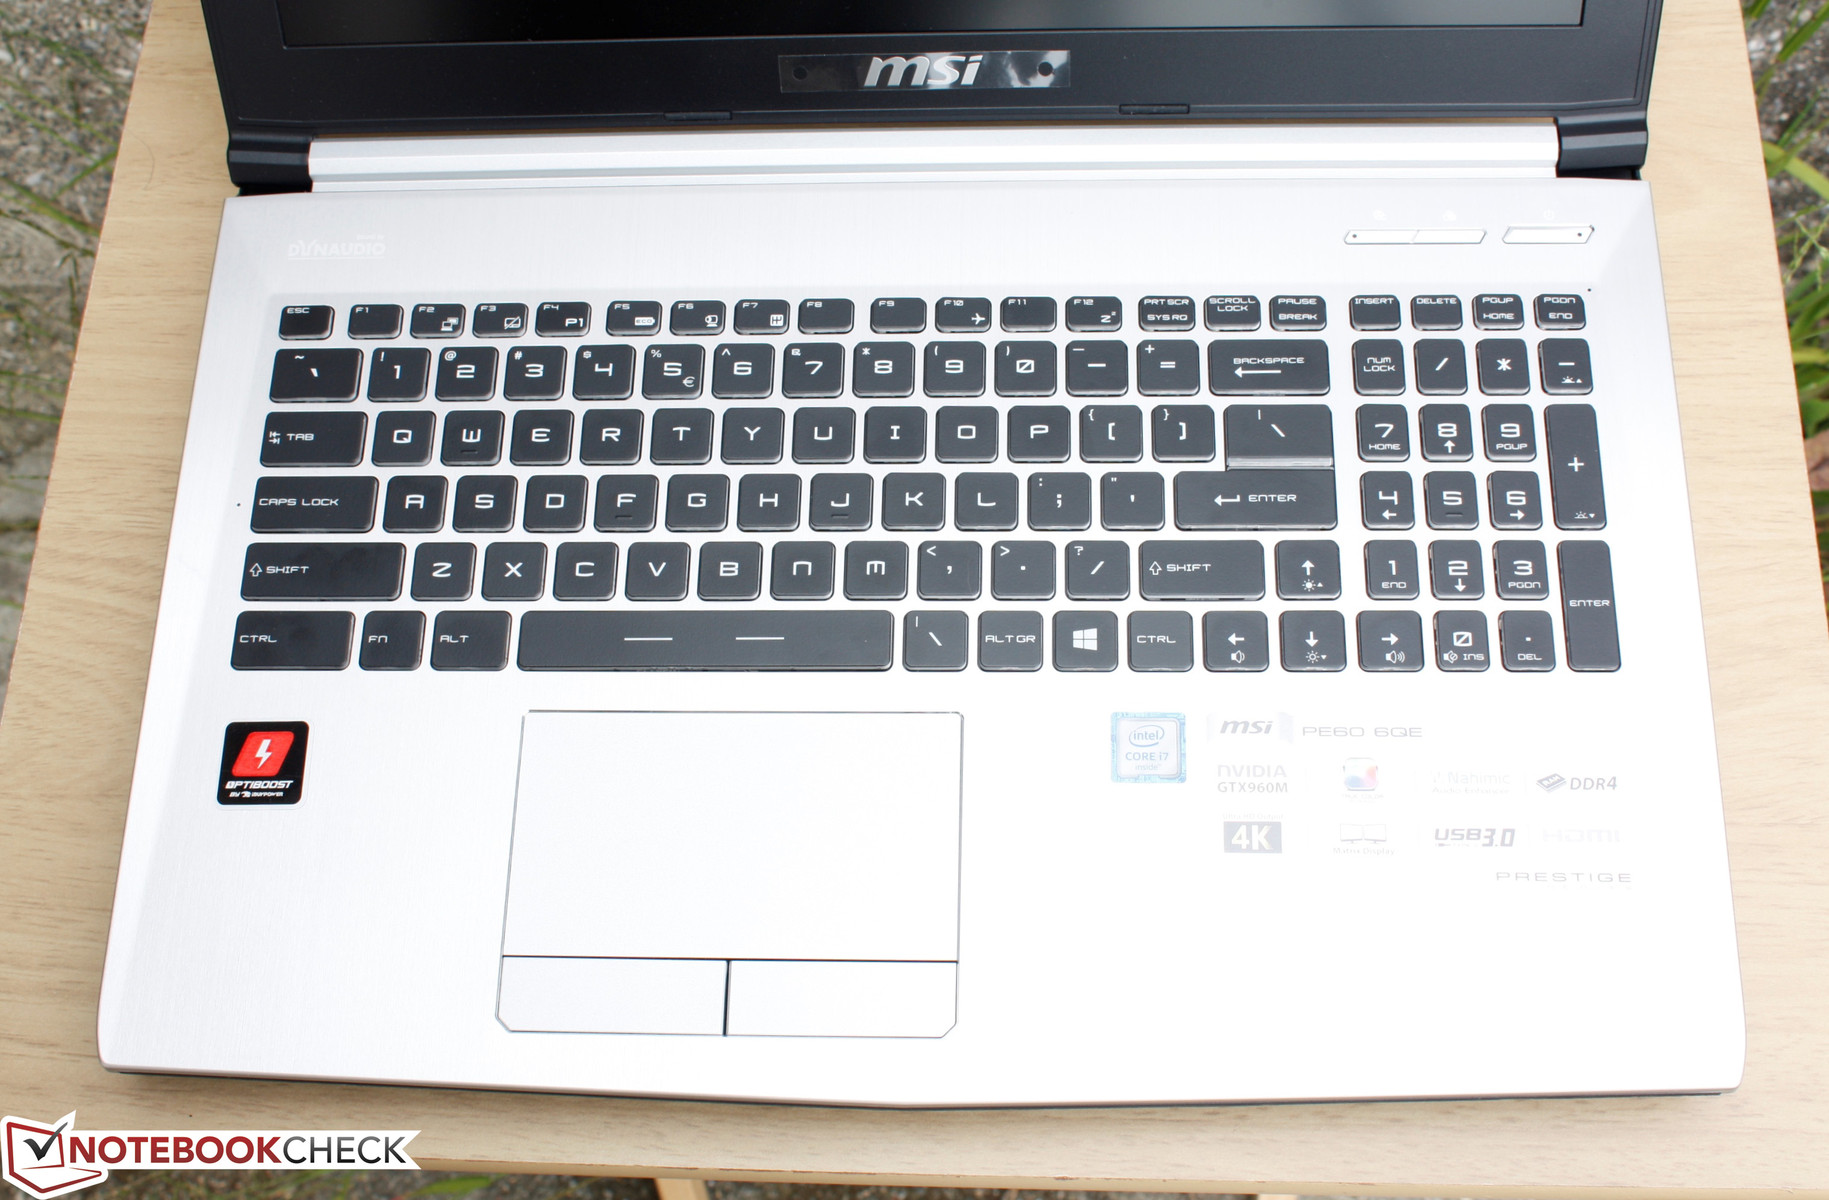
Input Devices
Keyboard
The keyboard is essentially the same as on the PE60 2QE except that the sides of each key are now translucent too allow for more even illumination when the backlight is on. The keys are surprisingly quiet with little clatter and are very comfortable with great travel and firm feedback. There is very little to complain here except for perhaps the lack of any dedicated multimedia or customizable Macro keys. For a business notebook, however, this shouldn't be a large issue. The Turbo Fan option as found on the gaming G series returns and is largely unneeded for day-to-day or gaming use.
Touchpad
The large touchpad (10.8 x 6.1 cm) is smooth to the touch with an even and reliable glide for cursor movement. The Synaptics V7.5 software recognizes up to three-finger gestures with easy two-finger scrolling and zooming. Meanwhile, the dedicated mouse keys are shallow in travel with a very firm and loud auditory feedback. The force required for an input can make constant double-clicking tiresome, so we find it easier to simply double-tap on the touchpad for quicker actions.
The system provides no TrackPoint that is normally a staple on core business notebooks.

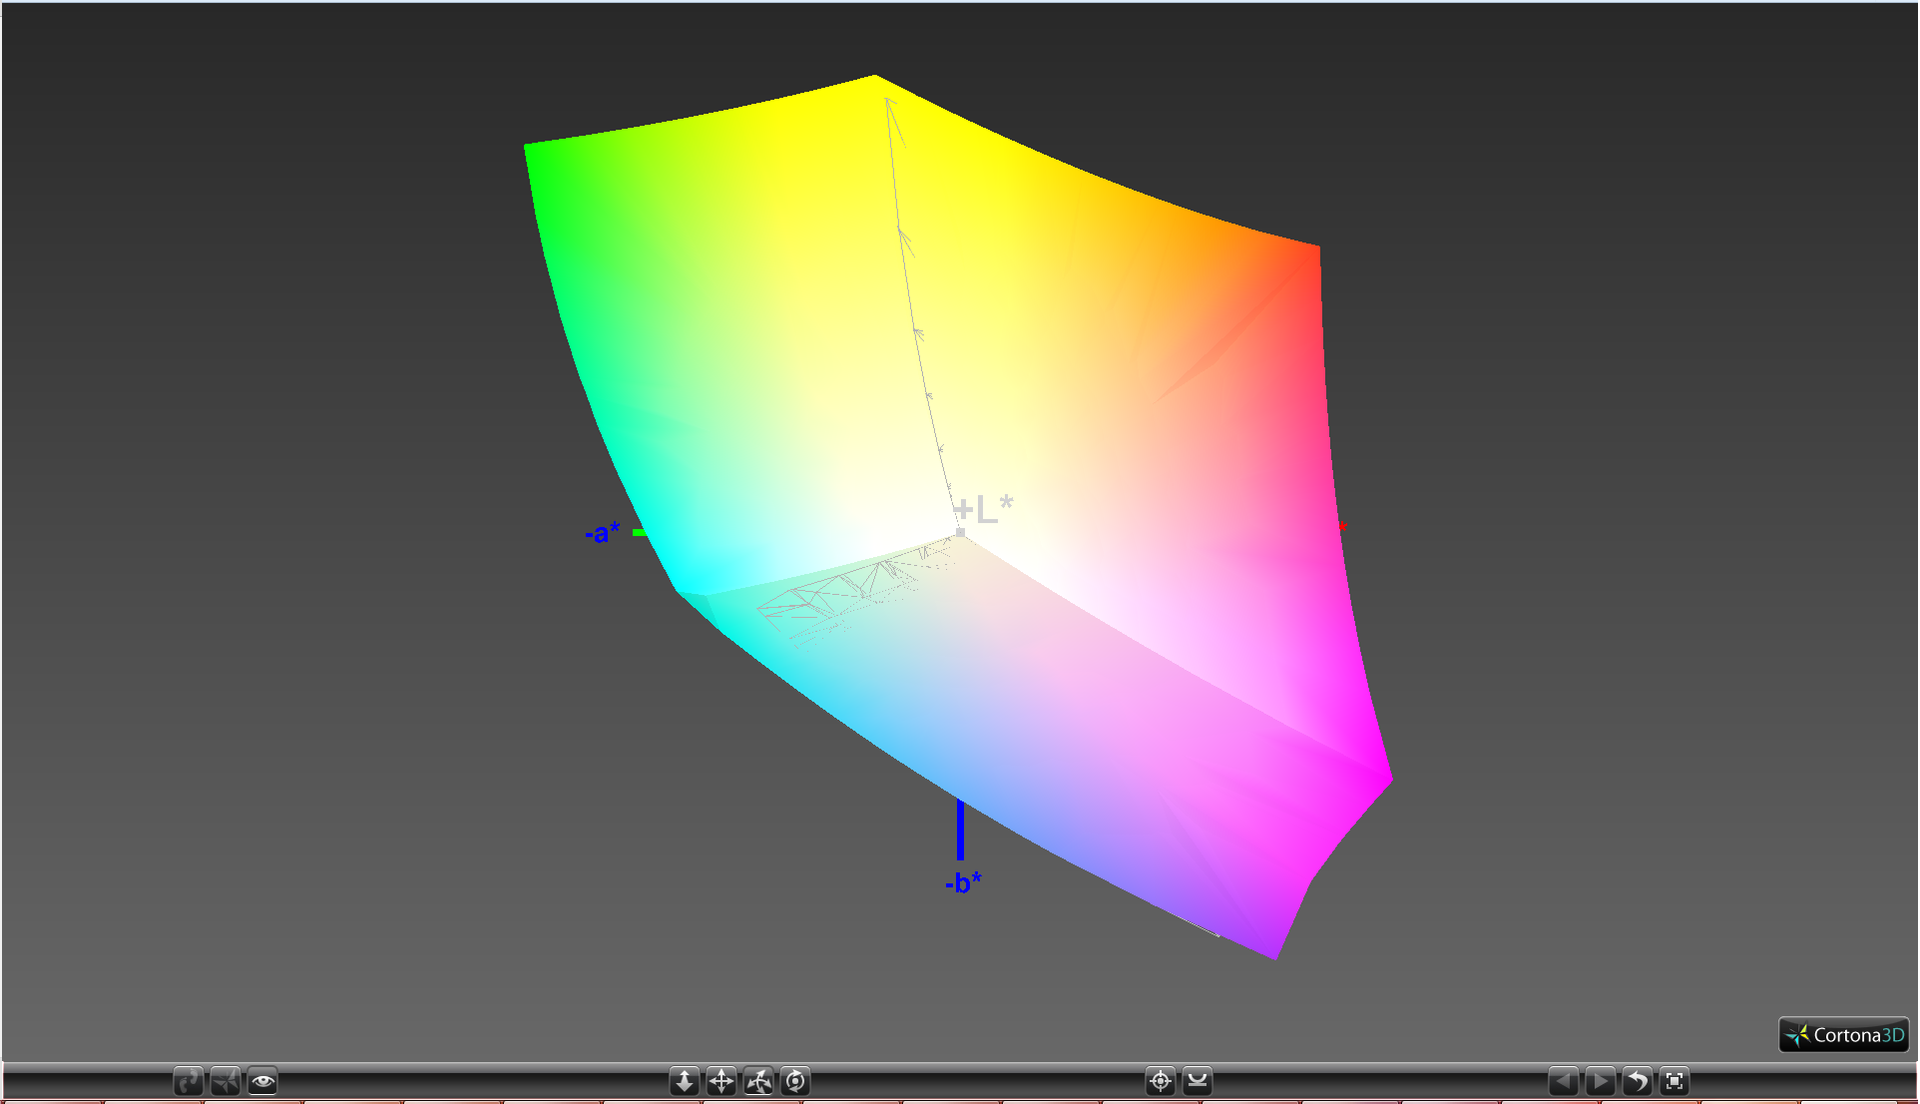
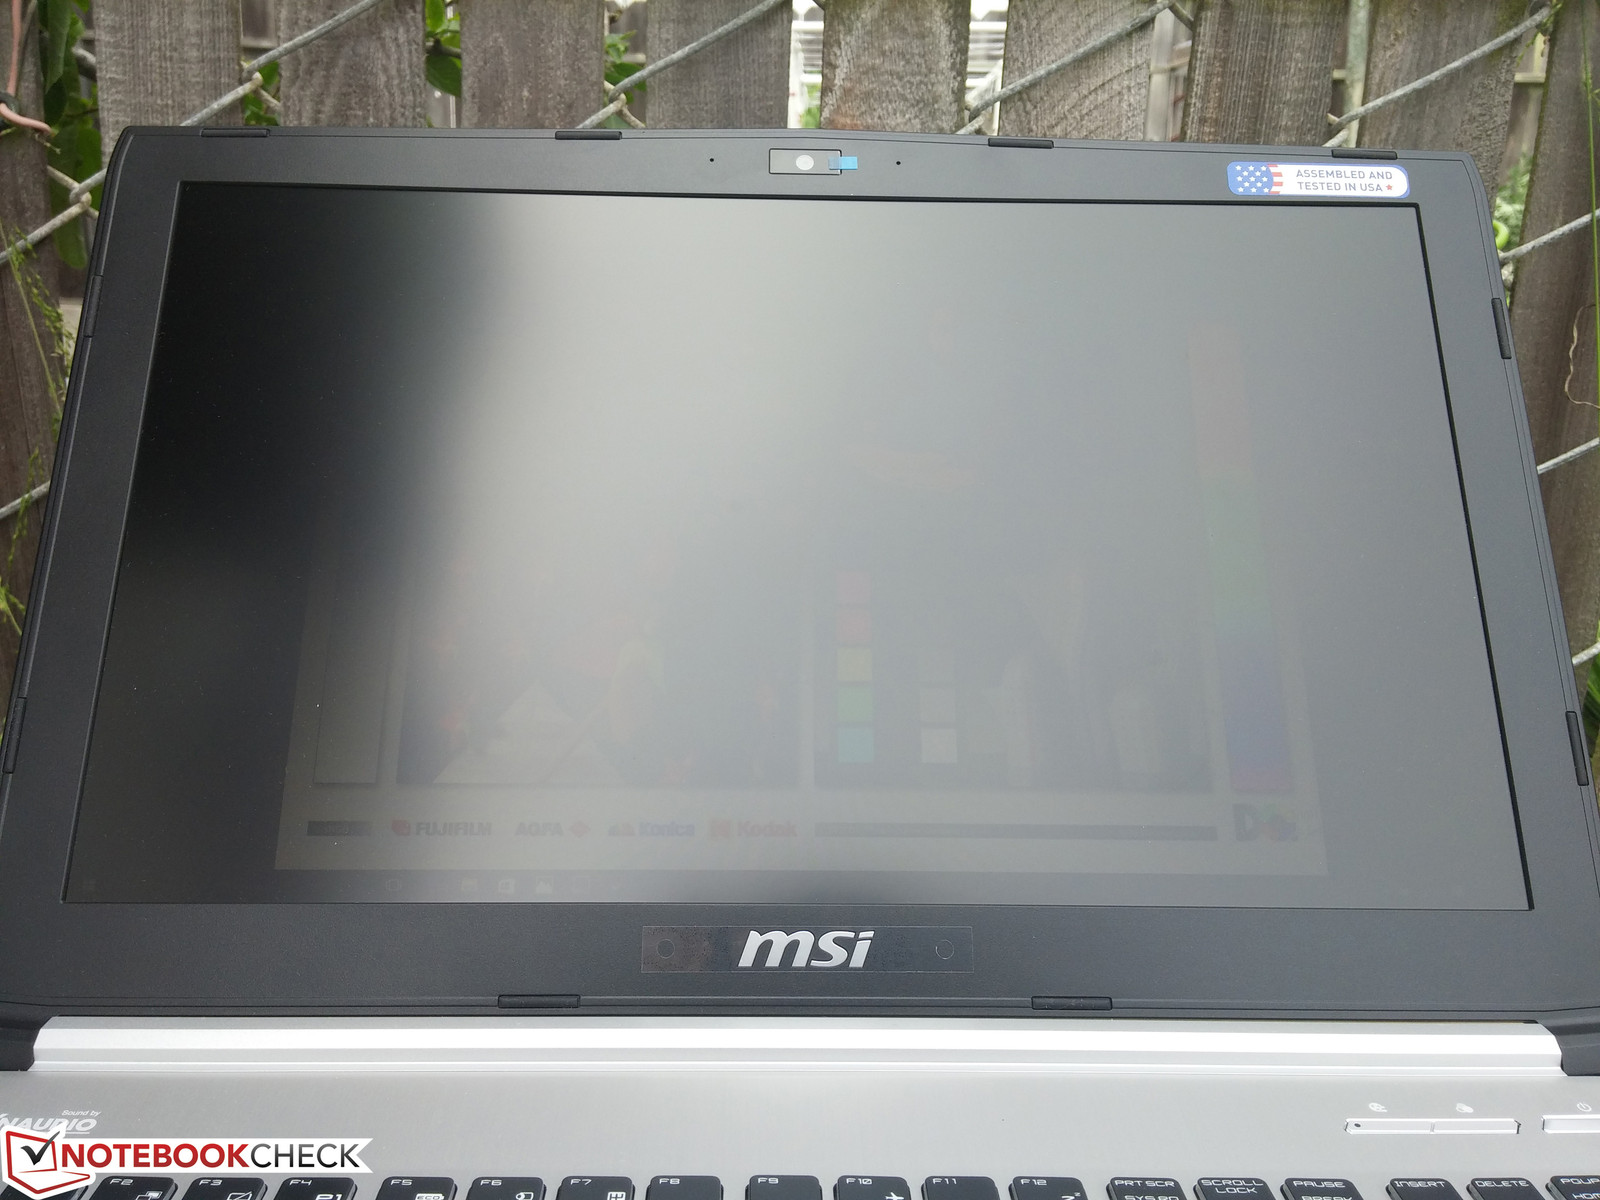
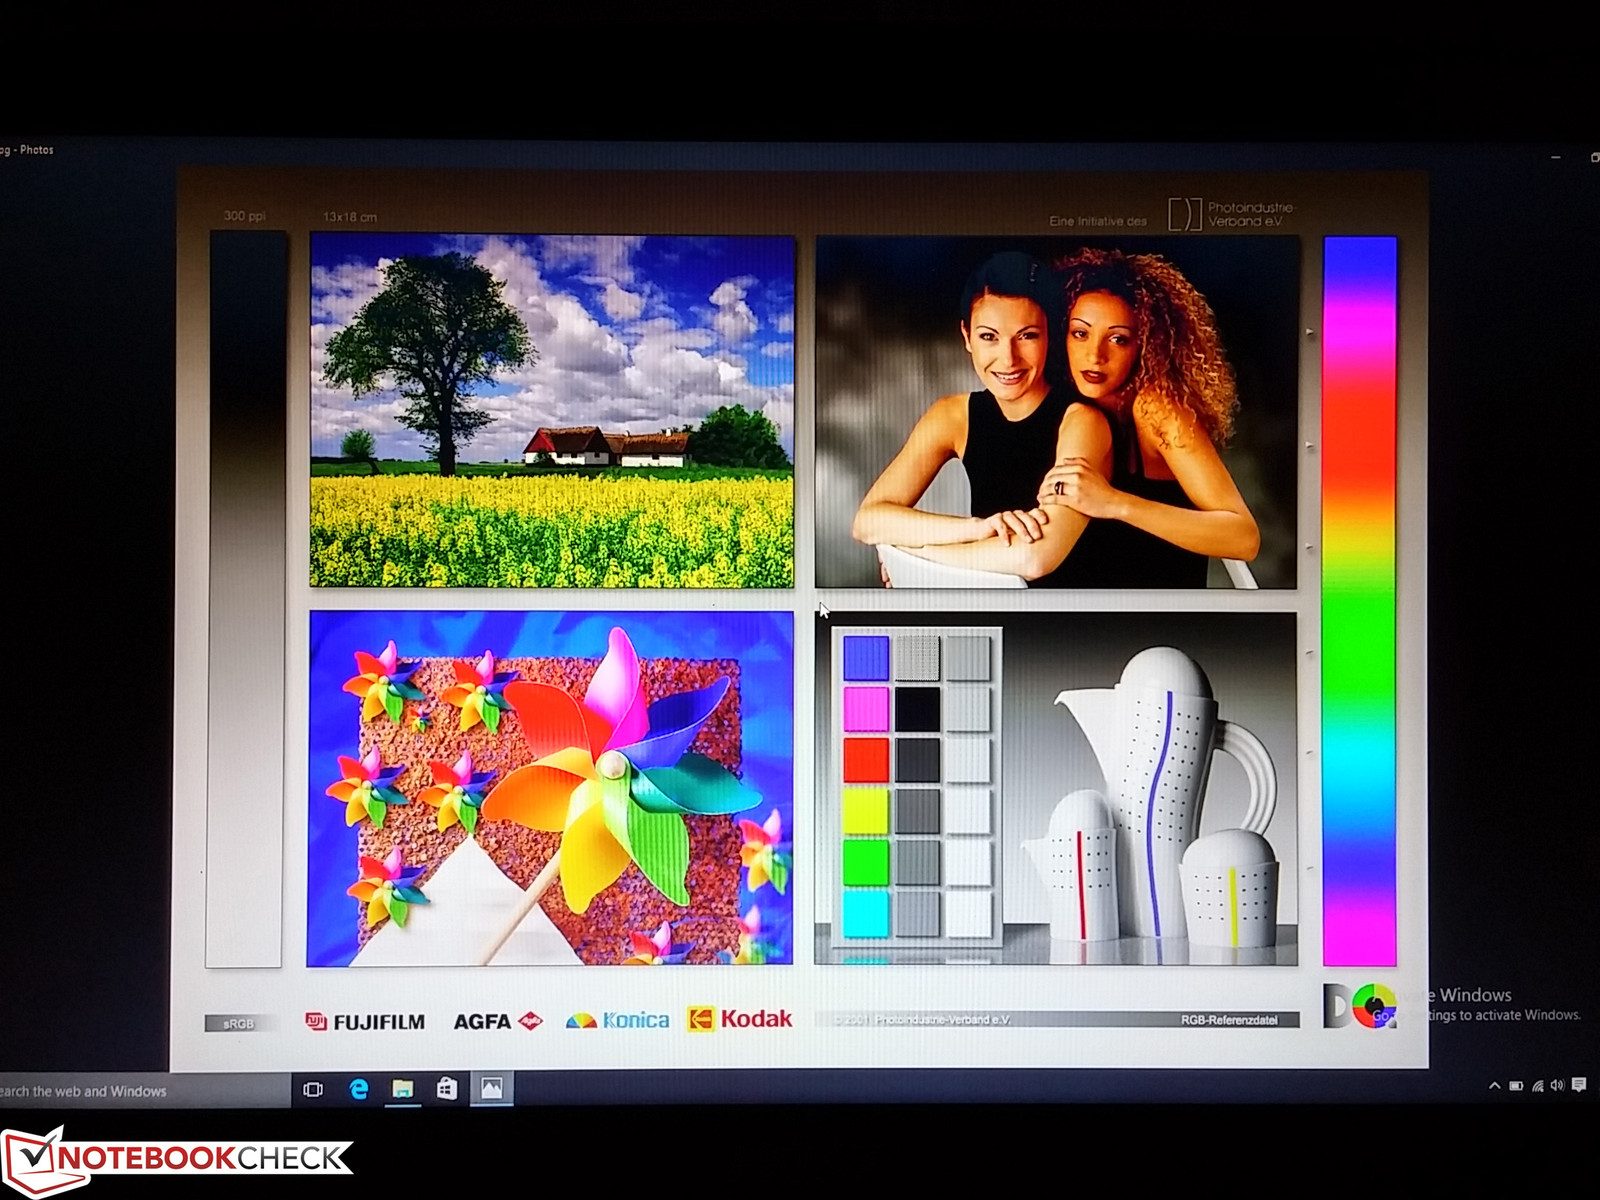
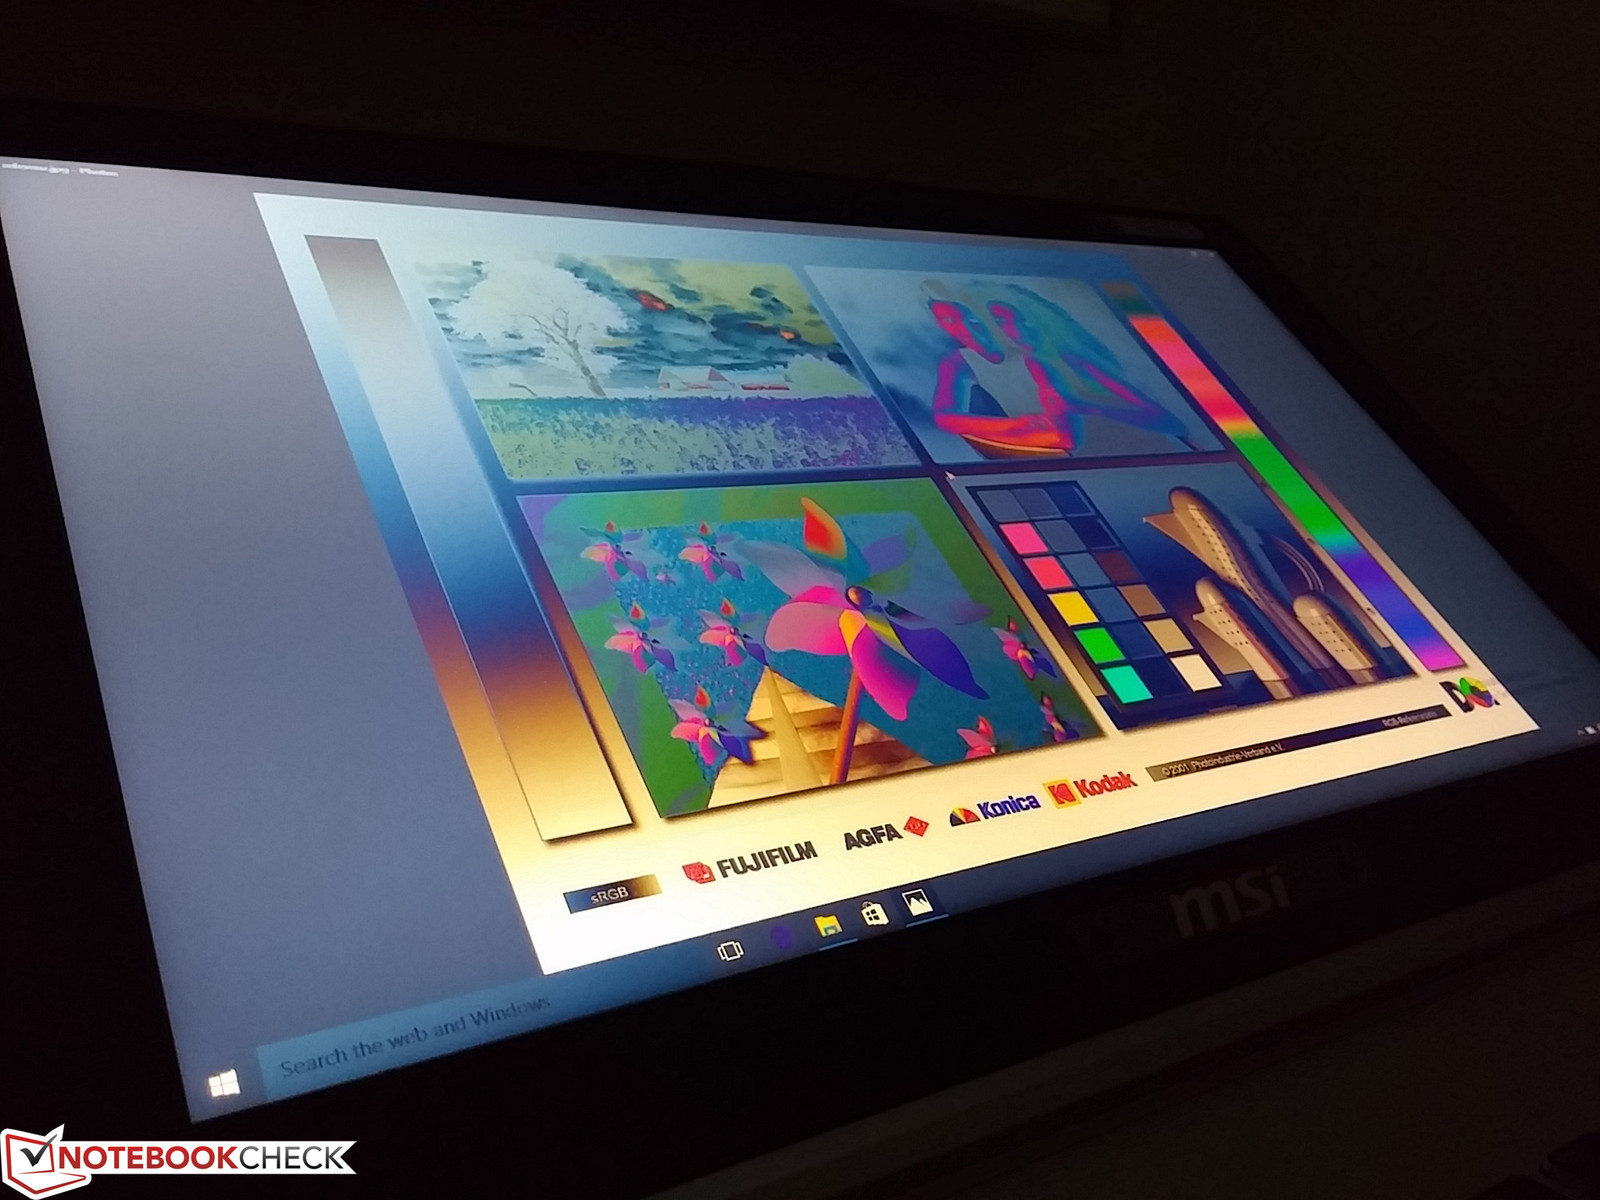
Display
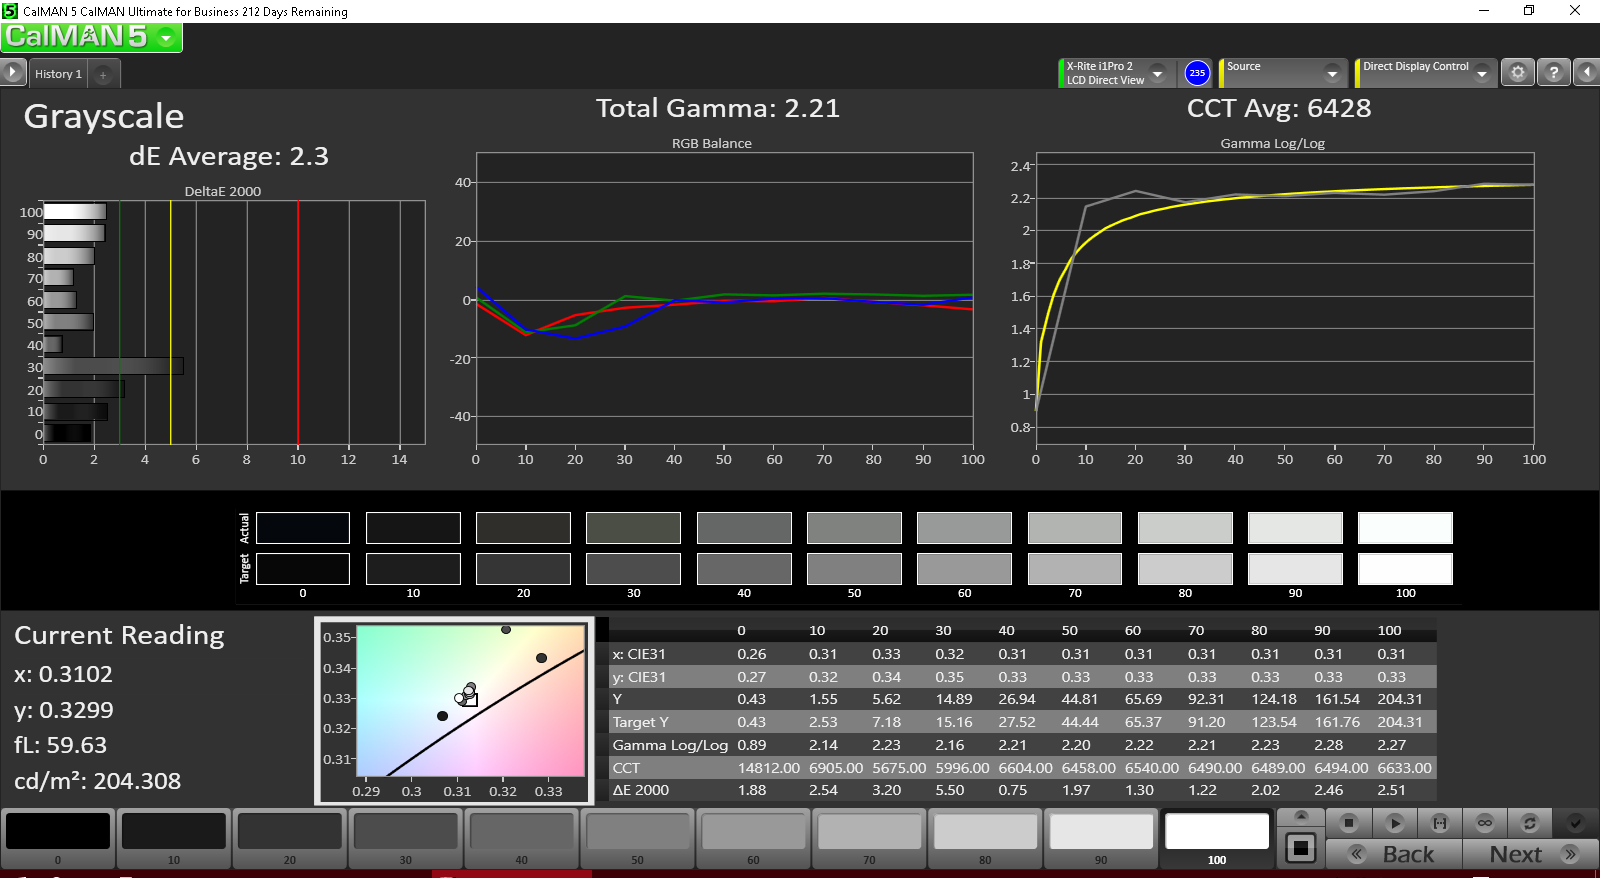
The matte 1080p display is the same Chi Mei N156HGE-EAL TN panel as found on our recently reviewed PX60 6QD and Acer Aspire V3-575G. This is compared to the Samsung LTN156HL01 IPS panel on our older PE60 2QE review unit. Unsurprisingly, the PE60 6QE suffers from the same issues as the PX60 6QD. Colors and grayscale are poor out-of-the-box and contrast levels are disappointing at under 500:1. Display brightness has also dropped dramatically from an average of 282 nits on the PE60 2QE to just 194 nits on the PE60 6QD. There appears to be no other resolution or touchscreen options available other than the base TN panel we have here.
Uneven backlight bleeding is minimal and almost unnoticeable even against a dark background. There is some clouding near the bottom edge, but it is largely insignificant. Users will be more likely to notice the apparent contrast changes from the TN panel than any clouding around the edges or corners.
| |||||||||||||||||||||||||
Brightness Distribution: 86 %
Center on Battery: 200.1 cd/m²
Contrast: 466:1 (Black: 0.429 cd/m²)
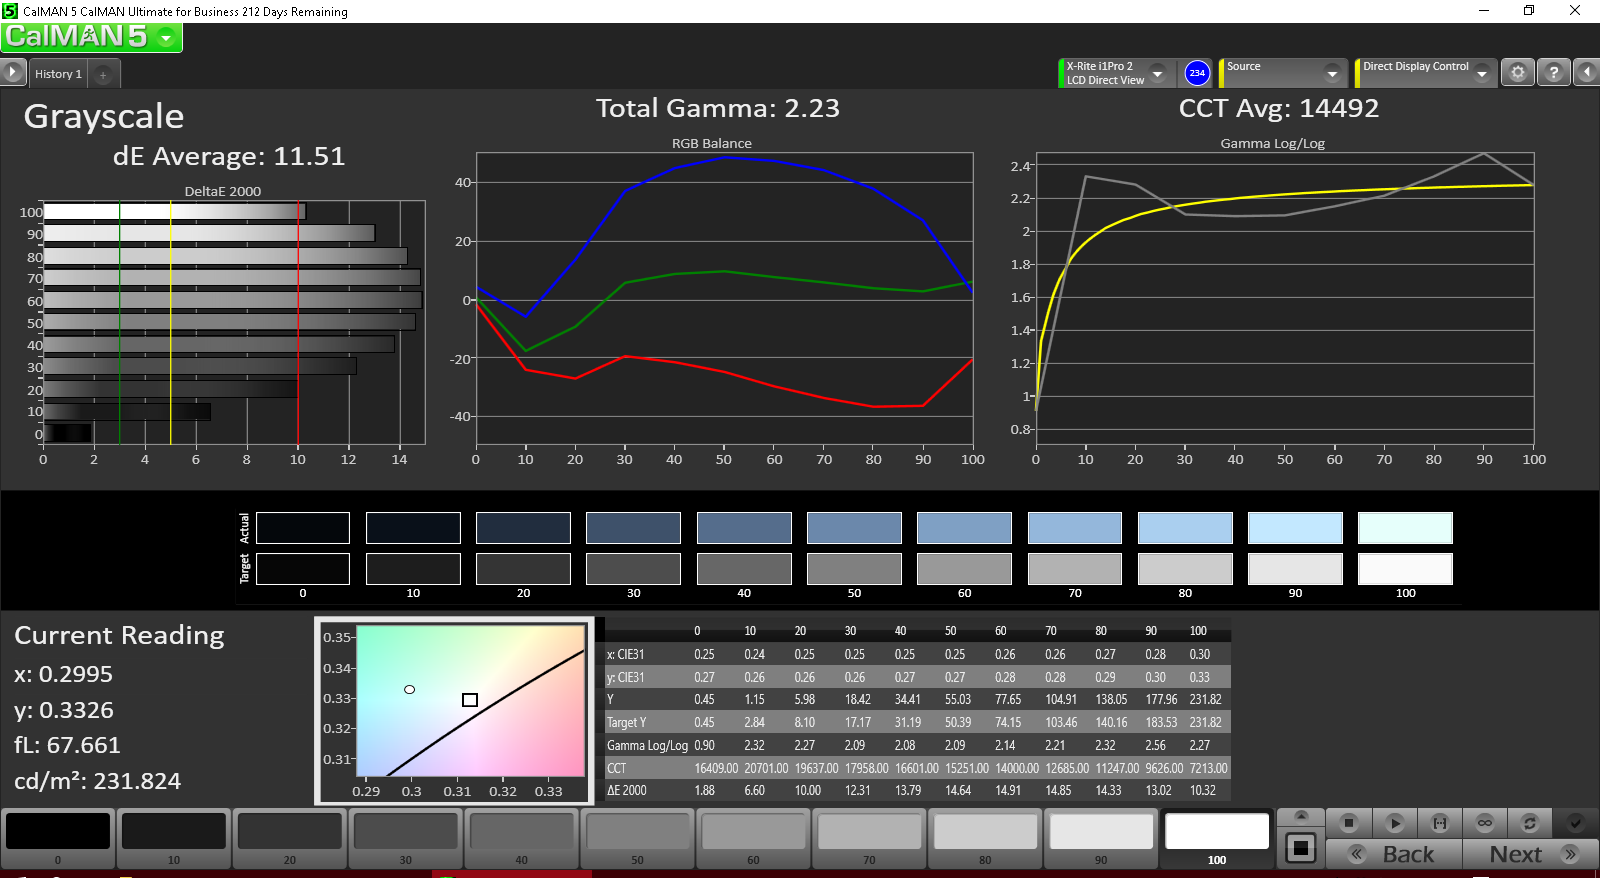
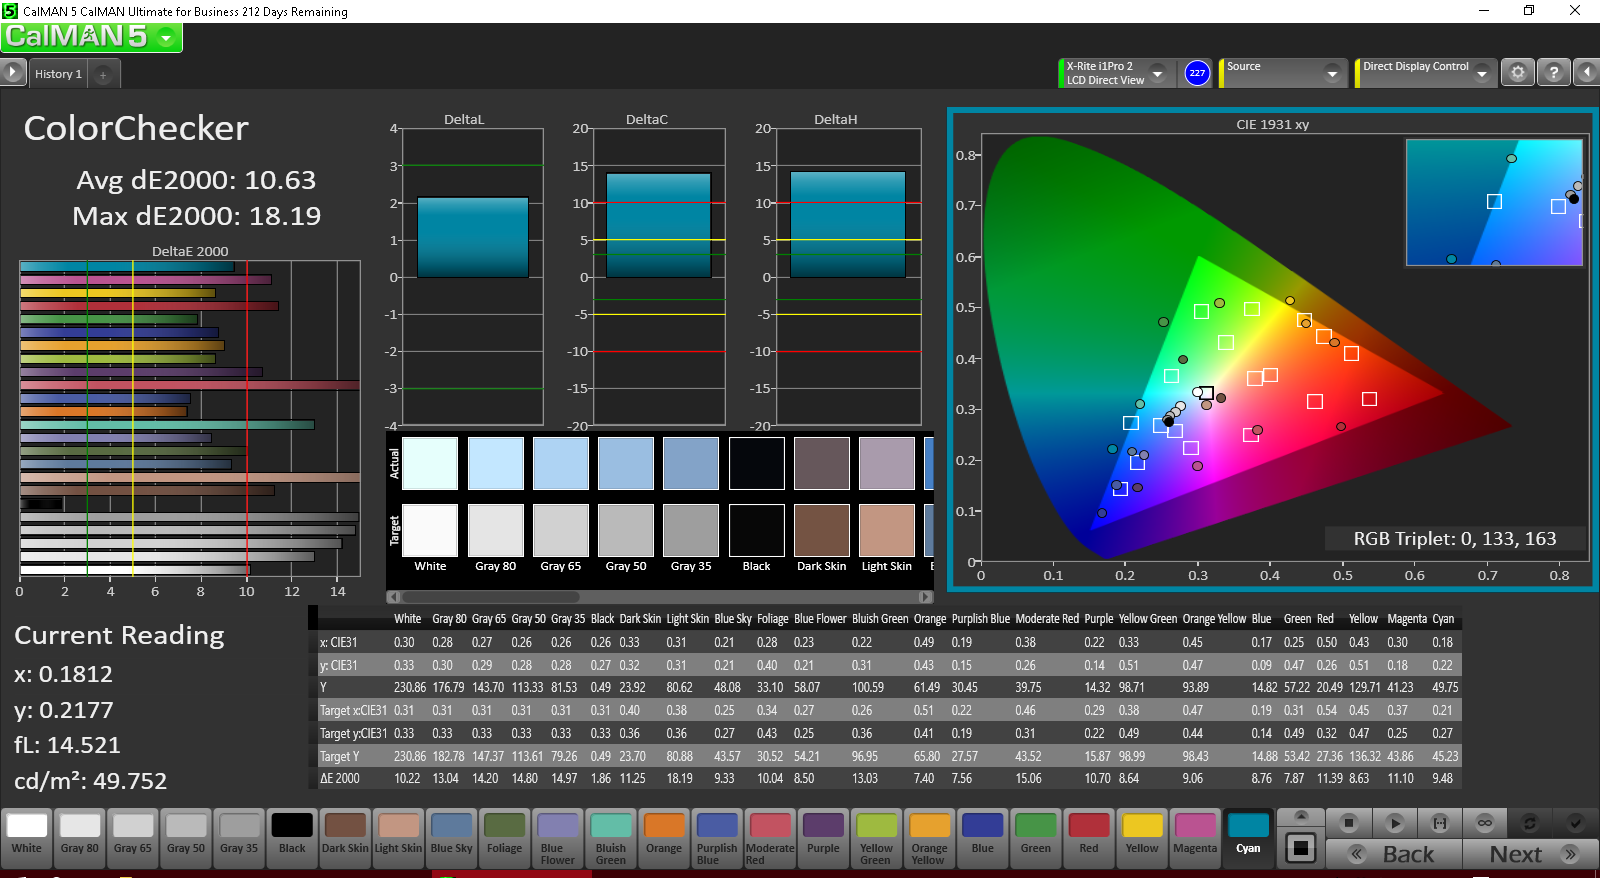
ΔE ColorChecker Calman: 10.63 | ∀{0.5-29.43 Ø4.73}
ΔE Greyscale Calman: 11.51 | ∀{0.09-98 Ø4.97}
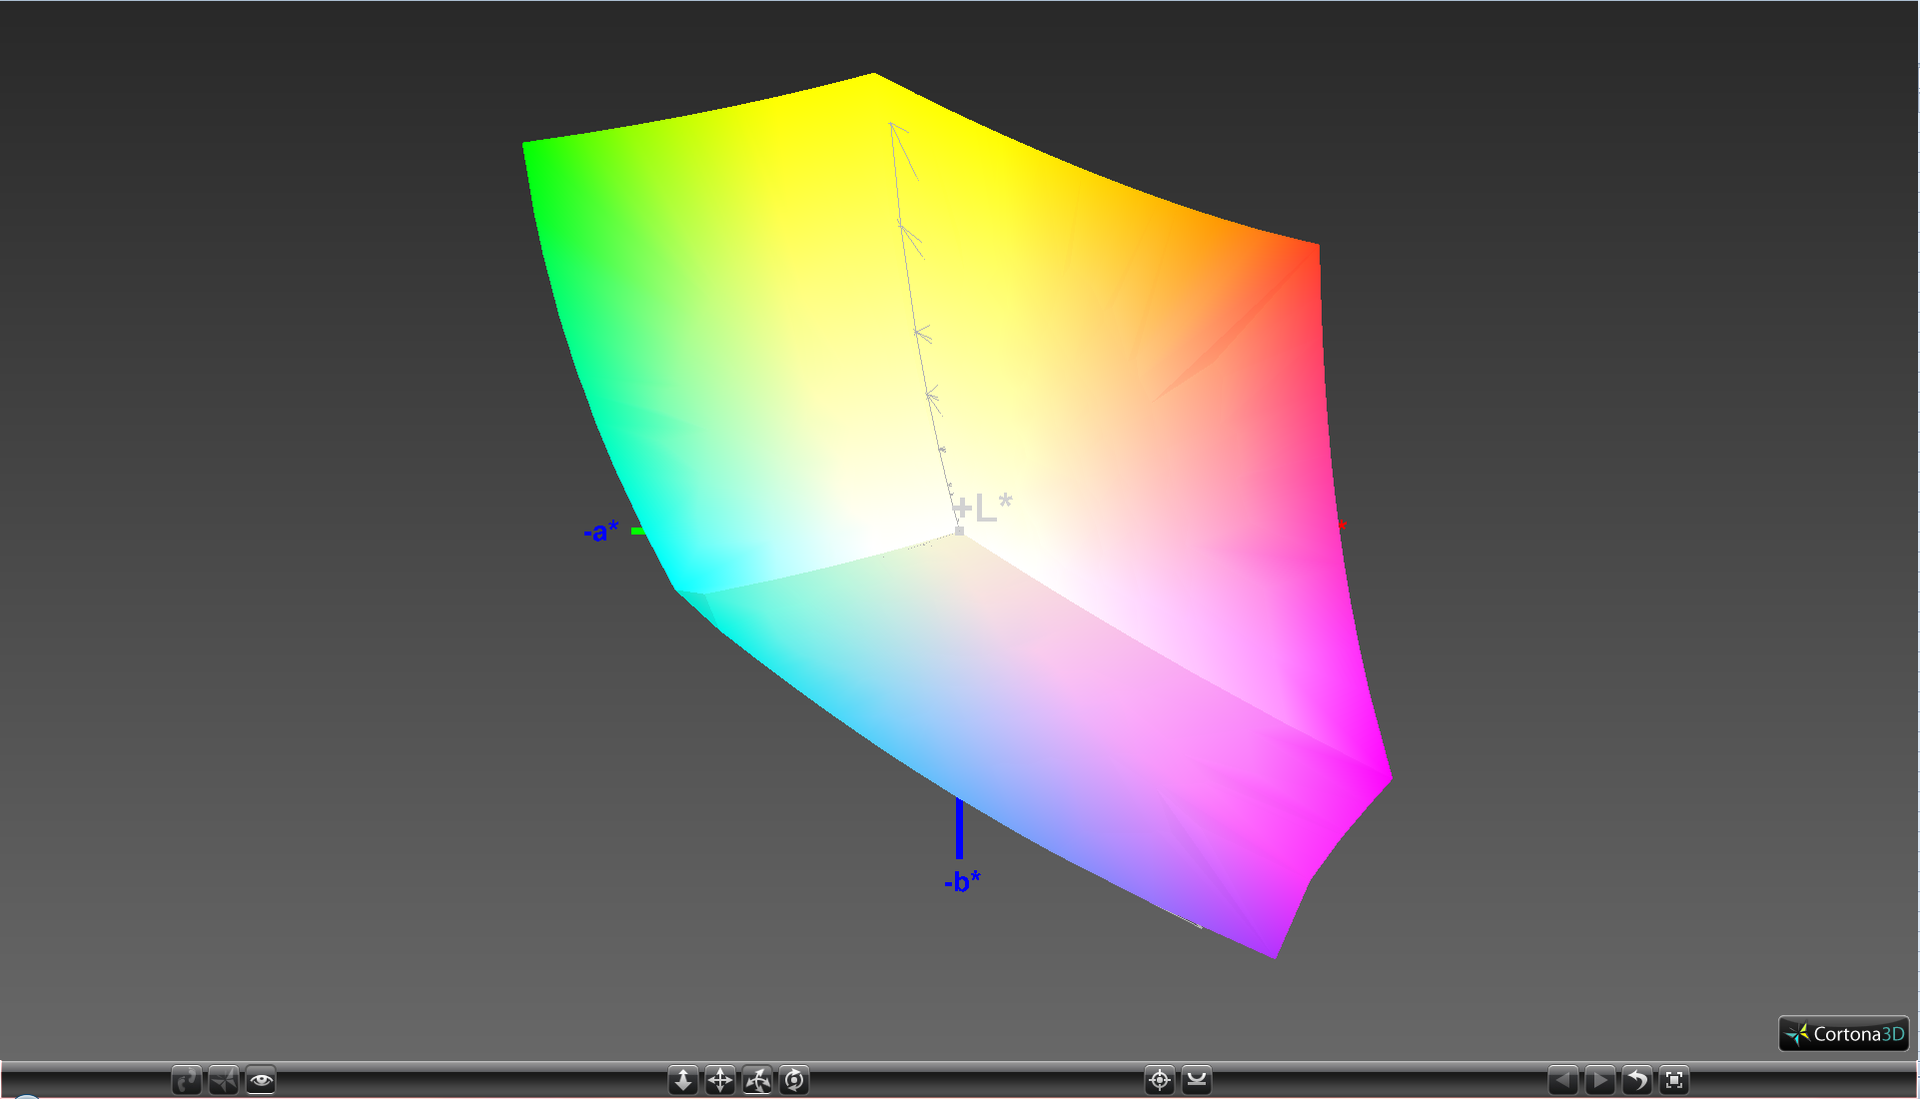
99.8% sRGB (Argyll 1.6.3 3D)
74.6% AdobeRGB 1998 (Argyll 1.6.3 3D)
84.2% AdobeRGB 1998 (Argyll 3D)
99.8% sRGB (Argyll 3D)
86% Display P3 (Argyll 3D)
Gamma: 2.23
CCT: 14492 K
| MSI PE60 6QE-056XUS 15.6", 1920x1080 | HP ZBook 15 G3 15.6", 1920x1080 | Lenovo Ideapad Y700 15ISK 80NW 15.6", 1920x1080 | Asus G501VW-FY081T 15.6", 1920x1080 | Dell XPS 15 9550 i7 FHD 15.6", 1920x1080 | |
|---|---|---|---|---|---|
| Display | -15% | -50% | -15% | -13% | |
| Display P3 Coverage (%) | 86 | 66.8 -22% | 38.55 -55% | 66.8 -22% | 68.5 -20% |
| sRGB Coverage (%) | 99.8 | 95.5 -4% | 57.6 -42% | 97.3 -3% | 97.2 -3% |
| AdobeRGB 1998 Coverage (%) | 84.2 | 69 -18% | 39.86 -53% | 68.6 -19% | 70.4 -16% |
| Response Times | -27% | 10% | -28% | -64% | |
| Response Time Grey 50% / Grey 80% * (ms) | 43.6 ? | 54 ? -24% | 40.8 ? 6% | 50 ? -15% | 64 ? -47% |
| Response Time Black / White * (ms) | 27.6 ? | 35.6 ? -29% | 24 ? 13% | 39 ? -41% | 50 ? -81% |
| PWM Frequency (Hz) | 1000 ? | 198 ? | 58.1 | 200 ? | |
| Screen | 33% | 18% | 44% | 54% | |
| Brightness middle (cd/m²) | 200.1 | 306 53% | 258.6 29% | 341 70% | 371.5 86% |
| Brightness (cd/m²) | 194 | 289 49% | 242 25% | 312 61% | 356 84% |
| Brightness Distribution (%) | 86 | 85 -1% | 88 2% | 83 -3% | 92 7% |
| Black Level * (cd/m²) | 0.429 | 0.34 21% | 0.277 35% | 0.32 25% | 0.252 41% |
| Contrast (:1) | 466 | 900 93% | 934 100% | 1066 129% | 1474 216% |
| Colorchecker dE 2000 * | 10.63 | 5.1 52% | 8.1 24% | 4.23 60% | 5.55 48% |
| Colorchecker dE 2000 max. * | 18.19 | 9.9 46% | 8.02 56% | 10.95 40% | |
| Greyscale dE 2000 * | 11.51 | 7.4 36% | 7.23 37% | 4.69 59% | 7.1 38% |
| Gamma | 2.23 99% | 2.37 93% | 1.99 111% | 2.53 87% | 2.1 105% |
| CCT | 14492 45% | 7263 89% | 6567 99% | 7549 86% | |
| Color Space (Percent of AdobeRGB 1998) (%) | 74.6 | 63 -16% | 36.5 -51% | 63 -16% | 63.4 -15% |
| Color Space (Percent of sRGB) (%) | 99.8 | 95 -5% | 57.2 -43% | 97 -3% | 97.9 -2% |
| Total Average (Program / Settings) | -3% /
15% | -7% /
2% | 0% /
23% | -8% /
25% |
* ... smaller is better
The wide gamut of the PE60 shows it uses a high-end panel despite the poor first impressions. Colors cover the sRGB spectrum entirely and almost 75 percent of the wider AdobeRGB standard. Colors are even deeper than on our pricier HP ZBook 15 G3 SKU. Some Clevo barebones like the Schenker XMG U726 aim for wider AdobeRGB coverage, though such notebooks are not common.


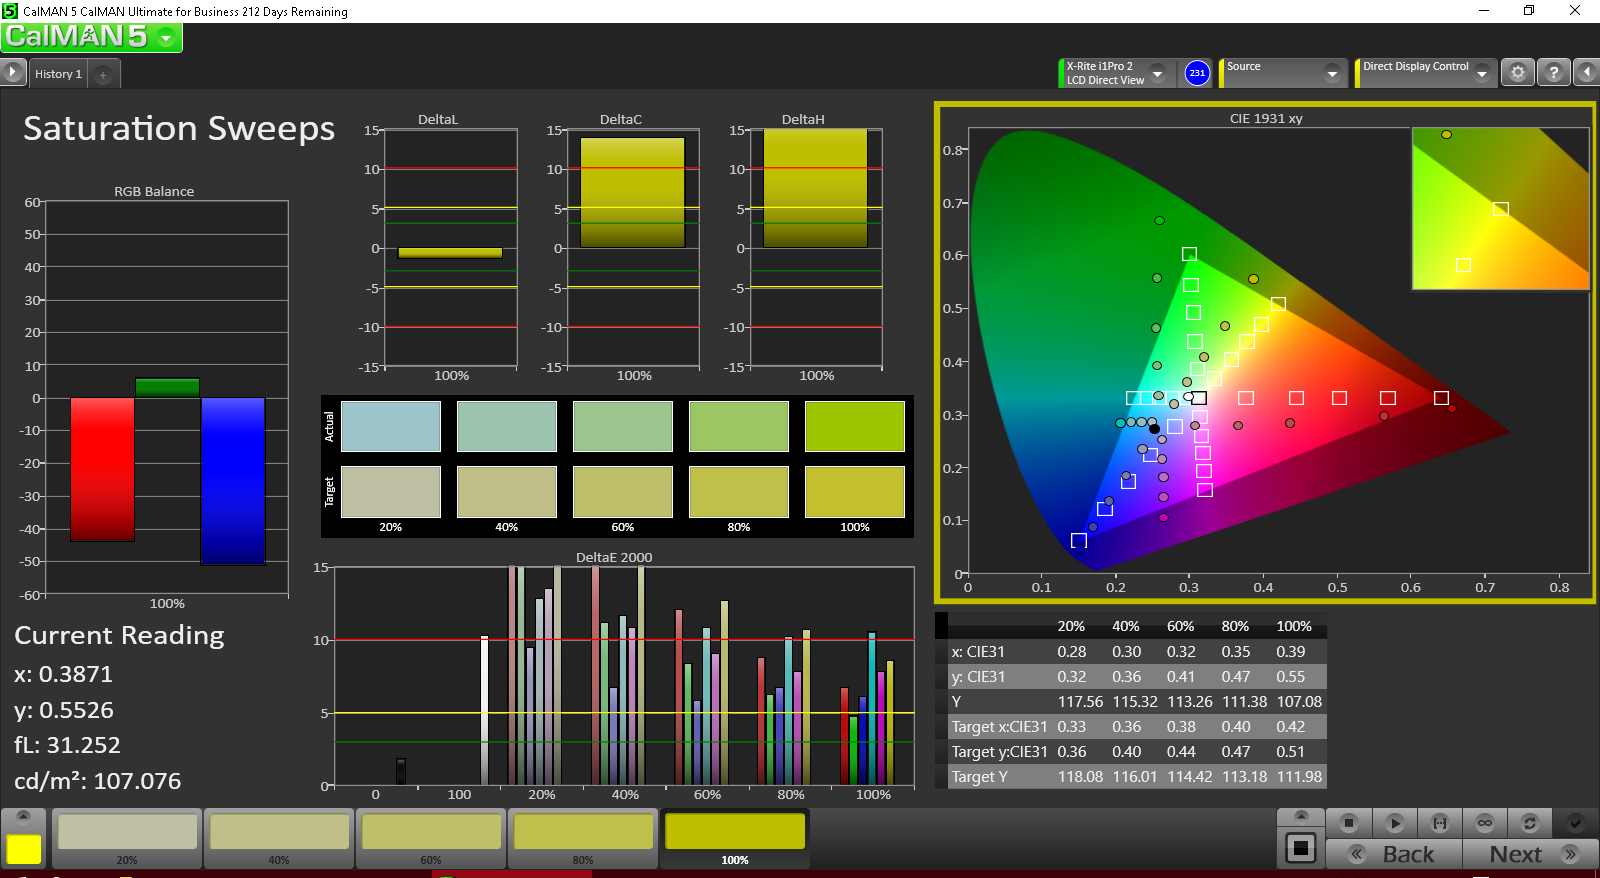
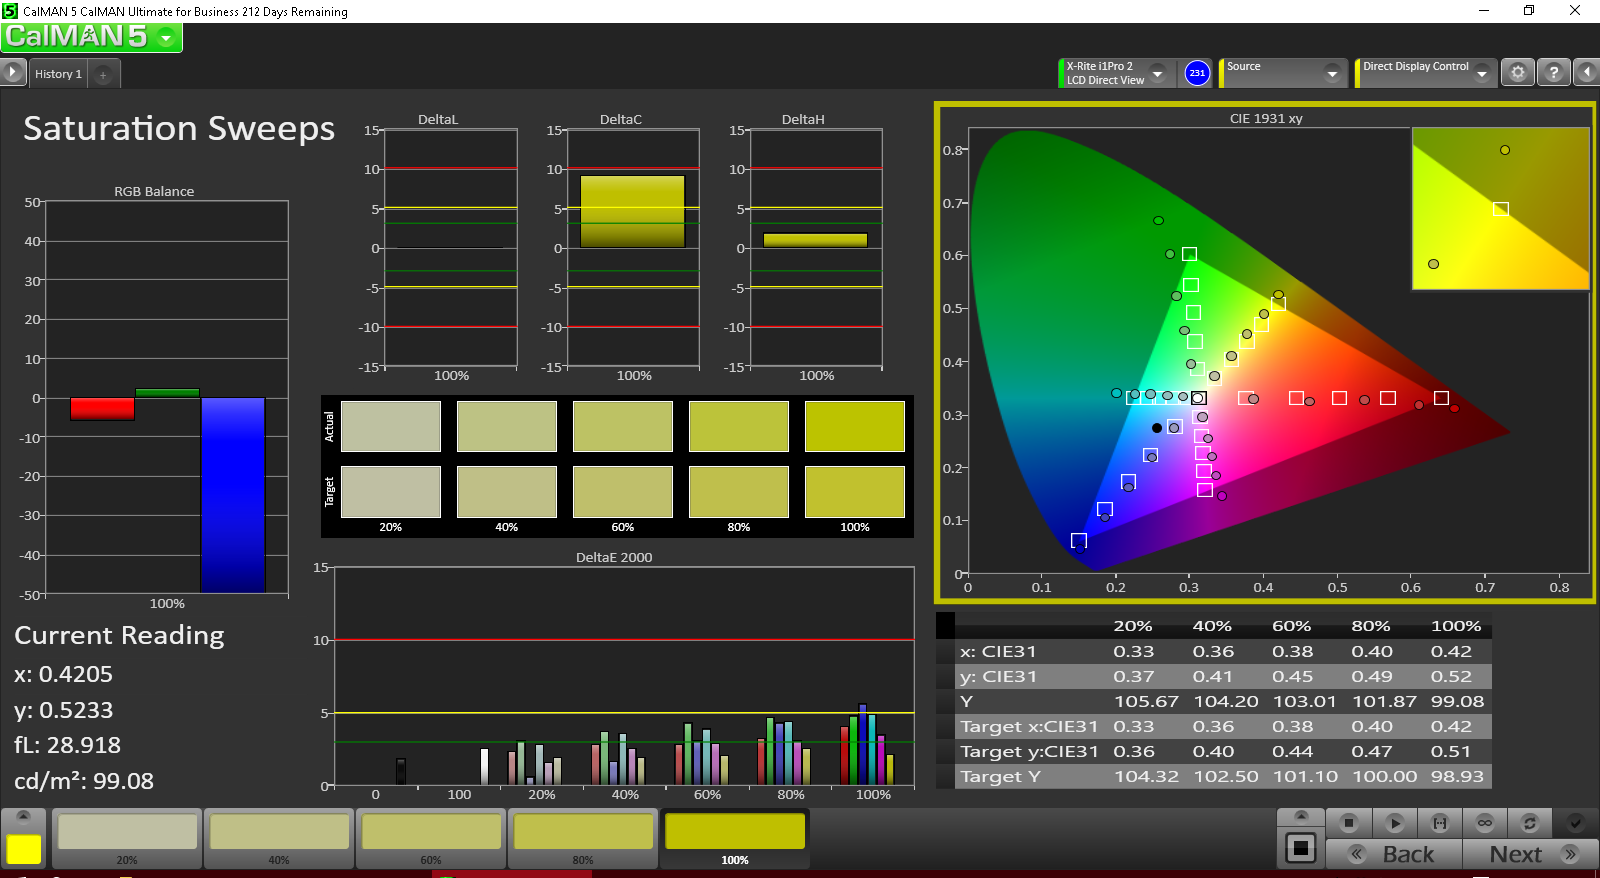
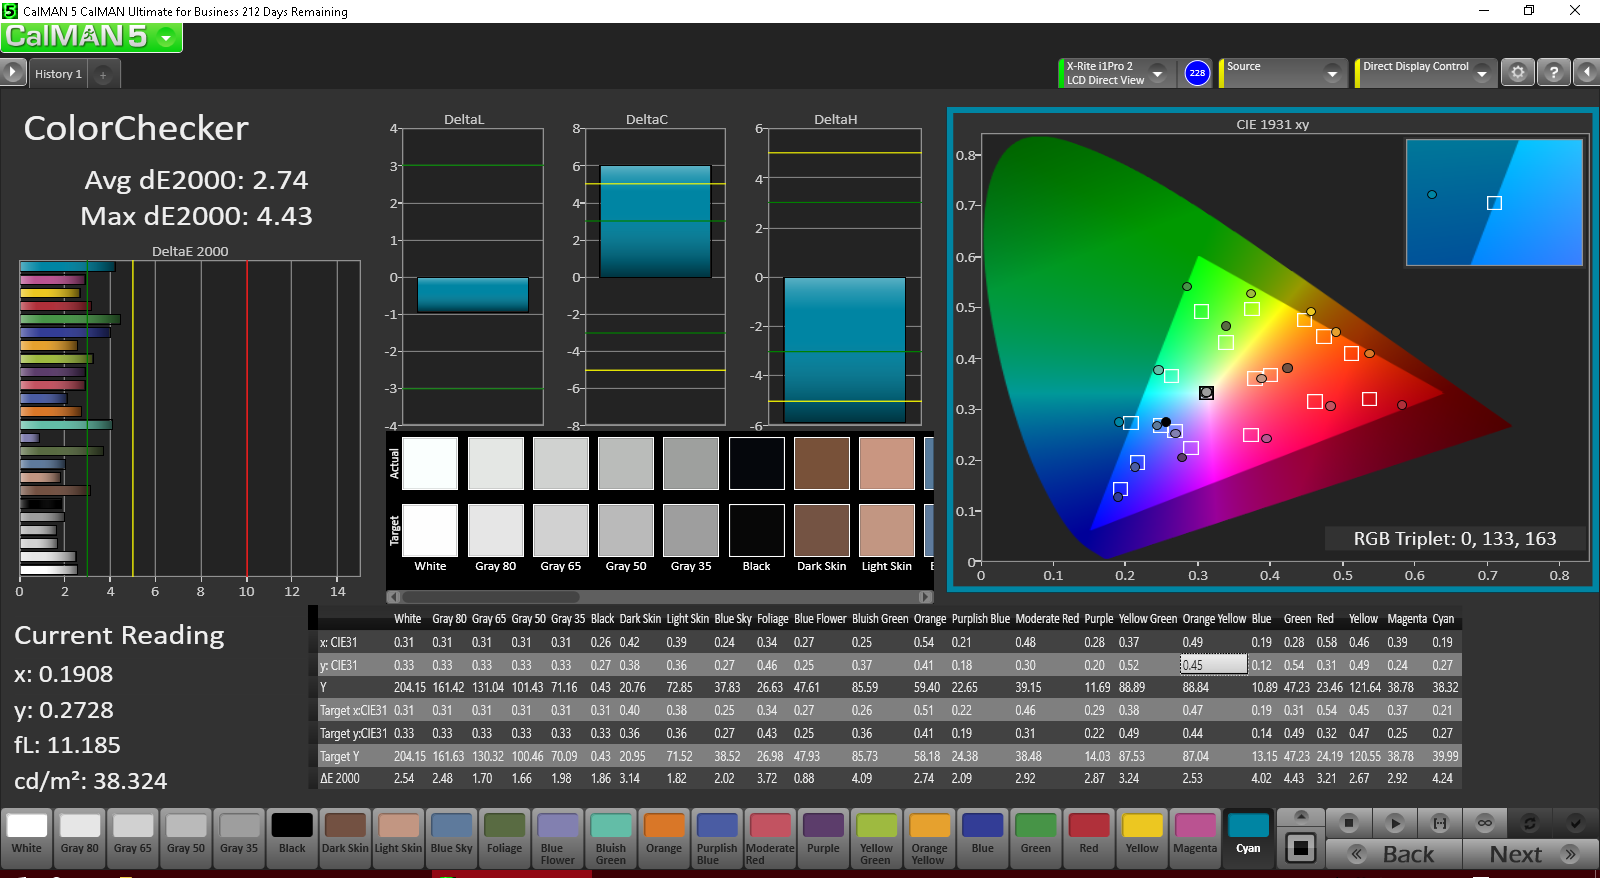
Measurements with an X-Rite spectrophotometer show that the system is in dire need of calibration. Like the recently reviewed PX60, color temperature is much too cool and gives way to more inaccurate colors at all tested saturation levels. A quick calibration flattens RGB Balance and corrects the color temperature for a significantly improved display. Colors still become increasingly less accurate the higher the saturation level, so additional tuning may likely be needed for more accuracy.
Display Response Times
| ↔ Response Time Black to White | ||
|---|---|---|
| 27.6 ms ... rise ↗ and fall ↘ combined | ↗ 10 ms rise | 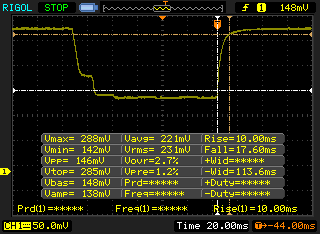 |
| ↘ 17.6 ms fall | ||
| The screen shows relatively slow response rates in our tests and may be too slow for gamers. In comparison, all tested devices range from 0.1 (minimum) to 240 (maximum) ms. » 70 % of all devices are better. This means that the measured response time is worse than the average of all tested devices (19.9 ms). | ||
| ↔ Response Time 50% Grey to 80% Grey | ||
| 43.6 ms ... rise ↗ and fall ↘ combined | ↗ 22 ms rise | 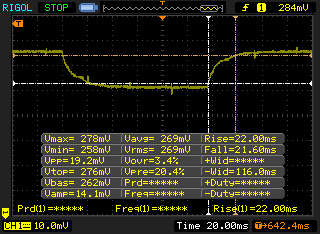 |
| ↘ 21.6 ms fall | ||
| The screen shows slow response rates in our tests and will be unsatisfactory for gamers. In comparison, all tested devices range from 0.165 (minimum) to 636 (maximum) ms. » 73 % of all devices are better. This means that the measured response time is worse than the average of all tested devices (31.1 ms). | ||
Screen Flickering / PWM (Pulse-Width Modulation)
| Screen flickering / PWM detected | 1000 Hz | ≤ 99 % brightness setting | 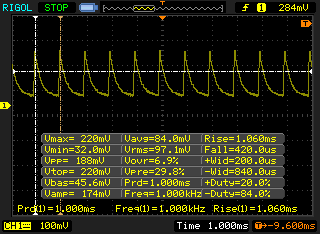 |
The display backlight flickers at 1000 Hz (worst case, e.g., utilizing PWM) Flickering detected at a brightness setting of 99 % and below. There should be no flickering or PWM above this brightness setting. The frequency of 1000 Hz is quite high, so most users sensitive to PWM should not notice any flickering. In comparison: 52 % of all tested devices do not use PWM to dim the display. If PWM was detected, an average of 7804 (minimum: 5 - maximum: 343500) Hz was measured. | |||
Outdoor usability is below average as expected and the wide angle from the hinges (up to 150 degrees) isn't so useful considering that the notebook uses a TN panel with more limited viewing angles. The backlight is especially disappointing as it is fit almost exclusively for indoor use only. The screen is already too dim when working under shade and even worse if under direct sunlight.
Viewing angles are good side-to-side, but degrade quickly if viewing from below the normal. This is expected from a TN panel and it is no different on the refreshed PE60.
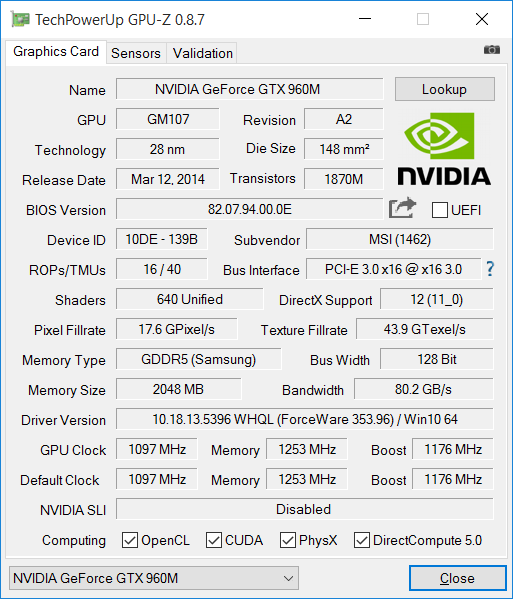
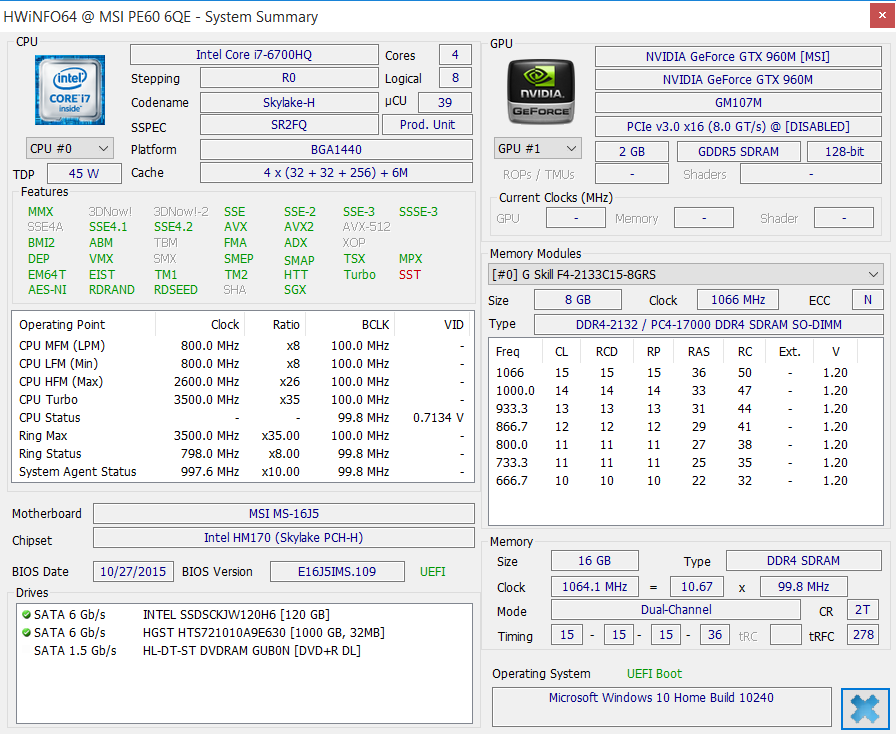
Performance
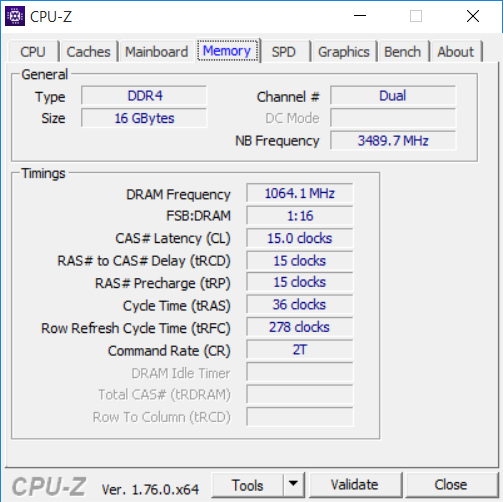
The current i7-6700HQ and GTX 960M GPU configuration is the only option for the PE60 6QE. Buyers can pre-configure RAM up to 16 GB and choose from a variety of M.2 SSDs and 2.5-inch secondary drives. It's a bit odd that there are no options to configure RAM up to 32 GB as each of the two DDR4 slots can support up to 16 GB.
Optimus comes standard for additional power savings with the integrated HD Graphics 530 GPU.
Processor
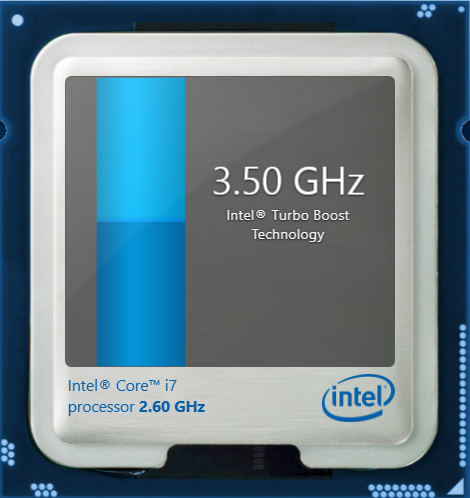
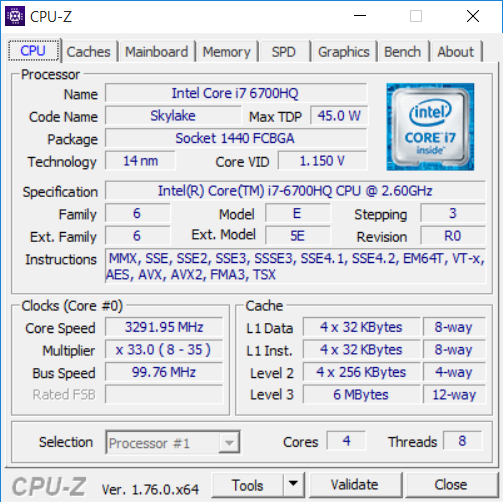
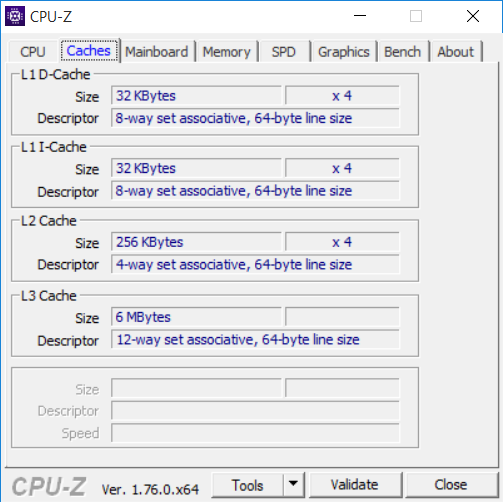
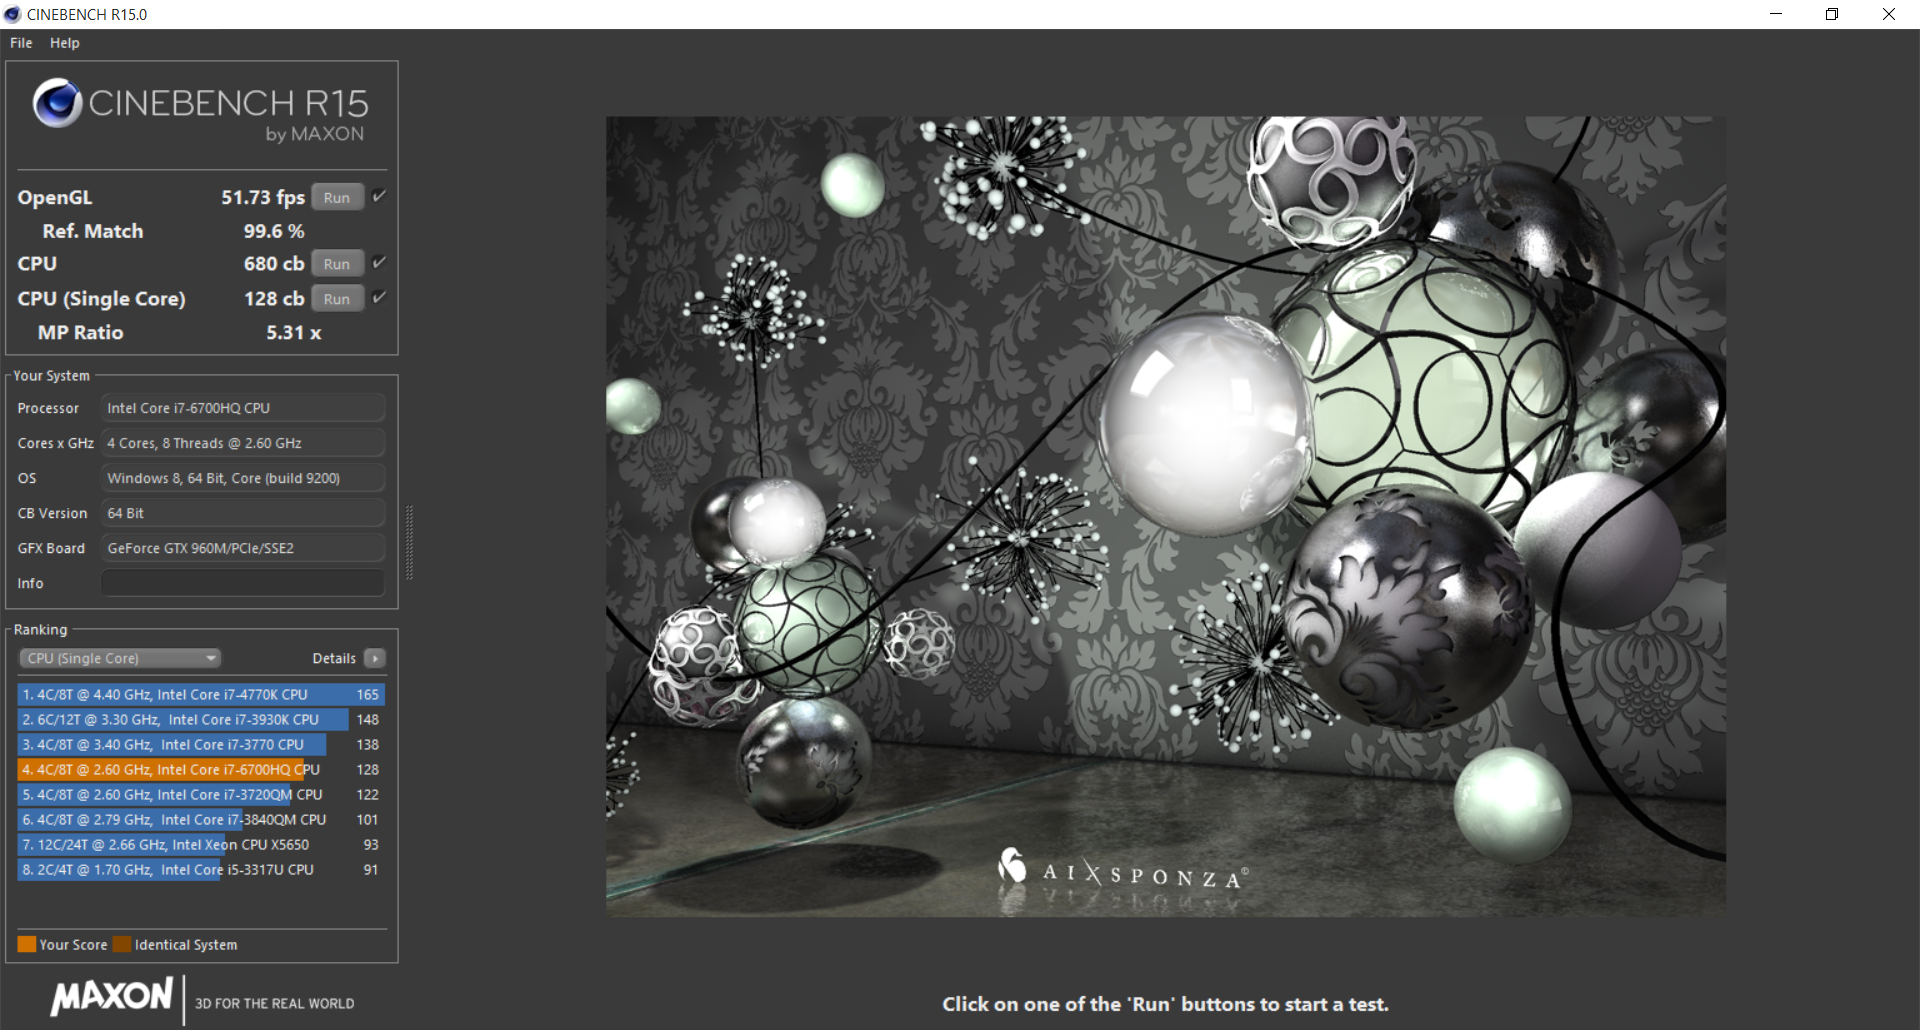
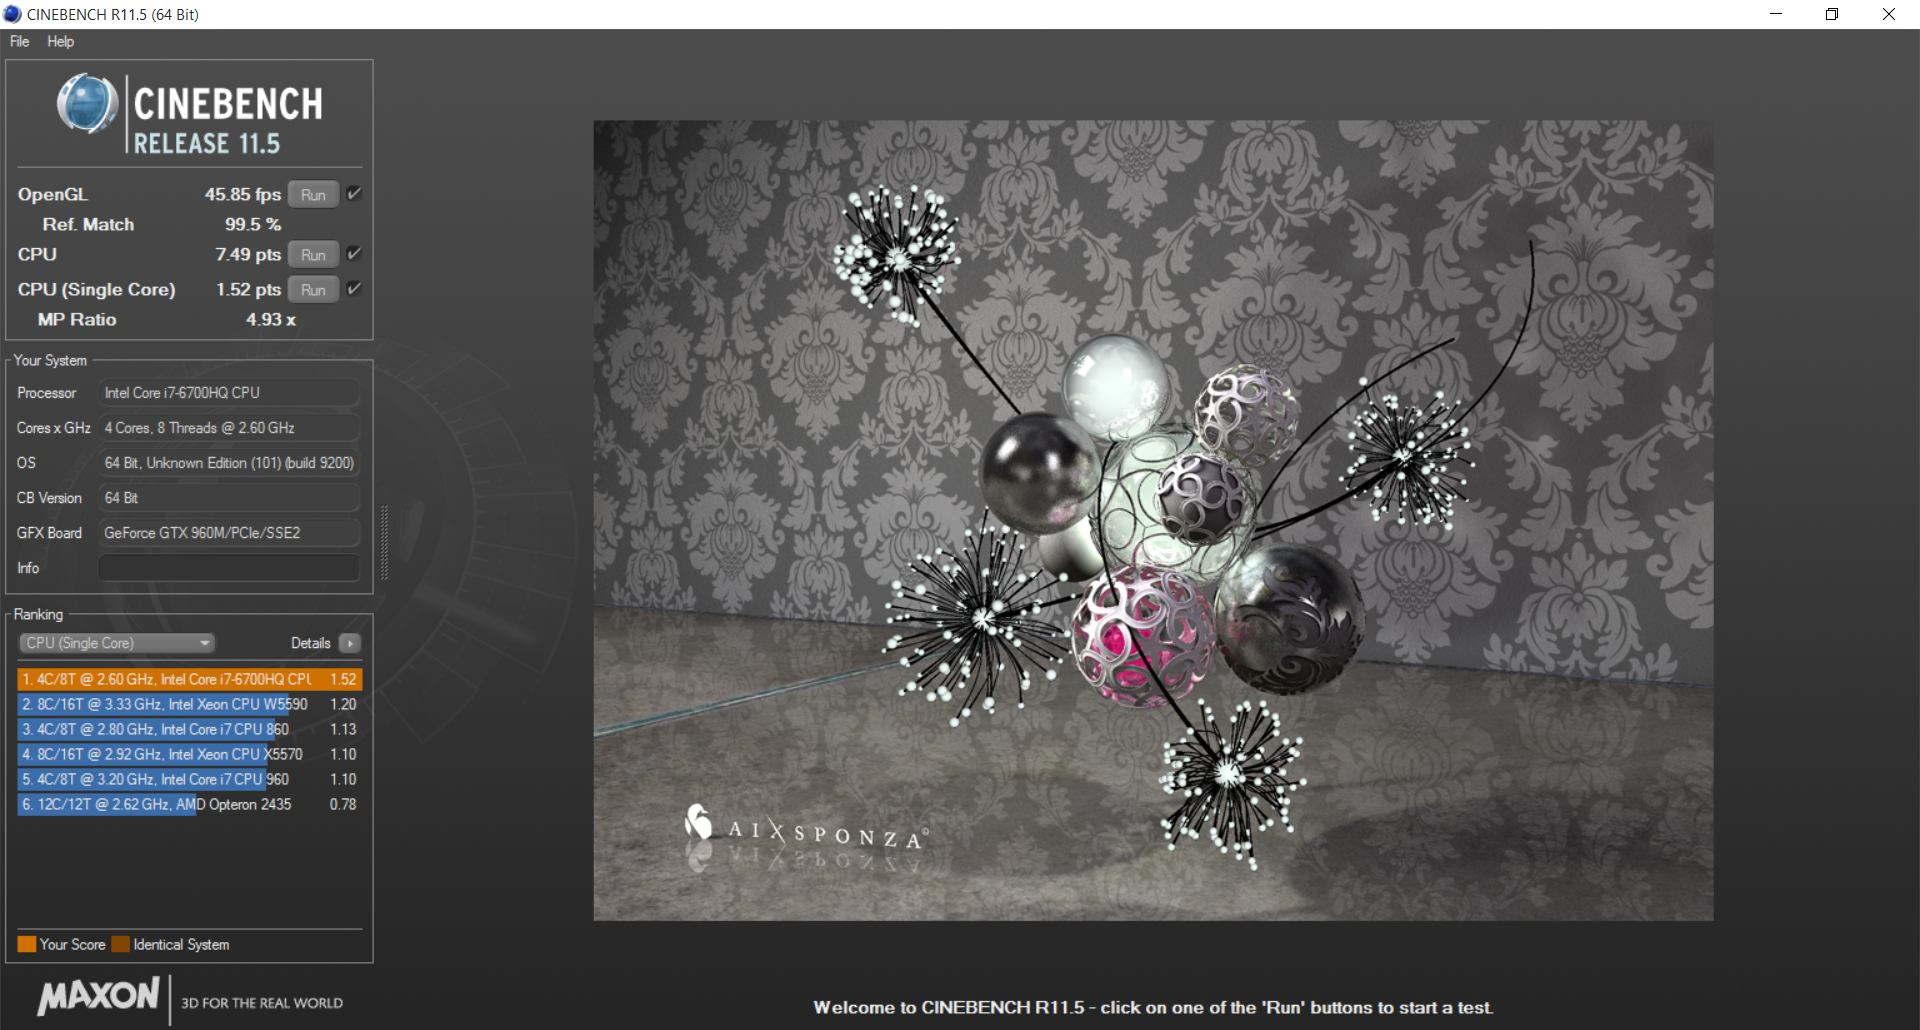
The quad-core Core i7-6700HQ is a common CPU of choice for the latest gaming notebooks. Higher-end and costlier gaming notebooks like the MSI GT80 or Eurocom DLX7 can be equipped with overclockable Core i7-6820HK or Core i7-6700K processors, respectively. The latter in particular can outperform the Core i7-6700HQ by 20 to 30 percent depending on the processing workload according to CineBench benchmarks. Otherwise, the i7-6700HQ isn't significantly faster than the previous generation Core i7-4700HQ or Core i7-5700HQ in terms of raw CPU performance.
See our dedicated CPU page on the Core i7-6700HQ for more technical information and comparisons.
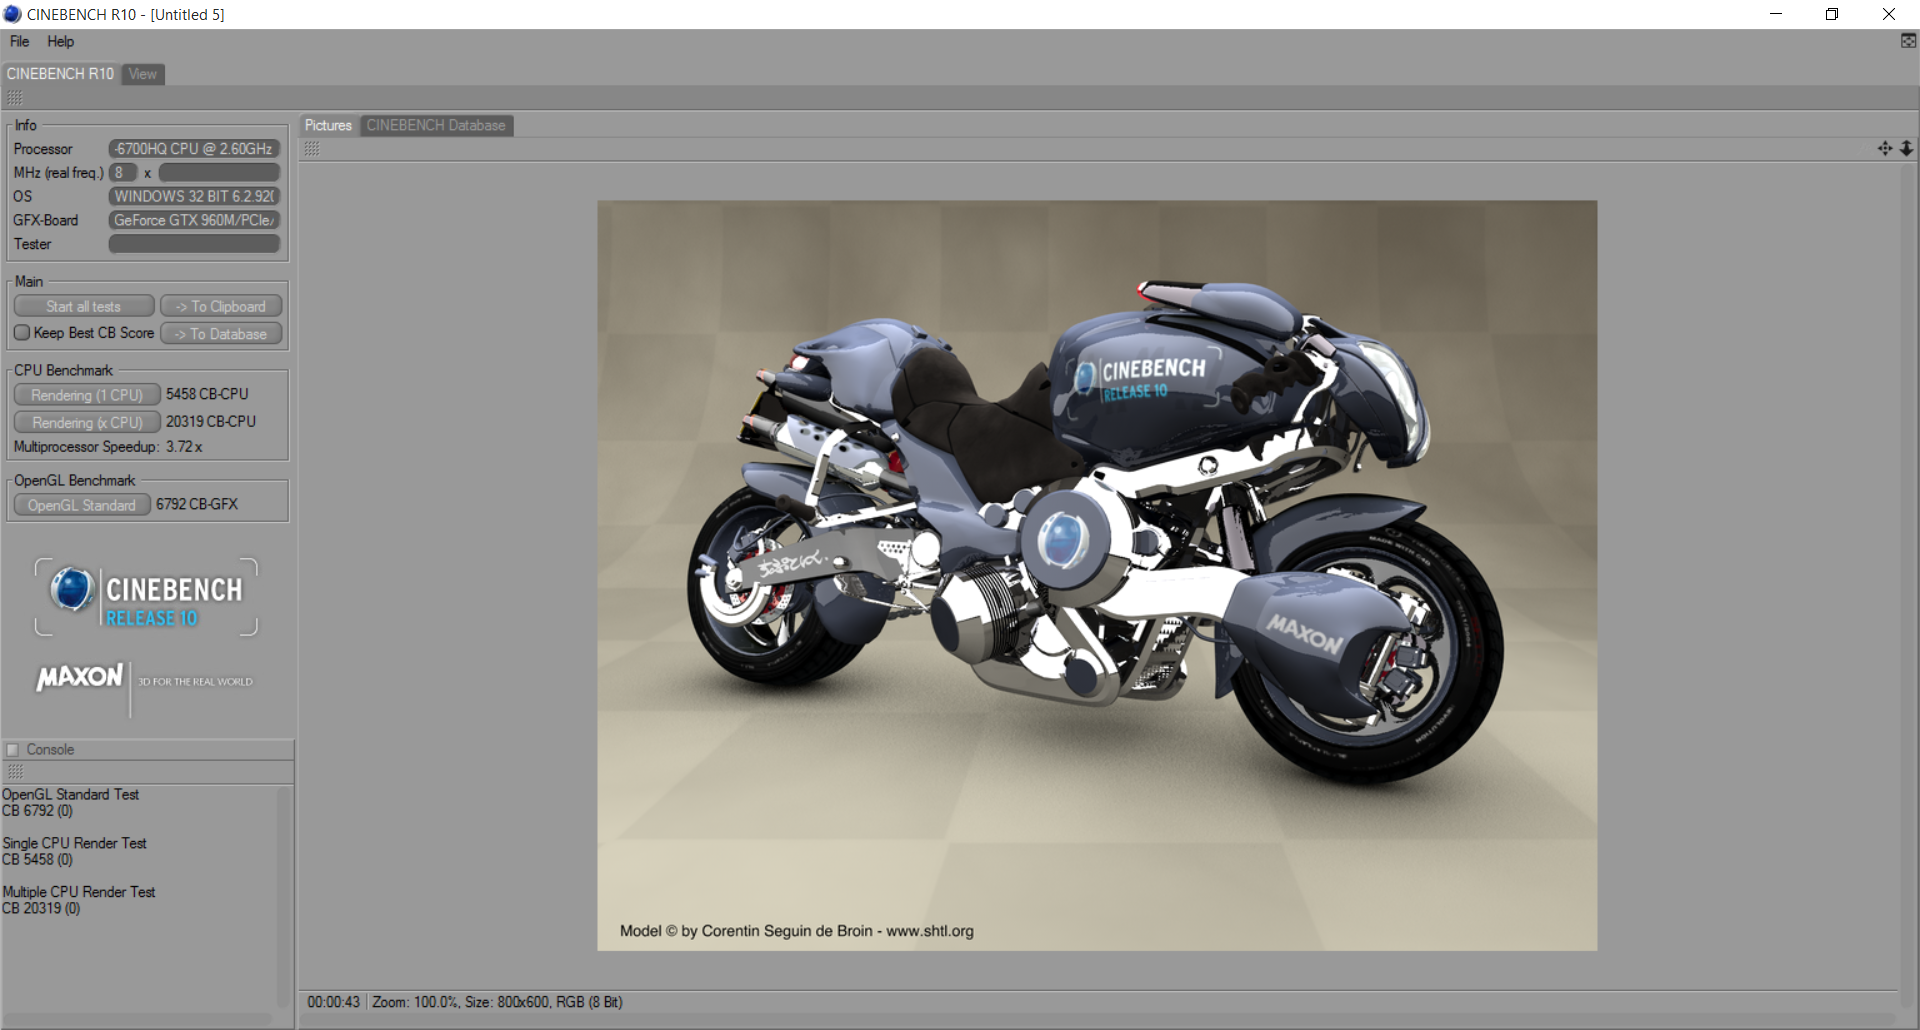
| Cinebench R10 | |
| Rendering Single 32Bit (sort by value) | |
| MSI PE60 6QE-056XUS | |
| DogHouse Systems Mobius SS | |
| Lenovo ThinkPad P70 | |
| Gigabyte P55 V4 | |
| Rendering Multiple CPUs 32Bit (sort by value) | |
| MSI PE60 6QE-056XUS | |
| DogHouse Systems Mobius SS | |
| Lenovo ThinkPad P70 | |
| Gigabyte P55 V4 | |
| wPrime 2.10 - 1024m (sort by value) | |
| MSI PE60 6QE-056XUS | |
| DogHouse Systems Mobius SS | |
| Lenovo ThinkPad P70 | |
| Gigabyte P55 V4 | |
| Super Pi Mod 1.5 XS 32M - 32M (sort by value) | |
| MSI PE60 6QE-056XUS | |
| DogHouse Systems Mobius SS | |
| Lenovo ThinkPad P70 | |
| Gigabyte P55 V4 | |
* ... smaller is better
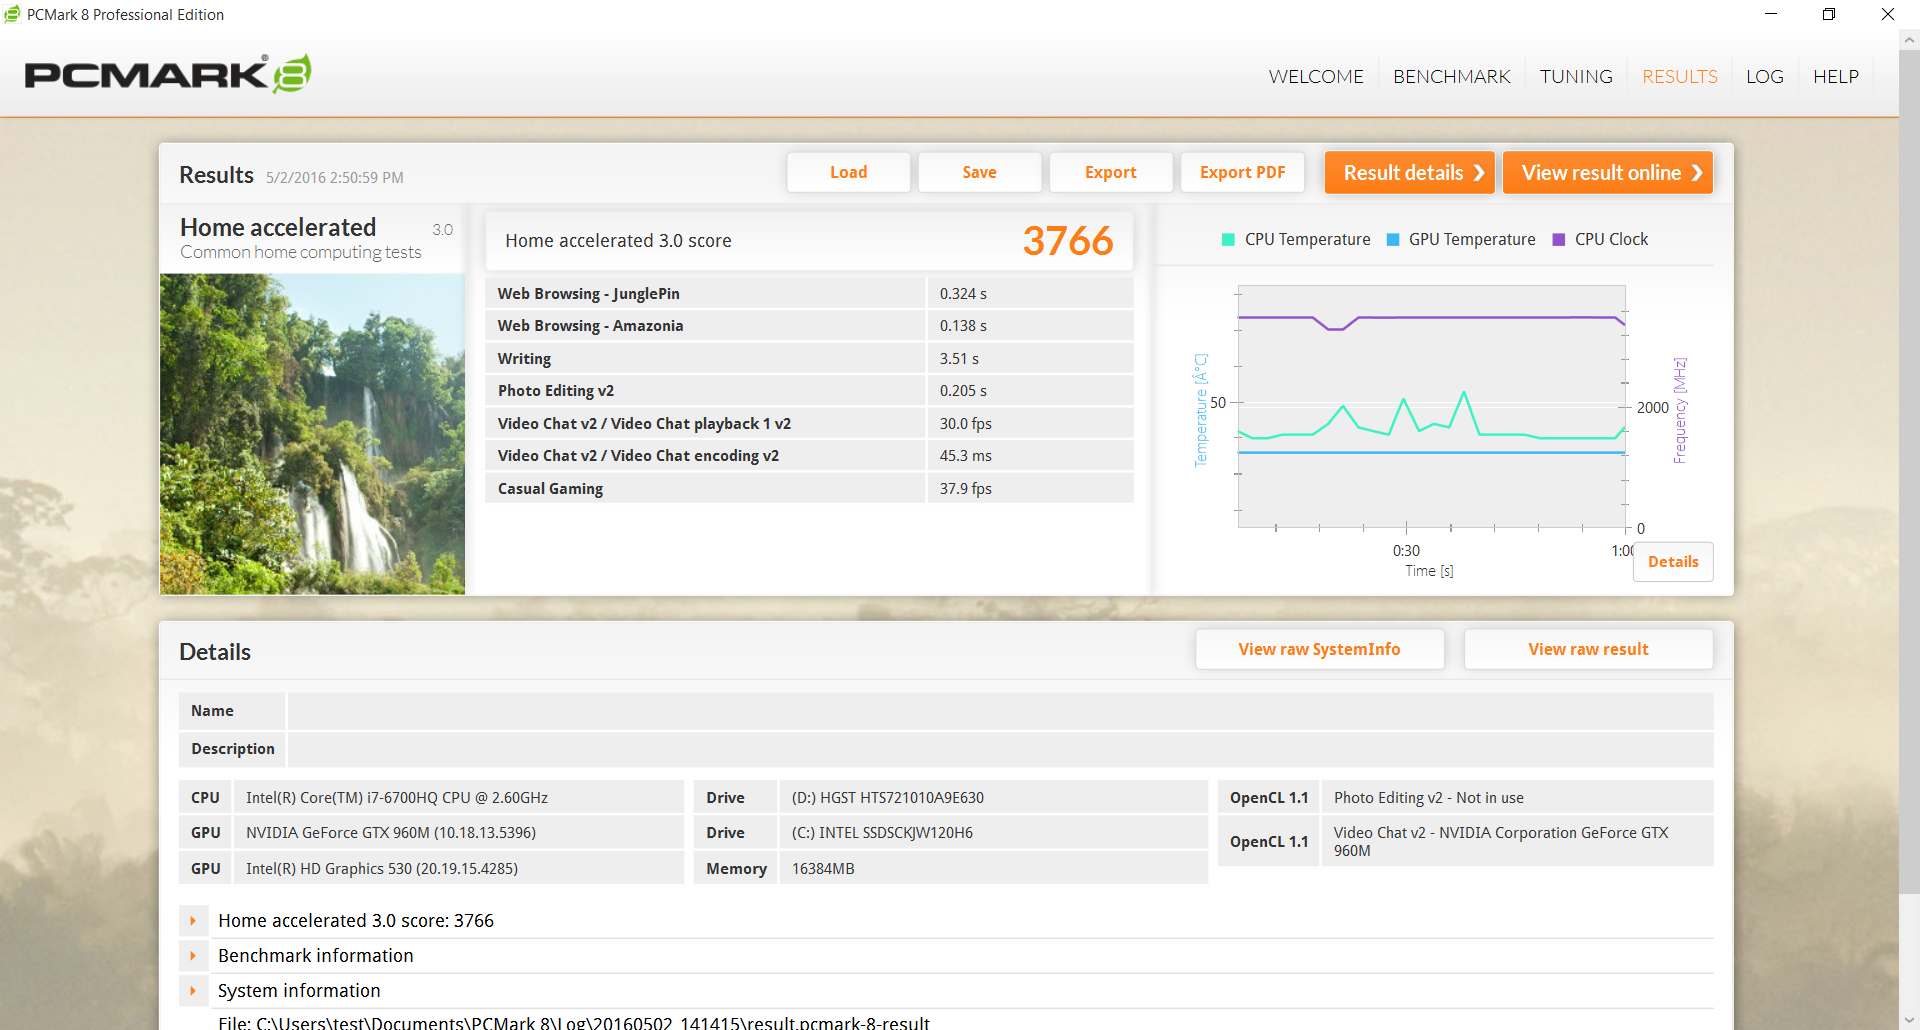
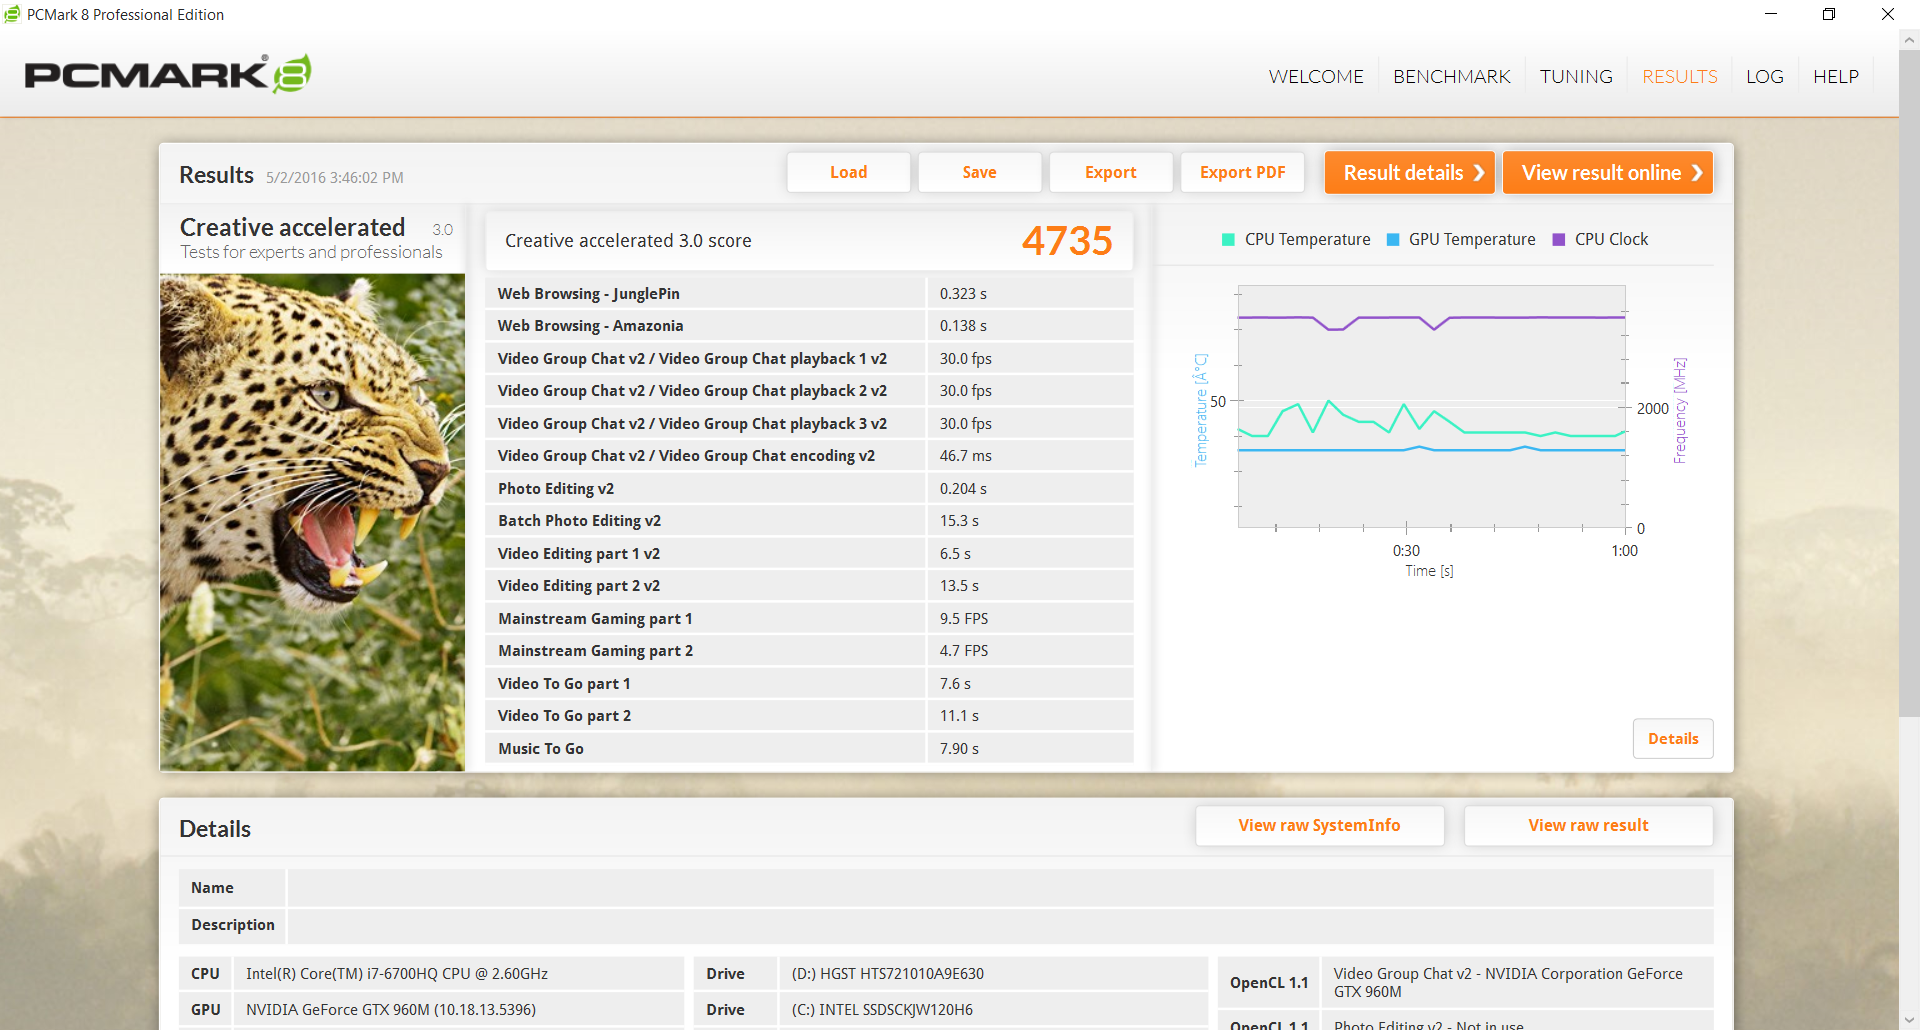
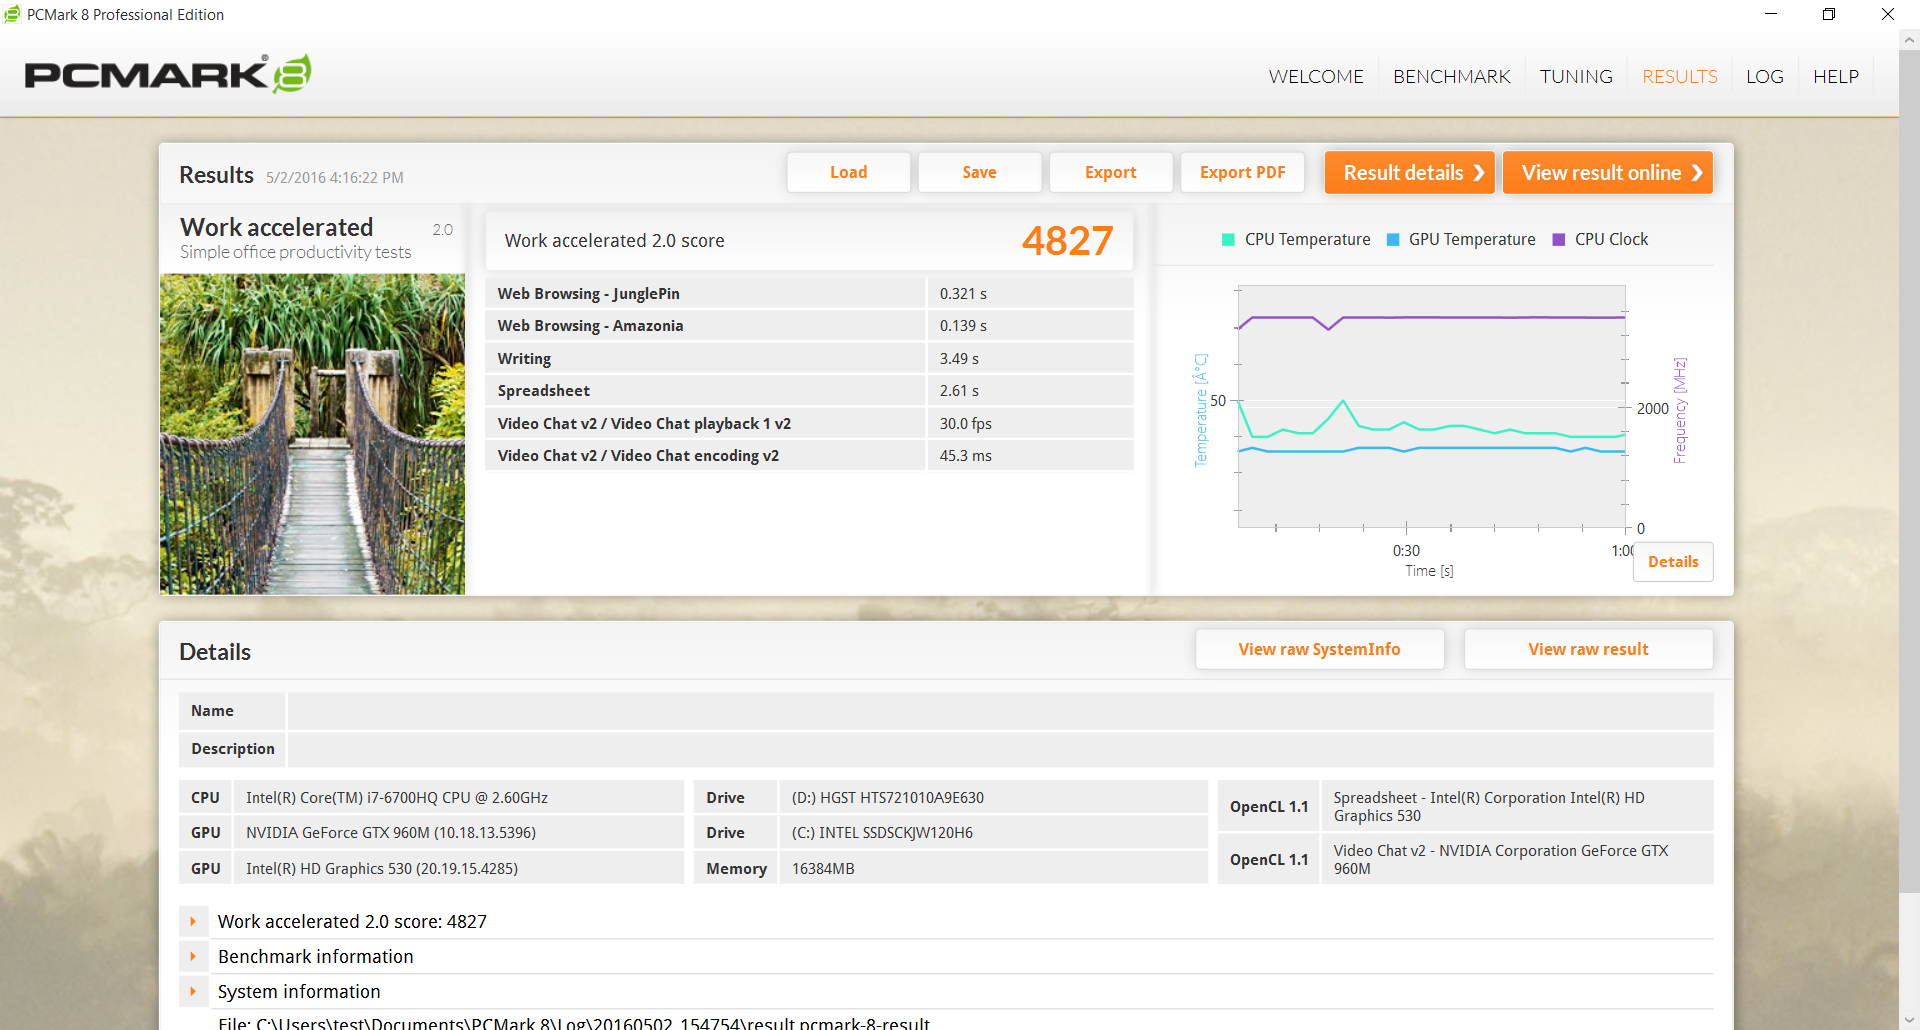
System Performance
PCMark benchmarks rank our MSI in the same ballpark as other systems sporting the same CPU and GPU like the Ideapad Y700 and XPS 15 9550. The newer SKU also comes out ahead of the older PE60 2QE by about 15 percent in PCMark 8 Home and Work.
Subjectively, the notebook performs swiftly and without any software or hardware issues specific to the test unit.
| PCMark 8 | |
| Home Score Accelerated v2 (sort by value) | |
| MSI PE60 6QE-056XUS | |
| MSI PE60-2QEi581 | |
| Lenovo Ideapad Y700 15ISK 80NW | |
| Dell XPS 15 9550 i7 FHD | |
| Asus G501VW-FY081T | |
| Work Score Accelerated v2 (sort by value) | |
| MSI PE60 6QE-056XUS | |
| MSI PE60-2QEi581 | |
| Lenovo Ideapad Y700 15ISK 80NW | |
| Dell XPS 15 9550 i7 FHD | |
| Asus G501VW-FY081T | |
| Creative Score Accelerated v2 (sort by value) | |
| MSI PE60 6QE-056XUS | |
| Lenovo Ideapad Y700 15ISK 80NW | |
| Dell XPS 15 9550 i7 FHD | |
| Asus G501VW-FY081T | |
| PCMark 8 Home Score Accelerated v2 | 3766 points | |
| PCMark 8 Creative Score Accelerated v2 | 4735 points | |
| PCMark 8 Work Score Accelerated v2 | 4827 points | |
Help | ||
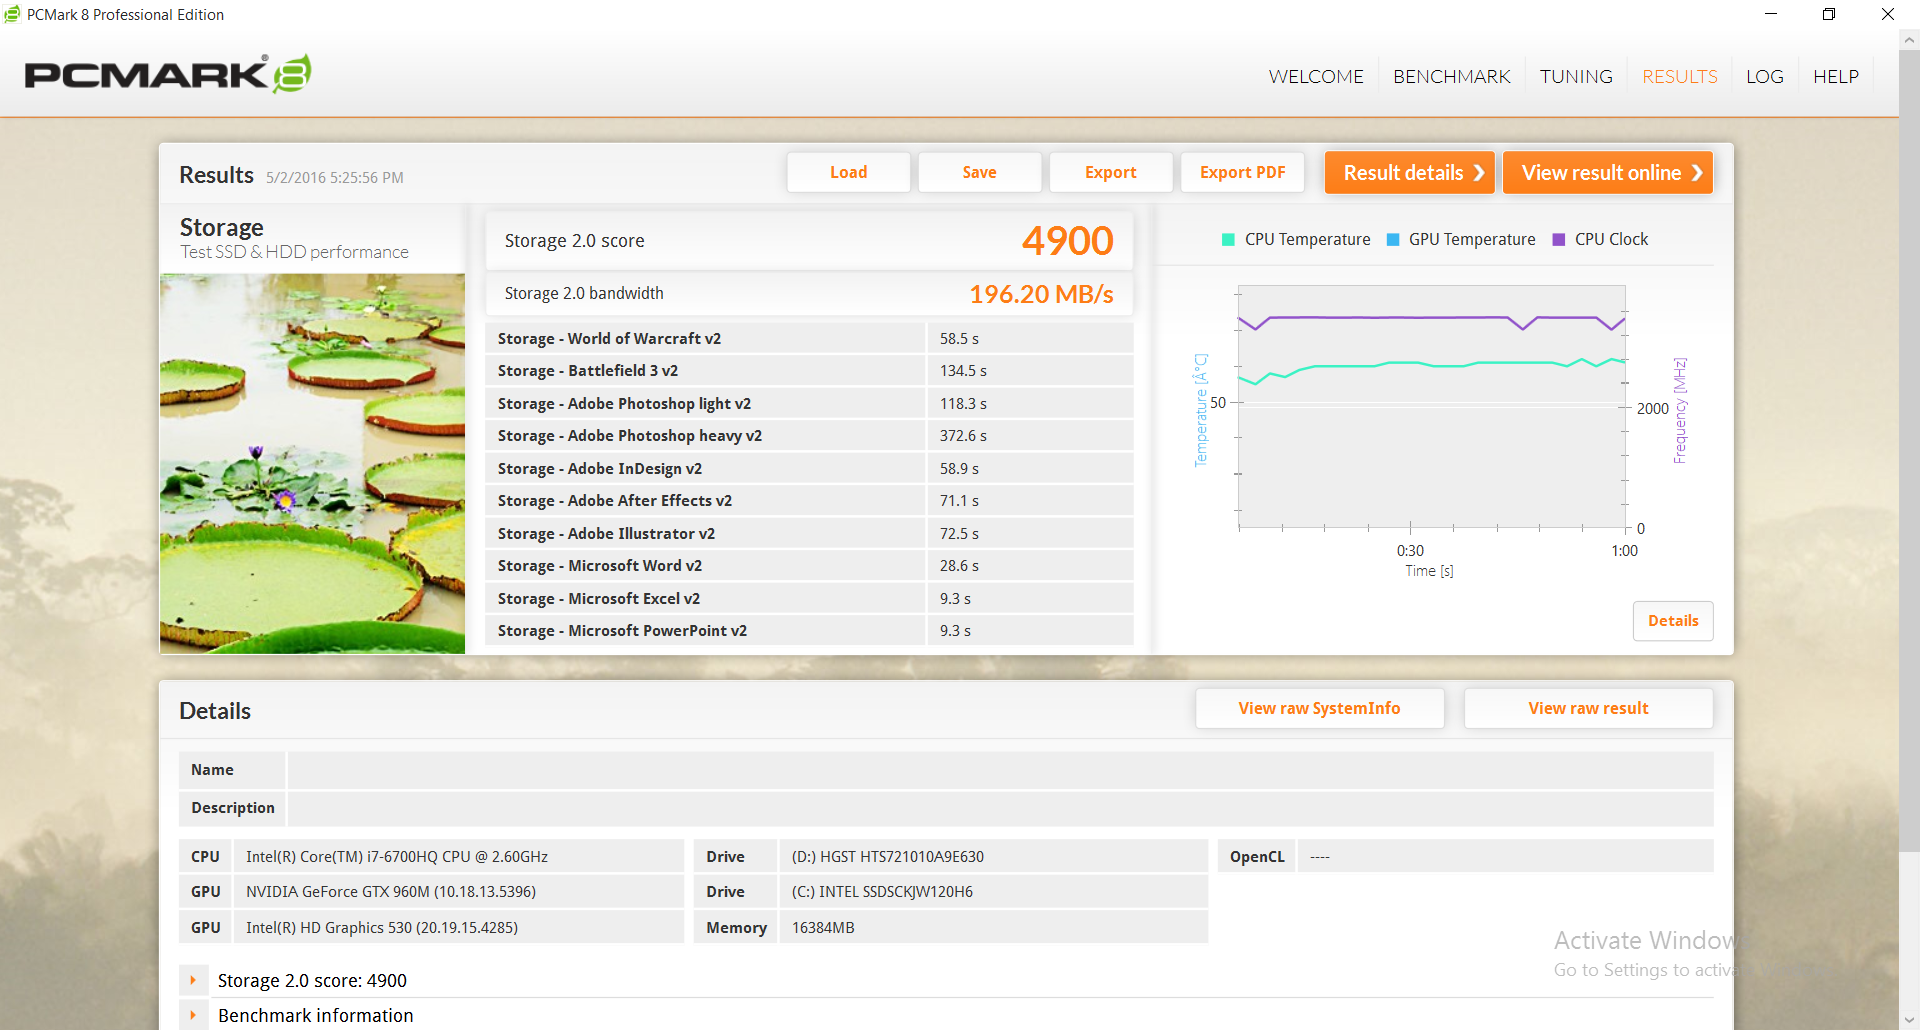
Storage Devices
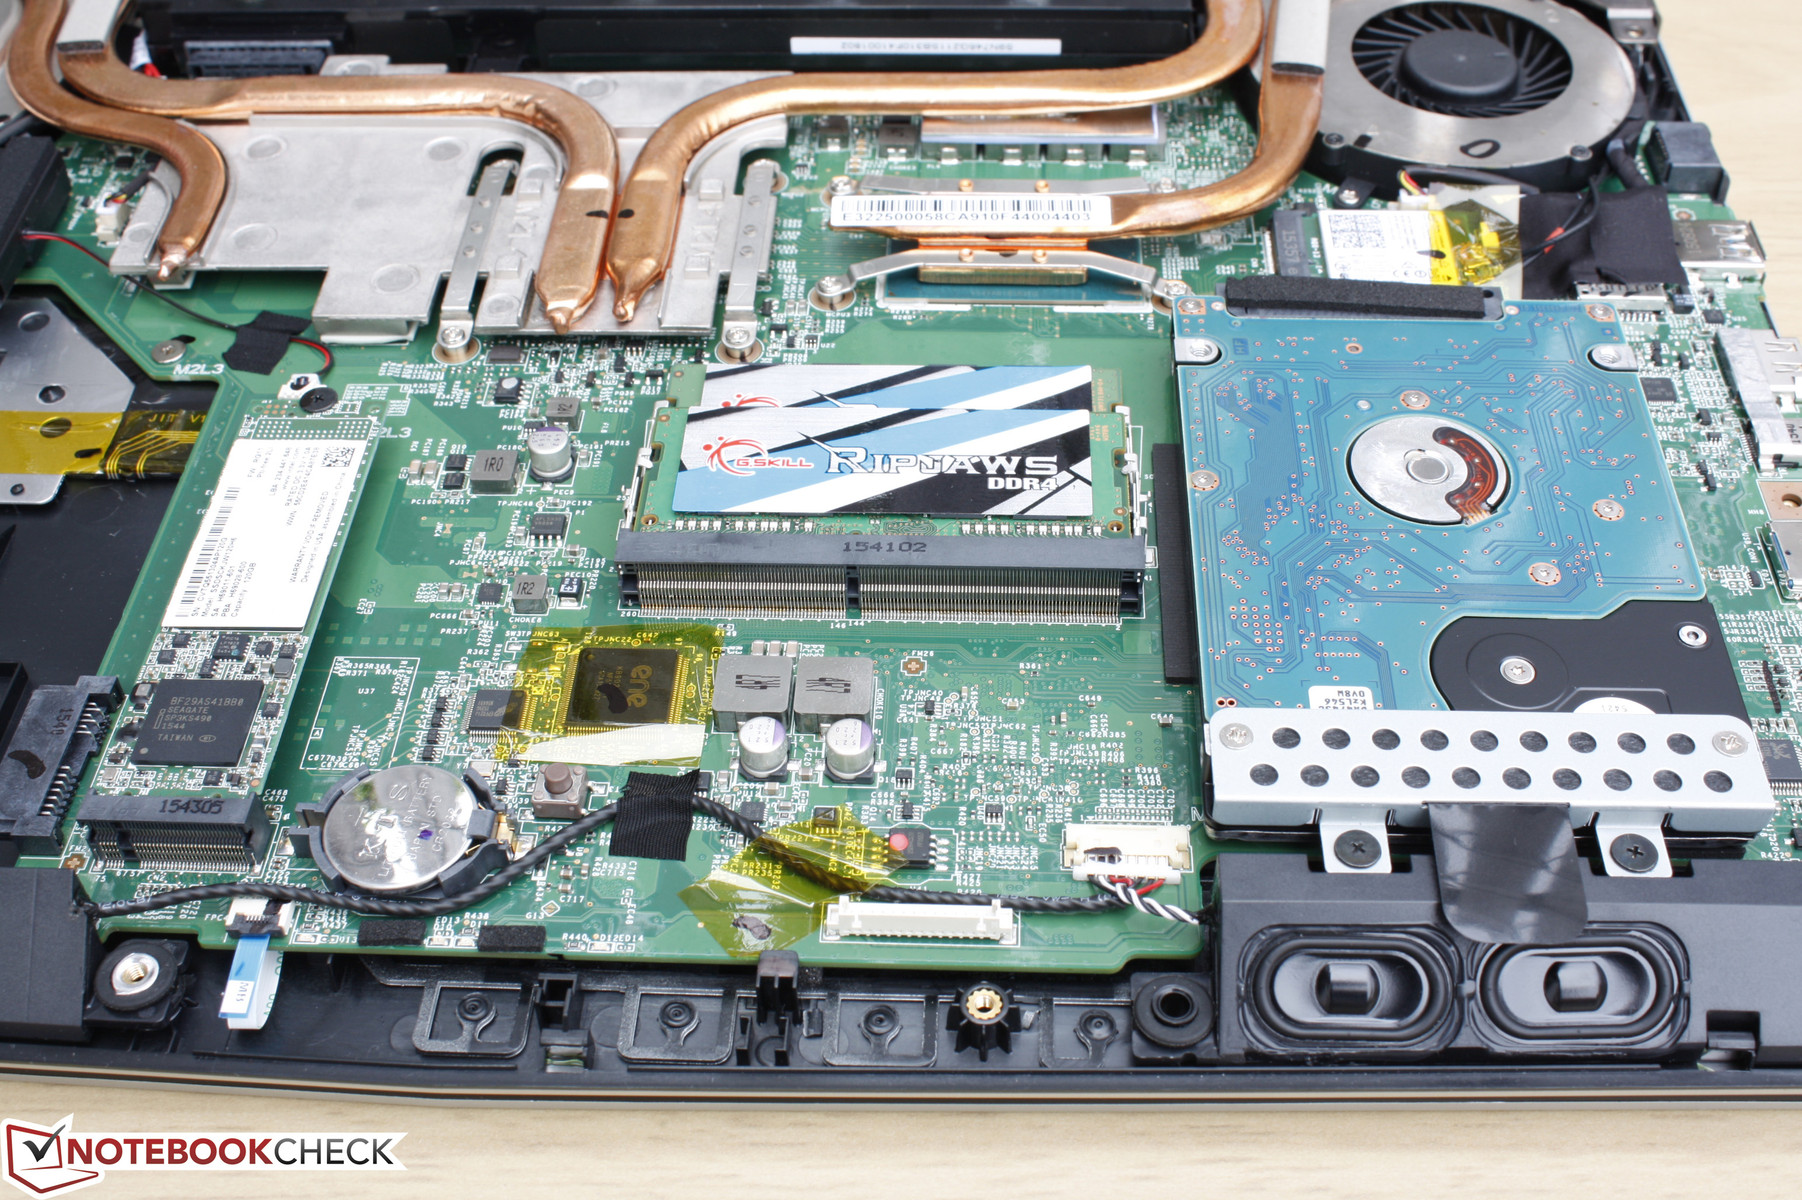
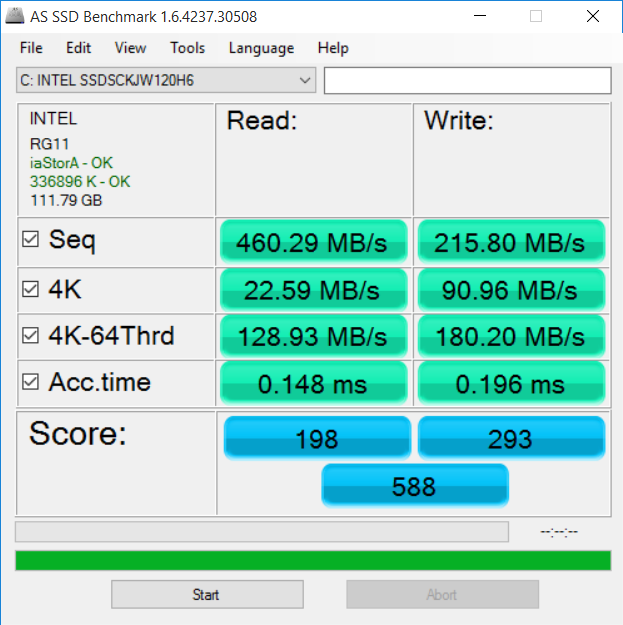
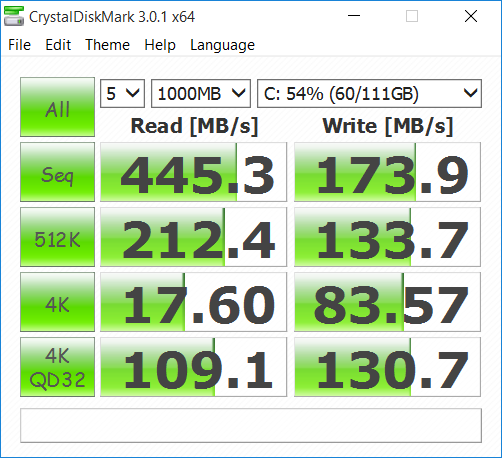
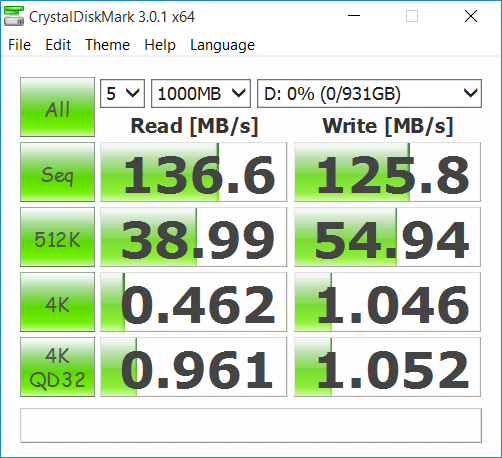
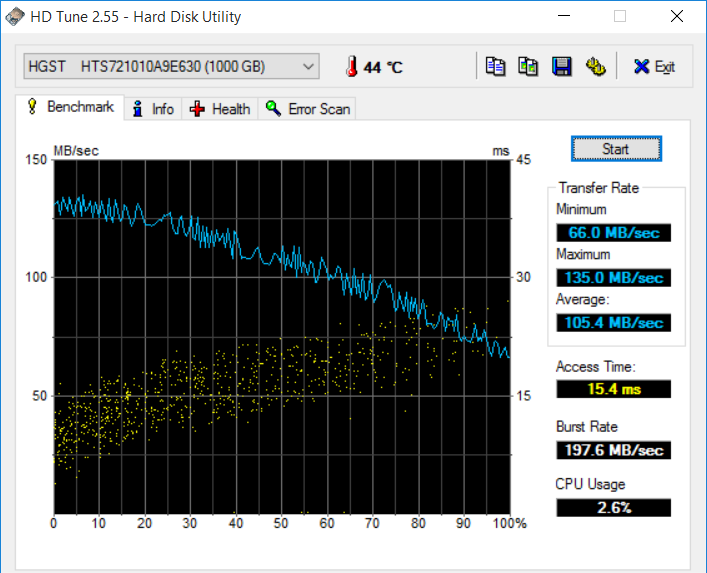
A total of two storage bays are available through the M.2 2280 slot and 2.5-inch SATA III bay. Our primary Intel SSD 535 drive performs favorably against the Samsung CM871 drive in our Asus G501. Nonetheless, it is limited to SATA III speeds and the system does not support the growing NVMe controller. Pricier systems that support NVMe SSDs trounce the PE60 in terms of storage performance such as the Asus UX501 or Dell XPS 15 9550. Meanwhile, the secondary 1 TB HGST drive shows an excellent average transfer rate of 105.4 MB/s according to HD Tune, which is where we expect a 7200 RPM HDD to perform. The notebook accepts both 7 mm and 9.5 mm drives.
See our growing list of HDDs and SSDs for more benchmarks and comparisons.
| MSI PE60 6QE-056XUS GeForce GTX 960M, 6700HQ, Intel SSD 535 SSDSCKJW120H6 | MSI PE60-2QEi78H11 SSD/4720HQ GeForce GTX 960M, 4720HQ, Toshiba HG6 THNSNJ128G8NU | HP ZBook 15 G3 Quadro M2000M, E3-1505M v5, Samsung SM951 MZVPV512HDGL m.2 PCI-e | Asus G501VW-FY081T GeForce GTX 960M, 6700HQ, Samsung CM871 MZNLF128HCHP | Dell XPS 15 9550 i7 FHD GeForce GTX 960M, 6700HQ, Samsung PM951 NVMe 512 GB | |
|---|---|---|---|---|---|
| AS SSD | 28% | 268% | -44% | 211% | |
| Copy Game MB/s (MB/s) | 307.1 | 261.9 -15% | 1023 233% | 141.5 -54% | 805 162% |
| Copy Program MB/s (MB/s) | 187.5 | 154.9 -17% | 585 212% | 99.9 -47% | 325.3 73% |
| Copy ISO MB/s (MB/s) | 280 | 353.4 26% | 1494 434% | 163 -42% | 1127 303% |
| Score Total (Points) | 588 | 865 47% | 2495 324% | 269 -54% | 2410 310% |
| Score Write (Points) | 293 | 207 -29% | 548 87% | 63 -78% | 675 130% |
| Score Read (Points) | 198 | 434 119% | 1302 558% | 152 -23% | 1180 496% |
| Access Time Write * (ms) | 0.196 | 0.056 71% | 0.024 88% | 0.225 -15% | 0.035 82% |
| Access Time Read * (ms) | 0.148 | 0.191 -29% | 0.031 79% | 0.207 -40% | 0.038 74% |
| 4K-64 Write (MB/s) | 180.2 | 99.9 -45% | 257 43% | 19.4 -89% | 513 185% |
| 4K-64 Read (MB/s) | 128.9 | 362.6 181% | 1066 727% | 87.6 -32% | 990 668% |
| 4K Write (MB/s) | 91 | 59.5 -35% | 173.1 90% | 30.66 -66% | 105.4 16% |
| 4K Read (MB/s) | 22.59 | 19.79 -12% | 52.5 132% | 13.87 -39% | 31.86 41% |
| Seq Write (MB/s) | 215.9 | 473.6 119% | 1181 447% | 126.9 -41% | 570 164% |
| Seq Read (MB/s) | 460.3 | 514 12% | 1841 300% | 504 9% | 1579 243% |
* ... smaller is better

GPU Performance
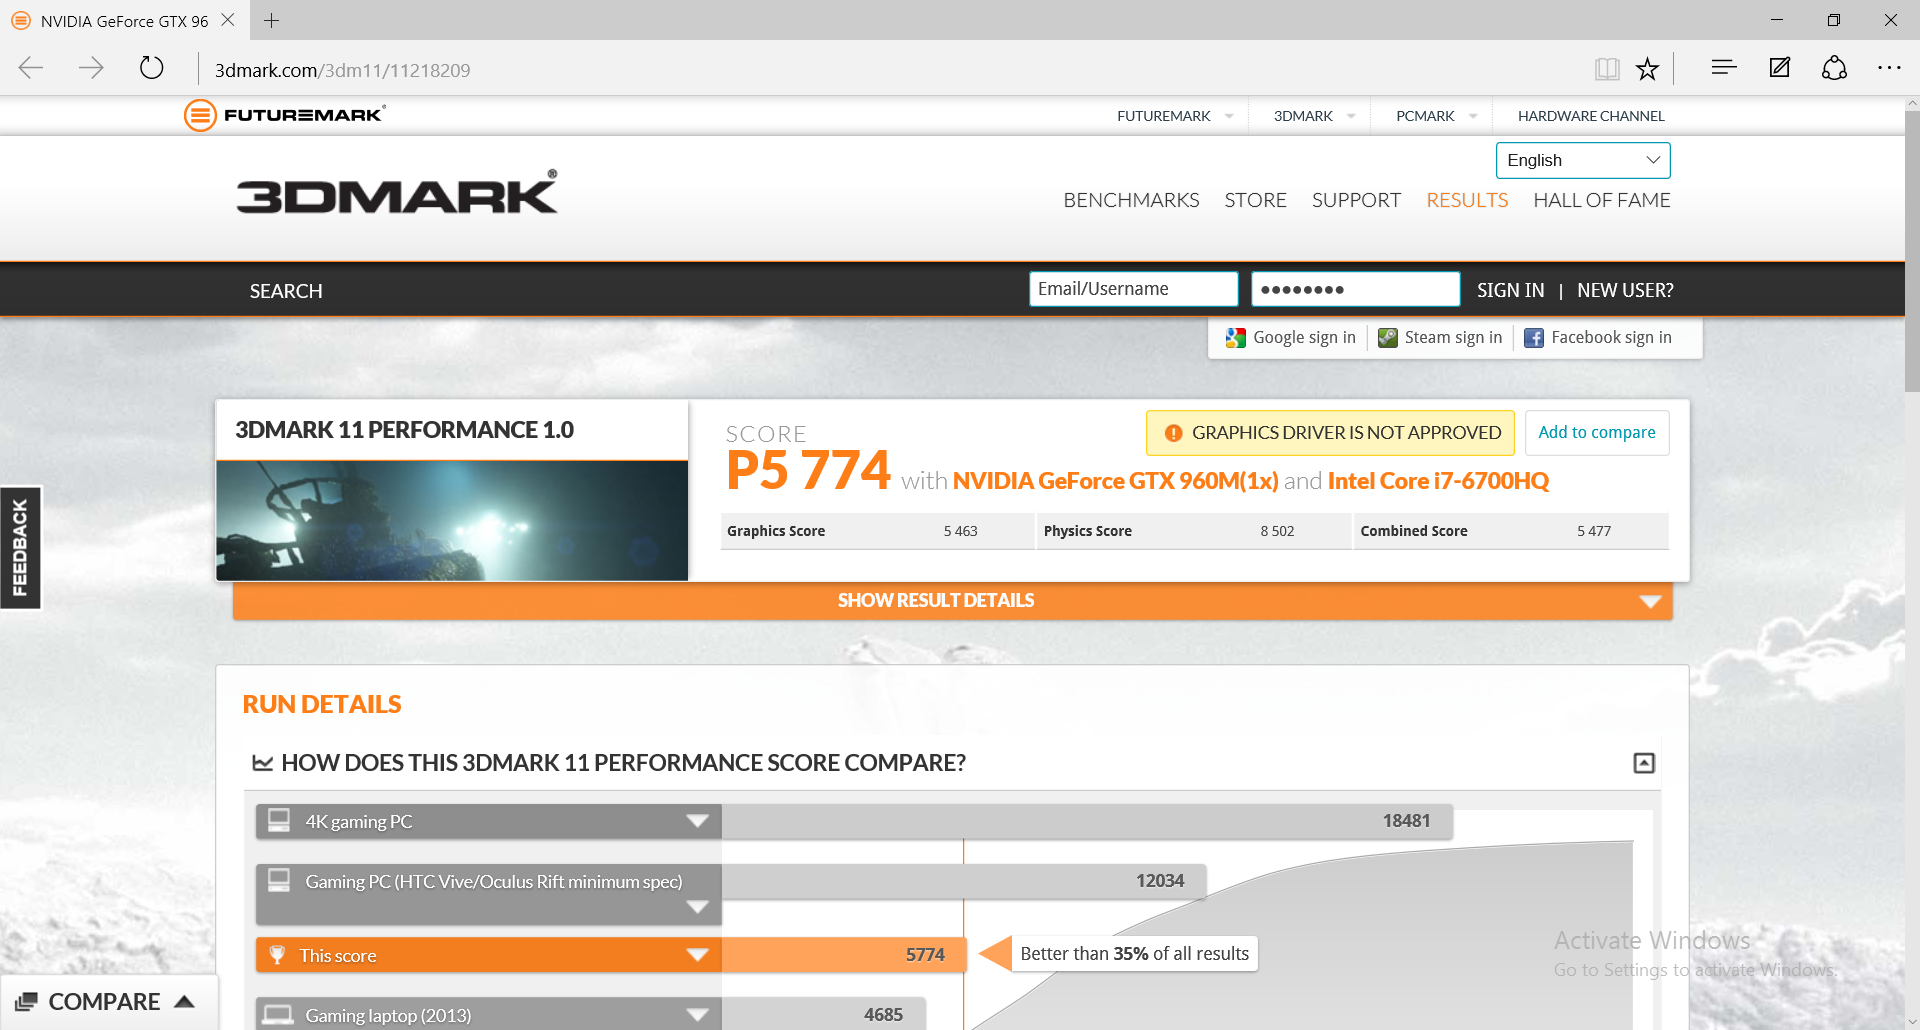
The GTX 960M GPU performs similarly to the one in the Asus G501, so the MSI system is not being artificially hindered in terms of graphics power. 3DMark benchmarks place the GPU roughly 20 percent ahead of the GTX 950M while the more powerful and demanding GTX 970M is ahead by 60 to 70 percent.
| 3DMark 11 | |
| 1280x720 Performance (sort by value) | |
| MSI PE60 6QE-056XUS | |
| Gigabyte P55W v5 | |
| Asus G501VW-FY081T | |
| MSI PE60 2QD | |
| Acer TravelMate P278-MG-76L2 | |
| 1280x720 Performance Combined (sort by value) | |
| MSI PE60 6QE-056XUS | |
| Gigabyte P55W v5 | |
| Asus G501VW-FY081T | |
| MSI PE60 2QD | |
| Acer TravelMate P278-MG-76L2 | |
| 1280x720 Performance Physics (sort by value) | |
| MSI PE60 6QE-056XUS | |
| Gigabyte P55W v5 | |
| Asus G501VW-FY081T | |
| MSI PE60 2QD | |
| Acer TravelMate P278-MG-76L2 | |
| 1280x720 Performance GPU (sort by value) | |
| MSI PE60 6QE-056XUS | |
| Gigabyte P55W v5 | |
| Asus G501VW-FY081T | |
| MSI PE60 2QD | |
| Acer TravelMate P278-MG-76L2 | |
| 3DMark | |
| 1920x1080 Fire Strike Score (sort by value) | |
| MSI PE60 6QE-056XUS | |
| Gigabyte P55W v5 | |
| Asus G501VW-FY081T | |
| MSI PE60 2QD | |
| Acer TravelMate P278-MG-76L2 | |
| 1920x1080 Fire Strike Combined (sort by value) | |
| MSI PE60 6QE-056XUS | |
| Gigabyte P55W v5 | |
| Asus G501VW-FY081T | |
| MSI PE60 2QD | |
| Acer TravelMate P278-MG-76L2 | |
| 1920x1080 Fire Strike Graphics (sort by value) | |
| MSI PE60 6QE-056XUS | |
| Gigabyte P55W v5 | |
| Asus G501VW-FY081T | |
| MSI PE60 2QD | |
| Acer TravelMate P278-MG-76L2 | |
| Fire Strike Extreme Physics (sort by value) | |
| MSI PE60 6QE-056XUS | |
| Acer TravelMate P278-MG-76L2 | |
| 3DMark 11 Performance | 5774 points | |
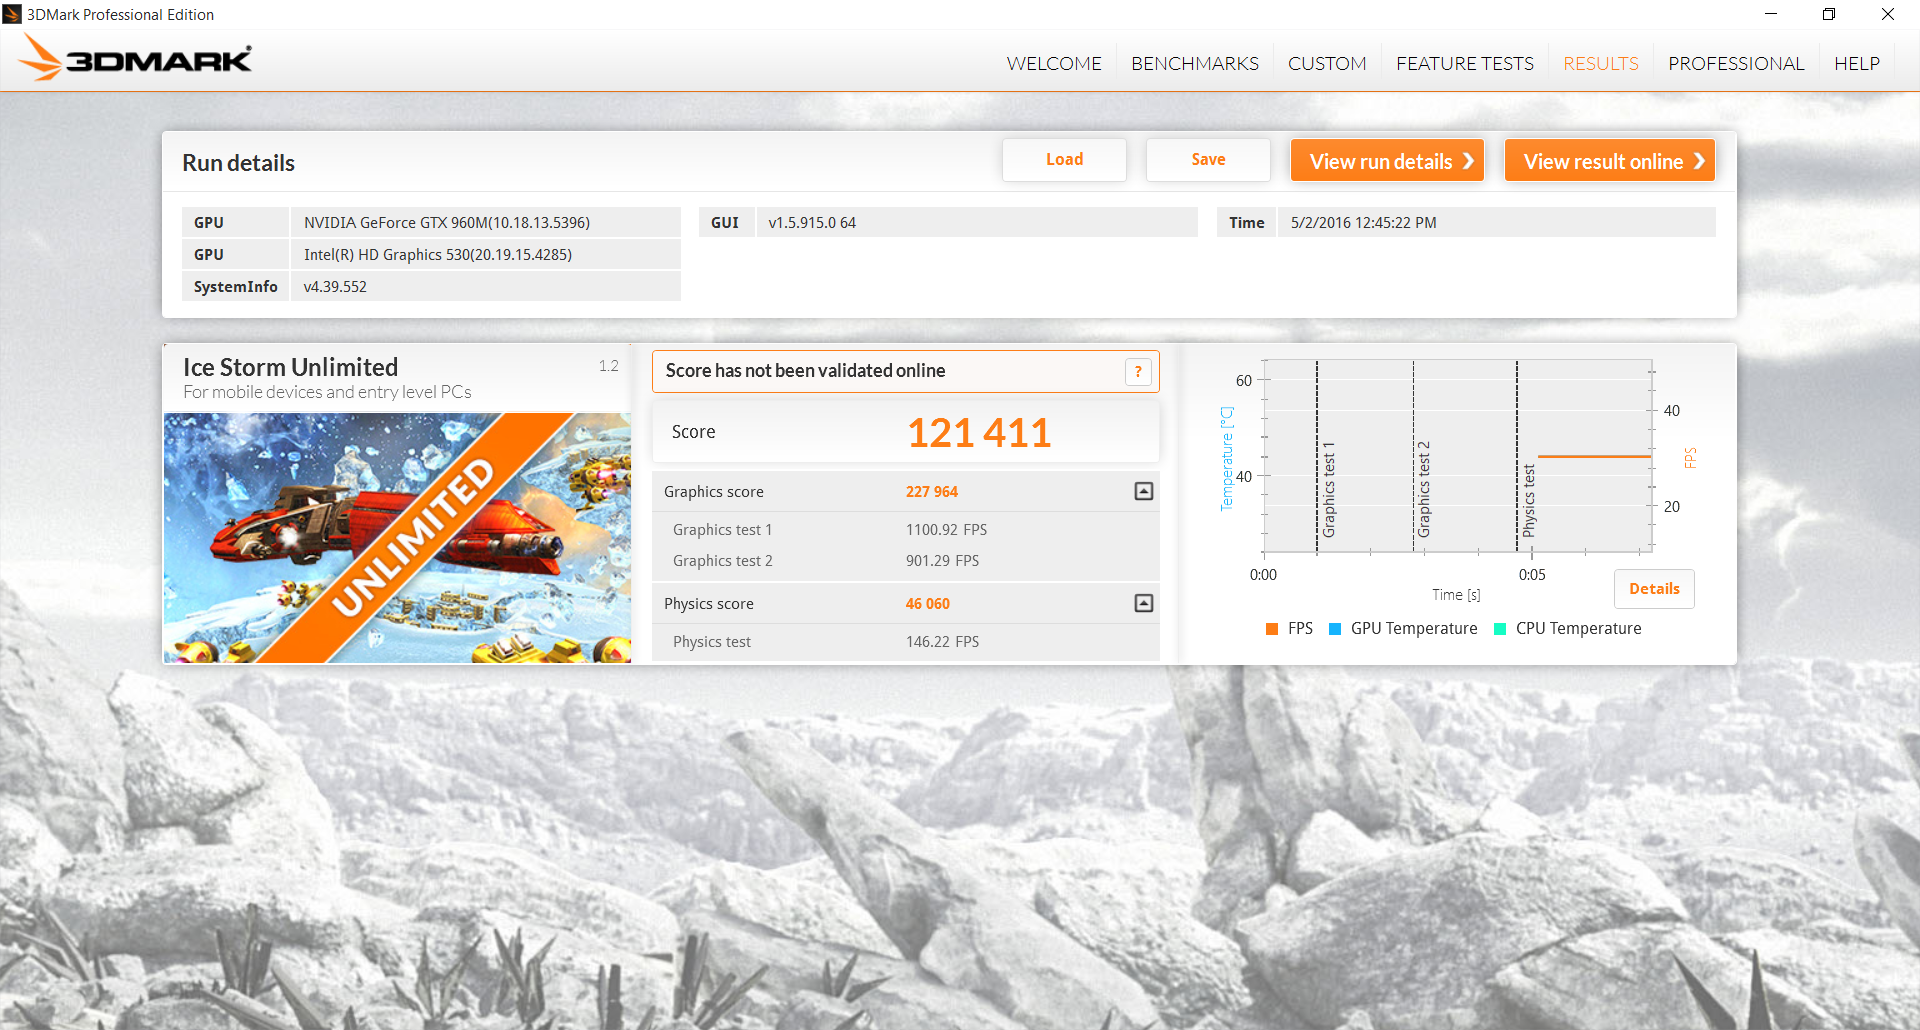
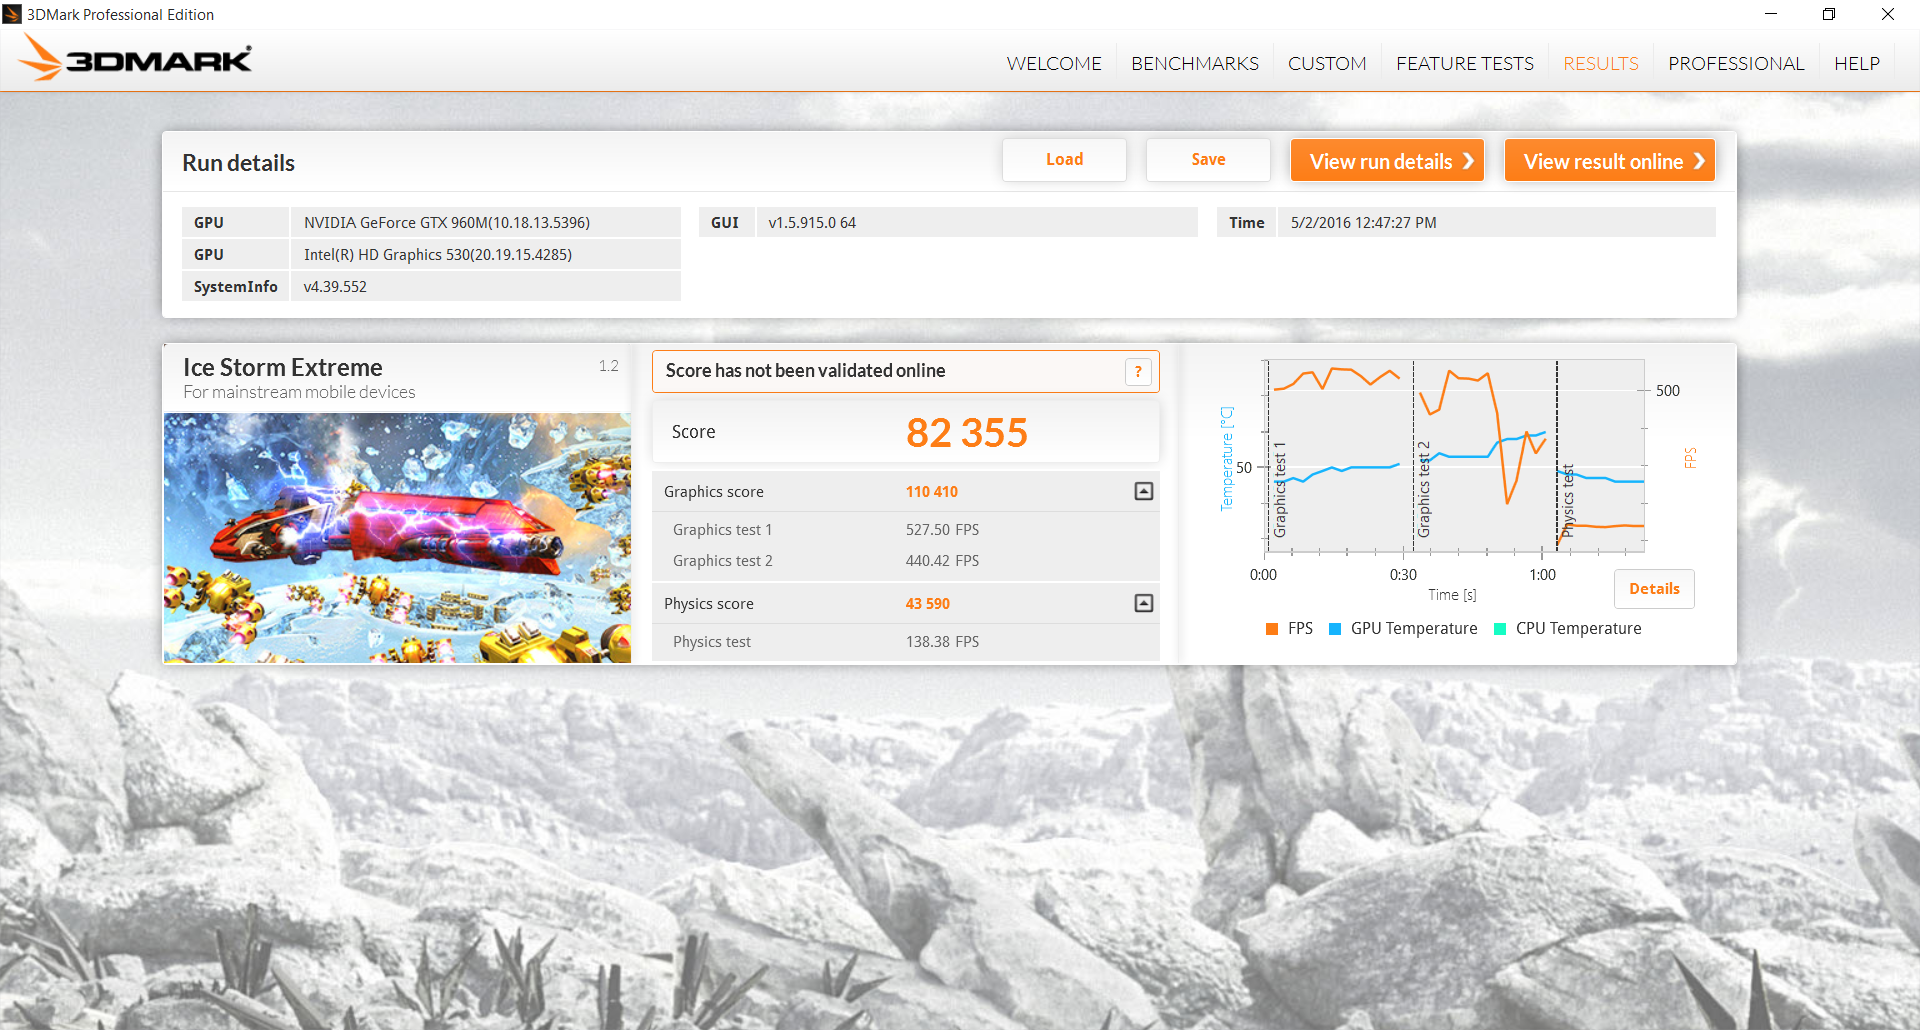
| 3DMark Ice Storm Standard Score | 85812 points | |
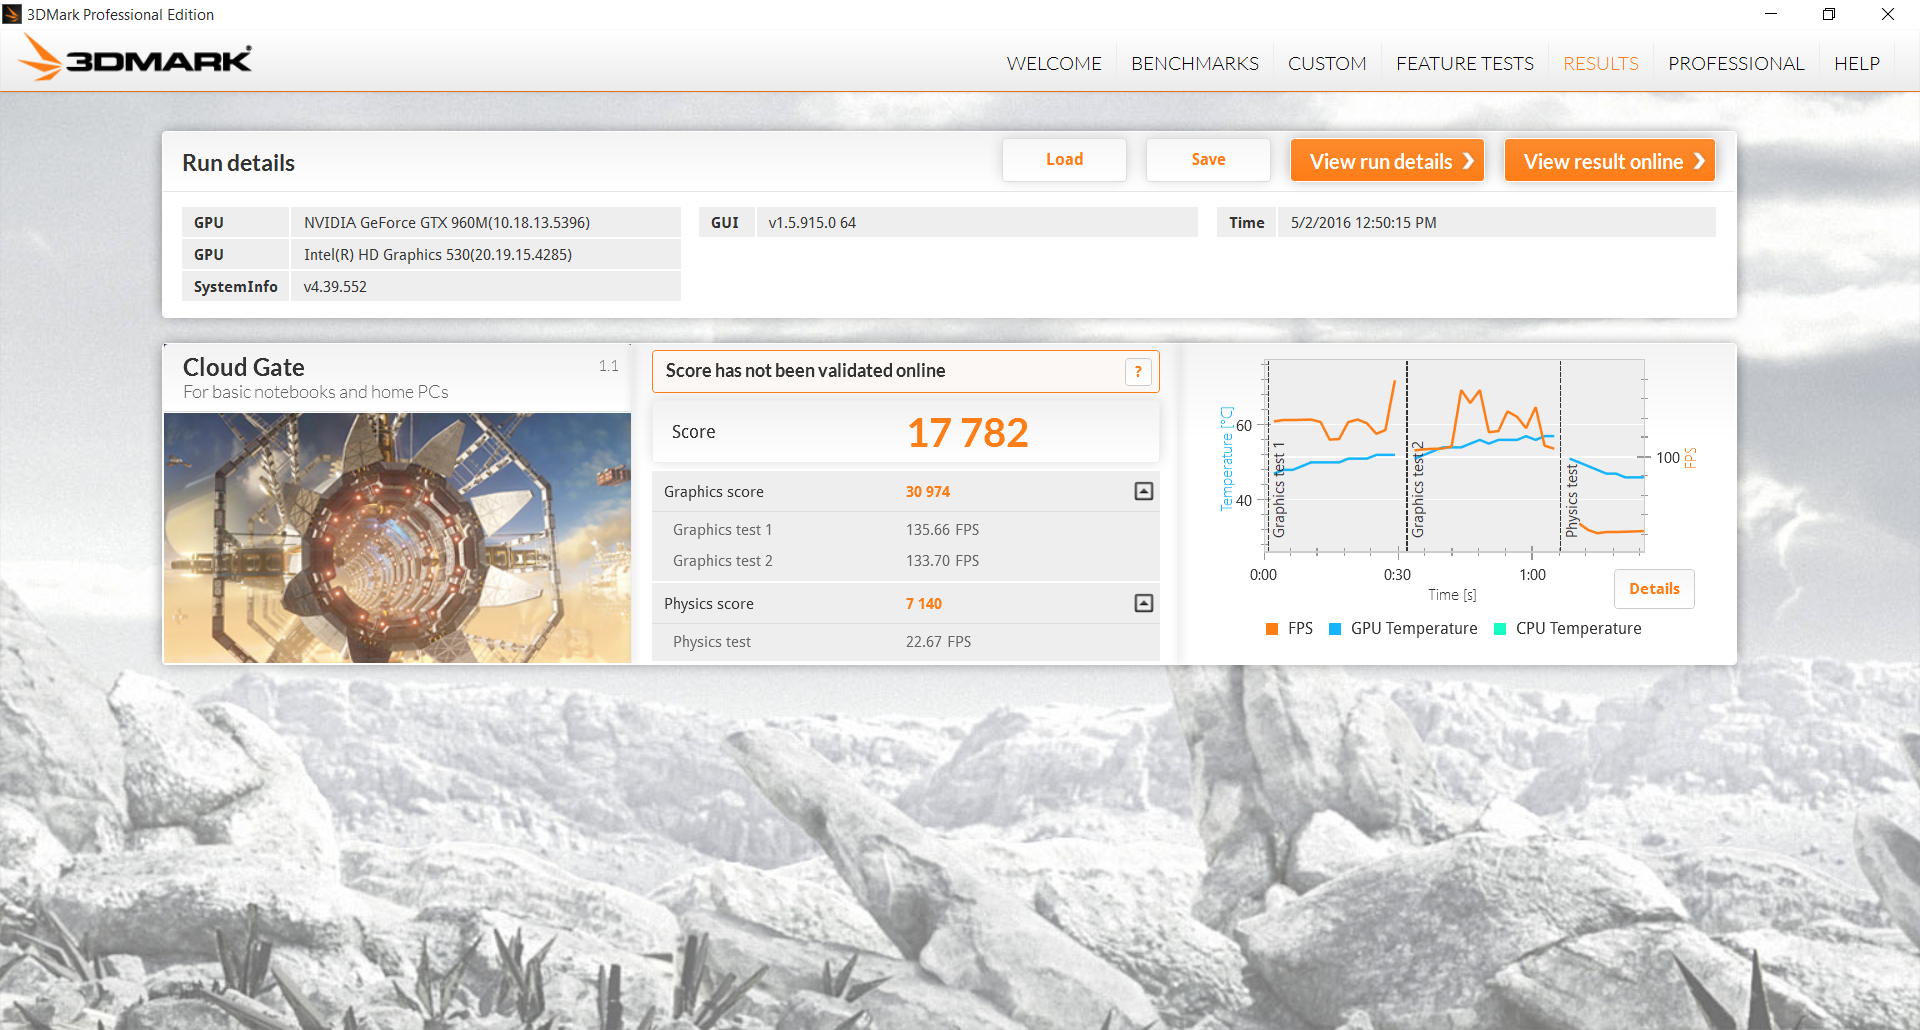
| 3DMark Cloud Gate Standard Score | 17782 points | |
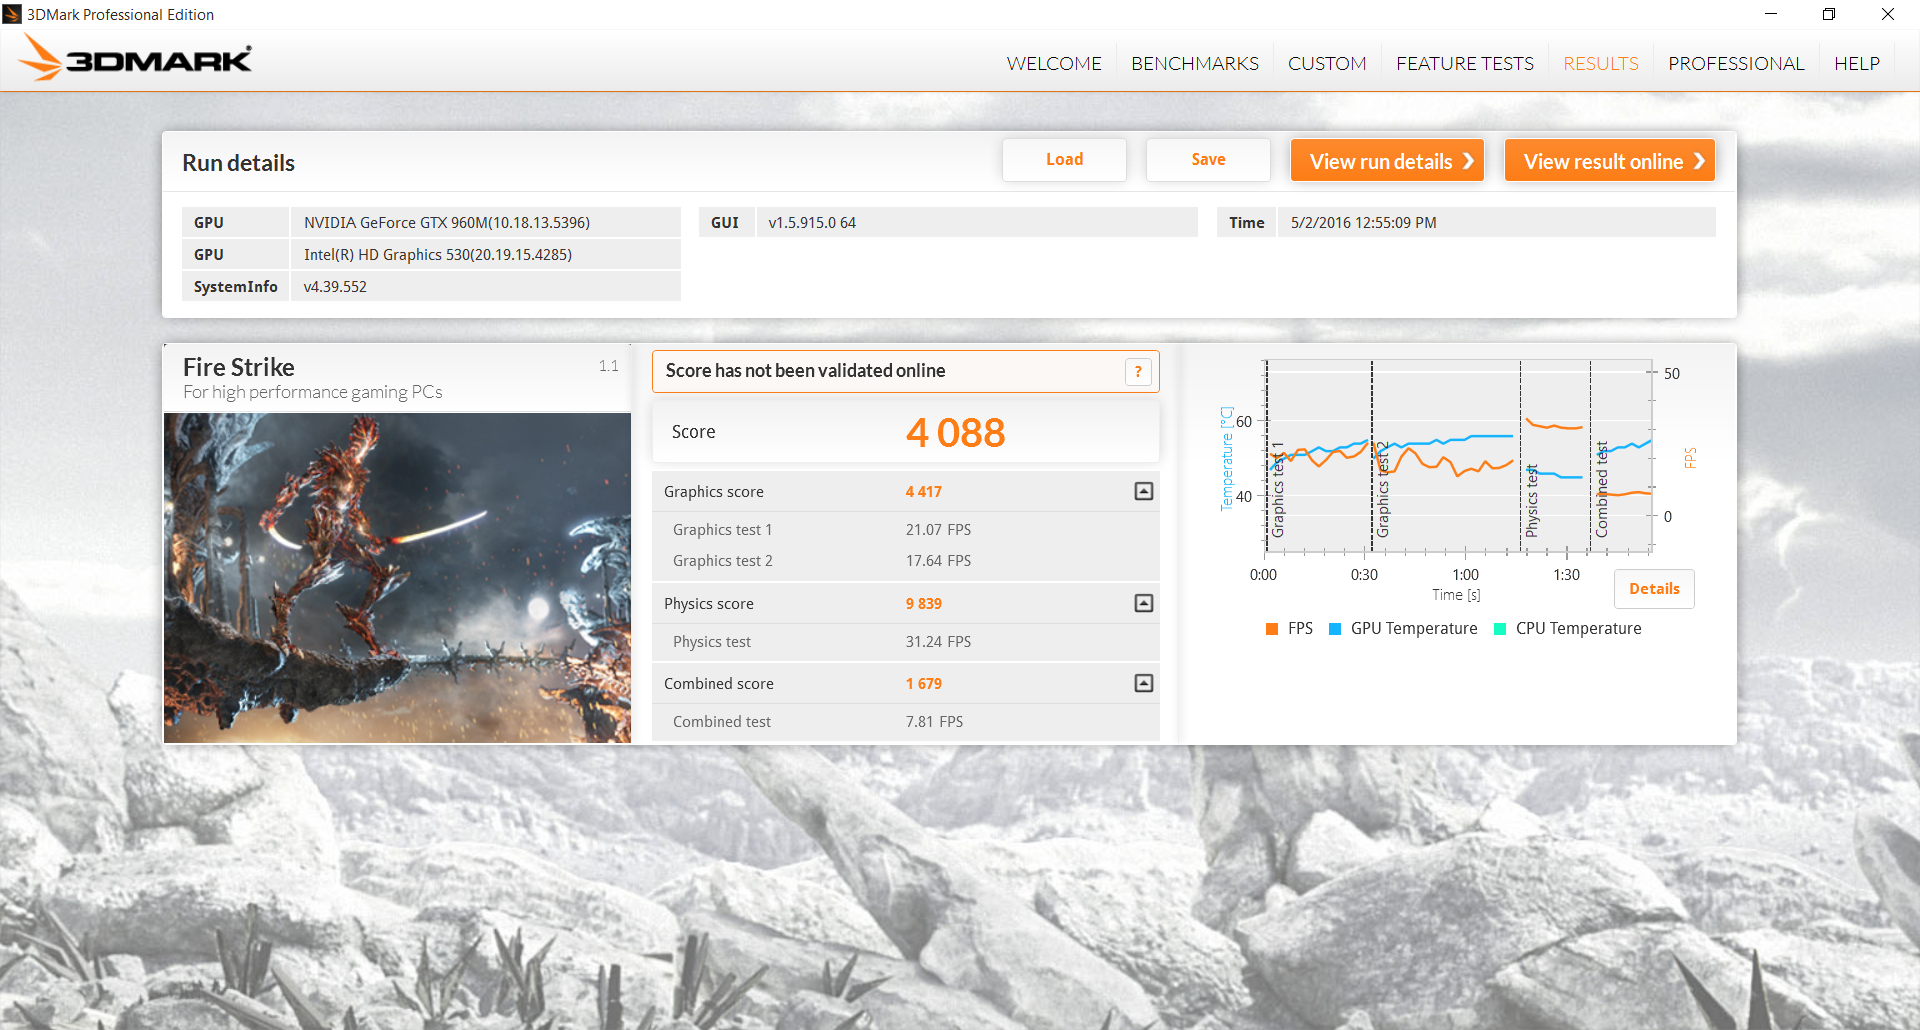
| 3DMark Fire Strike Score | 4088 points | |
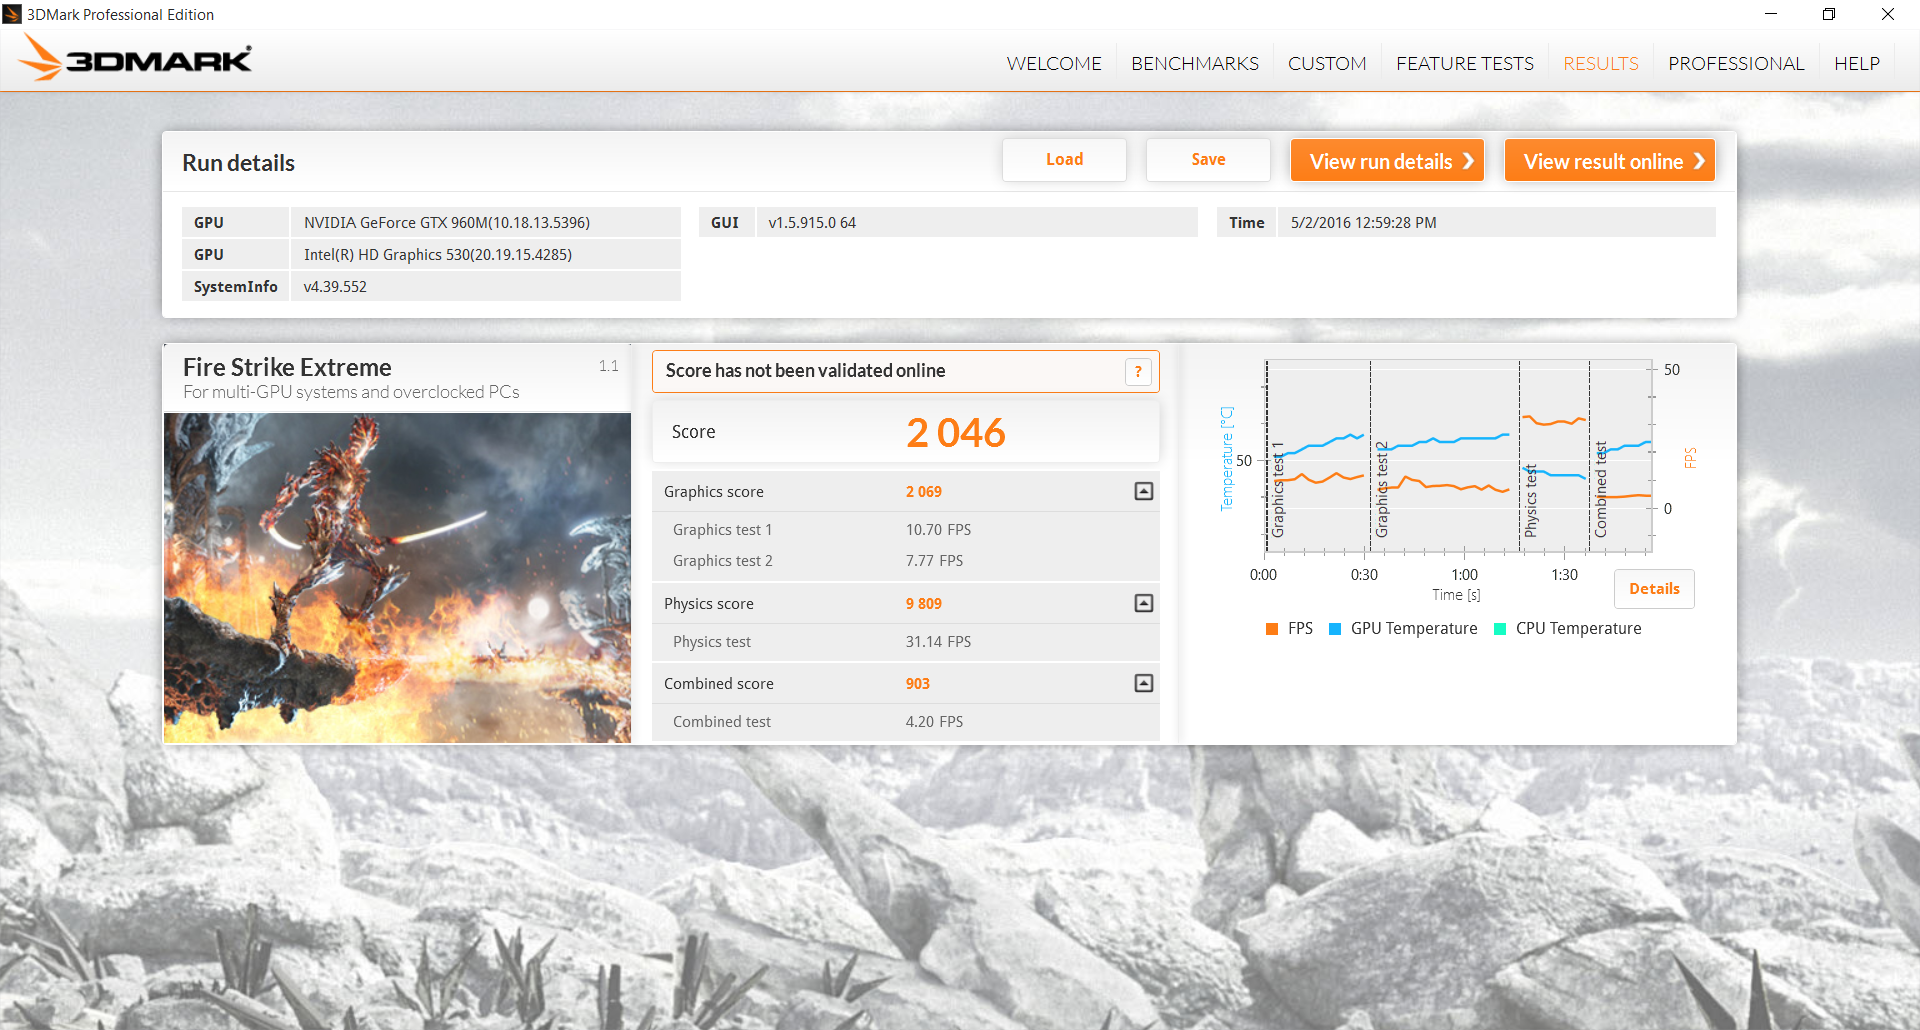
| 3DMark Fire Strike Extreme Score | 2046 points | |
Help | ||
Gaming Performance
Performance in games is where we expect a standard GTX 960M GPU to be, so there are no throttling issues or limits in place that may give users lower-than-expected results.
See our dedicated GPU page on the GeForce GTX 960M for more benchmarks and comparisons.
| BioShock Infinite - 1920x1080 Ultra Preset, DX11 (DDOF) | |
| Aorus X5S v5 | |
| Aorus X3 Plus v5 | |
| MSI PE60 6QE-056XUS | |
| MSI PX60 QD-034US | |
| Lenovo ThinkPad T460p-20FXS05500 | |
| Metro: Last Light - 1920x1080 Very High (DX11) AF:16x | |
| Aorus X5S v5 | |
| Aorus X3 Plus v5 | |
| MSI PE60 6QE-056XUS | |
| MSI PX60 QD-034US | |
| Lenovo ThinkPad T460p-20FXS05500 | |
| Thief - 1920x1080 Very High Preset AA:FXAA & High SS AF:8x | |
| Aorus X5S v5 | |
| Aorus X3 Plus v5 | |
| MSI PE60 6QE-056XUS | |
| MSI PX60 QD-034US | |
| Lenovo ThinkPad T460p-20FXS05500 | |
| Metal Gear Solid V - 1920x1080 Extra High / On | |
| Aorus X5S v5 | |
| Aorus X3 Plus v5 | |
| MSI PE60 6QE-056XUS | |
| MSI PX60 QD-034US | |
| Fallout 4 - 1920x1080 Ultra Preset AA:T AF:16x | |
| Aorus X5S v5 | |
| Aorus X3 Plus v5 | |
| MSI PE60 6QE-056XUS | |
| Rise of the Tomb Raider - 1920x1080 Very High Preset AA:FX AF:16x | |
| Aorus X5S v5 | |
| MSI PE60 6QE-056XUS | |
| low | med. | high | ultra | |
|---|---|---|---|---|
| BioShock Infinite (2013) | 130 | 117.4 | 45.8 | |
| Metro: Last Light (2013) | 100.3 | 59.9 | 31.7 | |
| Thief (2014) | 65.3 | 55.3 | 27.9 | |
| Batman: Arkham Knight (2015) | 60 | 32 | ||
| Metal Gear Solid V (2015) | 60 | 58 | 39.1 | |
| Fallout 4 (2015) | 57.5 | 31.6 | 24.9 | |
| Rise of the Tomb Raider (2016) | 53.7 | 30.3 | 23 |
Stress Test
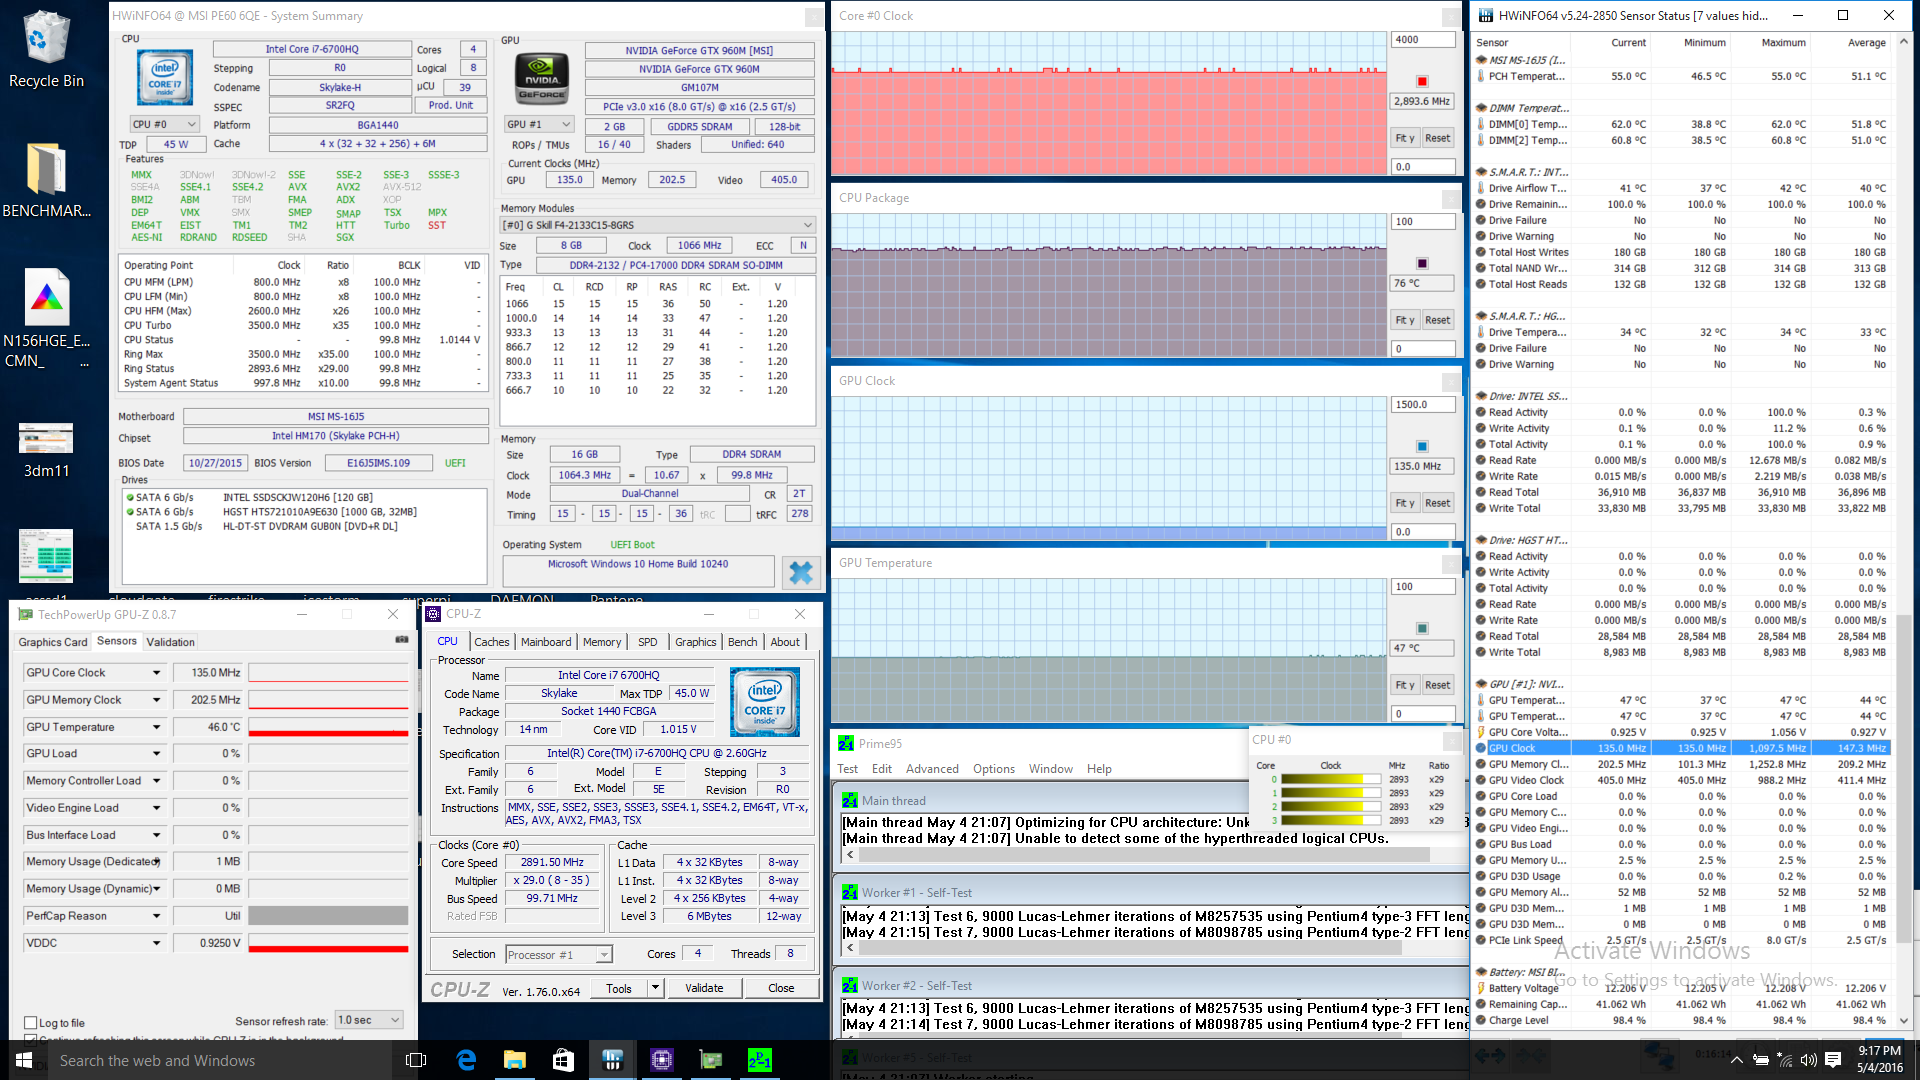
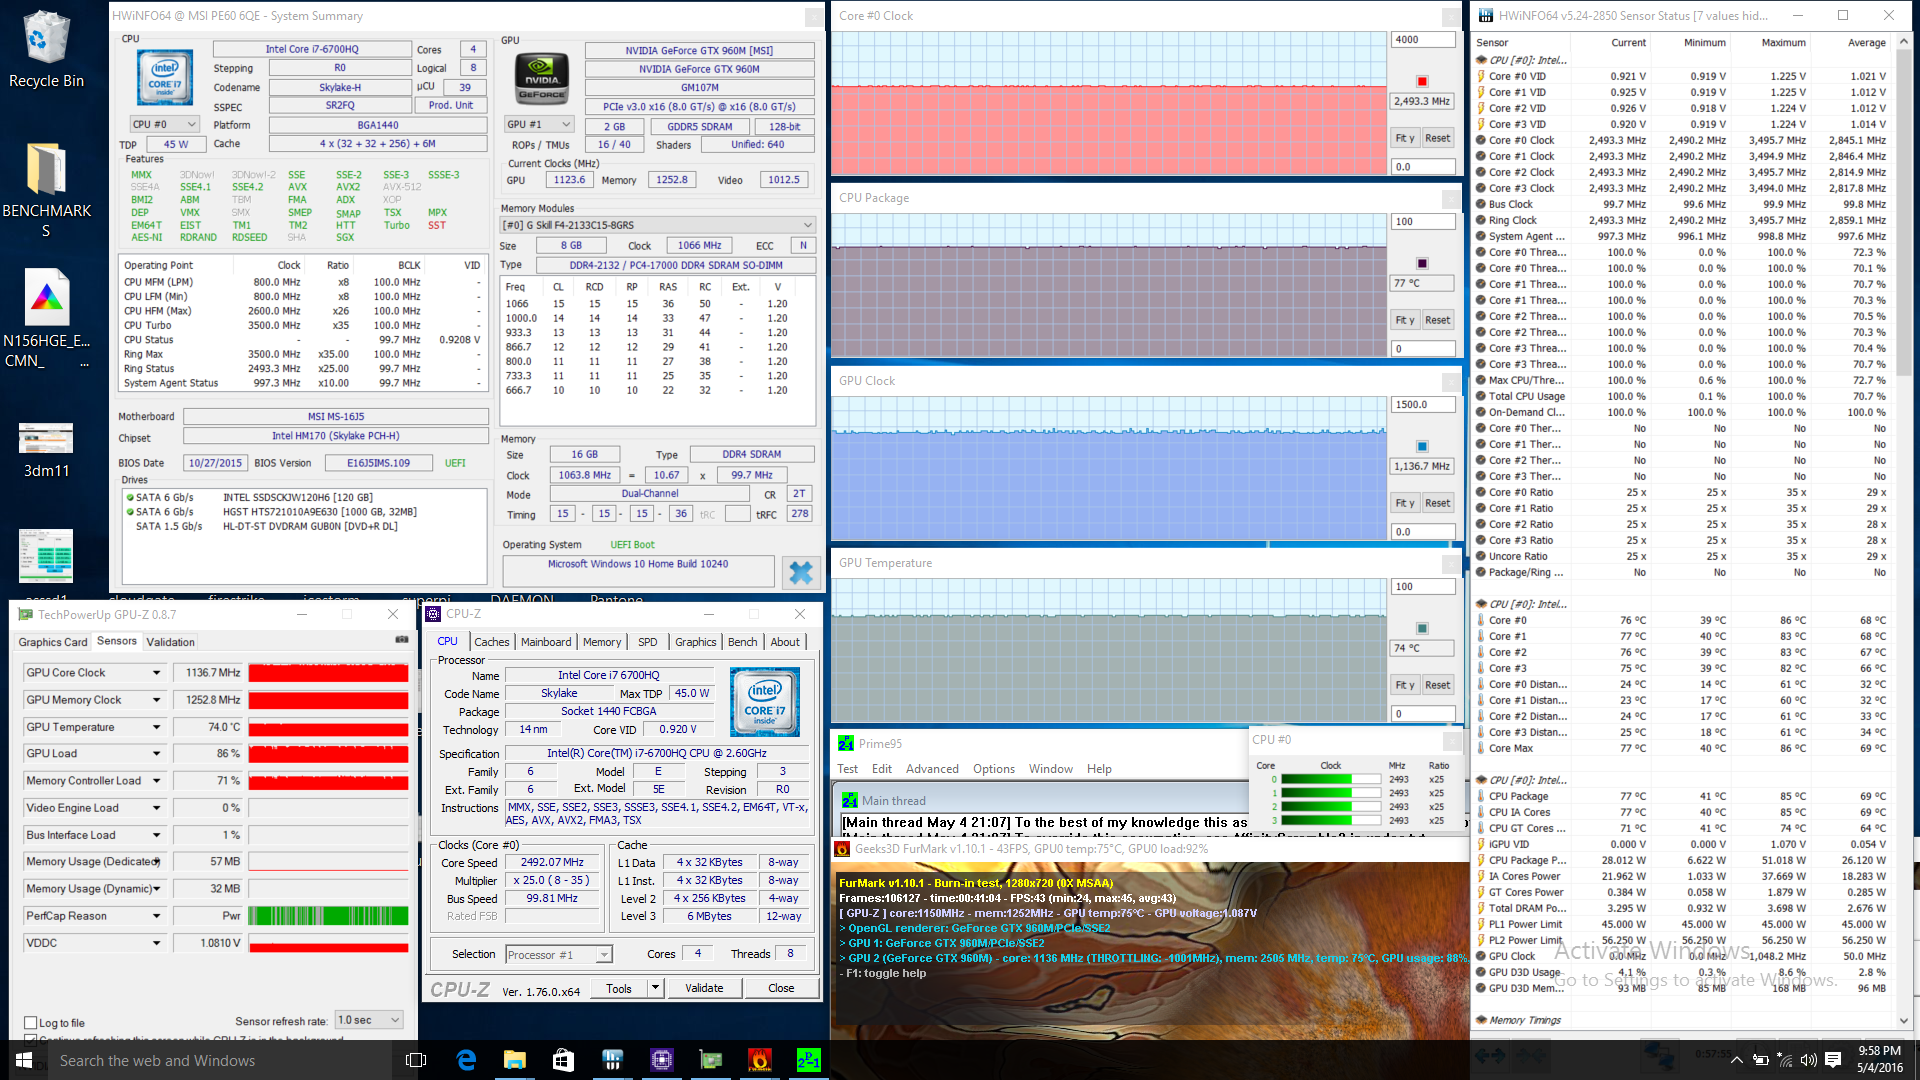
We stress the notebook with demanding benchmarks to observe for any stability or throttling issues. With only Prime95 active, the CPU maintains a core clock rate of 2.9 GHz or 200 MHz slower than its rated maximum Turbo Boost for all active cores. Core temperatures remain relatively cool (for a notebook) at around 76 C. FurMark stress will put the Nvidia GPU at a steady 1137 MHz and 69 C core temperature. Running both Prime95+FurMark simultaneously will throttle the CPU to 2.5 GHz with temperatures in the mid 70 C range.
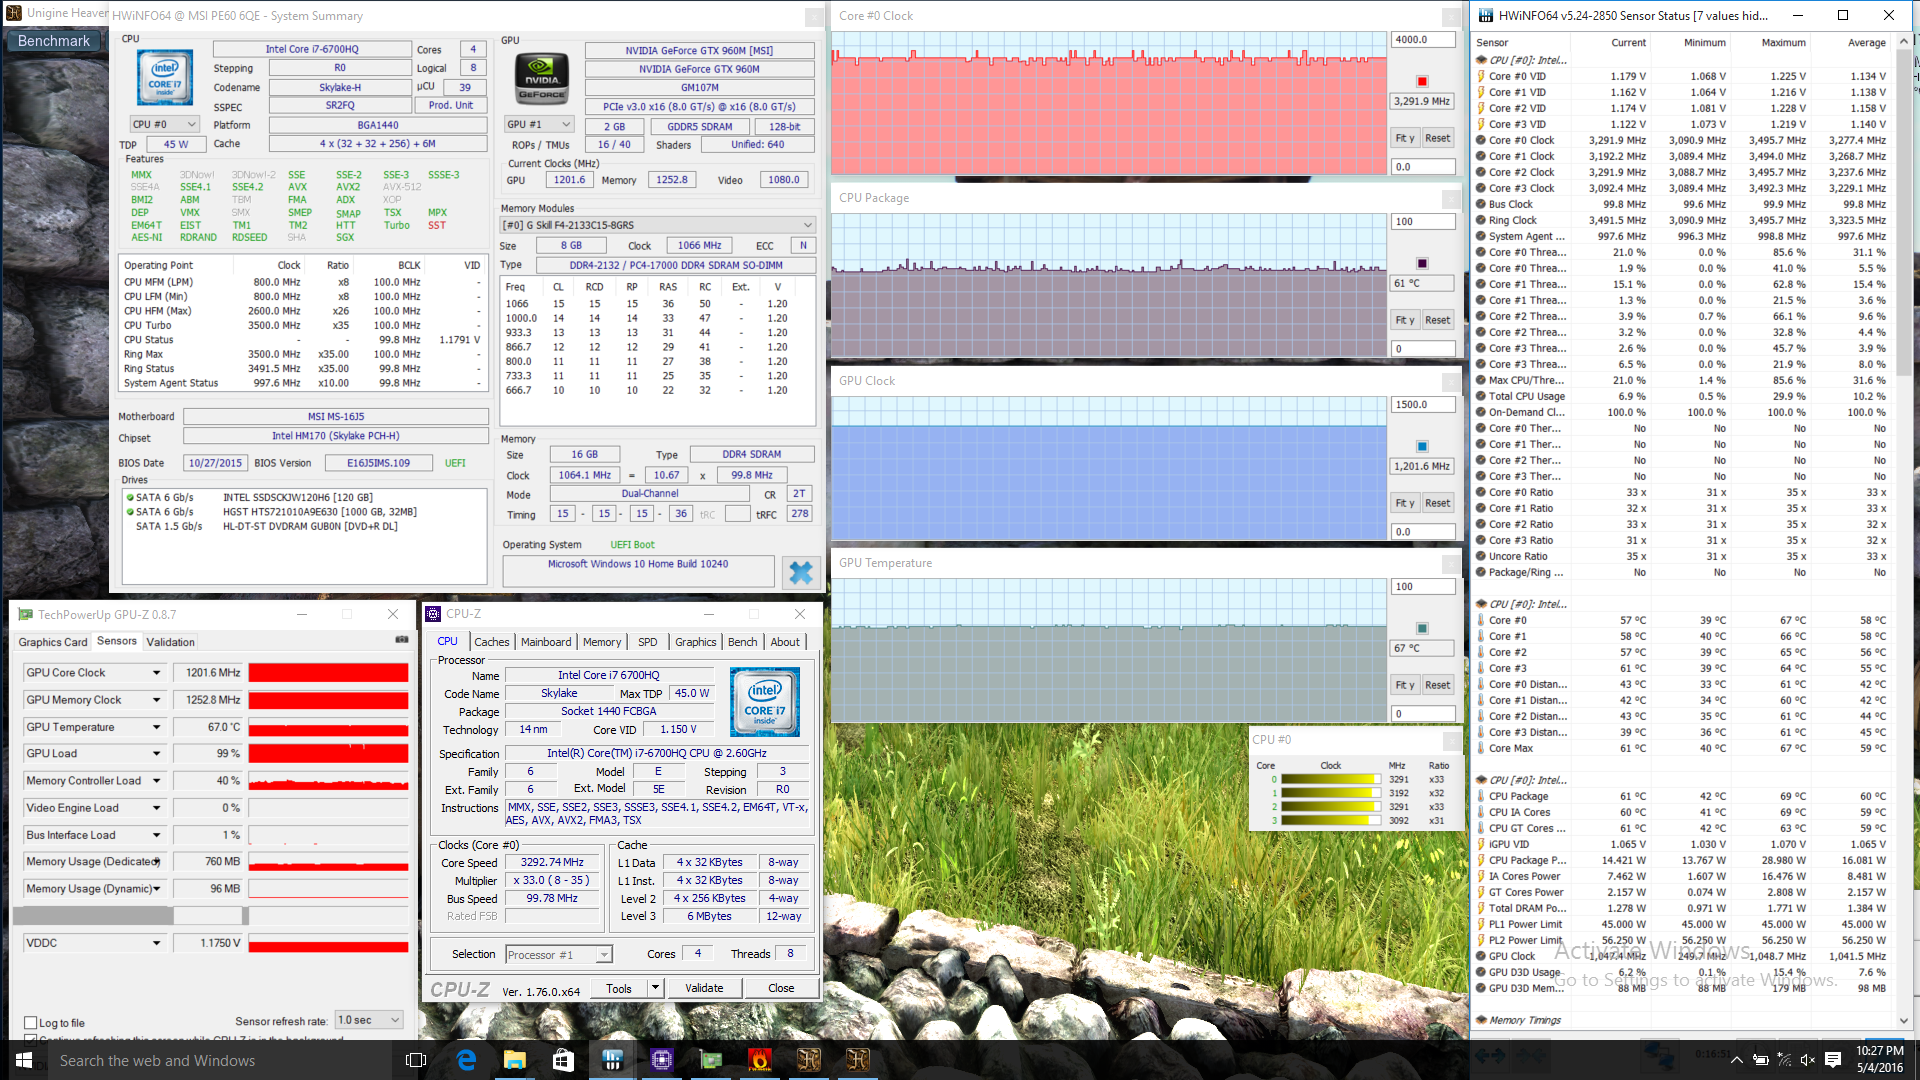
Unigine Heaven stress is more representative of gaming loads. The system is able to maintain its maximum CPU Turbo Boost of 3.1 GHz or greater depending on the onscreen load with a steady GPU clock rate of 1202 MHz (compared to its base clock rate of 1097 MHz). Users will not need to worry about throttling issues when gaming or running everyday tasks.
Running on battery power will not limit CPU or GPU performance. a 3DMark 11 test on batteries returns Physics and Graphics scores of 8461 and 5310 points, respectively, compared to 8502 and 5463 points when connected to mains.

| CPU Clock (GHz) | GPU Clock (MHz) | Average CPU Temperature (C) | Average GPU Temperature (C) | |
Prime95 Stress |
2.9 | -- | ~76 | -- |
FurMark Stress |
-- | 1137 | -- | ~69 |
Prime95 + FurMark Stress |
2.5 | 1137 | ~77 | ~74 |
Unigine Heaven Stress |
3.1+ | 1202 | ~61 | ~67 |
Emissions
System Noise
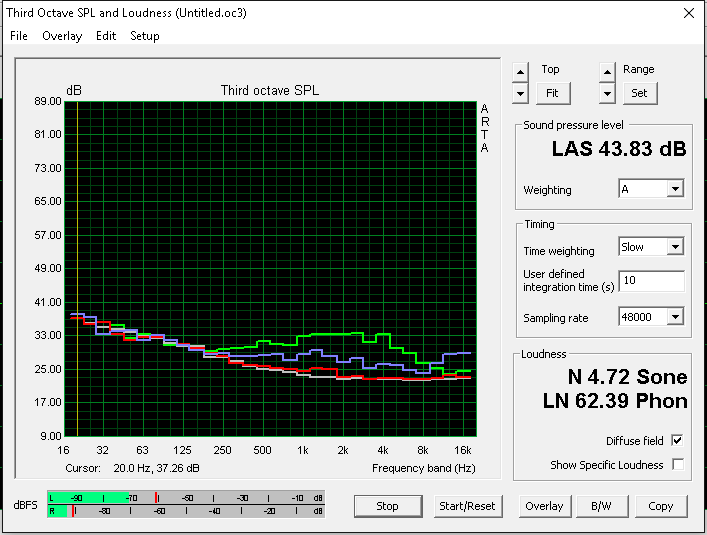
The cooling system consists of twin ~50 mm fans and four heat pipes spread across the CPU, GPU, and VRAM modules. Fan behavior remains unchanged from the PE60 2QE, so the fans are unfortunately always active at about 32.4 dB(A) when the system is idling. Prolonged use at low loads like browsing can bump fan noise to the 35 dB(A) range temporarily. This is compared to most competing 15-inch notebooks that are either silent under very low loads or have less sensitive fans.
Fan noise is not stable when gaming, either. Running Unigine Heaven will have the fans pulsate between 37 dB(A) and 40 dB(A) instead of just a steady speed. Nonetheless, this is slightly quieter than average as most 15-inch gaming notebooks operate at the 40 to 45 dB(A) range when under heavy loads. Running Prime95+FurMark will bump fan noise up to the 45 dB(A) range or even up to 49 dB(A) when the maximum fan speed option is enabled.
| MSI PE60 6QE-056XUS GeForce GTX 960M, 6700HQ, Intel SSD 535 SSDSCKJW120H6 | MSI PE60-2QEi581 GeForce GTX 960M, 4210H, HGST Travelstar 7K1000 HTS721010A9E630 | HP ZBook 15 G3 Quadro M2000M, E3-1505M v5, Samsung SM951 MZVPV512HDGL m.2 PCI-e | Asus G501VW-FY081T GeForce GTX 960M, 6700HQ, Samsung CM871 MZNLF128HCHP | Dell XPS 15 9550 i7 FHD GeForce GTX 960M, 6700HQ, Samsung PM951 NVMe 512 GB | |
|---|---|---|---|---|---|
| Noise | -2% | 1% | 0% | 8% | |
| off / environment * (dB) | 29.3 | 30 -2% | 31.2 -6% | ||
| Idle Minimum * (dB) | 32.4 | 32.8 -1% | 30 7% | 32.1 1% | 29.2 10% |
| Idle Average * (dB) | 32.4 | 32.8 -1% | 30 7% | 32.1 1% | 29.3 10% |
| Idle Maximum * (dB) | 35.4 | 35.4 -0% | 30 15% | 32.1 9% | 29.5 17% |
| Load Average * (dB) | 40.5 | 42.3 -4% | 45.3 -12% | 43.3 -7% | 36.5 10% |
| Load Maximum * (dB) | 45.3 | 47.4 -5% | 49.7 -10% | 44.3 2% | 47.7 -5% |
* ... smaller is better
Noise level
| Idle |
| 32.4 / 32.4 / 35.4 dB(A) |
| DVD |
| / 38.9 dB(A) |
| Load |
| 40.5 / 45.3 dB(A) |
 | ||
30 dB silent 40 dB(A) audible 50 dB(A) loud |
||
min: | ||
Temperature
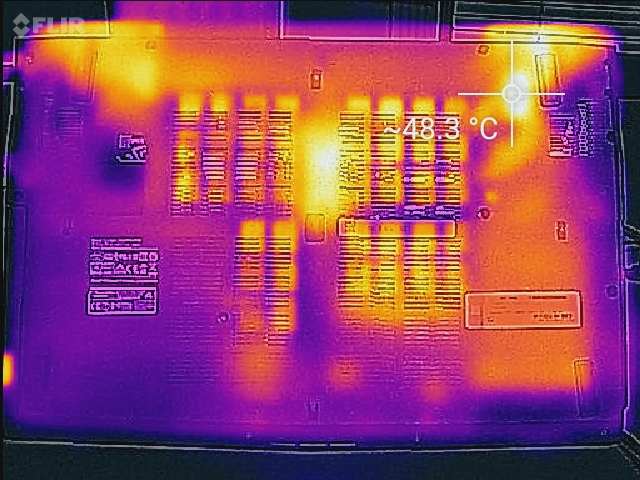
Surface Temperatures when idling are flat with the warmest spots around the touchpad. The bottom quadrant nearest the secondary HDD is also noticeably warmer than the rest of the notebook. These spots aren't uncomfortably warm, but it's a bit unusual for a notebook as most designs tend to keep the front areas cooler by moving motherboard components away from the area.
Maximum load with Prime95+FurMark stress will warm up the notebook significantly around the heat pipes and processor. The touchpad becomes even warmer at just over 40 C to make it uncomfortable (and sweaty) for palms and fingers. This is particularly something we'd like to see improved upon for future hardware revisions. Similarly equipped notebooks like the Asus G501 and XPS 15 experience much smaller temperature changes on their front halves compared to the MSI.
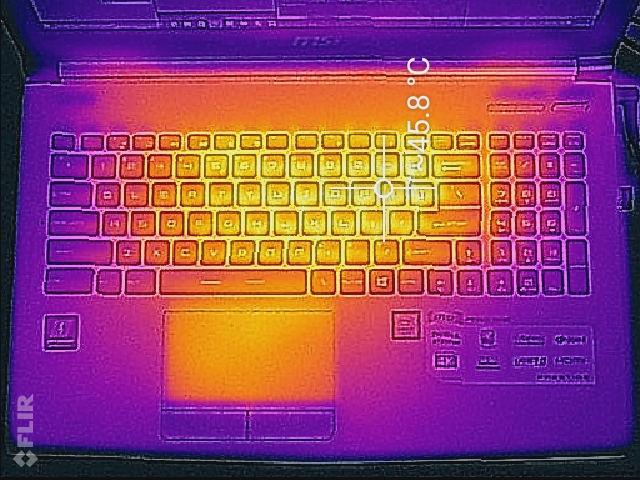
(±) The maximum temperature on the upper side is 43.2 °C / 110 F, compared to the average of 36.8 °C / 98 F, ranging from 21 to 71 °C for the class Multimedia.
(-) The bottom heats up to a maximum of 49 °C / 120 F, compared to the average of 39.1 °C / 102 F
(+) In idle usage, the average temperature for the upper side is 25.5 °C / 78 F, compared to the device average of 31.3 °C / 88 F.
(-) The palmrests and touchpad can get very hot to the touch with a maximum of 40.6 °C / 105.1 F.
(-) The average temperature of the palmrest area of similar devices was 28.7 °C / 83.7 F (-11.9 °C / -21.4 F).
Speakers
The four Dynaudio speakers and subwoofer offer very good sound quality considering the size. Maximum volume is loud with no static or significant imbalances. Microphone measurements still show a large fall at frequencies under ~120 Hz, so bass reproduction is not nearly as deep compared to dedicated home theaters and is rather typical of a large gaming notebook. Ideally, the Pink and White curves should be flatter across all tested frequencies. The dedicated gold-plated earphone and microphone jacks work without any issues.

")
Energy Management
Power Consumption
Compared to last year's model, the PE60 6QE is more energy efficient during low to medium loads. Otherwise, power draw between them are nearly identical when gaming or under stressful processing conditions. The system demands a bit more power than competing models with similar core hardware such as the Asus G501 and Lenovo Y700 15ISK.
The power adapter (15 x 7.5 x 2.5 cm) is rated for 120 W while our measurements under Prime95+FurMark stress show 122 W. MSI is leaving very little headroom in this regard.
| MSI PE60 6QE-056XUS GeForce GTX 960M, 6700HQ, Intel SSD 535 SSDSCKJW120H6 | MSI PE60-2QEi581 GeForce GTX 960M, 4210H, HGST Travelstar 7K1000 HTS721010A9E630 | HP ZBook 15 G3 Quadro M2000M, E3-1505M v5, Samsung SM951 MZVPV512HDGL m.2 PCI-e | Asus G501VW-FY081T GeForce GTX 960M, 6700HQ, Samsung CM871 MZNLF128HCHP | Lenovo Y700-15 80NV004LPB GeForce GTX 960M, 6700HQ, Samsung SSD 850 EVO 250GB | Dell XPS 15 2016 9550 GeForce GTX 960M, 6300HQ, WDC WD10SPCX-75KHST0 + LiteON CS1-SP32-11 M.2 2242 32GB | |
|---|---|---|---|---|---|---|
| Power Consumption | -50% | 15% | 22% | 4% | 10% | |
| Idle Minimum * (Watt) | 9.7 | 21.8 -125% | 5.7 41% | 6.9 29% | 4.2 57% | 9.9 -2% |
| Idle Average * (Watt) | 13.1 | 26.1 -99% | 12.2 7% | 10.7 18% | 10.5 20% | 12.6 4% |
| Idle Maximum * (Watt) | 23.2 | 26.6 -15% | 12.6 46% | 13.2 43% | 28.5 -23% | 16.8 28% |
| Load Average * (Watt) | 79.1 | 88.5 -12% | 83.1 -5% | 82 -4% | 113 -43% | 70 12% |
| Load Maximum * (Watt) | 122.9 | 119.7 3% | 138.2 -12% | 94 24% | 114.2 7% | 114 7% |
* ... smaller is better
| Off / Standby | |
| Idle | |
| Load |
|
Key:
min: | |
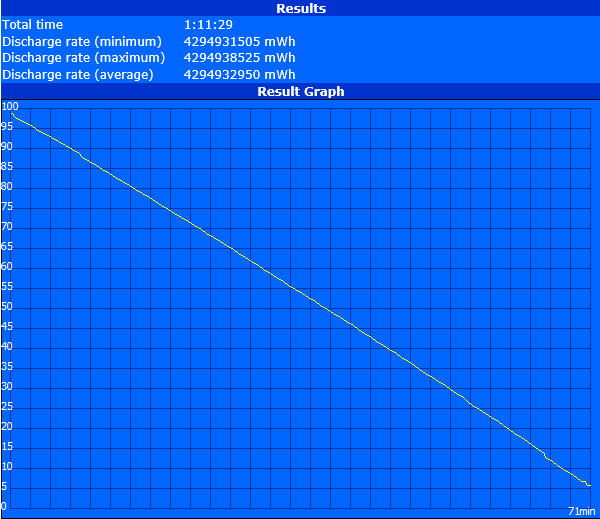
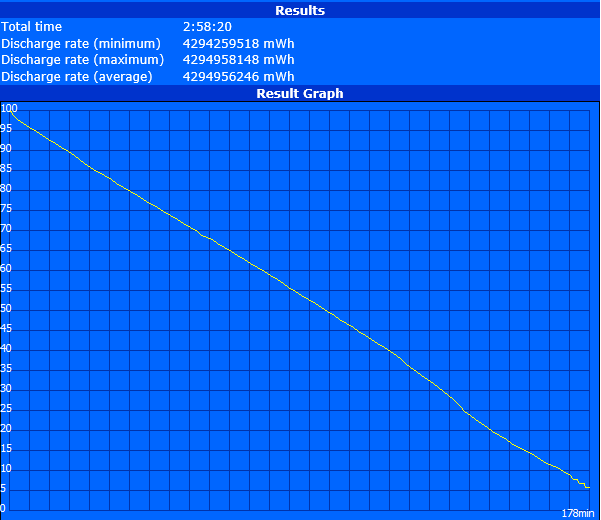
Battery Life
Runtimes from the small non-removable 42 Wh battery are essentially the same as on last year's model despite the CPU differences. Users can expect just under 3 hours of constant WLAN use, which is below average compared to other 15-inch notebooks where 4 to 6 hour runtimes are more common under similar testing conditions.

| MSI PE60 6QE-056XUS 42 Wh | MSI PE60-2QEi581 42 Wh | HP ZBook 15 G3 90 Wh | Asus G501VW-FY081T 60 Wh | Lenovo Ideapad Y700 15ISK 80NW 60 Wh | Dell XPS 15 9550 i7 FHD 84 Wh | |
|---|---|---|---|---|---|---|
| Battery runtime | 4% | 101% | 51% | 68% | 146% | |
| Reader / Idle (h) | 5.7 | 5.8 2% | 13.7 140% | 10.2 79% | 10.3 81% | 16.3 186% |
| WiFi v1.3 (h) | 3 | 2.8 -7% | 6.4 113% | 5.5 83% | 5.9 97% | 9.1 203% |
| Load (h) | 1.2 | 1.4 17% | 1.8 50% | 1.1 -8% | 1.5 25% | 1.8 50% |
Pros
Cons
Verdict
At its core, the MSI PE60 Prestige is a GE62 with a new coat of paint and a different name targeted at business and multimedia users. This essentially makes the PE60 a gaming notebook in disguise which, for business users, isn't the best news. Other than the wide gamut of the display after a proper calibration, there's very little here that may attract users. The latest XPS 15 runs laps around the MSI with longer battery life, lighter and thinner design, brighter display, faster NVMe SSD, USB Type-C with Thunderbolt 3, and stronger chassis with the same CPU and GPU.
The PE60 Prestige is marketed towards professional use, but MSI will need to try harder to incorporate features that business users can appreciate instead of simply re-skinning an existing gaming series. It's best described as a "professional gaming notebook" where better options exist for dedicated business users or dedicated hardcore gamers in the same price range.
MSI PE60 6QE-056XUS
- 12/09/2016 v6 (old)
Allen Ngo
Price comparison
