Lenovo ThinkPad P70 Workstation Review
For the original German review, see here.
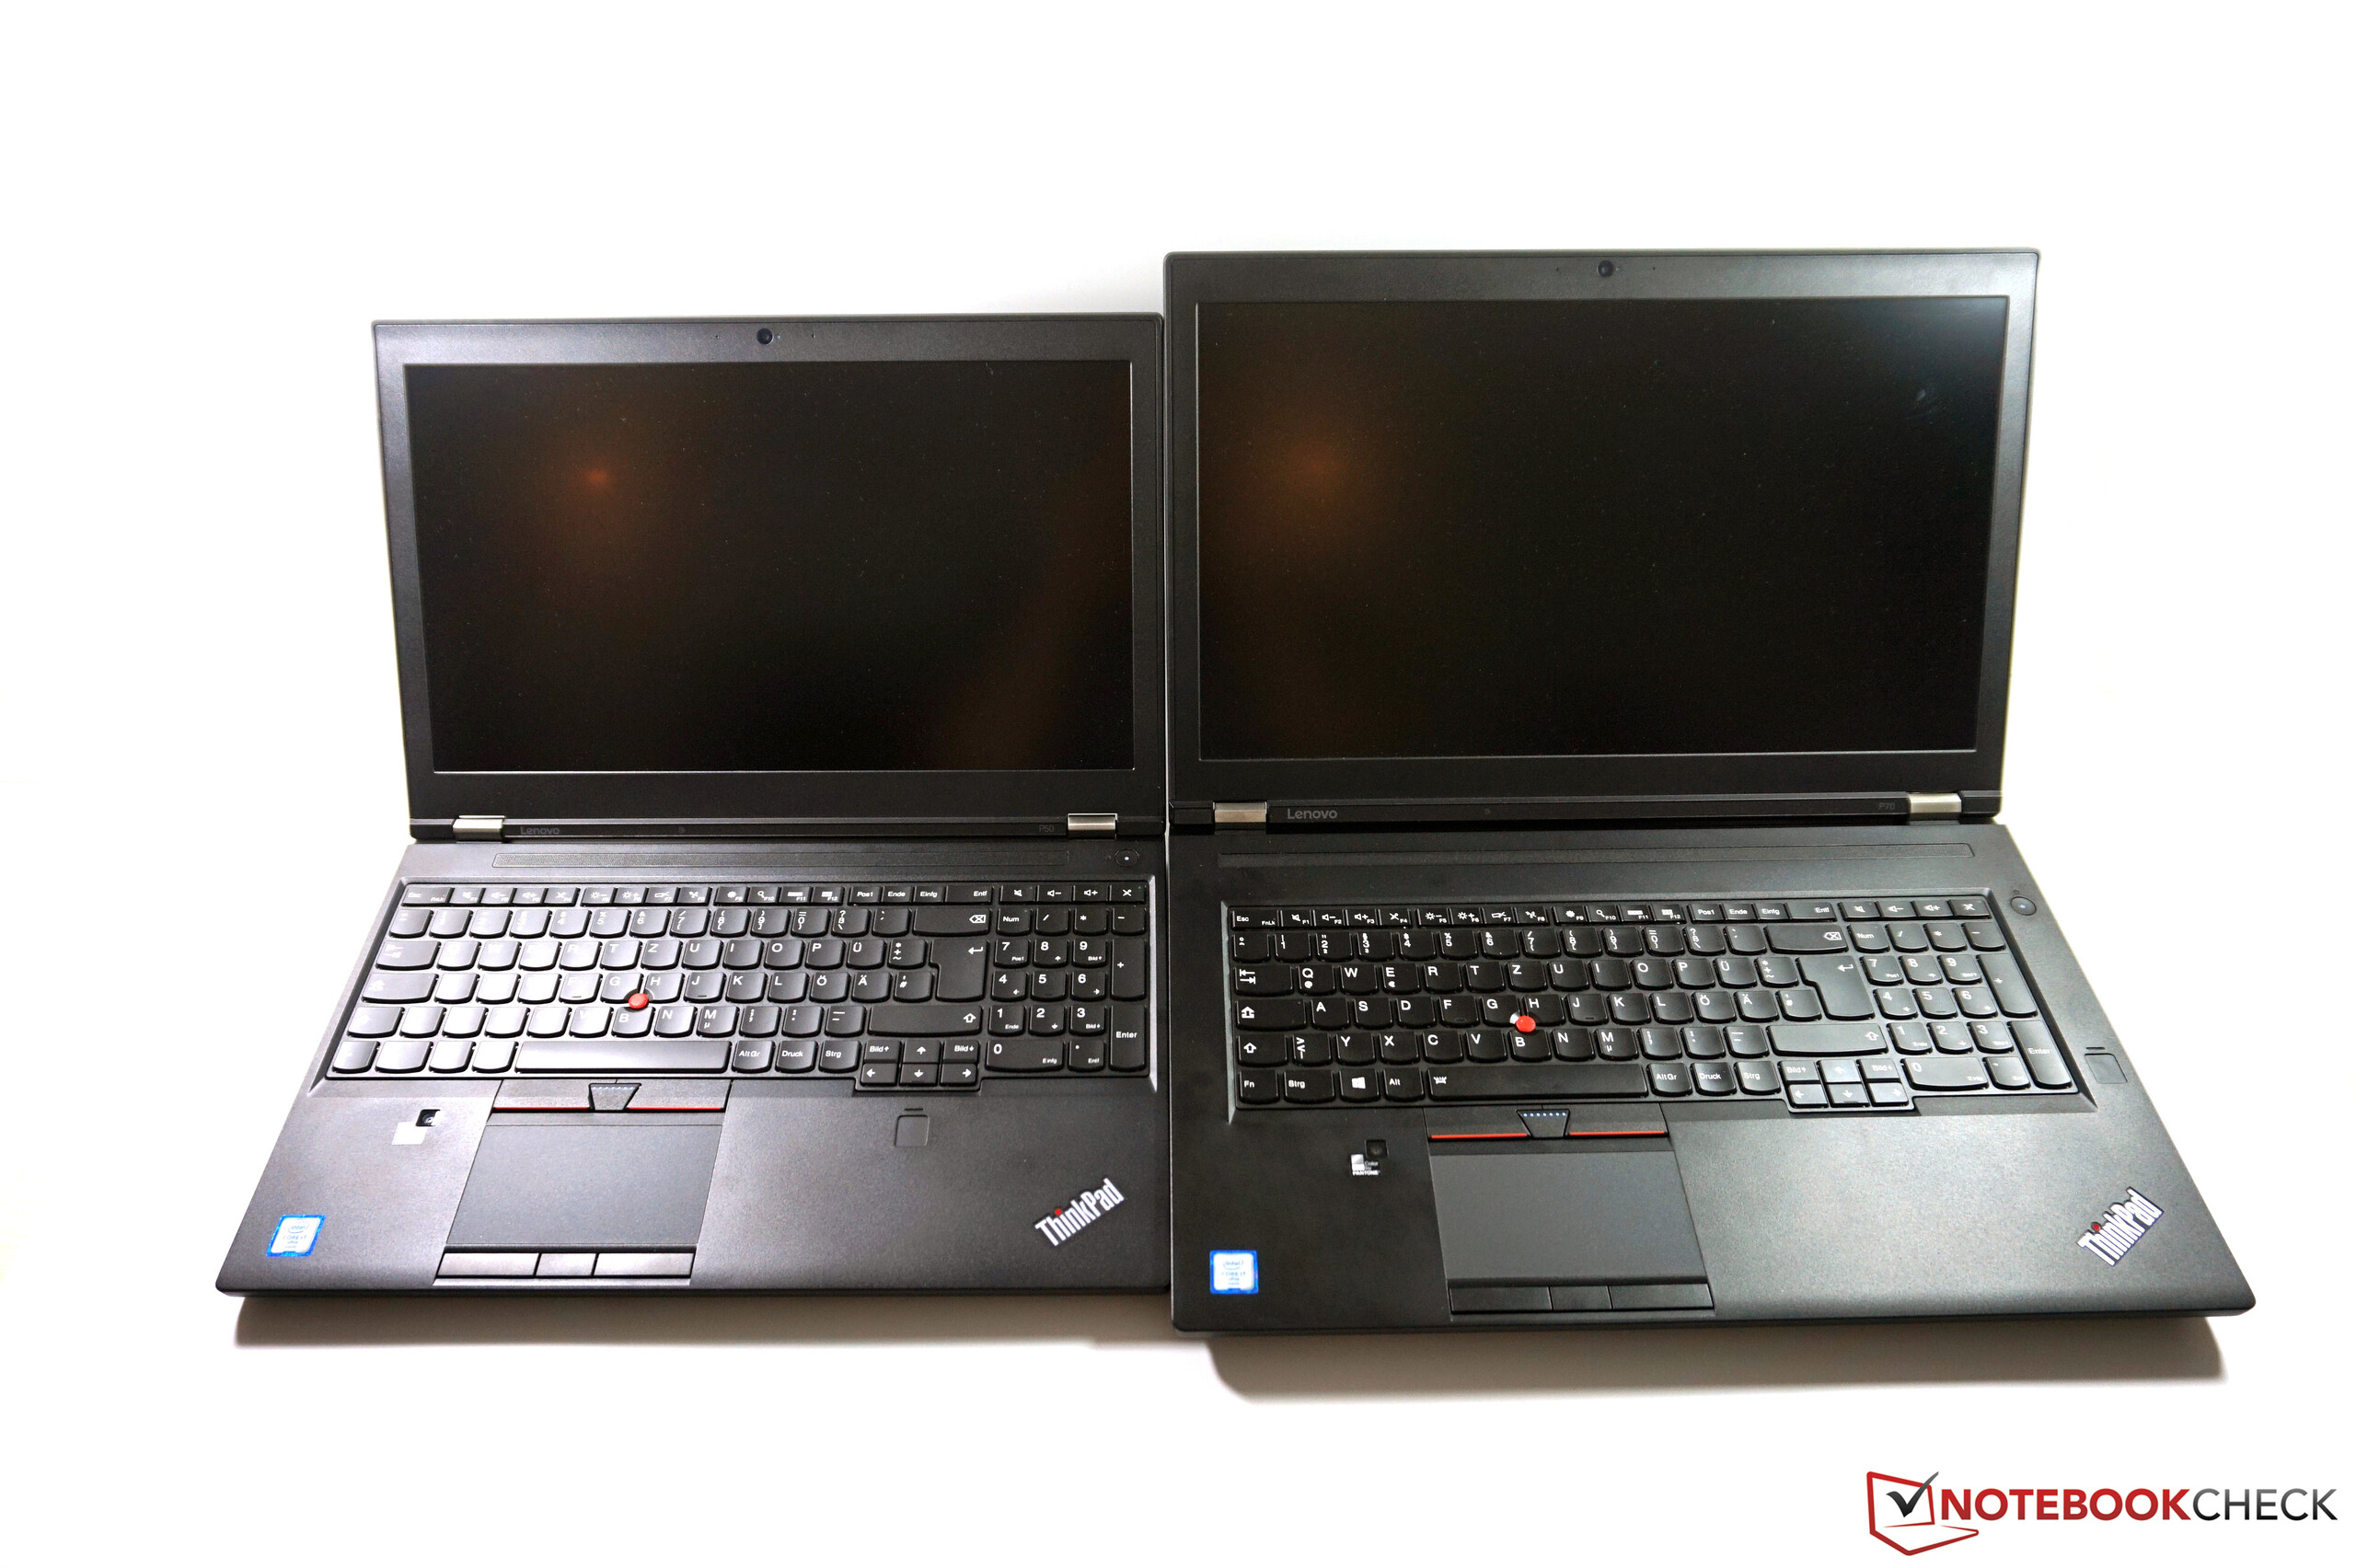
Lenovo has offered notebooks for professional users in the ThinkPad W-series since 2008, and we reviewed the last 17-inch model ThinkPad W701 back in 2010. The manufacturer changed its product lineup for 2016 a bit and will now offer its mobile workstations in the new ThinkPad P-series. Besides the two 15-inch models ThinkPad P50 and ThinkPad P50s (successors to the W541 and W550s, respectively) as well as the smaller Yoga P40, you can also get the 17-inch model ThinkPad P70. While the Yoga P40 and the ThinkPad P50s are more focused on mobility, both the P50 and the P70 are focused on performance.
This claim is supported by the specs of our review configuration, although they do not even represent the most powerful version. Our test model for around 3,400 Euros (~$3671) is a more mainstream configuration with a Core i7-6820HQ processor (Skylake 45 Watts), Nvidia's Quadro M3000M graphics cards, 16 GB DDR4-RAM as well as a 512 GB M.2 SSD (SATA). Particularly interesting is the 4K display, which does not support touch inputs, but it has a matte surface and can be calibrated with the integrated color calibrator.
The smallest configuration of the ThinkPad P70 starts at around 2,100 Euros (~$2267), while you will have to pay almost 6,500 Euros (~$7018) for the biggest model with the maximum RAM equipment (64 GB DDR4-ECC). Besides many pre-configured models, which are available in many online shops, you can also configure the ThinkPad P70 in Lenovo’s web shop. The manufacturer is very flexible, because it is no problem to equip the base configuration with the most powerful processor, a better display or a more powerful graphics card, for example. It is therefore possible to customize the device based on your personal preferences. Lenovo also offers special education models, where students or eligible scientific employees can get a big discount; the education model of our review unit, for example, is 400 Euros (~$431) less expensive.
The biggest rivals for the 17-inch workstation are traditionally provided by Dell (Precision 7710, review will be available soon) and HP (ZBook 17 G2), even though the latter is still based on the Haswell architecture. The successor ZBook 17 G3 was already announced and should be available in January 2016. Besides those dedicated workstations, some manufacturers also offer devices with professional components (often the GPU), which are based on normal consumer devices and therefore lack some business features. Examples from this category are the MSI WT72 or the Bullman E-Klasse Xeon 17.
Case
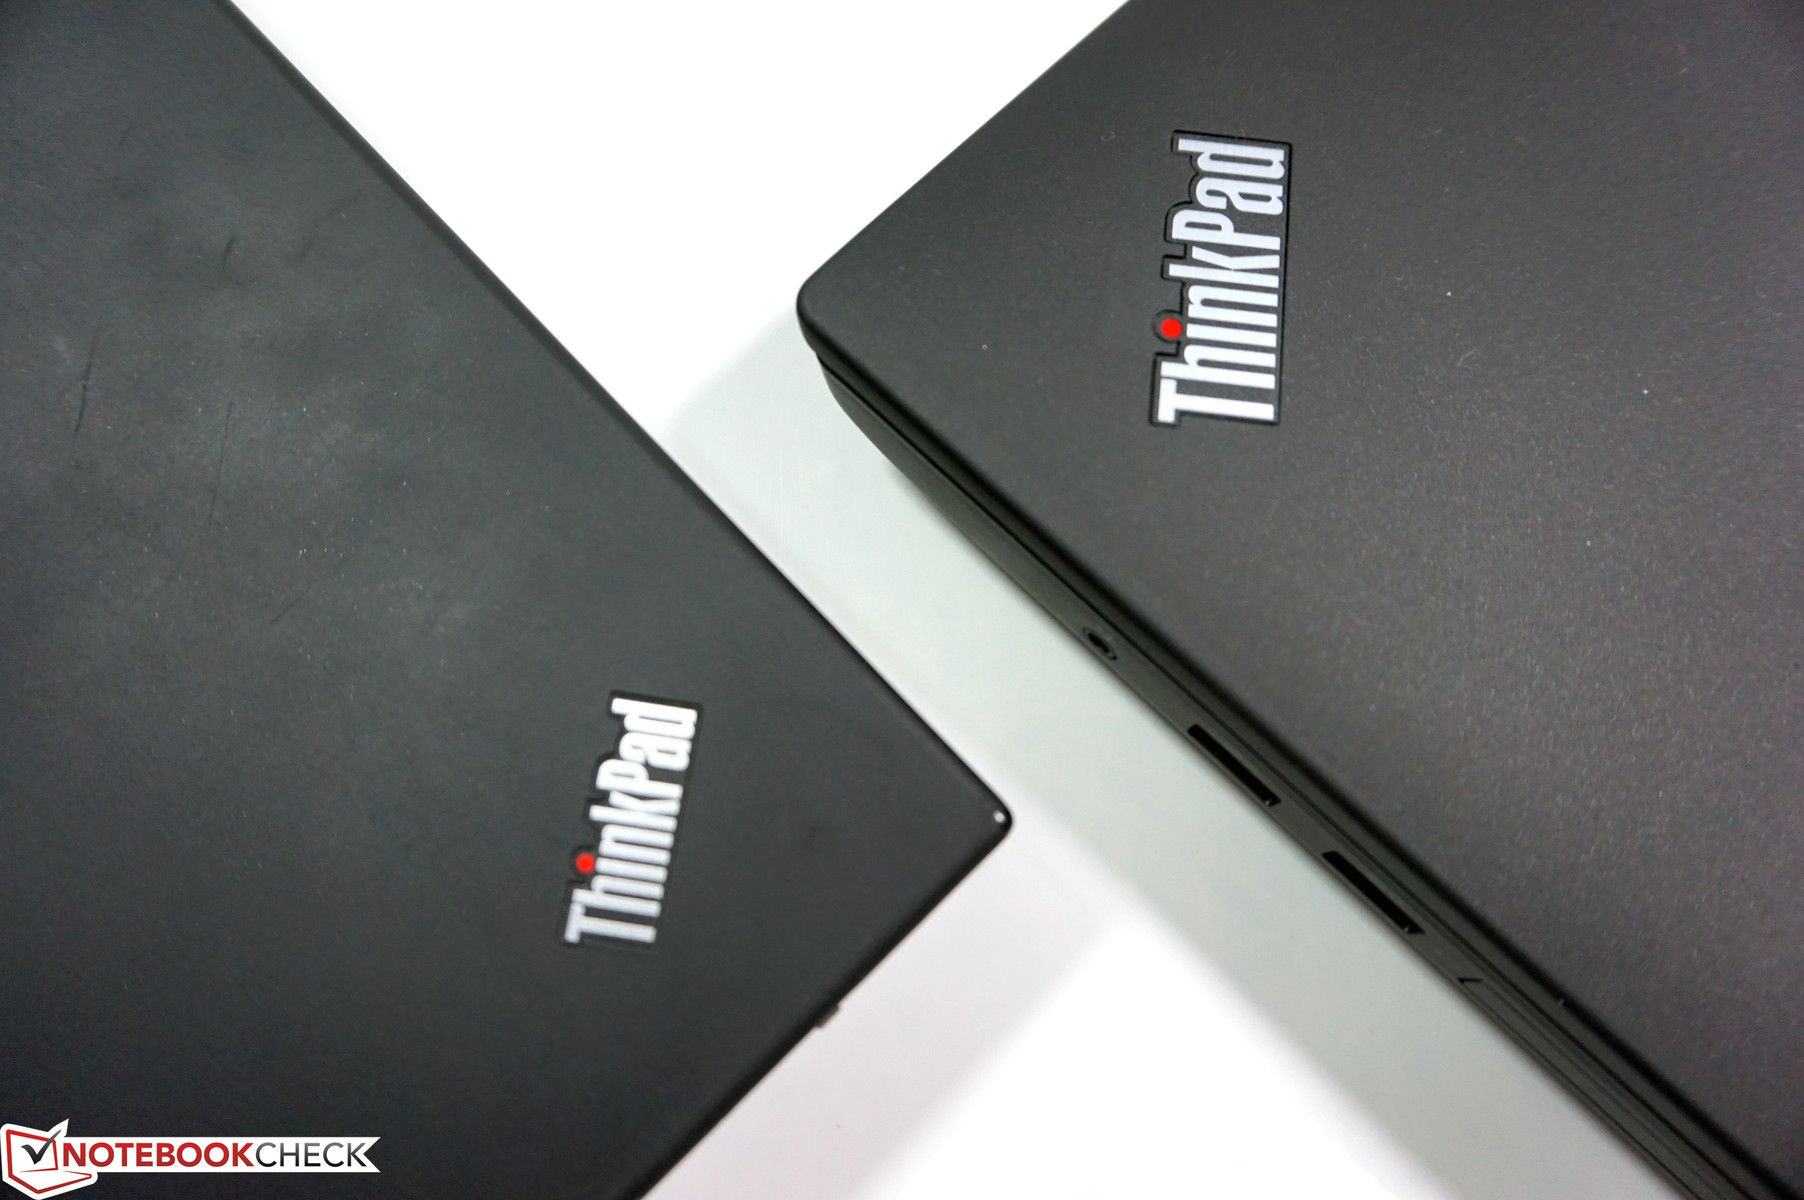
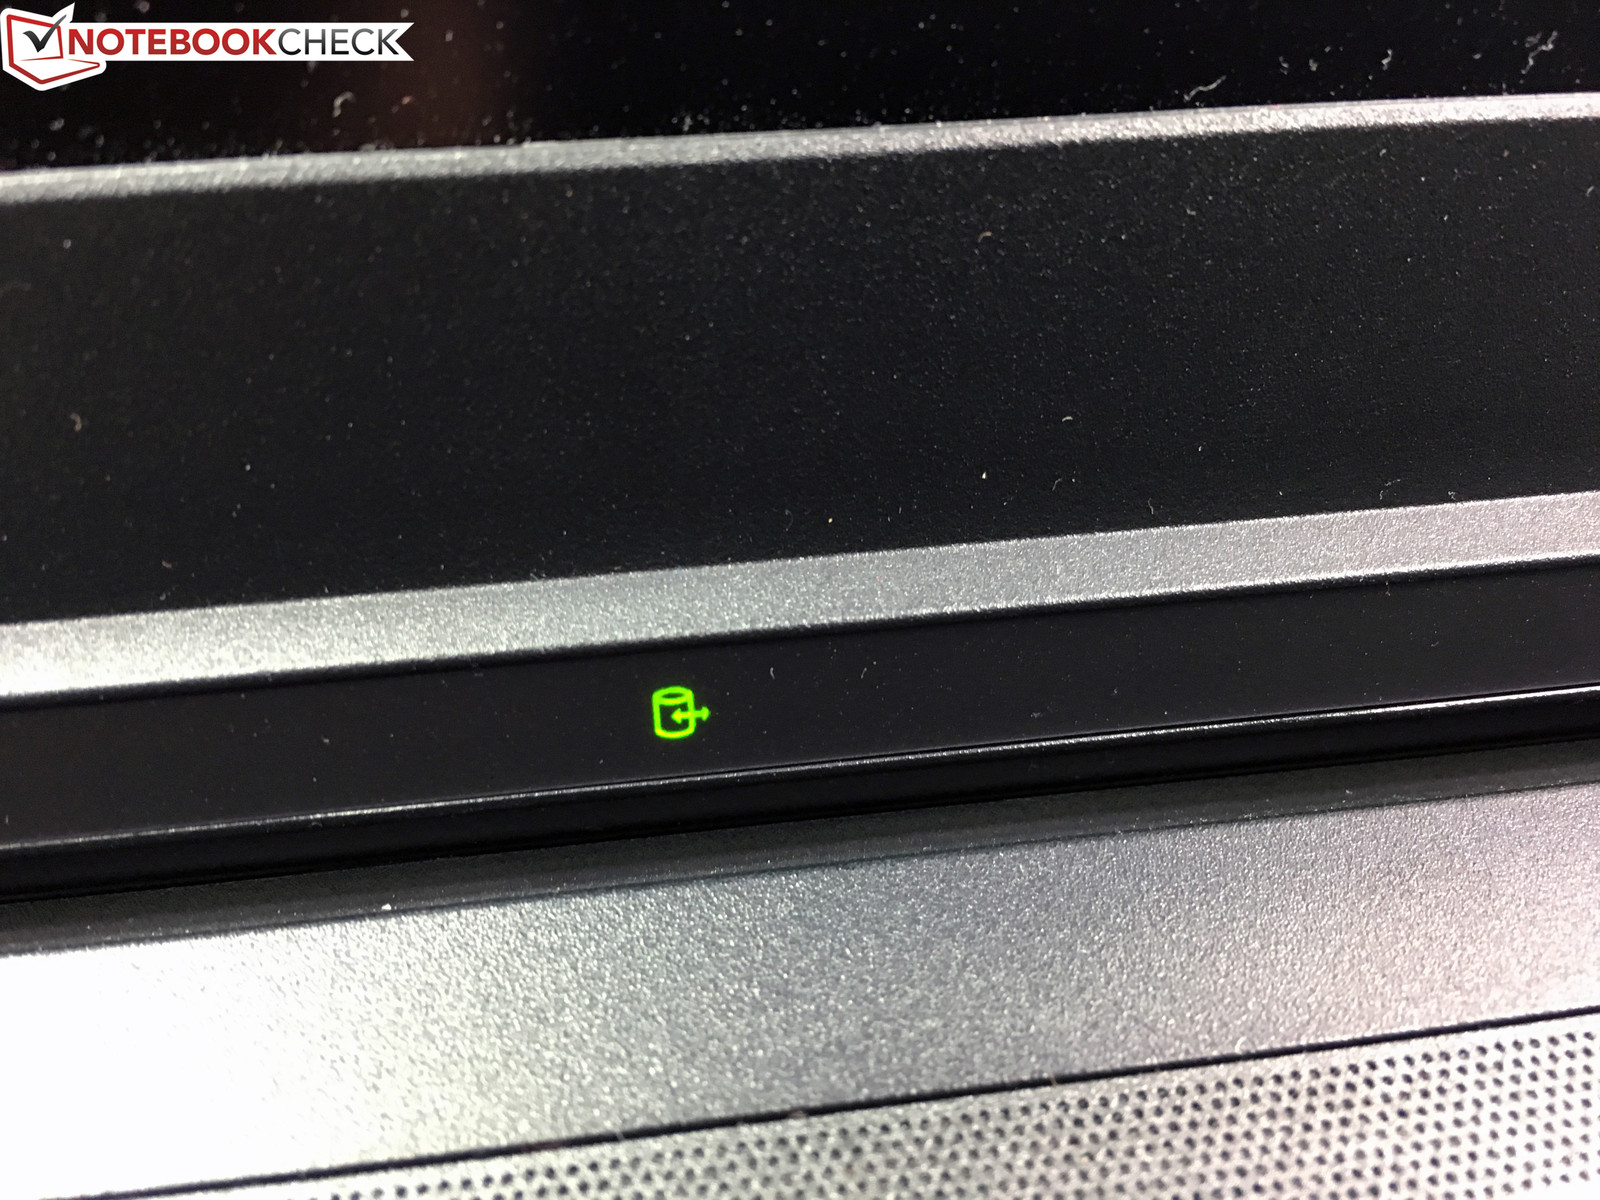
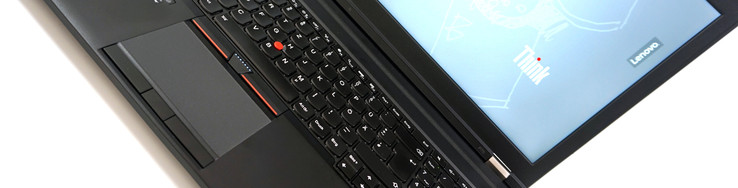
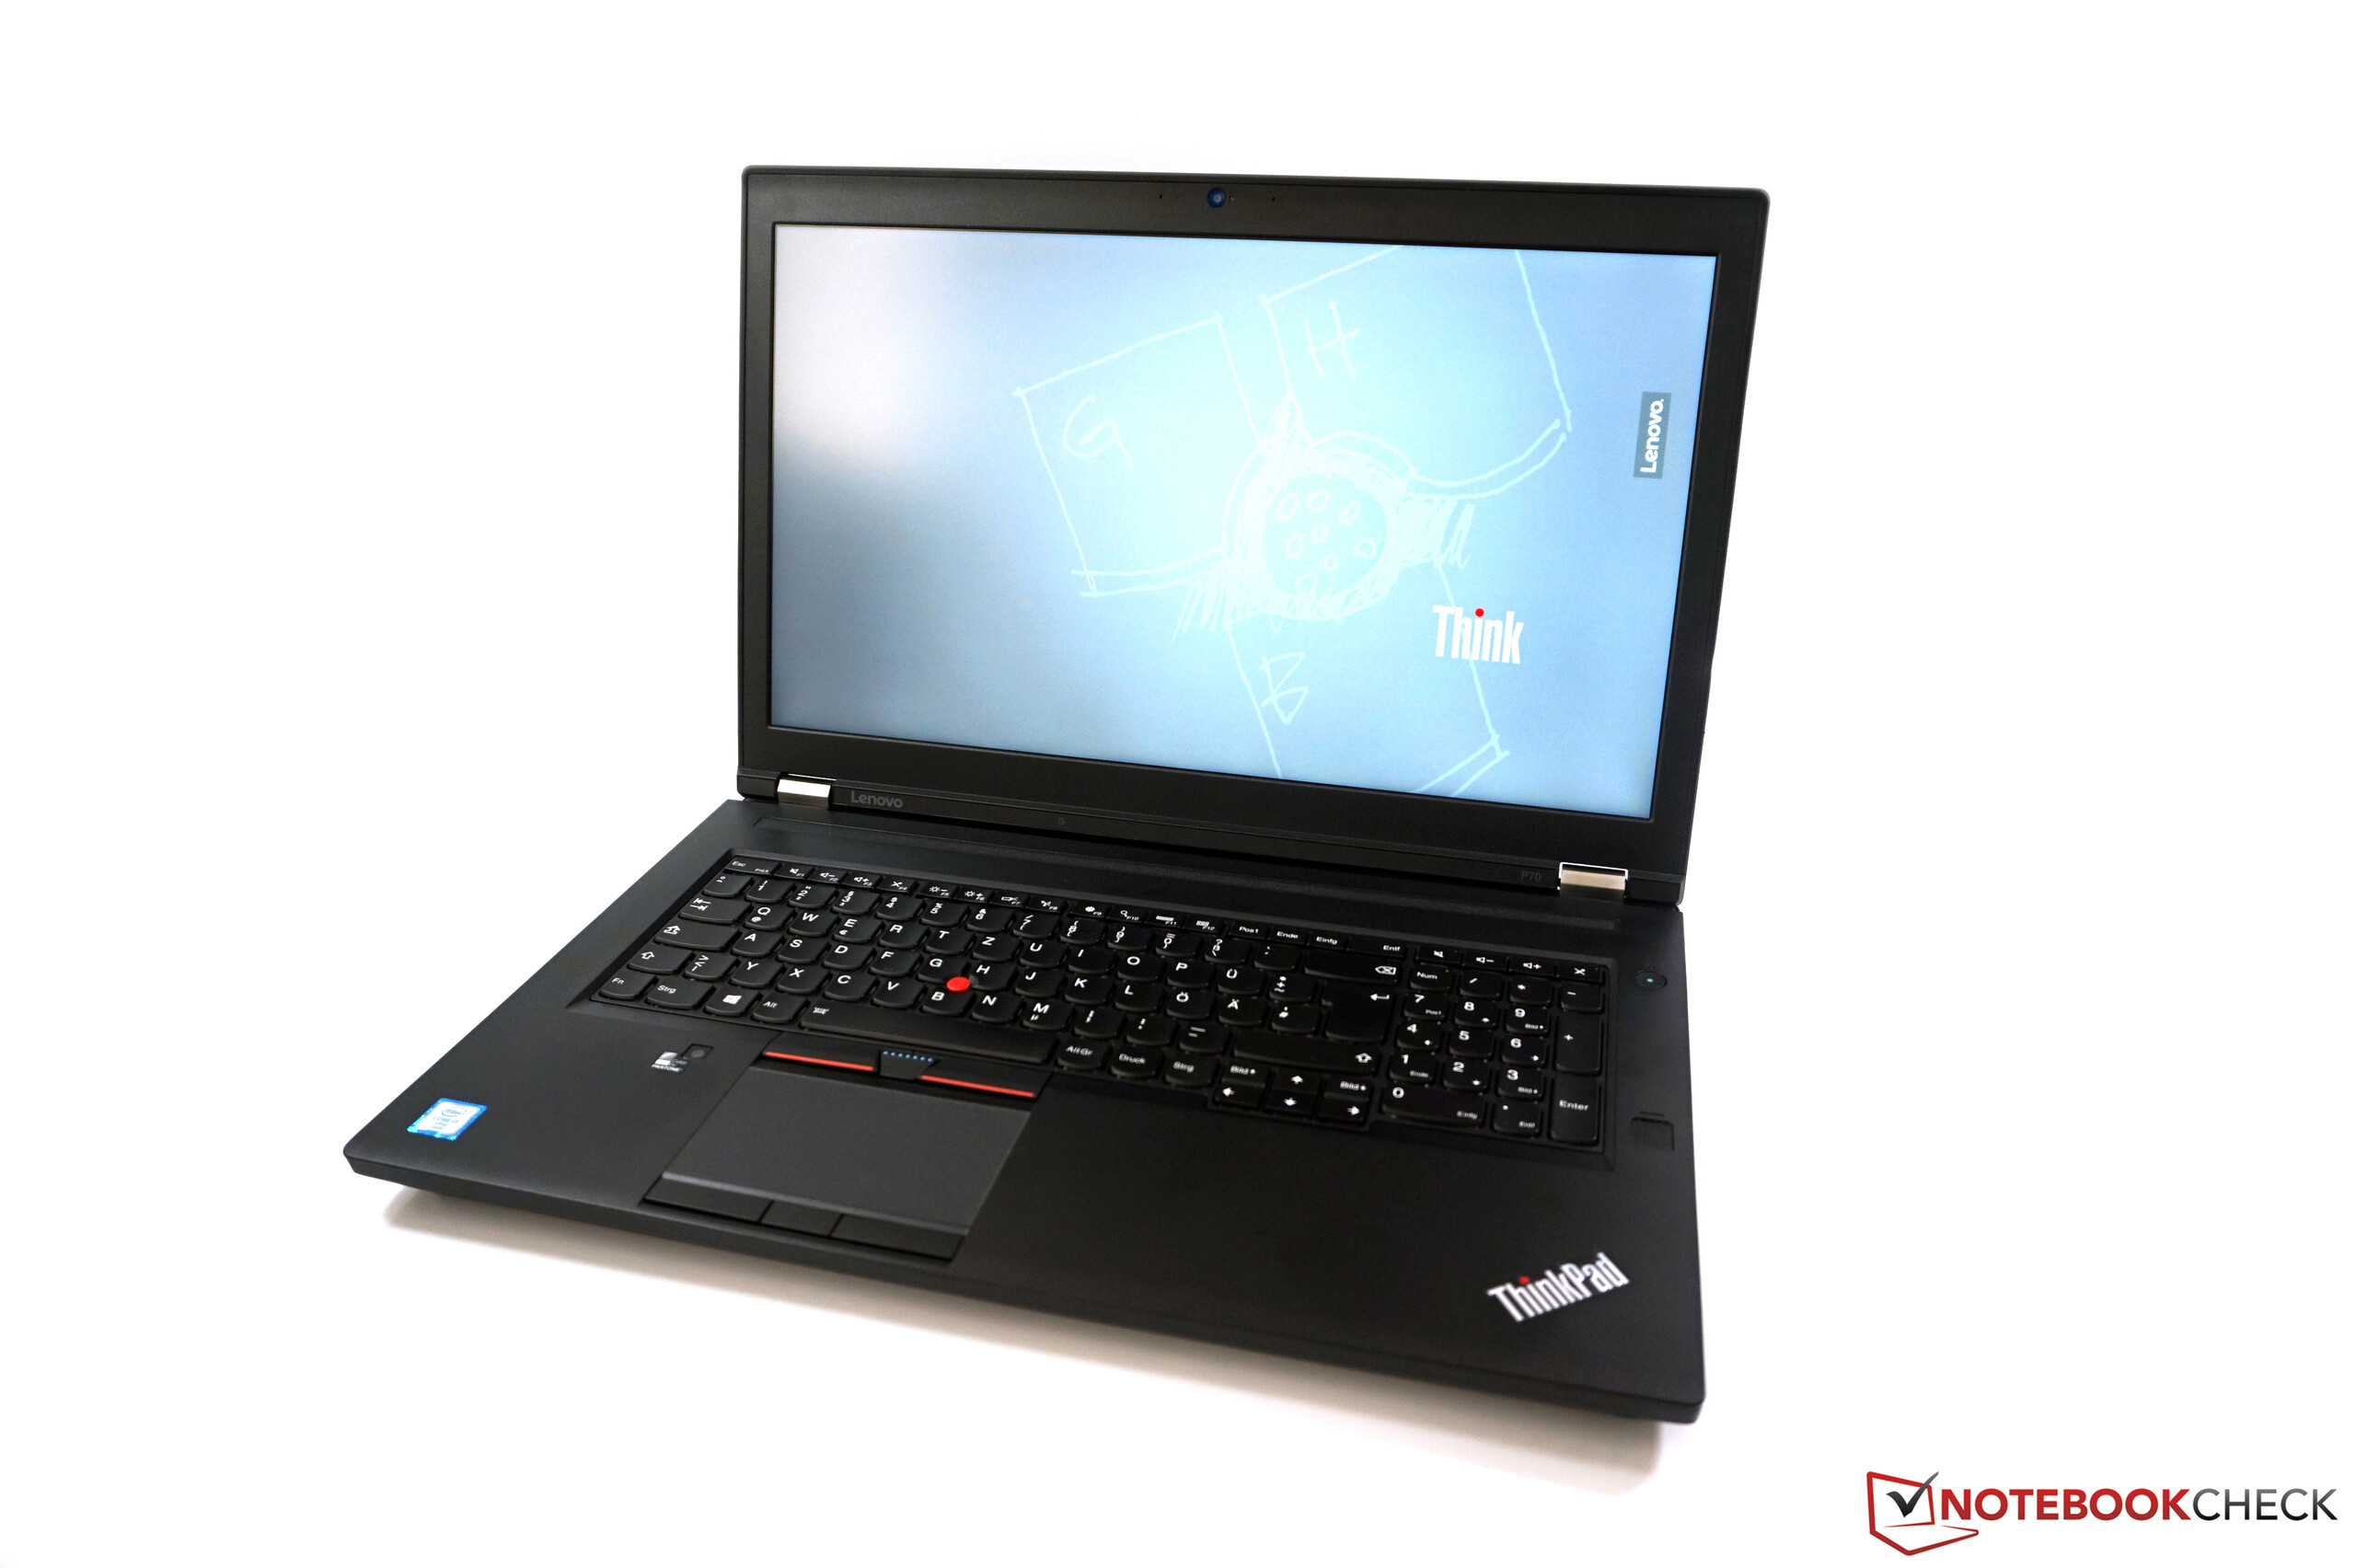
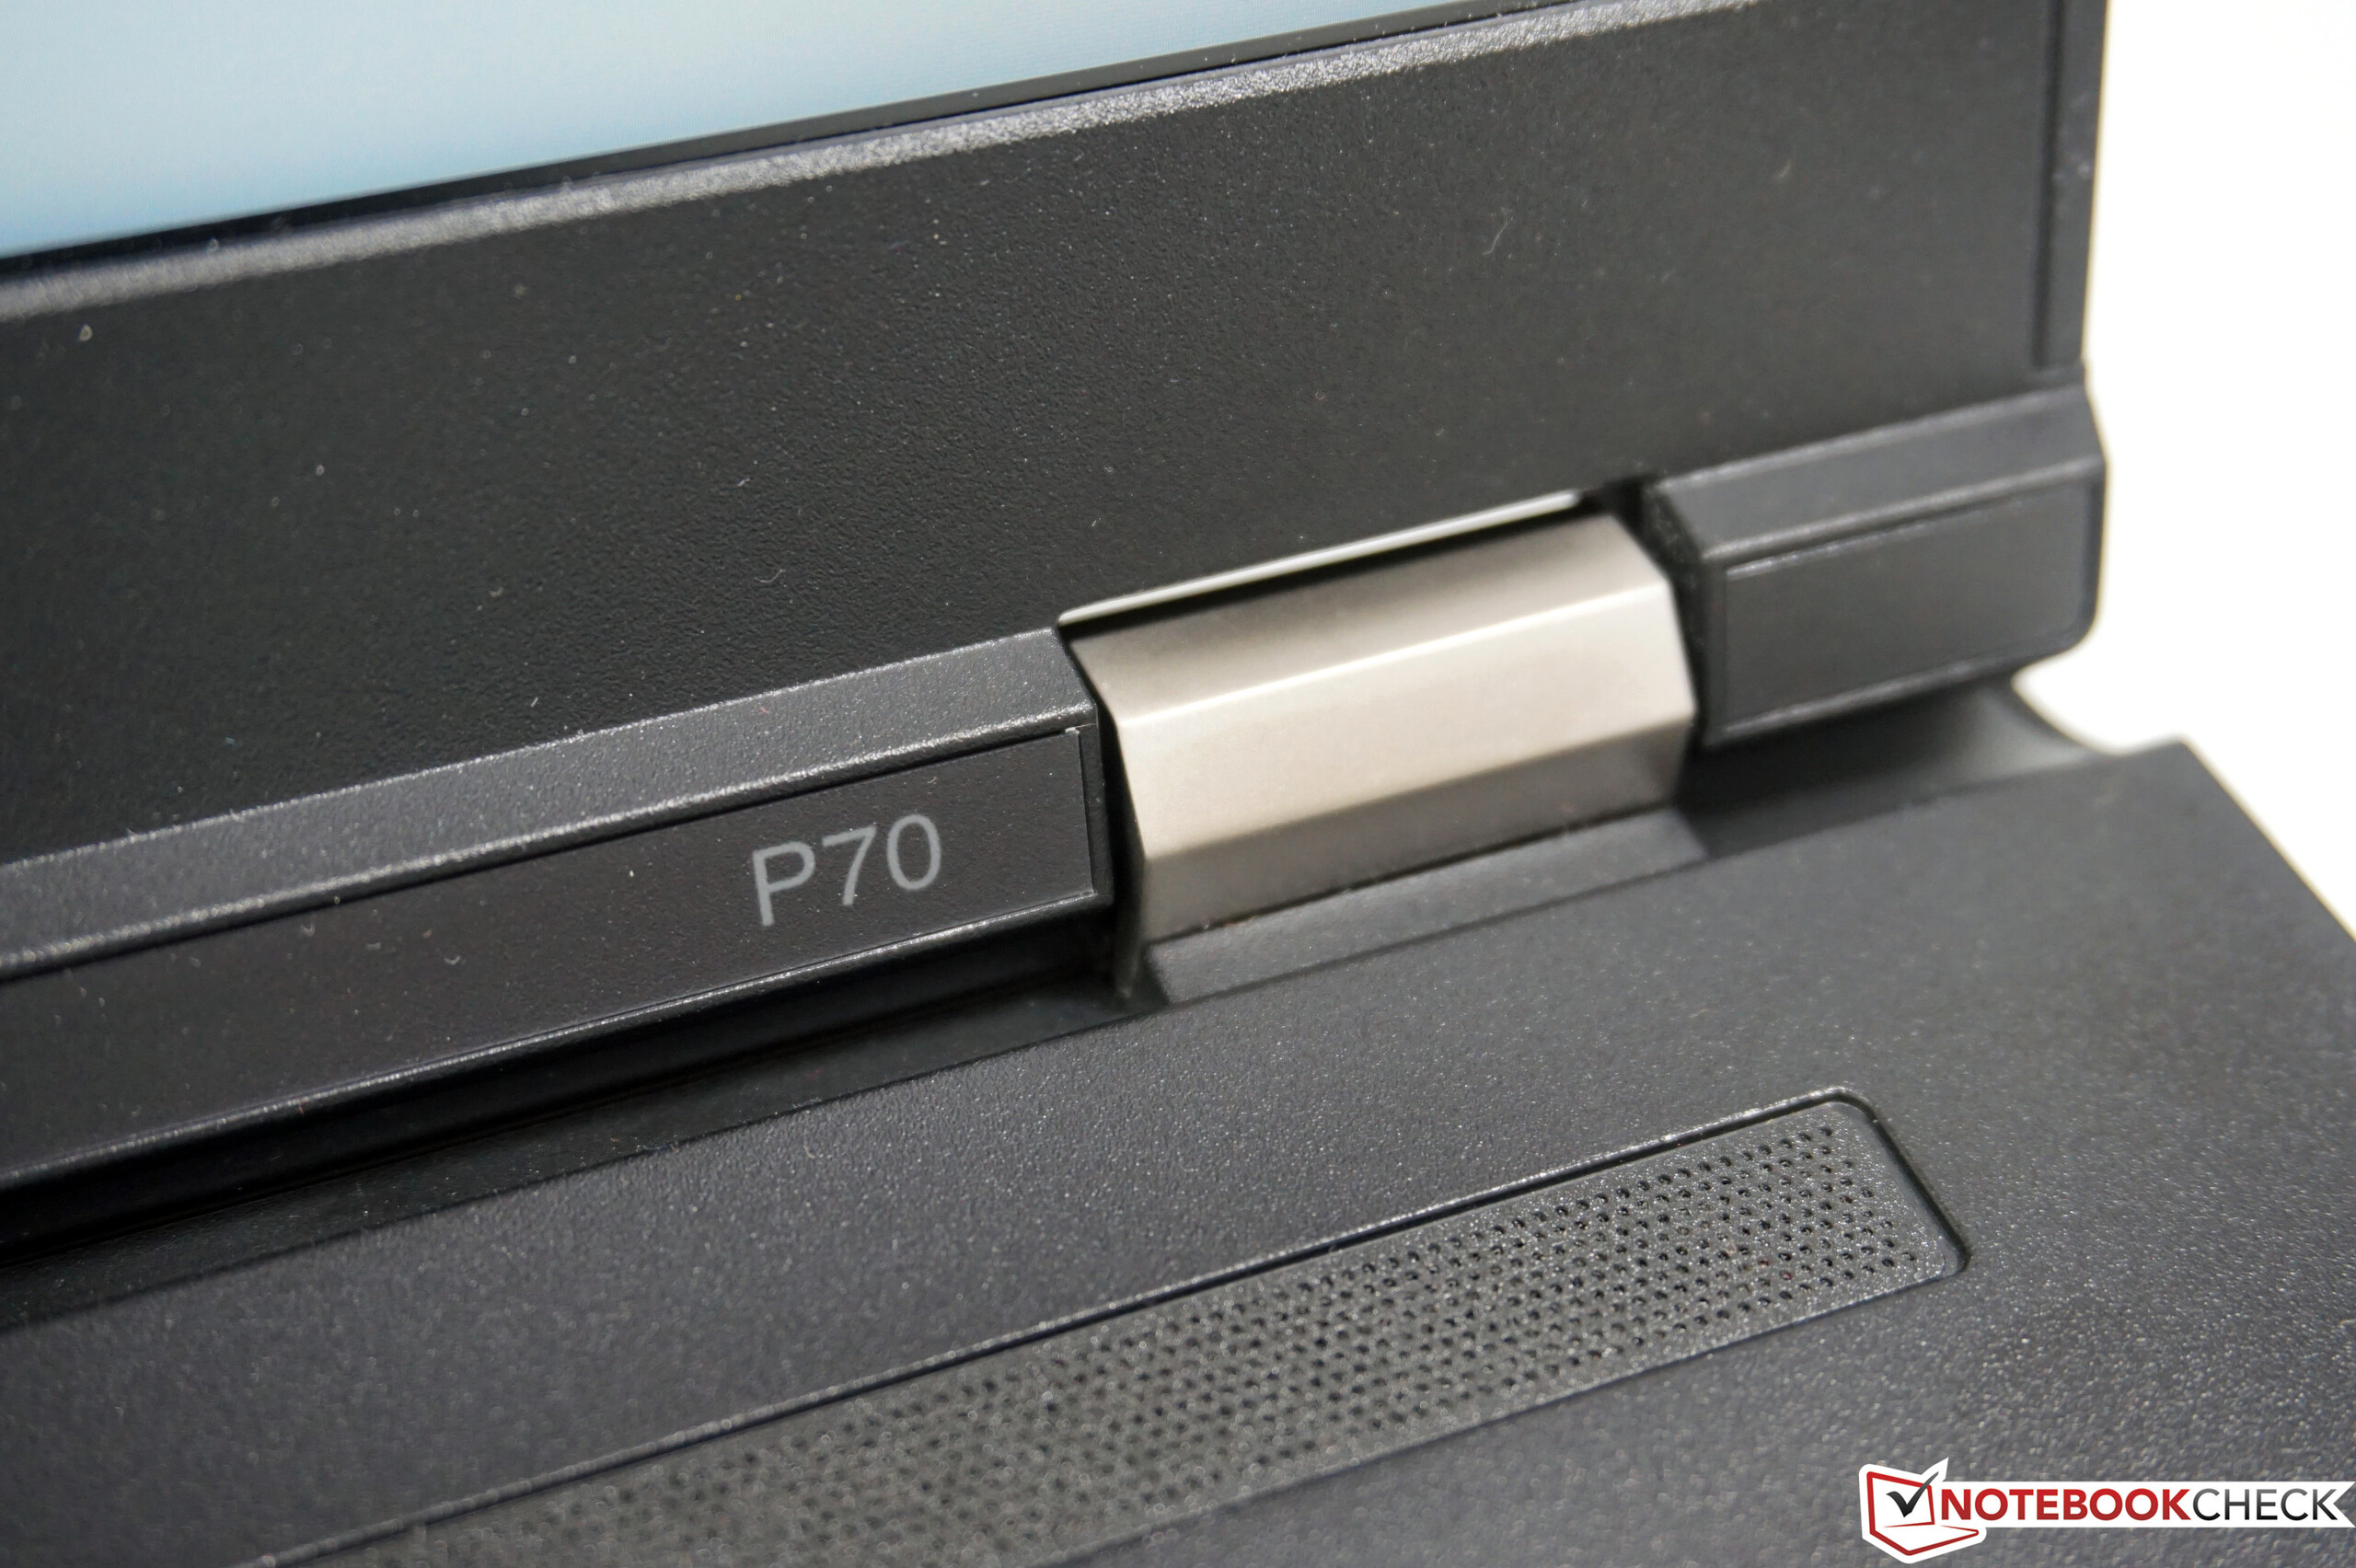
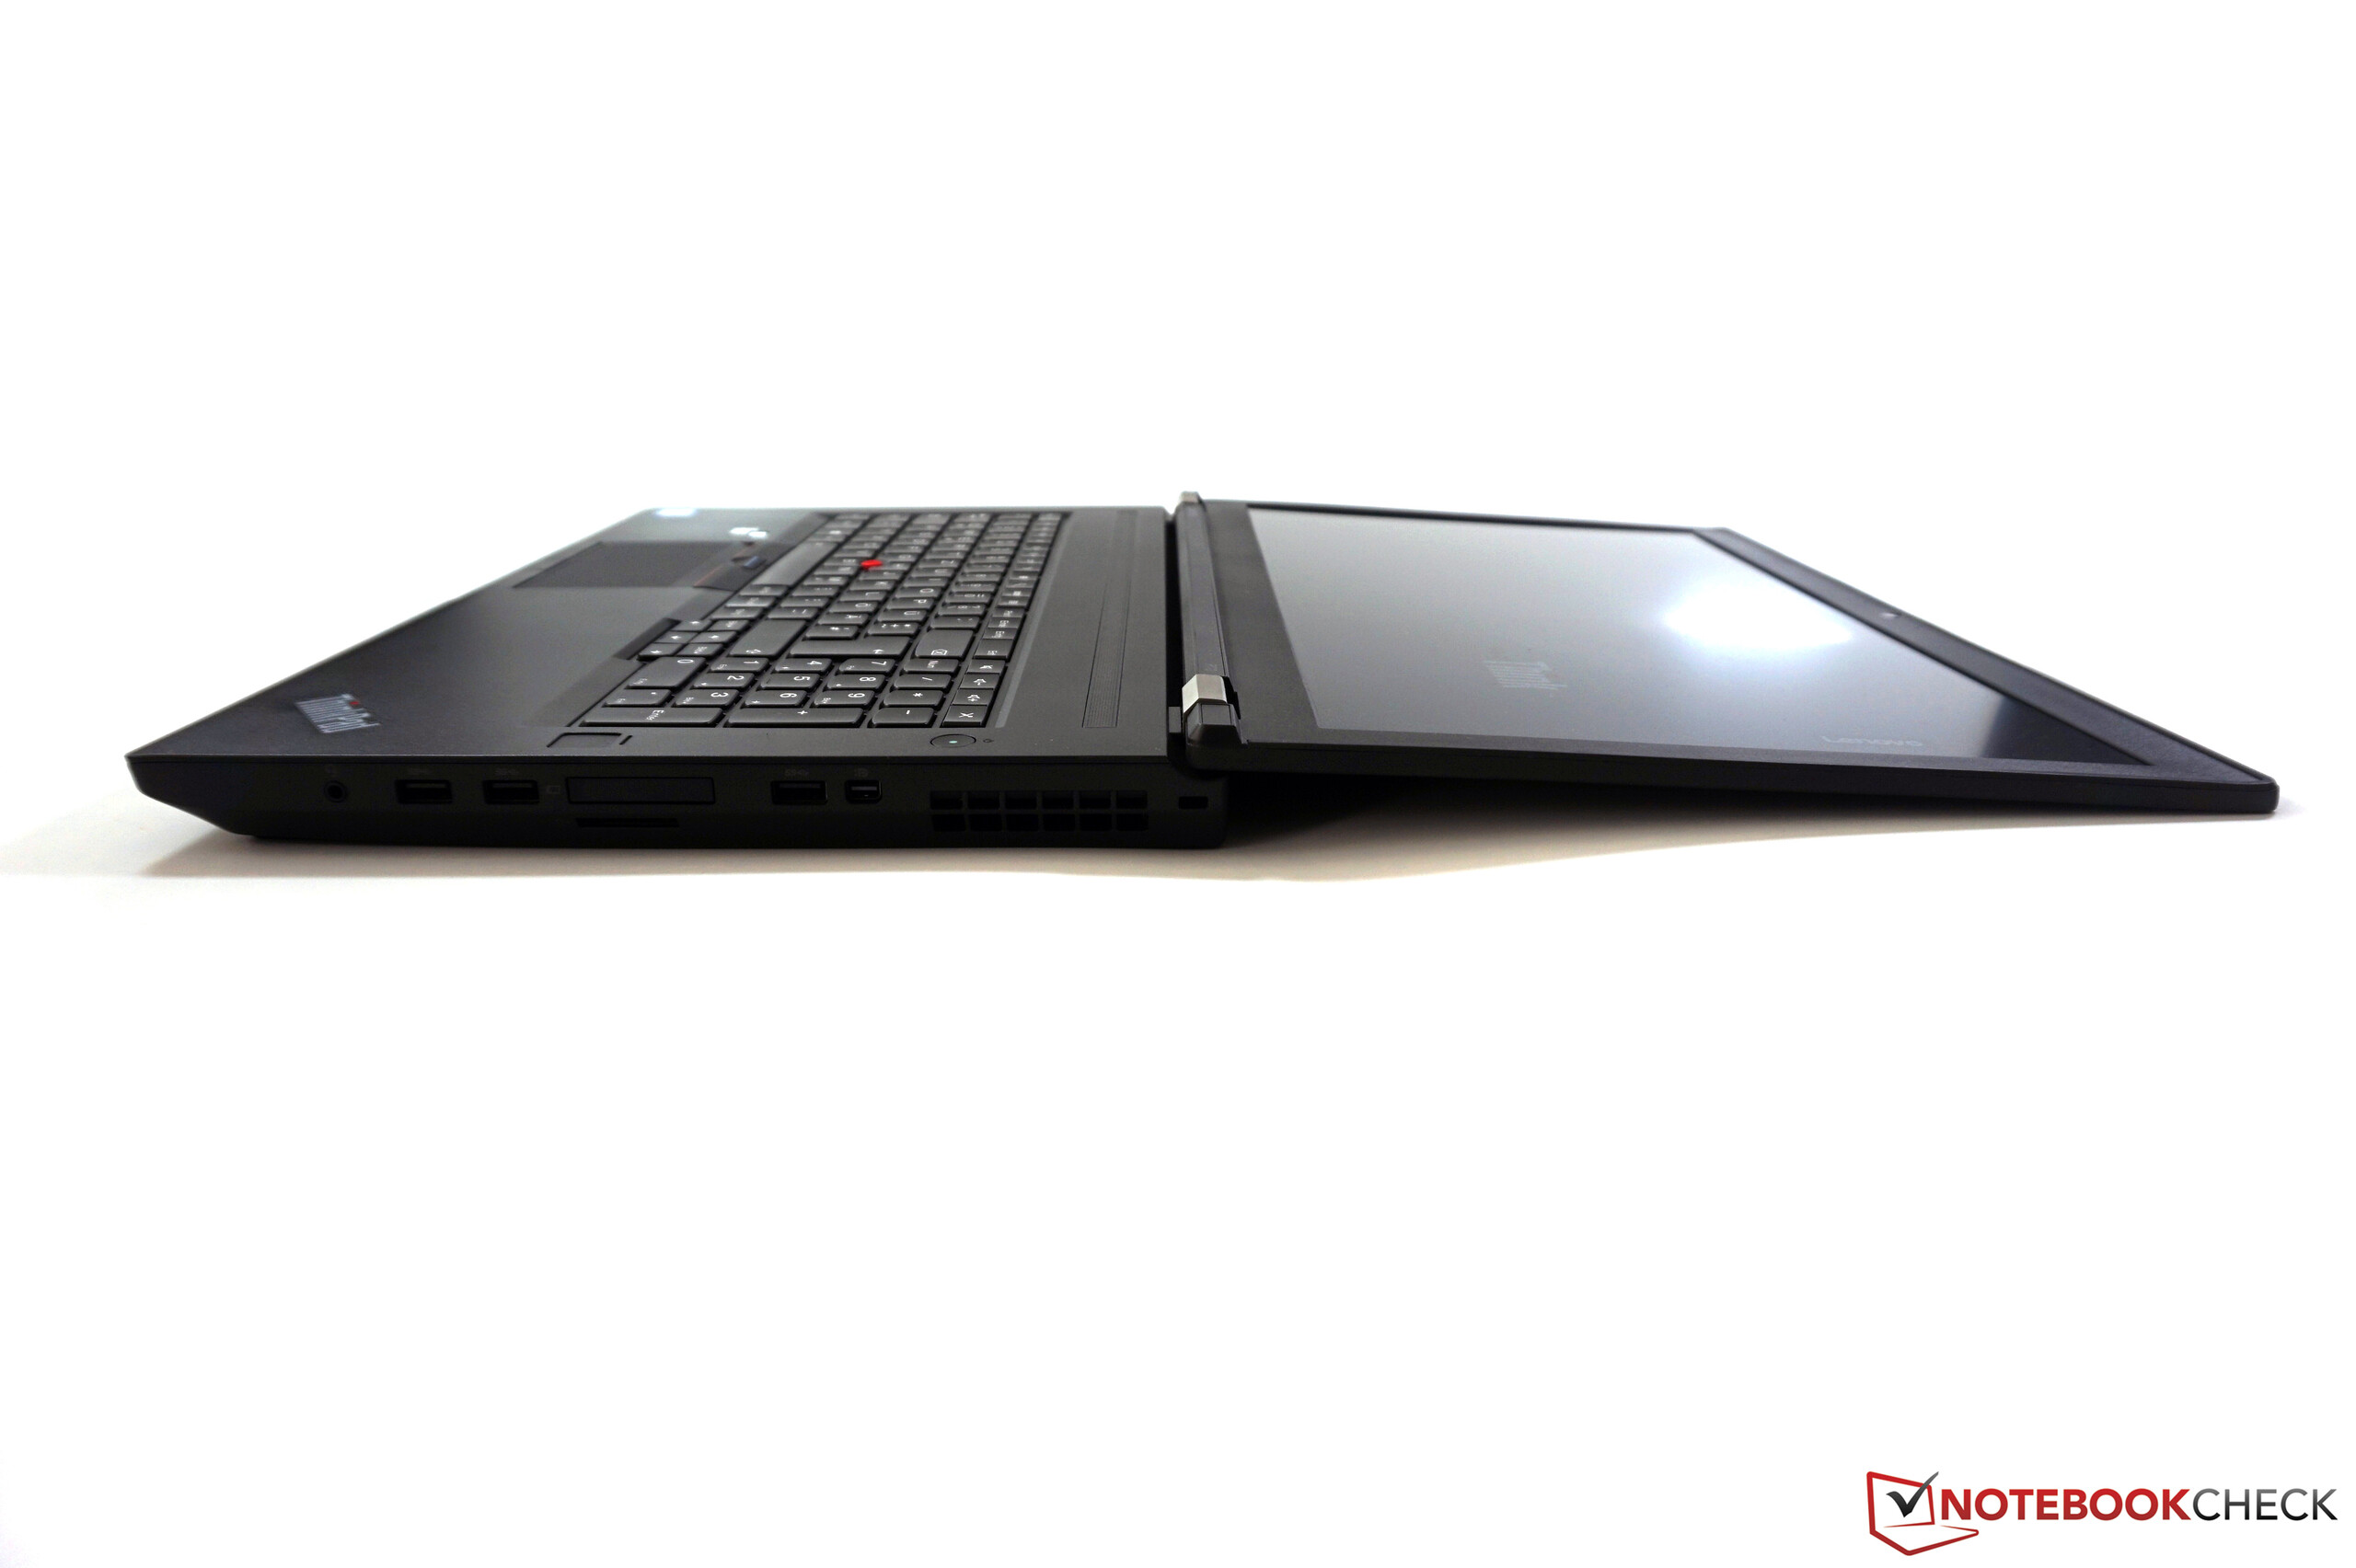
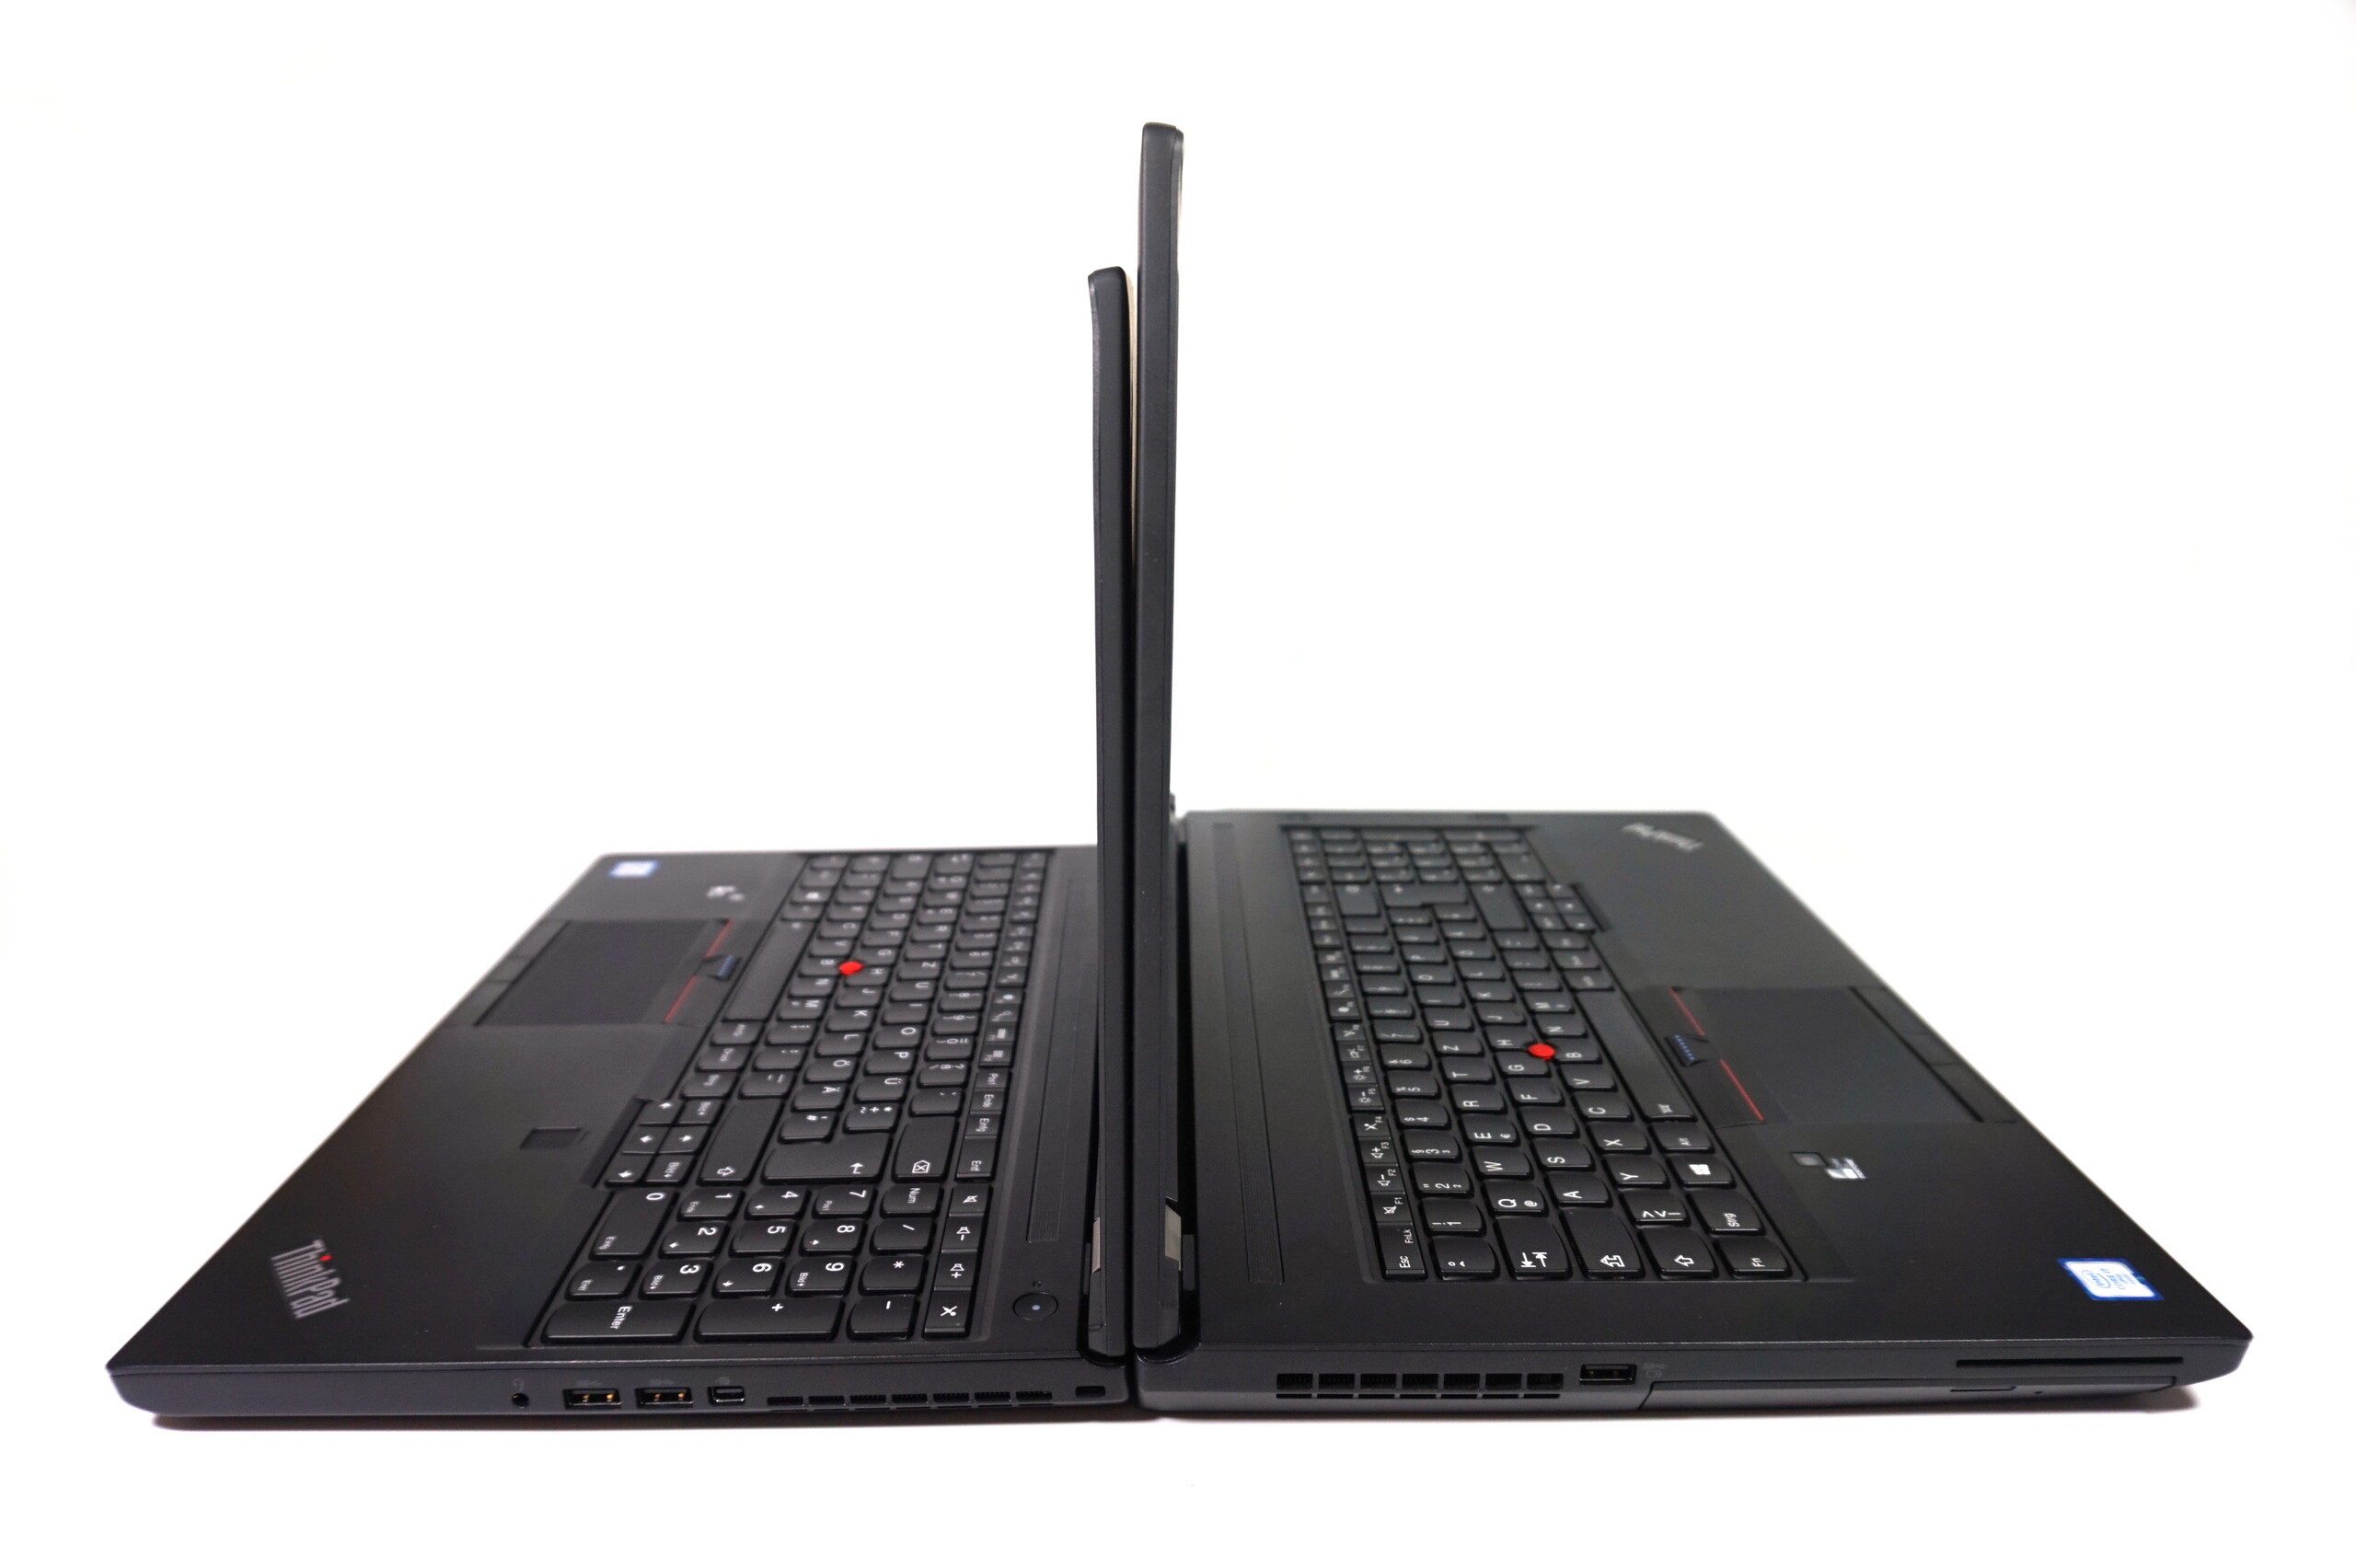
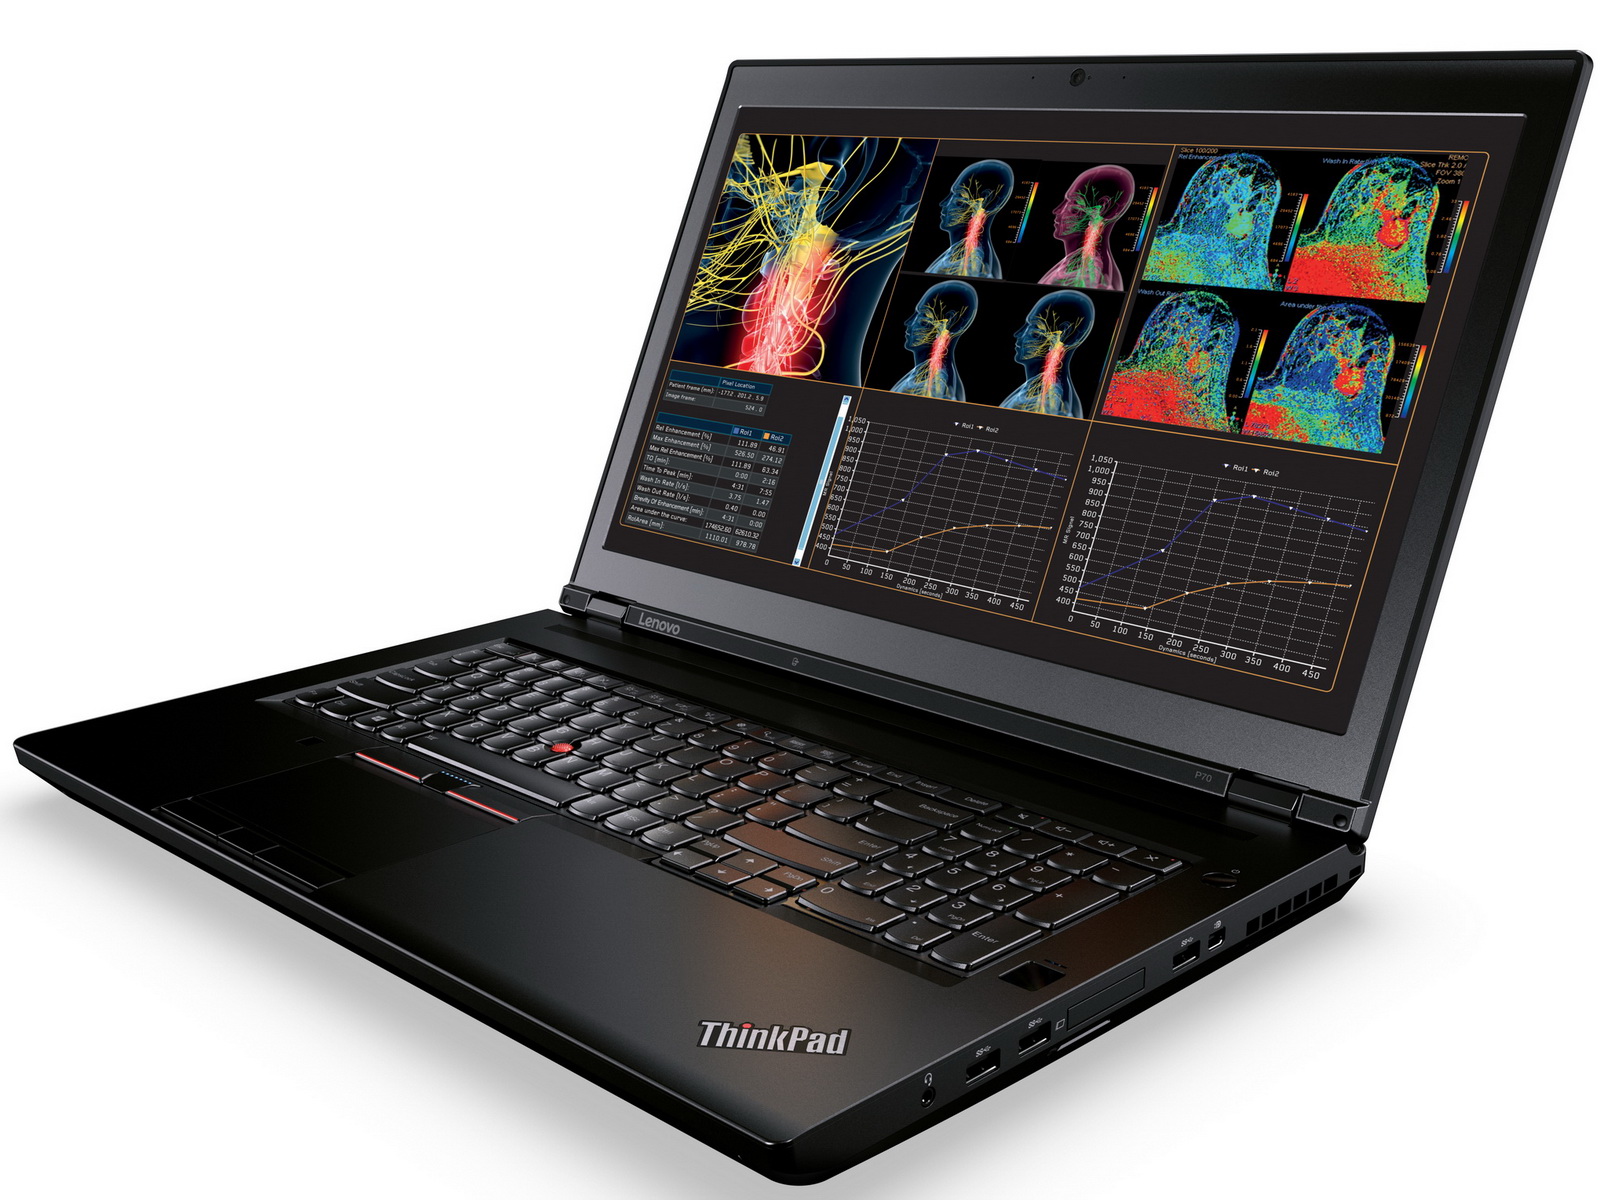
You can immediately see that Lenovo takes the mobile workstation very seriously. The chassis is 3.5 centimeters high and tips the scale at 3.6 kg, so it’s certainly not an Ultrabook, even though it fares pretty well compared to other 17-inch devices. Long-term ThinkPad users will also notice that Lenovo switched back to black cases and also included a status LED for the hard drive. As usual, you get plastic surfaces, while the underlying construction is made of an aluminum/magnesium alloy. We did not manage to dent the palm rest and the area above the smart-card reader, which is usually a bit of an issue, is also very sturdy. This impression continues for the keyboard, which only flexes a bit in the area around the TrackPoint, but it is no issue in practice. The "weakest" area of the base is the center area under the display, where the chassis can be pushed in under force. Still, it is not as bad compared to some older ThinkPads.
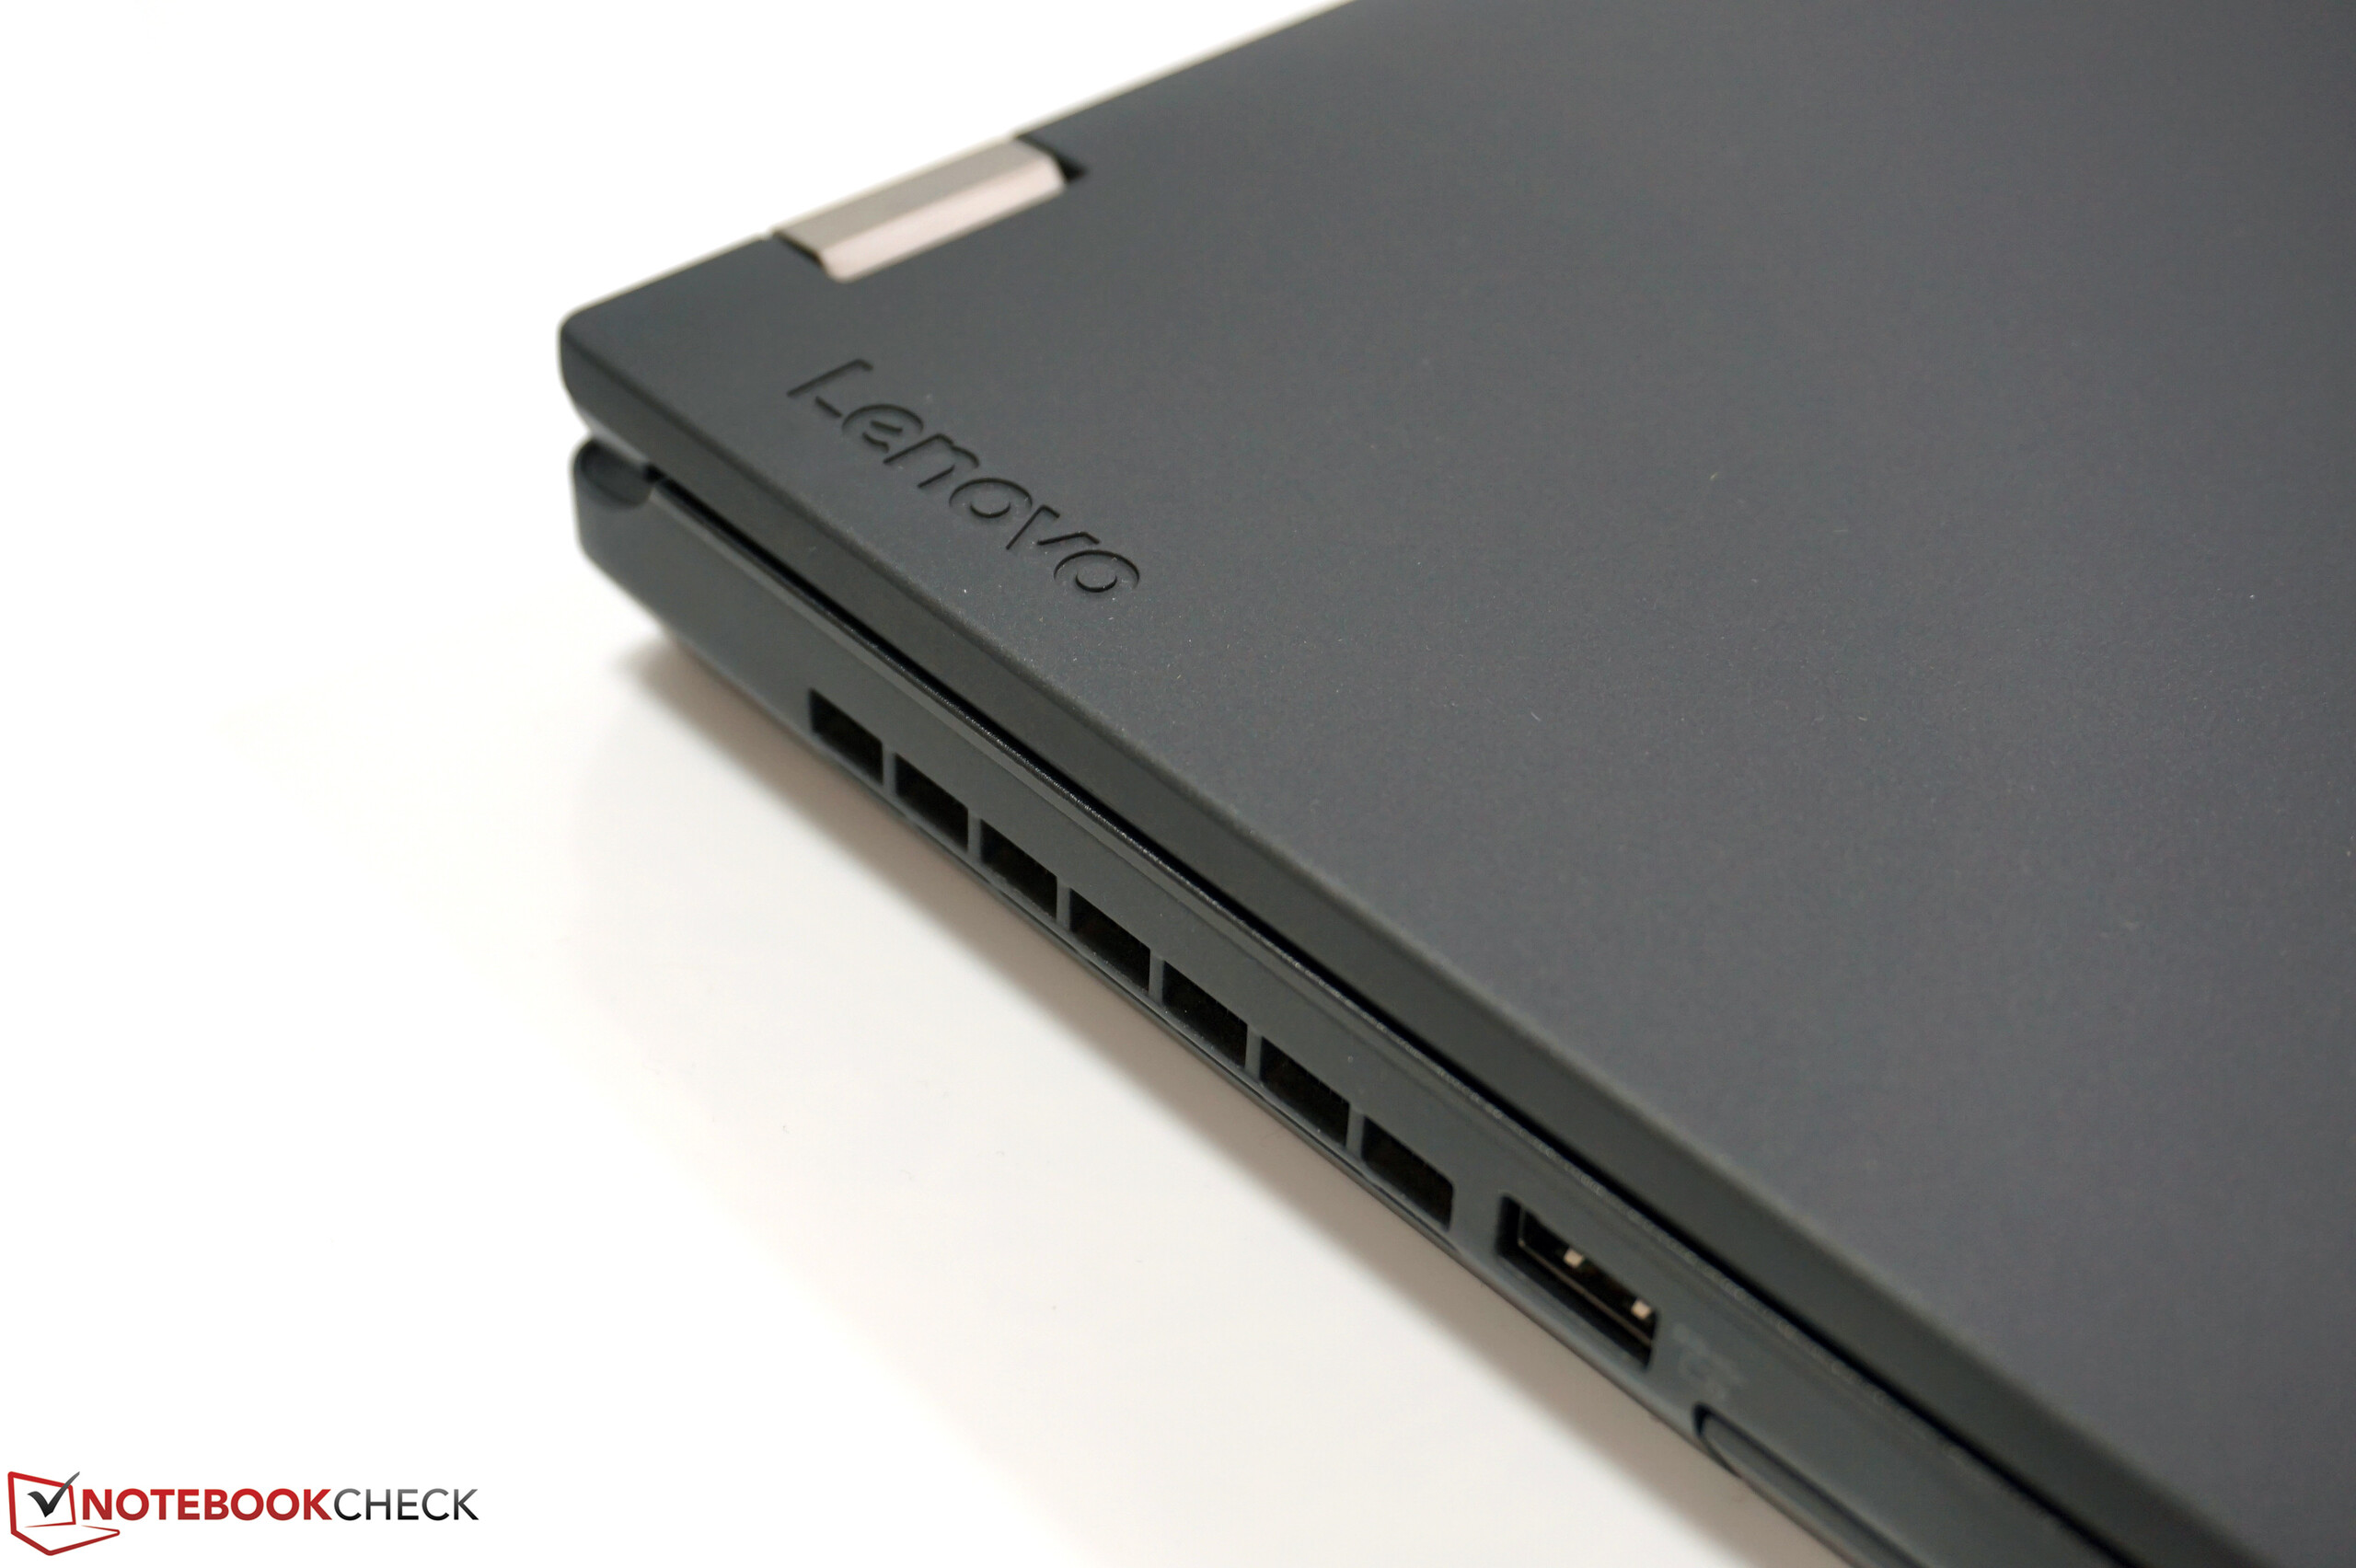
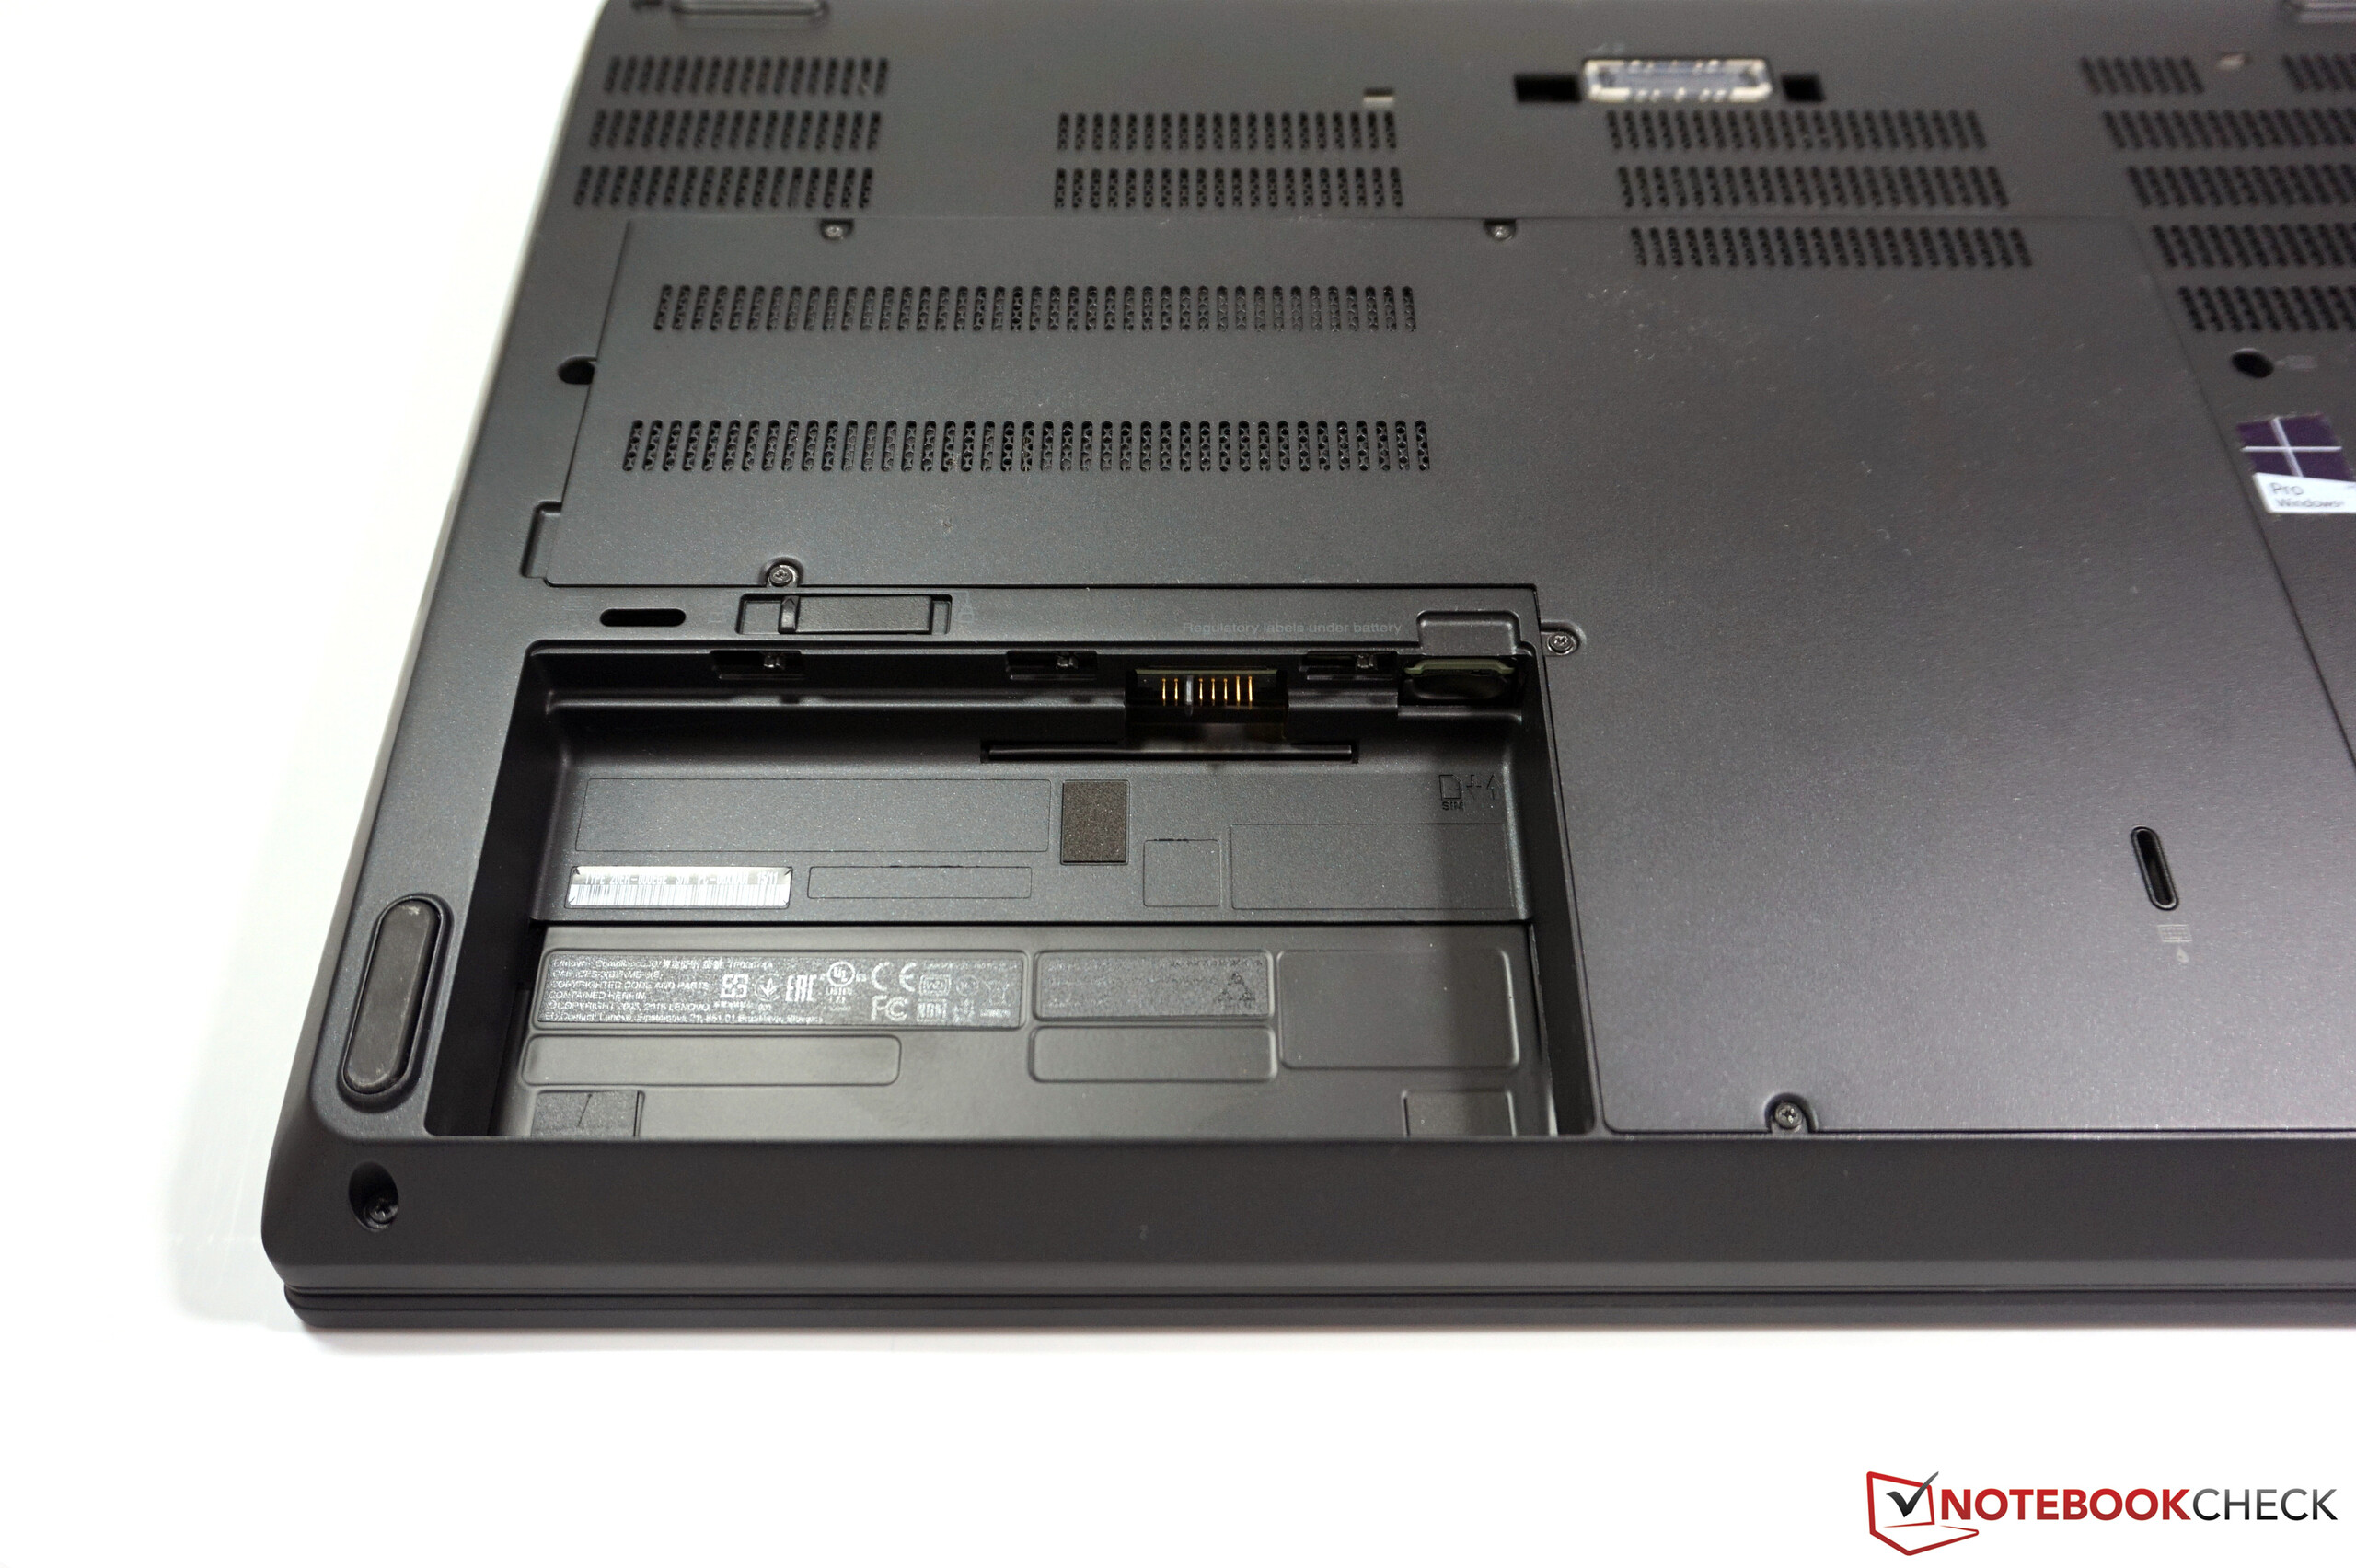
The black lid is rubberized and is nice to touch but also pretty susceptible to dirt and dust. The lid is also comparatively thin, which is why the stability cannot keep up with the base. It was too easy to twist in our opinion, but there was no creaking. Pressure from behind is not a big problem, either, and it does not result in picture distortions. The two metal hinges are taut and keep the display well in position. They just have problems with the big display at extreme opening angles (more than 180 degrees possible) and could therefore be even firmer. The battery is located in the front area of the base, so you can open the lid with just one hand.
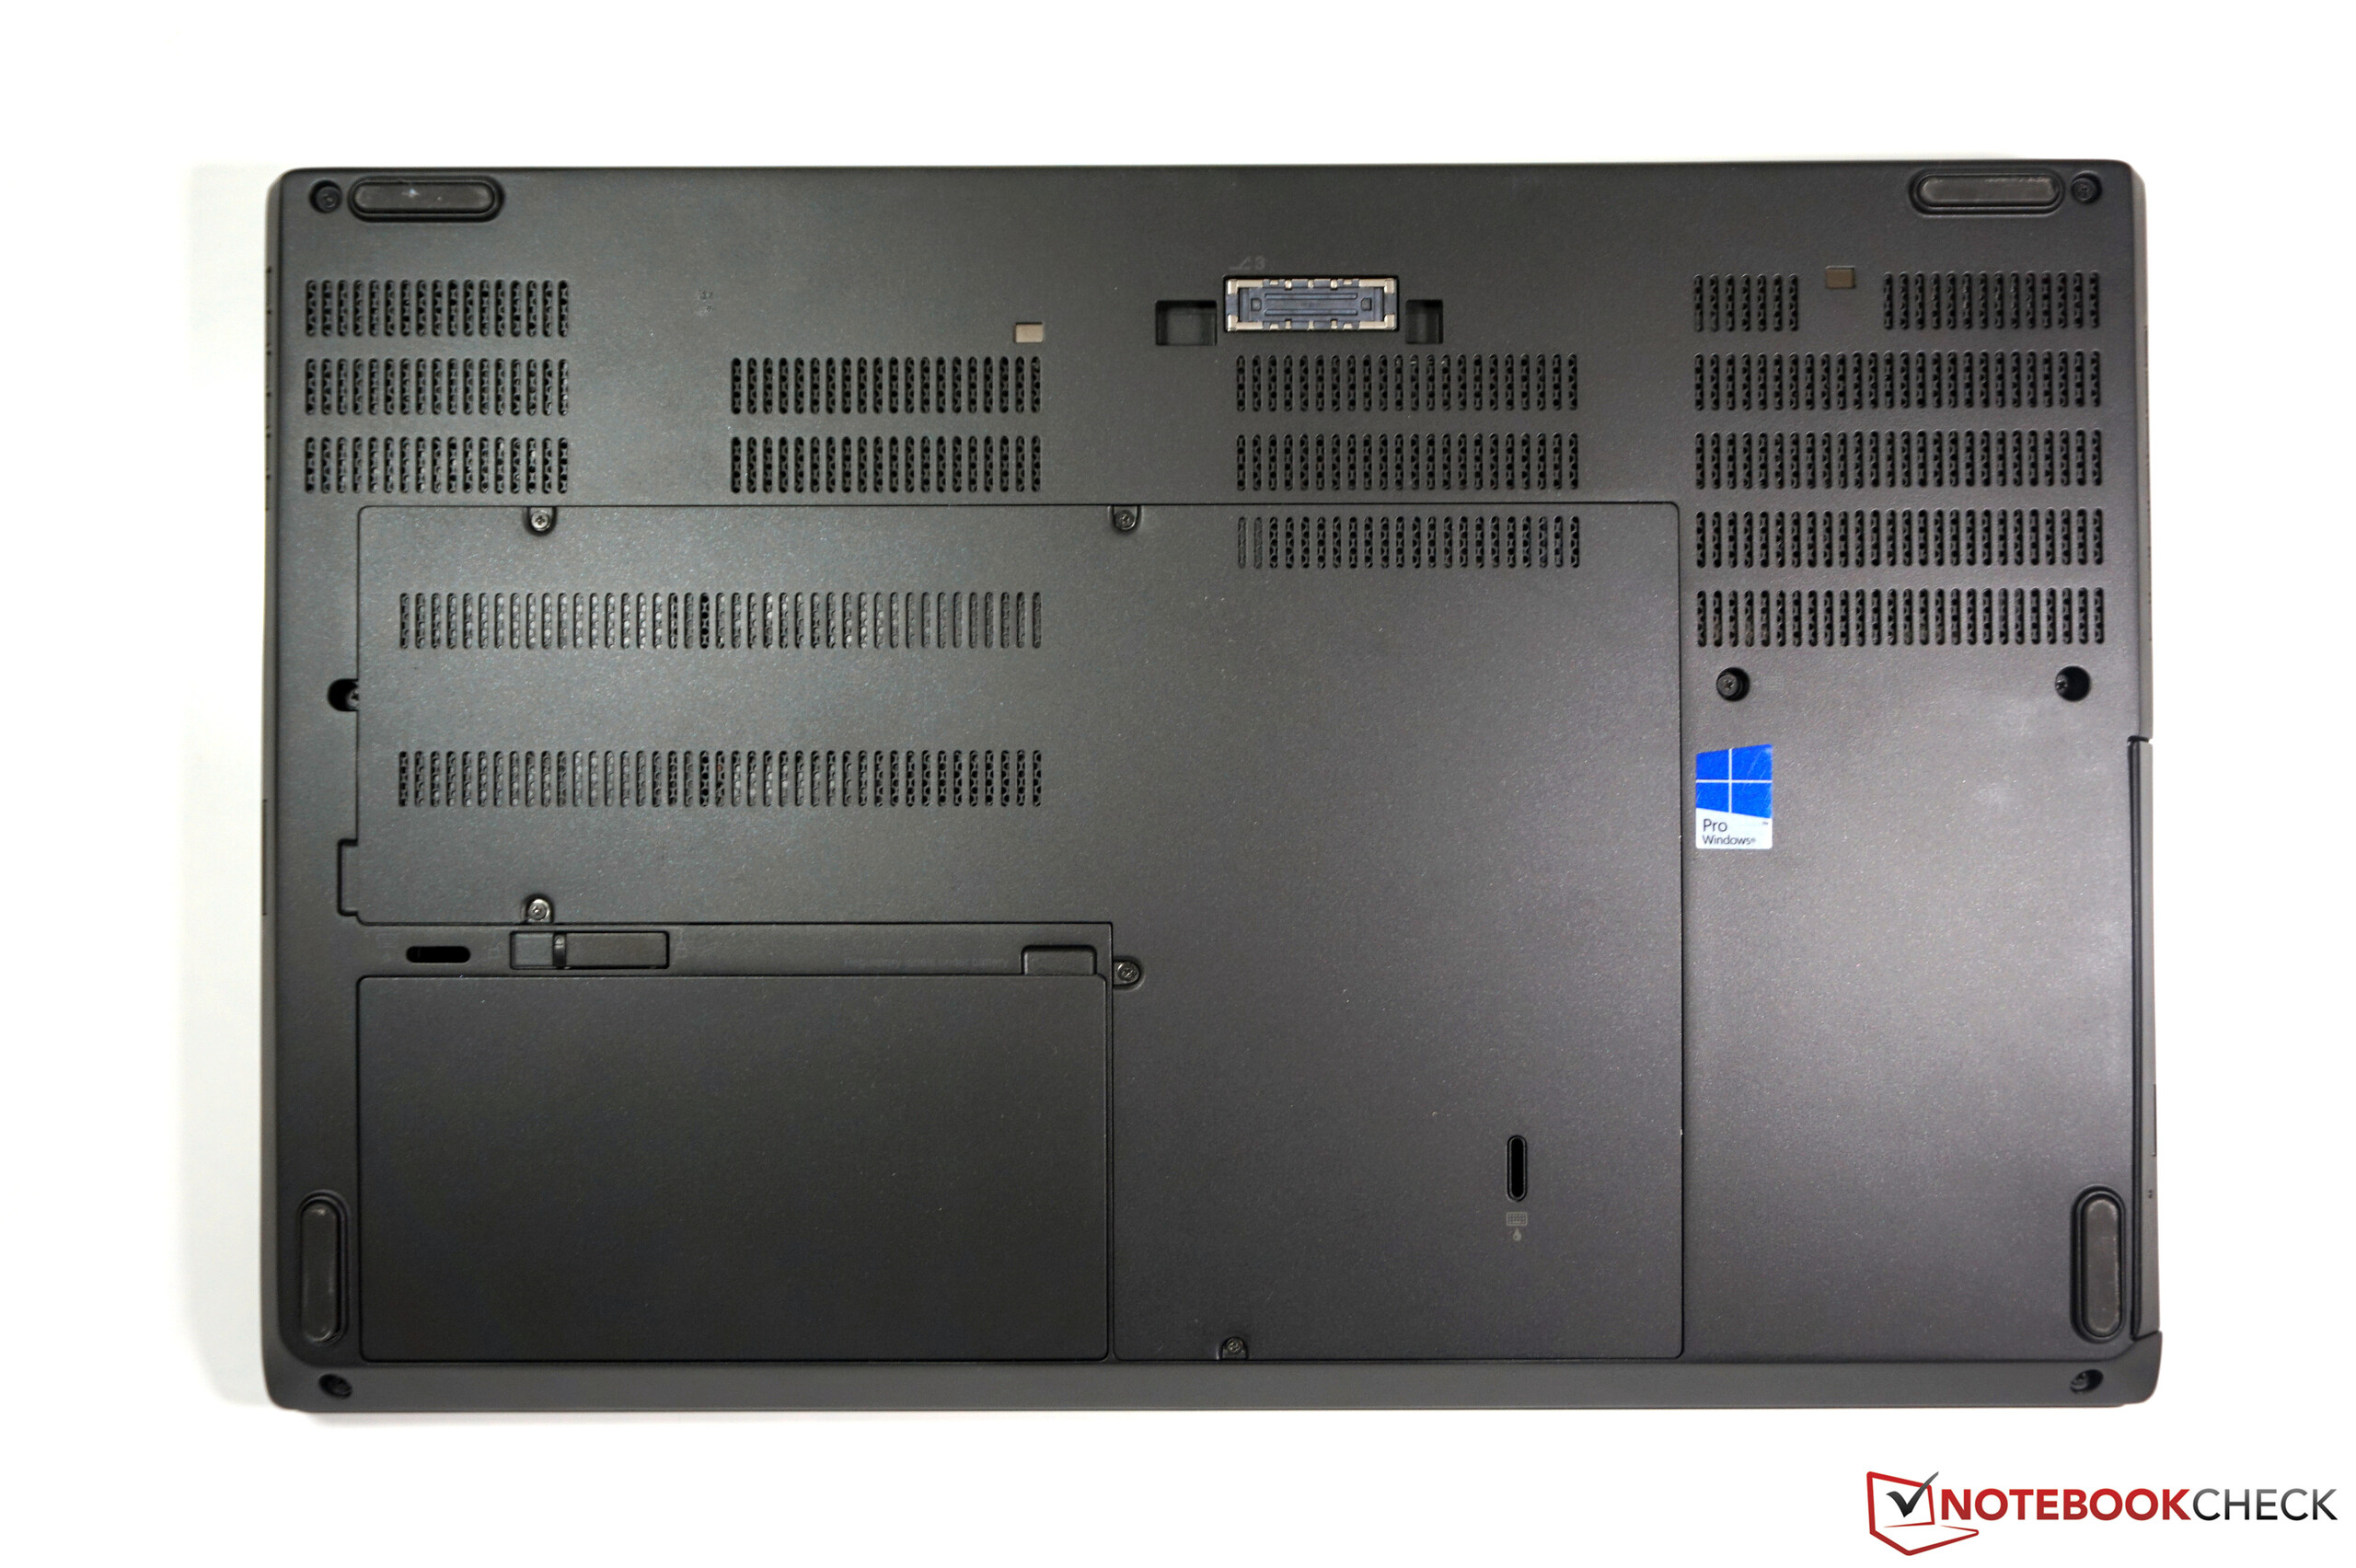
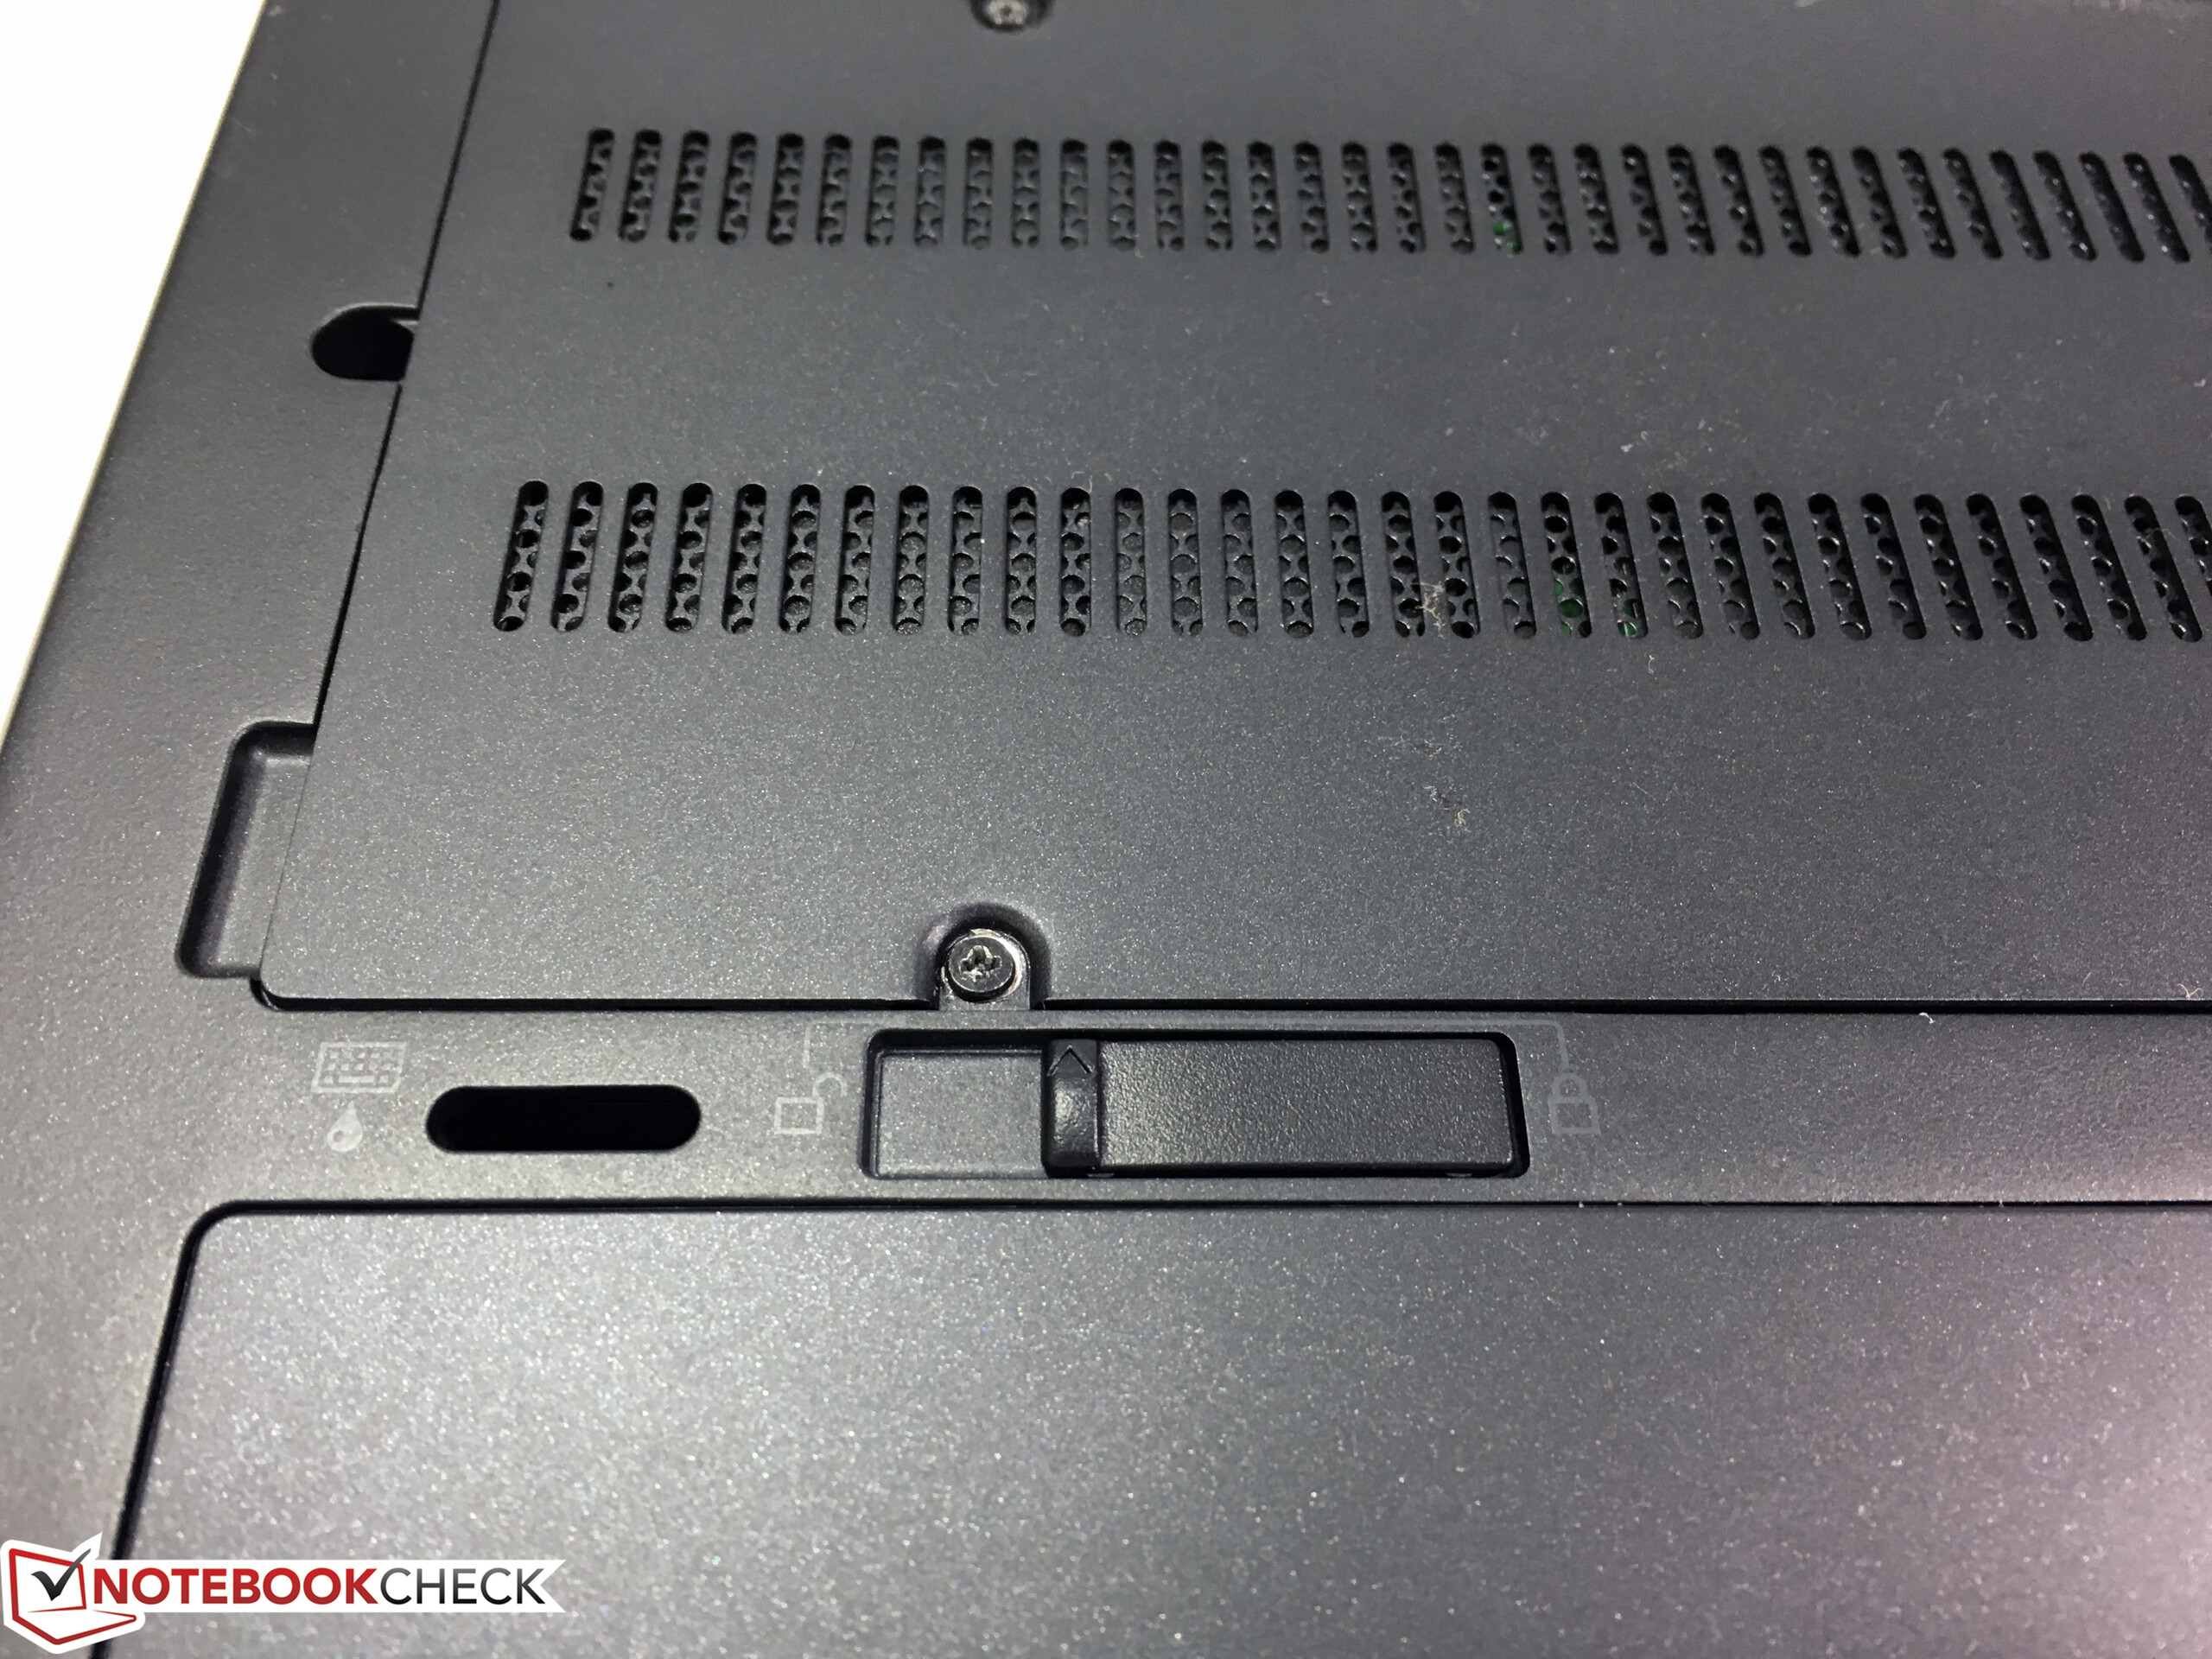
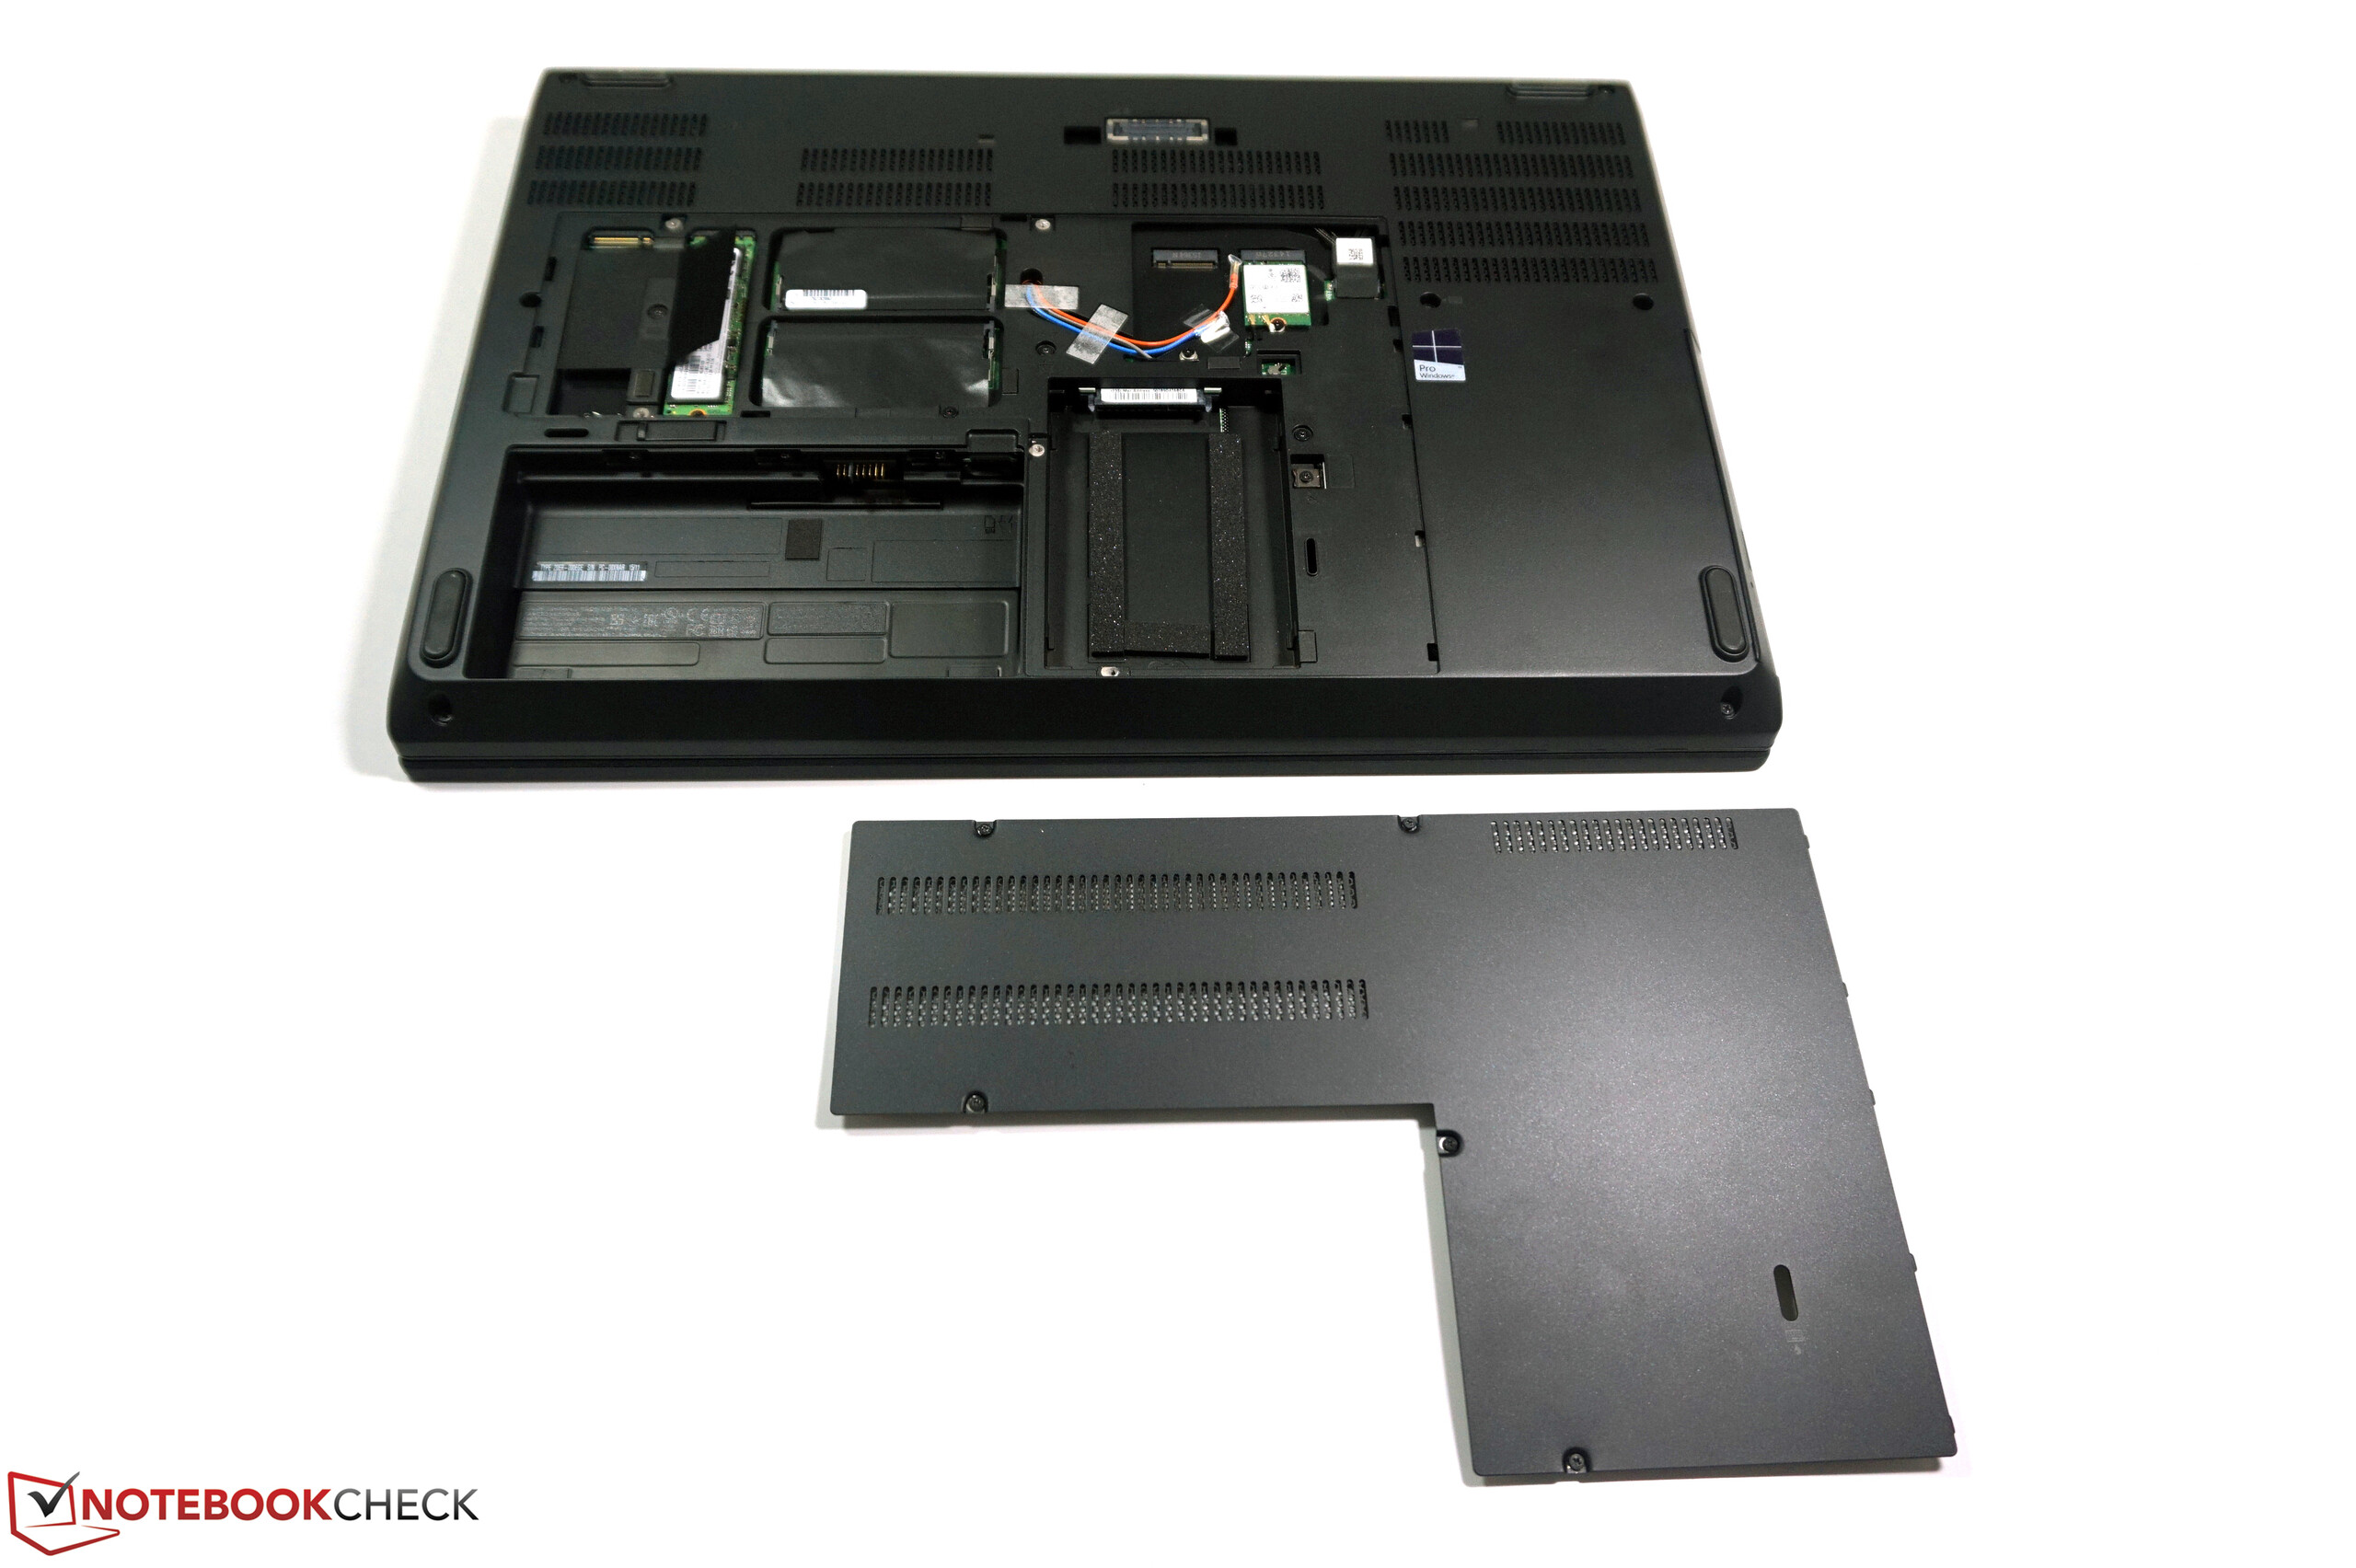
The battery at the bottom is secured by a lever mechanism and can easily be removed. There is also a large maintenance hatch that is just secured by a couple of screws. The notebook was tested according to the military standard MIL-STD 810G and is equipped with a spillwater-resistant keyboard. All in all, the device can convince us with its flawless build quality. You immediately get the impression you are using a robust and durable device.

Connectivity
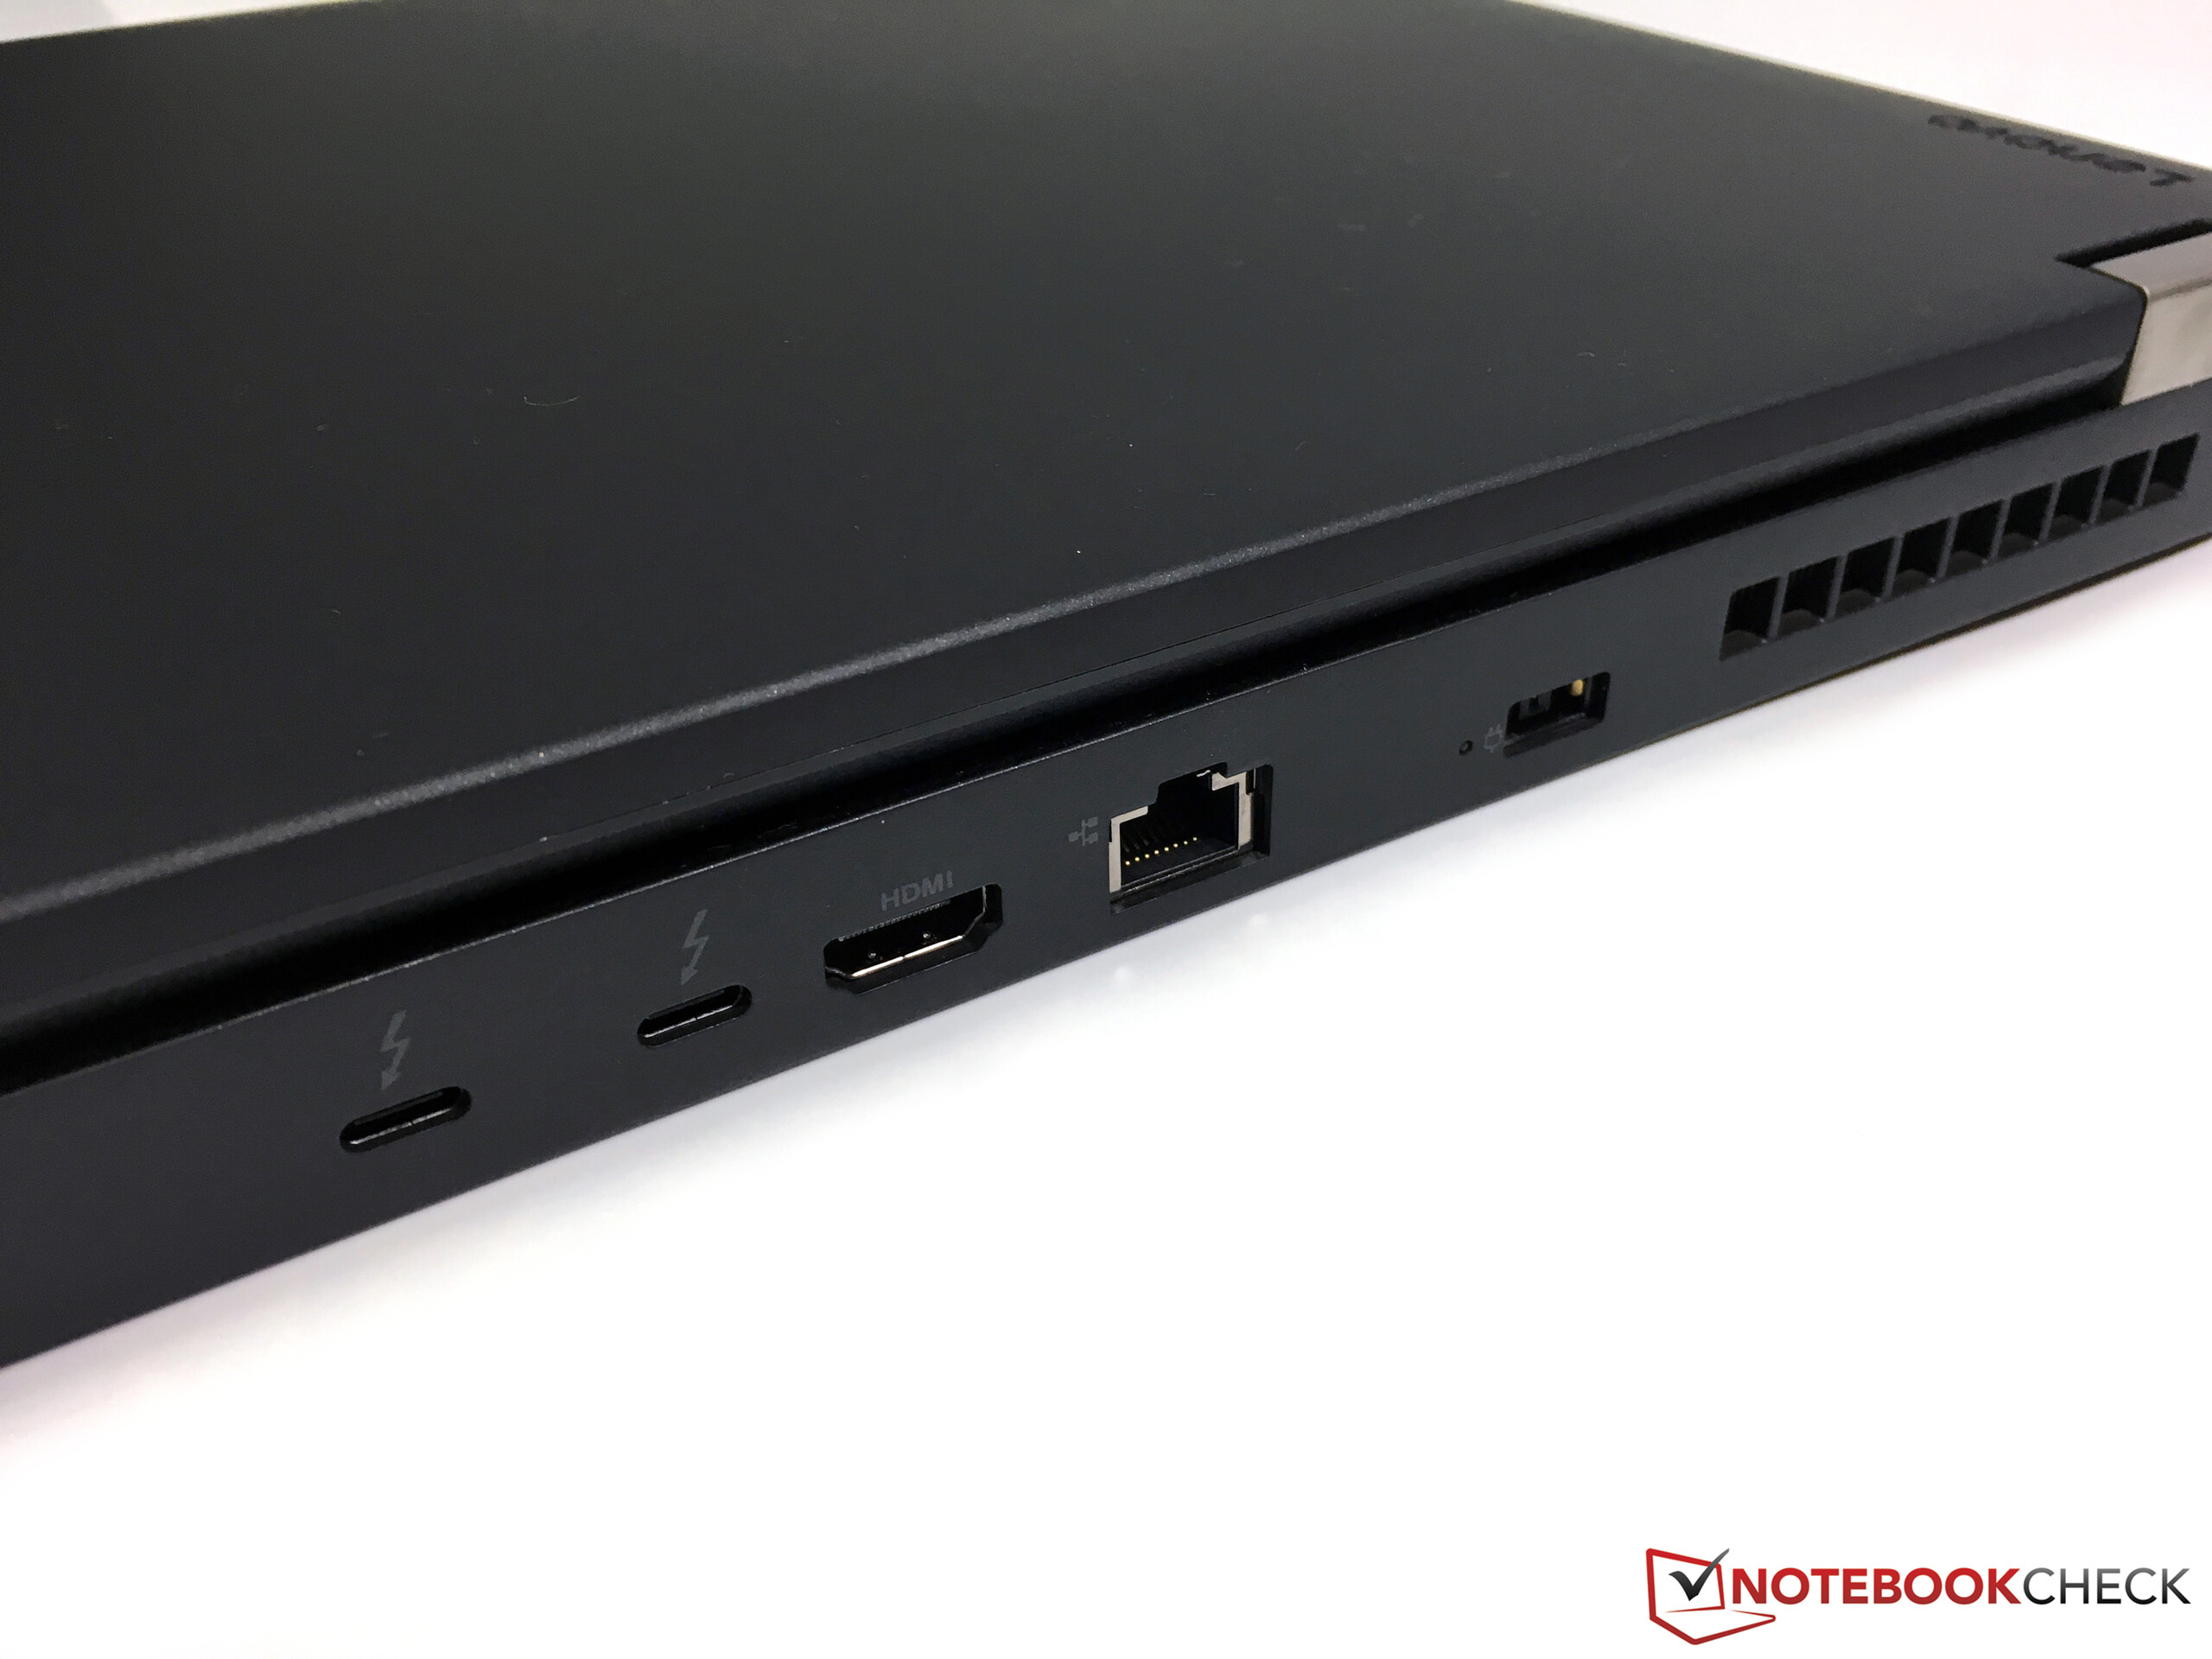
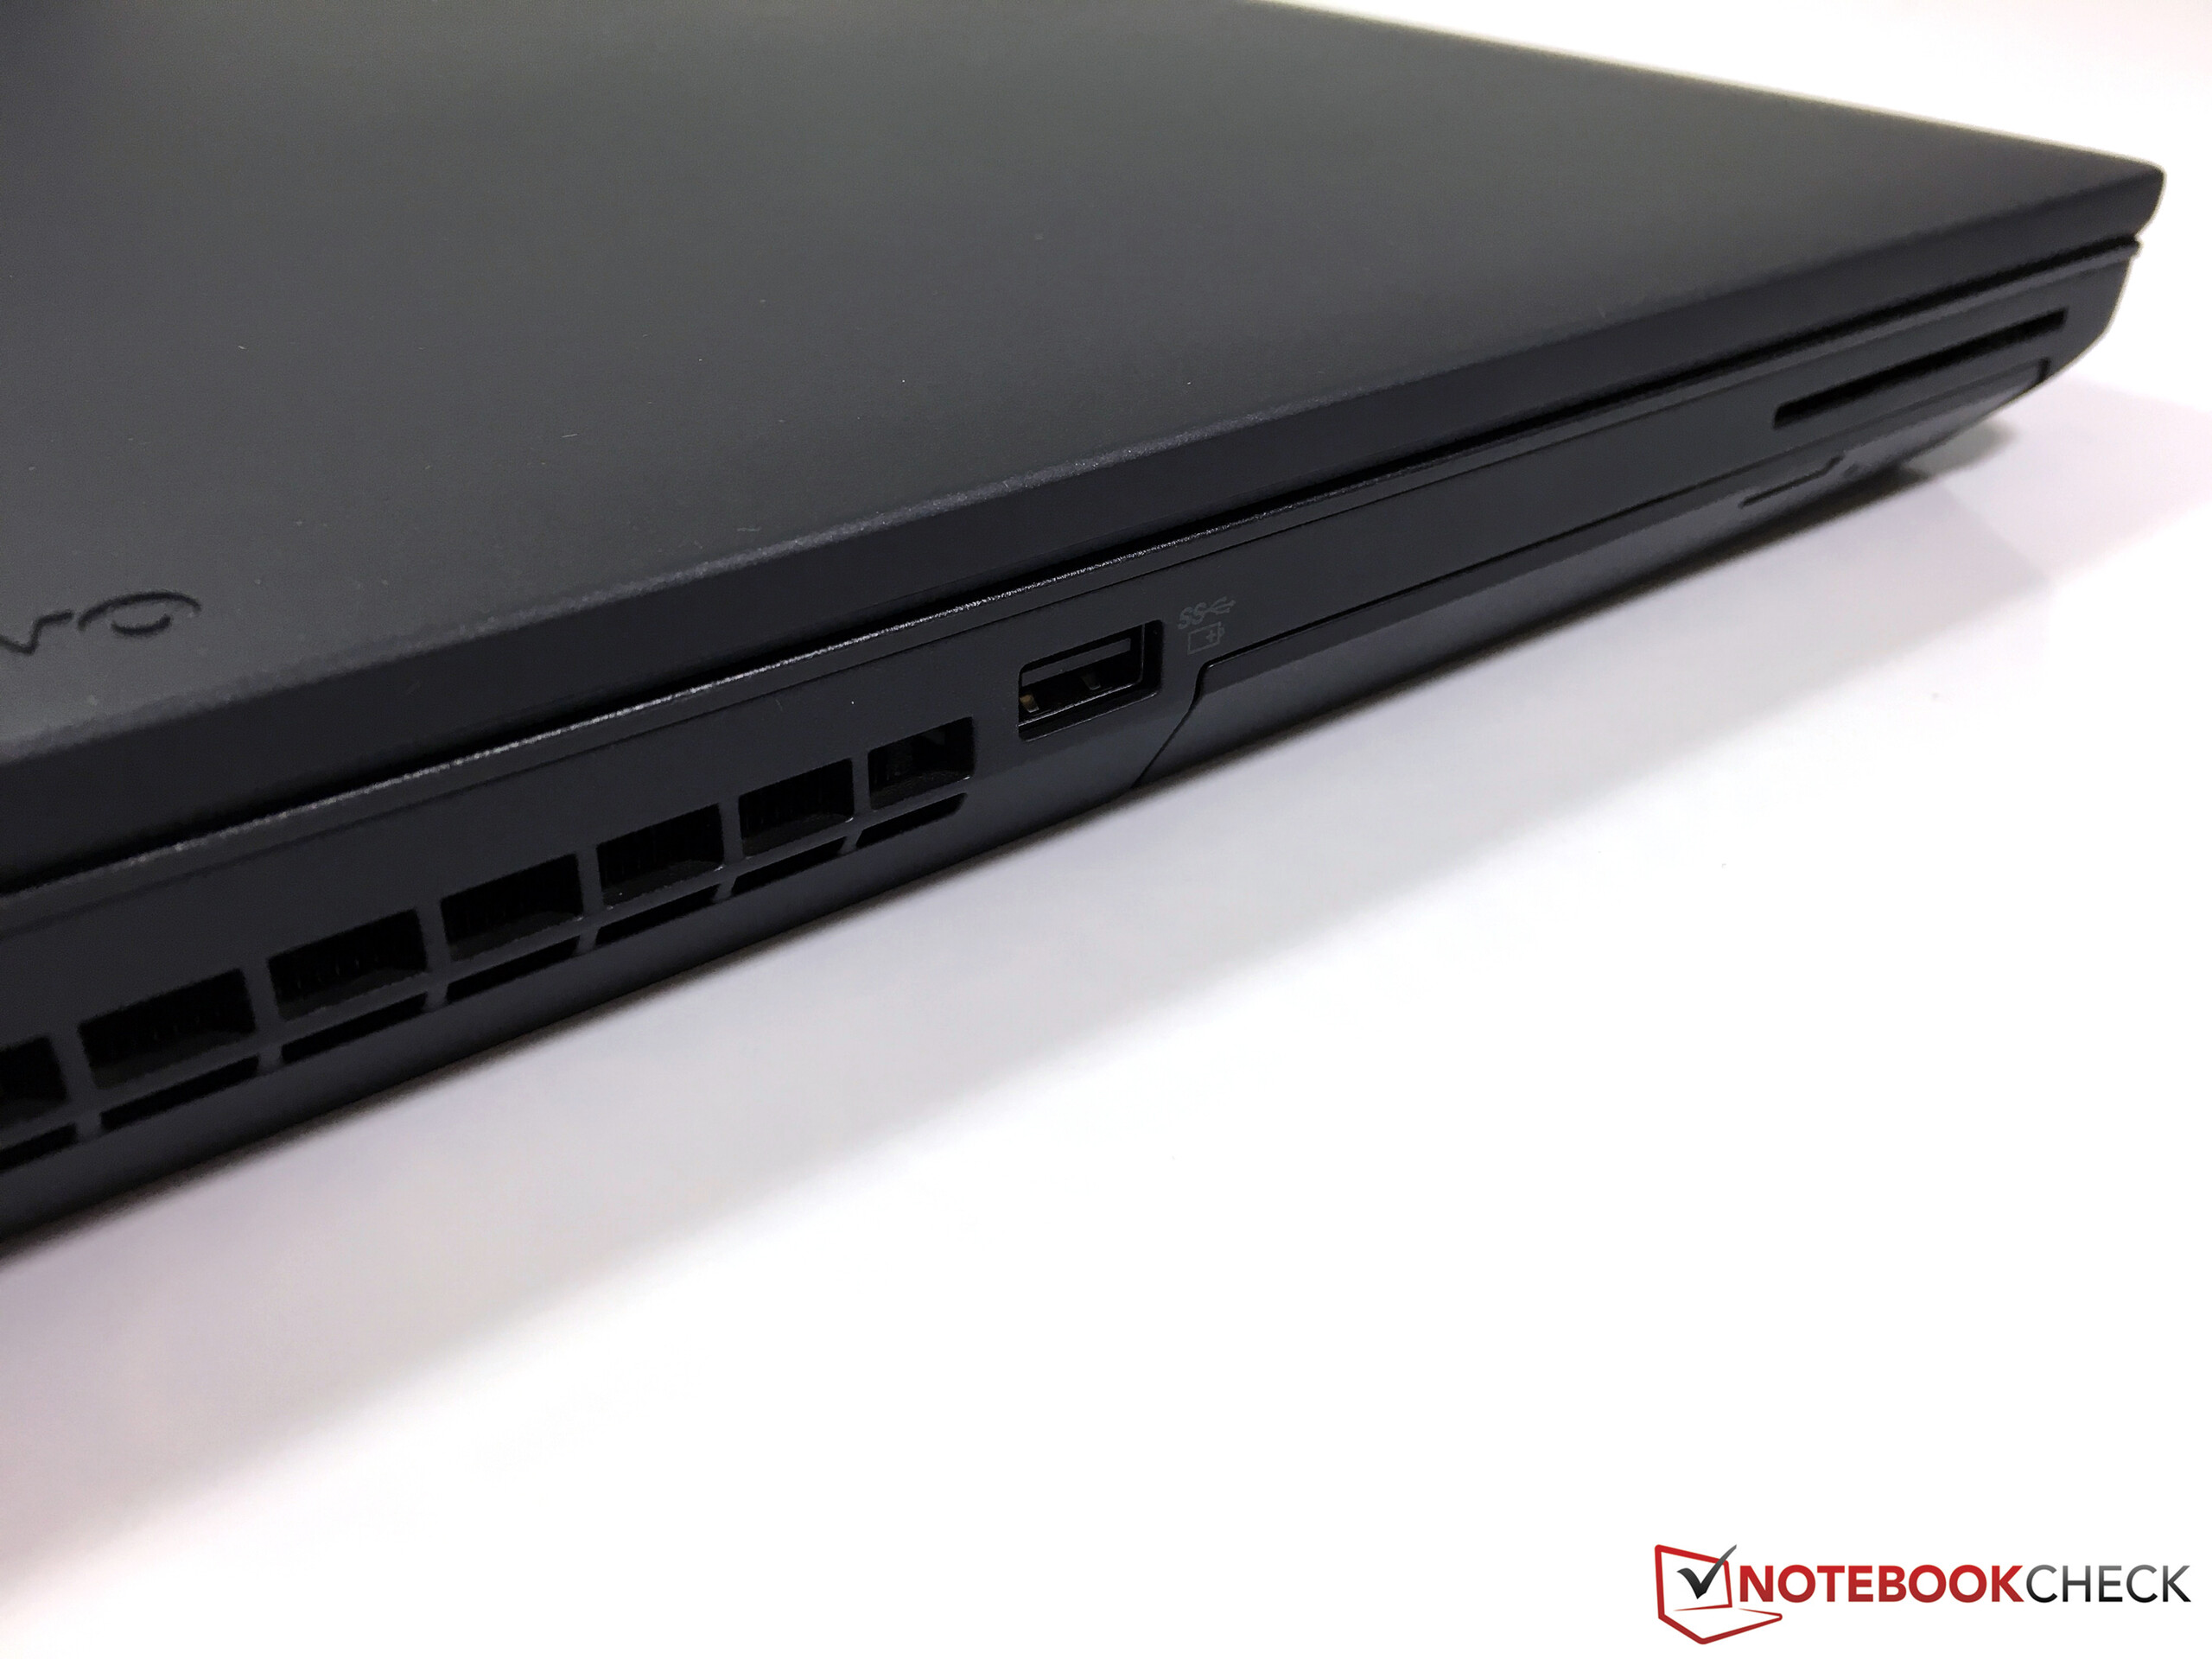
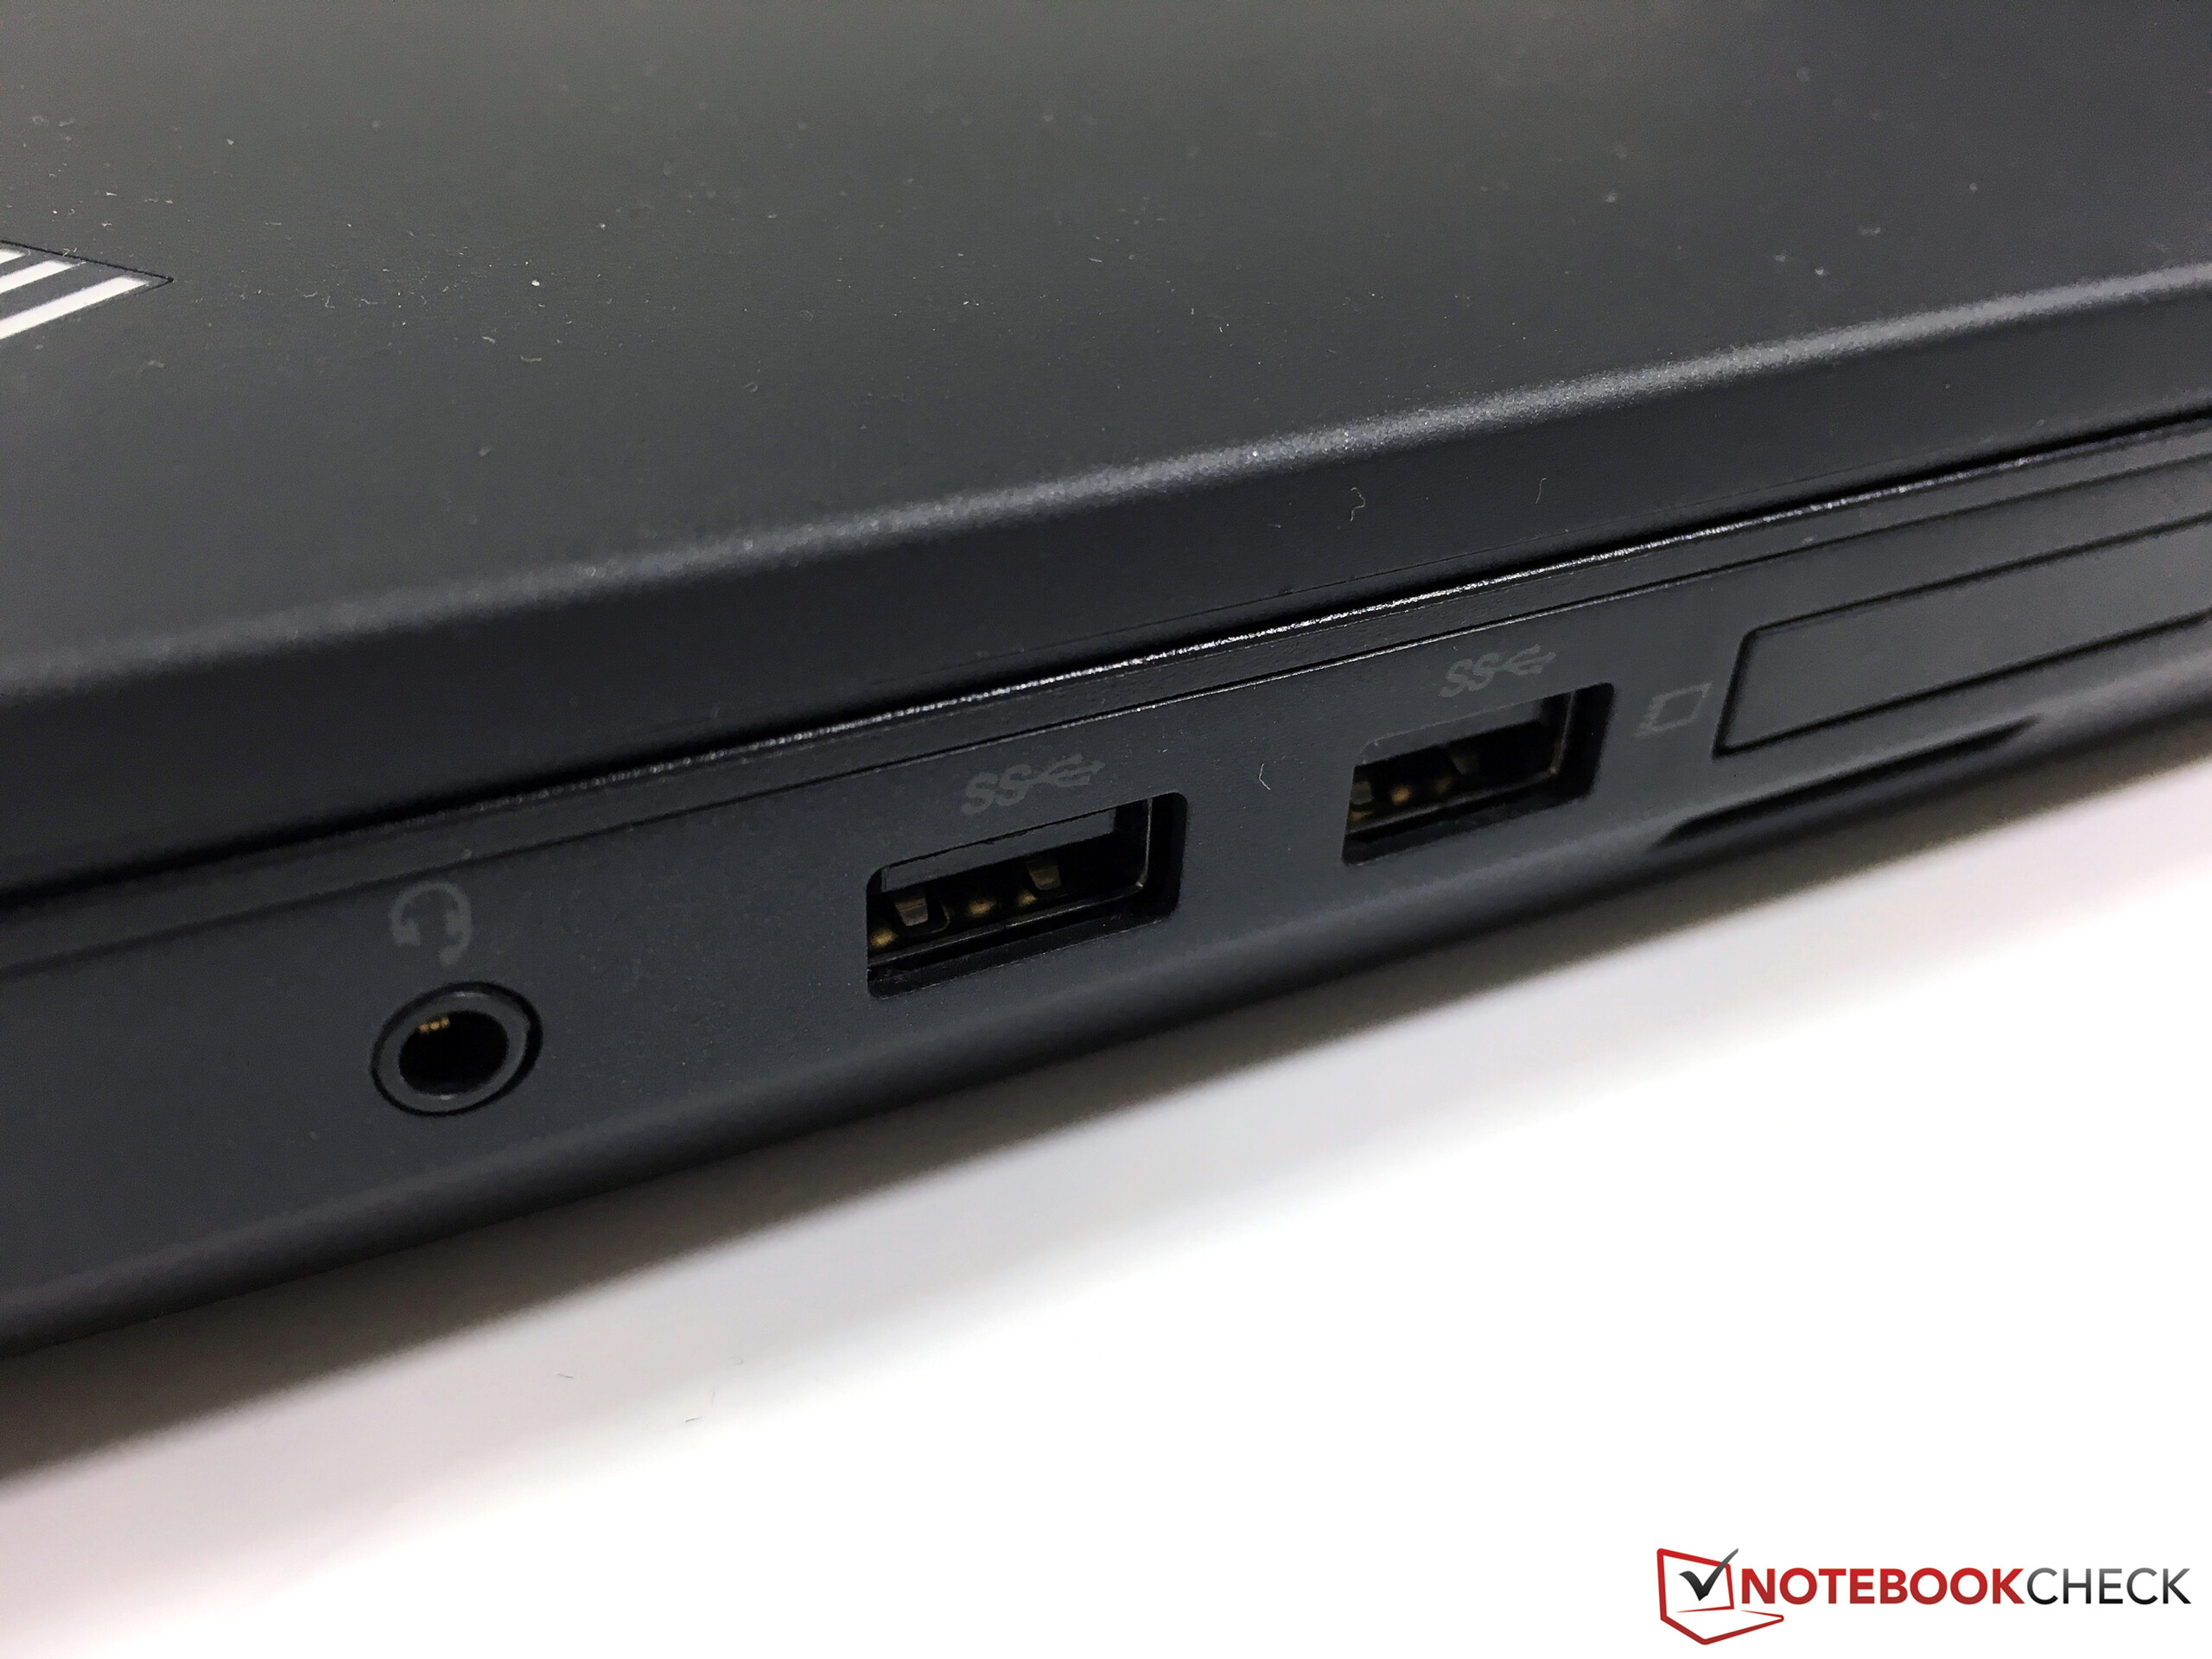
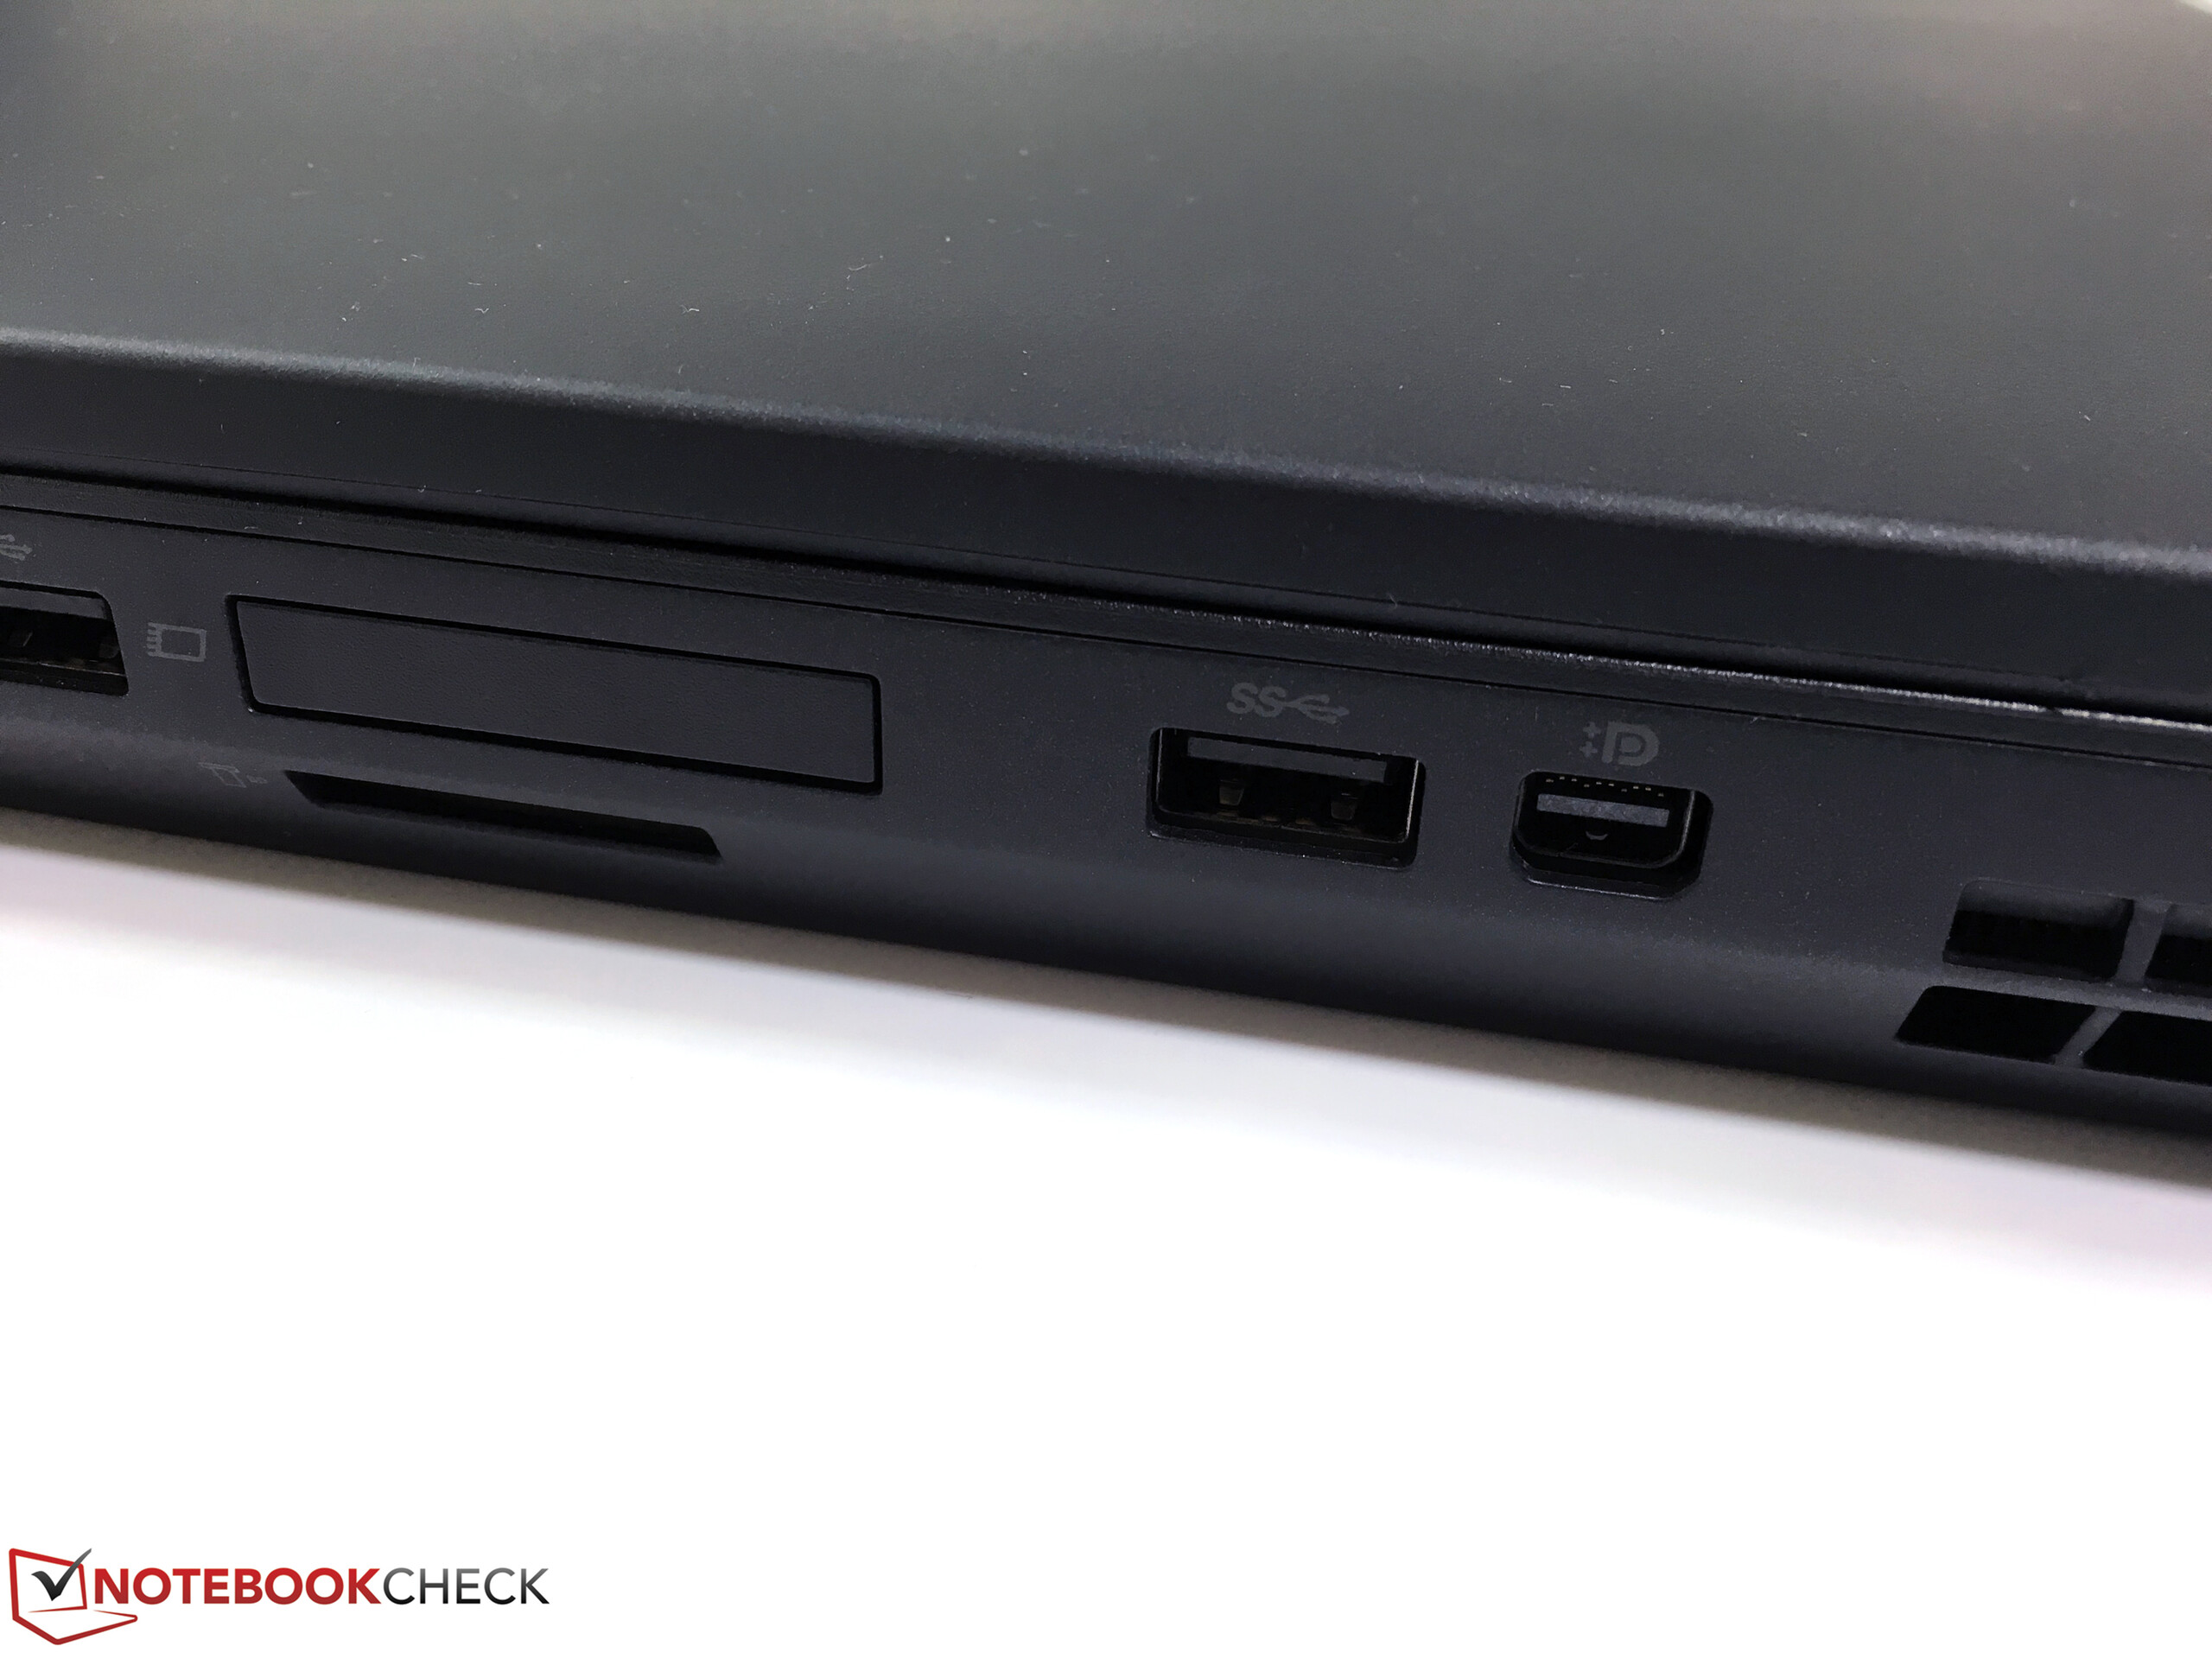
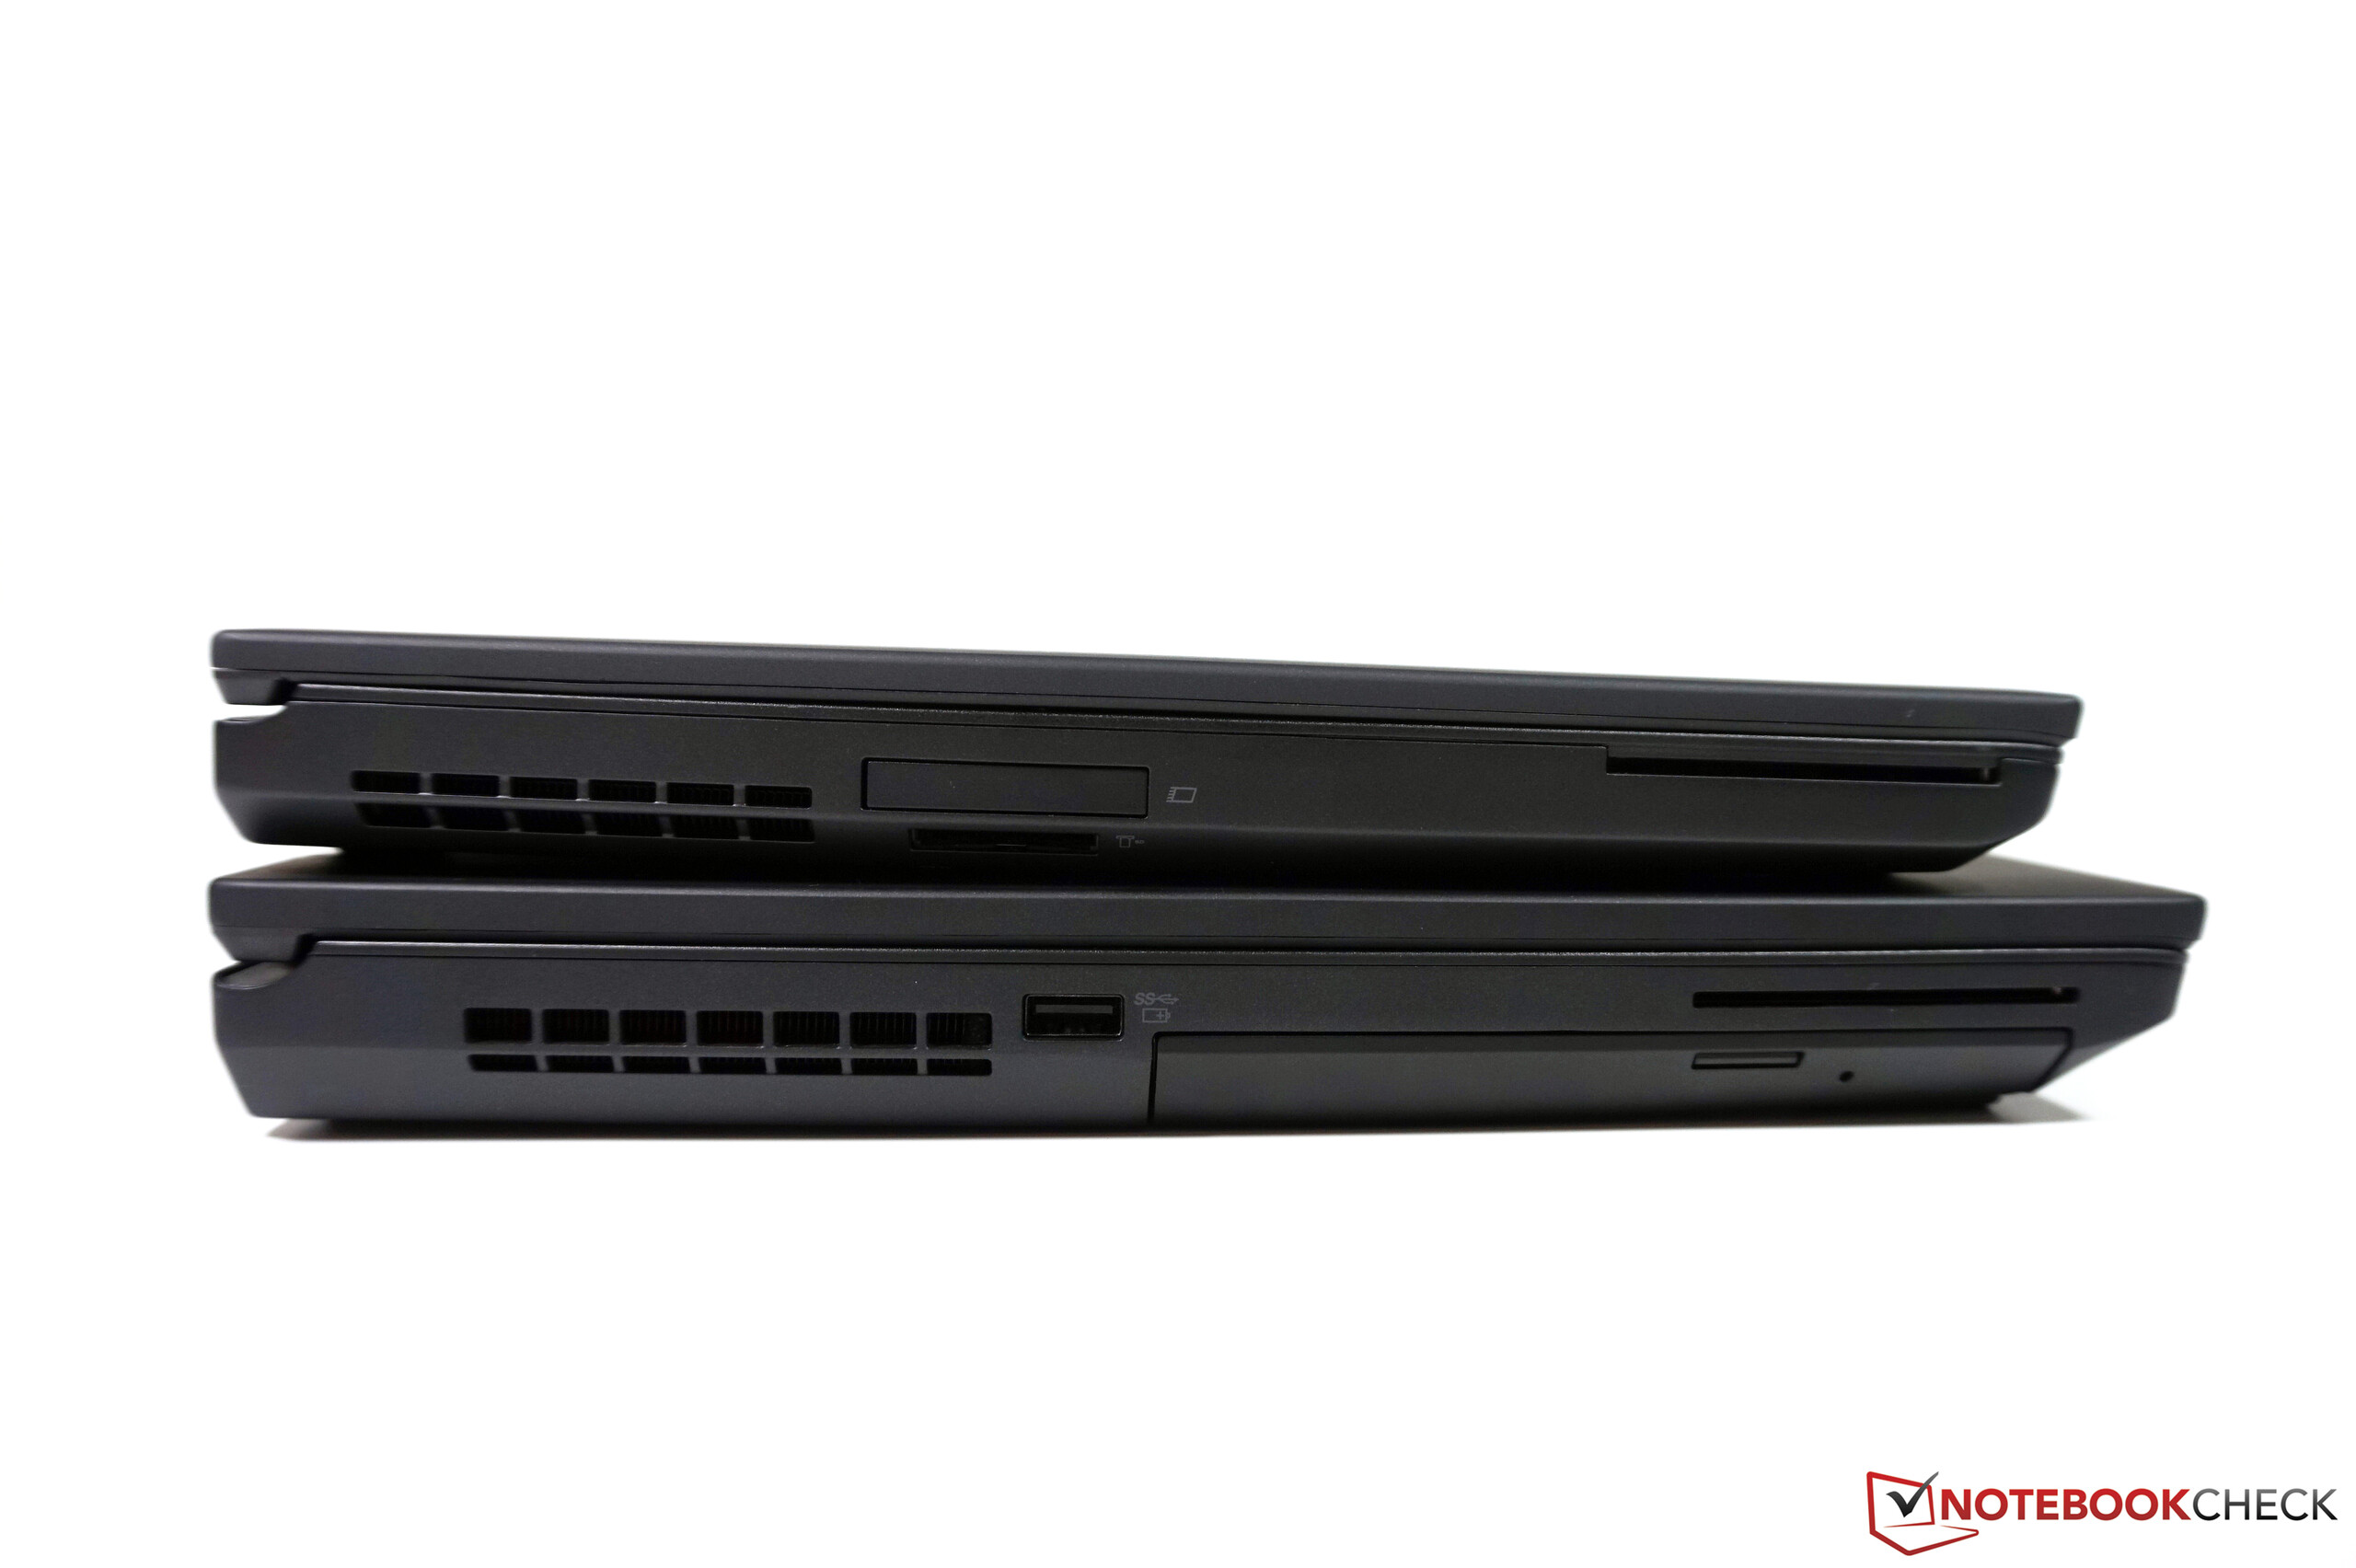
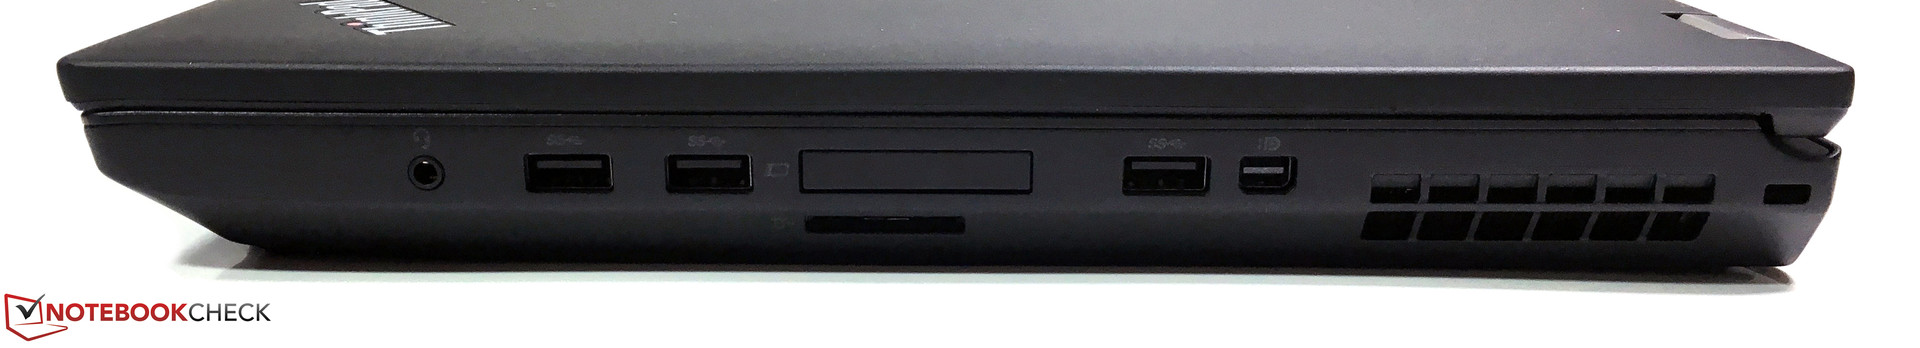
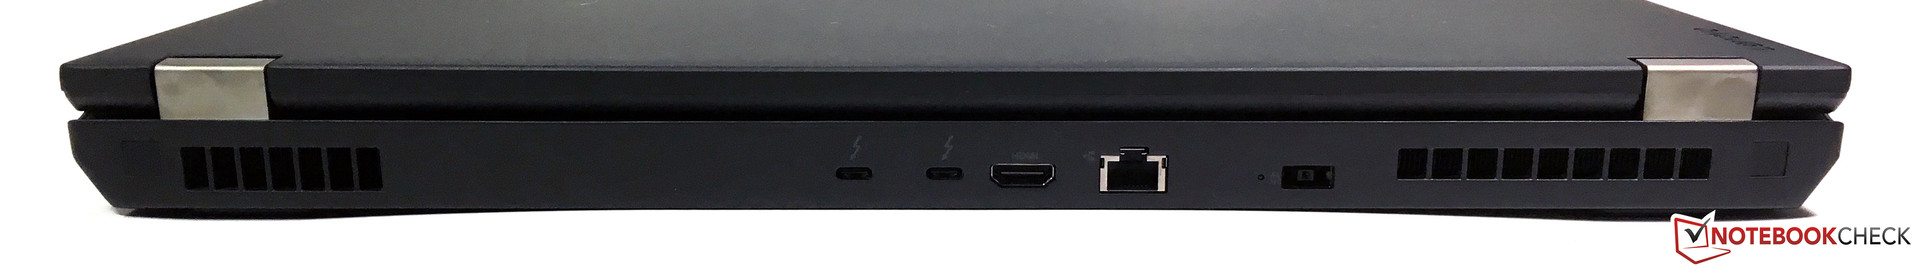
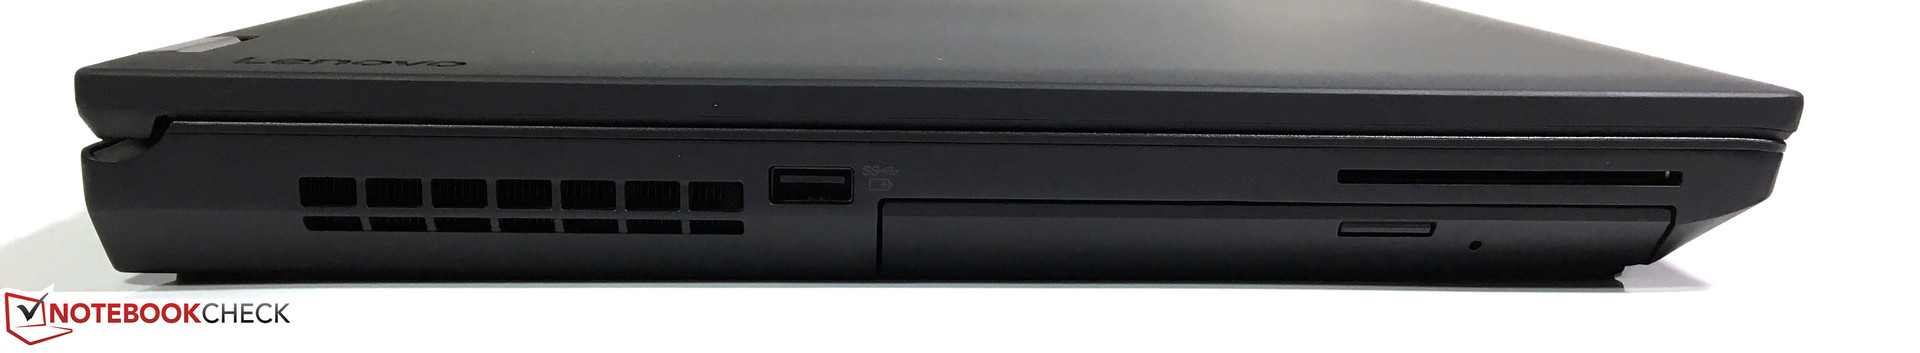
The port selection of the ThinkPad P70 is very good and can convince with many modern ports. This includes the two USB 3.1 Type-C ports (Gen 2) with Thunderbolt 3 support at the back, for example. You also get four common USB 3.0 ports (1x Always-On) and two more video ports. Particularly interesting for office environments are the smart-card reader and the docking port at the bottom. You can use it to attach the notebook very comfortably to all peripherals at your workspace. The port layout is convenient as well. Most of the ports are either at the back or the rear area of the sides. You also get one USB 3.0 port pretty far at the front of the right side, so it is easy to attach USB drives.
You can attach up to 5 external monitors to the ThinkPad P70 at the same time, because one Thunderbolt 3 port can drive up to two 4K displays (daisy chain). The maximum resolution of all three ports is 3840x2160 pixels. The HDMI output is only based on the 1.4 standard though, so the signal is limited to 30 Hz, while the Mini-DisplayPort and the two Thunderbolt 3 ports support 60 Hz. You can also use pretty much any external projector or monitor with according adapters. This is especially important for companies, where you can often still find the old VGA connector.
The performance of the USB ports cannot quite convince us. We checked two fast drives (Samsung SSD T1 256 GB, Samsung SSD 830 64 GB), which usually manage transfer rates of more than 400 MB/s. However, the maximum transfer rates of the ThinkPad P70 were limited to around 260 MB/s sequential read and 220 MB/s sequential write. We also had some problems when we attached external drives or USB thumb drives, respectively. The system sometimes showed the note that the drive could manage higher speeds at a faster port. The USB port also acted as a USB 2.0 port in this case with the according transfer rates (~30 MB/s). However, this was rare and not limited to just one of the ports, so we suspect a driver issue in combination with Windows 7.
The card reader also manages decent, but not overwhelming results. AS SSD determines 191 MB/s (read) and 115 MB/s (write) with our reference card (Toshiba Exceria Pro UHS-II 64 GB, up to 260 MB/s read). Pictures (~10 MB each) were transferred to the PC at 112 MB/s on average.
Communication
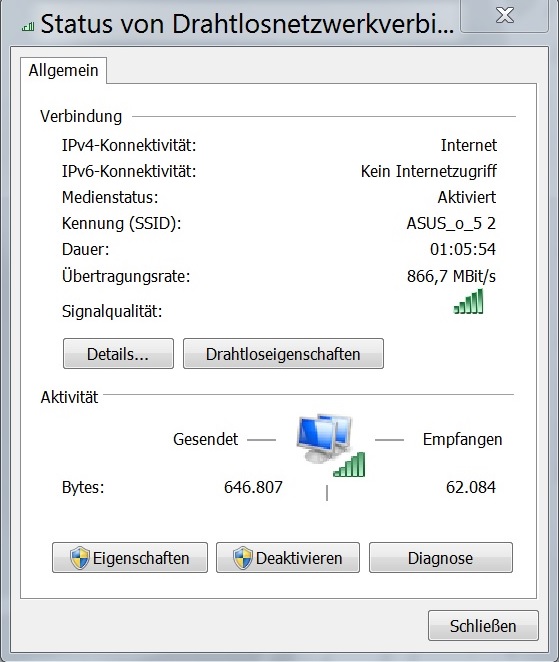
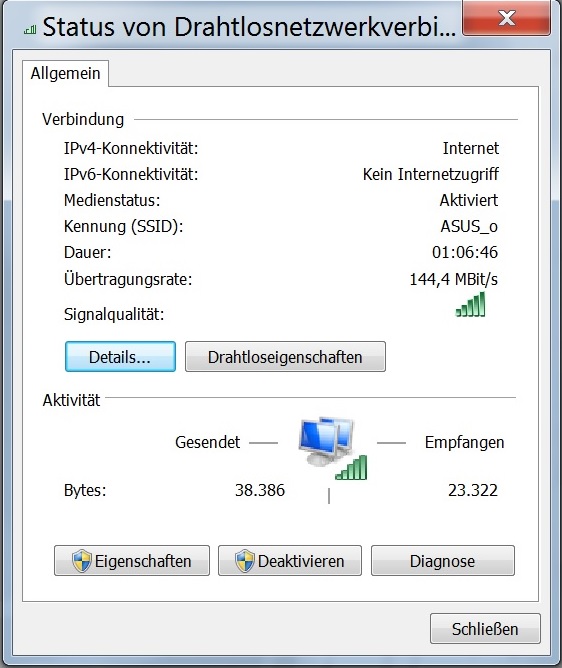
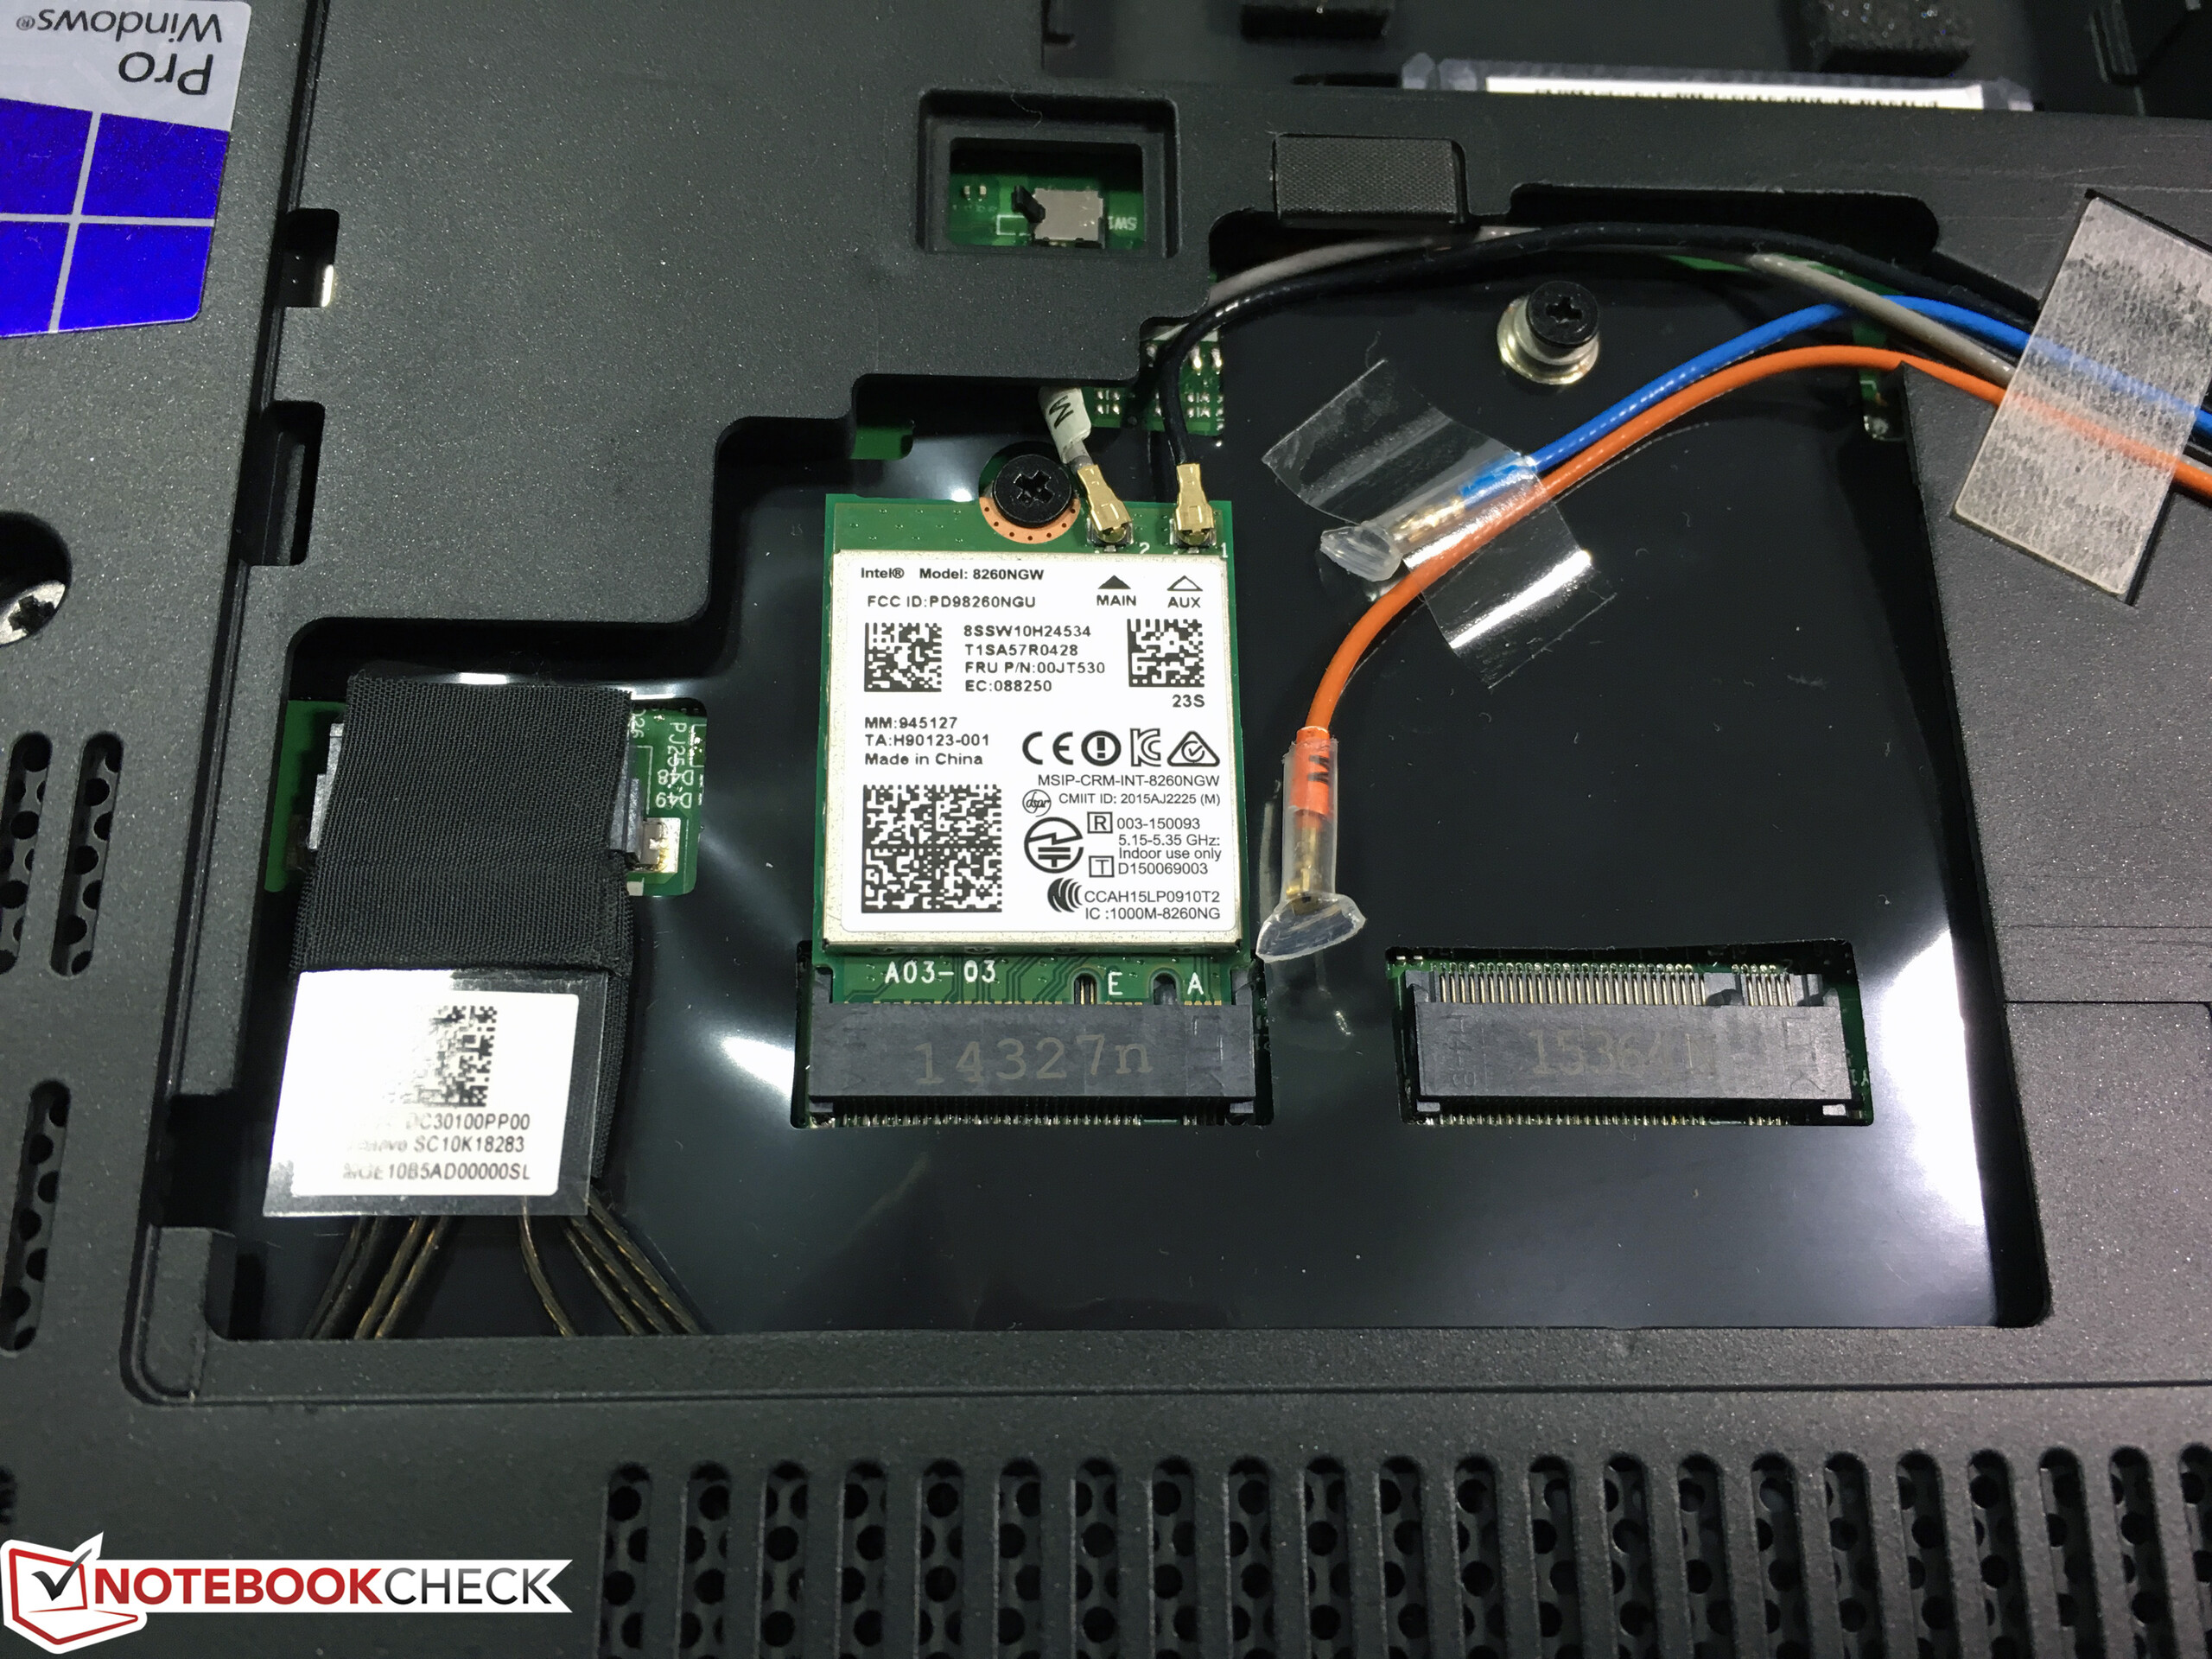
A Gigabit-Ethernet port is available for wired networks, while the wireless connectivity as well as Bluetooth 4.2 are provided by Intel's 8260 module. This dual-band M.2 module (2x2) supports the standards 802.11 a/b/g/n/ac in 2.4 as well as 5 GHz networks. The device sometimes had issues to connect to our Fritz!Box 7490 after it was in standby. However, there were no problems with the Asus RT AC56U router. Otherwise, we did not have any issues with the signal quality. At a distance of one meter to the router, we managed a steady transfer rate of around 60 MB/s in an ac-network and around 10 MB/s in an n-network.
Our review unit was not equipped with an LTE modem, but the necessary antennas are already integrated and just have to be attached to the optional M.2 module (Sierra Wireless EM7455). The micro-SIM slot is inside the battery tray.
Update 02/25/2016: We now received a statement from Lenovo regarding the optional LTE module:
"The current ThinkPad P50 and ThinkPad P70 models are unfortunately NOT "WWAN (LTE) READY" - even though some models are already equipped with the necessary antennas. From today's perspective, there will probably be no WWAN (LTE) upgrade-option for the ThinkPad P50 and ThinkPad P70, respectively.
Reason: The WWAN (LTE) module runs at a frequency of 2133 MHz - analog to to the Skylake CPU in combination with DDR4-RAM @ 2133 MHz. This creates "interferences", which means superposition when waves come together.
ThinkPad P50|70 with integrated WWAN (ex-works)
- configurable starting in April in CRM | Flex Config
- shipping in April"
A pretty important component in office environments is actually the webcam in combination with the microphones. Lenovo still only uses a 720p HD webcam. It gets the job done, but that's it. It is very unfortunate that such an expensive device is equipped with such a poor camera. The dual-array microphone leaves a much better impression; voices are still recorded very well from some distance (around 1.5 m).
Security
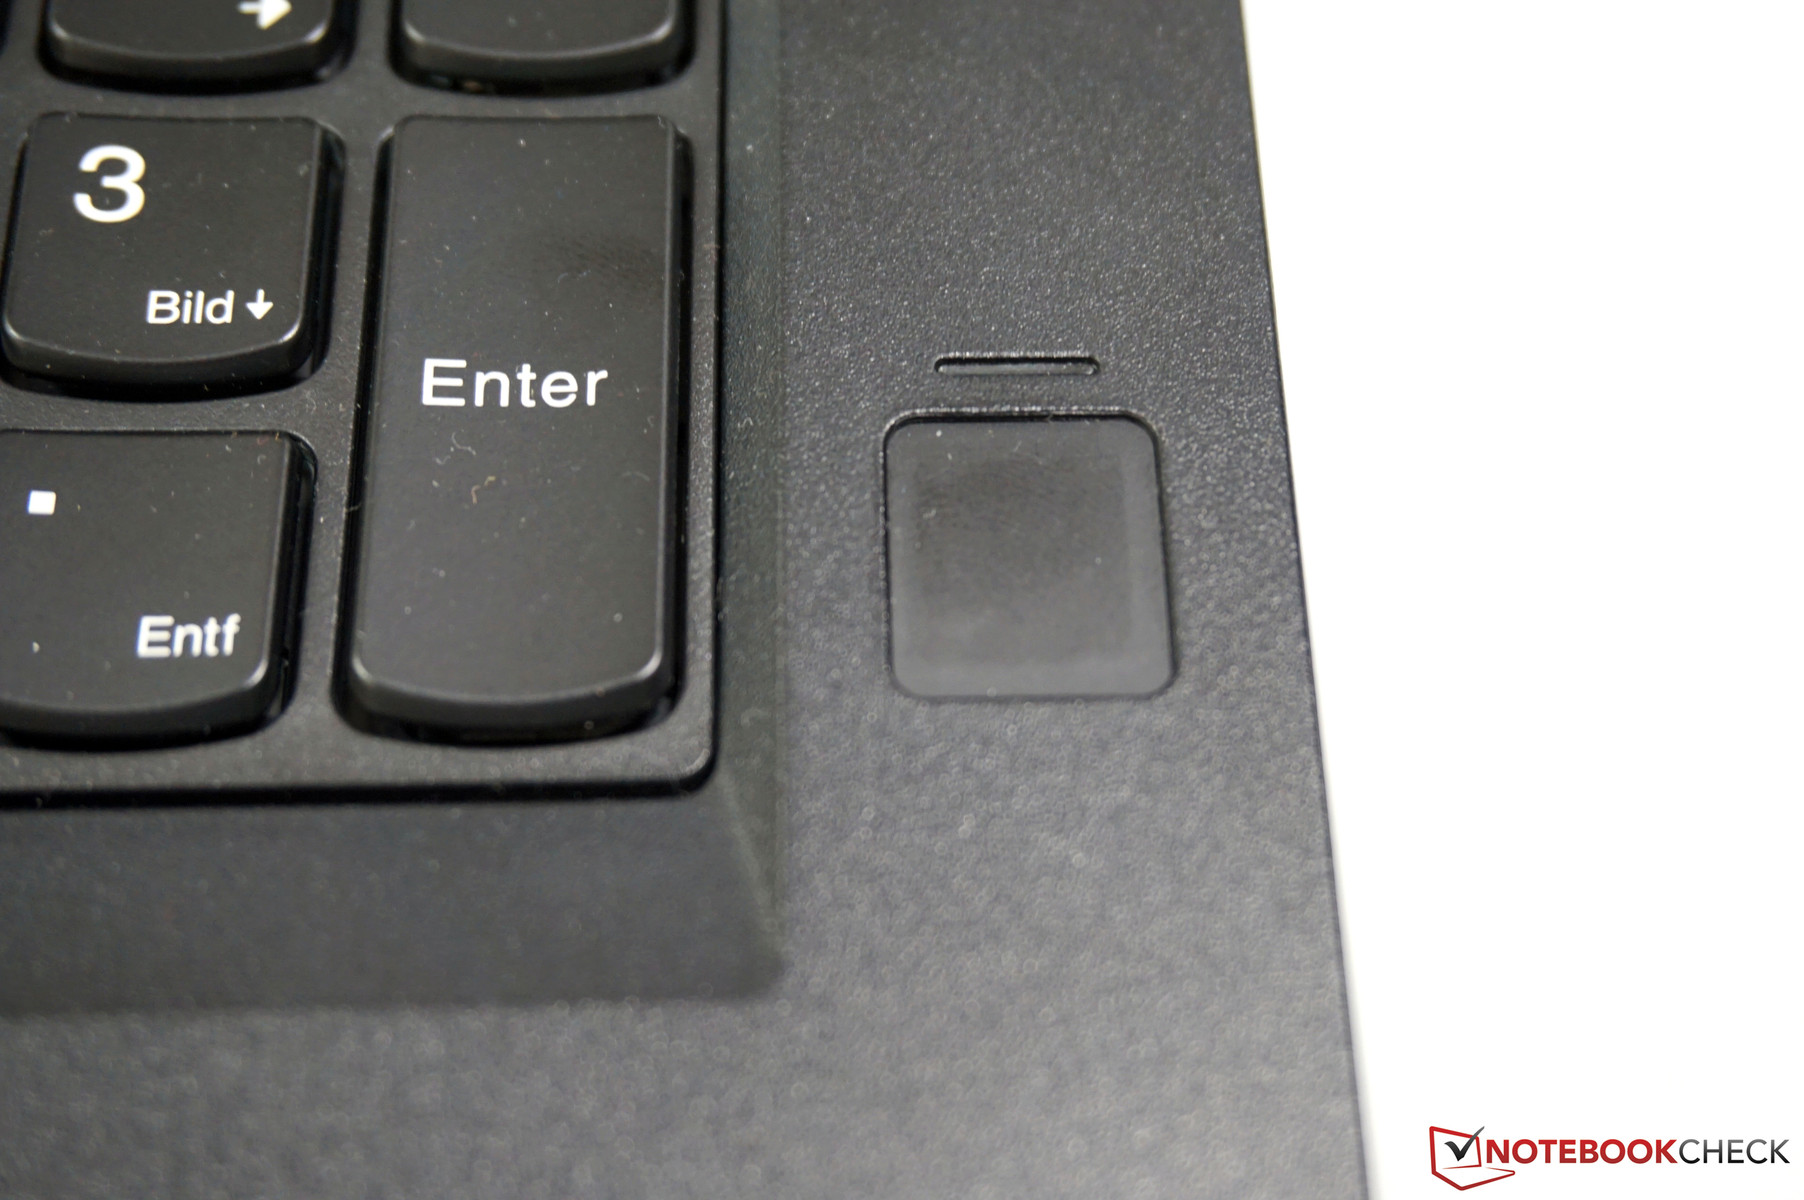
Security features are one topic where many consumer-workstations are usually at a disadvantage. You often just get a slot for a Kensington lock or a Trusted Platform Module at best. The Lenovo P70 on the other hand is perfectly equipped for company environments. The hardware includes a Kensington lock slot, a smart-card reader and a fingerprint scanner. The latter differs from previous models, where you had to swipe the finger across a thin stripe, while the new model just requires you to put your finger on the surface. This works quickly and reliably, and you can even increase the security settings in the BIOS (more precise scanning, but maybe some failed attempts). Other security features are TPM 1.2, Intel V-Pro and Anti-Theft (Computrace). You can set up different passwords in the BIOS (boot, hard drive access, BIOS access), which also work in combination with the fingerprint scanner. Lenovo also equips some configurations with self-encrypting drives (OPAL 2.0).
Accessories
Lenovo offers a wide range of optional accessories, including universal articles like input devices, bags, batteries or universal docking stations. Particularly interesting, however, is the docking station ThinkPad Performance Dock for around 220 Euros (~$237), which was specifically designed for the P70 (and P50). The Performance Dock provides the following ports for stationary operation: 6x USB 3.0, Gigabit-Ethernet, 1x VGA, 1x DVI, 1x HDMI 1.4, 2x DisplayPort 1.2, combo audio as well as a slot for a Kensington lock. The scope of delivery also includes a 230-Watt PSU. Older docking stations are not compatible with the new series anymore.
Additional modules for the drive bay should be available as well (additional battery, hard drive), but there is no further information yet. There is also a digitizer (ThinkPad Pen Pro) for models with a touchscreen.
Maintenance
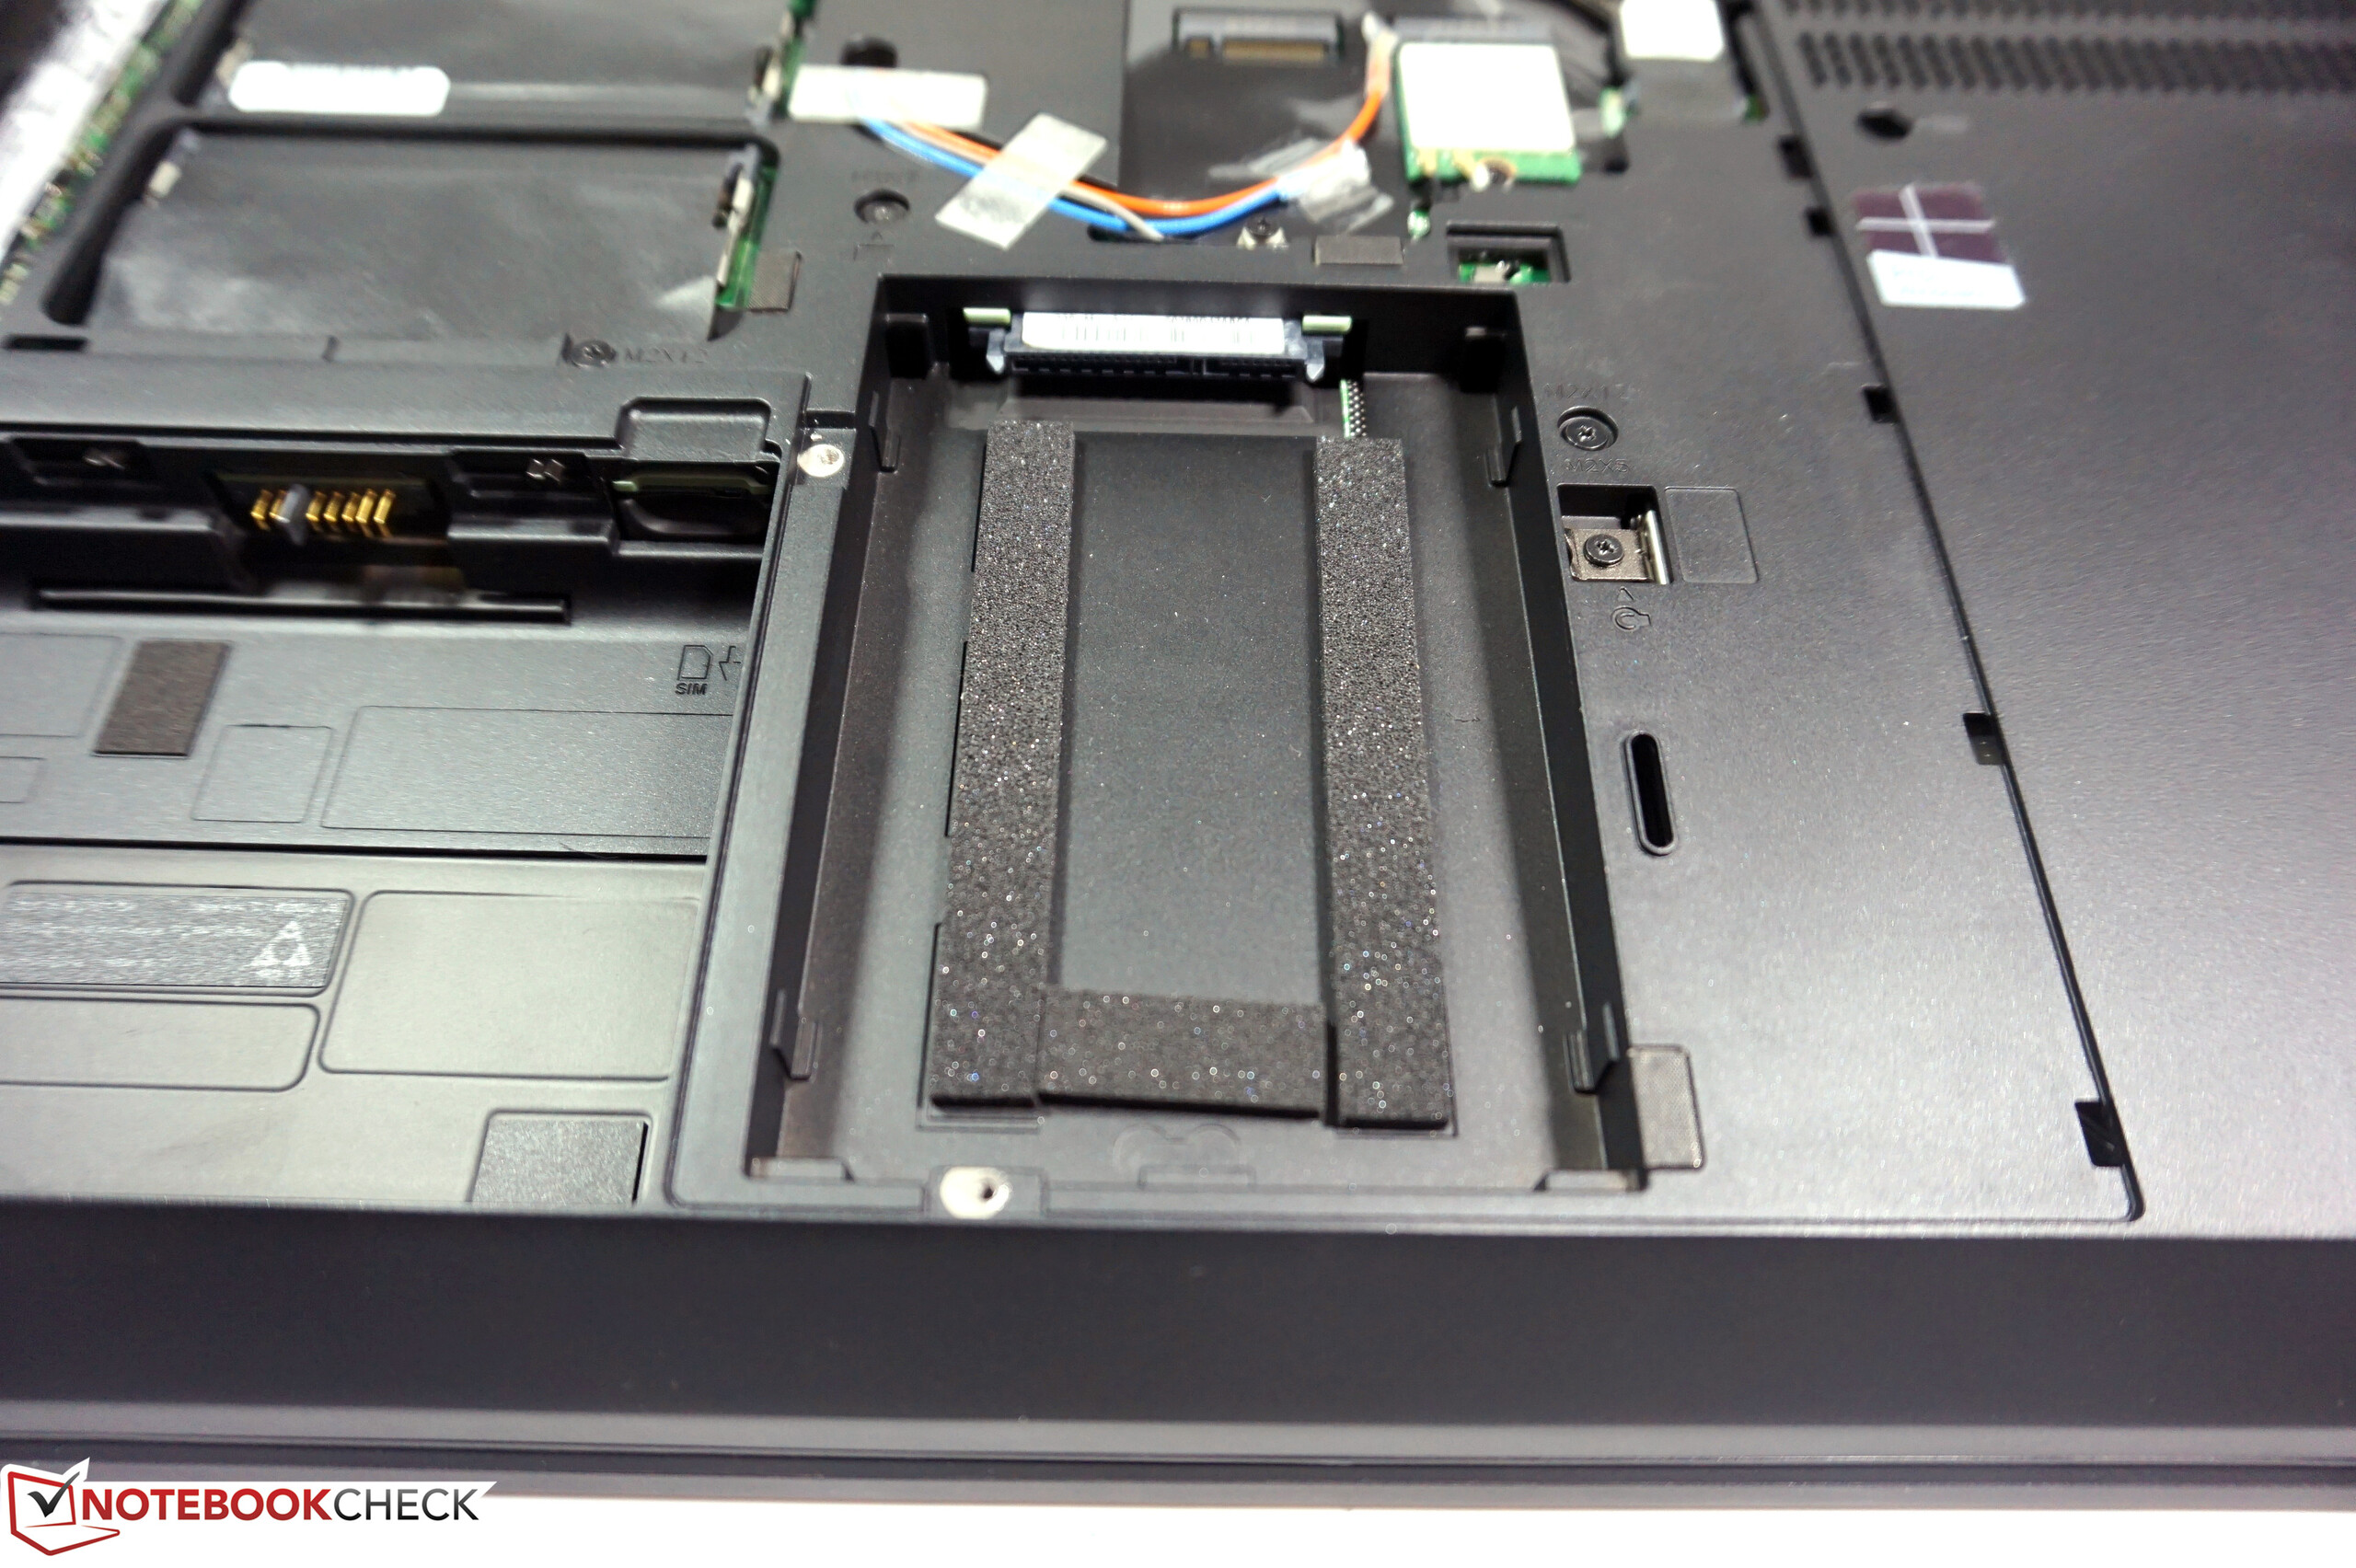
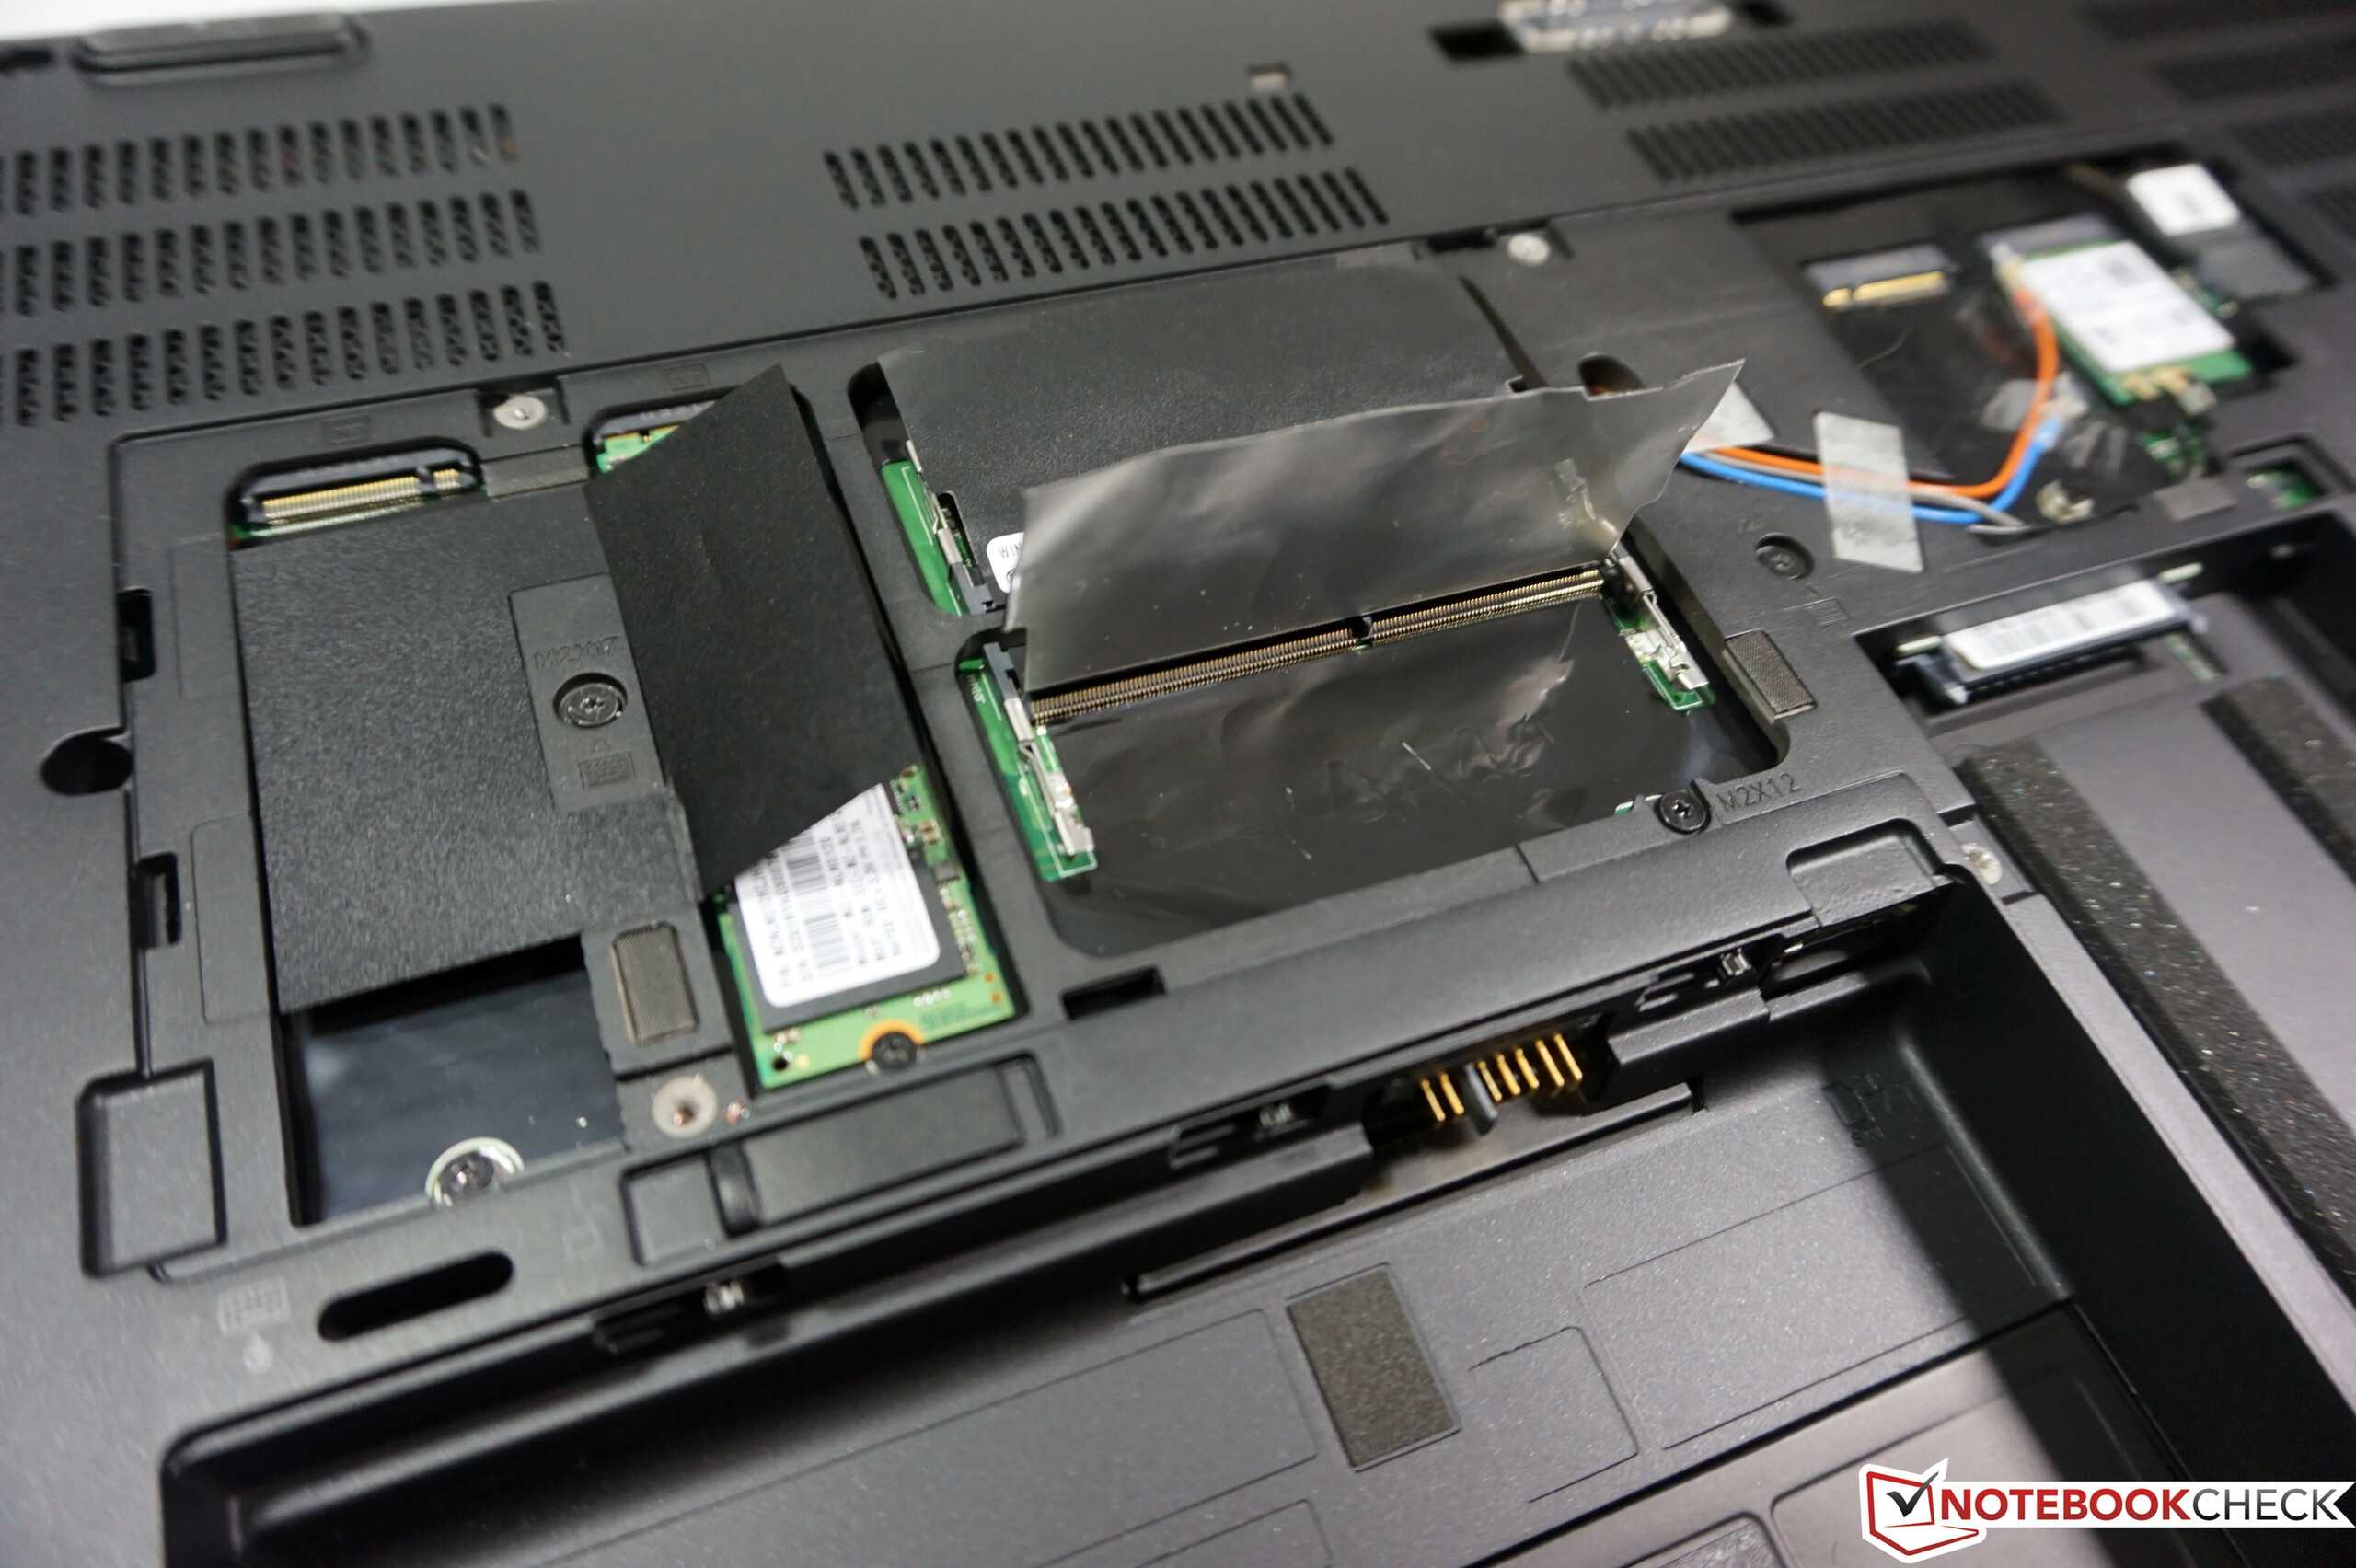
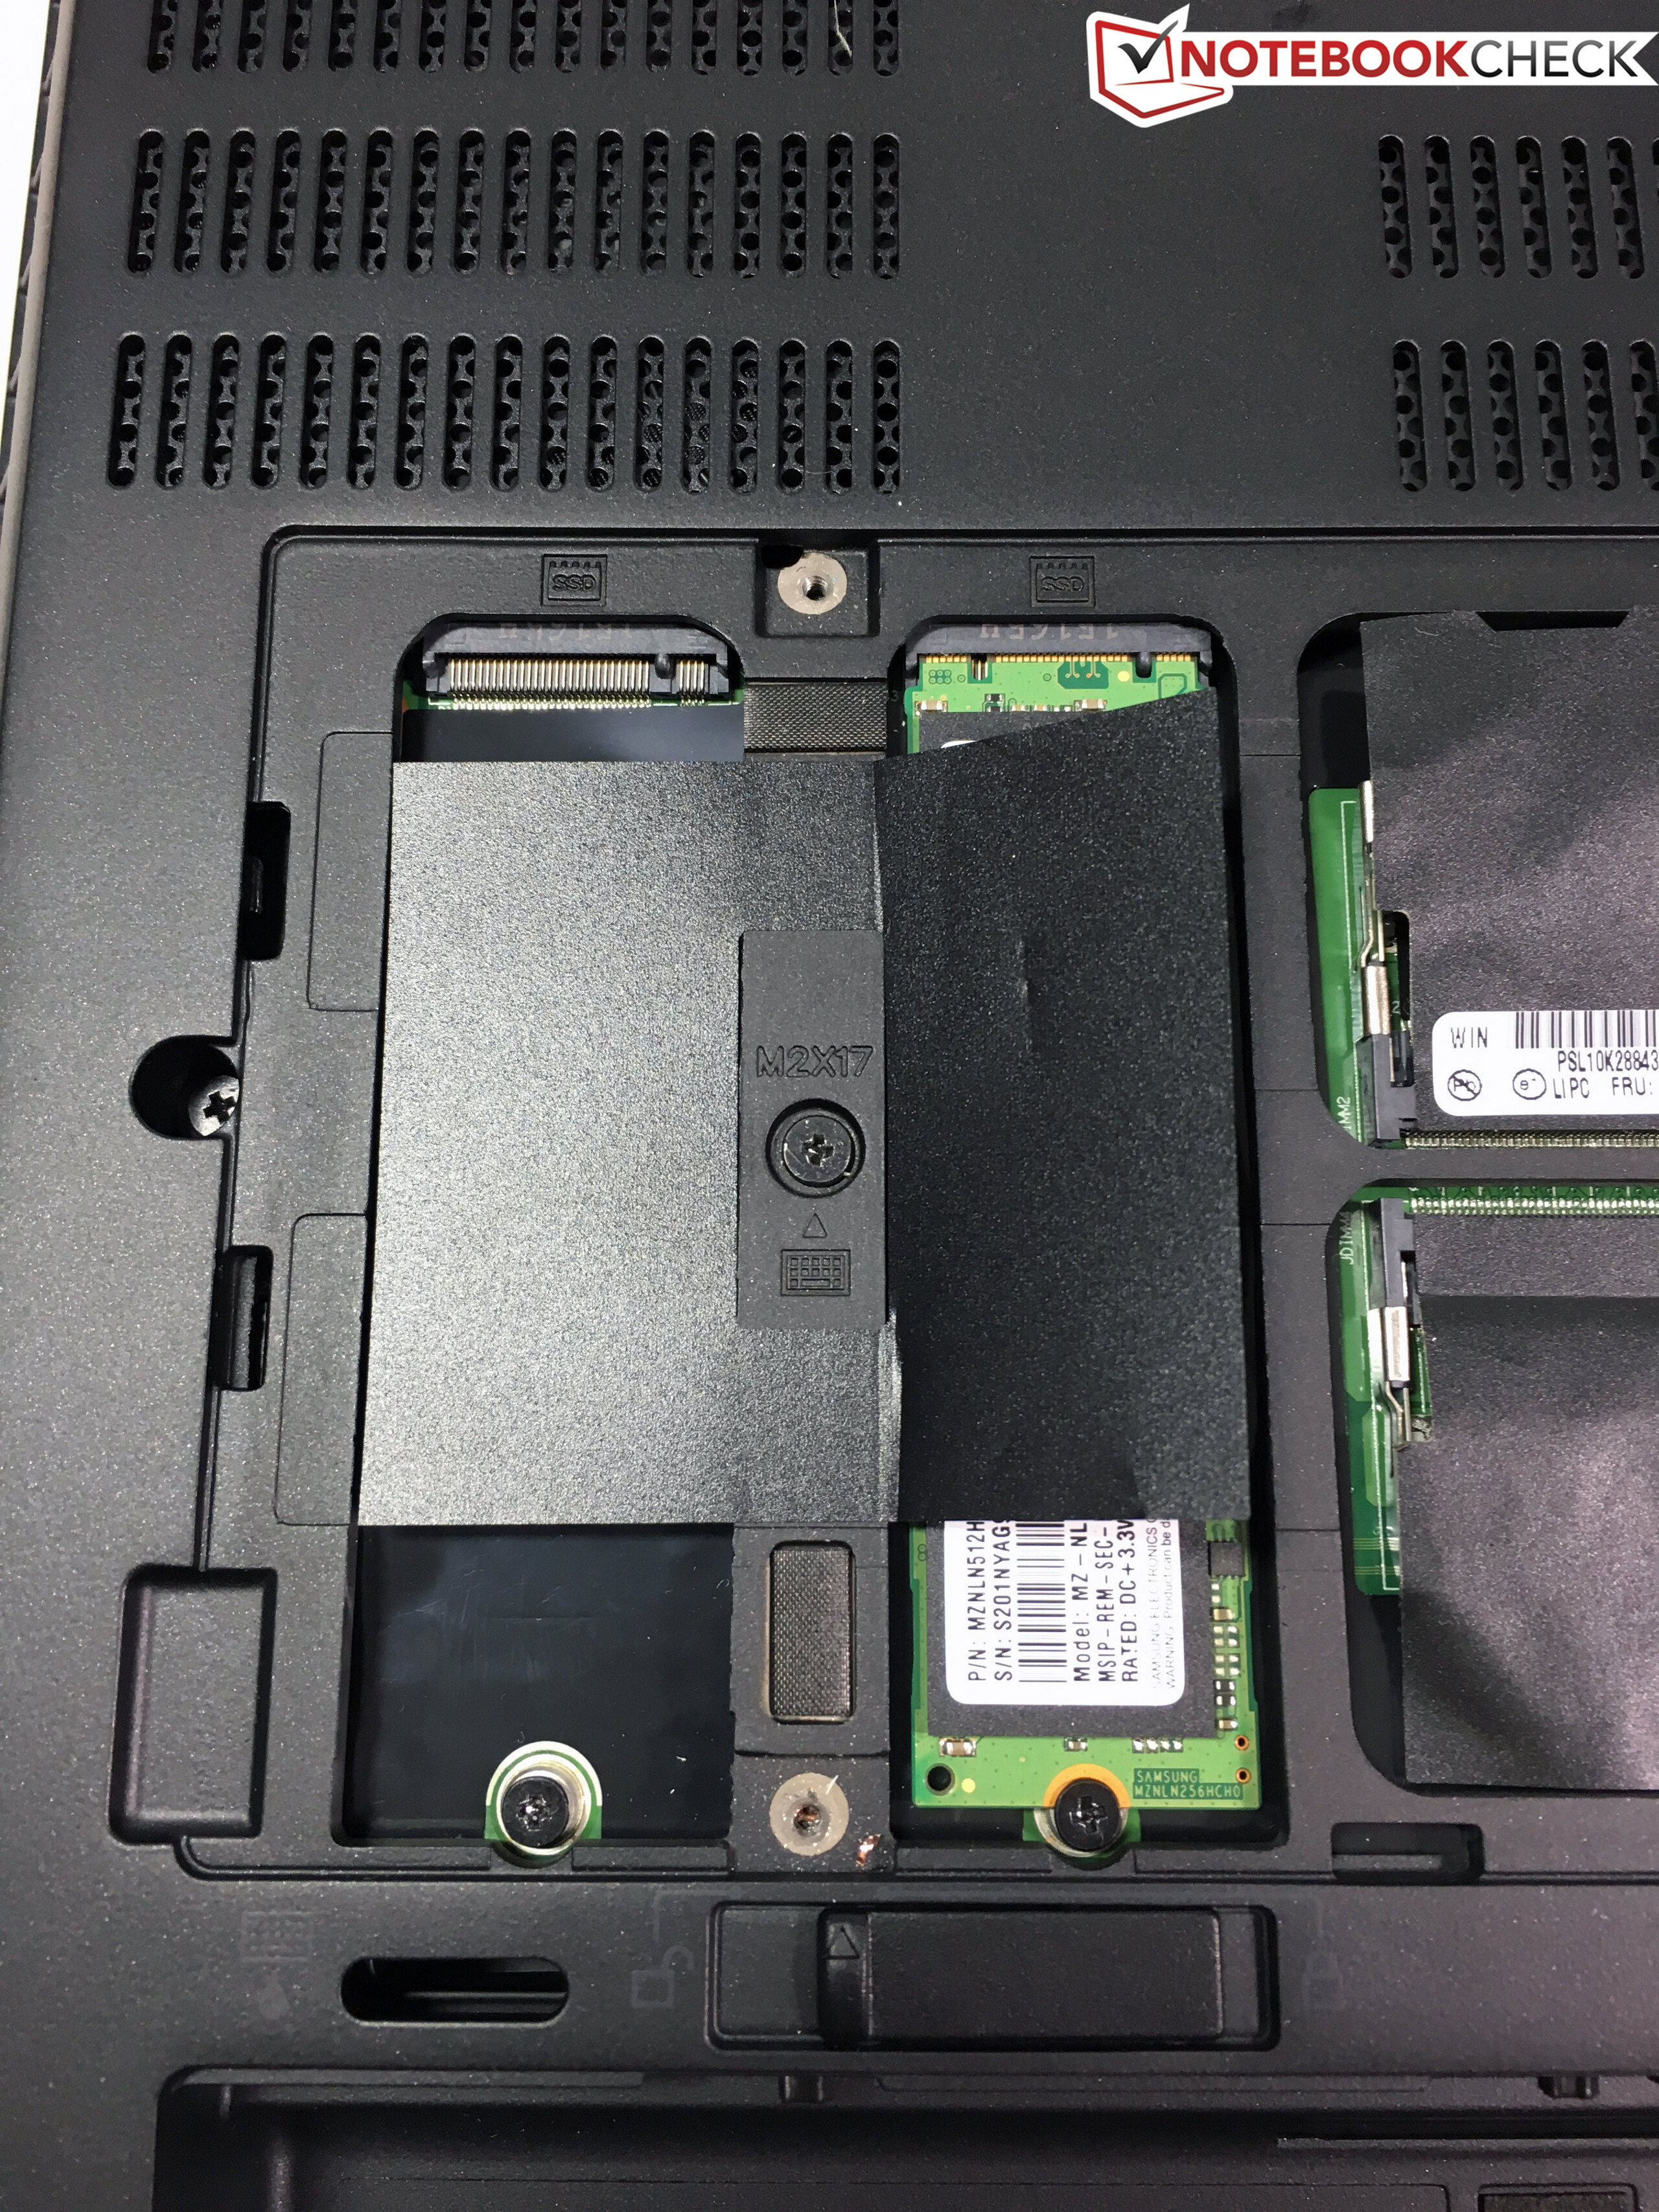
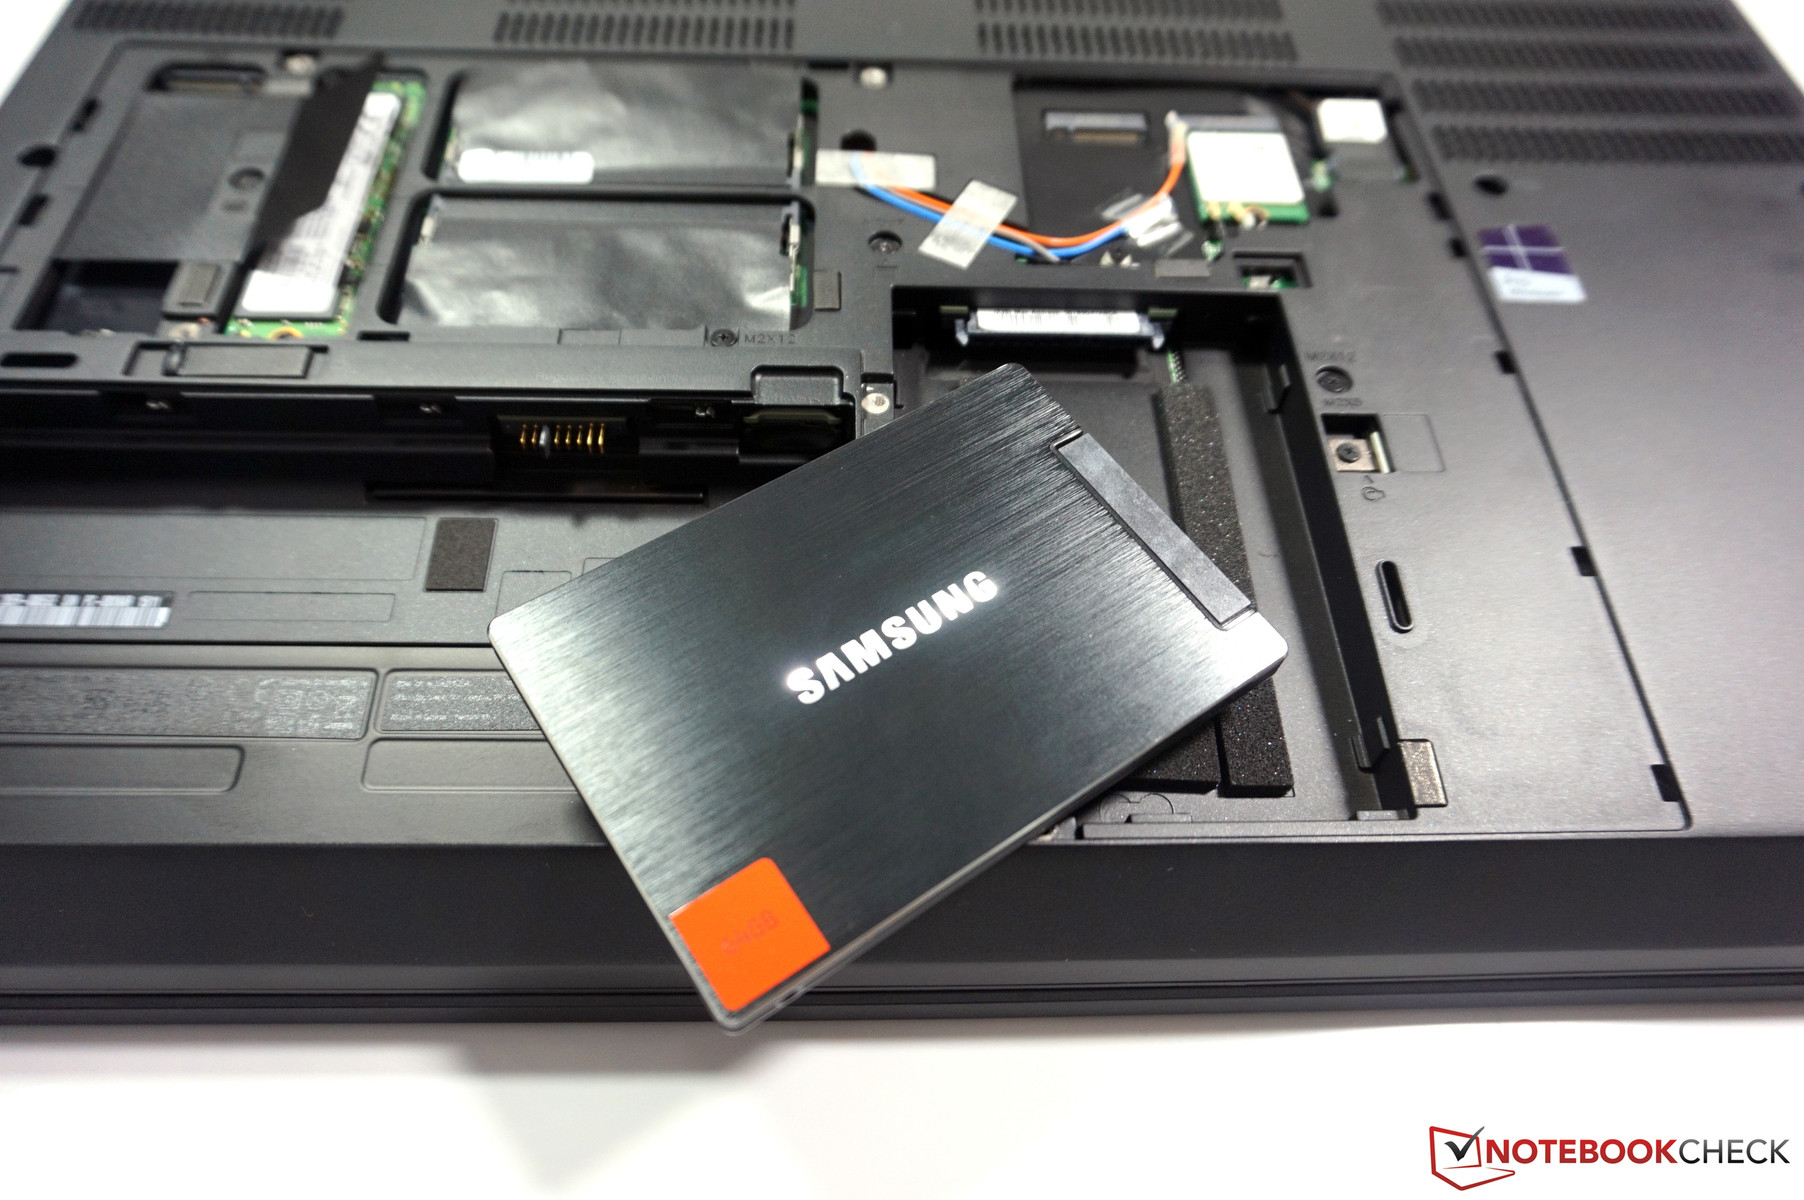
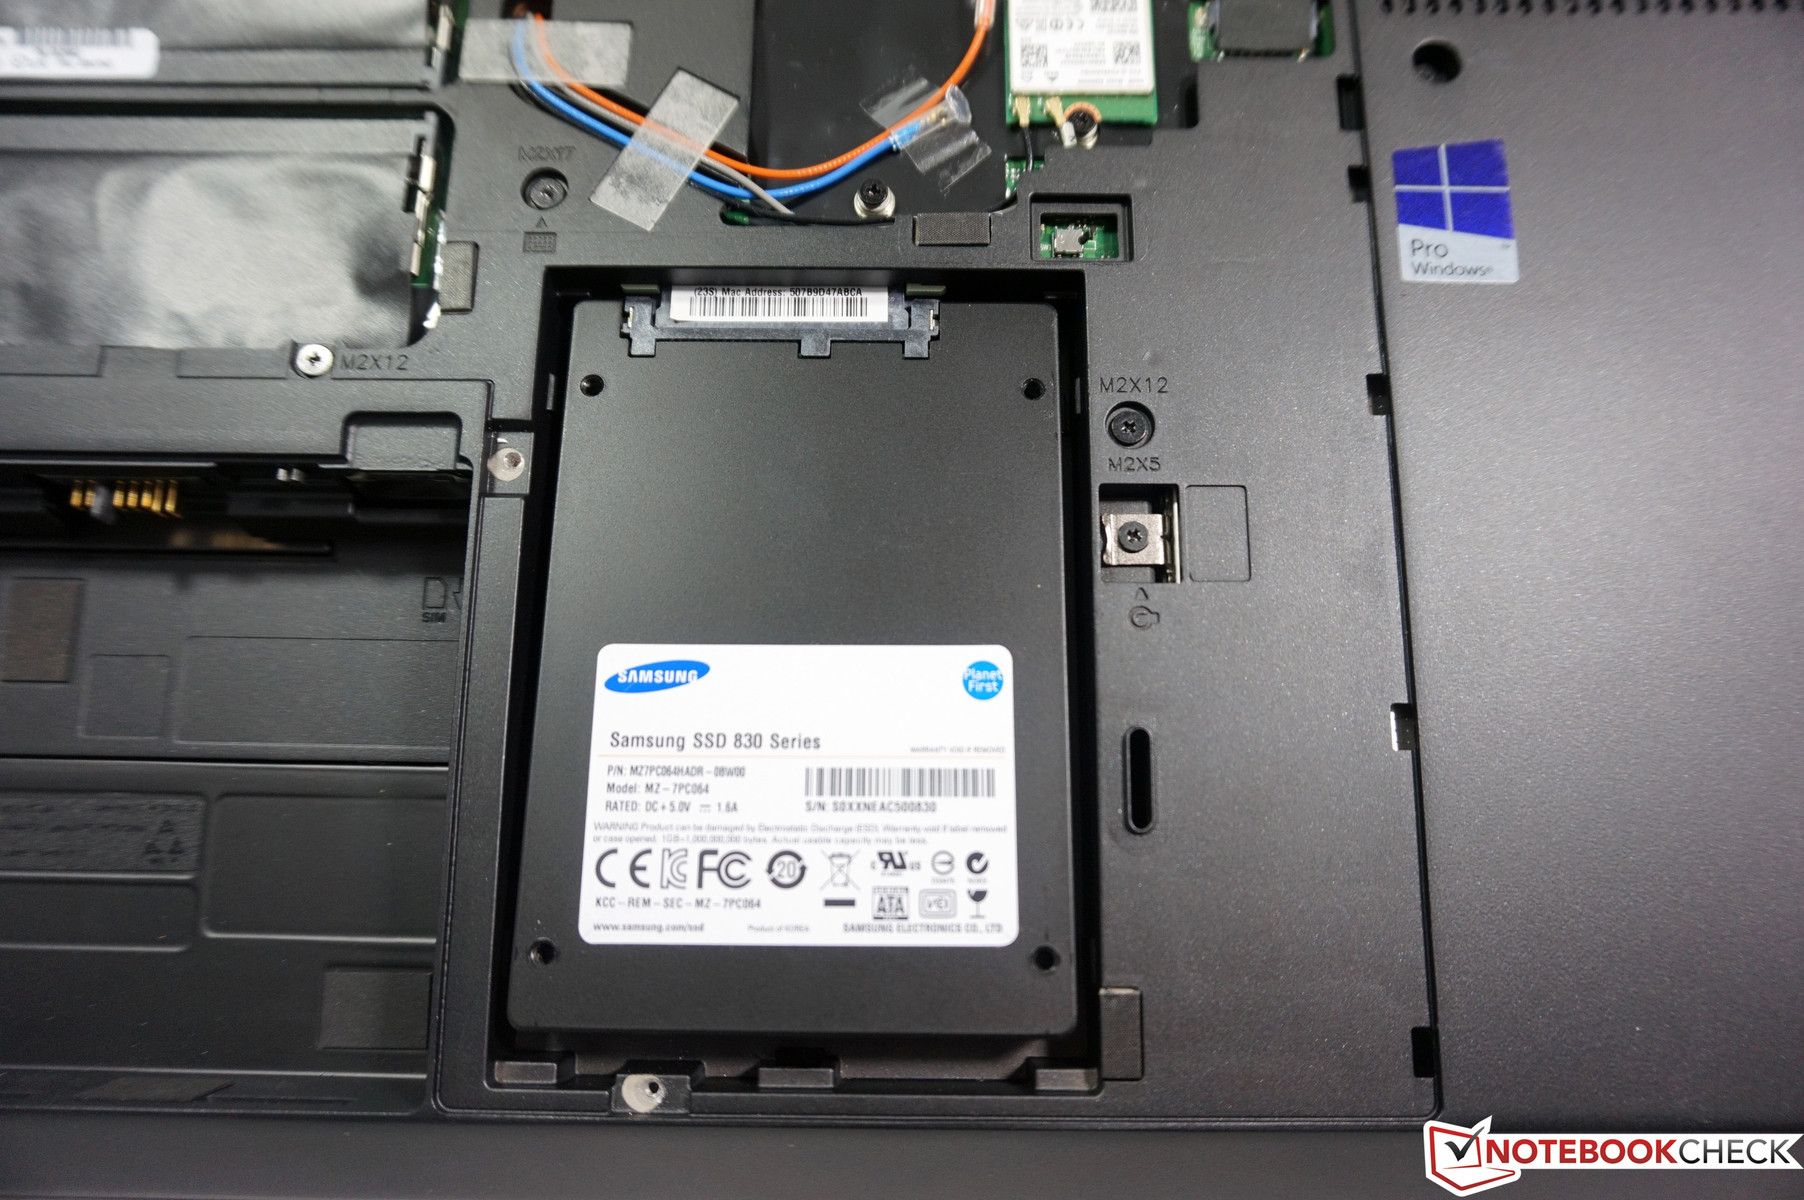
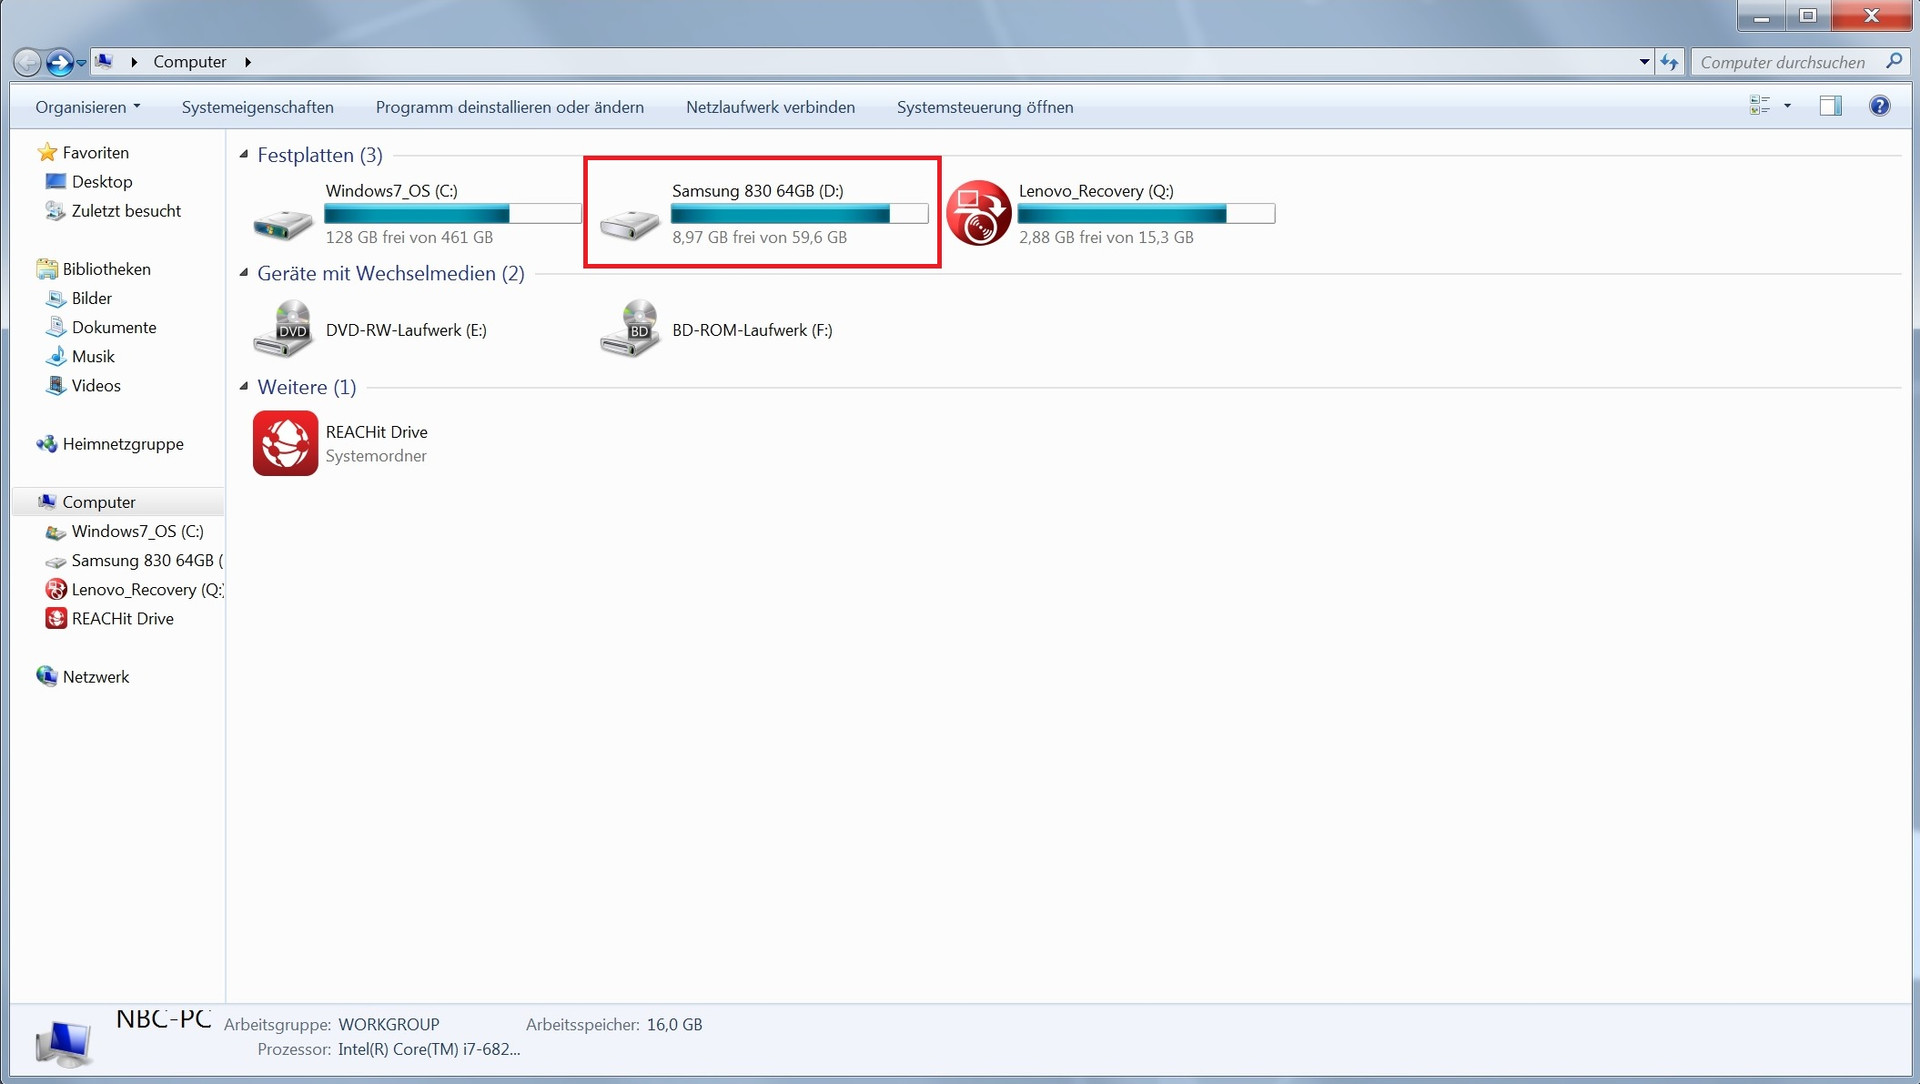
At the bottom is a large maintenance hatch, which is only secured by five Philips screws. After removal, you get access to the two M.2-SSD slots, two SODIMM slots, the Wi-Fi module, the M.2 slot for the LTE modem as well as a 2.5-inch bay for a conventional hard drive. The latter is equipped with some foam, so the hard drive is at the right spot. There is probably a corresponding adapter, but we could not find any information at this time. However, it should be sufficient to fix the hard drive with some filling material, so the drive cannot get loose once the hatch is attached. We just tried it with our 64 GB 2.5-inch SSD (Samsung 830). It was recognized by the OS without problems and we could just use it as a normal drive. The ThinkPad P70 can accommodate a total of four drives: 2x M.2-SSD, 1x 2.5-inch (7 mm) in the designated bay and another hard drive in the modular drive bay. The two memory slots underneath the maintenance hatch are still empty and can be easily upgraded, while the other two slots are underneath the keyboard, so you will have to disassemble more parts, which is also the case if you want to access the two fans. A big help is the so-called Hardware Maintenance Manual (HMM) as well as the User Guide for the ThinkPad P70. Both documents show comprehensive step-by-step instructions for the replacement of virtually every component of the notebook.
Warranty
The warranty period of the Lenovo ThinkPad P70 is three years, which is expected for this segment. It also includes an on-site service, but the battery is only covered for one year. This period can be extended to four (100 Euros, ~$107) or five years (200 Euros, ~$215). This extension can also be combined with accident protection, which is possible for an additional charge of 250 Euros (~$269, four years) or 400 Euros (~$431, five years), respectively. You do not necessarily have to decide for one option immediately after purchase, because an upgrade is possible within the first three years, which means it is also possible right before the end of the warranty.
Input Devices
Keyboard
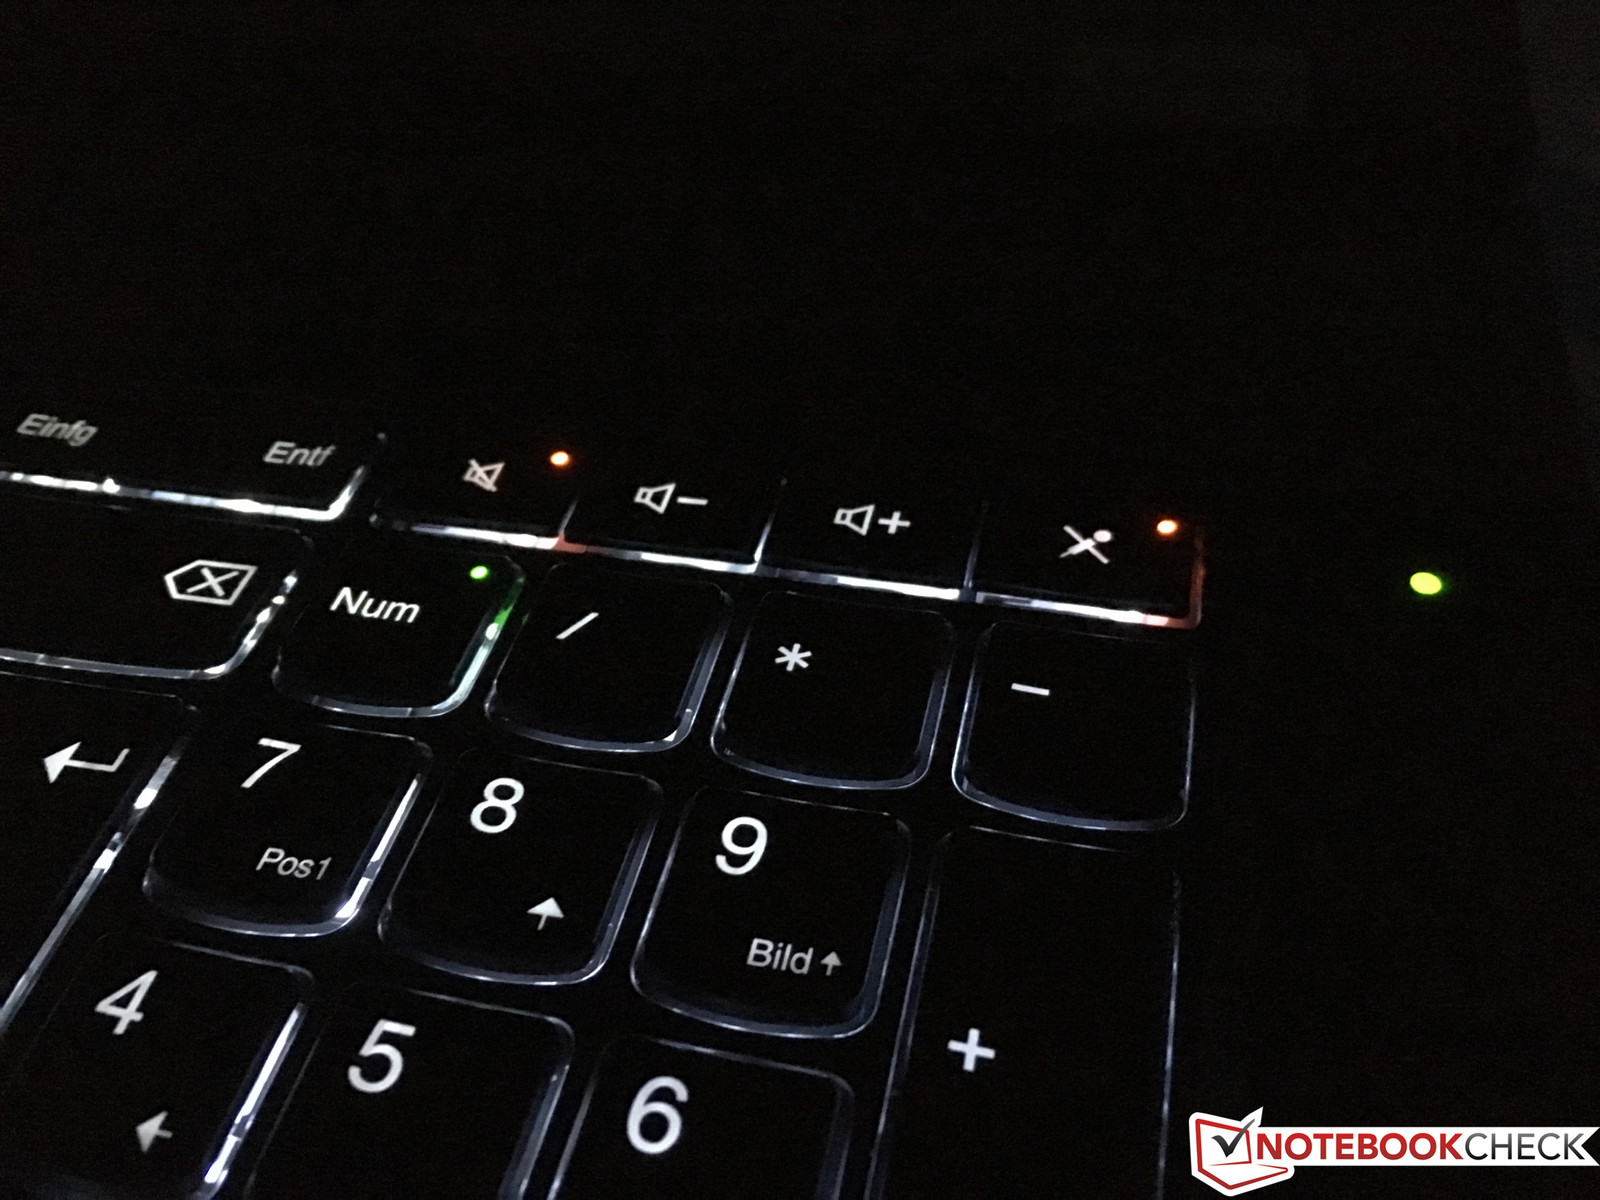
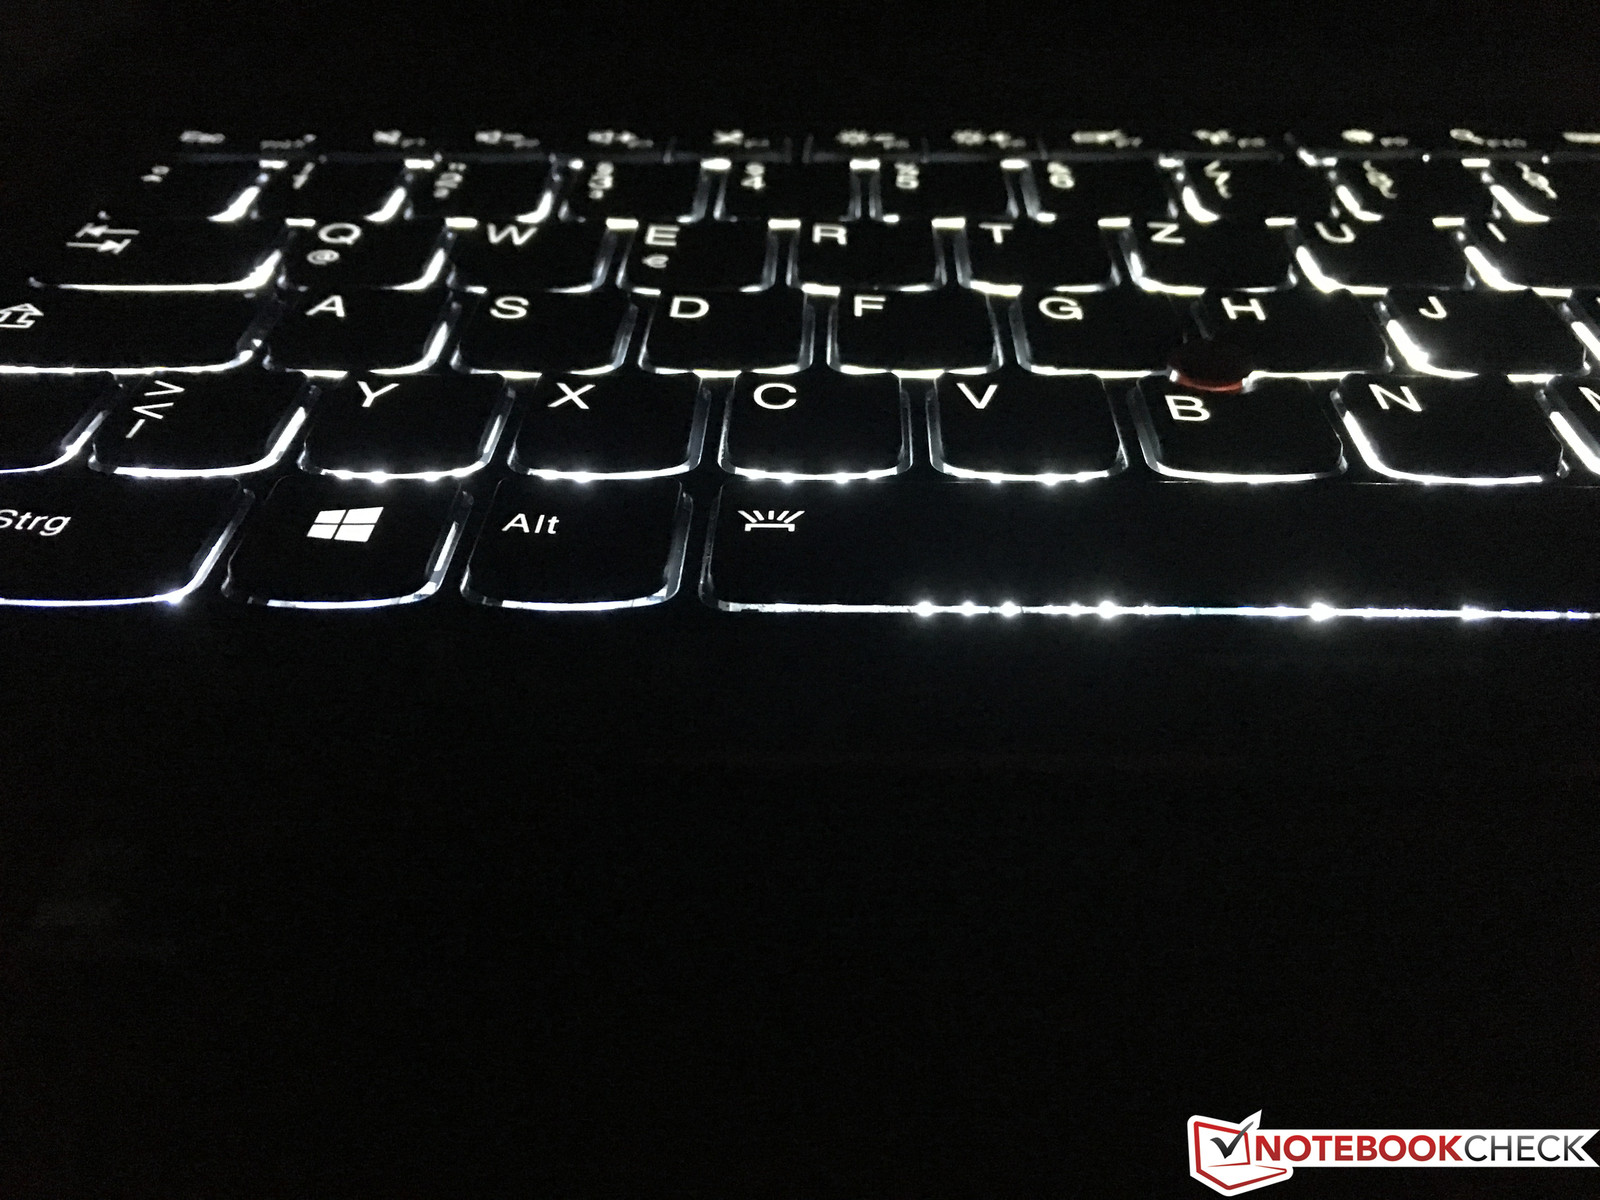
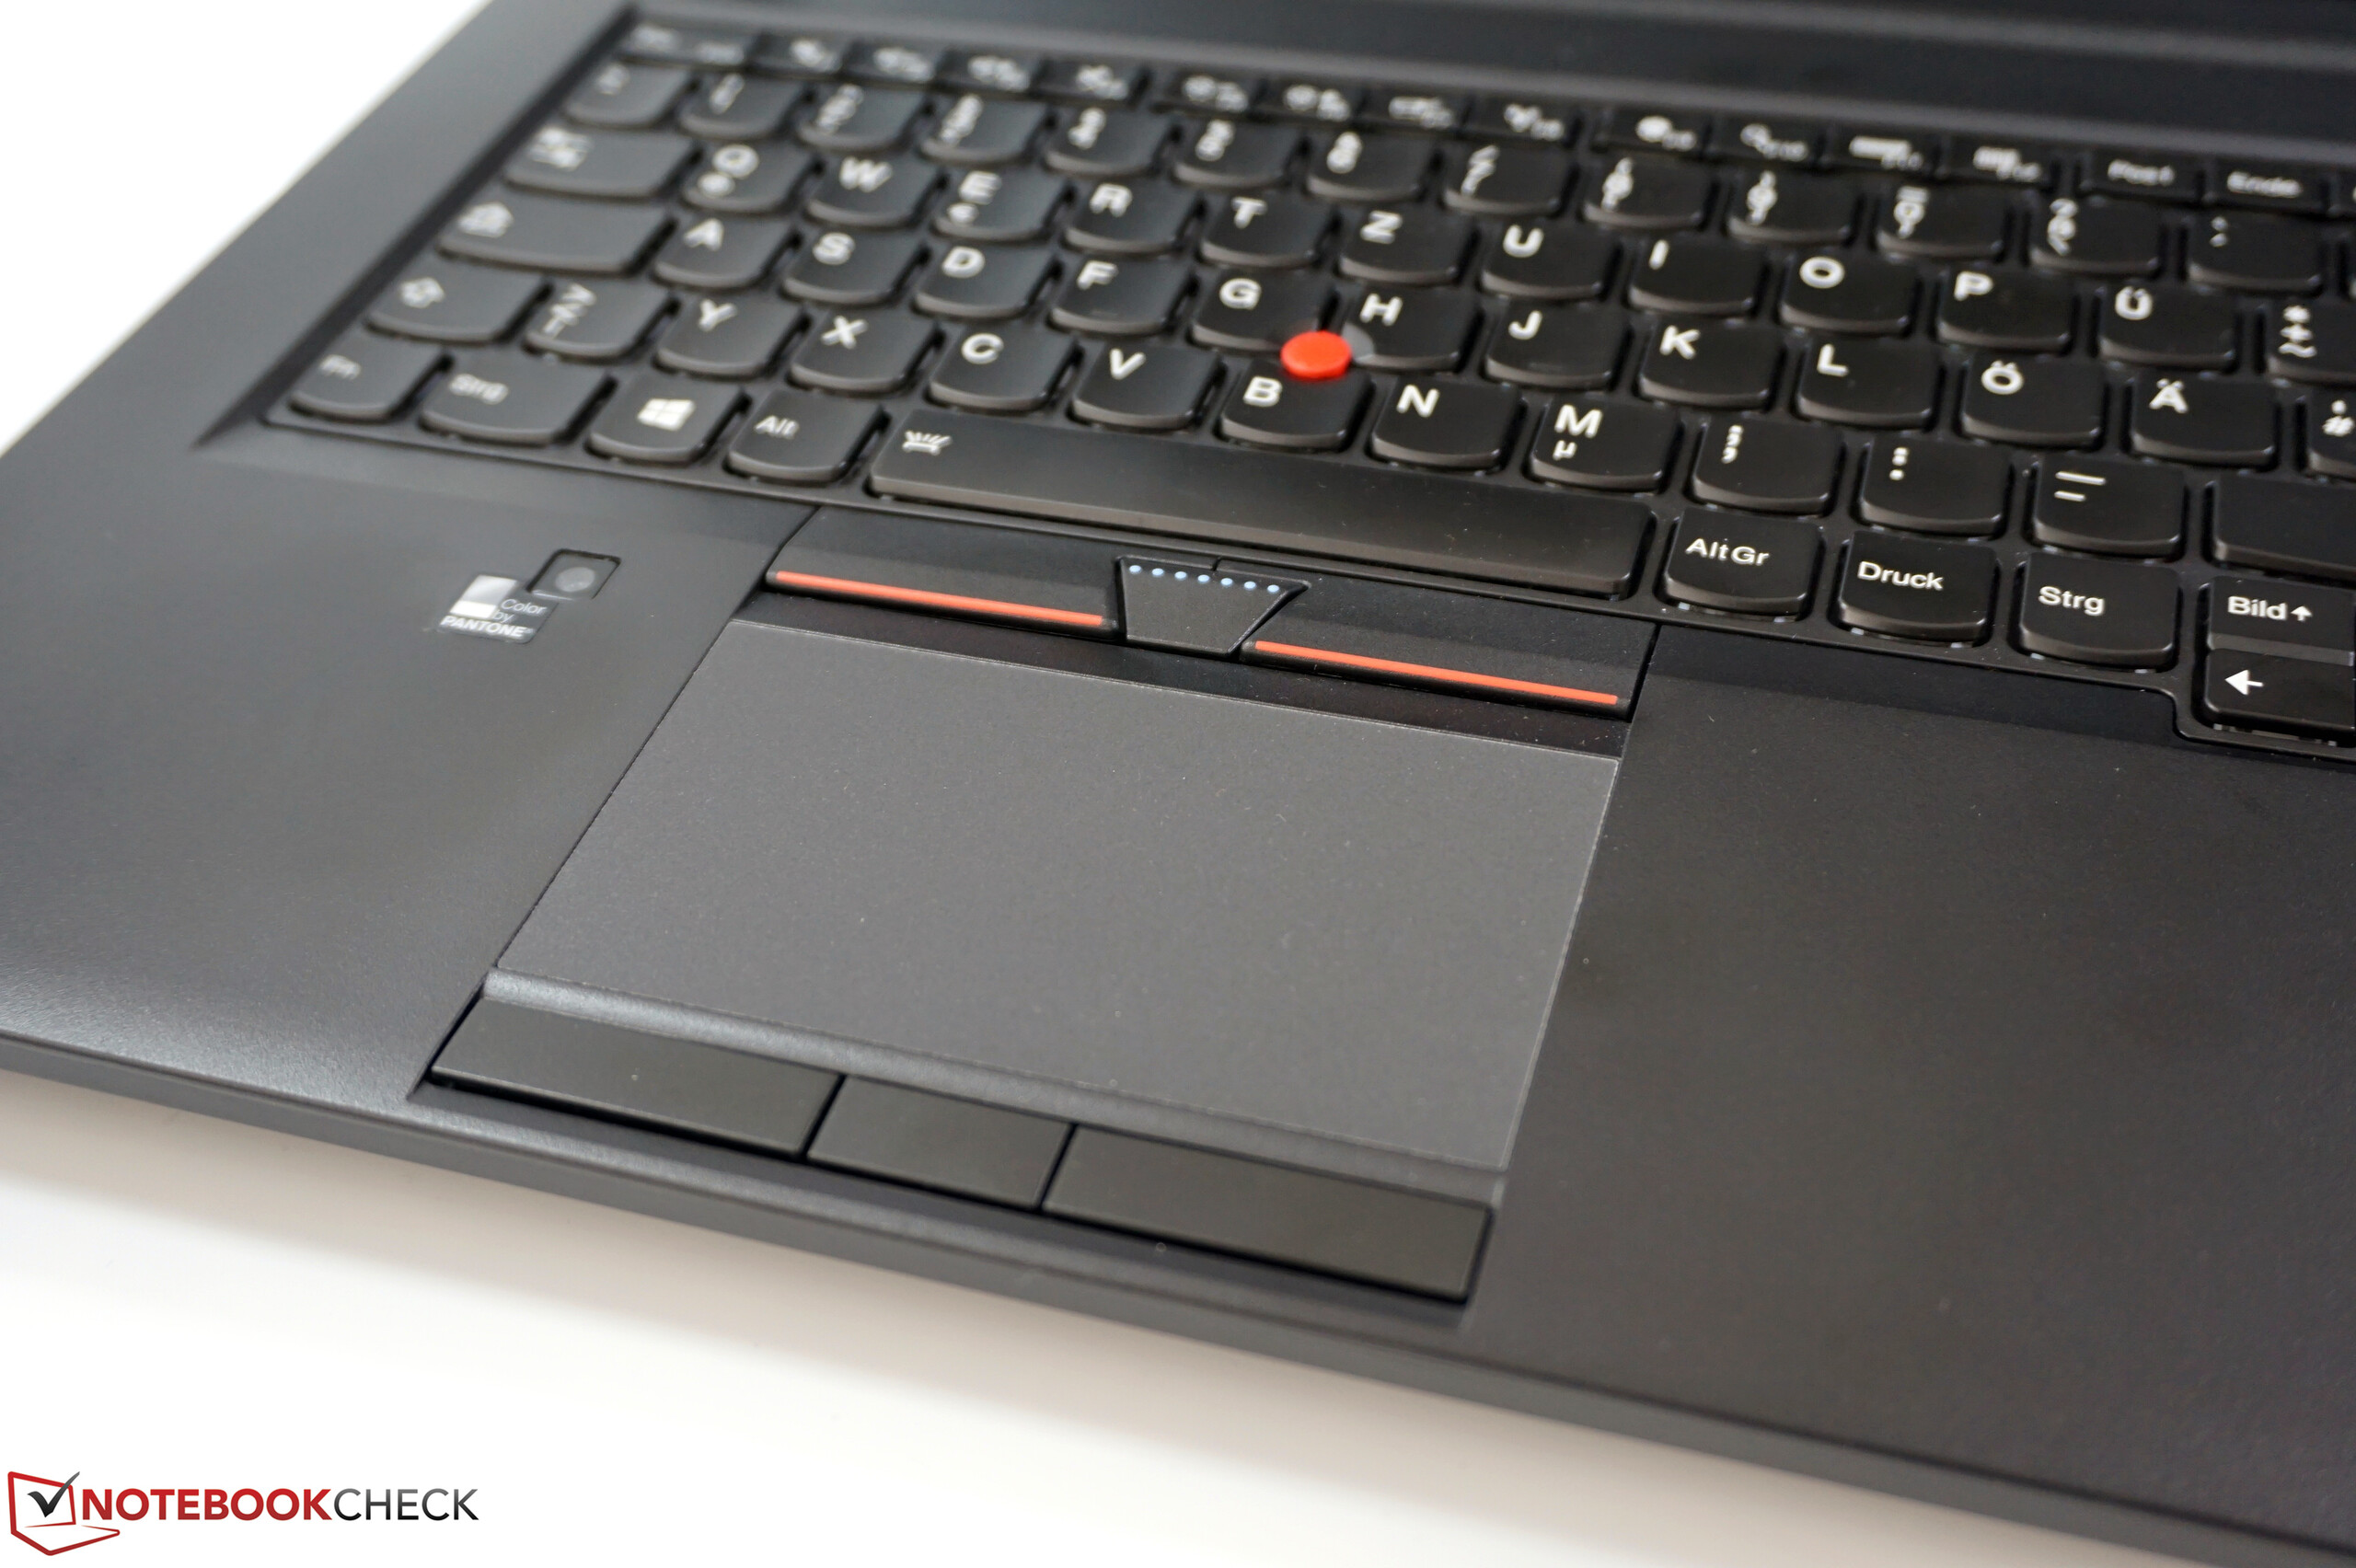
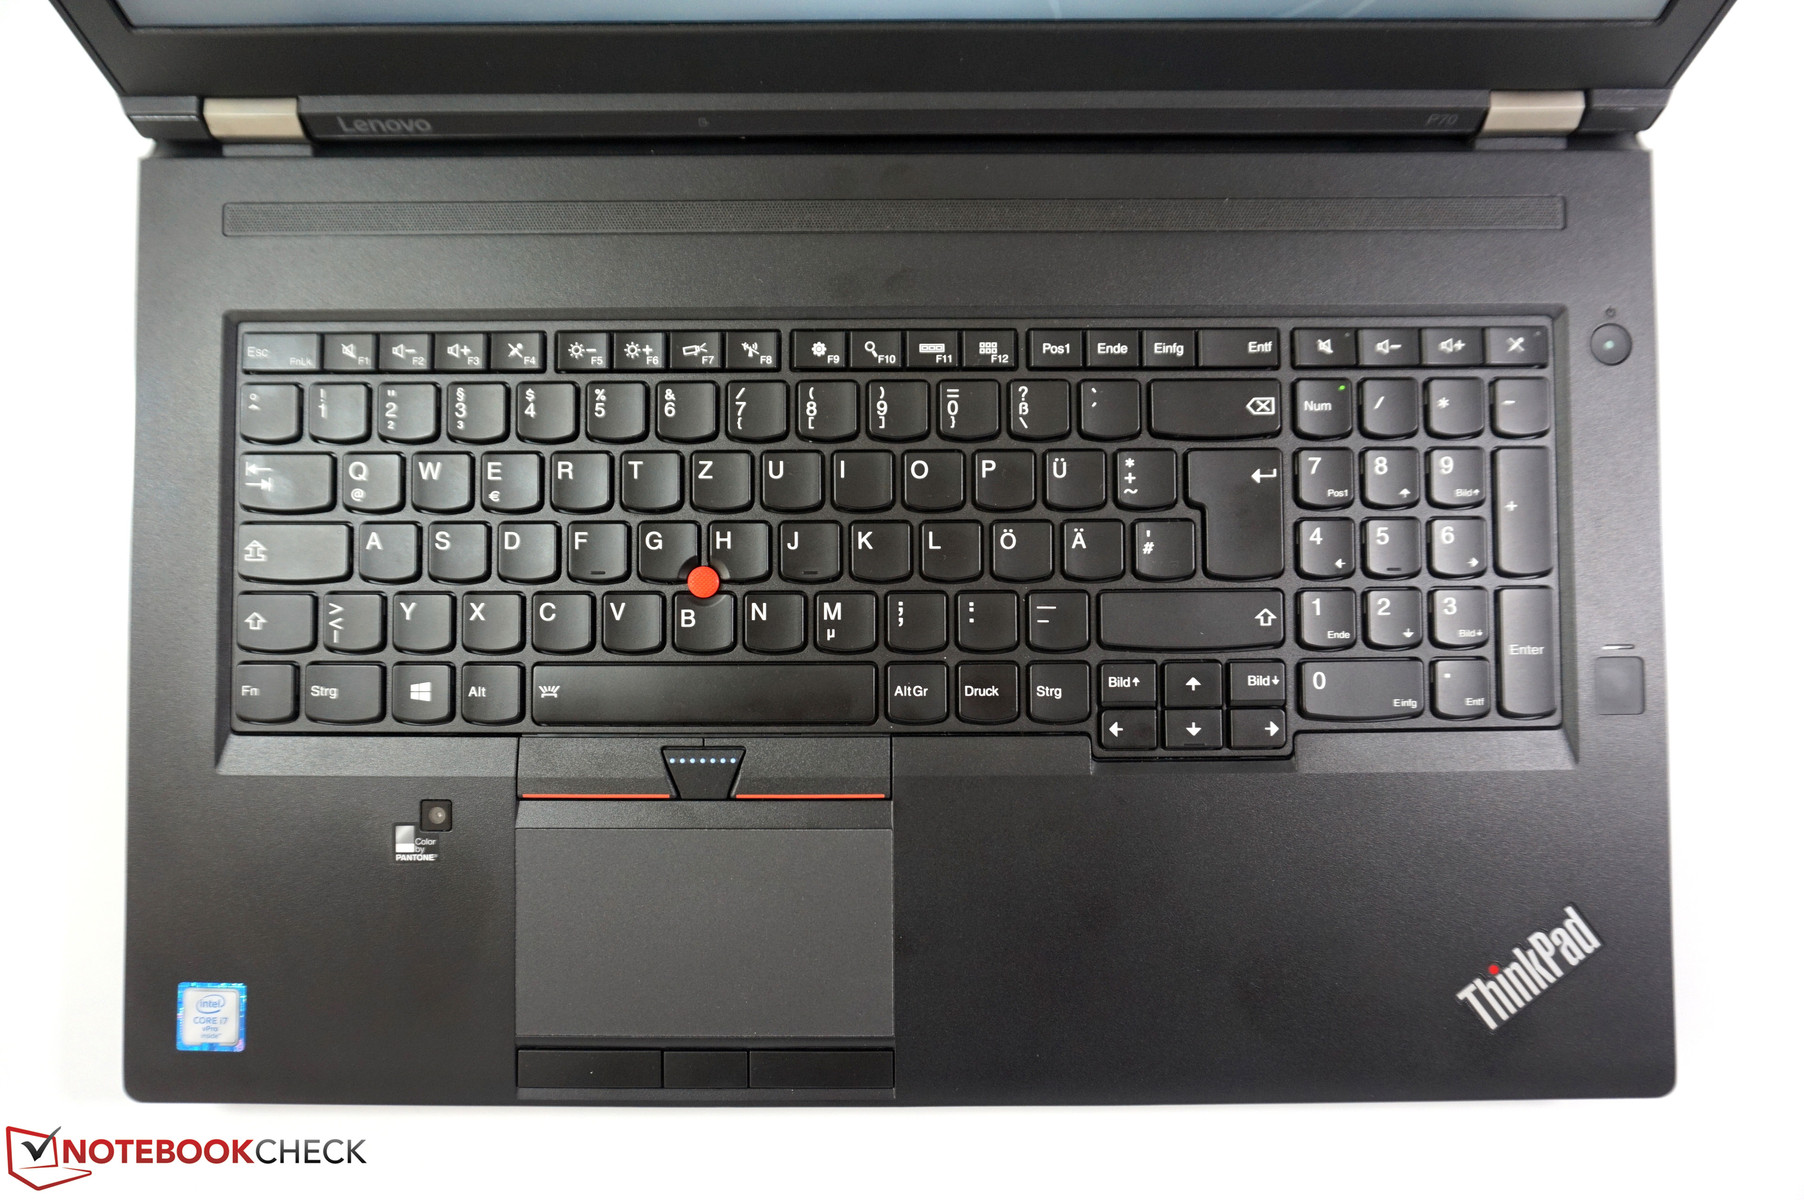
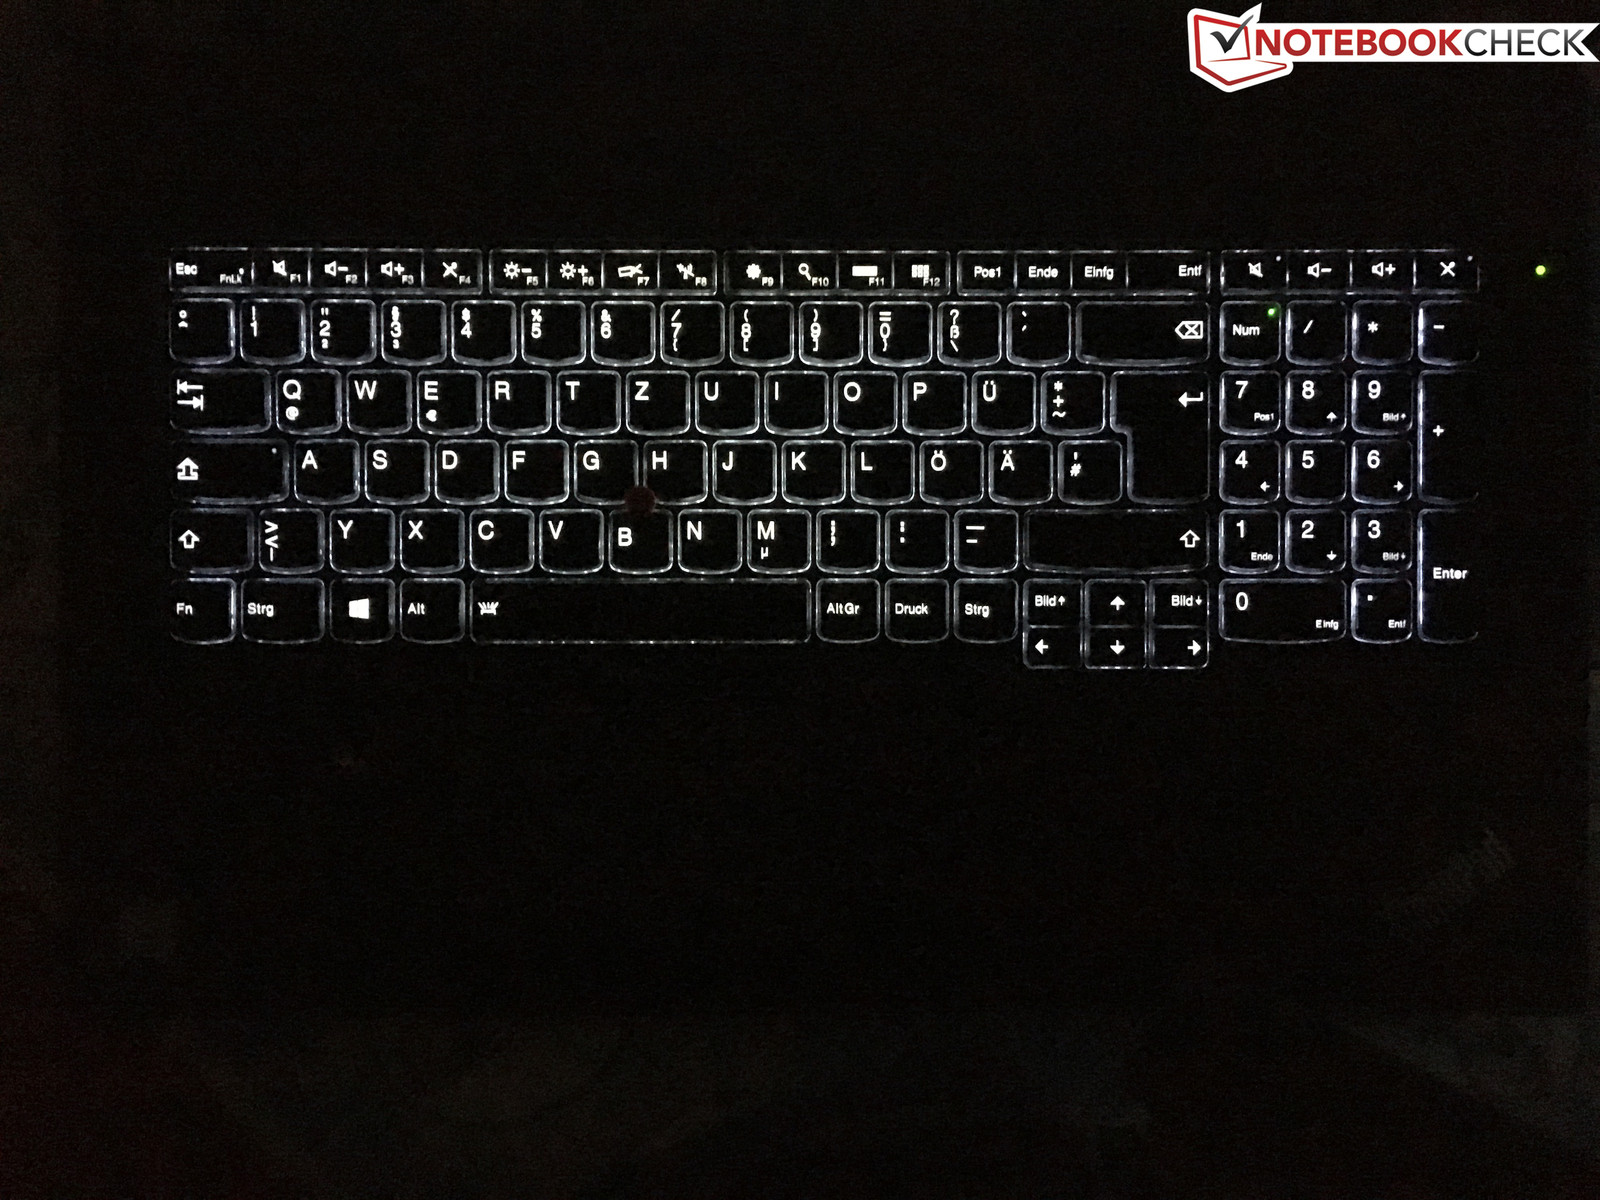
Lenovo implements a six-row chiclet keyboard with a white two-stage background illumination. The keys are slightly rounded and concave and there is also an additional numeric keypad. As usual, the layout slightly deviates from the standard; the most noticeable aspect is certainly the switched position of the Fn and Ctrl keys. ThinkPad newcomers will have to get used to it first, or just switch the allocation in the BIOS. The top row of the function keys is a bit smaller and the secondary functions like the brightness control are activated by default. This is a bit odd for a workstation but can be switched via the Fn-Lock (Fn + Esc). The keys above the keypad can, similar to the keys F1-F4, be used for the volume and microphone control. The manufacturer could have certainly implemented other functions or given the user four programmable macro keys, for example. Another problem is the background illumination of the keyboard. For starters, it could be more powerful for our taste, and similar to the predecessors, it can be a bit dazzling depending on your position (see picture). The keyboard is now equipped with more status LEDs compared to the previous generations (like the ThinkPad W550s).
However, much more important is obviously the typing experience. ThinkPad keyboards are traditionally among the best you can get in the mobile segment, so the expectations for the keyboard of the ThinkPad P70 are very high. We are not disappointed. Just like the palm rest, the keyboard is extremely stable, and it does not even flex under a lot of pressure. The only exception is the small area around the TrackPoint, but this does not matter in practice. All keys are very well integrated and there is no wobbling, which is also the case for large keys like the space bar. In combination with the firm stroke, the sufficient key travel and the good feedback, it results in a really comfortable typing experience. Another positive aspect is the low noise development, even during more energetic inputs.
Touchpad & TrackPoint
The touchpad (Synaptics) is probably the biggest new feature, because Lenovo surprisingly waives the ClickPad. After the last generation got back the dedicated TrackPoint buttons, Lenovo now spoils us with three dedicated mouse buttons for the touchpad. The middle mouse button, which is usually not available, is interesting. The function of the gray smooth touchpad can convince us as well. Inputs are also reliable in the peripheral areas and the gliding capabilities are good, but you might have to reposition your finger a couple of times to cover long distances due to the large panel and the very high resolution. Tap-to-Click with one and two fingers worked well and scrolling with two fingers was no problem, either. The pad supports gestures with up to four fingers. The keys have a pretty soft pressure point and create a rich clicking sound, but the sounds of the individual keys differ a bit.
Besides the touchpad, you can obviously use the red TrackPoint to control the cursor as well. It also has three dedicated buttons underneath the space bar, and the middle button can either be used for scrolling (default) or as a middle mouse button. The handling was flawless and like always, it is a matter of taste, but because of the large distances on the panel in particular, it is a comfortable alternative to the touchpad. The buttons of the TrackPoint are bigger compared to the touchpad and also create a slightly louder noise. The functionality on the other hand is not affected.
Display

Lenovo offers the ThinkPad P70 with three different 17.3-inch displays: two FHD panels and a 4K panel. All versions are based on IPS technology and have a matte surface. The standard FHD screen is advertised with a luminance of 300 nits, while the multi-touch FHD panel manages 270 nits. The color-space coverage is supposed to be at 72% (NTSC) for both versions. The third option is a matte 4K panel with 3840x2160 pixels, which is also the panel of our review unit. The brightness is supposed to be at 300 nits and the color-space coverage even at 90% (NTSC). It is one of the first 4K panels with a 17.3-inch diagonal size, which also has a matte surface. The panel has the designation LEN 4123 and is provided by Panasonic.
Our review unit manages an average brightness of 341 nits and therefore clearly surpasses the advertised 300 nits. The maximum value is even 379 nits, but the brightness distribution is just 85%. The black value of 0.4 cd/m² results in a contrast ratio of 913:1. The subjective picture impression is excellent. Fonts and pictures are razor-sharp and you cannot see individual pixels from a normal viewing distance thanks to a pixel density of 255 PPI.
Our screen unfortunately suffers from two clearly visible areas with screen bleeding and there is also a slight blue hue in the peripheral areas. The screen bleeding is particularly annoying, because it is clearly visible on a dark picture.
Another problem is the scaling of Windows 7. Contrary to Windows 8.1 and certainly Windows 10, this operating system was not optimized for such high resolutions. The scaling is set to 150% by default, which is a good compromise. You can still recognize the contents on 100% if necessary due to the large screen, but it is very tiring for the eyes. However, we only had problems with some applications (including Origin and Steam) during the review, but Windows menus had issues with fonts as well. So if you decide to get the 4K panel, you should also switch to Windows 10. It is also possible to reduce the screen resolution to Full HD (1920x1080 pixels), but this will slightly affect the extremely sharp presentation.
| |||||||||||||||||||||||||
Brightness Distribution: 85 %
Center on Battery: 361 cd/m²
Contrast: 913:1 (Black: 0.4 cd/m²)
ΔE ColorChecker Calman: 3.8 | ∀{0.5-29.43 Ø4.74}
ΔE Greyscale Calman: 6.09 | ∀{0.09-98 Ø4.98}
99.97% sRGB (Argyll 1.6.3 3D)
76.01% AdobeRGB 1998 (Argyll 1.6.3 3D)
85.4% AdobeRGB 1998 (Argyll 3D)
100% sRGB (Argyll 3D)
90.8% Display P3 (Argyll 3D)
Gamma: 2.3
CCT: 6332 K
| Lenovo ThinkPad P70 Quadro M3000M, 6820HQ, Samsung SSD PM871 MZNLN512HCJH | Dell Precision 7710 FirePro W7170M, E3-1535M v5, Samsung SM951 MZVPV256HDGL m.2 PCI-e | HP ZBook 17 E9X11AA-ABA Quadro K610M, 4900MQ, Micron RealSSD C400 MTFDDAK128MAM | MSI WT72-2OL32SR311BW Quadro K4100M, 4980HQ, 4x Toshiba HG6 THNSNJ256G8NU (RAID 0) | Bullman E-Klasse 5 Quadro K3100M, 4790K, Samsung SSD SM951 256GB MZHPV256HDGL | |
|---|---|---|---|---|---|
| Display | -17% | 3% | -24% | -23% | |
| Display P3 Coverage (%) | 90.8 | 66.6 -27% | 85.7 -6% | 66.5 -27% | 66.5 -27% |
| sRGB Coverage (%) | 100 | 96.9 -3% | 100 0% | 84.3 -16% | 84.5 -15% |
| AdobeRGB 1998 Coverage (%) | 85.4 | 68.6 -20% | 99.2 16% | 61.7 -28% | 61.8 -28% |
| Response Times | -22% | ||||
| Response Time Grey 50% / Grey 80% * (ms) | 44 ? | 50 ? -14% | |||
| Response Time Black / White * (ms) | 27.6 ? | 36 ? -30% | |||
| PWM Frequency (Hz) | 228 ? | 198 ? | |||
| Screen | 4% | 13% | -9% | -1% | |
| Brightness middle (cd/m²) | 365 | 332 -9% | 320 -12% | 303 -17% | 355 -3% |
| Brightness (cd/m²) | 341 | 307 -10% | 311 -9% | 276 -19% | 335 -2% |
| Brightness Distribution (%) | 85 | 83 -2% | 88 4% | 83 -2% | 89 5% |
| Black Level * (cd/m²) | 0.4 | 0.33 17% | 0.359 10% | 0.34 15% | 0.44 -10% |
| Contrast (:1) | 913 | 1006 10% | 891 -2% | 891 -2% | 807 -12% |
| Colorchecker dE 2000 * | 3.8 | 3 21% | 2.04 46% | 5.57 -47% | 3.73 2% |
| Greyscale dE 2000 * | 6.09 | 4 34% | 2.45 60% | 4.08 33% | 2.84 53% |
| Gamma | 2.3 96% | 2 110% | 2.28 96% | 2.19 100% | 2.12 104% |
| CCT | 6332 103% | 7089 92% | 6518 100% | 7362 88% | 6457 101% |
| Color Space (Percent of AdobeRGB 1998) (%) | 76.01 | 62 -18% | 93 22% | 55.34 -27% | 55.45 -27% |
| Color Space (Percent of sRGB) (%) | 99.97 | 97 -3% | 100 0% | 84.21 -16% | 84.39 -16% |
| Total Average (Program / Settings) | -12% /
-4% | 8% /
11% | -17% /
-13% | -12% /
-7% |
* ... smaller is better
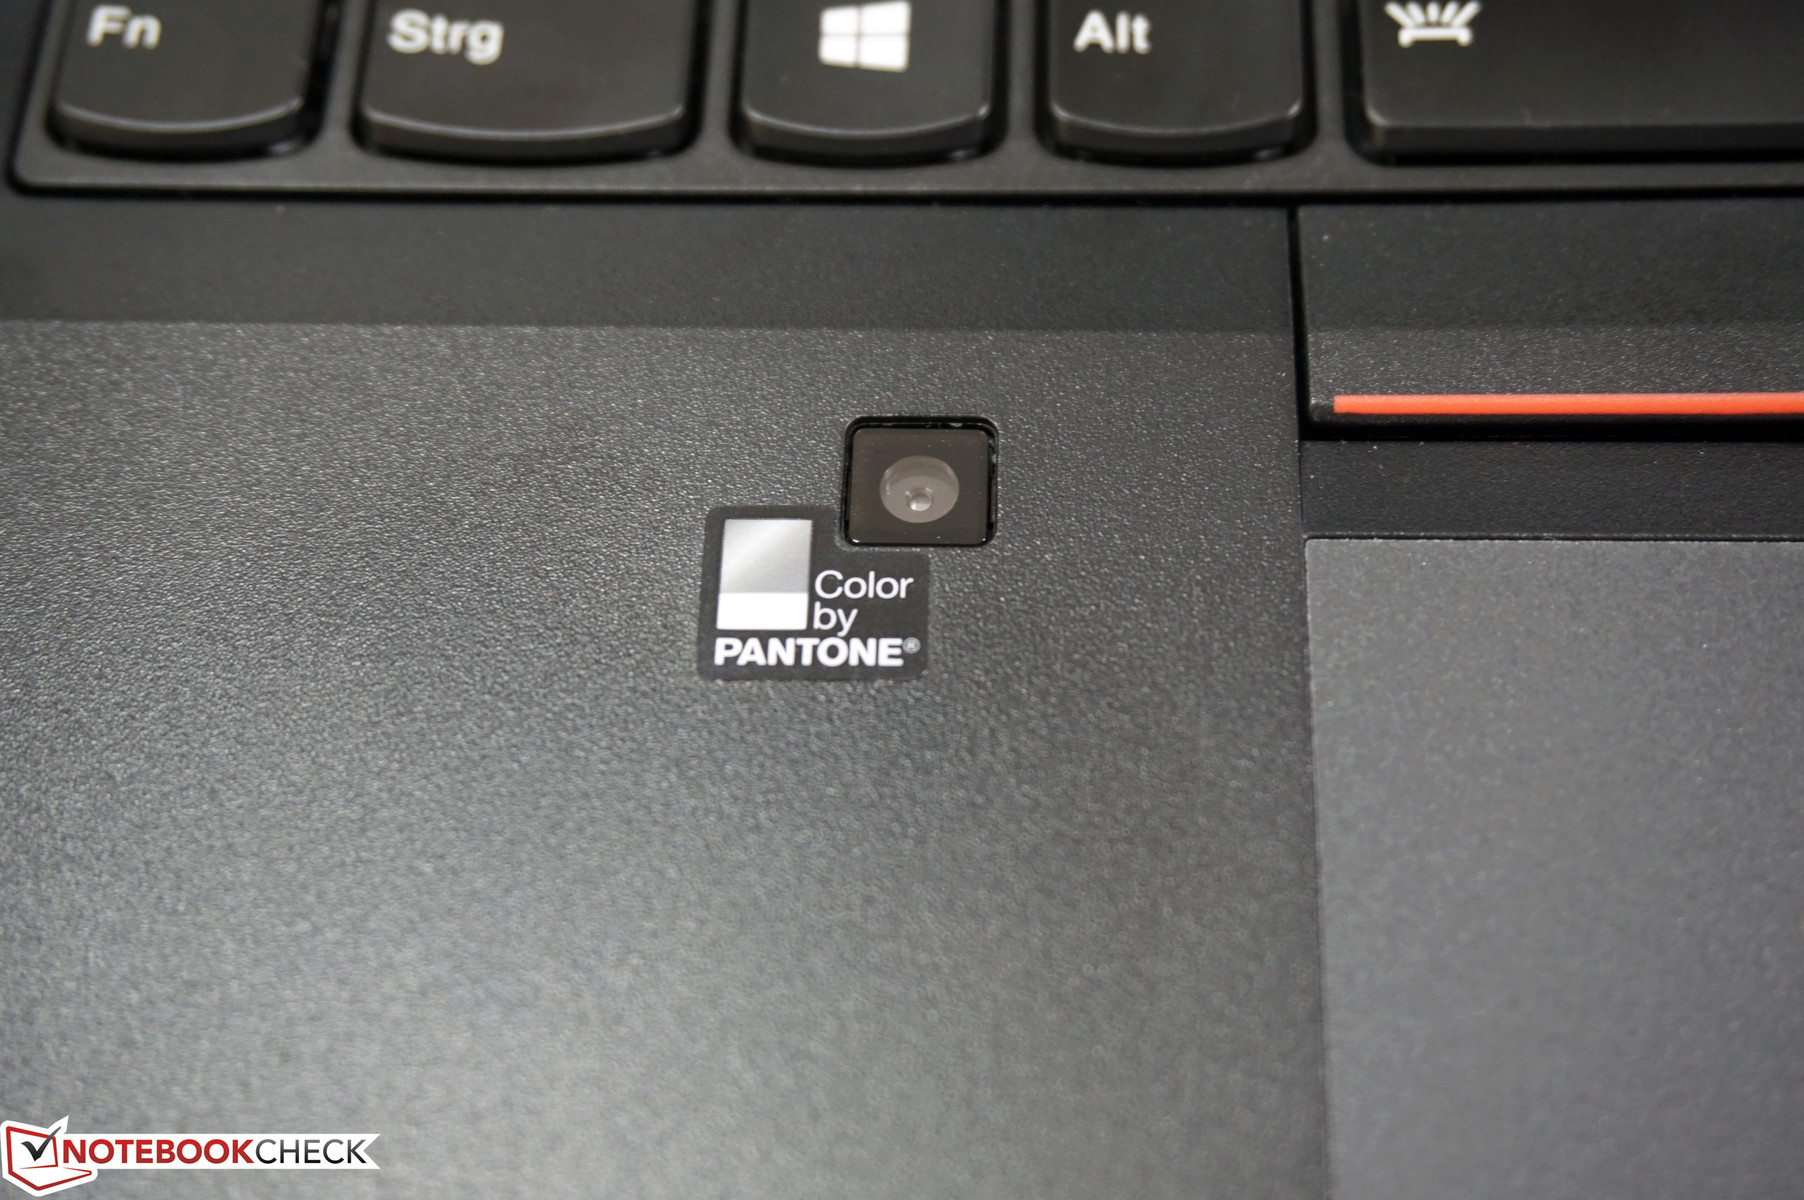
A special feature is the integrated X-Rite Pantone color calibrator, which can be used to calibrate the display. The procedure is very simple: launch the software, choose the profile and close the lid. It is an implemented feature, so we use the profiled results for our database and the rating. The comparison with our X-Rite i1 Pro 2 on the other hand shows that the results of the integrated solution are not ideal.
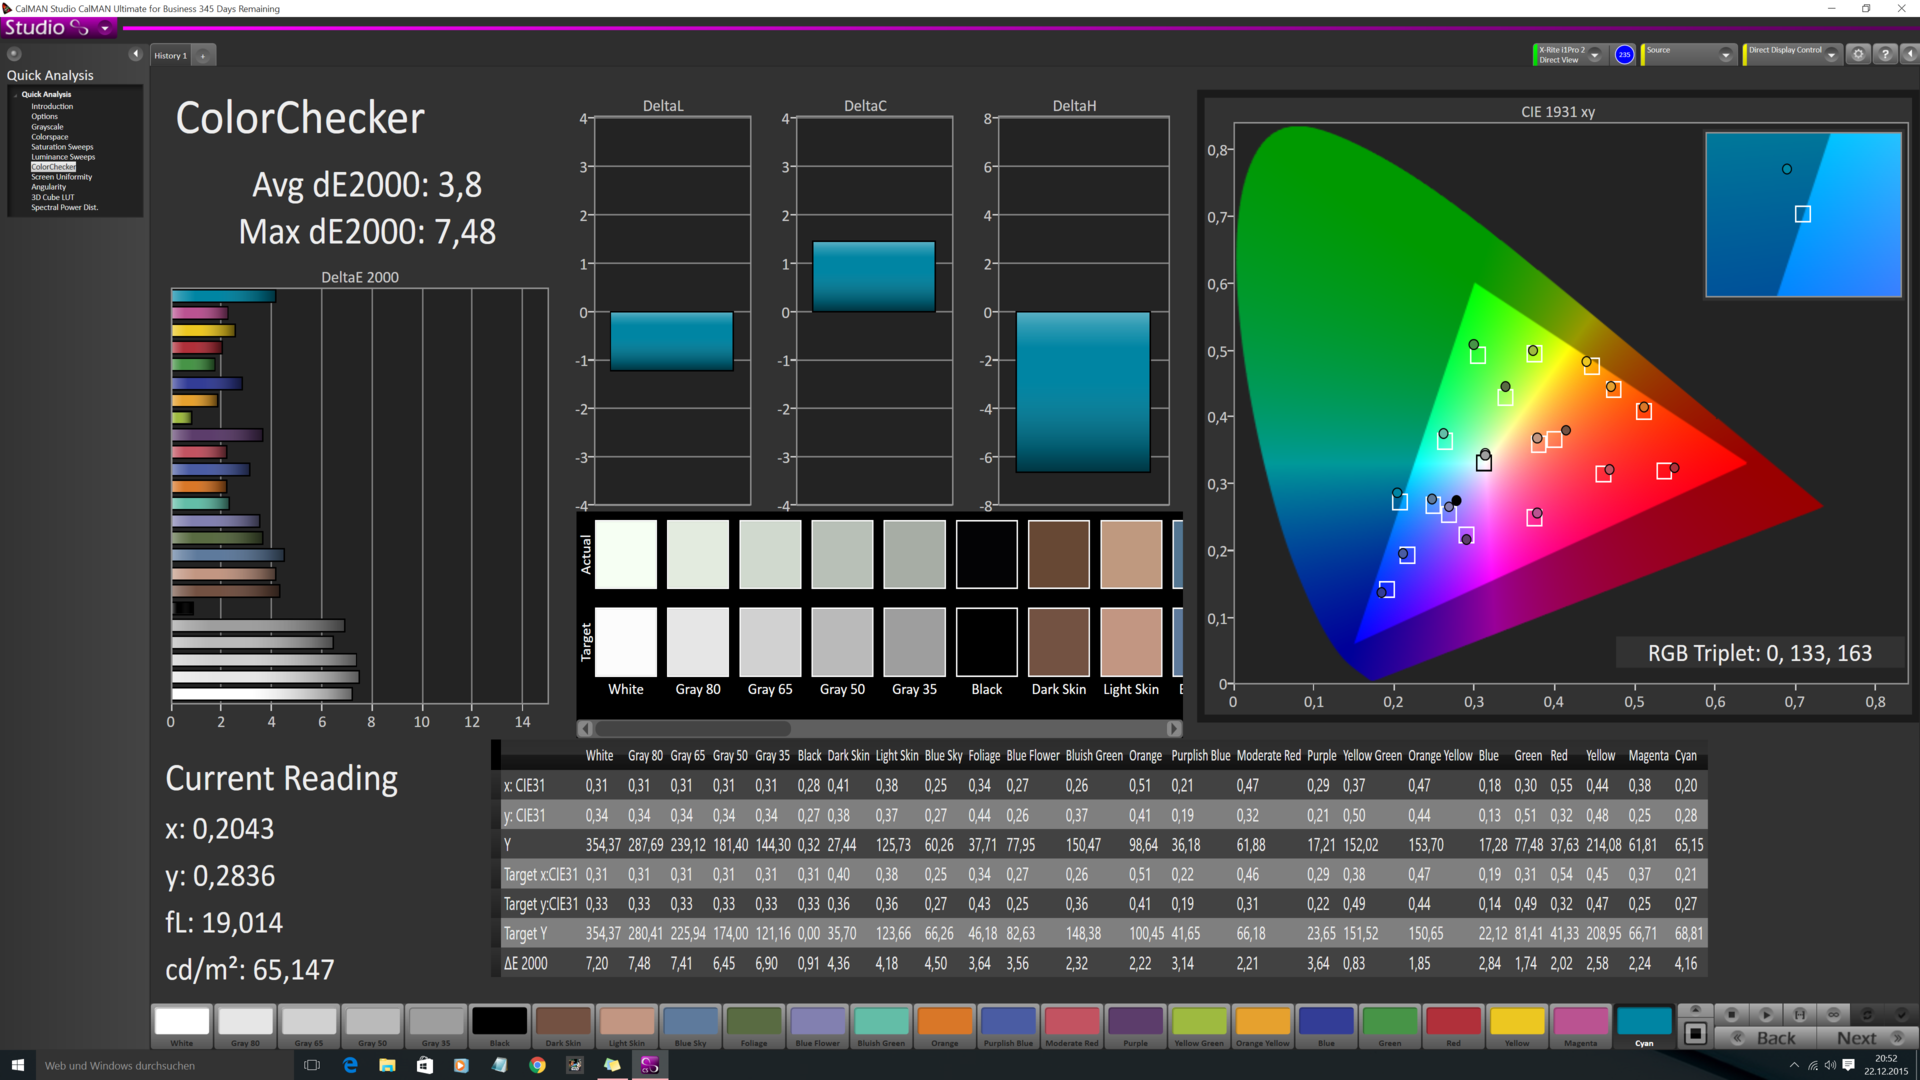
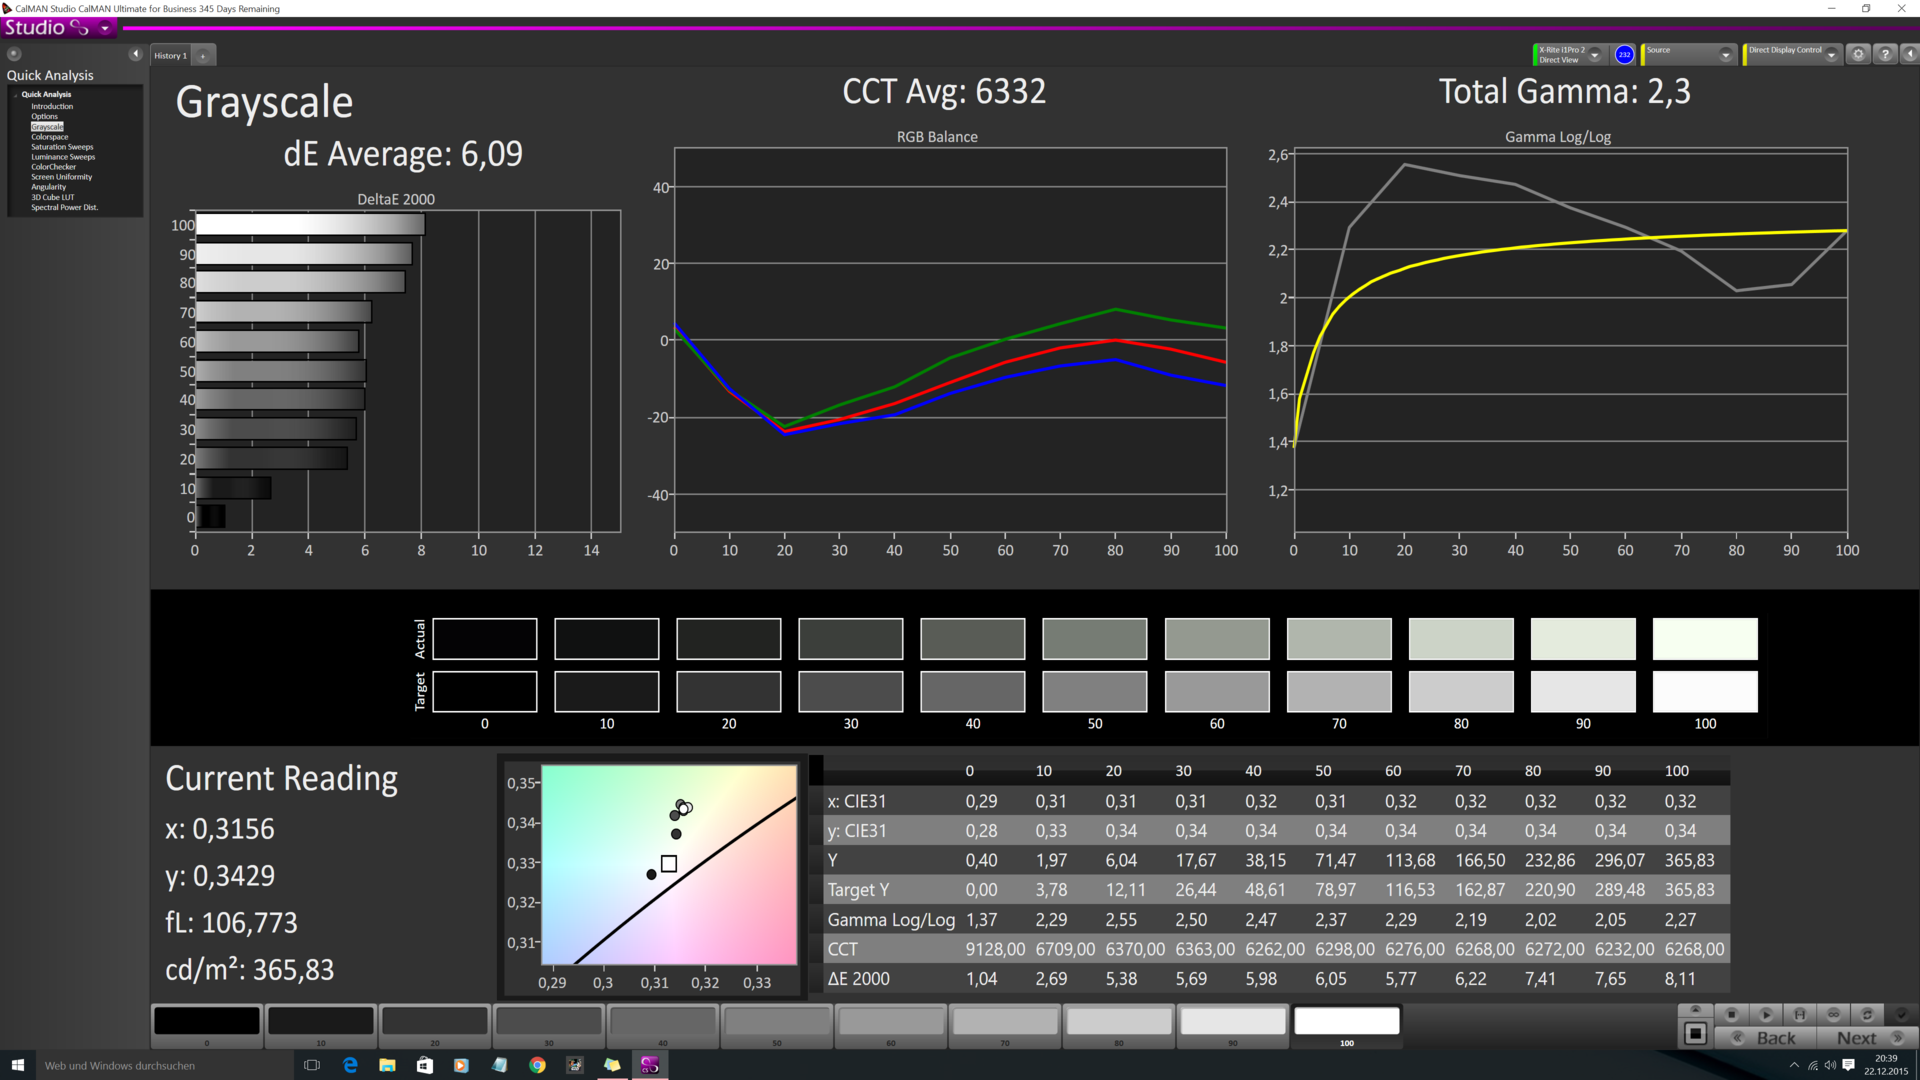
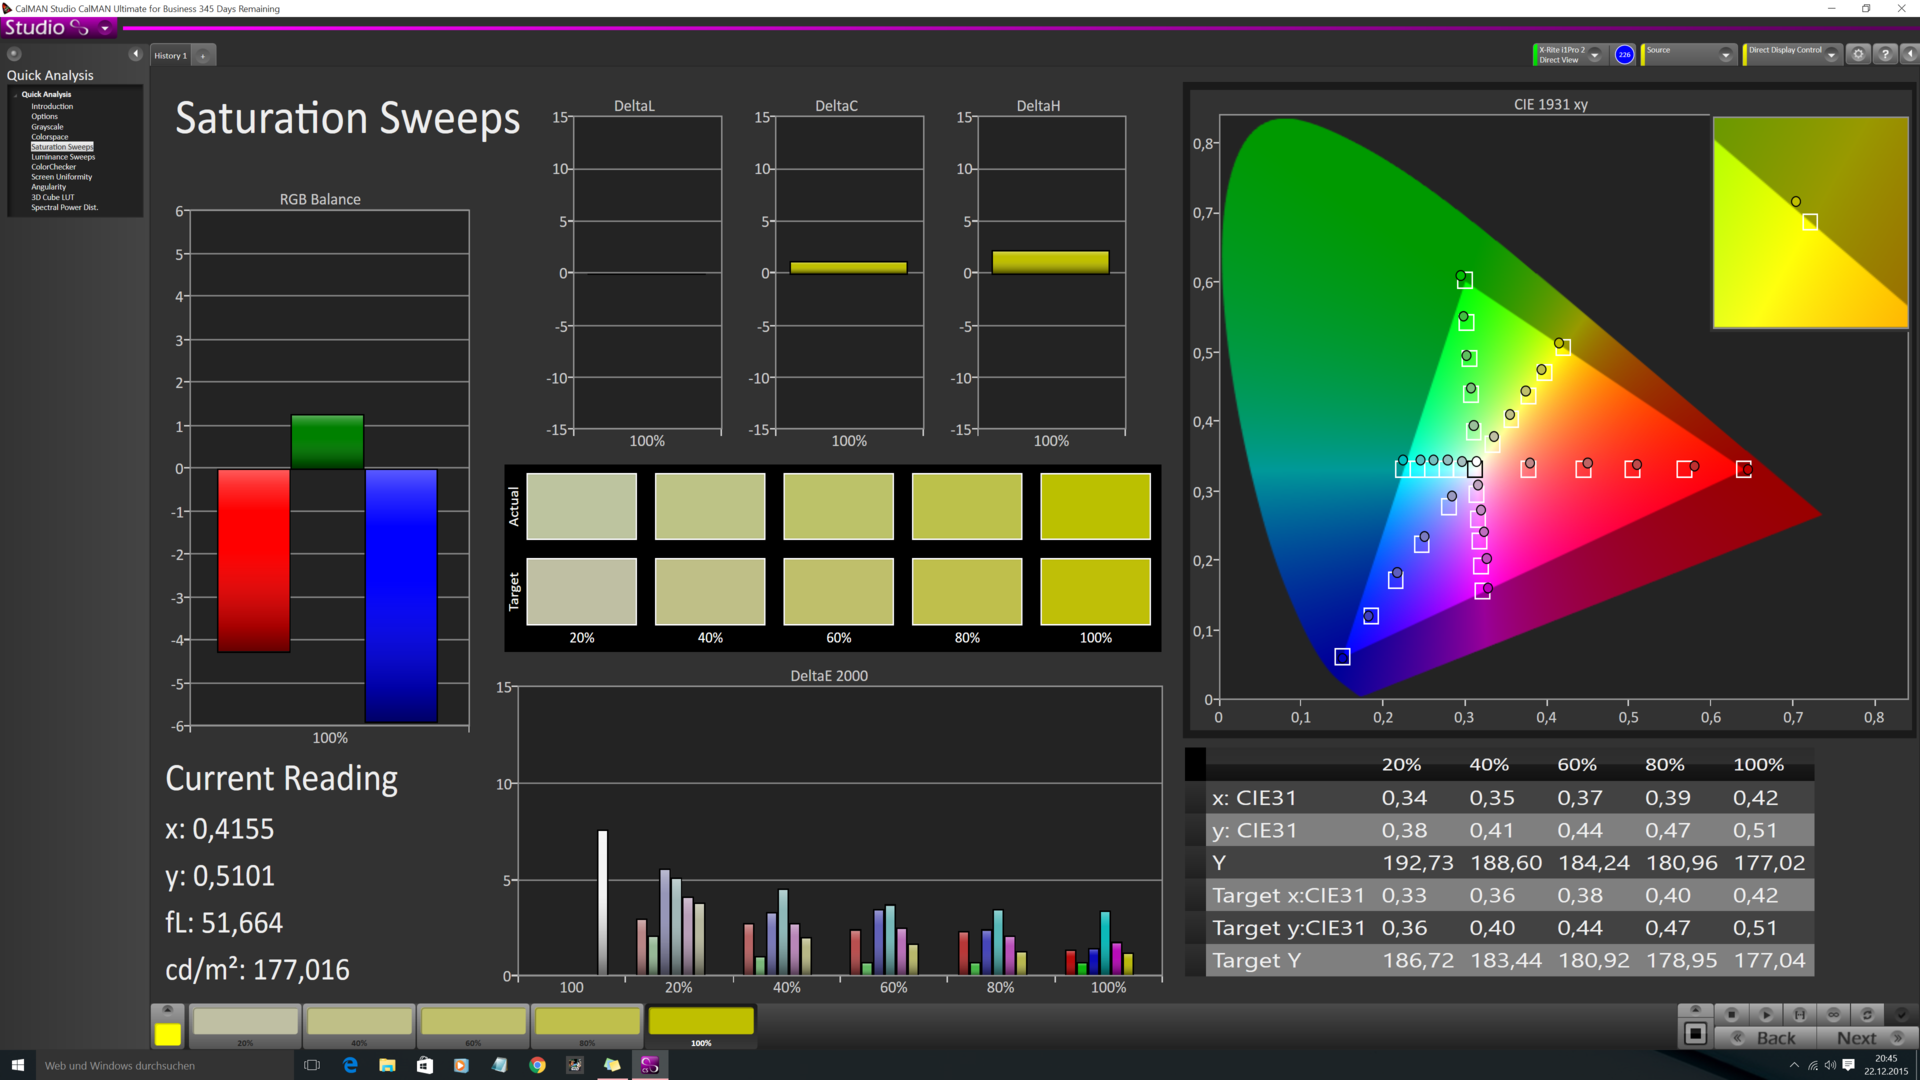
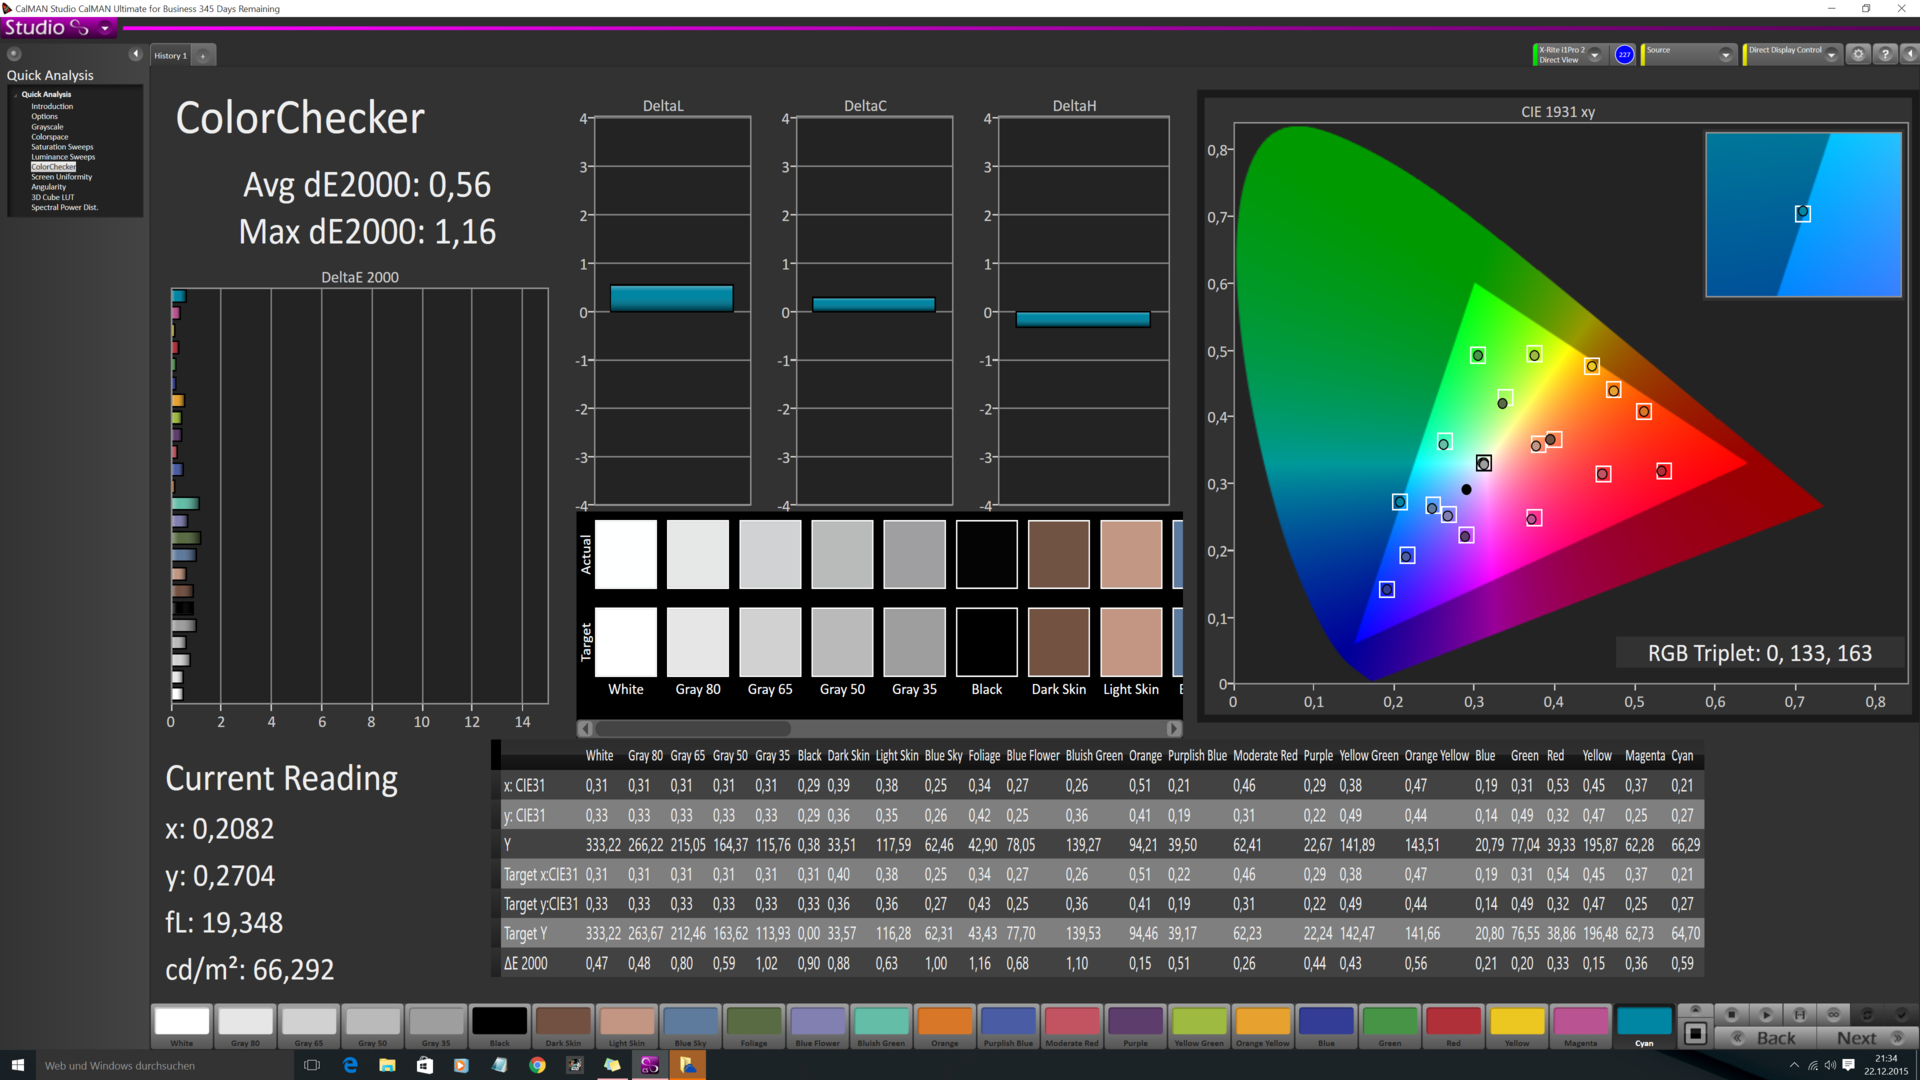
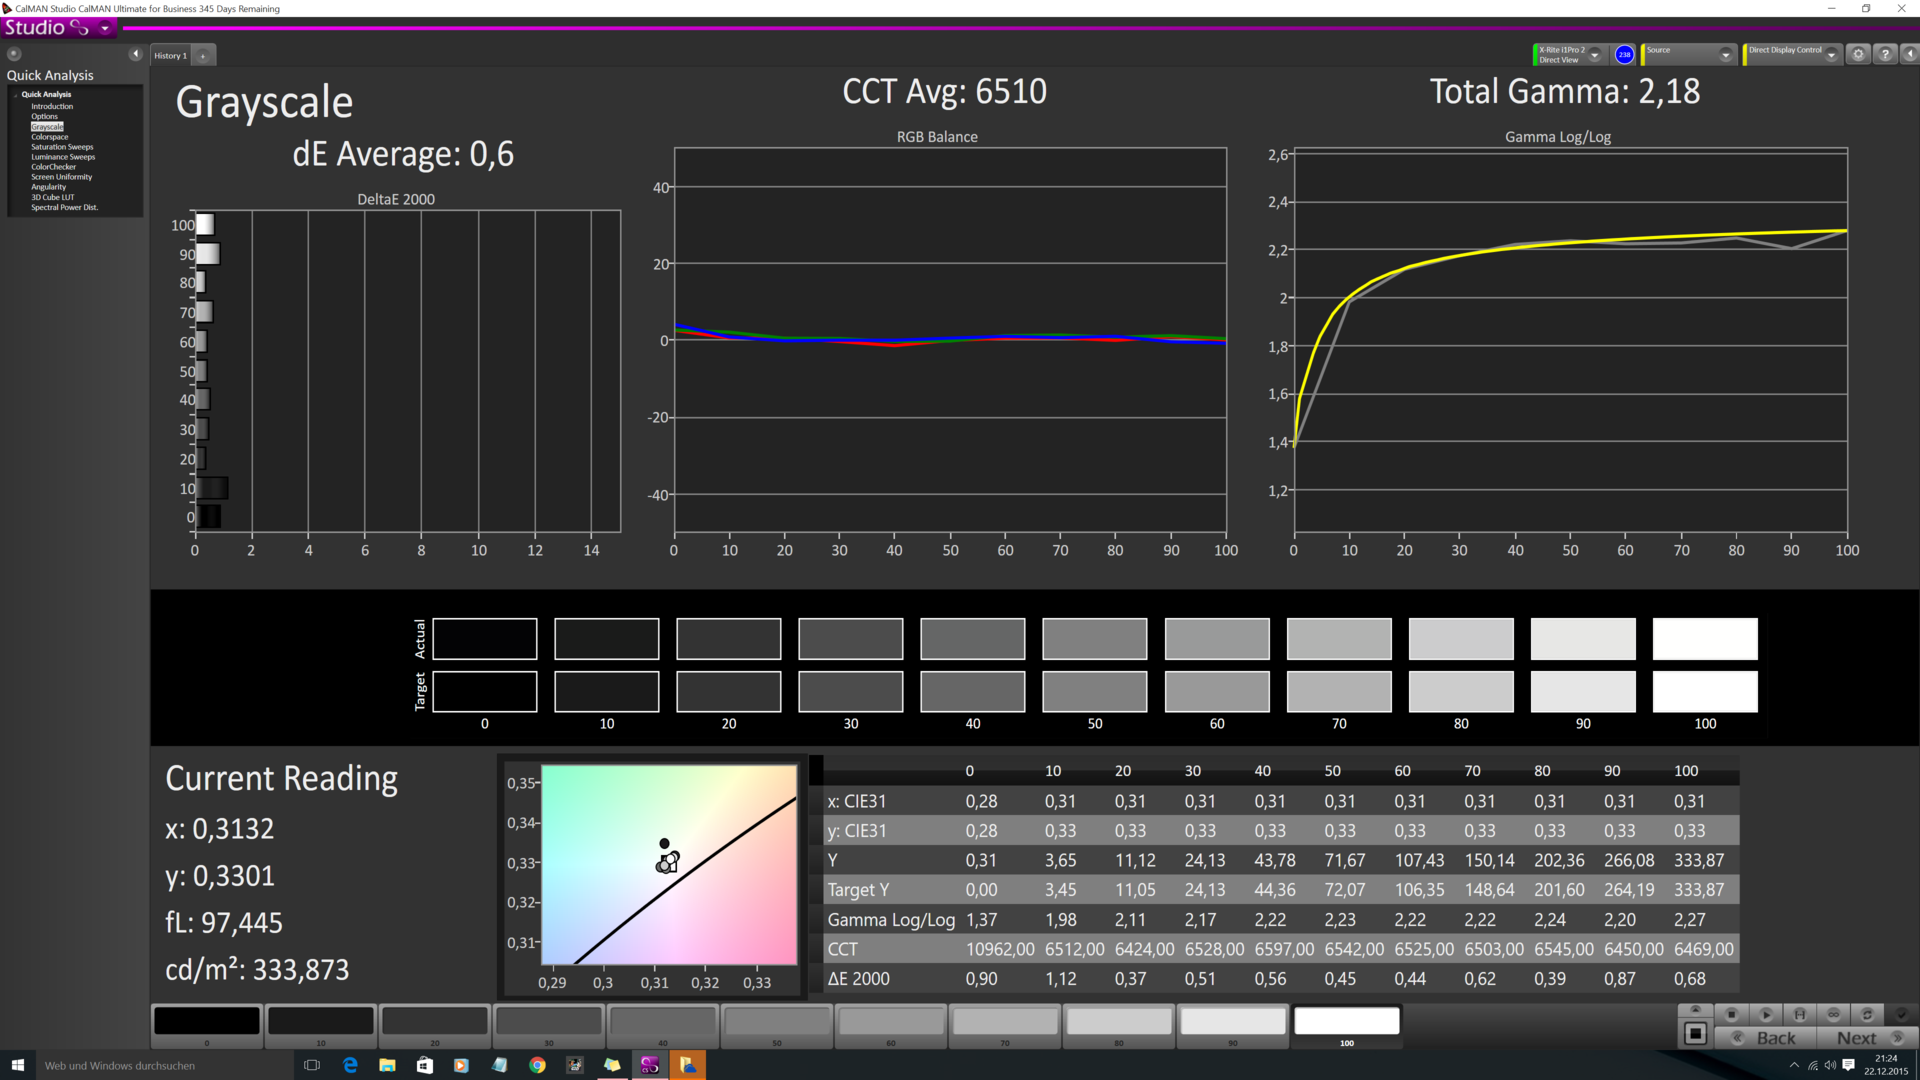
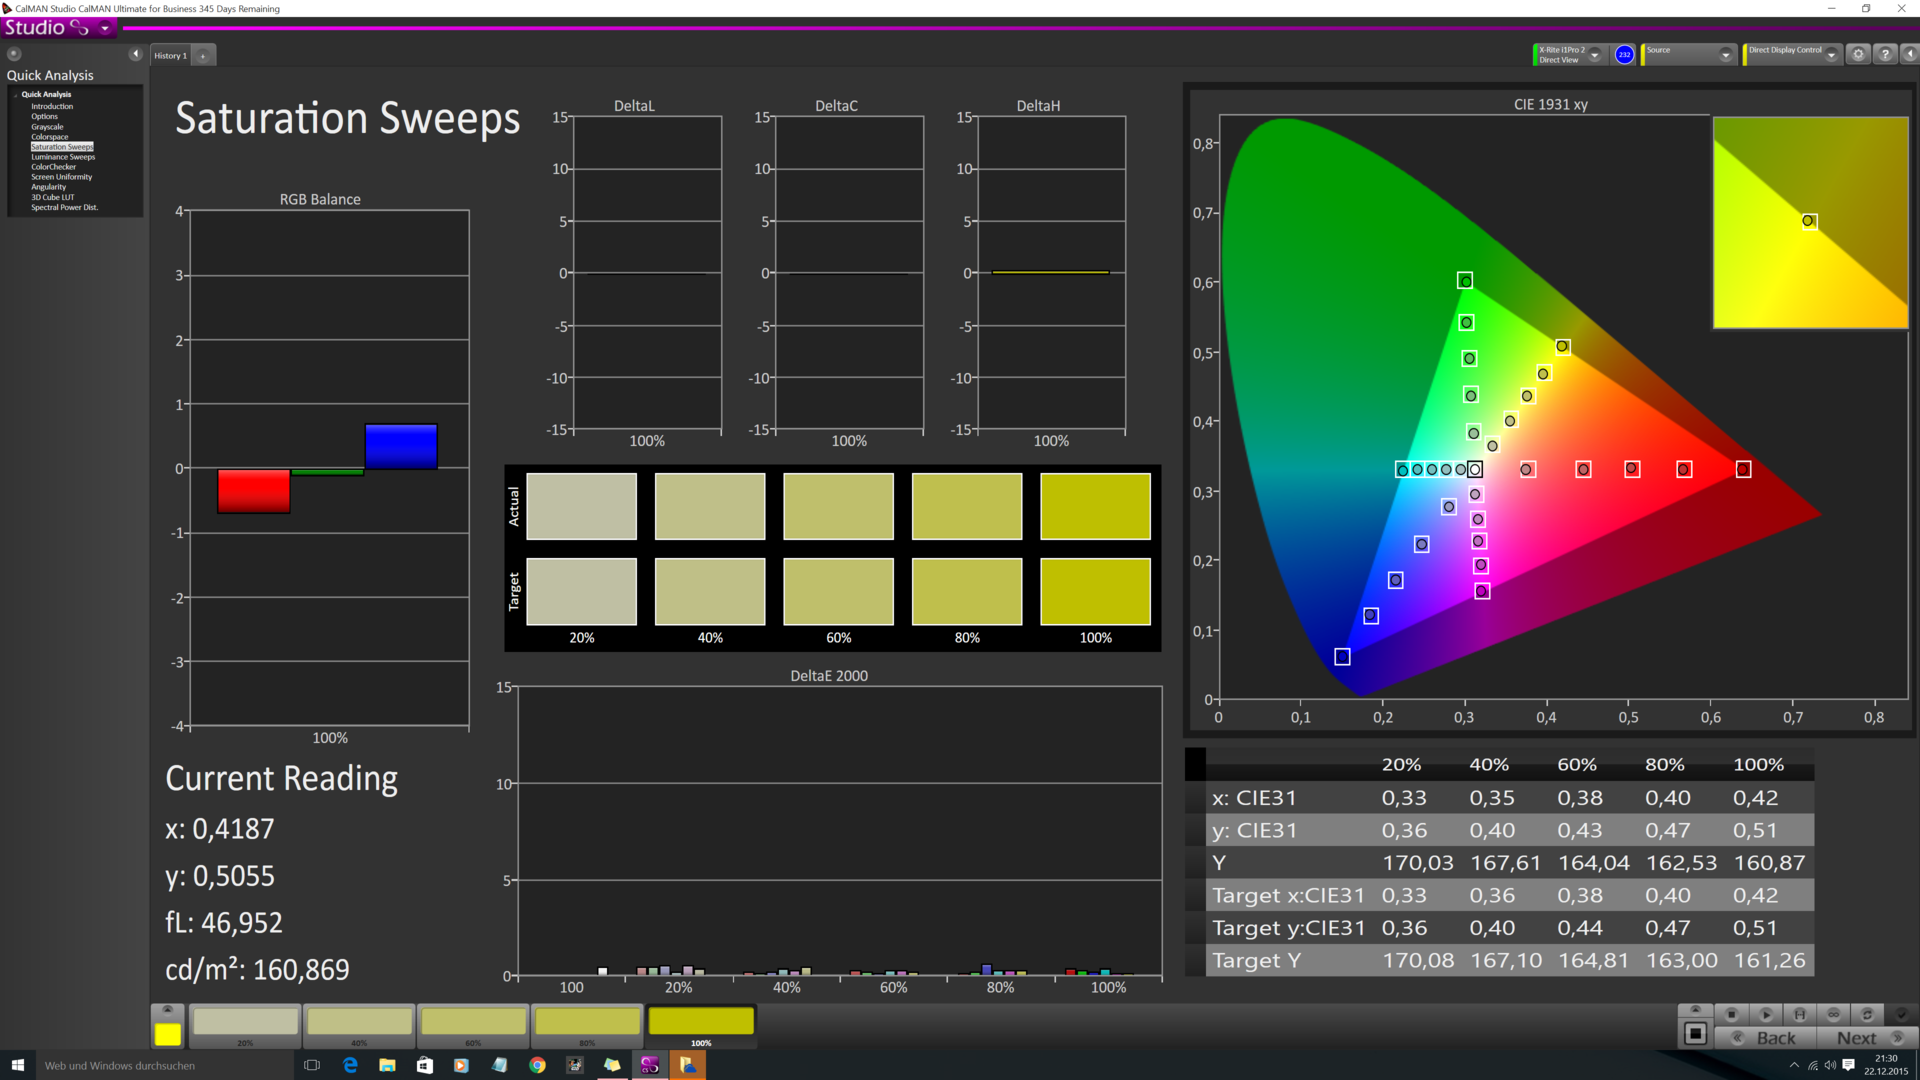
The average DeltaE deviations compared to the sRGB color space are 3.8 for the colors and 6.09 for the grayscale after the integrated calibration with the Pantone color calibrator. The gamma value is 2.3 and the color temperature is slightly too warm at 6332 K. The display can only reach its full potential with a "real" calibration, which improves all values: The average deviations for the colors and the grayscale drop to 0.56 and 0.6 and the color temperature is almost perfect at 6510 K, which is also the case for the gamma value of 2.18.
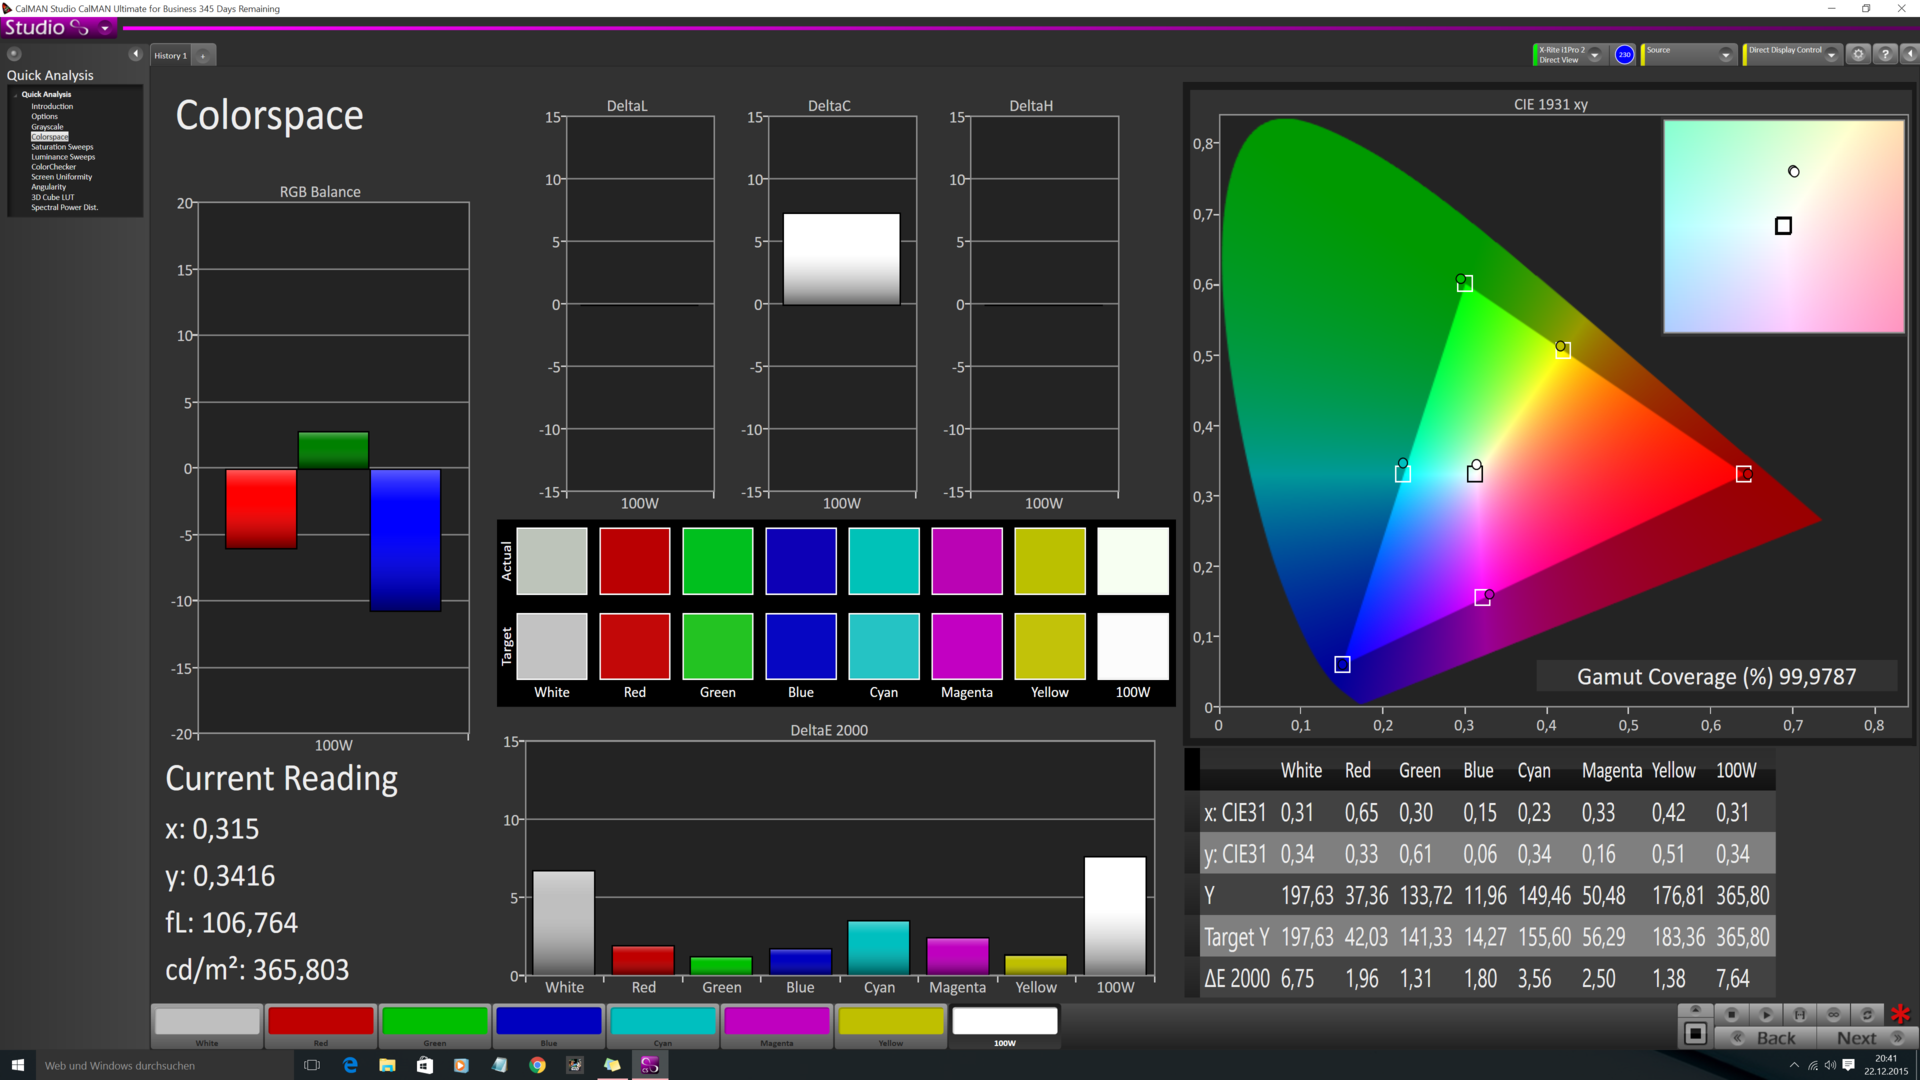
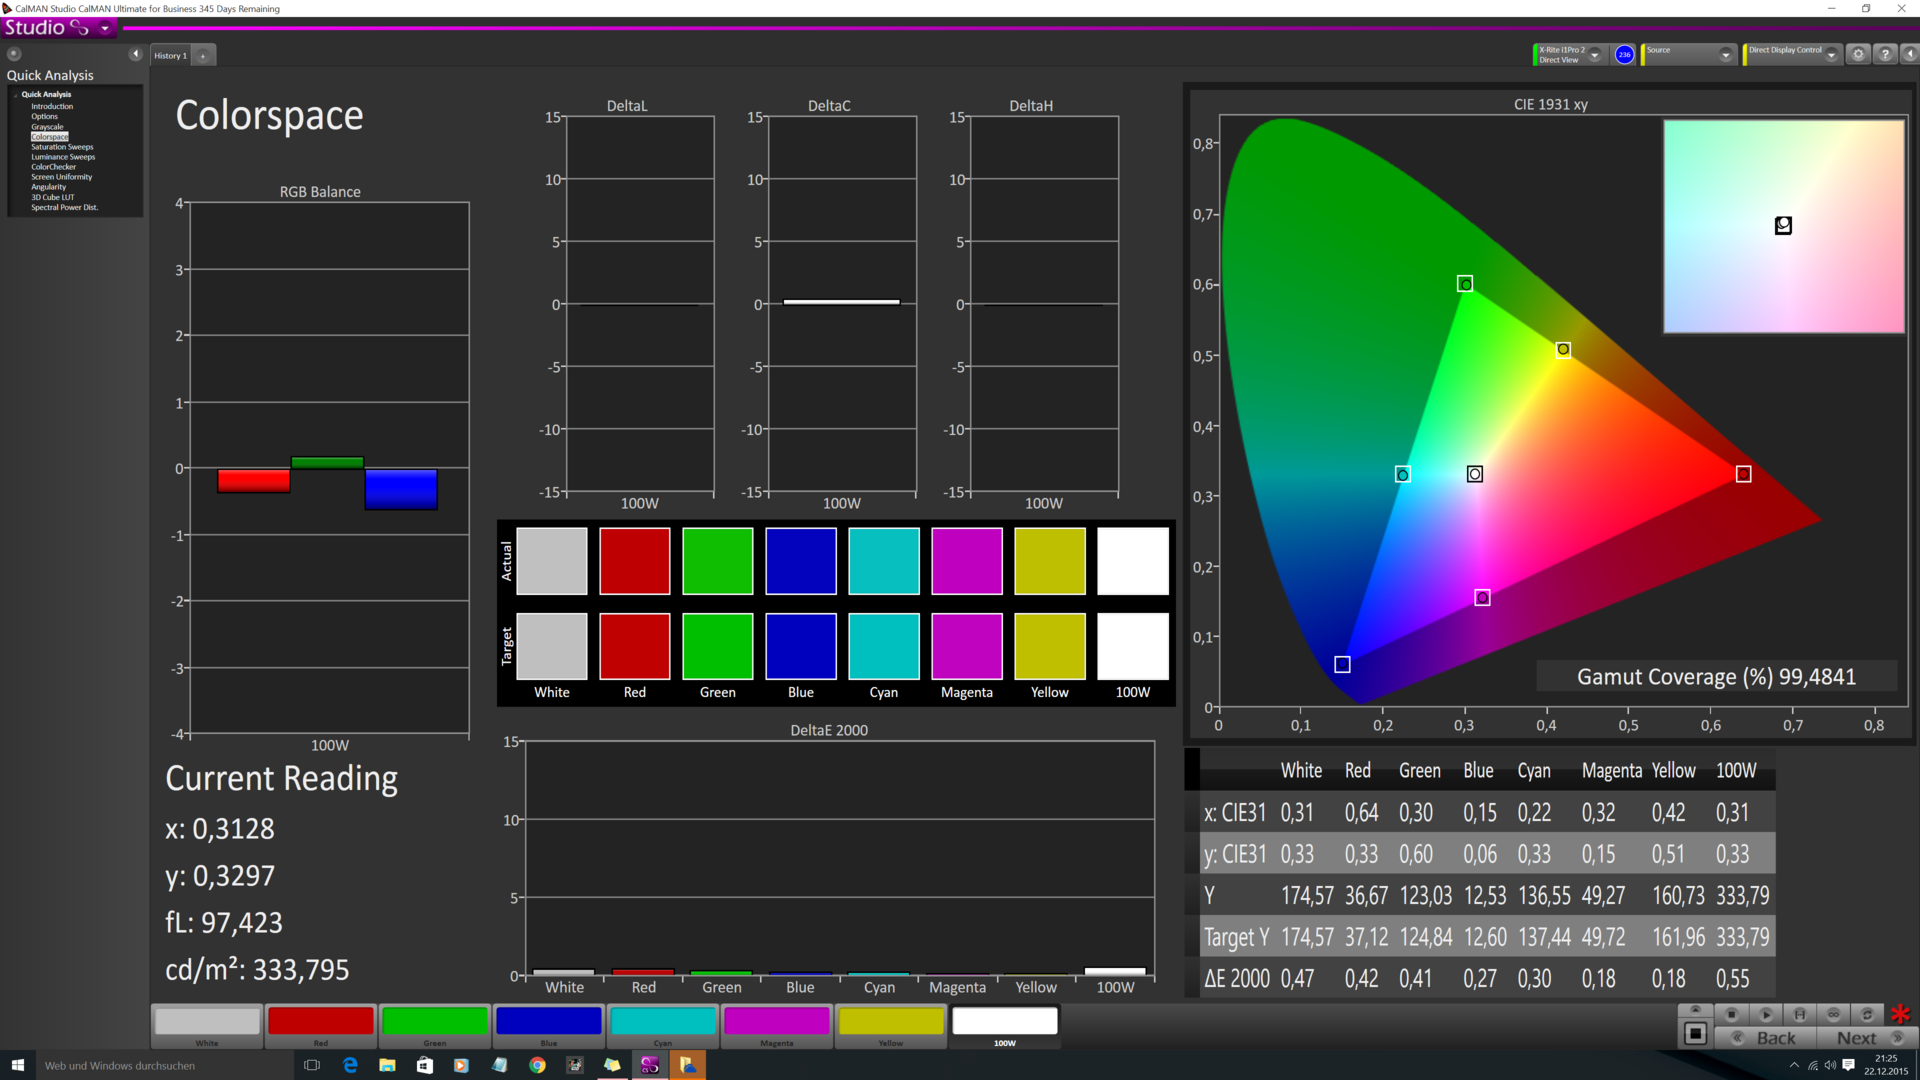
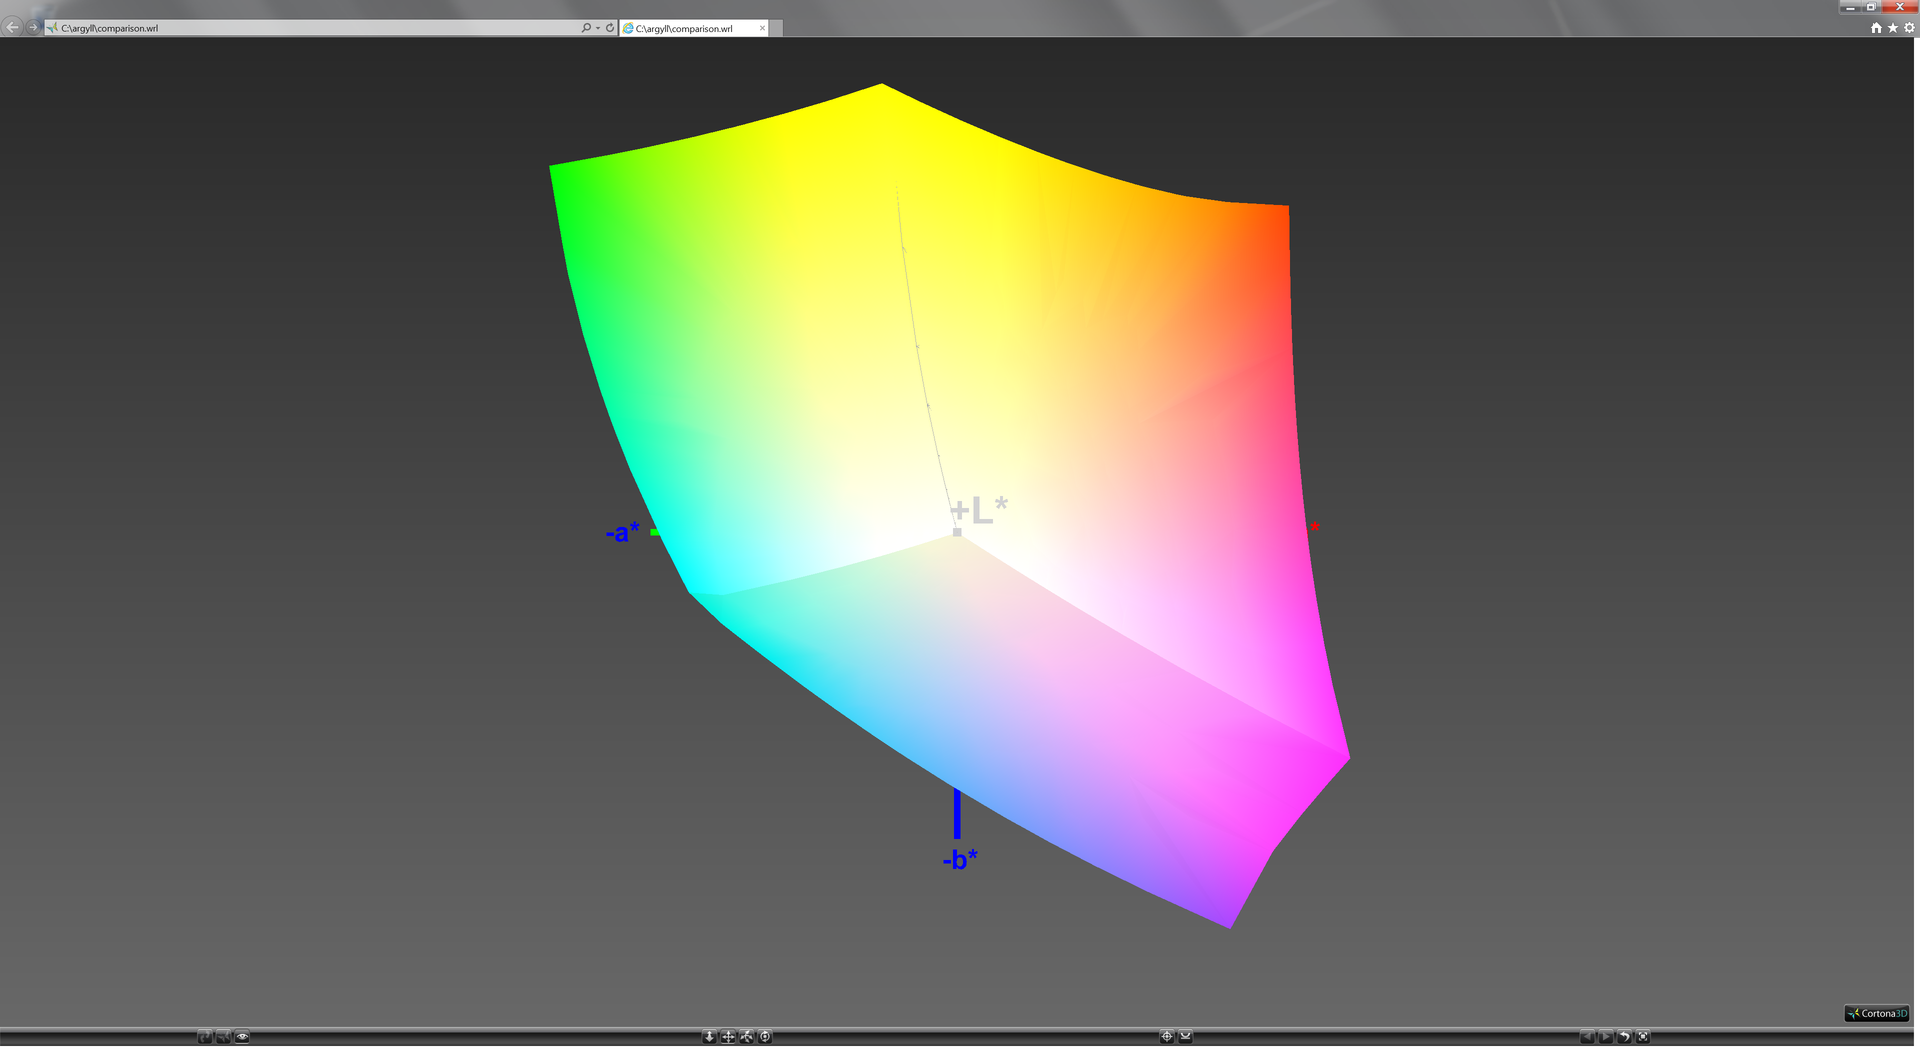
The screen can almost cover the whole sRGB color space (99.7%), but the AdobeRGB coverage is just 76%. This means the display can actually be used for picture editing, but very demanding users will probably want even better results, which are provided by the DreamColor display of HP's workstation, for example.

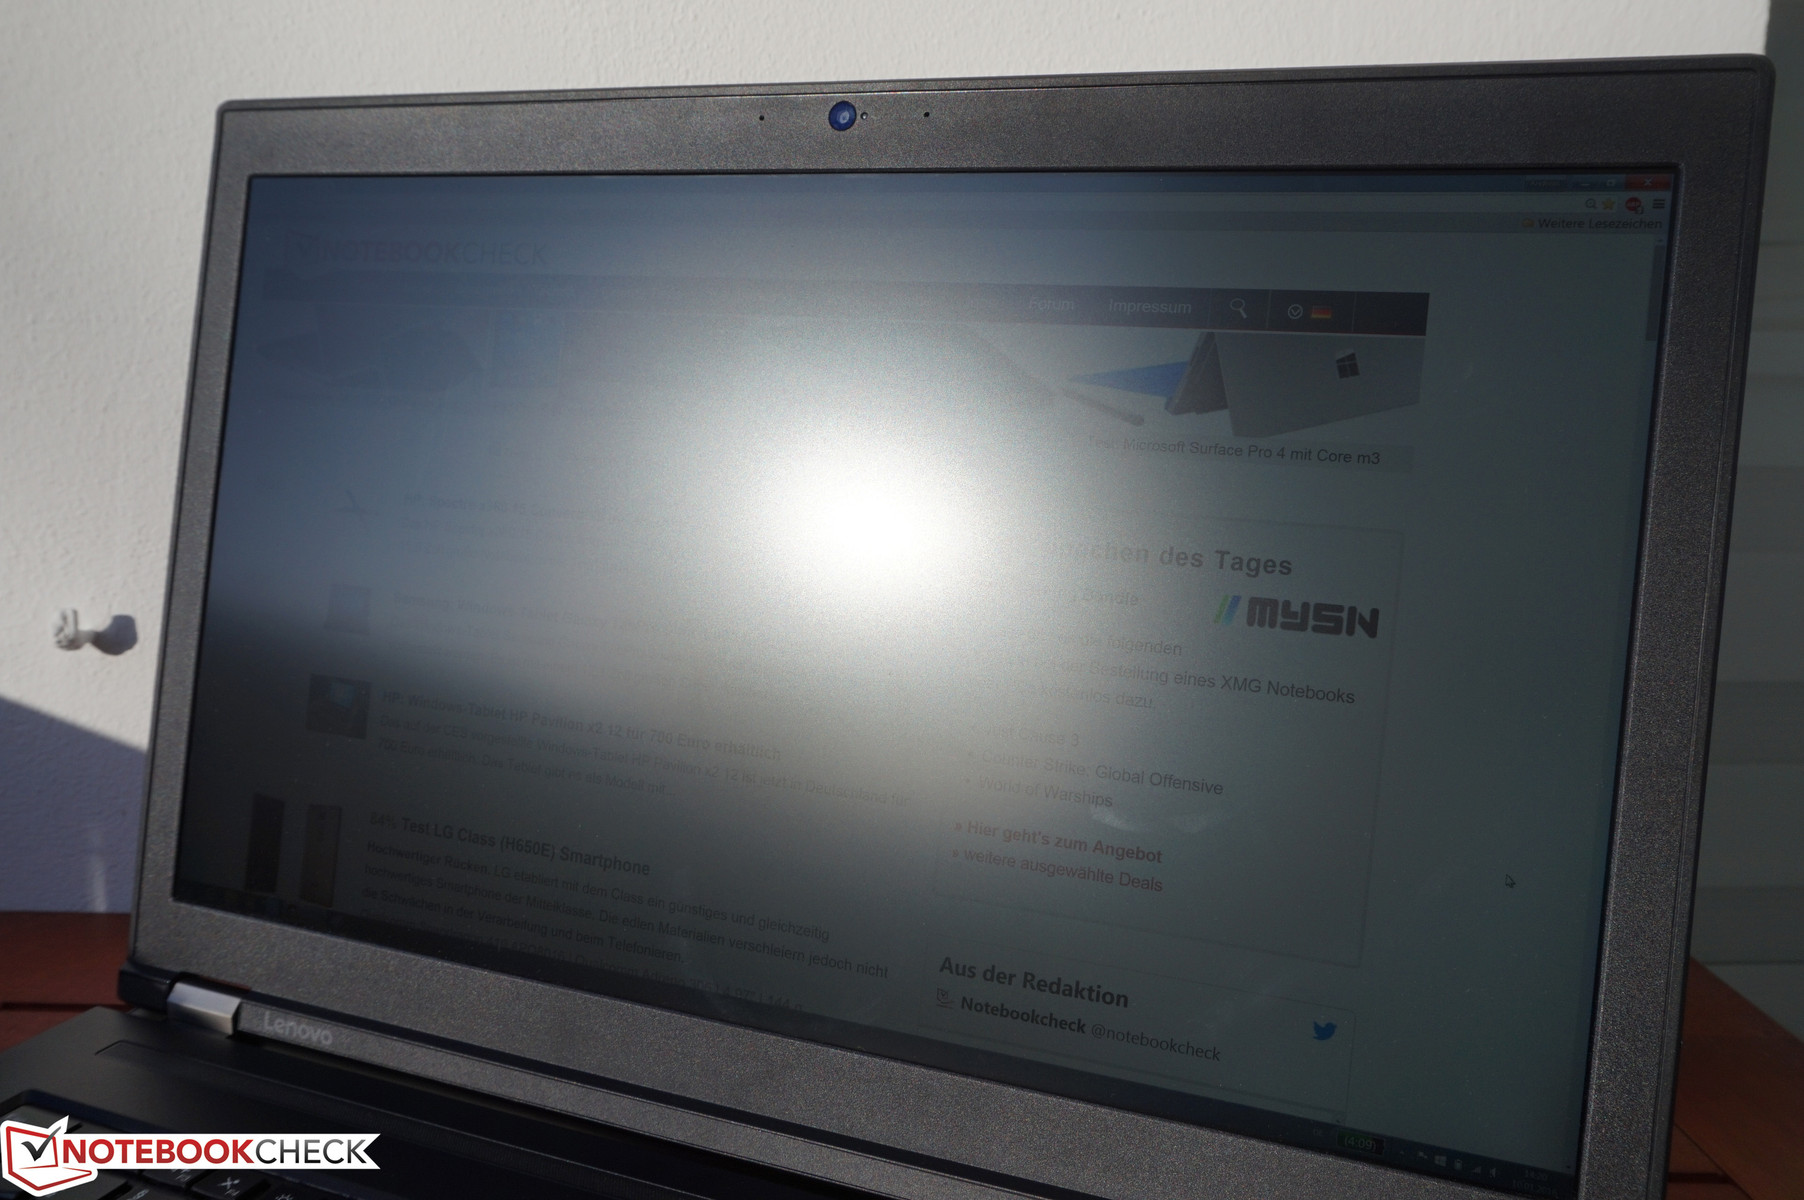
Thanks to the matte display and the very high luminance, which is not reduced on battery power, you can also use the ThinkPad P70 very comfortably in very bright environments. Our two sample pictures were taken on a very sunny winter day and under direct sunlight. You can see in the first picture that you should avoid direct reflections, but a small adjustment did the trick (picture 2). It was therefore no problem to use the notebook, even in this worst-case scenario.
Display Response Times
| ↔ Response Time Black to White | ||
|---|---|---|
| 27.6 ms ... rise ↗ and fall ↘ combined | ↗ 4.8 ms rise | 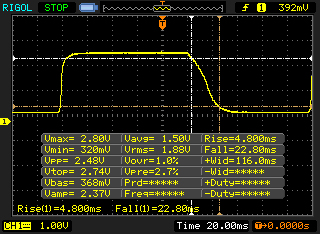 |
| ↘ 22.8 ms fall | ||
| The screen shows relatively slow response rates in our tests and may be too slow for gamers. In comparison, all tested devices range from 0.1 (minimum) to 240 (maximum) ms. » 70 % of all devices are better. This means that the measured response time is worse than the average of all tested devices (19.9 ms). | ||
| ↔ Response Time 50% Grey to 80% Grey | ||
| 44 ms ... rise ↗ and fall ↘ combined | ↗ 17.2 ms rise | 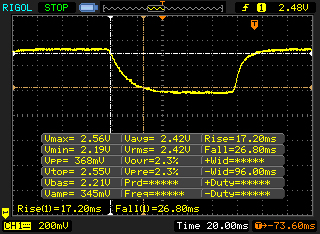 |
| ↘ 26.8 ms fall | ||
| The screen shows slow response rates in our tests and will be unsatisfactory for gamers. In comparison, all tested devices range from 0.165 (minimum) to 636 (maximum) ms. » 73 % of all devices are better. This means that the measured response time is worse than the average of all tested devices (31.1 ms). | ||
Screen Flickering / PWM (Pulse-Width Modulation)
| Screen flickering / PWM detected | 228 Hz | ≤ 95 % brightness setting | 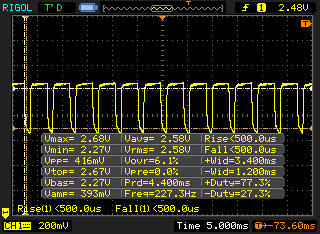 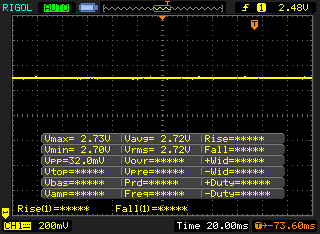 |
The display backlight flickers at 228 Hz (worst case, e.g., utilizing PWM) Flickering detected at a brightness setting of 95 % and below. There should be no flickering or PWM above this brightness setting. The frequency of 228 Hz is relatively low, so sensitive users will likely notice flickering and experience eyestrain at the stated brightness setting and below. In comparison: 52 % of all tested devices do not use PWM to dim the display. If PWM was detected, an average of 7854 (minimum: 5 - maximum: 343500) Hz was measured. | |||
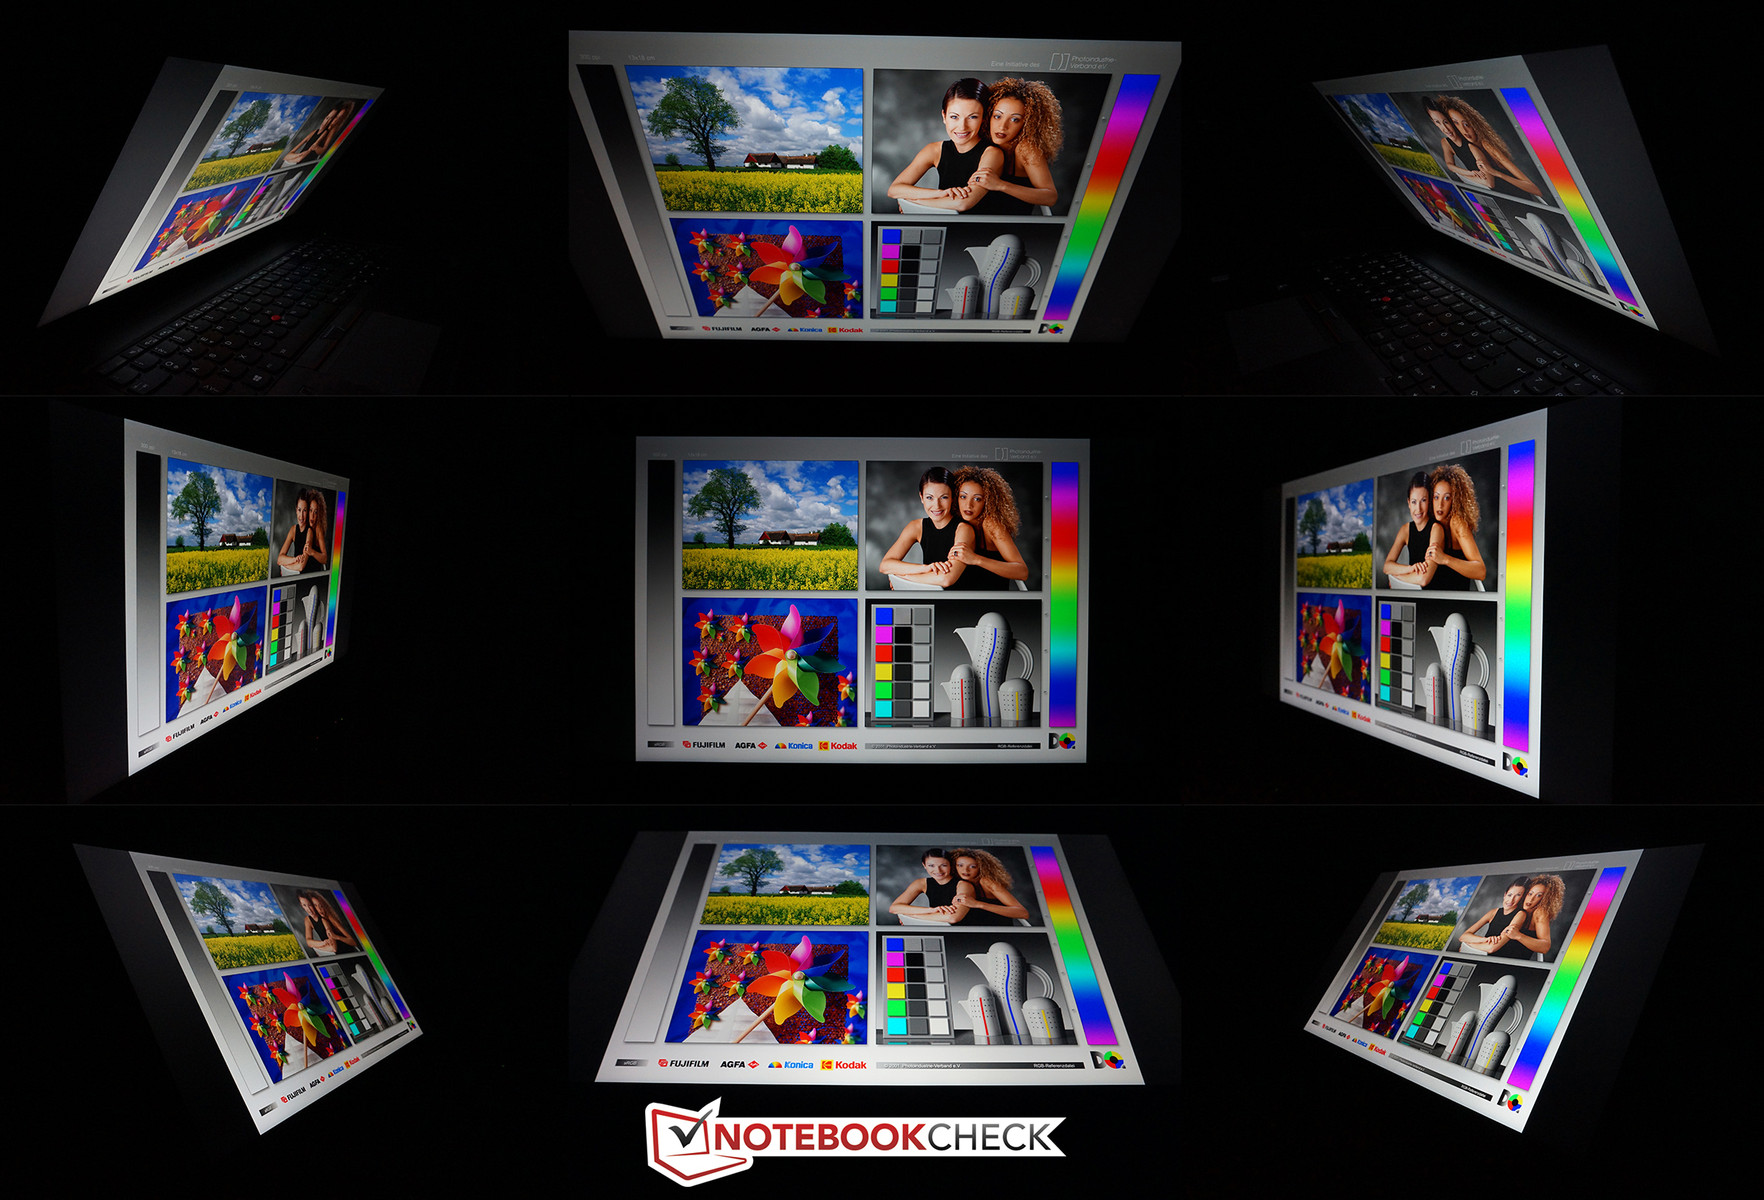
The IPS display also leaves a great impression in respect of the viewing angles. The picture is very stable even from extreme angles and multiple people can look at the display without restrictions.
Performance
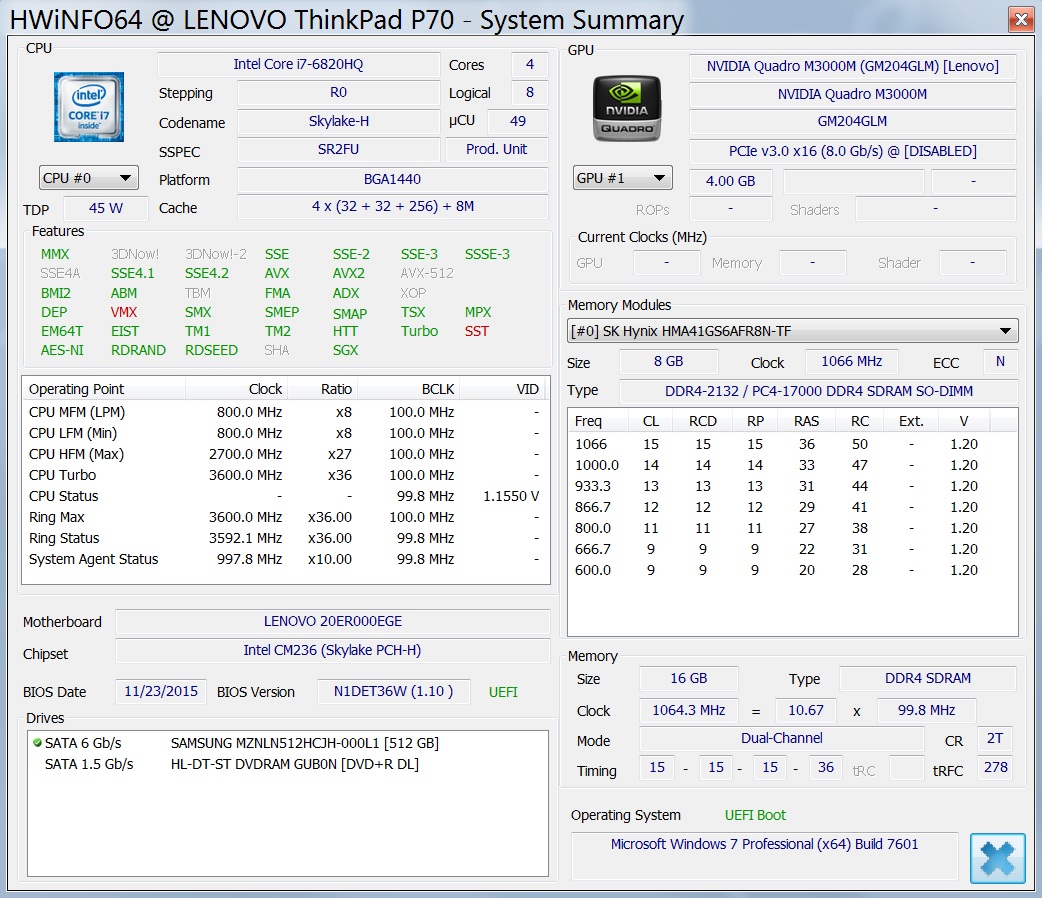
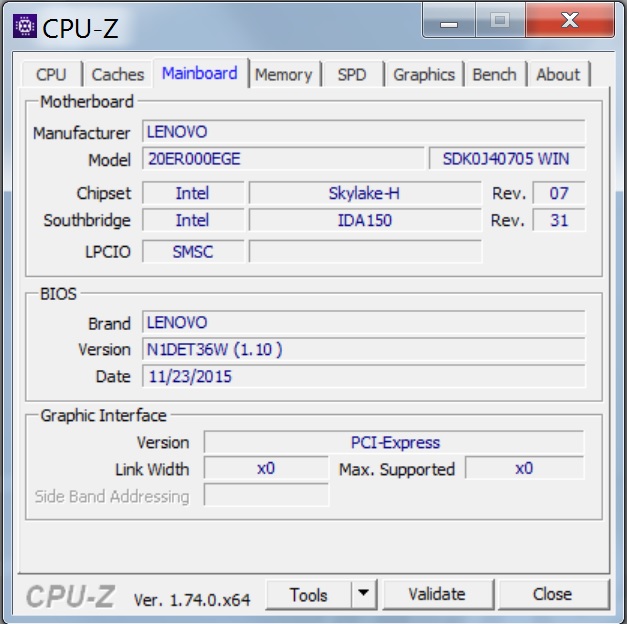
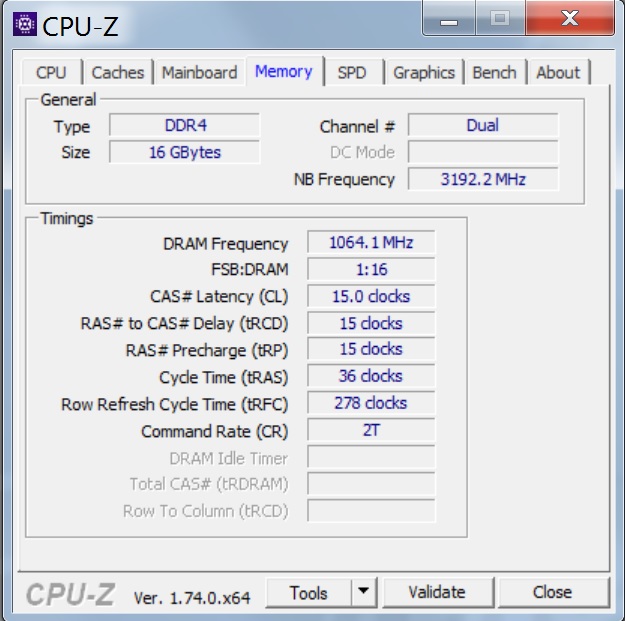
Lenovo offers multiple configurations of the ThinkPad P70 and you can even configure the device quite comprehensively in the online shop of the manufacturer. All models are equipped with a powerful quad-core processor (TDP 45 Watts) from Intel's current Skylake generation. A specialty is the mobile Xeon E3-1505M, which can be combined with ECC-RAM. Every model also gets a dedicated Nvidia Quadro GPU, starting with the small M600M all the way up to the top model M5000M. The memory selection is also very comprehensive; everything is possible from conventional HDDs all the way up to extremely fast NVMe-SSDs. The RAM can be upgraded all the way up to 64 GB thanks to the 4 SODIMM slots (DDR4).
Our review configuration (20ER000EGE) currently retails for 3,400 Euros (~$3671). For that money you get a Core i7-6820HQ, 16 GB DDR4-RAM (2133 MHz, no ECC), a 512 GB M.2-SSD and a dedicated Quadro M3000M with 4 GB GDDR5-VRAM. It is a very balanced configuration that should be sufficient for many usage scenarios.
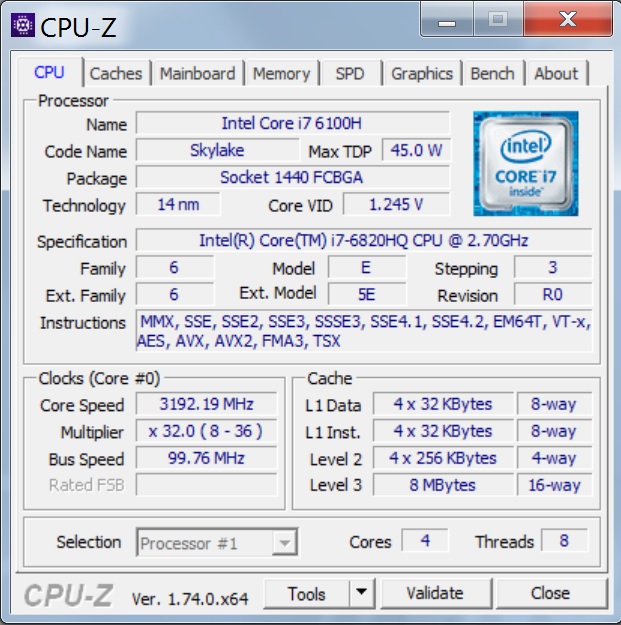
Processor
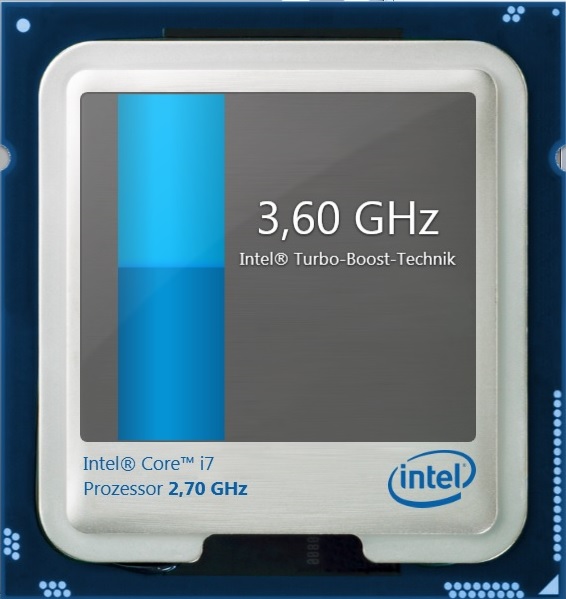
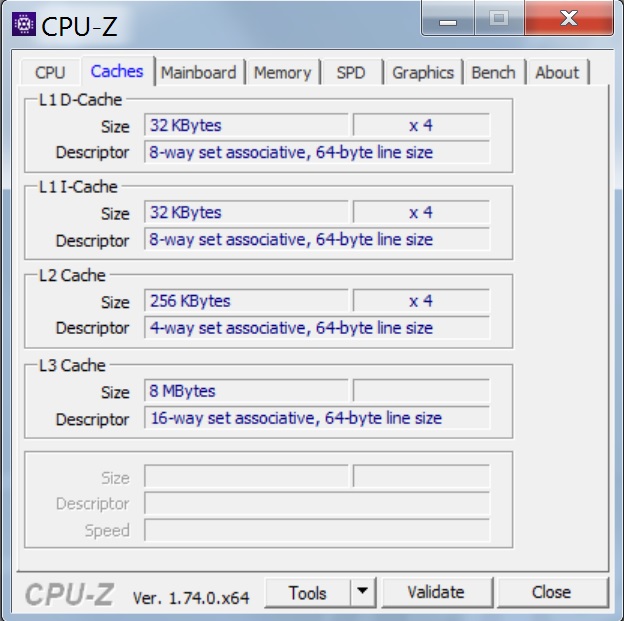
We already mentioned that the Core i7-6820HQ (TDP 45 Watts, Hyper-Threading) is a quad-core chip from Intel's current Skylake generation, with a maximum Turbo clock of 3.6 GHz (four cores 3.2 GHz). The performance is, as expected, very good and the processor can utilize its full performance potential. Even stress for all four cores results in a steady 3.2 GHz, which is also the case on battery power. More technical information and benchmarks of the Core i7-6820HQ are available in our Tech-section.
The comparison with the other two processors that are available for the P70 is interesting. The slower Core i7-6700HQ has a 2 MB smaller L3 cache and a slightly lower clock (-100 MHz). It only falls behind our chip by 5-8% in Cinebench R15. We only reviewed the Intel Xeon E3-1505M v5 in the 15-inch Dell Precision 510 so far. The chip also has an 8 MB L3 cache but is 100 MHz faster. It could not utilize its full potential (particularly in single-core scenarios) inside the Dell, which is why it even falls behind our review unit in some tests. The advantage in the Multi test (CB 15) is not very big at 5%, either.
So, if you want to save some money and do not need the last bit of performance, you can get the Core i7-6700HQ and not worry about the performance. The mobile Xeon is particularly interesting if you also want to use ECC-RAM (improved error correction). You have to get a desktop processor if you want even more performance, which are available in several barebones (like the Bullman E-Klasse 5).
| Cinebench R15 | |
| CPU Multi 64Bit (sort by value) | |
| Lenovo ThinkPad P70 | |
| Dell Precision 7710 | |
| HP ZBook 17 G2 J8Z55ET | |
| MSI WT72-2OL32SR311BW | |
| Bullman E-Klasse 5 | |
| Dell Precision 5510 | |
| MSI GE62-6QD16H11 | |
| CPU Single 64Bit (sort by value) | |
| Lenovo ThinkPad P70 | |
| Dell Precision 7710 | |
| HP ZBook 17 G2 J8Z55ET | |
| MSI WT72-2OL32SR311BW | |
| Bullman E-Klasse 5 | |
| Dell Precision 5510 | |
| MSI GE62-6QD16H11 | |
| Cinebench R11.5 | |
| CPU Multi 64Bit (sort by value) | |
| Lenovo ThinkPad P70 | |
| Dell Precision 7710 | |
| HP ZBook 17 G2 J8Z55ET | |
| MSI WT72-2OL32SR311BW | |
| Bullman E-Klasse 5 | |
| Dell Precision 5510 | |
| MSI GE62-6QD16H11 | |
| CPU Single 64Bit (sort by value) | |
| Lenovo ThinkPad P70 | |
| Dell Precision 7710 | |
| HP ZBook 17 G2 J8Z55ET | |
| MSI WT72-2OL32SR311BW | |
| Bullman E-Klasse 5 | |
| Dell Precision 5510 | |
| MSI GE62-6QD16H11 | |
| Cinebench R10 | |
| Rendering Multiple CPUs 64Bit (sort by value) | |
| Lenovo ThinkPad P70 | |
| Dell Precision 7710 | |
| HP ZBook 17 G2 J8Z55ET | |
| Bullman E-Klasse 5 | |
| Dell Precision 5510 | |
| MSI GE62-6QD16H11 | |
| Rendering Single CPUs 64Bit (sort by value) | |
| Lenovo ThinkPad P70 | |
| Dell Precision 7710 | |
| HP ZBook 17 G2 J8Z55ET | |
| Bullman E-Klasse 5 | |
| Dell Precision 5510 | |
| MSI GE62-6QD16H11 | |
System Performance
We evaluate the system performance with the PCMark benchmarks. Version 7 of the test benefits from fast SSD storage in particular, so our review unit is not among the fastest devices in the comparison group. The results in the Home and Work test of PCMark 8 are surprisingly low. Scores of just 3345 and 4411 points mean that the P70 is only in last place. We also repeated the tests to rule out problems during the benchmarks and also installed the latest drivers, but the results only changed marginally.
We cannot explain the low results, because the subjective performance did not cause any criticism. Windows started within a couple of seconds and applications were also launched without delays, which can be expected from an SSD-based system.
| PCMark 7 Score | 5003 points | |
| PCMark 8 Home Score Accelerated v2 | 3345 points | |
| PCMark 8 Work Score Accelerated v2 | 4411 points | |
Help | ||
| PCMark 7 - Score (sort by value) | |
| Lenovo ThinkPad P70 | |
| Dell Precision 7710 | |
| HP ZBook 17 G2 J8Z55ET | |
| Bullman E-Klasse 5 | |
| Dell Precision 5510 | |
| MSI GE62-6QD16H11 | |
| PCMark 8 | |
| Home Score Accelerated v2 (sort by value) | |
| Lenovo ThinkPad P70 | |
| Dell Precision 7710 | |
| HP ZBook 17 G2 J8Z55ET | |
| MSI WT72-2OL32SR311BW | |
| Bullman E-Klasse 5 | |
| Dell Precision 5510 | |
| MSI GE62-6QD16H11 | |
| Work Score Accelerated v2 (sort by value) | |
| Lenovo ThinkPad P70 | |
| Dell Precision 7710 | |
| HP ZBook 17 G2 J8Z55ET | |
| MSI WT72-2OL32SR311BW | |
| Bullman E-Klasse 5 | |
| Dell Precision 5510 | |
| MSI GE62-6QD16H11 | |
Storage Devices
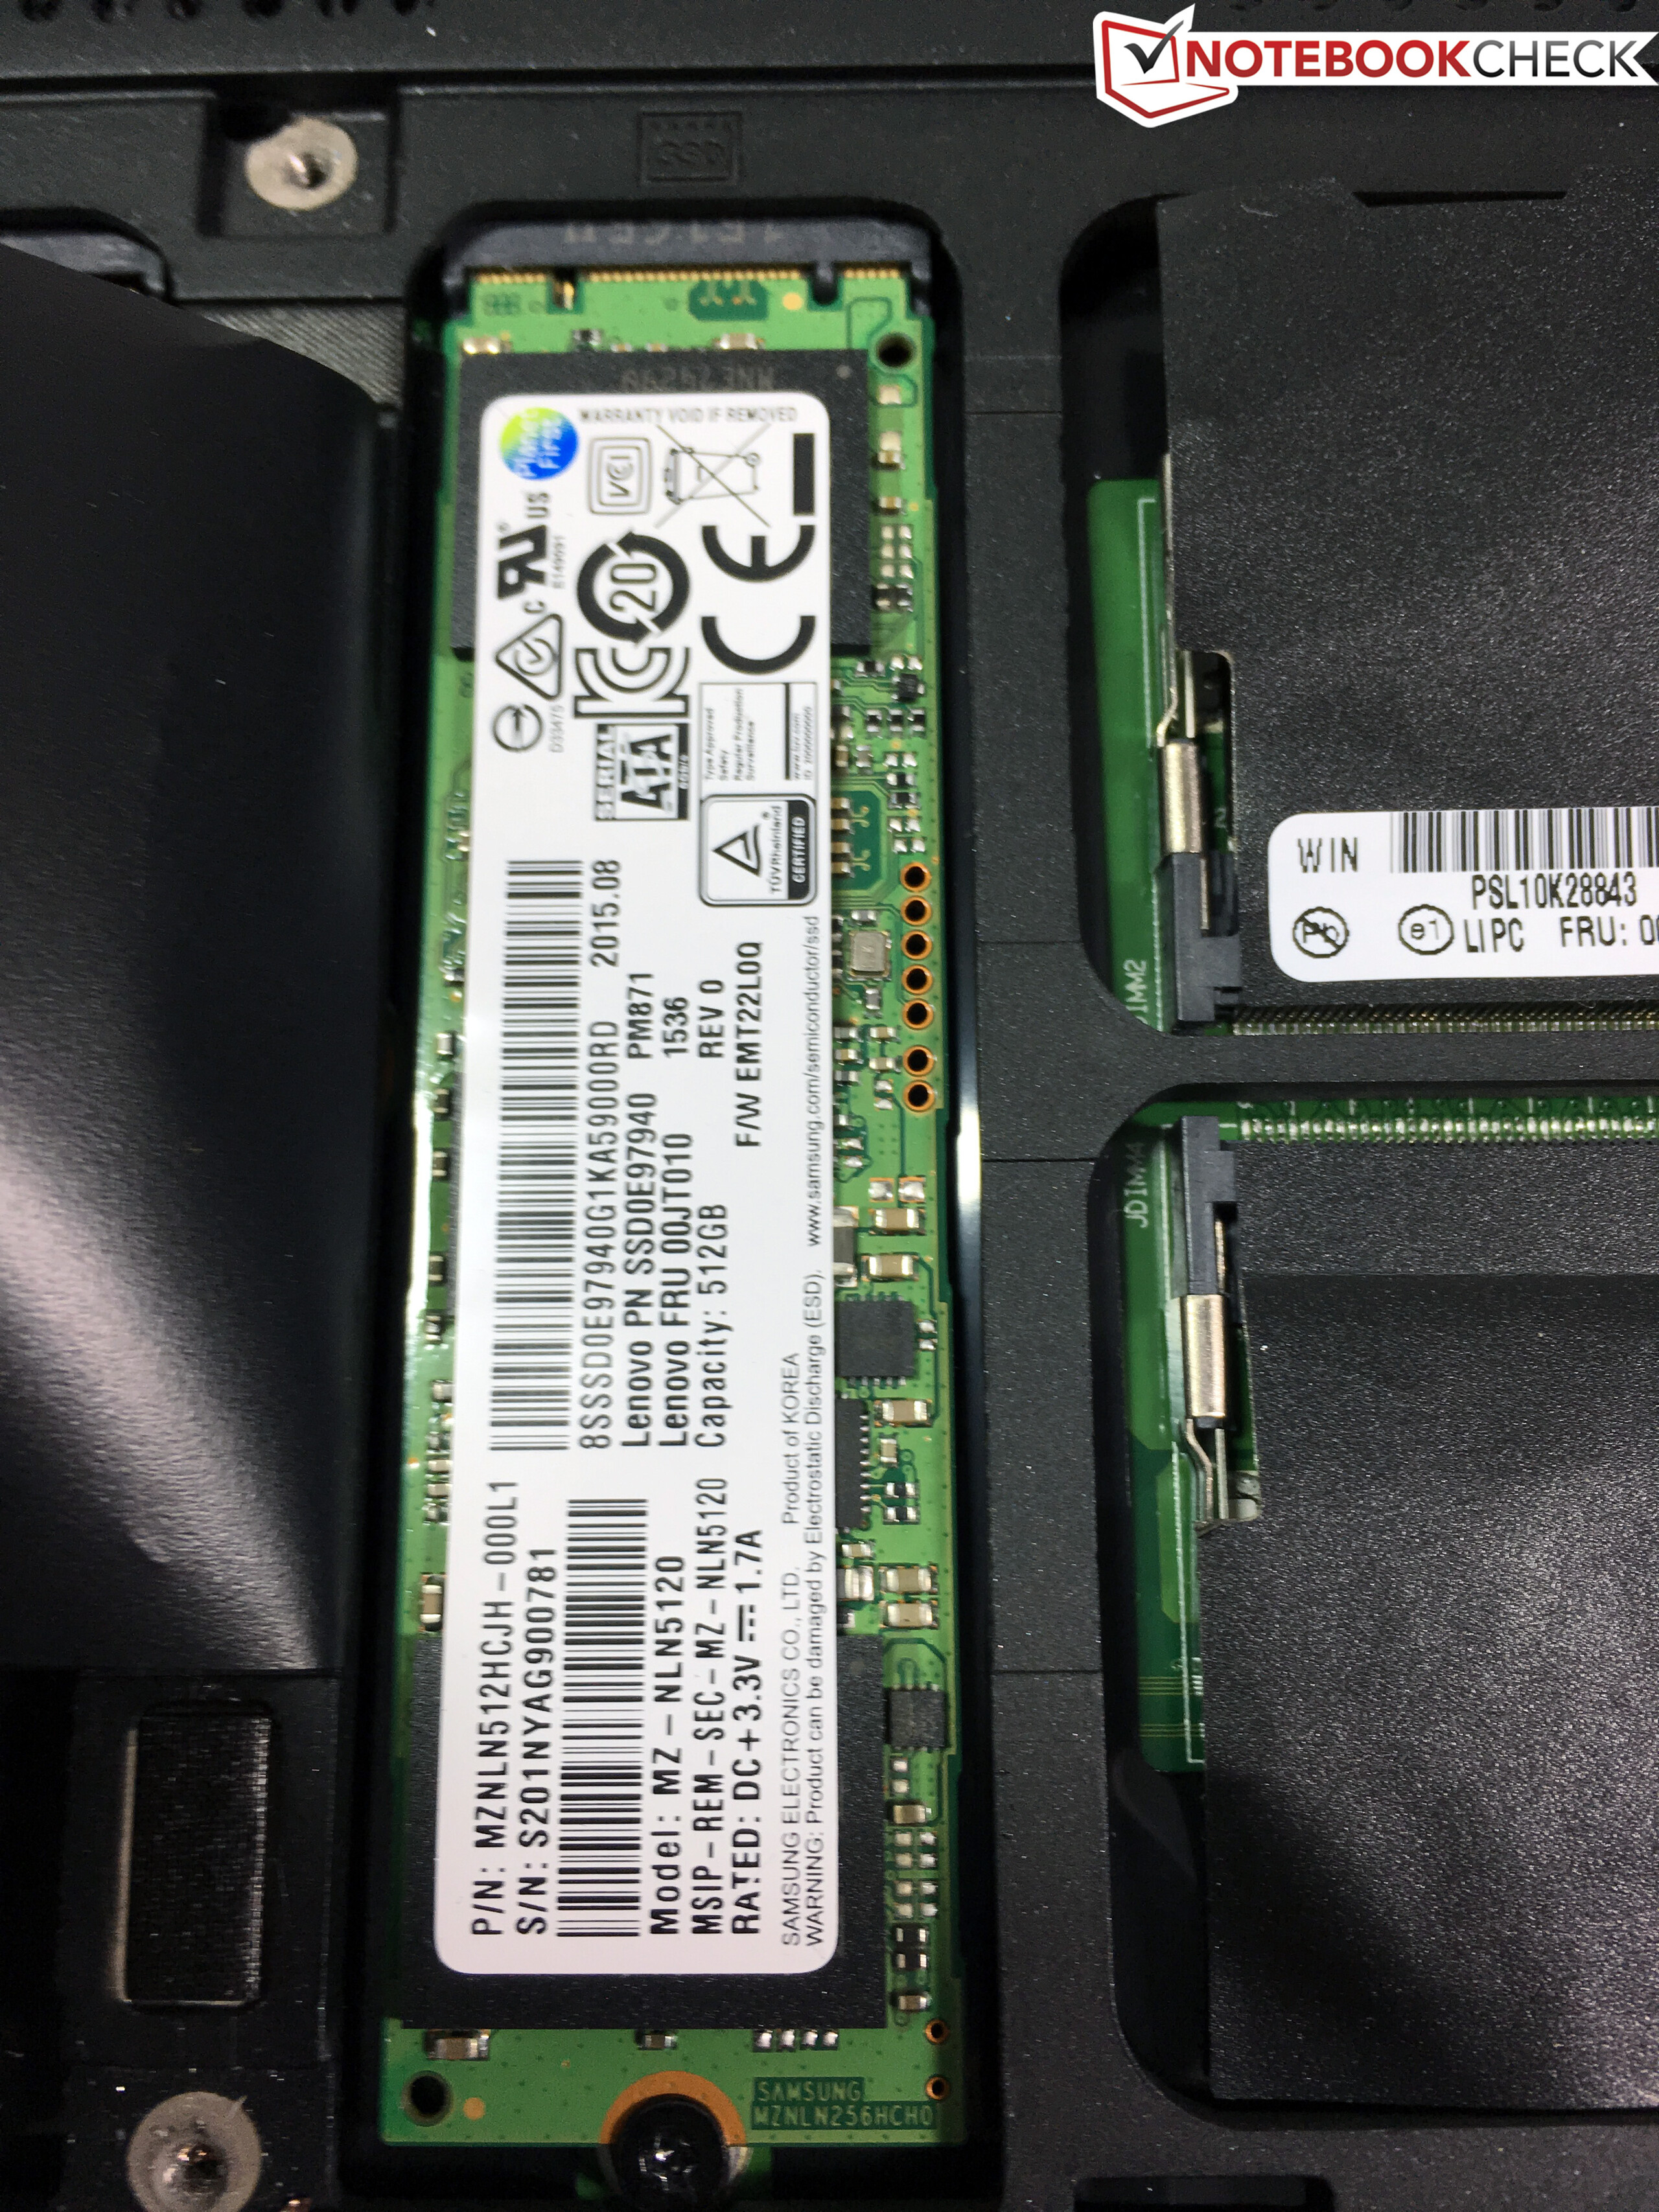
All pre-configured models of the P70 are equipped with SSDs by default; only the entry-level model in Lenovo's online shop uses a 500 GB hard drive (7200 rpm). However, there are big differences in respect of the SSDs. All models have two M.2 slots that can either be used with mSATA-SSDs or NVMe-SSDs, and some drives also support the OPAL 2.0 standard (self-encryption). We cannot really understand that not all models use the fastest storage solution, so you should check the configuration before you buy it. Our – admittedly not cheap – model uses a Samsung PM871. This M.2-SSD uses the SATA interface, which allows maximum transfer rates between 500-550 MB/s and is therefore clearly behind NVMe drives. Another specialty of Lenovo is the RAID support, because there are many models (incl. our review unit) that do not support RAID arrays. RAID-capable devices are marked in the online shop, but you should ask your retailer if you want to get one of the pre-configured models.
The capacity of our Samsung PM871 SSD is 512 GB, and you can use around 400 GB for your own files and applications, the rest is occupied by the Windows installation and the recovery partition. The performance of the drive is as expected at the upper end of the SATA standard. CrystalDiskMark determines 508 MB/s for sequential reads and almost 460 MB/s for sequential writes. More benchmarks and comparisons are available in our comprehensive SSD/HDD comparison.

GPU Performance
The Nvidia Quadro M3000M is based on the current Maxwell GM 204 chip and is very similar to the consumer GeForce GTX 965M with its 1024 shaders. The video memory, however, is much bigger at 4 GB GDDR-VRAM, which is also the case for the 256-bit interface. Compared to its predecessor, the Quadro K3100M, both the performance as well as the efficiency should be much higher. Thanks to the Optimus support, the graphics are handled by the integrated Intel HD Graphics 530 when you use simple applications or in the power-saving mode.
The professional chip differs from the consumer GeForce cards in terms of a modified BIOS as well as special drivers, which are designed for stability. Comprehensive certifications also ensure a trouble-free operation between hardware and software. The drivers can result in a significant performance advantage in OpenGL-optimized applications in particular. We use the benchmarks SPECviewperf 11 and 12 for professional purposes. They cover the areas CAD, CAM, geology and medical MRI. Overall, the Quadro M3000M performs very well and can usually clearly surpass its direct predecessor Quadro K3100M. Even the former top model from AMD, the FirePro M6100, is often pretty close and can sometimes be beaten.
Calculations can be transferred from the processor to the graphics card via the OpenCL interface, but the standards differ depending on the manufacturer. This includes Quick Sync (Intel), APP (AMD) or in our case CUDA, for example. Those methods are mainly used for picture and video conversions, financial analysis as well as encryption in practice. We use the two tools LuxMark 2.0 (ray tracing) and SiSoft Sandra 16 (GPGPU). LuxMark 2.0 shows the advantages of the new Maxwell GPU, because our Quadro M3000M can clearly beat the rivals and is even neck and neck with the supposedly much faster Quadro M5000M inside the Schenker W706. The results are also very good in SiSoft Sandra 16, but the brand-new FirePro W7170M from AMD (Dell Precision 7710) is even faster.
| LuxMark v2.0 64Bit | |
| Room GPUs-only (sort by value) | |
| Lenovo ThinkPad P70 | |
| Dell Precision 7710 | |
| HP ZBook 17 G2 J8Z55ET | |
| MSI WT72-2OL32SR311BW | |
| Bullman E-Klasse 5 | |
| Dell Precision 5510 | |
| Schenker W706 | |
| Sala GPUs-only (sort by value) | |
| Lenovo ThinkPad P70 | |
| Dell Precision 7710 | |
| HP ZBook 17 G2 J8Z55ET | |
| MSI WT72-2OL32SR311BW | |
| Bullman E-Klasse 5 | |
| Dell Precision 5510 | |
| Schenker W706 | |
| SiSoft Sandra 2016 | |
| Image Processing (sort by value) | |
| Lenovo ThinkPad P70 | |
| Dell Precision 7710 | |
| Dell Precision 5510 | |
| Schenker W706 | |
| GP Cryptography (Higher Security AES256+SHA2-512) (sort by value) | |
| Lenovo ThinkPad P70 | |
| Dell Precision 7710 | |
| Dell Precision 5510 | |
| Schenker W706 | |
| GP Financial Analysis (FP High/Double Precision) (sort by value) | |
| Lenovo ThinkPad P70 | |
| Dell Precision 7710 | |
| Dell Precision 5510 | |
| Schenker W706 | |
The raw performance of the hardware is important for DirectX applications, which include games. Our P70 scores 5835 points in the current 3DMark Fire Strike test and is therefore significantly faster than the popular GeForce GTX 960M (MSI GE62), which falls behind by more than 30%. The performance of the M3000M is pretty much right between the old GT965M (~5400 points) and the refreshed GTX 965M (Ti) (~6160 points). A GTX 970M has an advantage of around 14% (6672 points), while the Quadro M5000M (Schenker W706), which is also available for the ThinkPad P70, is another 41% faster (8210 points).
You can compare the DirectX and OpenGL performance (without optimizations) with the two benchmarks Unigine Heaven 3.0 and Unigine Valley 1.0; the DirectX results are significantly higher.
The GPU performance is reduced by around 14% on battery power (8493 vs. 7336 points in 3DMark 11). The memory clock is reduced to 800 MHz and the core varies between 900-980 MHz.
| 3DMark 06 Standard Score | 26746 points | |
| 3DMark Vantage P Result | 27405 points | |
| 3DMark 11 Performance | 8493 points | |
| 3DMark Ice Storm Standard Score | 42156 points | |
| 3DMark Cloud Gate Standard Score | 19732 points | |
| 3DMark Fire Strike Score | 5835 points | |
Help | ||
| Unigine Heaven 3.0 | |
| 1920x1080 OpenGL, Normal Tessellation, High Shaders AA:Off AF:Off (sort by value) | |
| Lenovo ThinkPad P70 | |
| Dell Precision 7710 | |
| HP ZBook 17 G2 J8Z55ET | |
| Bullman E-Klasse 5 | |
| Schenker W706 | |
| 1920x1080 DX 11, Normal Tessellation, High Shaders AA:Off AF:Off (sort by value) | |
| Lenovo ThinkPad P70 | |
| Dell Precision 7710 | |
| HP ZBook 17 G2 J8Z55ET | |
| Bullman E-Klasse 5 | |
| Schenker W706 | |
| Unigine Valley 1.0 | |
| 1920x1080 Extreme HD DirectX AA:x8 (sort by value) | |
| Lenovo ThinkPad P70 | |
| Dell Precision 7710 | |
| Schenker W706 | |
| 1920x1080 Extreme HD Preset OpenGL AA:x8 (sort by value) | |
| Lenovo ThinkPad P70 | |
| Dell Precision 7710 | |
| Schenker W706 | |
Gaming Performance
You might want to play games on the ThinkPad P70 if you do not only use it for work. A look at our gaming table shows that the performance of our review unit is even sufficient for smooth frame rates at the highest settings. Only very challenging titles like GTA V or the Witcher 3 should be played at the "High" preset.
High resolutions in particular benefit from the large VRAM and the 256-bit memory interface of the Quadro M3000M. It can usually beat the new GTX 965 (Ti) and is pretty close to the GTX 970M. More benchmarks are available in our gaming list.
We only had some issues with Star Wars: Battlefront at first, since the title required at least driver version 385.50. The ThinkPad P70 was shipped with version 354.25 and the latest version at the time of the review was 354.56. We therefore tested the normal GeForce driver 361.43 and it worked without problems. This means that you can have some issues with brand-new titles.
| Tomb Raider | |
| 1366x768 High Preset AA:FX AF:8x (sort by value) | |
| Lenovo ThinkPad P70 | |
| Dell Precision 7710 | |
| HP ZBook 17 G2 J8Z55ET | |
| Schenker W706 | |
| MSI GE72 965M Ti | |
| MSI GE62-2QEUi716H21BW | |
| 1920x1080 Ultra Preset AA:FX AF:16x (sort by value) | |
| Lenovo ThinkPad P70 | |
| Dell Precision 7710 | |
| HP ZBook 17 G2 J8Z55ET | |
| Schenker W706 | |
| MSI GE72 965M Ti | |
| MSI GE62-2QEUi716H21BW | |
| BioShock Infinite | |
| 1366x768 High Preset (sort by value) | |
| Lenovo ThinkPad P70 | |
| Dell Precision 7710 | |
| HP ZBook 17 G2 J8Z55ET | |
| Schenker W706 | |
| MSI GE72 965M Ti | |
| MSI GE62-2QEUi716H21BW | |
| 1920x1080 Ultra Preset, DX11 (DDOF) (sort by value) | |
| Lenovo ThinkPad P70 | |
| Dell Precision 7710 | |
| HP ZBook 17 G2 J8Z55ET | |
| Schenker W706 | |
| MSI GE72 965M Ti | |
| MSI GE62-2QEUi716H21BW | |
| Just Cause 3 | |
| 1920x1080 High / On AA:FX AF:8x (sort by value) | |
| Lenovo ThinkPad P70 | |
| MSI GE72 965M Ti | |
| 1920x1080 Very High / On AA:SM AF:16x (sort by value) | |
| Lenovo ThinkPad P70 | |
| MSI GE72 965M Ti | |
| 3840x2160 High / On AA:FX AF:8x (sort by value) | |
| Lenovo ThinkPad P70 | |
| Rainbow Six Siege | |
| 1920x1080 High Preset AA:T AF:4x (sort by value) | |
| Lenovo ThinkPad P70 | |
| MSI GE72 965M Ti | |
| 1920x1080 Ultra Preset AA:T AF:16x (sort by value) | |
| Lenovo ThinkPad P70 | |
| MSI GE72 965M Ti | |
| 3840x2160 High Preset AA:T AF:4x (sort by value) | |
| Lenovo ThinkPad P70 | |
| Star Wars Battlefront | |
| 1920x1080 High Preset AA:FX (sort by value) | |
| Lenovo ThinkPad P70 | |
| MSI GE72 965M Ti | |
| 1920x1080 Ultra Preset AA:FX (sort by value) | |
| Lenovo ThinkPad P70 | |
| MSI GE72 965M Ti | |
| 3840x2160 High Preset AA:FX (sort by value) | |
| Lenovo ThinkPad P70 | |
| MSI GE72 965M Ti | |
| The Witcher 3 | |
| 1920x1080 High Graphics & Postprocessing (Nvidia HairWorks Off) (sort by value) | |
| Lenovo ThinkPad P70 | |
| Dell Precision 7710 | |
| Schenker W706 | |
| MSI GE72 965M Ti | |
| Schenker XMG P506 | |
| 1920x1080 Ultra Graphics & Postprocessing (HBAO+) (sort by value) | |
| Lenovo ThinkPad P70 | |
| Dell Precision 7710 | |
| Schenker W706 | |
| MSI GE72 965M Ti | |
| Schenker XMG P506 | |
| 3840x2160 High Graphics & Postprocessing (Nvidia HairWorks Off) (sort by value) | |
| Lenovo ThinkPad P70 | |
| Dirt Rally | |
| 1920x1080 High Preset (sort by value) | |
| Lenovo ThinkPad P70 | |
| Dell Precision 7710 | |
| MSI WT72-2OL32SR311BW | |
| Bullman E-Klasse 5 | |
| Schenker W706 | |
| Schenker XMG P506 | |
| 1920x1080 Ultra Preset AA:4x MS (sort by value) | |
| Lenovo ThinkPad P70 | |
| Dell Precision 7710 | |
| MSI WT72-2OL32SR311BW | |
| Bullman E-Klasse 5 | |
| Schenker W706 | |
| Schenker XMG P506 | |
| 3840x2160 High Preset (sort by value) | |
| Lenovo ThinkPad P70 | |
| MSI WT72-2OL32SR311BW | |
| Bullman E-Klasse 5 | |
| GTA V | |
| 1920x1080 High/On (Advanced Graphics Off) AA:2xMSAA + FX AF:8x (sort by value) | |
| Lenovo ThinkPad P70 | |
| 1920x1080 Highest AA:4xMSAA + FX AF:16x (sort by value) | |
| Lenovo ThinkPad P70 | |
| 3840x2160 High/On (Advanced Graphics Off) AA:FX AF:8x (sort by value) | |
| Lenovo ThinkPad P70 | |
| Thief | |
| 1366x768 High Preset AA:FXAA & Low SS AF:4x (sort by value) | |
| Lenovo ThinkPad P70 | |
| Dell Precision 7710 | |
| HP ZBook 17 G2 J8Z55ET | |
| MSI WT72-2OL32SR311BW | |
| Bullman E-Klasse 5 | |
| Schenker W706 | |
| MSI GE72 965M Ti | |
| MSI GE62-2QEUi716H21BW | |
| 1920x1080 Very High Preset AA:FXAA & High SS AF:8x (sort by value) | |
| Lenovo ThinkPad P70 | |
| Dell Precision 7710 | |
| HP ZBook 17 G2 J8Z55ET | |
| MSI WT72-2OL32SR311BW | |
| Bullman E-Klasse 5 | |
| Schenker W706 | |
| MSI GE72 965M Ti | |
| MSI GE62-2QEUi716H21BW | |
| Metro: Last Light | |
| 1366x768 High (DX11) AF:16x (sort by value) | |
| Lenovo ThinkPad P70 | |
| Dell Precision 7710 | |
| HP ZBook 17 G2 J8Z55ET | |
| Schenker W706 | |
| MSI GE72 965M Ti | |
| 1920x1080 Very High (DX11) AF:16x (sort by value) | |
| Lenovo ThinkPad P70 | |
| Dell Precision 7710 | |
| HP ZBook 17 G2 J8Z55ET | |
| Schenker W706 | |
| MSI GE72 965M Ti | |
| low | med. | high | ultra | 4K | |
|---|---|---|---|---|---|
| Tomb Raider (2013) | 255.1 | 185 | 82.1 | ||
| BioShock Infinite (2013) | 176 | 163.8 | 69.7 | ||
| Metro: Last Light (2013) | 124.5 | 82.9 | 44.6 | ||
| Thief (2014) | 88.6 | 77.4 | 43.1 | ||
| GTA V (2015) | 136.1 | 69.1 | 29.7 | 35.3 | |
| Dirt Rally (2015) | 108.6 | 89.6 | 53.6 | 39.2 | |
| The Witcher 3 (2015) | 73.1 | 40.9 | 22.1 | 14.1 | |
| Star Wars Battlefront (2015) | 124.5 | 59.4 | 50.9 | 17.8 | |
| Rainbow Six Siege (2015) | 146.8 | 76.8 | 54.5 | 23.8 | |
| Just Cause 3 (2015) | 85.6 | 50.4 | 43.7 | 17.8 |
Emissions
System Noise
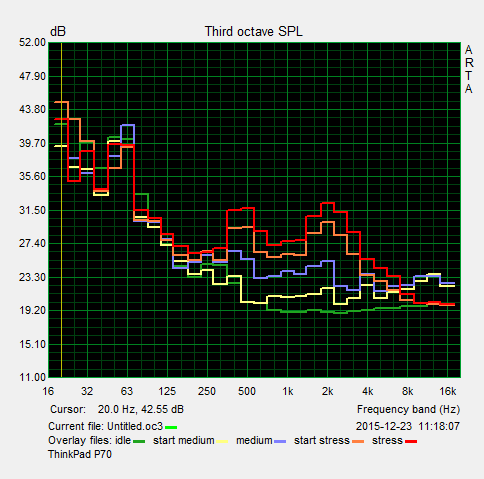
The ThinkPad P70 uses two fans that work very restrained in general. They are completely deactivated while idling or when you perform simple tasks, so the system is silent. We could not notice other annoying noises like coil whining, either. But the fans can also convince with a low noise development under load, where you can hardly hear more than a quiet and deep murmur at 36.5 dB(A). The only slightly annoying thing is the fact that the fans start at a high rpm-level and then settle down. You will therefore always notice when the fans start spinning. It does not get very loud under maximum load at up to 40.8 dB(A), either.
Noise level
| Idle |
| 30 / 30 / 30 dB(A) |
| Load |
| 36.5 / 40.8 dB(A) |
 | ||
30 dB silent 40 dB(A) audible 50 dB(A) loud |
||
min: | ||
Temperature
Does the low fan speed affect the temperature development? Our temperature graphics clearly show that the review unit is a very cool device. It does not really warm up at all while idling and the average values are just above 30 °C under load. The heat development is focused on the rear area of the base unit, where the fan exhausts are located. We can measure up to 39 °C at the back left. This is an impressive result for the ThinkPad P70 when you consider that many modern smartphones are warmer under load.
(+) The maximum temperature on the upper side is 39 °C / 102 F, compared to the average of 38.2 °C / 101 F, ranging from 22.2 to 69.8 °C for the class Workstation.
(+) The bottom heats up to a maximum of 35.4 °C / 96 F, compared to the average of 41.1 °C / 106 F
(+) In idle usage, the average temperature for the upper side is 28.2 °C / 83 F, compared to the device average of 32 °C / 90 F.
(+) The palmrests and touchpad are cooler than skin temperature with a maximum of 28.1 °C / 82.6 F and are therefore cool to the touch.
(±) The average temperature of the palmrest area of similar devices was 27.8 °C / 82 F (-0.3 °C / -0.6 F).
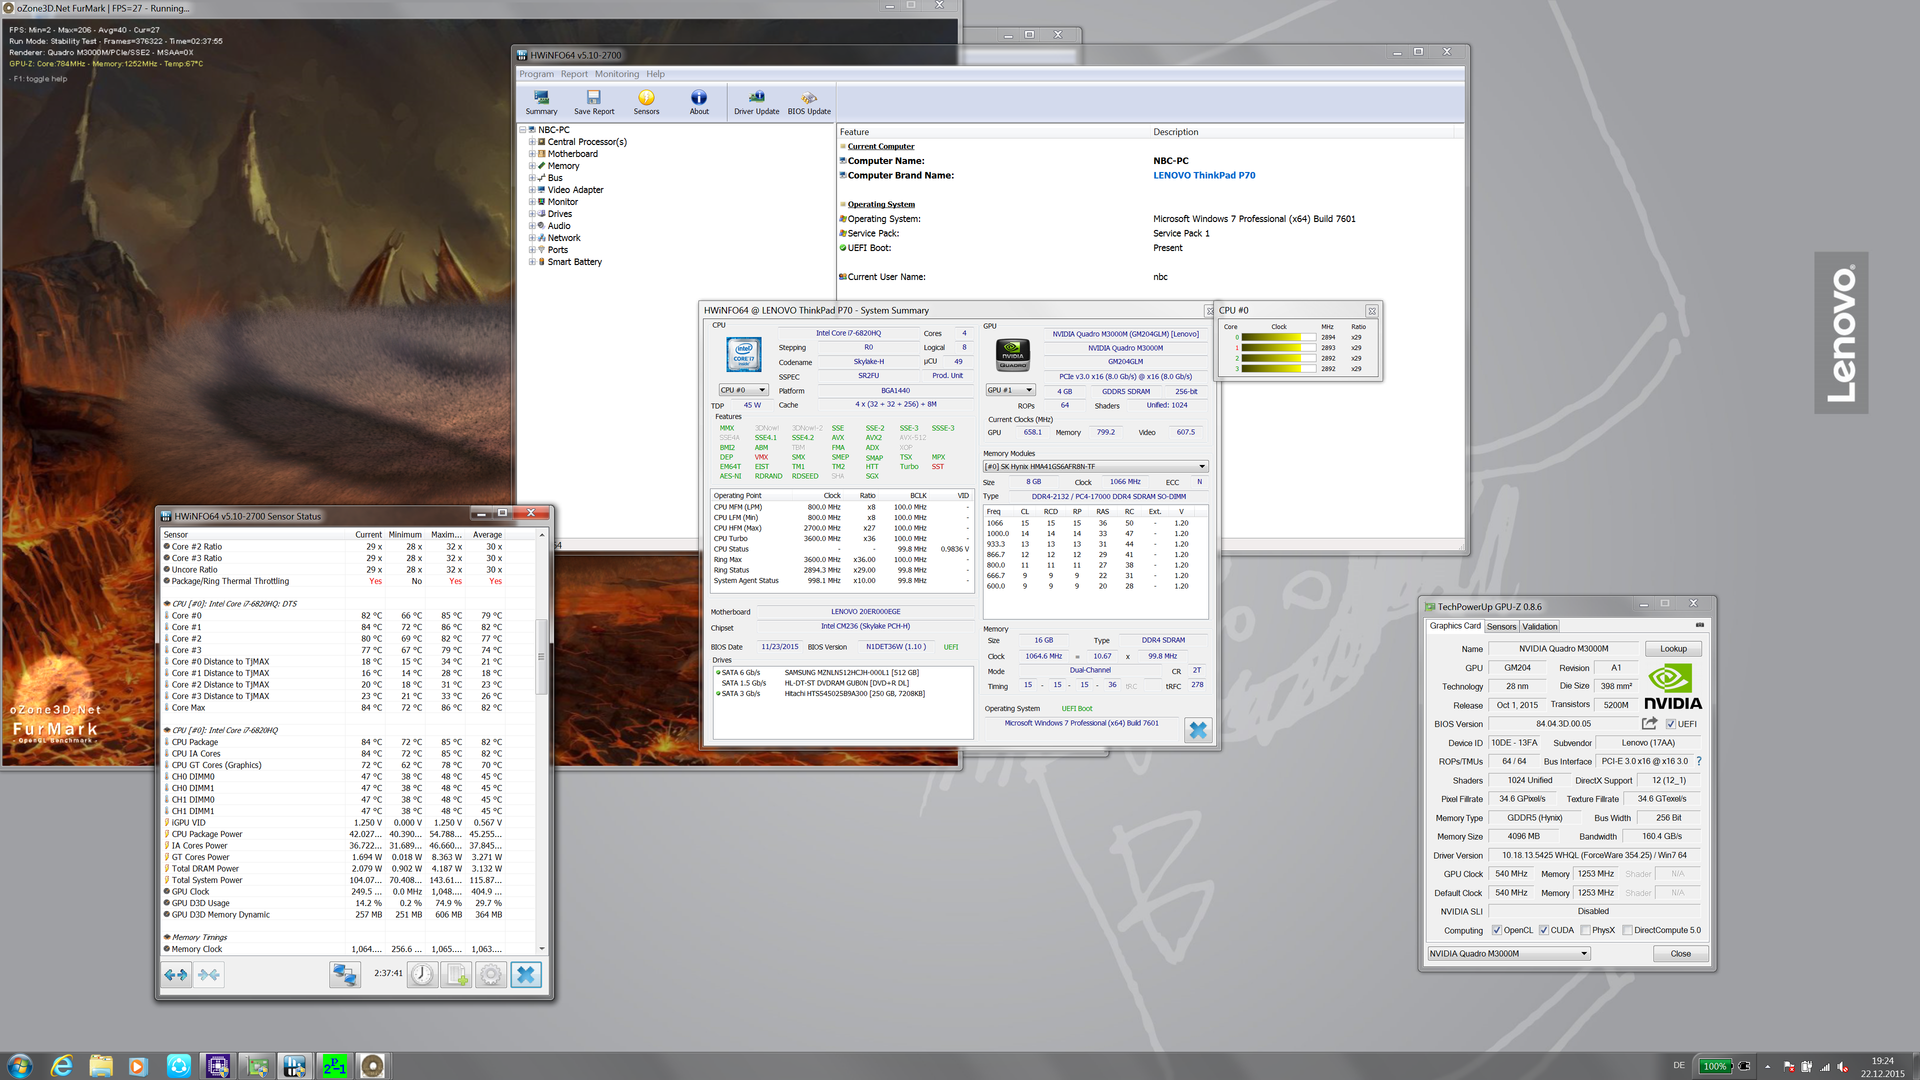
Stress Test
We use our stress test to see how the system behaves under maximum load and if the performance is affected in an extreme scenario. We start with CPU load via Prime95. The processor runs steadily at the maximum frequency of 3.2 GHz in this case and the consumption levels off at around 48 Watts, which means the CPU can surpass its TDP limit of 45 Watts. The chip warms up to 84 °C, but the fans are not running at their highest level. This behavior is identical on mains and battery power.
The processor already surpasses its TDP limit when we only stress the CPU, so we also wanted to see how it performs when we stress the integrated GPU via FurMark at the same time. The consumption even rises to 55 Watts in this case. The CPU clock is slightly reduced at 2.9 GHz, while the GPU can maintain its maximum core clock of 1000 MHz. The temperature is once again at around 85 °C. We will soon see that 85 °C is a limitation by the manufacturer.
Load for the dedicated GPU is not a big problem for the system. The Quadro M3000M can utilize its maximum core clock in FurMark (1050 MHz/memory 1253 MHz) and only warms up to 72 °C. The very quiet cooling in this scenario that you can hardly notice is impressive. The GPU performance is slightly reduced on battery power. It does not seem to be caused by the thermals, but it looks like a consumption limit by Lenovo, because the chip runs at 900-980 MHz (memory 800 MHz) and only warms up to 67 °C.
Simultaneous load via Prime95 and FurMark will result in the maximum clocks of the processor and the graphics card at first, until the CPU reaches a temperature of 85 °C. After that, the clock of the four cores will vary between 2.9 and 3 GHz, which does not change over the course of the test. There are also fluctuations for the graphics card (core/memory) depending on the load and the current temperature, but there is no throttling in general. The total consumption of the system is at around 110 Watts in this case, so Lenovo acts pretty conservatively, even though the processor could handle higher temperatures. A 3DMark 11 run immediately after the stress test did not result in a lower score, which was to be expected.
There is a consumption limit at 90 Watts on battery power according to HWInfo. The processor can use around 25 Watts, which is usually sufficient for a clock between 2.7-2.8 GHz. The graphics card on the other hand varies between 800-1000 MHz (core/memory 800 MHz). This limitation prevents the battery discharging too quickly, which would result in high temperatures. This could result in hardware problems or at least a reduced lifespan of the battery.
All in all, the cooling solution performs very well and should also have enough headroom for the faster components.
Speakers
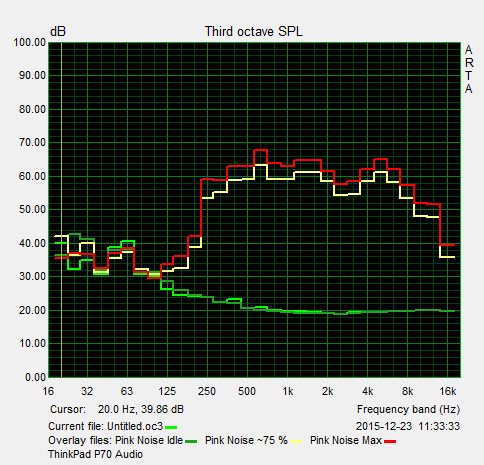
Above the keyboard are two stereo speakers with a rated output of 2 Watts each. The ThinkPad P70 is not a multimedia notebook, but we are still slightly disappointed by the performance. The maximum volume is not very high at 68 dB(A), but it can be slightly raised with the preloaded Dolby software. The software also provides different presets as well as an equalizer, but it cannot really change the sound that puts too much emphasis on the high tones. Bass is completely missing due to the lack of a subwoofer. They get the job done for conferences or Live-Meetings, but you should either use headphones or external speakers if you want to listen to music or watch a movie on the 4K panel when you are sitting in a hotel room. The playback via stereo jack was inconspicuous and we had no problems using a Bluetooth speaker (Denon Envaya Mini) with the P70.
Our test model had a pretty curious problem with the speakers. We noticed cracking noises in different situations (system sounds, for example), and it did not matter if the speakers were on or muted. A new installation of the driver did not help, so we assume a driver problem in combination with Windows 7.
Energy Management
Power Consumption
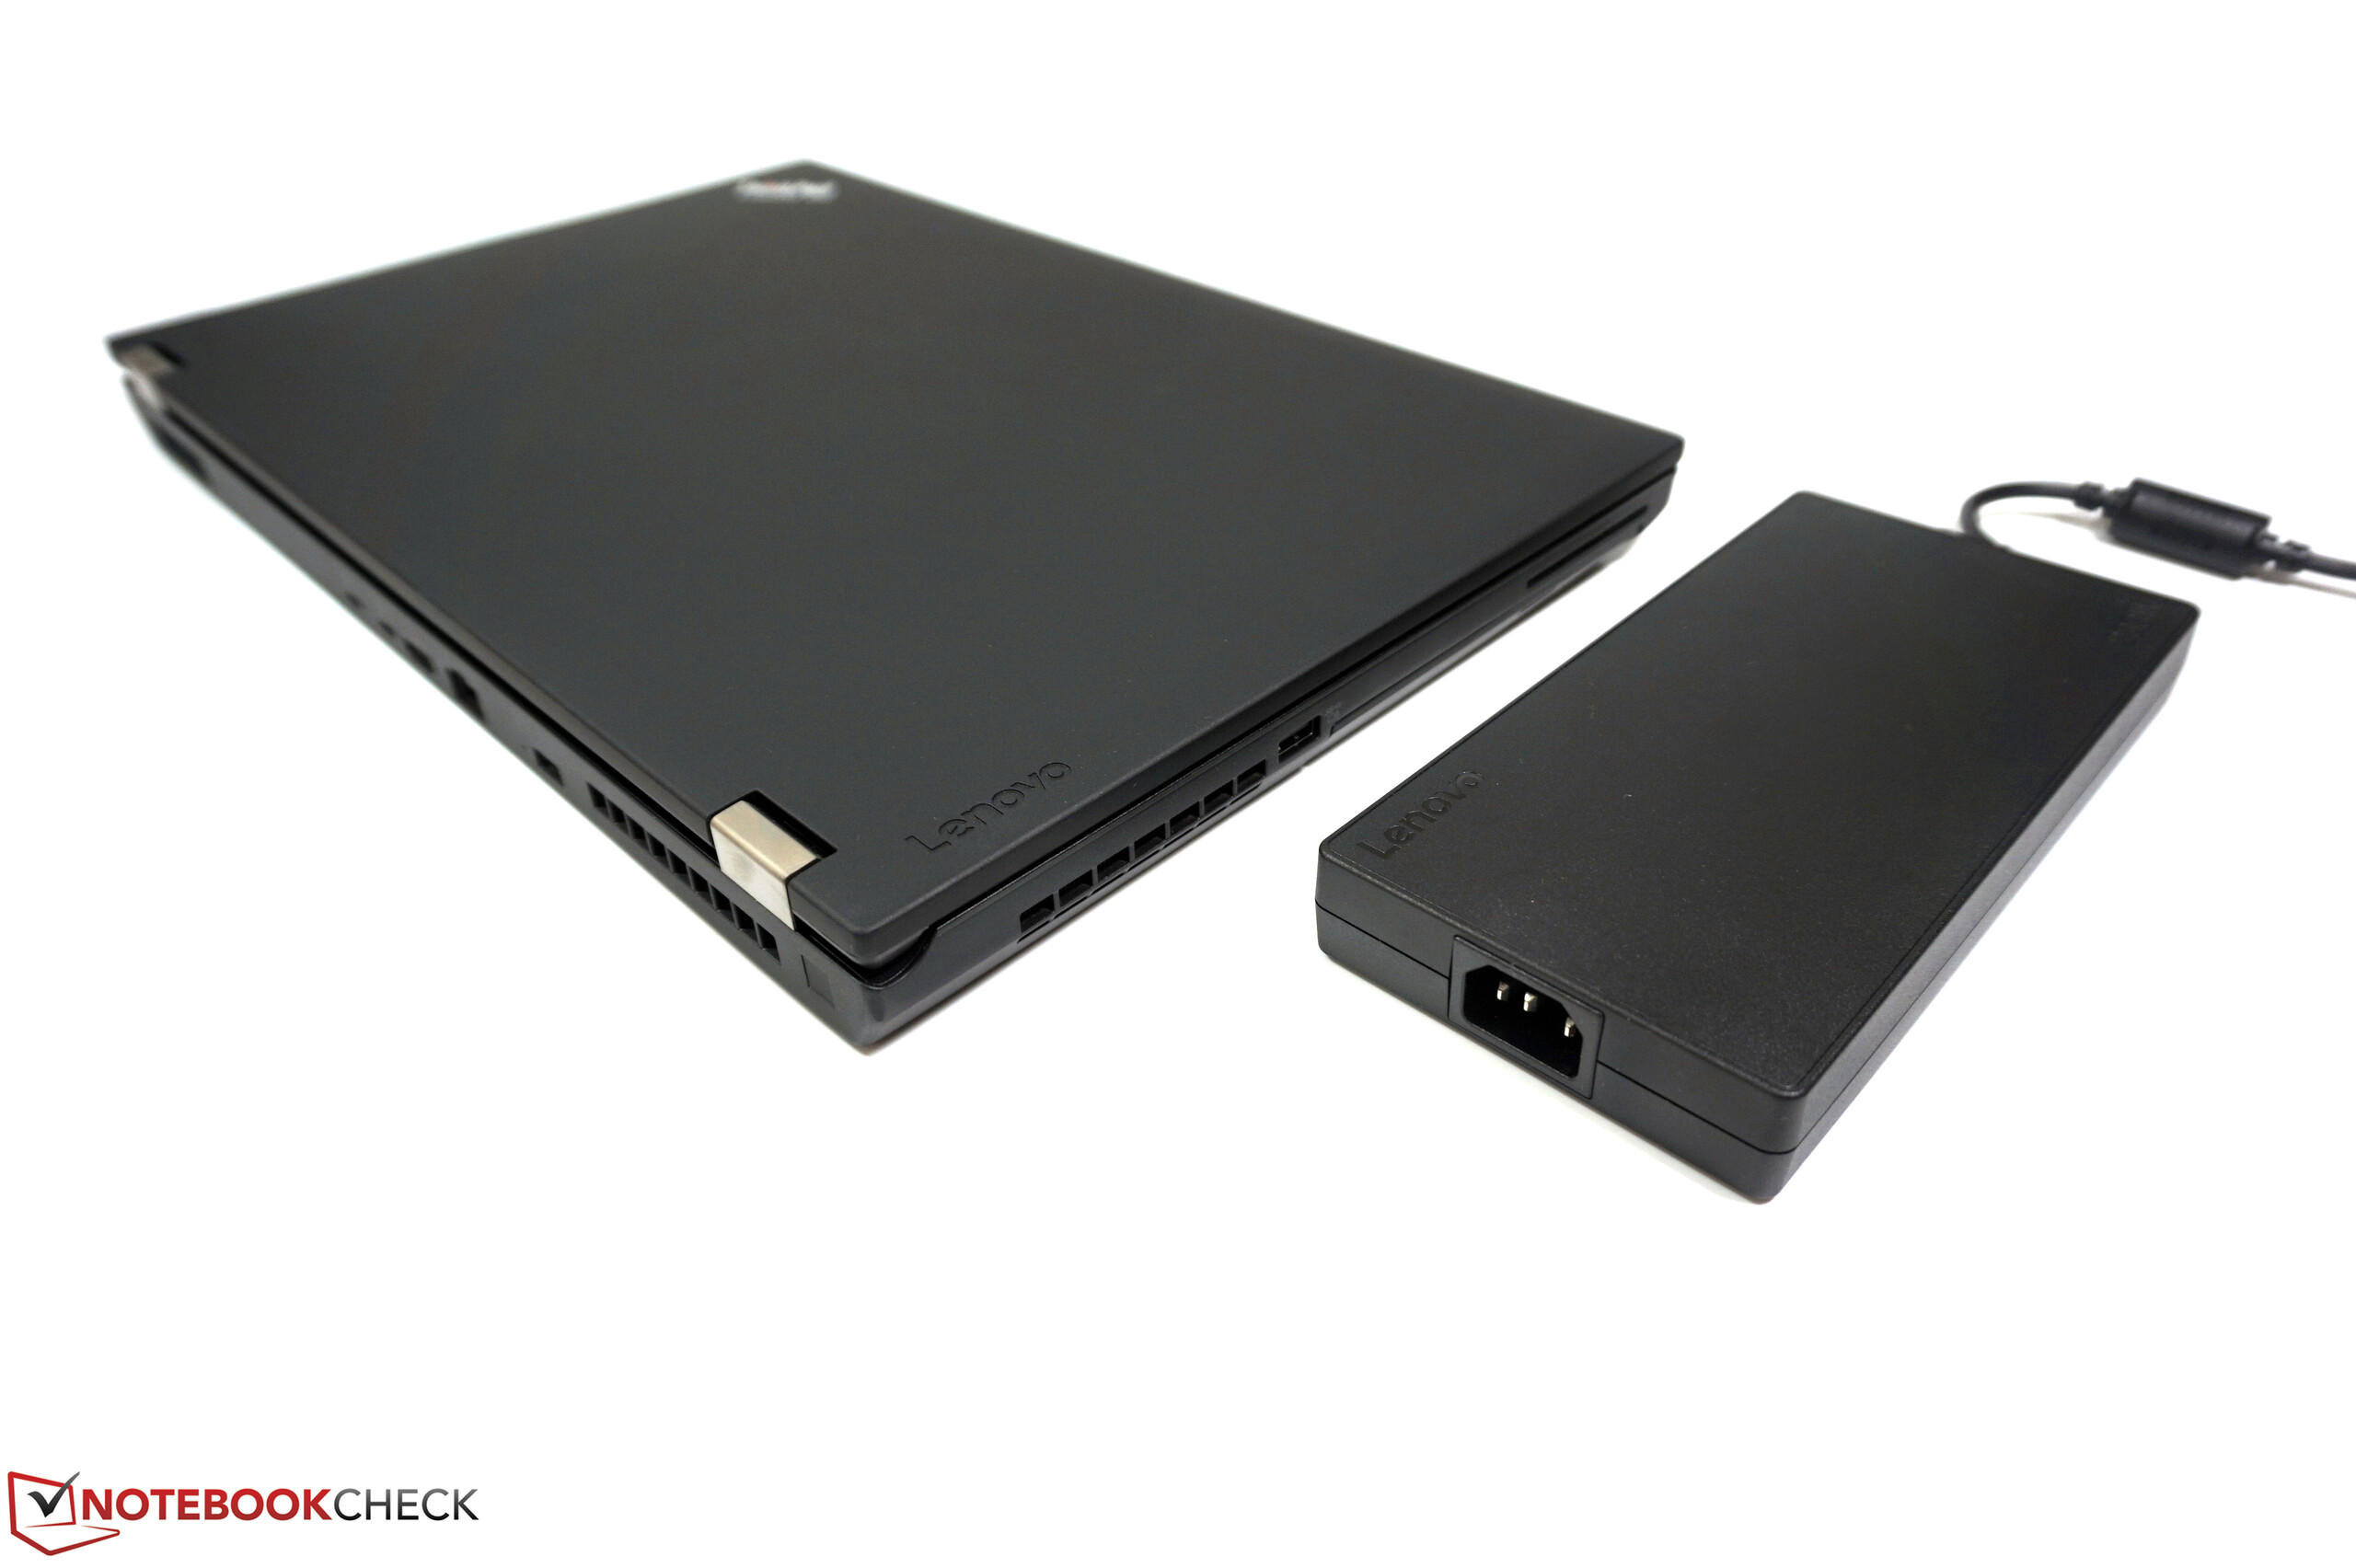
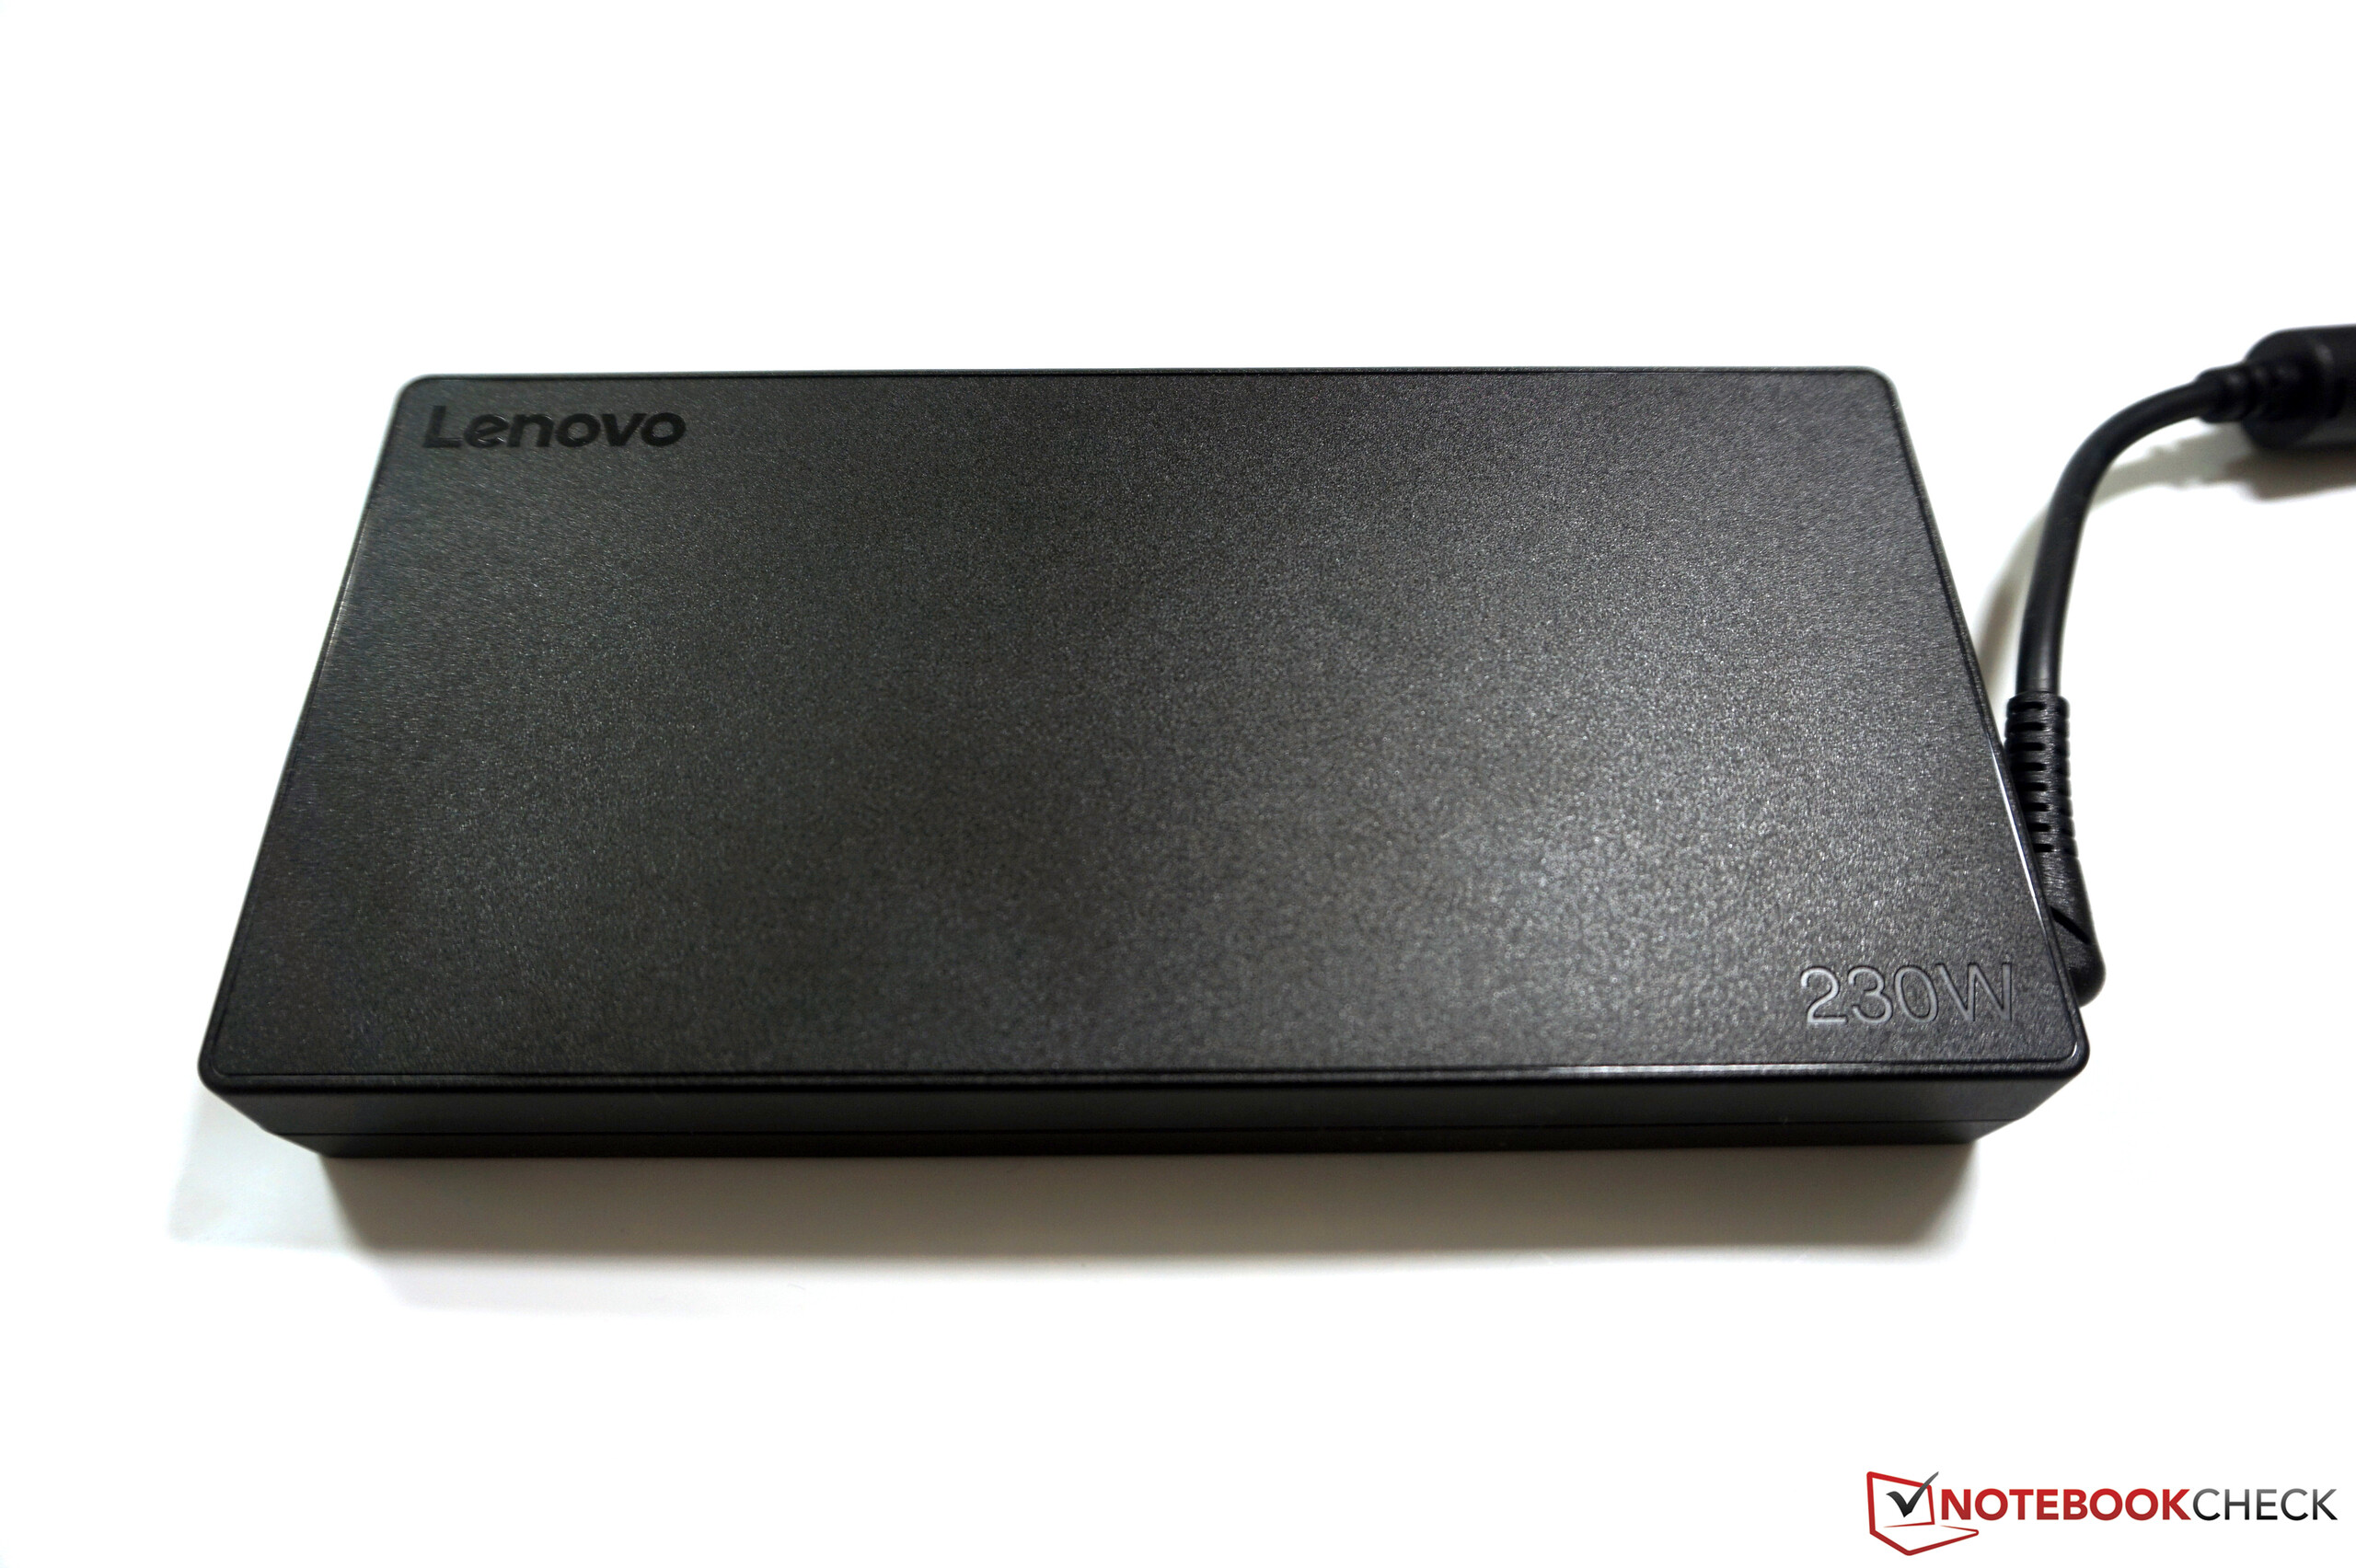
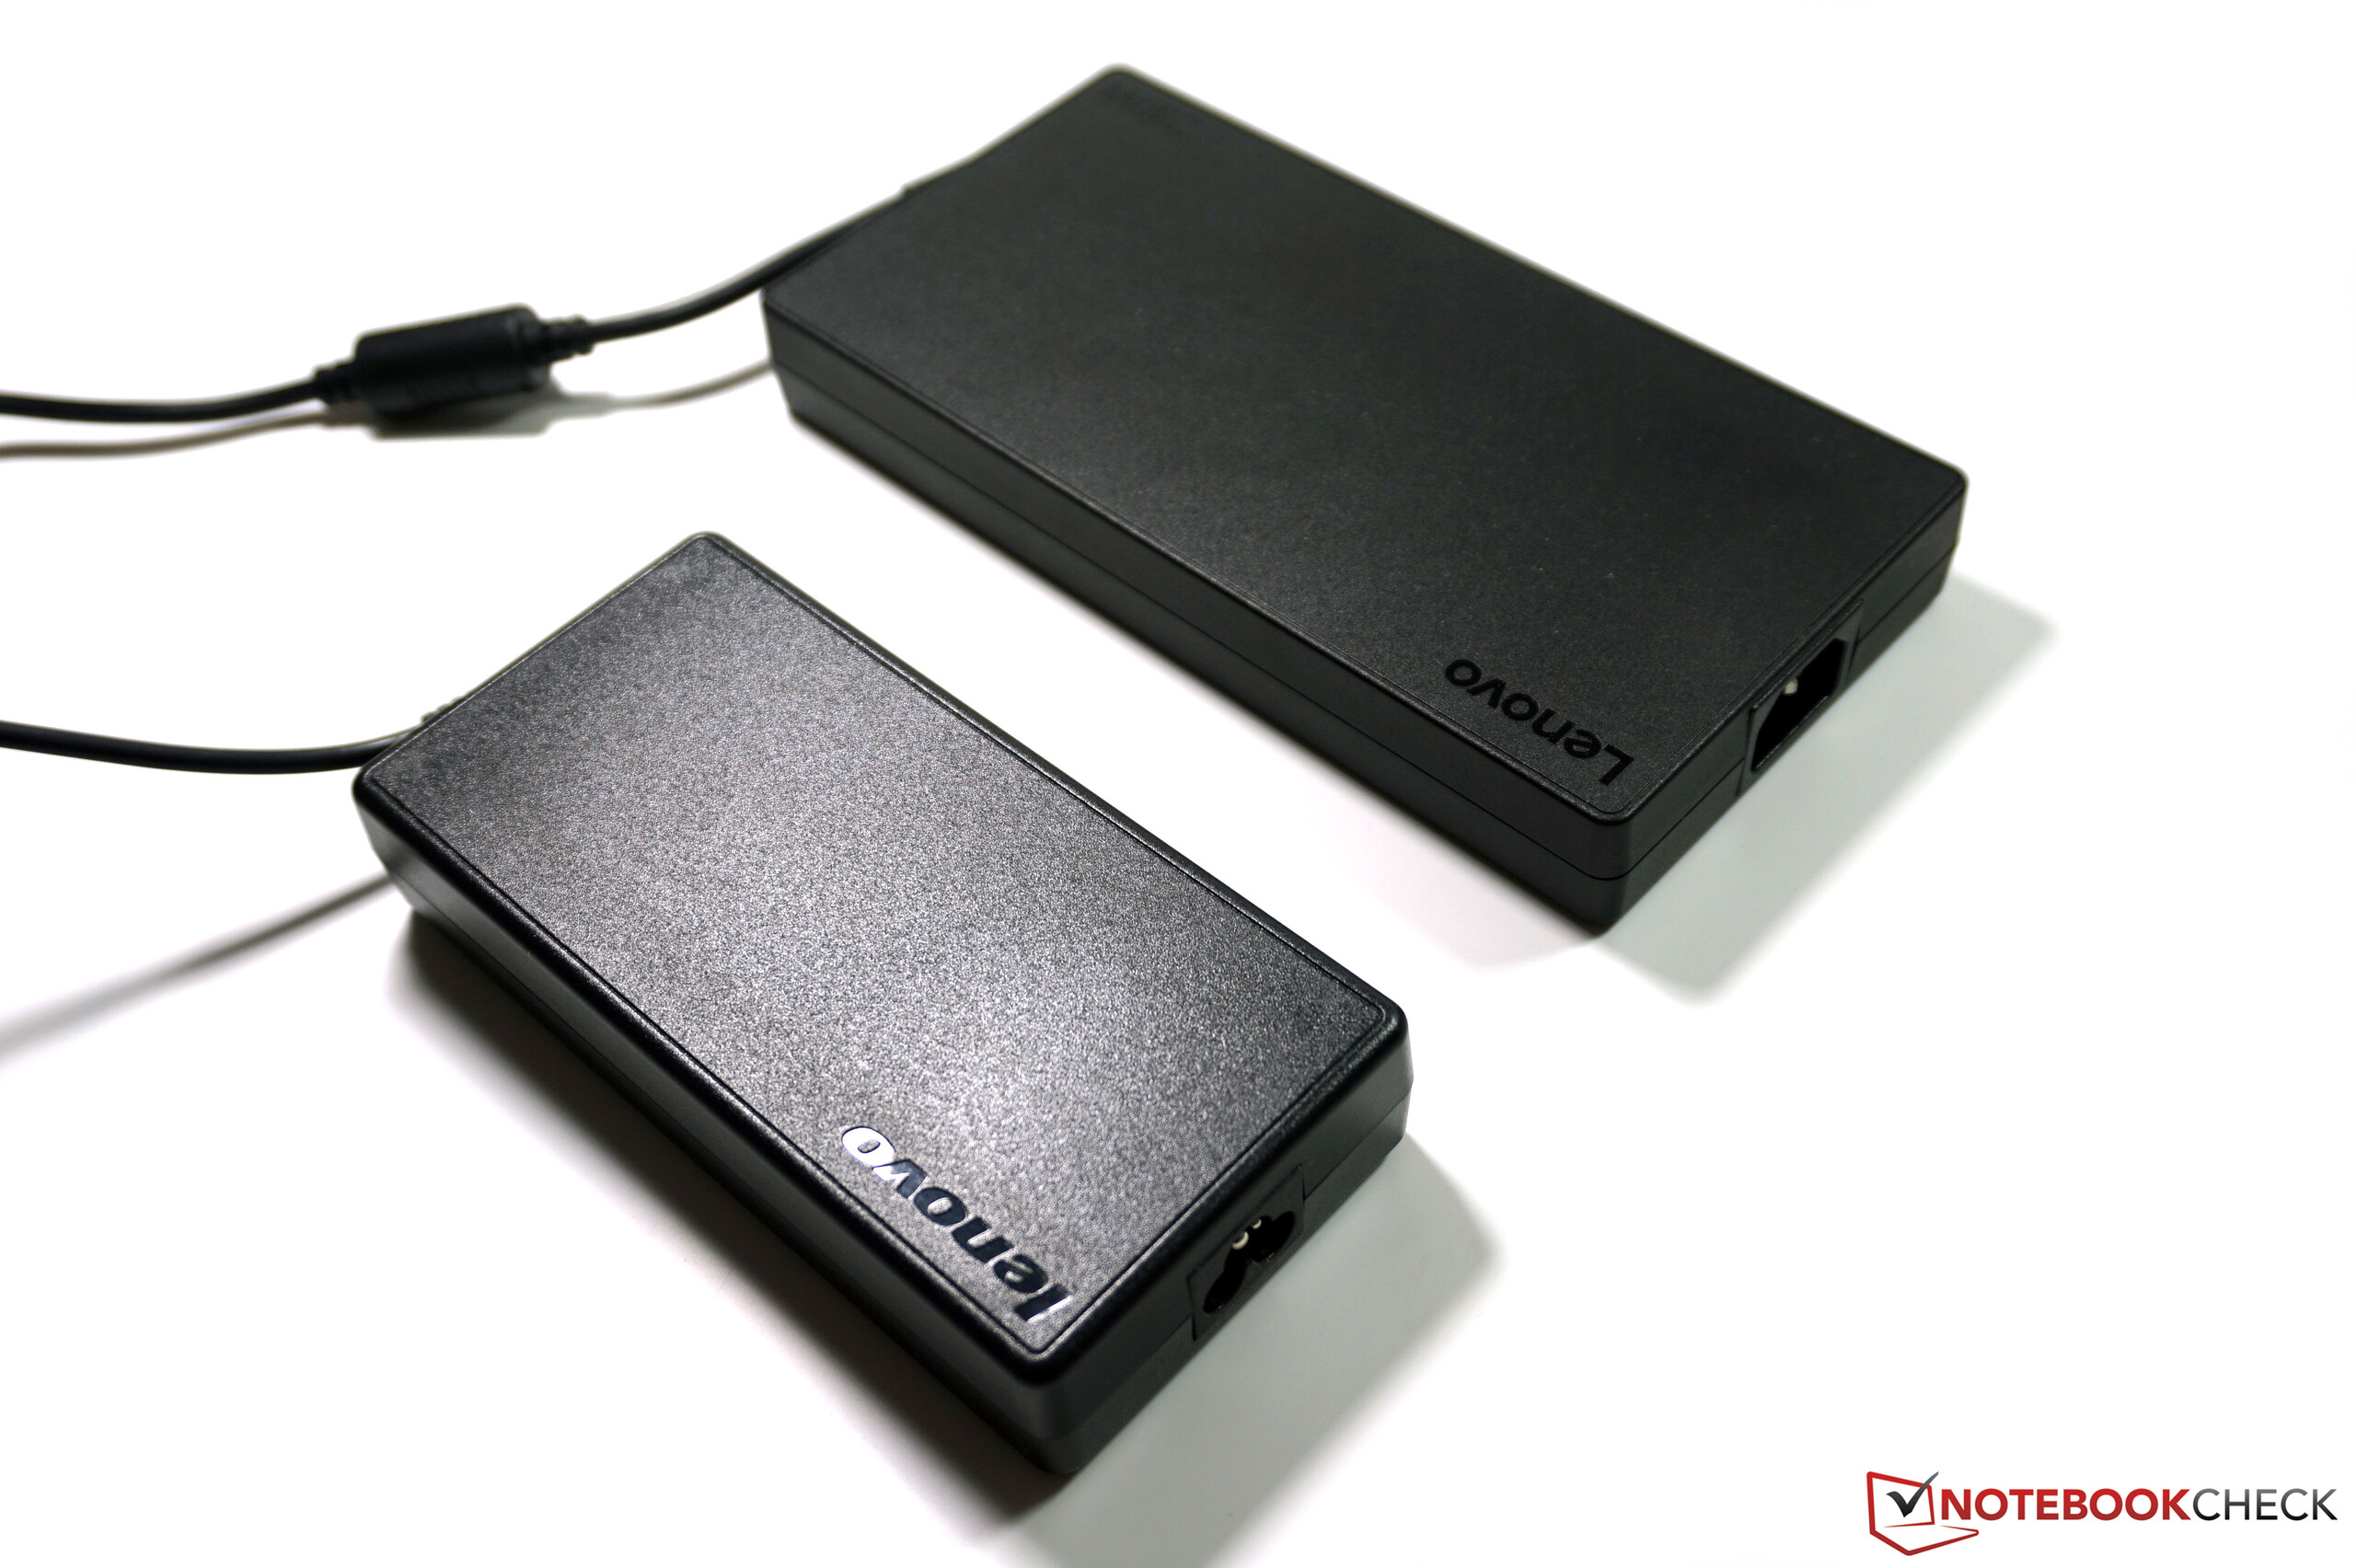
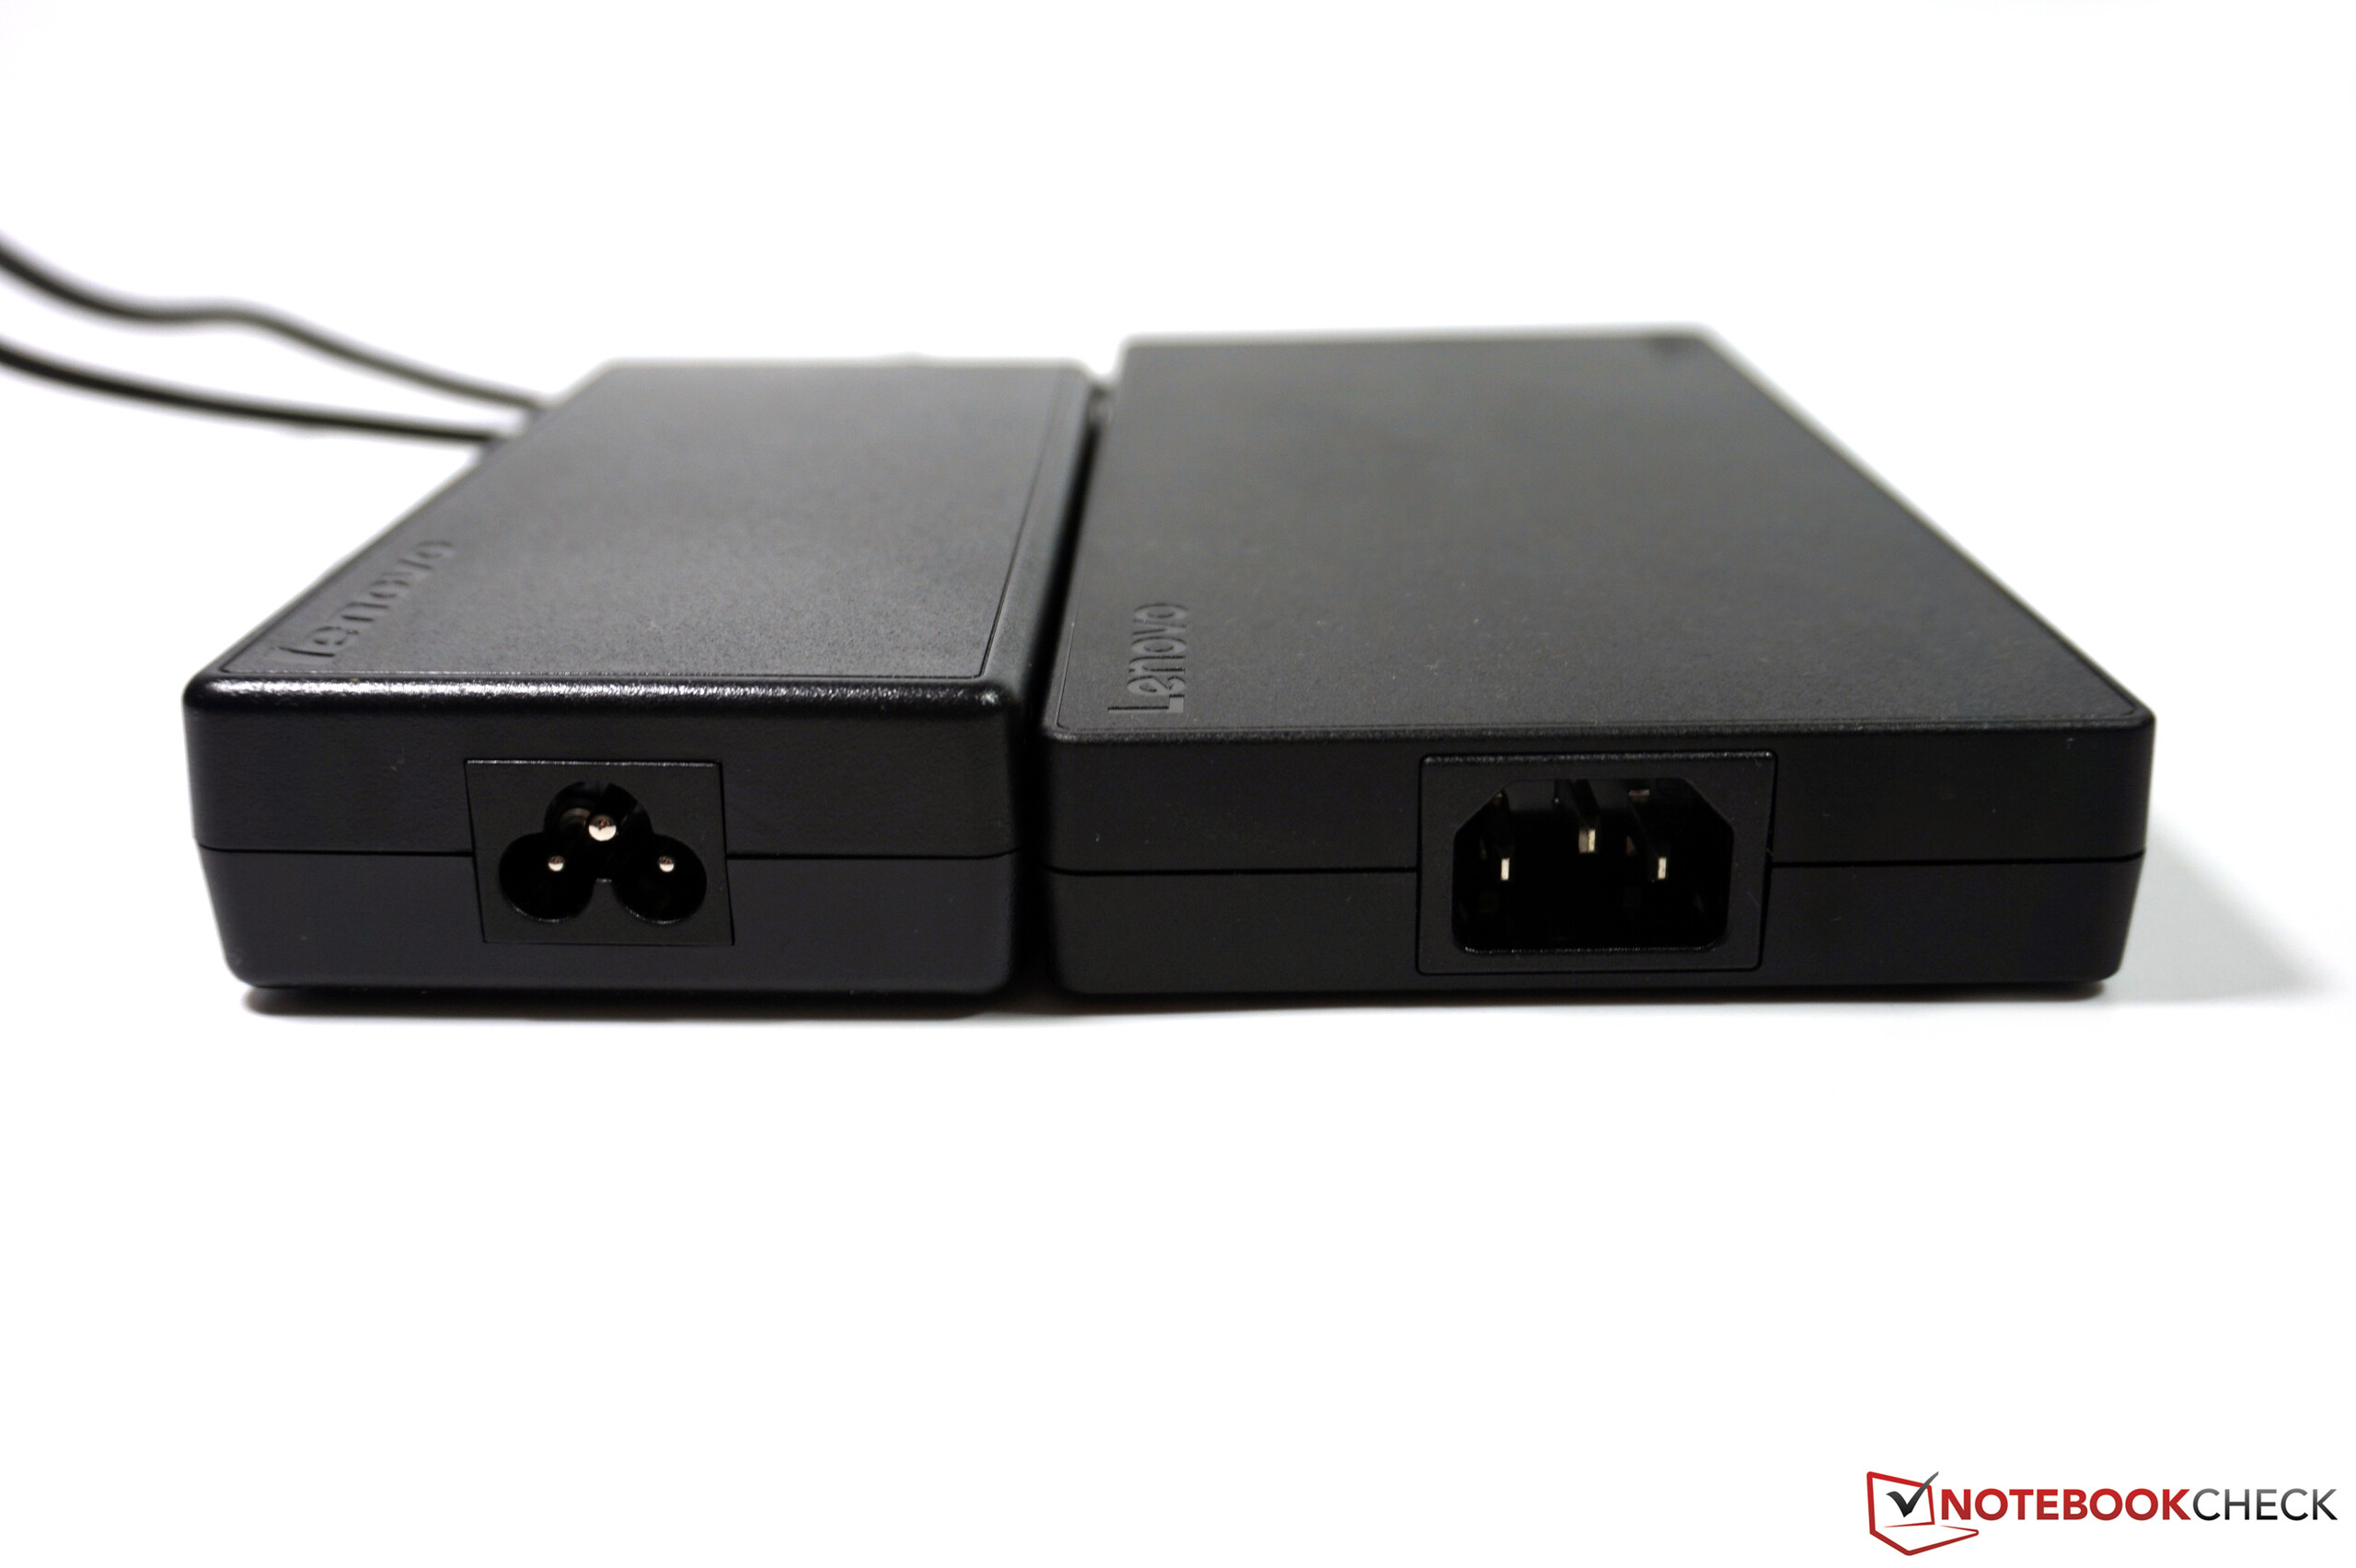
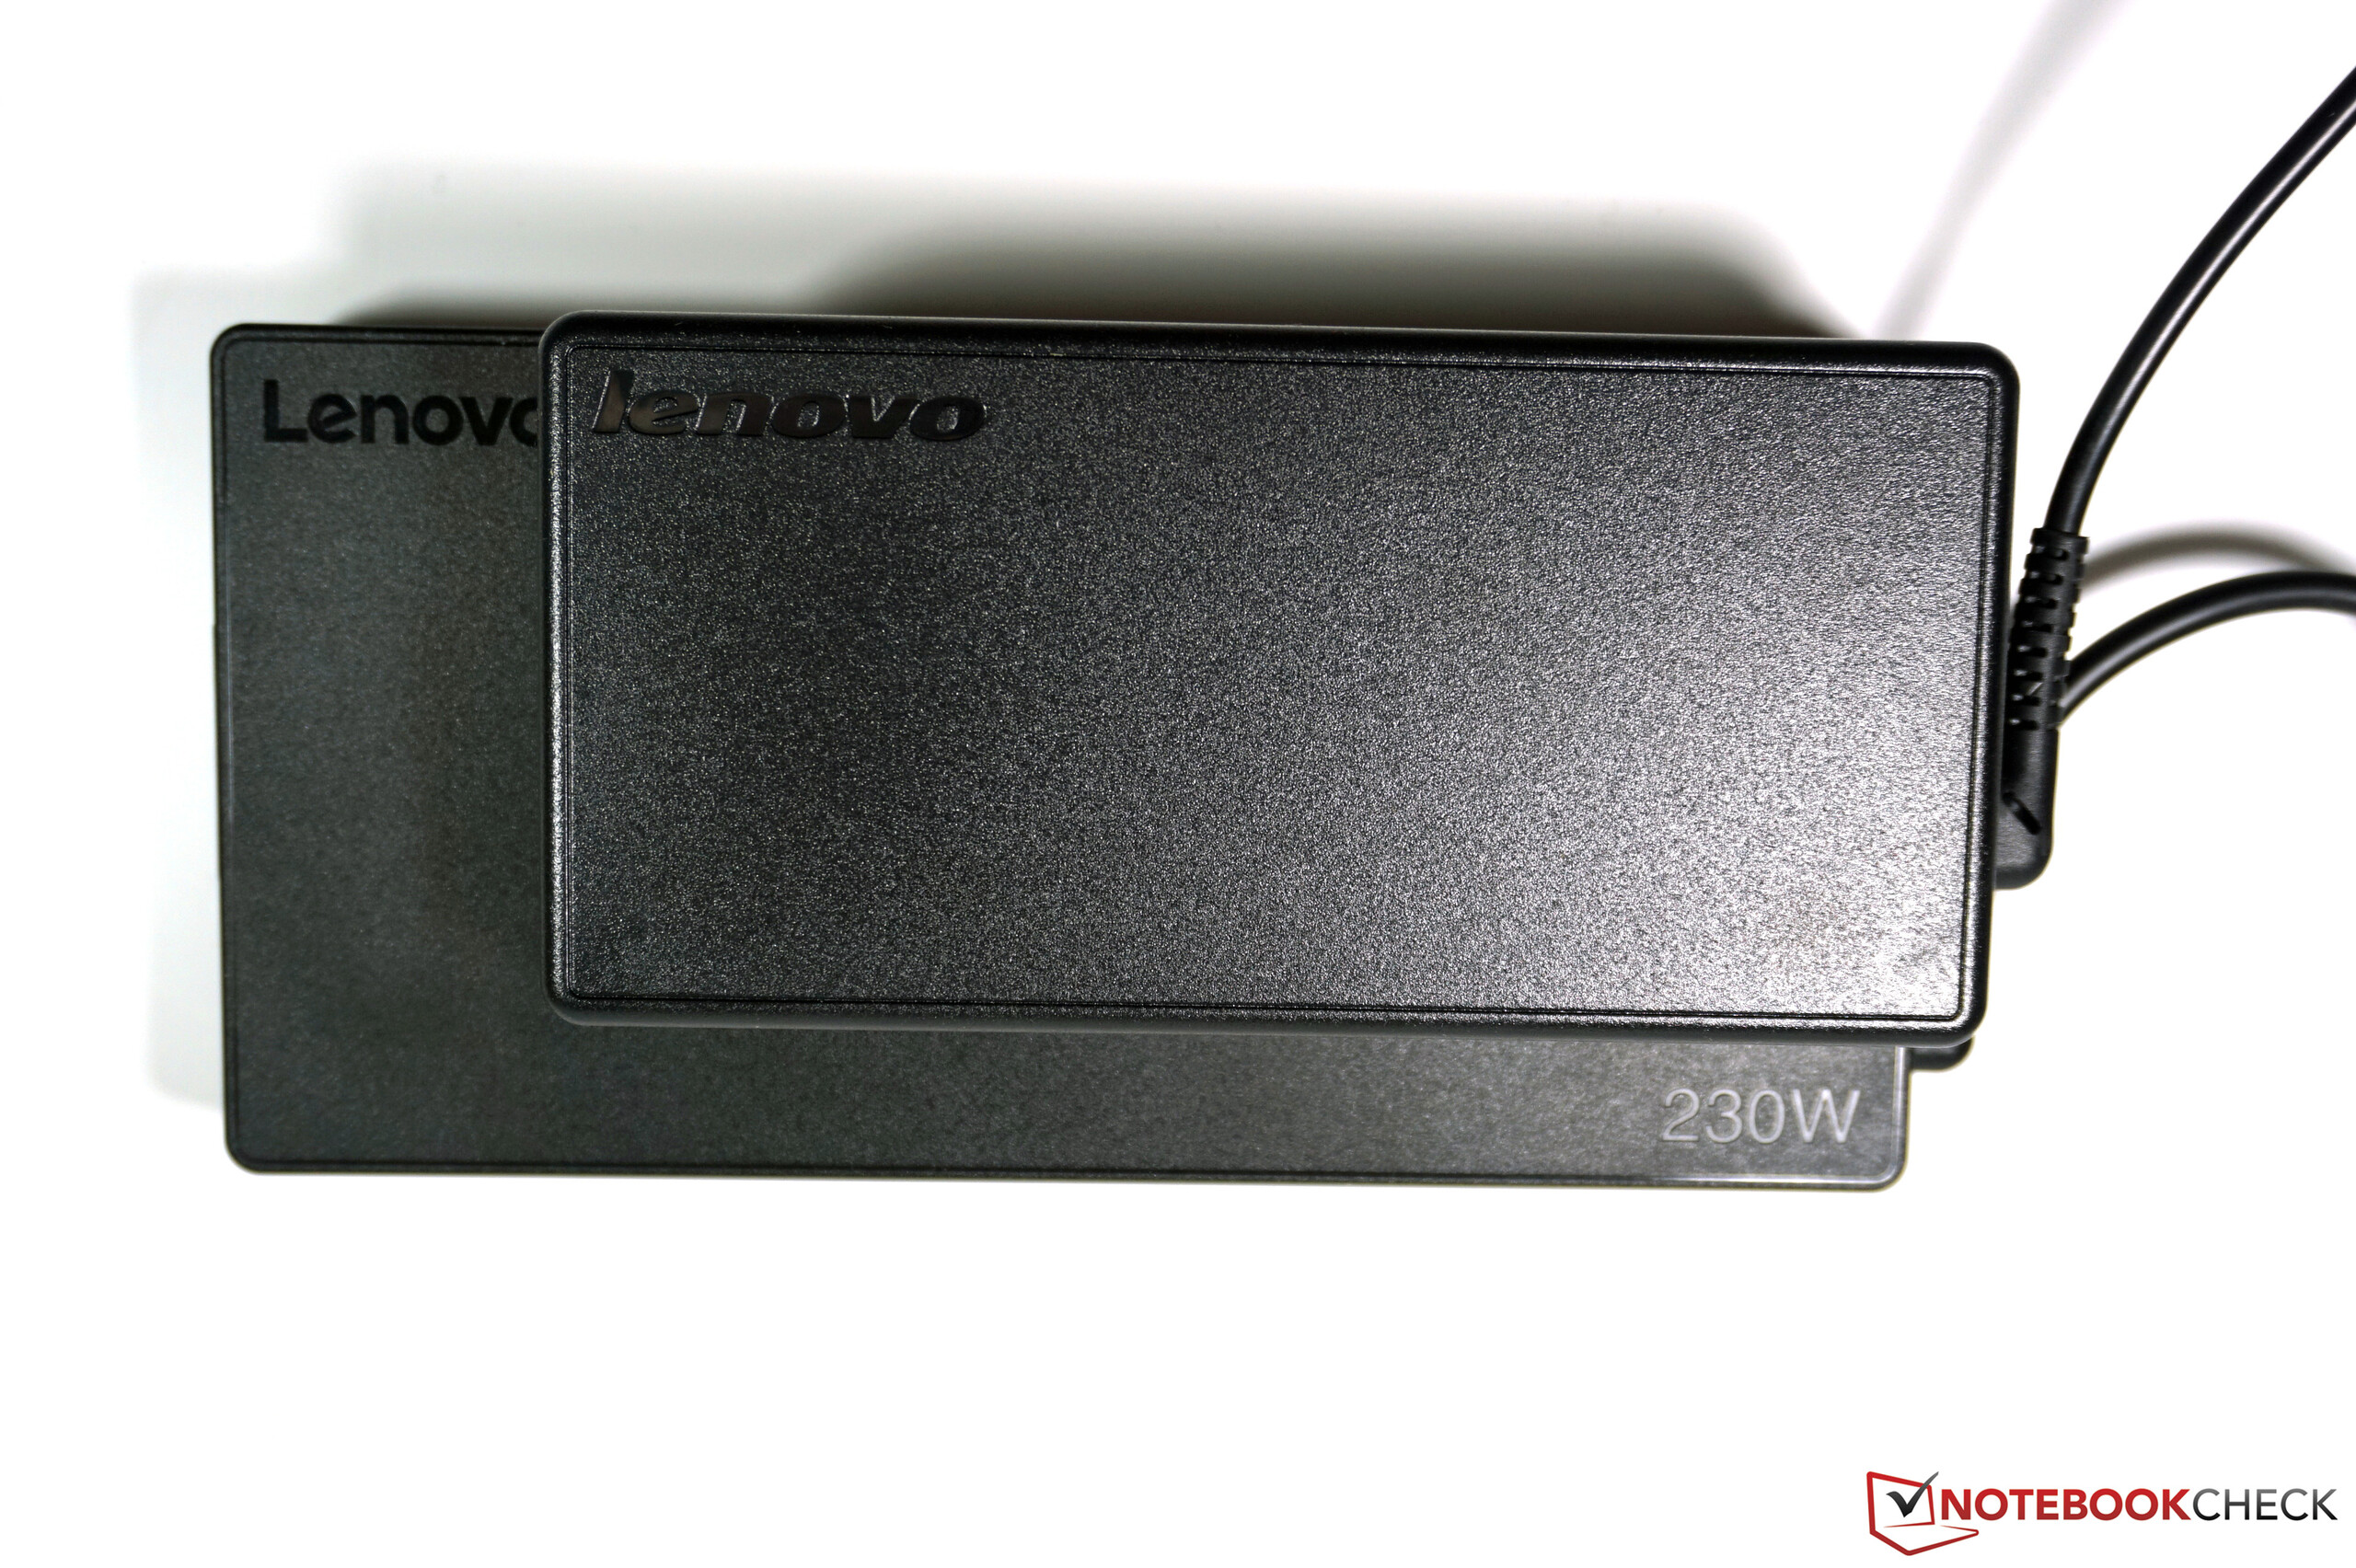
Our consumption measurements while idling or with light workloads are mainly influenced by the 4K display. The minimum value is 12.1 Watts and was measured at the lowest display brightness, but the consumption will drop to just 3.8 Watts (!) when we deactivate the display, so it is responsible for 2/3 of the consumption. This percentage is most likely even higher in the other two idle scenarios due to the high display brightness. This could actually be an interesting aspect for potential buyers that did not decide between the FHD and 4K panel yet. The maximum consumption under load is almost 140 Watts, but the bulky 230-Watt PSU (916 grams), which has its own support feet, obviously has no problems covering this consumption. Note: Some versions of the ThinkPad P70 are shipped with a 170-Watt PSU.
| Off / Standby | |
| Idle | |
| Load |
|
Key:
min: | |
Battery Runtime
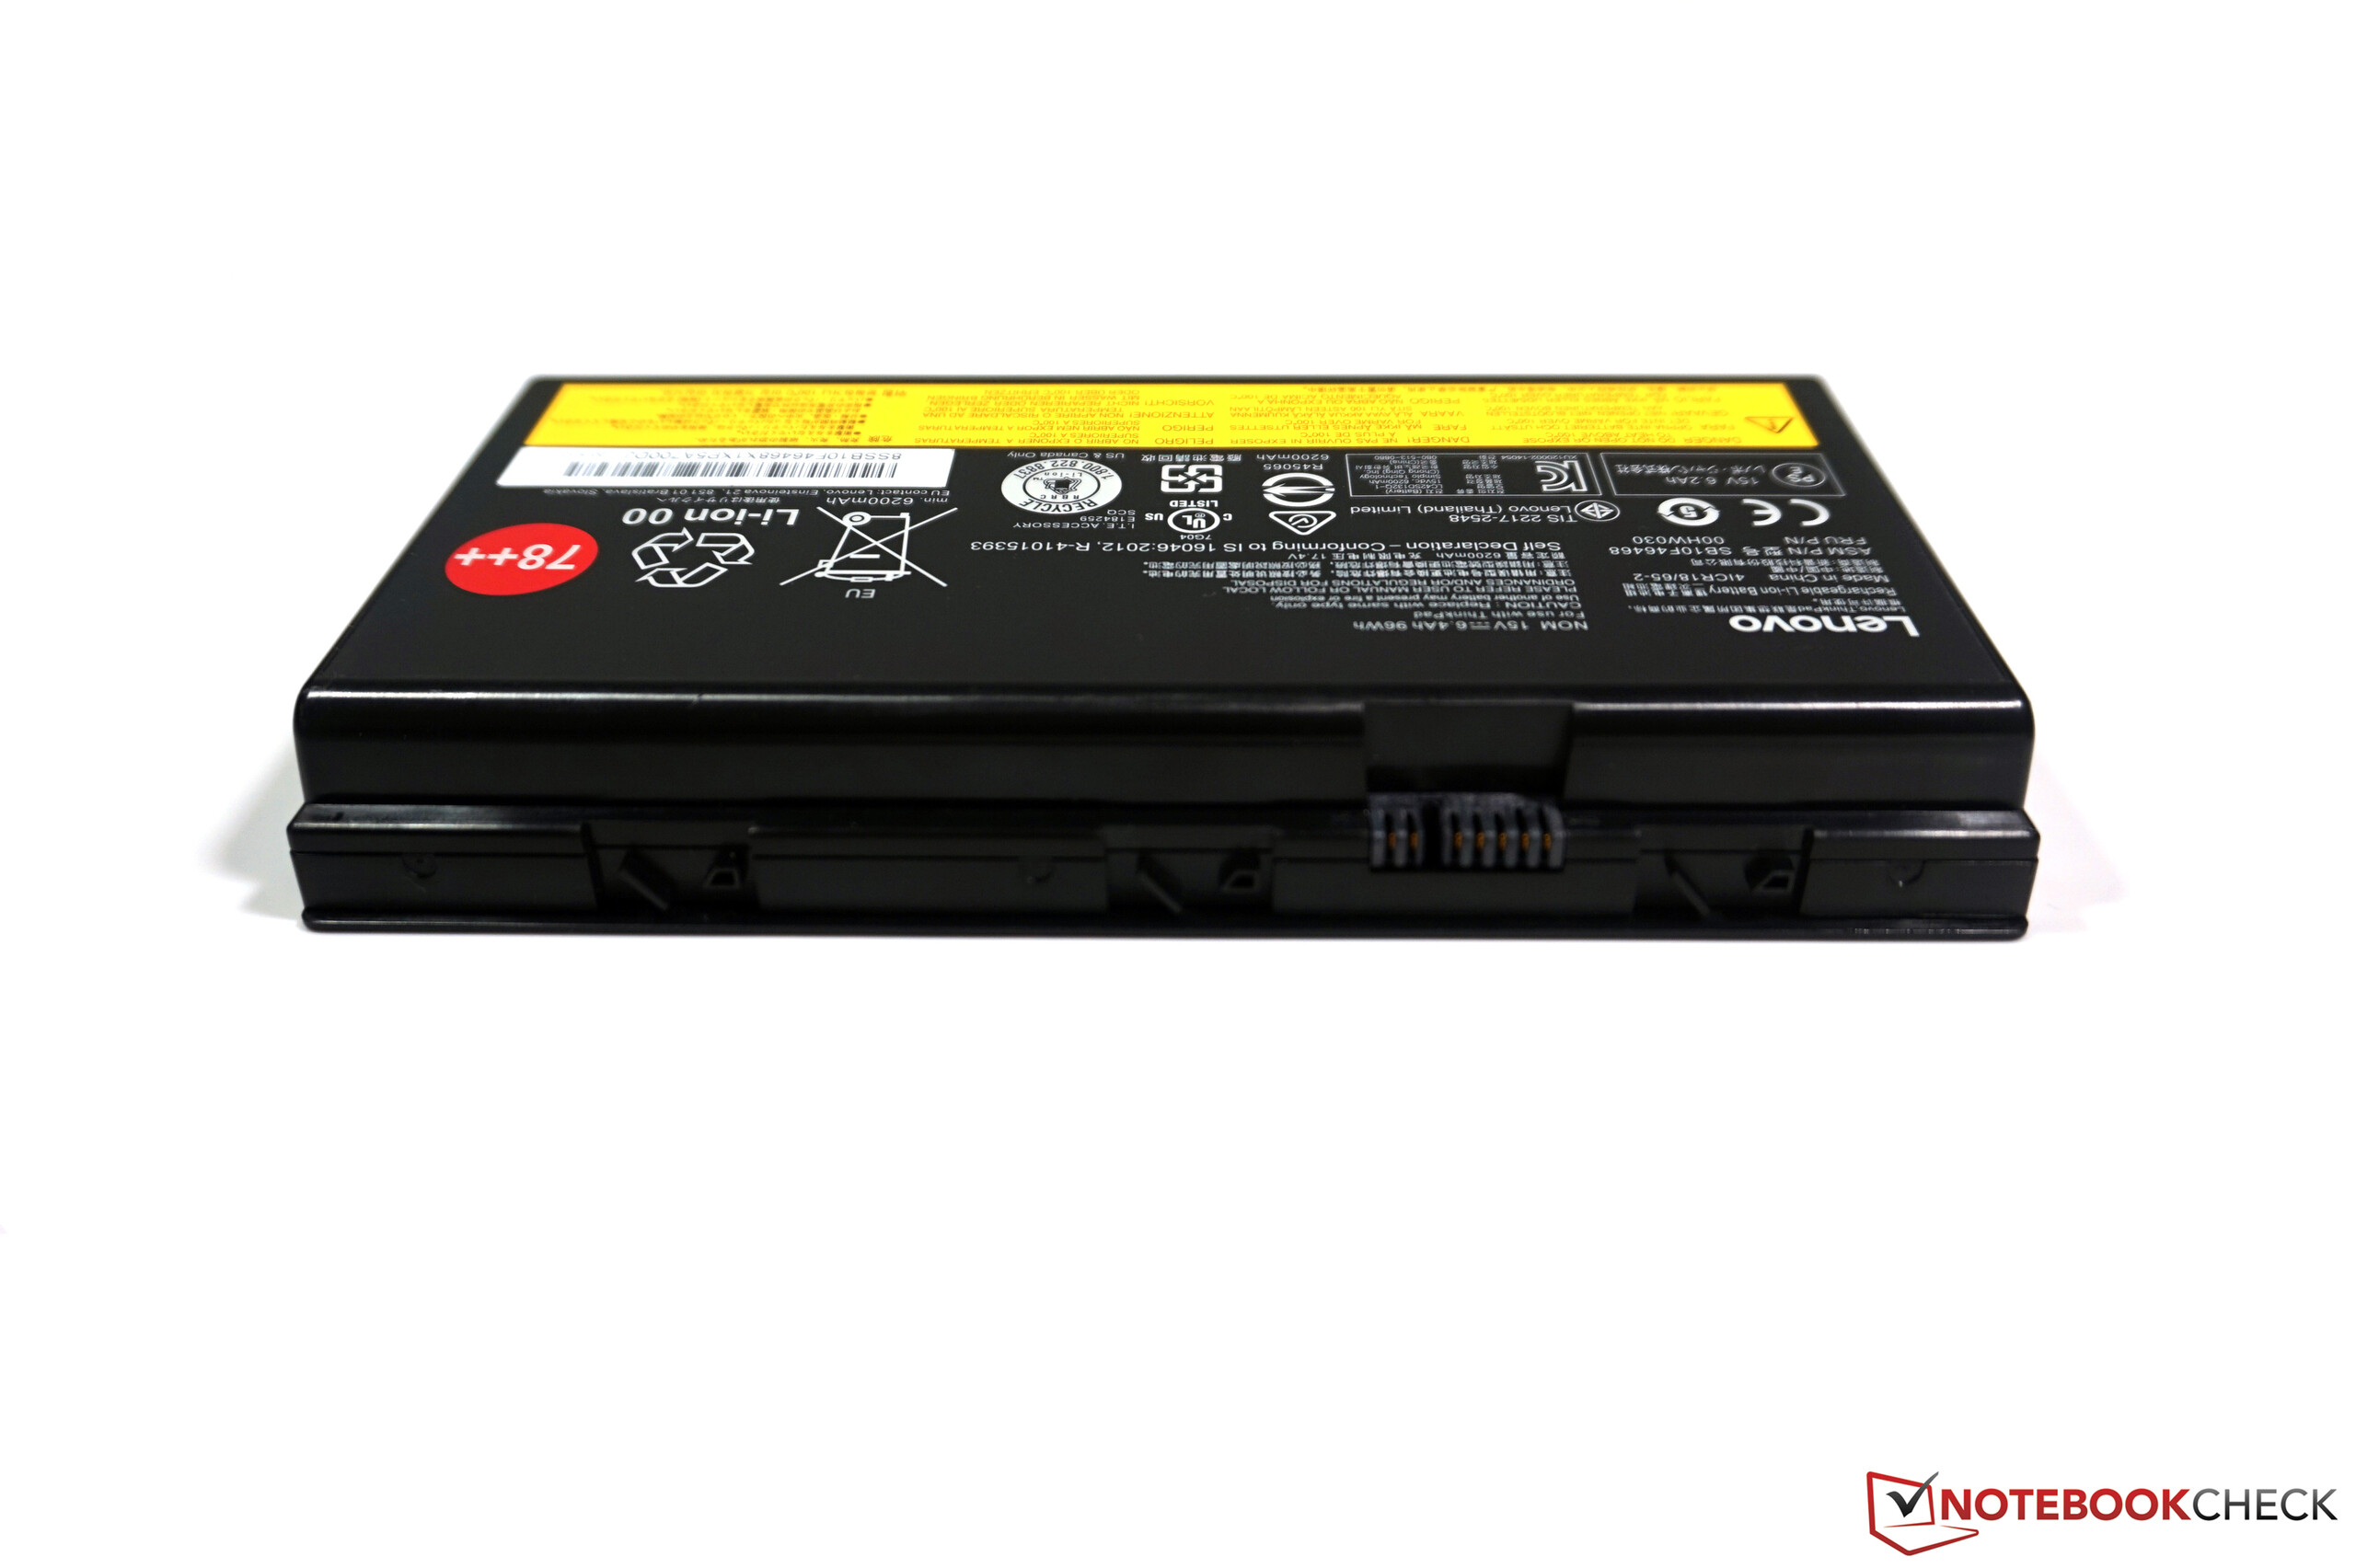
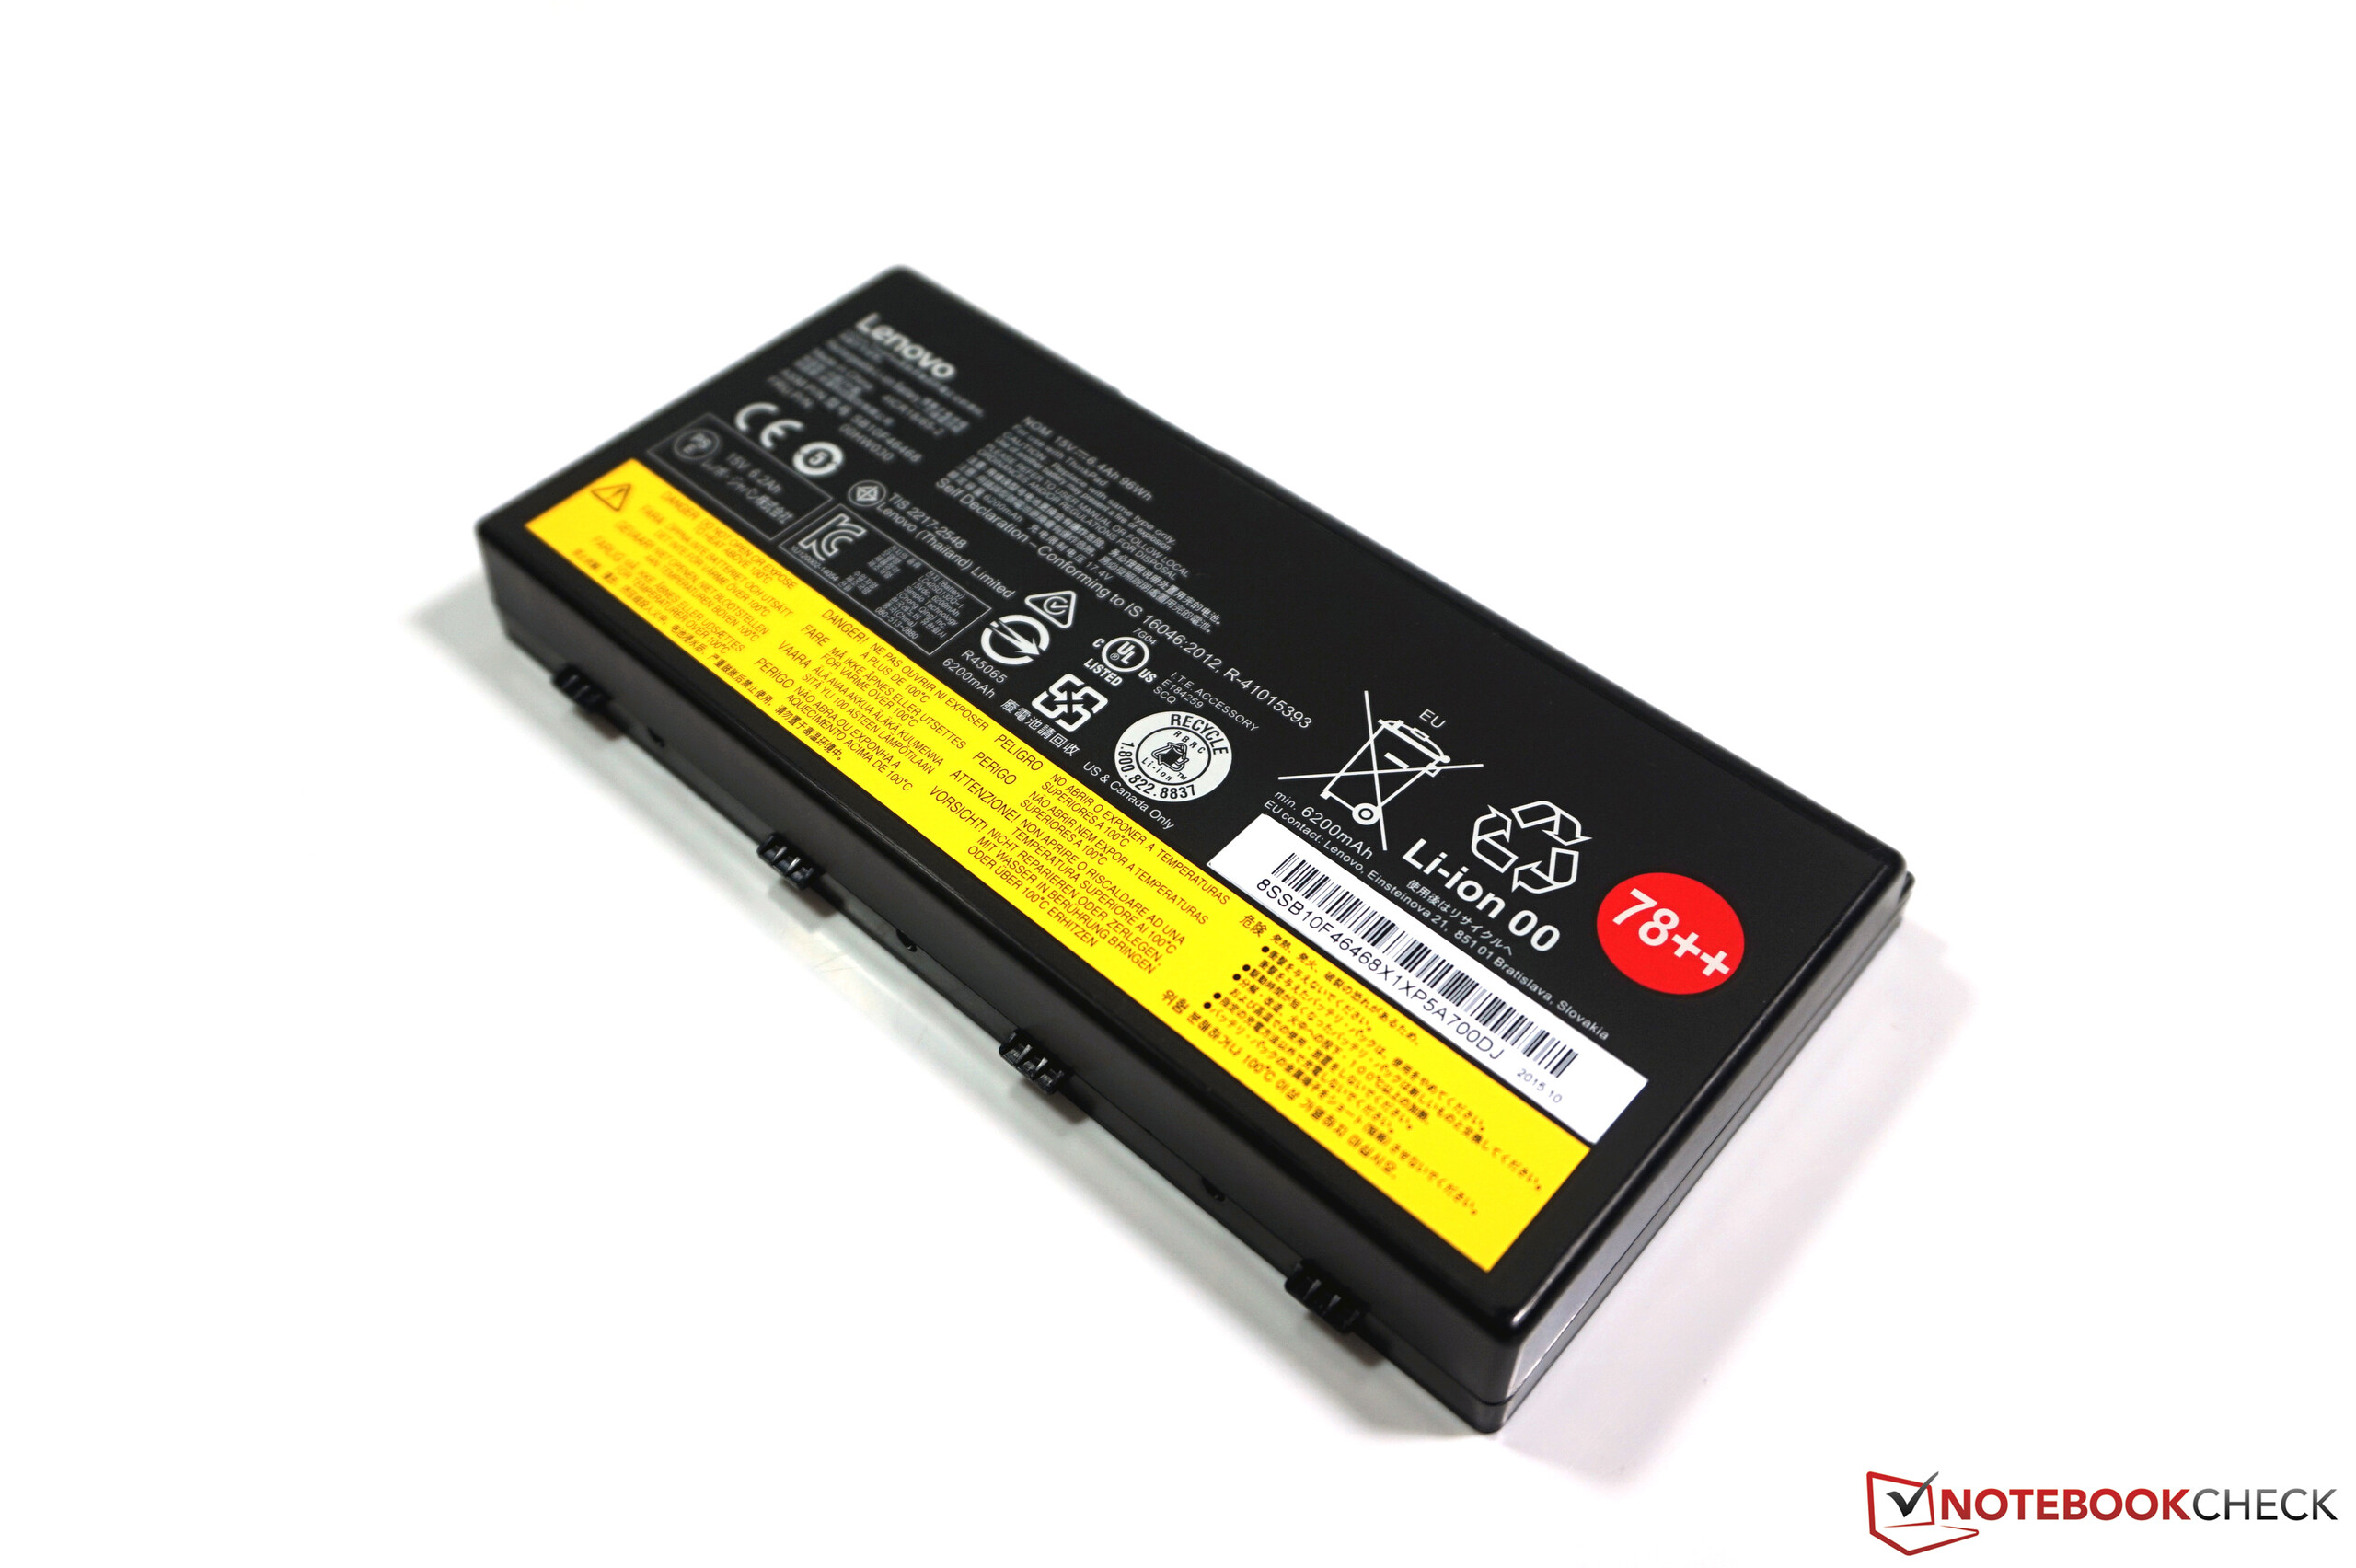
The large 96-Wh battery (lithium-ion, 8-cells) ensures very decent runtimes for the 17-inch workstation that you would not necessarily expect from such a device. The individual tests reflect our previous consumption measurements pretty accurately.
Maximum load, which is simulated by the Battery Eater Classic Test at the highest luminance and the high-performance power profile, will drain the battery in little more than one hour. This result confirms the consumption limitation at 90 Watts and therefore represents the worst-case scenario. A SPECviewperf 12 loop ran for 76 minutes.
The result in the other extreme scenario, the maximum runtime, is affected by the high idle values, but the result of 7:42 hours is still decent. It is interesting that the playback of an FHD video at 151 nits (12/15, Big Buck Bunny, H.264, Wi-Fi off) is also possible for 7:32 hours. The system is hardly challenged during video playback thanks to the integrated graphics card and the deciding factor is once again the display. Our Wi-Fi surfing test (also 151 nits) determines a runtime of 6 hours. We cannot say how big the consumption advantage of the FHD display is, but the runtimes should be much longer, especially in scenarios with light workloads.
The ThinkPad P70 supports the so-called quick-charge feature. The 230-Watt power adapter only needed 30 minutes to recharge the battery from 5% to 50% – while the device was turned on. It takes another 50 minutes to reach 90% and the last 10% is the slowest. The battery is fully recharged after 2:30 hours. You can also set charging limits, so that the battery is only recharged when the capacity drops below 90%, for instance.
Pros
Cons
Verdict
Lenovo's ThinkPad P70 is an excellent re-entry into the segment of 17-inch workstations. We especially like that Lenovo supposedly listened to the feedback of customers and reversed some controversial design decisions of previous generations and even improved them. We are talking about the touchpad and the TrackPoint in particular, which are once again equipped with dedicated buttons.
The chassis of the workstation, which is now black again, is perfectly built and the base unit as well as the keyboard in particular are extremely sturdy. The thin lid cannot quite keep up and the hinges also have problems with the heavy screen at extreme angles. Another advantage of the chassis is the large maintenance hatch and the good maintainability.
A very important aspect of a workstation is obviously the performance, and the ThinkPad P70 can convince with very good results. Thanks to the good (and also quiet) cooling solution, the components can also use a big part of their performance under extreme loads. The situation could have been even better if Lenovo wasn't so conservative in respect of the temperatures. Only the GPU performance is slightly reduced on battery power.
Welcome back, Lenovo! The ThinkPad P70 is once again an excellent workstation from the Chinese manufacturer after 5 years. Lenovo listened to the feedback from customers and avoided some problems of the previous generations.
We listed quite a few cons on the right side, but none of those is really serious and some of the points only apply for our review unit in combination with Windows 7. The P70 does not have any big problems, so you will notice the smaller issues. The most annoying problem is certainly the screen bleeding, which should not happen in this price range. Lenovo also saved some money in respect of the webcam and the speakers.
You should also use Windows 10 if you order a configuration with a 4K screen, because we noticed some scaling issues with Windows 7. If you still want to use the old operating system, you might want to consider the FHD model, which should also have a significant consumption advantage, especially in scenarios with light workloads.
Lenovo ThinkPad P70
- 03/17/2016 v5 (old)
Andreas Osthoff
Price comparison

