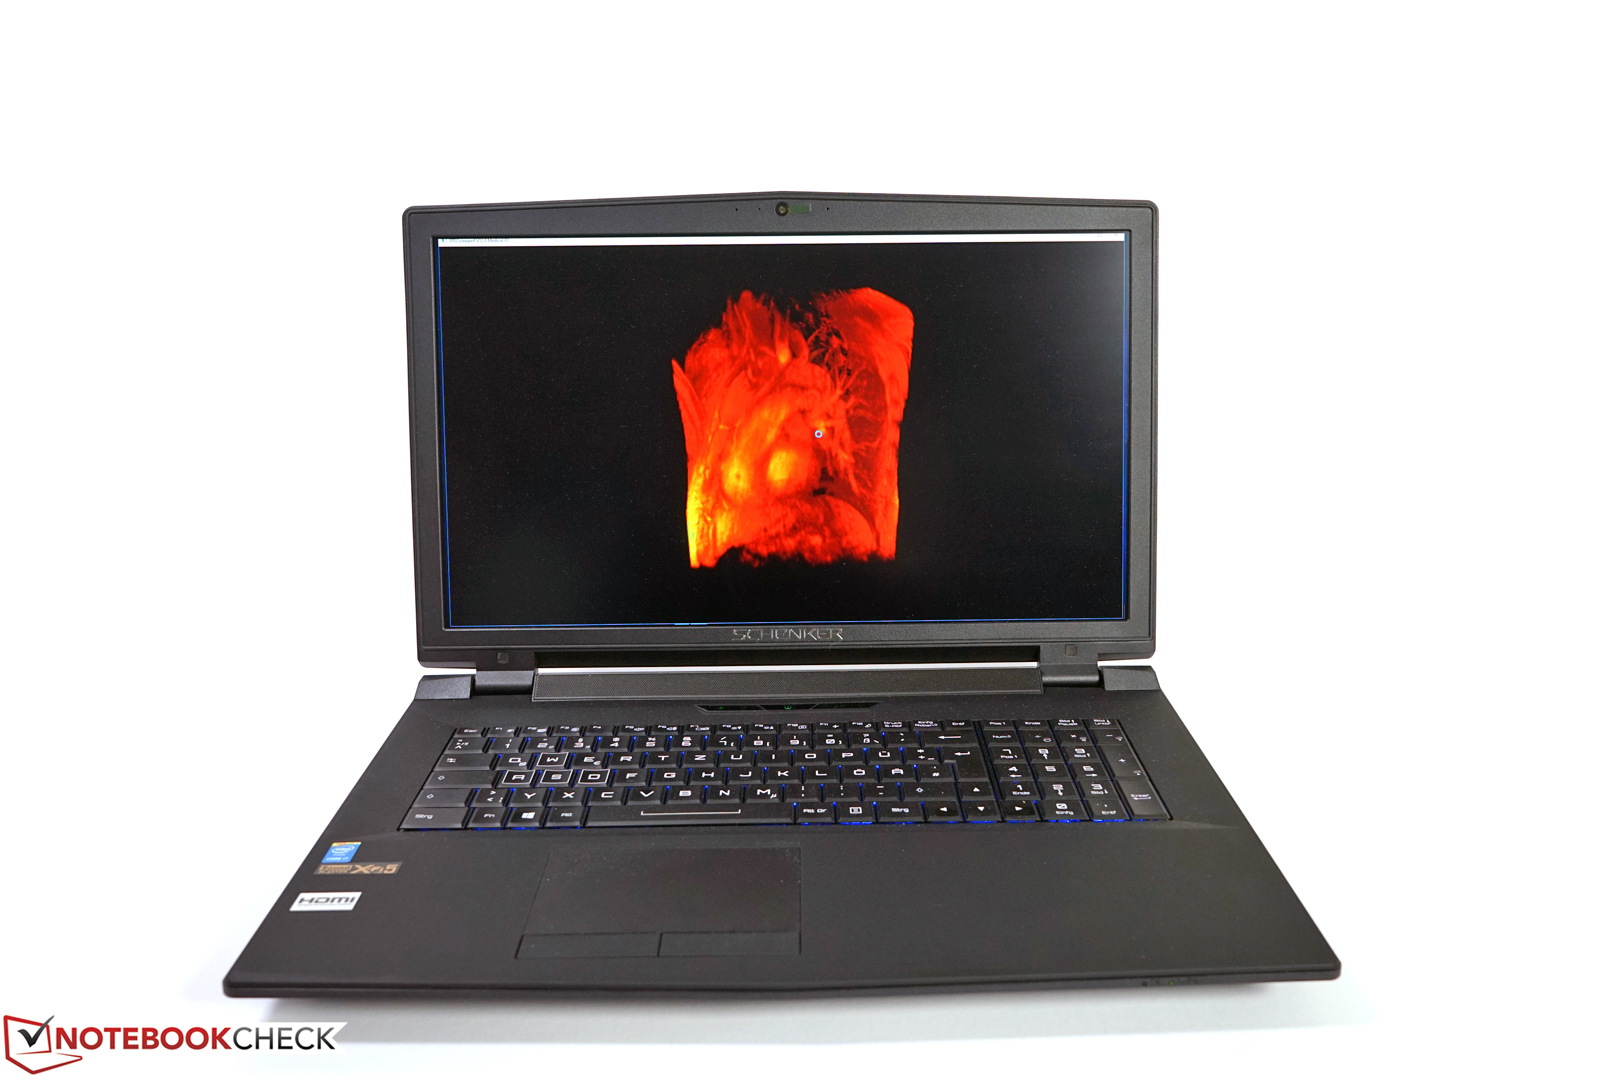
Schenker W706 (Clevo P771DM) Workstation Review
For the original German review, see here.
At a first glance, Schenker's W706 is definitely not a bargain for 4700 Euros (~$5124, gross price). However, if you consider the incorporated core components, including Nvidia Quadro M5000M graphics card, Intel Core i7-6700 processor, 32 of GB RAM and the 512 GB NVMe SSD, the driving cost factors can be quickly identified.
However, the mobile W706 workstation is a bit less expensive than its competitors from big, established manufacturers. A similarly equipped Dell Precision 7710 with Intel Core i7-6820HQ costs about 5000 Euros (~$5451, gross price) and a Lenovo ThinkPad P70 is priced at about 5100 Euros (~$5560, gross price). The Schenker model lacks usual business features, a UHD display or even an internal colorimeter.
Since the W706's case does not differ from the Gamer XMG U706's, we will only briefly discuss details relevant for its class in the related sections. Further, complementary impressions are available in our Schenker XMG U706 review.
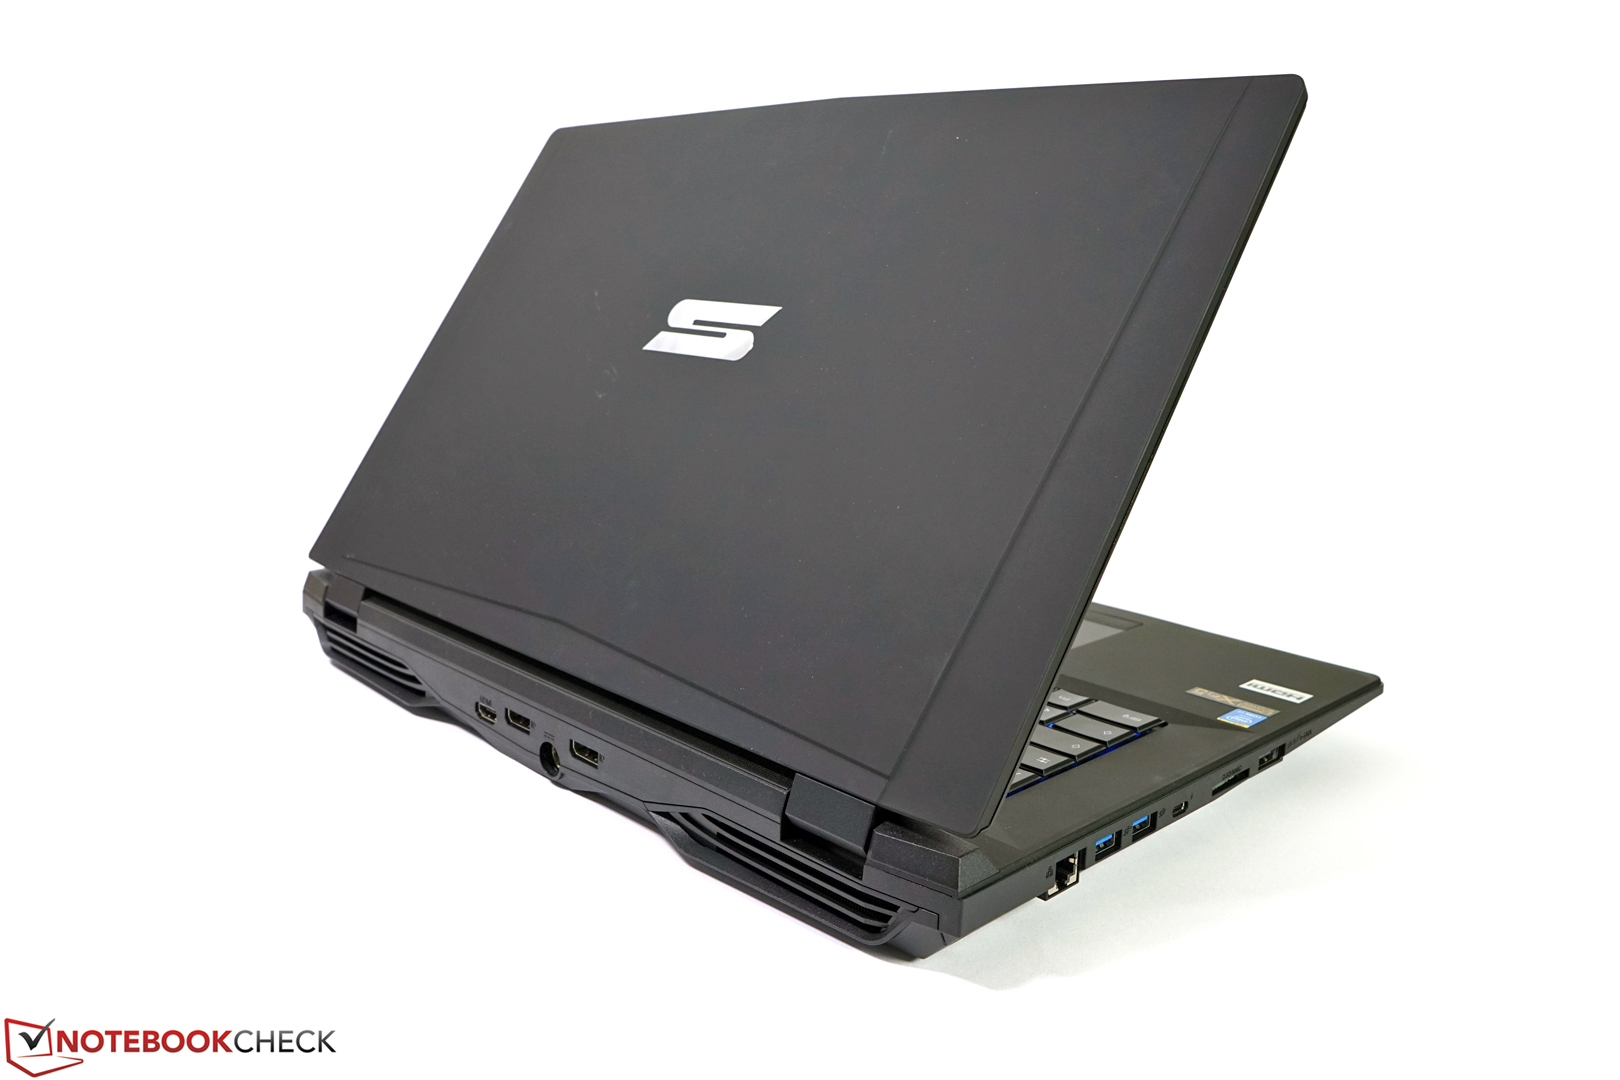
Case
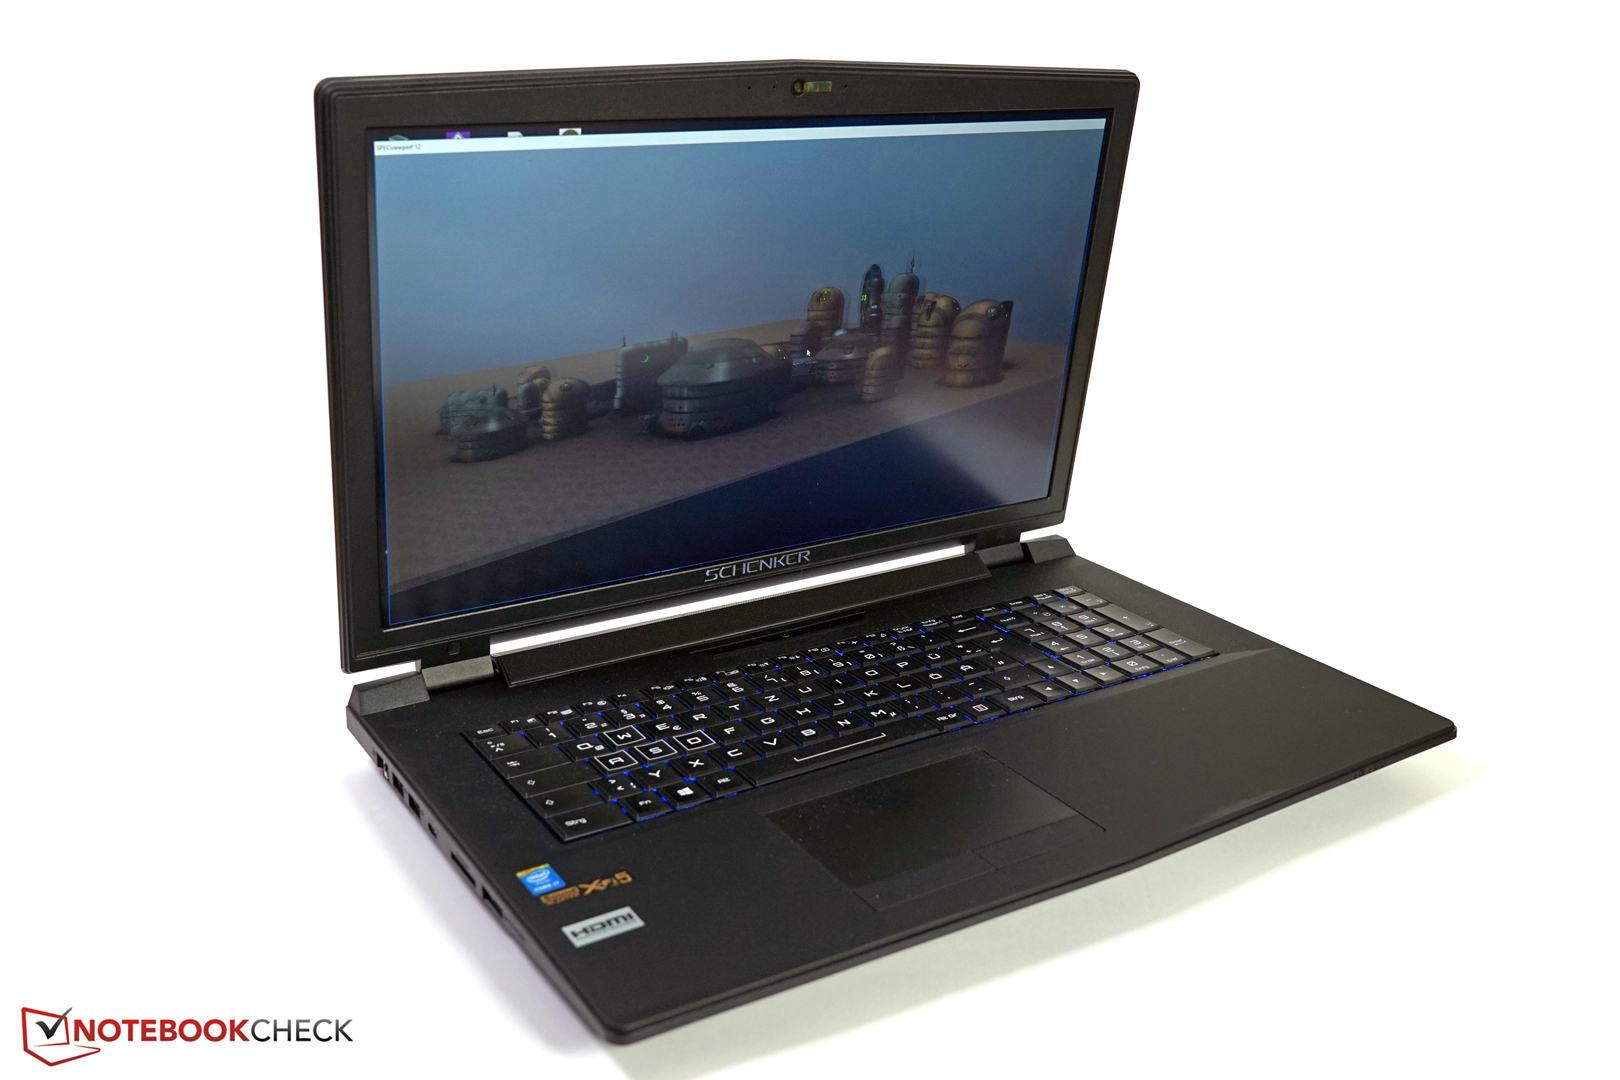
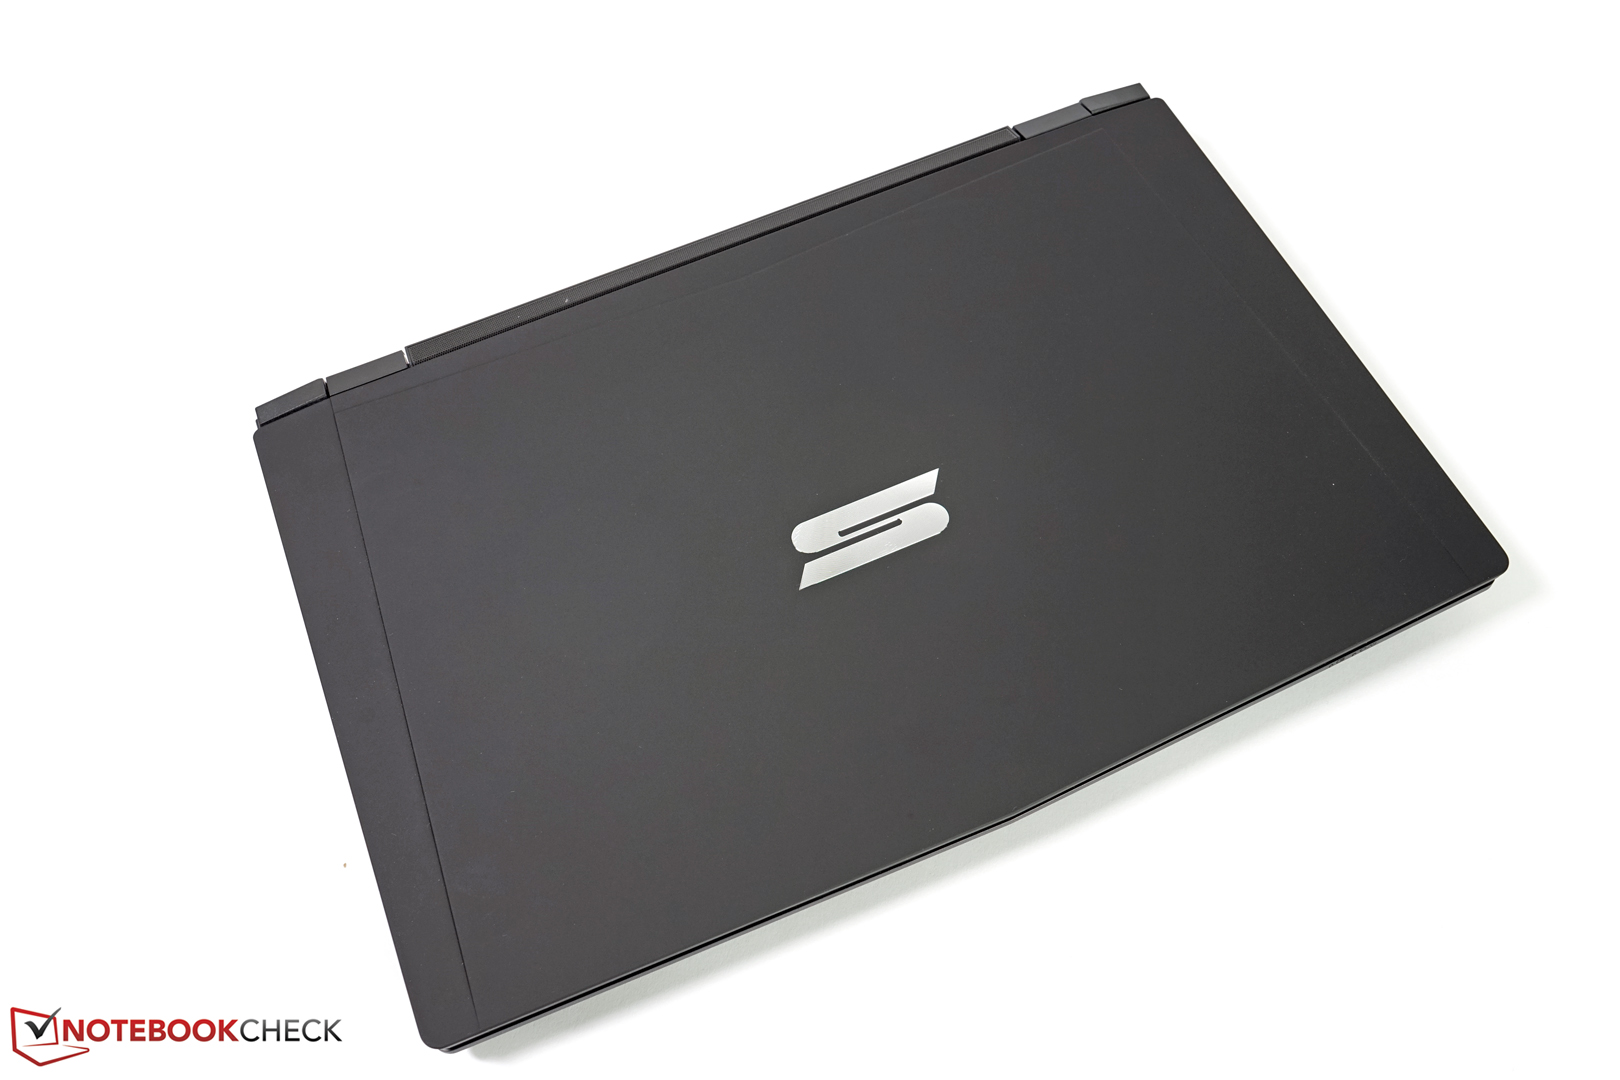
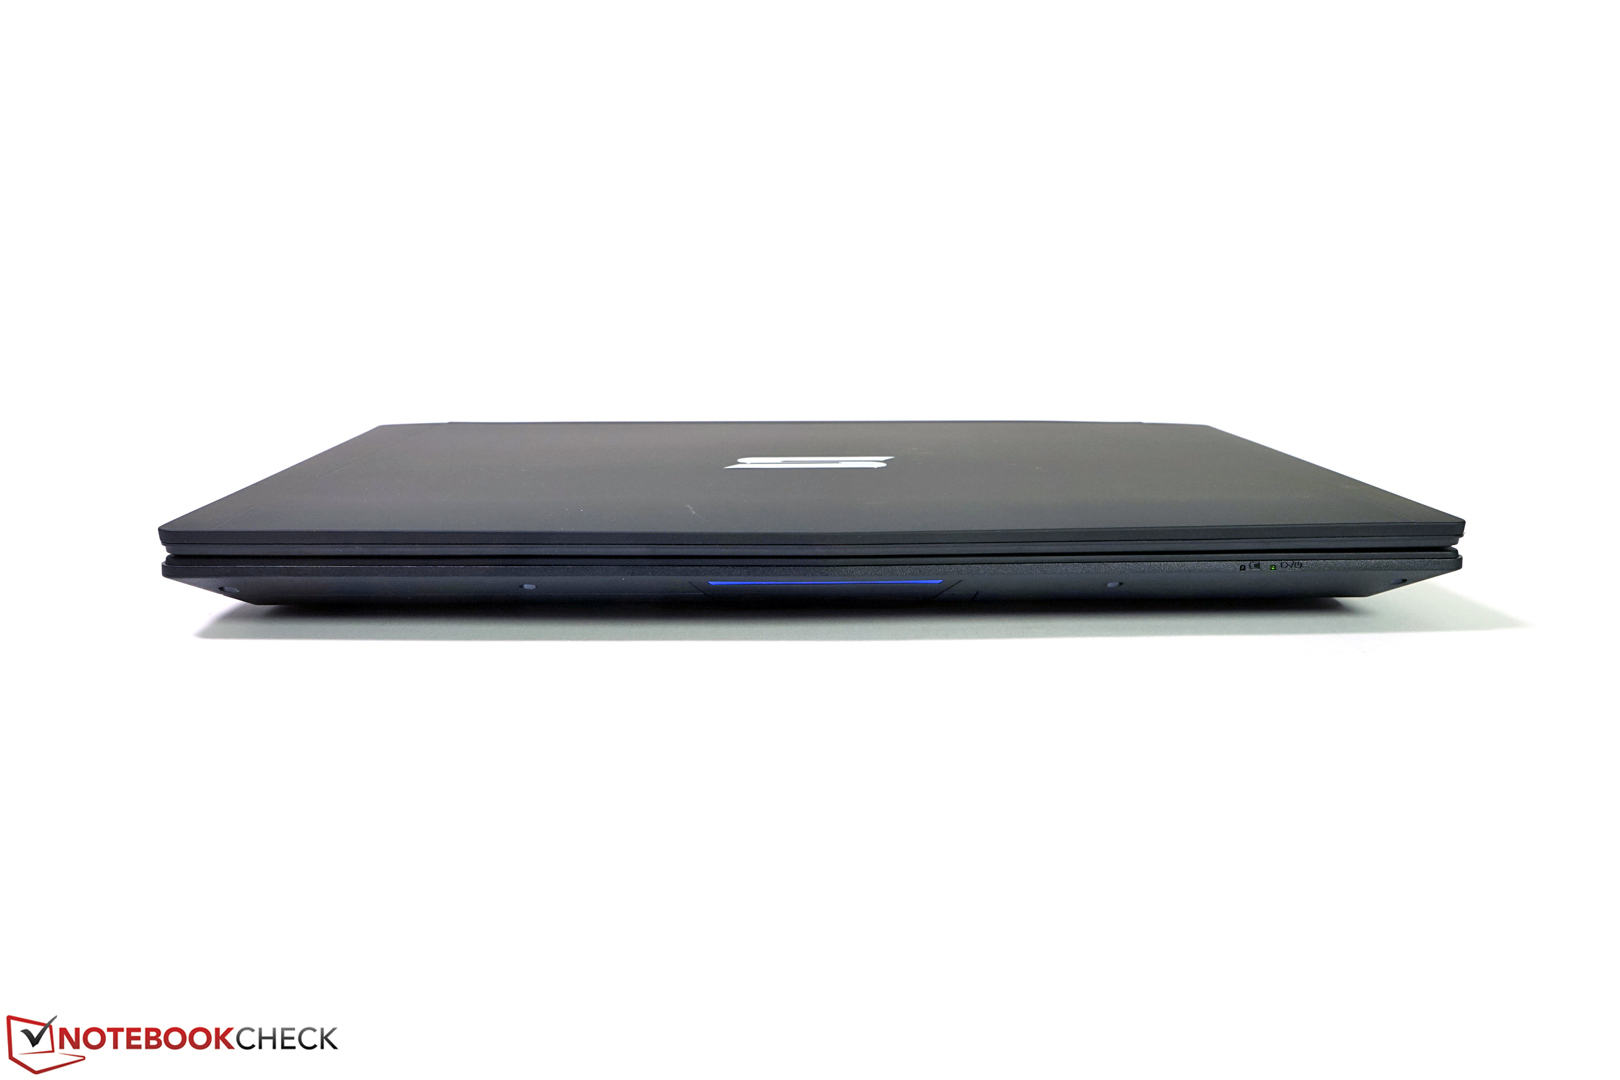
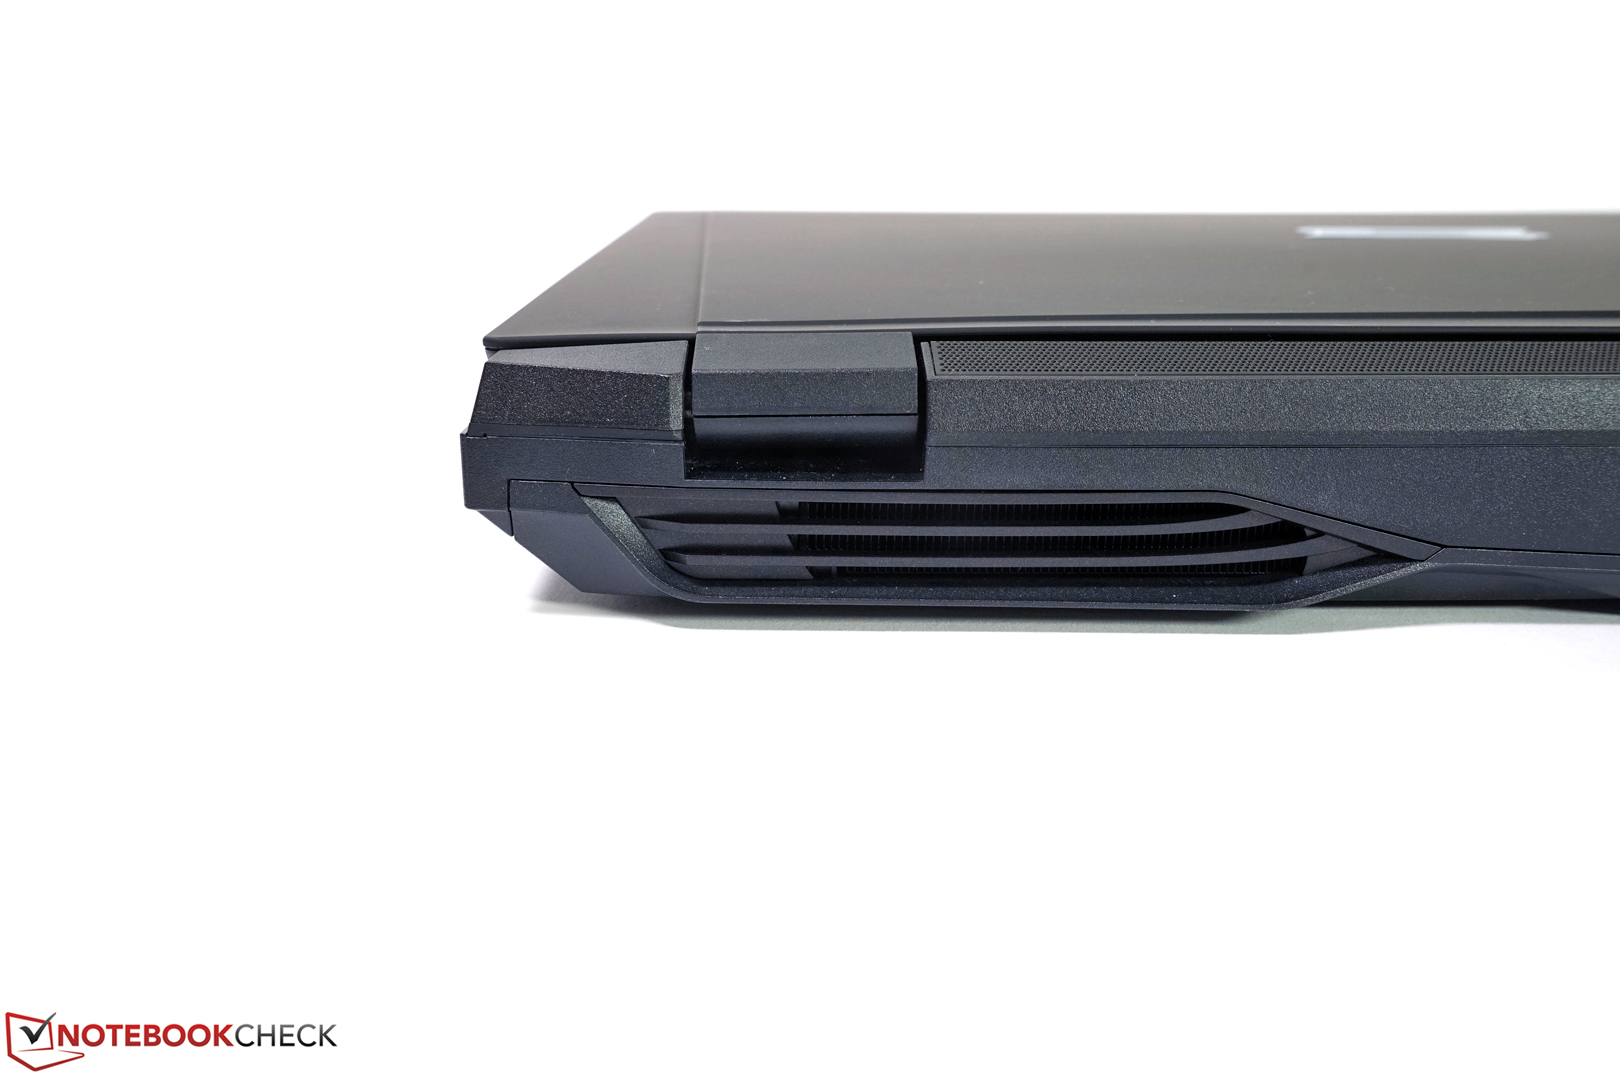
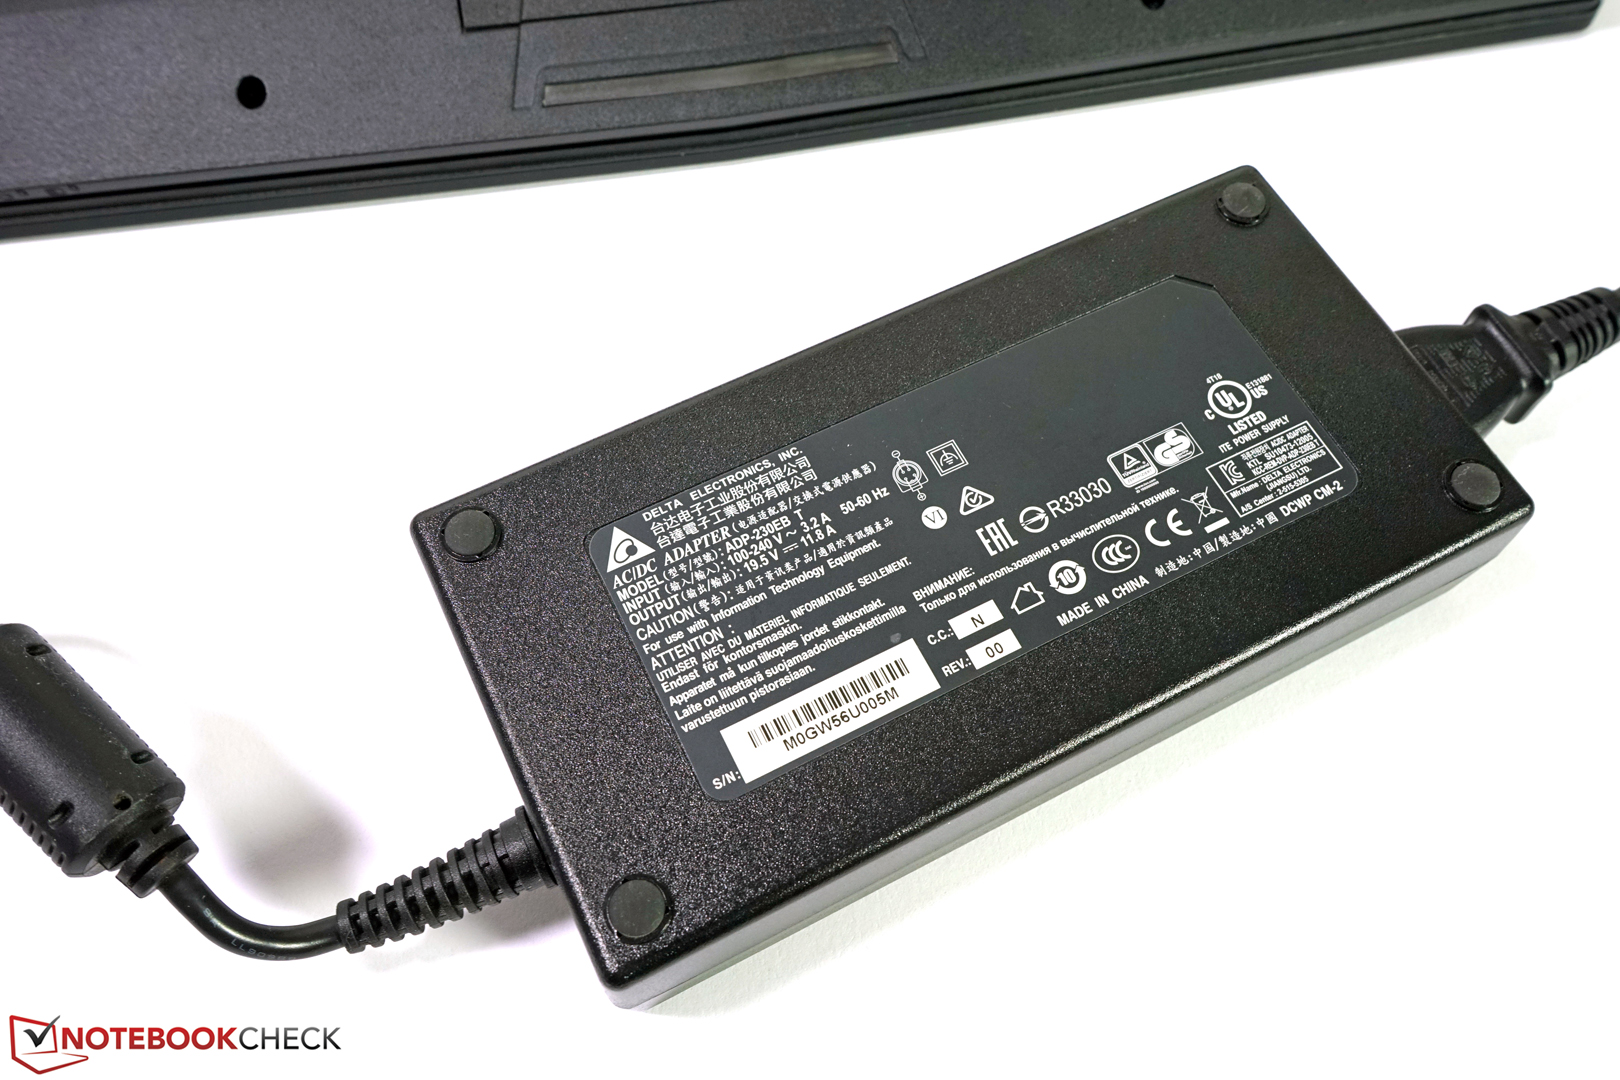
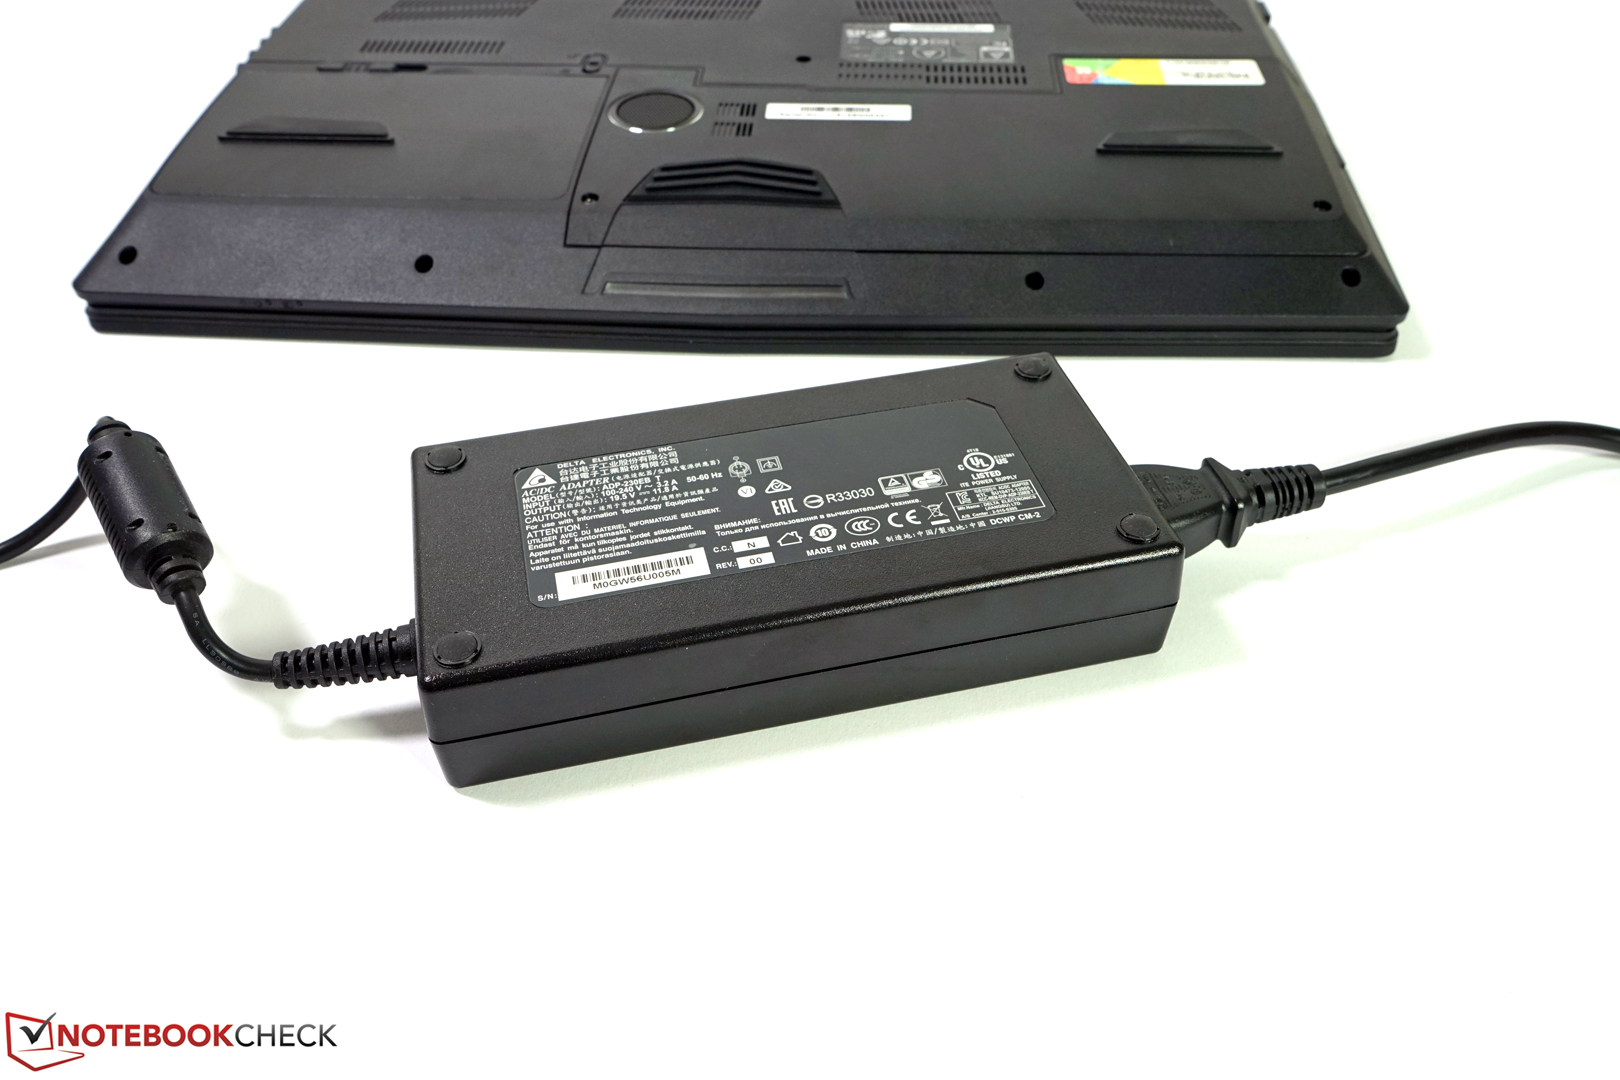
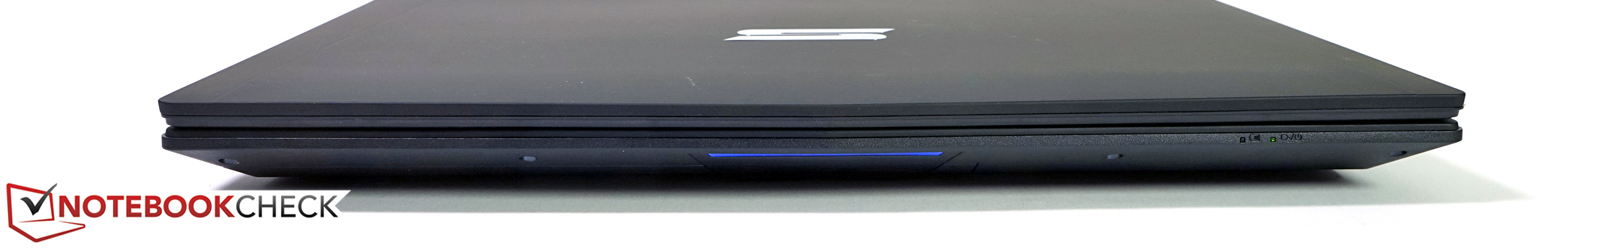
The case of the W706 workstation weighs 3810 g. Together with the 930 g power adapter, it is not light. In return, you'll get a quite stable plastic case with a lot of space for internal components. The palm rests are sturdy, the display hinges are stiff and the case is very rigid overall. The parts are precisely made and the interfaces accurately installed. Only the lid can be twisted a bit, but this does not reduce its protective effects.
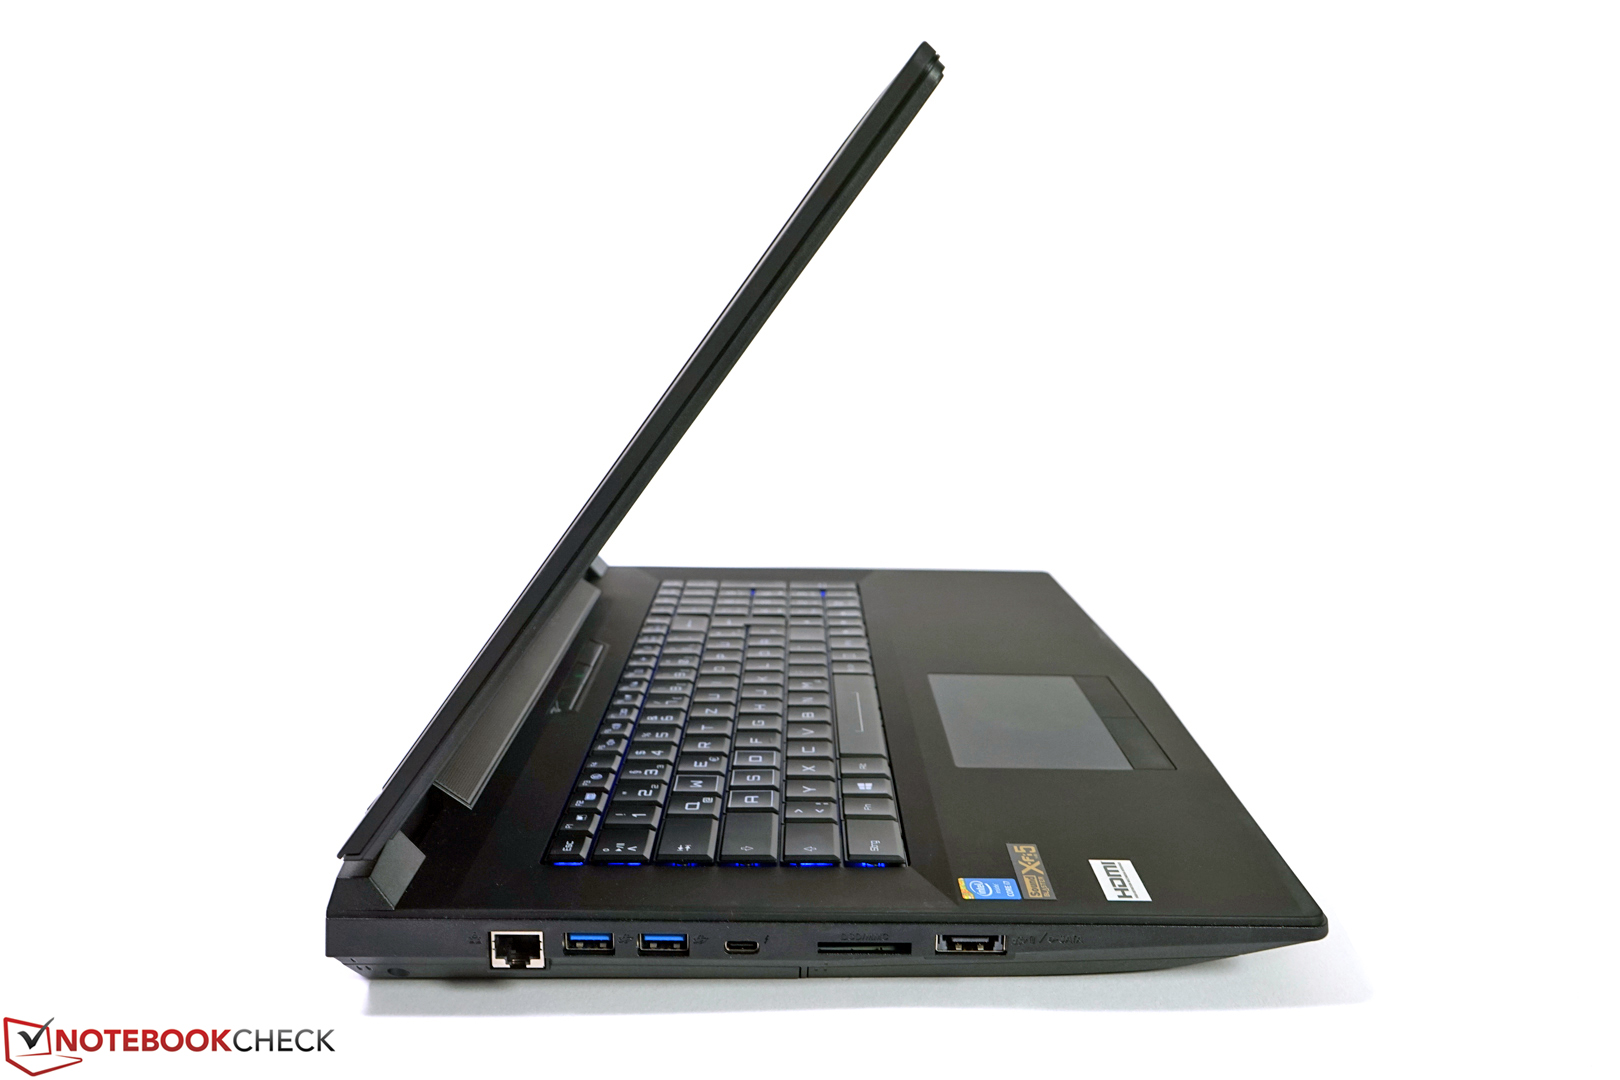
Connectivity
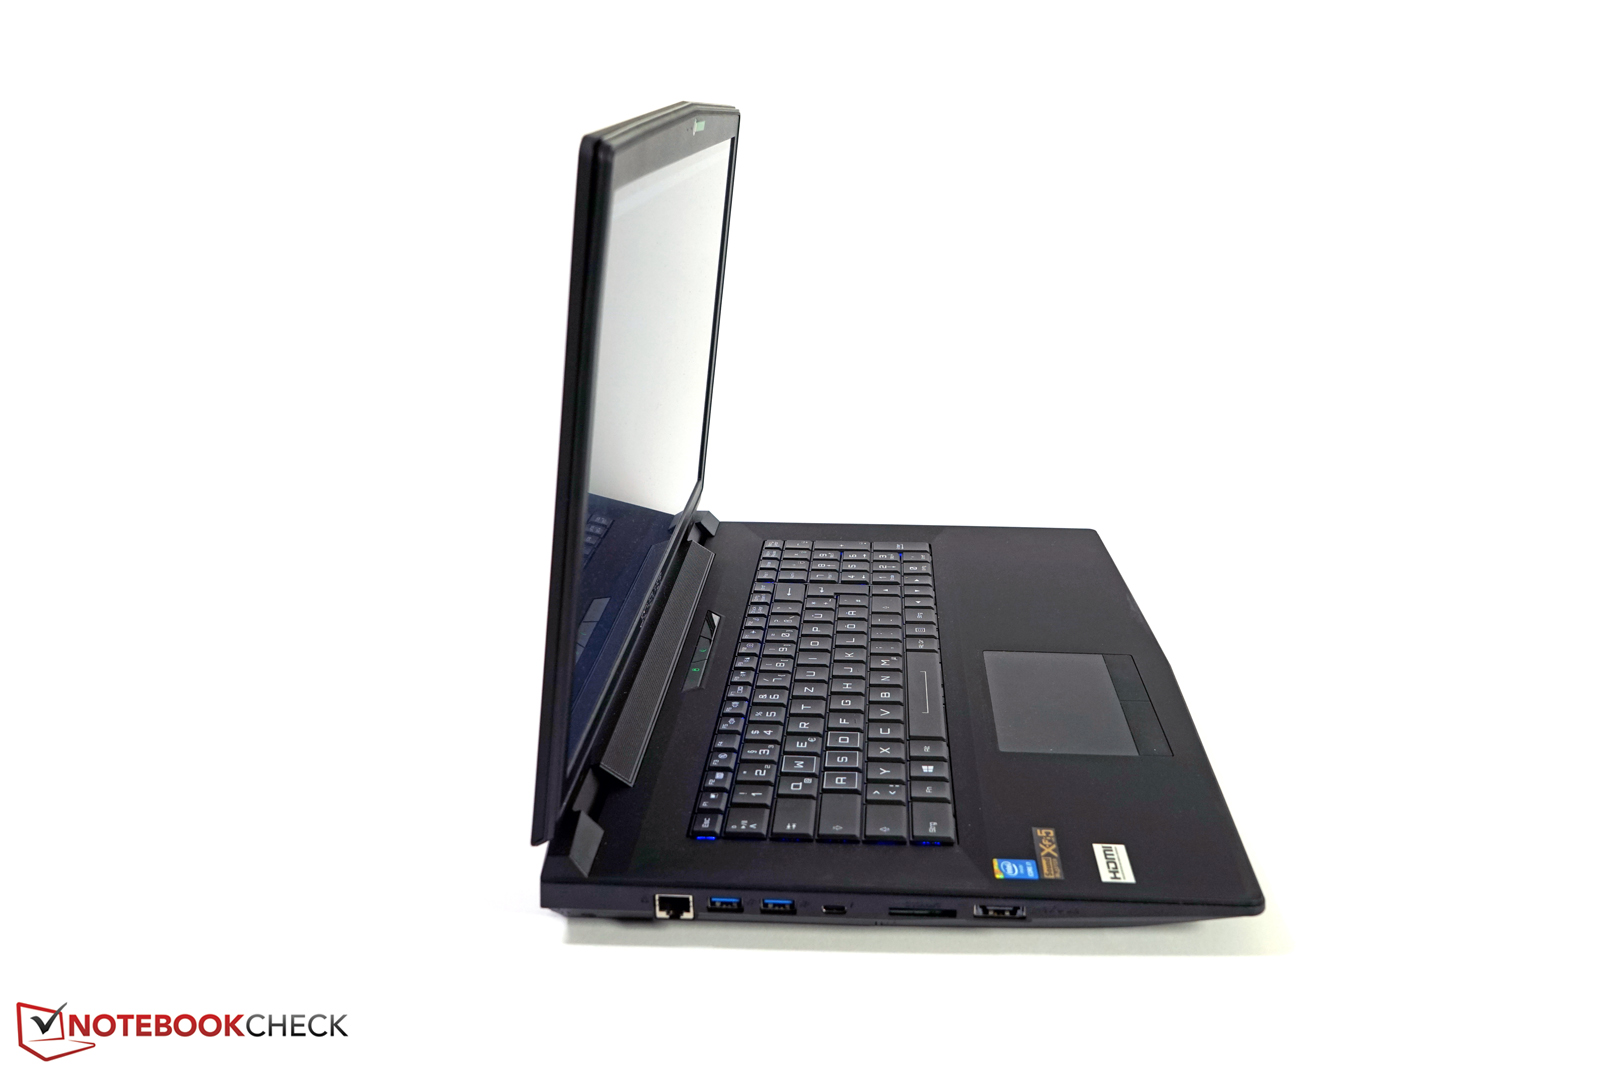
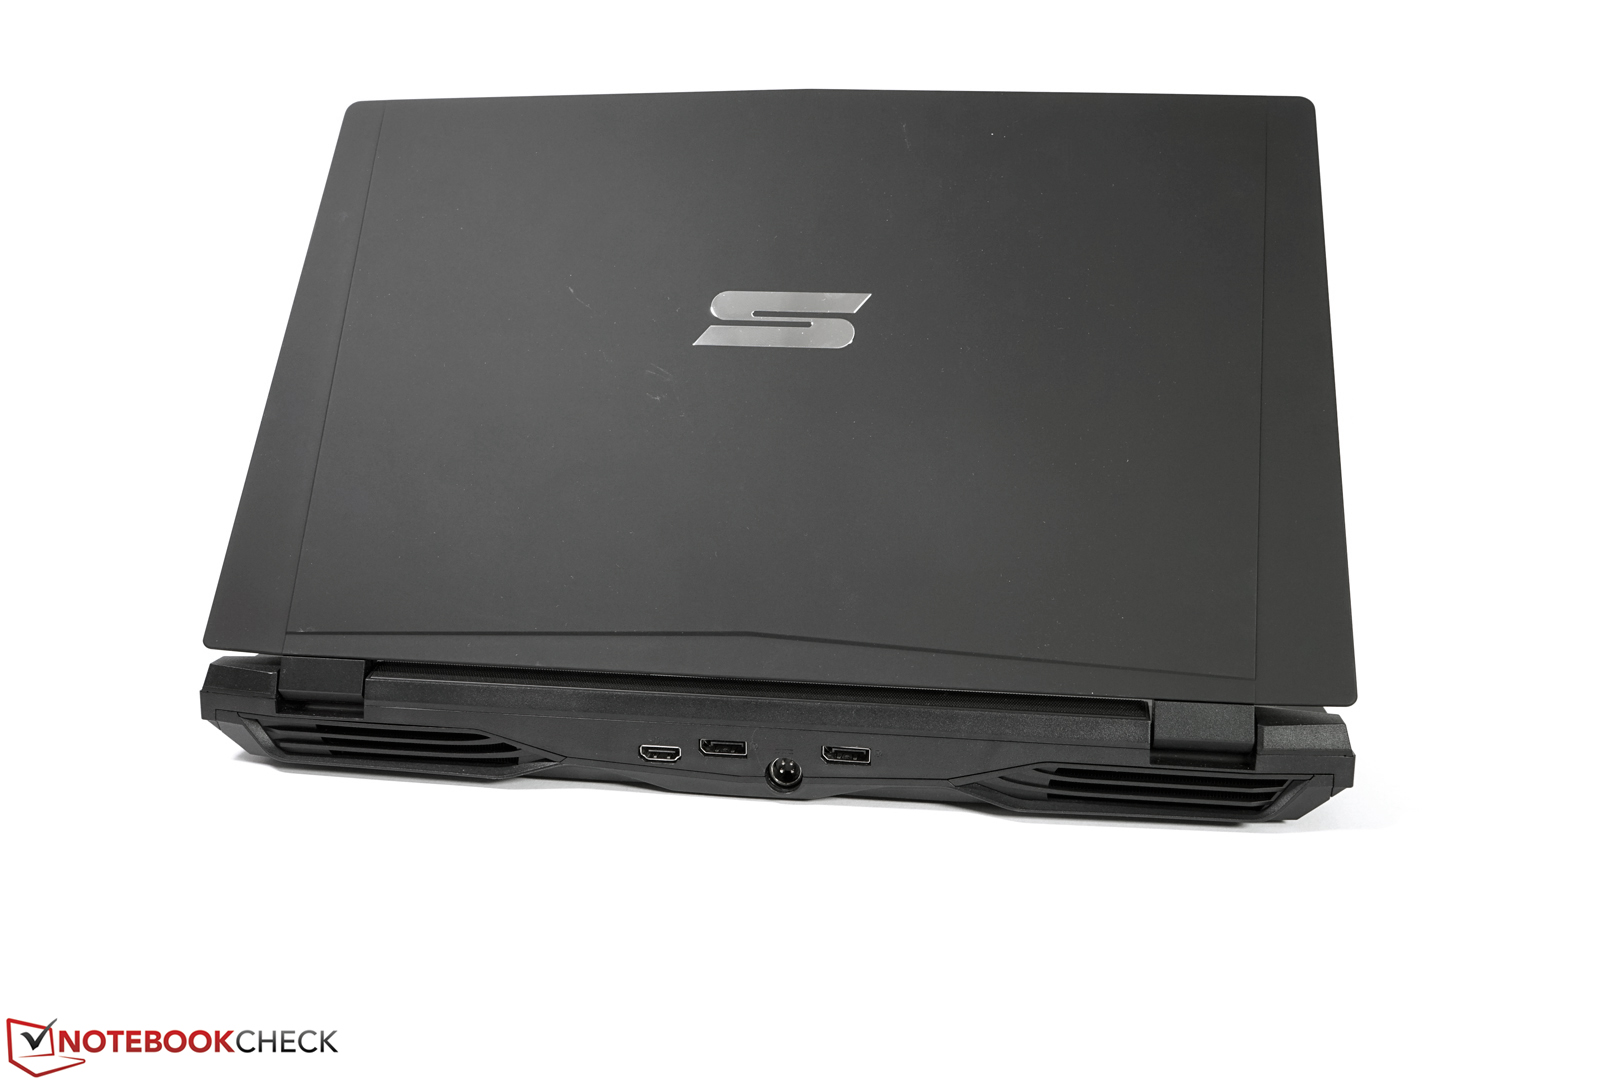
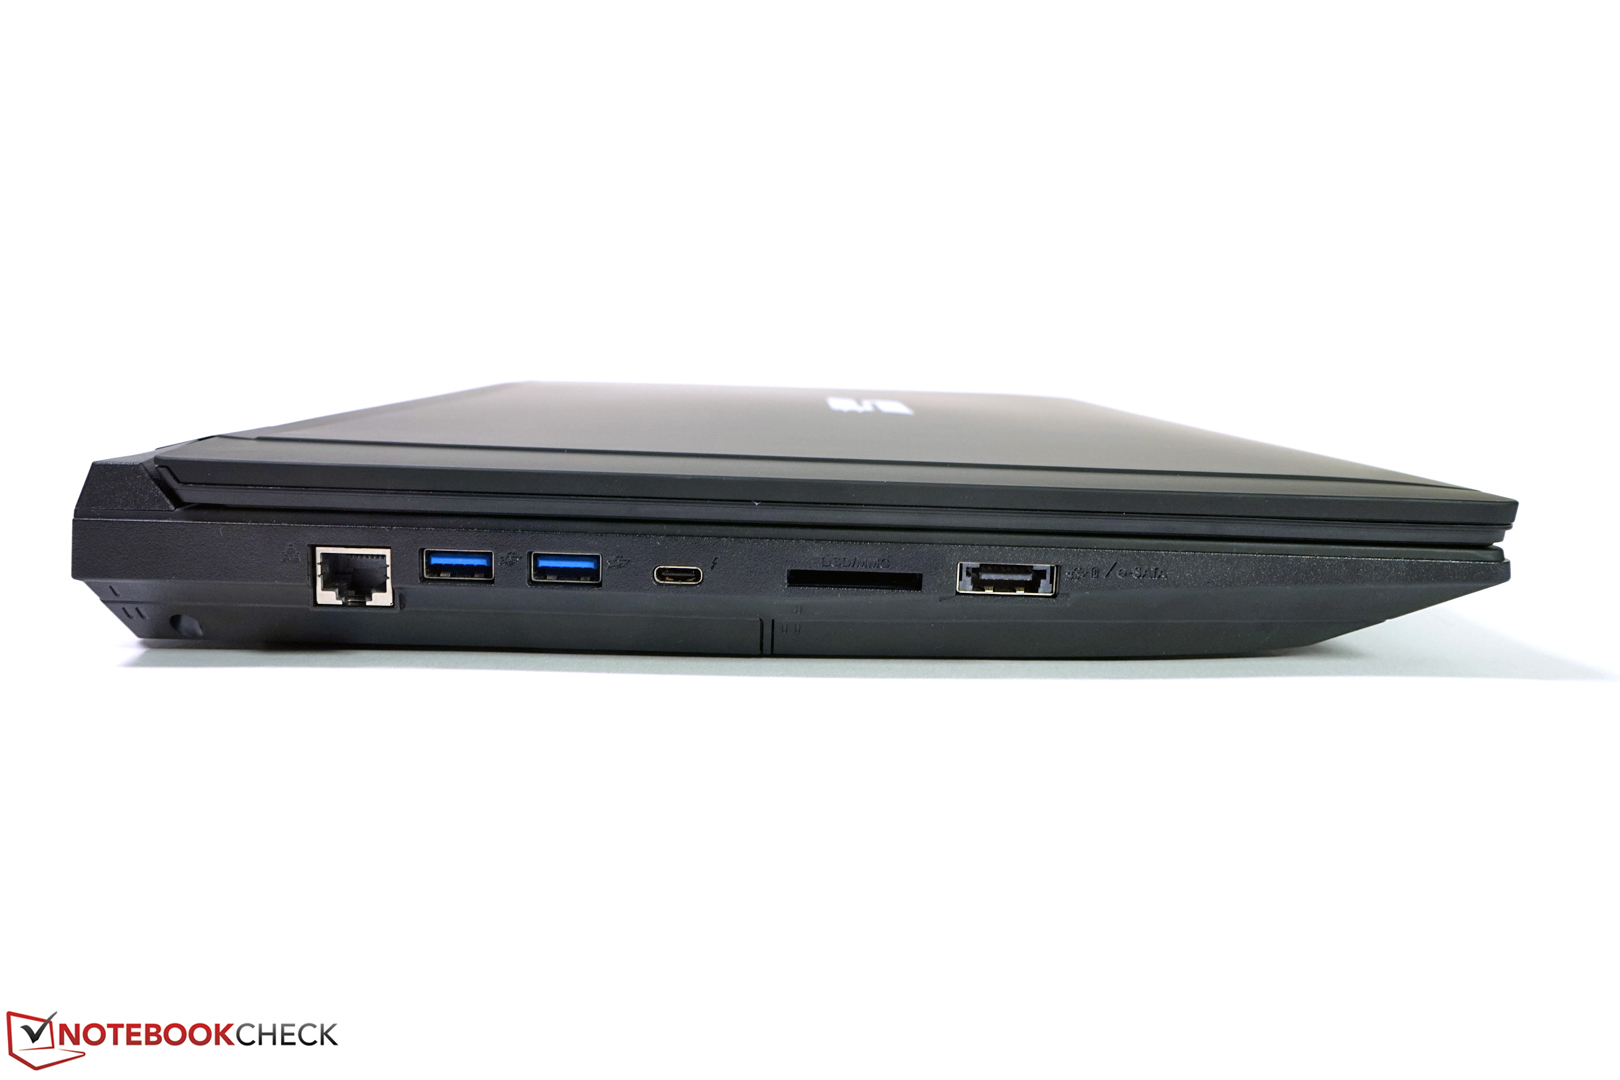
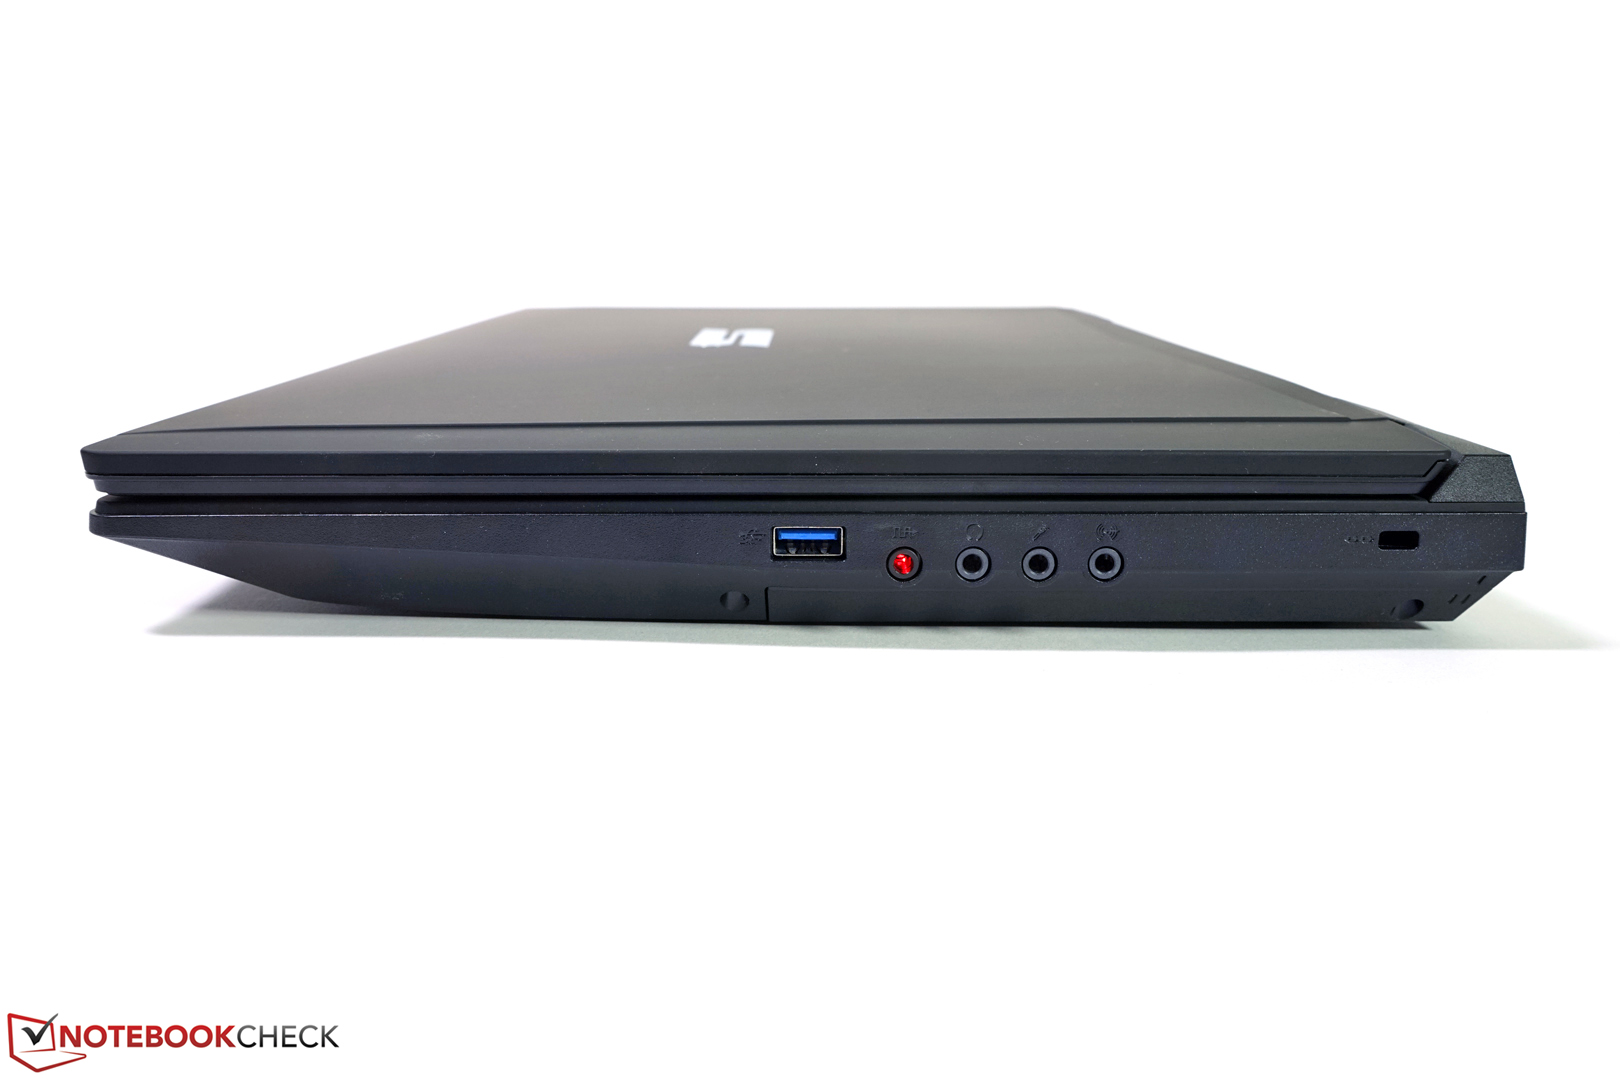
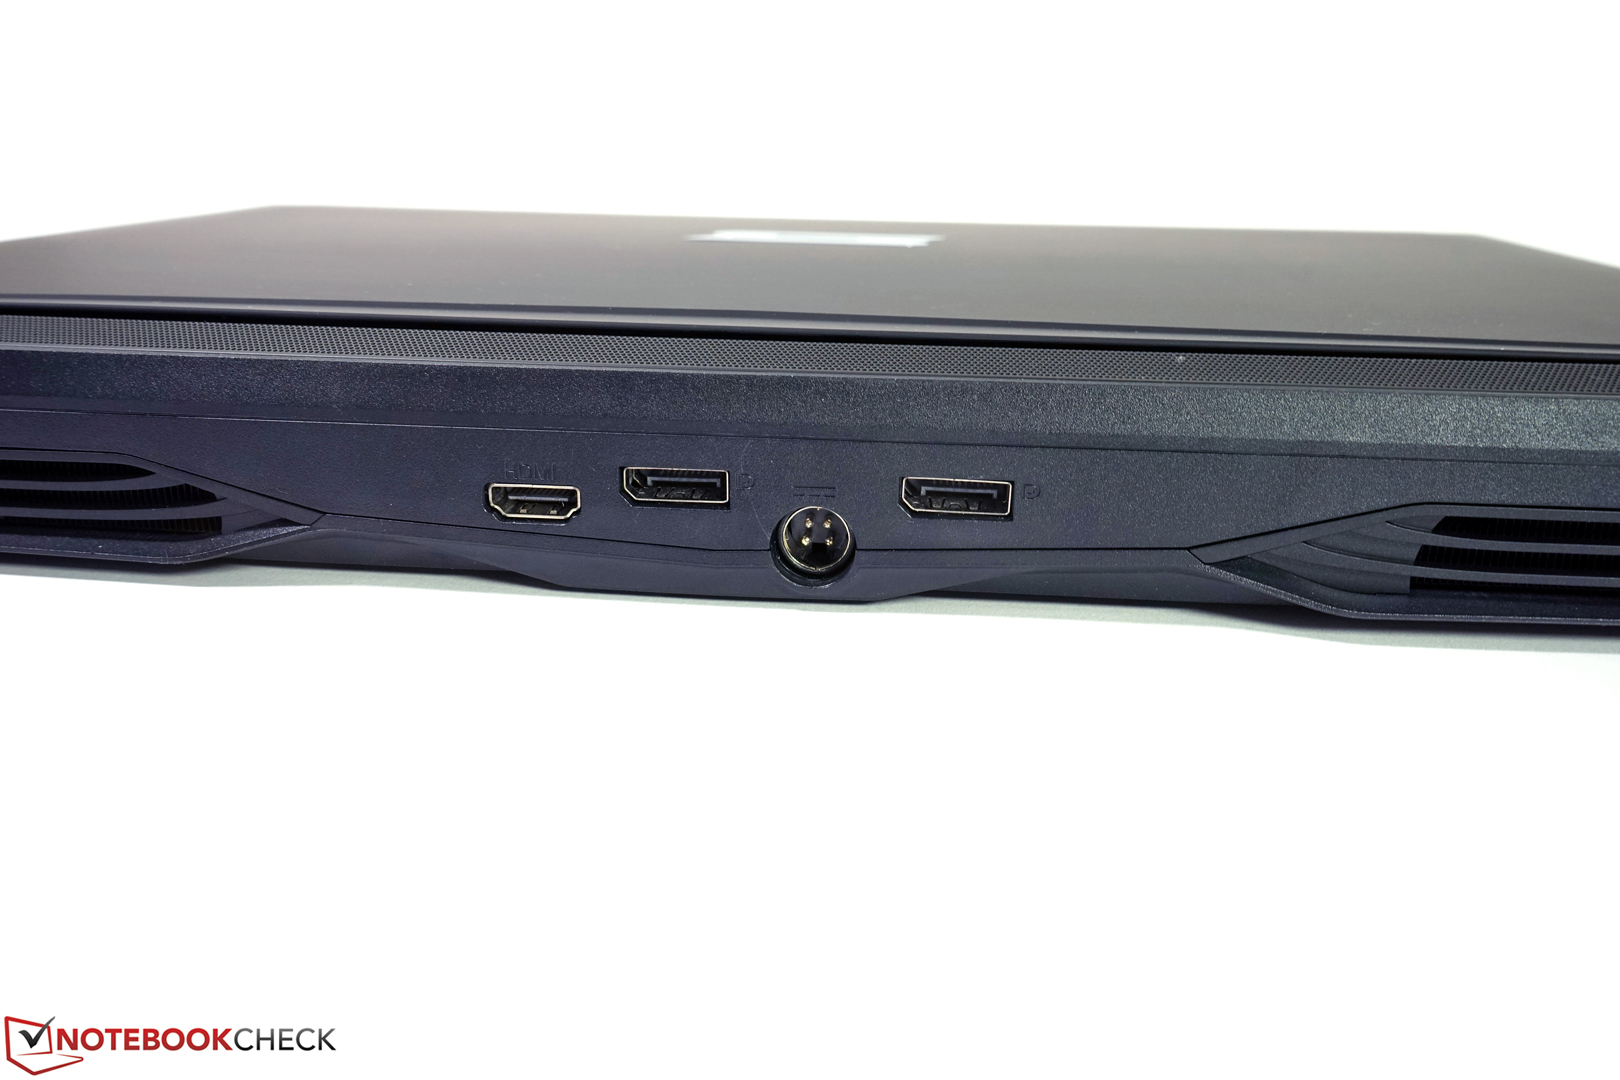
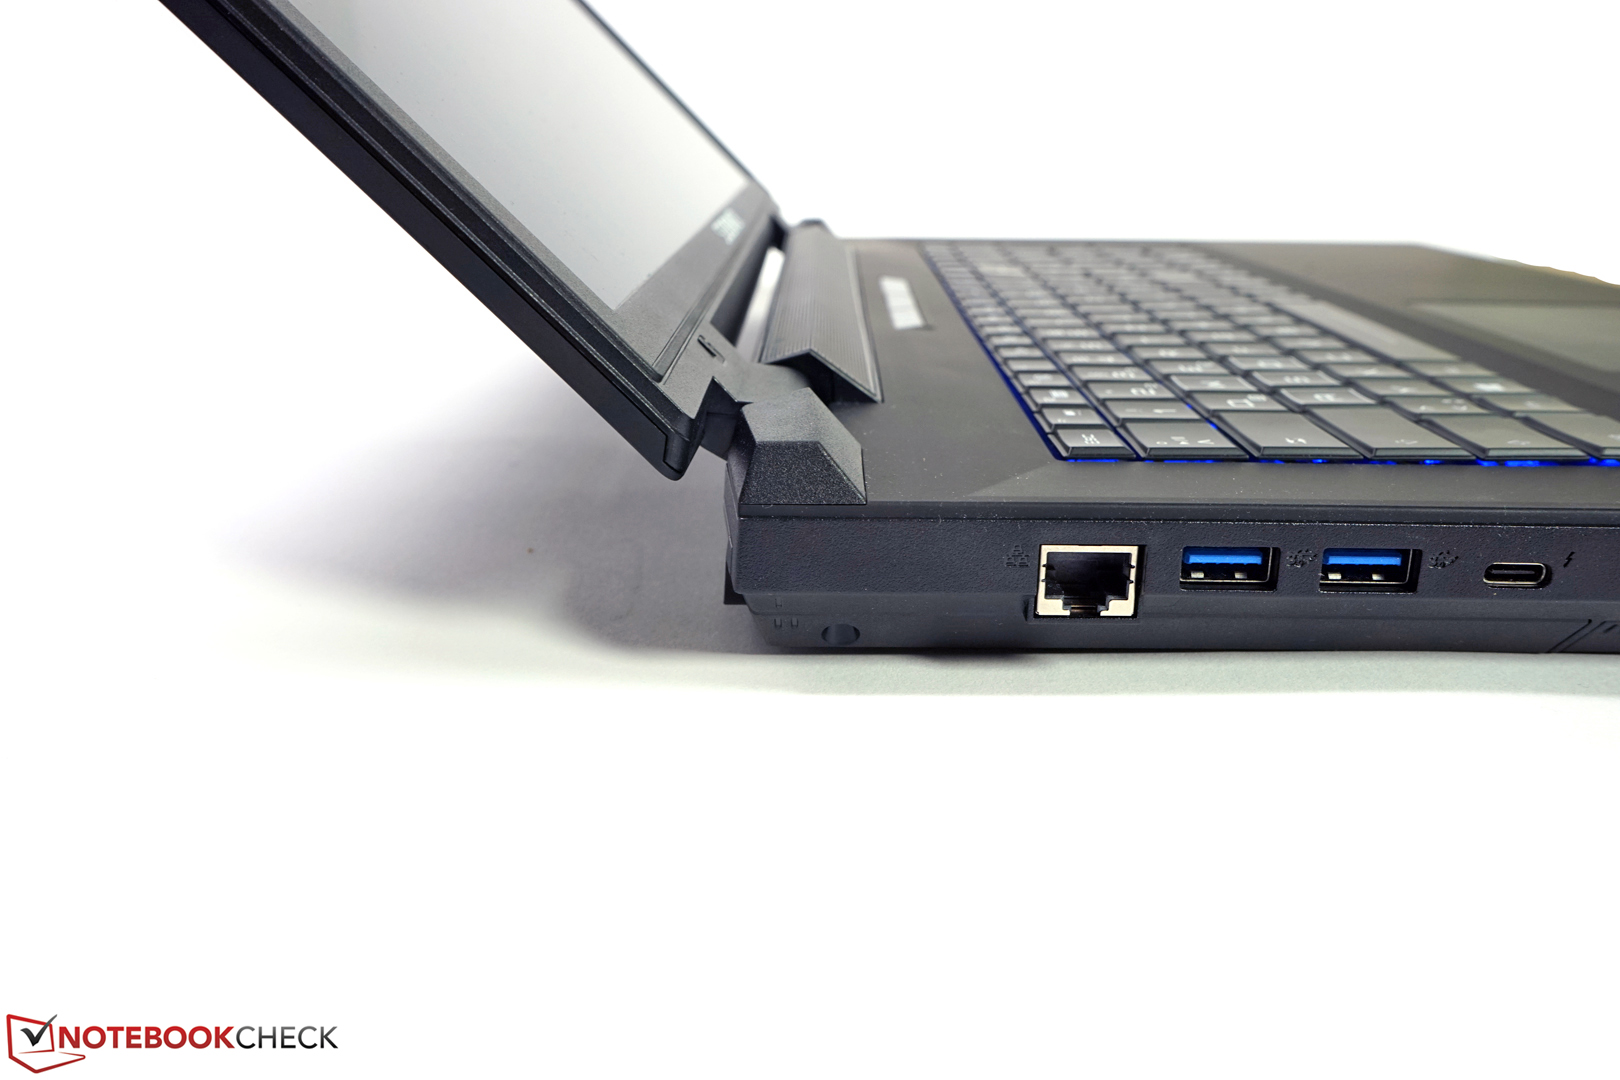
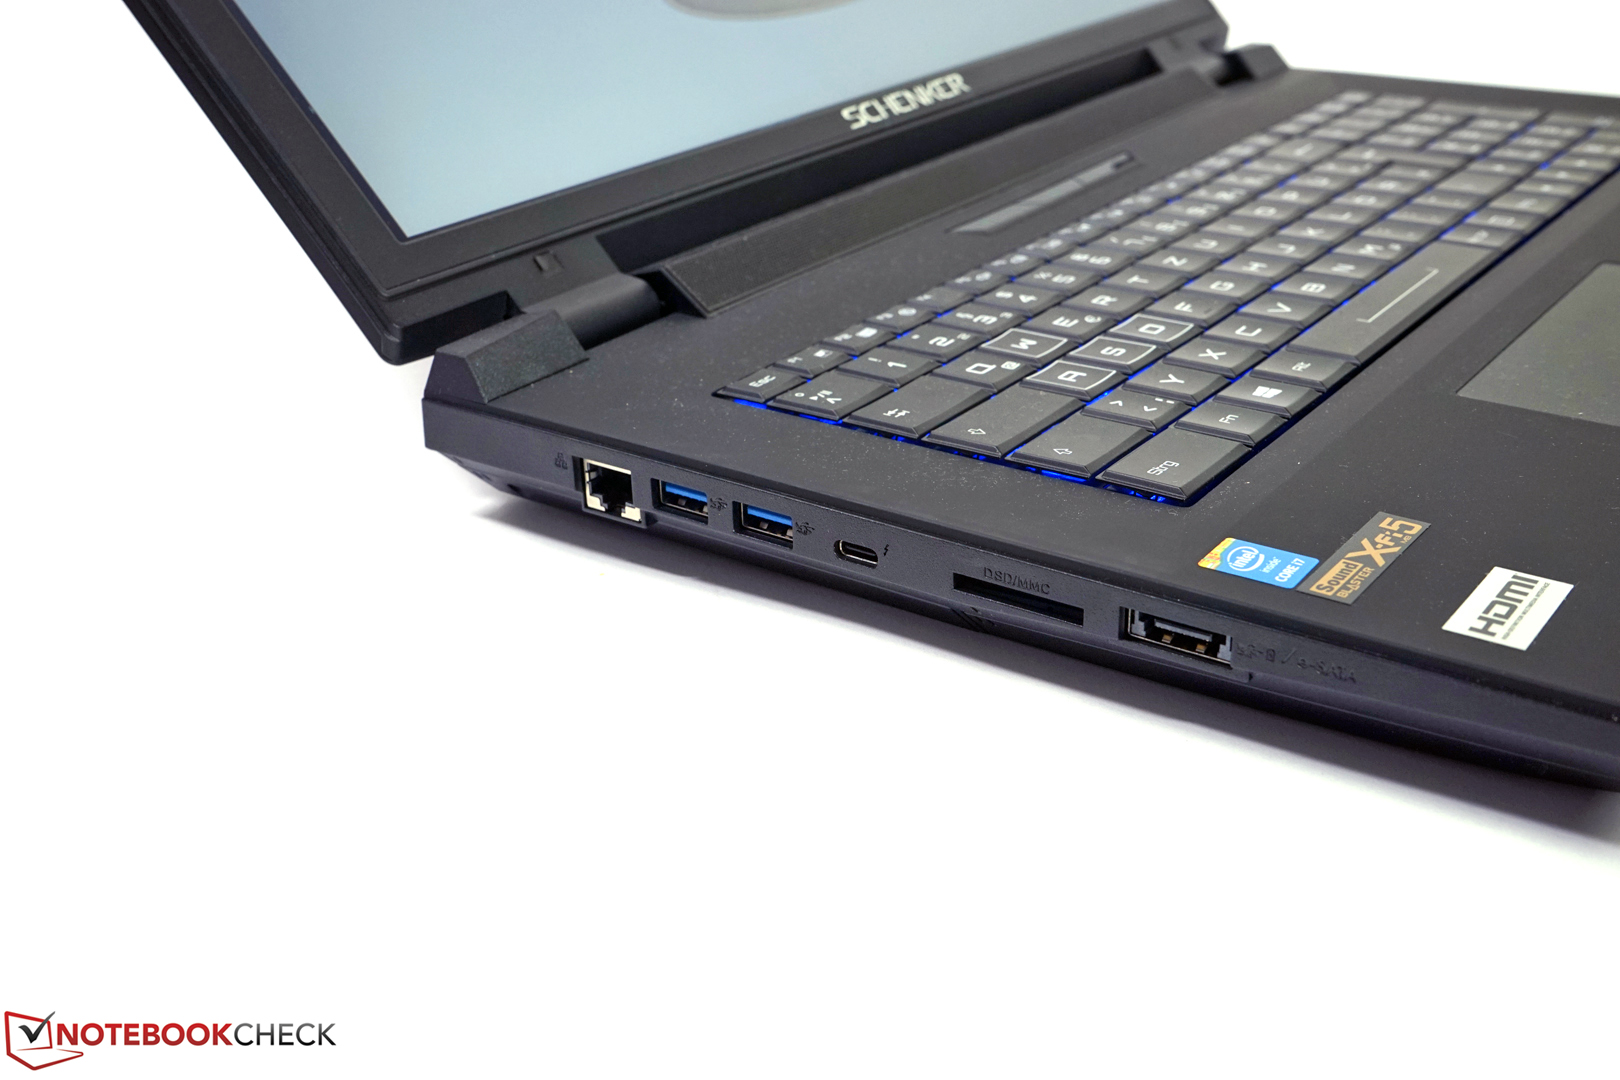
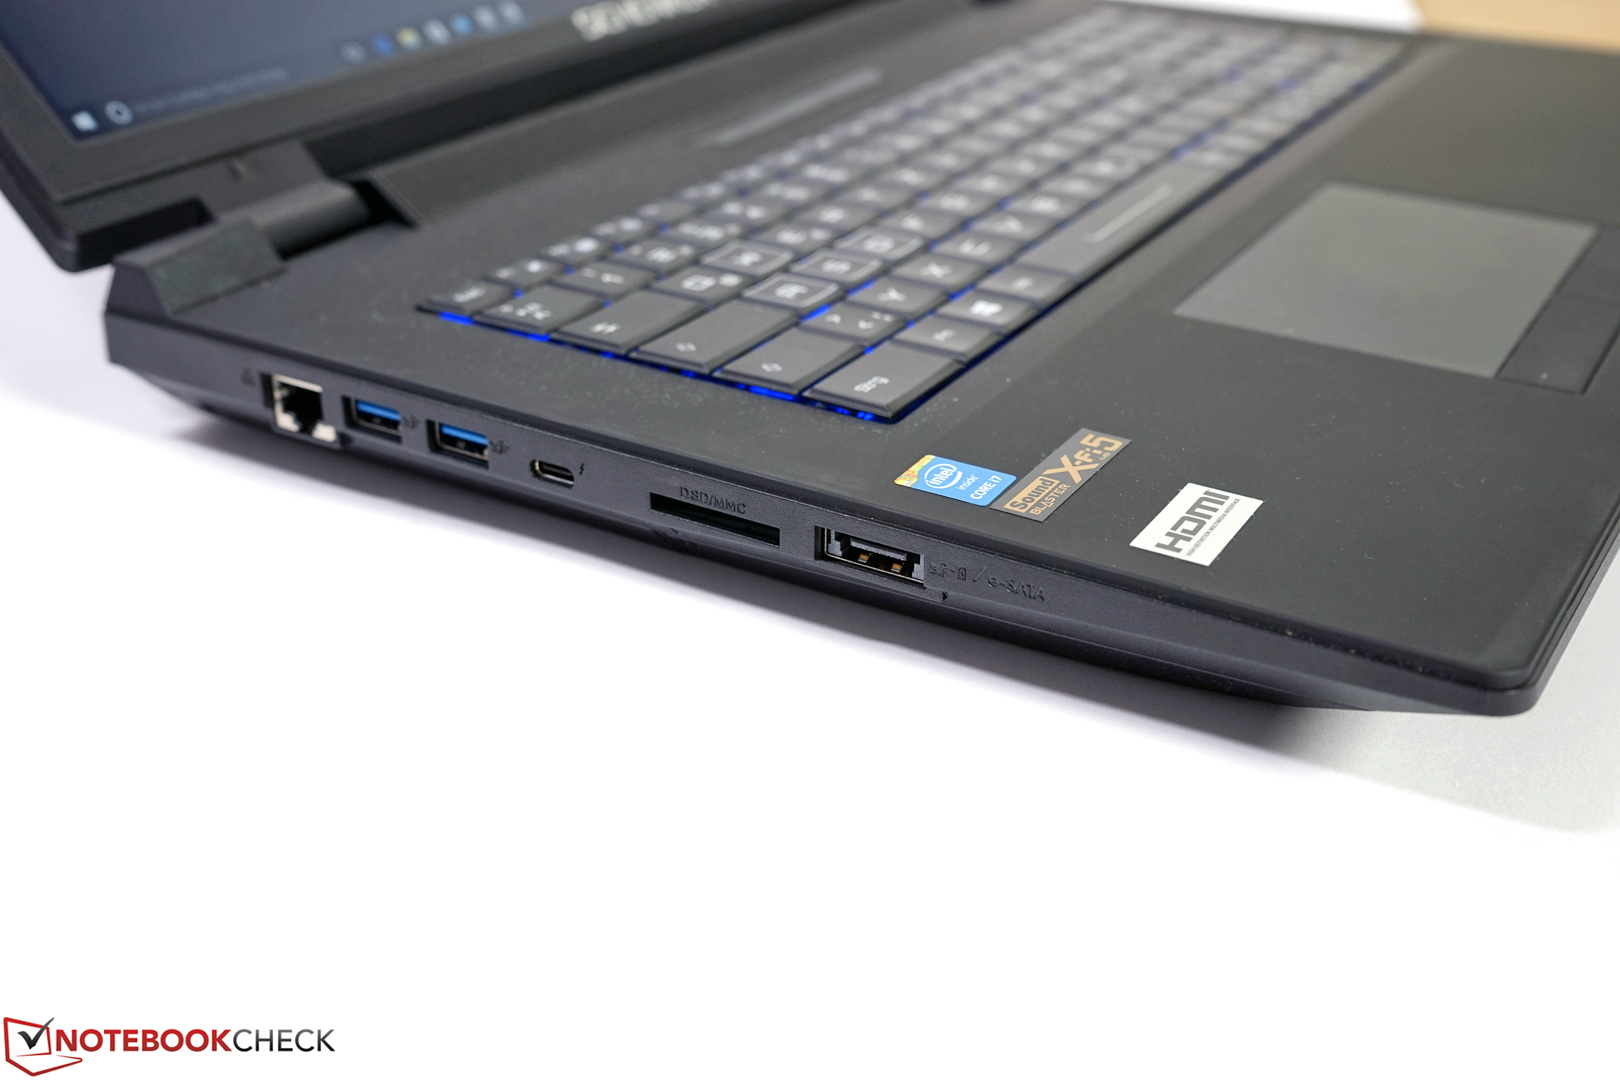
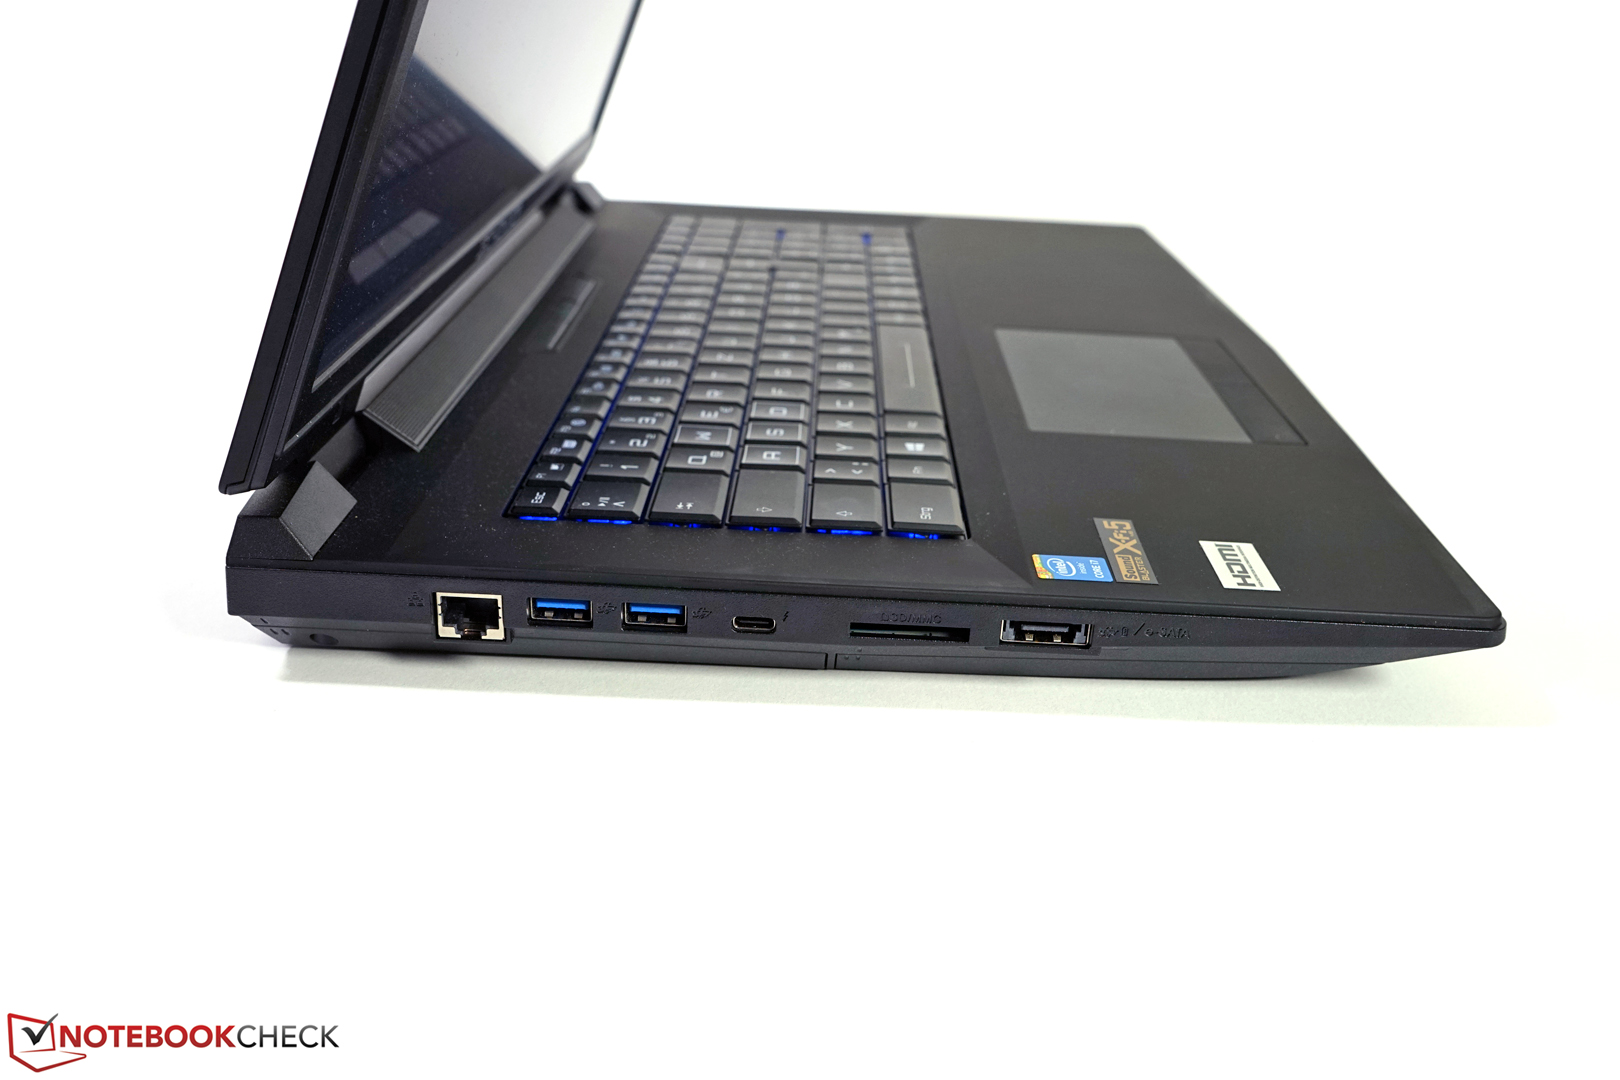
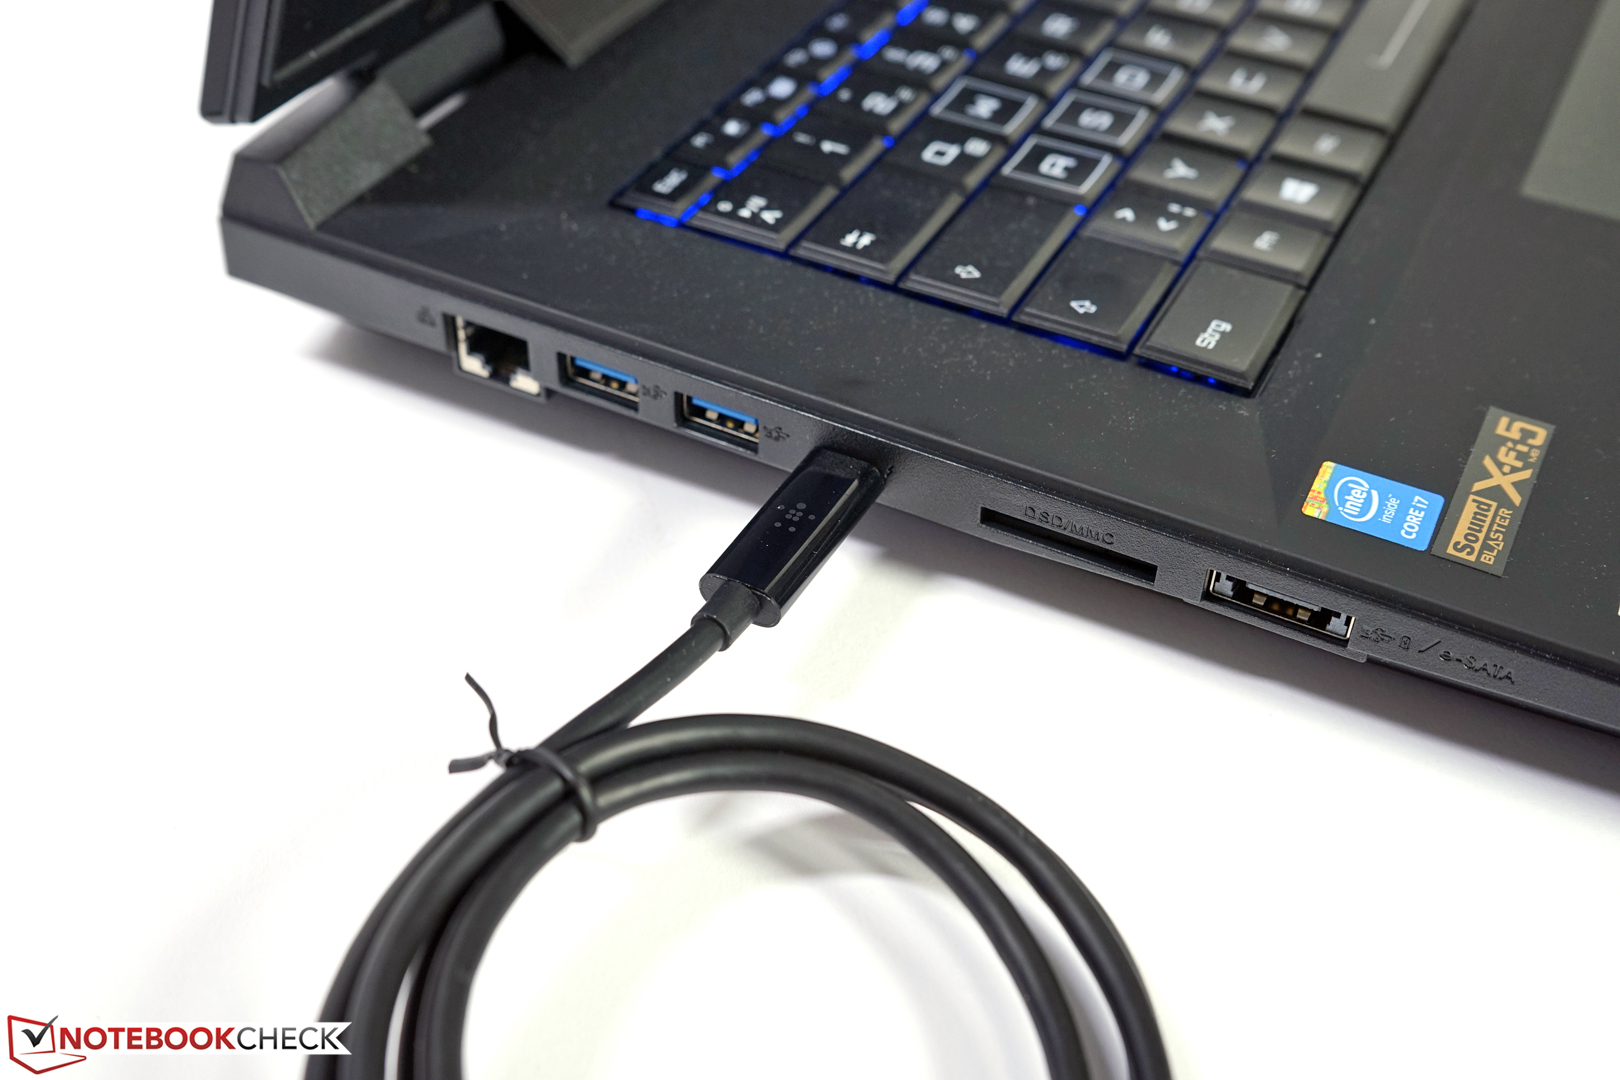
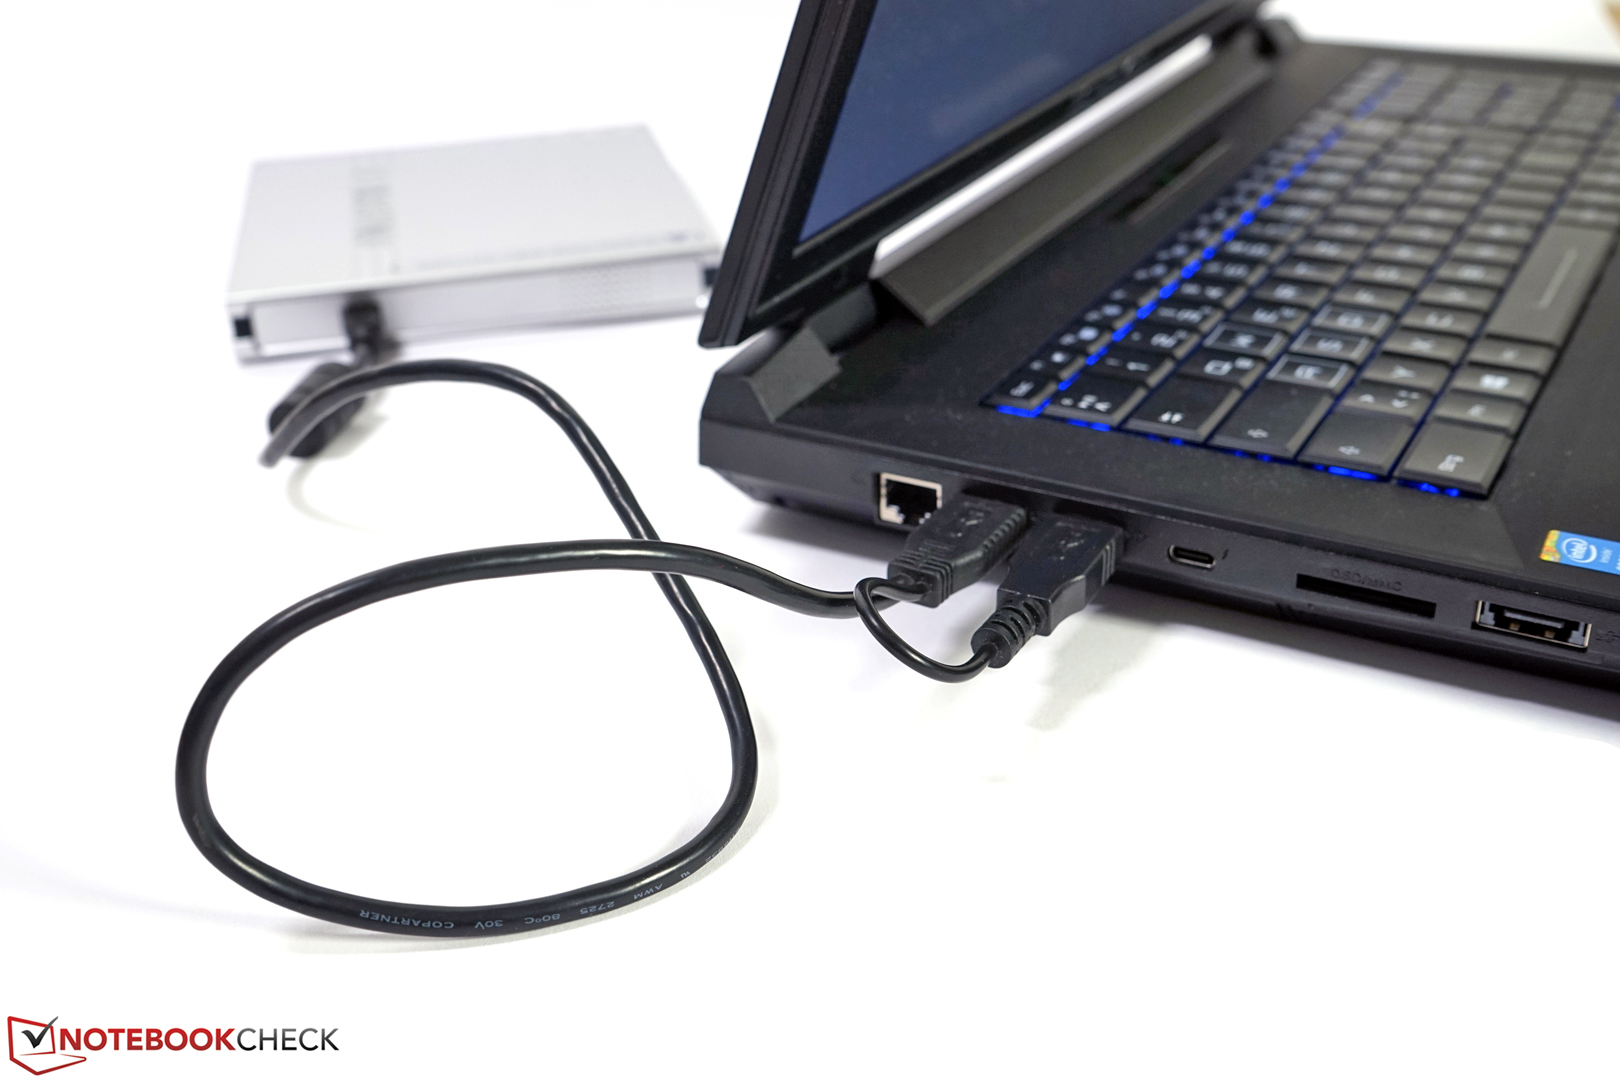
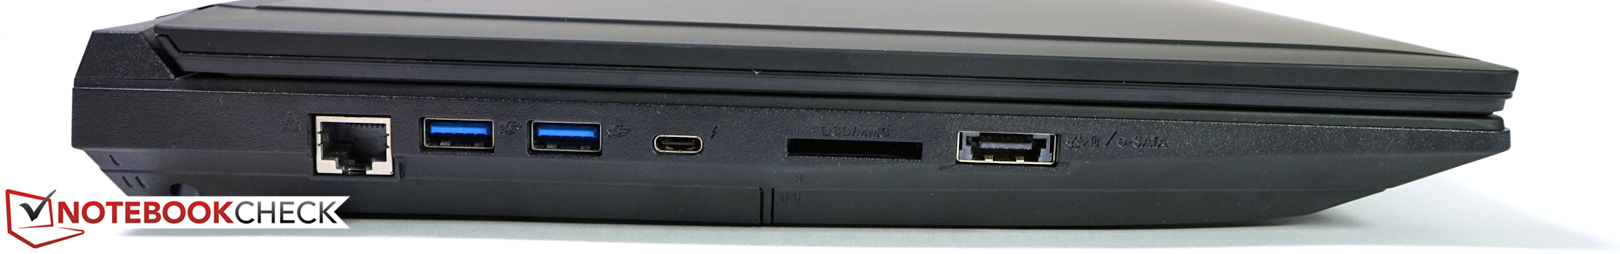
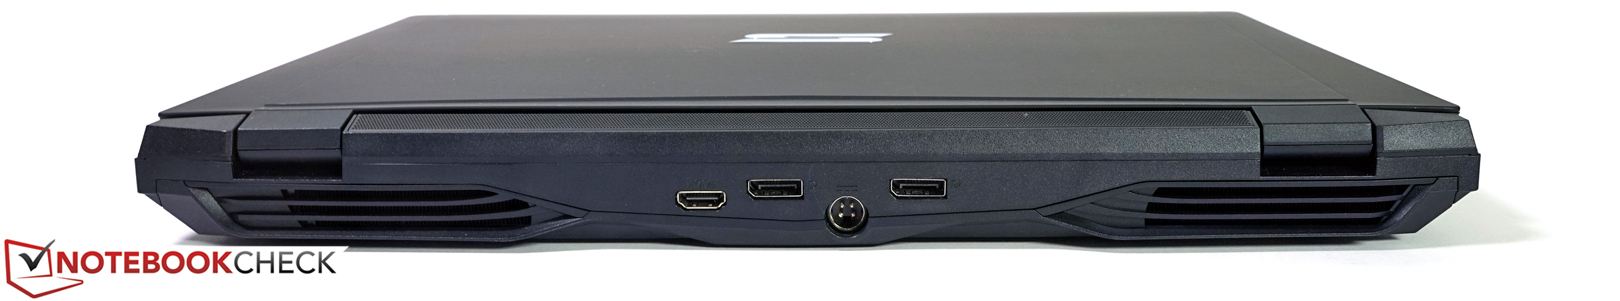
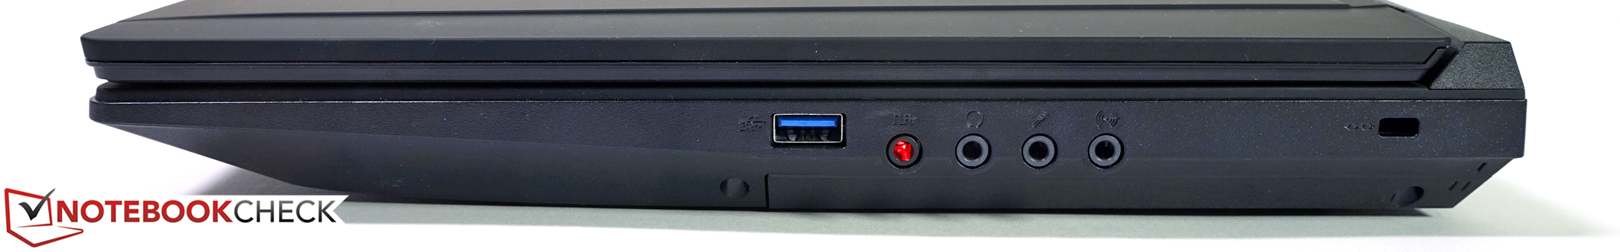
With DisplayPort 1.2, USB 3.1 Type-C, and HDMI 2.0, you'll find almost all the interface standards you might wish for. According to the manufacturer, the reversible USB 3.1 Gen.2 even supports Thunderbolt 3.0. Via BIOS setting, it can send a DisplayPort signal according to the specs, which, however, leads to deactivation of one of the rearward DisplayPorts (not tested). Moreover, owners of an older eSATA drive will be happy about the compatible eSATA / USB 3.0 combo port. Three further USB 3.0 ports, a fast card reader, and four separate audio ports complete the interface equipment.
The interface layout is practice-oriented. For example, the two USB 3.0 ports on the left side are far enough apart for combining a bigger USB thumb drive with a standard-sized USB cable. On the other hand, the distance is still small enough for powering devices with a Y-cable.
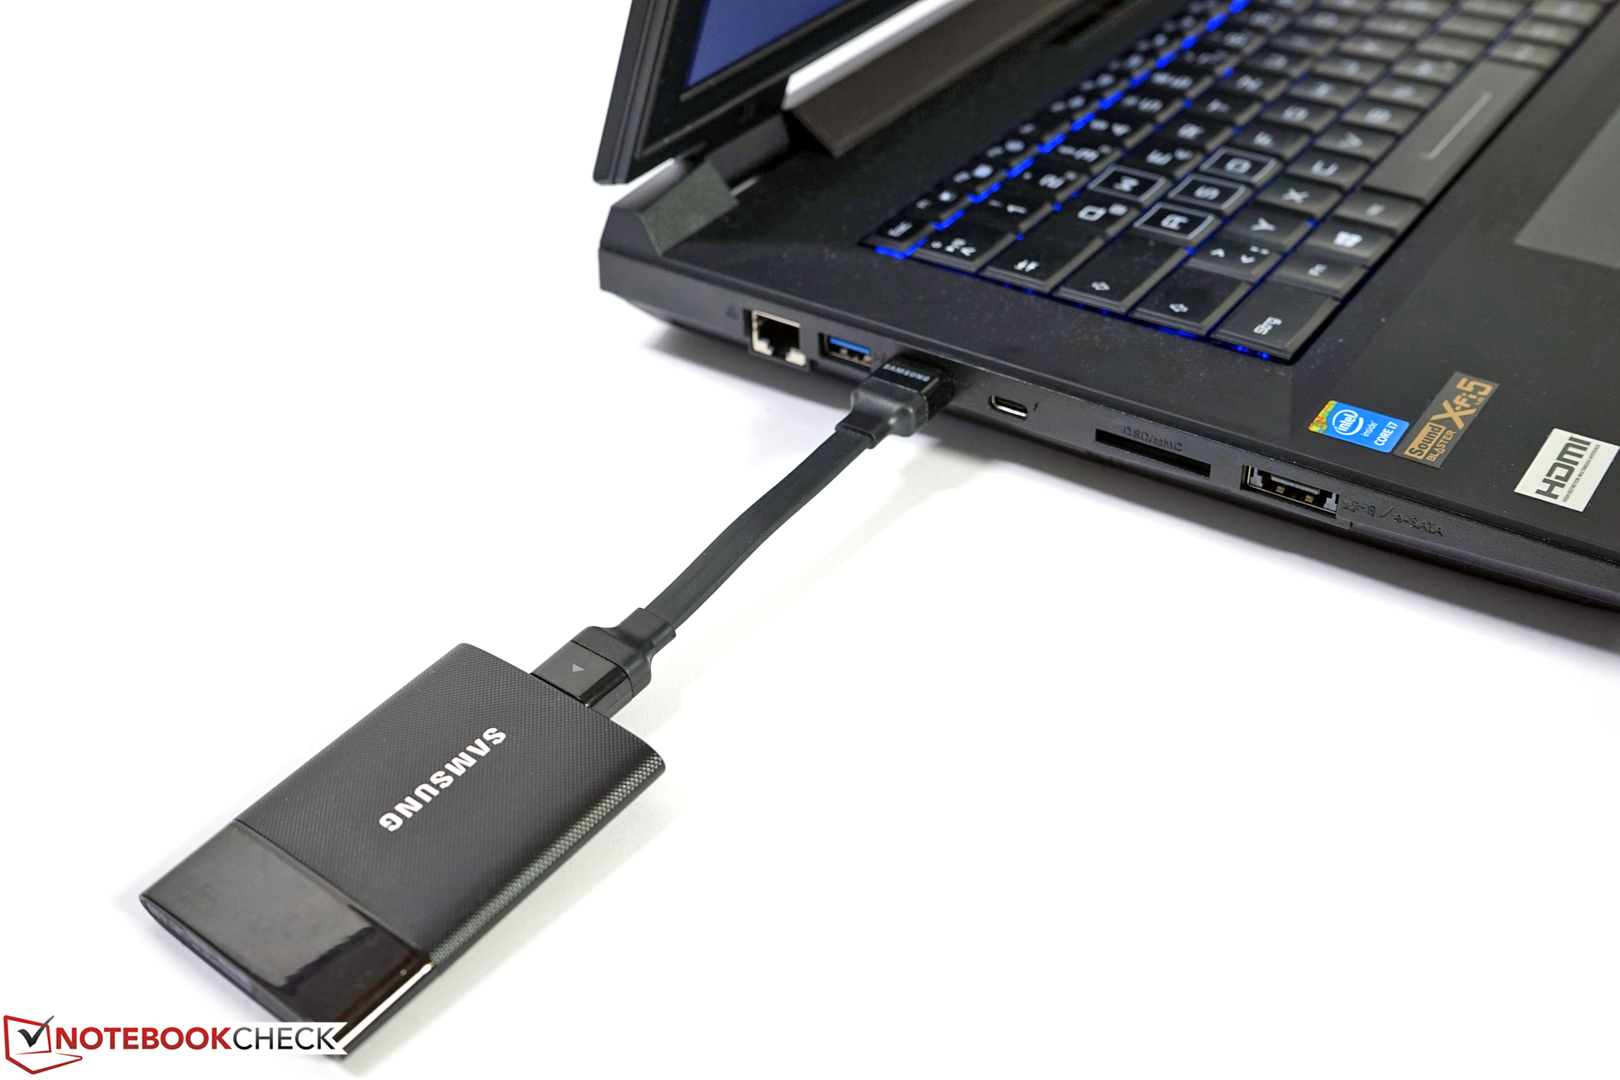
With our Toshiba Exceria Pro UHS-II card, the card reader achieves transfer rates of up to 185 MB/s according to AS SSD and up to 139 MB/s when moving our test image files. A Samsung SSD T1 achieved up to 428 MB/s via USB 3.0.
Communication
Apart from current dual band AC Wi-Fi, Gigabit LAN, and Bluetooth 4.0, our test model also comes with a 2.0 MP webcam with microphone. As usual, the latter is incorporated into the lid and its quality is sufficient for video chats. In about 15 m distance to a Fritzbox 7490 and through several indoor walls, the Wi-Fi module achieved signal strength between 2 and 3 bars.
Security
Apart from a Trusted Platform Module 2.0, the security features of the Schenker W706 workstation include the usual password security on BIOS and system level. At the time of writing, the online configuration does not allow opting for the fingerprint reader shown in the product images and listed in the specs. Our test model does not feature such.
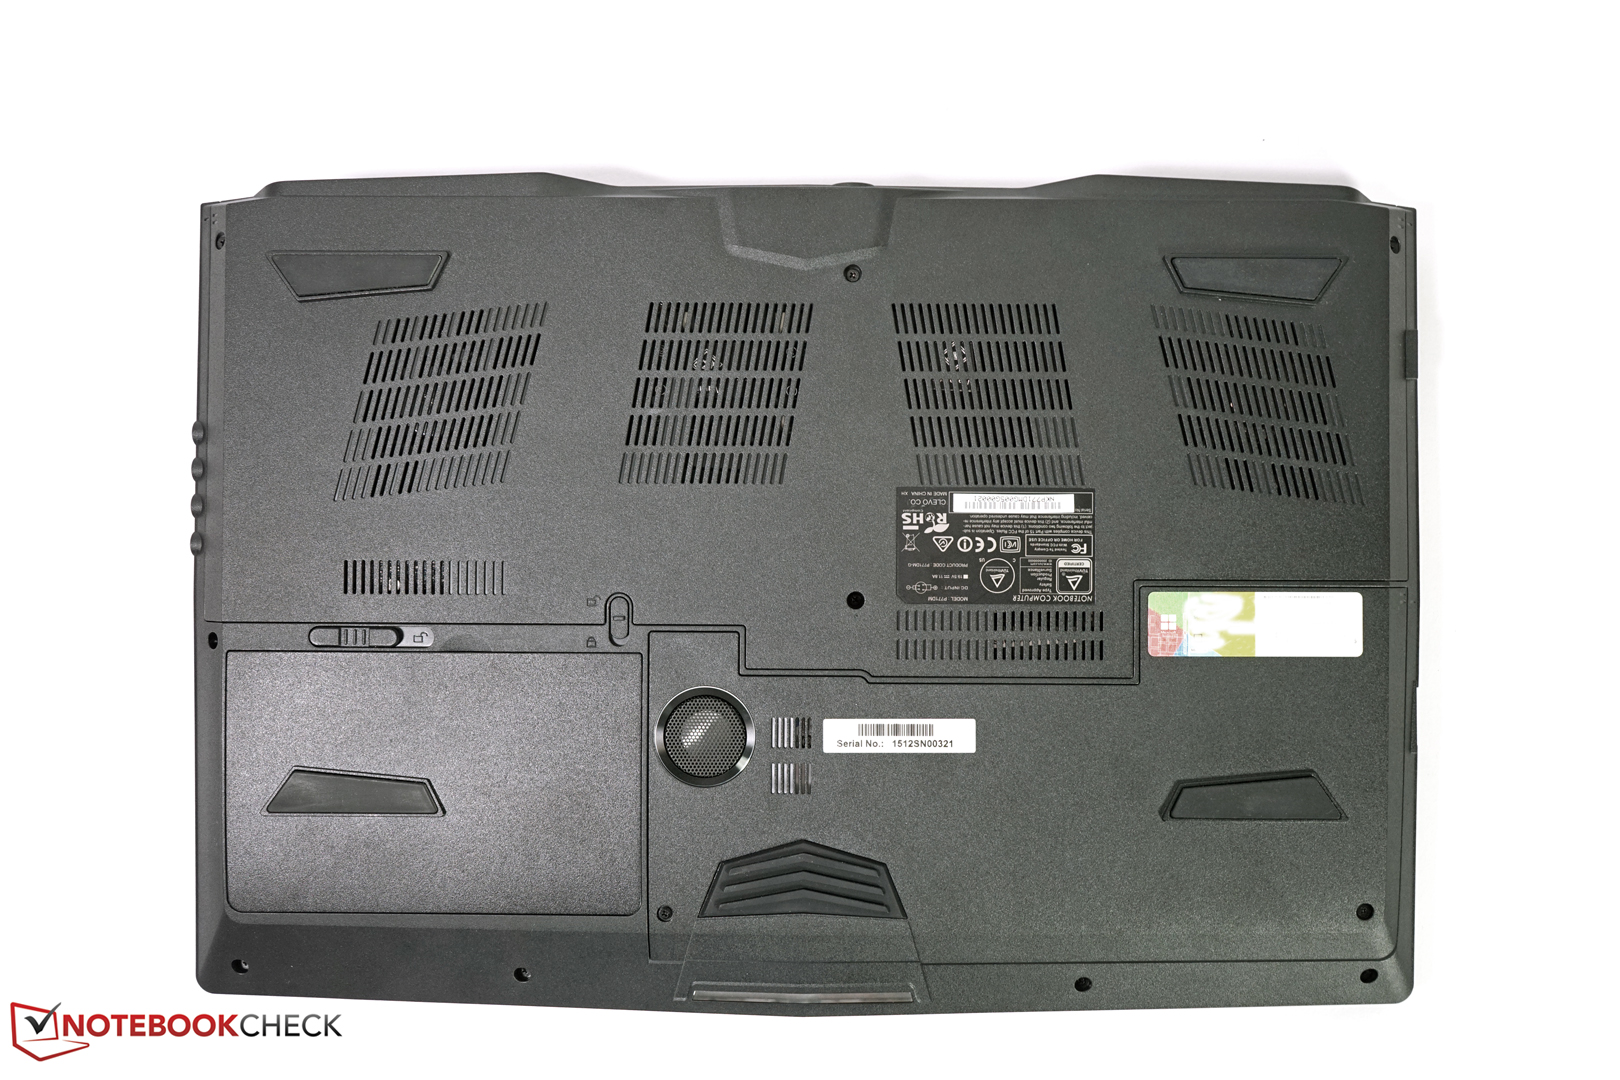
Maintenance
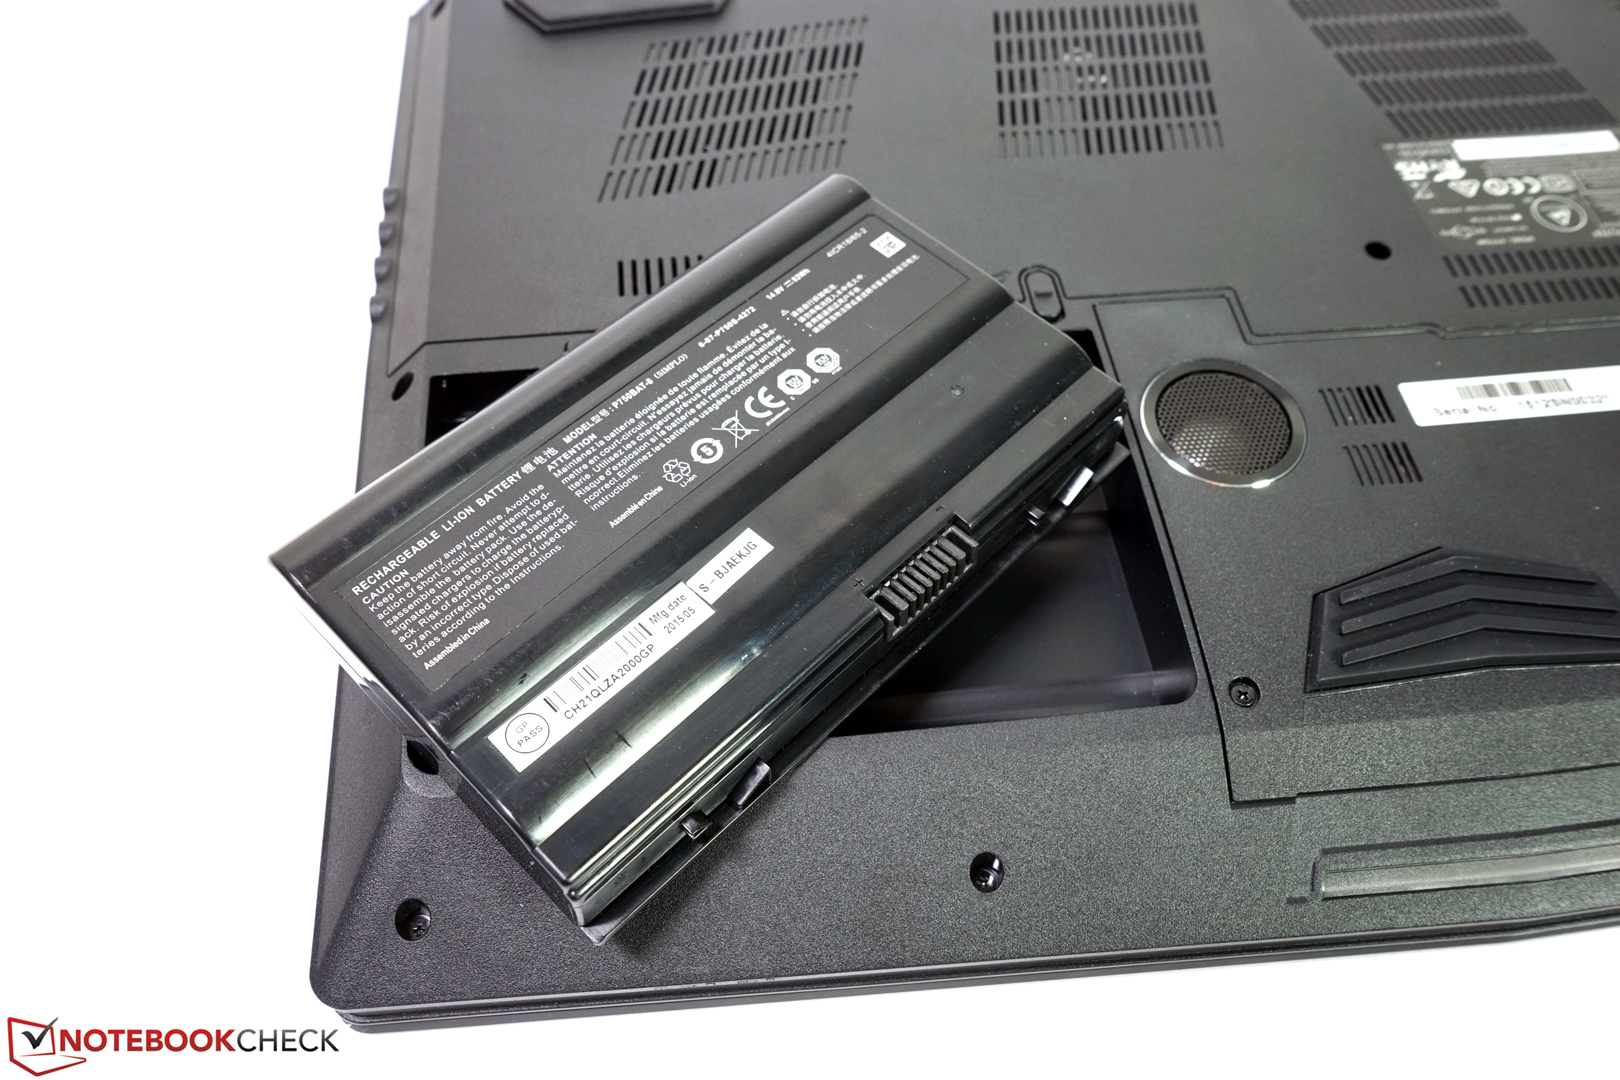
As usual, the maintenance of Clevo barebones is very good. All important components can be easily replaced or serviced. Even a GPU upgrade is done in a few minutes thanks to an MXM slot.
Warranty
Alike for the Gamer XMG U706, Schenker Technologies grants a 24-month warranty for the W706 workstation. A surcharge of 300 Euros (~$327) is due for a warranty extension to 36 months, which is otherwise usual in this category. This alone sets the actual price advantage compared to its competitors from Lenovo, Dell, and co. into perspective.
Input Devices
Keyboard
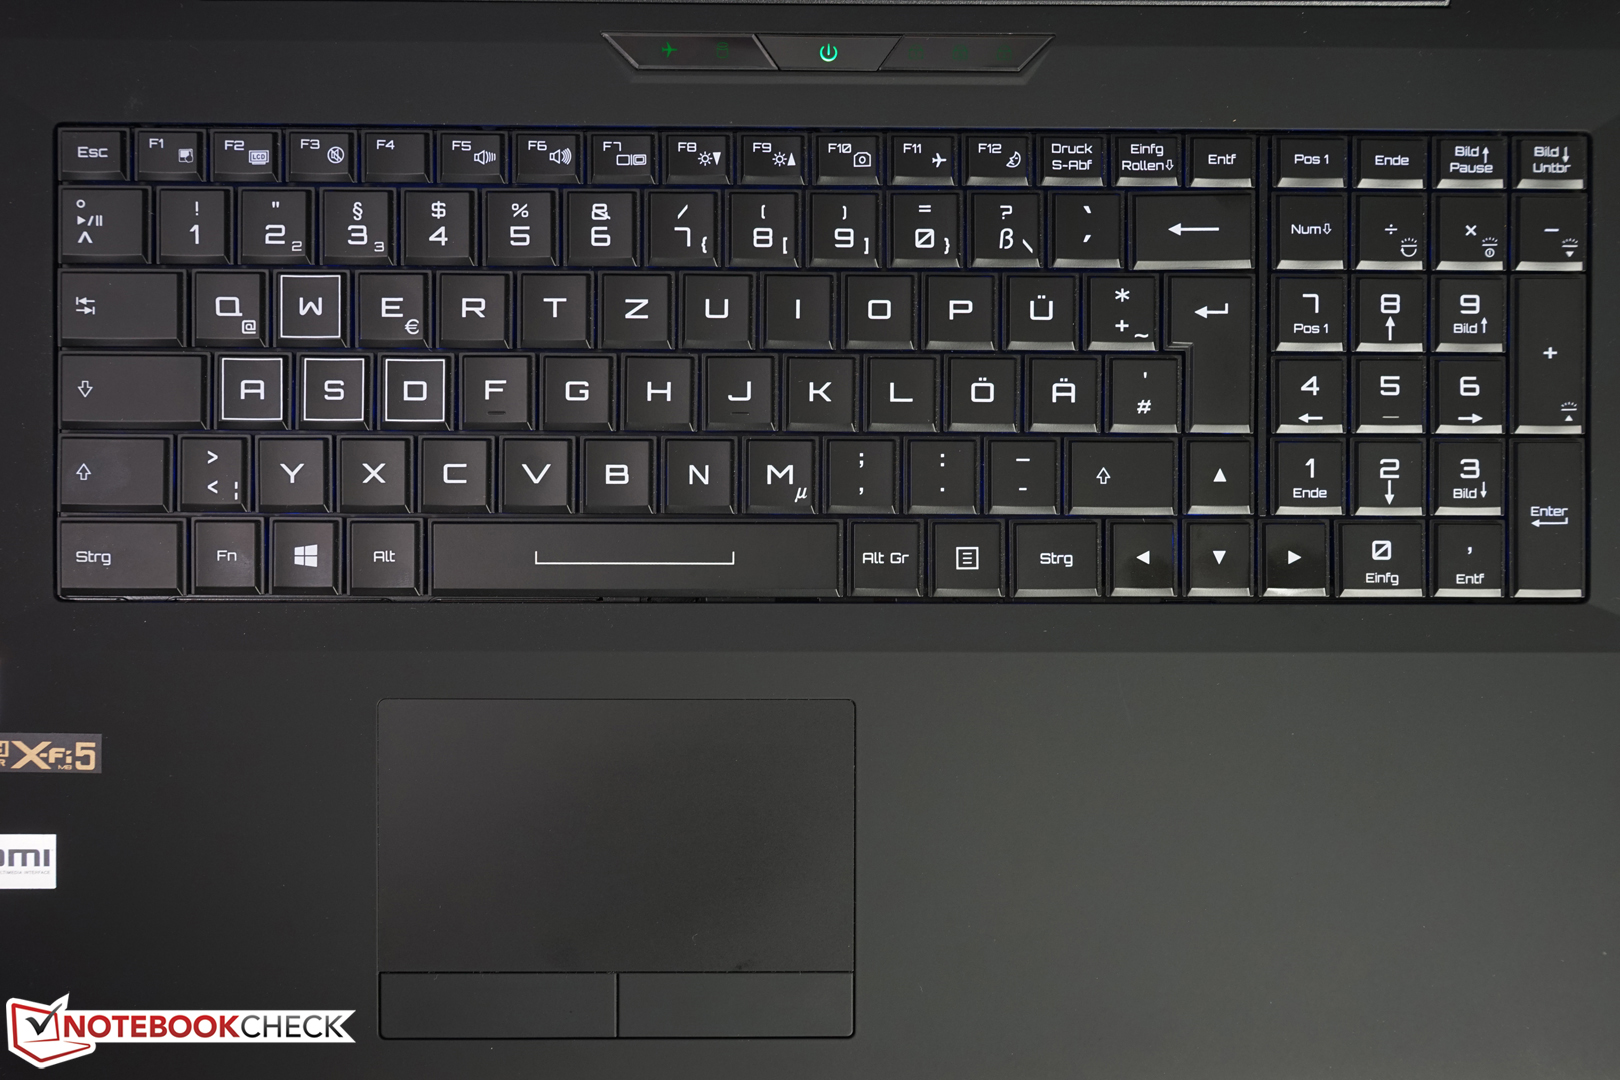
The keyboard of the Clevo barebones convinces with big keys in a 19 mm grid, a good pressure point and a convenient stroke. The keypad sits firmly in the case and does not bend anywhere. In particular, prolific writers might profit from the medium stroke and number crunchers will be happy about the dedicated number block. The key labels are contrast-rich and the keyboard light is helpful in low-light scenarios. The highlighted WASD keys show that the device was originally targeted at gaming. While the font of the key labels is a bit unconventional, it is still useful due to a big font size. As usual, several settings can be comfortably changed via FN combination.
Touchpad
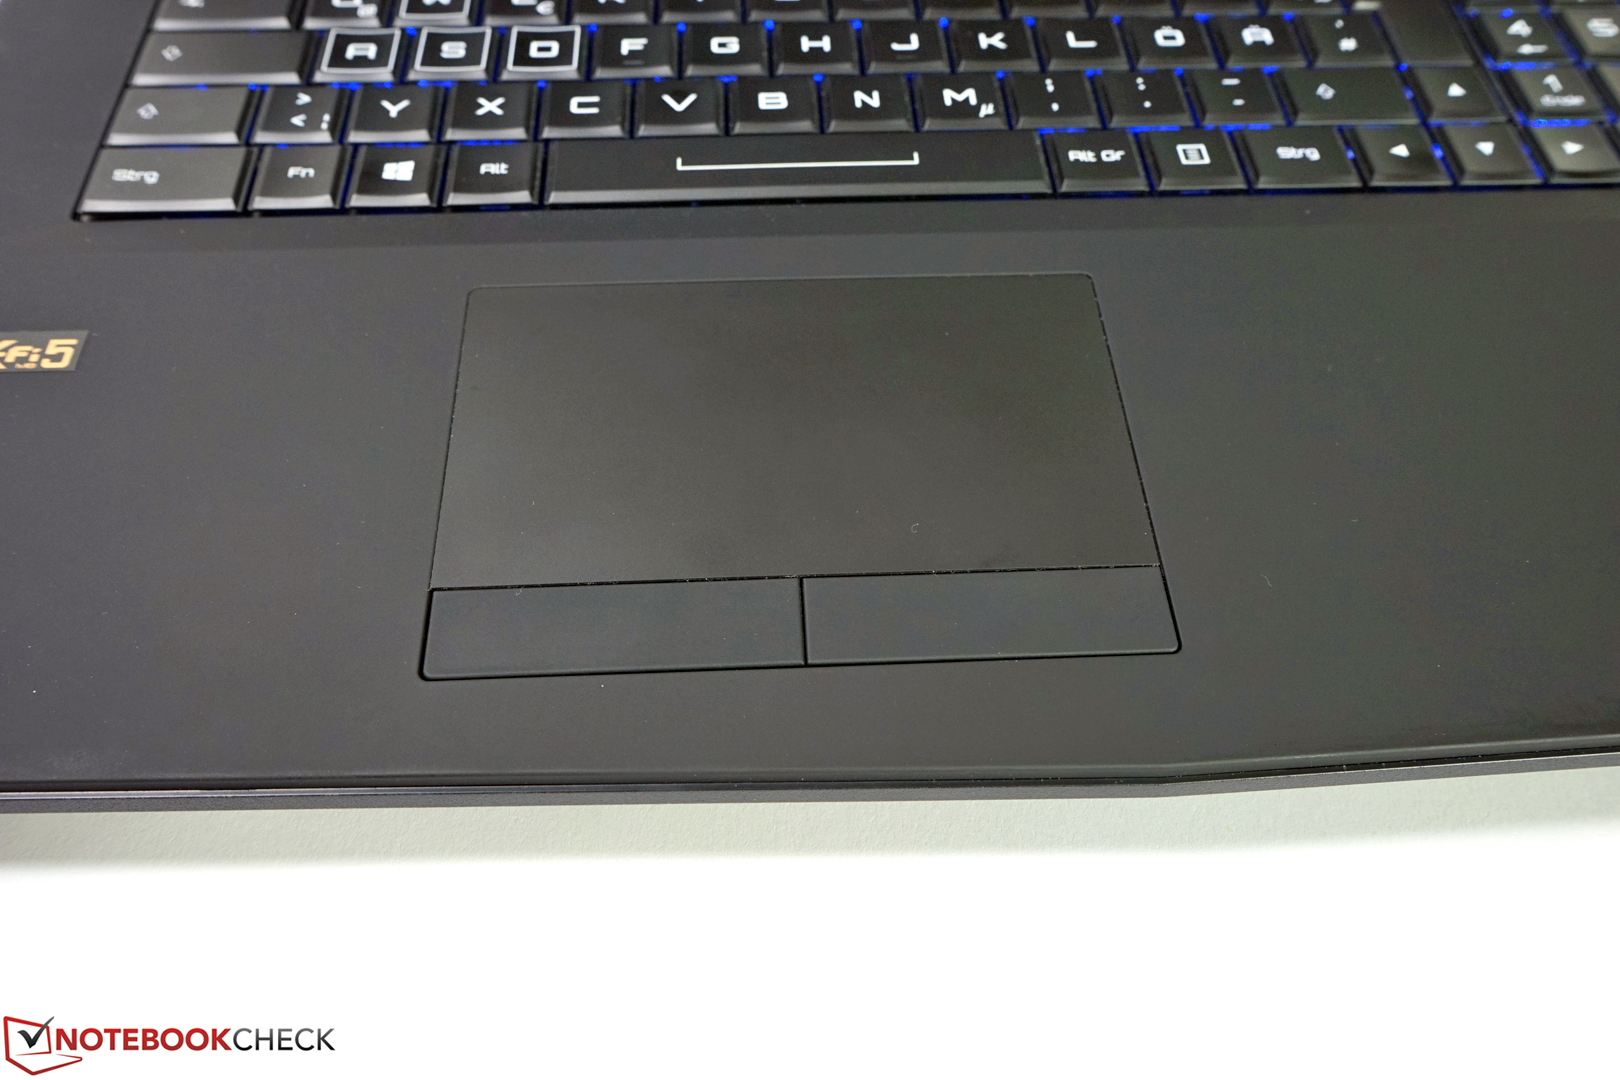
The touchpad comes with dedicated touchpad buttons. It is relatively big and features good gliding properties. It supports the usual multi-touch gestures, which make many inputs easier. However, you have to do without a TrackPoint, which many purebred workstations deliver as standard.
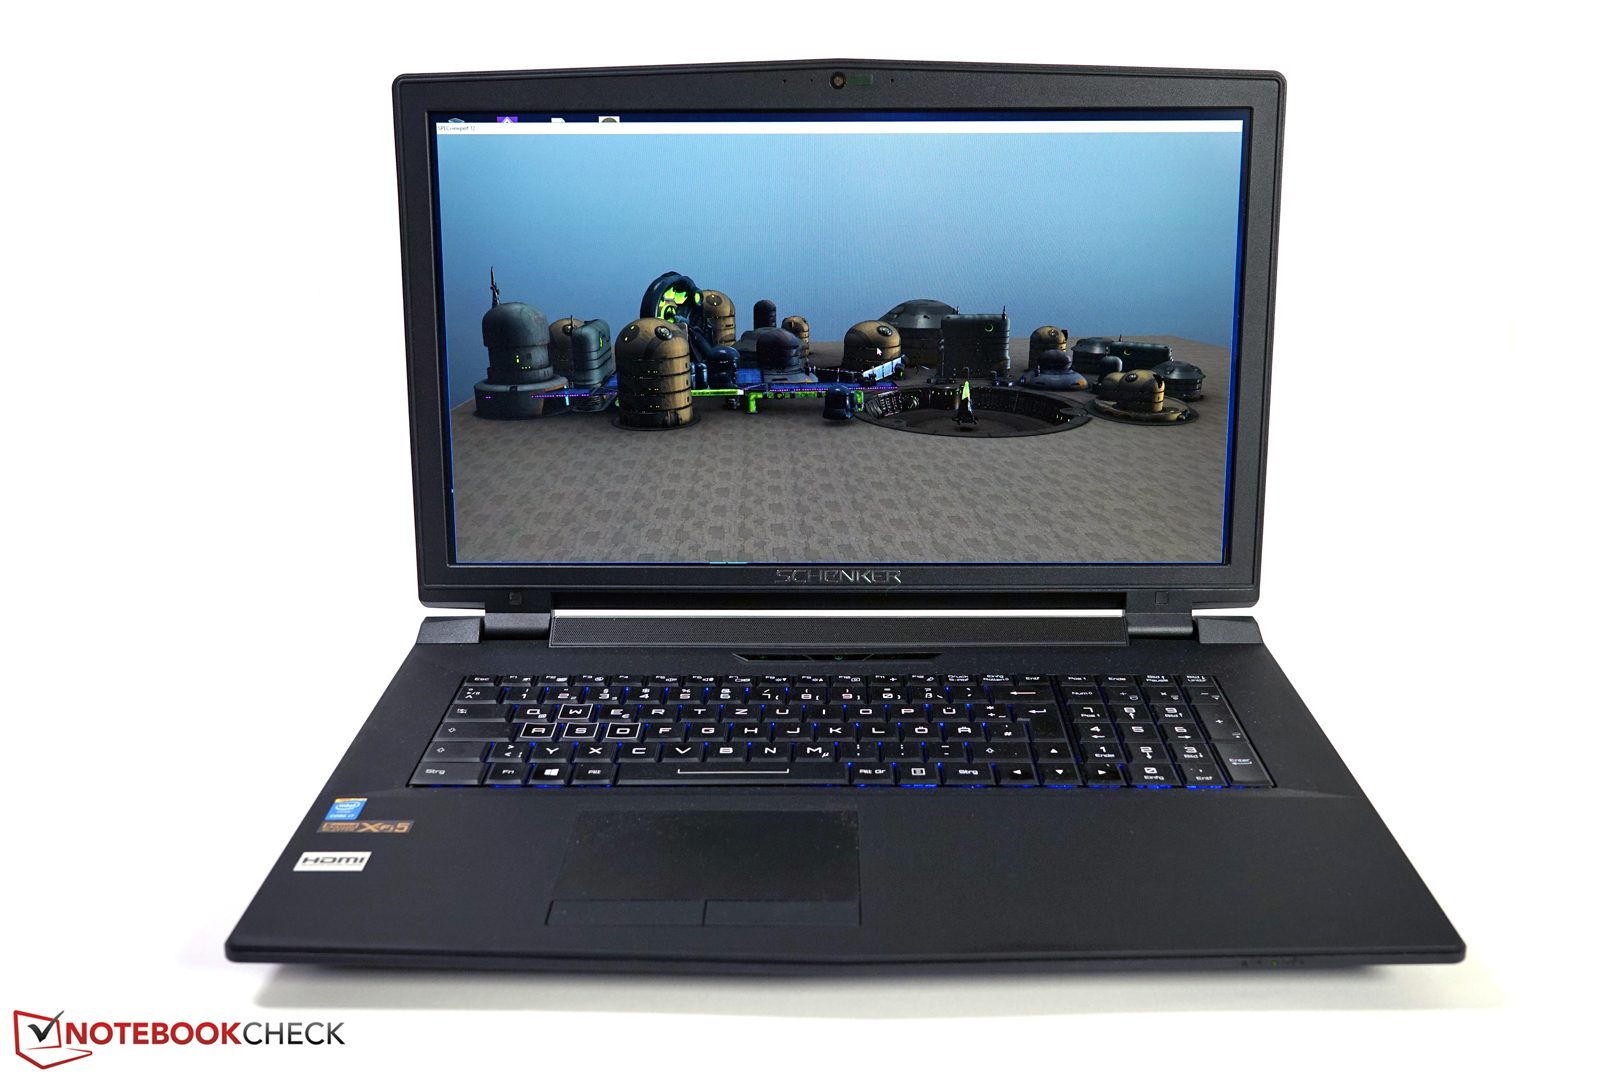
Display
The Full HD LP173WF4-SPD1 display from LG Philips is familiar to us. Other than Clevo barebones, notebooks from Medion, Asus, or MSI use it, too. Basically, it is a solid display with good basic properties. However, a new 17-inch display generation with significantly better properties has now become available. Competitors like Lenovo's ThinkPad P70 or Dell's Precision 7710 deliver big color spaces, 4k resolution, and better contrasts. In contrast, there are currently no other display options for Schenker's W706. As of now, 4k panels won't be available for this series, since the models available so far cannot be incorporated into the Clevo P771DM because of connection issues.
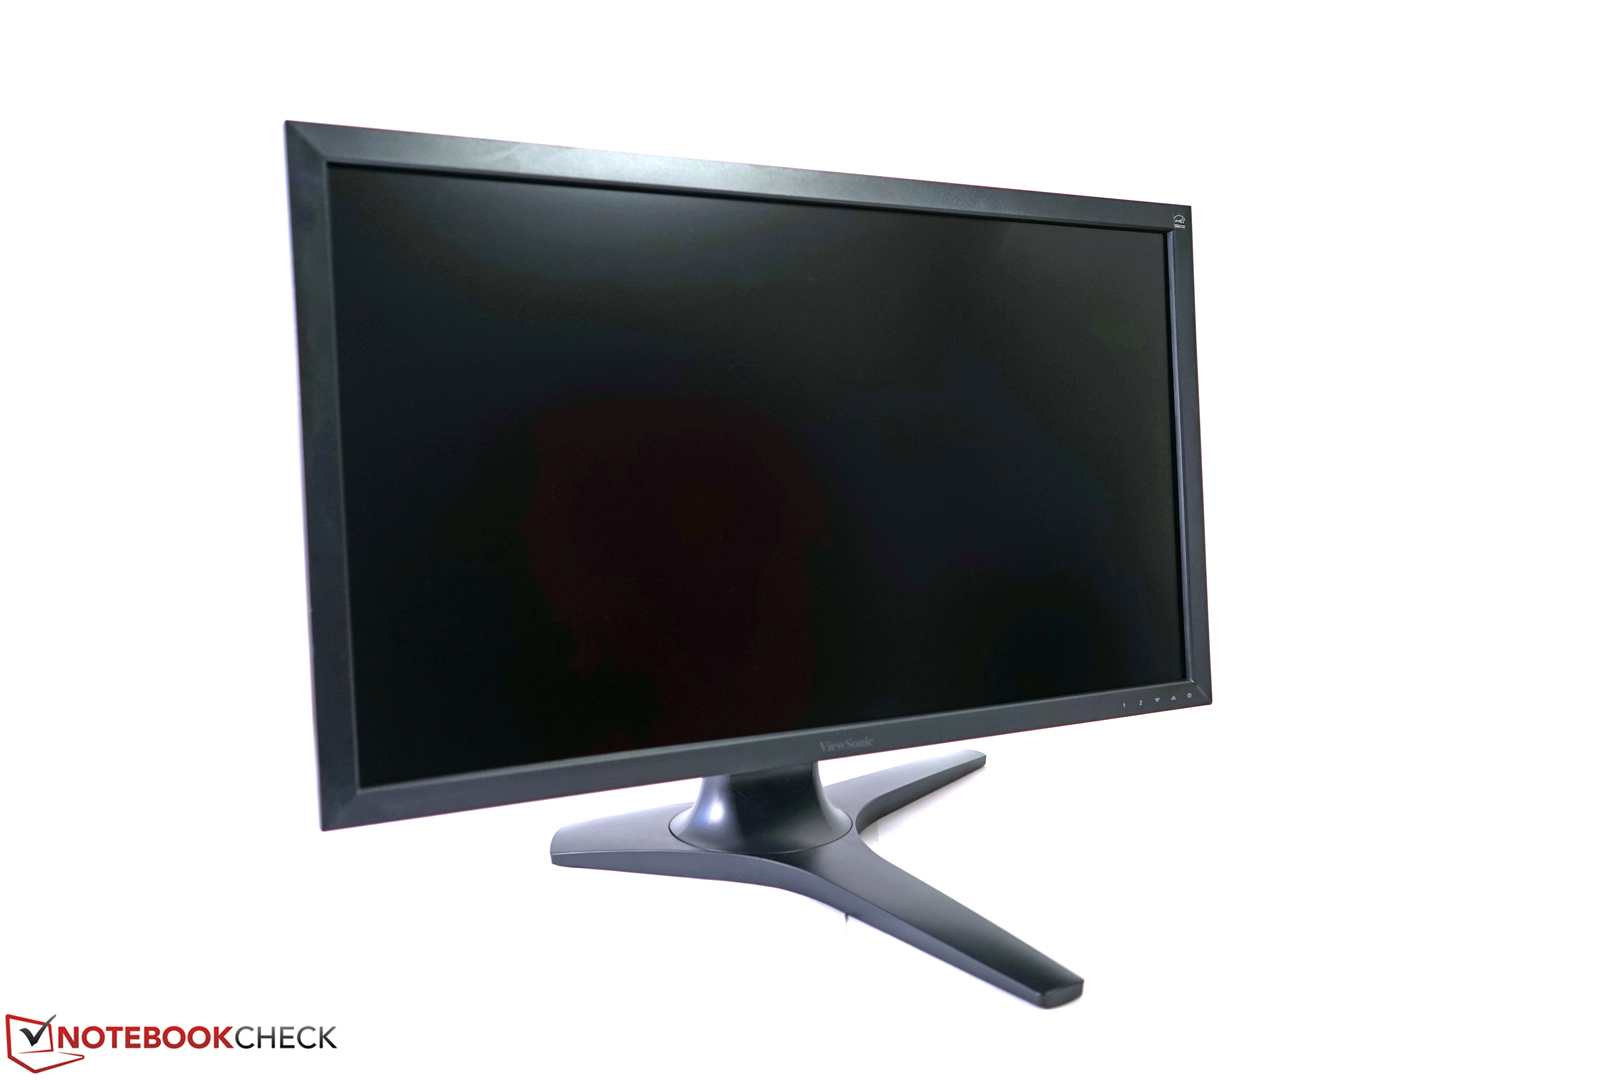
Thanks to DisplayPort 1.2 and HDMI 2.0 there are two options for connecting external 4k displays with native resolution at 60 Hz. We have tested this with Viewsonic's VP2780-4k and got a perfect image.
| |||||||||||||||||||||||||
Brightness Distribution: 86 %
Center on Battery: 346 cd/m²
Contrast: 742:1 (Black: 0.48 cd/m²)
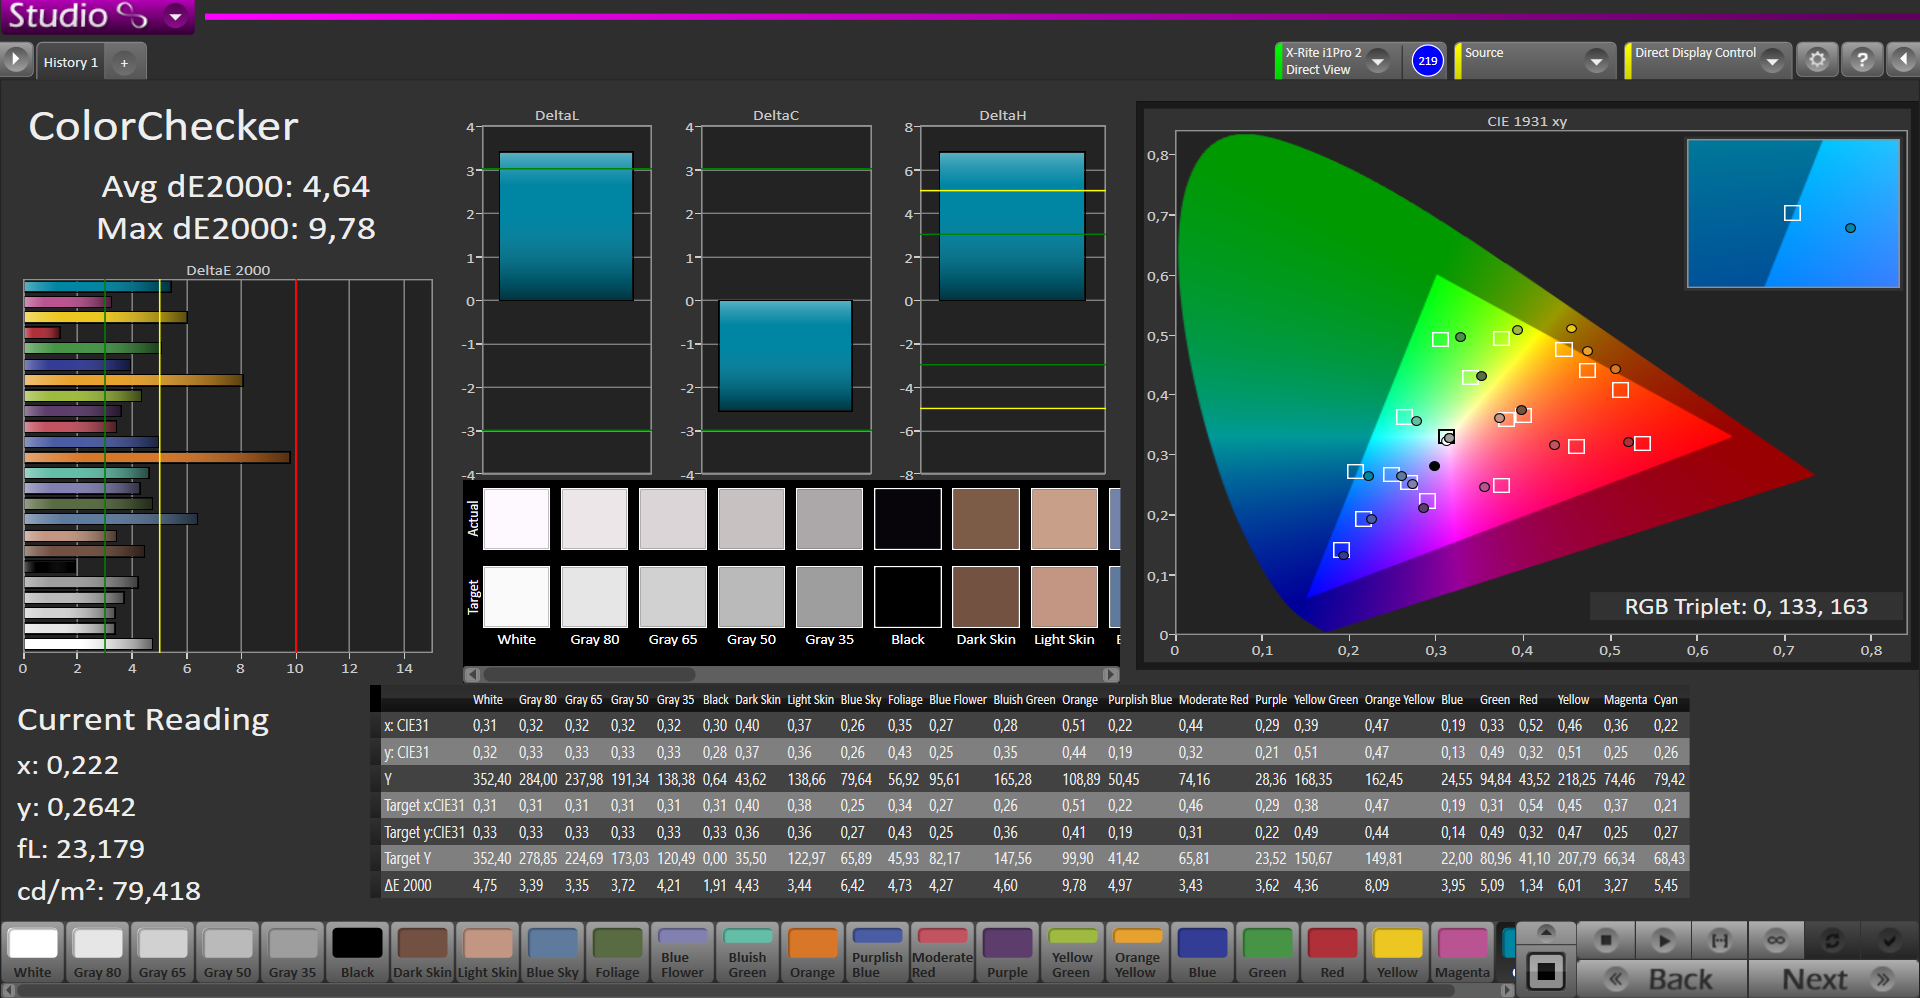
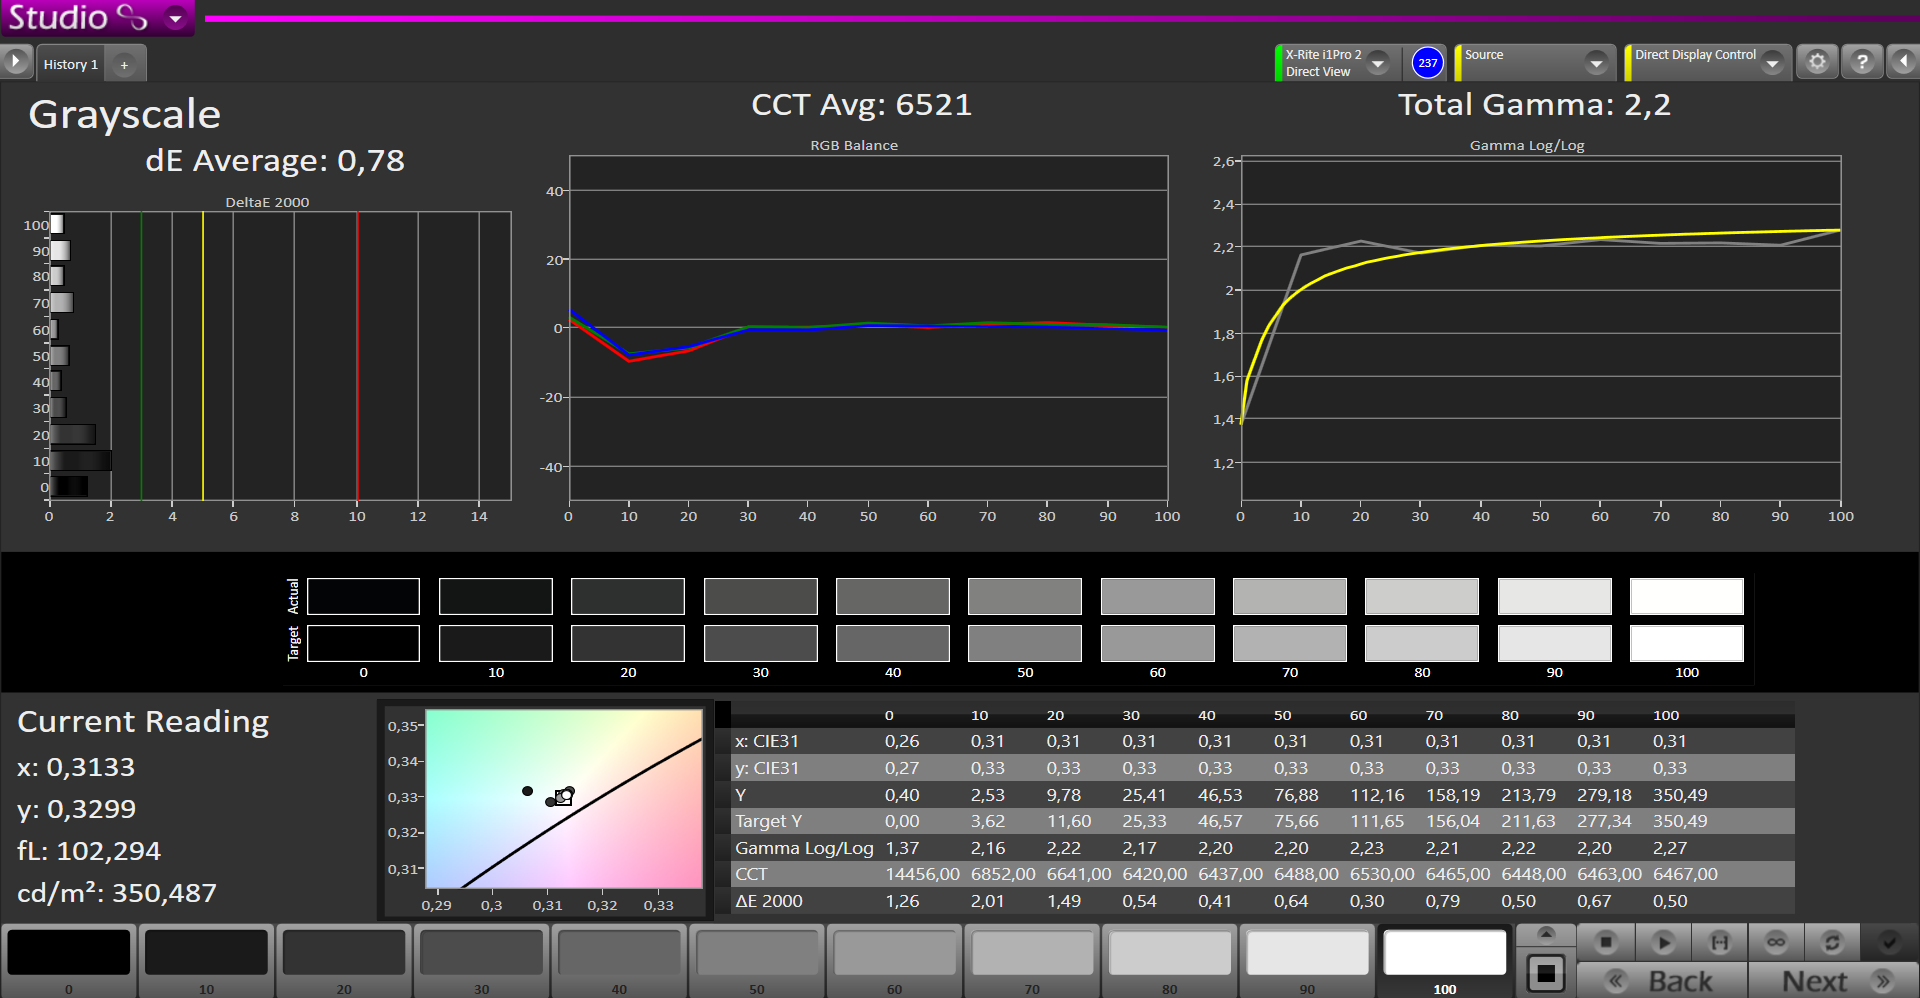
ΔE ColorChecker Calman: 4.64 | ∀{0.5-29.43 Ø4.71}
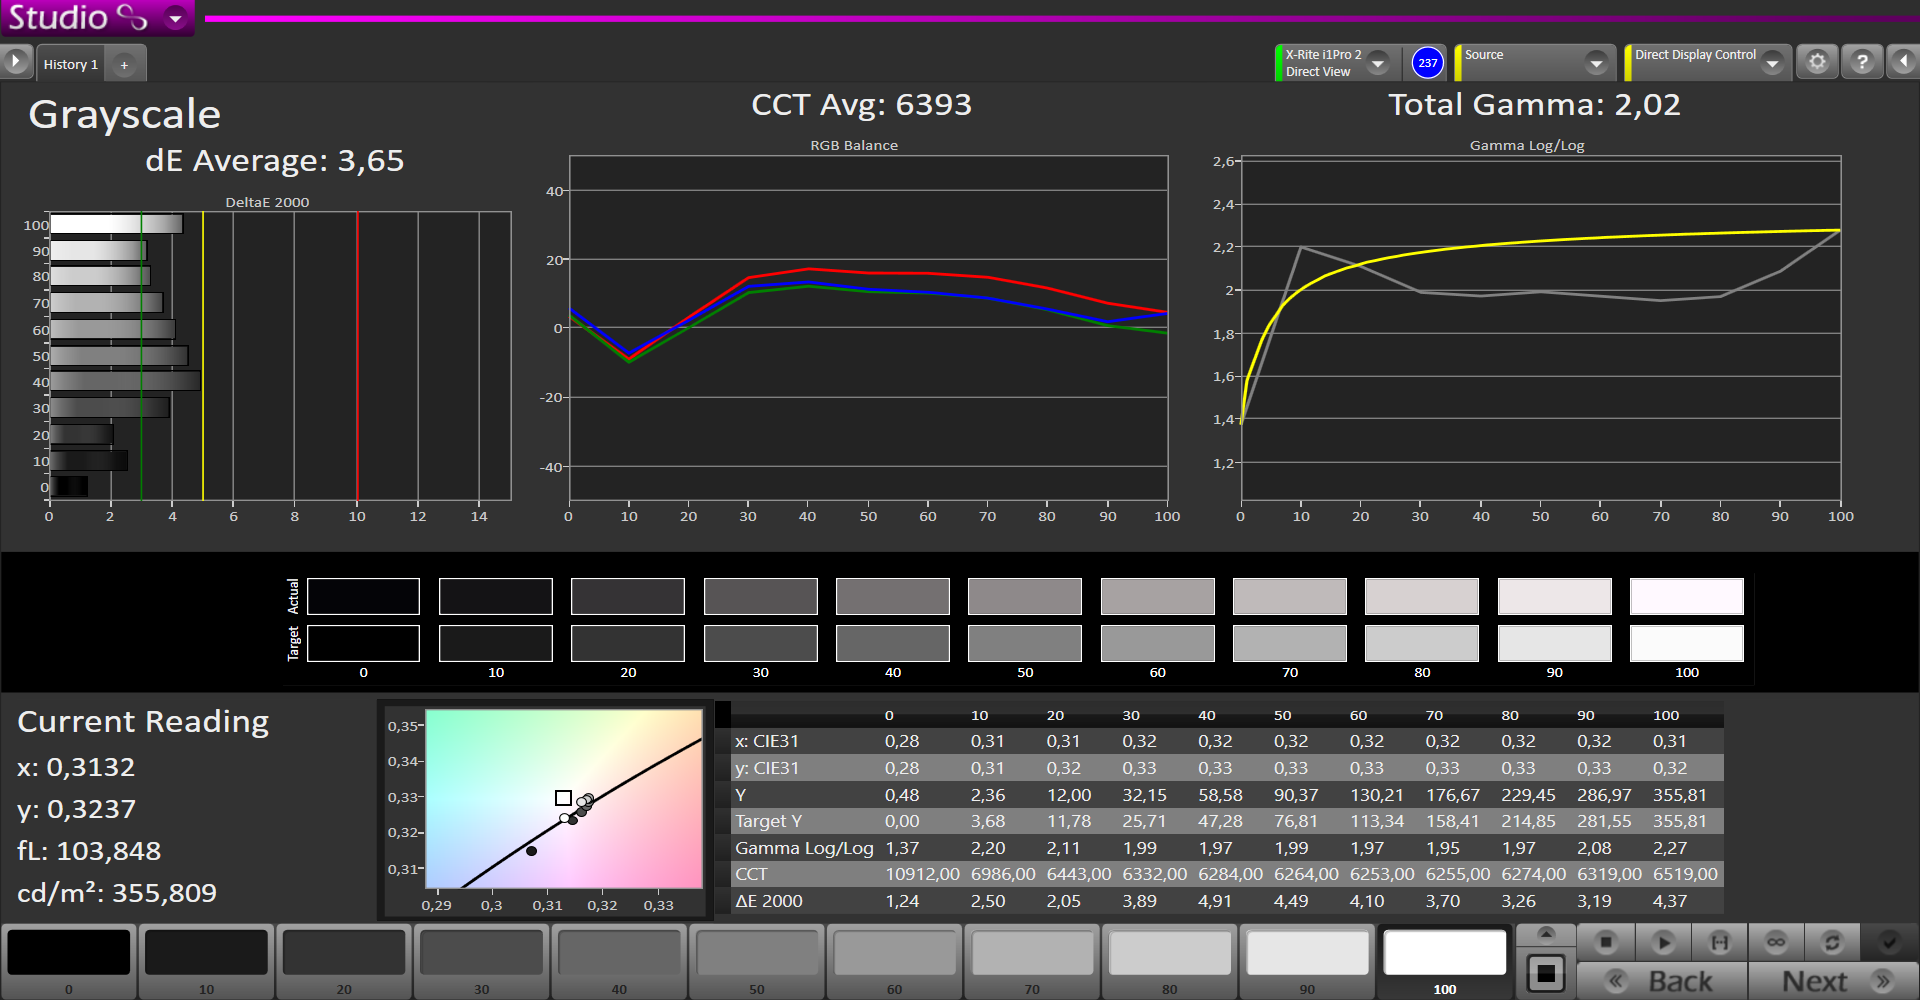
ΔE Greyscale Calman: 3.65 | ∀{0.09-98 Ø4.96}
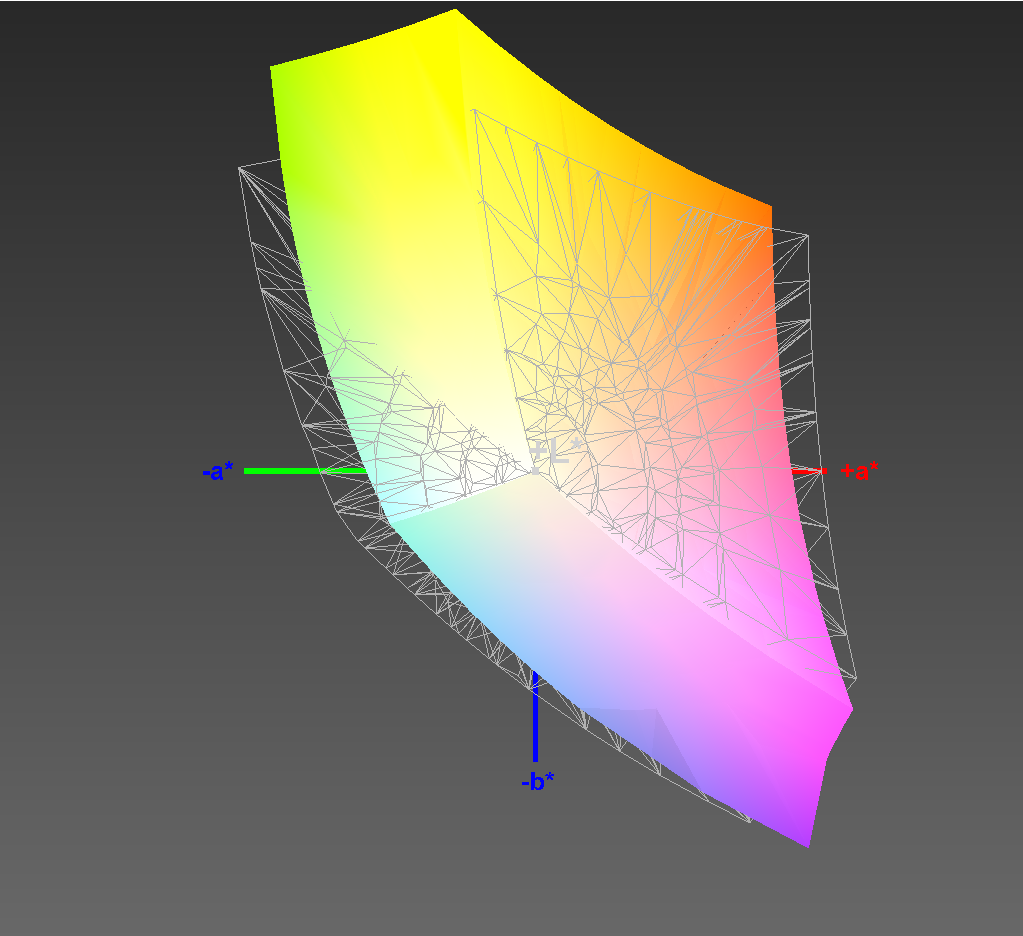
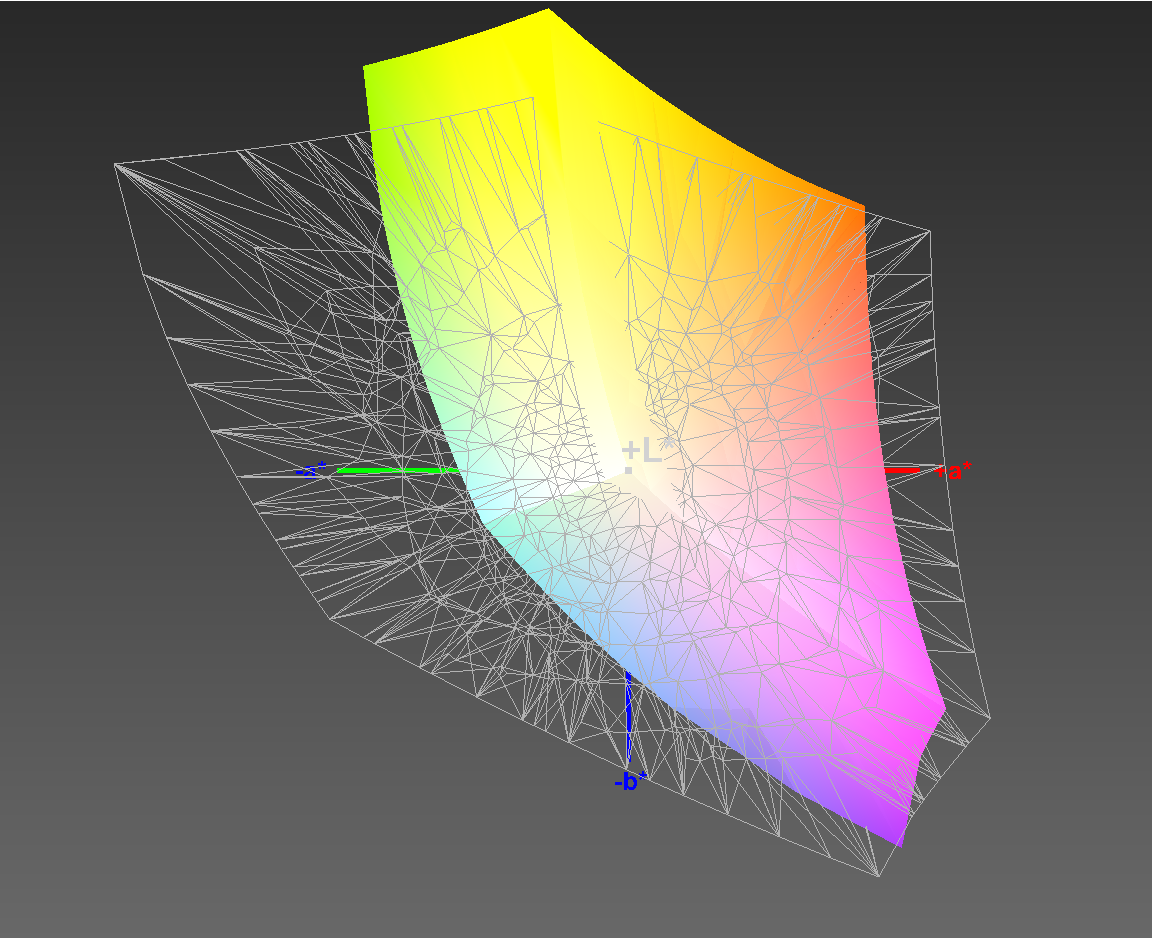
84% sRGB (Argyll 1.6.3 3D)
55% AdobeRGB 1998 (Argyll 1.6.3 3D)
61.5% AdobeRGB 1998 (Argyll 3D)
84.2% sRGB (Argyll 3D)
66.2% Display P3 (Argyll 3D)
Gamma: 2.02
CCT: 6393 K
The measured brightness in our nine segments ranges from 305 cd/m² in the left bottom edge to up 356 cd/m² in the central quadrant. On average, the maximum brightness is 331 cd/m² and the brightness distribution is 86%. Together with the matte display surface, the high brightness makes for a very good outdoor capability. The maximum display brightness is available on battery.
The contrast of 742:1 is competitive and makes for a significantly better black than many cheap standard displays. Images, videos, and games profit from the fact that colors appear quite vibrant. With 84% of the sRGB color space, the gamut is better than average, but it fails to cover sRGB, which is important for professional use.
| Display | |
| Display P3 Coverage (sort by value) | |
| Schenker W706 | |
| Lenovo ThinkPad P70 | |
| Dell Precision 7710 | |
| sRGB Coverage (sort by value) | |
| Schenker W706 | |
| Lenovo ThinkPad P70 | |
| Dell Precision 7710 | |
| AdobeRGB 1998 Coverage (sort by value) | |
| Schenker W706 | |
| Lenovo ThinkPad P70 | |
| Dell Precision 7710 | |
| Response Times | |
| Response Time Grey 50% / Grey 80% (sort by value) | |
| Schenker W706 (17.2, 26.8) | |
| Lenovo ThinkPad P70 (17.2, 26.8) | |
| Dell Precision 7710 (17, 33) | |
| Response Time Black / White (sort by value) | |
| Schenker W706 (8.4, 20.8) | |
| Lenovo ThinkPad P70 (4.8, 22.8) | |
| Dell Precision 7710 (11, 25) | |
| PWM Frequency (sort by value) | |
| Schenker W706 | |
| Lenovo ThinkPad P70 (95) | |
| Dell Precision 7710 (25) | |
| Screen | |
| Brightness middle (sort by value) | |
| Schenker W706 | |
| Lenovo ThinkPad P70 | |
| Dell Precision 7710 | |
| Brightness (sort by value) | |
| Schenker W706 | |
| Lenovo ThinkPad P70 | |
| Dell Precision 7710 | |
| Brightness Distribution (sort by value) | |
| Schenker W706 | |
| Lenovo ThinkPad P70 | |
| Dell Precision 7710 | |
| Black Level (sort by value) | |
| Schenker W706 | |
| Lenovo ThinkPad P70 | |
| Dell Precision 7710 | |
| Contrast (sort by value) | |
| Schenker W706 | |
| Lenovo ThinkPad P70 | |
| Dell Precision 7710 | |
| Colorchecker dE 2000 (sort by value) | |
| Schenker W706 | |
| Lenovo ThinkPad P70 | |
| Dell Precision 7710 | |
| Greyscale dE 2000 (sort by value) | |
| Schenker W706 | |
| Lenovo ThinkPad P70 | |
| Dell Precision 7710 | |
| Gamma (sort by value) | |
| Schenker W706 | |
| Lenovo ThinkPad P70 | |
| Dell Precision 7710 | |
| CCT (sort by value) | |
| Schenker W706 | |
| Lenovo ThinkPad P70 | |
| Dell Precision 7710 | |
| Color Space (Percent of AdobeRGB 1998) (sort by value) | |
| Schenker W706 | |
| Lenovo ThinkPad P70 | |
| Dell Precision 7710 | |
| Color Space (Percent of sRGB) (sort by value) | |
| Schenker W706 | |
| Lenovo ThinkPad P70 | |
| Dell Precision 7710 | |
* ... smaller is better
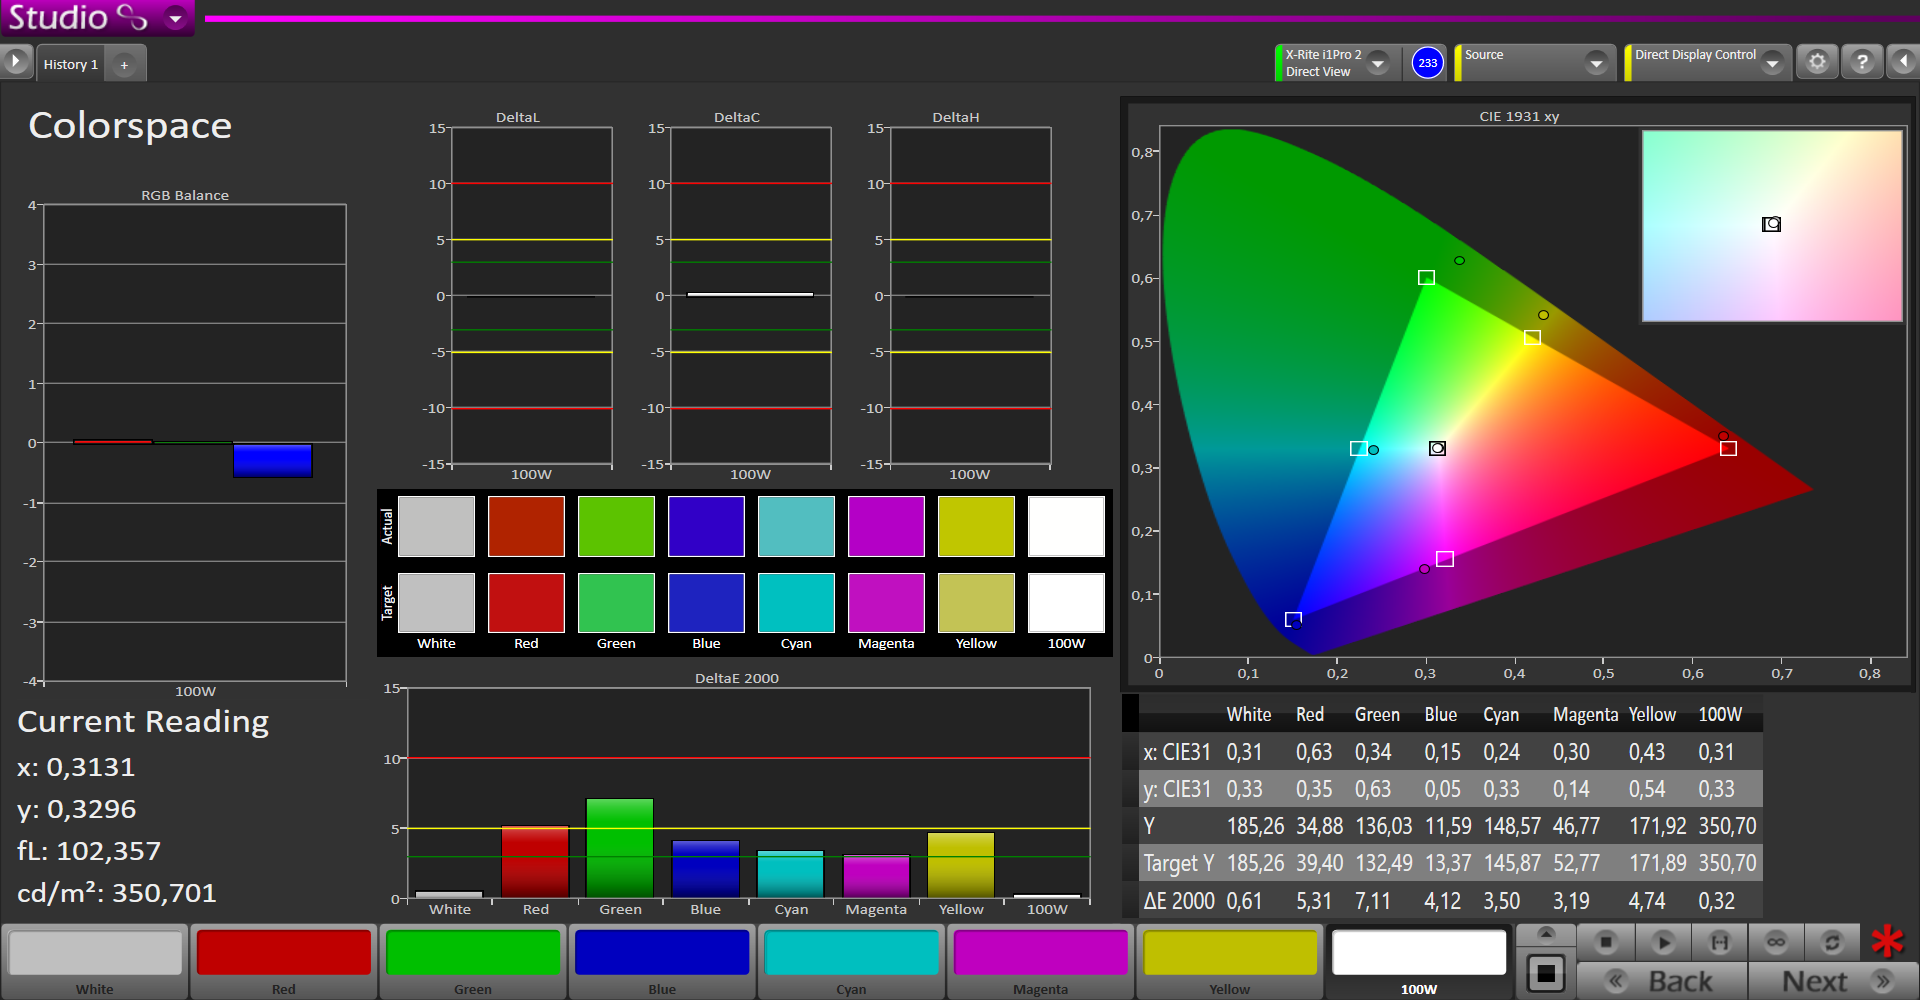
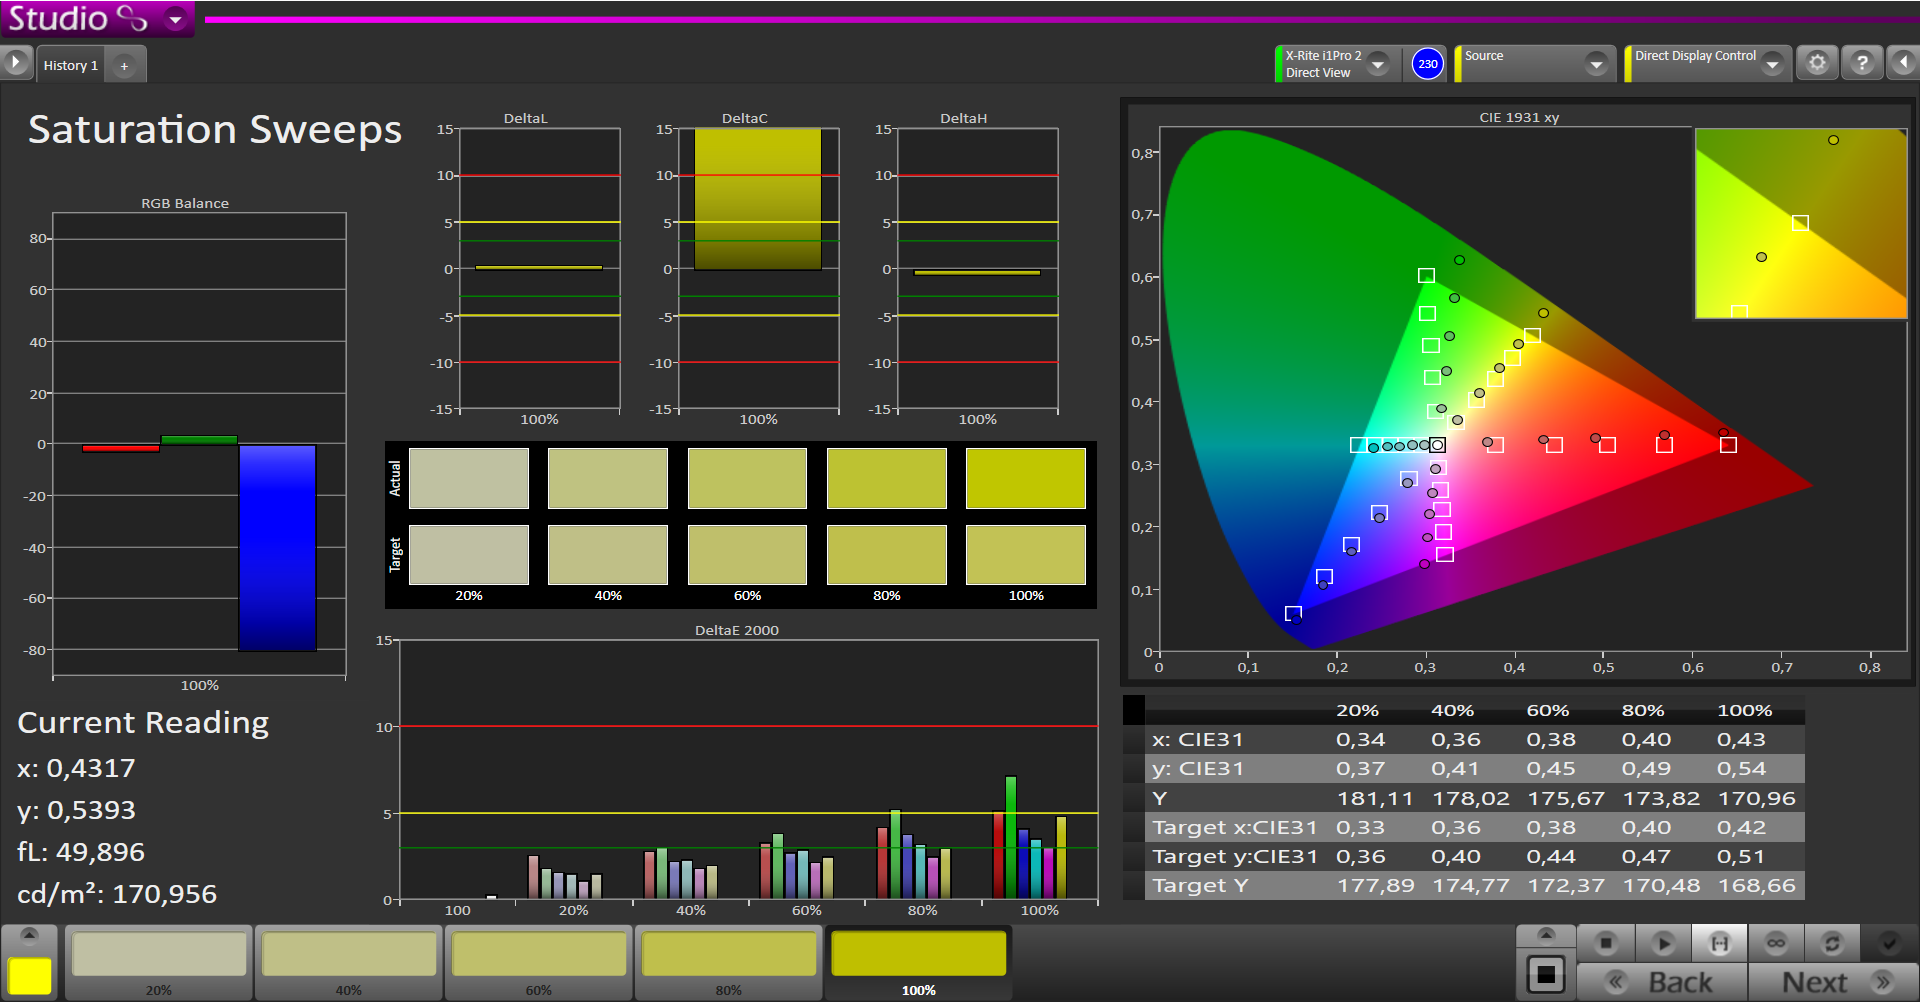
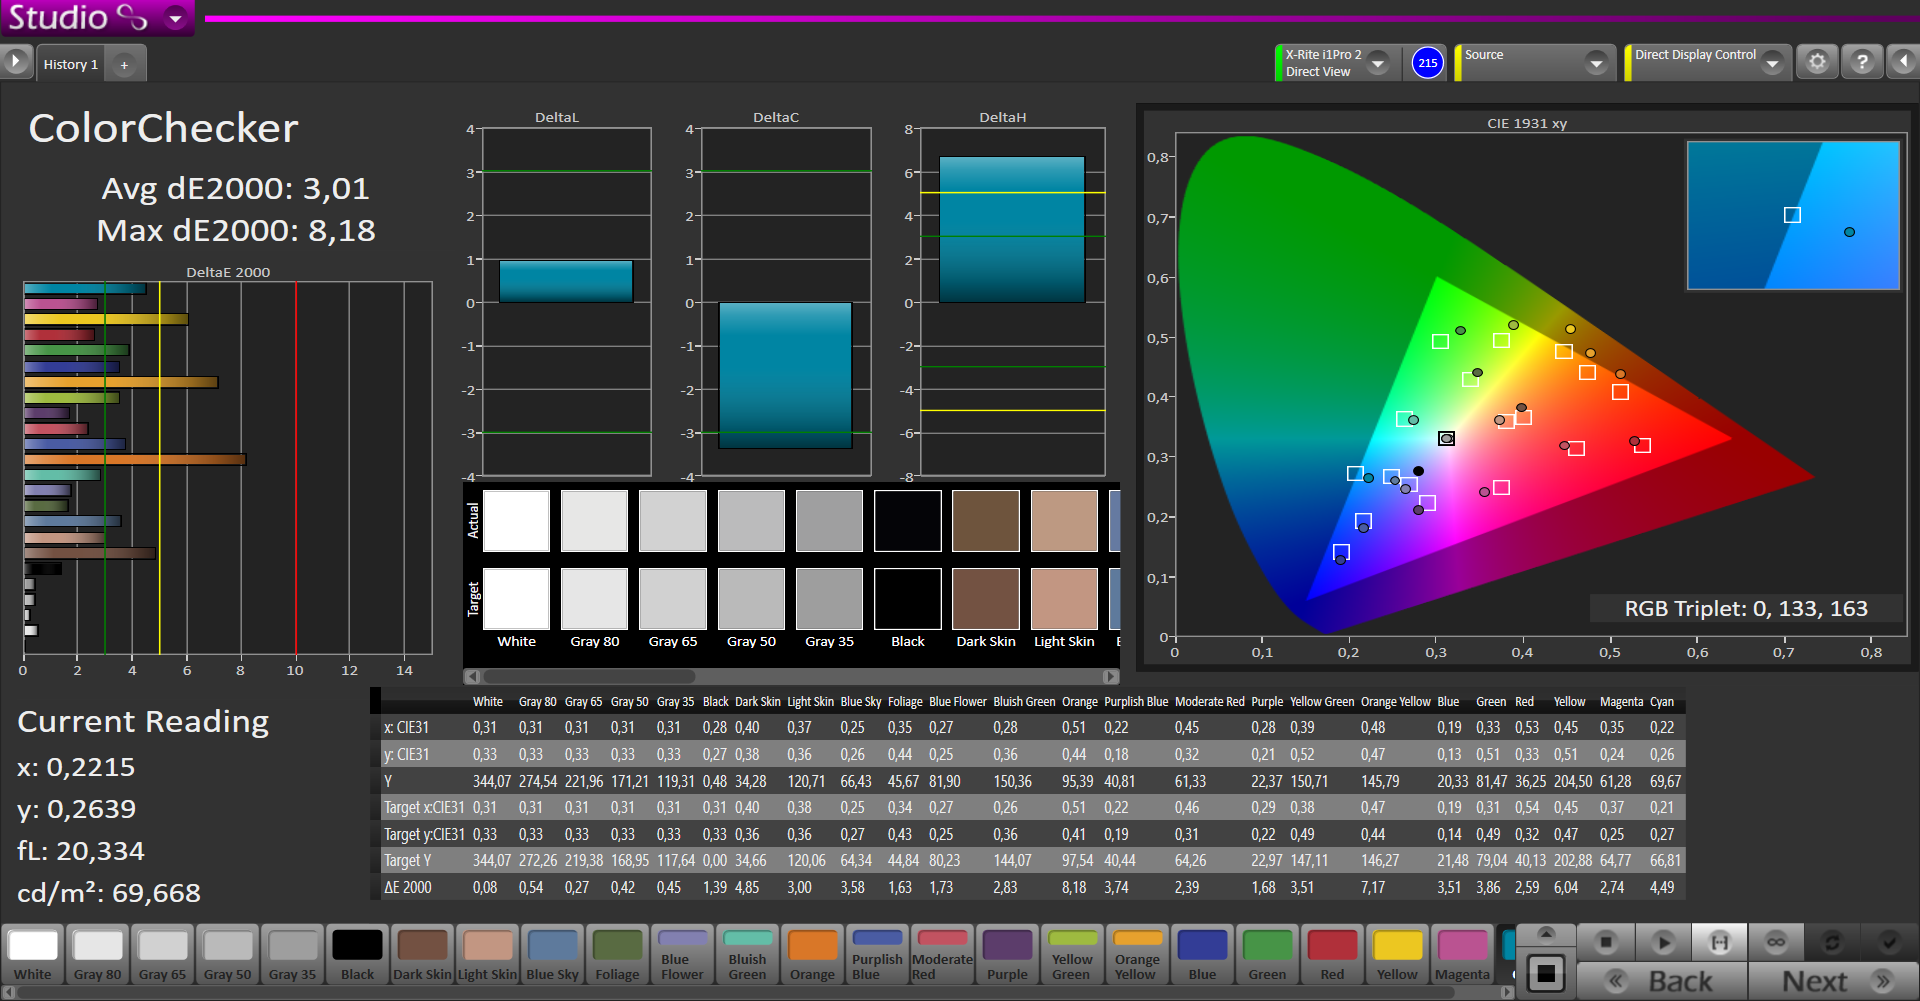
In terms of color fidelity, the not perfect color coverage especially has a negative impact. While the coverage of red and green is too small, yellow and magenta significantly exceed the limits. Although the average DeltaE of 4.64 in mixed colors (ColorChecker) and 3.65 in the grayscale suggest a good color fidelity, several orange colors significantly exceed the DeltaE2000 limit of 5 (up to 8.18). The primary color green is also far from the target with a DeltaE2000 of significantly above 7. Thus, color fidelity is not even possible with color profiles for professional work.


Display Response Times
| ↔ Response Time Black to White | ||
|---|---|---|
| 29.2 ms ... rise ↗ and fall ↘ combined | ↗ 8.4 ms rise | 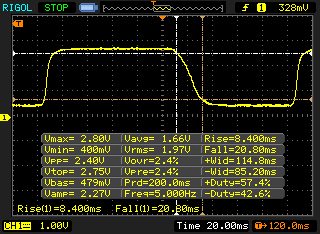 |
| ↘ 20.8 ms fall | ||
| The screen shows relatively slow response rates in our tests and may be too slow for gamers. In comparison, all tested devices range from 0.1 (minimum) to 240 (maximum) ms. » 78 % of all devices are better. This means that the measured response time is worse than the average of all tested devices (19.8 ms). | ||
| ↔ Response Time 50% Grey to 80% Grey | ||
| 44 ms ... rise ↗ and fall ↘ combined | ↗ 17.2 ms rise | 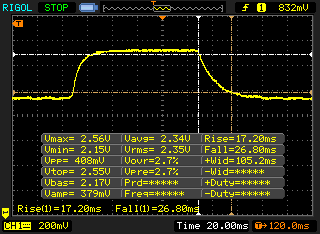 |
| ↘ 26.8 ms fall | ||
| The screen shows slow response rates in our tests and will be unsatisfactory for gamers. In comparison, all tested devices range from 0.165 (minimum) to 636 (maximum) ms. » 73 % of all devices are better. This means that the measured response time is worse than the average of all tested devices (30.9 ms). | ||
Screen Flickering / PWM (Pulse-Width Modulation)
| Screen flickering / PWM not detected | 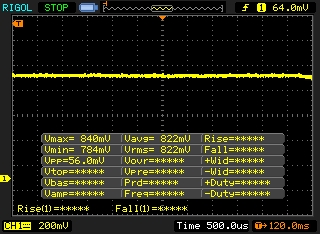 | ||
In comparison: 52 % of all tested devices do not use PWM to dim the display. If PWM was detected, an average of 7744 (minimum: 5 - maximum: 343500) Hz was measured. | |||
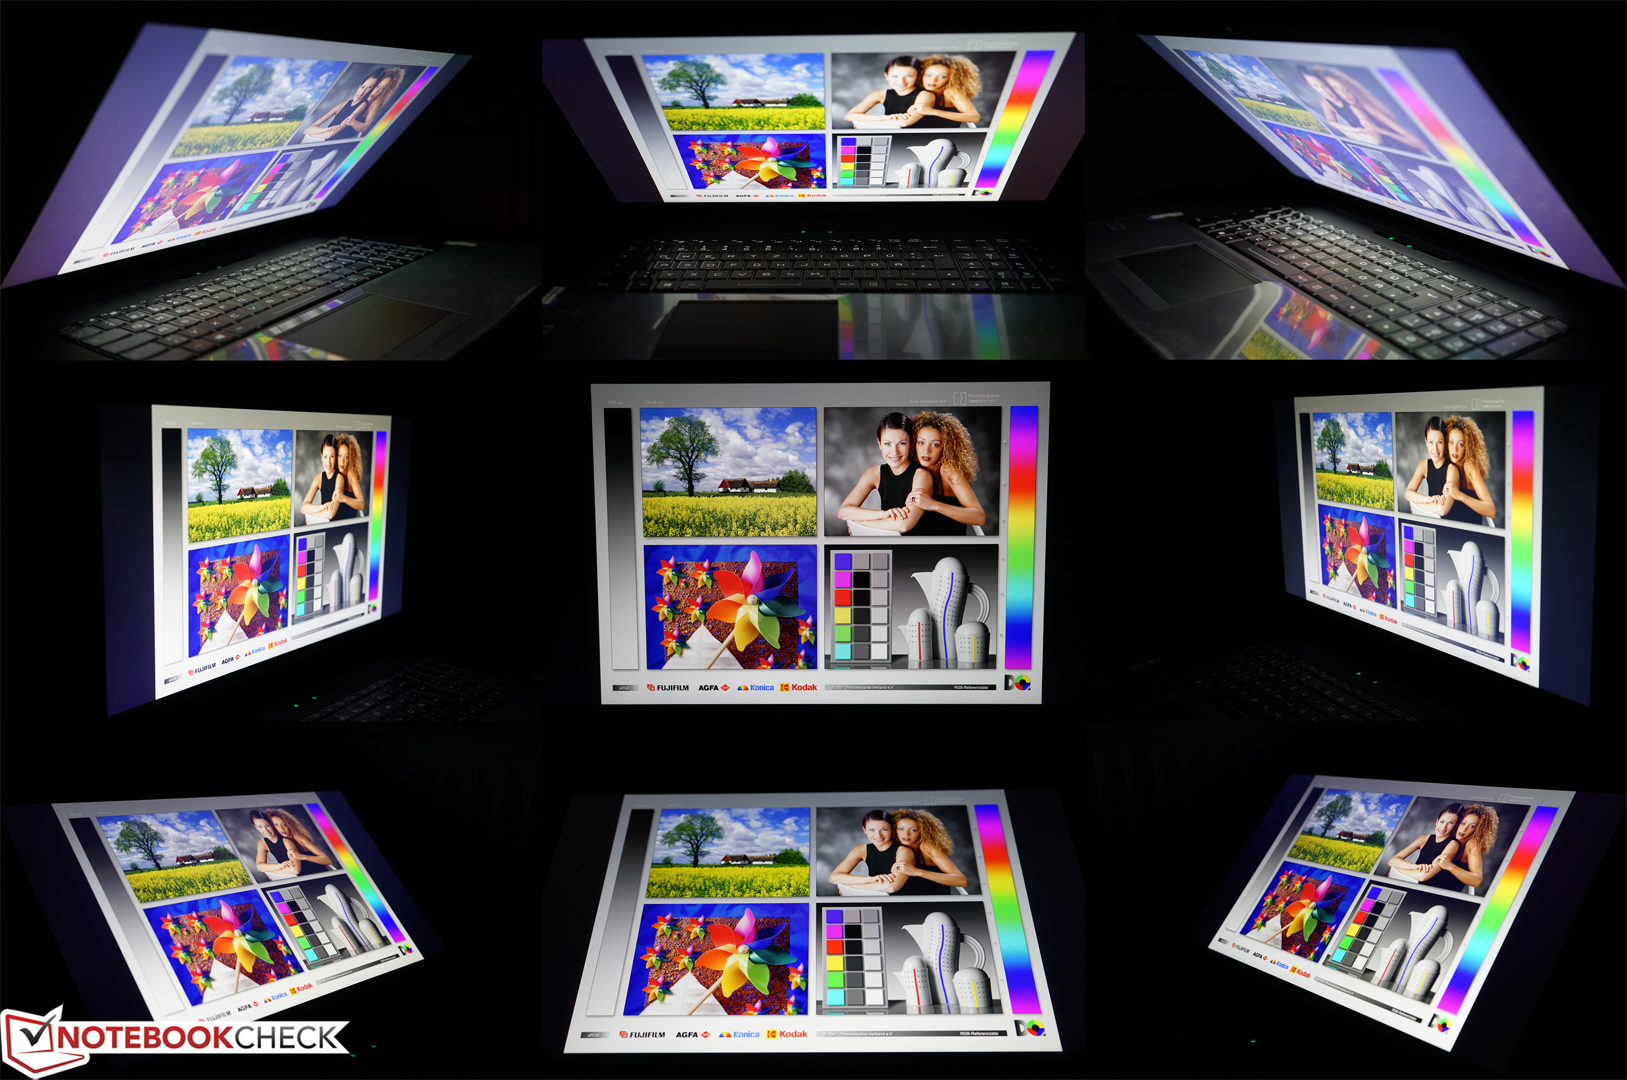
Typical for IPS displays, the viewing-angle stability is very good and slight weaknesses become first visible from very flat angles, but color deviations cannot be observed.
Performance
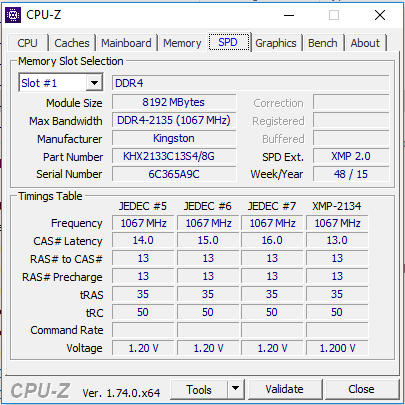
Schenker's mobile Workstation W706 is available from about 1700 Euros (~$1854) in the online configurator, but it can quickly reach the 7000-Euro (~$7632) level when equipped to the fullest. As usual for Schenker Technologies, you have many options to configure the device according to your needs. Our test sample comes with an Intel Core i7-6700 desktop CPU, the professional Nvidia Quadro M5000M, 32 GB of RAM and a 512 GB NVMe SSD. The price is about 4700 Euros (~$5124). Nvidia's professional graphics unit especially boosts the price.
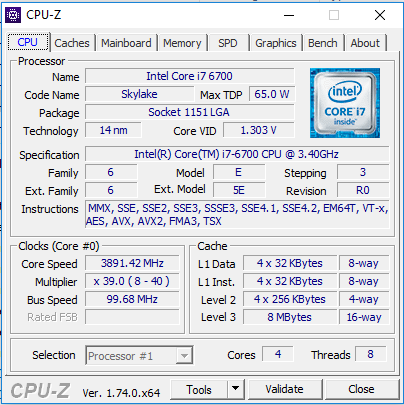
Processor
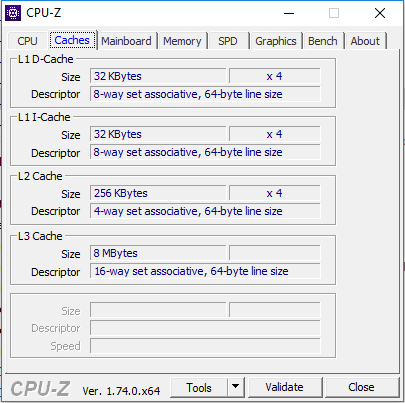
Intel's Core i7-6700 is a powerful desktop CPU with 4 cores (up to 8 threads thanks to Hyper-Threading), 8 MB Level 3 cache, and Intel's Turbo Boost technology (3.4 GHz to 4.0 GHz). The cooling requirements are significantly higher than those of comparable mobile processors with a thermal design power of 65 Watt.
Performance-wise, the quad-core processor ranks in between the new Intel Mobil-Xeons E3-1505M and E3-1535M. For example, it achieves a very good 743 points in the Cinebench R15 Multi Core test (64-bit) and wPrime 1024m is done in 209 seconds. Overall, this desktop processor got 7th in our extensive CPU benchmark list. Thus, it currently belongs to the most powerful processors in notebooks.
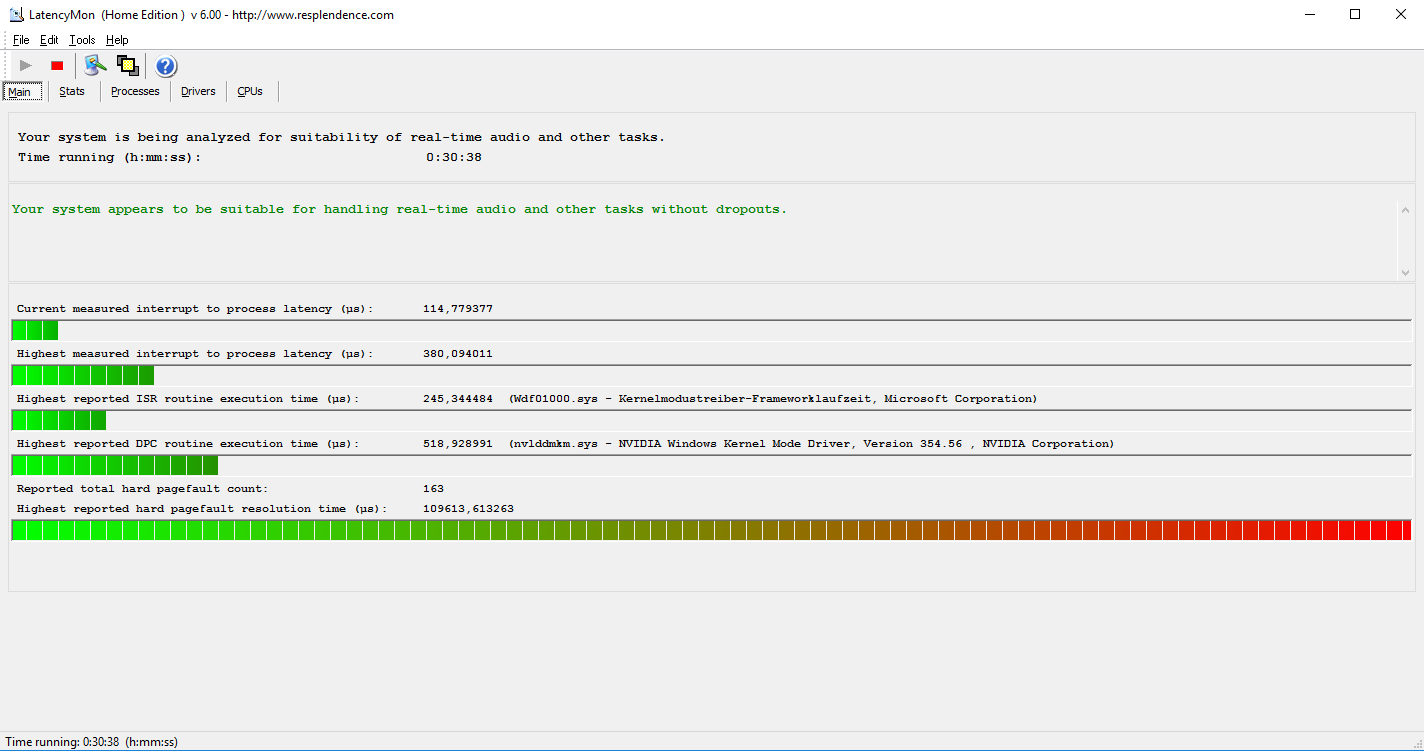
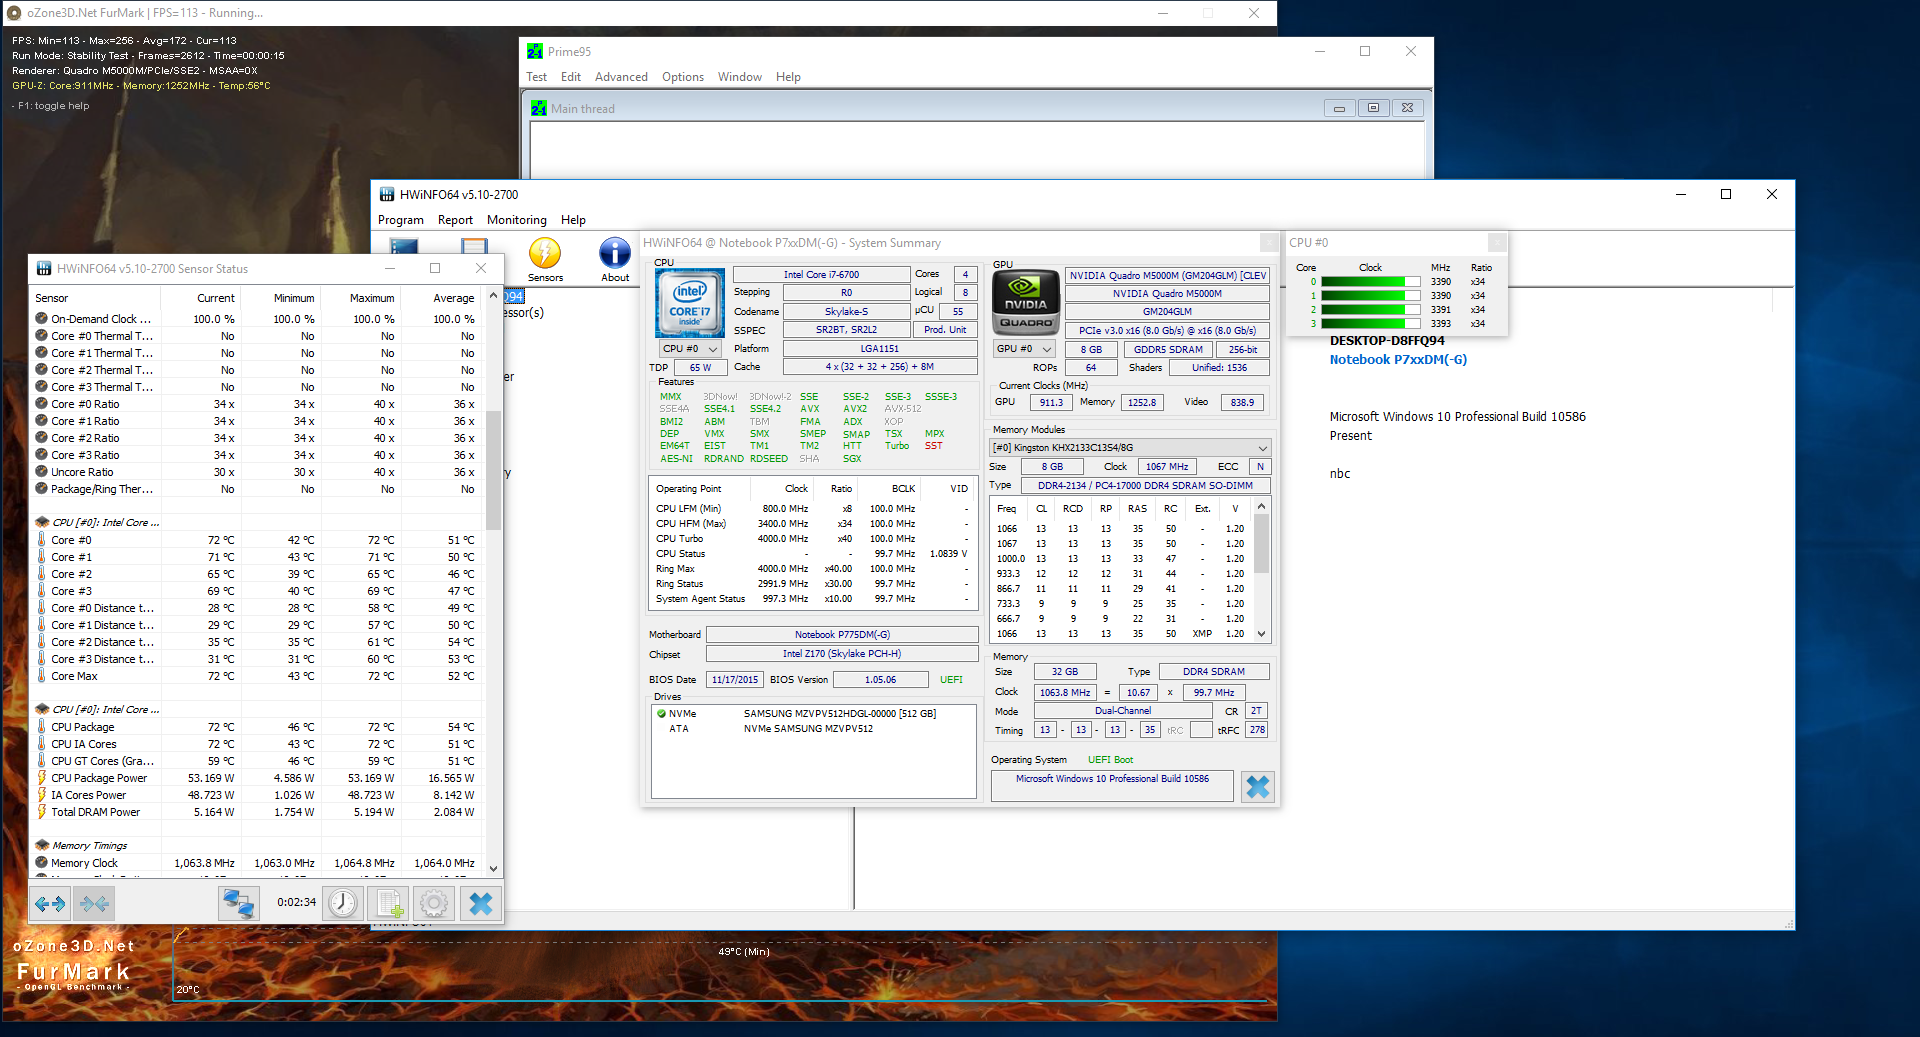
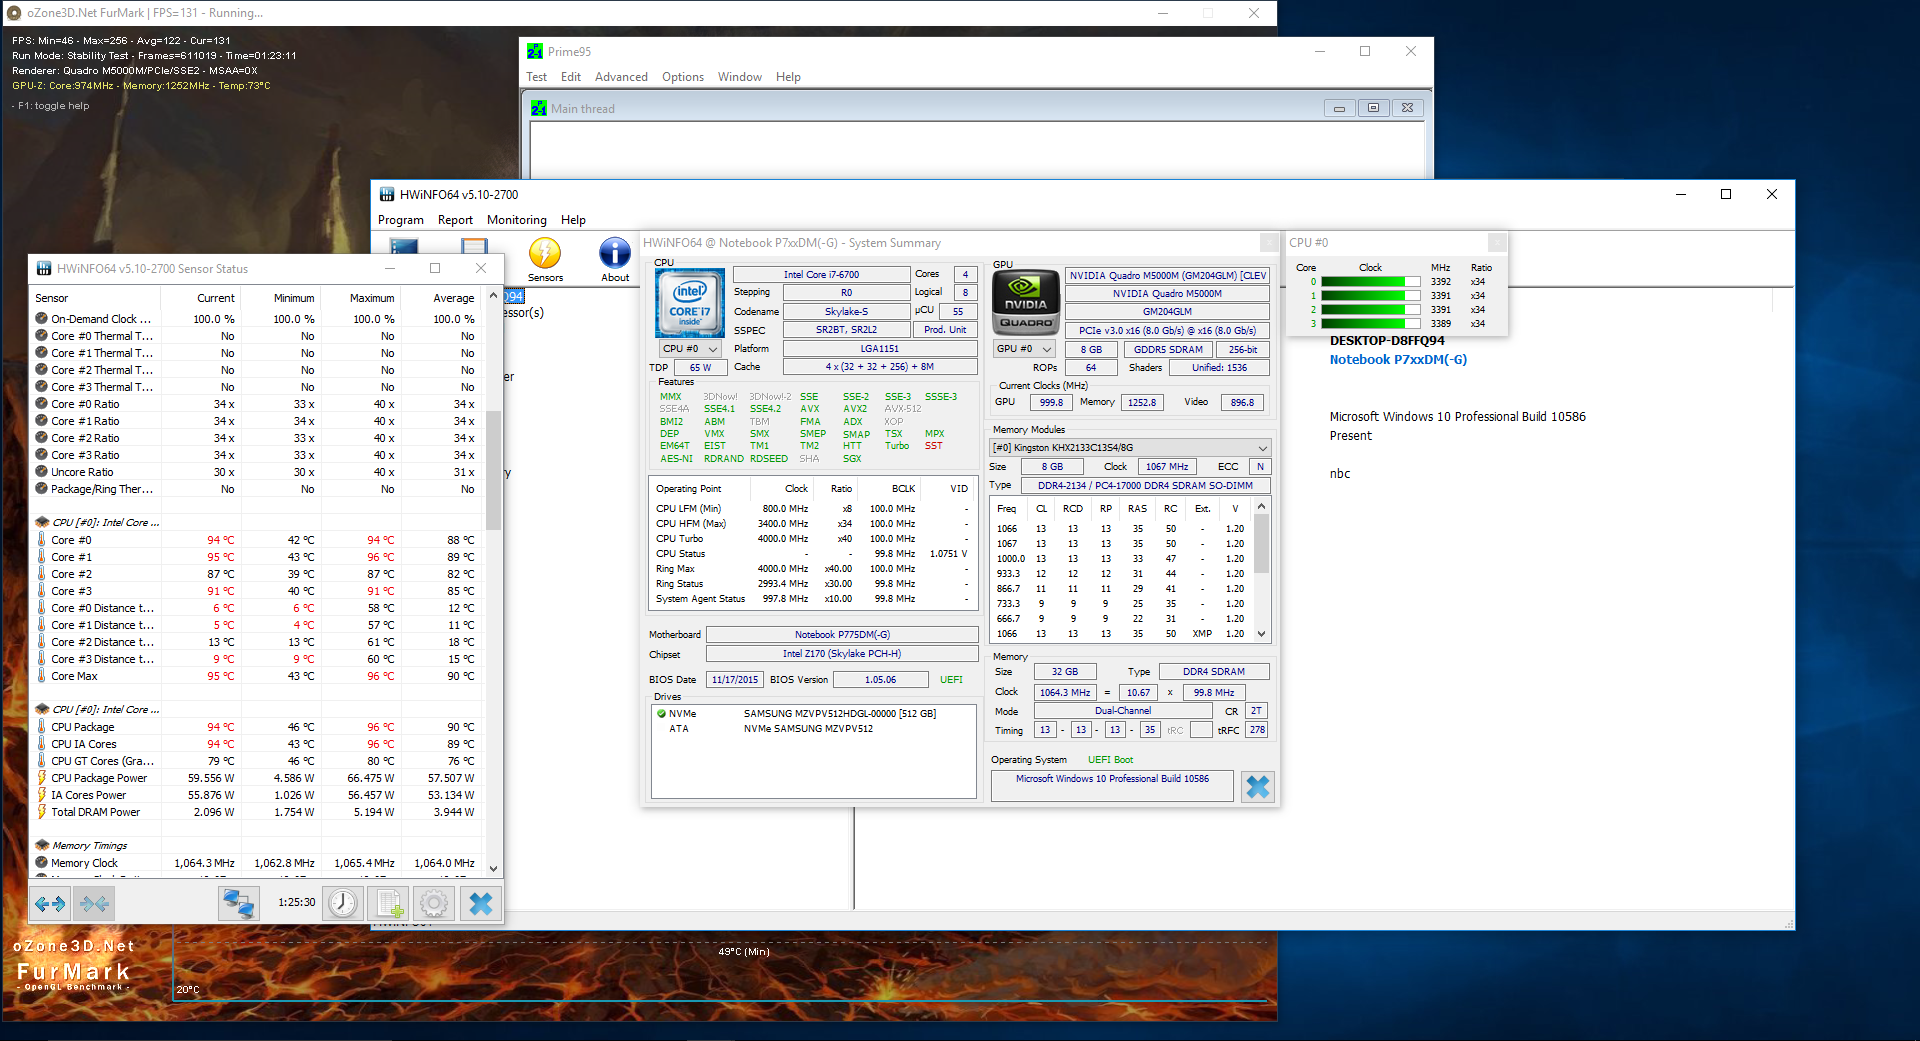
In the stress test, the system keeps permanently working at a very high performance level regardless of full load. HWinfo 64 still records a CPU clock of 3.4 GHz and a GPU clock of 1012 MHz after above 2 hours of Prime95 and Furmark. Thus, there is not the slightest evidence of throttling or other thermal problems. Top marks!
However, you have to accept a permanent CPU throttling to 2 GHz on battery. As a result, the system only achieves 4.84 points instead of 8.69 points in Cinebench R11.5 (multi, 64-bit).

System Performance
Our test system comes with powerful and well-balanced components. It does not have any bottlenecks. Certainly, the performance can still be improved a bit with RAID configurations, a more powerful CPU or faster and/or more RAM. However, it heavily depends on the user's requirements if the price-performance ratio is acceptable. 6772 points in PC Mark 8 Work is already very good and should continue to be of value in the distant future.
| PCMark 7 Score | 6859 points | |
| PCMark 8 Home Score Accelerated v2 | 4914 points | |
| PCMark 8 Creative Score Accelerated v2 | 6772 points | |
| PCMark 8 Work Score Accelerated v2 | 5151 points | |
Help | ||
Storage Devices
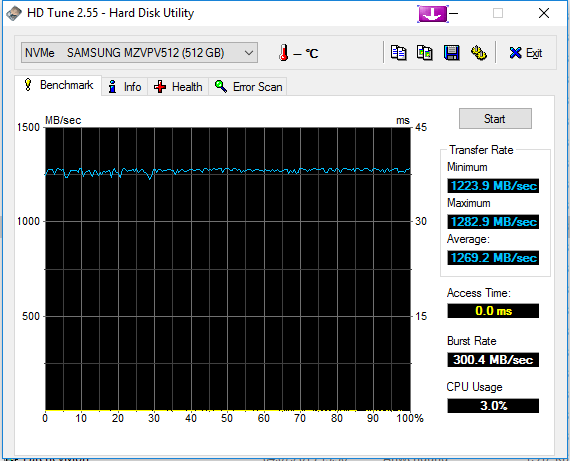
Schenker lists many storage devices in the online configurator. The two M.2 slots as well as the two 2.5-inch slots can be used in RAID 0/1 mode. We selected a 512 GB NVMe SSD for our test model, which is a good compromise in terms of performance and capacity. If you should run low on storage space, you can simply add another drive thanks to the good maintainability.
The Samsung SM951 NVMe SSD in the W706 workstation delivers excellent transfer rates with a maximum of 1915 MB/s in reading and 1511 MB/s in writing. The 4k values of just under 50 MB/s in reading and 146 MB/s in writing are alright. In everyday use, the system is very responsive and does not show signs of a slow storage device.

Graphics Card
Schenker also offers the W706 with three different professional Nvidia Quadro graphics cards apart from several consumer graphics cards. According to our definition, these are key components of a mobile workstation and the essential difference to gaming or consumer devices. Our test model comes with the brand new Nvidia Quadro M5000M (8 GB GDDR5, 256-bit, 1012 MHz core clock) top model of the new Maxwell generation, which is currently the most powerful professional graphics card. We have already tested the other options, the Nvidia Quadro M1000M and Nvidia Quadro M3000M, in the Dell Precision 5510 and the Lenovo ThinkPad P70. We have run further benchmarks on the Schenker W706 with the additionally provided M3000M. Thanks to an MXM slot, it is possible to quickly and easily replace the incorporated graphics cards with it. AMD Fire Pro alternatives are not supposed to be options for Schenker workstations in the foreseeable future.
The professional Quadro series especially differs from familiar consumer graphics chips by a modified BIOS, special drivers and a configuration optimized for stability. In the enterprise range, the many software certifications, which ensure trouble-free interactions between hardware and software, are important, too. Performance-wise, especially OpenGL optimized software profits from the special drivers. Calculation methods, which do not belong to the OpenGL standard yet, can be used and make for a performance gain.
We checked professional scenarios with the SPECviewperf benchmarks, which basically cover CAD, CAM, geology and medical MRT. The results show how much better the M5000M performs than its Quadro predecessors and the FirePro W7170M from AMD. The competitors are outperformed by a large margin. Directly compared to the Nvidia Quadro K5100M predecessor, the performance gain ranges from 20 to above 180%, depending on the subtest.
The free programming interface OpenCL allows running demanding calculations on the GPU instead of the CPU. This reduces the total system load and usually leads to faster results. In practice, OpenCL is primarily used in tasks such as encryption, conversion, image and video editing or financial analysis. We ran Luxmark 2.0 (ray tracing) and SiSoft Sandra 16 (GPGPU). The new Maxwell Quadro M5000M can particularly chalk up a huge performance gain in ray tracing and took the lead in many subtests. Only in finance analysis and image editing does AMD's FirePro W7170M still perform significantly better.
| SiSoft Sandra 2016 | |
| Image Processing (sort by value) | |
| Schenker W706 | |
| Dell Precision 5510 | |
| Lenovo ThinkPad P70 | |
| Dell Precision 7710 | |
| GP Cryptography (Higher Security AES256+SHA2-512) (sort by value) | |
| Schenker W706 | |
| Dell Precision 5510 | |
| Lenovo ThinkPad P70 | |
| Dell Precision 7710 | |
| GP Financial Analysis (FP High/Double Precision) (sort by value) | |
| Schenker W706 | |
| Dell Precision 5510 | |
| Lenovo ThinkPad P70 | |
| Dell Precision 7710 | |
In contrast to OpenGL optimized software, hardware performance is primarily important for DirectX. Thus, the results are on par with comparable consumer chips of the GeForce and Radeon series. For example, our test model achieves an excellent 9368 points in the GPU score of the Fire Strike test and 65687 points in Cloud Gate of the popular 3DMarks. Therewith, it ranks in just behind the Nvidia GeForce GTX 980M. In the Unigine Heaven 3.0 DX11 benchmark, the graphics chip achieves 116.9 fps and accomplishes 48.4 fps in the Valley 1.0 test. Compared to OpenGL runs under otherwise same conditions (no optimizations), it achieves a few frames more in each of them. You can use our GPU benchmark list to extensively compare graphics chips.
| 3DMark 06 Standard Score | 32607 points | |
| 3DMark 11 Performance | 11336 points | |
| 3DMark Ice Storm Standard Score | 150684 points | |
| 3DMark Cloud Gate Standard Score | 24971 points | |
| 3DMark Fire Strike Score | 8210 points | |
Help | ||
| Unigine Heaven 3.0 | |
| 1920x1080 OpenGL, Normal Tessellation, High Shaders AA:Off AF:Off (sort by value) | |
| Schenker W706 | |
| Dell Precision 5510 | |
| Lenovo ThinkPad P70 | |
| Dell Precision 7710 | |
| 1920x1080 DX 11, Normal Tessellation, High Shaders AA:Off AF:Off (sort by value) | |
| Schenker W706 | |
| Dell Precision 5510 | |
| Lenovo ThinkPad P70 | |
| Dell Precision 7710 | |
| Unigine Valley 1.0 | |
| 1920x1080 Extreme HD DirectX AA:x8 (sort by value) | |
| Schenker W706 | |
| Dell Precision 5510 | |
| Lenovo ThinkPad P70 | |
| Dell Precision 7710 | |
| 1920x1080 Extreme HD Preset OpenGL AA:x8 (sort by value) | |
| Schenker W706 | |
| Dell Precision 5510 | |
| Lenovo ThinkPad P70 | |
| Dell Precision 7710 | |
Gaming Performance
The gaming capabilities of professional graphics chips depend on the used hardware. The Nvidia Quadro M5000M ranks in just under the Nvidia GeForce GTX 980M. All titles tested by us run smoothly with maximum test settings. Further comparisons are possible by means of our extensive gaming benchmark list.
| low | med. | high | ultra | |
|---|---|---|---|---|
| Tomb Raider (2013) | 537 | 352 | 240 | 74.4 |
| BioShock Infinite (2013) | 289 | 228 | 212 | 92 |
| Metro: Last Light (2013) | 154 | 151 | 122 | 66 |
| Company of Heroes 2 (2013) | 66 | 66 | 65 | 35 |
| Total War: Rome II (2013) | 373 | 299 | 235 | 57 |
| Thief (2014) | 118 | 111 | 104 | 61 |
| GRID: Autosport (2014) | 368 | 190 | 155 | 106 |
| Middle-earth: Shadow of Mordor (2014) | 216 | 157 | 88 | 68 |
| Ryse: Son of Rome (2014) | 135 | 116 | 65 | 65 |
| F1 2014 (2014) | 121 | 121 | 122 | 120 |
| Dirt Rally (2015) | 386 | 160 | 126 | 73 |
| The Witcher 3 (2015) | 155 | 123 | 67 | 38 |
| Anno 2205 (2015) | 193 | 179 | 82 | 34 |
Emissions
System Noise
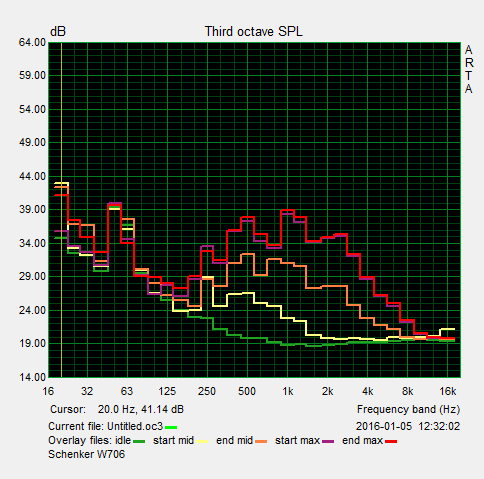
Under low load, the test model behaves as many users would want. It is often silent and almost never calls attention to itself. Even during short load periods of a few seconds, a reaction is not noticeable. However, the fans are clearly audible at medium load with a noise level of 40.2 dB(A), but the overall decent noise characteristic is a pro. The user is spared from high frequencies, pulsating noise or similar nuisances.
The system noise reaches up to 46 dB(A) under full load, which might be inconvenient or even annoying in the long run. In view of the device category and its performance, the noise is quite modest.
Noise level
| Idle |
| 30 / 30 / 30 dB(A) |
| Load |
| 40.2 / 46.14 dB(A) |
 | ||
30 dB silent 40 dB(A) audible 50 dB(A) loud |
||
min: | ||
Temperature
The temperature increase shows that the cooling capabilities of the 17-inch case are not perfect. Together with one of the offered 91-Watt CPUs, the limit might be exceeded. Although we measured up to 68 °C on the underside after the stress test, we do not think that this is an absolutely critical value for our test model.
The heat especially accumulates at the big heatpipes, where some of the heat is emitted to the outside. The case remains significantly cooler and just under 50 °C near the GPU and CPU with their big fans. Nevertheless, use on the lap is not possible in view of such a worst case scenario. Moreover, the question rises of how the case might react to permanent temperatures of up to 68 °C during hard workstation tasks in the long run.
(±) The maximum temperature on the upper side is 43.3 °C / 110 F, compared to the average of 38.2 °C / 101 F, ranging from 22.2 to 69.8 °C for the class Workstation.
(-) The bottom heats up to a maximum of 68 °C / 154 F, compared to the average of 41.1 °C / 106 F
(+) In idle usage, the average temperature for the upper side is 30.5 °C / 87 F, compared to the device average of 32 °C / 90 F.
(+) The palmrests and touchpad are cooler than skin temperature with a maximum of 30.8 °C / 87.4 F and are therefore cool to the touch.
(-) The average temperature of the palmrest area of similar devices was 27.8 °C / 82 F (-3 °C / -5.4 F).
Speakers
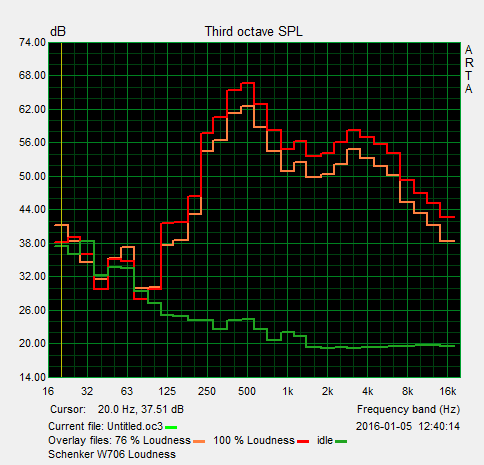
The gaming origin of the Schenker W706 becomes apparent with the speakers. The Onkyo system with subwoofer delivers an audibly better sound quality than many business notebooks. With decent mid-tones and acceptable basses, you'll get a pleasant alternative to the usual high-tone heavy solutions. Although the maximum volume of 68 dB(A) is a bit low, the sound remains undistorted. External solutions can be connected via USB, SPDIF, HDMI, Bluetooth, 3.5 mm jack or DisplayPort. Thanks to separate jacks for microphone and headphones, you can even use older headsets without needing an adapter.
Energy Management
Power Consumption
The power consumption is relatively high because of the used components. With a minimum power consumption of 25.9 Watt (minimum display brightness, energy-saving mode, radio modules off), our W706 workstation requires, for example, twice as much energy than our Lenovo ThinkPad P70 test model (12.1 Watt). The desktop CPU and the lack of a graphics switch especially have an impact here. At medium load, the power consumption already reaches 104.7 Watt and a maximum of 193 Watt is required under full load. Thus, the reserve capacity of the power adapter rated at 230 Watt is sufficient for adding the one or other storage device at a later time. The battery capacity of 81 Wh is good in general, but it only makes for basic battery runtimes due to the high power consumption.
| Off / Standby | |
| Idle | |
| Load |
|
Key:
min: | |
Battery Life
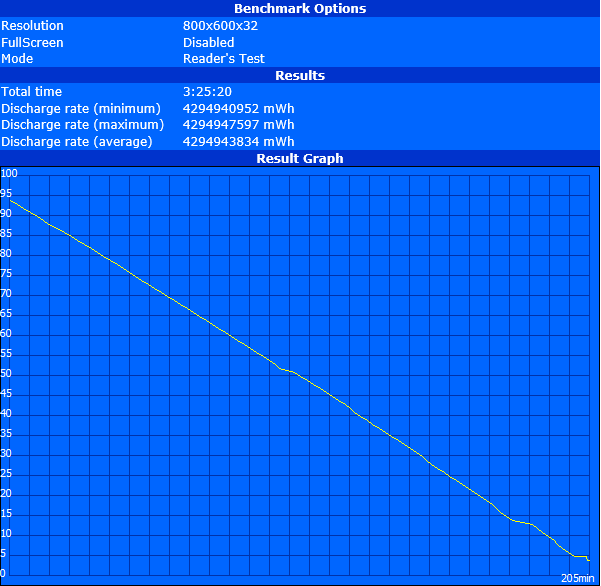
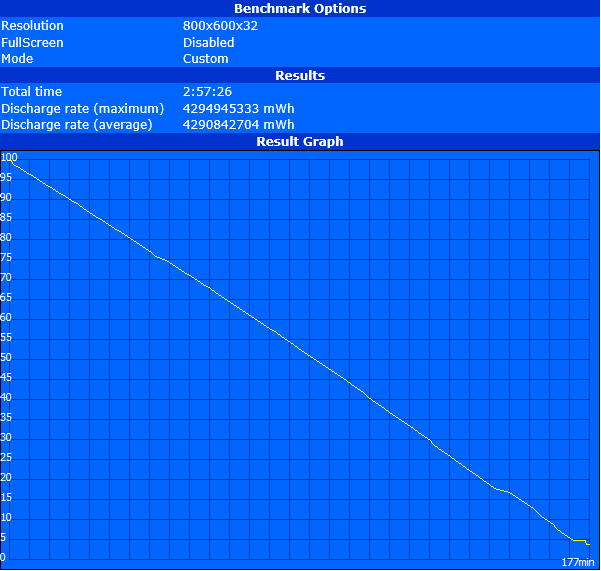
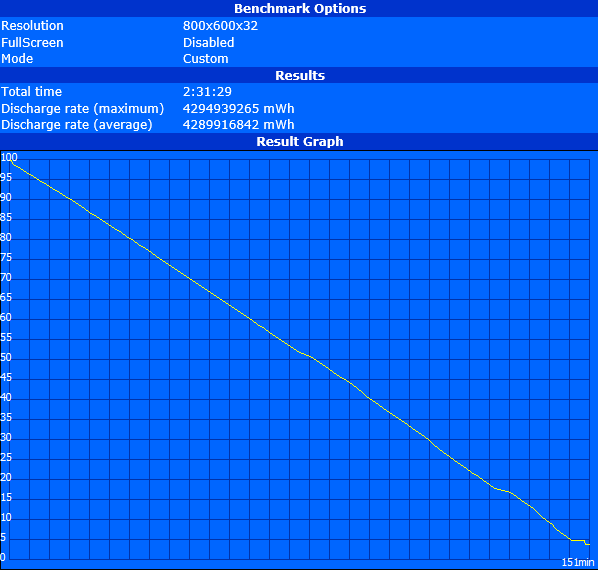
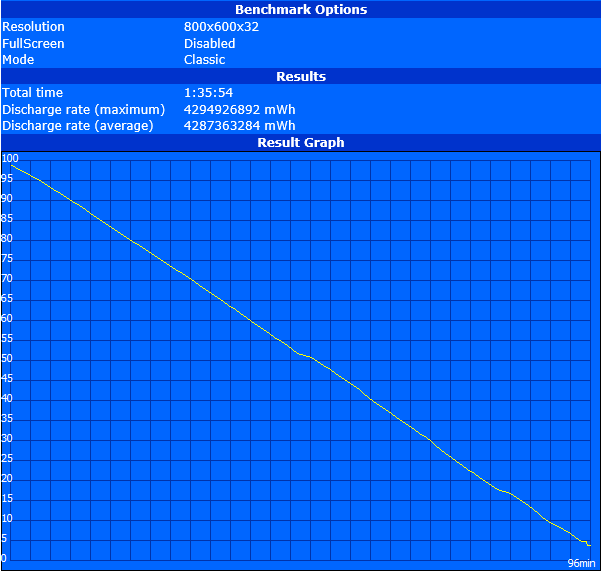
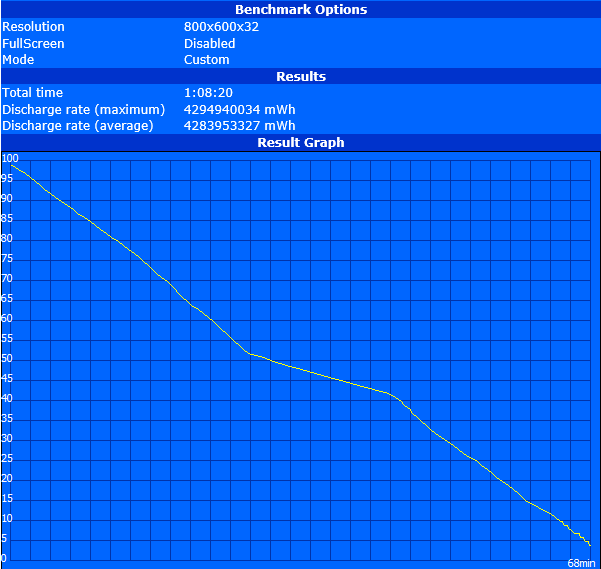
The powerhouse just lasts 3:25 hours in the Battery Eater Reader's test (minimum display brightness, radio modules off, energy-saving profile). In more realistic scenarios such as our Wi-Fi test and the video test (151 cd/m² display brightness), the battery life falls to 2.5 to 3 hours. In case you demand maximum performance from the system: It only lasts 68 minutes when running the SPECviewperf. test in a loop. Moreover, this battery life is only possible since the CPU (2000 MHz) and GPU (800 MHz) throttle on battery. In the Battery Eater Classic test (maximum display brightness, radio modules on, maximum performance profile) the minimum battery life is slightly better with 1.5 hours, since the Classic test apparently does not use the system to capacity.
Pros
Cons
Verdict
Schenker's mobile W706 workstation is a powerful notebook, which is suitable for many application scenarios.
Due to top results in system, processor, and graphics benchmarks, the powerhouse might be primarily interesting for performance enthusiasts.
Moreover, we liked the many configuration options, its moderate system noise, good maintainability, and many interfaces. In addition, the Schenker W706 workstation features solid input devices and a business suitable, discreet look.
While the used desktop CPU is powerful, it is also very power-hungry. The high minimum power consumption results in low battery runtimes in low-load scenarios. Together with the Nvidia Quadro M5000M, the high waste heat leads to borderline high temperatures at some spots.
While you can mitigate these disadvantages with a less powerful configuration to some extent, you cannot get around problems related to the concept such as missing business features or the slightly weak display.
All things considered, a moderate price advantage compared to workstations from established manufacturers remains, depending on the model the Schenker is compared to. But, it not only has to compensate for the mentioned weaknesses but also for the shorter warranty.
Schenker W706
- 03/17/2016 v5 (old)
Tobias Winkler