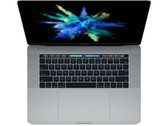
Intel Core i7-6820HQ

The Intel Core i7-6820HQ is a quad-core processor based on the Skylake architecture, that has been launched in September 2015. In addition to four CPU cores with Hyper-Threading clocked at 2.7 - 3.6 GHz (4 cores: max. 3.2 GHz, 2 cores: max. 3.4 GHz), the chip also integrates an HD Graphics 530 GPU and a dual-channel DDR4-2133/DDR3L-1600 memory controller. The CPU is manufactured using a 14 nm process with FinFET transistors.
Compared to the very similar Core i7-6820HK, the Core i7-6820HQ supports additional administration and security features like Intel vPro and TXT, but lacks the unlocked multiplier for OC.
Architecture
Skylake replaces both Haswell and Broadwell and brings the same microarchitecture in every TDP class from 4.5 to 45 W. The extensive improvements of the Skylake design include increased out-of-order buffers, optimized prefetching and branch prediction as well as additional performance gains through Hyper-Threading. Overall, however, performance per clock has been increased by only 5 to 10 percent (compared to Haswell) respectively under 5 percent (compard to Broadwell), which is quite modest for a new architecture ("Tock").
Performance
Thanks to the improved architecture, the Core i7-6820HQ performs roughly on par with the former Core i7-4900MQ (Haswell) or the Core i7-5700HQ (Broadwell). Under long-lasting full load, the Skylake chip will take the lead over most of its Haswell-based predecessors, as the advanced 14 nm process leads to a higher energy efficiency and reduces throttling.
Even the most demanding applications and excessive multitasking are handled easily.
Graphics
The integrated graphics unit called HD Graphics 530 represents the "GT2" version of the Skylake GPU (Intel Gen. 9). The 24 Execution Units, also called EUs, are clocked at 350 - 1050 MHz and offer a performance about 20 percent above the old HD Graphics 4600. Games of 2015 can thus be played smoothly in low or medium settings. For more information about performance and features, check our page for the HD Graphics 530.
Power Consumption
Specified at a TDP of 45 W (including CPU, GPU and memory controller), the CPU is best suited for bigger notebooks 15-inches in size and above. Optionally, the TDP can be lowered to 35 watts (cTDP down), reducing both heat dissipation and performance.
Series | Intel Core i7 |
Codename | Skylake |
Series: Core i7 Skylake | |
Clock Rate | 2700 - 3600 MHz |
Level 1 Cache | 256 KB |
Level 2 Cache | 1 MB |
Level 3 Cache | 8 MB |
Number of Cores / Threads | 4 / 8 |
Power Consumption (TDP = Thermal Design Power) | 45 Watt |
Manufacturing Technology | 14 nm |
Die Size | 122 mm2 |
Max. Temperature | 100 °C |
Socket | BGA |
Features | Dual-Channel DDR3L-1600/DDR4-2133 Memory Controller, AVX, AVX2, Quick Sync, Virtualization, AES-NI, vPro, TXT |
GPU | Intel HD Graphics 530 (350 - 1050 MHz) |
64 Bit | 64 Bit support |
Architecture | x86 |
Starting Price | $378 U.S. |
Announcement Date | 09/01/2015 |
| |
Product Link (external) | Intel Core i7 6820HQ |
Benchmarks
Cinebench R15 - Cinebench R15 CPU Multi 64 Bit
min: 699 avg: 703 median: 704 (16%) max: 706 Points
...
...
Cinebench R15 - Cinebench R15 CPU Single 64 Bit
min: 149 avg: 152 median: 153 (56%) max: 154 Points
...
...
Cinebench R11.5 - Cinebench R11.5 CPU Multi 64 Bit
min: 7.63 avg: 7.7 median: 7.7 (15%) max: 7.7 Points
...
Intel Xeon X5670 -2%
...
Cinebench R11.5 - Cinebench R11.5 CPU Single 64 Bit
min: 1.7 avg: 1.7 median: 1.7 (55%) max: 1.74 Points
...
...
Cinebench R10 - Cinebench R10 Rend. Single (32bit)
min: 5401 avg: 5470 median: 5429 (48%) max: 5580 points
...
...
Cinebench R10 - Cinebench R10 Rend. Multi (32bit)
min: 20682 avg: 20876 median: 20868 (35%) max: 21079 points
...
...
Cinebench R10 - Cinebench R10 Rend. Multi (64bit)
min: 27072 avg: 27217 median: 27217 (26%) max: 27362 Points
...
Intel Core i7-980X EE -1%
Intel Core i7-990X EE 2%
...
Cinebench R10 - Cinebench R10 Rend. Single (64bit)
min: 6965 avg: 6978 median: 6978 (53%) max: 6991 Points
...
...
wPrime 2.10 - wPrime 2.0 1024m *
min: 230.77 avg: 236 median: 235.9 (3%) max: 241 s
...
...
VIA C3-M C3-M-1200 3485%
wPrime 2.10 - wPrime 2.0 32m *
min: 7.77 avg: 7.9 median: 7.9 (2%) max: 8.03 s
...
...
min: 3187 avg: 3642 median: 3642 (23%) max: 4097 points
...
...
X264 HD Benchmark 4.0 - x264 Pass 2
min: 44 avg: 44.2 median: 44.2 (20%) max: 44.3 fps
Intel Pentium 4 2.4 GHz -96%
...
...
X264 HD Benchmark 4.0 - x264 Pass 1
min: 160.9 avg: 164 median: 164 (48%) max: 167 fps
...
...
TrueCrypt - TrueCrypt Serpent
min: 0.386 avg: 0.4 median: 0.4 (17%) max: 0.41 GB/s
...
...
TrueCrypt - TrueCrypt Twofish
min: 0.665 avg: 0.7 median: 0.7 (18%) max: 0.69 GB/s
...
...
TrueCrypt - TrueCrypt AES
3.9 GB/s (14%)
...
...
3DMark 06 - CPU - 3DMark 06 - CPU
min: 6835 avg: 7008 median: 6866 (38%) max: 7323 Points
...
Intel Core i7-990X EE -1%
Intel Core i7-980X EE 2%
...
Super Pi mod 1.5 XS 1M - Super Pi mod 1.5 XS 1M *
min: 10 avg: 10.5 median: 10.5 (2%) max: 10.99 s
...
...
VIA C3-M C3-M-1200 4310%
Super Pi mod 1.5 XS 2M - Super Pi mod 1.5 XS 2M *
min: 23 avg: 23.6 median: 23.6 (1%) max: 24.1 s
...
Intel Core i7-990X EE 2%
...
Super Pi Mod 1.5 XS 32M - Super Pi mod 1.5 XS 32M *
min: 561 avg: 571 median: 571 (3%) max: 581 s
...
...
VIA C3-M C3-M-1200 3843%
3DMark Vantage - 3DM Vant. Perf. CPU no Physx
min: 24707 avg: 25336 median: 25336 (29%) max: 25965 Points
...
...
3DMark 11 - 3DM11 Performance Physics
min: 8943 avg: 9524 median: 9731 (40%) max: 9897 Points
...
...
3DMark - 3DMark Ice Storm Physics
min: 39574 avg: 39915 median: 39915 (26%) max: 40256 Points
...
...
3DMark - 3DMark Ice Storm Unlimited Physics
48991 Points (51%)
...
...
3DMark - 3DMark Cloud Gate Physics
min: 7287 avg: 7356 median: 7350 (19%) max: 7431 Points
...
...
3DMark - 3DMark Fire Strike Standard Physics
min: 9944 avg: 10113 median: 10096 (25%) max: 10300 Points
...
...
3DMark - 3DMark Time Spy CPU
4047 Points (28%)
...
...
Geekbench 3 - Geekbench 3 32 Bit Multi-Core
13090 points (23%)
...
...
Geekbench 3 - Geekbench 3 32 Bit Single-Core
3668 points (75%)
...
...
Geekbench 3 - Geekbench 3 64 Bit Multi-Core
13856 points (22%)
...
...
Geekbench 3 - Geekbench 3 64 Bit Single-Core
3849 points (78%)
...
...
Geekbench 4.0 - Geekbench 4.0 64 Bit Single-Core
4257 points (66%)
...
...
Geekbench 4.0 - Geekbench 4.0 64 Bit Multi-Core
13339 points (32%)
...
Samsung Exynos 2100 5G 9%
...
Mozilla Kraken 1.1 - Kraken 1.1 Total Score *
1834 ms (3%)
...
Samsung Exynos 2100 5G -3%
...
Sunspider - Sunspider 1.0 Total Score *
84.2 ms (1%)
...
...
Octane V2 - Octane V2 Total Score
19404 Points (31%)
...
...
Power Consumption - Prime95 Power Consumption - external Monitor *
77.8 Watt (21%)
...
...
Power Consumption - Cinebench R15 Multi Power Consumption - external Monitor *
35.9 Watt (9%)
...
...
- Range of benchmark values for this graphics card

- Average benchmark values for this graphics card
* Smaller numbers mean a higher performance
v1.16
log 27. 04:13:14
#0 no ids found in url (should be separated by "_") +0s ... 0s
#1 not redirecting to Ajax server +0s ... 0s
#2 did not recreate cache, as it is less than 5 days old! Created at Tue, 26 Jan 2021 18:06:04 +0100 +0s ... 0.001s
#3 composed specs +0.018s ... 0.018s
#4 did output specs +0s ... 0.018s
#5 getting avg benchmarks for device 6975 +0.001s ... 0.019s
#6 got single benchmarks 6975 +0.014s ... 0.033s
#7 got avg benchmarks for devices +0s ... 0.033s
#8 min, max, avg, median took s +0.33s ... 0.363s
#9 return log +0.025s ... 0.388s