Apple MacBook Pro 15 (Late 2016, 2.7 GHz, 455) Notebook Review

For the original German review, see here.
After we have already tested the entry-level model as well as the high-end spec of the current MacBook Pro 15 from Apple, we also check the performance of the mainstream configuration for $2799. The additional $400 compared to the entry-level spec includes a slightly faster processor (Core i7-6820HQ), twice the amount of SSD capacity (512 GB) as well as a faster graphics card AMD Radeon Pro 455.
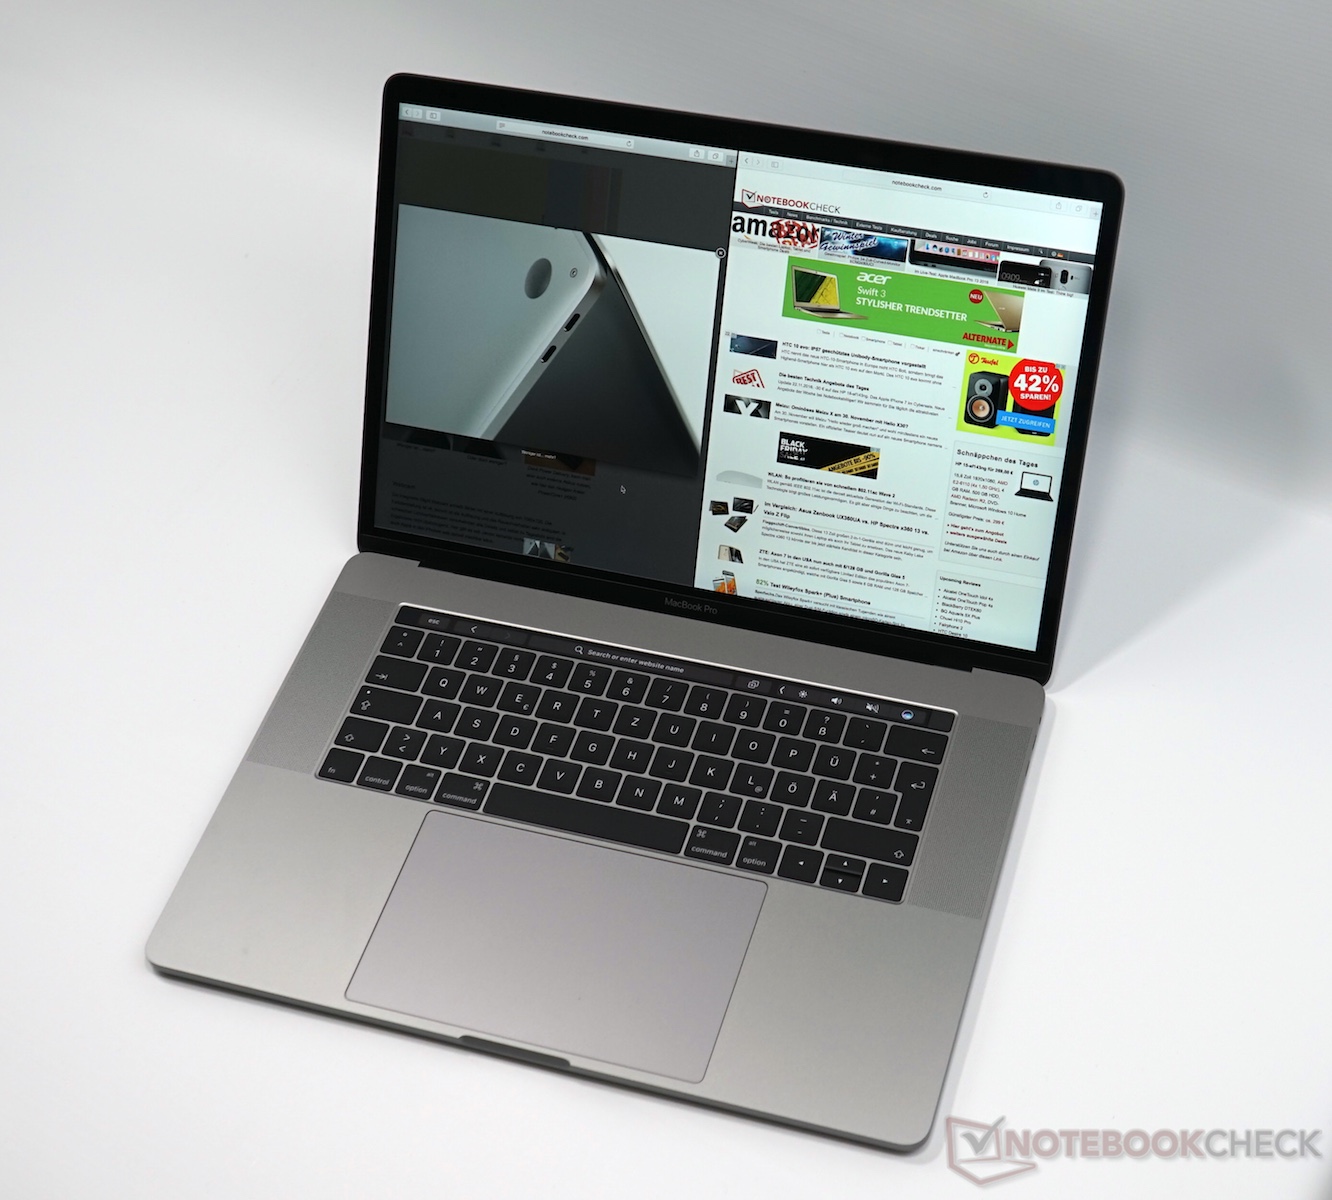
We already covered the important new features of the current MacBook Pro generation, which include the slimmer chassis, the reworked keyboard and obviously the Touch Bar above the keyboard, which replaces the function keys. We will once again focus on the performance and the emissions in this review update. The display is also a small surprise, but more on that below. All the information about the other areas of the Apple MacBook Pro 15 is available in our in-depth review of the entry-level model.
- Apple MacBook Pro 15 Late 2016 review (2.6 GHz, Radeon Pro 450)
- Apple MacBook Pro 15 Late 2016 review (2.9 GHz, Radeon Pro 460)
- Apple MacBook Pro 13 Late 2016 review (2.9 GHz)
- Windows 10 (Boot Camp) on the MacBook
We also just reviewed the new 2017 model of the Dell XPS 15, which is one of the biggest competitors for the MacBook Pro. Contrary to Apple, however, Dell uses the latest Kaby Lake processors and Pascal GPUs from Nvidia.

Display
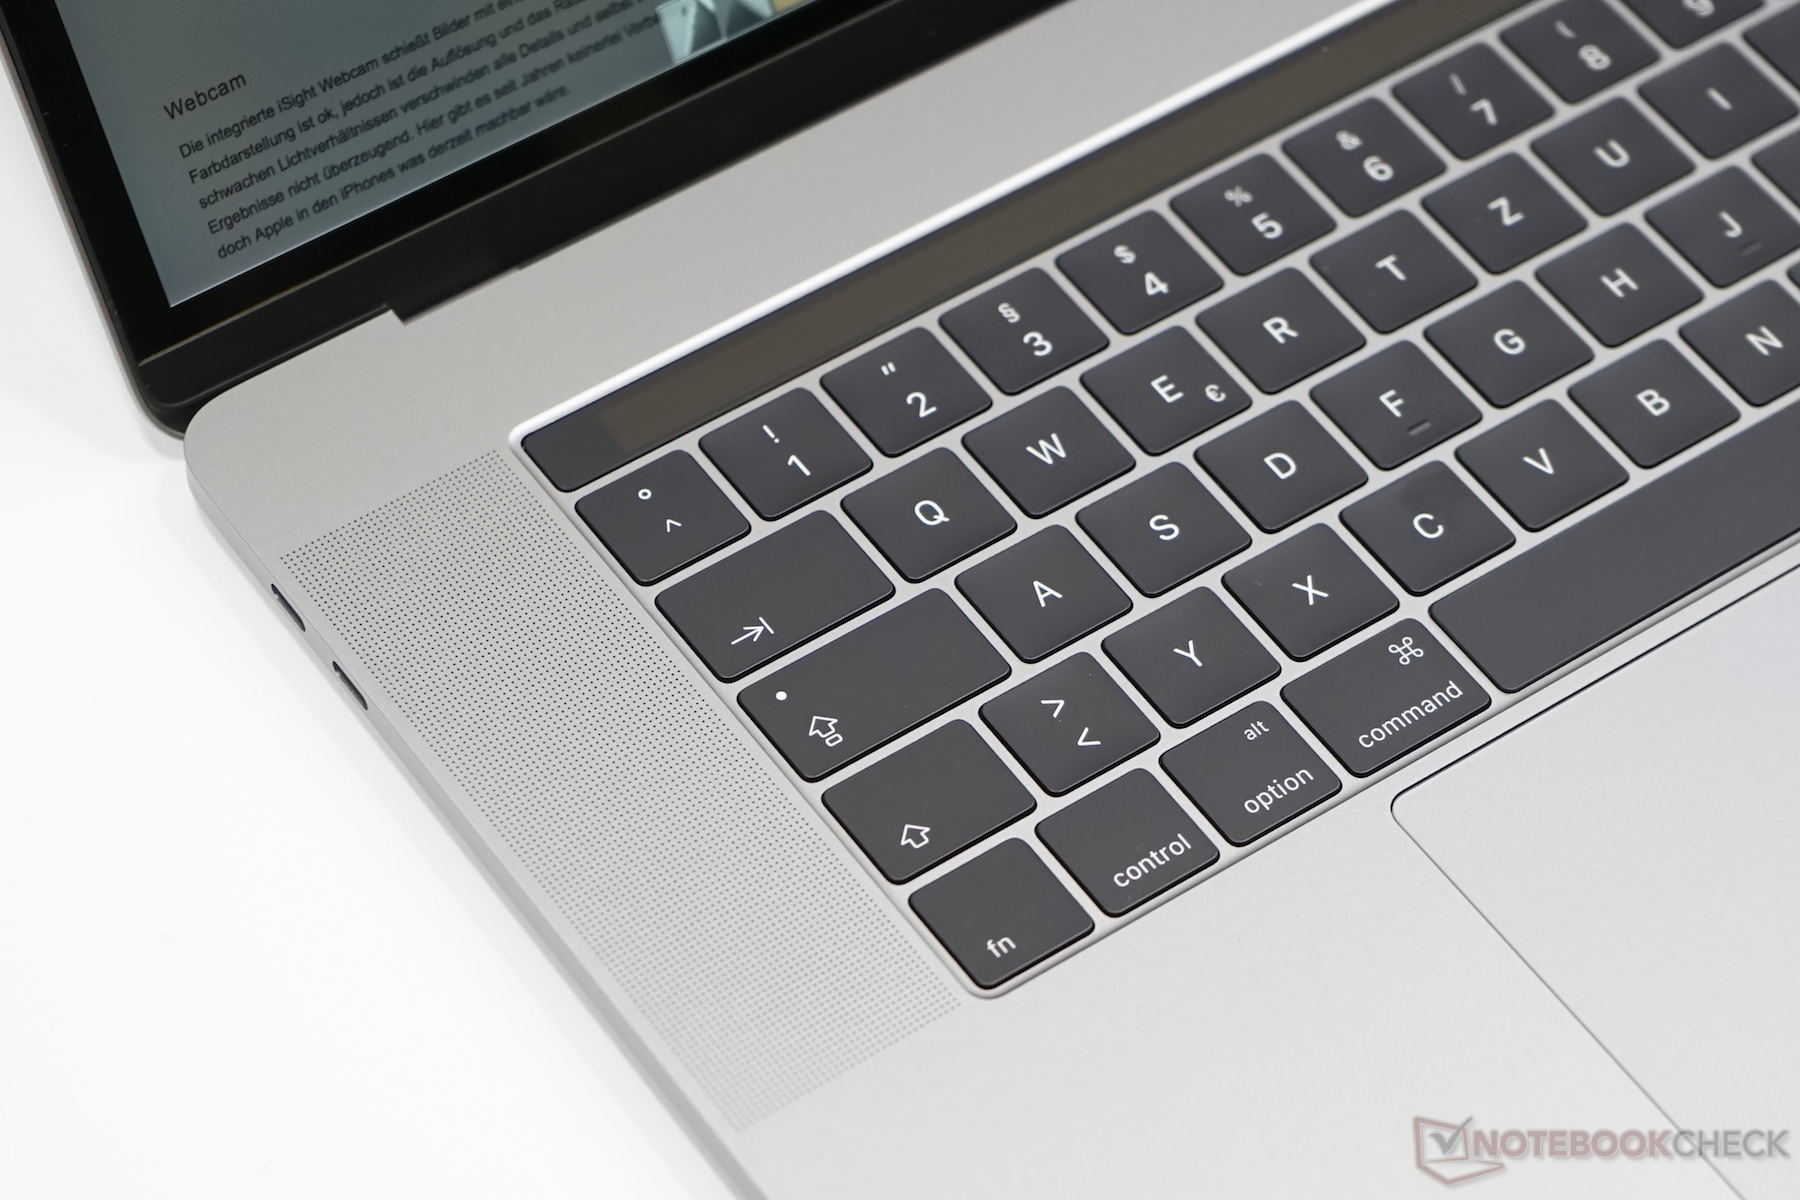
The display is actually a surprise, because contrary to the entry-level model and the high-end spec, which were equipped with the APPA030 panel, this test model uses the APPA031 screen. It is obviously once again a 15.4-inch IPS display with a resolution of 2880x1800 pixels, but Apple seems to use multiple suppliers.
We already know this procedure from many other manufacturers in the mobile segment, but there are often important differences between the panels. This is also the case here, because the APPA031 produces better results in almost all tests. This starts with the luminance, where we can determine almost 570 nits. That the average luminance drops to ~520 nits is a result of the darker upper-right corner, which also affects the brightness distribution (83%). However, you cannot see a difference in practice due to the enormous luminance. The black value is a bit surprising, because it is a bit better at 0.29 cd/m² – despite the higher luminance. This also results in a contrast ratio of more than 1900:1 – only OLED panels are better in this respect. Even the very good 4K display of the old Dell XPS 15 cannot compete with these results. We are already eager to see whether the new XPS 15 9560 might perform better (review soon).
| |||||||||||||||||||||||||
Brightness Distribution: 83 %
Center on Battery: 568 cd/m²
Contrast: 1912:1 (Black: 0.297 cd/m²)
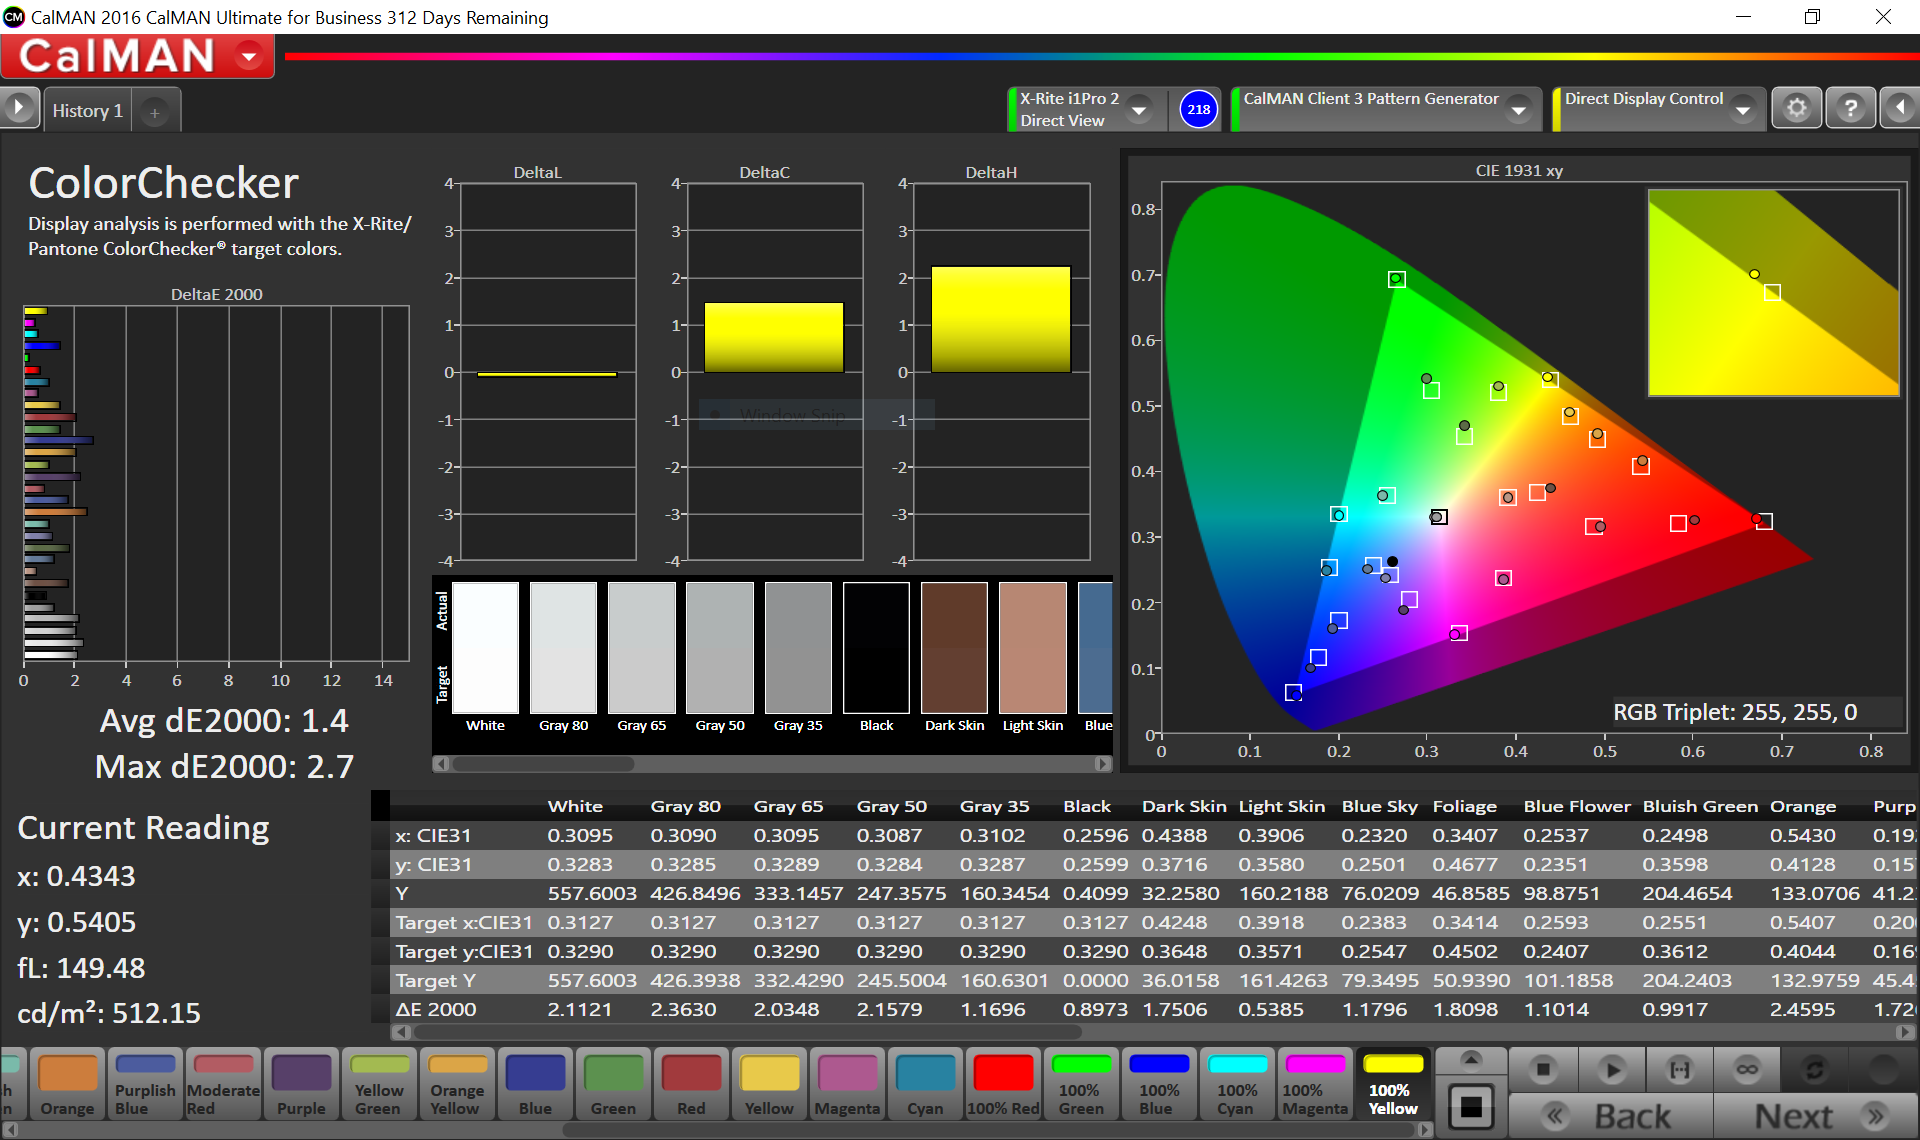
ΔE ColorChecker Calman: 1.4 | ∀{0.5-29.43 Ø4.73}
ΔE Greyscale Calman: 2.3 | ∀{0.09-98 Ø4.97}
99.9% sRGB (Argyll 1.6.3 3D)
77.4% AdobeRGB 1998 (Argyll 1.6.3 3D)
86.4% AdobeRGB 1998 (Argyll 3D)
99.9% sRGB (Argyll 3D)
98.5% Display P3 (Argyll 3D)
Gamma: 2.29
CCT: 7165 K
| Apple MacBook Pro 15 2016 (2.7 GHz, 455) APPA031, , 2880x1800, 15.4" | Apple MacBook Pro 15 2016 (2.9 GHz, 460) Apple APPA030, , 2880x1800, 15.4" | Apple MacBook Pro 15 2016 (2.6 GHz, 450) 2880x1800, 15.4" | Apple MacBook Pro Retina 15 inch 2015-05 APPA02E, , 2880x1800, 15.4" | Dell XPS 15-9550 i7 SHARP LQ156D1JX01 Dell PN: 7PHPT, , 3840x2160, 15.6" | Dell XPS 15 2017 9560 (7300HQ, Full-HD) Sharp SHP1453 LQ156M1, , 1920x1080, 15.6" | |
|---|---|---|---|---|---|---|
| Display | 1% | -25% | 1% | -16% | ||
| Display P3 Coverage (%) | 98.5 | 99 1% | 61.4 -38% | 87.8 -11% | 68.9 -30% | |
| sRGB Coverage (%) | 99.9 | 100 0% | 90.8 -9% | 100 0% | 98.9 -1% | |
| AdobeRGB 1998 Coverage (%) | 86.4 | 87.3 1% | 62.9 -27% | 99.4 15% | 70.9 -18% | |
| Response Times | -21% | 9% | -7% | -25% | ||
| Response Time Grey 50% / Grey 80% * (ms) | 46.4 ? | 46 ? 1% | 47.3 ? -2% | 58 ? -25% | 54 ? -16% | |
| Response Time Black / White * (ms) | 39.2 ? | 56 ? -43% | 31.2 ? 20% | 35 ? 11% | 52.4 ? -34% | |
| PWM Frequency (Hz) | 119000 ? | 117000 ? | ||||
| Screen | -32% | -3% | -23% | -57% | -85% | |
| Brightness middle (cd/m²) | 568 | 420 -26% | 483 -15% | 341 -40% | 361 -36% | 400 -30% |
| Brightness (cd/m²) | 532 | 401 -25% | 465 -13% | 315 -41% | 344 -35% | 392 -26% |
| Brightness Distribution (%) | 83 | 90 8% | 92 11% | 82 -1% | 90 8% | 89 7% |
| Black Level * (cd/m²) | 0.297 | 0.3 -1% | 0.33 -11% | 0.34 -14% | 0.38 -28% | 0.26 12% |
| Contrast (:1) | 1912 | 1400 -27% | 1464 -23% | 1003 -48% | 950 -50% | 1538 -20% |
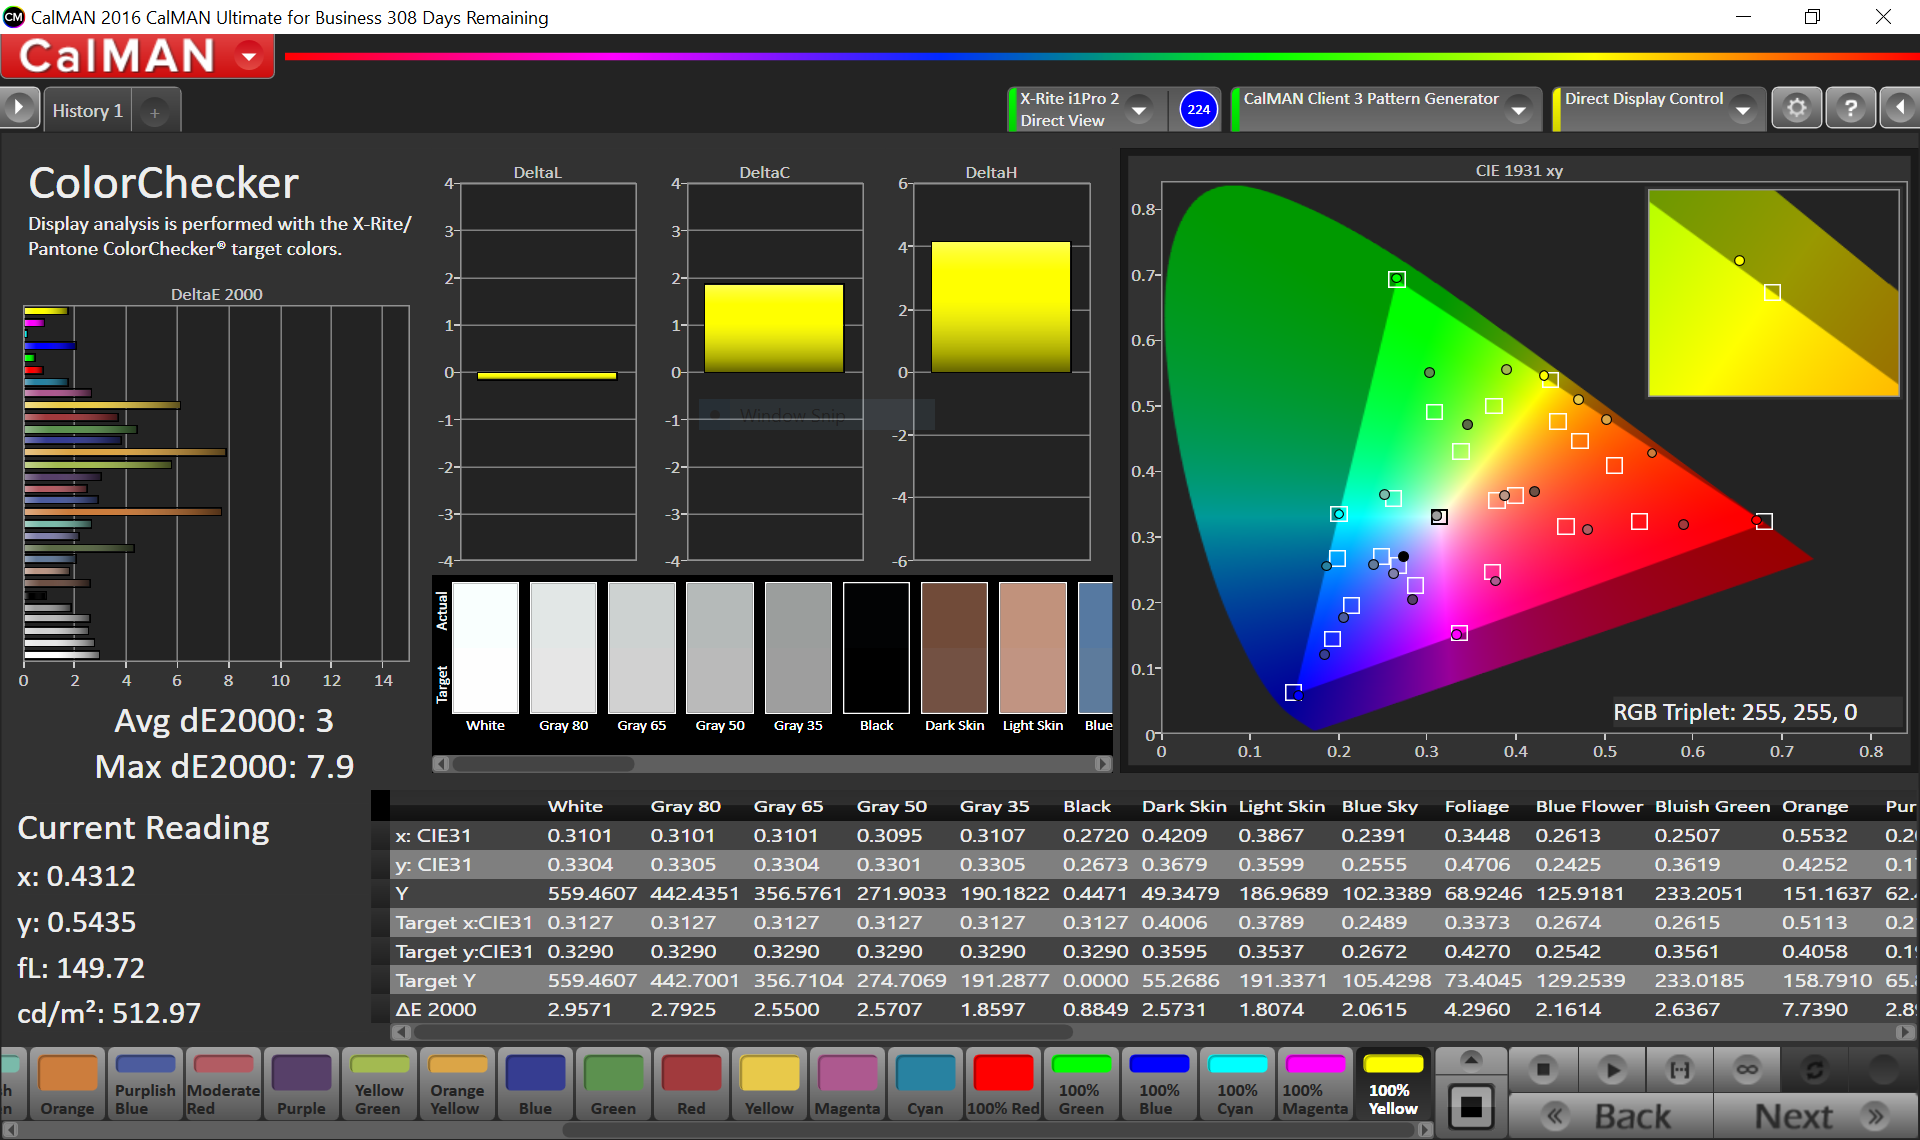
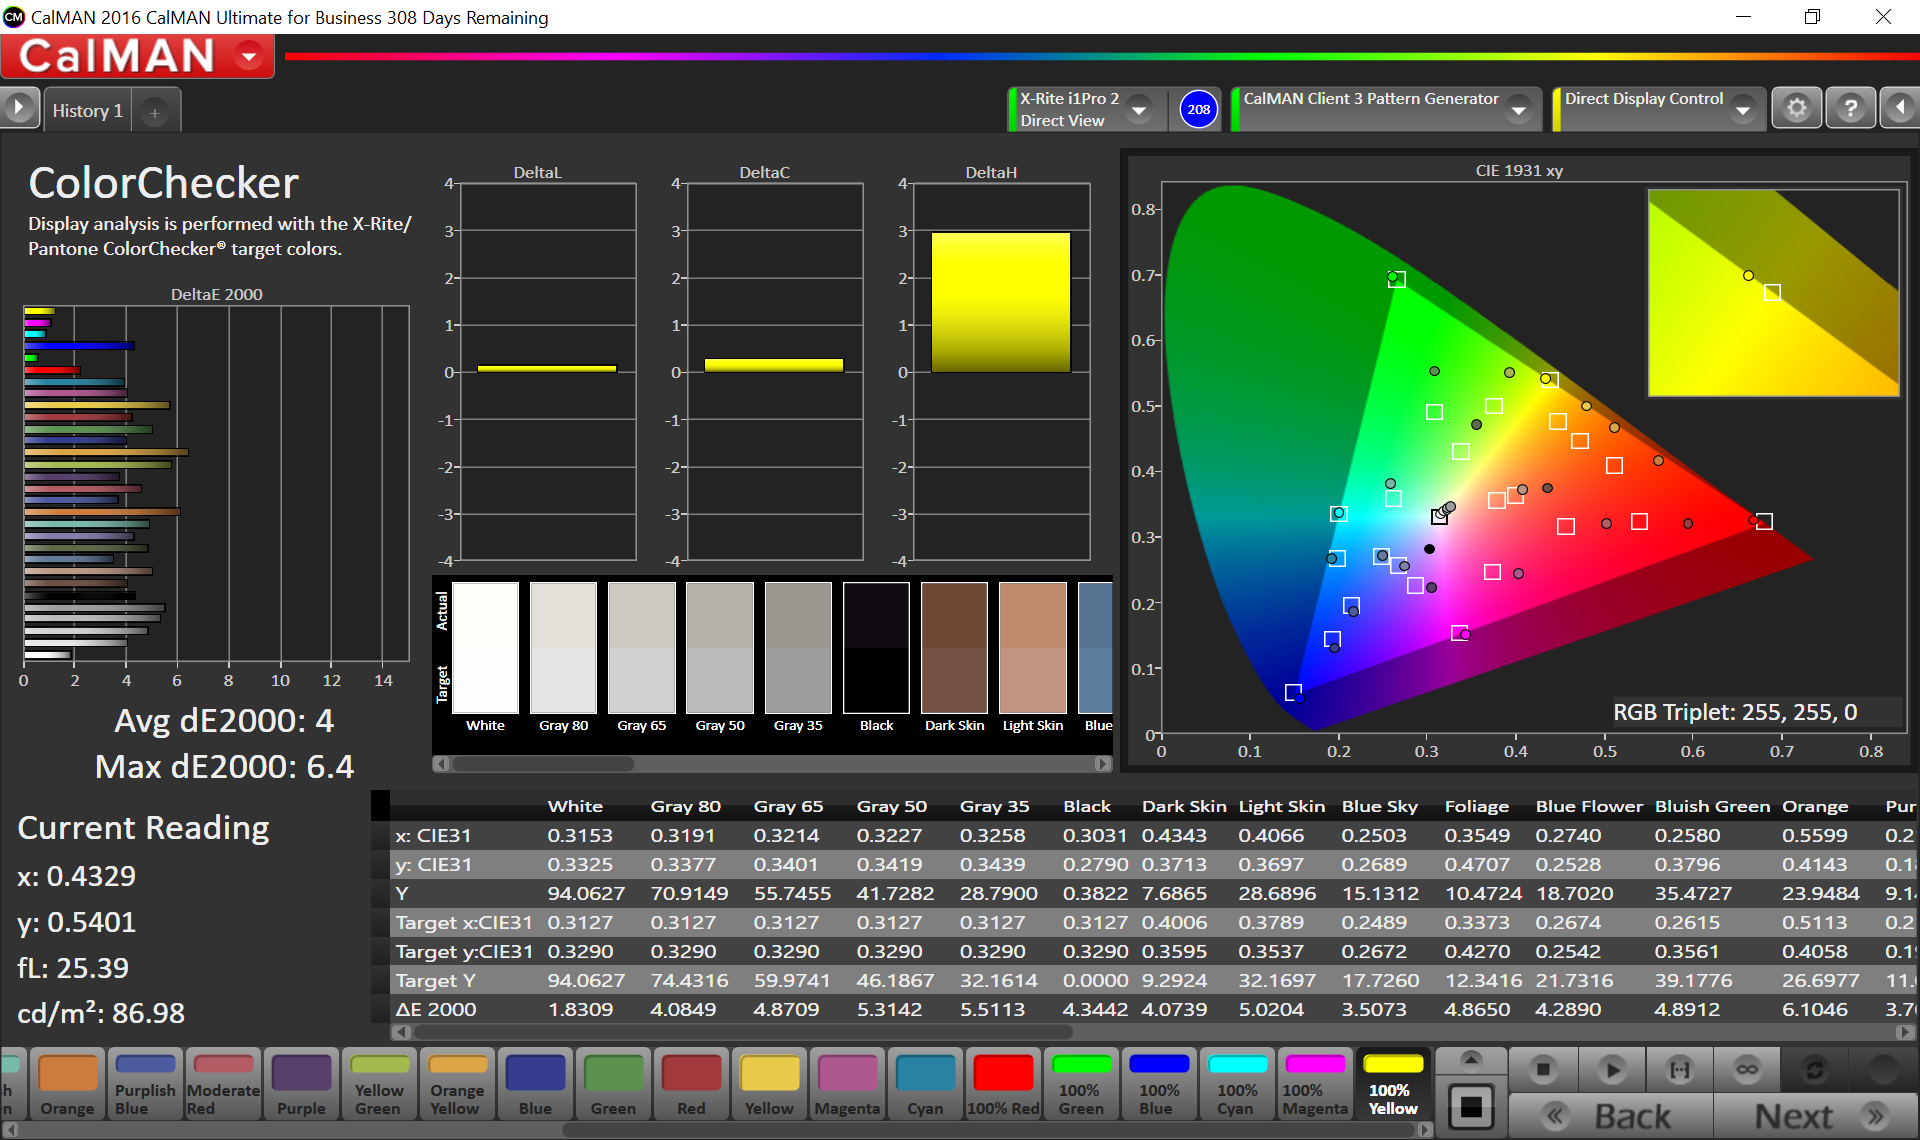
| Colorchecker dE 2000 * | 1.4 | 3.33 -138% | 1.4 -0% | 2.07 -48% | 5.34 -281% | 4.9 -250% |
| Colorchecker dE 2000 max. * | 2.7 | 5.11 -89% | 3 -11% | 3.27 -21% | 11 -307% | |
| Greyscale dE 2000 * | 2.3 | 2.73 -19% | 1.5 35% | 1.9 17% | 4.84 -110% | 7.2 -213% |
| Gamma | 2.29 96% | 2.48 89% | 2.34 94% | 2.62 84% | 2.21 100% | 2.11 104% |
| CCT | 7165 91% | 6457 101% | 6650 98% | 6514 100% | 7395 88% | 6911 94% |
| Color Space (Percent of AdobeRGB 1998) (%) | 77.4 | 78.09 1% | 58 -25% | 89 15% | 64.2 -17% | |
| Color Space (Percent of sRGB) (%) | 99.9 | 99.97 0% | 91 -9% | 100 0% | 98.9 -1% | |
| Total Average (Program / Settings) | -17% /
-24% | 3% /
-1% | -24% /
-23% | -21% /
-38% | -42% /
-63% |
* ... smaller is better
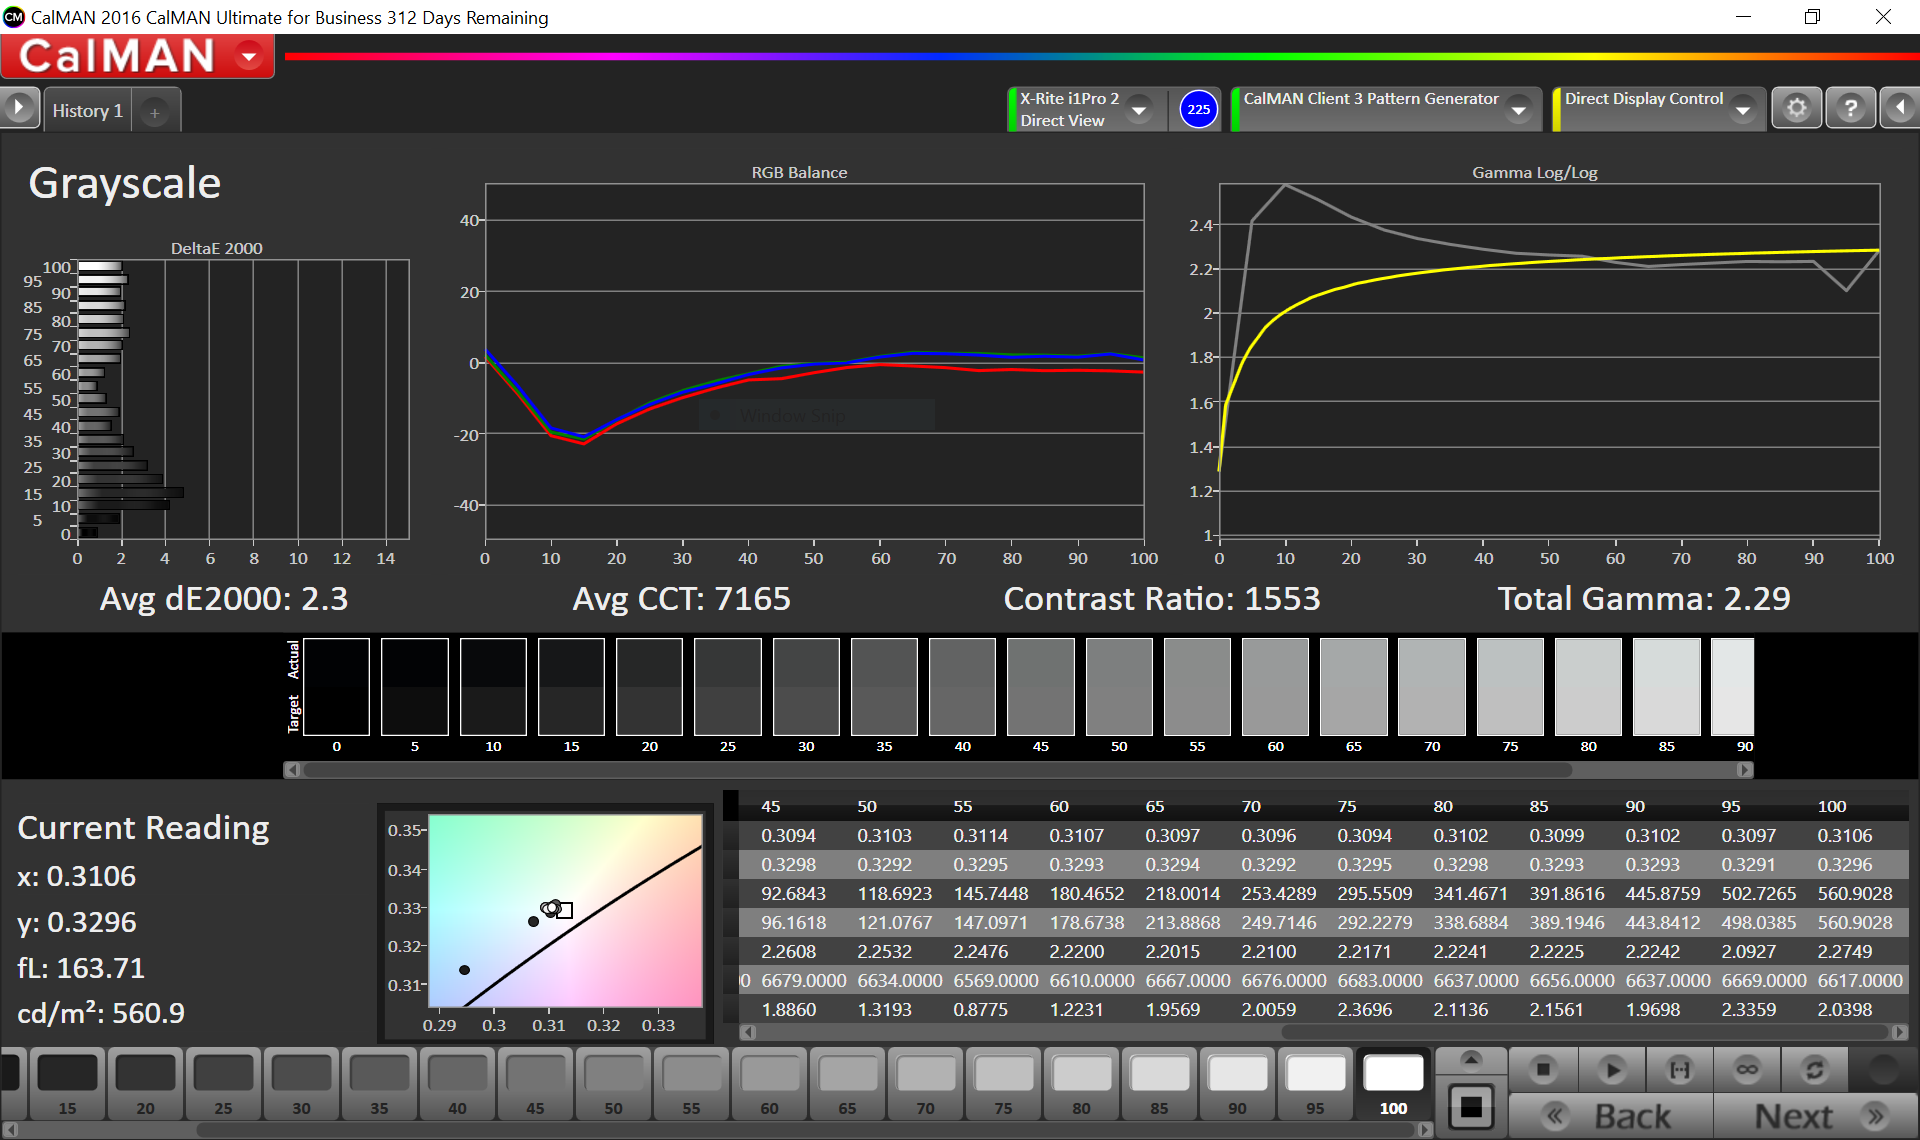
The panel also leaves a very good impression in respect to the color accuracy and the average color deviations for the colors and the grayscale compared to the P3 color space are already smaller than 3 ex-works. However, the APPA030 panel of the entry-level model was slightly better in terms of grayscale performance. All in all, the APPA031 panel is therefore the better choice, and it also has an advantage in terms of black-to-black response times (39.2 vs. 56 ms).
Display Response Times
| ↔ Response Time Black to White | ||
|---|---|---|
| 39.2 ms ... rise ↗ and fall ↘ combined | ↗ 7.6 ms rise | 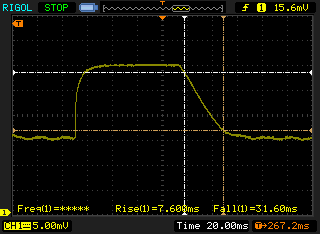 |
| ↘ 31.6 ms fall | ||
| The screen shows slow response rates in our tests and will be unsatisfactory for gamers. In comparison, all tested devices range from 0.1 (minimum) to 240 (maximum) ms. » 97 % of all devices are better. This means that the measured response time is worse than the average of all tested devices (19.9 ms). | ||
| ↔ Response Time 50% Grey to 80% Grey | ||
| 46.4 ms ... rise ↗ and fall ↘ combined | ↗ 18.8 ms rise | 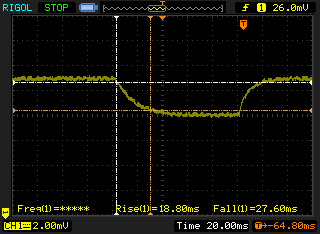 |
| ↘ 27.6 ms fall | ||
| The screen shows slow response rates in our tests and will be unsatisfactory for gamers. In comparison, all tested devices range from 0.165 (minimum) to 636 (maximum) ms. » 80 % of all devices are better. This means that the measured response time is worse than the average of all tested devices (31.1 ms). | ||
Screen Flickering / PWM (Pulse-Width Modulation)
| Screen flickering / PWM not detected | ||
In comparison: 52 % of all tested devices do not use PWM to dim the display. If PWM was detected, an average of 7794 (minimum: 5 - maximum: 343500) Hz was measured. | ||
Performance
Every model of the current MacBook Pro 15 is a powerful multimedia notebook. All SKUs are equipped with 16 GB RAM and PCIe-SSDs, only the capacity differs from 256 GB up to 2 TB. Users can only customize the quad-core processor as well as the graphics card. Our test model is the mainstream spec, which retails for $2799 in Apple's online store. This model includes a 512 GB SSD and the slightly faster CPU/GPU combination (Core i7-6820HQ and AMD Radeon Pro 455).
Processor
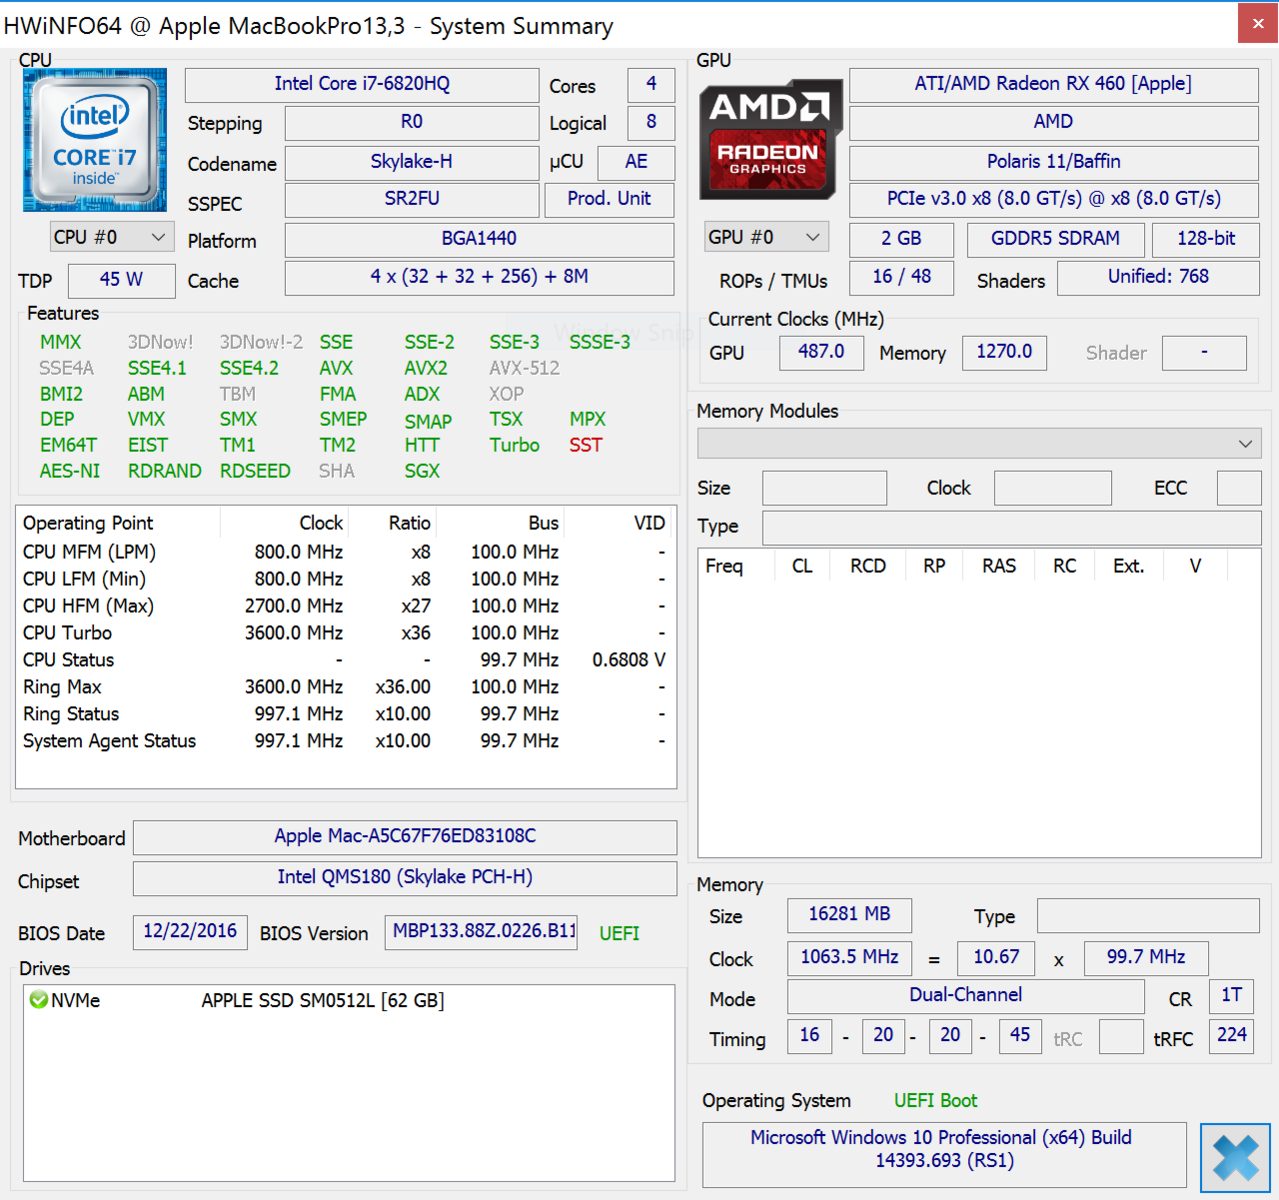
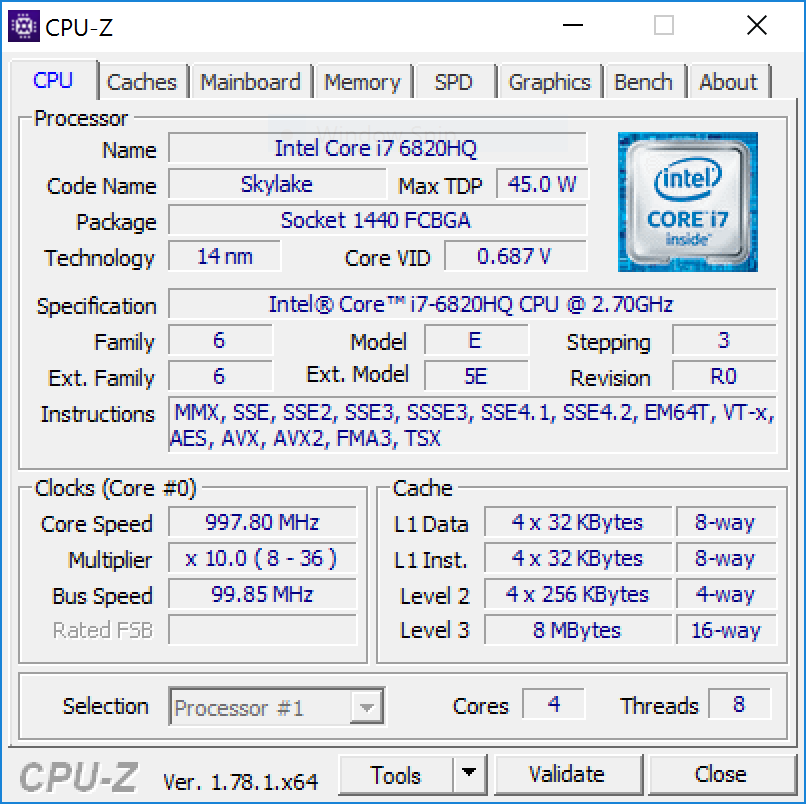
Intel's Core i7-6820HQ is a powerful mobile quad-core processor with a TDP of 45 Watts. The base frequency is 2.7 GHz with a Turbo range of up to 3.6 GHz for one core (2 cores: 3.4 GHz, 4 cores: 3.2 GHz), which is only 100 MHz higher compared to the Core i7-6700HQ from the entry-level spec. Apple still uses Skylake chips, although the new chips based on the Kaby Lake architecture are already available (~10% faster thanks to higher clocks). The processor is also equipped with the integrated HD Graphics 530 GPU, but it is only available on macOS (Boot Camp Windows only dGPU).
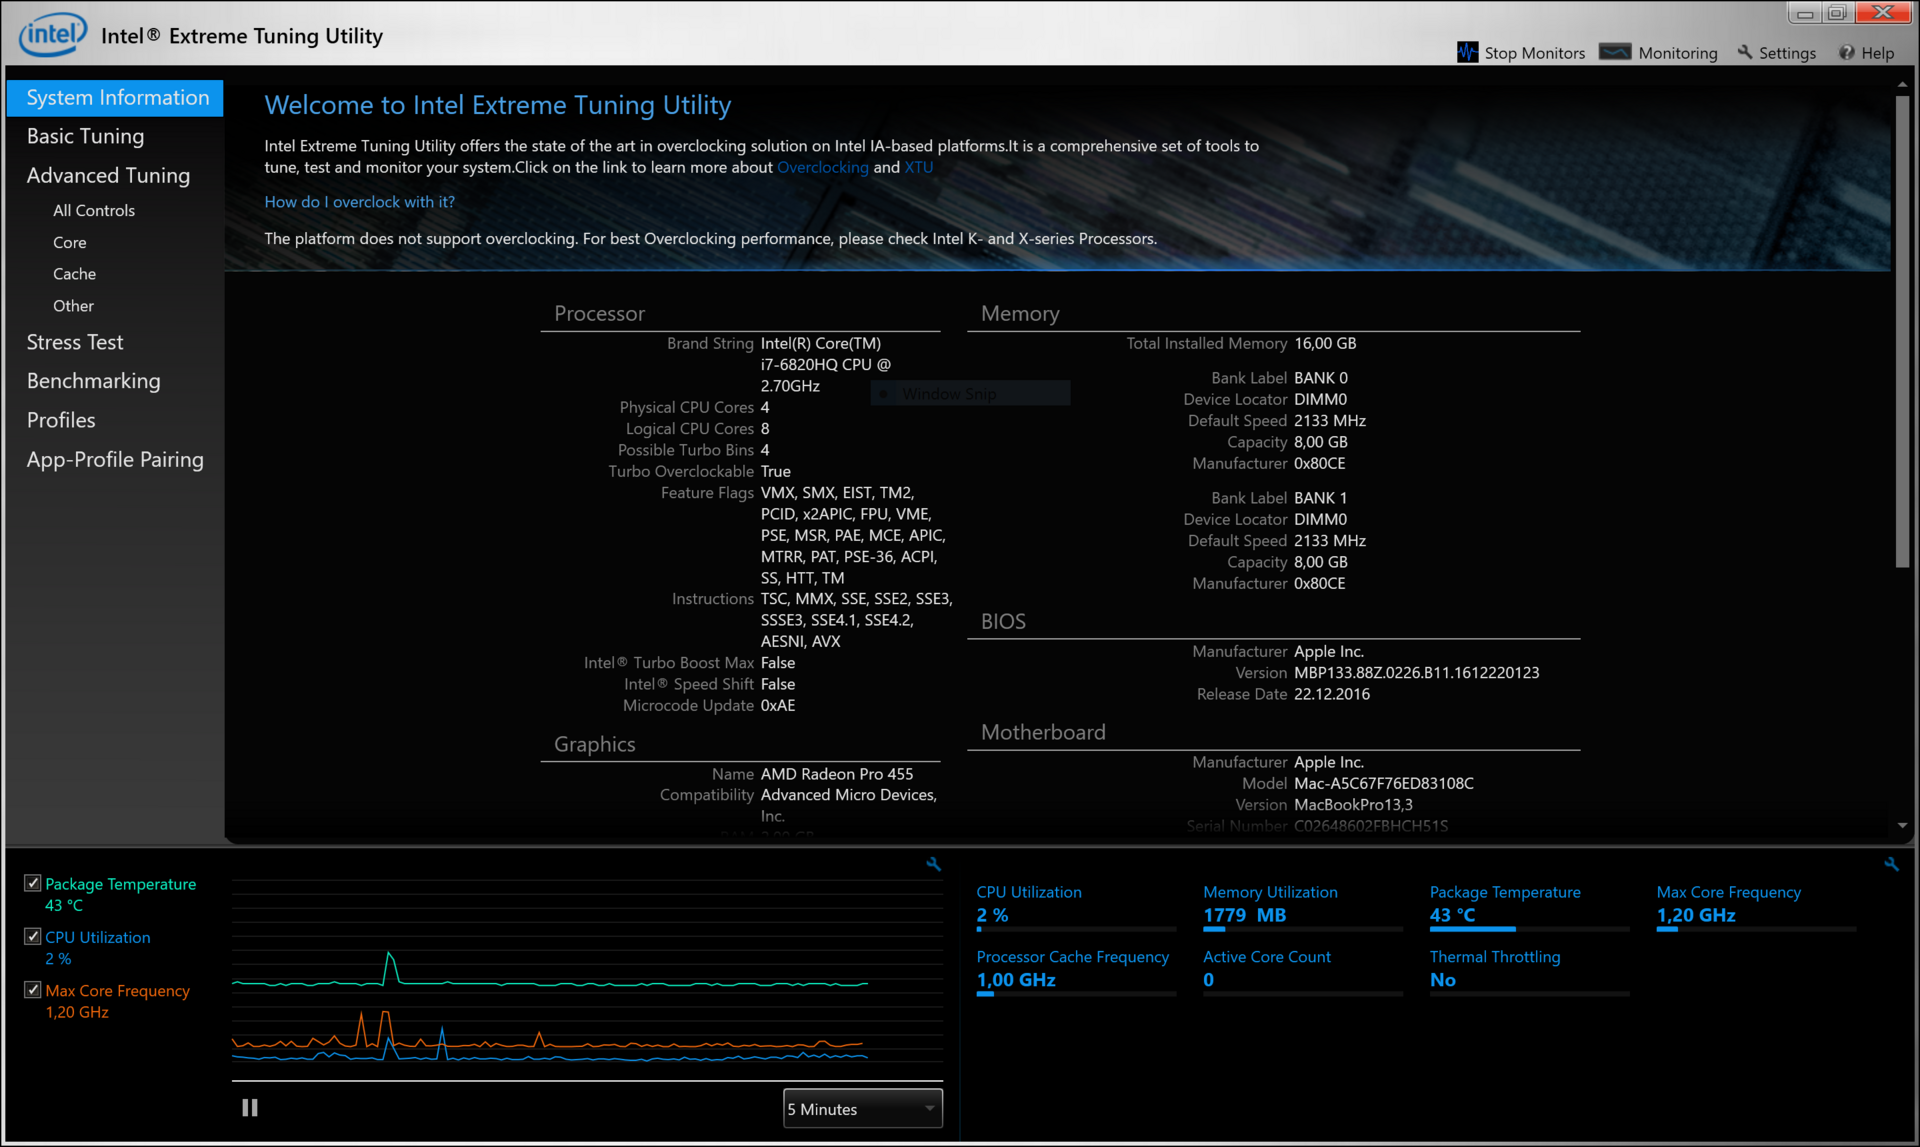
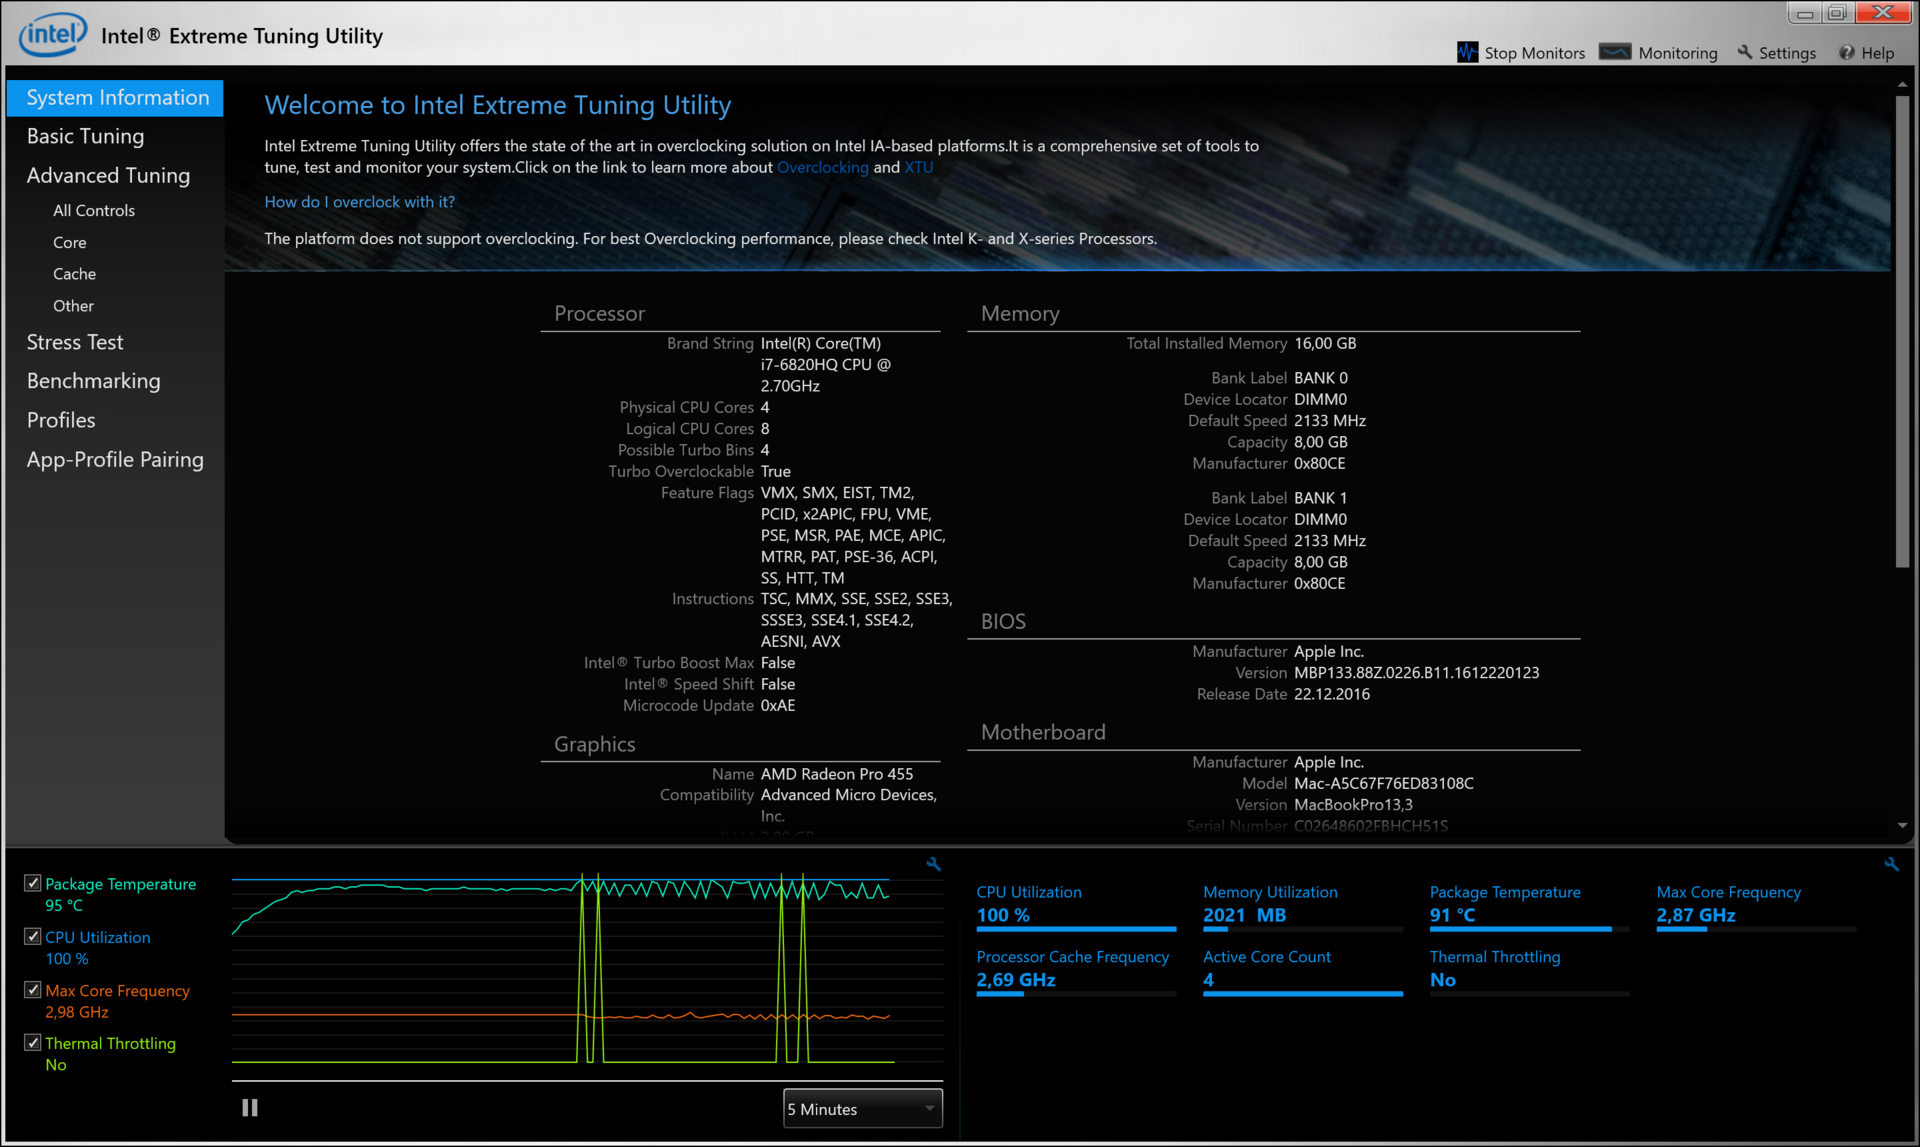
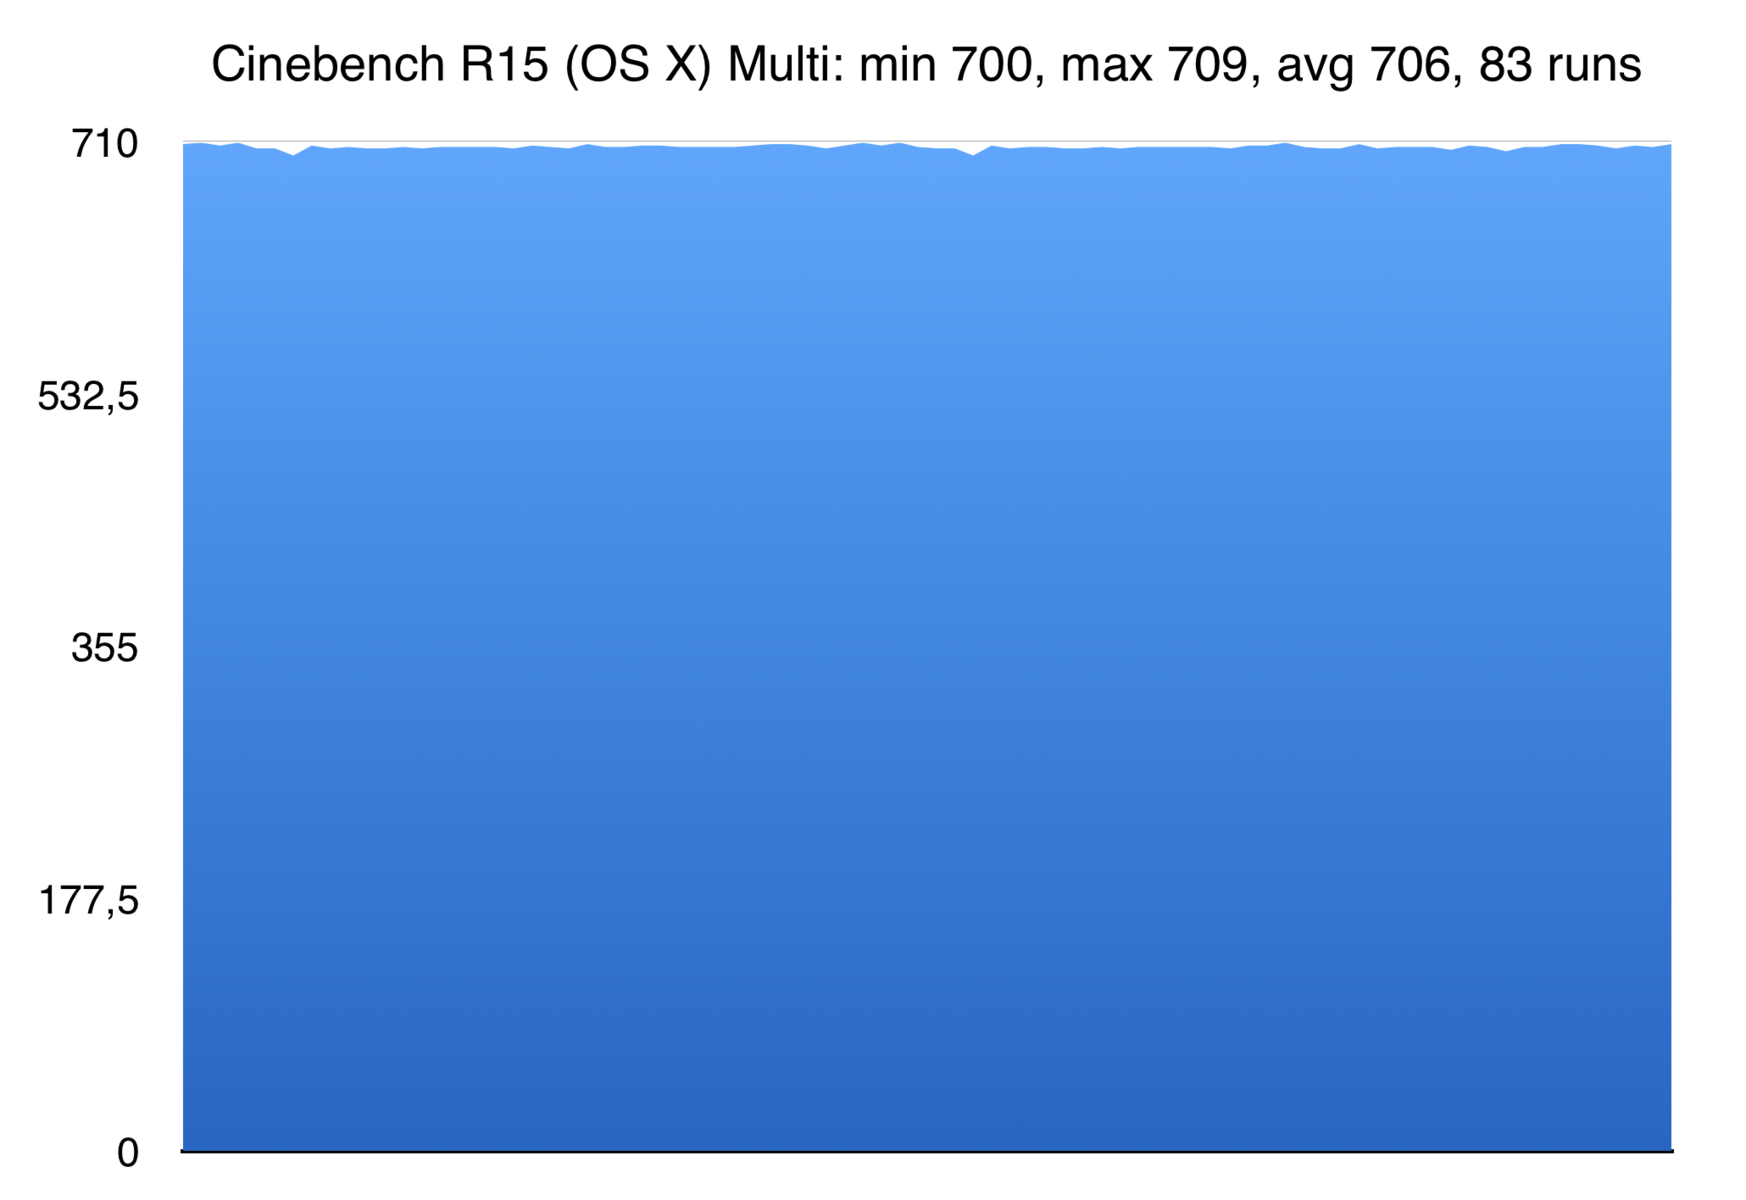
As per usual, Apple removes the standard TDP limit and does not restrict the processor – only the temperature is a limiting factor. The benchmark results are therefore good and the processor can maintain its maximum clock in the benchmarks. We also ran a loop of the Cinebench R15 Multi test on macOS, but there are only small fluctuations after more than 80 runs. Only extreme workloads, like Prime95 on Windows, result in processor temperatures of almost 100 °C, where the clock will start to drop a bit. We are still within the Turbo Boost range; throttling is no problem when you only stress the CPU.
Overall, the Core i7-6820HQ is between 6-9% (Single/Multi) faster than the standard i7-6700HQ. The Core i7-6920HQ from the top-spec is another ~6% faster, which is also the case for the new entry-level Kaby Lake chip i7-7700HQ. More benchmarks with the i7-6820HQ and the other processors are available in our Tech section.
System Performance
Subjectively, the mainstream configuration of the current MacBook Pro 15 does not reveal any performance problems, either. Thanks to the fast SSD and the powerful components, the whole system is very responsive and applications are launched quickly as well. The synthetic PCMark 8 (Boot Camp Windows) supports our impression and ranks the test model between its two siblings.
| PCMark 8 Home Score Accelerated v2 | 3728 points | |
| PCMark 8 Creative Score Accelerated v2 | 4569 points | |
| PCMark 8 Work Score Accelerated v2 | 4522 points | |
Help | ||
Storage Devices
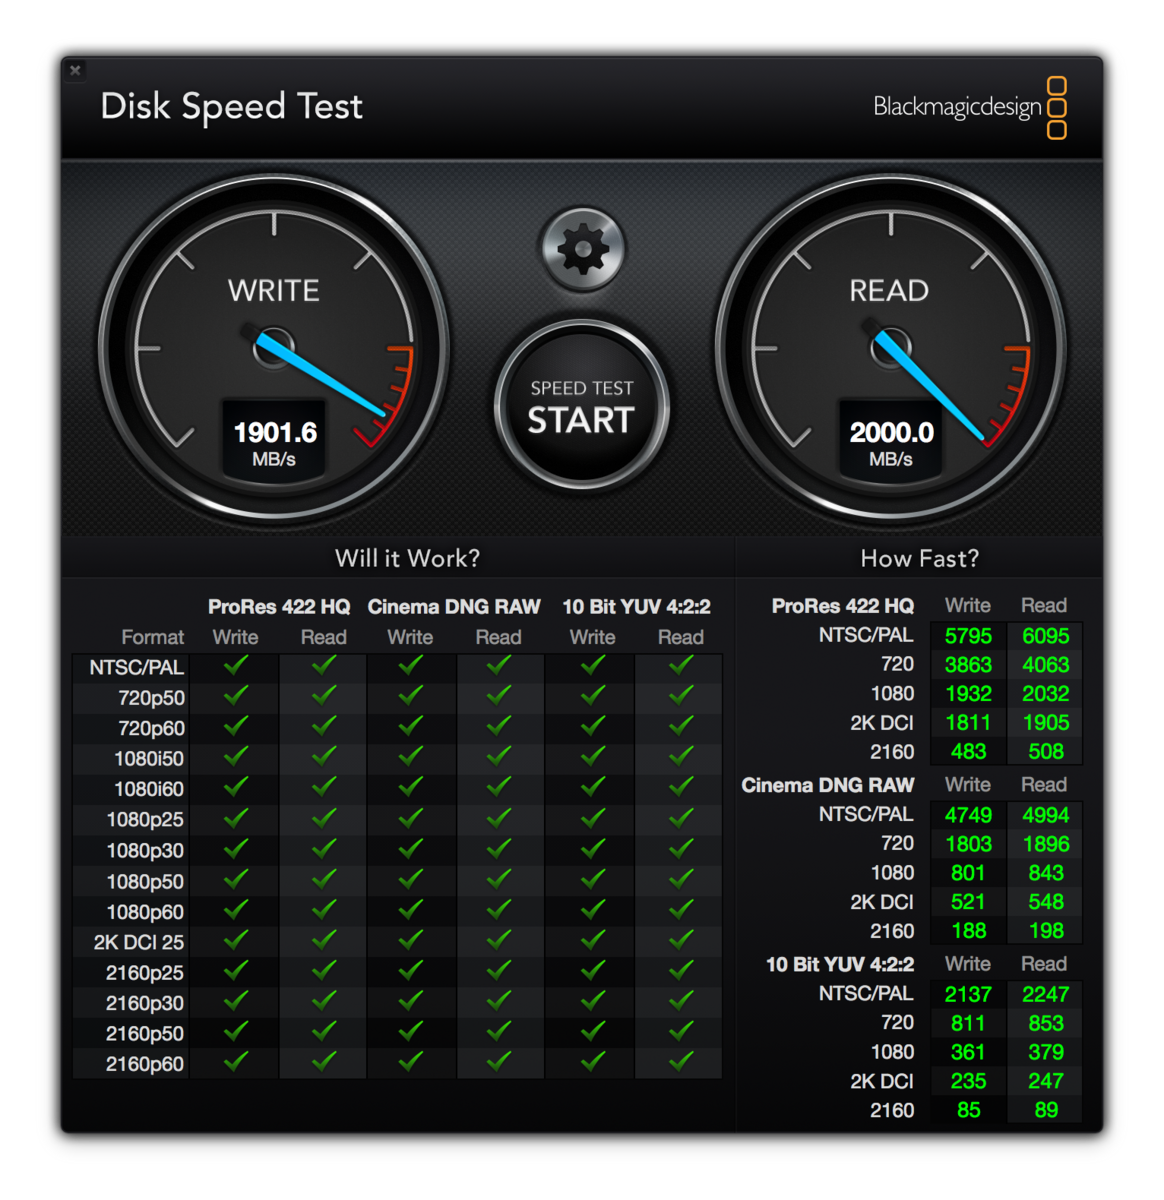
We already mentioned that all SKUs of the MacBook Pro are equipped with fast PCIe-SSDs. Only the capacity differs from 256 GB up to 2 TB, but the additional prices are quite extreme. An upgrade from the 512 GB SSD in our test model to the 2 TB version will set you back by $1200. There is at least no criticism for the performance, because at transfer rates of around 2000 MB/s for read and write operations, the SSDs are among the best you can get.
The 512 GB model is particularly faster than the 256 GB drive in terms of write performance (+500 MB/s) and is therefore on par with the larger 1 TB drive. However, all three models have conspicuously low 4K values at ~10 MB/s. One thing to note here is that our benchmarks (CDM and AS SSD) were performed running on Windows (Boot Camp). This can easily be a lack of optimization of Apple's Boot Camp driver, but we did not notice any problems in practice.

GPU Performance
AMD's Radeon Pro 455 is a mainstream graphics card based on the Polaris architecture. Contrary to the fastest model from the series, the Radeon Pro 460, you only get 786 of the full 1024 shaders and the core clock of the Polaris 11 chip (14 nm) is a bit lower as well at 855 MHz. The memory equipment is similar to the base model of the MBP 15 at 2 GB GDDR5-VRAM (128-bit). The performance of the Radeon Pro 455 should be somewhere between the other two available GPUs.
This assumption is mostly supported by the synthetic benchmarks (Windows Boot Camp), although the distance is greater to the Radeon Pro 460 than to the Radeon Pro 450. The 455 cannot keep up with the old GeForce GTX 960M in the 3DMarks, either. Dell's XPS 15 shows what is currently possible in this segment. The new GeForce GTX 1050 is between 50-70% faster in the GPU sub-scores.
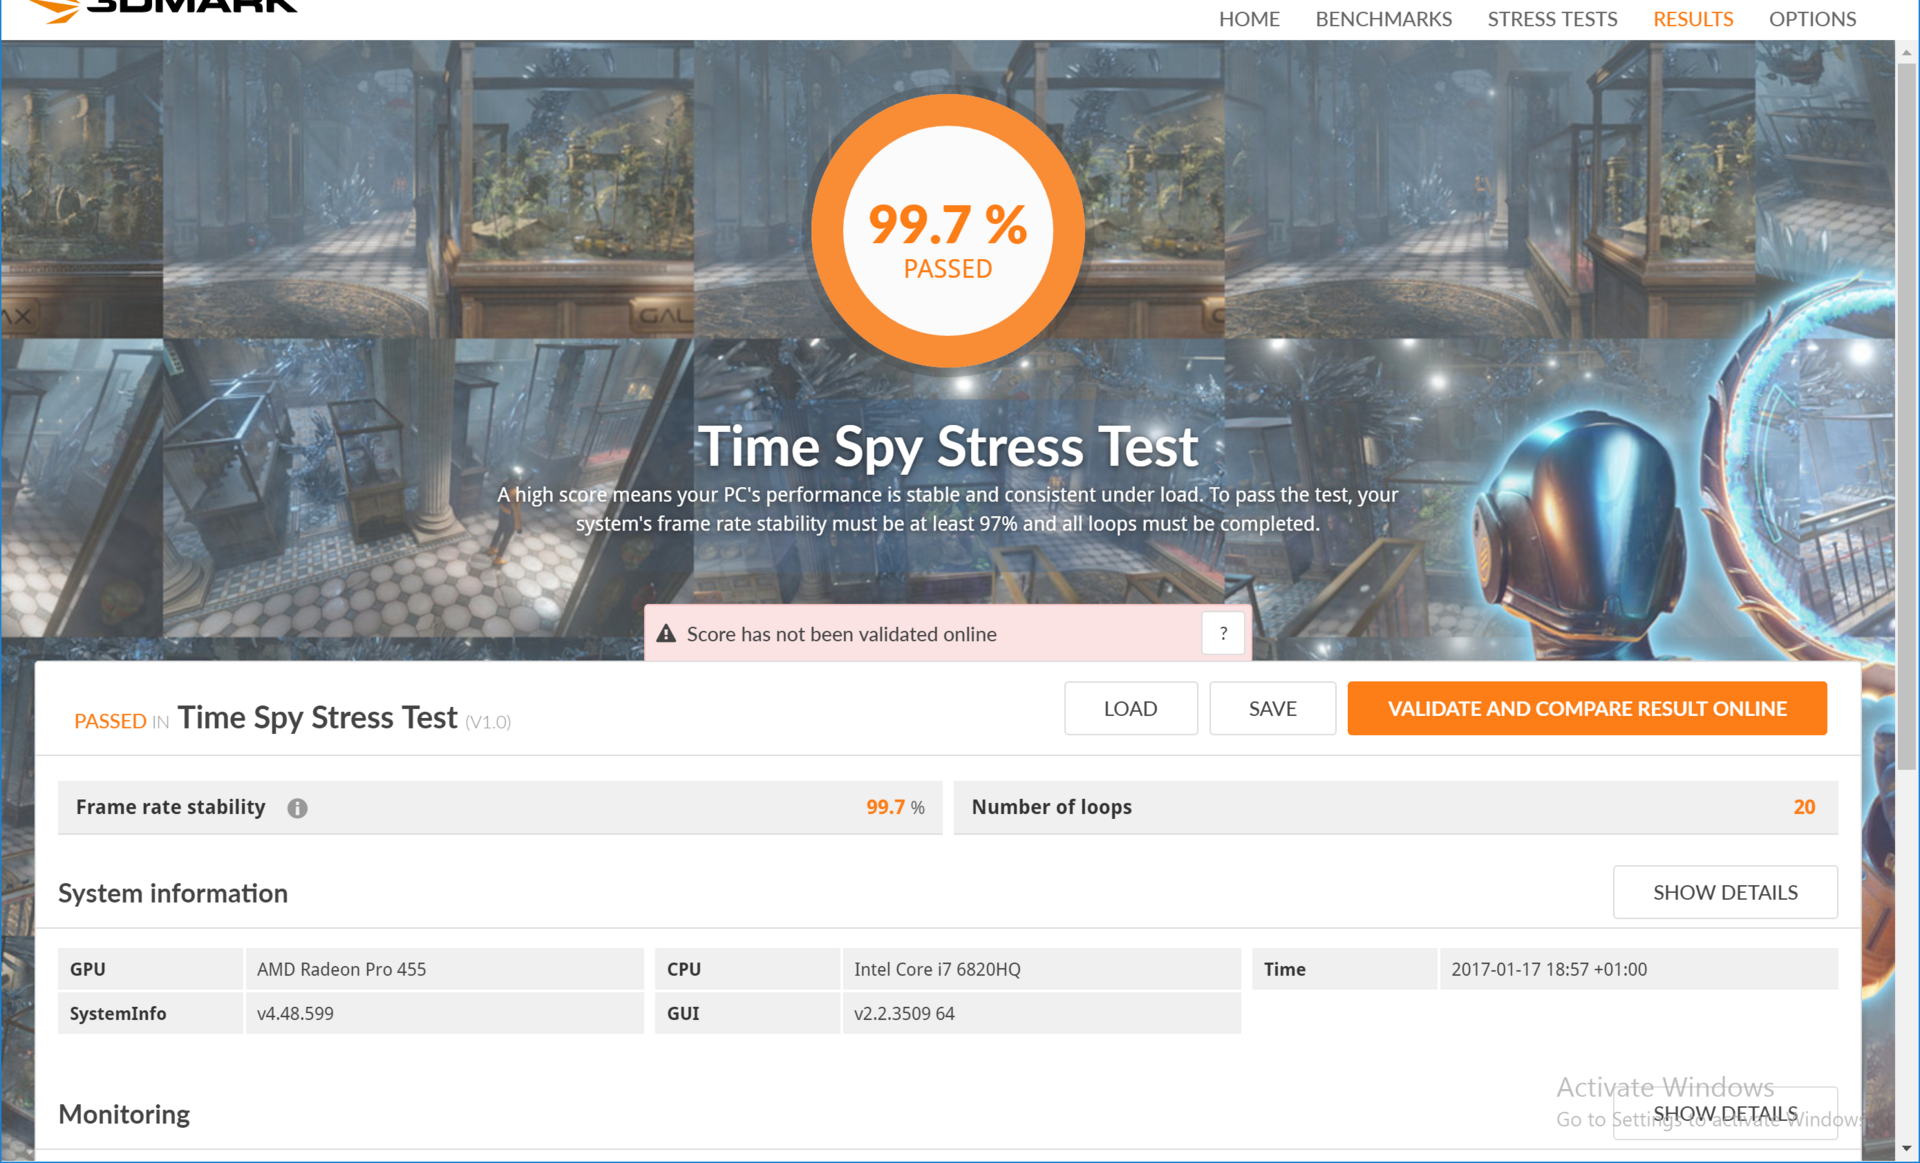
The Radeon Pro 455 is also beaten by the 460 and also the Nvidia Quadro M1000M in terms of OpenGL performance. The 455 does not have an advantage over the 450 from the base model in the Unigine Valley test, either. The Radeon can at least utilize its full potential under load; our test with The Witcher 3 was executed at a steady 855 MHz (75 °C) and the 3DMark Time Spy Stress Test was executed successfully as well.
| 3DMark 06 Standard Score | 25873 points | |
| 3DMark Vantage P Result | 16522 points | |
| 3DMark 11 Performance | 5774 points | |
| 3DMark Cloud Gate Standard Score | 15766 points | |
| 3DMark Fire Strike Score | 3463 points | |
| 3DMark Time Spy Score | 1254 points | |
Help | ||
Gaming Performance
The performance of the AMD Radeon Pro 455 on Windows 10 is often not sufficient for the combination of the Full HD resolution and high graphics details. You will have to reduce some details in challenging titles to ensure smooth gameplay, like Rise of the Tomb Raider, The Witcher 3 or Battlefield 1. Within the Apple models, the Radeon Pro 455 is between its siblings, but it is much closer to the Radeon Pro 450 due to the low amount of VRAM. If you plan to play a lot, you should definitely get the more powerful Radeon Pro 460. The GeForce GTX 1050 is once again much more powerful and can even handle challenging titles at high details. A big problem for Windows 10 gamers is the mediocre driver support for the graphics card. The regular driver launches from AMD do not support the Radeon Pro GPUs in the MacBook Pros. A manual installation was not successful, either. This means the GPU cannot use its full potential when you use Windows / Boot Camp and there will also be problems with upcoming titles in the future.
The macOS gaming performance is, as usual, much lower compared to Windows 10. Ported games like Tomb Raider do not perform as well as their Windows 10 counterparts.
| The Witcher 3 - 1920x1080 High Graphics & Postprocessing (Nvidia HairWorks Off) | |
| Acer Aspire VX5-591G-D0DD | |
| Dell XPS 15 2017 9560 (7300HQ, Full-HD) | |
| Asus Strix GL753VD-GC045T | |
| Apple MacBook Pro 15 2016 (2.9 GHz, 460) | |
| Apple MacBook Pro 15 2016 (2.7 GHz, 455) | |
| Apple MacBook Pro 15 2016 (2.6 GHz, 450) | |
| Apple MacBook Pro Retina 15 inch 2015-05 | |
| Anno 2205 - 1920x1080 High Preset AA:4x | |
| Asus Strix GL753VD-GC045T | |
| Apple MacBook Pro 15 2016 (2.9 GHz, 460) | |
| Apple MacBook Pro 15 2016 (2.6 GHz, 450) | |
| Apple MacBook Pro 15 2016 (2.7 GHz, 455) | |
| Call of Duty Infinite Warfare - 1920x1080 High / On AA:FX | |
| Schenker XMG P507 PRO | |
| Asus Strix GL753VD-GC045T | |
| Apple MacBook Pro 15 2016 (2.9 GHz, 460) | |
| Apple MacBook Pro 15 2016 (2.7 GHz, 455) | |
| Apple MacBook Pro 15 2016 (2.6 GHz, 450) | |
| low | med. | high | ultra | 4K | |
|---|---|---|---|---|---|
| Counter-Strike: GO (2012) | 145 | ||||
| BioShock Infinite (2013) | 230 | 37.8 | |||
| Sims 4 (2014) | 50.6 | ||||
| GTA V (2015) | 37.1 | 11.1 | |||
| The Witcher 3 (2015) | 69.5 | 24.6 | 14.2 | ||
| Dota 2 Reborn (2015) | 67.2 | 61.5 | 22.8 | ||
| World of Warships (2015) | 188 | 70.7 | 53 | ||
| Anno 2205 (2015) | 86 | 17.5 | 7.7 | ||
| Fallout 4 (2015) | 27.8 | ||||
| Rainbow Six Siege (2015) | 162 | 52.7 | 33.7 | ||
| Rise of the Tomb Raider (2016) | 84 | 24.9 | 18.3 | ||
| XCOM 2 (2016) | 70 | 27.2 | 17.9 | 5.9 | |
| Far Cry Primal (2016) | 70 | 32 | 30 | 20 | |
| The Division (2016) | 88 | 25.2 | 18.5 | ||
| Hitman 2016 (2016) | 75 | 20.4 | |||
| Ashes of the Singularity (2016) | 33.8 | 21.3 | 19.3 | ||
| Doom (2016) | 53.1 | 19.8 | |||
| Overwatch (2016) | 178 | 65.8 | 30.1 | 18.7 | |
| Deus Ex Mankind Divided (2016) | 59.5 | 21.5 | 8.9 | ||
| FIFA 17 (2016) | 107 | ||||
| Mafia 3 (2016) | 32.8 | 15.1 | |||
| Battlefield 1 (2016) | 109 | 28.9 | 25.3 | ||
| Civilization 6 (2016) | 69 | 28.8 | 21.6 | ||
| Farming Simulator 17 (2016) | 71.7 | 25.8 | 22.8 | ||
| Titanfall 2 (2016) | 33.1 | 28.8 | |||
| Call of Duty Infinite Warfare (2016) | 40.2 | 34.4 | |||
| Dishonored 2 (2016) | 44.1 | 20.6 | |||
| Watch Dogs 2 (2016) | 54.4 | 20.7 | |||
| Resident Evil 7 (2017) | 146 | 59.4 | 34.6 | 19.7 |
Emissions
System Noise
The fan behavior of our test model basically does not differ from the other models. The fans are always active, but you can only hear a slight murmur in very quiet environments. They react to load very late and increase their speed seamlessly. A normal 3DMark06 run was not enough to increase their speed. Sustained workloads (multiple benchmark runs and The Witcher 3) result in a slightly higher noise at ~38 dB(A) compared to the other models. The maximum noise is also a bit higher (48 dB(A)). This is probably a result of the Boot Camp driver, because the indicated BIOS version differs from the other test models.
Noise level
| Idle |
| 30.8 / 30.8 / 30.8 dB(A) |
| HDD |
| 30.8 dB(A) |
| Load |
| 38.7 / 48.8 dB(A) |
 | ||
30 dB silent 40 dB(A) audible 50 dB(A) loud |
||
min: | ||
| 6820HQ, Radeon Pro 455 Radeon Pro 455, 6820HQ, Apple SSD SM0512L | 6920HQ, Radeon Pro 460 Radeon Pro 460, 6920HQ, Apple SSD SM1024L | 6700HQ, Radeon Pro 450 Radeon Pro 450, 6700HQ, Apple SSD SM0256L | 4870HQ, Radeon R9 M370X Radeon R9 M370X, 4870HQ, Apple SSD SM0512G | 6700HQ, GeForce GTX 960M GeForce GTX 960M, 6700HQ, Samsung PM951 NVMe 512 GB | i5-7300HQ, GeForce GTX 1050 Mobile GeForce GTX 1050 Mobile, i5-7300HQ, WDC WD10SPCX-75KHST0 + SanDisk Z400s M.2 2242 32 GB Cache | |
|---|---|---|---|---|---|---|
| Noise | 4% | 3% | 1% | -6% | -6% | |
| off / environment * (dB) | 30.4 | 29 5% | 30.4 -0% | 30.3 -0% | ||
| Idle Minimum * (dB) | 30.8 | 30.3 2% | 30.6 1% | 28.9 6% | 31.4 -2% | 31.6 -3% |
| Idle Average * (dB) | 30.8 | 30.3 2% | 30.6 1% | 28.9 6% | 32.5 -6% | 31.6 -3% |
| Idle Maximum * (dB) | 30.8 | 30.3 2% | 30.6 1% | 28.9 6% | 33.6 -9% | 33.4 -8% |
| Load Average * (dB) | 38.7 | 35.1 9% | 34.7 10% | 46 -19% | 45.2 -17% | 47.8 -24% |
| Load Maximum * (dB) | 48.8 | 46 6% | 46.3 5% | 46 6% | 46 6% | 47.8 2% |
* ... smaller is better
Temperature
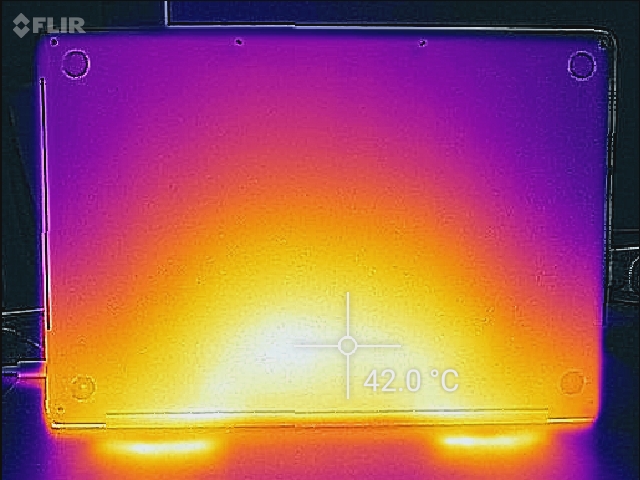
The surface temperatures also differ a bit compared to our two previous test models. The center of the top gets a bit warmer at 46 °C, while the maximum temperature at the bottom is ~2 °C cooler. The palm rests are once again conveniently cool.
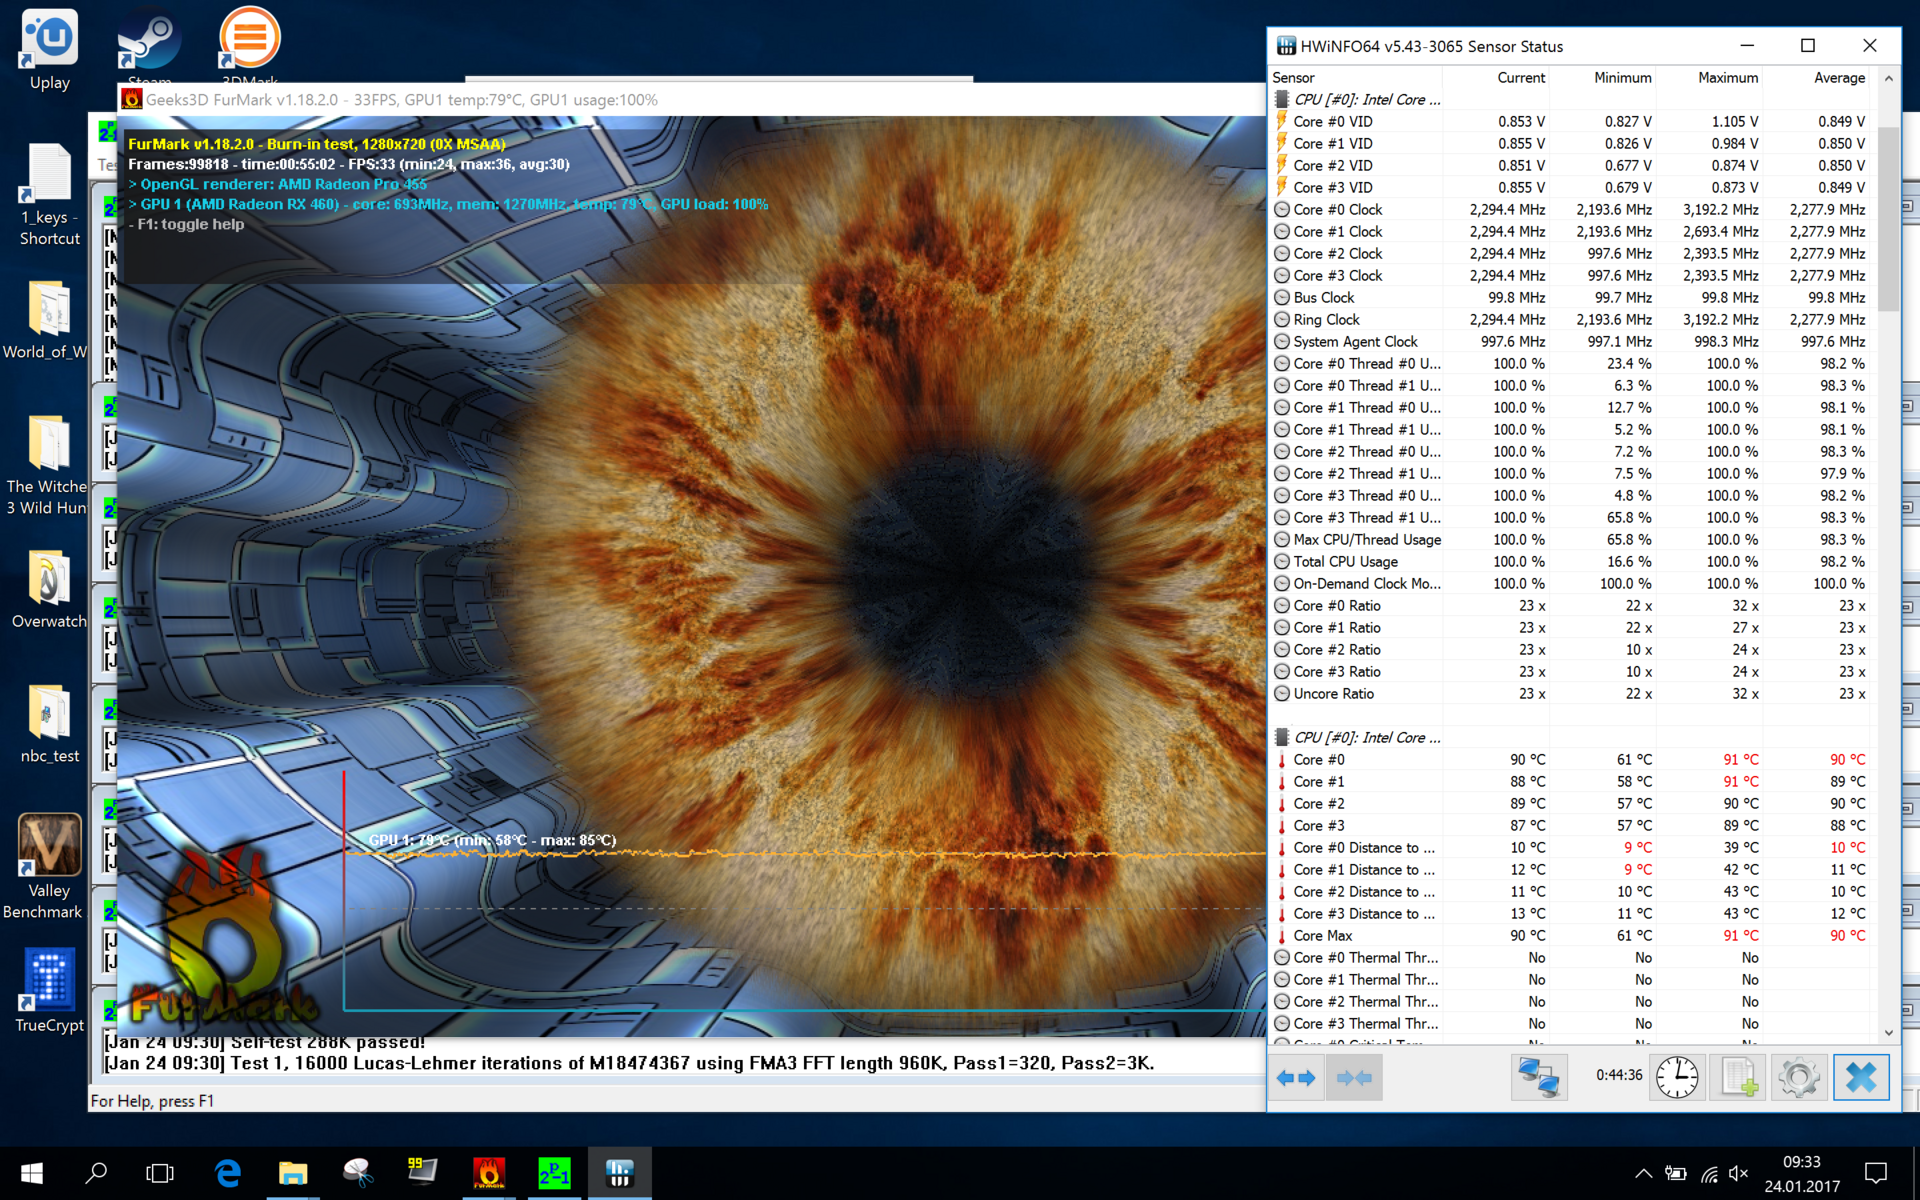
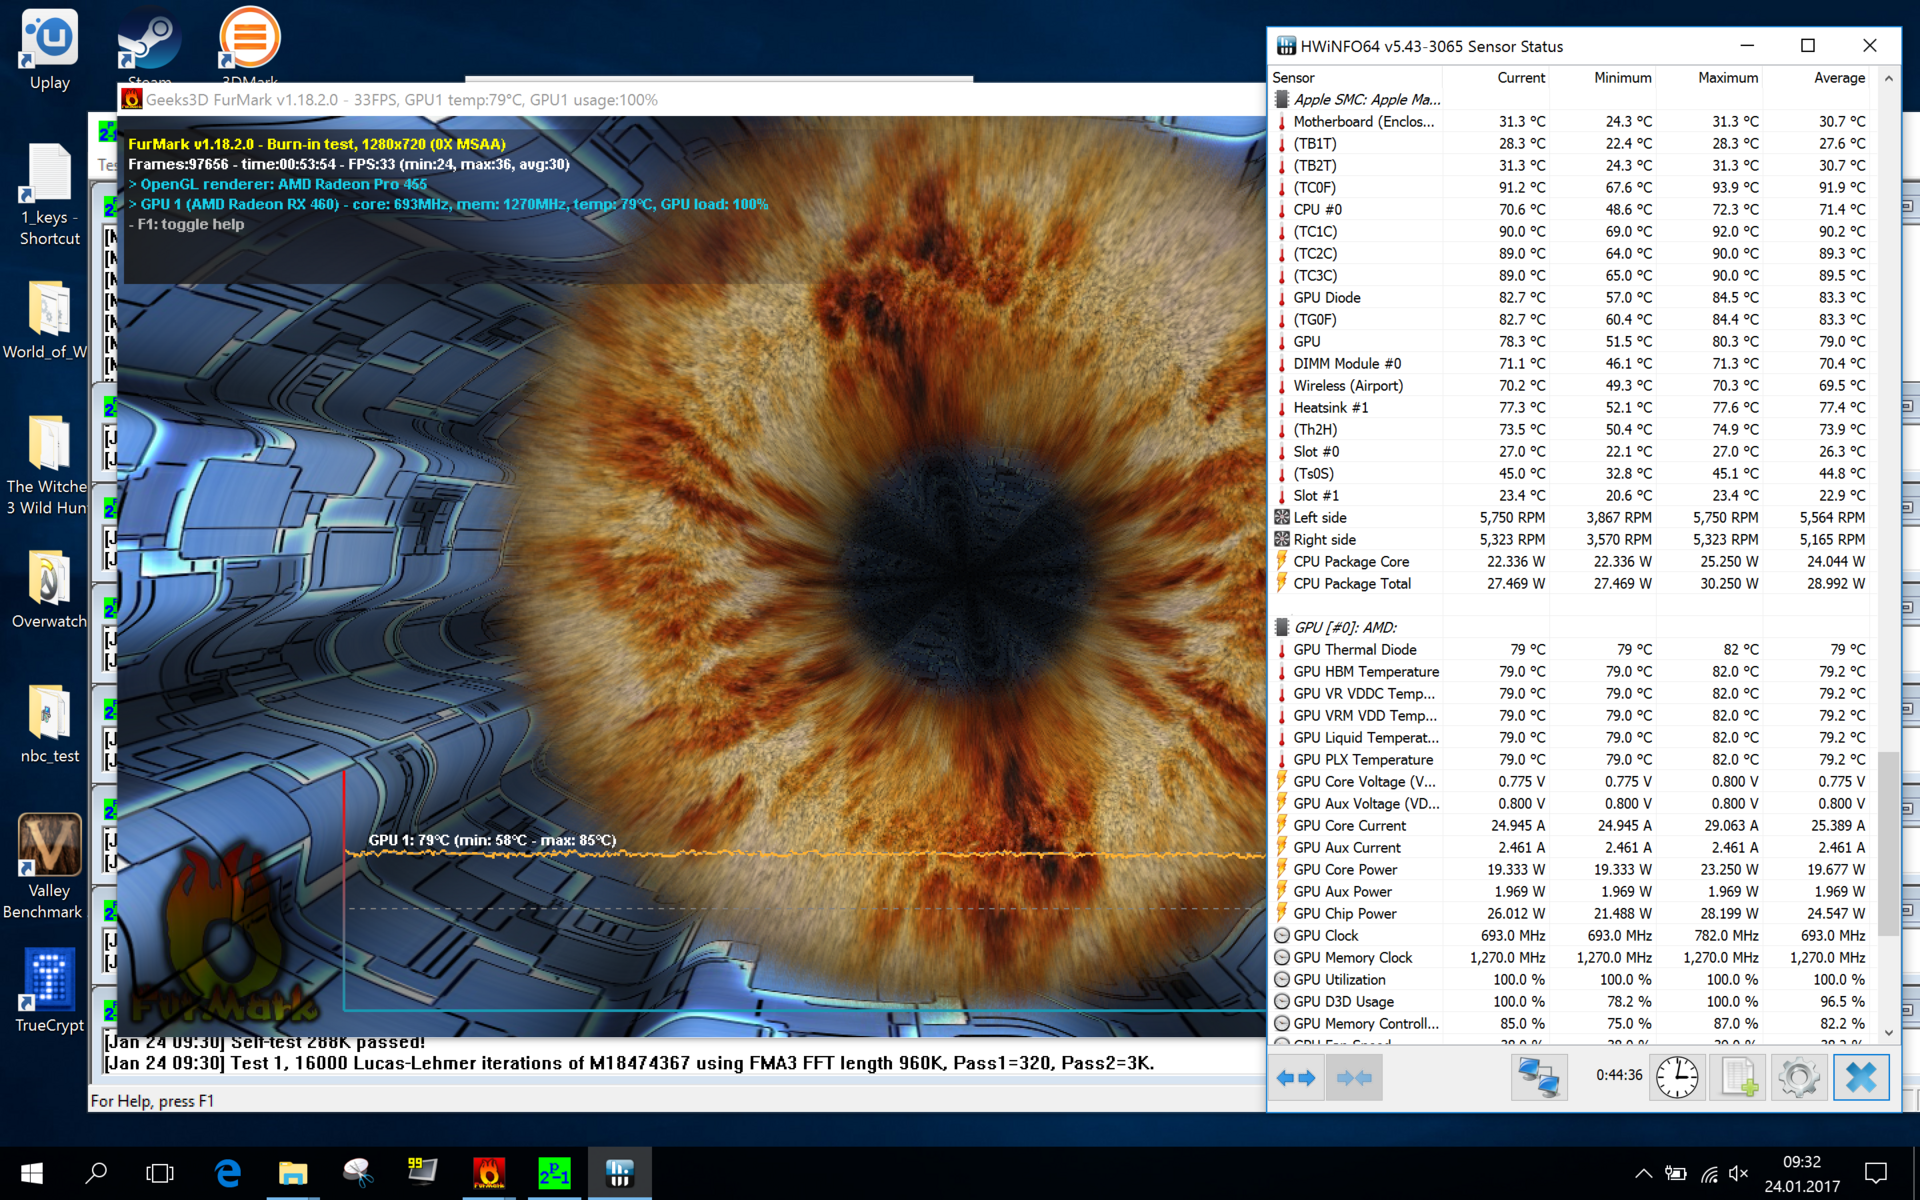
We can see a consumption limit of the provided 87-Watt power adapter in our stress test with the tools FurMark and Prime95. The processor levels off at around 2.3 GHz and 91 °C, while the Radeon Pro 455 runs at ~700 MHz and 79 °C. This means there is still some headroom for higher clocks.
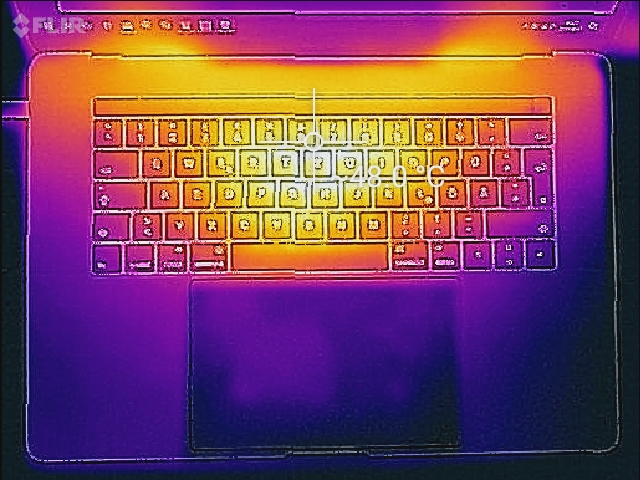
(-) The maximum temperature on the upper side is 46 °C / 115 F, compared to the average of 36.8 °C / 98 F, ranging from 21 to 71 °C for the class Multimedia.
(+) The bottom heats up to a maximum of 39 °C / 102 F, compared to the average of 39.1 °C / 102 F
(+) The palmrests and touchpad are cooler than skin temperature with a maximum of 29 °C / 84.2 F and are therefore cool to the touch.
(±) The average temperature of the palmrest area of similar devices was 28.7 °C / 83.7 F (-0.3 °C / -0.5 F).
| Apple MacBook Pro 15 2016 (2.7 GHz, 455) 6820HQ, Radeon Pro 455 | Apple MacBook Pro 15 2016 (2.9 GHz, 460) 6920HQ, Radeon Pro 460 | Apple MacBook Pro 15 2016 (2.6 GHz, 450) 6700HQ, Radeon Pro 450 | Apple MacBook Pro Retina 15 inch 2015-05 4870HQ, Radeon R9 M370X | Dell XPS 15-9550 i7 6700HQ, GeForce GTX 960M | Dell XPS 15 2017 9560 (7300HQ, Full-HD) i5-7300HQ, GeForce GTX 1050 Mobile | |
|---|---|---|---|---|---|---|
| Heat | -2% | 2% | 3% | -25% | -6% | |
| Maximum Upper Side * (°C) | 46 | 44.2 4% | 43 7% | 43.2 6% | 55.9 -22% | 47.6 -3% |
| Maximum Bottom * (°C) | 39 | 41.6 -7% | 40 -3% | 39 -0% | 50 -28% | 42.1 -8% |
| Idle Upper Side * (°C) | 33.6 | 26 | 30 | 28.1 | 29.9 | |
| Idle Bottom * (°C) | 31.1 | 25 | 29.3 | 27.9 | 29.8 |
* ... smaller is better
Energy Management
Power Consumption
The integrated GPU is only available in combination with macOS, so we also performed the idle measurements with it. We used the regular Windows tools for the load scenarios. All in all, there are only small deviations from the other two models, and the 87-Watt power adapter is once again the limiting factor under maximum load.
| Idle | |
| Load |
|
Key:
min: | |
| Apple MacBook Pro 15 2016 (2.7 GHz, 455) 6820HQ, Radeon Pro 455 | Apple MacBook Pro 15 2016 (2.9 GHz, 460) 6920HQ, Radeon Pro 460 | Apple MacBook Pro 15 2016 (2.6 GHz, 450) 6700HQ, Radeon Pro 450 | Apple MacBook Pro Retina 15 inch 2015-05 4870HQ, Radeon R9 M370X | Dell XPS 15-9550 i7 6700HQ, GeForce GTX 960M | Dell XPS 15 2017 9560 (7300HQ, Full-HD) i5-7300HQ, GeForce GTX 1050 Mobile | |
|---|---|---|---|---|---|---|
| Power Consumption | 1% | 8% | -25% | -97% | -23% | |
| Idle Minimum * (Watt) | 4 | 3 25% | 2.9 27% | 6 -50% | 12.5 -213% | 6.6 -65% |
| Idle Average * (Watt) | 10.9 | 9.9 9% | 9.7 11% | 12.8 -17% | 19.6 -80% | 9 17% |
| Idle Maximum * (Watt) | 10.9 | 12.5 -15% | 10.1 7% | 13.3 -22% | 22.8 -109% | 10.7 2% |
| Load Average * (Watt) | 64.6 | 70.6 -9% | 65 -1% | 82.4 -28% | 102 -58% | 77.5 -20% |
| Load Maximum * (Watt) | 86.7 | 90.8 -5% | 89.5 -3% | 91.8 -6% | 107 -23% | 130 -50% |
* ... smaller is better
Battery Runtime
Our third test model also manages the advertised battery runtime of 10 hours. The 76-Wh battery in our MacBook Pro 15 lasts for more than 10.5 hours in our Wi-Fi test at an adjusted luminance of 150 nits, and it even beats the other models by a couple of minutes. You can expect little more than 50 minutes when you really stress the system.
| Apple MacBook Pro 15 2016 (2.7 GHz, 455) 6820HQ, Radeon Pro 455, 76 Wh | Apple MacBook Pro 15 2016 (2.9 GHz, 460) 6920HQ, Radeon Pro 460, 76 Wh | Apple MacBook Pro 15 2016 (2.6 GHz, 450) 6700HQ, Radeon Pro 450, 76 Wh | Apple MacBook Pro Retina 15 inch 2015-05 4870HQ, Radeon R9 M370X, 100 Wh | Dell XPS 15-9550 i7 6700HQ, GeForce GTX 960M, 84 Wh | Dell XPS 15 2017 9560 (7300HQ, Full-HD) i5-7300HQ, GeForce GTX 1050 Mobile, 56 Wh | |
|---|---|---|---|---|---|---|
| Battery runtime | -2% | -3% | 34% | 41% | 5% | |
| WiFi v1.3 (h) | 10.6 | 10.3 -3% | 10 -6% | 7.2 -32% | 5.2 -51% | 5.6 -47% |
| Load (h) | 0.9 | 0.9 0% | 0.9 0% | 1.8 100% | 2.1 133% | 1.4 56% |
| H.264 (h) | 9.1 | 8.6 | 6.9 | 5.3 | ||
| Reader / Idle (h) | 17.3 | 8.8 | 9.4 |
Pros
Cons
Verdict
The review of the third Apple MacBook Pro 15 configuration actually revealed some surprising results. However, we do not speak about the two faster core components. The processor in our mainstream configuration for $2799 is 100 MHz faster than the base model, which results in a single-digit advantage in the benchmarks, but you will not notice it in practice.
The graphics card AMD Radeon Pro 455 ranks between the two siblings 450 and 460, which is no surprise. However, it is closer to the regular Radeon Pro 450 due to the small amount of video memory (2 GB GDDR5). If you are not happy with the graphics performance of the regular Radeon Pro 450, you would be better off getting the more powerful 460 with 4 GB GDDR5-VRAM.
The big surprise is the screen, which has another designation (APPA031) and manages higher luminance results. The black value does not suffer from that, so the contrast is better as well. It seems to be pure luck right now what panel you get. Both the entry-level version and the high-end spec were equipped with the slightly darker panel, so there does not seem to be a relation with faster components.
We started this review with the question of whether the upgrades are worth it. The answer in this case is: it depends. The processor is hardly any faster and power users will get the optional Core i7-6920HQ anyway, which is also the case for the graphics card. However, the upgrade also includes the larger 512 GB SSD and preconfigured models are often less expensive in online shops, so the model might actually be interesting even when you only want the additional storage capacity. The general advantages and drawbacks of the Apple MacBook Pro 15 still apply here, so we once again want to refer to our in-depth review of the entry-level model.
Apple MacBook Pro 15 2016 (2.7 GHz, 455)
- 02/13/2017 v6 (old)
Klaus A. Hinum, Andreas Osthoff
Price comparison
