Apple MacBook Pro 13 (Late 2016, 2.9 GHz i5, Touch Bar) Notebook Review
After we already reviewed two new MacBook Pros (MacBook Pro 15 and MacBook Pro 13 without Touch Bar), the new MacBook Pro 13 Touch Bar was finally delivered, too. As well as the OLED display above the keyboard, which replaces the conventional function keys, there are more differences compared to the entry-level model. This includes two additional Thunderbolt 3 ports as well as a slightly smaller battery (49.2 vs. 54.5 Wh). The Touch Bar model is also equipped with faster processors and a more powerful Intel Iris GPU. Intel's new Kaby Lake chips, however, are not available for the MBP 13 Touch Bar.
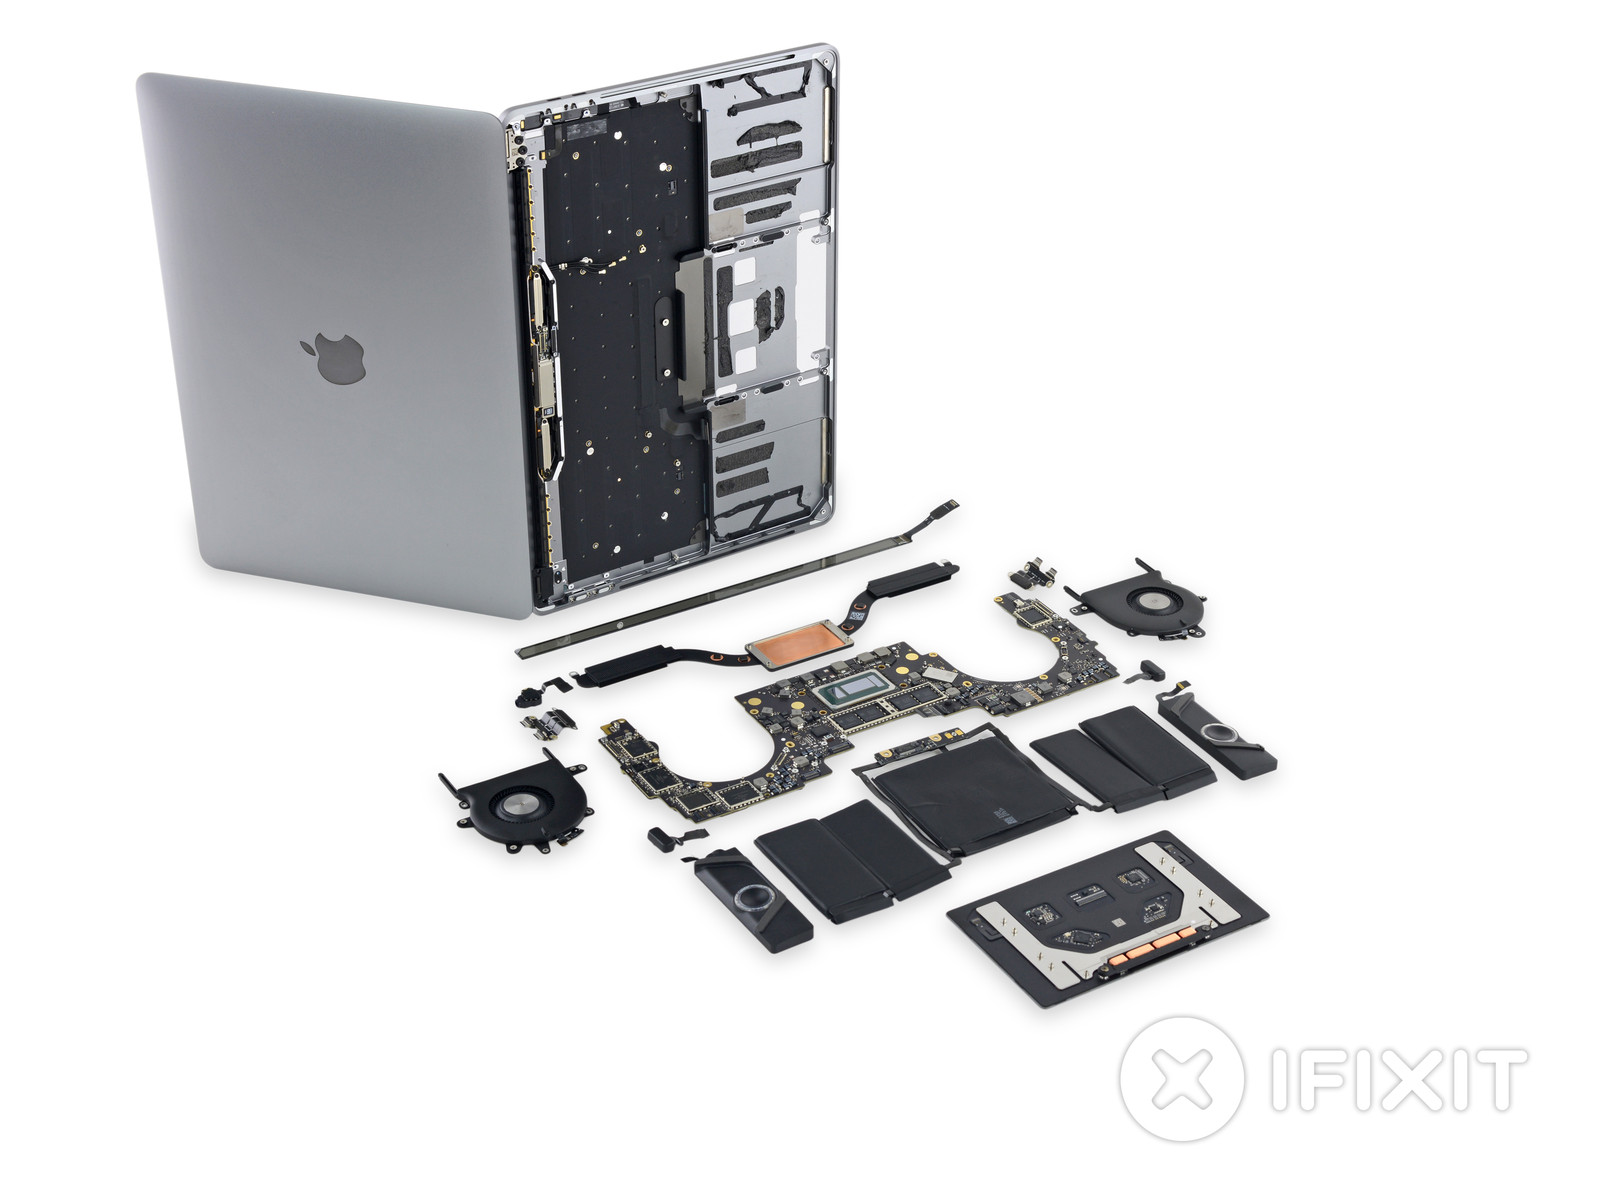
Our test model was once again ordered in Apple's online shop (no press sample). We got the smallest configuration, but it is far away from inexpensive at $1799. In return, you get a 2.9 GHz Intel Core i5 processor (dual-core) with the Iris 550 GPU. Otherwise, the performance figures are pretty similar. One interesting aspect is the internal design though, because it differs quite a lot from the 13-inch model without Touch Bar. We refer to our colleagues from iFixit at this point; they have already disassembled both versions.
| MacBook Pro 13 without Touch Bar | MacBook Pro 13 Touch Bar | MacBook Pro 13 (old model) | |
| Processor | Core i5 2.0 GHz (Skylake, 15 W) Core i7 2.4 GHz (Skylake, 15 W) |
Core i5 2.9 GHz (Skylake, 28 W) Core i5 3.1 GHz (Skylake, 28 W) Core i7 3.3 GHz (Skylake, 28 W) |
Core i5 2.7 GHz (Broadwell, 28 W) Core i5 2.9 GHz (Broadwell, 28 W) Core i7 3.1 GHz (Broadwell, 28 W) |
| Graphics card | Intel Iris Graphics 540 | Intel Iris Graphics 550 | Intel Iris Graphics 6100 |
| RAM | 8 GB LPDDR3-1866 16 GB LPDDR3-1866 |
8 GB LPDDR3-2133 16 GB LPDDR3-2133 |
8 GB LPDDR3-1866 16 GB LPDDR3-1866 |
| SSD | 256 GB 512 GB 1 TB |
256 GB 512 GB 1 TB |
128 GB 256 GB 512 GB 1 TB |
| Display | 13.3-icnh IPS 2560 x 1600 pixels | 13.3-inch IPS 2560 x 1600 pixels | 13.3-inch IPS 2560 x 1600 pixels |
| Ports | 2x Thunderbolt 3 with USB-C jack 3.5 mm headset |
4x Thunderbolt 3 wit USB-C jack 3.5 mm headset |
2x Thunderbolt 2 2x USB 3.0 MagSafe HDMI SD-card reader 3.5 mm headset |
| Price | starts at $1499 | starts at $1799 | starts at $1299 |
Besides the differences compared to the MacBook Pro 13 without Touch Bar and the predecessor (which is still available), we are particularly interested in the new dynamic OLED display above the keyboard. Does it really improve workflow, or is it more of a gimmick that actually complicates things in practice?
Change log
- 11/26 20:00 CET – Basic display measurements, PWM, CPU+GPU benchmarks, System Noise, Wi-Fi battery runtime
- 11/29 09:30 CET – Temperatures, thermal images, Gaming benchmarks, video runtime and stress test added
- 11/30 23:30 CET – Wi-Fi performance, power consumption added
- 12/02 22:30 CET – Battery runtime load, input devices, color gamut
- 12/05 23:30 CET – Case, viewing angles, SSD, Pros & Cons, Verdict, Rating
Case
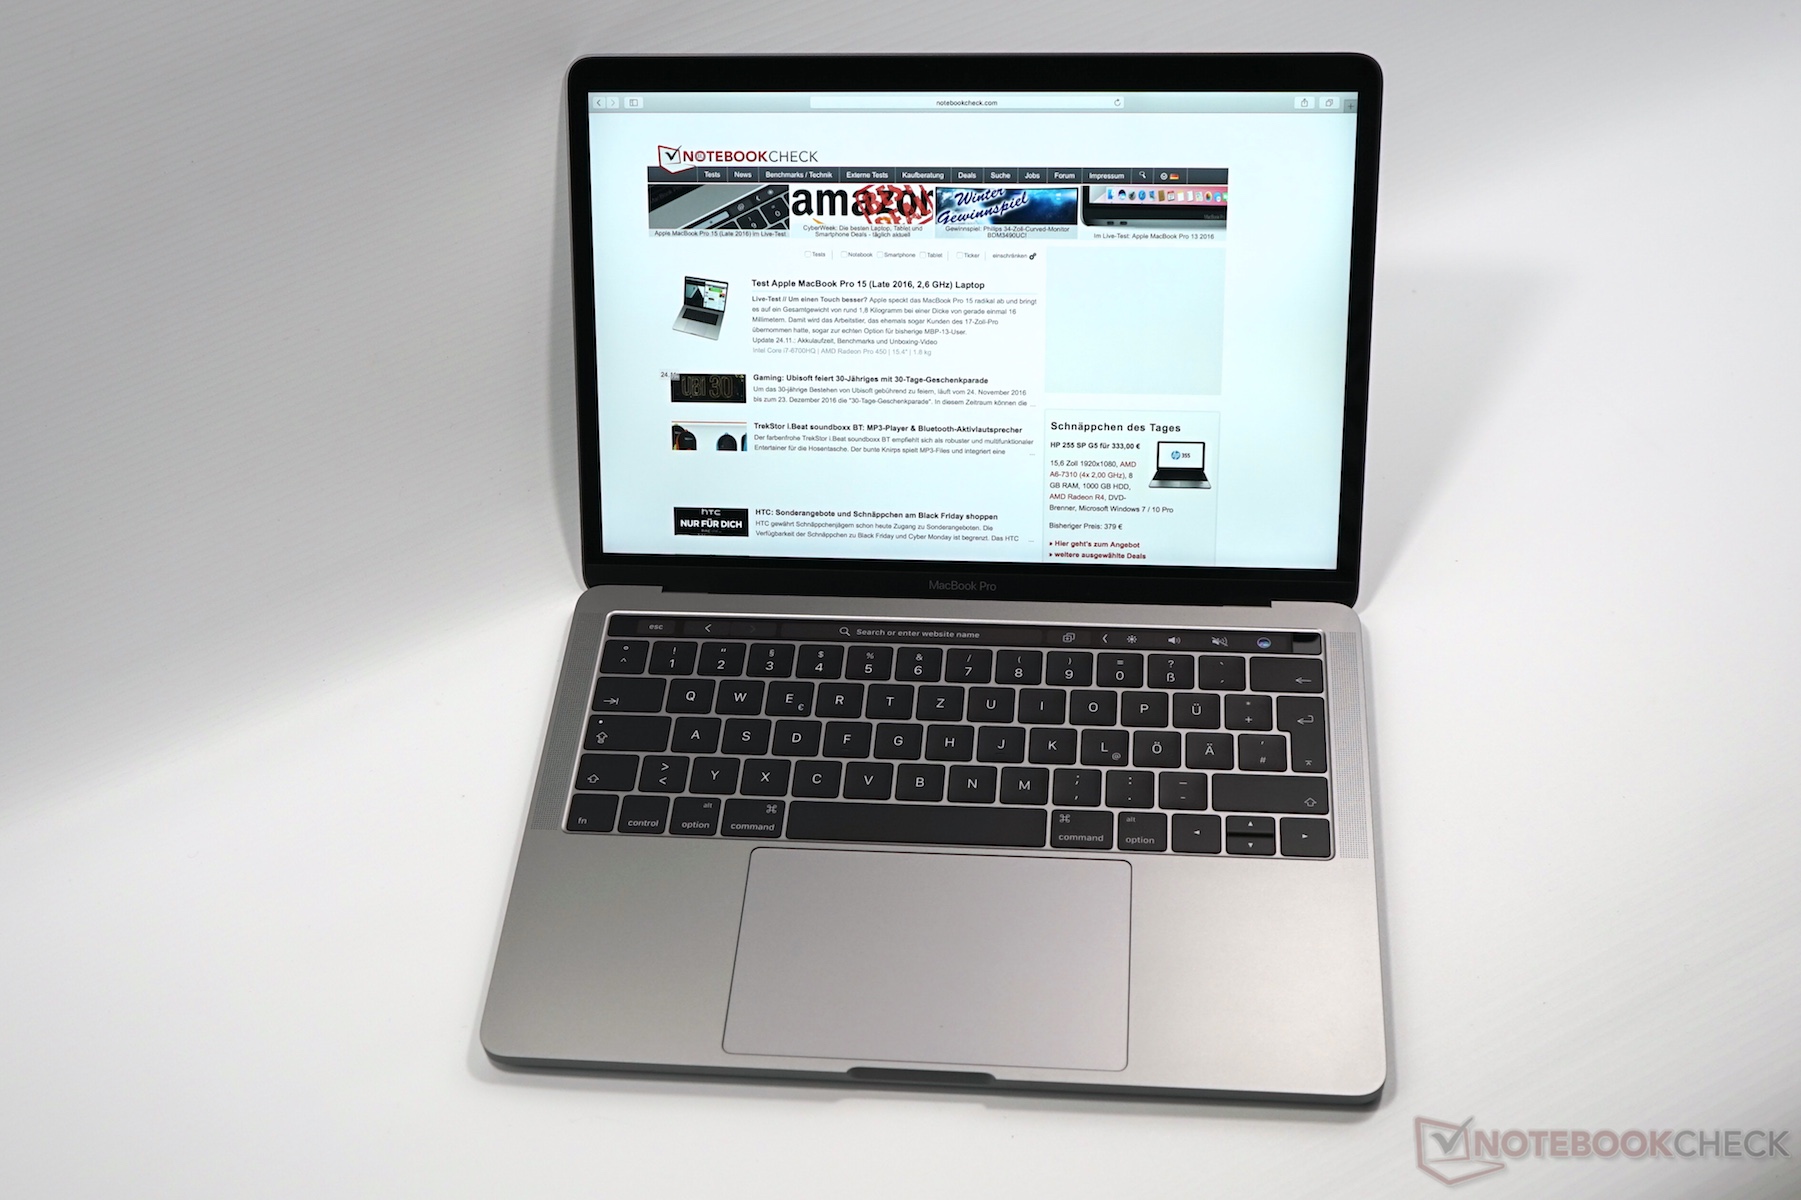
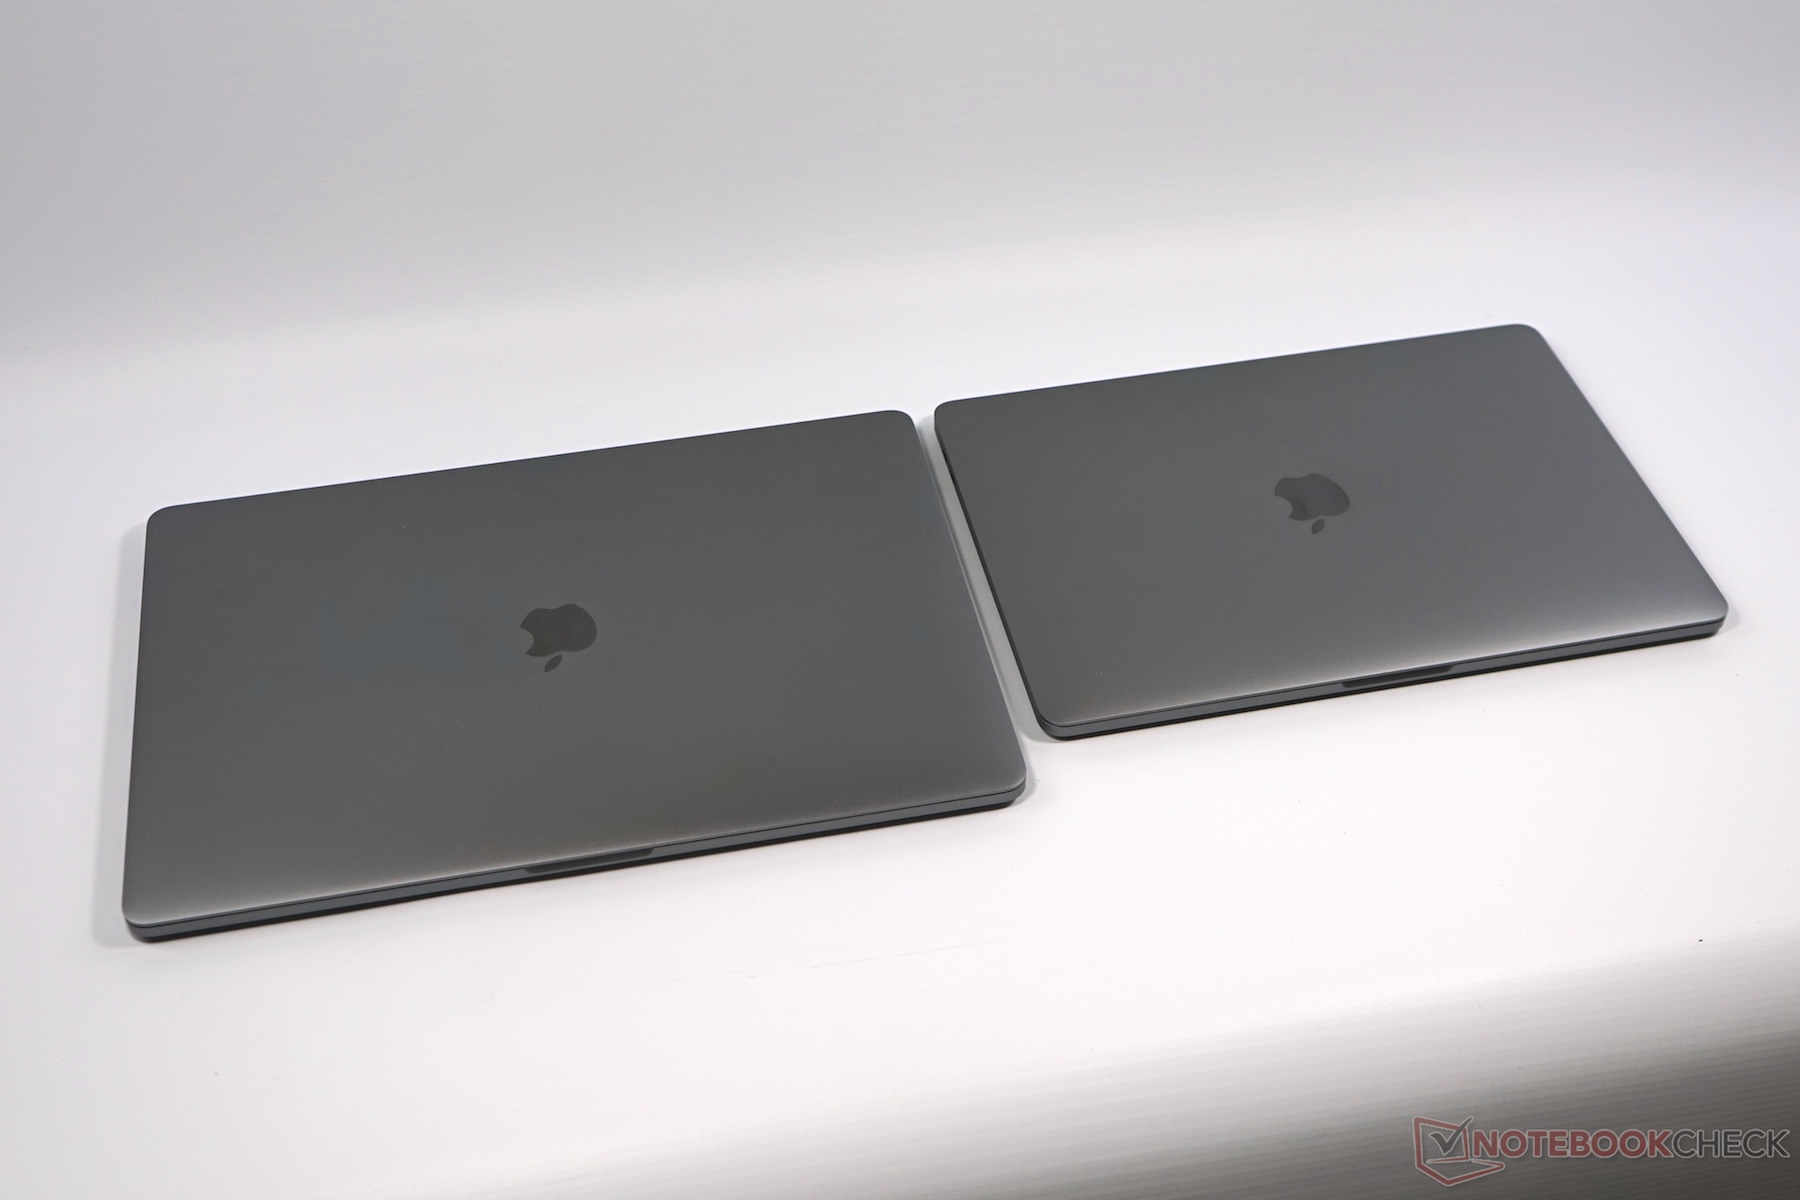
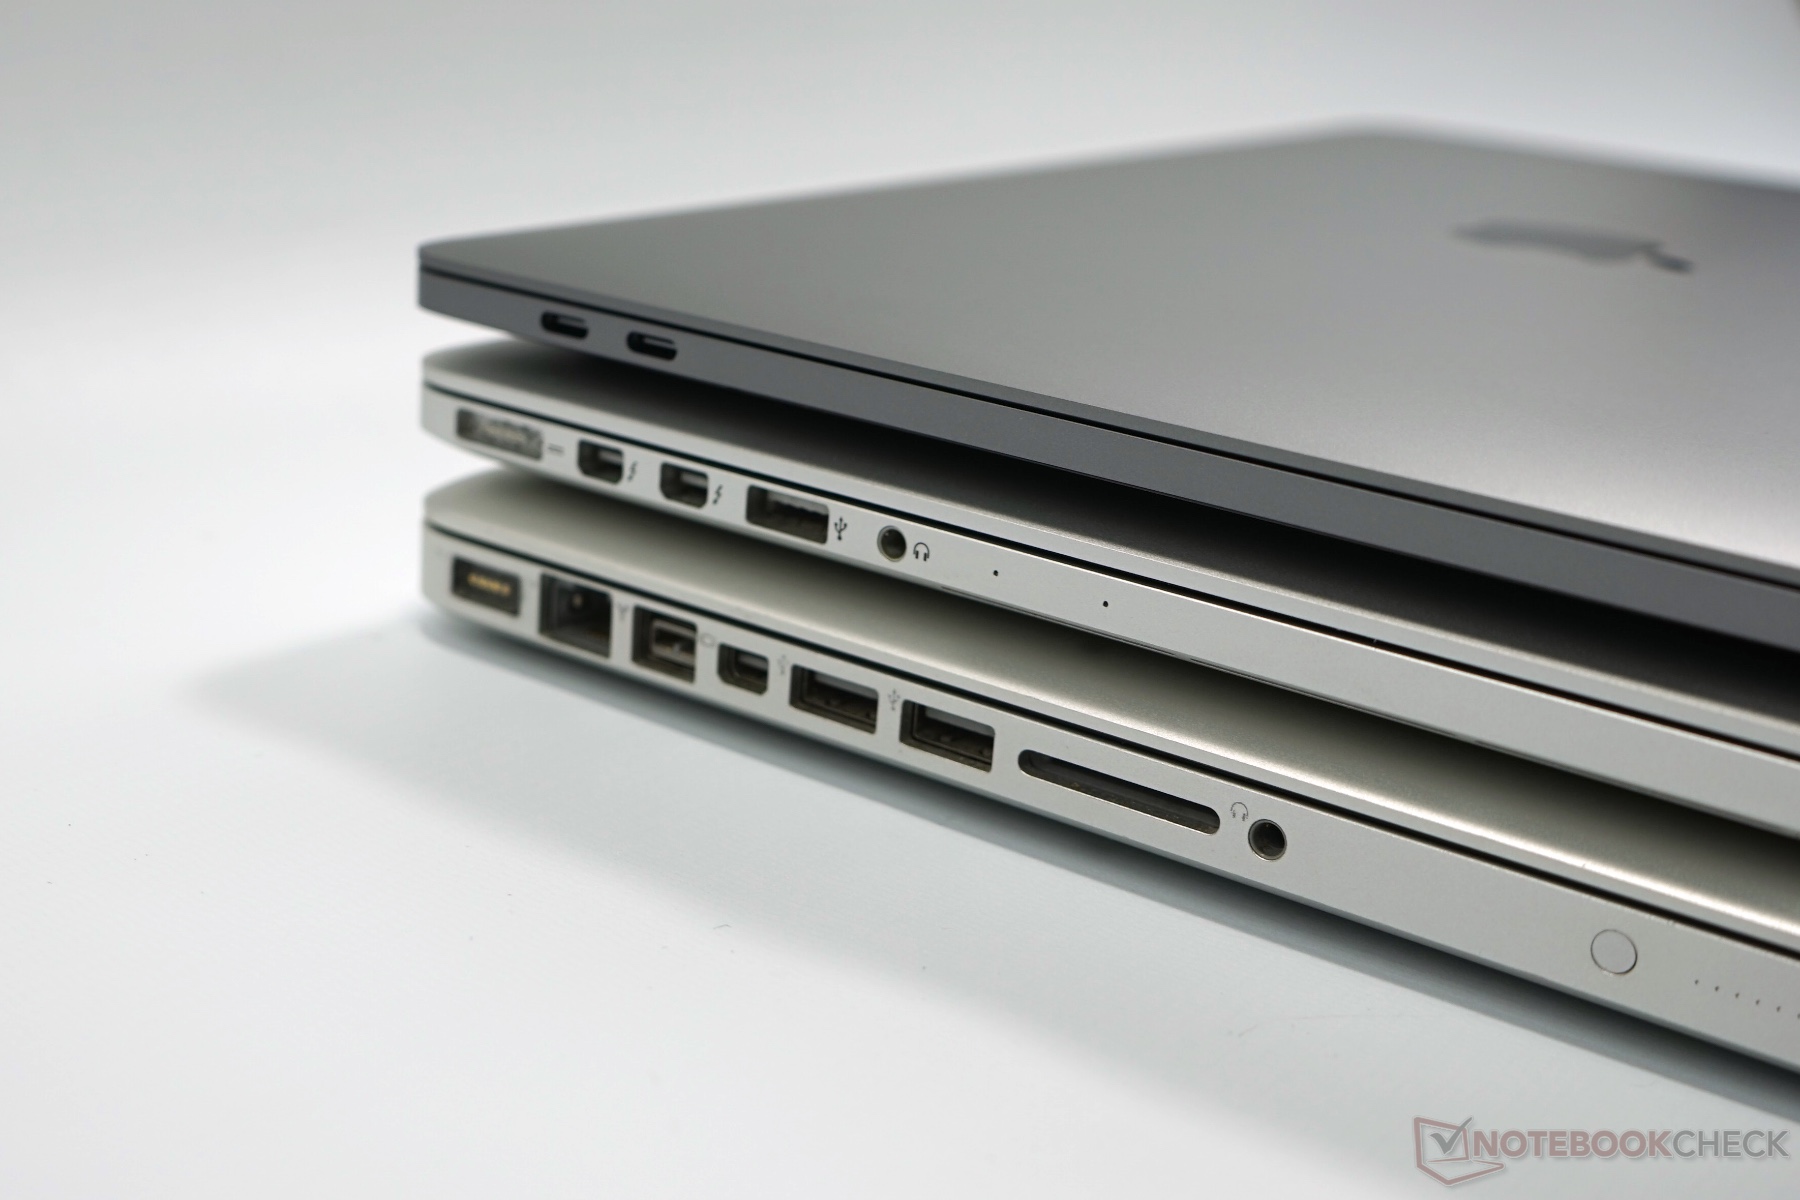
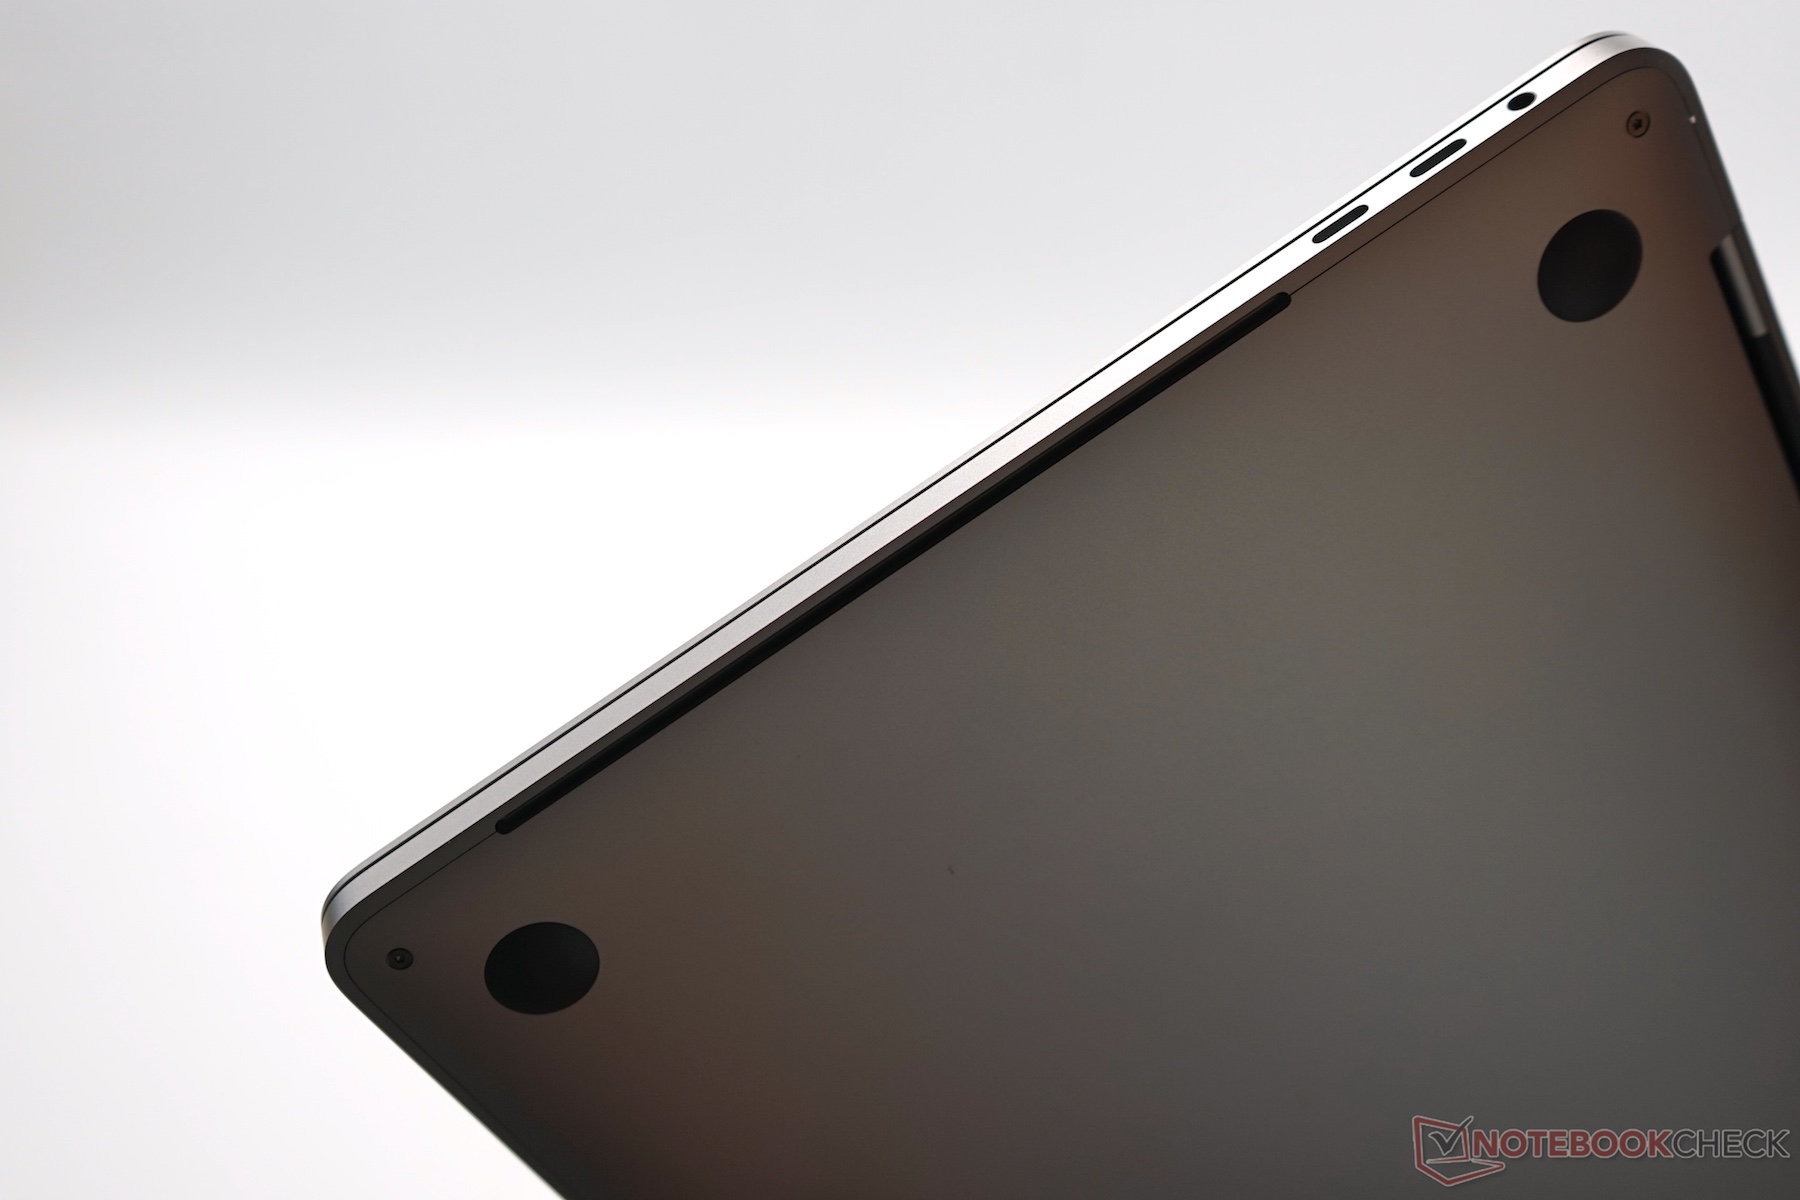
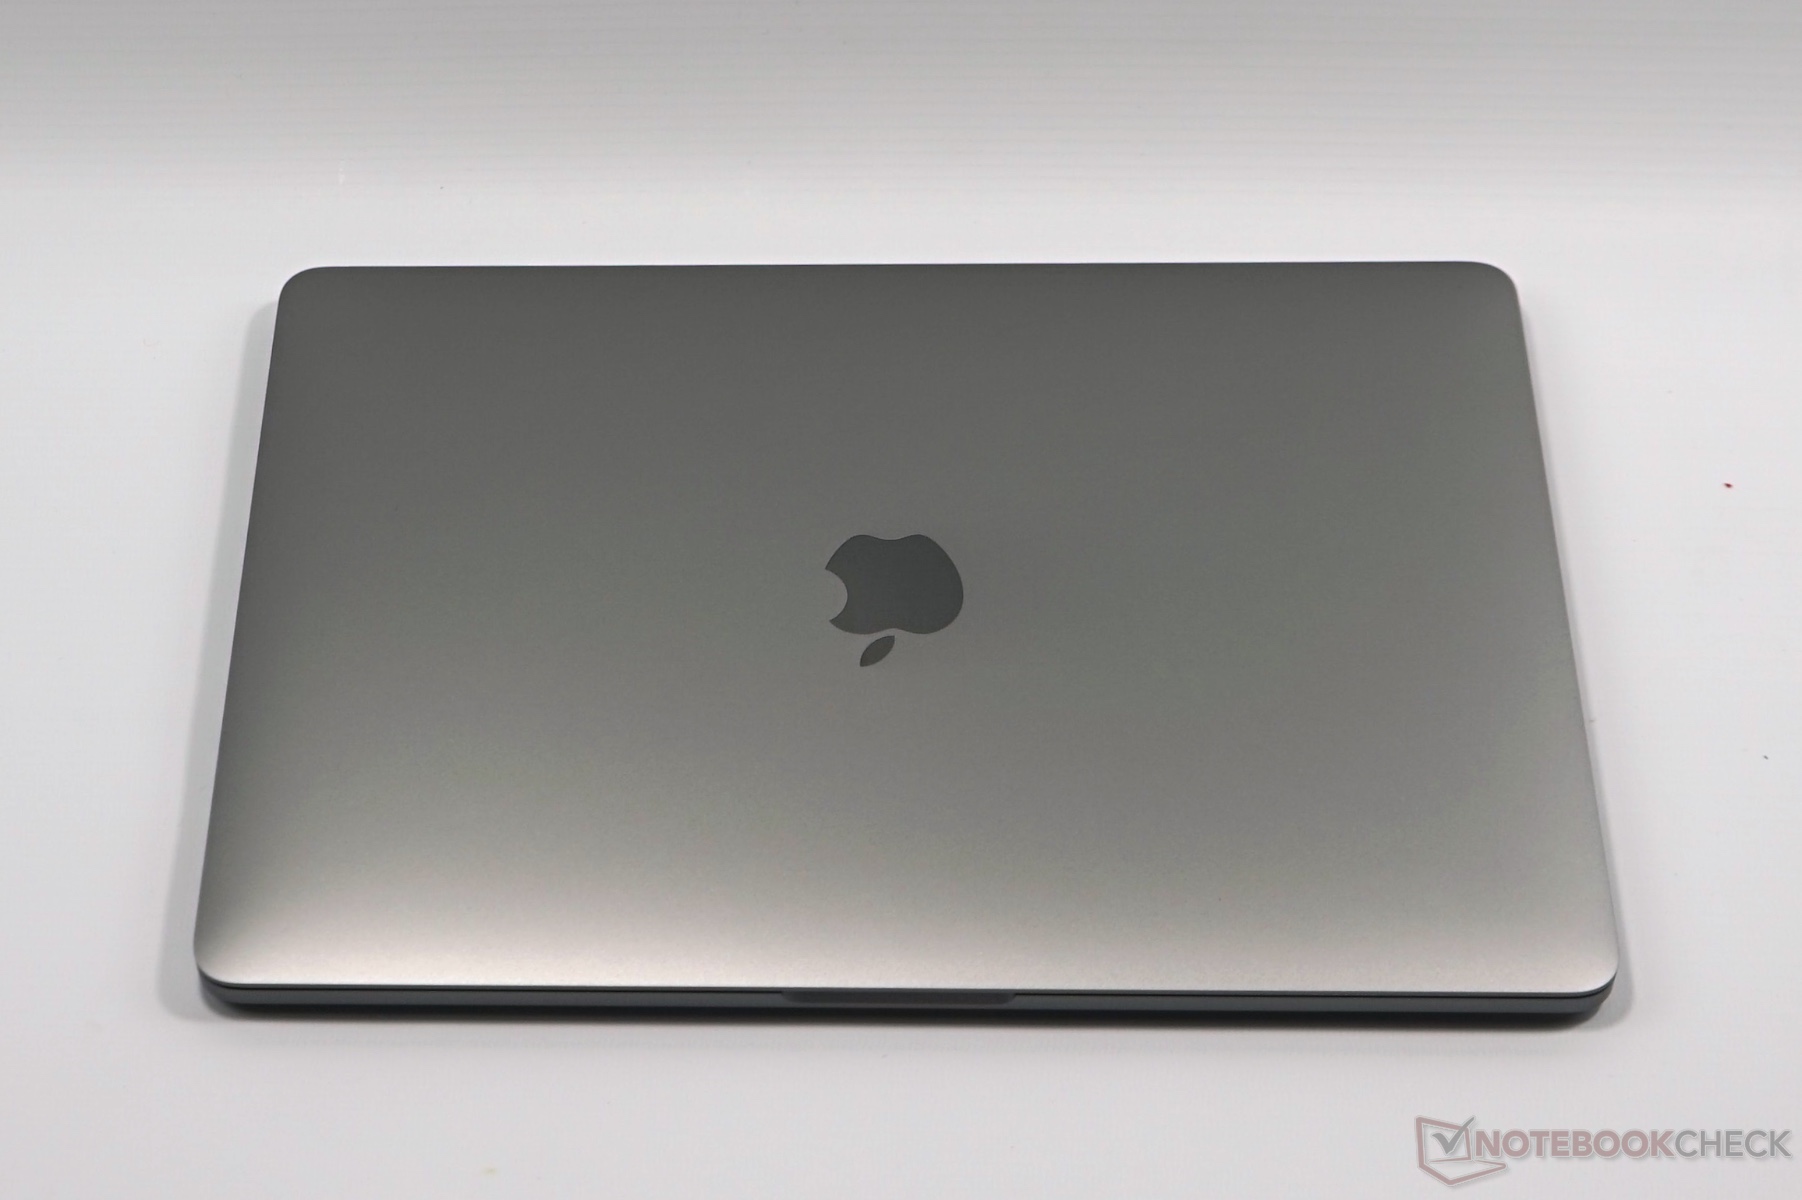
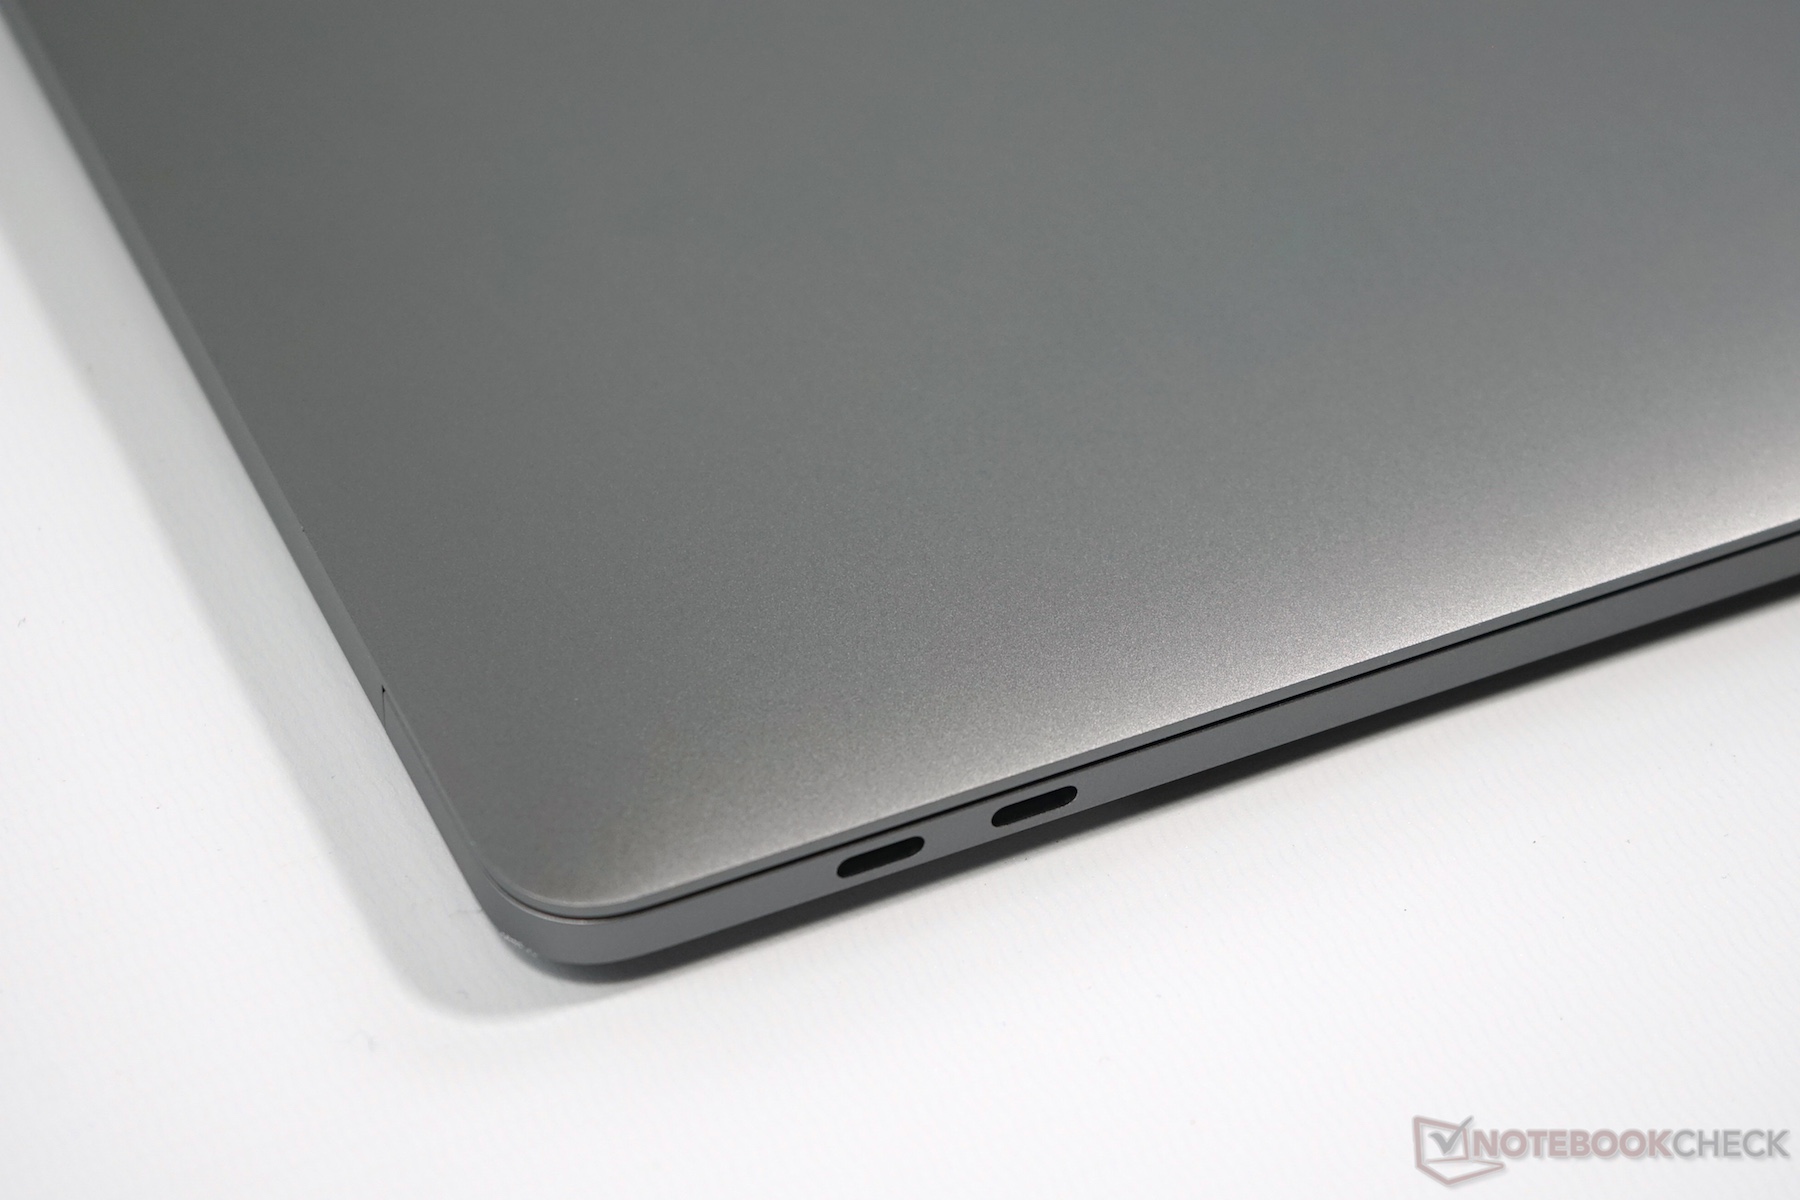
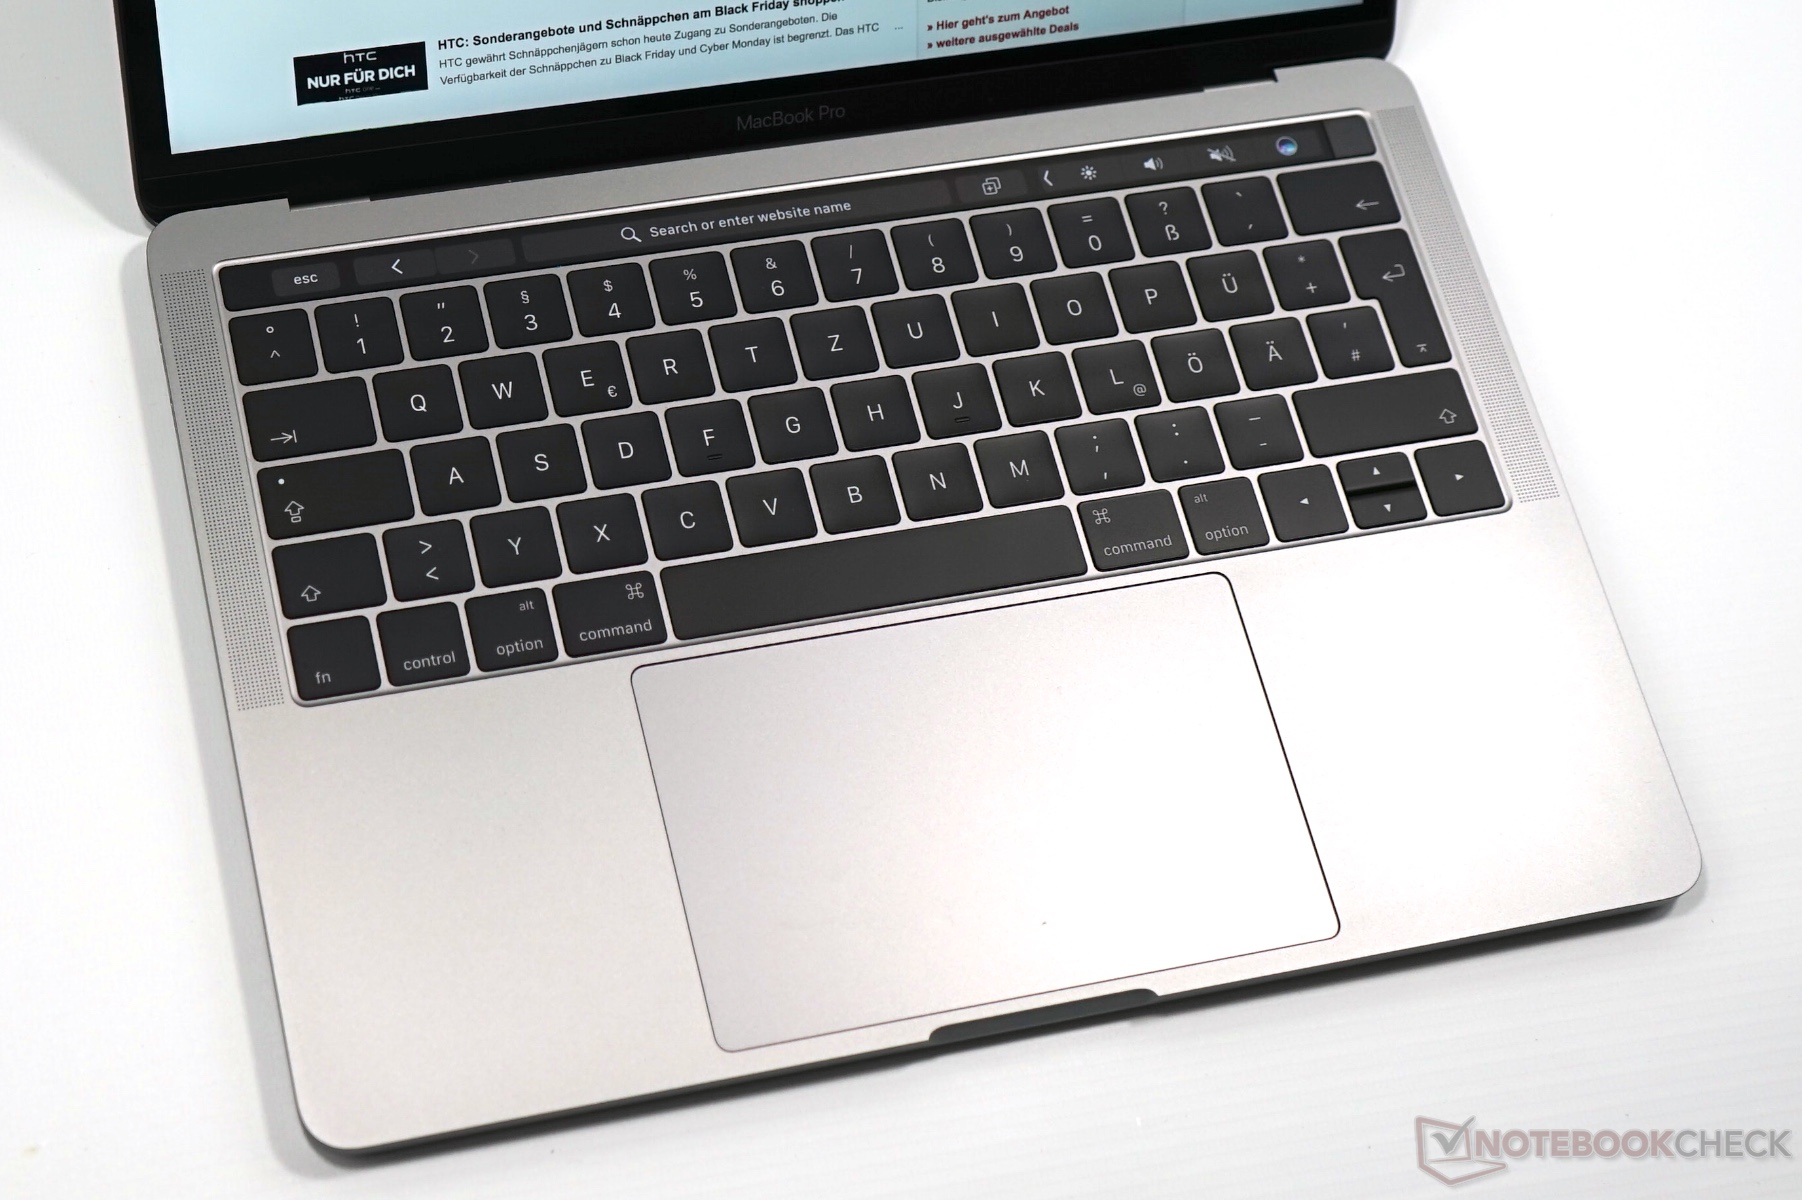
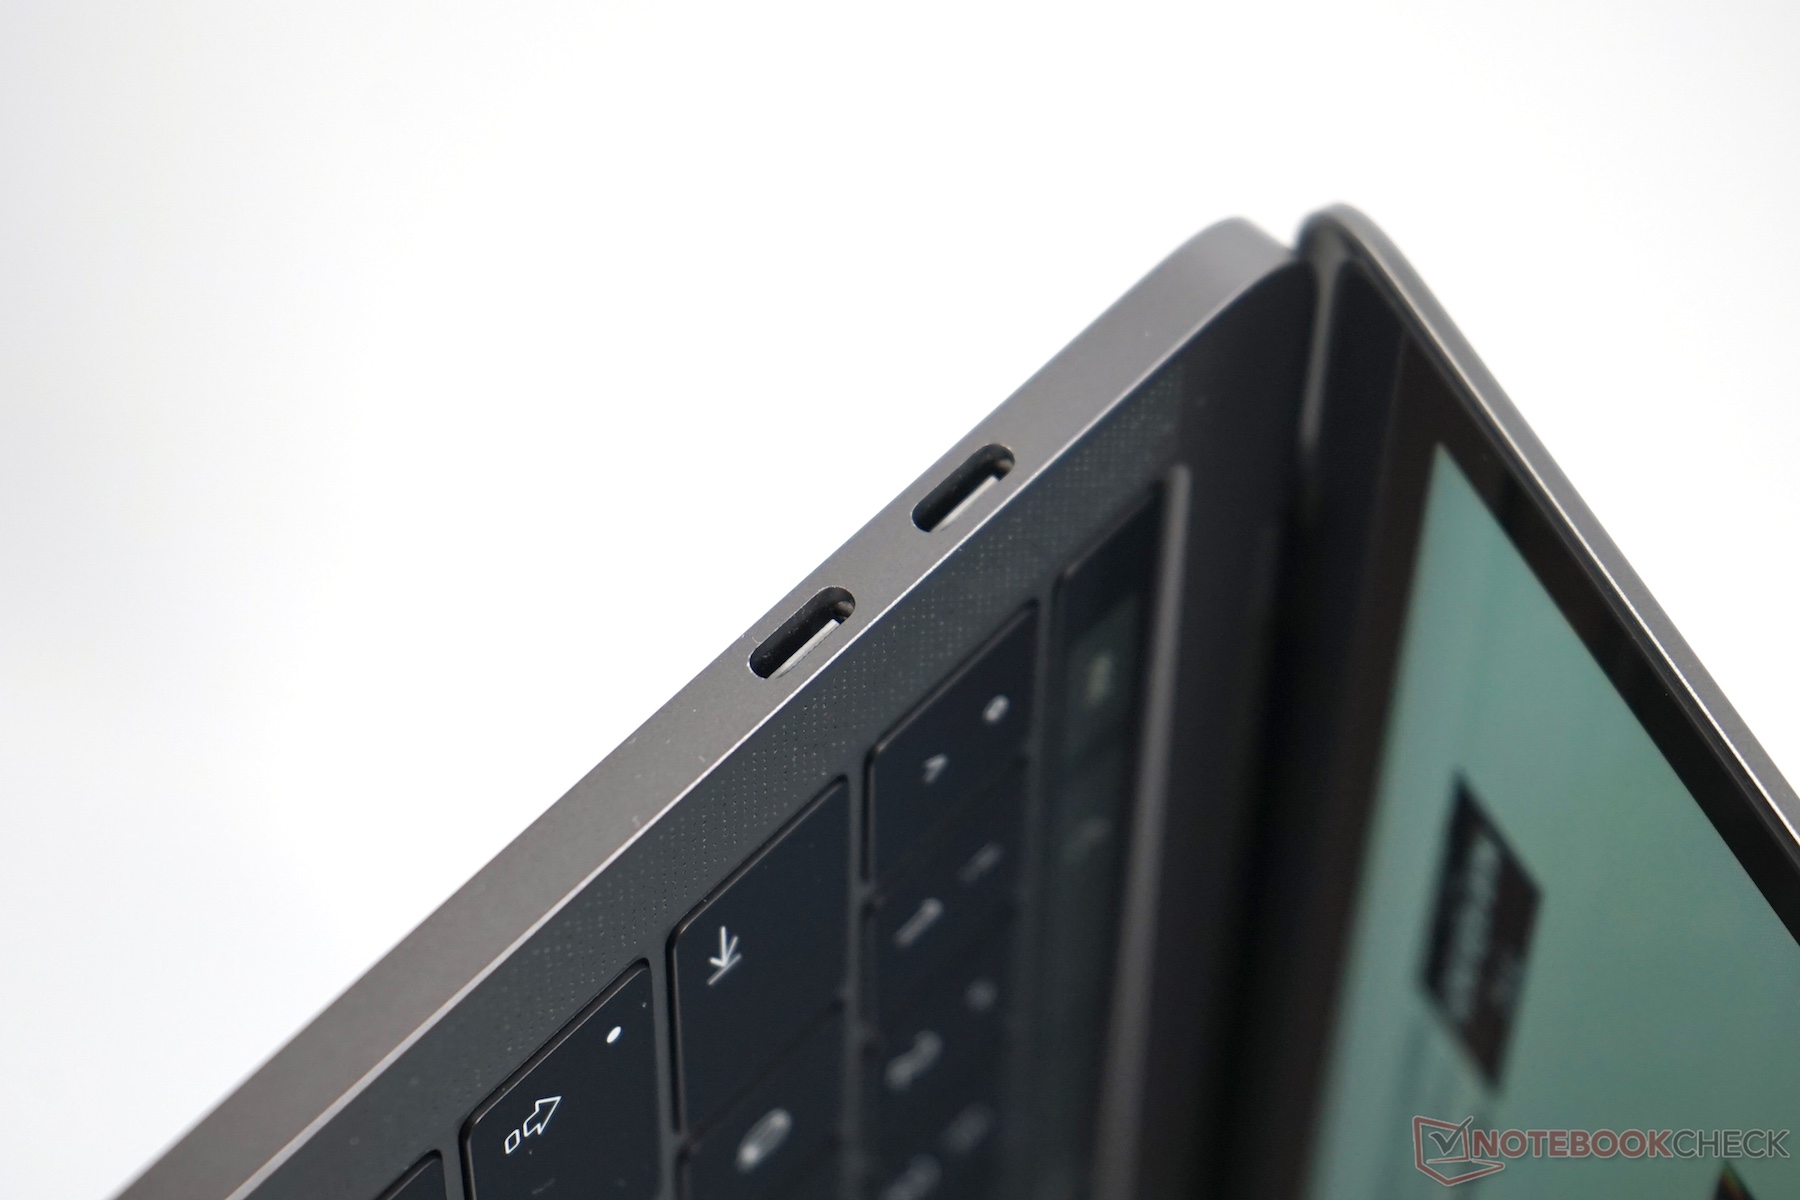
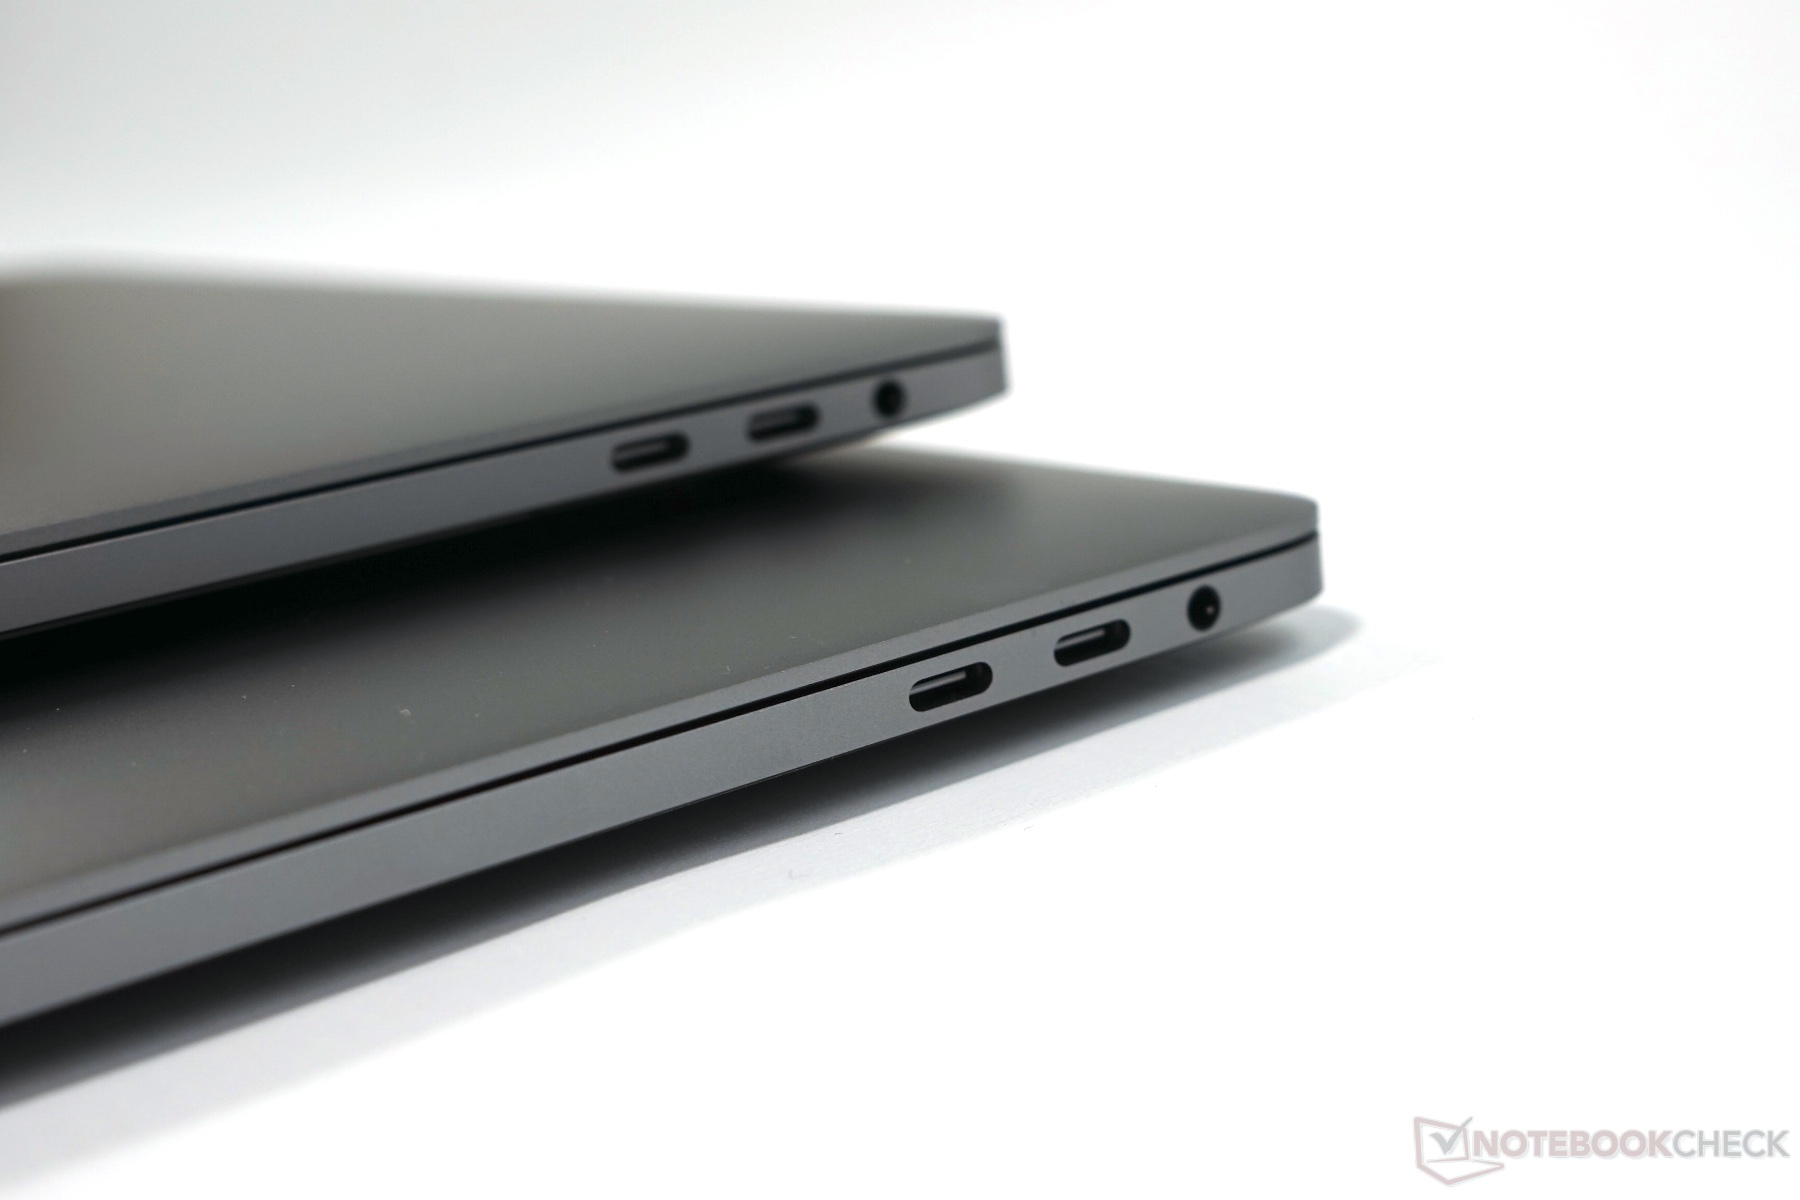
Only the two additional Thunderbolt 3 ports at the right side of the chassis indicate the more expensive model with the Touch Bar, otherwise, the two cases of the new 13-inch MacBook Pros look identical. Besides the familiar version in "Silver", Apple also offers the system in the slightly darker "Space Gray". Opening the device is subjectively not different from the old model, even though the hinge is now much thinner. Underneath the display is once again space for the "MacBook Pro" lettering, which was not the case for the previous Retina models. Once you open the lid, you will immediately notice the Touch Bar above the keyboard as well as the huge trackpad.
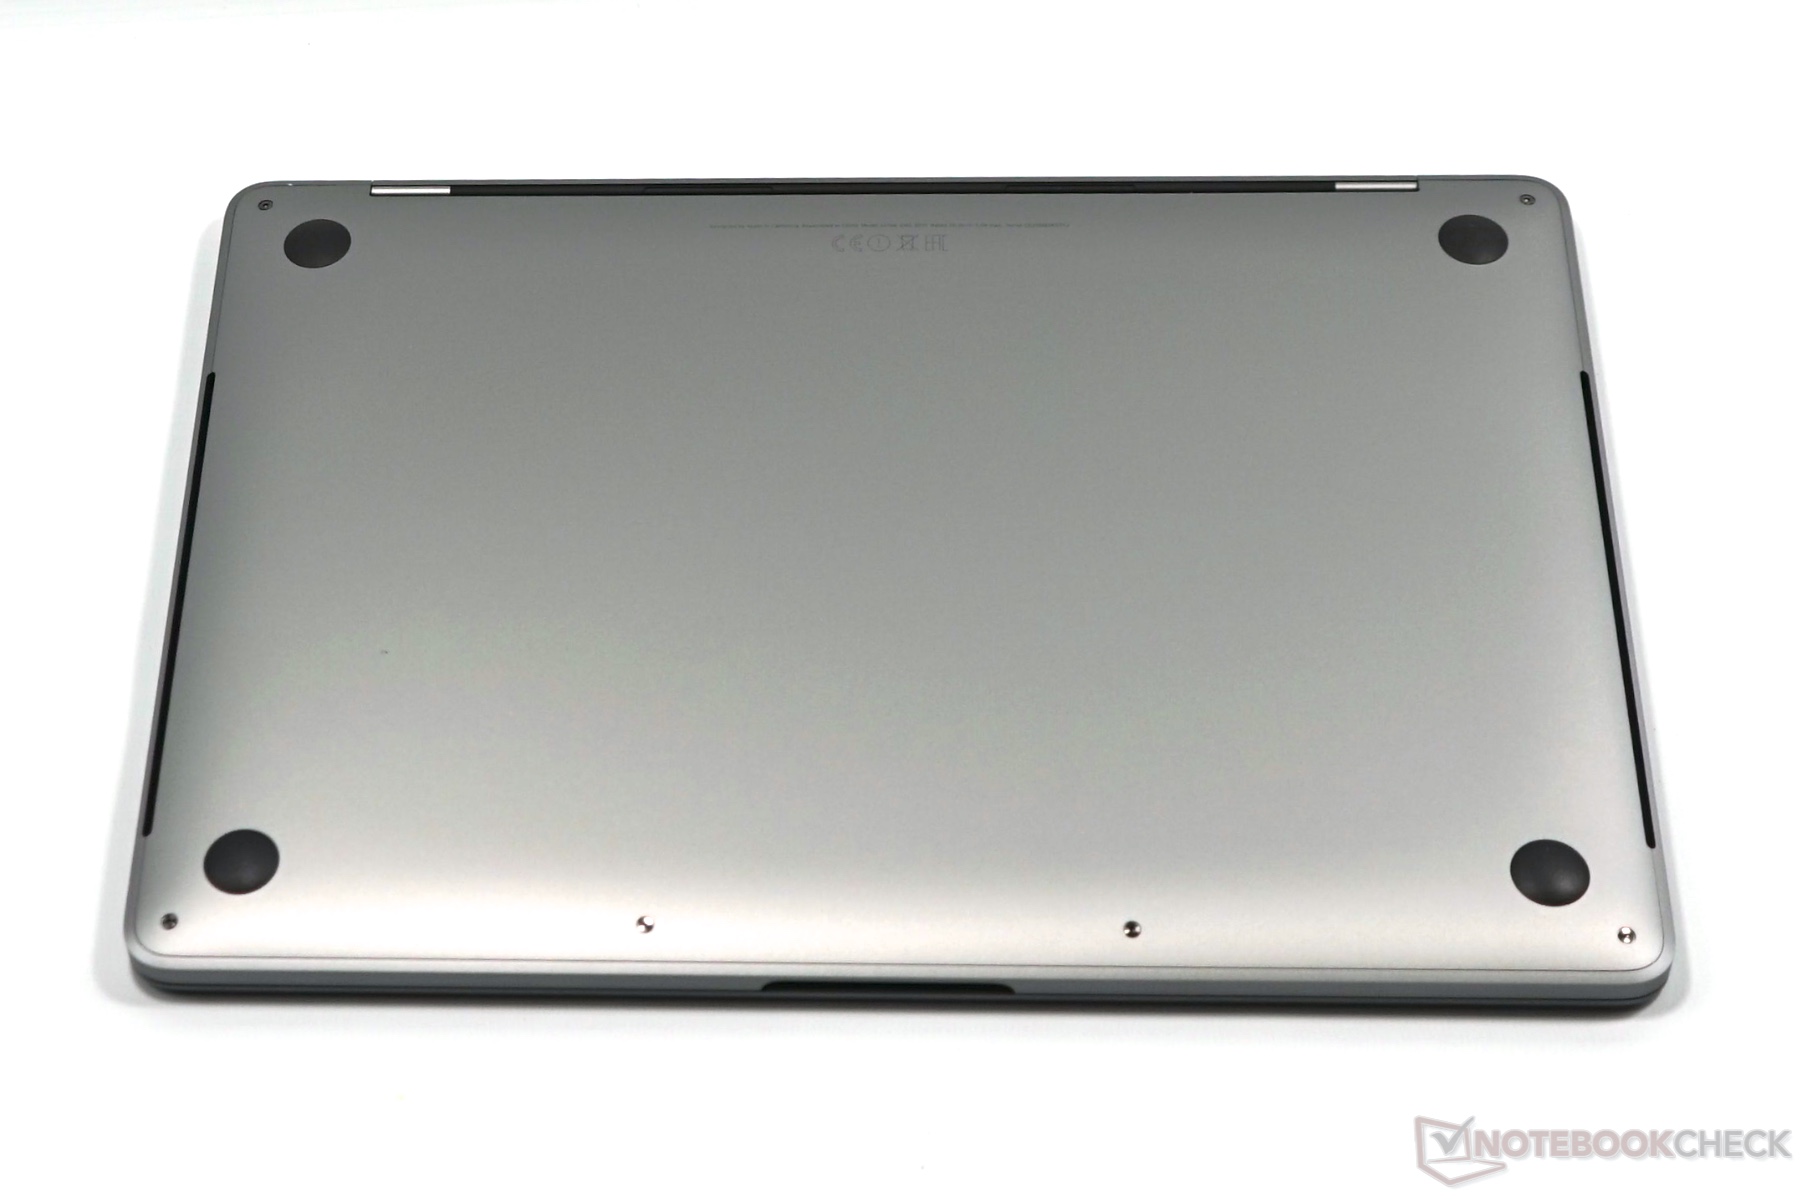
Not much changed in terms of quality, because the aluminum unibody chassis is still excellent. This is the case for the design, the tactile feel as well as the stability. The Apple logo on the lid is not illuminated anymore and is now glossy, similar to the MacBook 12. Apple does not use a plastic cover for the hinge of the new model anymore, because it is now completely made of aluminum. The bottom panel is still secured by Pentalobe screws.
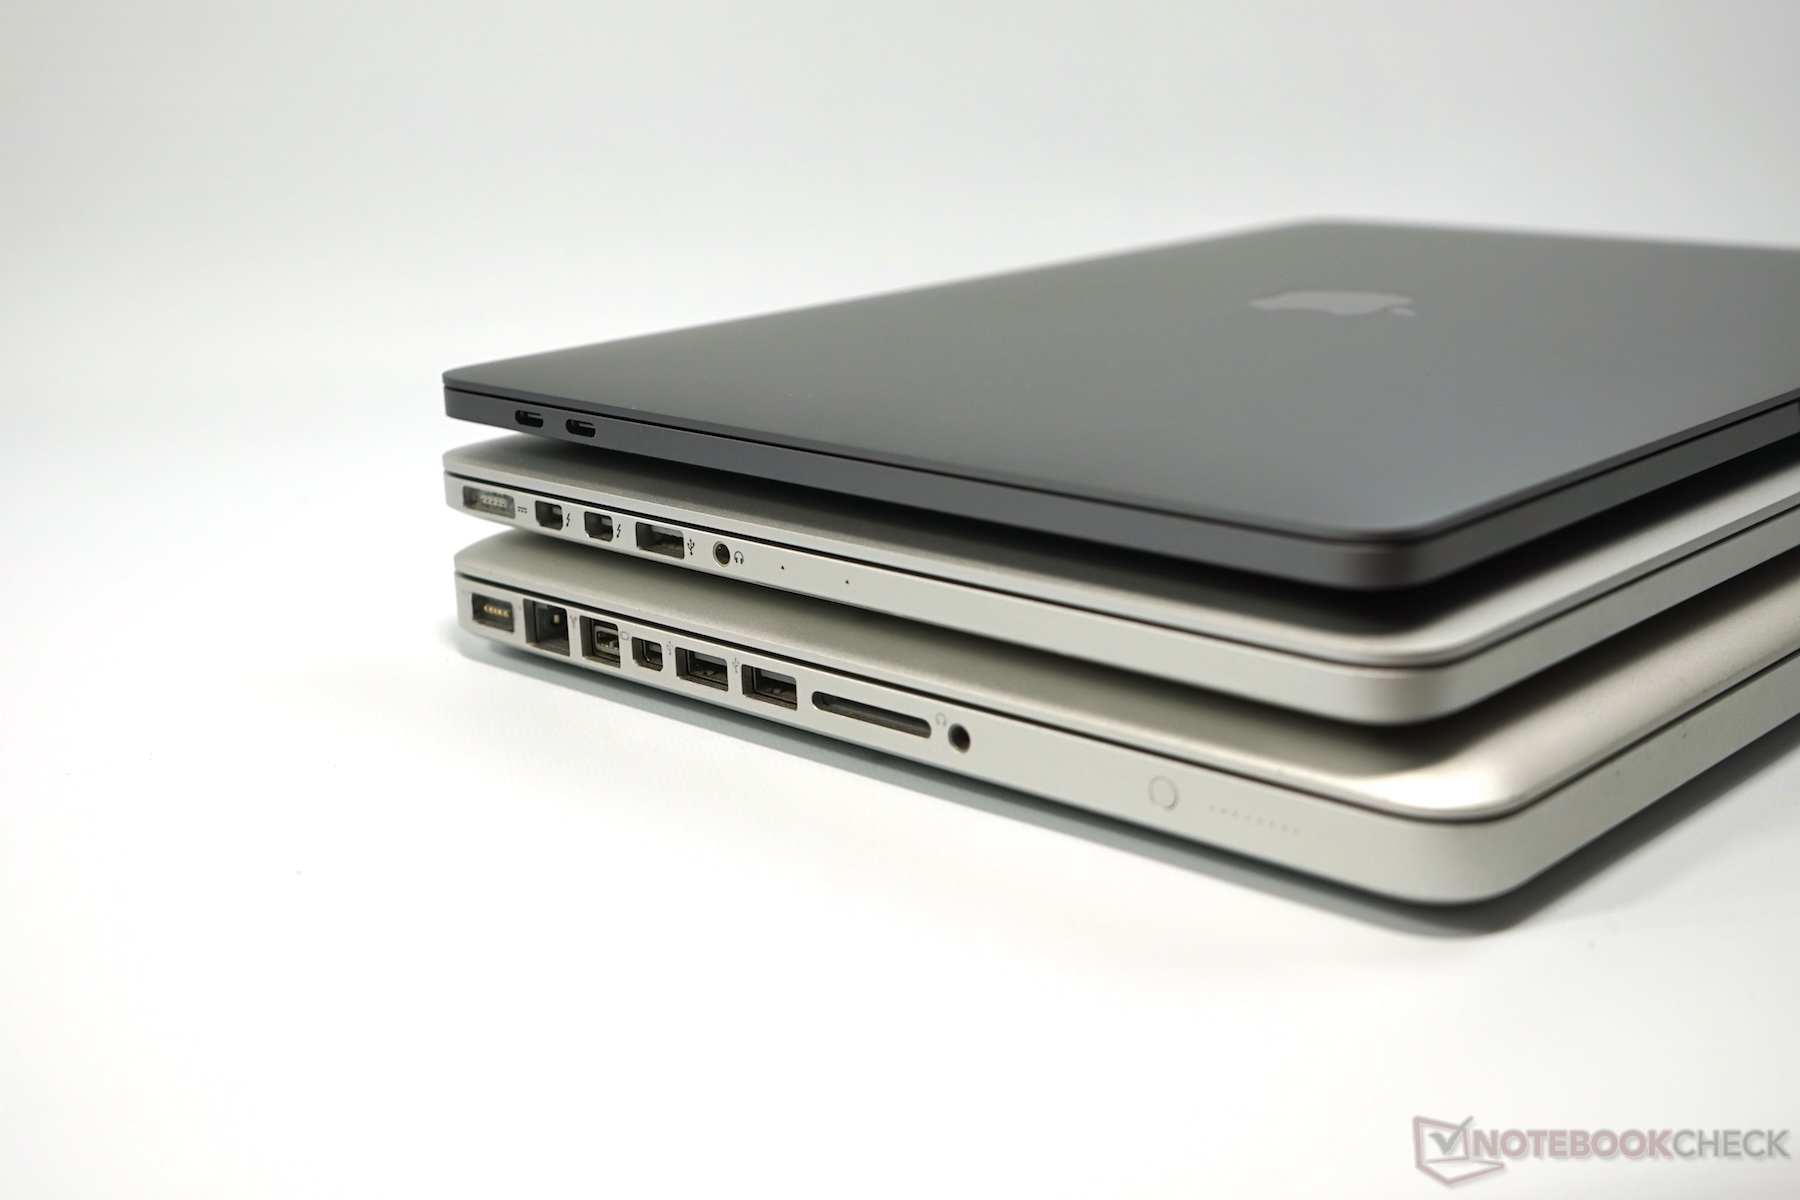
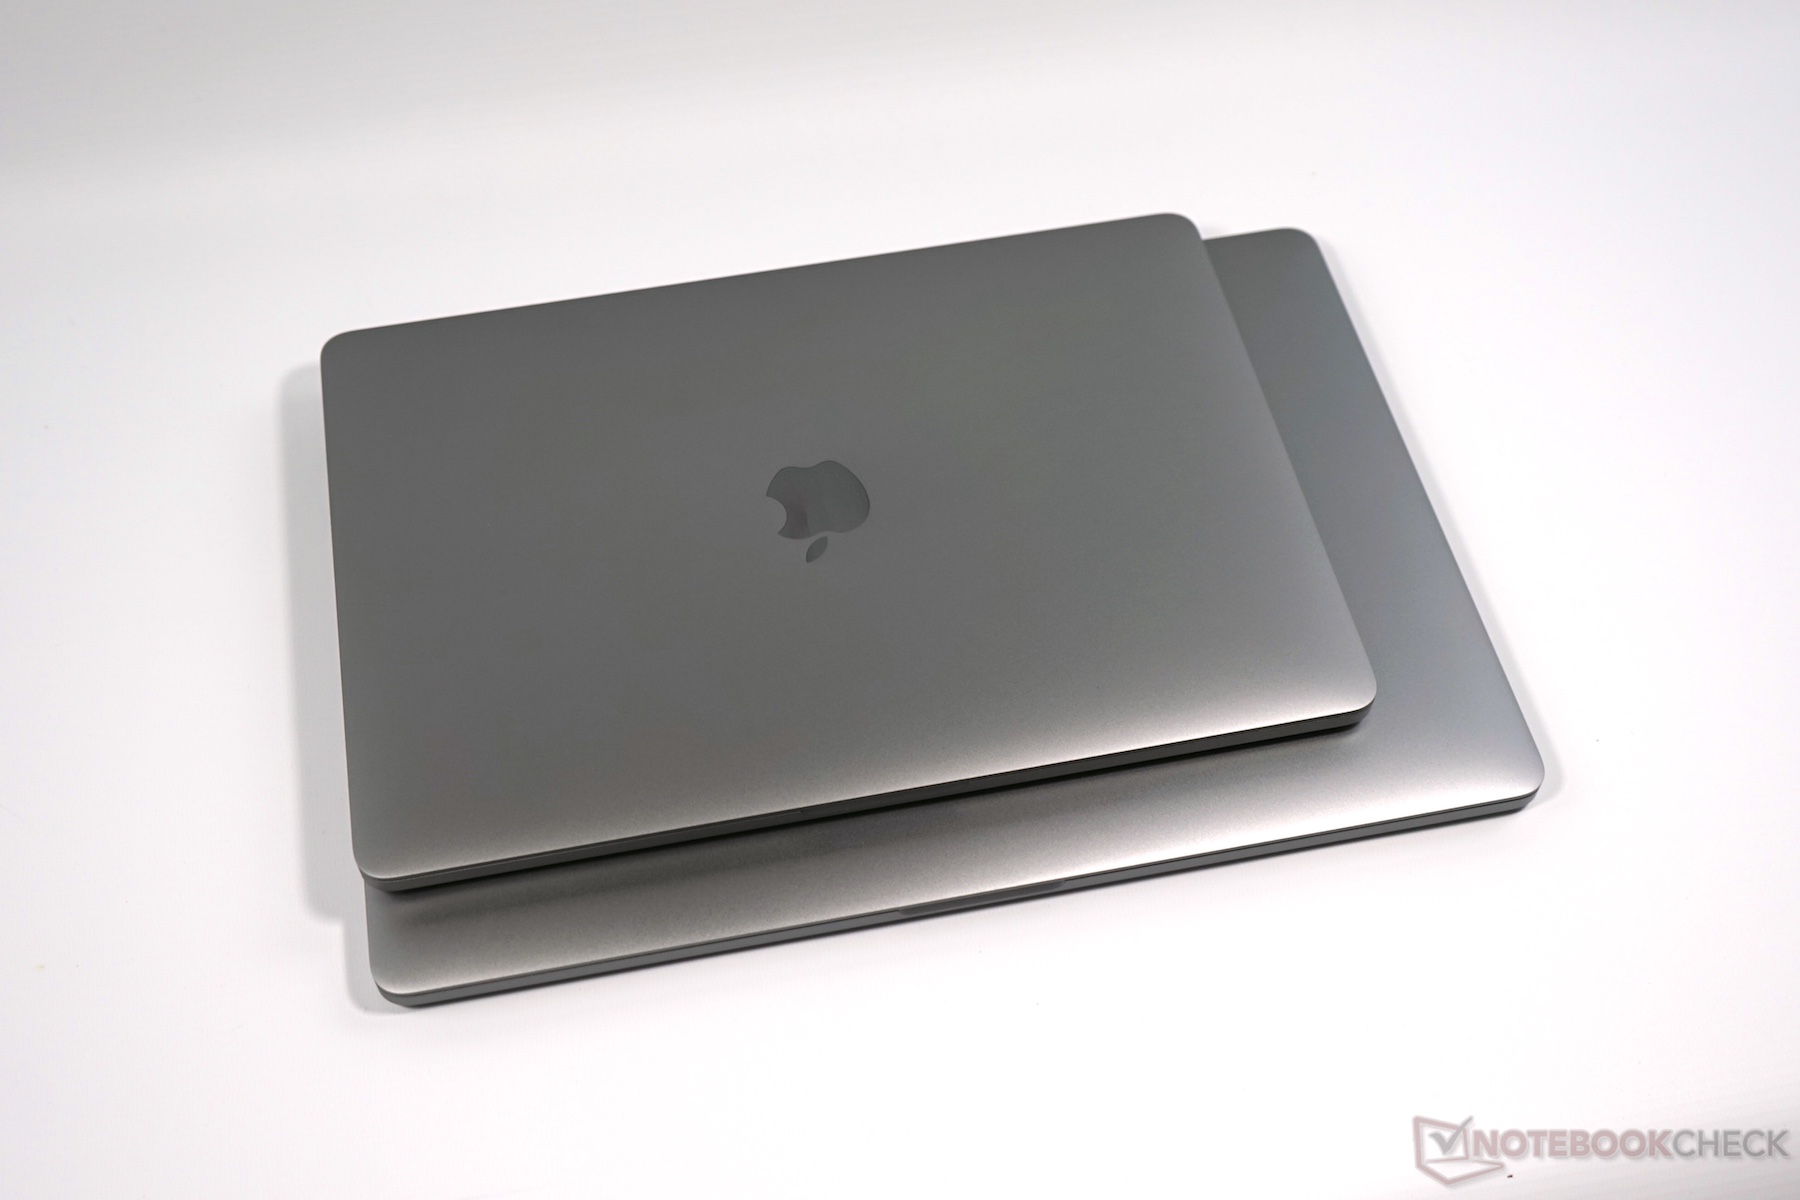
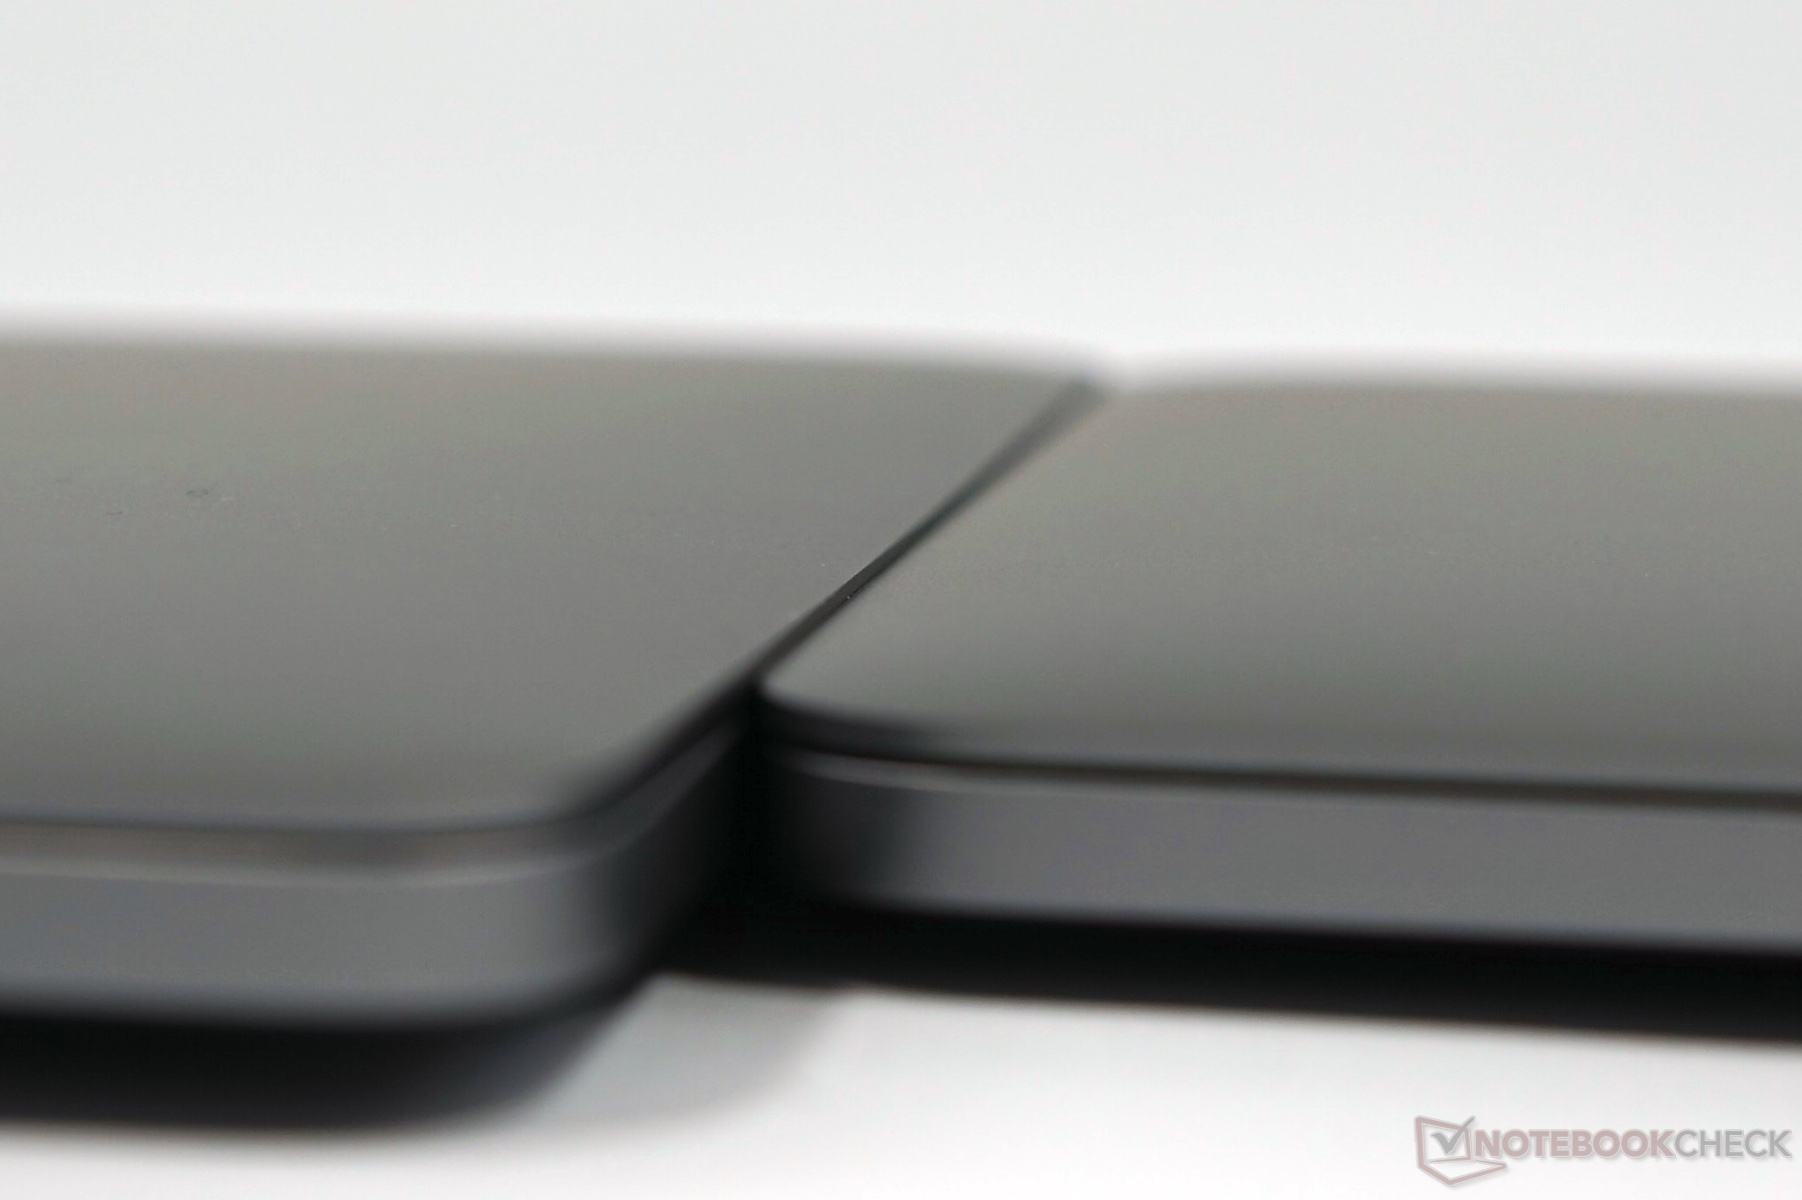
Due to the internal differences (different cooling system with second fan, smaller battery etc.), we can measure a weight difference of 22 grams between the two models of the new MacBook Pro 13, but it does no matter at all in practice.
Compared to the other models from Apple's lineup, the new Apple MacBook Pro 2016 has much more compact dimensions, both compared to the direct predecessor as well as the MacBook Air 13. At up to 17 millimeters at its thickest spot, the latter is even 2 millimeters thicker than the new Pro. The weight of the Air 13 and the new MacBook Pro is roughly on par, and the previous MacBook Pro 13 is about 200 grams heavier. The new 15-inch model tips the scale at about 1800 grams and therefore 400 grams more than its 13-inch counterpart, but it is just one millimeter thicker.
Connectivity
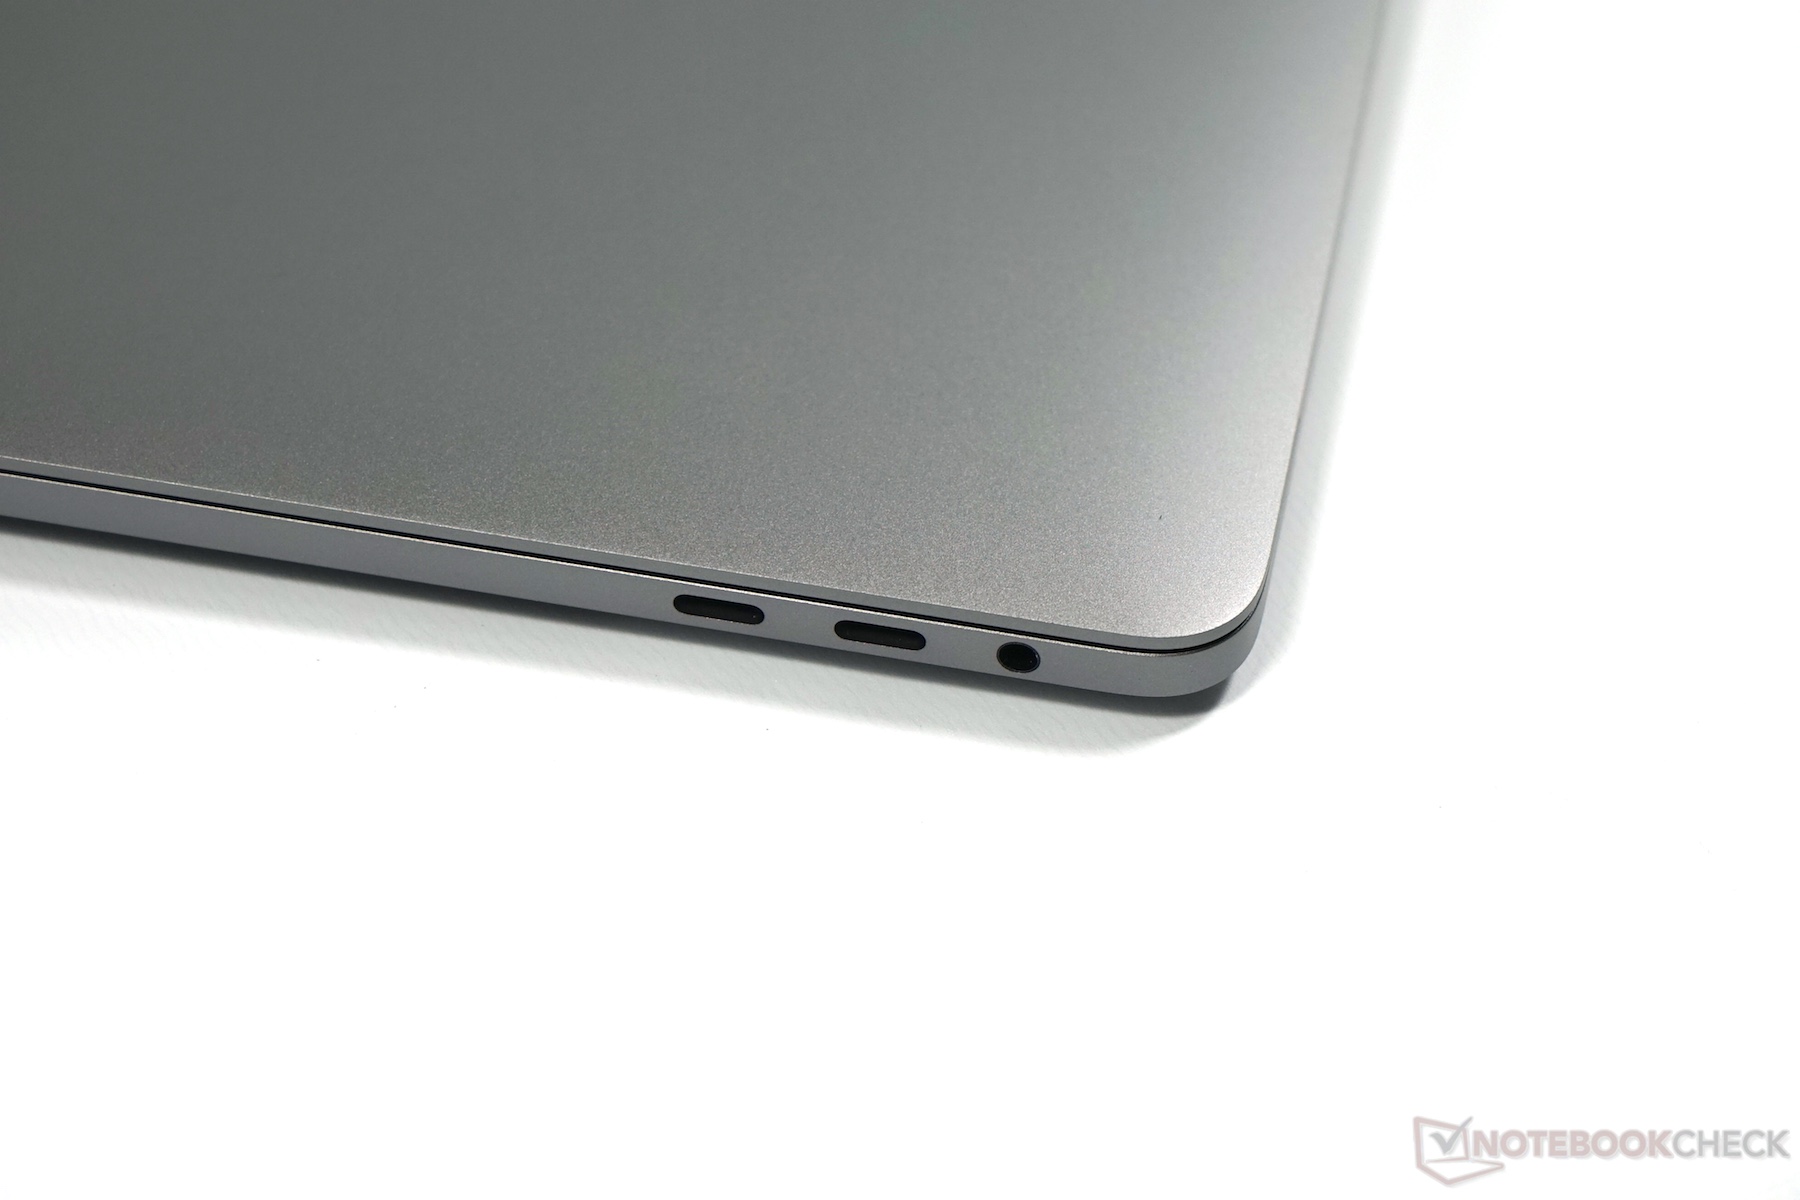
The port selection of the new MacBook Pro is probably one of the most discussed and criticized changes. Apple equips the new MBP 13 Touch Bar with a total of four Thunderbolt 3 ports. They are extremely versatile, but you will most likely require (expensive) adapters in the foreseeable future. Contrary to the bigger MacBook Pro 15, there seems to be a difference in respect to the Thunderbolt ports, because Apple says that only the two ports on the left side support the full Thunderbolt 3 bandwidth. The two ports on the right side on the other hand only support half of that. Last but not least, you also get a classic 3.5 mm headset port on the right side.
Although the ports are obviously very versatile, we would have preferred a less radical approach, because even Apple's own hardware (e. g. iPhone or iPad) cannot be attached without an adapter. Here are some examples for adapters from Apple: USB-C to USB-A adapter: $19, Thunderbolt 3 to Thunderbolt 2 (mDP): $49, USB-C to Gigabit Ethernet: $34.95.
Communication
The transfer rates of the MBP 13 Touch Bar are excellent in our standardized WLAN test (router Linksys EA8500). At around 950 Mbps (send/receive), the test model shares the top spot in our comparison with the MacBook Pro 15 (Late 2016). The model without Touch Bar falls behind by about 30 %; the Windows competition is even further behind. There is no reason for criticism at an increased distance, either. The performance in the 2.4 GHz network was even better compared to the MacBook Pro 13 Late 2013, which was at the top so far.
However, the 13-inch model with the Touch Bar is also affected by the 2.4 GHz WLAN problems when a USB-C device is attached. There can be occasional signal problems both with macOS and Windows. Besides a software issue, this could also be a hardware problem if the USB ports or the WLAN antennas, respectively, are not shielded properly (more information is available here).
| Networking | |
| iperf3 transmit AX12 | |
| Apple MacBook Pro 15 2016 (2.6 GHz, 450) (Klaus I211) | |
| Apple MacBook Pro 13 2016 (2.9 GHz) | |
| Apple MacBook Pro 13 2016 (Klaus I211) | |
| Dell XPS 13 9360 QHD+ i7 | |
| Lenovo ThinkPad T460s-20FA003GGE | |
| iperf3 receive AX12 | |
| Apple MacBook Pro 13 2016 (2.9 GHz) | |
| Apple MacBook Pro 15 2016 (2.6 GHz, 450) (Klaus I211) | |
| Apple MacBook Pro 13 2016 (Klaus I211) | |
| Dell XPS 13 9360 QHD+ i7 | |
| Lenovo ThinkPad T460s-20FA003GGE | |
Maintenance
We already mentioned that the internal design of the two new MacBook Pro 13 models differs. The MacBook Pro 13 Touch Bar is actually basically a smaller version of the MacBook Pro 15. We can notice differences in terms of cooling solution, position of the speakers, the batteries etc.
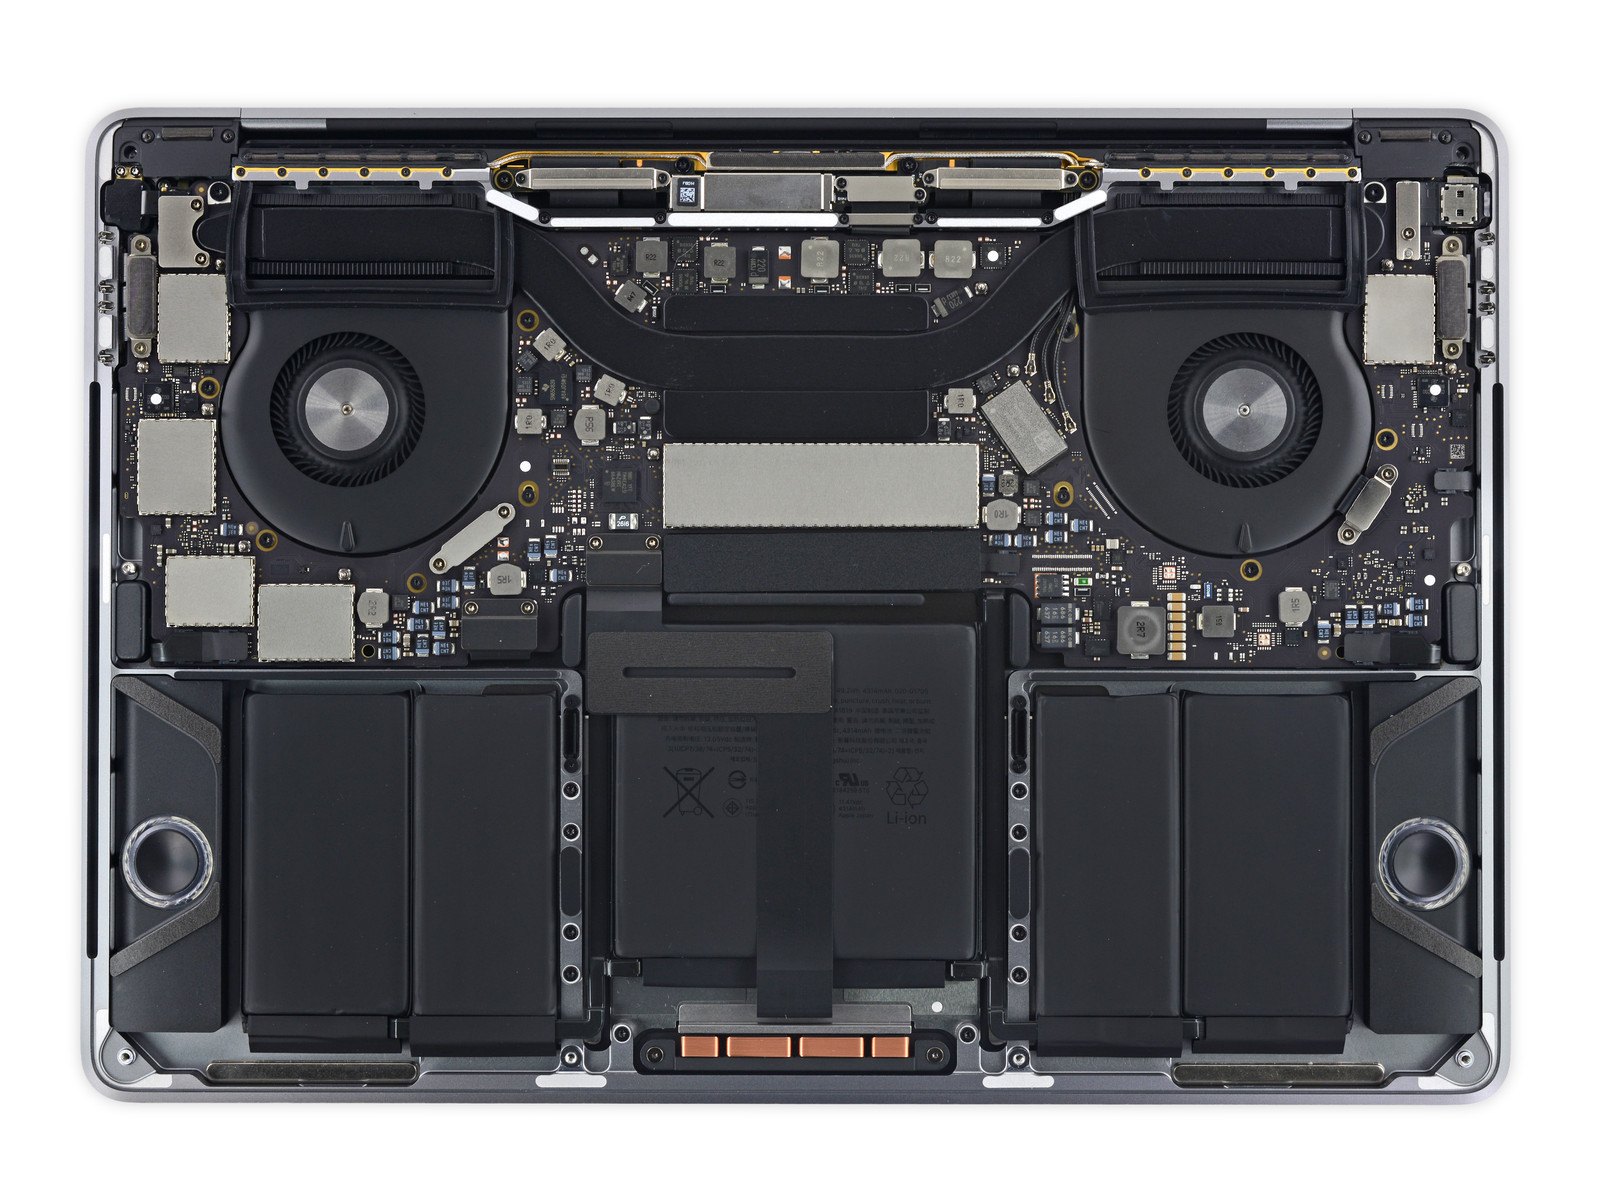
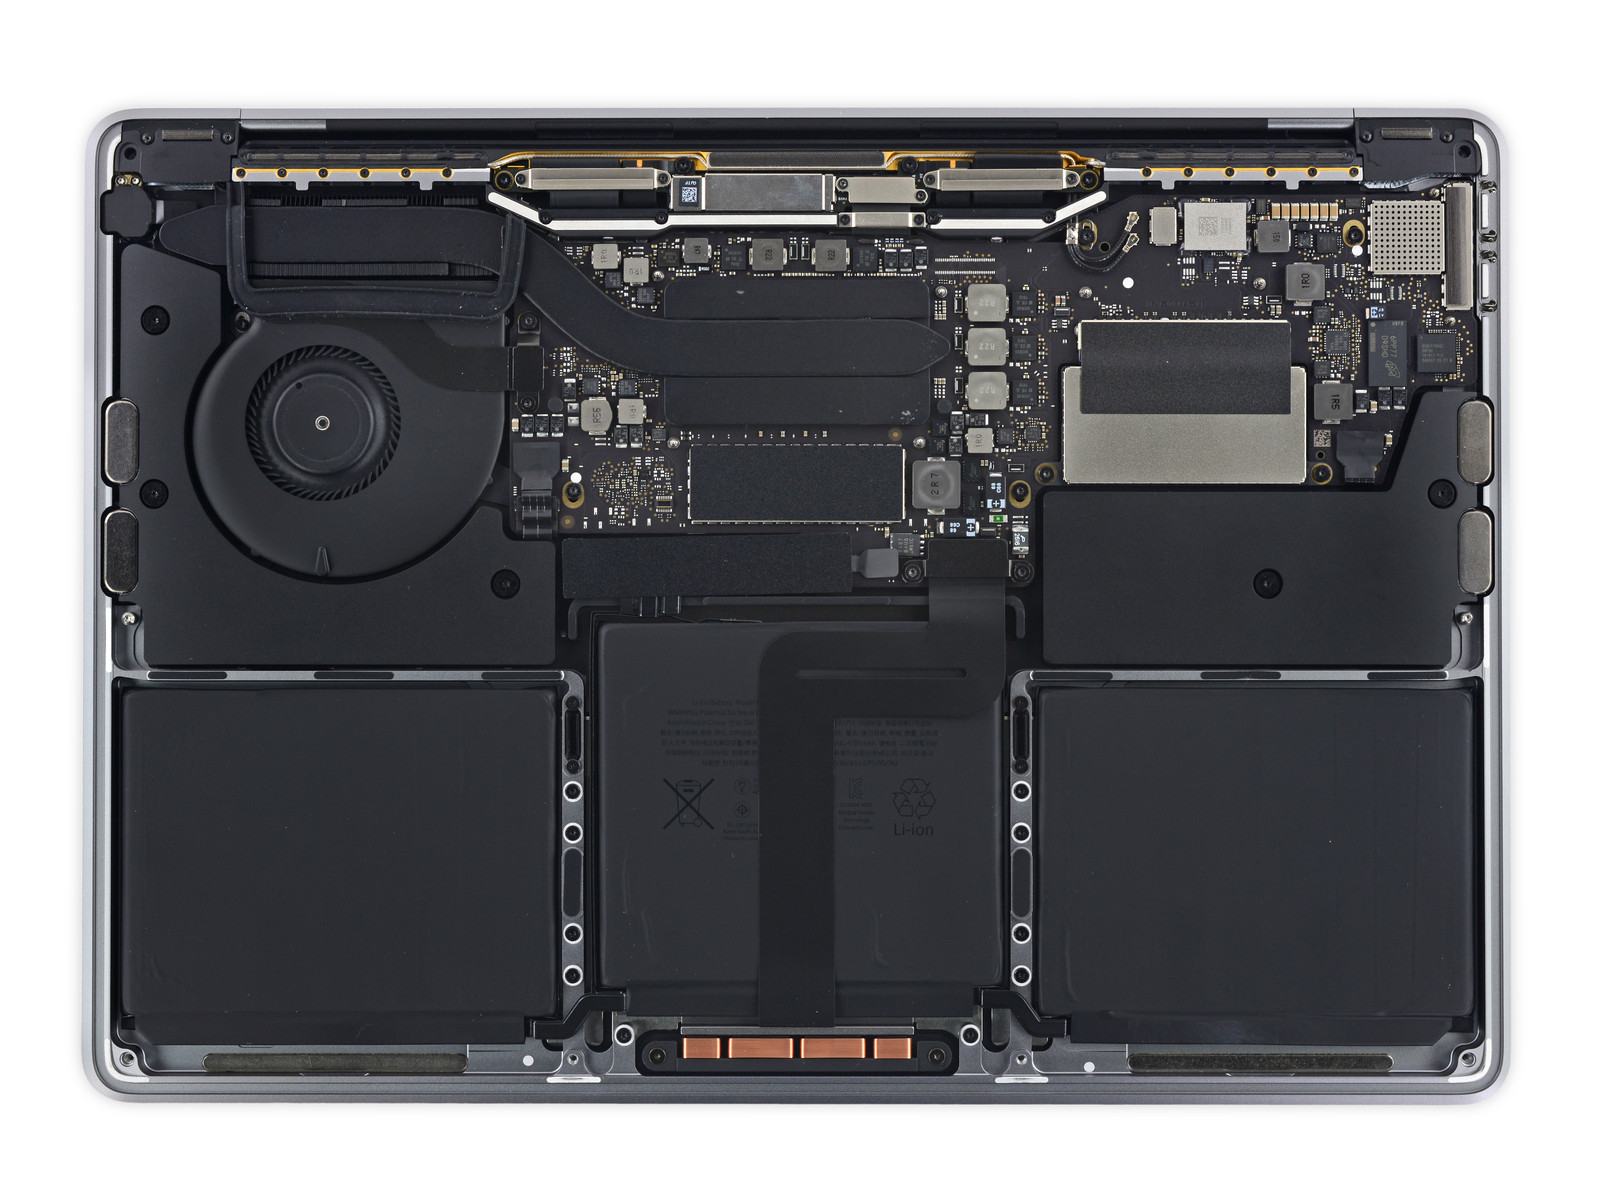
Because of the additional display and the soldered components – the SSD is soldered here as well – the maintainability/reparability is even worse than before. Removing the bottom panel requires a special Pentalobe screwdriver, but you can pretty much only clean the fans. An overview about all the components is provided in the teardown by our colleagues from iFixit, which is also the source of the following picture.
Warranty
Apple grants a one-year warranty for the MacBook Pro 13. It is possible to extend the warranty period to three years (including phone support) for $249.
Input Devices
Keyboard
The MacBook Pro 13 is also shipped with the new Butterfly keyboard. Similar to the 12-inch MacBook, the shallow travel of the individual keys will be a shock when you use it for the first time. The very even stroke does leave a positive impression though. This second generation of Apple's own Butterfly mechanism was noticeably improved compared to the 12-inch MacBook, but you still have to get used to the typing experience. After this has happened, the switch back to the old MacBook pro is actually pretty difficult, because we now found it to be rather spongy in comparison. We did not notice any differences in typing speed compared to the previous MacBook Pro models, and quick inputs without typos were no problem even in the first session. The typing noise will depend heavily on your usage scenario. It is slightly louder compared to the old model with ten fingers, but we do not consider it to be disturbing even in quiet environments. If you type forcefully with just two fingers though, the noise will be much louder. You can see a comparison in the video below this section.
Because of the shallow travel, the 16-level keyboard illumination of the individual keys is well implemented into the case and it will not dazzle.
Touchpad
The glass trackpad of the new MacBook Pro models is much bigger compared to the previous models, but the technology is otherwise identical. It is still the reference for a touchpad, even though Windows devices like the Surface 4 Pro start to close the gap. Thanks to the taptic engine, tactile clicks are identical all over the surface and it is also possible to trigger a firmer "Force Press". Both systems work so well that you do not want to go back to a conventional touchpad with rocker switches. The software support of the trackpad (in macOS) is also still unrivaled. Gestures, Drag & Drop (via second finger in the corner) and the response times were excellent in our tests. The palm rejection worked well, but it is also necessary due to the larger surface, because you will often put a finger or two on the touchpad. Accidental cursor movements were very rare when we used the keyboard.
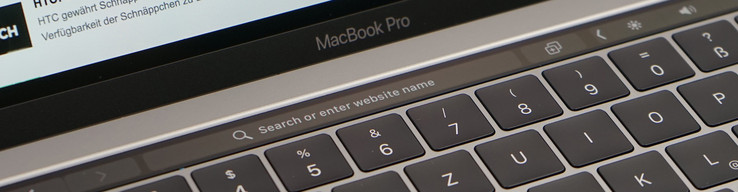
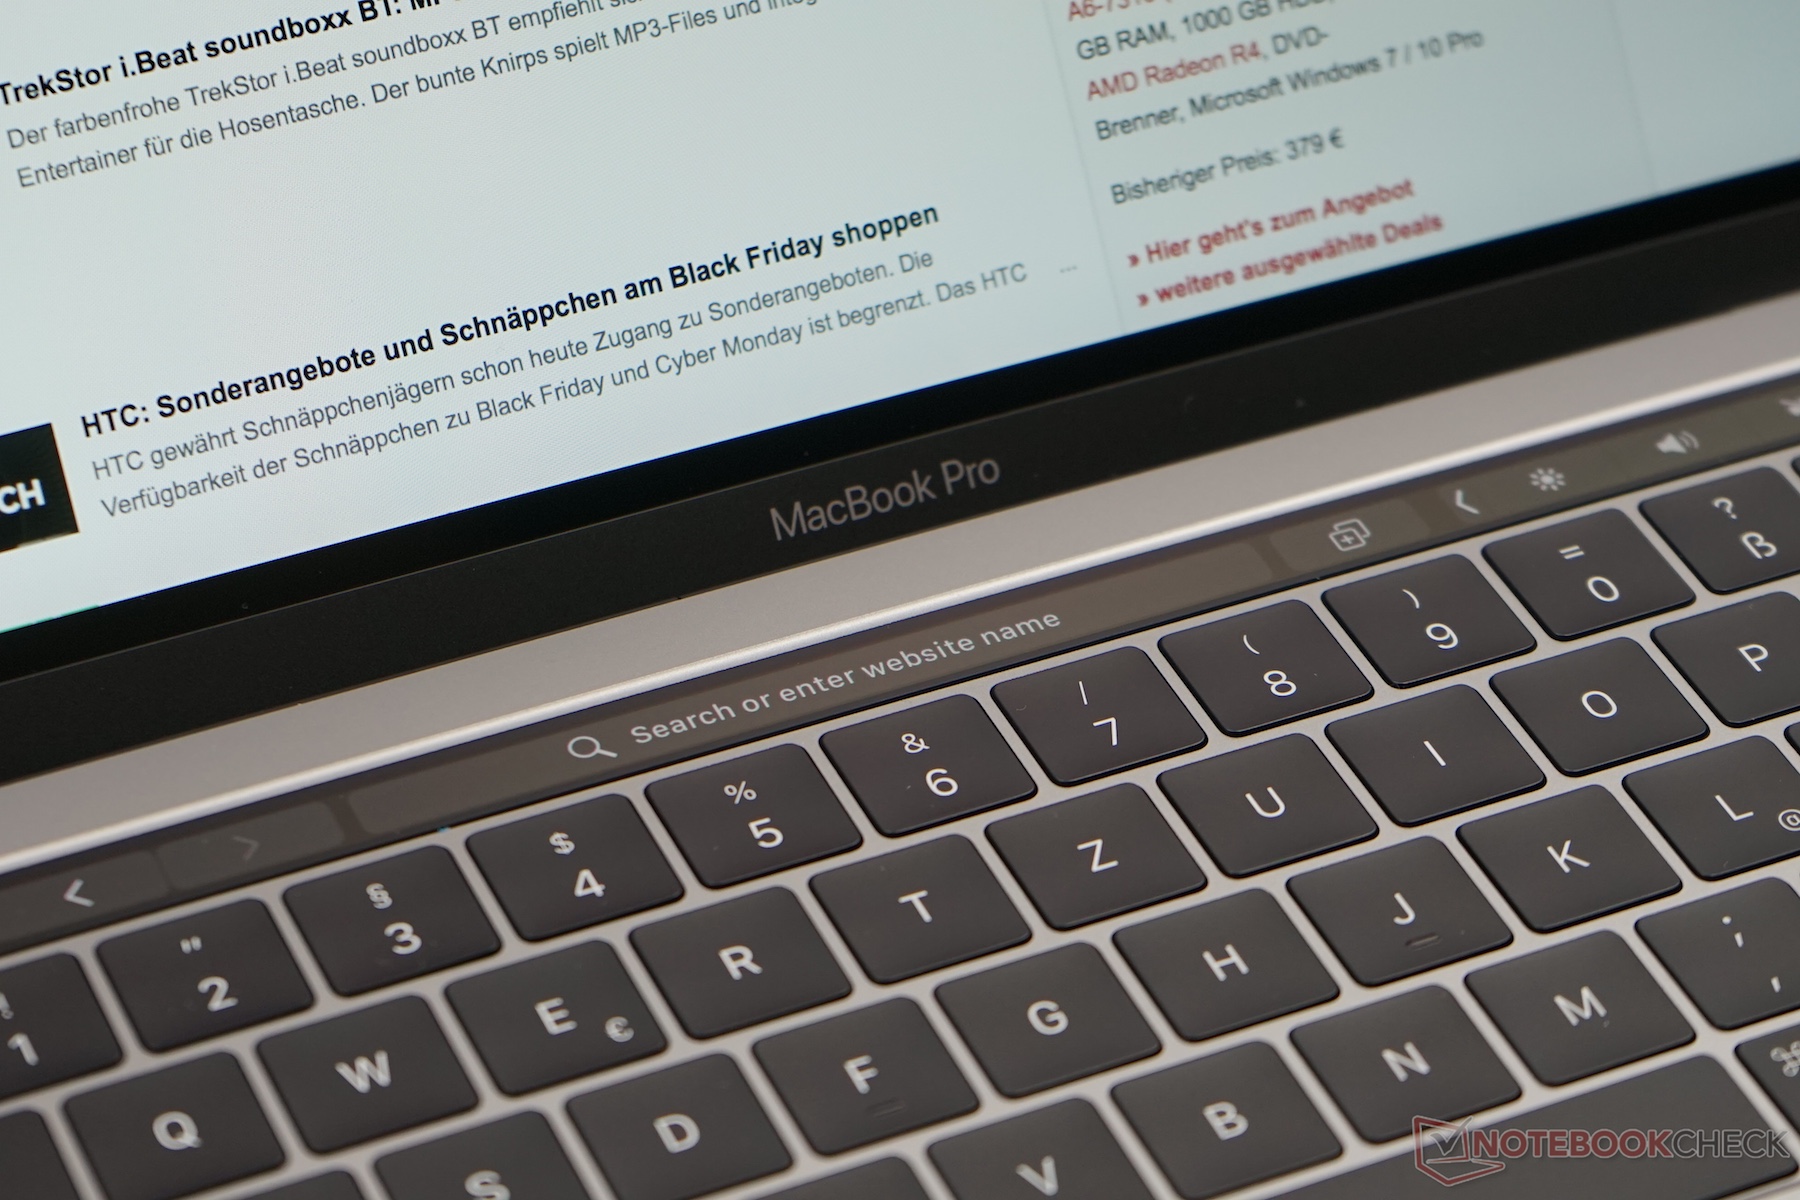
Touch Bar
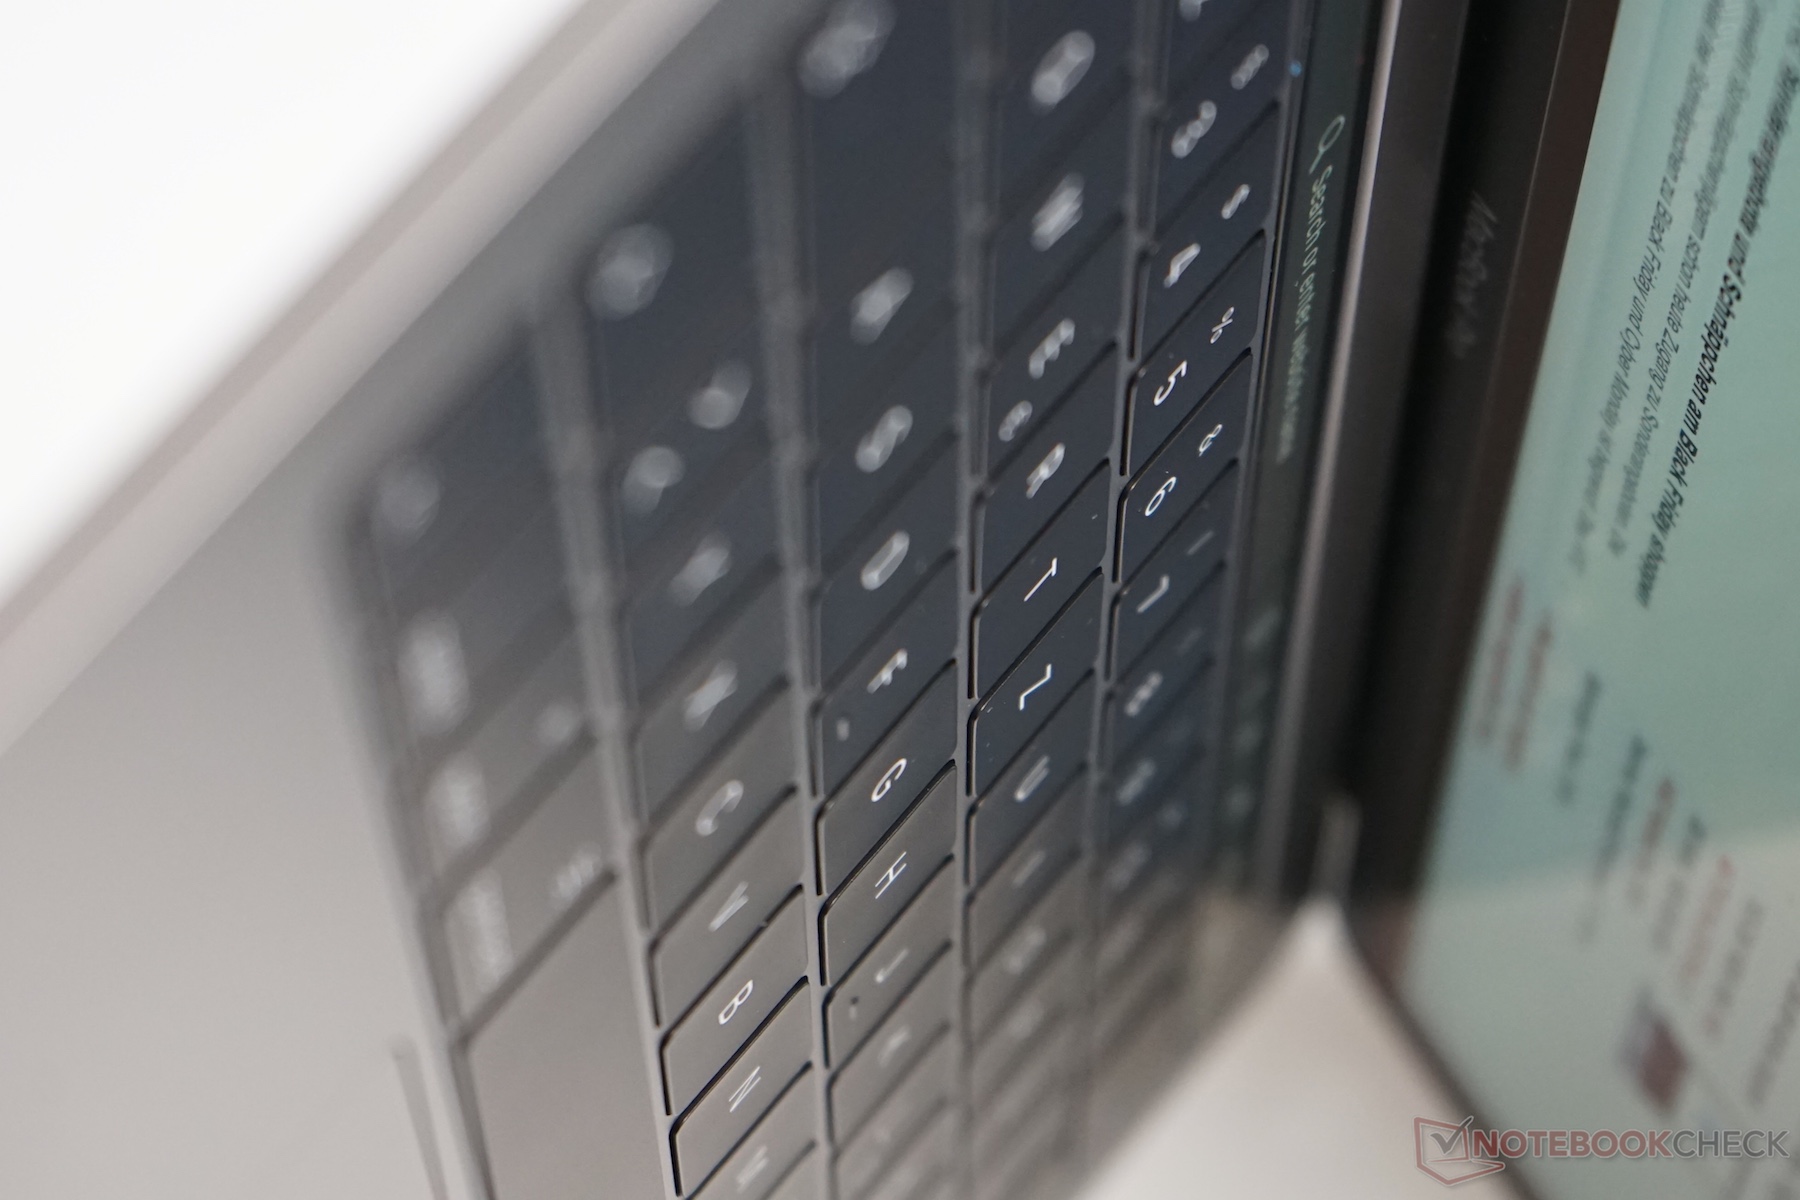
Similar to the bigger 15-inch model, our test unit is equipped with the Touch Bar above the keyboard, which replaces the function keys. Besides familiar special and function keys, it can also show customized options and commands based on the application you use. However, this feature has to be supported by the software and the range is between useful and gimmicky right now. A handy function is the indication of the runtime when you watch videos, for example.
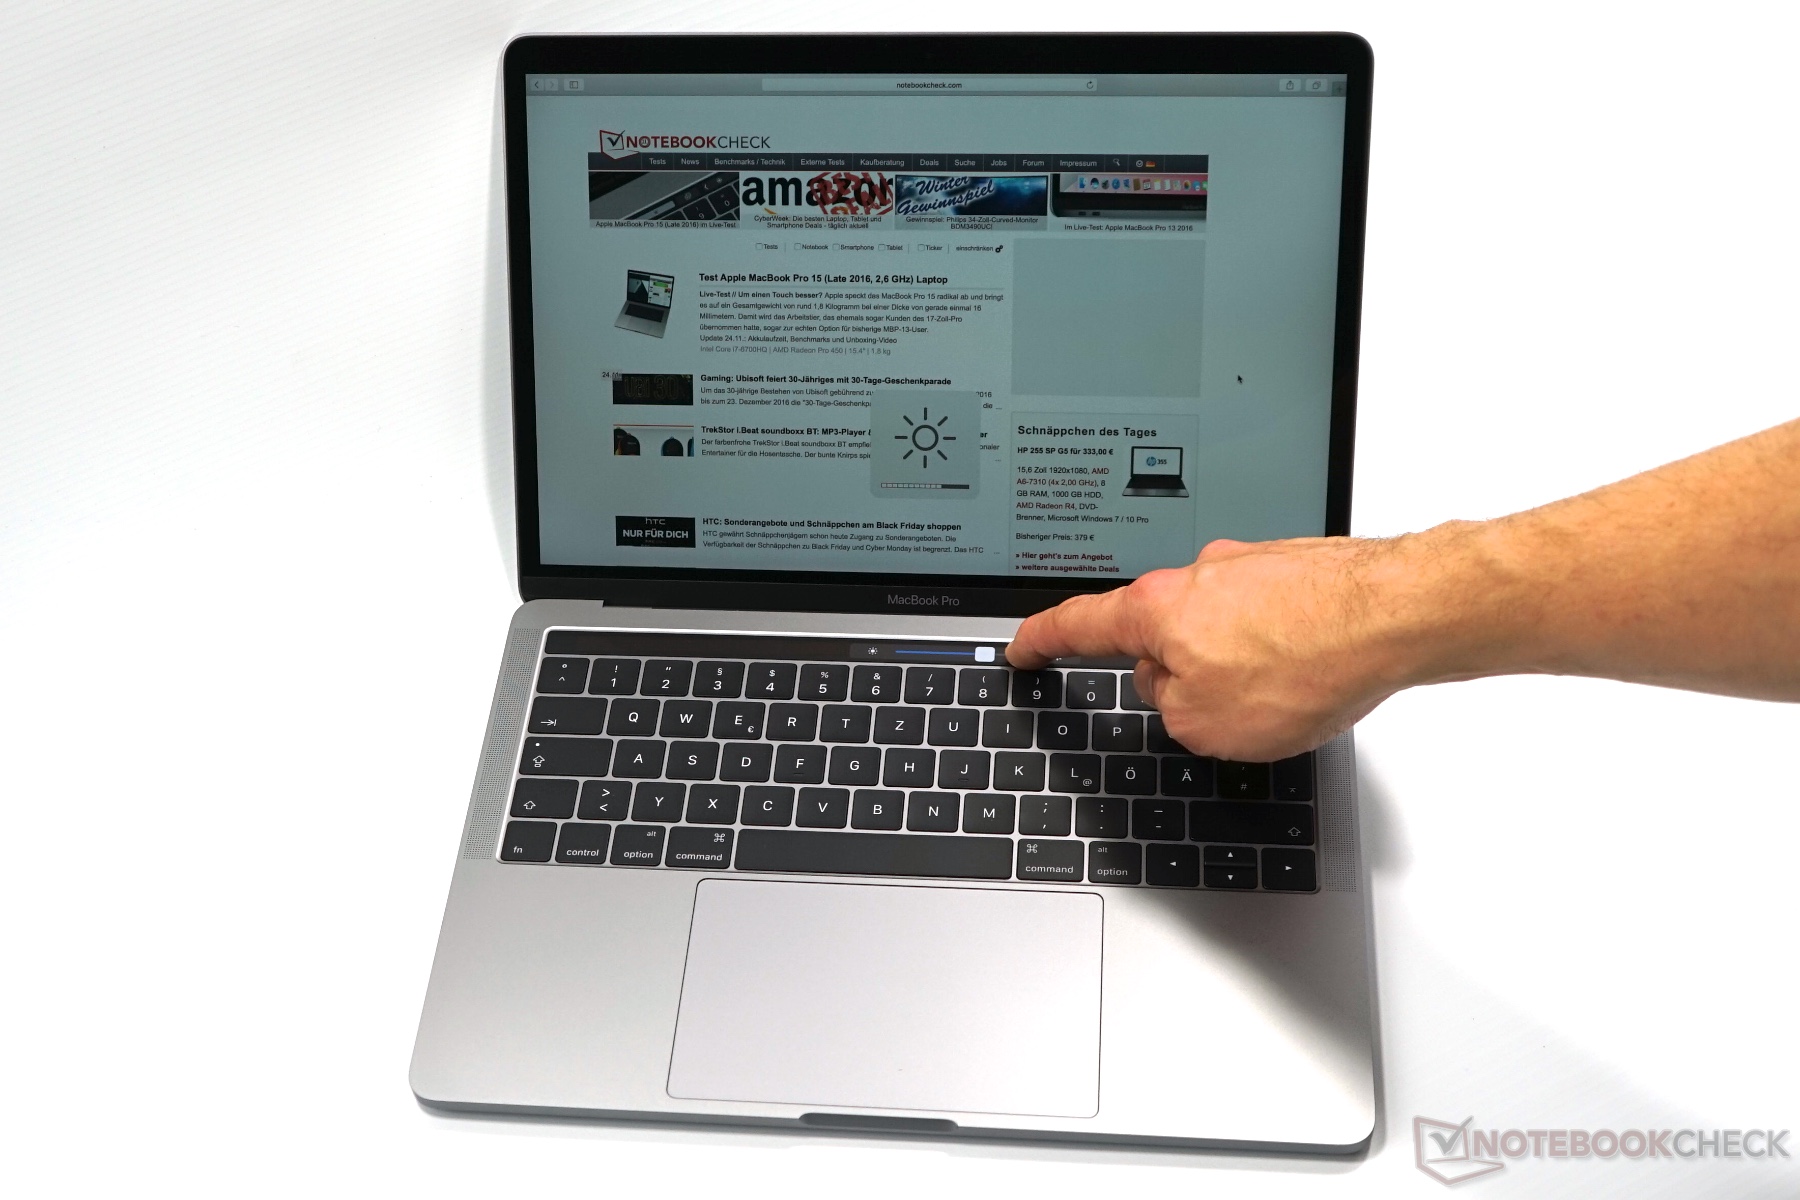
The hardware itself was well implemented. The surface does feature convenient gliding capabilities and the execution was always smooth and sufficiently quick during our tests. Adjusting the luminance was no problem, either. The use of PWM to adjust the luminance could be an issue for some users though. We can also notice slight color fringes around the edges of letters.
There are drawbacks with the new Touch Bar as well. Especially the "blind" adjustment of the volume and the luminance is not possible anymore. The Touch Bar is also deactivated when you do not use it for a while to save power, so it requires 2 touches to trigger a function (like the Esc key).
All in all, the Touch Bar is currently more of a gimmick in our opinion right now. However, this might change with better software support. We do miss a tactile feedback – similar to the trackpad via taptic engine – in general.
Touch ID Sensor
The power button on the right side of the Touch Bar is equipped with the Touch ID sensor we know from the iPhone. It recognizes the finger print quickly and reliably for authentication. It worked really well in practice, only the tactile feedback of the button is not perfect.
Display
As expected, the 13.3-inch IPS displays of the two MacBook Pro models are very similar. We can find another Panel ID (APPA033 vs. APPA034), but our measurement results do not differ much. We can also see the big difference compared to the previous model: The resolution is still 2560x1600 pixels (227 PPI), but the new models are much brighter at around 550 nits and also beat the Windows competition pretty clearly. Our model without Touch Bar was slightly brighter, but the differences can be explained with the usual variation.
You will be happy about the low minimum luminance at just 6.1 nits if you like to work in the dark. The downside of the high luminance is the high black value (0.56 cd/m²) though, so the contrast ratio (~1000:1) is still on the (good) level of the previous version. Some rivals like the Dell XPS 13 (1489:1), however, manage better results. Despite the enormous luminance, which is also available on battery power, we can measure a very good brightness distribution of 90%.
| |||||||||||||||||||||||||
Brightness Distribution: 90 %
Center on Battery: 569 cd/m²
Contrast: 1016:1 (Black: 0.56 cd/m²)
ΔE ColorChecker Calman: 1.4 | ∀{0.5-29.43 Ø4.71}
ΔE Greyscale Calman: 1.8 | ∀{0.09-98 Ø4.96}
99.3% sRGB (Argyll 1.6.3 3D)
78.4% AdobeRGB 1998 (Argyll 1.6.3 3D)
87.6% AdobeRGB 1998 (Argyll 3D)
99.9% sRGB (Argyll 3D)
99.2% Display P3 (Argyll 3D)
Gamma: 2.16
CCT: 6877 K
| Apple MacBook Pro 13 2016 (2.9 GHz) APPA033, , 2560x1600, 13.3" | Apple MacBook Pro 13 2016 APPA034, , 2560x1600, 13.3" | Apple MacBook Pro Retina 13 inch 2015-03 APPA02A, , 2560x1600, 13.3" | Dell XPS 13 9360 QHD+ i7 Sharp SHP144A, , 3200x1800, 13.3" | Lenovo ThinkPad X1 Carbon 20FB003RGE VVX14T058J00, , 2560x1440, 14" | |
|---|---|---|---|---|---|
| Display | -1% | -20% | -25% | -20% | |
| Display P3 Coverage (%) | 99.2 | 97.1 -2% | 65.9 -34% | 62.8 -37% | 66.7 -33% |
| sRGB Coverage (%) | 99.9 | 99.8 0% | 97 -3% | 89.4 -11% | 94.7 -5% |
| AdobeRGB 1998 Coverage (%) | 87.6 | 86.7 -1% | 67.4 -23% | 64.6 -26% | 68.4 -22% |
| Response Times | 2% | 27% | 31% | ||
| Response Time Grey 50% / Grey 80% * (ms) | 47.2 ? | 47.2 ? -0% | 43.6 ? 8% | 44 ? 7% | |
| Response Time Black / White * (ms) | 53 ? | 51.6 ? 3% | 29.2 ? 45% | 24 ? 55% | |
| PWM Frequency (Hz) | 220 ? | ||||
| Screen | -2% | -12% | -48% | -39% | |
| Brightness middle (cd/m²) | 569 | 600 5% | 361 -37% | 396.2 -30% | 272 -52% |
| Brightness (cd/m²) | 542 | 564 4% | 342 -37% | 357 -34% | 268 -51% |
| Brightness Distribution (%) | 90 | 89 -1% | 81 -10% | 84 -7% | 95 6% |
| Black Level * (cd/m²) | 0.56 | 0.57 -2% | 0.361 36% | 0.266 52% | 0.32 43% |
| Contrast (:1) | 1016 | 1053 4% | 1000 -2% | 1489 47% | 850 -16% |
| Colorchecker dE 2000 * | 1.4 | 1.5 -7% | 1.82 -30% | 3.9 -179% | 2.61 -86% |
| Colorchecker dE 2000 max. * | 2.9 | 2.9 -0% | 3.26 -12% | 7.58 -161% | 6.43 -122% |
| Greyscale dE 2000 * | 1.8 | 2 -11% | 1.8 -0% | 4.16 -131% | 3.31 -84% |
| Gamma | 2.16 102% | 2.27 97% | 2.49 88% | 2.31 95% | 2.35 94% |
| CCT | 6877 95% | 6855 95% | 6417 101% | 6514 100% | 6360 102% |
| Color Space (Percent of AdobeRGB 1998) (%) | 78.4 | 77 -2% | 61.9 -21% | 57.5 -27% | 63 -20% |
| Color Space (Percent of sRGB) (%) | 99.3 | 92 -7% | 96.9 -2% | 88.7 -11% | 95 -4% |
| Total Average (Program / Settings) | -0% /
-1% | -16% /
-13% | -15% /
-33% | -9% /
-26% |
* ... smaller is better
Similar to the version without Touch Bar, we can measure very accurate colors out-of-the-box. The average DeltaE-2000 deviations compared to the P3 reference color space are just 1.4 for the colors and 1.8 for the grayscale, respectively. There are no outliers above the important mark of 3, so a display calibration is not required. We can determine slightly wider color gamut compared to the MacBook Pro 13 with Function Keys. AdobeRGB is covered by 78 %; sRGB almost completely (99.3 %).


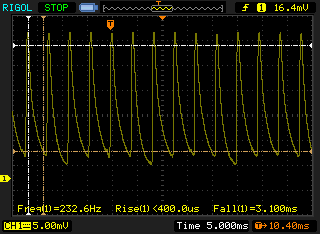
The IPS display is not particularly fast in our tests, but we like the lack of pulse-width modulation. We cannot even measure any fluctuations of the luminance at the lowest setting. The background illumination of the keyboard does not seem to use PWM, either. Only the Touch Bar should be (as per usual for OLED) dimmed by PWM; our oscilloscope shows a clear signal.
Display Response Times
| ↔ Response Time Black to White | ||
|---|---|---|
| 53 ms ... rise ↗ and fall ↘ combined | ↗ 10 ms rise | 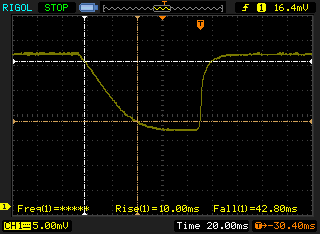 |
| ↘ 43 ms fall | ||
| The screen shows slow response rates in our tests and will be unsatisfactory for gamers. In comparison, all tested devices range from 0.1 (minimum) to 240 (maximum) ms. » 99 % of all devices are better. This means that the measured response time is worse than the average of all tested devices (19.8 ms). | ||
| ↔ Response Time 50% Grey to 80% Grey | ||
| 47.2 ms ... rise ↗ and fall ↘ combined | ↗ 19.6 ms rise | 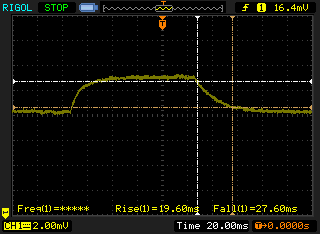 |
| ↘ 27.6 ms fall | ||
| The screen shows slow response rates in our tests and will be unsatisfactory for gamers. In comparison, all tested devices range from 0.165 (minimum) to 636 (maximum) ms. » 82 % of all devices are better. This means that the measured response time is worse than the average of all tested devices (30.9 ms). | ||
Screen Flickering / PWM (Pulse-Width Modulation)
| Screen flickering / PWM not detected | 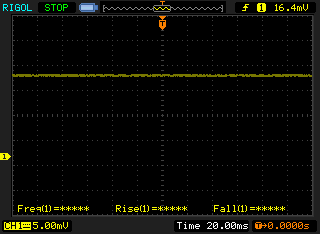 | ||
In comparison: 52 % of all tested devices do not use PWM to dim the display. If PWM was detected, an average of 7741 (minimum: 5 - maximum: 343500) Hz was measured. | |||
Thanks to the extreme luminance, the MacBook Pro 13 also works pretty well outdoors. There are obviously limitations die to the glossy panel surface, so you should avoid reflections from direct light sources. But the wide viewing angles of the IPS display usually ensure that you will find a suitable spot.
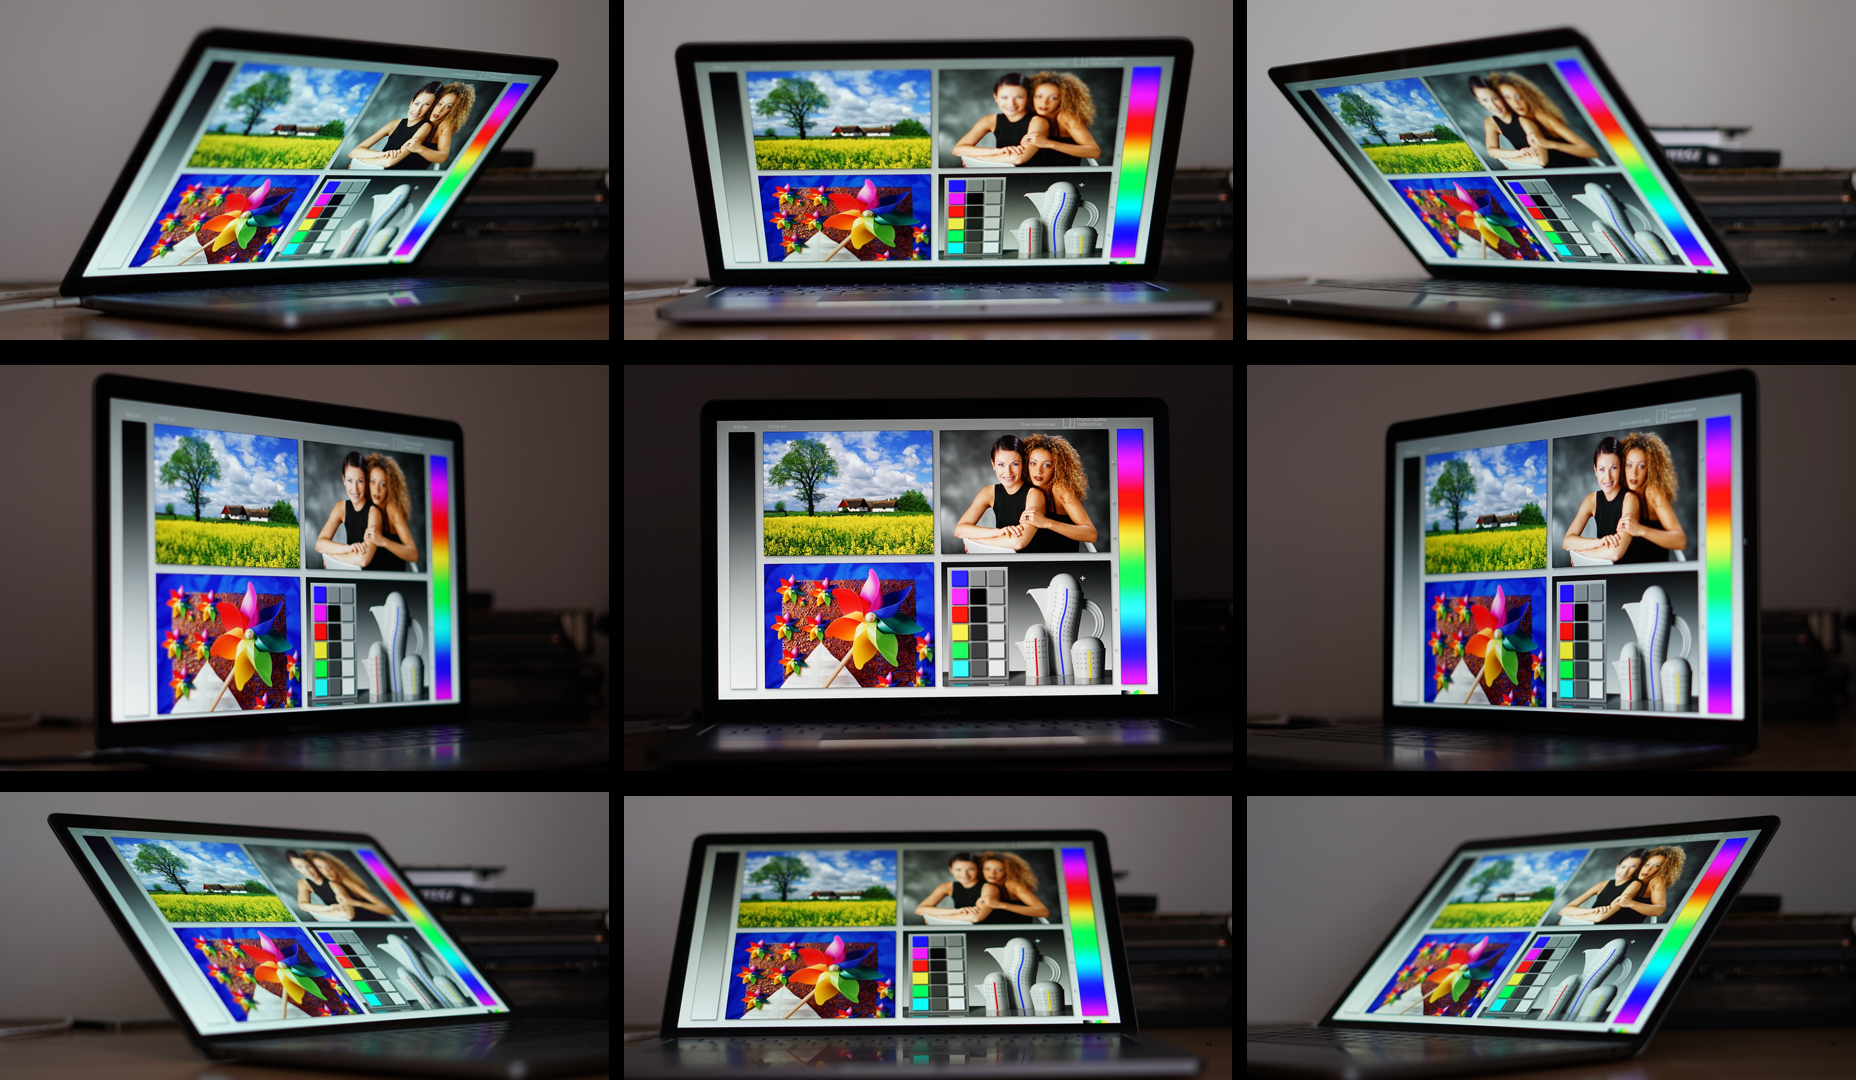
Note: The following picture was taken from the MacBook Pro 13 without Touch Bar, but is also representative for our test model.
Performance
The two 13-inch models of the MacBook Pro are equipped with different components, and the Touch Bar model gets faster components in general. This is supported by the processor clock (2.0 vs. 2.9 GHz for the entry-level models), the graphics card (Intel Iris Graphics 540 vs. 550) and the speed of the memory (LPDDR3-1866 vs. LPDDR3-2133).
Quad-core processors or dedicated graphics adapters are not available for the MacBook Pro 13 though; they are reserved for the bigger MacBook Pro 15. The memory configurations do not differ between the models and you can get up to 16 GB RAM and up to 1 TB SSD storage, but the updates are expensive. The fully-equipped model with Core i7 processor, 16 GB RAM and 1 TB SSD retails for $2899.

Processor
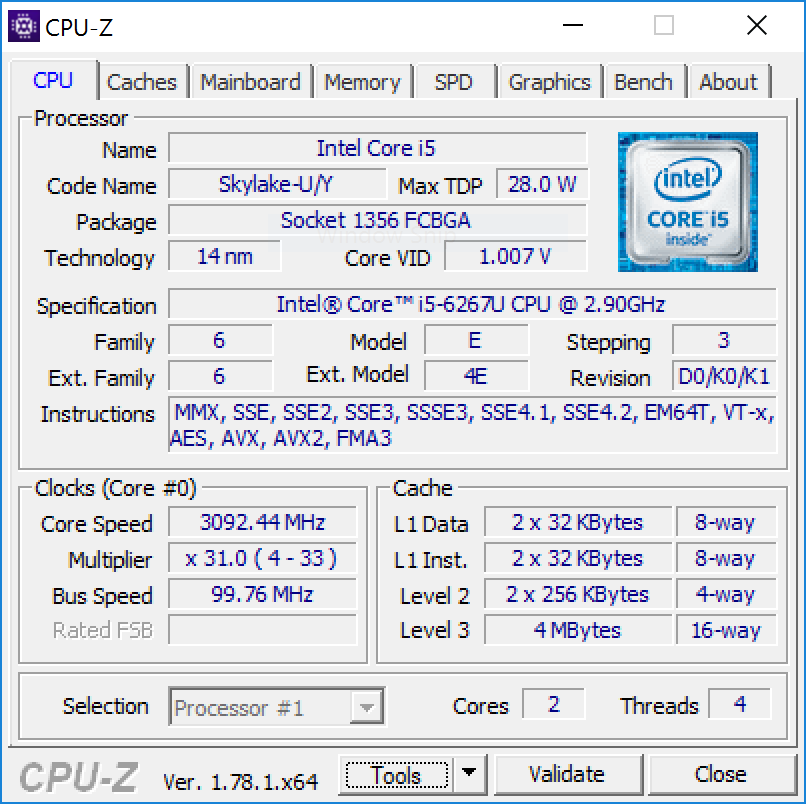
The dual-core processor of our test model carries the designation Core i5-6267U. Contrary to the popular ULV processors with a TDP of 15 Watts, this processor can consume up to 28 Watts, so it has more headroom for the clocks as well as the integrated GPU. The processor is still based on the Skylake architecture, which was introduced in September 2015. Intel's new Kaby Lake chips are not yet available in 28-Watt configurations, so we will probably have to wait for the next refresh to see them. The high base clock of 2.9 GHz (Turbo up to 3.3 GHz) is noticeable, so the chip should have an advantage compared to the standard ULV models, especially in multithread scenarios.
The processor leaves a very good impression in our initial Cinebench R15 tests in macOS. After 20 runs (loop), we can see scores between 335-339 points (338 on average), and the maximum score is also reached in the 10th run. Throttling is therefore not a problem. The processor is roughly 10% ahead of the Core i5 in the MacBook Pro 13 without Touch Bar.
System Performance
We evaluate the system performance with PCMark 8 running on Bootcamp Windows. Thanks to the lower display resolution, the Touch Bar model can actually beat the MacBook Pro 15 in the Home test and is at the top of the ranking. The score in the Work test is also very good and all systems are pretty close. No limitations here.
| PCMark 8 Home Score Accelerated v2 | 3738 points | |
| PCMark 8 Work Score Accelerated v2 | 4218 points | |
Help | ||
Storage Devices
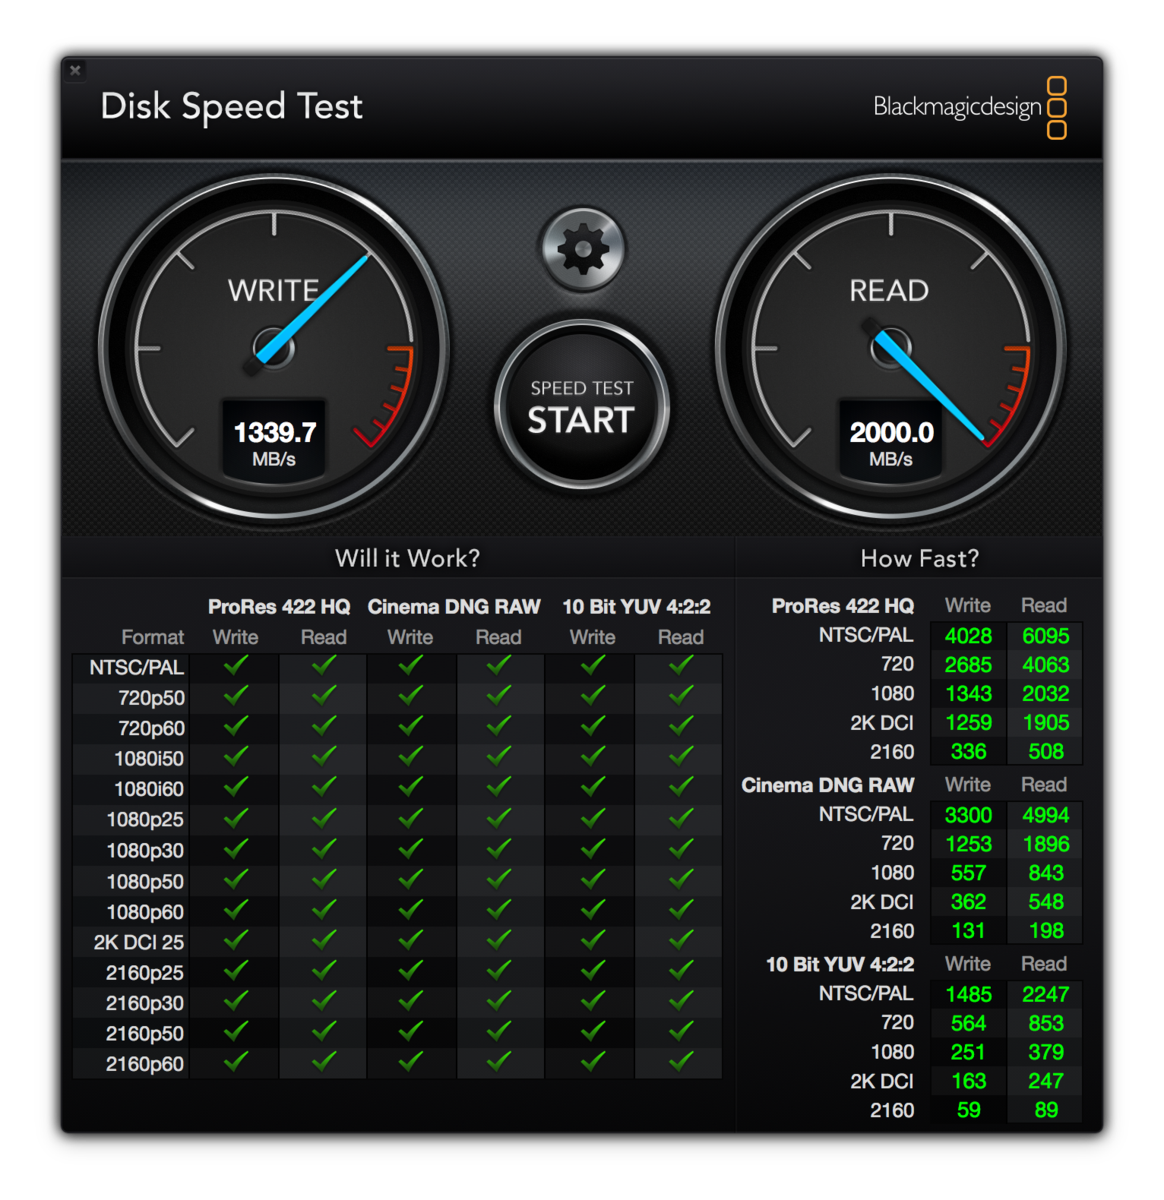
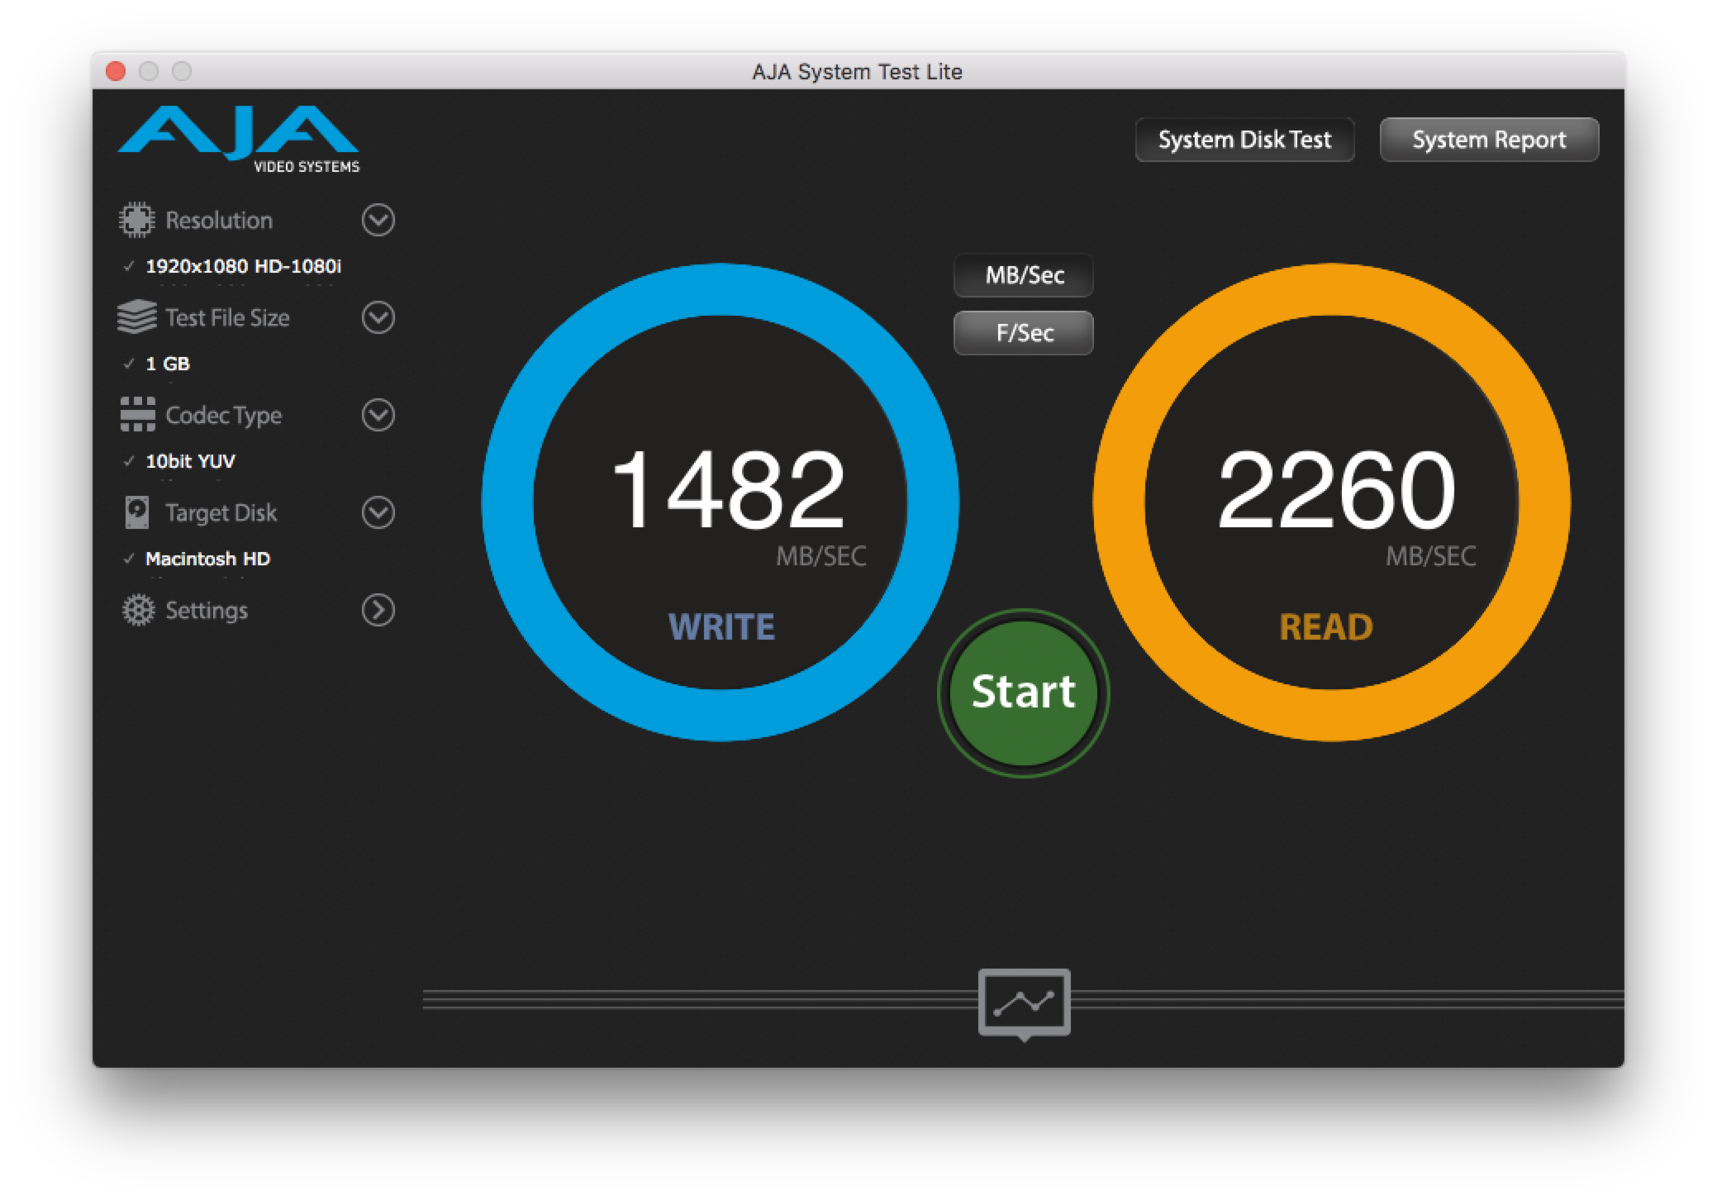
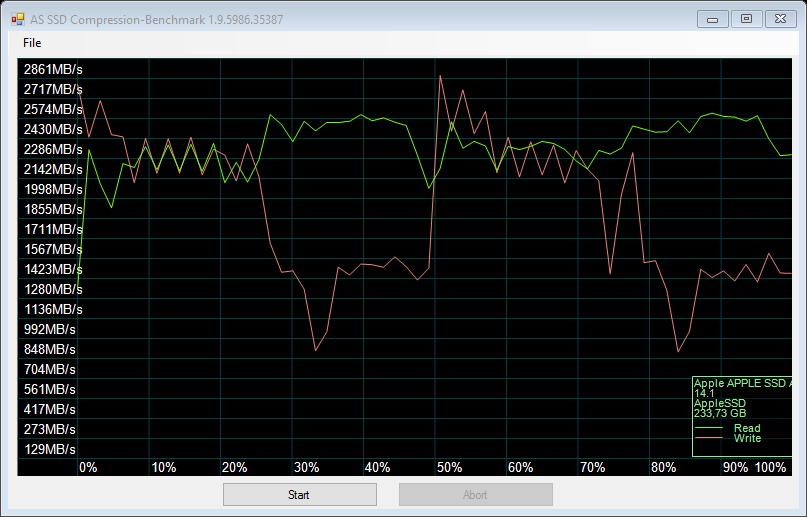
The MacBook pro 13 Touch Bar is equipped with the same SSD with Apple's own controller we can find in the other 2016 models. The performance figures of the 256 GB models hardly differ. AS SSD does unfortunately produce some error messages in many tests, so some results are incomplete.

GPU Performance
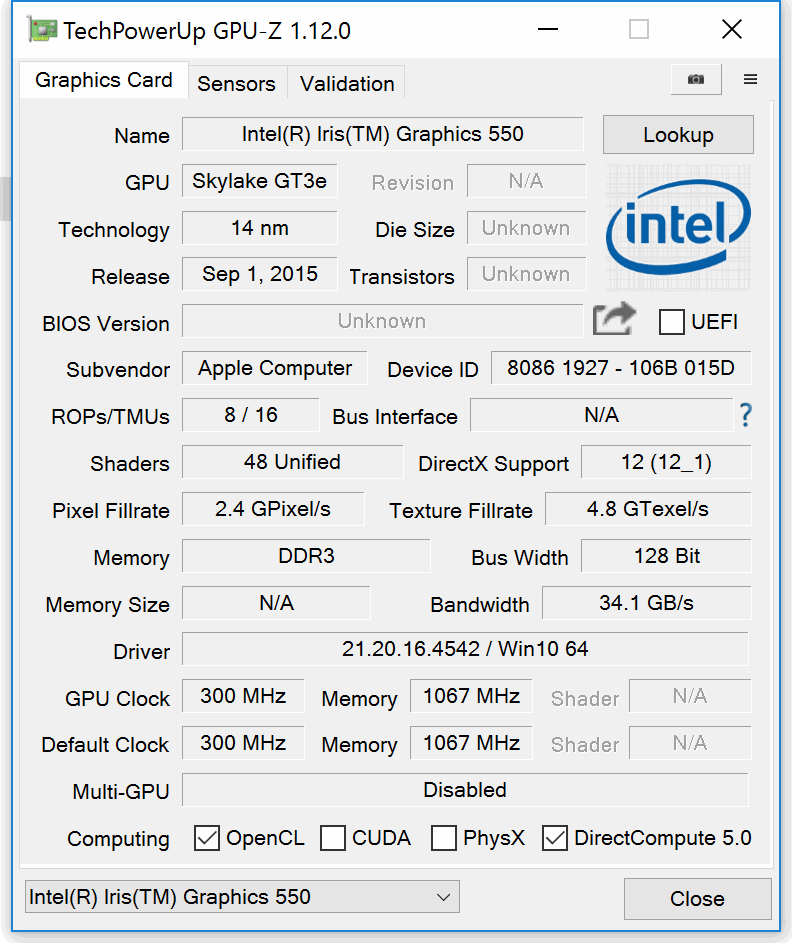
Graphics calculations are handled by the integrated Intel Iris Graphics 550 GPU. It is the GT3e model of the Skylake GPU (Intel Gen. 9) with 48 Execution units clocked at up to 1050 MHz. Contrary to the very popular ULV versions like the HD Graphics 520, for example, the Iris Graphics 550 is equipped with 64 MB eDRAM and therefore offers much more performance. More technical information about the GPU is available in our Tech section.
The 3DMark benchmarks running on Windows (Bootcamp) determine very good results and the MacBook can beat all Windows devices equipped with the Intel iris Graphics 550. The MacBook Pro without Touch Bar falls behind by 11-16% depending on the test, while the advantage over the previous model with Iris Graphics 6100 is pretty significant (minus 37-40%).
| 3DMark 06 Standard Score | 15951 points | |
| 3DMark 11 Performance | 2881 points | |
| 3DMark Cloud Gate Standard Score | 8105 points | |
| 3DMark Fire Strike Score | 1550 points | |
| 3DMark Time Spy Score | 620 points | |
Help | ||
Gaming Performance
The gaming benchmarks show an advantage over the MBP 13 with Function Keys, but the test model with the faster Iris 550 GPU is still not a great gaming machine. You should focus on older or less demanding titles like Bioshock Infinite or DOTA 2, which will also run smoothly with High details. Contrary to the synthetic benchmarks, the dedicated GeForce 940MX is faster than the Iris GPU in the gaming tests.
More benchmarks are available in our gaming list.
| The Witcher 3 - 1024x768 Low Graphics & Postprocessing | |
| Asus Zenbook UX310UQ-GL011T | |
| Apple MacBook Pro 13 2016 (2.9 GHz) | |
| Apple MacBook Pro 13 2016 | |
| Dell XPS 13 9360 QHD+ i7 | |
| Razer Blade Stealth QHD i7-7500U | |
| Rise of the Tomb Raider - 1024x768 Lowest Preset | |
| Apple MacBook Pro 13 2016 (2.9 GHz) | |
| Apple MacBook Pro 13 2016 | |
| Dell XPS 13 9360 QHD+ i7 | |
| Razer Blade Stealth QHD i7-7500U | |
| Deus Ex Mankind Divided - 1280x720 Low Preset AF:1x | |
| Apple MacBook Pro 13 2016 (2.9 GHz) | |
| Apple MacBook Pro 13 2016 | |
| Apple MacBook Pro 13 2016 | |
| low | med. | high | ultra | |
|---|---|---|---|---|
| BioShock Infinite (2013) | 103 | 56.2 | 47.9 | 13.8 |
| The Witcher 3 (2015) | 21.6 | 14.9 | ||
| Dota 2 Reborn (2015) | 40.3 | 33.6 | ||
| Rainbow Six Siege (2015) | 52.9 | 32.3 | 19 | 14.6 |
| Rise of the Tomb Raider (2016) | 27.3 | 21.9 | ||
| Far Cry Primal (2016) | 27 | 14 | ||
| Overwatch (2016) | 86 | 58.8 | 26.2 | |
| Deus Ex Mankind Divided (2016) | 26 | |||
| Battlefield 1 (2016) | 49.6 | 29.8 | 15.1 | |
| Farming Simulator 17 (2016) | 93 | 34.7 | 20.8 | |
| Titanfall 2 (2016) | 65 | 45.2 | 17.7 | |
| Watch Dogs 2 (2016) | 23.4 | 19.9 |
Emissions
System Noise
Contrary to the MacBook Pro 13 without Touch Bar, Apple equips the more expensive model with two fans. We cannot notice a clattering sound this time. The fans don't spin while idling and with light workloads according to the iStat menus. Even more challenging workloads, in this case 30 iterations of the Cinebench R15 benchmark, only result in 2000-2800 rpm and a very quiet 30.8 dB(A) according to our measurement device. 3D load simulated by the Unigine Valley benchmark will result in a seamless rpm increase over time. After about 15 minutes, the cooling system runs at 4150 and 4500 rpm, respectively, and a quiet 36.8 dB(A). The fans can spin up to 6336 and 6864 rpm and will be quite loud at 47.9 dB(A), but we did not reach this level during our tests so far.
Noise level
| Idle |
| 30.2 / 30.2 / 30.2 dB(A) |
| Load |
| 33 / 36.2 dB(A) |
 | ||
30 dB silent 40 dB(A) audible 50 dB(A) loud |
||
min: | ||
Temperature
The MacBook does not warm up at all while idling or with light workloads and does stay conveniently cool. Apple was able to compensate the faster components with the second fan, because we can determine almost identical average temperatures of around 36 °C compared to the version without Touch Bar. The rear area of the top in particular does get a bit warmer at up to 45 °C, but both the palm rest as well as the trackpad are cooler in return. There should once again be no problems when you want to use the MacBook on your lap.
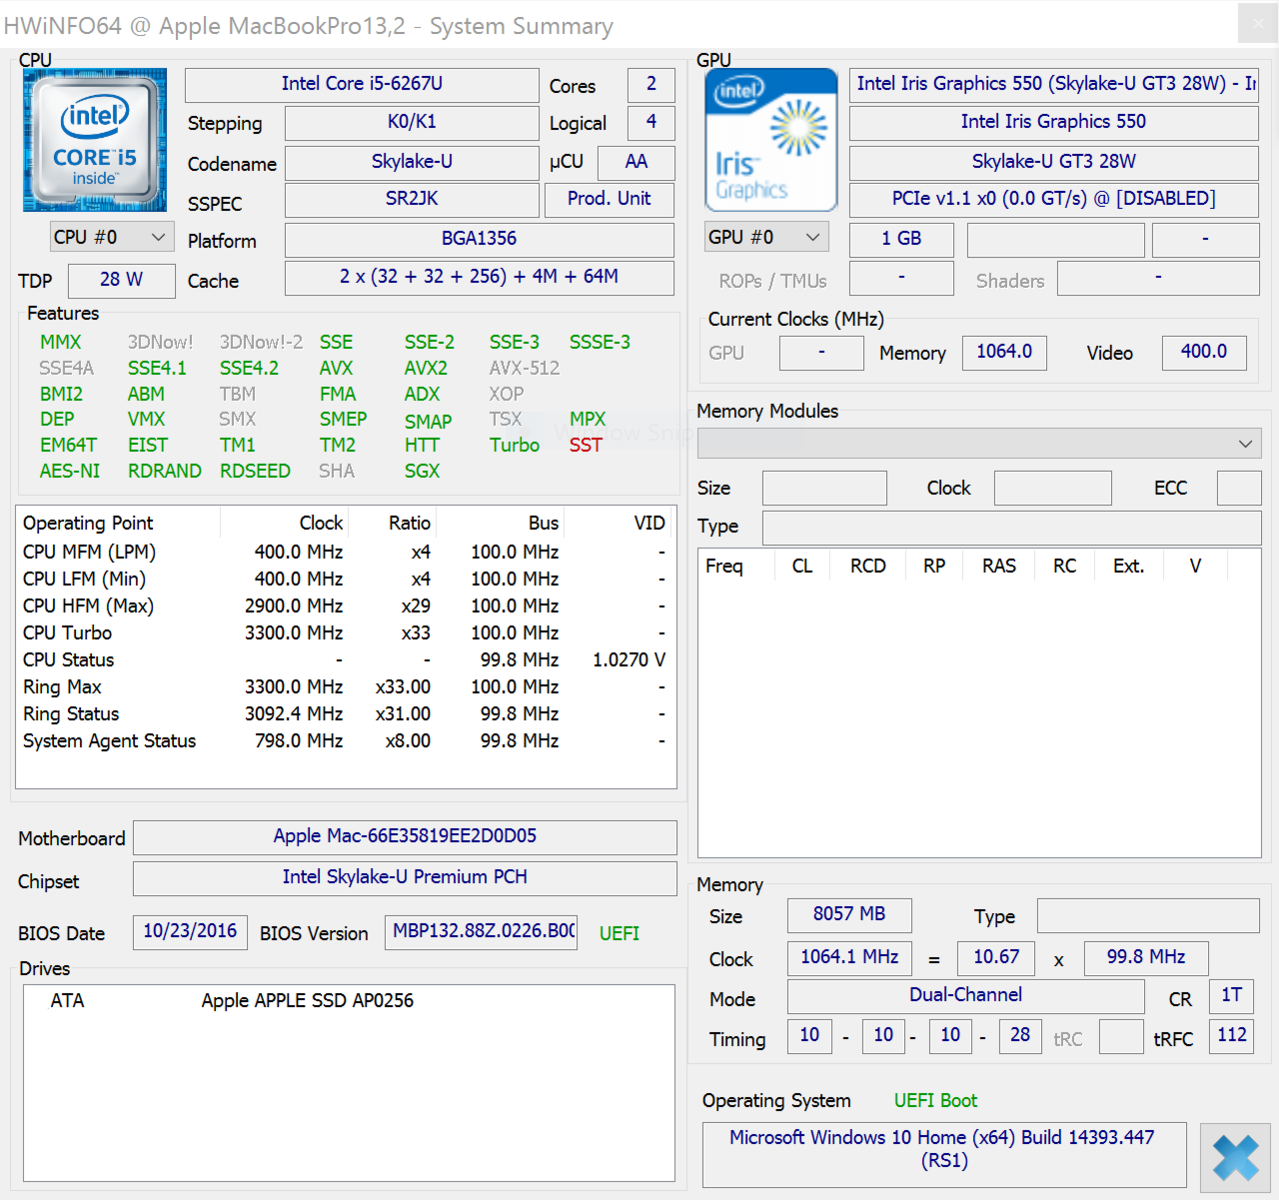
We use the tools Prime95 and FurMark running on Windows for our stress test, and the MacBook performs very well. After about 2.5 hours, we can measure 36.8 dB(A). The tool HWiNFO was unfortunately a bit not working as expected and did not log the whole test, so we cannot give you exact figures for the clocks. One interesting aspect is the power consumption though. Similar to other MacBooks, the processor is not limited by the 28-Watt TDP and can consume more power. We saw a steady value of 35 Watts, so throttling is no problem for the test model.
(±) The maximum temperature on the upper side is 45 °C / 113 F, compared to the average of 35.9 °C / 97 F, ranging from 21.4 to 59 °C for the class Subnotebook.
(+) The bottom heats up to a maximum of 39 °C / 102 F, compared to the average of 39.2 °C / 103 F
(+) In idle usage, the average temperature for the upper side is 23.9 °C / 75 F, compared to the device average of 30.8 °C / 87 F.
(+) The palmrests and touchpad are cooler than skin temperature with a maximum of 29 °C / 84.2 F and are therefore cool to the touch.
(±) The average temperature of the palmrest area of similar devices was 28.2 °C / 82.8 F (-0.8 °C / -1.4 F).
Speakers
We have already seen the different speaker setups of the two 13-inch models, and the location inside the case differs as well. In practice, you mainly notice the higher maximum level (86.9 vs. 83.2 dB(A)), but otherwise, they sound very similar. This is also supported by our measurements and the Touch Bar model does convince with very good sound quality, especially for such a thin base unit.
Contrary to our test model of the new MacBook Pro 15, we did not have any speaker issues on the 13-inch model caused by the Windows installation via Boot Camp.
Apple MacBook Pro 13 2016 (2.9 GHz) audio analysis
(+) | speakers can play relatively loud (86.9 dB)
Bass 100 - 315 Hz
(±) | reduced bass - on average 13.2% lower than median
(±) | linearity of bass is average (10.7% delta to prev. frequency)
Mids 400 - 2000 Hz
(+) | balanced mids - only 4.1% away from median
(+) | mids are linear (6.3% delta to prev. frequency)
Highs 2 - 16 kHz
(+) | balanced highs - only 2.9% away from median
(+) | highs are linear (4% delta to prev. frequency)
Overall 100 - 16.000 Hz
(+) | overall sound is linear (12.2% difference to median)
Compared to same class
» 15% of all tested devices in this class were better, 5% similar, 80% worse
» The best had a delta of 5%, average was 18%, worst was 53%
Compared to all devices tested
» 10% of all tested devices were better, 2% similar, 88% worse
» The best had a delta of 4%, average was 23%, worst was 134%
Apple MacBook Pro 13 2016 audio analysis
(+) | speakers can play relatively loud (83.2 dB)
Bass 100 - 315 Hz
(±) | reduced bass - on average 8.4% lower than median
(-) | bass is not linear (16.7% delta to prev. frequency)
Mids 400 - 2000 Hz
(+) | balanced mids - only 4.7% away from median
(+) | mids are linear (6.3% delta to prev. frequency)
Highs 2 - 16 kHz
(+) | balanced highs - only 1.1% away from median
(+) | highs are linear (2.6% delta to prev. frequency)
Overall 100 - 16.000 Hz
(+) | overall sound is linear (9.8% difference to median)
Compared to same class
» 6% of all tested devices in this class were better, 2% similar, 92% worse
» The best had a delta of 5%, average was 18%, worst was 53%
Compared to all devices tested
» 4% of all tested devices were better, 1% similar, 95% worse
» The best had a delta of 4%, average was 23%, worst was 134%
Apple MacBook Pro 15 2016 (2.6 GHz, 450) audio analysis
(+) | speakers can play relatively loud (86 dB)
Bass 100 - 315 Hz
(±) | reduced bass - on average 6.9% lower than median
(±) | linearity of bass is average (12.7% delta to prev. frequency)
Mids 400 - 2000 Hz
(±) | higher mids - on average 5% higher than median
(±) | linearity of mids is average (9.5% delta to prev. frequency)
Highs 2 - 16 kHz
(+) | balanced highs - only 2% away from median
(+) | highs are linear (4.3% delta to prev. frequency)
Overall 100 - 16.000 Hz
(+) | overall sound is linear (9.7% difference to median)
Compared to same class
» 13% of all tested devices in this class were better, 1% similar, 85% worse
» The best had a delta of 5%, average was 17%, worst was 45%
Compared to all devices tested
» 4% of all tested devices were better, 1% similar, 95% worse
» The best had a delta of 4%, average was 23%, worst was 134%
Frequency comparison (checkboxes select/deselectable)
Energy Management
Power Consumption
The MacBook pro 13 Touch Bar manages excellent results in our consumption measurements. Despite the enormous luminance, both the model without Touch Bar as well as the predecessor are beaten in the idle tests. We can notice the faster components under load though, and we can measure up to 60 Watts. The provided 61-Watt power adapter is therefore just sufficient, but there is not much headroom if you want to charge the battery in this case.
| Off / Standby | |
| Idle | |
| Load |
|
Key:
min: | |
| Apple MacBook Pro 13 2016 (2.9 GHz) 6267U, Iris Graphics 550, 2560x1600, 13.3" | Apple MacBook Pro 13 2016 6360U, Iris Graphics 540, 2560x1600, 13.3" | Apple MacBook Pro Retina 13 inch 2015-03 5257U, Iris Graphics 6100, 2560x1600, 13.3" | Apple MacBook Air 13 inch 2015-03 5650U, HD Graphics 6000, 1440x900, 13.3" | Dell XPS 13 9360 QHD+ i7 i7-7500U, HD Graphics 620, 3200x1800, 13.3" | Lenovo ThinkPad X1 Carbon 20FB003RGE 6500U, HD Graphics 520, 2560x1440, 14" | Lenovo ThinkPad T460s-20FA003GGE 6600U, HD Graphics 520, 2560x1440, 14" | |
|---|---|---|---|---|---|---|---|
| Power Consumption | -3% | -7% | 21% | -16% | 1% | -2% | |
| Idle Minimum * (Watt) | 2.1 | 3 -43% | 2.8 -33% | 2.7 -29% | 6.4 -205% | 3.8 -81% | 3.8 -81% |
| Idle Average * (Watt) | 7.6 | 8.9 -17% | 7.8 -3% | 5.7 25% | 6.6 13% | 7.1 7% | 7.1 7% |
| Idle Maximum * (Watt) | 8.2 | 8.9 -9% | 8.1 1% | 6 27% | 6.8 17% | 7.7 6% | 7.8 5% |
| Load Average * (Watt) | 56.4 | 43.4 23% | 52.4 7% | 32.1 43% | 27.5 51% | 30.2 46% | 36.3 36% |
| Load Maximum * (Watt) | 59.8 | 42.1 30% | 62.8 -5% | 36.2 39% | 32.4 46% | 44.7 25% | 46 23% |
* ... smaller is better
Battery Runtime
Apple advertises a runtime of 10 hours for both 13-inch models of the new MacBook Pro. The smaller version with the function keys easily lasts that long (11.5 hours), but the Touch Bar model just misses it. Our WLAN test determines little more than 9.5 hours. This is still a very good result, and it even beats the old MBP 13, despite the significantly lower battery capacity. Dell's XPS 13 is pretty close, while the two rivals from Lenovo are clearly beaten.
The Touch Bar models performs a bit worse in the video test (8:03 hours) compared to the WLAN test. Not only the does the less expensive version without the additional OLED panel lasts longer, but also the predecessor as well as the X1 Carbon from Lenovo. Here we can notice the reduced battery capacity.
The MacBook can maintain its performance level in demanding games, but the battery is drained pretty quickly in return. The Witcher 3 (lowest details) ran at a steady 20-21 FPS and 152 nits for 1 hour and 14 minutes. The remaining battery capacity was 7 %, and the system shut down 1-2 minutes and could not be started due to the low battery capacity. by the way, the MacBook Pro 13 without Touch Bar lasted much longer with similar settings (1 hour 51 minutes).
| Apple MacBook Pro 13 2016 (2.9 GHz) 6267U, Iris Graphics 550, 49.2 Wh | Apple MacBook Pro 13 2016 6360U, Iris Graphics 540, 54 Wh | Apple MacBook Pro Retina 13 inch 2015-03 5257U, Iris Graphics 6100, 75 Wh | Apple MacBook Air 13 inch 2015-03 5650U, HD Graphics 6000, 54 Wh | Dell XPS 13 9360 QHD+ i7 i7-7500U, HD Graphics 620, 60 Wh | Lenovo ThinkPad X1 Carbon 20FB003RGE 6500U, HD Graphics 520, 52 Wh | Lenovo ThinkPad T460s-20FA003GGE 6600U, HD Graphics 520, 49 Wh | |
|---|---|---|---|---|---|---|---|
| Battery runtime | 34% | 20% | 28% | 46% | 18% | -22% | |
| H.264 (h) | 8.1 | 10.3 27% | 9.7 20% | 8.5 5% | 6.6 -19% | ||
| WiFi v1.3 (h) | 9.4 | 11.4 21% | 9 -4% | 10.3 10% | 8.6 -9% | 7.2 -23% | 5.7 -39% |
| Load (h) | 1.1 | 1.7 55% | 1.6 45% | 1.6 45% | 2.2 100% | 1.9 73% | 1 -9% |
Pros
Cons
Verdict
The two models of the new Apple MacBook Pro 13 are – as expected – similar in many respects. This includes the excellent chassis, which is still extremely sturdy despite the diet. You also get one of the best and brightest displays on the market, independent of the model. This is also the case for the trackpad, which is now much bigger than before. The keyboard is also identical – except for the Touch Bar. Because of the shallow key travel, the input will require a learning period, but it convinces with very good precision in practice. The implementation of the Touch Bar was well-executed by Apple, but the success will depend on the software support in practice. Right now, it is more of a gimmick in our opinion, and it can actually make things a bit more complicated when you just want to use the normal function keys or special function like brightness control, for example. One handy new feature is the Touch ID sensor in the power button though.
Apple basically defines the more expensive model by the Touch Bar. If you look inside the chassis, however, you will find a completely different system. The cooling solution was adjusted for the more powerful components (28 vs. 15-Watt TDP) and we like it a lot, components were moved and the battery capacity is a bit smaller. This also affects the battery runtimes, especially under load, where you will have to charge the device after little more than one hour. The more expensive MBP 13 is also beaten by the model without Touch Bar in the practical tests, but the determined runtimes are still good. A bit half-hearted is the implementation of the two additional Thunderbolt 3 ports. Contrary to the bigger MacBook Pro 15, you cannot use their full bandwidth, so it might have been better to implement other ports.
This brings us to the problems. It is pretty much impossible to use the new MacBook Pro 13 without adapters in practice. Four – admittedly – very universal ports make the system pretty future-proof, but two would have been sufficient in our opinion. The lack of the SD-card reader will also be a No-Go for photographers in particular. Then there is the 2.4 GHz Wi-Fi issue, because there can be connection problems when a USB-C device is attached. It is questionable if there will be a software solution. Similar to the sibling, we therefore deduct 2 % from the final rating. Unfortunate, especially since the small device manages very good transfer rates.
Finally, there is the price, or the additional price over the smaller model, respectively. A base price of $1799 is already quite a lot, and whether the Touch Bar and the slightly higher performance are really worth $300 is at least questionable. Both systems are very fast with everyday tasks, and whether pro users will be satisfied with the comparatively small performance advantage (no quad-core, no dedicated GPU), is another question.
All in all, Apple's new MacBook Pro 13 Touch Bar is a very good subnotebook. But can it justify its "Pro" designation? Well, this mainly depends on your usage scenarios. It is the benchmark in some categories, but many users will most likely have a problem with the lack of proven (and still modern) standards.
Apple MacBook Pro 13 2016 (2.9 GHz)
- 12/07/2016 v6 (old)
Klaus Hinum, Andreas Osthoff
Price comparison

