Apple MacBook Pro 13 (Late 2016, 2 GHz i5, without Touch Bar) Laptop Review
As always, there were many rumors and speculations about new features ahead of the announcement on October 27th. Many of them were confirmed, especially the new Touch Bar, a multifunctional touch display strip instead of the function keys, which is supposed to offer many additional input options depending on the application. The new MacBook Pro 13 is also thinner, lighter and reduces the port variety to Thunderbolt ports.
The lineup includes 13 as well as 15-inch systems, although the 13-inch model is also available as slimmed-down version without Touch Bar, only two Thunderbolt ports (instead of four), and less powerful CPU/GPU configurations. We already have the latter in review, which is supposed to be very similar to the Touch Bar siblings except for the mentioned differences. The "full versions" with Touch Bar are expected in about three weeks. Apple's shipping date for our orders are between November 24th and December 1st. We will obviously review the Touch Bar versions as soon as we get them.
Our test model for the following article was purchased in Apple's online store (no press sample).
Update 11/23: We now have the new Apple MacBook Pro 15 in review as well.
Change log
- 11/02 16:15 CET – Display measurements, Cinebench, Pink Noise; fan rattling noticed on our test model
- 11/02 18:04 CET – Fan characteristics (without rattling) analyzed
- 11/02 18:45 CET – WiFi tests
- 11/03 10:00 CET – GPU performance, 3DMark and PCMark added
- 11/03 18:30 CET – Heat development, storage performance and gaming performance added
- 11/04 08:30 CET – WiFi battery runtime
- 11/04 19:30 CET – USB-C Docking Stations tested
- 11/05 12:00 CET – Viewing angles
- 11/06 22:00 CET – PWM and response times of the display
- 11/06 23:00 CET – Throttling
- 11/08 20:20 CET – Headset port analyzed, Gaming Battery test added
- 11/09 17:45 CET – WiFi problems in 2.4 GHz networks, pro/contra added
- 11/10 23:50 CET – Keyboard & touchpad
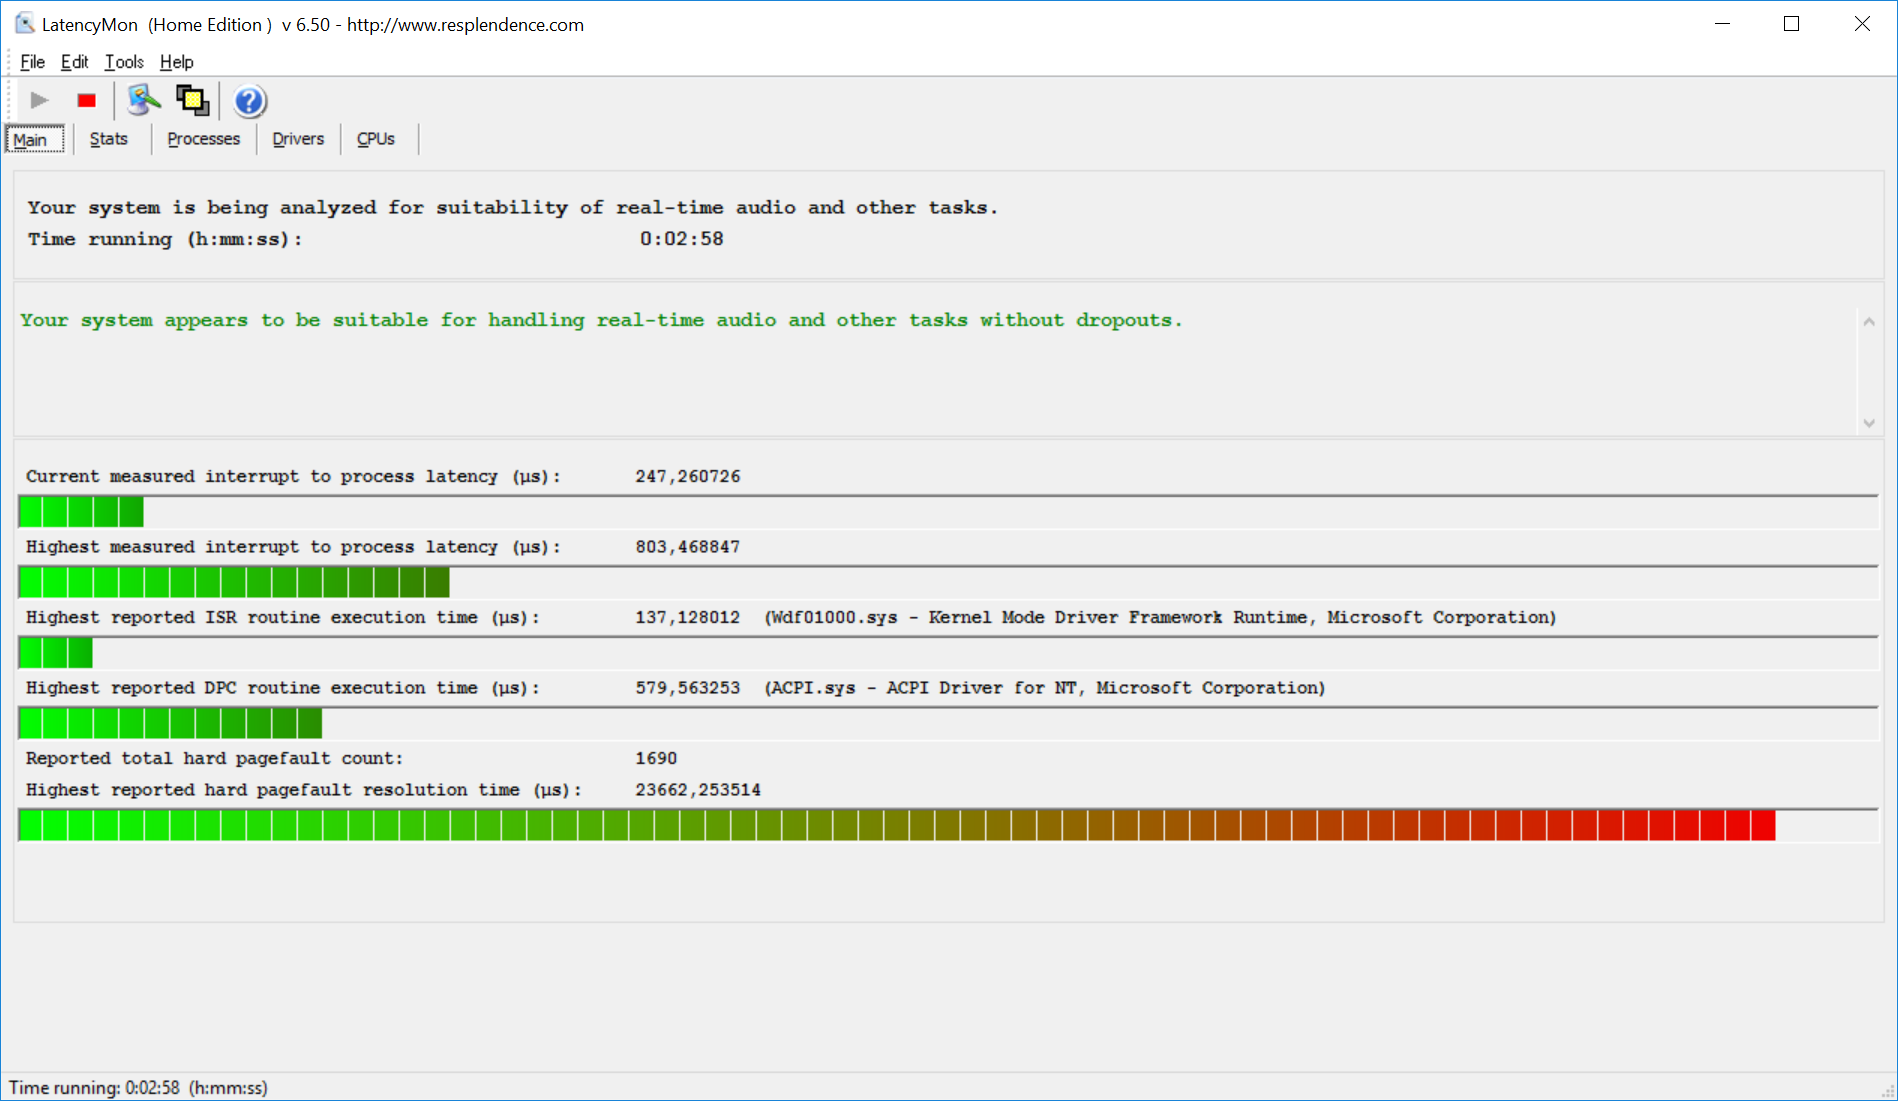
- 11/21 16:00 CET – WLAN update (also problems with Windows), WiFi runtime improved (second run added), gaming performance reworked, DPC Latency added (screenshot), Verdict updated
- 11/23 09:30 CET – Chassis rating updated (too low because of an error) and category switched to Subnotebook, Maintenance and Warranty added
Case
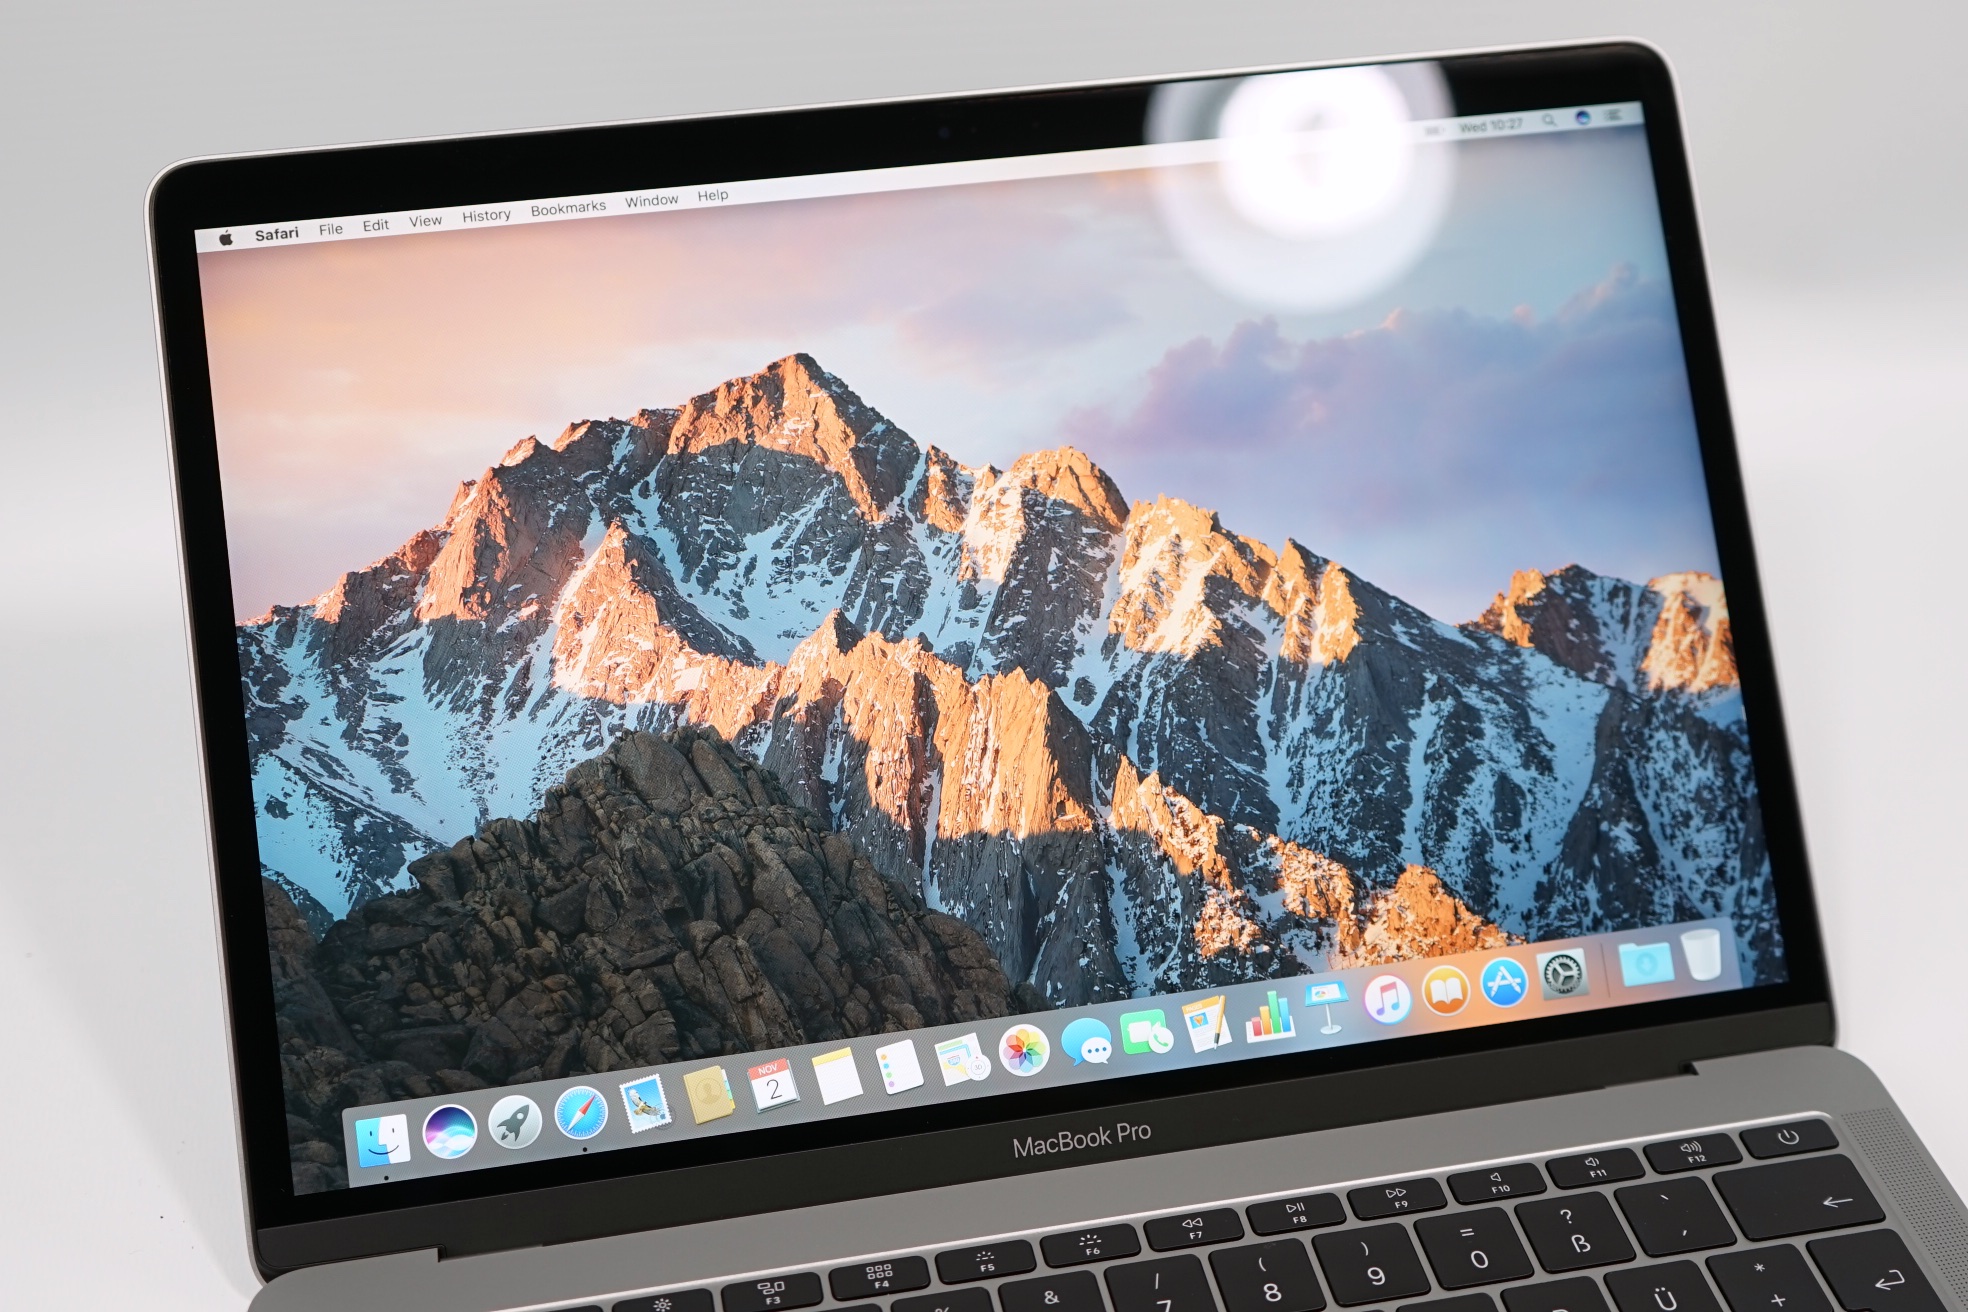
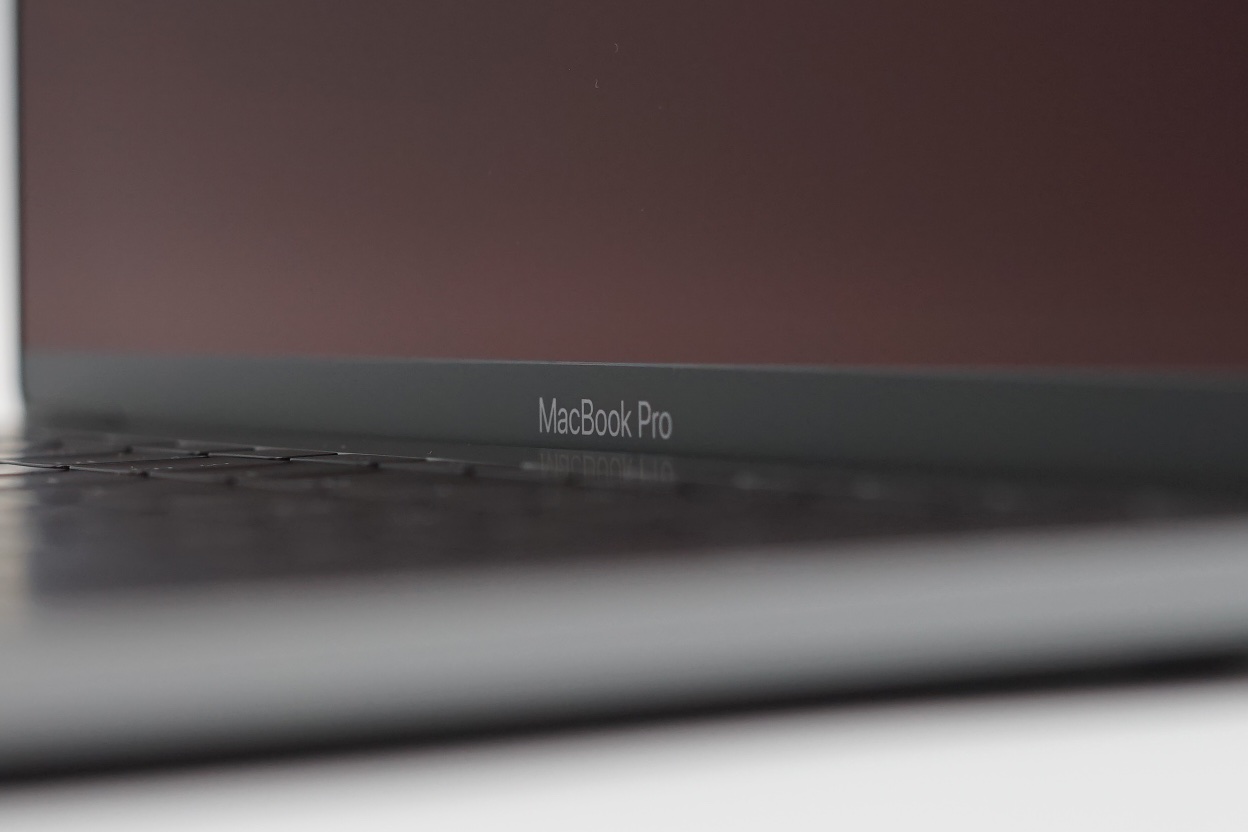
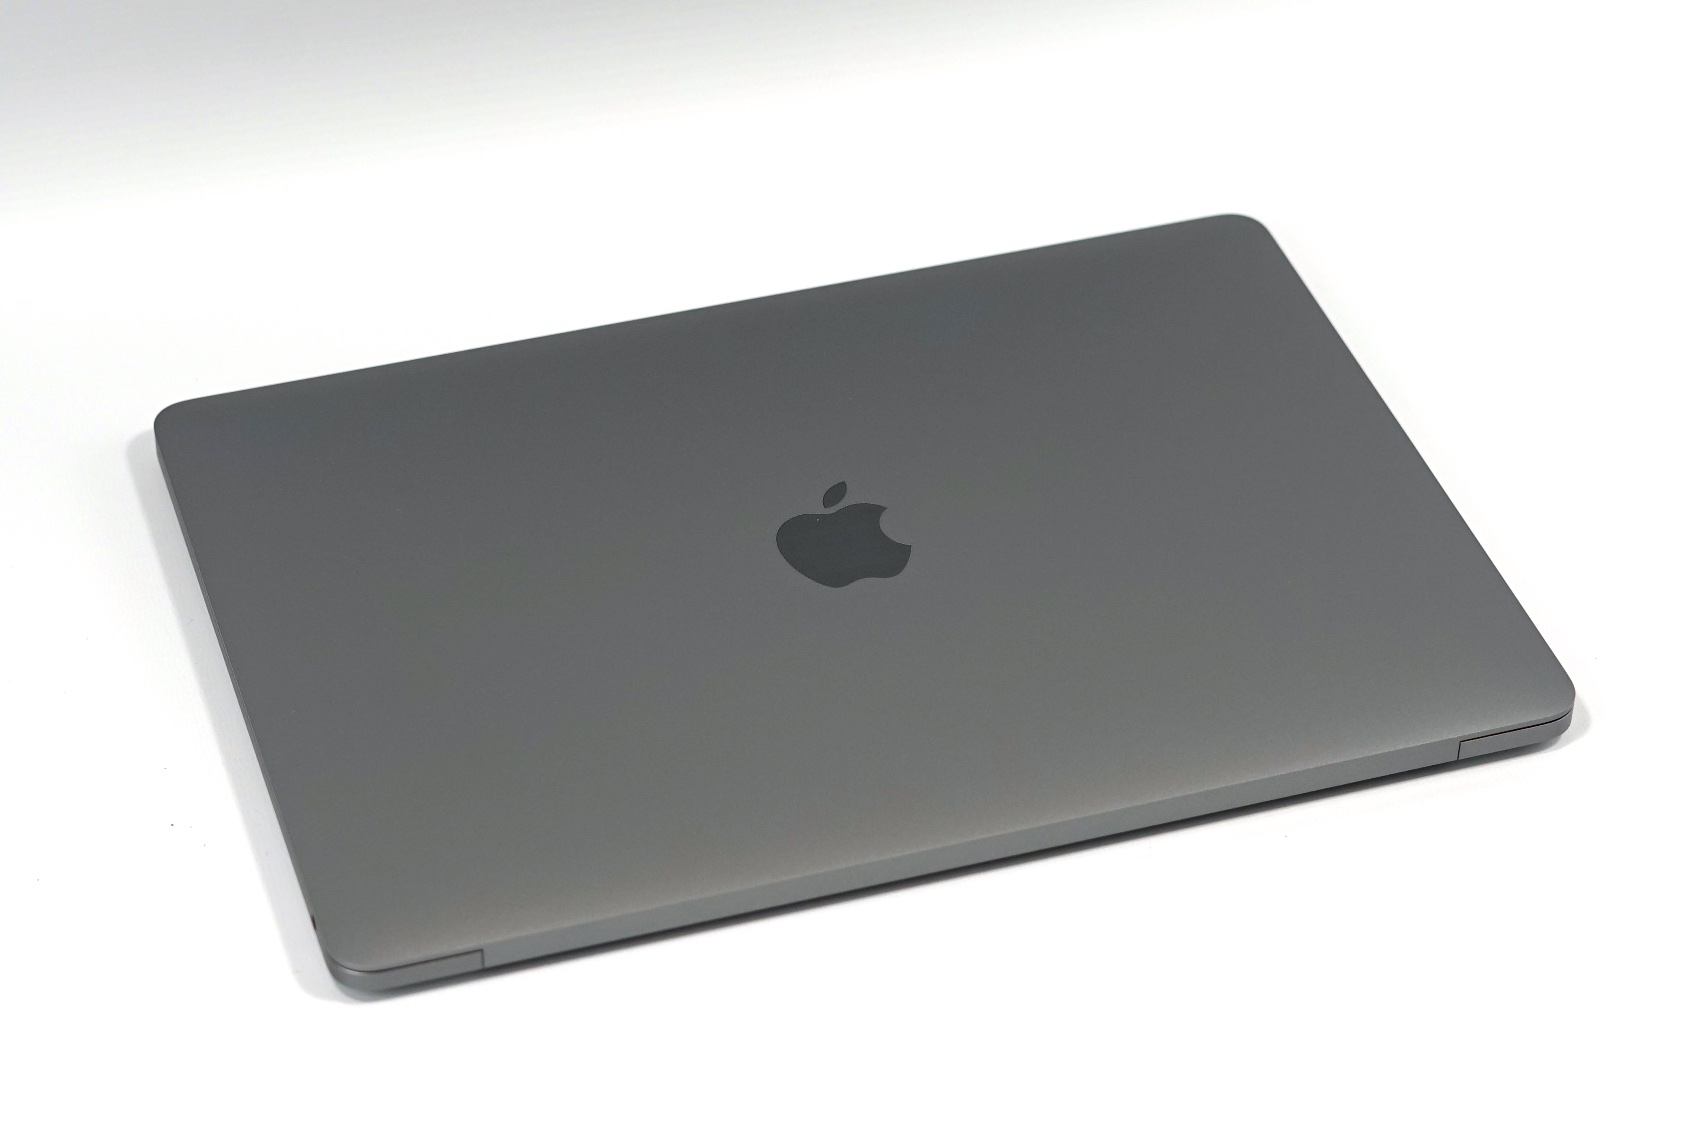
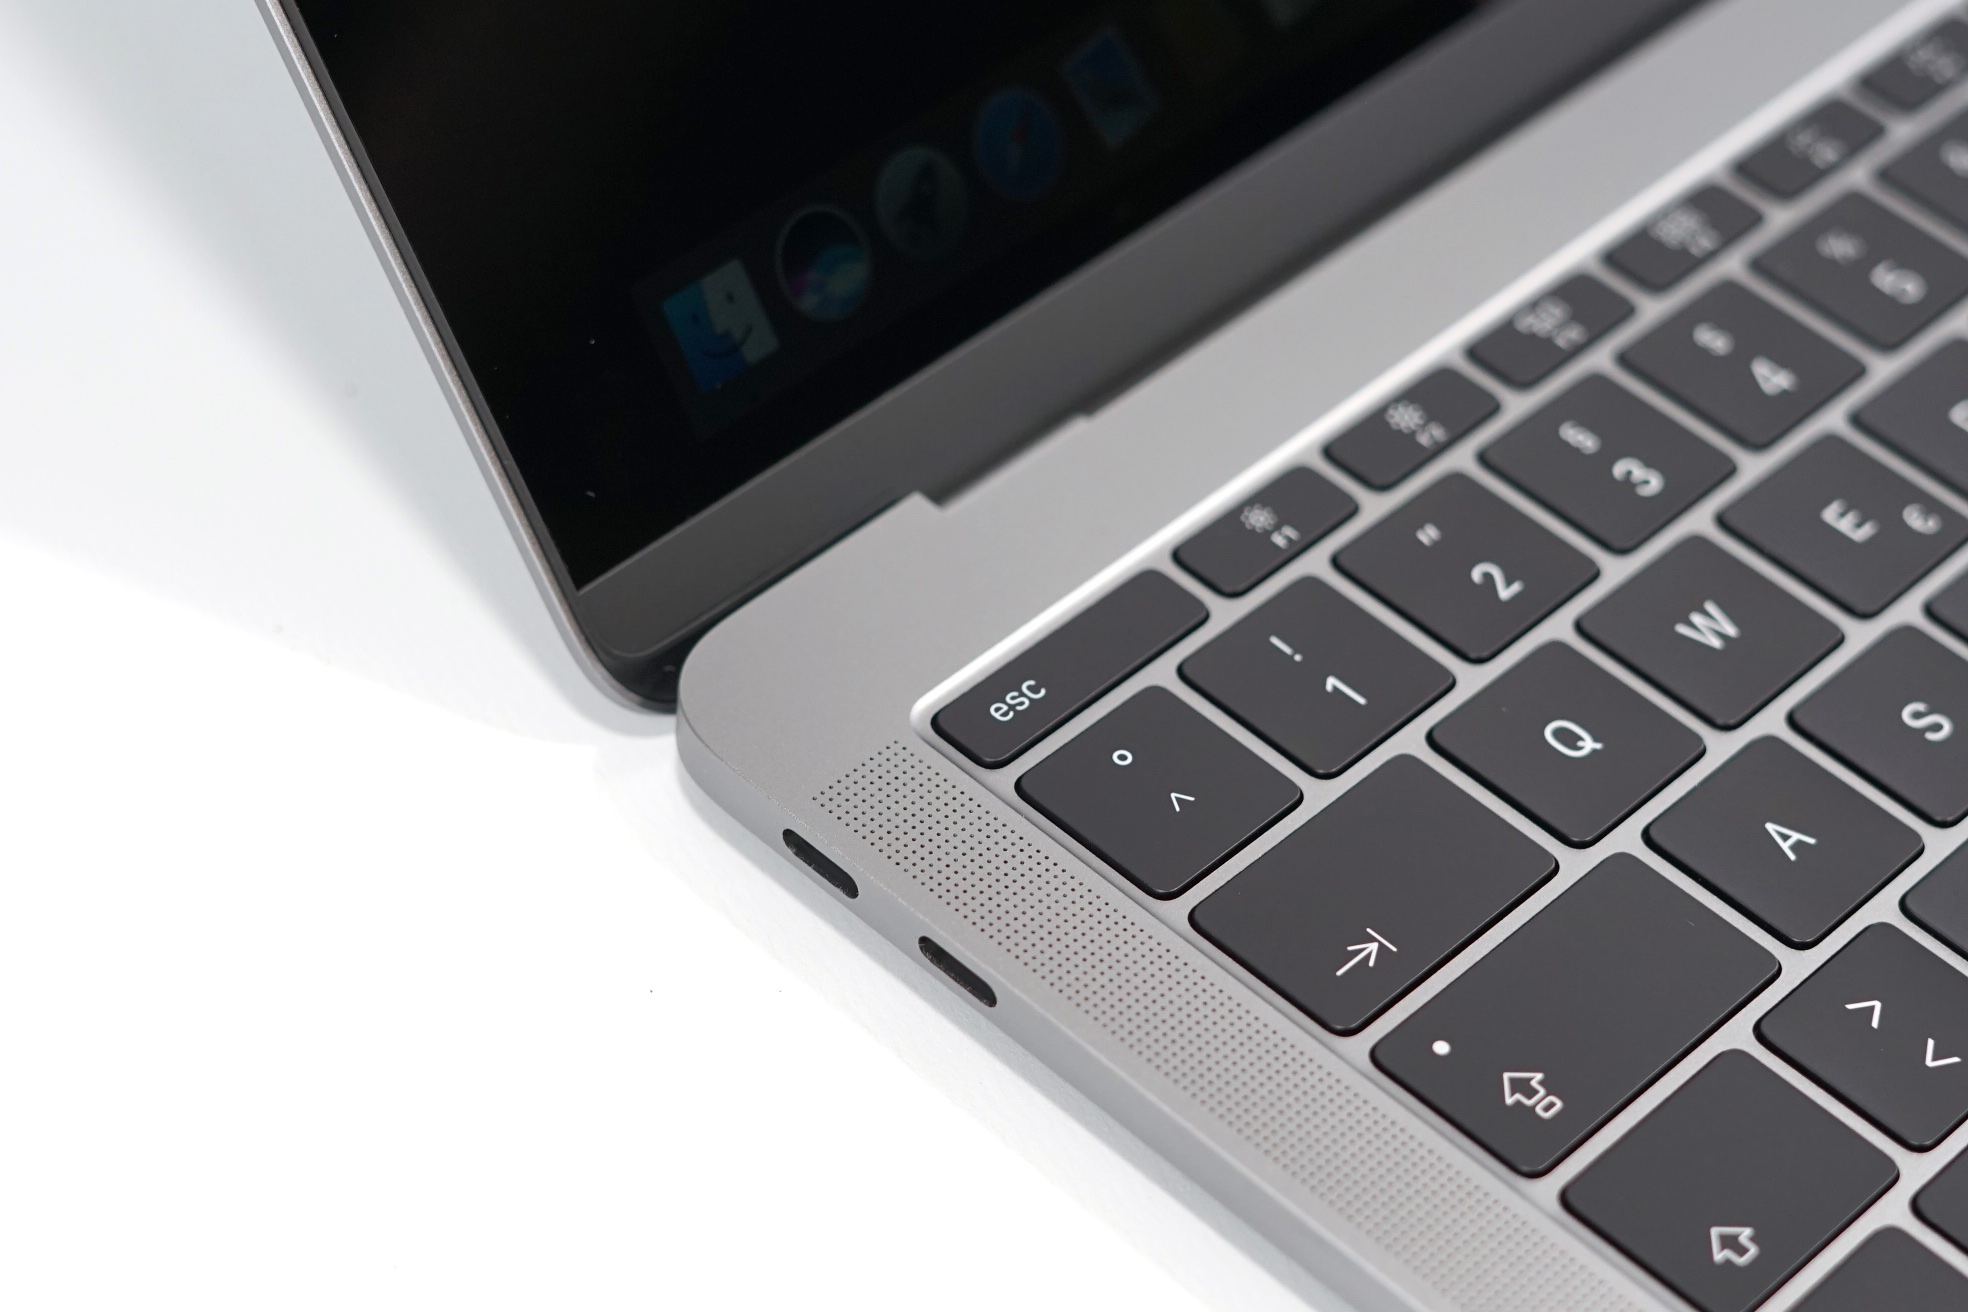
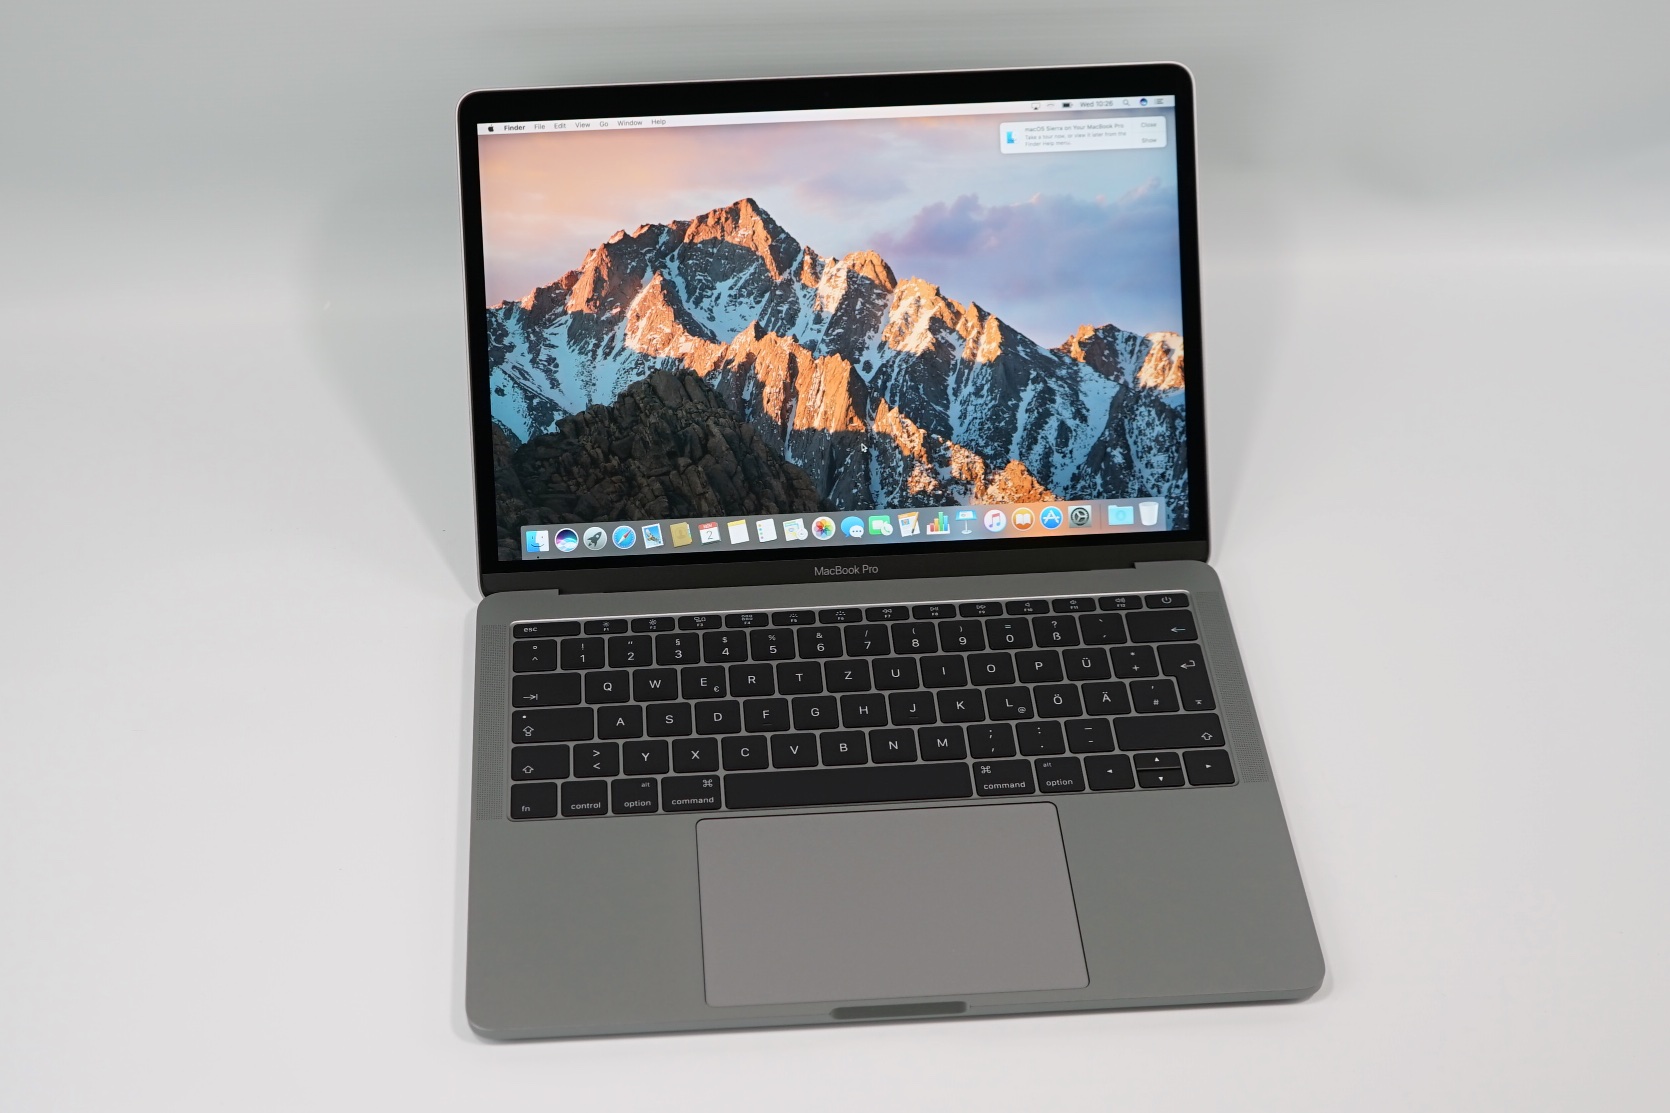
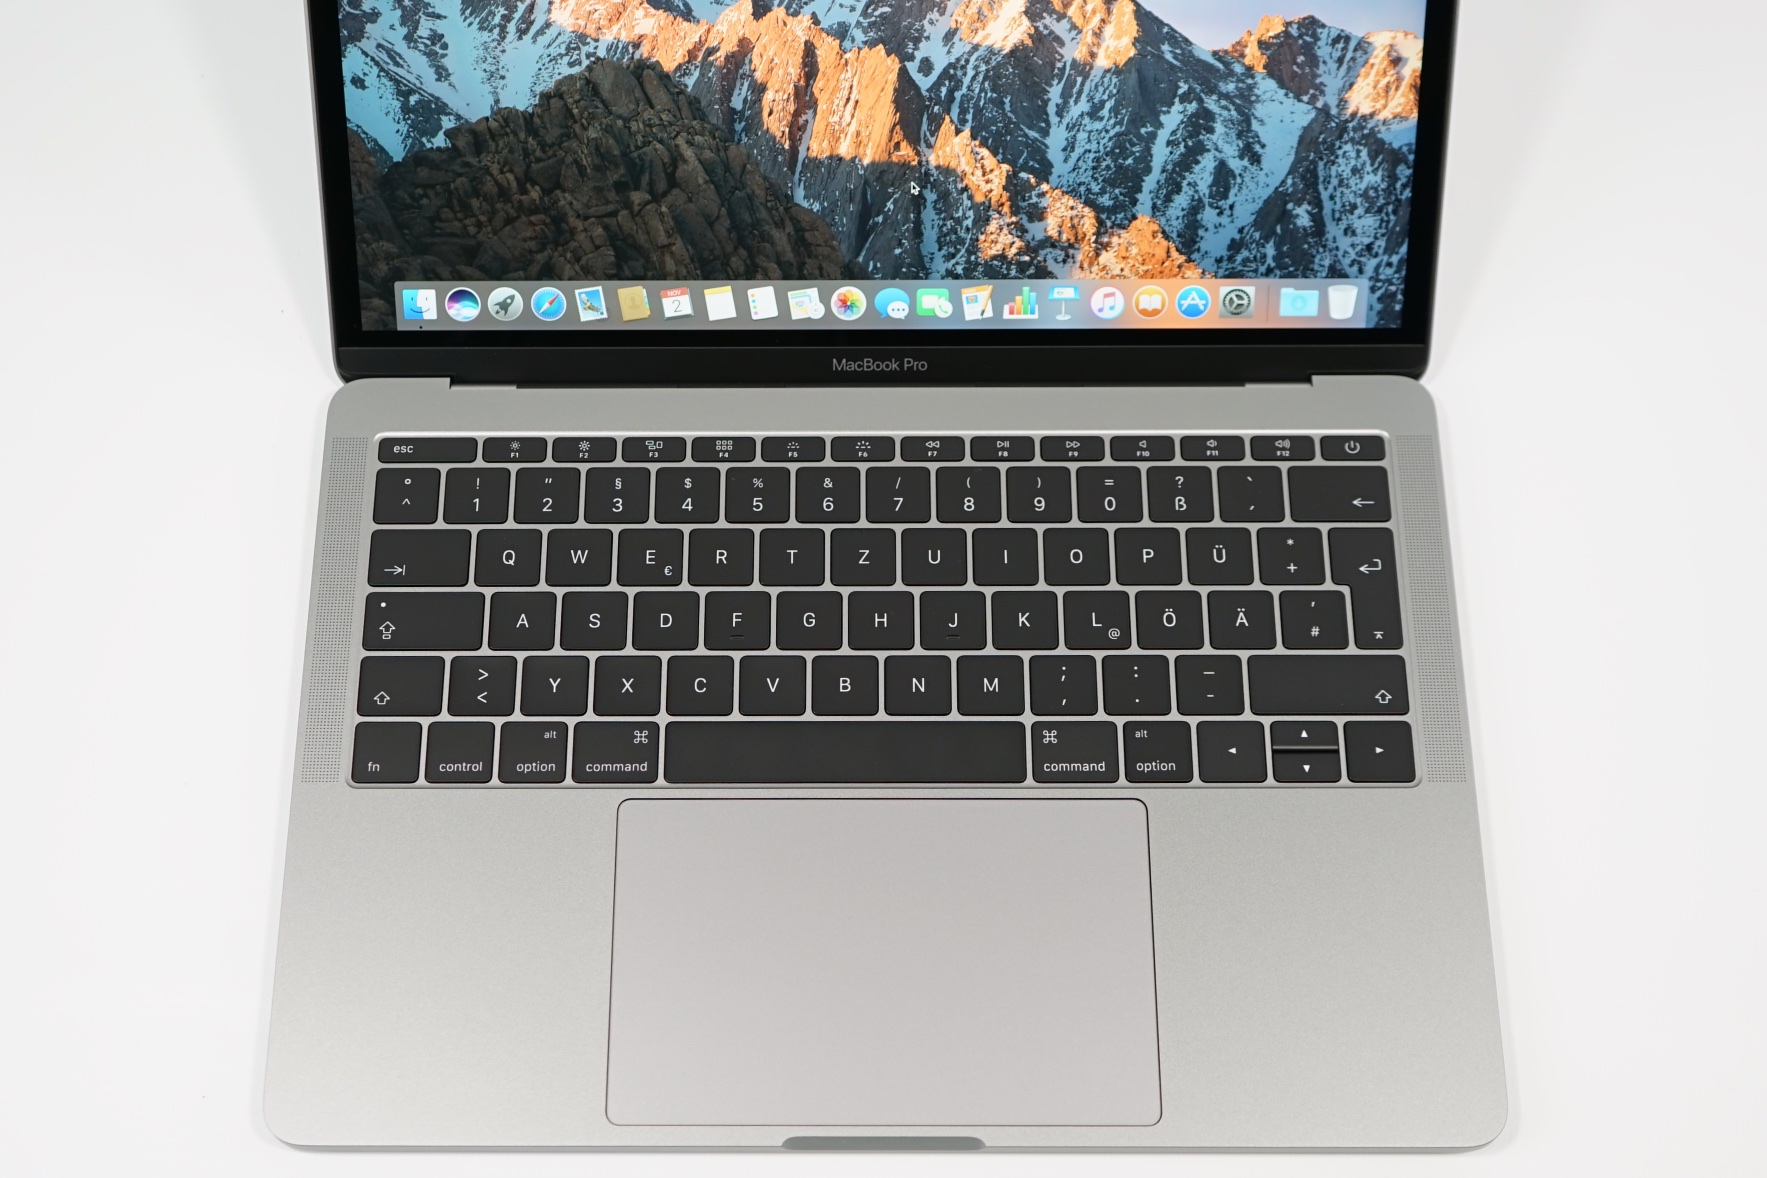
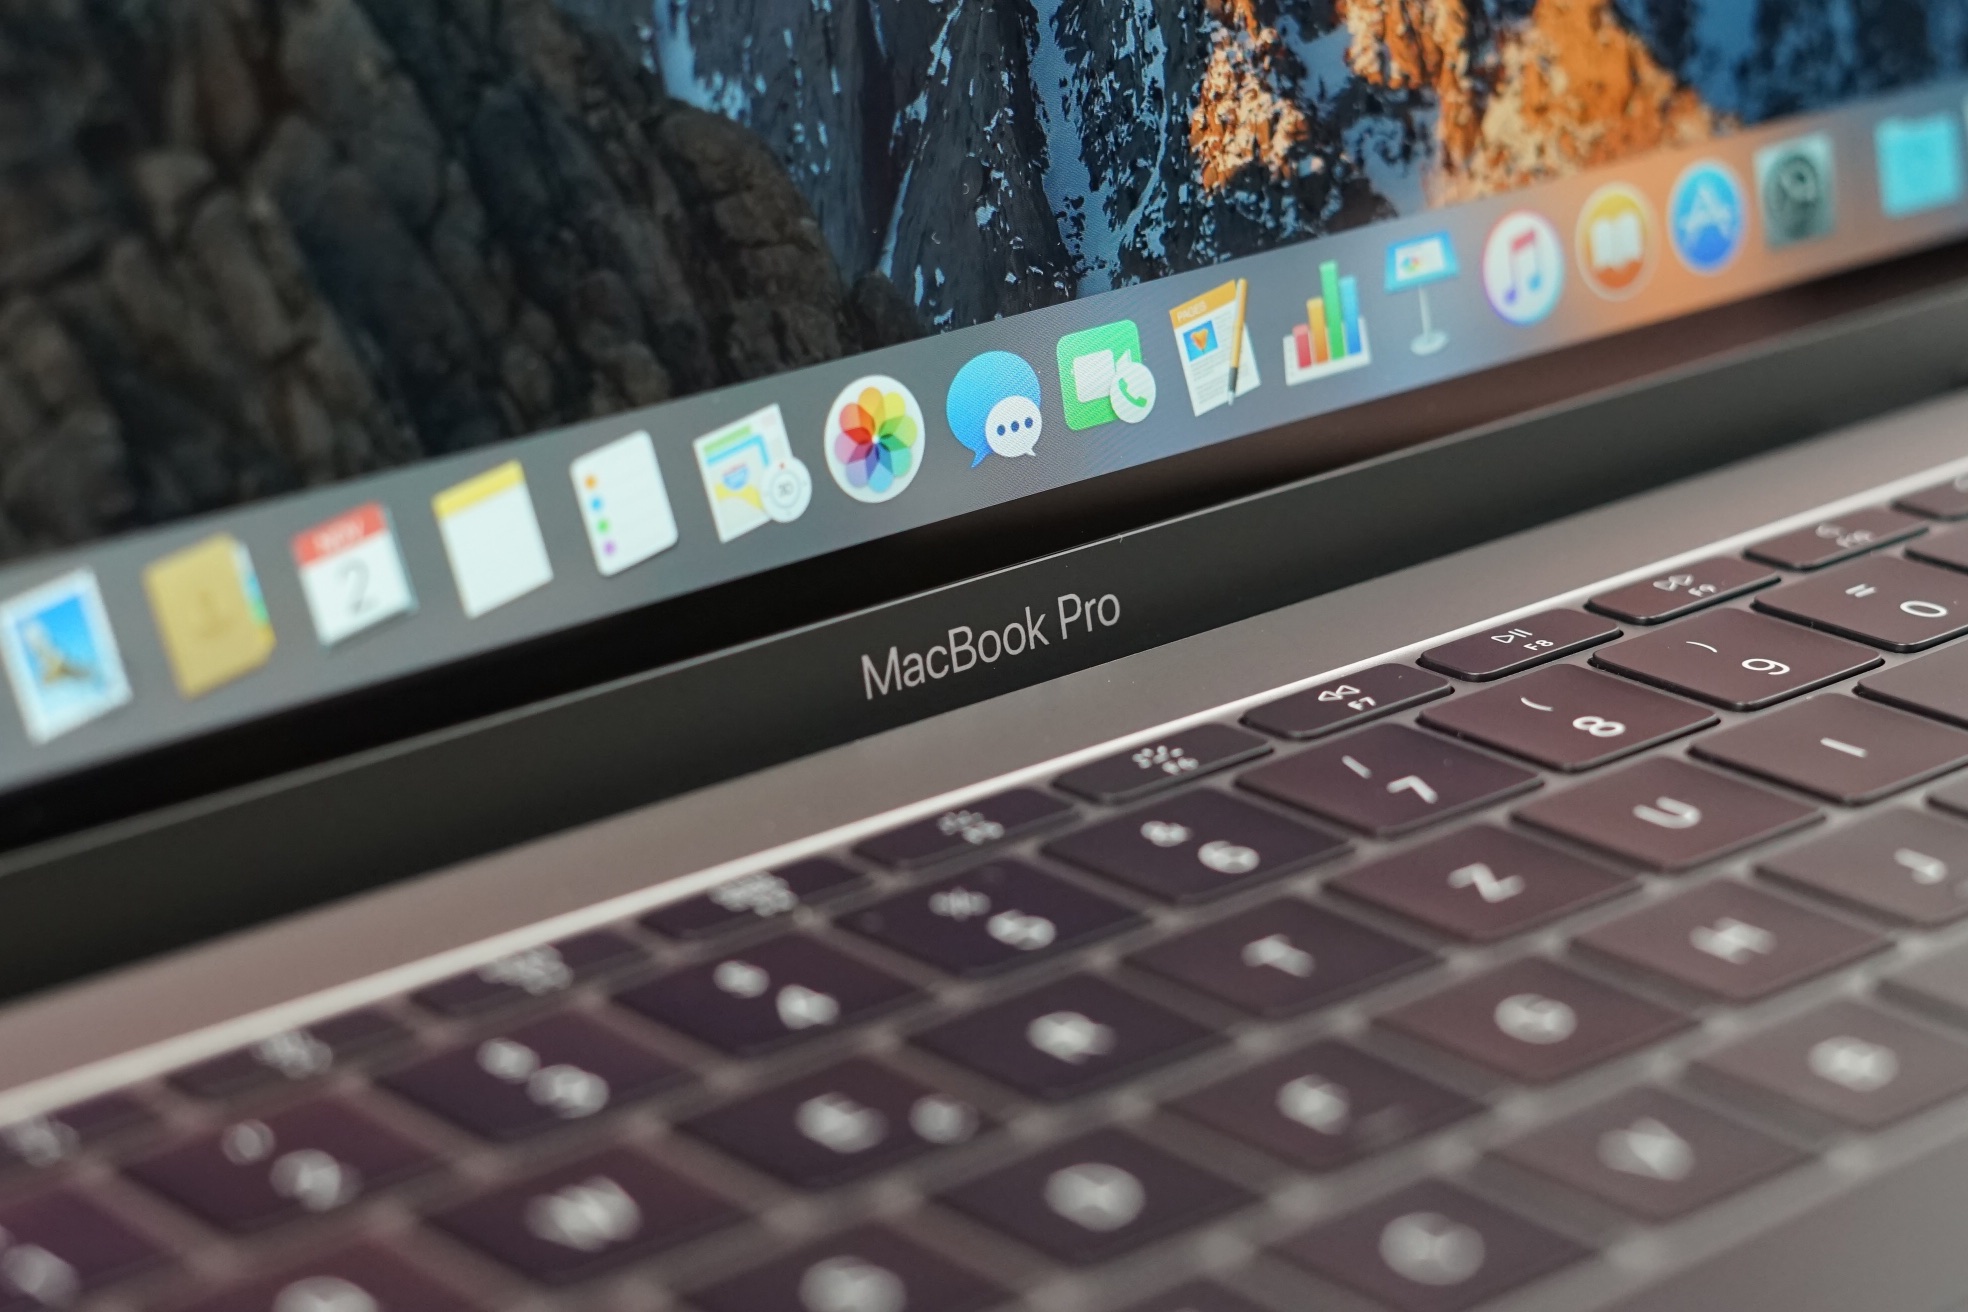
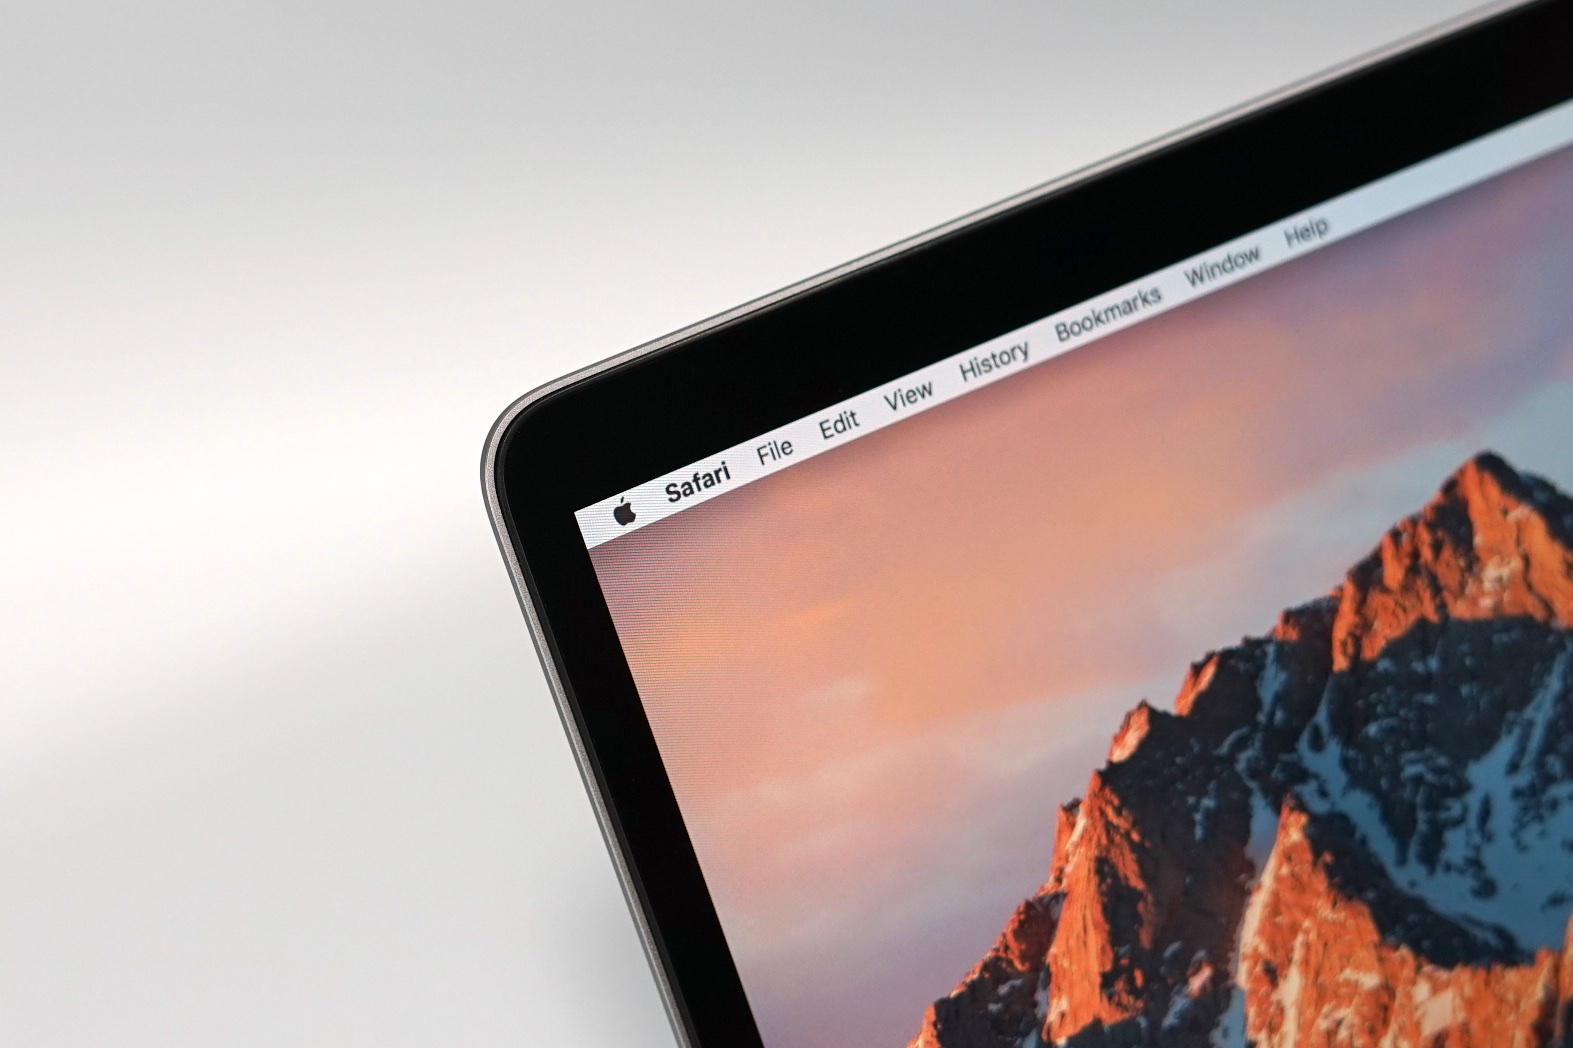
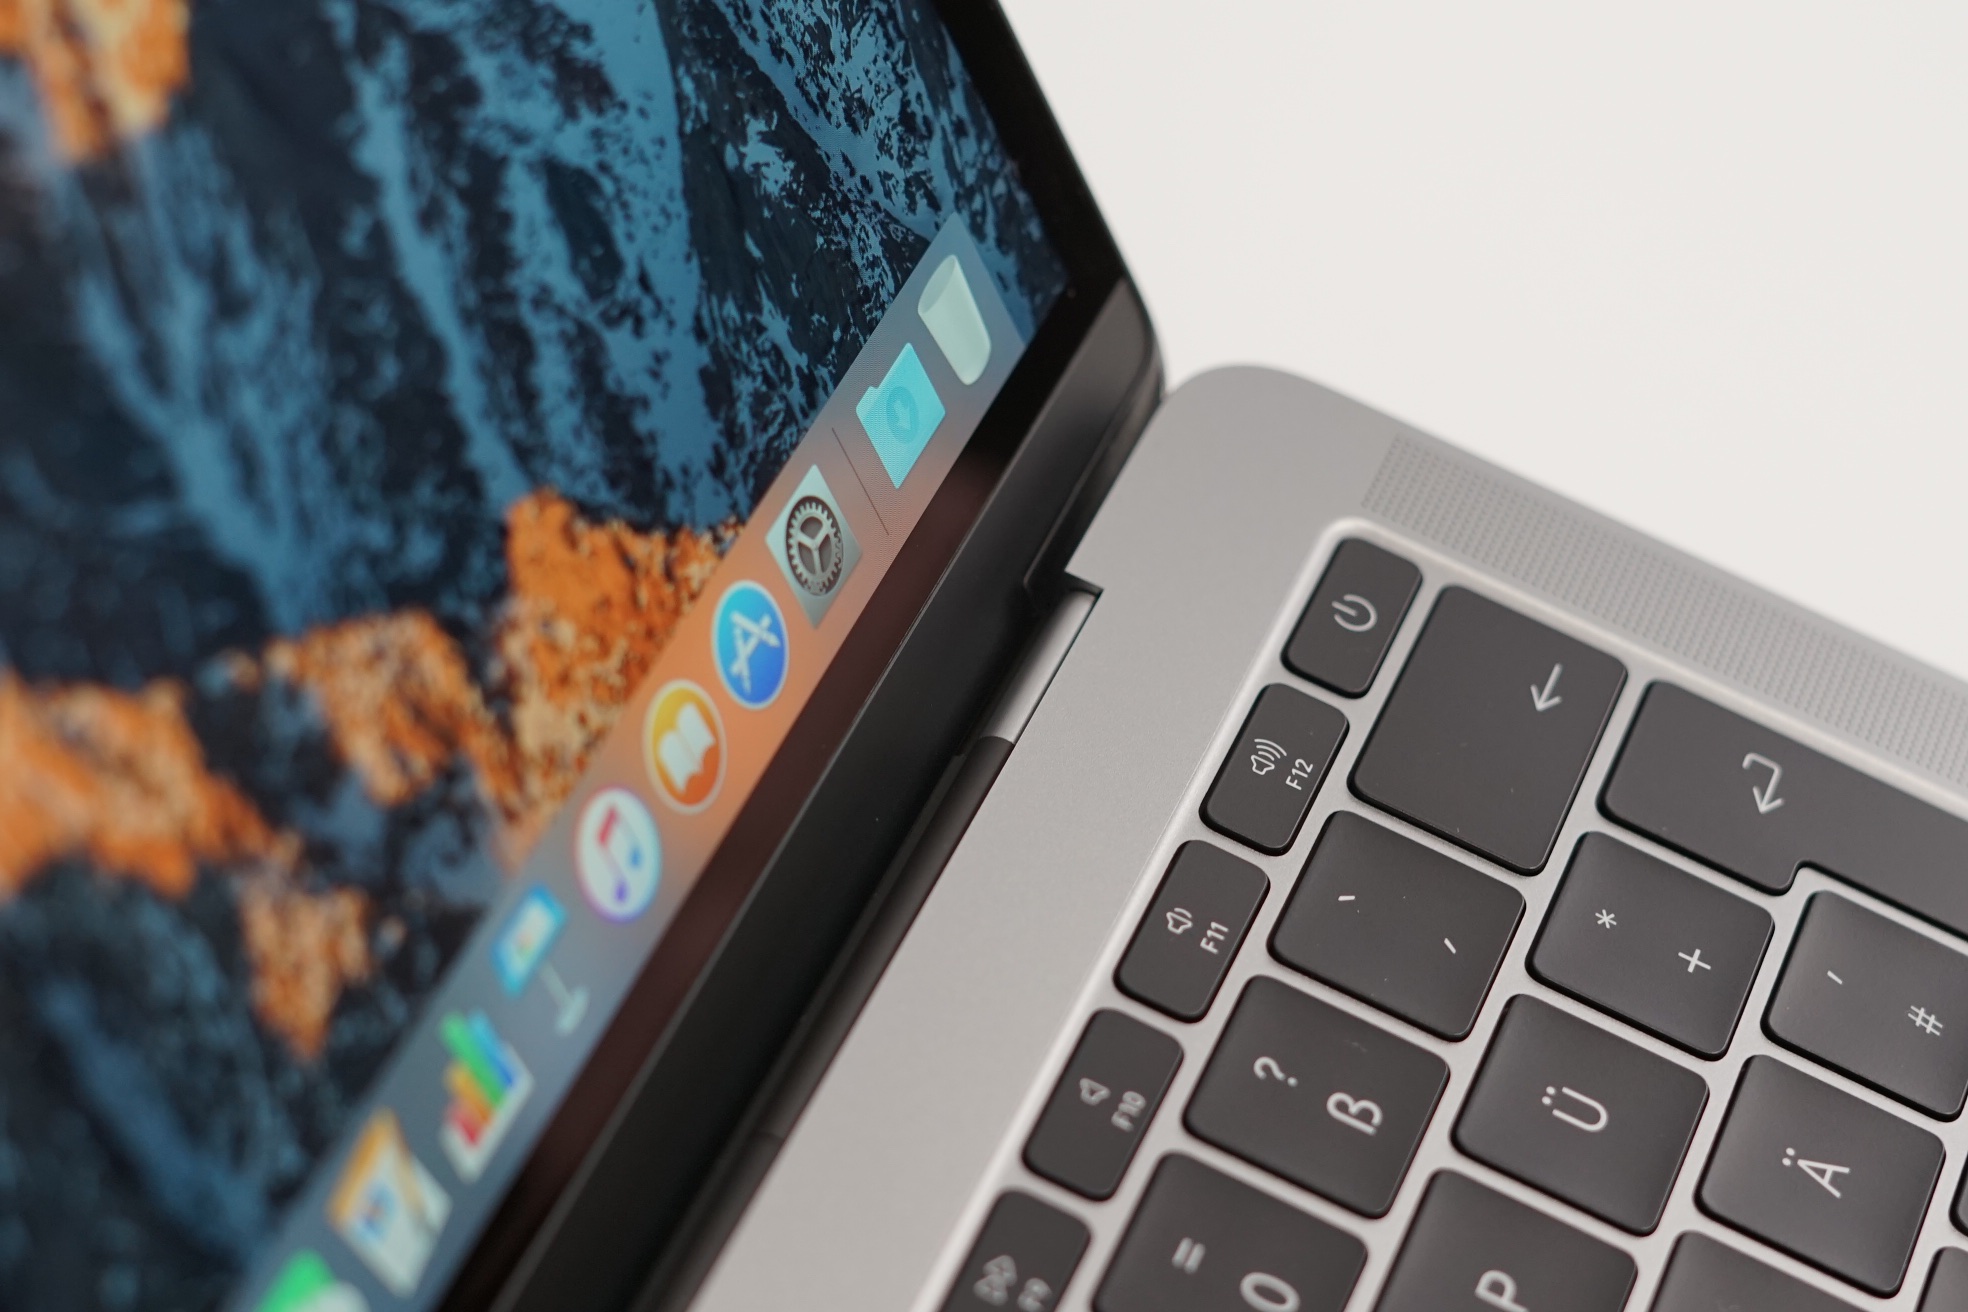
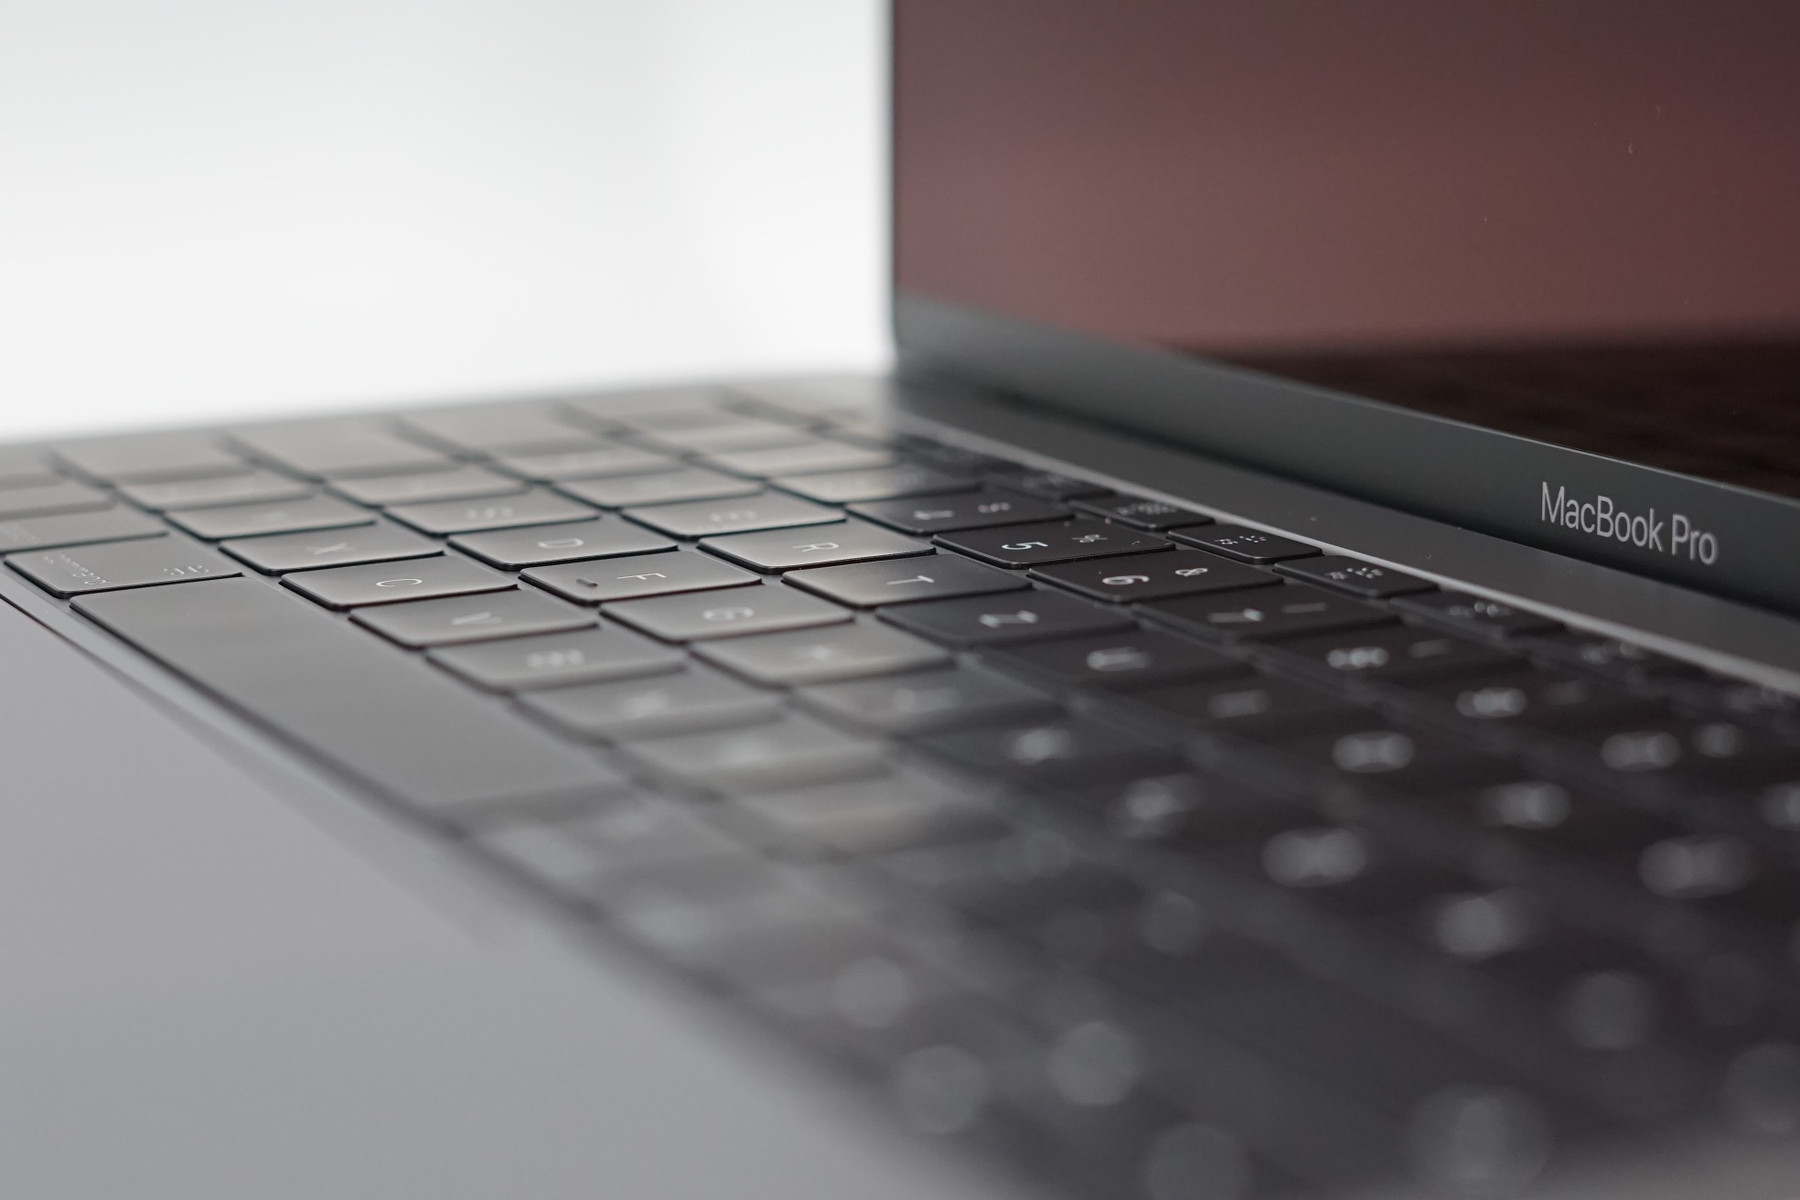
Thinner, lighter, and also available in "Space Gray" – this is how the new MacBook Pro case can be characterized. You still get the excellent impression of the unibody aluminum case, which is familiar from the previous models and the rest of Apple's lineup. Stability, tactile feel and design are on the highest level. The new and particularly thin hinge is subjectively not all that different from the old one. The speakers are now located next to the keyboard and the new touchpad is much bigger. Apple also reworked the keyboard and it is very similar to the small 12-inch MacBook. The illuminated Apple logo on the lid was removed to enable a thinner case and is now just as glossy as on the 12-inch model. The bottom panel is still secured with proprietary Pentalobe screws.
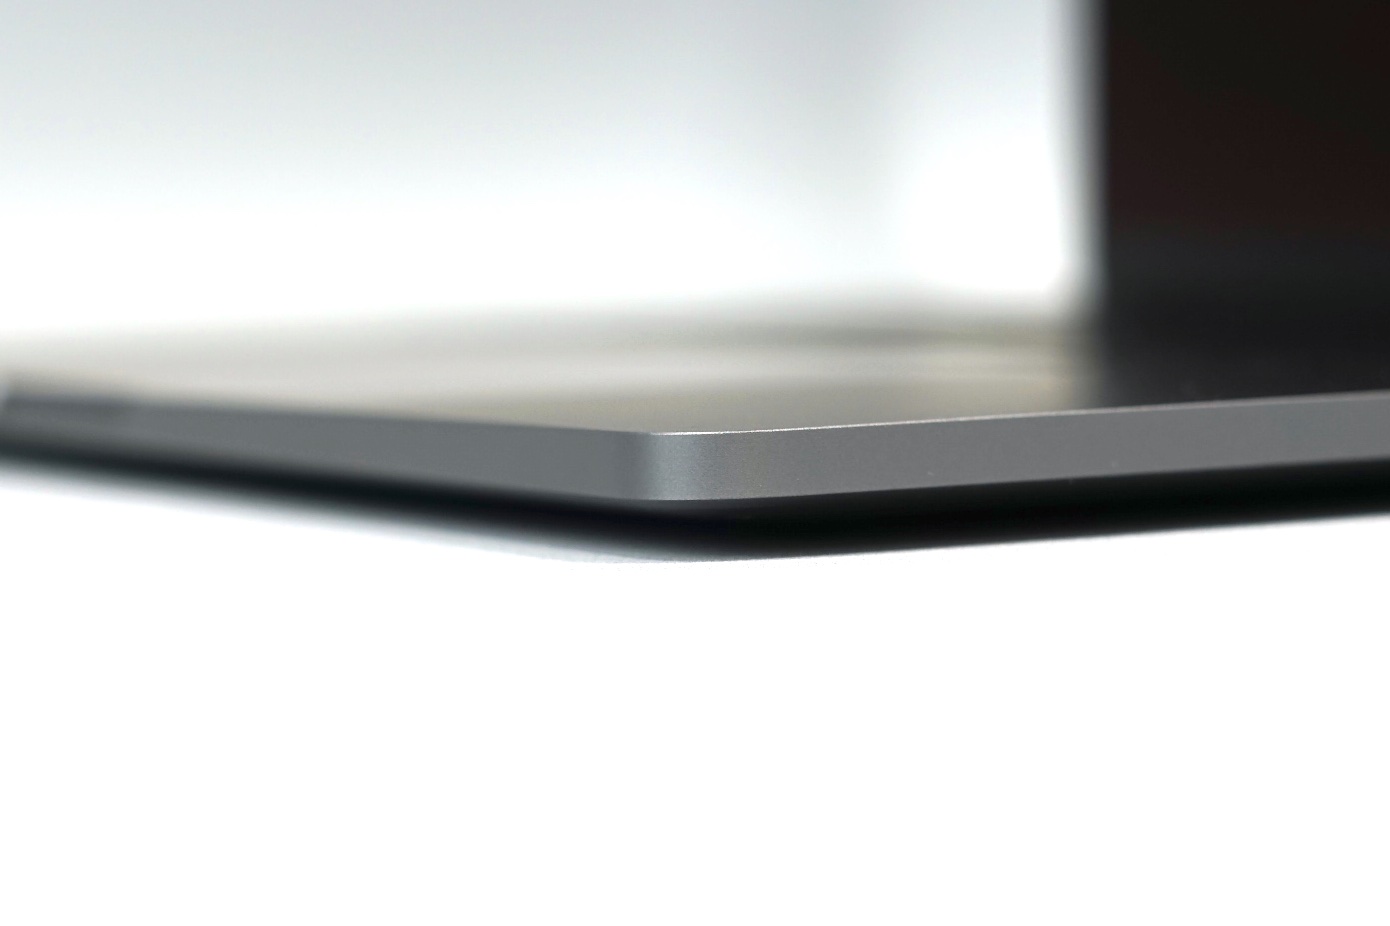
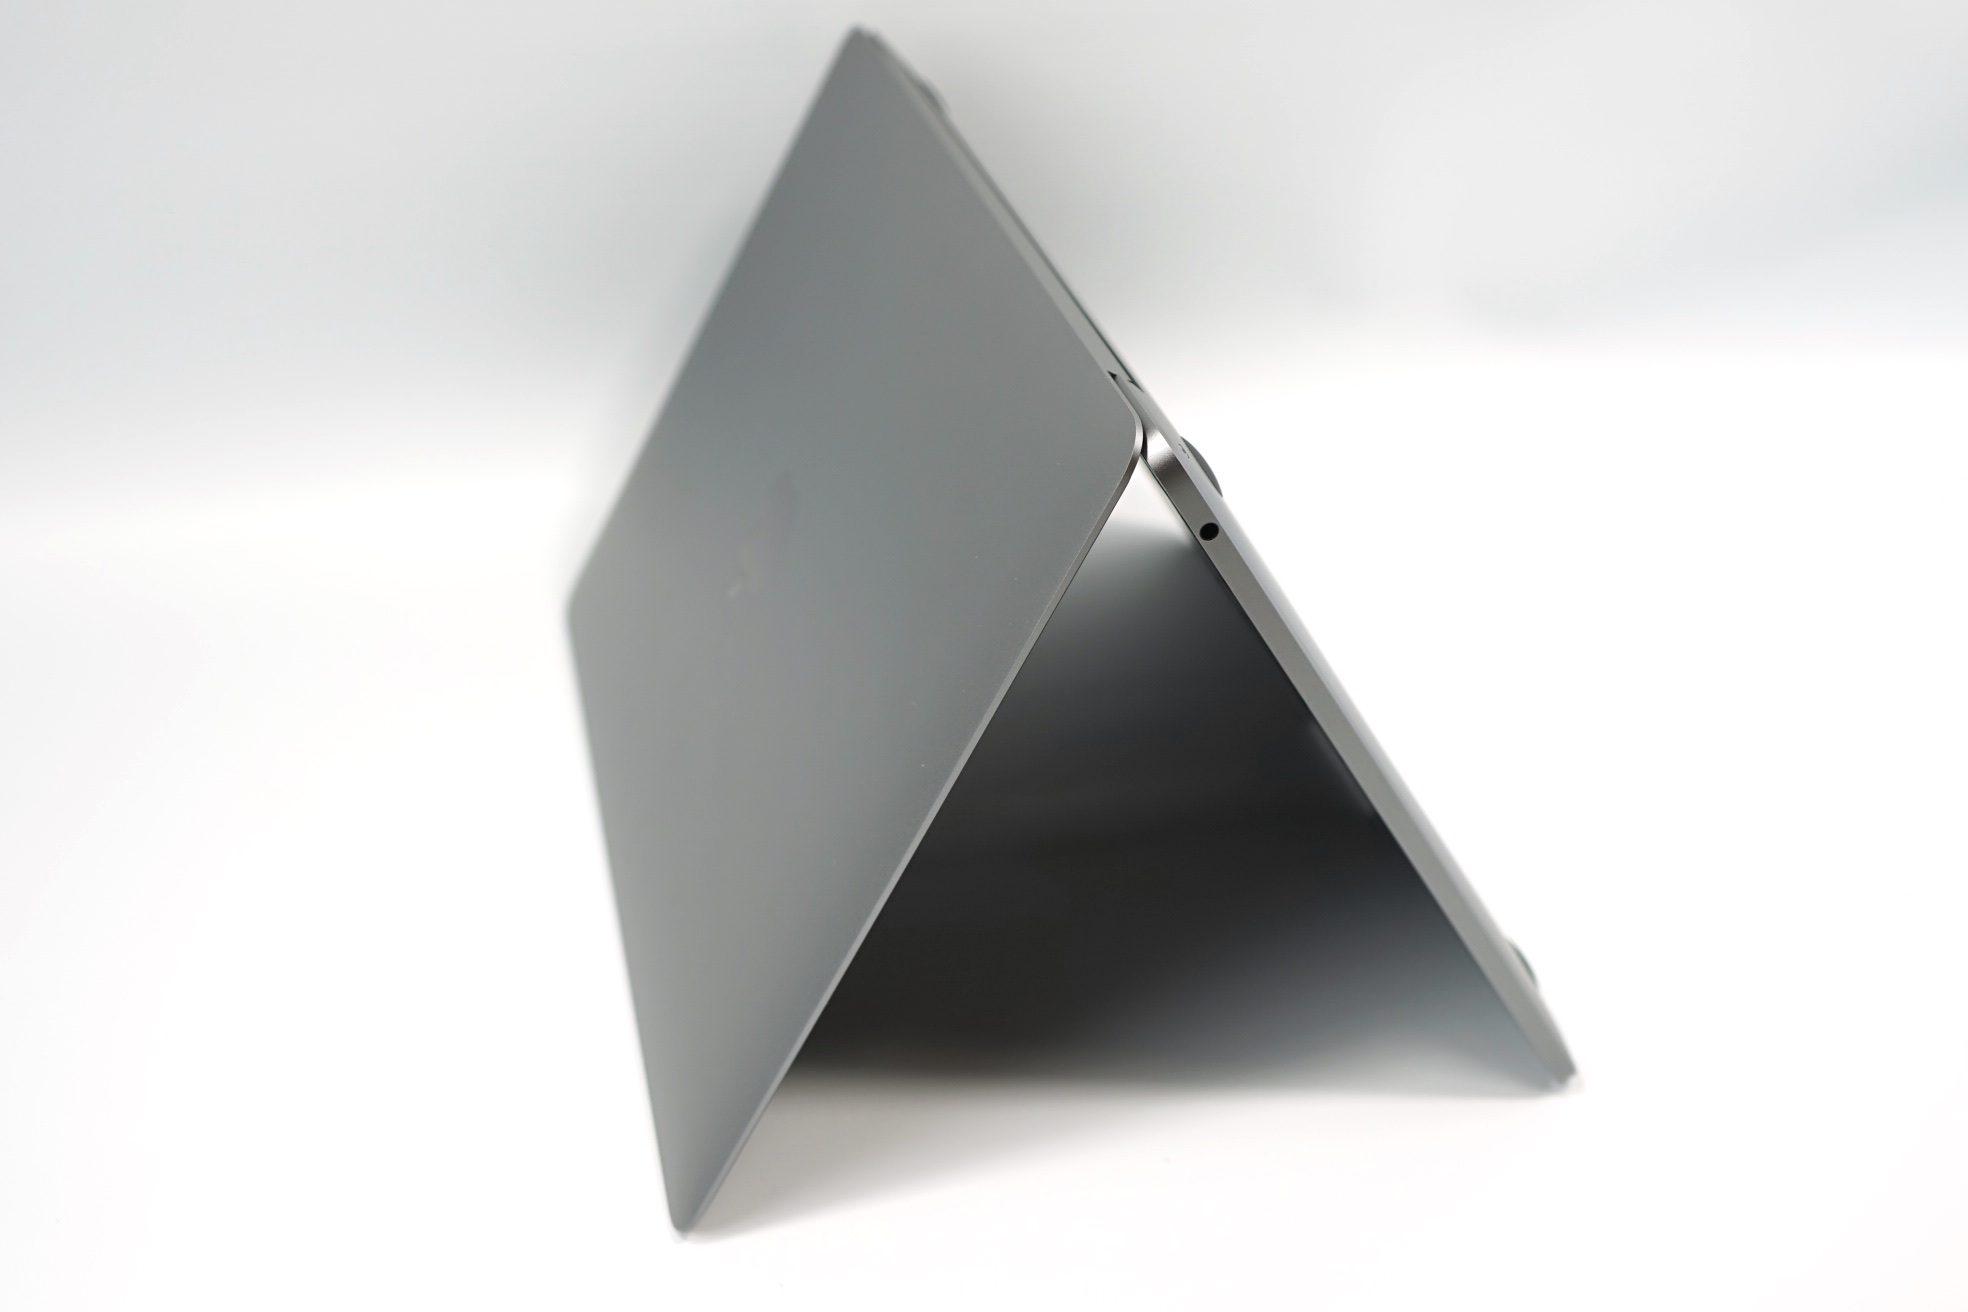
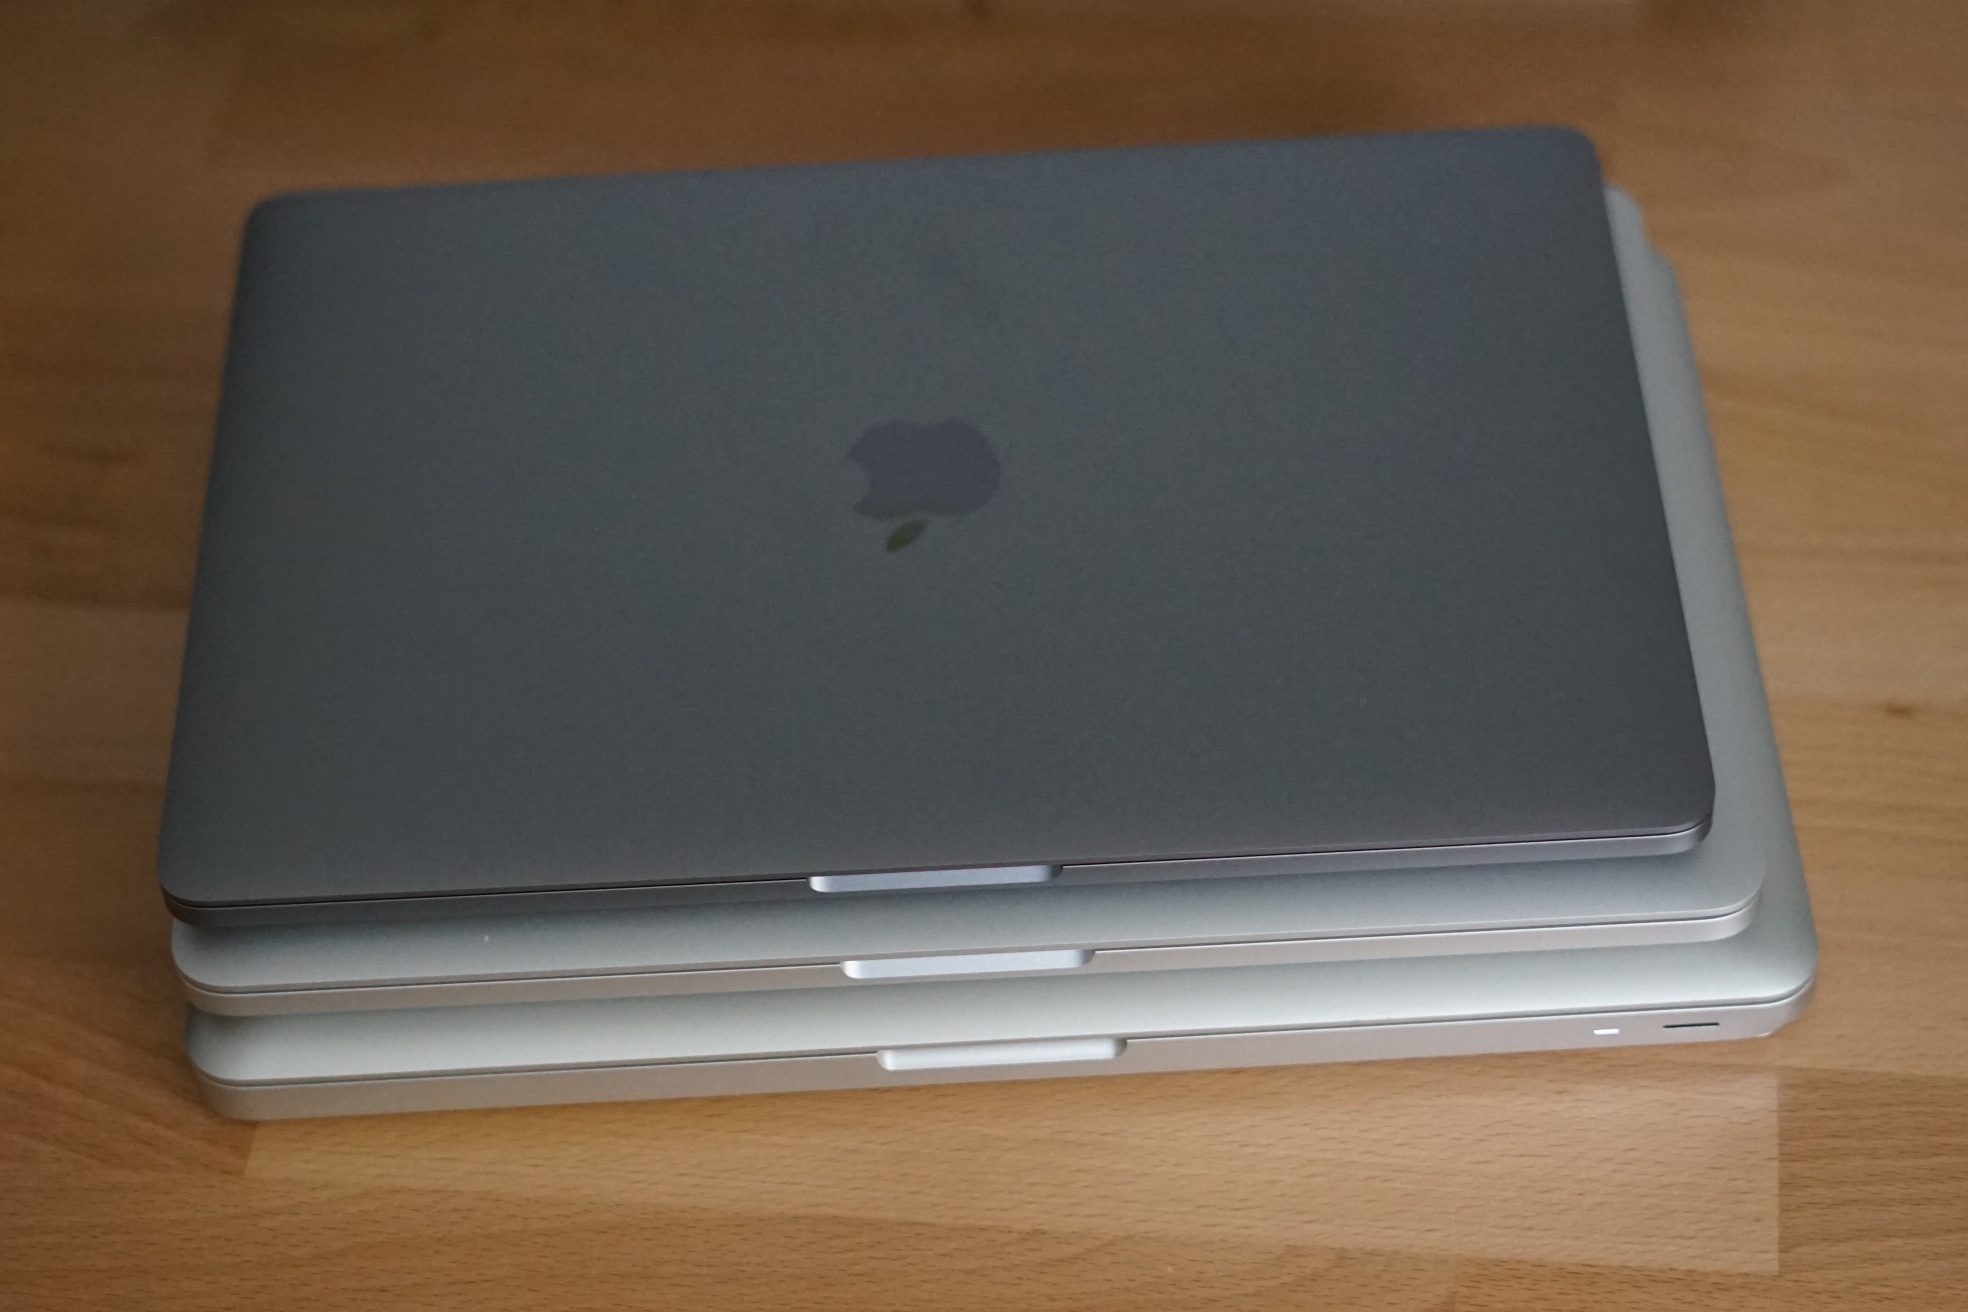
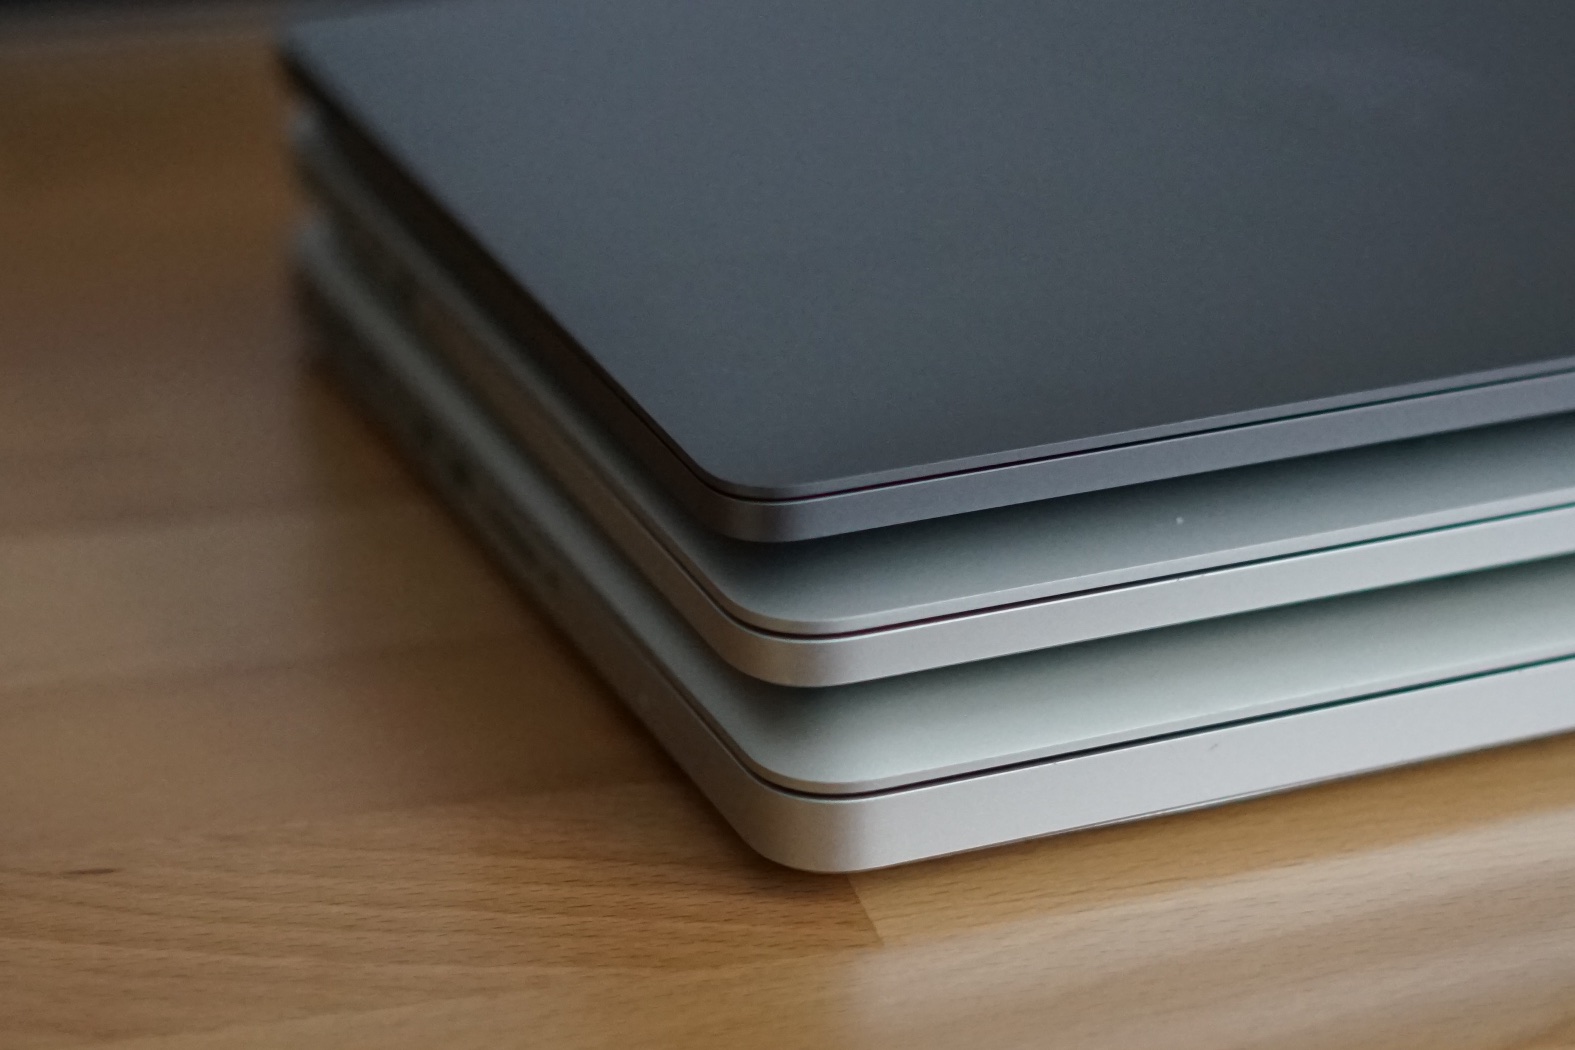
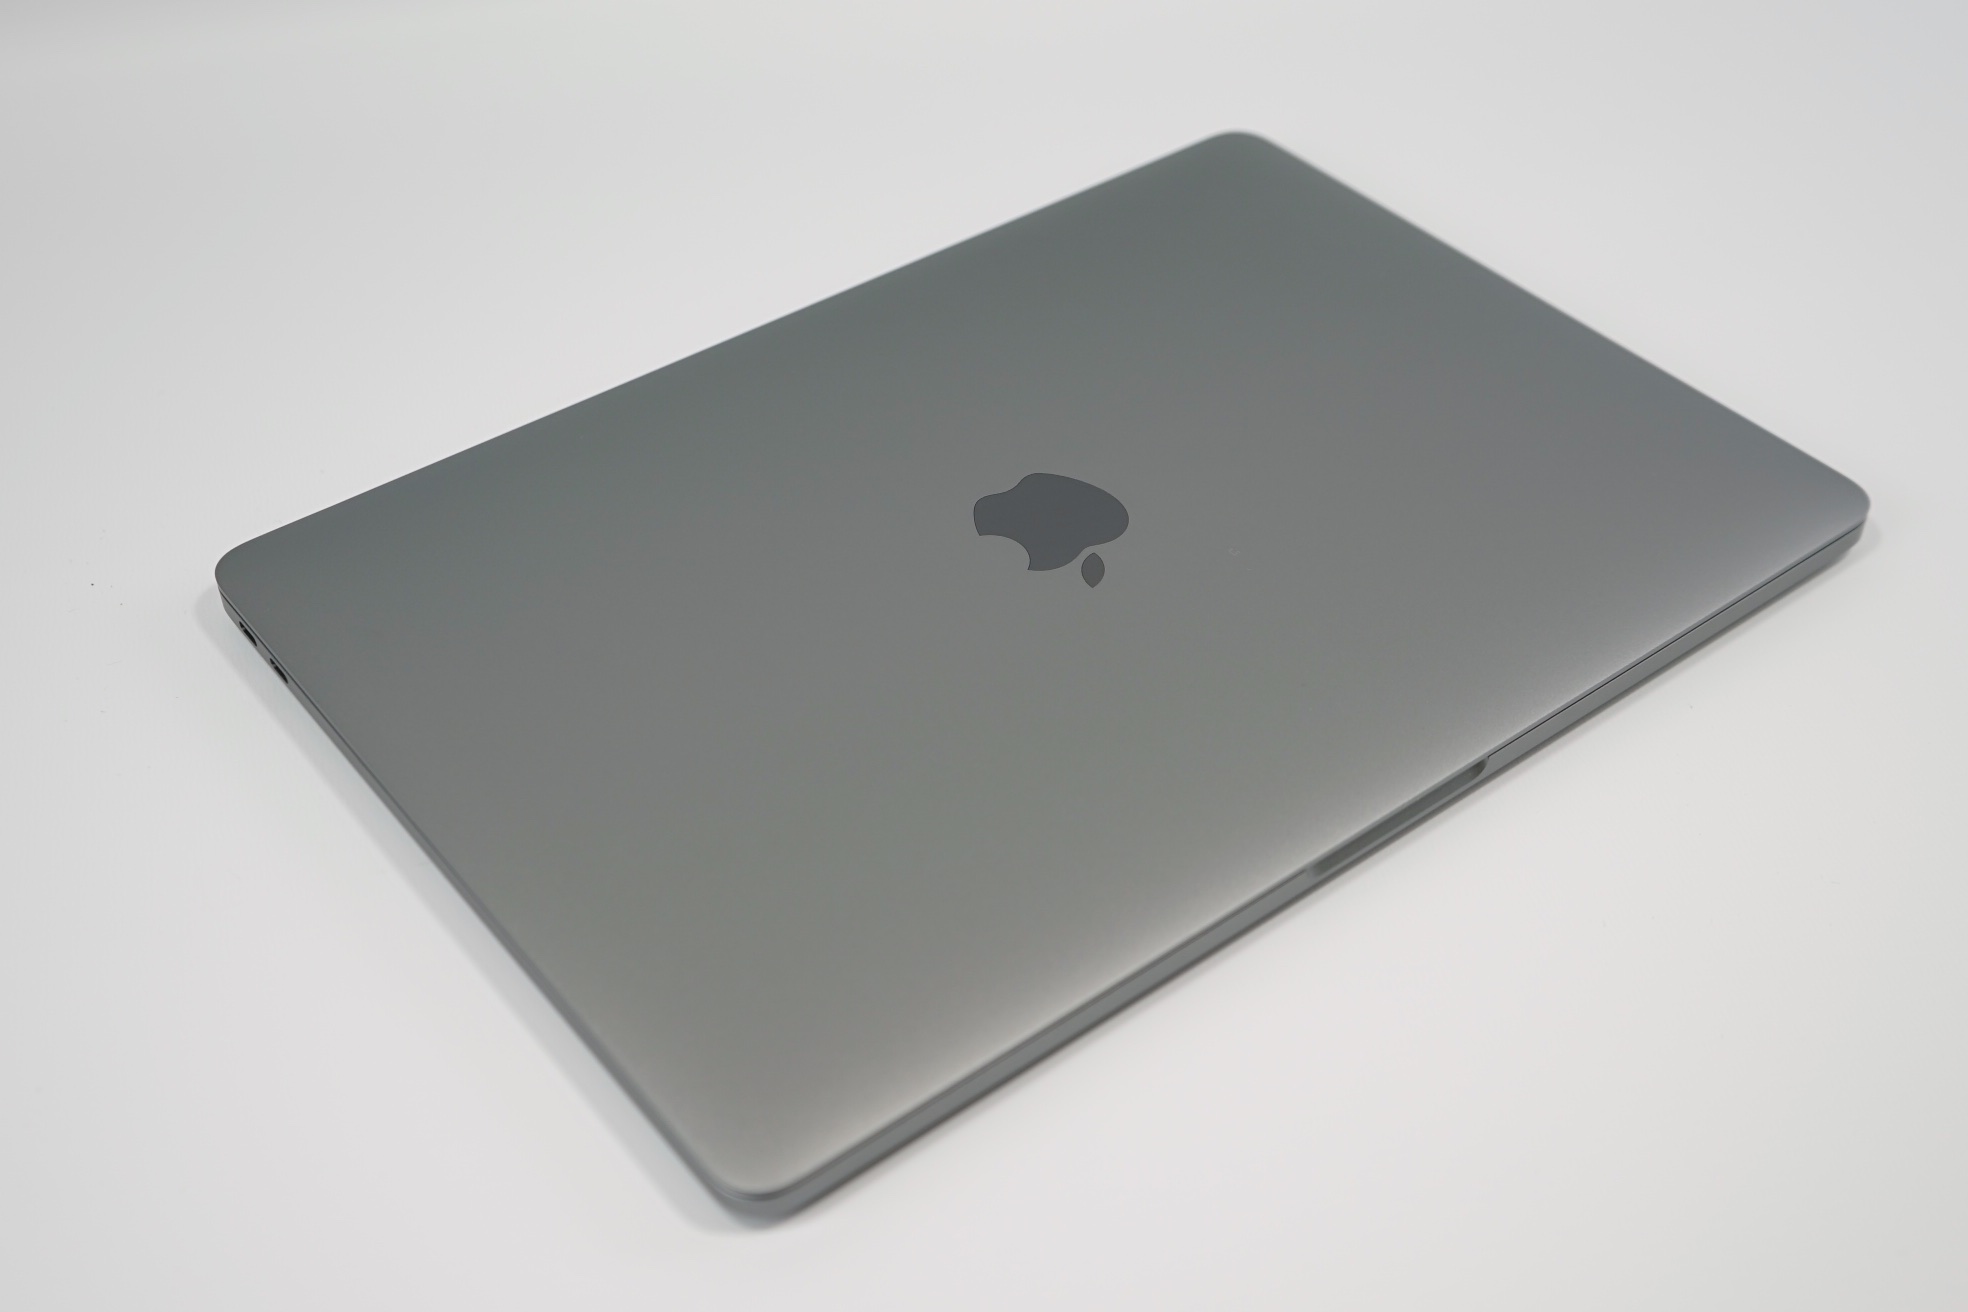


Compared to the other models from Apple's lineup, the new Apple MacBook Pro 2016 has much more compact dimensions, both compared to the direct predecessor as well as the MacBook Air 13. At up to 17 millimeters at its thickest spot, the latter is even 2 millimeters thicker than the new Pro. The weight of the Air 13 and the new MacBook Pro is roughly on par, and the previous MacBook Pro 13 is about 200 grams heavier. The new 15-inch model will tip the scale at about 1800 grams and therefore 400 grams more than its 13-inch counterpart, but it will be just one millimeter thicker.
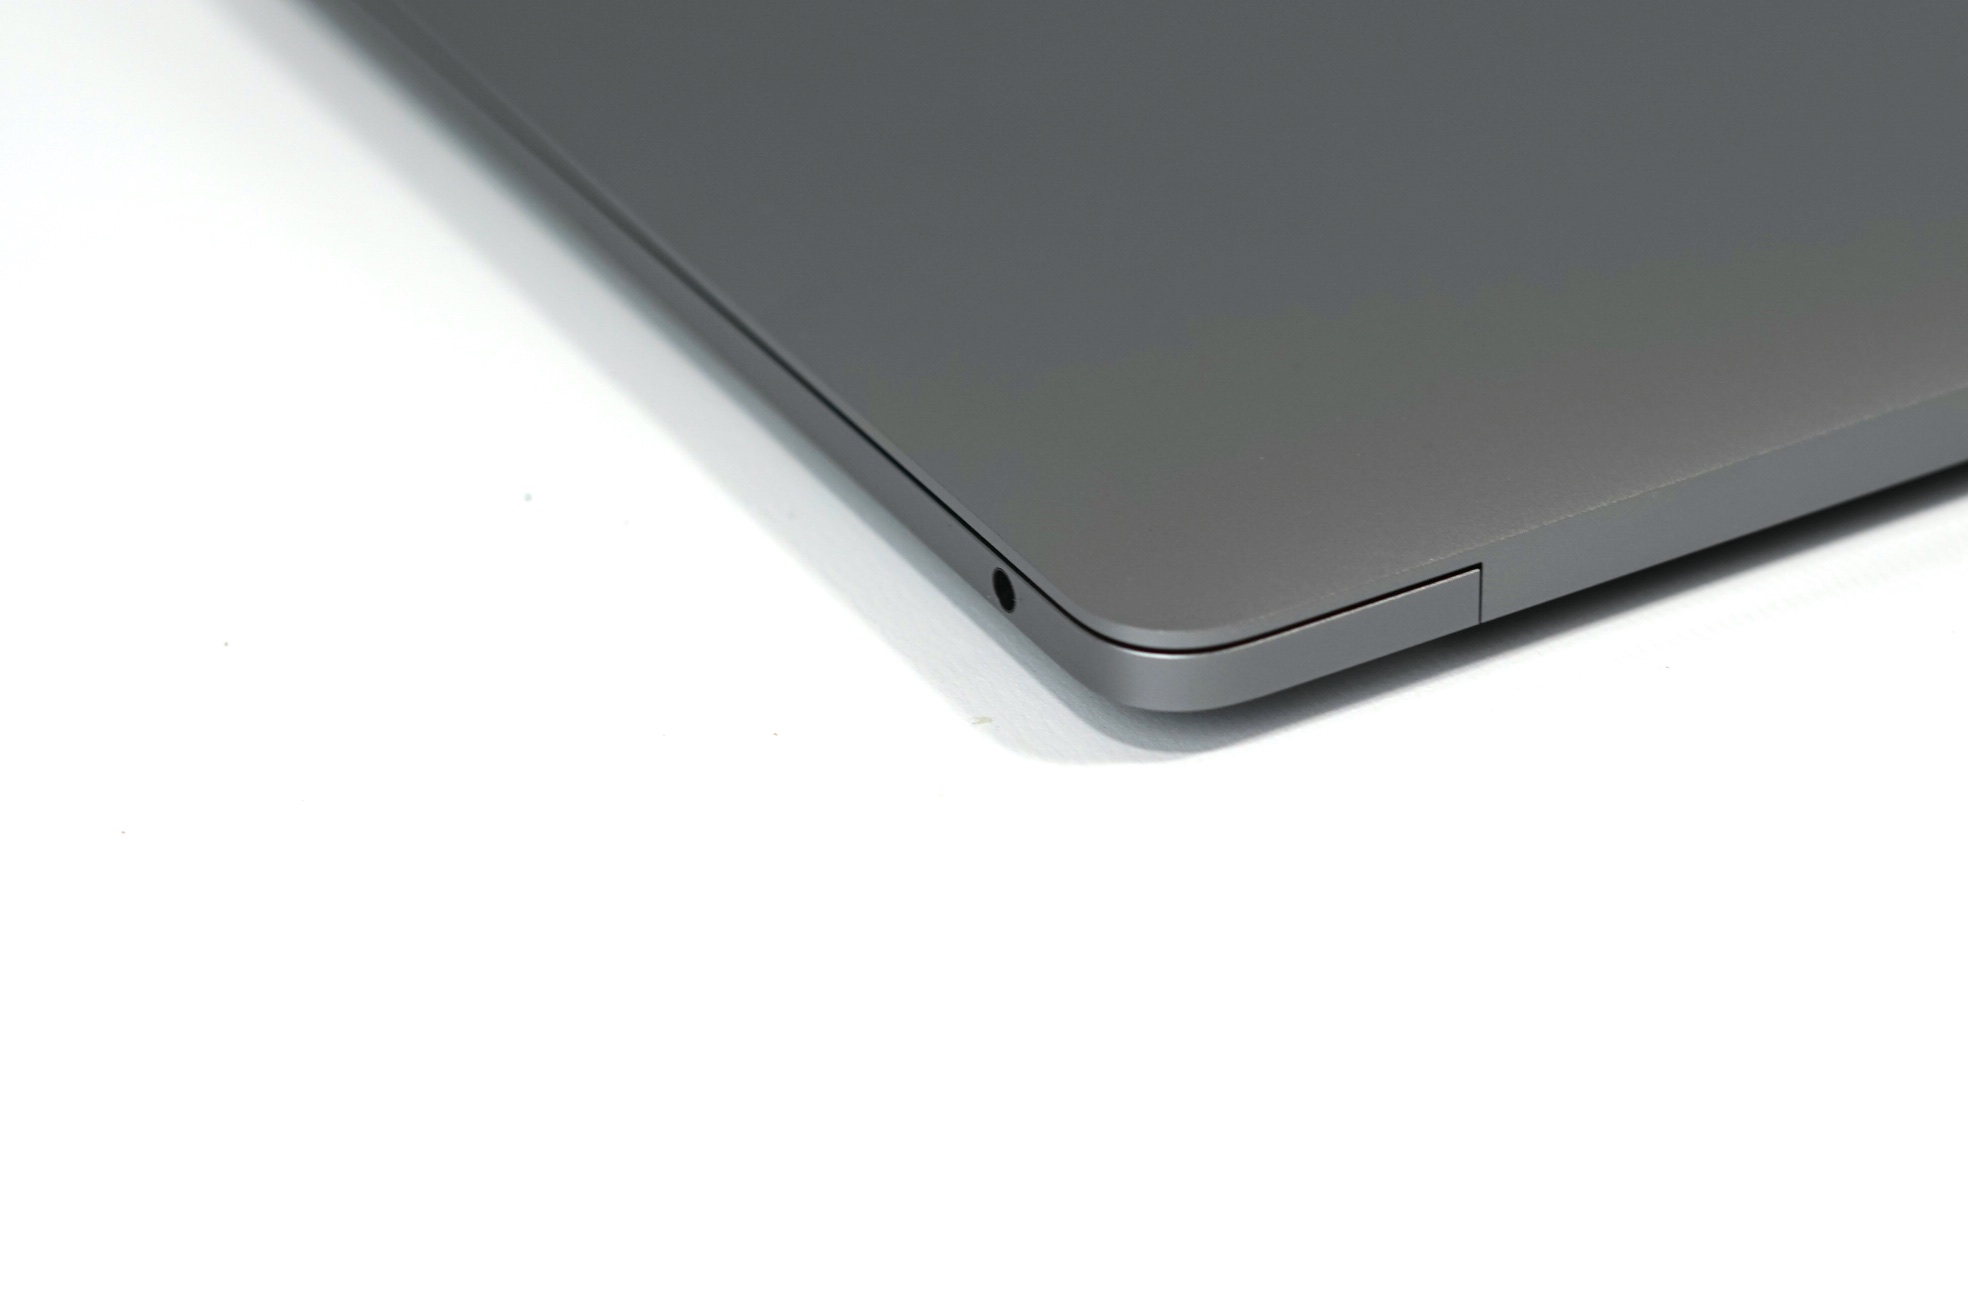
Connectivity
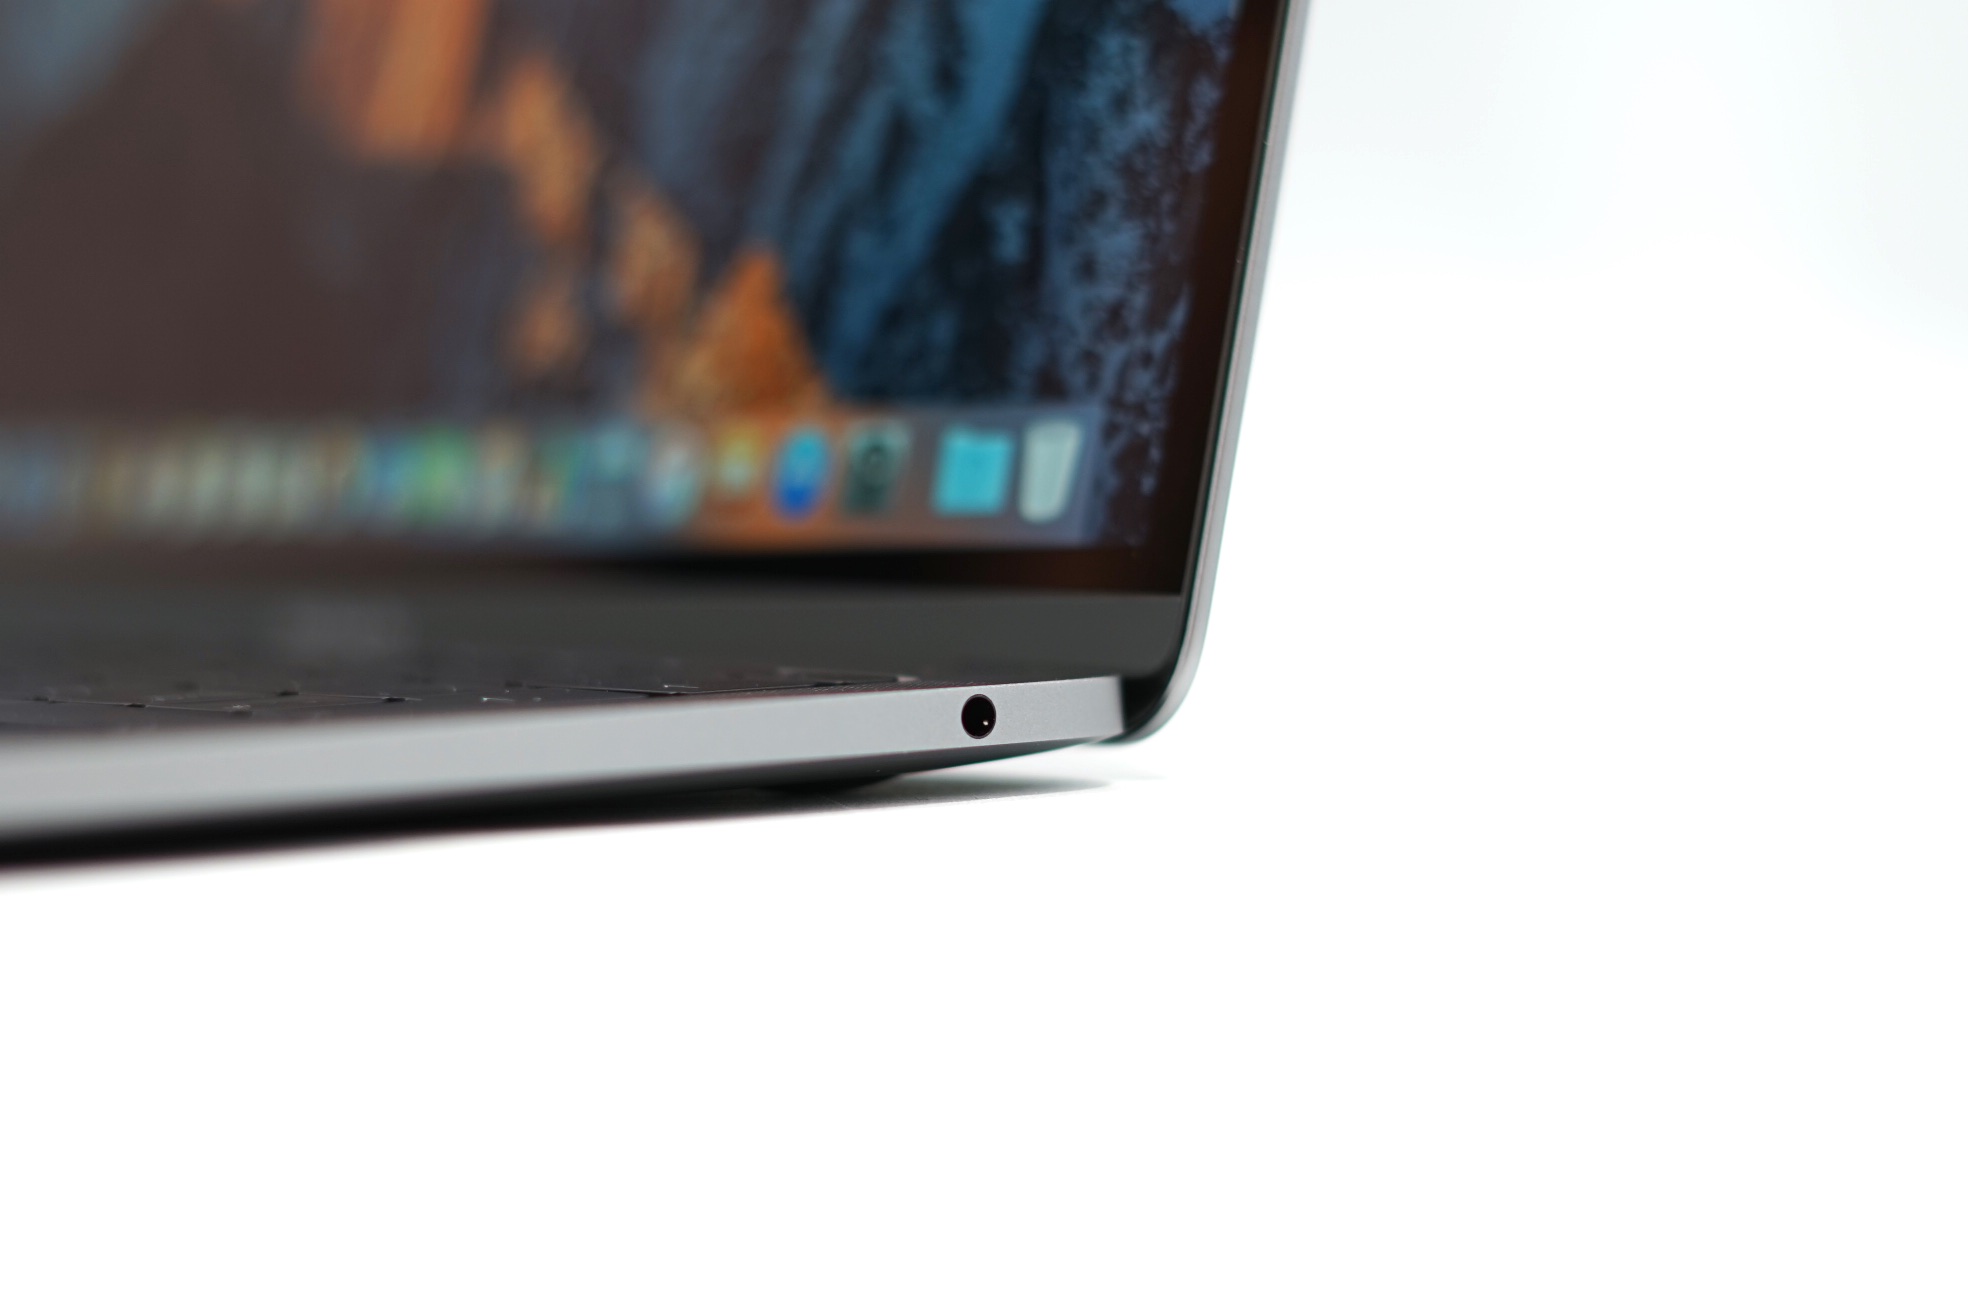
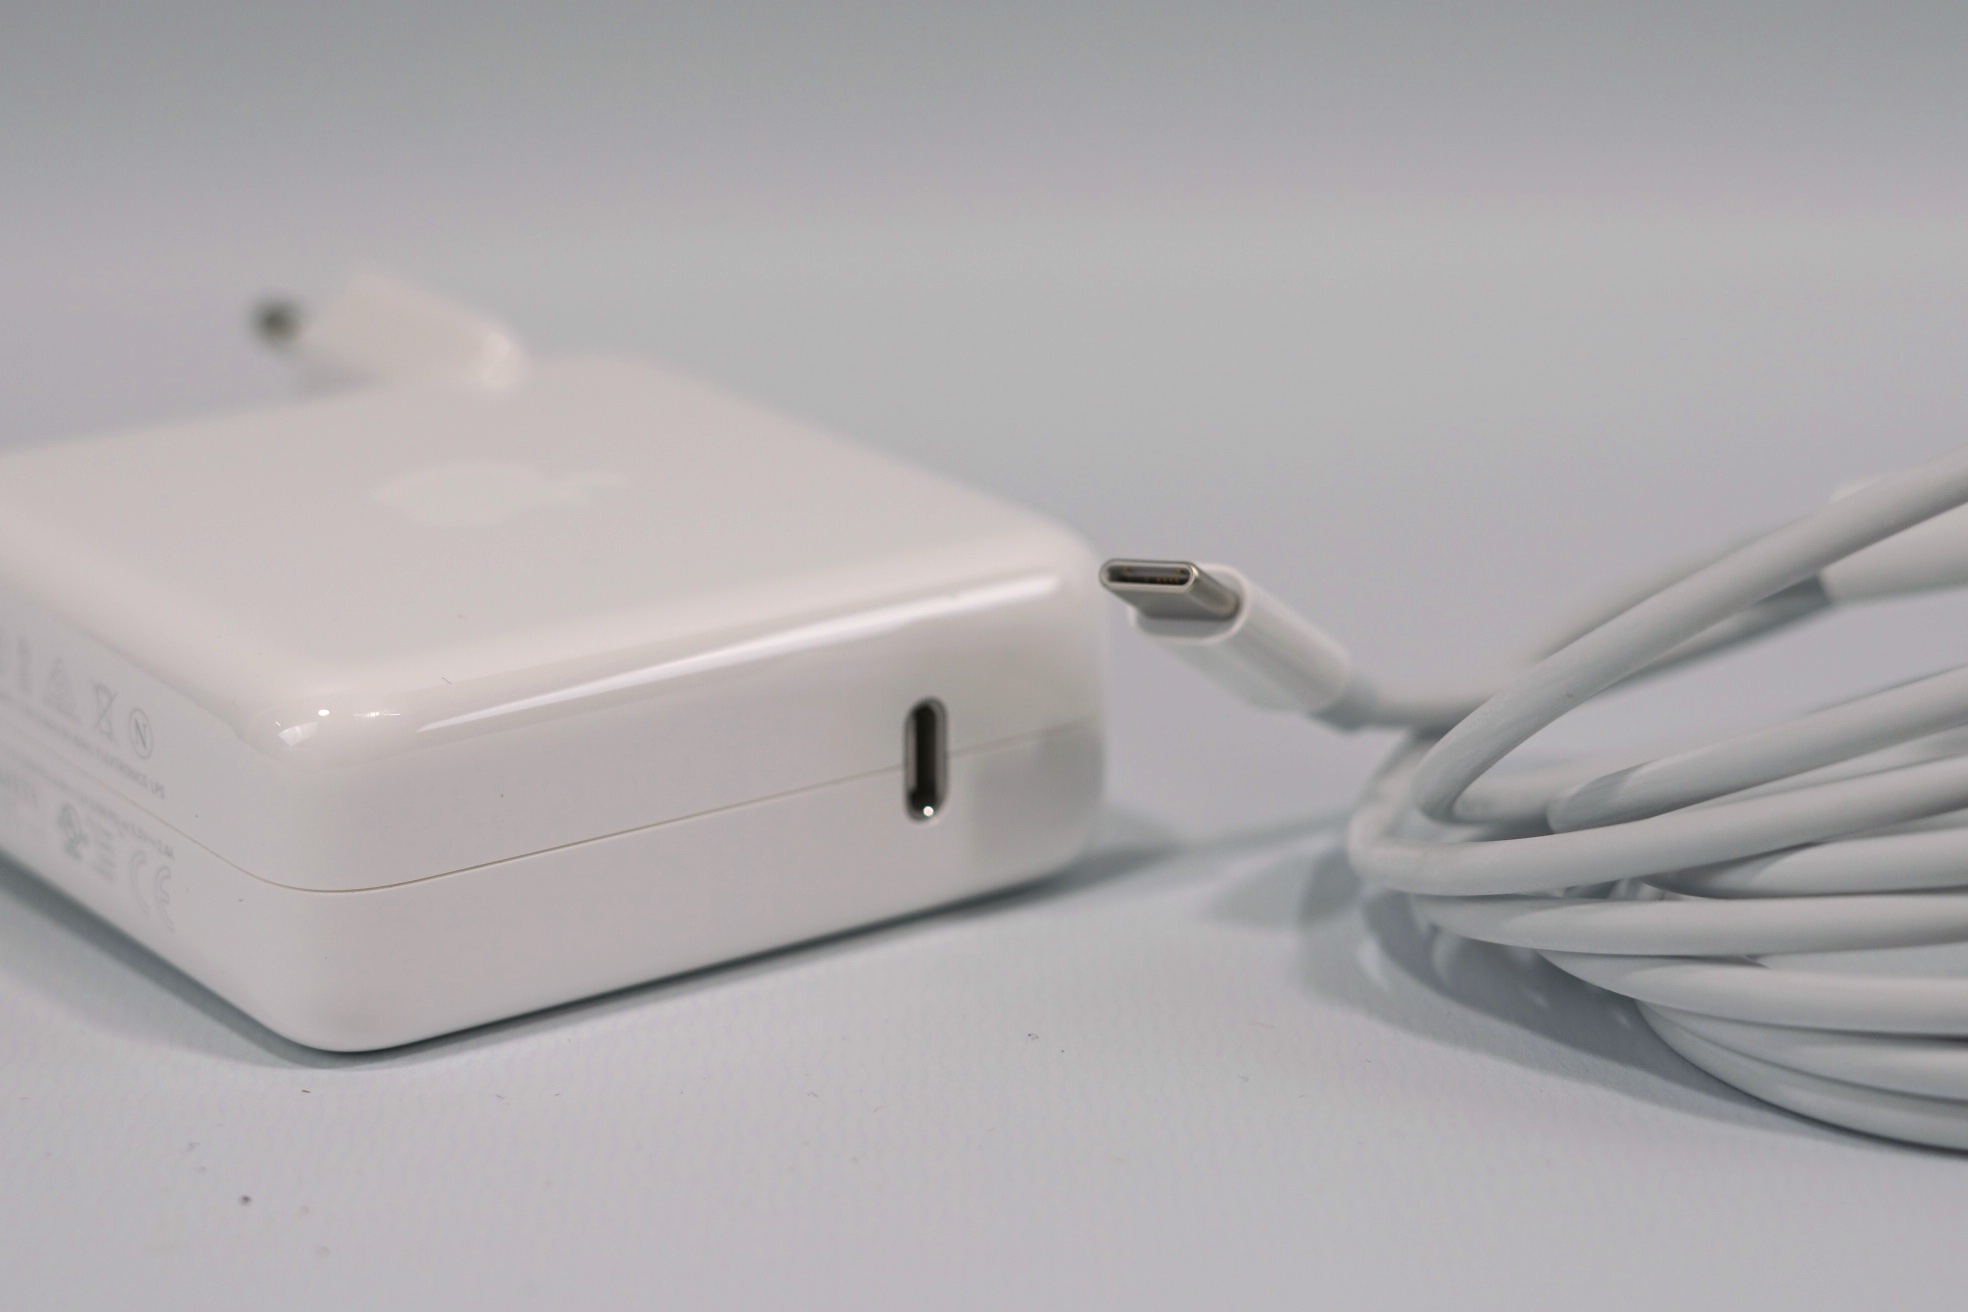
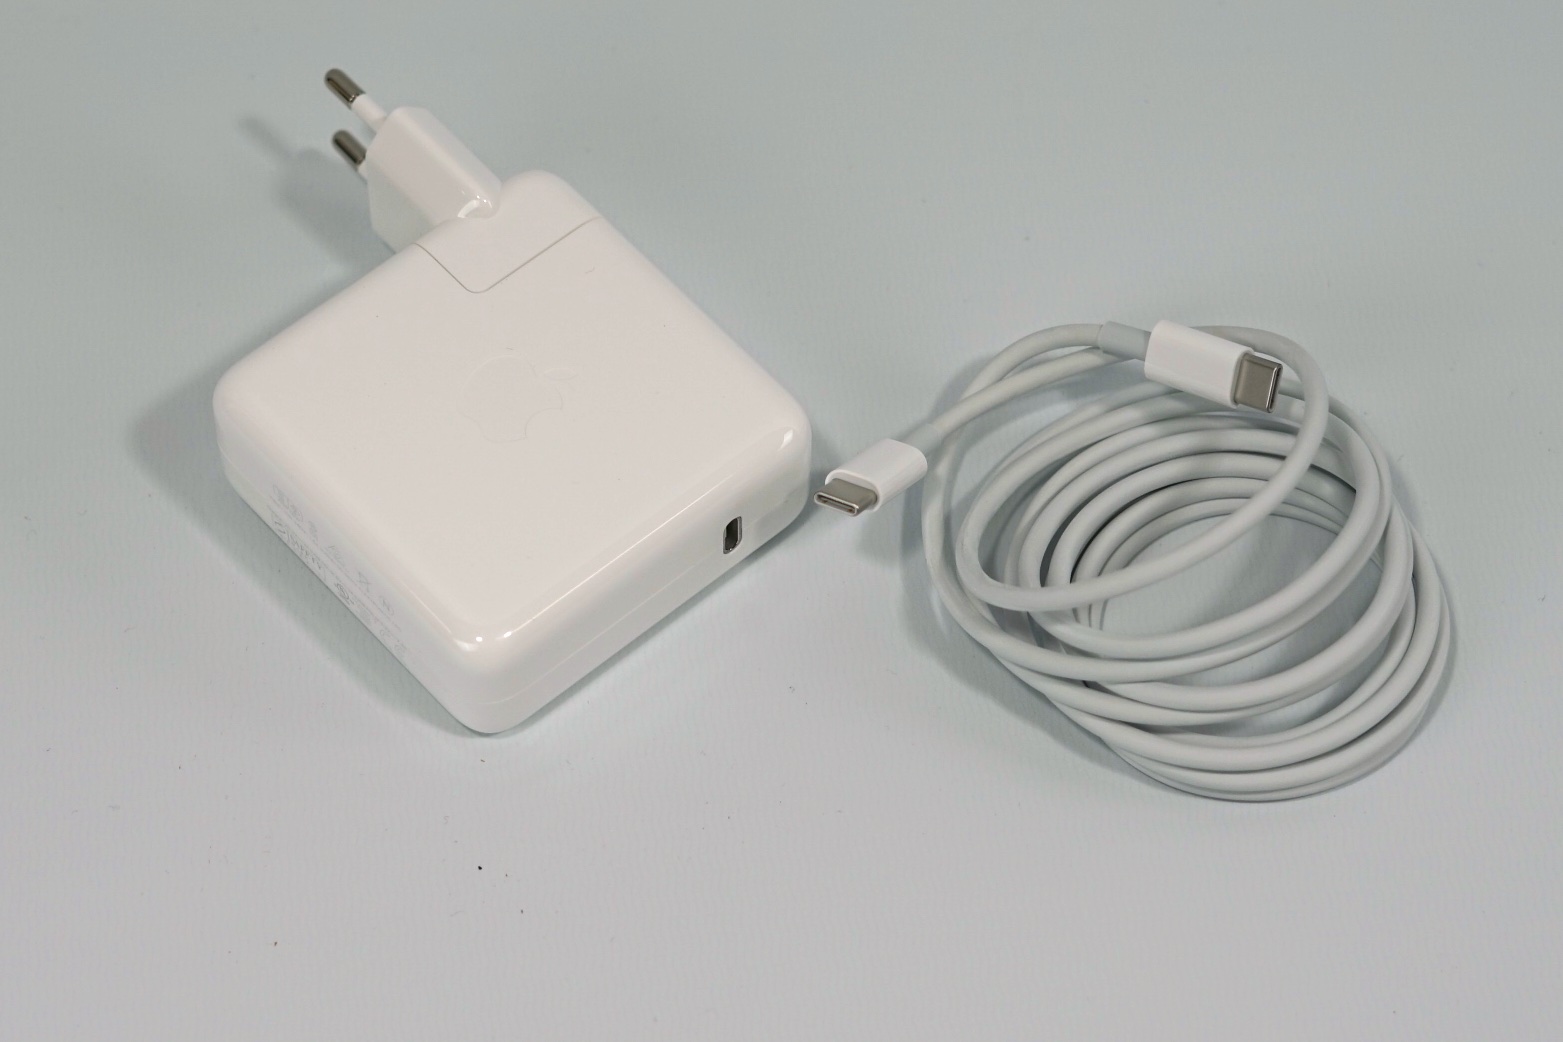
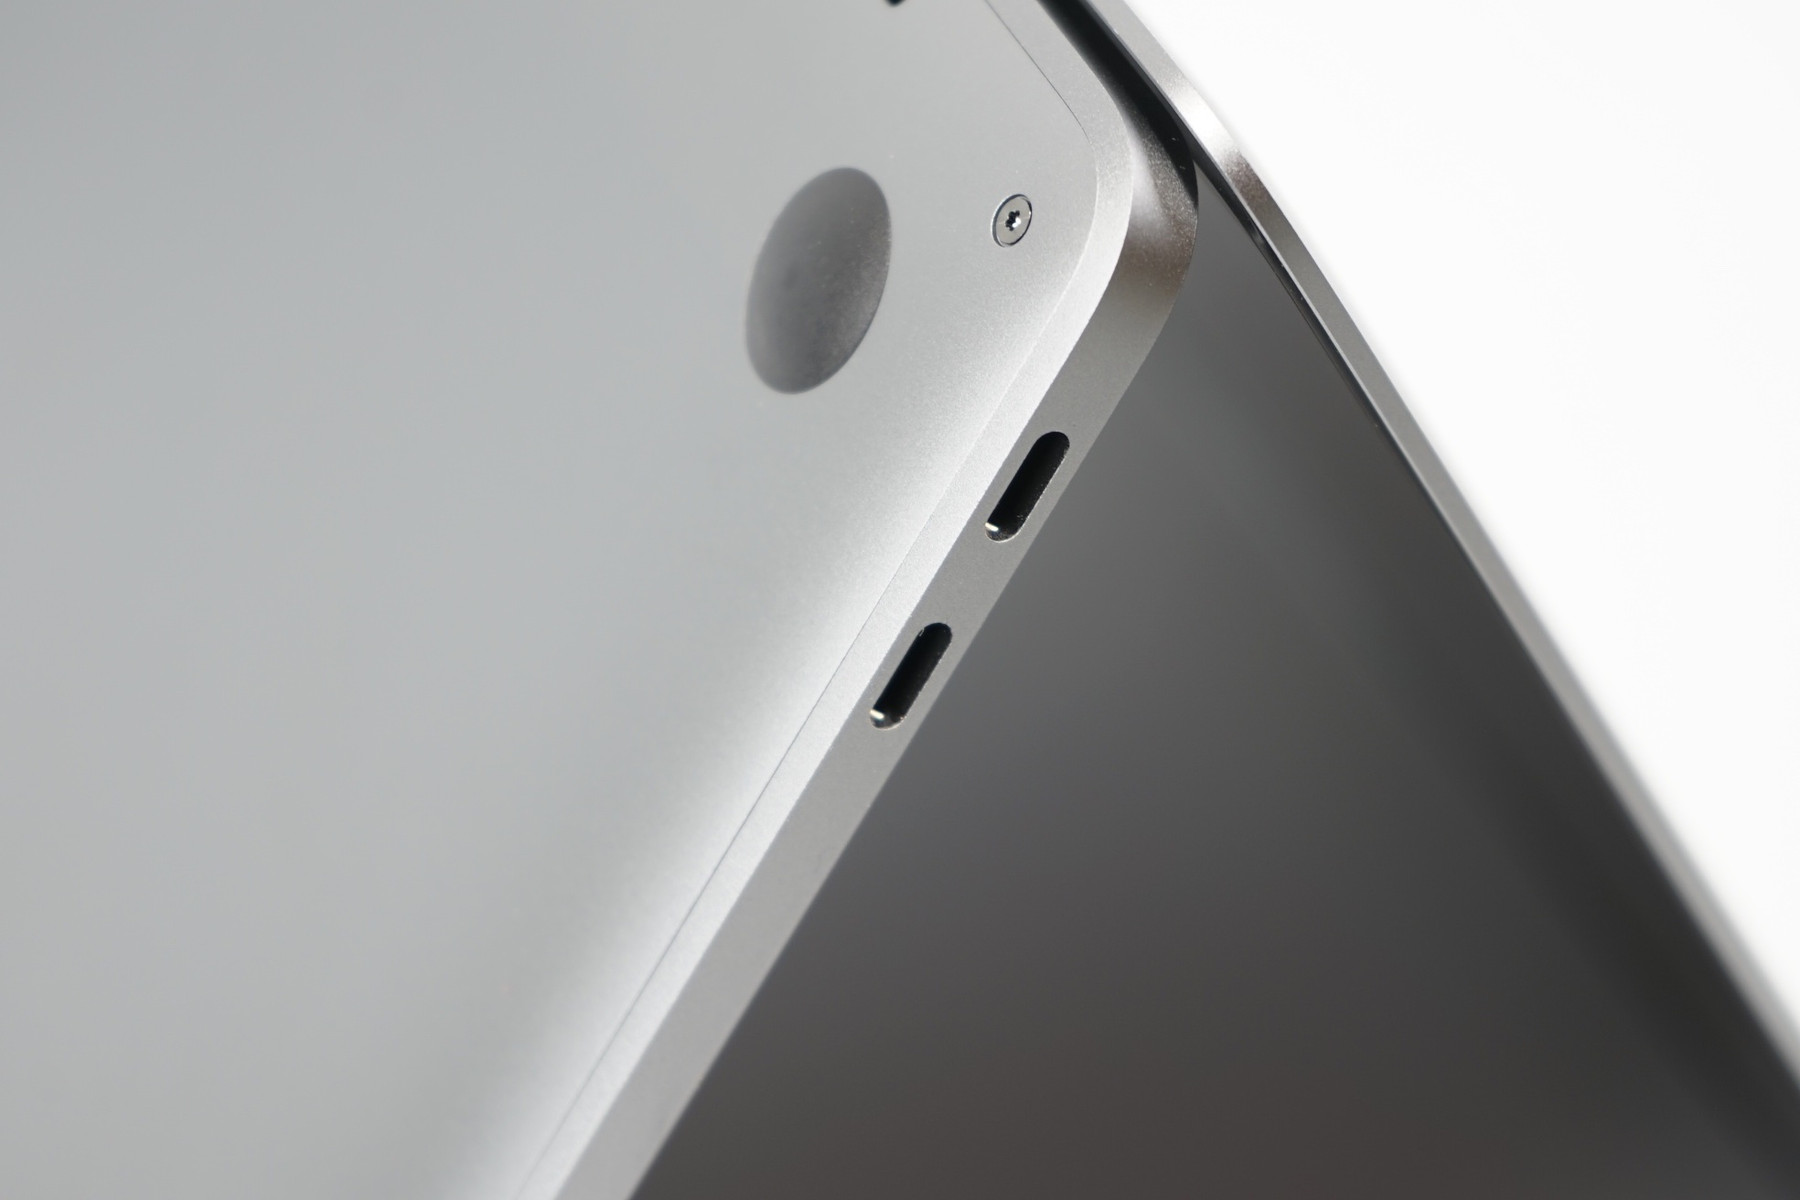
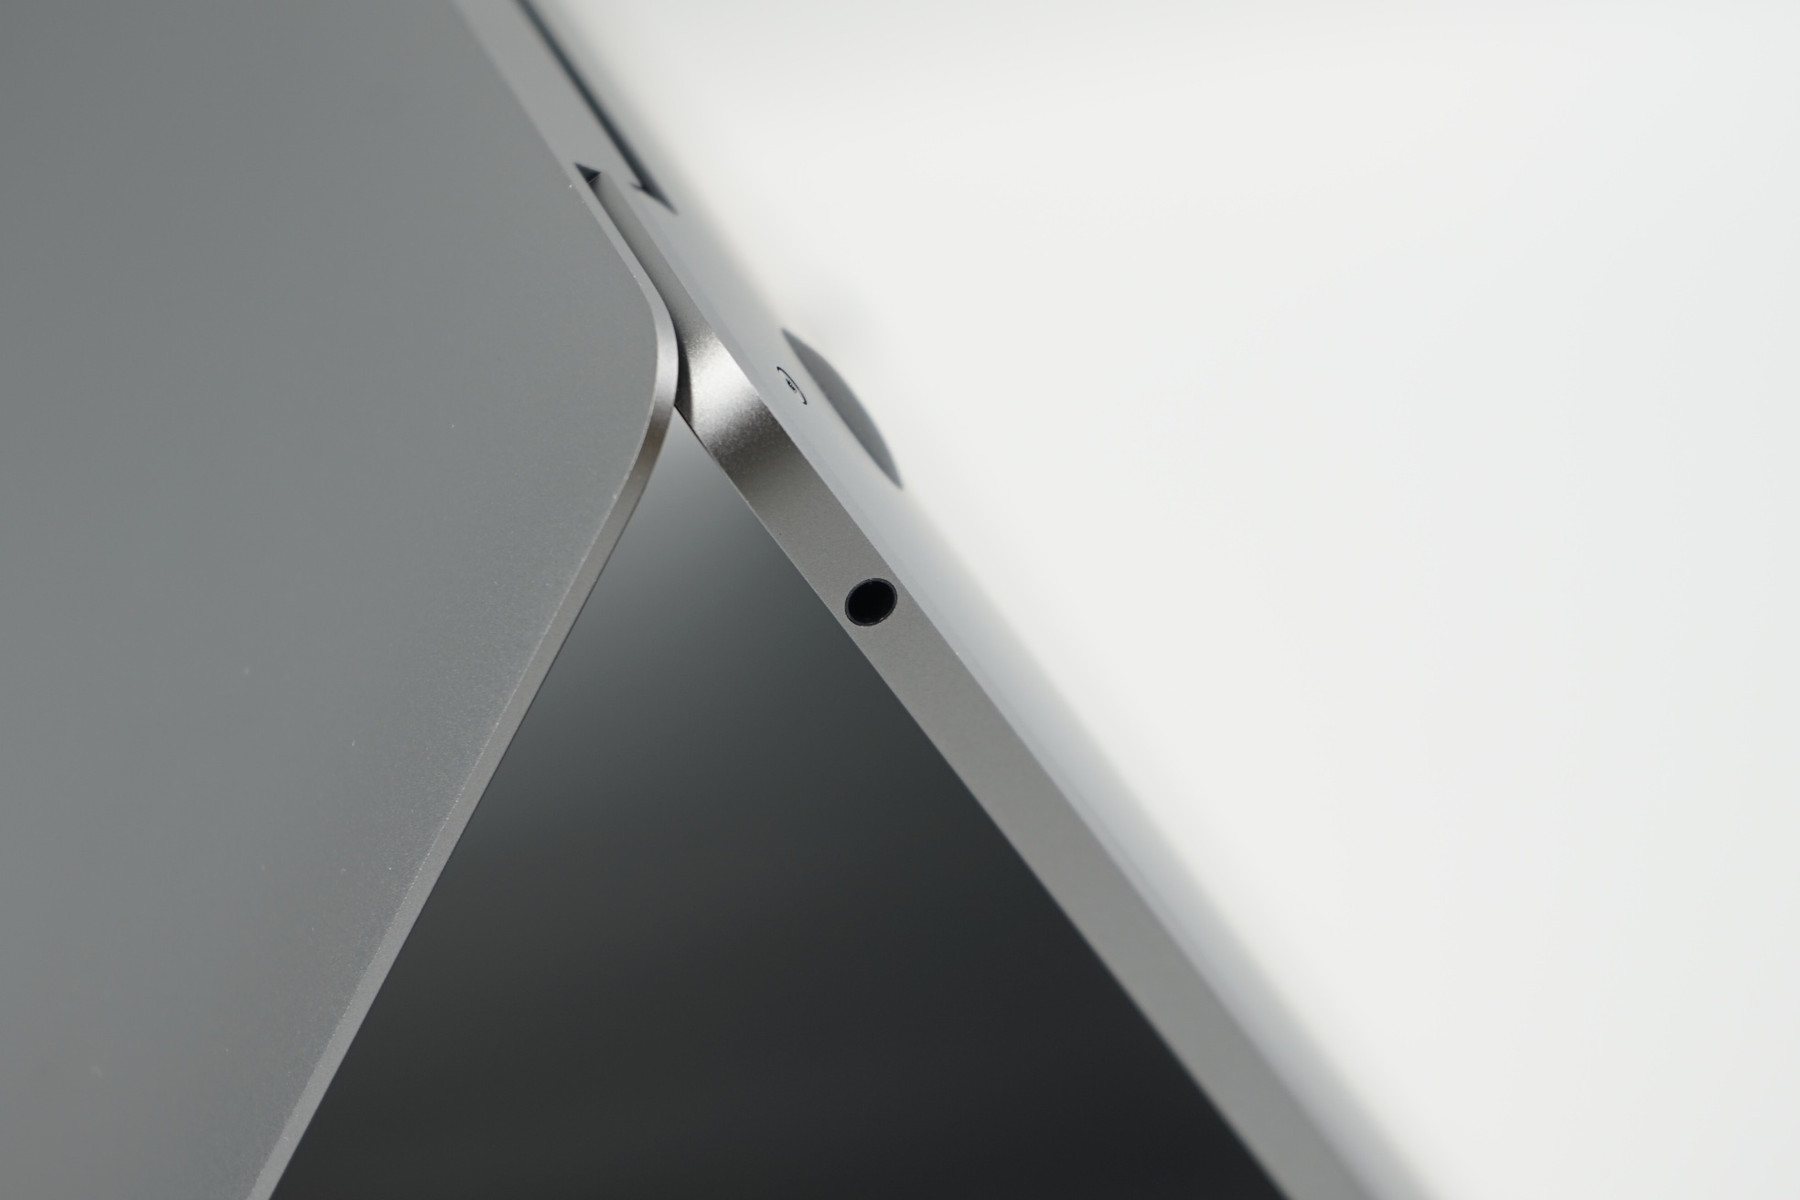
Two Thunderbolt 3 ports with a USB Type-C connector and one stereo jack for headphones – that's it. The two Thunderbolt ports are, however, very versatile, at least when you have the corresponding (expensive) adapter. Besides the power supply, you can also attach displays and transfer up to 40 GB/s of data via the port. The more expensive models have 4 ports (the two ports on the right side of the 13-inch model are only half-speed).
Here are some examples for adapters from Apple: USB-C to USB-A adapter: $19.00, Thunderbolt 3 to Thunderbolt 2 (mDP): $49.00, USB-C to Gigabit Ethernet: $34.95.
Webcam
The integrated iSight webcam takes pictures with a resolution of 1080 x 720. The colors are okay, but both the resolution as well as the noise behavior are very outdated. All details disappear in low-light situations and the results are not even very convincing in daylight. There has not been an improvement in this department for years now. It is unfortunate, especially since Apple's iPhones show what is currently possible.


Communication
The integrated AC WLAN card cannot use antennas behind a black plastic strip anymore. However, our WLAN test does not confirm any suspicions that the performance is now reduced. The excellent performance of the previous model (in this case the 2013 model) is not reached by the new MBP, but it is still faster than the fastest Windows notebook, so this is criticism on a very high level. Apple probably equipped the entry-level system with a lower-spec WLAN card, the Touch Bar models should perform even better.
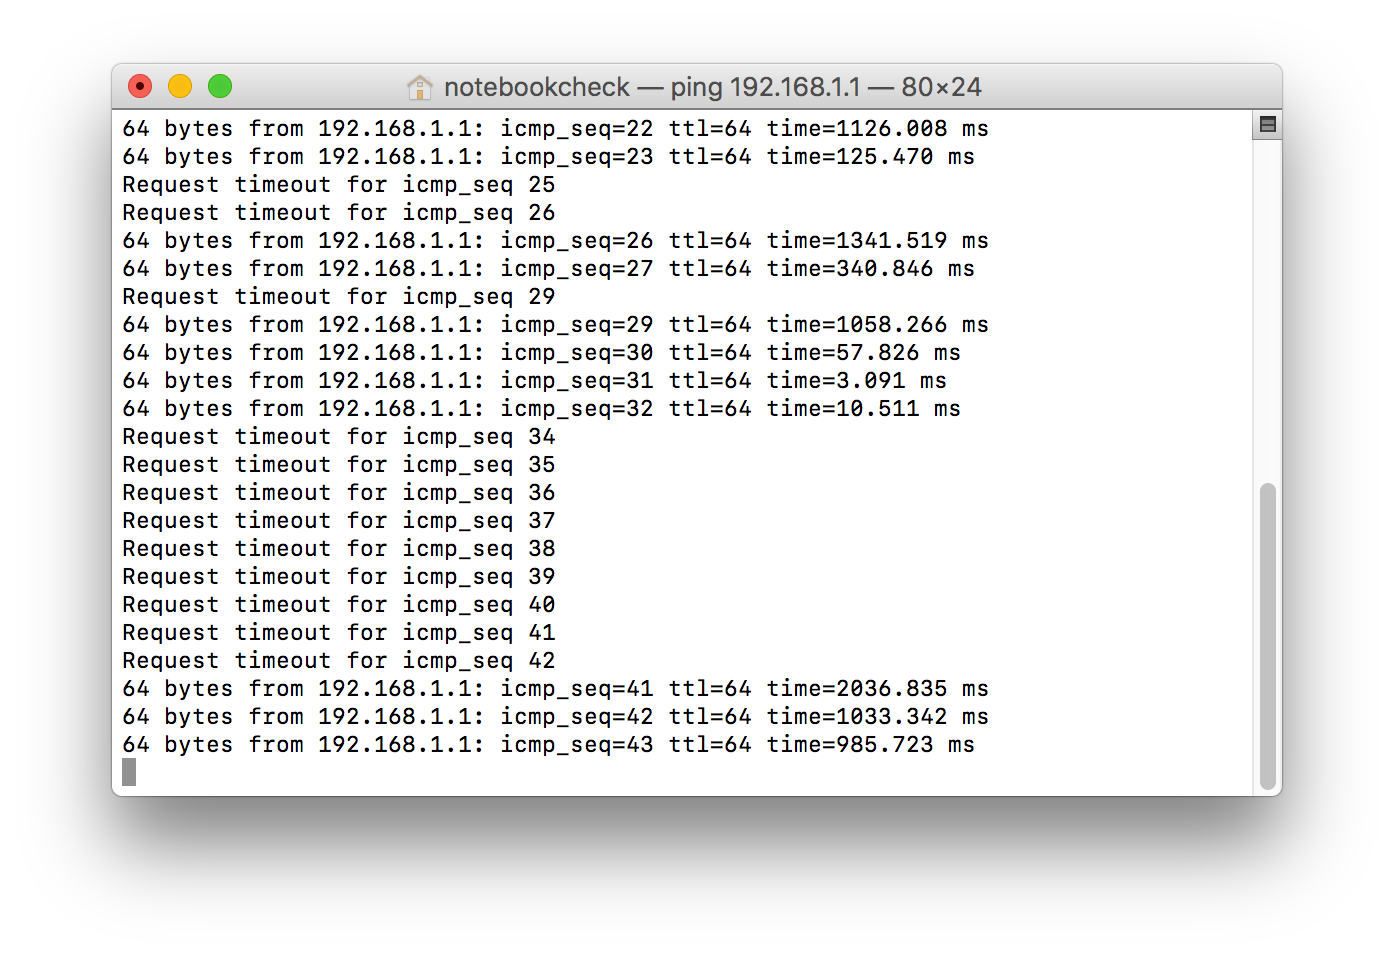
We did notice some connectivity problems when we used a 2.4 GHz AC WLAN from our Linksys EA8500 router in combination with an external USB-C device. We often noticed it with the Kensington Docking Station, for example. The phenomenon is unfortunately not reproducible all the time and we did not have any issues while running Windows 10 in the beginning, either (one time over the course of the review). We therefore hope this is a software problem, which will hopefully be fixed in the near future.
| Networking | |
| iperf3 transmit AX12 | |
| Apple MacBook Pro Retina 13 inch 2013-10 (Klaus I211) | |
| Apple MacBook Pro 13 2016 (Klaus I211) | |
| Acer Spin 7 SP714-51-M09D (jseb) | |
| Microsoft Surface Pro 4, Core i5, 128GB (Klaus I211) | |
| Dell XPS 13 9360 QHD+ i7 | |
| Intel NUC5i5RYH (Klaus I211) | |
| Lenovo ThinkPad T460s-20FA003GGE | |
| iperf3 receive AX12 | |
| Apple MacBook Pro Retina 13 inch 2013-10 (Klaus I211) | |
| Apple MacBook Pro 13 2016 (Klaus I211) | |
| Dell XPS 13 9360 QHD+ i7 | |
| Lenovo ThinkPad T460s-20FA003GGE | |
| Acer Spin 7 SP714-51-M09D (jseb) | |
| Microsoft Surface Pro 4, Core i5, 128GB (Klaus I211) | |
| Intel NUC5i5RYH (Klaus I211) | |
Maintenance
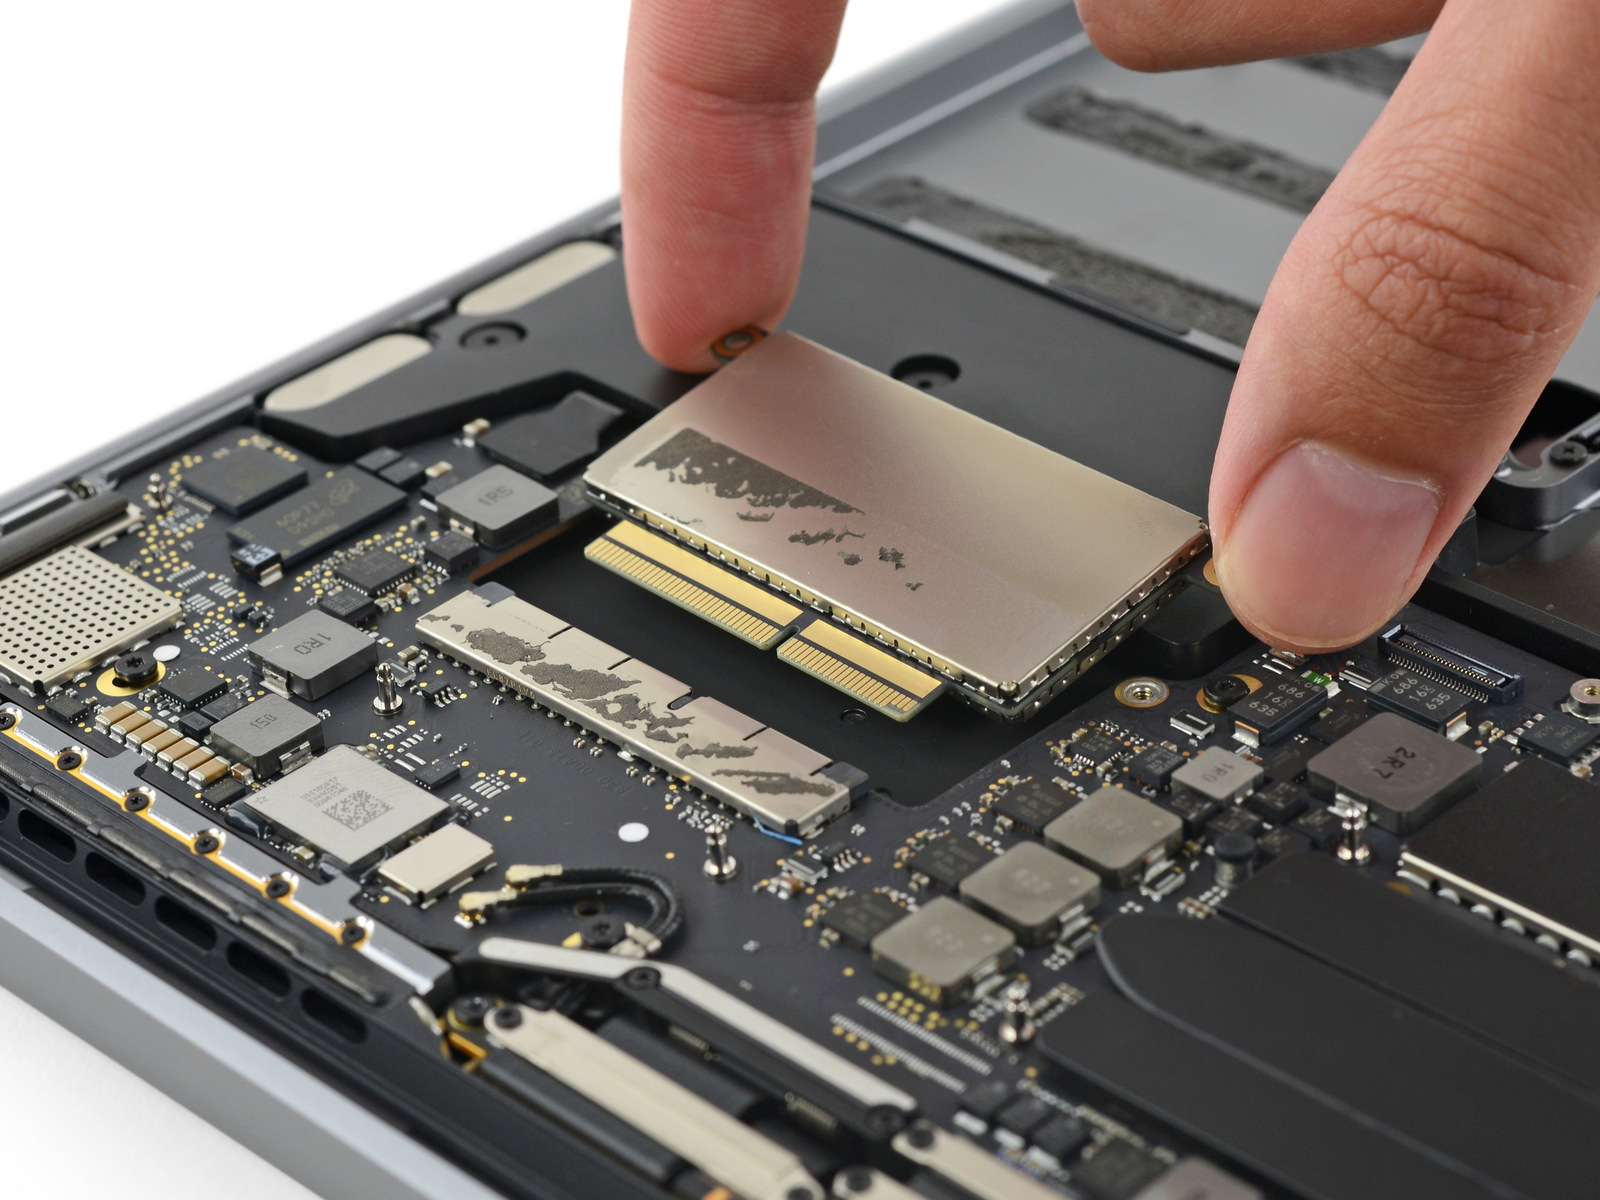
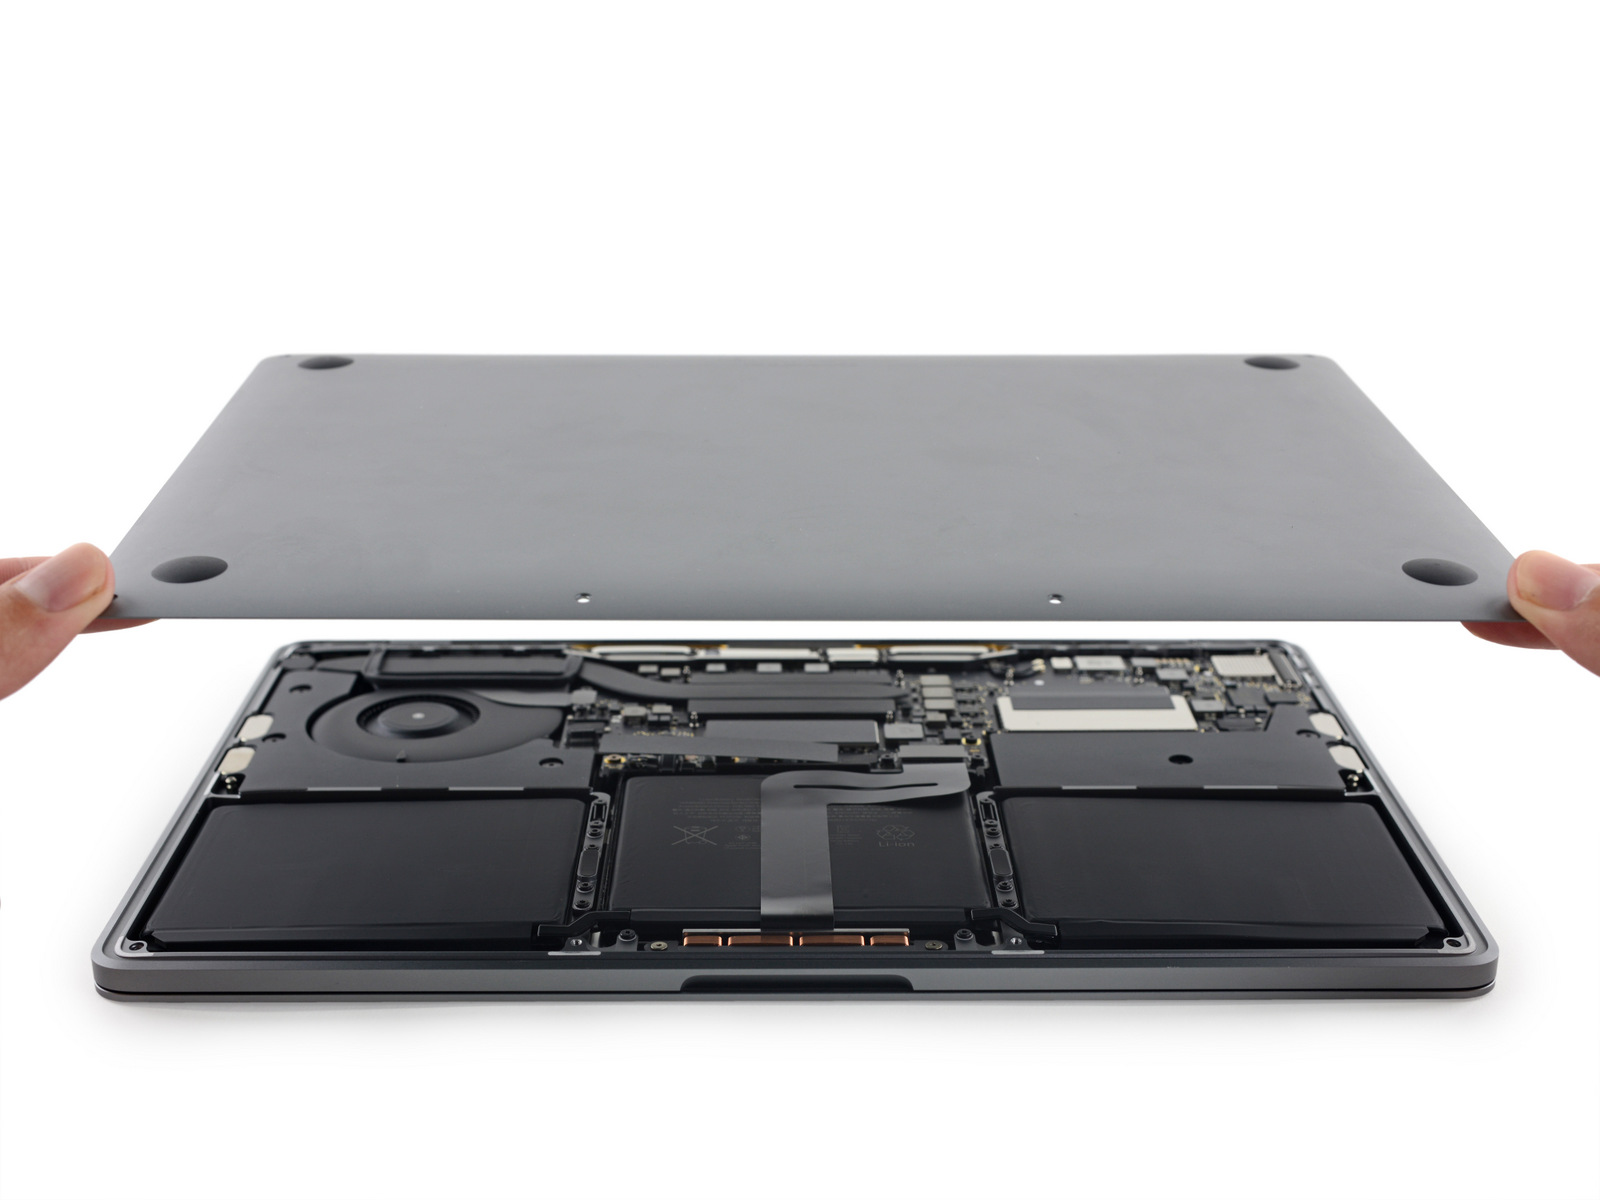
The bottom panel is secured by Pentalobe screws and grants pretty easy access to the components (when you have the corresponding screw driver). However, cleaning the fans is unfortunately the only thing you can do, maybe also replace the proprietary SSD (currently not yet available as a single part). The previous 2015 model still had a socketed WLAN card, but it is now soldered as well. A full overview about the internal design is provided by the iFixit teardown of the MacBook Pro 13, which is also the source of the following two pictures.
Warranty
Apple grants a 1-year warranty for its notebooks, which can be extended to 3 years for a comparatively high price (including phone support though – also for software).
Please see our Guarantees, Return Policies & Warranties FAQ for country-specific information.
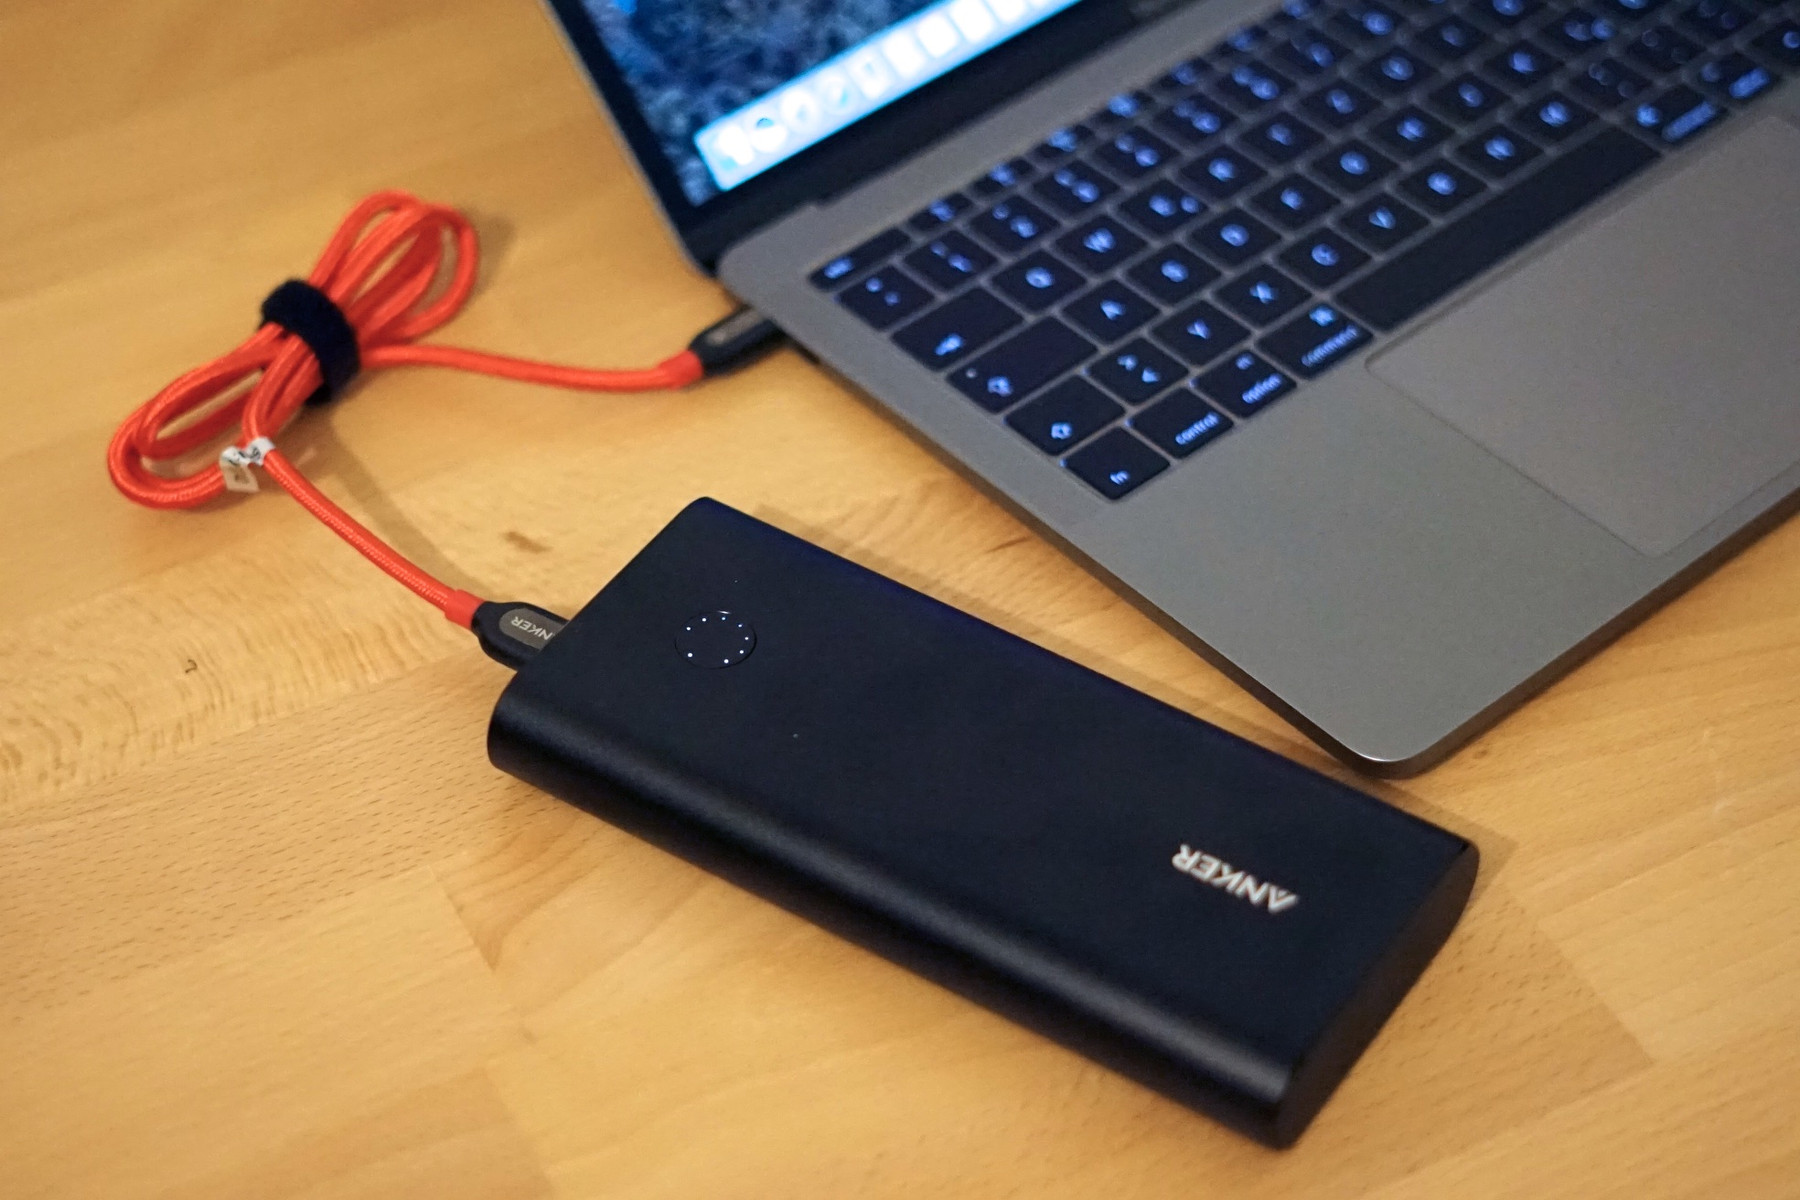
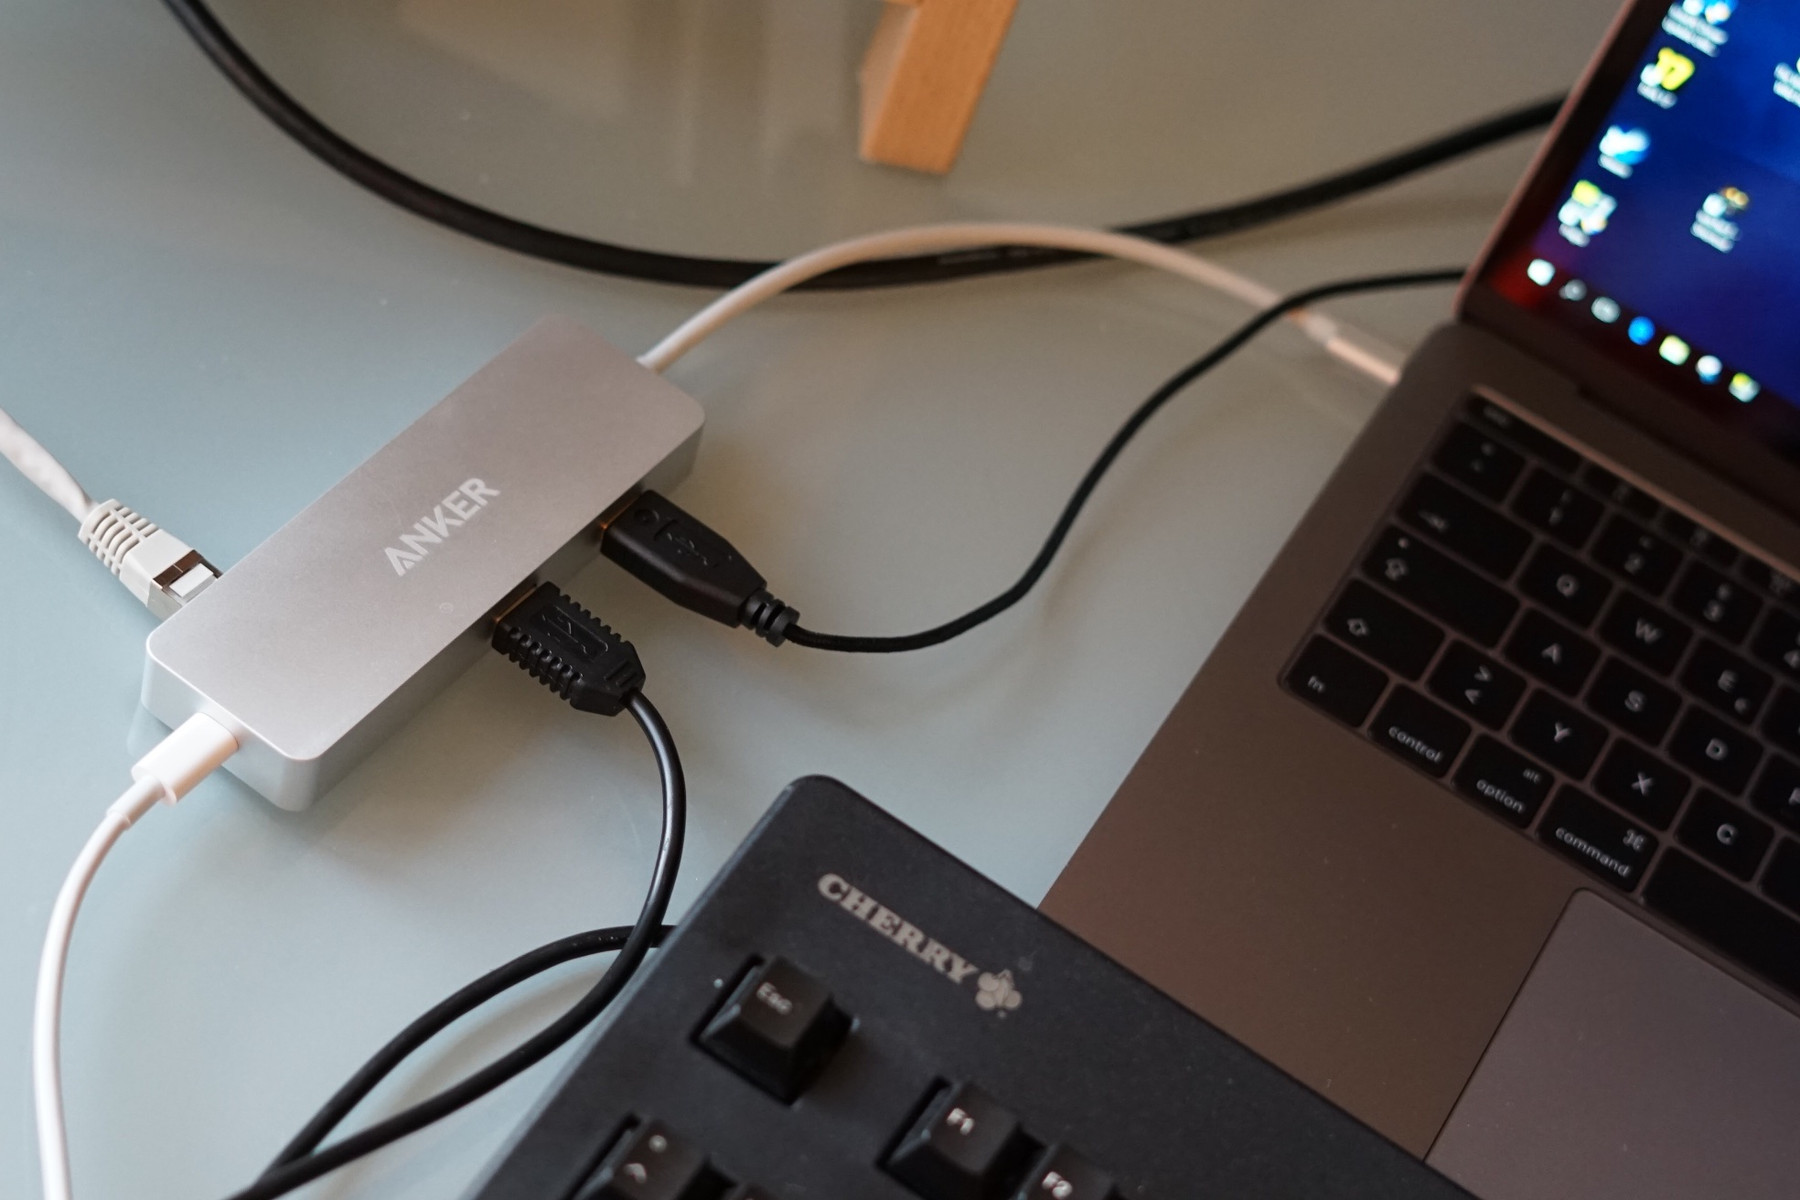
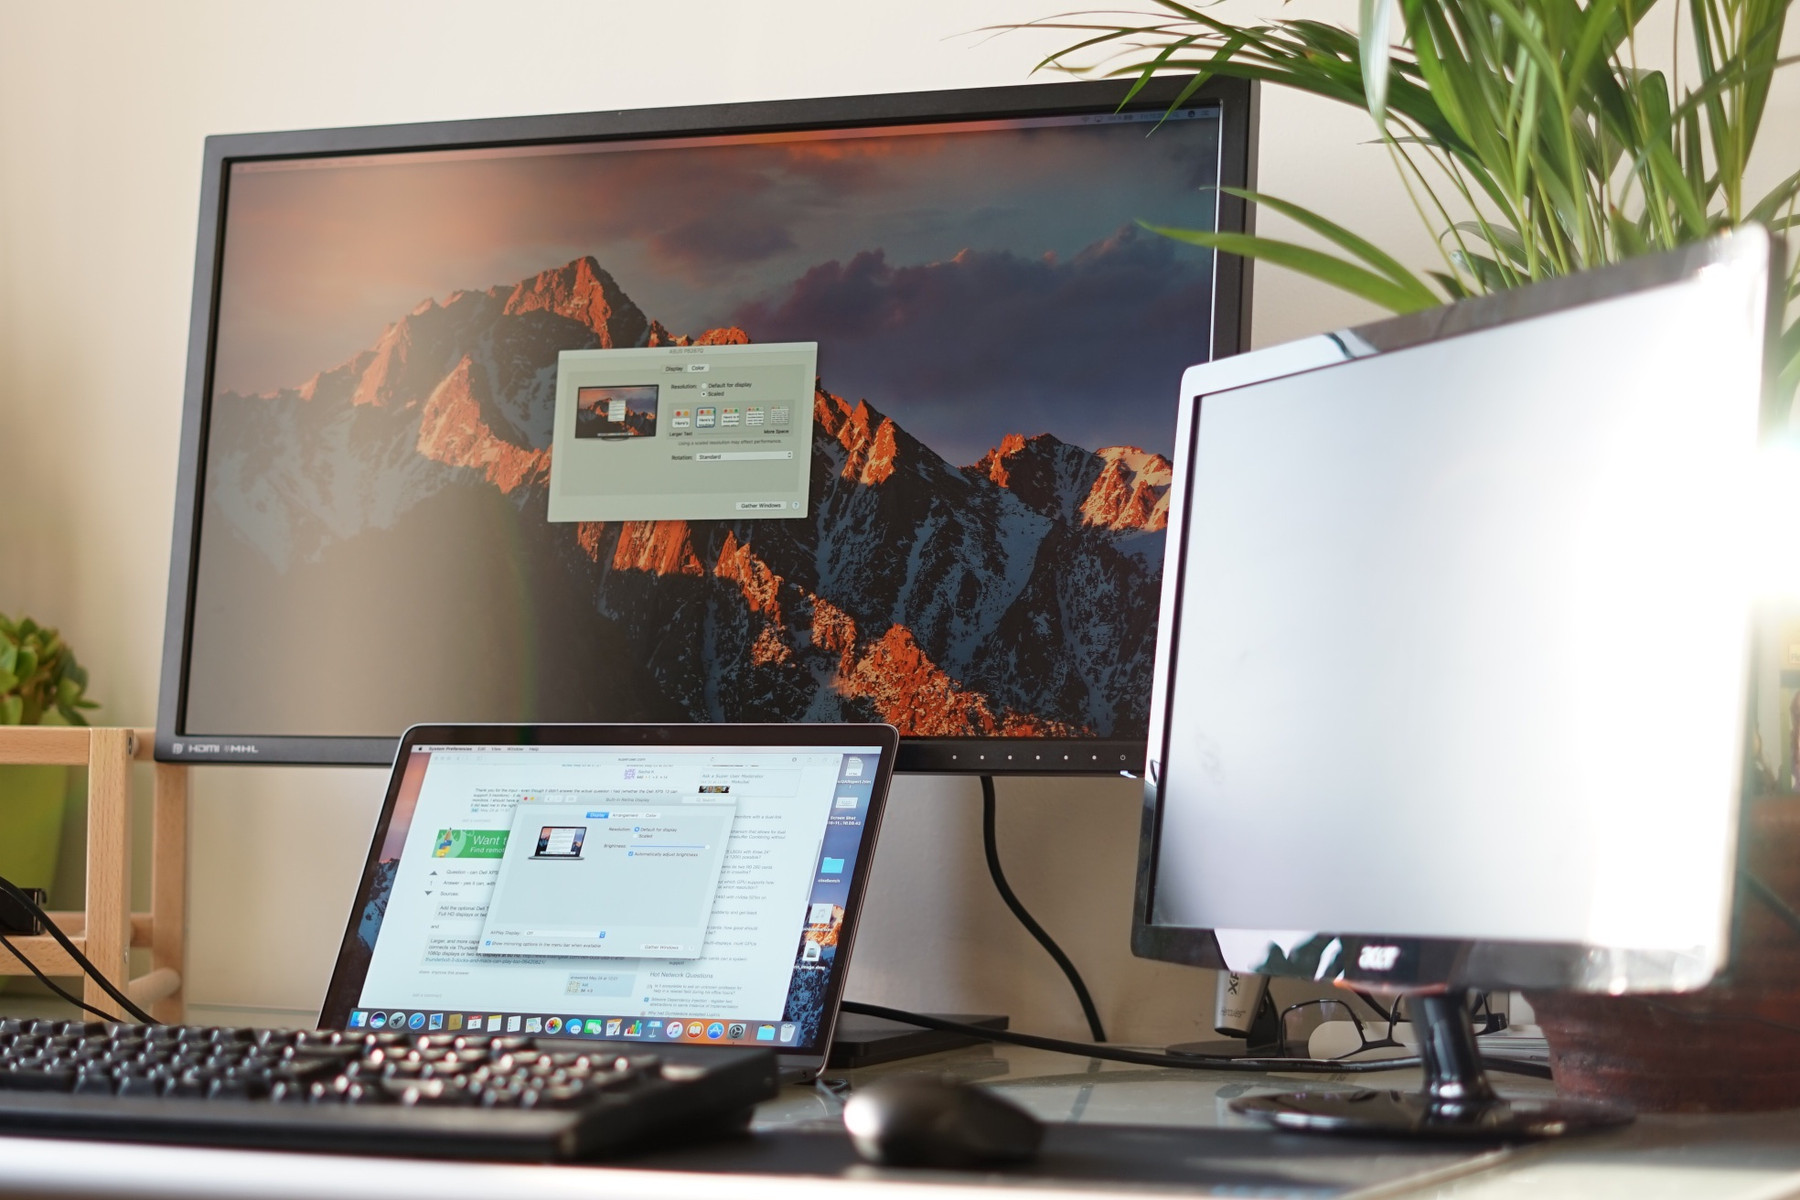
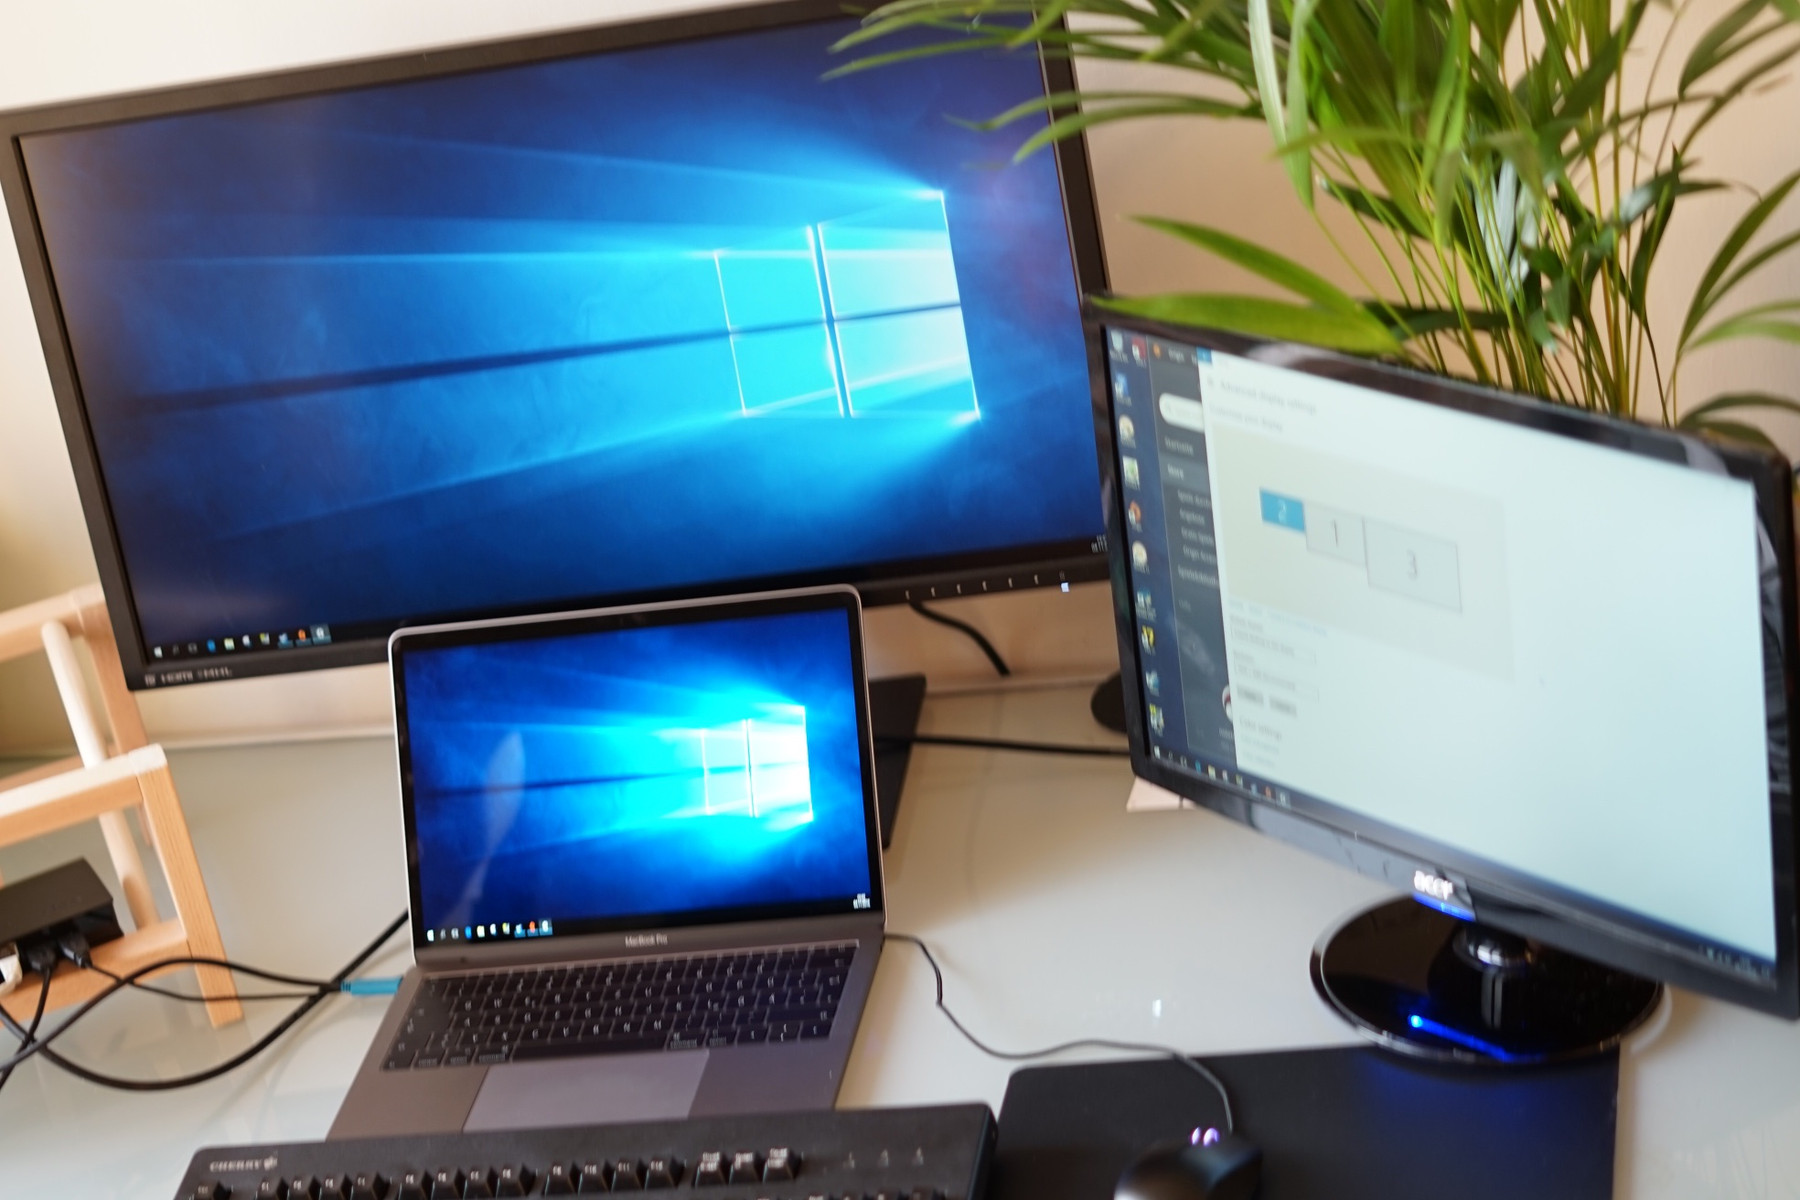
USB-C Docking Stations
With only 2 USB-C / Thunderbolt 3 ports, docking stations are basically a must-have accessory for the majority of users. We tested the simple Anker Premium USB-C Hub with LAN, 2x USB-A and power delivery as well as the more expensive Kensington SD4600P Docking Station with HDMI, DisplayPort, LAN, and common USB-A ports. Both stations were recognized and worked immediately with macOS as well as Windows 10. The LAN port of the Anker was only recognized at the second Thunderbolt port, but worked without problems after that. The Kensington could only access the LAN via driver with macOS, but that worked well. An external 4K monitor from Asus ran immediately at 60 Hz both with macOS and Windows 10, but an additional Full-HD display via HDMI only worked as extended display in Windows 10. Thunderbolt 3 accessories based on the TI 65982 USB-C chip, however, seem to have problems with the MacBooks.
Input Devices
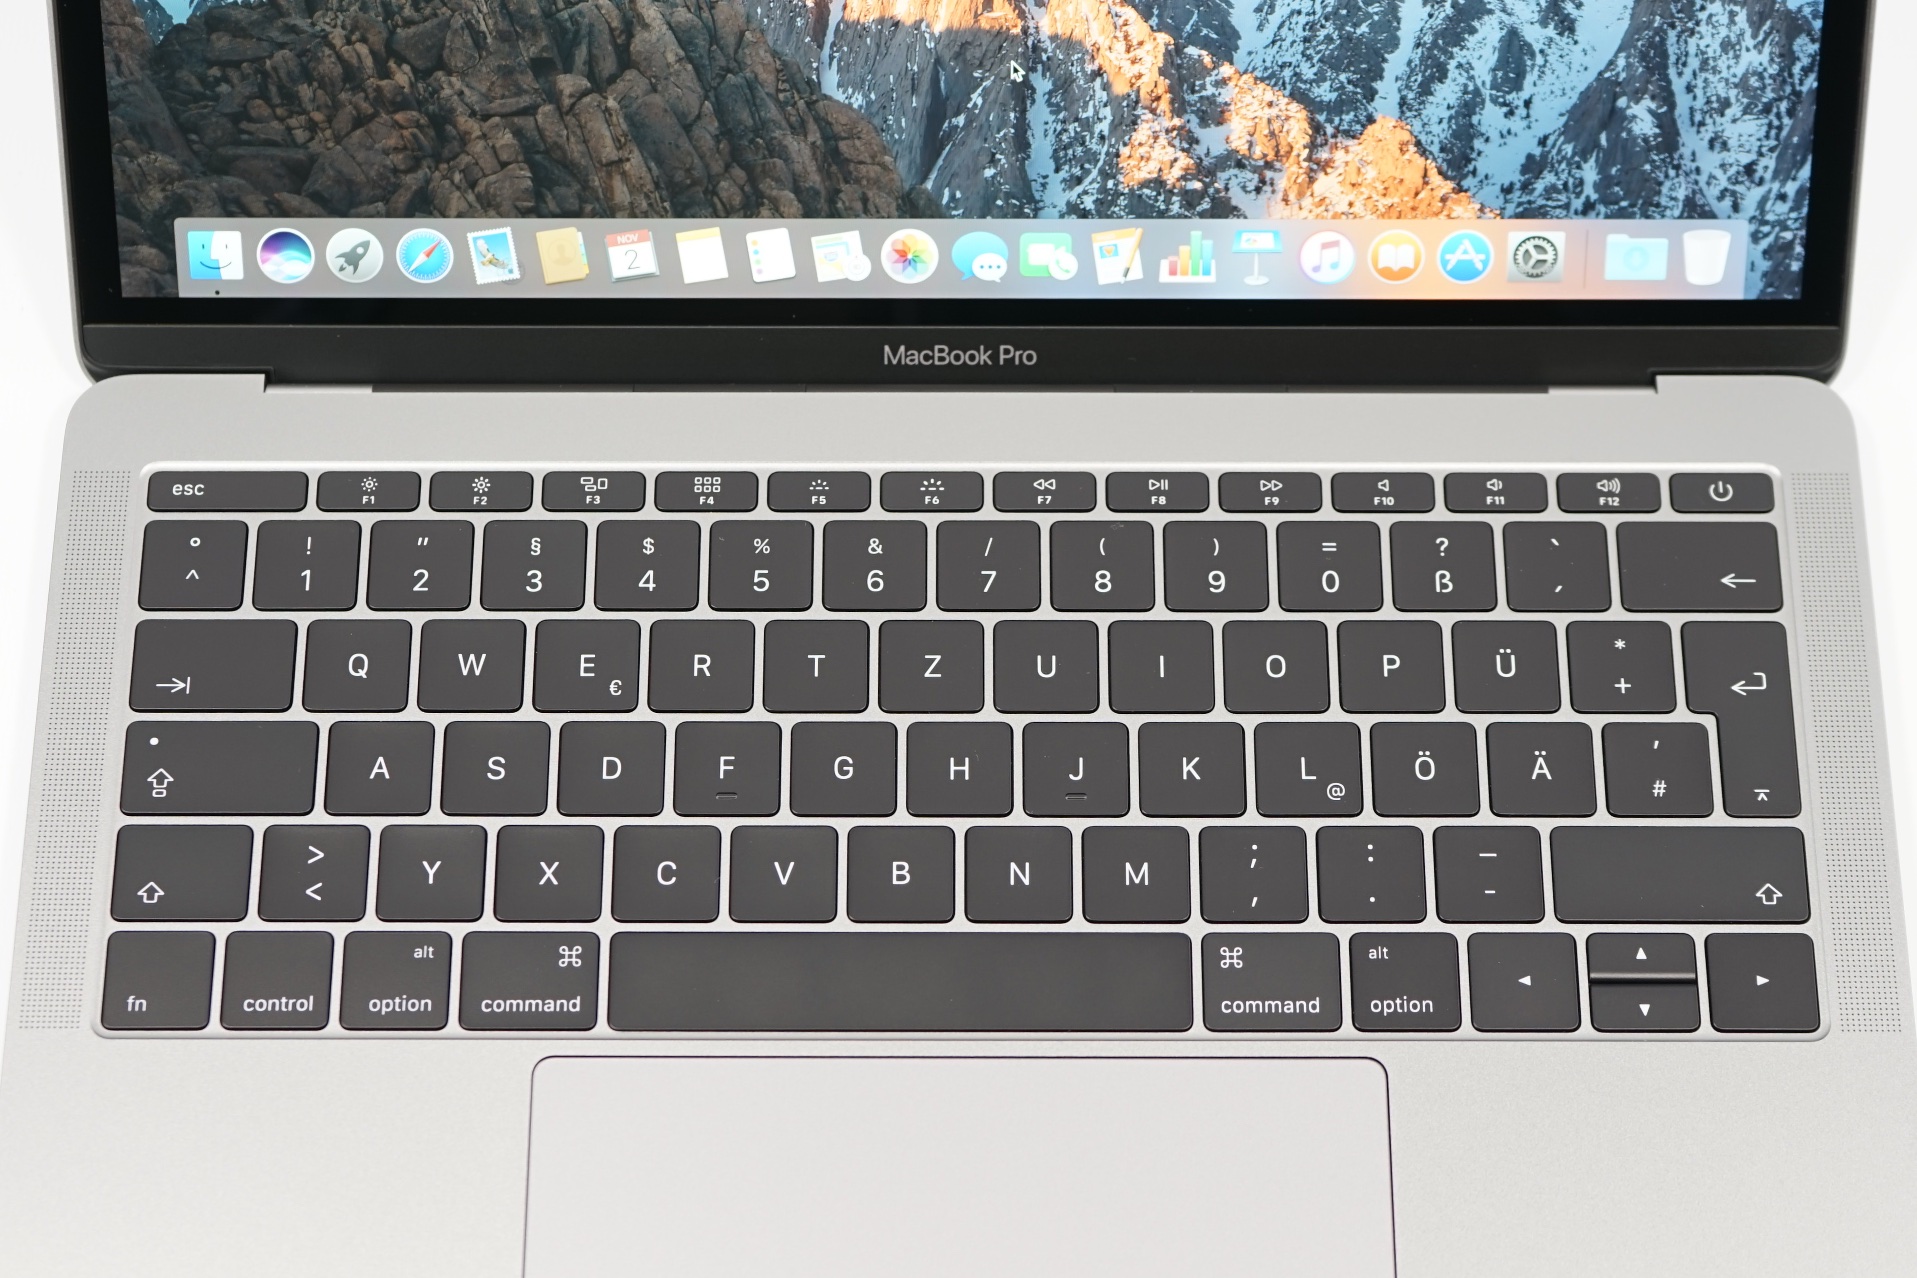
Keyboard
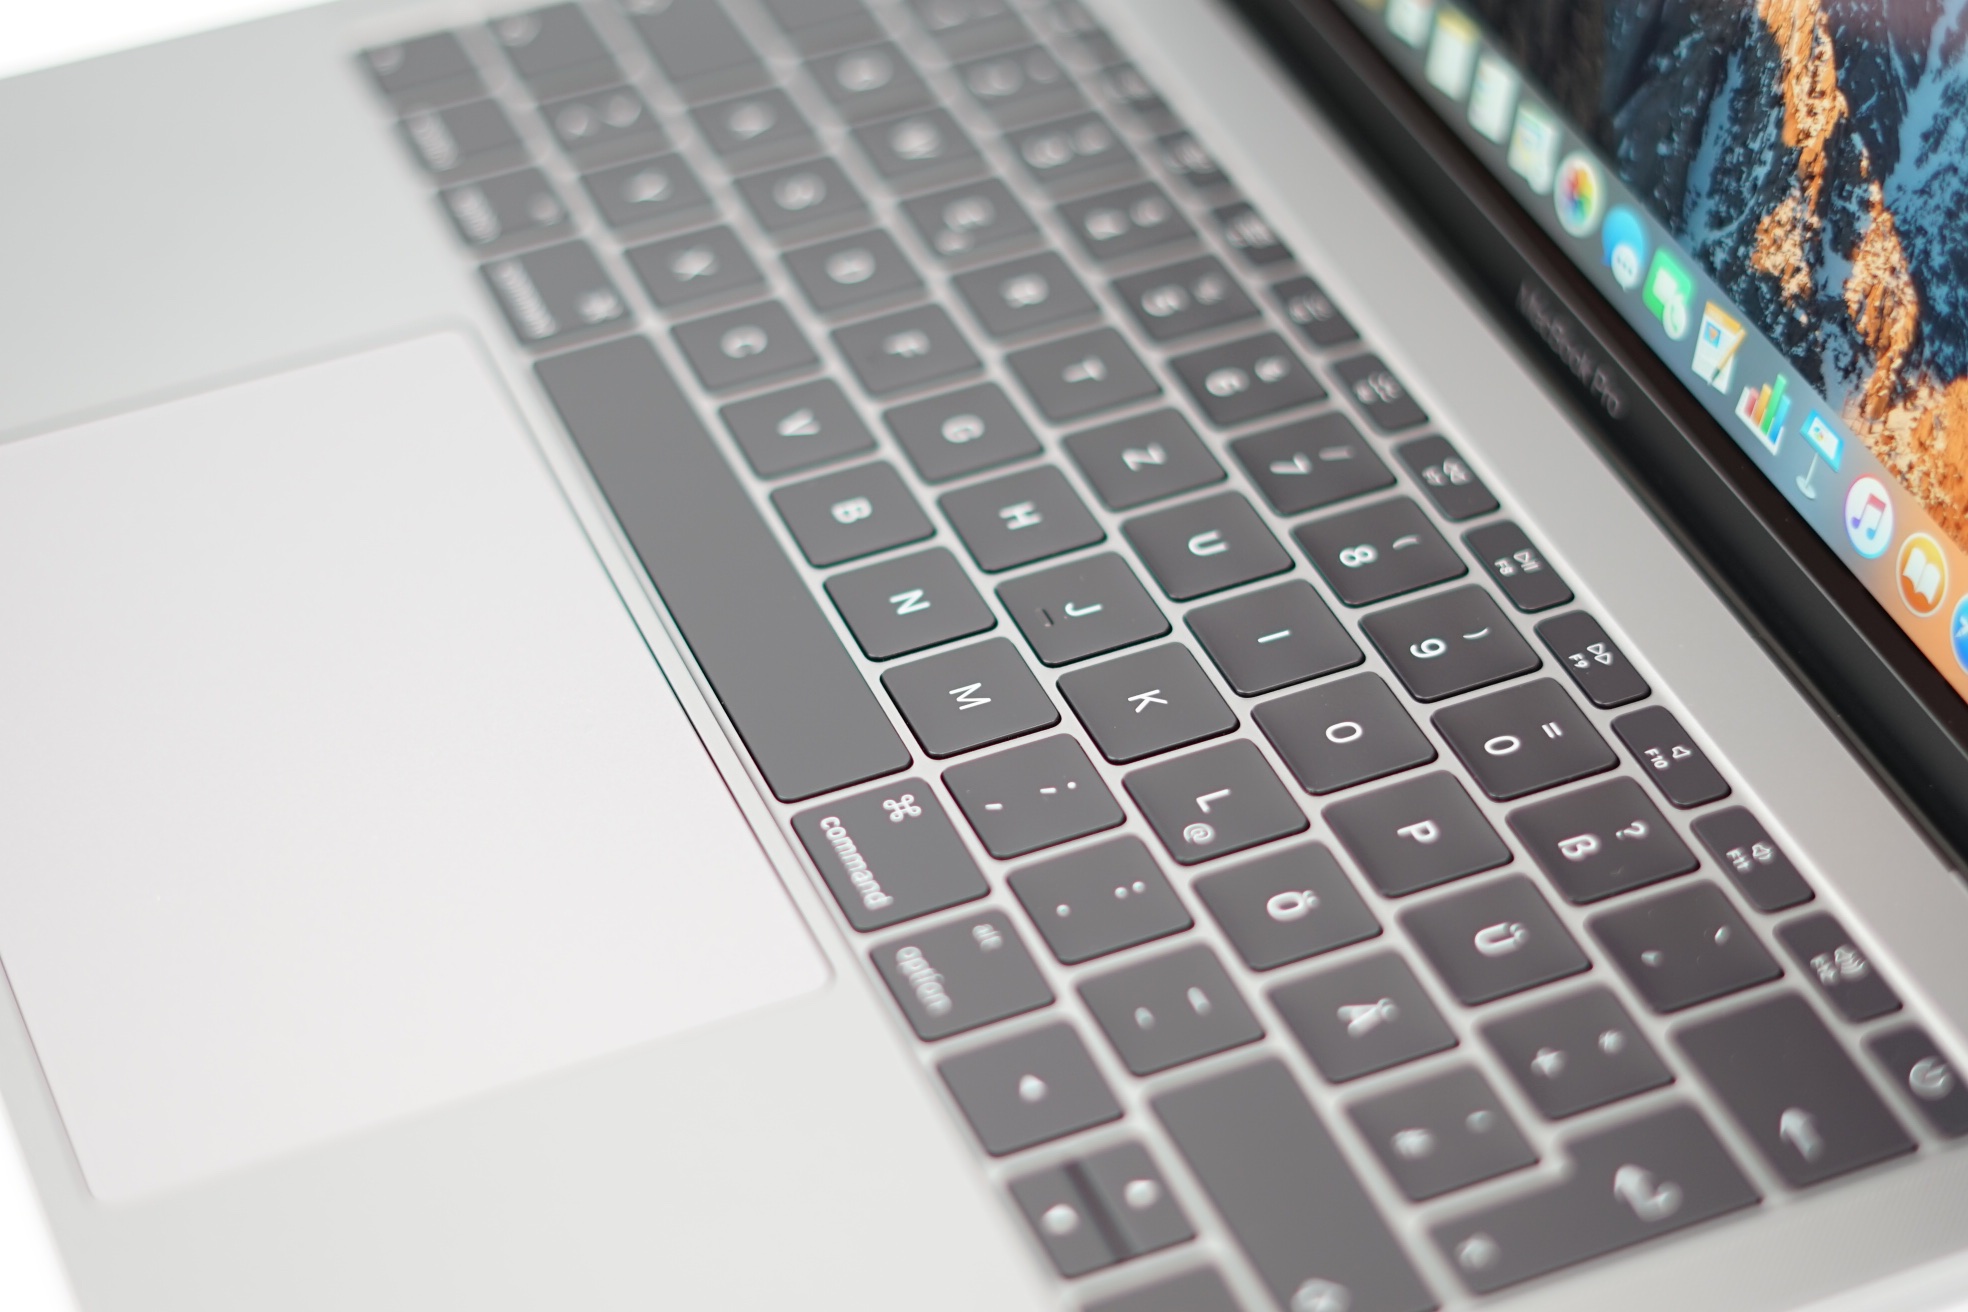
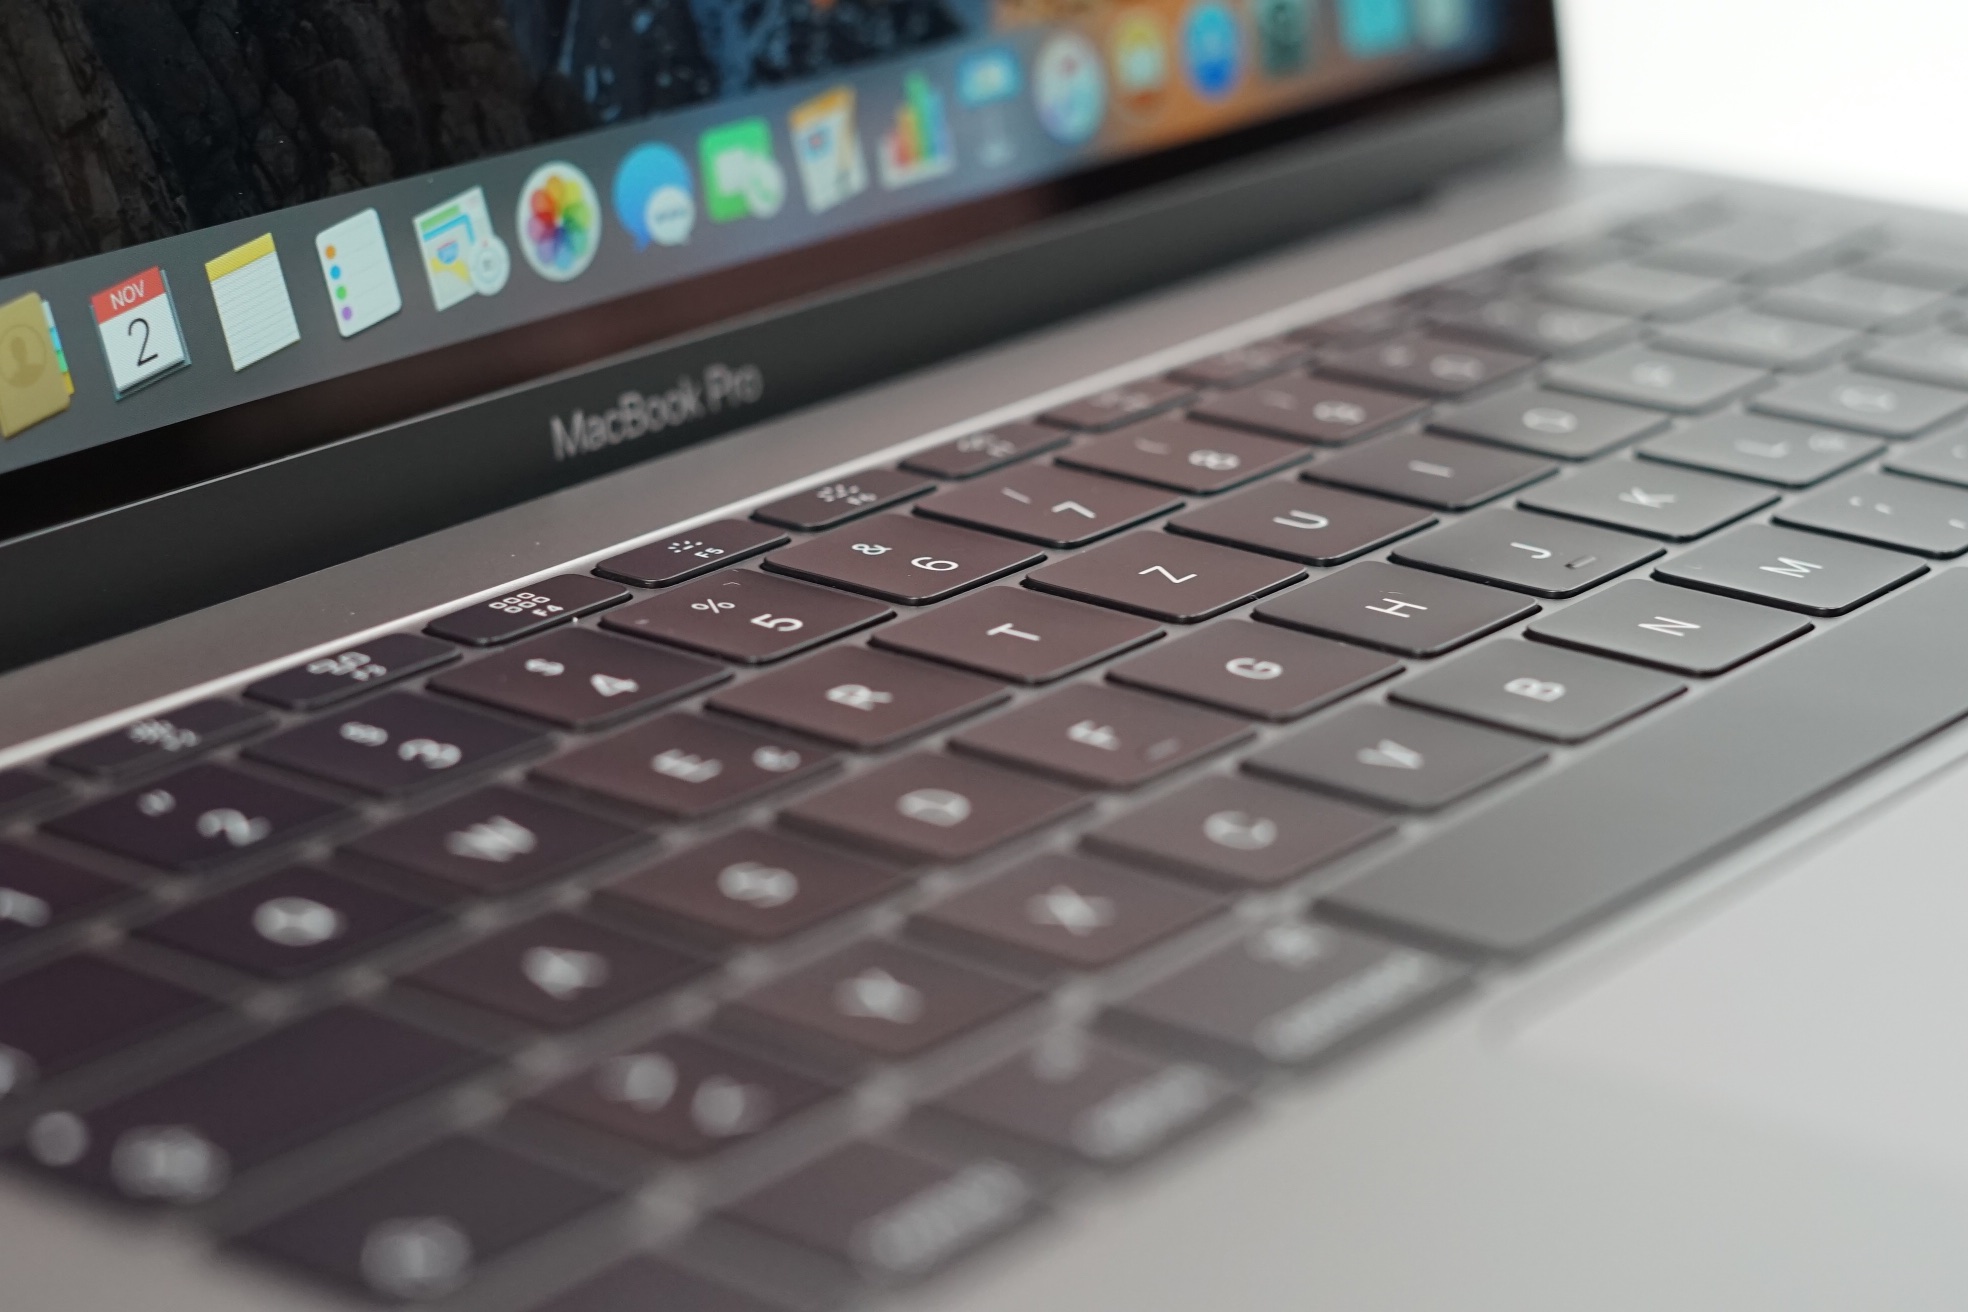
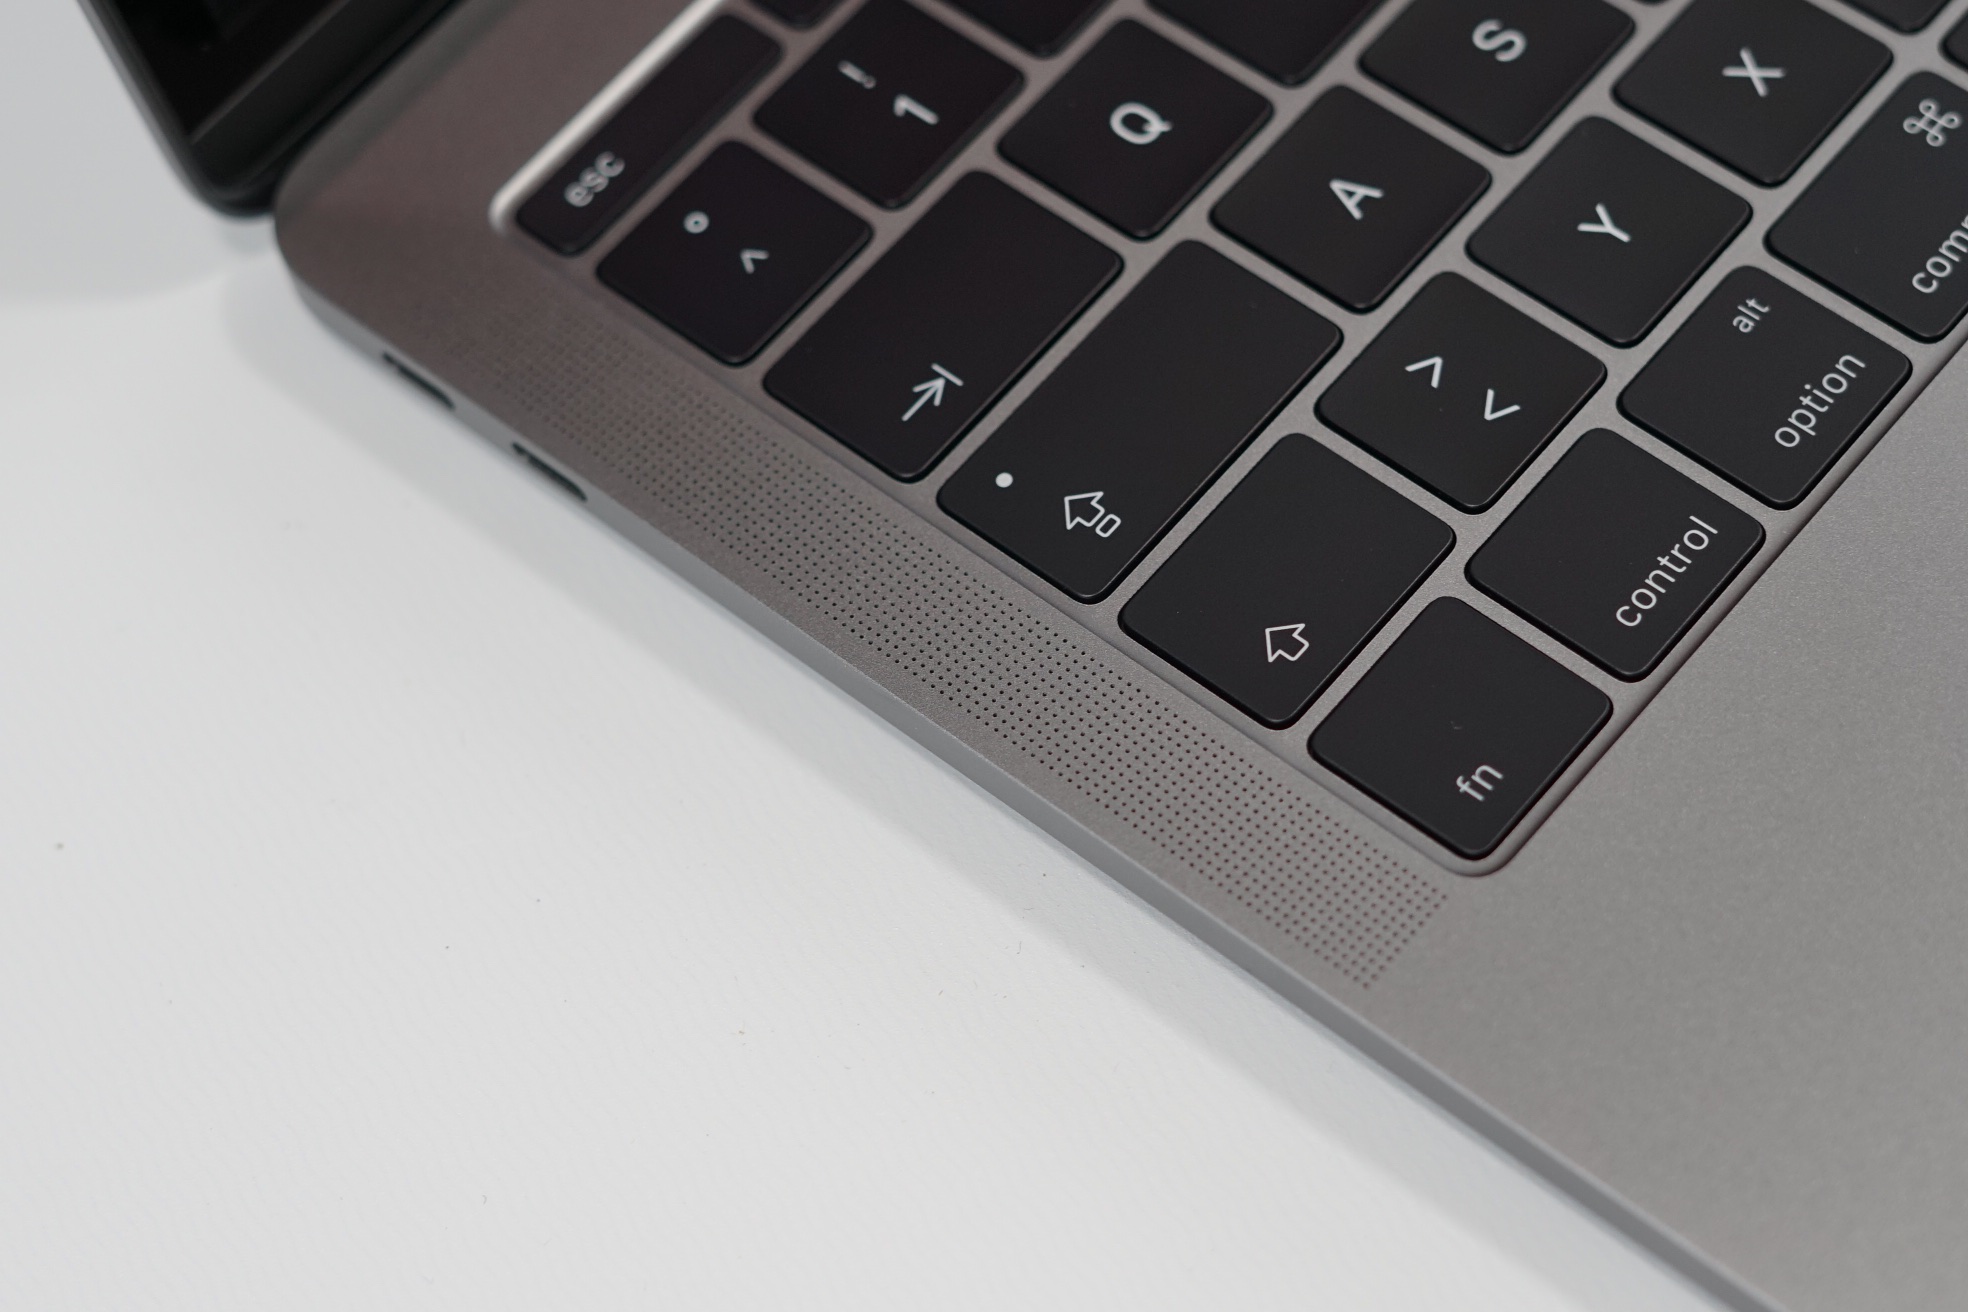
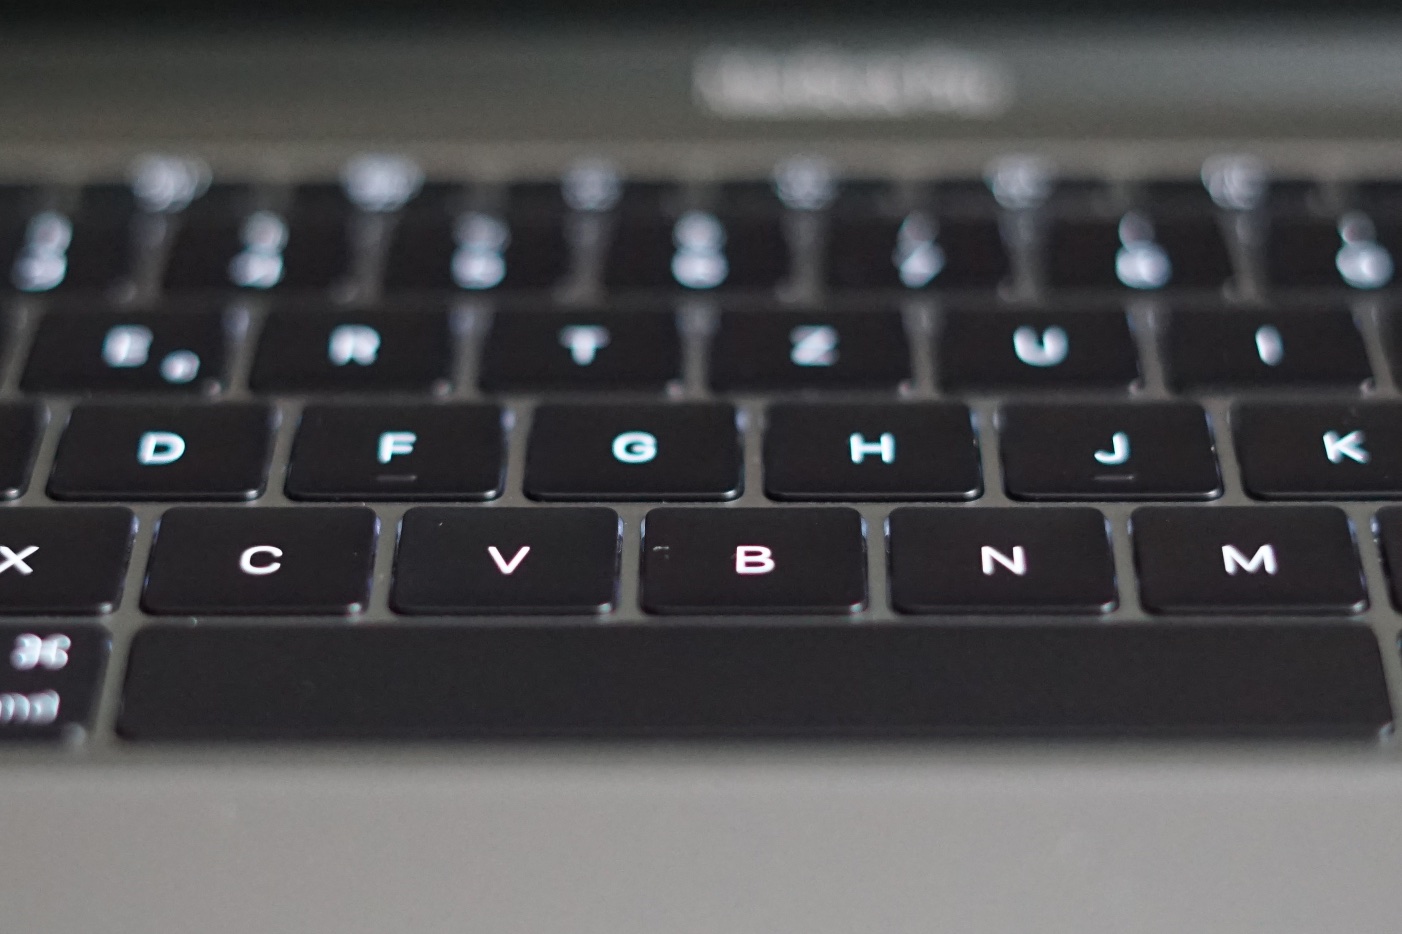
The new 2016 MacBooks use the second generation of the chiclet keyboard, which was introduced with the 12-inch MacBook. The shallow travel will once again be a shock when you use it for the first time. The very even stroke does leave a positive impression though. This second generation of Apple's own Butterfly mechanism was noticeably improved compared to the 12-inch MacBook, but you still have to get used to the typing experience. After this has happened, the switch back to the old MacBook pro is actually pretty difficult, because we now found it to be rather spongy in comparison. We did not notice any differences in typing speed compared to the previous MacBook Pro models, and quick inputs without typos were no problem even in the first session. The typing noise will depend heavily on your usage scenario. It is slightly louder compared to the old model with ten fingers, but we do not consider it to be disturbing even in quiet environments. If you type forcefully with just two fingers though, the noise will be much louder. You can see a comparison in the video below this section.
Because of the shallow travel, the 16-level keyboard illumination of the individual keys is well implemented into the case and it will not dazzle.
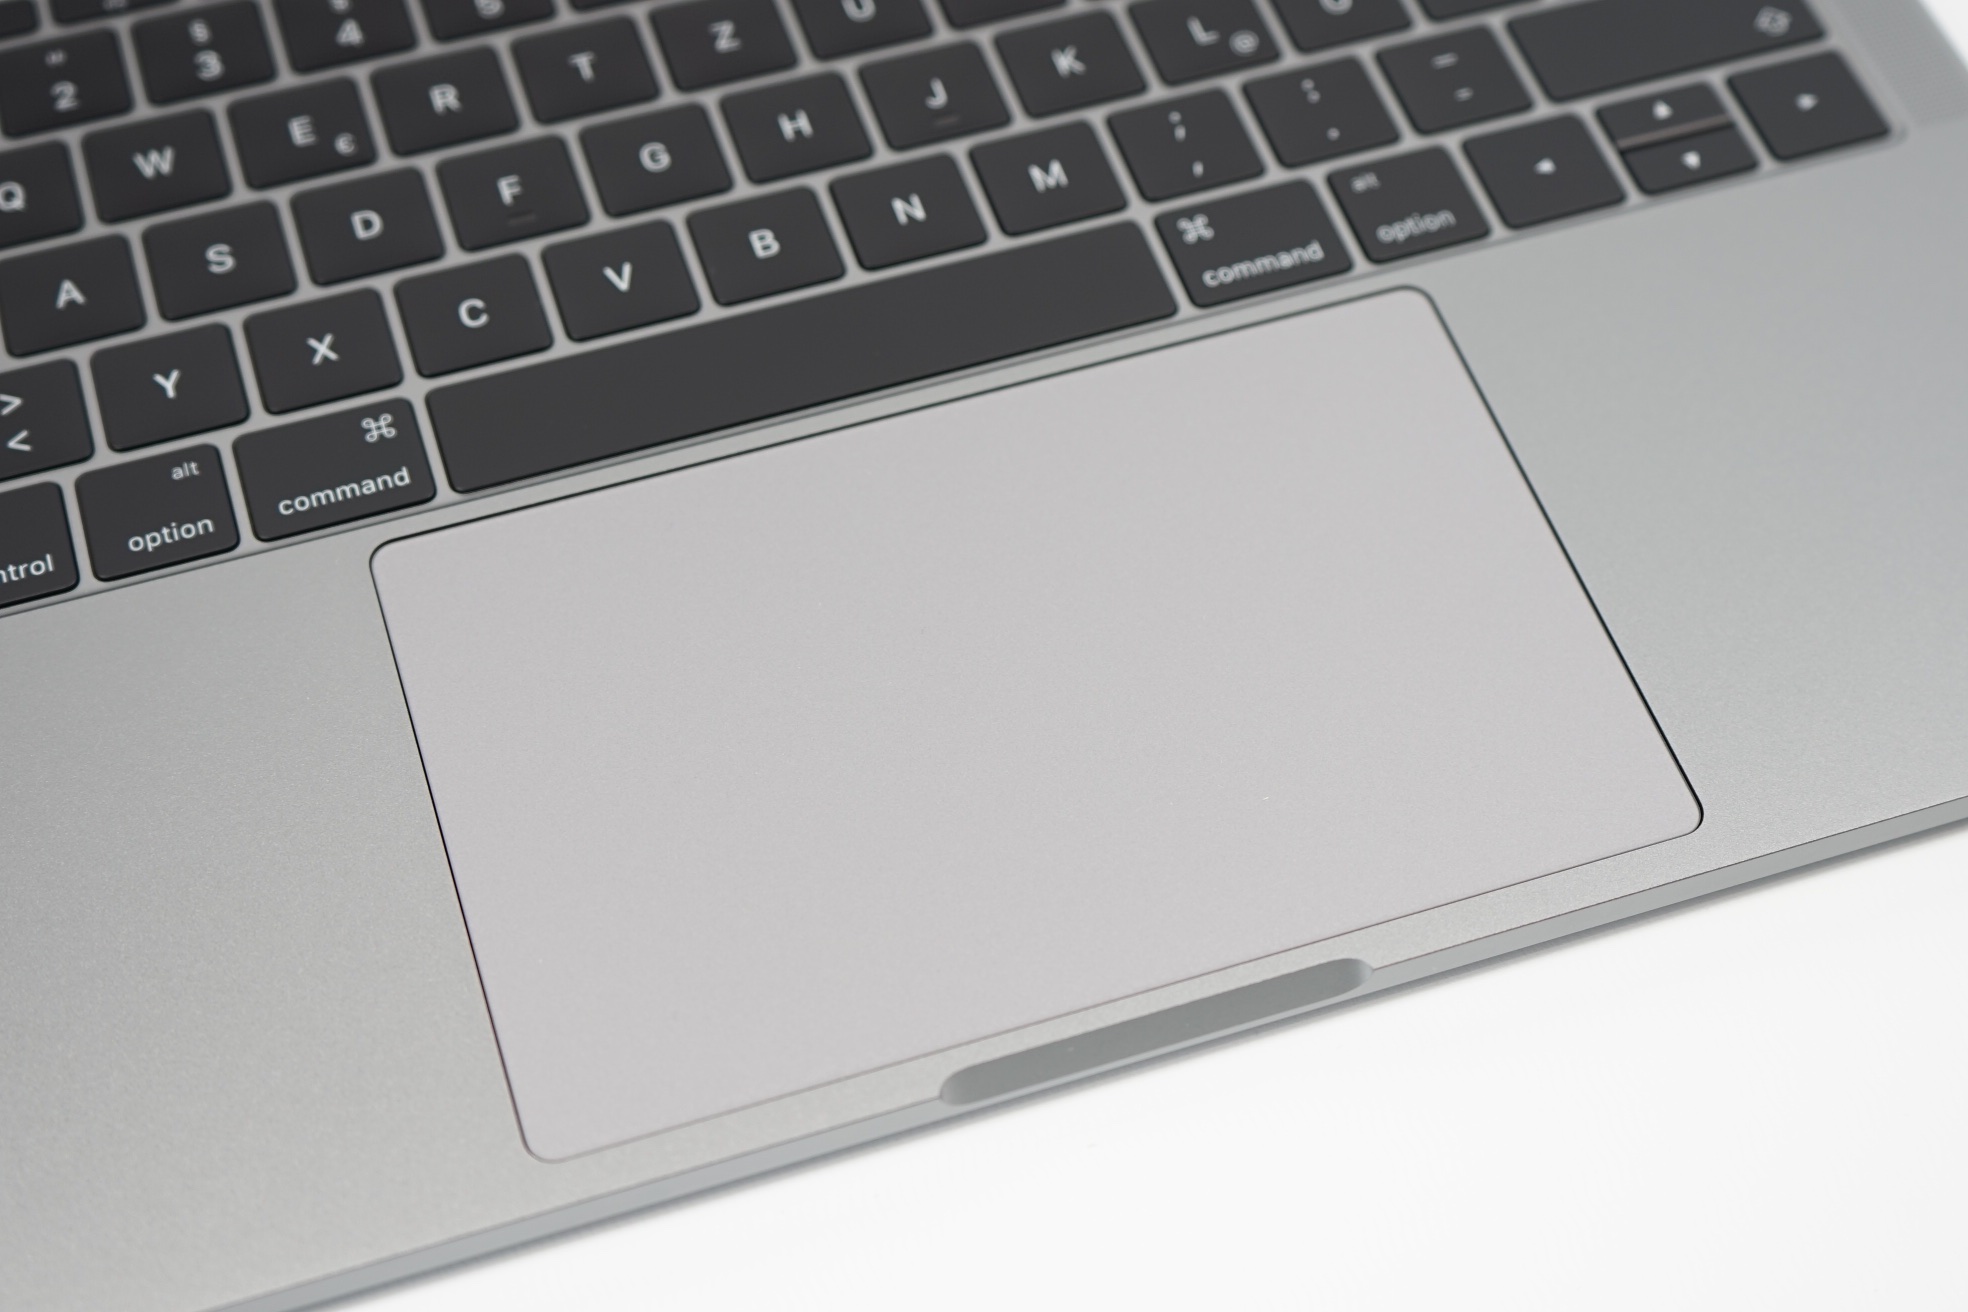
Touchpad
The glass trackpad of the new MacBook Pro models is much bigger compared to the previous models, but the technology is otherwise identical. It is still the reference for a touchpad, even though Windows devices like the Surface 4 Pro start to close the gap. Thanks to the taptic engine, tactile clicks are identical all over the surface and it is also possible to trigger a firmer "Force Press". Both systems work so well that you do not want to go back to a conventional touchpad with rocker switches. The software support of the trackpad (in macOS) is also still unrivaled. Gestures, Drag & Drop (via second finger in the corner) and the response times were excellent in our tests. The palm rejection worked well, but it is also necessary due to the larger surface, because you will often put a finger or two on the touchpad. Accidental cursor movements were very rare when we used the keyboard.
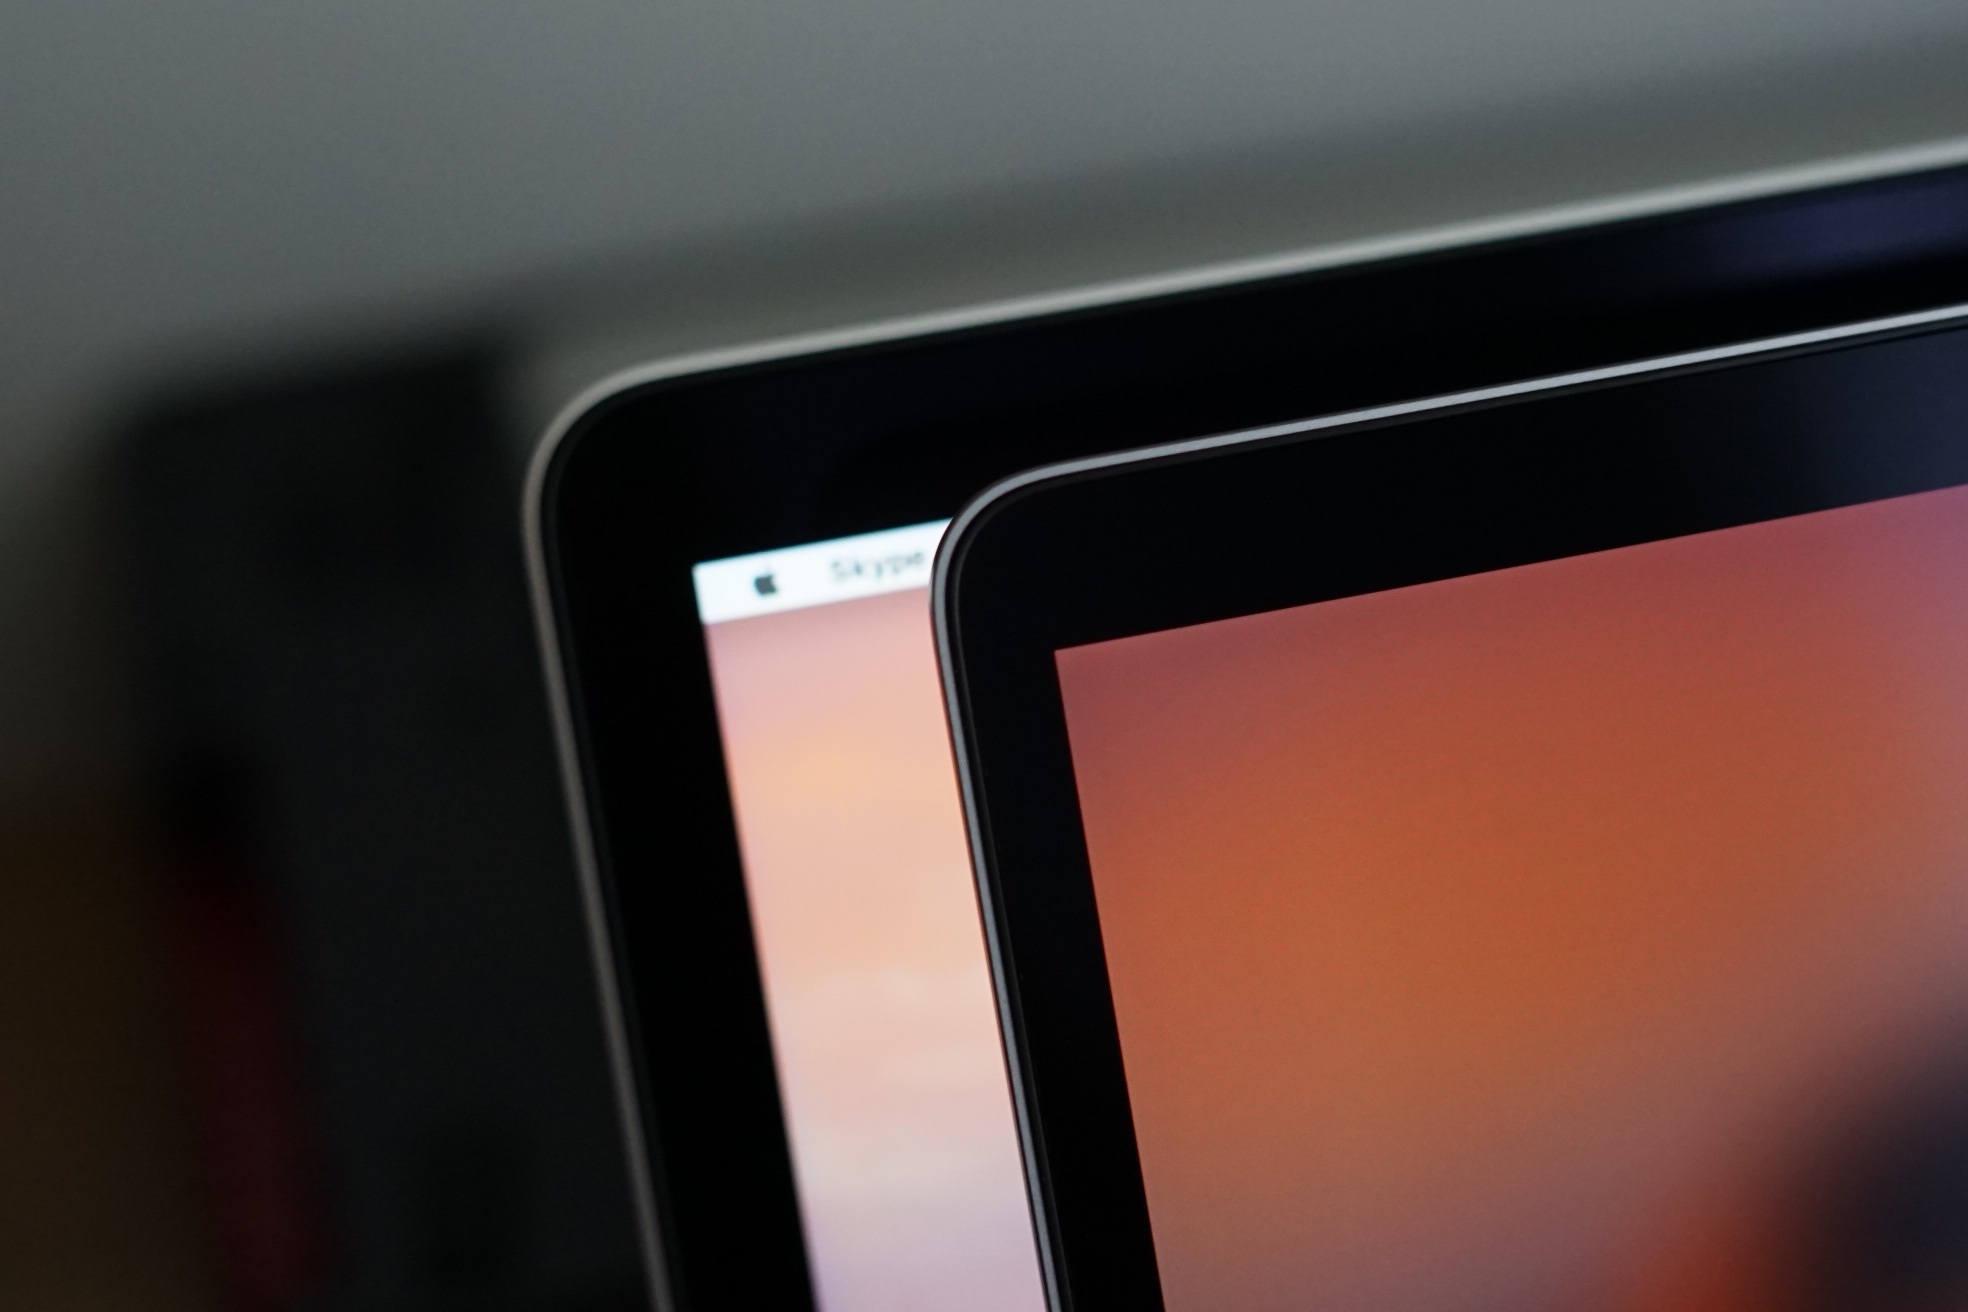
Display
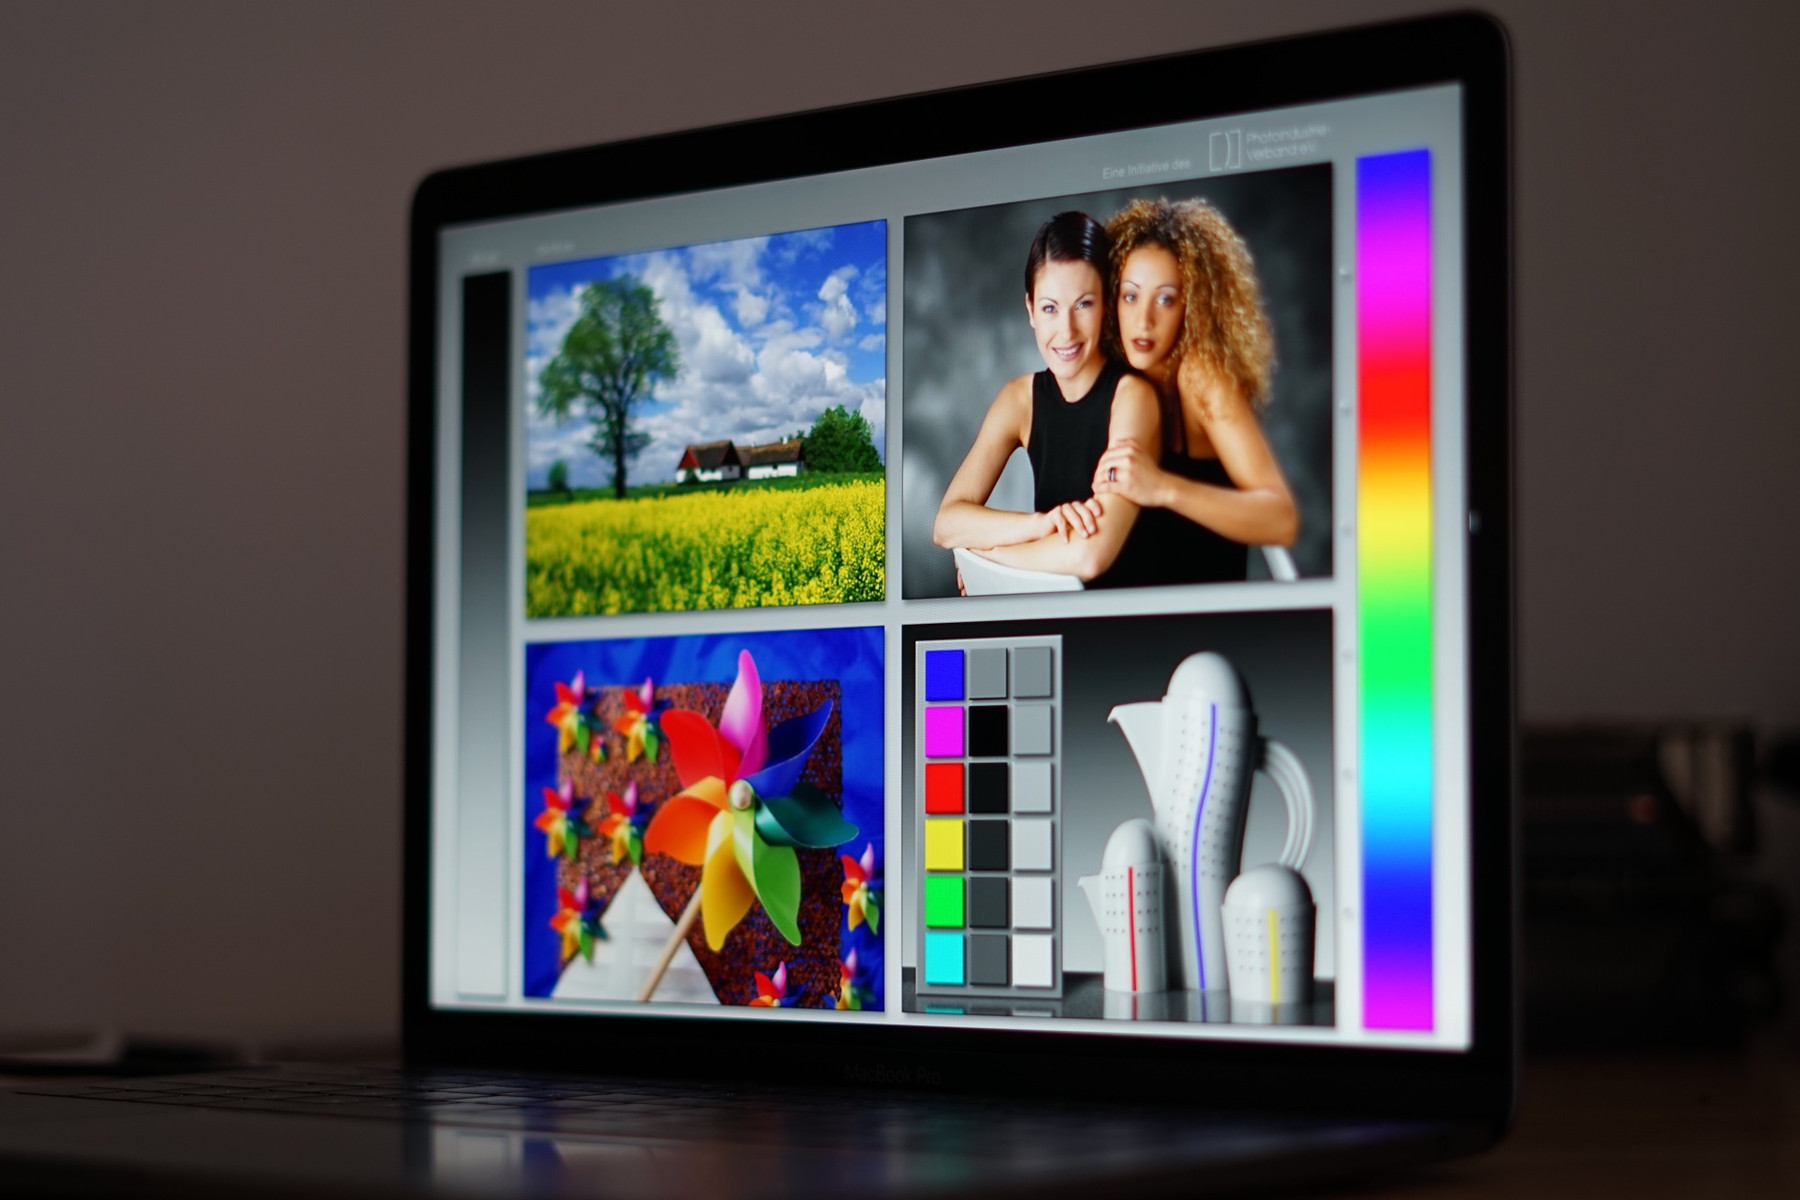
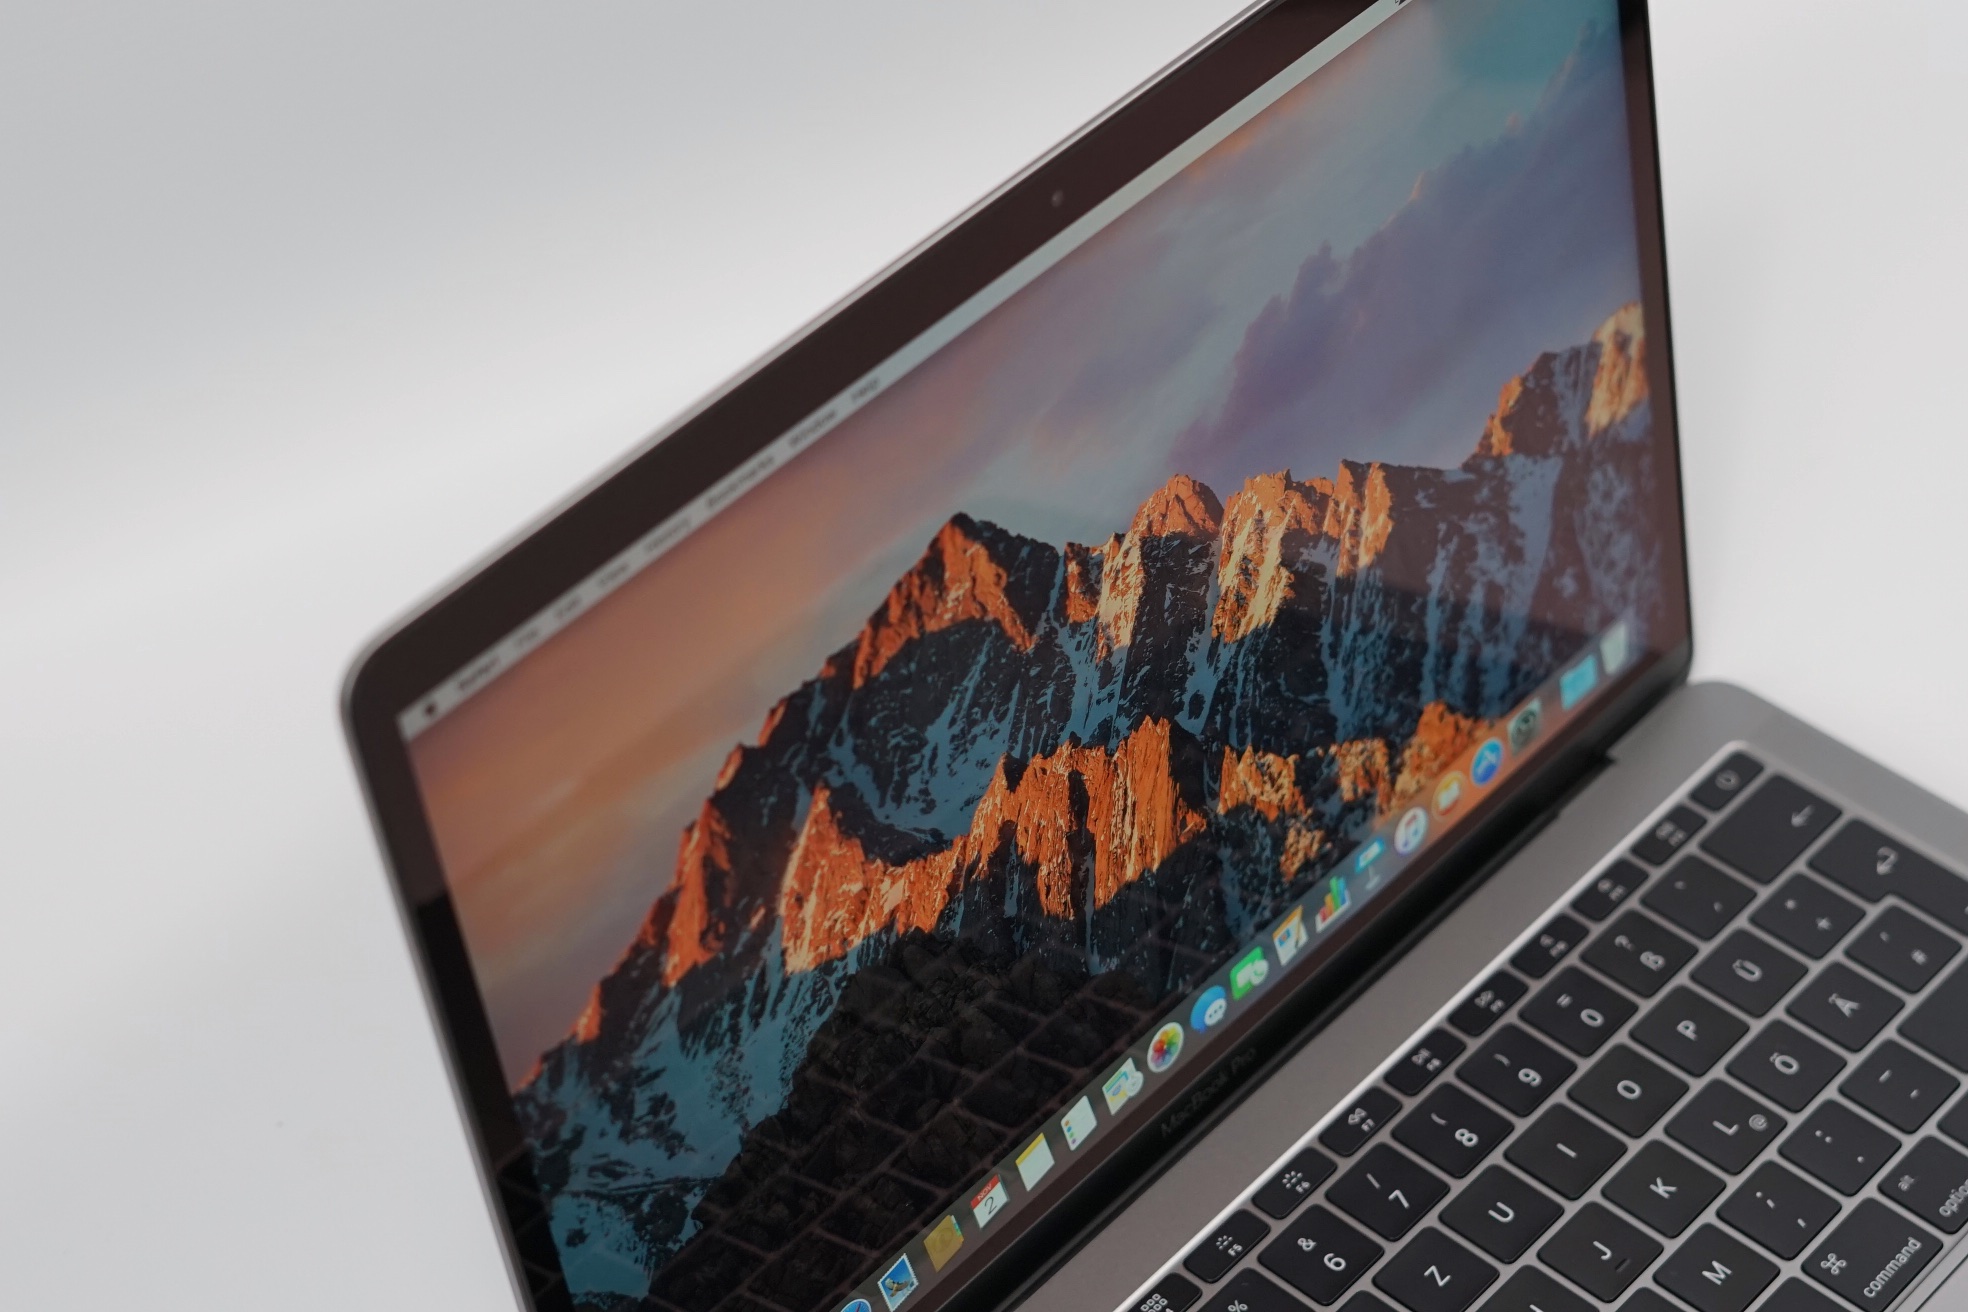
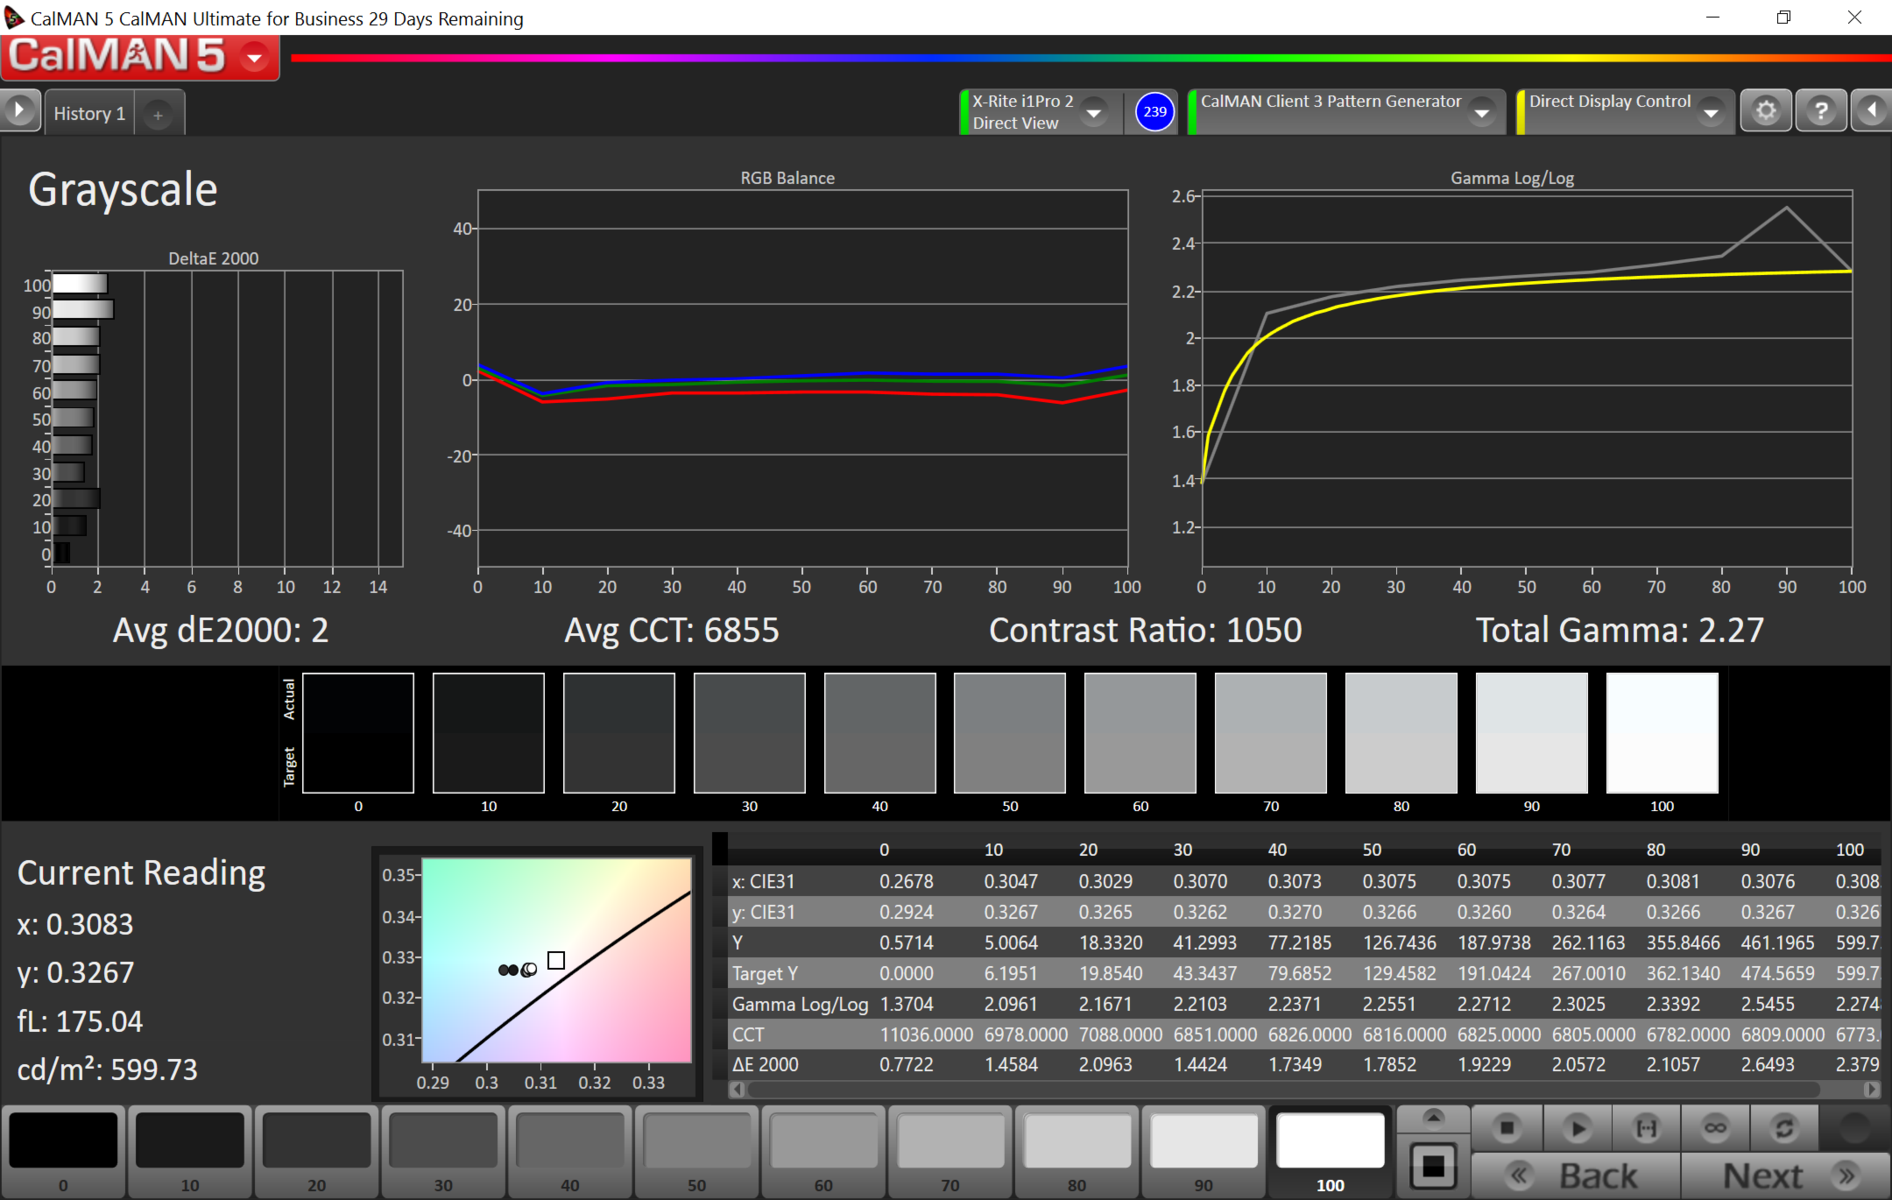
Apple does not change its Retina display and still uses a 13.3-inch IPS-LED panel with a resolution of 2560 x 1600 pixels. Contrary to the previous model, however, is the default scaling to 1440 x 900 instead of 1280 x 800. Possible alternatives are 1680 x 1050 as well as 1024 x 640. Apple advertises a luminance of 500 nits in the spec sheet, and we can confirm the results in our measurements. The actual results are even better at more than 600 nits in the center. There is a slight drop towards the edges, but the brightness distribution is still very good at 89 percent. You can also use the full luminance on battery power. The minimum brightness is very low at 6.8 nits, so the display is also very comfortable to use in dark environments. Thanks to the high maximum luminance, the black value of 0.57 cd/m² results in a very good maximum contrast ratio of 1053:1 for the new MacBook Pro 13-inch.
Our comparison shows that the new Apple MacBook Pro 13 performs very well. All the siblings from Apple, but also important rivals are clearly beaten in terms of luminance. The black value is a bit higher compared to the predecessor and the other comparison devices, but this is compensated by the contrast ratio. Only the QHD+ panel of the new Dell XPS 13 9360 is a bit better in this respect.
| |||||||||||||||||||||||||
Brightness Distribution: 89 %
Center on Battery: 600 cd/m²
Contrast: 1053:1 (Black: 0.57 cd/m²)
ΔE ColorChecker Calman: 1.5 | ∀{0.5-29.43 Ø4.71}
ΔE Greyscale Calman: 2 | ∀{0.09-98 Ø4.96}
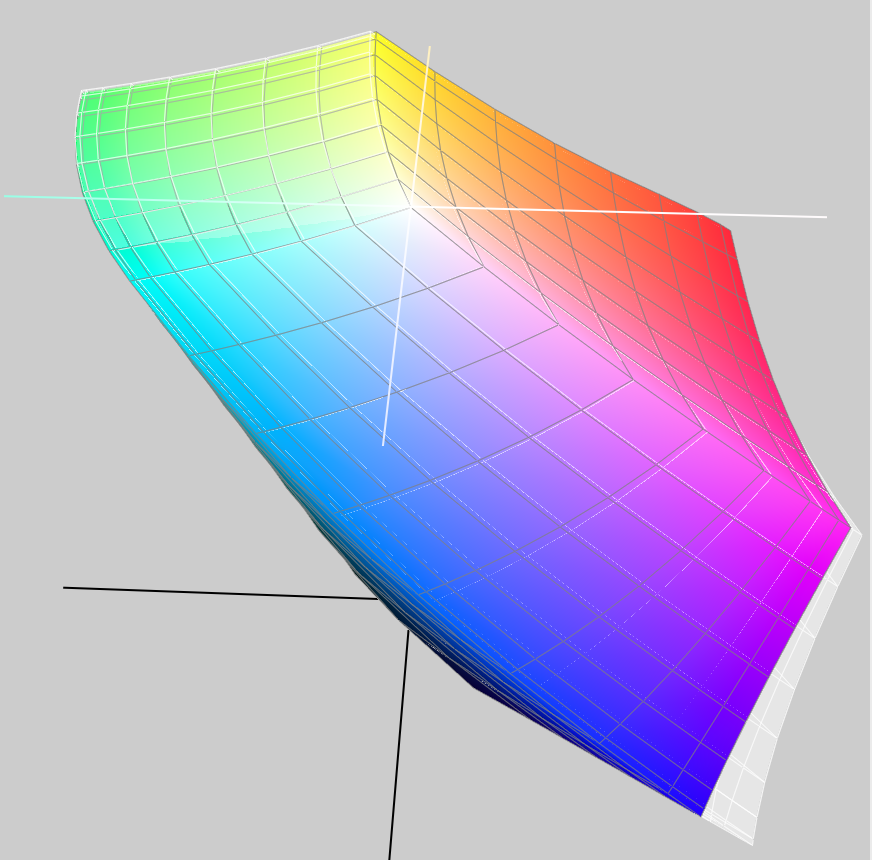
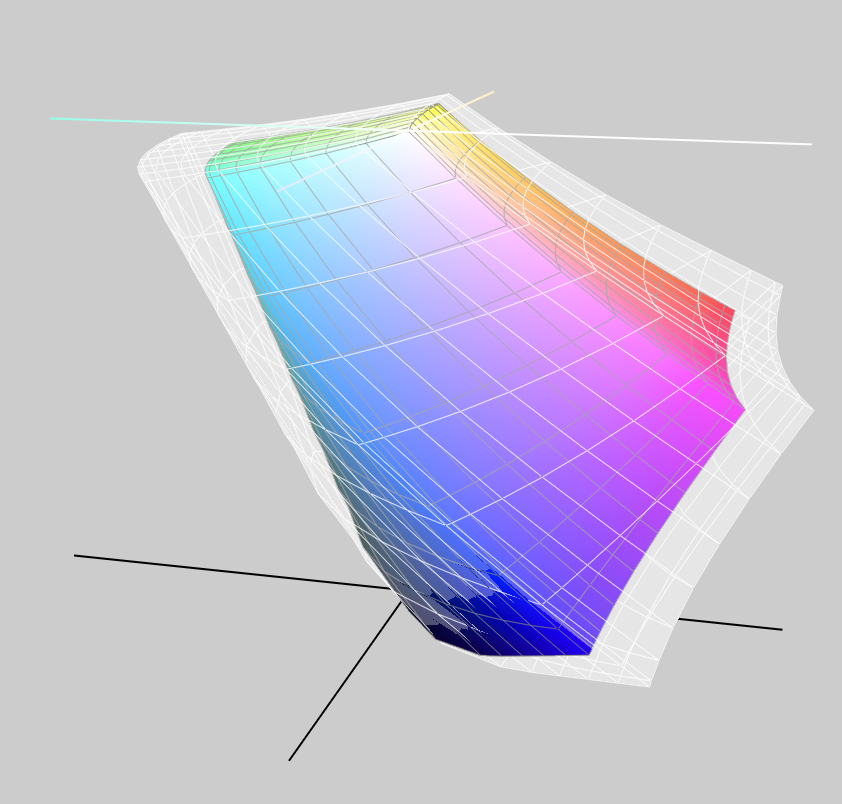
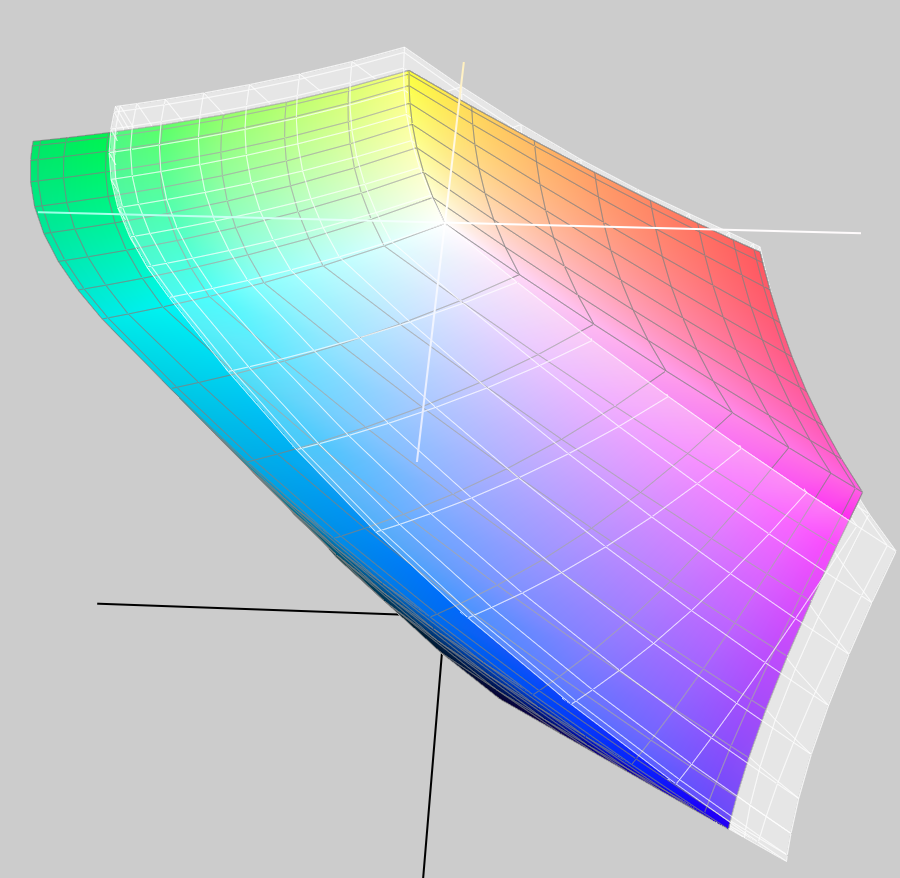
92% sRGB (Argyll 1.6.3 3D)
77% AdobeRGB 1998 (Argyll 1.6.3 3D)
86.7% AdobeRGB 1998 (Argyll 3D)
99.8% sRGB (Argyll 3D)
97.1% Display P3 (Argyll 3D)
Gamma: 2.27
CCT: 6855 K
| Apple MacBook Pro 13 2016 APPA034, , 2560x1600, 13.3" | Apple MacBook Pro Retina 13 inch 2015-03 APPA02A, , 2560x1600, 13.3" | Dell XPS 13 9360 QHD+ i7 Sharp SHP144A, , 3200x1800, 13.3" | Razer Blade Stealth QHD i7-7500U Sharp SHP142F (LQ125T1JW02), , 2560x1440, 12.5" | Apple MacBook Air 13 inch 2015-03 Apple APP9CF0, , 1440x900, 13.3" | Apple MacBook 12 (Early 2016) 1.1 GHz APPA027, , 2304x1440, 12" | |
|---|---|---|---|---|---|---|
| Display | -19% | -23% | -17% | -50% | -19% | |
| Display P3 Coverage (%) | 97.1 | 65.9 -32% | 62.8 -35% | 68.7 -29% | 40.1 -59% | 66.8 -31% |
| sRGB Coverage (%) | 99.8 | 97 -3% | 89.4 -10% | 95.8 -4% | 59.8 -40% | 95.4 -4% |
| AdobeRGB 1998 Coverage (%) | 86.7 | 67.4 -22% | 64.6 -25% | 69.9 -19% | 41.51 -52% | 68 -22% |
| Response Times | 26% | 29% | 27% | |||
| Response Time Grey 50% / Grey 80% * (ms) | 47.2 ? | 43.6 ? 8% | 37 ? 22% | 41.2 ? 13% | ||
| Response Time Black / White * (ms) | 51.6 ? | 29.2 ? 43% | 33.4 ? 35% | 30.4 ? 41% | ||
| PWM Frequency (Hz) | 200 ? | |||||
| Screen | -9% | -44% | -49% | -58% | -10% | |
| Brightness middle (cd/m²) | 600 | 361 -40% | 396.2 -34% | 402 -33% | 329 -45% | 387 -35% |
| Brightness (cd/m²) | 564 | 342 -39% | 357 -37% | 382 -32% | 310 -45% | 358 -37% |
| Brightness Distribution (%) | 89 | 81 -9% | 84 -6% | 88 -1% | 82 -8% | 88 -1% |
| Black Level * (cd/m²) | 0.57 | 0.361 37% | 0.266 53% | 0.45 21% | 0.405 29% | 0.47 18% |
| Contrast (:1) | 1053 | 1000 -5% | 1489 41% | 893 -15% | 812 -23% | 823 -22% |
| Colorchecker dE 2000 * | 1.5 | 1.82 -21% | 3.9 -160% | 3.6 -140% | 3.96 -164% | 1.6 -7% |
| Colorchecker dE 2000 max. * | 2.9 | 3.26 -12% | 7.58 -161% | 7.5 -159% | 7.51 -159% | 4 -38% |
| Greyscale dE 2000 * | 2 | 1.8 10% | 4.16 -108% | 4.3 -115% | 3.51 -76% | 1 50% |
| Gamma | 2.27 97% | 2.49 88% | 2.31 95% | 2.1 105% | 3.83 57% | 2.26 97% |
| CCT | 6855 95% | 6417 101% | 6514 100% | 6572 99% | 6711 97% | 6680 97% |
| Color Space (Percent of AdobeRGB 1998) (%) | 77 | 61.9 -20% | 57.5 -25% | 62.3 -19% | 38.4 -50% | 61.6 -20% |
| Color Space (Percent of sRGB) (%) | 92 | 96.9 5% | 88.7 -4% | 95.7 4% | 59.8 -35% | 82.2 -11% |
| Total Average (Program / Settings) | -14% /
-12% | -14% /
-31% | -12% /
-32% | -54% /
-56% | -1% /
-7% |
* ... smaller is better
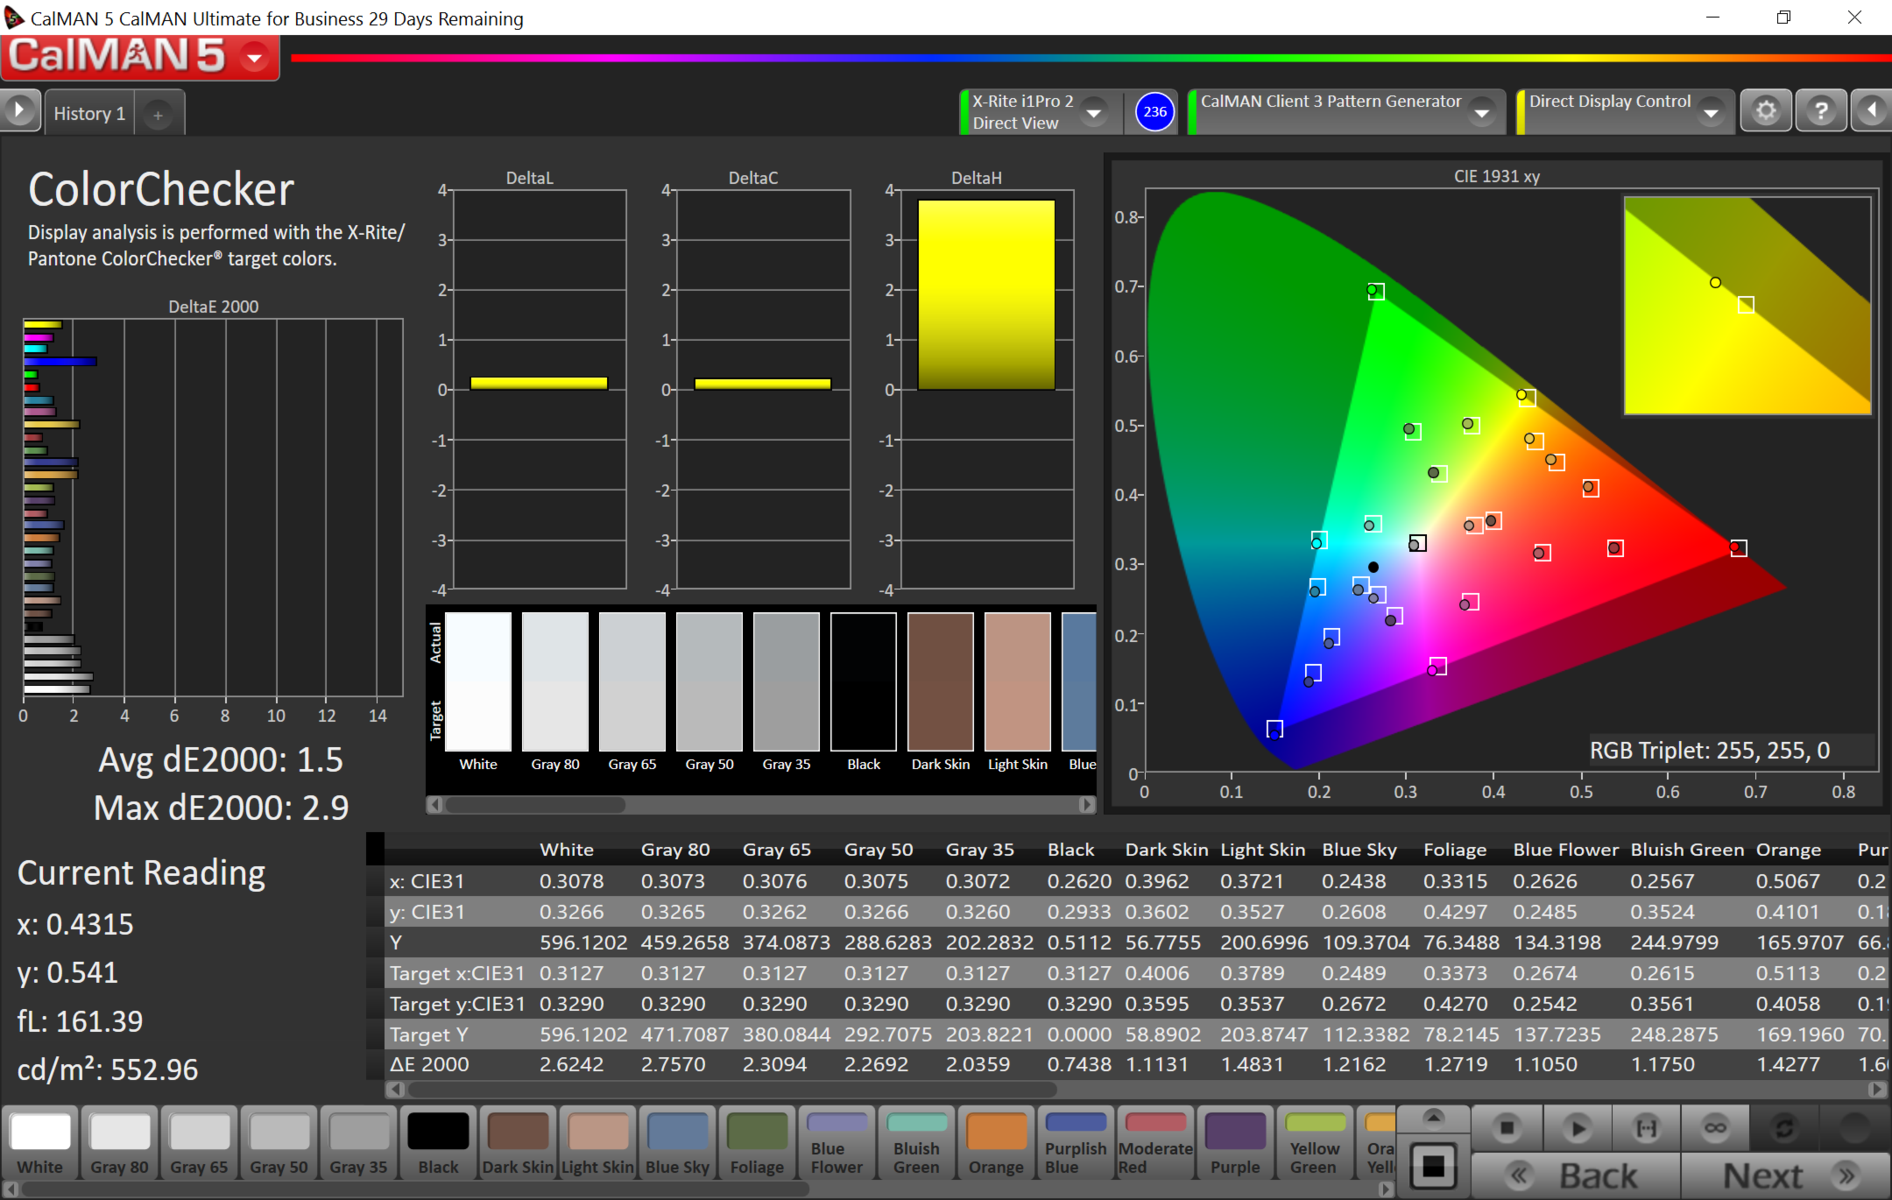
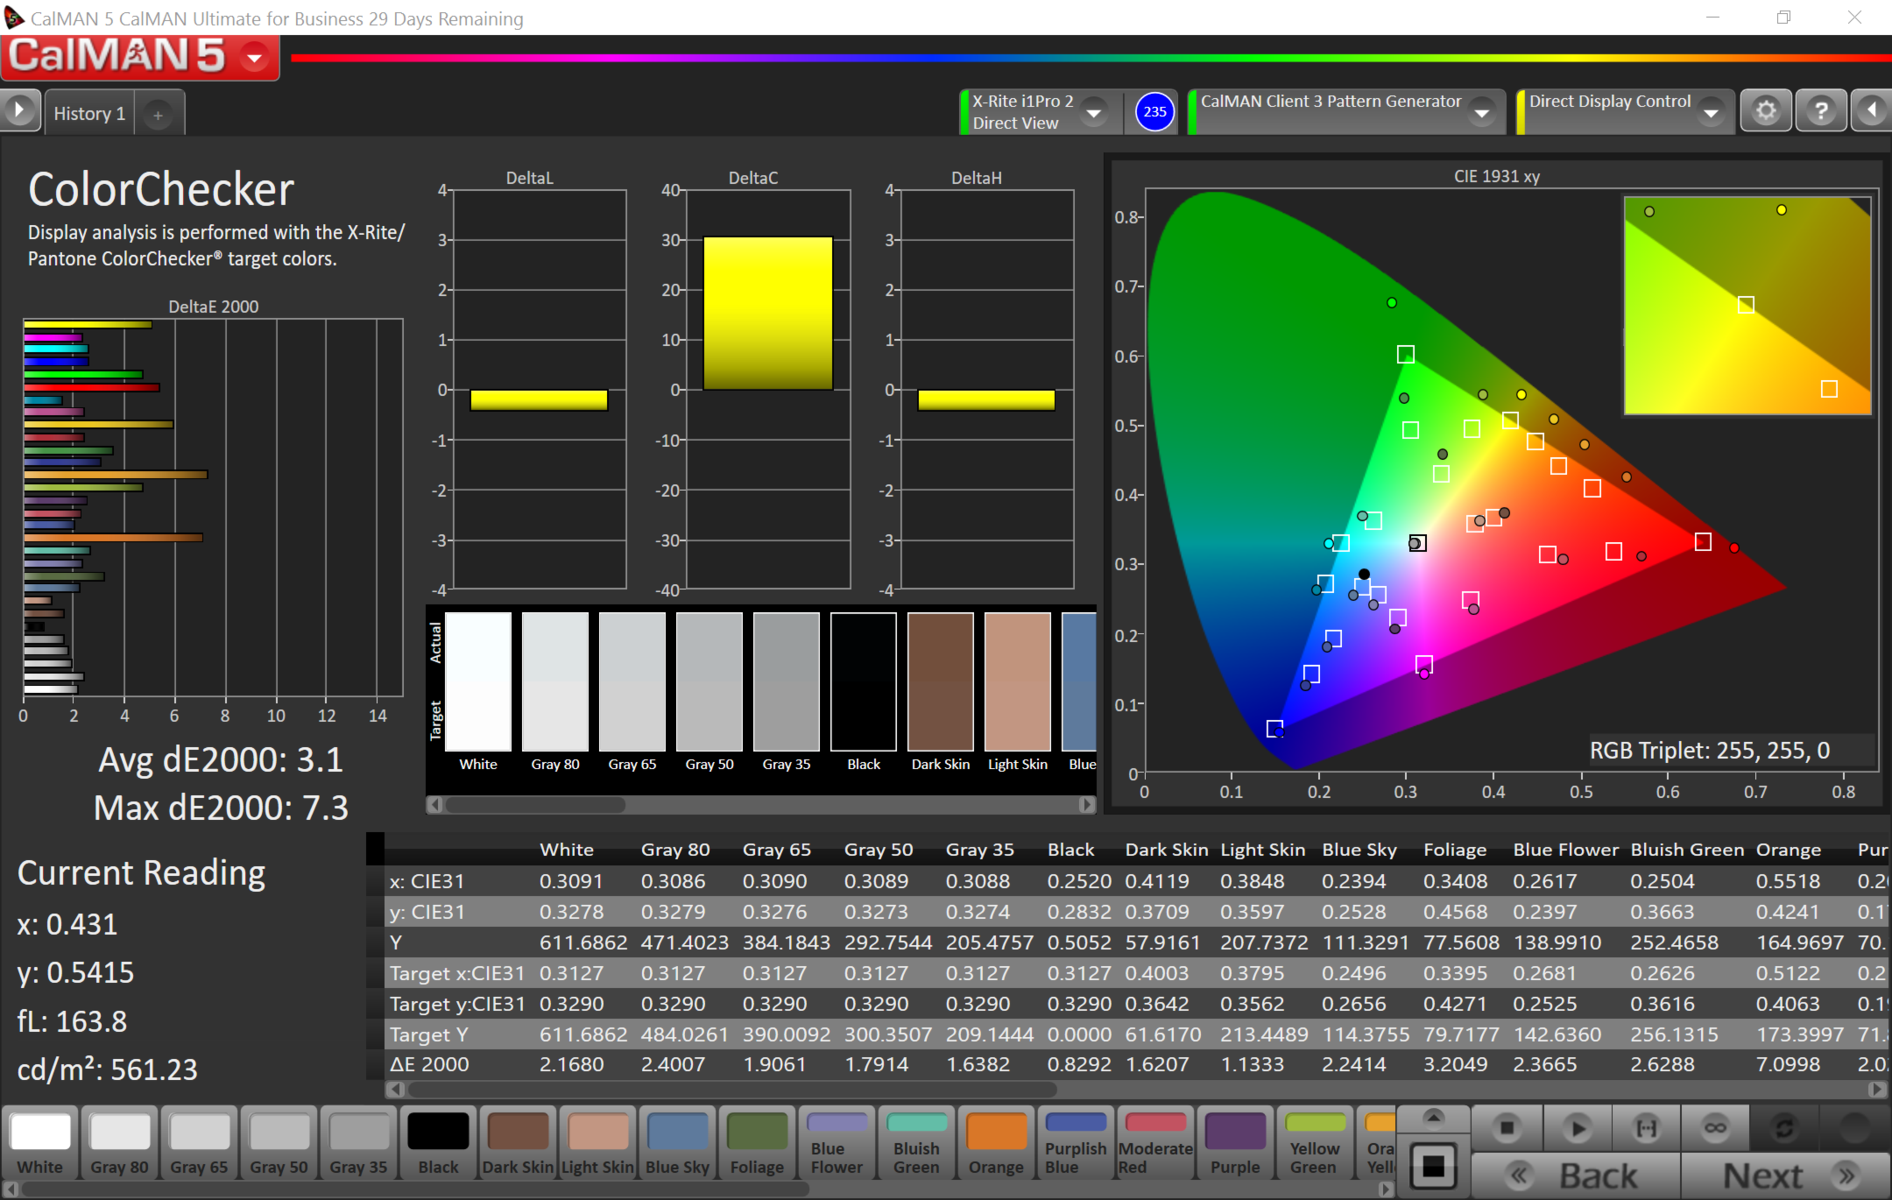
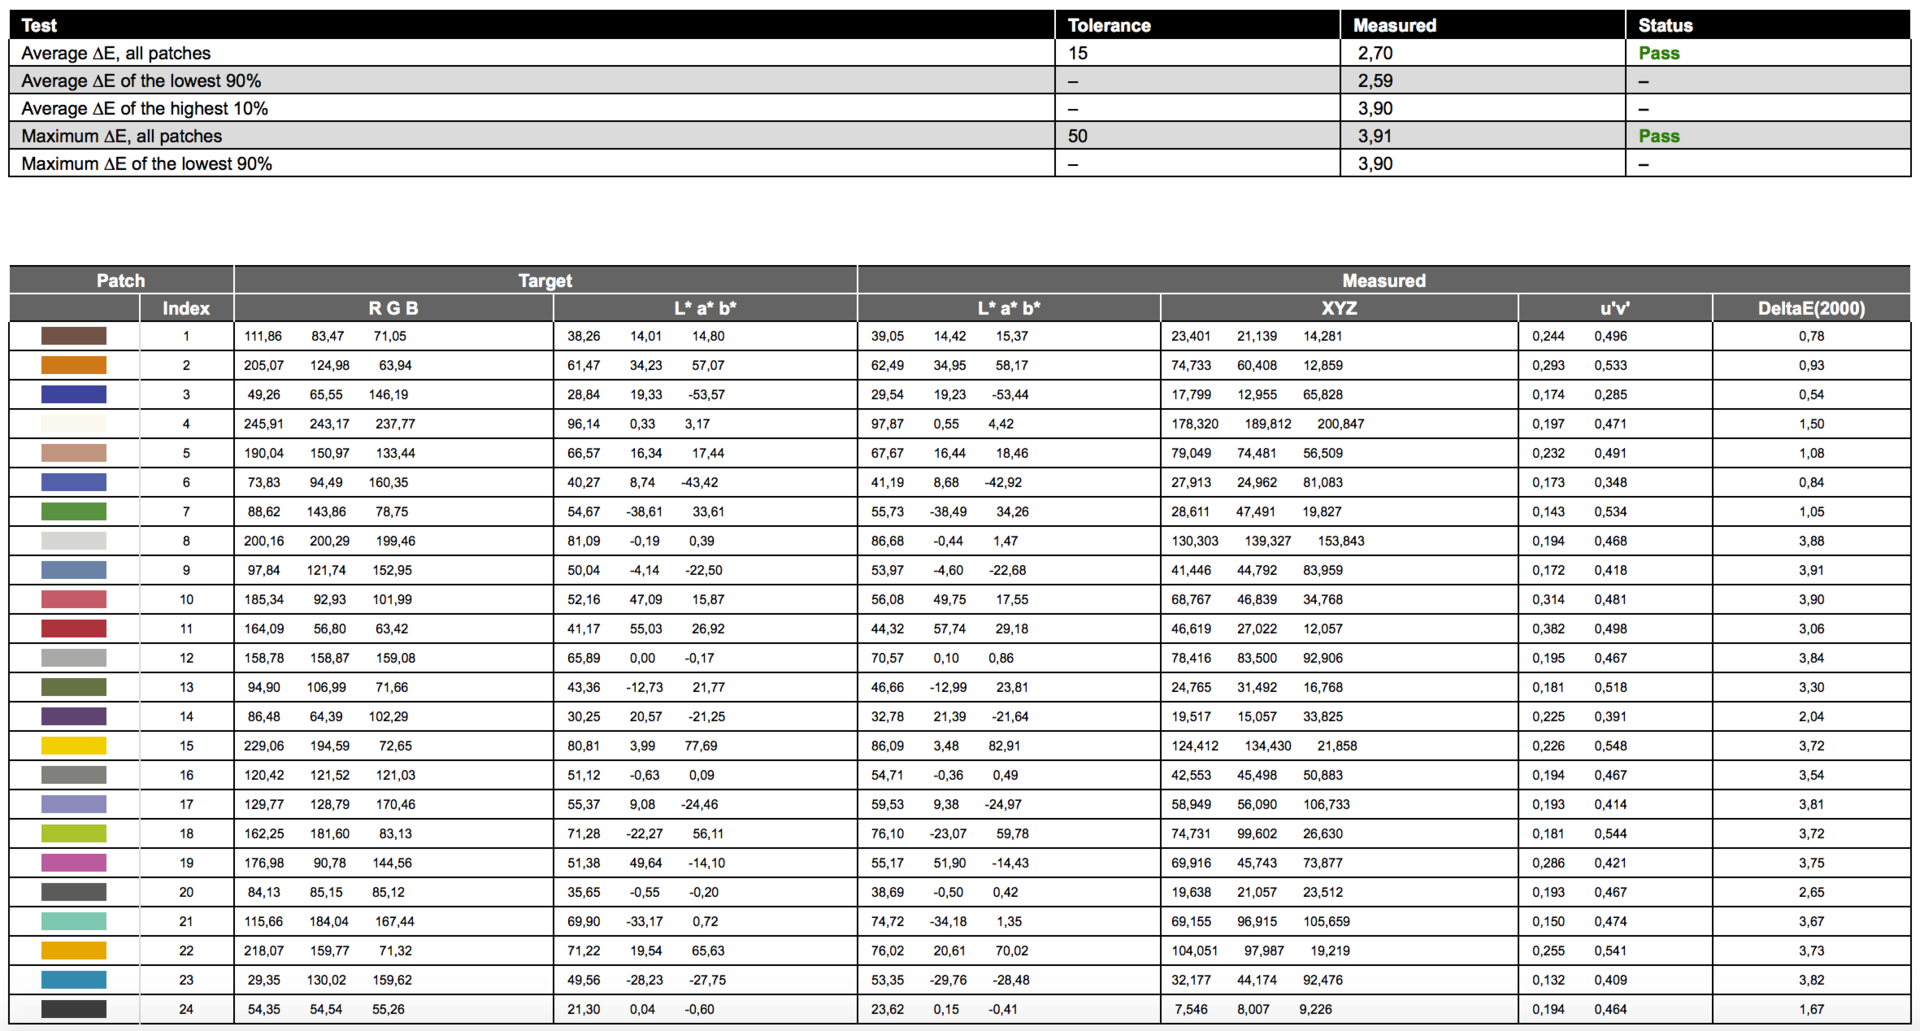
Our initial evaluation of the color accuracy and the grayscale performance of the display reveals accurate results ex-works. We can measure a DeltaE of 2 (max. 2.6) for the grayscale, while the ColorChecker shows a DeltaE of 3.1 with a maximum deviation of more than 7 for orange colors with the default sRGB color space. The situation for the MacBook Pro 13 is much better in the DCI P3 color space with an average DeltaE of 1.5 and a maximum deviation of 2.9 for blue.
Display Response Times
| ↔ Response Time Black to White | ||
|---|---|---|
| 51.6 ms ... rise ↗ and fall ↘ combined | ↗ 8.4 ms rise | 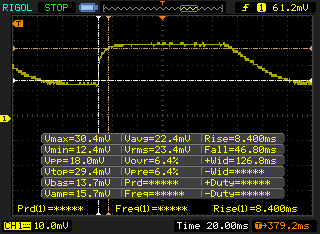 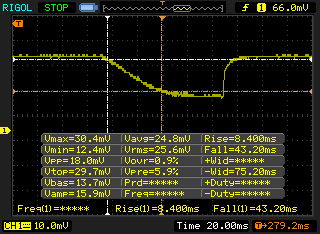 |
| ↘ 43.2 ms fall | ||
| The screen shows slow response rates in our tests and will be unsatisfactory for gamers. In comparison, all tested devices range from 0.1 (minimum) to 240 (maximum) ms. » 99 % of all devices are better. This means that the measured response time is worse than the average of all tested devices (19.8 ms). | ||
| ↔ Response Time 50% Grey to 80% Grey | ||
| 47.2 ms ... rise ↗ and fall ↘ combined | ↗ 21.6 ms rise | 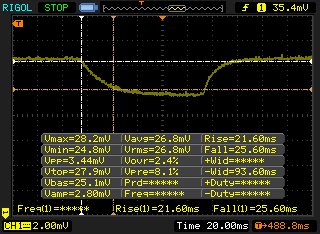 |
| ↘ 25.6 ms fall | ||
| The screen shows slow response rates in our tests and will be unsatisfactory for gamers. In comparison, all tested devices range from 0.165 (minimum) to 636 (maximum) ms. » 82 % of all devices are better. This means that the measured response time is worse than the average of all tested devices (31 ms). | ||
Screen Flickering / PWM (Pulse-Width Modulation)
| Screen flickering / PWM not detected | 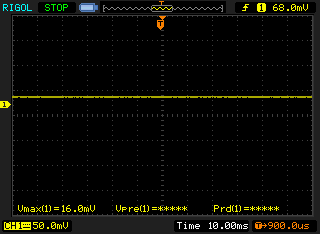 | ||
In comparison: 52 % of all tested devices do not use PWM to dim the display. If PWM was detected, an average of 7747 (minimum: 5 - maximum: 343500) Hz was measured. | |||
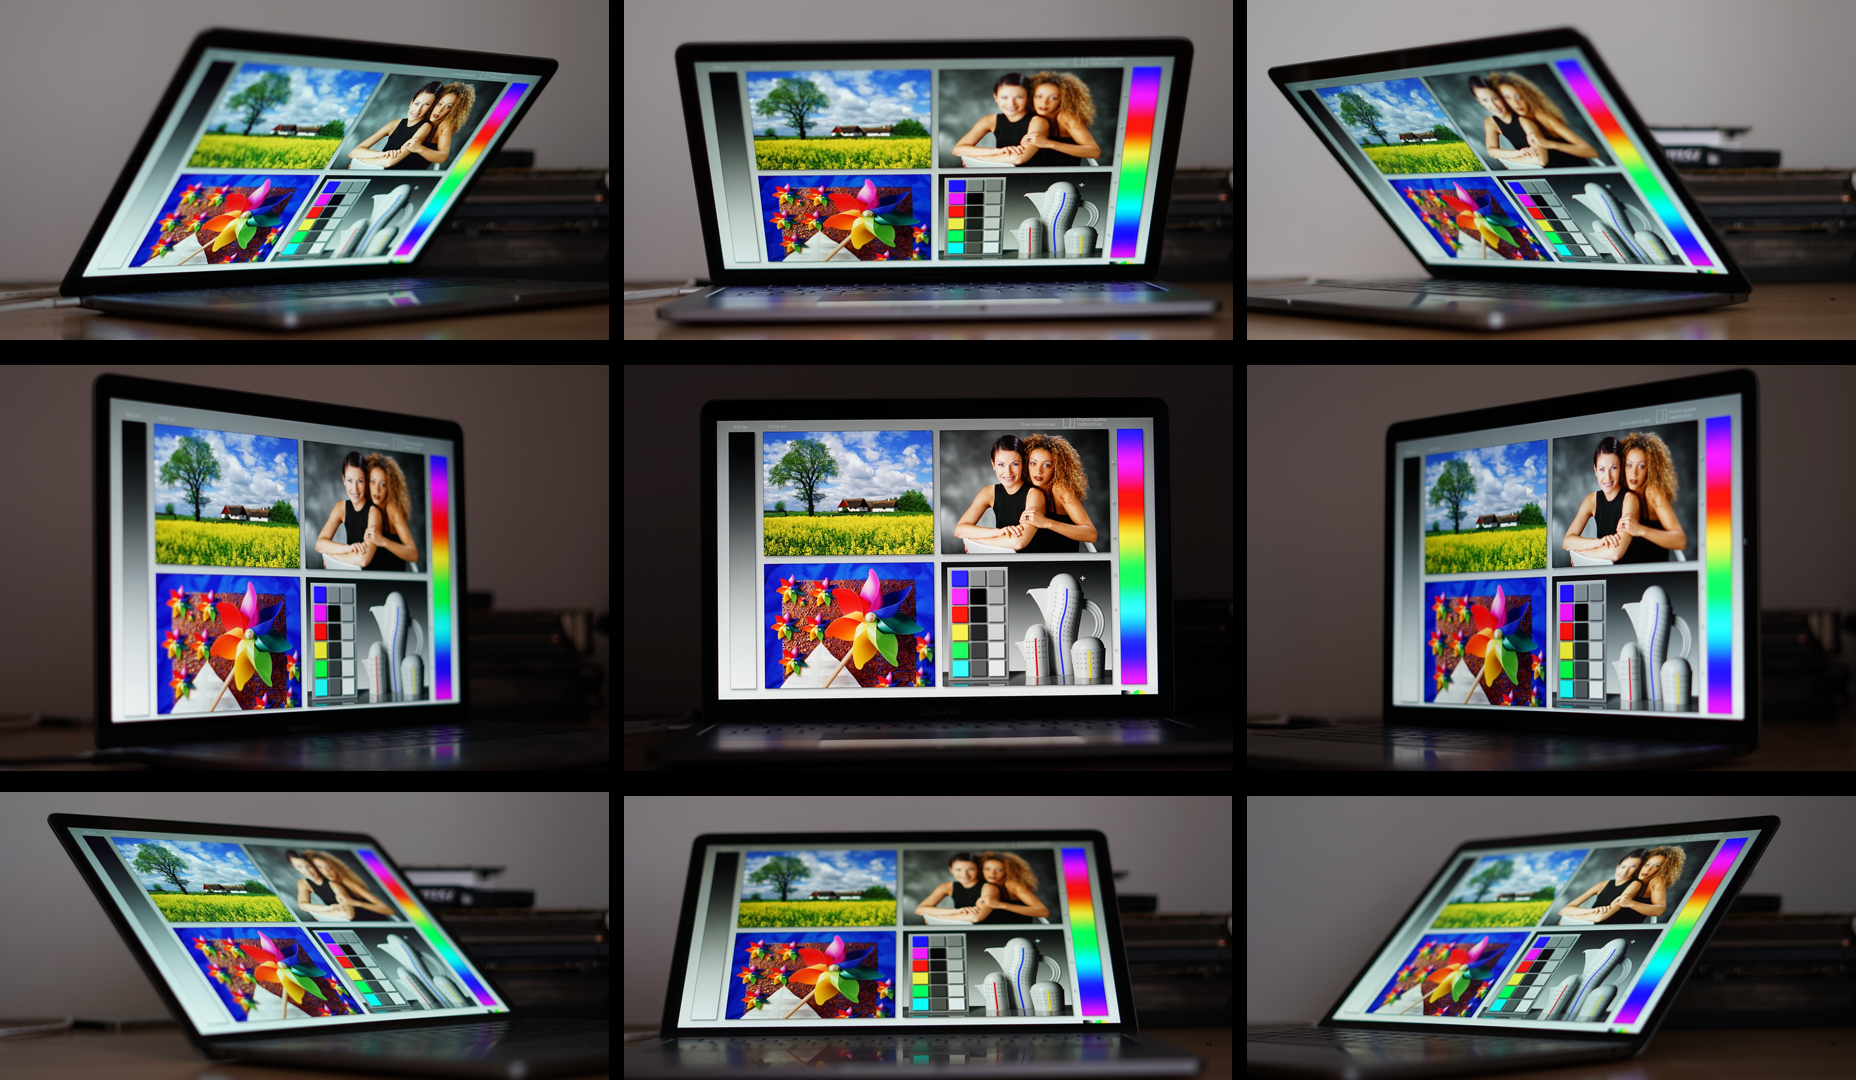
Thanks to the used IPS technology, the Retina display retains a balanced color reproduction even from extreme angles.
Performance
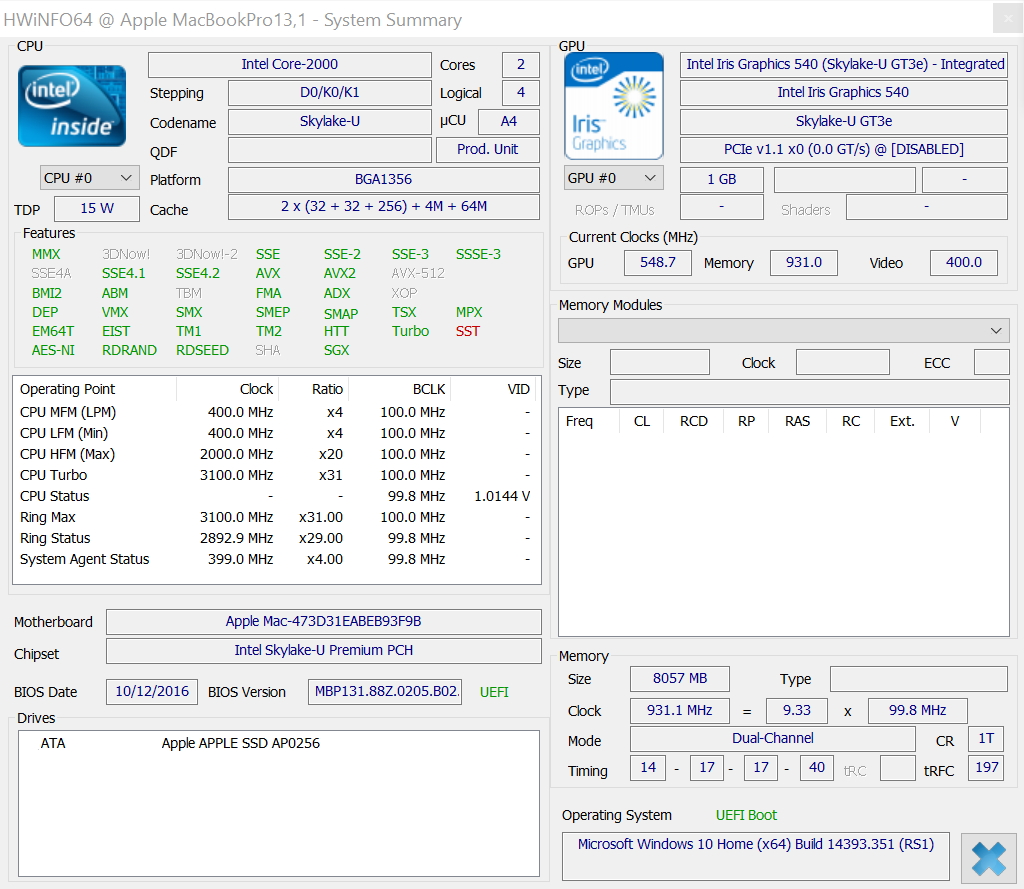
Our model of the new MacBook Pro 13-inch without Touch Bar is equipped with the default "2.0 GHz Dual-Core Intel Core i5" processor. With the specifications and the help of various tools, we can clearly identify the Intel Core i5-6360U. This chip is still a model from the Skylake CPU generation with two cores, 4 MB L3-cache, and manufactured in a 14-nm process. The CPU is clocked between 2.0-3.1 GHz at a TDP of 15 Watts. The specialty of the i5-6360U is a "tweaked" integrated GPU, the Intel Iris Graphics 540 with 64 MB eDRAM. Intel's Kaby Lake did not fit into Apple's schedule, because the new processors are only available for a couple of weeks now. If you do not want to waive the Kaby Lake advantages, you will have to wait for new Apple devices in about a year.
Processor
Let's have a look at the CPU performance, and there does not seem to be a big difference compared to the predecessor with the i5-5257U processor. A bit faster is the i7-6560U we tested in the Dell XPS 13 9350. This chip has a slightly higher clock between 2.2-3.2 GHz. About 10 percent faster (here Aspire V3-372 with comparable CPU) should be the Touch Bar model with the "2.9 GHz Dual-Core i5", both in the single-core as well as multi-core tests. According to Dell, the CPU should be the i5-6267U, which is also equipped with the more powerful Iris Graphics 550. The i5-6267U should be on par with the recently announced top model U-series CPU from the Kaby Lake generation, the i7-7500U (in the new Razer Blade Stealth, for example).
System Performance
We use the PCMark benchmarks running on Bootcamp Windows to evaluate the system performance. A score of 3280 points in the Home v2 test for the new Apple MacBook Pro 13 is on par with the Razer Blade Stealth and the previous MBP 13 from 2015. Dell's XPS 13 with i7-6560U is a bit faster, just like the MacBook Air from 2015. Both the Dell (FHD) and the Air (1440 x 900) benefit from the lower resolutions.
| PCMark 8 Home Score Accelerated v2 | 3280 points | |
| PCMark 8 Creative Score Accelerated v2 | 4205 points | |
| PCMark 8 Work Score Accelerated v2 | 3853 points | |
Help | ||
Storage Devices
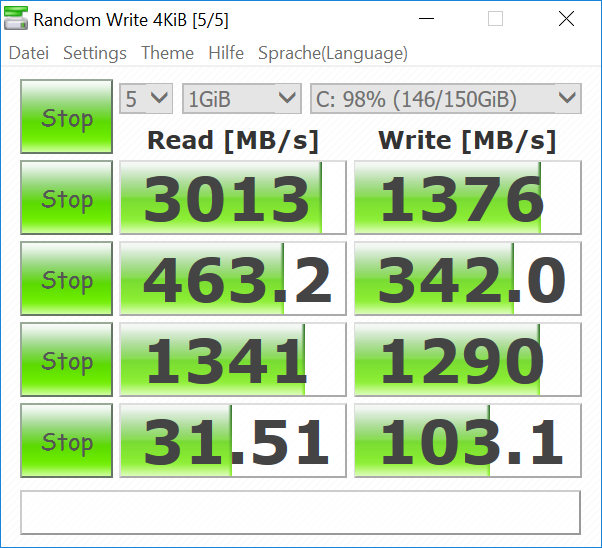
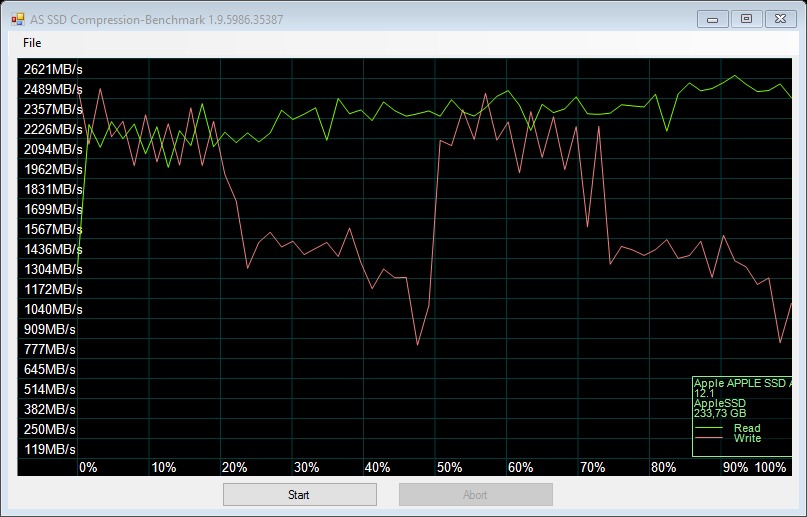
The storage solution is probably the fastest drive Apple used for its laptops so far. It has the designation Apple SSD AP0256, a storage capacity of 256 GB, and is attached via PCIe. Apple uses memory chips from SanDisk in combination with its own controller. The drive is attached to the logic board, but Apple does use a proprietary standard, so replacing the drive by yourself is pretty much impossible.
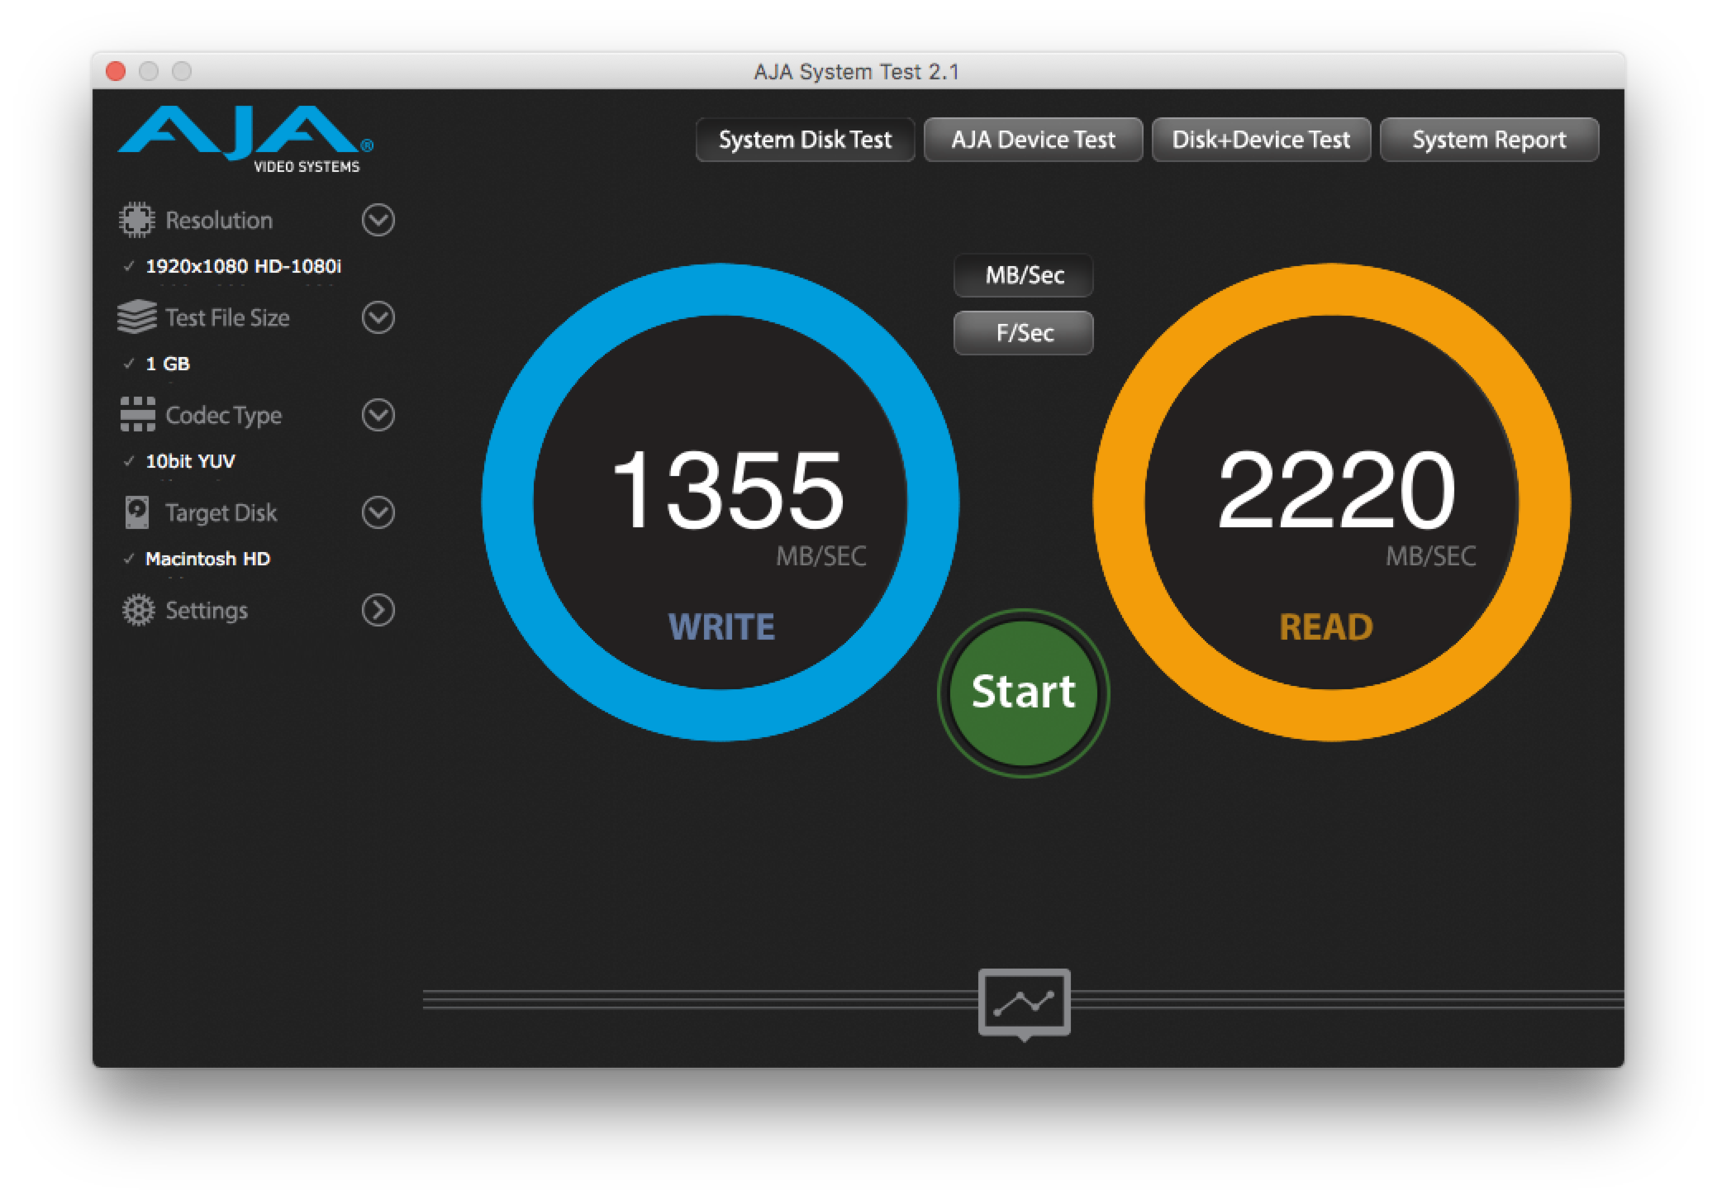
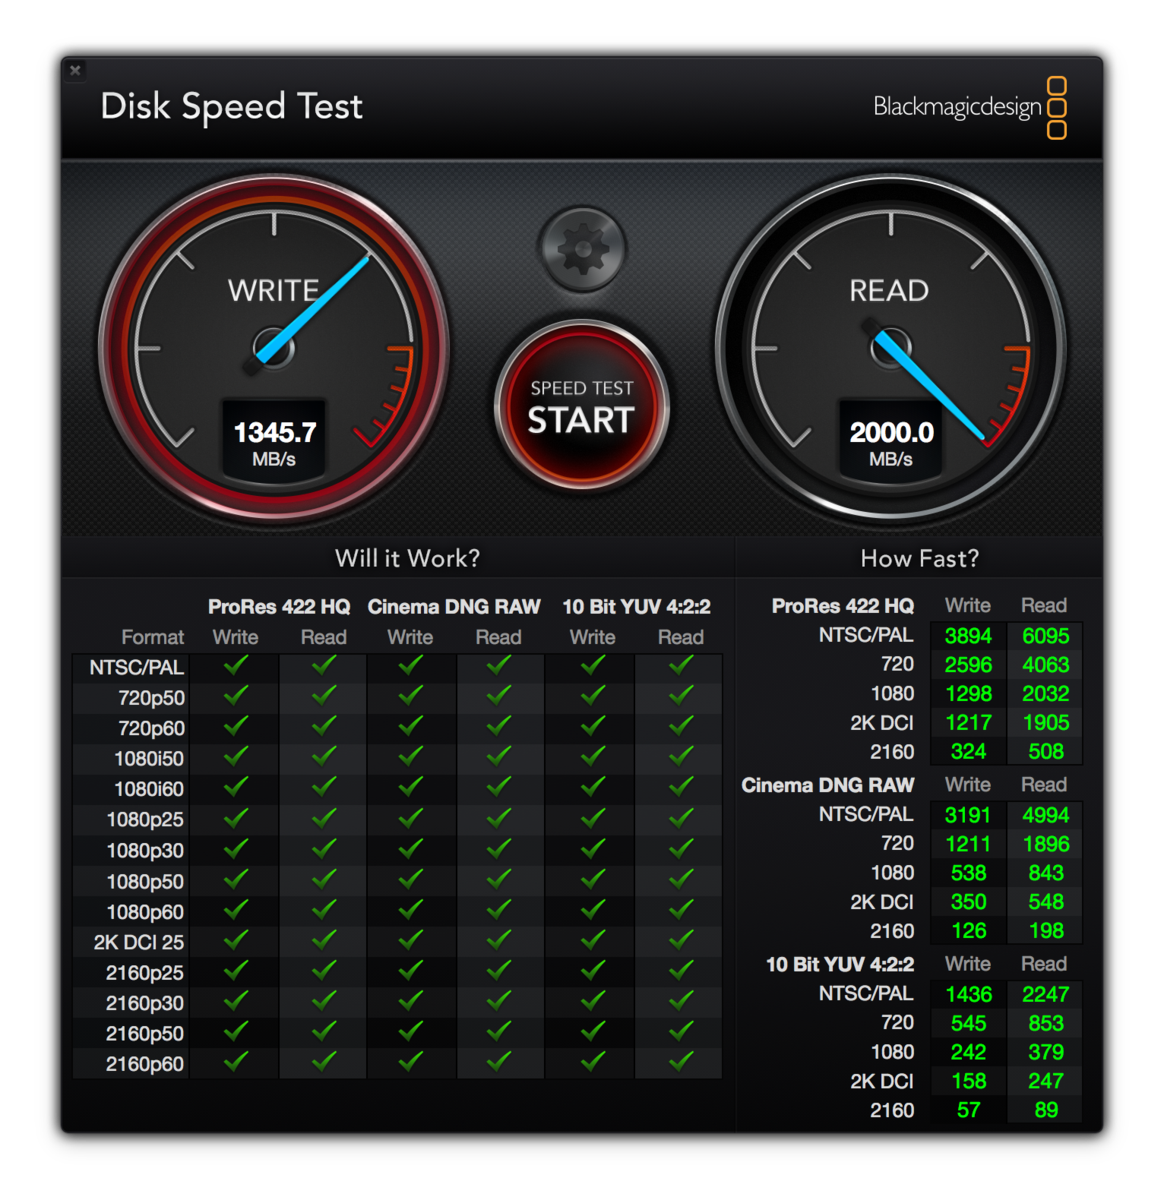
The highlight in the benchmarks is the extremely high sequential transfer rate. 2275 MB/s as well as 1435 MB/s (write) are almost unrivaled in the comparison. The drive is, however, beaten in the 4K tests and the access times are also a bit higher compared to the rivals.
| Apple MacBook Pro 13 2016 Apple SSD AP0256 | Apple MacBook Pro Retina 13 inch 2015-03 Apple SSD SM0128G | Apple MacBook Air 13 inch 2015-03 Apple SSD SD0256F | Dell XPS 13 9360 QHD+ i7 Toshiba NVMe THNSN5256GPUK | Razer Blade Stealth QHD i7-7500U Samsung PM951 NVMe MZVLV256 | Apple MacBook 12 (Early 2016) 1.1 GHz Apple SSD AP0256 | Dell XPS 13 2016 9350 (FHD, i7-6560U) Samsung PM951 NVMe MZ-VLV256D | |
|---|---|---|---|---|---|---|---|
| CrystalDiskMark 3.0 | -1% | 9% | 117% | 140% | -21% | 112% | |
| Read Seq (MB/s) | 1345 | 1403 4% | 1352 1% | 1214 -10% | 1178 -12% | 754 -44% | 1131 -16% |
| Write Seq (MB/s) | 1320 | 657 -50% | 1111 -16% | 655 -50% | 305.4 -77% | 638 -52% | 311.4 -76% |
| Read 512 (MB/s) | 831 | 810 -3% | 880 6% | 1019 23% | 638 -23% | 616 -26% | 685 -18% |
| Write 512 (MB/s) | 1486 | 648 -56% | 1023 -31% | 445.7 -70% | 305.7 -79% | 678 -54% | 276.3 -81% |
| Read 4k (MB/s) | 31.68 | 20.95 -34% | 21.93 -31% | 35.55 12% | 38.54 22% | 14.6 -54% | 39.63 25% |
| Write 4k (MB/s) | 11.02 | 32.43 194% | 30.94 181% | 130 1080% | 153.4 1292% | 20.5 86% | 133.9 1115% |
| Read 4k QD32 (MB/s) | 533 | 343.6 -36% | 339.5 -36% | 537 1% | 614 15% | 464 -13% | 399.7 -25% |
| Write 4k QD32 (MB/s) | 362 | 254.4 -30% | 342.9 -5% | 173.8 -52% | 302.7 -16% | 315 -13% | 245.6 -32% |
| AS SSD | 7% | 10% | 80% | 116% | -12% | 92% | |
| Seq Read (MB/s) | 2275 | 1233 -46% | 1212 -47% | 1346 -41% | 1332 -41% | 1056 -54% | 1323 -42% |
| Seq Write (MB/s) | 1435 | 616 -57% | 1001 -30% | 586 -59% | 283.6 -80% | 651 -55% | 235.3 -84% |
| 4K Read (MB/s) | 13.3 | 20.6 55% | 19.16 44% | 31.64 138% | 35.2 165% | 16.4 23% | 35.4 166% |
| 4K Write (MB/s) | 15.4 | 30.2 96% | 23.73 54% | 95.6 521% | 127.2 726% | 22.1 44% | 108.3 603% |
| 4K-64 Read (MB/s) | 904 | 891 -1% | 1140 26% | 655 -28% | 891 -1% | 509 -44% | 767 -15% |
| 4K-64 Write (MB/s) | 417 | 221.2 -47% | 338.9 -19% | 205.6 -51% | 256.9 -38% | 283 -32% | 186.3 -55% |
| Access Time Read * (ms) | 0.288 | 0.141 51% | 0.171 41% | 0.065 77% | 0.06 79% | 0.186 35% | 0.088 69% |
| Access Time Write * (ms) | 0.123 | 0.155 | 0.033 | 0.03 | 0.035 | ||
| Total Average (Program / Settings) | 3% /
3% | 10% /
9% | 99% /
99% | 128% /
129% | -17% /
-17% | 102% /
102% |
* ... smaller is better

GPU Performance
The graphics adapter of the small MacBook Pro 13 is the integrated Intel Iris Graphics 540 (see for more details and benchmarks). It has 48 EUs running at up to 900 MHz. The GPU can also use the fast, but small 64 MB eDRAM, while the rest of the memory is shared with the LPDDR3 (933 MHz) system memory.
We check the graphics performance of the integrated chip with Windows 10 (via Bootcamp), because we have more comparison devices. The Iris 540 actually performs pretty well in 3DMark 11 and is just behind the Iris 540 inside the Surface Pro 4 with Core i7-6650U (+2 %). The old Dell XPS 13 only manages 80 % of the performance. For comparison: Intel's new integrated graphics unit of the recently announced Kaby Lake processors (HD Graphics 620) is more than 30 % slower. The current 3DMark Cloud Gate test confirms the 3DMark 11 results.
Compared to dedicated graphics cards, the Intel 540 is sitting between the GeForce 930M and 940M in the synthetic benchmarks.
Gaming Performance
The challenging title Witcher 3 is not really playable even with low details, but the new Apple MacBook Pro 13 can beat numerous comparable or even better equipped notebooks. The Aspire V3-372 with the Intel HD Graphics 550, for example, is just beaten, and the HD 540 in the Lenovo 710S is about 13 % behind.
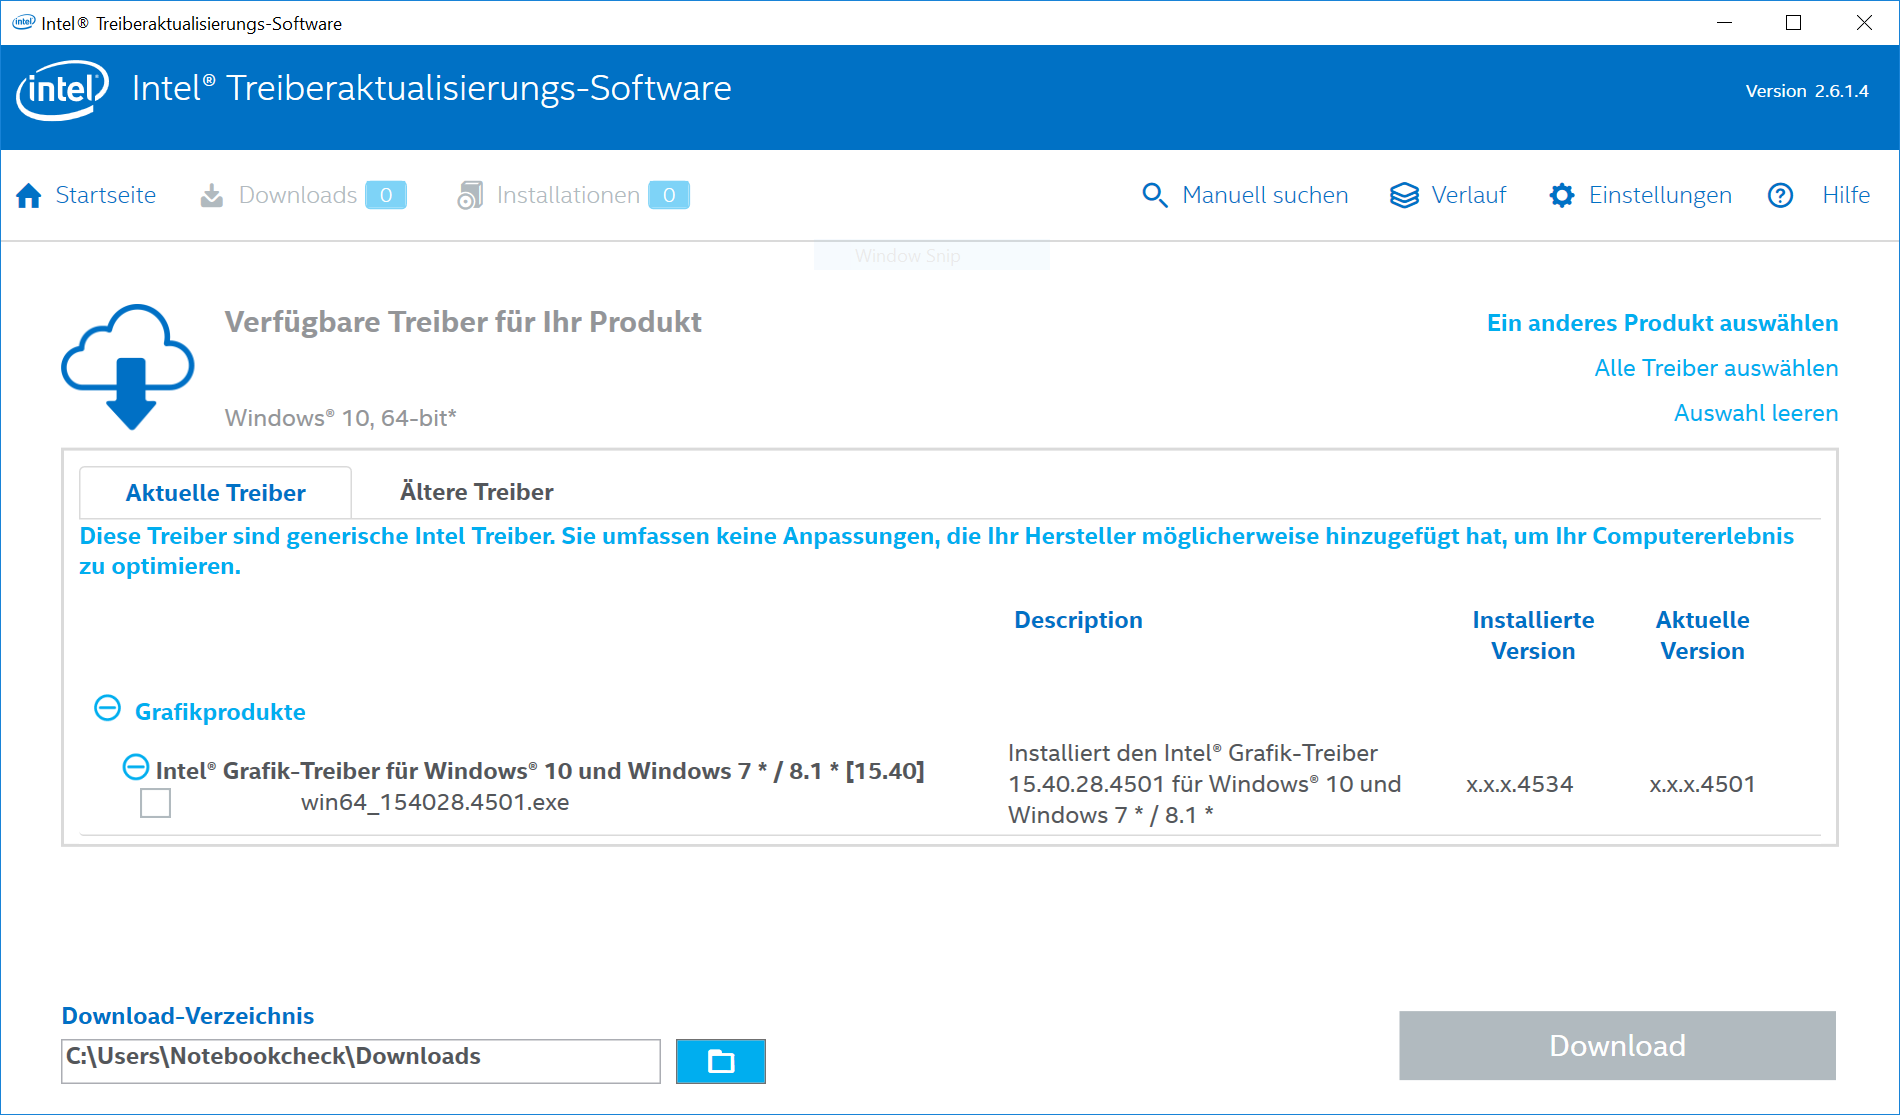
The Iris 540 is generally no gaming GPU. Many modern titles cannot be played and there are also some graphics errors right now. The GPU does at least support beta drivers and Intel is obviously trying to launch new updates faster than before. The performance once again falls behind the 940M and even the slow 920M is sometimes faster.
Using macOS, the gaming performance is always worse compared to Windows due to OpenGL. A comparison with DOTA 2, for example, shows that you have to reduce both the resolution and the details in macOS. Only World of Warcraft is an example with support for the newer Metal API, but we do not expect extensive support.
| The Witcher 3 - 1024x768 Low Graphics & Postprocessing | |
| MSI GP62 2QD | |
| MSI CX61 2QC 2970M MS-16GD | |
| Apple MacBook Pro 13 2016 | |
| Intel NUC6i5SYH | |
| Acer Aspire V3-372-57CW | |
| Lenovo IdeaPad 710S-13ISK | |
| Dell XPS 13 2016 9350 (FHD, i7-6560U) | |
| Dell XPS 13 9360 QHD+ i7 | |
| Razer Blade Stealth QHD i7-7500U | |
| Asus Zenbook UX360UA-C4159T | |
| Battlefield 1 - 1366x768 Medium Preset AA:FX | |
| XFX RX-460P4DFG5 Double Dissipation 4 GB | |
| MSI GP62 2QD | |
| Apple MacBook Pro 13 2016 | |
| MSI CX61 2QC 2970M MS-16GD | |
| Deus Ex Mankind Divided - 1280x720 Low Preset AF:1x | |
| XFX RX-460P4DFG5 Double Dissipation 4 GB | |
| Apple MacBook Pro 13 2016 | |
| Apple MacBook Pro 13 2016 | |
| MSI GP62 2QD | |
| MSI CX61 2QC 2970M MS-16GD | |
| World of Warships - 1920x1080 High Preset AF:8x | |
| MSI GP62 2QD | |
| Acer Aspire V3-372-57CW | |
| Intel NUC6i5SYH | |
| Apple MacBook Pro 13 2016 | |
| MSI CX61 2QC 2970M MS-16GD | |
| Dell XPS 13 2016 9350 (FHD, i7-6560U) | |
| Razer Blade Stealth QHD i7-7500U | |
| Metro: Last Light - 1366x768 Medium (DX10) AF:4x | |
| Intel NUC6i5SYH | |
| Acer Aspire V3-372-57CW | |
| Apple MacBook Pro 13 2016 | |
| MSI CX61 2QC 2970M MS-16GD | |
| BioShock Infinite - 1366x768 High Preset | |
| MSI GP62 2QD | |
| Acer Aspire V3-372-57CW | |
| Apple MacBook Pro 13 2016 | |
| Intel NUC6i5SYH | |
| Lenovo IdeaPad 710S-13ISK | |
| MSI CX61 2QC 2970M MS-16GD | |
| Dell XPS 13 9360 QHD+ i7 | |
| Asus Zenbook UX360UA-C4159T | |
| Dirt Rally - 1366x768 Medium Preset | |
| MSI CX61 2QC 2970M MS-16GD | |
| Acer Aspire V3-372-57CW | |
| Intel NUC6i5SYH | |
| Apple MacBook Pro 13 2016 | |
| Lenovo IdeaPad 710S-13ISK | |
| low | med. | high | ultra | |
|---|---|---|---|---|
| BioShock Infinite (2013) | 40.3 | 11.6 | ||
| Metro: Last Light (2013) | 42 | 35.4 | 22.1 | |
| Dirt Rally (2015) | 149 | 36.8 | 18.7 | |
| The Witcher 3 (2015) | 20.5 | |||
| Dota 2 Reborn (2015) | 59.8 | 46.9 | 29.2 | 34.6 |
| World of Warships (2015) | 73.3 | 33.5 | ||
| Fallout 4 (2015) | 23.2 | |||
| Rise of the Tomb Raider (2016) | 24 small graphical problems (wrong clouds) | 16 small graphical problems (wrong clouds) | ||
| Far Cry Primal (2016) | 23 | 12 | ||
| Ashes of the Singularity (2016) | 13.3 | |||
| Doom (2016) | 31.5 | |||
| Overwatch (2016) | 68 | 47.6 | 21.3 | |
| Mirror's Edge Catalyst (2016) | 35 | 20.5 | ||
| Deus Ex Mankind Divided (2016) | 16.7 | |||
| FIFA 17 (2016) | 61 small graphical problems | 72 small graphical problems | 0 small graphical problems | |
| Mafia 3 (2016) | 11.3 | |||
| Battlefield 1 (2016) | 43.4 | 25.3 | 12.6 | |
| Farming Simulator 17 (2016) | 112 | 76 | 30.6 | 19.1 |
| Titanfall 2 (2016) | 55.3 | 38.6 | 14.3 | |
| Call of Duty Infinite Warfare (2016) | 30 | 27.3 | ||
| Dishonored 2 (2016) | 17.3 |
Throttling / Performance under load
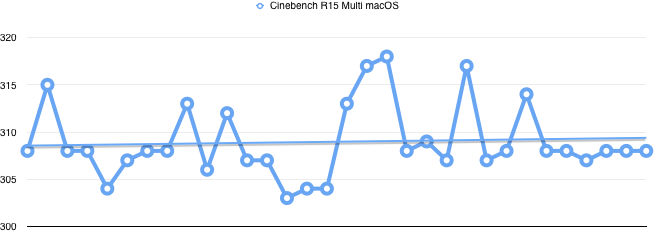
Neither a loop of the Cinebench R15 Multi Test (see results below), nor the GPU benchmark Unigine Valley in macOS determine throttling or performance drops. Quite the contrary: We saw the highest scores after a couple of runs in both benchmarks. However, the fluctuations in the Unigine Valley benchmark (8.7-8.9 FPS) are not significant.
Emissions
System Noise
Our initial impression with the test model is pretty typical for devices from Apple: You cannot hear the fan (Touch Bar model: two fans) with office workloads. You will only hear a quiet increase of the fan speed unter sustained workloads. But then it happens: The fan of our test model starts to rattle and is very sensitive to position changes of the notebook. We have to assume a defect of our test model. But the fan is subjectively a bit more unpleasant than the old model as well, even without the rattling. While you could only hear a murmur so far, you can now also hear a slightly high-pitched sound.
We analyzed the fan noise under macOS with the GPU benchmark Unigine Valley. The single fan steadily increases its speed over the one-hour test period according to the istat tool. The latter also hows that the fan is deactivated while idling, while the old MacBook models had slowly running fans that were always active. Our test therefore starts with the ambient noise of 30.5 dB(A). The MacBook is basically silent for the first couple of minutes and reached up to 3300 rpm and 31.2 dB(A). After that, we noticed a linear increase to 40.4 dB(A) at 5870 rpm. We also selected the maximum fan speed at 7200 rpm manually via istat and measured up to 45.4 dB(A). However, we never reached the maximum fan speed with any of our reviewed Macs. The noise characteristics differs a lot from the previous model. The 2015 MacBook Pro 13 had the peaks of up to 47 dB(A) at 1500 and 3500 Hz. The new and flatter fan has three peaks at 500 Hz, 2500 Hz and pretty high-pitched 5000 Hz. The previously mentioned and recorded rattling was not audible anymore in this test, maybe it was stopped by the movements in the video.
Temperature
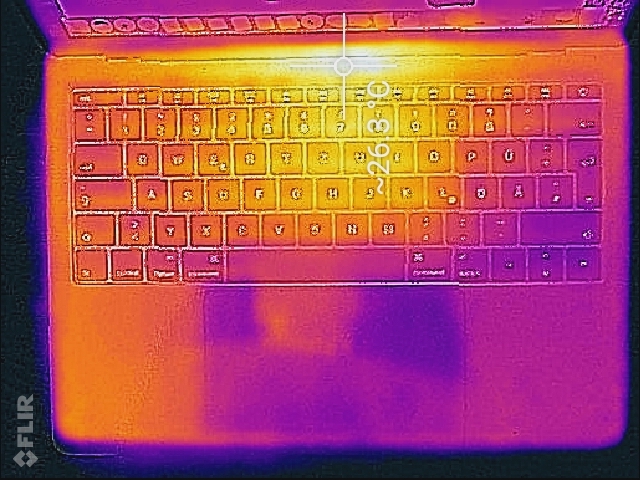
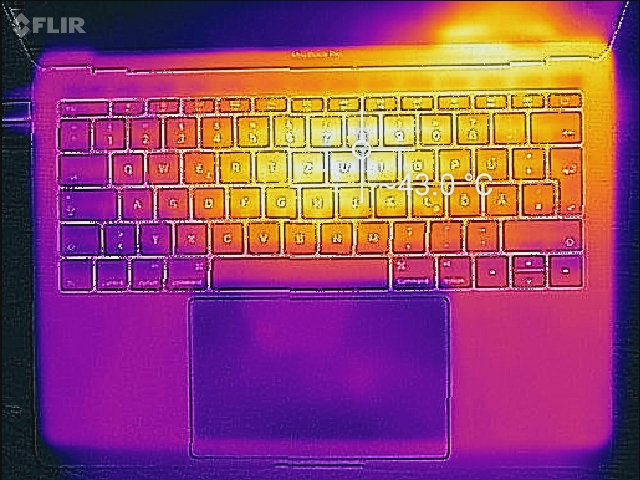
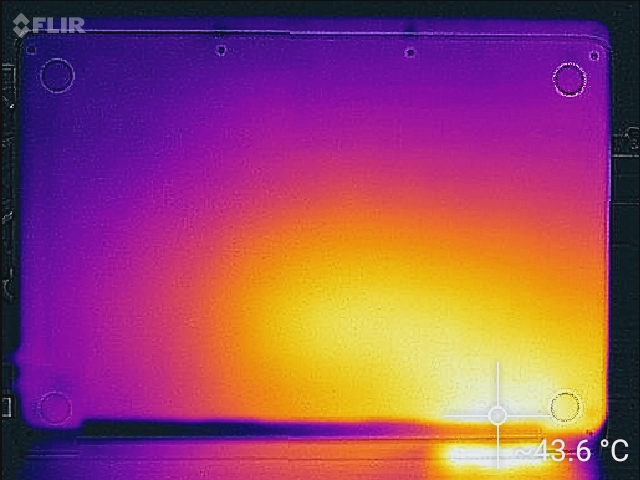
Sustained workloads will result in a perceptible and measurable warming of the MacBook Pro 13, especially in the rear area where the logic board as well as the core components are located. At up to 42 °C at the top and 41 °C at the bottom, the maximum temperatures are still pretty comfortable within the comparison. The previous MBP shows a very similar temperature development, but gets a bit warmer at the top. We can see slightly higher temperatures for the components of the new MacBook Pro though (35/39/36 vs. 33/40/31 °C), and the front and center part of the keyboard get a bit warmer as well. Apple was able to distribute the heat more across the chassis compared to the predecessor.
(±) The maximum temperature on the upper side is 42 °C / 108 F, compared to the average of 35.9 °C / 97 F, ranging from 21.4 to 59 °C for the class Subnotebook.
(±) The bottom heats up to a maximum of 41 °C / 106 F, compared to the average of 39.2 °C / 103 F
(+) In idle usage, the average temperature for the upper side is 24.8 °C / 77 F, compared to the device average of 30.8 °C / 87 F.
(+) The palmrests and touchpad are cooler than skin temperature with a maximum of 31 °C / 87.8 F and are therefore cool to the touch.
(-) The average temperature of the palmrest area of similar devices was 28.2 °C / 82.8 F (-2.8 °C / -5 F).
Speakers
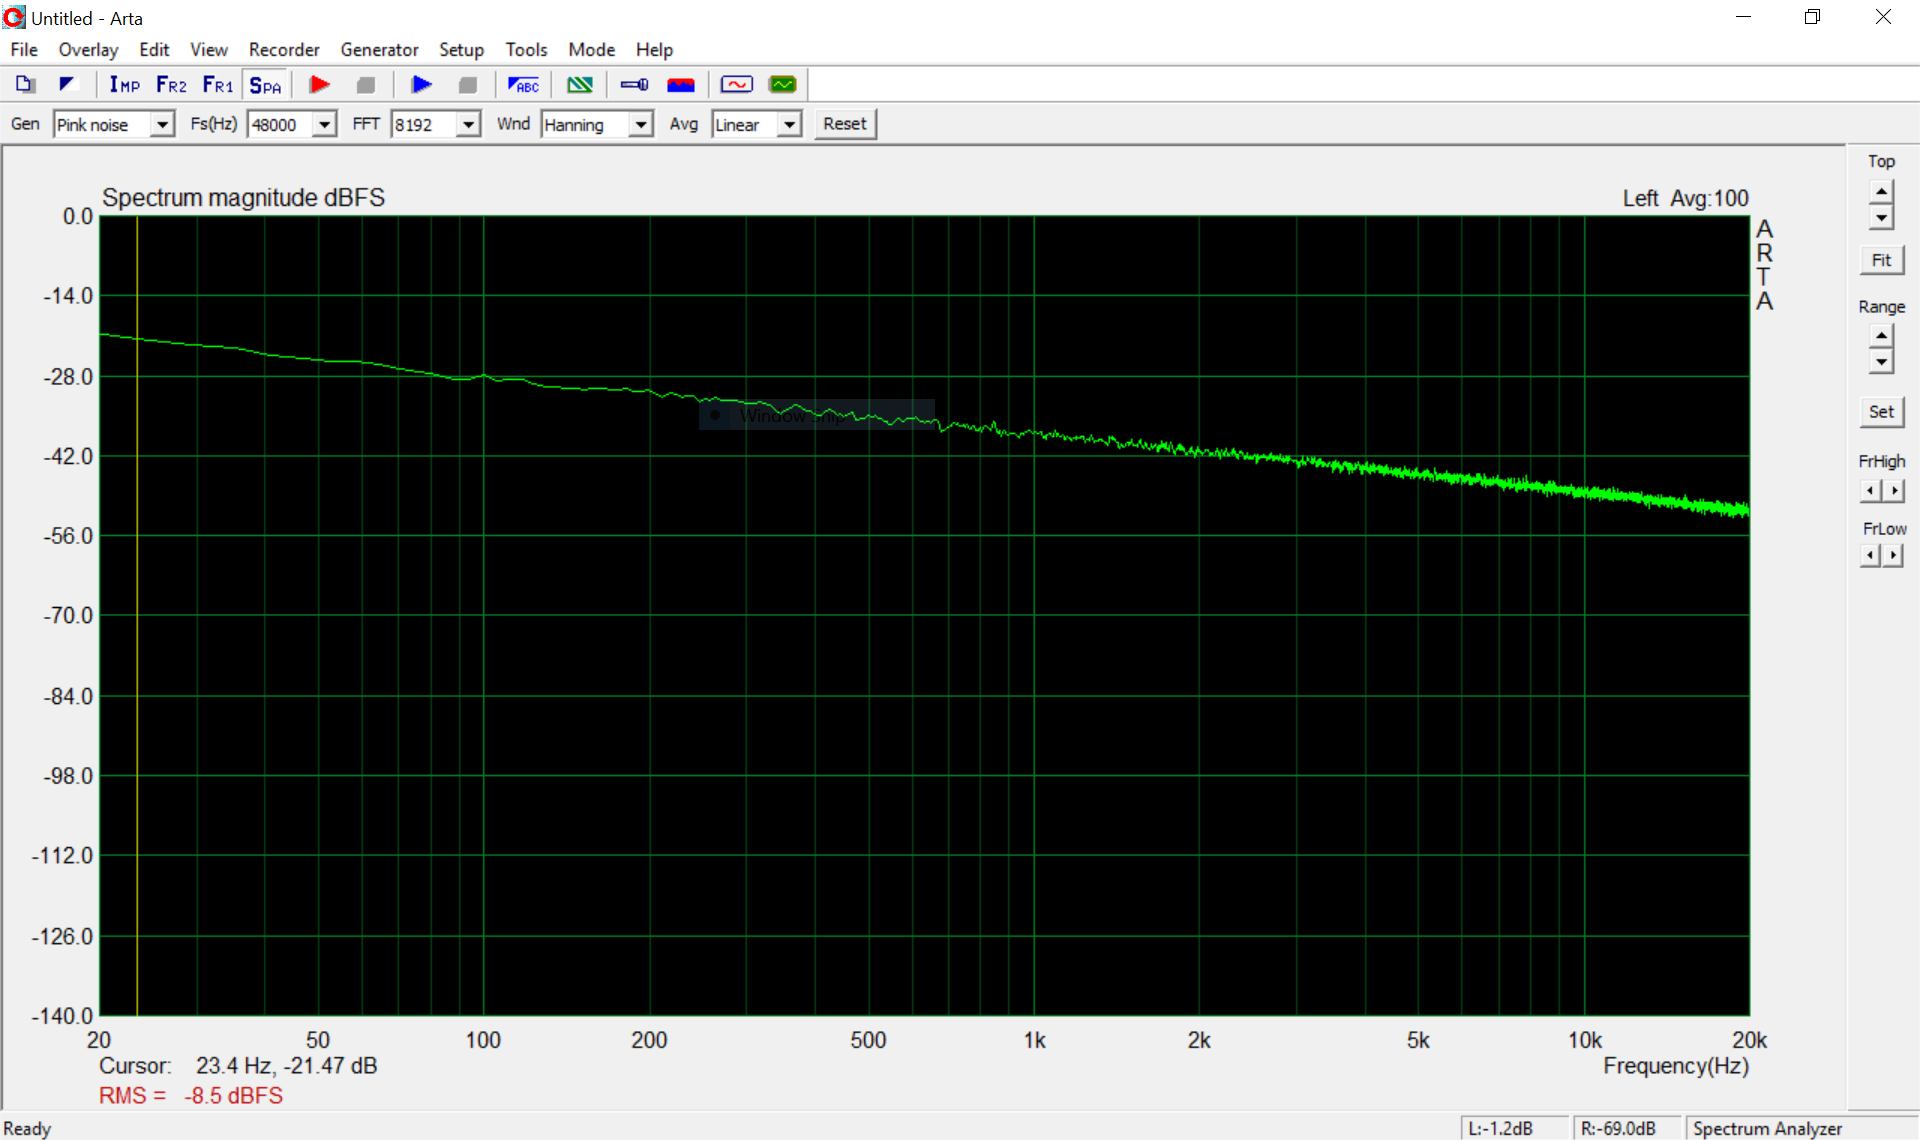
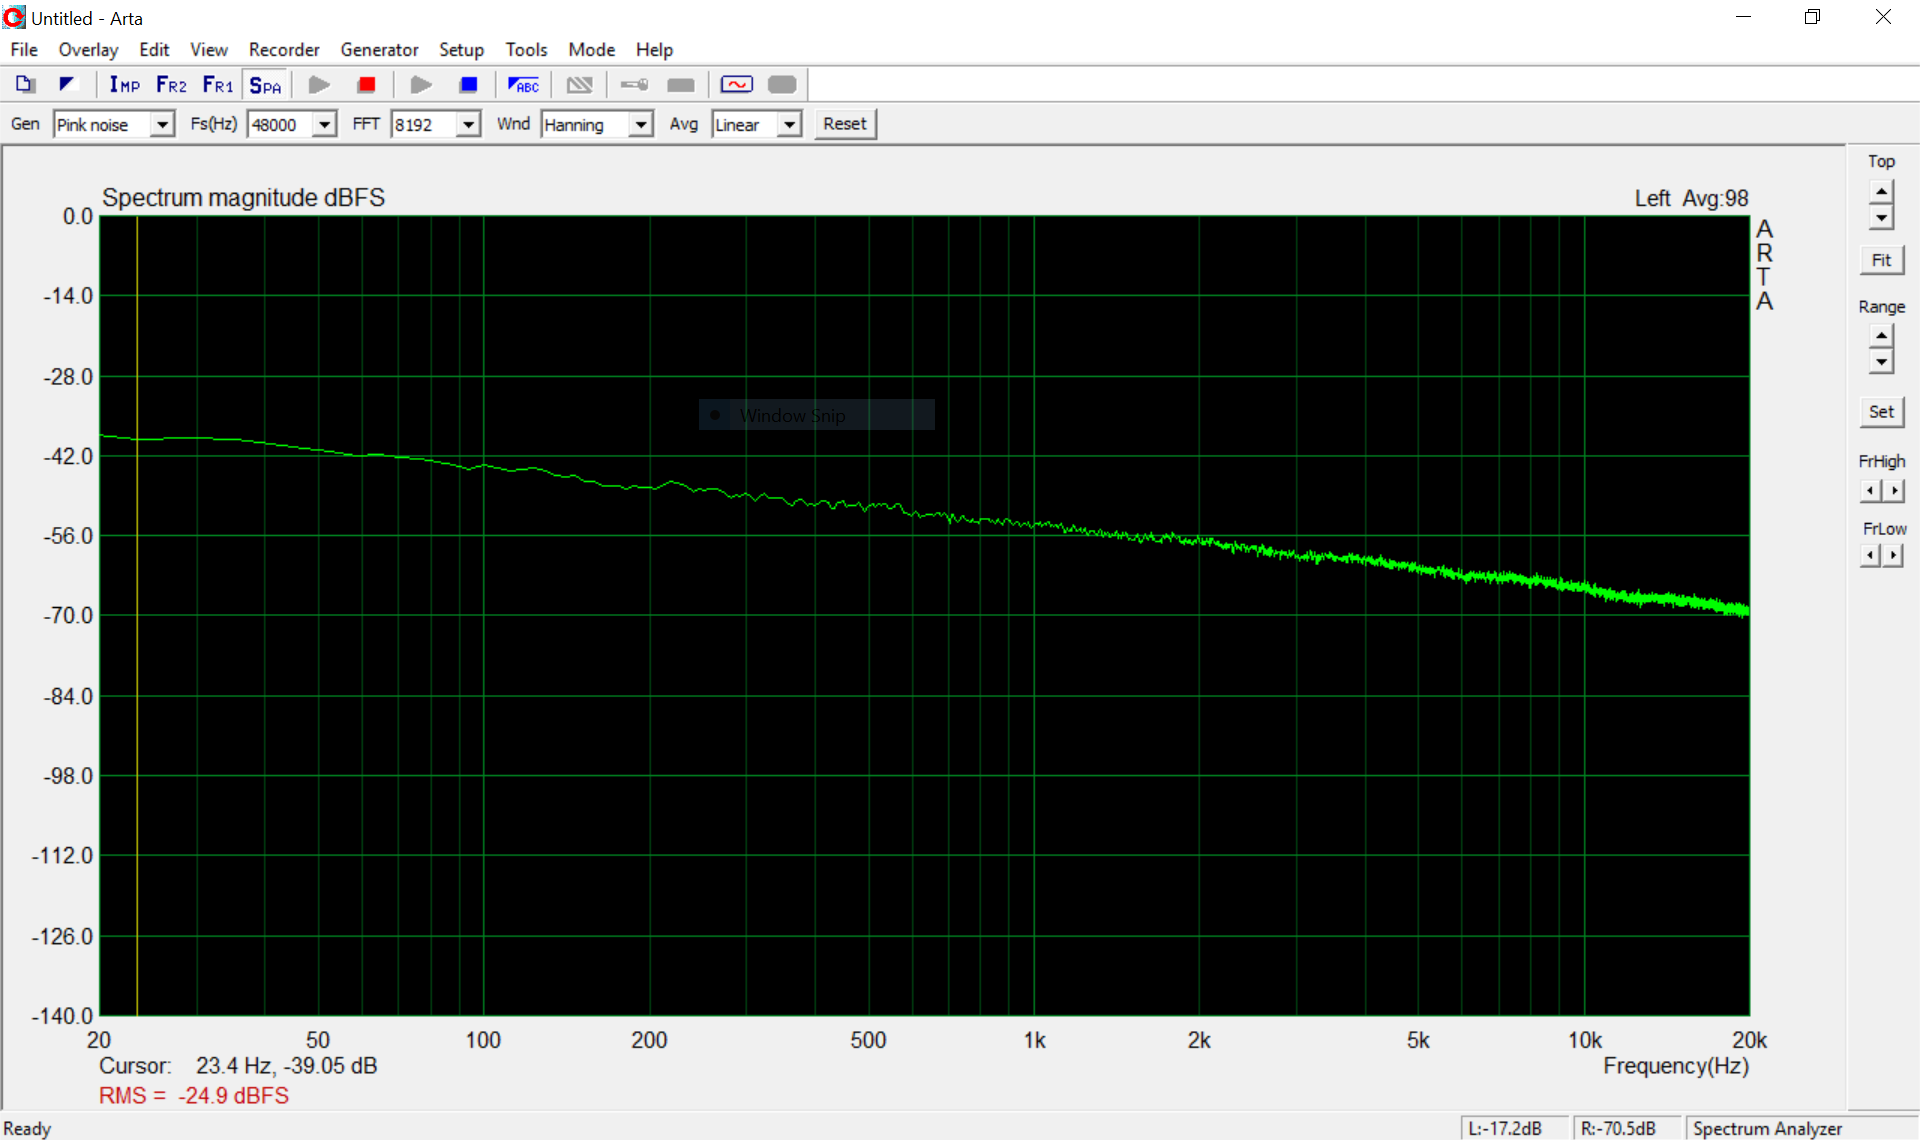
After Apple's ultra-compact MacBook 12 surprised us with a new reference for notebook sound, we had pretty high expectations for the new Apple MacBook Pro 13. After our measurements, we can say that Apple delivers the expected quality. The speaker characteristics are very similar to the MacBook 12, the small differences in terms of volume should be a result of the different positions of the speakers in relation to the fixed position of our measuring microphone. The curve is even more linear when we move the microphone from our default position towards the position of the user's head.
All in all, the new Apple MacBook Pro 13 delivers sufficient sound pressure in the low tone area and an almost perfectly linear characteristic all the way up to the super-high tones. A maximum volume of 83.2 dB(A) is more than sufficient for a room and the sound quality is very good for a laptop.
Apple MacBook Pro 13 2016 audio analysis
(+) | speakers can play relatively loud (83.2 dB)
Bass 100 - 315 Hz
(±) | reduced bass - on average 8.4% lower than median
(-) | bass is not linear (16.7% delta to prev. frequency)
Mids 400 - 2000 Hz
(+) | balanced mids - only 4.7% away from median
(+) | mids are linear (6.3% delta to prev. frequency)
Highs 2 - 16 kHz
(+) | balanced highs - only 1.1% away from median
(+) | highs are linear (2.6% delta to prev. frequency)
Overall 100 - 16.000 Hz
(+) | overall sound is linear (9.8% difference to median)
Compared to same class
» 6% of all tested devices in this class were better, 2% similar, 92% worse
» The best had a delta of 5%, average was 18%, worst was 53%
Compared to all devices tested
» 4% of all tested devices were better, 1% similar, 95% worse
» The best had a delta of 4%, average was 23%, worst was 134%
Apple MacBook 12 (Early 2016) 1.1 GHz audio analysis
(+) | speakers can play relatively loud (83.6 dB)
Bass 100 - 315 Hz
(±) | reduced bass - on average 11.3% lower than median
(±) | linearity of bass is average (14.2% delta to prev. frequency)
Mids 400 - 2000 Hz
(+) | balanced mids - only 2.4% away from median
(+) | mids are linear (5.5% delta to prev. frequency)
Highs 2 - 16 kHz
(+) | balanced highs - only 2% away from median
(+) | highs are linear (4.5% delta to prev. frequency)
Overall 100 - 16.000 Hz
(+) | overall sound is linear (10.2% difference to median)
Compared to same class
» 7% of all tested devices in this class were better, 2% similar, 90% worse
» The best had a delta of 5%, average was 18%, worst was 53%
Compared to all devices tested
» 5% of all tested devices were better, 1% similar, 94% worse
» The best had a delta of 4%, average was 23%, worst was 134%
Frequency Comparison (Checkboxes select/deselectable!)
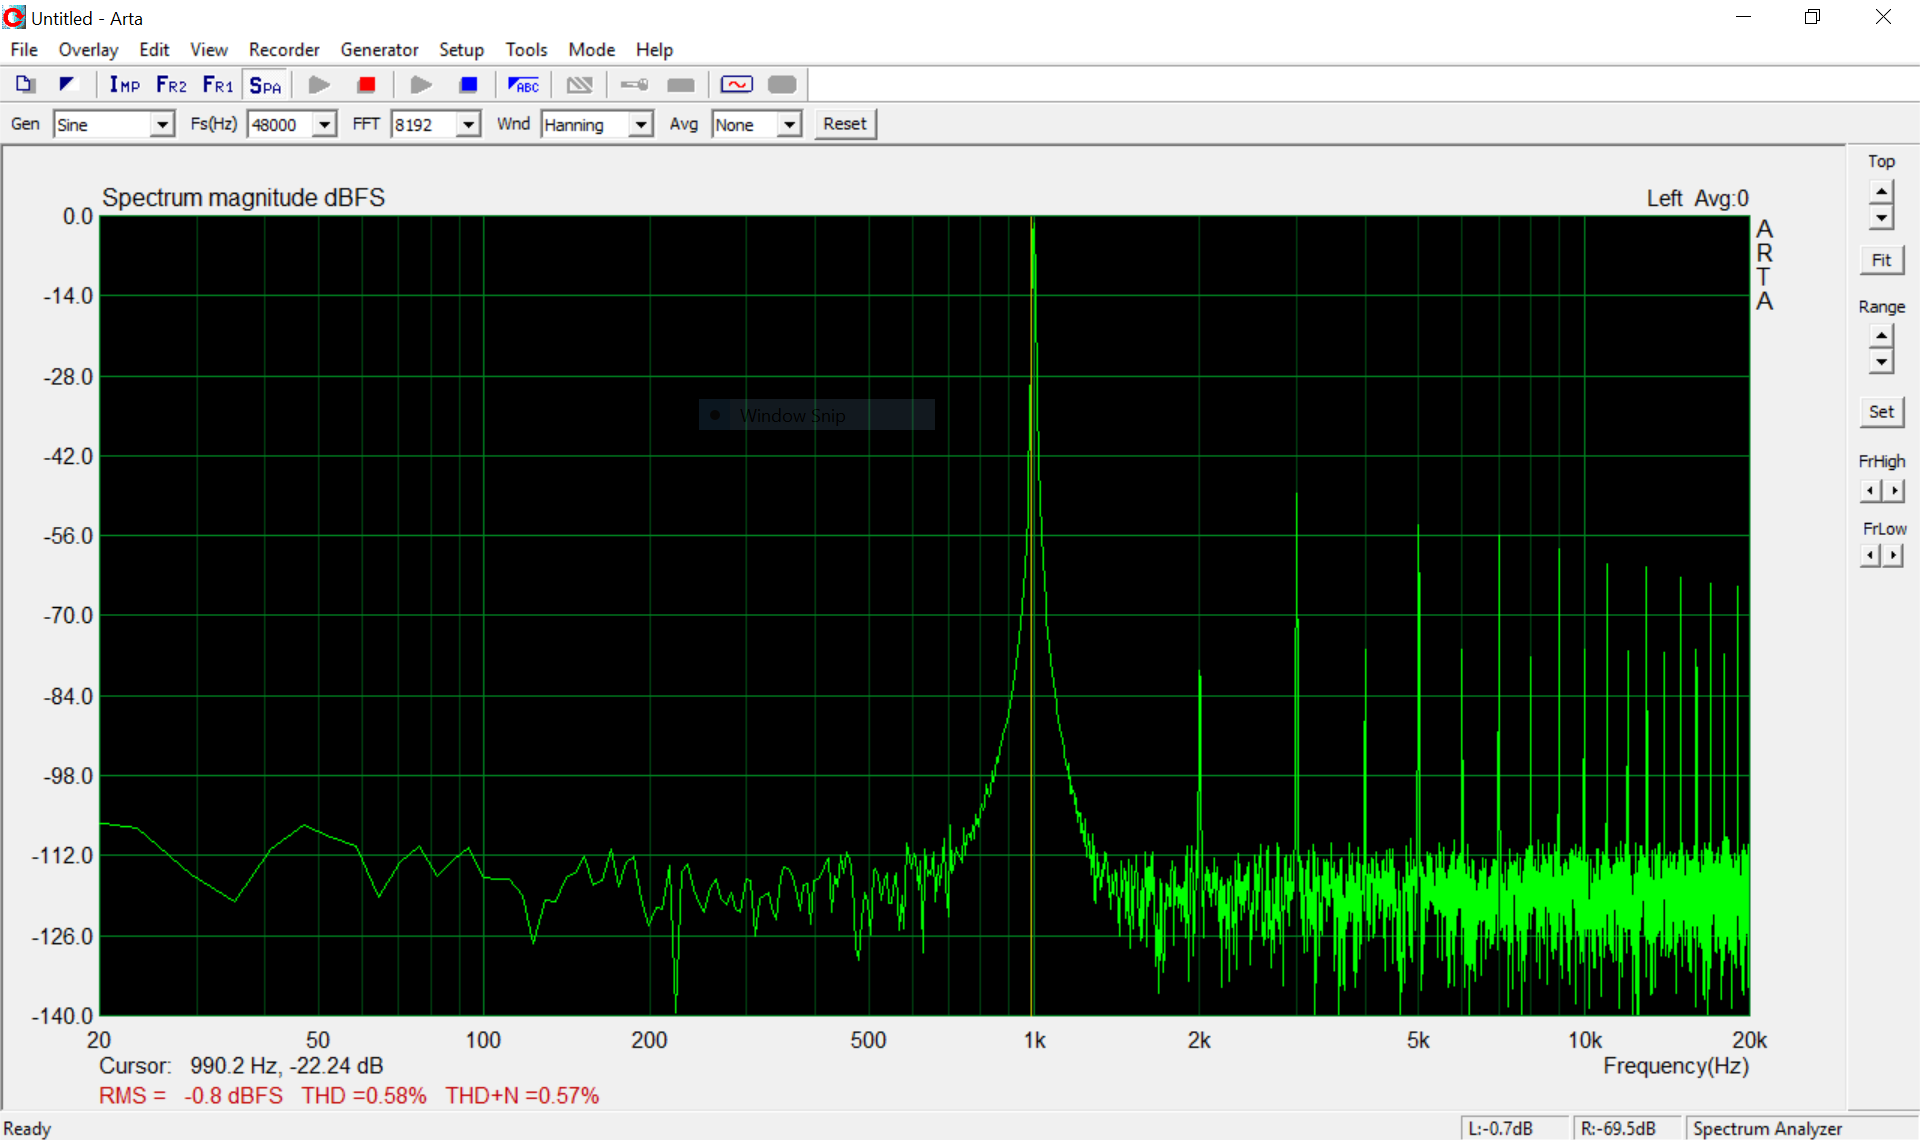
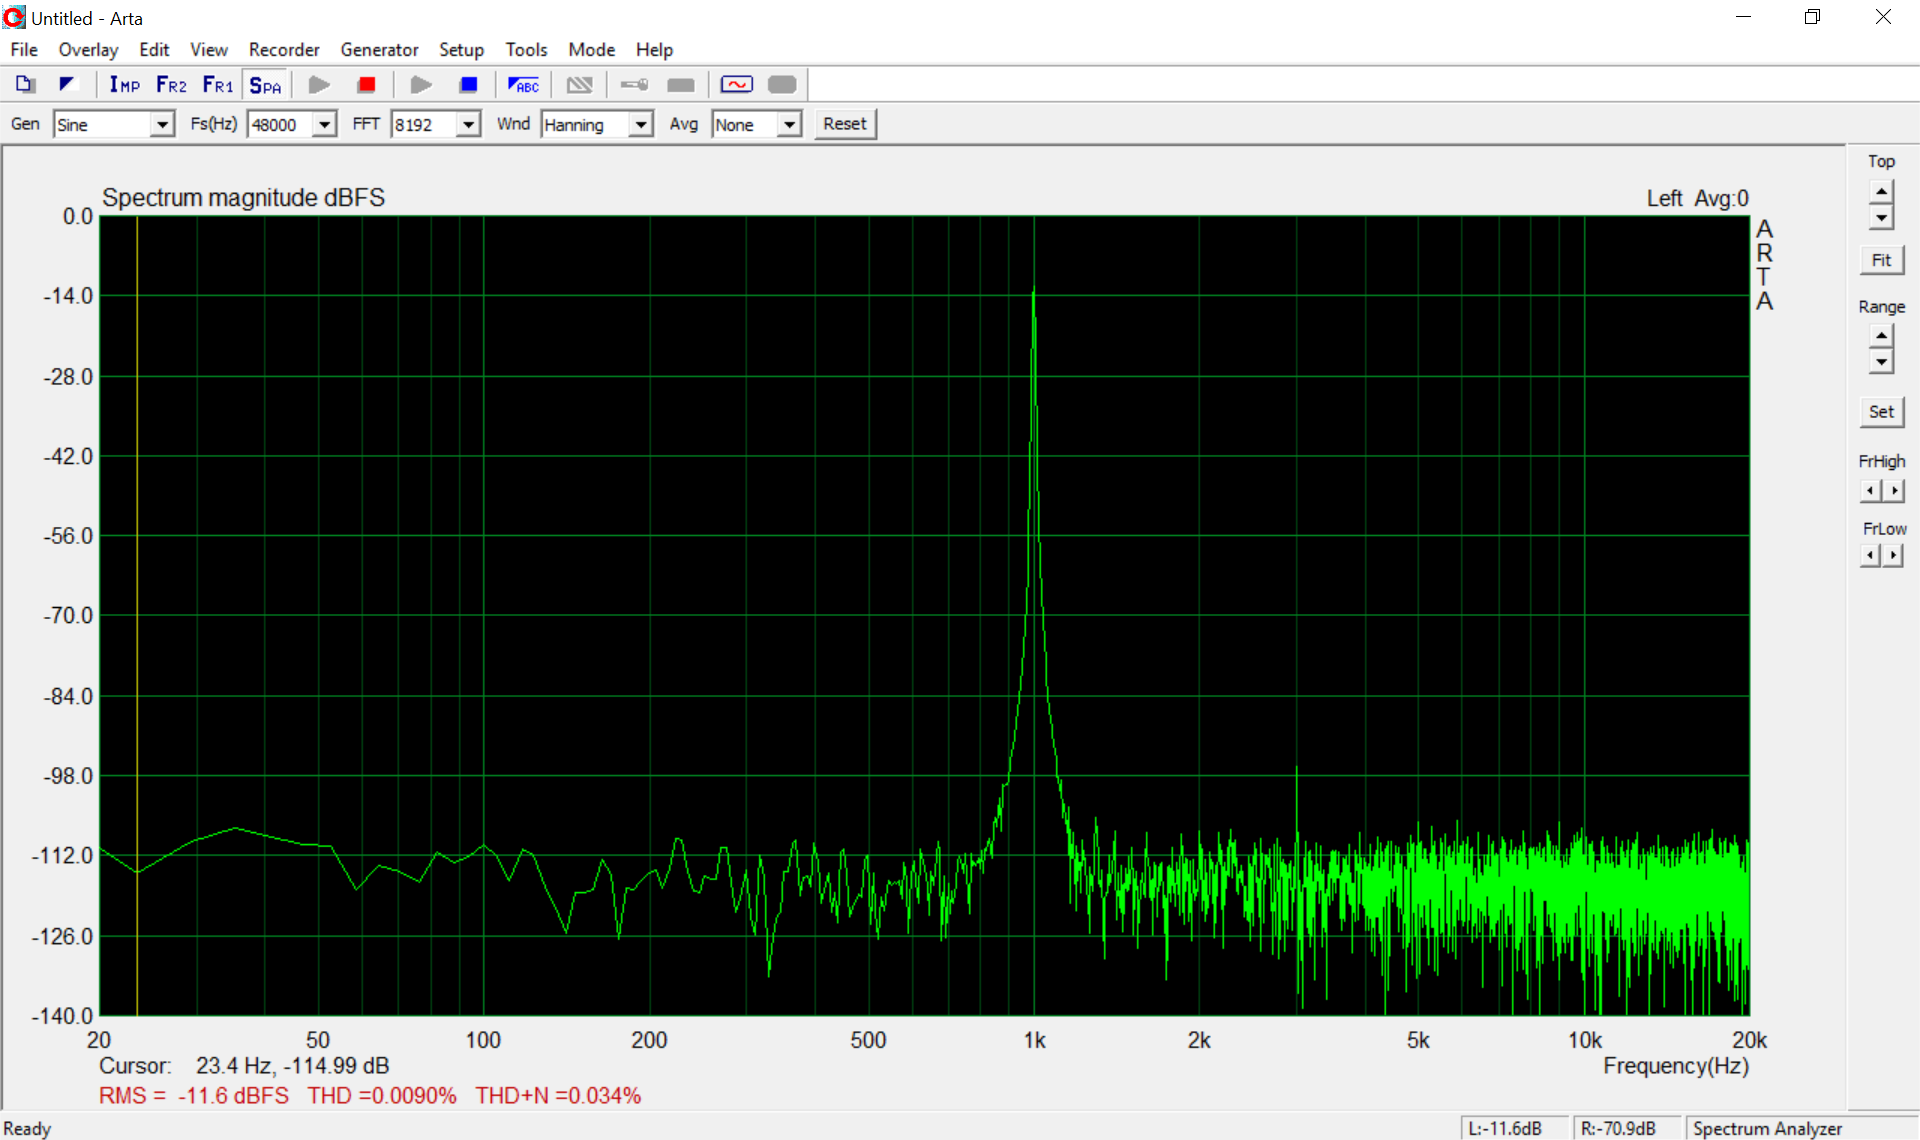
Headset Port
The headphones/microphone port at the right side of the case is powerful enough for an AKG K701 and the playback is noise-free. The spectrum is pretty linear in a test with Arta and an external Steinberg UR22 sound card (hardly a difference to the Steinberg sound card), but the THD+N test with a 1000 Hz pure tone on the other hand shows clear interferences. We reach the best result of 0.57 % at -4 of the maximum, while the Steinberg UR22 manages 0.034 % in comparison (smaller is better). Audio enthusiasts should therefore not expect too much from the integrated sound card (in the Intel SoC).

| Off / Standby | |
| Idle | |
| Load |
|
Key:
min: | |
Battery Runtime
We perform our standardized WLAN test with a luminance of 164 nits (level 12) and dimmed keyboard illumination. Apple has no problems to reach the advertised runtime of 10 hours and just misses the 11.5 hours mark (almost 11 hours in the first run, but the adaptive brightness might have affected the result). This means it lasts a bit longer than the old MacBook Air 13 and beat the 2015 MacBook Pro Retina 13 quite clearly. The smaller battery can therefore really be compensated with more efficient components.
The MacBook Pro ran for 1 hour and 51 minutes in our gaming test (Witcher 3, Windows 10, 151 nits) in Windows 10 before we had to recharge it.
| Apple MacBook Pro 13 2016 6360U, Iris Graphics 540, 54 Wh | Apple MacBook Air 13 inch 2015-03 5650U, HD Graphics 6000, 54 Wh | Apple MacBook 12 (Early 2016) 1.3 GHz 6Y75, HD Graphics 515, 41.4 Wh | Dell XPS 13 9360 QHD+ i5 i5-7200U, HD Graphics 620, 60 Wh | Microsoft Surface Pro 4 Core i7 6650U, Iris Graphics 540, 38 Wh | Microsoft Surface Pro 4, Core i5, 128GB 6300U, HD Graphics 520, 38 Wh | Lenovo ThinkPad T460s-20FA003GGE 6600U, HD Graphics 520, 49 Wh | |
|---|---|---|---|---|---|---|---|
| Battery runtime | -18% | 29% | 0% | -52% | -30% | -49% | |
| Reader / Idle (h) | 42.6 | 26.2 -38% | 10.9 -74% | 15 -65% | 13.9 -67% | ||
| H.264 (h) | 10.3 | 10.3 0% | 9.1 -12% | 6.6 -36% | |||
| WiFi v1.3 (h) | 11.4 | 10.3 -10% | 9.2 -19% | 8.8 -23% | 4.9 -57% | 7.1 -38% | 5.7 -50% |
| Load (h) | 1.7 | 1.6 -6% | 3.5 106% | 2.3 35% | 1.3 -24% | 1.9 12% | 1 -41% |
Pros
Cons
Verdict
Before we can get our hands on Apple's highly praised Touch Bar, we can review the entry-level model of the new MacBook Pro 13, which is already available. It is also supposed to replace the less expensive Air models in the medium-term if you ask Apple. At 1699 Euros ($1499), however, is still pretty expensive and far away from the Air, but the situation is better for the hardware.
The display is brighter than ever and also performs pretty well in the measurements. The processor performance did not change. Compared to the old MacBook Pro, the switch to the 15-Watt Skylake chip even results in a lower performance. This is probably the reason that Apple compares it with the Air 13. The graphics performance on the other hand makes a jump thanks to the integrated EDRAM. Battery runtime and emissions are still excellent. The fan noise is subjectively even a bit worse (especially since our test model sometimes created rattling sounds). As expected, Apple now delivers the first-class sound quality of the MacBook 12 in the MacBook Pro 13 as well. The new keyboard does take some time getting used to, but works very well in practice. The trackpad is still the benchmark and much better than the Windows competition.
One big problem right now are the stability problems of the WLAN card in 2.4 GHz networks when you use USB-C peripherals at the same time. We hope Apple will fix this issue with an update. Apple did not want to comment on this topic. Until the problem is solved, we deduct 2 % from the final rating.
The biggest drawback is obviously the limited number of ports. Two Thunderbolt 3 ports are future-proof, but always force the user to use adapters and dongles. Not a convenient experience.
Apple MacBook Pro 13 2016
- 12/07/2016 v6 (old)
J. Simon Leitner, Klaus A. Hinum
Price comparison

