Dell XPS 13 9360 QHD+ i7-7500U Notebook Review

The XPS 13 series has always been a popular seller and a high recommendation on our Top 10 list especially after the InfinityEdge redesign. Thus, it's only natural that Dell refreshes its XPS 13 9350 Skylake family with Kaby Lake options in time for the Holiday shopping season.
We recently checked out the XPS 13 9360 with the Core i5-7200U and our latest SKU today is similar but with the faster i7-7500U CPU. Does this small performance upgrade bring any drawbacks in terms of throttling, temperatures, and battery life?
We recommend checking out our original review page on the XPS 13 9360 for more information on the chassis and its features.
Case
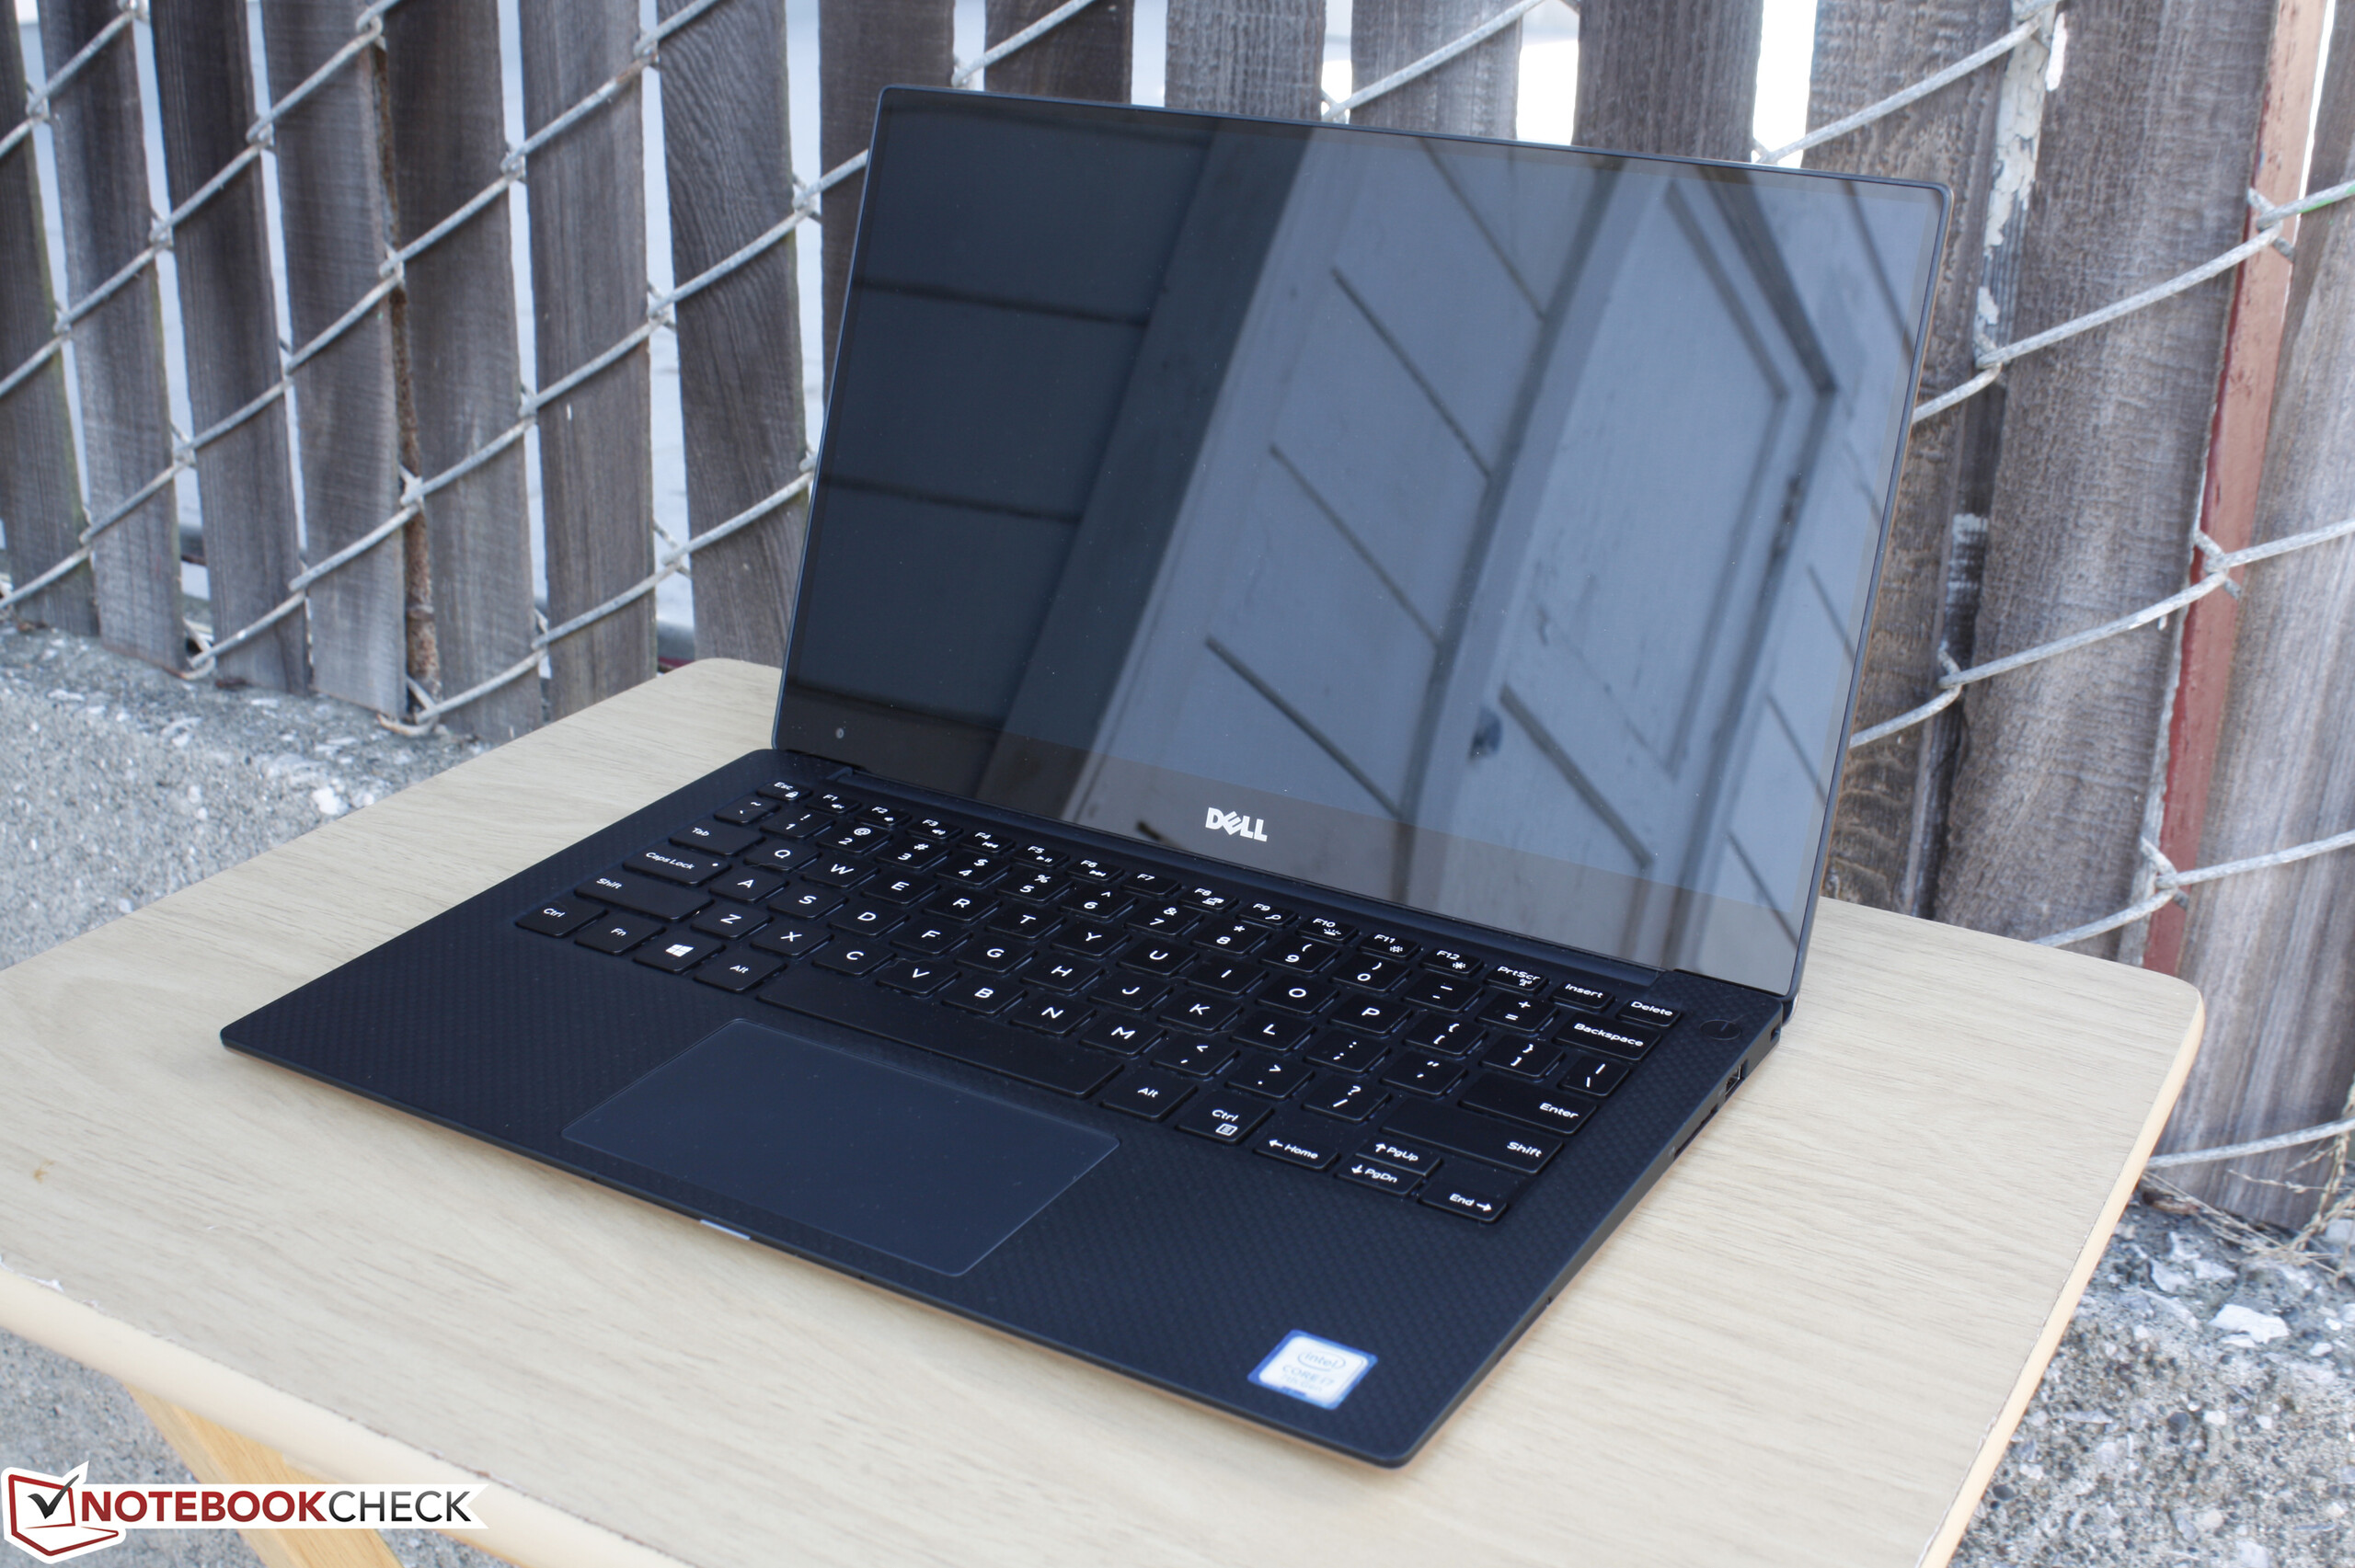
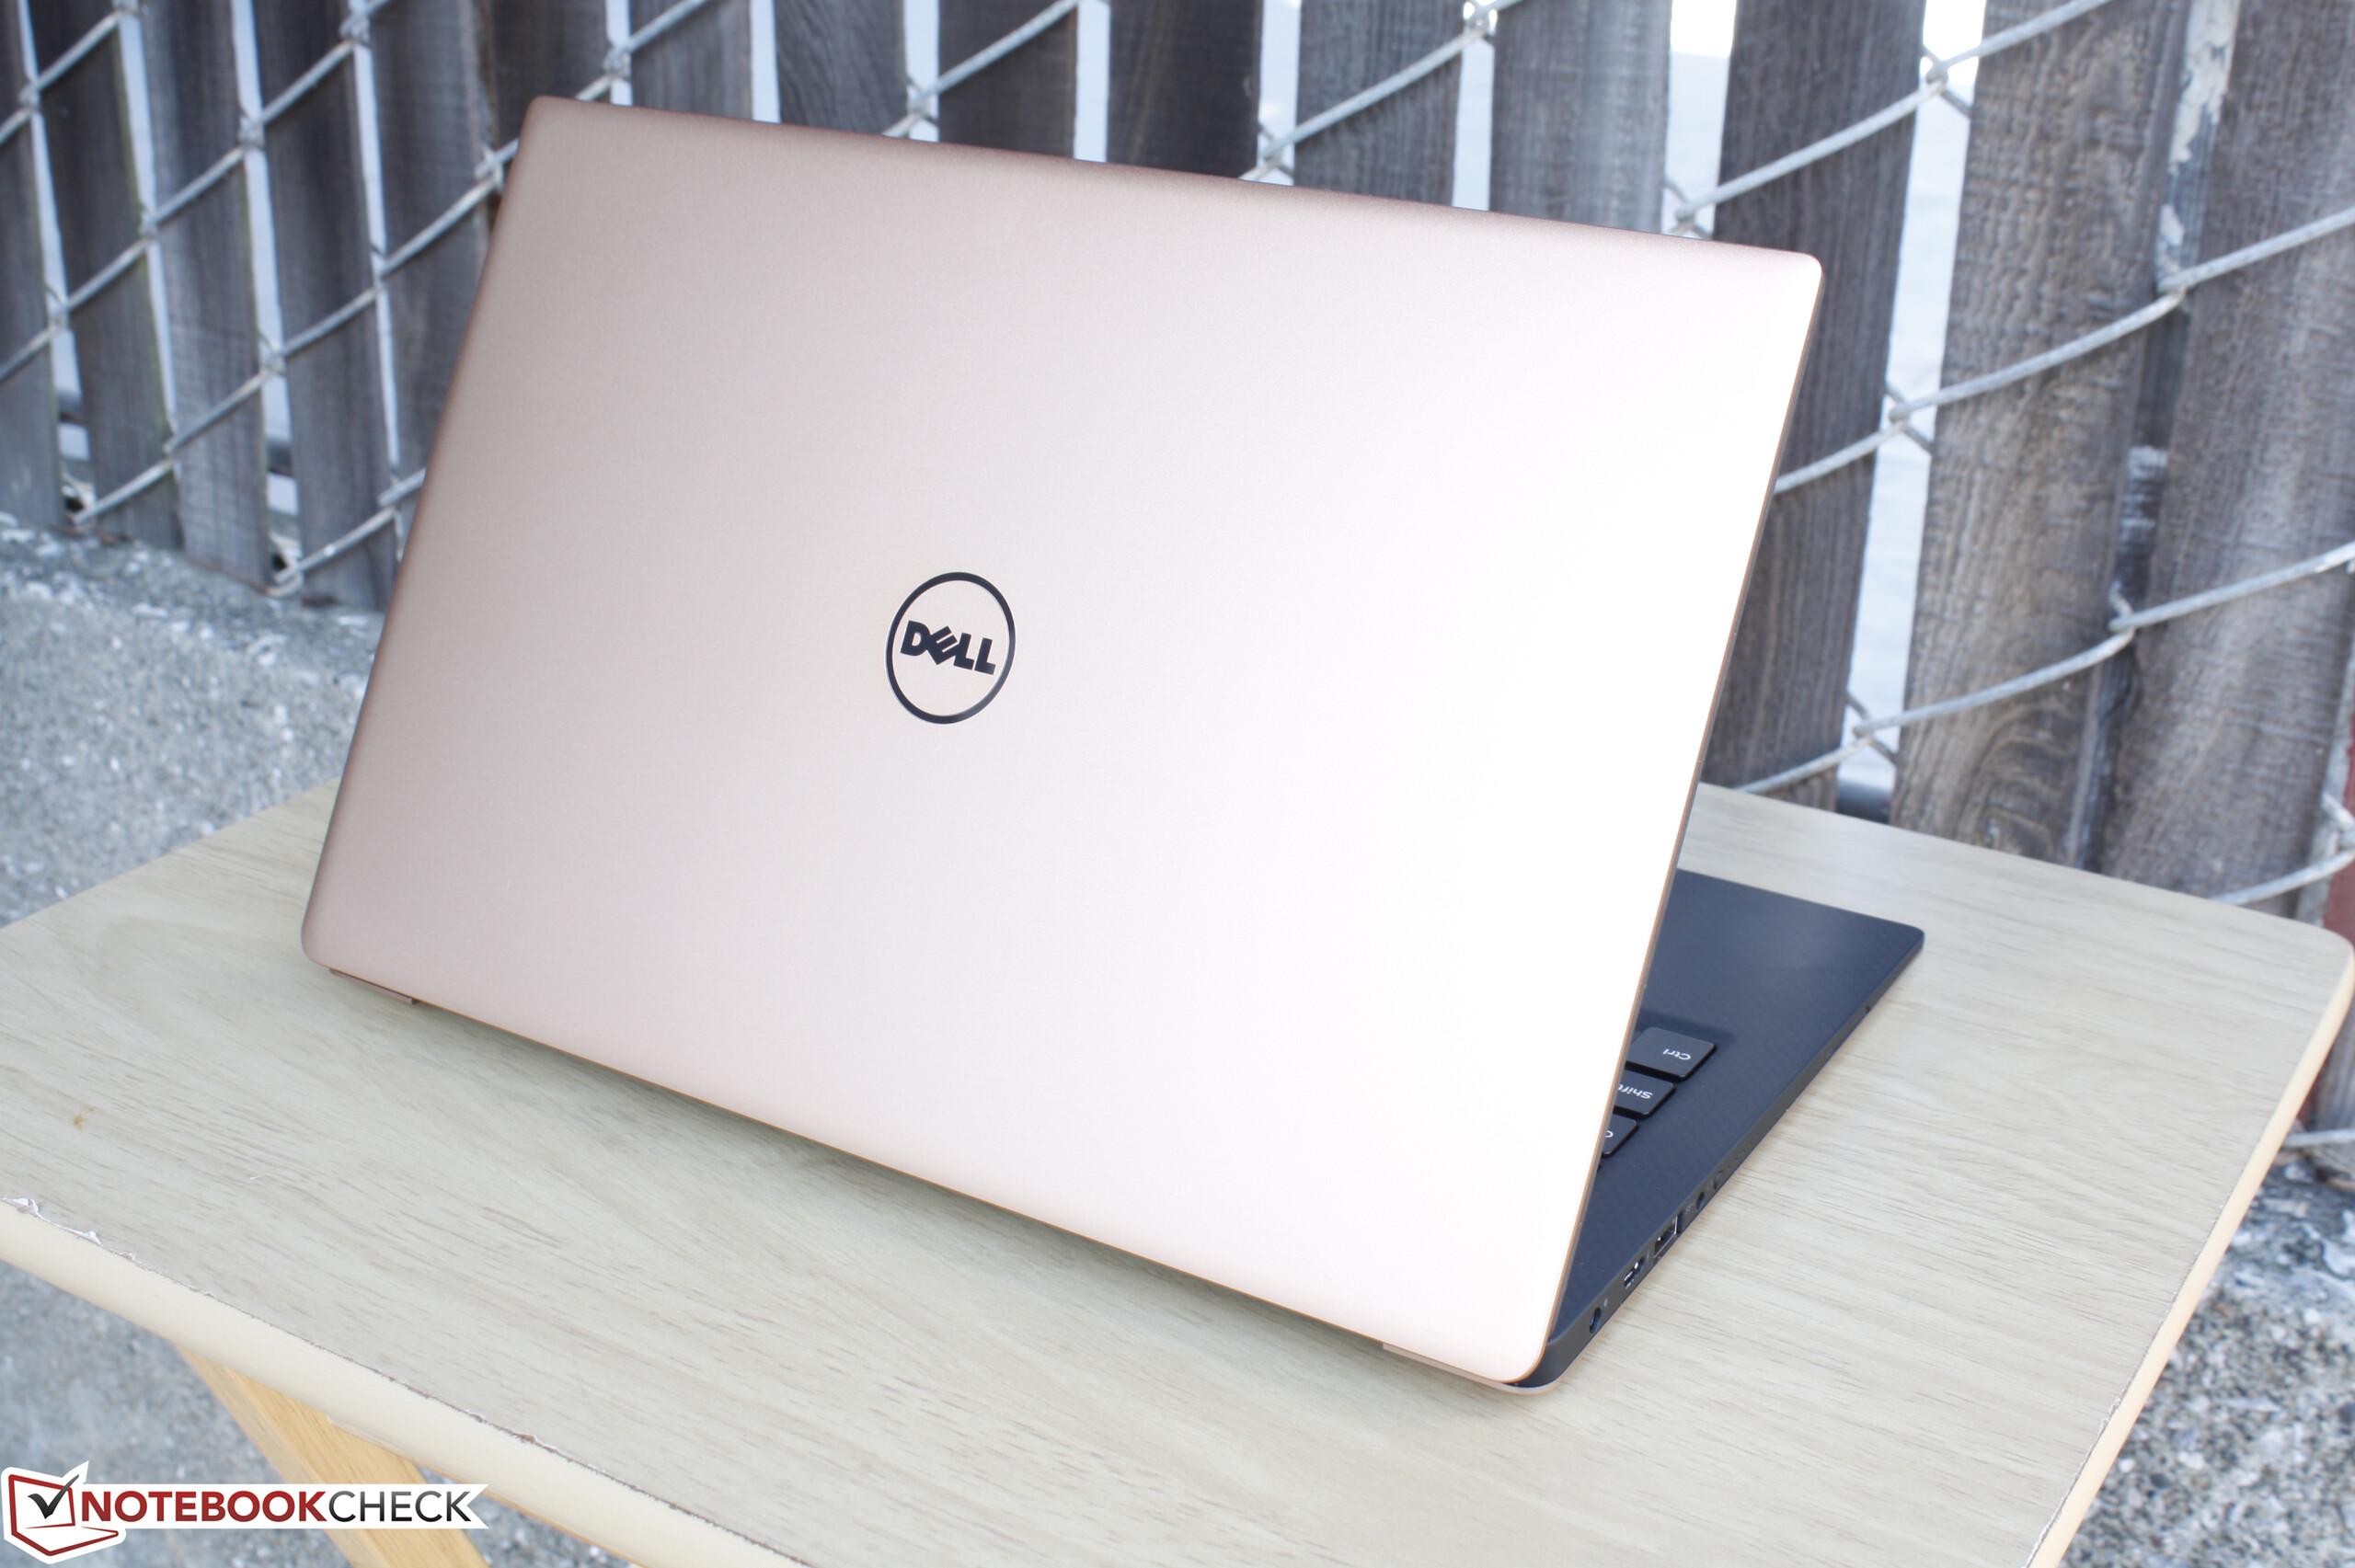
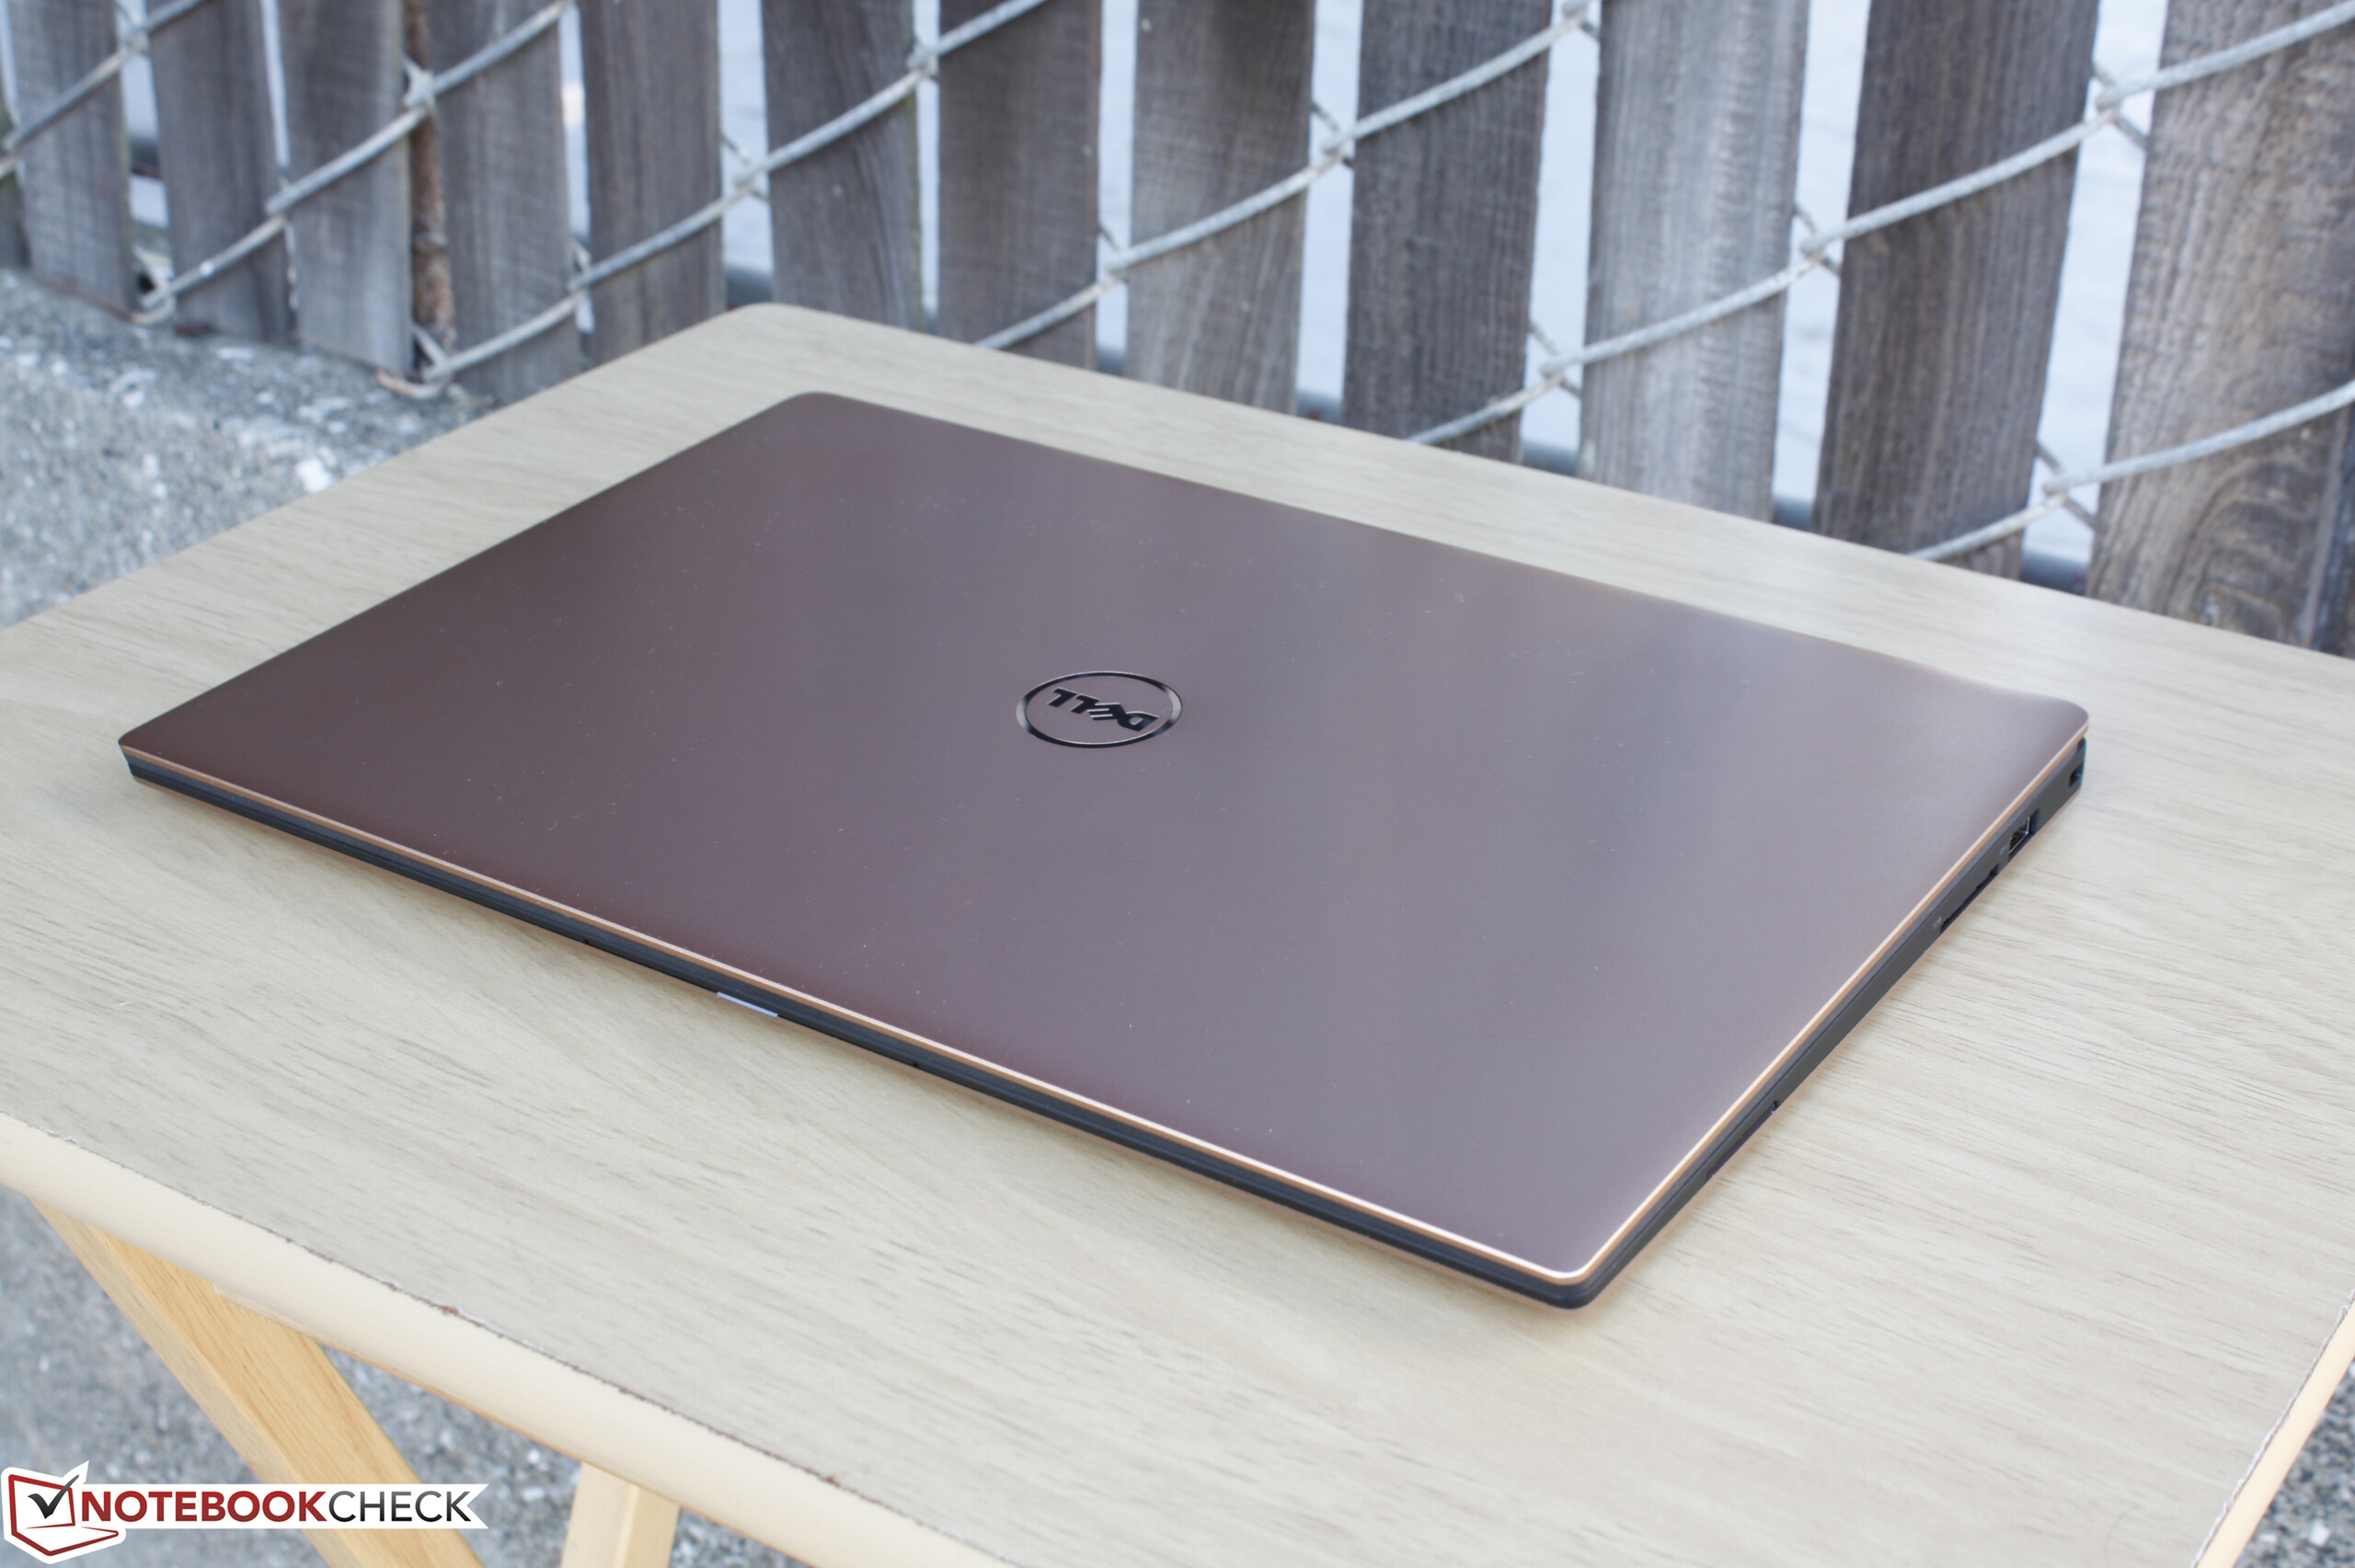
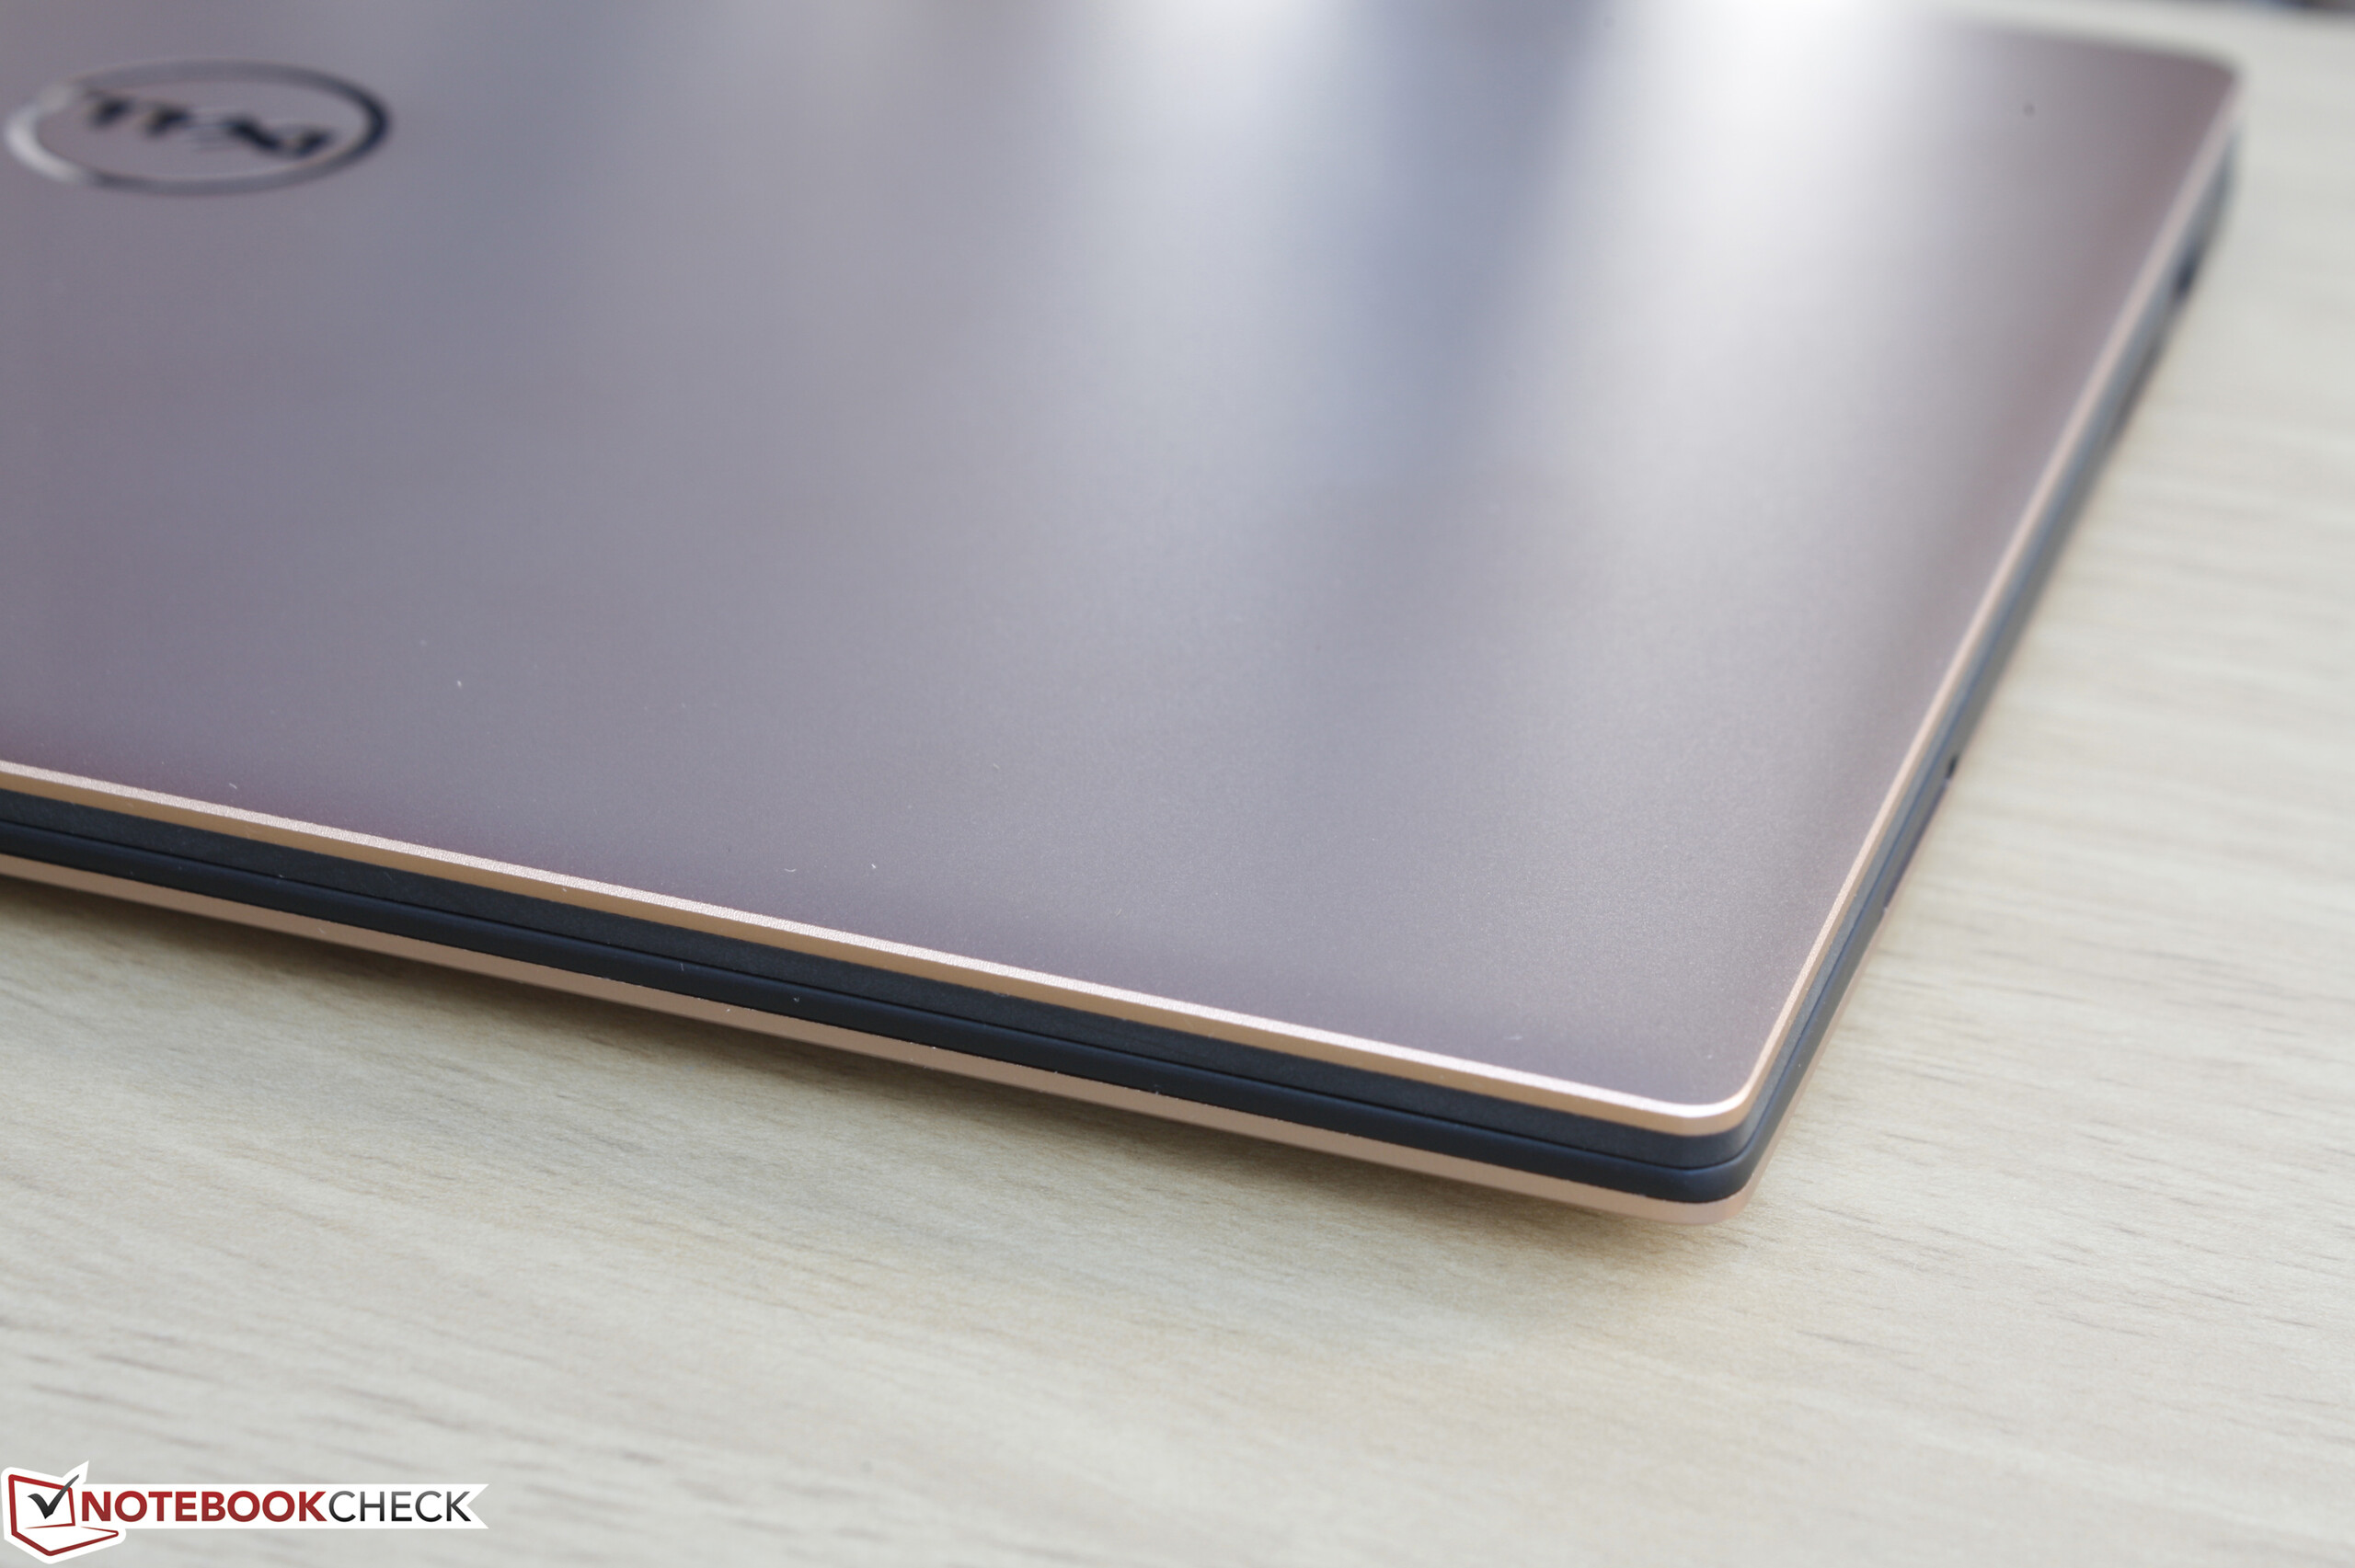
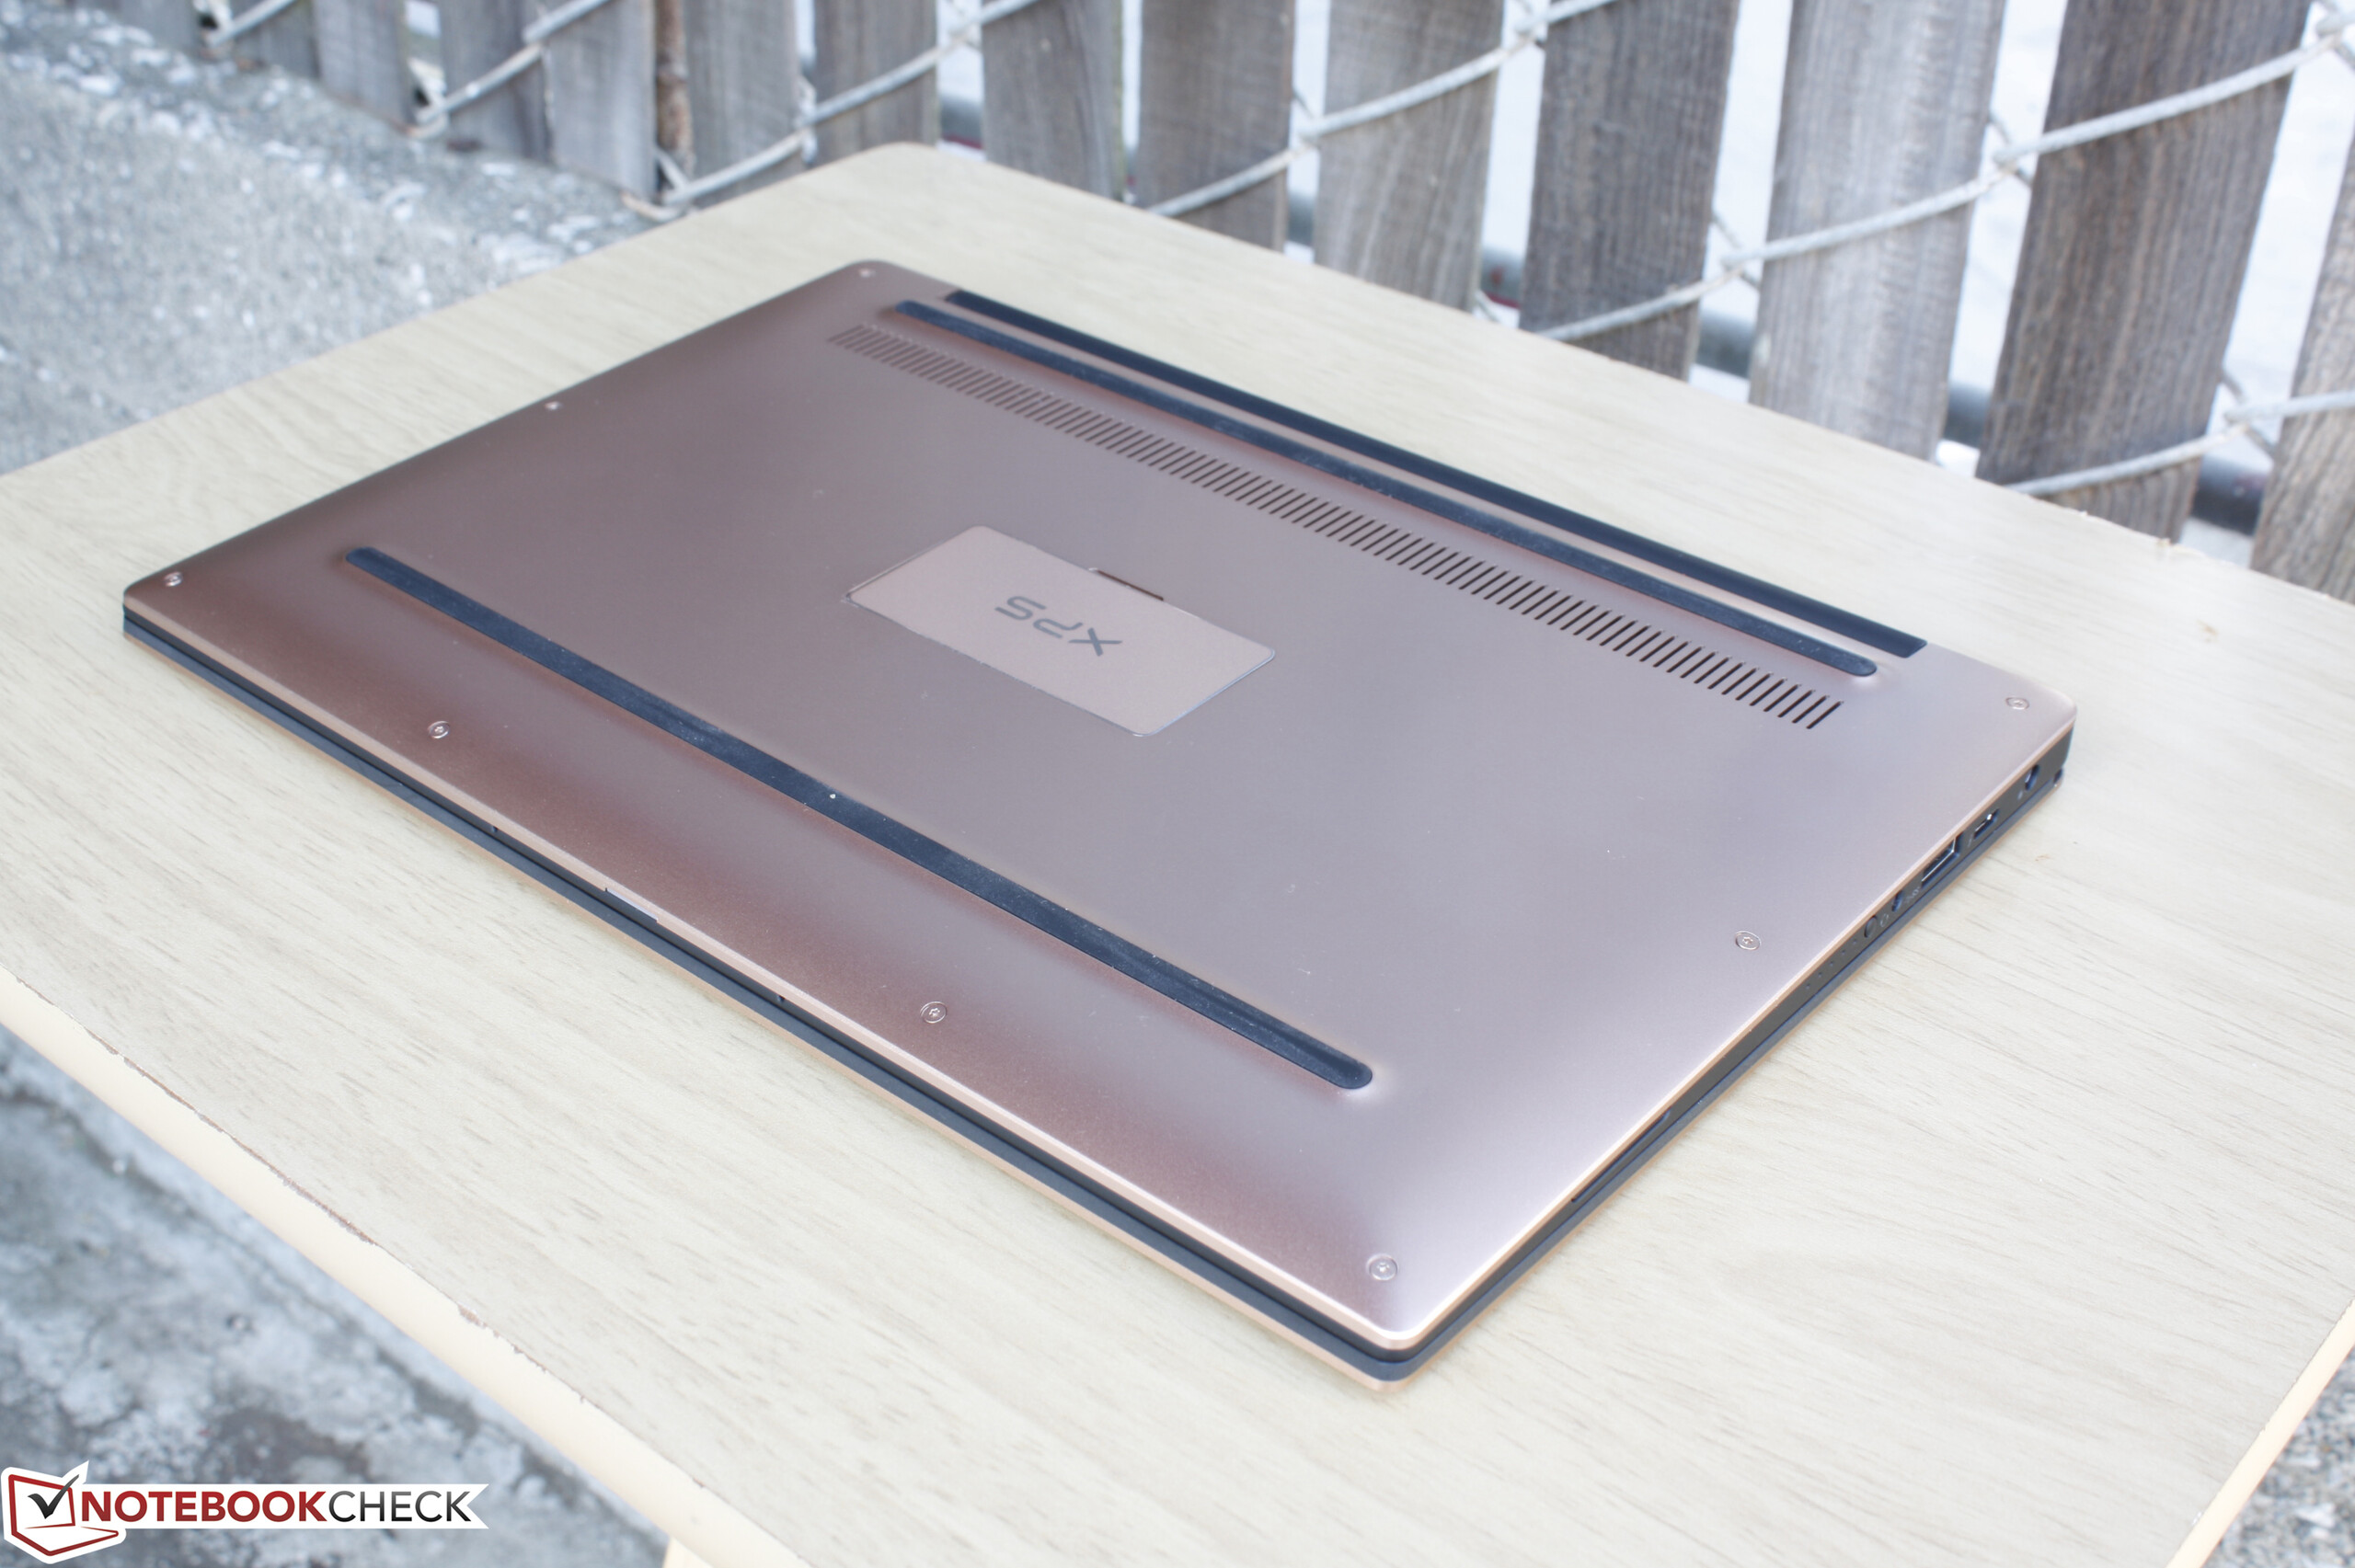
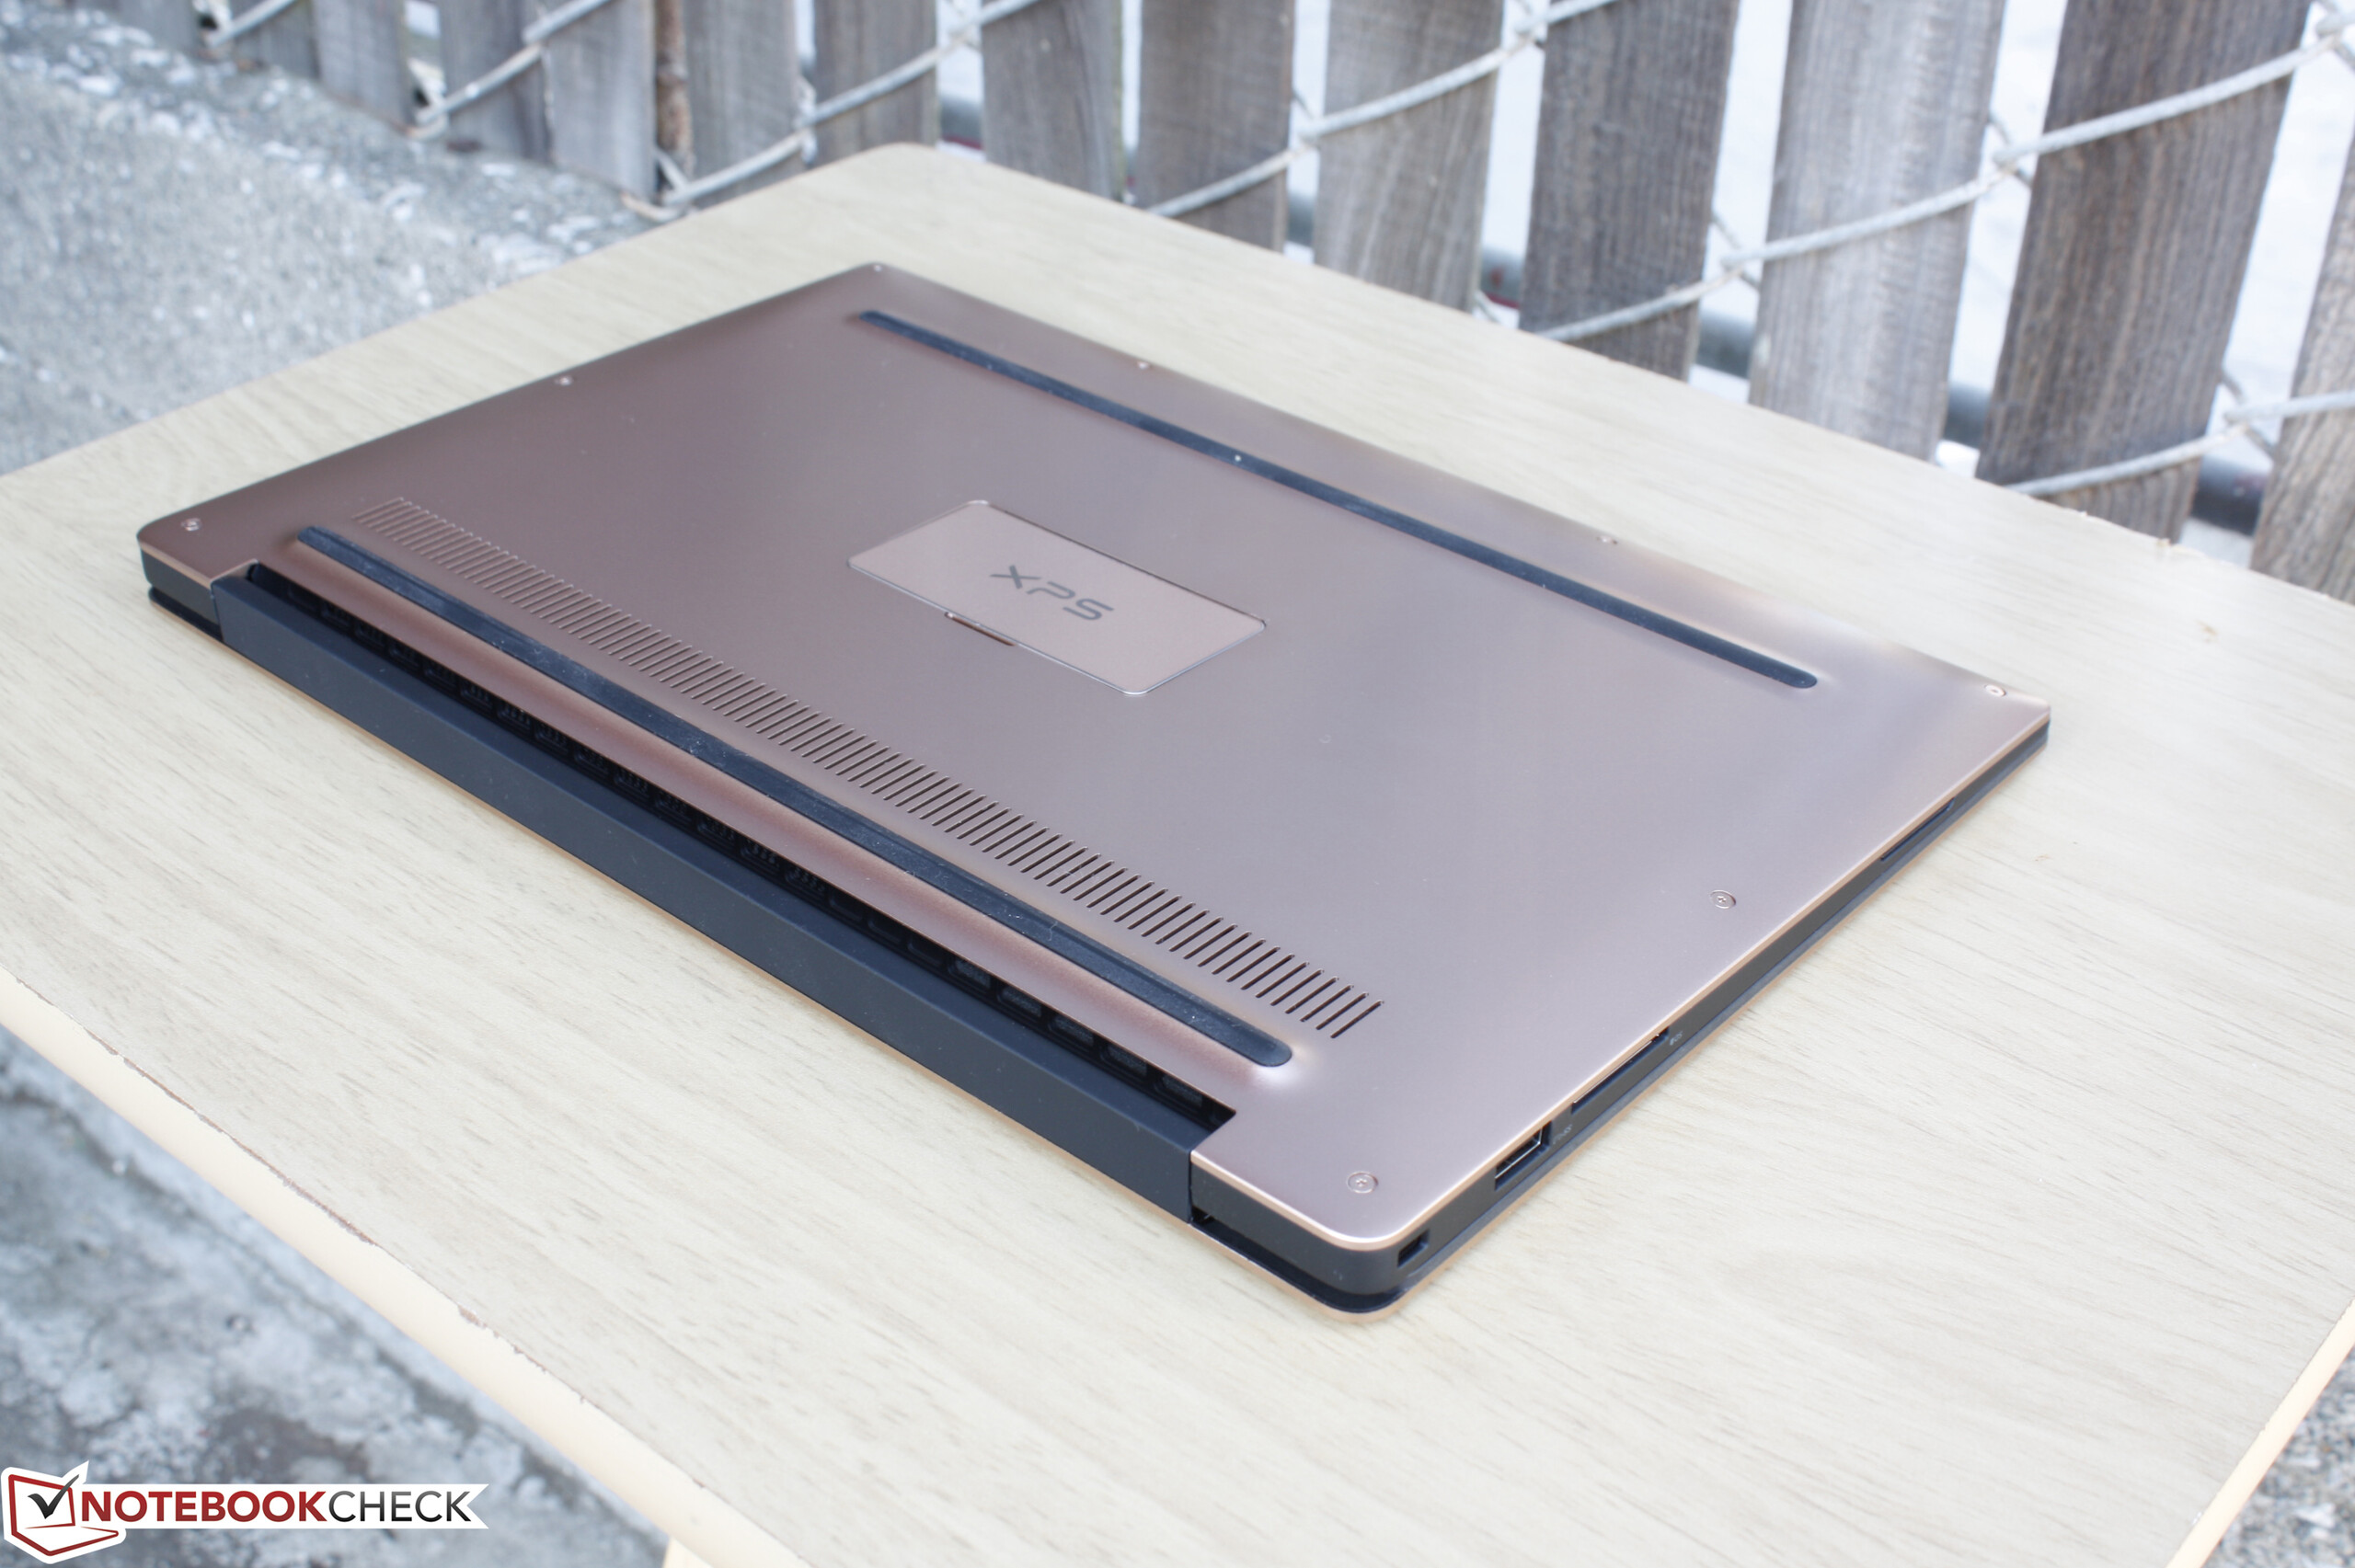
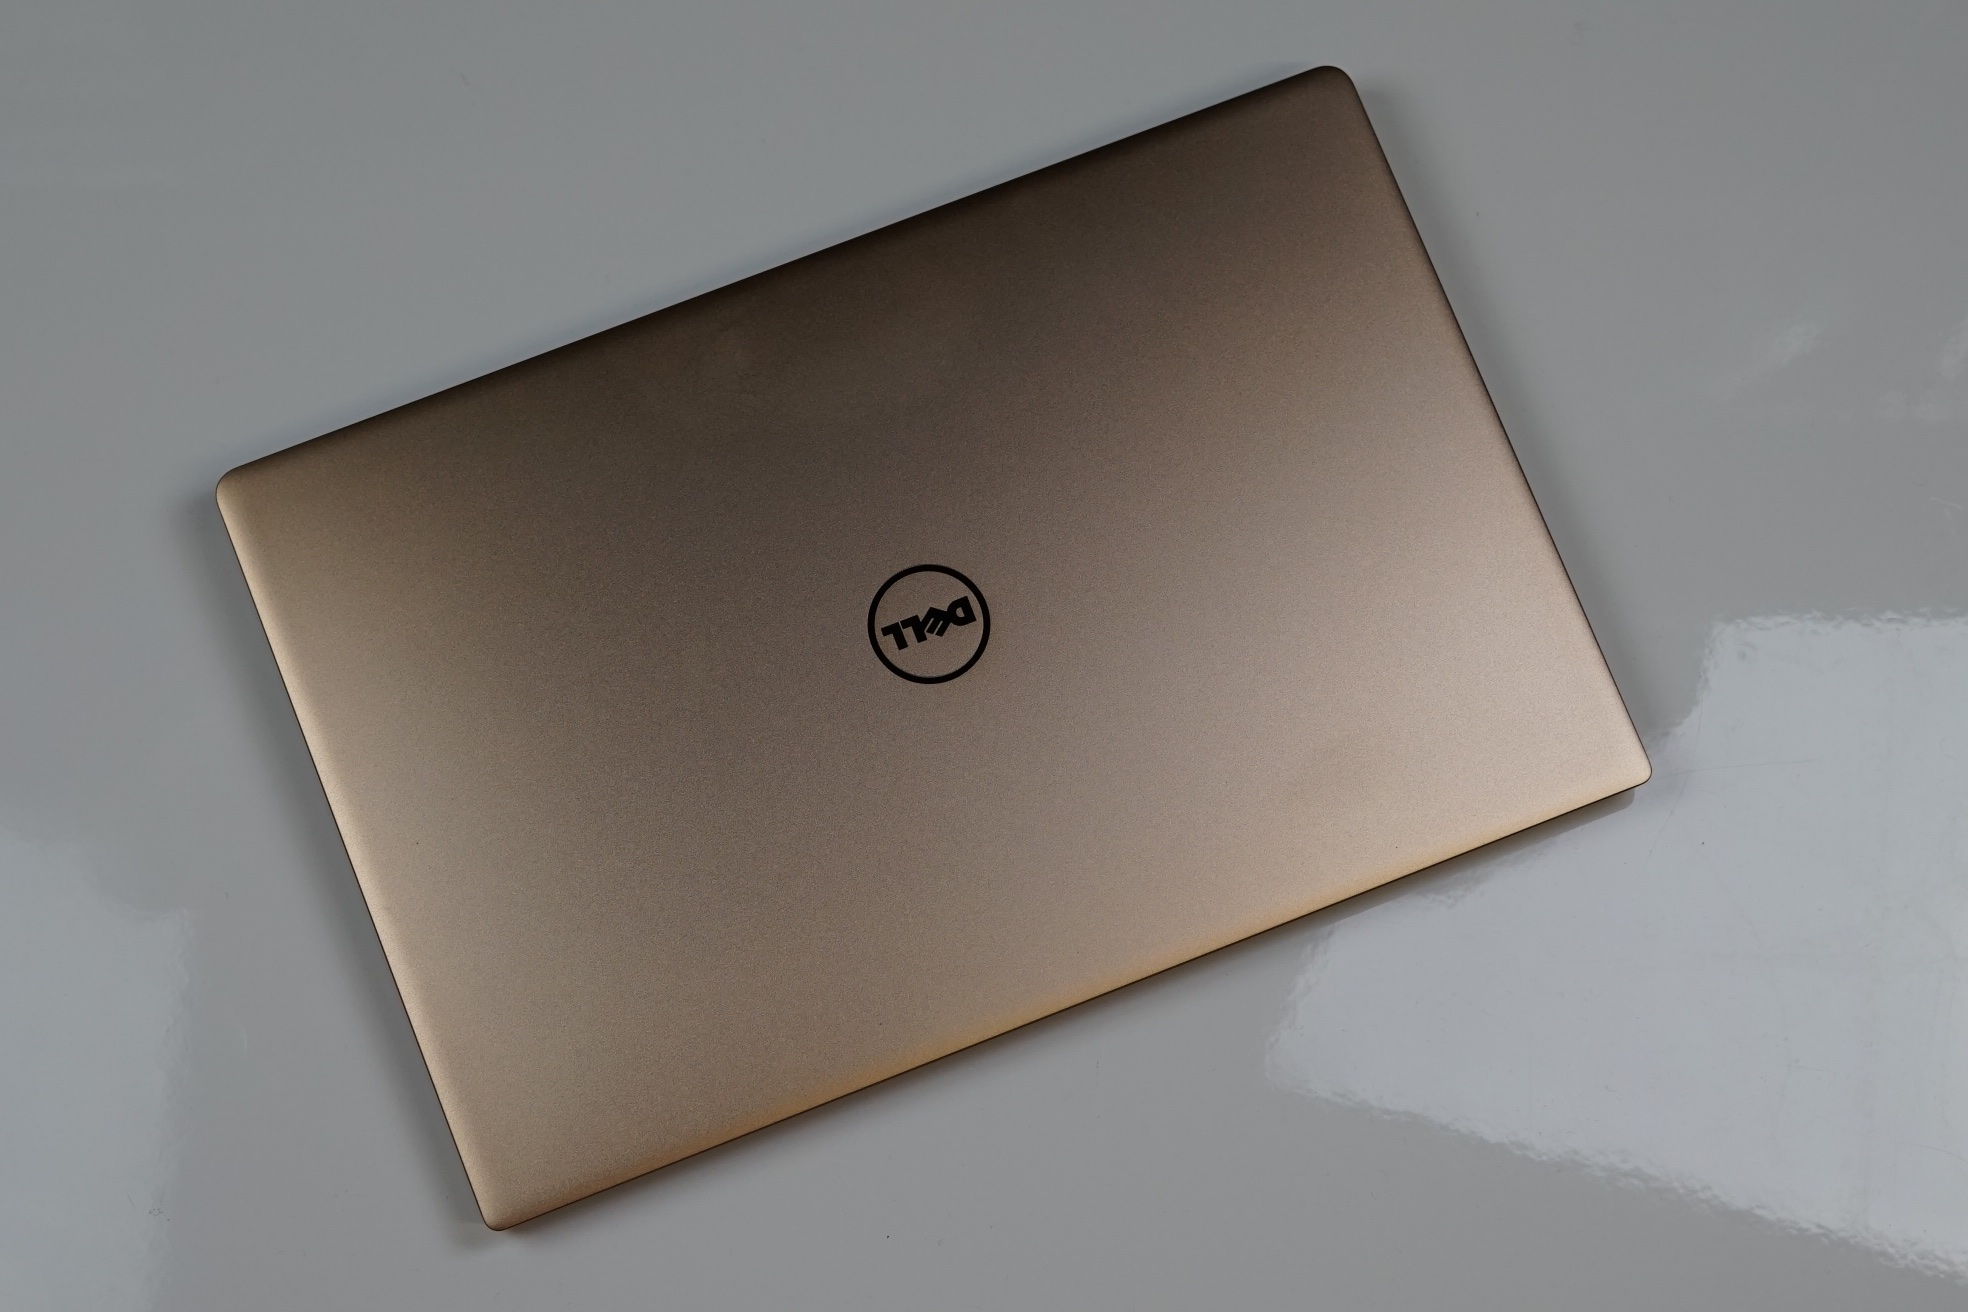
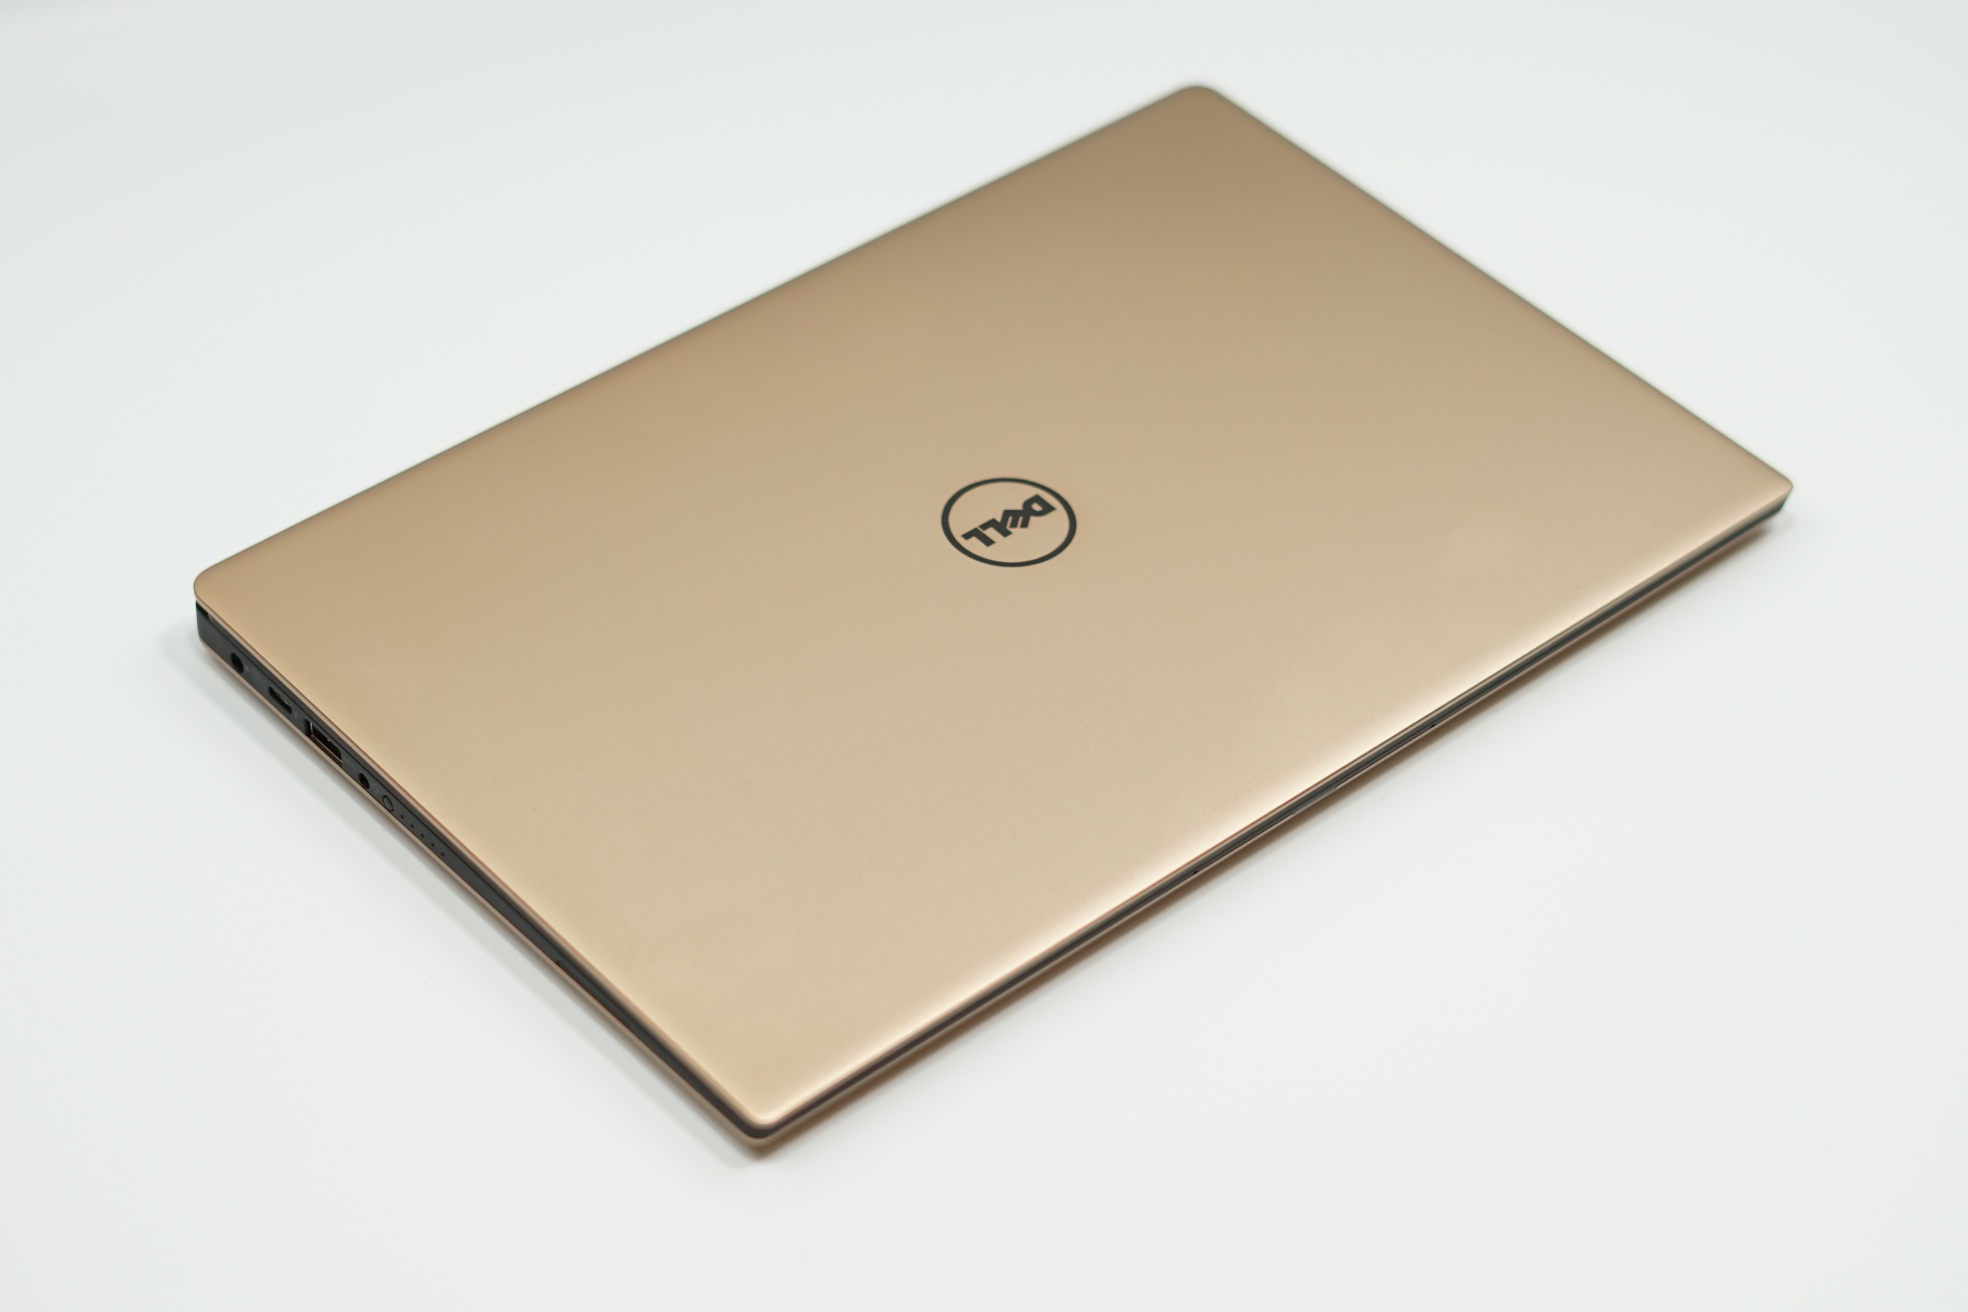
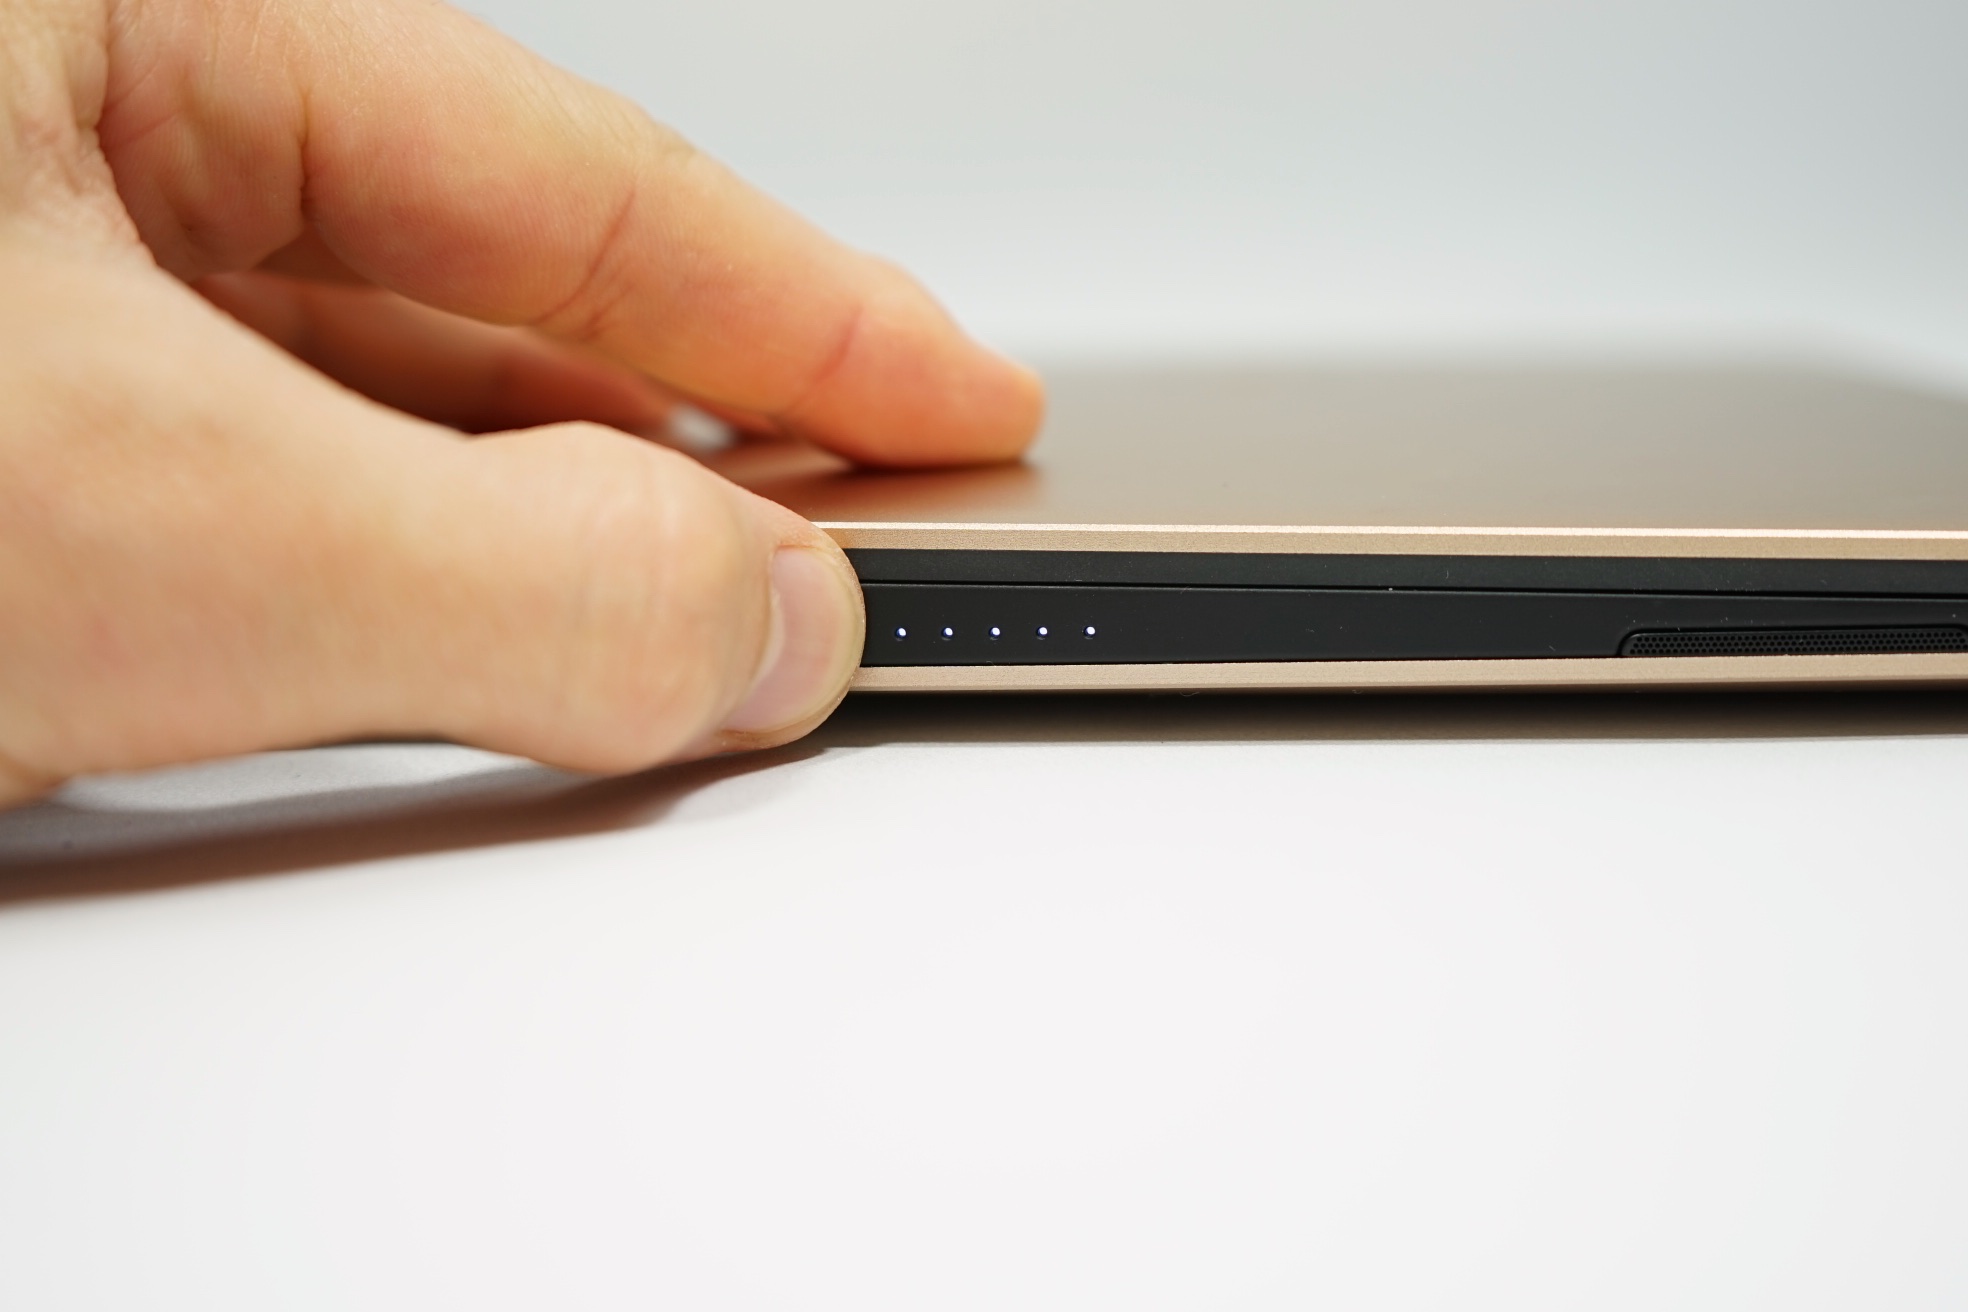
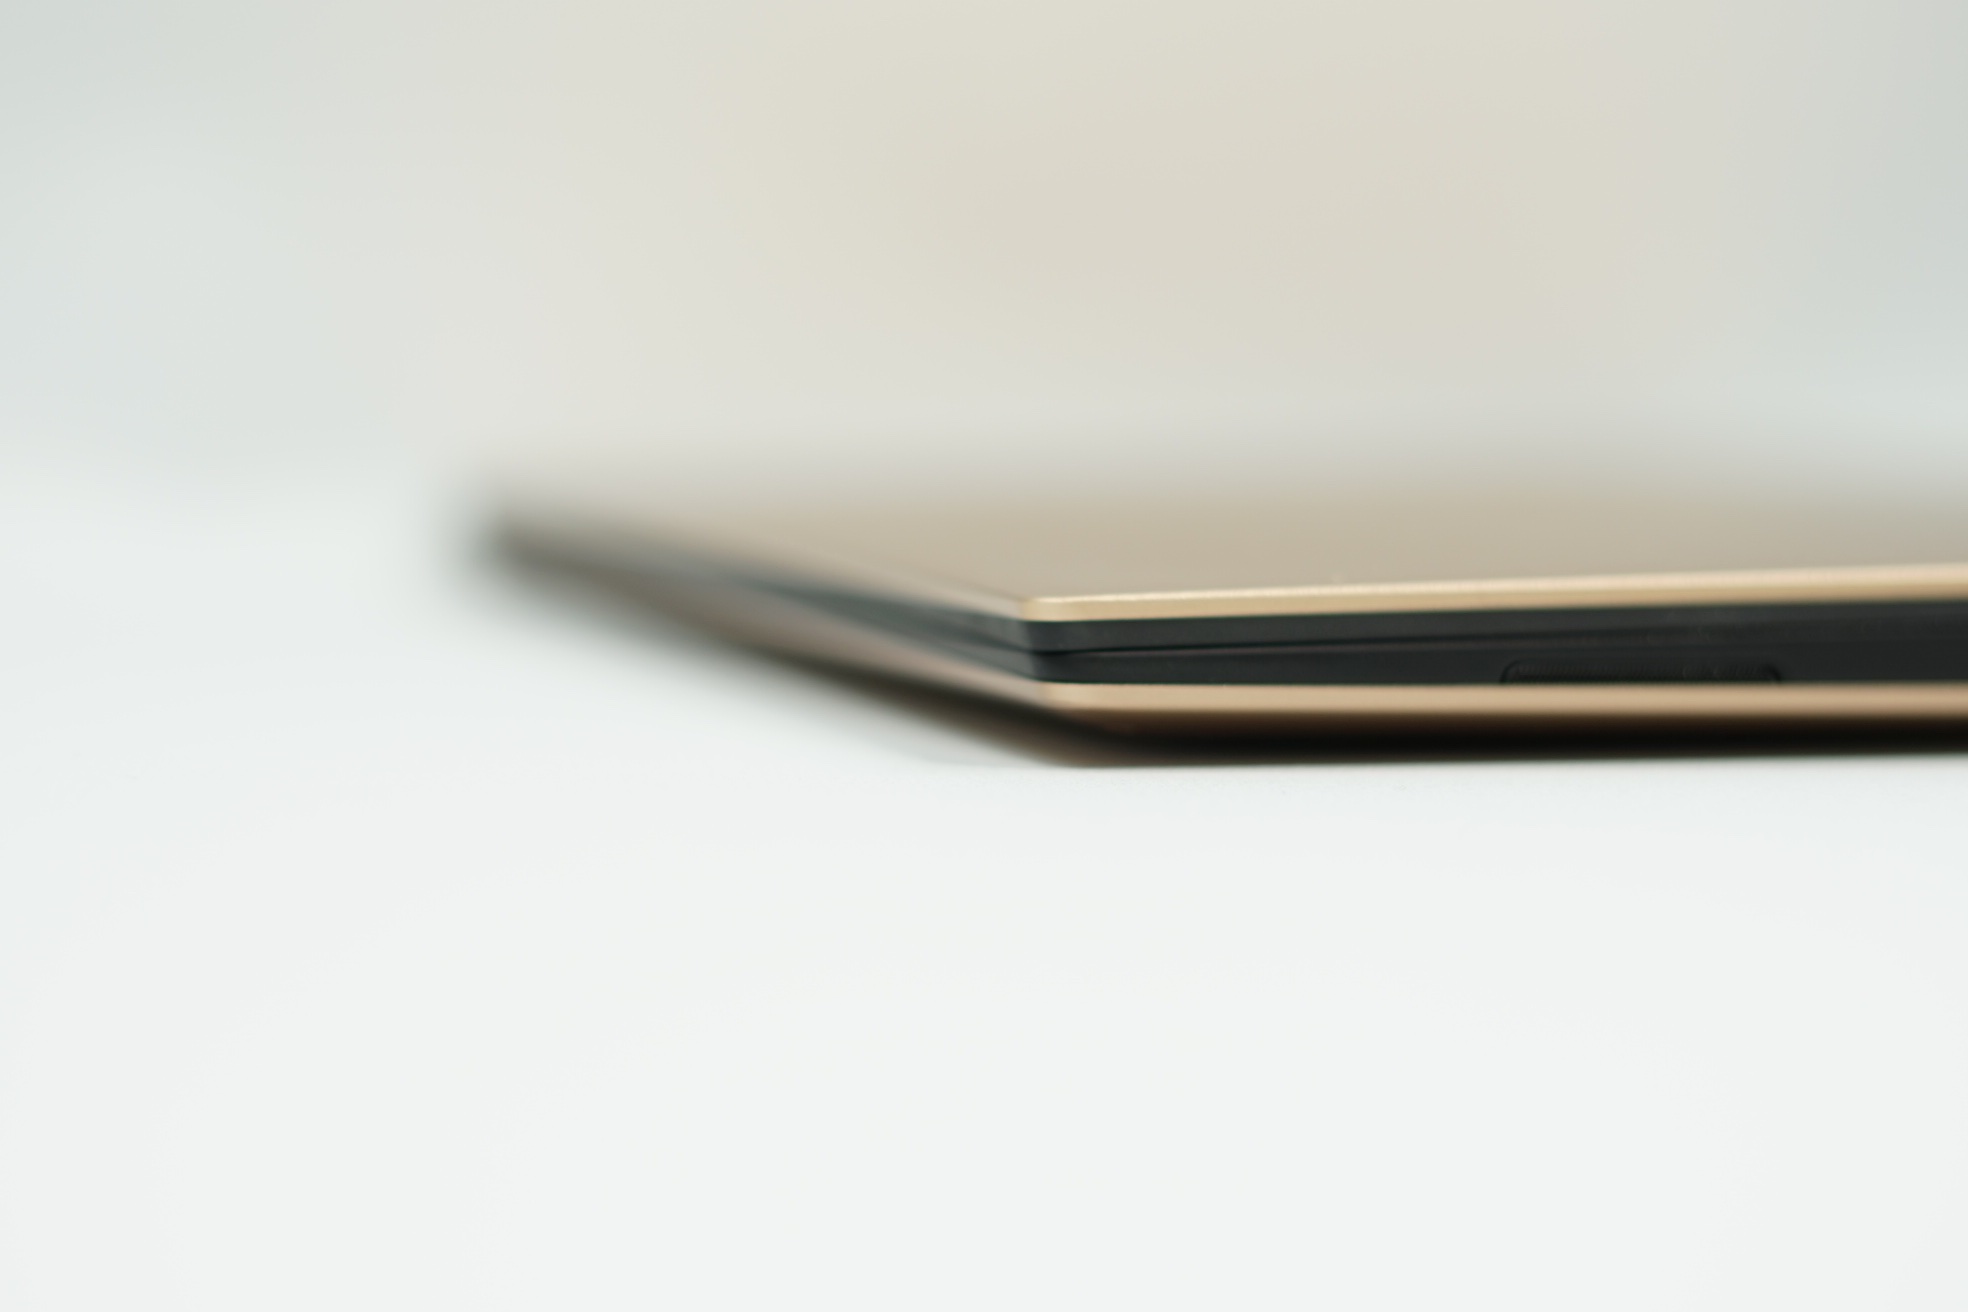
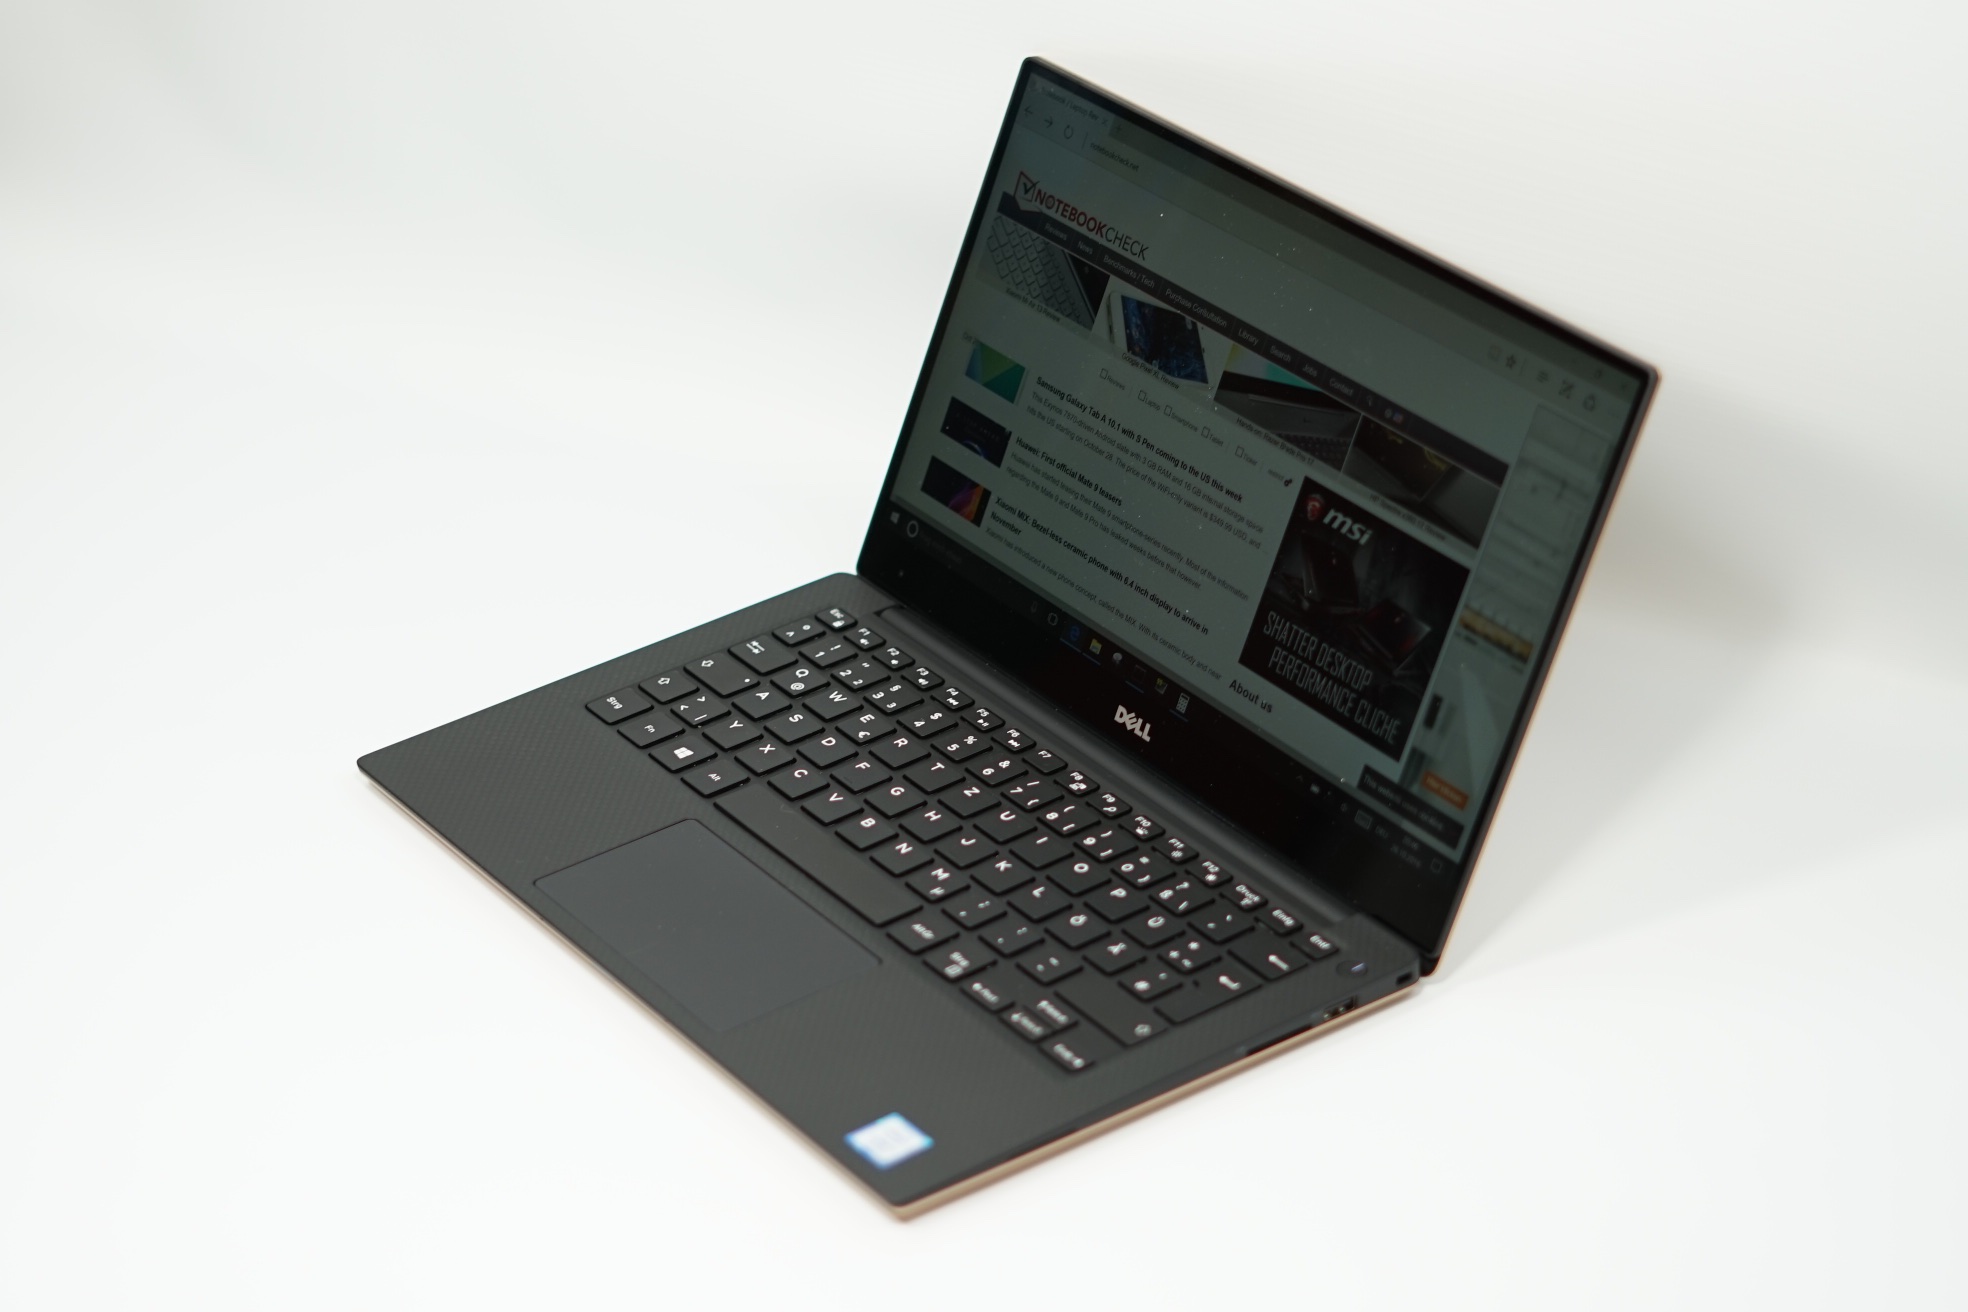
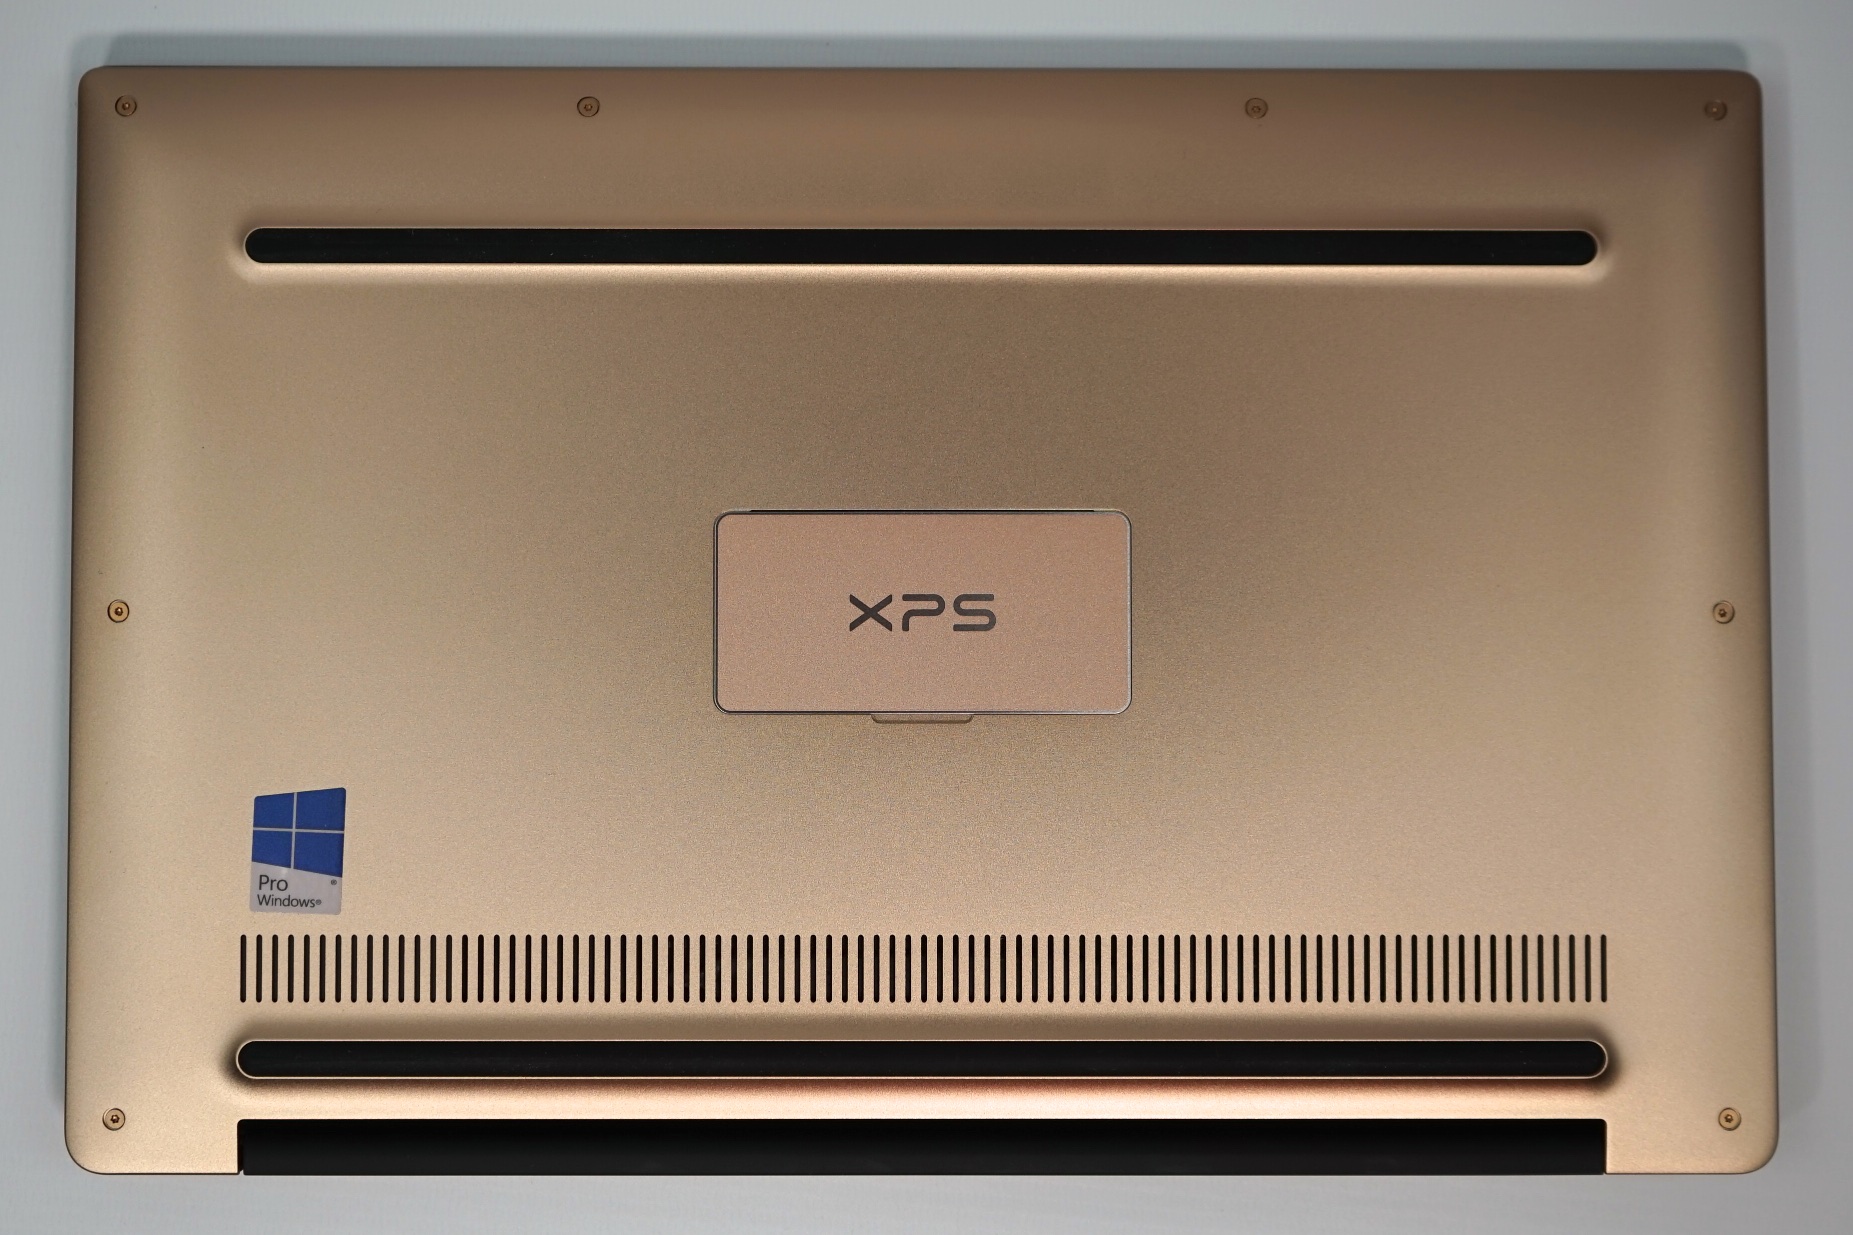
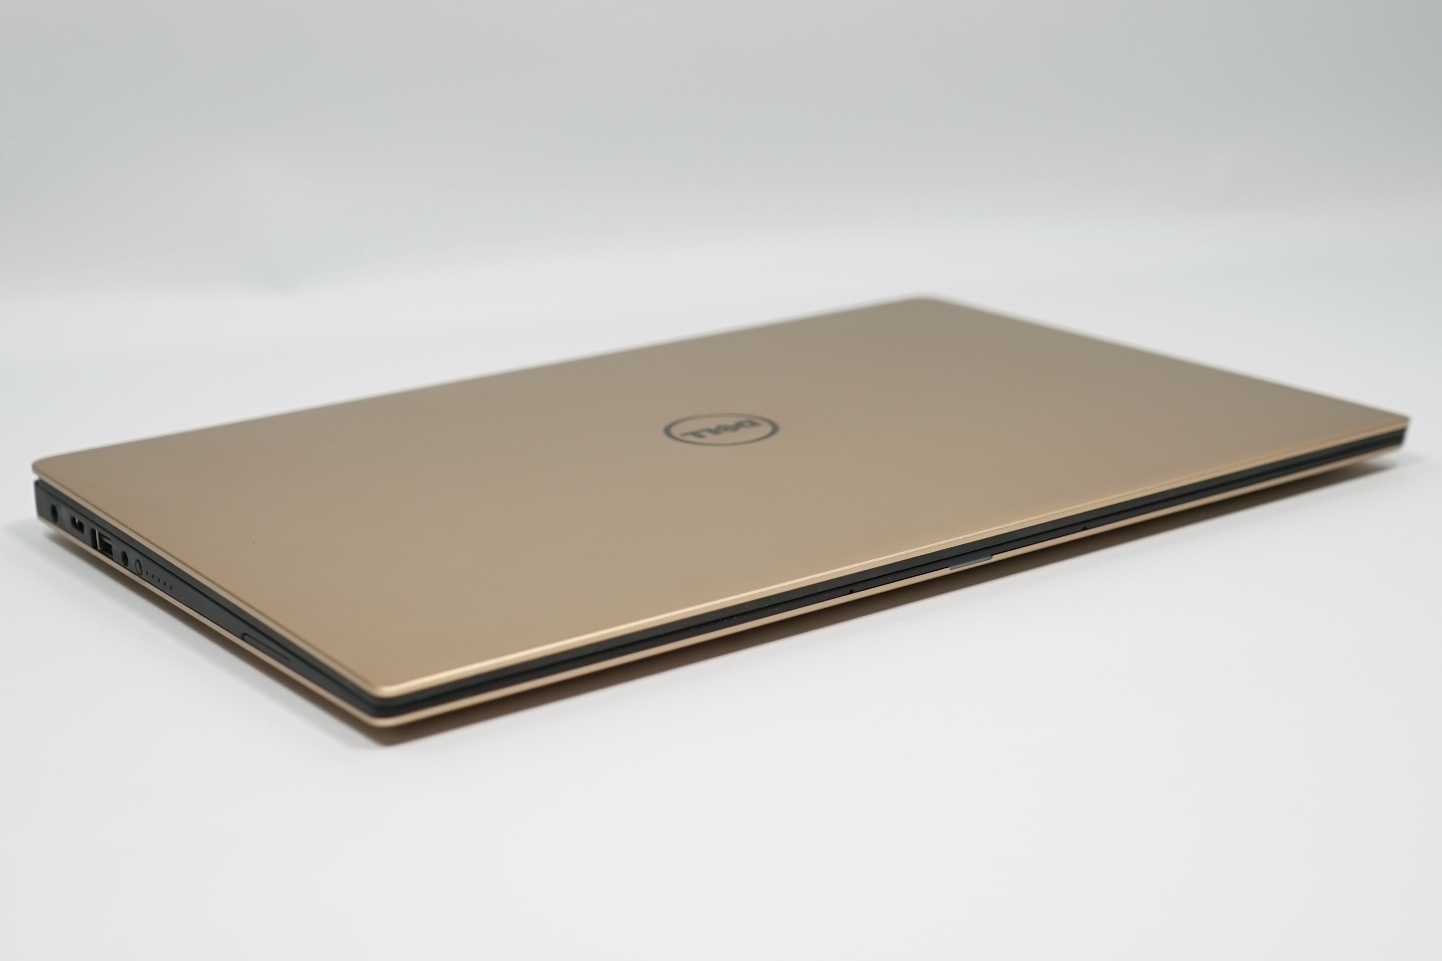
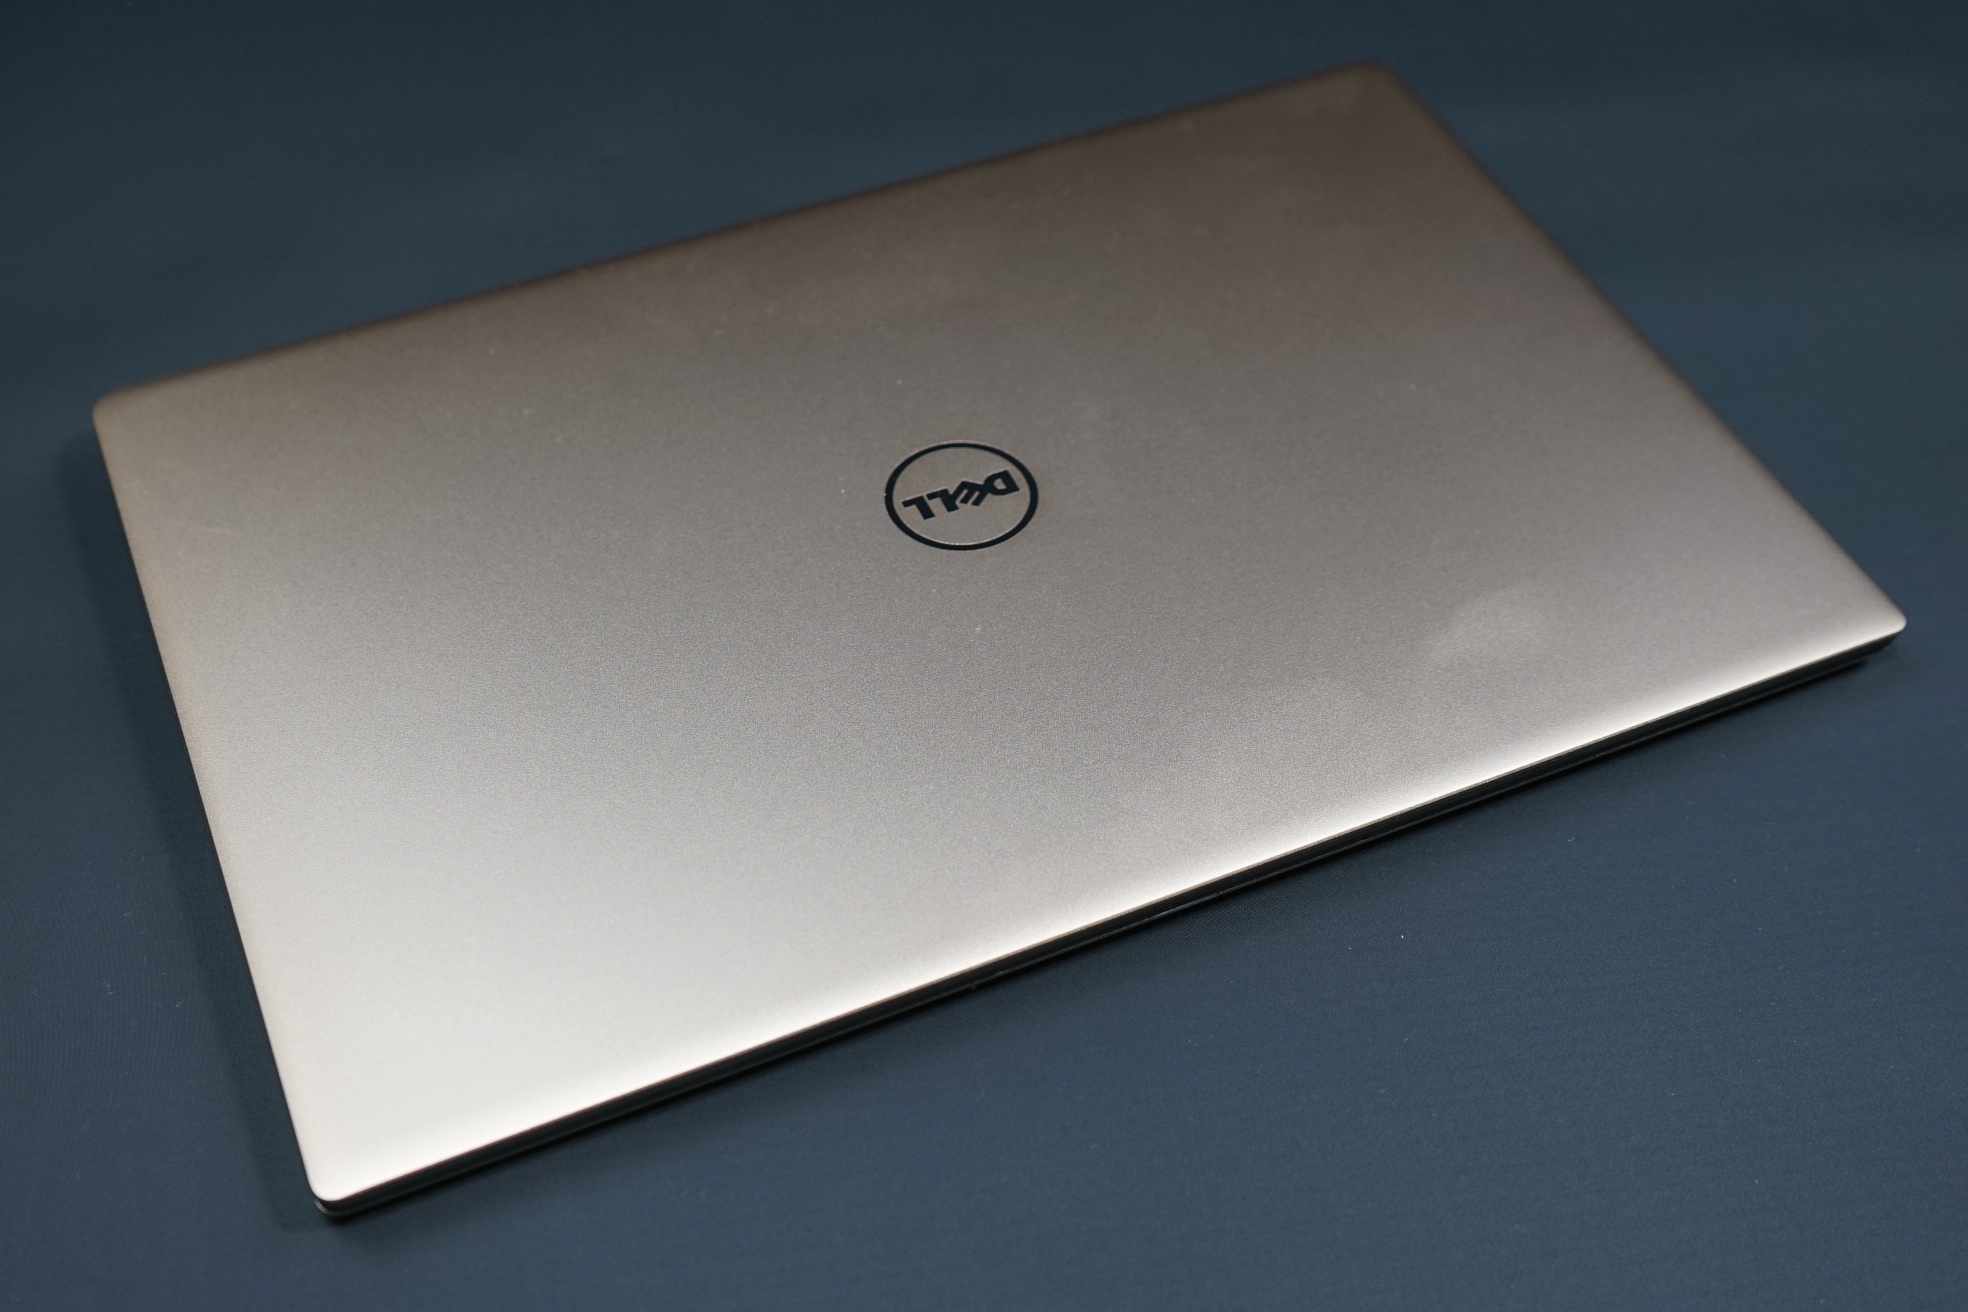
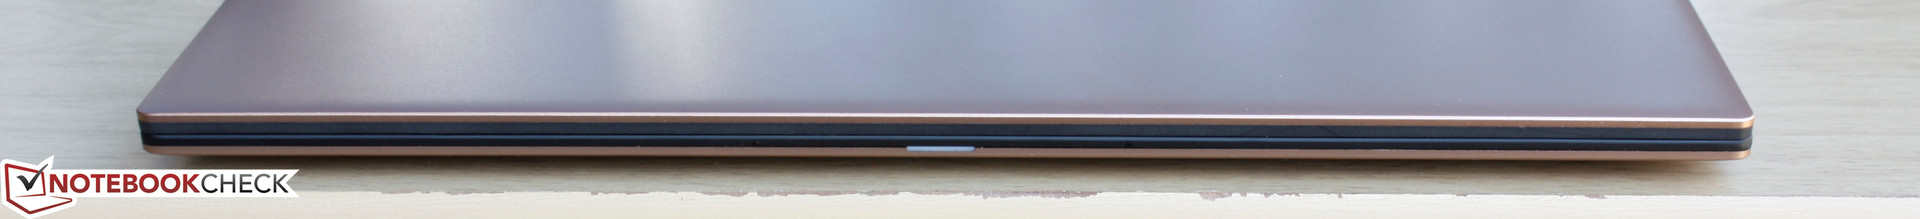
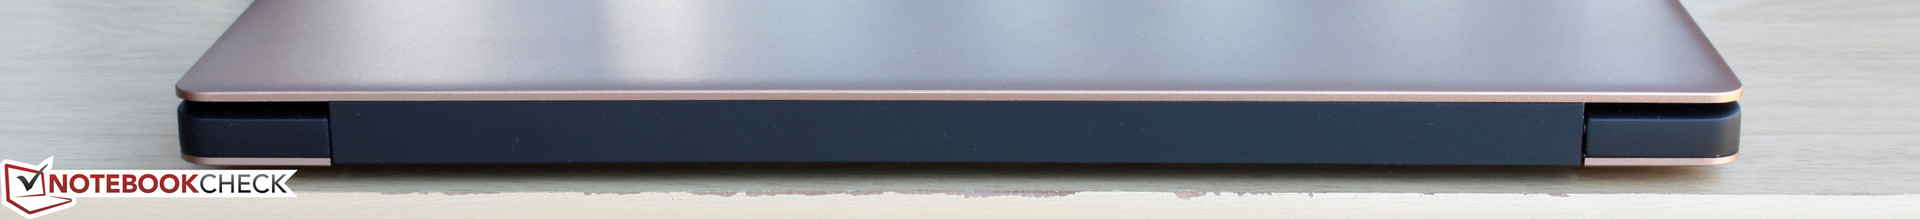
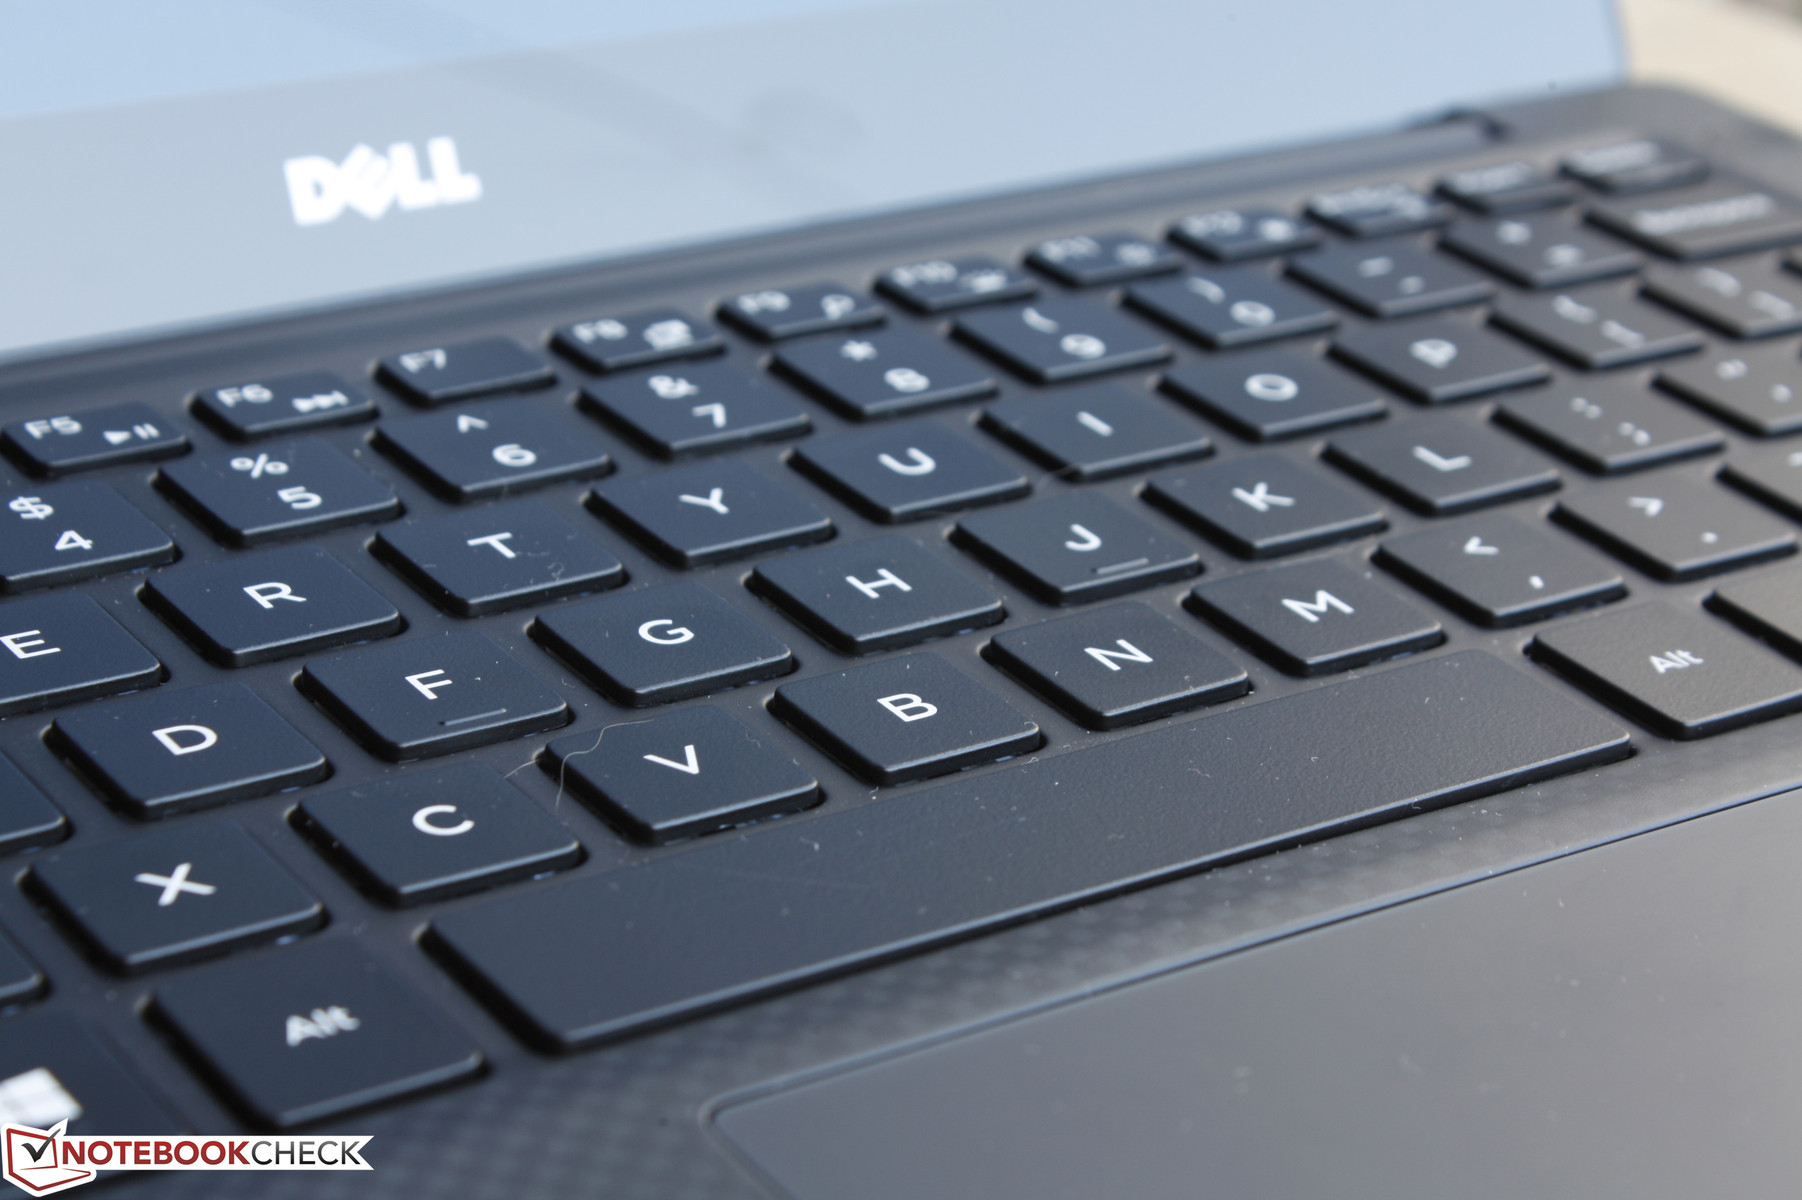
The 9360 is but a minor internal update compared to the 9350, so the aluminum chassis remains identical to last year's model in terms of quality and workmanship with a new Rose Gold color option. There is almost no creaking around the base and the lid itself is surprisingly more rigid compared to most other notebooks due to its thickness and Gorilla Glass reinforcement. Pushing down on the center of the outer lid just barely warps the surface with excellent resistance to twisting.
Main drawbacks are minor and mostly superficial including rubberized palm rests that attract fingerprints and a smooth matte outer lid that can be easily scratched. Furthermore, the display continues to be difficult to open when in its closed position as the front edge includes no tab or recess for easier gripping.

Connectivity
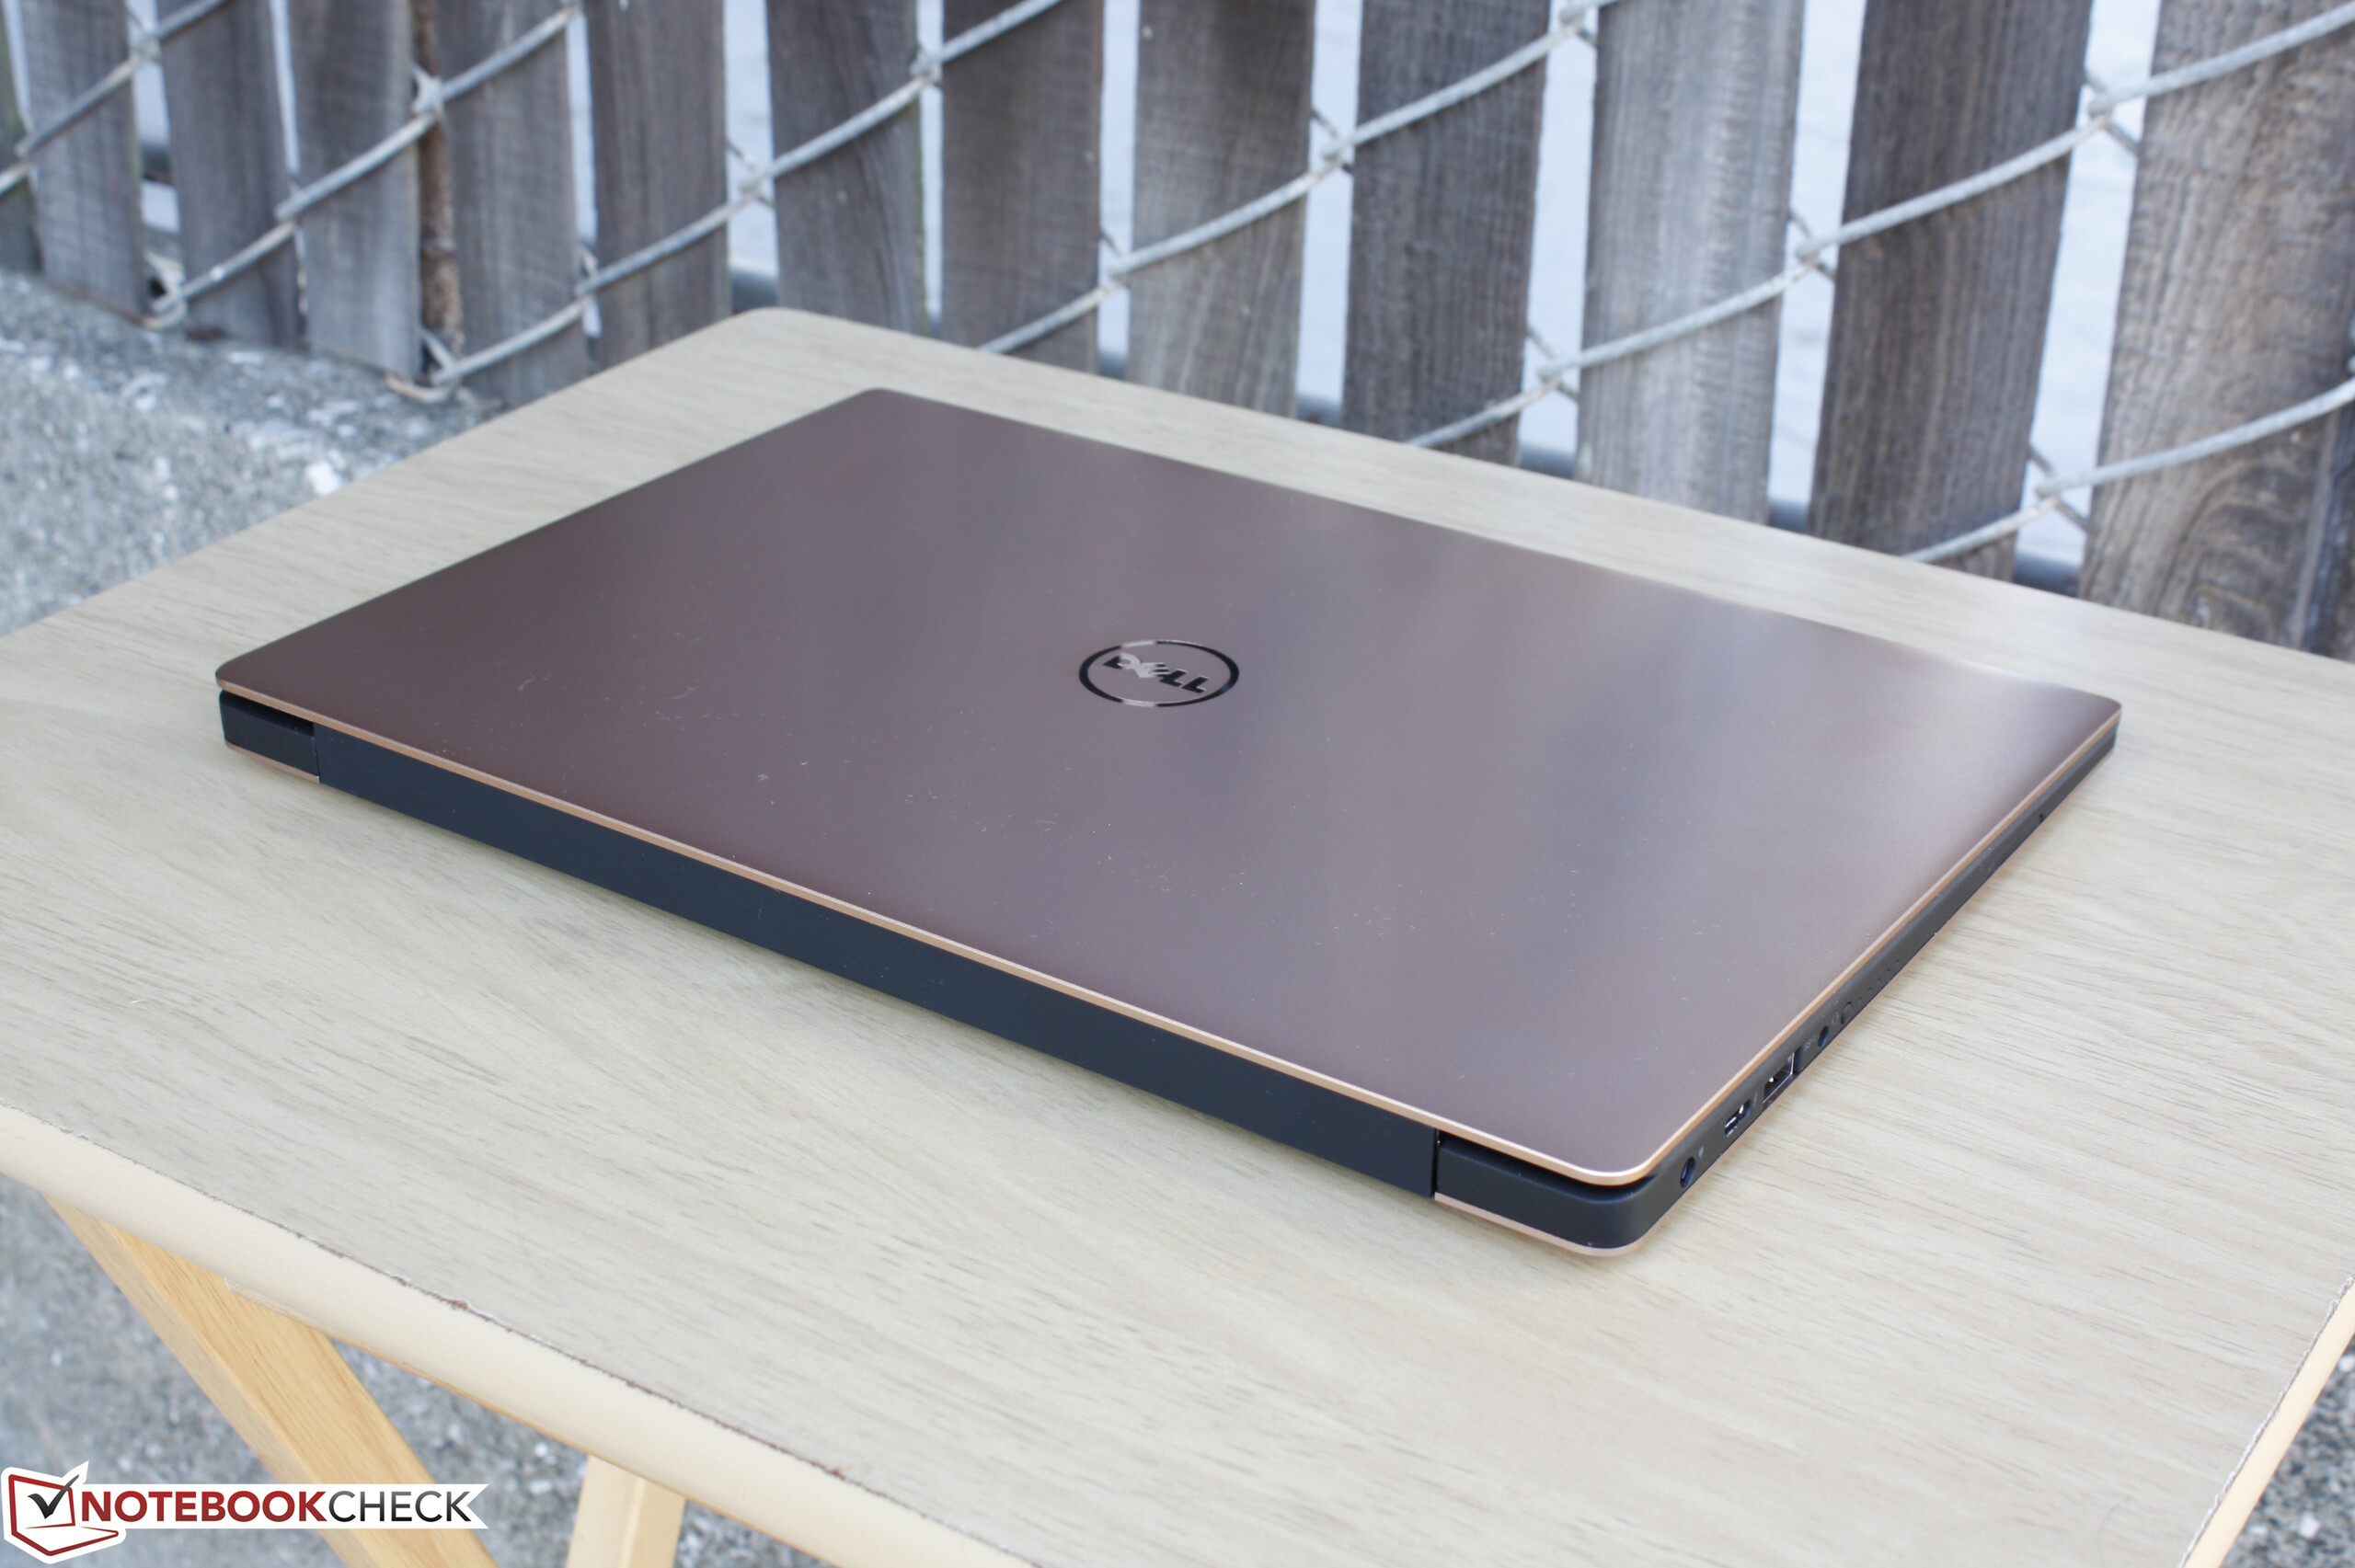
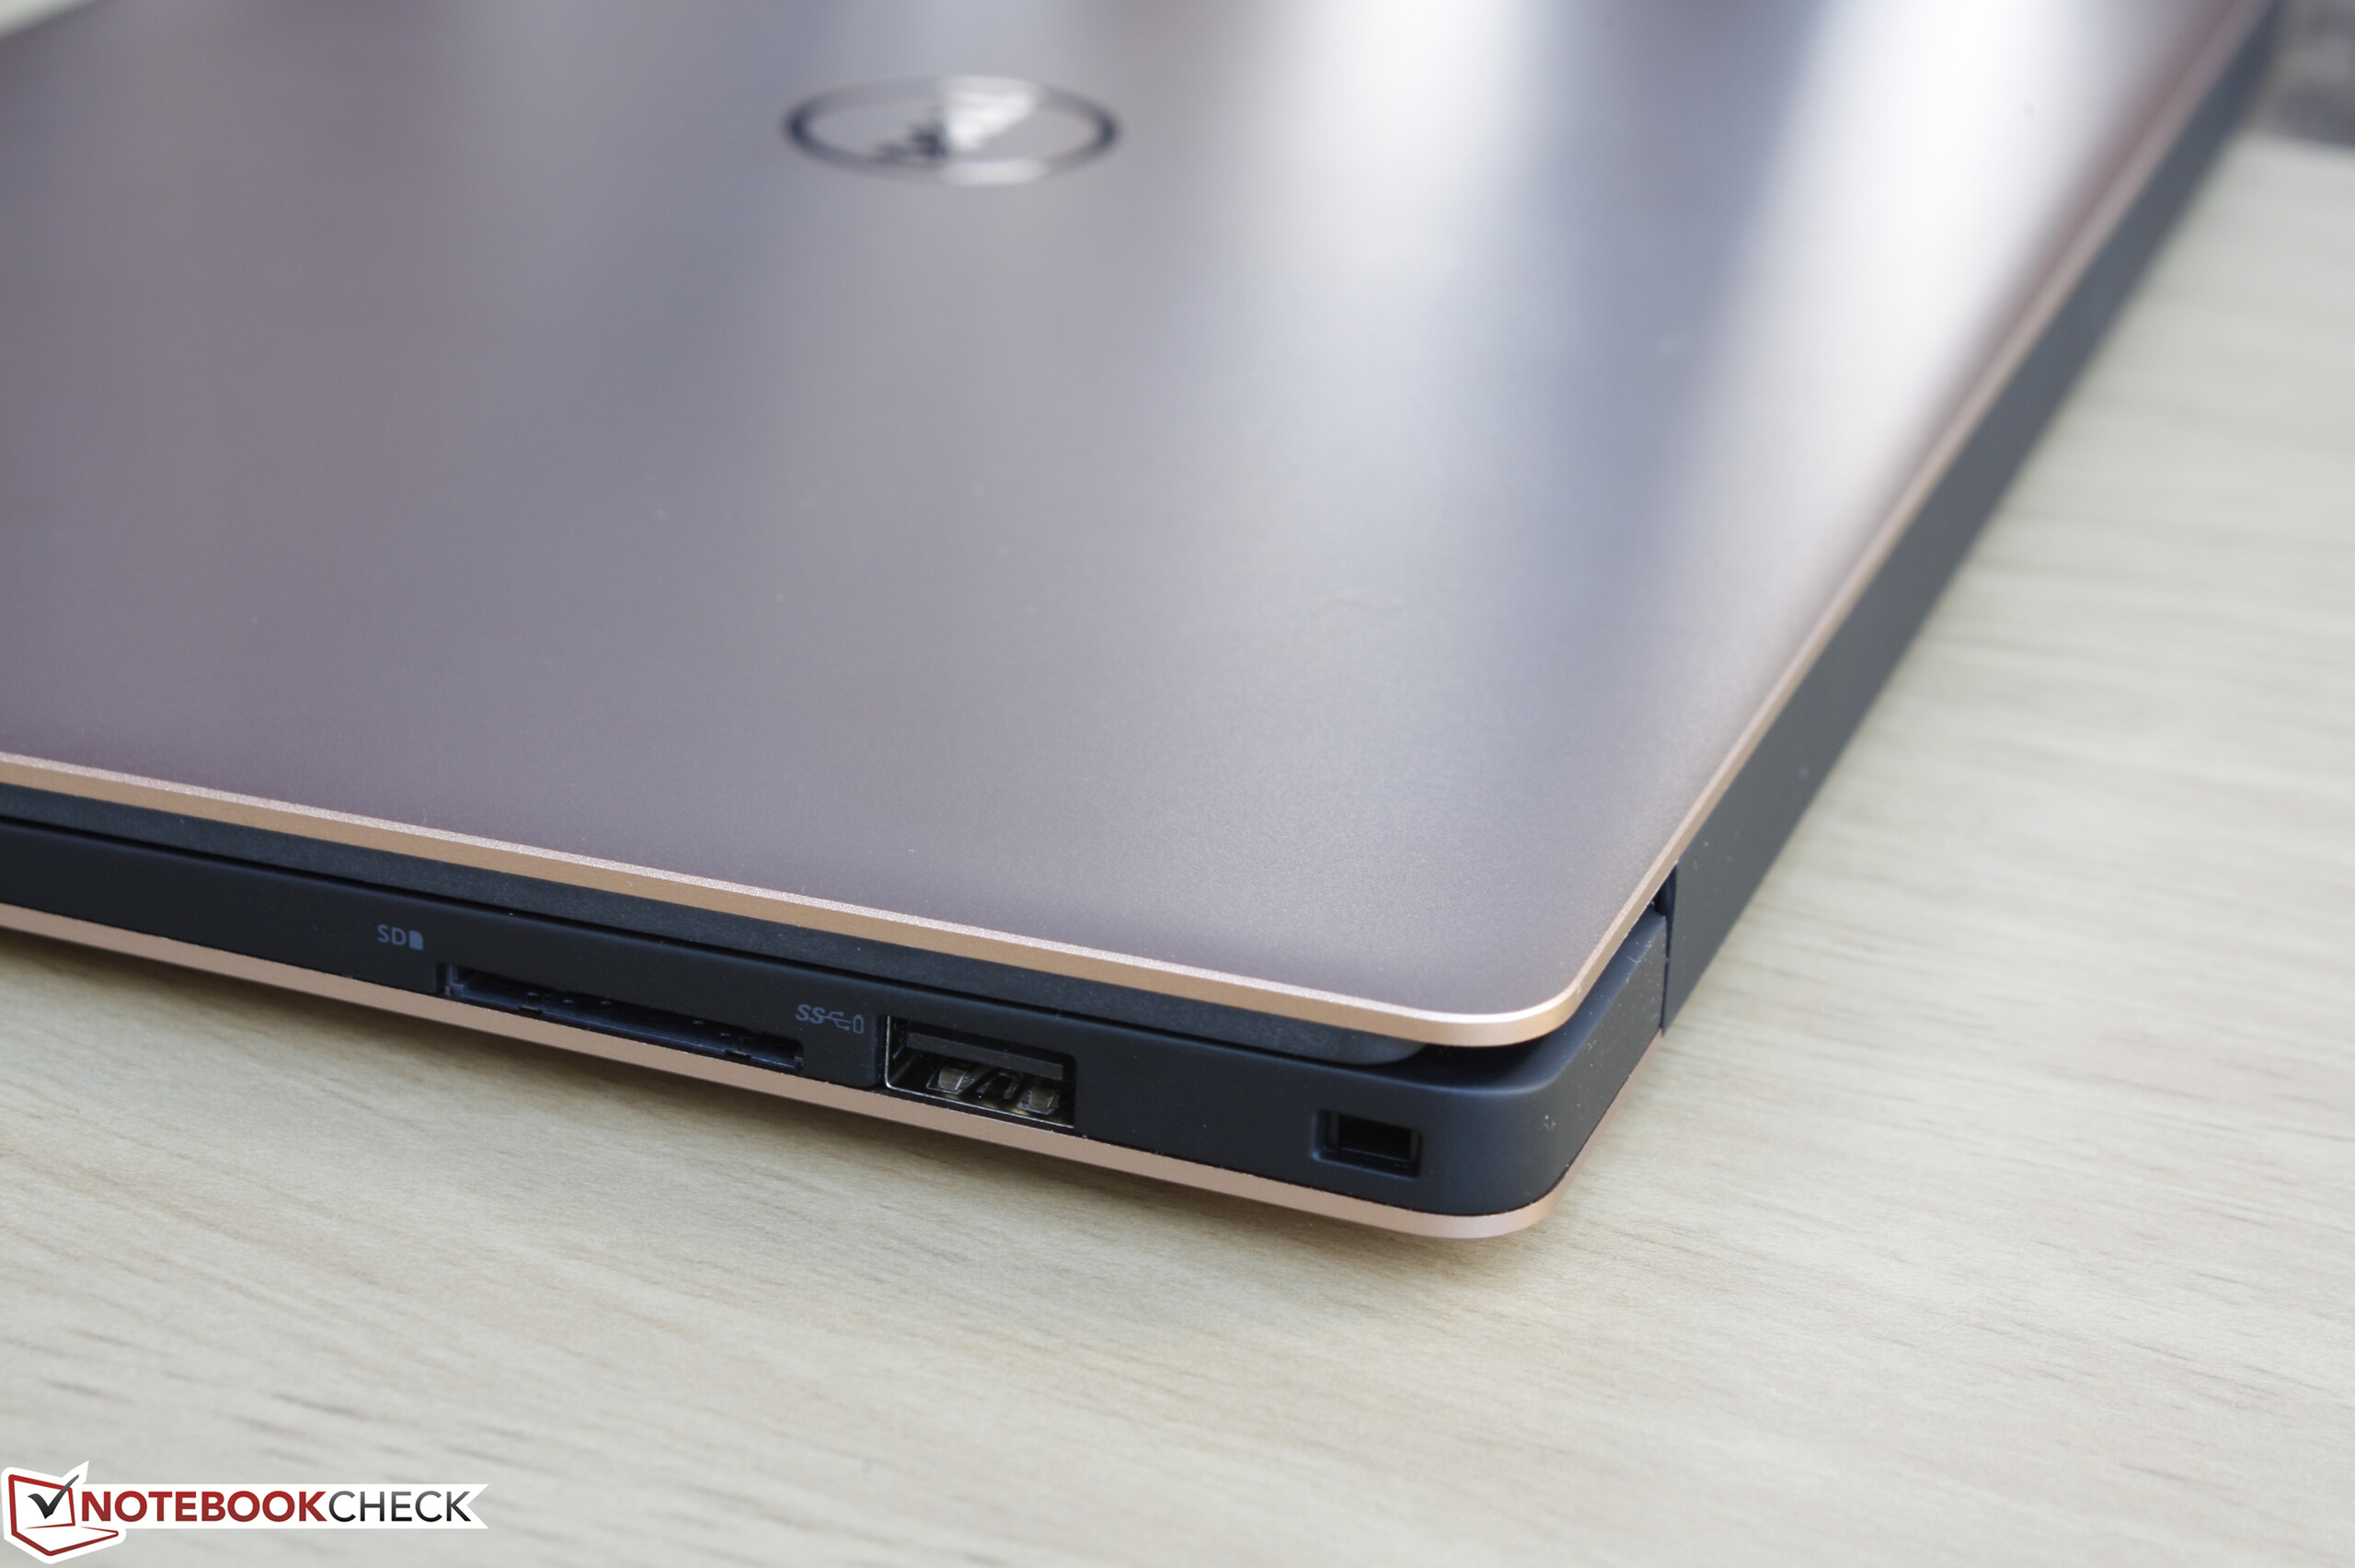
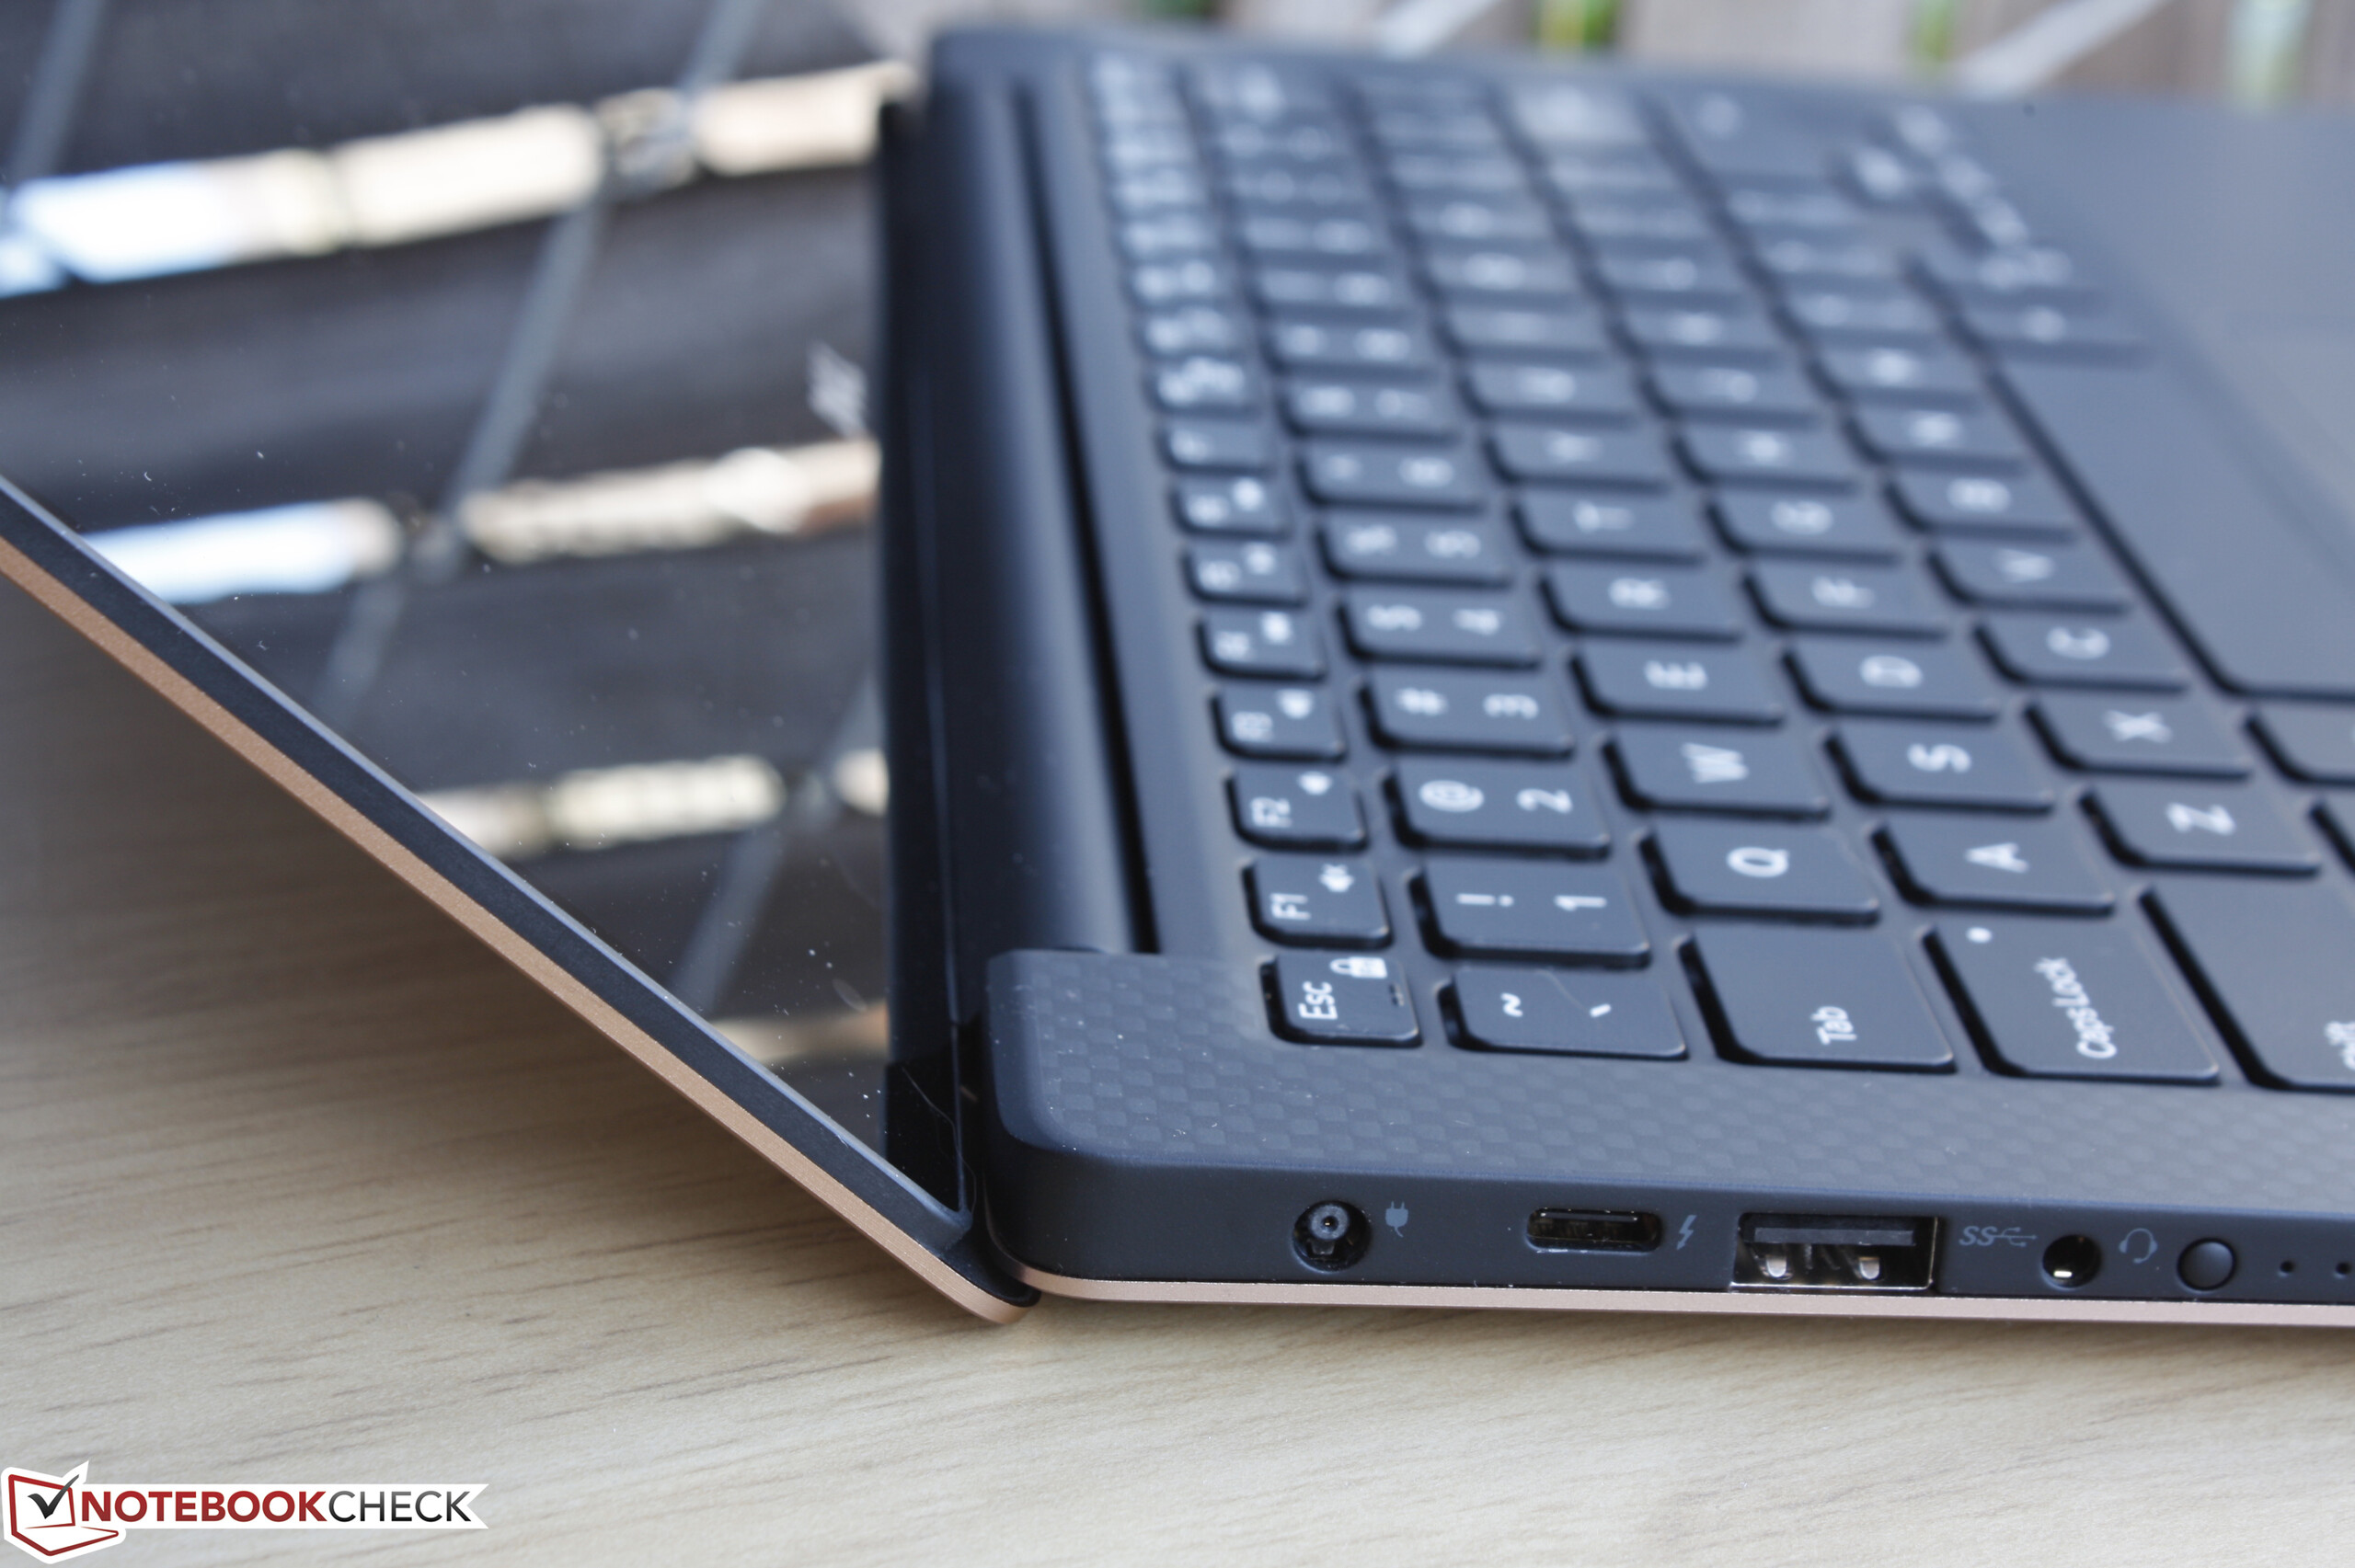
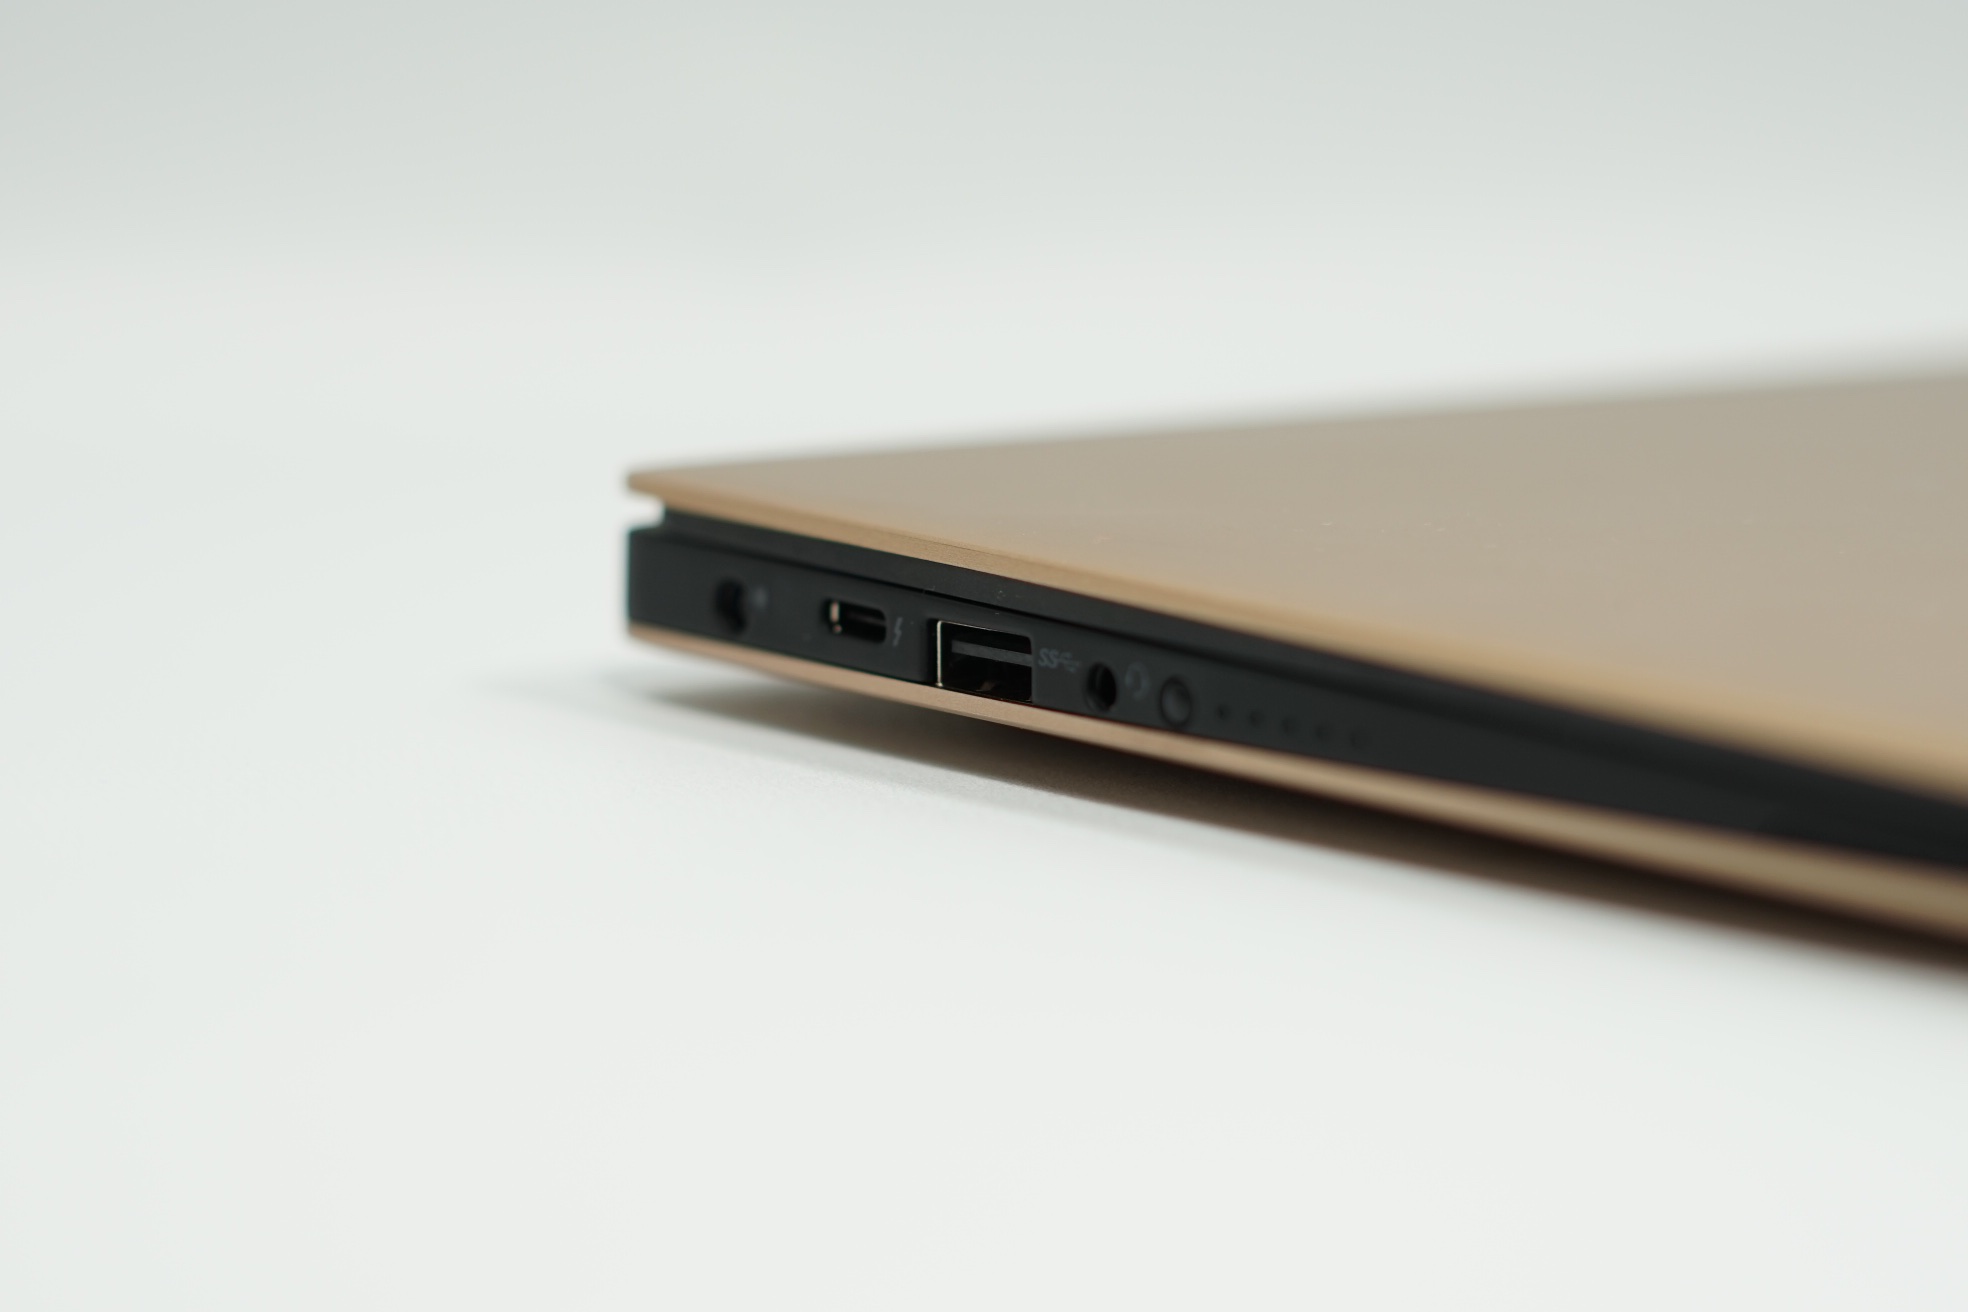
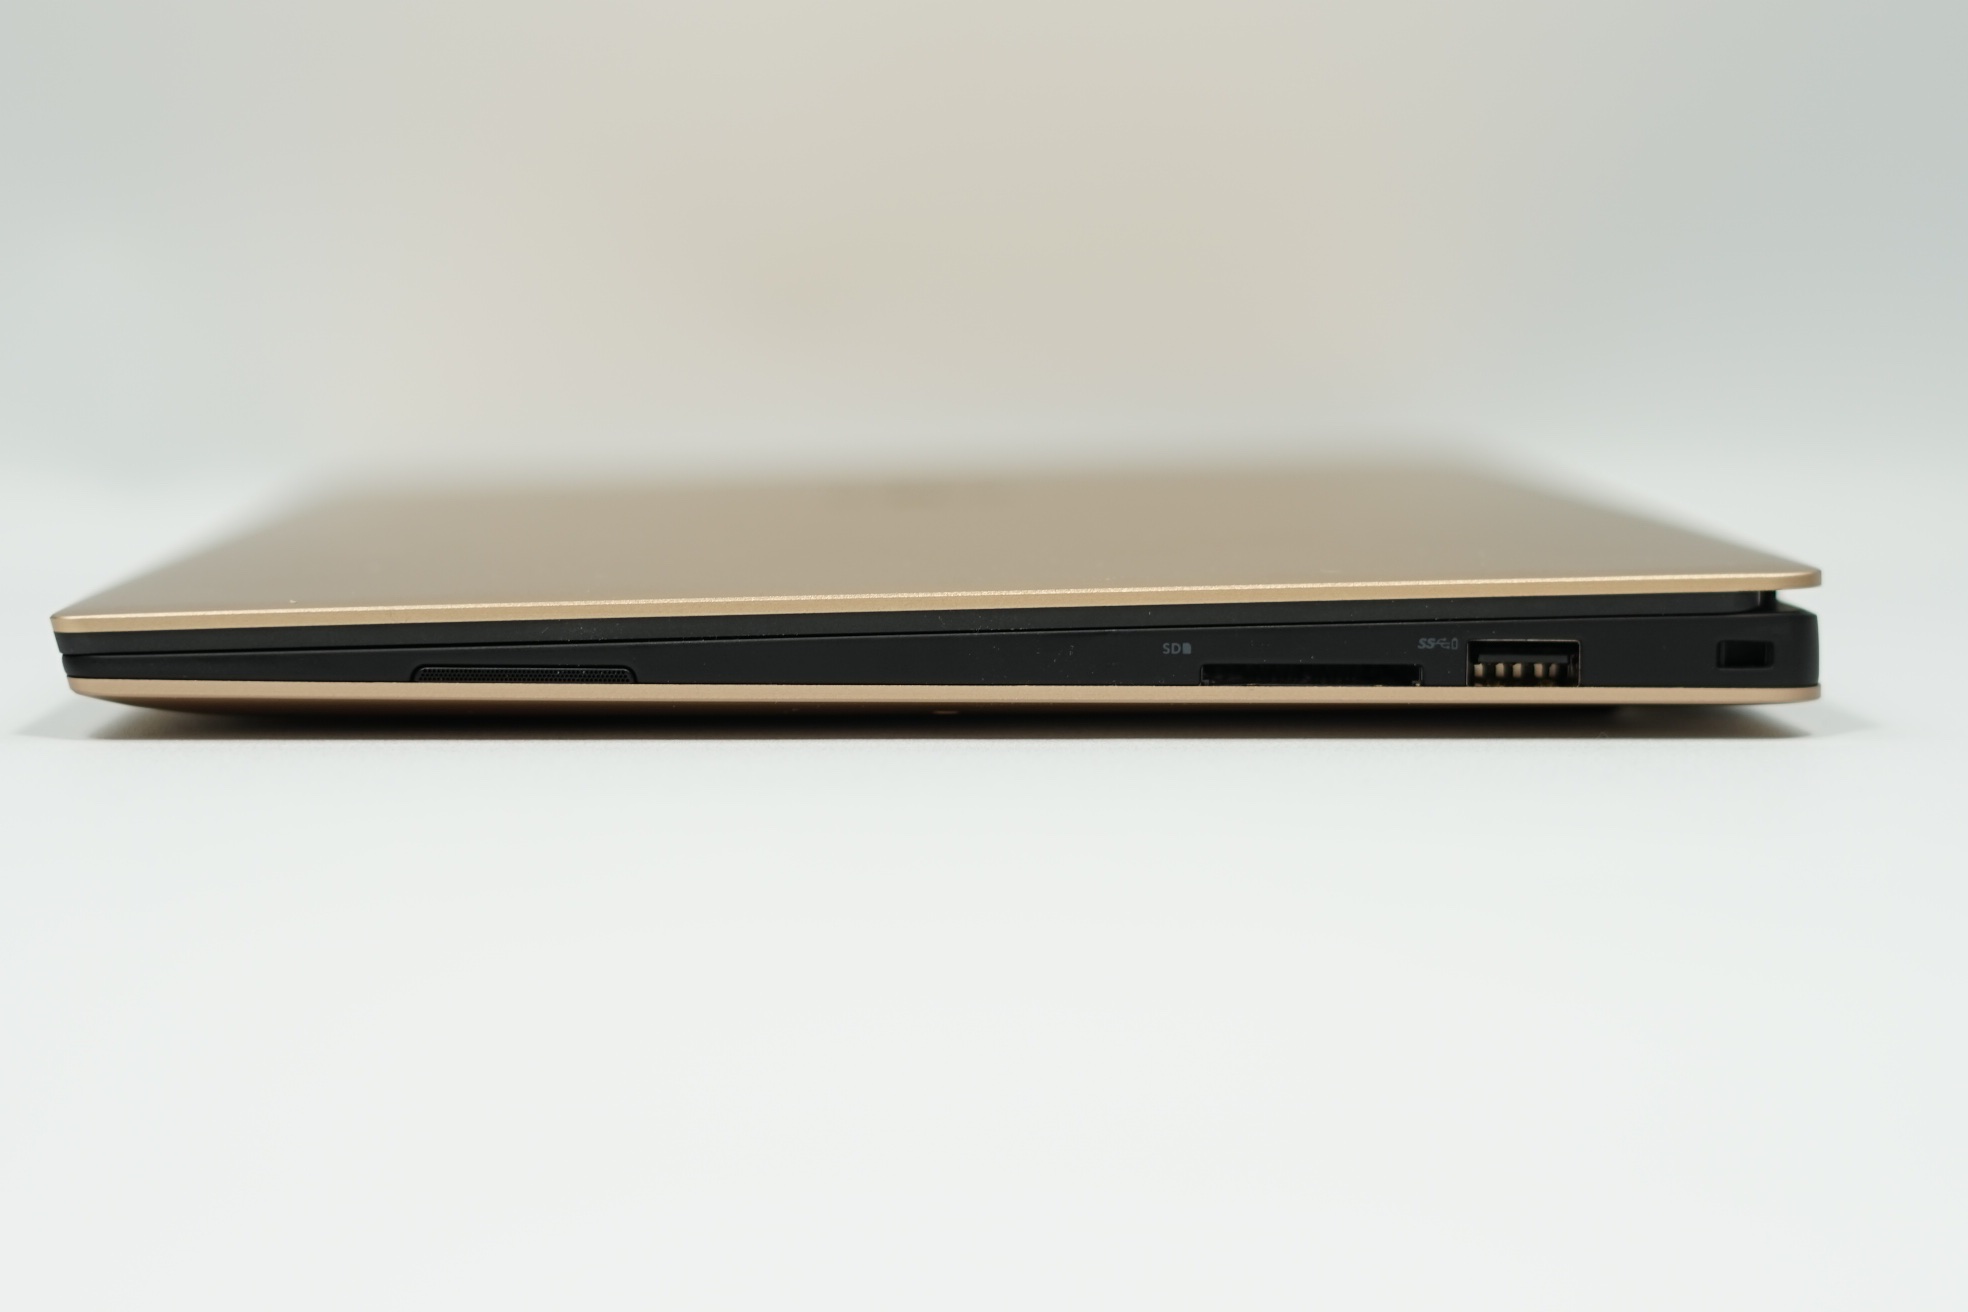
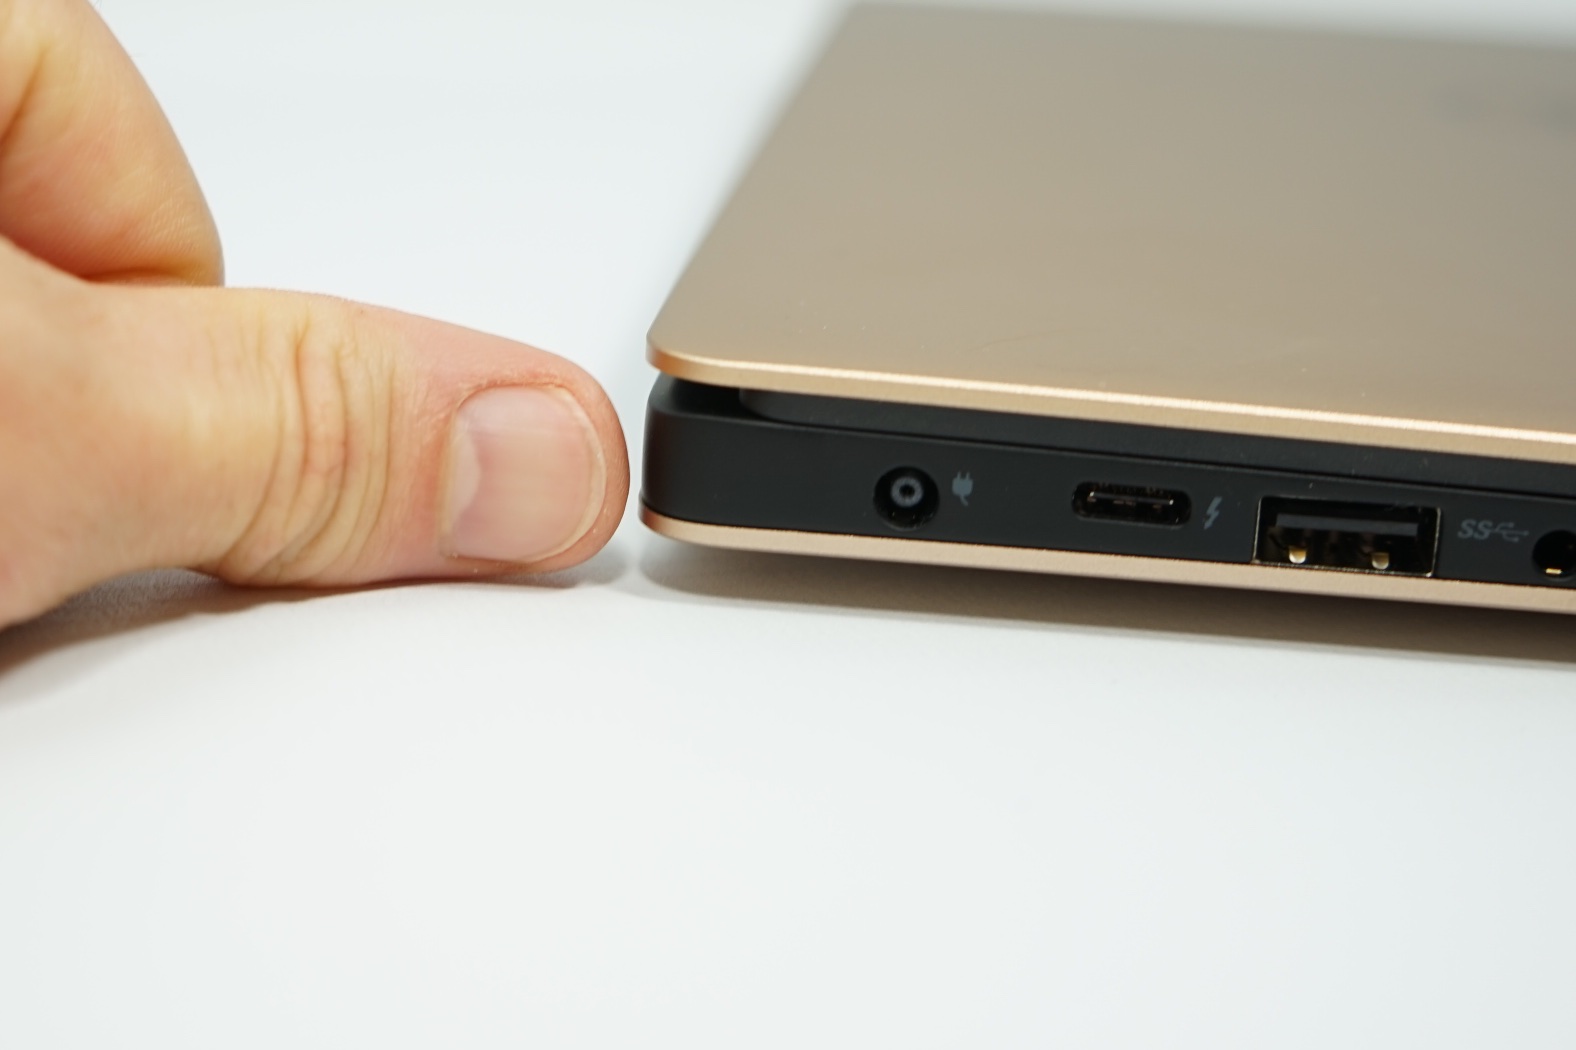
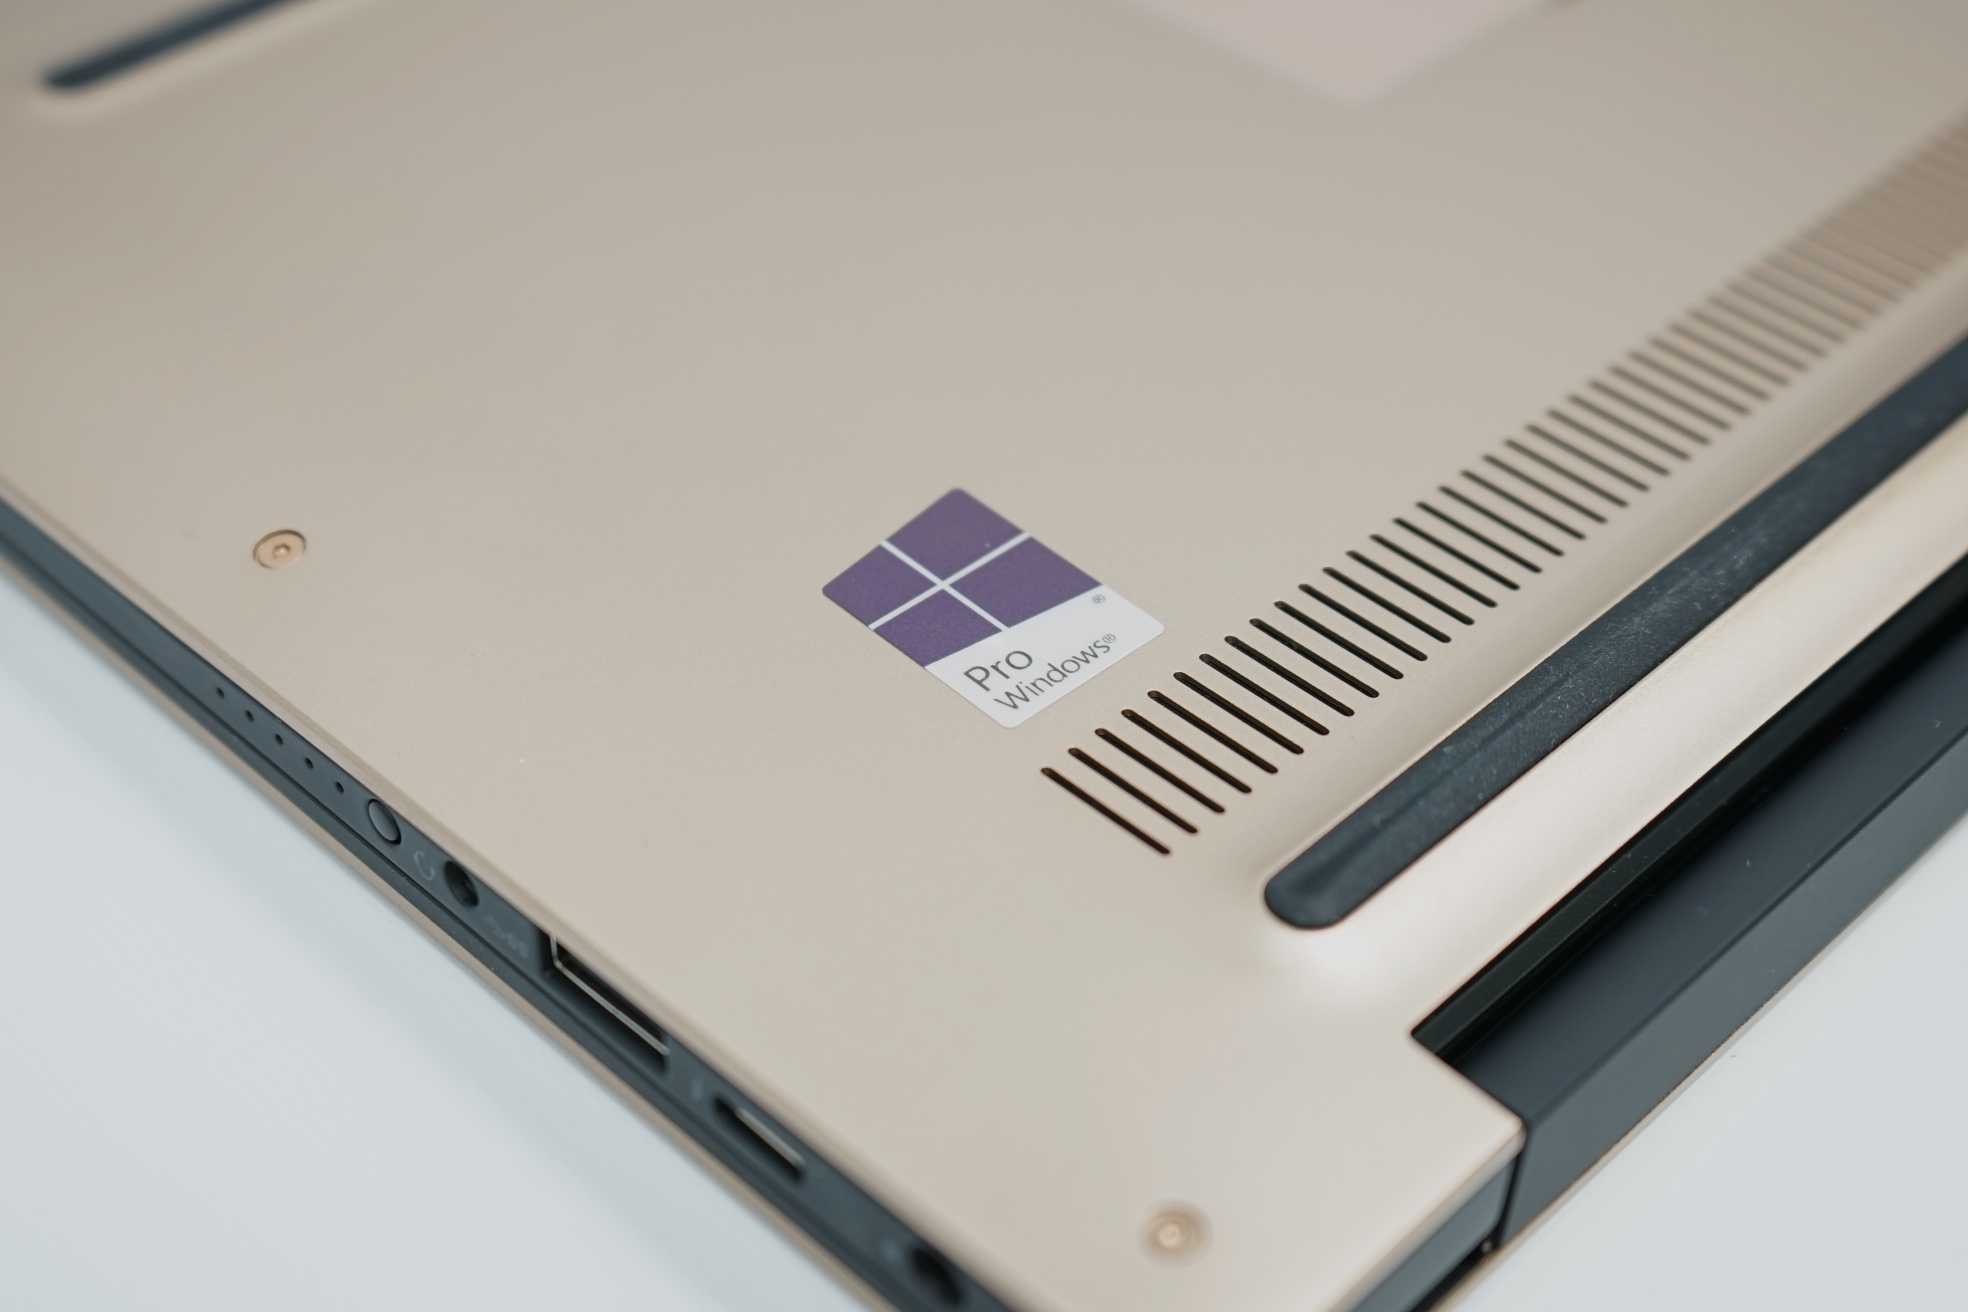
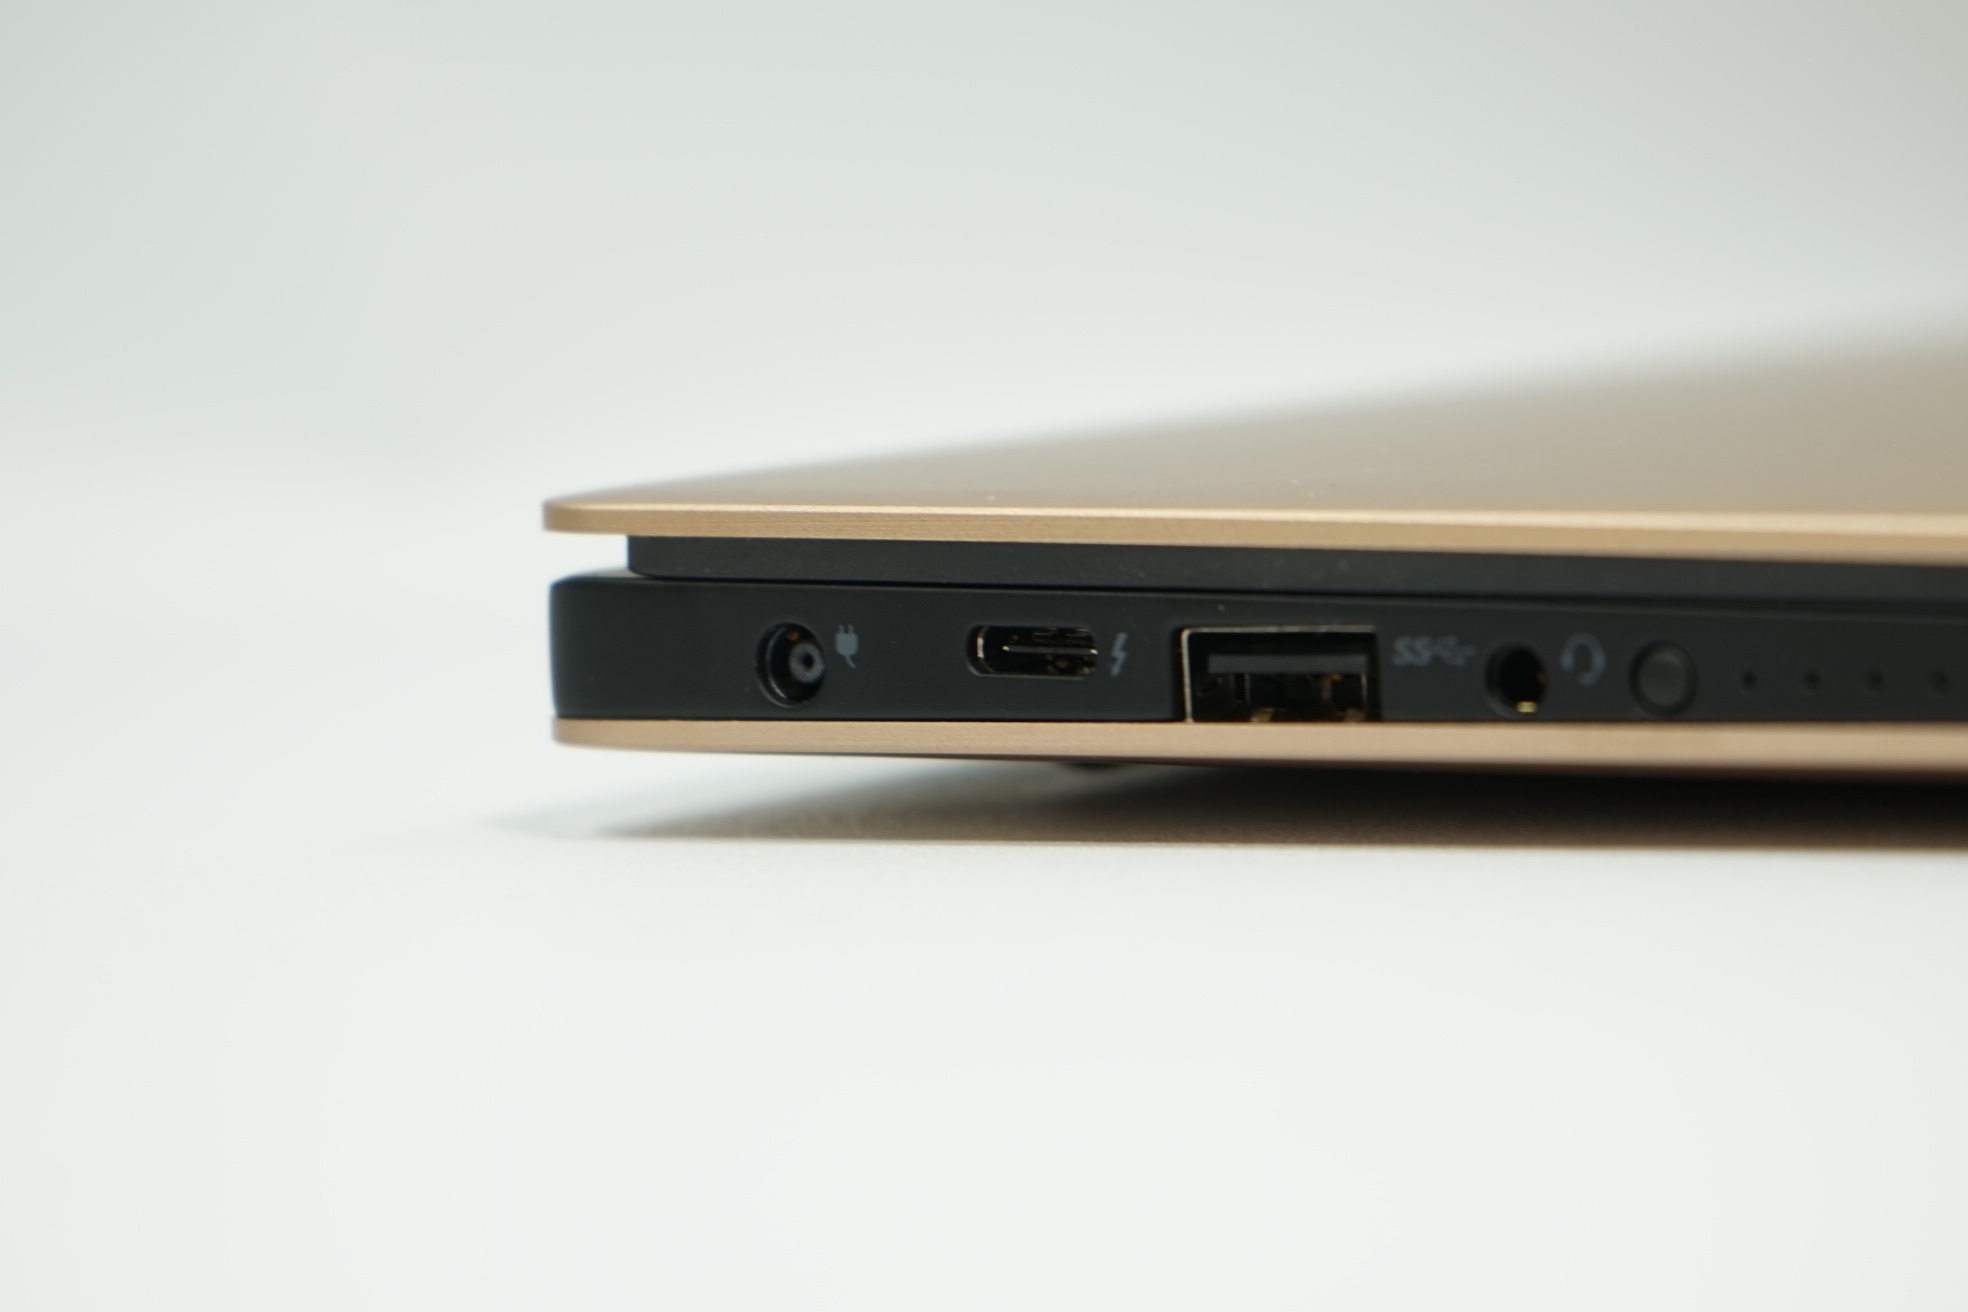
Available interfaces have not changed. The Thunderbolt 3 port in particular is noteworthy as it future-proofs the system in terms of docking capabilities and support for external 4K monitors. The lack of any native HDMI or cabled Ethernet ports will force owners into purchasing adapters. To Dell's credit, however, more Ultrabooks are also dropping these ports in favor of Thunderbolt or USB Type-C including the Spectre 13 and the upcoming Zenbook 3.


SD Card Reader
The SD card reader is capable of read rates of over 248 MB/s on our Toshiba Exceria Pro UHS-II test card to be faster than most SD readers on mainstream and budget notebooks. Real-world transfer rates of multiple files are slower as it takes about 8 seconds to transfer 1 GB worth of photos from the card reader to desktop.
| SD Card Reader | |
| average JPG Copy Test (av. of 3 runs) | |
| MSI GT73VR 6RF | |
| Dell XPS 13 9360 QHD+ i7 | |
| Asus Zenbook UX360UA-C4159T | |
| maximum AS SSD Seq Read Test (1GB) | |
| Dell XPS 13 9360 QHD+ i7 | |
| MSI GT73VR 6RF | |
| Asus Zenbook UX360UA-C4159T | |
Communication
WLAN has been upgraded to the dual-band Killer 1535 for all SKUs of the XPS 13 9360. This is rather unexpected as the Killer module targets gamers and is typically a high-end option for flagship gaming notebooks. Nonetheless, XPS 13 users can now take advantage of new features including the Killer Network Manager software, DoubleShot Pro, and MU-MIMO for routers that support it.
A quick iPerf test reveals a real-world transfer rate of about 660 Mbps against a theoretical maximum of 768 Mbps when connected 1 meter away from our Linksys EA8500 router. See our dedicated performance review on the Killer 1535 for more information on the WLAN module.
| Networking | |
| Wi-Fi Client 1m 512KB | |
| Wi-Fi Server 1m 512KB |
Accessories
There are no included extras outside of a Quick Start guide and a warranty card. THis is somewhat disappointing as most other high-end or flagship notebooks commonly ship with cleaning cloths, adapters, or protective sleeves.
The Thunderbolt 3 port allows for a wide range of accessories including the useful Dell DA200 all-in-one adapter for RJ-45, HDMI, and VGA.
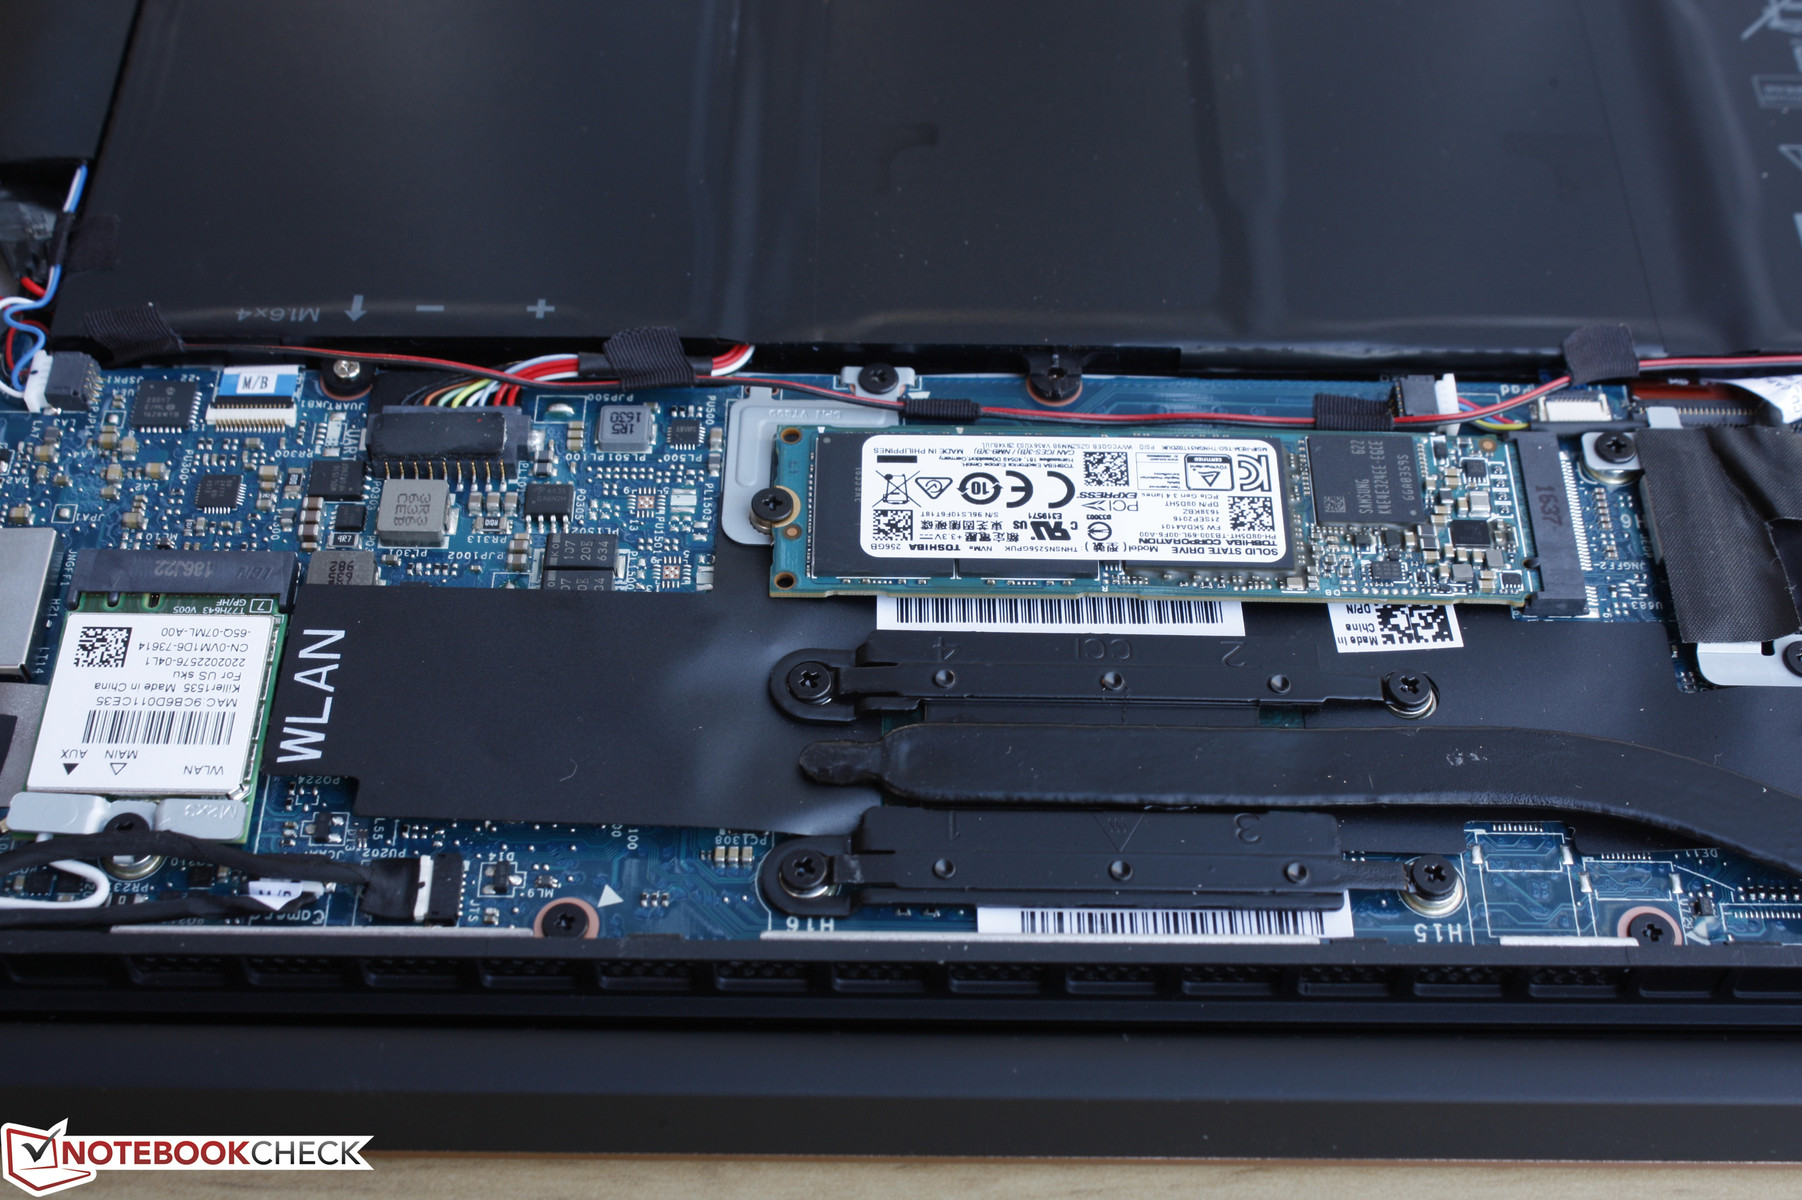
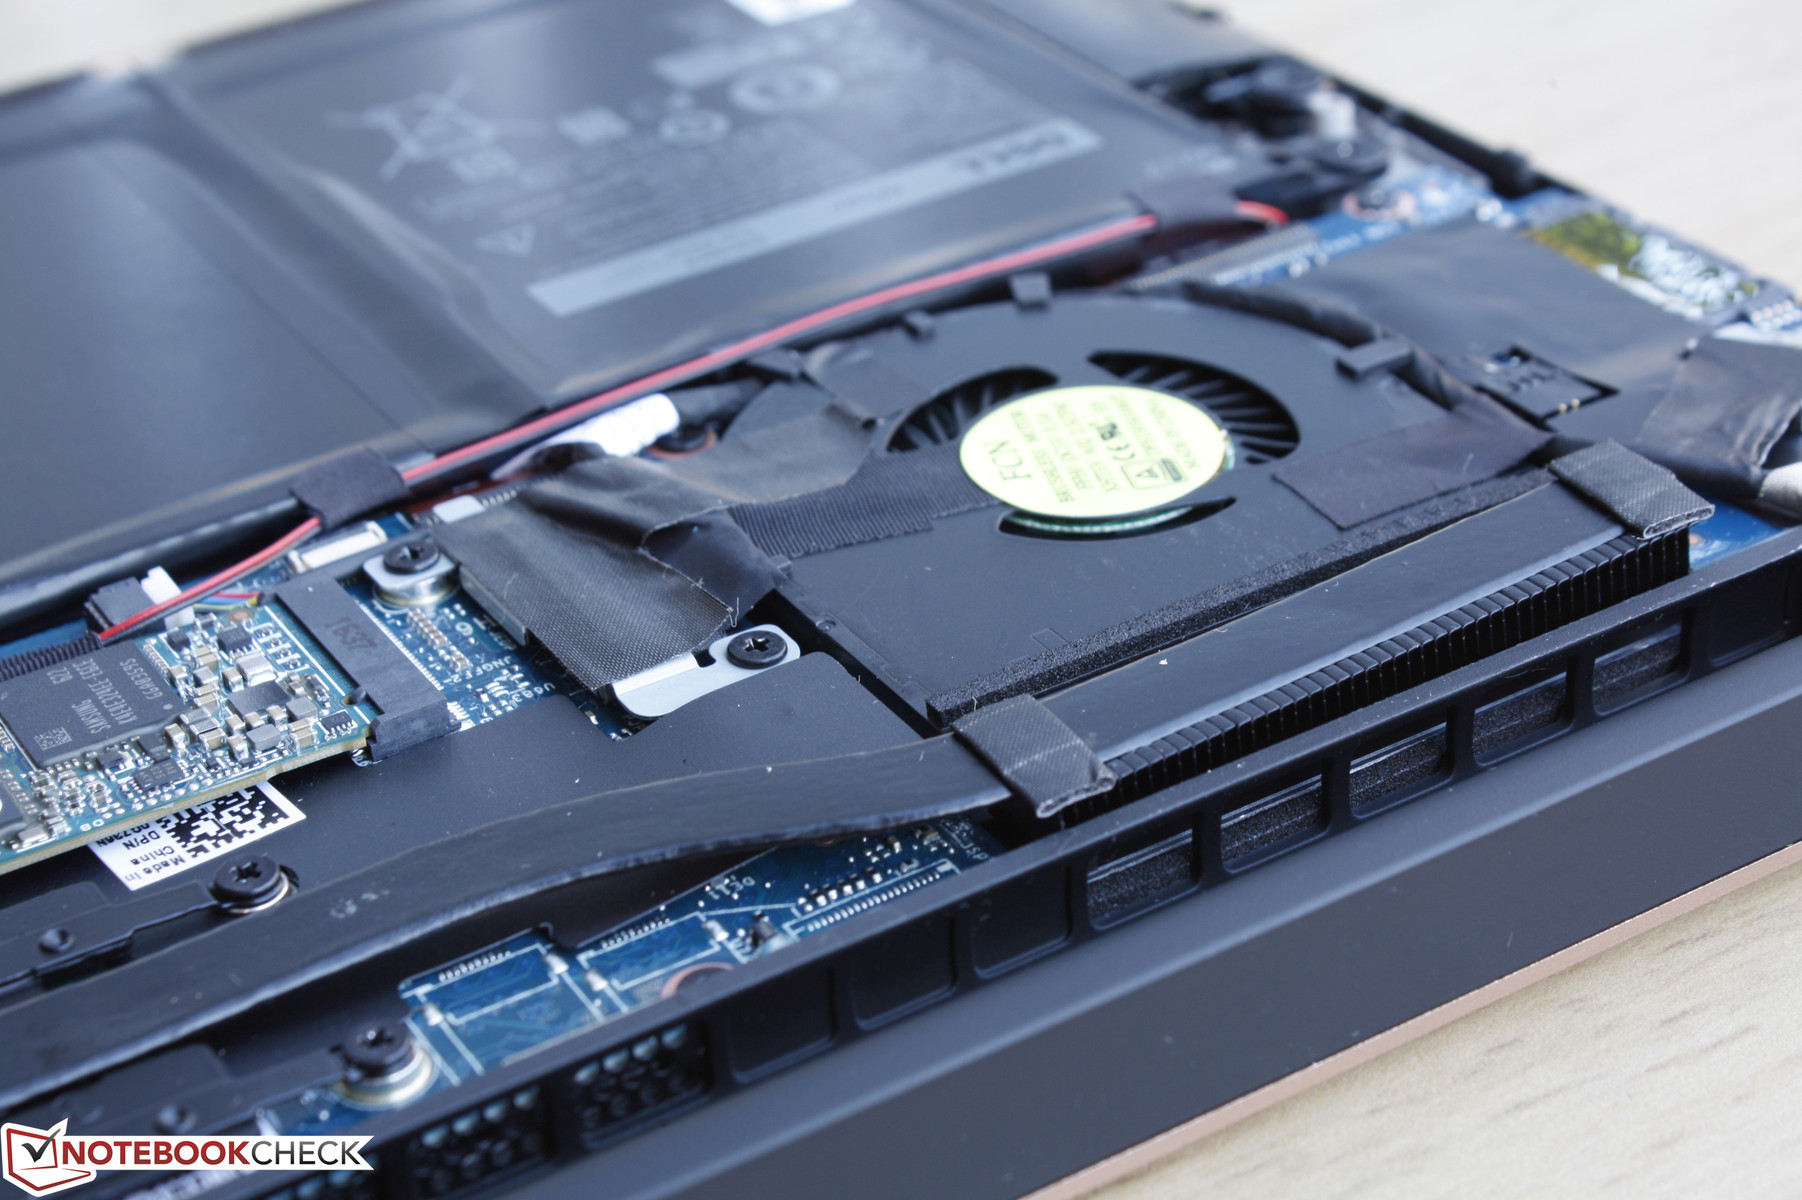
Maintenance
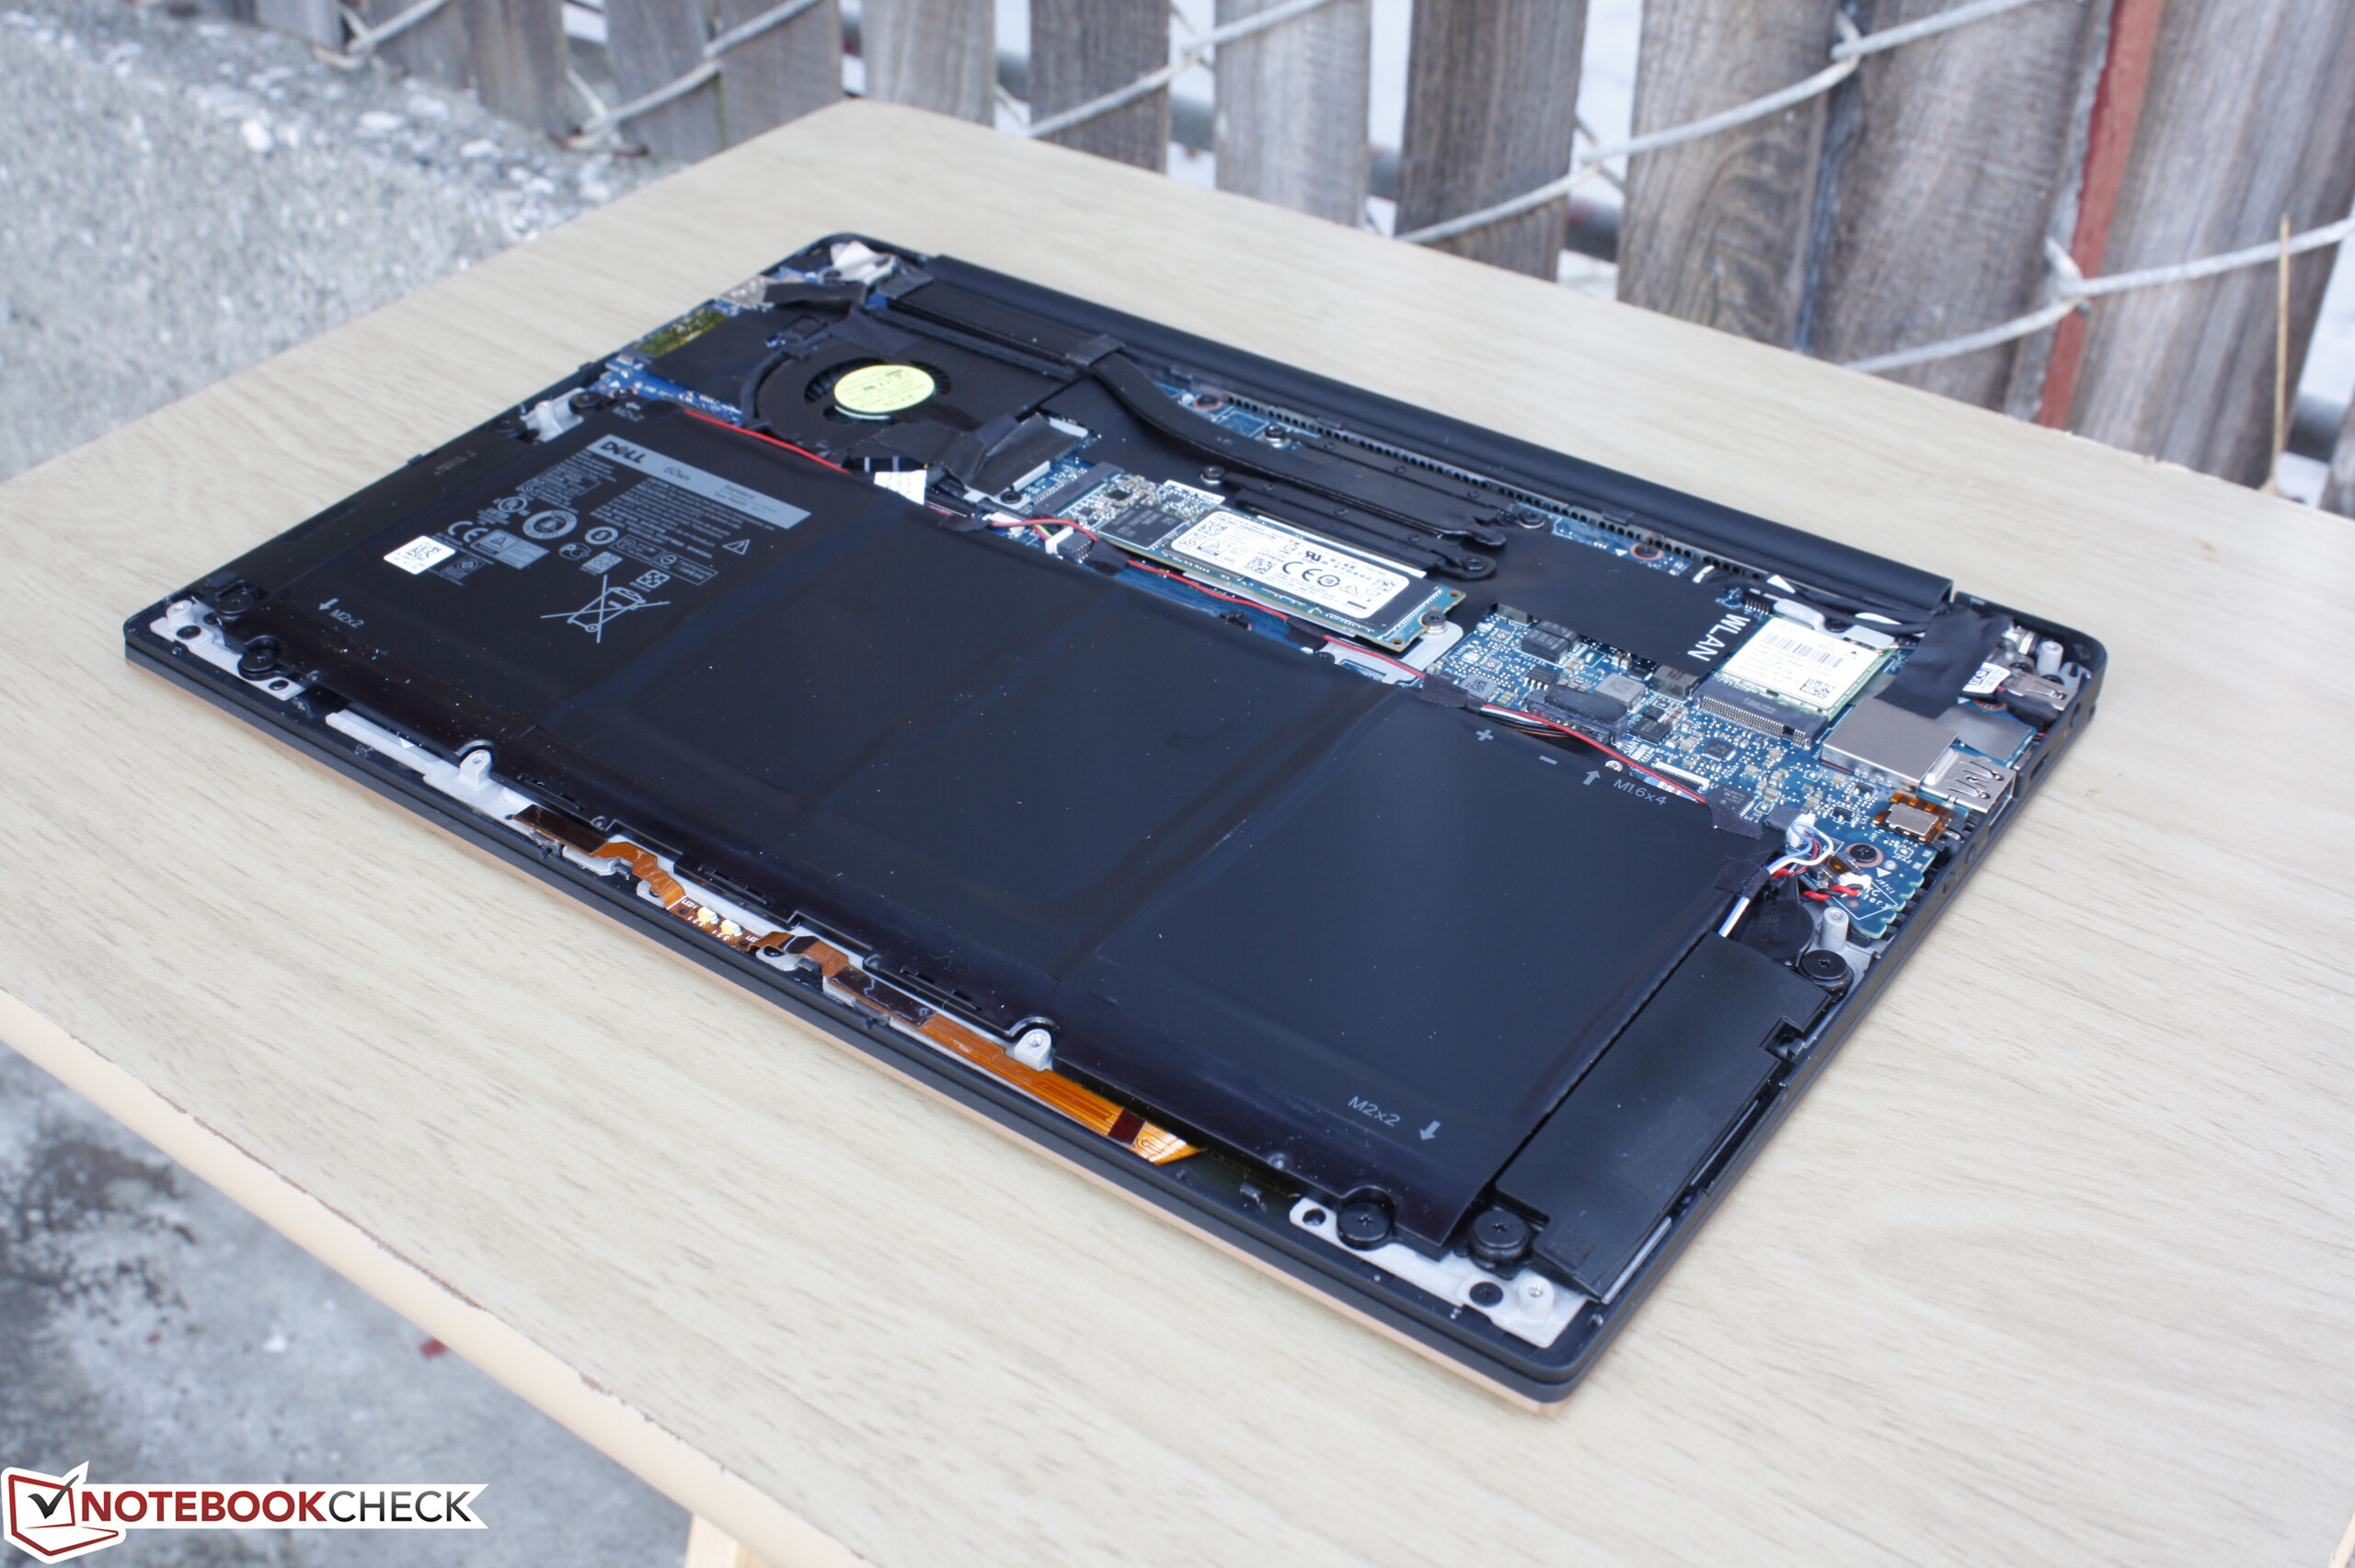
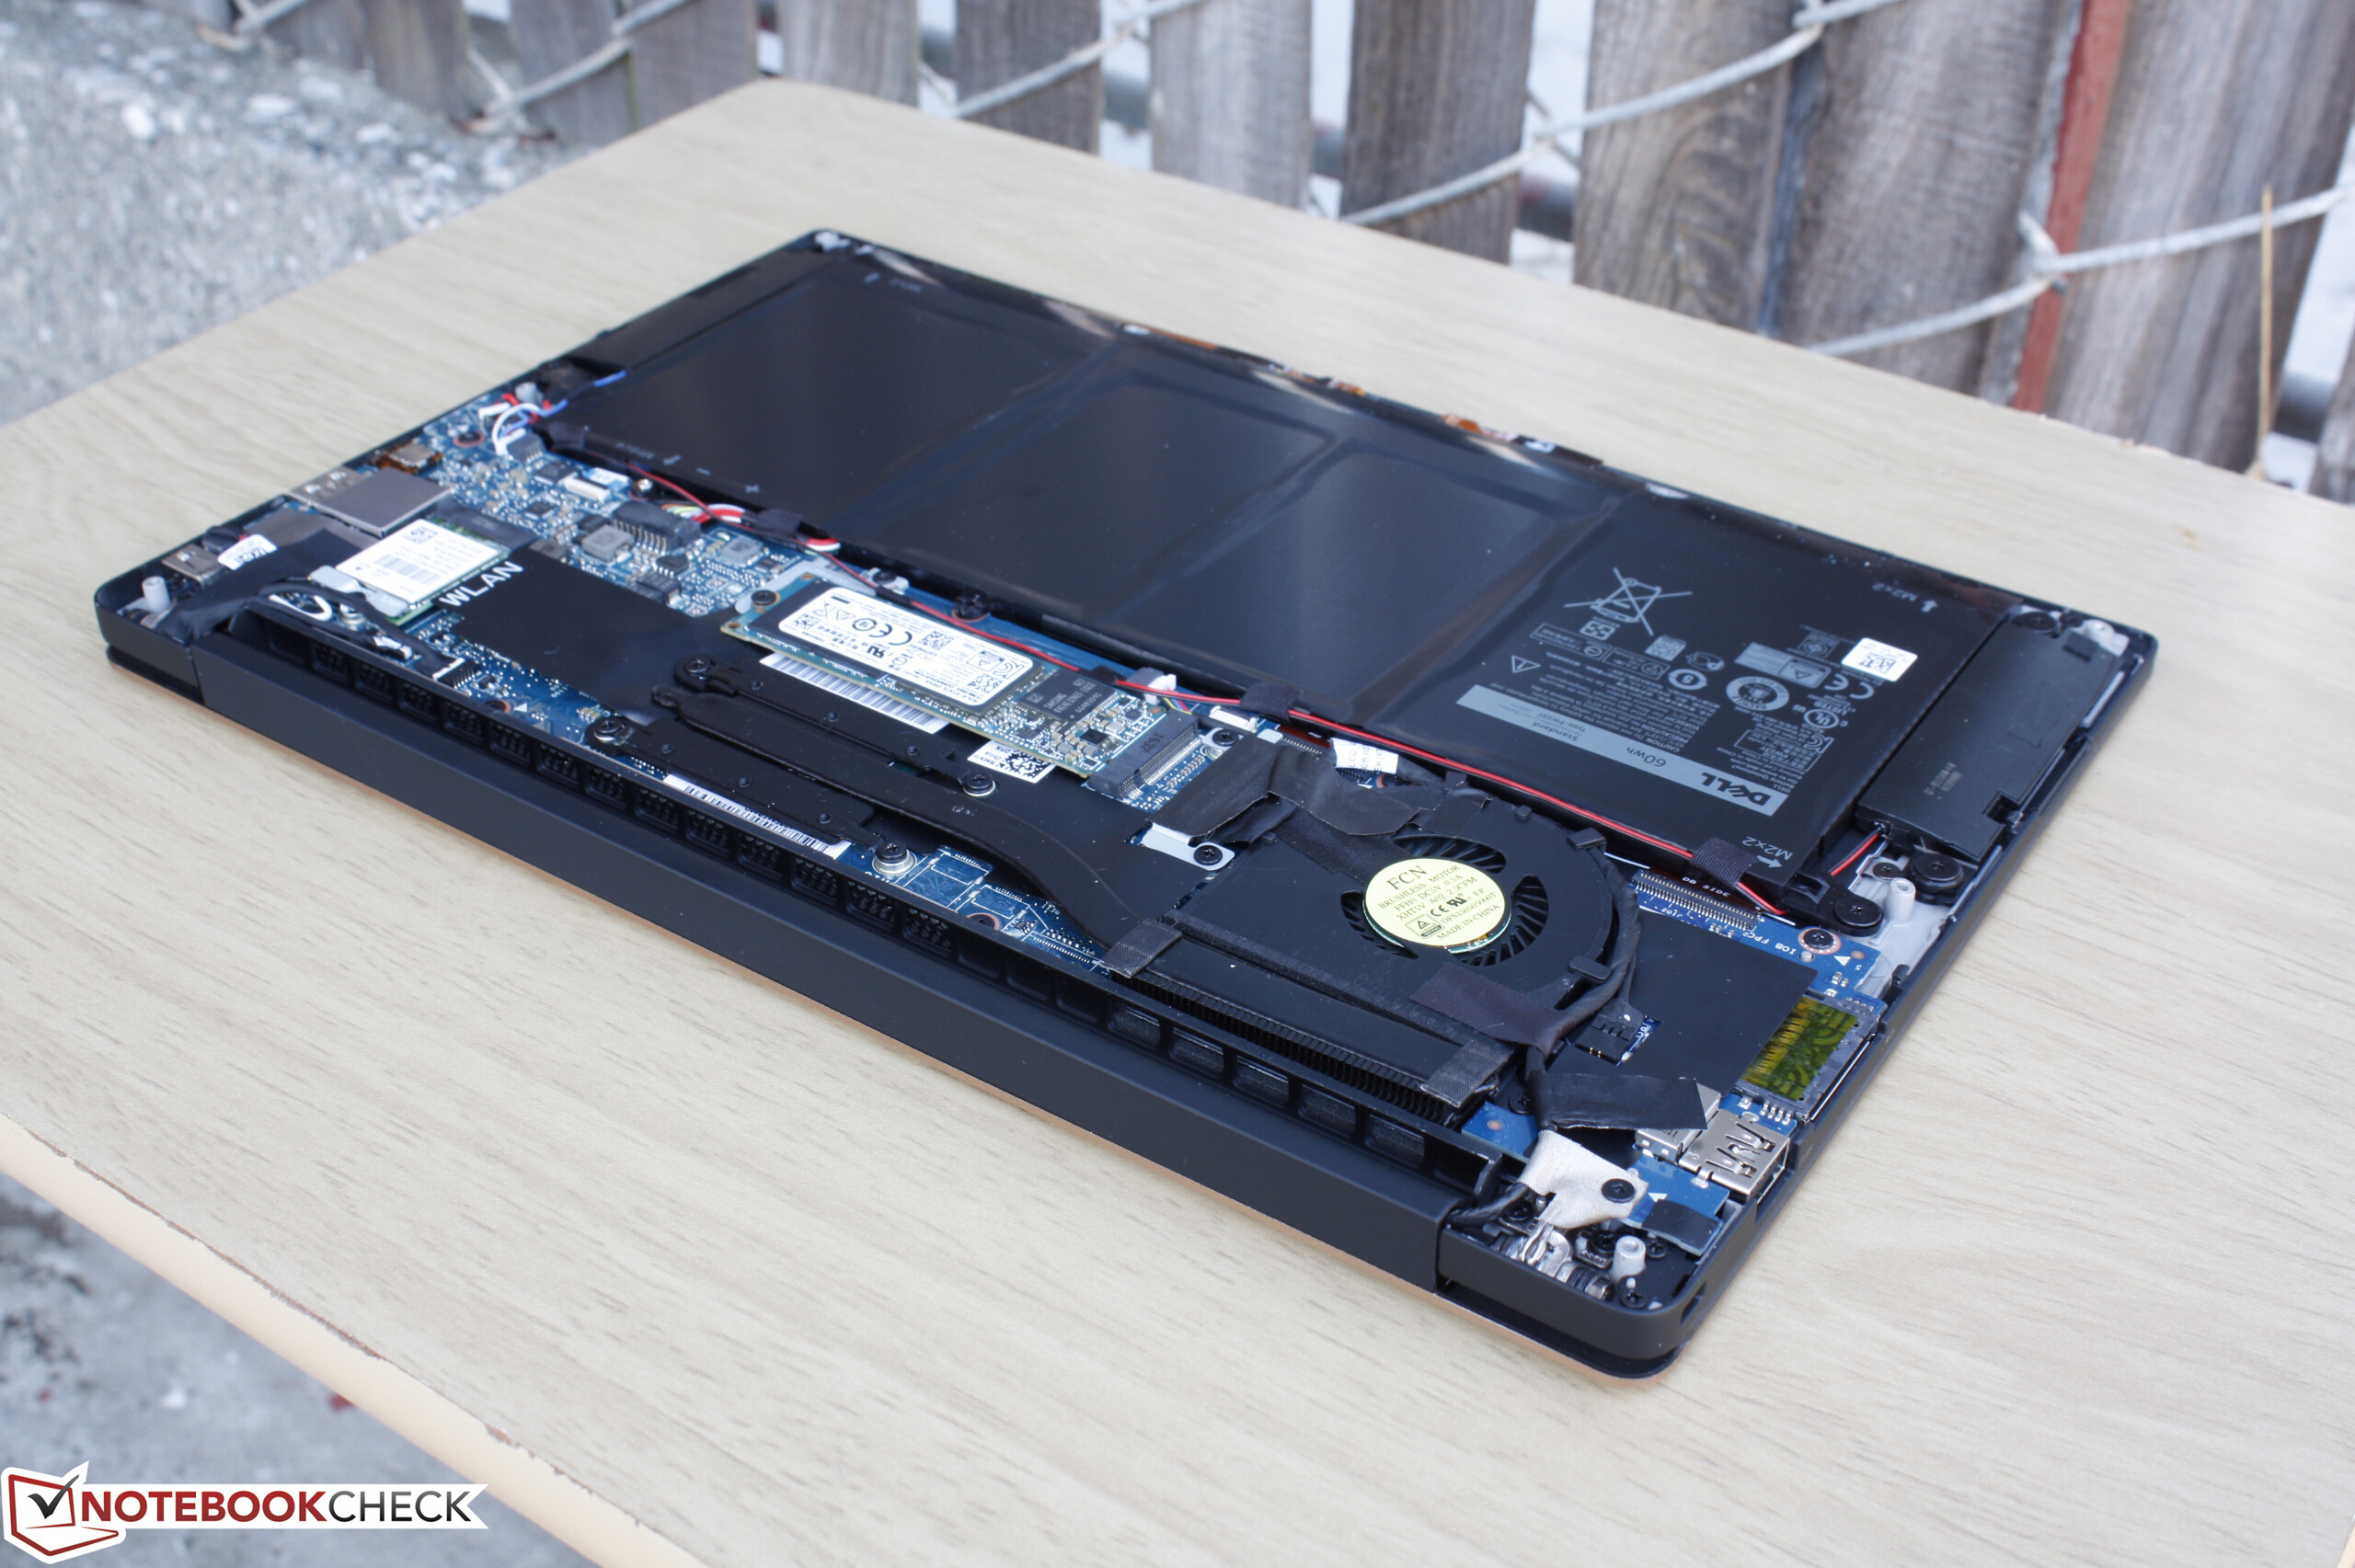
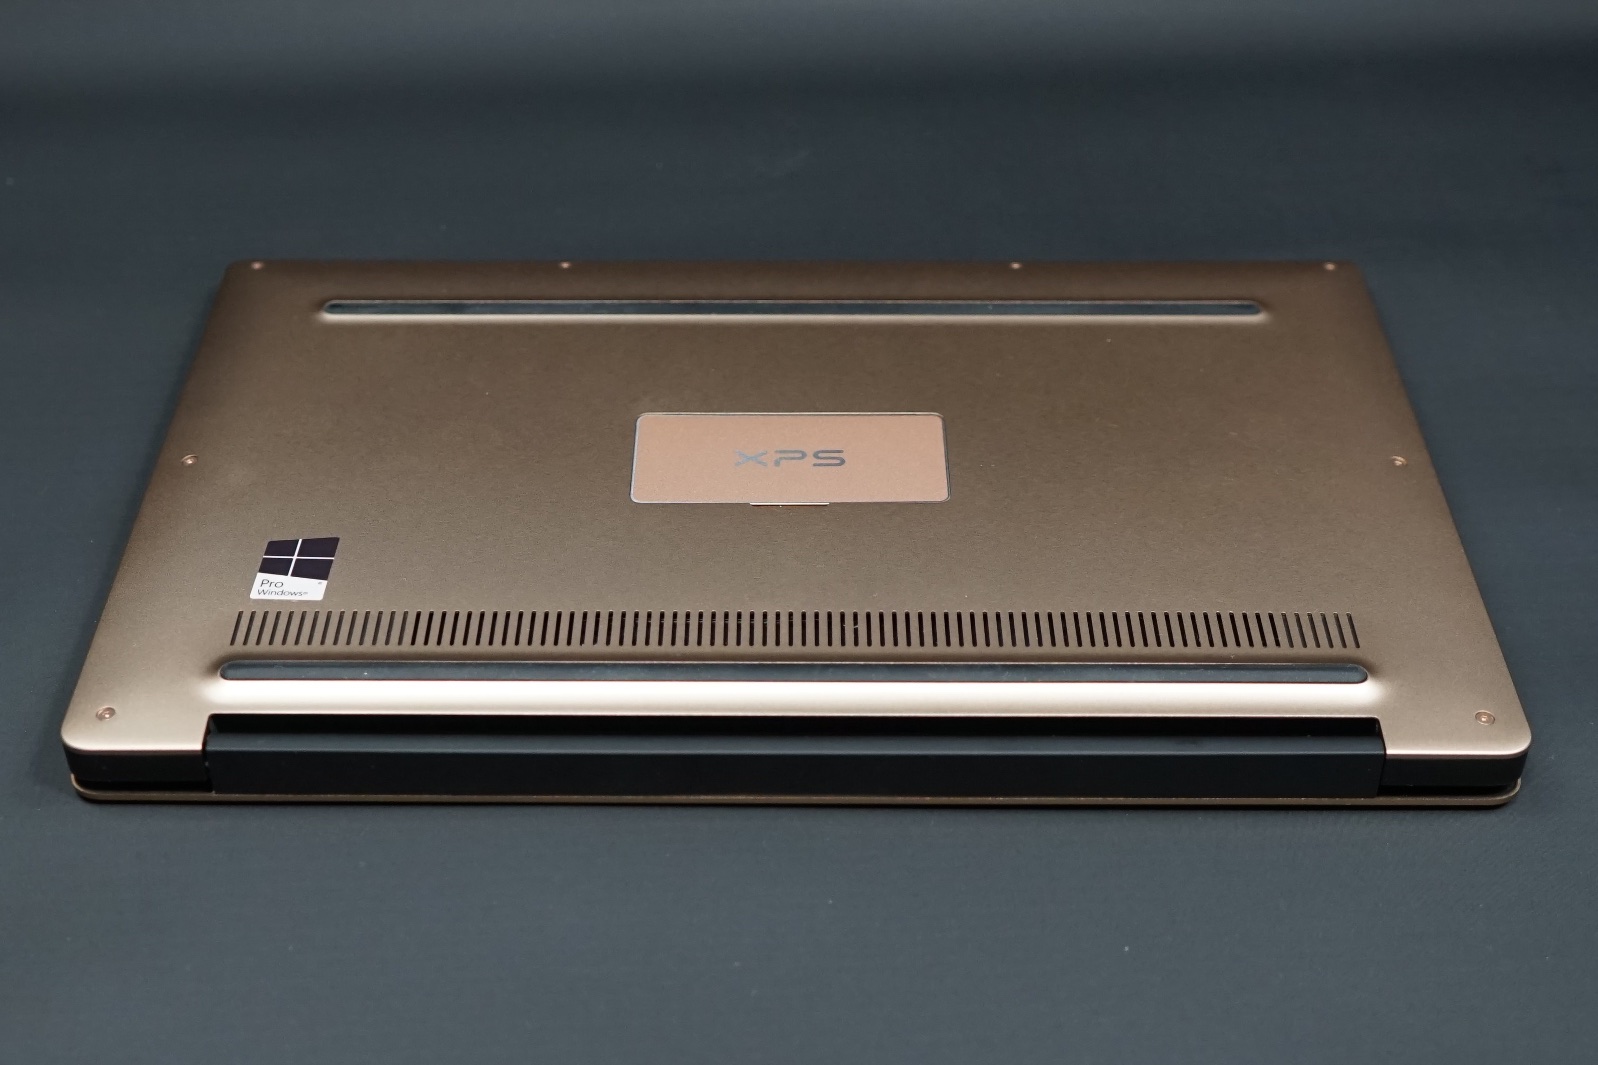
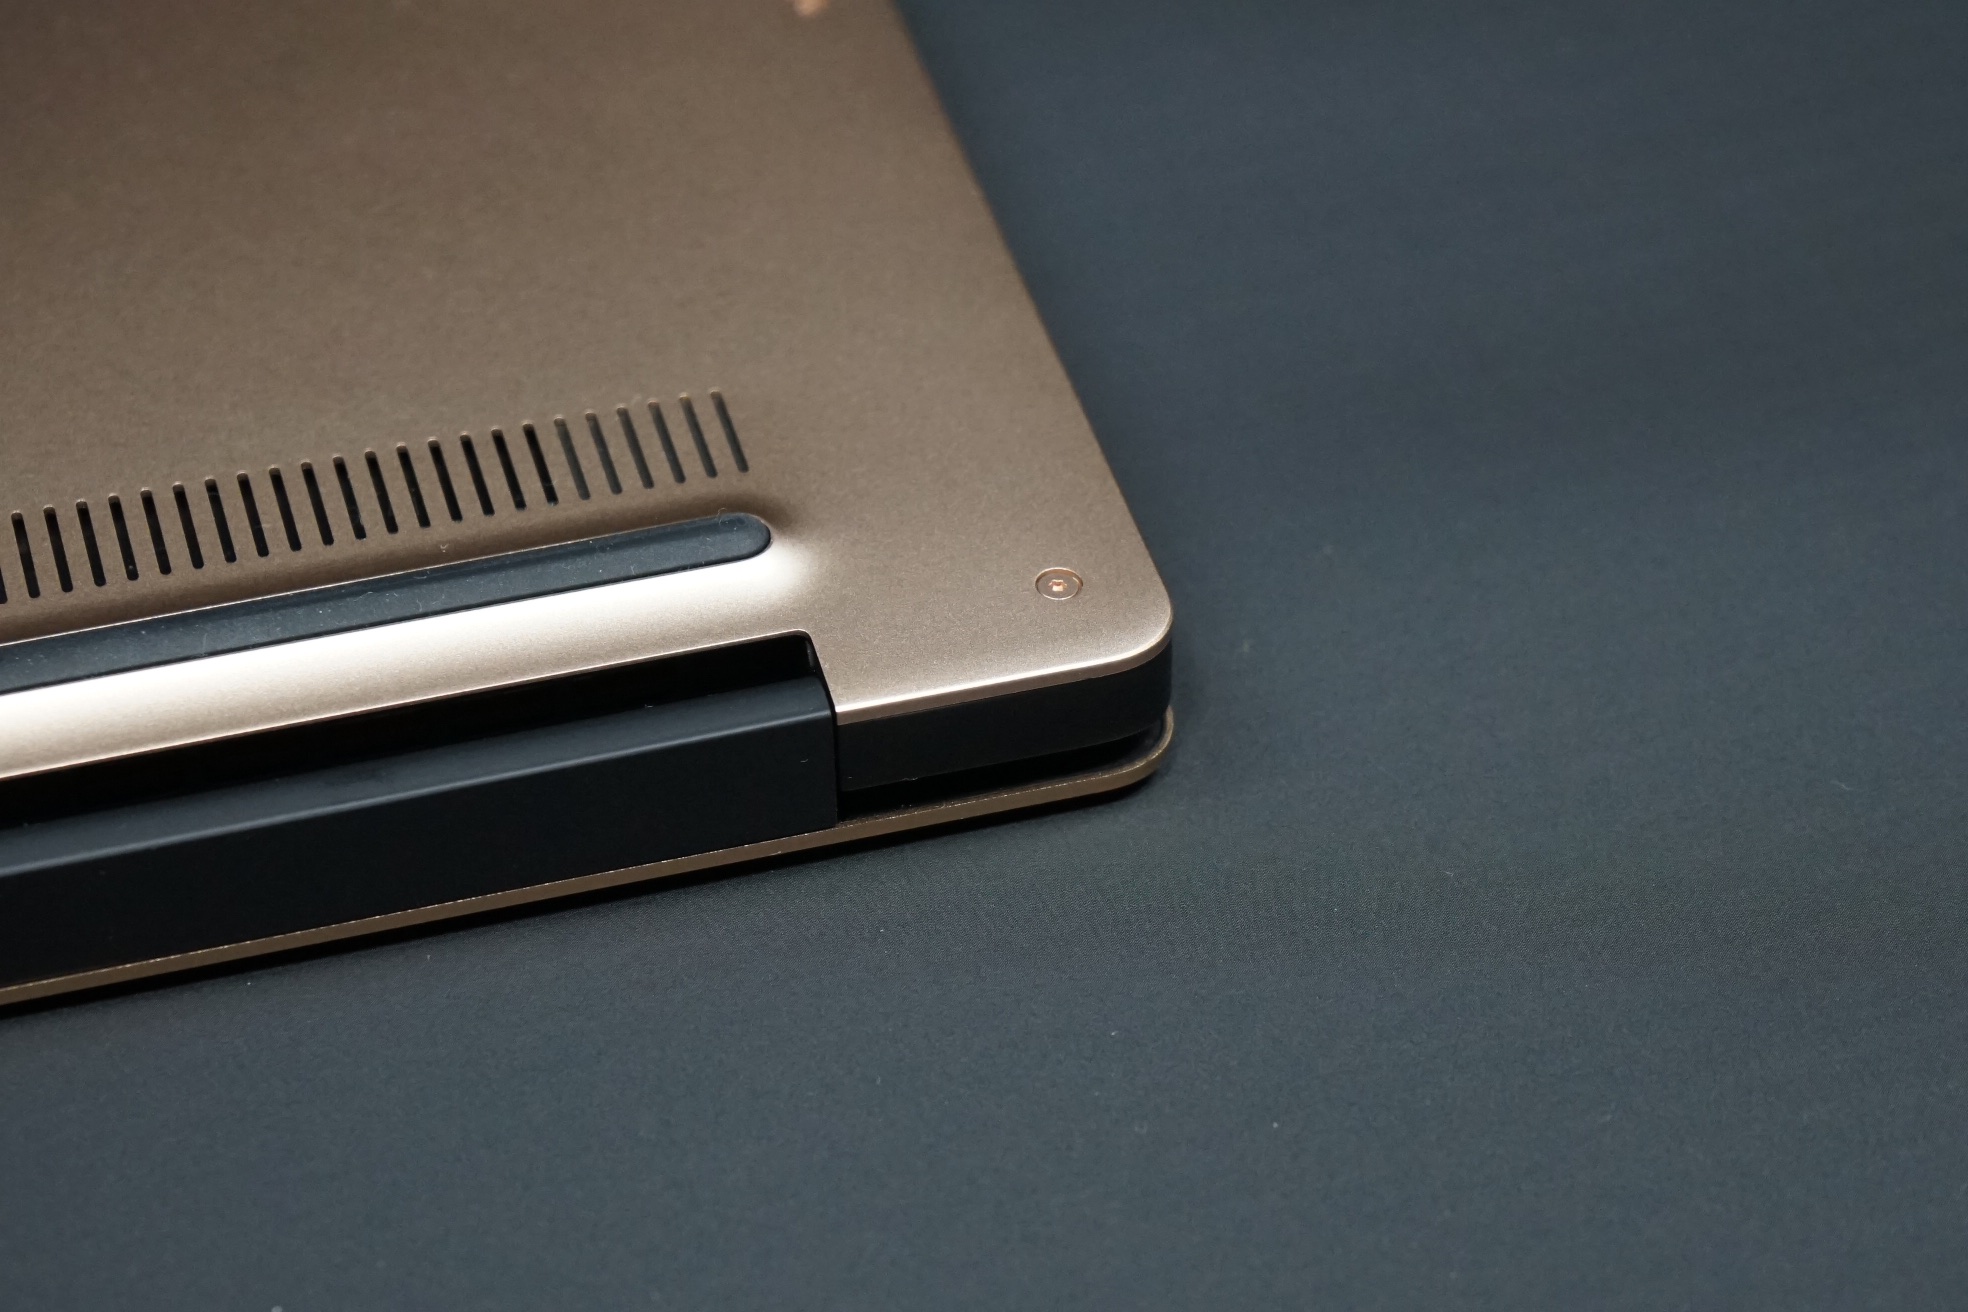
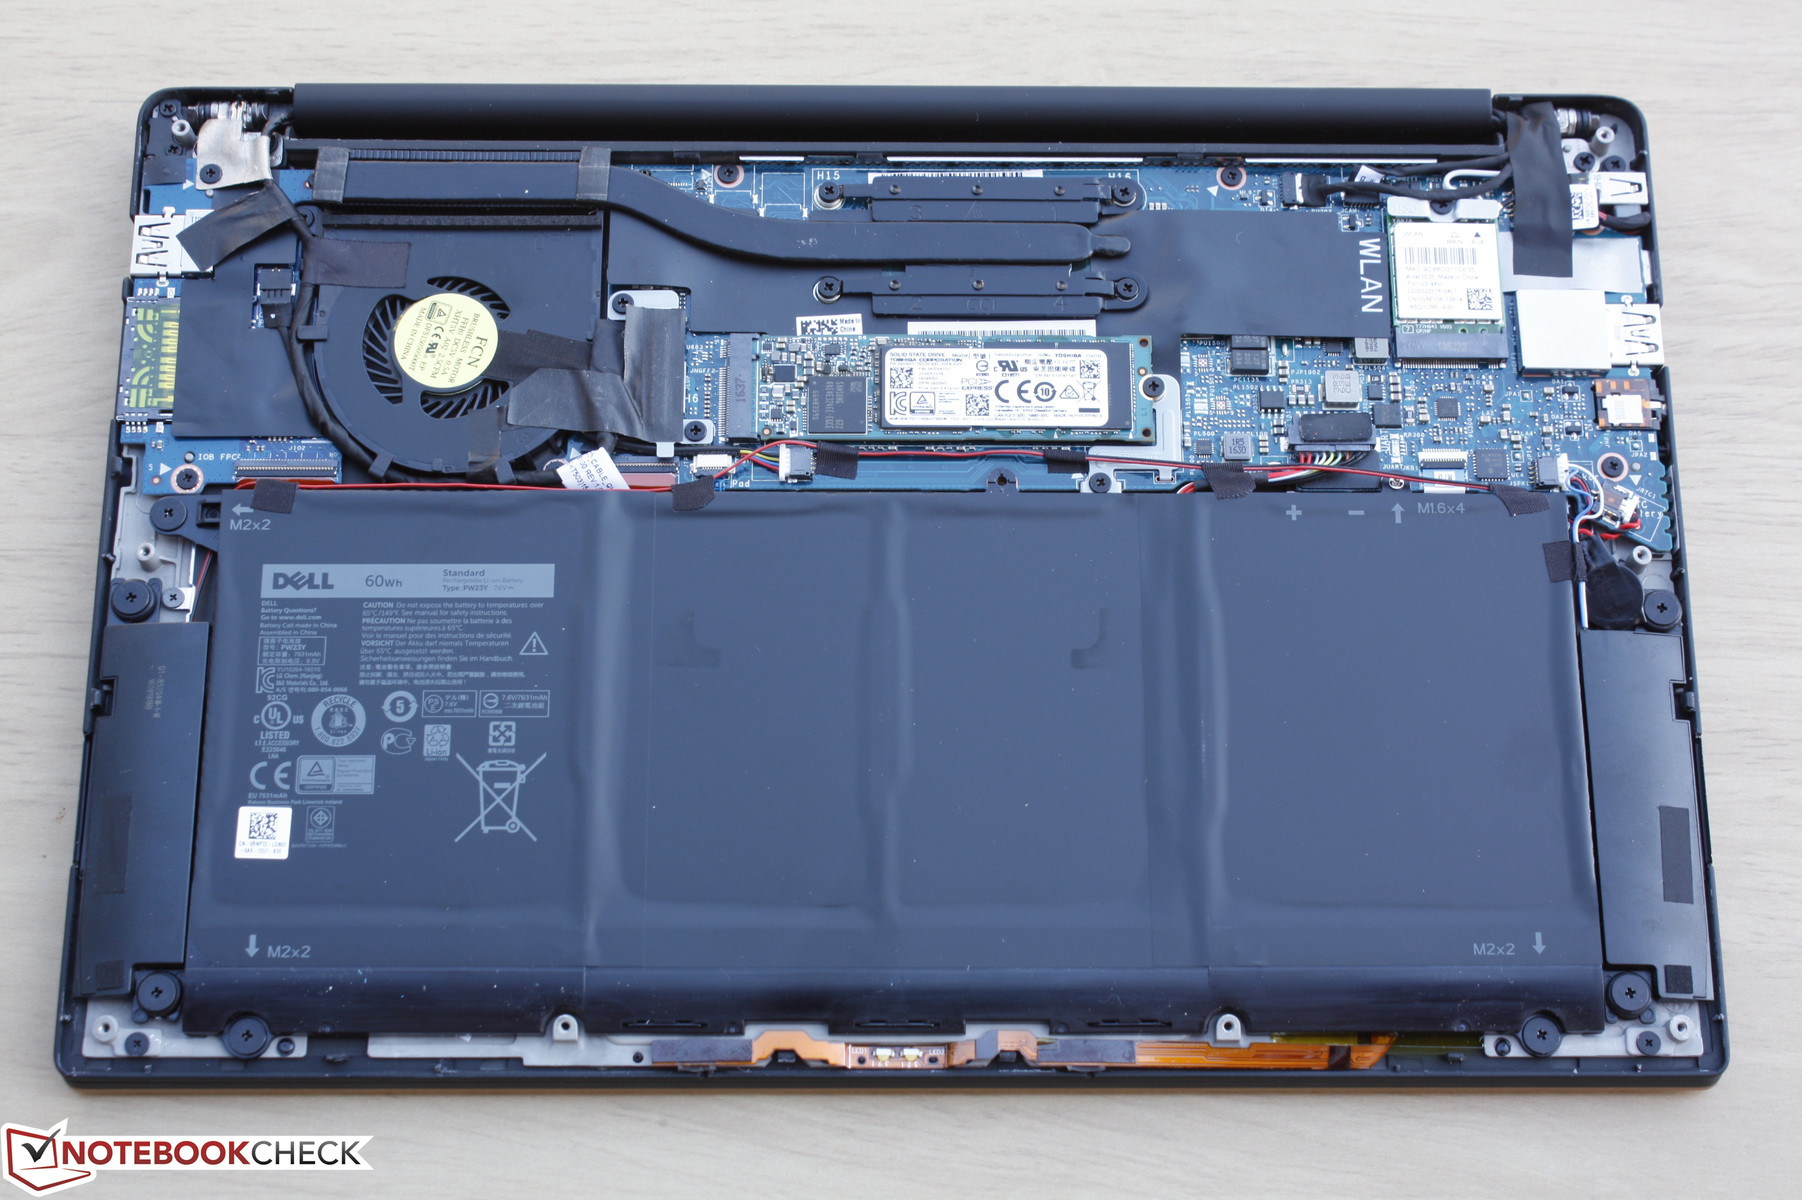
Both a T5 Hex wrench and a standard Philips screwdriver are required to pop out the bottom panel. There are no hidden screws underneath the rubber footing, though the tight latches around the outer edges can be difficult to detach without a sharp edge.
Users have direct access to the system fan, M.2 SSD, battery, and WLAN module. RAM continues to be soldered and not upgradeable.
Warranty
The standard one-year limited warranty applies to users in the U.S. with included onsite service thrown in for free. Options are available to extend warranty for up to four years.
Please see our Guarantees, Return Policies & Warranties FAQ for country-specific information.
Input Devices
Keyboard and Touchpad
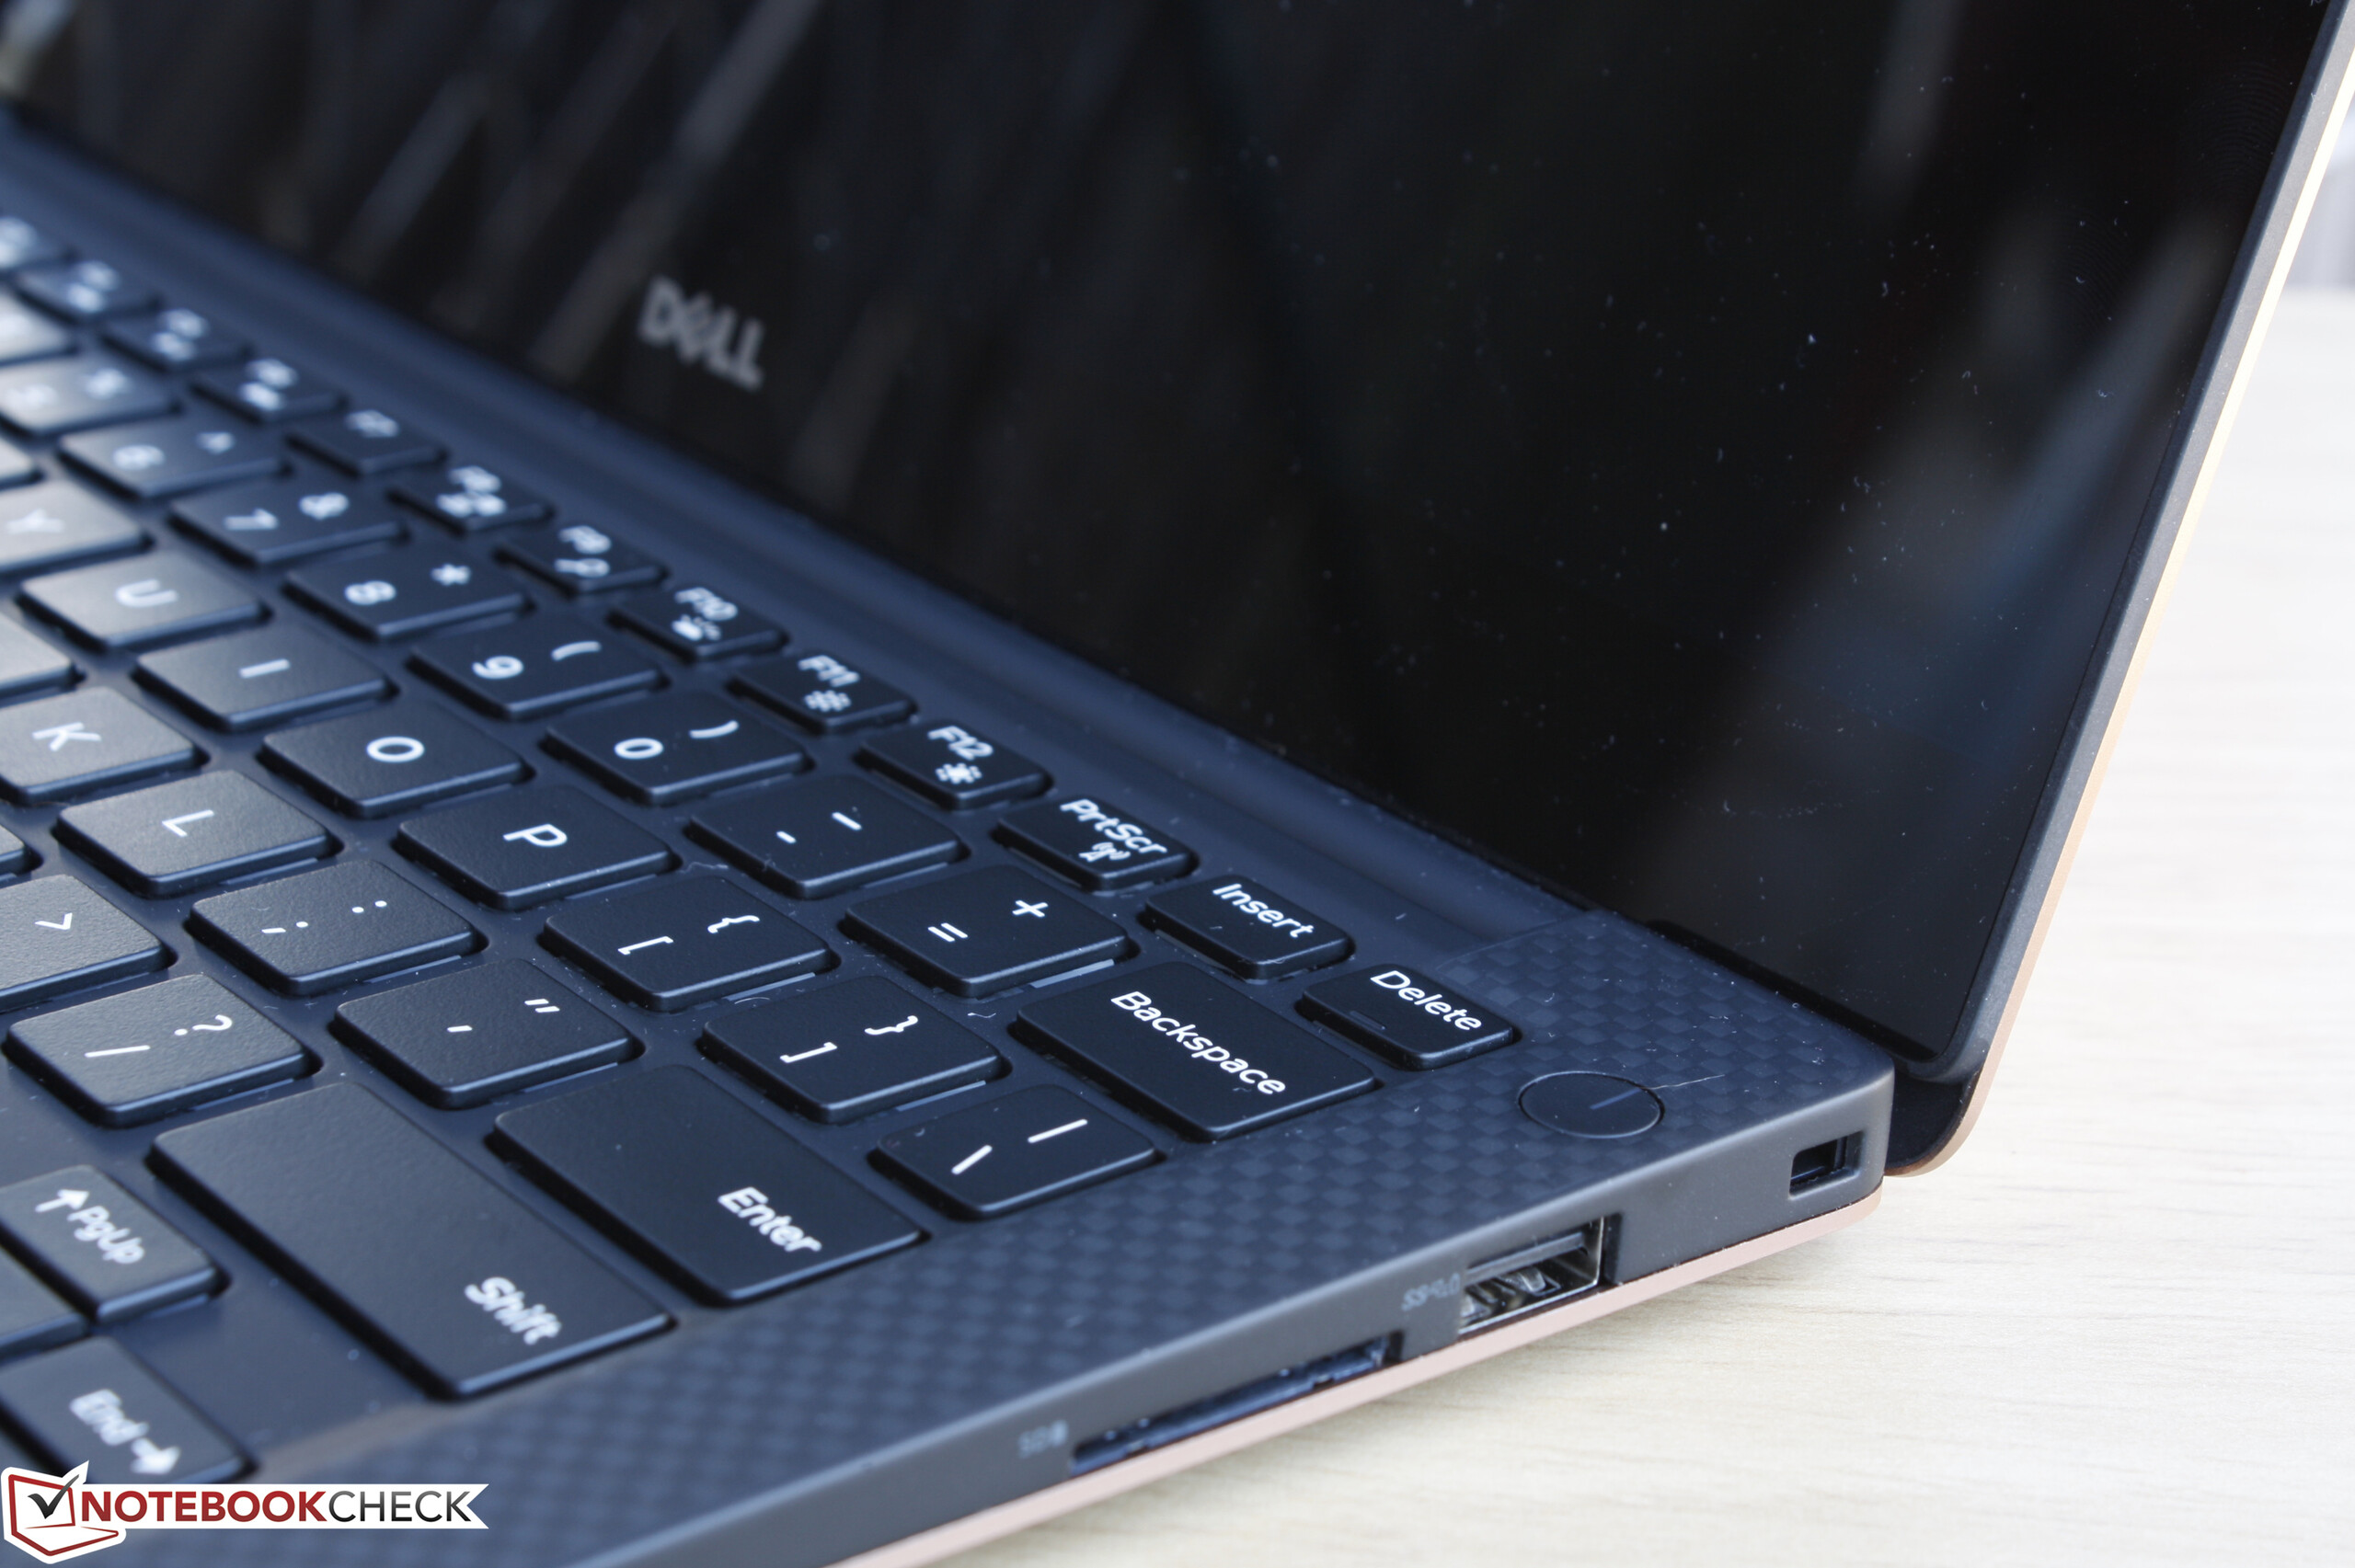
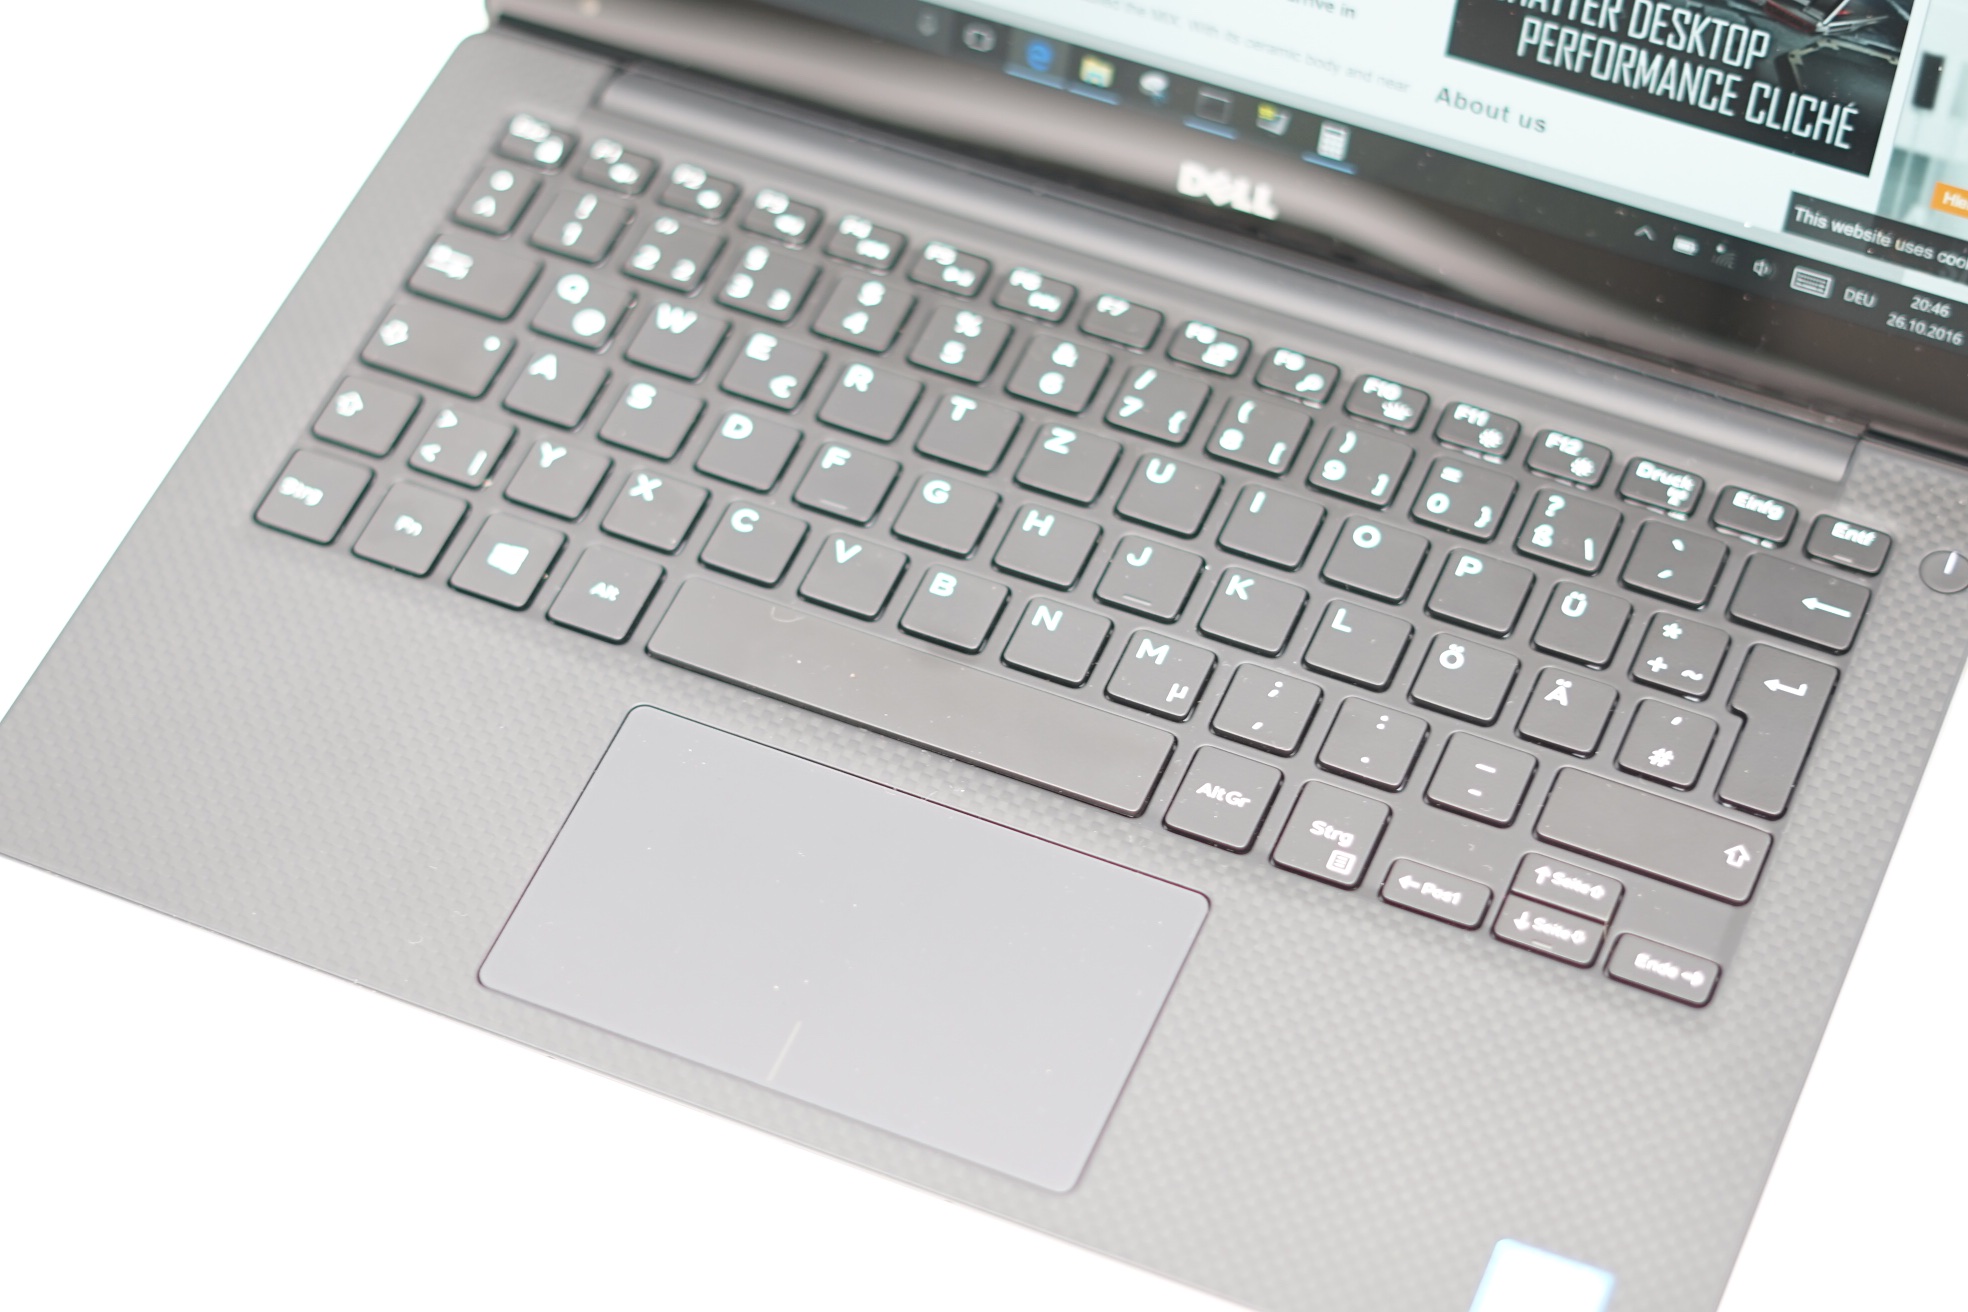
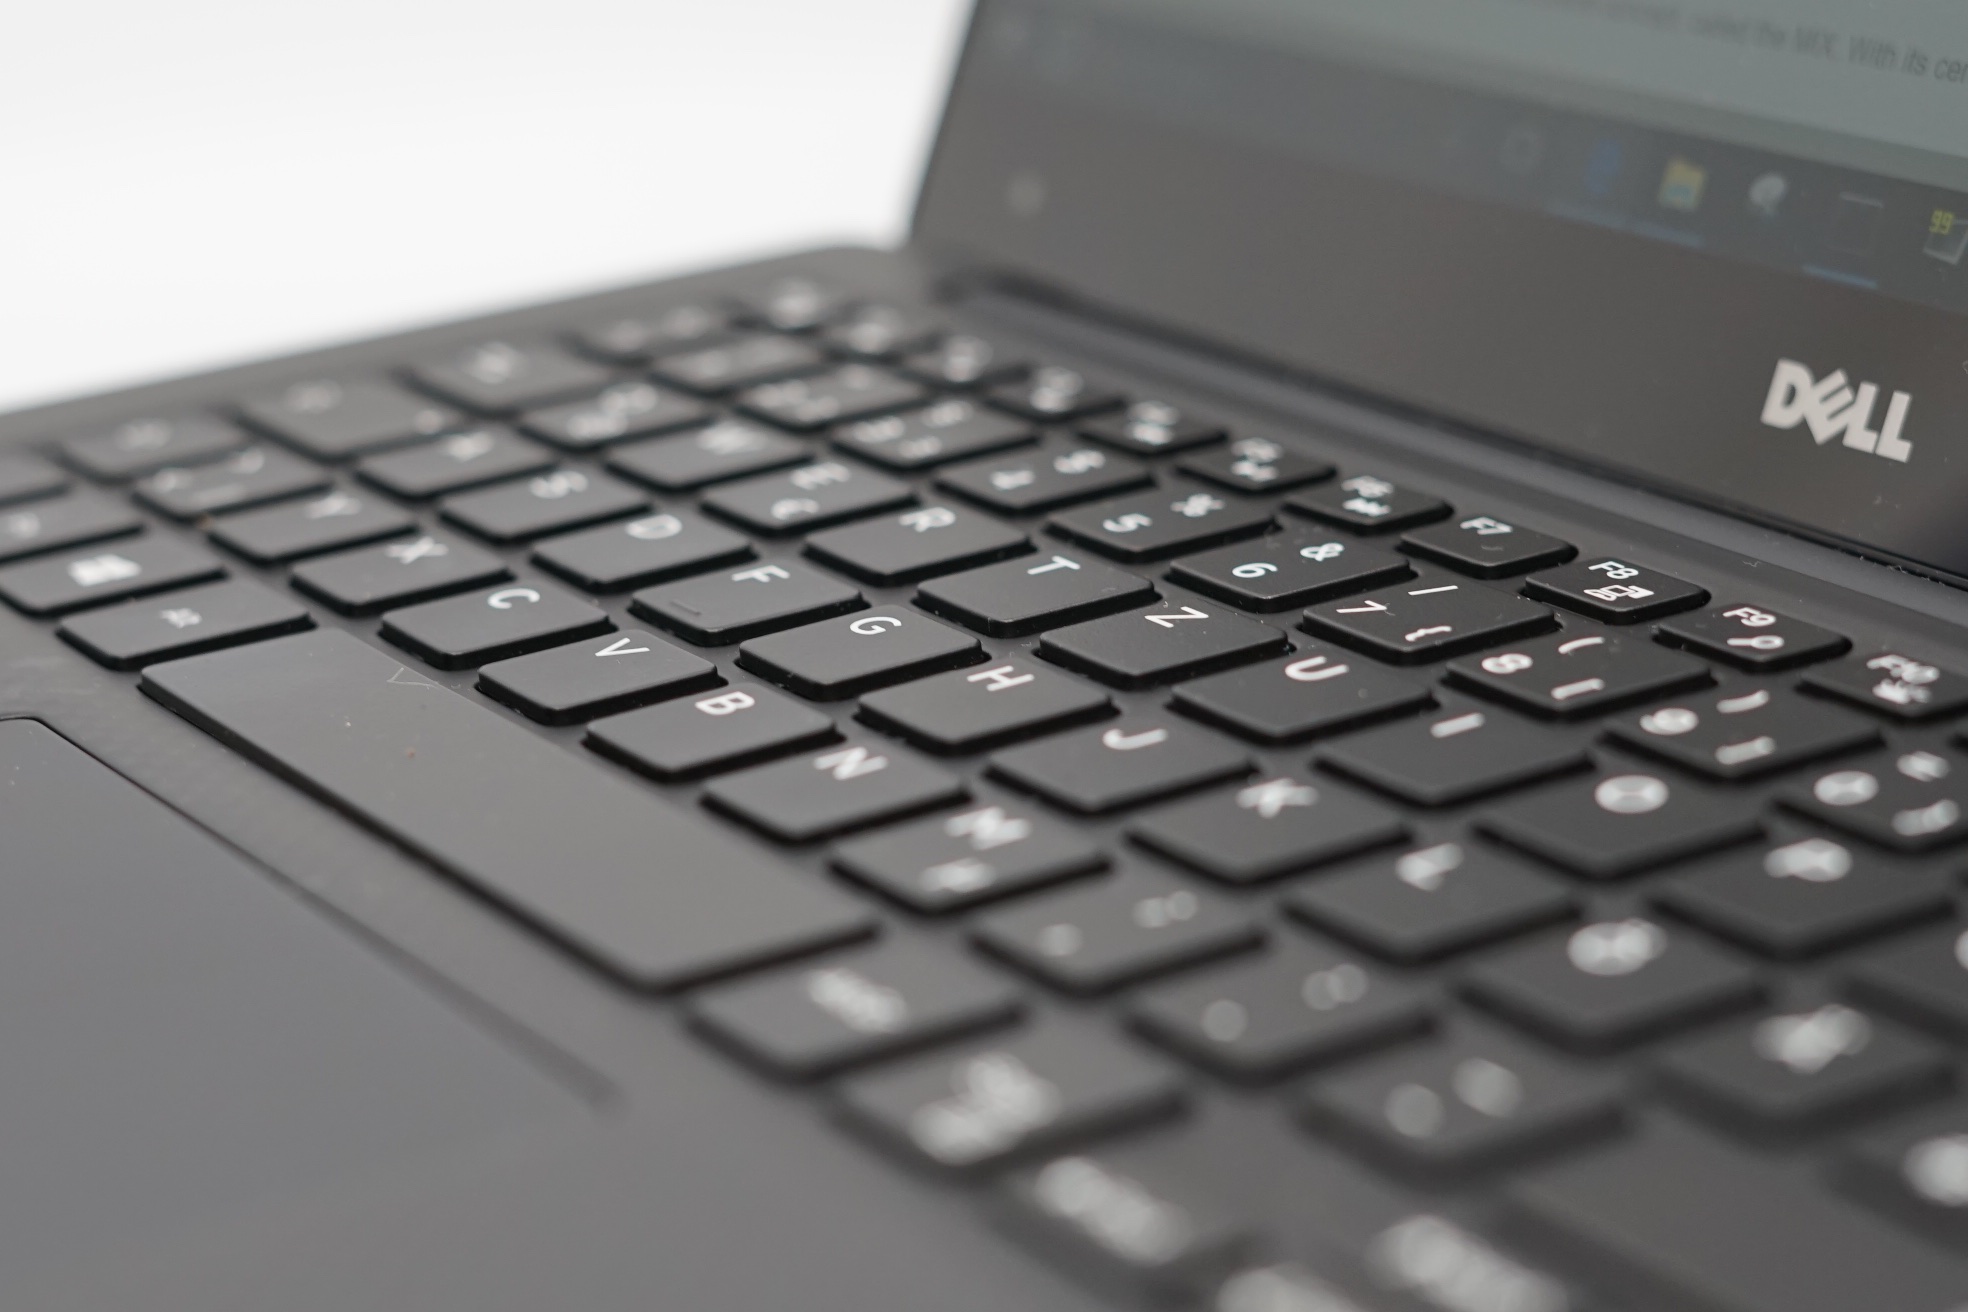
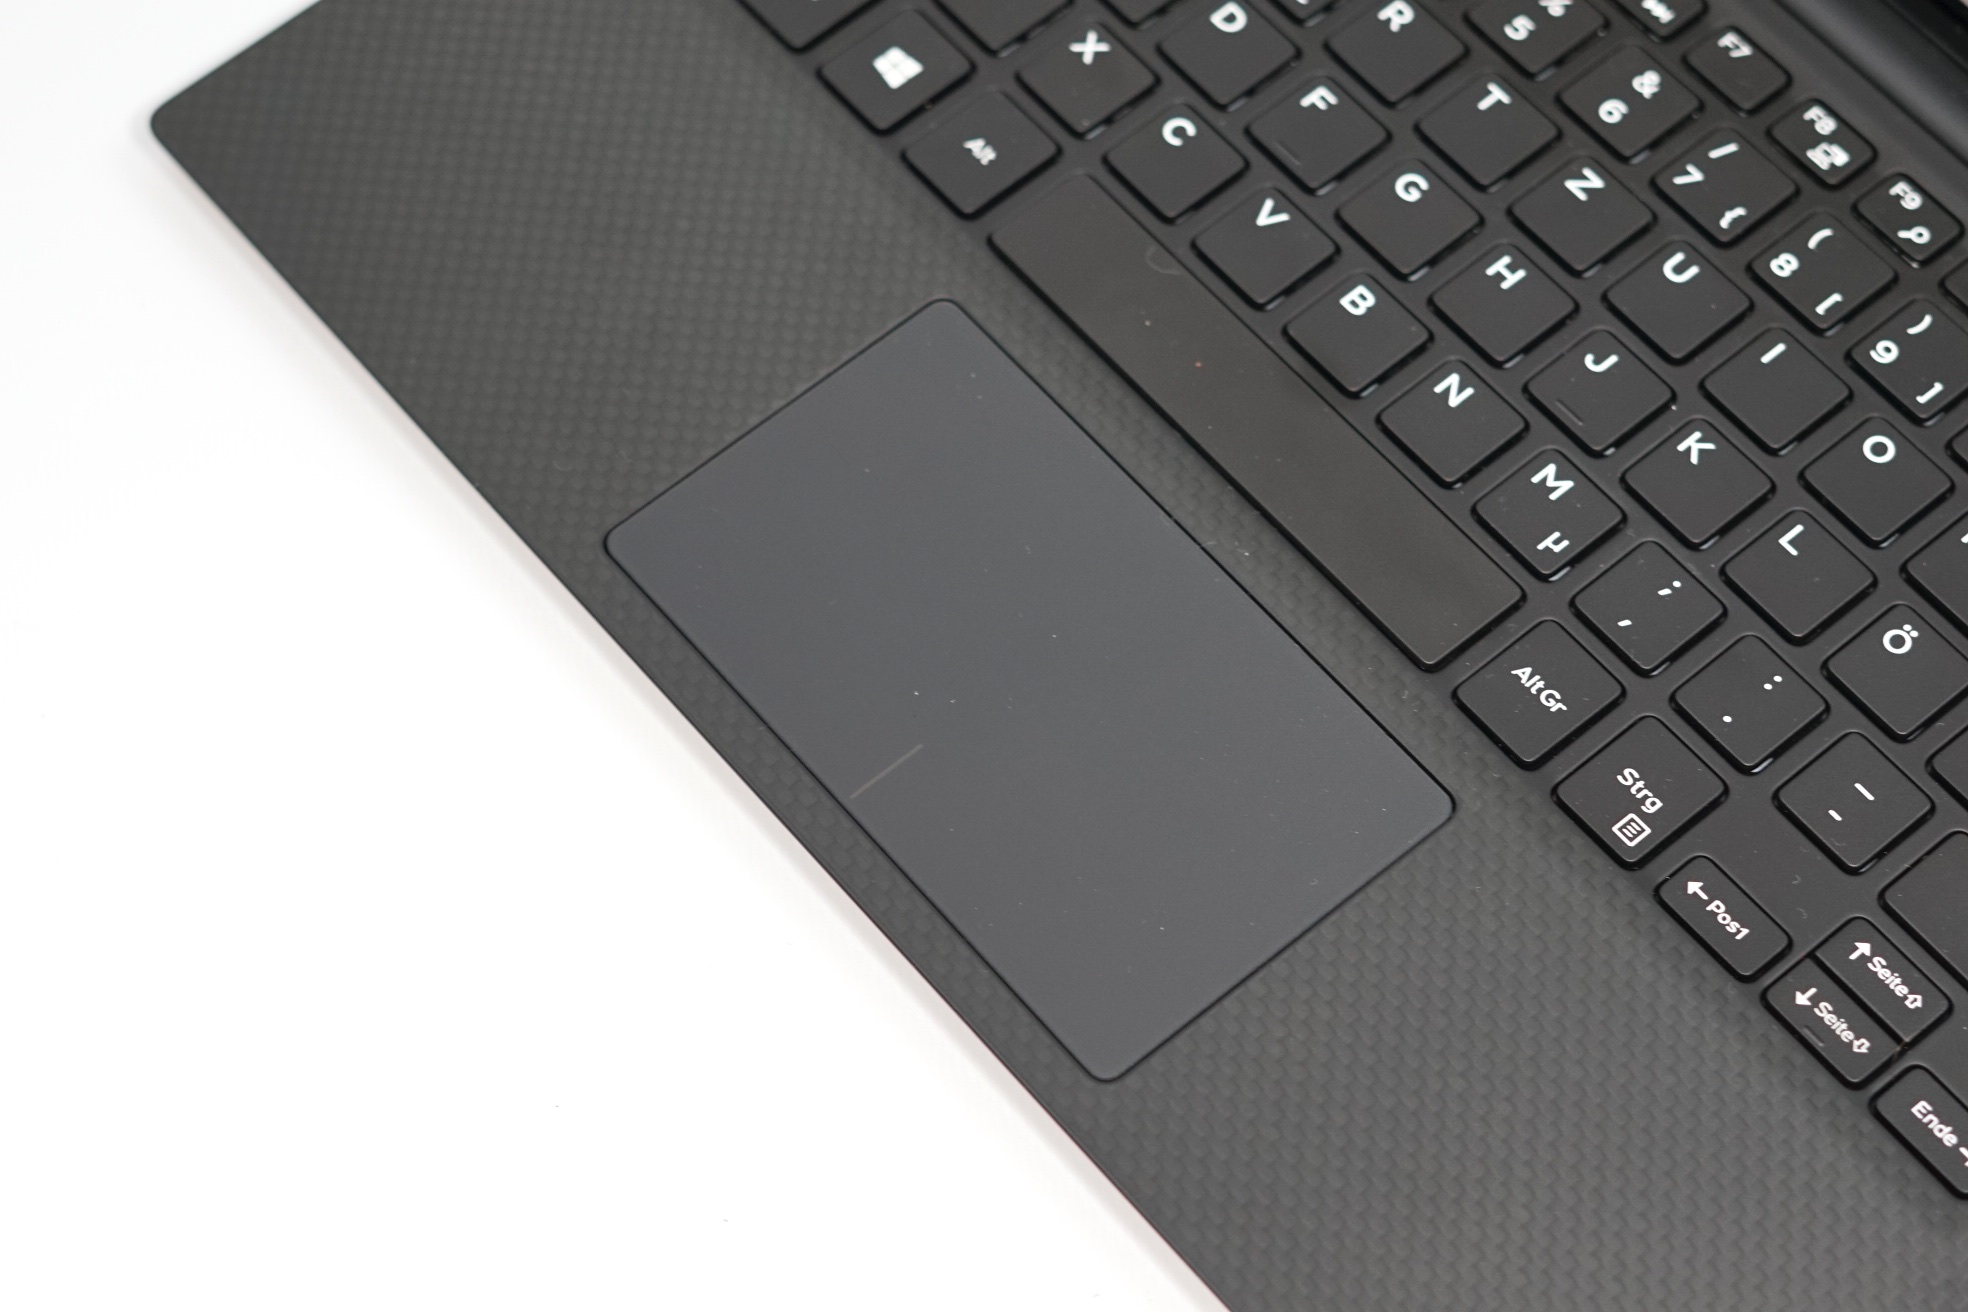
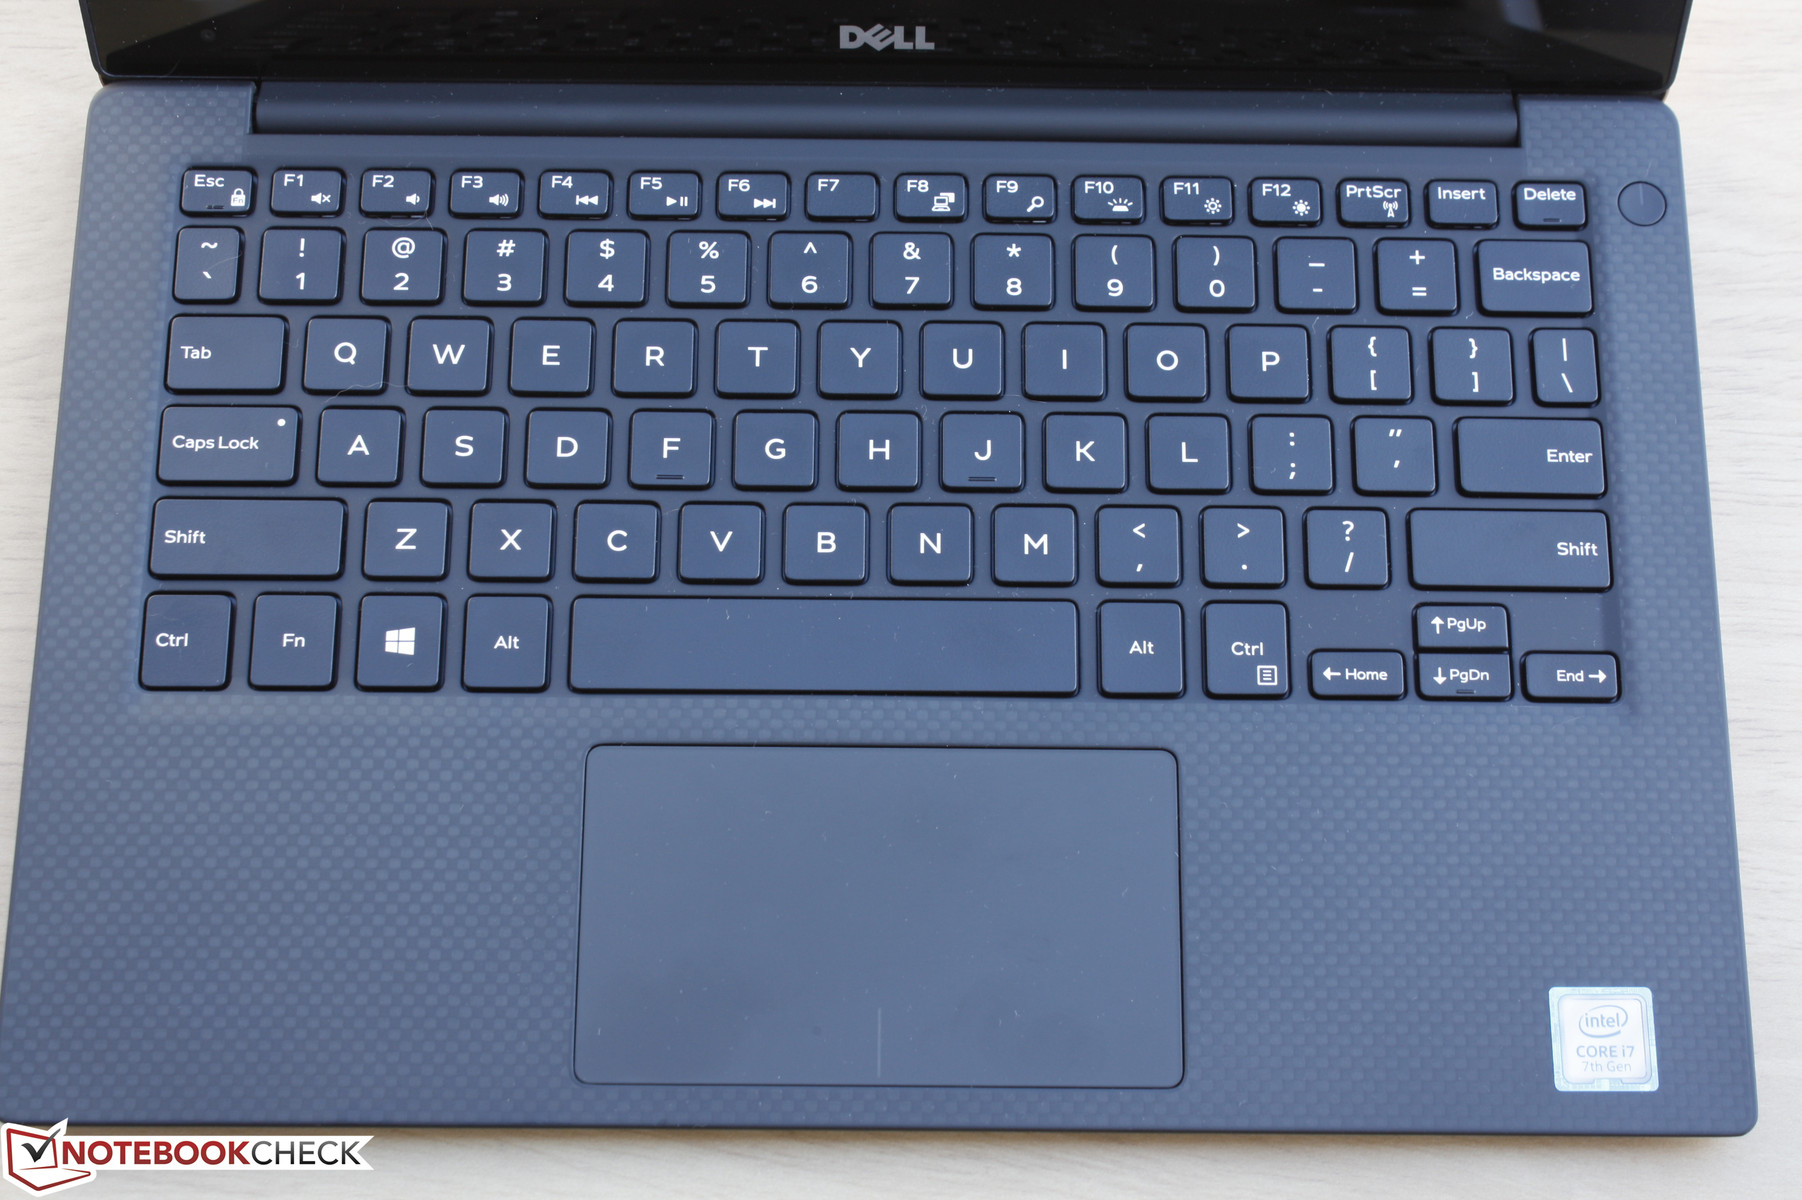
Our previous comments on the keyboard (26.5 x 10.2 cm) and touchpad (10.5 x 6 cm) of the XPS 13 9350 still apply here. The backlit keys have 1.3 mm of travel similar to the Spectre x360 13 with satisfactory feedback and soft clatter. The smaller keys tend to have comparatively weaker feedback including the Arrow and Function keys. There are no dedicated auxiliary keys and the keyboard size is actually smaller than on the Spectre x360 13 for a more cramped experience.
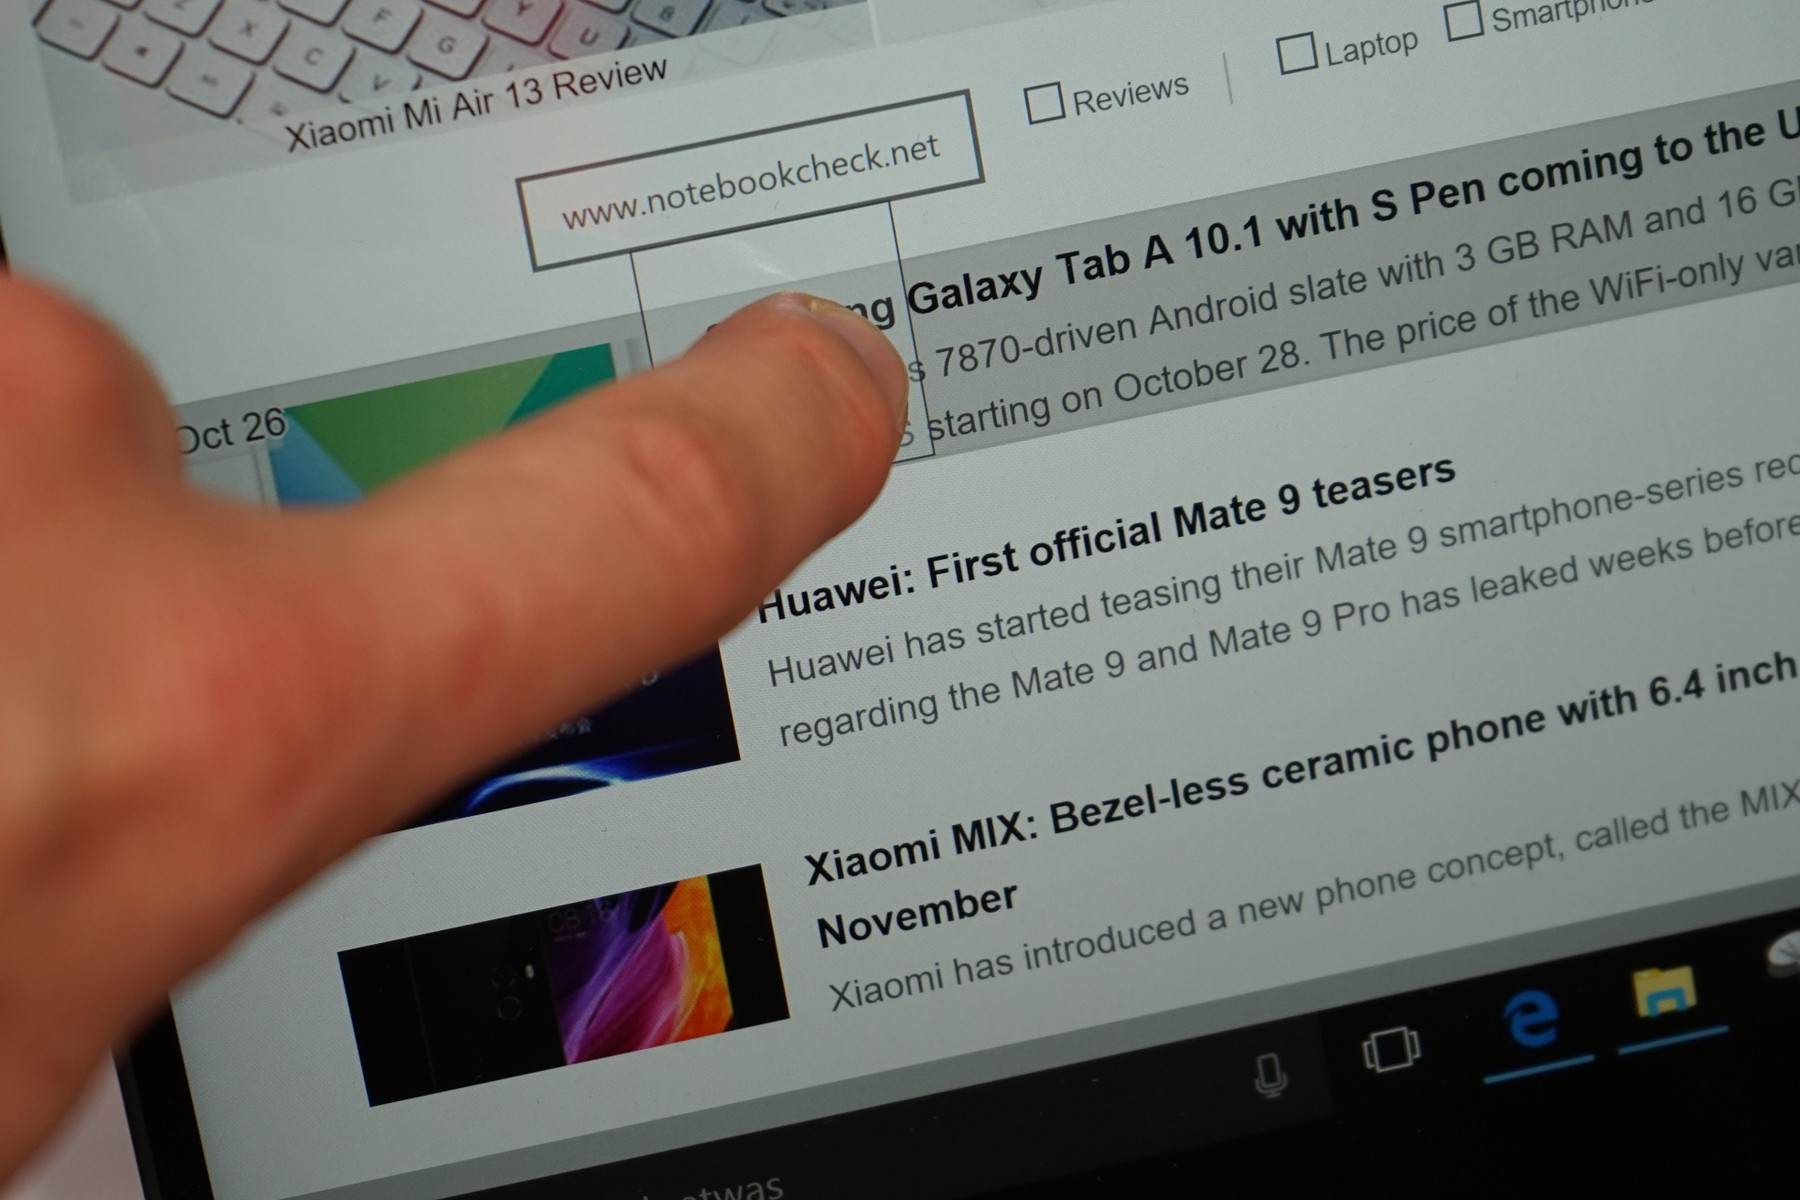
The slightly rubberized clickpad works flawlessly for simple cursor control with no jitters. Its integrated mouse clicks are very shallow in travel and the feedback could have benefited from a more solid feel. Beyond this, the touchpad is still comfortable to use should an external mouse be unavailable. Using the touchscreen here is also more practical than on other touchscreen-enabled notebooks since the display teeters less significantly in response.
Display
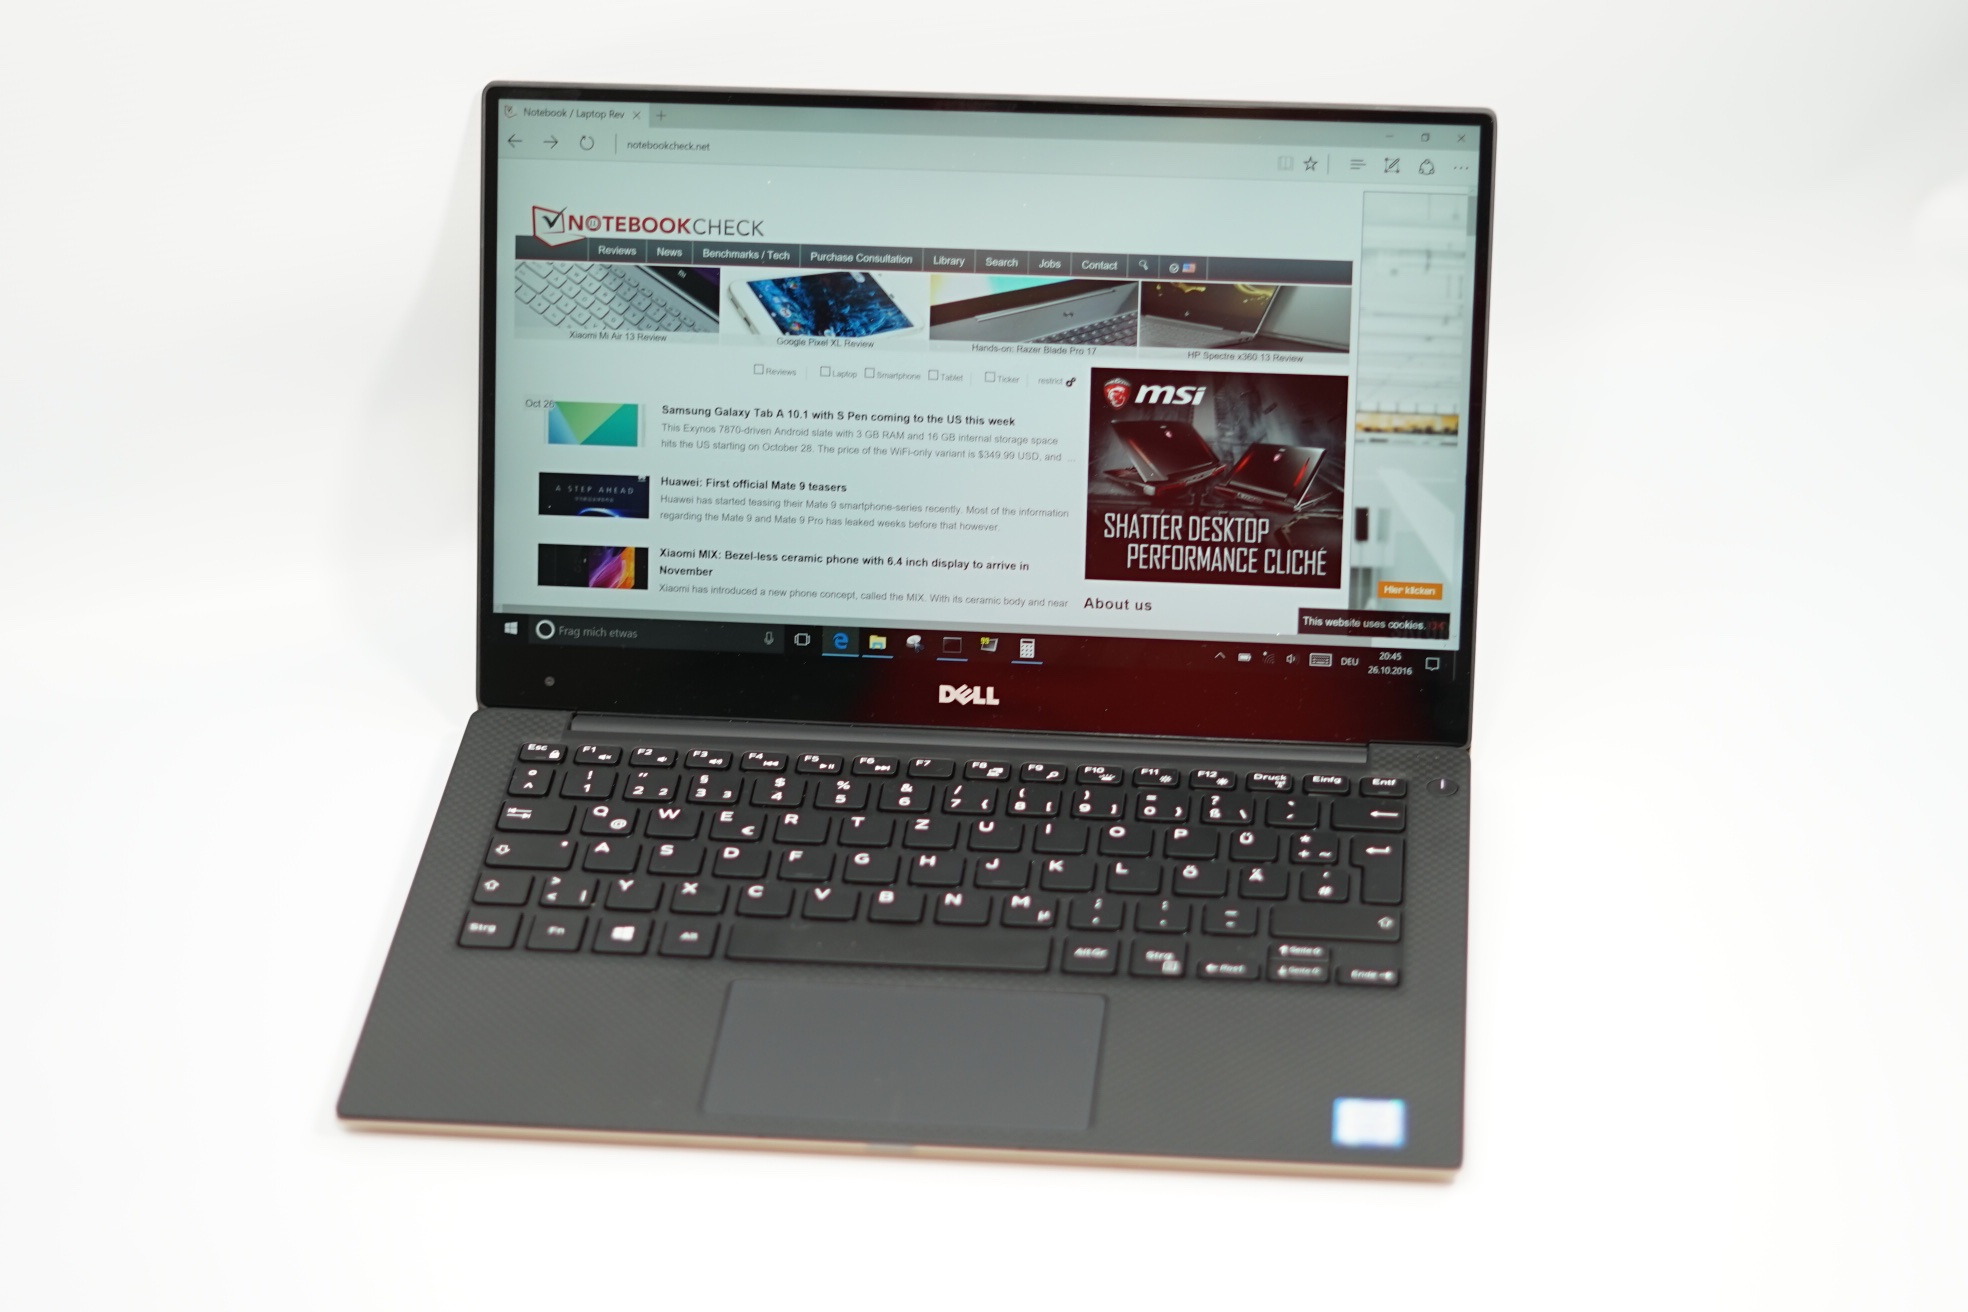
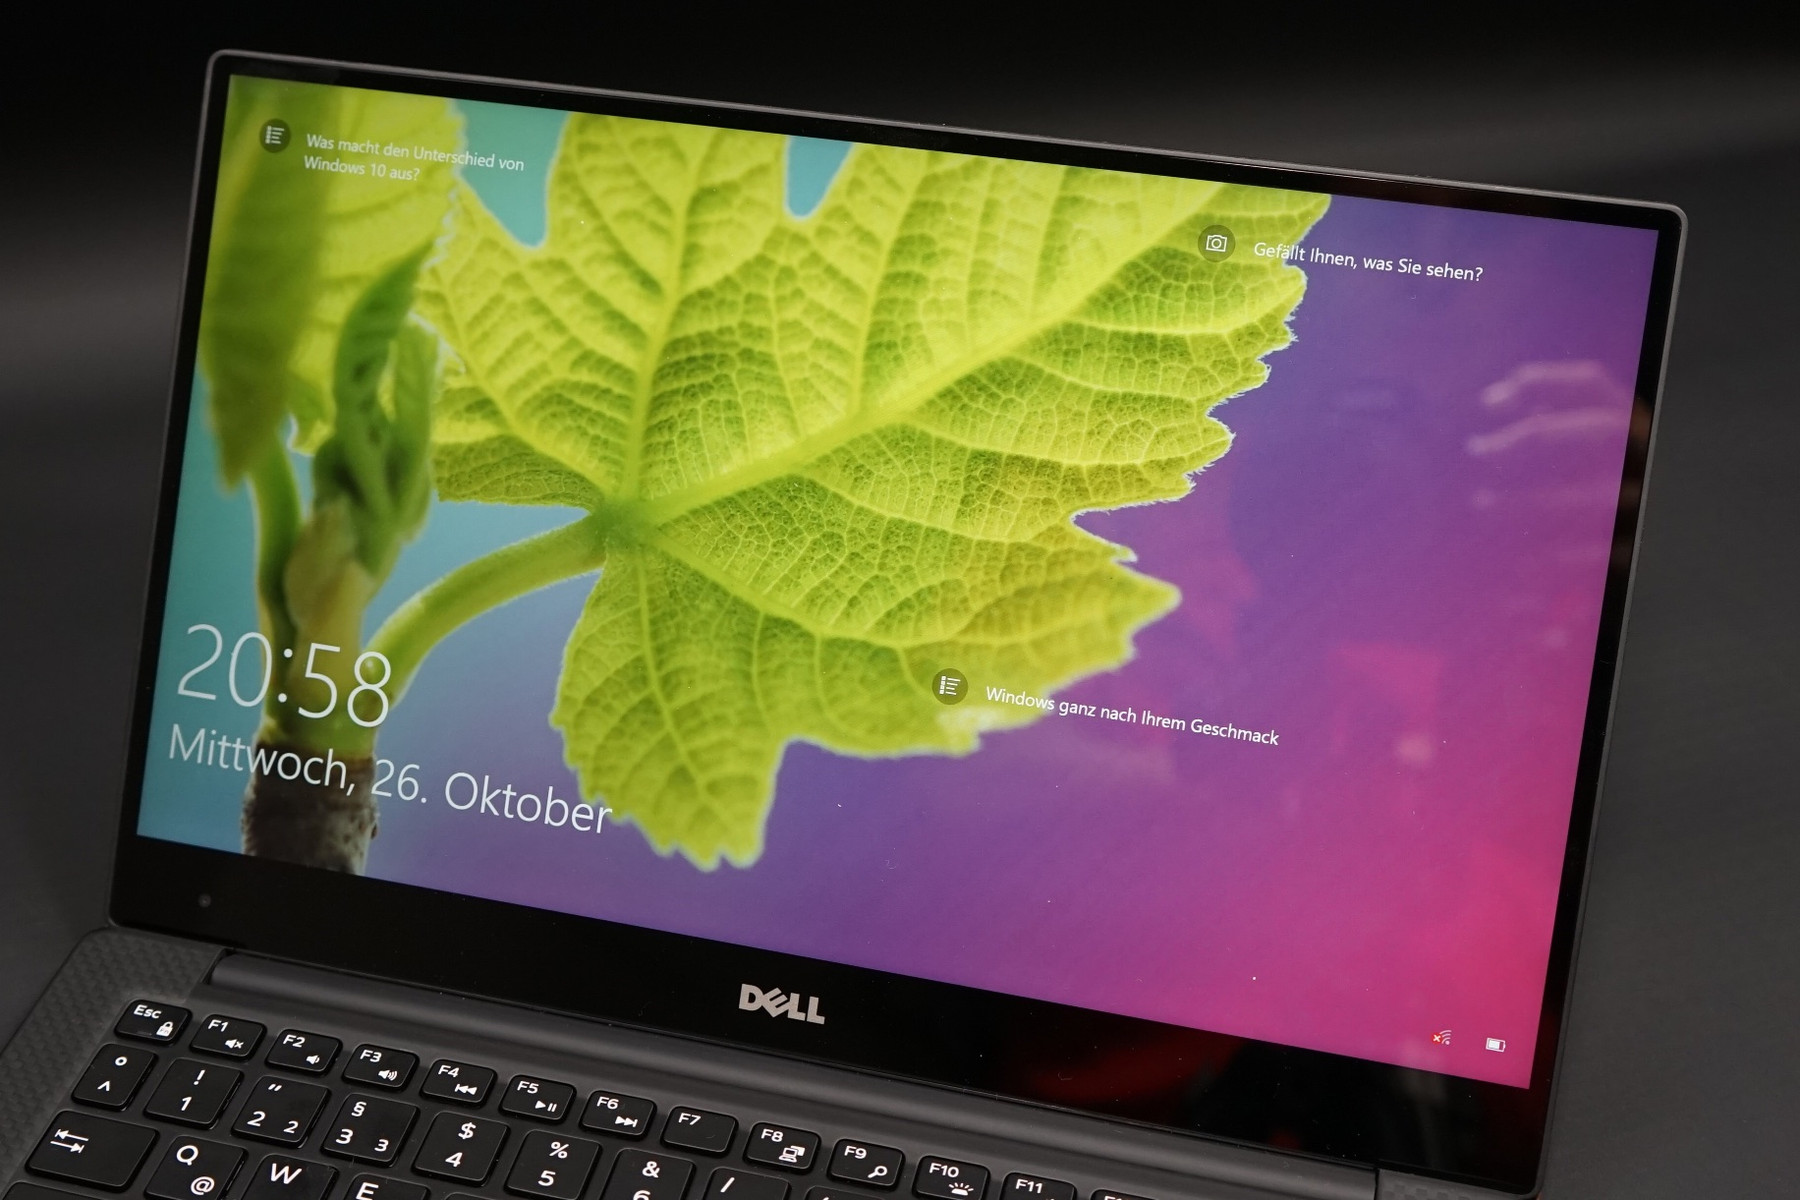
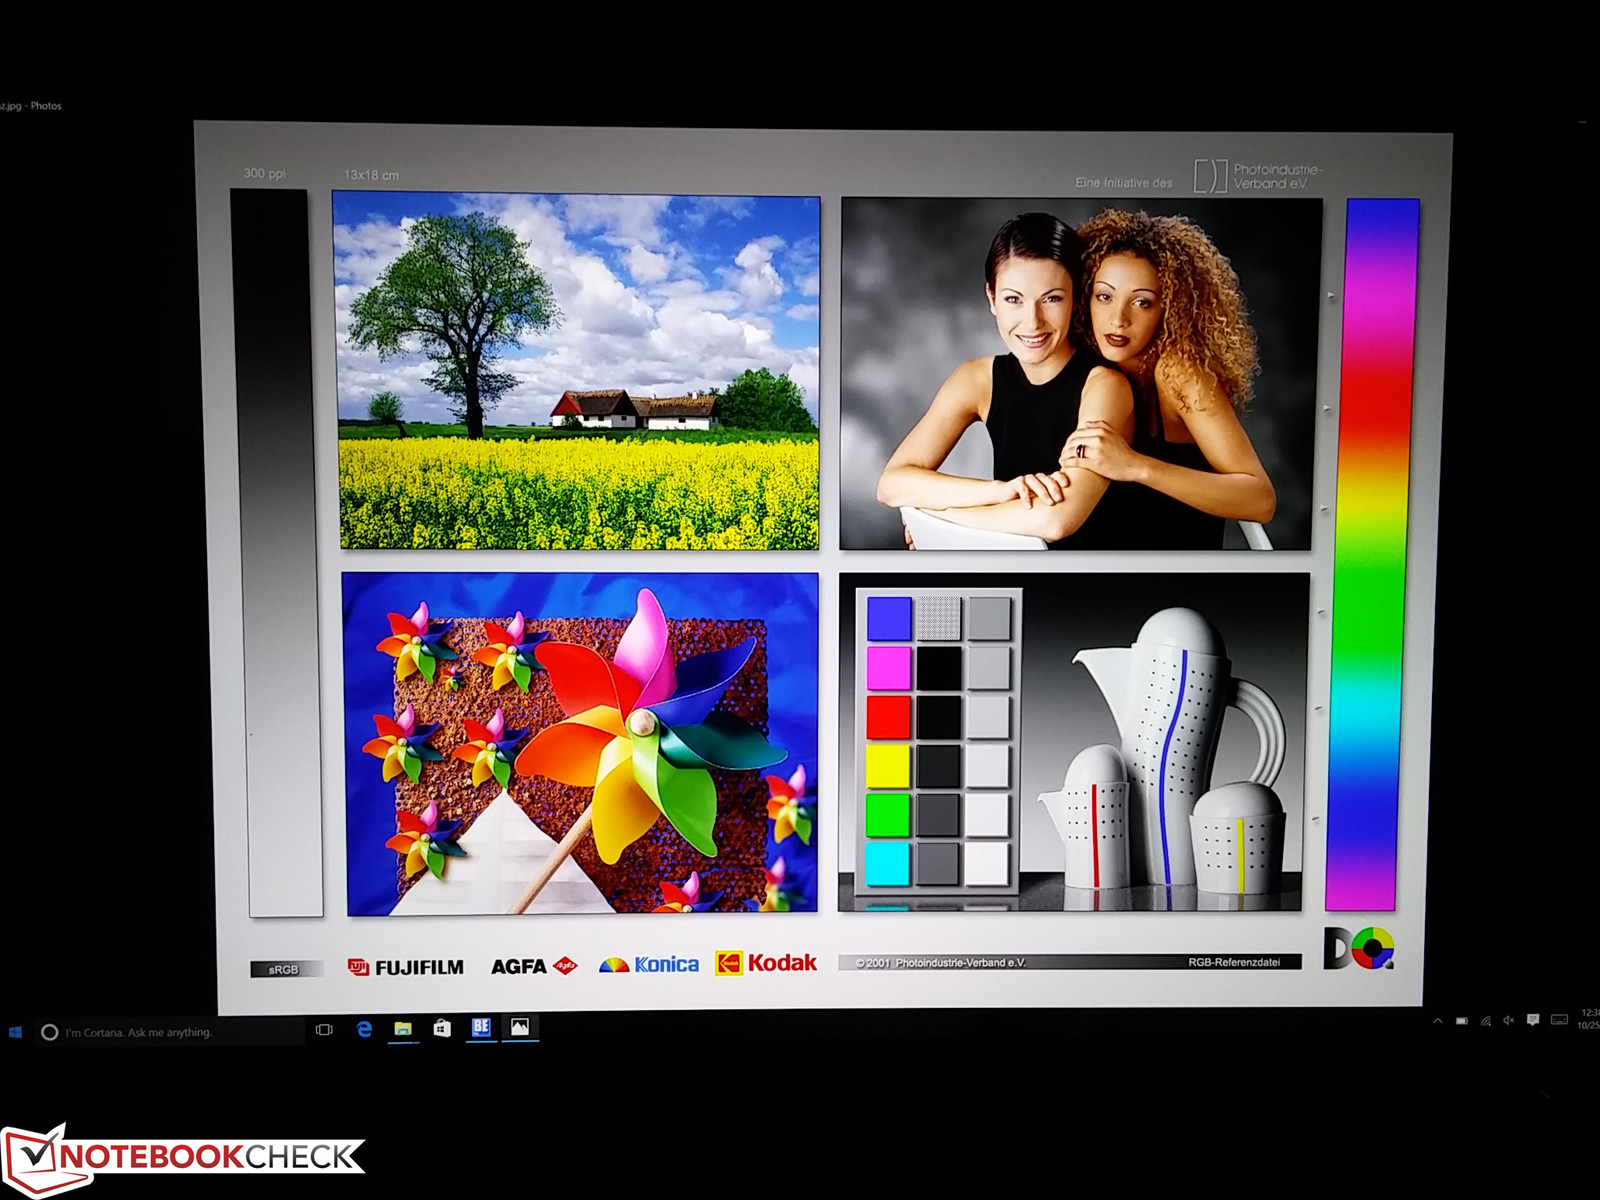
Our XPS 13 i7 SKU is equipped with the same QHD+ display from Sharp as on our i5 SKU. A search for its SHP144A panel name shows that the previous generation XPS 13 9350 utilizes the same screen, so users can expect very similar properties between them including contrast and gamut. Backlight brightness is also comparable to other flagship Ultrabooks at well over 300 nits maximum. Unfortunately, the system still utilizes CABC by default and so our brightness measurements are difficult to reproduce even between SKUs with the same QHD display.
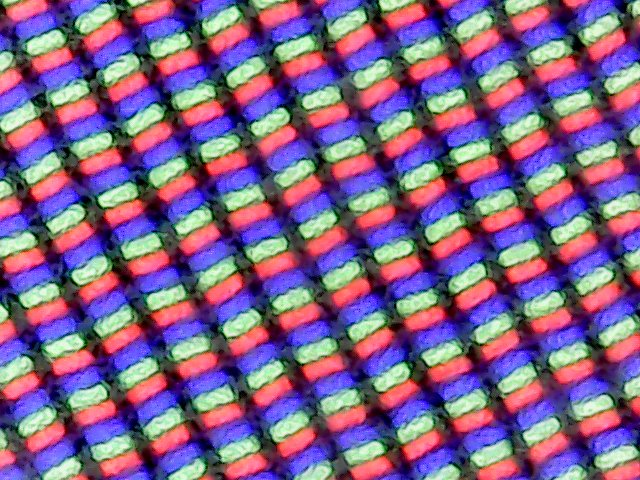
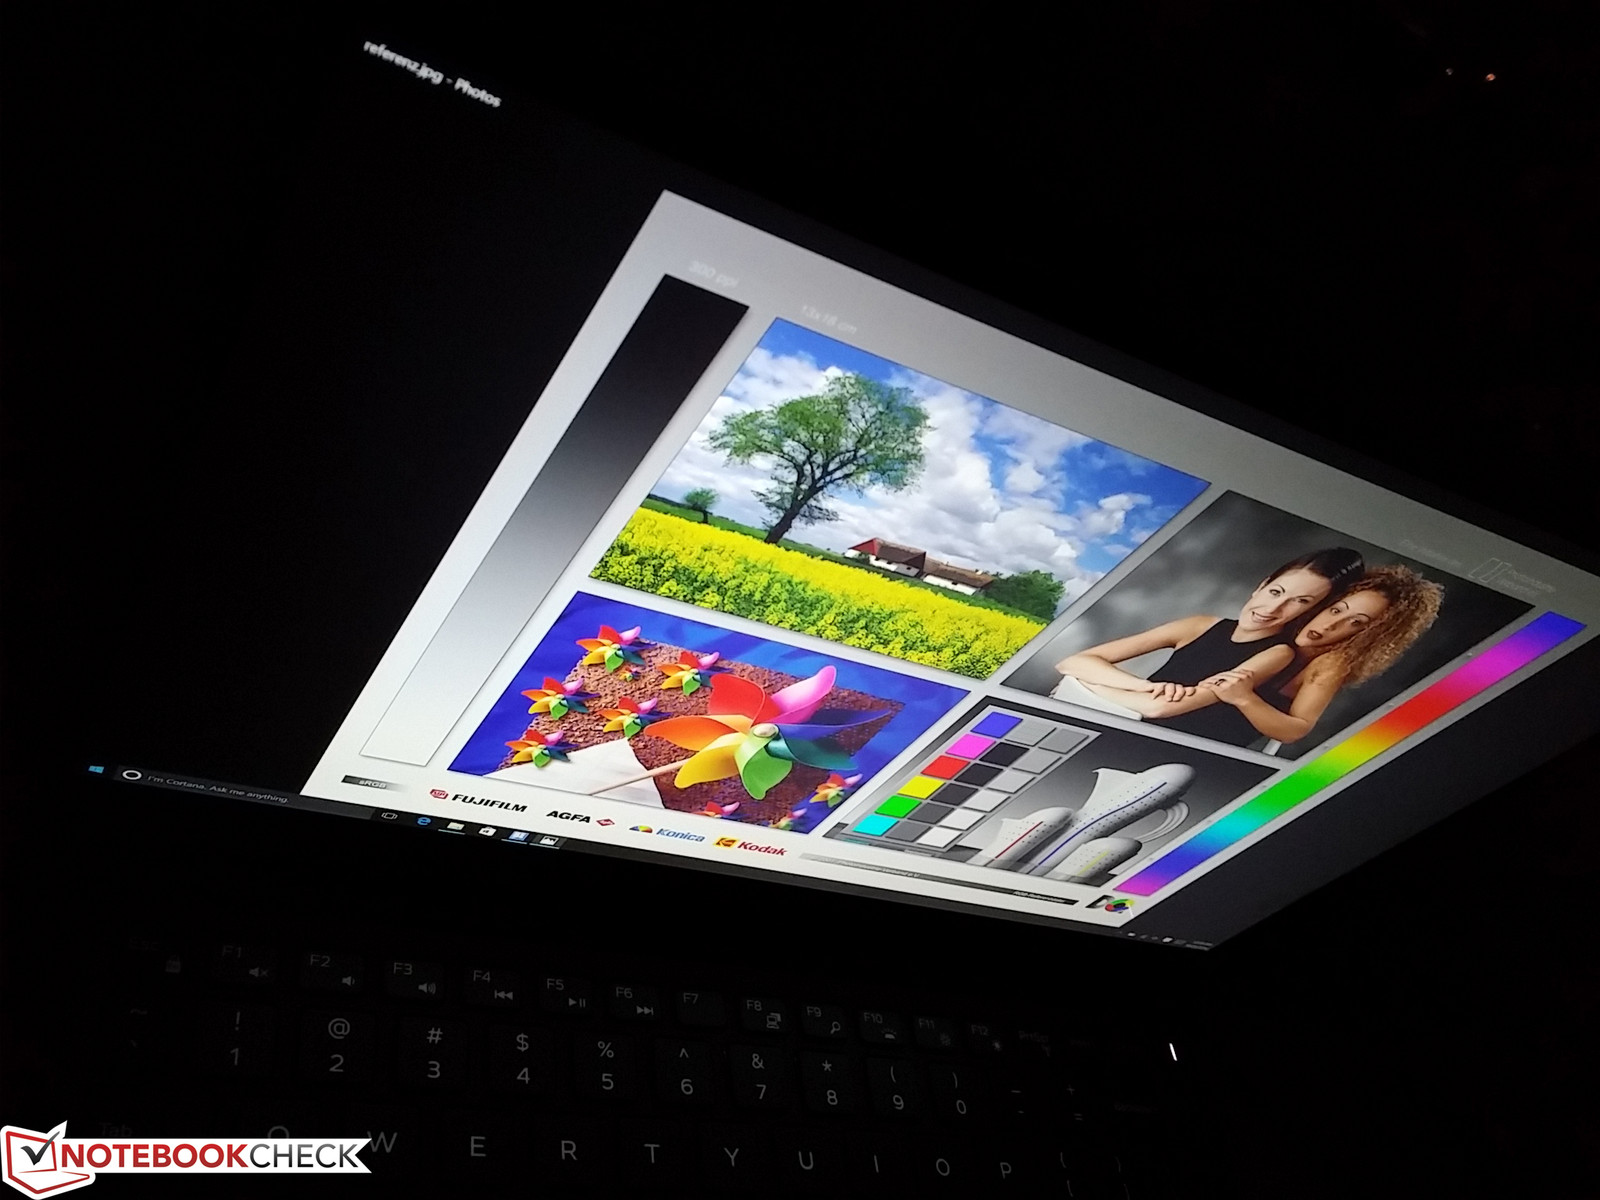
Subjectively, onscreen content is crisp with no visible grains unlike on many matte panels. Scaling issues are essentially unavoidable at this high of a density on such a small screen. A non-touchcreen matte FHD SKU of the XPS 13 is available for those who find little value in the higher resolution display and our review on this configuration will come in the next several weeks.
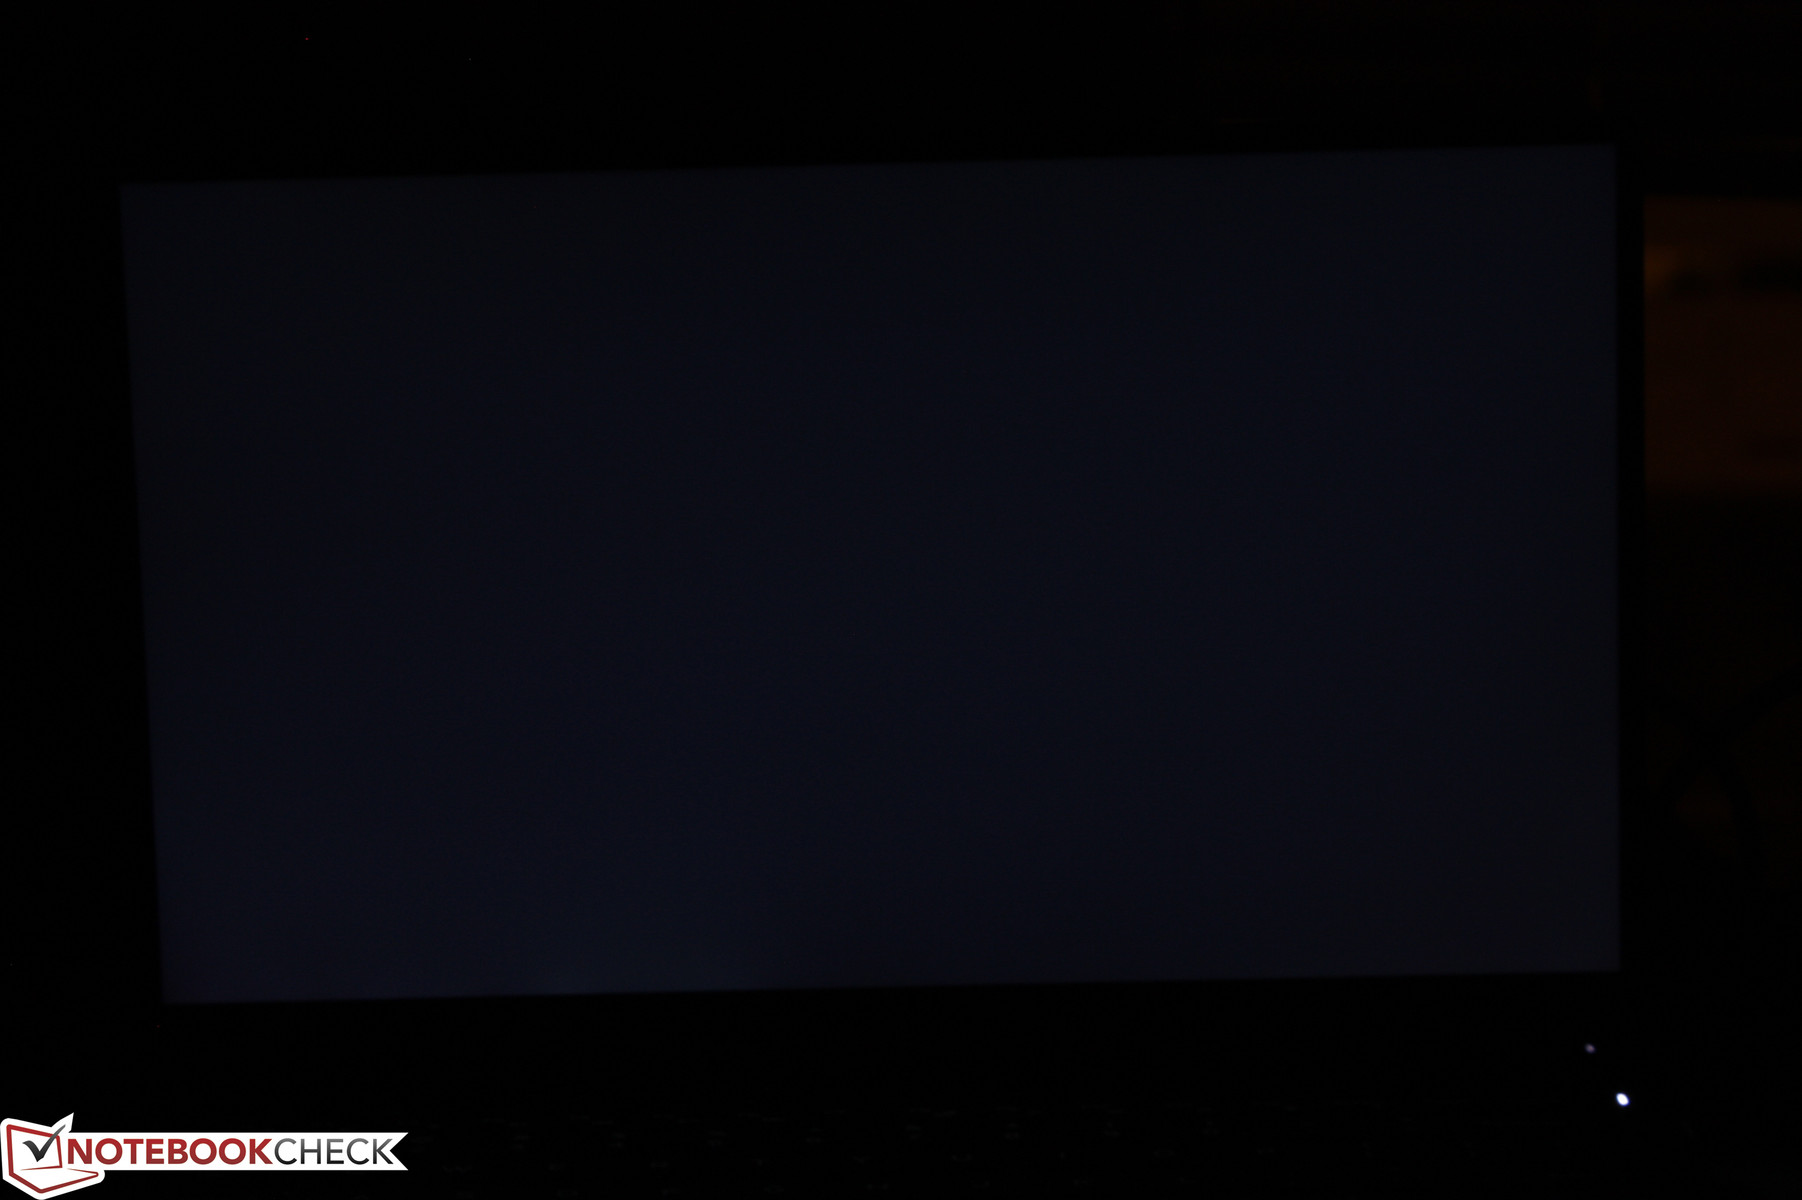
There is very slight uneven backlight bleeding on the bottom edge, but this is difficult to notice even during movie playback with black bars.
| |||||||||||||||||||||||||
Brightness Distribution: 84 %
Center on Battery: 396.2 cd/m²
Contrast: 1489:1 (Black: 0.266 cd/m²)
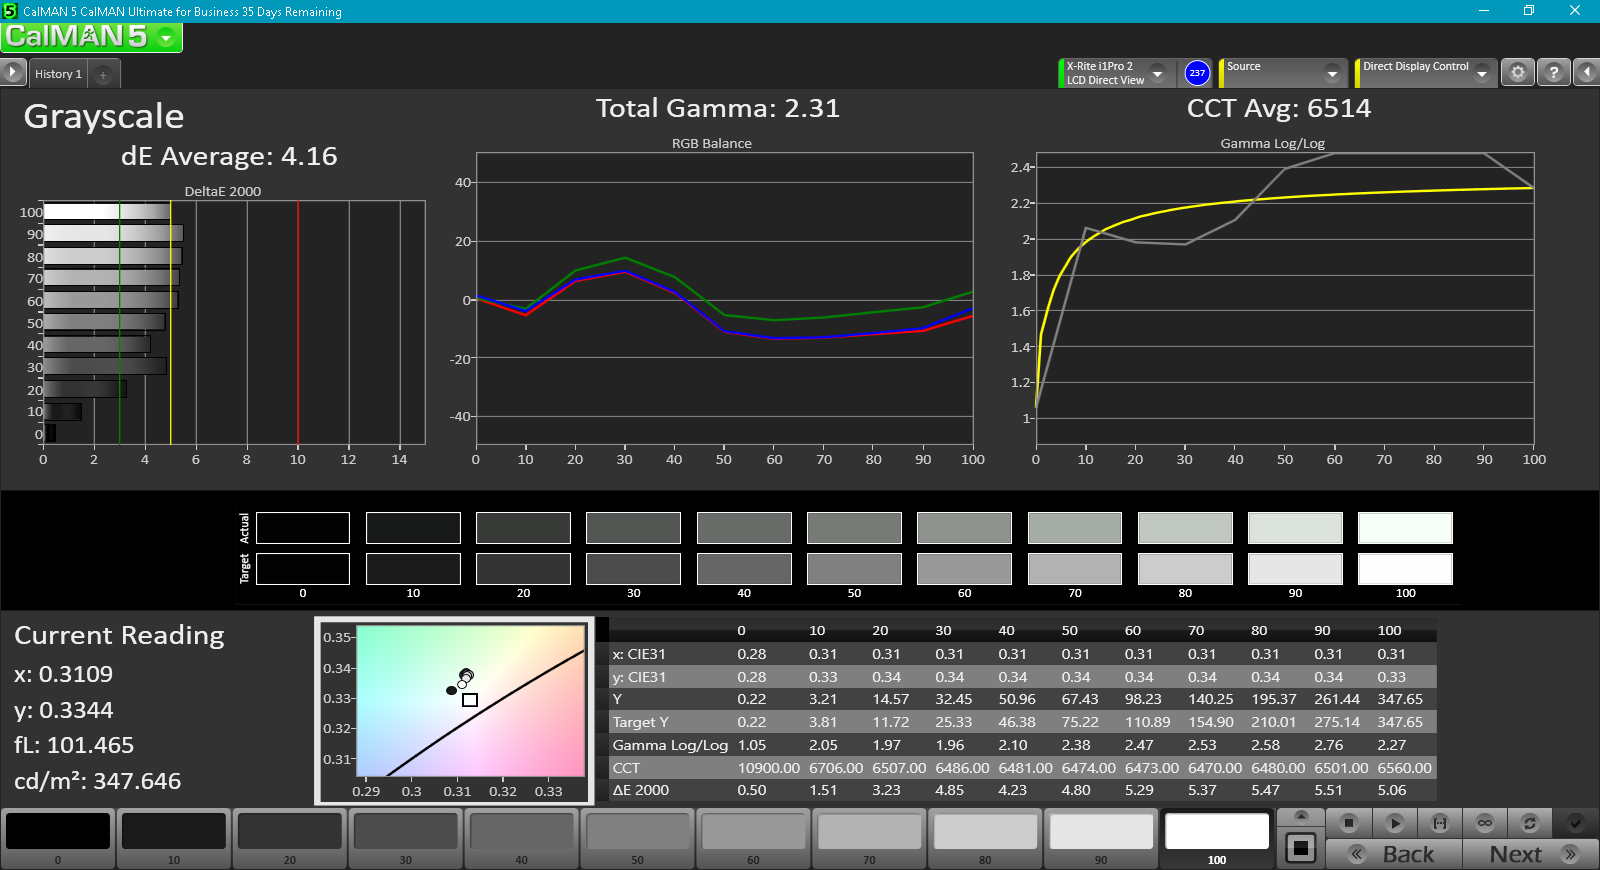
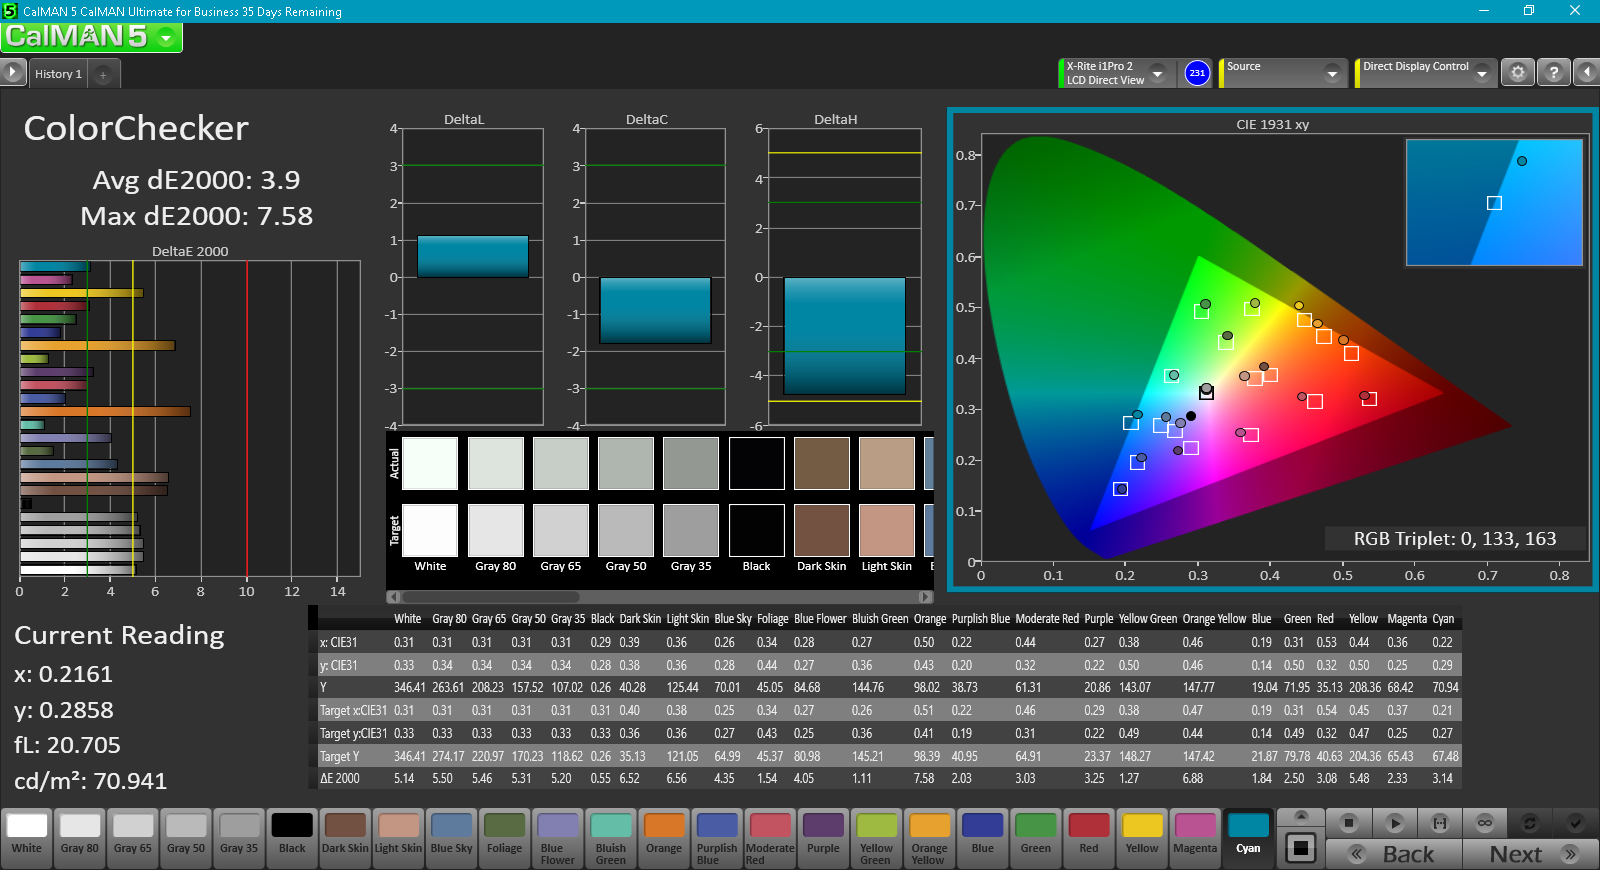
ΔE ColorChecker Calman: 3.9 | ∀{0.5-29.43 Ø4.72}
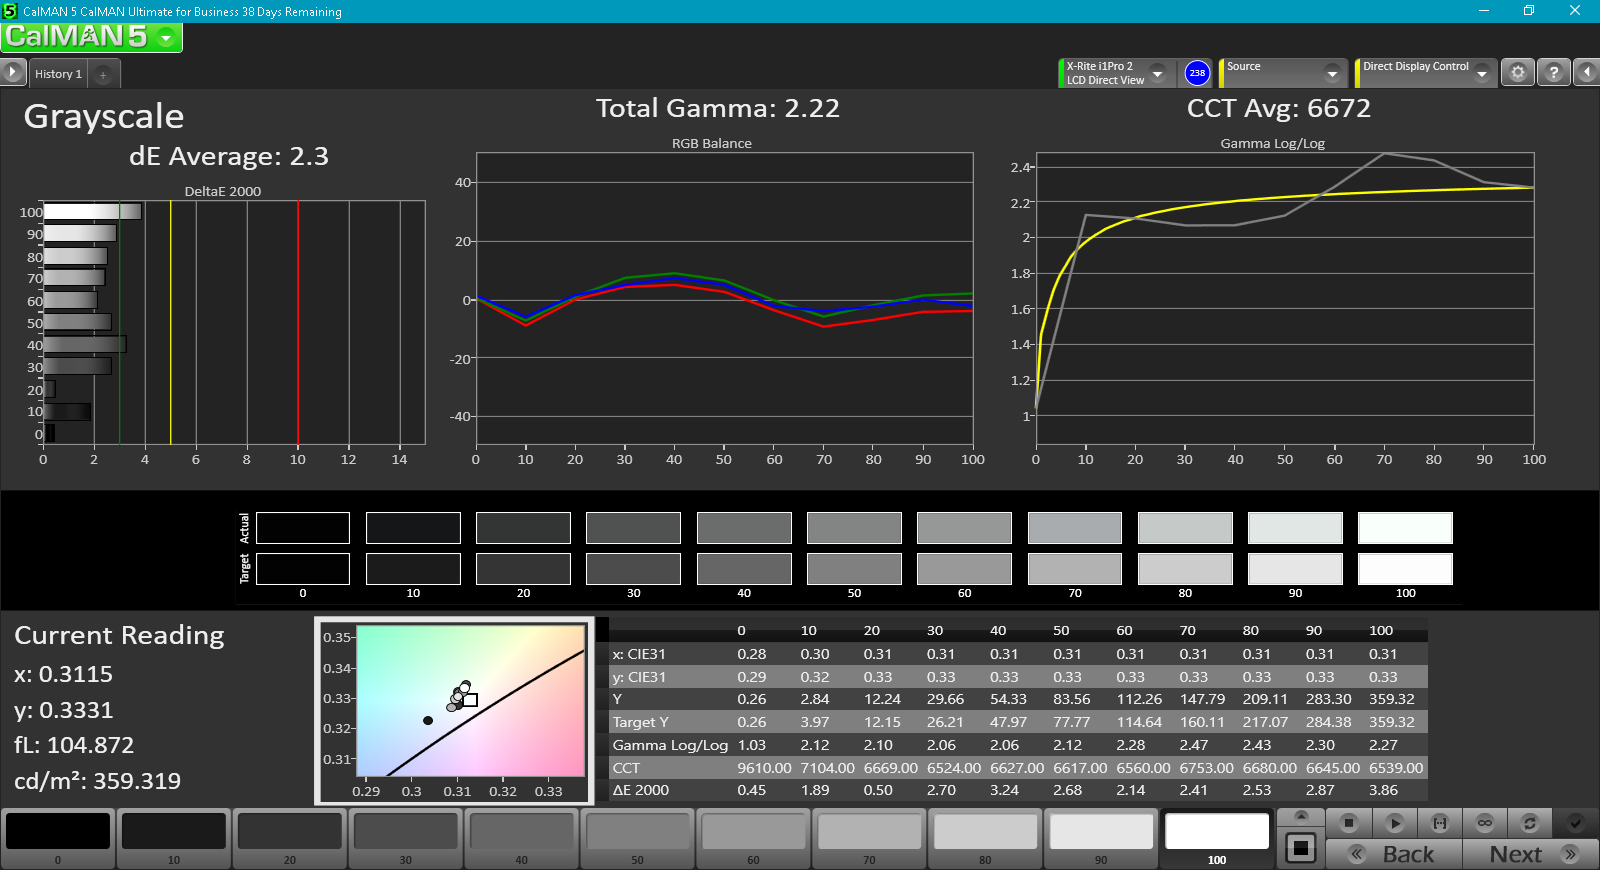
ΔE Greyscale Calman: 4.16 | ∀{0.09-98 Ø4.97}
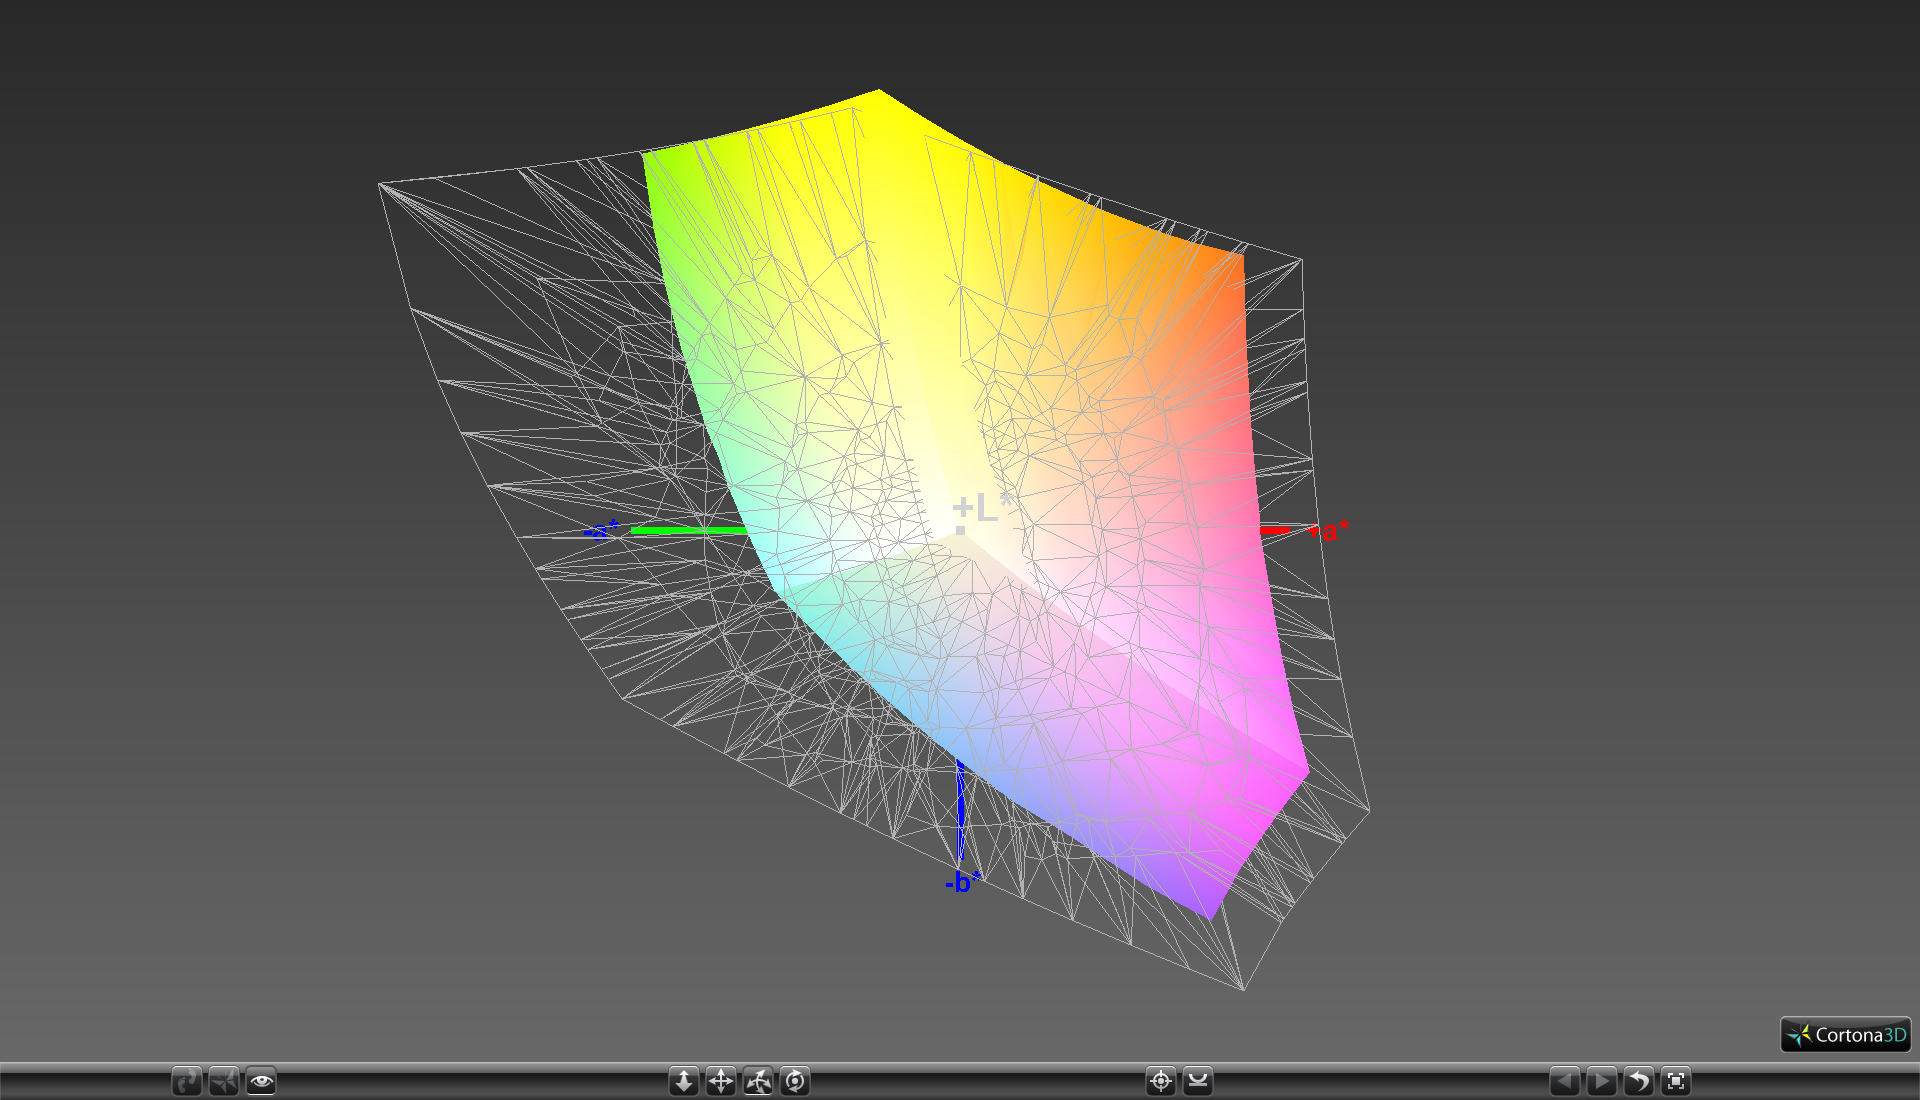
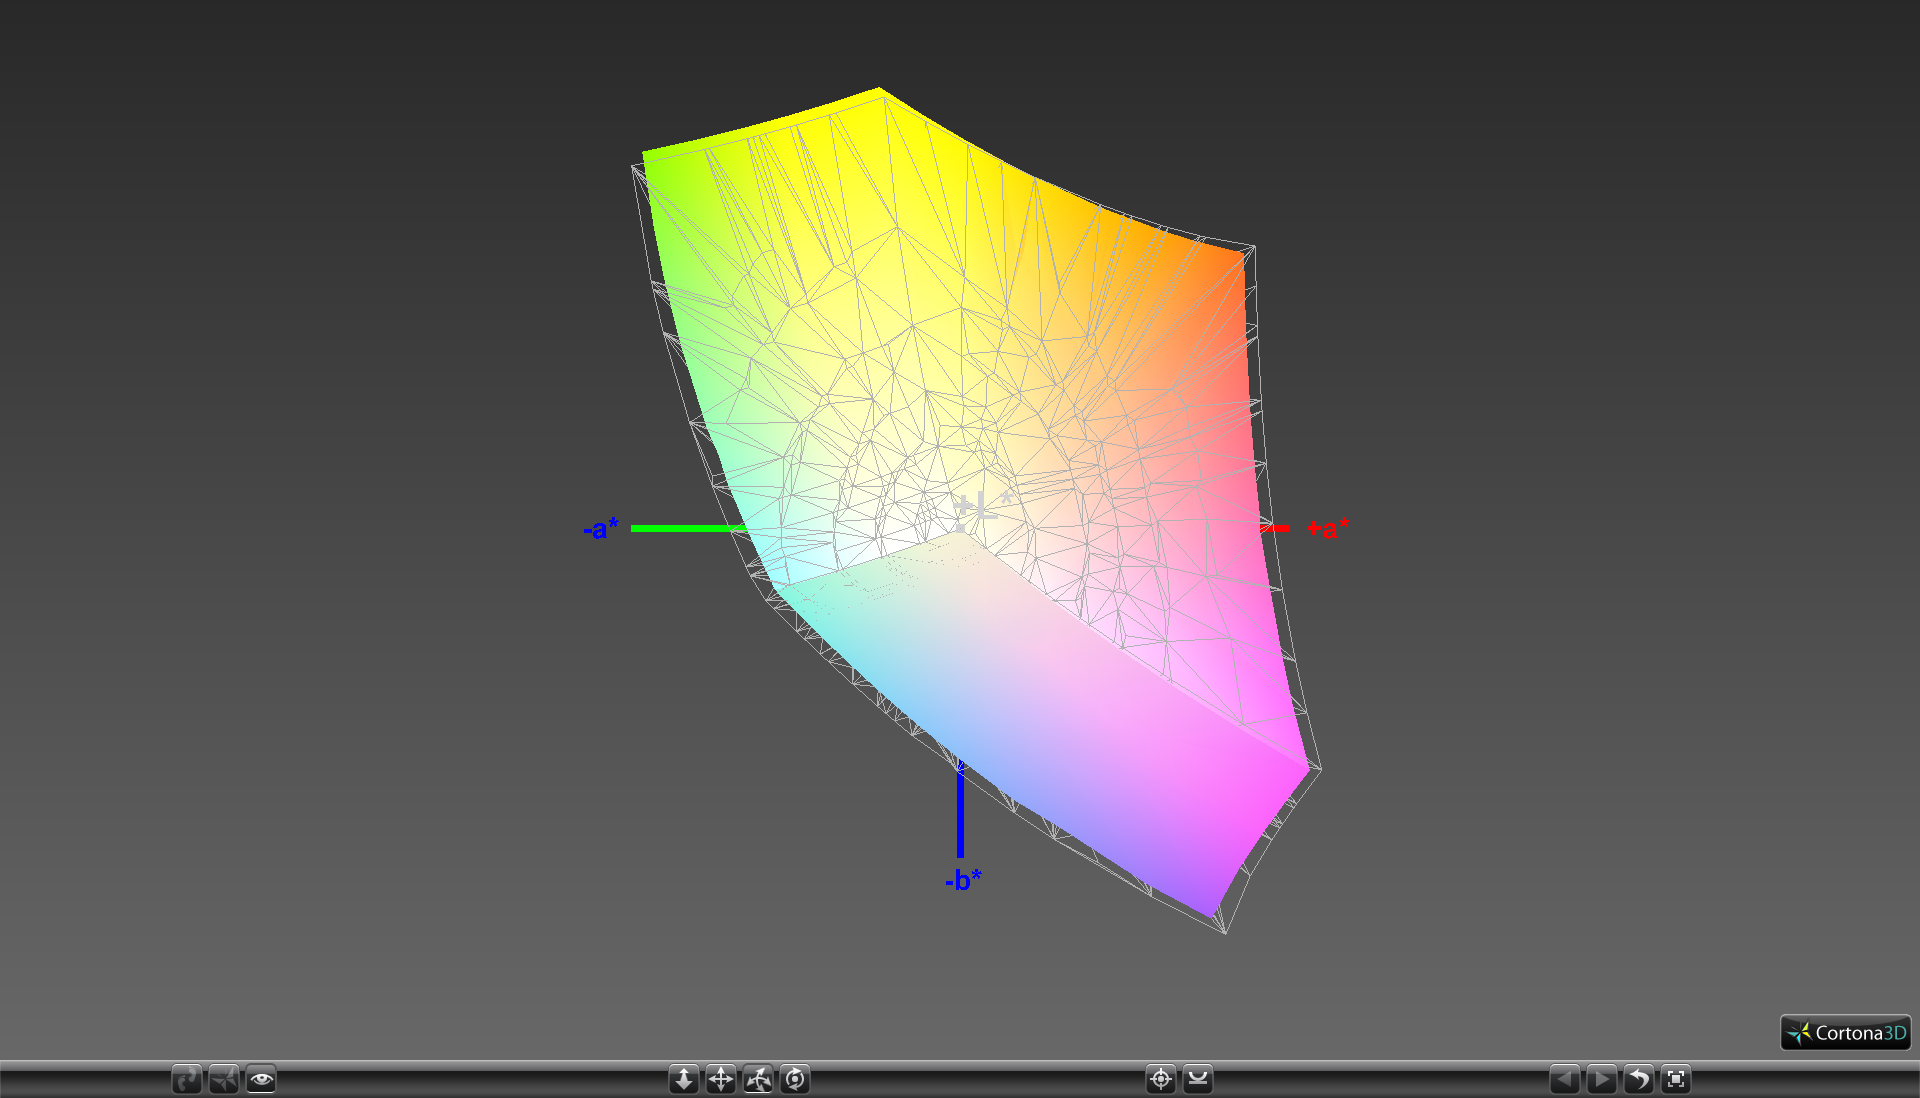
88.7% sRGB (Argyll 1.6.3 3D)
57.5% AdobeRGB 1998 (Argyll 1.6.3 3D)
64.6% AdobeRGB 1998 (Argyll 3D)
89.4% sRGB (Argyll 3D)
62.8% Display P3 (Argyll 3D)
Gamma: 2.31
CCT: 6514 K
| Dell XPS 13 9360 QHD+ i7 Sharp SHP144A, IPS, 13.3", 3200x1800 | HP Spectre x360 13-w023dx Chi Mei CMN1367, IPS, 13.3", 1920x1080 | HP EliteBook 1030 G1-X2F03EA Sharp SHP1465, IPS, 13.3", 3200x1800 | Asus Zenbook UX360UA-C4159T AU Optronics AOU272D / B133HAN02.7, IPS, 13.3", 1920x1080 | Apple MacBook Air 13 inch 2015-03 Apple APP9CF0, TN LED, 13.3", 1440x900 | |
|---|---|---|---|---|---|
| Display | 2% | 7% | 3% | -35% | |
| Display P3 Coverage (%) | 62.8 | 65.4 4% | 67.6 8% | 64.8 3% | 40.1 -36% |
| sRGB Coverage (%) | 89.4 | 90.4 1% | 94.7 6% | 93.1 4% | 59.8 -33% |
| AdobeRGB 1998 Coverage (%) | 64.6 | 65.8 2% | 69 7% | 66 2% | 41.51 -36% |
| Response Times | 14% | 8% | 34% | ||
| Response Time Grey 50% / Grey 80% * (ms) | 43.6 ? | 33.2 ? 24% | 42.4 ? 3% | 29 ? 33% | |
| Response Time Black / White * (ms) | 29.2 ? | 28 ? 4% | 25.6 ? 12% | 19 ? 35% | |
| PWM Frequency (Hz) | 50 ? | ||||
| Screen | -28% | -1% | -16% | -18% | |
| Brightness middle (cd/m²) | 396.2 | 334.6 -16% | 401 1% | 344 -13% | 329 -17% |
| Brightness (cd/m²) | 357 | 319 -11% | 369 3% | 326 -9% | 310 -13% |
| Brightness Distribution (%) | 84 | 90 7% | 85 1% | 86 2% | 82 -2% |
| Black Level * (cd/m²) | 0.266 | 0.336 -26% | 0.35 -32% | 0.27 -2% | 0.405 -52% |
| Contrast (:1) | 1489 | 996 -33% | 1146 -23% | 1274 -14% | 812 -45% |
| Colorchecker dE 2000 * | 3.9 | 6.21 -59% | 3.5 10% | 5.53 -42% | 3.96 -2% |
| Colorchecker dE 2000 max. * | 7.58 | 12 -58% | 6.33 16% | 10.01 -32% | 7.51 1% |
| Greyscale dE 2000 * | 4.16 | 7.71 -85% | 4.13 1% | 6.67 -60% | 3.51 16% |
| Gamma | 2.31 95% | 2.36 93% | 2.28 96% | 2.43 91% | 3.83 57% |
| CCT | 6514 100% | 6458 101% | 6508 100% | 7012 93% | 6711 97% |
| Color Space (Percent of AdobeRGB 1998) (%) | 57.5 | 58.6 2% | 61.56 7% | 60 4% | 38.4 -33% |
| Color Space (Percent of sRGB) (%) | 88.7 | 90 1% | 94.64 7% | 93 5% | 59.8 -33% |
| Total Average (Program / Settings) | -4% /
-16% | 5% /
2% | 7% /
-6% | -27% /
-22% |
* ... smaller is better
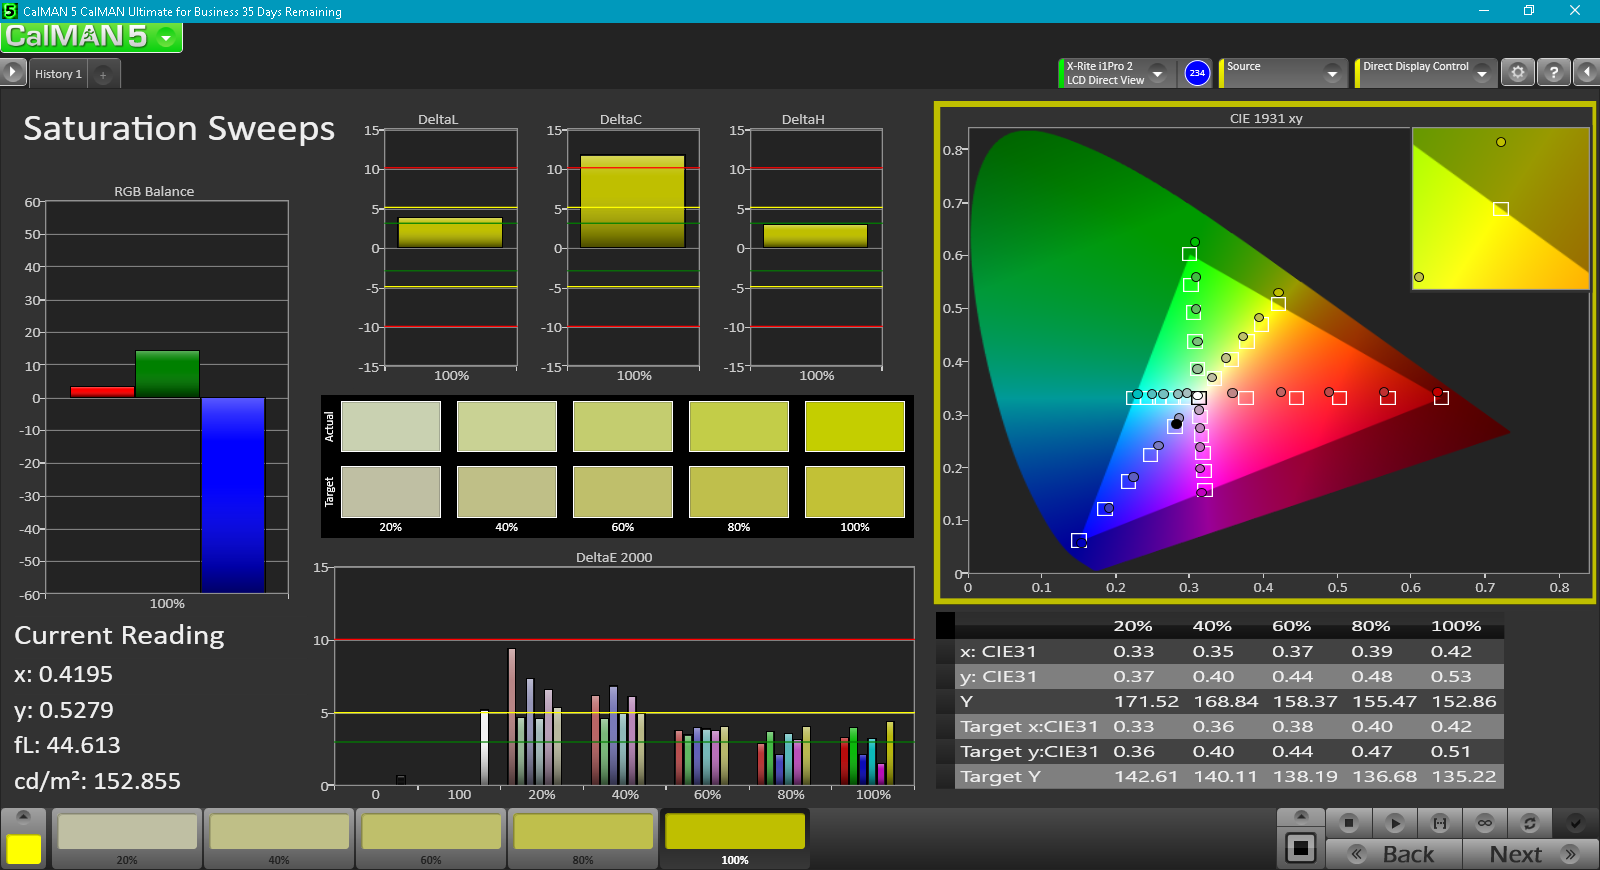
Color coverage is approximately 89 percent and 58 percent of the AdobeRGB and sRGB standards, respectively, to be more or less similar to most of its recent flagship competitors. Cheaper TN panels that aren't capable of deeper colors have a much narrower gamut at about 60 percent of sRGB, but such high color accuracy is largely insignificant for browsing and word processing.


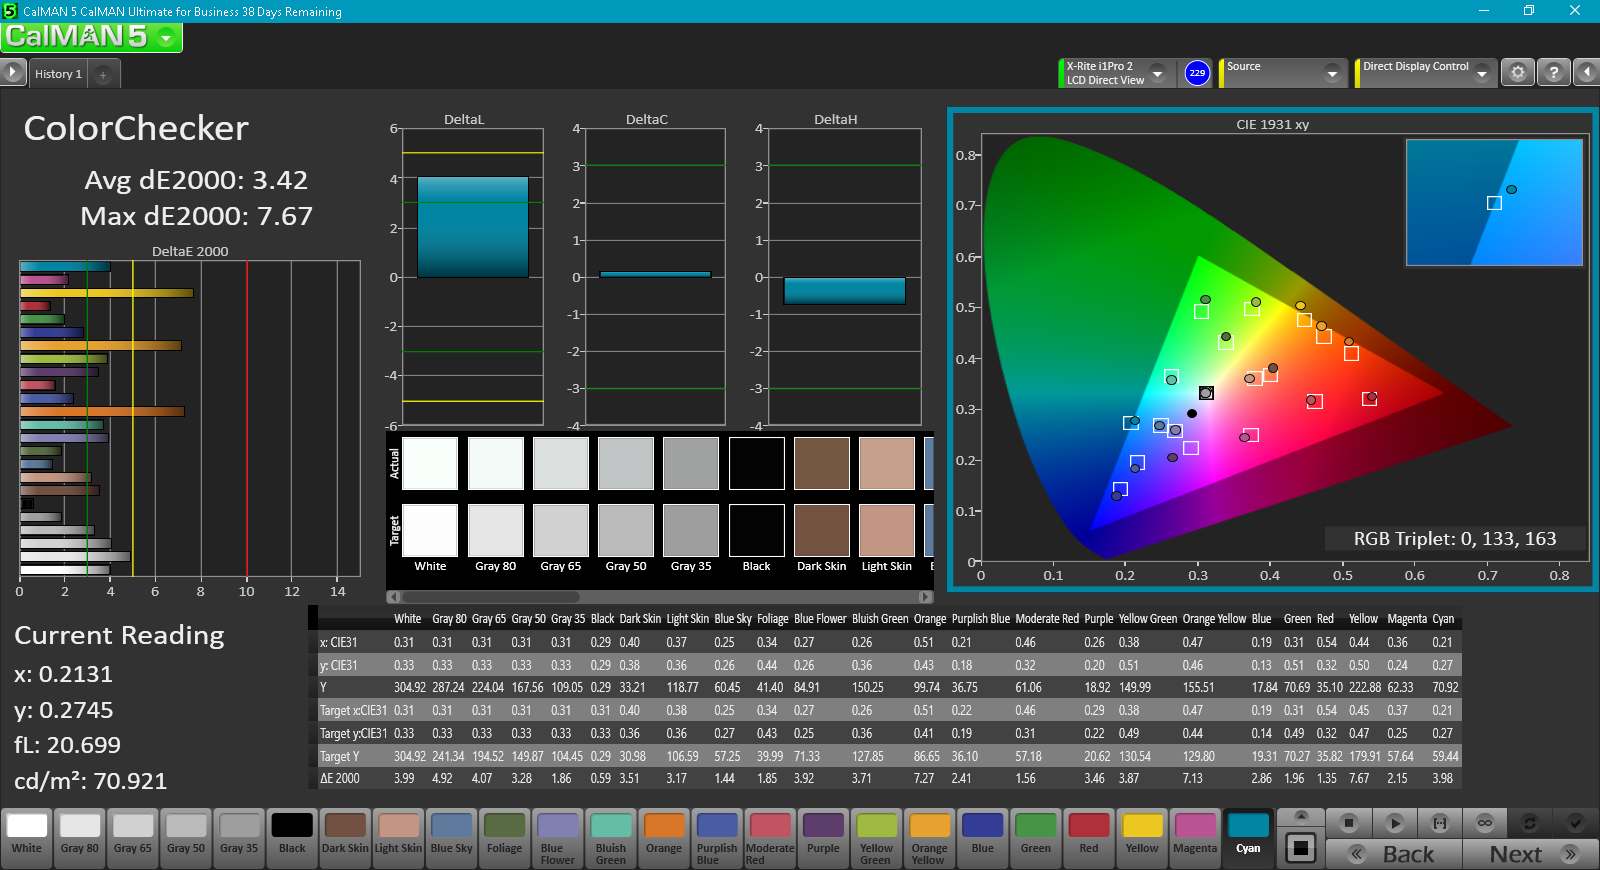
Grayscale and colors are both generally accurate out of the box. A quick calibration improves grayscale, but RGB balance could have been better and may require more manual calibration to refine. Color accuracy will never be perfect at higher saturation levels since the panel does not cover the complete sRGB spectrum.

Display Response Times
| ↔ Response Time Black to White | ||
|---|---|---|
| 29.2 ms ... rise ↗ and fall ↘ combined | ↗ 9.2 ms rise | 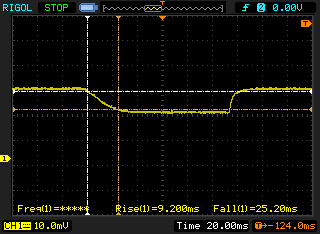 |
| ↘ 20 ms fall | ||
| The screen shows relatively slow response rates in our tests and may be too slow for gamers. In comparison, all tested devices range from 0.1 (minimum) to 240 (maximum) ms. » 78 % of all devices are better. This means that the measured response time is worse than the average of all tested devices (19.8 ms). | ||
| ↔ Response Time 50% Grey to 80% Grey | ||
| 43.6 ms ... rise ↗ and fall ↘ combined | ↗ 13.6 ms rise | 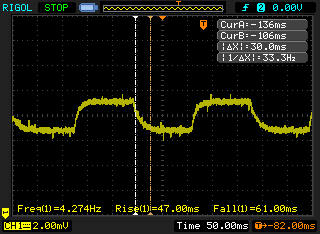 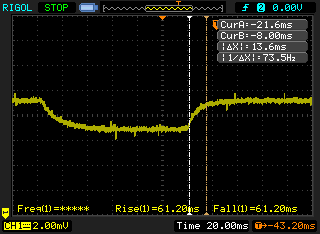 |
| ↘ 30 ms fall | ||
| The screen shows slow response rates in our tests and will be unsatisfactory for gamers. In comparison, all tested devices range from 0.165 (minimum) to 636 (maximum) ms. » 73 % of all devices are better. This means that the measured response time is worse than the average of all tested devices (31 ms). | ||
Screen Flickering / PWM (Pulse-Width Modulation)
| Screen flickering / PWM not detected | 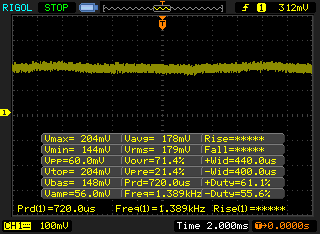 | ||
In comparison: 52 % of all tested devices do not use PWM to dim the display. If PWM was detected, an average of 7753 (minimum: 5 - maximum: 343500) Hz was measured. | |||
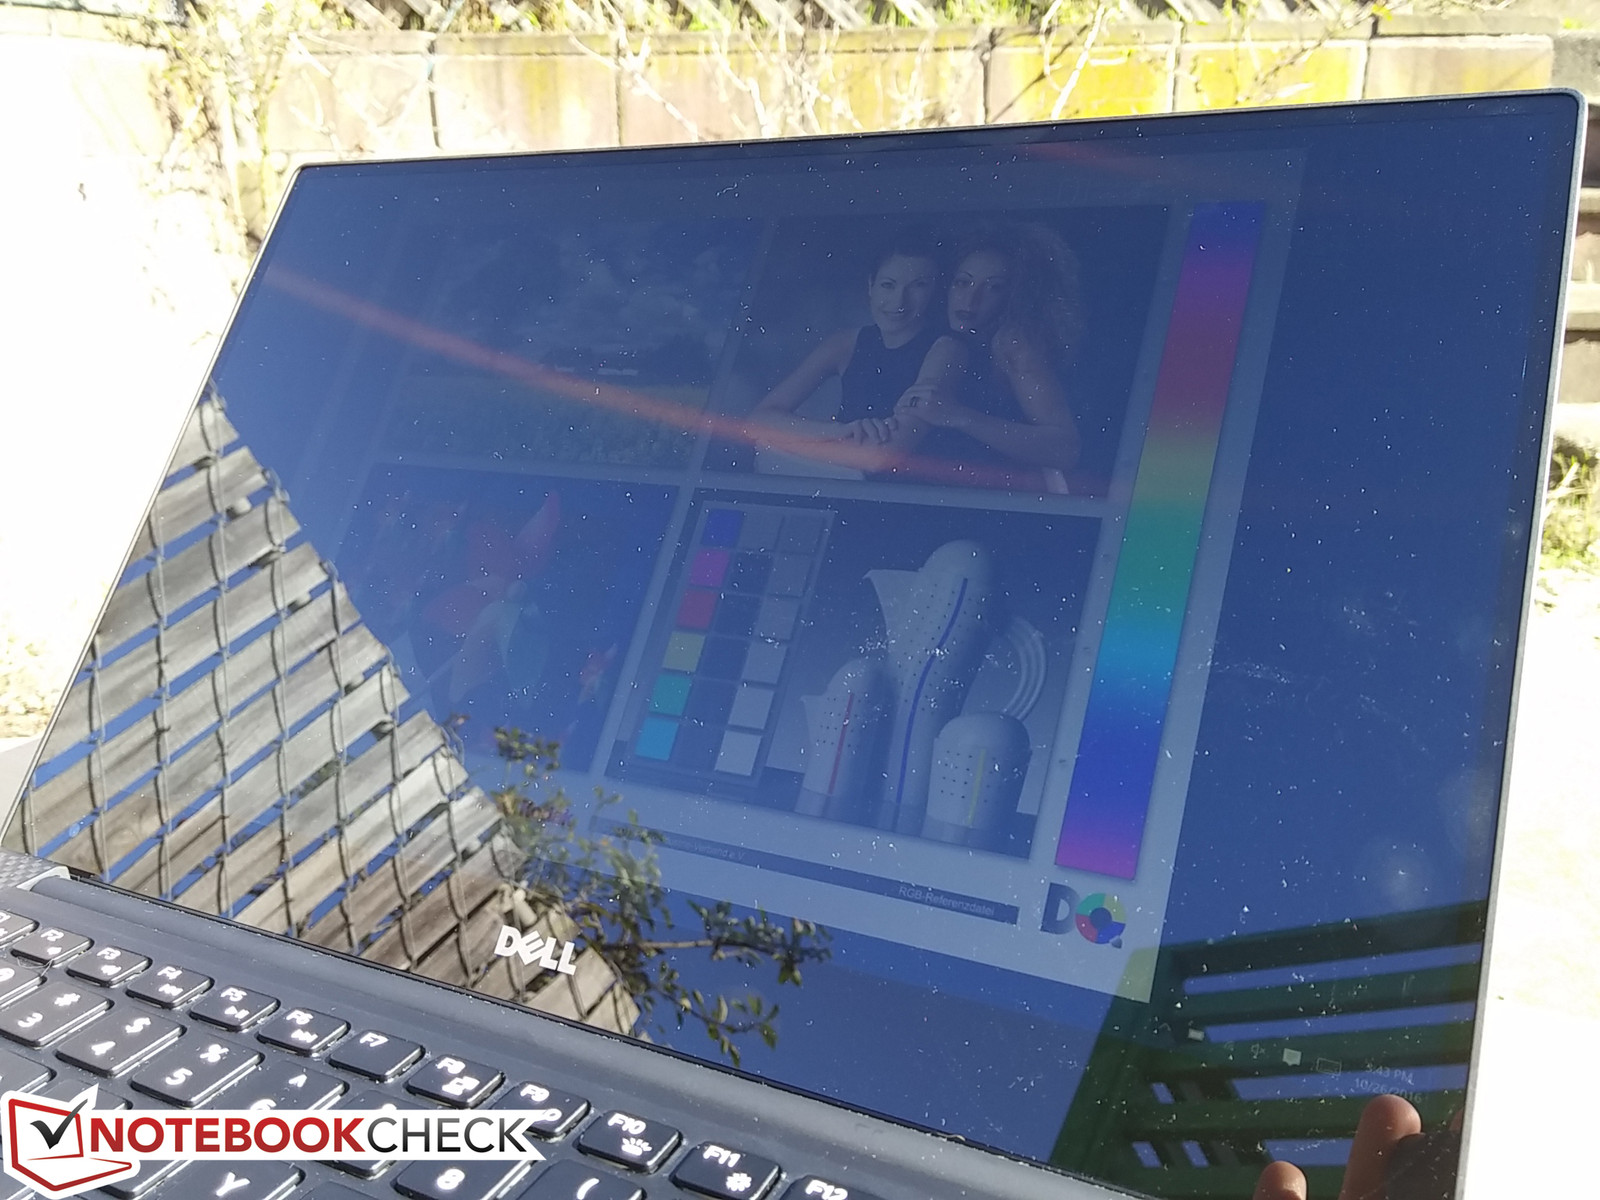
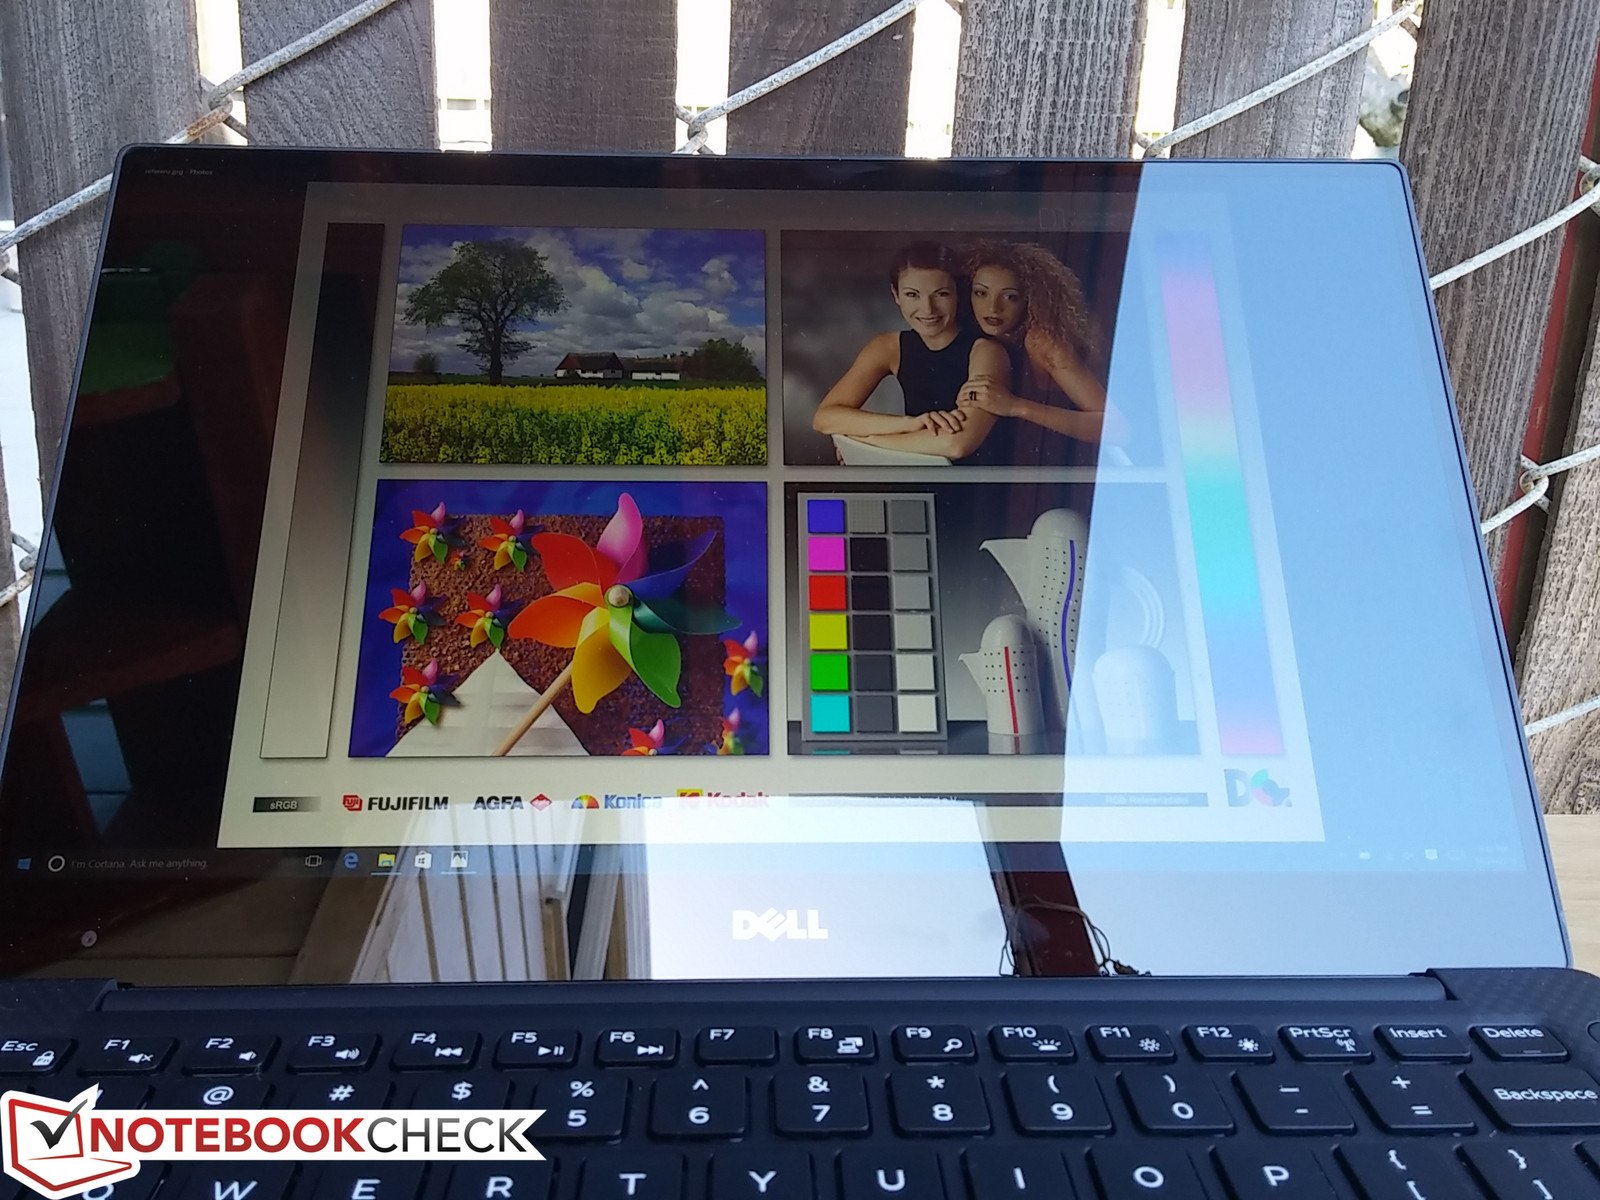
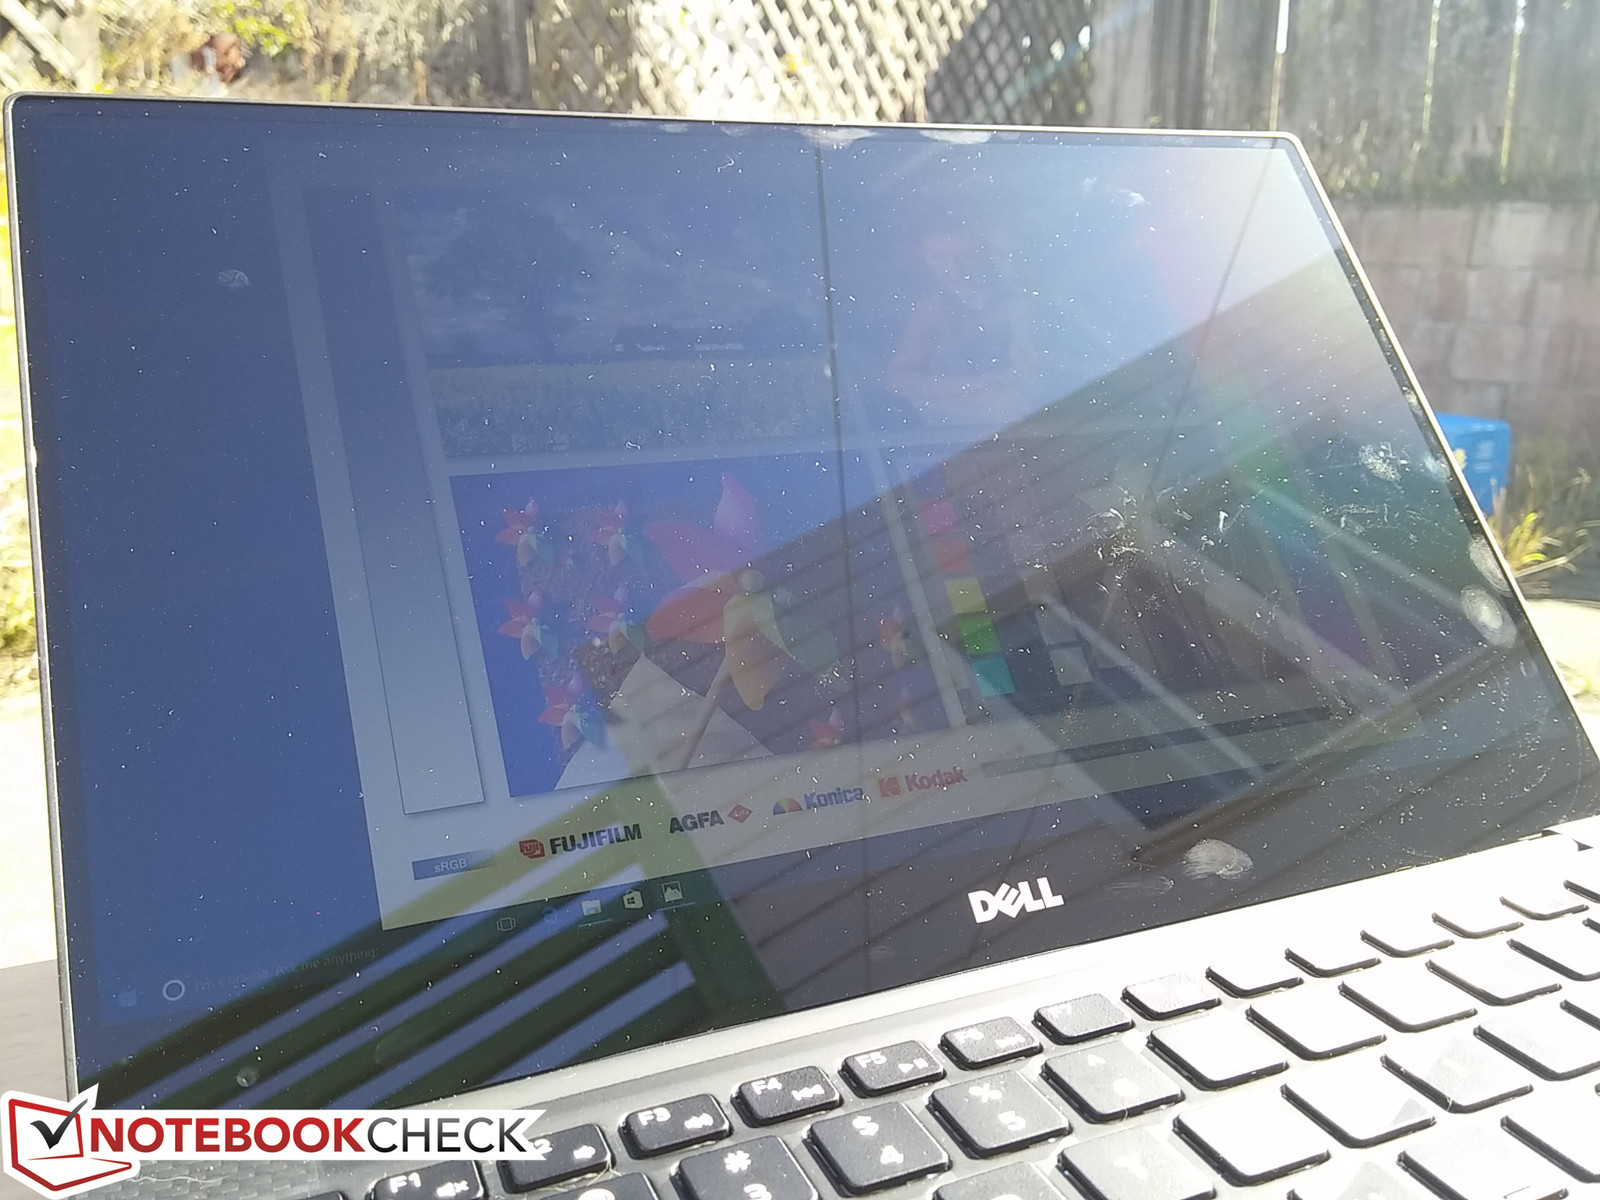
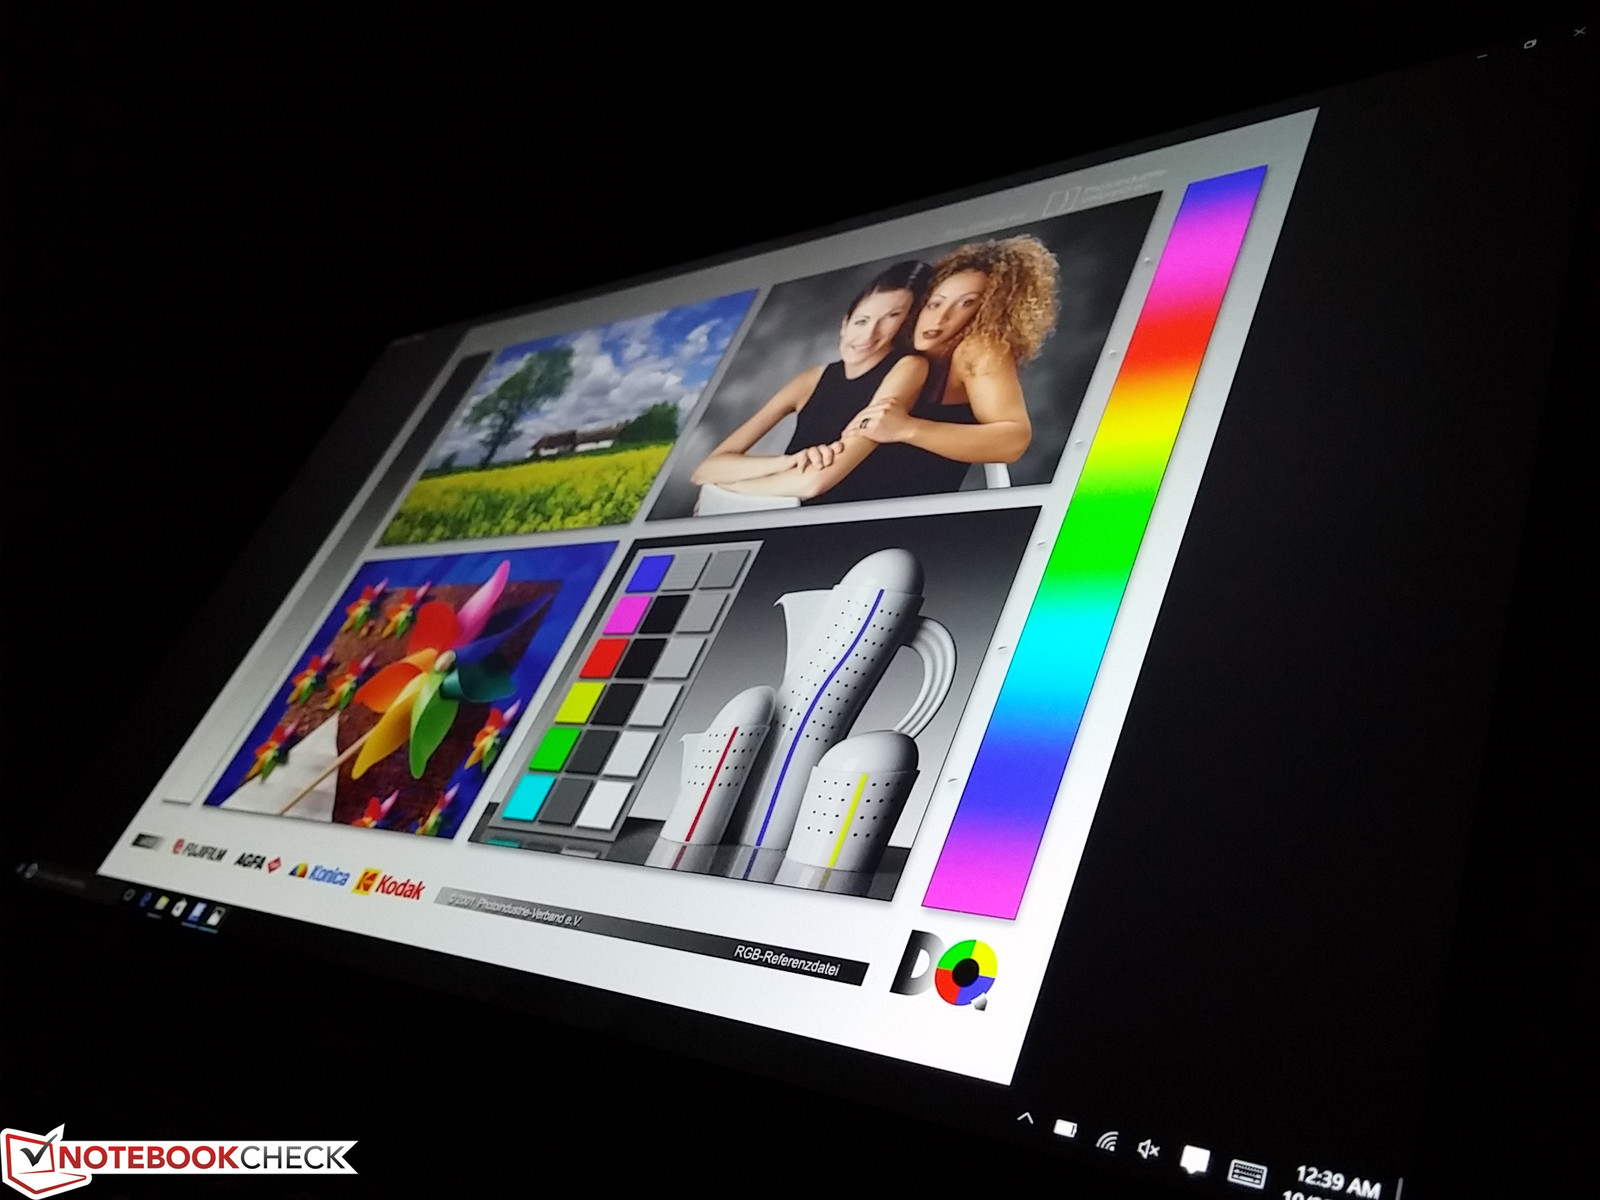
Outdoor visibility is limited due to the glossy screen. The backlight is just barely sufficient for comfortable use when under shade, but anything brighter like overcast or direct sunlight will wash out onscreen content. The 140-degree hinges and wide IPS viewing angles come in handy to reduce glare when outdoors, but apparent brightness still drops if viewing too far off from the center.
Performance
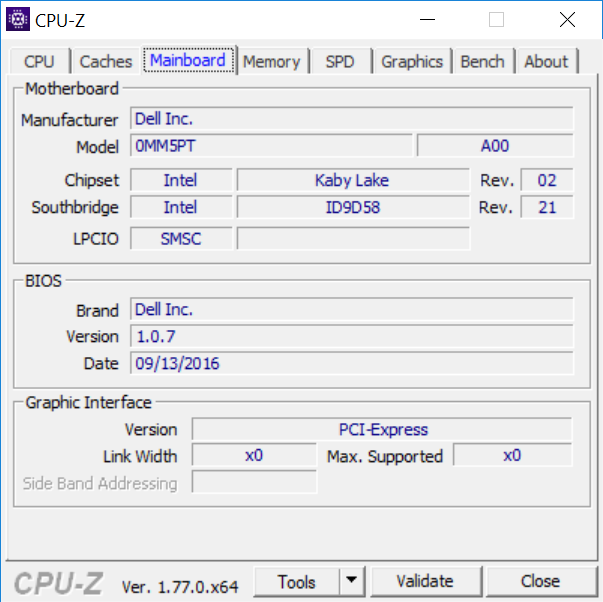
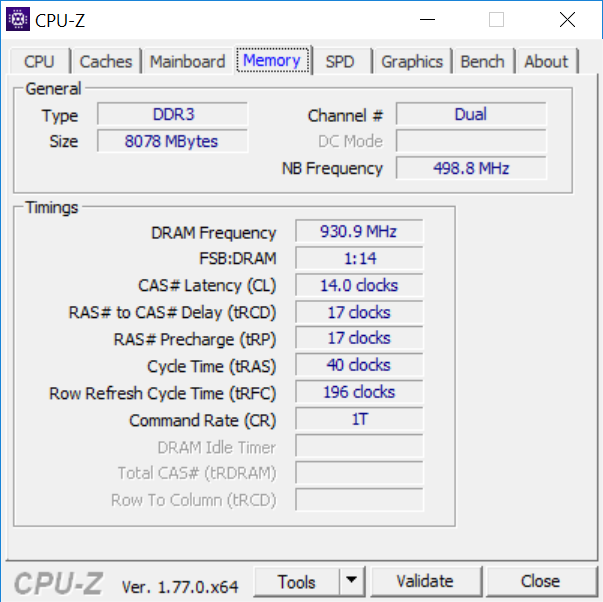
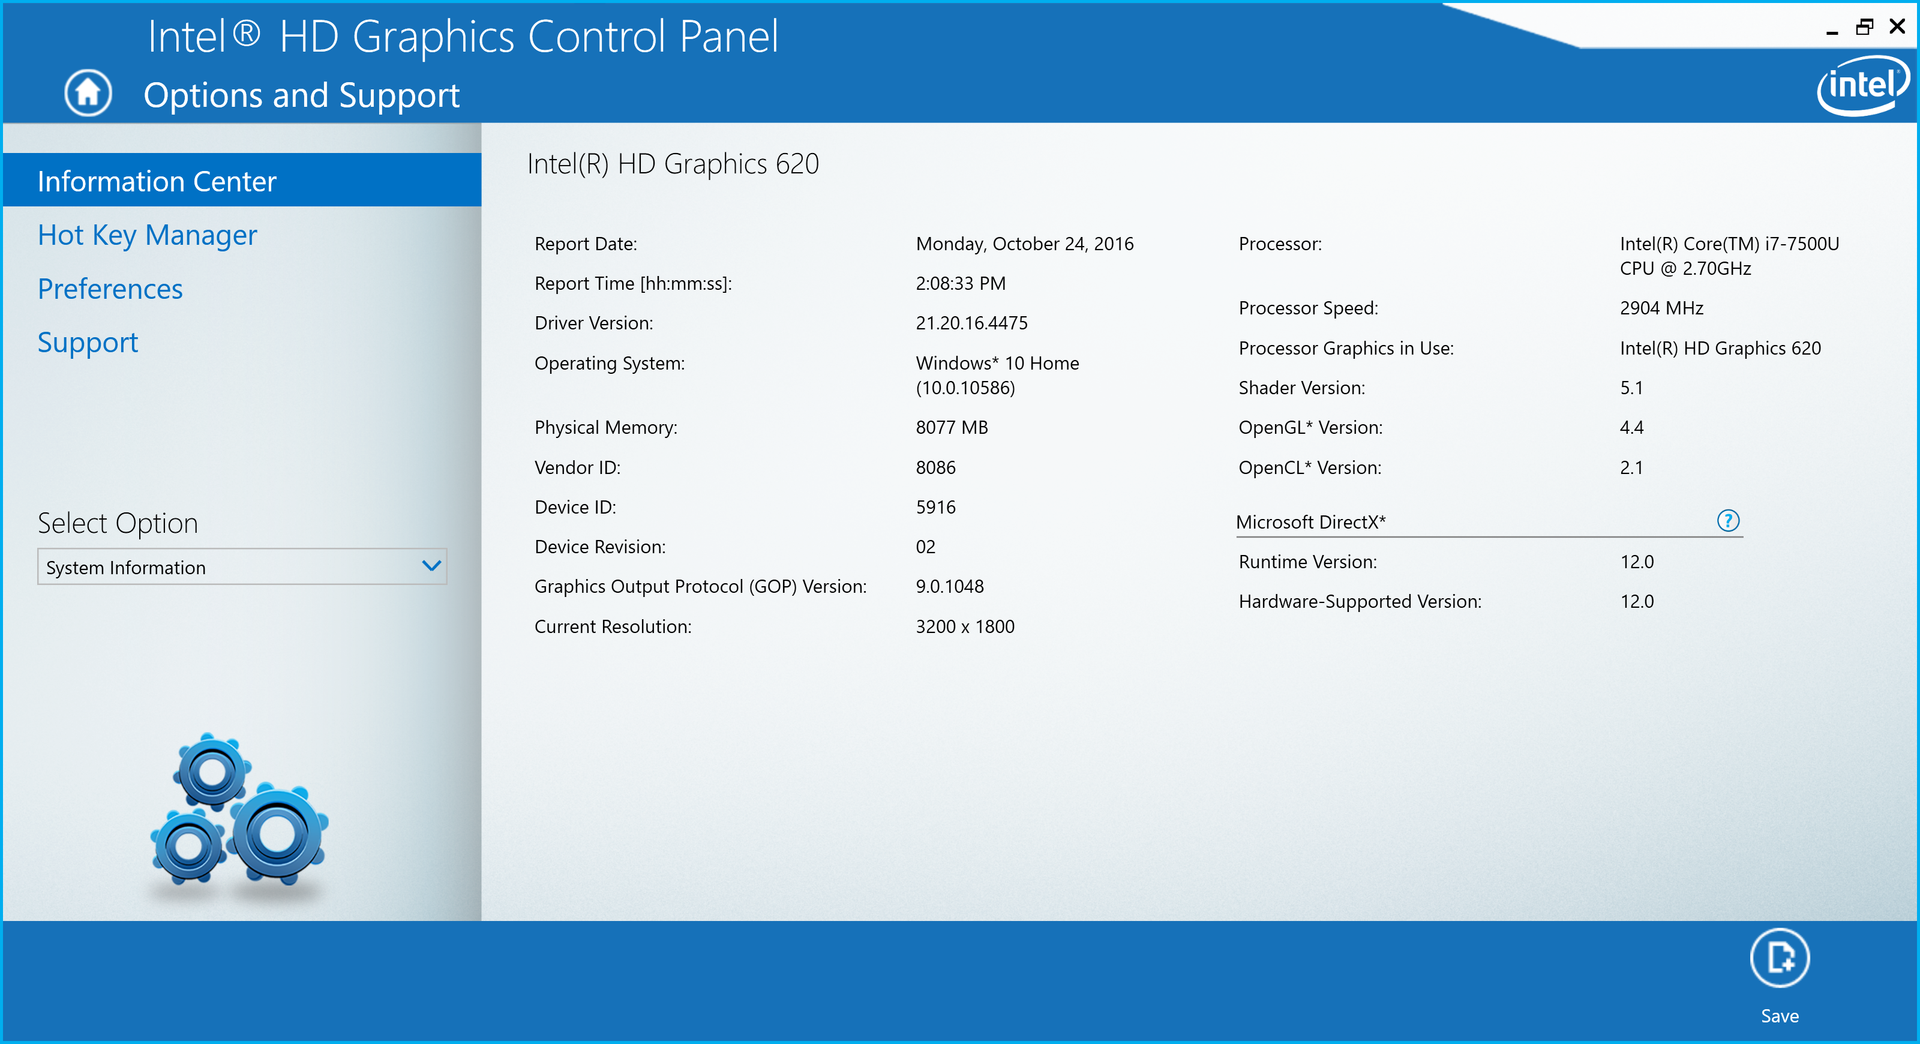
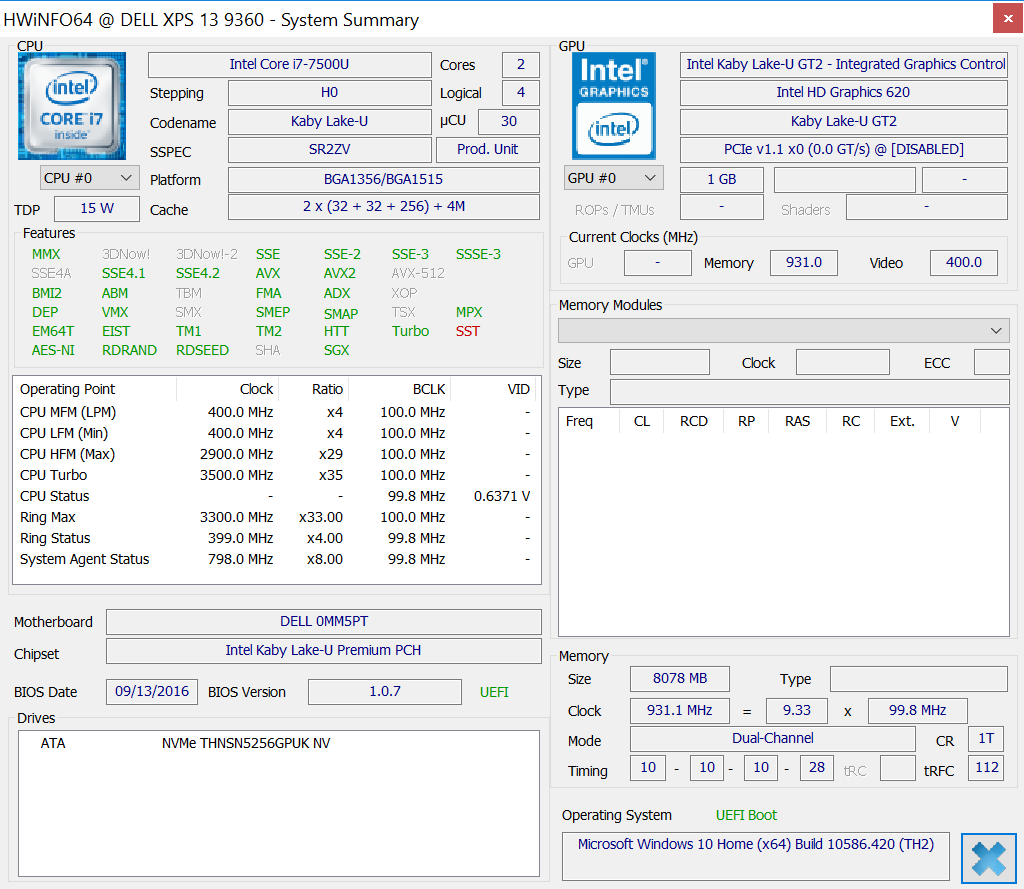
At least seven different SKUs are available with i7-7100U, i5-7200U, and i7-7500U ULV options, 4 GB to 16 GB of LPDDR3 RAM, 128 GB to 512 GB SSD, and FHD or QHD display. Dell has chosen to forego the more power-efficient DDR4 likely to save on costs or due to compatibility reasons. Our i7-7500U configuration directly replaces the previous XPS 15 9350 with the Skylake i7-6500U. There are currently no Kaby Lake XPS 13 options with Iris graphics to directly replace the XPS 13 9350 with the i7-6560U.
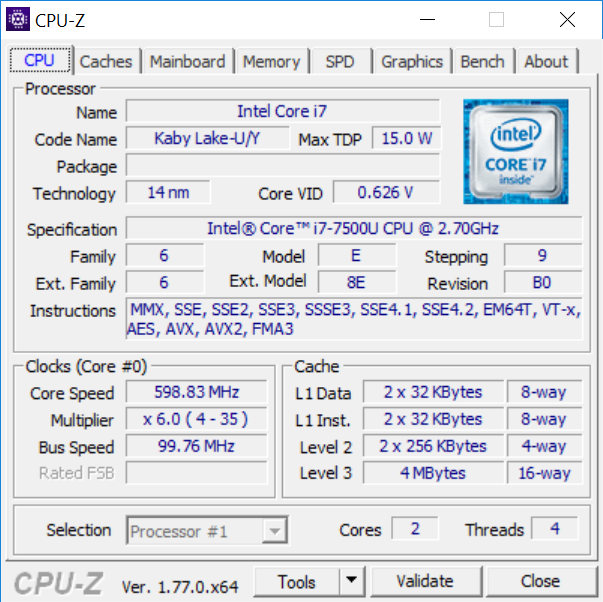
Processor
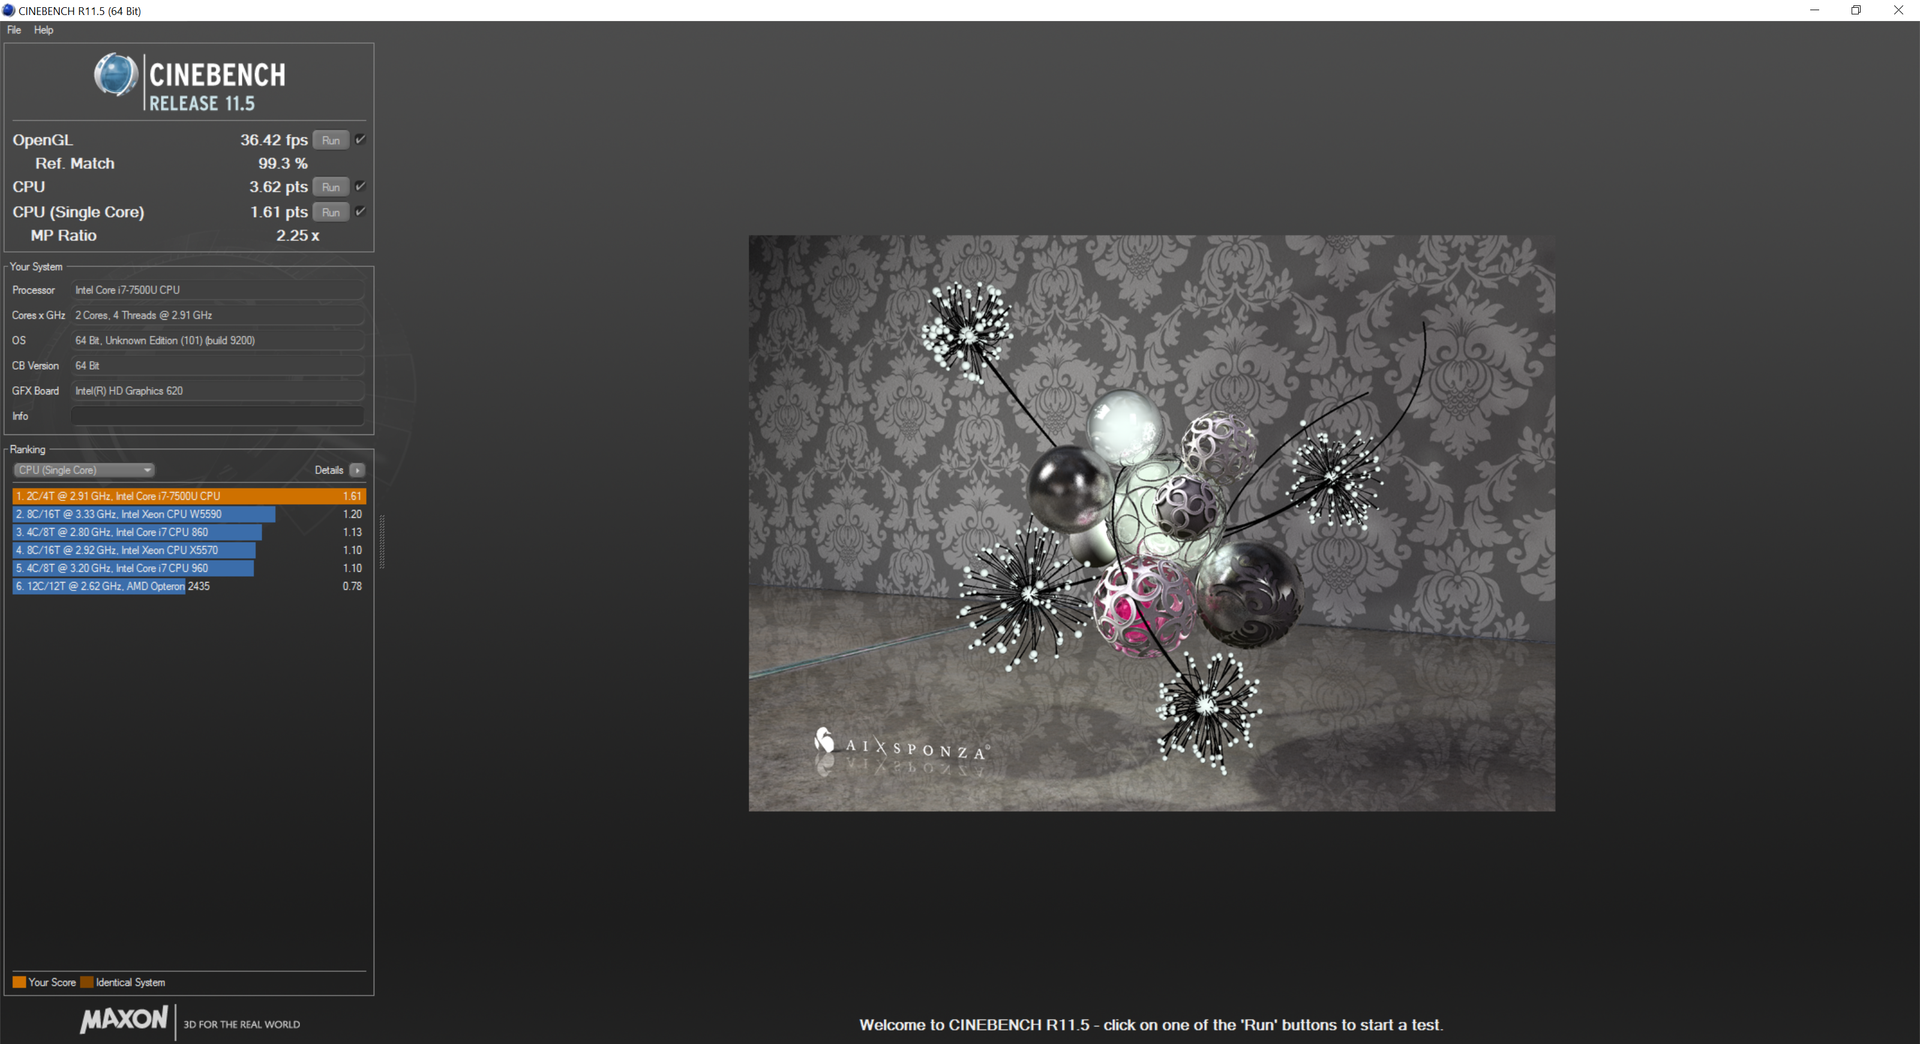
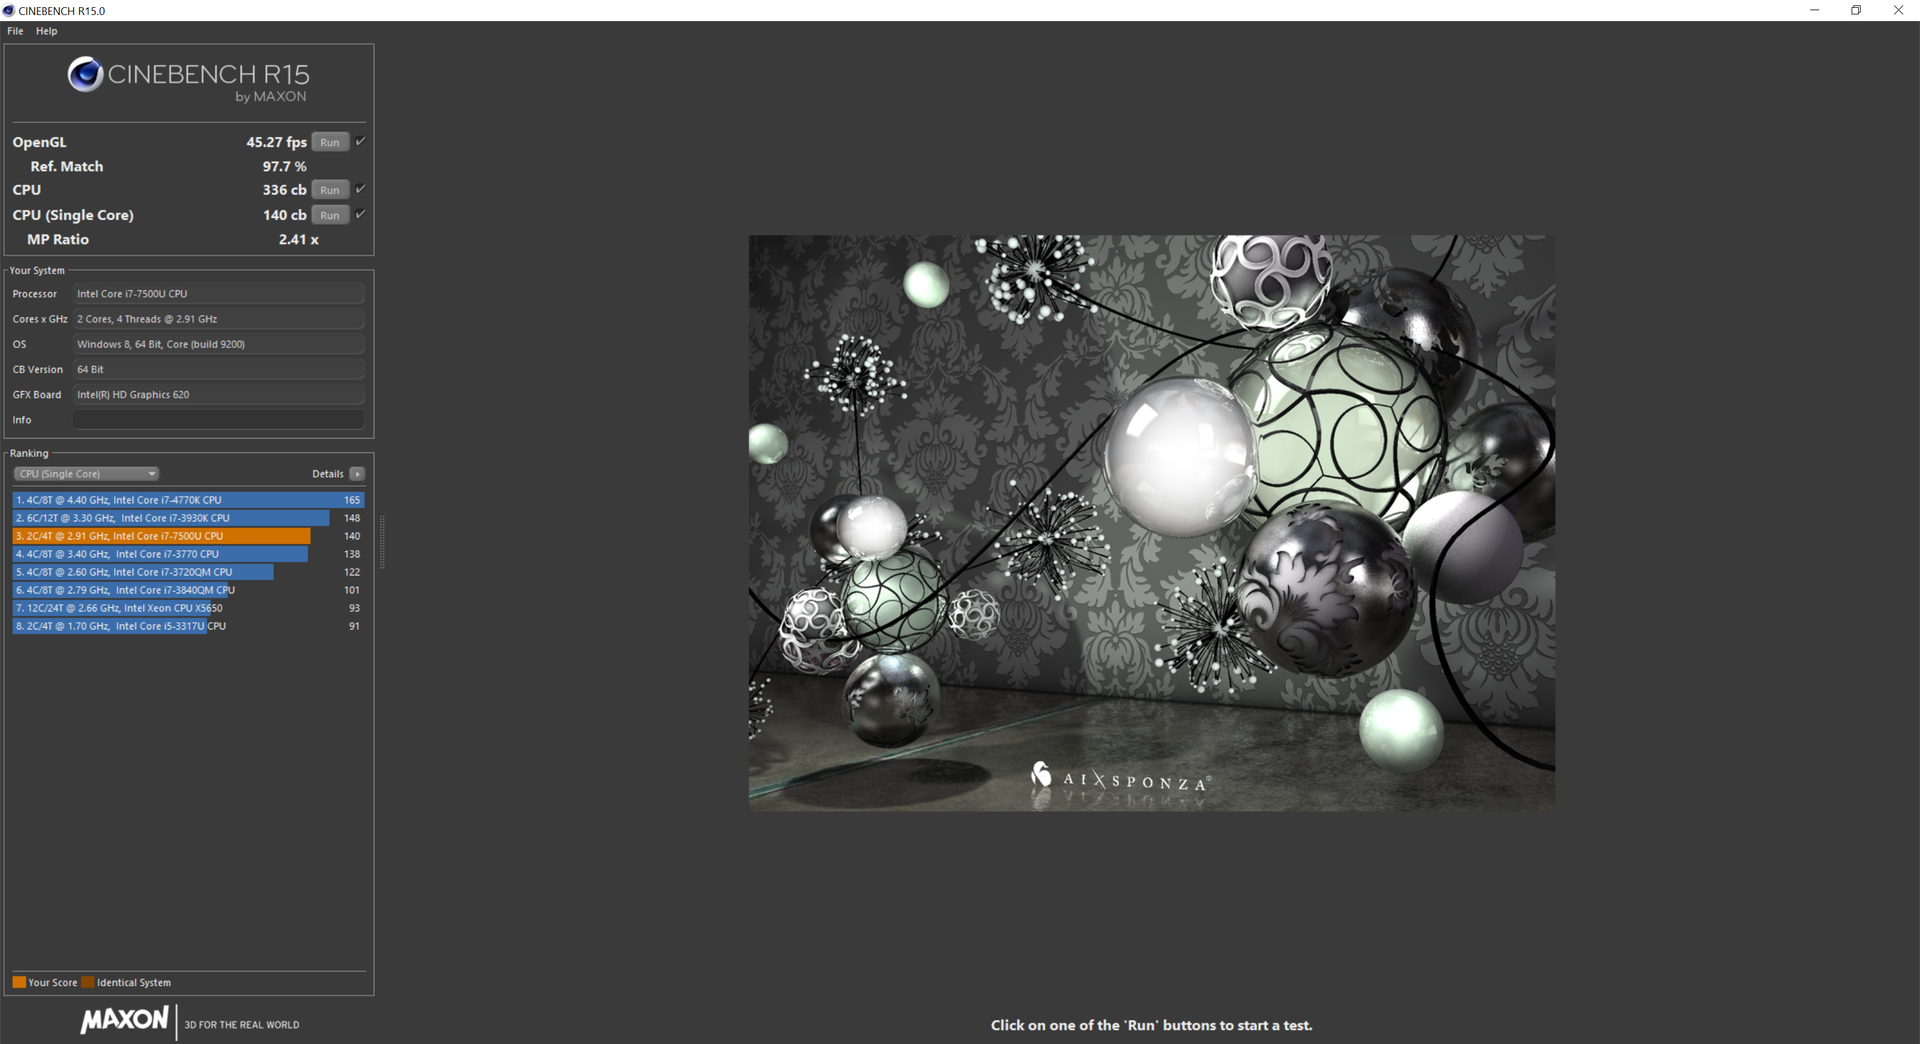
The i7-7500U offers marginally faster CPU performance than the Skylake i7-6500U at just a few percentage points according to CineBench benchmarks. The same Kaby Lake CPU in our MSI CX72 reference is faster still due to its superior Turbo Boost performance when under high loads compared to the XPS 13 9360. Nonetheless, users can expect a 10 to 15 percent performance boost from the XPS 13 i7-7500U SKU over the i5-7200U SKU.
See our dedicated CPU page on the Core i7-7500U for more benchmark comparisons and our review on the new Kaby Lake series for more technical details.
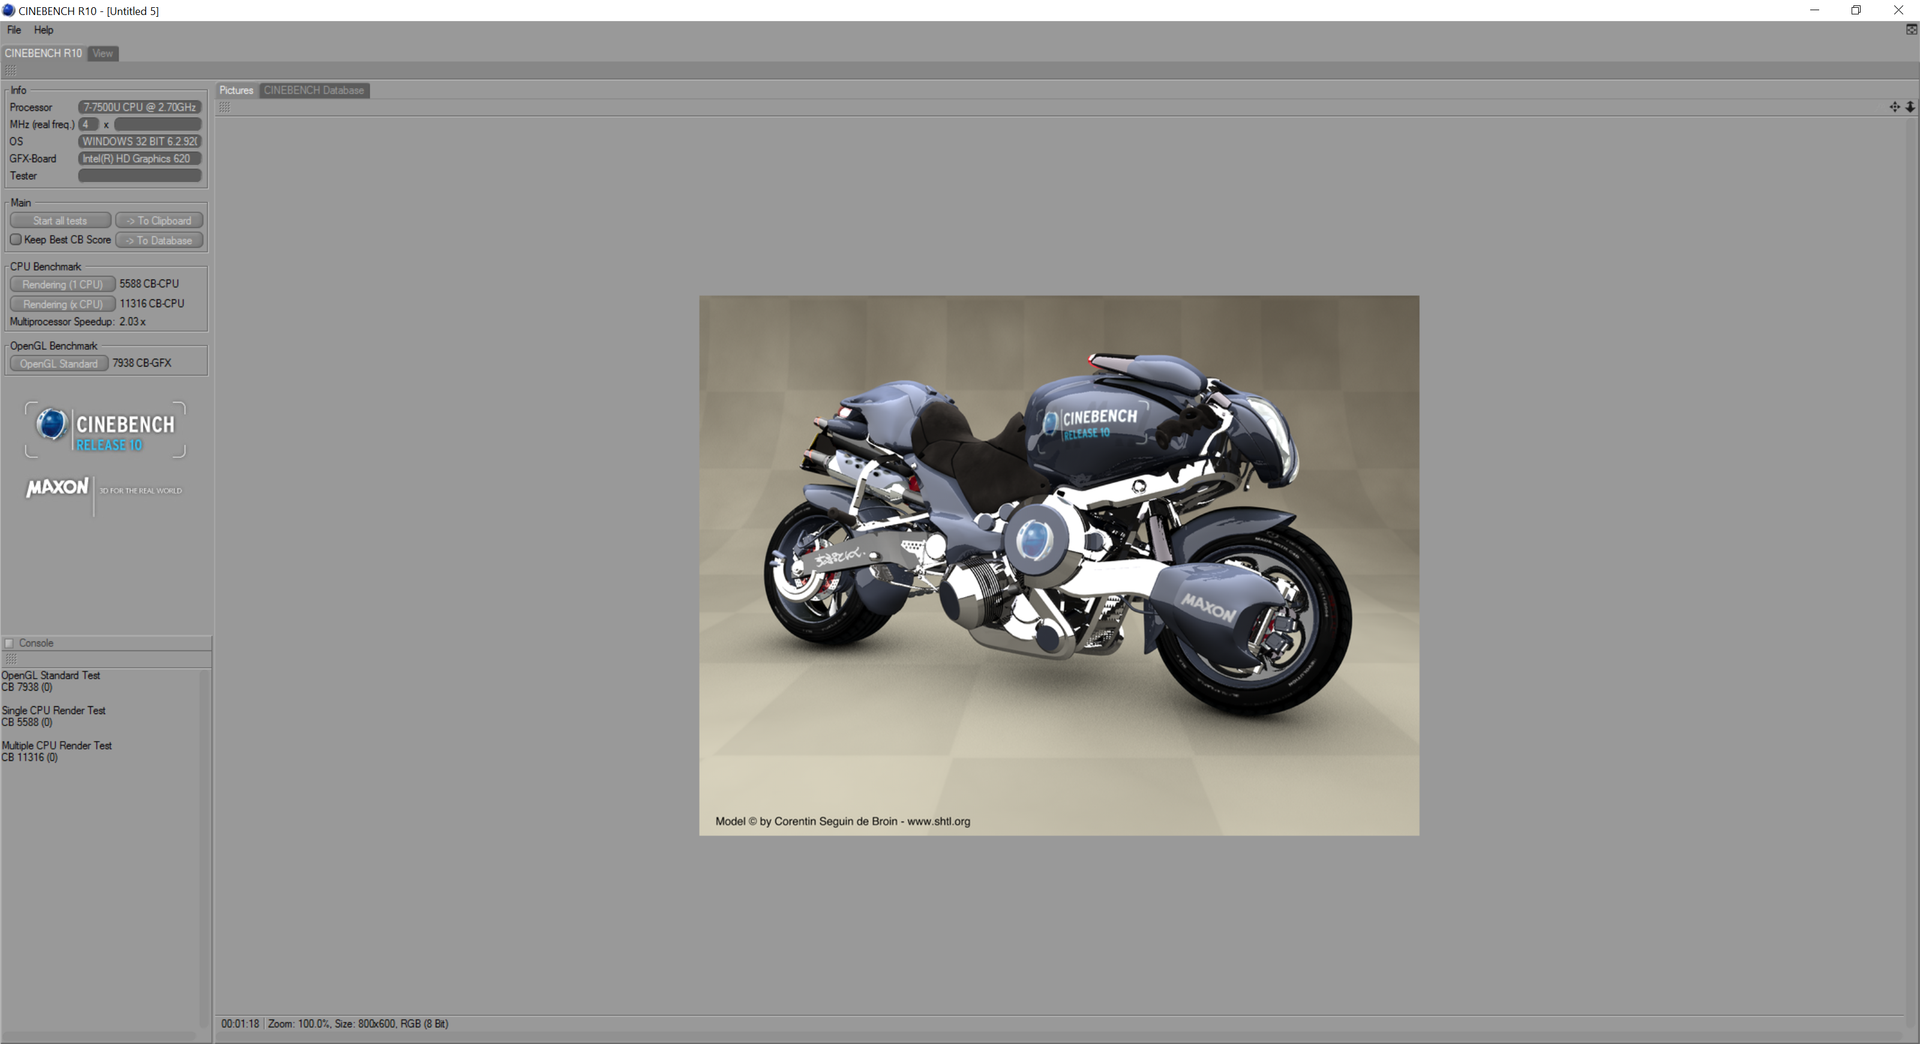
| Cinebench R10 | |
| Rendering Multiple CPUs 32Bit | |
| Intel Skull Canyon NUC6i7KYK | |
| MSI CX72-7QL | |
| Dell XPS 13 9360 QHD+ i7 | |
| Acer Aspire E5-774G-78NA | |
| Lenovo U31-70 80M5003EGE | |
| Rendering Single 32Bit | |
| MSI CX72-7QL | |
| Dell XPS 13 9360 QHD+ i7 | |
| Intel Skull Canyon NUC6i7KYK | |
| Acer Aspire E5-774G-78NA | |
| Lenovo U31-70 80M5003EGE | |
| wPrime 2.10 - 1024m | |
| Lenovo Y40-59423035 | |
| Dell XPS 13 9360 QHD+ i5 | |
| Dell XPS 13 9360 QHD+ i7 | |
| MSI CX72-7QL | |
| Intel Skull Canyon NUC6i7KYK | |
| Super Pi Mod 1.5 XS 32M - 32M | |
| Lenovo Y40-59423035 | |
| Dell XPS 13 9360 QHD+ i7 | |
| MSI CX72-7QL | |
| Intel Skull Canyon NUC6i7KYK | |
* ... smaller is better
System Performance
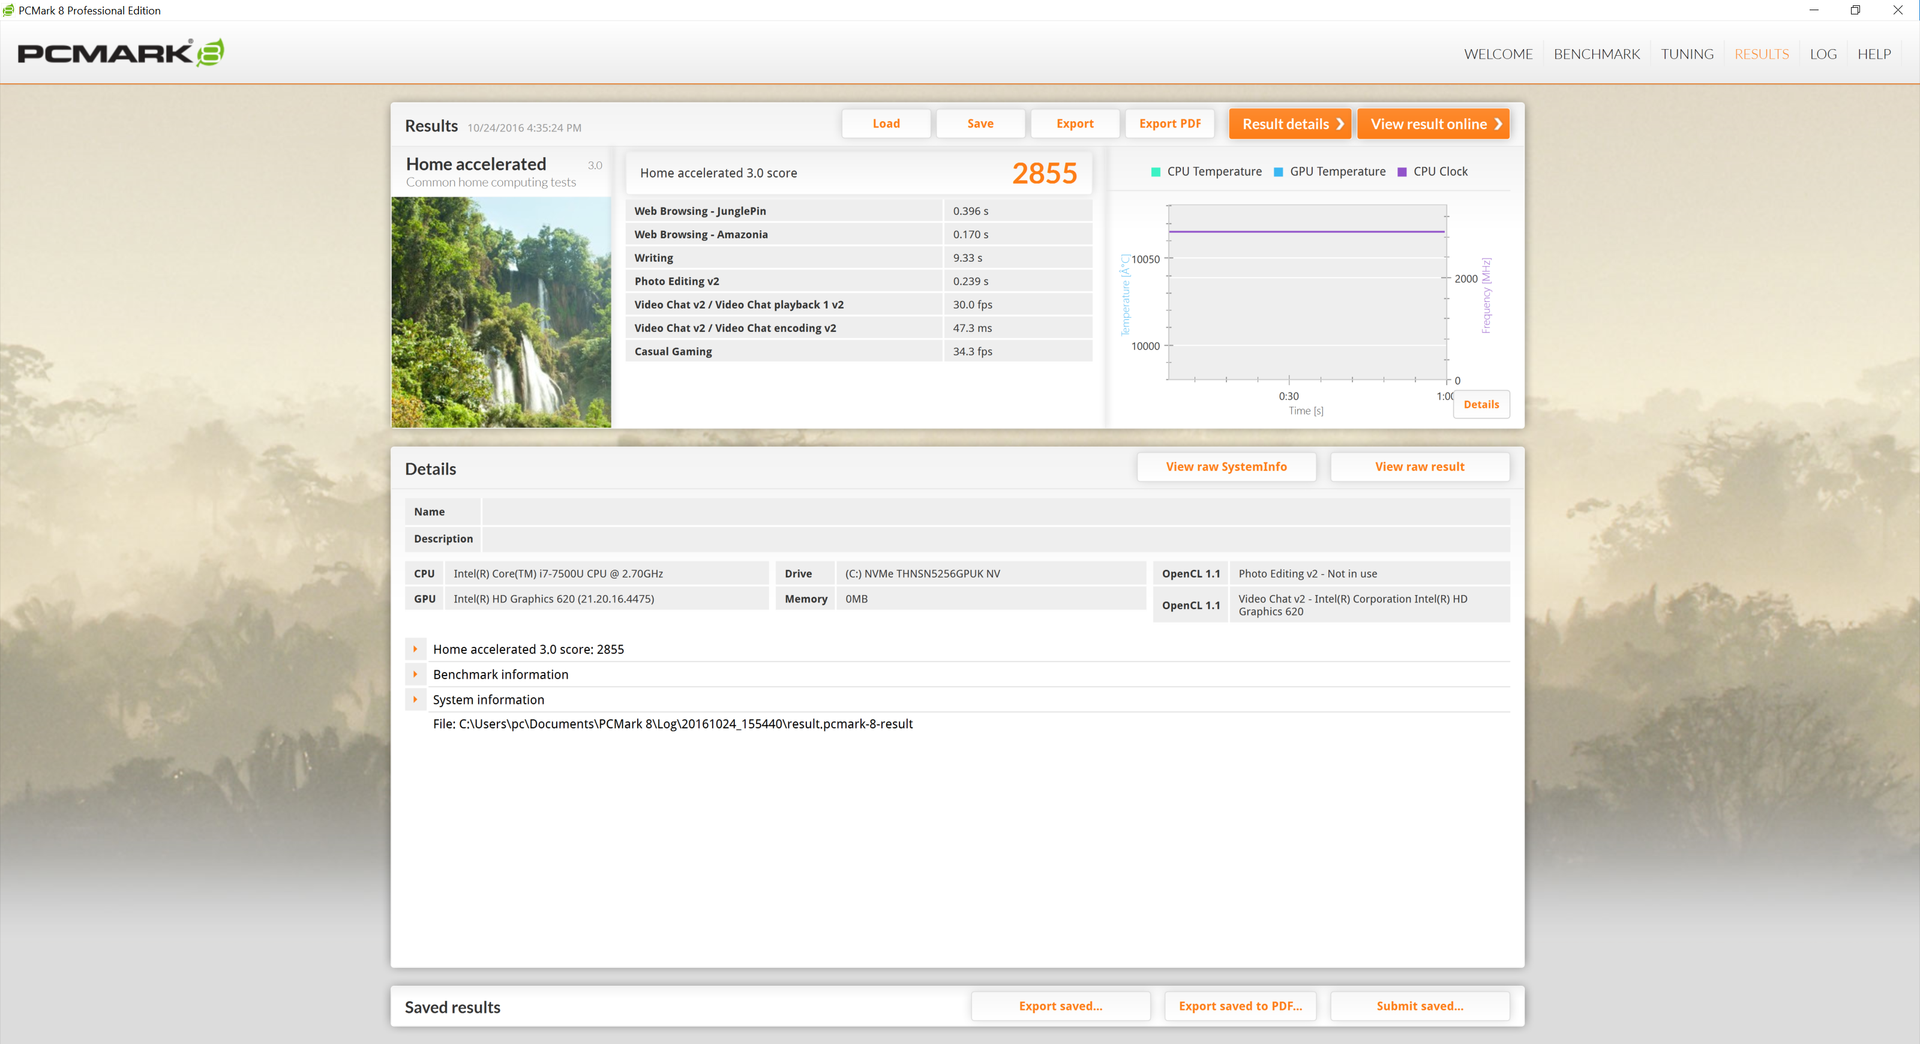
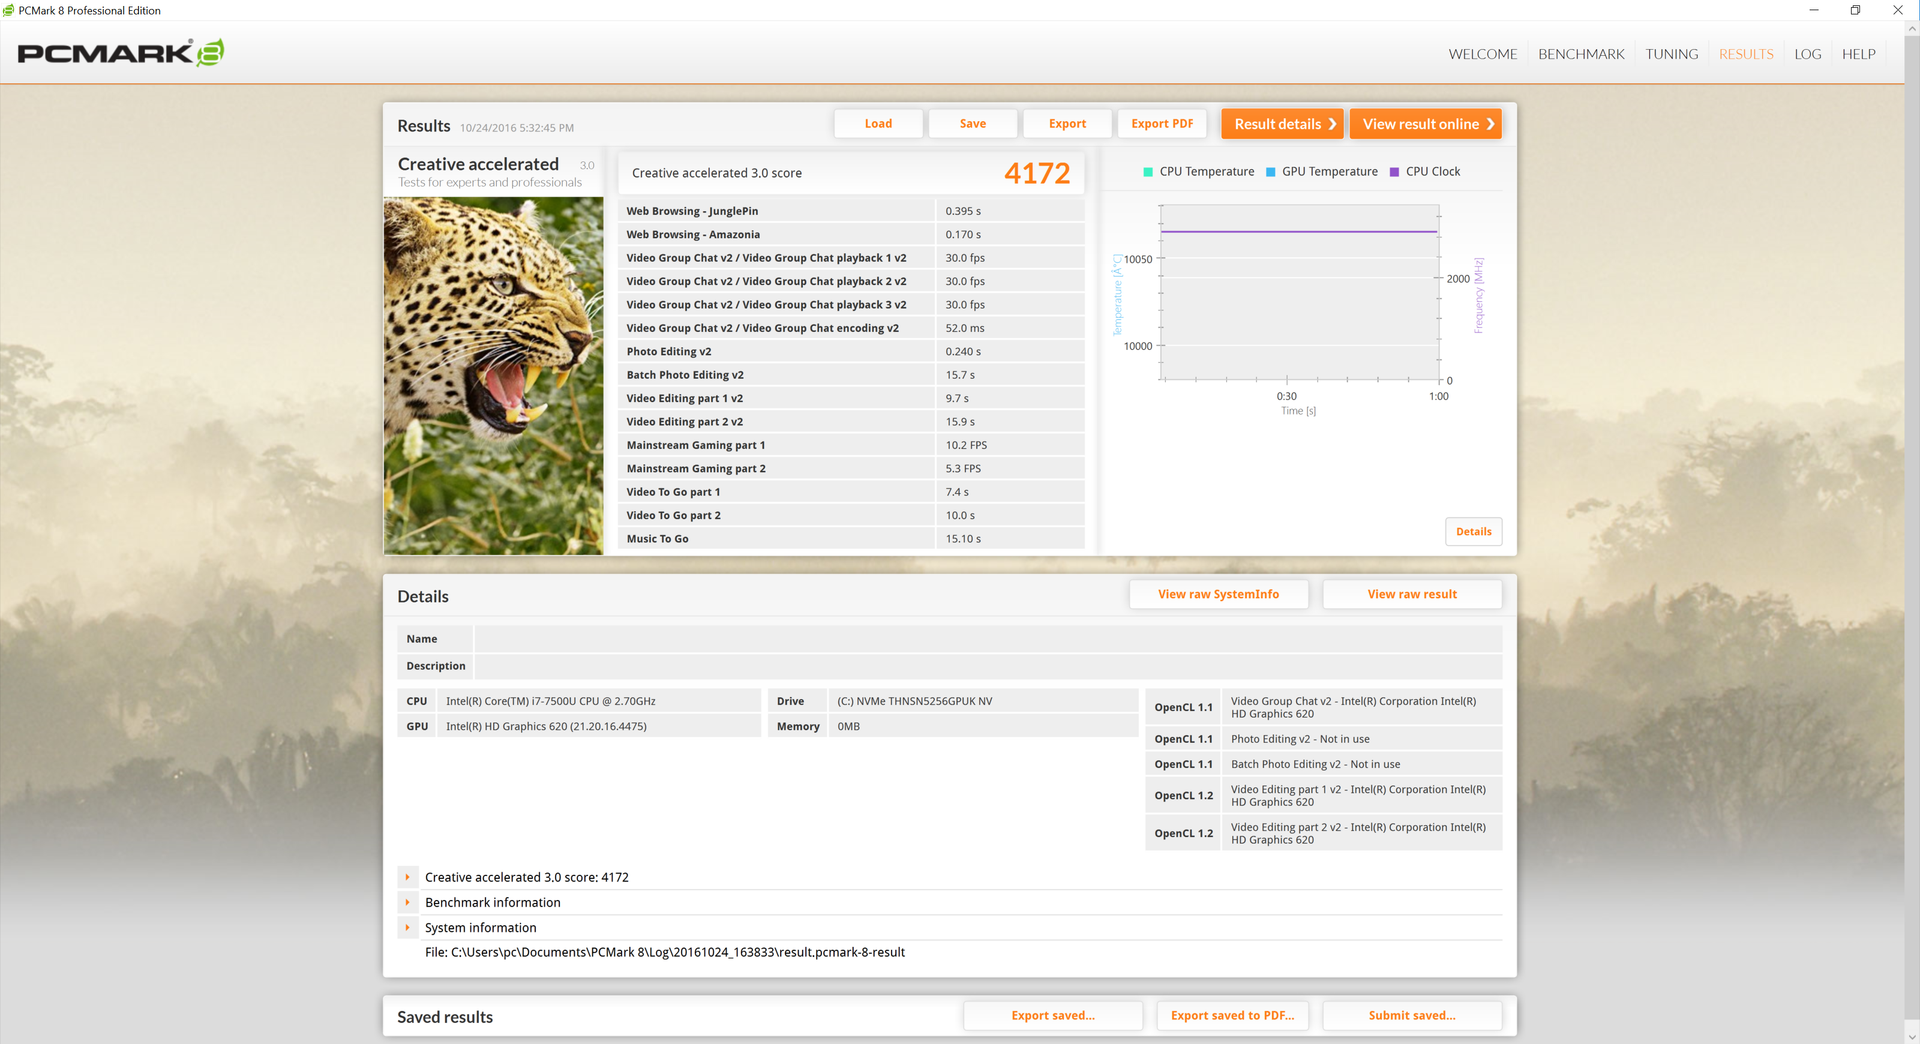
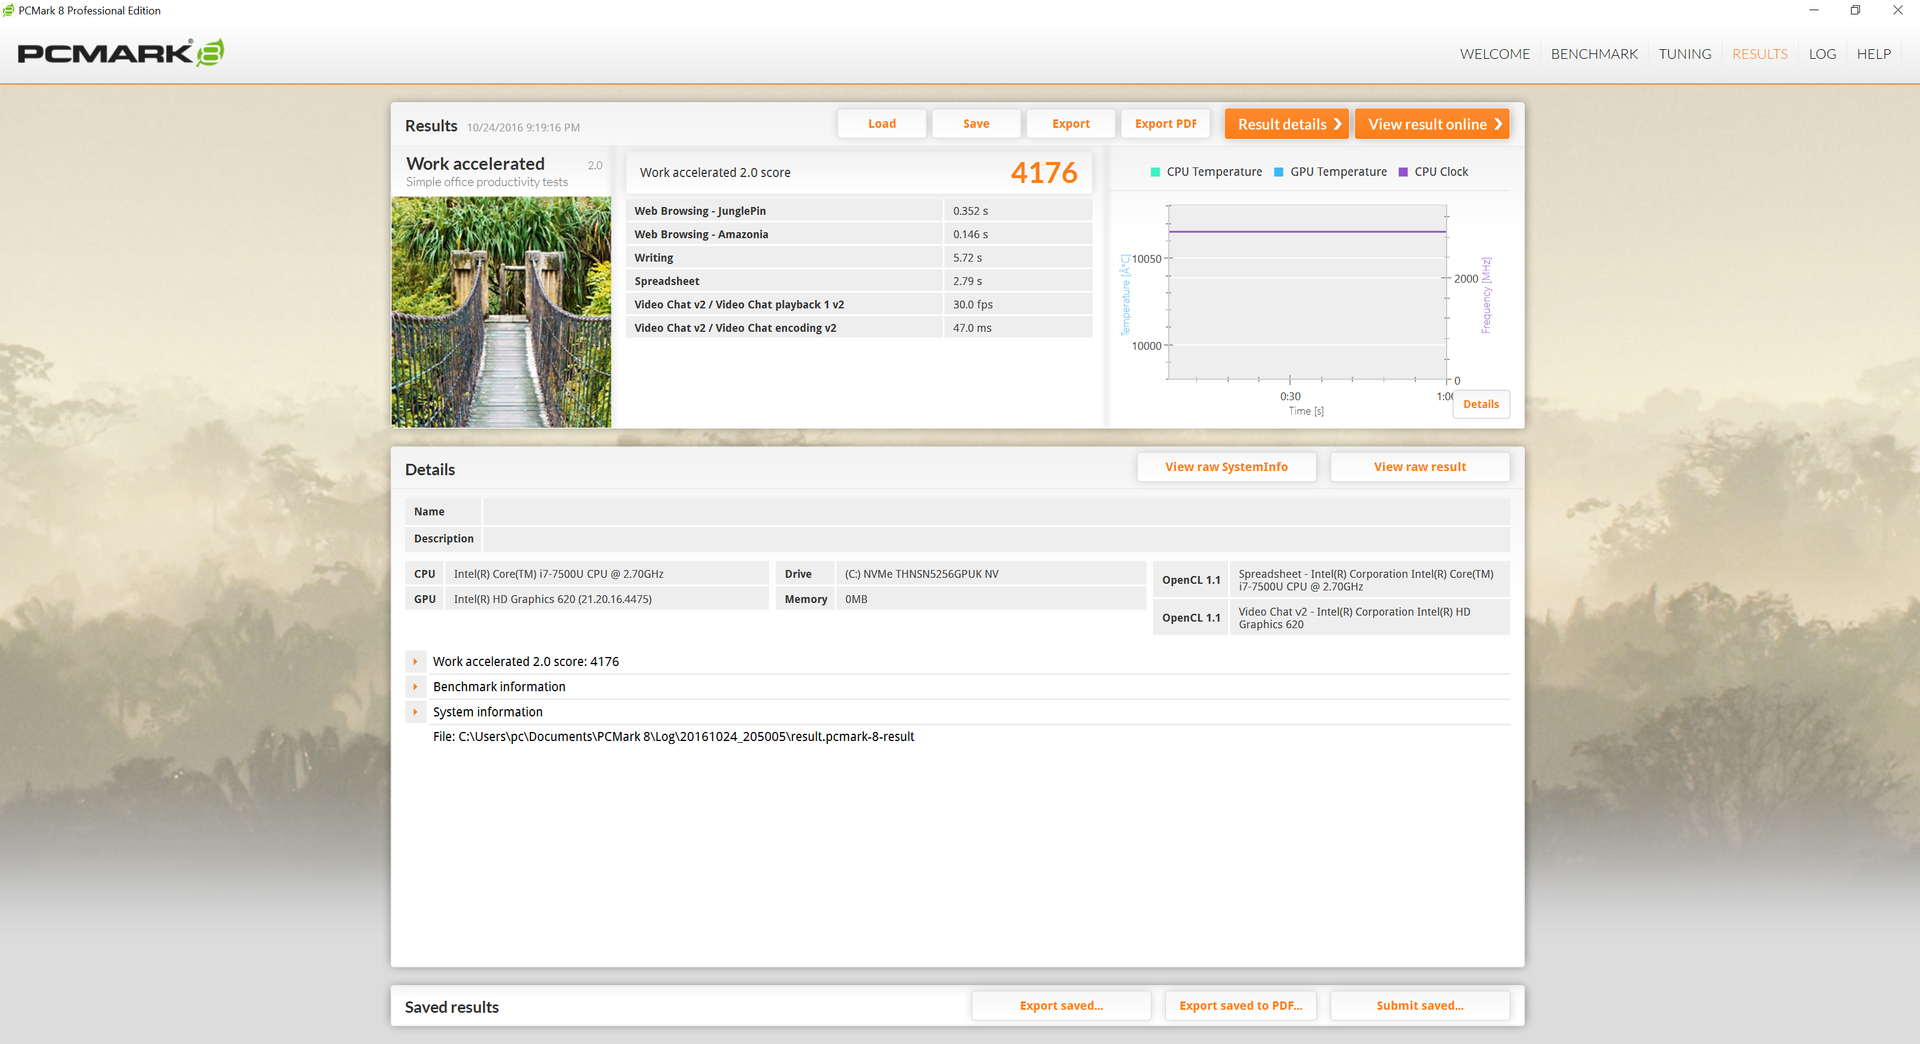
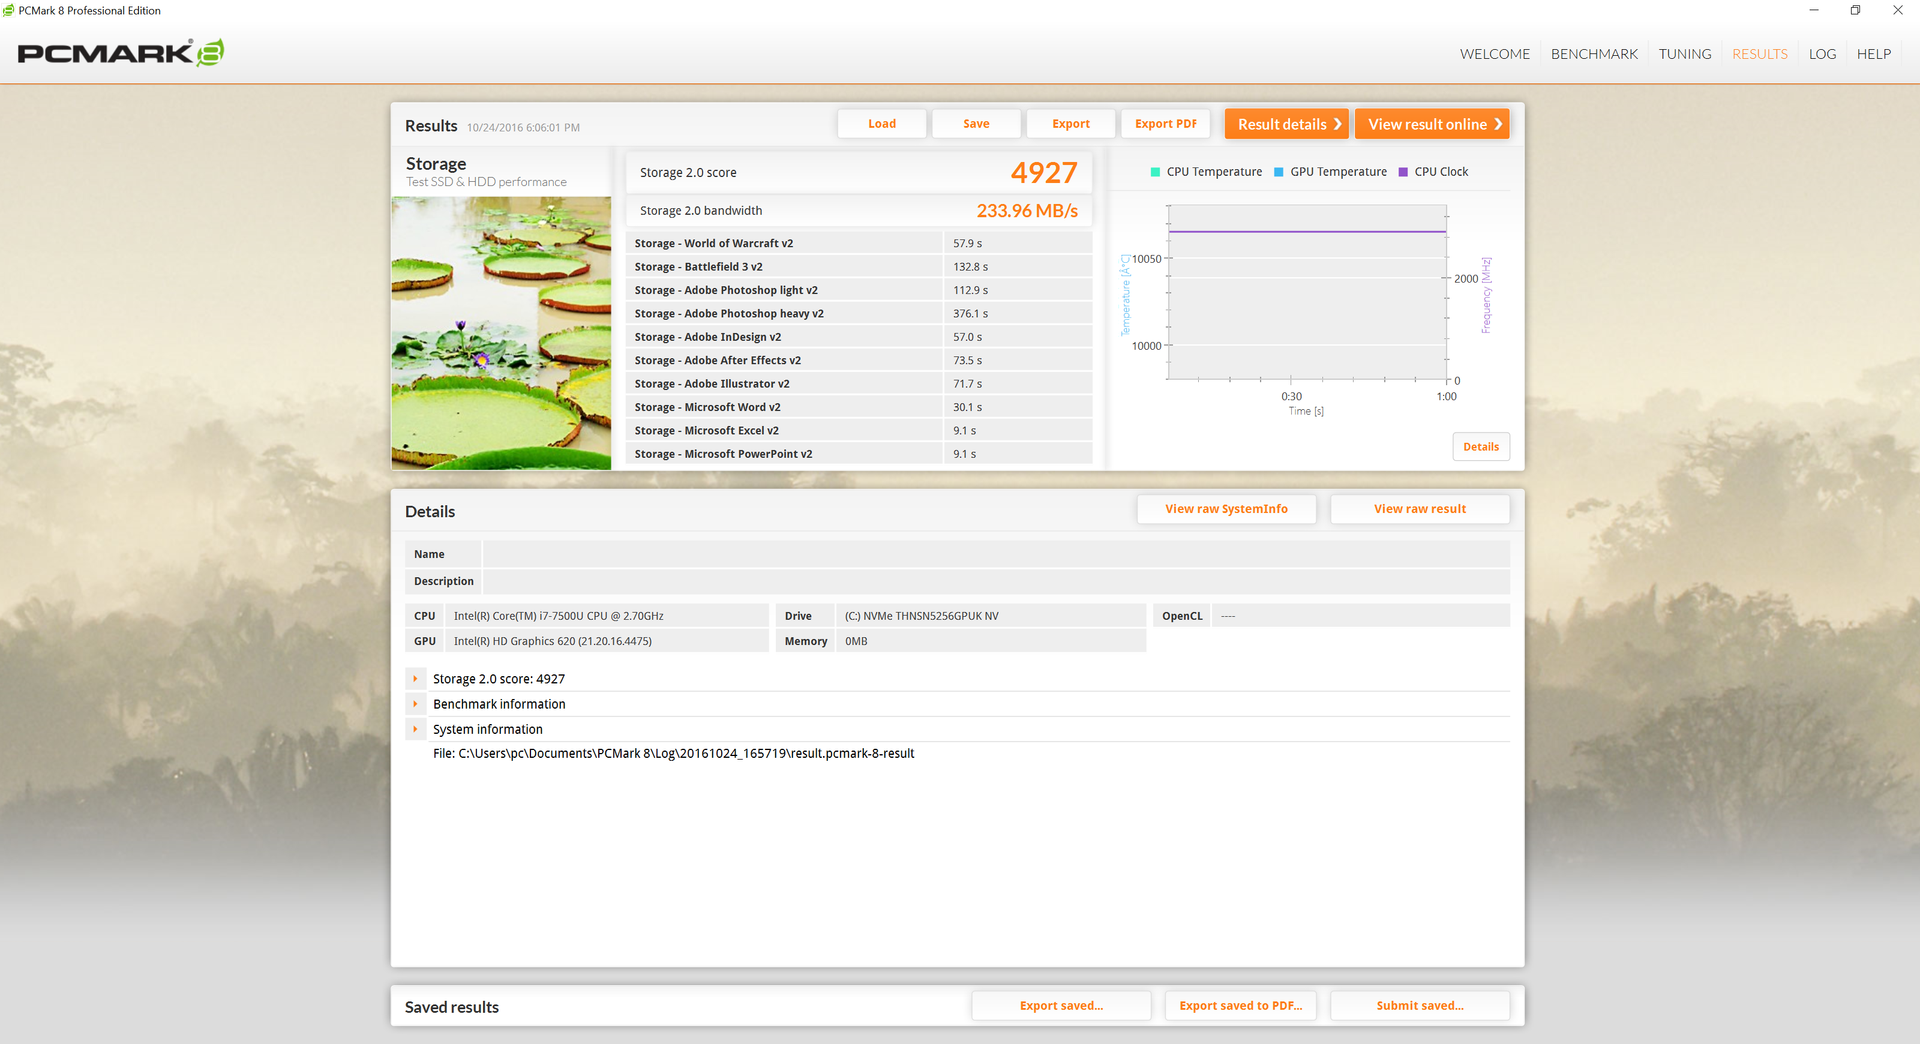
PCMark benchmarks rank our configuration lower than many competing systems with older processors including the Spectre 13 and the Zenbook UX360UA. it does, however, outscore the XPS 13 i5-7200U SKU by three percentage points.
Subjectively, system performance is very fast as expected from a SSD-based system. We experienced no software or hardware issues during our time with i7-7500U SKU aside from the inconvenient dynamic brightness control.
| PCMark 8 | |
| Home Score Accelerated v2 | |
| Intel Skull Canyon NUC6i7KYK | |
| HP Spectre x360 13-w023dx | |
| HP Spectre 13 | |
| Asus Zenbook UX360UA-C4159T | |
| Dell XPS 13 9360 QHD+ i7 | |
| Dell XPS 13 9360 QHD+ i5 | |
| Work Score Accelerated v2 | |
| Intel Skull Canyon NUC6i7KYK | |
| HP Spectre x360 13-w023dx | |
| HP Spectre 13 | |
| Asus Zenbook UX360UA-C4159T | |
| Dell XPS 13 9360 QHD+ i7 | |
| Creative Score Accelerated v2 | |
| Intel Skull Canyon NUC6i7KYK | |
| HP Spectre x360 13-w023dx | |
| HP Spectre 13 | |
| Dell XPS 13 9360 QHD+ i7 | |
| PCMark 8 Home Score Accelerated v2 | 2855 points | |
| PCMark 8 Creative Score Accelerated v2 | 4172 points | |
| PCMark 8 Work Score Accelerated v2 | 4176 points | |
Help | ||
Storage Devices
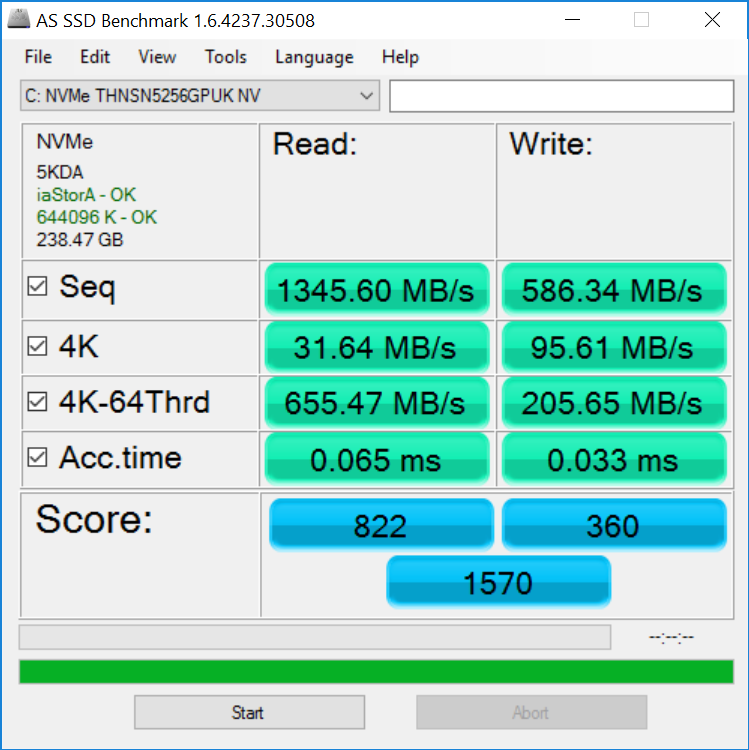
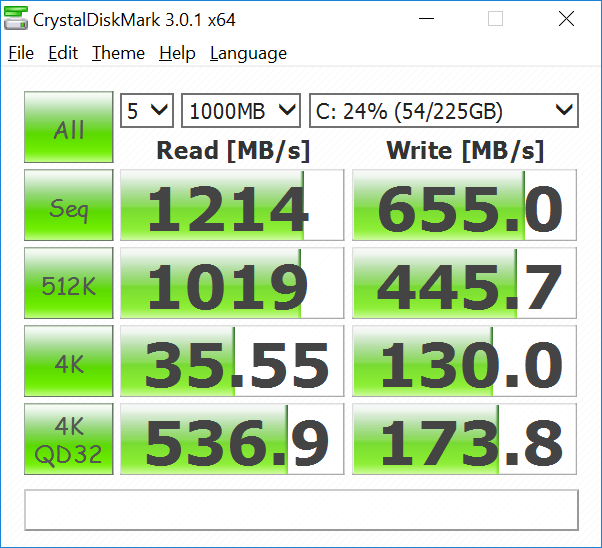
Our Dell XPS 13 i7 SKU houses the same 256 GB Toshiba NVMe SSD as our XPS 13 i5 SKU and our results below show very similar overall results. Sequential write rates, however, are about twice as fast as on our i5 SKU possibly due to background activity during the benchmark. Otherwise, performance is not unlike other PCIe NVMe SSDs including the Samsung PM951 and the Apple SD0256F. Other SSDs limited by the SATA III interface will run substantially slower.
See our table of HDDs and SSDs for more benchmarks and comparisons.
| Dell XPS 13 9360 QHD+ i7 Toshiba NVMe THNSN5256GPUK | HP Spectre x360 13-w023dx Samsung PM951 NVMe MZVLV512 | HP EliteBook 1030 G1-X2F03EA Sandisk X300 SD7SN6S-512G-1006 | Apple MacBook Air 13 inch 2015-03 Apple SSD SD0256F | Dell XPS 13 9360 QHD+ i5 Toshiba NVMe THNSN5256GPUK | |
|---|---|---|---|---|---|
| CrystalDiskMark 3.0 | 16% | -38% | 18% | -1% | |
| Read Seq (MB/s) | 1214 | 1376 13% | 387.5 -68% | 1352 11% | 1168 -4% |
| Write Seq (MB/s) | 655 | 571 -13% | 348.7 -47% | 1111 70% | 329 -50% |
| Read 512 (MB/s) | 1019 | 679 -33% | 239.9 -76% | 880 -14% | 1015 0% |
| Write 512 (MB/s) | 445.7 | 571 28% | 335.3 -25% | 1023 130% | 307 -31% |
| Read 4k (MB/s) | 35.55 | 42.66 20% | 30.34 -15% | 21.93 -38% | 33 -7% |
| Write 4k (MB/s) | 130 | 137.9 6% | 75.9 -42% | 30.94 -76% | 132 2% |
| Read 4k QD32 (MB/s) | 537 | 535 0% | 311.3 -42% | 339.5 -37% | 525 -2% |
| Write 4k QD32 (MB/s) | 173.8 | 361.2 108% | 192.8 11% | 342.9 97% | 325 87% |

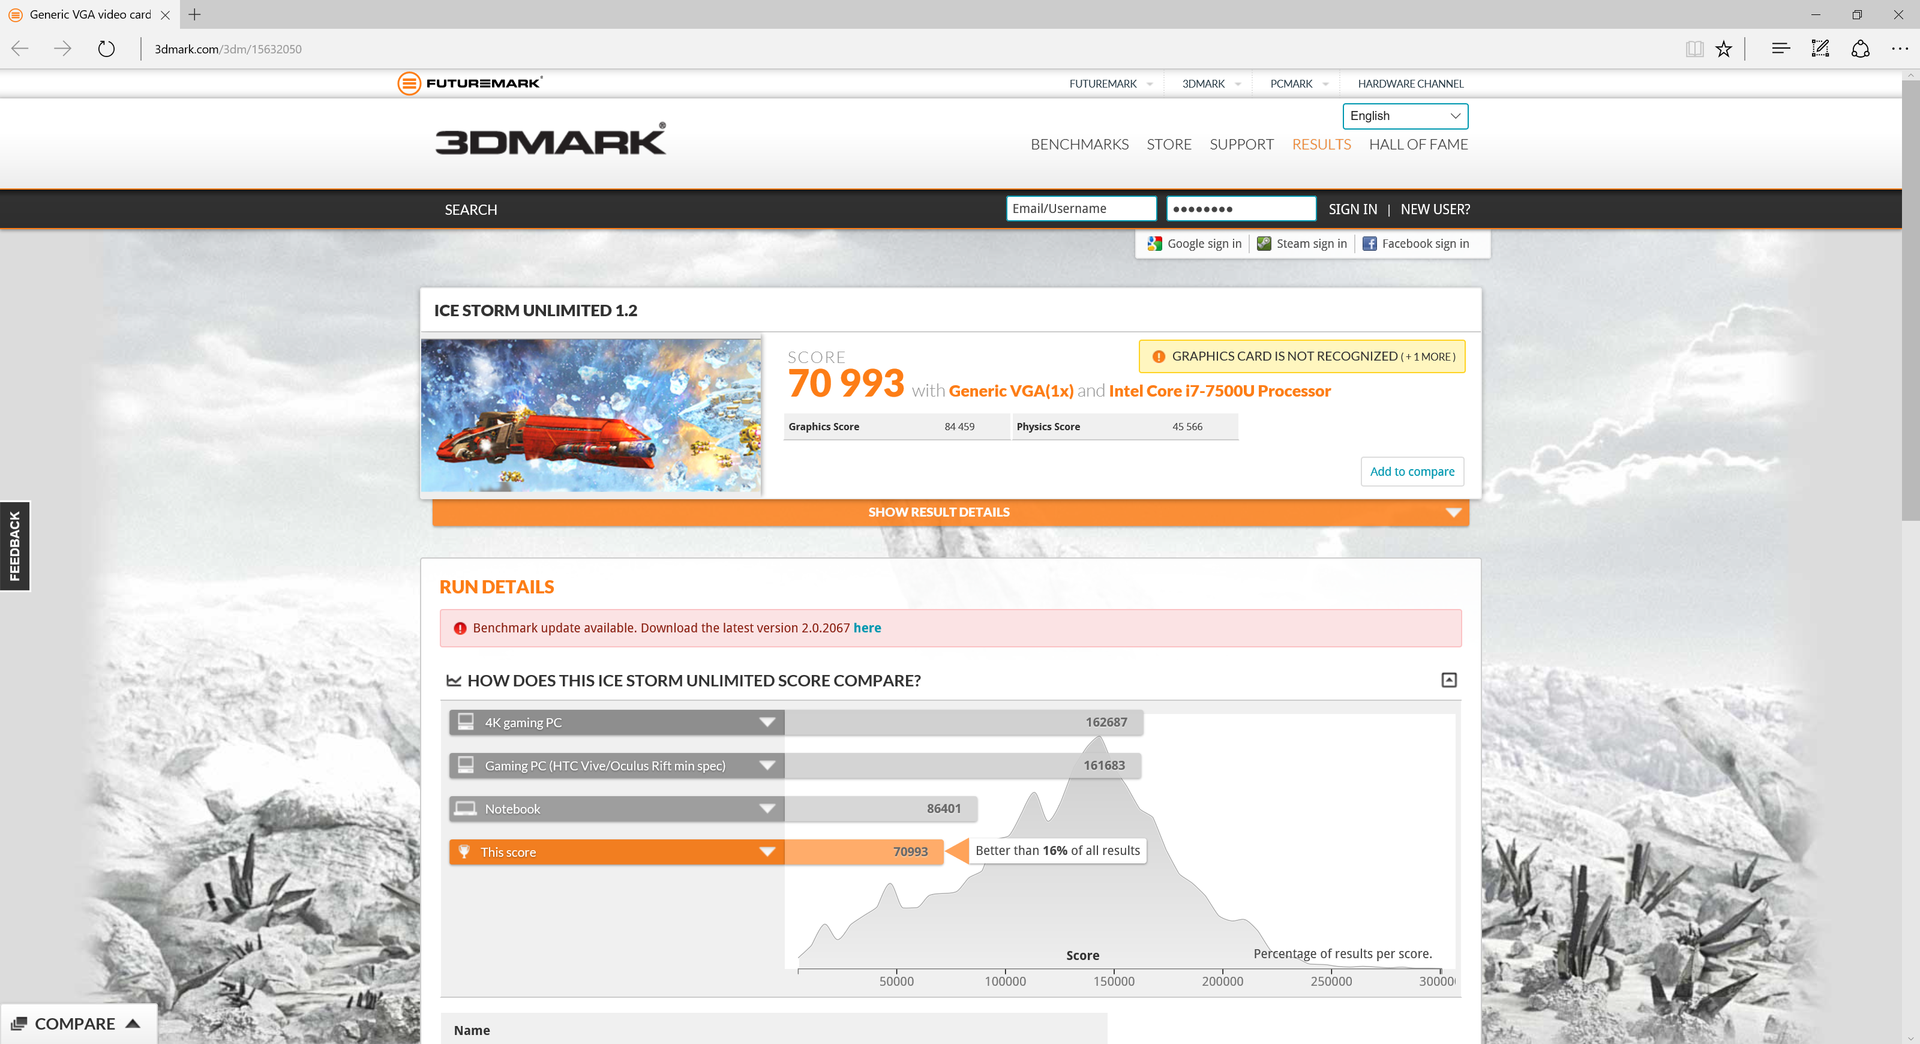
GPU Performance
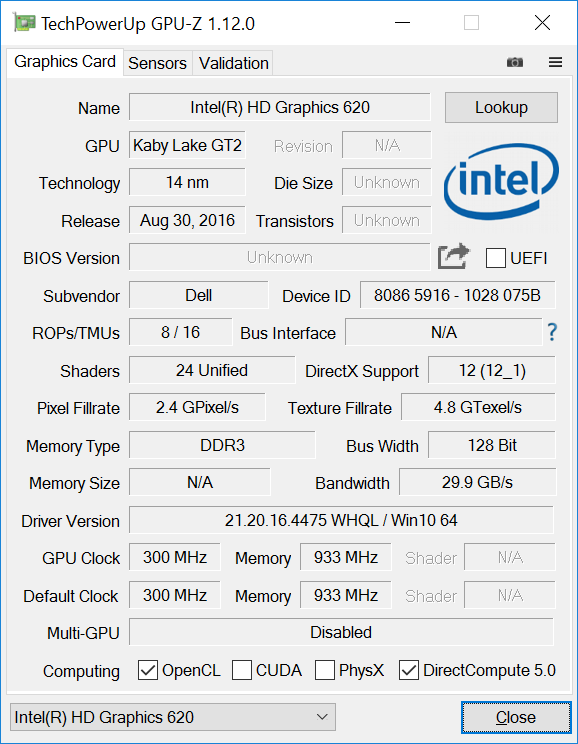
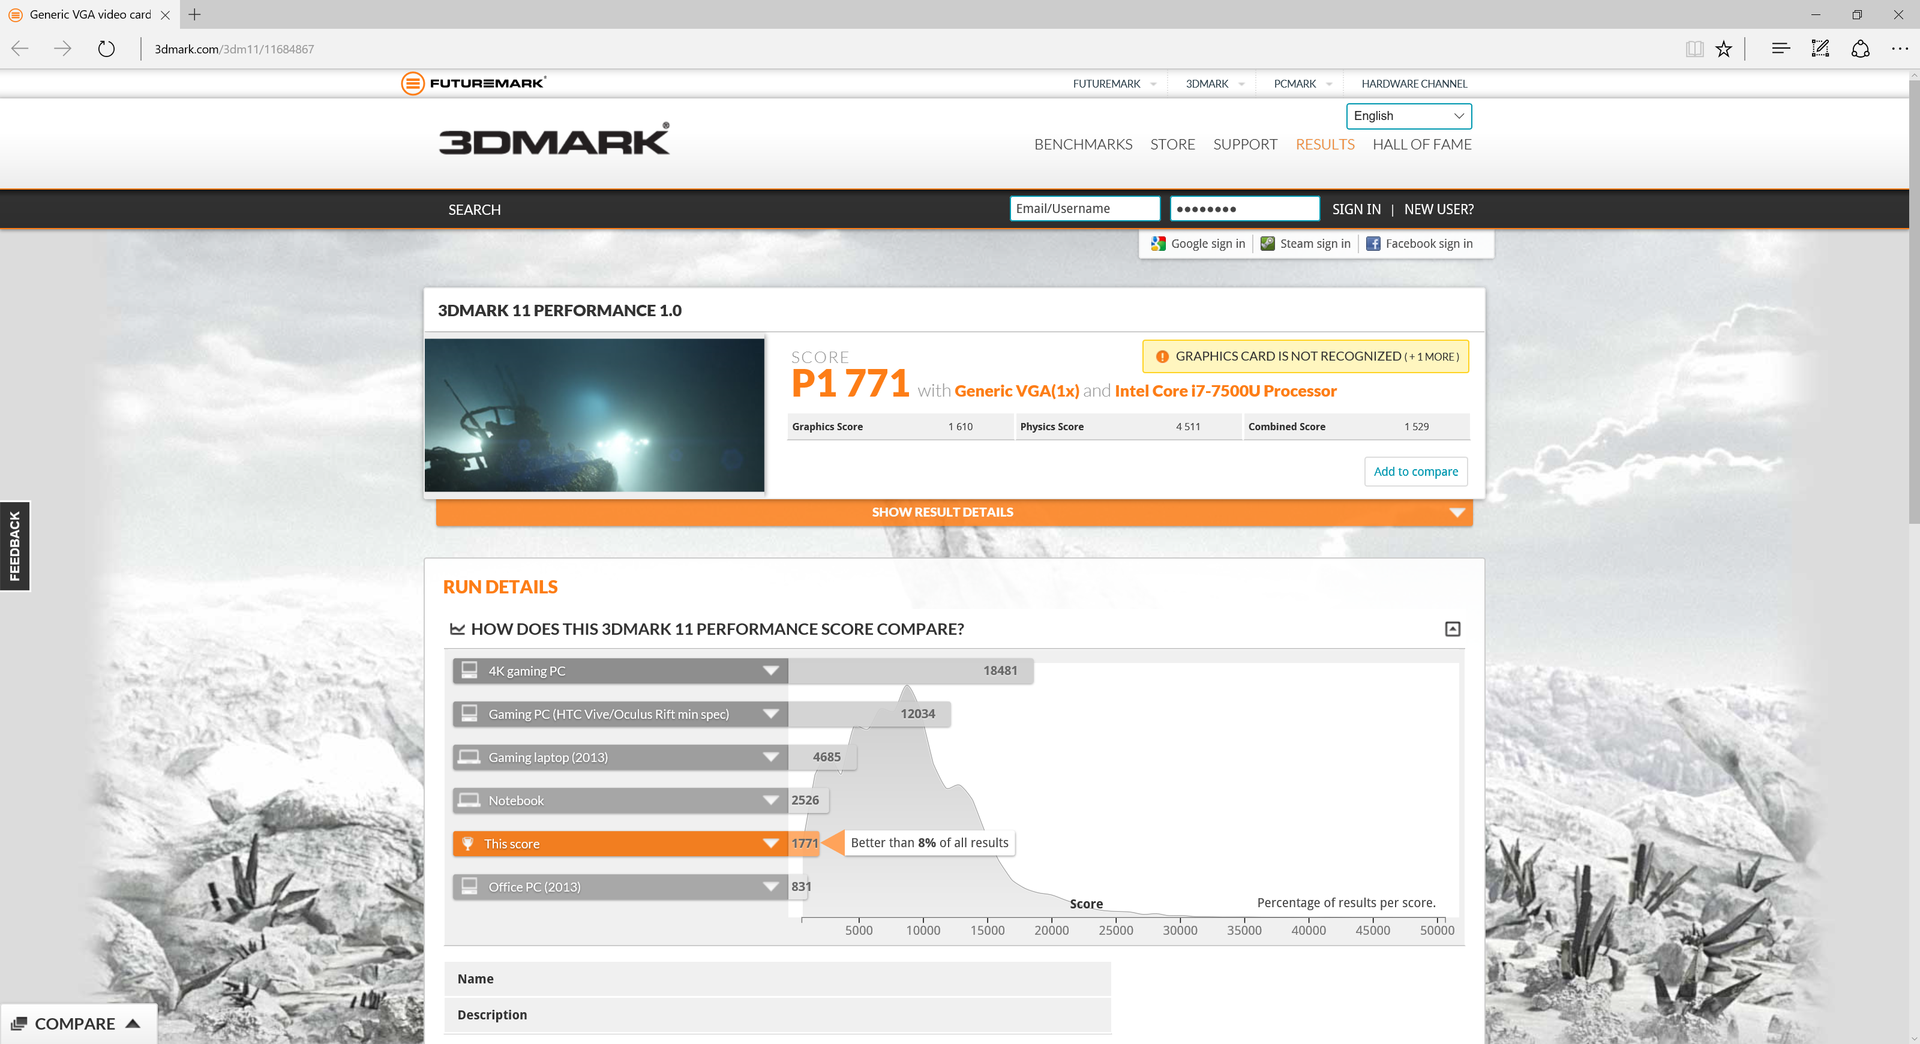
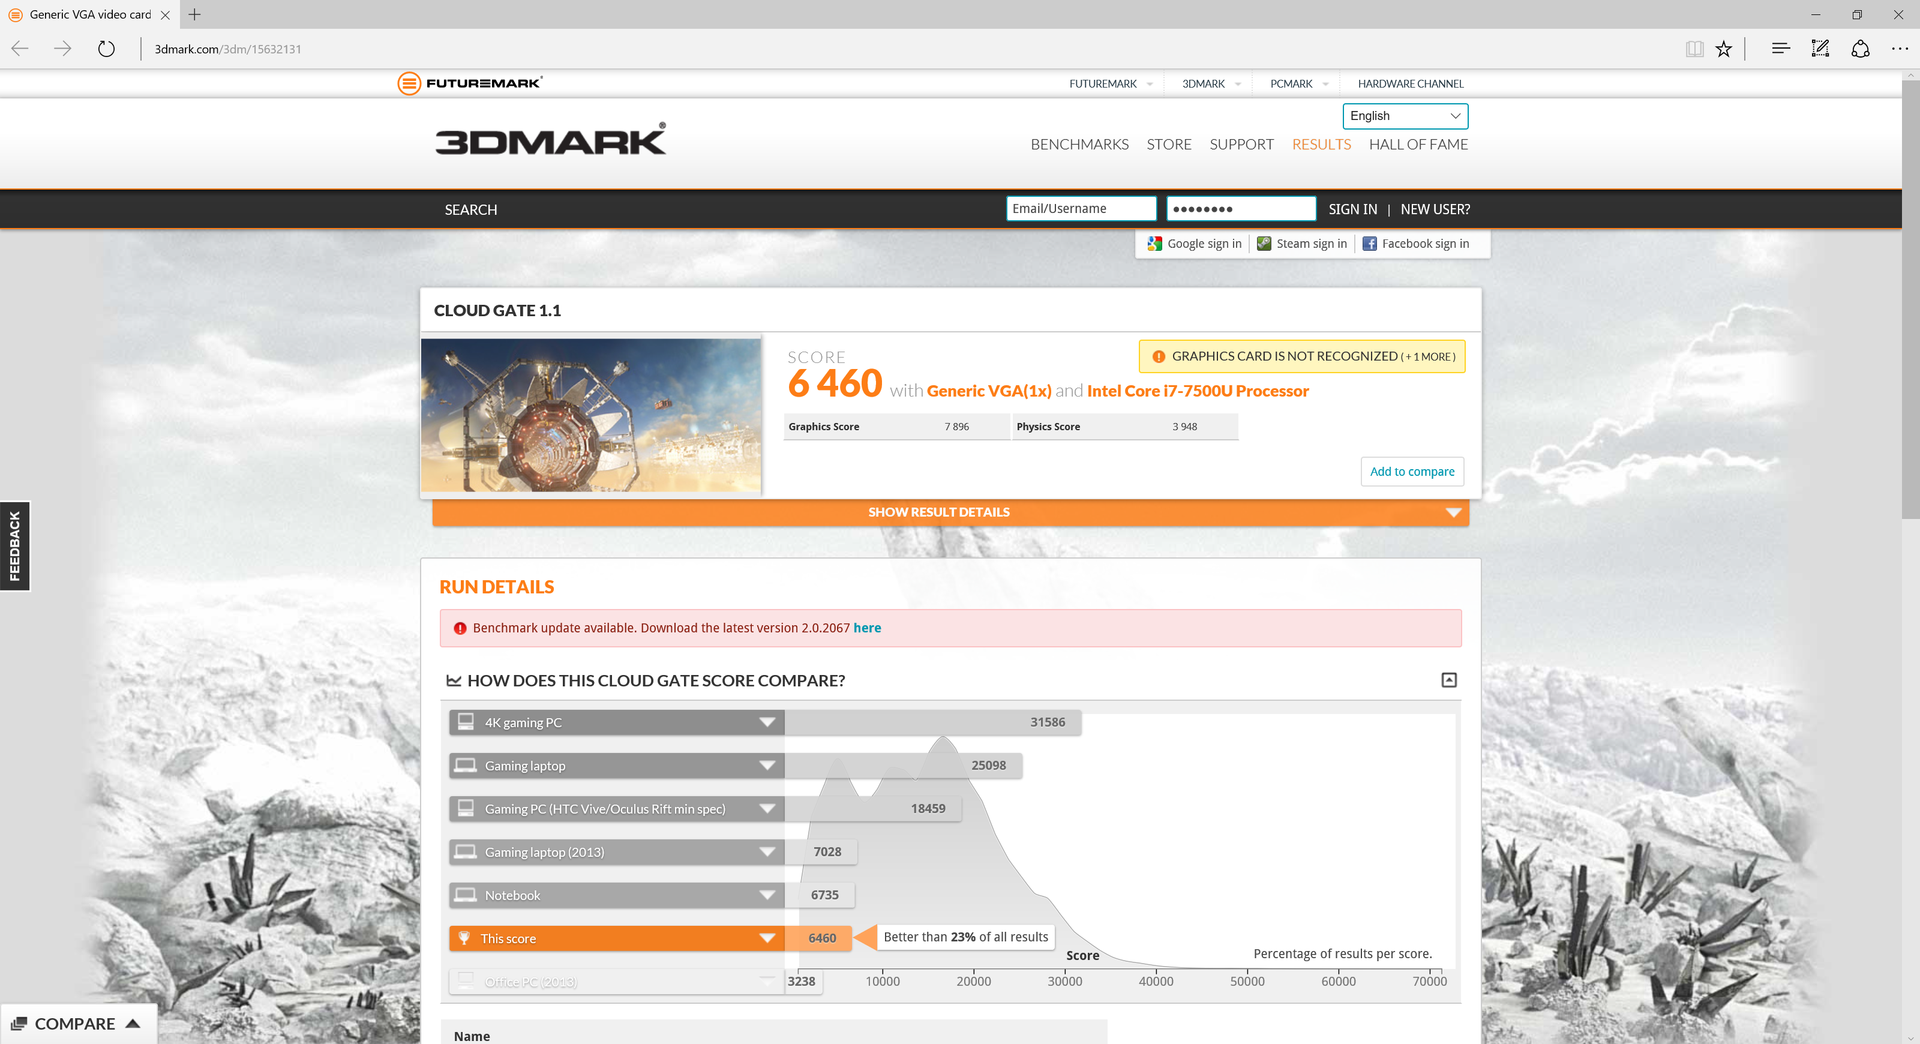
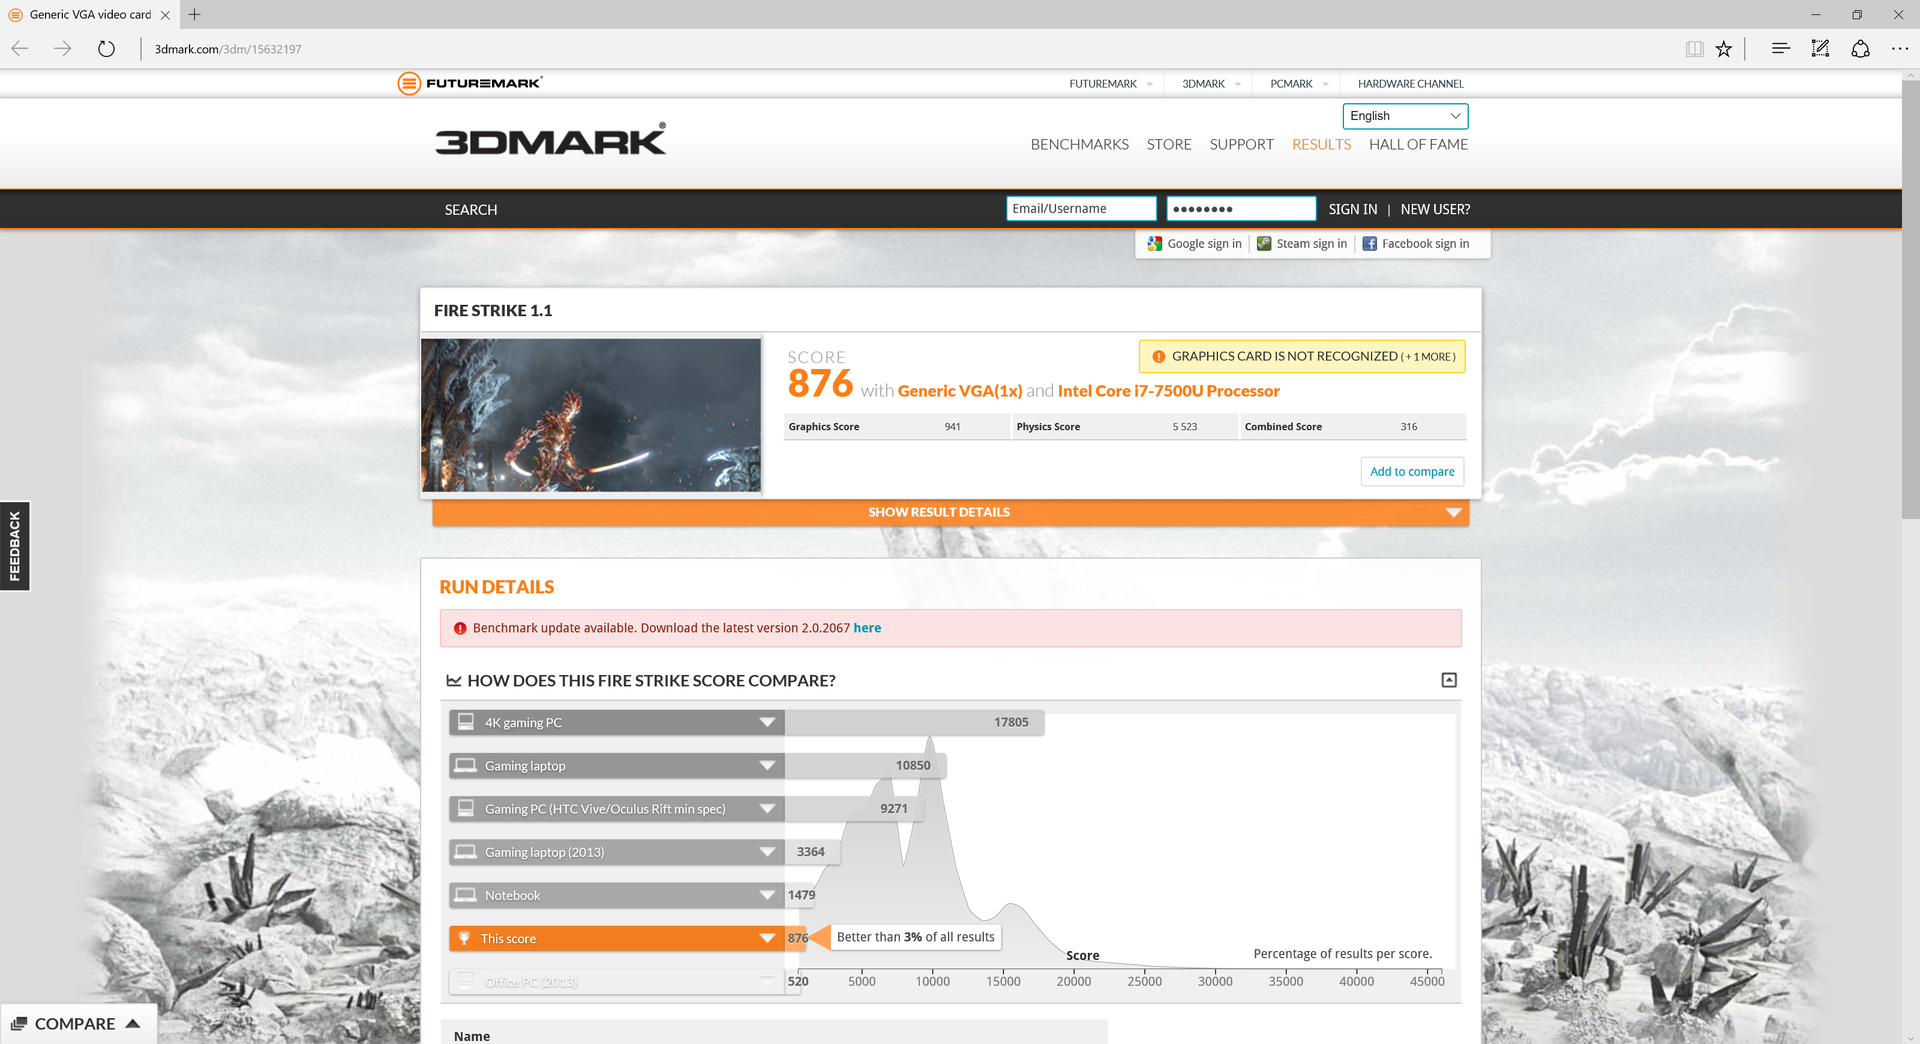
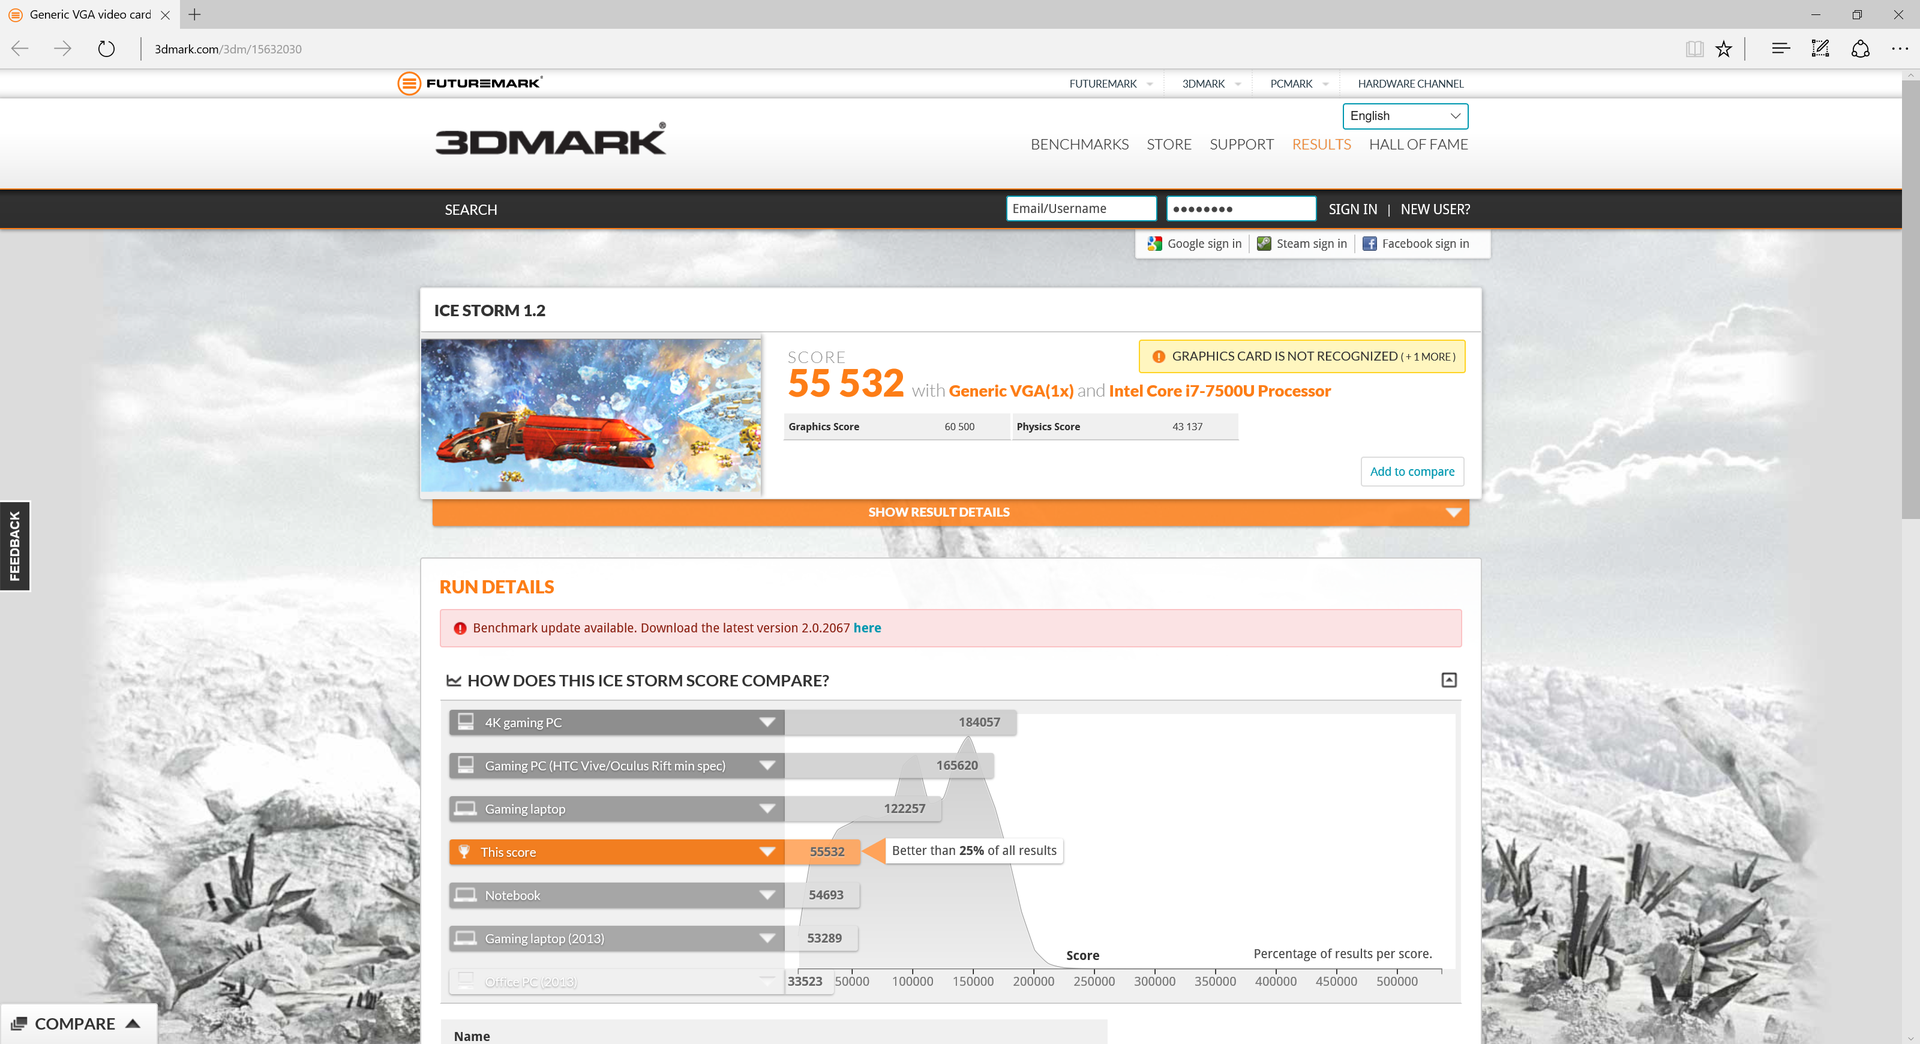
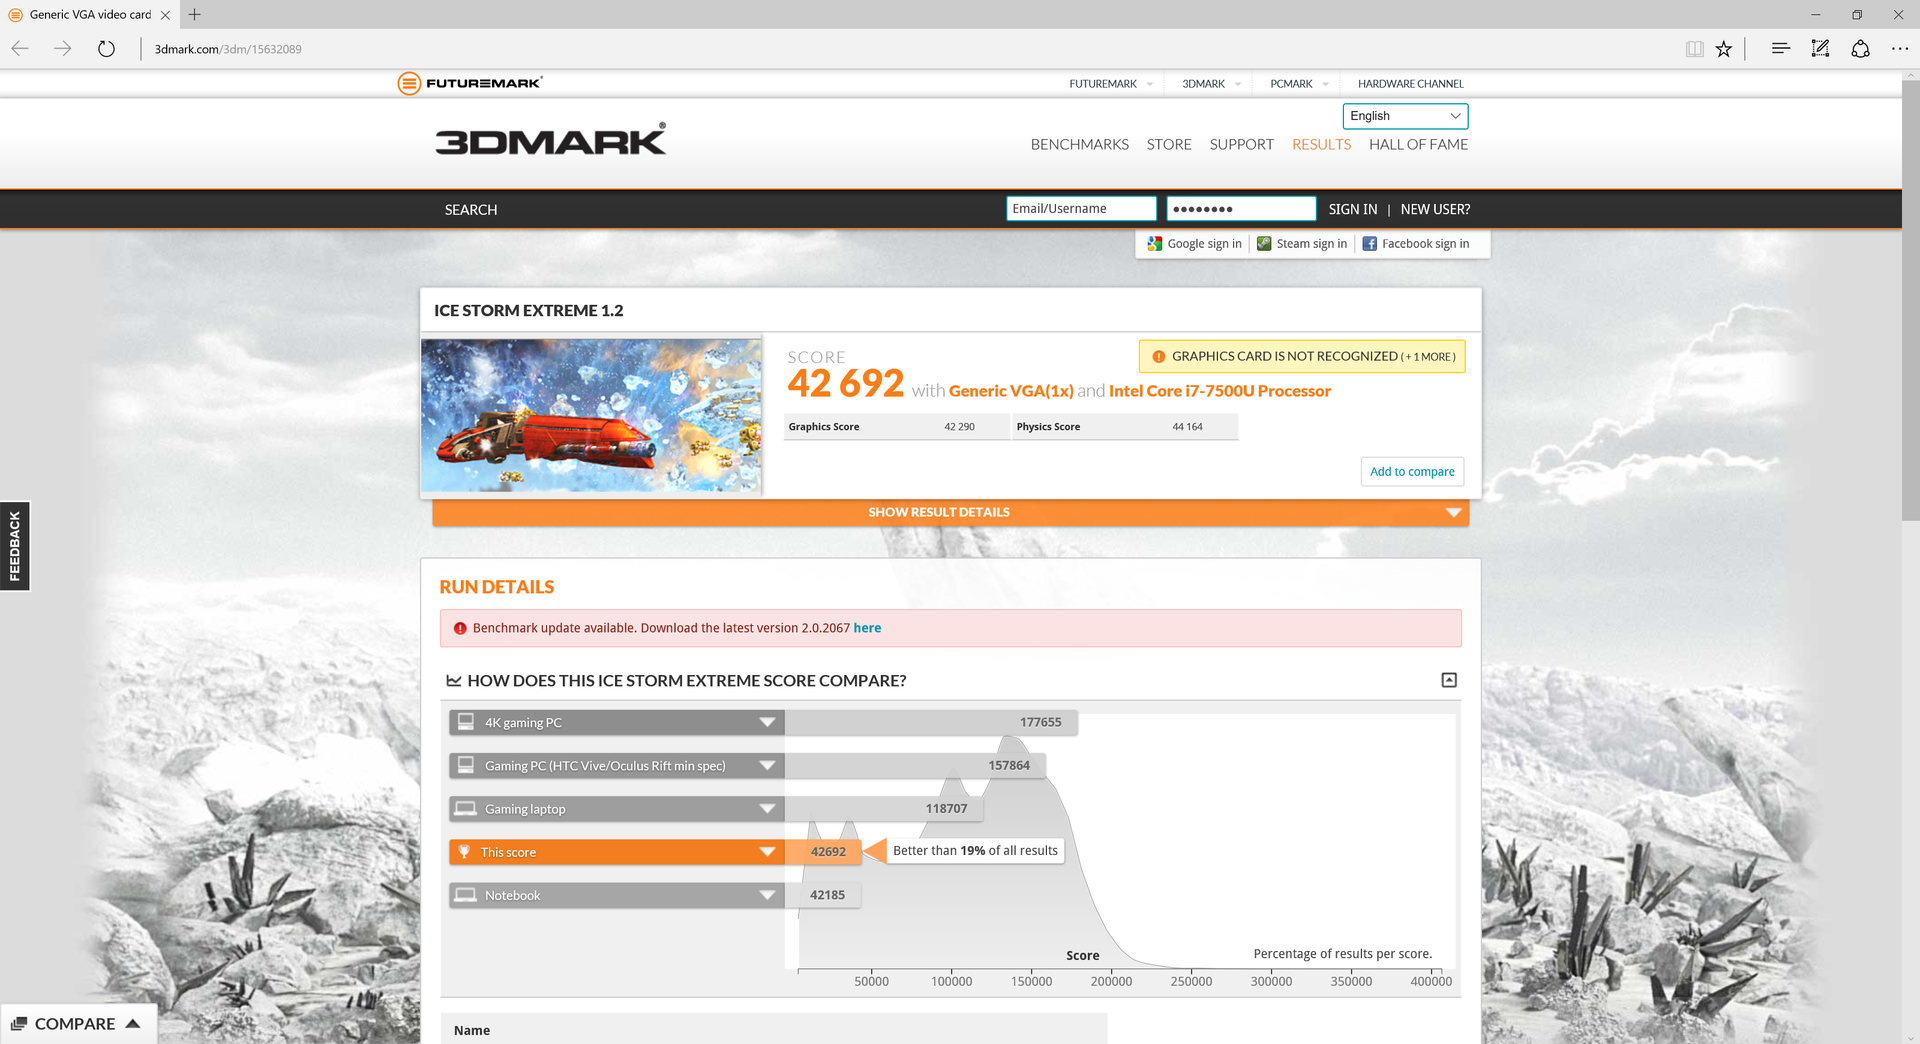
3DMark benchmarks show the XPS 13 i7-7500U SKU to be just a couple percentage points faster than the i7-7200U SKU and about 20 percent faster than the outgoing HD Graphics 520. It's worth noting that our similarly configured reference MSI CX72 performs slightly faster than our Dell system when gaming, so users may not be getting the full power of this particular Kaby Lake CPU from the XPS 13. Nonetheless, entry-level Nvidia Maxwell GPUs or previous generation Iris Pro Graphics can still handily outperform the HD Graphics 620.
See our dedicated GPU page on the HD Graphics 620 for more technical information and benchmark comparisons.
| 3DMark | |
| 1280x720 Cloud Gate Standard Graphics | |
| Intel Skull Canyon NUC6i7KYK | |
| MSI CX72-7QL | |
| Dell XPS 13 9360 QHD+ i7 | |
| Asus X302UV-FN016T | |
| Dell XPS 13 9360 QHD+ i5 | |
| Lenovo Ideapad 510S-13ISK | |
| HP Pavilion x2 12-b000ng | |
| Dell Vostro 3546 JAN15HSW1601_1K9_Win | |
| Lenovo B50-50 80S2000QGE | |
| 1920x1080 Fire Strike Graphics | |
| Intel Skull Canyon NUC6i7KYK | |
| Asus X302UV-FN016T | |
| MSI CX72-7QL | |
| Dell XPS 13 9360 QHD+ i7 | |
| Dell XPS 13 9360 QHD+ i5 | |
| Lenovo Ideapad 510S-13ISK | |
| HP Pavilion x2 12-b000ng | |
| Lenovo B50-50 80S2000QGE | |
| Dell Vostro 3546 JAN15HSW1601_1K9_Win | |
| 3DMark 11 | |
| 1280x720 Performance GPU | |
| Intel Skull Canyon NUC6i7KYK | |
| Asus X302UV-FN016T | |
| MSI CX72-7QL | |
| Dell XPS 13 9360 QHD+ i7 | |
| Dell XPS 13 9360 QHD+ i5 | |
| Lenovo Ideapad 510S-13ISK | |
| HP Pavilion x2 12-b000ng | |
| Lenovo B50-50 80S2000QGE | |
| Dell Vostro 3546 JAN15HSW1601_1K9_Win | |
| 1280x720 Performance Combined | |
| Intel Skull Canyon NUC6i7KYK | |
| MSI CX72-7QL | |
| Asus X302UV-FN016T | |
| Dell XPS 13 9360 QHD+ i7 | |
| Dell XPS 13 9360 QHD+ i5 | |
| Lenovo Ideapad 510S-13ISK | |
| HP Pavilion x2 12-b000ng | |
| Lenovo B50-50 80S2000QGE | |
| Dell Vostro 3546 JAN15HSW1601_1K9_Win | |
| 3DMark 06 Standard Score | 9655 points | |
| 3DMark 11 Performance | 1771 points | |
| 3DMark Ice Storm Standard Score | 55532 points | |
| 3DMark Cloud Gate Standard Score | 6460 points | |
| 3DMark Fire Strike Score | 876 points | |
| 3DMark Fire Strike Extreme Score | 401 points | |
Help | ||
Gaming Performance
The Bioshock Infinite benchmark reveals slightly larger performance gaps between the HD Graphics 620 in the XPS 13 and the older HD Graphics 5500 and HD Graphics 520. Our reference MSI CX72 is still outperforming our Dell despite them both sharing the same core configuration.
Gamers will be limited to the lowest of resolution settings for most modern titles including Dota 2.
| BioShock Infinite | |
| 1280x720 Very Low Preset | |
| Acer TravelMate P278-MG-76L2 | |
| Acer Aspire E5-574-53YZ | |
| MSI CX72-7QL | |
| Dell XPS 13 9360 QHD+ i7 | |
| Lenovo ThinkPad Yoga 12 20DK002EPB | |
| HP ProBook 650 G2 V1A44ET | |
| 1366x768 Medium Preset | |
| Acer TravelMate P278-MG-76L2 | |
| Acer Aspire E5-574-53YZ | |
| MSI CX72-7QL | |
| Dell XPS 13 9360 QHD+ i7 | |
| Lenovo ThinkPad Yoga 12 20DK002EPB | |
| HP ProBook 650 G2 V1A44ET | |
| 1366x768 High Preset | |
| Acer TravelMate P278-MG-76L2 | |
| Acer Aspire E5-574-53YZ | |
| MSI CX72-7QL | |
| Dell XPS 13 9360 QHD+ i7 | |
| Lenovo ThinkPad Yoga 12 20DK002EPB | |
| HP ProBook 650 G2 V1A44ET | |
| low | med. | high | ultra | |
|---|---|---|---|---|
| BioShock Infinite (2013) | 55 | 28.2 | 26.1 | 8.3 |
| The Witcher 3 (2015) | 15.7 | |||
| Dota 2 Reborn (2015) | 59.6 | 50.7 | 27 | 24.2 |
| Rise of the Tomb Raider (2016) | 21.8 | 12.5 | 6.2 | |
| Overwatch (2016) | 49.7 | 34.8 | 16.4 | |
| FIFA 17 (2016) | 56 severe graphical problems (flickering and slowdowns) | |||
| Battlefield 1 (2016) | 30.3 | |||
| Titanfall 2 (2016) | 36.6 | 24.9 |
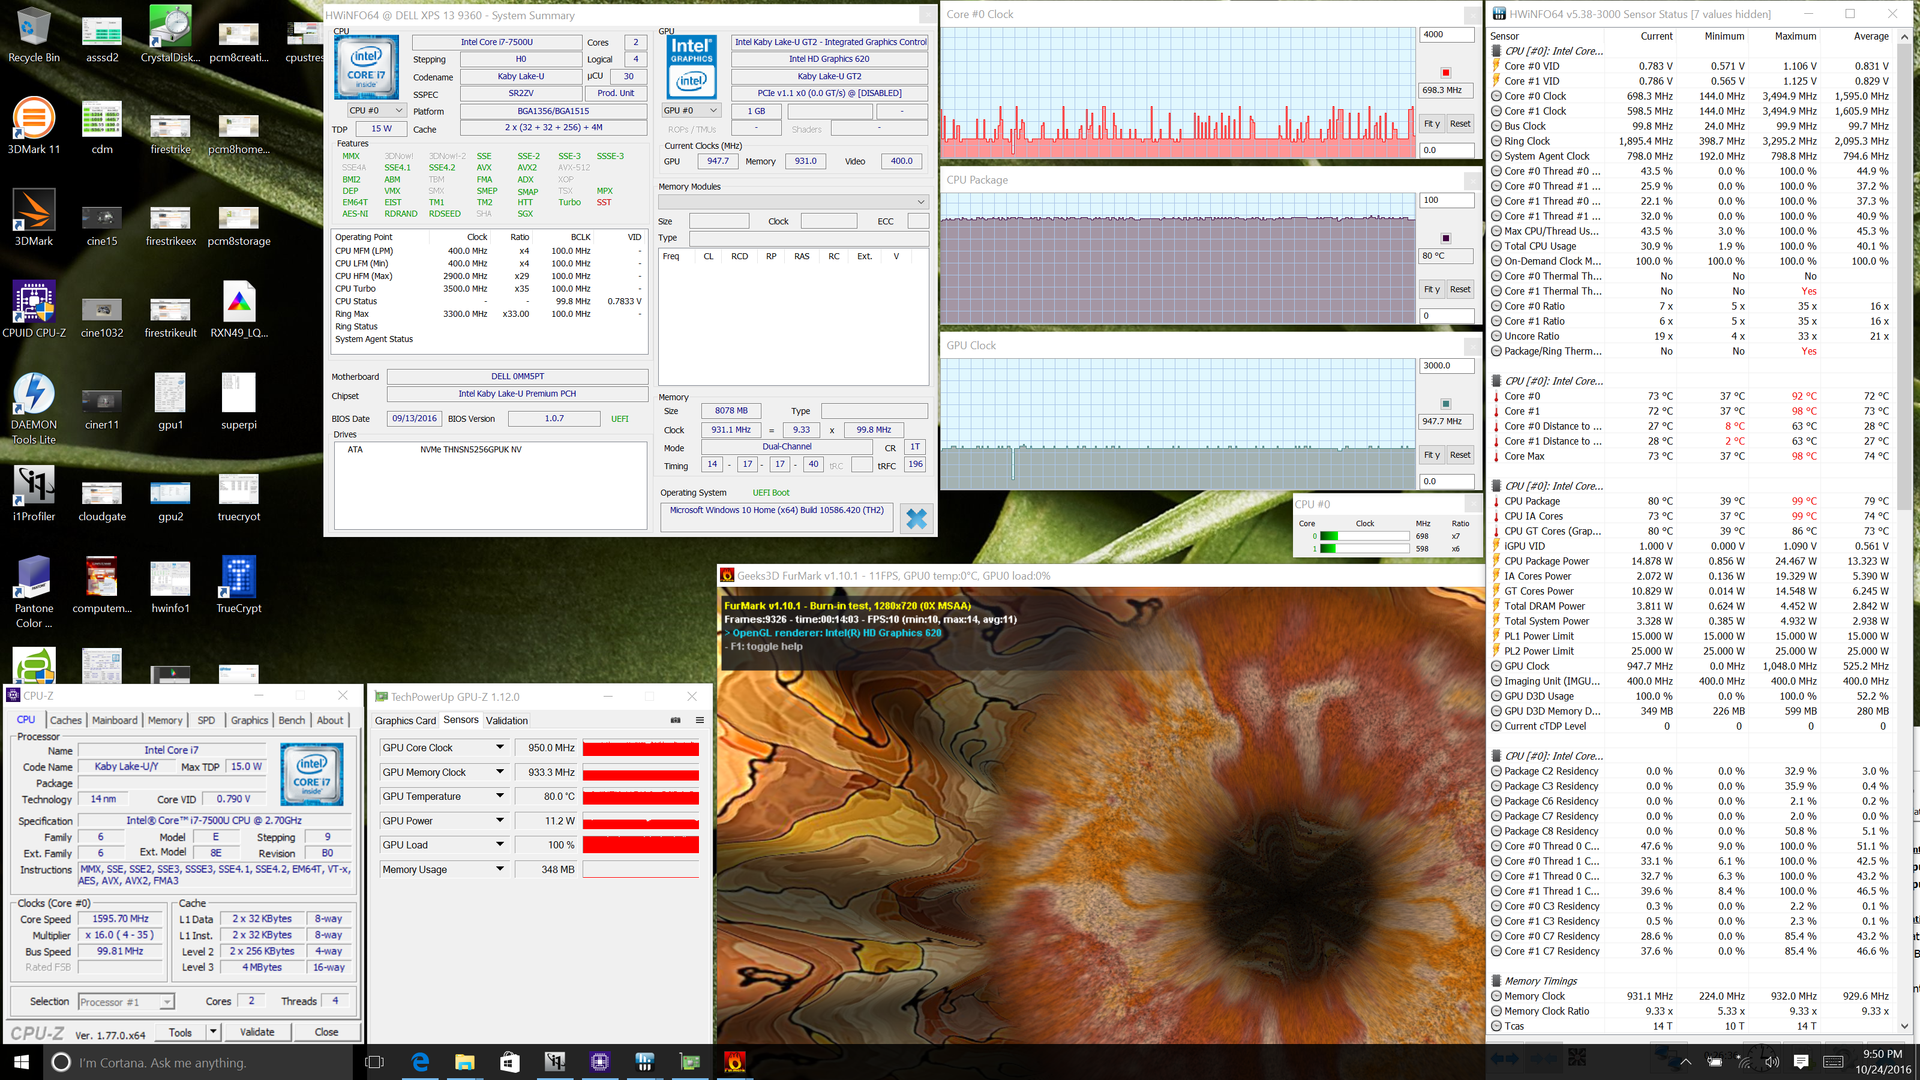
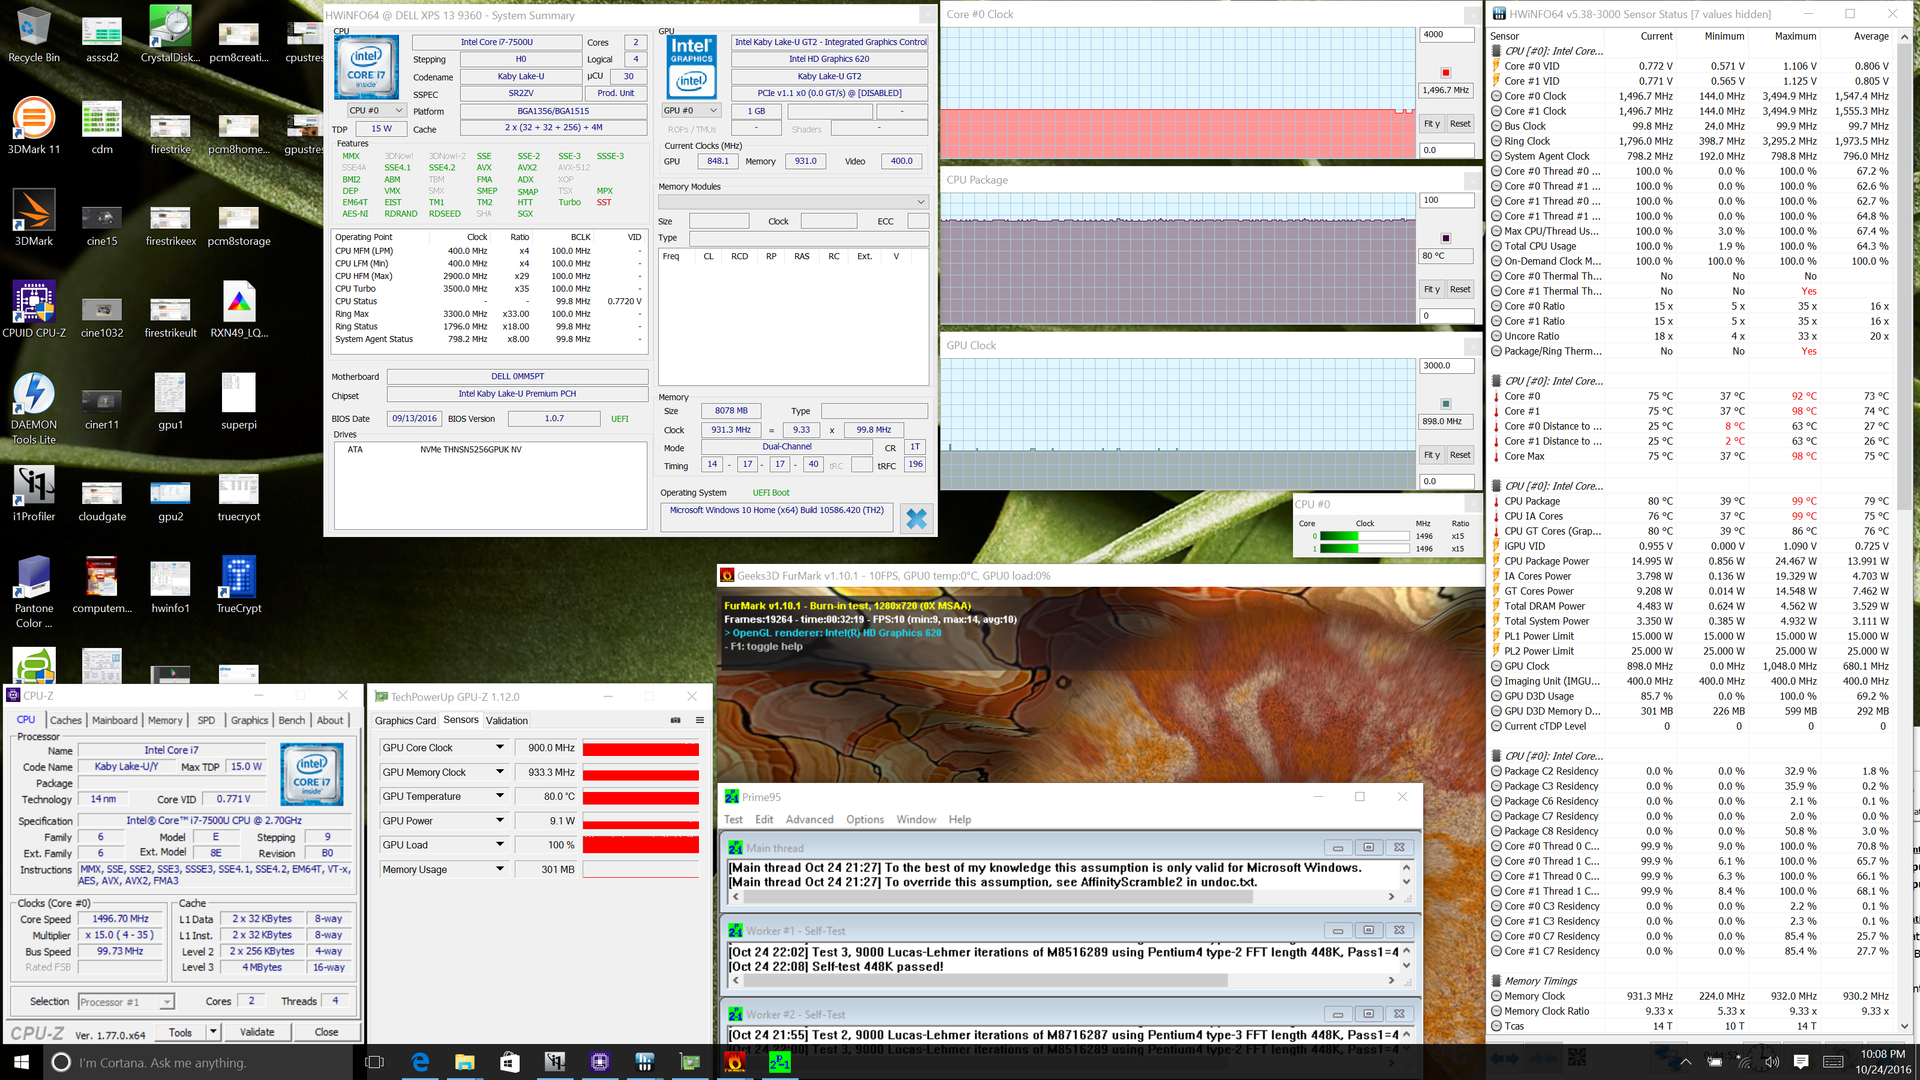
Stress Test
We stress the notebook with processor-intensive benchmarks to test for potential throttling or stability issues. Running Prime95 will cause the CPU to run at its maximum multi-core Turbo Boost speed of 3.5 GHz until core temperature reaches an alarming 99 C in a matter of seconds. Afterwards, the CPU throttles down to a steady 3.0 GHz (or 300 MHz above its base clock rate) to maintain a core temperature of 88 C. Running both Prime95 and FurMark simultaneously will throttle the CPU dramatically to just 1.5 GHz in order to maintain a safer core temperature of 80 C.
Unigine Valley is a more accurate representation of gaming loads than Prime95 and FurMark. The GPU runs steady at its maximum rated clock rate of 1050 MHz while the CPU will run anywhere between 600 MHz and its 3.5 GHz maximum depending on the current load. Core temperatures are slightly lower at 76 C, but still warmer than the Spectre x360 13 with the same i7-7500U CPU configuration.
Running on battery power will not limit CPU or GPU performance. A 3DMark 11 run on batteries returns Physics and Graphics scores of 4512 and 1622 points, respectively, compared to 4511 and 1610 points when on mains.
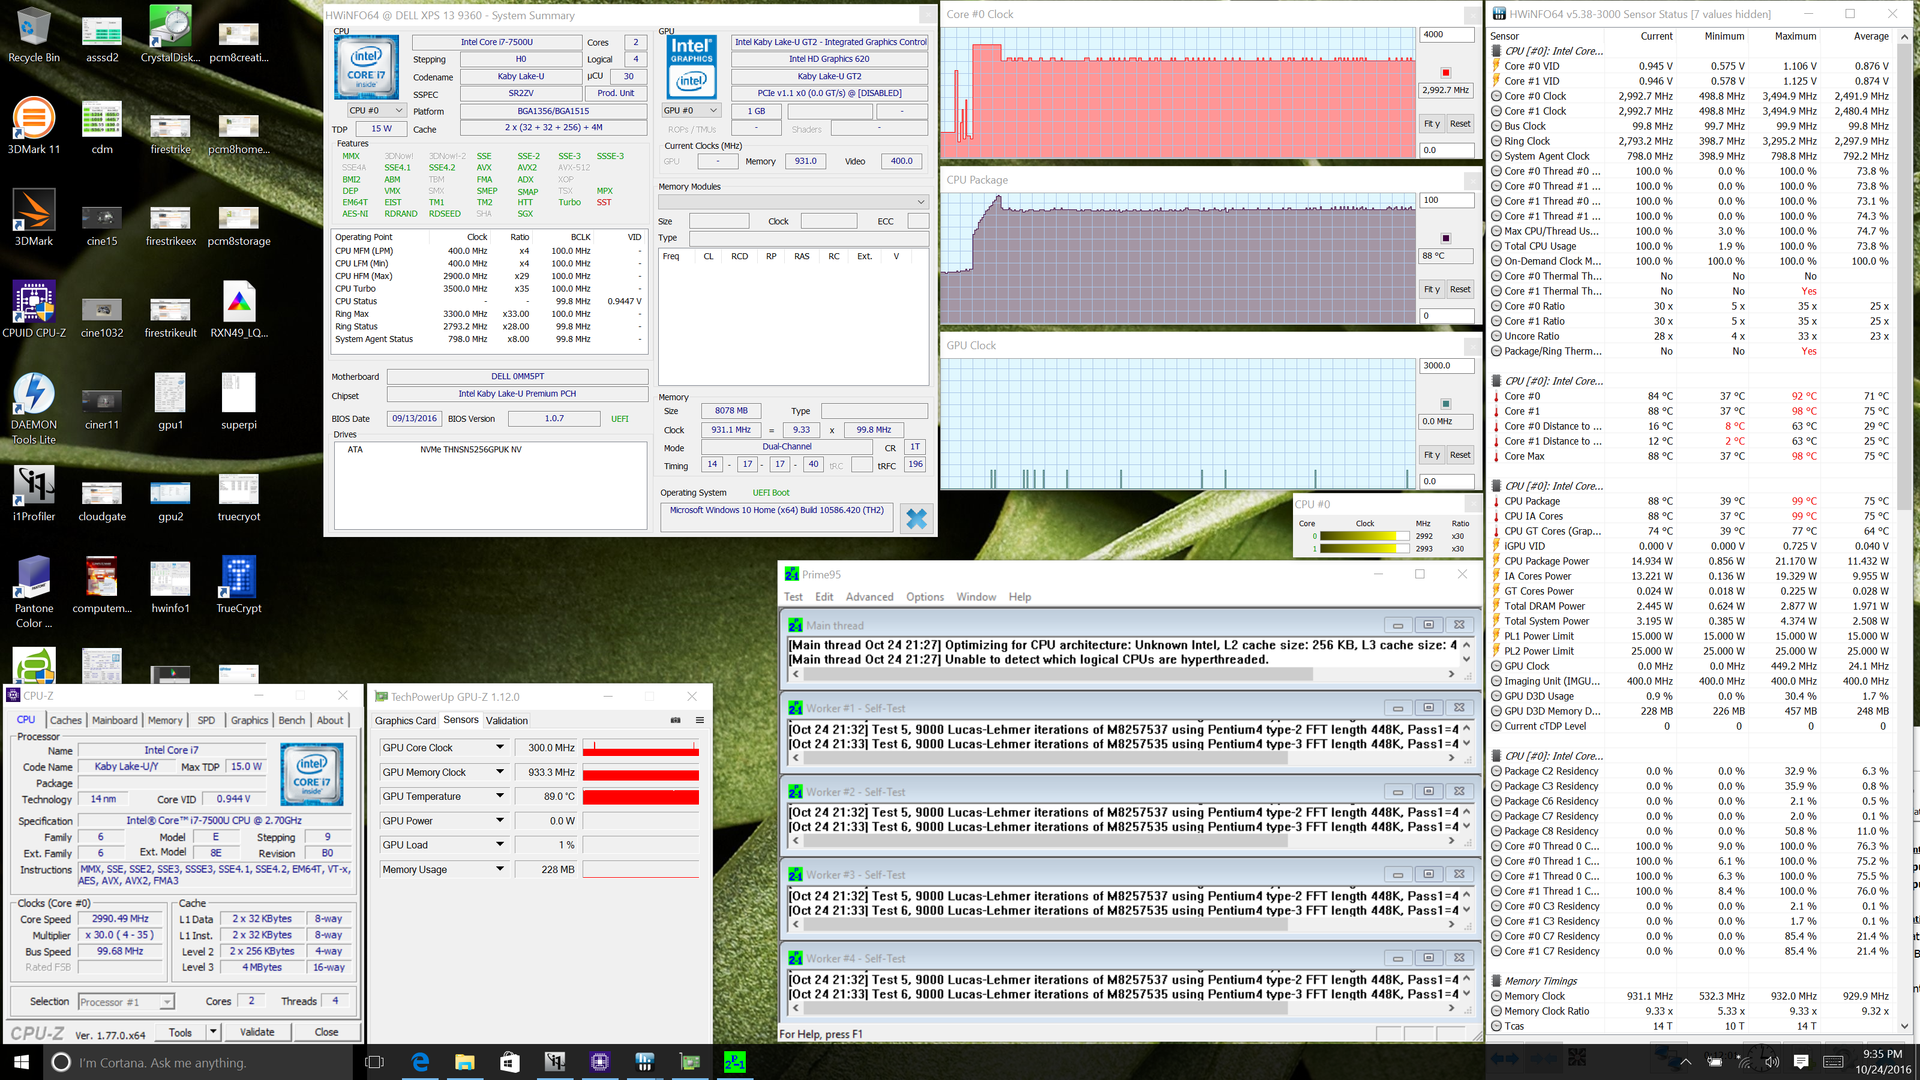
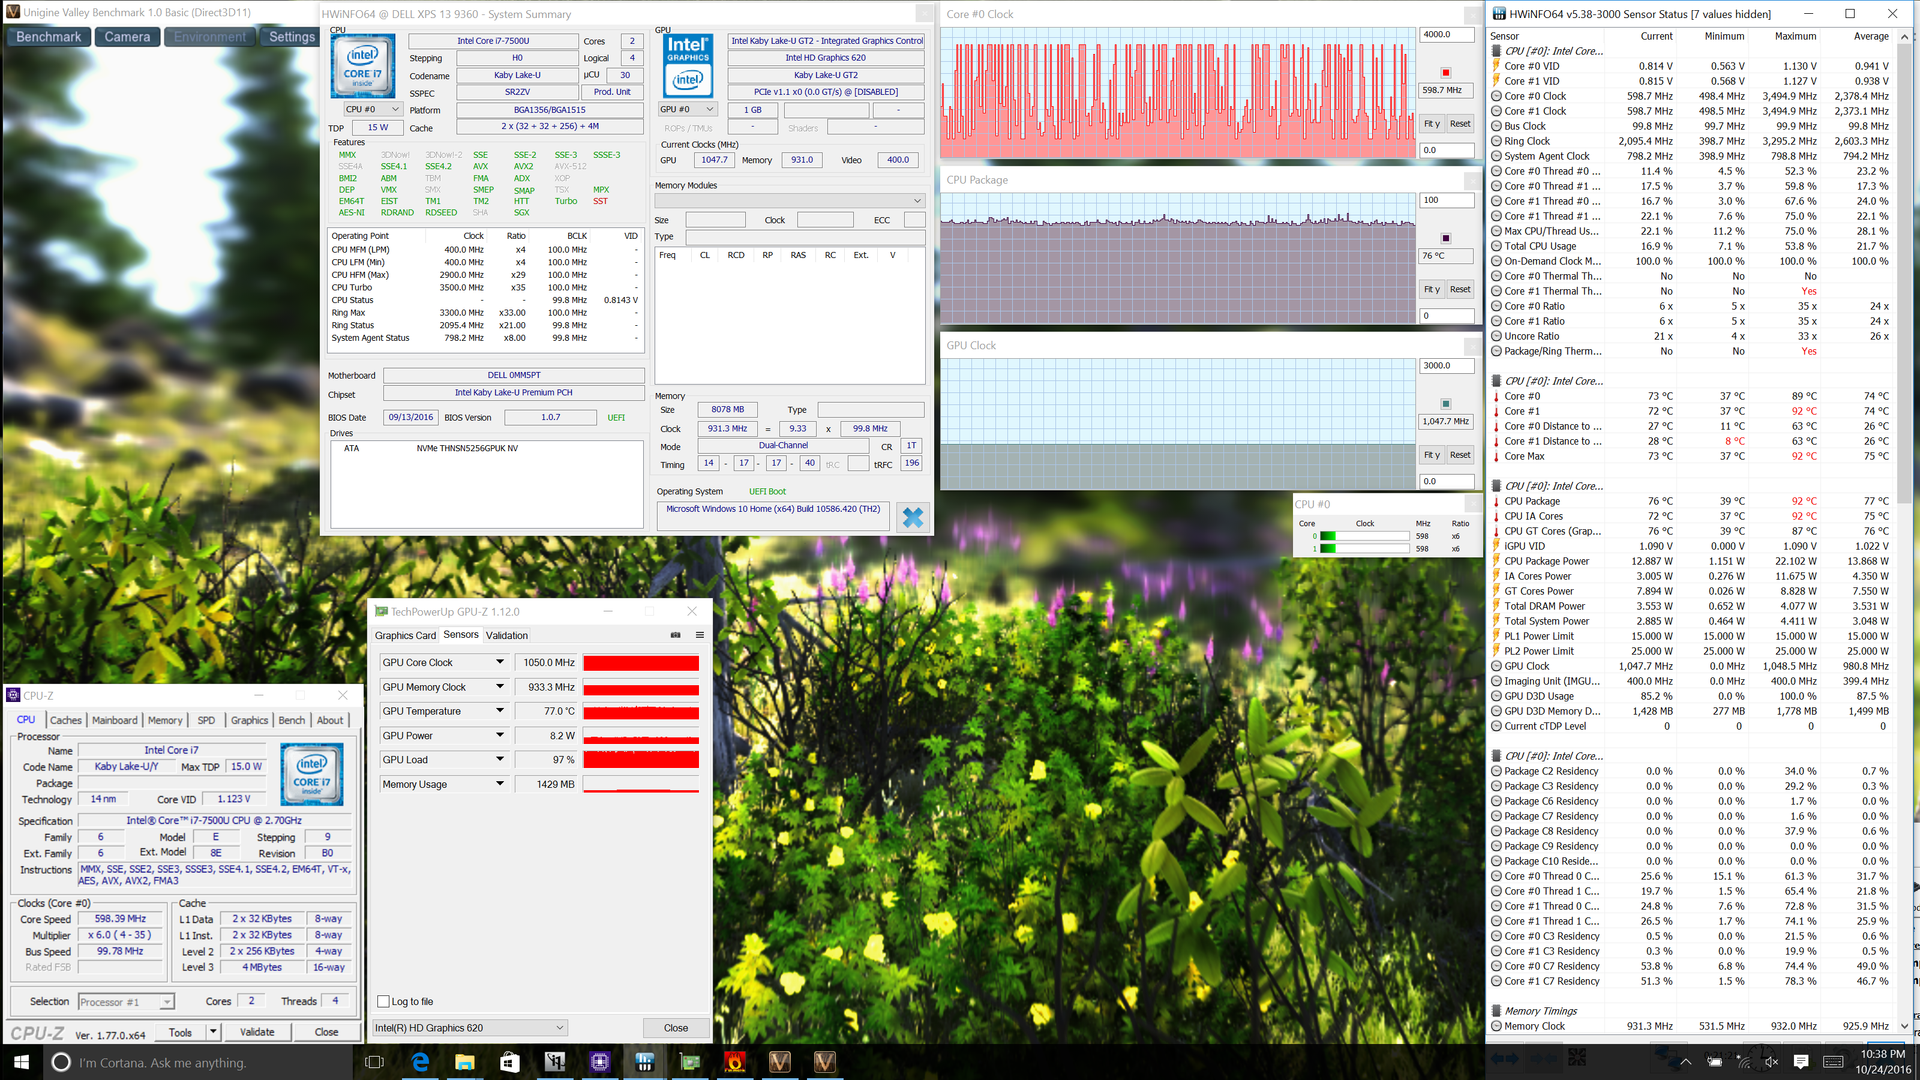
| CPU Clock (GHz) | GPU Clock (MHz) | Average CPU Temperature (°C) | |
| Prime95 Stress | 3.0 | -- | 88 |
| FurMark Stress | -- | 948 | 80 |
| Prime95 + FurMark Stress | 1.5 | 898 | 80 |
| Unigine Valley Stress | 0.6+ | 1048 | 76 |
Emissions
System Noise
The single system fan is silent during low loads like browsing or word processing. Moderate loads with heavy multi-tasking can bump fan noise to just under 31 dB(A), which is still very quiet and almost unnoticeable in an office or classroom. Heavier loads like gaming or Prime95 will induce a maximum fan noise of about 35 dB(A) to be one of the quietest 13-inch notebooks available. In comparison, most Ultrabooks will run louder than 35 dB(A) under similar gaming loads and can frequently reach near or over 40 dB(A) when on maximum stress. Strangely enough, we were unable to reach the 38 dB(A) range like on our i5 SKU even when running intensive applications like Prime95 or Witcher 3.
We have two Core i7 SKUs for comparison purposes and one system exhibits coil whining while the other does not. The high-pitched noise may be distracting to some users and we recommend checking for coil whine when plugging and unplugging the notebook from its AC adapter.
Noise level
| Idle |
| 28.8 / 28.8 / 30.8 dB(A) |
| Load |
| 34.8 / 34.8 dB(A) |
 | ||
30 dB silent 40 dB(A) audible 50 dB(A) loud |
||
min: | ||
| Dell XPS 13 9360 QHD+ i7 HD Graphics 620, i7-7500U, Toshiba NVMe THNSN5256GPUK | HP Spectre x360 13-w023dx HD Graphics 620, i7-7500U, Samsung PM951 NVMe MZVLV512 | HP Spectre 13 HD Graphics 520, 6500U, Samsung PM951 NVMe MZVLV256 | Apple MacBook Air 13 inch 2015-03 HD Graphics 6000, 5650U, Apple SSD SD0256F | Dell XPS 13 9360 QHD+ i5 HD Graphics 620, i5-7200U, Toshiba NVMe THNSN5256GPUK | |
|---|---|---|---|---|---|
| Noise | -4% | -6% | -9% | -4% | |
| off / environment * (dB) | 28.8 | 29.1 -1% | 28.5 1% | 30.3 -5% | |
| Idle Minimum * (dB) | 28.8 | 29.1 -1% | 28.5 1% | 29.2 -1% | 30.6 -6% |
| Idle Average * (dB) | 28.8 | 29.1 -1% | 30.9 -7% | 29.2 -1% | 30.6 -6% |
| Idle Maximum * (dB) | 30.8 | 31.2 -1% | 31.6 -3% | 29.2 5% | 32.2 -5% |
| Load Average * (dB) | 34.8 | 37.3 -7% | 38.8 -11% | 40.2 -16% | 32.2 7% |
| Load Maximum * (dB) | 34.8 | 39.6 -14% | 41.4 -19% | 46.3 -33% | 38.5 -11% |
* ... smaller is better
Temperature
The XPS 13 is very compact with relatively high core temperatures and low fan noise, so surface temperatures are generally warmer than much of the competition even when idling on desktop. The left half of the keyboard and palm rests will be warmer than the right with another hot spot near the exhaust grilles. Fortunately, the system never becomes uncomfortable to use during day-to-day loads and is only slightly warmer than the less powerful Core i5-7200U SKU.
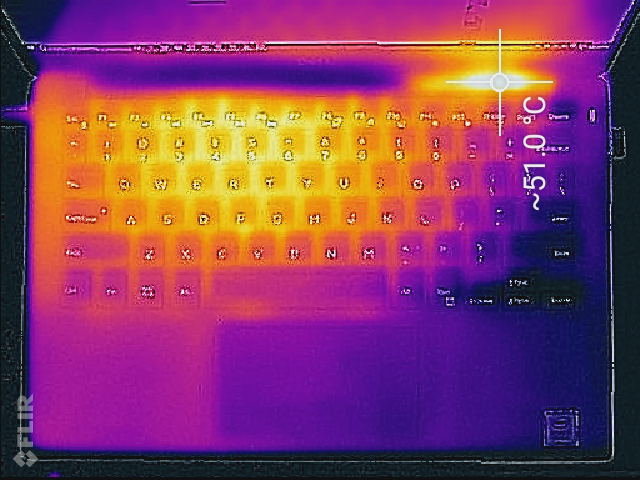
(-) The maximum temperature on the upper side is 50.8 °C / 123 F, compared to the average of 35.9 °C / 97 F, ranging from 21.4 to 59 °C for the class Subnotebook.
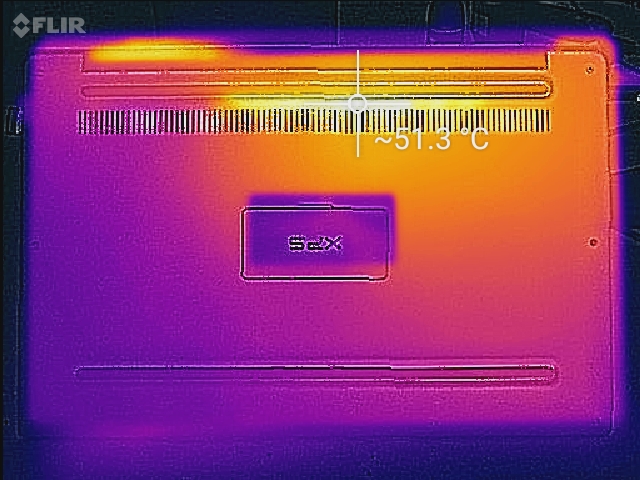
(-) The bottom heats up to a maximum of 50.8 °C / 123 F, compared to the average of 39.2 °C / 103 F
(+) In idle usage, the average temperature for the upper side is 25.7 °C / 78 F, compared to the device average of 30.8 °C / 87 F.
(+) The palmrests and touchpad are cooler than skin temperature with a maximum of 31 °C / 87.8 F and are therefore cool to the touch.
(-) The average temperature of the palmrest area of similar devices was 28.2 °C / 82.8 F (-2.8 °C / -5 F).
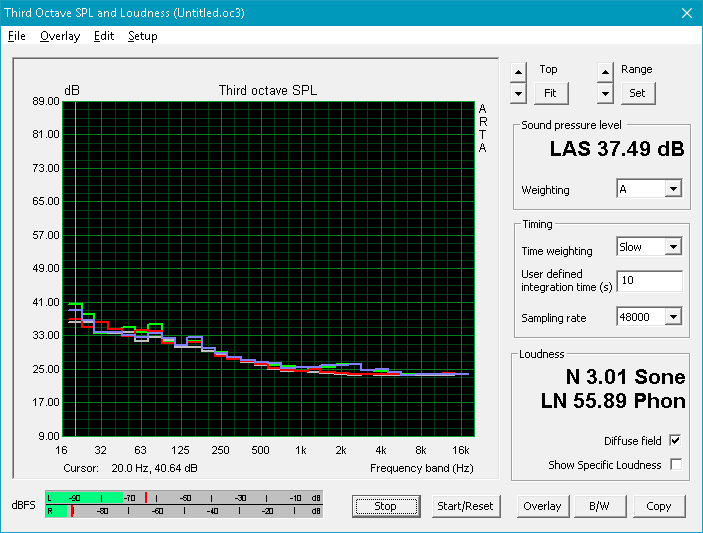
Speakers
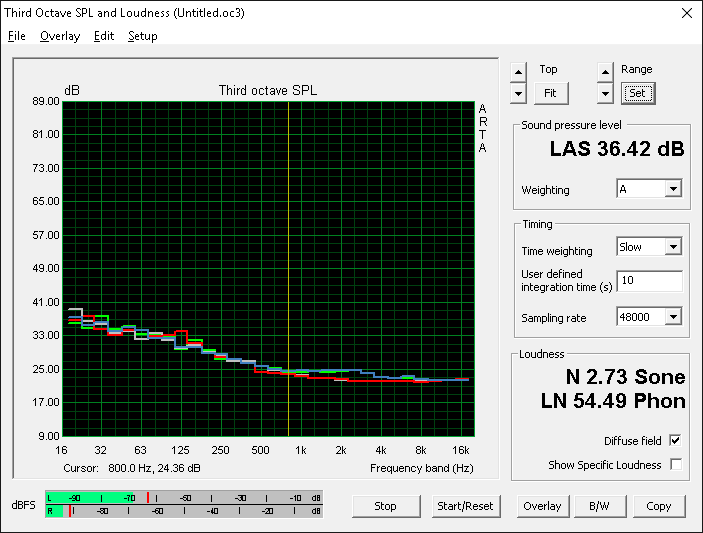
The stereo 1 W speakers are unimpressive and relatively unbalanced with poor reproduction of higher tones as shown by our microphone measurements below. This is expected from a subnotebook this size, so earphones or external speakers are recommended for longer sessions. Nonetheless, maximum volume produces no static or distracting reverberations of the chassis.
")


Dell XPS 13 9360 QHD+ i7 audio analysis
(±) | speaker loudness is average but good (72.4 dB)
Bass 100 - 315 Hz
(±) | reduced bass - on average 6.5% lower than median
(±) | linearity of bass is average (12.6% delta to prev. frequency)
Mids 400 - 2000 Hz
(+) | balanced mids - only 4.6% away from median
(+) | mids are linear (6.9% delta to prev. frequency)
Highs 2 - 16 kHz
(+) | balanced highs - only 3.4% away from median
(-) | highs are not linear (18.9% delta to prev. frequency)
Overall 100 - 16.000 Hz
(±) | linearity of overall sound is average (20.8% difference to median)
Compared to same class
» 68% of all tested devices in this class were better, 7% similar, 25% worse
» The best had a delta of 5%, average was 18%, worst was 53%
Compared to all devices tested
» 56% of all tested devices were better, 8% similar, 36% worse
» The best had a delta of 4%, average was 23%, worst was 134%
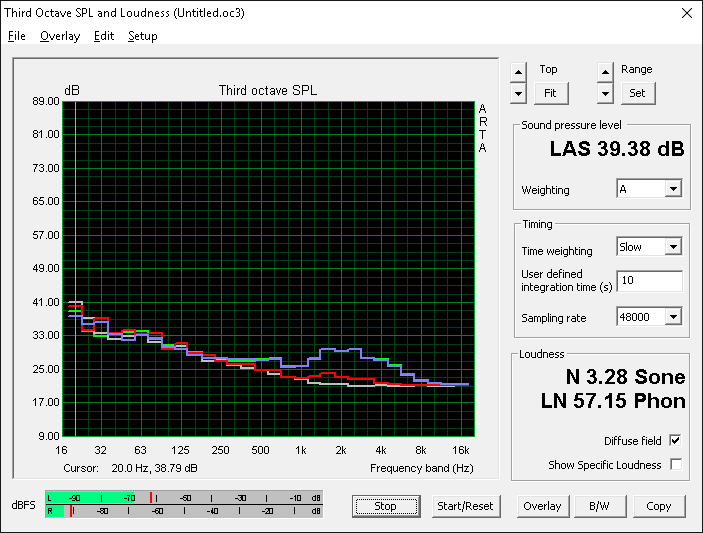
Apple MacBook 12 (Early 2016) 1.1 GHz audio analysis
(+) | speakers can play relatively loud (83.6 dB)
Bass 100 - 315 Hz
(±) | reduced bass - on average 11.3% lower than median
(±) | linearity of bass is average (14.2% delta to prev. frequency)
Mids 400 - 2000 Hz
(+) | balanced mids - only 2.4% away from median
(+) | mids are linear (5.5% delta to prev. frequency)
Highs 2 - 16 kHz
(+) | balanced highs - only 2% away from median
(+) | highs are linear (4.5% delta to prev. frequency)
Overall 100 - 16.000 Hz
(+) | overall sound is linear (10.2% difference to median)
Compared to same class
» 7% of all tested devices in this class were better, 2% similar, 91% worse
» The best had a delta of 5%, average was 18%, worst was 53%
Compared to all devices tested
» 5% of all tested devices were better, 1% similar, 94% worse
» The best had a delta of 4%, average was 23%, worst was 134%
Frequency Comparison (Checkbox selectable!)
Graph 1: Pink Noise 100% Vol.; Graph 2: Audio off
Energy Management
Power Consumption
Power demand from the XPS 13 i7-7500U SKU is not significantly different than on the XPS 13 i5-7200U SKU. Idling on desktop will draw just under 7 W while gaming loads will demand about 28 W. This is noticeably less demanding than both the Spectre x360 13 with the same CPU and the MacBook Air 13 with the older Haswell Core i5-5650U.
Maximum load with both Prime95 and FurMark active will draw about 32 W from the small (~8.5 x 5.5 x 2.5 cm) 45 W AC adapter.
| Off / Standby | |
| Idle | |
| Load |
|
Key:
min: | |
| Dell XPS 13 9360 QHD+ i7 i7-7500U, HD Graphics 620, Toshiba NVMe THNSN5256GPUK, IPS, 3200x1800, 13.3" | HP Spectre x360 13-w023dx i7-7500U, HD Graphics 620, Samsung PM951 NVMe MZVLV512, IPS, 1920x1080, 13.3" | HP EliteBook 1030 G1-X2F03EA 6Y75, HD Graphics 515, Sandisk X300 SD7SN6S-512G-1006, IPS, 3200x1800, 13.3" | Apple MacBook Air 13 inch 2015-03 5650U, HD Graphics 6000, Apple SSD SD0256F, TN LED, 1440x900, 13.3" | Dell XPS 13 9360 QHD+ i5 i5-7200U, HD Graphics 620, Toshiba NVMe THNSN5256GPUK, , 3200x1800, 13.3" | |
|---|---|---|---|---|---|
| Power Consumption | -4% | -3% | 11% | 9% | |
| Idle Minimum * (Watt) | 6.4 | 5.5 14% | 4 37% | 2.7 58% | 3.7 42% |
| Idle Average * (Watt) | 6.6 | 6.7 -2% | 8 -21% | 5.7 14% | 6.1 8% |
| Idle Maximum * (Watt) | 6.8 | 7.1 -4% | 8.6 -26% | 6 12% | 6.5 4% |
| Load Average * (Watt) | 27.5 | 33.1 -20% | 26.5 4% | 32.1 -17% | 29.5 -7% |
| Load Maximum * (Watt) | 32.4 | 35.2 -9% | 34.8 -7% | 36.2 -12% | 33 -2% |
* ... smaller is better
Battery Life
Runtimes are incredibly long on this Kaby Lake system at just over 8.5 hours when under real-world WLAN conditions. Simply idling on desktop at minimum brightness will last for over 17 hours, so users who are more conservative with power settings can squeeze out longer hours than our recorded WLAN runtime. Capacity has been upped from 56 Wh on the 9350 family to 60 Wh on the latest Kaby Lake generation.
Battery life is very similar to our less powerful XPS 13 i5 SKU. The new HP Spectre x360 13 with the same i7 processor can outlast the Dell by about an hour or more when under similar conditions.
Charging from near empty to full capacity will take between 2 to 2.5 hours.
| Dell XPS 13 9360 QHD+ i7 i7-7500U, HD Graphics 620, 60 Wh | HP Spectre x360 13-w023dx i7-7500U, HD Graphics 620, 57.8 Wh | HP EliteBook 1030 G1-X2F03EA 6Y75, HD Graphics 515, 40 Wh | Apple MacBook Air 13 inch 2015-03 5650U, HD Graphics 6000, 54 Wh | Dell XPS 13 9360 QHD+ i5 i5-7200U, HD Graphics 620, 60 Wh | |
|---|---|---|---|---|---|
| Battery runtime | 5% | -24% | 14% | 4% | |
| Reader / Idle (h) | 17.6 | 20.6 17% | 10.3 -41% | 26.2 49% | |
| WiFi v1.3 (h) | 8.6 | 9.3 8% | 5.1 -41% | 10.3 20% | 8.8 2% |
| Load (h) | 2.2 | 2 -9% | 2.4 9% | 1.6 -27% | 2.3 5% |
Pros
Cons
Verdict
To the majority users, the most important part of the Kaby Lake XPS 13 9360 update is the fact that the Skylake XPS 13 9350 will now be cheaper. The performance deltas between these nearly identical notebooks are so minimal that buyers intending to use the notebook for classwork, browsing, or multimedia will find very few tangible benefits from Kaby Lake. In fact, certain XPS 13 9350 SKUs with Iris Graphics can outperform the newer Kaby Lake SKUs if users demand more graphical horsepower.
The XPS 13 is still one of the better traditional 13-inch Ultrabooks available if fancy 360-degree hinges or detachable displays are not important. Its small size and quality design can't be underestimated and its super-narrow bezels are already being incorporated onto competing notebooks including the upcoming Yoga 910. Not much has changed for the XPS 13, but the series will remain very competitive moving into the Holidays nonetheless.
Buyers willing to pay a bit more for the Kaby Lake XPS 13 will find slightly faster performance and battery life. Otherwise, the outgoing Skylake XPS 13 will give an almost identical experience for less.
Dell XPS 13 9360 QHD+ i7
- 11/22/2016 v5.1 (old)
Allen Ngo, Klaus Hinum
Price comparison
