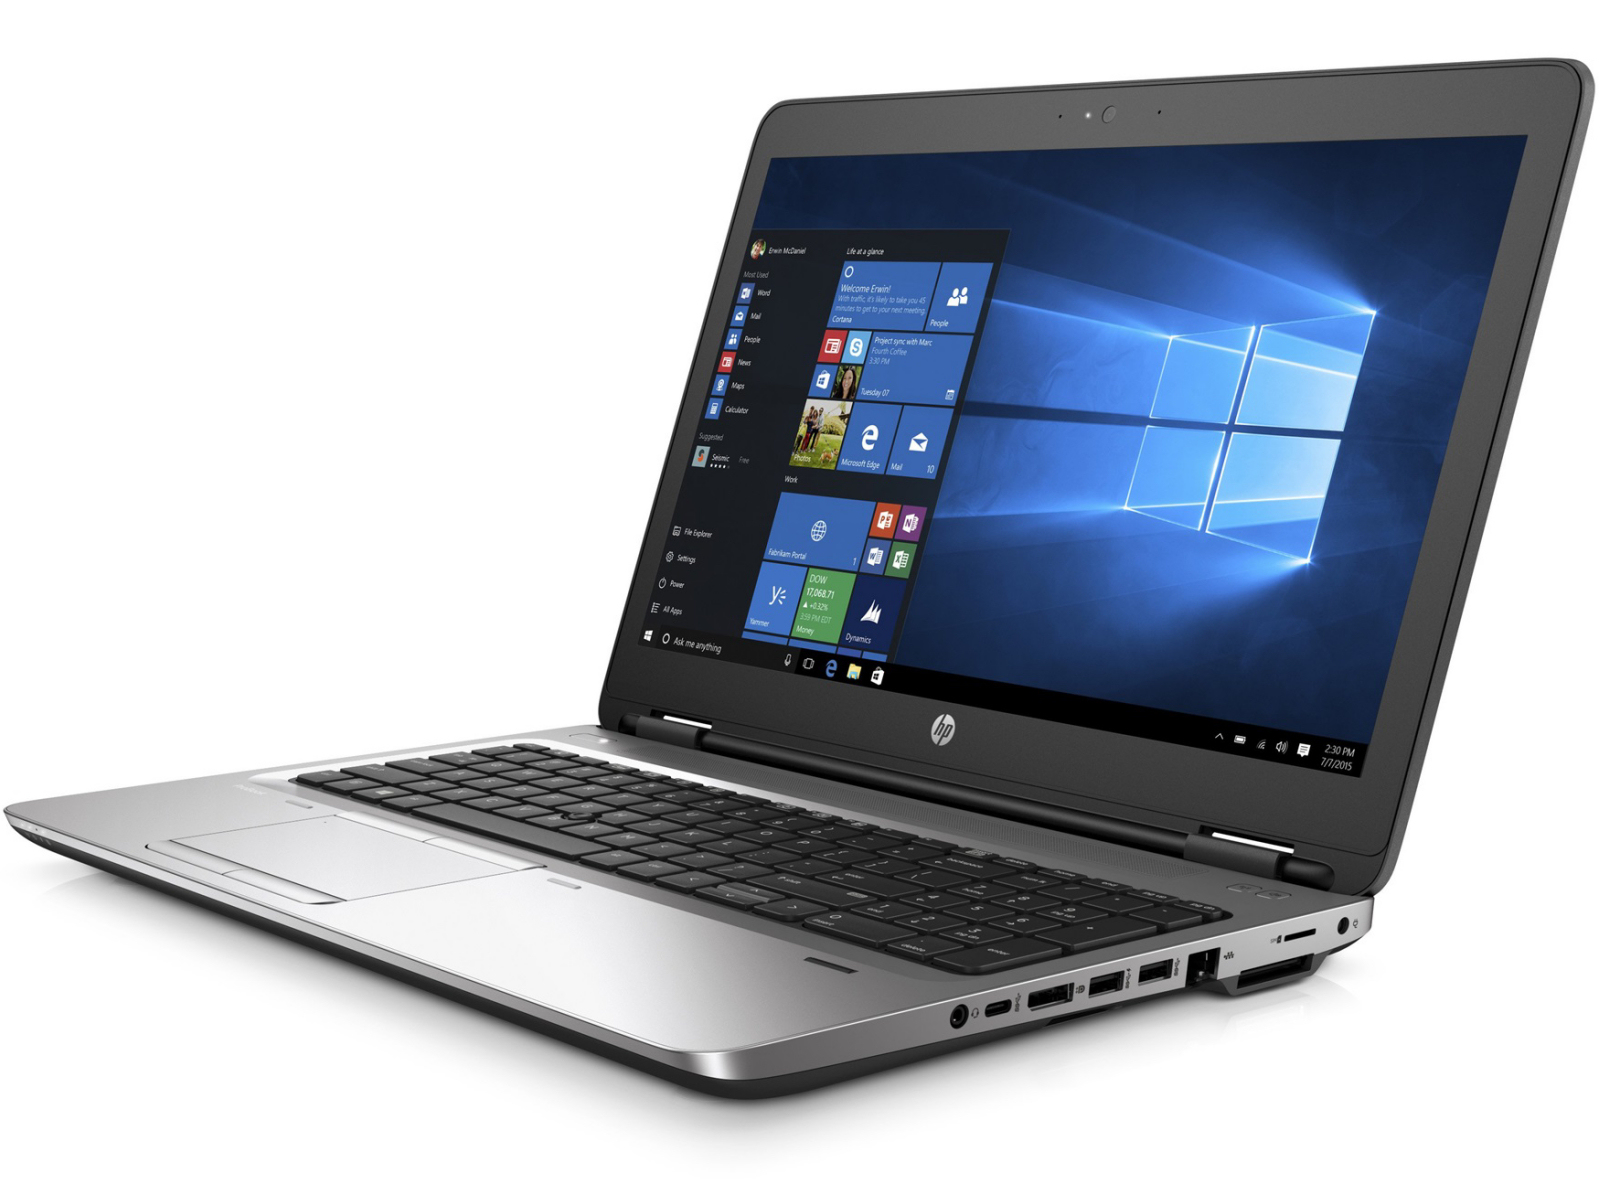
HP ProBook 650 G2 Notebook (Full HD) Review

For the original German review, see here.
We recently tested an HD model of the ProBook 650 G2. The device could not really impress us. HP got in hot water primarily with the bad screen. Now we are facing a Full HD model of the ProBook. Our report reveals whether HP can score with the Full HD panel. Rivals are laptops such as Lenovo's ThinkPad L560, Dell's Latitude 15 E5570, and Acer's TravelMate P658-M.
Since both ProBook 650 G2 models that we tested are identical, we will not go in-depth about casing, connectivity, input devices, and speakers. The corresponding information can be found in the review of the ProBook 650 G2 T9X61ET.
Connectivity
| SD Card Reader | |
| average JPG Copy Test (av. of 3 runs) | |
| Dell Latitude 15 E5570 | |
| Lenovo ThinkPad L560-20F10026GE | |
| Acer TravelMate P658-M-537B | |
| HP ProBook 650 G2-T9X61ET | |
| HP ProBook 650 G2 V1A44ET | |
| maximum AS SSD Seq Read Test (1GB) | |
| HP ProBook 650 G2-T9X61ET | |
| Lenovo ThinkPad L560-20F10026GE | |
| Networking | |
| iperf Server (receive) TCP 1 m | |
| HP ProBook 650 G2 V1A44ET (jseb) | |
| Dell Latitude 15 E5570 | |
| iperf Client (transmit) TCP 1 m | |
| HP ProBook 650 G2 V1A44ET (jseb) | |
| Dell Latitude 15 E5570 | |
Display

Our review sample is furnished with a matte, 15.6-inch screen that has a native resolution of 1920x1080 pixels. The brightness (295.9 cd/m²) we measured is good. We expect more from the contrast (531:1). The price level demands a minimum contrast of 1000:1. Unfortunately, the screen exhibits PWM flickering at a frequency of 200 Hz in brightness levels of 90 percent and less. This can cause headaches and/or eye problems in sensitive users.
| |||||||||||||||||||||||||
Brightness Distribution: 90 %
Center on Battery: 313 cd/m²
Contrast: 531:1 (Black: 0.59 cd/m²)
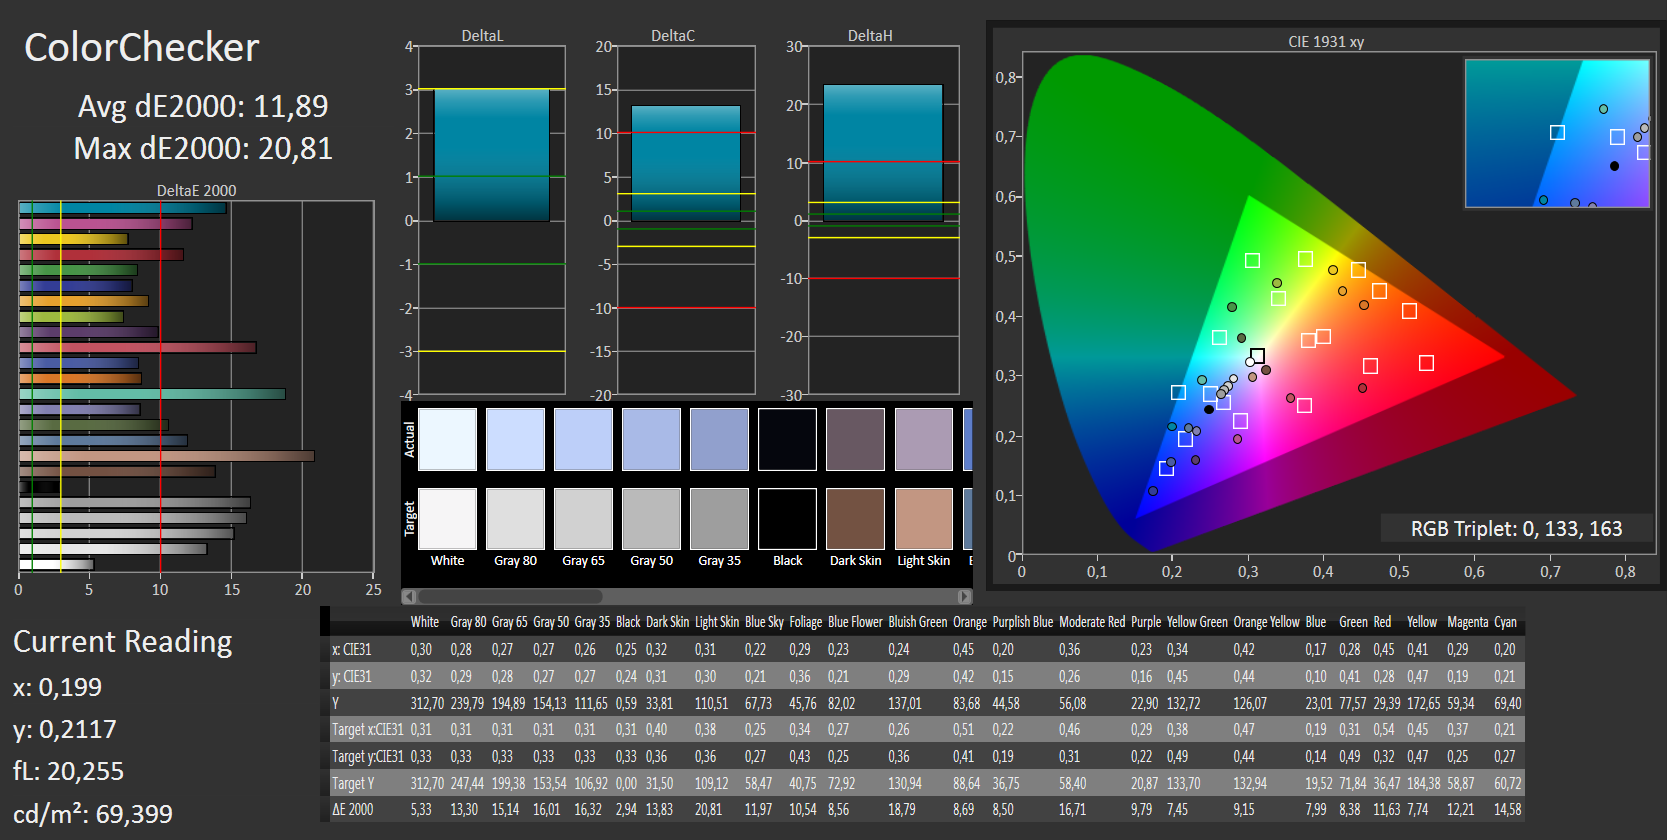
ΔE ColorChecker Calman: 11.89 | ∀{0.5-29.43 Ø4.71}
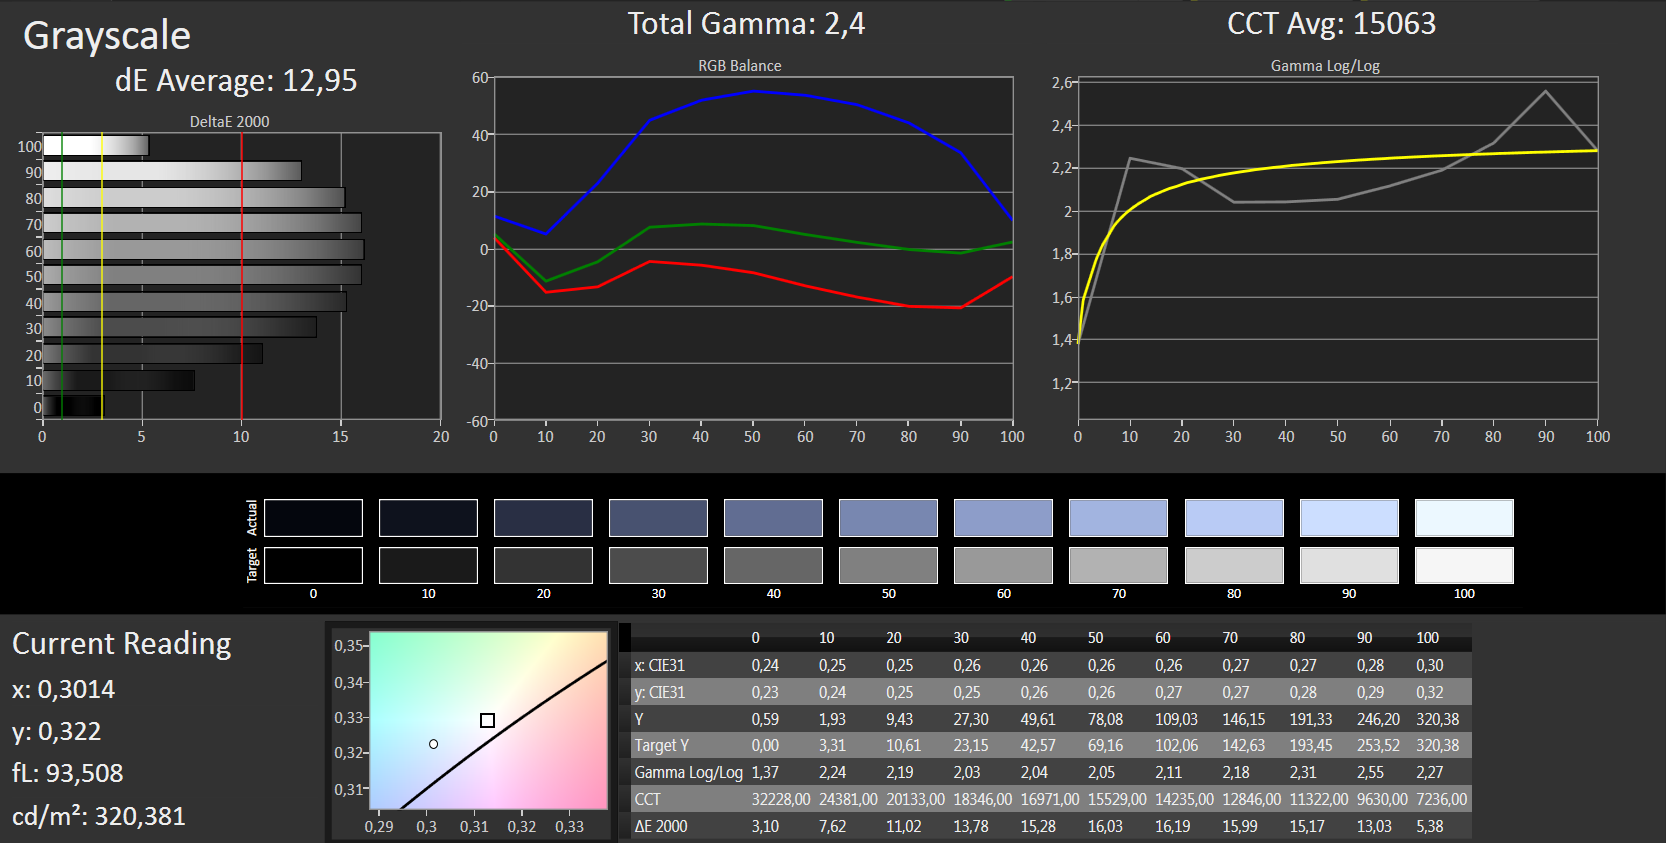
ΔE Greyscale Calman: 12.95 | ∀{0.09-98 Ø4.96}
78% sRGB (Argyll 1.6.3 3D)
50% AdobeRGB 1998 (Argyll 1.6.3 3D)
53.7% AdobeRGB 1998 (Argyll 3D)
78.3% sRGB (Argyll 3D)
52.1% Display P3 (Argyll 3D)
Gamma: 2.4
CCT: 15063 K
| HP ProBook 650 G2 V1A44ET TN LED, 1920x1080 | HP ProBook 650 G2-T9X61ET TN LED, 1366x768 | Acer TravelMate P658-M-537B IPS, 1920x1080 | Dell Latitude 15 E5570 TN LED, 1366x768 | Lenovo ThinkPad L560-20F10026GE AH-IPS, 1920x1080 | |
|---|---|---|---|---|---|
| Display | -20% | 18% | -22% | -25% | |
| Display P3 Coverage (%) | 52.1 | 41.59 -20% | 66.6 28% | 40.48 -22% | 39 -25% |
| sRGB Coverage (%) | 78.3 | 62.3 -20% | 85.7 9% | 60.9 -22% | 58.3 -26% |
| AdobeRGB 1998 Coverage (%) | 53.7 | 43 -20% | 62.8 17% | 41.82 -22% | 40.33 -25% |
| Response Times | -9% | 7% | -8% | 0% | |
| Response Time Grey 50% / Grey 80% * (ms) | 41 ? | 40.4 ? 1% | 38 ? 7% | 47 ? -15% | 39.2 ? 4% |
| Response Time Black / White * (ms) | 27 ? | 32 ? -19% | 25 ? 7% | 27 ? -0% | 28 ? -4% |
| PWM Frequency (Hz) | 200 ? | 200 ? | |||
| Screen | -5% | 19% | -5% | 12% | |
| Brightness middle (cd/m²) | 313 | 247 -21% | 308 -2% | 228 -27% | 262 -16% |
| Brightness (cd/m²) | 296 | 223 -25% | 319 8% | 236 -20% | 250 -16% |
| Brightness Distribution (%) | 90 | 85 -6% | 71 -21% | 90 0% | 92 2% |
| Black Level * (cd/m²) | 0.59 | 0.61 -3% | 0.61 -3% | 0.56 5% | 0.29 51% |
| Contrast (:1) | 531 | 405 -24% | 505 -5% | 407 -23% | 903 70% |
| Colorchecker dE 2000 * | 11.89 | 8.8 26% | 4.51 62% | 10.02 16% | 8.49 29% |
| Colorchecker dE 2000 max. * | 20.81 | 15.98 23% | 10.19 51% | 15.93 23% | 17.99 14% |
| Greyscale dE 2000 * | 12.95 | 10.13 22% | 2.91 78% | 10.66 18% | 8.11 37% |
| Gamma | 2.4 92% | 2.34 94% | 2.4 92% | 2.48 89% | 2.37 93% |
| CCT | 15063 43% | 12581 52% | 6740 96% | 11800 55% | 6300 103% |
| Color Space (Percent of AdobeRGB 1998) (%) | 50 | 39.6 -21% | 56 12% | 39 -22% | 37.07 -26% |
| Color Space (Percent of sRGB) (%) | 78 | 62.2 -20% | 86 10% | 61 -22% | 57.94 -26% |
| Total Average (Program / Settings) | -11% /
-8% | 15% /
17% | -12% /
-9% | -4% /
3% |
* ... smaller is better
Screen Flickering / PWM (Pulse-Width Modulation)
| Screen flickering / PWM detected | 200 Hz | ≤ 90 % brightness setting |  |
The display backlight flickers at 200 Hz (worst case, e.g., utilizing PWM) Flickering detected at a brightness setting of 90 % and below. There should be no flickering or PWM above this brightness setting. The frequency of 200 Hz is relatively low, so sensitive users will likely notice flickering and experience eyestrain at the stated brightness setting and below. In comparison: 52 % of all tested devices do not use PWM to dim the display. If PWM was detected, an average of 7744 (minimum: 5 - maximum: 343500) Hz was measured. | |||
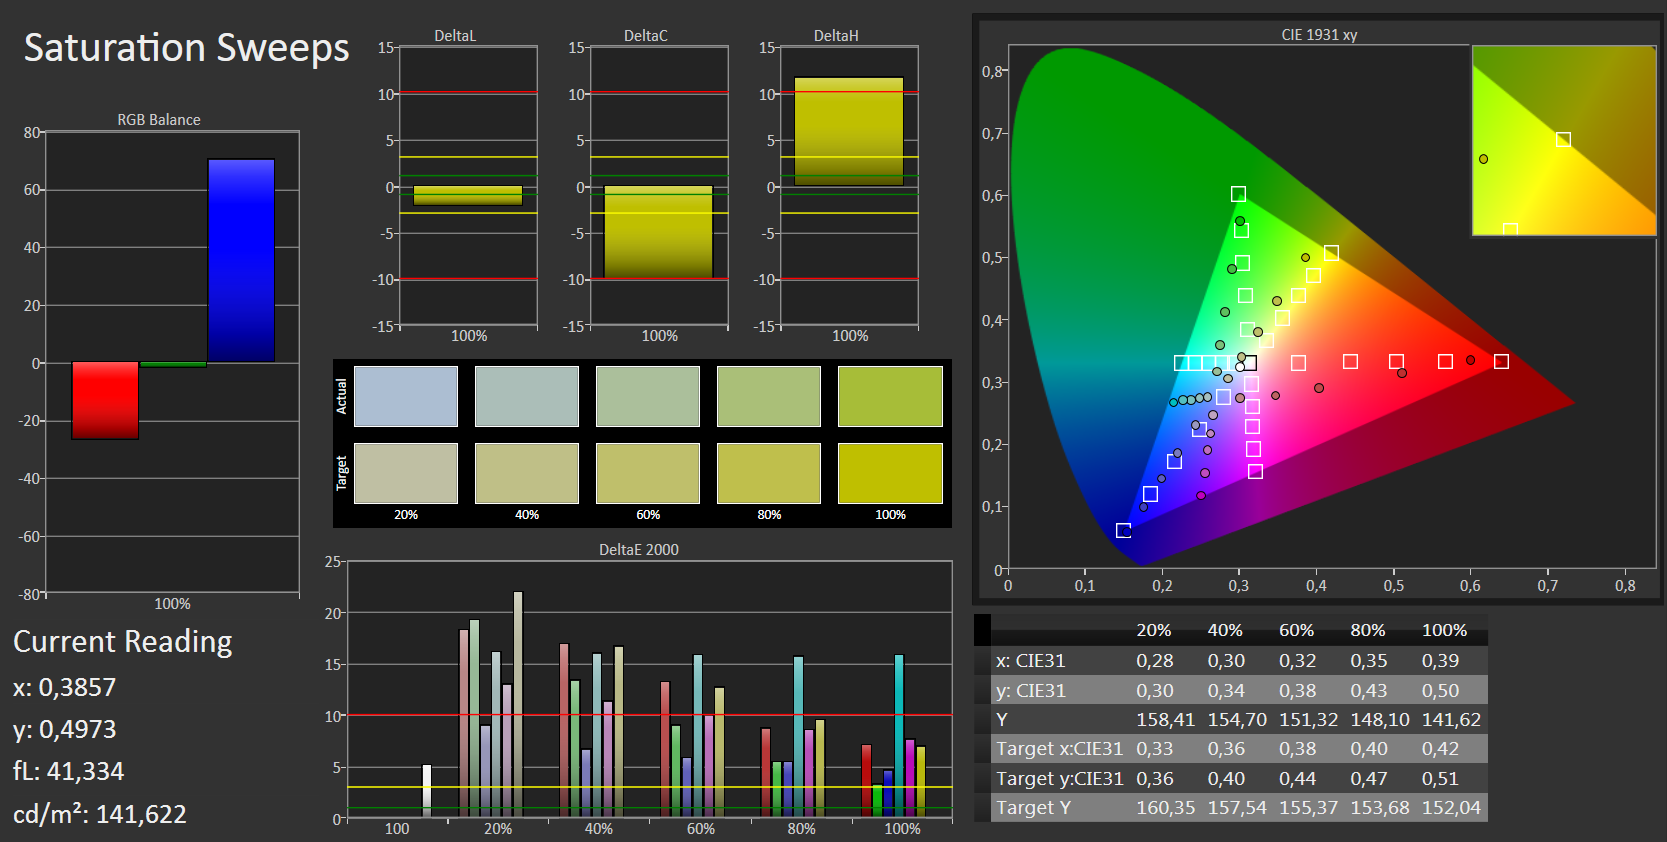
The DeltaE 2000 color shift is 11.89 in delivery state. This rate can be accepted in the low-cost sector, but not in a 1050 Euro (~$1179) ProBook. A rate less than 3 would be desirable. Beyond that, the screen displays a visible bluish tint. The screen cannot reproduce either the sRGB or AdobeRGB color space. The coverage rates are 78 percent (sRGB) and 50 percent (AdobeRGB).
Display Response Times
| ↔ Response Time Black to White | ||
|---|---|---|
| 27 ms ... rise ↗ and fall ↘ combined | ↗ 10 ms rise | 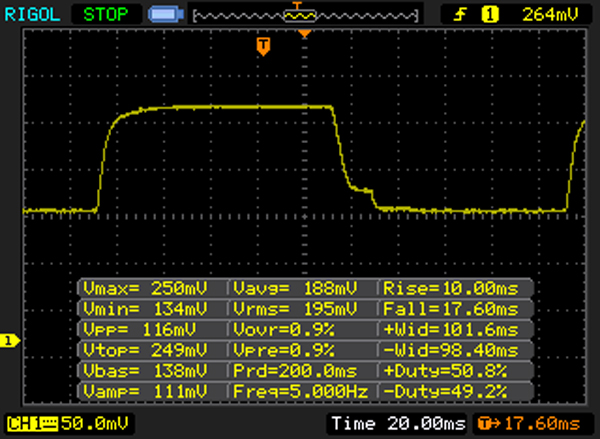 |
| ↘ 17 ms fall | ||
| The screen shows relatively slow response rates in our tests and may be too slow for gamers. In comparison, all tested devices range from 0.1 (minimum) to 240 (maximum) ms. » 68 % of all devices are better. This means that the measured response time is worse than the average of all tested devices (19.8 ms). | ||
| ↔ Response Time 50% Grey to 80% Grey | ||
| 41 ms ... rise ↗ and fall ↘ combined | ↗ 23 ms rise | 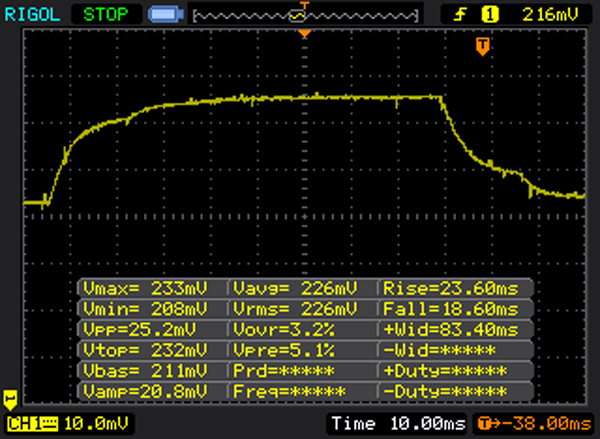 |
| ↘ 18 ms fall | ||
| The screen shows slow response rates in our tests and will be unsatisfactory for gamers. In comparison, all tested devices range from 0.165 (minimum) to 636 (maximum) ms. » 65 % of all devices are better. This means that the measured response time is worse than the average of all tested devices (30.9 ms). | ||
The Full HD screen is a viewing angle dependent TN panel. Thus, the screen is not legible from every position. We would have expected a viewing angle stable IPS panel here. The ProBook is usable outdoors, however, the sun should not be too bright.
Performance
With the ProBook 650 G2, HP delivers a 15.6-inch mid-range business laptop. It has enough computing power for all common application scenarios. A docking port, TPM, and 3G modem are onboard. Our review sample is priced at approximately 1050 Euros (~$1179). Other configurations exist. The cheapest model at test time carried a price tag of around 860 Euros (~$965). The identically built ProBook 655 G2 lineup (furnished with AMD APUs) expands the offer.
Processor
Inside our review sample, we find a mid-range CPU by Intel in form of the Core i5-6200U (Skylake) dual-core processor. It should completely satisfy the needs of most users. The CPU is a member of the frugal ULV processors (TDP: 15 watts). The processor clocks at a base speed of 2.3 GHz that can be boosted to 2.7 GHz (both cores) and 2.8 GHz (one core only) via Turbo. Turbo is only utilized in AC mode. The CPU performed our tests at 2.1 to 2.4 GHz in battery mode. The reason: The option "Enable Turbo Boost on DC" is disabled in the laptop's BIOS. When enabled, Turbo is also utilized in battery mode.
| Geekbench 3 | |
| 32 Bit Single-Core Score | |
| Dell Latitude 15 E5570 | |
| HP ProBook 650 G2 V1A44ET | |
| 32 Bit Multi-Core Score | |
| Dell Latitude 15 E5570 | |
| HP ProBook 650 G2 V1A44ET | |
| JetStream 1.1 - 1.1 Total | |
| HP ProBook 650 G2-T9X61ET | |
| Dell Latitude 15 E5570 | |
| HP ProBook 650 G2 V1A44ET | |
| Lenovo ThinkPad L560-20F10026GE | |
System Performance
A powerful processor and swift solid-state drive result in a fast-running system. The PCMark benchmark scores are very good. Increasing the performance slightly is possible. Installing a second working memory bank would enable dual-channel mode and consequently increase graphics performance.
| PCMark 8 Home Score Accelerated v2 | 3234 points | |
Help | ||
| PCMark 8 - Home Score Accelerated v2 | |
| Acer TravelMate P658-M-537B | |
| Dell Latitude 15 E5570 | |
| HP ProBook 650 G2 V1A44ET | |
| HP ProBook 650 G2-T9X61ET | |
| Lenovo ThinkPad L560-20F10026GE | |
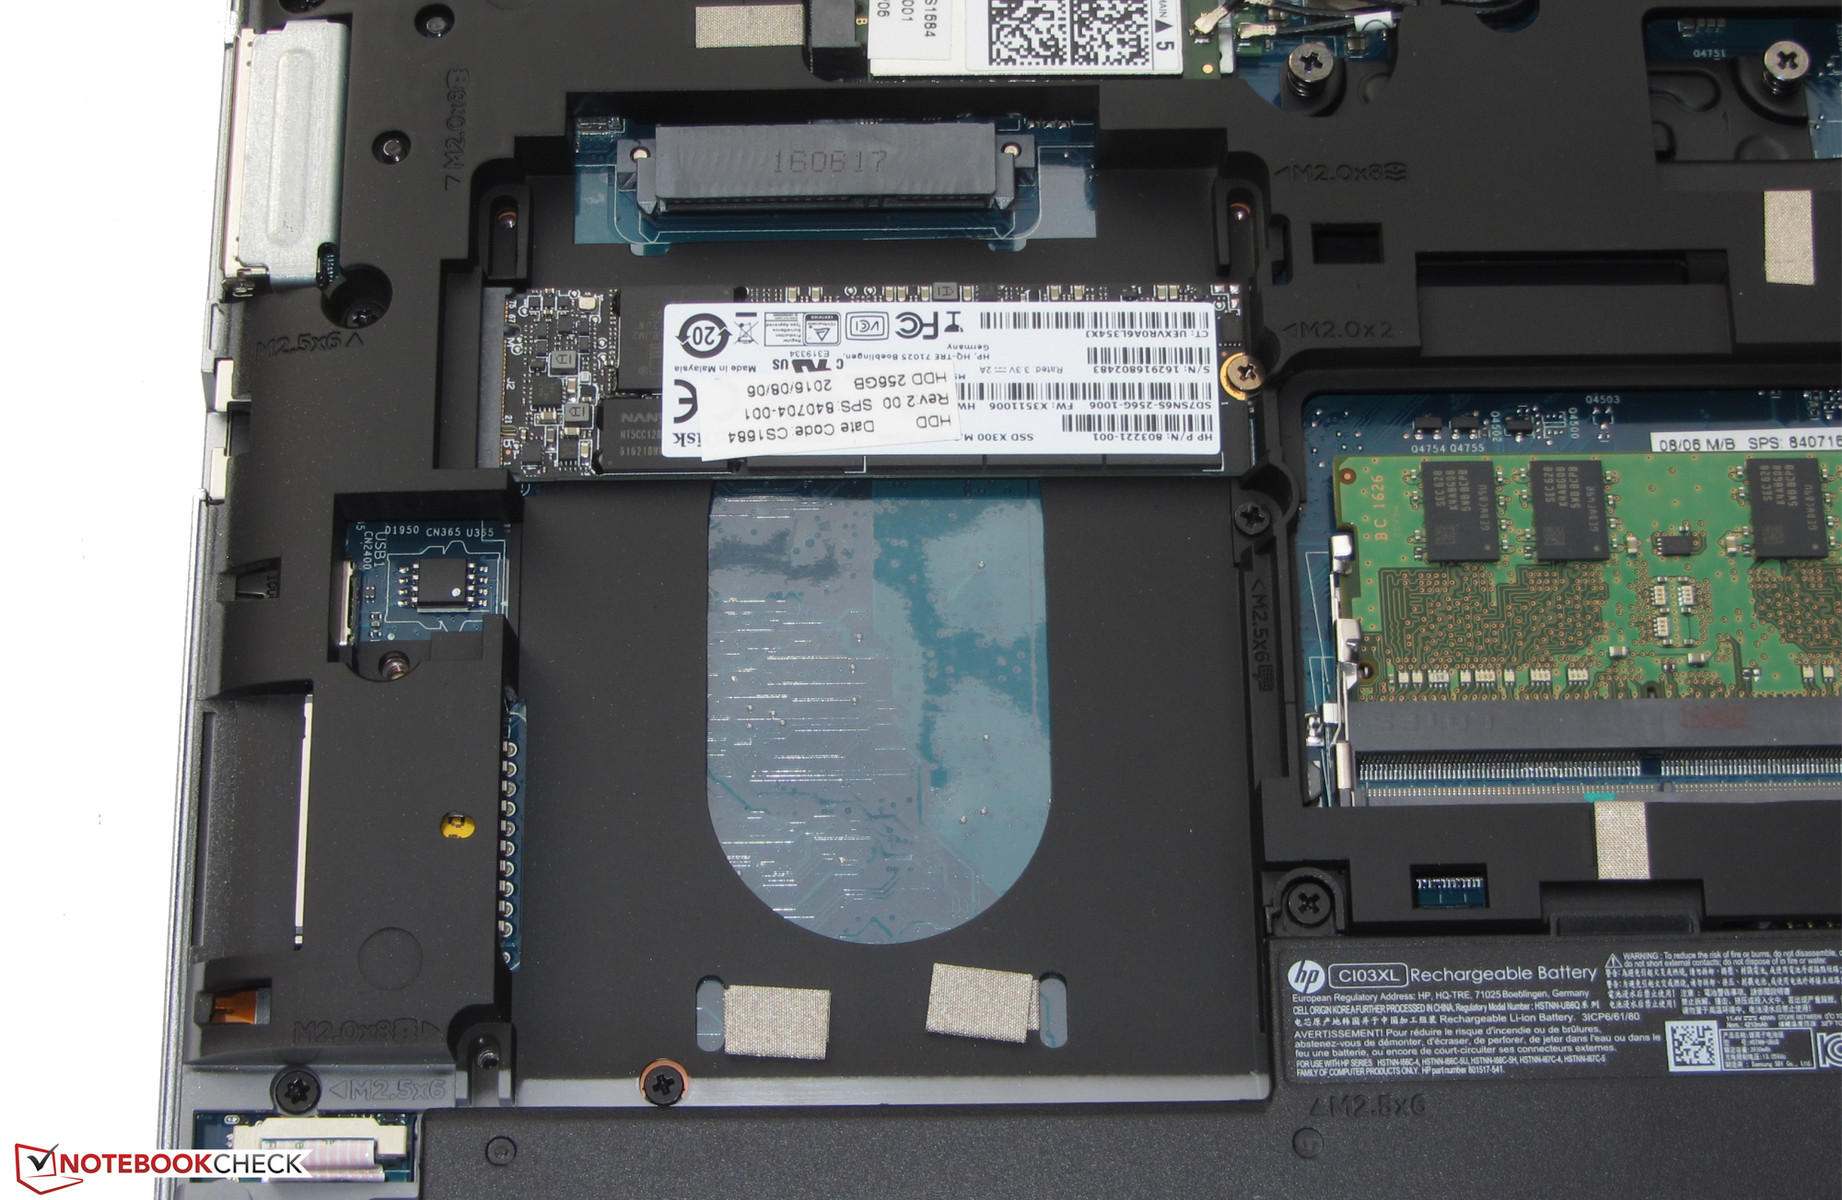
Storage Device
A solid-state drive by SanDisk is installed as the system drive. It is an M.2 model. The SSD has a capacity of 256 GB. Roughly 190 GB can be used. The rest of the storage is reserved by the Windows installation and recovery partition. The transfer rates are good.
The installed SSD is a SATA model. However, PCIe SSDs can be inserted into the M.2 slot. According to the maintenance manual, HP offers SSDs for the ProBook that are connected via PCI Express 3.0 x4 (NVMe support present). These SSDs achieve much higher transfer rates than SATA models.

| HP ProBook 650 G2 V1A44ET Sandisk X300 SD7SN6S-256G-1006 | HP ProBook 650 G2-T9X61ET Hitachi Travelstar Z7K500 HTS725050A7E630 | Acer TravelMate P658-M-537B Kingston RBU-SNS8152S3256GG2 | Dell Latitude 15 E5570 Samsung SSD PM871 MZ7LN128HCHP | Lenovo ThinkPad L560-20F10026GE WDC Slim WD10SPCX-21KHST0 | |
|---|---|---|---|---|---|
| CrystalDiskMark 3.0 | -90% | -1% | -13% | -89% | |
| Read Seq (MB/s) | 475 | 109.6 -77% | 479.1 1% | 474.7 0% | 113.6 -76% |
| Write Seq (MB/s) | 435 | 109.1 -75% | 333.1 -23% | 155 -64% | 111.7 -74% |
| Read 512 (MB/s) | 280.4 | 30.66 -89% | 418 49% | 393.6 40% | 39.65 -86% |
| Write 512 (MB/s) | 265.5 | 45.71 -83% | 320.5 21% | 119.7 -55% | 55.3 -79% |
| Read 4k (MB/s) | 32.71 | 0.351 -99% | 25.66 -22% | 34 4% | 0.488 -99% |
| Write 4k (MB/s) | 98.7 | 0.798 -99% | 64.7 -34% | 96.6 -2% | 1.022 -99% |
| Read 4k QD32 (MB/s) | 347.2 | 0.656 -100% | 226.2 -35% | 383.3 10% | 1.367 -100% |
| Write 4k QD32 (MB/s) | 154.1 | 0.787 -99% | 211.4 37% | 100.2 -35% | 1.036 -99% |
Graphics Card
Intel's HD Graphics 520 graphics unit is onboard. It supports DirectX 12 and clocks at speeds of up to 950 MHz. The GPU's 3DMark scores are on a normal level. Increasing the performance would be possible by installing a second working memory module. The then enabled dual-channel mode would better utilize the GPU.
| 3DMark 11 Performance | 1344 points | |
Help | ||
| 3DMark 11 - 1280x720 Performance GPU | |
| Acer TravelMate P658-M-537B | |
| HP ProBook 650 G2-T9X61ET | |
| Dell Latitude 15 E5570 | |
| Lenovo ThinkPad L560-20F10026GE | |
| HP ProBook 650 G2 V1A44ET | |
Gaming Performance
Although the ProBook is an office device, an occasional game can be played on it - in low resolutions and low quality settings. This involves games that do not have exorbitant demands on the hardware. Installing a second working memory module (= dual-channel mode enabled) would lead to higher frame rates.
| low | med. | high | ultra | |
|---|---|---|---|---|
| BioShock Infinite (2013) | 38.3 | 21.7 | 17.9 |
Emissions & Energy
System Noise
The ProBook hardly produces noise over the entire load range. The fan is sometimes inactive in idle and silence prevails. It usually spins at a low speed. The fan did not speed up much even during the stress test. We measured a noise level of just 34.5 dB(A).
Noise level
| Idle |
| 30.5 / 31.6 / 31.9 dB(A) |
| Load |
| 34.7 / 34.5 dB(A) |
 | ||
30 dB silent 40 dB(A) audible 50 dB(A) loud |
||
min: | ||
Temperature
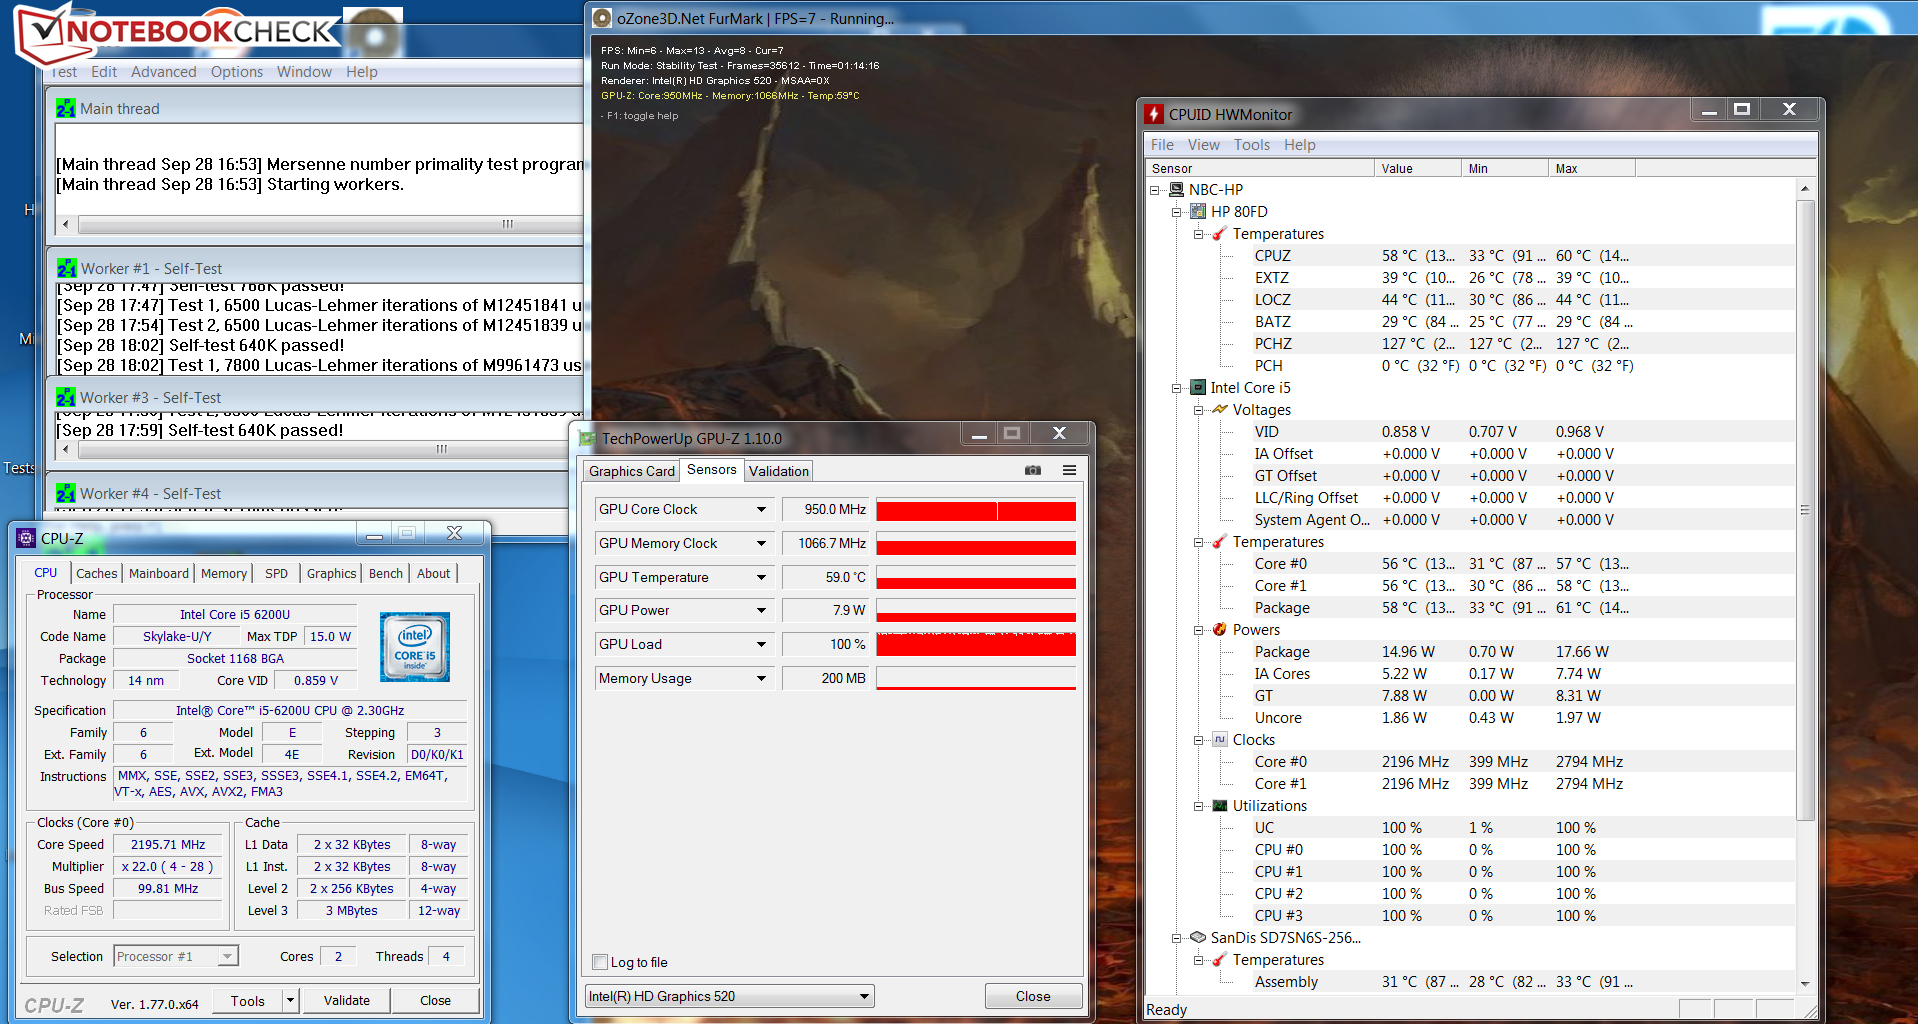
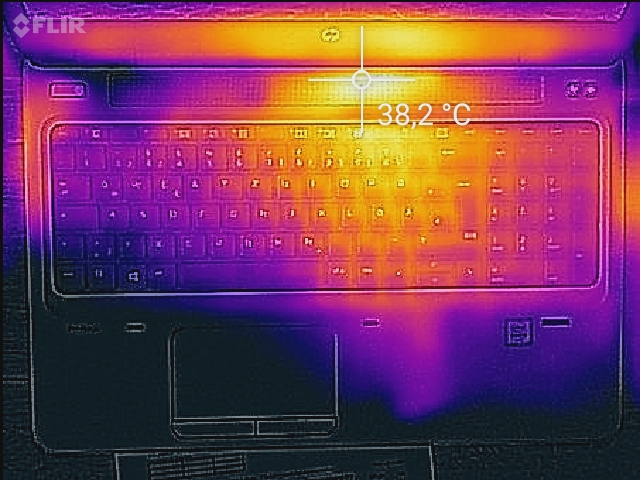
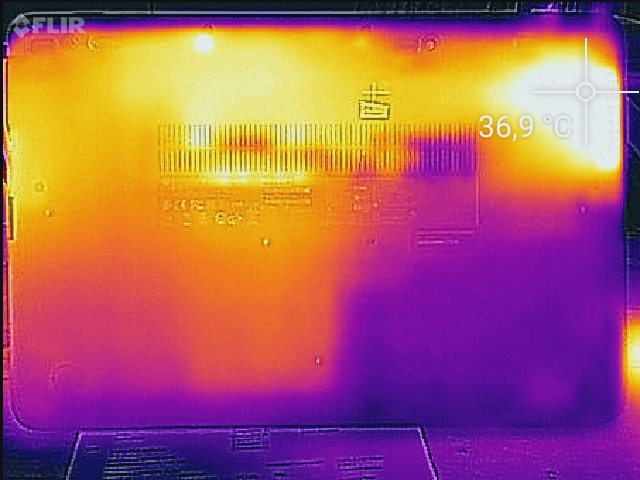
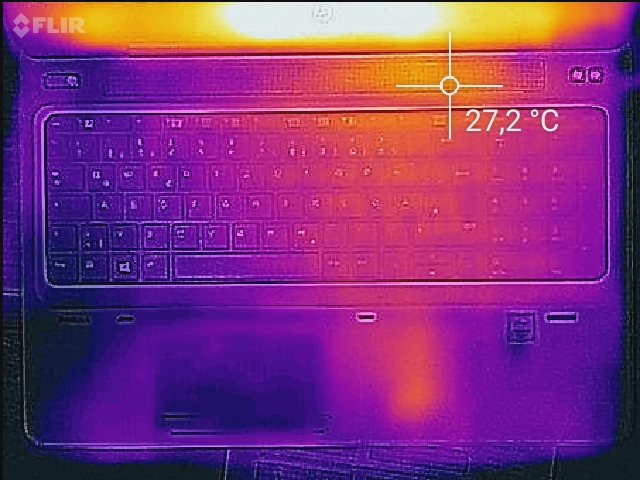
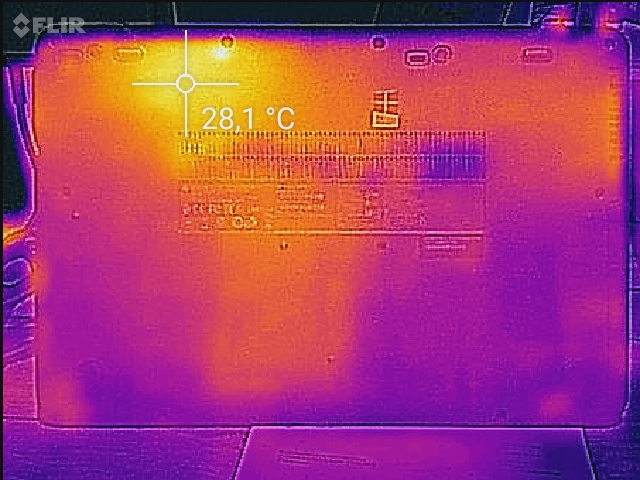
The ProBook performed our stress test (Prime95 and FurMark run for at least one hour) differently in AC and battery mode. The processor clocked at 2.7 GHz for only a short time in AC mode. Its speed then throttled permanently to 2.1 to 2.2 GHz where it remained. The graphics unit clocked at full speed. The CPU (1.5 GHz) and GPU (500 MHz) reduced their speeds in battery mode. The laptop heated up moderately. Forty degrees Celsius (104 Fahrenheit) was only surpassed on one measuring point.
(+) The maximum temperature on the upper side is 39.6 °C / 103 F, compared to the average of 34.3 °C / 94 F, ranging from 21.2 to 62.5 °C for the class Office.
(±) The bottom heats up to a maximum of 41.8 °C / 107 F, compared to the average of 36.8 °C / 98 F
(+) In idle usage, the average temperature for the upper side is 26.4 °C / 80 F, compared to the device average of 29.5 °C / 85 F.
(+) The palmrests and touchpad are cooler than skin temperature with a maximum of 29.7 °C / 85.5 F and are therefore cool to the touch.
(-) The average temperature of the palmrest area of similar devices was 27.6 °C / 81.7 F (-2.1 °C / -3.8 F).
Speakers
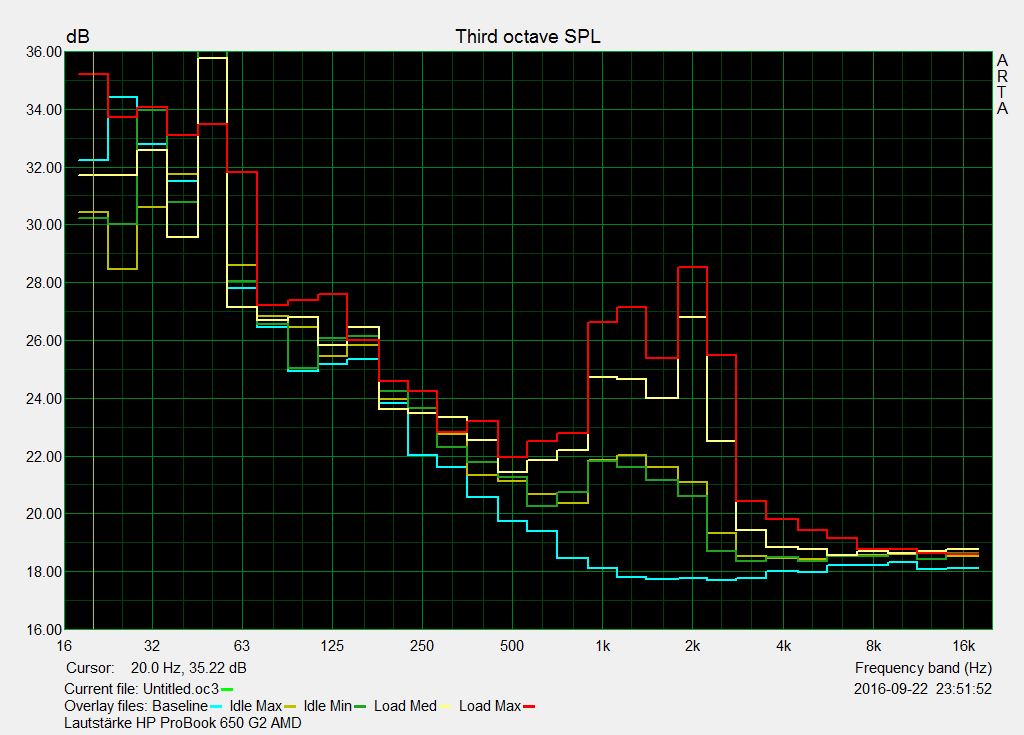
HP ProBook 650 G2 V1A44ET audio analysis
(±) | speaker loudness is average but good (72 dB)
Bass 100 - 315 Hz
(-) | nearly no bass - on average 36.7% lower than median
(±) | linearity of bass is average (7.4% delta to prev. frequency)
Mids 400 - 2000 Hz
(±) | reduced mids - on average 6.7% lower than median
(±) | linearity of mids is average (11.4% delta to prev. frequency)
Highs 2 - 16 kHz
(+) | balanced highs - only 2.6% away from median
(+) | highs are linear (4.7% delta to prev. frequency)
Overall 100 - 16.000 Hz
(±) | linearity of overall sound is average (26.4% difference to median)
Compared to same class
» 81% of all tested devices in this class were better, 6% similar, 12% worse
» The best had a delta of 7%, average was 21%, worst was 53%
Compared to all devices tested
» 81% of all tested devices were better, 4% similar, 15% worse
» The best had a delta of 4%, average was 23%, worst was 134%
Apple MacBook 12 (Early 2016) 1.1 GHz audio analysis
(+) | speakers can play relatively loud (83.6 dB)
Bass 100 - 315 Hz
(±) | reduced bass - on average 11.3% lower than median
(±) | linearity of bass is average (14.2% delta to prev. frequency)
Mids 400 - 2000 Hz
(+) | balanced mids - only 2.4% away from median
(+) | mids are linear (5.5% delta to prev. frequency)
Highs 2 - 16 kHz
(+) | balanced highs - only 2% away from median
(+) | highs are linear (4.5% delta to prev. frequency)
Overall 100 - 16.000 Hz
(+) | overall sound is linear (10.2% difference to median)
Compared to same class
» 7% of all tested devices in this class were better, 2% similar, 90% worse
» The best had a delta of 5%, average was 18%, worst was 53%
Compared to all devices tested
» 5% of all tested devices were better, 1% similar, 94% worse
» The best had a delta of 4%, average was 23%, worst was 134%
Frequency diagram in comparison (check boxes above can be turned on/off!)
Power Consumption
The ProBook does not demand much energy. We measured a maximum idle power consumption of 7.6 watts - a good rate. The requirement climbed to 39.5 watts for a moment in the stress test. When CPU throttling set in, the rate dropped to 28.4 watts. The power supply has a nominal output of 45 watts.
| Off / Standby | |
| Idle | |
| Load |
|
Key:
min: | |
Battery Runtime
Our practical Wi-Fi test simulates the load needed for opening websites. The "Balanced" profile is enabled, the laptop's energy-saving functions are disabled, and the screen's brightness is set to approximately 150 cd/m². The ProBook achieved a runtime of 7:04 hours. Thus, it lasts a bit longer than its HD sibling.
| Battery Runtime - WiFi Websurfing | |
| Dell Latitude 15 E5570 | |
| Acer TravelMate P658-M-537B | |
| HP ProBook 650 G2 V1A44ET | |
| HP ProBook 650 G2-T9X61ET | |
| Lenovo ThinkPad L560-20F10026GE | |
Pros
Cons
Verdict
HP delivers a mid-range business laptop in the form of the ProBook 650 G2. It has enough computing power for all common application scenarios. The laptop always runs quietly and hardly heats up. A swift solid-state drive results in a fast-running system. Replacing the SSD would be possible after removing the laptop's base tray. This is quite easy to do. The installed keyboard is pleasing although it does not have a backlight. It should be equipped as standard in a device like the ProBook. The battery life is good.
HP puts the existence of this series in question itself with the ProBook 650 G2 since the price difference to the cheaper ProBook 450 lineup is low. We expected more from the ProBook 650 in total.
We cannot say much good about the installed Full HD panel. It is low-contrast, viewing angle dependent, exhibits a poor color reproduction, and only offers a small color space coverage. It is improper to install such a screen. It firstly contradicts the claim the HP should have on the ProBook 650 series and secondly, it is completely inappropriate in view of the laptop's purchase price.
HP ProBook 650 G2 V1A44ET
- 10/02/2016 v5.1 (old)
Sascha Mölck
Price comparison
