Notebookcheck Logo

Overwatch Notebook and Desktop Benchmarks

Topsy-turvy house. Overwatch might look like a chaotic action spectacle on speed at first, but Blizzard's multiplayer shooter turns out to be very beginner-friendly in practice. Is this also the case for the system requirements? We tested it with our notebook benchmarks.

For the original German article, see here.

Graphics

When you look at Blizzard lineup, you can quickly see that the American developer has a thing for comic graphics. Besides StarCraft II and World of Warcraft, Hearthstone and Heroes of the Storm are pretty colorful as well. Only Diablo III uses paler colors to support the darker atmosphere.

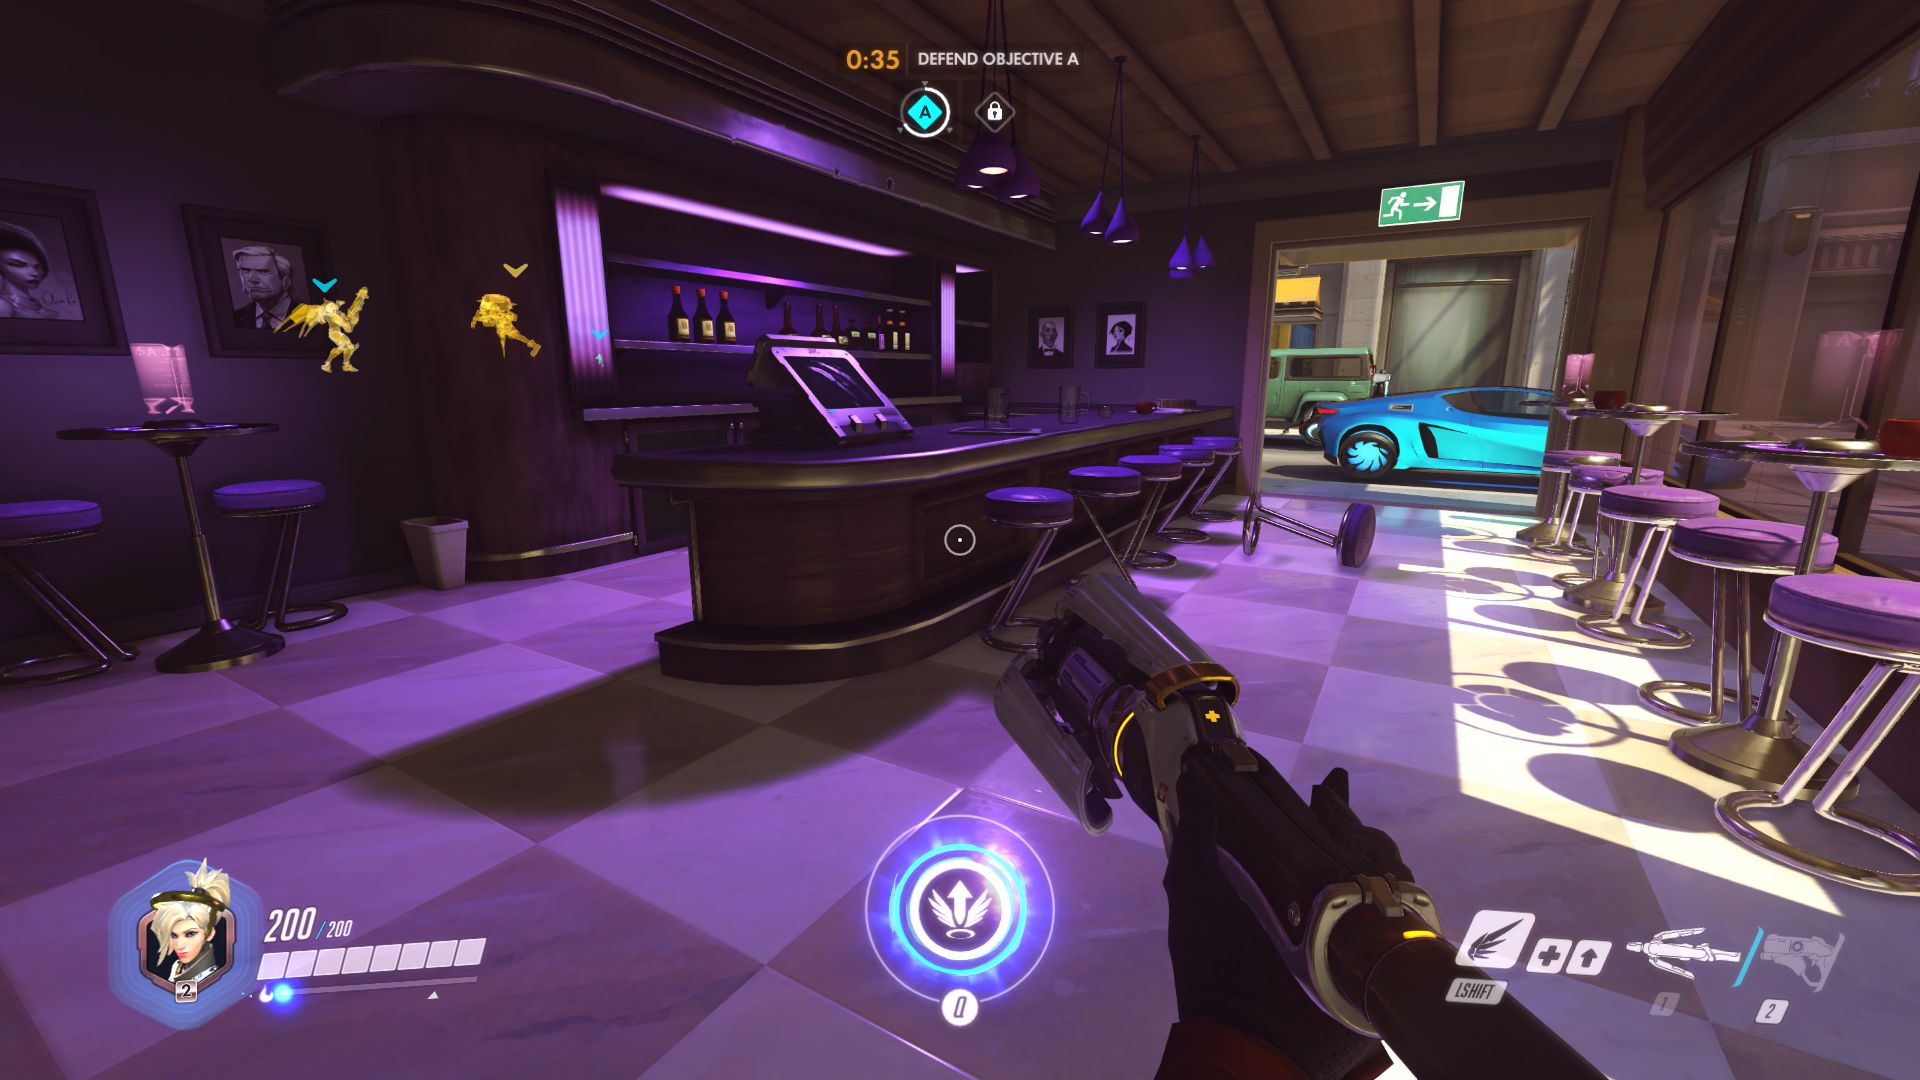
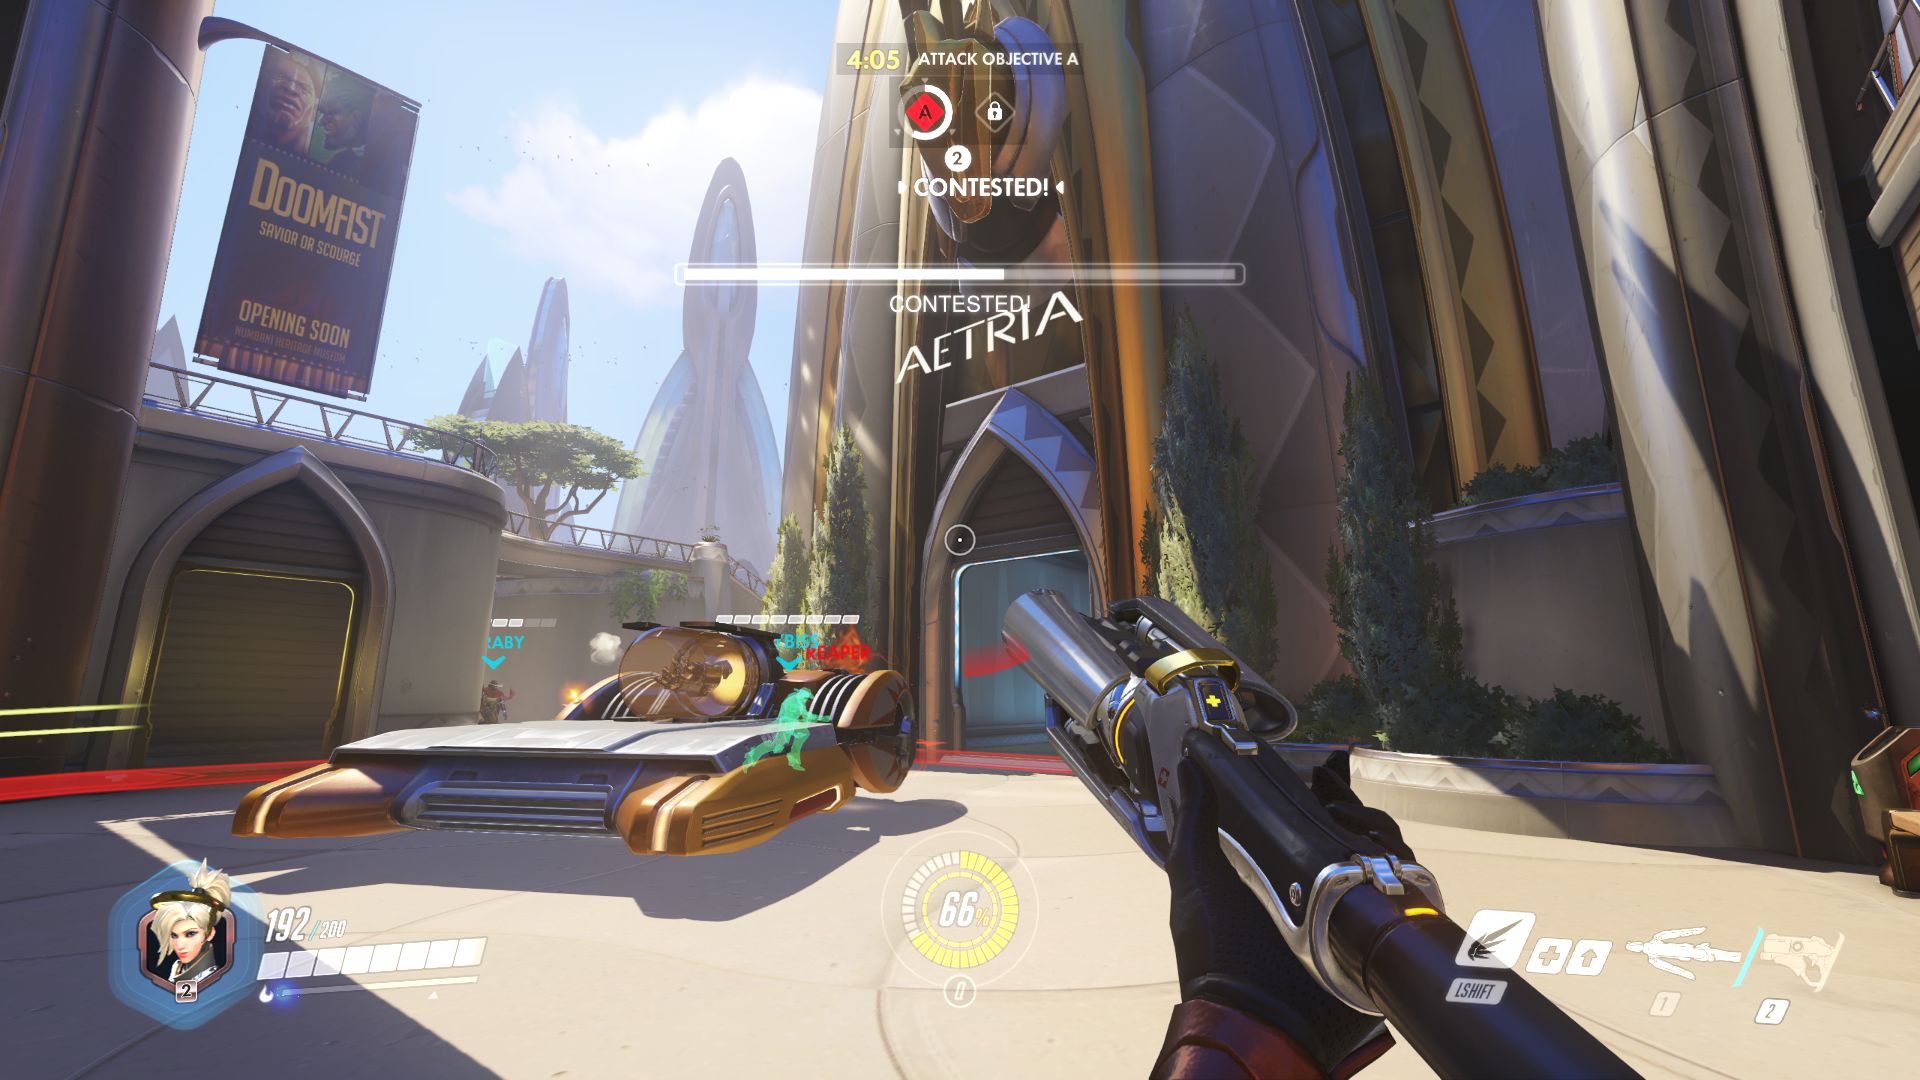
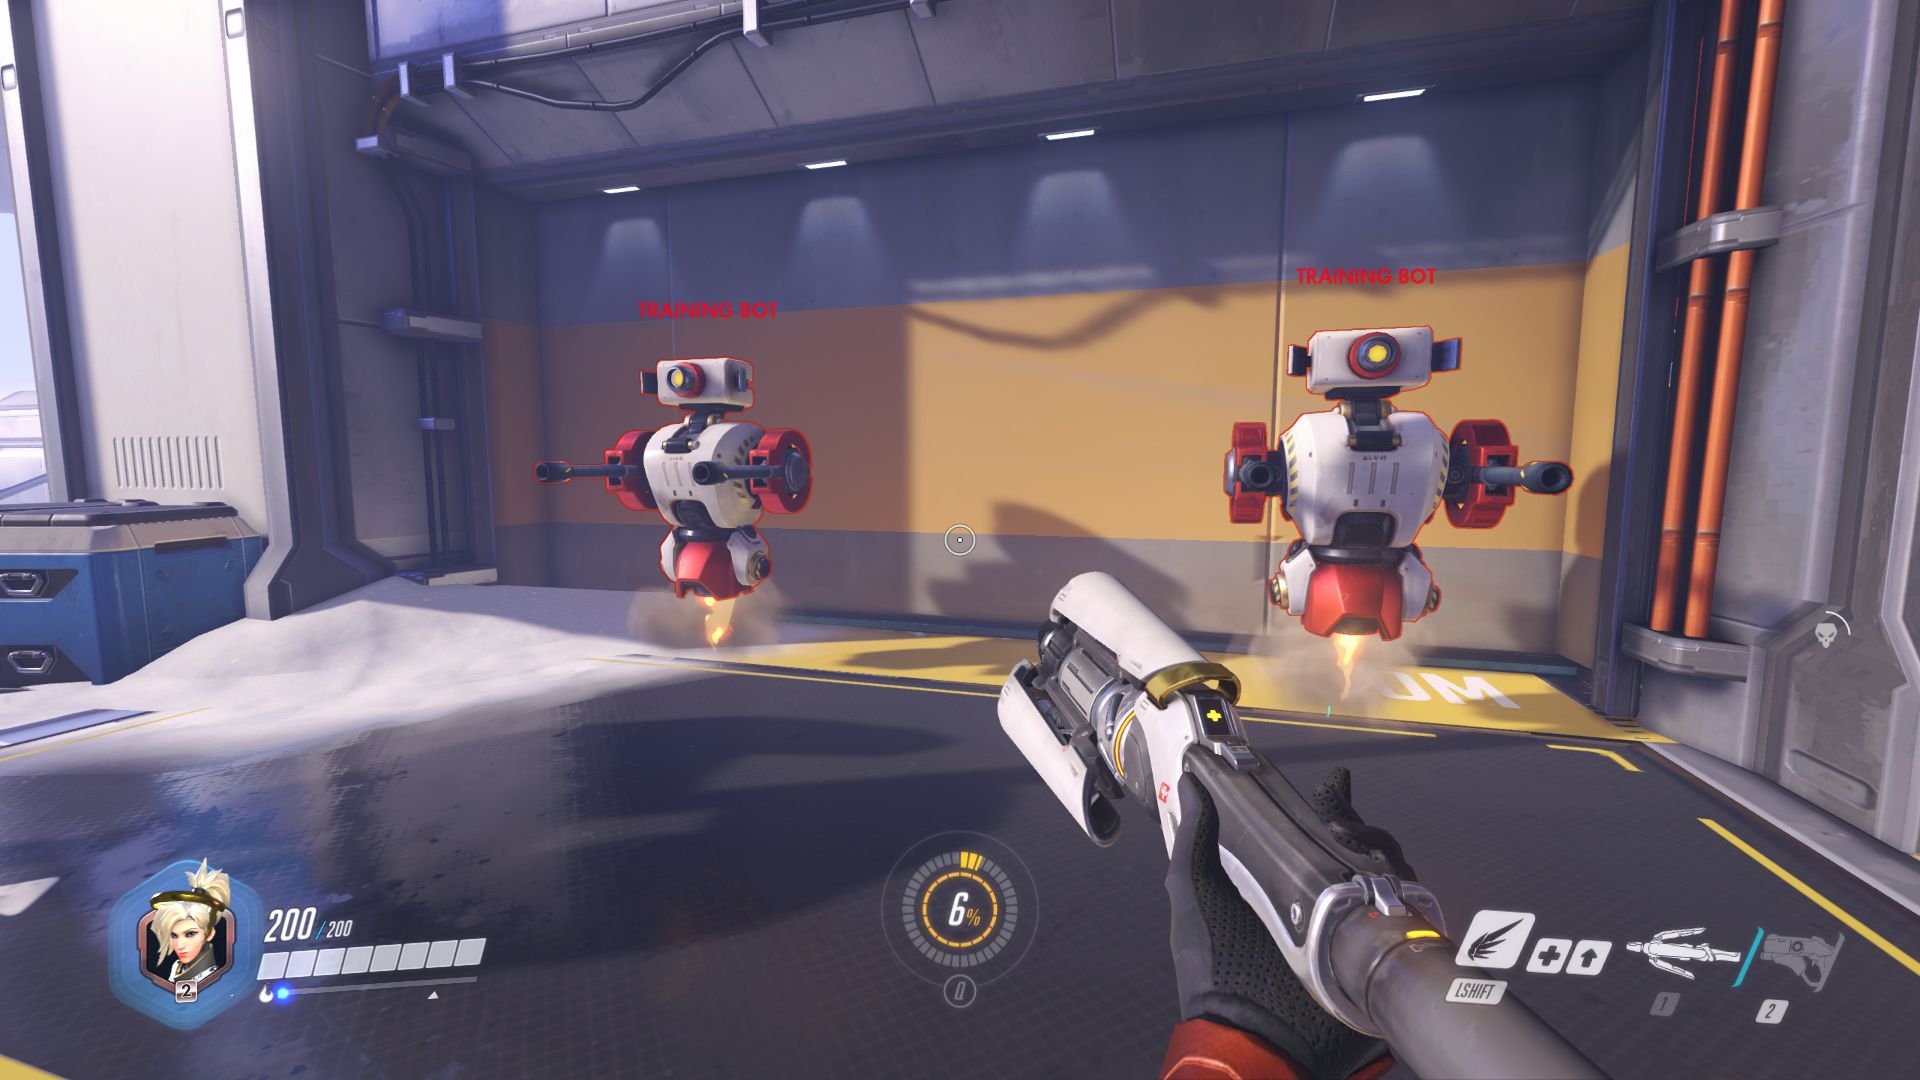
Compared to the previously mentioned titles, Overwatch even cranks it up a notch and turns out to be a graphics firework, at least in terms of saturation levels and effects. You can actually lose overview pretty easily when multiple enemies come together with a lot of energy beams and particles. The graphics quality is – similar to all Blizzard titles – otherwise just mediocre. The textures are not bad by any means, but competitors (e. g. Star Wars Battlefront) play on another level.

Overwatch
Overwatch
Overwatch
Overwatch
Overwatch
Overwatch

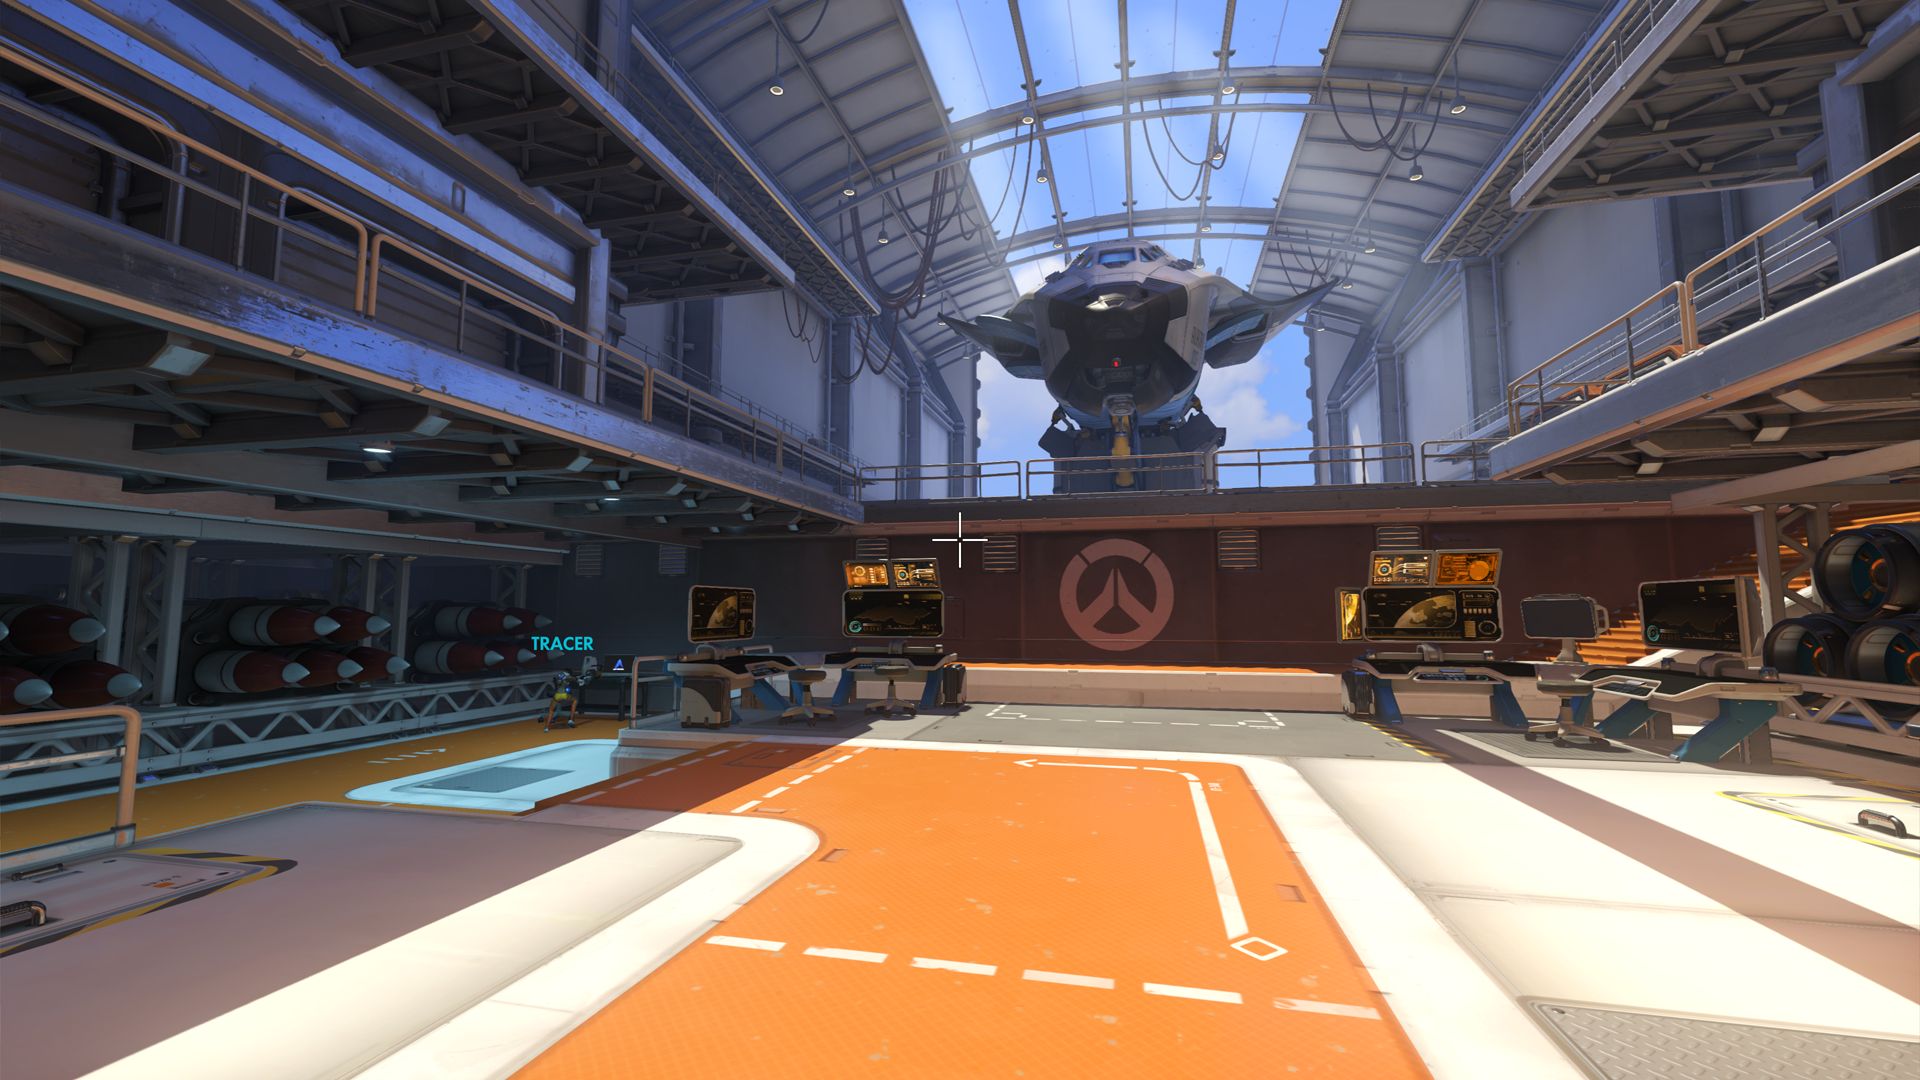
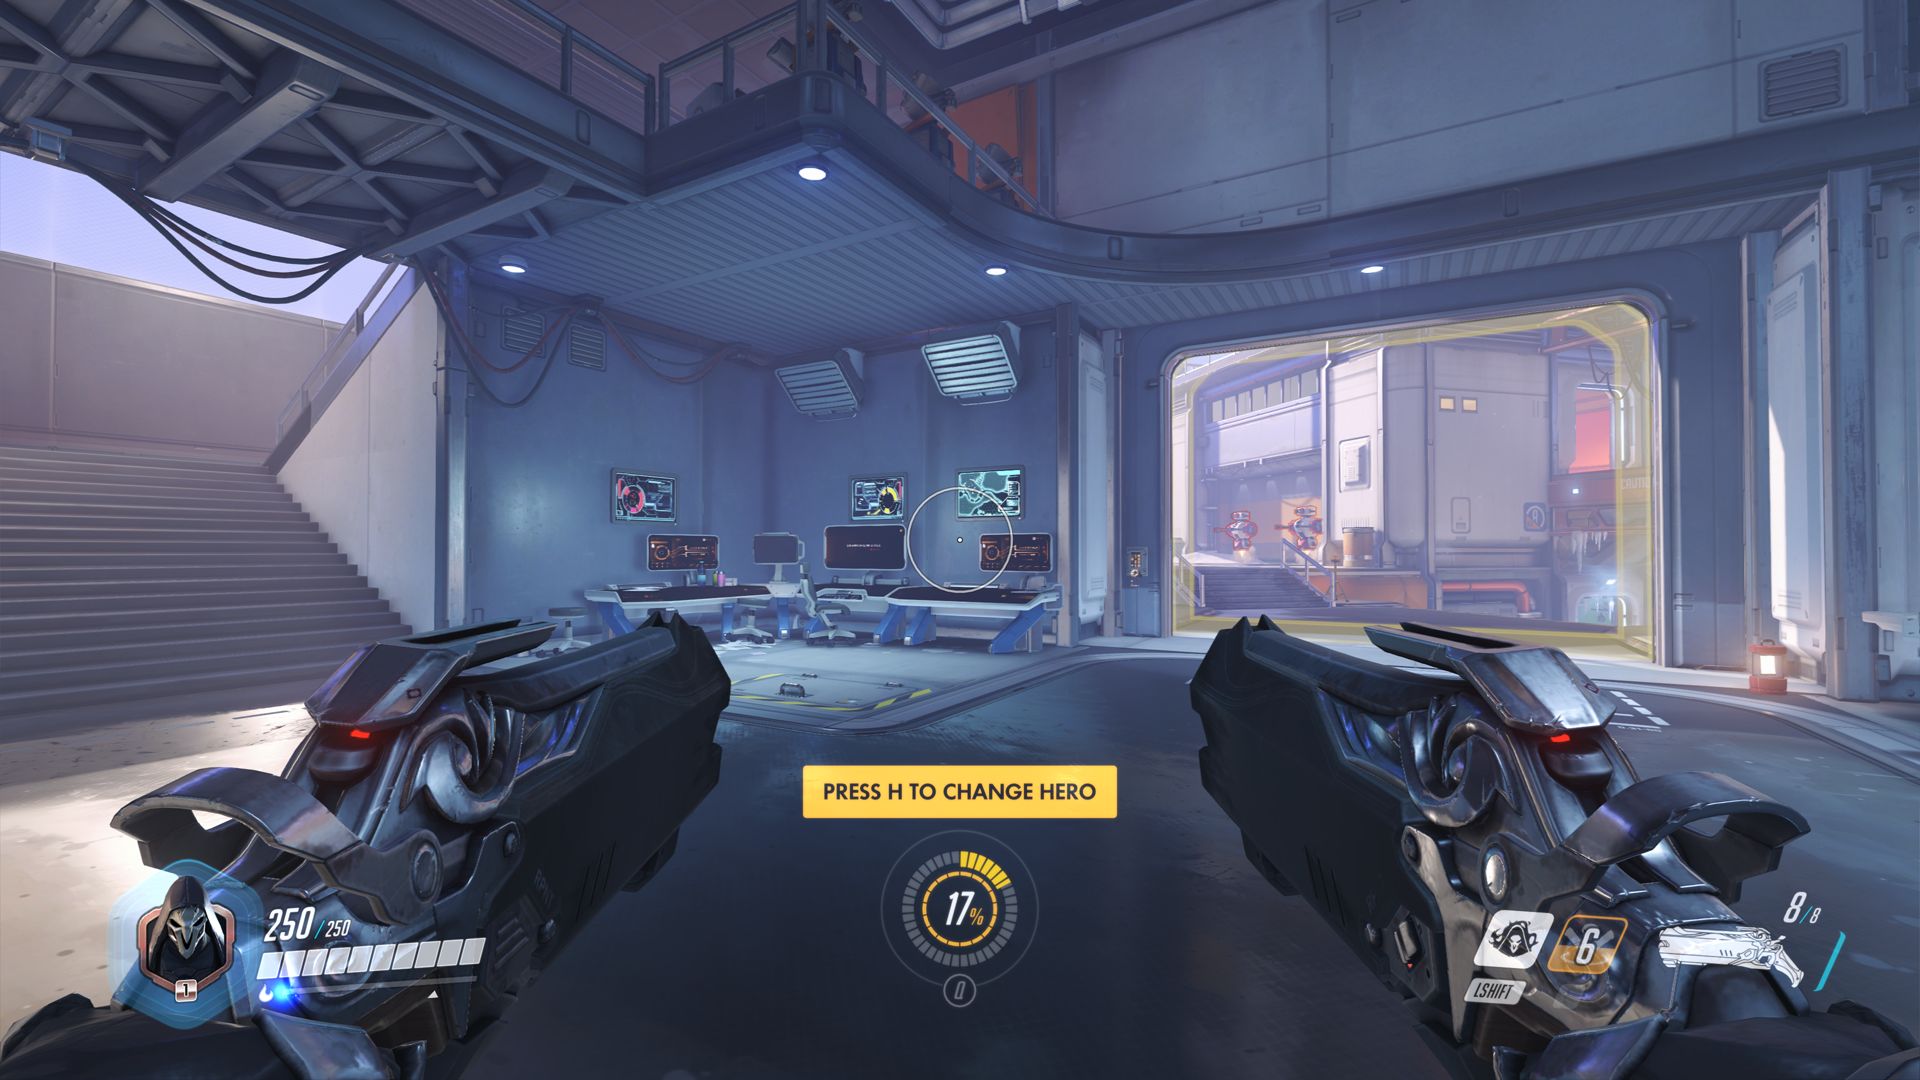
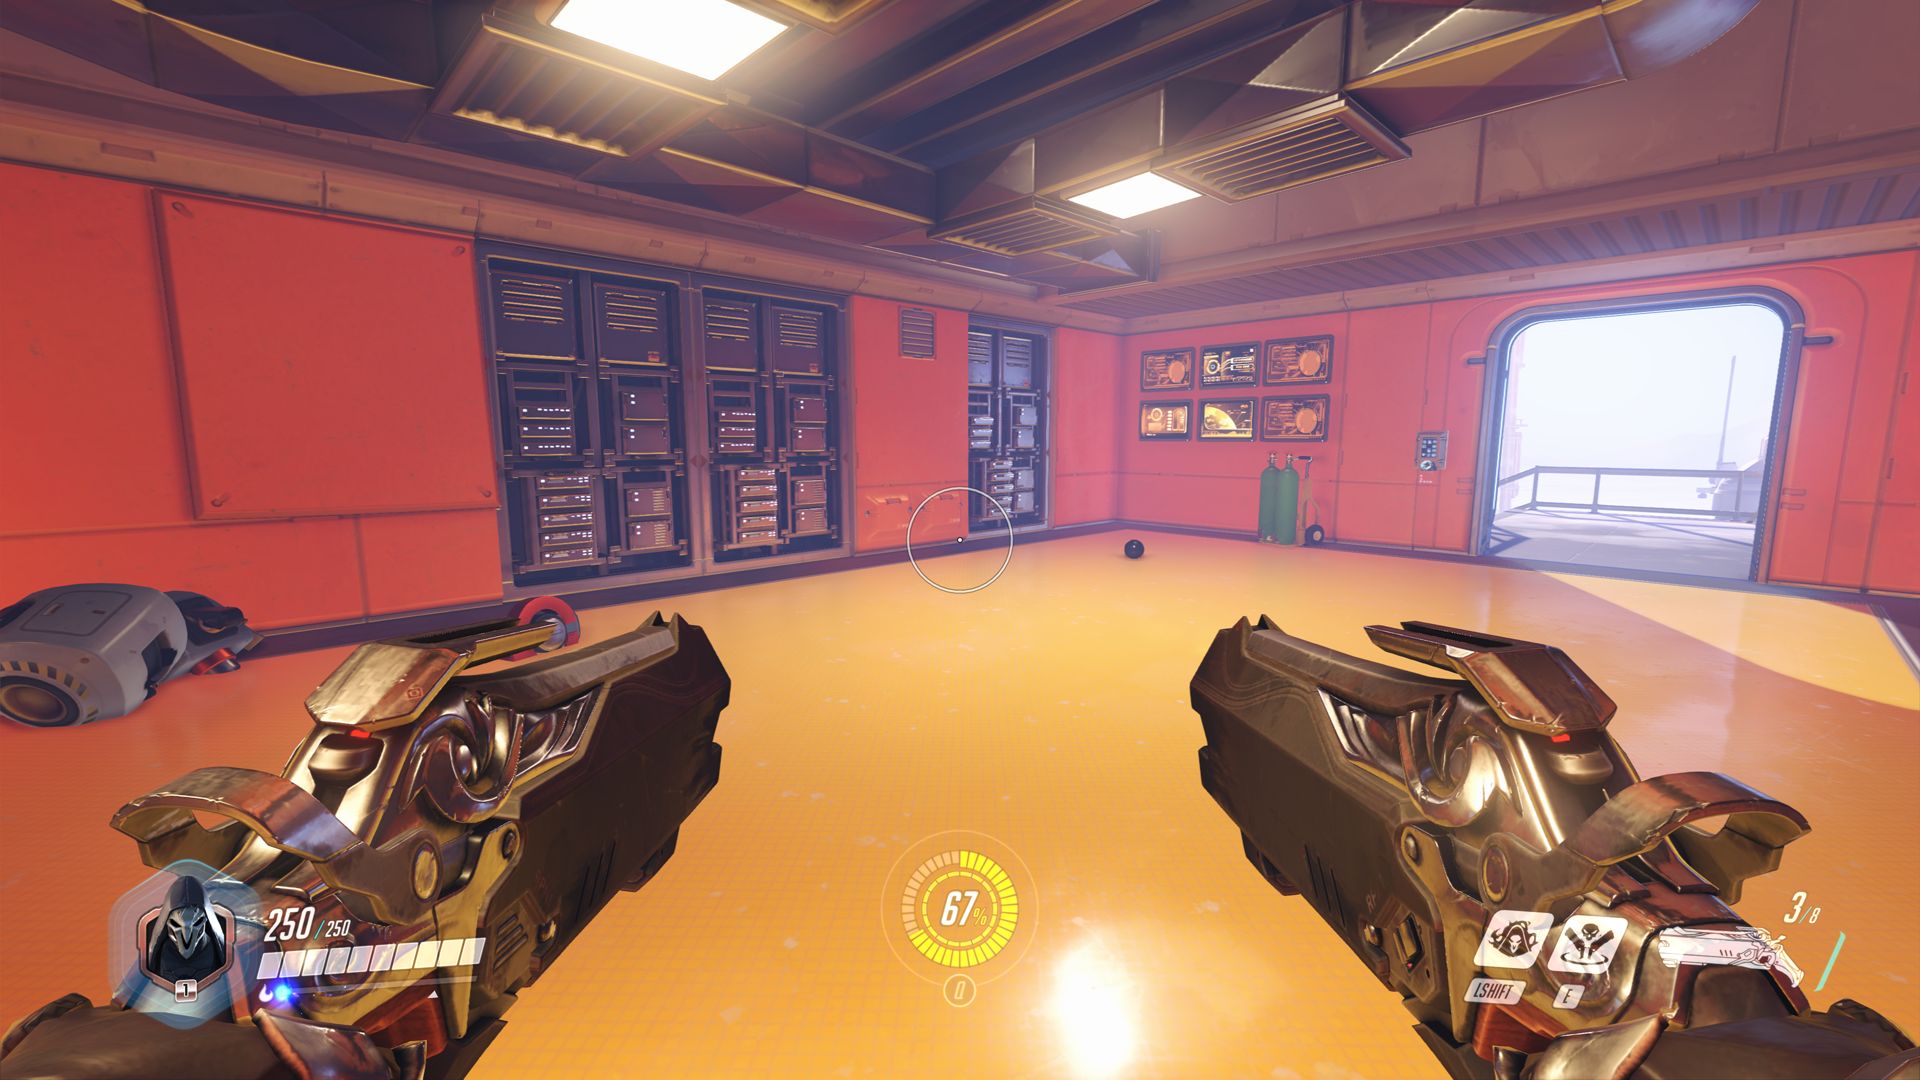
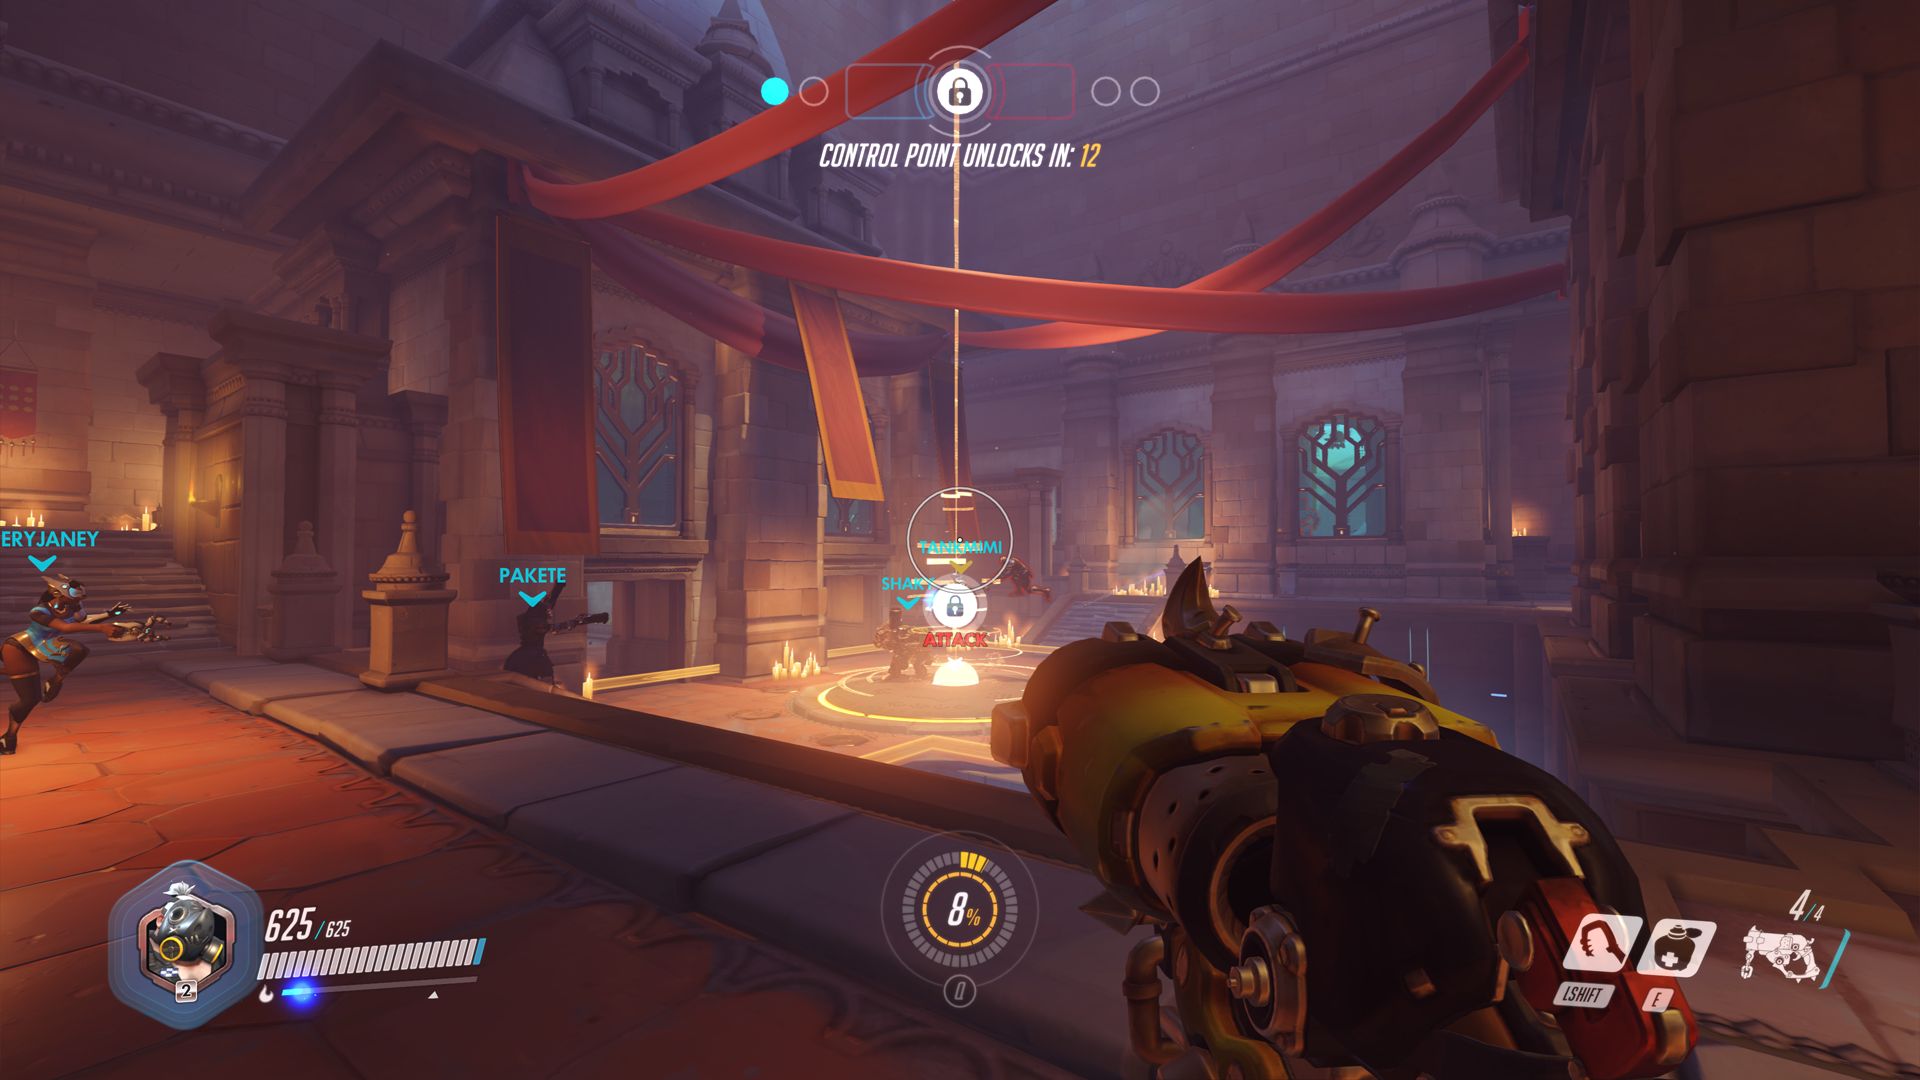
Blizzard does, however, choose the suitable comic style on purpose to keep the system requirements as low as possible to attract a bigger audience. Not every gamer is equipped with a high-end gaming system for 2,000 Euros. Considering the graphics style, Overwatch looks more than decent.

The title ran surprisingly well in our tests. We did neither experience crashes and connection issues nor lags, graphics errors or other bugs during the benchmarks. It seems Blizzard pulled off a pretty successful launch without issues. Thanks to short loading times, clever tutorials, smooth gameplay and the convenient controls, you do not only get into the game very quickly, but you will be able to manage some achievements pretty soon as well. Overwatch reminds us pretty heavily of Team Fortress 2 in general, both in respect of the graphics and gameplay, even though the title from Valve did not offer as many characters and the animations were not quite as fine, either.

Overwatch
Overwatch
Overwatch
Overwatch
Overwatch
Overwatch

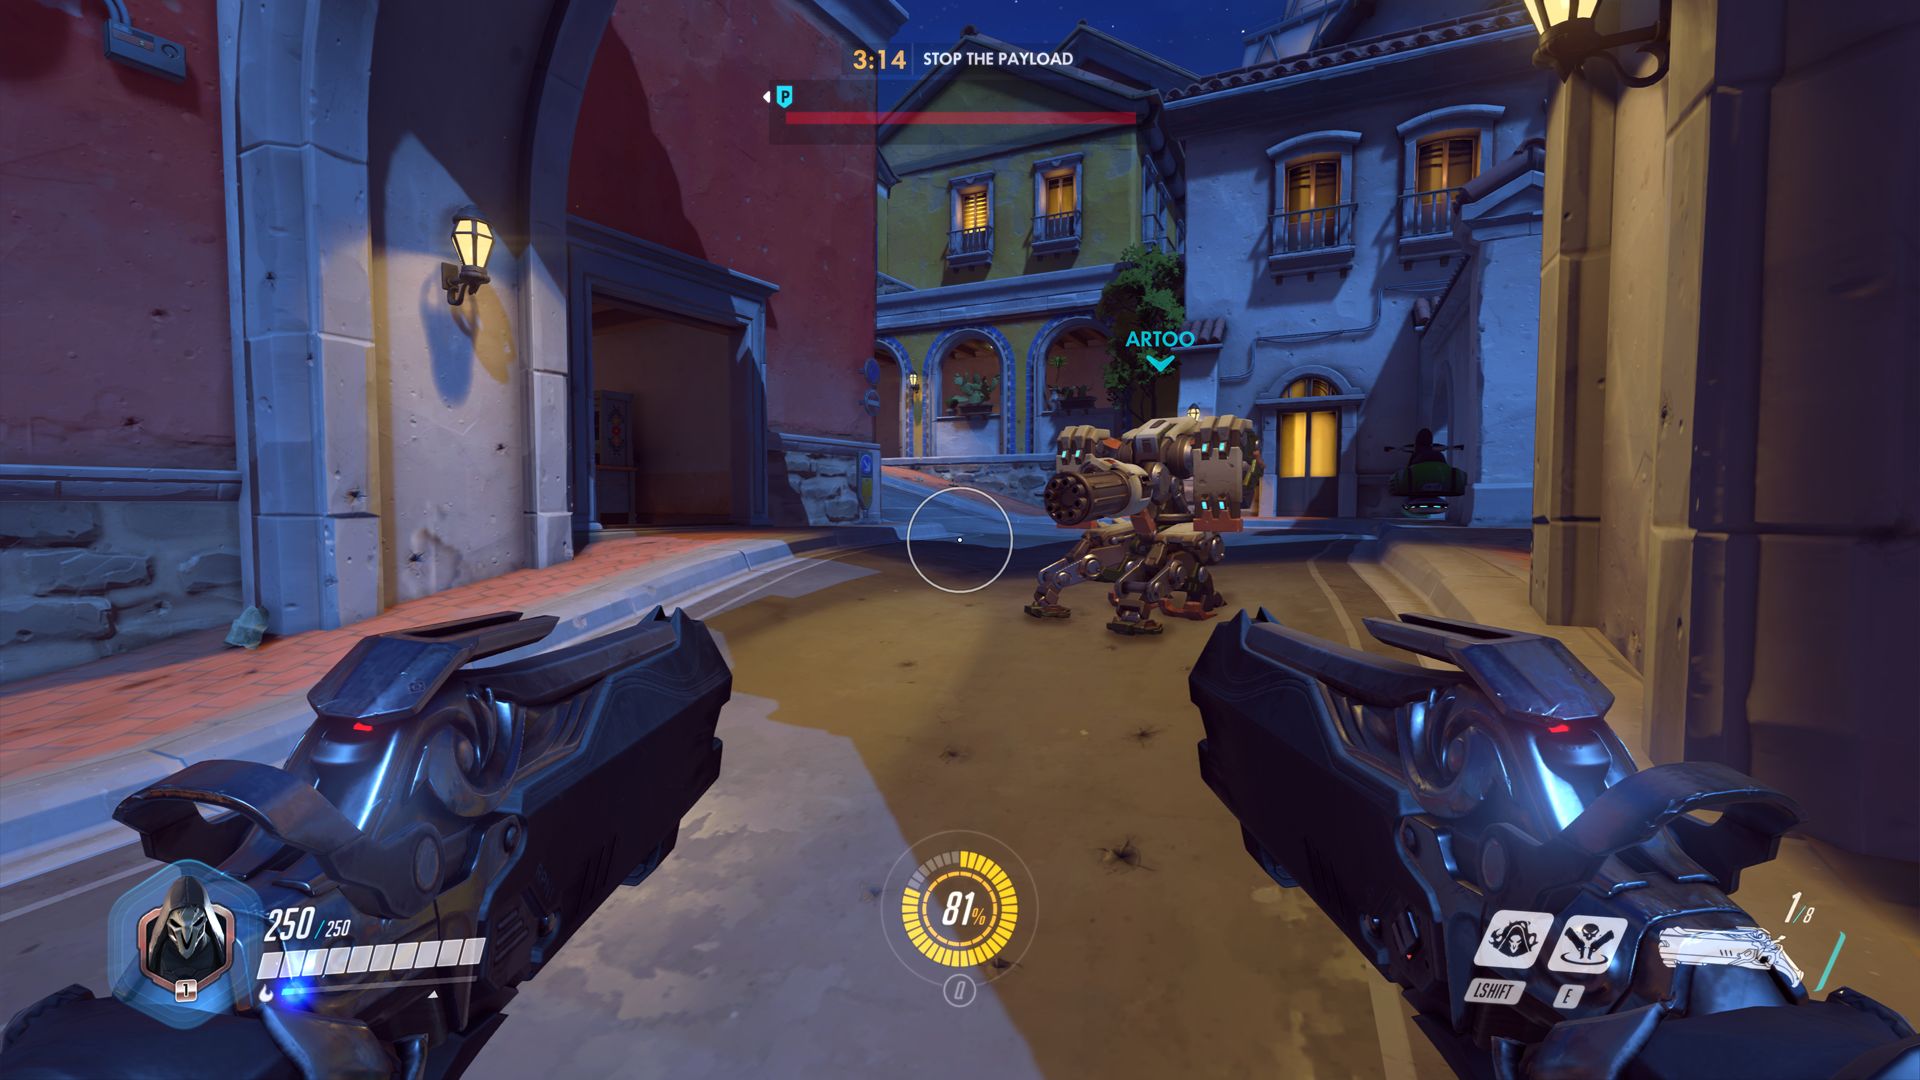
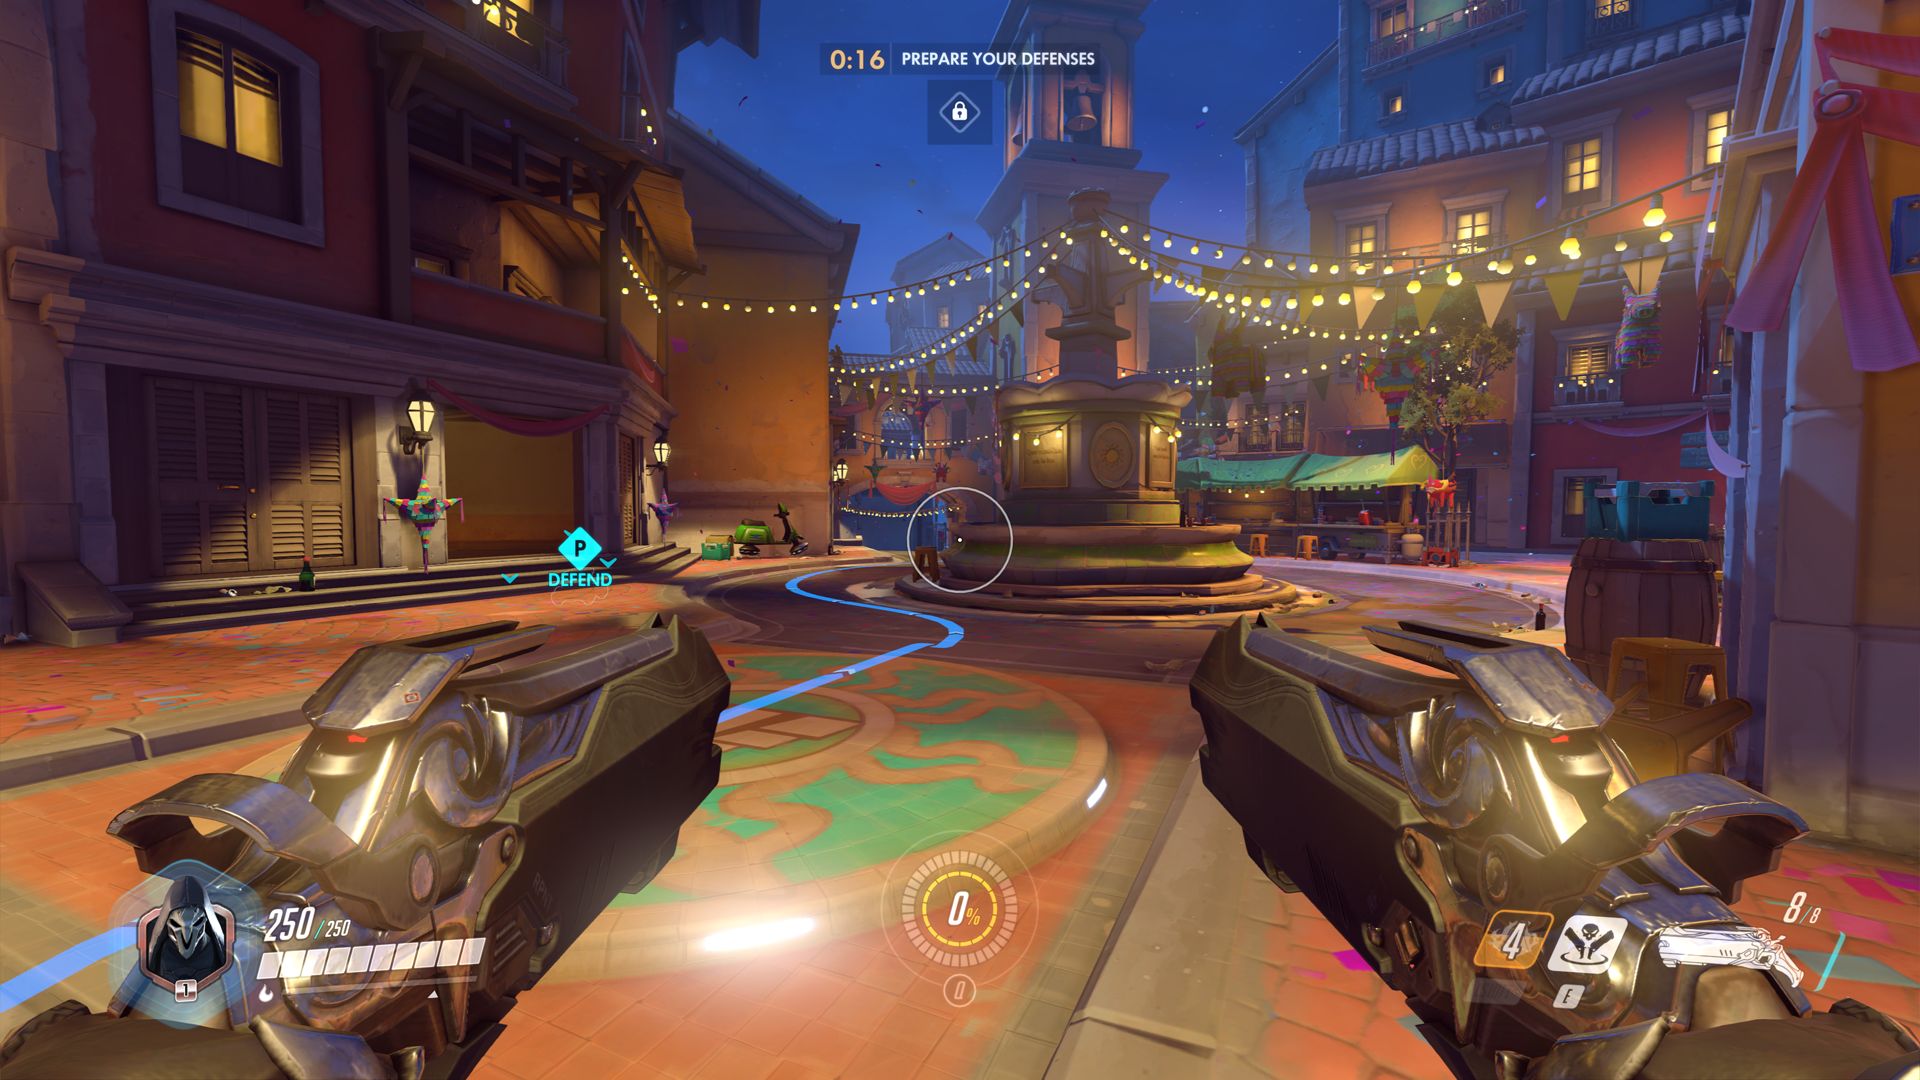
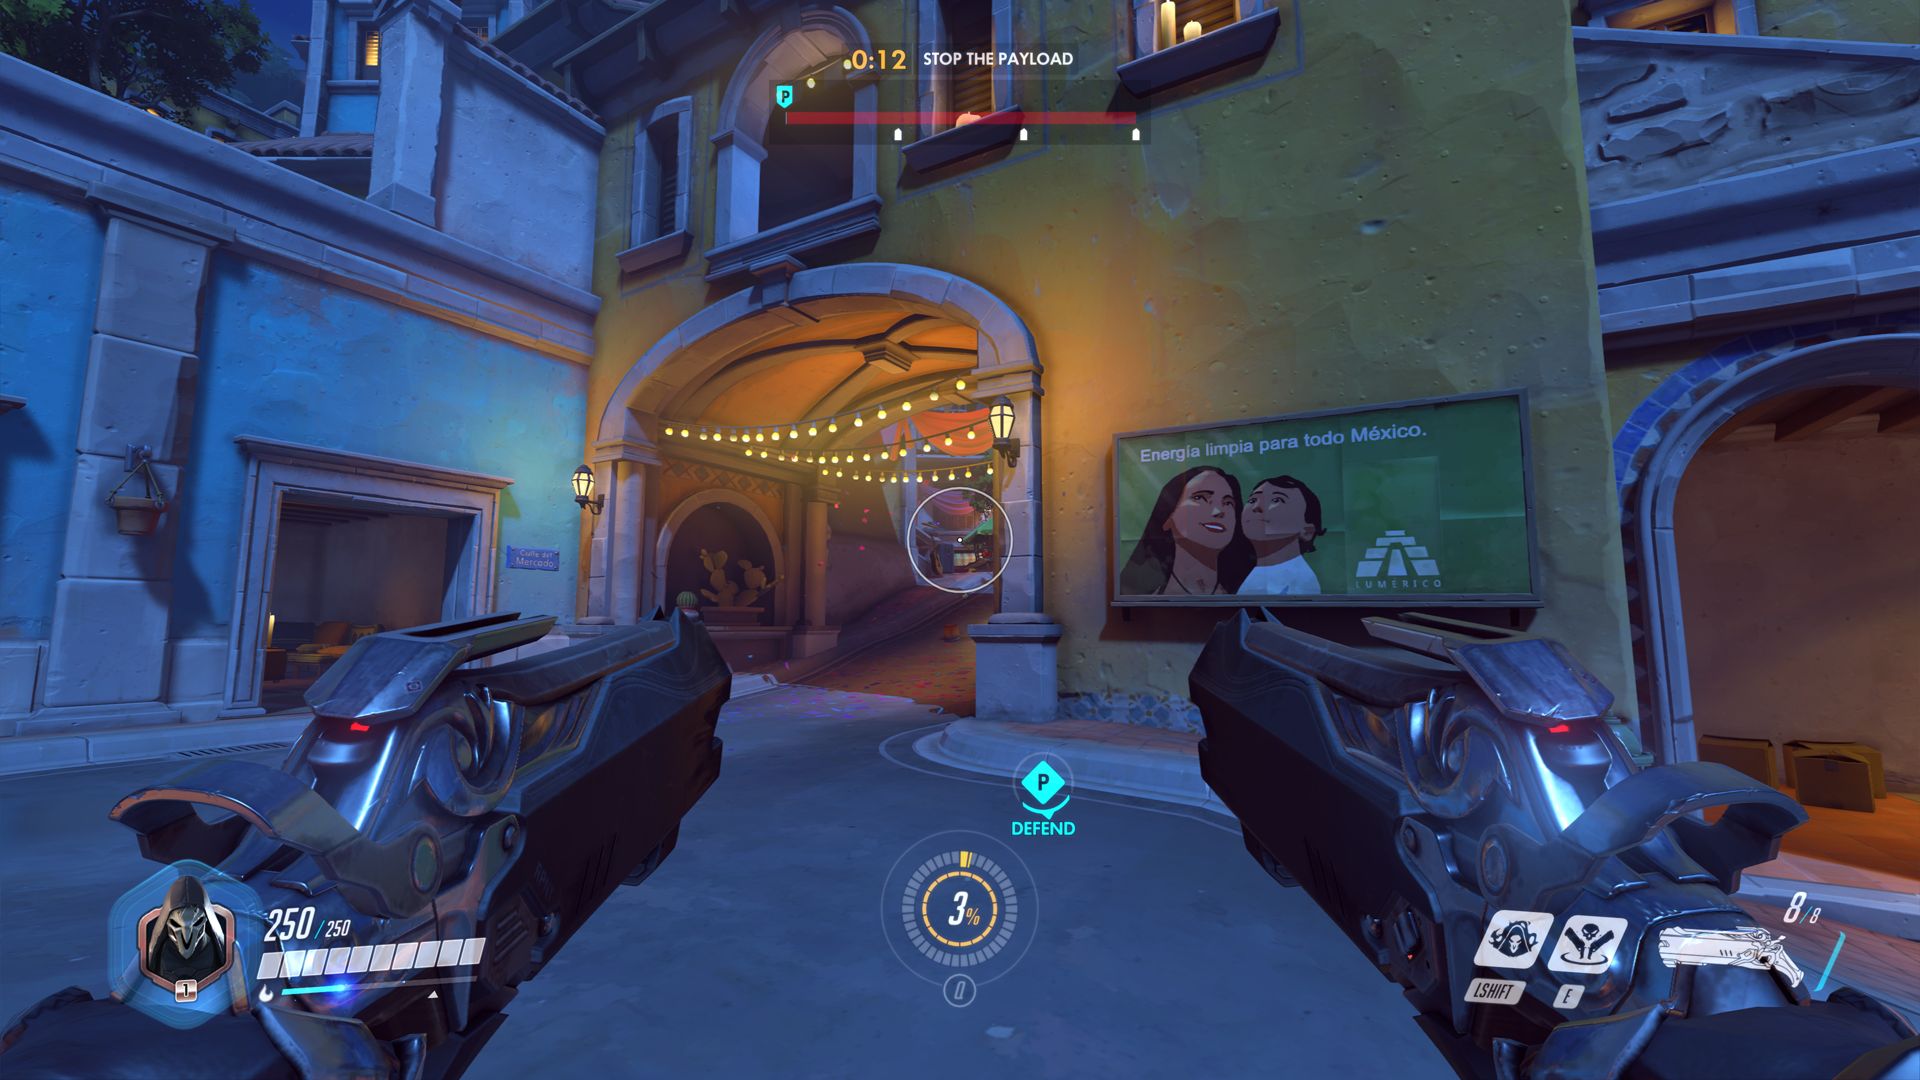
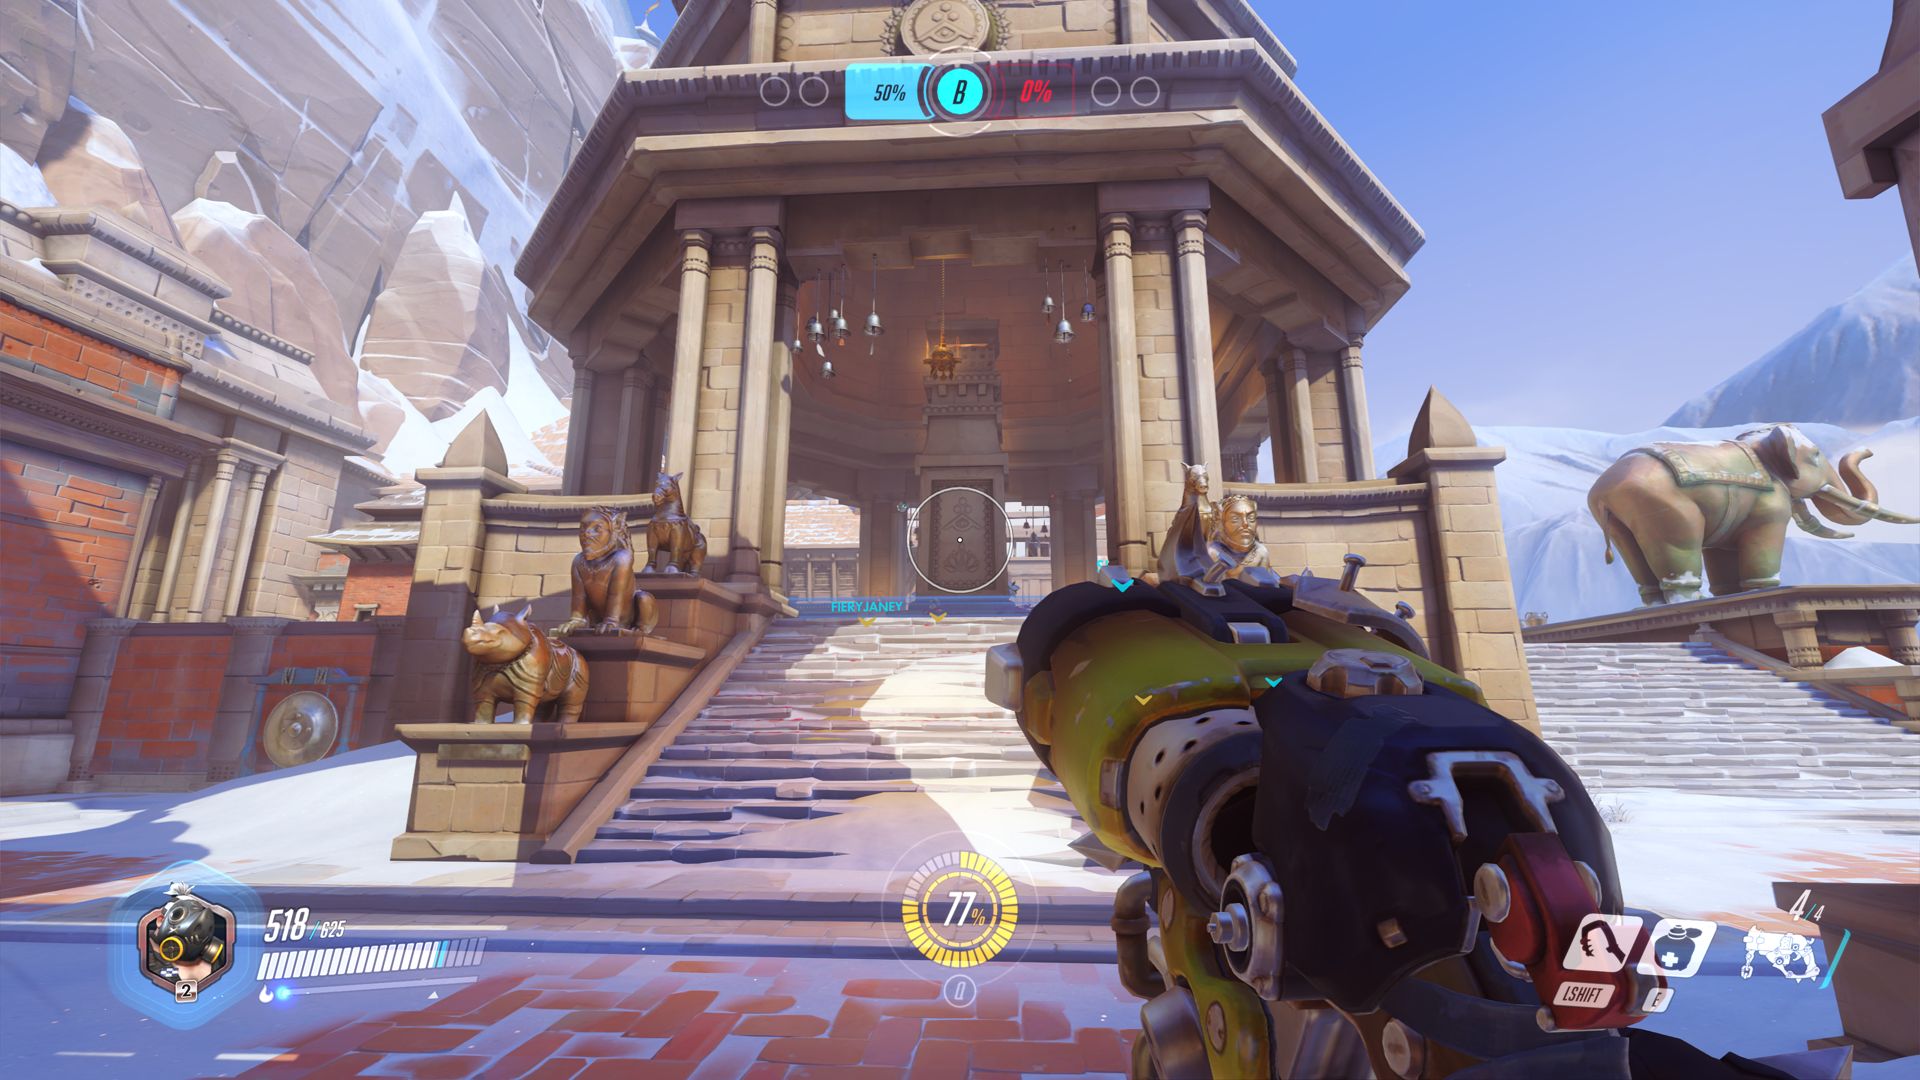
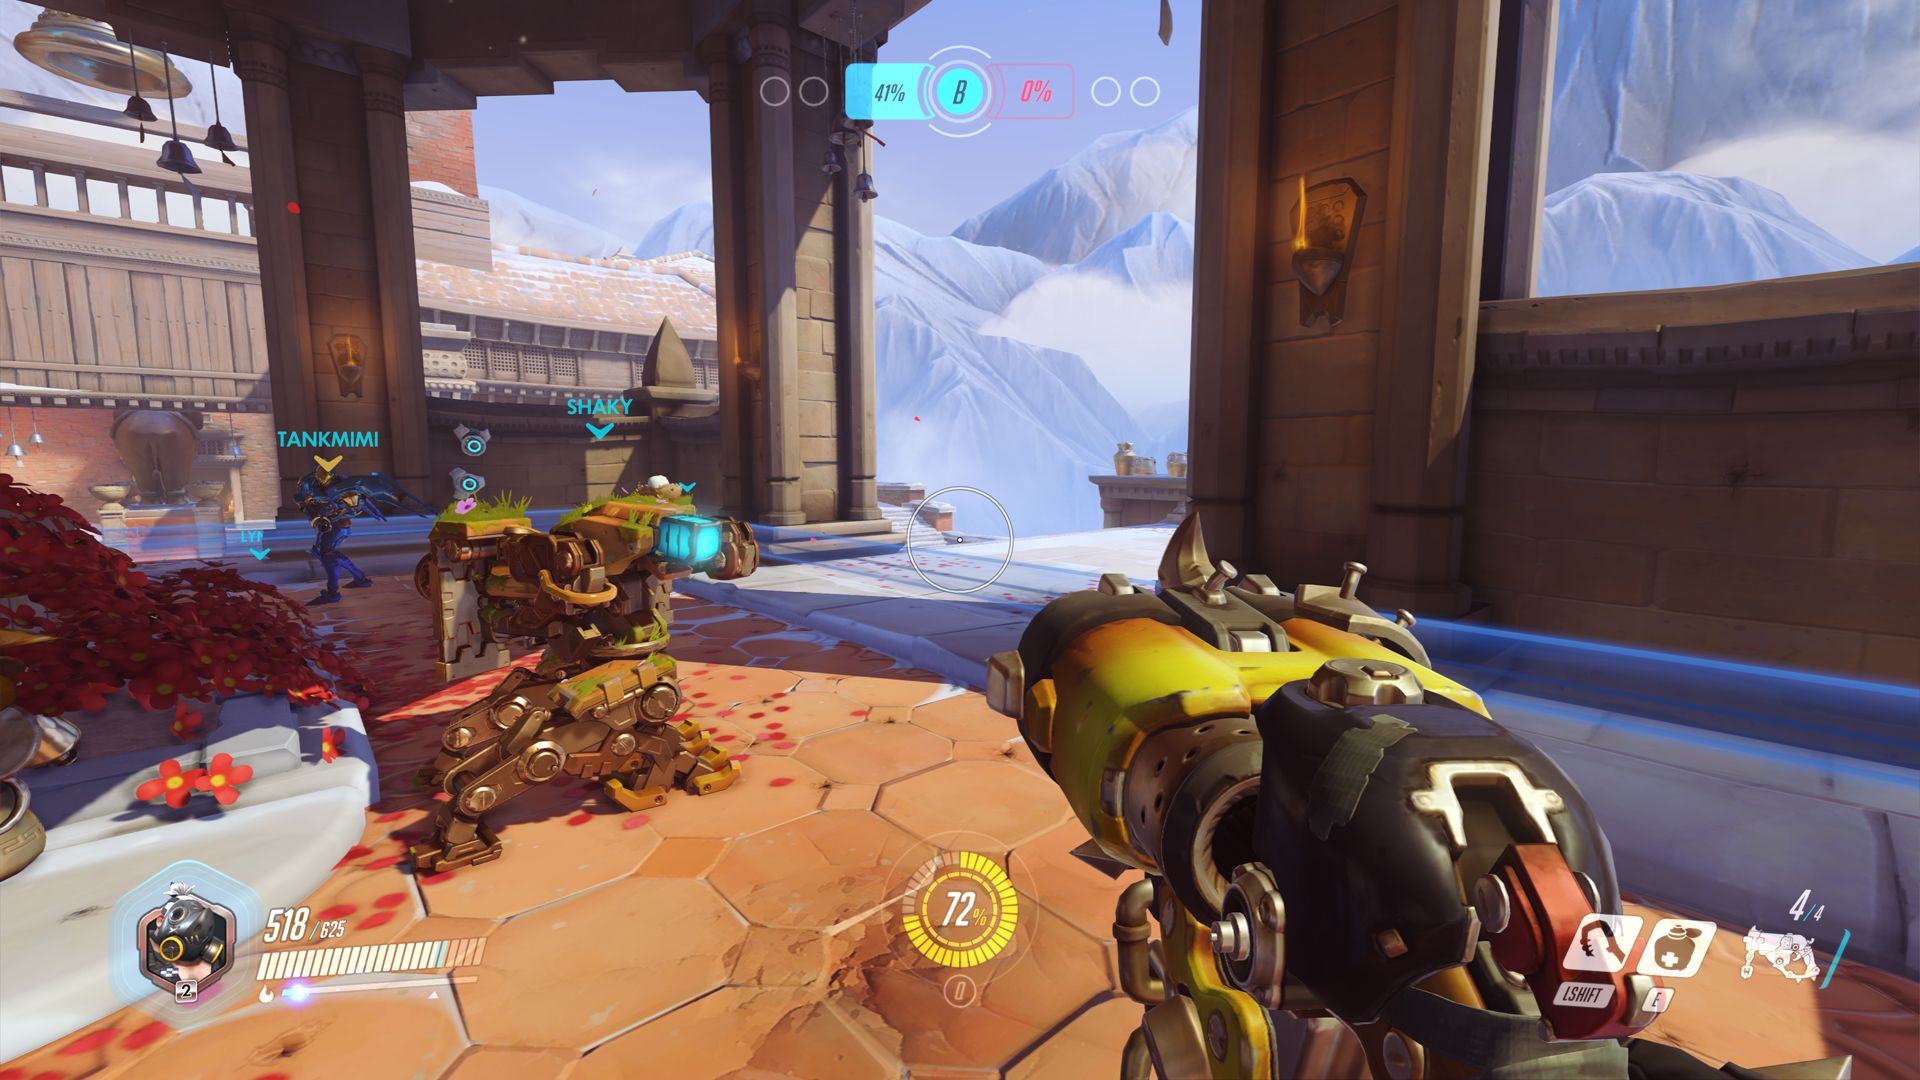
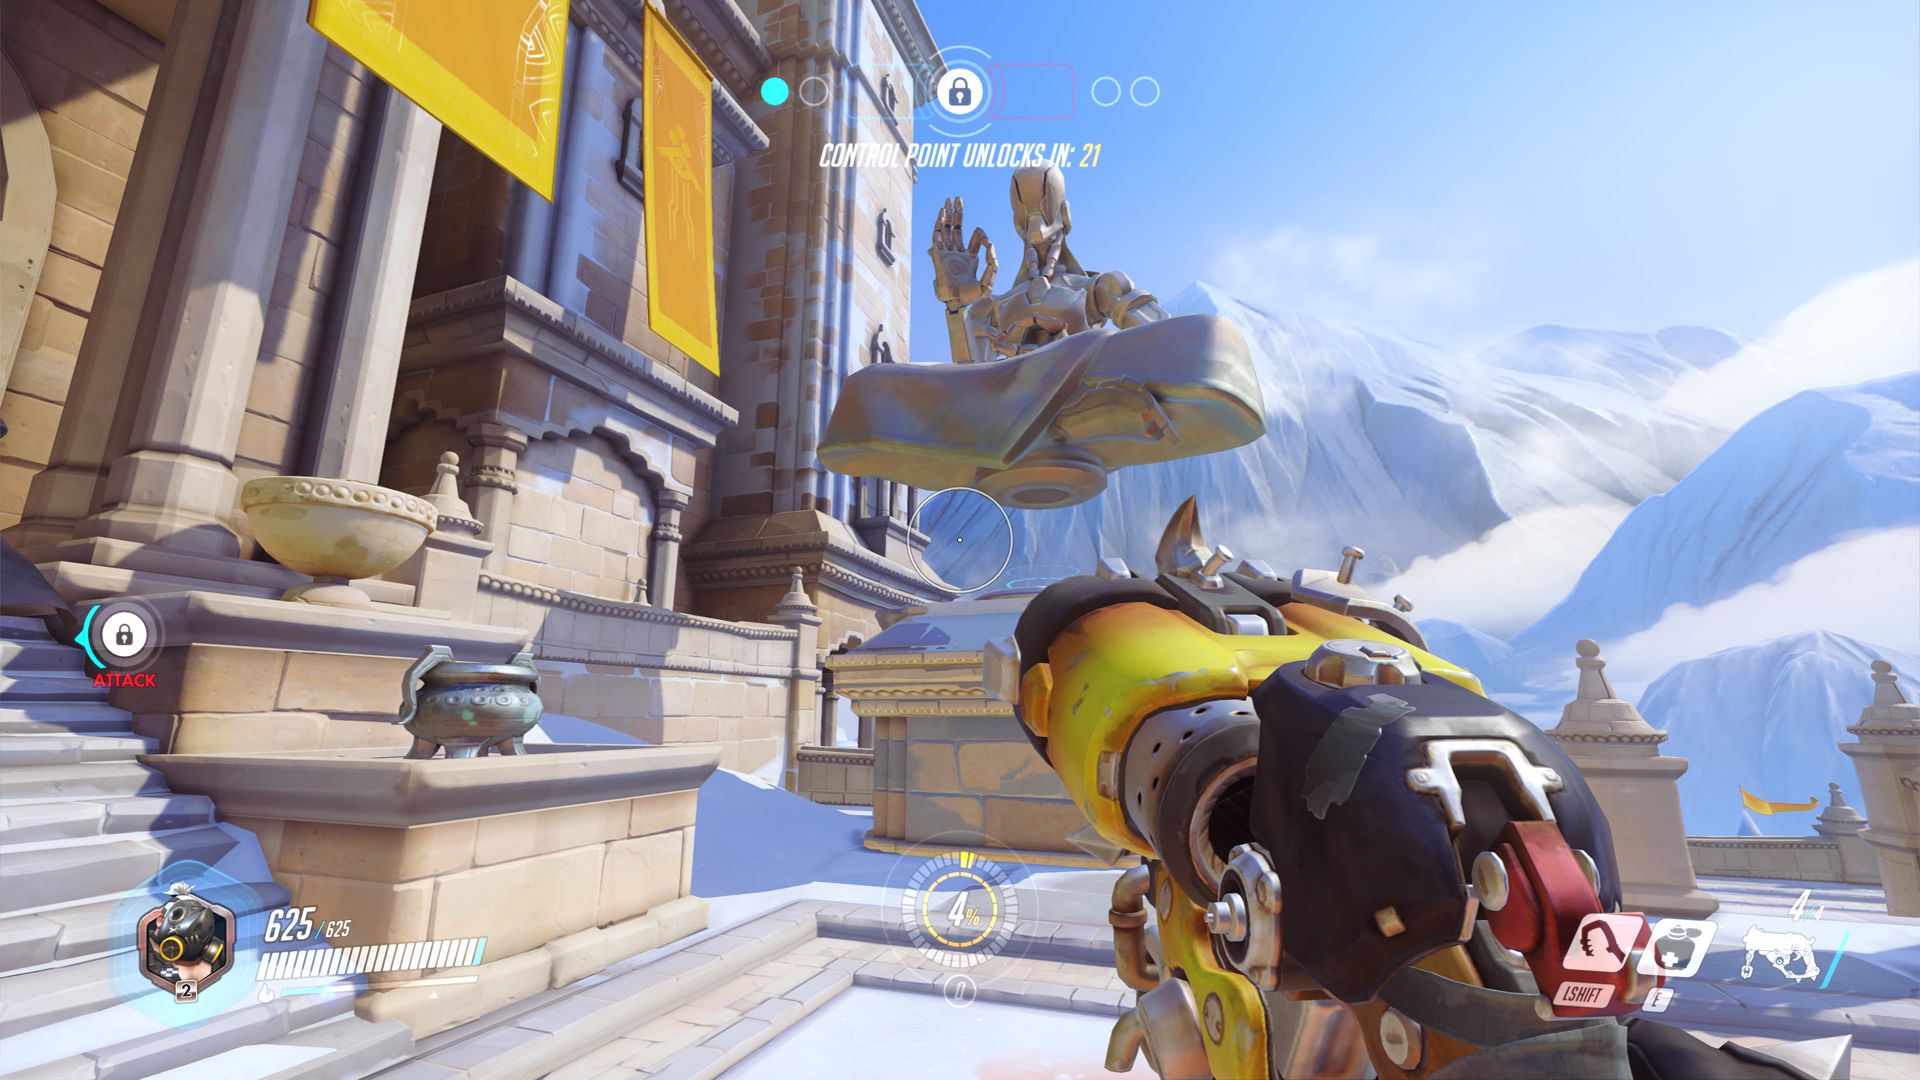
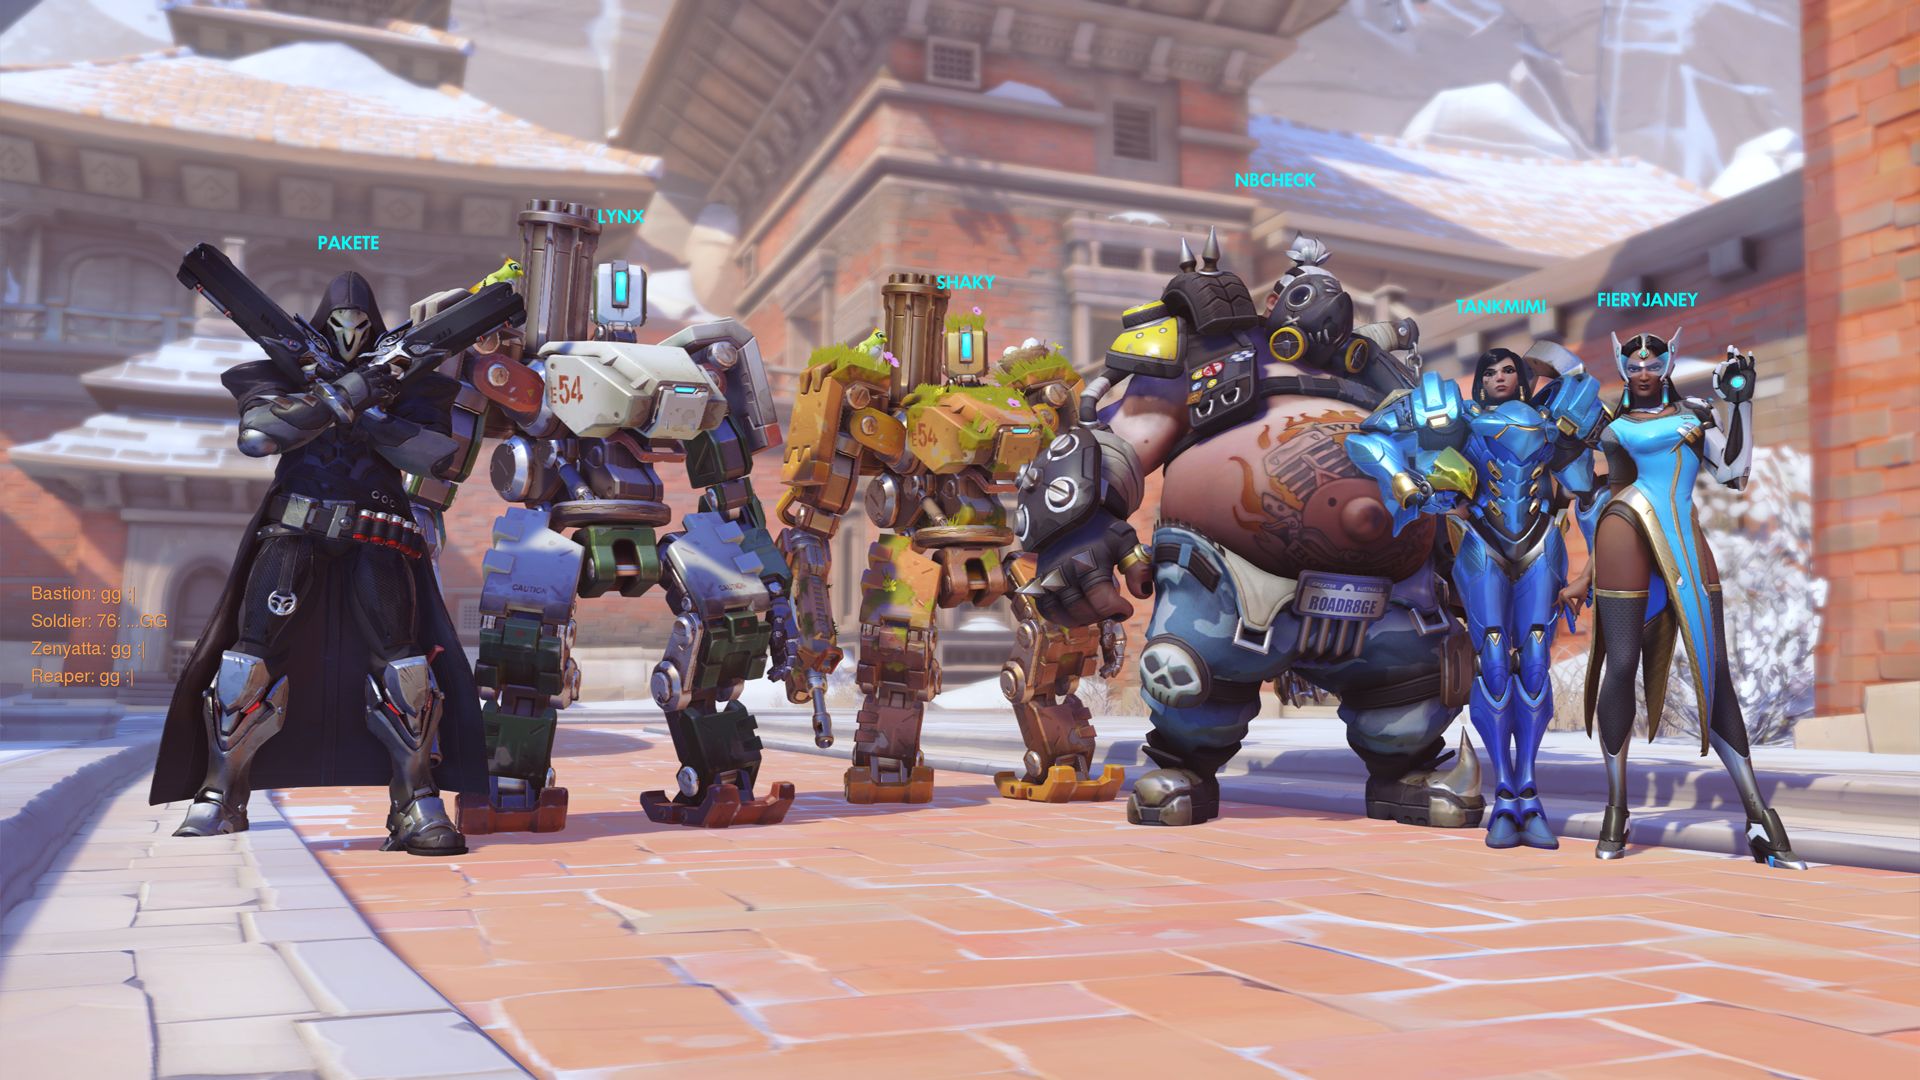
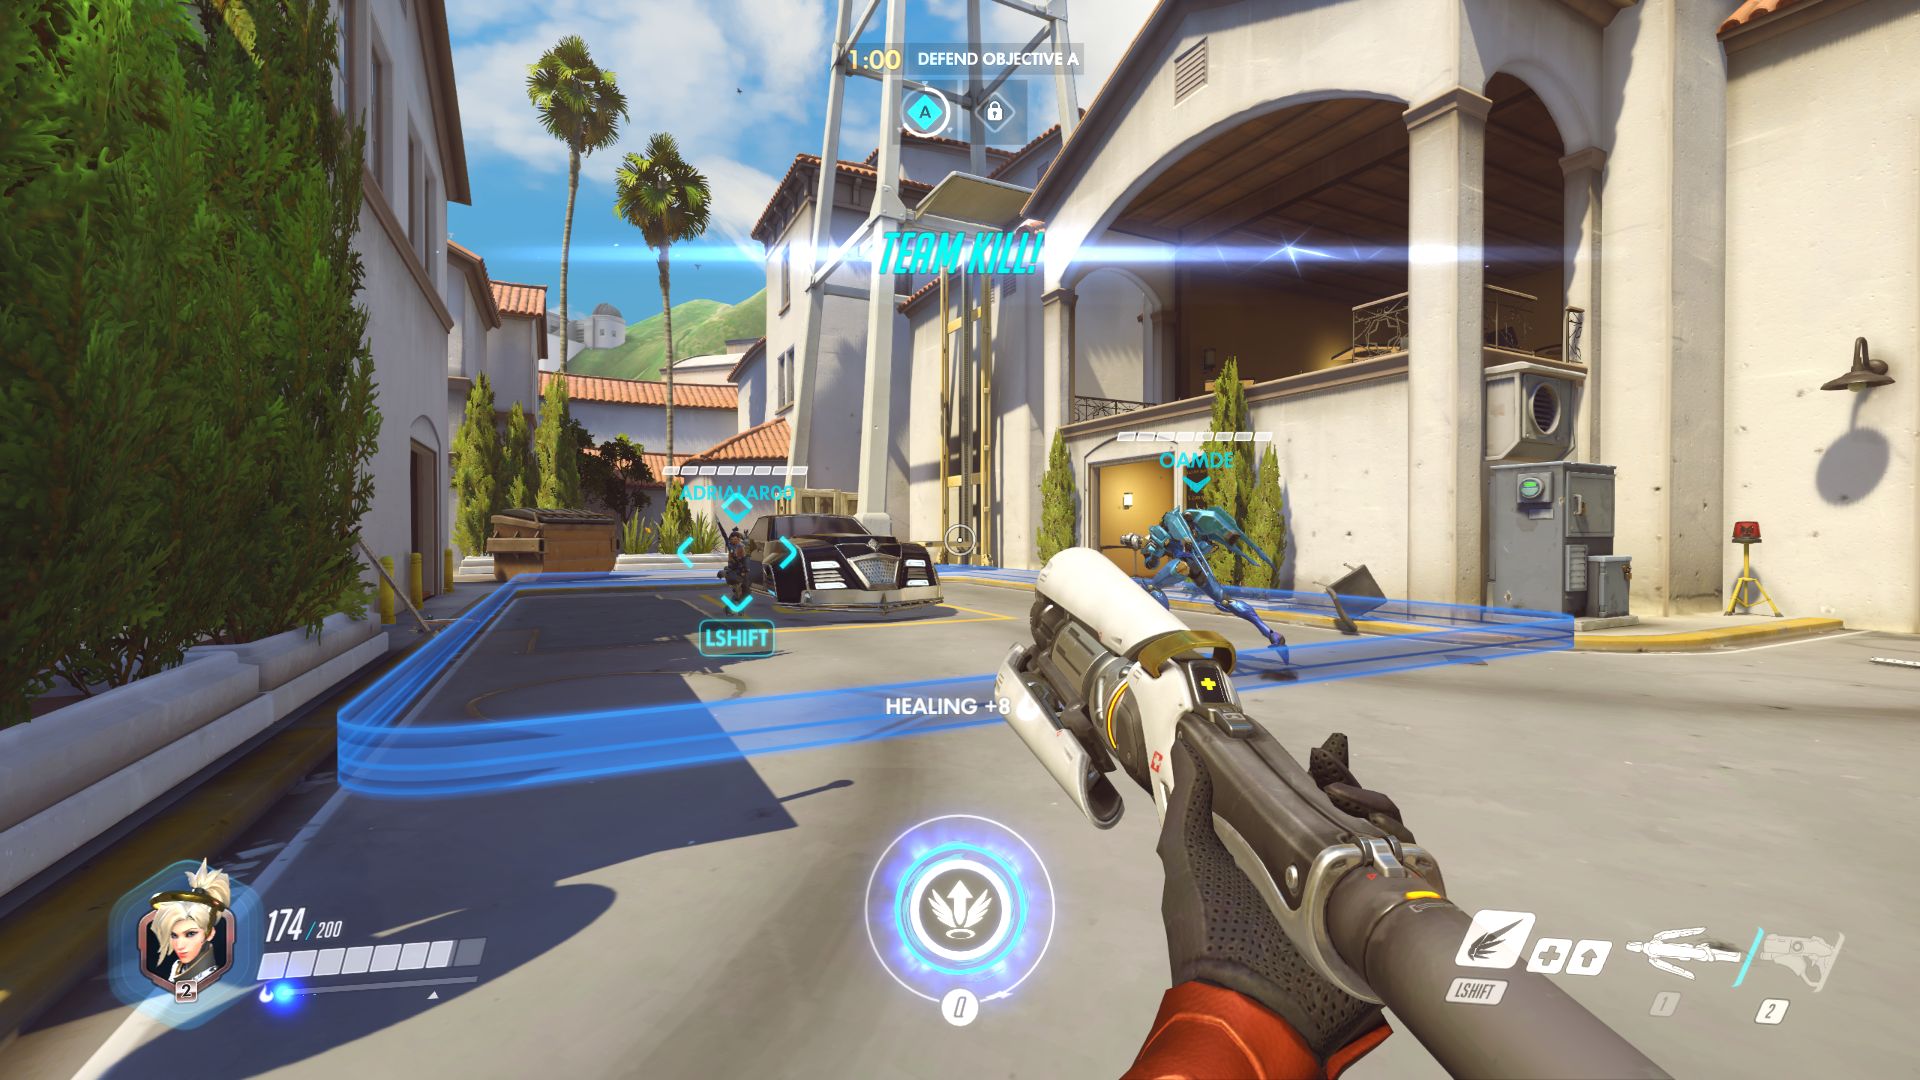
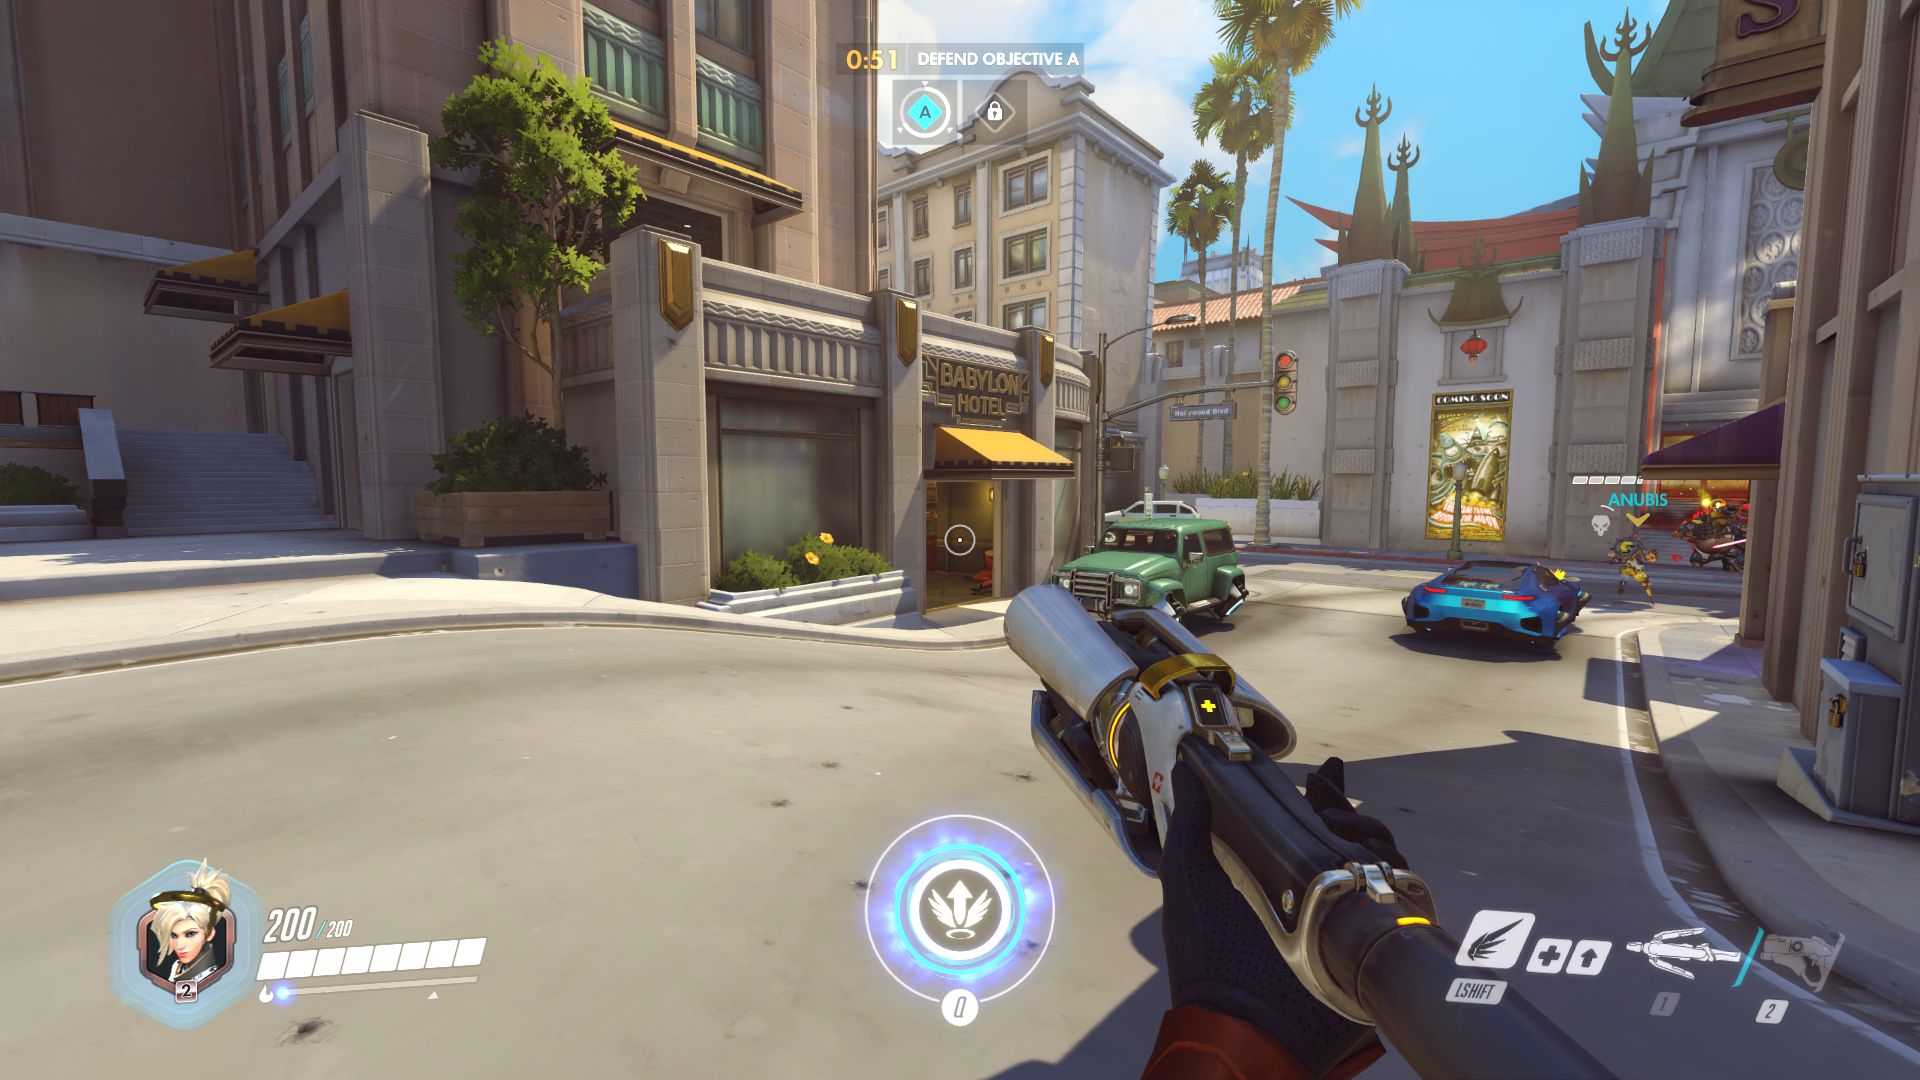
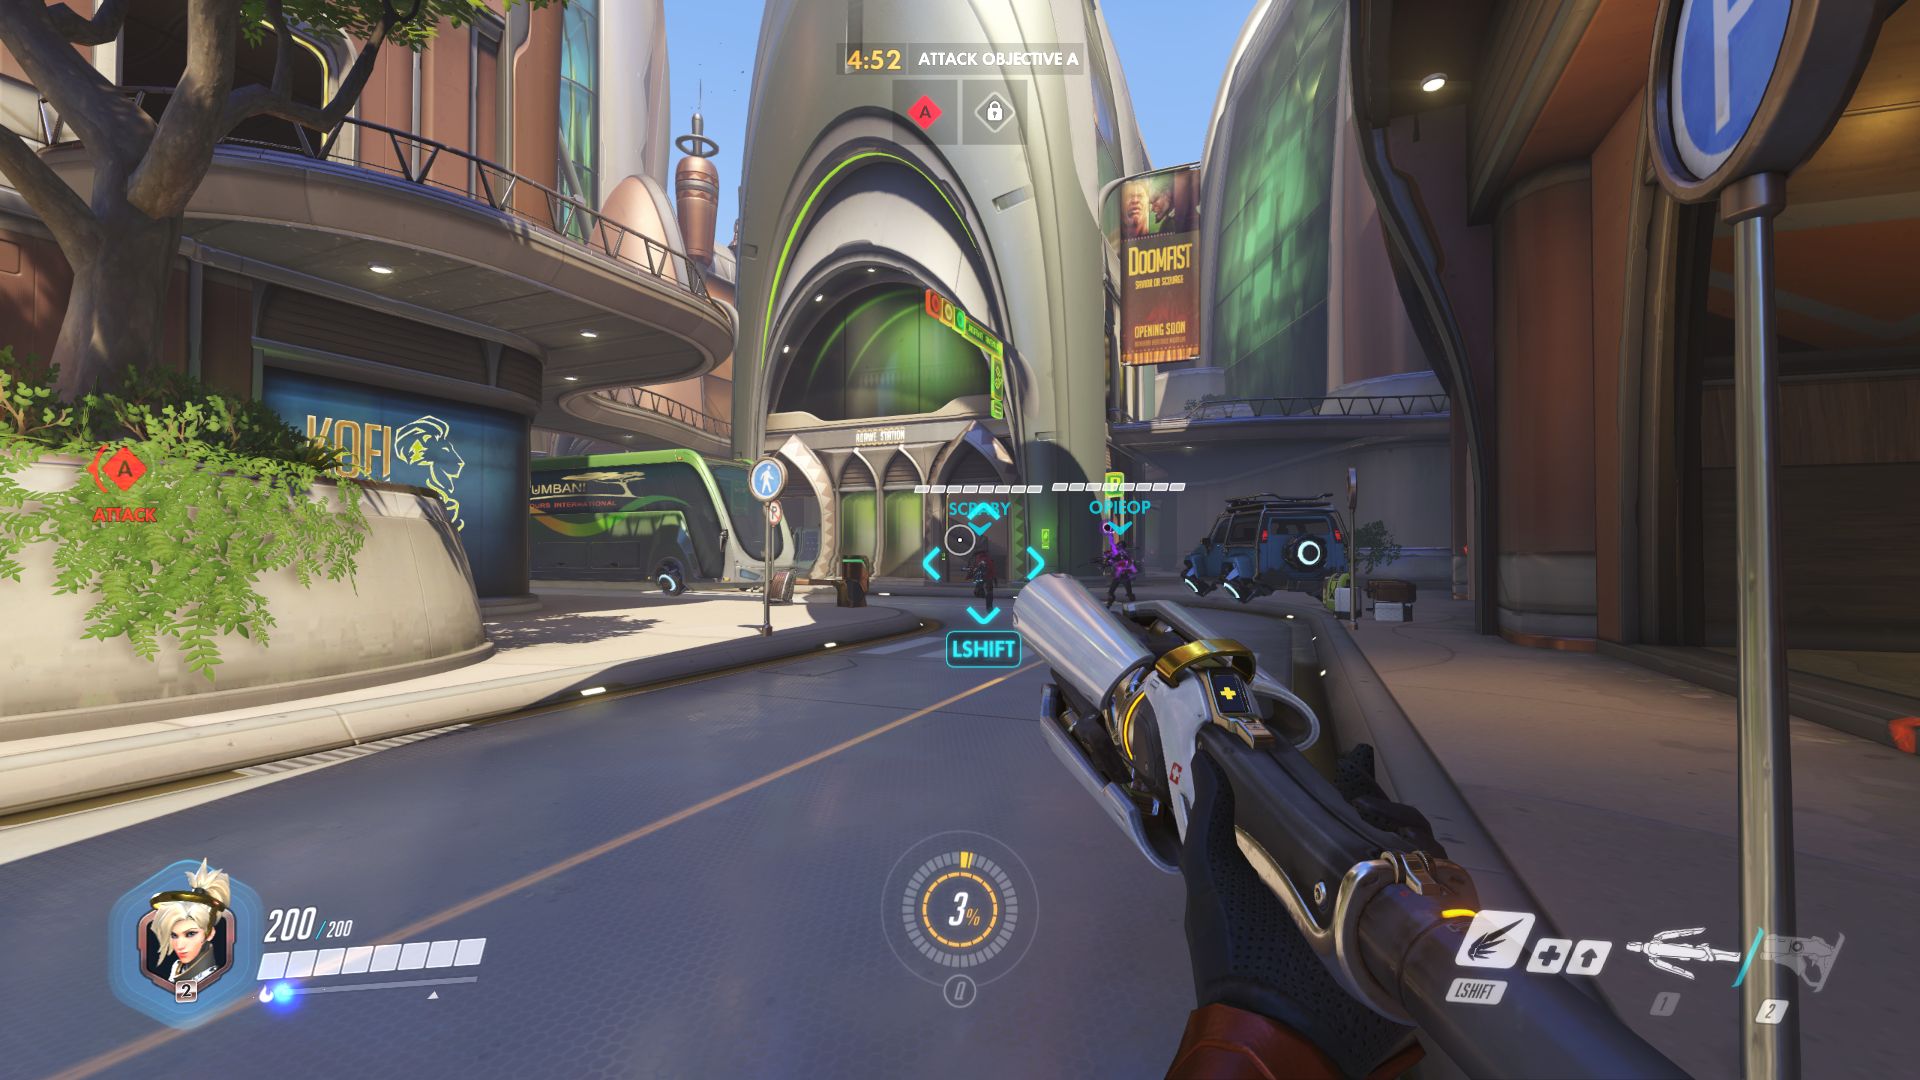
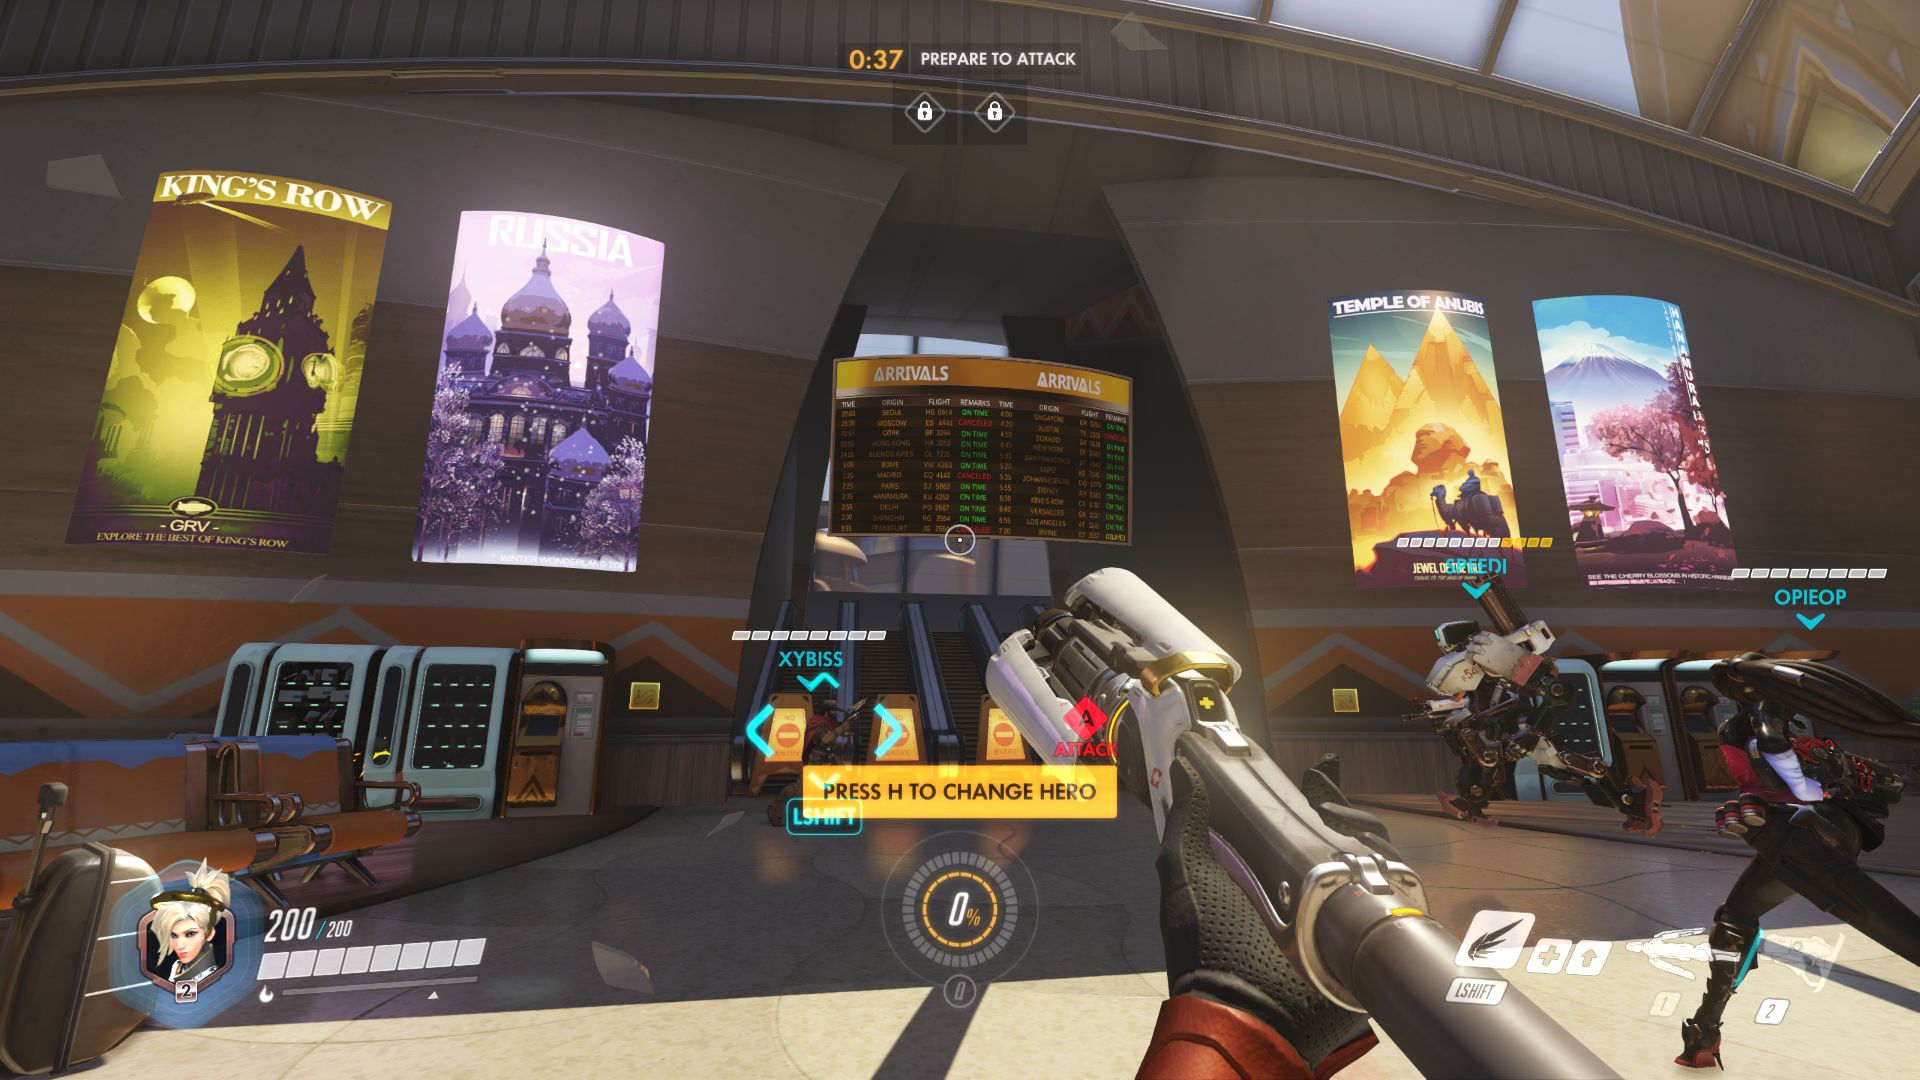
Speaking of gameplay: Even though the number and appeal of the game modes is still limited at this point, we are convinced by Overwatch. This is a result of the previously mentioned aspects as well as the diverse levels. Blizzard presents a nice range starting with futuristic cities up to deserts and snow scenarios.

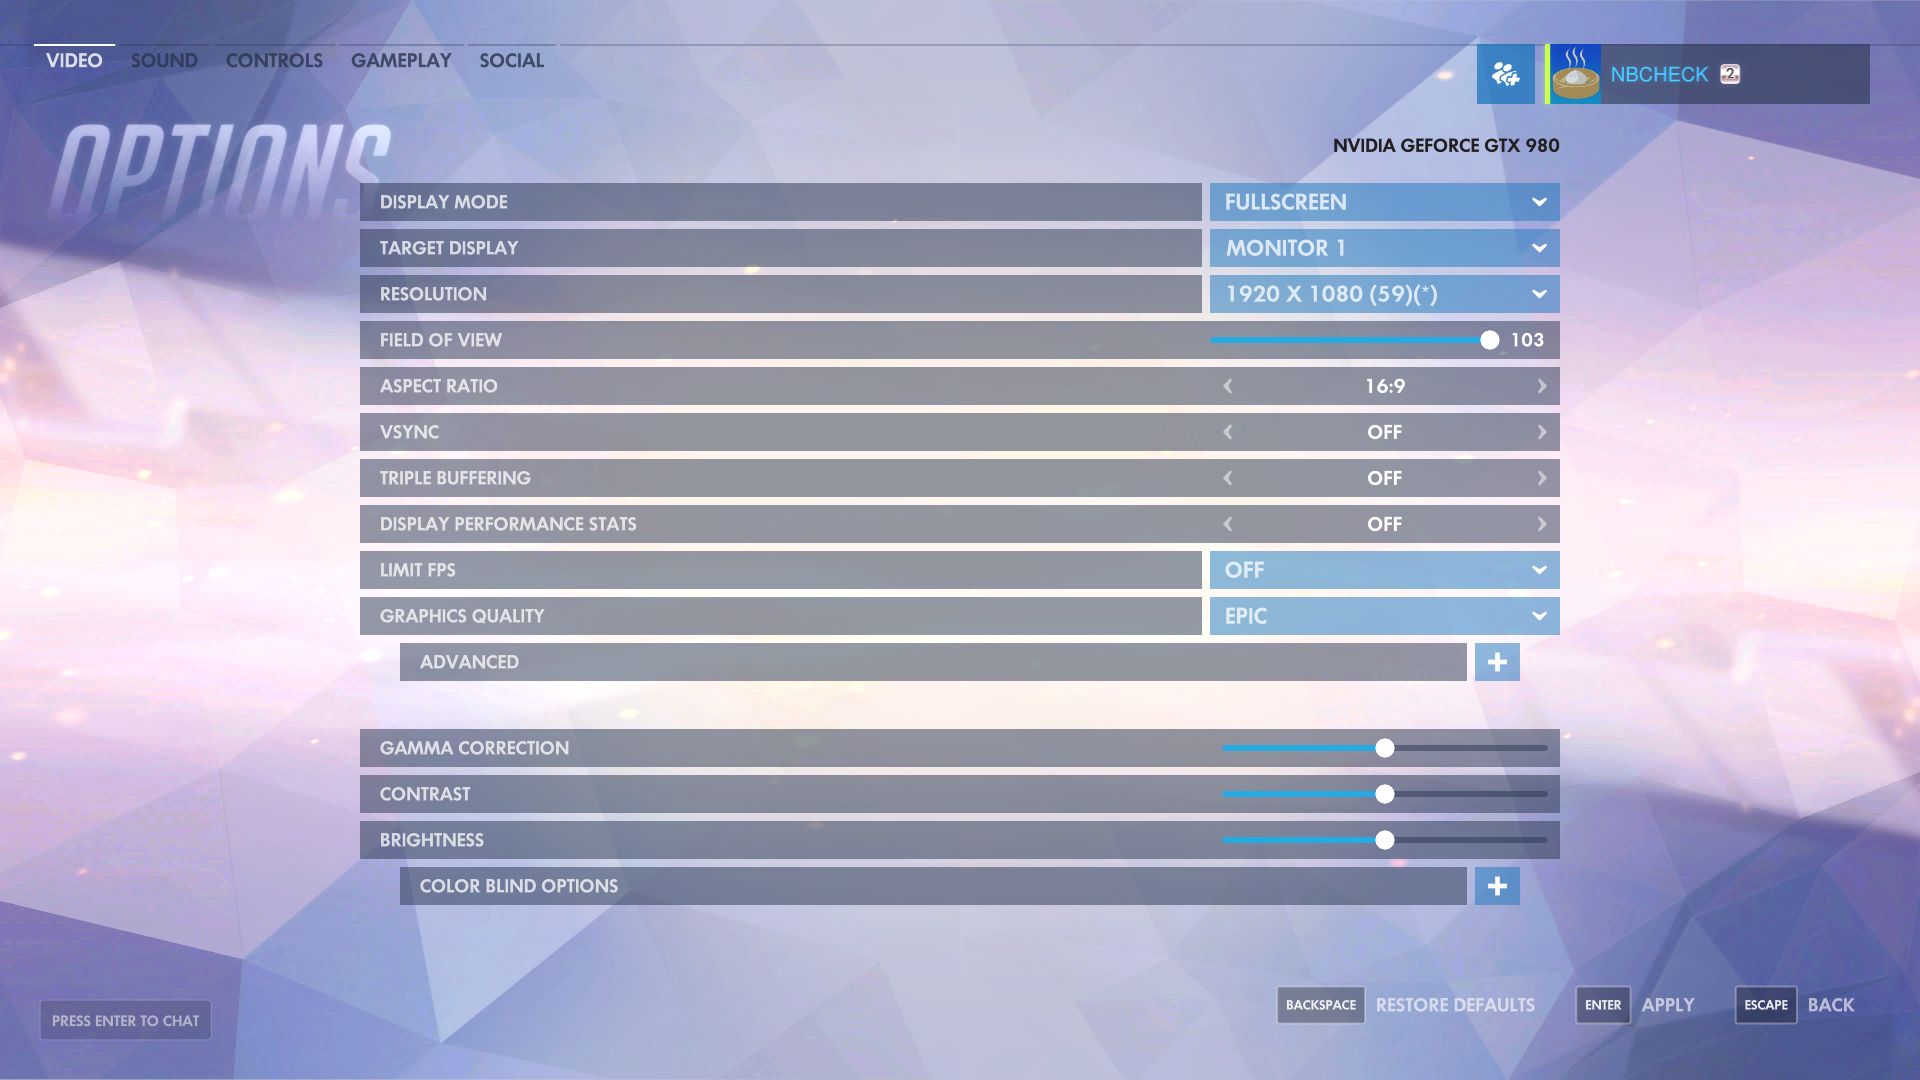
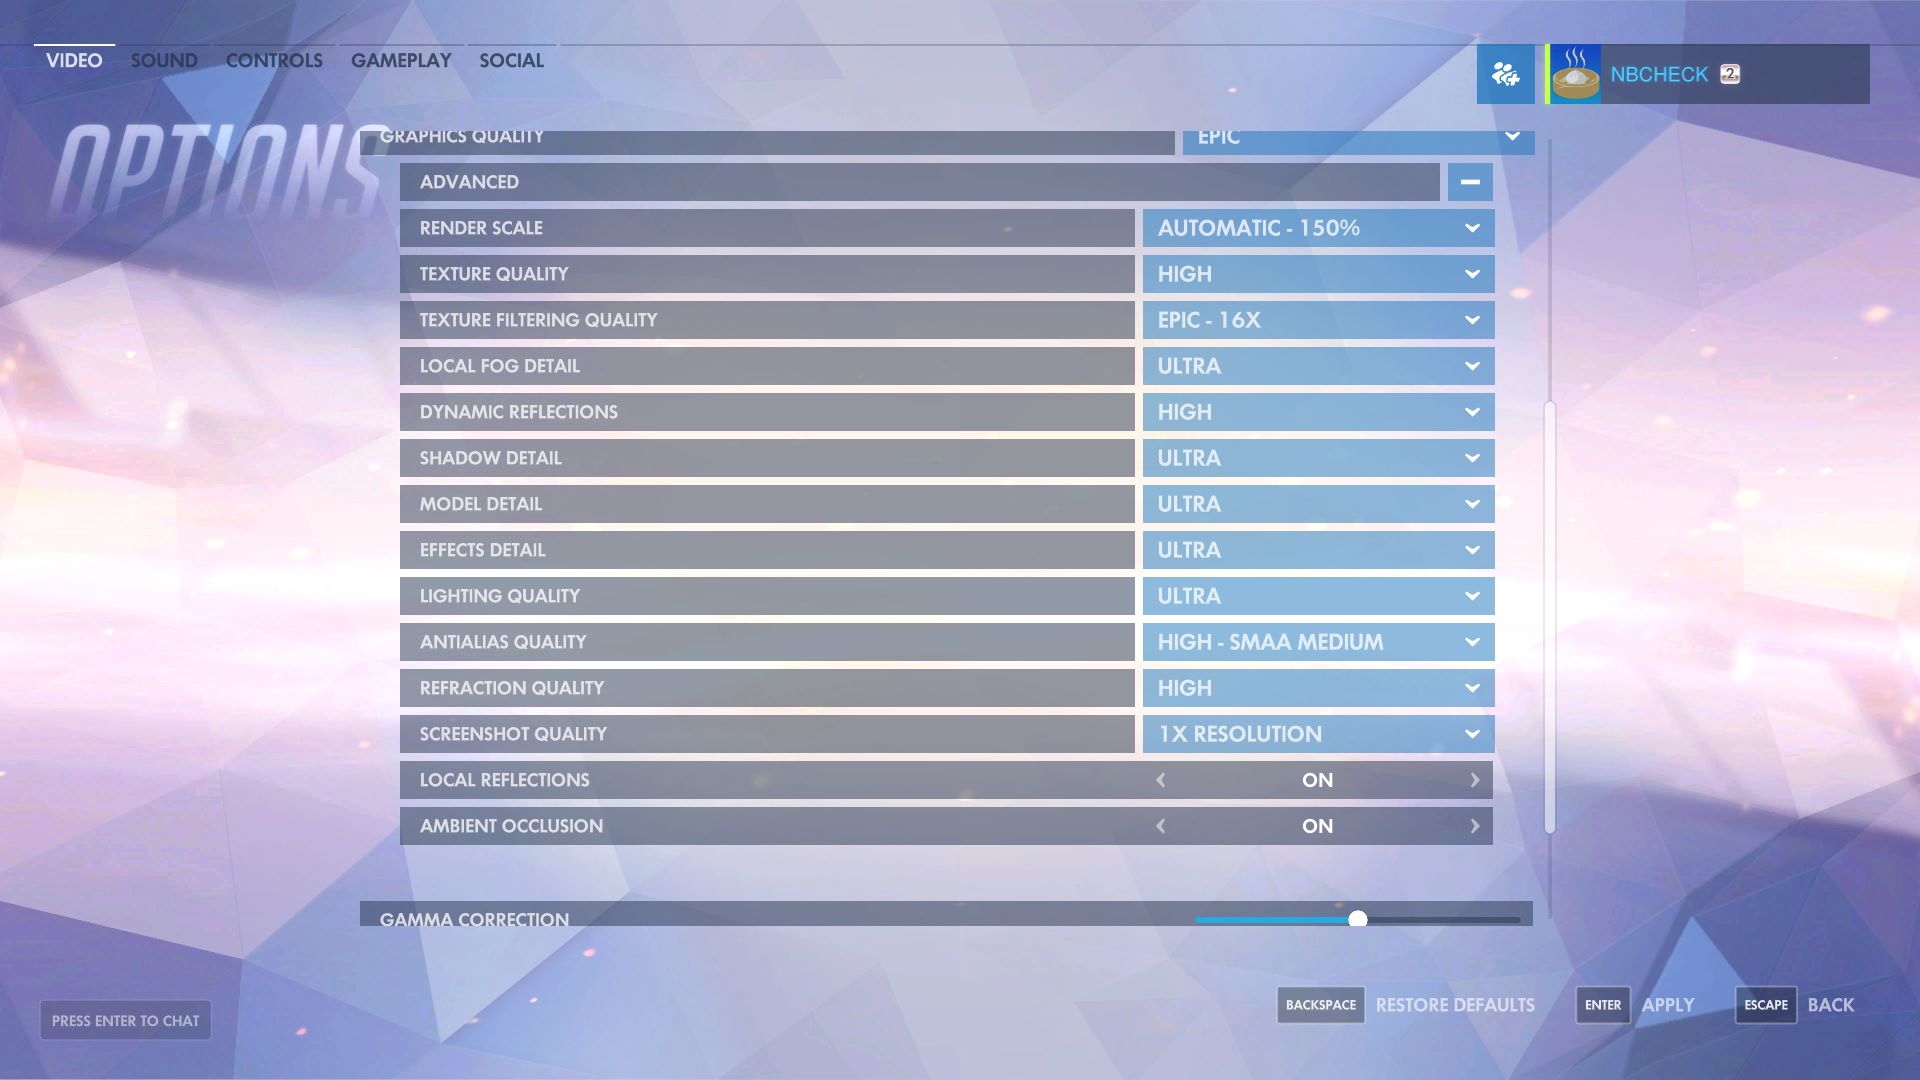
The situation is also pretty good for the settings. As you expect from a good PC title, you will find dozens of settings in the options menu (see screenshots). The developers also included five presets to adjust all the settings at once, but changing them does require a restart. Advanced and professional users get numerous detail settings to play with in the Advanced menu.

Overwatch
Overwatch
Overwatch
Overwatch
Overwatch
Overwatch

Attention: Depending on the monitor and resolution, Overwatch will automatically use up and downsampling. We always set the option "Render Scale" to 100 % to get consistent results. The item  "Limit FPS", which usually limits the frame rate, is deactivated (there is still a limit at 300 fps). Otherwise, we used the presets Low, Medium, High and Epic.

Except for the significant changes to the shadow quality, you can often not see a big difference between the individual presets. This means Overwatch does not look ugly, even with the lowest settings. We also have to praise the fact that the size of the title is just 6 GB. Modern action games usually need more than 30 GB.

Video Options
Video Options
Advanced Options
Advanced Options

Benchmark

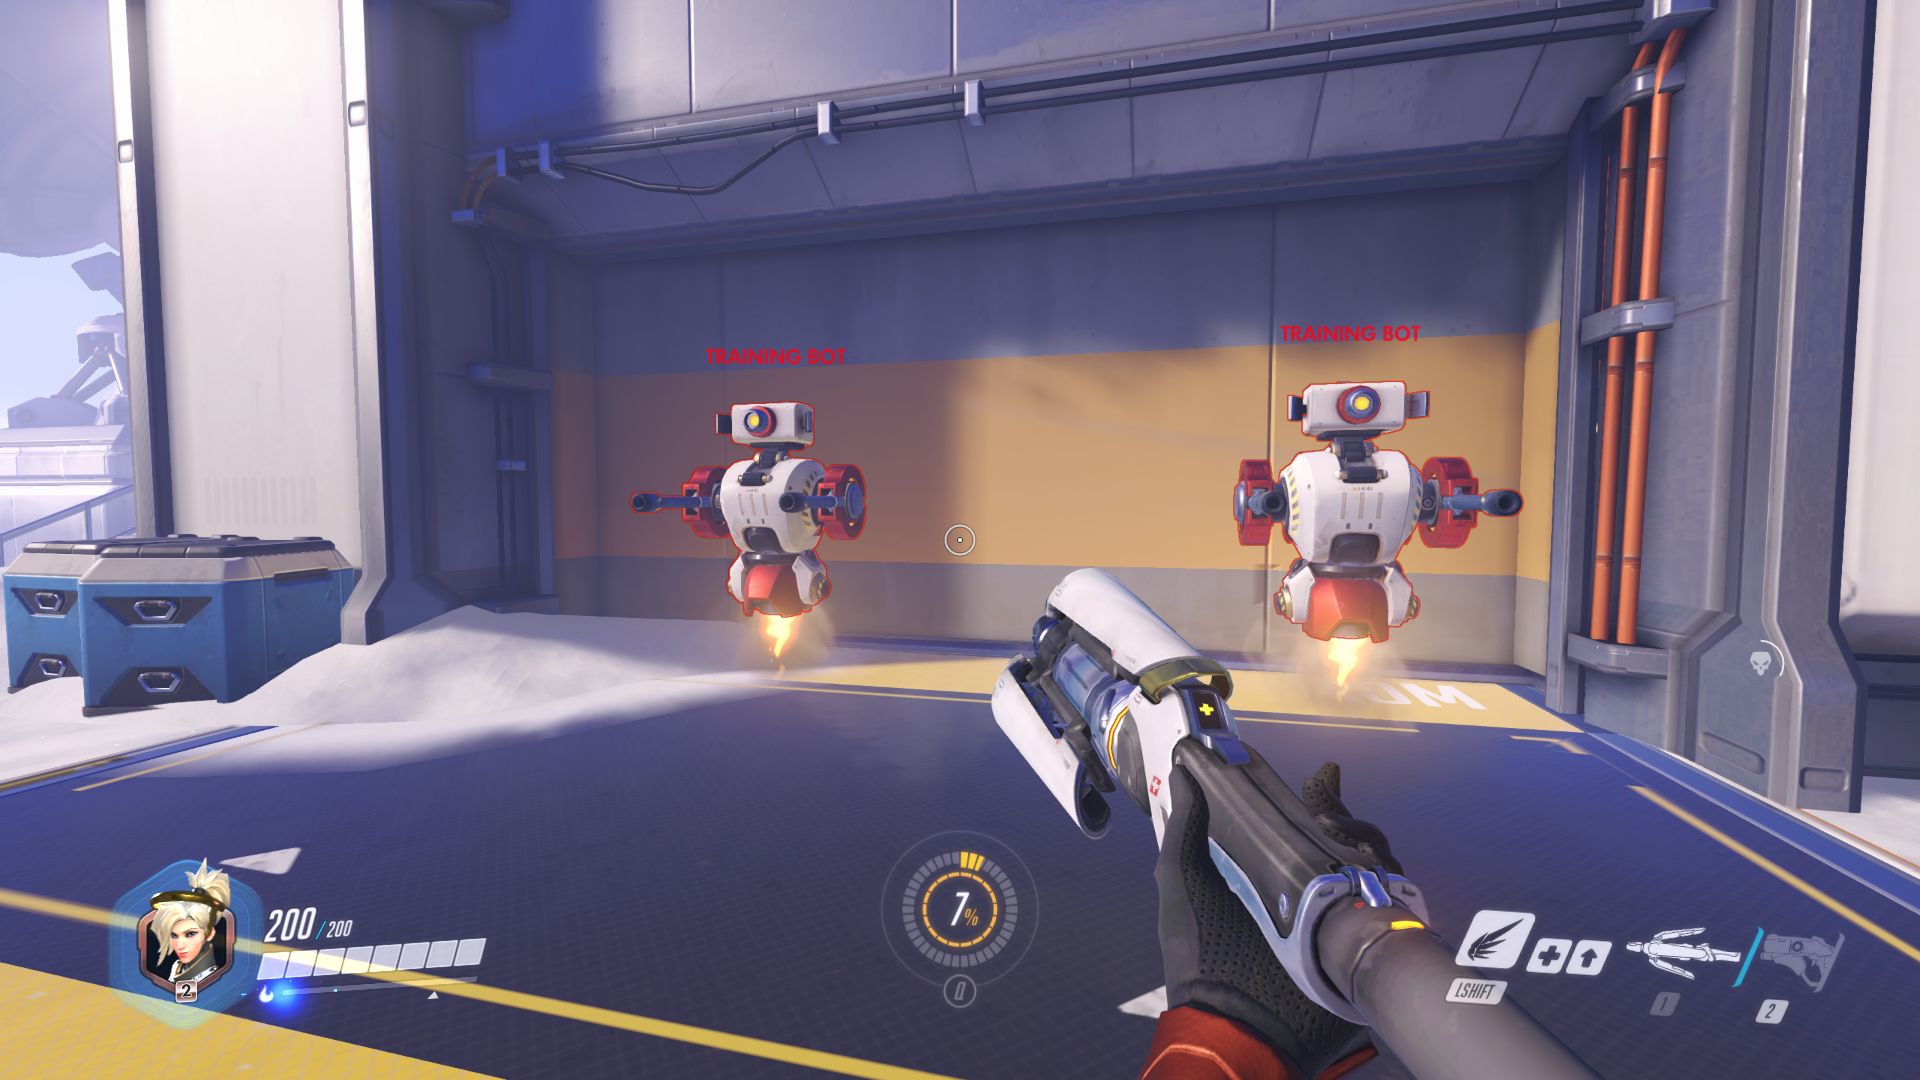
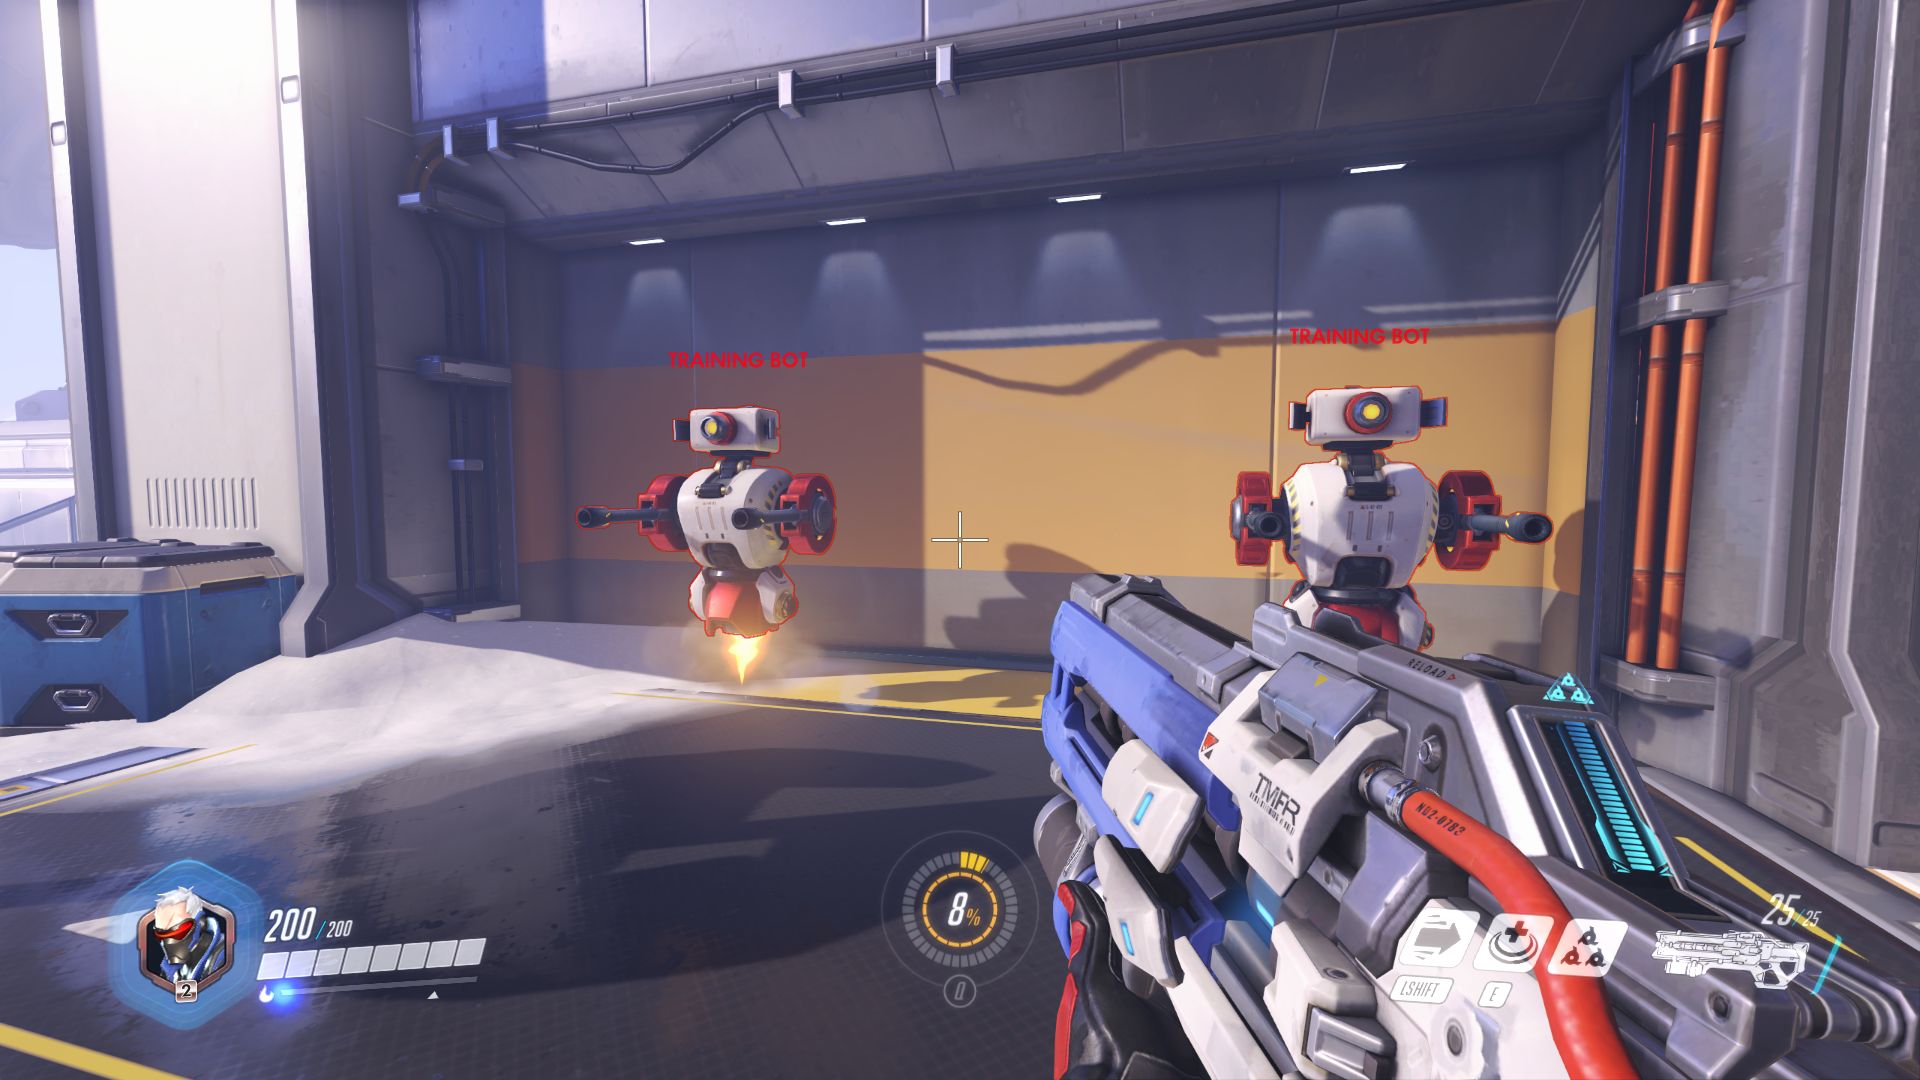
Online matches usually vary heavily and do not deliver consistent results, so we use the so called "Practice Range" from the training for our measurements. We run through the latter on a predetermined path with the character Soldier 76 for about 30 seconds. The tutorial hardly differs from a typical multiplayer match in terms of frame rate, so the results are meaningful. Because of the enormous speed of the gameplay, you should play with at least 45 fps on average.

Note: Overwatch does warn about the use of Fraps, because the software is supposedly not supported. However, the fps tool did run without problems. If you just want to see the frame rate, you can also show it via "Display Performance Stats".

Results

Overwatch is no giant for an ego-shooter in terms of resources. Users of entry-level notebooks cannot enjoy the full graphics prowess of the title, but GPUs like the HD Graphics 4600 or GeForce GT 740M do at least mange 1280 x 720 pixels in combination with the Low preset. 1366 x 768 pixels and the Medium preset require a mainstream chip like the GeForce GT 750M.

Low
Low
Medium
Medium
High
High
Ultra
Ultra
Epic
Epic

You will need a powerful multimedia GPU (GTX 850M or better) for 1920 x 1080 pixels and High settings. A combination of FHD and the Epic preset only runs smoothly on high-end GPUs like the GeForce GTX 870M/880M, while 4K or UHD, respectively, require a GeForce GTX 980M or similarly powerful SLI setups (>45 fps @3840 x 2160 + High). The processor is not that important for Overwatch. The CPU only limited – if at all – at low up to medium details with our test systems.

Overwatch
    3820x2160 Epic (Render Scale 100 %) AA:SM AF:16x     2560x1440 Epic (Render Scale 100 %) AA:SM AF:16x     3840x2160 High (Render Scale 100 %) AA:SM AF:4x     1920x1080 Epic (Render Scale 100 %) AA:SM AF:16x     1920x1080 High (Render Scale 100 %) AA:SM AF:4x     1920x1080 Medium (Render Scale 100 %) AA:FX AF:2x     1366x768 Medium (Render Scale 100 %) AA:FX AF:2x     1280x720 Low (Render Scale 100 %) AA:FX AF:1x
NVIDIA GeForce GTX 1080 (Desktop), 4790K
Nvidia GeForce GTX 1080 Founders Edition
104 (88min) fps ∼39%
196 (164min) fps ∼65%
284 (251min) fps ∼81%
293 (281min) fps ∼73%
293 (283min) fps ∼61%
296 (291min) fps ∼58%
NVIDIA GeForce GTX 1070 (Desktop), 4790K
MSI Gaming Z GeForce GTX 1070 OC Bios Desktop PC
91 (78min) fps ∼34%
171 (144min) fps ∼57%
272 (223min) fps ∼78%
NVIDIA GeForce GTX 980 Ti, 4790K
Asus Strix GTX 980 Ti Desktop PC
87 (75min) fps ∼33%
154 (129min) fps ∼51%
256 (202min) fps ∼73%
AMD Radeon R9 Fury, 4790K
XFX Radeon R9 Fury Pro
77 (64min) fps ∼29%
121 (94min) fps ∼40%
233 (178min) fps ∼66%
NVIDIA GeForce GTX 980, 6700K
Desktop PC
62.3 (53min) fps ∼23%
117 (97min) fps ∼39%
197 (154min) fps ∼56%
244 (199min) fps ∼61%
298 (289min) fps ∼62%
299 (296min) fps ∼59%
AMD Radeon R9 290X, 4790K
Sapphire Radeon R9 290X Tri-X OC
65.4 (55min) fps ∼24%
97 (78min) fps ∼32%
198 fps ∼56%
NVIDIA GeForce GTX 980M, 4700MQ
Schenker W504
47.3 (39min) fps ∼18%
75.1 (57min) fps ∼25%
141 (109min) fps ∼40%
177 (153min) fps ∼44%
217 (200min) fps ∼45%
231 (216min) fps ∼45%
AMD Radeon R9 280X, 4790K
Asus Z97 Deluxe Desktop i7-4790K, R9 280X
47.4 (39min) fps ∼18%
73 (59min) fps ∼24%
146 (110min) fps ∼42%
NVIDIA GeForce GTX 970M, 4700MQ
Schenker W504
36 (28min) fps ∼13%
62.6 (53min) fps ∼21%
97.1 (72min) fps ∼28%
112 (94min) fps ∼28%
202 (172min) fps ∼42%
228 (178min) fps ∼45%
NVIDIA GeForce GTX 880M, 4700MQ
Schenker W504
30.4 (26min) fps ∼11%
54.5 (45min) fps ∼18%
96.1 (78min) fps ∼27%
124 (101min) fps ∼31%
198 (158min) fps ∼41%
230 (215min) fps ∼45%
NVIDIA GeForce GTX 950, 6700K
Desktop PC
28.8 (24min) fps ∼11%
55.2 (47min) fps ∼18%
95.8 (78min) fps ∼27%
121 (100min) fps ∼30%
207 (162min) fps ∼43%
287 (237min) fps ∼57%
AMD Radeon R7 370, 4790K
MSI Gaming R7 370 2GB
31.5 (26min) fps ∼12%
47.6 (40min) fps ∼16%
102 (81min) fps ∼29%
113 (90min) fps ∼28%
183 (137min) fps ∼38%
NVIDIA GeForce GTX 965M, 6700HQ
MSI GE72 965M Ti
18.2 (15min) fps ∼9%
35.7 (30min) fps ∼13%
28 (23min) fps ∼10%
51.2 (44min) fps ∼17%
87 (72min) fps ∼25%
NVIDIA GeForce GTX 870M, 4700MQ
Schenker W504
24.4 (20min) fps ∼9%
44.4 (37min) fps ∼15%
77.4 (64min) fps ∼22%
101 (83min) fps ∼25%
163 (129min) fps ∼34%
219 (186min) fps ∼43%
NVIDIA GeForce GTX 960M, 4720HQ
Schenker XMG A505
20.3 (17min) fps ∼8%
39.8 (34min) fps ∼13%
69 (57min) fps ∼20%
86.2 (71min) fps ∼21%
145 (113min) fps ∼30%
195 (168min) fps ∼38%
NVIDIA GeForce GTX 860M, 4700MQ
Schenker W504
17 (14min) fps ∼6%
31.3 (26min) fps ∼10%
54.8 (45min) fps ∼16%
69.8 (57min) fps ∼17%
117 (93min) fps ∼24%
177 (139min) fps ∼35%
NVIDIA GeForce GTX 950M, 6700HQ
MSI PE60 2QD
10.8 (9min) fps ∼5%
22.7 (19min) fps ∼8%
34 (29min) fps ∼11%
59 (48min) fps ∼17%
NVIDIA GeForce 940MX, 6700HQ
MSI CX72 6QD
5.1 (4min) fps ∼3%
10.2 (8min) fps ∼4%
15.5 (12min) fps ∼5%
24.5 (19min) fps ∼7%
31.2 (24min) fps ∼8%
55.7 (44min) fps ∼12%
78.3 (61min) fps ∼15%
NVIDIA GeForce 940M, 5700HQ
MSI GP62 2QD
15.3 (12min) fps ∼5%
24.9 (19min) fps ∼7%
31.7 (25min) fps ∼8%
55 (43min) fps ∼11%
79.4 (60min) fps ∼16%
AMD Radeon R9 M280X, FX-7600P
Asus N551ZU-CN007H
15.8 (9min) fps ∼6%
27.6 (23min) fps ∼9%
55 (34min) fps ∼16%
59 (46min) fps ∼15%
78 (59min) fps ∼16%
81 (63min) fps ∼16%
NVIDIA GeForce 920M, 2970M
MSI CX61 2QC 2970M MS-16GD
17.1 (14min) fps ∼5%
22.1 (18min) fps ∼5%
38.4 (30min) fps ∼8%
54 (42min) fps ∼11%
NVIDIA GeForce GT 740M, 4200M
HP Envy 15-j011sg
16.4 (14min) fps ∼5%
21.2 (17min) fps ∼5%
36.9 (29min) fps ∼8%
51.7 (40min) fps ∼10%
Intel HD Graphics 4600, 4700MQ
Schenker W504
14.6 (12min) fps ∼4%
24.8 (19min) fps ∼5%
42.3 (31min) fps ∼8%

Overview

Show Restrictions
PosModel< PrevNext >Overwatch
 Overwatch (2016)
low
1280x720
Low (Render Scale 100 %)
1xAF FXAA
med.
1366x768
Medium (Render Scale 100 %)
2xAF FXAA
high
1920x1080
High (Render Scale 100 %)
4xAF SMAA
ultra
1920x1080
Epic (Render Scale 100 %)
16xAF SMAA
4K
3840x2160
High (Render Scale 100 %)
4xAF SMAA
NVIDIA Titan RTX
300
300
300
298
267
NVIDIA GeForce RTX 2080 Ti (Desktop)
0n2
0n2
0n2
0n2
0n2
NVIDIA GeForce RTX 2080 Super (Desktop)
300
300
300
267
152
NVIDIA GeForce RTX 2080 (Desktop)
0n2
0n2
0n2
0n2
0n2
NVIDIA GeForce RTX 2080 Mobile
299
238
130
NVIDIA GeForce GTX 1080 Ti (Desktop)
263
143
NVIDIA Titan X Pascal
299.9
299.9
253.4
196.8
165.8
NVIDIA GeForce RTX 2070 Super (Desktop)
300
300
300
245
136
AMD Radeon VII
300
226
226
128
101
AMD Radeon RX 5700 XT (Desktop)
300
300
228
154
NVIDIA GeForce RTX 2070 (Desktop)
0n4
0n4
0n4
0n4
0n3
NVIDIA GeForce GTX 1080 (Desktop)
296
293
284
0n2
0n2
NVIDIA GeForce RTX 2060 Super (Desktop)
0n2
0n2
0n2
0n2
0n2
AMD Radeon RX 5700 (Desktop)
299
298
201
138
AMD Radeon RX 6650M
507.9
481.9
350.9
150
NVIDIA GeForce RTX 2070 Mobile
291
184
101
NVIDIA GeForce RTX 2080 Max-Q
0n3
0n3
0n2
NVIDIA GeForce RTX 2060 (Desktop)
279.9
275.2
266.8
110.2
102.2
NVIDIA GeForce GTX 1080 Mobile
287
0n5
0n5
PosModel< PrevNext >Overwatch
low med. high ultra 4K
NVIDIA GeForce GTX 1070 Ti (Desktop)
182
88.7
NVIDIA GeForce RTX 2070 Max-Q
218
140
77.6
AMD Radeon RX Vega 56
300
300
189
101
107
NVIDIA GeForce RTX 2060 Mobile
250
148
78.3
NVIDIA GeForce GTX 1070 (Desktop)
300
297.2
0n3
0n4
0n4
NVIDIA GeForce GTX 1080 Max-Q
172
NVIDIA GeForce GTX 1070 Mobile
0n2
0n6
0n3
NVIDIA GeForce RTX 2060 Max-Q
299.9
299.7
229.7
146.9
NVIDIA GeForce GTX 1660 Ti (Desktop)
300
298
154
102
116
NVIDIA GeForce GTX 1660 Ti Mobile
225
133
75.3
NVIDIA GeForce GTX 980 Ti
256
154
87
NVIDIA GeForce GTX 1070 Max-Q
0n3
70.1
AMD Radeon R9 Fury
233
121
77
AMD Radeon R9 Nano
227
117
75.6
NVIDIA GeForce GTX 980
299
298
197
0n2
62.3
NVIDIA GeForce GTX 1660 Ti Max-Q
193.7
140.7
116
AMD Radeon RX 590 (Desktop)
300
299.3
238.3
124.6
76
AMD Radeon RX 580 (Desktop)
300
299.9
213.4
145.7
68.6
NVIDIA GeForce GTX 980 (Laptop)
299.9
299.9
212.4
0n2
69.4
NVIDIA GeForce GTX 1060 (Desktop)
300
300
190
116
61.1
PosModel< PrevNext >Overwatch
low med. high ultra 4K
AMD Radeon RX 570 (Desktop)
299
290
204
103
69
AMD Radeon RX 480 (Desktop)
197
139
57
NVIDIA GeForce GTX 1060 Mobile
169
0n12
0n2
AMD Radeon RX 5500M
124
109
74
AMD Radeon Pro 5500M
98
AMD Radeon RX 580 (Laptop)
276.3
276
191.1
96.2
NVIDIA GeForce GTX 1650 (Desktop)
291
300
149
87
46.9
NVIDIA GeForce GTX 1650 Mobile
165.2
0n2
0n2
47.1
NVIDIA GeForce GTX 970
287.8
187.5
0n2
58.2
NVIDIA GeForce GTX 1060 Max-Q
299.2
266.2
0n2
0n3
50.3
AMD Radeon RX 470 (Desktop)
94
54.4
NVIDIA GeForce GTX 1650 Max-Q
119
69.5
39.1
AMD Radeon R9 290X
198
97
65.4
NVIDIA GeForce GTX 980M
231
217
0n2
0n3
47.3
AMD Radeon RX Vega M GH
197.3
148.3
71
AMD Radeon R9 280X
146
73
47.4
NVIDIA GeForce GTX 960
266.7
206.6
115.7
66.9
38.6
NVIDIA GeForce GTX 1050 Ti Mobile
0n3
0n3
0n2
NVIDIA GeForce GTX 1050 Ti (Desktop)
114
68
35.6
NVIDIA GeForce GTX 970M
228
202
97.1
62.6
36
PosModel< PrevNext >Overwatch
low med. high ultra 4K
NVIDIA GeForce GTX 680
299.6
262.2
125.4
77.3
40
NVIDIA GeForce GTX 1050 Ti Max-Q
285.4
233.9
117.7
70.5
37
AMD Radeon RX Vega M GL / 870
184.3
108.2
50
AMD Radeon Pro WX Vega M GL
193.7
173.4
109.8
52.3
32.9
NVIDIA GeForce GTX 1050 (Desktop)
108
63
33.1
NVIDIA GeForce GTX 1050 Mobile
290.2
122.9
0n5
0n7
0n2
AMD Radeon R7 370
183
102
47.6
31.5
NVIDIA GeForce GTX 880M
230
198
96.1
54.5
30.4
NVIDIA GeForce GTX 1050 Max-Q
256.9
160
80.5
48.9
26
NVIDIA GeForce GTX 950
287
207
95.8
55.2
28.8
AMD Radeon RX 460 (Desktop)
94
46.3
26.5
NVIDIA GeForce GTX 965M
0n2
0n2
0n3
0n3
0n2
AMD Radeon RX 560X (Laptop)
205
178
95
46.9
AMD Radeon RX 560 (Laptop)
224.2
176.1
95.4
47.9
NVIDIA GeForce GTX 870M
219
163
77.4
44.4
24.4
AMD Radeon HD 8970M
172.3
126.6
116.3
54.2
AMD Radeon RX 460 (Laptop)
100
79.7
43
AMD Radeon Pro 560X
235
165
91
45.1
AMD Radeon Pro 460
201.5
106.7
48.8
Intel Iris Xe Graphics G7 96EUs
158.9
111.9
57.6
32
PosModel< PrevNext >Overwatch
low med. high ultra 4K
NVIDIA GeForce MX350
192.2
143.9
64
42.5
NVIDIA GeForce GTX 960M
0n2
0n2
0n3
0n4
0n2
AMD Radeon Pro 555
63.6
30.5
AMD Radeon Pro 455
178
65.8
30.1
18.7
NVIDIA GeForce GT 1030 (Desktop)
183.4
119.2
54.5
33.8
16.5
NVIDIA GeForce MX250
0n2
0n2
0n2
0n2
NVIDIA GeForce MX150
0n6
0n7
0n9
0n9
AMD Radeon RX 540
0n2
0n2
0n2
0n2
NVIDIA GeForce GTX 860M
177
117
54.8
31.3
17
NVIDIA GeForce GTX 950M
152.7
107.4
0n2
0n2
AMD Radeon Pro 450
153
57
39.5
AMD Radeon 540X
120.8
99.9
46.4
22.1
AMD Radeon RX Vega 11
139
96
54.2
28.3
AMD Radeon R9 M280X
81
78
55
27.6
15.8
Intel Iris Plus Graphics G7 (Ice Lake 64 EU)
0n6
0n6
0n4
0n3
AMD Radeon RX Vega 10
46.2
42
27.4
Intel Iris Pro Graphics 580
60.5
53.3
42.9
23.1
AMD Radeon RX Vega 9
92.3
36.3
19.3
NVIDIA GeForce MX230
0n2
0n2
0n2
0n2
AMD Radeon RX Vega 8 (Ryzen 4000/5000)
146
59.7
30.7
PosModel< PrevNext >Overwatch
low med. high ultra 4K
AMD Radeon RX Vega 7
115.3
82.9
45.3
22.9
NVIDIA GeForce MX130
0n2
0n2
0n2
21.9
NVIDIA GeForce 940MX
0n4
0n4
0n2
0n2
AMD Radeon RX Vega 8 (Ryzen 2000/3000)
0n3
0n2
0n2
0n2
NVIDIA GeForce 940M
79.4
55
24.9
15.3
Intel Iris Plus Graphics G4 (Ice Lake 48 EU)
0n3
0n2
0n2
0n2
NVIDIA GeForce 930MX
74.2
52.2
23.3
14.8
AMD Radeon R9 M375
76.8
65.4
29.6
14.3
Intel Iris Plus Graphics 655
91
68
29.9
18.2
AMD Radeon R7 M445
75.3
52.6
23.5
14.1
AMD Radeon R7 512 Cores (Kaveri Desktop)
59
46.3
22.3
NVIDIA GeForce GT 740M
51.7
36.9
16.4
Intel Iris Plus Graphics 650
79.2
57.4
25.6
21.4
NVIDIA GeForce 930M
68.3
48.1
Intel Iris Graphics 550
86
58.8
26.2
AMD Radeon 530
0n3
0n3
0n2
AMD Radeon RX Vega 6 (Ryzen 4000/5000)
0n2
0n2
0n2
0n2
NVIDIA GeForce MX110
0n2
0n2
0n2
0n2
Intel Iris Plus Graphics 640
0n4
0n4
0n3
19.5
NVIDIA GeForce 920MX
90.4
60.3
27.3
15.4
PosModel< PrevNext >Overwatch
low med. high ultra 4K
Intel Iris Graphics 540
0n2
0n2
0n2
NVIDIA GeForce GT 640M
52
44.7
22.1
AMD Radeon R7 (Kaveri)
45.5
35.9
16.7
NVIDIA GeForce 920M
54
38.4
17.1
AMD Radeon R7 M440
60.5
42.6
22.3
12.4
AMD Radeon R7 M340
54.8
44.9
AMD Radeon 520
41.9
33
14.6
AMD Radeon RX Vega 6 (Ryzen 2000/3000)
75.7
60.1
28.9
14
AMD Radeon RX Vega 5
95
68.1
34.7
18.2
Intel UHD Graphics G1 (Ice Lake 32 EU)
71.4
52.3
23.5
Intel UHD Graphics 630
62
41.5
19.5
Intel HD Graphics 630
58.3
40.2
17.5
Intel HD Graphics 530
45.1
31
AMD Radeon R5 (Bristol Ridge)
32.5
29
16
11.6
Intel UHD Graphics 620
0n3
0n3
0n3
Intel HD Graphics 620
0n6
0n6
0n4
AMD Radeon R6 (Carrizo)
26.1
Intel HD Graphics 5600
40
28
NVIDIA GeForce GT 630M
39.6
28
AMD Radeon R5 M430
41.3
31.3
14.5
PosModel< PrevNext >Overwatch
low med. high ultra 4K
AMD Radeon R5 M255
54
44.6
20.5
AMD Radeon RX Vega 3
43.5
32.5
18.8
Intel HD Graphics 520
0n2
0n2
0n2
Intel Iris Graphics 6100
33.6
25
NVIDIA GeForce GT 720M
41.2
28.6
AMD Radeon R5 (Stoney Ridge)
30.4
24.6
Intel HD Graphics 6000
25
Intel HD Graphics 4600
0n2
0n2
Intel HD Graphics 5500
31.6
Intel UHD Graphics 615
29.9
21.6
Intel HD Graphics 615
28.2
21.9
Intel HD Graphics 515
0n2
8.4
Intel UHD Graphics 610
24.8
17.7
Intel HD Graphics 610
27
19.2
Intel HD Graphics 4400
31.3
20.4
Intel UHD Graphics 605
11.4
8.3
Intel HD Graphics 505
7.1
Intel HD Graphics 4000
25.6
AMD Radeon R4 (Stoney Ridge)
20.7
16.9
AMD Radeon R5 (Beema/Carrizo-L)
20.4
17.1
PosModel< PrevNext >Overwatch
low med. high ultra 4K
AMD Radeon R2 (Stoney Ridge)
17.5
15
Intel UHD Graphics 600
5
3
Intel HD Graphics 500
15.9
Intel HD Graphics 400 (Braswell)
0n2
0n2
Intel HD Graphics (Haswell)
26.1
16.3
(-) * Smaller values are better. / n123 Number of benchmarks for this median value / * Approximate position


Legend
5Stutters – This game is very likely to stutter and have poor frame rates. Based on all known benchmarks using the specified graphical settings, average frame rates are expected to fall below 25fps
May Stutter – This graphics card has not been explicitly tested on this game. Based on interpolated information from surrounding graphics cards of similar performance levels, stutters and poor frame rates are expected.
30Fluent – Based on all known benchmarks using the specified graphical settings, this game should run at or above 25fps
40Fluent – Based on all known benchmarks using the specified graphical settings, this game should run at or above 35fps
60Fluent – Based on all known benchmarks using the specified graphical settings, this game should run at or above 58fps
May Run Fluently – This graphics card has not been explicitly tested on this game. Based on interpolated information from surrounding graphics cards of similar performance levels, fluent frame rates are expected.
?Uncertain – This graphics card experienced unexpected performance issues during testing for this game. A slower card may be able to achieve better and more consistent frame rates than this particular GPU running the same benchmark scene.
Uncertain – This graphics card has not been explicitly tested on this game and no reliable interpolation can be made based on the performances of surrounding cards of the same class or family.
The value in the fields displays the average frame rate of all values in the database. Move your cursor over the value to see individual results.

Test Systems

Desktop-PCs Custom Nvidia Custom AMD
Mainboard Asus Z170-A Asus Z97-Deluxe
Processor Intel Core i7-6700K (Skylake) Intel Core i7-4790K (Haswell)
GPU Nvidia GeForce GTX 980 (4 GB GDDR5)
PNY GeForce GTX 950 (2 GB GDDR5)
Nvidia GeForce GTX 1080 (8 GB GDDR5X)
Asus GeForce GTX 980 Ti (6 GB GDDR5)
XFX Radeon R9 Fury (4 GB HBM)
Sapphire Radeon R9 290X (4 GB GDDR5)
Sapphire Radeon R9 280X (3 GB GDDR5)
MSI Radeon R7 370 (2 GB GDDR5)
RAM 2 x 8 GB DDR4-2133 2 x 4 GB DDR3-1600
Storage Crucial MX100 SSD (256 GB)
Crucial M500 SSD (480 GB)
OCZ Trion 100 SSD (480 GB)
OCZ Trion 150 SSD (960 GB)
Intel SSD 530 (240 GB)
OCZ Trion 100 SSD (480 GB)
OS Windows 10 Pro 64-bit Windows 10 Home 64-bit
Schenker Notebooks Schenker W504 Schenker XMG A505 Schenker S413
Mainboard Intel HM87 Intel HM87 Intel HM87
Processor Intel Core i7-4700MQ (Haswell) Intel Core i7-4720HQ (Haswell) Intel Core i7-4750HQ (Haswell)
GPU Nvidia GeForce GTX 980M (8 GB GDDR5)
GTX 970M (6 GB GDDR5)
GTX 880M (8 GB GDDR5)
GTX 870M (6 GB GDDR5)
GTX 860M Kepler (4 GB GDDR5)
Nvidia GeForce GTX 960M (2 GB GDDR5) Intel Iris Pro Graphics 5200
RAM 2x 4 GB DDR3-1600 2x 4 GB DDR3-1600 2x 8 GB DDR3-1600
Storage Samsung SSD 840 EVO (250 GB)
Seagate Laptop Thin SSHD (500 GB)
Micron M600 SSD (128 GB)
HGST Travelstar 7K1000 HDD (1000 GB)
Intel SSD
OS Windows 10 Pro 64-bit Windows 10 Home 64-bit Windows 10 Home 64-bit
MSI Notebooks MSI GE72 MSI PE60 MSI GP62 MSI CX61 MSI CX61
Mainboard Intel HM170 Intel HM170 Intel HM86 Intel HM86 Intel HM86
Processor Intel Core i7-6700HQ (Skylake) Intel Core i7-6700HQ (Skylake) Intel Core i7-5700HQ (Broadwell) Intel Celeron 2970M (Haswell) Intel Core i5-4200M (Haswell)
GPU Nvidia GeForce GTX 965M 2016 (2 GB GDDR5) Nvidia GeForce GTX 950M (2 GB GDDR5) Nvidia GeForce 940M (2 GB DDR3) Nvidia GeForce 920M (2 GB DDR3) Nvidia GeForce GT 720M (2 GB DDR3)
RAM 1 x 8 GB DDR4-2133 2 x 4 GB DDR4-2133 1 x 8 GB DDR3-1600 1 x 8 GB DDR3-1600 1 x 8 GB DDR3-1600
Storage Toshiba THNSNJ128G8NU SSD (128 GB)
WDC WD10JPVX HDD (1000 GB)
OCZ Trion 100 SSD (480 GB)
Toshiba MQ01ABF050 HDD (500 GB) WDC Scorpio Blue HDD (1000 GB)
OS Windows 10 Home 64-bit Windows 10 Windows 10 Windows 10 Windows 7 Home Premium 64-bit
other Notebooks HP Envy 15 Asus N551ZU
Mainboard Intel HM87 AMD K15.1
Processor Intel Core i5-4200M (Haswell) AMD FX-7600P (Kaveri)
GPU Nvidia GeForce GT 740M (2 GB DDR3) AMD Radeon R9 M280X (4 GB GDDR5)
RAM 1 x 8 GB DDR3-1600 2 x 4 GB DDR3-1600
Storage Samsung SSD 830 (256 GB) Samsung SSD 830 256 GB
OS Windows 10 Home 64-bit Windows 10 64-bit
4K Monitor Nvidia Driver AMD Driver Intel Driver
2 x Asus PB287Q ForceWare 368.22 Crimson 16.5.3 Hotfix 15.40.22.4424
Read all 5 comments / answer
static version load dynamic
Loading Comments
Comment on this article
Please share our article, every link counts!
.170
> Notebook / Laptop Reviews and News > Reviews > Overwatch Notebook and Desktop Benchmarks
Florian Glaser, 2016-06- 2 (Update: 2022-01-21)