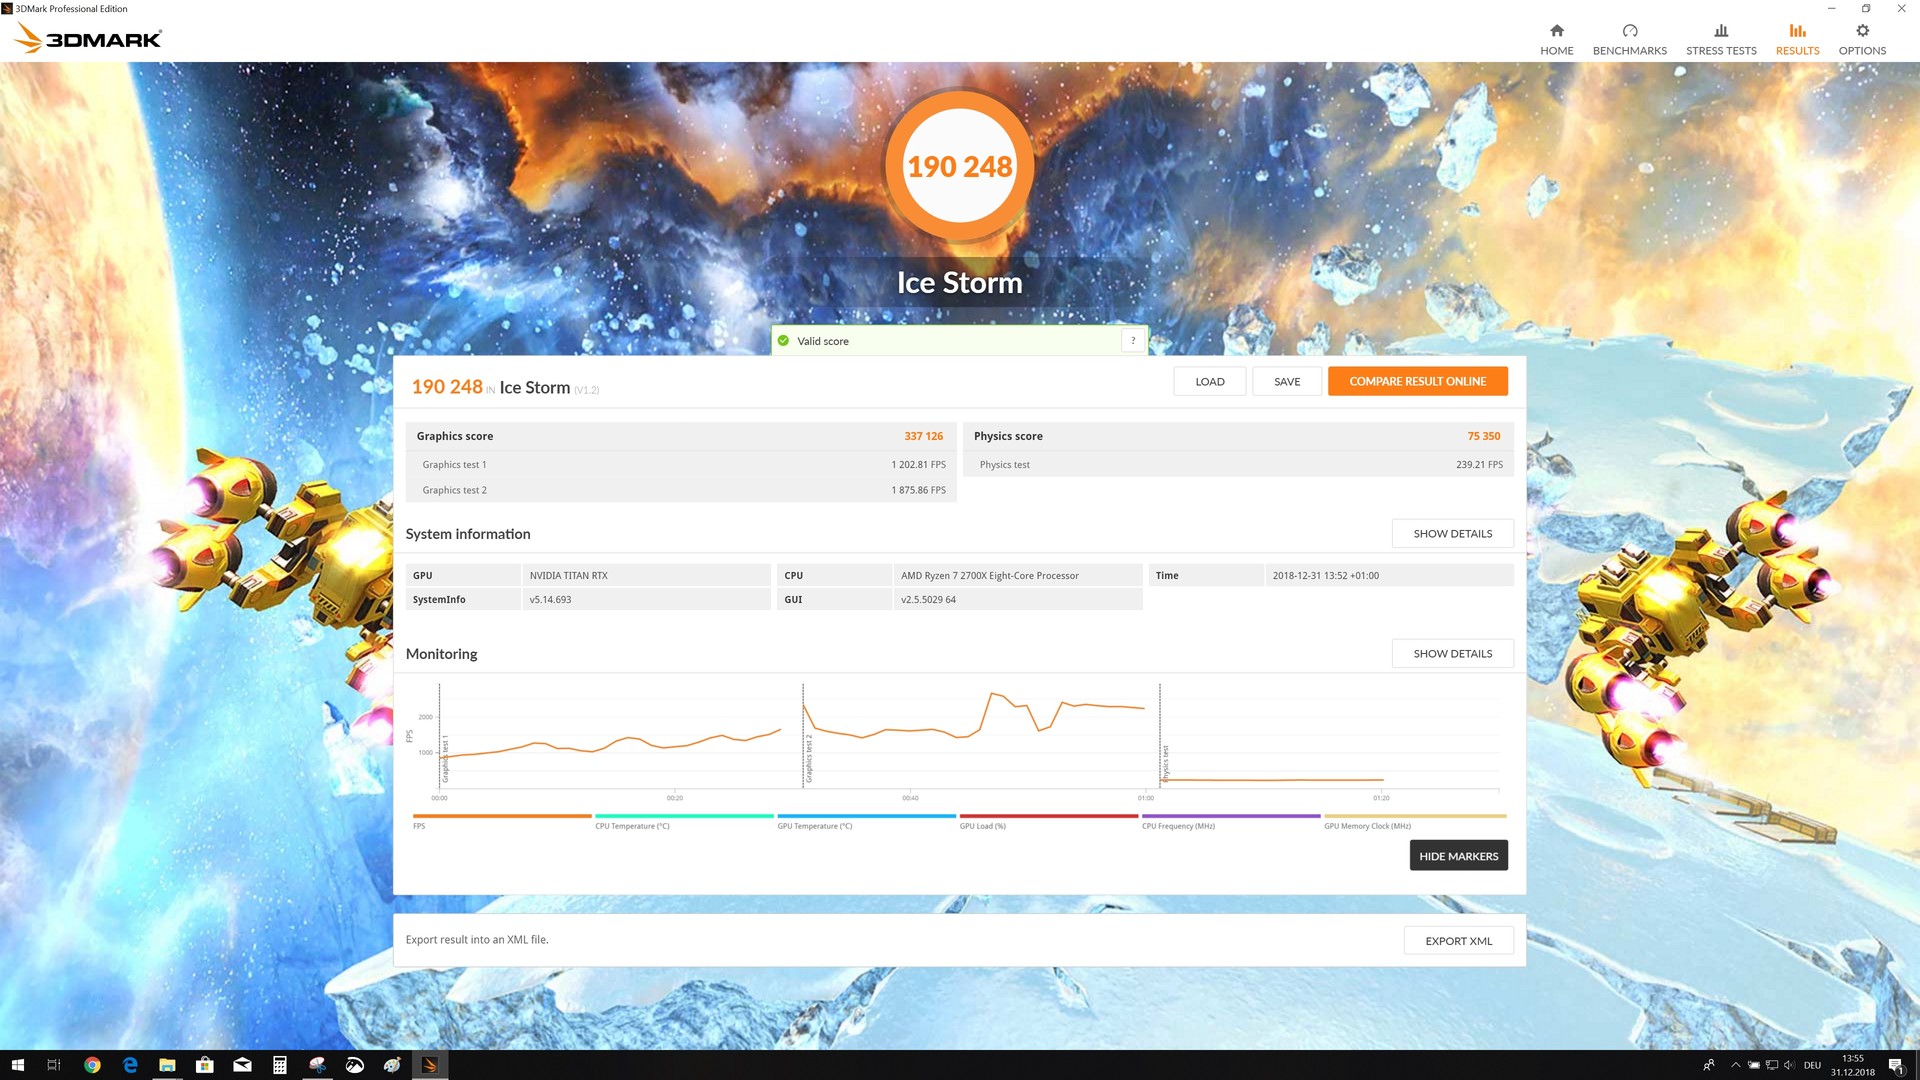
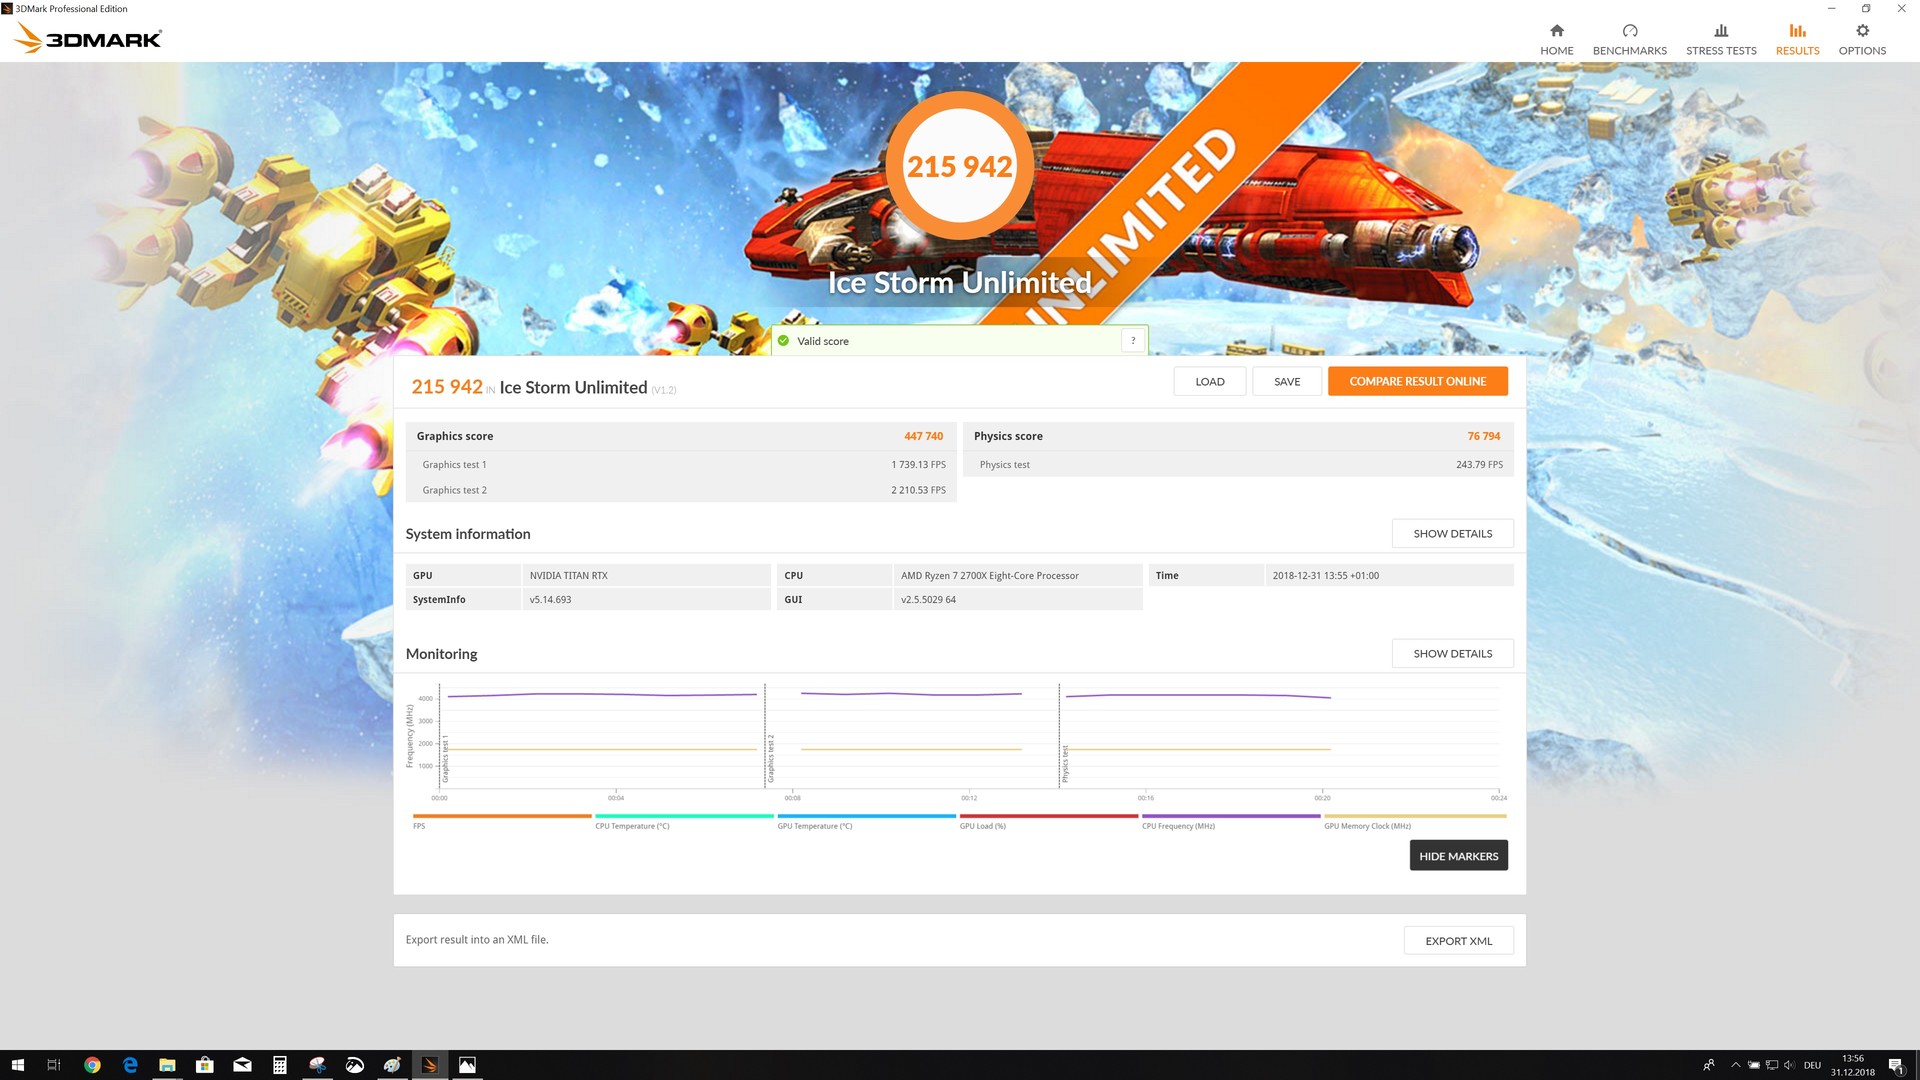
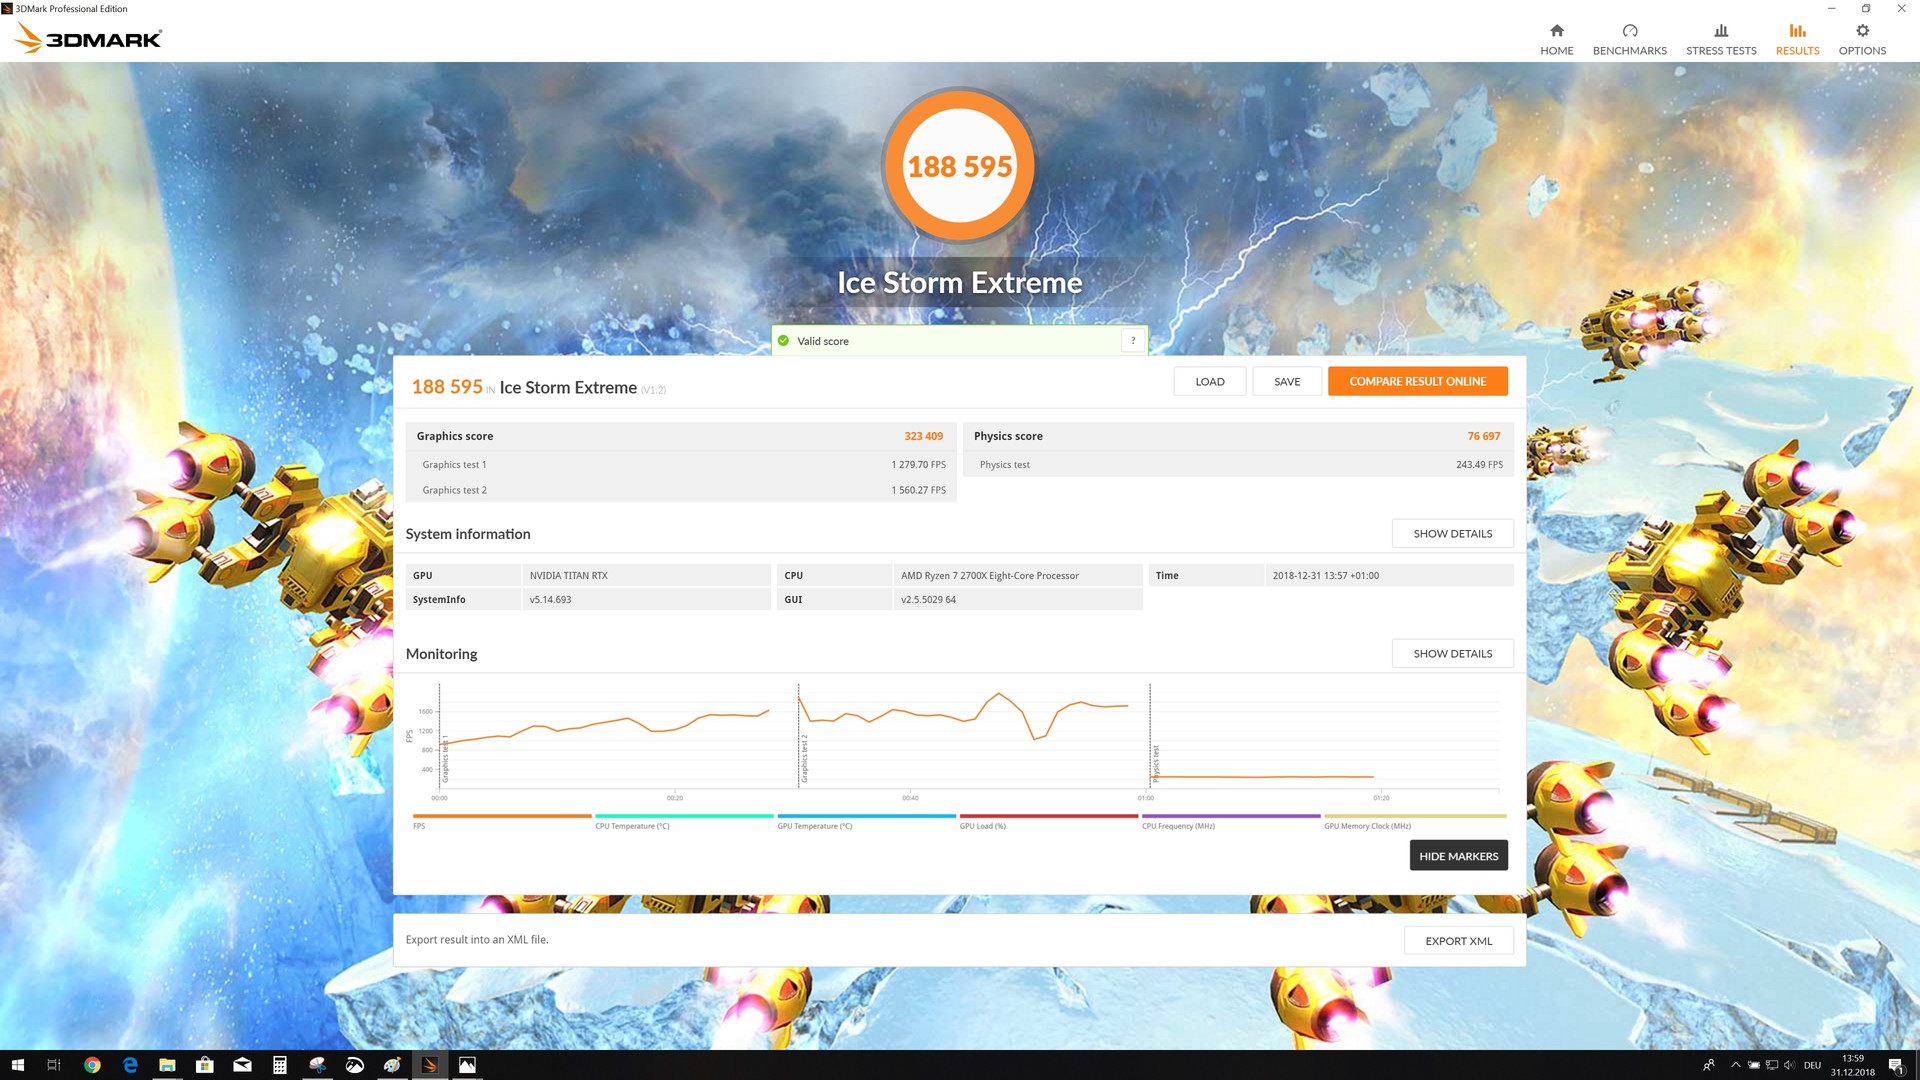
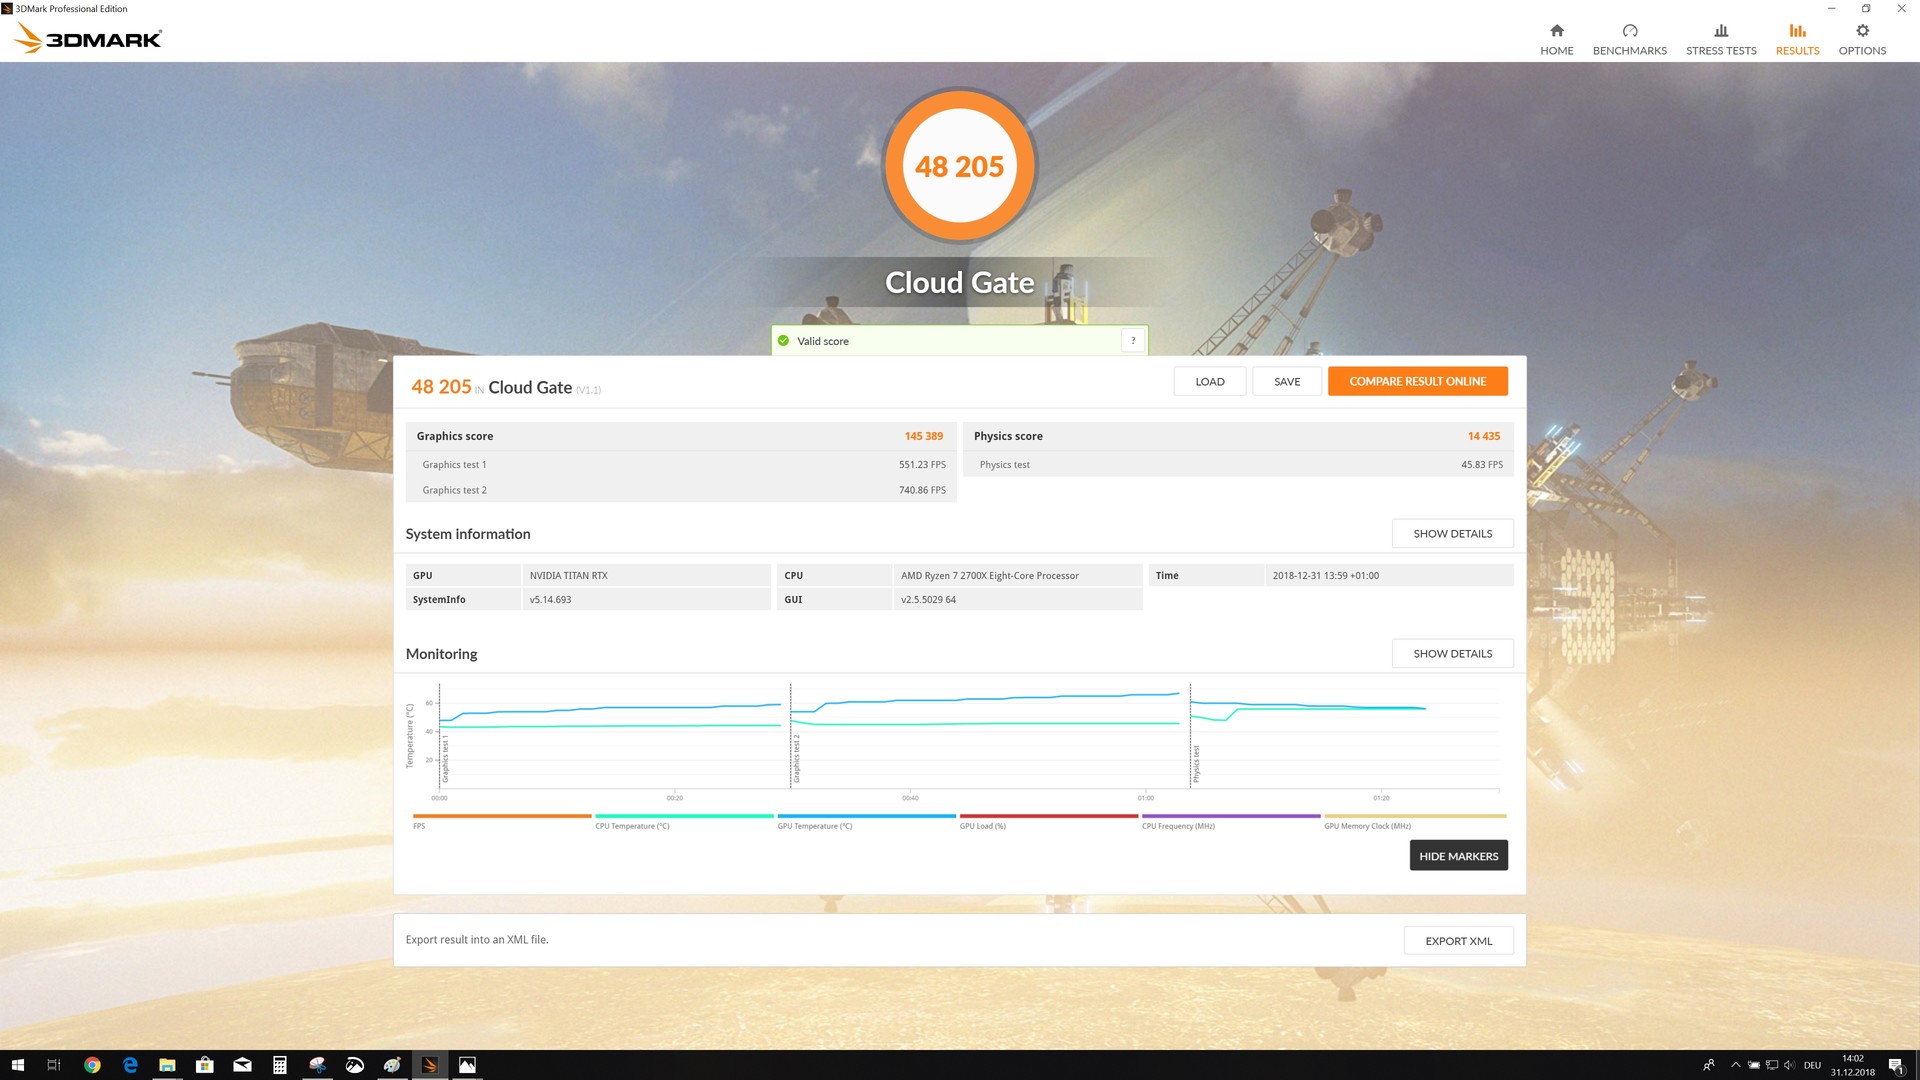
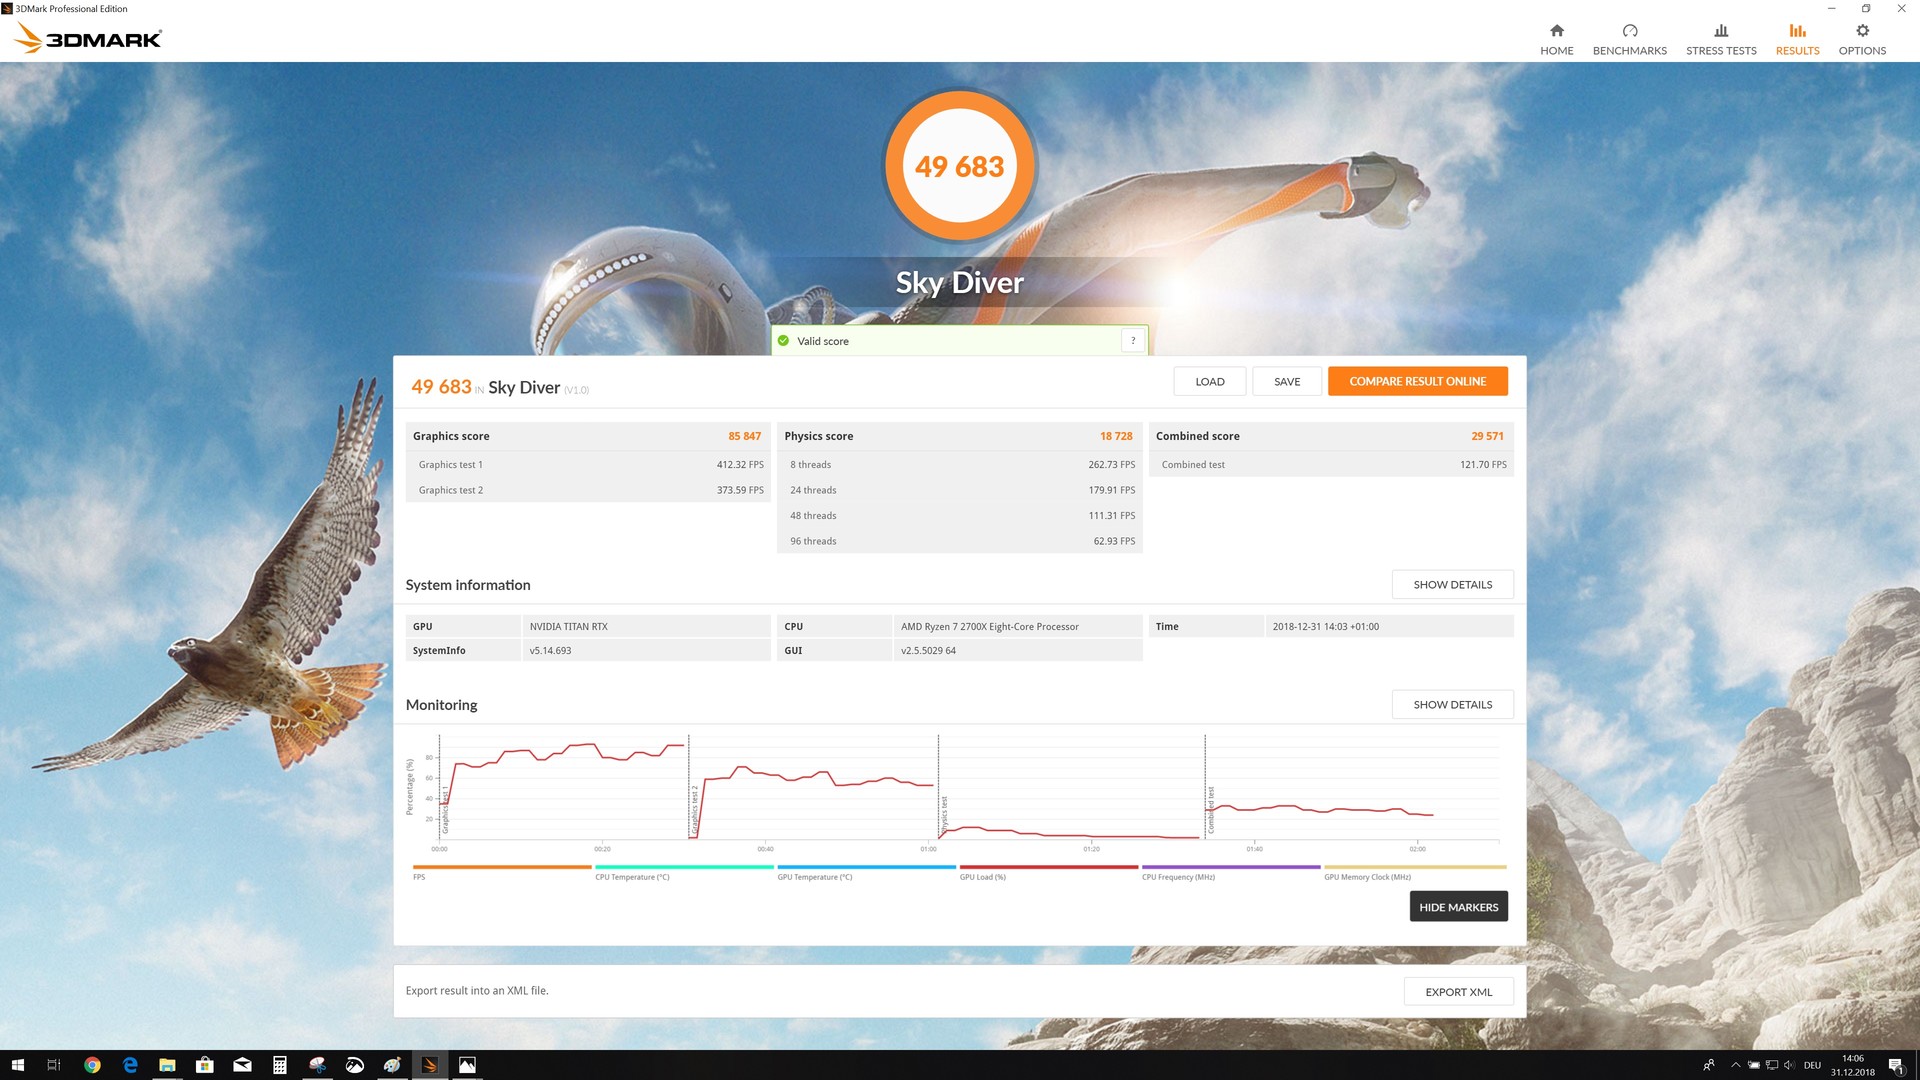
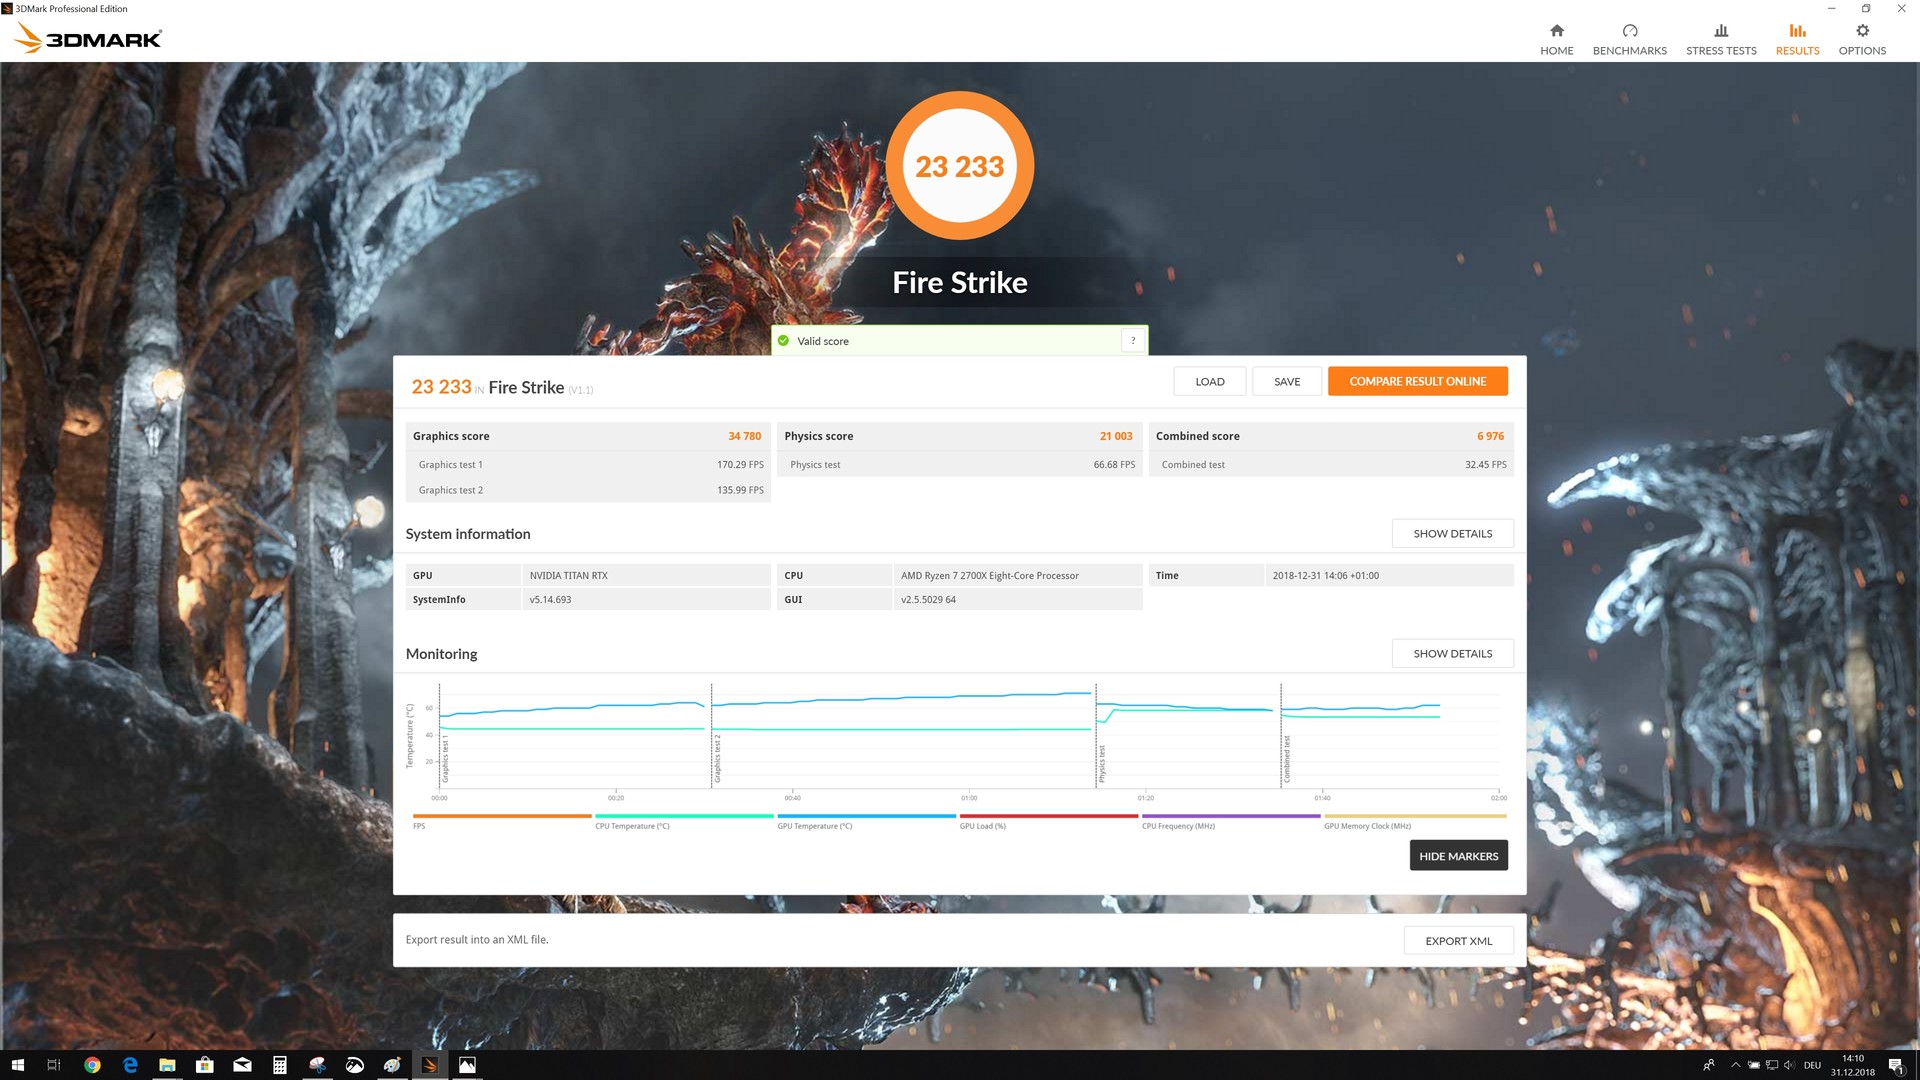
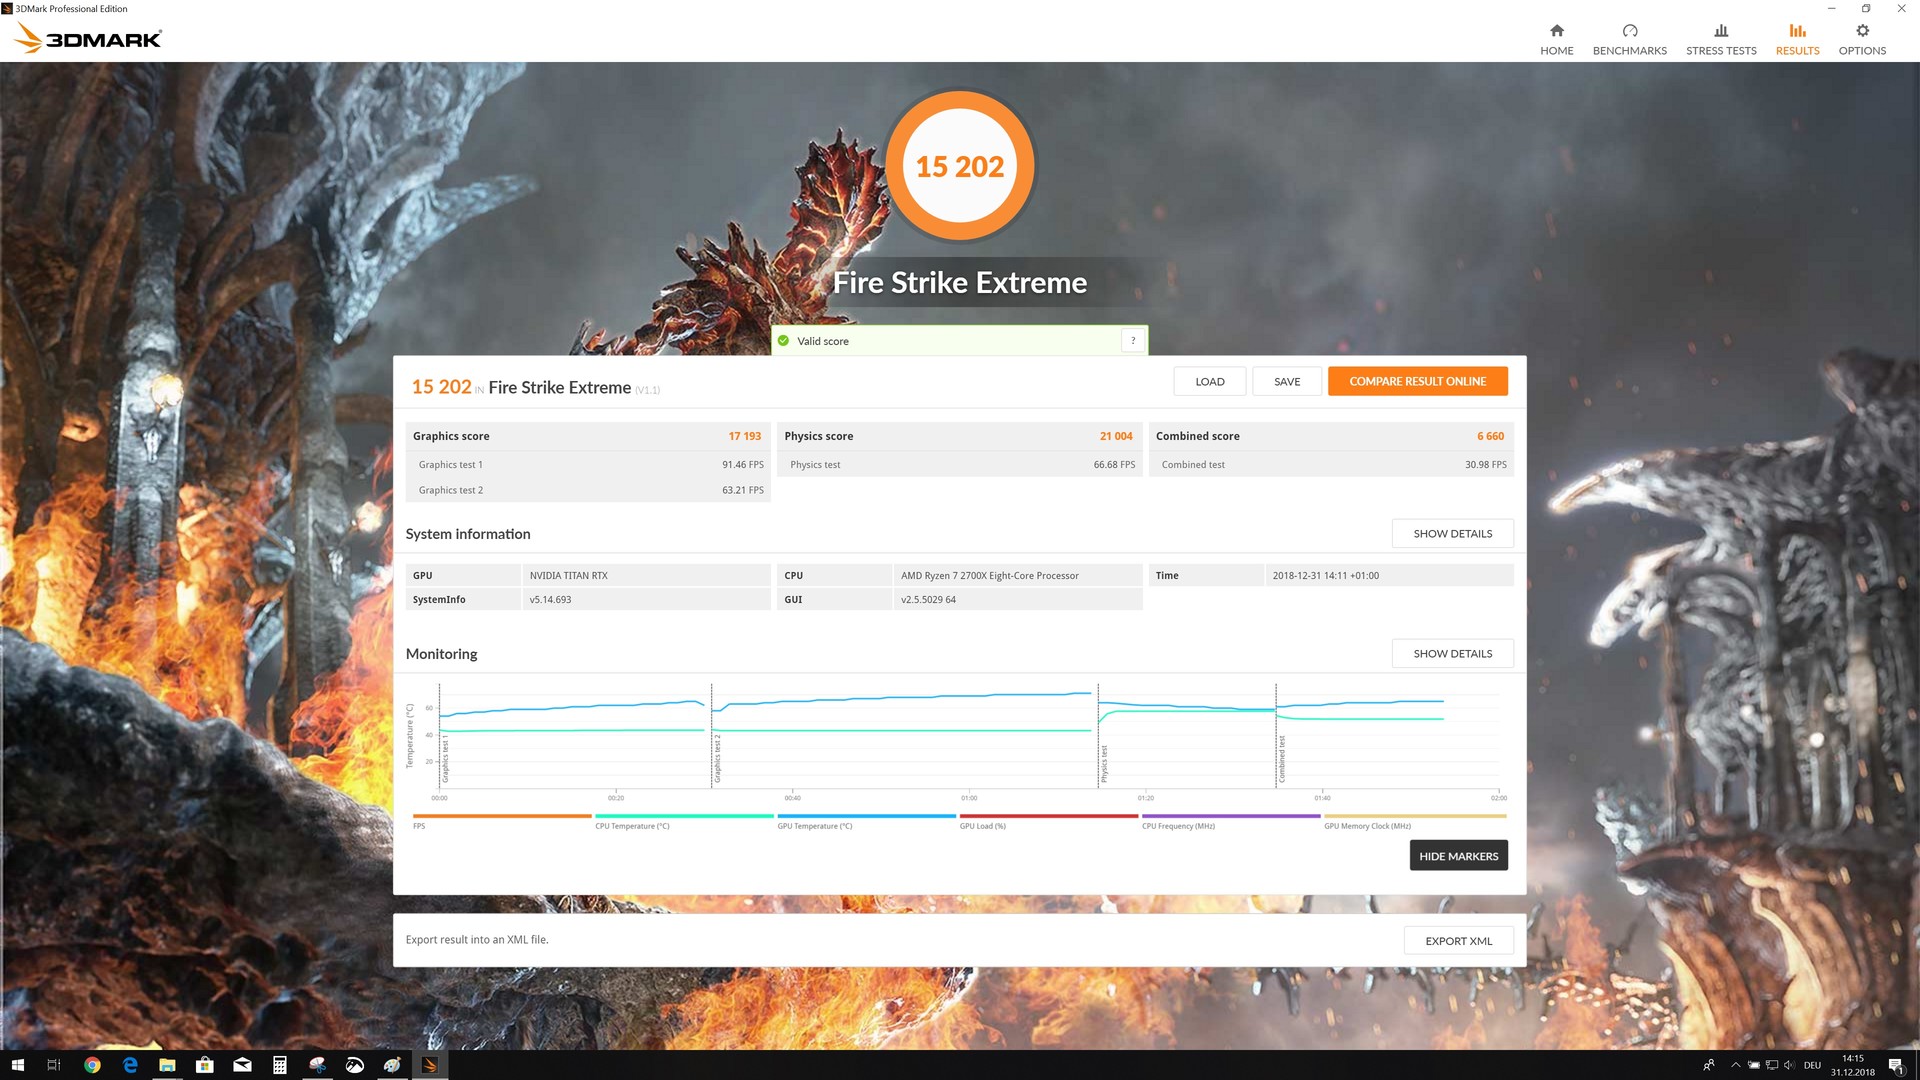
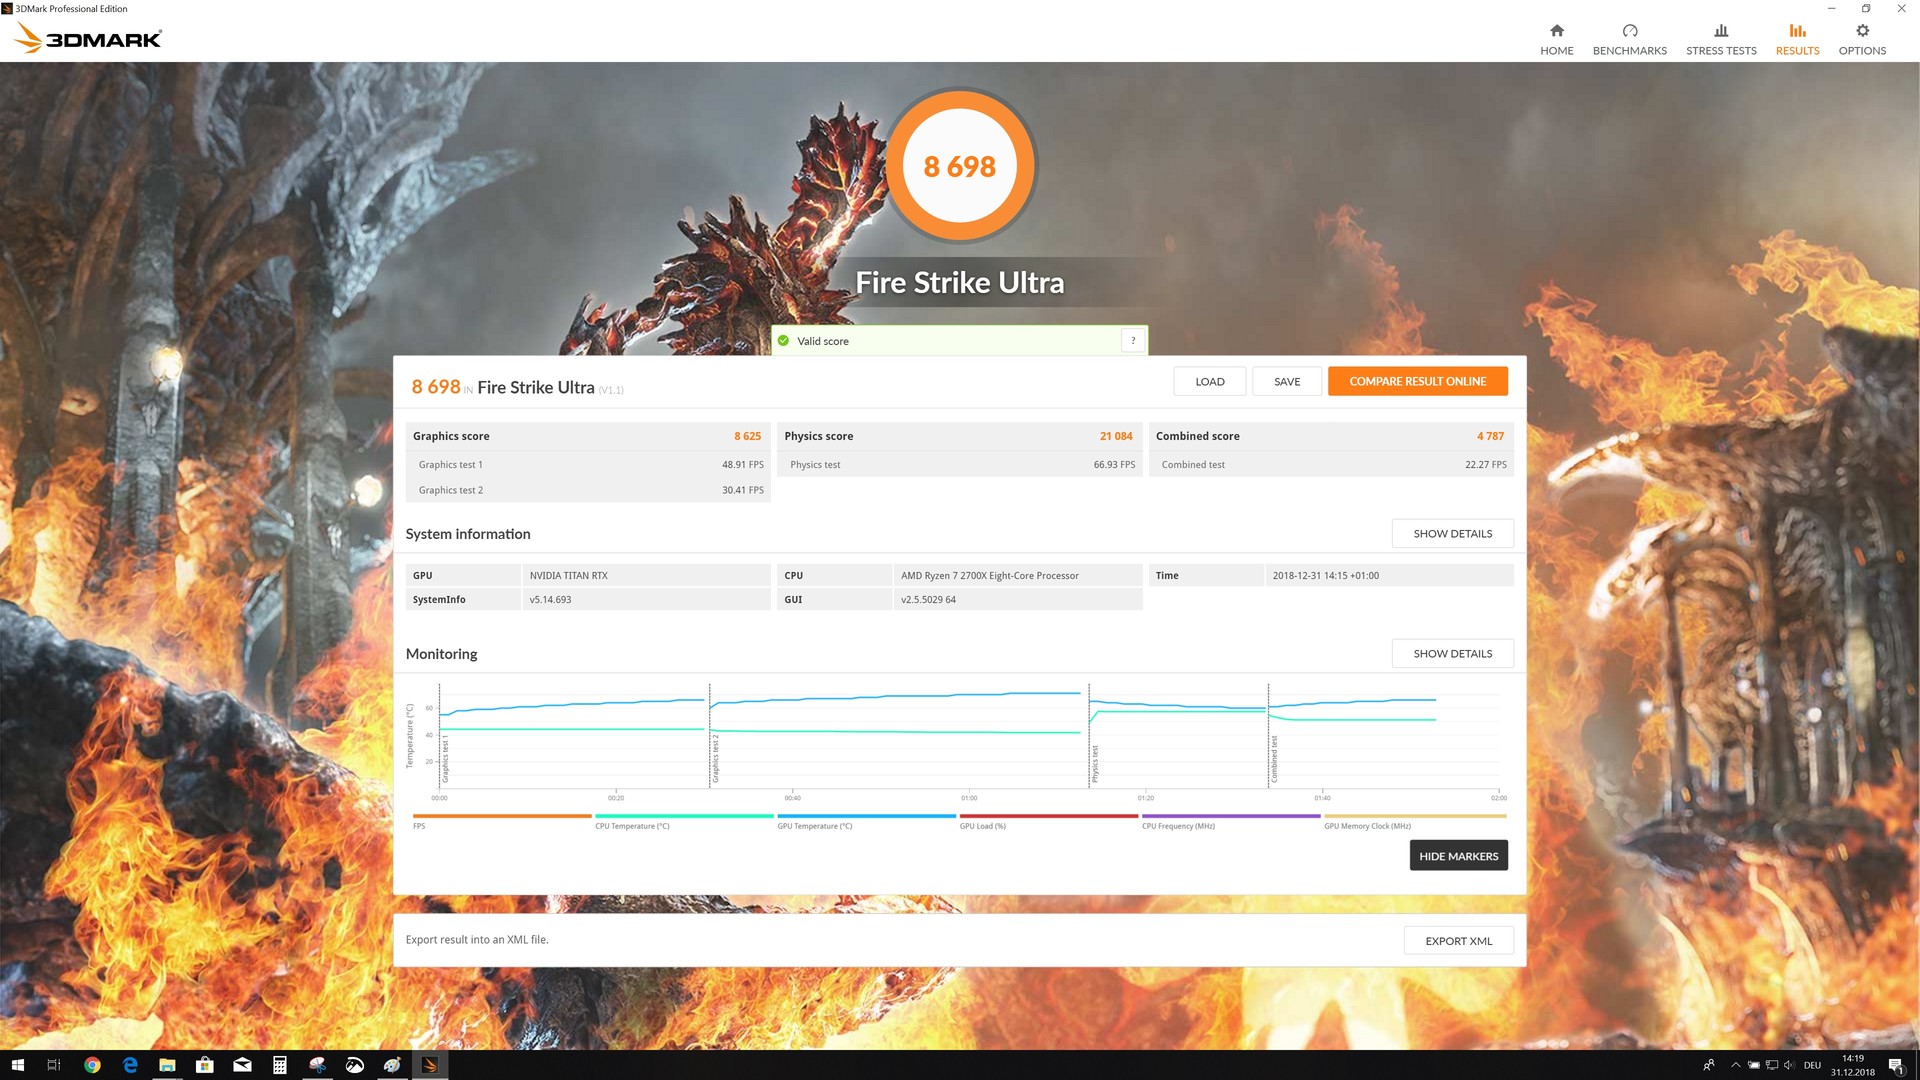
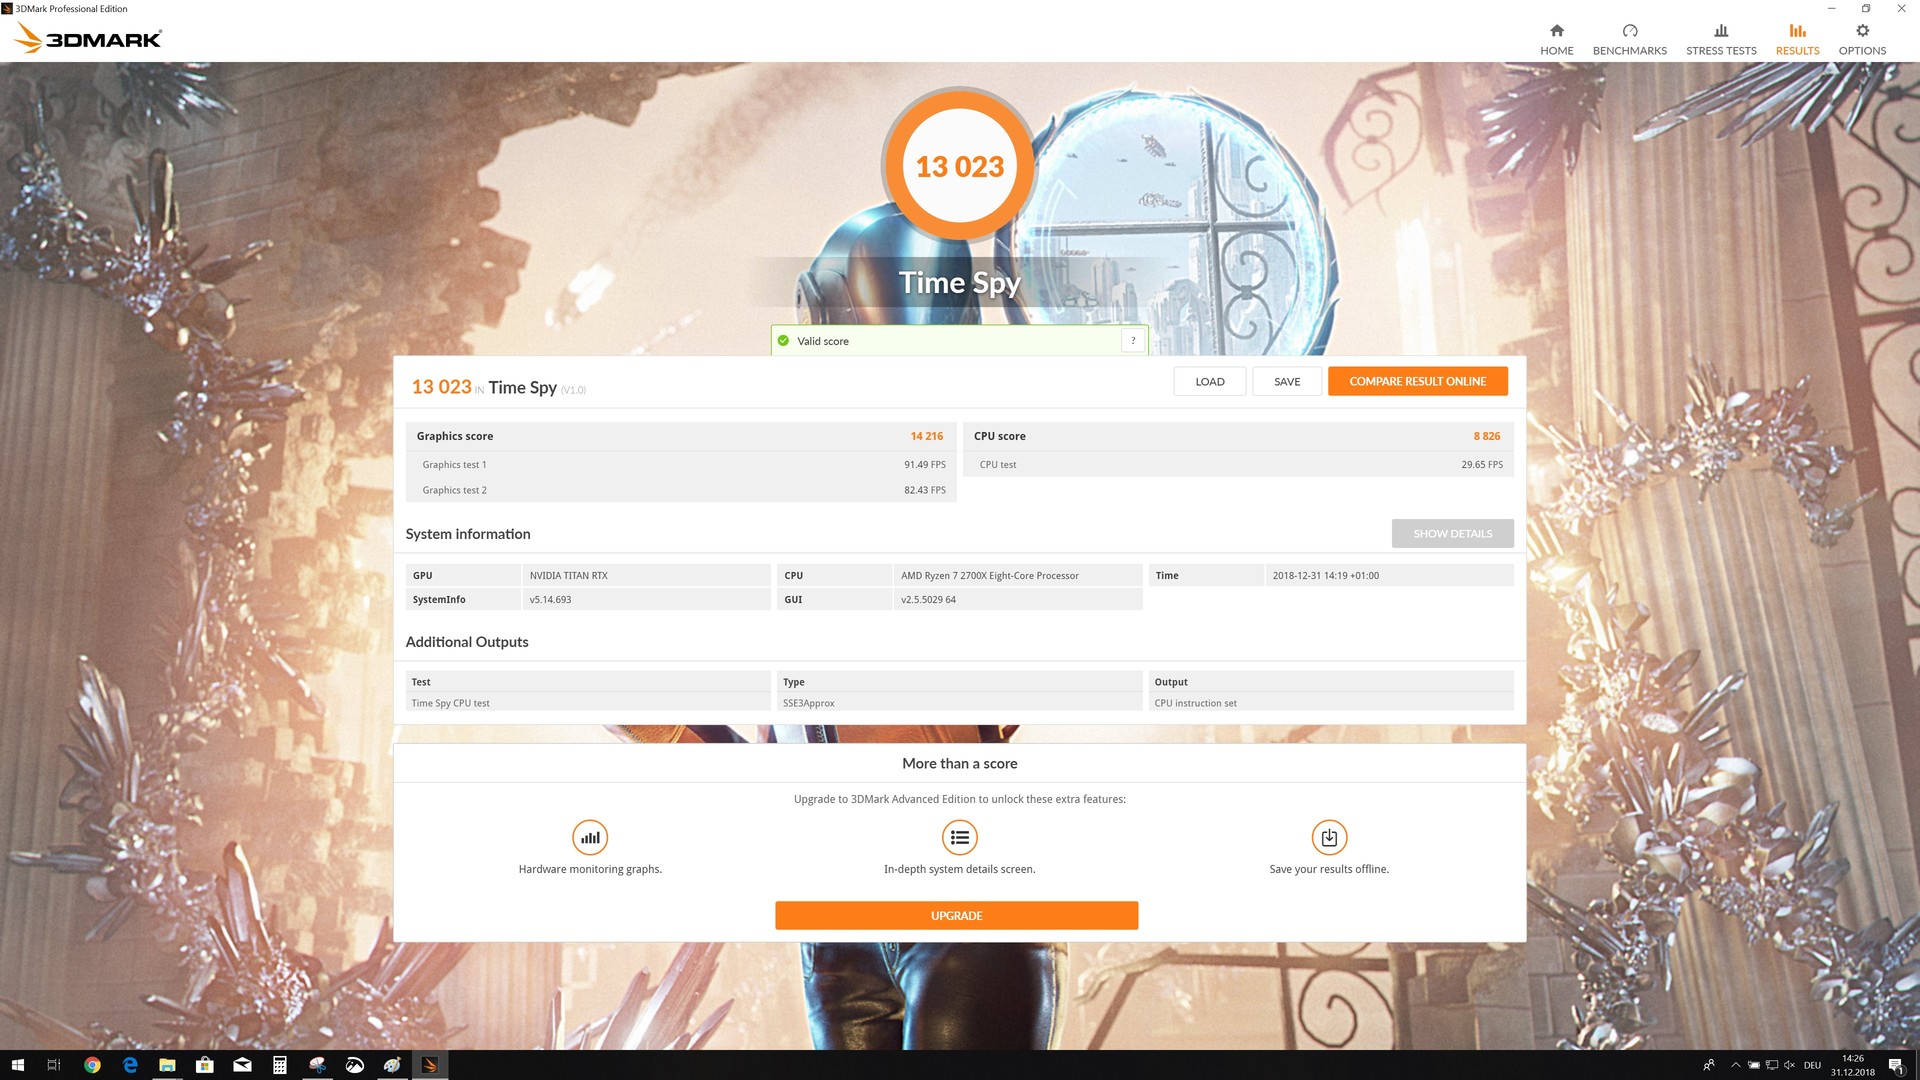
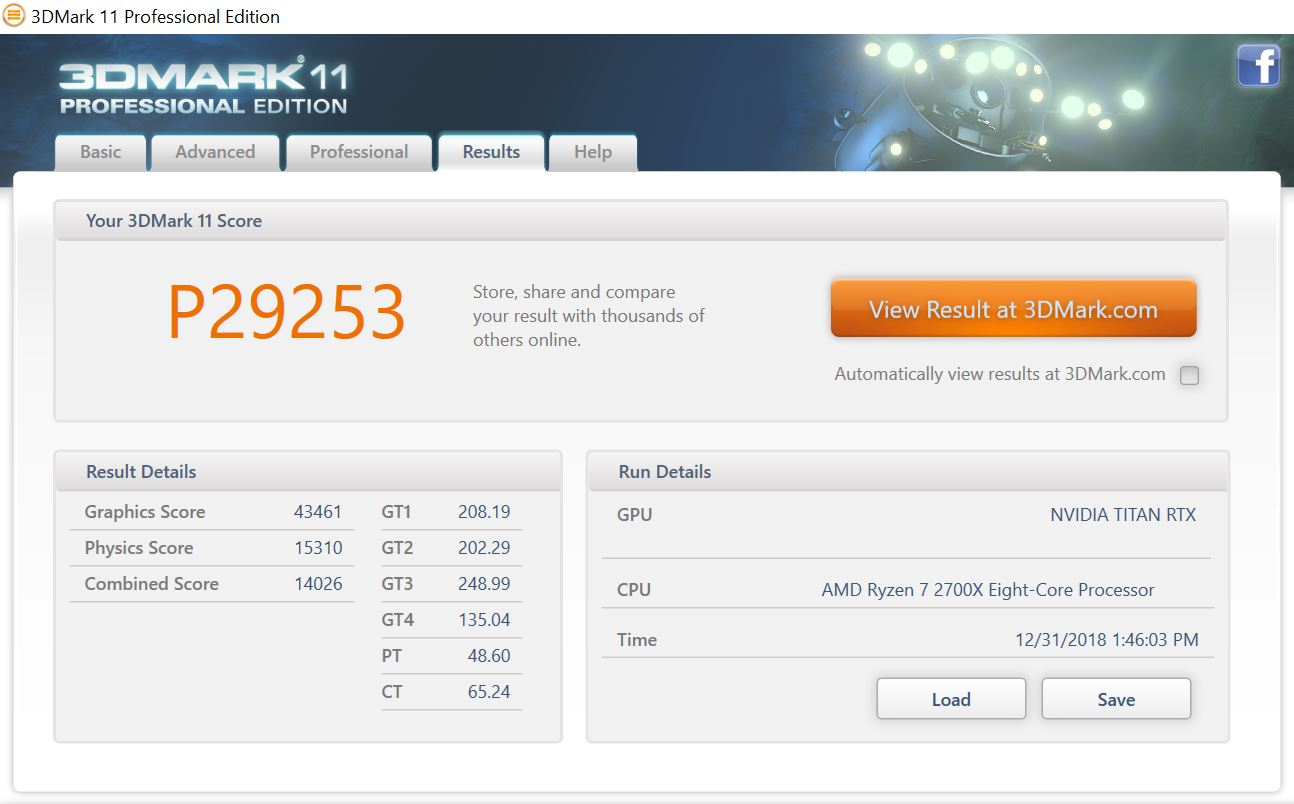
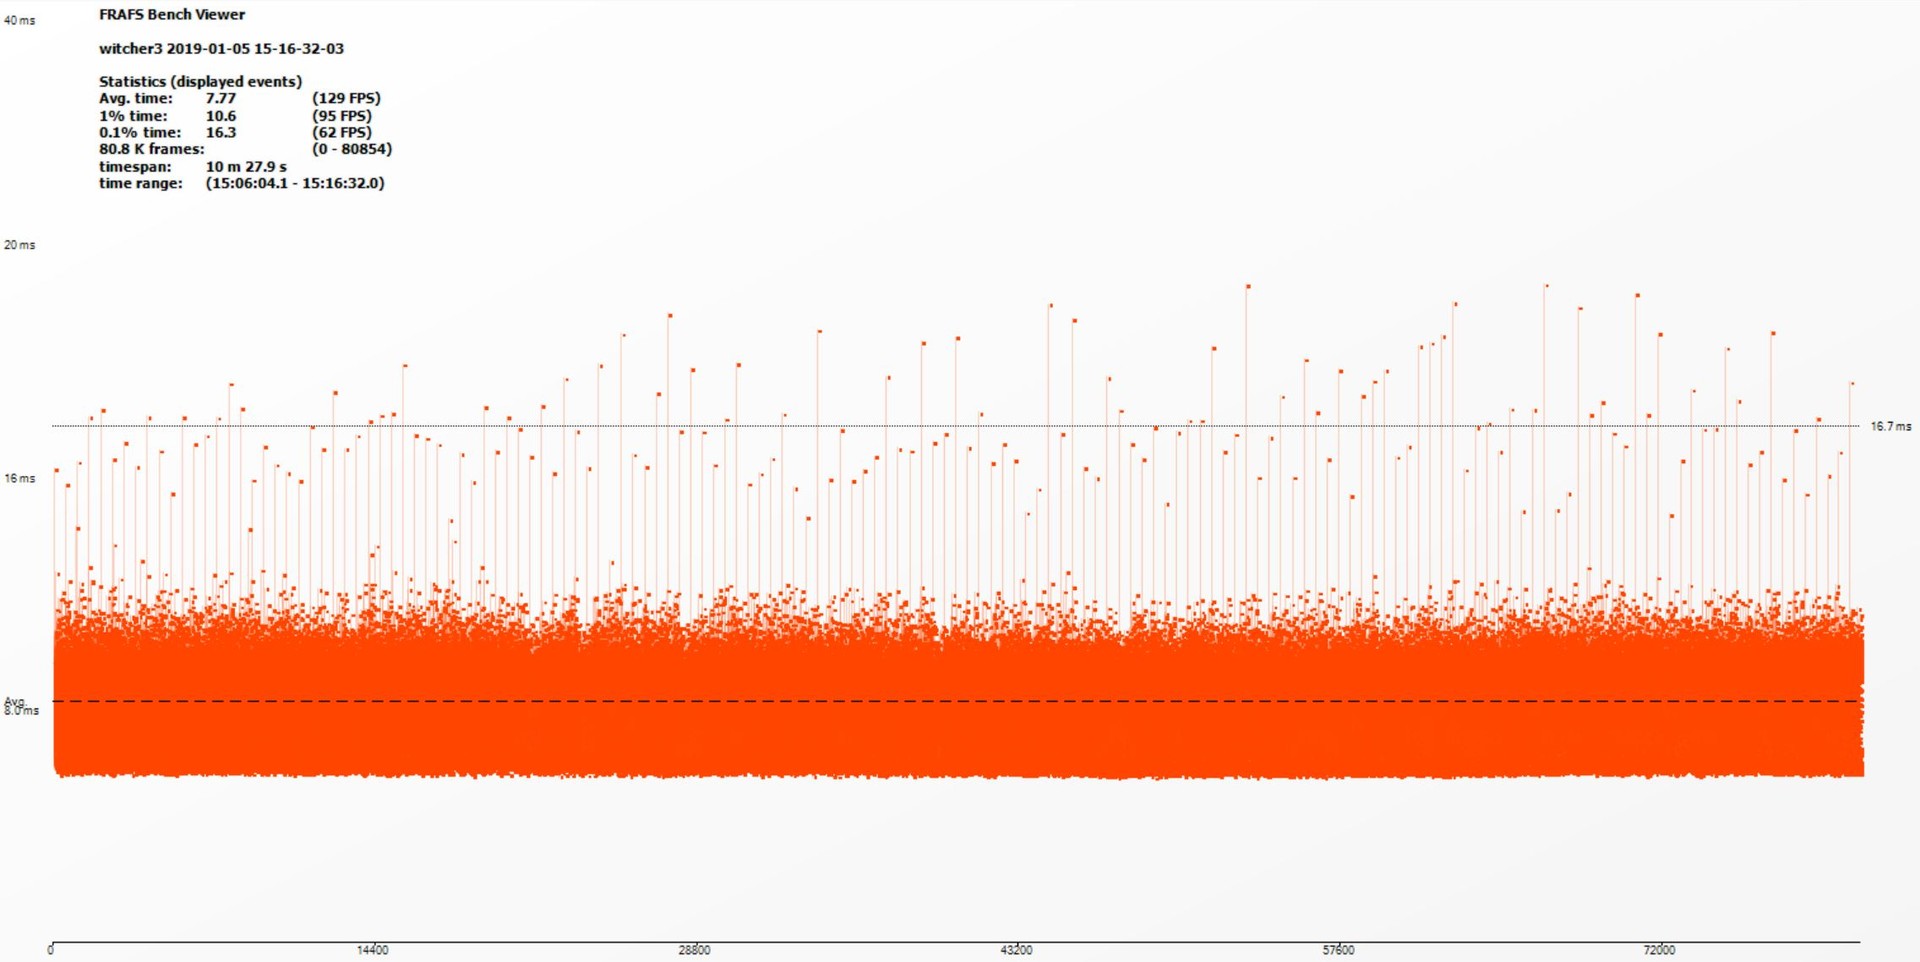
Notebookcheck Logo

NVIDIA TITAN RTX Desktop GPU Review

If money is no object NVIDIA announced the TITAN RTX in December last year, and now we have it in for review. Read on to find out how this monster of a Desktop GPU performs in our tests and whether it can set itself apart from NVIDIA’s other GPUs.

After the release of NVIDIA’s Turing architecture GeForce RTX GPUs last year, it became apparent that the company also planned to upgrade its TITAN series. NVIDIA officially unveiled the TITAN RTX in early December last year, and now we have it in for review to put it through its paces.

NVIDIA positions the TITAN RTX ahead of the GeForce RTX 2080 Ti Founders Edition, with an increased number of CUDA cores, texture units, tensor cores and RT cores. The TITAN RTX has the same base clock speed as the RTX 2080 Ti, but it has a 225 MHz higher boost clock speed coupled with an increased memory bus and a 66 GB/s higher memory bandwidth. Moreover, NVIDIA has equipped the TITAN RTX with 24 GB GDDR6 VRAM, which is more than double what the RTX 2080 Ti has. This extra performance also coincides with an additional 30-W power consumption that brings the TITAN RTX up to 280 W, which is almost 100 W higher than the RTX 2070 and 65 W more than the GTX 1080 Ti.

The TITAN RTX has the same radiator design as the RTX 2080 Ti FE, but NVIDIA has finished the former in gold compared to the silver that it has used on its GeForce RTX FE GPUs. Our test unit is exquisitely made with its gold TITAN RTX lettering standing out against its black middle panel. NVIDIA has redesigned the fans compared to those used in the TITAN X too. The company has replaced the single radial fan for two axial fans, with which it has also equipped its GeForce RTX GPUs. NVIDIA states that the two fans are more effective at cooling the TITAN RTX’s vapour chamber than is the single fan in the TITAN X, which should allow the card to run cooler and better maintain its performance when pushed hard.

The TITAN RTX uses two 8-pin power plugs and has numerous ports. NVIDIA has included three DisplayPort 1.4 ports, one HDMI 2.0b, and a USB Type-C port. You can also run two of these monsters together via NVIDIA’s NVLink  Bridge if you have around $5,000 to spend on GPUs.

NVIDIA TITAN RTX
NVIDIA TITAN RTX
NVIDIA TITAN RTX
NVIDIA TITAN RTX
NVIDIA TITAN RTX
NVIDIA TITAN RTX
NVIDIA TITAN RTX
NVIDIA TITAN RTX
NVIDIA TITAN RTX
NVIDIA TITAN RTX
NVIDIA TITAN RTX
NVIDIA TITAN RTX
NVIDIA TITAN RTX
NVIDIA TITAN RTX
NVIDIA TITAN RTX
NVIDIA TITAN RTX
NVIDIA TITAN RTX & the NVIDIA TITAN X (Pascal)

Comparing the TITAN RTX against other NVIDIA GPUs

Specifications TITAN RTX TITAN X Pascal RTX 2080 Ti RTX 2080 RTX 2070 GTX 1080 Ti
Chip TU102 GP102 TU102 TU104 TU106 GP102
FinFET process 12 nm 16 nm 12 nm 12 nm 12 nm 16 nm
CUDA cores 4,608 3,584 4,352 2,944 2,304 3,584
Texture Units 288 224 272 184 144 224
Tensor Cores 576 - 544 368 288 -
RT Cores 72 - 68 46 36 -
GPU base clock 1,350 MHz 1,417 MHz 1,350 MHz 1,515 MHz 1,410 MHz 1,481 MHz
GPU oost clock 1,770 MHz 1,531 MHz 1,545 MHz 1,710 MHz 1,620 MHz 1,582 MHz
Memory Bus 384-bit 384-bit 352-bit 256-bit 256-bit 352-bit
Memory Bandwidth 672 GB/s 480.4 GB/s 616 GB/s 448 GB/s 448 GB/s 484.4 GB/s
Video memory 24 GB GDDR6 12 GB GDDR5X 11 GB GDDR6 8 GB GDDR6 8 GB GDDR6 11 GB GDDR5X
Power consumption 280 W 250 W 250 W 215 W 175 W 215 W

The Test System

We have based our test system on the GIGABYTE X470 Aorus Gaming 7 Wi-Fi motherboard that we have paired with an AMD Ryzen 7 2700X APU, which offers good CPU performance for the money. We also chose the Be Quiet Silent Loop 280 mm AIO for cooling and 16 GB of G-Skill DDR4-3400 RAM, while we installed Windows 10 Pro 64-bit on an ADATA SP900 M.2 SSD. We installed the games against which we will benchmark the TITAN RTX on a 2 TB Western Digital HDD and ran our test system on an Acer Predator XB321HK 4K monitor.

We would like to thank AMD for graciously providing us with our test system.

Unfortunately, we did not have the opportunity to also test the TITAN RTX on an Intel-based system at the time of our review. We should also mention that we chose the Ryzen 7 2700X over the Threadripper 2920X as the former delivered slightly better results when paired with the TITAN RTX than the latter. Please keep in mind that the CPU often bottlenecked our test system when playing games at 1080p and below. You should also expect a comparable Intel 9th generation Core-ix CPU to outperform its AMD counterparts thanks to the former’s higher instructions per cycle (IPC).

AMD Ryzen 7 2700X
GIGABYTE X470 Aorus Gaming 7 WiFi motherboard
G-Skill Sniper X DDR4 3,400 MHz
Case Corsair Carbide Air 540 ATX Cube
GPU NVIDIA TITAN RTX
CPU AMD Ryzen 7 2700X
CPU coolr Be Quiet Silent Loop 280 mm
RAM G-Skill Sniper X 16 GB DDR4 3,400 MHz
Motherboard GIGABYTE X470 Aorus Gaming 7 WiFi
Monitor Acer Predator XB321HK 4K
SSD ADATA SP900 M.2 SSD
HDD 2 TB Western Digital (for games)
OS Microsoft Windows 10 Professional 64-bit: Version 1809
Driver NVIDIA 417.35

Synthetic Benchmarks

We have mainly relied on 3DMark benchmarks for this section. The TITAN RTX and the Ryzen 7 2700X blow away our comparison test systems, with the Turing GPU finishing 35% ahead of the RTX 2080 and 25% ahead of the TITAN X in Fire Strike Ultra Graphics at 4K. Please keep in mind that we could not include an RTX 2080 Ti in our comparison tables at the time of writing, which may have given the TITAN RTX more of a run for its money than our other comparison GPUs.

Interestingly, the TITAN RTX lost its edge over other NVIDIA GPUs when we ran Cloud Gate at 1,280x720 and only scored 11% more than the RTX 2070. Hence, we would recommend gaming at beyond 1080p if you want to get the most from your TITAN RTX. Additionally, our test GPU completely outclassed the AMD Radeon RX Vega 64 in 3DMark, scoring 59% more in Fire Strike Ultra Graphics at 4K, despite being paired with the same Ryzen 7 2700X APU.

3DMark Ice Storm
3DMark Ice Storm Unlimited
3DMark Ice Storm Extreme
3DMark Cloud Gate
3DMark Sky Diver
3DMark Fire Strike
3DMark Fire Strike Extreme
3DMark Fire Strike Ultra
3DMark Fire Time Spy
3DMark 11
3DMark
1920x1080 Fire Strike Graphics
NVIDIA Titan RTX
AMD Ryzen 7 2700X
34780 Points
NVIDIA GeForce GTX 1080 Ti (Desktop)
Intel Core i9-7900X
27582 Points
NVIDIA Titan X Pascal
AMD Ryzen Threadripper 1950X
27349 Points
NVIDIA GeForce RTX 2080 (Desktop)
AMD Ryzen 7 2700X
27228 Points
NVIDIA GeForce RTX 2070 (Desktop)
AMD Ryzen 7 2700X
23373 Points
NVIDIA GeForce GTX 1080 (Desktop)
Intel Core i7-4790K
22555 Points
AMD Radeon RX Vega 64
AMD Ryzen 7 2700X
22338 Points
NVIDIA GeForce GTX 1080 (Desktop)
Intel Core i7-4790K
20268 Points
AMD Radeon RX 590 (Desktop)
AMD Ryzen 7 2700X
16746 Points
NVIDIA GeForce GTX 1070 (Desktop)
Intel Core i7-4790K
16685 Points
AMD Radeon RX 580 (Desktop)
AMD Ryzen 7 2700X
14161 Points
AMD Radeon RX 580 (Desktop)
AMD Ryzen 7 1800X
13692 Points
NVIDIA GeForce GTX 1060 (Desktop)
Intel Core i7-6700K
12984 Points
1280x720 Cloud Gate Standard Graphics
NVIDIA Titan RTX
AMD Ryzen 7 2700X
145389 Points
NVIDIA GeForce RTX 2080 (Desktop)
AMD Ryzen 7 2700X
143576 Points
NVIDIA GeForce RTX 2070 (Desktop)
AMD Ryzen 7 2700X
130614 Points
NVIDIA GeForce GTX 1080 (Desktop)
Intel Core i7-4790K
129042 Points
NVIDIA GeForce GTX 1080 (Desktop)
Intel Core i7-4790K
128611 Points
AMD Radeon RX Vega 64
AMD Ryzen 7 2700X
120426 Points
NVIDIA GeForce GTX 1070 (Desktop)
Intel Core i7-4790K
104764 Points
NVIDIA Titan X Pascal
AMD Ryzen Threadripper 1950X
102781 Points
AMD Radeon RX 590 (Desktop)
AMD Ryzen 7 2700X
87448 Points
AMD Radeon RX 580 (Desktop)
AMD Ryzen 7 1800X
87394 Points
NVIDIA GeForce GTX 1060 (Desktop)
Intel Core i7-6700K
80879 Points
AMD Radeon RX 580 (Desktop)
AMD Ryzen 7 2700X
77638 Points
3840x2160 Fire Strike Ultra Graphics
NVIDIA Titan RTX
AMD Ryzen 7 2700X
8625 Points
NVIDIA Titan X Pascal
AMD Ryzen Threadripper 1950X
6911 Points
NVIDIA GeForce RTX 2080 (Desktop)
AMD Ryzen 7 2700X
6379 Points
NVIDIA GeForce RTX 2070 (Desktop)
AMD Ryzen 7 2700X
5501 Points
AMD Radeon RX Vega 64
AMD Ryzen 7 2700X
5441 Points
NVIDIA GeForce GTX 1080 (Desktop)
Intel Core i7-4790K
4841 Points
NVIDIA GeForce GTX 1070 (Desktop)
Intel Core i7-4790K
4126 Points
AMD Radeon RX 590 (Desktop)
AMD Ryzen 7 2700X
3702 Points
AMD Radeon RX 580 (Desktop)
AMD Ryzen 7 2700X
3140 Points
AMD Radeon RX 580 (Desktop)
AMD Ryzen 7 1800X
2977 Points
NVIDIA GeForce GTX 1060 (Desktop)
Intel Core i7-6700K
2893 Points
3DMark 11 - 1280x720 Performance GPU
NVIDIA Titan RTX
AMD Ryzen 7 2700X
43461 Points
NVIDIA GeForce RTX 2080 (Desktop)
AMD Ryzen 7 2700X
39651 Points
NVIDIA GeForce GTX 1080 Ti (Desktop)
Intel Core i9-7900X
38335 Points
NVIDIA GeForce GTX 1080 (Desktop)
Intel Core i7-4790K
32126 Points
NVIDIA GeForce RTX 2070 (Desktop)
AMD Ryzen 7 2700X
31595 Points
NVIDIA GeForce GTX 1080 (Desktop)
Intel Core i7-4790K
29443 Points
AMD Radeon RX Vega 64
AMD Ryzen 7 2700X
29285 Points
NVIDIA Titan X Pascal
AMD Ryzen Threadripper 1950X
27632 Points
NVIDIA GeForce GTX 1070 (Desktop)
Intel Core i7-4790K
23990 Points
AMD Radeon RX 590 (Desktop)
AMD Ryzen 7 2700X
23202 Points
AMD Radeon RX 580 (Desktop)
AMD Ryzen 7 1800X
19961 Points
AMD Radeon RX 580 (Desktop)
AMD Ryzen 7 2700X
18587 Points
NVIDIA GeForce GTX 1060 (Desktop)
Intel Core i7-6700K
17401 Points
Unigine Heaven 4.0 - Extreme Preset DX11
NVIDIA Titan RTX
AMD Ryzen 7 2700X
207.2 fps
NVIDIA GeForce RTX 2080 (Desktop)
AMD Ryzen 7 2700X
175.8 fps
NVIDIA GeForce RTX 2070 (Desktop)
AMD Ryzen 7 2700X
148.1 fps
NVIDIA GeForce GTX 1080 (Desktop)
Intel Core i7-4790K
147.4 fps
NVIDIA GeForce GTX 1080 (Desktop)
Intel Core i7-4790K
137.7 fps
NVIDIA GeForce GTX 1070 (Desktop)
Intel Core i7-4790K
117 fps
NVIDIA GeForce GTX 1060 (Desktop)
Intel Core i7-6700K
82.7 fps
AMD Radeon RX 590 (Desktop)
AMD Ryzen 7 2700X
76.1 fps
AMD Radeon RX 580 (Desktop)
AMD Ryzen 7 1800X
73.7 fps
AMD Radeon RX 580 (Desktop)
AMD Ryzen 7 2700X
66.7 fps
Unigine Valley 1.0 - 1920x1080 Extreme HD DirectX AA:x8
NVIDIA Titan RTX
AMD Ryzen 7 2700X
135 fps
NVIDIA GeForce RTX 2080 (Desktop)
AMD Ryzen 7 2700X
123.3 fps
NVIDIA GeForce RTX 2070 (Desktop)
AMD Ryzen 7 2700X
113.1 fps
NVIDIA GeForce GTX 1080 (Desktop)
Intel Core i7-4790K
109.8 (43min - 218max) fps
NVIDIA GeForce GTX 1080 (Desktop)
Intel Core i7-4790K
106.9 fps
NVIDIA GeForce GTX 1070 (Desktop)
Intel Core i7-4790K
92.6 fps
AMD Radeon RX 580 (Desktop)
AMD Ryzen 7 1800X
58.1 fps
AMD Radeon RX 590 (Desktop)
AMD Ryzen 7 2700X
57.3 fps
AMD Radeon RX 580 (Desktop)
AMD Ryzen 7 2700X
53.8 fps

Game Benchmarks

FPS while playing The Witcher 3 on Ultra

While NVIDIA does not explicitly market the TITAN RTX as a gaming GPU on account of its exorbitant cost, it delivers class-leading gaming performance, nonetheless. The TITAN RTX handled all games that we threw at it with ease and is powerful enough to play even the most complex triple-A titles in 4K at high graphics. A few games such as "Kingdom Come: Deliverance" and "Assassin’s Creed Odyssey" averaged less than 60 FPS at these settings, but only marginally so.

The TITAN RTX generally finished around 30% ahead of the GeForce RTX 2080 in our gaming tests, with the Radeon RX Vega 64 even further in the TITAN RTX’s wake. We expect that the GeForce RTX 2080 Ti would typically finish a close second to the TITAN RTX, although it may eclipse in some games thanks to its higher clock speeds.

We also subjected the TITAN RTX to a 10 minute "The Witcher 3" test that we ran on ultra graphics. Predictably, the GPU handled the game without any issues and averaged 129 FPS, with framerates dropping to a minimum of 124 FPS.

Overall, the TITAN RTX delivers exceptional performance in games, although it remains to be seen how much of an effect its Raytracing and DLSS support will have compared to other GPUs although its influence on the performance of the games in the future remains to be seen. Currently few games support these technologies, and the jury is out on their effectiveness in games that do. "Battlefield V" is one such game that supports Raytracing and DLSS and while the TITAN RTX can handle the game in 4K with DXR set to high, dropping the resolution to 1440p resulted in a smoother gaming experience. Ultimately, the visual improvements come at a huge cost in performance right now, which we have also experienced in "Shadow of the Tomb Raider".

FPS while playing The Witcher 3 on Ultra

05101520253035404550556065707580859095100105110115120125130Tooltip
Nvidia Titan RTX NVIDIA Titan RTX, R7 2700X, ADATA Premier Pro SP900NS38 512 GB: Ø128.8 (124-132)
Just Cause 4
3840x2160 Very High / On AA:SM AF:16x
NVIDIA Titan RTX
NVIDIA Titan RTX, R7 2700X, ADATA Premier Pro SP900NS38 512 GB
67 (63min - 72max) fps
NVIDIA Titan X Pascal
Titan X Pascal, TR 1950X, Samsung SM951 MZHPV512HDGL m.2 PCI-e
48.1 (44min - 51max) fps
AMD Radeon RX Vega 64
RX Vega 64, R7 2700X
36.4 (33min - 41max) fps
AMD Radeon RX 590 (Desktop)
Radeon RX 590, R7 2700X
25.8 (23min - 28max) fps
1920x1080 Very High / On AA:SM AF:16x
NVIDIA Titan RTX
NVIDIA Titan RTX, R7 2700X, ADATA Premier Pro SP900NS38 512 GB
151 (144min - 159max) fps
NVIDIA Titan X Pascal
Titan X Pascal, TR 1950X, Samsung SM951 MZHPV512HDGL m.2 PCI-e
105.7 (97min - 114max) fps
AMD Radeon RX Vega 64
RX Vega 64, R7 2700X
92.3 (85min - 101max) fps
AMD Radeon RX 590 (Desktop)
Radeon RX 590, R7 2700X
69.4 (63min - 74max) fps
Battlefield V
3840x2160 Ultra Preset
NVIDIA Titan RTX
NVIDIA Titan RTX, R7 2700X, ADATA Premier Pro SP900NS38 512 GB
97.3 (62min - 147max) fps
NVIDIA Titan X Pascal
Titan X Pascal, TR 1950X, Samsung SM951 MZHPV512HDGL m.2 PCI-e
71.2 (57min - 104max) fps
AMD Radeon RX Vega 64
RX Vega 64, R7 2700X
60.3 (49min - 98max) fps
AMD Radeon RX 590 (Desktop)
Radeon RX 590, R7 2700X
39.6 (32min - 66max) fps
1920x1080 Ultra Preset
NVIDIA Titan RTX
NVIDIA Titan RTX, R7 2700X, ADATA Premier Pro SP900NS38 512 GB
160.4 (129min - 168max) fps
AMD Radeon RX Vega 64
RX Vega 64, R7 2700X
138.7 (112min - 194max) fps
NVIDIA Titan X Pascal
Titan X Pascal, TR 1950X, Samsung SM951 MZHPV512HDGL m.2 PCI-e
137 (111min - 170max) fps
AMD Radeon RX 590 (Desktop)
Radeon RX 590, R7 2700X
99.6 (78min - 154max) fps
Call of Duty Black Ops 4
1920x1080 Very High / On
NVIDIA Titan RTX
NVIDIA Titan RTX, R7 2700X, ADATA Premier Pro SP900NS38 512 GB
200 (159min - 238max) fps
NVIDIA GeForce RTX 2080 (Desktop)
GeForce RTX 2080 (Desktop), R7 2700X
175 (130min - 216max) fps
AMD Radeon RX Vega 64
RX Vega 64, R7 2700X
166.2 (125min - 210max) fps
NVIDIA Titan X Pascal
Titan X Pascal, TR 1950X, Samsung SM951 MZHPV512HDGL m.2 PCI-e
160.9 (120min - 196max) fps
NVIDIA GeForce RTX 2070 (Desktop)
GeForce RTX 2070 (Desktop), R7 2700X
149 (117min - 184max) fps
AMD Radeon RX 590 (Desktop)
Radeon RX 590, R7 2700X
115.3 (86min - 143max) fps
3840x2160 Very High / On
NVIDIA Titan RTX
NVIDIA Titan RTX, R7 2700X, ADATA Premier Pro SP900NS38 512 GB
88 (66min - 109max) fps
NVIDIA GeForce RTX 2080 (Desktop)
GeForce RTX 2080 (Desktop), R7 2700X
68 (52min - 86max) fps
NVIDIA Titan X Pascal
Titan X Pascal, TR 1950X, Samsung SM951 MZHPV512HDGL m.2 PCI-e
62.6 (44min - 79max) fps
AMD Radeon RX Vega 64
RX Vega 64, R7 2700X
58.8 (43min - 78max) fps
NVIDIA GeForce RTX 2070 (Desktop)
GeForce RTX 2070 (Desktop), R7 2700X
53 (39min - 69max) fps
AMD Radeon RX 590 (Desktop)
Radeon RX 590, R7 2700X
39 (33min - 47max) fps
Assassin´s Creed Odyssey
1920x1080 Ultra High Preset
NVIDIA Titan RTX
NVIDIA Titan RTX, R7 2700X, ADATA Premier Pro SP900NS38 512 GB
79 fps
NVIDIA GeForce RTX 2080 (Desktop)
GeForce RTX 2080 (Desktop), R7 2700X
68 (31min - 121max) fps
NVIDIA Titan X Pascal
Titan X Pascal, TR 1950X, Samsung SM951 MZHPV512HDGL m.2 PCI-e
67 (30min - 125max) fps
NVIDIA GeForce RTX 2070 (Desktop)
GeForce RTX 2070 (Desktop), R7 2700X
61 fps
AMD Radeon RX Vega 64
RX Vega 64, R7 2700X
50 (25min - 75max) fps
AMD Radeon RX 590 (Desktop)
Radeon RX 590, R7 2700X
39 (23min - 60max) fps
AMD Radeon RX 580 (Desktop)
Radeon RX 580, R7 2700X
33 (23min - 79max) fps
3840x2160 Ultra High Preset
NVIDIA Titan RTX
NVIDIA Titan RTX, R7 2700X, ADATA Premier Pro SP900NS38 512 GB
52 fps
NVIDIA GeForce RTX 2080 (Desktop)
GeForce RTX 2080 (Desktop), R7 2700X
40 (19min - 86max) fps
NVIDIA Titan X Pascal
Titan X Pascal, TR 1950X, Samsung SM951 MZHPV512HDGL m.2 PCI-e
38 (24min - 67max) fps
NVIDIA GeForce RTX 2070 (Desktop)
GeForce RTX 2070 (Desktop), R7 2700X
36 fps
AMD Radeon RX Vega 64
RX Vega 64, R7 2700X
29 (5min - 64max) fps
AMD Radeon RX 590 (Desktop)
Radeon RX 590, R7 2700X
19 (16min - 26max) fps
AMD Radeon RX 580 (Desktop)
Radeon RX 580, R7 2700X
17 (14min - 24max) fps
FIFA 19
1920x1080 Ultra Preset AA:4x MS
AMD Radeon RX Vega 64
RX Vega 64, R7 2700X
287.8 (267min - 331max) fps
AMD Radeon RX 580 (Desktop)
Radeon RX 580, R7 2700X
252.5 (234min - 279max) fps
NVIDIA Titan RTX
NVIDIA Titan RTX, R7 2700X, ADATA Premier Pro SP900NS38 512 GB
251 (233min - 258max) fps
AMD Radeon RX 590 (Desktop)
Radeon RX 590, R7 2700X
243.6 (223min - 252max) fps
NVIDIA GeForce RTX 2080 (Desktop)
GeForce RTX 2080 (Desktop), R7 2700X
232.9 (223min - 249max) fps
NVIDIA Titan X Pascal
Titan X Pascal, TR 1950X, Samsung SM951 MZHPV512HDGL m.2 PCI-e
221 (8min, 235P1 - 200max) fps
NVIDIA GeForce RTX 2070 (Desktop)
GeForce RTX 2070 (Desktop), R7 2700X
219 (207min - 244max) fps
3840x2160 Ultra Preset AA:4x MS
NVIDIA Titan RTX
NVIDIA Titan RTX, R7 2700X, ADATA Premier Pro SP900NS38 512 GB
213 (203min - 231max) fps
NVIDIA GeForce RTX 2080 (Desktop)
GeForce RTX 2080 (Desktop), R7 2700X
212.4 (196min - 218max) fps
NVIDIA Titan X Pascal
Titan X Pascal, TR 1950X, Samsung SM951 MZHPV512HDGL m.2 PCI-e
206.7 (186min - 226max) fps
NVIDIA GeForce RTX 2070 (Desktop)
GeForce RTX 2070 (Desktop), R7 2700X
203 (187min - 226max) fps
AMD Radeon RX Vega 64
RX Vega 64, R7 2700X
161.4 (148min - 181max) fps
AMD Radeon RX 580 (Desktop)
Radeon RX 580, R7 2700X
97.6 (82min - 112max) fps
AMD Radeon RX 590 (Desktop)
Radeon RX 590, R7 2700X
95.6 (83min - 101max) fps
Forza Horizon 4
1920x1080 Ultra Preset AA:2xMS
NVIDIA Titan RTX
NVIDIA Titan RTX, R7 2700X, ADATA Premier Pro SP900NS38 512 GB
132 fps
NVIDIA GeForce RTX 2080 (Desktop)
GeForce RTX 2080 (Desktop), R7 2700X
125 fps
AMD Radeon RX Vega 64
RX Vega 64, R7 2700X
121 fps
NVIDIA Titan X Pascal
Titan X Pascal, TR 1950X, Samsung SM951 MZHPV512HDGL m.2 PCI-e
112 fps
NVIDIA GeForce RTX 2070 (Desktop)
GeForce RTX 2070 (Desktop), R7 2700X
107 fps
AMD Radeon RX 590 (Desktop)
Radeon RX 590, R7 2700X
91 fps
AMD Radeon RX 580 (Desktop)
Radeon RX 580, R7 2700X
78 fps
3840x2160 Ultra Preset AA:2xMS
NVIDIA Titan RTX
NVIDIA Titan RTX, R7 2700X, ADATA Premier Pro SP900NS38 512 GB
90 fps
NVIDIA GeForce RTX 2080 (Desktop)
GeForce RTX 2080 (Desktop), R7 2700X
77 fps
NVIDIA Titan X Pascal
Titan X Pascal, TR 1950X, Samsung SM951 MZHPV512HDGL m.2 PCI-e
73 fps
AMD Radeon RX Vega 64
RX Vega 64, R7 2700X
62 fps
NVIDIA GeForce RTX 2070 (Desktop)
GeForce RTX 2070 (Desktop), R7 2700X
60 fps
AMD Radeon RX 590 (Desktop)
Radeon RX 590, R7 2700X
46 fps
AMD Radeon RX 580 (Desktop)
Radeon RX 580, R7 2700X
39 fps
F1 2018
1920x1080 Ultra High Preset AA:T AF:16x
NVIDIA Titan RTX
NVIDIA Titan RTX, R7 2700X, ADATA Premier Pro SP900NS38 512 GB
143 (117min - 164max) fps
NVIDIA GeForce RTX 2080 (Desktop)
GeForce RTX 2080 (Desktop), R7 2700X
141 (117min - 160max) fps
NVIDIA GeForce RTX 2070 (Desktop)
GeForce RTX 2070 (Desktop), R7 2700X
121 (107min - 139max) fps
NVIDIA Titan X Pascal
Titan X Pascal, TR 1950X, Samsung SM951 MZHPV512HDGL m.2 PCI-e
117 (87min - 141max) fps
AMD Radeon RX Vega 64
RX Vega 64, R7 2700X
86 (68min - 108max) fps
AMD Radeon RX 590 (Desktop)
Radeon RX 590, R7 2700X
84 (64min - 100max) fps
AMD Radeon RX 580 (Desktop)
Radeon RX 580, R7 2700X
73 (62min - 88max) fps
3840x2160 Ultra High Preset AA:T AF:16x
NVIDIA Titan RTX
NVIDIA Titan RTX, R7 2700X, ADATA Premier Pro SP900NS38 512 GB
99 (89min - 109max) fps
NVIDIA GeForce RTX 2080 (Desktop)
GeForce RTX 2080 (Desktop), R7 2700X
77 (53min - 85max) fps
NVIDIA Titan X Pascal
Titan X Pascal, TR 1950X, Samsung SM951 MZHPV512HDGL m.2 PCI-e
74 (63min - 83max) fps
NVIDIA GeForce RTX 2070 (Desktop)
GeForce RTX 2070 (Desktop), R7 2700X
62 (34min - 70max) fps
AMD Radeon RX Vega 64
RX Vega 64, R7 2700X
49 (42min - 55max) fps
AMD Radeon RX 590 (Desktop)
Radeon RX 590, R7 2700X
39 (34min - 45max) fps
Monster Hunter World
1920x1080 Highest Preset (Image Quality High)
NVIDIA Titan RTX
NVIDIA Titan RTX, R7 2700X, ADATA Premier Pro SP900NS38 512 GB
136 (95min - 157max) fps
NVIDIA GeForce RTX 2080 (Desktop)
GeForce RTX 2080 (Desktop), R7 2700X
116.5 (89min - 145max) fps
NVIDIA Titan X Pascal
Titan X Pascal, TR 1950X, Samsung SM951 MZHPV512HDGL m.2 PCI-e
104.4 (84min - 128max) fps
NVIDIA GeForce RTX 2070 (Desktop)
GeForce RTX 2070 (Desktop), R7 2700X
97.6 (74min - 116max) fps
AMD Radeon RX Vega 64
RX Vega 64, R7 2700X
85.2 (61min - 109max) fps
AMD Radeon RX 590 (Desktop)
Radeon RX 590, R7 2700X
57.8 (48min - 69max) fps
AMD Radeon RX 580 (Desktop)
Radeon RX 580, R7 2700X
49.6 (41min - 58max) fps
3840x2160 Highest Preset (Image Quality High)
NVIDIA Titan RTX
NVIDIA Titan RTX, R7 2700X, ADATA Premier Pro SP900NS38 512 GB
54 (46min - 64max) fps
NVIDIA GeForce RTX 2080 (Desktop)
GeForce RTX 2080 (Desktop), R7 2700X
38.2 (33min - 43max) fps
NVIDIA Titan X Pascal
Titan X Pascal, TR 1950X, Samsung SM951 MZHPV512HDGL m.2 PCI-e
35.4 (32min - 44max) fps
NVIDIA GeForce RTX 2070 (Desktop)
GeForce RTX 2070 (Desktop), R7 2700X
31.2 (27min - 37max) fps
AMD Radeon RX Vega 64
RX Vega 64, R7 2700X
28.9 (26min - 34max) fps
AMD Radeon RX 590 (Desktop)
Radeon RX 590, R7 2700X
17.9 (16min - 21max) fps
AMD Radeon RX 580 (Desktop)
Radeon RX 580, R7 2700X
15.9 (14min - 19max) fps
Far Cry 5
1920x1080 Ultra Preset AA:T
NVIDIA GeForce RTX 2070 (Desktop)
GeForce RTX 2070 (Desktop), R7 2700X
105 (83min - 140max) fps
NVIDIA GeForce RTX 2080 (Desktop)
GeForce RTX 2080 (Desktop), R7 2700X
105 (81min - 140max) fps
NVIDIA Titan RTX
NVIDIA Titan RTX, R7 2700X, ADATA Premier Pro SP900NS38 512 GB
103 (77min - 137max) fps
AMD Radeon RX Vega 64
RX Vega 64, R7 2700X
99 (78min - 124max) fps
NVIDIA Titan X Pascal
Titan X Pascal, TR 1950X, Samsung SM951 MZHPV512HDGL m.2 PCI-e
80 (64min - 107max) fps
AMD Radeon RX 590 (Desktop)
Radeon RX 590, R7 2700X
74 (67min - 88max) fps
AMD Radeon RX 580 (Desktop)
Radeon RX 580, R7 2700X
68 (60min - 81max) fps
3840x2160 Ultra Preset AA:T
NVIDIA Titan RTX
NVIDIA Titan RTX, R7 2700X, ADATA Premier Pro SP900NS38 512 GB
75 (61min - 89max) fps
NVIDIA GeForce RTX 2080 (Desktop)
GeForce RTX 2080 (Desktop), R7 2700X
58 (52min - 69max) fps
NVIDIA Titan X Pascal
Titan X Pascal, TR 1950X, Samsung SM951 MZHPV512HDGL m.2 PCI-e
53 (46min - 64max) fps
NVIDIA GeForce RTX 2070 (Desktop)
GeForce RTX 2070 (Desktop), R7 2700X
49 (43min - 58max) fps
AMD Radeon RX Vega 64
RX Vega 64, R7 2700X
44 (37min - 56max) fps
AMD Radeon RX 580 (Desktop)
Radeon RX 580, R7 2700X
26 (22min - 33max) fps
AMD Radeon RX 590 (Desktop)
Radeon RX 590, R7 2700X
24 (21min - 29max) fps
The Crew 2
1920x1080 Ultra Preset
NVIDIA Titan X Pascal
Titan X Pascal, TR 1950X, Samsung SM951 MZHPV512HDGL m.2 PCI-e
60 fps
AMD Radeon RX 580 (Desktop)
Radeon RX 580, R7 2700X
60 fps
NVIDIA GeForce RTX 2070 (Desktop)
GeForce RTX 2070 (Desktop), R7 2700X
60 fps
NVIDIA GeForce RTX 2080 (Desktop)
GeForce RTX 2080 (Desktop), R7 2700X
60 fps
AMD Radeon RX 590 (Desktop)
Radeon RX 590, R7 2700X
60 fps
NVIDIA Titan RTX
NVIDIA Titan RTX, R7 2700X, ADATA Premier Pro SP900NS38 512 GB
60 fps
3840x2160 Ultra Preset
NVIDIA GeForce RTX 2080 (Desktop)
GeForce RTX 2080 (Desktop), R7 2700X
60 fps
NVIDIA Titan RTX
NVIDIA Titan RTX, R7 2700X, ADATA Premier Pro SP900NS38 512 GB
60 fps
NVIDIA GeForce RTX 2070 (Desktop)
GeForce RTX 2070 (Desktop), R7 2700X
56 fps
NVIDIA Titan X Pascal
Titan X Pascal, TR 1950X, Samsung SM951 MZHPV512HDGL m.2 PCI-e
49.7 (44min - 58max) fps
AMD Radeon RX 580 (Desktop)
Radeon RX 580, R7 2700X
28 fps
AMD Radeon RX 590 (Desktop)
Radeon RX 590, R7 2700X
26.8 fps
Assassin´s Creed Origins
1920x1080 Ultra High Preset
NVIDIA GeForce RTX 2080 (Desktop)
GeForce RTX 2080 (Desktop), R7 2700X
87 fps
NVIDIA Titan RTX
NVIDIA Titan RTX, R7 2700X, ADATA Premier Pro SP900NS38 512 GB
87 fps
NVIDIA GeForce RTX 2070 (Desktop)
GeForce RTX 2070 (Desktop), R7 2700X
83 fps
AMD Radeon RX Vega 64
RX Vega 64, R7 2700X
63 fps
AMD Radeon RX 590 (Desktop)
Radeon RX 590, R7 2700X
53 fps
AMD Radeon RX 580 (Desktop)
Radeon RX 580, R7 1800X
47 fps
AMD Radeon RX 580 (Desktop)
Radeon RX 580, R7 2700X
45 fps
3840x2160 Ultra High Preset
NVIDIA Titan RTX
NVIDIA Titan RTX, R7 2700X, ADATA Premier Pro SP900NS38 512 GB
65 fps
NVIDIA GeForce RTX 2080 (Desktop)
GeForce RTX 2080 (Desktop), R7 2700X
51 fps
NVIDIA GeForce RTX 2070 (Desktop)
GeForce RTX 2070 (Desktop), R7 2700X
46 fps
AMD Radeon RX Vega 64
RX Vega 64, R7 2700X
33 fps
AMD Radeon RX 590 (Desktop)
Radeon RX 590, R7 2700X
25 fps
AMD Radeon RX 580 (Desktop)
Radeon RX 580, R7 1800X
23 fps
AMD Radeon RX 580 (Desktop)
Radeon RX 580, R7 2700X
21 fps
Kingdom Come: Deliverance
1920x1080 Ultra High Preset
NVIDIA GeForce RTX 2080 (Desktop)
GeForce RTX 2080 (Desktop), R7 2700X
83.3 (58min - 103max) fps
NVIDIA GeForce RTX 2070 (Desktop)
GeForce RTX 2070 (Desktop), R7 2700X
79.8 (61min - 100max) fps
NVIDIA Titan RTX
NVIDIA Titan RTX, R7 2700X, ADATA Premier Pro SP900NS38 512 GB
79 (61min - 108max) fps
AMD Radeon RX Vega 64
RX Vega 64, R7 2700X
72.9 (55min - 90max) fps
AMD Radeon RX 590 (Desktop)
Radeon RX 590, R7 2700X
54.6 (43min - 65max) fps
AMD Radeon RX 580 (Desktop)
Radeon RX 580, R7 2700X
49.6 (39min - 58max) fps
AMD Radeon RX 580 (Desktop)
Radeon RX 580, R7 1800X
49.3 (37min - 59max) fps
3840x2160 Ultra High Preset
NVIDIA Titan RTX
NVIDIA Titan RTX, R7 2700X, ADATA Premier Pro SP900NS38 512 GB
49 (41min - 56max) fps
NVIDIA GeForce RTX 2080 (Desktop)
GeForce RTX 2080 (Desktop), R7 2700X
38.5 (32min - 44max) fps
AMD Radeon RX Vega 64
RX Vega 64, R7 2700X
36.5 (31min - 40max) fps
NVIDIA GeForce RTX 2070 (Desktop)
GeForce RTX 2070 (Desktop), R7 2700X
31 (26min - 35max) fps
AMD Radeon RX 590 (Desktop)
Radeon RX 590, R7 2700X
17 (13min - 20max) fps
AMD Radeon RX 580 (Desktop)
Radeon RX 580, R7 1800X
15.8 (13min - 19max) fps
AMD Radeon RX 580 (Desktop)
Radeon RX 580, R7 2700X
15.8 (13min - 18max) fps
Fortnite
1920x1080 Epic Preset
NVIDIA GeForce RTX 2080 (Desktop)
GeForce RTX 2080 (Desktop), R7 2700X
165.3 fps
NVIDIA GeForce RTX 2070 (Desktop)
GeForce RTX 2070 (Desktop), R7 2700X
155.9 (129min - 182max) fps
NVIDIA Titan RTX
NVIDIA Titan RTX, R7 2700X, ADATA Premier Pro SP900NS38 512 GB
134 (100min - 197max) fps
AMD Radeon RX 590 (Desktop)
Radeon RX 590, R7 2700X
95.8 (83min - 106max) fps
AMD Radeon RX 580 (Desktop)
Radeon RX 580, R7 2700X
80.7 fps
AMD Radeon RX 580 (Desktop)
Radeon RX 580, R7 1800X
80.2 (53min - 93max) fps
3840x2160 Epic Preset
NVIDIA Titan RTX
NVIDIA Titan RTX, R7 2700X, ADATA Premier Pro SP900NS38 512 GB
74 (59min - 87max) fps
NVIDIA GeForce RTX 2080 (Desktop)
GeForce RTX 2080 (Desktop), R7 2700X
63.6 fps
NVIDIA GeForce RTX 2070 (Desktop)
GeForce RTX 2070 (Desktop), R7 2700X
53.3 (43min - 62max) fps
AMD Radeon RX 590 (Desktop)
Radeon RX 590, R7 2700X
28.7 (26min - 31max) fps
AMD Radeon RX 580 (Desktop)
Radeon RX 580, R7 2700X
23.3 fps
AMD Radeon RX 580 (Desktop)
Radeon RX 580, R7 1800X
23.2 (10min - 27max) fps
Final Fantasy XV Benchmark
1920x1080 High Quality
NVIDIA Titan RTX
NVIDIA Titan RTX, R7 2700X, ADATA Premier Pro SP900NS38 512 GB
112 (65min - 172max) fps
NVIDIA GeForce RTX 2080 (Desktop)
GeForce RTX 2080 (Desktop), R7 2700X
96.6 (54min - 142max) fps
NVIDIA GeForce RTX 2070 (Desktop)
GeForce RTX 2070 (Desktop), R7 2700X
85.7 (48min - 130max) fps
NVIDIA GeForce GTX 1080 (Desktop)
GeForce GTX 1080 (Desktop), 4790K, Samsung SSD 840 Pro 256GB MZ7PD256HAFV-0Z000
69 fps
AMD Radeon RX Vega 64
RX Vega 64, R7 2700X
58.5 (23min - 92max) fps
AMD Radeon RX Vega 64
RX Vega 64, R7 2700X
58.5 (23min - 92max) fps
AMD Radeon RX 590 (Desktop)
Radeon RX 590, R7 2700X
43.3 (25min - 66max) fps
AMD Radeon RX 580 (Desktop)
Radeon RX 580, R7 2700X
37.3 (16min - 59max) fps
AMD Radeon RX 580 (Desktop)
Radeon RX 580, R7 1800X
31.9 (3min - 60max) fps
3840x2160 High Quality
NVIDIA Titan RTX
NVIDIA Titan RTX, R7 2700X, ADATA Premier Pro SP900NS38 512 GB
58 (39min - 87max) fps
NVIDIA GeForce RTX 2080 (Desktop)
GeForce RTX 2080 (Desktop), R7 2700X
44.5 (21min - 63max) fps
NVIDIA GeForce RTX 2070 (Desktop)
GeForce RTX 2070 (Desktop), R7 2700X
38.3 (21min - 57max) fps
NVIDIA GeForce GTX 1080 (Desktop)
GeForce GTX 1080 (Desktop), 4790K, Samsung SSD 840 Pro 256GB MZ7PD256HAFV-0Z000
30.4 (22min - 44max) fps
AMD Radeon RX Vega 64
RX Vega 64, R7 2700X
27.9 (20min - 42max) fps
AMD Radeon RX Vega 64
RX Vega 64, R7 2700X
27.9 (20min - 42max) fps
AMD Radeon RX 590 (Desktop)
Radeon RX 590, R7 2700X
19.6 (14min - 29max) fps
AMD Radeon RX 580 (Desktop)
Radeon RX 580, R7 2700X
16.9 (8min - 26max) fps
AMD Radeon RX 580 (Desktop)
Radeon RX 580, R7 1800X
15 (2min - 27max) fps
Destiny 2
1920x1080 Highest Preset AA:SM AF:16x
NVIDIA GeForce RTX 2080 (Desktop)
GeForce RTX 2080 (Desktop), R7 2700X
169.2 fps
NVIDIA GeForce RTX 2070 (Desktop)
GeForce RTX 2070 (Desktop), R7 2700X
157 fps
NVIDIA Titan RTX
NVIDIA Titan RTX, R7 2700X, ADATA Premier Pro SP900NS38 512 GB
154 fps
AMD Radeon RX 580 (Desktop)
Radeon RX 580, R7 1800X
83.8 fps
3840x2160 Highest Preset AA:SM AF:16x
NVIDIA Titan RTX
NVIDIA Titan RTX, R7 2700X, ADATA Premier Pro SP900NS38 512 GB
94 fps
NVIDIA GeForce RTX 2080 (Desktop)
GeForce RTX 2080 (Desktop), R7 2700X
71.5 fps
NVIDIA GeForce RTX 2070 (Desktop)
GeForce RTX 2070 (Desktop), R7 2700X
60 fps
AMD Radeon RX 580 (Desktop)
Radeon RX 580, R7 1800X
27.9 fps
Far Cry Primal
1920x1080 Ultra Preset AA:SM
NVIDIA GeForce GTX 1080 (Desktop)
GeForce GTX 1080 (Desktop), 4790K, Samsung SSD 840 Pro 256GB MZ7PD256HAFV-0Z000
107 (82min - 125max) fps
NVIDIA GeForce GTX 1080 (Desktop)
GeForce GTX 1080 (Desktop), 4790K, Samsung SSD 840 Pro 256GB MZ7PD256HAFV-0Z000
106 (80min - 125max) fps
NVIDIA GeForce RTX 2080 (Desktop)
GeForce RTX 2080 (Desktop), R7 2700X
97 (69min - 113max) fps
AMD Radeon RX Vega 64
RX Vega 64, R7 2700X
96 (67min - 113max) fps
NVIDIA GeForce RTX 2070 (Desktop)
GeForce RTX 2070 (Desktop), R7 2700X
95 (64min - 113max) fps
NVIDIA GeForce GTX 1070 (Desktop)
GeForce GTX 1070 (Desktop), 4790K, Samsung SSD 840 Pro 256GB MZ7PD256HAFV-0Z000
90 (72min - 105max) fps
NVIDIA Titan RTX
NVIDIA Titan RTX, R7 2700X, ADATA Premier Pro SP900NS38 512 GB
88 (63min - 105max) fps
AMD Radeon RX 590 (Desktop)
Radeon RX 590, R7 2700X
68 (54min - 86max) fps
NVIDIA GeForce GTX 1060 (Desktop)
GeForce GTX 1060 (Desktop), 6700K
67 fps
AMD Radeon RX 580 (Desktop)
Radeon RX 580, R7 1800X
62 (49min - 75max) fps
AMD Radeon RX 580 (Desktop)
Radeon RX 580, R7 2700X
60 (47min - 75max) fps
3840x2160 High Preset AA:SM
NVIDIA Titan RTX
NVIDIA Titan RTX, R7 2700X, ADATA Premier Pro SP900NS38 512 GB
88 (72min - 99max) fps
NVIDIA GeForce RTX 2080 (Desktop)
GeForce RTX 2080 (Desktop), R7 2700X
68 (63min - 75max) fps
NVIDIA GeForce RTX 2070 (Desktop)
GeForce RTX 2070 (Desktop), R7 2700X
59 (53min - 64max) fps
NVIDIA GeForce GTX 1080 (Desktop)
GeForce GTX 1080 (Desktop), 4790K, Samsung SSD 840 Pro 256GB MZ7PD256HAFV-0Z000
50 (46min - 54max) fps
NVIDIA GeForce GTX 1080 (Desktop)
GeForce GTX 1080 (Desktop), 4790K, Samsung SSD 840 Pro 256GB MZ7PD256HAFV-0Z000
49 (46min - 53max) fps
AMD Radeon RX Vega 64
RX Vega 64, R7 2700X
49 (45min - 54max) fps
NVIDIA GeForce GTX 1070 (Desktop)
GeForce GTX 1070 (Desktop), 4790K, Samsung SSD 840 Pro 256GB MZ7PD256HAFV-0Z000
38 (36min - 42max) fps
AMD Radeon RX 590 (Desktop)
Radeon RX 590, R7 2700X
34 (31min - 37max) fps
AMD Radeon RX 580 (Desktop)
Radeon RX 580, R7 1800X
31 (29min - 34max) fps
AMD Radeon RX 580 (Desktop)
Radeon RX 580, R7 2700X
30 (28min - 33max) fps
NVIDIA GeForce GTX 1060 (Desktop)
GeForce GTX 1060 (Desktop), 6700K
28 fps
The Witcher 3
1920x1080 Ultra Graphics & Postprocessing (HBAO+)
NVIDIA Titan RTX
NVIDIA Titan RTX, R7 2700X, ADATA Premier Pro SP900NS38 512 GB
128 (111min - 142max) fps
NVIDIA GeForce RTX 2080 (Desktop)
GeForce RTX 2080 (Desktop), R7 2700X
103.4 (81min - 119max) fps
NVIDIA GeForce GTX 1080 Ti (Desktop)
GeForce GTX 1080 Ti, i9-7900X
97 (80min - 112max) fps
NVIDIA GeForce RTX 2070 (Desktop)
GeForce RTX 2070 (Desktop), R7 2700X
87 (72min - 100max) fps
NVIDIA GeForce GTX 1080 (Desktop)
GeForce GTX 1080 (Desktop), 4790K, Samsung SSD 840 Pro 256GB MZ7PD256HAFV-0Z000
82 (70min - 90max) fps
AMD Radeon RX Vega 64
RX Vega 64, R7 2700X
77 (67min - 84max) fps
NVIDIA GeForce GTX 1080 (Desktop)
GeForce GTX 1080 (Desktop), 4790K, Samsung SSD 840 Pro 256GB MZ7PD256HAFV-0Z000
76.4 (64min - 85max) fps
NVIDIA GeForce GTX 1070 (Desktop)
GeForce GTX 1070 (Desktop), 4790K, Samsung SSD 840 Pro 256GB MZ7PD256HAFV-0Z000
62 fps
AMD Radeon RX 590 (Desktop)
Radeon RX 590, R7 2700X
50.8 (42min - 57max) fps
AMD Radeon RX 580 (Desktop)
Radeon RX 580, R7 1800X
45.6 (37min - 51max) fps
NVIDIA GeForce GTX 1060 (Desktop)
GeForce GTX 1060 (Desktop), 6700K
44.4 fps
AMD Radeon RX 580 (Desktop)
Radeon RX 580, R7 2700X
41.8 (35min - 46max) fps
3840x2160 High Graphics & Postprocessing (Nvidia HairWorks Off)
NVIDIA Titan RTX
NVIDIA Titan RTX, R7 2700X, ADATA Premier Pro SP900NS38 512 GB
102 (90min - 110max) fps
NVIDIA GeForce RTX 2080 (Desktop)
GeForce RTX 2080 (Desktop), R7 2700X
73.8 (66min - 81max) fps
NVIDIA GeForce RTX 2070 (Desktop)
GeForce RTX 2070 (Desktop), R7 2700X
61.8 (52min - 69max) fps
NVIDIA GeForce GTX 1080 (Desktop)
GeForce GTX 1080 (Desktop), 4790K, Samsung SSD 840 Pro 256GB MZ7PD256HAFV-0Z000
56.5 (49min - 61max) fps
NVIDIA GeForce GTX 1080 (Desktop)
GeForce GTX 1080 (Desktop), 4790K, Samsung SSD 840 Pro 256GB MZ7PD256HAFV-0Z000
55 fps
AMD Radeon RX Vega 64
RX Vega 64, R7 2700X
49.1 (44min - 54max) fps
NVIDIA GeForce GTX 1070 (Desktop)
GeForce GTX 1070 (Desktop), 4790K, Samsung SSD 840 Pro 256GB MZ7PD256HAFV-0Z000
43 fps
AMD Radeon RX 590 (Desktop)
Radeon RX 590, R7 2700X
31.6 (26min - 34max) fps
NVIDIA GeForce GTX 1060 (Desktop)
GeForce GTX 1060 (Desktop), 6700K
29 fps
AMD Radeon RX 580 (Desktop)
Radeon RX 580, R7 1800X
28.1 (20min - 31max) fps
AMD Radeon RX 580 (Desktop)
Radeon RX 580, R7 2700X
24.9 (20min - 27max) fps
Watch Dogs 2
1920x1080 Ultra Preset
NVIDIA Titan RTX
NVIDIA Titan RTX, R7 2700X, ADATA Premier Pro SP900NS38 512 GB
100 (75min - 119max) fps
NVIDIA GeForce RTX 2080 (Desktop)
GeForce RTX 2080 (Desktop), R7 2700X
88.1 (70min - 103max) fps
NVIDIA GeForce RTX 2070 (Desktop)
GeForce RTX 2070 (Desktop), R7 2700X
78.3 (63min - 91max) fps
NVIDIA GeForce GTX 1080 (Desktop)
GeForce GTX 1080 (Desktop), 4790K, Samsung SSD 840 Pro 256GB MZ7PD256HAFV-0Z000
73.5 (58min - 90max) fps
AMD Radeon RX Vega 64
RX Vega 64, R7 2700X
68.2 (56min - 78max) fps
AMD Radeon RX 590 (Desktop)
Radeon RX 590, R7 2700X
46.1 (37min - 53max) fps
AMD Radeon RX 580 (Desktop)
Radeon RX 580, R7 1800X
44.2 (35min - 50max) fps
AMD Radeon RX 580 (Desktop)
Radeon RX 580, R7 2700X
40.4 (32min - 46max) fps
3840x2160 High Preset
NVIDIA Titan RTX
NVIDIA Titan RTX, R7 2700X, ADATA Premier Pro SP900NS38 512 GB
70 (63min - 78max) fps
NVIDIA GeForce RTX 2080 (Desktop)
GeForce RTX 2080 (Desktop), R7 2700X
55.6 (51min - 62max) fps
NVIDIA GeForce RTX 2070 (Desktop)
GeForce RTX 2070 (Desktop), R7 2700X
47 (63min - 91max) fps
NVIDIA GeForce GTX 1080 (Desktop)
GeForce GTX 1080 (Desktop), 4790K, Samsung SSD 840 Pro 256GB MZ7PD256HAFV-0Z000
46.7 (42min - 52max) fps
AMD Radeon RX Vega 64
RX Vega 64, R7 2700X
36.9 (32min - 42max) fps
AMD Radeon RX 590 (Desktop)
Radeon RX 590, R7 2700X
25.1 (22min - 28max) fps
AMD Radeon RX 580 (Desktop)
Radeon RX 580, R7 1800X
23.8 (21min - 27max) fps
AMD Radeon RX 580 (Desktop)
Radeon RX 580, R7 2700X
22.6 (20min - 26max) fps
Battlefield 1
1920x1080 Ultra Preset AA:T
NVIDIA Titan RTX
NVIDIA Titan RTX, R7 2700X, ADATA Premier Pro SP900NS38 512 GB
154.2 (141min - 162max) fps
NVIDIA GeForce RTX 2080 (Desktop)
GeForce RTX 2080 (Desktop), R7 2700X
154.1 (137min - 166max) fps
NVIDIA GeForce GTX 1080 (Desktop)
GeForce GTX 1080 (Desktop), 4790K, Samsung SSD 840 Pro 256GB MZ7PD256HAFV-0Z000
148 (133min - 157max) fps
NVIDIA GeForce GTX 1080 (Desktop)
GeForce GTX 1080 (Desktop), 4790K, Samsung SSD 840 Pro 256GB MZ7PD256HAFV-0Z000
147 (132min - 155max) fps
AMD Radeon RX Vega 64
RX Vega 64, R7 2700X
145.1 (131min - 167max) fps
NVIDIA GeForce RTX 2070 (Desktop)
GeForce RTX 2070 (Desktop), R7 2700X
137.3 (116min - 147max) fps
AMD Radeon RX 590 (Desktop)
Radeon RX 590, R7 2700X
98.6 (85min - 108max) fps
AMD Radeon RX 580 (Desktop)
Radeon RX 580, R7 1800X
88.5 (75min - 95max) fps
3840x2160 High Preset AA:T
NVIDIA Titan RTX
NVIDIA Titan RTX, R7 2700X, ADATA Premier Pro SP900NS38 512 GB
111.8 (104min - 118max) fps
NVIDIA GeForce RTX 2080 (Desktop)
GeForce RTX 2080 (Desktop), R7 2700X
90 (82min - 93max) fps
NVIDIA GeForce RTX 2070 (Desktop)
GeForce RTX 2070 (Desktop), R7 2700X
75.8 (70min - 79max) fps
NVIDIA GeForce GTX 1080 (Desktop)
GeForce GTX 1080 (Desktop), 4790K, Samsung SSD 840 Pro 256GB MZ7PD256HAFV-0Z000
70.7 (66min - 73max) fps
NVIDIA GeForce GTX 1080 (Desktop)
GeForce GTX 1080 (Desktop), 4790K, Samsung SSD 840 Pro 256GB MZ7PD256HAFV-0Z000
70.6 (64min - 74max) fps
AMD Radeon RX Vega 64
RX Vega 64, R7 2700X
65.2 (58min - 71max) fps
AMD Radeon RX 590 (Desktop)
Radeon RX 590, R7 2700X
43.2 (38min - 46max) fps
AMD Radeon RX 580 (Desktop)
Radeon RX 580, R7 1800X
40.2 (34min - 43max) fps
The Division
1920x1080 Ultra Preset AF:16x
NVIDIA Titan RTX
NVIDIA Titan RTX, R7 2700X, ADATA Premier Pro SP900NS38 512 GB
163 fps
NVIDIA GeForce RTX 2080 (Desktop)
GeForce RTX 2080 (Desktop), R7 2700X
129.8 fps
NVIDIA GeForce RTX 2070 (Desktop)
GeForce RTX 2070 (Desktop), R7 2700X
112 fps
AMD Radeon RX Vega 64
RX Vega 64, R7 2700X
102.3 fps
NVIDIA GeForce GTX 1080 (Desktop)
GeForce GTX 1080 (Desktop), 4790K, Samsung SSD 840 Pro 256GB MZ7PD256HAFV-0Z000
102 (54min - 135max) fps
NVIDIA GeForce GTX 1080 (Desktop)
GeForce GTX 1080 (Desktop), 4790K, Samsung SSD 840 Pro 256GB MZ7PD256HAFV-0Z000
95 (55min - 125max) fps
NVIDIA GeForce GTX 1070 (Desktop)
GeForce GTX 1070 (Desktop), 4790K, Samsung SSD 840 Pro 256GB MZ7PD256HAFV-0Z000
80.6 (41min - 108max) fps
AMD Radeon RX 590 (Desktop)
Radeon RX 590, R7 2700X
70.6 fps
AMD Radeon RX 580 (Desktop)
Radeon RX 580, R7 1800X
63.3 fps
NVIDIA GeForce GTX 1060 (Desktop)
GeForce GTX 1060 (Desktop), 6700K
59.6 fps
AMD Radeon RX 580 (Desktop)
Radeon RX 580, R7 2700X
58.8 fps
3840x2160 High Preset AF:8x
NVIDIA Titan RTX
NVIDIA Titan RTX, R7 2700X, ADATA Premier Pro SP900NS38 512 GB
91 fps
NVIDIA GeForce RTX 2080 (Desktop)
GeForce RTX 2080 (Desktop), R7 2700X
69.1 fps
NVIDIA GeForce RTX 2070 (Desktop)
GeForce RTX 2070 (Desktop), R7 2700X
58.3 fps
NVIDIA GeForce GTX 1080 (Desktop)
GeForce GTX 1080 (Desktop), 4790K, Samsung SSD 840 Pro 256GB MZ7PD256HAFV-0Z000
51.2 (24min - 62max) fps
AMD Radeon RX Vega 64
RX Vega 64, R7 2700X
50.6 fps
NVIDIA GeForce GTX 1080 (Desktop)
GeForce GTX 1080 (Desktop), 4790K, Samsung SSD 840 Pro 256GB MZ7PD256HAFV-0Z000
48.5 (19min - 65max) fps
NVIDIA GeForce GTX 1070 (Desktop)
GeForce GTX 1070 (Desktop), 4790K, Samsung SSD 840 Pro 256GB MZ7PD256HAFV-0Z000
39.7 (17min - 52max) fps
AMD Radeon RX 590 (Desktop)
Radeon RX 590, R7 2700X
36.1 fps
AMD Radeon RX 580 (Desktop)
Radeon RX 580, R7 1800X
33.1 fps
AMD Radeon RX 580 (Desktop)
Radeon RX 580, R7 2700X
30.9 fps
NVIDIA GeForce GTX 1060 (Desktop)
GeForce GTX 1060 (Desktop), 6700K
28.2 fps
For Honor
1920x1080 Extreme Preset AA:T AF:16x
NVIDIA Titan RTX
NVIDIA Titan RTX, R7 2700X, ADATA Premier Pro SP900NS38 512 GB
213 (107min - 286max) fps
NVIDIA GeForce RTX 2080 (Desktop)
GeForce RTX 2080 (Desktop), R7 2700X
172.6 fps
NVIDIA GeForce RTX 2070 (Desktop)
GeForce RTX 2070 (Desktop), R7 2700X
148.7 (110min - 192max) fps
NVIDIA GeForce GTX 1080 (Desktop)
GeForce GTX 1080 (Desktop), 4790K, Samsung SSD 840 Pro 256GB MZ7PD256HAFV-0Z000
138 (77min - 198max) fps
AMD Radeon RX Vega 64
RX Vega 64, R7 2700X
127.7 (106min - 167max) fps
NVIDIA GeForce GTX 1070 (Desktop)
GeForce GTX 1070 (Desktop), 4790K, Samsung SSD 840 Pro 256GB MZ7PD256HAFV-0Z000
111 (50min - 148max) fps
AMD Radeon RX 590 (Desktop)
Radeon RX 590, R7 2700X
91 (71min - 118max) fps
AMD Radeon RX 580 (Desktop)
Radeon RX 580, R7 2700X
82 (65min - 110max) fps
AMD Radeon RX 580 (Desktop)
Radeon RX 580, R7 1800X
79.8 (61.5min - 109.2max) fps
3840x2160 High Preset AA:T AF:8x
NVIDIA Titan RTX
NVIDIA Titan RTX, R7 2700X, ADATA Premier Pro SP900NS38 512 GB
101 (68min - 127max) fps
NVIDIA GeForce GTX 1080 Ti (Desktop)
GeForce GTX 1080 Ti, i9-7900X
78 (62min - 105max) fps
NVIDIA GeForce RTX 2080 (Desktop)
GeForce RTX 2080 (Desktop), R7 2700X
77.6 (47min - 92max) fps
NVIDIA GeForce GTX 1080 (Desktop)
GeForce GTX 1080 (Desktop), 4790K, Samsung SSD 840 Pro 256GB MZ7PD256HAFV-0Z000
54.9 (42min - 65max) fps
NVIDIA GeForce RTX 2070 (Desktop)
GeForce RTX 2070 (Desktop), R7 2700X
53.7 (43min - 67max) fps
AMD Radeon RX Vega 64
RX Vega 64, R7 2700X
49 (40min - 58max) fps
NVIDIA GeForce GTX 1070 (Desktop)
GeForce GTX 1070 (Desktop), 4790K, Samsung SSD 840 Pro 256GB MZ7PD256HAFV-0Z000
43.9 (36min - 56max) fps
AMD Radeon RX 590 (Desktop)
Radeon RX 590, R7 2700X
35.2 (28min - 41max) fps
AMD Radeon RX 580 (Desktop)
Radeon RX 580, R7 1800X
33.5 (27.3min - 38.6max) fps
AMD Radeon RX 580 (Desktop)
Radeon RX 580, R7 2700X
33 (27min - 40max) fps
Ghost Recon Wildlands
1920x1080 Ultra Preset AA:T AF:16x
NVIDIA Titan RTX
NVIDIA Titan RTX, R7 2700X, ADATA Premier Pro SP900NS38 512 GB
86 (70min - 96max) fps
NVIDIA GeForce RTX 2080 (Desktop)
GeForce RTX 2080 (Desktop), R7 2700X
74 (62min - 84max) fps
NVIDIA GeForce RTX 2070 (Desktop)
GeForce RTX 2070 (Desktop), R7 2700X
65 (56min - 73max) fps
AMD Radeon RX Vega 64
RX Vega 64, R7 2700X
53 (43min - 60max) fps
NVIDIA GeForce GTX 1070 (Desktop)
GeForce GTX 1070 (Desktop), 4790K, Samsung SSD 840 Pro 256GB MZ7PD256HAFV-0Z000
50.2 (43min - 58max) fps
AMD Radeon RX 590 (Desktop)
Radeon RX 590, R7 2700X
41.3 (34min - 48max) fps
AMD Radeon RX 580 (Desktop)
Radeon RX 580, R7 1800X
37.6 (31.5min - 43.8max) fps
AMD Radeon RX 580 (Desktop)
Radeon RX 580, R7 2700X
35 (29min - 41max) fps
3840x2160 Ultra Preset AA:T AF:16x
NVIDIA Titan RTX
NVIDIA Titan RTX, R7 2700X, ADATA Premier Pro SP900NS38 512 GB
49 (42min - 55max) fps
Doom
1920x1080 Ultra Preset AA:SM
NVIDIA GeForce GTX 1080 (Desktop)
GeForce GTX 1080 (Desktop), 4790K, Samsung SSD 840 Pro 256GB MZ7PD256HAFV-0Z000
160 (136min - 199max) fps
NVIDIA GeForce RTX 2080 (Desktop)
GeForce RTX 2080 (Desktop), R7 2700X
150.3 fps
NVIDIA GeForce RTX 2070 (Desktop)
GeForce RTX 2070 (Desktop), R7 2700X
150 (109min - 191max) fps
NVIDIA Titan RTX
NVIDIA Titan RTX, R7 2700X, ADATA Premier Pro SP900NS38 512 GB
144 (97min - 198max) fps
NVIDIA GeForce GTX 1080 (Desktop)
GeForce GTX 1080 (Desktop), 4790K, Samsung SSD 840 Pro 256GB MZ7PD256HAFV-0Z000
137 (112min - 191max) fps
NVIDIA GeForce GTX 1070 (Desktop)
GeForce GTX 1070 (Desktop), 4790K, Samsung SSD 840 Pro 256GB MZ7PD256HAFV-0Z000
134 (111min - 173max) fps
NVIDIA GeForce GTX 1060 (Desktop)
GeForce GTX 1060 (Desktop), 6700K
99.7 fps
AMD Radeon RX 590 (Desktop)
Radeon RX 590, R7 2700X
92.1 (70min - 125max) fps
AMD Radeon RX 580 (Desktop)
Radeon RX 580, R7 1800X
73.6 (62min - 87max) fps
3840x2160 High Preset AA:FX
NVIDIA Titan RTX
NVIDIA Titan RTX, R7 2700X, ADATA Premier Pro SP900NS38 512 GB
140 (102min - 184max) fps
NVIDIA GeForce RTX 2080 (Desktop)
GeForce RTX 2080 (Desktop), R7 2700X
115.1 fps
NVIDIA GeForce RTX 2070 (Desktop)
GeForce RTX 2070 (Desktop), R7 2700X
93 (75min - 119max) fps
NVIDIA GeForce GTX 1080 (Desktop)
GeForce GTX 1080 (Desktop), 4790K, Samsung SSD 840 Pro 256GB MZ7PD256HAFV-0Z000
72 (62min - 91max) fps
NVIDIA GeForce GTX 1080 (Desktop)
GeForce GTX 1080 (Desktop), 4790K, Samsung SSD 840 Pro 256GB MZ7PD256HAFV-0Z000
56.5 fps
NVIDIA GeForce GTX 1070 (Desktop)
GeForce GTX 1070 (Desktop), 4790K, Samsung SSD 840 Pro 256GB MZ7PD256HAFV-0Z000
48.6 (42min - 60max) fps
AMD Radeon RX 590 (Desktop)
Radeon RX 590, R7 2700X
36.6 (30min - 46max) fps
NVIDIA GeForce GTX 1060 (Desktop)
GeForce GTX 1060 (Desktop), 6700K
34.2 fps
AMD Radeon RX 580 (Desktop)
Radeon RX 580, R7 1800X
31.9 (27min - 40max) fps
GTA V
1920x1080 Highest Settings possible AA:4xMSAA + FX AF:16x
NVIDIA GeForce RTX 2080 (Desktop)
GeForce RTX 2080 (Desktop), R7 2700X
132.5 fps
NVIDIA Titan RTX
NVIDIA Titan RTX, R7 2700X, ADATA Premier Pro SP900NS38 512 GB
125.1 fps
NVIDIA GeForce RTX 2070 (Desktop)
GeForce RTX 2070 (Desktop), R7 2700X
110.5 fps
NVIDIA GeForce GTX 1080 (Desktop)
GeForce GTX 1080 (Desktop), 4790K, Samsung SSD 840 Pro 256GB MZ7PD256HAFV-0Z000
86 (44min - 161max) fps
NVIDIA GeForce GTX 1080 (Desktop)
GeForce GTX 1080 (Desktop), 4790K, Samsung SSD 840 Pro 256GB MZ7PD256HAFV-0Z000
80 (32min - 158max) fps
NVIDIA GeForce GTX 1070 (Desktop)
GeForce GTX 1070 (Desktop), 4790K, Samsung SSD 840 Pro 256GB MZ7PD256HAFV-0Z000
73 fps
AMD Radeon RX 590 (Desktop)
Radeon RX 590, R7 2700X
61.9 fps
AMD Radeon RX 580 (Desktop)
Radeon RX 580, R7 1800X
54.9 fps
3840x2160 High/On (Advanced Graphics Off) AA:FX AF:8x
NVIDIA Titan RTX
NVIDIA Titan RTX, R7 2700X, ADATA Premier Pro SP900NS38 512 GB
140.6 fps
NVIDIA GeForce RTX 2080 (Desktop)
GeForce RTX 2080 (Desktop), R7 2700X
124 fps
NVIDIA GeForce RTX 2070 (Desktop)
GeForce RTX 2070 (Desktop), R7 2700X
111.9 fps
NVIDIA GeForce GTX 1080 (Desktop)
GeForce GTX 1080 (Desktop), 4790K, Samsung SSD 840 Pro 256GB MZ7PD256HAFV-0Z000
73.9 (39min - 222max) fps
NVIDIA GeForce GTX 1080 (Desktop)
GeForce GTX 1080 (Desktop), 4790K, Samsung SSD 840 Pro 256GB MZ7PD256HAFV-0Z000
71.2 (11.6min - 170max) fps
NVIDIA GeForce GTX 1070 (Desktop)
GeForce GTX 1070 (Desktop), 4790K, Samsung SSD 840 Pro 256GB MZ7PD256HAFV-0Z000
59.1 fps
AMD Radeon RX 580 (Desktop)
Radeon RX 580, R7 1800X
56.8 fps
AMD Radeon RX 590 (Desktop)
Radeon RX 590, R7 2700X
41.4 fps
Battlefield 4 - 3840x2160 High Preset
NVIDIA Titan RTX
NVIDIA Titan RTX, R7 2700X, ADATA Premier Pro SP900NS38 512 GB
159 fps
NVIDIA GeForce RTX 2080 (Desktop)
GeForce RTX 2080 (Desktop), R7 2700X
121 fps
NVIDIA GeForce RTX 2070 (Desktop)
GeForce RTX 2070 (Desktop), R7 2700X
102 fps
NVIDIA GeForce GTX 1080 (Desktop)
GeForce GTX 1080 (Desktop), 4790K, Samsung SSD 840 Pro 256GB MZ7PD256HAFV-0Z000
90 fps
AMD Radeon RX Vega 64
RX Vega 64, R7 2700X
77 (70min - 92max) fps
NVIDIA GeForce GTX 1070 (Desktop)
GeForce GTX 1070 (Desktop), 4790K, Samsung SSD 840 Pro 256GB MZ7PD256HAFV-0Z000
69.8 (61min - 83max) fps
AMD Radeon RX 590 (Desktop)
Radeon RX 590, R7 2700X
51 (45min - 61max) fps
AMD Radeon RX 580 (Desktop)
Radeon RX 580, R7 1800X
47 (42min - 56max) fps
Rocket League
3840x2160 High Quality AA:High FX
NVIDIA Titan RTX
NVIDIA Titan RTX, R7 2700X, ADATA Premier Pro SP900NS38 512 GB
197 (162min - 247max) fps
NVIDIA GeForce RTX 2080 (Desktop)
GeForce RTX 2080 (Desktop), R7 2700X
146.1 (124min - 186max) fps
NVIDIA GeForce RTX 2070 (Desktop)
GeForce RTX 2070 (Desktop), R7 2700X
128.5 (108min - 152max) fps
NVIDIA GeForce GTX 1070 (Desktop)
GeForce GTX 1070 (Desktop), 4790K, Samsung SSD 840 Pro 256GB MZ7PD256HAFV-0Z000
95.4 (78min - 140max) fps
AMD Radeon RX 590 (Desktop)
Radeon RX 590, R7 2700X
81.6 (67min - 113max) fps
AMD Radeon RX 580 (Desktop)
Radeon RX 580, R7 1800X
72.6 (57min - 95max) fps
1920x1080 High Quality AA:High FX
NVIDIA Titan RTX
NVIDIA Titan RTX, R7 2700X, ADATA Premier Pro SP900NS38 512 GB
248 (216min - 252max) fps
NVIDIA GeForce RTX 2080 (Desktop)
GeForce RTX 2080 (Desktop), R7 2700X
242.4 (209min - 252max) fps
NVIDIA GeForce RTX 2070 (Desktop)
GeForce RTX 2070 (Desktop), R7 2700X
240.6 (208min - 252max) fps
AMD Radeon RX 590 (Desktop)
Radeon RX 590, R7 2700X
230.2 (192min - 252max) fps
AMD Radeon RX 580 (Desktop)
Radeon RX 580, R7 1800X
172.6 (140min - 236max) fps
Rise of the Tomb Raider
3840x2160 High Preset AA:FX AF:4x
NVIDIA Titan RTX
NVIDIA Titan RTX, R7 2700X, ADATA Premier Pro SP900NS38 512 GB
99 (91min - 112max) fps
NVIDIA GeForce RTX 2080 (Desktop)
GeForce RTX 2080 (Desktop), R7 2700X
73.4 (67min - 80max) fps
NVIDIA GeForce RTX 2070 (Desktop)
GeForce RTX 2070 (Desktop), R7 2700X
59.4 (54min - 67max) fps
NVIDIA GeForce GTX 1080 (Desktop)
GeForce GTX 1080 (Desktop), 4790K, Samsung SSD 840 Pro 256GB MZ7PD256HAFV-0Z000
53 fps
AMD Radeon RX Vega 64
RX Vega 64, R7 2700X
50.4 (45min - 57max) fps
NVIDIA GeForce GTX 1080 (Desktop)
GeForce GTX 1080 (Desktop), 4790K, Samsung SSD 840 Pro 256GB MZ7PD256HAFV-0Z000
50 fps
NVIDIA GeForce GTX 1080 (Desktop)
GeForce GTX 1080 (Desktop), 4790K, Samsung SSD 840 Pro 256GB MZ7PD256HAFV-0Z000
47.8 (43min - 54max) fps
NVIDIA GeForce GTX 1070 (Desktop)
GeForce GTX 1070 (Desktop), 4790K, Samsung SSD 840 Pro 256GB MZ7PD256HAFV-0Z000
38.9 (35min - 44max) fps
AMD Radeon RX 590 (Desktop)
Radeon RX 590, R7 2700X
32.6 (30min - 38max) fps
NVIDIA GeForce GTX 1060 (Desktop)
GeForce GTX 1060 (Desktop), 6700K
29.3 fps
NVIDIA GeForce GTX 1060 (Desktop)
GeForce GTX 1060 (Desktop), 6700K
27 fps
AMD Radeon RX 580 (Desktop)
Radeon RX 580, R7 1800X
27.8 (23min - 33max) fps
1920x1080 Very High Preset AA:FX AF:16x
NVIDIA Titan RTX
NVIDIA Titan RTX, R7 2700X, ADATA Premier Pro SP900NS38 512 GB
188 (164min - 200max) fps
NVIDIA GeForce RTX 2080 (Desktop)
GeForce RTX 2080 (Desktop), R7 2700X
158.5 (144min - 173max) fps
NVIDIA GeForce RTX 2070 (Desktop)
GeForce RTX 2070 (Desktop), R7 2700X
134 (124min - 149max) fps
NVIDIA GeForce GTX 1080 (Desktop)
GeForce GTX 1080 (Desktop), 4790K, Samsung SSD 840 Pro 256GB MZ7PD256HAFV-0Z000
125 fps
NVIDIA GeForce GTX 1080 (Desktop)
GeForce GTX 1080 (Desktop), 4790K, Samsung SSD 840 Pro 256GB MZ7PD256HAFV-0Z000
112 (105min - 124max) fps
NVIDIA GeForce GTX 1080 (Desktop)
GeForce GTX 1080 (Desktop), 4790K, Samsung SSD 840 Pro 256GB MZ7PD256HAFV-0Z000
112 (105min) fps
NVIDIA GeForce GTX 1080 (Desktop)
GeForce GTX 1080 (Desktop), 4790K, Samsung SSD 840 Pro 256GB MZ7PD256HAFV-0Z000
112 fps
NVIDIA GeForce GTX 1070 (Desktop)
GeForce GTX 1070 (Desktop), 4790K, Samsung SSD 840 Pro 256GB MZ7PD256HAFV-0Z000
94 (85min - 104max) fps
AMD Radeon RX Vega 64
RX Vega 64, R7 2700X
91.5 (82min - 103max) fps
AMD Radeon RX 590 (Desktop)
Radeon RX 590, R7 2700X
68.1 (61min - 77max) fps
NVIDIA GeForce GTX 1060 (Desktop)
GeForce GTX 1060 (Desktop), 6700K
66.9 fps
NVIDIA GeForce GTX 1060 (Desktop)
GeForce GTX 1060 (Desktop), 6700K
66.5 fps
AMD Radeon RX 580 (Desktop)
Radeon RX 580, R7 1800X
65.4 (57min - 75max) fps
Deus Ex Mankind Divided
3840x2160 High Preset AF:4x
NVIDIA Titan RTX
NVIDIA Titan RTX, R7 2700X, ADATA Premier Pro SP900NS38 512 GB
71.6 (60min - 89max) fps
NVIDIA GeForce RTX 2080 (Desktop)
GeForce RTX 2080 (Desktop), R7 2700X
53.6 (45min - 66max) fps
NVIDIA GeForce RTX 2070 (Desktop)
GeForce RTX 2070 (Desktop), R7 2700X
45 (37.7min - 55.3max) fps
AMD Radeon RX Vega 64
RX Vega 64, R7 2700X
37.5 (29min - 47.2max) fps
NVIDIA GeForce GTX 1080 (Desktop)
GeForce GTX 1080 (Desktop), 4790K, Samsung SSD 840 Pro 256GB MZ7PD256HAFV-0Z000
36.9 (31min - 44max) fps
NVIDIA GeForce GTX 1080 (Desktop)
GeForce GTX 1080 (Desktop), 4790K, Samsung SSD 840 Pro 256GB MZ7PD256HAFV-0Z000
30.8 (26min - 36max) fps
NVIDIA GeForce GTX 1070 (Desktop)
GeForce GTX 1070 (Desktop), 4790K, Samsung SSD 840 Pro 256GB MZ7PD256HAFV-0Z000
28.3 (24min - 34max) fps
AMD Radeon RX 590 (Desktop)
Radeon RX 590, R7 2700X
25.1 (21min - 31max) fps
AMD Radeon RX 580 (Desktop)
Radeon RX 580, R7 1800X
23 (19.4min - 28.4max) fps
1920x1080 Ultra Preset AA:2xMS AF:8x
NVIDIA Titan RTX
NVIDIA Titan RTX, R7 2700X, ADATA Premier Pro SP900NS38 512 GB
120.7 (82min - 169max) fps
NVIDIA GeForce RTX 2080 (Desktop)
GeForce RTX 2080 (Desktop), R7 2700X
80.5 (62min - 105max) fps
NVIDIA GeForce RTX 2070 (Desktop)
GeForce RTX 2070 (Desktop), R7 2700X
69.5 (53.9min - 90.5max) fps
NVIDIA GeForce GTX 1080 (Desktop)
GeForce GTX 1080 (Desktop), 4790K, Samsung SSD 840 Pro 256GB MZ7PD256HAFV-0Z000
55.9 (43min - 71max) fps
AMD Radeon RX Vega 64
RX Vega 64, R7 2700X
54.9 (41.3min - 73.5max) fps
NVIDIA GeForce GTX 1080 (Desktop)
GeForce GTX 1080 (Desktop), 4790K, Samsung SSD 840 Pro 256GB MZ7PD256HAFV-0Z000
51.4 (40min - 64max) fps
AMD Radeon RX 590 (Desktop)
Radeon RX 590, R7 2700X
38.7 (31min - 50max) fps
AMD Radeon RX 580 (Desktop)
Radeon RX 580, R7 1800X
37.3 (29.6min - 48.3max) fps
Dirt 4
3840x2160 Ultra Preset AF:16x
NVIDIA Titan RTX
NVIDIA Titan RTX, R7 2700X, ADATA Premier Pro SP900NS38 512 GB
124 (111min - 139max) fps
NVIDIA GeForce RTX 2080 (Desktop)
GeForce RTX 2080 (Desktop), R7 2700X
99.2 (88min - 114max) fps
NVIDIA GeForce RTX 2070 (Desktop)
GeForce RTX 2070 (Desktop), R7 2700X
75.9 (66min - 88max) fps
AMD Radeon RX 590 (Desktop)
Radeon RX 590, R7 2700X
44.9 (39min - 55max) fps
AMD Radeon RX 580 (Desktop)
Radeon RX 580, R7 1800X
39.8 (35min - 49max) fps
1920x1080 Ultra Preset AA:4xMS AF:16x
NVIDIA Titan RTX
NVIDIA Titan RTX, R7 2700X, ADATA Premier Pro SP900NS38 512 GB
192 (172min - 214max) fps
NVIDIA GeForce RTX 2080 (Desktop)
GeForce RTX 2080 (Desktop), R7 2700X
159.6 (137min - 184max) fps
NVIDIA GeForce RTX 2070 (Desktop)
GeForce RTX 2070 (Desktop), R7 2700X
131.1 (116min - 156max) fps
AMD Radeon RX 590 (Desktop)
Radeon RX 590, R7 2700X
79.2 (67min - 100max) fps
AMD Radeon RX 580 (Desktop)
Radeon RX 580, R7 1800X
70.2 (59min - 90max) fps
Farming Simulator 19
3840x2160 Very High Preset
NVIDIA Titan RTX
NVIDIA Titan RTX, R7 2700X, ADATA Premier Pro SP900NS38 512 GB
112 (89min - 160max) fps
NVIDIA Titan X Pascal
Titan X Pascal, TR 1950X, Samsung SM951 MZHPV512HDGL m.2 PCI-e
89.1 (74min - 122max) fps
AMD Radeon RX Vega 64
RX Vega 64, R7 2700X
41.5 (33min - 69max) fps
AMD Radeon RX 590 (Desktop)
Radeon RX 590, R7 2700X
23 (17min - 47max) fps
1920x1080 Very High Preset
NVIDIA Titan RTX
NVIDIA Titan RTX, R7 2700X, ADATA Premier Pro SP900NS38 512 GB
125 (106min - 167max) fps
AMD Radeon RX Vega 64
RX Vega 64, R7 2700X
100 (72min - 144max) fps
NVIDIA Titan X Pascal
Titan X Pascal, TR 1950X, Samsung SM951 MZHPV512HDGL m.2 PCI-e
99.2 (87min - 130max) fps
AMD Radeon RX 590 (Desktop)
Radeon RX 590, R7 2700X
69 (44min - 117max) fps
Hitman 2
3840x2160 Ultra AF:16x
NVIDIA Titan RTX
NVIDIA Titan RTX, R7 2700X, ADATA Premier Pro SP900NS38 512 GB
75 (54min - 106max) fps
NVIDIA Titan X Pascal
Titan X Pascal, TR 1950X, Samsung SM951 MZHPV512HDGL m.2 PCI-e
52.7 (37min - 59max) fps
AMD Radeon RX Vega 64
RX Vega 64, R7 2700X
47.4 (41min - 55max) fps
AMD Radeon RX 590 (Desktop)
Radeon RX 590, R7 2700X
30.1 (25min - 35max) fps
1920x1080 Ultra AF:16x
AMD Radeon RX Vega 64
RX Vega 64, R7 2700X
78.2 (58min - 110max) fps
NVIDIA Titan RTX
NVIDIA Titan RTX, R7 2700X, ADATA Premier Pro SP900NS38 512 GB
75 (55min - 107max) fps
AMD Radeon RX 590 (Desktop)
Radeon RX 590, R7 2700X
71 (55min - 89max) fps
NVIDIA Titan X Pascal
Titan X Pascal, TR 1950X, Samsung SM951 MZHPV512HDGL m.2 PCI-e
64.4 (47min - 90max) fps
Overwatch
3840x2160 High (Render Scale 100 %) AA:SM AF:4x
NVIDIA Titan RTX
NVIDIA Titan RTX, R7 2700X, ADATA Premier Pro SP900NS38 512 GB
267 fps
NVIDIA GeForce RTX 2080 (Desktop)
GeForce RTX 2080 (Desktop), R7 2700X
150 (129min - 174max) fps
NVIDIA GeForce RTX 2070 (Desktop)
GeForce RTX 2070 (Desktop), R7 2700X
128 (111min - 143max) fps
NVIDIA GeForce GTX 1080 (Desktop)
GeForce GTX 1080 (Desktop), 4790K, Samsung SSD 840 Pro 256GB MZ7PD256HAFV-0Z000
113 (97min - 127max) fps
NVIDIA GeForce GTX 1080 (Desktop)
GeForce GTX 1080 (Desktop), 4790K, Samsung SSD 840 Pro 256GB MZ7PD256HAFV-0Z000
104 (88min - 121max) fps
NVIDIA GeForce GTX 1070 (Desktop)
GeForce GTX 1070 (Desktop), 4790K, Samsung SSD 840 Pro 256GB MZ7PD256HAFV-0Z000
85.5 (74min - 98max) fps
AMD Radeon RX 590 (Desktop)
Radeon RX 590, R7 2700X
76 (62min - 89max) fps
AMD Radeon RX 580 (Desktop)
Radeon RX 580, R7 1800X
68.6 fps
NVIDIA GeForce GTX 1060 (Desktop)
GeForce GTX 1060 (Desktop), 6700K
61.1 fps
1920x1080 Epic (Render Scale 100 %) AA:SM AF:16x
NVIDIA Titan RTX
NVIDIA Titan RTX, R7 2700X, ADATA Premier Pro SP900NS38 512 GB
298 fps
NVIDIA GeForce RTX 2080 (Desktop)
GeForce RTX 2080 (Desktop), R7 2700X
262 fps
NVIDIA GeForce RTX 2070 (Desktop)
GeForce RTX 2070 (Desktop), R7 2700X
206 (177min - 260max) fps
NVIDIA GeForce GTX 1080 (Desktop)
GeForce GTX 1080 (Desktop), 4790K, Samsung SSD 840 Pro 256GB MZ7PD256HAFV-0Z000
196 (164min - 231max) fps
NVIDIA GeForce GTX 1070 (Desktop)
GeForce GTX 1070 (Desktop), 4790K, Samsung SSD 840 Pro 256GB MZ7PD256HAFV-0Z000
161 (135min - 187max) fps
AMD Radeon RX 580 (Desktop)
Radeon RX 580, R7 1800X
145.7 fps
AMD Radeon RX 590 (Desktop)
Radeon RX 590, R7 2700X
124.6 (100min - 146max) fps
NVIDIA GeForce GTX 1060 (Desktop)
GeForce GTX 1060 (Desktop), 6700K
116 fps
Shadow of the Tomb Raider
3840x2160 Highest Preset AA:T
NVIDIA Titan RTX
NVIDIA Titan RTX, R7 2700X, ADATA Premier Pro SP900NS38 512 GB
59 fps
NVIDIA GeForce RTX 2080 (Desktop)
GeForce RTX 2080 (Desktop), R7 2700X
45 fps
NVIDIA Titan X Pascal
Titan X Pascal, TR 1950X, Samsung SM951 MZHPV512HDGL m.2 PCI-e
43 fps
NVIDIA GeForce RTX 2070 (Desktop)
GeForce RTX 2070 (Desktop), R7 2700X
38 fps
AMD Radeon RX Vega 64
RX Vega 64, R7 2700X
29 fps
AMD Radeon RX 590 (Desktop)
Radeon RX 590, R7 2700X
24 fps
1920x1080 Highest Preset AA:T
NVIDIA Titan RTX
NVIDIA Titan RTX, R7 2700X, ADATA Premier Pro SP900NS38 512 GB
116 fps
NVIDIA GeForce RTX 2080 (Desktop)
GeForce RTX 2080 (Desktop), R7 2700X
111 fps
NVIDIA Titan X Pascal
Titan X Pascal, TR 1950X, Samsung SM951 MZHPV512HDGL m.2 PCI-e
103 fps
NVIDIA GeForce RTX 2070 (Desktop)
GeForce RTX 2070 (Desktop), R7 2700X
101 fps
AMD Radeon RX Vega 64
RX Vega 64, R7 2700X
85 fps
AMD Radeon RX 590 (Desktop)
Radeon RX 590, R7 2700X
66 fps
Darksiders III
3840x2160 Epic
NVIDIA Titan RTX
NVIDIA Titan RTX, R7 2700X, ADATA Premier Pro SP900NS38 512 GB
74 (57min - 84max) fps
NVIDIA Titan X Pascal
Titan X Pascal, TR 1950X, Samsung SM951 MZHPV512HDGL m.2 PCI-e
54.6 (40min - 62max) fps
AMD Radeon RX Vega 64
RX Vega 64, R7 2700X
35.8 (31min - 40max) fps
AMD Radeon RX 590 (Desktop)
Radeon RX 590, R7 2700X
23.1 (20min - 26max) fps
1920x1080 Epic
NVIDIA Titan RTX
NVIDIA Titan RTX, R7 2700X, ADATA Premier Pro SP900NS38 512 GB
131 (69min - 164max) fps
NVIDIA Titan X Pascal
Titan X Pascal, TR 1950X, Samsung SM951 MZHPV512HDGL m.2 PCI-e
106.1 (52min - 138max) fps
AMD Radeon RX Vega 64
RX Vega 64, R7 2700X
99.4 (48min - 116max) fps
AMD Radeon RX 590 (Desktop)
Radeon RX 590, R7 2700X
68.2 (50min - 76max) fps
Need for Speed Payback
3840x2160 Ultra Preset
NVIDIA Titan RTX
NVIDIA Titan RTX, R7 2700X, ADATA Premier Pro SP900NS38 512 GB
90 (71min - 104max) fps
AMD Radeon RX 590 (Desktop)
Radeon RX 590, R7 2700X
33.9 (25min - 38max) fps
AMD Radeon RX 580 (Desktop)
Radeon RX 580, R7 1800X
30.7 (22min - 36max) fps
1920x1080 Ultra Preset
NVIDIA Titan RTX
NVIDIA Titan RTX, R7 2700X, ADATA Premier Pro SP900NS38 512 GB
121 (85min - 170max) fps
AMD Radeon RX 590 (Desktop)
Radeon RX 590, R7 2700X
105.7 (76min - 131max) fps
AMD Radeon RX 580 (Desktop)
Radeon RX 580, R7 1800X
91.5 (61min - 117max) fps
low med. high ultra4K
BioShock Infinite (2013) 311.5 287.3 262.2 212.8
Battlefield 4 (2013) 200 200 200 200 159
GTA V (2015) 171.1 166.9 146.6 125.1 140.6
The Witcher 3 (2015) 300 270 215 128 102
Rainbow Six Siege (2015) 327 281 275 274 177
Rise of the Tomb Raider (2016) 272 196 189 188 99
Far Cry Primal (2016) 116 104 95 88 88
The Division (2016) 277 241 188 163 91
Doom (2016) 147 139 139 144 140
Overwatch (2016) 300 300 300 298 267
Deus Ex Mankind Divided (2016) 157.8 148.1 128.7 120.7 71.6
FIFA 17 (2016) 420 411 390 386 355
Battlefield 1 (2016) 193.7 179.9 166.2 154.2 111.8
Dishonored 2 (2016) 120 119 119 115 104
Watch Dogs 2 (2016) 141 125 112 100 70
For Honor (2017) 268 245 243 213 101
Ghost Recon Wildlands (2017) 140 114 112 86 67
Rocket League (2017) 248 248 248 197
Dirt 4 (2017) 323 254 220 192 124
Playerunknown's Battlegrounds (PUBG) (2017) 206 202 163 136 96
F1 2017 (2017) 232 188 156 141 101
FIFA 18 (2017) 361 356 327 325 302
Destiny 2 (2017) 149 154 150 154 94
Assassin´s Creed Origins (2017) 115 104 102 87 65
Call of Duty WWII (2017) 255 255 185 179 127
Need for Speed Payback (2017) 138 128 123 121 90
Fortnite (2018) 274 169 176 134 74
Final Fantasy XV Benchmark (2018) 155 144 112 58
Kingdom Come: Deliverance (2018) 140 127 101 79 49
Far Cry 5 (2018) 129 115 109 103 75
The Crew 2 (2018) 60 60 60 60 60
Monster Hunter World (2018) 148 142 141 136 54
F1 2018 (2018) 234 206 160 143 99
Shadow of the Tomb Raider (2018) 135 122 121 116 59
FIFA 19 (2018) 286 281 254 251 213
Forza Horizon 4 (2018) 173 153 152 132 90
Assassin´s Creed Odyssey (2018) 114 104 95 79 52
Call of Duty Black Ops 4 (2018) 225 209 205 200 88
Hitman 2 (2018) 87 85 78 75 75
Fallout 76 (2018) 60 60 60 60 60
Battlefield V (2018) 169.5 163.2 163.8 160.4 97.3
Farming Simulator 19 (2018) 198 157 131 125 112
Darksiders III (2018) 214 145 138 131 74
Just Cause 4 (2018) 208 201 156 151 67

NVIDIA Asteroids Demo

NVIDIA has also developed its Asteroids demo to demonstrate the power of its Turing GPUs. The demo is currently only playable on NVIDIA RTX GPUs and has 350,000 asteroids which you fly a spaceship among. The TITAN RTX averages around 50 FPS with the level of detail set to dynamic at 2160p, but framerates do not drop below 40 FPS. We have included a short video of the benchmark below to show how well the TITAN RTX performs.

Application Performance

The TITAN RTX also finished top of LuxMark benchmarks, in which it outscored the RTX 2080 by at least 36% and a whopping 55% more than the TITAN X. The TITAN RTX has a considerable performance advantage in ComputeMark benchmarks too, although its lead is cut to 15% in the Mandel Vector benchmark.

LuxMark v2.0 64Bit
Room GPUs-only
NVIDIA Titan RTX
Nvidia Titan RTX, AMD Ryzen 7 2700X
4643 Samples/s
NVIDIA GeForce RTX 2080 (Desktop)
Asus ROG Strix RTX 2080 OC, AMD Ryzen 7 2700X
3423 Samples/s
NVIDIA GeForce RTX 2070 (Desktop)
Asus ROG Strix RTX 2070 OC, AMD Ryzen 7 2700X
3333 Samples/s
NVIDIA Titan X Pascal
Nvidia Titan X (Pascal), Intel Xeon E5-2680 v4
2991 Samples/s
NVIDIA GeForce GTX 1070 (Desktop)
Nvidia GeForce GTX 1070 Founders Edition, Intel Core i7-4790K
2474 Samples/s
NVIDIA GeForce GTX 1080 (Desktop)
Nvidia GeForce GTX 1080 Founders Edition, Intel Core i7-4790K
2327 Samples/s
NVIDIA GeForce GTX 1080 (Desktop)
MSI Gaming X GeForce GTX 1080 Desktop PC, Intel Core i7-4790K
2136 Samples/s
AMD Radeon RX 590 (Desktop)
XFX AMD Radeon RX 590 OC+ 8 GB, AMD Ryzen 7 2700X
1996 Samples/s
NVIDIA GeForce GTX 1060 (Desktop)
Nvidia GeForce GTX 1060 Founders Edition 6 GB, Intel Core i7-6700K
1773 Samples/s
AMD Radeon RX 580 (Desktop)
Sapphire Radeon RX 580 Nitro+ 8 GB, AMD Ryzen 7 1800X
1757 Samples/s
Sala GPUs-only
NVIDIA Titan RTX
Nvidia Titan RTX, AMD Ryzen 7 2700X
10799 Samples/s
NVIDIA GeForce RTX 2080 (Desktop)
Asus ROG Strix RTX 2080 OC, AMD Ryzen 7 2700X
7886 Samples/s
NVIDIA GeForce RTX 2070 (Desktop)
Asus ROG Strix RTX 2070 OC, AMD Ryzen 7 2700X
7293 Samples/s
NVIDIA Titan X Pascal
Nvidia Titan X (Pascal), Intel Xeon E5-2680 v4
6920 Samples/s
NVIDIA GeForce GTX 1070 (Desktop)
Nvidia GeForce GTX 1070 Founders Edition, Intel Core i7-4790K
5012 Samples/s
NVIDIA GeForce GTX 1080 (Desktop)
MSI Gaming X GeForce GTX 1080 Desktop PC, Intel Core i7-4790K
4791 Samples/s
NVIDIA GeForce GTX 1080 (Desktop)
Nvidia GeForce GTX 1080 Founders Edition, Intel Core i7-4790K
4708 Samples/s
AMD Radeon RX 590 (Desktop)
XFX AMD Radeon RX 590 OC+ 8 GB, AMD Ryzen 7 2700X
4084 Samples/s
AMD Radeon RX 580 (Desktop)
Sapphire Radeon RX 580 Nitro+ 8 GB, AMD Ryzen 7 1800X
3612 Samples/s
NVIDIA GeForce GTX 1060 (Desktop)
Nvidia GeForce GTX 1060 Founders Edition 6 GB, Intel Core i7-6700K
2584 Samples/s
ComputeMark v2.1
1024x600 Normal, QJuliaRayTrace
NVIDIA Titan RTX
Nvidia Titan RTX, AMD Ryzen 7 2700X
9418 Points
NVIDIA Titan X Pascal
Nvidia Titan X (Pascal), Intel Xeon E5-2680 v4
7847 Points
NVIDIA GeForce RTX 2080 (Desktop)
Asus ROG Strix RTX 2080 OC, AMD Ryzen 7 2700X
7122 Points
NVIDIA GeForce GTX 1080 (Desktop)
MSI Gaming X GeForce GTX 1080 Desktop PC, Intel Core i7-4790K
6555 Points
NVIDIA GeForce GTX 1080 (Desktop)
Nvidia GeForce GTX 1080 Founders Edition, Intel Core i7-4790K
6191 Points
NVIDIA GeForce RTX 2070 (Desktop)
Asus ROG Strix RTX 2070 OC, AMD Ryzen 7 2700X
6038 Points
NVIDIA GeForce GTX 1070 (Desktop)
Nvidia GeForce GTX 1070 Founders Edition, Intel Core i7-4790K
4761 Points
NVIDIA GeForce GTX 1060 (Desktop)
Nvidia GeForce GTX 1060 Founders Edition 6 GB, Intel Core i7-6700K
3322 Points
AMD Radeon RX 590 (Desktop)
XFX AMD Radeon RX 590 OC+ 8 GB, AMD Ryzen 7 2700X
3299 Points
AMD Radeon RX 580 (Desktop)
Sapphire Radeon RX 580 Nitro+ 8 GB, AMD Ryzen 7 1800X
2777 Points
1024x600 Normal, Mandel Scalar
NVIDIA Titan RTX
Nvidia Titan RTX, AMD Ryzen 7 2700X
5977 Points
NVIDIA Titan X Pascal
Nvidia Titan X (Pascal), Intel Xeon E5-2680 v4
5096 Points
NVIDIA GeForce RTX 2080 (Desktop)
Asus ROG Strix RTX 2080 OC, AMD Ryzen 7 2700X
4427 Points
NVIDIA GeForce GTX 1080 (Desktop)
MSI Gaming X GeForce GTX 1080 Desktop PC, Intel Core i7-4790K
4080 Points
NVIDIA GeForce RTX 2070 (Desktop)
Asus ROG Strix RTX 2070 OC, AMD Ryzen 7 2700X
3662 Points
NVIDIA GeForce GTX 1080 (Desktop)
Nvidia GeForce GTX 1080 Founders Edition, Intel Core i7-4790K
3646 Points
AMD Radeon RX 590 (Desktop)
XFX AMD Radeon RX 590 OC+ 8 GB, AMD Ryzen 7 2700X
3312 Points
NVIDIA GeForce GTX 1070 (Desktop)
Nvidia GeForce GTX 1070 Founders Edition, Intel Core i7-4790K
2861 Points
AMD Radeon RX 580 (Desktop)
Sapphire Radeon RX 580 Nitro+ 8 GB, AMD Ryzen 7 1800X
2806 Points
NVIDIA GeForce GTX 1060 (Desktop)
Nvidia GeForce GTX 1060 Founders Edition 6 GB, Intel Core i7-6700K
2002 Points
1024x600 Normal, Mandel Vector
NVIDIA Titan RTX
Nvidia Titan RTX, AMD Ryzen 7 2700X
4944 Points
NVIDIA Titan X Pascal
Nvidia Titan X (Pascal), Intel Xeon E5-2680 v4
4284 Points
NVIDIA GeForce RTX 2080 (Desktop)
Asus ROG Strix RTX 2080 OC, AMD Ryzen 7 2700X
3865 Points
NVIDIA GeForce GTX 1080 (Desktop)
MSI Gaming X GeForce GTX 1080 Desktop PC, Intel Core i7-4790K
3630 Points
NVIDIA GeForce RTX 2070 (Desktop)
Asus ROG Strix RTX 2070 OC, AMD Ryzen 7 2700X
3316 Points
NVIDIA GeForce GTX 1080 (Desktop)
Nvidia GeForce GTX 1080 Founders Edition, Intel Core i7-4790K
3284 Points
AMD Radeon RX 590 (Desktop)
XFX AMD Radeon RX 590 OC+ 8 GB, AMD Ryzen 7 2700X
2802 Points
NVIDIA GeForce GTX 1070 (Desktop)
Nvidia GeForce GTX 1070 Founders Edition, Intel Core i7-4790K
2706 Points
AMD Radeon RX 580 (Desktop)
Sapphire Radeon RX 580 Nitro+ 8 GB, AMD Ryzen 7 1800X
2407 Points
NVIDIA GeForce GTX 1060 (Desktop)
Nvidia GeForce GTX 1060 Founders Edition 6 GB, Intel Core i7-6700K
1994 Points
1024x600 Normal, Fluid 2DTexArr
NVIDIA Titan RTX
Nvidia Titan RTX, AMD Ryzen 7 2700X
3691 Points
NVIDIA GeForce RTX 2080 (Desktop)
Asus ROG Strix RTX 2080 OC, AMD Ryzen 7 2700X
2506 Points
NVIDIA GeForce RTX 2070 (Desktop)
Asus ROG Strix RTX 2070 OC, AMD Ryzen 7 2700X
2407 Points
NVIDIA Titan X Pascal
Nvidia Titan X (Pascal), Intel Xeon E5-2680 v4
2032 Points
NVIDIA GeForce GTX 1080 (Desktop)
MSI Gaming X GeForce GTX 1080 Desktop PC, Intel Core i7-4790K
1775 Points
NVIDIA GeForce GTX 1080 (Desktop)
Nvidia GeForce GTX 1080 Founders Edition, Intel Core i7-4790K
1758 Points
NVIDIA GeForce GTX 1070 (Desktop)
Nvidia GeForce GTX 1070 Founders Edition, Intel Core i7-4790K
1390 Points
AMD Radeon RX 590 (Desktop)
XFX AMD Radeon RX 590 OC+ 8 GB, AMD Ryzen 7 2700X
1140 Points
AMD Radeon RX 580 (Desktop)
Sapphire Radeon RX 580 Nitro+ 8 GB, AMD Ryzen 7 1800X
1031 Points
NVIDIA GeForce GTX 1060 (Desktop)
Nvidia GeForce GTX 1060 Founders Edition 6 GB, Intel Core i7-6700K
963 Points
1024x600 Normal, Fluid 3DTex
NVIDIA Titan RTX
Nvidia Titan RTX, AMD Ryzen 7 2700X
3877 Points
NVIDIA GeForce RTX 2080 (Desktop)
Asus ROG Strix RTX 2080 OC, AMD Ryzen 7 2700X
2564 Points
NVIDIA GeForce RTX 2070 (Desktop)
Asus ROG Strix RTX 2070 OC, AMD Ryzen 7 2700X
2536 Points
NVIDIA Titan X Pascal
Nvidia Titan X (Pascal), Intel Xeon E5-2680 v4
2254 Points
NVIDIA GeForce GTX 1080 (Desktop)
MSI Gaming X GeForce GTX 1080 Desktop PC, Intel Core i7-4790K
1767 Points
NVIDIA GeForce GTX 1080 (Desktop)
Nvidia GeForce GTX 1080 Founders Edition, Intel Core i7-4790K
1730 Points
NVIDIA GeForce GTX 1070 (Desktop)
Nvidia GeForce GTX 1070 Founders Edition, Intel Core i7-4790K
1402 Points
AMD Radeon RX 590 (Desktop)
XFX AMD Radeon RX 590 OC+ 8 GB, AMD Ryzen 7 2700X
1239 Points
AMD Radeon RX 580 (Desktop)
Sapphire Radeon RX 580 Nitro+ 8 GB, AMD Ryzen 7 1800X
1189 Points
NVIDIA GeForce GTX 1060 (Desktop)
Nvidia GeForce GTX 1060 Founders Edition 6 GB, Intel Core i7-6700K
985 Points
1024x600 Normal, Score
NVIDIA Titan RTX
Nvidia Titan RTX, AMD Ryzen 7 2700X
27907 Points
NVIDIA Titan X Pascal
Nvidia Titan X (Pascal), Intel Xeon E5-2680 v4
21512 Points
NVIDIA GeForce RTX 2080 (Desktop)
Asus ROG Strix RTX 2080 OC, AMD Ryzen 7 2700X
20484 Points
NVIDIA GeForce GTX 1080 (Desktop)
MSI Gaming X GeForce GTX 1080 Desktop PC, Intel Core i7-4790K
17806 Points
NVIDIA GeForce RTX 2070 (Desktop)
Asus ROG Strix RTX 2070 OC, AMD Ryzen 7 2700X
17690 Points
NVIDIA GeForce GTX 1080 (Desktop)
Nvidia GeForce GTX 1080 Founders Edition, Intel Core i7-4790K
16610 Points
NVIDIA GeForce GTX 1070 (Desktop)
Nvidia GeForce GTX 1070 Founders Edition, Intel Core i7-4790K
13121 Points
AMD Radeon RX 590 (Desktop)
XFX AMD Radeon RX 590 OC+ 8 GB, AMD Ryzen 7 2700X
11791 Points
AMD Radeon RX 580 (Desktop)
Sapphire Radeon RX 580 Nitro+ 8 GB, AMD Ryzen 7 1800X
10210 Points
NVIDIA GeForce GTX 1060 (Desktop)
Nvidia GeForce GTX 1060 Founders Edition 6 GB, Intel Core i7-6700K
9266 Points

Professional Applications

The TITAN RTX would also appear to be well-suited for as a workstation GPU considering how powerful it is. Unfortunately, NVIDIA does not certify the GPU’s GeForce drivers for professional applications, which puts the TITAN RTX at a disadvantage compared to current Quadro GPUs. The TITAN RTX performed well in SPECviewperf benchmarks though compared to the Quadro M5000M and outperformed its predecessor, the TITAN X. The GeForce RTX 2080 and RTX 2070 are generally on par with the Radeon RX Vega 64 in these benchmarks, although they occasionally outperform the TITAN RTX.

However, the TITAN RTX will be no match for Quadro RTX series GPUs, which also use a TU102 chip and are equipped with up to 24 GB of VRAM. The TITAN RTX costs about as much as the Quadro RTX 5000, which you can currently pre-order from NVIDIA for $2,300. It is a bargain compared to the Quadro RTX 6000 though, which NVIDIA sells for $6,300.

NVIDIA Titan RTX
Nvidia Titan RTX, AMD Ryzen 7 2700X
NVIDIA Titan X Pascal
NVIDIA Titan X Pascal, AMD Ryzen Threadripper 1950X
NVIDIA GeForce RTX 2080 (Desktop)
Asus ROG Strix RTX 2080 OC, AMD Ryzen 7 2700X
NVIDIA GeForce RTX 2070 (Desktop)
Asus ROG Strix RTX 2070 OC, AMD Ryzen 7 2700X
AMD Radeon RX Vega 64
AMD Threadripper 2920X, AMD Radeon RX Vega 64, AMD Ryzen Threadripper 2920X
AMD Radeon RX 580 (Desktop)
Asus ROG Strix RX 580 8 GB, AMD Ryzen 7 2700X
NVIDIA Quadro M5000M
MSI WT72-6QM, Intel Xeon E3-1505M v5
SPECviewperf 12
1900x1060 Solidworks (sw-03)
139.6
77.1
69.5
61
74.6
66
101
1900x1060 Siemens NX (snx-02)
256.3
206.8
11.74
8.56
22.74
21.27
86.9
1900x1060 Showcase (showcase-01)
191.6
137
137.9
128.2
110.9
72.3
44.14
1900x1060 Medical (medical-01)
87
79.6
45.26
41.41
46.31
31.76
31.35
1900x1060 Maya (maya-04)
132.8
79.7
150.4
148.6
76.1
61.5
69.6
1900x1060 Energy (energy-01)
28.12
19.78
12.38
11.61
12.16
6.02
6.86
1900x1060 Creo (creo-01)
106.3
75.4
52.1
45.56
53.5
45
81.3
1900x1060 Catia (catia-04)
178.1
100.3
107.5
83
151.3
109.1
94.4
1900x1060 3ds Max (3dsmax-05)
268.2
151.9
176.2
166.5
136.1
115.5
SPECviewperf 13
Solidworks (sw-04)
132.9
82.1
95.4
78.8
Siemens NX (snx-03)
462.4
370.9
41.07
38.19
Showcase (showcase-02)
192
136.8
110.9
72.2
Medical (medical-02)
89.3
71.4
34.83
26.86
Maya (maya-05)
367.8
236.5
200.7
147.4
Energy (energy-02)
51.9
32.46
22.77
8.45
Creo (creo-02)
307.6
185.2
109.2
80.1
Catia (catia-05)
260.4
161.4
228.3
158
3ds Max (3dsmax-06)
268.7
153.4
140.6
115.7
Total Average (Program / Settings)

Emissions

NVIDIA TITAN RTX during a stress test

NVIDIA has done an excellent job of redesigning the TITAN RTX’s radiator. Our GPU is quieter when idling than the rest of the components in our test system, while the fans only spin up moderately when we are pushing the card hard. In short, the fan experience is worlds apart from the TITAN X. The two axial fans are not only considerably quieter than the single radial fan in the TITAN X, but they are also more effective.

The TITAN RTX also maintains its 1,770 MHz base clock speed without thermal throttling; it is only held back by its power target. The TITAN RTX suffers from coil whine like almost all modern graphics cards, which we can hear when games are running at 200 FPS and higher. Moreover, the coil whine gets louder as frame rates increase. Fortunately, activating G-Sync or V-Sync reduces the intensity of the whining somewhat.

We also subjected the TITAN RTX to a stress test, during which GPU core temperatures reached a maximum of 78 °C (~172 °F). It should be noted that the card starts to thermal throttle at 89 °C (~192 °F) to prevent it from overheating. Our test GPU averaged around 1,800 MHz during a FurMark stress test though, which is above NVIDIA’s stated boost clock speed. The two fans only span at 2,200 RPM too, such is the effectiveness of the TITAN RTX’s cooling. 2,200 RPM represents approximately 59% fan speed, for reference.

Increasing the power target to 114% caused the clock speed to rise to 1,860 MHz, although the core temperatures also rose by a further 4 °C (~8 °F) to 82 °C (~180 °F). The additional 14% power target also causes power consumption to spike to 320 W for just the GPU. The increased power consumption is around 40 W, or around 15%, higher than consumption at stock levels.

Our test system consumed a minimum of 432 W while playing "The Witcher 3" at 1,920x1,080, which peaked at 452 W. Please keep in mind that we measured this directly from the socket and it does not include how much power our test monitor also consumes.

Power Consumption - 1920x1080 The Witcher 3 ultra (external Monitor)
AMD Ryzen 7 2700X
NVIDIA Titan RTX
437.4 (432min - 452max) Watt *
AMD Ryzen 7 2700X
AMD Radeon RX Vega 64 (Idle: 74.3 W)
408 Watt *
Intel Core i9-7900X
NVIDIA GeForce GTX 1080 Ti (Desktop) (99 fps, Idle: 63.4 W)
373 Watt *
AMD Ryzen 7 2700X
AMD Radeon RX 590 (Desktop)
346.9 (326min - 364max) Watt *
Intel Core i7-4790K
NVIDIA GeForce GTX 1080 (Desktop) (Idle: 71.1 W)
331 Watt *
AMD Ryzen 7 2700X
NVIDIA GeForce RTX 2070 (Desktop)
329 Watt *
Intel Core i7-4790K
NVIDIA GeForce GTX 1080 (Desktop) (Idle: 68.3 W)
294 Watt *
Intel Core i7-4790K
NVIDIA GeForce GTX 1070 (Desktop) (Idle: 68 W)
243 Watt *

* ... smaller is better

Verdict

The NVIDIA TITAN RTX Desktop GPU review.

The NVIDIA TITAN RTX is currently the fastest graphics card that money can buy. However, you must game in at least 2160p and high graphics to exploit its potential. The TITAN RTX is simply not worth the money if you only game at 1080p. The TITAN RTX will only be available from NVIDIA too, so you will not be able to buy a cheaper or overclocked third-party card. By contrast, there are already third-party RTX 2080 Ti GPUs that can consume up to 380 W, and which will outperform the TITAN RTX. Moreover, NVIDIA’s new TITAN GPU is currently around double the cost of a TITAN X, which puts its improved performance into perspective.

The NVIDIA TITAN RTX is the GPU to get if you want the best that money can buy. It cannot outperform a much cheaper and overclocked RTX 2080 Ti though, despite costing several hundred $ more.

The TITAN RTX looks and performs like a premium GPU, while its new cooling solution is whisper quiet. However, it is not first on our list of GPUs that we would recommend to gamers. The TITAN RTX is too expensive and does not set itself apart from the RTX 2080 Ti. It is not ideally suited as a workstation GPU either, although its 24 GB of GDDR6 VRAM would come in usual and it is much cheaper than a comparable Quadro RTX card. In short, the TITAN RTX will suit a niche crowd of gamers, but there are better value GPUs on the market that deliver comparable performance.

Notebook reviews with NVIDIA Titan RTX graphics card

Intel Alder Lake-S review: Does Intel have the fastest gaming CPU again?

Intel Alder Lake-S review: Does Intel have the fastest gaming CPU again?

Starting today, Intel's 12th generation of the Core processors is available for sale, seeking to attract buyers. Find out in this review what you can expect fro...
Intel Core i5-12600K | NVIDIA Titan RTX | 32.00"
Intel Alder Lake-S review: Does Intel have the fastest gaming CPU again?

Intel Alder Lake-S review: Does Intel have the fastest gaming CPU again?

Starting today, Intel's 12th generation of the Core processors is available for sale, seeking to attract buyers. Find out in this review what you can expect fro...
Intel Core i9-12900K | NVIDIA Titan RTX | 32.00"
Intel Core i5-11400F desktop processor

Intel Core i5-11400F desktop processor

Intel's Core i5-11400F is a fast 6-core processor with Hyperthreading based on the new Rocket Lake S architecture. Thus, this CPU is ideally suited for gaming. ...
Intel Core i5-11400F | NVIDIA Titan RTX | 32.00"
A second look at the Vermeer - AMD Ryzen 9 5950X and AMD Ryzen 5 5600X Review

A second look at the Vermeer - AMD Ryzen 9 5950X and AMD Ryzen 5 5600X Review

After the new Vermeer processors, alias Ryzen 5000, were officially introduced on 10/8/2020, the expectations were high. In a first test of the Ryzen 9 5900X an...
AMD Ryzen 9 5950X | NVIDIA Titan RTX | 32.00"
A second look at the Vermeer - AMD Ryzen 9 5950X and AMD Ryzen 5 5600X Review

A second look at the Vermeer - AMD Ryzen 9 5950X and AMD Ryzen 5 5600X Review

After the new Vermeer processors, alias Ryzen 5000, were officially introduced on 10/8/2020, the expectations were high. In a first test of the Ryzen 9 5900X an...
AMD Ryzen 5 5600X | NVIDIA Titan RTX | 32.00"

AMD Ryzen 9 5900X: AMD Ryzen 9 5900X, 32.00"
  Review » AMD Ryzen 9 5900X and AMD Ryzen 7 5800X in Review: AMD dethrones Intel as Fastest Gaming CPU

  Review » AMD Ryzen 9 5900X and AMD Ryzen 7 5800X in Review: AMD dethrones Intel as Fastest Gaming CPU

  Review » Intel Core i7-10700K desktop processor

  Review » AMD Ryzen 7 3800XT Desktop CPU in review: Matisse refresh for the AM4 socket

  Review » Benchmarking Intel Comet Lake-S CPUs with up to 10 cores

  Review » Benchmarking Intel Comet Lake-S CPUs with up to 10 cores

  Review » AMD Ryzen 3 3100 and Ryzen 3 3300X with 4 cores and 8 threads in review

  Review » AMD Ryzen 3 3100 and Ryzen 3 3300X with 4 cores and 8 threads in review

  Review » AMD Ryzen 3 3100 and Ryzen 3 3300X with 4 cores and 8 threads in review

  Review » AMD Ryzen 3 3100 and Ryzen 3 3300X with 4 cores and 8 threads in review

  Review » AMD Ryzen 3 3100 and Ryzen 3 3300X with 4 cores and 8 threads in review

  Review » AMD Ryzen 9 3950X - The flagship for the AM4 socket in review

  Review » Alphacool Eisbaer Aurora 360 - digital RGB LED upgrade for a modular AIO

  Review » Intel Core i9-9900KS with 5 GHz All-Core-Boost Review

  Review » Alphacool Eisbaer 280 - Modular AIO in Review

  Article » Intel Rocket Lake-S Review: Only 8 cores for the Core i9-11900K

  Article » Intel Rocket Lake-S Review: Only 8 cores for the Core i9-11900K

   » AMD Ryzen 3 finally with 4 cores and 8 threads

   » AMD Ryzen 3 finally with 4 cores and 8 threads

   » How Intel can get back on top

   » How Intel can get back on top

   » How Intel can get back on top

   » Intel Core i3-10100 Desktop Processor - Benchmarks and Specs

static version load dynamic
Loading Comments
Comment on this article
Please share our article, every link counts!
> Expert Reviews and News on Laptops, Smartphones and Tech Innovations > Reviews > NVIDIA TITAN RTX Desktop GPU Review
Sebastian Bade, 2019-01-25 (Update: 2023-09-22)