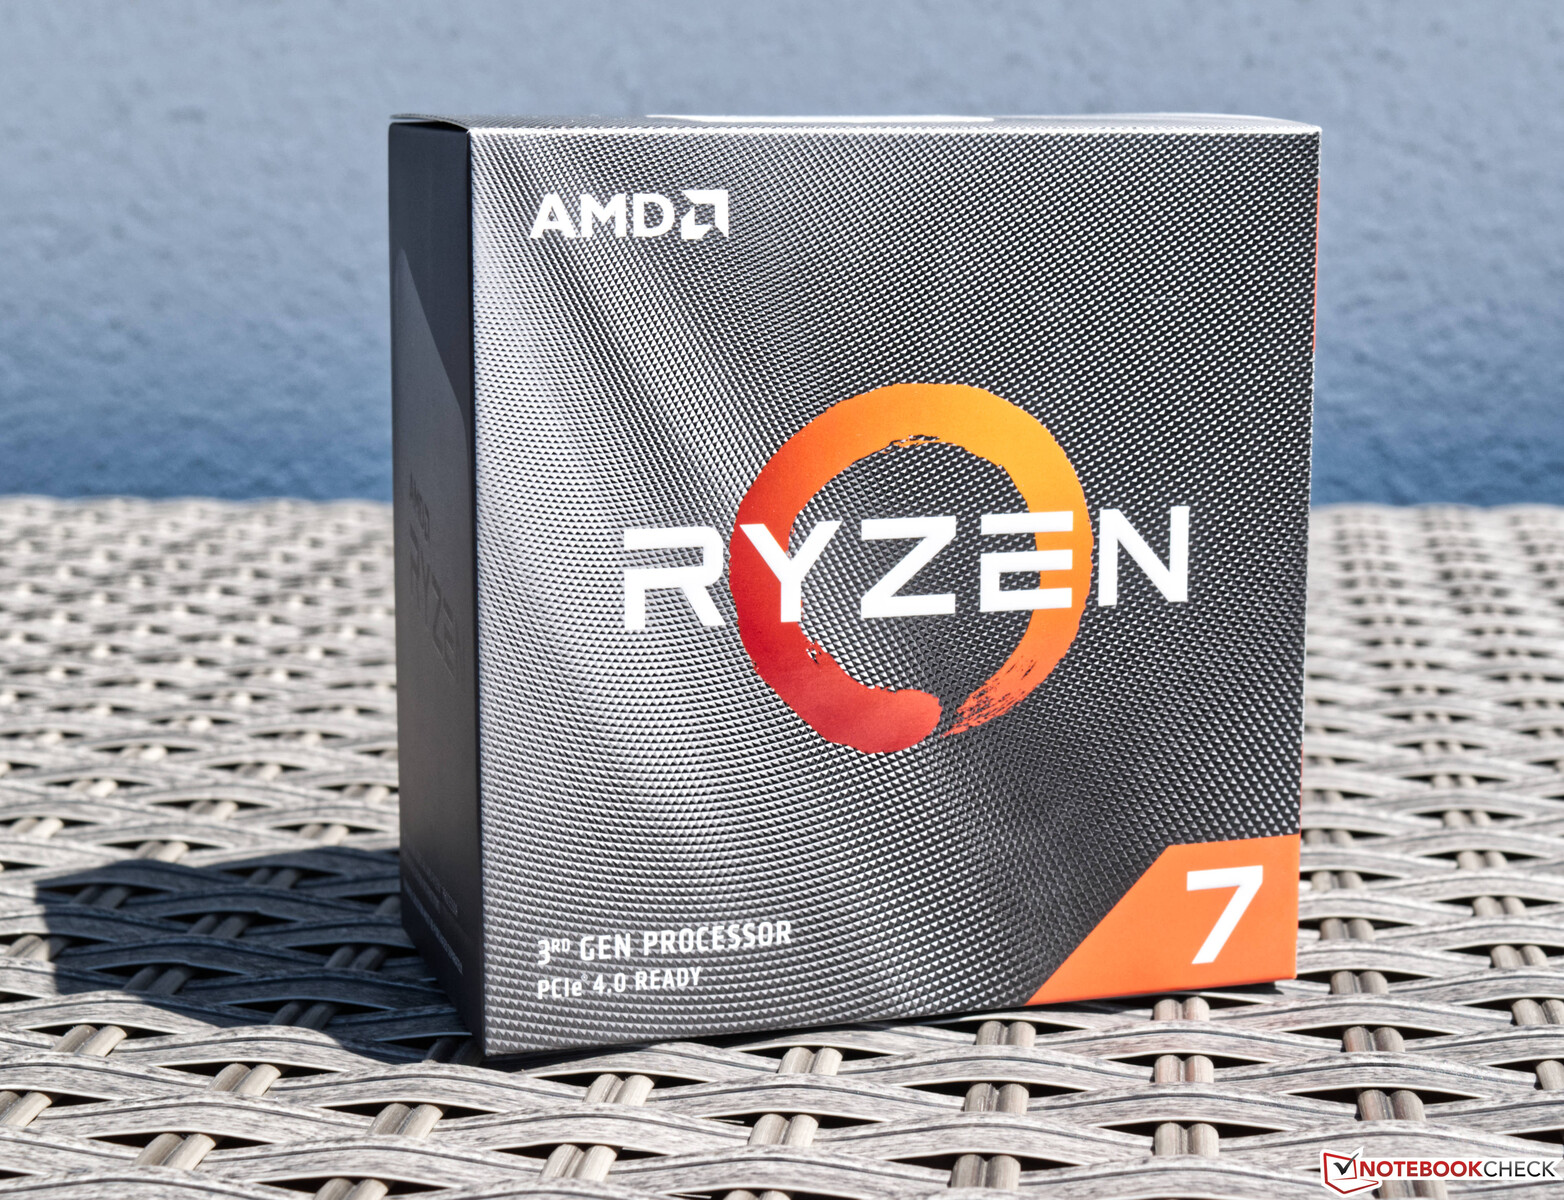
AMD Ryzen 7 3800XT Desktop CPU in review: Matisse refresh for the AM4 socket
We have known the Zen2 architecture for almost exactly one year now. The advantages of the chipset design are obvious and before Zen3 replaces Zen2 as its successor, AMD has introduced three new processors based on the Zen2 architecture. The flagship, the AMD Ryzen 9 3950X, remains the same. The 12-, 8-, and 6-core processors however have undergone various clock speed modifications. In the naming scheme, the new Ryzen models are given an XT, indicating the Refresh-CPUs.
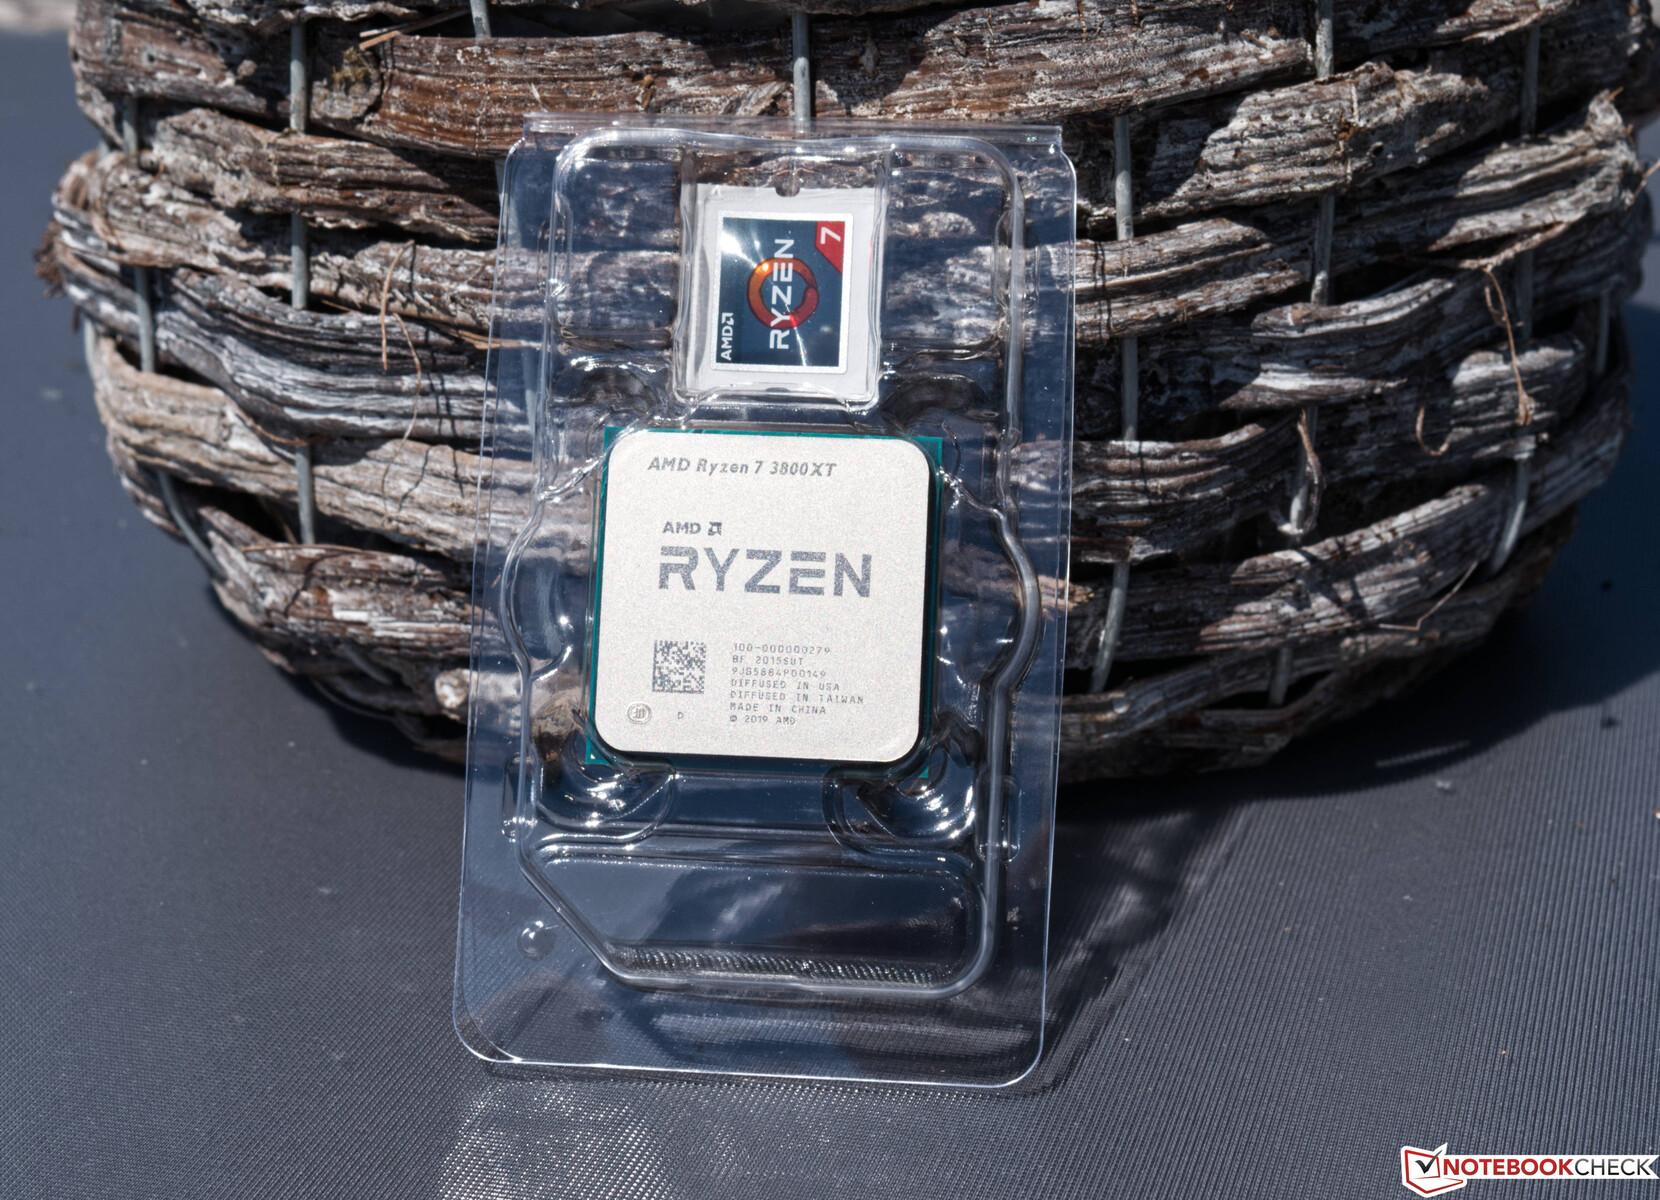
In our review, we took a closer look at the AMD Ryzen 7 3800XT with its 8-cores and 16-threads and let it compete against current models from its own ranks as well as current Intel processors for a direct comparison. AMD does not change the base clock on the Ryzen 7 3800XT compared to the Ryzen 7 3800X. Only the boost clock has been raised by 200 MHz, so that 4.7 GHz can now be reached. On the Ryzen 5 3600XT and the Ryzen 9 3900XT, the increase in maximum boost is a mere 100 MHz, which means less performance difference to the non-XT models.
Our sample is priced at 419 Euros (~$475). For the Ryzen 5 3600XT AMD charges 259 Euros (~$293), whereas 529 Euros (~$599) are due for the 12-core model. These prices already include German VAT.
AMD Ryzen processors at a glance
| Model | Cores / Threads | Base clock | Turbo clock | L3 cache | TDP | Launch price |
|---|---|---|---|---|---|---|
| Ryzen R9 3950X | 16/32 | 3.5 GHz | 4.7 GHz | 64 MB | 105 watts | €819/~$923 |
| Ryzen R9 3900XT | 12/24 | 3.8 GHz | 4.7 GHz | 64 MB | 105 watts | €529/~$597 |
| Ryzen R9 3900X | 12/24 | 3.8 GHz | 4.6 GHz | 64 MB | 105 watts | €529/~$597 |
| Ryzen R7 3800XT | 8/16 | 3.9 GHz | 4.7 GHz | 32 MB | 105 watts | €419/~$473 |
| Ryzen R7 3800X | 8/16 | 3.9 GHz | 4.5 GHz | 32 MB | 105 watts | €429/~$484 |
| Ryzen R7 3700X | 8/16 | 3.6 GHz | 4.4 GHz | 32 MB | 65 watts | €349/~$394 |
| Ryzen R5 3600XT | 6/12 | 3.8 GHz | 4.5 GHz | 32 MB | 95 watts | €259/~$292 |
| Ryzen R5 3600X | 6/12 | 3.8 GHz | 4.4 GHz | 32 MB | 95 watts | €265/~$299 |
| Ryzen R5 3600 | 6/12 | 3.6 GHz | 4.2 GHz | 32 MB | 65 watts | €209/~$236 |
| Ryzen R3 3300X | 4/8 | 3.8 GHz | 4.3 GHz | 16 MB | 65 watts | €129/~$146 |
| Ryzen R3 3100 | 4/8 | 3.6 GHz | 3.9 GHz | 16 MB | 65 watts | €109/~$123 |
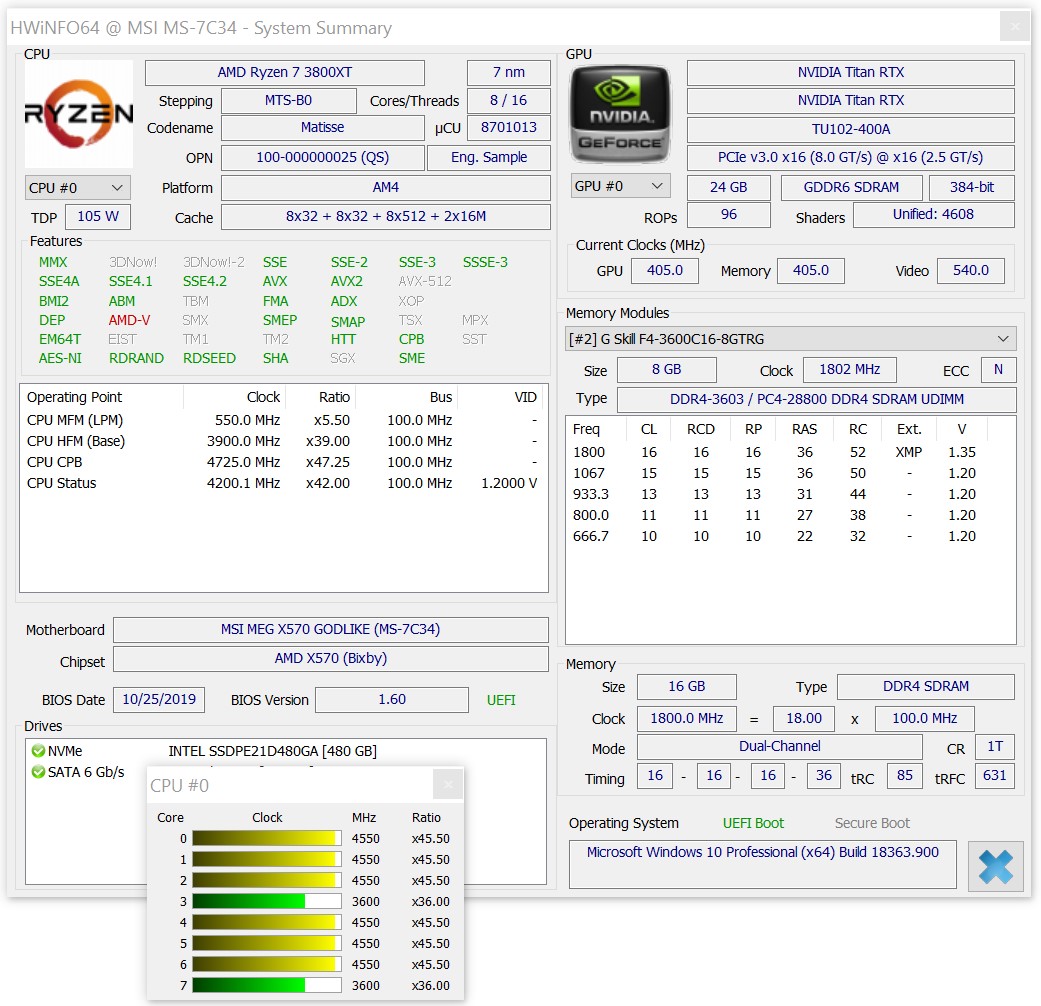
Details about our test system
We used the following hardware for our test system:
- Raijintek Pean Benchtable
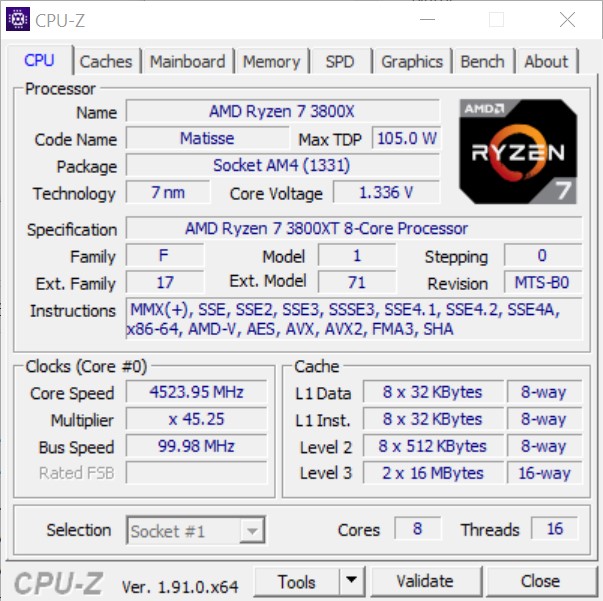
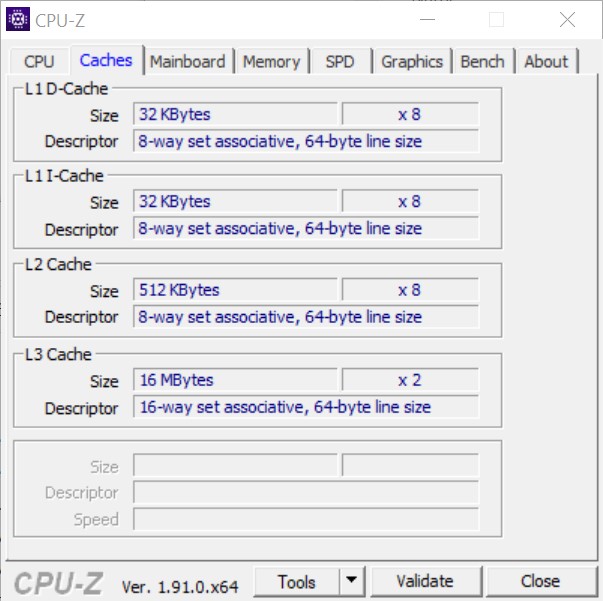
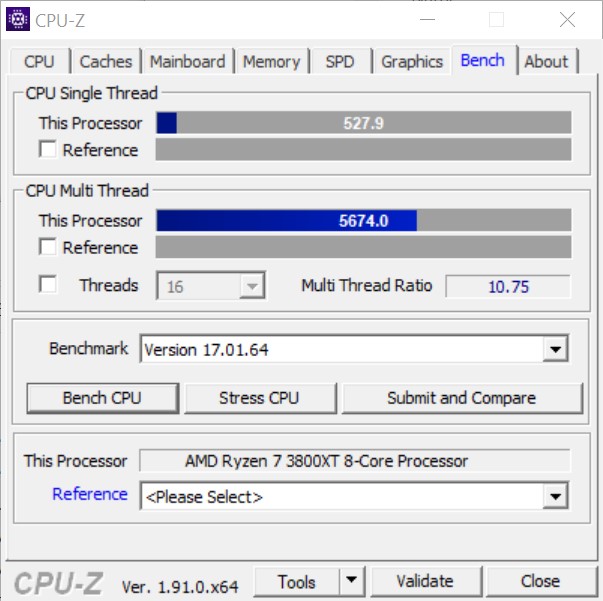
- AMD Ryzen 7 3800XT
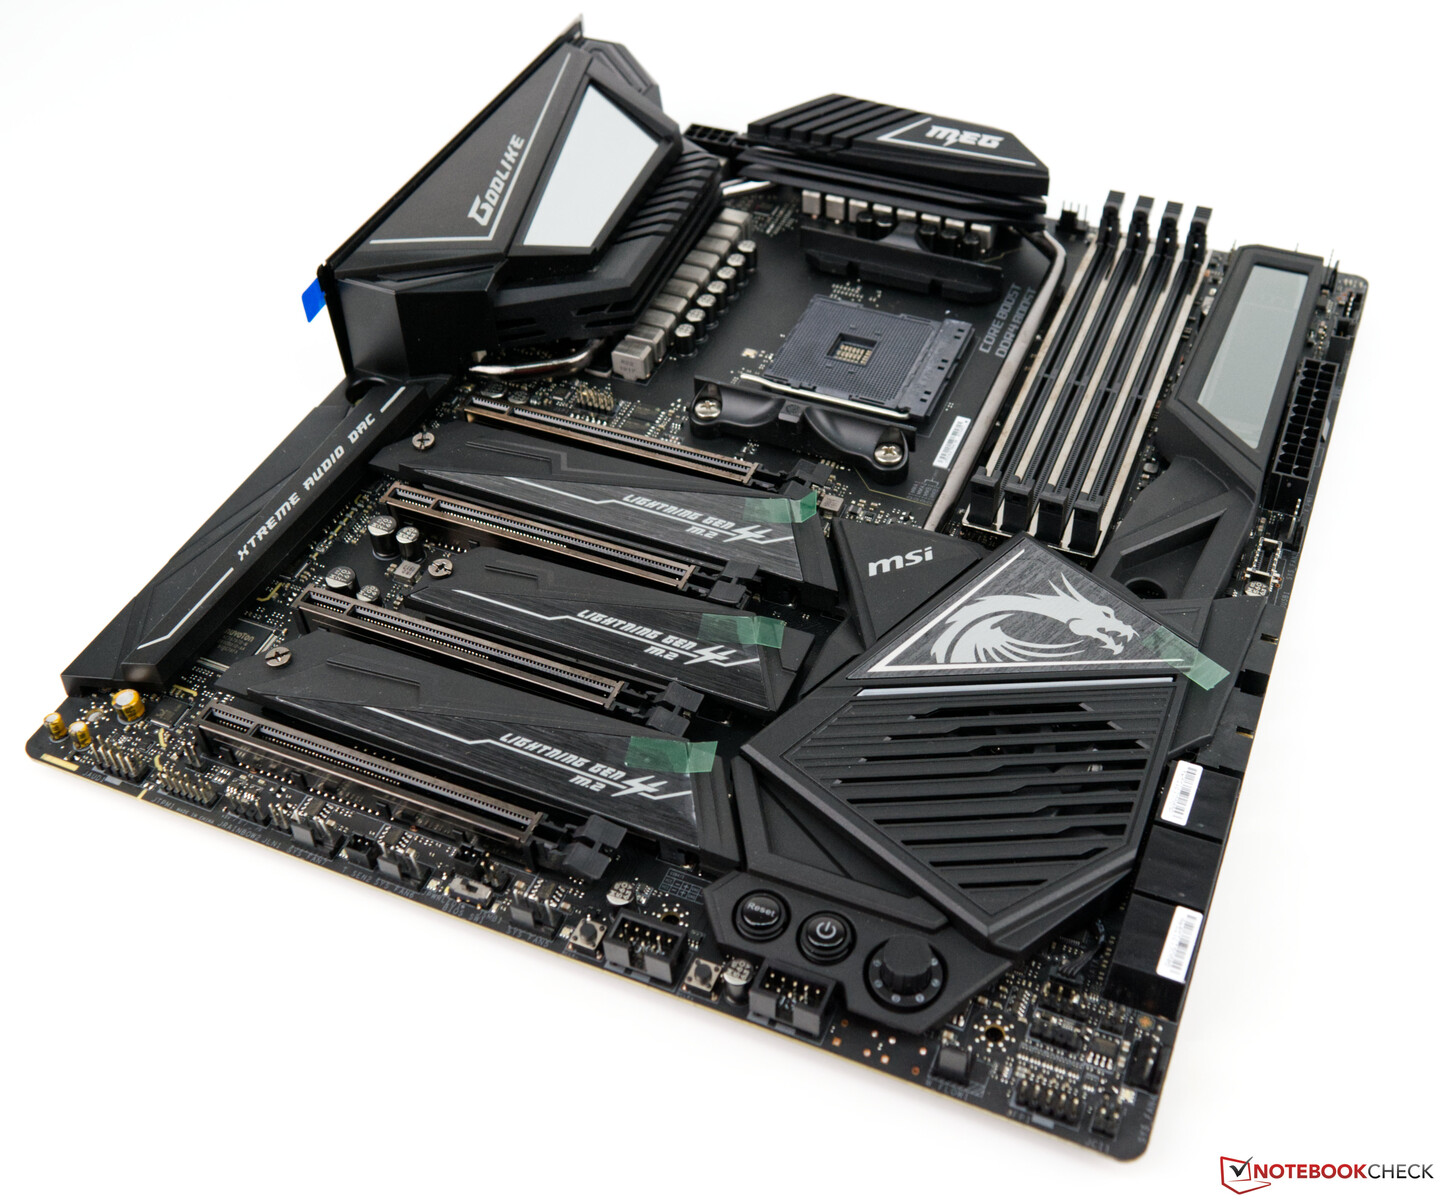
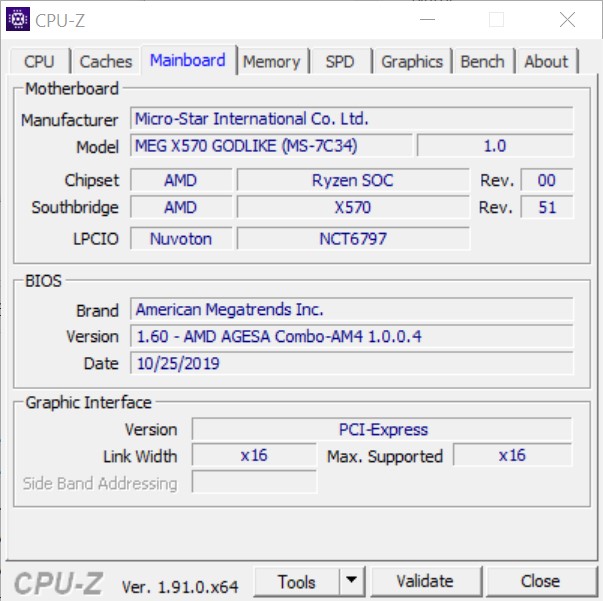
- MSI MEG X570 Godlike
- Alphacool Eisbear 280 AiO
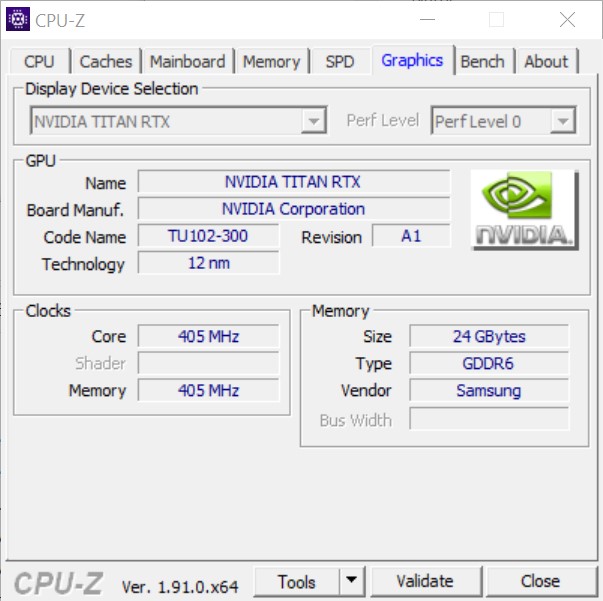
- Nvidia Titan RTX
- Corsair RM 1000X PSU
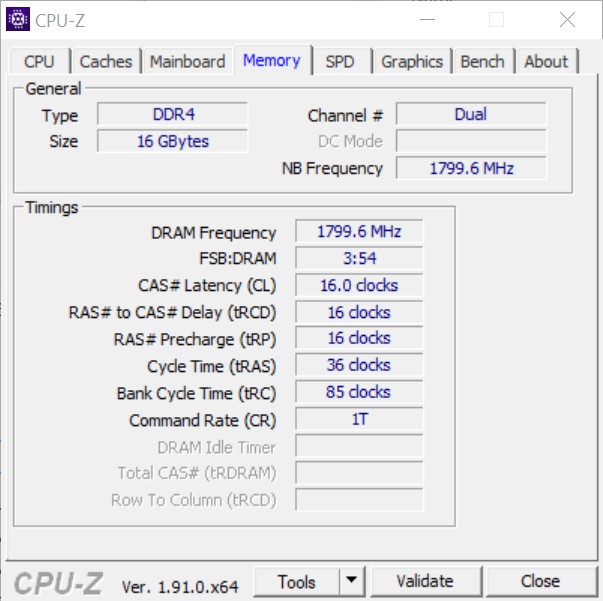
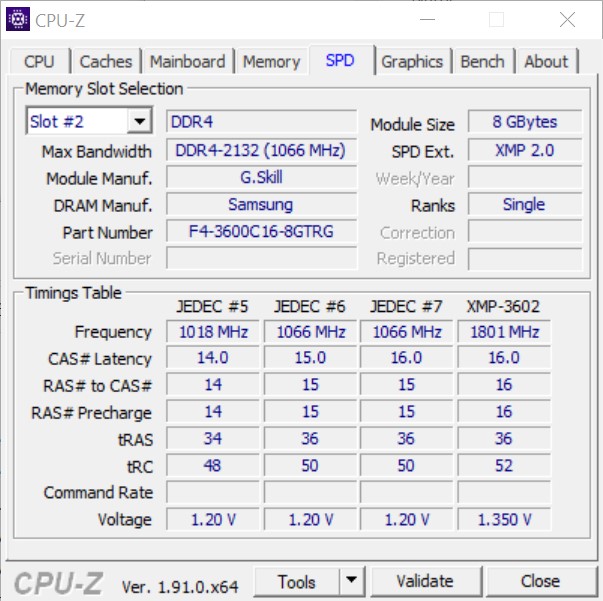
- G-Skill Trident Z Royal gold DDR4-3600 memory kit 2 x 8 GB, set to DDR4-3600 CL16-16-16-36
- Intel Optane 905P 480GB PCIe-SSD
- Microsoft Windows 10 Professional 64-Bit (Version 1909)
We would like to thank Caseking for lending us the Raijintek Pean, which came with custom laser engravings. Mainboard and RAM are directly from AMD and were included in the press kit for the release of the Zen2 processors AMD Ryzen 9 3900X and AMD Ryzen 7 3700X. As cooling we use the Alphacool Eisbear 280, which Alphacool provided us with.
Processor Benchmarks
In the pure CPU benchmarks, the AMD Ryzen 7 3800XT beats the Intel Core i7-9700K. Nevertheless, this comparison, which AMD itself is using in its product briefing, isn't quite fair in our opinion, because the Core i7-9700K only offers 8 threads with 8 cores. Rather, the comparison with an Intel Core i9-9900K is worthwhile because it is similarly priced. The Ryzen 7 3800XT also has the edge here, although the point for the better single core performance goes to Intel. The Ryzen 7 3800XT however can't compete with an Intel Core i9-10900K. The extremely high clock speed of the Intel flagship in combination with 10 cores provides better performance, but also has its drawbacks (keyword: TDP).
The AMD Ryzen 7 3800X has had a hard time confirming its right to exist alongside the much more economical Ryzen 7 3700X. Due to the now higher boost clock rate, the role of the Ryzen 7 3800XT is now somewhat clearer, although the performance advantage over the Ryzen 7 3700X is still only a few percent.
| R Benchmark 2.5 - Overall mean | |
| Intel Core i5-10600K | |
| AMD Ryzen 9 3900X | |
| AMD Ryzen 3 3300X | |
| Intel Core i9-10900K | |
| AMD Ryzen 9 3950X | |
| AMD Ryzen 7 3800XT | |
| LibreOffice - 20 Documents To PDF | |
| Intel Core i9-10900K | |
| AMD Ryzen 9 3900X | |
| AMD Ryzen 9 3950X | |
| AMD Ryzen 3 3300X | |
| Intel Core i5-10600K | |
| AMD Ryzen 7 3800XT | |
| WebXPRT 3 - Overall | |
| Intel Core i9-10900K | |
| AMD Ryzen 7 3800XT | |
| AMD Ryzen 9 3950X | |
| Intel Core i5-10600K | |
| AMD Ryzen 3 3300X | |
| Mozilla Kraken 1.1 - Total | |
| Intel Core i5-10600K | |
| AMD Ryzen 3 3300X | |
| Intel Core i9-10900K | |
| AMD Ryzen 9 3950X | |
| AMD Ryzen 7 3800XT | |
* ... smaller is better
Stress test with Cinebench R15 multi loop
Our stress test, the Cinebench R15 multi loop poses no problem for the AMD Ryzen 7 3800XT. The built-in AiO together with the 280 millimeter (11 inches) radiator can reliably cool the AMD Ryzen 7 3800XT without difficulty.
Application Performance
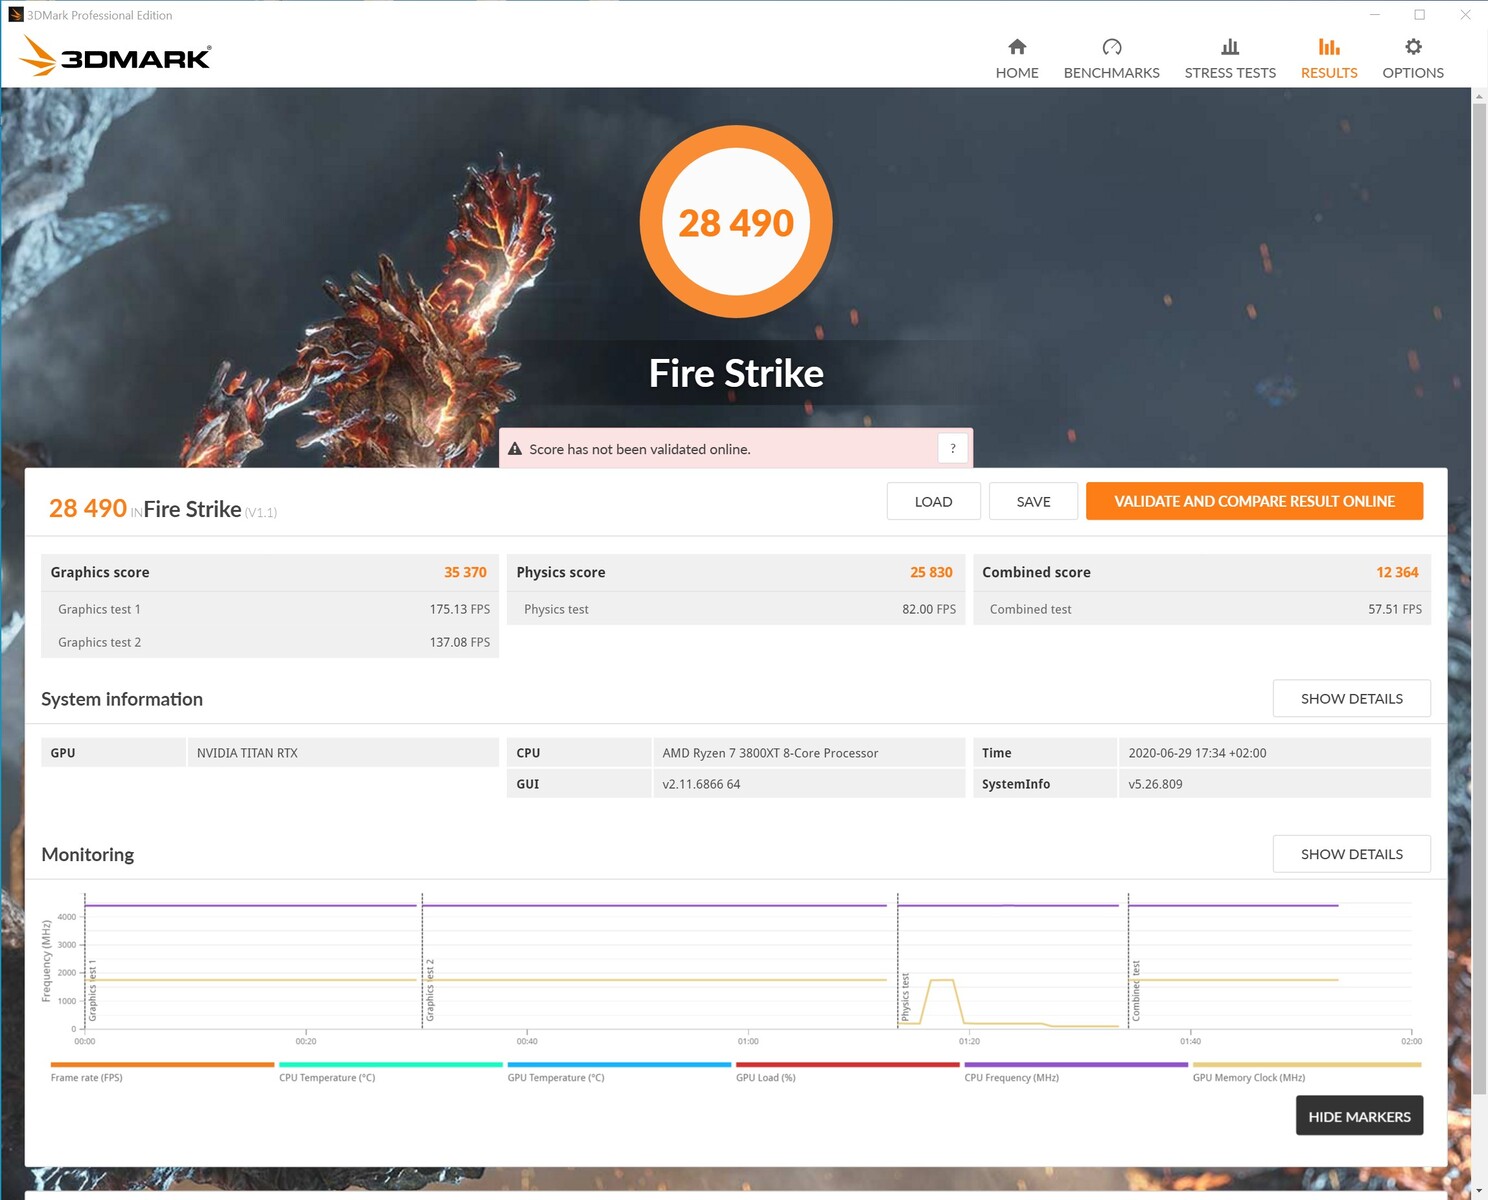
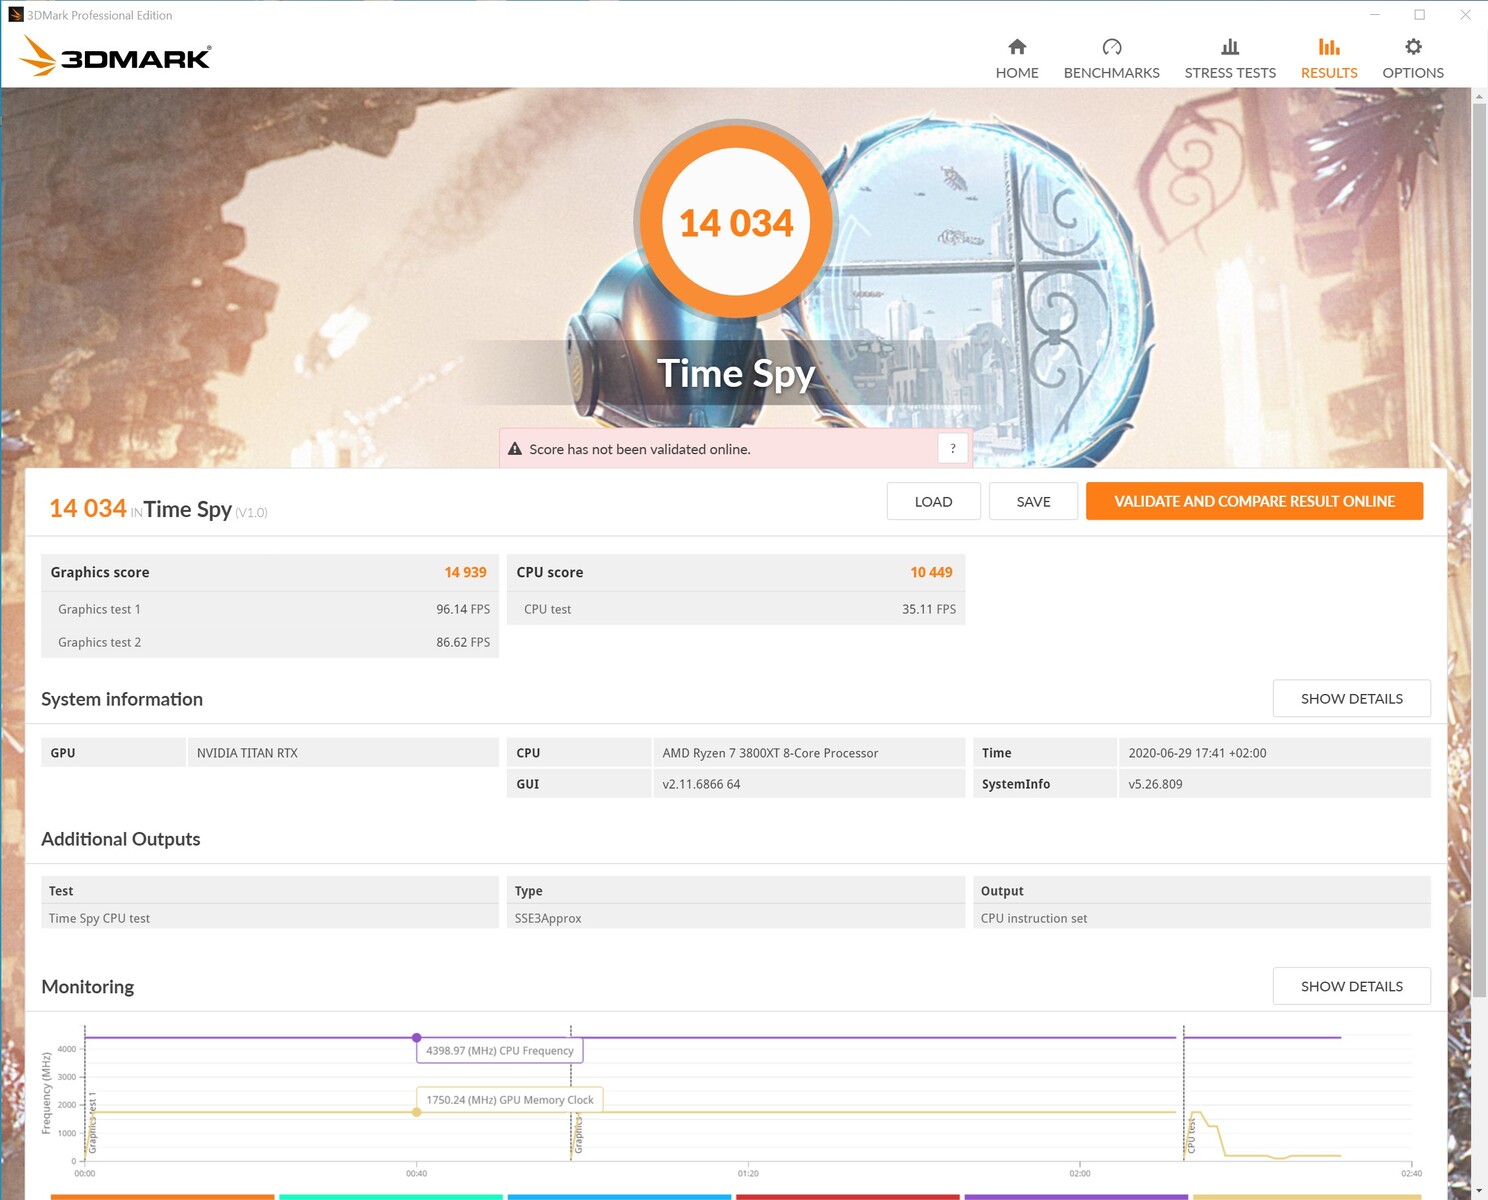
Many applications scale quite well with up to 8 cores. Beyond that, a higher core count only slightly increases the performance, as can be seen in the comparison with the AMD Ryzen 9 3950X. The significantly more expensive flagship is only three percentage points ahead of the Ryzen 7 3800XT and right on par in the synthetic 3D benchmarks. Even the inexpensive Ryzen 3 3300X can keep up here with the same GPU configuration. Intel manages to get a small, but in our case not noticeably significant, advantage.
Gaming Performance
The AMD Ryzen 7 3800XT is definitely suitable for a pure gaming system. Nevertheless, you should be aware that Intel has the best gaming CPUs on the market with the current Comet Lake S processors. In higher resolutions and with maximum details, however, the advantage of Intel CPUs over AMD's Ryzen models diminishes. In combination with our Nvidia Titan RTX (comparable to an RTX 2080 Ti), even the most modern titles can be enjoyed at maximum details. However, with increasing graphic load the CPU plays a lesser role. If you want to stream at the same time though, the 8 cores will come in handy.
| Borderlands 3 | |
| 1280x720 Very Low Overall Quality (DX11) | |
| Intel Core i9-10900K | |
| Intel Core i5-10600K | |
| Intel Core i9-9900KS, Nvidia Titan RTX | |
| AMD Ryzen 9 3900X | |
| AMD Ryzen 9 3950X | |
| AMD Ryzen 7 3800XT | |
| AMD Ryzen 3 3300X | |
| AMD Radeon RX Vega 64 | |
| AMD Ryzen 3 3100 | |
| 1920x1080 Badass Overall Quality (DX11) | |
| Intel Core i9-10900K | |
| AMD Ryzen 7 3800XT | |
| Intel Core i5-10600K | |
| Intel Core i9-9900KS, Nvidia Titan RTX | |
| AMD Ryzen 9 3900X | |
| AMD Ryzen 9 3950X | |
| AMD Ryzen 3 3300X | |
| AMD Ryzen 3 3100 | |
| AMD Radeon RX Vega 64 | |
| Metro Exodus | |
| 1280x720 Low Quality AF:4x | |
| Intel Core i9-10900K | |
| Intel Core i5-10600K | |
| Intel Core i9-9900KS, Nvidia Titan RTX | |
| AMD Ryzen 7 3800XT | |
| AMD Ryzen 9 3900X | |
| AMD Ryzen 3 3300X | |
| AMD Ryzen 9 3950X | |
| AMD Ryzen 3 3100 | |
| 1920x1080 Ultra Quality AF:16x | |
| Intel Core i9-10900K | |
| Intel Core i5-10600K | |
| Intel Core i9-9900KS, Nvidia Titan RTX | |
| AMD Ryzen 3 3300X | |
| AMD Ryzen 7 3800XT | |
| AMD Ryzen 9 3900X | |
| AMD Ryzen 9 3950X | |
| AMD Ryzen 3 3100 | |
| X-Plane 11.11 | |
| 1280x720 low (fps_test=1) | |
| Intel Core i9-10900K | |
| Intel Core i9-9900KS, Nvidia Titan RTX | |
| Intel Core i5-10600K | |
| AMD Ryzen 7 3800XT | |
| AMD Ryzen 9 3900X | |
| AMD Ryzen 9 3950X | |
| AMD Ryzen 3 3300X | |
| AMD Ryzen 3 3100 | |
| AMD Radeon RX Vega 64 | |
| AMD Radeon RX Vega 64 | |
| 1920x1080 high (fps_test=3) | |
| Intel Core i9-9900KS, Nvidia Titan RTX | |
| Intel Core i9-10900K | |
| Intel Core i5-10600K | |
| AMD Ryzen 7 3800XT | |
| AMD Ryzen 9 3900X | |
| AMD Ryzen 9 3950X | |
| AMD Ryzen 3 3300X | |
| AMD Ryzen 3 3100 | |
| AMD Radeon RX Vega 64 | |
| AMD Radeon RX Vega 64 | |
| Dota 2 Reborn | |
| 1280x720 min (0/3) fastest | |
| Intel Core i9-10900K | |
| Intel Core i9-9900KS, Nvidia Titan RTX | |
| Intel Core i5-10600K | |
| AMD Ryzen 7 3800XT | |
| AMD Radeon RX Vega 64 | |
| AMD Ryzen 9 3900X | |
| AMD Radeon RX Vega 64 | |
| AMD Ryzen 9 3950X | |
| AMD Ryzen 3 3300X | |
| AMD Ryzen 3 3100 | |
| 1920x1080 ultra (3/3) best looking | |
| Intel Core i9-10900K | |
| Intel Core i9-9900KS, Nvidia Titan RTX | |
| Intel Core i5-10600K | |
| AMD Radeon RX Vega 64 | |
| AMD Ryzen 7 3800XT | |
| AMD Ryzen 9 3900X | |
| AMD Radeon RX Vega 64 | |
| AMD Ryzen 9 3950X | |
| AMD Ryzen 3 3300X | |
| AMD Ryzen 3 3100 | |
Intel Core i9-10900K + Nvidia Titan RTX
| low | med. | high | ultra | QHD | 4K | |
|---|---|---|---|---|---|---|
| The Witcher 3 (2015) | 388 | 348 | 252 | 139 | 103 | |
| Dota 2 Reborn (2015) | 169.8 | 151.6 | 151.2 | 139.7 | 138.1 | |
| Final Fantasy XV Benchmark (2018) | 189 | 161 | 118 | 59.3 | ||
| X-Plane 11.11 (2018) | 131 | 118 | 96 | 82.8 | ||
| Far Cry 5 (2018) | 148 | 129 | 122 | 115 | 110 | 78 |
| Shadow of the Tomb Raider (2018) | 154 | 145 | 142 | 138 | 118 | 66.8 |
| Forza Horizon 4 (2018) | 210 | 185 | 184 | 173 | 157 | 112 |
| Far Cry New Dawn (2019) | 132 | 115 | 111 | 101 | 97 | 76 |
| Metro Exodus (2019) | 169 | 142 | 121 | 99.3 | 80.2 | 52.3 |
| Borderlands 3 (2019) | 151 | 138 | 124 | 116 | 93.1 | 52.8 |
Energy consumption - more efficient than Intel
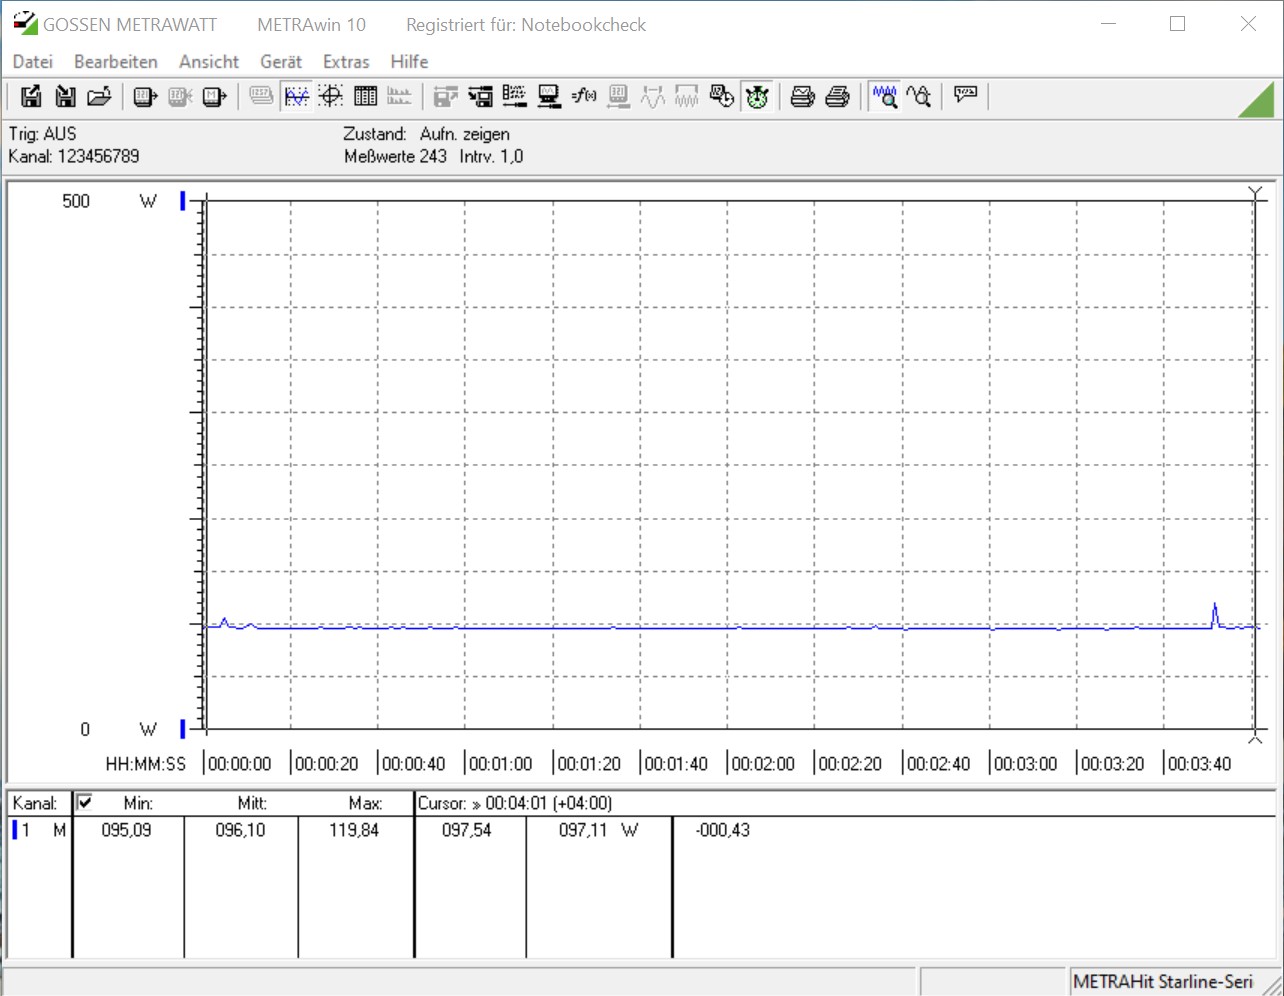
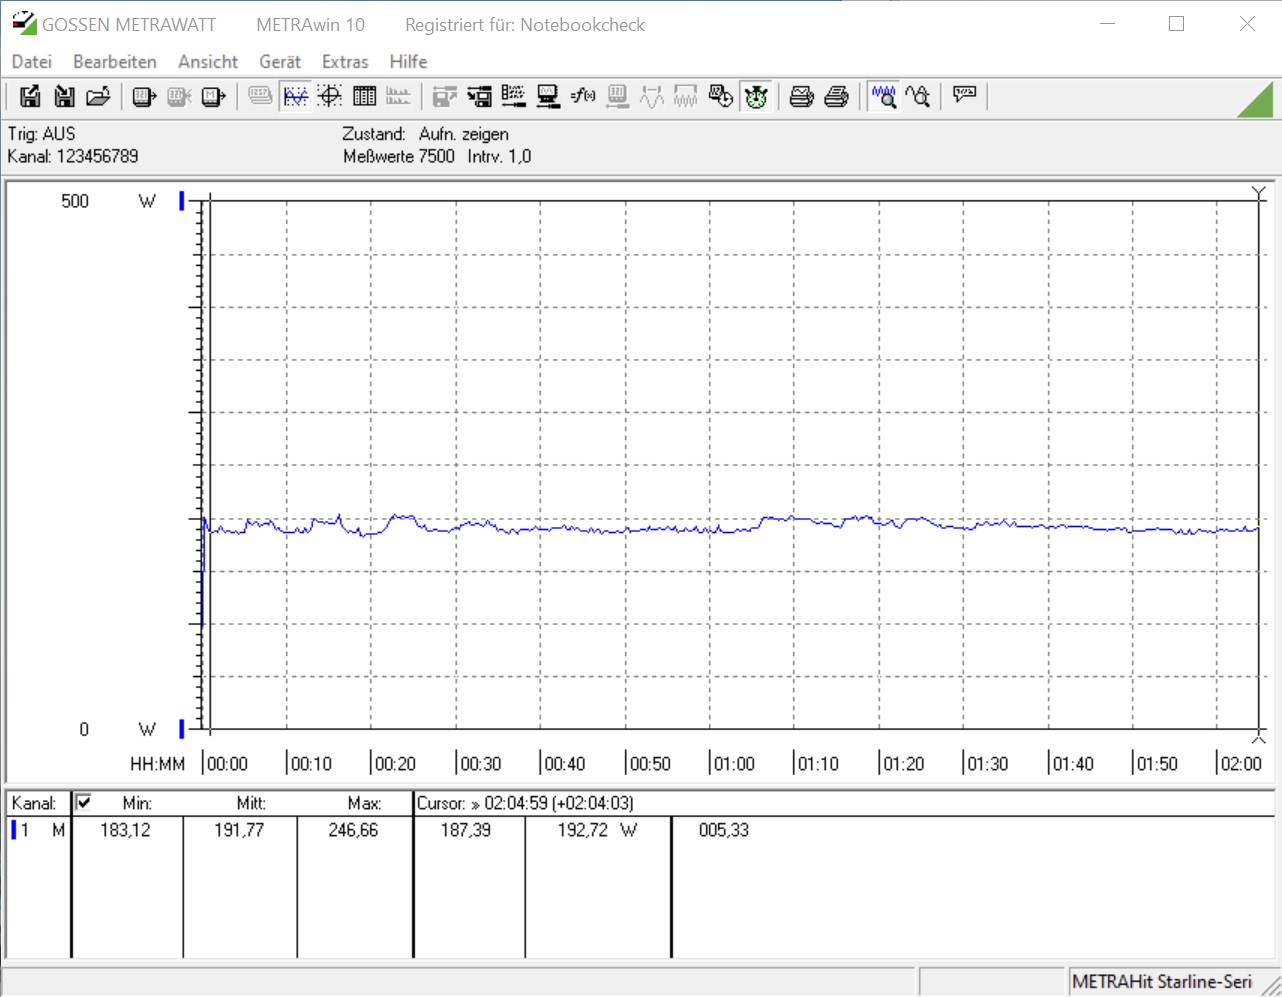
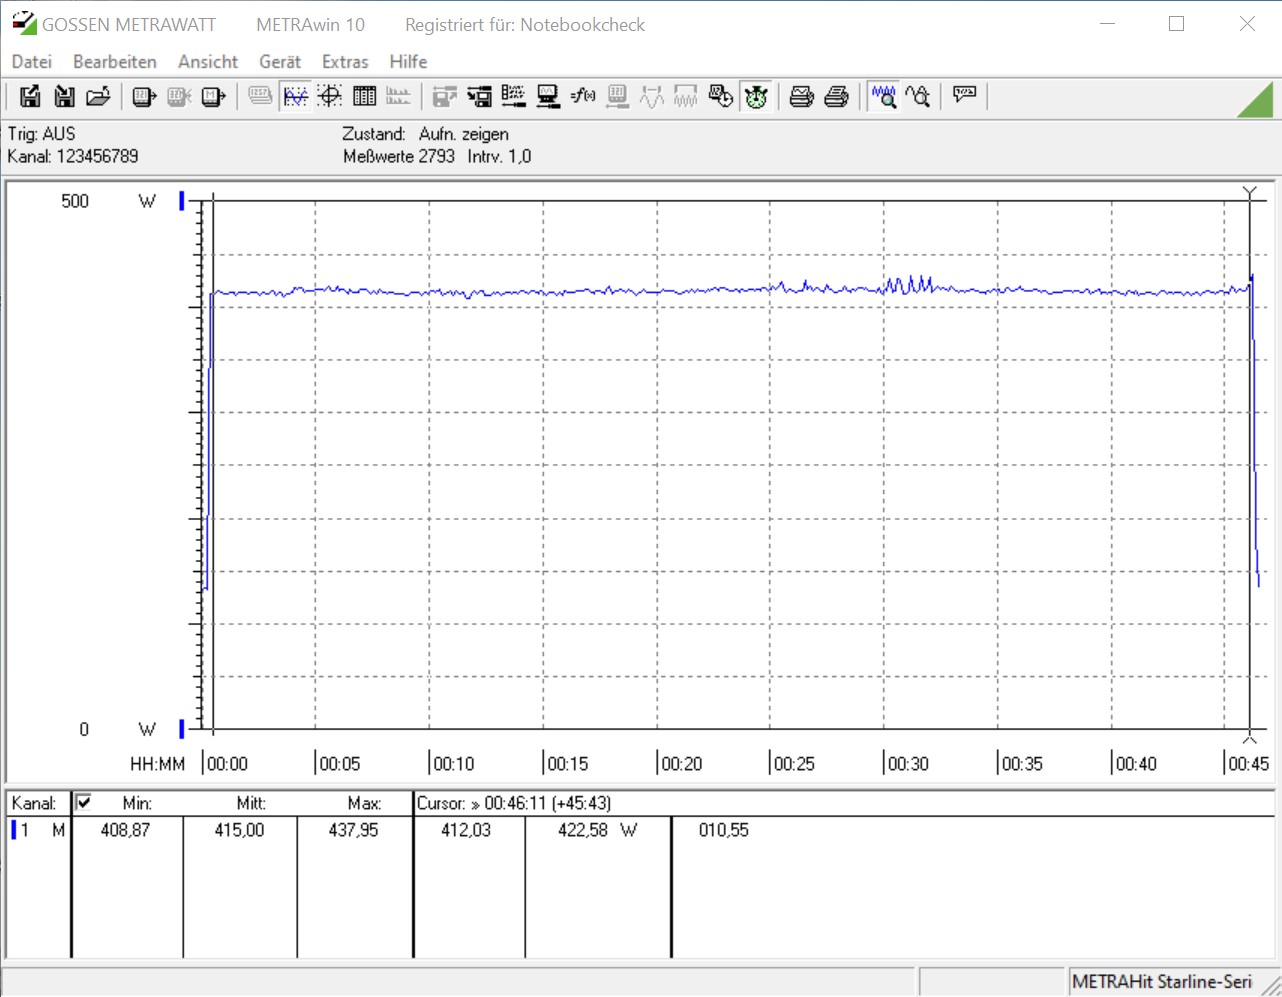
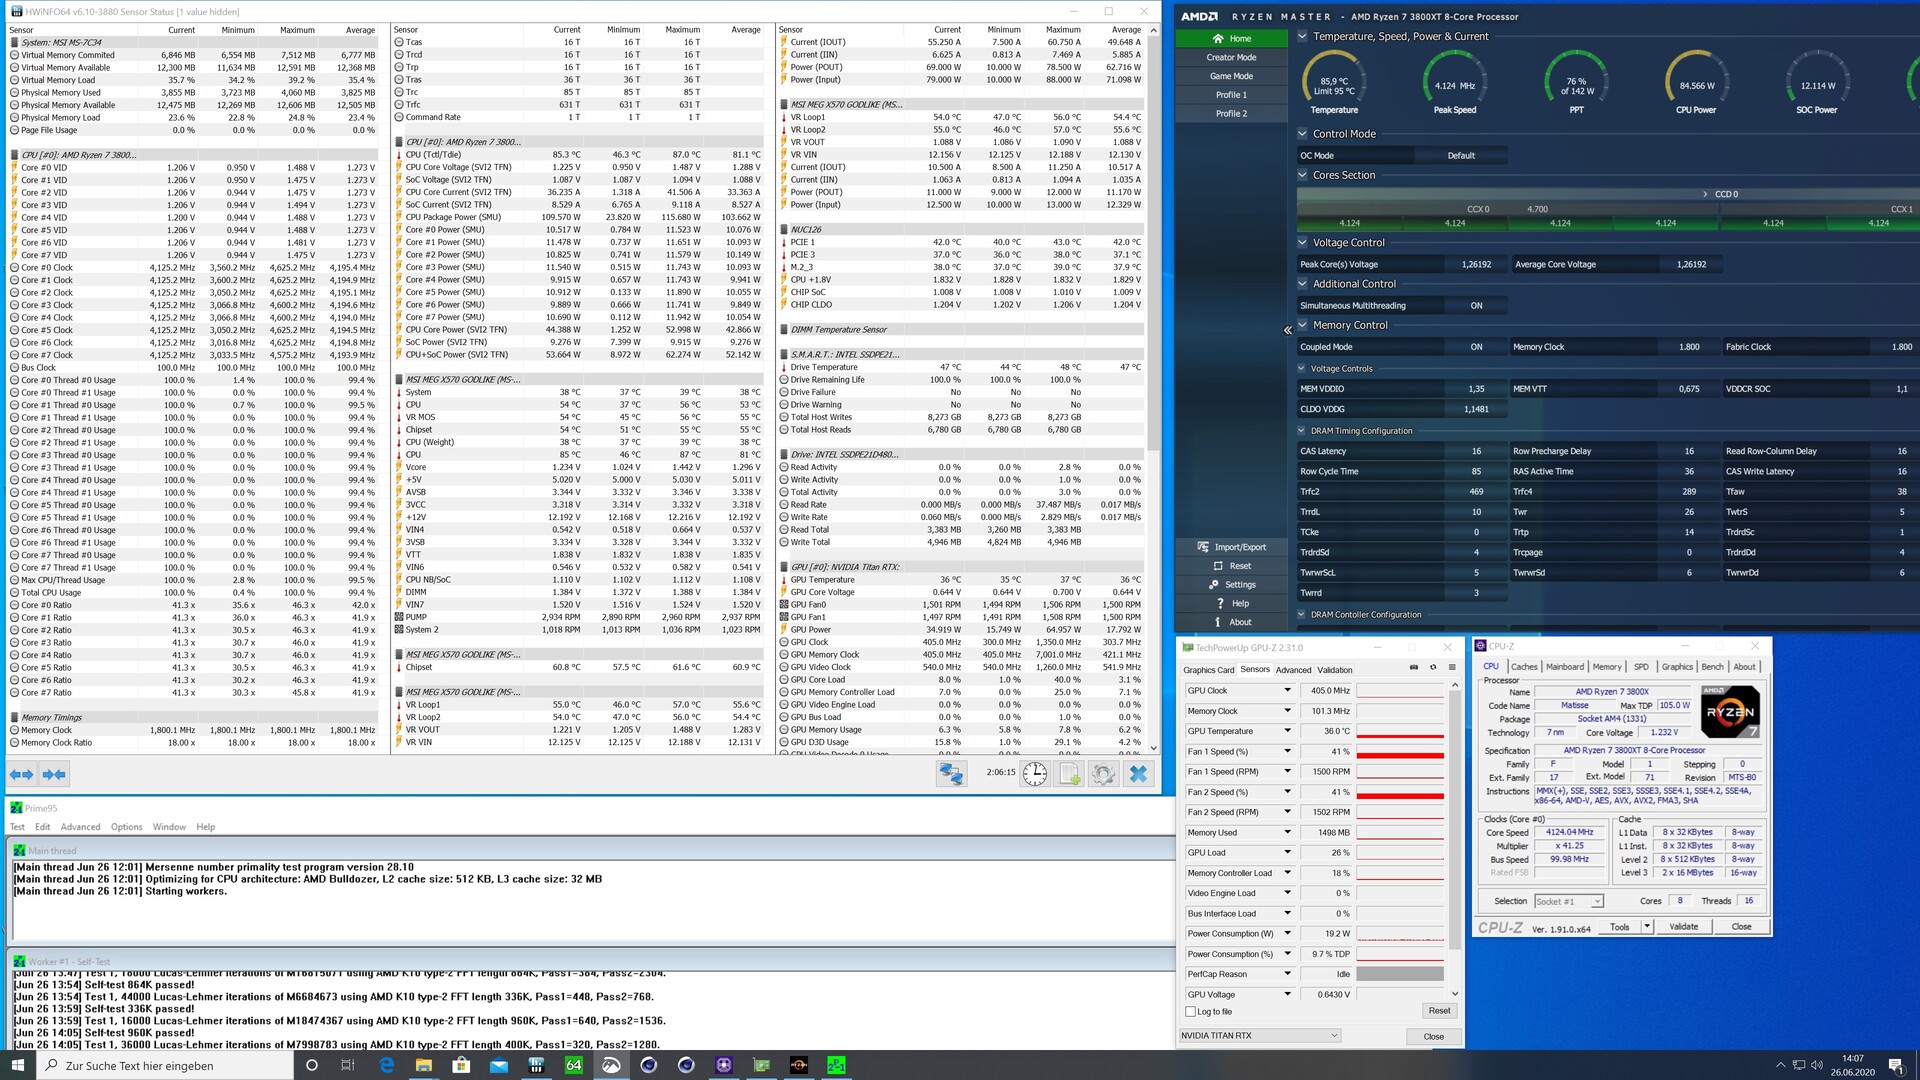
AMD specifies a TDP of 105 watts for the Ryzen 7 3800XT. The same as for the two Ryzen 9 models. Nevertheless, we know that under certain circumstances this TDP limit may be exceeded. Intel does the same and even allows up to 250 watts in the Core i9-10900K. In our stress test with Prime95 (v.28.10), HWiNFO shows a maximum of 115 watts for the CPU. The average consumption levelled off at 103.7 watts. For the entire system we measured 191.8 watts during the stress test, which is minimally less in comparison to the Ryzen 9 3900X. The consumption climbs to 415 watts during gaming due to the additional load on the GPU. Compared to the two Ryzen 9 models, the Ryzen 7 3800XT does not consume much less.
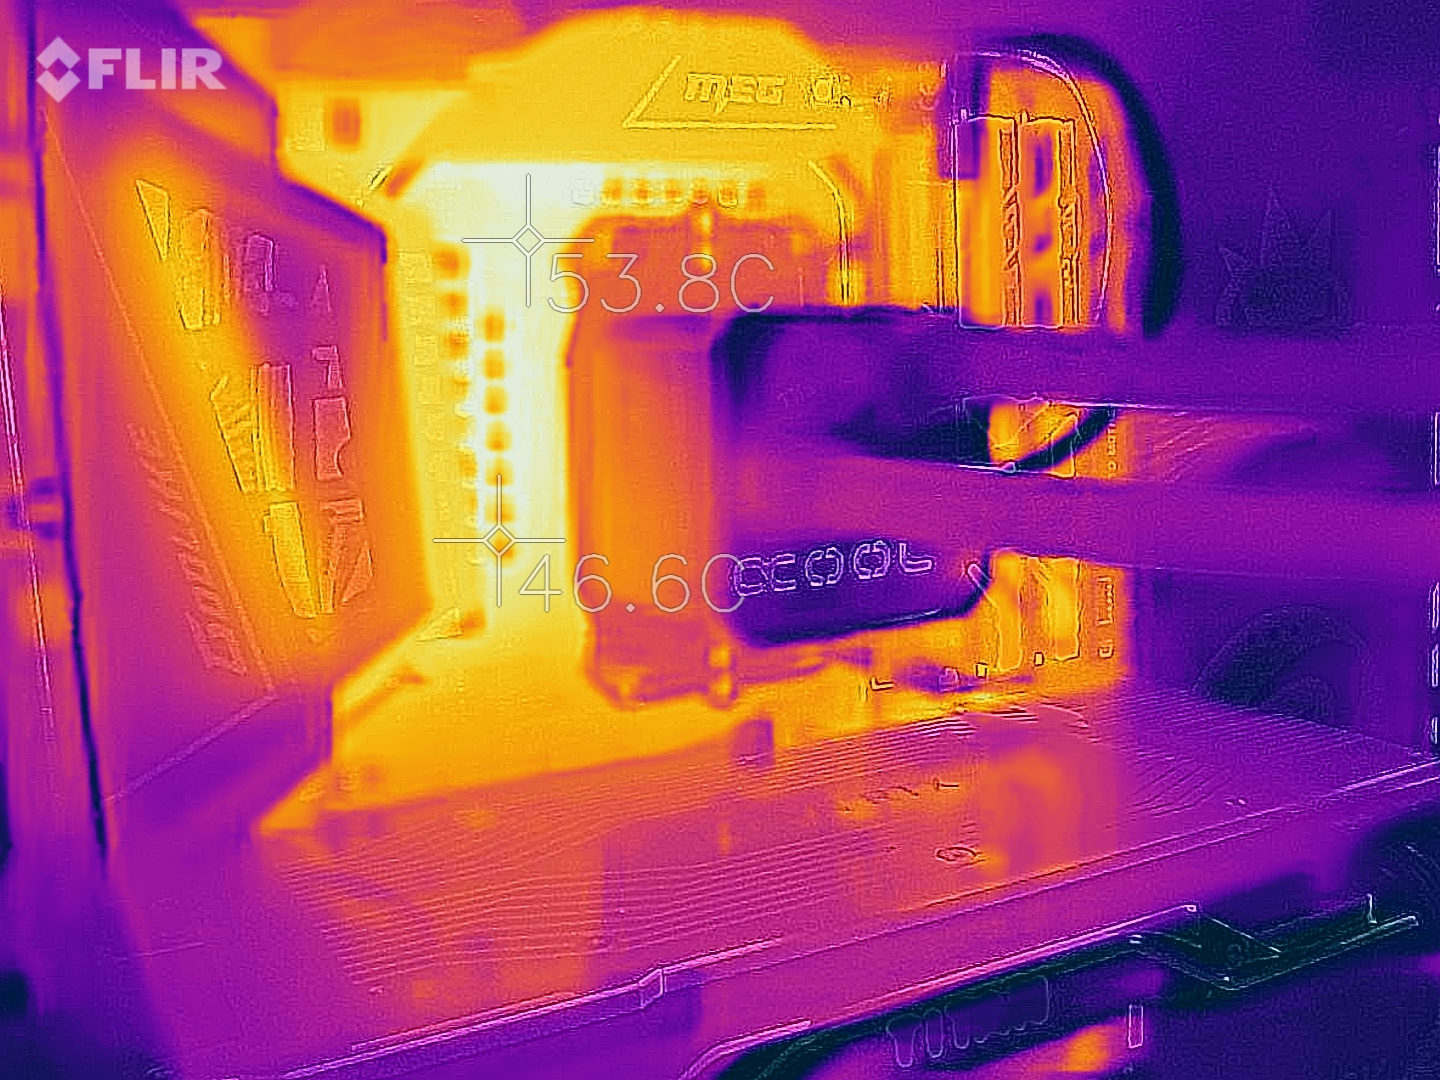
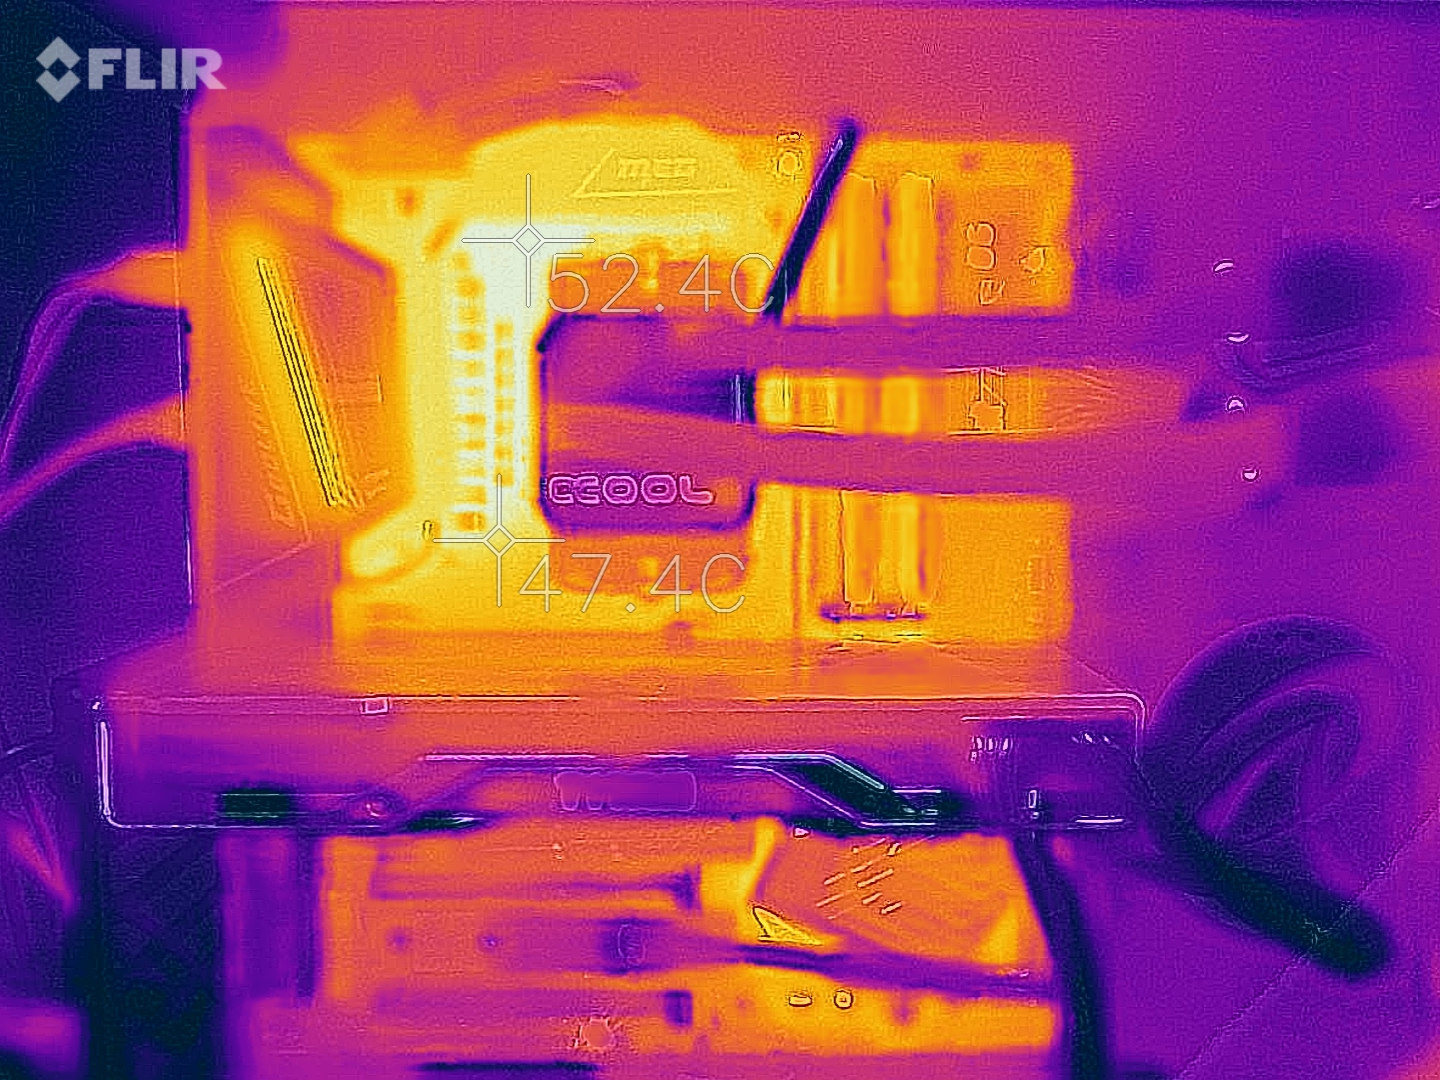
CPU temperatures were measured in an open test setup on our test bench. Despite the well-dimensioned AiO from Alphacool, the maximum CPU temperature during the stress test was 87 °C (188.6 °F). Since AMD sells the Ryzen 7 3800X without a fan, buying this CPU should involve considering a powerful cooler, too.
* ... smaller is better

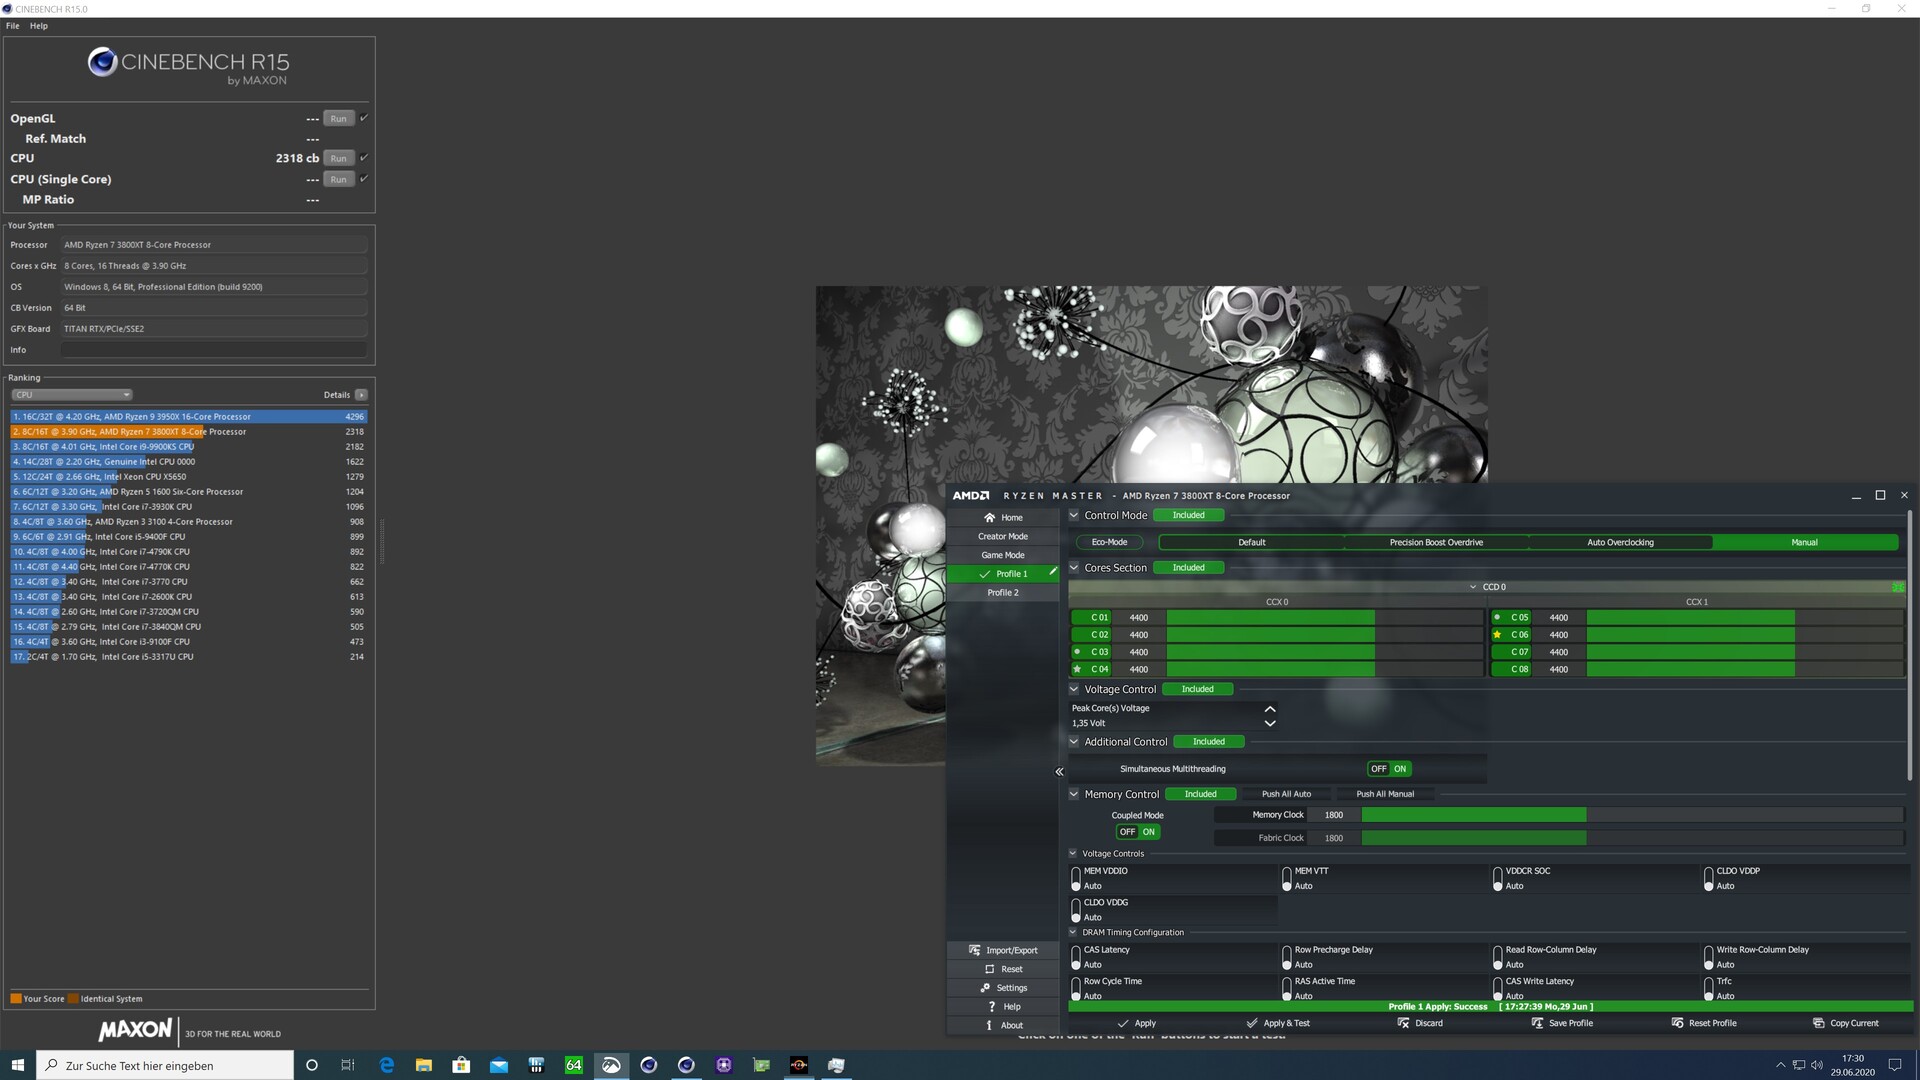
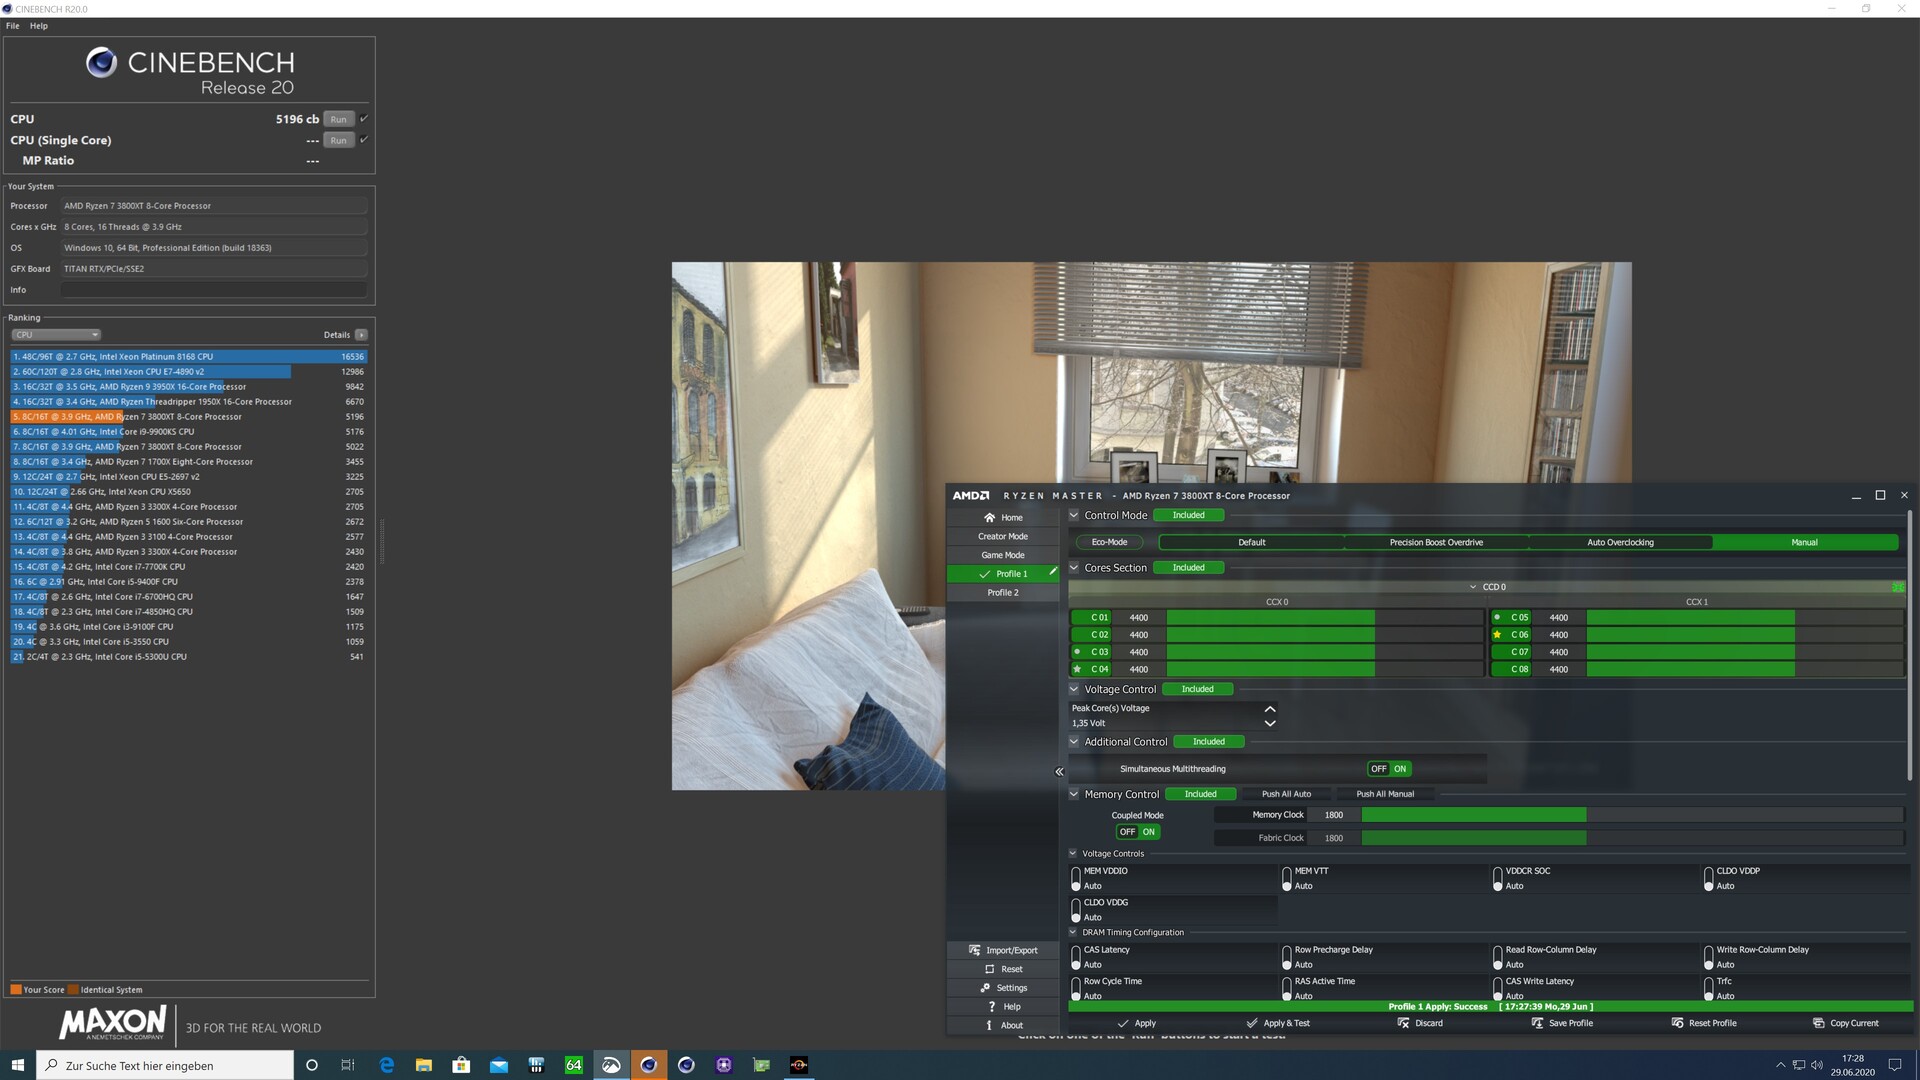
Overclocking - not recommended
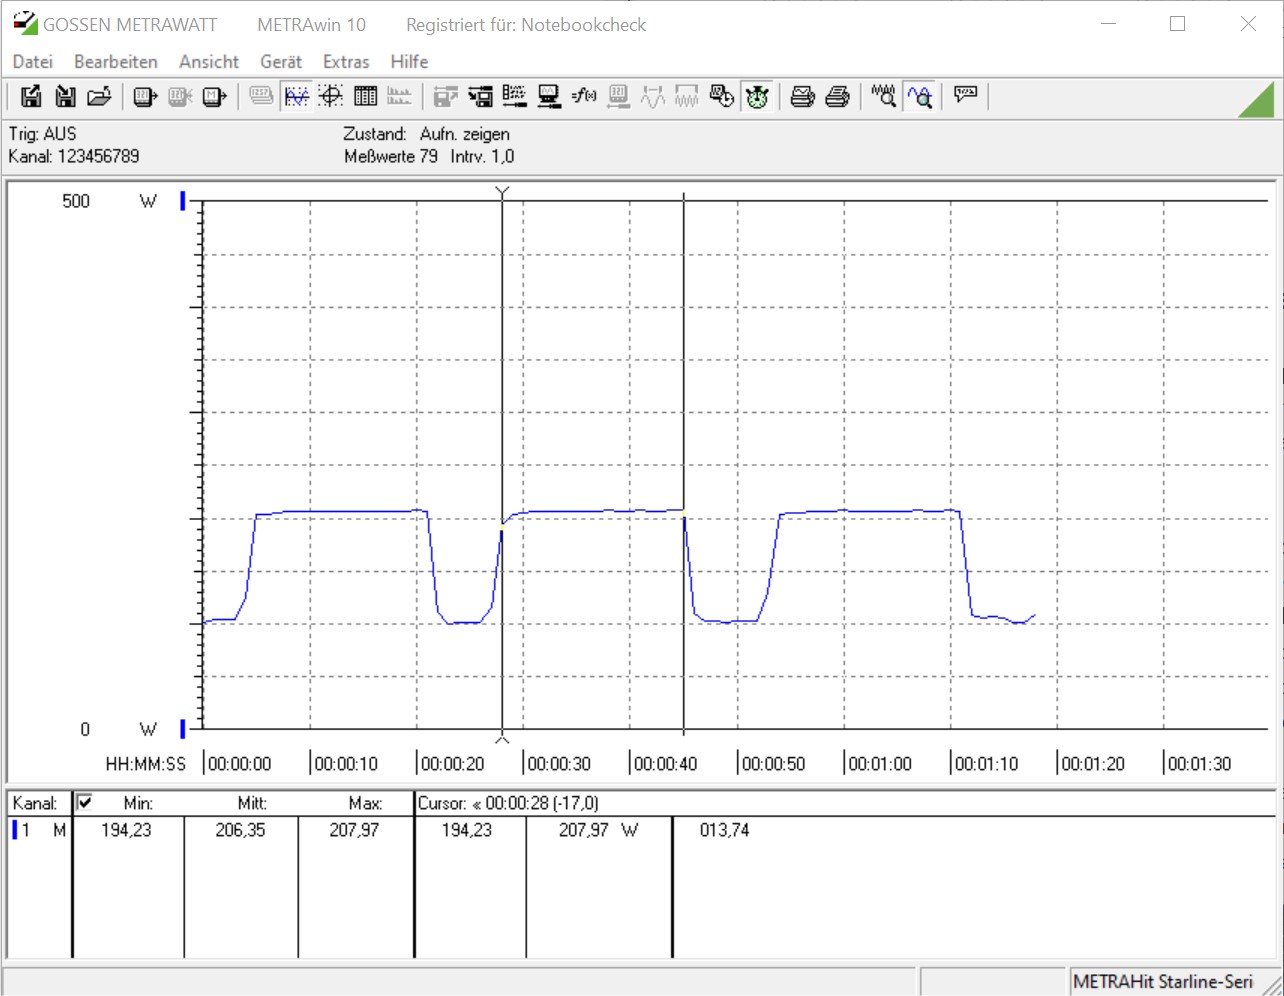
Even though the AMD Ryzen 7 3800XT already delivers very good performance, many want to squeeze a bit more out of their CPU with the help of overclocking. With Ryzen Master you can easily overclock AMD Ryzen processors from within Windows. However, you should know that this will void all warranties. In addition, PBO (Precision Boost Overdrive) is deactivated, which then no longer allows the maximum turbo of 4.7 GHz and thus has a negative impact on single-thread performance. In our case we were able to run the AMD Ryzen 7 3800XT at 4.4 GHz on all eight cores without much effort. The performance increase can be measured, but it is not noticeable. In the same breath, the voltage had to be increased slightly, which results in a slightly higher power consumption. Precisely, the power consumption of the system increased by 13 watts in the Cinebench R15 multi benchmark, to now 206 watts.
We advise against continuous operation outside the given specifications for the reasons mentioned above. The expected increase in performance is simply too low.
Pros
Cons
Verdict - the price decides on victory or defeat!

The AMD Ryzen 7 3800XT succeeds the AMD Ryzen 7 3800X, which due to it's difficult placement has yet to be able to stand out from the crowd. The refresh of the Ryzen 7 3800X will also have to live with these prejudices. In our test, the 8-core CPU delivers good performance, which levels off between the Ryzen 7 3700X and the Ryzen 9 3900X. This was to be expected. At the same time the higher TDP compared to the Ryzen 7 3700X is still a point of criticism when choosing an 8-core CPU from AMD. The 40 watts higher TDP of AMD's Ryzen 7 3800XT compared to the Ryzen 7 3700X does not reflect a noticeable performance gain. The increase of the turbo to up to 4.7 GHz will primarily benefit single-thread applications.
The AMD Ryzen 7 3800XT is a fast gaming CPU, which will continue to have a hard time attracting buyers due to its price.
AMD is asking for 529 Euros (~$599) at the release of this CPU, which in our opinion is at least 100 Euros too expensive if you look at the performance in relation to this price. The Ryzen 7 3800X is now available for as little as 310 Euros (~$351), which does not exactly play out in favor of the Ryzen 7 3800XT.
On the whole, AMD only does minimal product maintenance with the XT processors. The question arises why these processors are being released now, since the launch of Zen3 is expected to come this year, if you believe the rumor mill.
