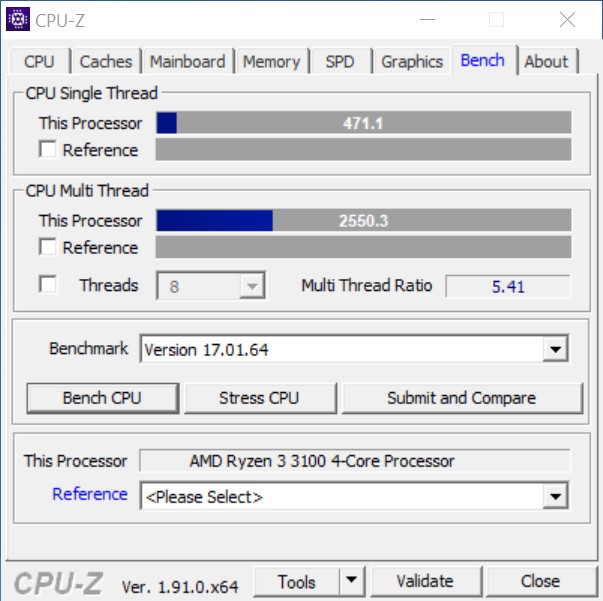
AMD Ryzen 3 3100 and Ryzen 3 3300X with 4 cores and 8 threads in review
The simple gamer doesn't necessarily need a CPU with 12 or 16 cores, which is offered as the top model for the AM4 platform. Instead, four cores with a high clock rate are sufficient. This has been the argument that has counted to this date. Intel was always one step ahead of AMD in this respect due to the much better IPC, but this has changed somewhat with the introduction of the Zen2 architecture. AMD was able to catch up considerably and also the entry-level CPUs benefit from these advantages now.
Unlike Intel, these CPUs also offer SMT, which means that a total of 8 threads can be processed simultaneously, because both the Ryzen 3 3100 and the Ryzen 3 3300X are natively quad-core processors. It remains to be seen how the new AMD CPUs will perform against the already announced Comet Lake processors, because Intel has also learned a lesson and is using Hyper-Threading on almost all of the new processors.
AMD has put Intel under a lot of pressure lately, which ultimately has also had an impact on the prices. AMD is continuing on this path, and the Ryzen 3 3100 costs just under 110 Euros (~$119) at launch, even though the Ryzen 3 3300X costs only about 20 Euros (~$22) more at just under 130 Euros (~$141). This is a clear declaration of war against Intel, as the Intel Core i5-9400F costs around 160 Euros (~$173) at the time of conducting the review.
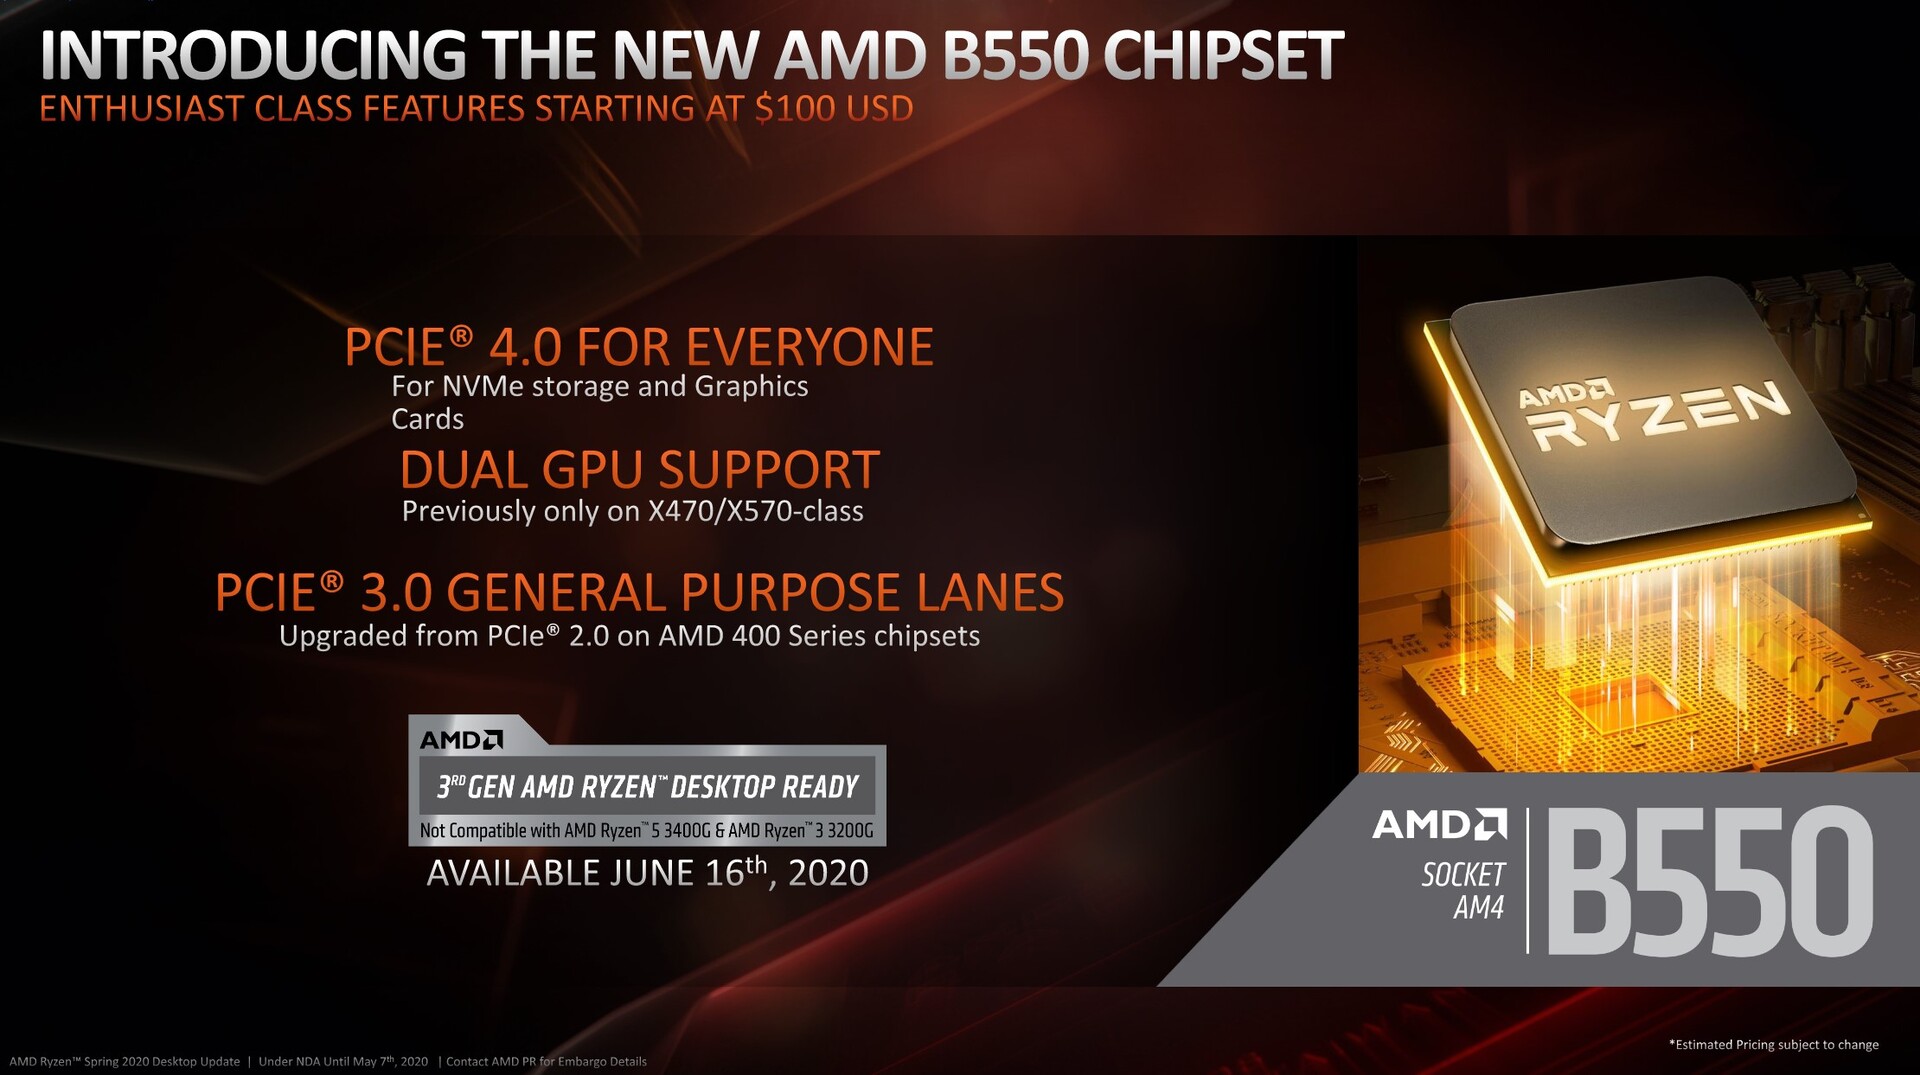
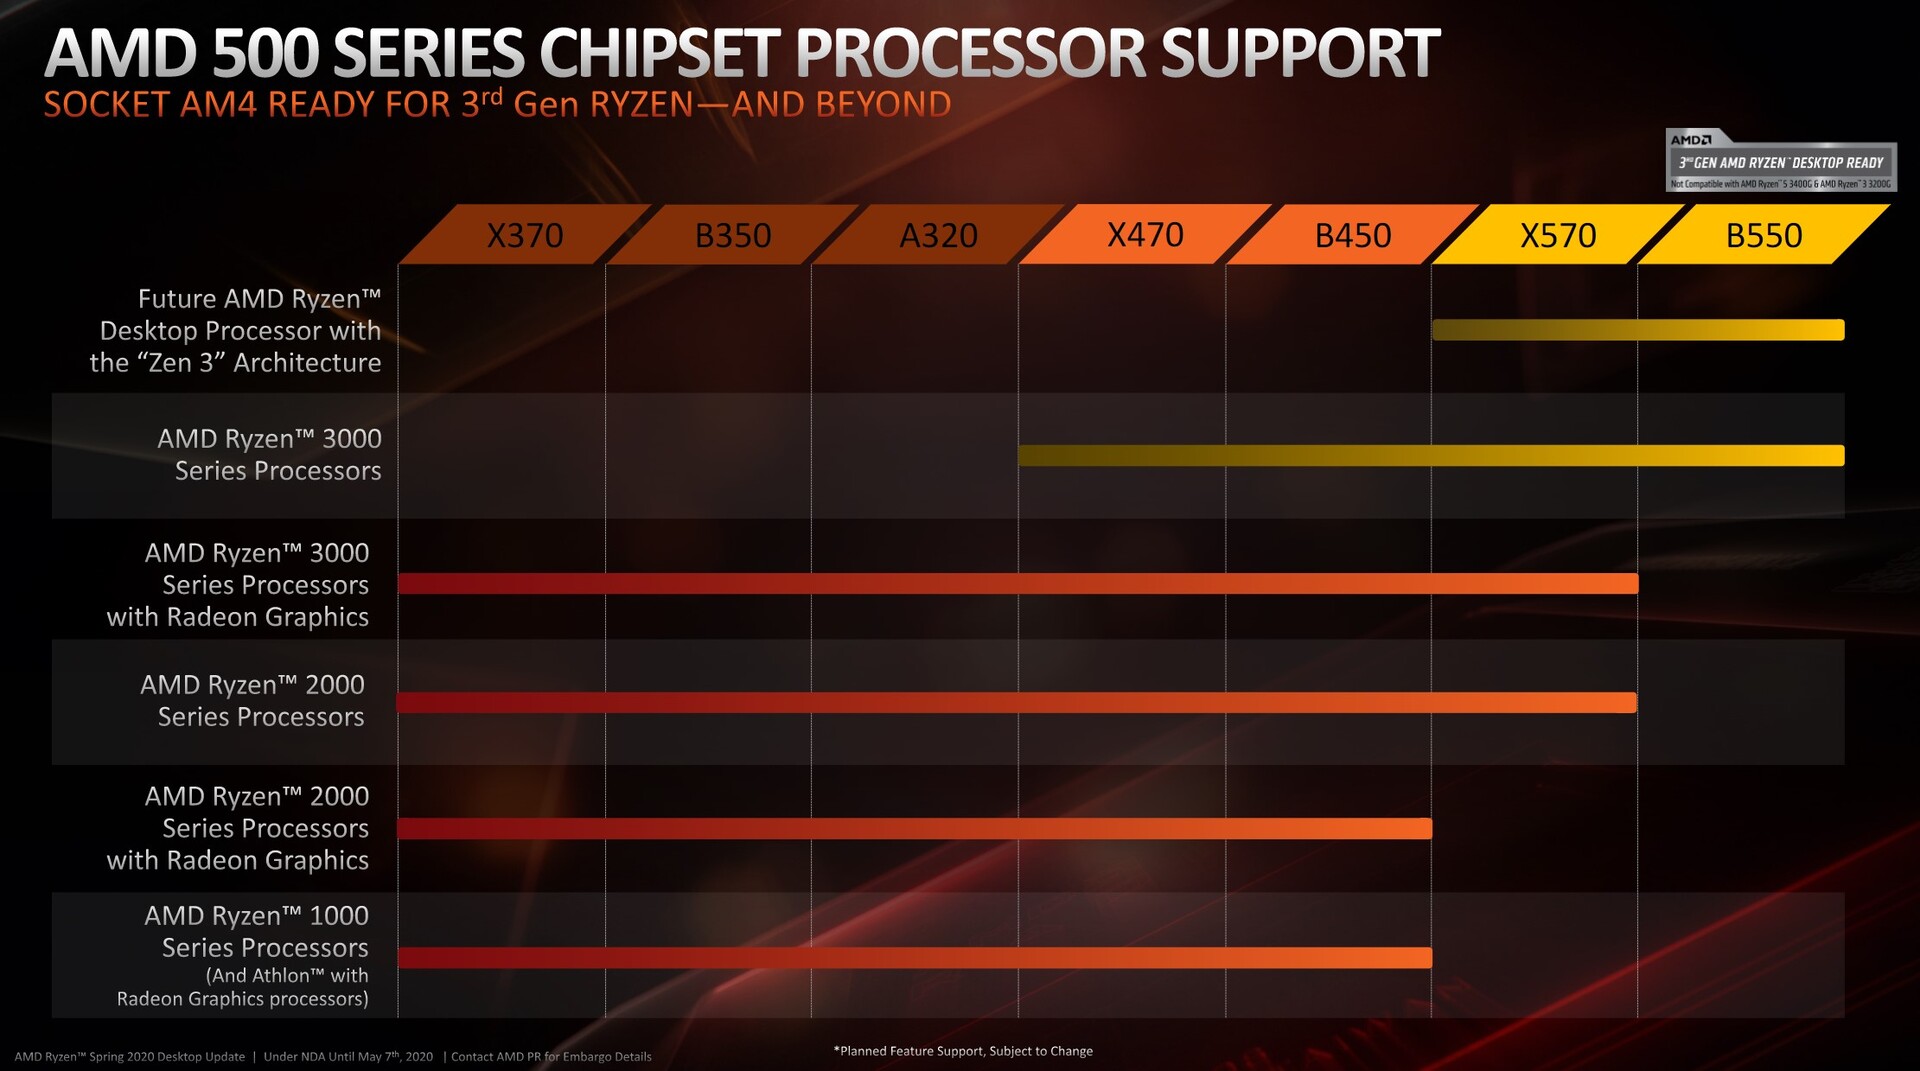
If you want to use the new Ryzen 3 3000 series, you don't necessarily have to install an expensive X570 board. With the release of the two new Ryzen models, AMD also introduced the B550 chipset, which allows for much cheaper motherboards. But if you still own a motherboard with the X470 or B450 chipset, you are lucky because these are also compatible after a BIOS update. Future Zen3 processors will only be supported by the latest chipsets at that time.
The AMD Ryzen processors in overview
| Model | Cores/ Threads |
Base clock speed | Turbo clock speed | L3 cache | TDP | Launch price |
|---|---|---|---|---|---|---|
| Ryzen R9 3900X | 12/24 | 3.8 GHz | 4.6 GHz | 64 MB | 105 Watt | 529 Euros |
| Ryzen R7 3800X | 8/16 | 3.9 GHz | 4.5 GHz | 32 MB | 105 Watt | 429 Euros |
| Ryzen R7 3700X | 8/16 | 3.6 GHz | 4.4 GHz | 32 MB | 65 Watt | 349 Euros |
| Ryzen R5 3600X | 6/12 | 3.8 GHz | 4.4 GHz | 32 MB | 95 Watt | 265 Euros |
| Ryzen R5 3600 | 6/12 | 3.6 GHz | 4.2 GHz | 32 MB | 65 Watt | 209 Euros |
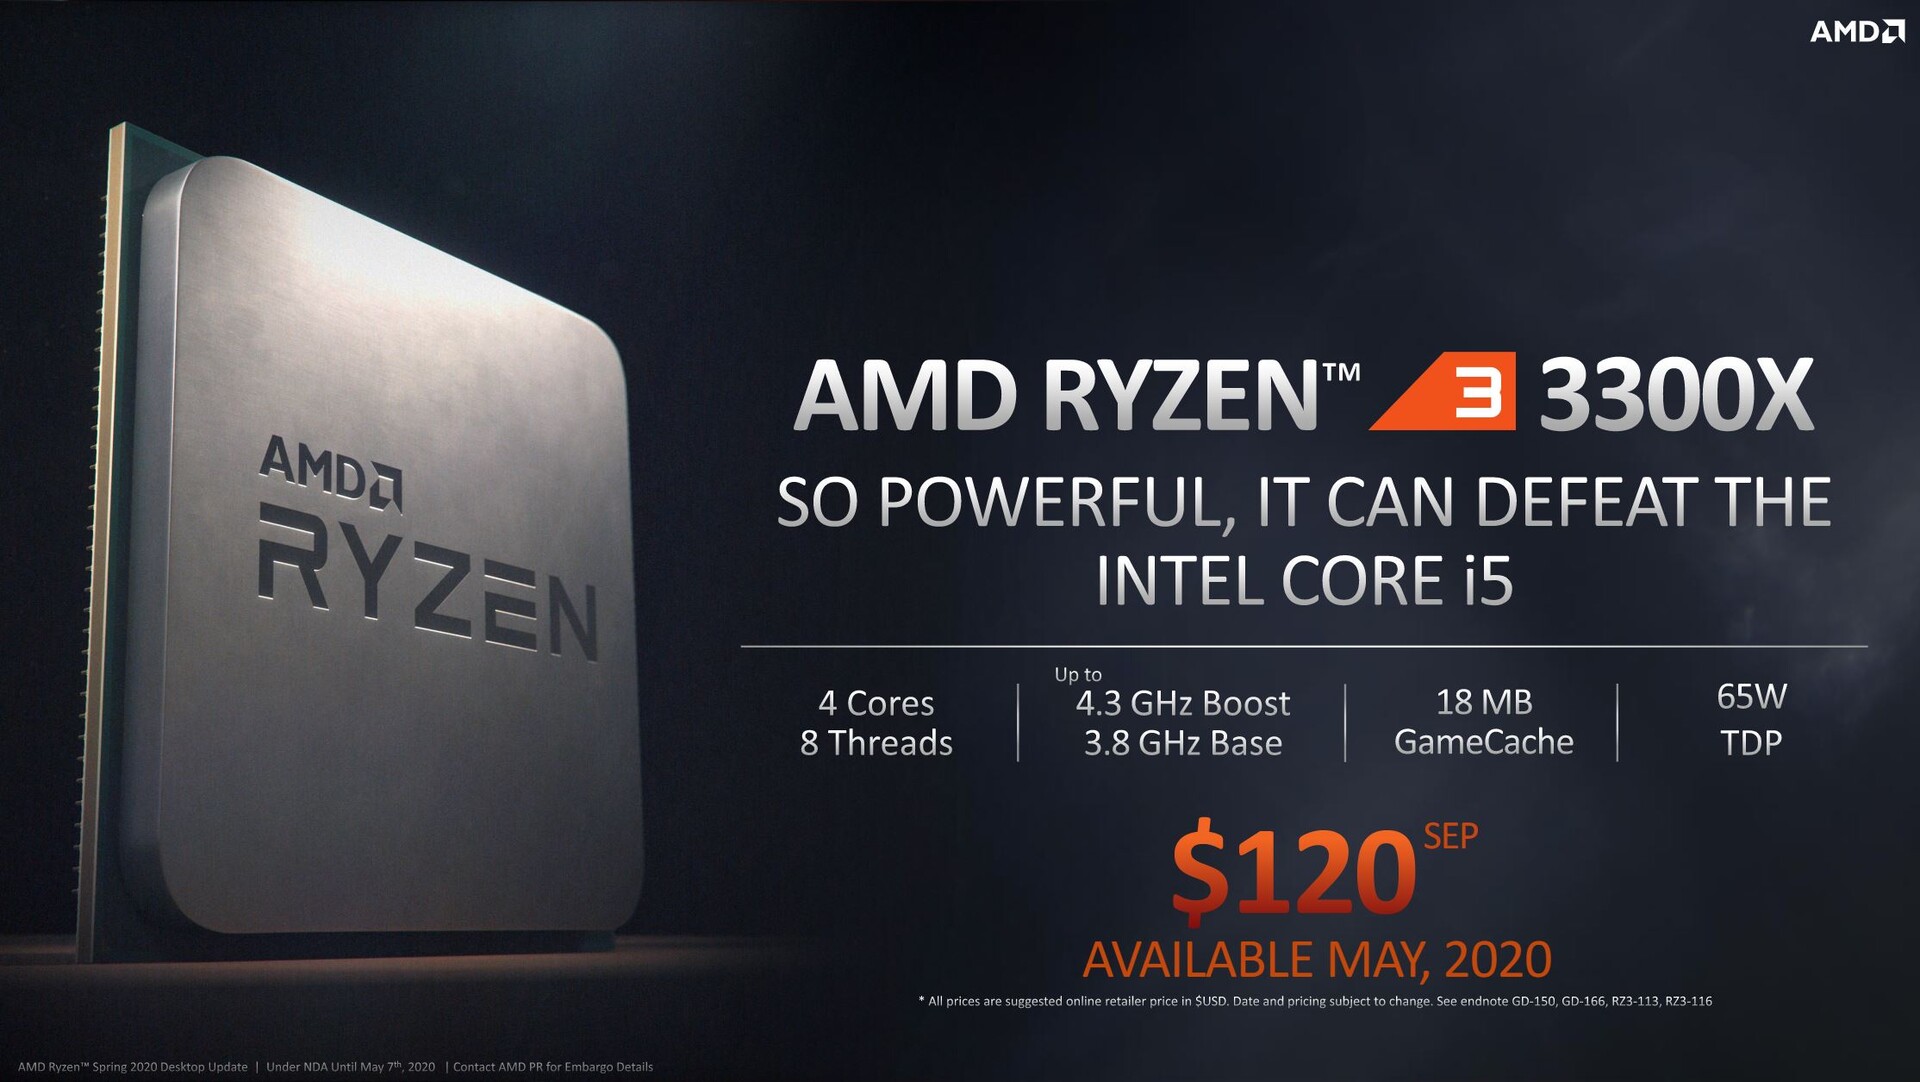
| Ryzen R3 3300X | 4/8 | 3.8 GHz | 4.3 GHz | 16 MB | 65 Watt | 129 Euros |
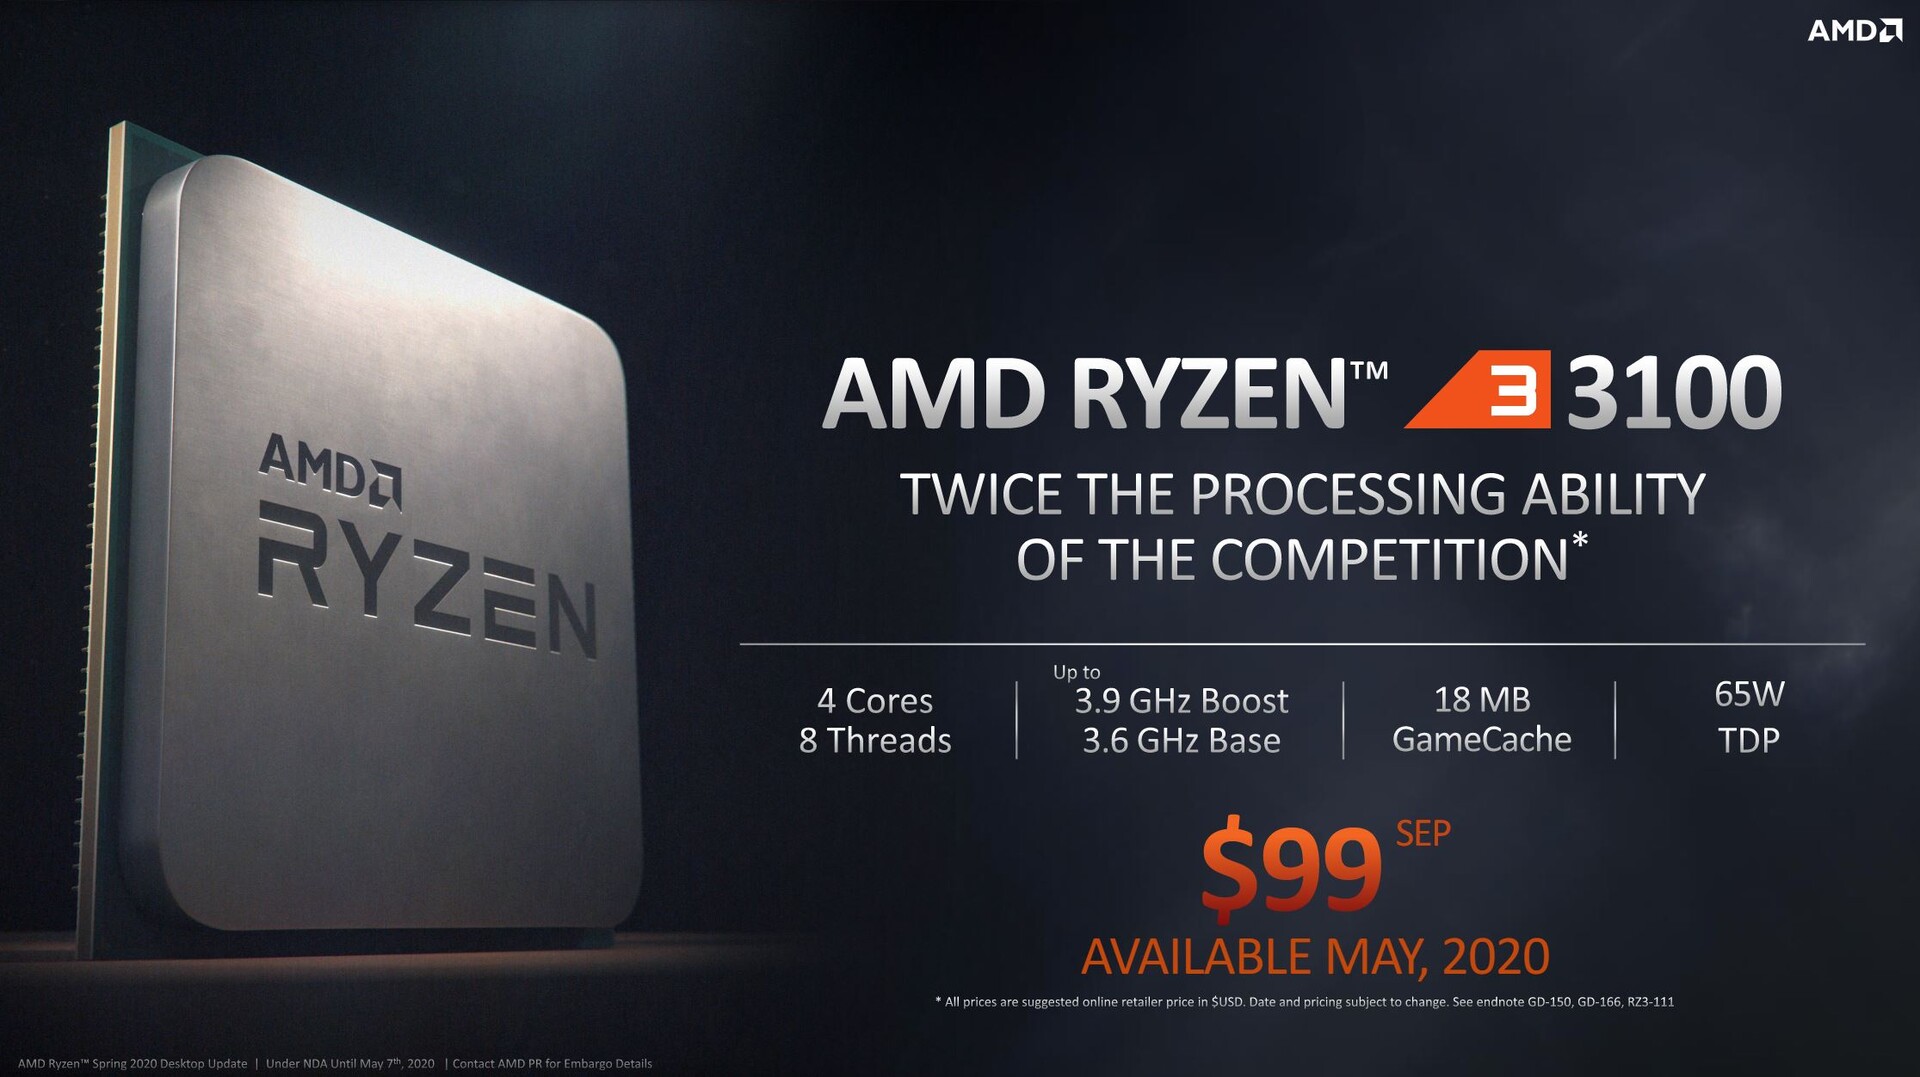
| Ryzen R3 3100 | 4/8 | 3.6 GHz | 3.9 GHz | 16 MB | 65 Watt | 109 Euros |
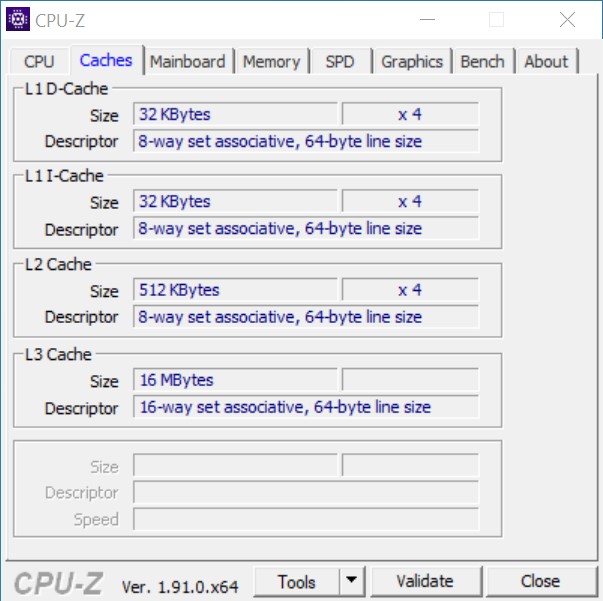
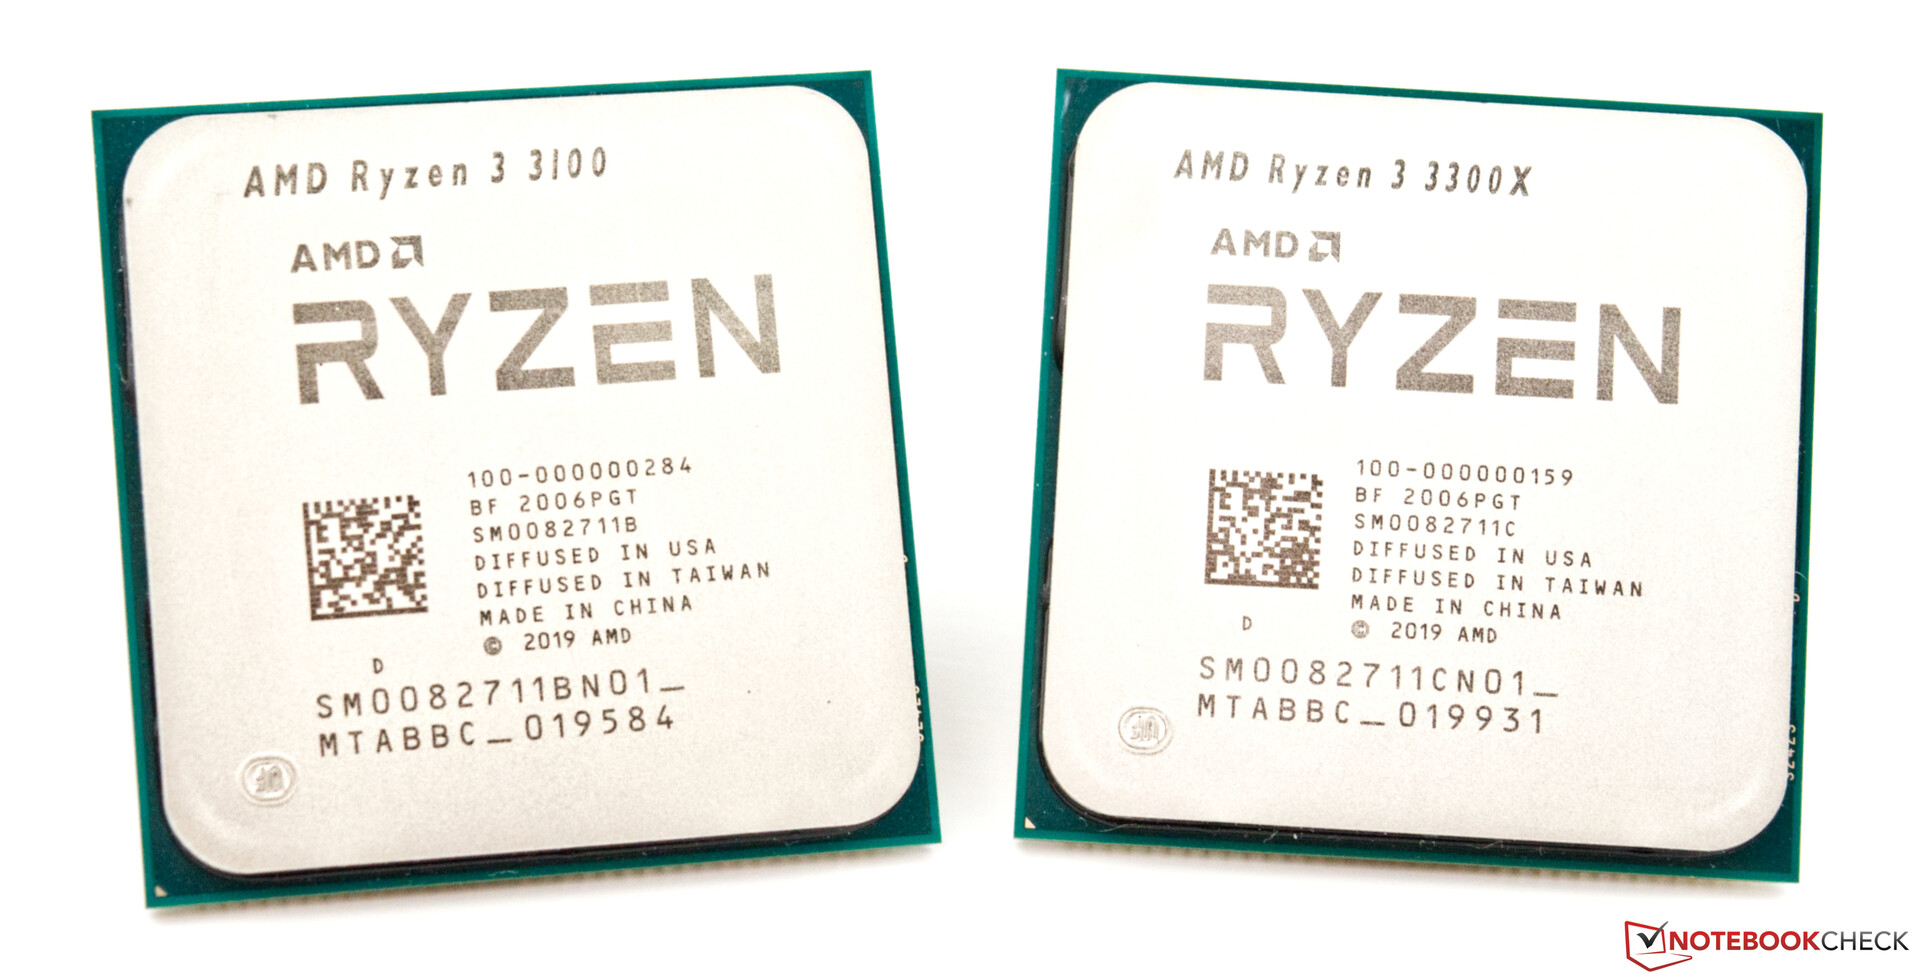
AMD Ryzen 3 3100 and AMD Ryzen 3 3300X in detail
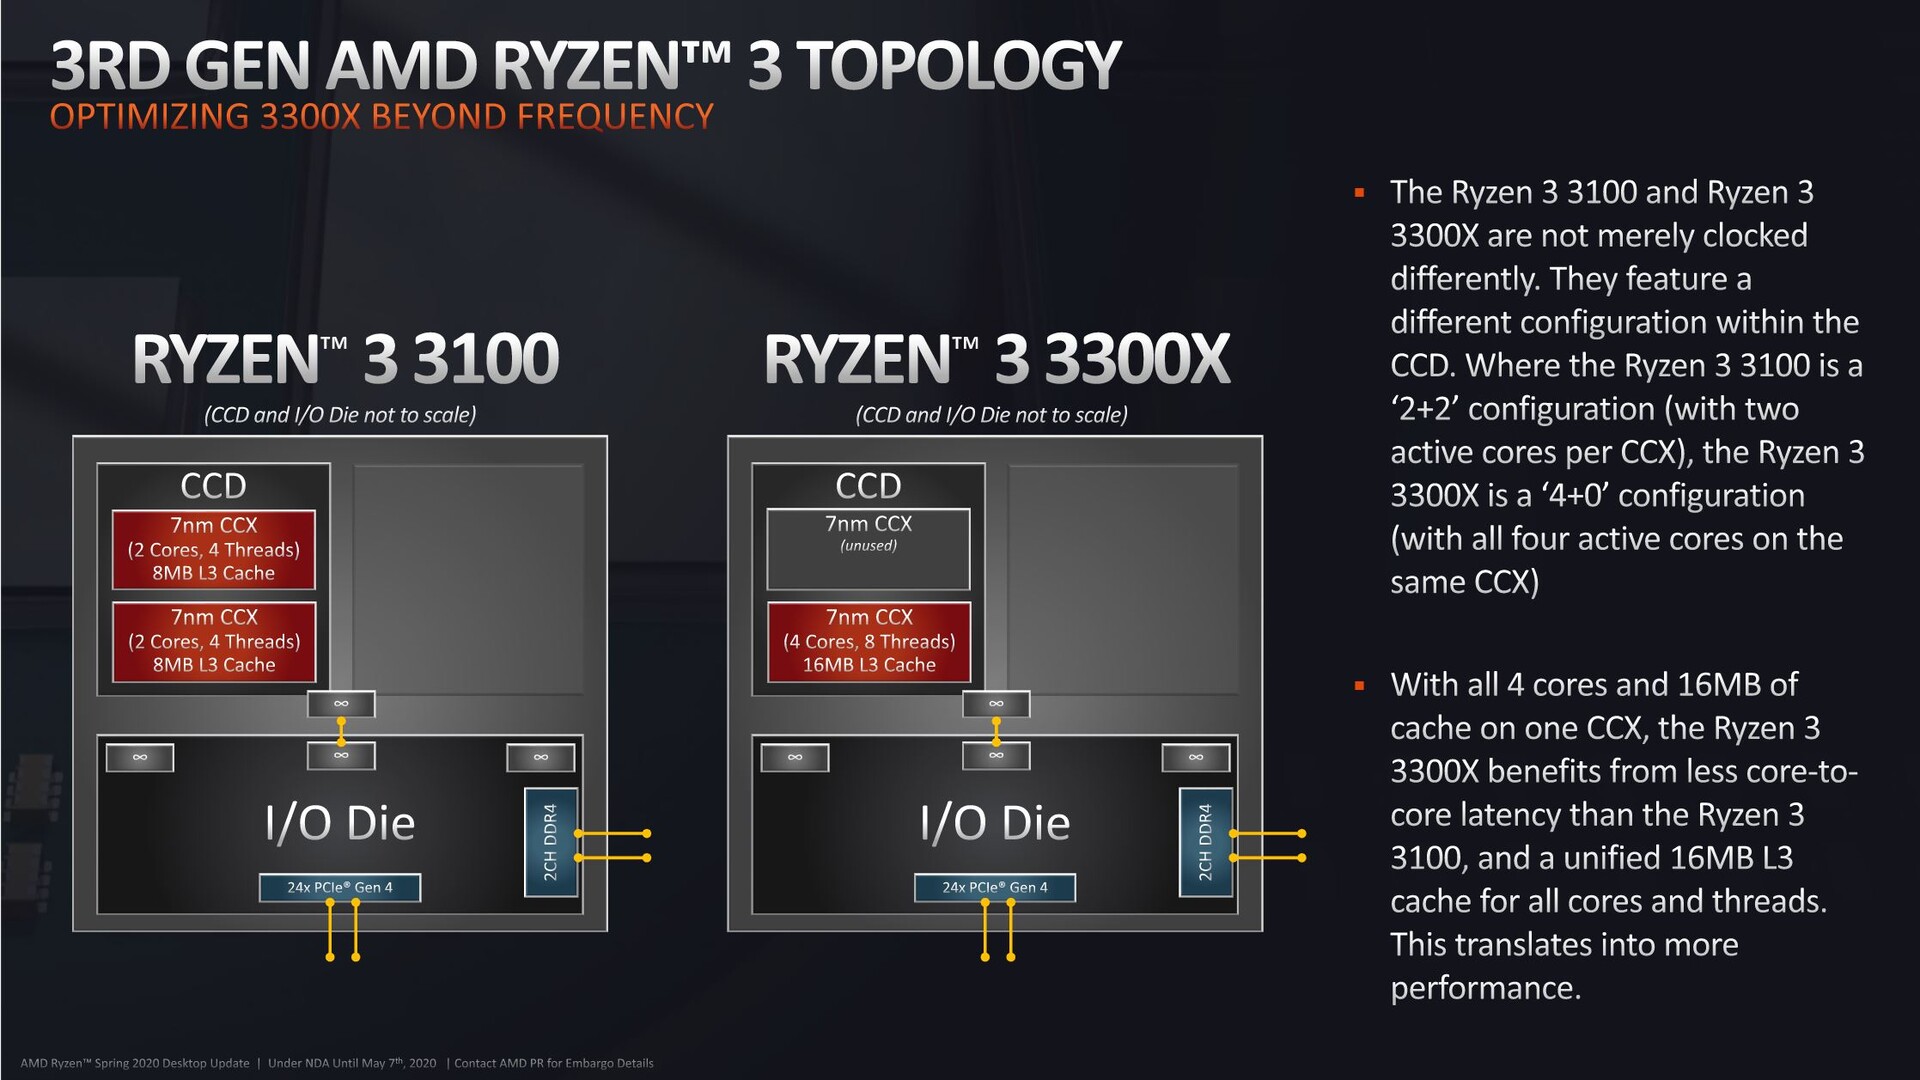
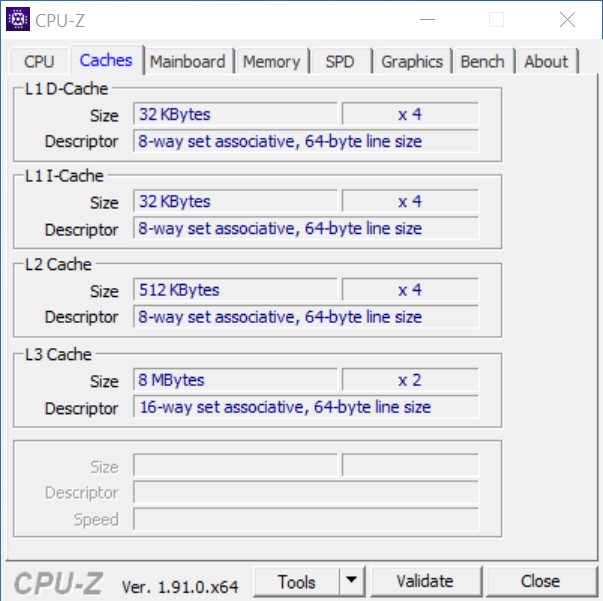
As already mentioned, both Ryzen 3 models use four Zen2 cores including SMT (simultaneous multithreading). However, there are clear differences in the design and use of the native cores. The graph provided by AMD shows that the Ryzen 3 3100 has two active CCX clusters with two active cores each. One CCX cluster has a maximum of four cores, as is the case with the example of the Ryzen 3 3300X, which has only one active CCX cluster.
Furthermore, the two processors differ in their clock speeds, which also helps to define the different performance classes. However, AMD specifies an identical TDP of 65 watts for both processors. AMD itself created a ranking in terms of price-performance, which led us to use the direct competitors (Intel Core i3-9100F and Intel Core i5-9400F) for this test.

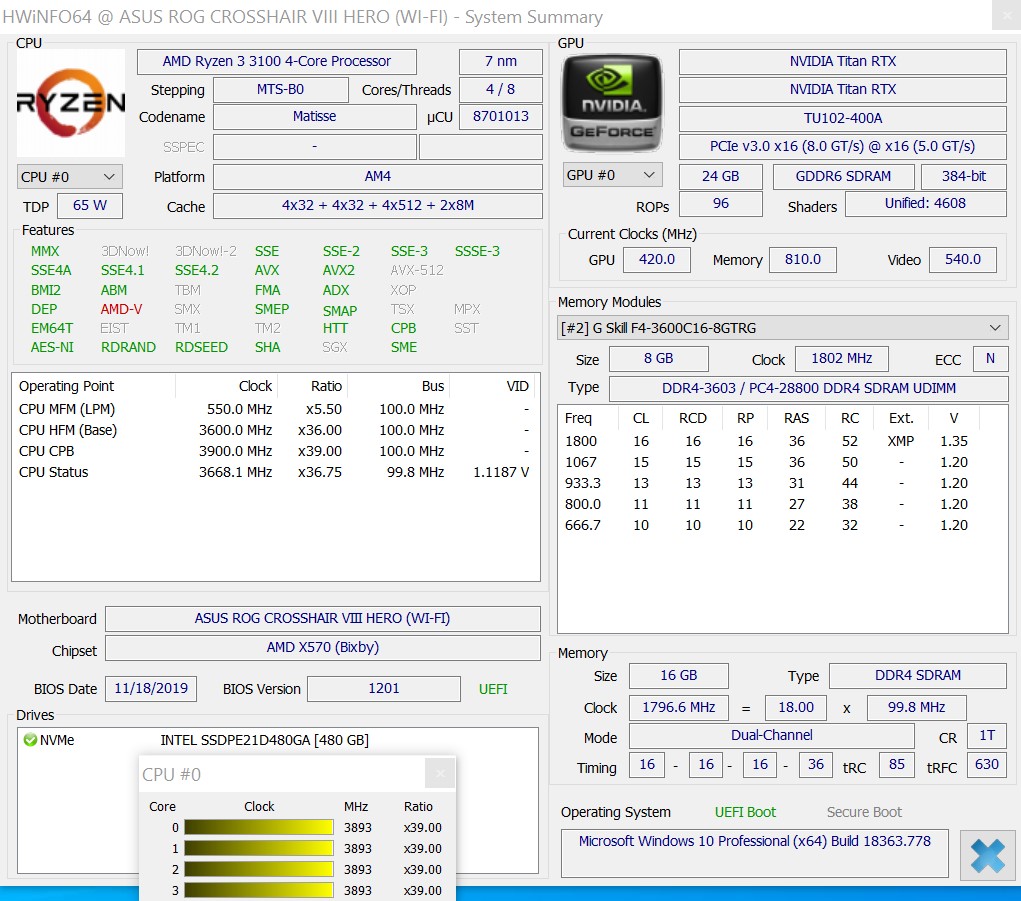
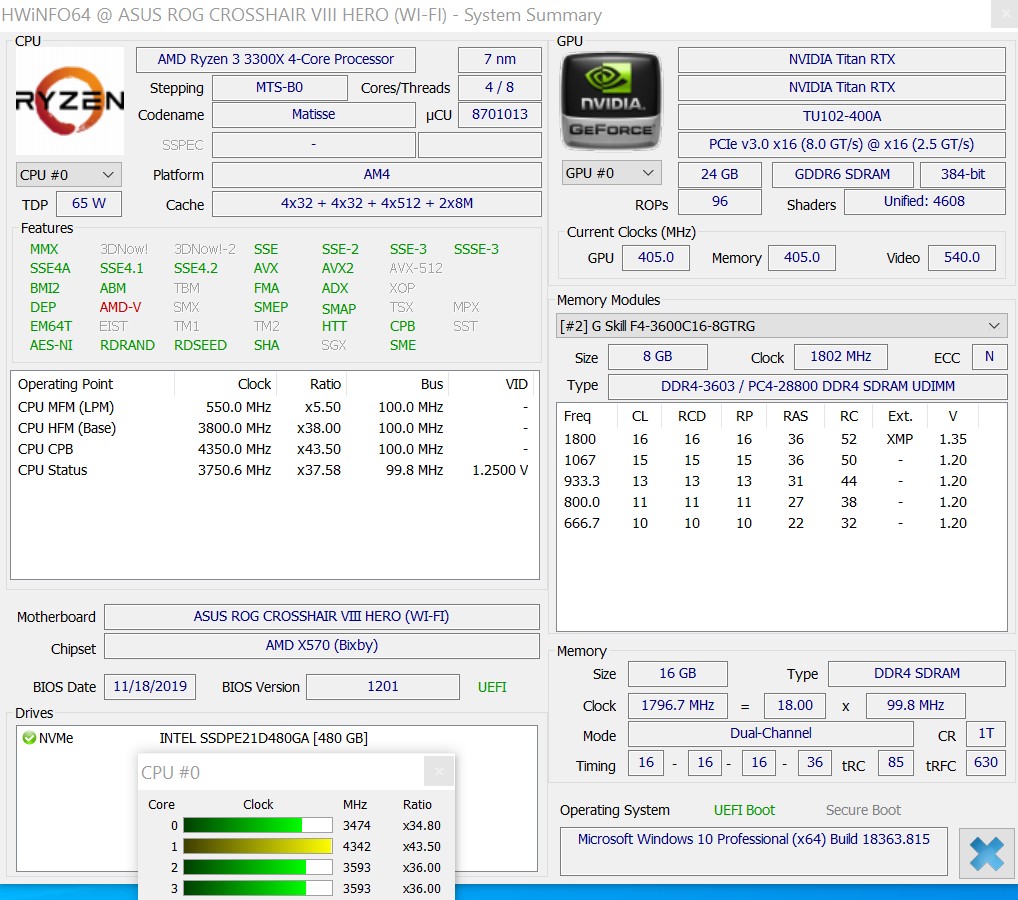
Test system details - AMD vs. Intel
We use the following system for the subsequent benchmarks and tests:
- Raijintek Pean Benchtable
- AMD Ryzen 3 3100 / AMD Ryzen 3 3300X
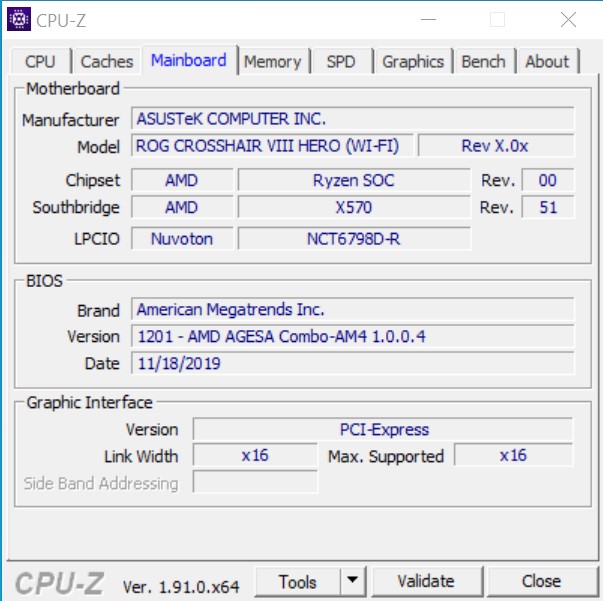
- Asus ROG Crosshair VIII Hero X570
- Intel Core i3-9100F / Intel Core i5-9400F
- Asus ROG Strix Z390E-Gaming
- Alphacool Eisbaer 280 AiO
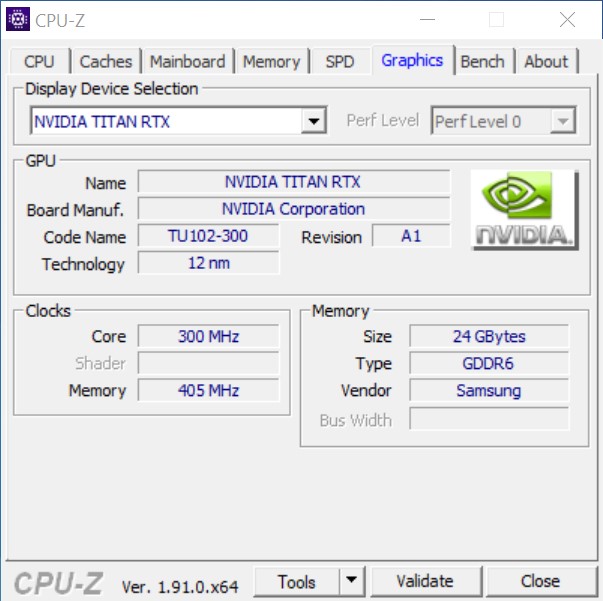
- Nvidia Titan RTX
- Corsair RM1000X power supply
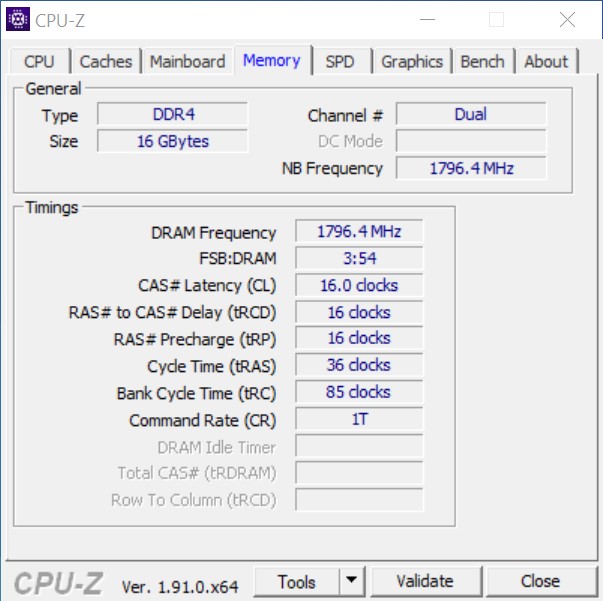
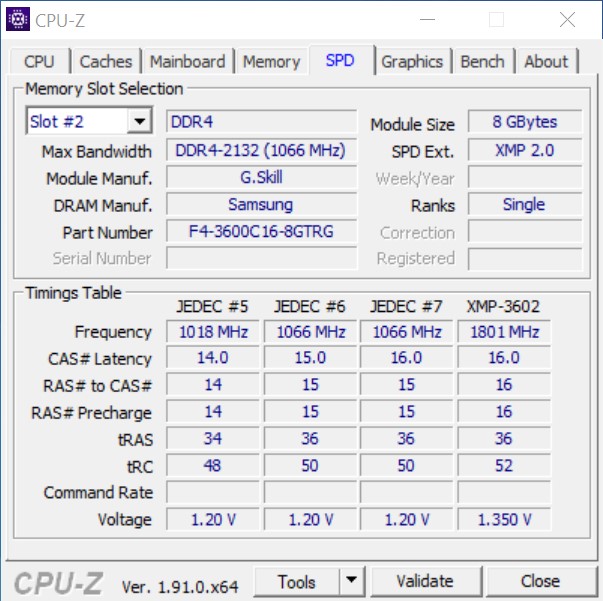
- G.Skill Trident Z Royal gold DDR4-3600 memory kit (2 x 8 GB), set to DDR4-3600 CL16-16-16-36
- Intel Optane 905P 480 GB PCIe SSD
- Microsoft Windows 10 Professional 64-bit (version 1909)
The components provided for this test, such as the motherboard and the RAM as well as the CPUs, come directly from AMD. We would also like to thank Asus for lending us the Z390 motherboard, which serves as our Intel foundation. The cooling comes from Alphacool, which we had also already reviewed extensively, and the case came to be in cooperation with Caseking.
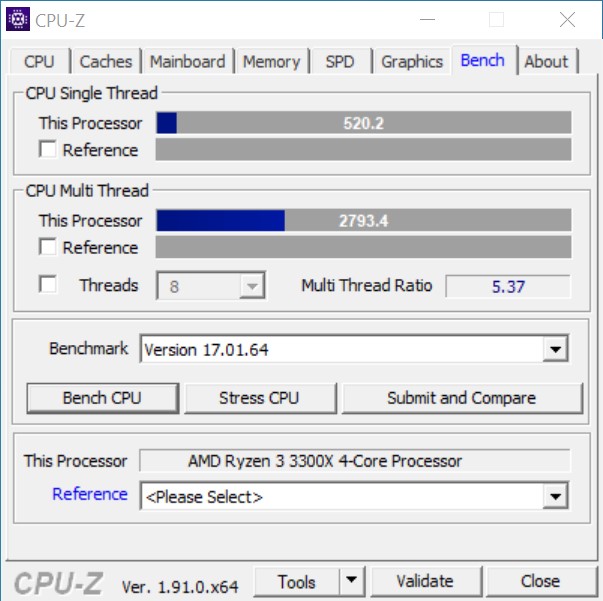
Processor benchmarks
When looking purely at the CPU benchmarks, the AMD Ryzen 3 3300X clearly sets the tone. Nevertheless, the Intel Core i5-9400F can play out its strengths in the Geekbench Multi tests and easily push itself in front of the AMD Ryzen 3 3300X. The six physical computing cores of the Intel Core i5 seem to pay off a bit here. Overall, the native hexa-core processor can't come out on top against the AMD Ryzen 3 3300X. The Intel Core i3-9100F has to settle for last place in almost every test. It's clearly shown here that a quad-core processor without HT is mercilessly destroyed in modern systems. This underlines once again the step that AMD has taken with the new Ryzen 3 and that Intel will also follow in the near future.
AMD Ryzen 3 3100


AMD Ryzen 3 3300X


| Performance rating - Percent | |
| Average Intel Core i7-7740X | |
| AMD Ryzen 3 3300X | |
| Intel Core i5-9400F | |
| AMD Ryzen 3 3100 | |
| AMD Ryzen 5 1600 | |
| Intel Core i3-9100F | |
| Cinebench R10 | |
| Rendering Single CPUs 64Bit | |
| AMD Ryzen 3 3300X | |
| Average Intel Core i7-7740X (n=1) | |
| AMD Ryzen 3 3100 | |
| Intel Core i3-9100F | |
| Intel Core i5-9400F | |
| AMD Ryzen 5 1600 | |
| Rendering Multiple CPUs 64Bit | |
| AMD Ryzen 5 1600 | |
| AMD Ryzen 3 3300X | |
| Intel Core i5-9400F | |
| Average Intel Core i7-7740X (n=1) | |
| AMD Ryzen 3 3100 | |
| Intel Core i3-9100F | |
| Blender - v2.79 BMW27 CPU | |
| Intel Core i3-9100F | |
| AMD Ryzen 3 3100 | |
| Intel Core i5-9400F | |
| Average Intel Core i7-7740X (n=1) | |
| AMD Ryzen 3 3300X | |
| AMD Ryzen 5 1600 | |
| WinRAR - Result | |
| AMD Ryzen 3 3300X | |
| Average Intel Core i7-7740X (n=1) | |
| Intel Core i5-9400F | |
| AMD Ryzen 3 3100 | |
| AMD Ryzen 5 1600 | |
| Intel Core i3-9100F | |
| Geekbench 4.4 | |
| 64 Bit Single-Core Score | |
| Average Intel Core i7-7740X (n=1) | |
| AMD Ryzen 3 3300X | |
| Intel Core i5-9400F | |
| Intel Core i3-9100F | |
| AMD Ryzen 3 3100 | |
| AMD Ryzen 5 1600 | |
| 64 Bit Multi-Core Score | |
| Intel Core i5-9400F | |
| AMD Ryzen 5 1600 | |
| AMD Ryzen 3 3300X | |
| Average Intel Core i7-7740X (n=1) | |
| AMD Ryzen 3 3100 | |
| Intel Core i3-9100F | |
| 3DMark 11 - 1280x720 Performance Physics | |
| AMD Ryzen 3 3300X | |
| Average Intel Core i7-7740X (12196 - 12488, n=6) | |
| AMD Ryzen 5 1600 | |
| Intel Core i5-9400F | |
| AMD Ryzen 3 3100 | |
| Intel Core i3-9100F | |
| HWBOT x265 Benchmark v2.2 - 4k Preset | |
| Intel Core i5-9400F | |
| Average Intel Core i7-7740X (n=1) | |
| AMD Ryzen 3 3300X | |
| AMD Ryzen 3 3100 | |
| AMD Ryzen 5 1600 | |
| Intel Core i3-9100F | |
| R Benchmark 2.5 - Overall mean | |
| Intel Core i5-9400F | |
| Intel Core i3-9100F | |
| AMD Ryzen 5 1600 | |
| AMD Ryzen 3 3100 | |
| Average Intel Core i7-7740X (n=1) | |
| AMD Ryzen 3 3300X | |
| LibreOffice - 20 Documents To PDF | |
| AMD Ryzen 5 1600 | |
| Intel Core i3-9100F | |
| AMD Ryzen 3 3100 | |
| Intel Core i5-9400F | |
| Average Intel Core i7-7740X (n=1) | |
| AMD Ryzen 3 3300X | |
| WebXPRT 3 - Overall | |
| Average Intel Core i7-7740X (247 - 265, n=2) | |
| AMD Ryzen 3 3300X | |
| Intel Core i5-9400F | |
| AMD Ryzen 3 3100 | |
| Intel Core i3-9100F | |
| AMD Ryzen 5 1600 | |
| Mozilla Kraken 1.1 - Total | |
| AMD Ryzen 5 1600 | |
| Intel Core i5-9400F | |
| Intel Core i3-9100F | |
| AMD Ryzen 3 3100 | |
| Average Intel Core i7-7740X (n=1) | |
| AMD Ryzen 3 3300X | |
| 3DMark | |
| 3840x2160 Fire Strike Ultra Physics | |
| AMD Ryzen 5 1600 | |
| AMD Ryzen 3 3300X | |
| Average Intel Core i7-7740X (n=1) | |
| AMD Ryzen 3 3100 | |
| Intel Core i5-9400F | |
| Intel Core i3-9100F | |
| 1920x1080 Fire Strike Physics | |
| AMD Ryzen 5 1600 | |
| AMD Ryzen 3 3300X | |
| Average Intel Core i7-7740X (13230 - 14523, n=7) | |
| AMD Ryzen 3 3100 | |
| Intel Core i5-9400F | |
| Intel Core i3-9100F | |
| 2560x1440 Time Spy CPU | |
| AMD Ryzen 5 1600 | |
| Intel Core i5-9400F | |
| Average Intel Core i7-7740X (5632 - 5792, n=7) | |
| AMD Ryzen 3 3300X | |
| AMD Ryzen 3 3100 | |
| Intel Core i3-9100F | |
* ... smaller is better
The test subjects in the Cinebench R15 multi-loop
During the stress test with the Cinebench R15 multi-loop, the almost oversized AiO ensures that all measurements remain stable. Both Ryzen 3 models can even beat the competition from Intel in this test. Even the Core i5-9400F with its six cores has to admit defeat to the small Ryzen 3 3100 with only four cores. The newly released Ryzen 5 1600 (in 12 nm) clearly leads the field thanks to its six cores including SMT.
Application performance
In everyday life, all systems perform well and run very fast. But in the details, you can see the subtleties that the Zen2 platform has to offer. In comparison to the popular AMD Ryzen 5 1600, which experienced a revival with Zen+, the new Zen2 processors can clearly set themselves apart. Intel also came more and more under pressure due to the innovations of AMD. But with Comet Lake-S, the successors of the Coffee Lake-R CPUs are already in the starting blocks.
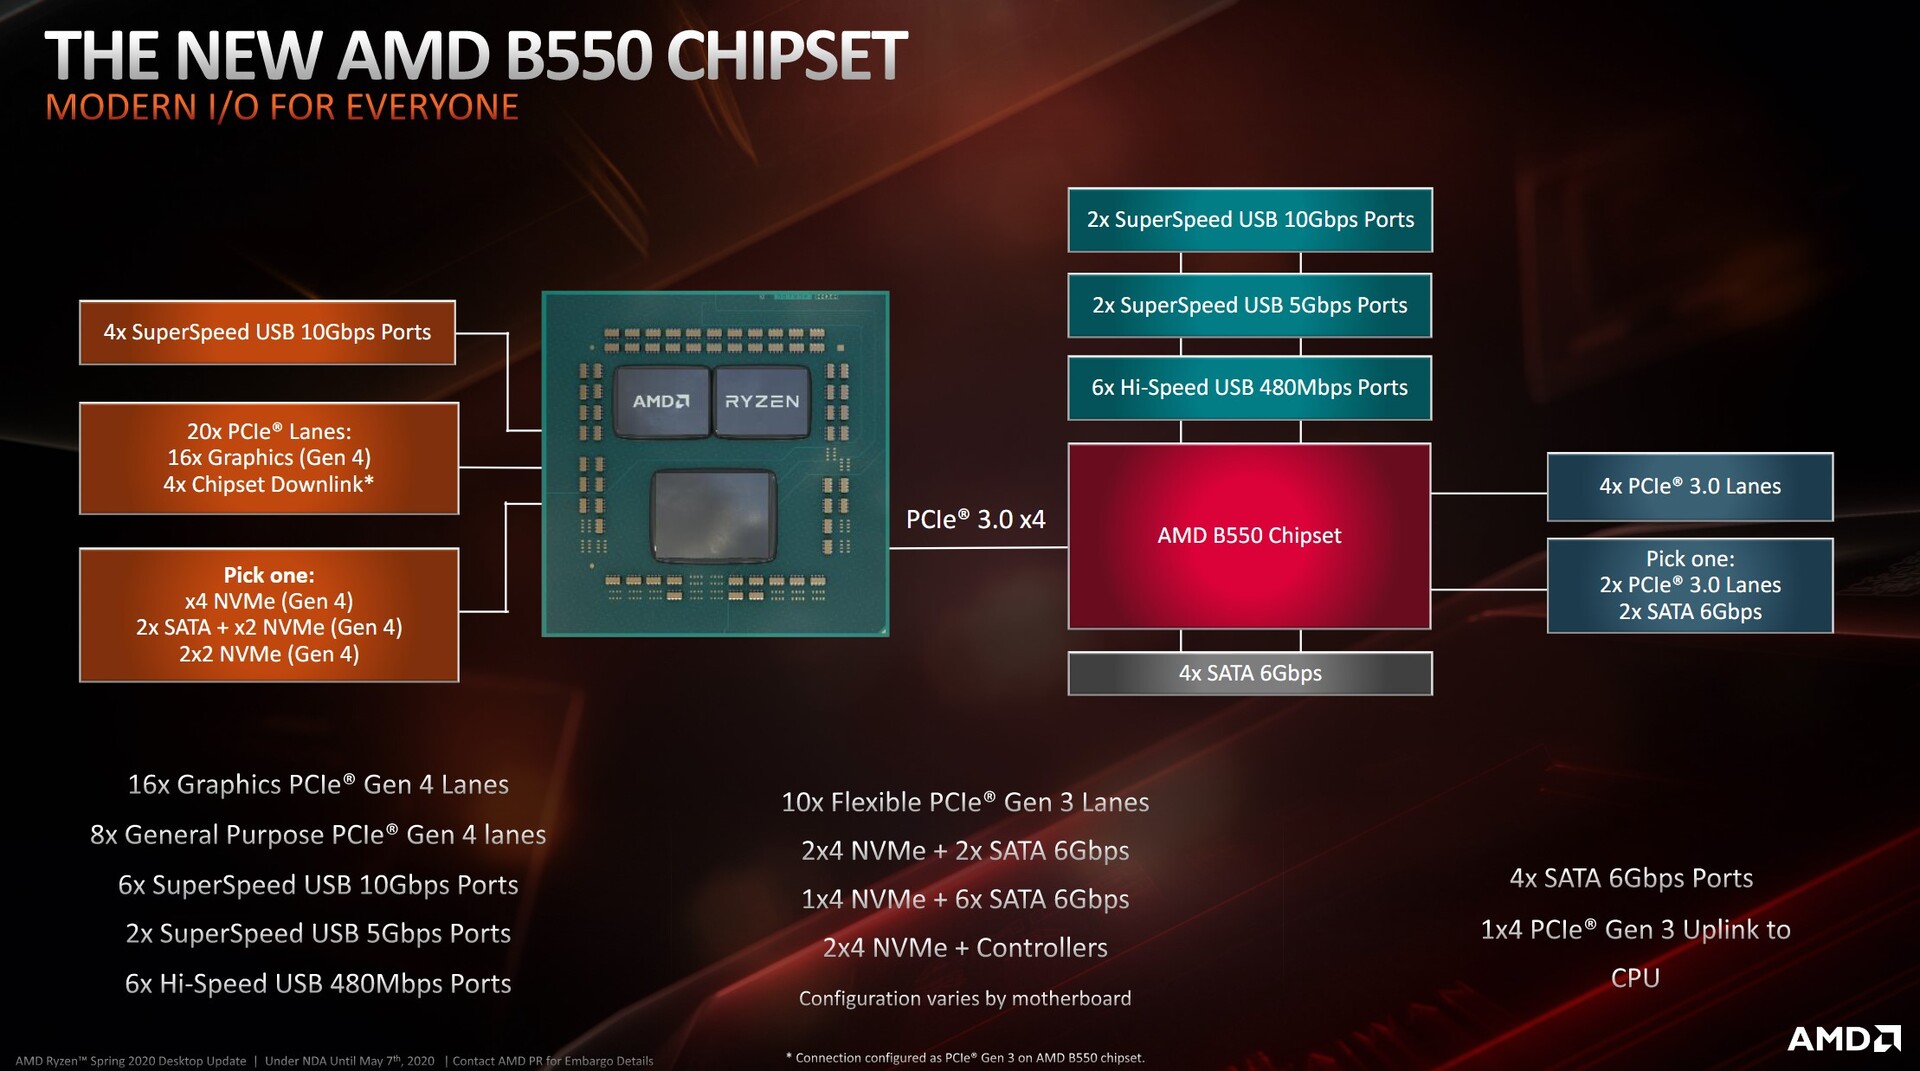
As an unbeatable purchase argument, AMD can still score points with PCI Express 4.0, because Intel doesn't support the latter with Comet Lake-S either. In addition, the new B550 chipset ensures that even inexpensive systems can have access to the new standard.
| PCMark 10 - Score | |
| AMD Ryzen 3 3300X | |
| Intel Core i5-9400F | |
| AMD Ryzen 3 3100 | |
| Intel Core i3-9100F | |
| AMD Ryzen 5 1600 | |
| PCMark 8 | |
| Work Score Accelerated v2 | |
| AMD Ryzen 3 3300X | |
| Intel Core i3-9100F | |
| Intel Core i5-9400F | |
| AMD Ryzen 3 3100 | |
| AMD Ryzen 5 1600 | |
| Creative Score Accelerated v2 | |
| AMD Ryzen 3 3300X | |
| Intel Core i5-9400F | |
| AMD Ryzen 3 3100 | |
| Intel Core i3-9100F | |
| AMD Ryzen 5 1600 | |
| Home Score Accelerated v2 | |
| AMD Ryzen 3 3300X | |
| Intel Core i5-9400F | |
| Intel Core i3-9100F | |
| AMD Ryzen 3 3100 | |
| AMD Ryzen 5 1600 | |
| Performance rating - Percent | |
| AMD Ryzen 3 3300X | |
| Intel Core i5-9400F | |
| AMD Ryzen 5 1600 | |
| AMD Ryzen 3 3100 | |
| Intel Core i3-9100F | |
| 3DMark 11 | |
| 1280x720 Performance | |
| AMD Ryzen 3 3300X | |
| Intel Core i5-9400F | |
| AMD Ryzen 5 1600 | |
| AMD Ryzen 3 3100 | |
| Intel Core i3-9100F | |
| 1280x720 Performance GPU | |
| Intel Core i3-9100F | |
| Intel Core i5-9400F | |
| AMD Ryzen 3 3300X | |
| AMD Ryzen 5 1600 | |
| AMD Ryzen 3 3100 | |
| 3DMark | |
| 1920x1080 Fire Strike Score | |
| AMD Ryzen 3 3300X | |
| Intel Core i5-9400F | |
| AMD Ryzen 5 1600 | |
| AMD Ryzen 3 3100 | |
| Intel Core i3-9100F | |
| 1920x1080 Fire Strike Graphics | |
| Intel Core i3-9100F | |
| Intel Core i5-9400F | |
| AMD Ryzen 3 3100 | |
| AMD Ryzen 3 3300X | |
| AMD Ryzen 5 1600 | |
| 3840x2160 Fire Strike Ultra Score | |
| AMD Ryzen 3 3300X | |
| Intel Core i5-9400F | |
| AMD Ryzen 5 1600 | |
| AMD Ryzen 3 3100 | |
| Intel Core i3-9100F | |
| 2560x1440 Time Spy Graphics | |
| Intel Core i5-9400F | |
| AMD Ryzen 3 3300X | |
| Intel Core i3-9100F | |
| AMD Ryzen 5 1600 | |
| AMD Ryzen 3 3100 | |
| 2560x1440 Time Spy Score | |
| Intel Core i5-9400F | |
| AMD Ryzen 5 1600 | |
| AMD Ryzen 3 3300X | |
| AMD Ryzen 3 3100 | |
| Intel Core i3-9100F | |
The new Ryzen CPUs in the gaming test
In contrast to the pure CPU benchmarks, it's shown here that AMD is not so superior in the gaming tests carried out. Intel is also well positioned with the older Core i3 and Core i5, and especially the Intel Core i5-9400F could produce the highest frame rates in our gaming tests. The performance advantage shrinks with higher resolutions, as the graphics card increasingly becomes the decisive factor here. However, it's evident that the newer Zen2 architecture has a clear performance advantage over Zen+. The Ryzen 5 1600 offers six cores just like the Core i5-9400F. Due to the lower IPC, the Ryzen 5 is almost always in last place.
| Performance rating - Percent | |
| Intel Core i5 9400F | |
| AMD Ryzen 3 3300X | |
| Intel Core i3 9100F | |
| AMD Ryzen 3 3100 | |
| AMD Ryzen 5 1600 (12nm) | |
| Borderlands 3 | |
| 1280x720 Very Low Overall Quality (DX11) | |
| Intel Core i5 9400F | |
| AMD Ryzen 3 3300X | |
| Intel Core i3 9100F | |
| AMD Ryzen 3 3100 | |
| AMD Ryzen 5 1600 (12nm) | |
| 1920x1080 Badass Overall Quality (DX11) | |
| Intel Core i5 9400F | |
| AMD Ryzen 3 3300X | |
| Intel Core i3 9100F | |
| AMD Ryzen 3 3100 | |
| AMD Ryzen 5 1600 (12nm) | |
| Metro Exodus | |
| 1280x720 Low Quality AF:4x | |
| Intel Core i5 9400F | |
| AMD Ryzen 3 3300X | |
| AMD Ryzen 3 3100 | |
| AMD Ryzen 5 1600 (12nm) | |
| Intel Core i3 9100F | |
| 1920x1080 Ultra Quality AF:16x | |
| Intel Core i5 9400F | |
| AMD Ryzen 3 3300X | |
| AMD Ryzen 3 3100 | |
| AMD Ryzen 5 1600 (12nm) | |
| Intel Core i3 9100F | |
| Far Cry New Dawn | |
| 1280x720 Low Preset | |
| Intel Core i5 9400F | |
| AMD Ryzen 3 3300X | |
| Intel Core i3 9100F | |
| AMD Ryzen 5 1600 (12nm) | |
| AMD Ryzen 3 3100 | |
| 1920x1080 Ultra Preset | |
| Intel Core i5 9400F | |
| Intel Core i3 9100F | |
| AMD Ryzen 3 3300X | |
| AMD Ryzen 3 3100 | |
| AMD Ryzen 5 1600 (12nm) | |
| Forza Horizon 4 | |
| 1280x720 Very Low Preset | |
| Intel Core i5 9400F | |
| AMD Ryzen 3 3300X | |
| Intel Core i3 9100F | |
| AMD Ryzen 3 3100 | |
| AMD Ryzen 5 1600 (12nm) | |
| 1920x1080 Ultra Preset AA:2xMS | |
| Intel Core i5 9400F | |
| AMD Ryzen 3 3300X | |
| Intel Core i3 9100F | |
| AMD Ryzen 3 3100 | |
| AMD Ryzen 5 1600 (12nm) | |
| Shadow of the Tomb Raider | |
| 1280x720 Lowest Preset | |
| Intel Core i5 9400F | |
| AMD Ryzen 3 3300X | |
| Intel Core i3 9100F | |
| AMD Ryzen 3 3100 | |
| AMD Ryzen 5 1600 (12nm) | |
| 1920x1080 Highest Preset AA:T | |
| Intel Core i5 9400F | |
| AMD Ryzen 3 3300X | |
| AMD Ryzen 3 3100 | |
| AMD Ryzen 5 1600 (12nm) | |
| Intel Core i3 9100F | |
| Far Cry 5 | |
| 1280x720 Low Preset AA:T | |
| AMD Ryzen 3 3300X | |
| Intel Core i5 9400F | |
| AMD Ryzen 3 3100 | |
| AMD Ryzen 5 1600 (12nm) | |
| Intel Core i3 9100F | |
| 1920x1080 Ultra Preset AA:T | |
| Intel Core i5 9400F | |
| AMD Ryzen 3 3300X | |
| AMD Ryzen 3 3100 | |
| AMD Ryzen 5 1600 (12nm) | |
| Intel Core i3 9100F | |
| X-Plane 11.11 | |
| 1280x720 low (fps_test=1) | |
| Intel Core i5 9400F | |
| AMD Ryzen 3 3300X | |
| Intel Core i3 9100F | |
| AMD Ryzen 3 3100 | |
| AMD Ryzen 5 1600 (12nm) | |
| 1920x1080 high (fps_test=3) | |
| Intel Core i5 9400F | |
| AMD Ryzen 3 3300X | |
| Intel Core i3 9100F | |
| AMD Ryzen 3 3100 | |
| AMD Ryzen 5 1600 (12nm) | |
| Final Fantasy XV Benchmark | |
| 1280x720 Lite Quality | |
| Intel Core i5 9400F | |
| AMD Ryzen 3 3300X | |
| AMD Ryzen 3 3100 | |
| AMD Ryzen 5 1600 (12nm) | |
| Intel Core i3 9100F | |
| 1920x1080 High Quality | |
| Intel Core i5 9400F | |
| AMD Ryzen 3 3300X | |
| AMD Ryzen 5 1600 (12nm) | |
| AMD Ryzen 3 3100 | |
| Intel Core i3 9100F | |
| Dota 2 Reborn | |
| 1280x720 min (0/3) fastest | |
| Intel Core i5 9400F | |
| Intel Core i3 9100F | |
| AMD Ryzen 3 3300X | |
| AMD Ryzen 5 1600 (12nm) | |
| AMD Ryzen 3 3100 | |
| 1920x1080 ultra (3/3) best looking | |
| Intel Core i5 9400F | |
| Intel Core i3 9100F | |
| AMD Ryzen 3 3300X | |
| AMD Ryzen 5 1600 (12nm) | |
| AMD Ryzen 3 3100 | |
| The Witcher 3 | |
| 1024x768 Low Graphics & Postprocessing | |
| Intel Core i5 9400F | |
| AMD Ryzen 3 3300X | |
| AMD Ryzen 5 1600 (12nm) | |
| AMD Ryzen 3 3100 | |
| Intel Core i3 9100F | |
| 1920x1080 Ultra Graphics & Postprocessing (HBAO+) | |
| Intel Core i5 9400F | |
| AMD Ryzen 5 1600 (12nm) | |
| AMD Ryzen 3 3300X | |
| Intel Core i3 9100F | |
| AMD Ryzen 3 3100 | |
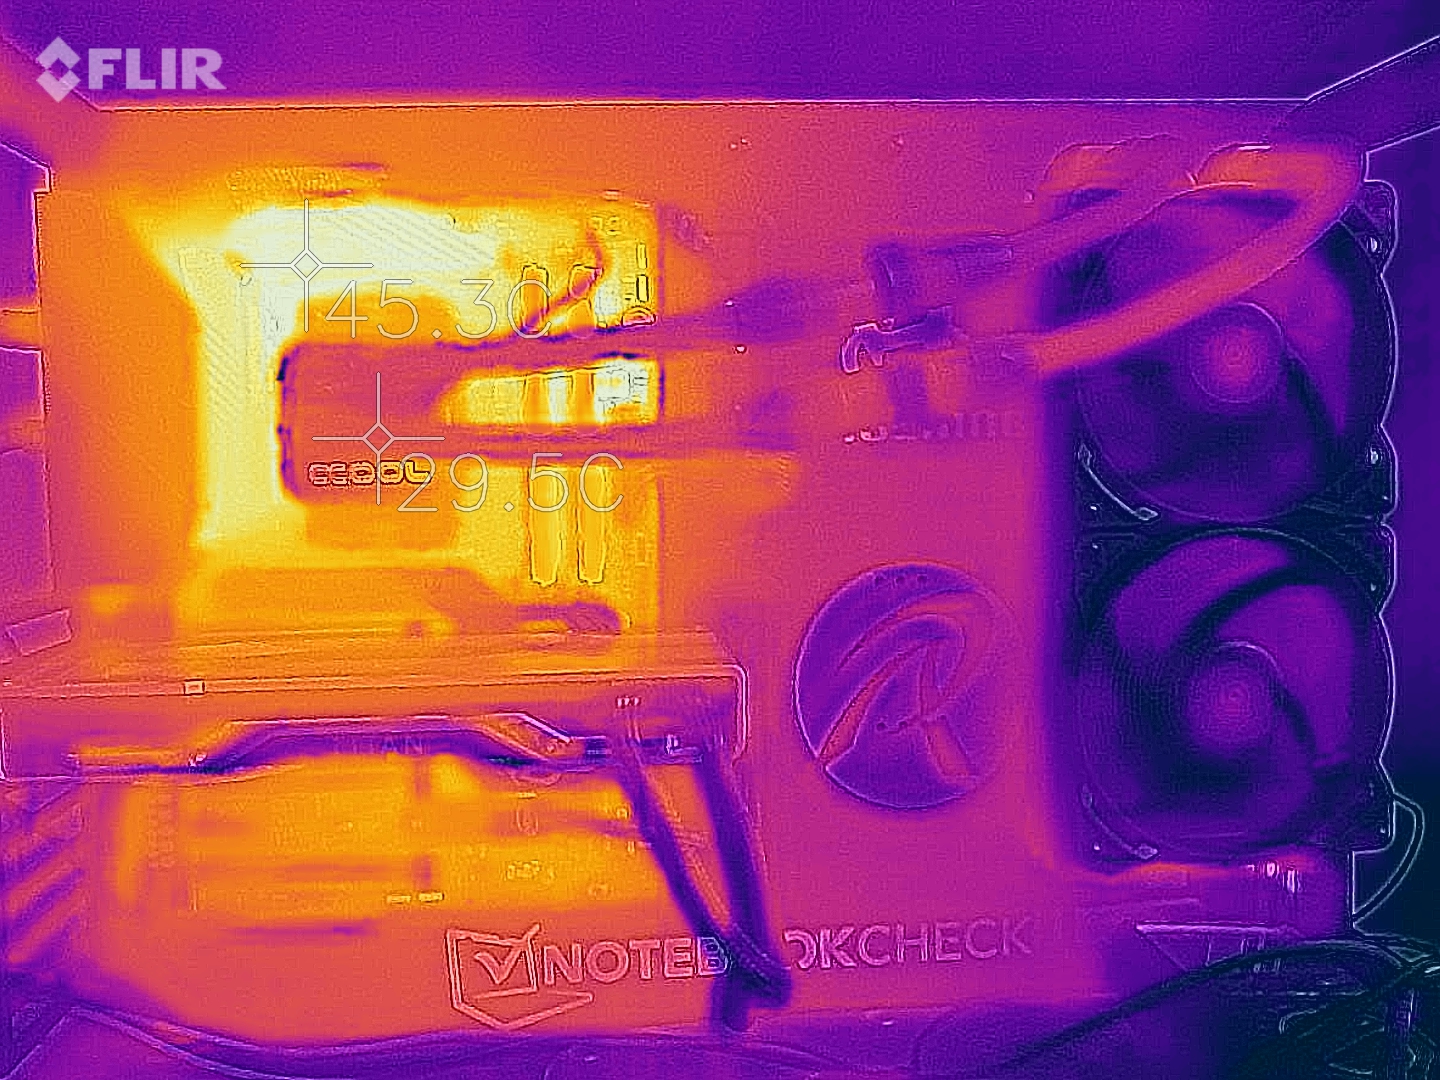
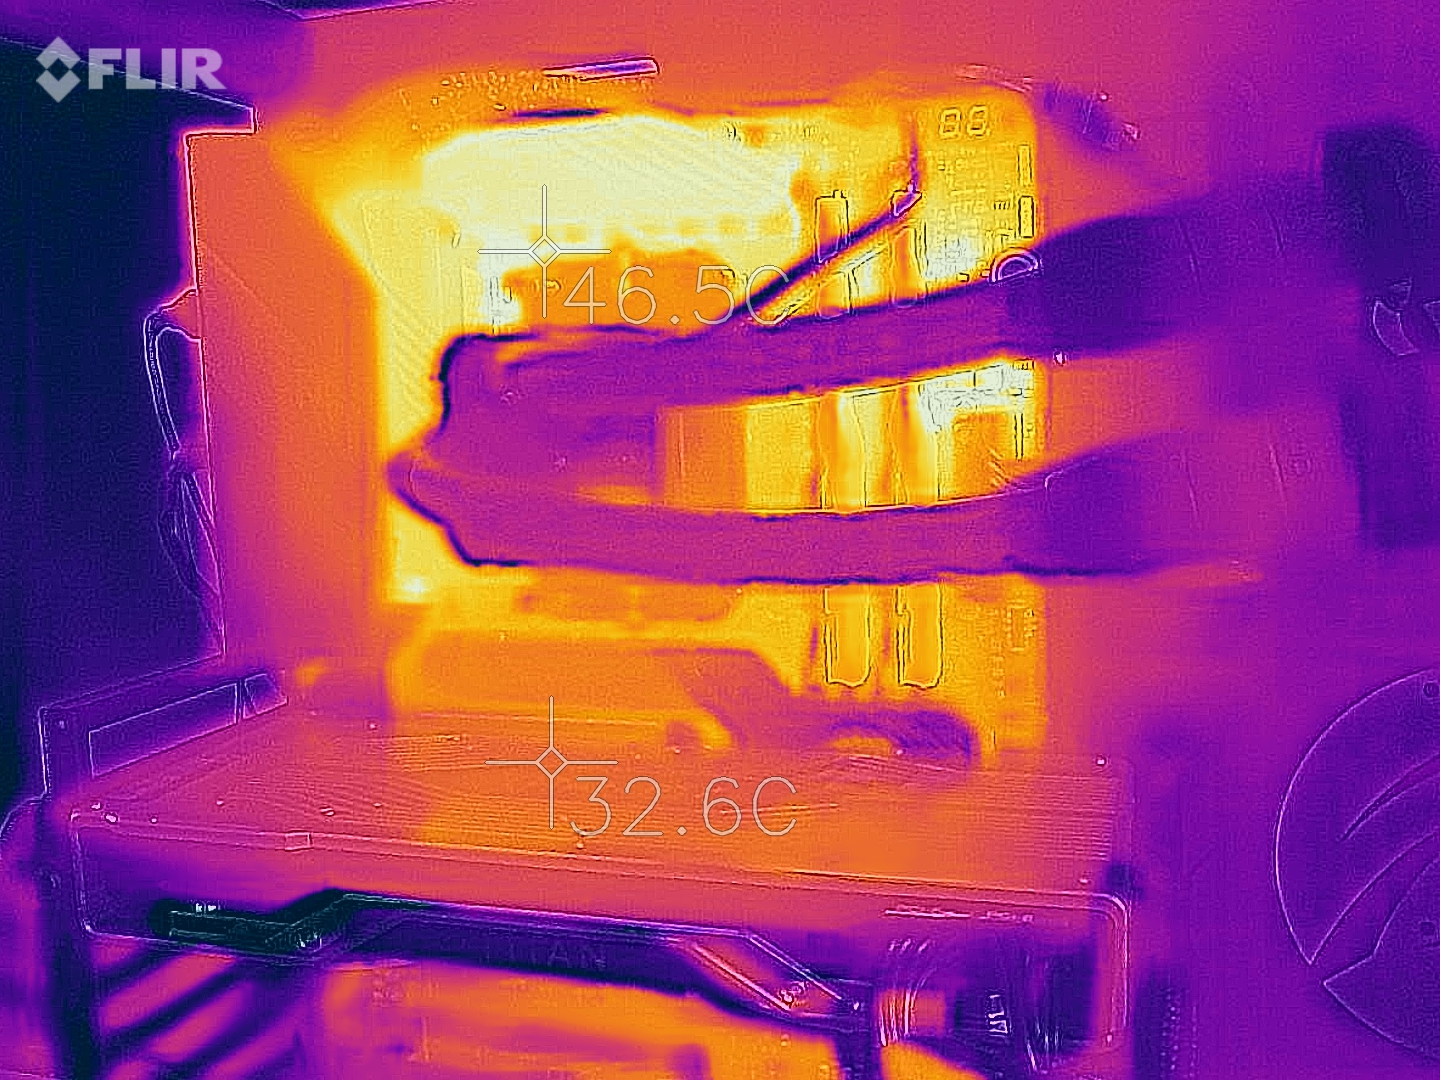
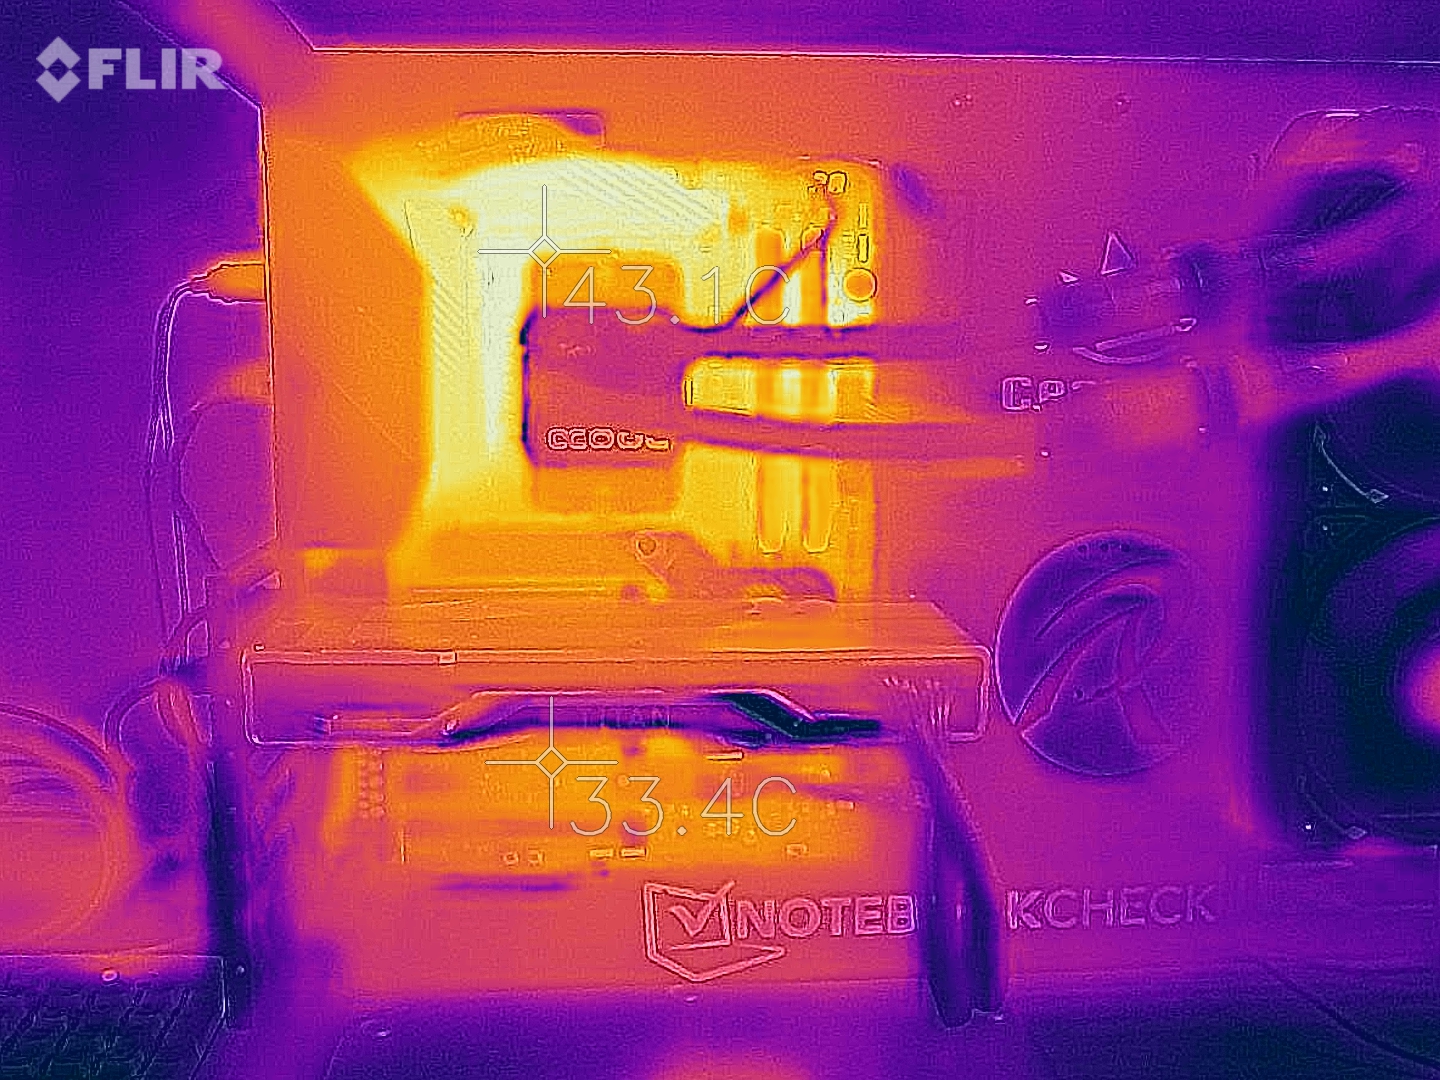
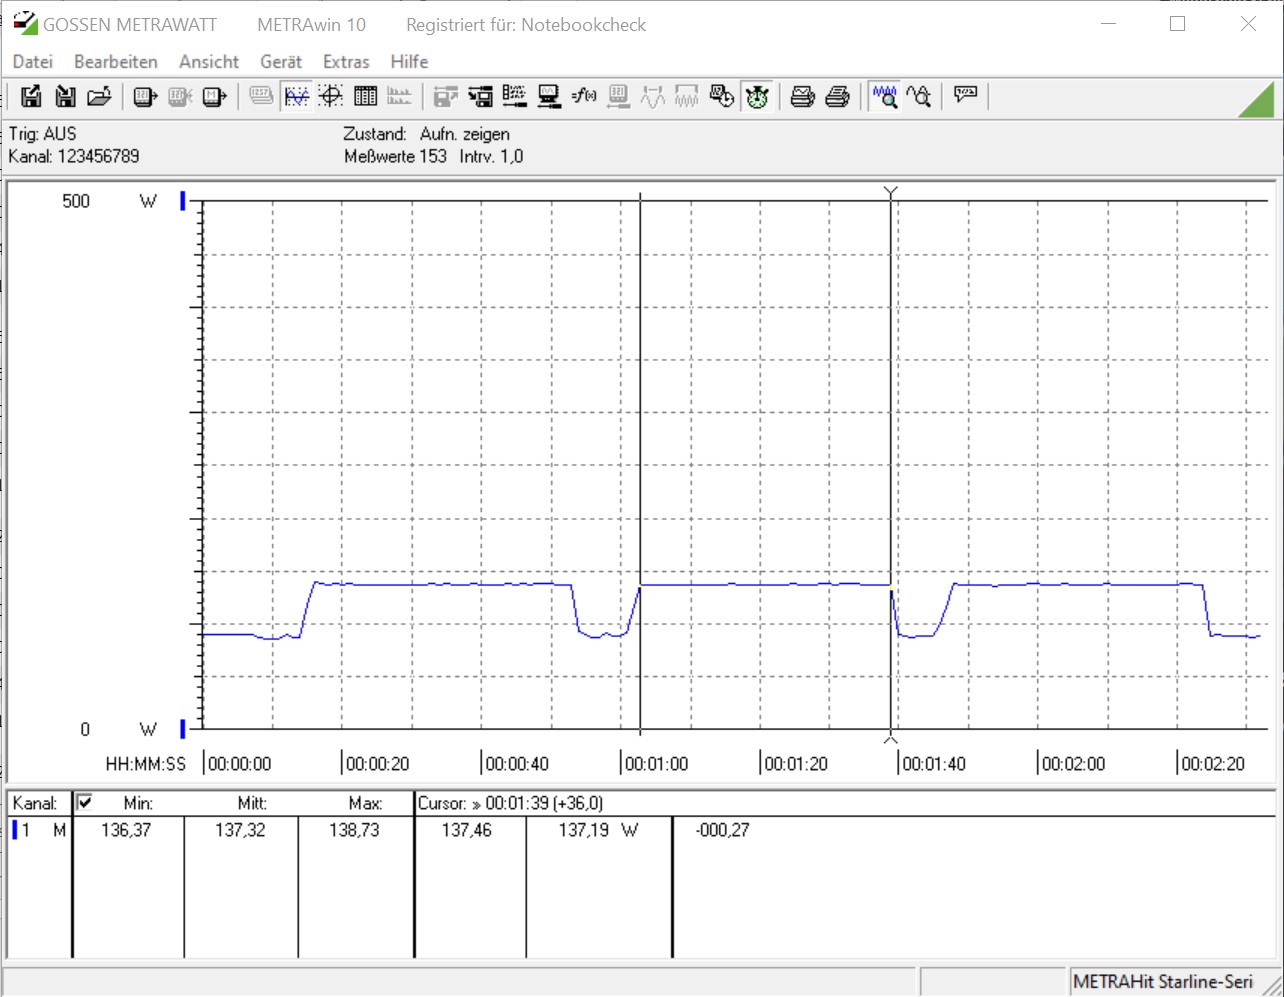
Energy consumption - How energy-efficient are the new quad-core CPUs?
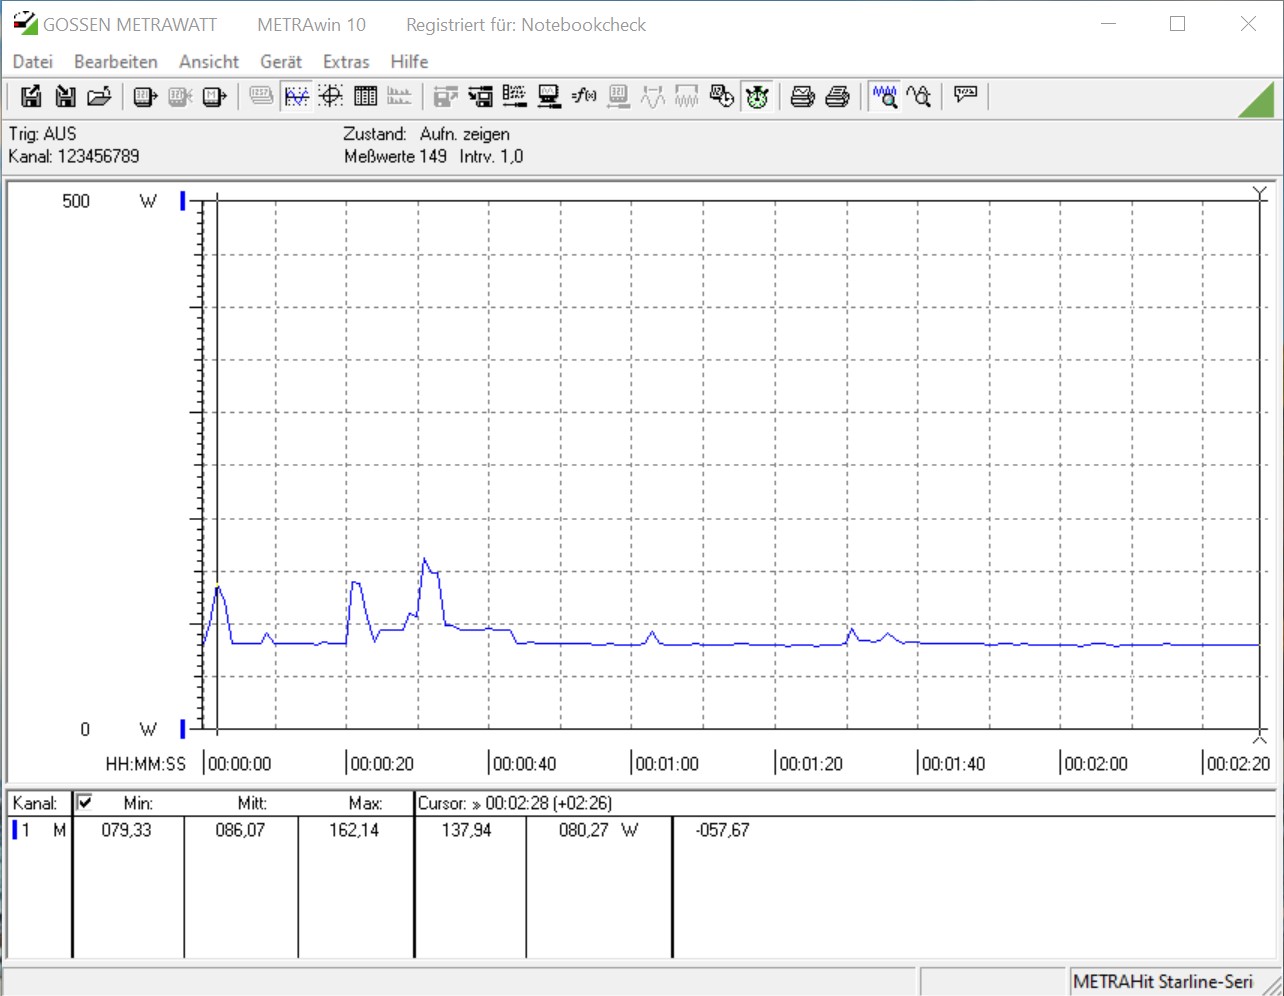
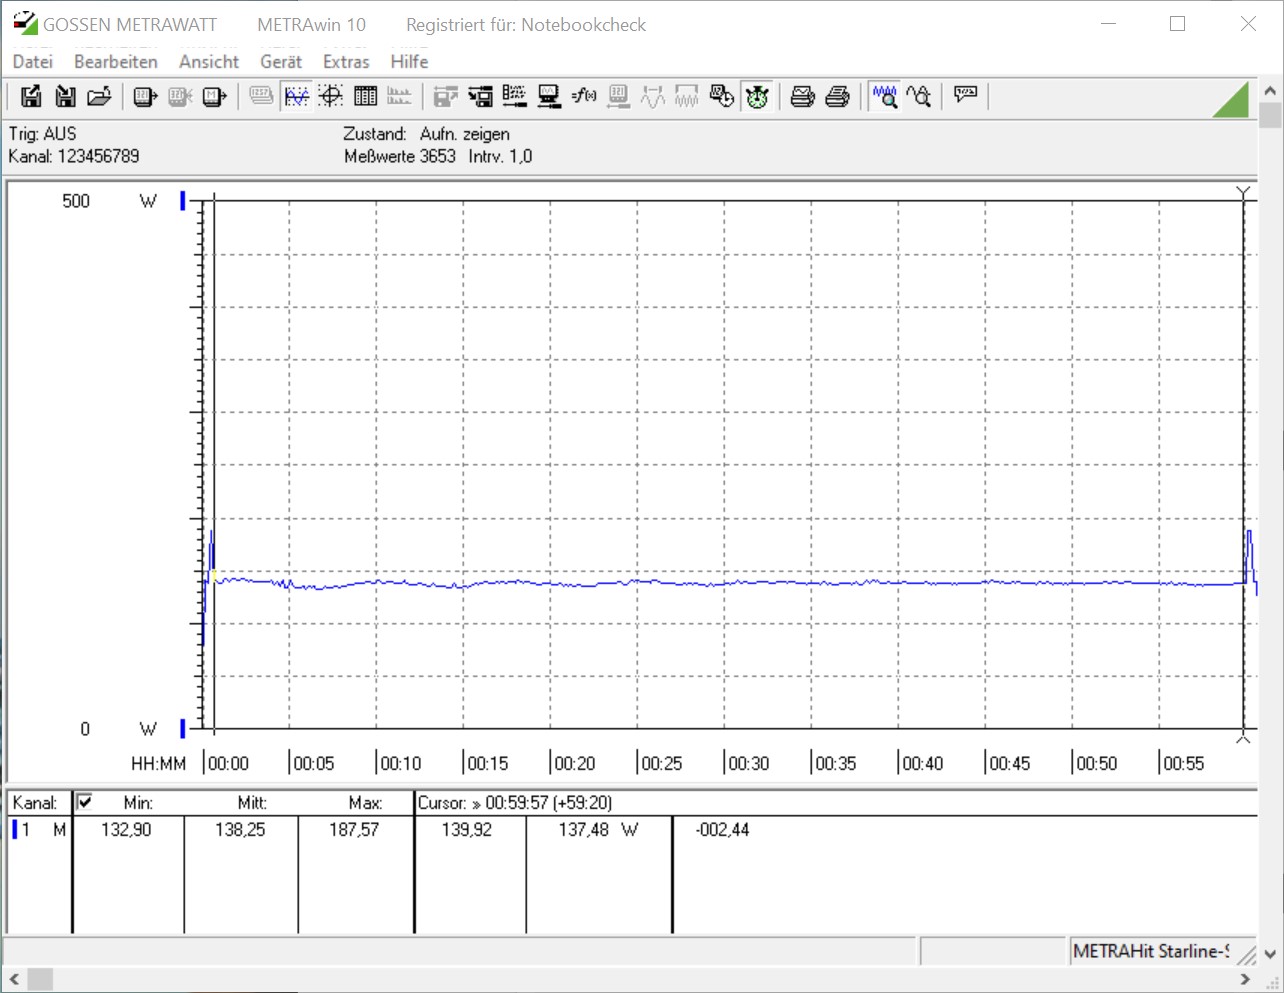
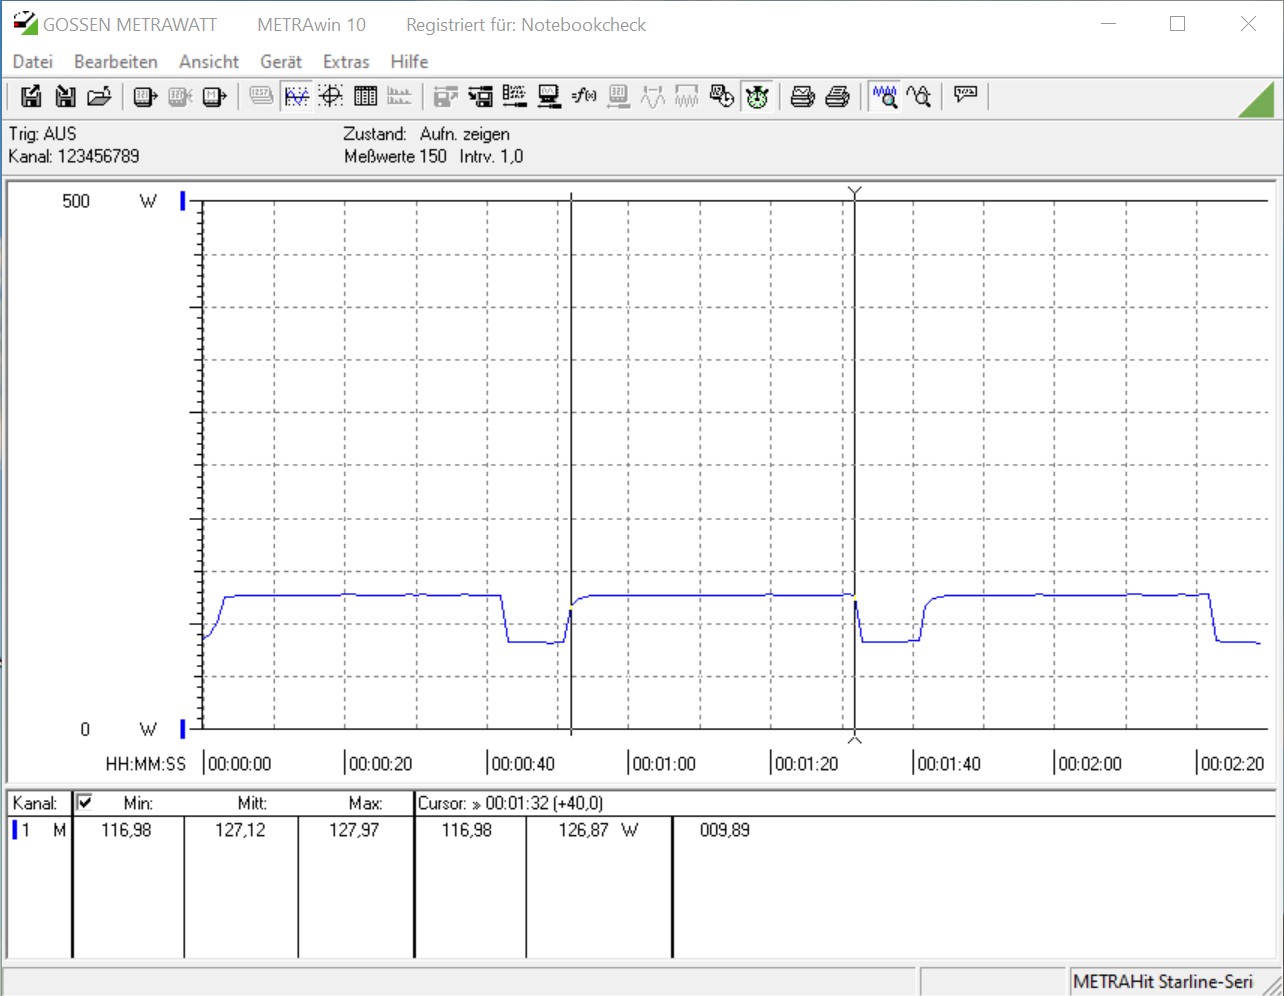
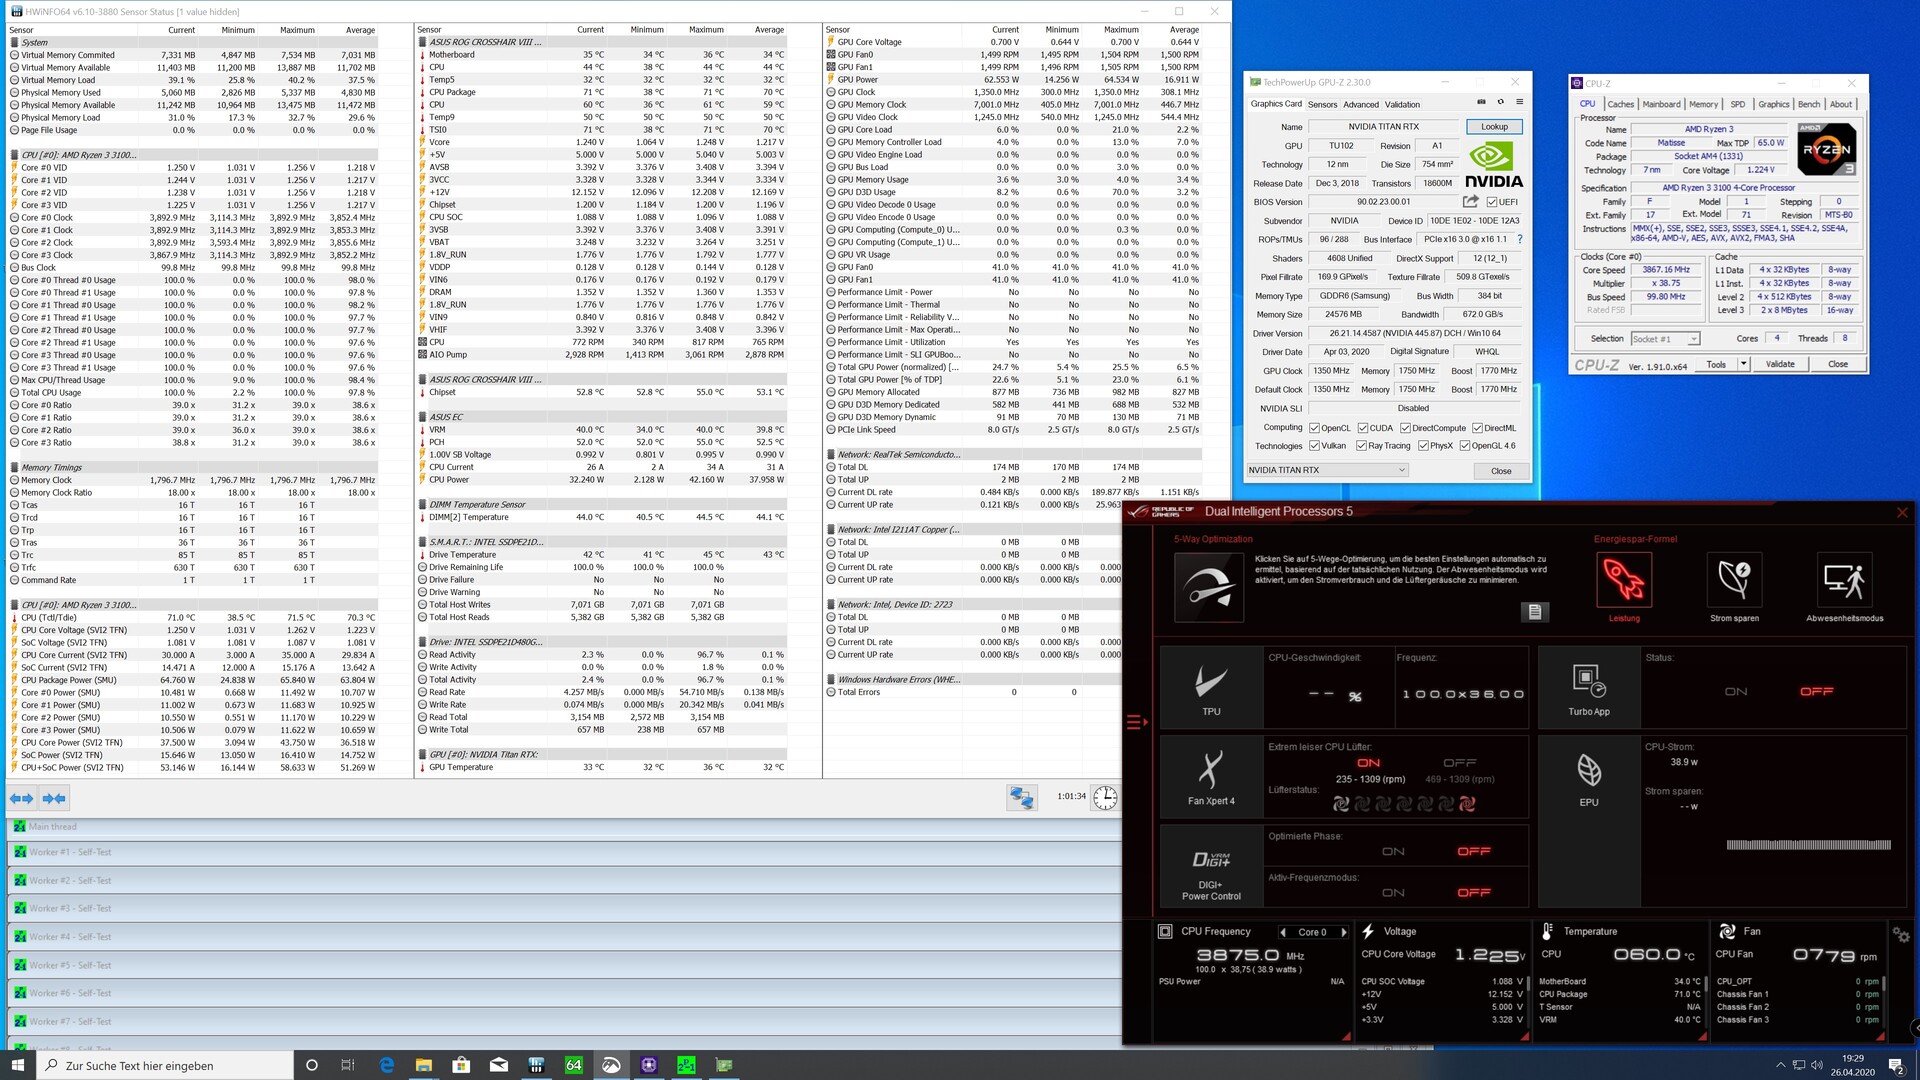
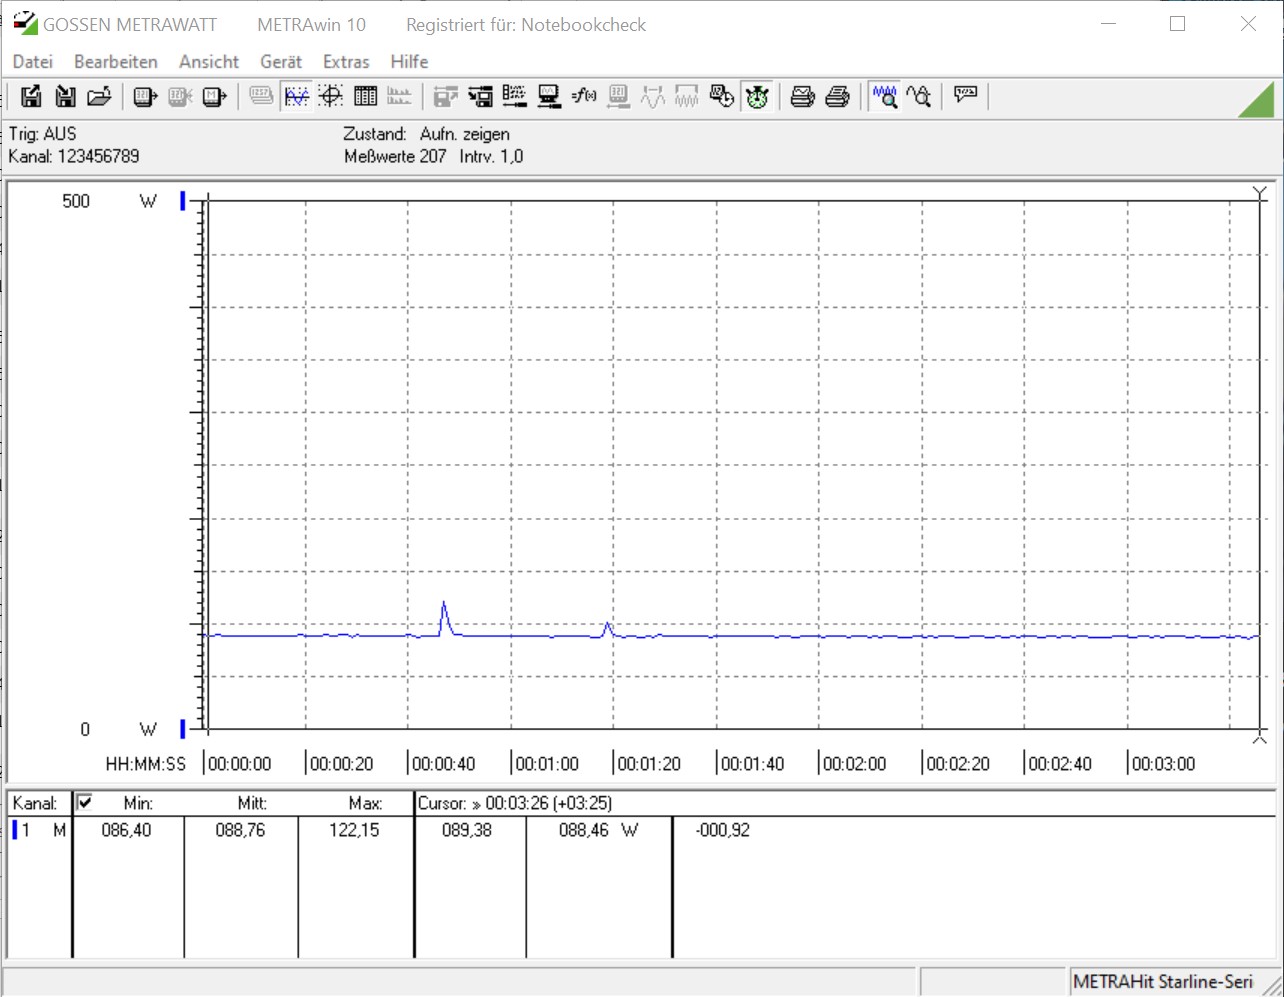
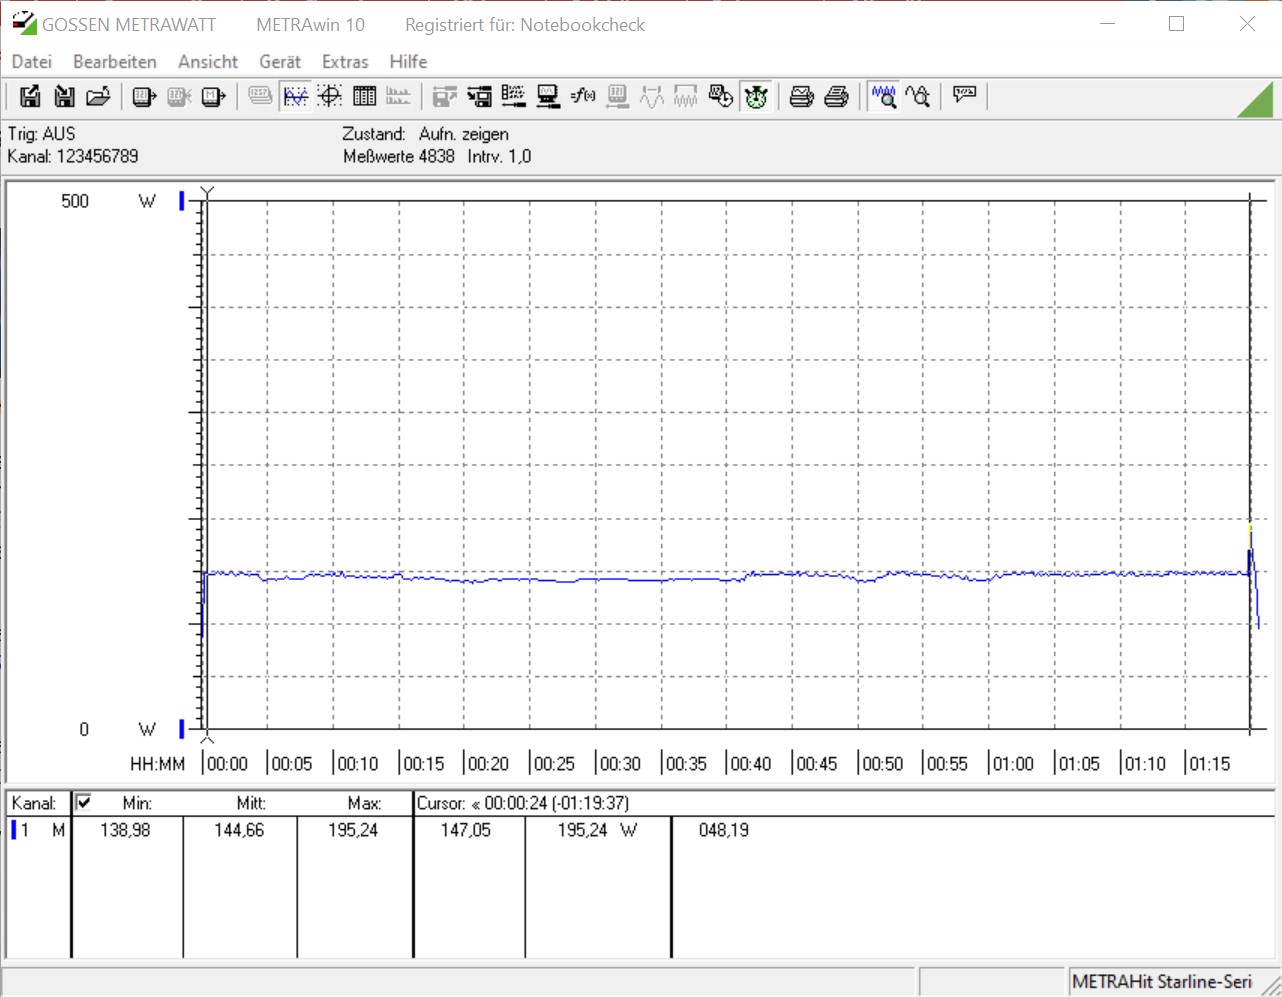
According to AMD, both new Ryzen 3 models are specified with a maximum TDP of 65 watts, which was also met in the stress test of our review. However, AMD still has to do some homework regarding idle mode if the company wants to put Intel under more pressure here. With 86 and 88 watts, the AMD system consumes without load almost 30 watts more energy than our Intel platform. The motherboard and the corresponding BIOS settings also play an important role in this rating, so you shouldn't blame the AMD CPUs alone for the higher power consumption.
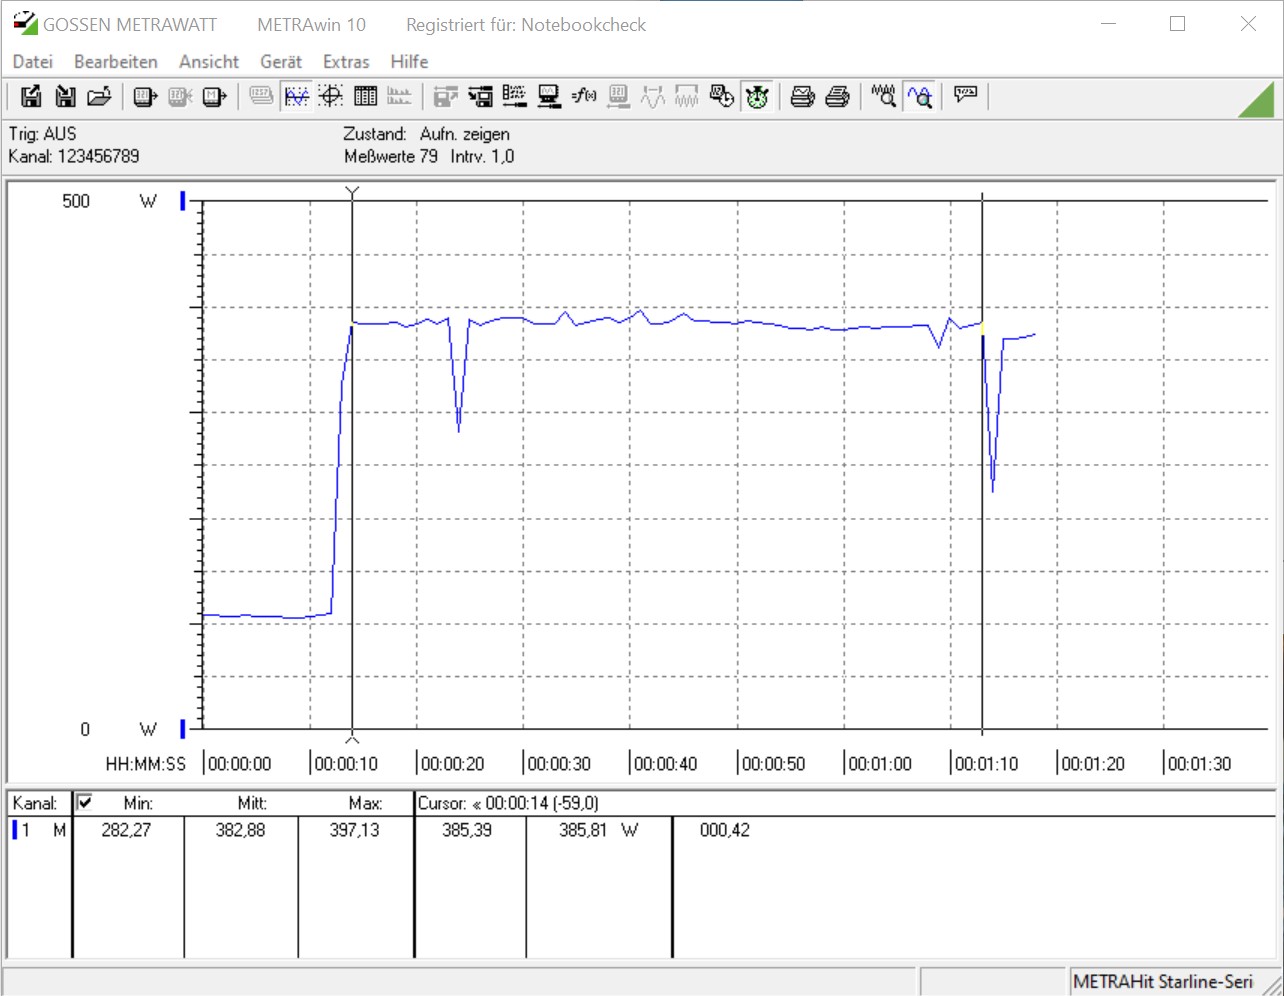
In practice, the AMD Ryzen 3 3100 is somewhat more energy-efficient than the AMD Ryzen 3 3300X. Nevertheless, Intel shows at this point that its power management works quite well. When playing games in which the graphics card (Nvidia Titan RTX with approx. 280 watts) accounts for the most part, all systems are close to one another.
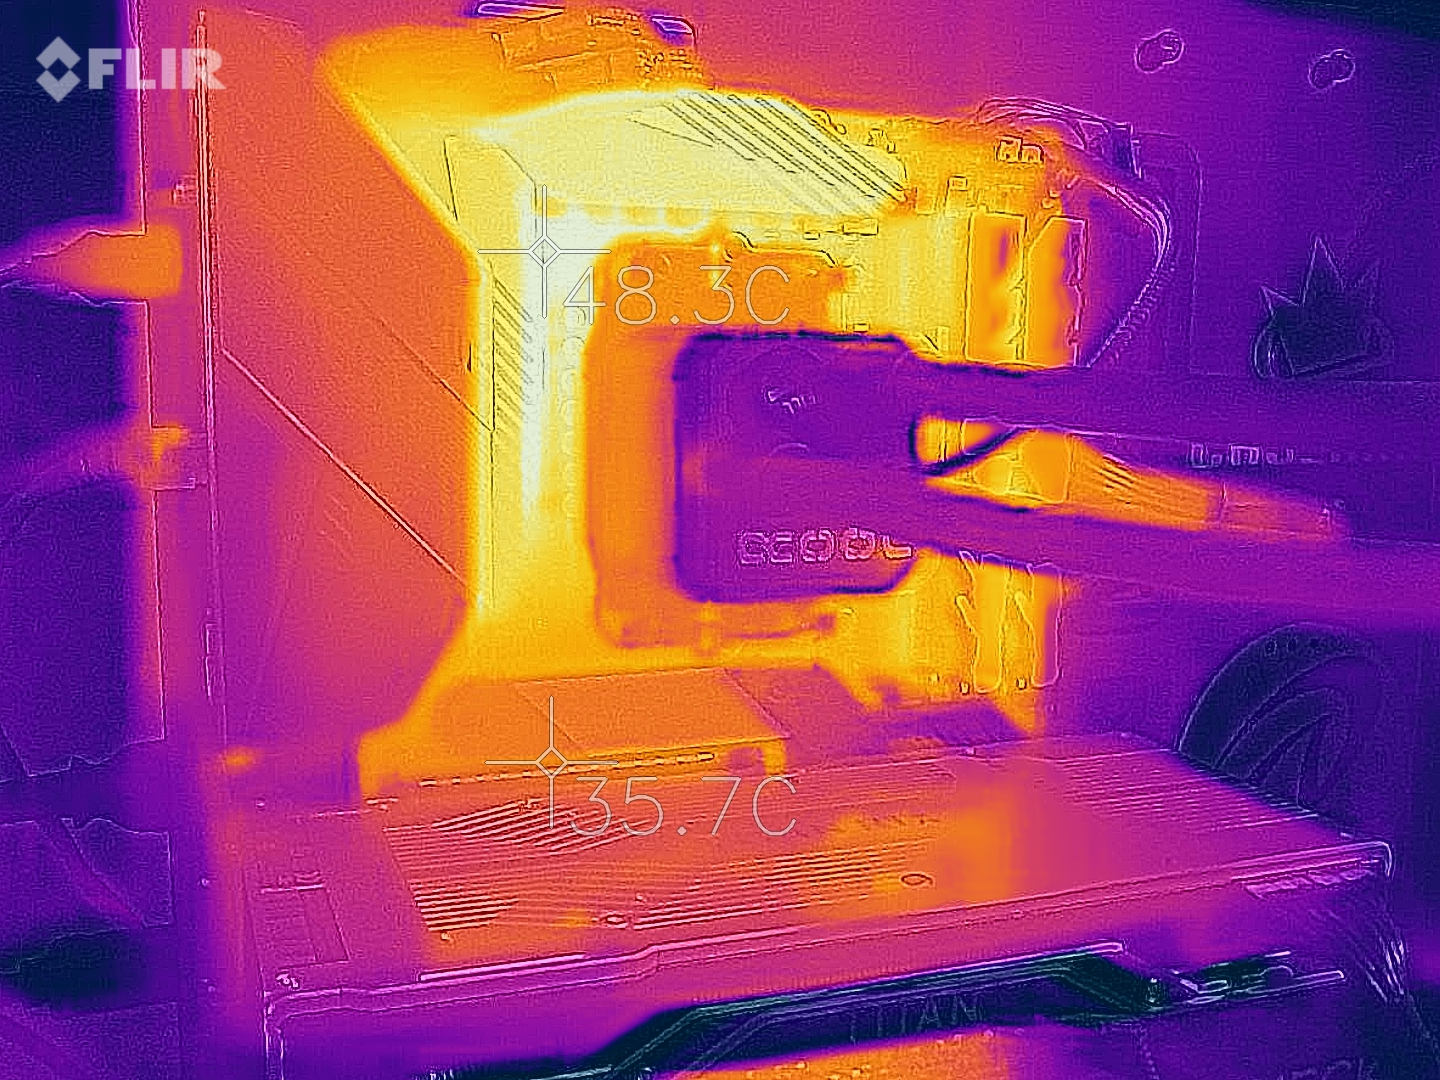
The measured temperatures in the stress test are in uncritical ranges at all times due to the Alphacool Eisbaer 280 AiO. The AMD Ryzen 3 3300X was the warmest at 77.5 °C (~172 °F). Since only one CCX cluster is active here, the heat is concentrated on a smaller area, which is probably also the reason why the processor became a bit warmer than the AMD Ryzen 3 3100 (70.3 °C (~159 °F)) in the test.
Note: The entire test system was considered without a monitor to determine the energy consumption values.
| Power Consumption | |
| 1920x1080 The Witcher 3 ultra (external Monitor) | |
| AMD Ryzen 5 1600 (12nm) (Idle: 85.9 W) | |
| AMD Ryzen 3 3300X (Idle: 88.8 W) | |
| AMD Ryzen 3 3100 (Idle: 86 W) | |
| Intel Core i5 9400F (Idle: 57 W) | |
| Intel Core i3 9100F (Idle: 56 W) | |
| Prime95 V2810 Stress (external Monitor) | |
| AMD Ryzen 5 1600 (12nm) (Idle: 85.9 W) | |
| AMD Ryzen 3 3300X (Idle: 88.8 W) | |
| Intel Core i3 9100F (Idle: 56 W) | |
| AMD Ryzen 3 3100 (Idle: 86 W) | |
| Intel Core i5 9400F (Idle: 57 W) | |
| Cinebench R15 Multi (external Monitor) | |
| AMD Ryzen 5 1600 (12nm) (Idle: 85.9 W) | |
| AMD Ryzen 3 3300X (Idle: 88.8 W) | |
| AMD Ryzen 3 3100 (Idle: 86 W) | |
| Intel Core i5 9400F (Idle: 57 W) | |
| Intel Core i3 9100F (Idle: 56 W) | |
| Temperatures - CPU Temperature Prime95 | |
| AMD Ryzen 3 3300X | |
| Intel Core i3 9100F | |
| AMD Ryzen 3 3100 | |
| AMD Ryzen 5 1600 (12nm) | |
| Intel Core i5 9400F | |
* ... smaller is better

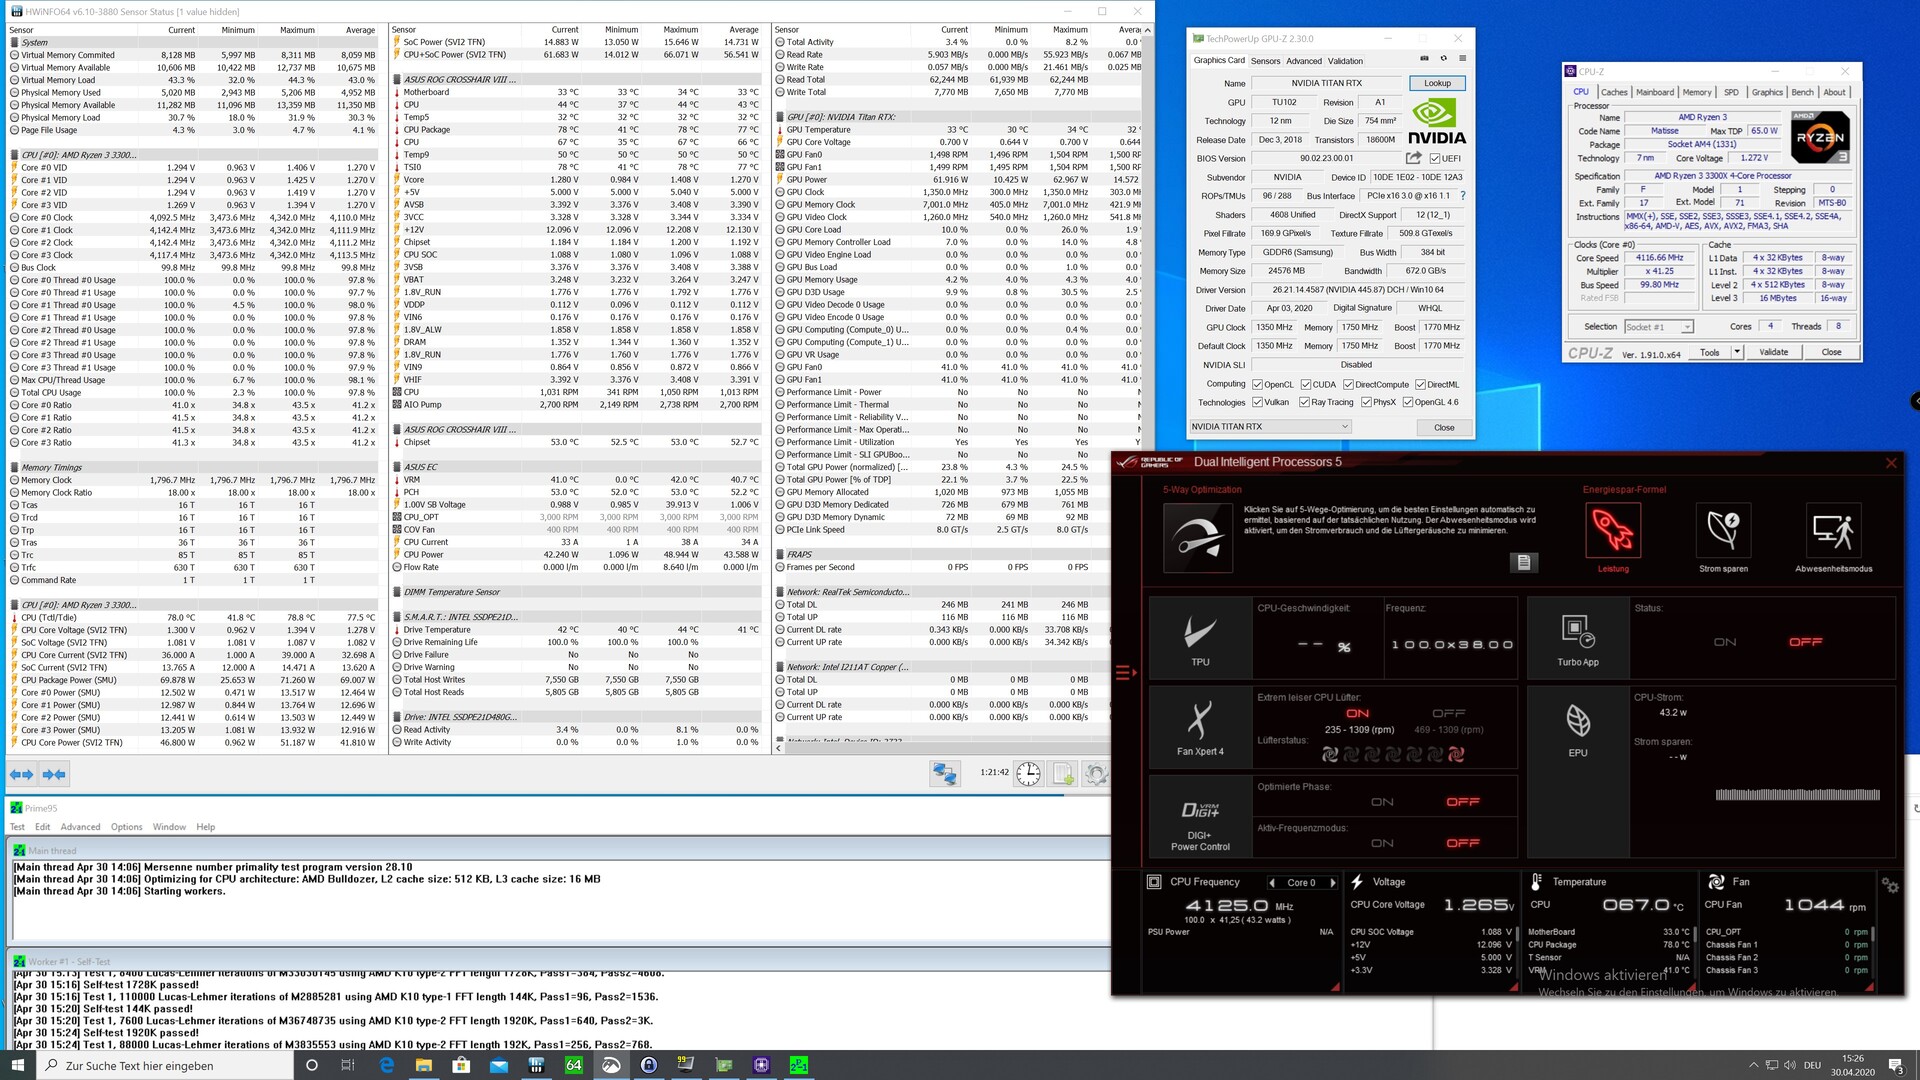
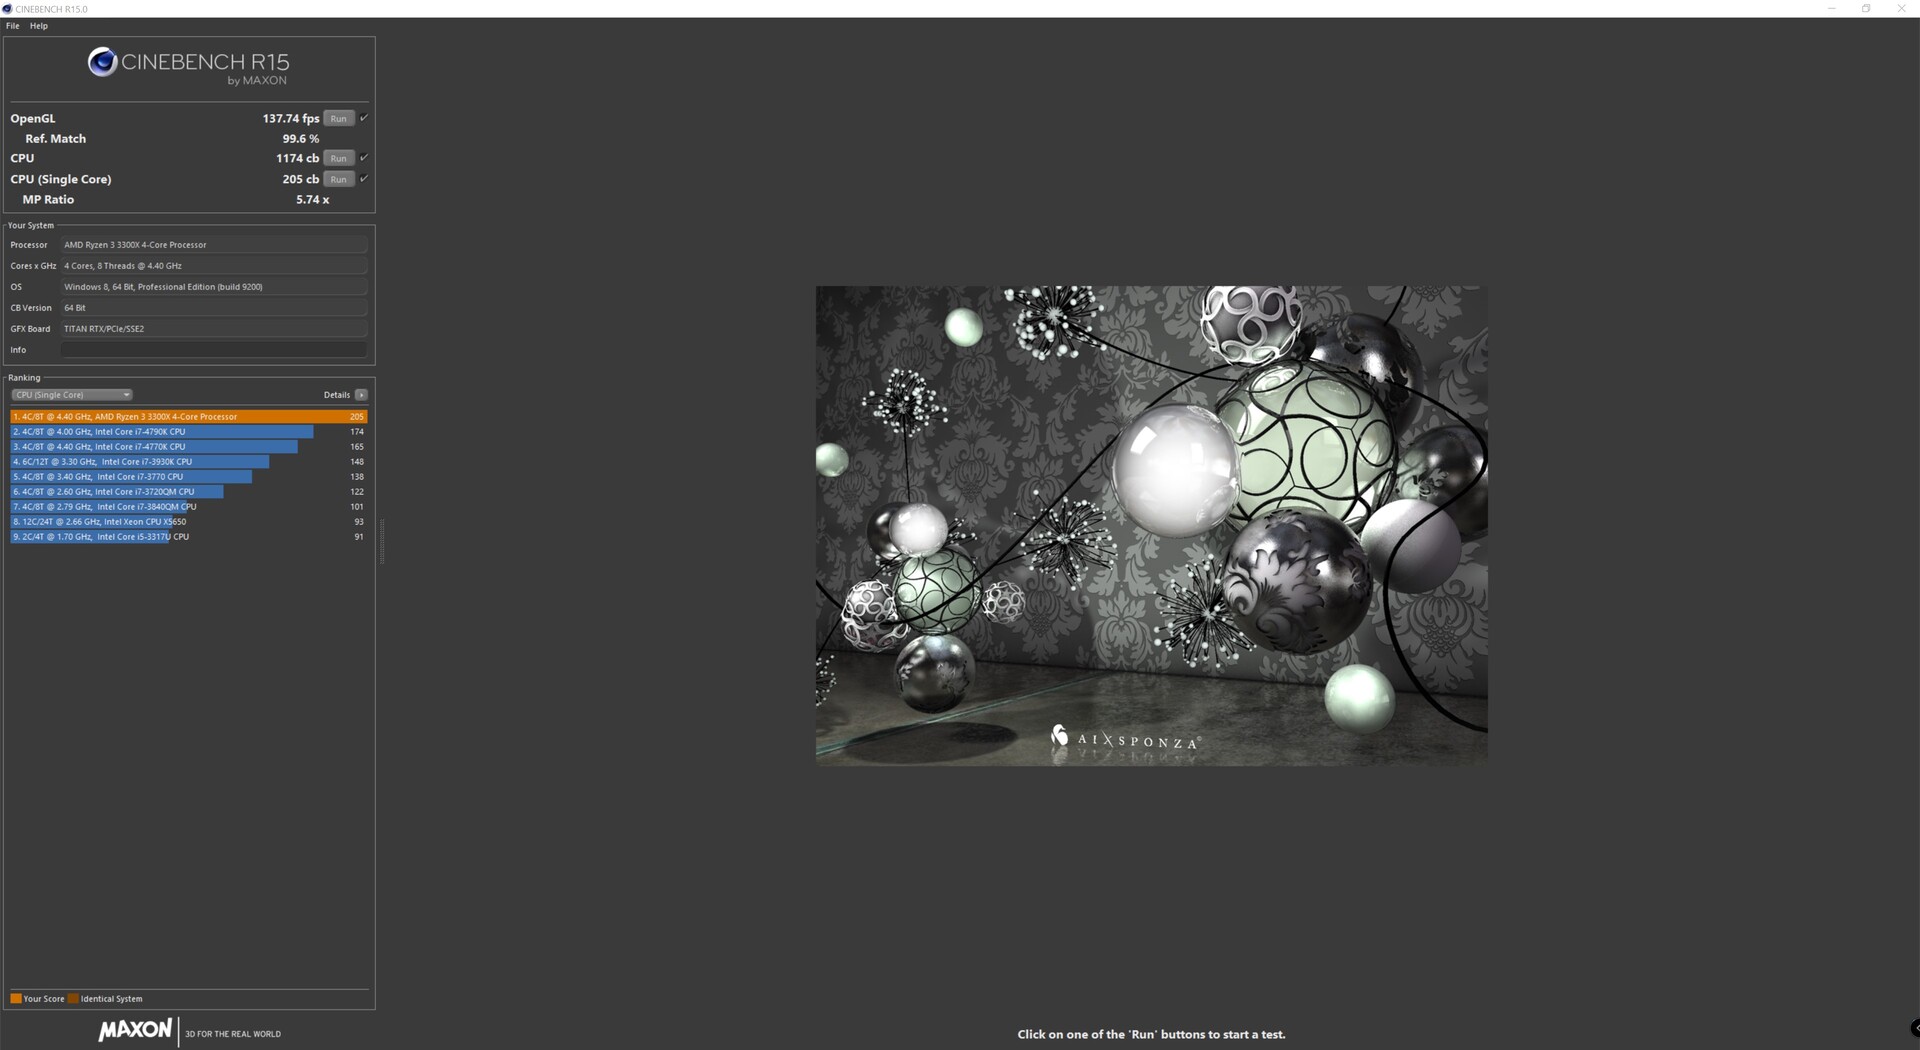
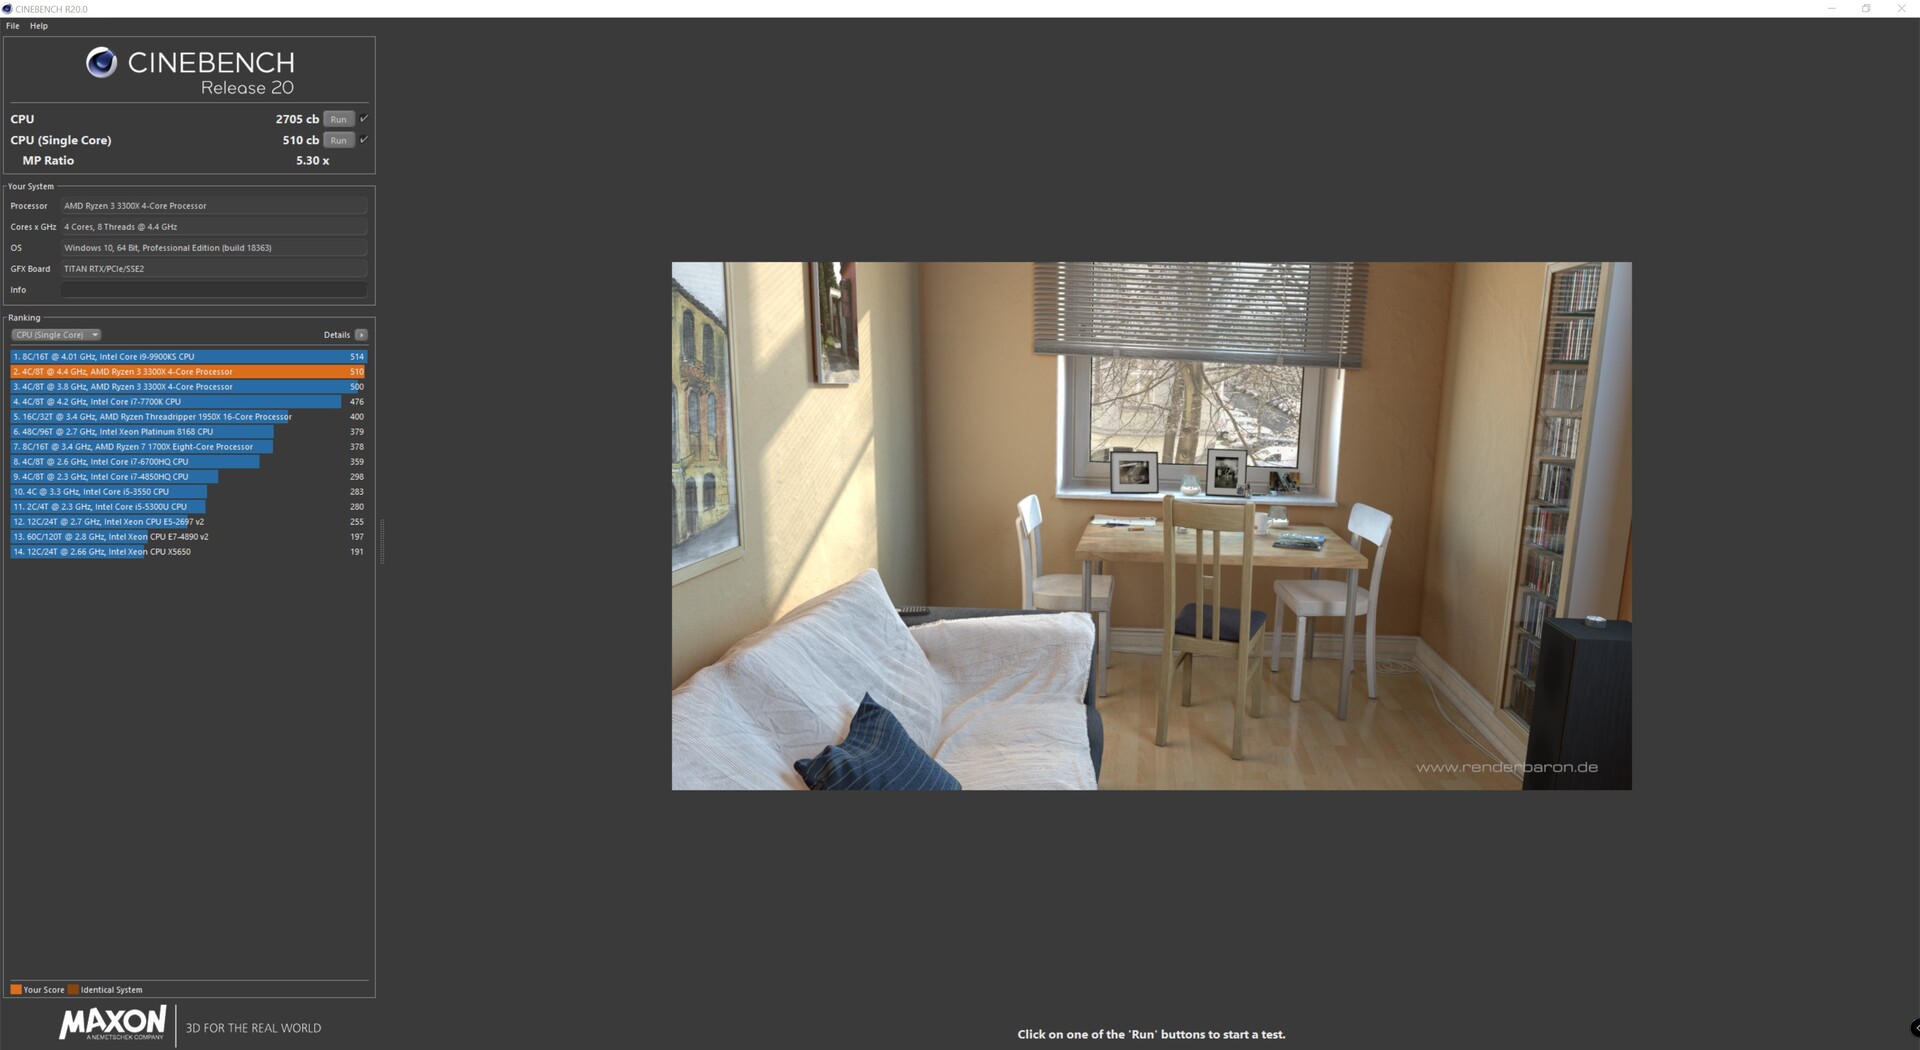
Overclocking - Extracting the hidden power
If you want to squeeze out a bit more performance from the processor, the only option left is overclocking. We also did this with the two Ryzen 3 models and were able to achieve an increase in performance of up to 14%. The AMD Ryzen 3 3100 makes the bigger performance leap due to the lower base clock speed.
Both processors could be run at 4.4 GHz on all cores without any problems and with little effort. However, a stable operation was no longer possible at 4.5 GHz. But this requires sufficient cooling to ensure a stable operation. The Nvidia Titan RTX used in the test couldn't benefit from the improved CPU performance though.
| Performance rating - Percent | |
| AMD Ryzen 3 3300X @ 4.4 GHz | |
| AMD Ryzen 3 3300X | |
| AMD Ryzen 3 3100 @ 4.4 GHz | |
| AMD Ryzen 5 1600 (12nm) | |
| Intel Core i5 9400F | |
| AMD Ryzen 3 3100 | |
| Intel Core i3 9100F | |
| Cinebench R15 | |
| CPU Single 64Bit | |
| AMD Ryzen 3 3300X @ 4.4 GHz | |
| AMD Ryzen 3 3100 @ 4.4 GHz | |
| AMD Ryzen 3 3300X | |
| AMD Ryzen 3 3100 | |
| Intel Core i5 9400F | |
| Intel Core i3 9100F | |
| AMD Ryzen 5 1600 (12nm) | |
| CPU Multi 64Bit | |
| AMD Ryzen 5 1600 (12nm) | |
| AMD Ryzen 3 3300X @ 4.4 GHz | |
| AMD Ryzen 3 3100 @ 4.4 GHz | |
| AMD Ryzen 3 3300X | |
| AMD Ryzen 3 3100 | |
| Intel Core i5 9400F | |
| Intel Core i3 9100F | |
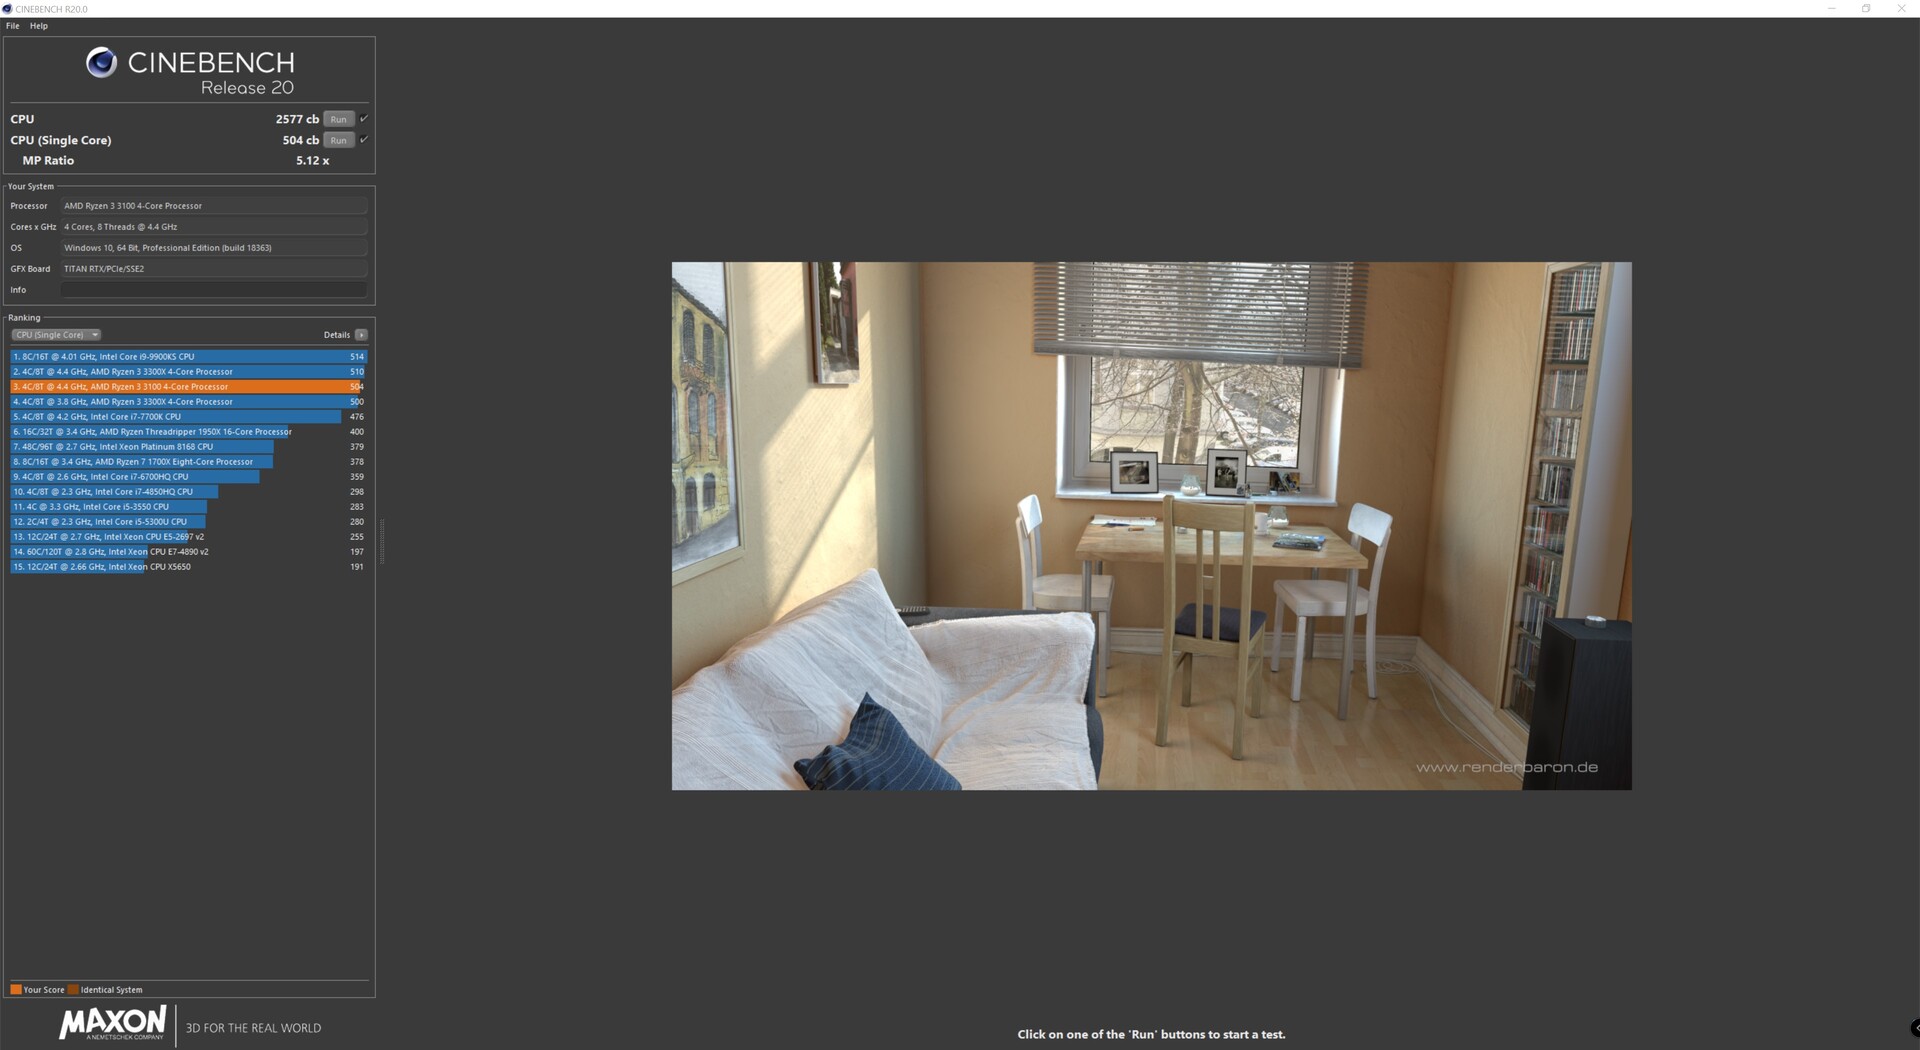
| Cinebench R20 | |
| CPU (Single Core) | |
| AMD Ryzen 3 3300X @ 4.4 GHz | |
| AMD Ryzen 3 3100 @ 4.4 GHz | |
| AMD Ryzen 3 3300X | |
| AMD Ryzen 3 3100 | |
| Intel Core i5 9400F | |
| Intel Core i3 9100F | |
| AMD Ryzen 5 1600 (12nm) | |
| CPU (Multi Core) | |
| AMD Ryzen 3 3300X @ 4.4 GHz | |
| AMD Ryzen 5 1600 (12nm) | |
| AMD Ryzen 3 3100 @ 4.4 GHz | |
| AMD Ryzen 3 3300X | |
| Intel Core i5 9400F | |
| AMD Ryzen 3 3100 | |
| Intel Core i3 9100F | |
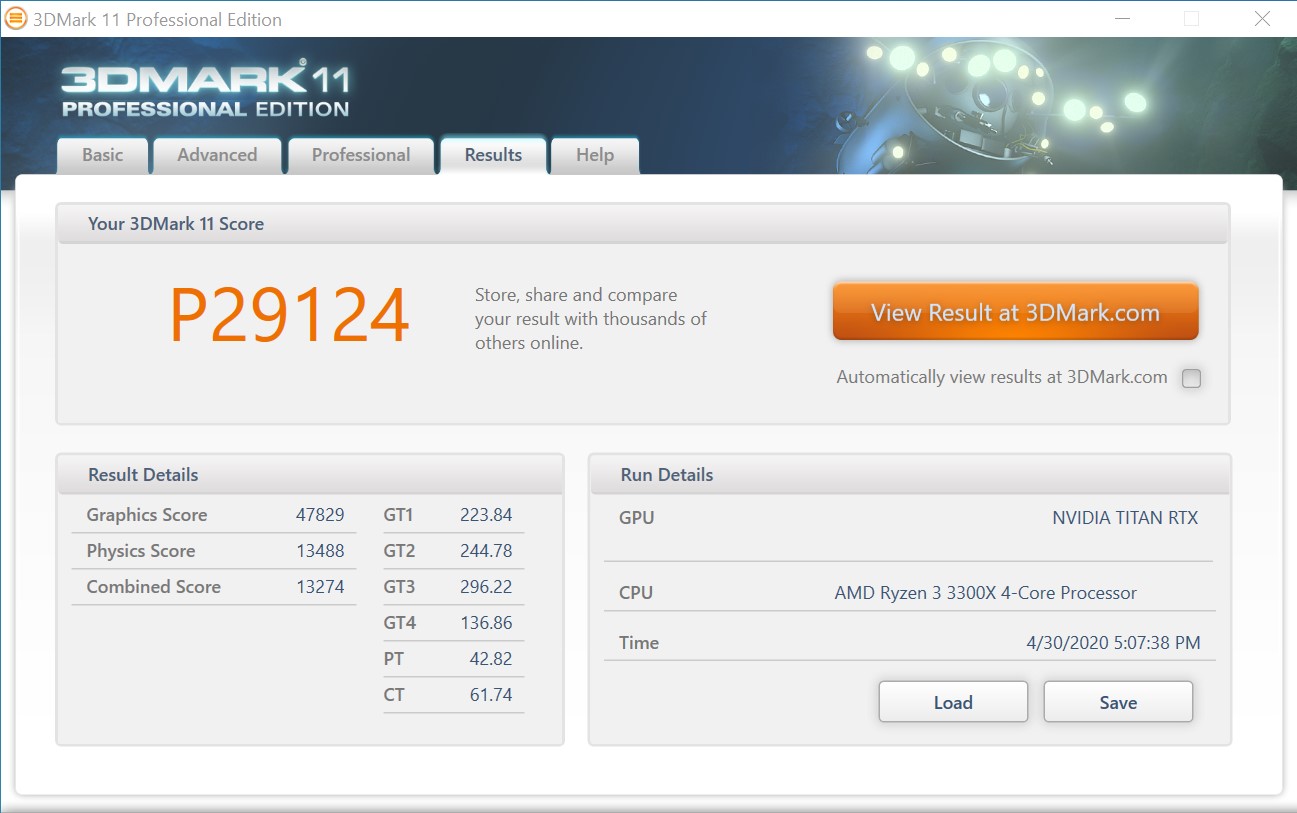
| 3DMark 11 | |
| 1280x720 Performance | |
| AMD Ryzen 3 3300X @ 4.4 GHz | |
| AMD Ryzen 3 3300X | |
| AMD Ryzen 3 3100 @ 4.4 GHz | |
| Intel Core i5 9400F | |
| AMD Ryzen 5 1600 (12nm) | |
| AMD Ryzen 3 3100 | |
| Intel Core i3 9100F | |
| 1280x720 Performance GPU | |
| Intel Core i3 9100F | |
| Intel Core i5 9400F | |
| AMD Ryzen 3 3300X | |
| AMD Ryzen 3 3100 @ 4.4 GHz | |
| AMD Ryzen 3 3300X @ 4.4 GHz | |
| AMD Ryzen 5 1600 (12nm) | |
| AMD Ryzen 3 3100 | |
| 1280x720 Performance Physics | |
| AMD Ryzen 3 3300X @ 4.4 GHz | |
| AMD Ryzen 3 3300X | |
| AMD Ryzen 5 1600 (12nm) | |
| AMD Ryzen 3 3100 @ 4.4 GHz | |
| Intel Core i5 9400F | |
| AMD Ryzen 3 3100 | |
| Intel Core i3 9100F | |
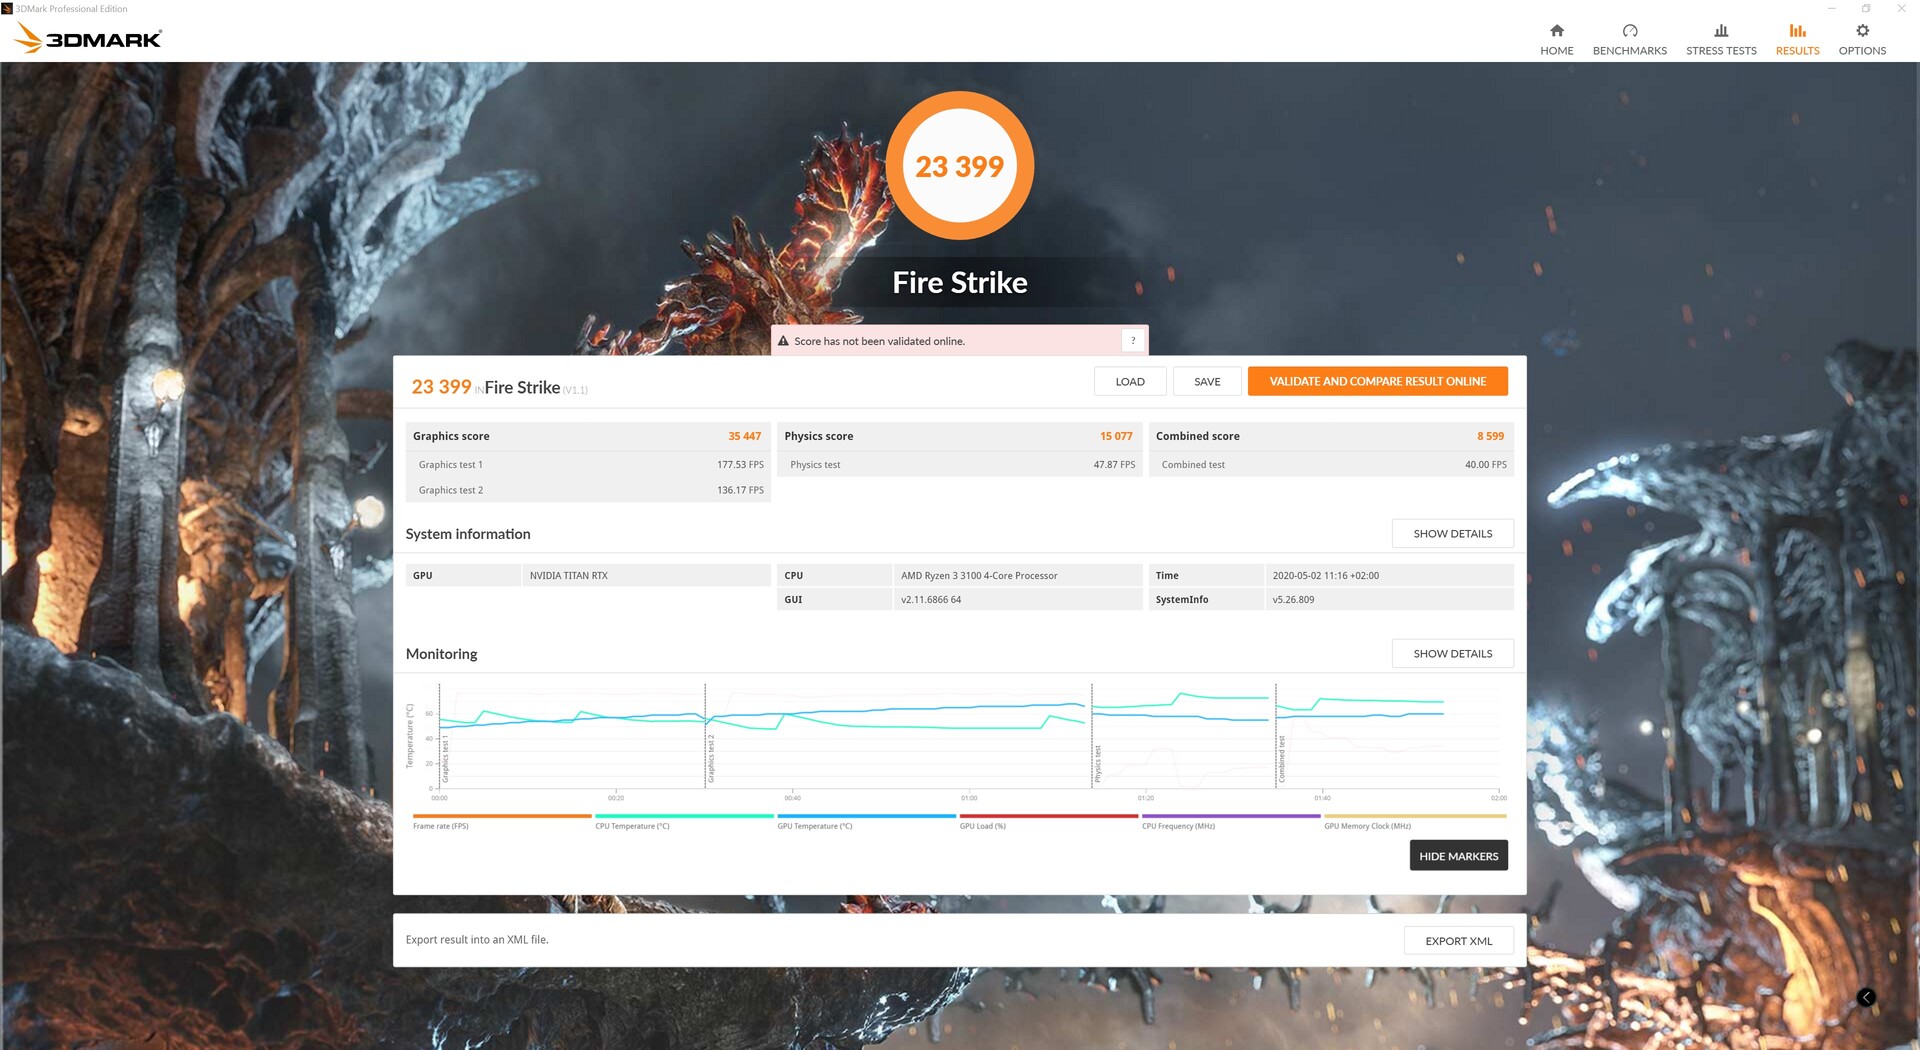
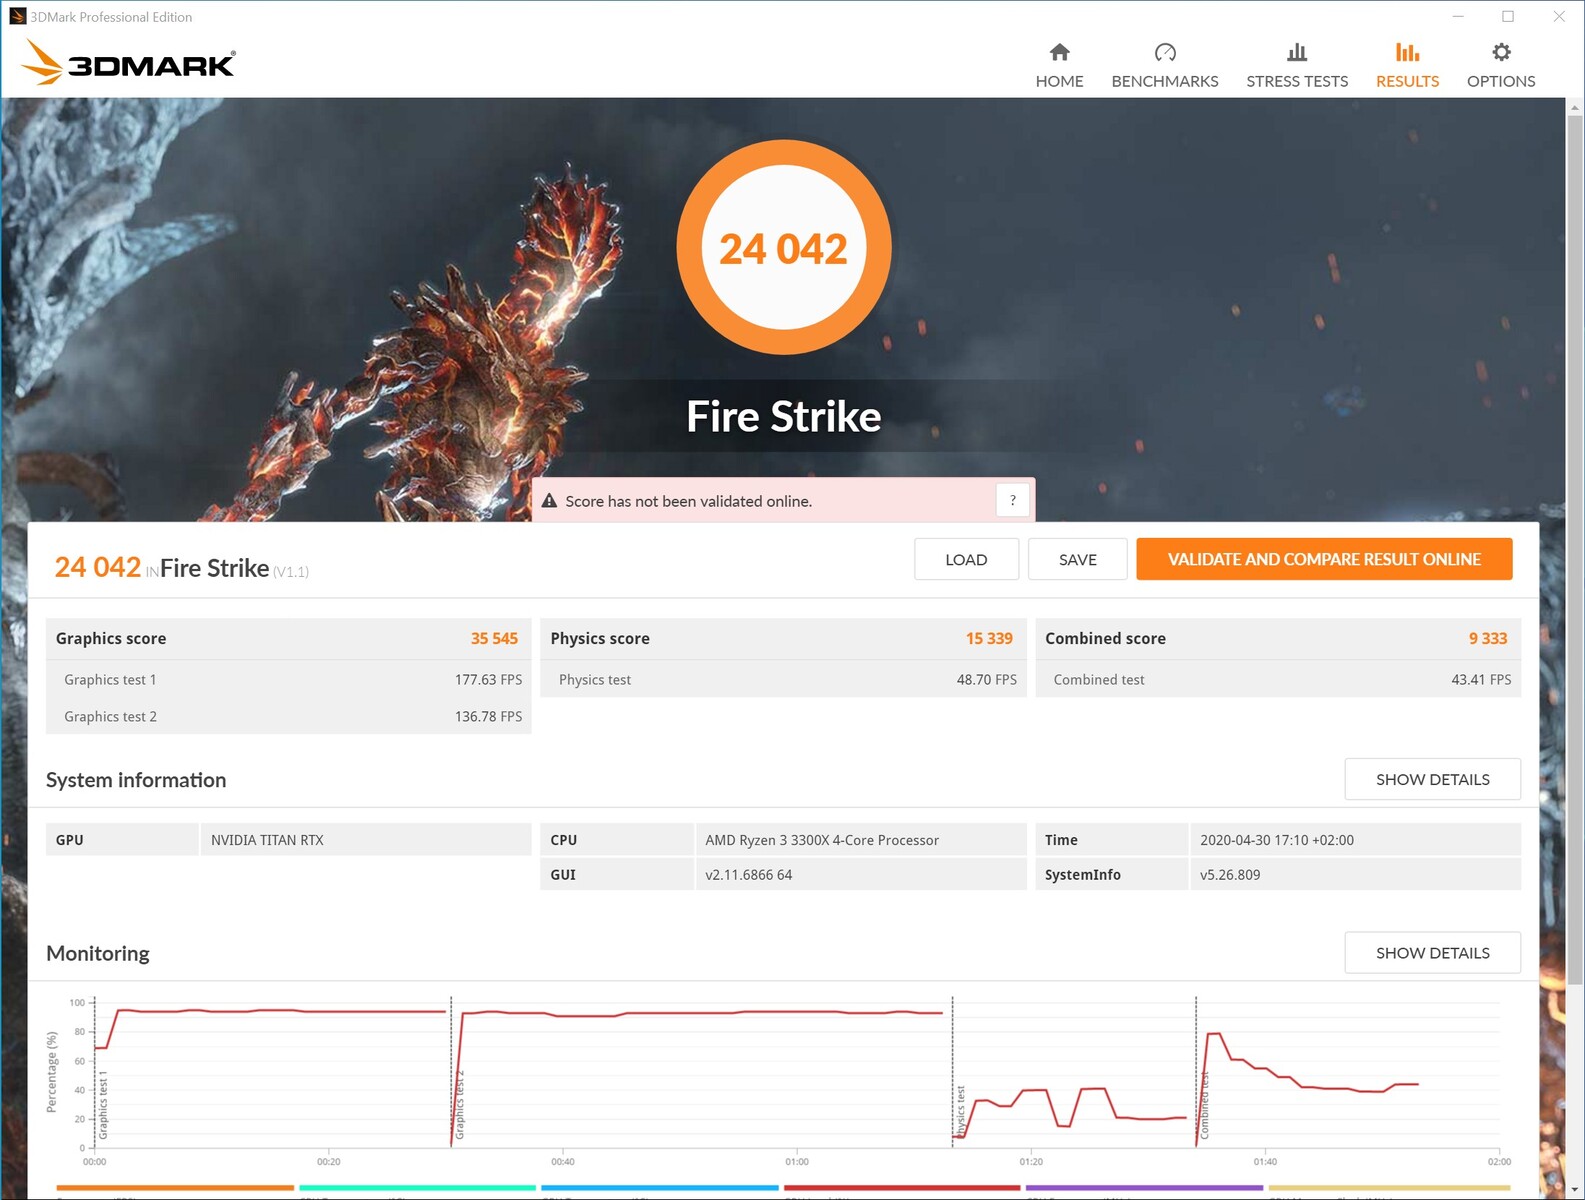
| 3DMark | |
| 1920x1080 Fire Strike Score | |
| AMD Ryzen 3 3300X @ 4.4 GHz | |
| AMD Ryzen 3 3300X | |
| AMD Ryzen 3 3100 @ 4.4 GHz | |
| Intel Core i5 9400F | |
| AMD Ryzen 5 1600 (12nm) | |
| AMD Ryzen 3 3100 | |
| Intel Core i3 9100F | |
| 1920x1080 Fire Strike Graphics | |
| Intel Core i3 9100F | |
| Intel Core i5 9400F | |
| AMD Ryzen 3 3100 | |
| AMD Ryzen 3 3300X @ 4.4 GHz | |
| AMD Ryzen 3 3100 @ 4.4 GHz | |
| AMD Ryzen 3 3300X | |
| AMD Ryzen 5 1600 (12nm) | |
| 1920x1080 Fire Strike Physics | |
| AMD Ryzen 5 1600 (12nm) | |
| AMD Ryzen 3 3300X @ 4.4 GHz | |
| AMD Ryzen 3 3100 @ 4.4 GHz | |
| AMD Ryzen 3 3300X | |
| AMD Ryzen 3 3100 | |
| Intel Core i5 9400F | |
| Intel Core i3 9100F | |
Ryzen 3 3100 @ 4.4 GHz


Ryzen 3 3300X @ 4.4 GHz
Pros
Cons
Verdict - A lot of performance for a small price
With the new Ryzen 3, AMD shows once again what's possible with Zen2. Compared to the previous generation based on Zen+, the performance could be increased significantly. In addition, Intel became increasingly under pressure, but this may look different again soon because Comet Lake-S is already in the starting blocks. For this reason, one could almost think that AMD has slept through the start of the new Ryzen 3 generation a bit, since Zen2 has been on the market for a while. But AMD can still rely on PCI Express 4.0 as a unique selling point, since Intel's 10th generation will not support this either. The fact that Ryzen 3 is now also equipped with SMT is not only pleasing to us but has been demanded for a long time. This enables a few percent points in the performance comparison, which AMD often wins with the new processors compared to Intel.
The budget version of the new Ryzen 3 processors turns out to be a true price-performance winner due to its good overclocking capabilities.
Both Ryzen models are fast in terms of pure performance, although the six native cores of the Intel Core i5-9400F provide slightly better frame rates in games. Both models are close together when it comes to pricing and are significantly cheaper than the Intel Core i5-9400F. The AMD Ryzen 3 3100 makes a start with 109 Euros (~$118) and offers a solid performance to get a fast system up and running. Due to the lower base and turbo clock speeds, the Ryzen 3 3100 lacks a bit of IPC in comparison to the Ryzen 3 3300X, so that the Ryzen 3 3300X achieved significantly better frame rates in games together with the Nvidia Titan RTX. You only have to pay 20 Euros (~$22) more for the faster model, which we find justifiable.
However, both models get a purchase recommendation because they deliver a very good performance for the respective use without putting a deep dent in the wallet. In addition, there's good overclocking capabilities of the Ryzen 3 3100, which can reach the performance of a Ryzen 3 3300X with a few skillful adjustments. The overclocking potential of the Ryzen 3 3300X is significantly lower.

