A second look at the Vermeer - AMD Ryzen 9 5950X and AMD Ryzen 5 5600X Review
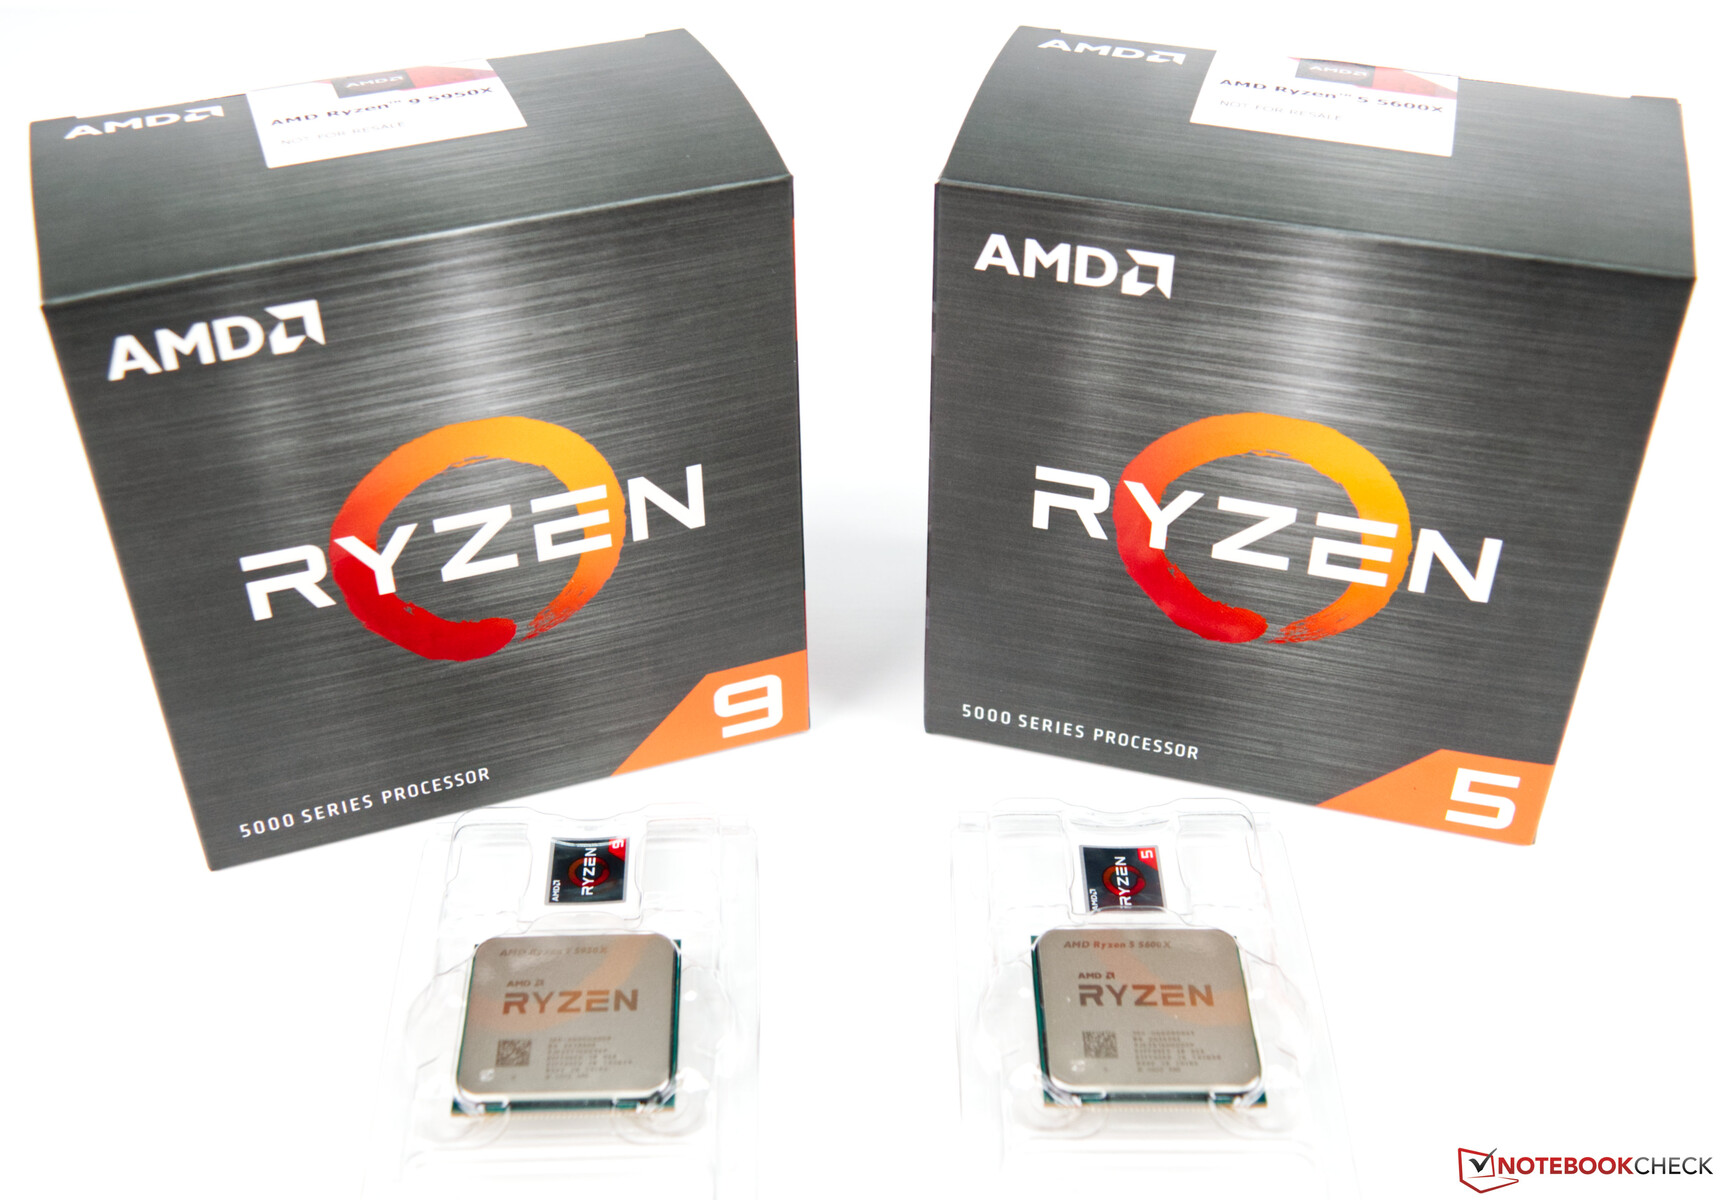
After we previously evaluated the AMD Ryzen 9 5900X and AMD Ryzen 7 5800X in depth, in this review, we will take a look at the AMD Ryzen 9 5950X and the AMD Ryzen 5 5600X. With these processors, AMD extends the top and bottom of the new Vermeer series in its new portfolio.
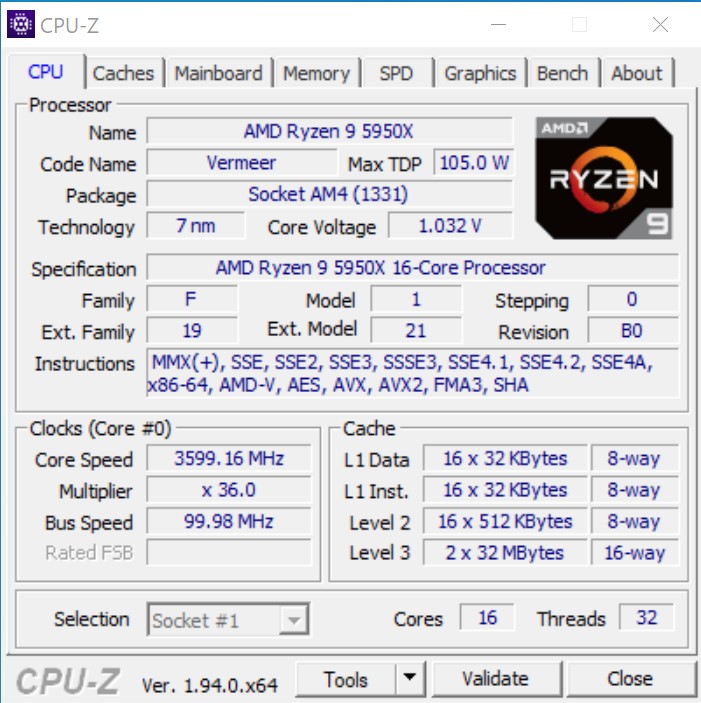
The AMD Ryzen 9 5950X is a successor of the AMD Ryzen 9 3950X and also offers 16 cores and 32 threads. The many innovations of the Vermeer architecture also promise a decent performance jump. At the same time, the new top model does not consume more power than its predecessor, since AMD also specifies a TDP of 105 watts. Whether this value is also reflected in the reality, we will explain at a later point.
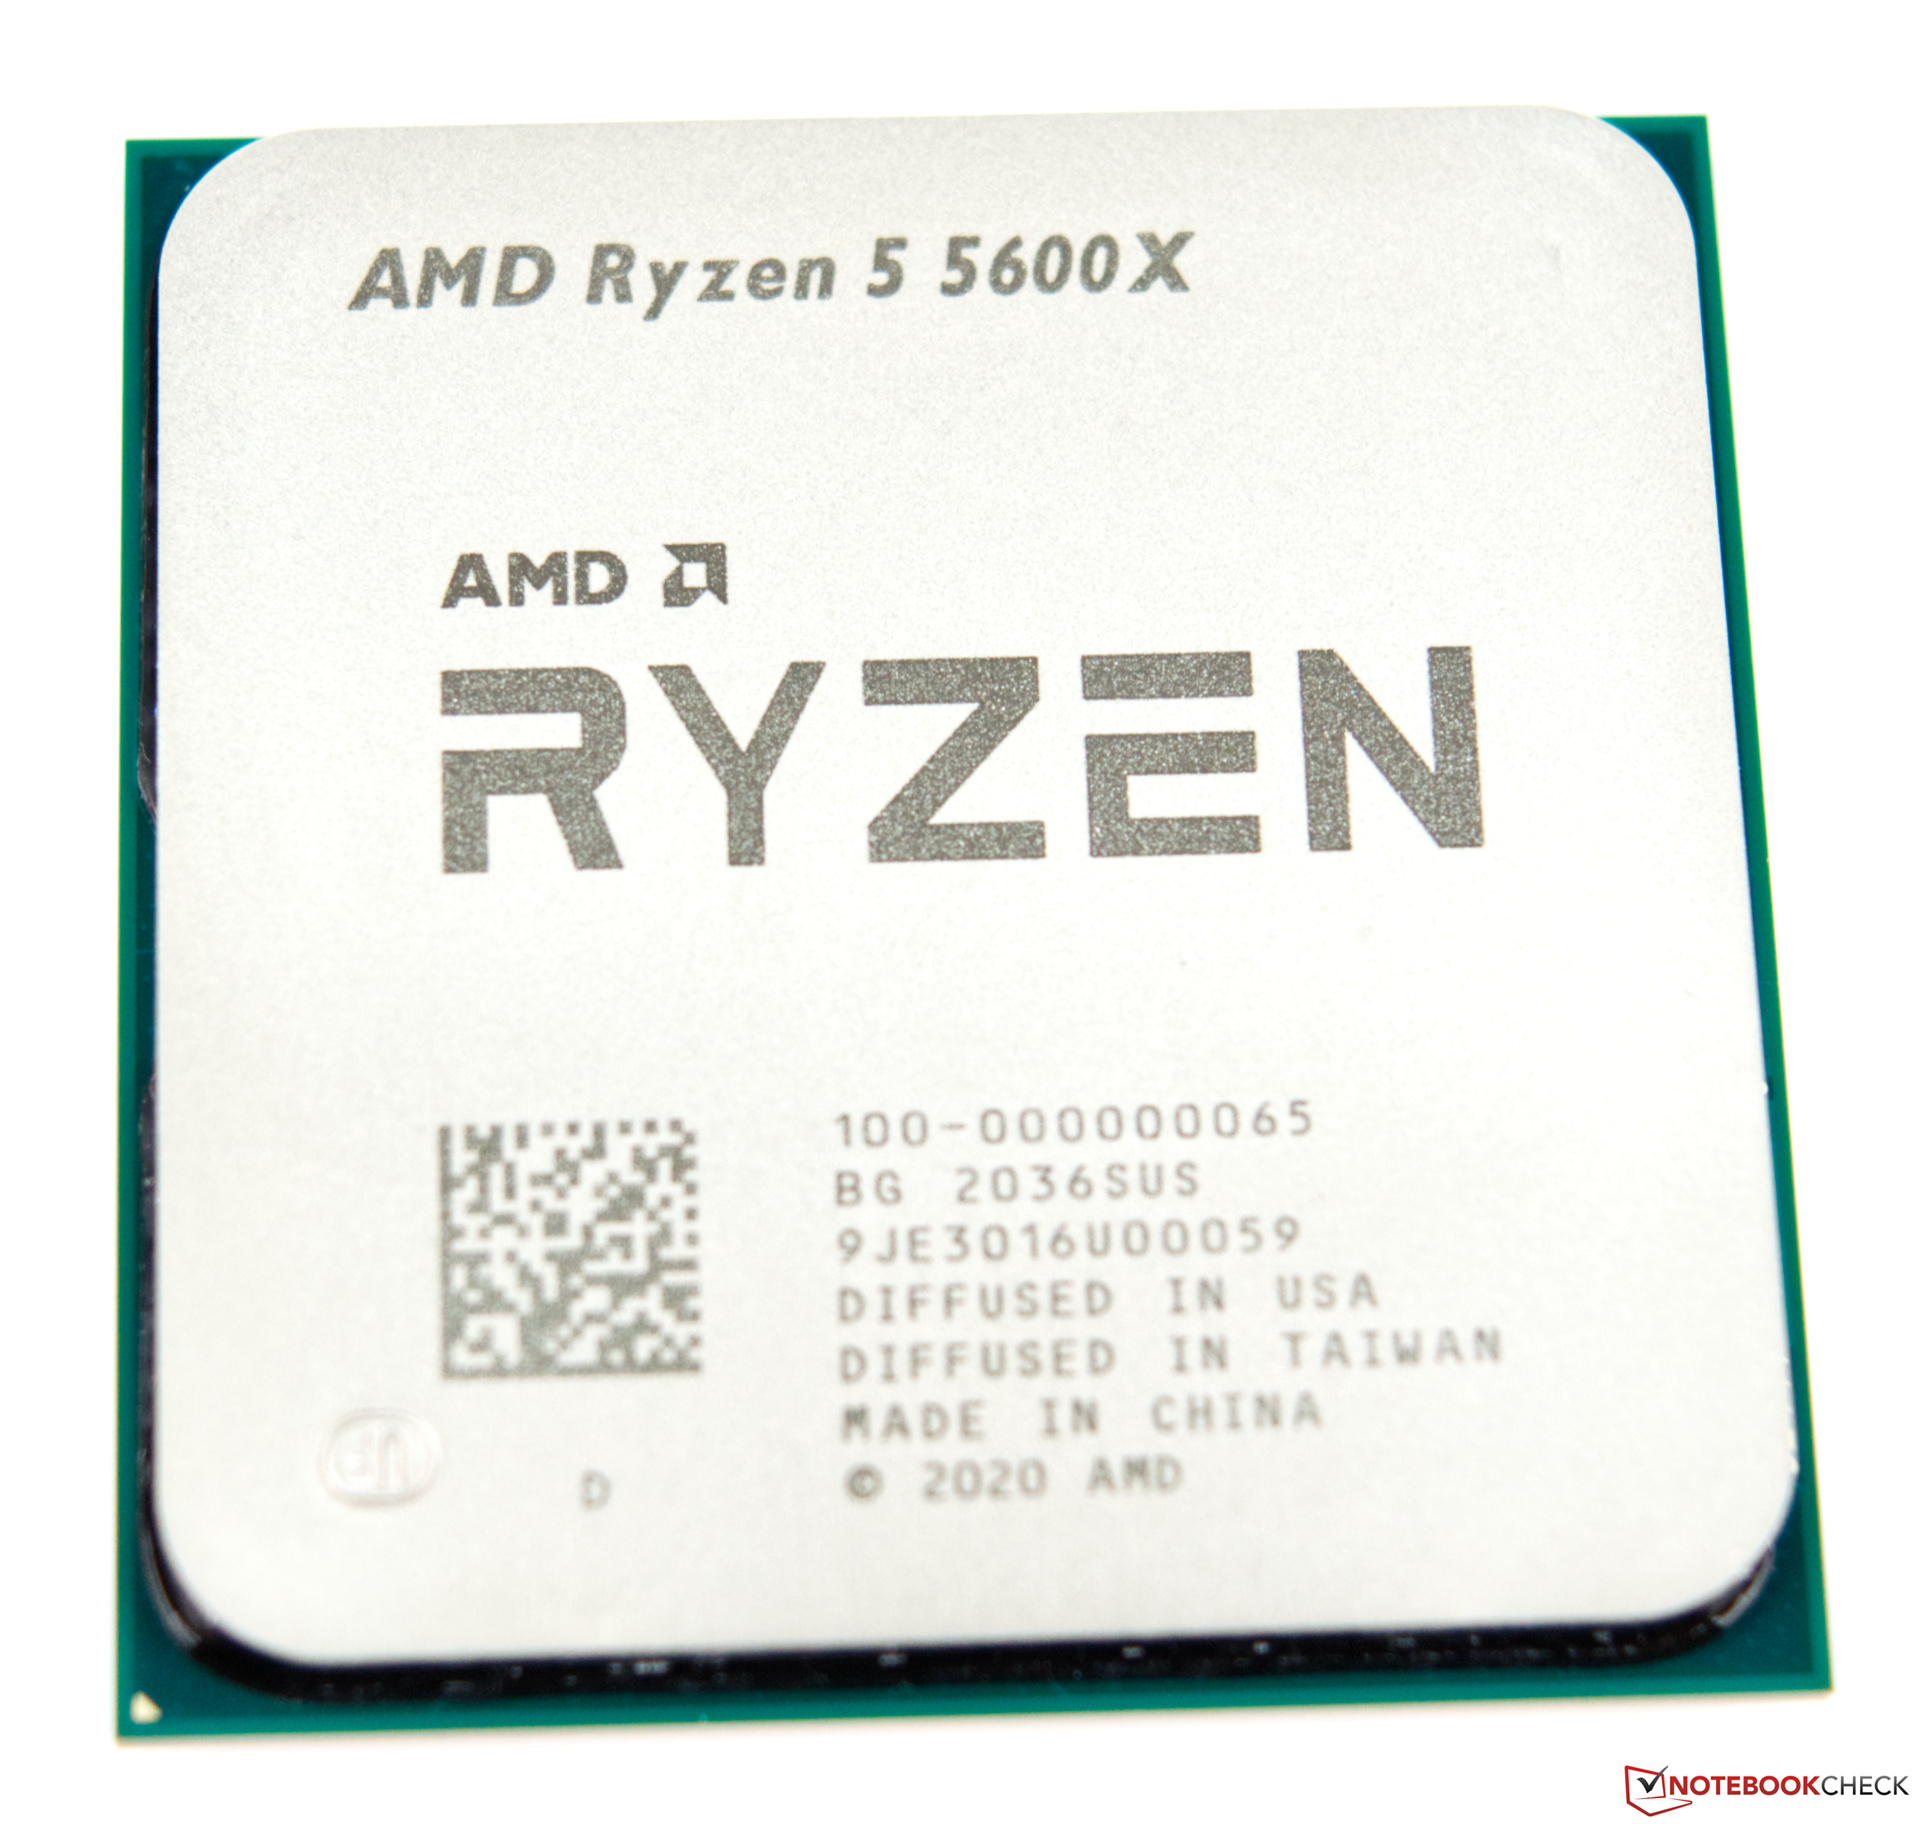
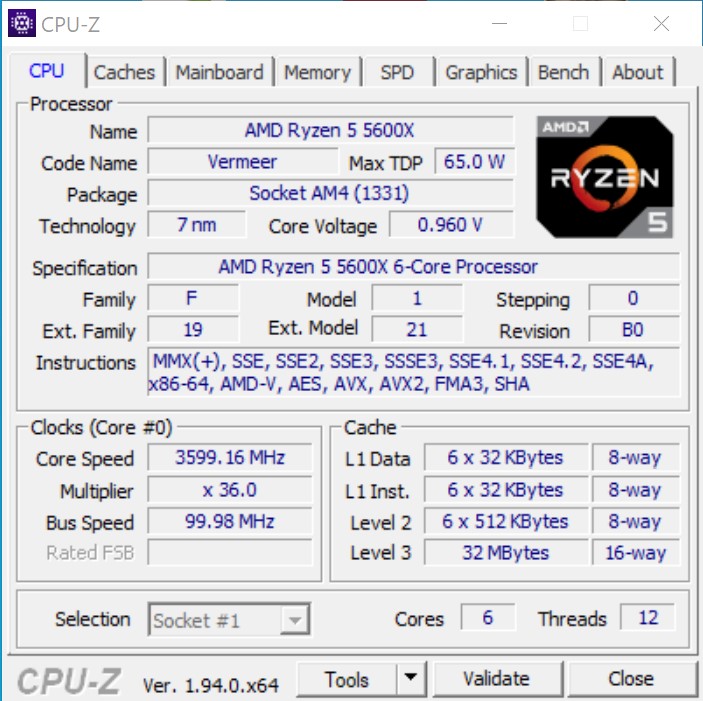
Finally, the AMD Ryzen 5 5600X is not only the smallest Ryzen with 6 cores and 12 threads, but with a TDP of 65 watts, also the most efficient, if you compare the purely technical specifications.
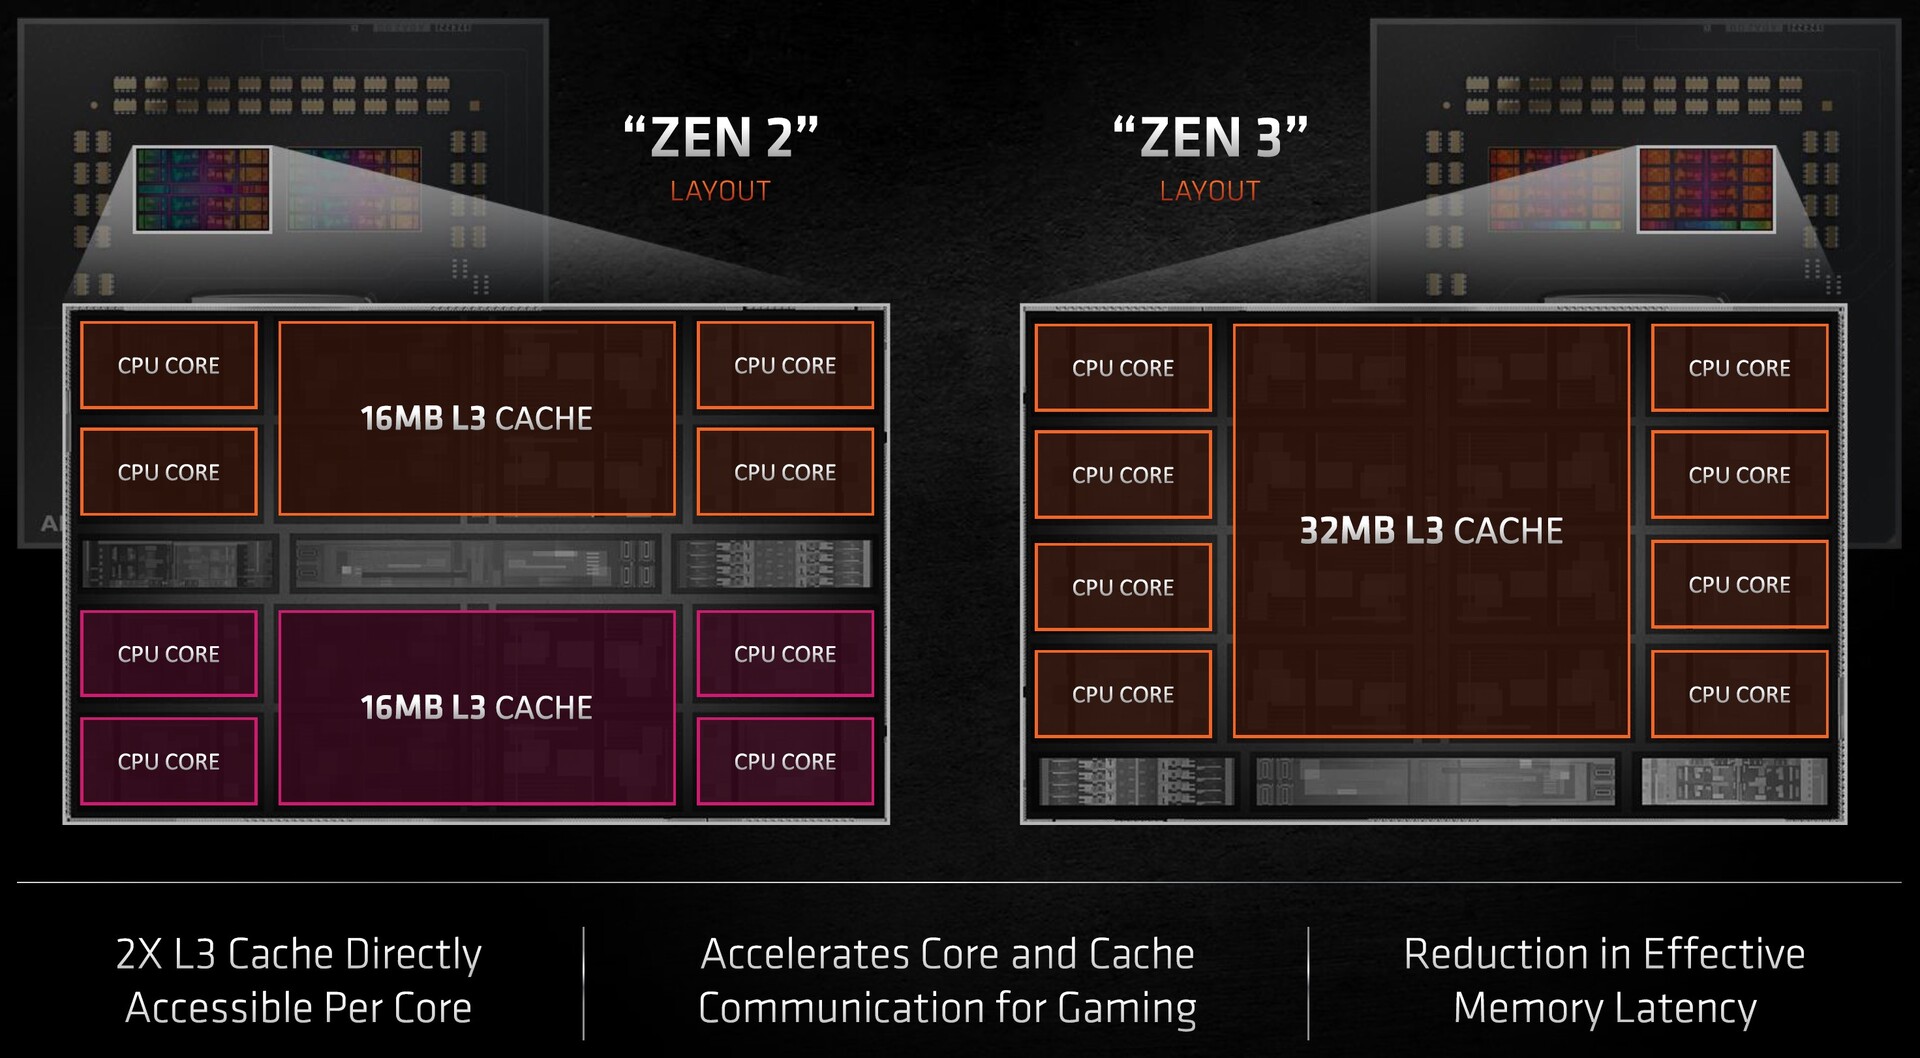
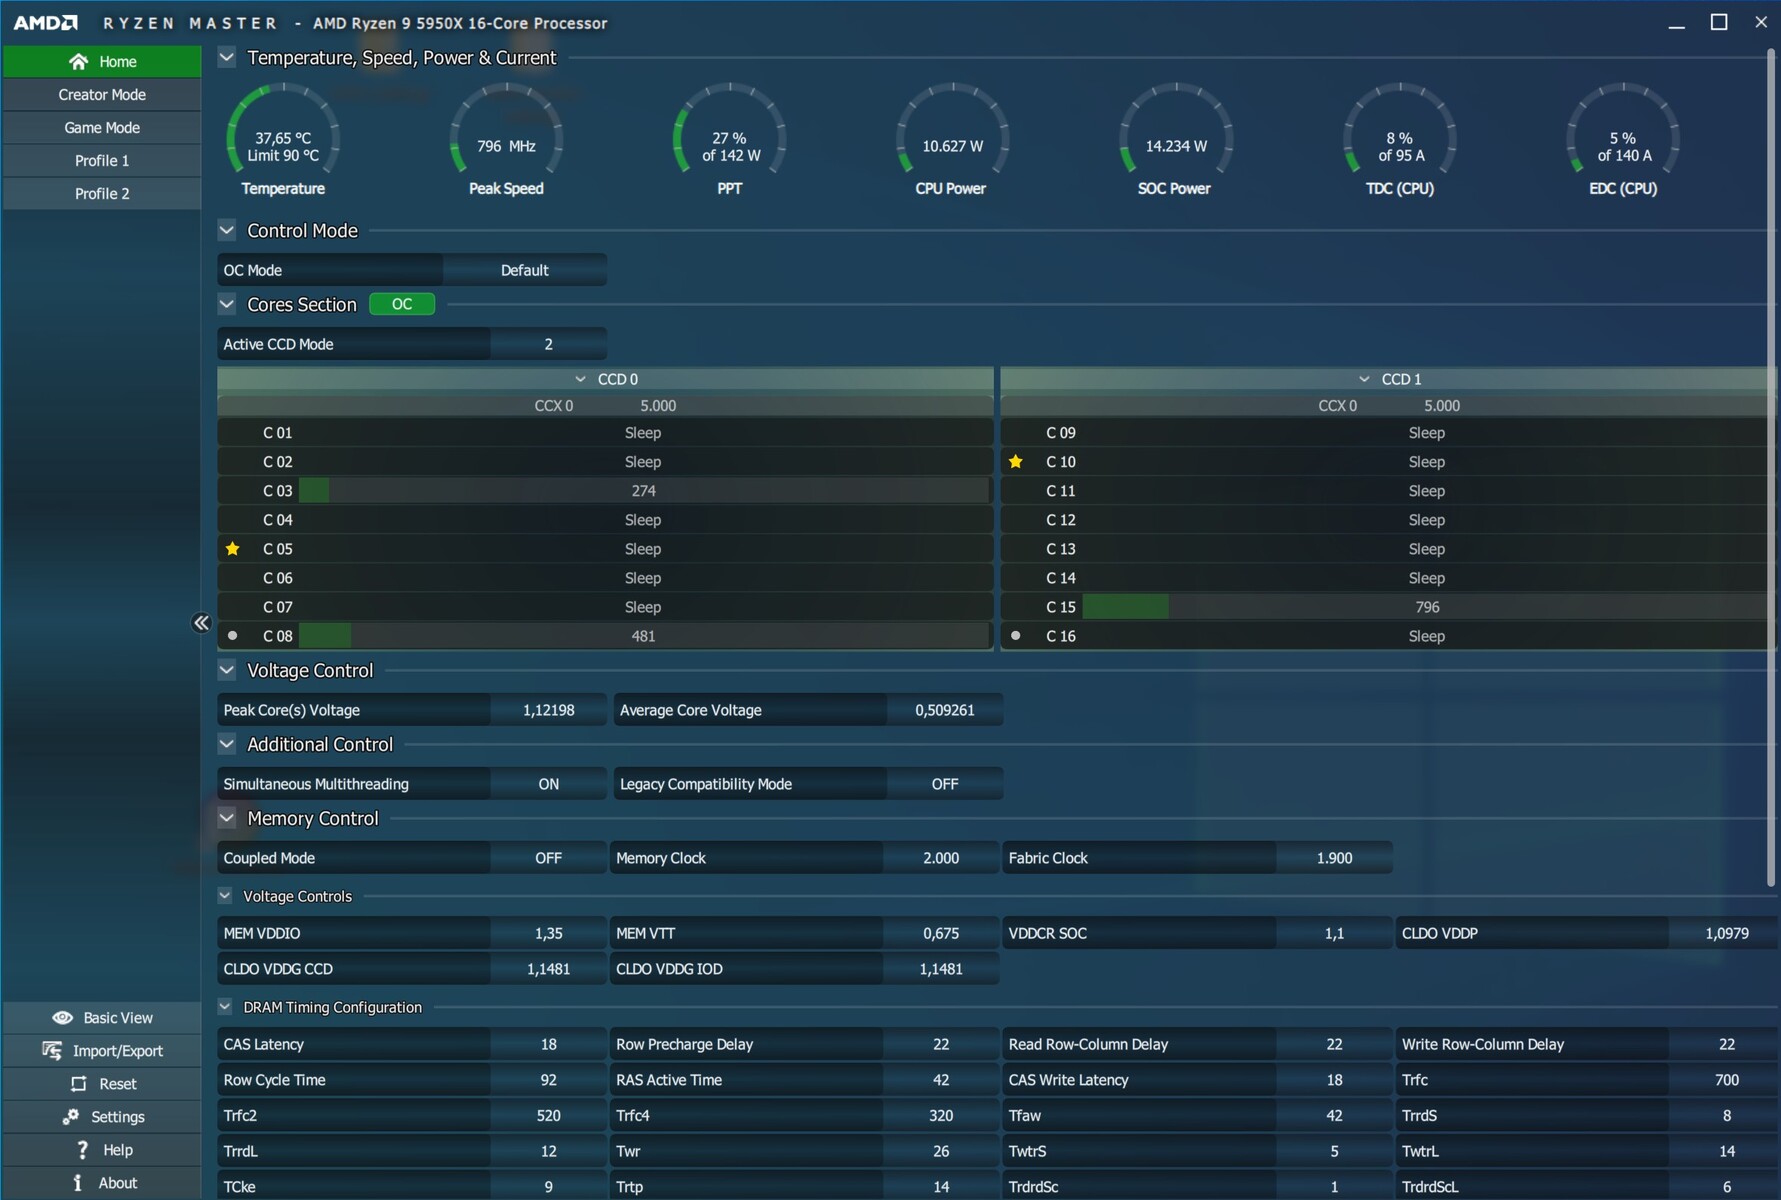
In terms of its internal makeup, as the top model, the Ryzen 9 5950X uses 2 CCDs with 8 cores each. In the Ryzen 5 5600X, only 6 cores of one CCD are active. In comparison to Intel (PL2 250 watts), the top model is also significantly more efficient at 142 watts when using the PL2. We already evaluated additional innovations of the Zen-3 architecture in this test.
Overview of the AMD Ryzen Processors
| Model | Cores/Threads | Clock Speed | Turbo Speed | L3 Cache | TDP | Launch Price |
|---|---|---|---|---|---|---|
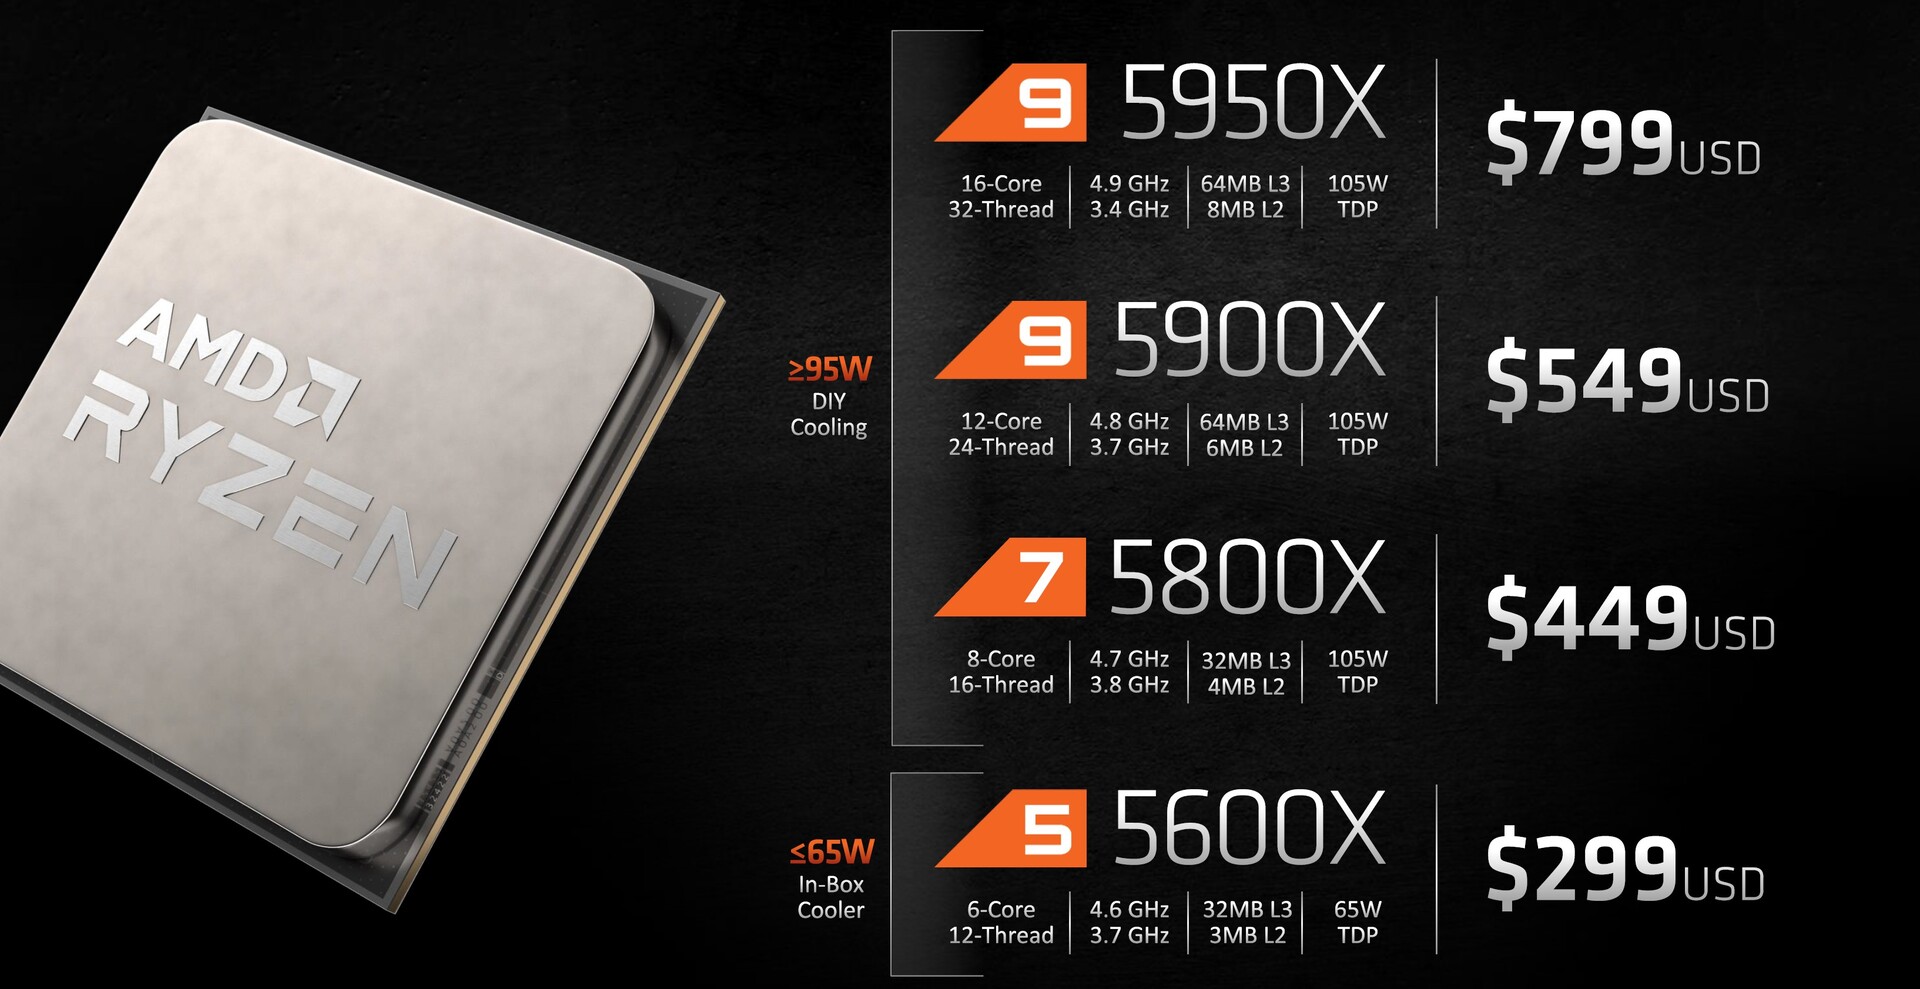
| Ryzen 9 5950X | 16/32 | 3.4 GHz | 4.9 GHz | 64 MB | 105 Watt | 799 USD |
| Ryzen 9 3950X | 16/32 | 3,5 GHz | 4,7 GHz | 64 MB | 105 Watt | 749 USD |
| Ryzen 9 5900X | 12/24 | 3.7 GHz | 4.8 GHz | 64 MB | 105 Watt | 549 USD |
| Ryzen 9 3900XT | 12/24 | 3,8 GHz | 4,7 GHz | 64 MB | 105 Watt | 499 USD |
| Ryzen 9 3900X | 12/24 | 3,8 GHz | 4,6 GHz | 64 MB | 105 Watt | 499 USD |
| Ryzen 7 5800X | 8/16 | 3.8 GHz | 4.7 GHz | 32 MB | 105 Watt | 449 USD |
| Ryzen 7 3800XT | 8/16 | 3.9 GHz | 4.7 GHz | 32 MB | 105 Watt | 399 USD |
| Ryzen 7 3800X | 8/16 | 3.9 GHz | 4.5 GHz | 32 MB | 105 Watt | 399 USD |
| Ryzen 7 3700X | 8/16 | 3.6 GHz | 4.4 GHz | 32 MB | 65 Watt | 329 USD |
| Ryzen 5 5600X | 6/12 | 3.7 GHz | 4.6 GHz | 32 MB | 65 Watt | 299 USD |
| Ryzen 5 3600XT | 6/12 | 3,8 GHz | 4.5 GHz | 32 MB | 95 Watt | 249 USD |
| Ryzen 5 3600X | 6/12 | 3.8 GHz | 4.4 GHz | 32 MB | 95 Watt | 229 USD |
| Ryzen 5 3600 | 6/12 | 3.6 GHz | 4.2 GHz | 32 MB | 65 Watt | 199 USD |
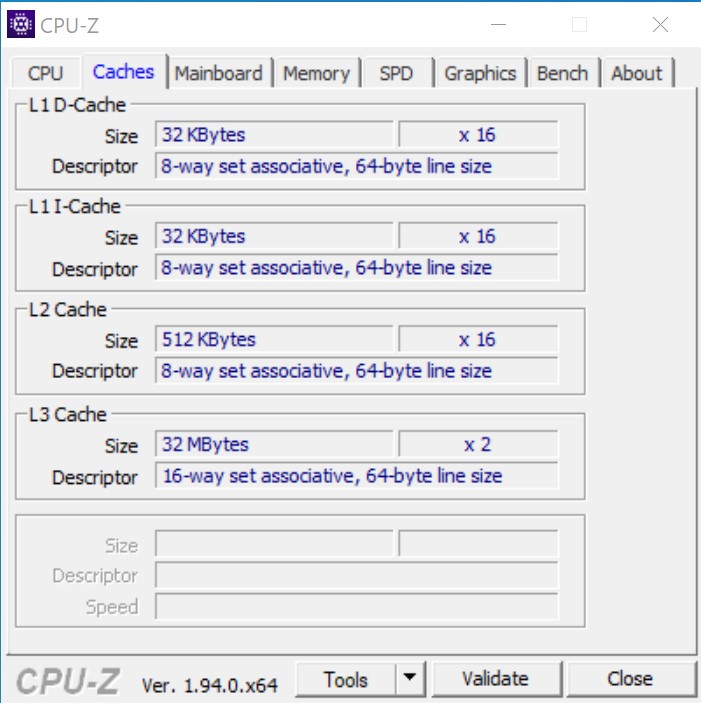
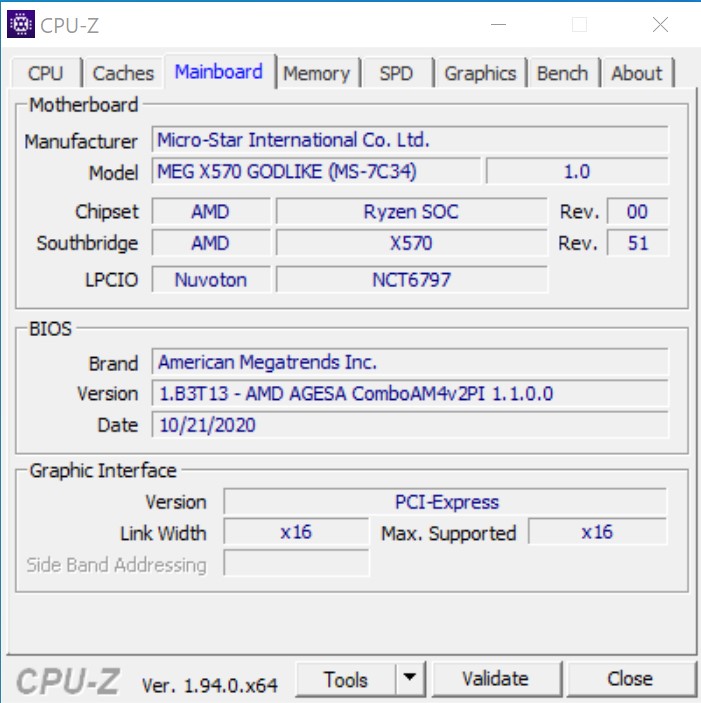
Details of our Test System
We use the following system for the benchmarks below:
- Raijintek Pean Benchtable
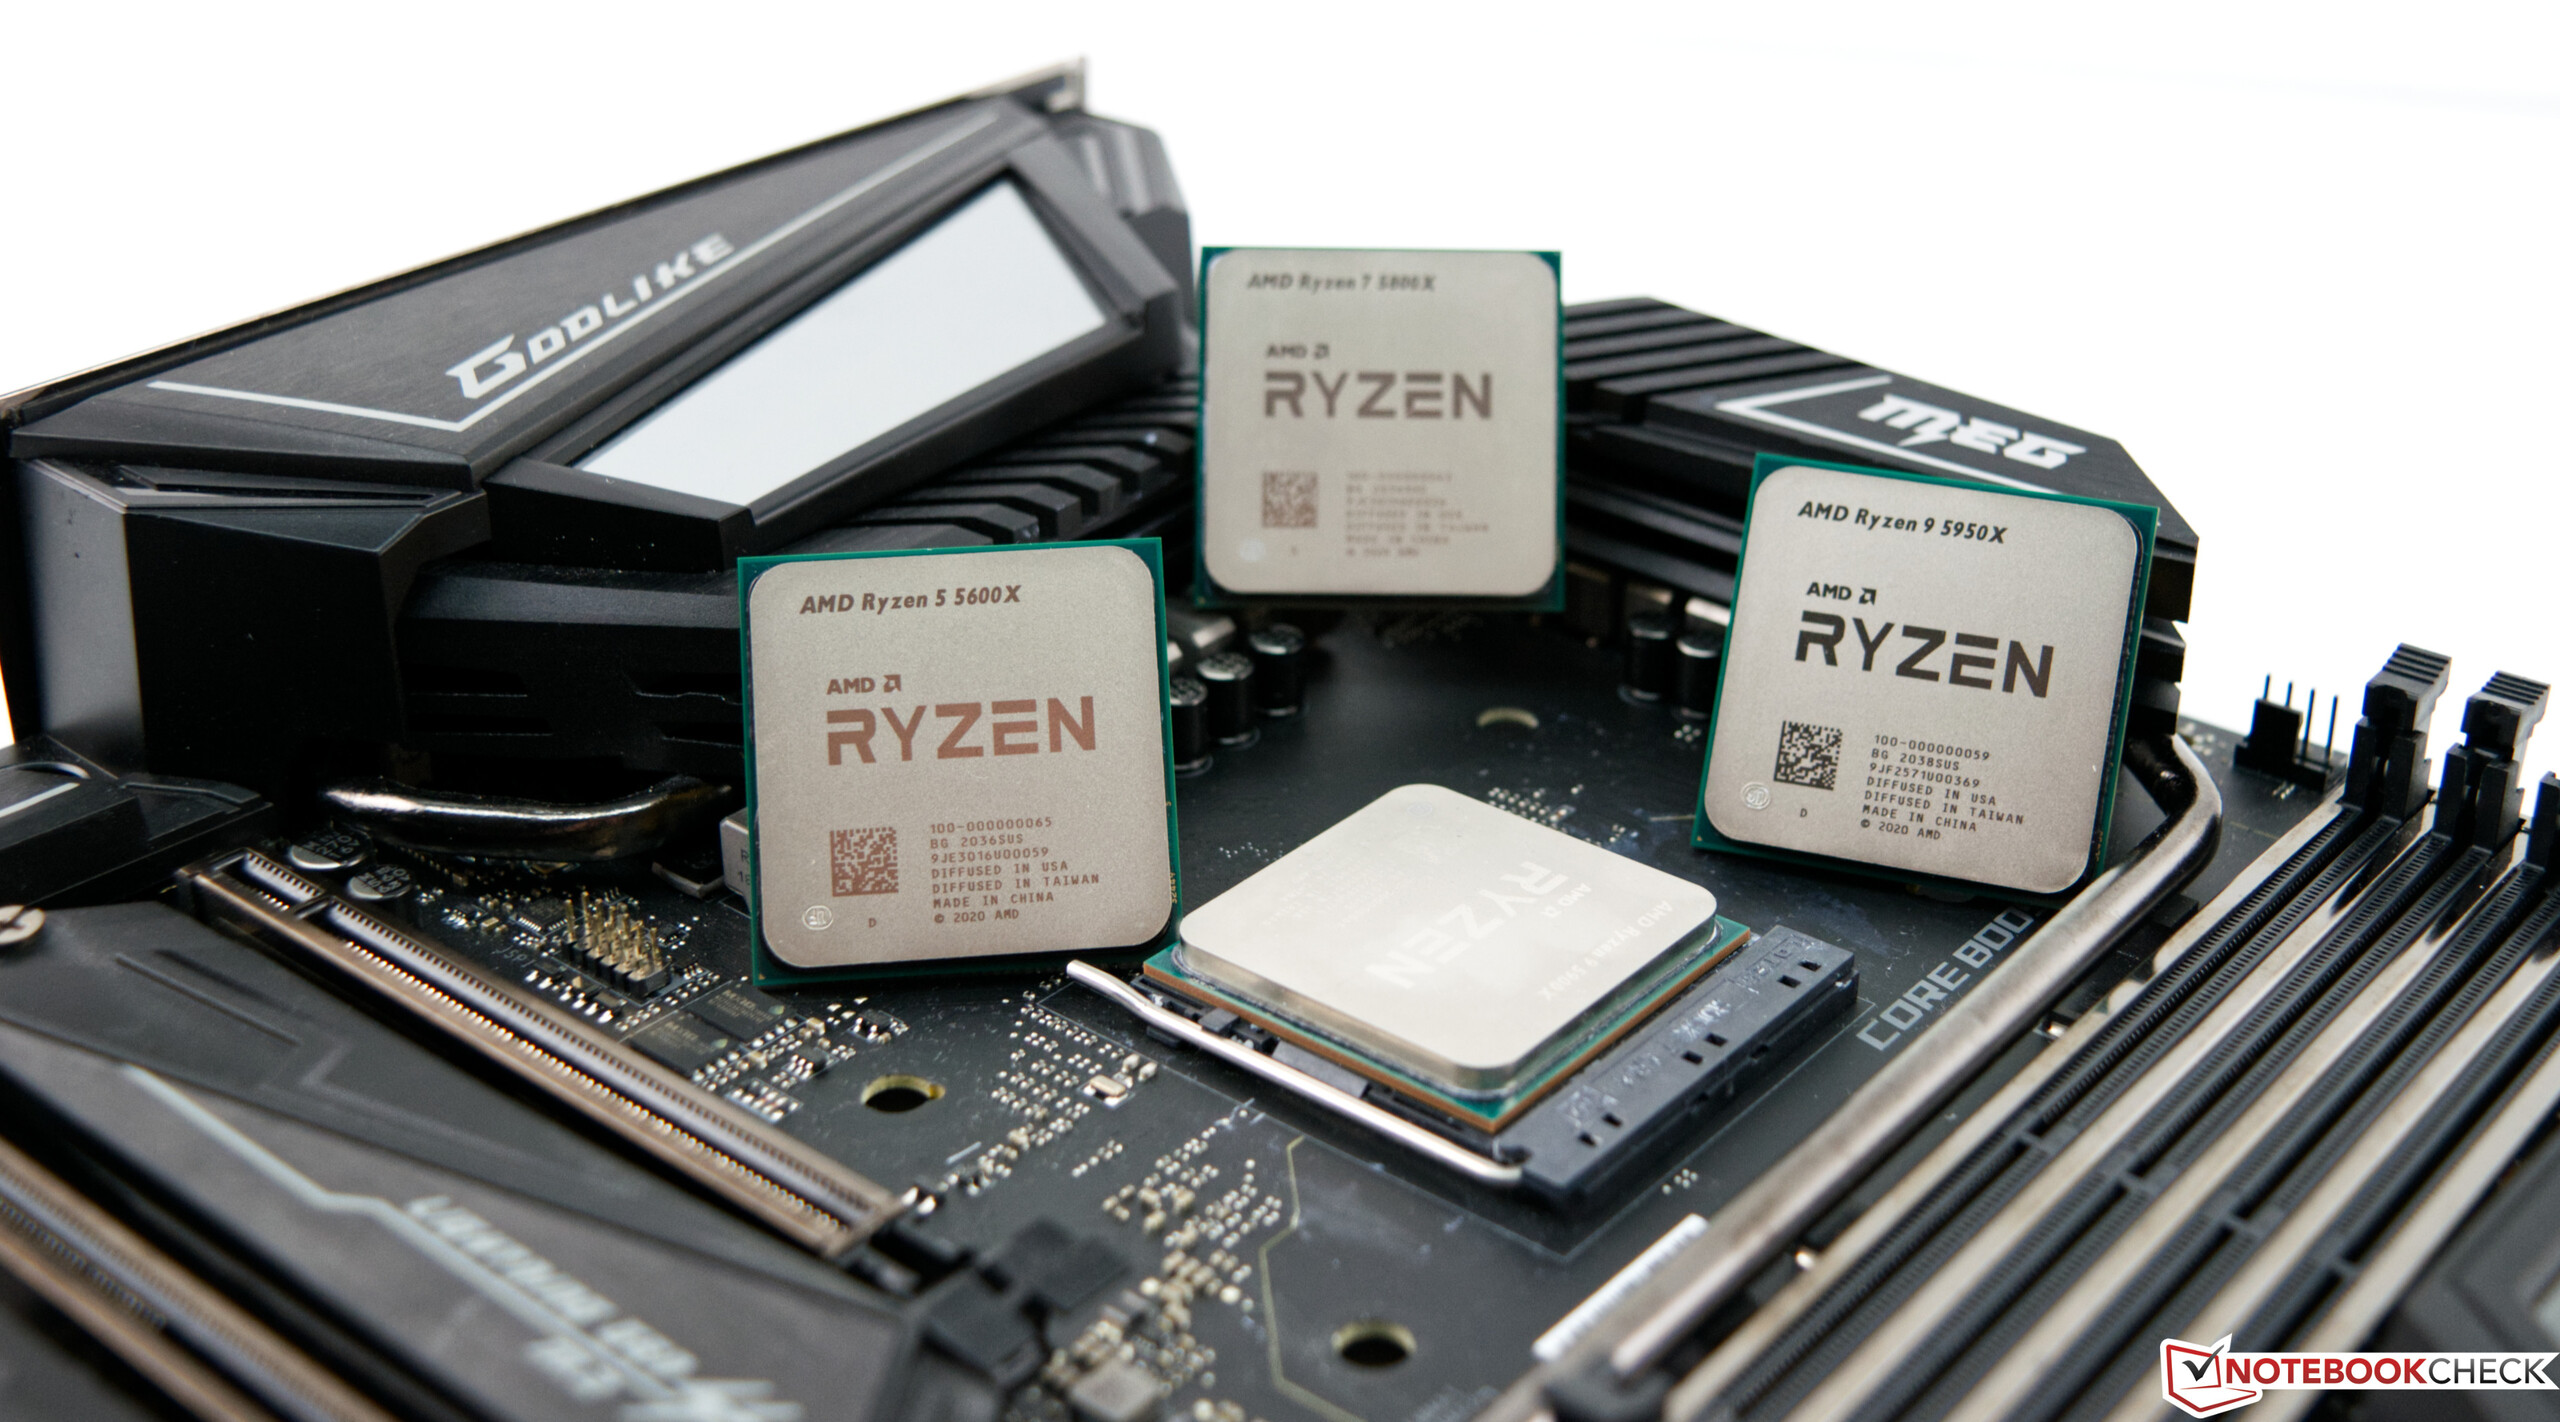
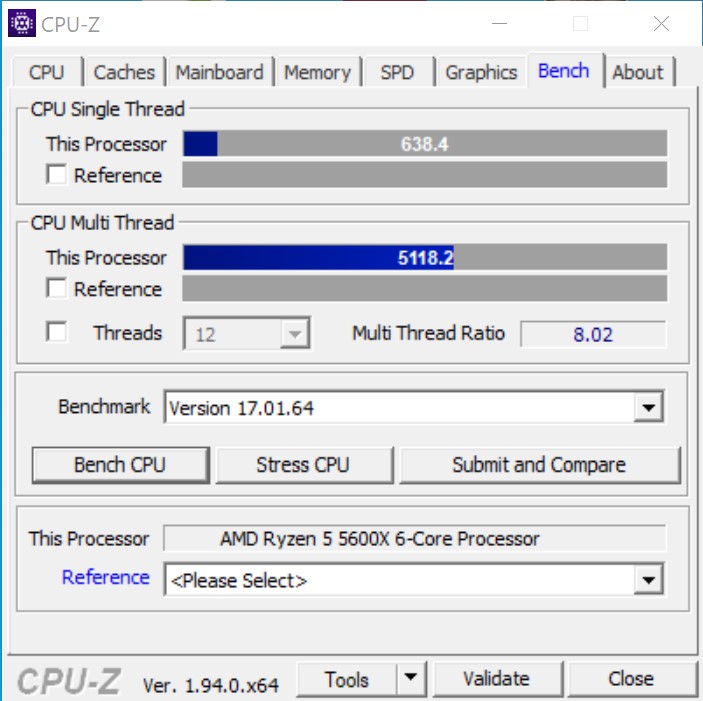
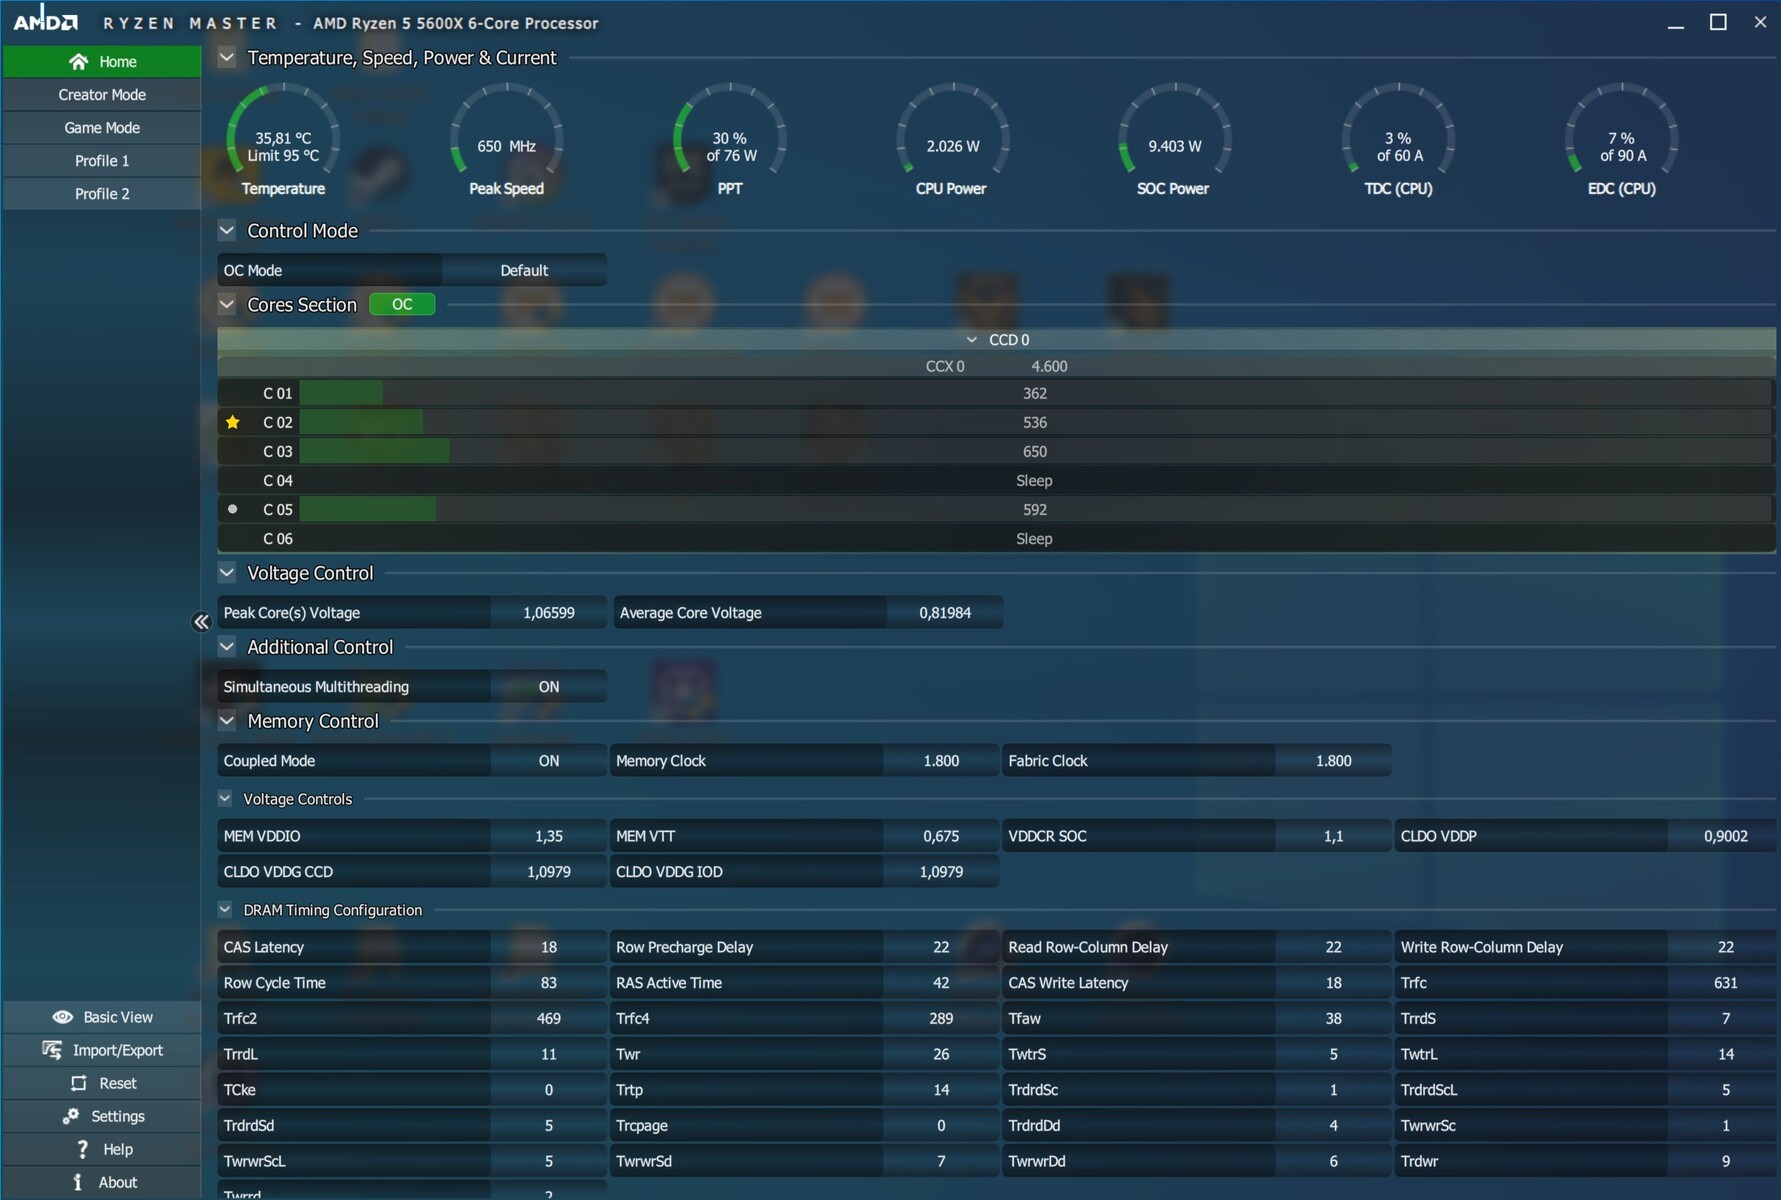
- AMD Ryzen 9 5950X, AMD Ryzen 5 5600X
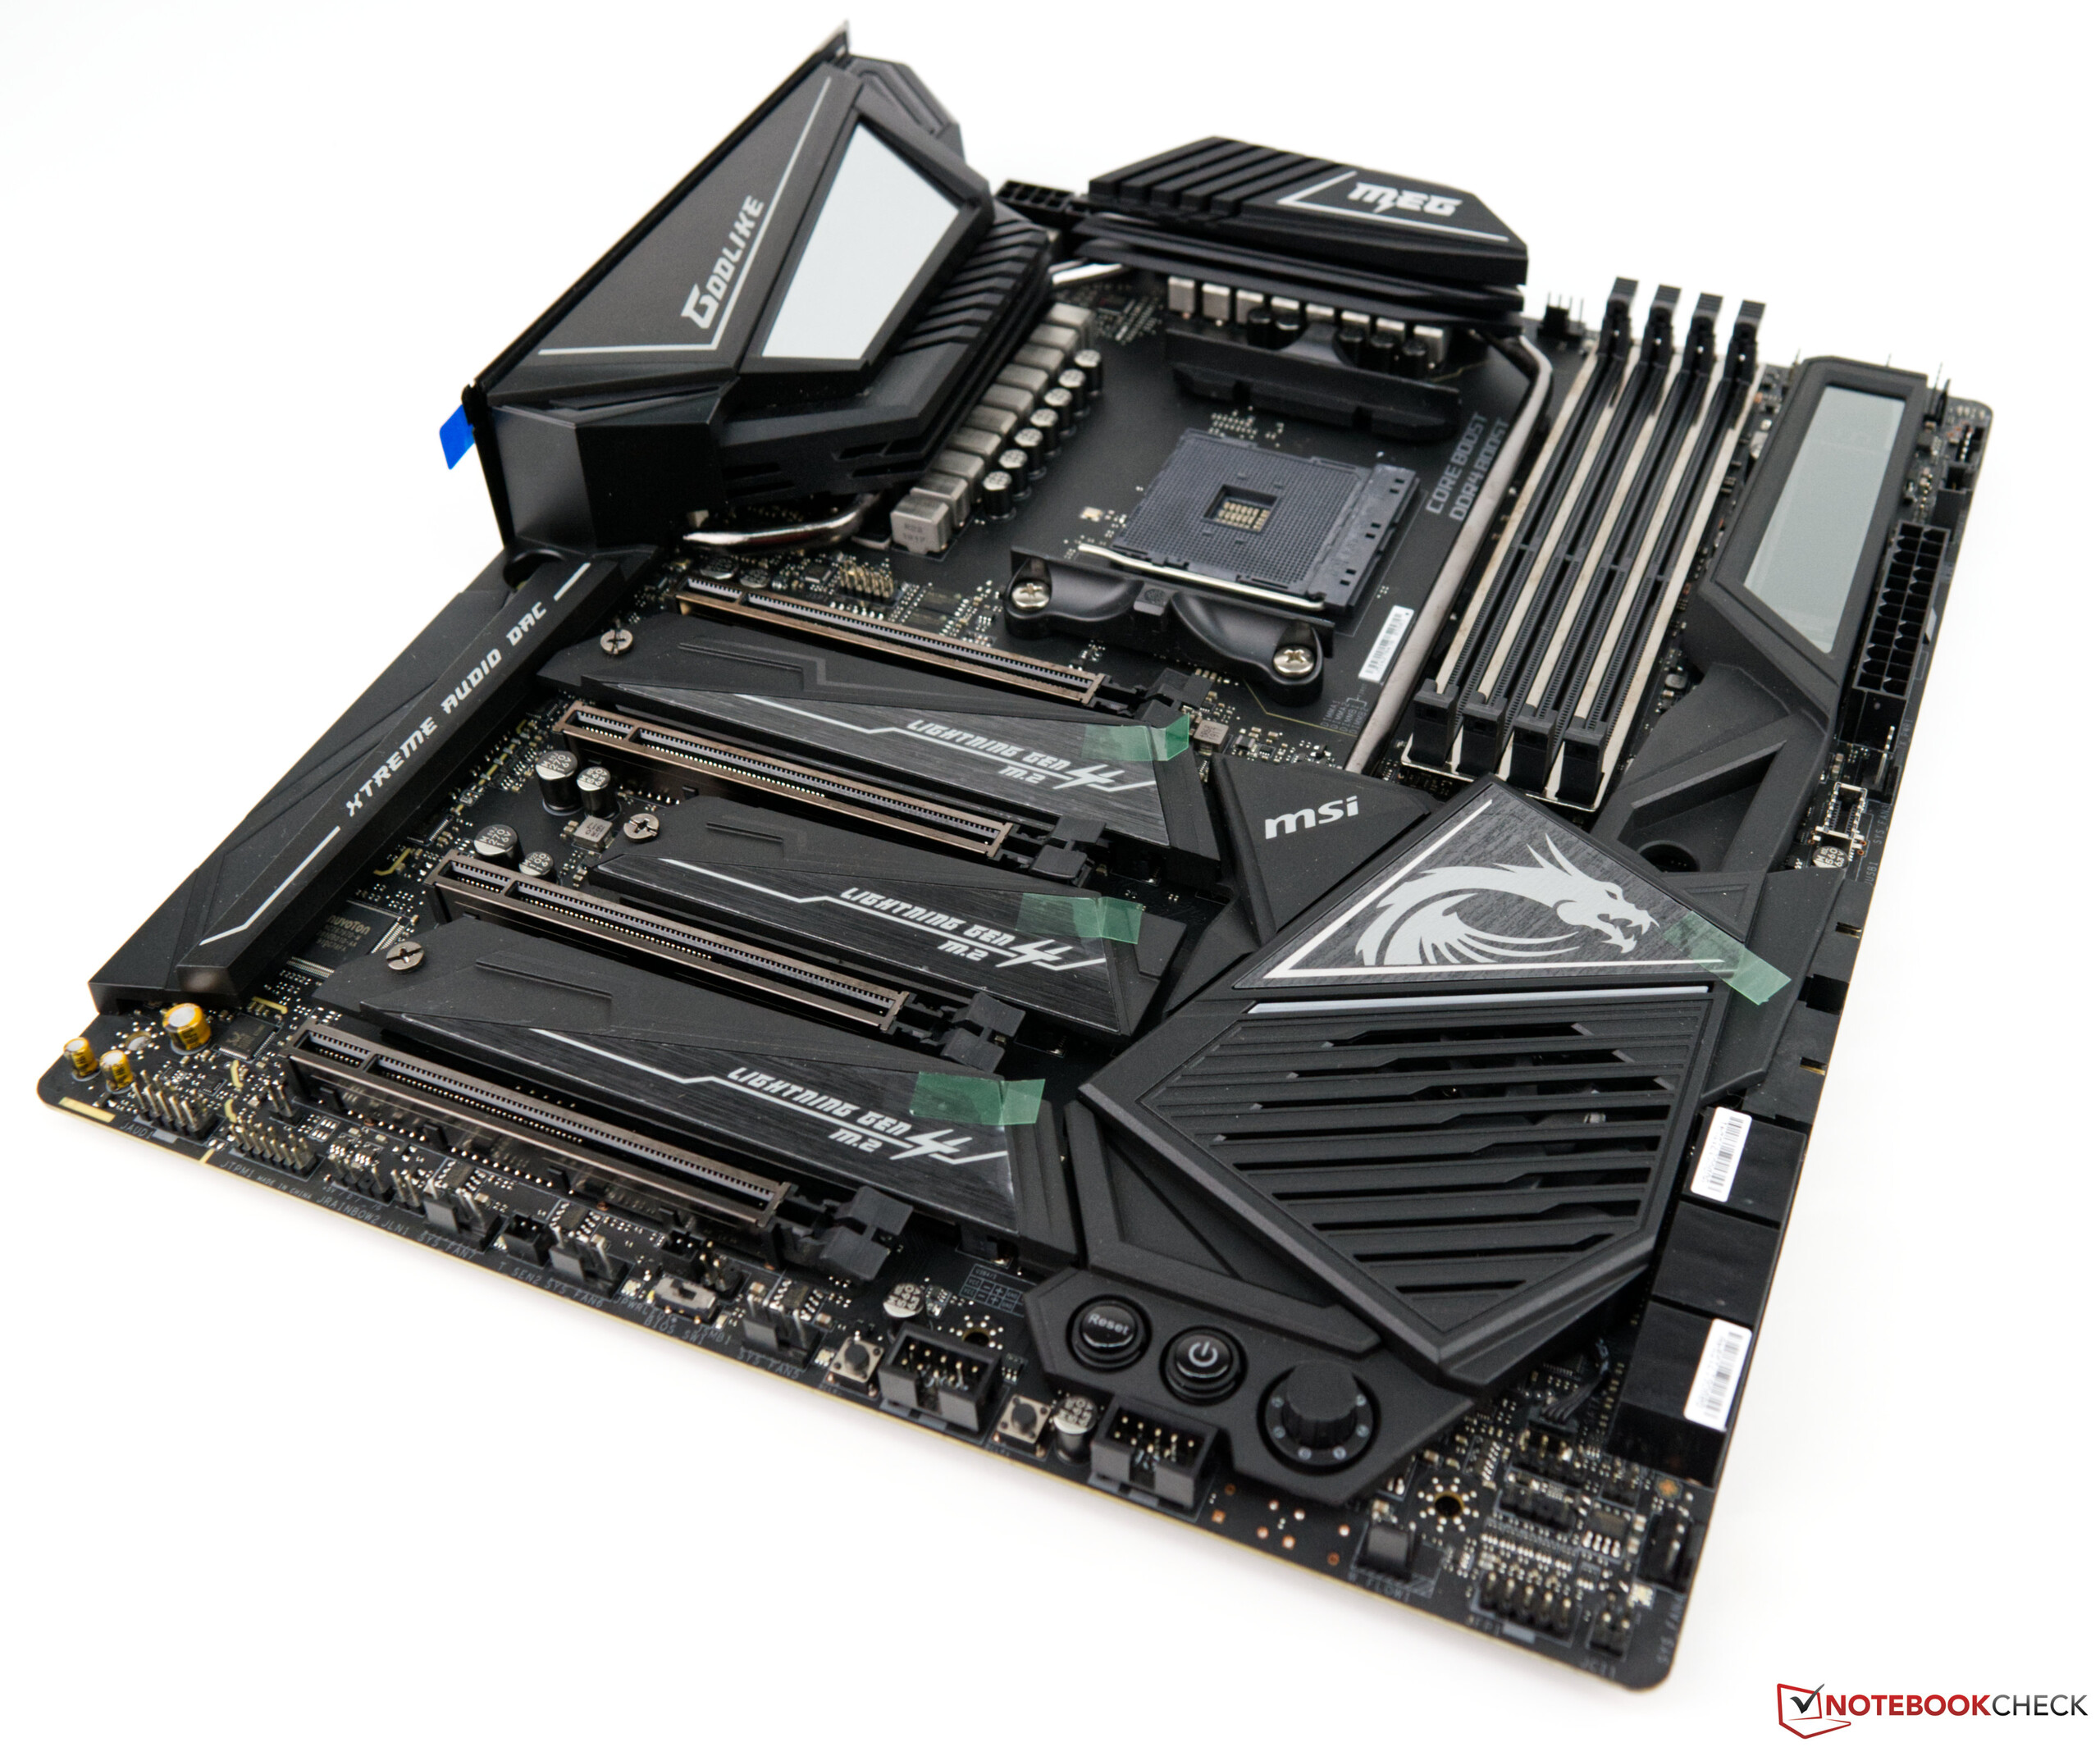
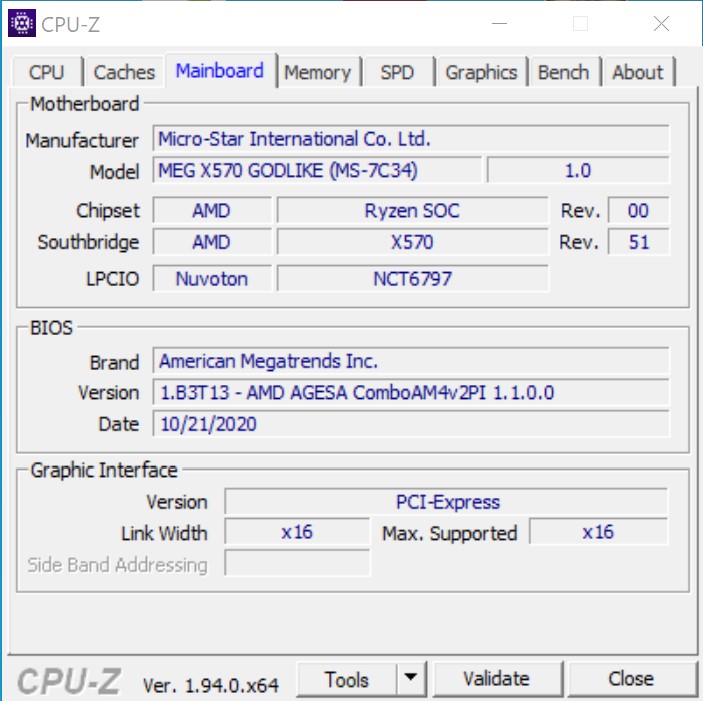
- MSI MEG X570 Godlike
- Alphacool Eisbear 280 AiO
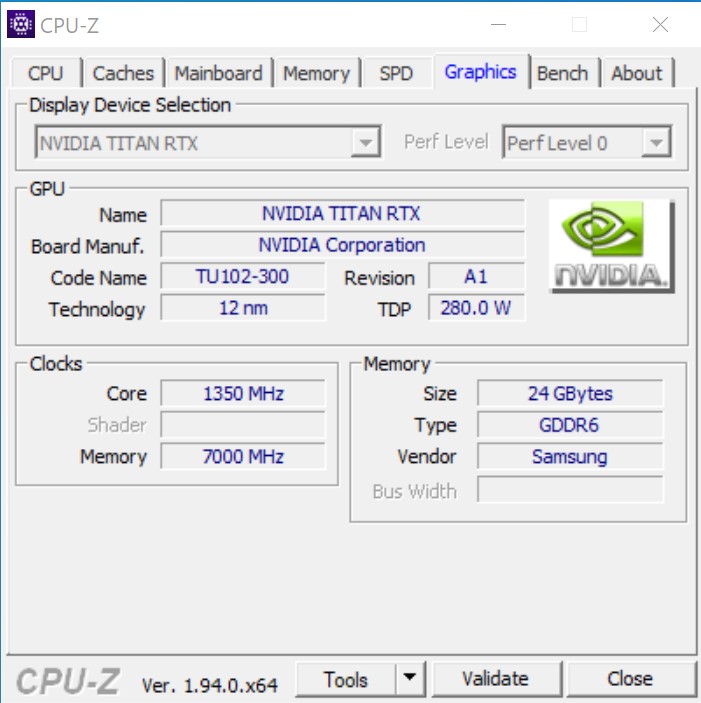
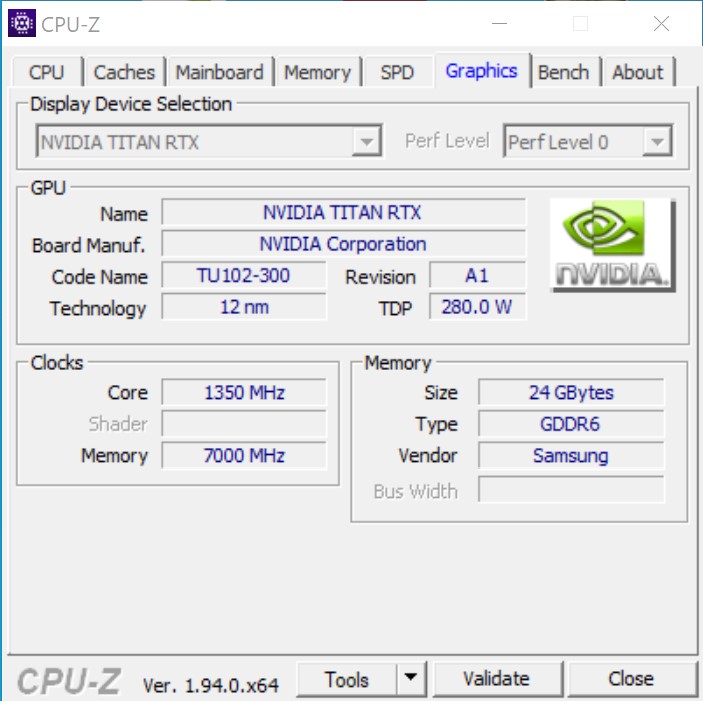
- Nvidia Titan RTX
- Corsair HX 1200i power supply
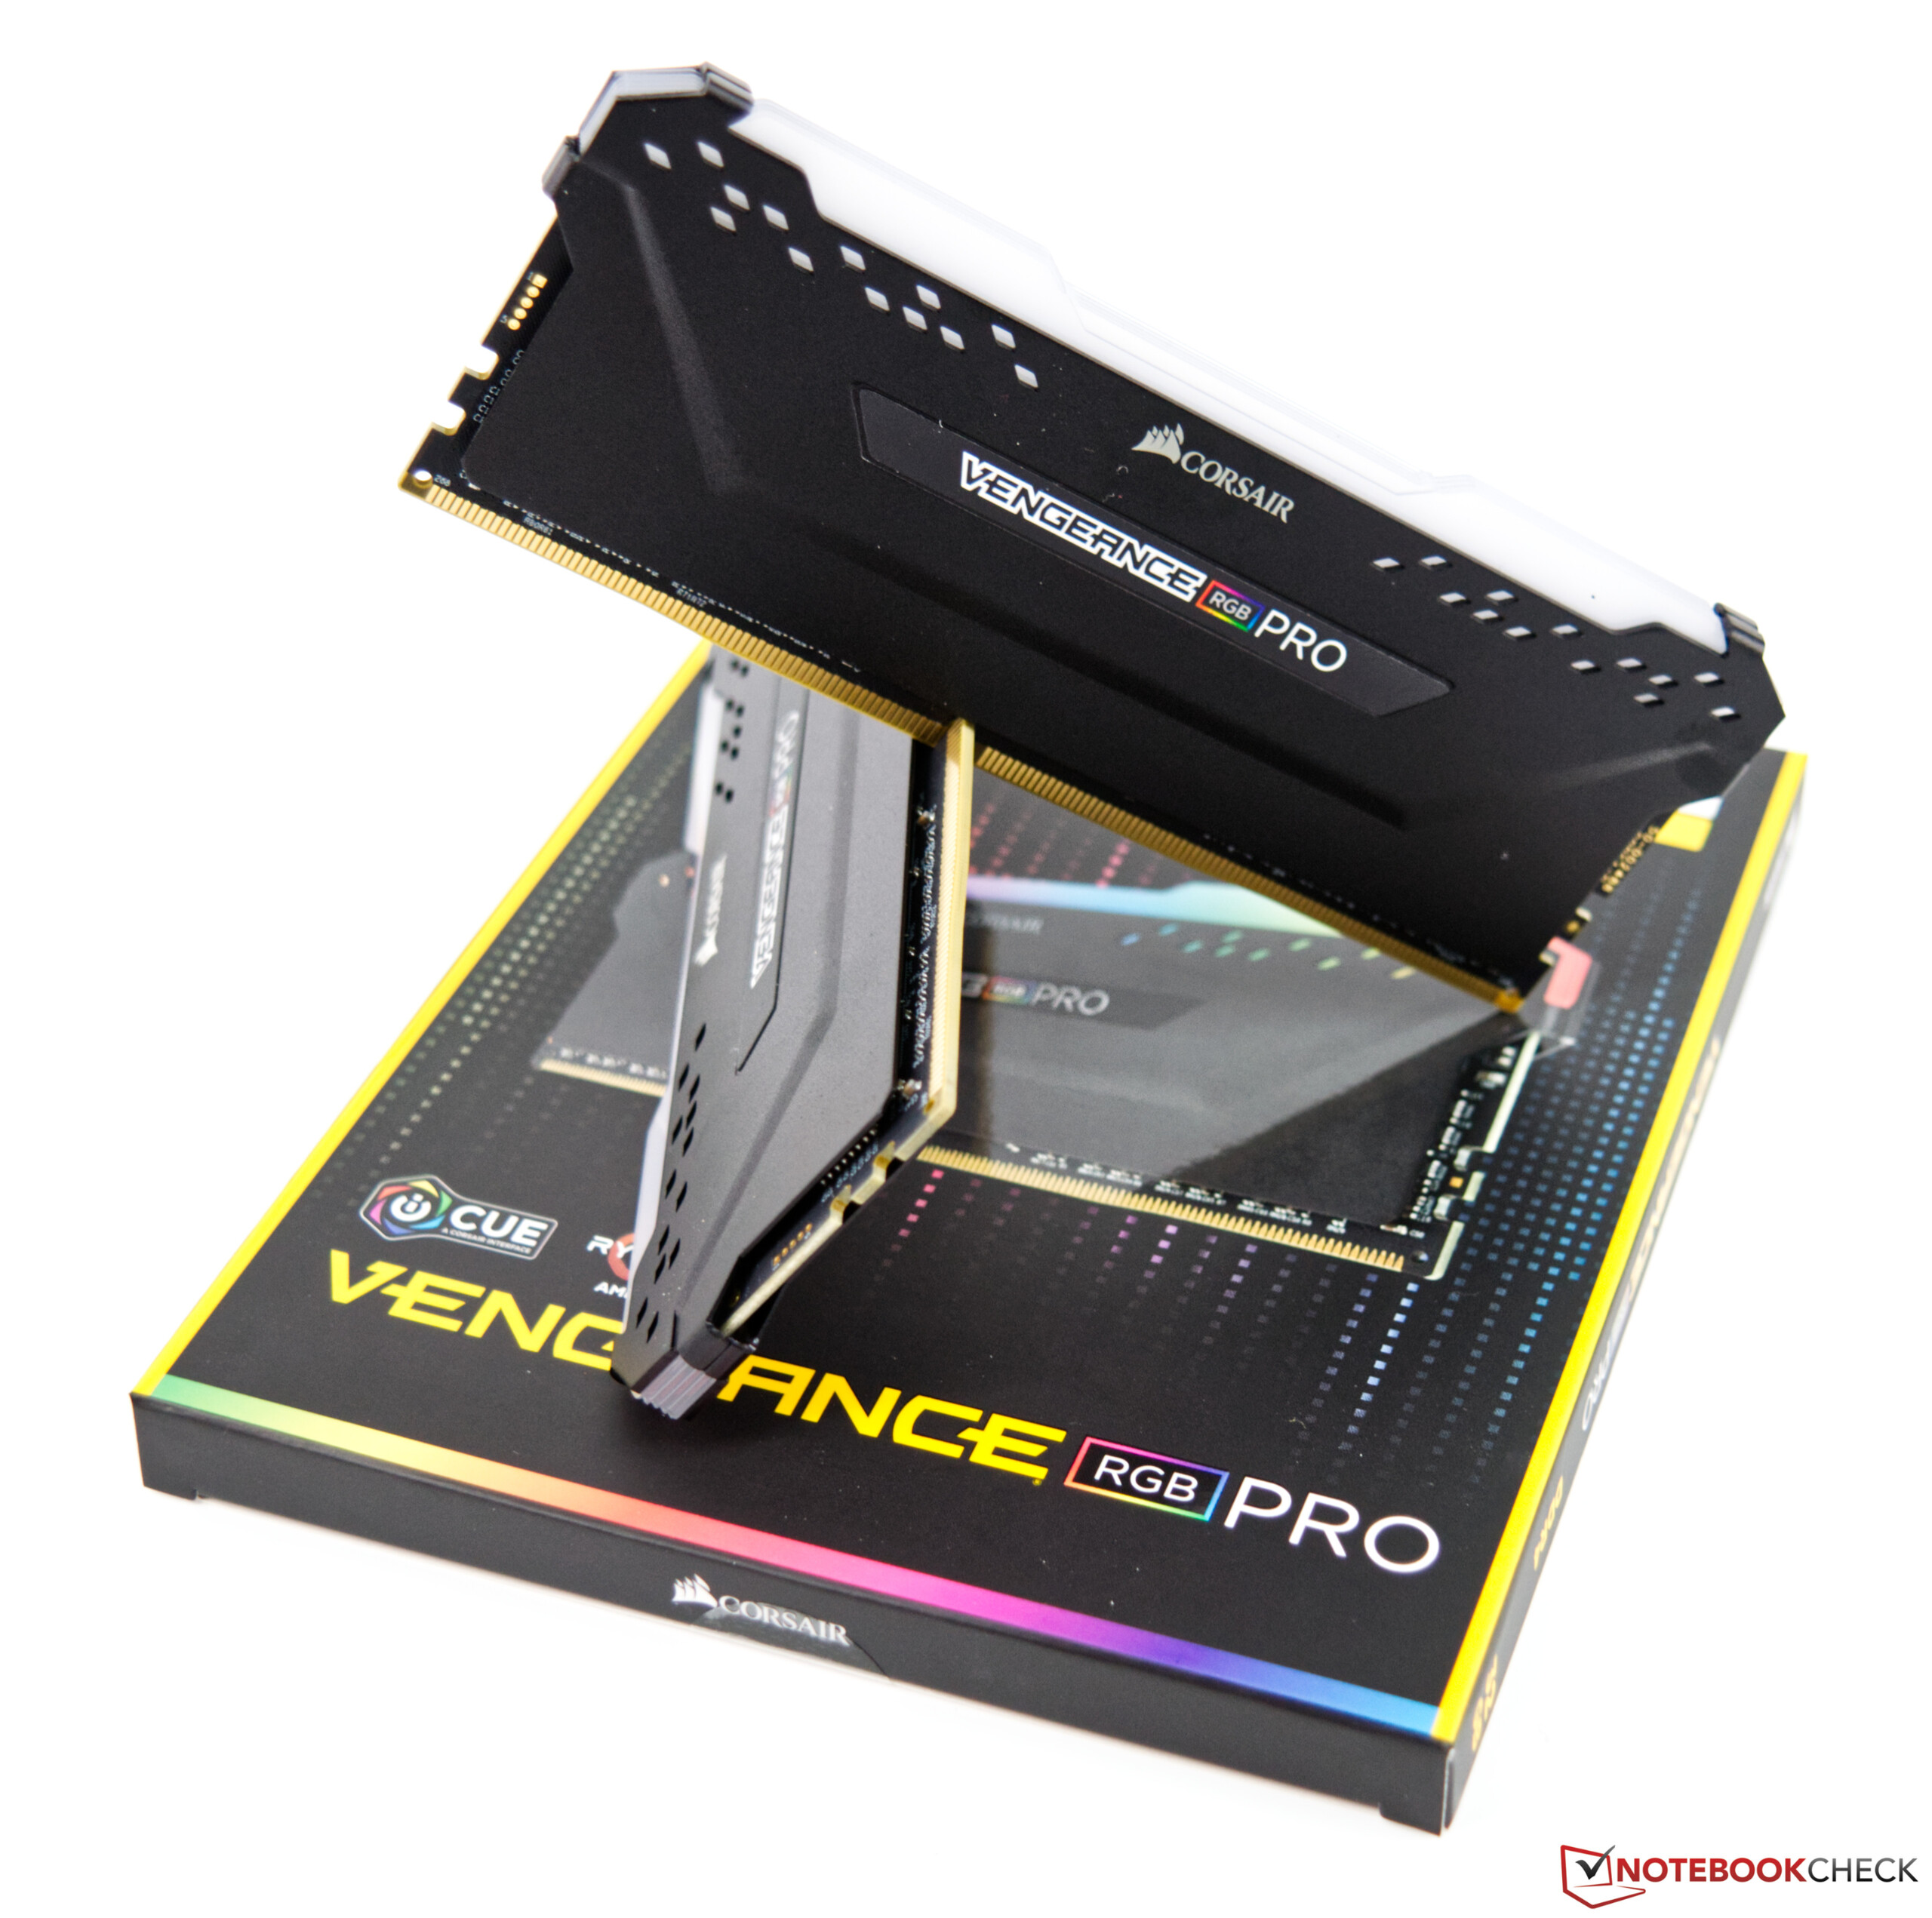
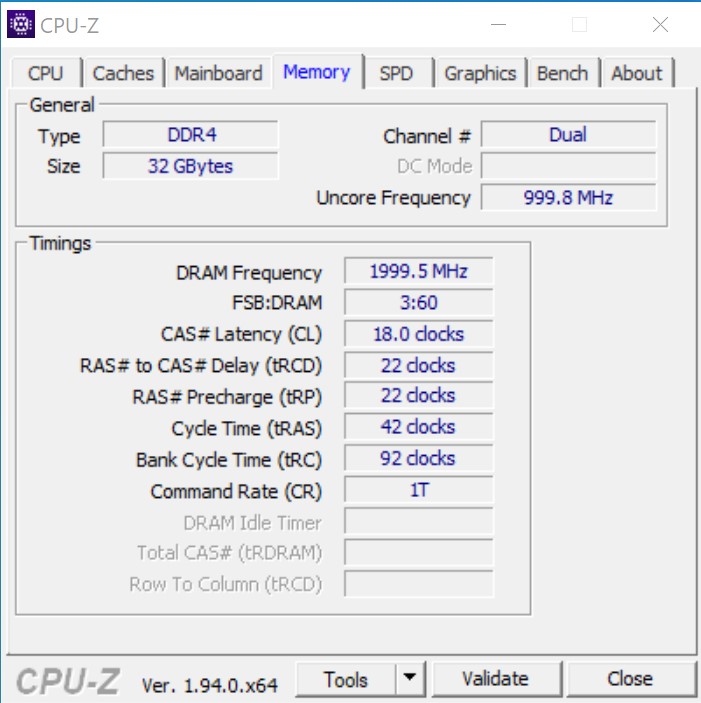
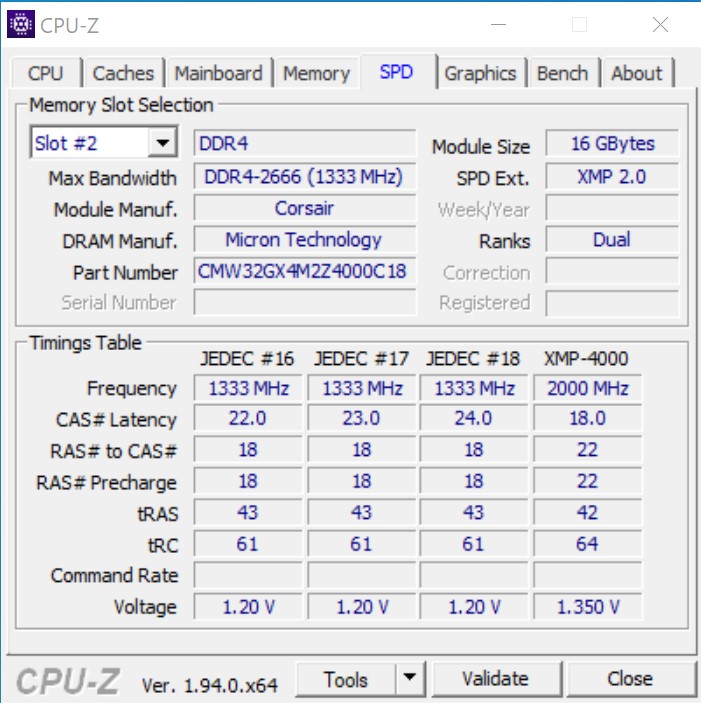
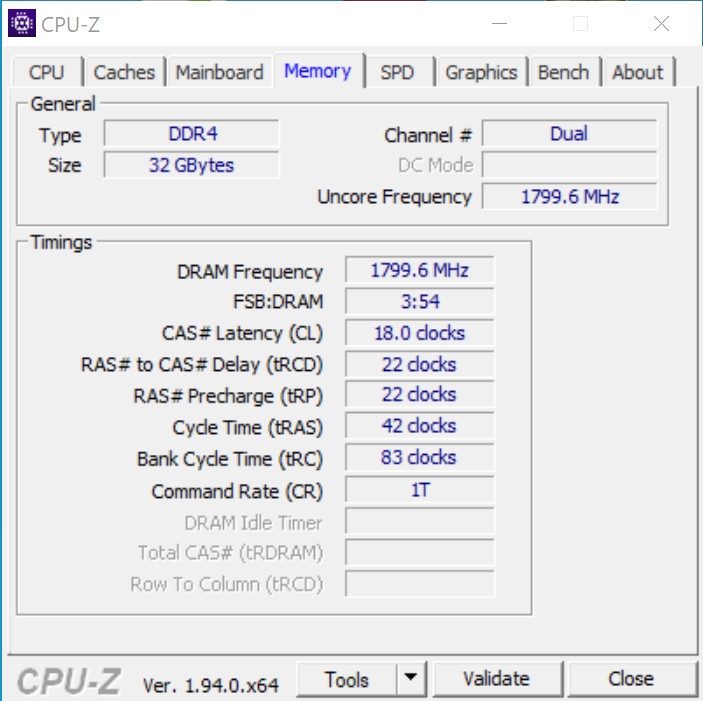
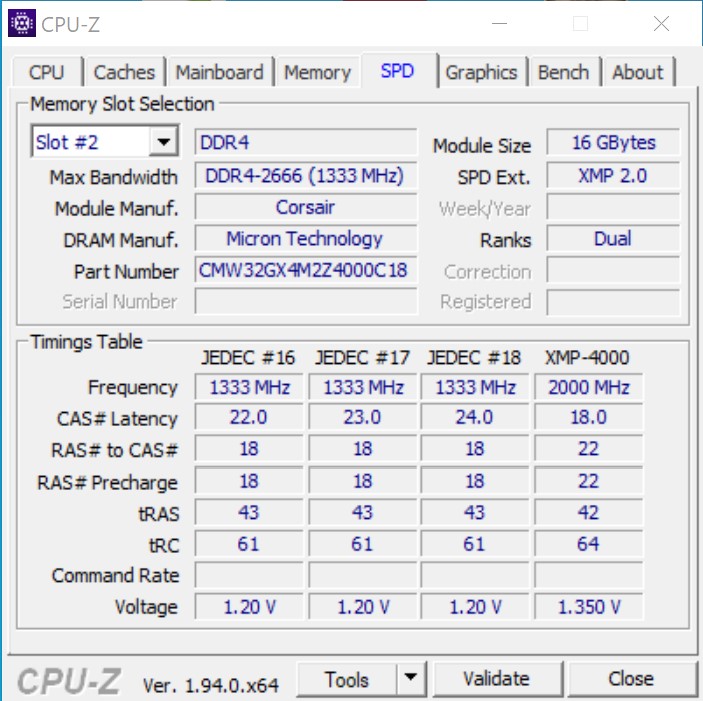
- Corsair Vengeance RGB Pro DDR4-4000 storage kit 2 x 16 GB
- Intel Optane 905P 480GB PCIe SSD
- Microsoft Windows 10 Professional 64-Bit (Version 2004)
At this point, we would like to thank Caseking for loaning us the Raijintek Pean, which was also individualized with laser engravings. AMD Direct provided the mainboard, which was included in the press kit on the release of the AMD Ryzen 9 3900X and AMD Ryzen 7 3700X Zen 2 processors. As cooling, we use the Alphacool Eisbear 280 that Alphacool provided to us. We would also like to thank Corsair for their support for the working memory.


Processor Benchmarks
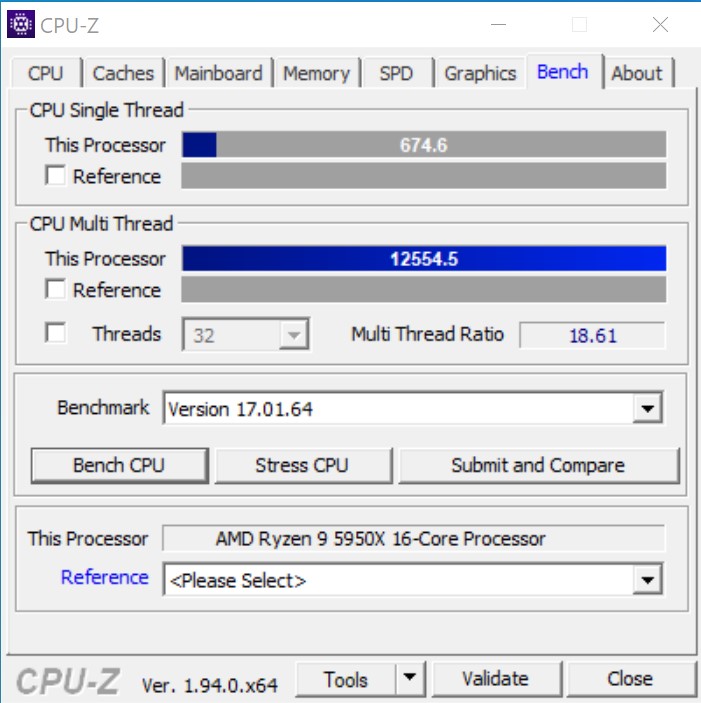
We were already able to determine that the innovations of the Zen 3 architecture have been successful. With the 16-core processor, AMD is now upping the ante once again, not only increasing the multi-core performance. Due to the higher Boost, the single-core performance is also increased compared to the AMD Ryzen 9 5900X. The processor does not stop at 4.9 GHz but often even surpasses the 5 GHz limit. As expected, the AMD Ryzen 5 5600X places behind its larger siblings. However, the performance of the 6-core processor should not be underestimated, since it often surpasses even the Intel Core i9-10900K in the single-core comparison. In the multi-core performance, it is almost enough to approach the AMD Ryzen 7 3700X, even though that offers two more cores.
You can find additional benchmarks on the processors here.
AMD Ryzen 9 5950X
AMD Ryzen 5 5600X
| Blender - v2.79 BMW27 CPU | |
| AMD Ryzen 3 3300X | |
| AMD Ryzen 5 5600X | |
| AMD Ryzen 7 5800X | |
| AMD Ryzen 7 3700X | |
| Intel Core i9-10900K | |
| AMD Ryzen 9 3900X | |
| AMD Ryzen 9 5900X | |
| AMD Ryzen 9 3950X | |
| AMD Ryzen 9 5950X | |
| WinRAR - Result | |
| AMD Ryzen 7 5800X | |
| AMD Ryzen 9 5900X | |
| AMD Ryzen 5 5600X | |
| AMD Ryzen 9 5950X | |
| Intel Core i9-10900K | |
| AMD Ryzen 9 3900X | |
| AMD Ryzen 7 3700X | |
| AMD Ryzen 9 3950X | |
| AMD Ryzen 3 3300X | |
| 3DMark 11 - 1280x720 Performance Physics | |
| AMD Ryzen 9 5950X | |
| AMD Ryzen 9 5900X | |
| AMD Ryzen 7 5800X | |
| Intel Core i9-10900K | |
| AMD Ryzen 9 3950X | |
| AMD Ryzen 5 5600X | |
| AMD Ryzen 9 3900X | |
| AMD Ryzen 7 3700X | |
| AMD Ryzen 3 3300X | |
| HWBOT x265 Benchmark v2.2 - 4k Preset | |
| AMD Ryzen 9 5950X | |
| AMD Ryzen 9 5900X | |
| Intel Core i9-10900K | |
| AMD Ryzen 9 3900X | |
| AMD Ryzen 7 5800X | |
| AMD Ryzen 9 3950X | |
| AMD Ryzen 5 5600X | |
| AMD Ryzen 7 3700X | |
| AMD Ryzen 3 3300X | |
| R Benchmark 2.5 - Overall mean | |
| AMD Ryzen 9 3900X | |
| AMD Ryzen 3 3300X | |
| Intel Core i9-10900K | |
| AMD Ryzen 9 3950X | |
| AMD Ryzen 5 5600X | |
| AMD Ryzen 9 5950X | |
| AMD Ryzen 9 5900X | |
| AMD Ryzen 7 5800X | |
| LibreOffice - 20 Documents To PDF | |
| Intel Core i9-10900K | |
| AMD Ryzen 9 3900X | |
| AMD Ryzen 9 3950X | |
| AMD Ryzen 3 3300X | |
| AMD Ryzen 9 5900X | |
| AMD Ryzen 9 5950X | |
| AMD Ryzen 5 5600X | |
| AMD Ryzen 7 5800X | |
| WebXPRT 3 - Overall | |
| AMD Ryzen 7 5800X | |
| AMD Ryzen 9 5950X | |
| AMD Ryzen 5 5600X | |
| AMD Ryzen 9 5900X | |
| Intel Core i9-10900K | |
| AMD Ryzen 9 3950X | |
| AMD Ryzen 3 3300X | |
| Mozilla Kraken 1.1 - Total | |
| AMD Ryzen 3 3300X | |
| Intel Core i9-10900K | |
| AMD Ryzen 9 3950X | |
| AMD Ryzen 5 5600X | |
| AMD Ryzen 9 5900X | |
| AMD Ryzen 7 5800X | |
| AMD Ryzen 9 5950X | |
* ... smaller is better
Load Test with the Cinebench R15 Multi Loop
In the load test with the Cinebench R15 multi loop, neither the AMD Ryzen 9 5950X nor the AMD Ryzen 5 5600X have any problems. The built-in AiO together with the 280-millimeter (11 in) radiator have no trouble to reliably cool the processors. By the way, it is significantly easier to cool the AMD Ryzen 5 5600X due to its lower power consumption.
The Gaming Performance of the Ryzen 3000 Processors
Since 11/5/2020, it is official that AMD offers the fastest gaming CPU at this point. Nonetheless, the AMD Ryzen 9 5950X is still able to squeeze a few more FPS from the Nvidia Titan RTX in some games. However, this does not make a noticeable difference for the gaming fun. With increasing resolution and quality settings, the advantages of the CPUs start melting, so that even the AMD Ryzen 5 5600X is able to keep up with the AMD Ryzen 9 5950X. If you are only concerned about pure gaming performance, you are currently not making any mistake if you decide for the entry-level processor. Content creators as well as streamers, for example, are able to get along without a separate streaming PC, if they choose the AMD Ryzen 9 5950X. This offers sufficient resources to also handle the online stream in addition to the pure gaming.
| 3DMark 11 - 1280x720 Performance GPU | |
| Intel Core i7-10700K | |
| Intel Core i9-10900K | |
| AMD Ryzen 9 5950X | |
| AMD Ryzen 7 5800X | |
| AMD Ryzen 5 5600X | |
| AMD Ryzen 7 3800XT | |
| AMD Ryzen 3 3300X | |
| AMD Ryzen 9 5900X | |
| AMD Ryzen 3 3100 | |
| AMD Ryzen 9 3950X | |
| AMD Ryzen 5 1600 | |
| AMD Ryzen 3 3100 | |
| AMD Ryzen 9 3900X | |
| AMD Ryzen 7 2700X | |
| Unigine Heaven 4.0 | |
| Extreme Preset DX11 | |
| AMD Ryzen 9 5900X | |
| AMD Ryzen 9 5950X | |
| AMD Ryzen 7 5800X | |
| AMD Ryzen 9 3900X | |
| AMD Ryzen 5 5600X | |
| AMD Ryzen 7 2700X | |
| Extreme Preset OpenGL | |
| AMD Ryzen 7 5800X | |
| AMD Ryzen 9 5900X | |
| AMD Ryzen 9 5950X | |
| AMD Ryzen 9 3900X | |
| AMD Ryzen 5 5600X | |
| AMD Ryzen 7 2700X | |
| Unigine Valley 1.0 | |
| 1920x1080 Extreme HD Preset OpenGL AA:x8 | |
| AMD Ryzen 9 5900X | |
| AMD Ryzen 7 5800X | |
| AMD Ryzen 9 5950X | |
| AMD Ryzen 5 5600X | |
| AMD Ryzen 9 3900X | |
| AMD Ryzen 7 2700X | |
| 1920x1080 Extreme HD DirectX AA:x8 | |
| AMD Ryzen 9 5950X | |
| AMD Ryzen 9 5900X | |
| AMD Ryzen 7 5800X | |
| AMD Ryzen 5 5600X | |
| AMD Ryzen 9 3900X | |
| AMD Ryzen 7 2700X | |
| Unigine Superposition | |
| 1280x720 720p Low | |
| AMD Ryzen 7 5800X | |
| AMD Ryzen 5 5600X | |
| AMD Ryzen 9 5950X | |
| AMD Ryzen 9 5900X | |
| AMD Ryzen 9 3900X | |
| 1920x1080 1080p Extreme | |
| AMD Ryzen 9 5900X | |
| AMD Ryzen 7 5800X | |
| AMD Ryzen 9 5950X | |
| AMD Ryzen 5 5600X | |
| AMD Ryzen 9 3900X | |
| 7680x4320 8k Optimized | |
| AMD Ryzen 9 5900X | |
| AMD Ryzen 5 5600X | |
| AMD Ryzen 7 5800X | |
| AMD Ryzen 9 5950X | |
| AMD Ryzen 9 3900X | |
Ryzen 9 5950X with Nvidia Titan RTX
| low | med. | high | ultra | QHD | 4K | |
|---|---|---|---|---|---|---|
| GTA V (2015) | 187 | 186 | 182 | 121 | 113 | 134 |
| The Witcher 3 (2015) | 594 | 420 | 271 | 141 | 102 | |
| Dota 2 Reborn (2015) | 214.5 | 192.3 | 193.3 | 179.2 | 161.6 | |
| Final Fantasy XV Benchmark (2018) | 225 | 183 | 141 | 105 | 63.4 | |
| X-Plane 11.11 (2018) | 168 | 152 | 117 | 101 | ||
| Far Cry 5 (2018) | 201 | 174 | 166 | 154 | 137 | 80 |
| Strange Brigade (2018) | 604 | 350 | 286 | 241 | 183 | 110 |
| Shadow of the Tomb Raider (2018) | 225.1 | 184.2 | 177.9 | 166.1 | 120.1 | 66.4 |
| Far Cry New Dawn (2019) | 165 | 142 | 123 | 115 | 82 | |
| Metro Exodus (2019) | 232 | 172 | 133 | 106 | 86.1 | 56.4 |
| Borderlands 3 (2019) | 217 | 182 | 141 | 117 | 84.4 | 46.6 |
Ryzen 5 5600X with Nvidia Titan RTX
| low | med. | high | ultra | QHD | 4K | |
|---|---|---|---|---|---|---|
| GTA V (2015) | 187 | 186 | 181 | 118 | 109 | 133 |
| The Witcher 3 (2015) | 570 | 413 | 268 | 139 | 101 | |
| Dota 2 Reborn (2015) | 228.9 | 200.7 | 191 | 180 | 168.3 | |
| Final Fantasy XV Benchmark (2018) | 225 | 179 | 138 | 104 | 63.2 | |
| X-Plane 11.11 (2018) | 172 | 156 | 123 | 105 | ||
| Far Cry 5 (2018) | 200 | 171 | 166 | 153 | 135 | 80 |
| Strange Brigade (2018) | 643 | 351 | 286 | 243 | 184 | 110 |
| Shadow of the Tomb Raider (2018) | 217 | 185 | 178 | 165 | 121 | 66.5 |
| Far Cry New Dawn (2019) | 164 | 144 | 136 | 123 | 116 | 81 |
| Metro Exodus (2019) | 236 | 172 | 133 | 107 | 85.4 | 54.6 |
| Borderlands 3 (2019) | 214 | 177 | 138 | 115 | 83.9 | 46.5 |
Application Performance
As we already saw in the CPU benchmarks, all the new Vermeer processors are on a very good trajectory in terms of the performance. This is also reflected in our application and render tests. The whole system runs very fast, even if the SSD does not use the newest PCI Express 4.0 standard. However, in everyday usage this is not a disadvantage, since the Intel Optane 905P still belongs to the faster PCIe SSDs.
In the PCMark 10, the AMD Ryzen 9 5950X is able to come out on top and achieve a small advantage of 4% compared to the AMD Ryzen 9 5900X. The smaller Ryzen 5 5600X is at eyelevel with the AMD Ryzen 7 5800X, but clearly better than the older top model, the AMD Ryzen 9 3950X. The Intel processors can only be found in the middle of the field with a disadvantage of 15% compared to the Ryzen 9 5950X.
In the render tests, the overall result looks more mixed, since the graphics card is the limiting factor here. However, it is possible to see in some tests that with an increasing number of cores, the performance is also increasing, although the number of CPU cores does not matter in some workloads. Here, you have to carefully weigh what is most important to you, if you are not willing to always pick the top model.
* ... smaller is better
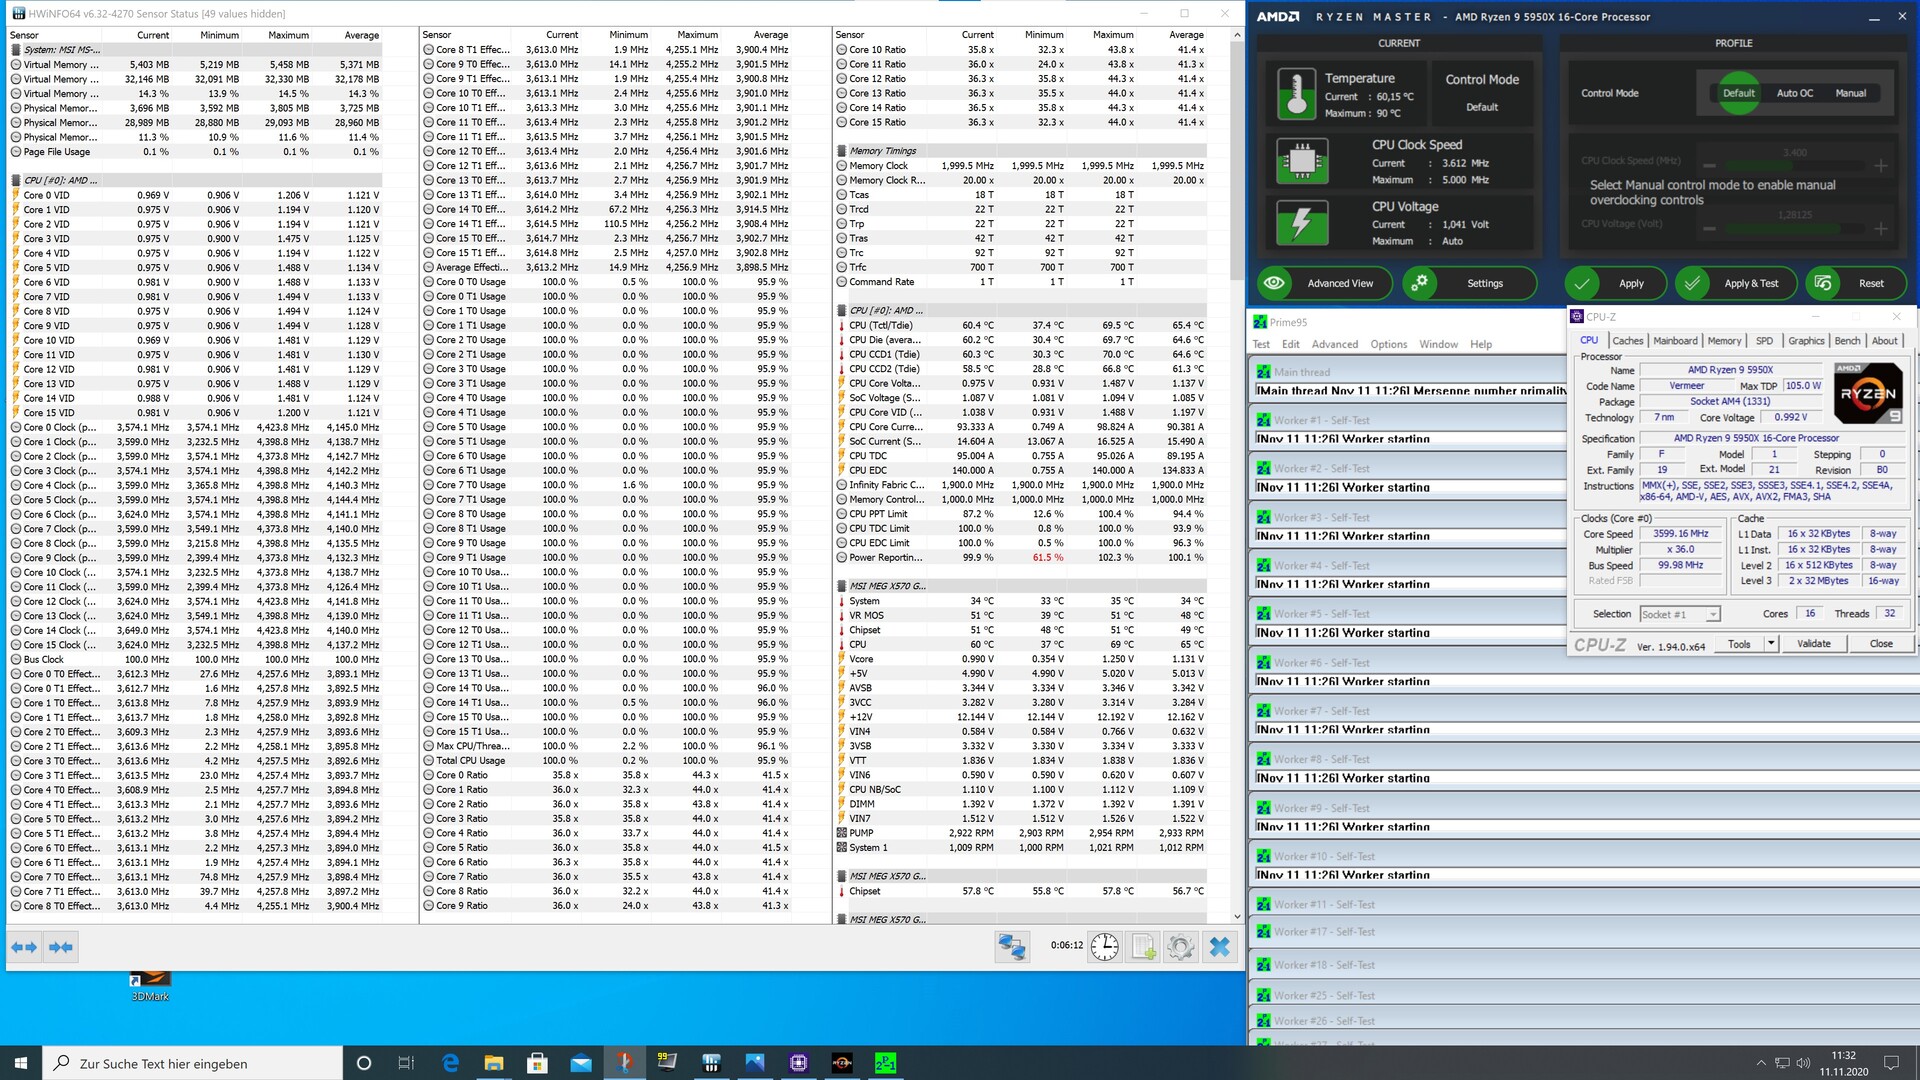
Power Consumption

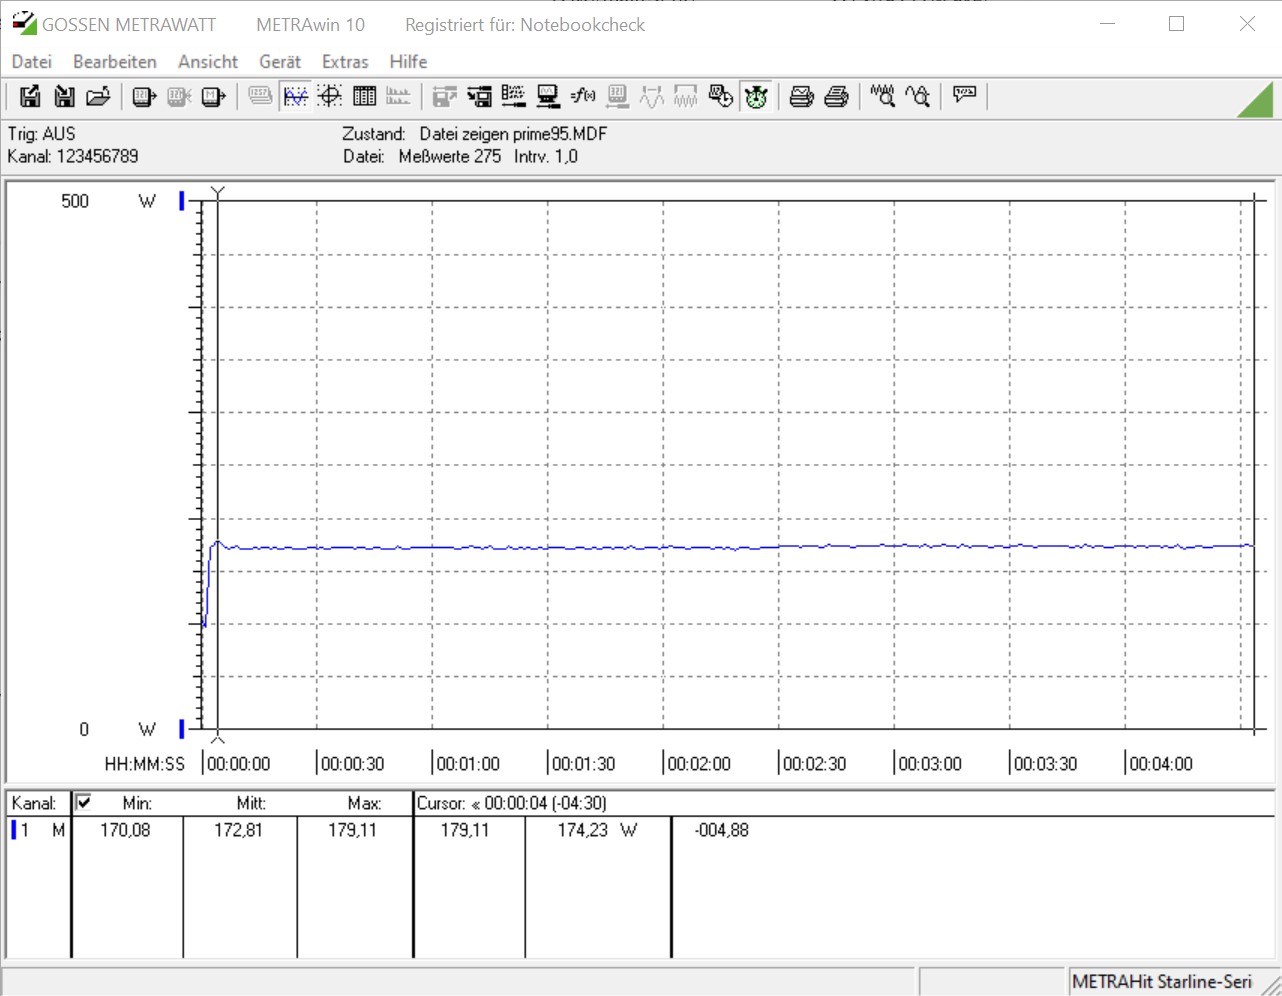
As already for the Ryzen 9 5900X and Ryzen 7 5800X before, AMD also specifies a TDP of 105 watts for the Ryzen 9 5950X. With this, it remains within the specifications of the X570 platform, since AMD did not introduce a new chipset with the Vermeer generation. However, in the end the 105 watts are not enough, since the power limit of the CPU lies at 142 watts, which the 16-core processor indeed consumes under load.
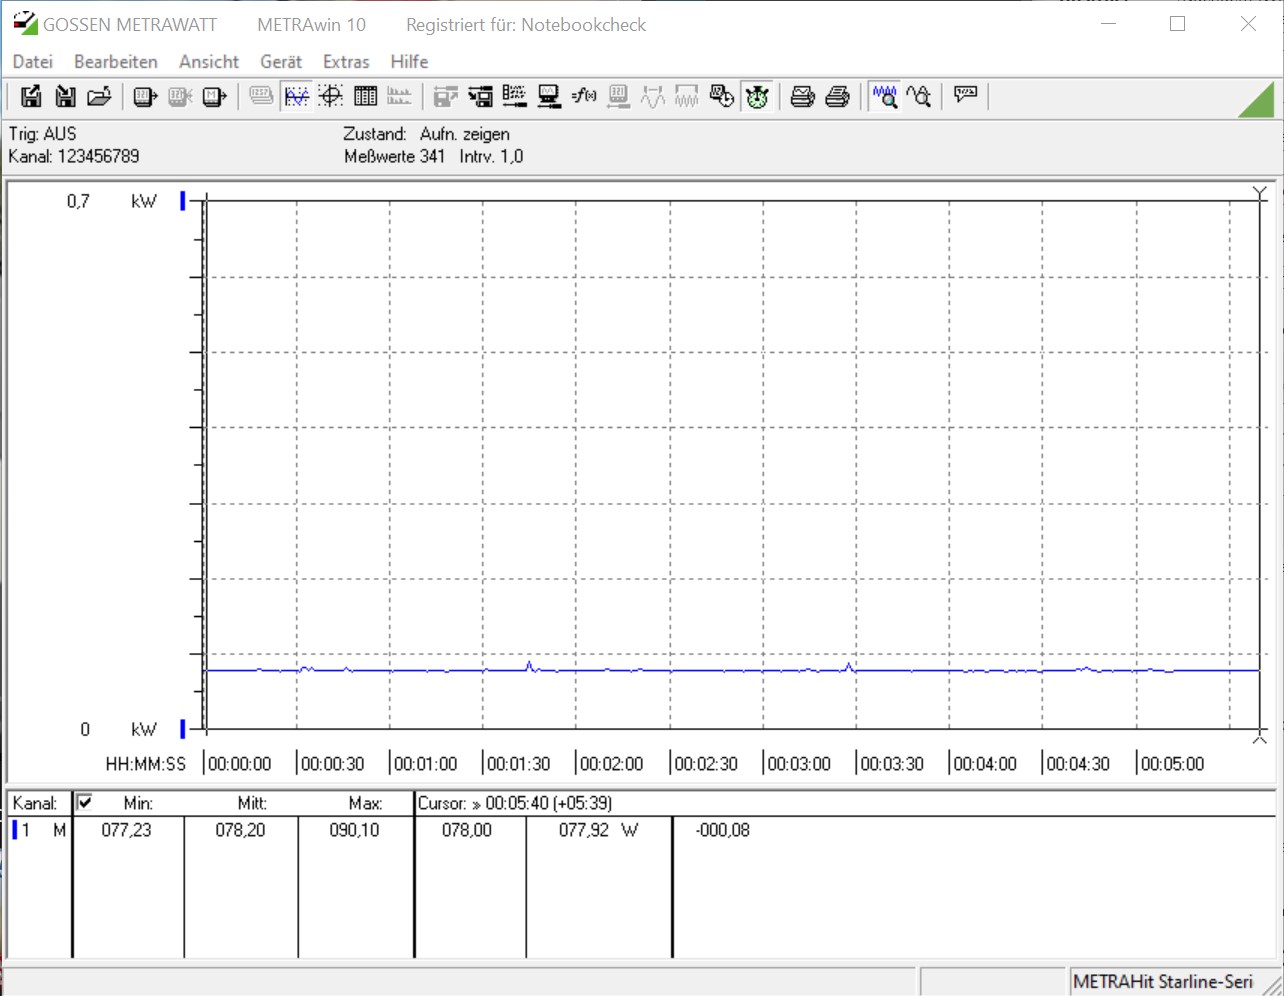
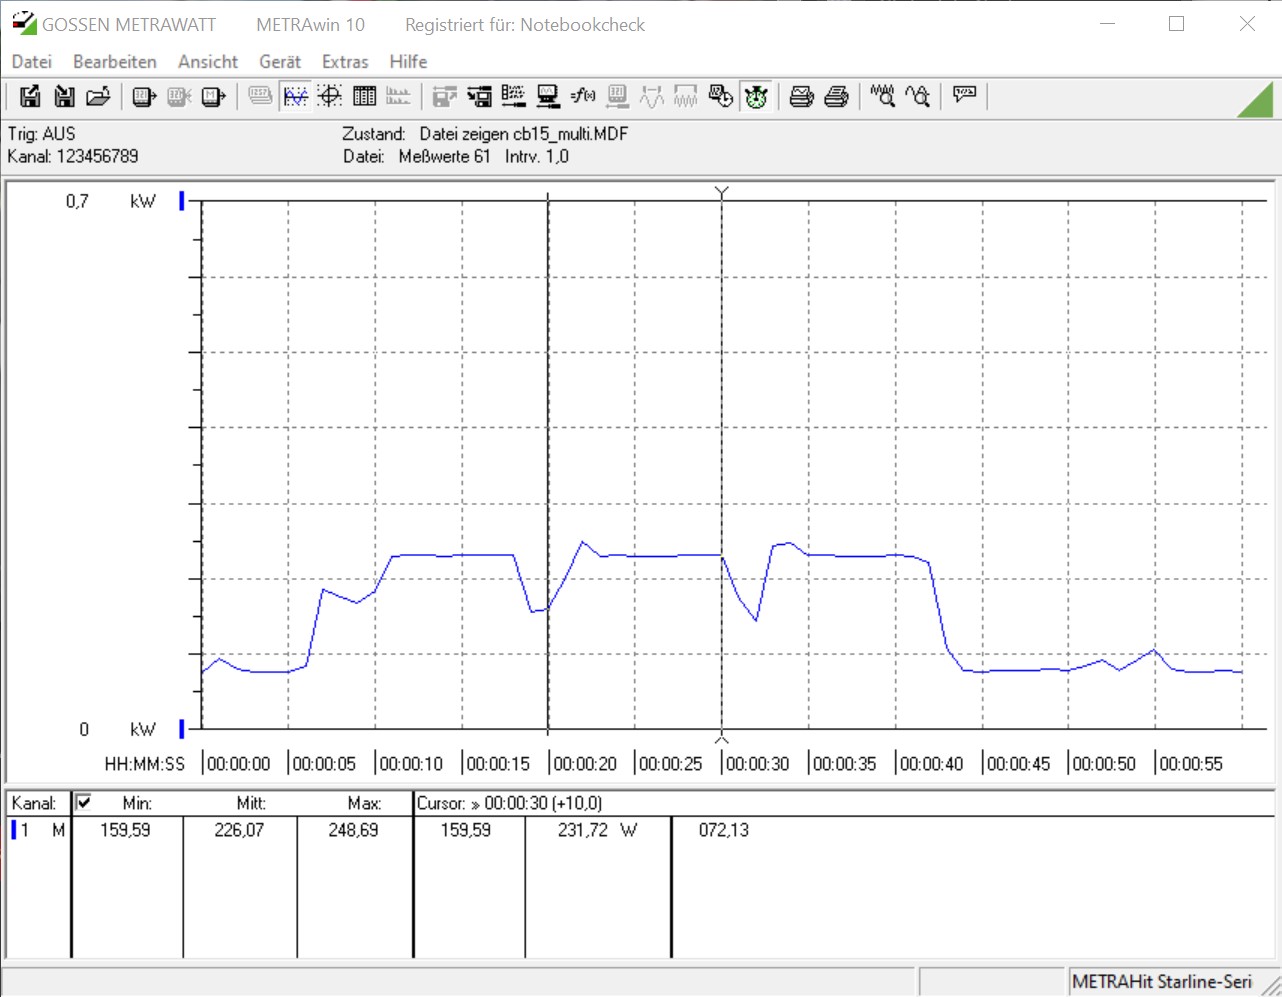
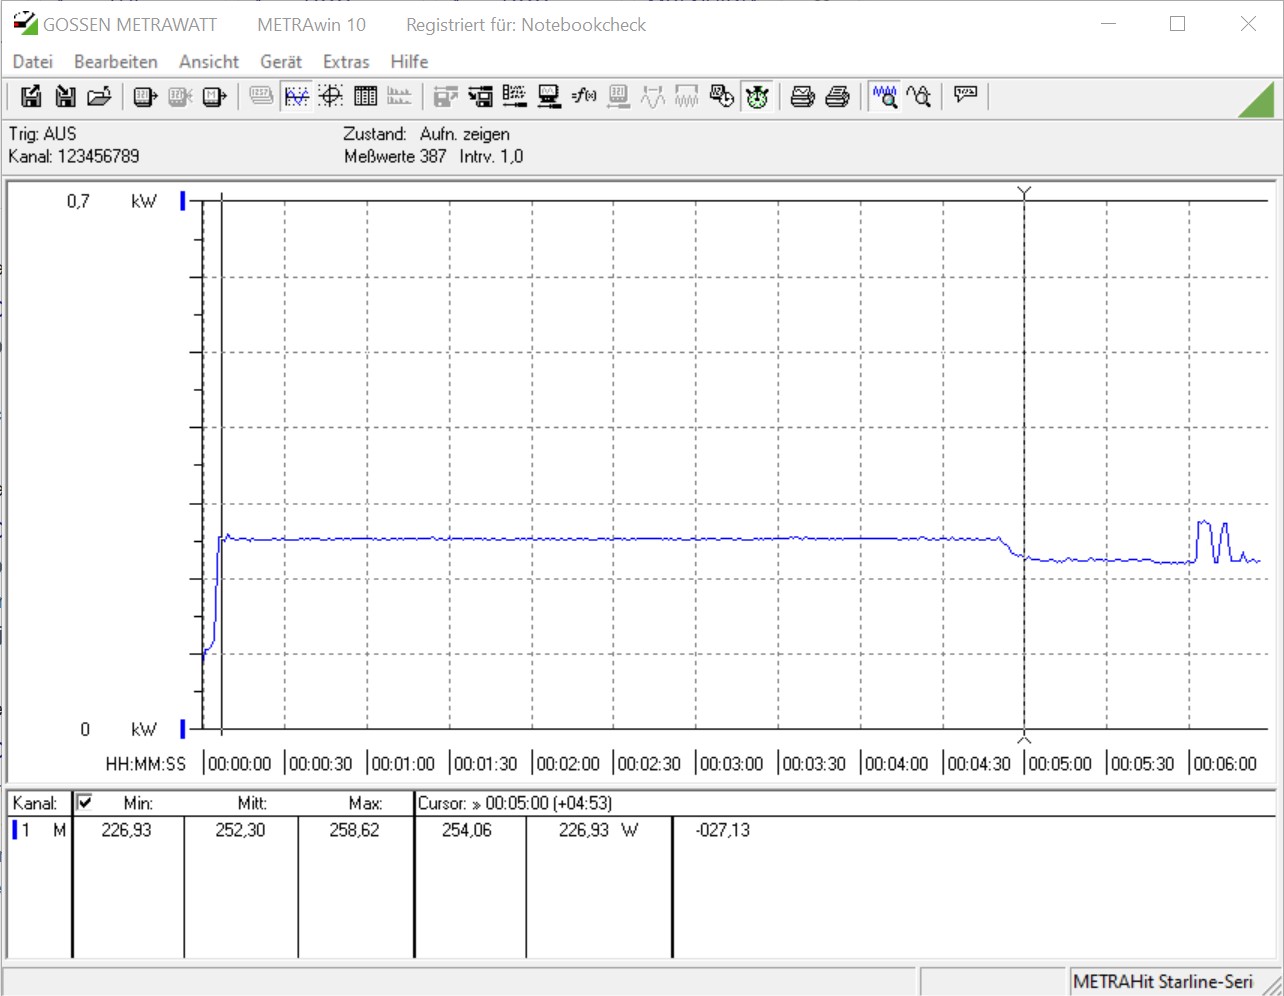
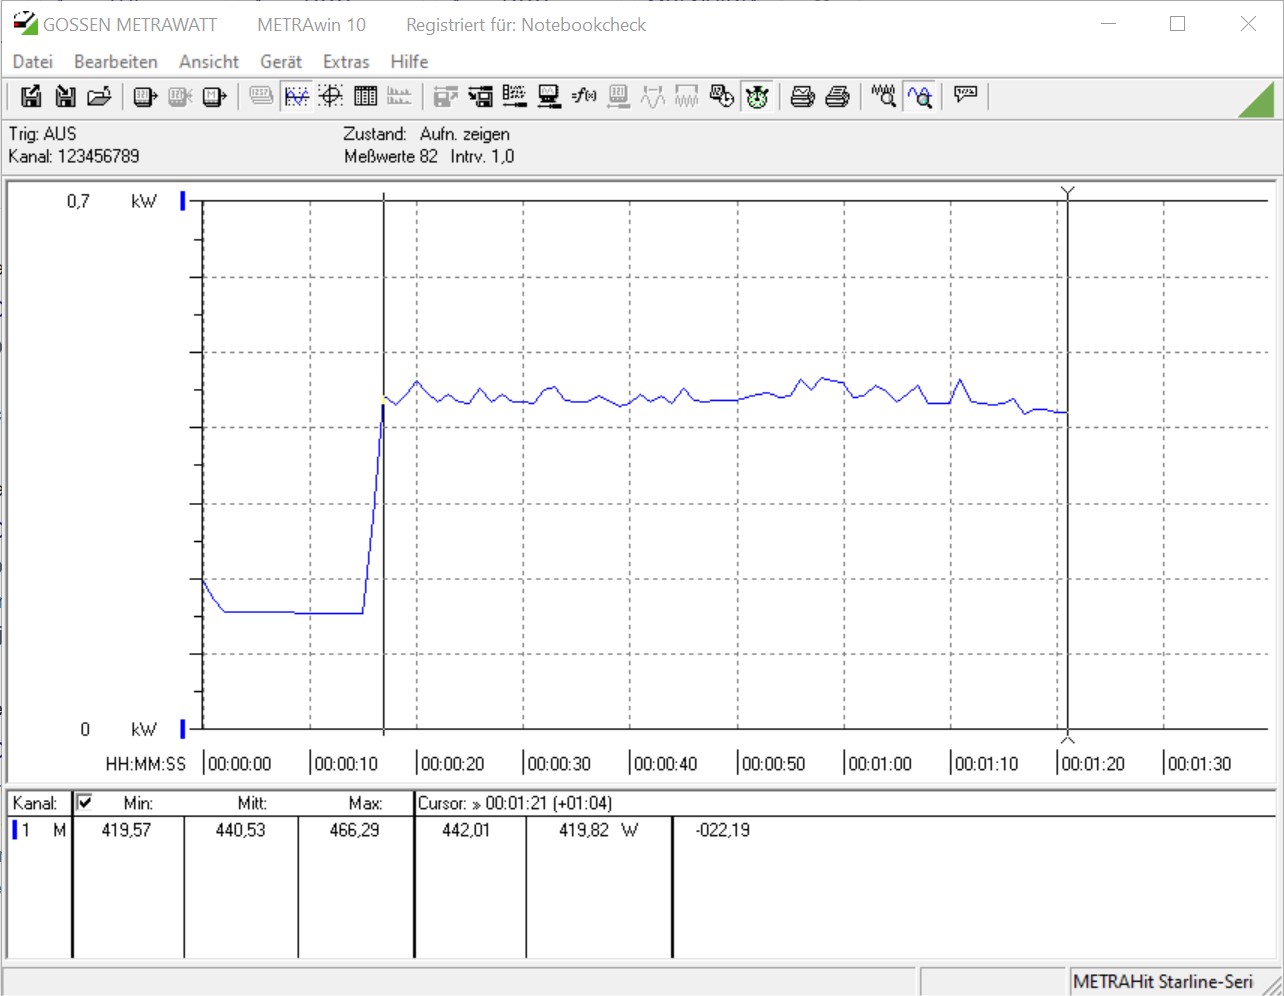
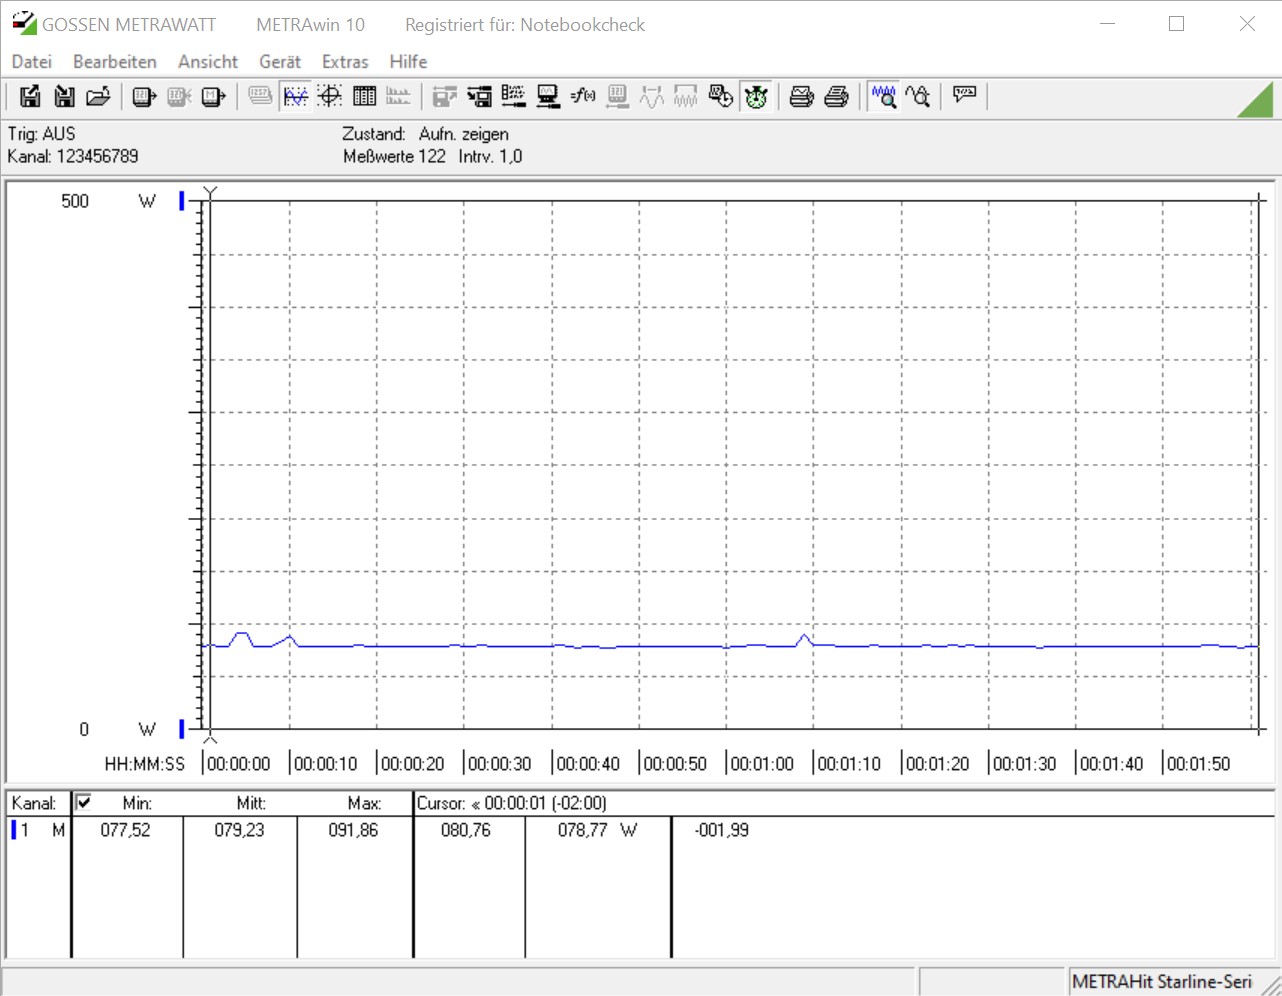
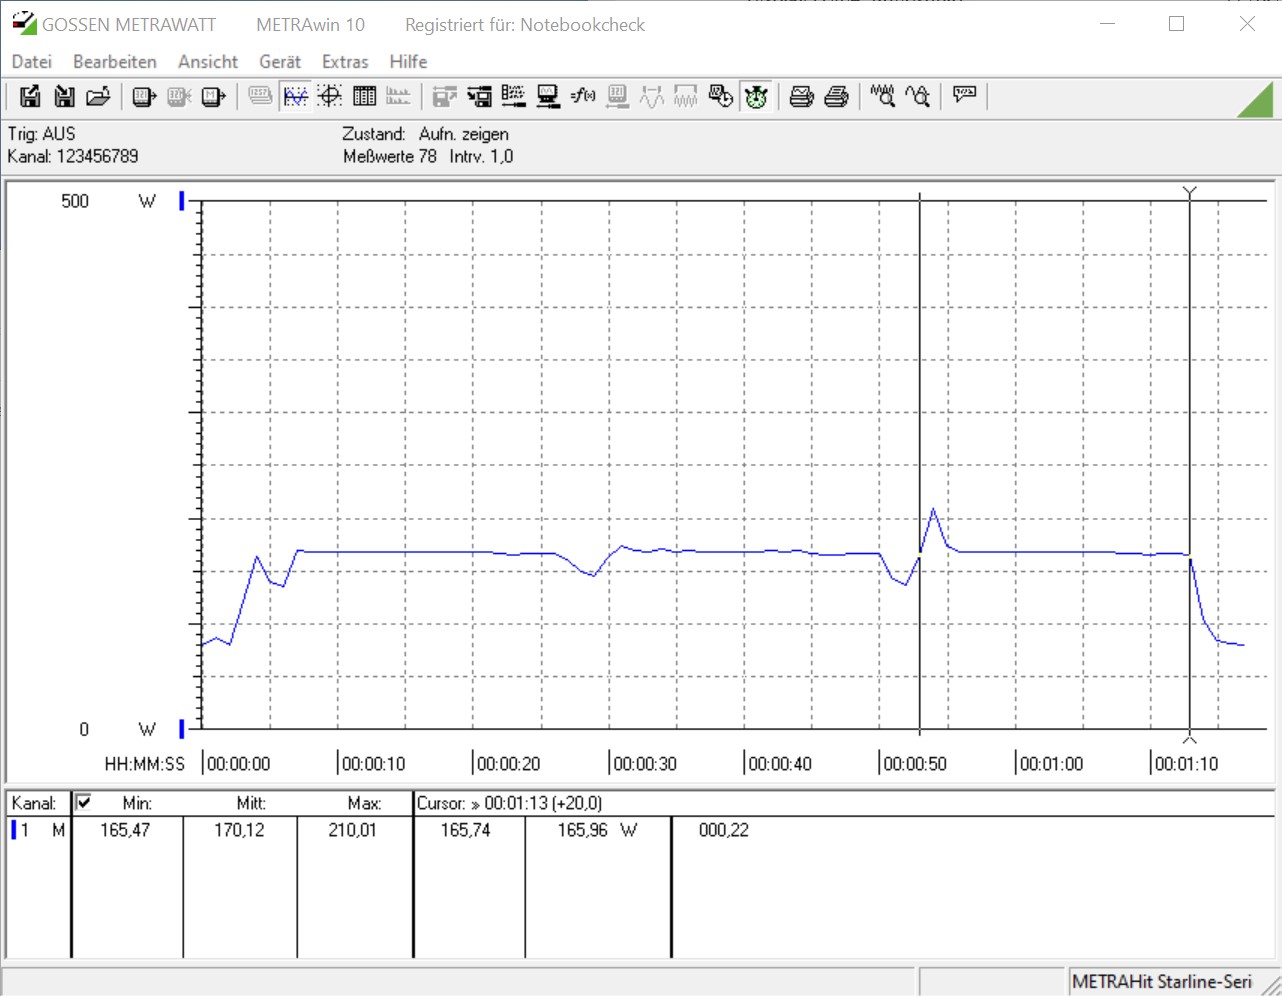
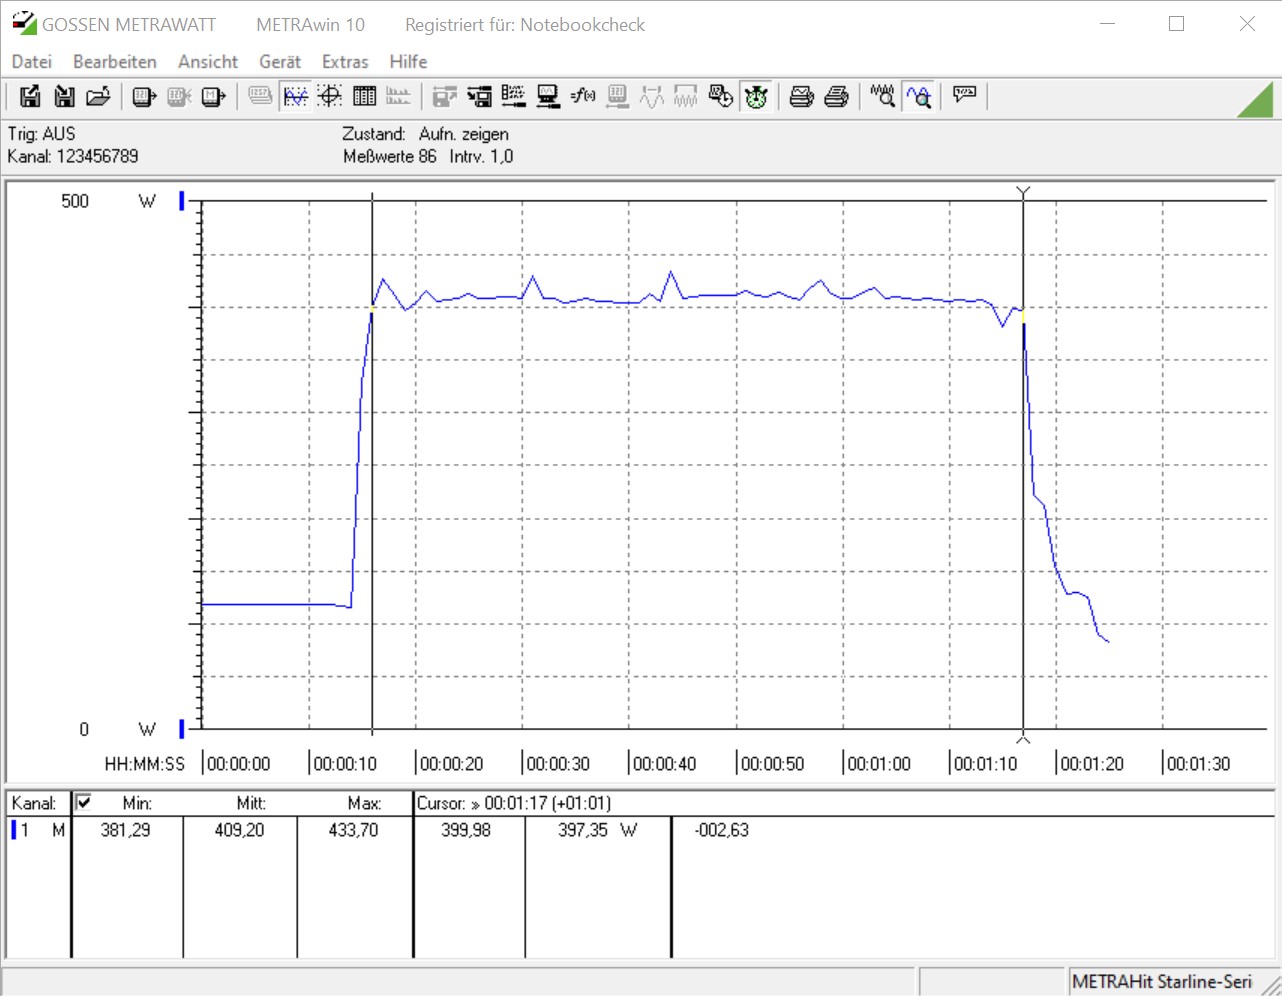
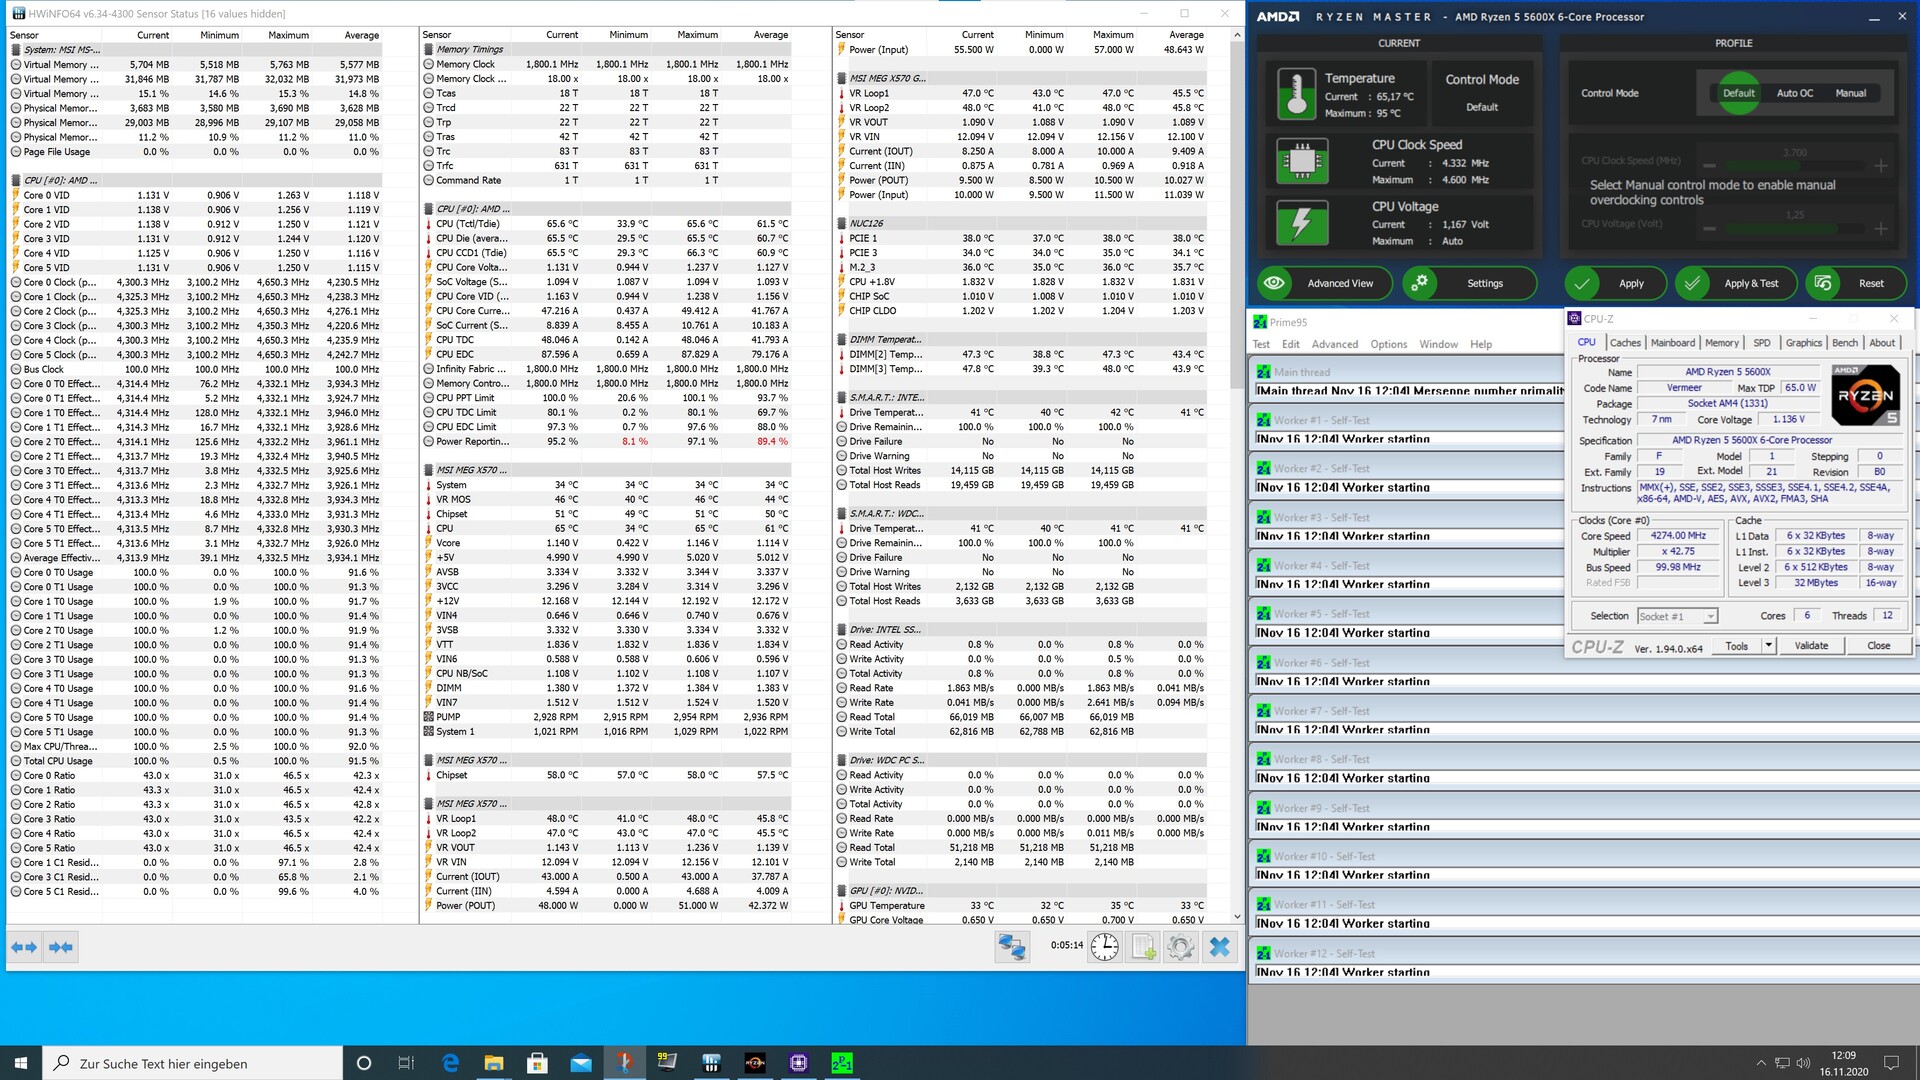
Without load, there are no changes from the two other Vermeer CPUs, and we measure just below 80 watts between the outlet and power supply with our measurement device. Under load, the consumption increases. In the Cinebench R15 multi test, we determine 226 watts for the 16-core processor. With the Ryzen 5 5600X, the consumption of the test system lies at 170 watts in the same test. This is a good result for both candidates. While gaming, the AMD Ryzen 9 5950X is leading the pack with 440 watts. However, at 439 watts, our test system with the AMD Ryzen 5 5900X isn't much more frugal. With the AMD Ryzen 5 5600X, the power consumption slightly drops by about 30 watts. However, under full load you also have to calculate about 280 watts for the graphics card, which always plays a part during the gaming test.
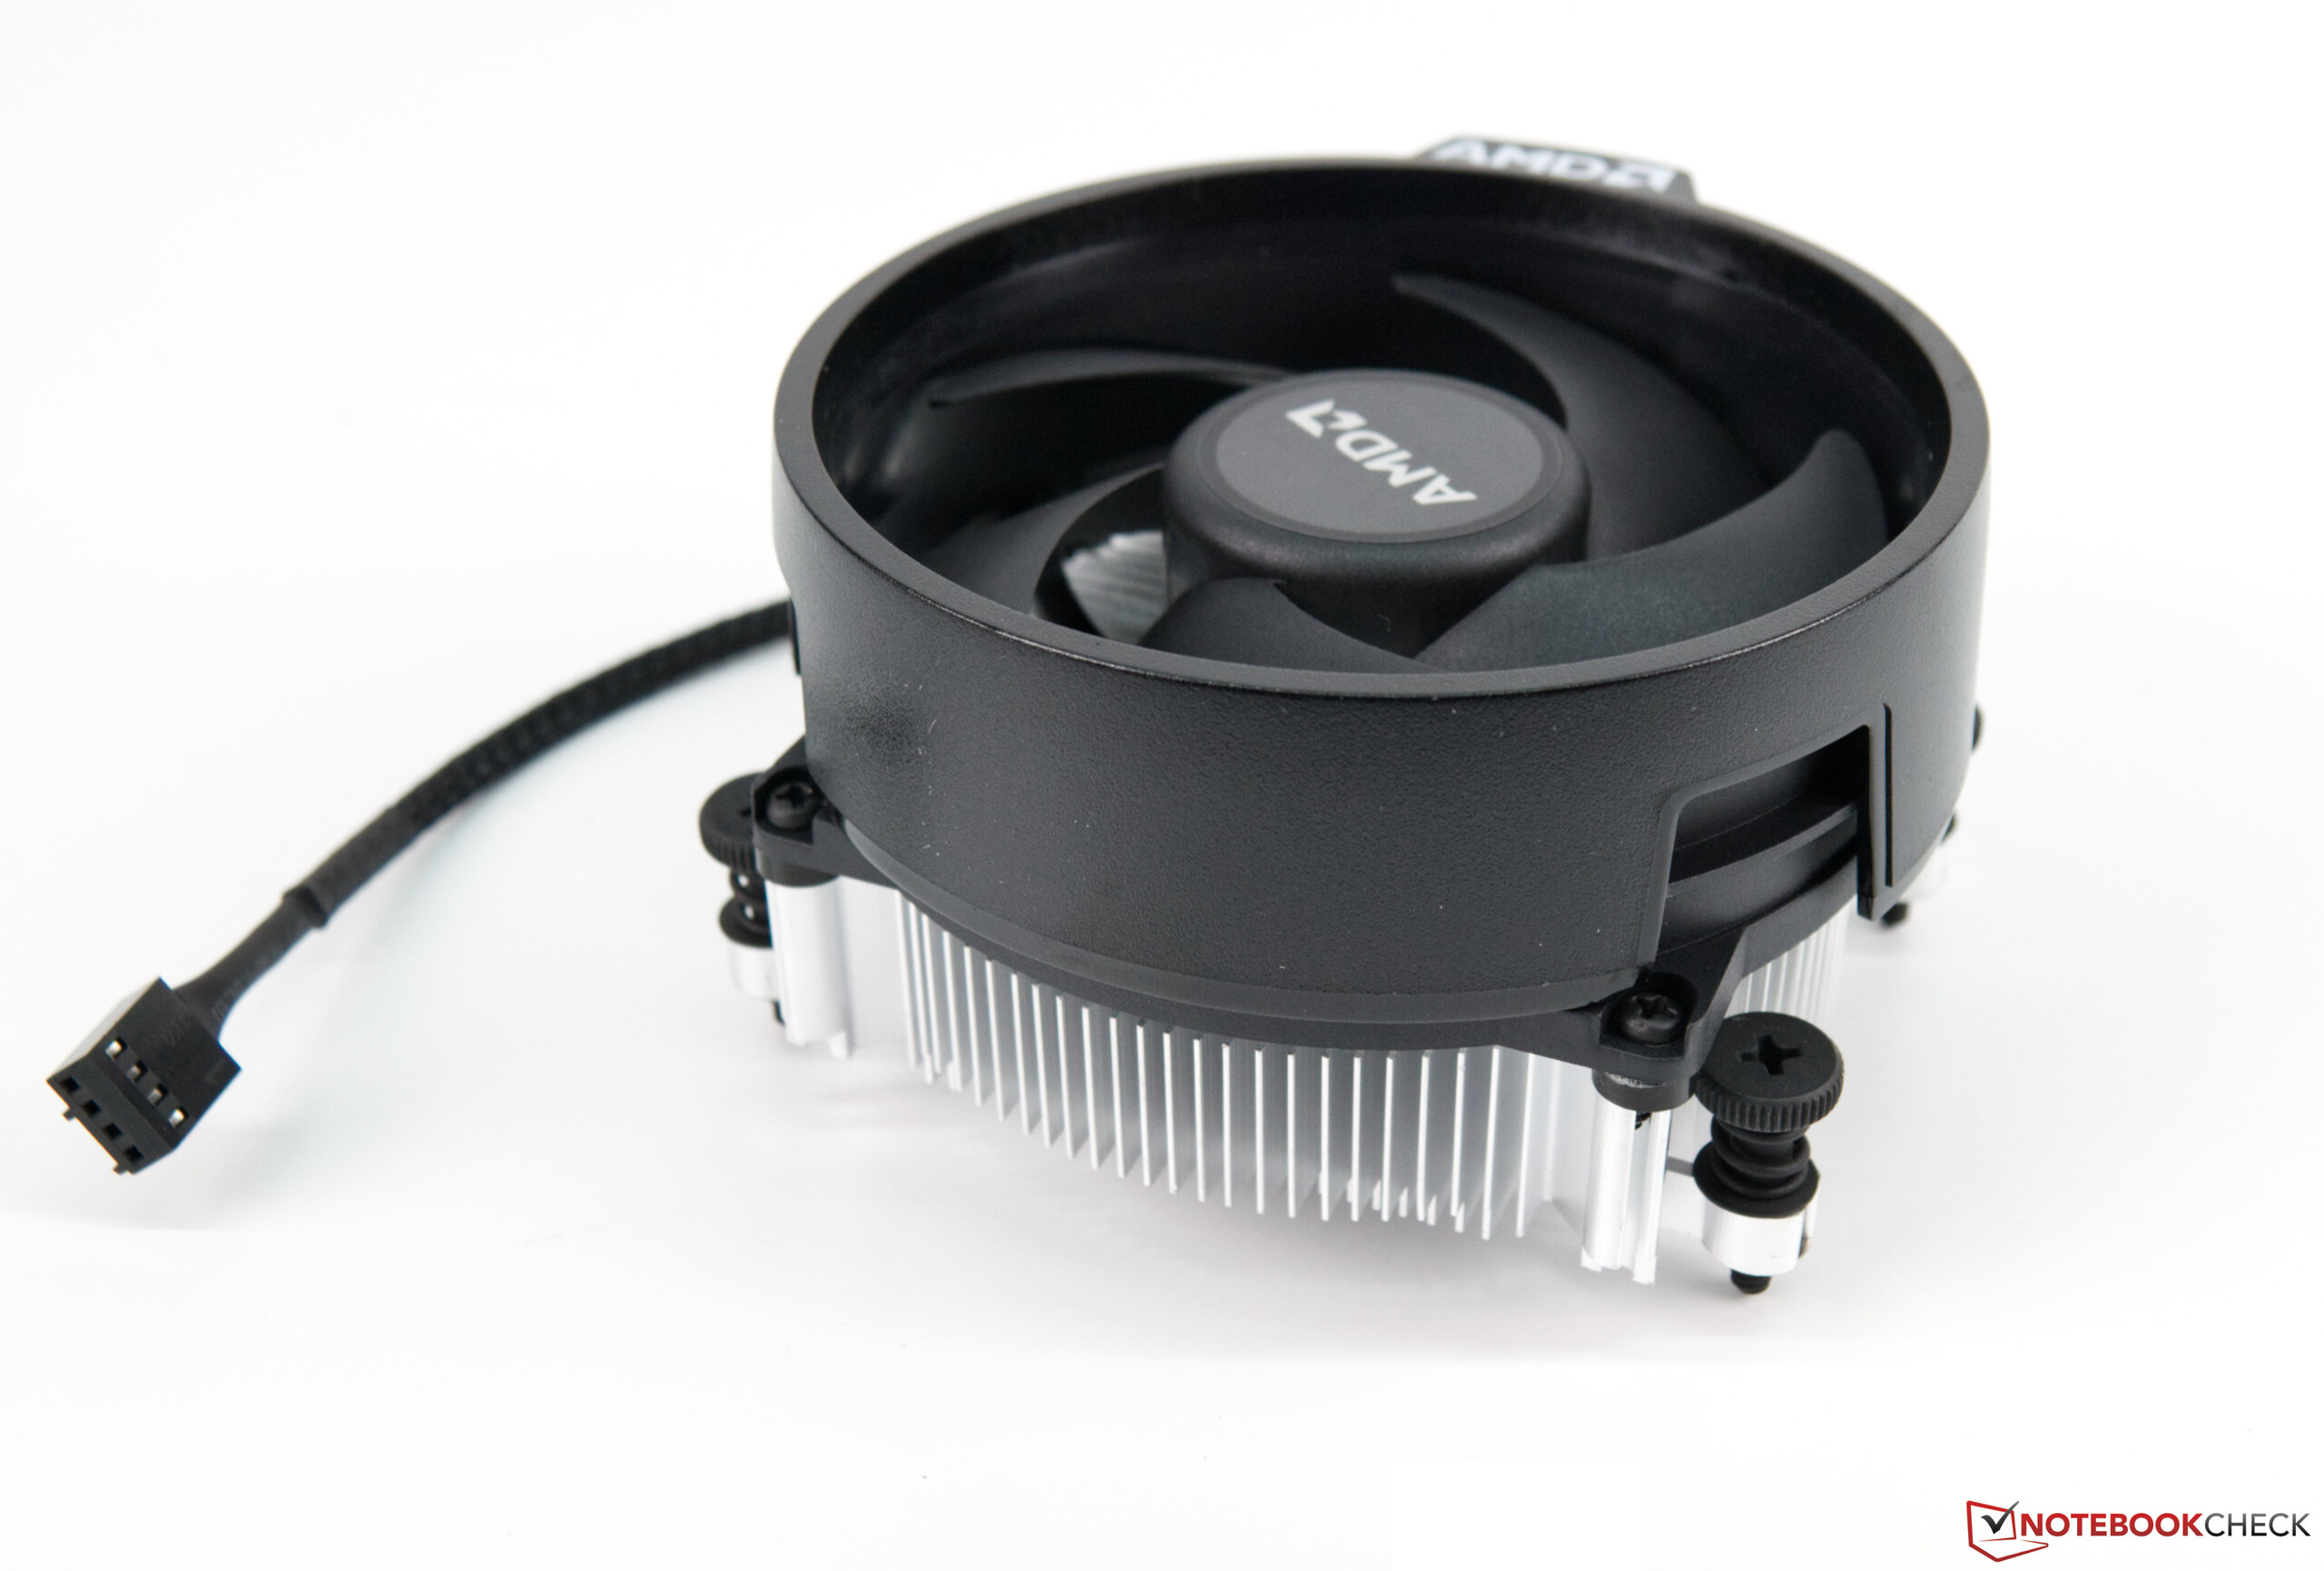
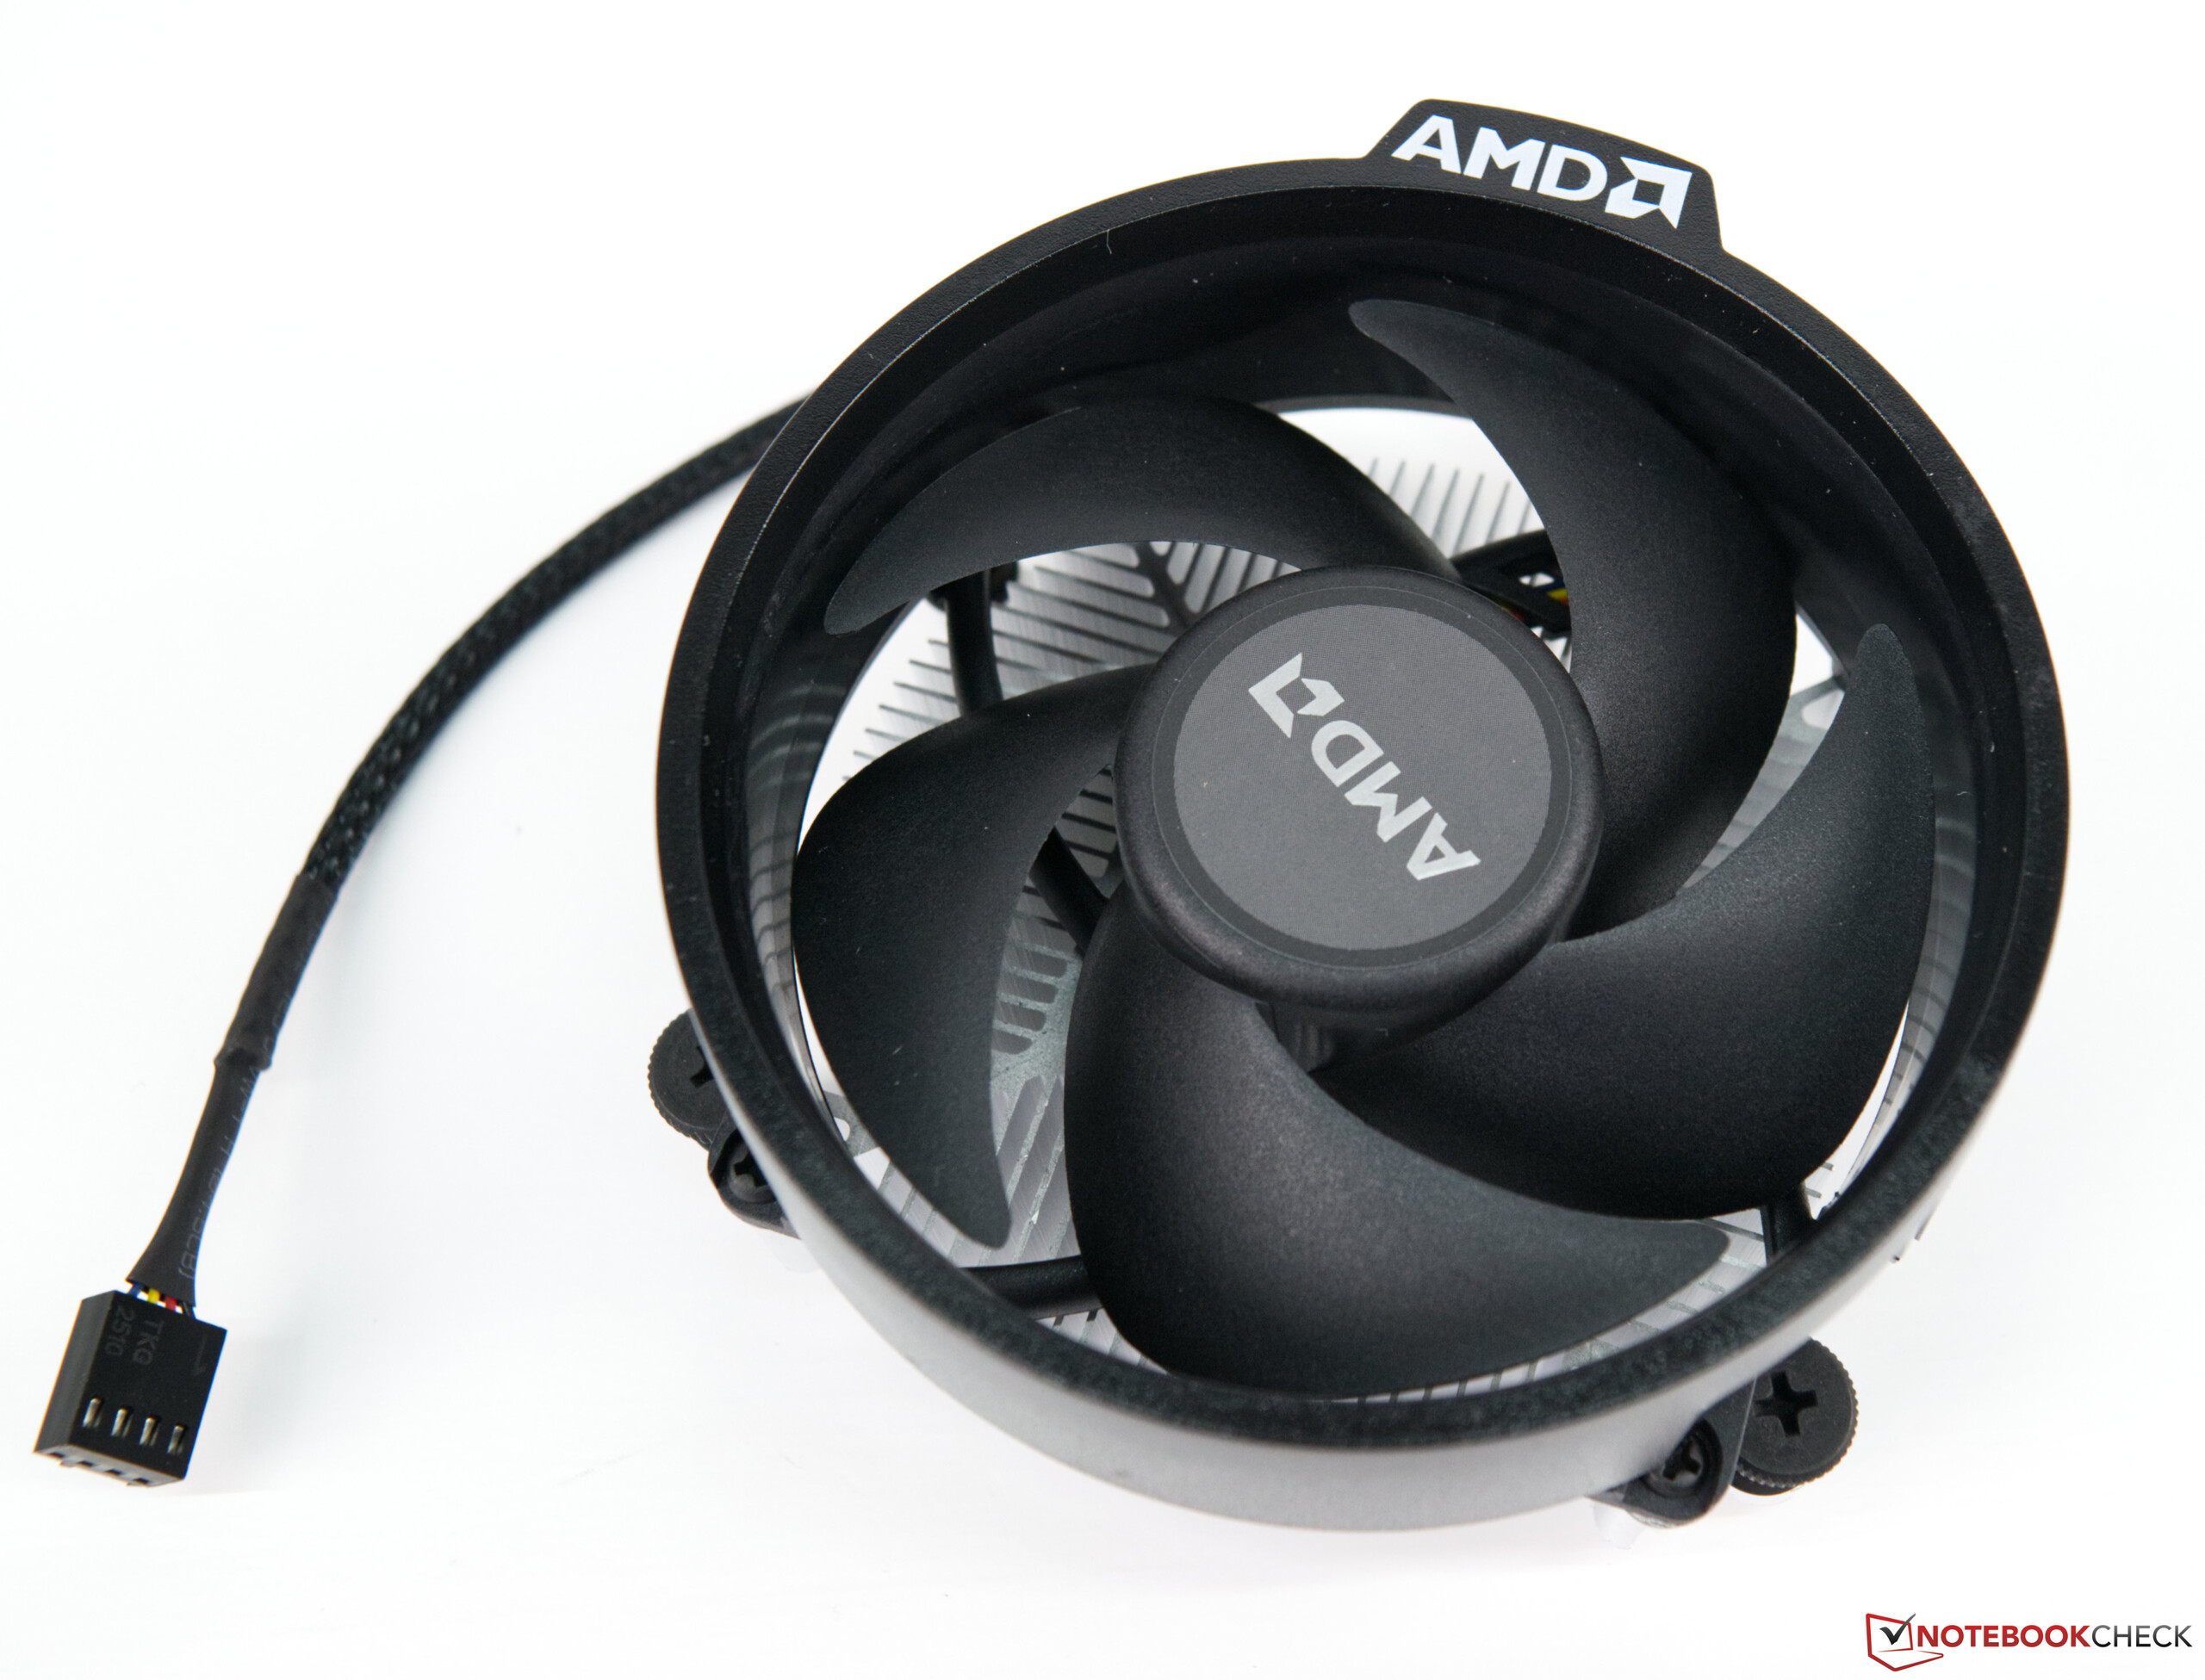
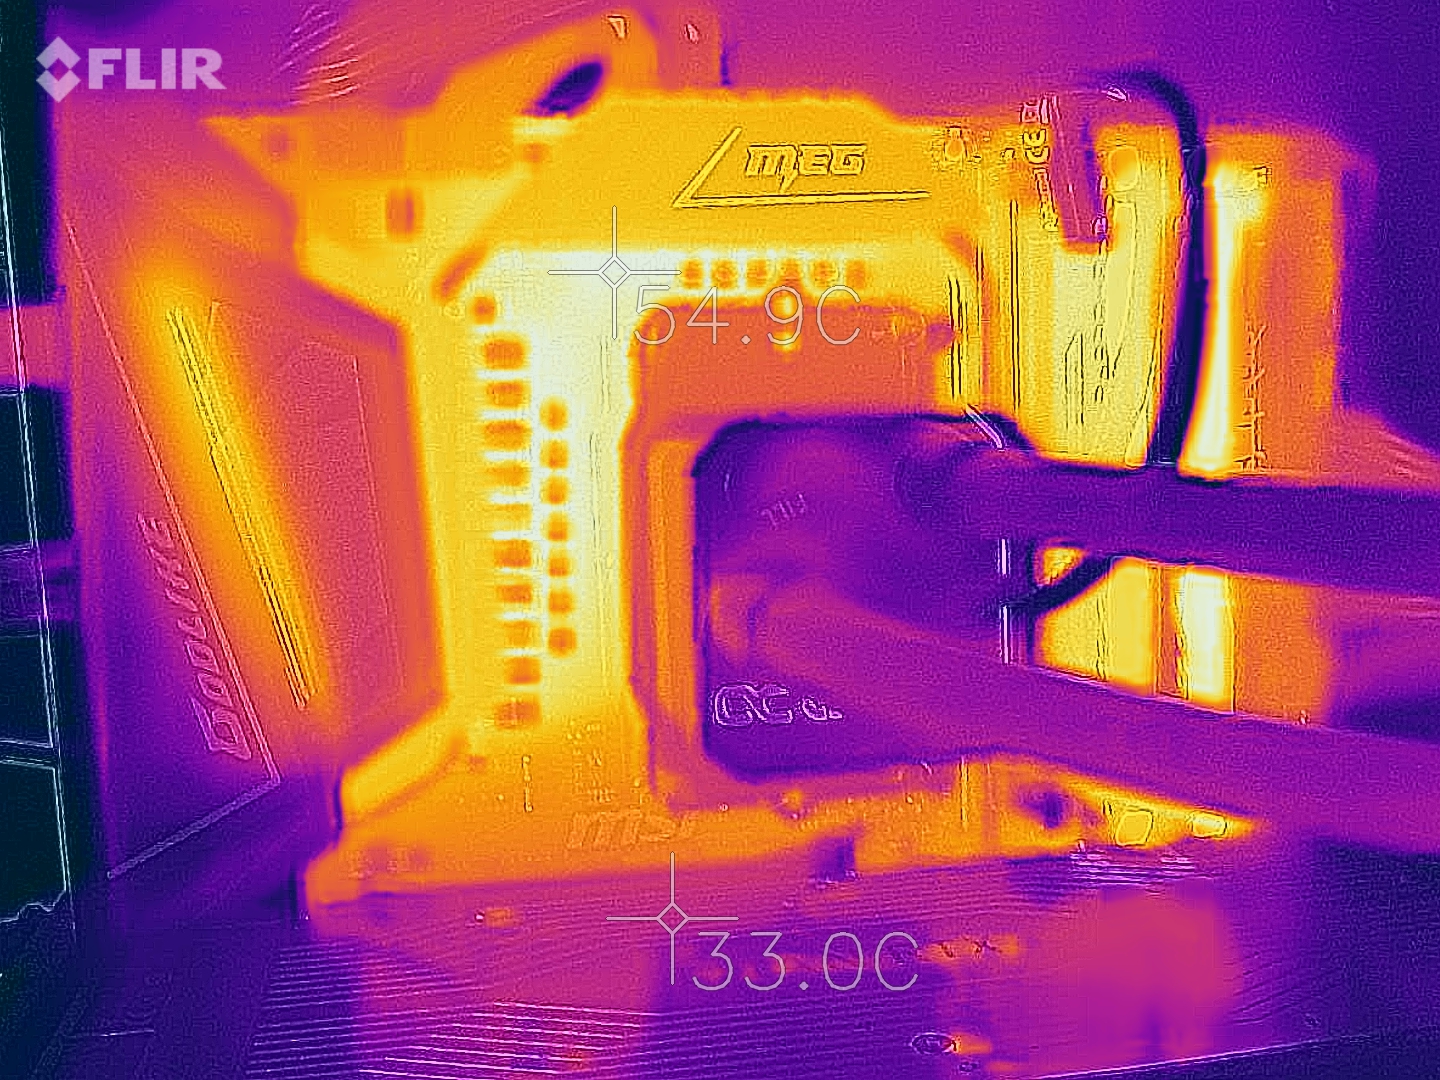
There are no concerns about the temperatures. In the stress test, the Ryzen 9 5950X reached barely 70 °C (158 °F), although the Ryzen 5 5600X remained slightly cooler at almost 66 °C (151 °F). So the AiO from Alphacool that was used has no problem in keeping the top model reliably cool. AMD includes a small boxed cooler with the Ryzen 5 5600X.
AMD Ryzen 9 5950X
AMD Ryzen 5 5600X
| Power Consumption / The Witcher 3 ultra (external Monitor) | |
| AMD Ryzen 9 5950X, NVIDIA Titan RTX (Idle: 78 W) | |
| AMD Ryzen 9 5900X, NVIDIA Titan RTX (Idle: 78.1 W) | |
| AMD Ryzen 7 2700X, NVIDIA Titan RTX | |
| AMD Ryzen 9 3950X, NVIDIA Titan RTX (Idle: 95 W) | |
| AMD Ryzen 9 3900X, NVIDIA Titan RTX (Idle: 87.4 W) | |
| AMD Ryzen 7 5800X, NVIDIA Titan RTX (Idle: 77.5 W) | |
| AMD Ryzen 7 3800XT, NVIDIA Titan RTX (Idle: 96.1 W) | |
| AMD Ryzen 5 5600X, NVIDIA Titan RTX (Idle: 79.23 W) | |
| AMD Ryzen 5 1600, NVIDIA Titan RTX (Idle: 85.9 W) | |
| Intel Core i7-10700K, NVIDIA Titan RTX (Idle: 67.7 W) | |
| AMD Ryzen 3 3300X, NVIDIA Titan RTX (Idle: 88.8 W) | |
| Intel Core i9-10900K, NVIDIA Titan RTX (Idle: 52.3 W) | |
| AMD Ryzen 3 3100, NVIDIA Titan RTX (Idle: 86 W) | |
| Power Consumption / Prime95 V2810 Stress (external Monitor) | |
| Intel Core i9-10900K, NVIDIA Titan RTX (Idle: 52.3 W) | |
| AMD Ryzen 9 5950X, NVIDIA Titan RTX (Idle: 78 W) | |
| AMD Ryzen 7 5800X, NVIDIA Titan RTX (Idle: 77.5 W) | |
| AMD Ryzen 9 5900X, NVIDIA Titan RTX (Idle: 78.1 W) | |
| Intel Core i7-10700K, NVIDIA Titan RTX (Idle: 67.7 W) | |
| AMD Ryzen 9 3950X, NVIDIA Titan RTX (Idle: 95 W) | |
| AMD Ryzen 9 3900X, NVIDIA Titan RTX (Idle: 87.4 W) | |
| AMD Ryzen 7 3800XT, NVIDIA Titan RTX (Idle: 96.1 W) | |
| AMD Ryzen 5 1600, NVIDIA Titan RTX (Idle: 85.9 W) | |
| AMD Ryzen 5 5600X, NVIDIA Titan RTX (Idle: 79.23 W) | |
| AMD Ryzen 3 3300X, NVIDIA Titan RTX (Idle: 88.8 W) | |
| AMD Ryzen 3 3100, NVIDIA Titan RTX (Idle: 86 W) | |
| Power Consumption / Cinebench R15 Multi (external Monitor) | |
| Intel Core i9-10900K, NVIDIA Titan RTX (Idle: 52.3 W) | |
| AMD Ryzen 9 5900X, NVIDIA Titan RTX (Idle: 78.1 W) | |
| AMD Ryzen 9 5950X, NVIDIA Titan RTX (Idle: 78 W) | |
| AMD Ryzen 7 5800X, NVIDIA Titan RTX (Idle: 77.5 W) | |
| AMD Ryzen 9 3950X, NVIDIA Titan RTX (Idle: 95 W) | |
| AMD Ryzen 9 3900X, NVIDIA Titan RTX (Idle: 87.4 W) | |
| Intel Core i7-10700K, NVIDIA Titan RTX (Idle: 67.7 W) | |
| AMD Ryzen 7 3800XT, NVIDIA Titan RTX (Idle: 96.1 W) | |
| AMD Ryzen 5 5600X, NVIDIA Titan RTX (Idle: 79.23 W) | |
| AMD Ryzen 5 1600, NVIDIA Titan RTX (Idle: 85.9 W) | |
| AMD Ryzen 3 3300X, NVIDIA Titan RTX (Idle: 88.8 W) | |
| AMD Ryzen 3 3100, NVIDIA Titan RTX (Idle: 86 W) | |
| Power Consumption / Cinebench R20 Multi (external Monitor) | |
| AMD Ryzen 9 5950X, NVIDIA Titan RTX (78) | |
| AMD Ryzen 5 5600X, NVIDIA Titan RTX (79.23) | |
| Power Consumption / Cinebench R20 Single (external Monitor) | |
| AMD Ryzen 9 5950X, NVIDIA Titan RTX (78) | |
| AMD Ryzen 5 5600X, NVIDIA Titan RTX (79.23) | |
* ... smaller is better
Pros
Cons
Verdict - Very fast AMD Ryzen 5000
After the first review of the new Ryzen 5000 series, we were already positively surprised about the performance. The earlier weakness of the single-core performance compared to Intel is a thing of the past since the introduction of the new Ryzen 5000 family. Even the small Ryzen 5 5600X is able to easily outrun an Intel Core i9-10900K. At the same time, we have to wait whether Intel is able to counter with Rocket Lake in the near future.
But until then, AMD is able to wear the crown of the fastest gaming CPU. We have already attested this for the AMD Ryzen 9 5900X. The AMD Ryzen 9 5950X is even able to improve on this in terms of the single-thread performance. However, nothing else is able to keep up with the AMD Ryzen 9 5950X in multi-thread performance. AMD even clearly downgrades the AMD Ryzen 9 3950X.
While you can talk about the price, the top model is currently listed at 899 Euros (~$1063). This is 100 Euros (~$118) more than the recommended retail price at the introduction, which is due to the current lack of availability. For the entry-level model, availability does not look much better, resulting in current prices that are much higher than the recommended retail price of 299 Euros (~$353). Those who consider buying a new Ryzen 5000 should plan for the long term at this point, since it is currently too expensive. Once the stocks in the stores recovered a bit, the prices should return to more reasonable levels. But for now, there is some problem with availability. The new AMD Radeon RX 6800 graphics cards are also unavailable, and things don't look any different for Nvidia's GeForce RTX 3000 cards either.
AMD raises the bar for the most powerful gaming CPU to a new level, and the specified clock speeds are almost always exceeded significantly.
Those fortunate ones who are still able to grab one of the new Ryzen CPUs will be able to confirm the noticeable performance increase. However, everyone has to decide for themselves on which CPU is right for them. If it is purely a question of gaming, the AMD Ryzen 5 5600X is sufficient. But if you also want to do video processing, the AMD Ryzen 7 5800X would be worthwhile. And for content creators, the Ryzen 9 models that can also replace an additional streaming PC are worth purchasing.

