Corsair One i300 desktop PC tames Core i9-12900K and RTX 3080 Ti in a 12-Liter case

Corsair has been selling the One series since 2018, packing current gaming hardware in a compact case that includes water cooling. We already saw in the Corsair One i160 that this system works.
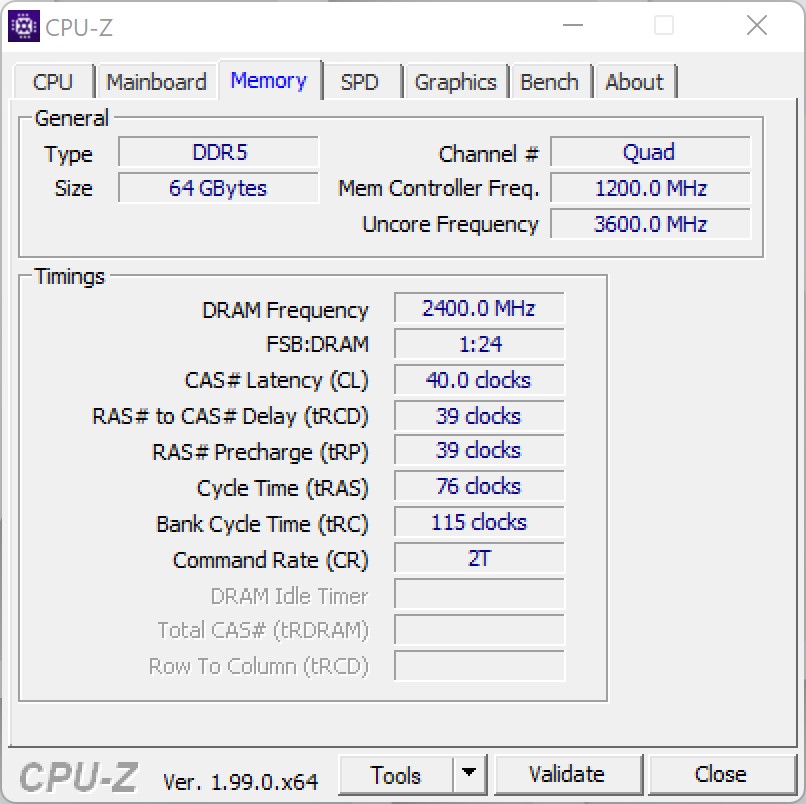
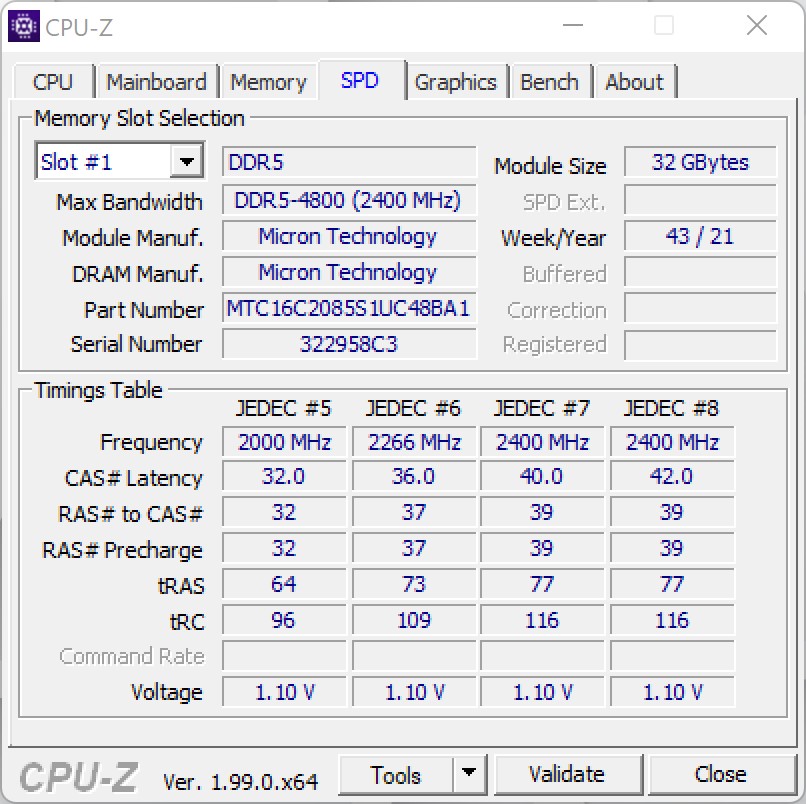
At this-year's CES, Corsair announced an update for the Corsair One that is equipped with the current Alder Lake series, which has now regained the performance crown as the fastest gaming CPU. In addition to the Intel Core i9-12900K, Corsair also includes an Nvidia GeForce RTX 3080 Ti. Both components provide an excellent basis for 4K gaming without compromises. After our initial tests, we were also able to confirm this, even though the manufacturer still keeps the Intel Core i9-12900K somewhat on a leash. More on this later in the test. In terms of the powerful components, there are also ample 64 GB of working memory and a lightning-fast 2-TB SSD including the professional version of Windows 11.
Corsair asks for 5100 Euros (~$5724) for the system as equipped in our test. If you are content with 32 GB of working memory and an Nvidia GeForce RTX 3080, you have to pay exactly 1000 Euros (~$1122) less.
Case
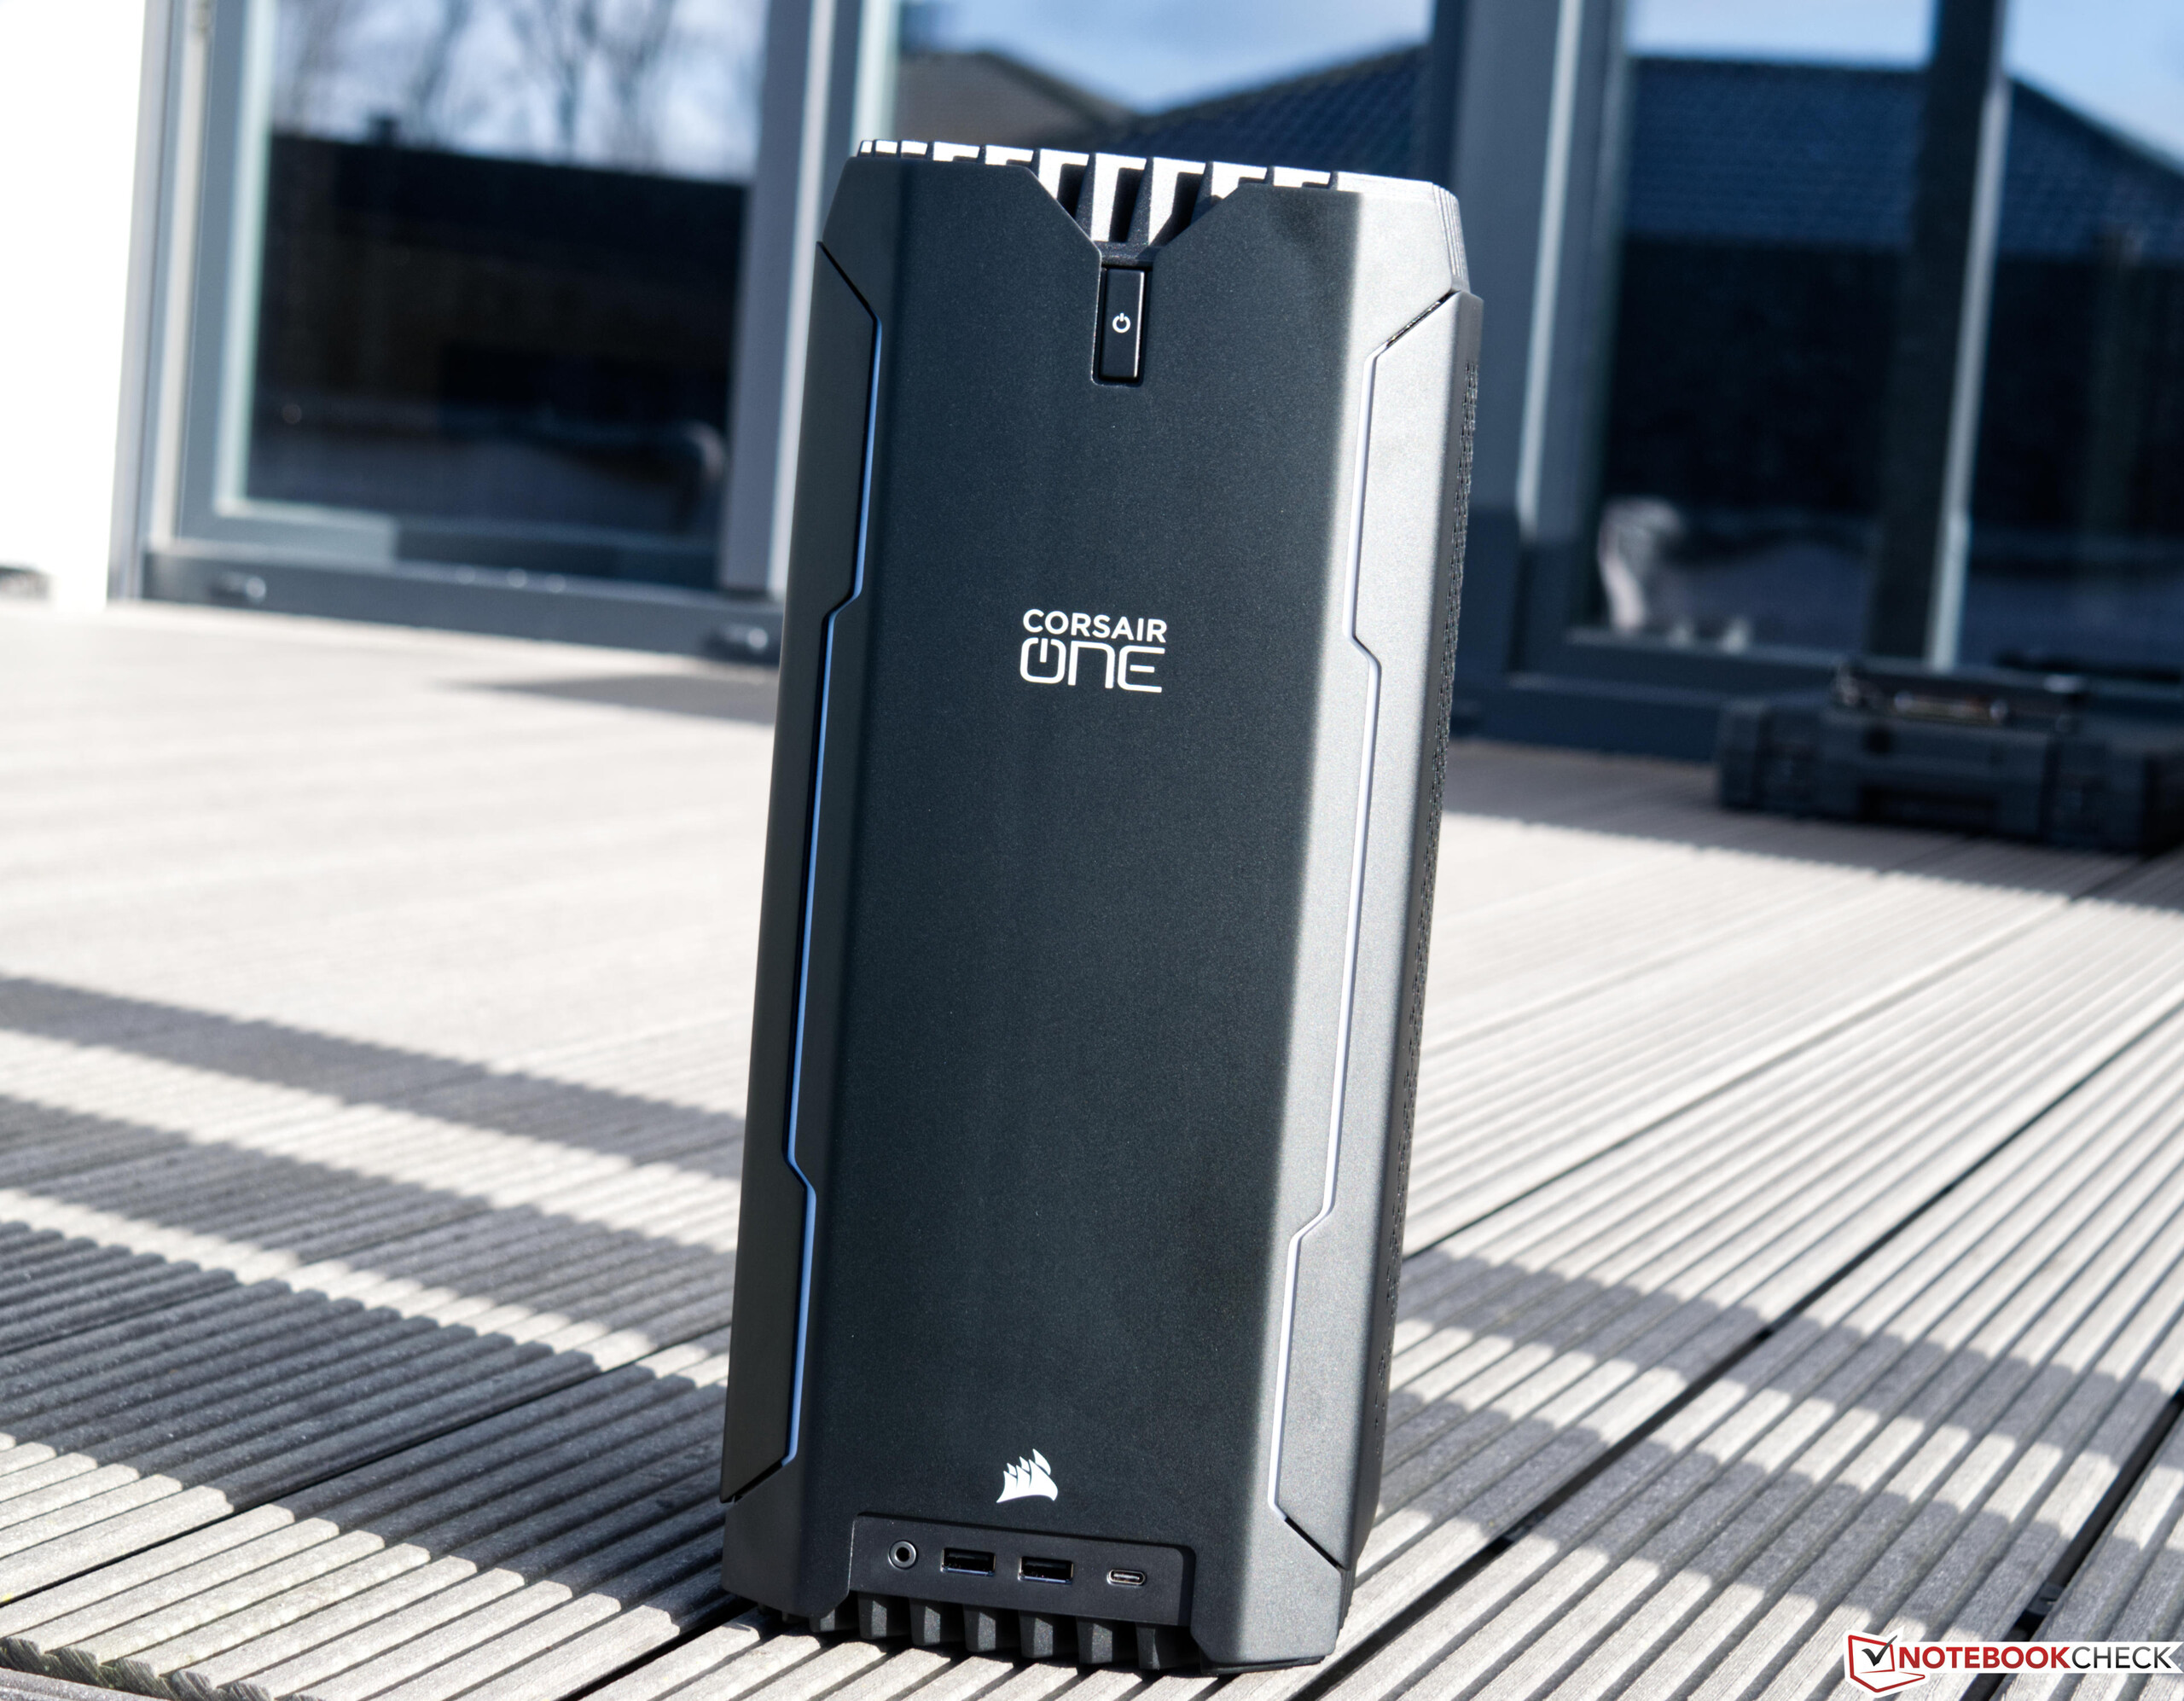
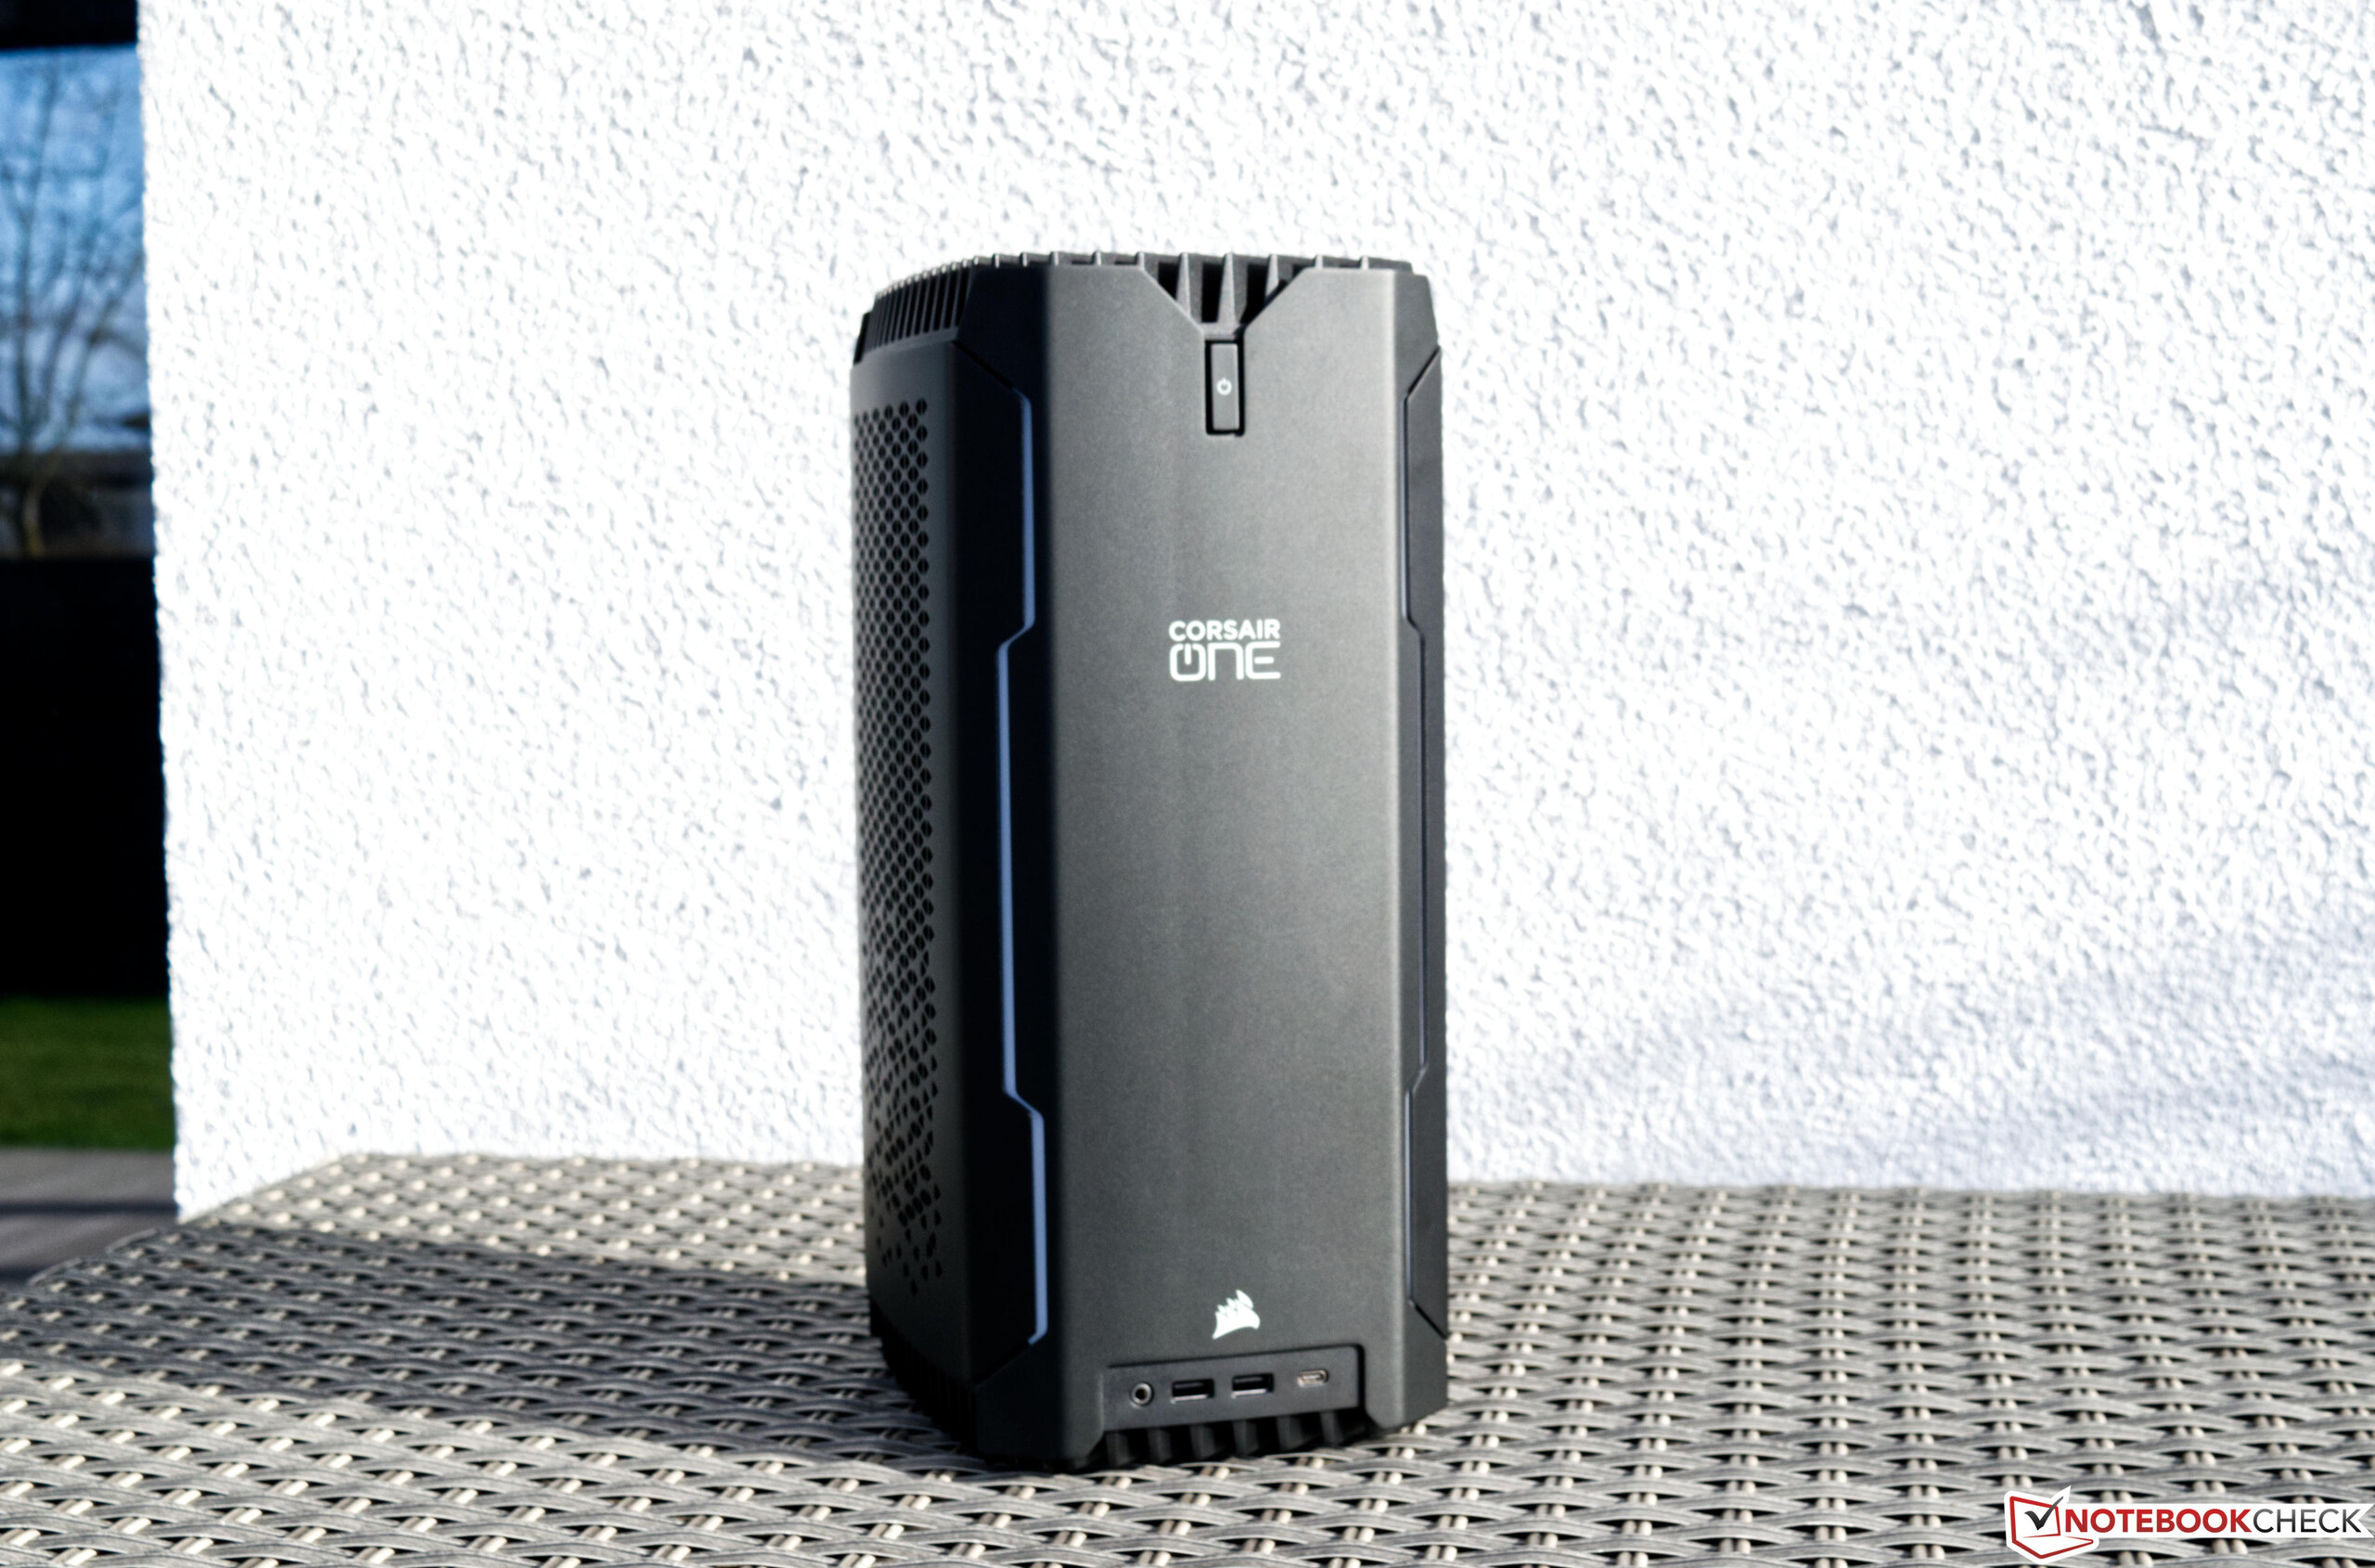
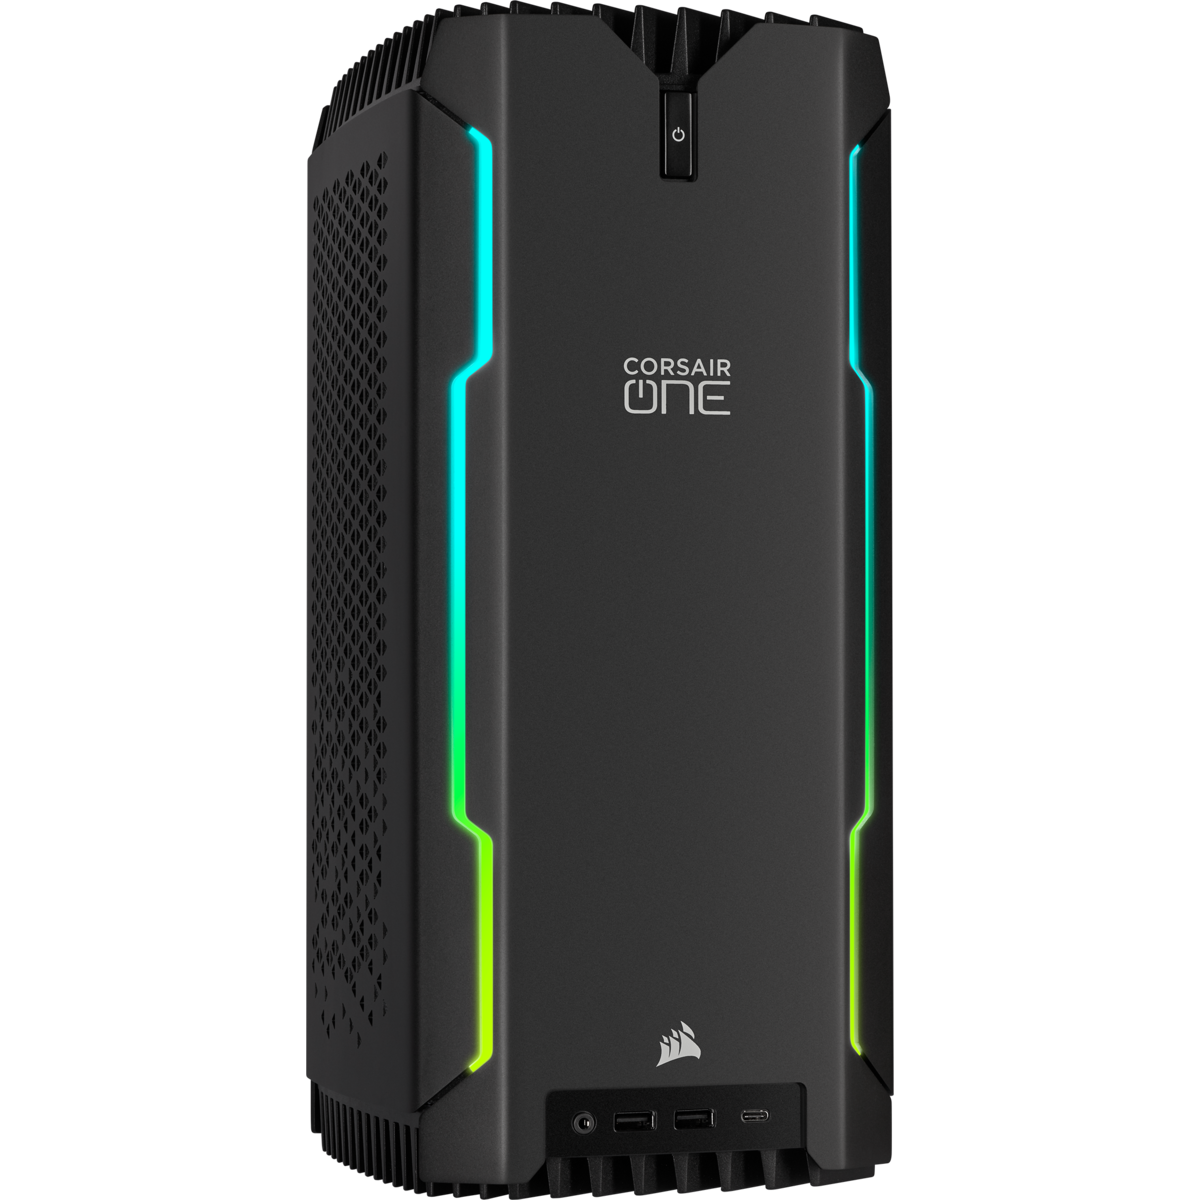
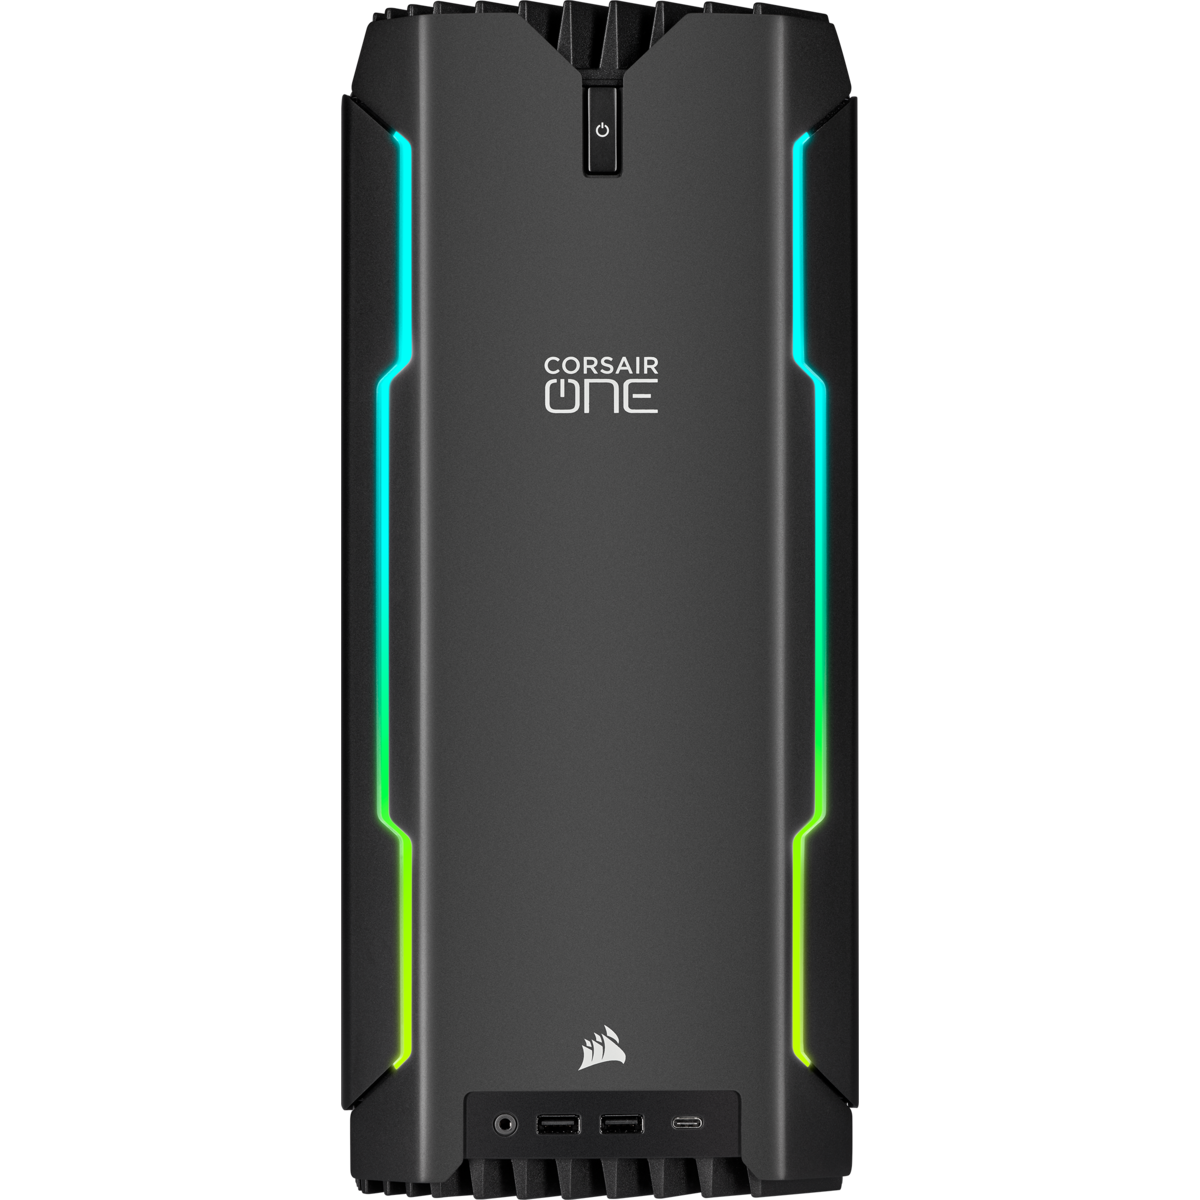
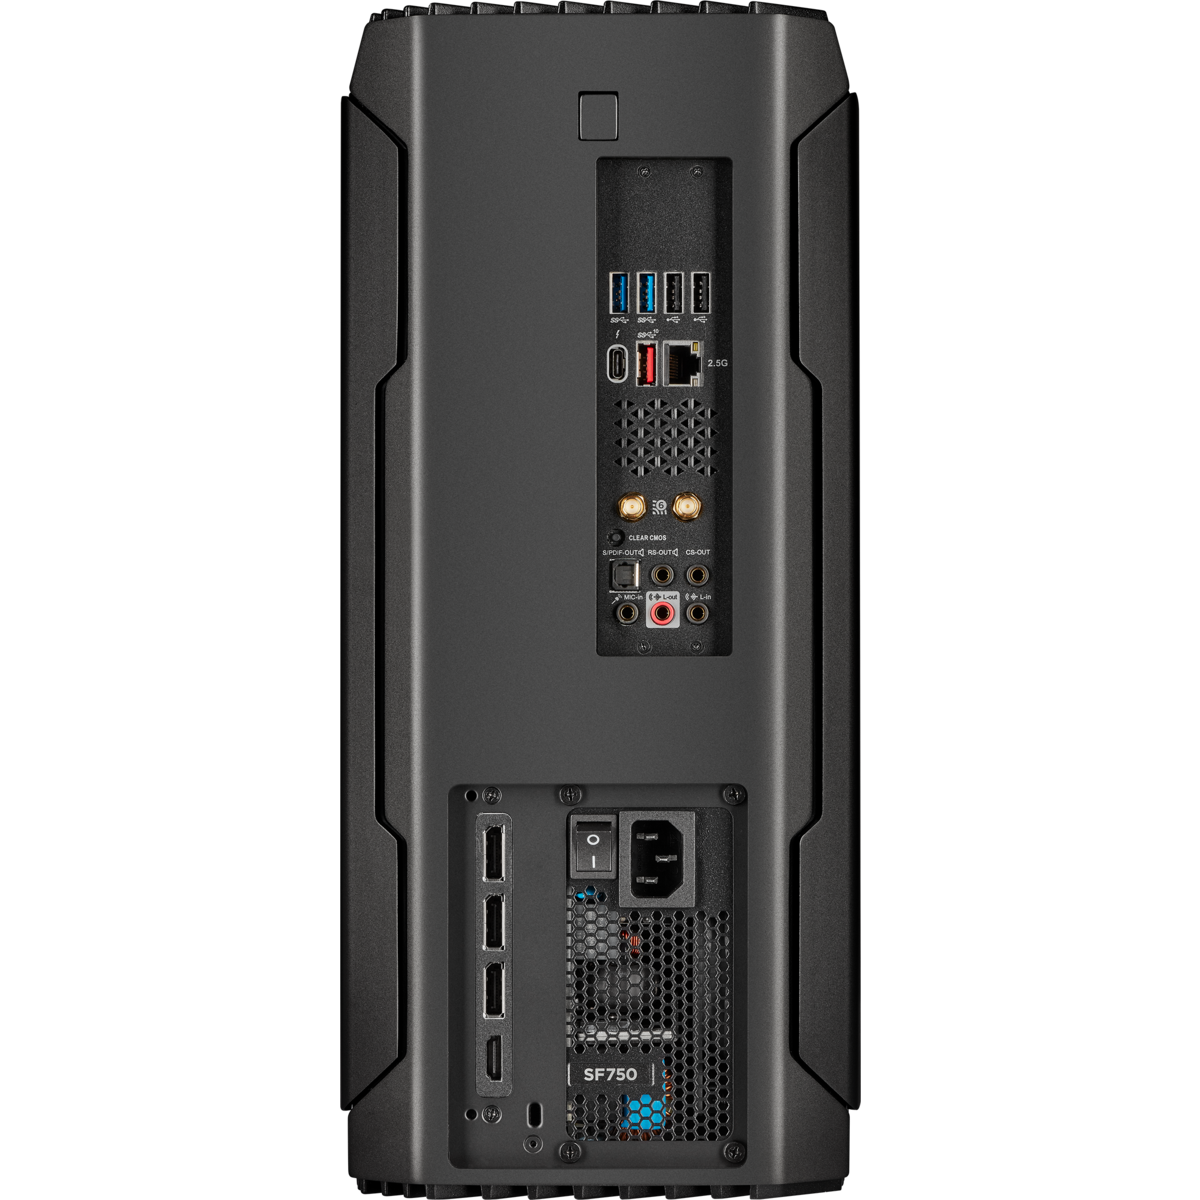
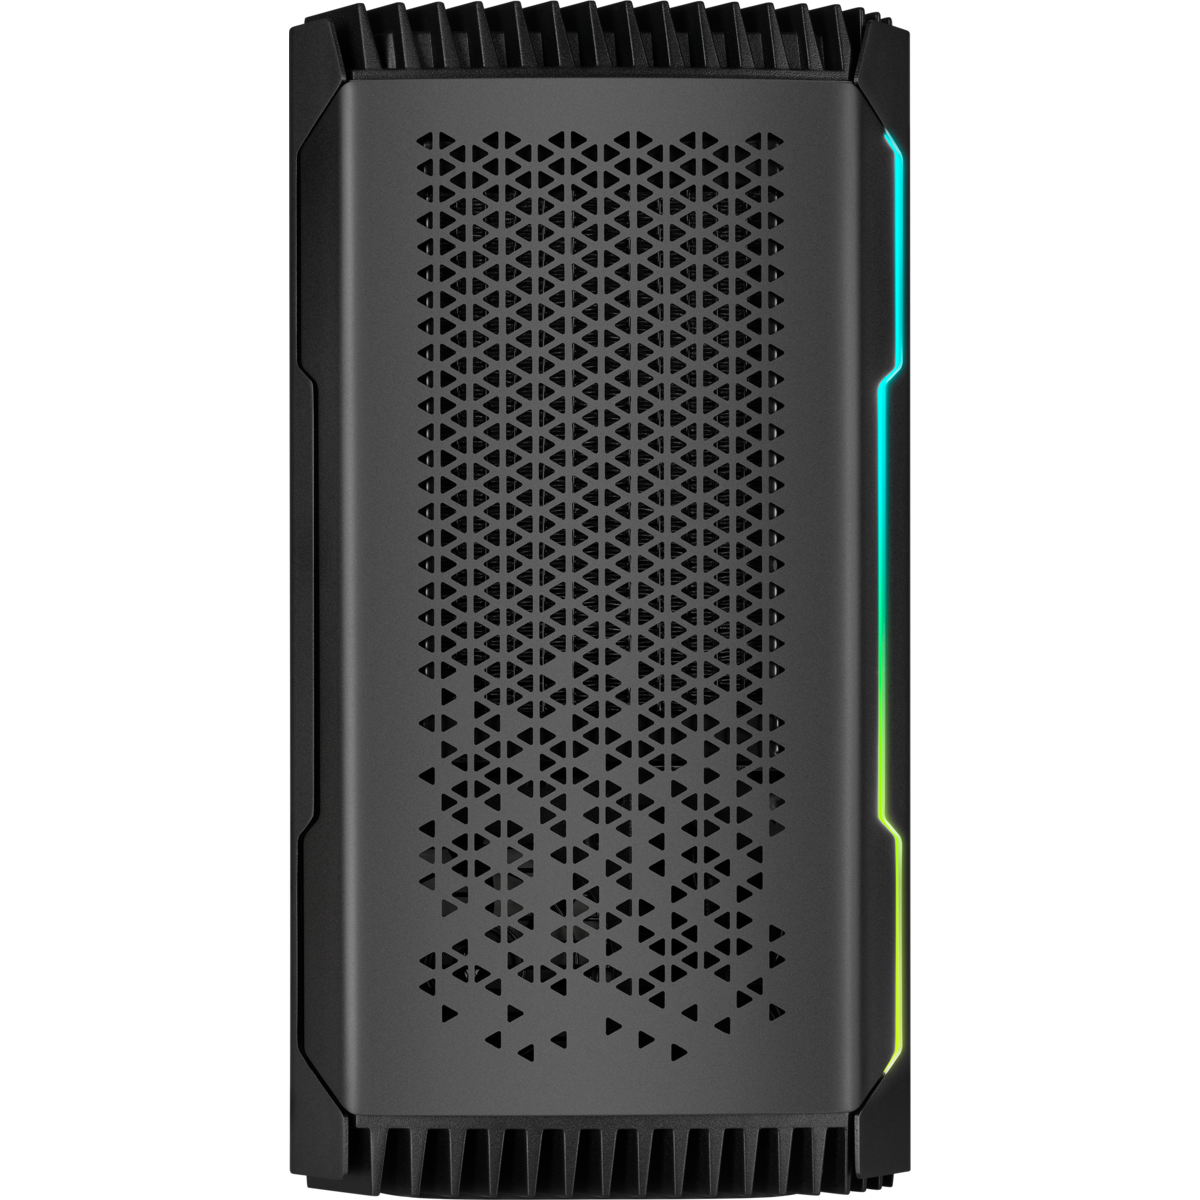
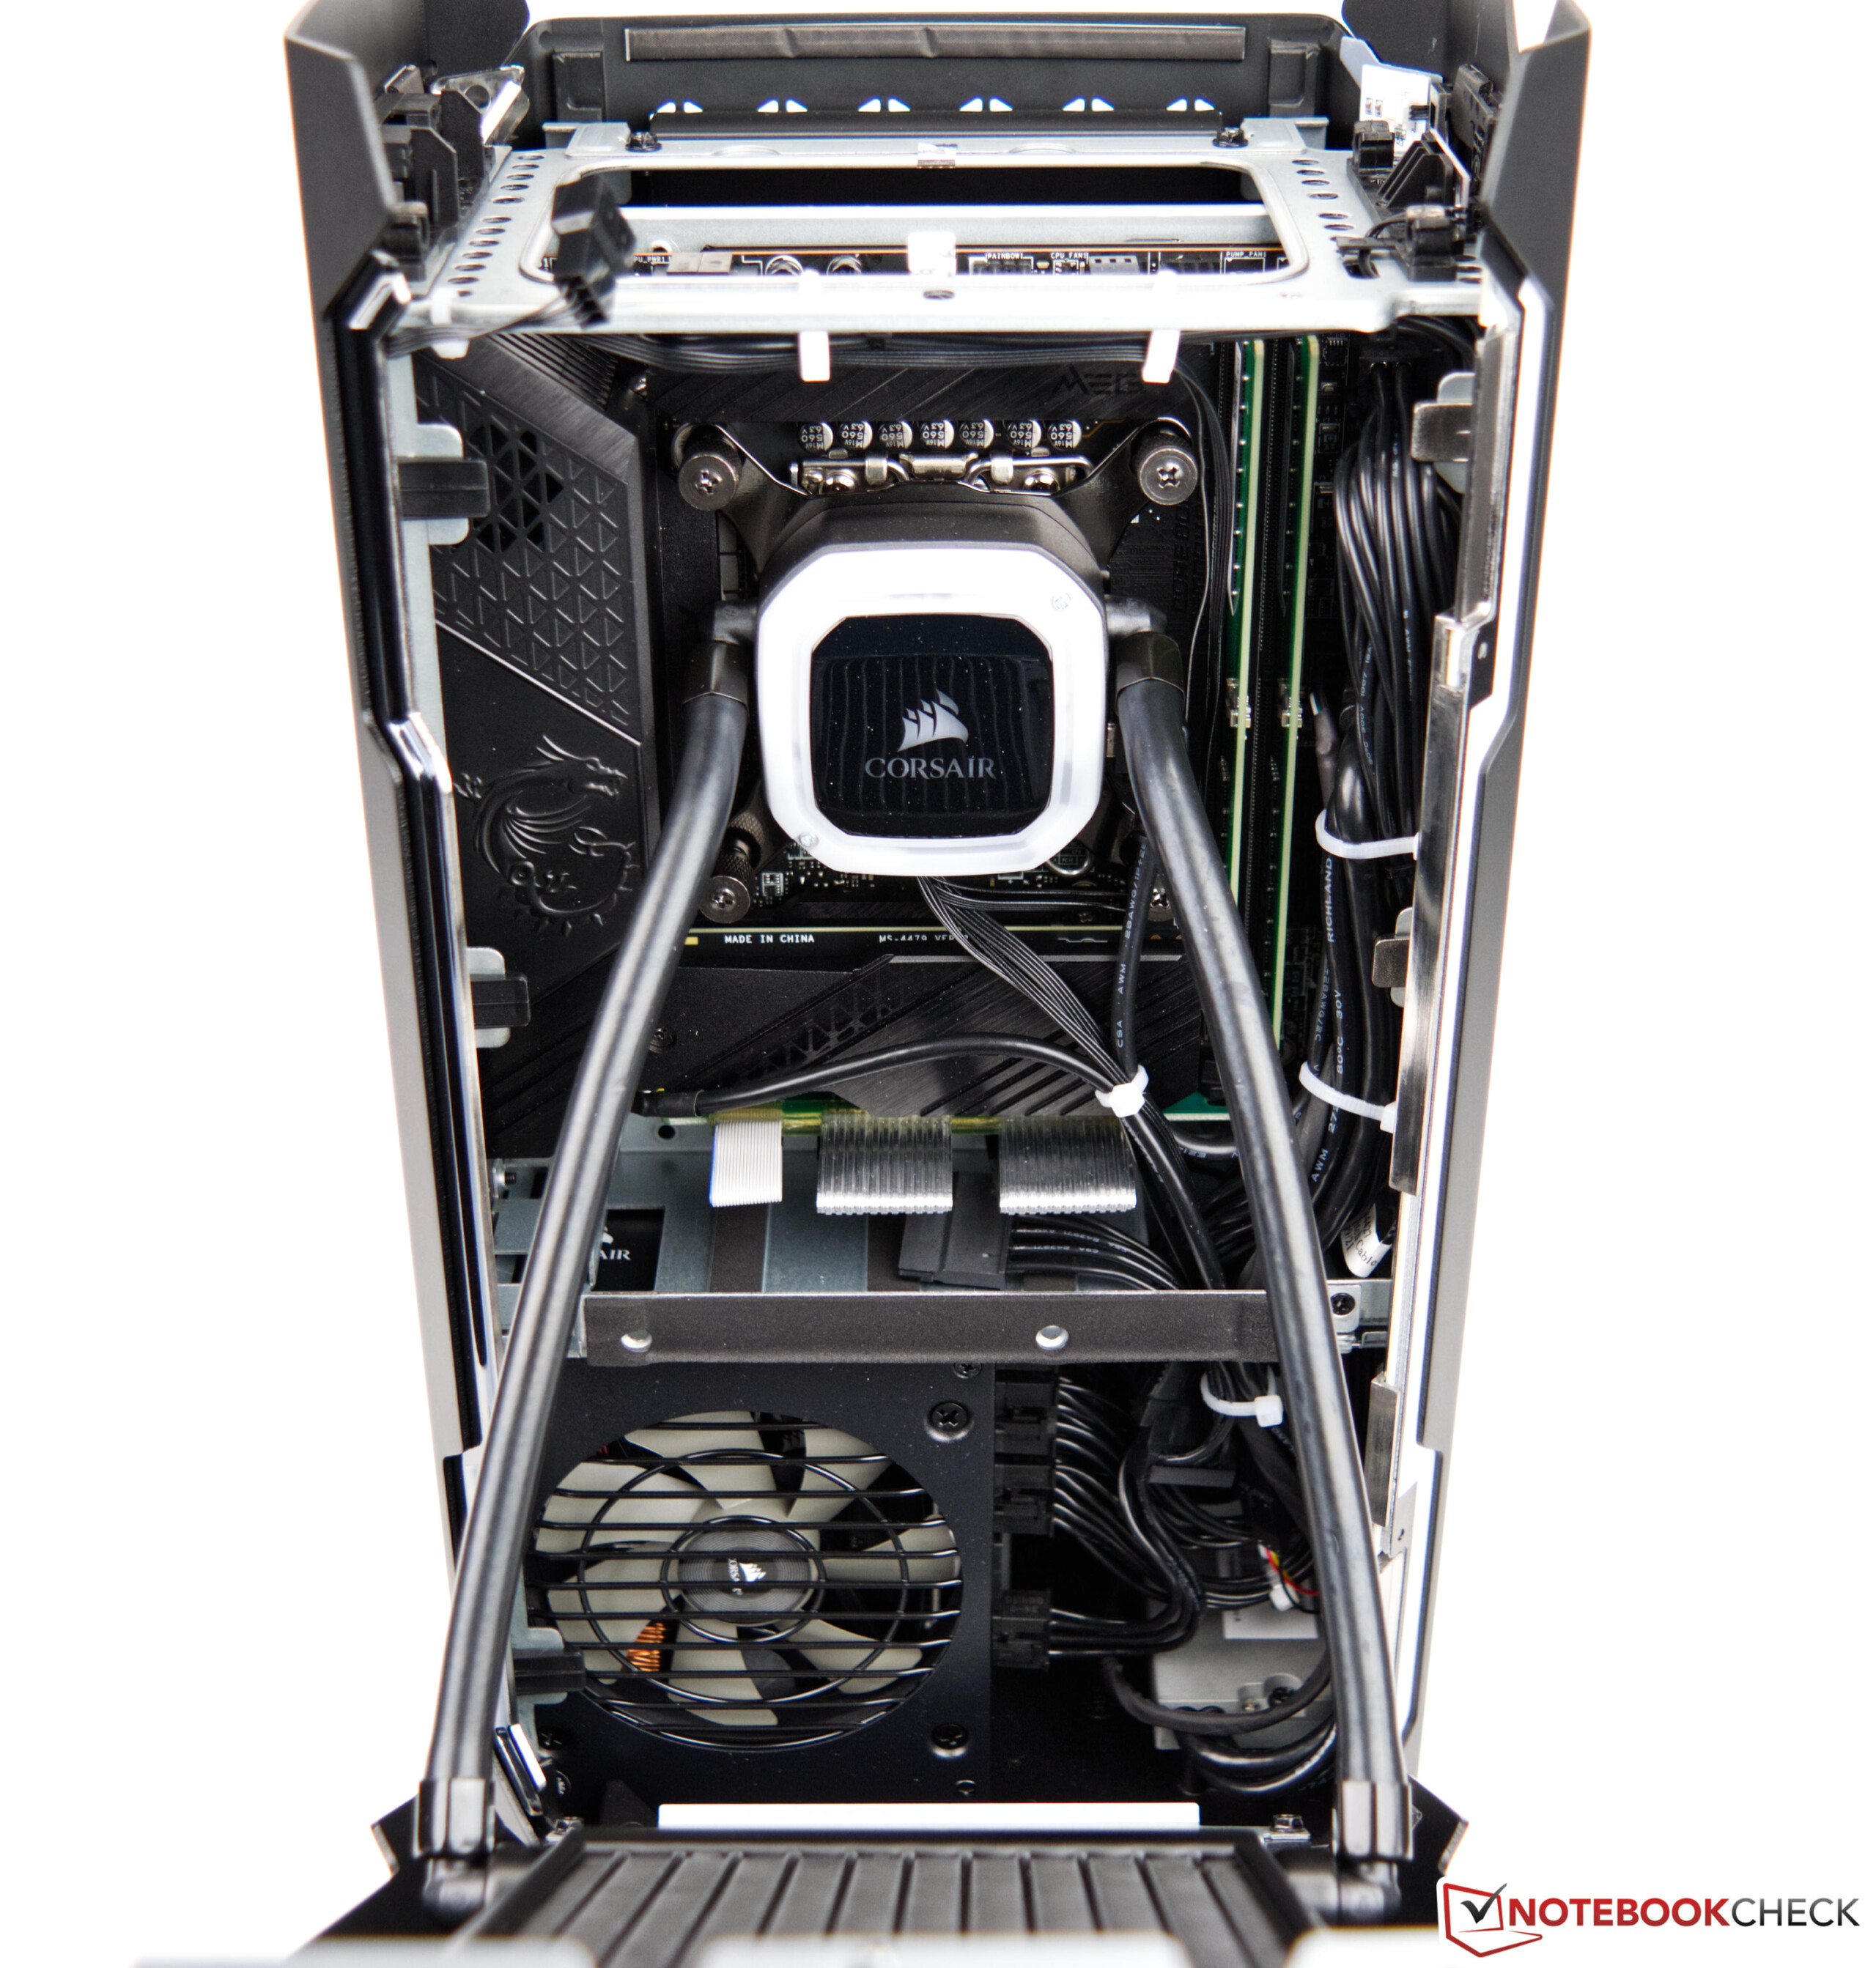
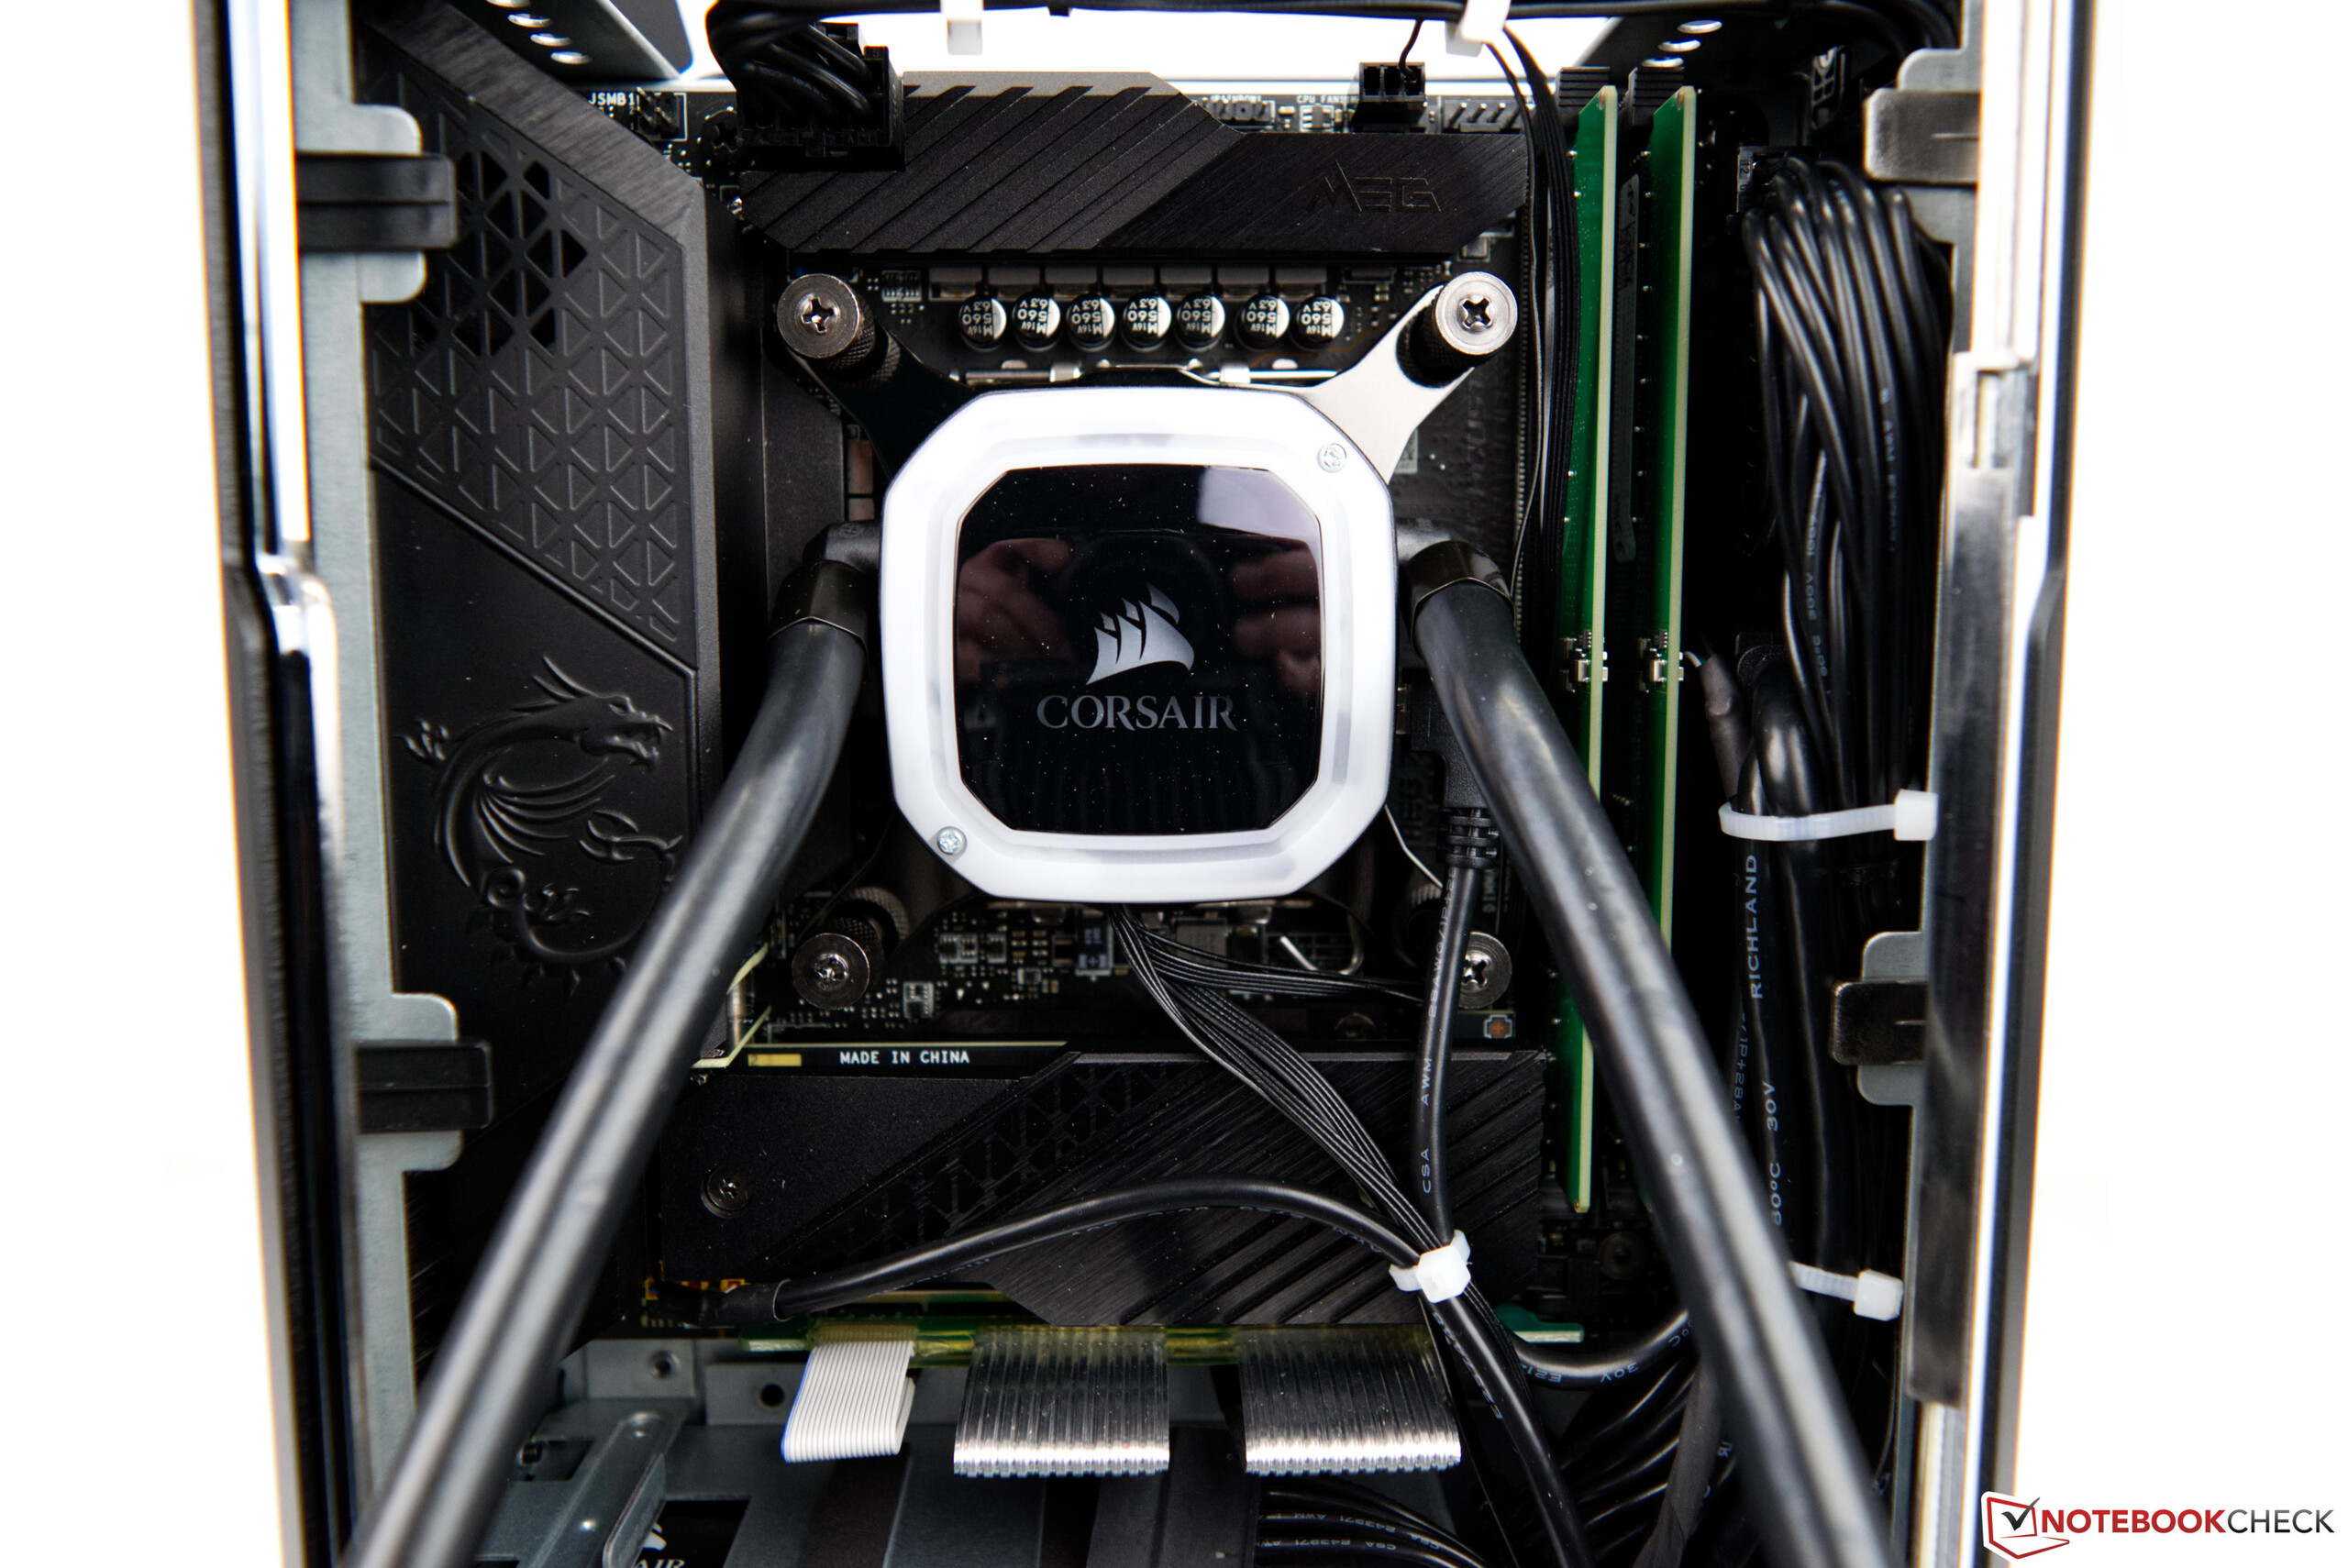
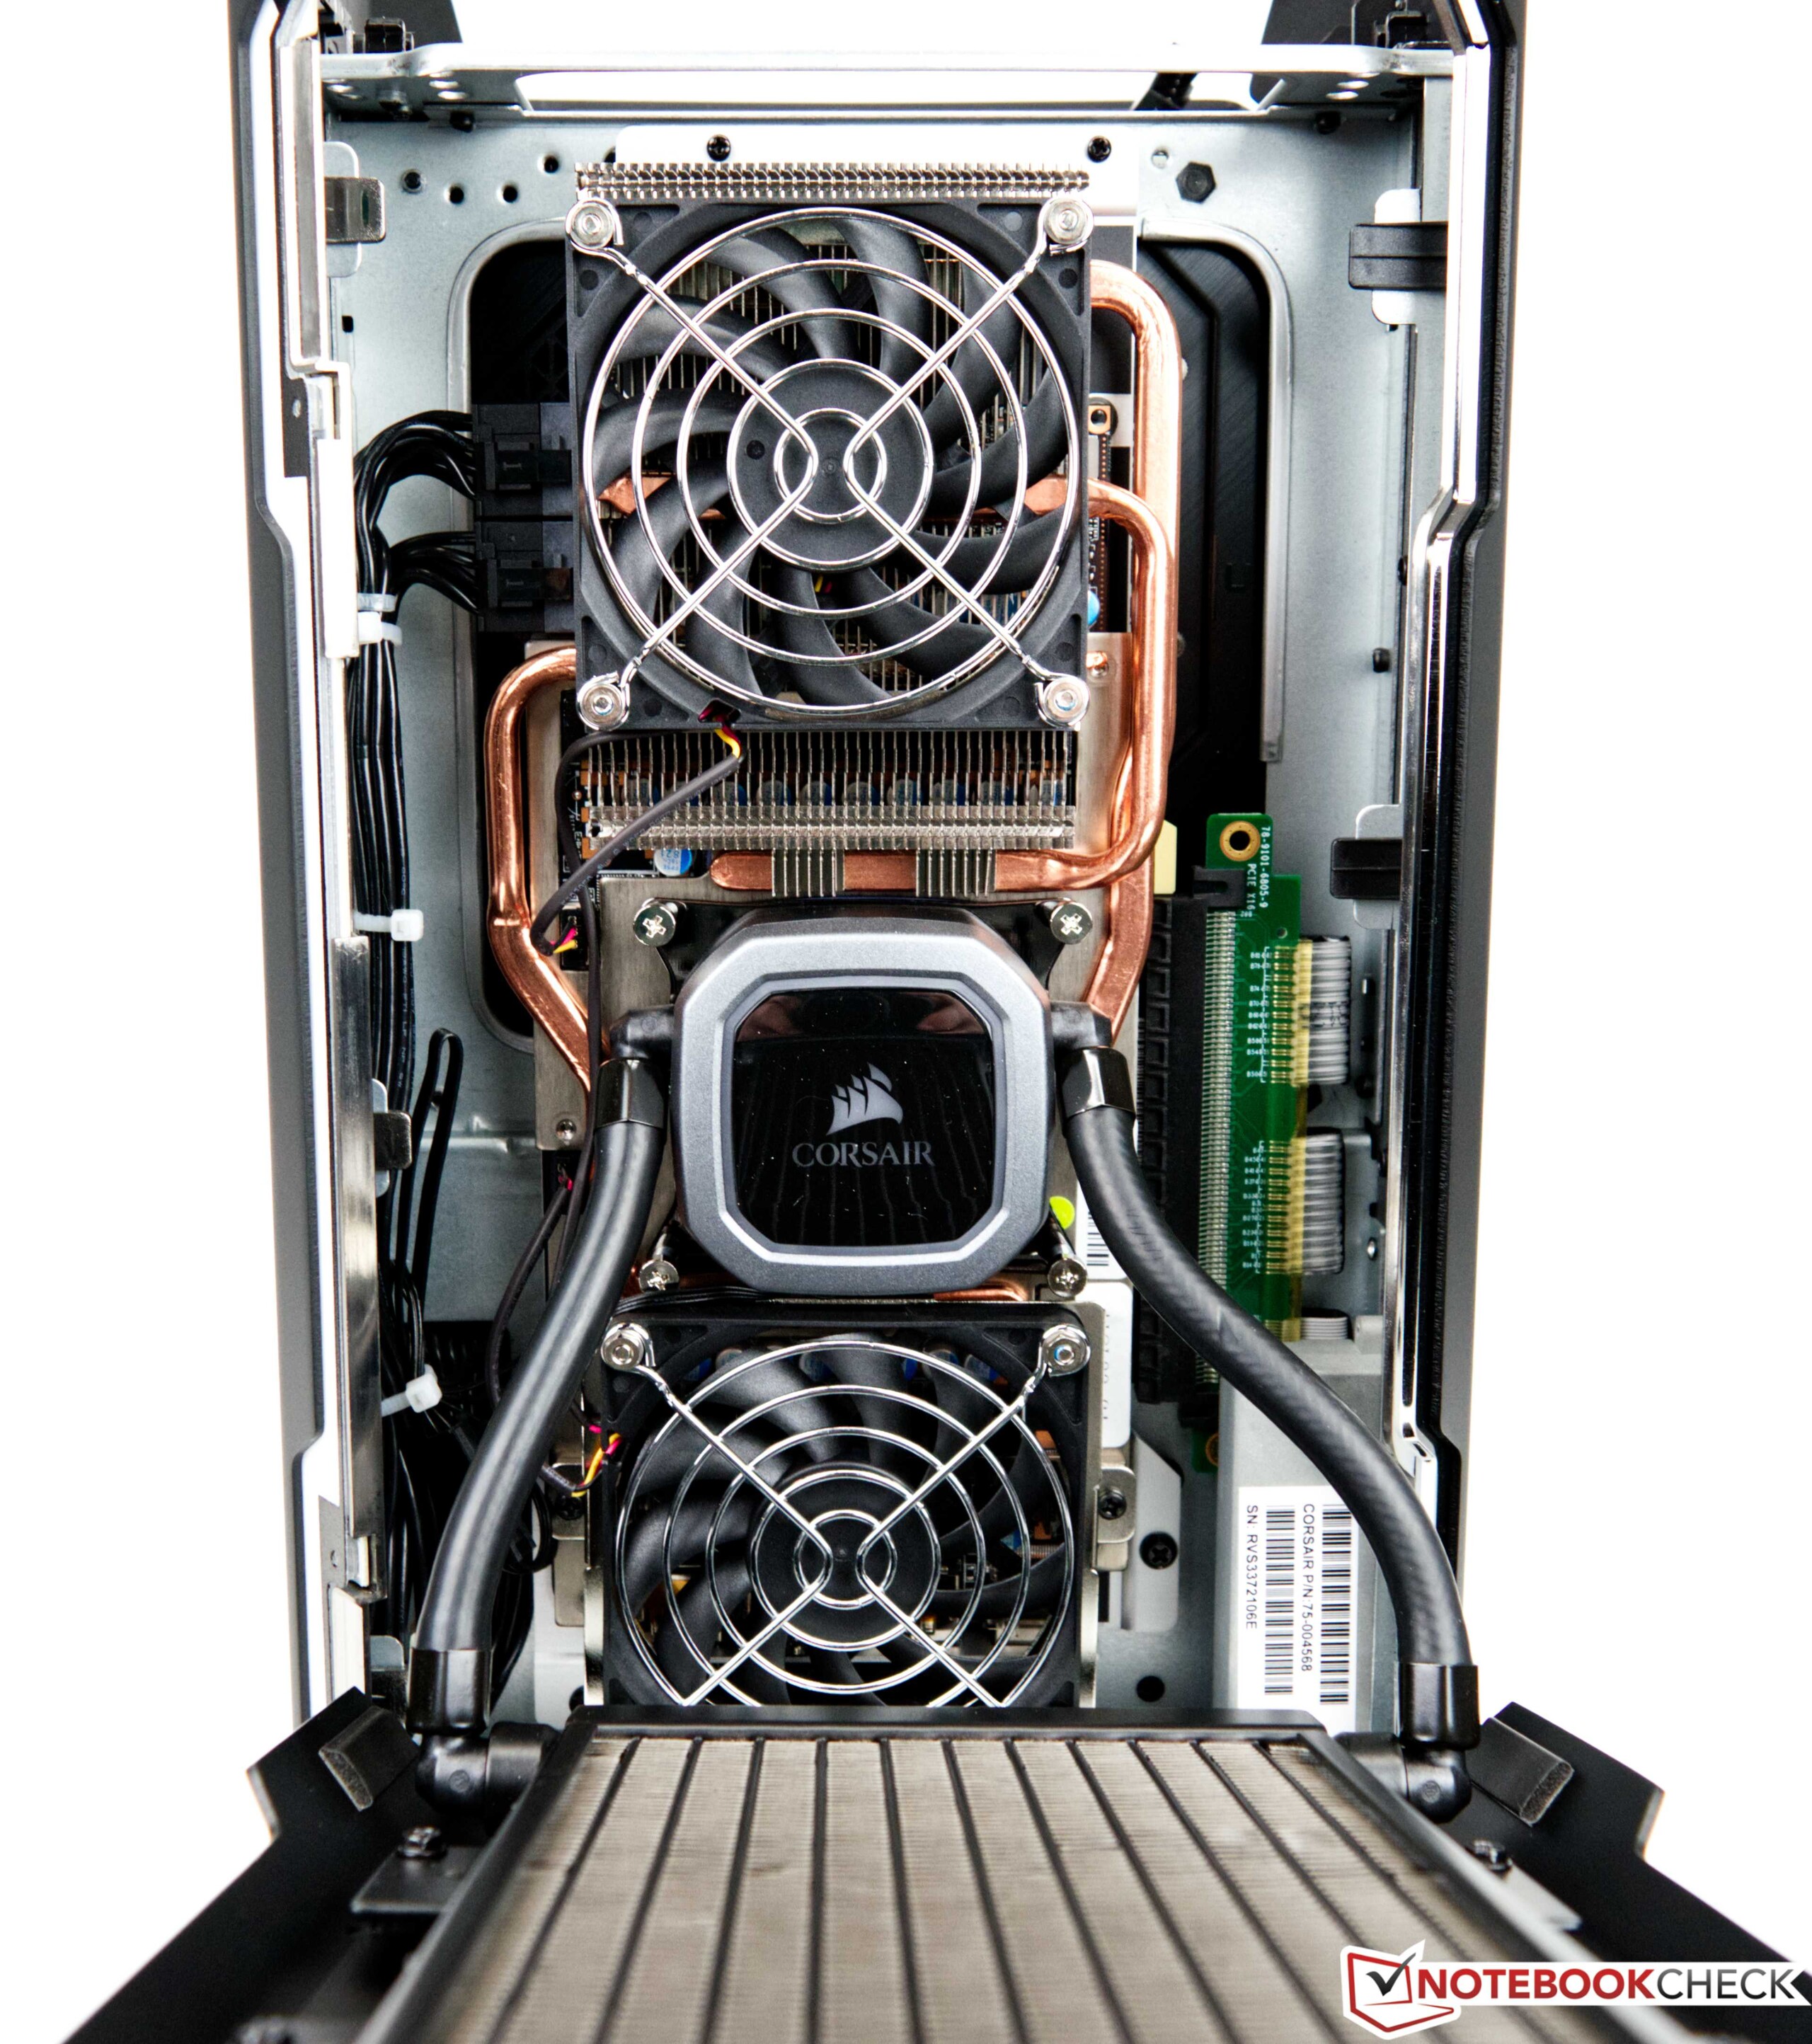
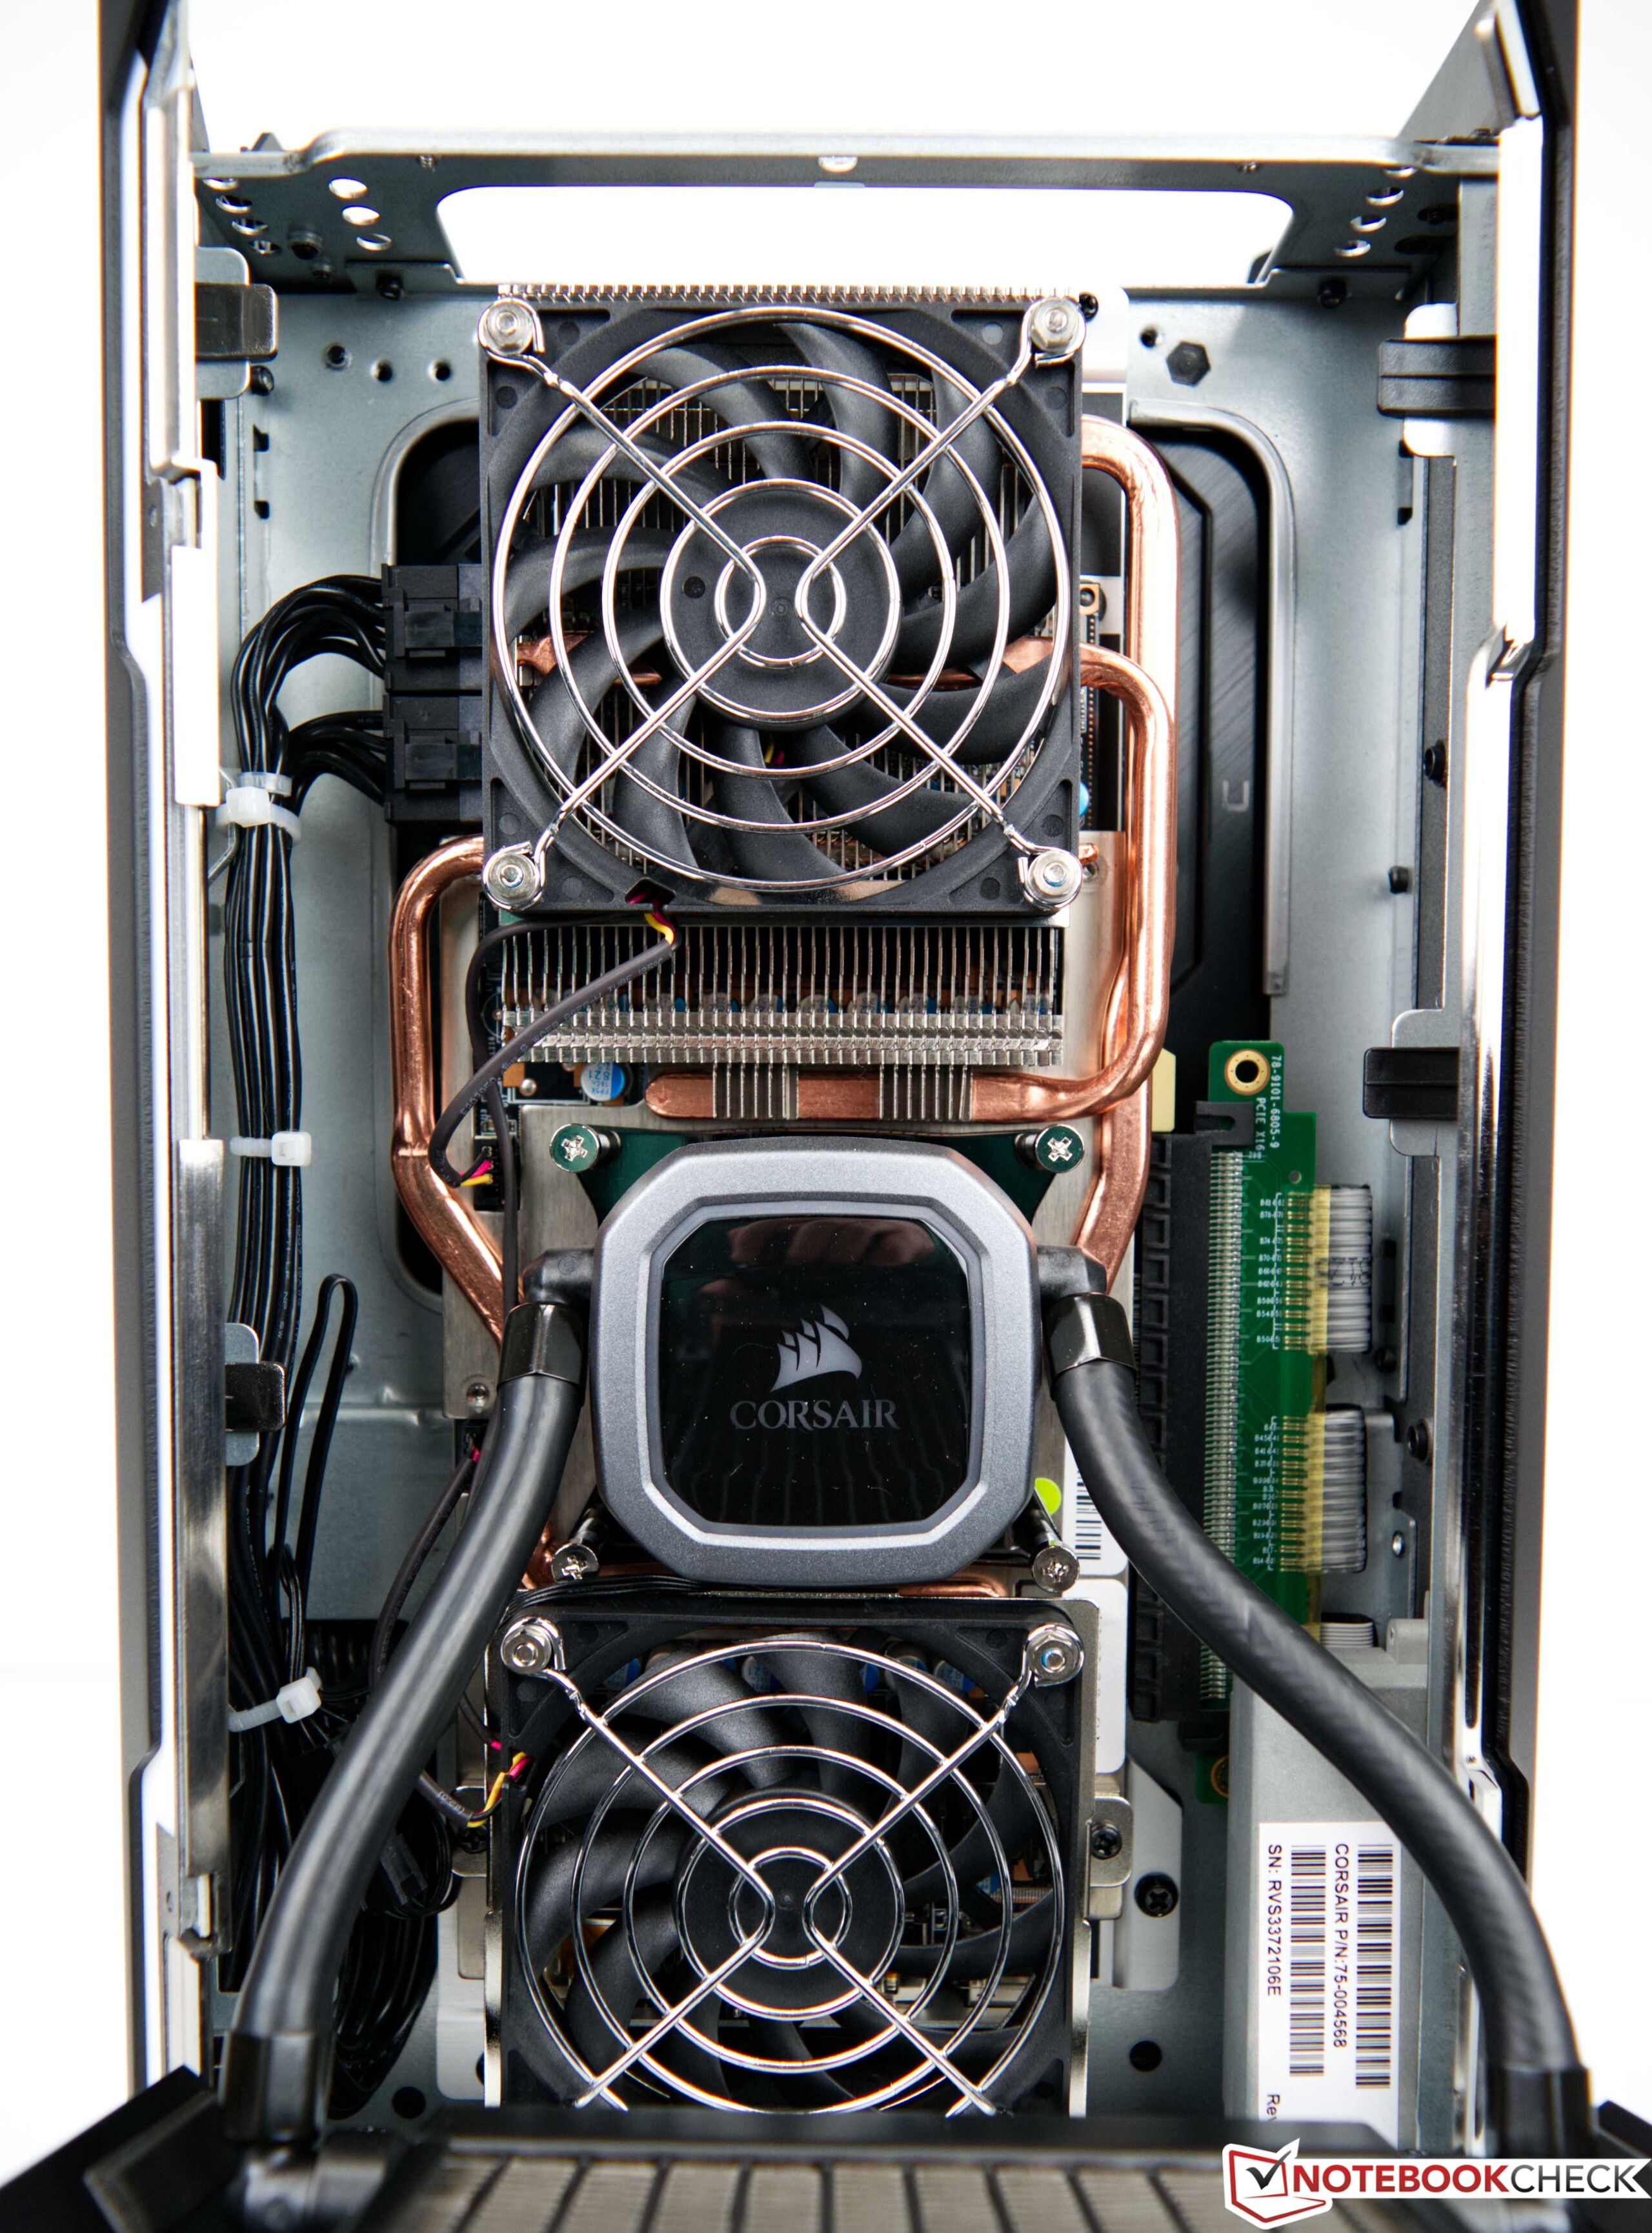
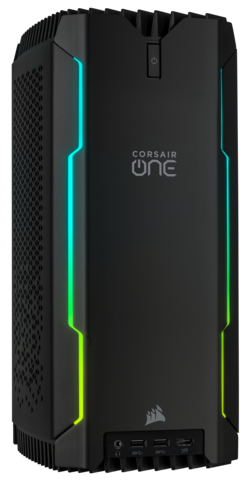
Visually, the case of the Corsair One i300 can hardly be distinguished from the Corsair One i160, and in terms of the choice of materials, the manufacturer also kept the same concept with all the surfaces made of metal that offers a high-quality impression not only in terms of the looks. The haptics also give an impression of always having a very high-quality product in your hands. The black, modest design is marked by two RGB light bars in front, which can be adjusted according to your preferences using the iCUE software. The workmanship is topnotch, and we did not see any faults. The design of the insides offers space for two independent water-cooling systems for CPU and GPU.
Despite its compactness, the small PC brings 7.5 kg to the scale. You wouldn't expect this at first glance, but this also confirms the materials used, since in such a small case, everything possible needs to be used to transfer the heat created.

Equipment - The most current
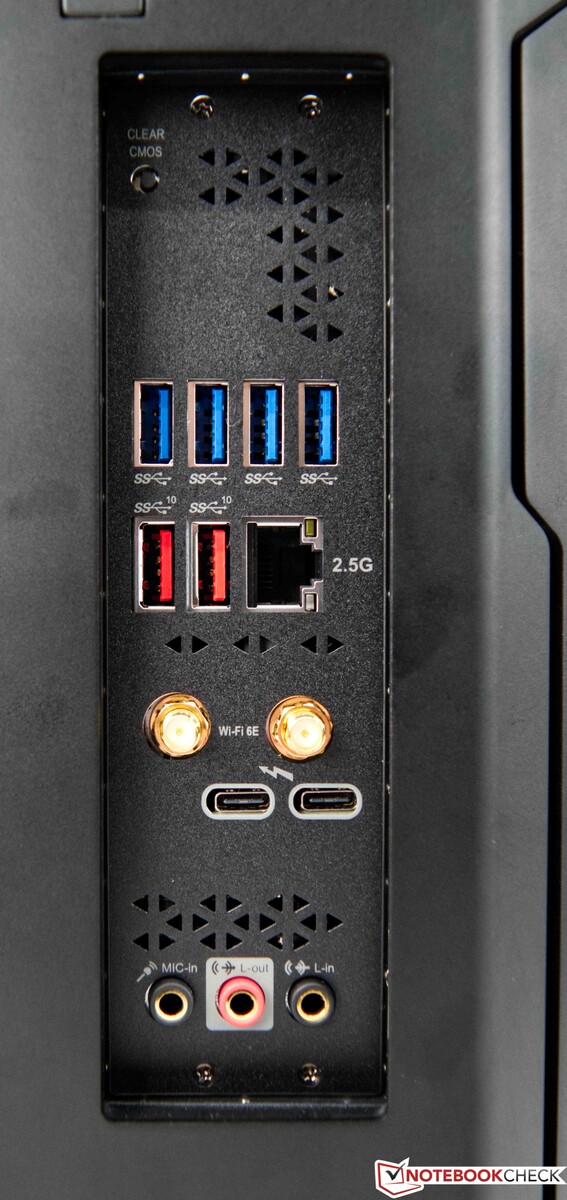
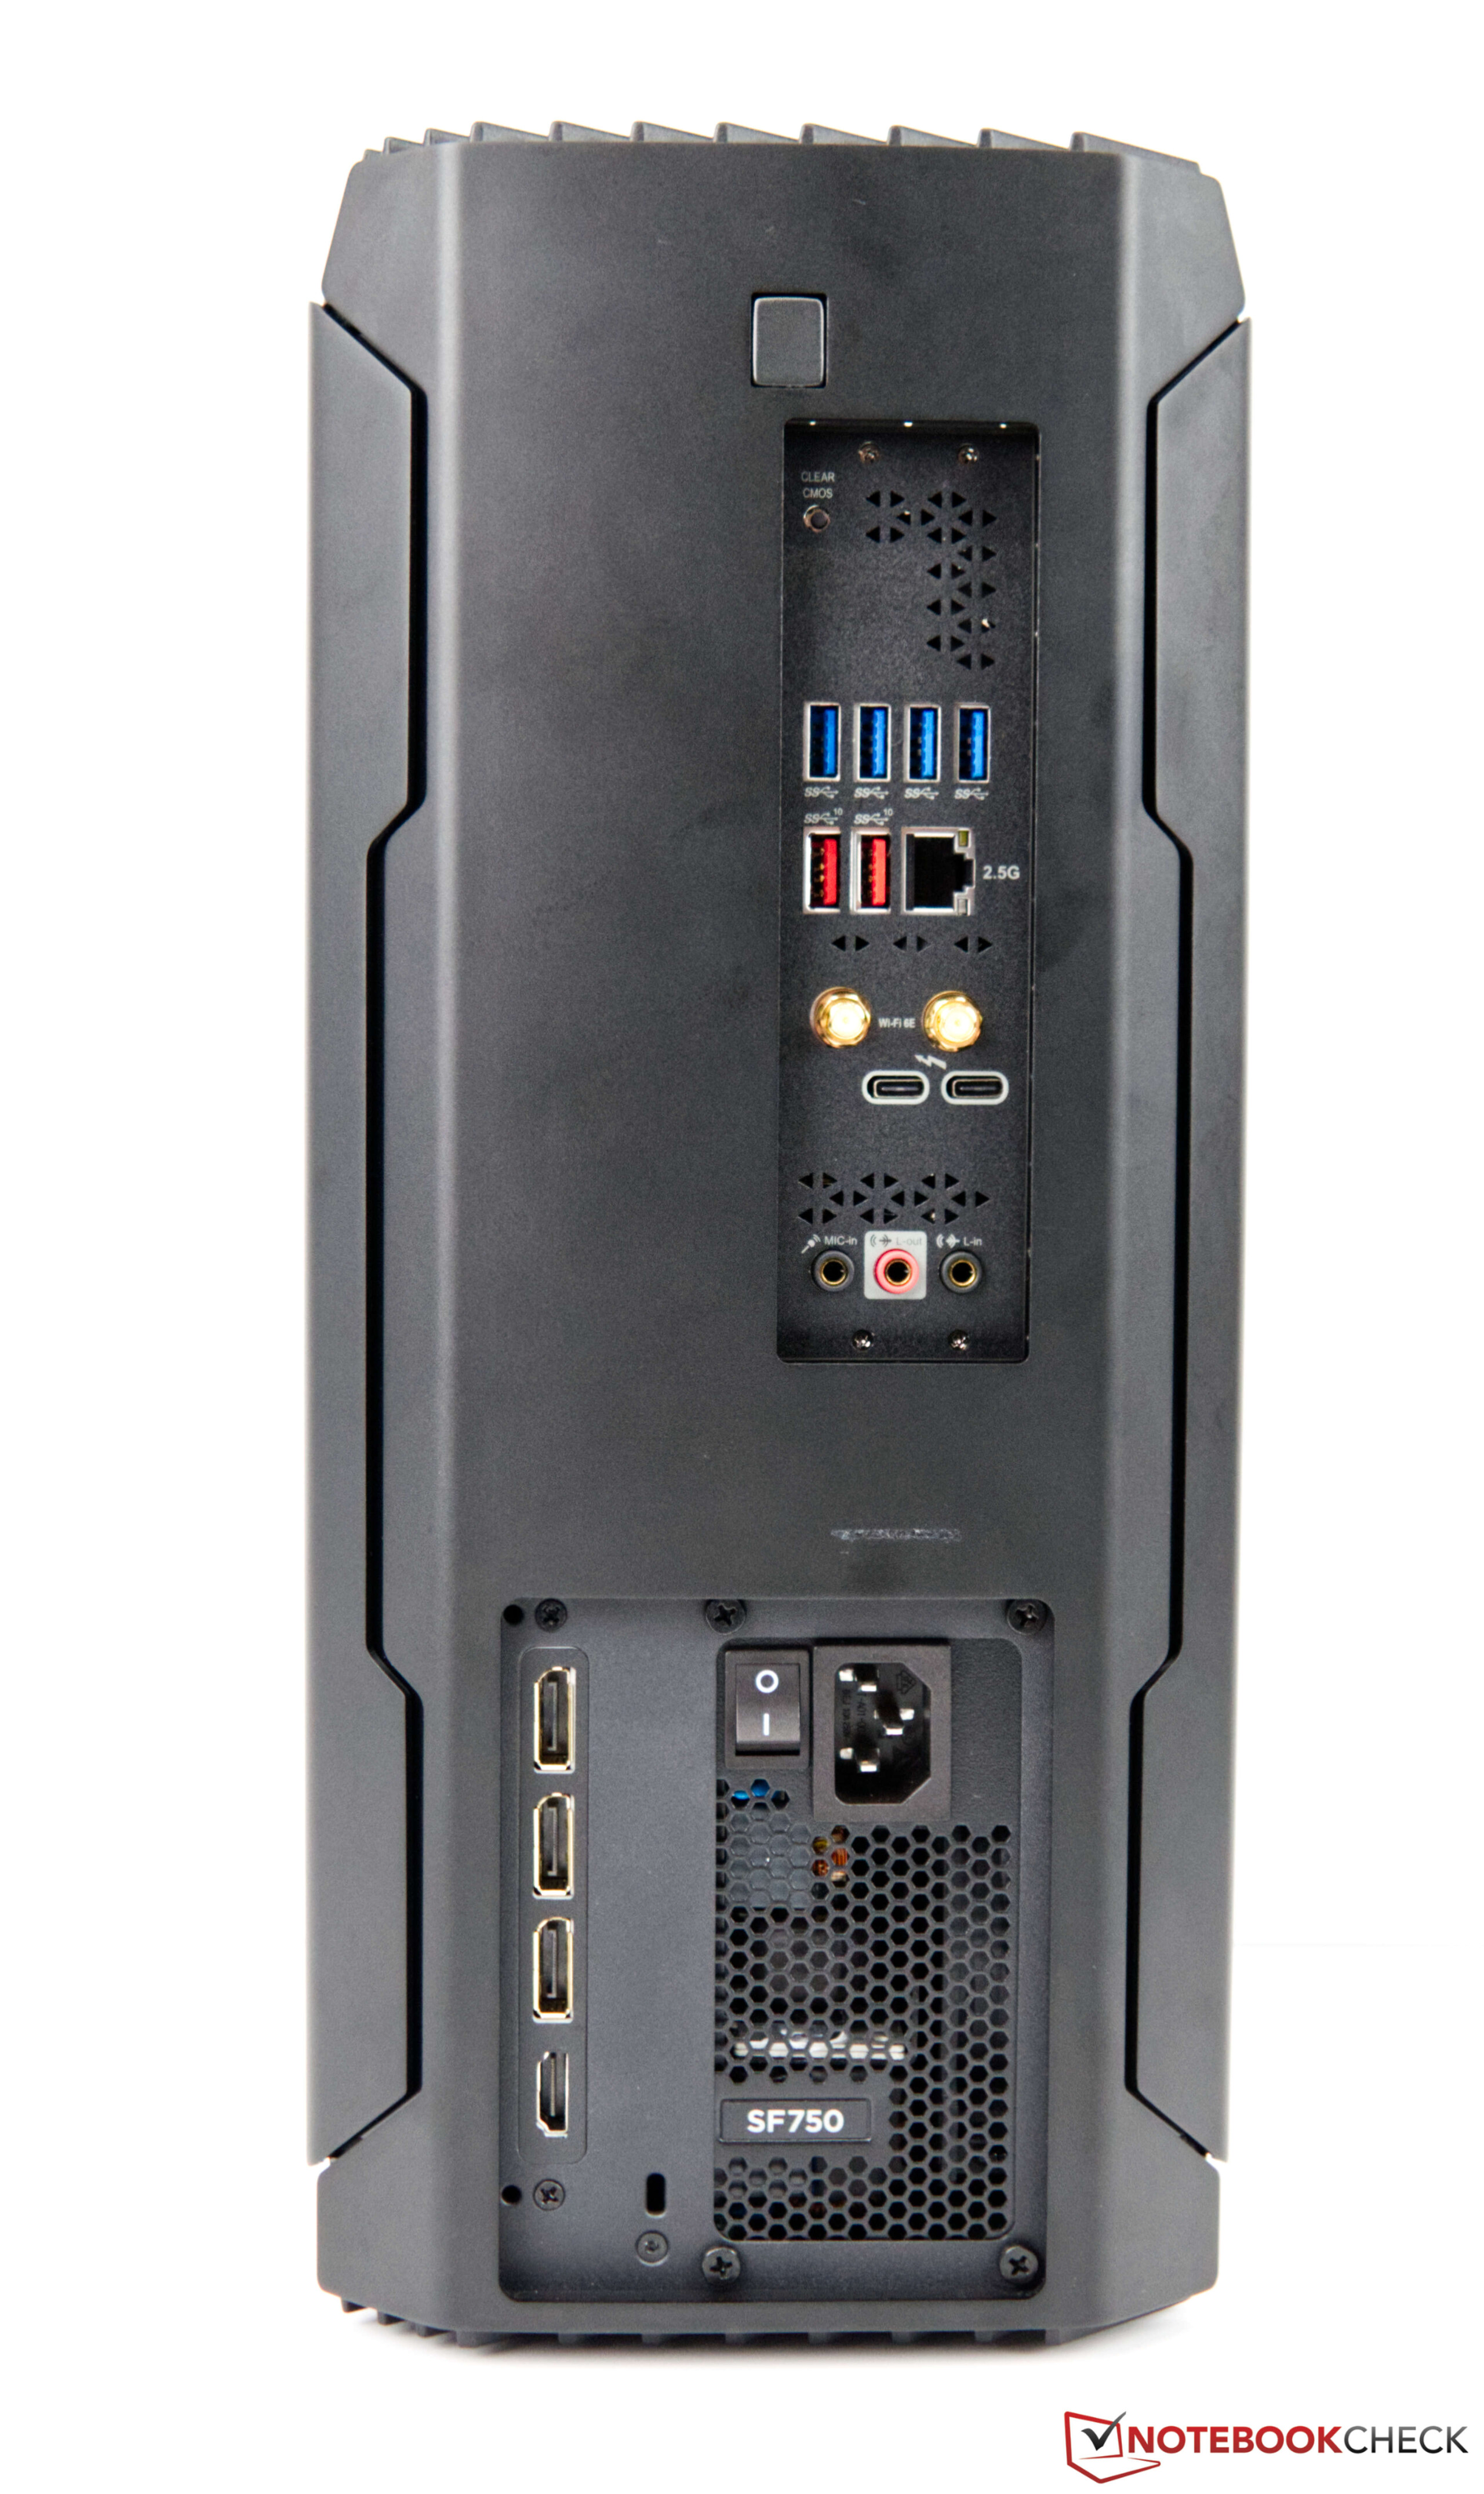
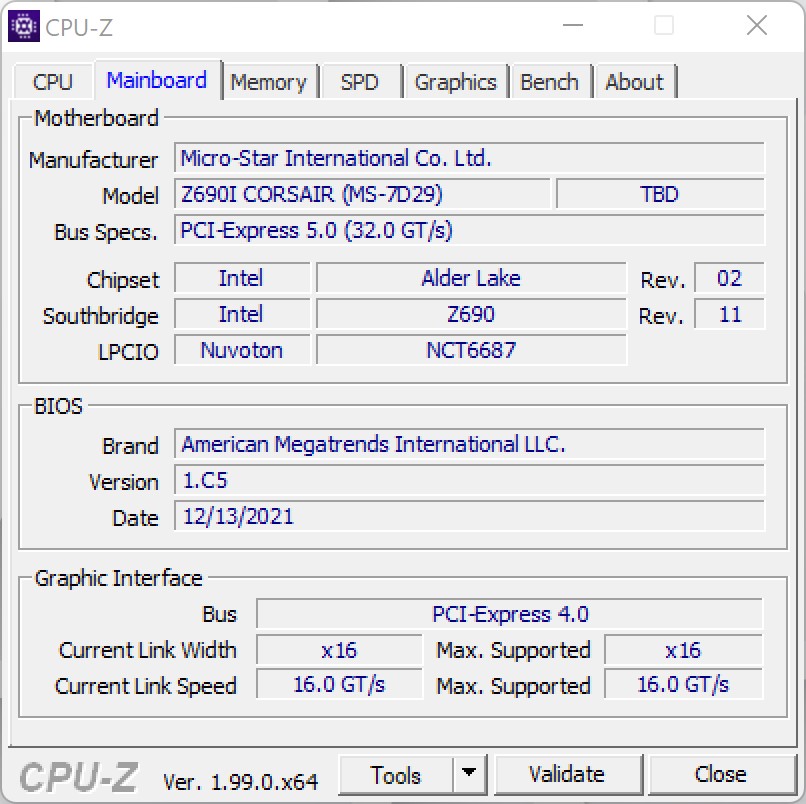
In the One i300, Corsair uses a conventional Mini-ITX mainboard from MSI. To be exact, Corsair uses the MSI MEG Z690I Unify in our test unit. With this, the desktop PC is also well-equipped with external connections. There are a total of 8 USB ports in the back, two of which also support Thunderbolt 4. The front houses an additional 3 USB ports. The Nvidia GeForce RTX 3080 Ti itself also adds 3x DisplayPort and one HDMI connection.
In terms of network connections, the user can choose either WLAN at the most current standard or Ethernet (2.5G).
Communication
The Intel Wi-Fi 6E AX211 module built into the main board is the most current available, so you can also use Wi-Fi 6G networks. Using our current test router, which also supports the newest standard, the Corsair One i300 delivers fast and stable transfer rates in our WLAN test.
Note: Since our test unit was unfortunately sent to us without the original WLAN antennas, we performed this test using alternative antennas. We are currently unable to say whether the transfer rates are even slightly better when using the original antennas.
| Networking | |
| iperf3 transmit AX12 | |
| Asus ROG Flow Z13 GZ301ZE | |
| Average Intel Wi-Fi 6E AX211 (1003 - 1501, n=4) | |
| Huawei MateBook 13s i5 11300H | |
| iperf3 receive AX12 | |
| Average Intel Wi-Fi 6E AX211 (1178 - 1623, n=4) | |
| Asus ROG Flow Z13 GZ301ZE | |
| Huawei MateBook 13s i5 11300H | |
| iperf3 receive AXE11000 | |
| MSI Stealth GS66 12UGS | |
| Average Intel Wi-Fi 6E AX211 (582 - 1890, n=276) | |
| Corsair One i300 | |
| Average of class Desktop (n=1last 2 years) | |
| iperf3 transmit AXE11000 | |
| Corsair One i300 | |
| Average Intel Wi-Fi 6E AX211 (64 - 1921, n=276) | |
| Average of class Desktop (n=1last 2 years) | |
Maintenance
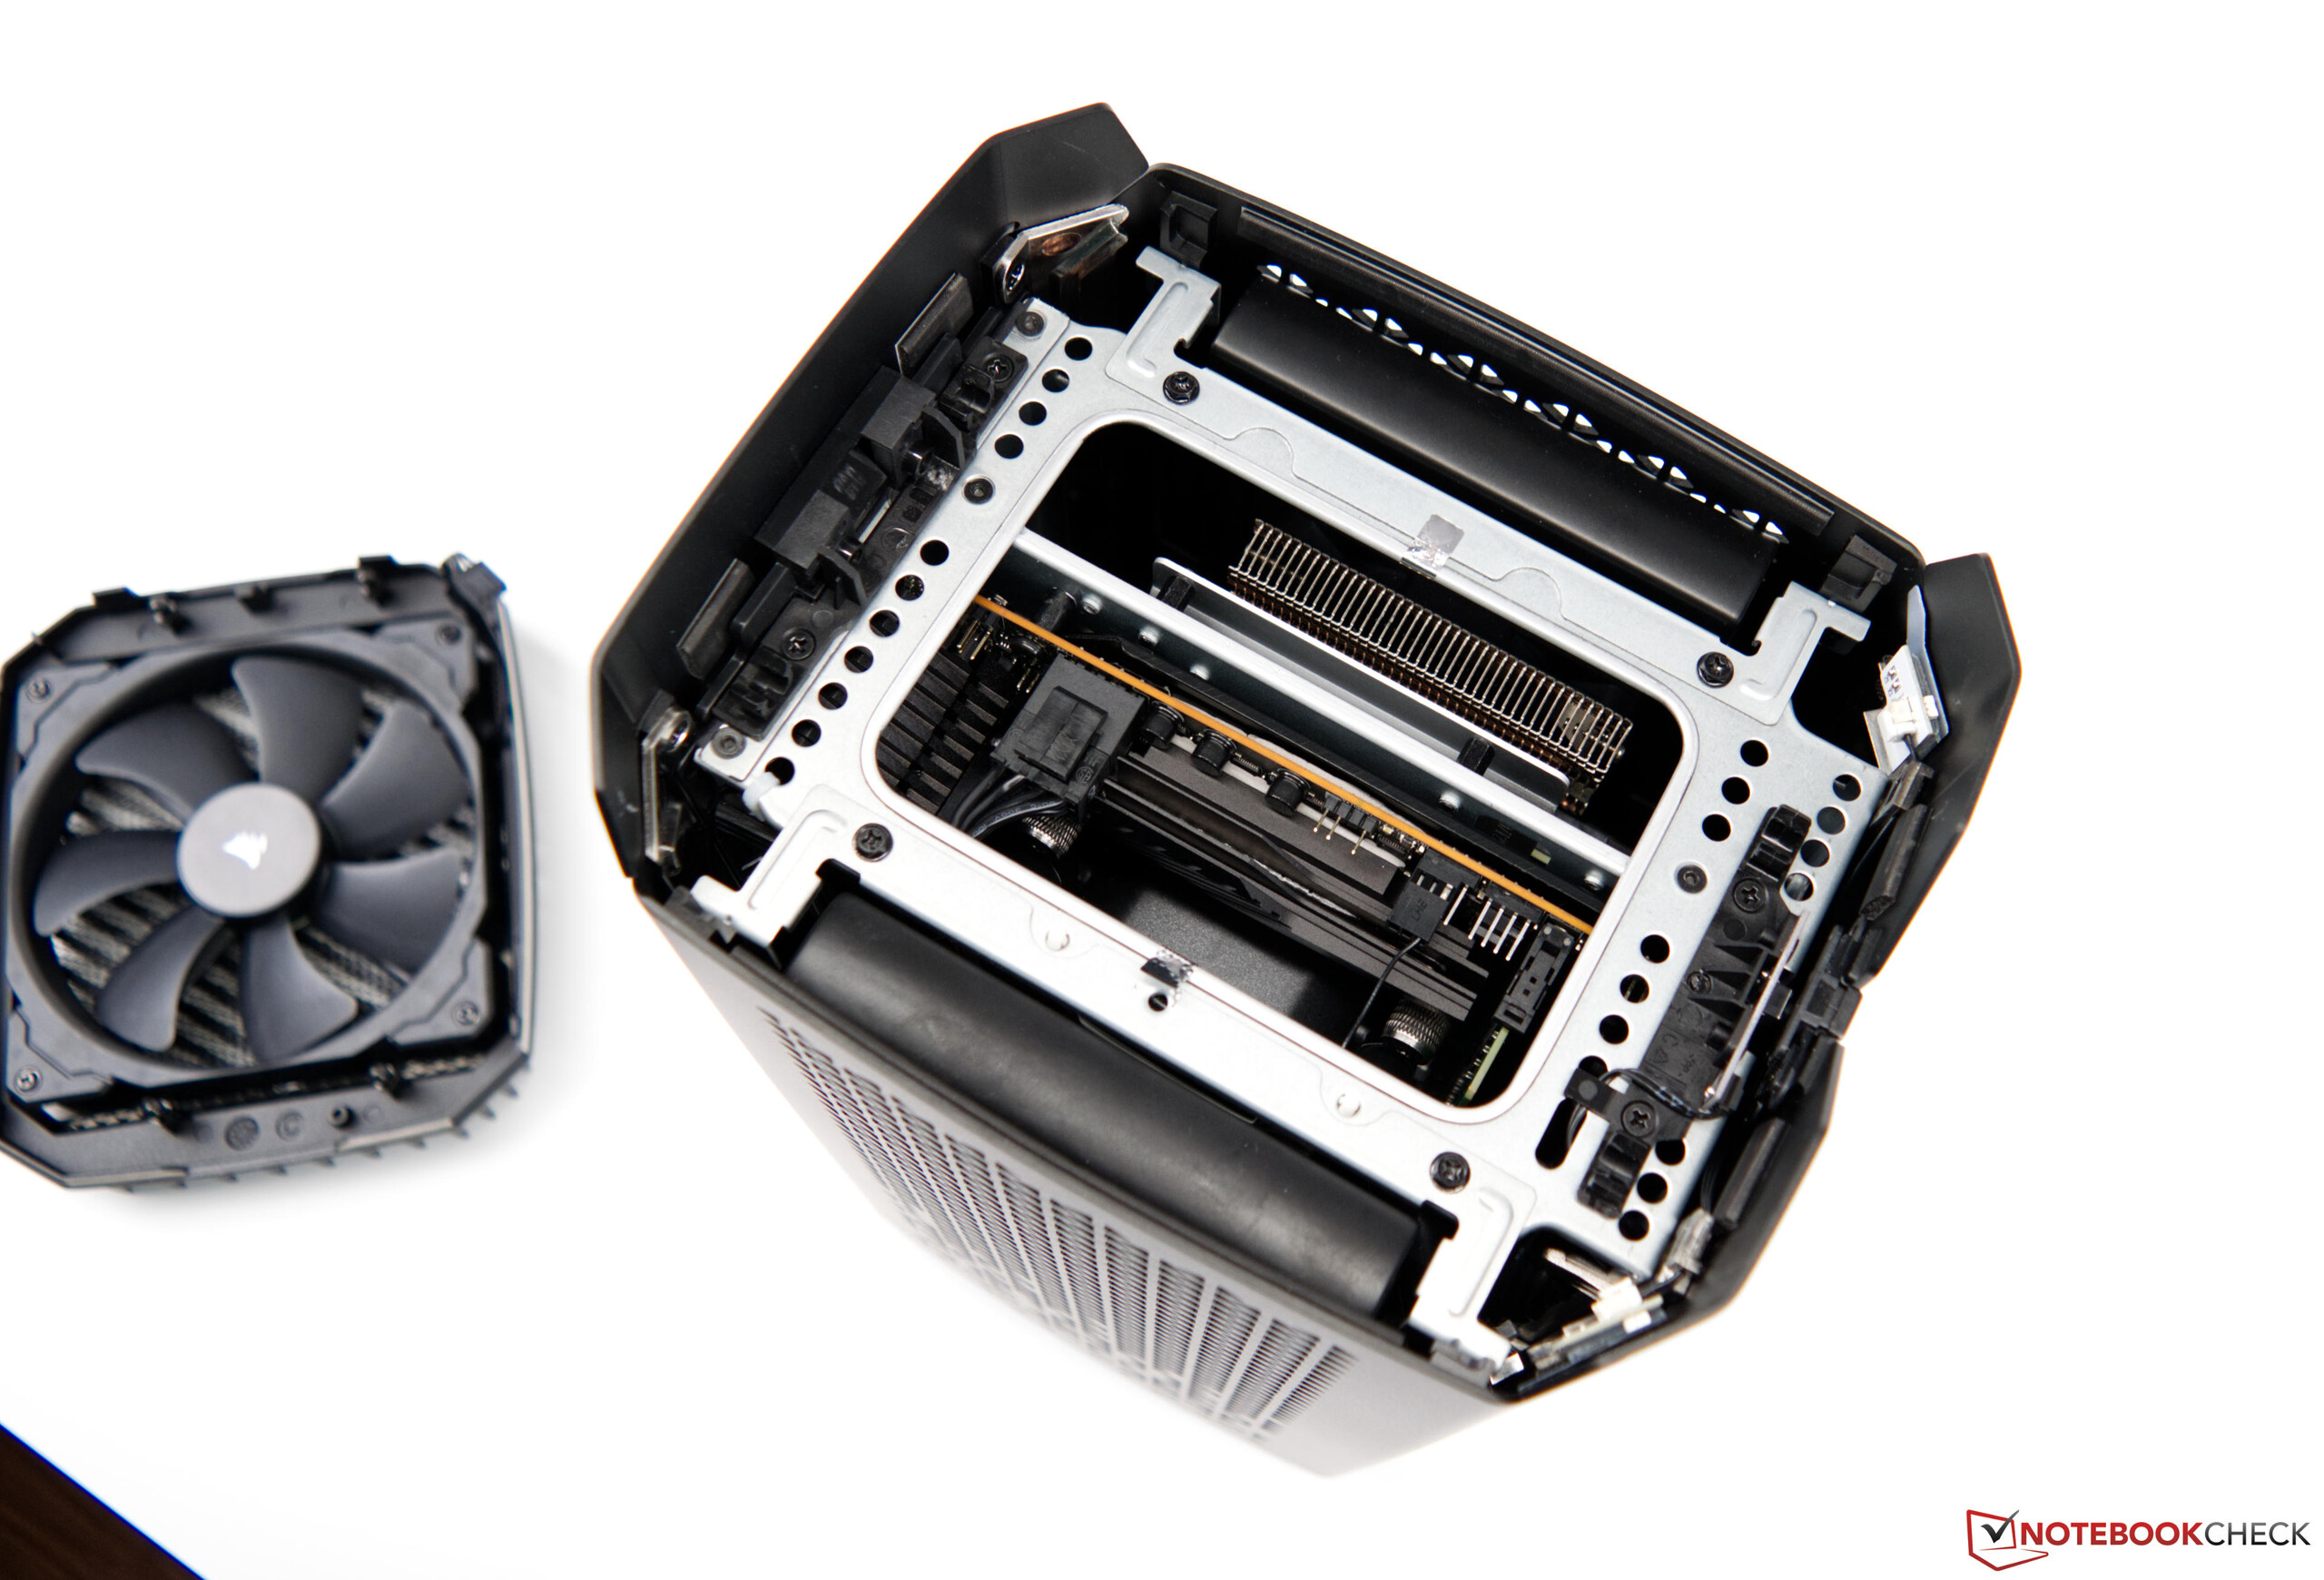
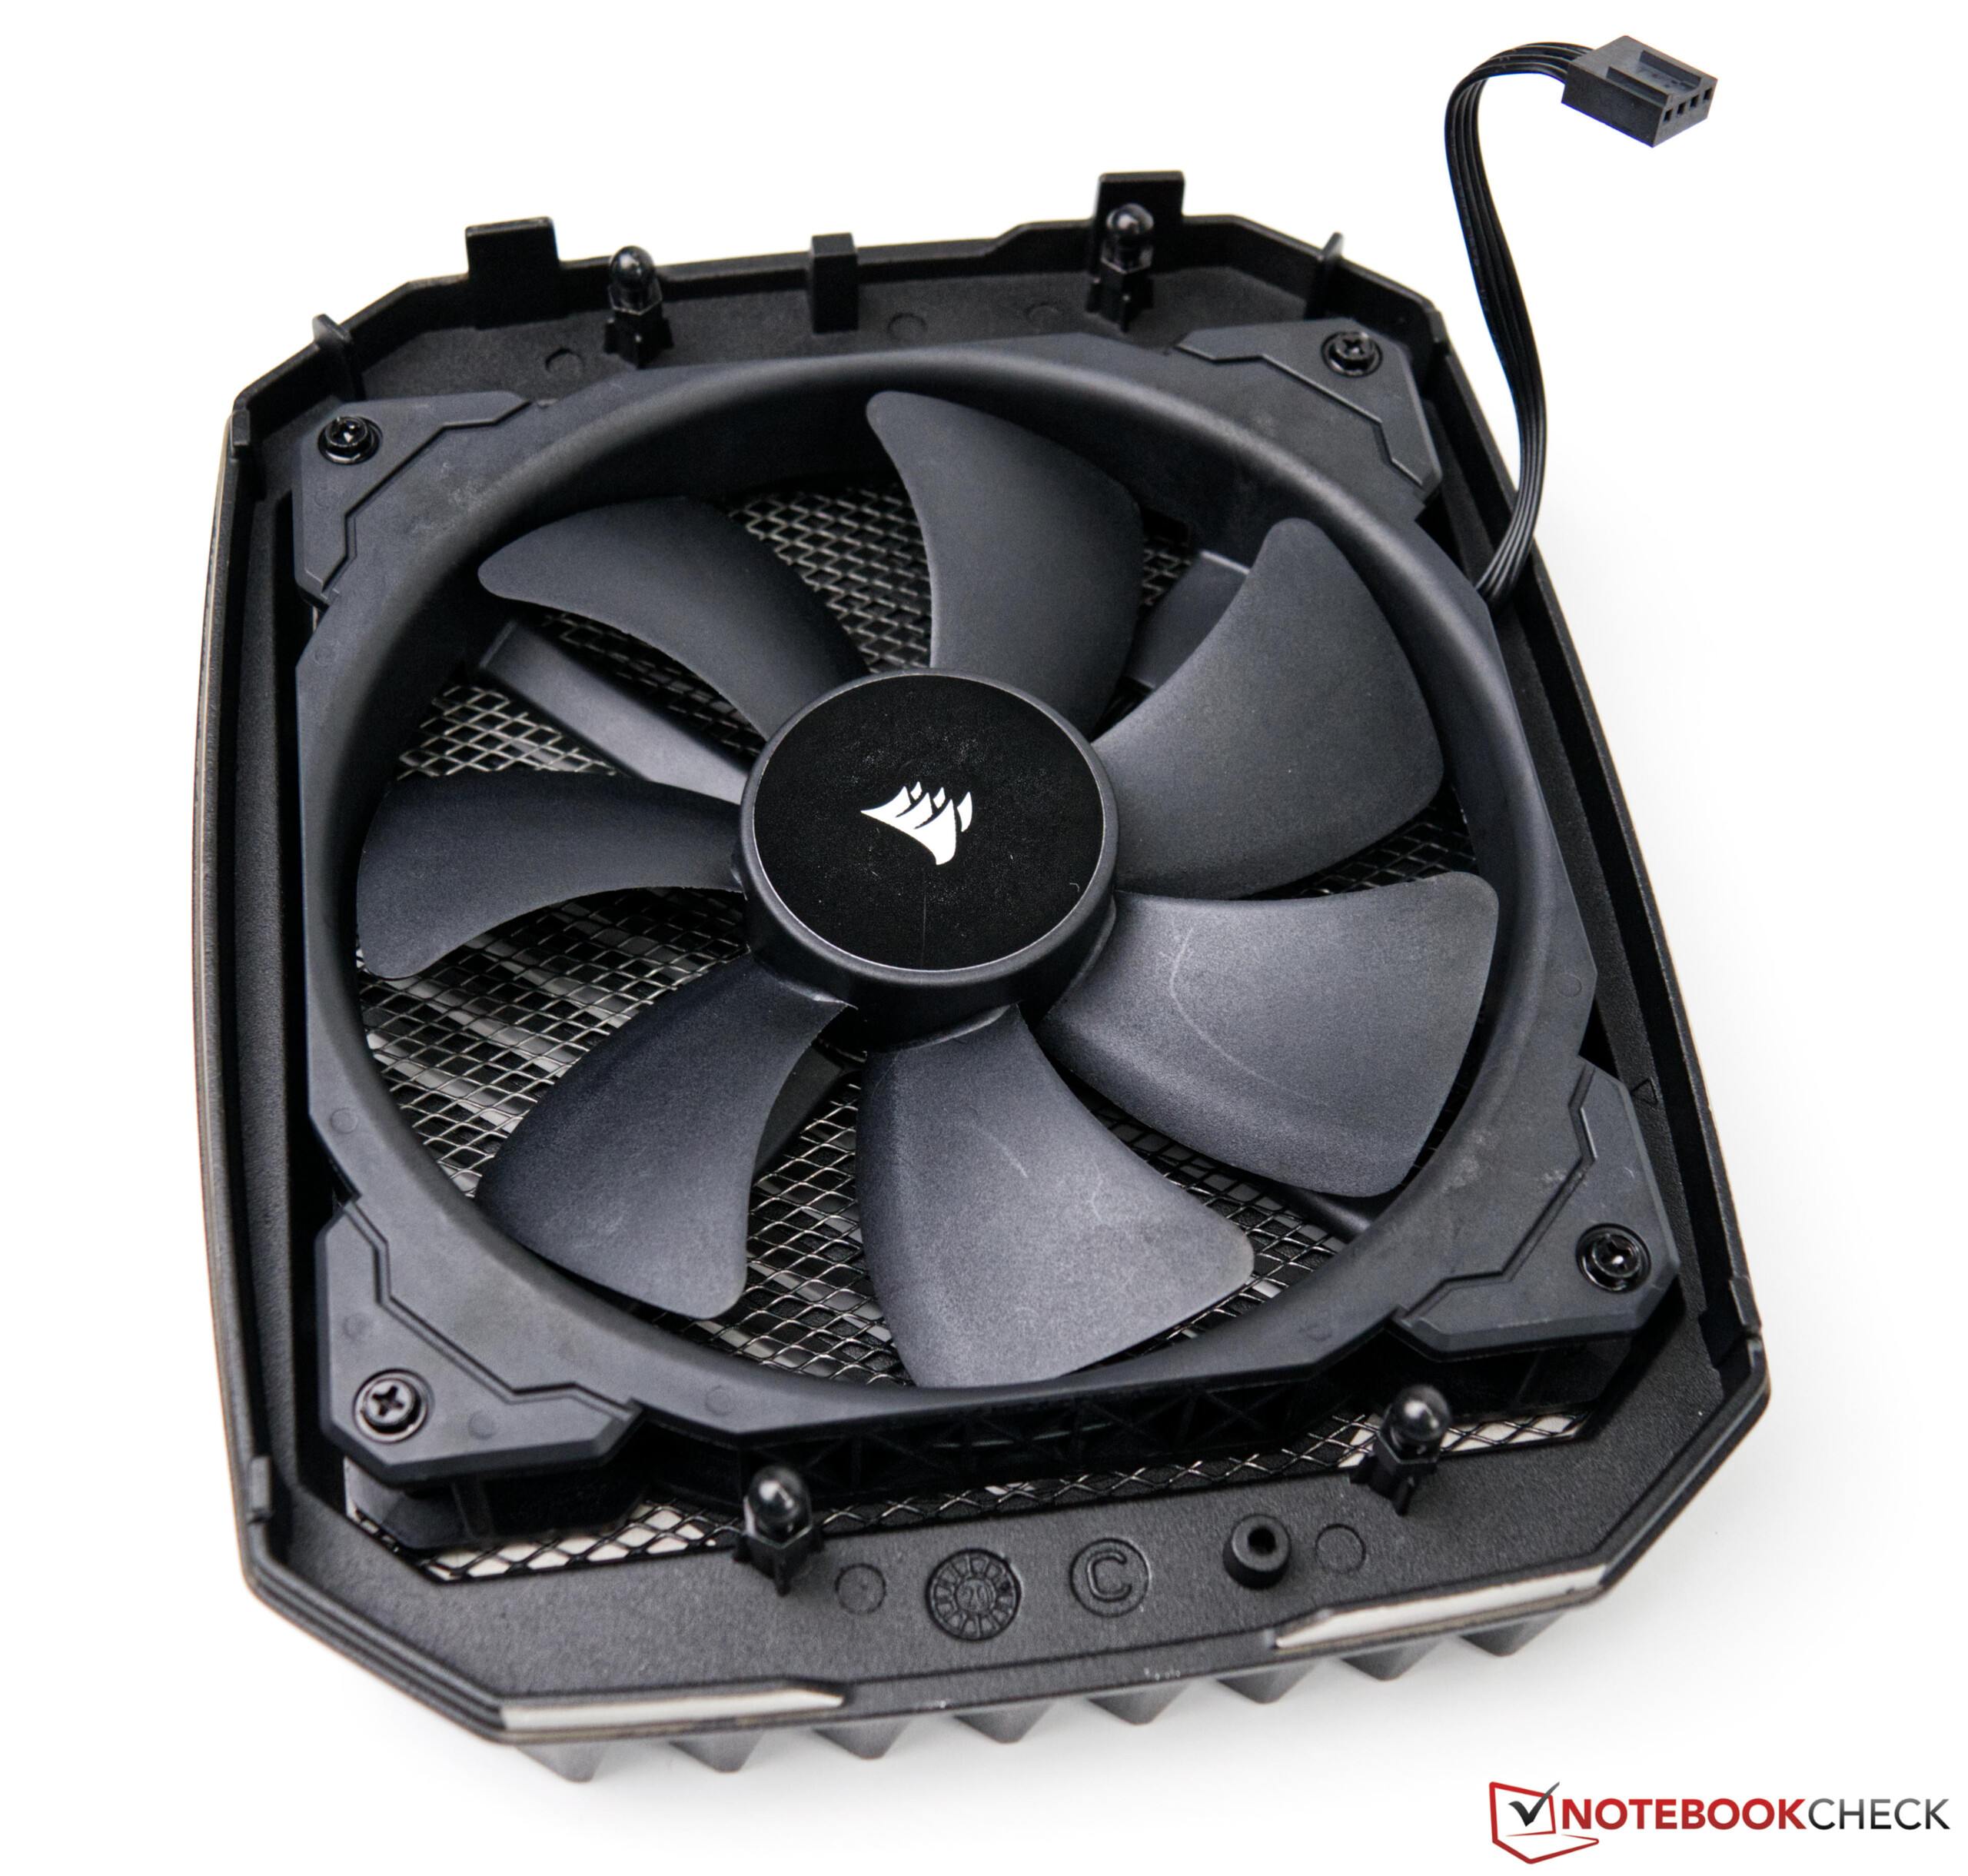
In case the performance of the Corsair One i300 is insufficient or the storage solution turns out too small, you can also upgrade the computer. However, you should be careful, since the space inside is very limited. The desktop PC can be opened easily. The top case cover with the 140-mm fan is quickly removed and the side covers are only attached with two screws. But then the hoses of the AiOs will hinder a quick replacement of the components. While you can still access the working memory fairly easily, things look more difficult if you want to get to the storage solution. For this reason, we would have liked another option in the available configurations, since there is a total of three M.2 slots on the mainboard. However, the system is already well-equipped with 2 TB of storage.
Performance
Looking purely in terms of the components used, the Corsair One i300 offers very fast processors for gaming with the Intel Core i9-12900K and the Nvidia GeForce RTX 3080 Ti. Currently, the GeForce RTX 3080 Ti is Nvidia's second fastest graphics card, remaining only a few percentage points behind the GeForce RTX 3090. Although that might also have fit into the case if you only consider the physical size, the cooling of the VRAM chips probably led Corsair to "only" use a GeForce RTX 3080 Ti. The slightly weaker model of the Corsair One i300 is equipped with a GeForce RTX 3080, which might be the more reasonable choice because of its lower purchase price.
Processor
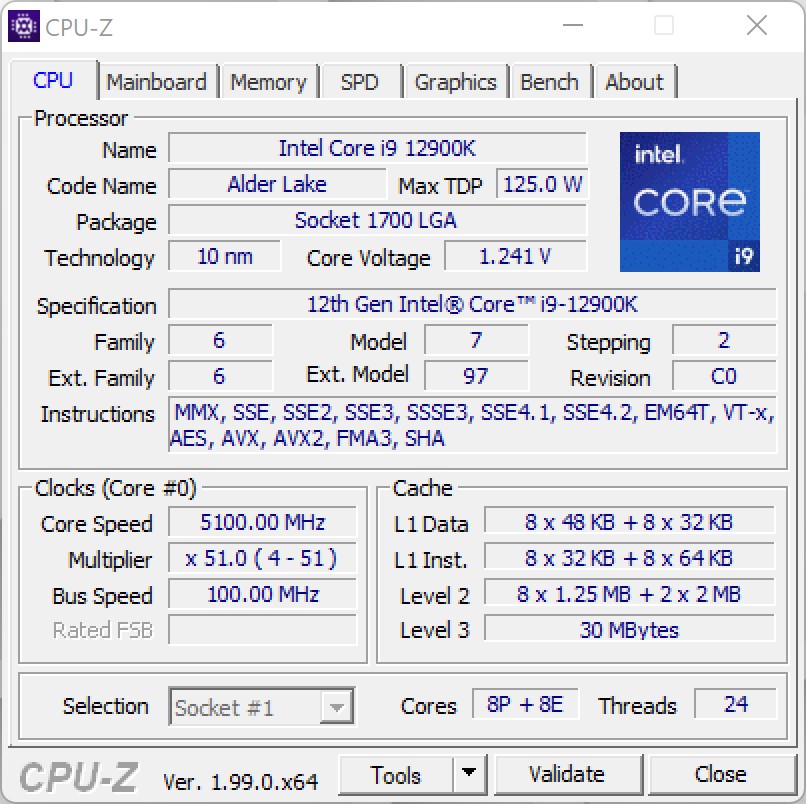
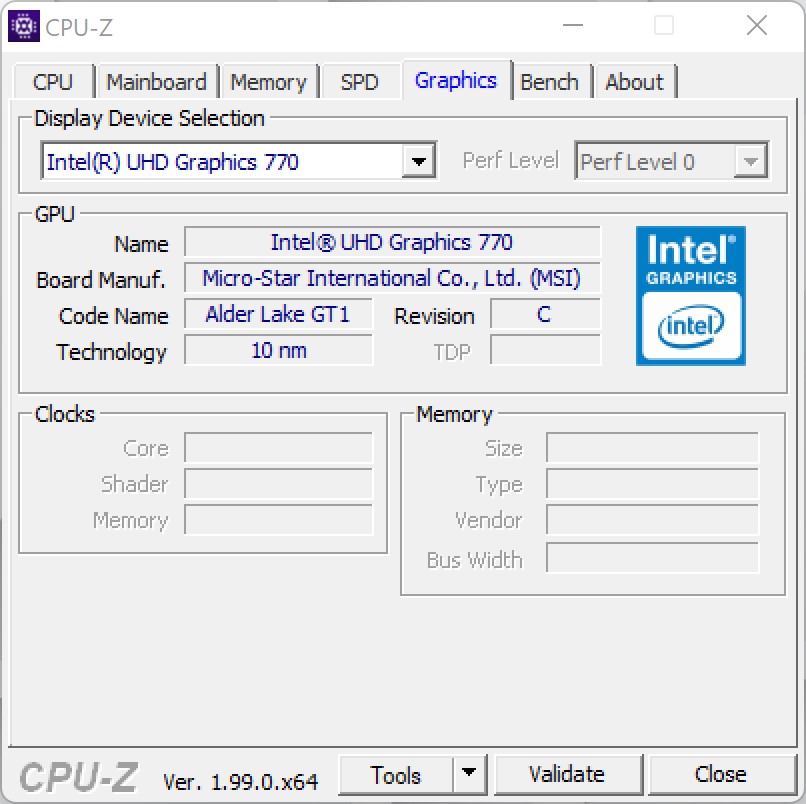
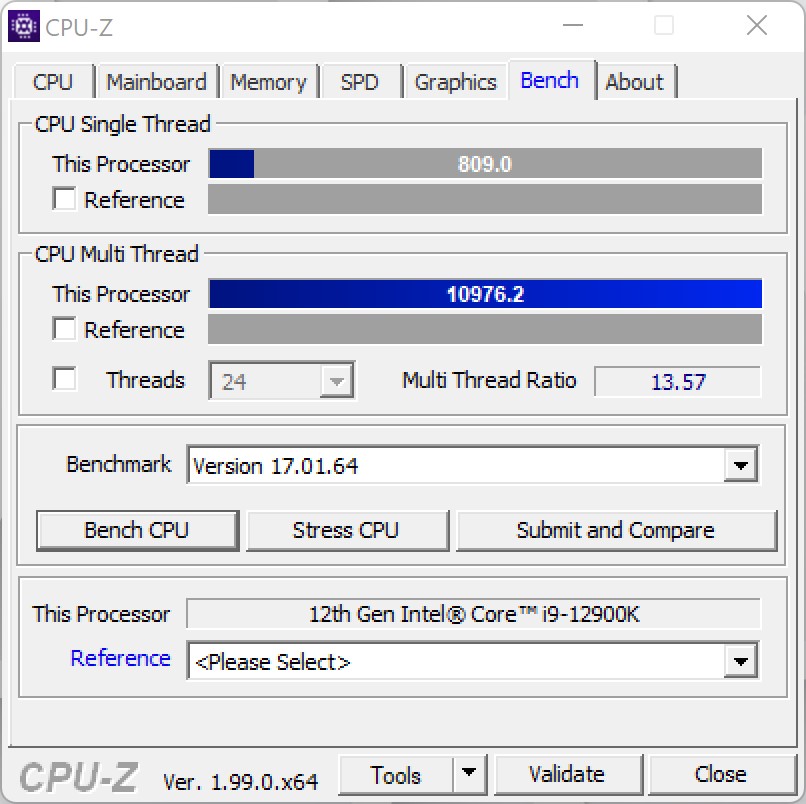
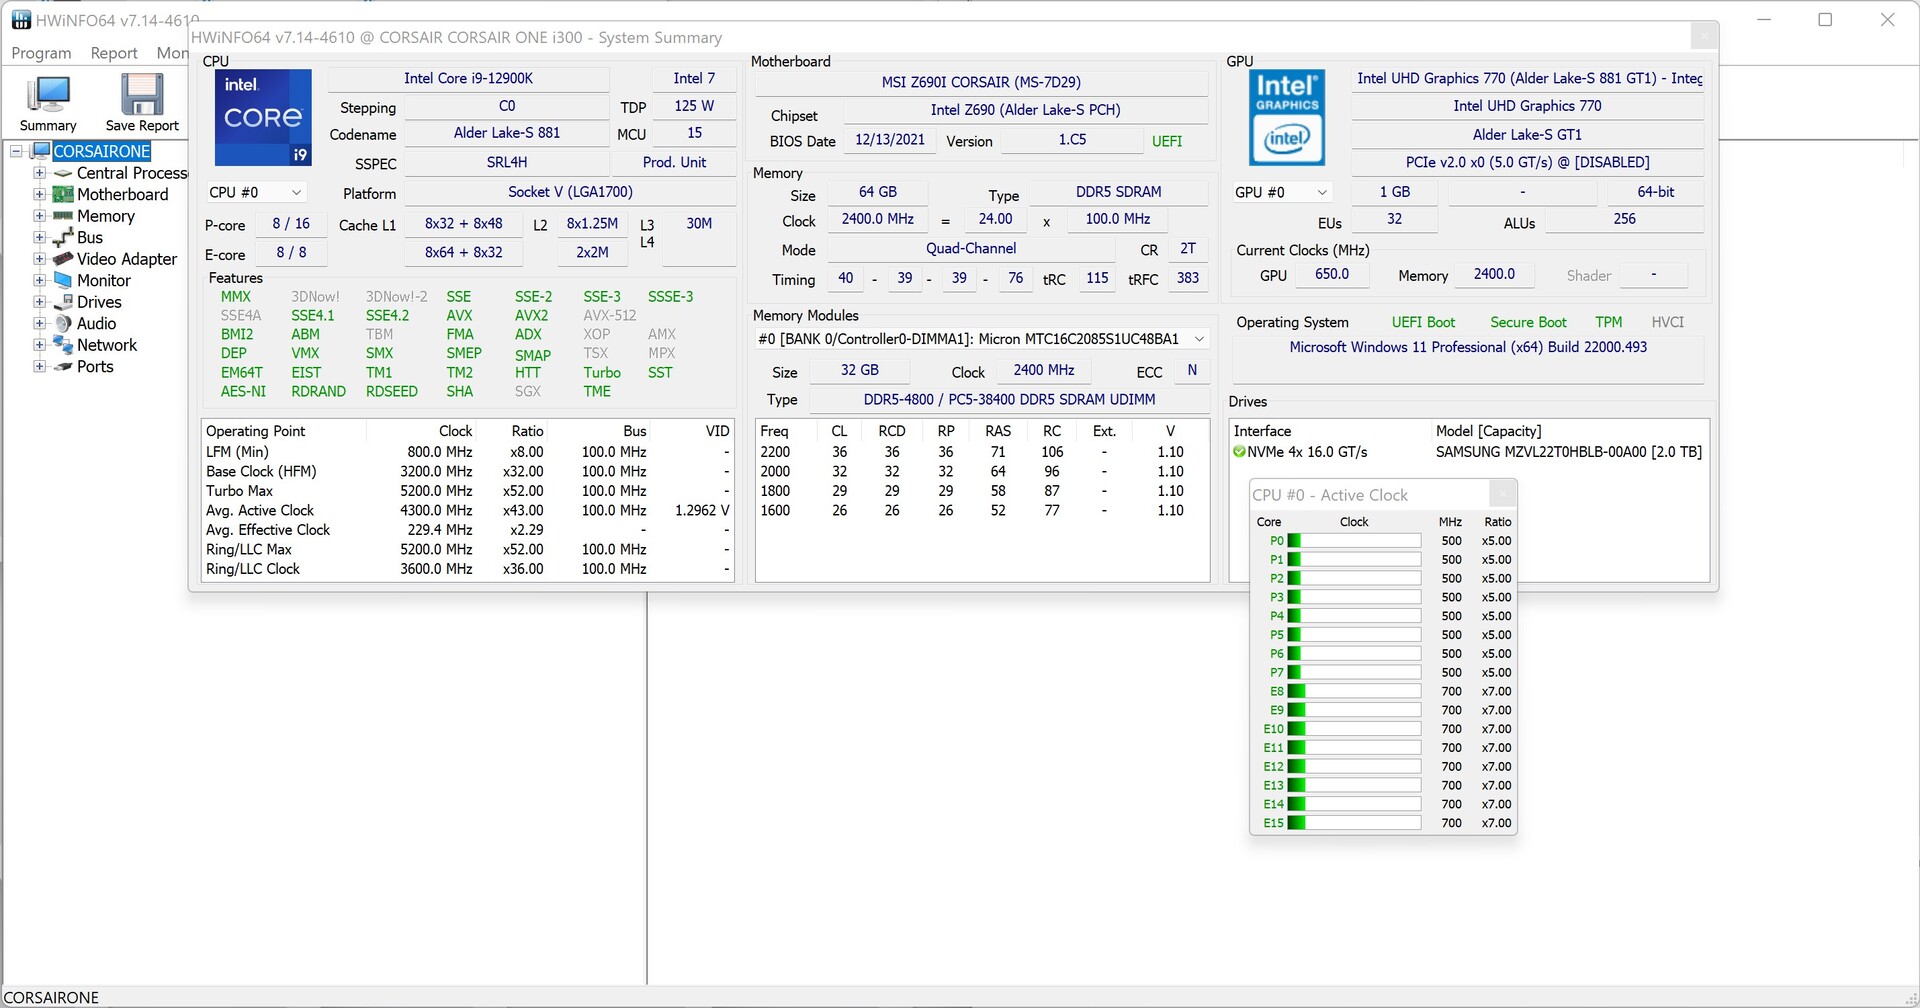
The Corsair One i300 is equipped with Intel's fastest processor that is currently available for gaming. To be exact, Corsair uses the Intel Core i9-12900K based on a Z690 board from MSI. We were already able to see in advance what performance can be delivered by the new flagship from Intel. For additional details concerning the Intel Core i9-12900K, we refer to this page. However, there is a small limitation in the Corsair One i300 in terms of the maximum power consumption. PL1 and also PL2 are limited to the values of 165 and 175 watts respectively, which means that the processor is slightly throttled under load. Without this limitation, the Intel Core i9-12900K should be able to consume up to 241 watts. On the other hand, this option can be modified in the BIOS. But this would then also result in a higher noise volume and higher temperatures.
In the benchmark we are running, the Intel Core i9-12900K does very well, even if it is unable to use its full performance under load. The performance increase compared to the Corsair One i160 is immense. In the overall rating, the current system offers 48% more performance.
For additional comparisons and benchmarks, we refer you to our CPU comparison chart.
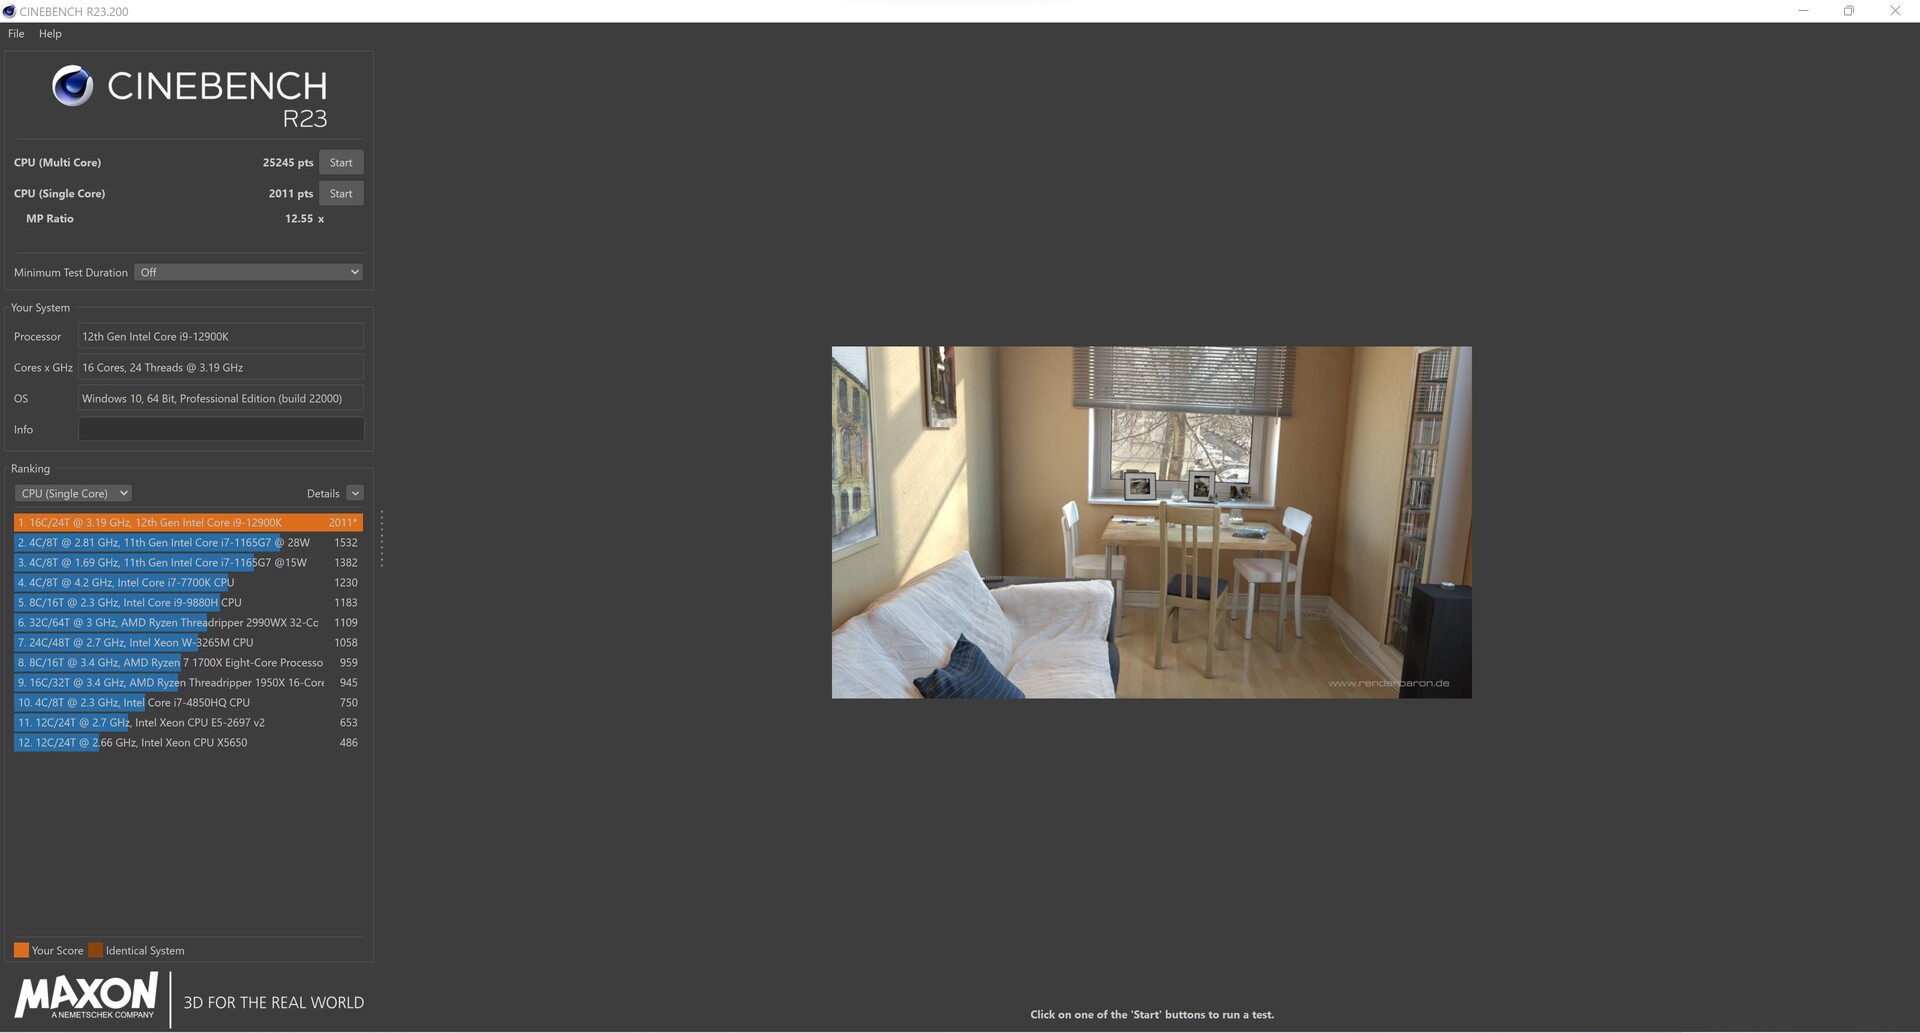
Cinebench R23: Multi Core | Single Core
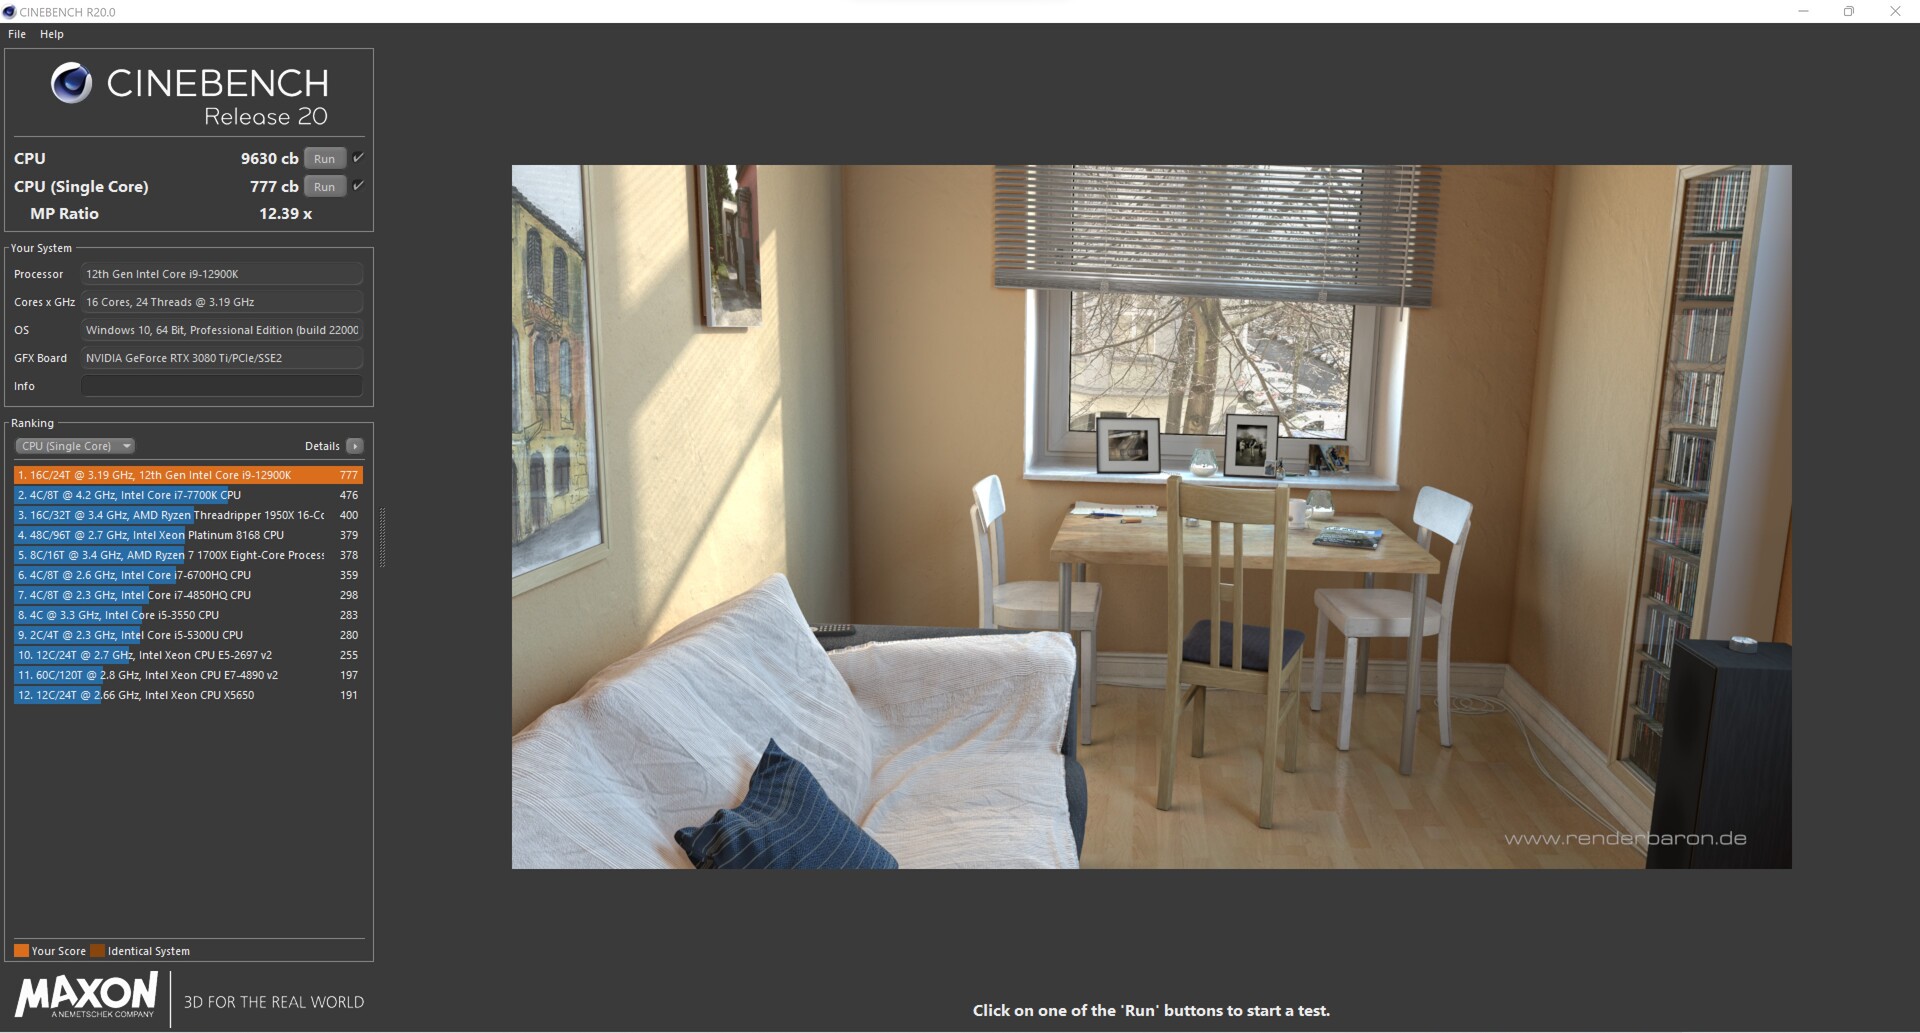
Cinebench R20: CPU (Multi Core) | CPU (Single Core)
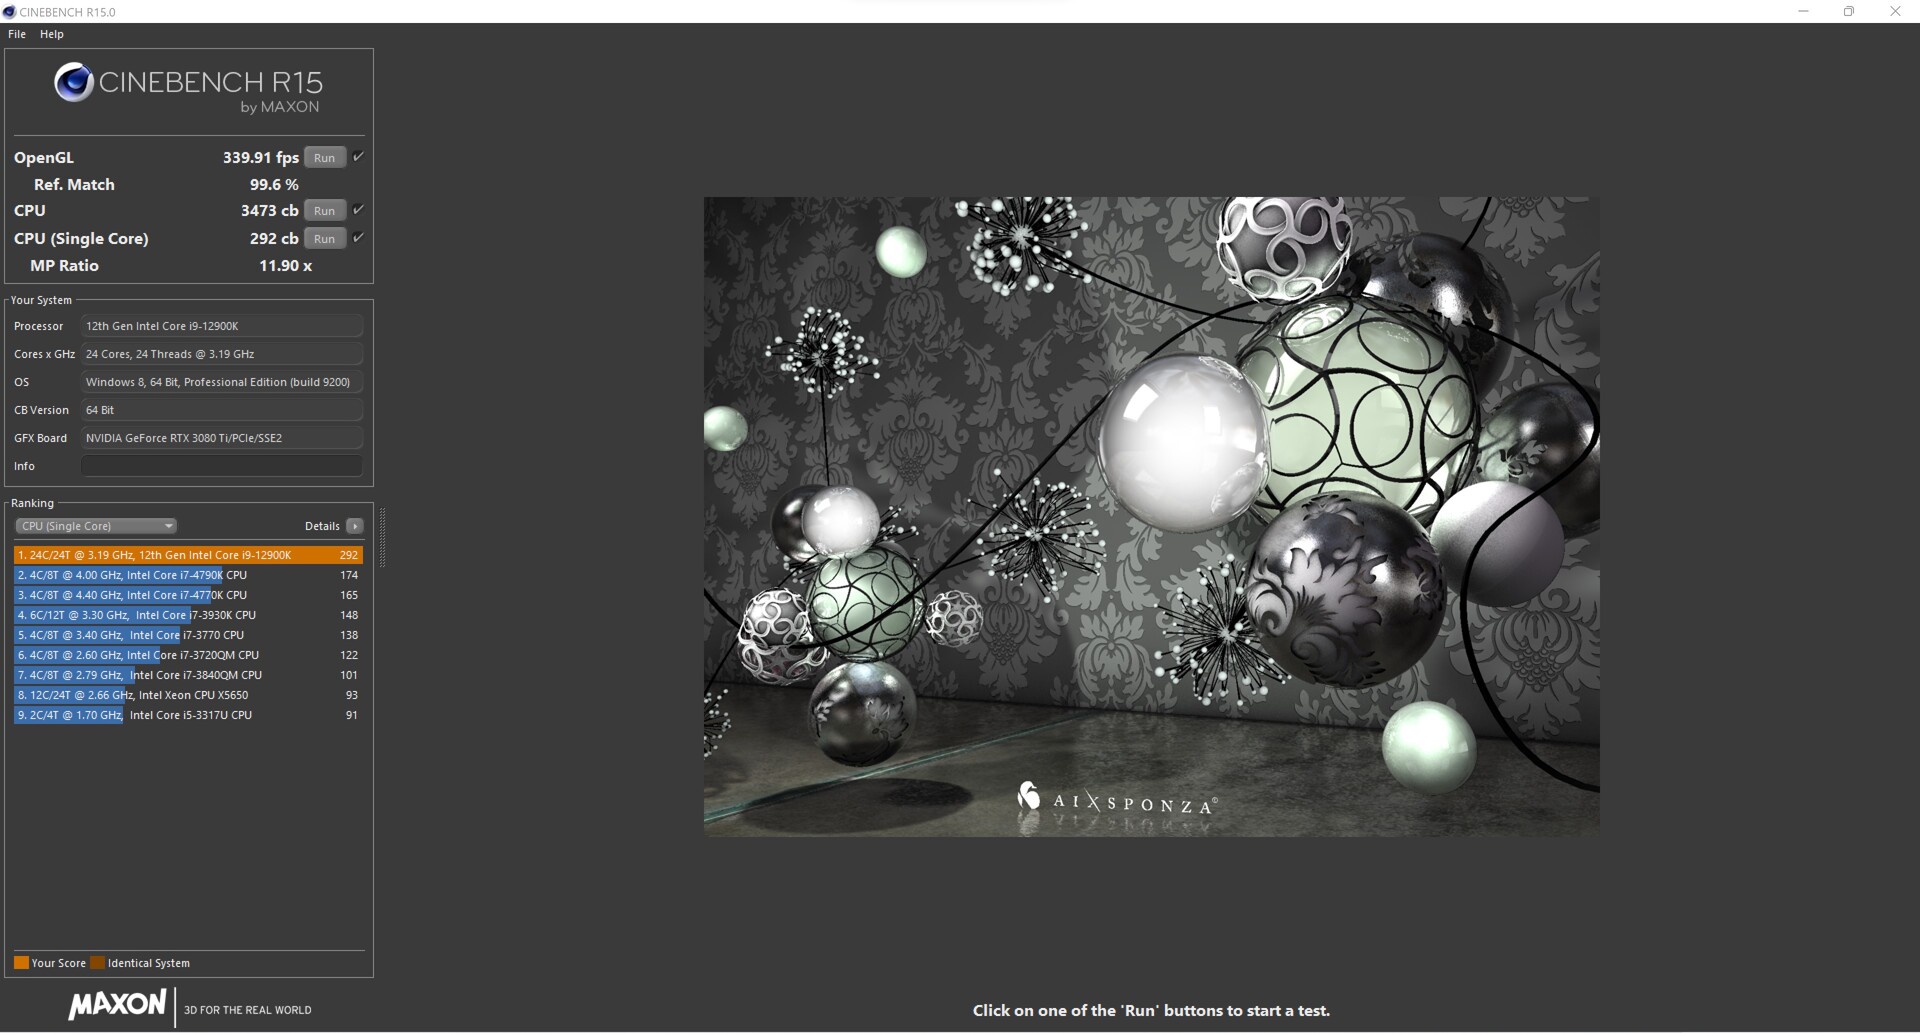
Cinebench R15: CPU Multi 64Bit | CPU Single 64Bit
Blender: v2.79 BMW27 CPU
7-Zip 18.03: 7z b 4 | 7z b 4 -mmt1
Geekbench 5.5: Multi-Core | Single-Core
HWBOT x265 Benchmark v2.2: 4k Preset
LibreOffice : 20 Documents To PDF
R Benchmark 2.5: Overall mean
| CPU Performance rating | |
| Average of class Desktop | |
| Intel Core i9-12900K | |
| Average Intel Core i9-12900K | |
| AMD Ryzen 9 5950X | |
| Intel Core i9-12900K | |
| AMD Ryzen 9 5900X | |
| Intel Core i9-11900K | |
| Intel Core i9-10900K | |
| Intel Core i9-9900K -6! | |
| Cinebench R23 / Multi Core | |
| Average of class Desktop (16119 - 44253, n=16, last 2 years) | |
| AMD Ryzen 9 5950X | |
| Intel Core i9-12900K | |
| Average Intel Core i9-12900K (25245 - 27005, n=2) | |
| Intel Core i9-12900K | |
| AMD Ryzen 9 5900X | |
| Intel Core i9-10900K | |
| Intel Core i9-11900K | |
| Cinebench R23 / Single Core | |
| Average of class Desktop (1722 - 2439, n=16, last 2 years) | |
| Intel Core i9-12900K | |
| Average Intel Core i9-12900K (1998 - 2011, n=2) | |
| Intel Core i9-12900K | |
| Intel Core i9-11900K | |
| AMD Ryzen 9 5950X | |
| AMD Ryzen 9 5900X | |
| Intel Core i9-10900K | |
| Cinebench R20 / CPU (Multi Core) | |
| Average of class Desktop (5710 - 17190, n=15, last 2 years) | |
| AMD Ryzen 9 5950X | |
| Intel Core i9-12900K | |
| Average Intel Core i9-12900K (9630 - 10240, n=2) | |
| Intel Core i9-12900K | |
| AMD Ryzen 9 5900X | |
| Intel Core i9-10900K | |
| Intel Core i9-11900K | |
| Intel Core i9-9900K | |
| Cinebench R20 / CPU (Single Core) | |
| Average of class Desktop (674 - 922, n=15, last 2 years) | |
| Intel Core i9-12900K | |
| Average Intel Core i9-12900K (766 - 777, n=2) | |
| Intel Core i9-12900K | |
| Intel Core i9-11900K | |
| AMD Ryzen 9 5950X | |
| AMD Ryzen 9 5900X | |
| Intel Core i9-10900K | |
| Intel Core i9-9900K | |
| Cinebench R15 / CPU Multi 64Bit | |
| Average of class Desktop (2652 - 6656, n=16, last 2 years) | |
| AMD Ryzen 9 5950X | |
| Intel Core i9-12900K | |
| Average Intel Core i9-12900K (3473 - 4102, n=3) | |
| AMD Ryzen 9 5900X | |
| Intel Core i9-12900K | |
| Intel Core i9-10900K | |
| Intel Core i9-11900K | |
| Intel Core i9-9900K | |
| Cinebench R15 / CPU Single 64Bit | |
| Average of class Desktop (246 - 356, n=16, last 2 years) | |
| Intel Core i9-12900K | |
| Average Intel Core i9-12900K (286 - 292, n=3) | |
| Intel Core i9-12900K | |
| AMD Ryzen 9 5950X | |
| AMD Ryzen 9 5900X | |
| Intel Core i9-11900K | |
| Intel Core i9-10900K | |
| Intel Core i9-9900K | |
| Blender / v2.79 BMW27 CPU | |
| Intel Core i9-9900K | |
| Intel Core i9-11900K | |
| Intel Core i9-10900K | |
| AMD Ryzen 9 5900X | |
| Intel Core i9-12900K | |
| Average Intel Core i9-12900K (121.1 - 128.3, n=2) | |
| Intel Core i9-12900K | |
| Average of class Desktop (75 - 218, n=15, last 2 years) | |
| AMD Ryzen 9 5950X | |
| 7-Zip 18.03 / 7z b 4 | |
| AMD Ryzen 9 5950X | |
| Average of class Desktop (91898 - 163125, n=17, last 2 years) | |
| Intel Core i9-12900K | |
| Average Intel Core i9-12900K (96960 - 97671, n=2) | |
| Intel Core i9-12900K | |
| AMD Ryzen 9 5900X | |
| Intel Core i9-10900K | |
| Intel Core i9-11900K | |
| Intel Core i9-9900K | |
| 7-Zip 18.03 / 7z b 4 -mmt1 | |
| Average of class Desktop (5092 - 8790, n=17, last 2 years) | |
| AMD Ryzen 9 5950X | |
| AMD Ryzen 9 5900X | |
| Intel Core i9-11900K | |
| Intel Core i9-12900K | |
| Average Intel Core i9-12900K (6571 - 6580, n=2) | |
| Intel Core i9-12900K | |
| Intel Core i9-10900K | |
| Intel Core i9-9900K | |
| Geekbench 5.5 / Multi-Core | |
| Average of class Desktop (12626 - 28535, n=30, last 2 years) | |
| Intel Core i9-12900K | |
| Average Intel Core i9-12900K (17698 - 17854, n=2) | |
| Intel Core i9-12900K | |
| AMD Ryzen 9 5950X | |
| AMD Ryzen 9 5900X | |
| Intel Core i9-10900K | |
| Intel Core i9-11900K | |
| Geekbench 5.5 / Single-Core | |
| Average of class Desktop (1755 - 2597, n=30, last 2 years) | |
| Intel Core i9-12900K | |
| Average Intel Core i9-12900K (1969 - 2042, n=2) | |
| Intel Core i9-12900K | |
| Intel Core i9-11900K | |
| AMD Ryzen 9 5950X | |
| AMD Ryzen 9 5900X | |
| Intel Core i9-10900K | |
| HWBOT x265 Benchmark v2.2 / 4k Preset | |
| Average of class Desktop (18.6 - 48.5, n=15, last 2 years) | |
| AMD Ryzen 9 5950X | |
| Intel Core i9-12900K | |
| Average Intel Core i9-12900K (29 - 30, n=2) | |
| Intel Core i9-12900K | |
| AMD Ryzen 9 5900X | |
| Intel Core i9-10900K | |
| Intel Core i9-11900K | |
| Intel Core i9-9900K | |
| LibreOffice / 20 Documents To PDF | |
| Intel Core i9-10900K | |
| Intel Core i9-11900K | |
| AMD Ryzen 9 5900X | |
| AMD Ryzen 9 5950X | |
| Average of class Desktop (35.5 - 79.2, n=16, last 2 years) | |
| Intel Core i9-12900K | |
| Average Intel Core i9-12900K (38.1 - 40.6, n=2) | |
| Intel Core i9-12900K | |
| R Benchmark 2.5 / Overall mean | |
| Intel Core i9-10900K | |
| Intel Core i9-11900K | |
| AMD Ryzen 9 5950X | |
| AMD Ryzen 9 5900X | |
| Intel Core i9-12900K | |
| Average Intel Core i9-12900K (0.3946 - 0.4216, n=2) | |
| Intel Core i9-12900K | |
| Average of class Desktop (0.3299 - 0.4909, n=16, last 2 years) | |
* ... smaller is better
AIDA64: FP32 Ray-Trace | FPU Julia | CPU SHA3 | CPU Queen | FPU SinJulia | FPU Mandel | CPU AES | CPU ZLib | FP64 Ray-Trace | CPU PhotoWorxx
| Performance rating | |
| Average of class Desktop | |
| AMD Ryzen 9 5950X, NVIDIA Titan RTX | |
| AMD Ryzen 9 5900X, NVIDIA Titan RTX | |
| Intel Core i9-11900K, NVIDIA Titan RTX | |
| Intel Core i9-12900K, NVIDIA GeForce RTX 3080 Ti | |
| Average Intel Core i9-12900K | |
| Intel Core i9-12900K, NVIDIA Titan RTX | |
| AIDA64 / FP32 Ray-Trace | |
| Average of class Desktop (12248 - 84577, n=21, last 2 years) | |
| AMD Ryzen 9 5950X, NVIDIA Titan RTX | |
| AMD Ryzen 9 5900X, NVIDIA Titan RTX | |
| Intel Core i9-11900K, NVIDIA Titan RTX | |
| Intel Core i9-12900K, NVIDIA Titan RTX | |
| Average Intel Core i9-12900K (12739 - 13345, n=3) | |
| Intel Core i9-12900K, NVIDIA GeForce RTX 3080 Ti | |
| AIDA64 / FPU Julia | |
| Average of class Desktop (65152 - 246125, n=21, last 2 years) | |
| AMD Ryzen 9 5950X, NVIDIA Titan RTX | |
| AMD Ryzen 9 5900X, NVIDIA Titan RTX | |
| Intel Core i9-11900K, NVIDIA Titan RTX | |
| Intel Core i9-12900K, NVIDIA Titan RTX | |
| Average Intel Core i9-12900K (58406 - 59419, n=3) | |
| Intel Core i9-12900K, NVIDIA GeForce RTX 3080 Ti | |
| AIDA64 / CPU SHA3 | |
| Average of class Desktop (2982 - 10804, n=21, last 2 years) | |
| Intel Core i9-11900K, NVIDIA Titan RTX | |
| Average Intel Core i9-12900K (4796 - 5127, n=3) | |
| Intel Core i9-12900K, NVIDIA Titan RTX | |
| Intel Core i9-12900K, NVIDIA GeForce RTX 3080 Ti | |
| AMD Ryzen 9 5950X, NVIDIA Titan RTX | |
| AMD Ryzen 9 5900X, NVIDIA Titan RTX | |
| AIDA64 / CPU Queen | |
| AMD Ryzen 9 5950X, NVIDIA Titan RTX | |
| AMD Ryzen 9 5900X, NVIDIA Titan RTX | |
| Average of class Desktop (76512 - 187912, n=18, last 2 years) | |
| Intel Core i9-12900K, NVIDIA Titan RTX | |
| Average Intel Core i9-12900K (112066 - 112694, n=3) | |
| Intel Core i9-12900K, NVIDIA GeForce RTX 3080 Ti | |
| Intel Core i9-11900K, NVIDIA Titan RTX | |
| AIDA64 / FPU SinJulia | |
| AMD Ryzen 9 5950X, NVIDIA Titan RTX | |
| AMD Ryzen 9 5900X, NVIDIA Titan RTX | |
| Average of class Desktop (6443 - 35251, n=21, last 2 years) | |
| Intel Core i9-12900K, NVIDIA Titan RTX | |
| Average Intel Core i9-12900K (14590 - 14664, n=3) | |
| Intel Core i9-12900K, NVIDIA GeForce RTX 3080 Ti | |
| Intel Core i9-11900K, NVIDIA Titan RTX | |
| AIDA64 / FPU Mandel | |
| Average of class Desktop (31697 - 129745, n=21, last 2 years) | |
| AMD Ryzen 9 5950X, NVIDIA Titan RTX | |
| AMD Ryzen 9 5900X, NVIDIA Titan RTX | |
| Intel Core i9-11900K, NVIDIA Titan RTX | |
| Intel Core i9-12900K, NVIDIA Titan RTX | |
| Average Intel Core i9-12900K (35801 - 39323, n=3) | |
| Intel Core i9-12900K, NVIDIA GeForce RTX 3080 Ti | |
| AIDA64 / CPU AES | |
| Intel Core i9-11900K, NVIDIA Titan RTX | |
| AMD Ryzen 9 5950X, NVIDIA Titan RTX | |
| Average of class Desktop (57777 - 513073, n=21, last 2 years) | |
| Intel Core i9-12900K, NVIDIA GeForce RTX 3080 Ti | |
| Average Intel Core i9-12900K (94062 - 140055, n=3) | |
| AMD Ryzen 9 5900X, NVIDIA Titan RTX | |
| Intel Core i9-12900K, NVIDIA Titan RTX | |
| AIDA64 / CPU ZLib | |
| AMD Ryzen 9 5950X, NVIDIA Titan RTX | |
| Average of class Desktop (887 - 2674, n=21, last 2 years) | |
| Average Intel Core i9-12900K (1537 - 1608, n=3) | |
| Intel Core i9-12900K, NVIDIA Titan RTX | |
| Intel Core i9-12900K, NVIDIA GeForce RTX 3080 Ti | |
| AMD Ryzen 9 5900X, NVIDIA Titan RTX | |
| Intel Core i9-11900K, NVIDIA Titan RTX | |
| AIDA64 / FP64 Ray-Trace | |
| Average of class Desktop (6471 - 44013, n=21, last 2 years) | |
| AMD Ryzen 9 5950X, NVIDIA Titan RTX | |
| AMD Ryzen 9 5900X, NVIDIA Titan RTX | |
| Intel Core i9-11900K, NVIDIA Titan RTX | |
| Intel Core i9-12900K, NVIDIA Titan RTX | |
| Average Intel Core i9-12900K (7586 - 8283, n=3) | |
| Intel Core i9-12900K, NVIDIA GeForce RTX 3080 Ti | |
| AIDA64 / CPU PhotoWorxx | |
| Intel Core i9-12900K, NVIDIA GeForce RTX 3080 Ti | |
| Intel Core i9-12900K, NVIDIA Titan RTX | |
| Average of class Desktop (38071 - 63949, n=21, last 2 years) | |
| Average Intel Core i9-12900K (33311 - 49236, n=3) | |
| Intel Core i9-11900K, NVIDIA Titan RTX | |
| AMD Ryzen 9 5950X, NVIDIA Titan RTX | |
| AMD Ryzen 9 5900X, NVIDIA Titan RTX | |
Cinebench R15 Multi Constant Load Test
We take a look at the system under constant load using the Cinebench-R15 Multi loop. In this way, we can determine whether the cooling system is powerful enough to cool the processor effectively. In the Corsair One i300, the work of the AiO is very reliable, and the result remains constant even after 50 runs. However, the slightly lower TDP of the Intel Core i9-12900K is clearly noticeable here. If you let the Core i9-12900K run free from the limitations, it can achieve almost 500 points more.
System Performance
During our testing period, the whole system ran very fast. This is also reflected in the system benchmarks. In the PCMark 10 tests, the Corsair One i300 takes the lead in all the individual tests. Only in the render tests, the Corsair One i300 isn't quite able to keep up due to the graphics card. The Nvidia Titan RTX of the comparison systems is the better choice here, which is due to the closeness to the quad series.
| LuxMark v2.0 64Bit | |
| Room GPUs-only | |
| Intel Core i9-12900K | |
| Intel Core i9-9900K | |
| Sala GPUs-only | |
| Intel Core i9-12900K | |
| Intel Core i9-9900K | |
| ComputeMark v2.1 | |
| 1024x600 Normal, Score | |
| Intel Core i9-12900K | |
| Intel Core i9-9900K | |
| 1024x600 Normal, Fluid 3DTex | |
| Intel Core i9-12900K | |
| Intel Core i9-9900K | |
| 1024x600 Normal, Fluid 2DTexArr | |
| Intel Core i9-12900K | |
| Intel Core i9-9900K | |
| 1024x600 Normal, Mandel Vector | |
| Intel Core i9-12900K | |
| Intel Core i9-9900K | |
| 1024x600 Normal, Mandel Scalar | |
| Intel Core i9-12900K | |
| Intel Core i9-9900K | |
| 1024x600 Normal, QJuliaRayTrace | |
| Intel Core i9-12900K | |
| Intel Core i9-9900K | |
| PCMark 10 Score | 8897 points | |
Help | ||
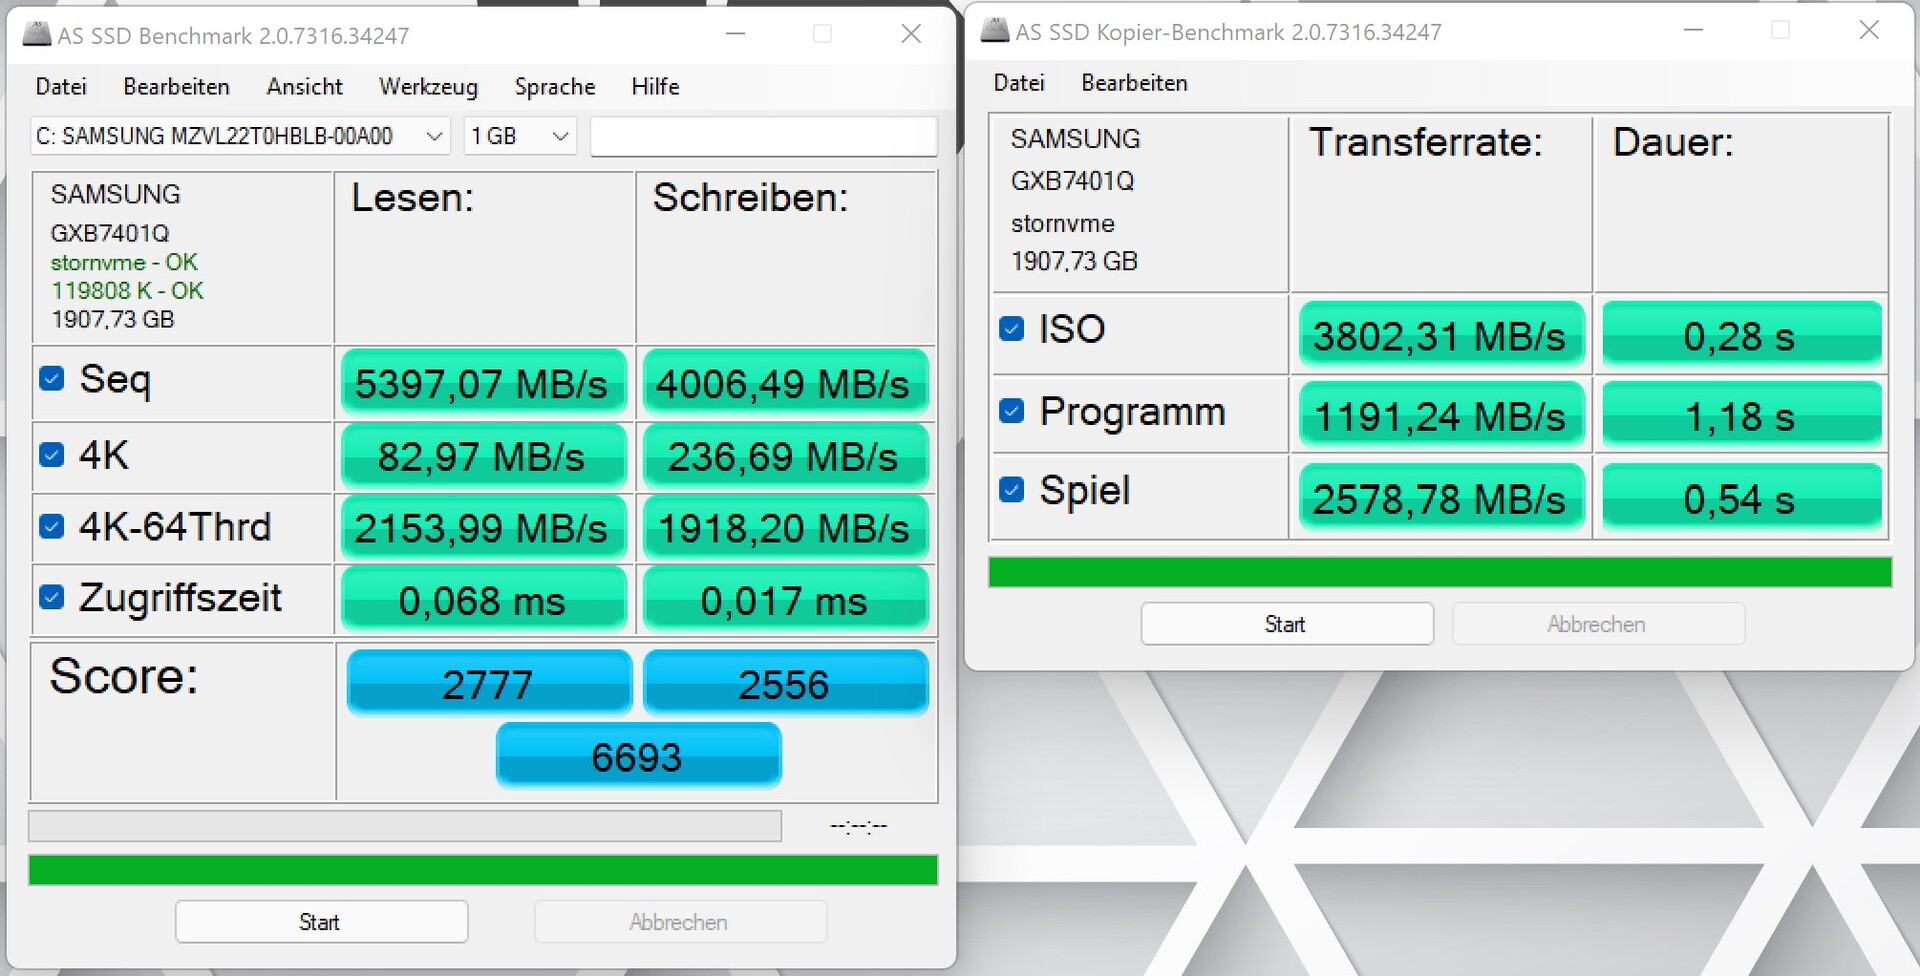
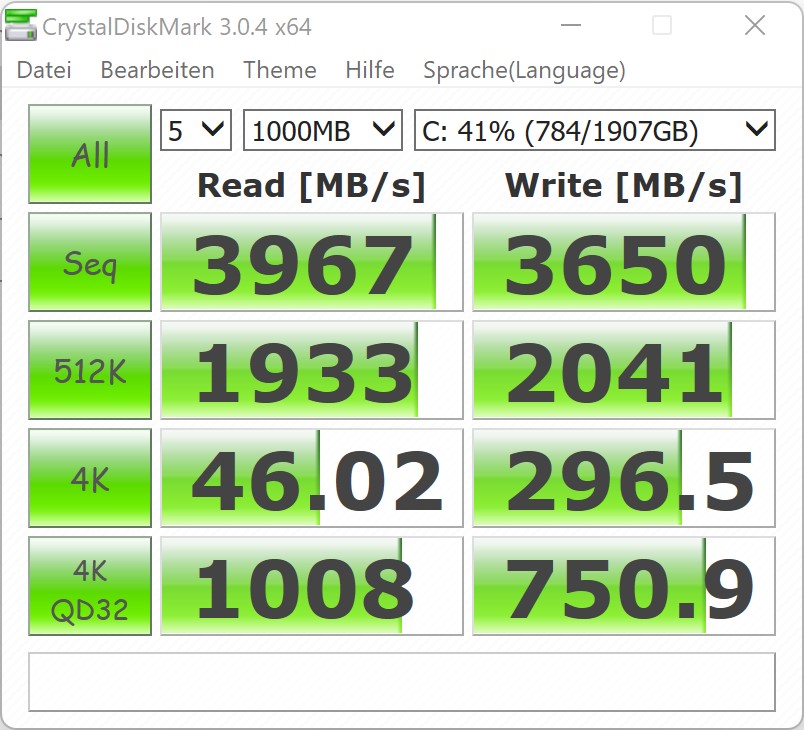
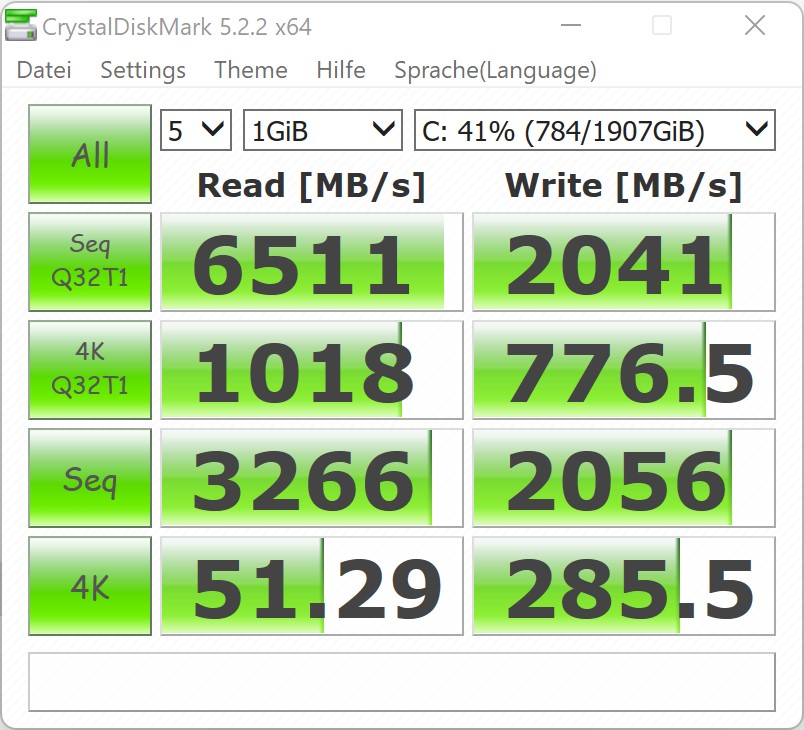
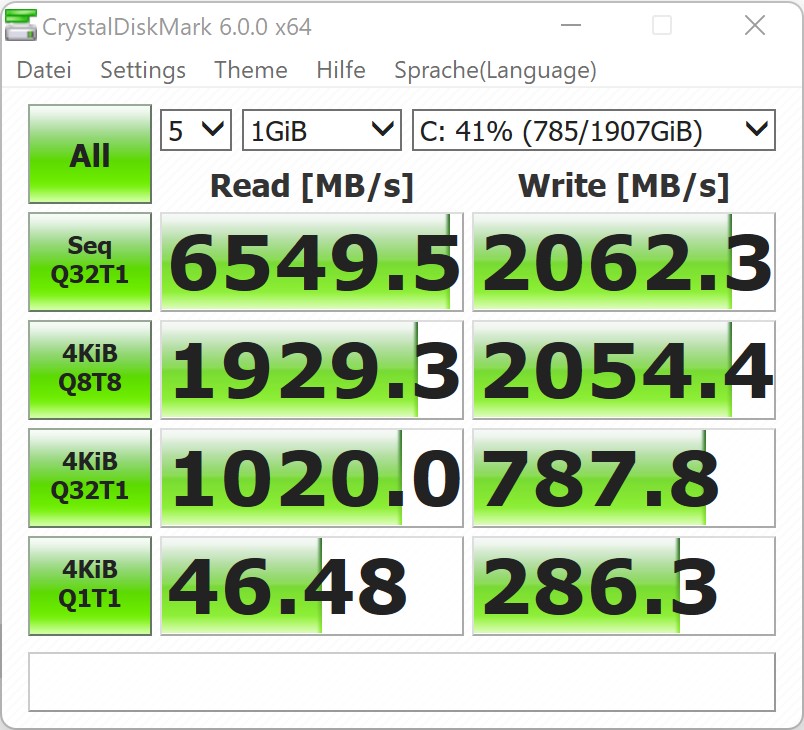
Storage Solution
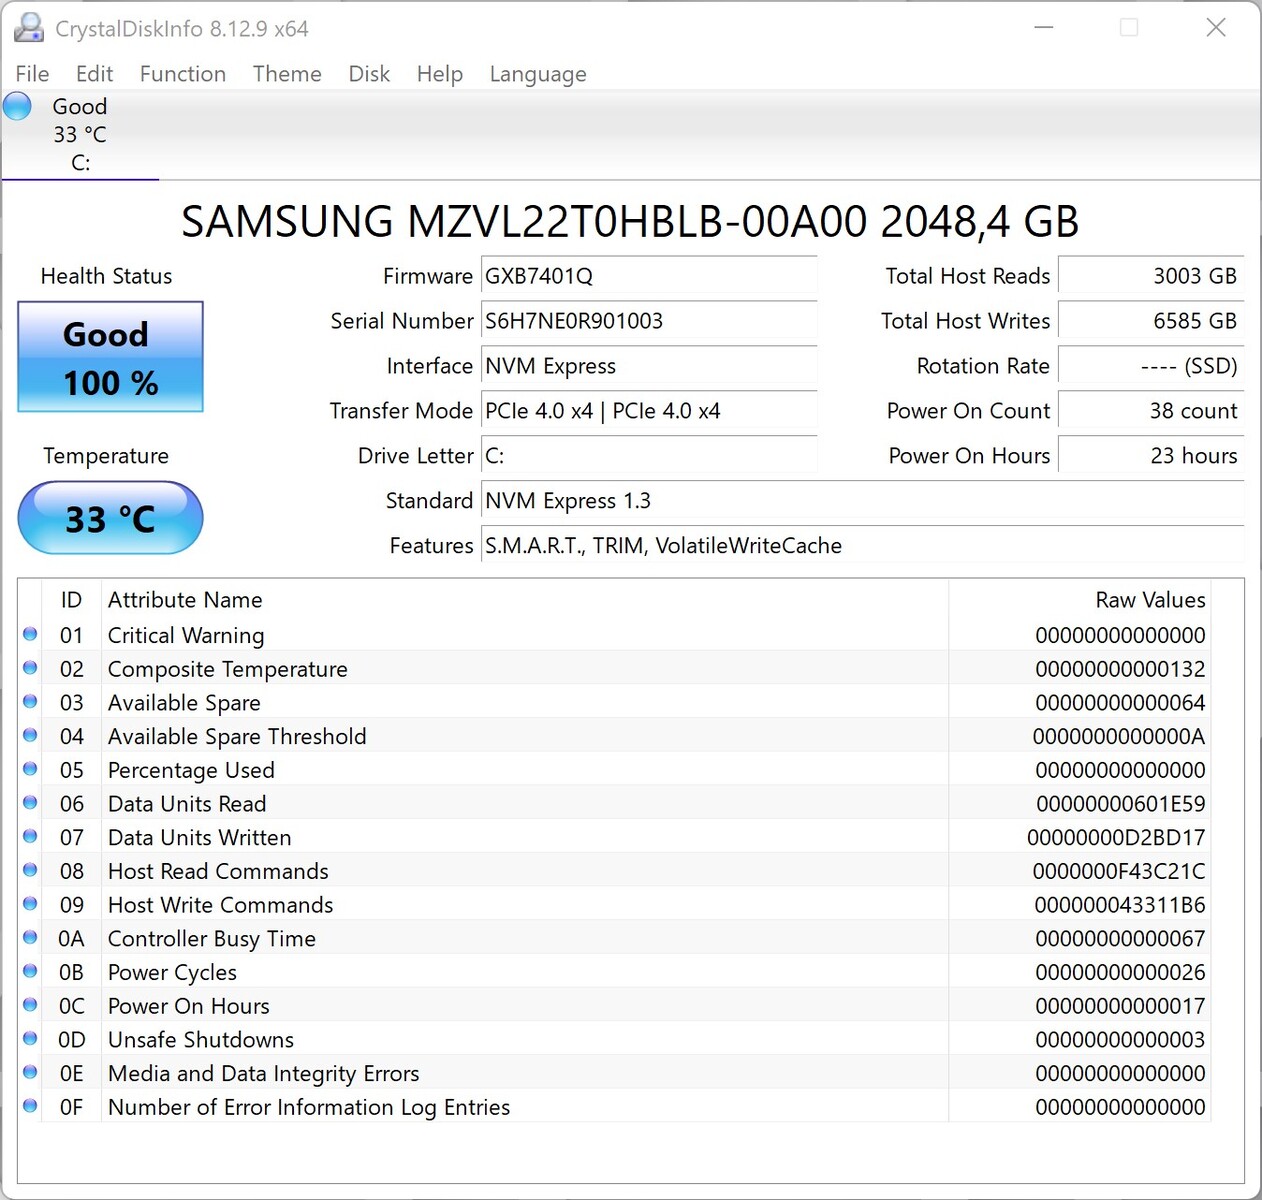
In our test unit, Corsair uses a fast NVMe SSD with 2 TB of storage. With this, users will get sufficient storage space to install several games without any trouble. In the test, the Samsung SSD was able to impress us with very high transfer rates. There is no additional conventional hard drive as was still the case in the Corsair One i160. The system can also be expanded with additional M.2 SSDs. However, if you want to add them, you should have some tinkering experience, since the space inside the case is very limited.
Unfortunately, the compact case does not offer space for any other storage modules.

| Drive Performance rating - Percent | |
| Average of class Desktop | |
| Corsair One i300 | |
| Average Samsung PM9A1 MZVL22T0HBLB | |
| AMD Ryzen 9 5950X | |
| Intel Beast Canyon NUC | |
| Corsair One i160 -8! | |
| Zotac Magnus One (ECM73070C) | |
* ... smaller is better
Graphics Card
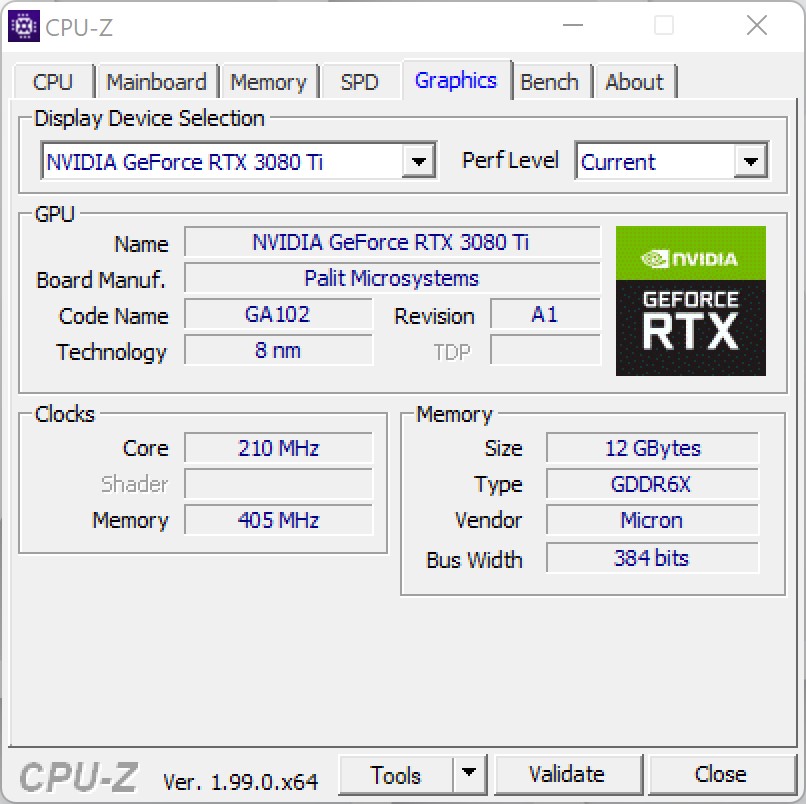
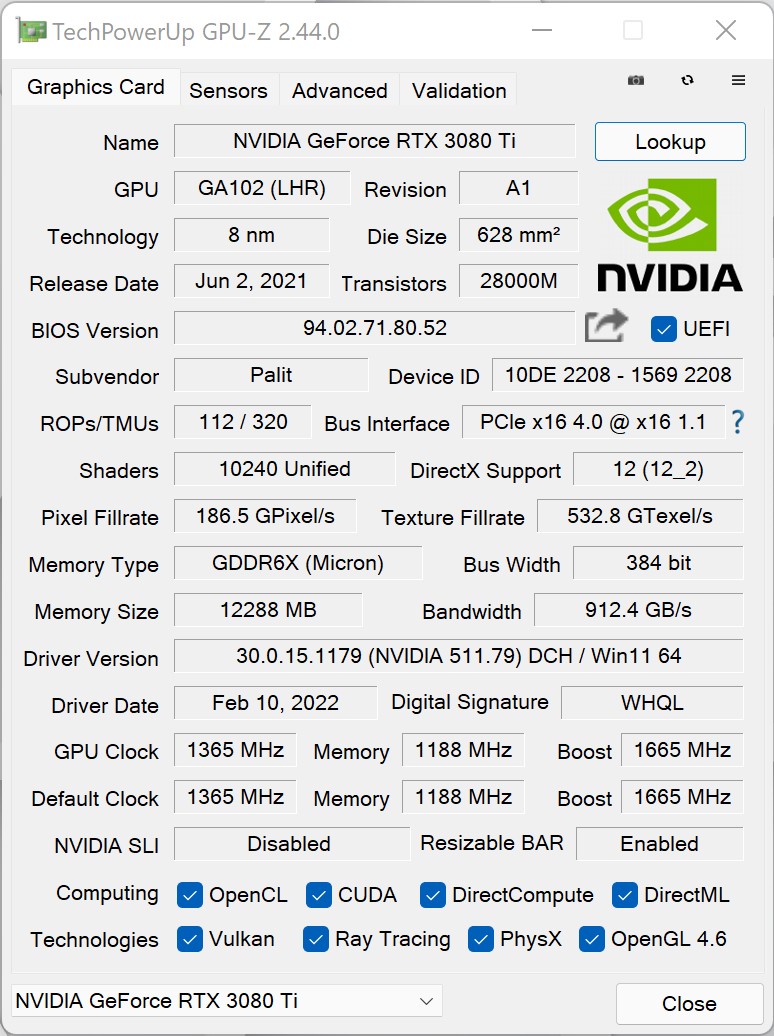
In the compact gaming system, Corsair uses an Nvidia GeForce RTX 3080 Ti, which is almost identical to an Nvidia GeForce RTX 3090 in terms of the performance. However, with 12 GB of VRAM, it only offers half as much RAM as Nvidia's top model, but this doesn't matter much with the current games. With this, the system offers absolute performance in terms of gaming. The cooling of the graphics card is very well designed, since an AiO is used as in the CPU. In addition, there are also two small fans on the graphics card, in order to provide some additional active cooling to the transformer and VRAM. You can see that this design works well, if you take a look at the synthetic benchmarks. The Corsair One i300 also achieves best values due to the Intel Core i9-12900K.
Compared to the Corsair One i160, you can expect a performance increase by 20 to 30%.
| 3DMark 05 Standard | 63621 points | |
| 3DMark 06 Standard Score | 66161 points | |
| 3DMark Vantage P Result | 120236 points | |
| 3DMark 11 Performance | 47170 points | |
| 3DMark Ice Storm Standard Score | 336443 points | |
| 3DMark Cloud Gate Standard Score | 81921 points | |
| 3DMark Fire Strike Score | 40079 points | |
| 3DMark Fire Strike Extreme Score | 23109 points | |
| 3DMark Time Spy Score | 18985 points | |
Help | ||
Gaming Performance
Since Corsair uses the most current hardware in the One i300, it was clear that the gaming performance of the system is also at the top level. Currently, you can enjoy all games without any compromises in 2160p. Compared to the other desktop GPUs that we tested previously, the performance of our test unit turns out significantly better. The relatively high advantage compared to the Nvidia GeForce RTX 3090 is due to the better CPU of the Corsair One i300. Our GPU test system is based on an AMD Ryzen 9 5900X, which has a significant disadvantage to the Intel Core i9-12900K.
As already in the CPU tests, we also put the graphics card under load for a longer time period. To do this, we use "The Witcher 3" with the Ultra preset. During the test, the performance of the Nvidia GeForce RTX 3080 Ti remains stable throughout, and we do not notice any performance drops. At an average of 189 frames per second, the game runs very well, allowing you to also use monitors with 165 Hz.
| The Witcher 3 | |
| 1920x1080 Ultra Graphics & Postprocessing (HBAO+) | |
| Corsair One i300 | |
| Average NVIDIA GeForce RTX 3090 (160 - 192.6, n=18) | |
| Average AMD Radeon RX 6800 (152.1 - 156, n=3) | |
| Average NVIDIA GeForce RTX 3080 (145 - 152, n=2) | |
| Average NVIDIA Titan RTX (124 - 150, n=28) | |
| Average AMD Radeon RX 6700 XT (117 - 130.4, n=3) | |
| Average NVIDIA GeForce RTX 3070 (52.8 - 132.2, n=7) | |
| 3840x2160 High Graphics & Postprocessing (Nvidia HairWorks Off) | |
| Average NVIDIA GeForce RTX 3090 (128 - 160.2, n=14) | |
| Corsair One i300 | |
| Average NVIDIA GeForce RTX 3080 (114 - 115, n=2) | |
| Average NVIDIA Titan RTX (94 - 107.1, n=28) | |
| Average AMD Radeon RX 6800 (96.8 - 100.7, n=3) | |
| Average NVIDIA GeForce RTX 3070 (84 - 93.9, n=5) | |
| Average AMD Radeon RX 6700 XT (63 - 75.7, n=3) | |
| Rise of the Tomb Raider | |
| 1920x1080 Very High Preset AA:FX AF:16x | |
| Average NVIDIA GeForce RTX 3090 (240 - 254, n=2) | |
| Average NVIDIA GeForce RTX 3080 (217 - 233, n=2) | |
| Corsair One i300 | |
| Average NVIDIA Titan RTX (n=1) | |
| Average AMD Radeon RX 6800 (n=1) | |
| Average NVIDIA GeForce RTX 3070 (151 - 169, n=3) | |
| Average AMD Radeon RX 6700 XT (n=1) | |
| 3840x2160 High Preset AA:FX AF:4x | |
| Average NVIDIA GeForce RTX 3090 (128 - 128.1, n=2) | |
| Corsair One i300 | |
| Average NVIDIA GeForce RTX 3080 (107 - 114, n=2) | |
| Average NVIDIA Titan RTX (n=1) | |
| Average AMD Radeon RX 6800 (n=1) | |
| Average NVIDIA GeForce RTX 3070 (76.7 - 83.8, n=3) | |
| Average AMD Radeon RX 6700 XT (n=1) | |
| Far Cry 6 | |
| 1920x1080 Ultra Graphics Quality + HD Textures AA:T | |
| Corsair One i300 | |
| Average NVIDIA GeForce RTX 3090 (94 - 177.6, n=10) | |
| Average AMD Radeon RX 6800 (116 - 152.5, n=3) | |
| Average NVIDIA Titan RTX (94.7 - 138.9, n=6) | |
| Average AMD Radeon RX 6700 XT (102 - 136.6, n=3) | |
| Average NVIDIA GeForce RTX 3070 (91 - 114.2, n=2) | |
| Average NVIDIA GeForce RTX 3080 (n=1) | |
| 3840x2160 Ultra Graphics Quality + HD Textures AA:T | |
| Average NVIDIA GeForce RTX 3090 (77 - 86.7, n=10) | |
| Corsair One i300 | |
| Average NVIDIA GeForce RTX 3080 (n=1) | |
| Average AMD Radeon RX 6800 (68.1 - 69.7, n=3) | |
| Average NVIDIA Titan RTX (52.8 - 64.2, n=6) | |
| Average AMD Radeon RX 6700 XT (50 - 52.7, n=3) | |
| Average NVIDIA GeForce RTX 3070 (26.4 - 57, n=2) | |
| F1 2021 | |
| 1920x1080 Ultra High Preset + Raytracing AA:T AF:16x | |
| Corsair One i300 | |
| Average NVIDIA GeForce RTX 3090 (154 - 244, n=13) | |
| Average AMD Radeon RX 6800 (167 - 175.5, n=3) | |
| Average NVIDIA Titan RTX (160 - 172, n=6) | |
| Average NVIDIA GeForce RTX 3070 (148 - 158, n=2) | |
| Average NVIDIA GeForce RTX 3080 (n=1) | |
| Average AMD Radeon RX 6700 XT (143 - 145.2, n=3) | |
| 3840x2160 Ultra High Preset + Raytracing AA:T AF:16x | |
| Average NVIDIA GeForce RTX 3090 (100.4 - 110, n=13) | |
| Corsair One i300 | |
| Average NVIDIA GeForce RTX 3080 (n=1) | |
| Average NVIDIA Titan RTX (71.9 - 74.5, n=6) | |
| Average AMD Radeon RX 6800 (71.8 - 74, n=3) | |
| Average NVIDIA GeForce RTX 3070 (64 - 67.3, n=2) | |
| Average AMD Radeon RX 6700 XT (56.3 - 56.9, n=3) | |
The Witcher 3 FPS Chart
| low | med. | high | ultra | QHD | 4K | |
|---|---|---|---|---|---|---|
| GTA V (2015) | 187 | 187 | 187 | 149 | 147 | 180 |
| The Witcher 3 (2015) | 681 | 554 | 365 | 183 | 149 | |
| Dota 2 Reborn (2015) | 240.3 | 214.8 | 207.6 | 196.1 | 191.5 | |
| Rise of the Tomb Raider (2016) | 487 | 340 | 257 | 221 | 114 | |
| Final Fantasy XV Benchmark (2018) | 232 | 227 | 175 | 136 | 84 | |
| X-Plane 11.11 (2018) | 205 | 178 | 135 | 118 | ||
| Far Cry 5 (2018) | 230 | 200 | 190 | 175 | 168 | 108 |
| Strange Brigade (2018) | 667 | 484 | 392 | 345 | 260 | 156 |
| Shadow of the Tomb Raider (2018) | 245 | 226 | 226 | 212 | 164 | 93.7 |
| Far Cry New Dawn (2019) | 190 | 165 | 157 | 141 | 137 | 107 |
| Metro Exodus (2019) | 258 | 212 | 169 | 137 | 113 | 75 |
| Anno 1800 (2019) | 159 | 163 | 124 | 69.4 | 66.1 | 55.9 |
| Control (2019) | 240 | 233 | 187 | 124 | 63.9 | |
| Borderlands 3 (2019) | 208 | 181 | 167 | 152 | 125 | 72 |
| F1 2020 (2020) | 478 | 379 | 397 | 298 | 233 | 143 |
| F1 2021 (2021) | 534 | 498 | 410 | 219 | 170 | 101 |
| New World (2021) | 194 | 165 | 153 | 142 | 133 | 79.2 |
| Far Cry 6 (2021) | 200 | 176 | 155 | 149 | 129 | 81.6 |
| Guardians of the Galaxy (2021) | 194 | 196 | 191 | 191 | 186 | 110 |
| Riders Republic (2021) | 284 | 220 | 188 | 176 | 136 | 80 |
| Forza Horizon 5 (2021) | 292 | 200 | 188 | 126 | 111 | 84 |
| Battlefield 2042 (2021) | 216 | 194 | 169 | 150 | 123 | 83 |
| Farming Simulator 22 (2021) | 349 | 270 | 226 | 203 | 201 | 157 |
| Halo Infinite (2021) | 229 | 198 | 188 | 142 | 83.1 | |
| God of War (2022) | 209 | 181 | 163 | 117 | 98.7 | 64.7 |
| Rainbow Six Extraction (2022) | 365 | 353 | 348 | 282 | 194 | 104 |
| Dying Light 2 (2022) | 189 | 164 | 149 | 109 | 61.5 |
Emissions
Noise Emissions
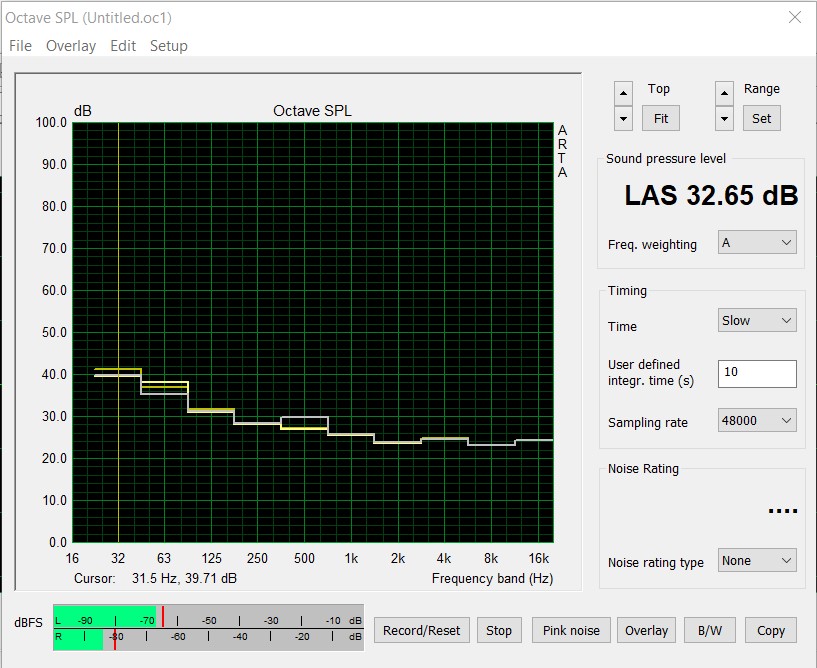
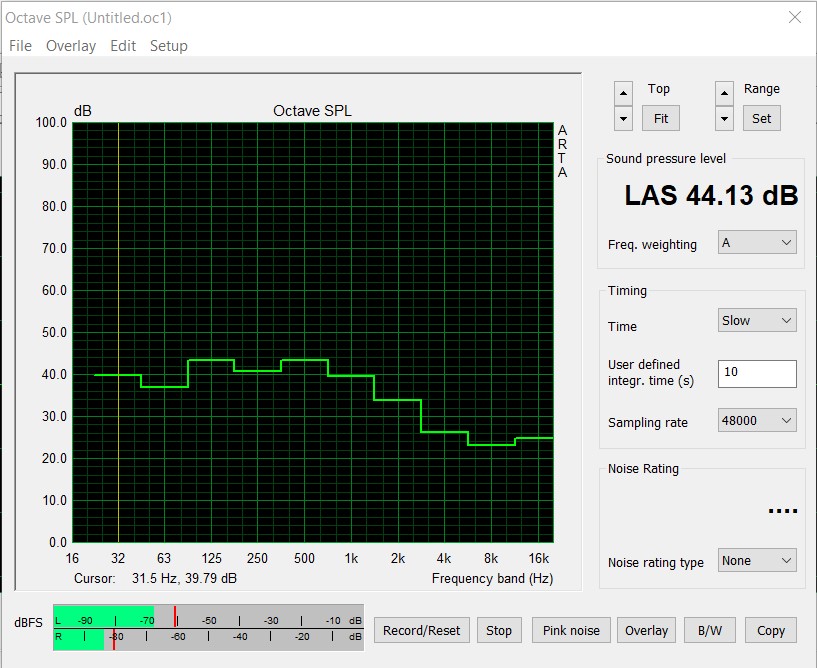
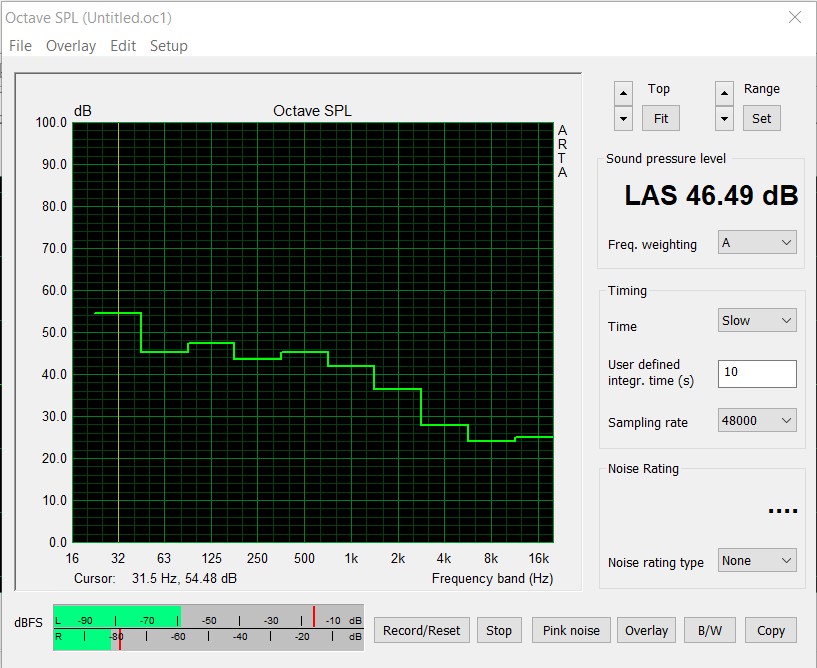
The cooling of the Corsair One i300 is based on the same method as that of the Corsair One i160. In 2D operation, the system runs relatively quietly at about 32.6 dB(A). At this point, the large 140-mm fan does not run yet, but you can hear the two pumps of the AiO and their sound always remains present. Unfortunately, this is not very pleasant in the long run. There must also be some pumps that can do their work while remaining significantly quieter. Under load, the 140-mm fan in the case cover will also start to run after a short time. At 44 dB(A) during the stress test, the system then can be heard clearly. While gaming, it even gets a bit louder at slightly more than 46 dB(A).
Noise level
| Idle |
| 32.4 / 32.5 / 32.6 dB(A) |
| Load |
| / 44.13 dB(A) |
 | ||
30 dB silent 40 dB(A) audible 50 dB(A) loud |
||
min: | ||
Temperature and Power Consumption
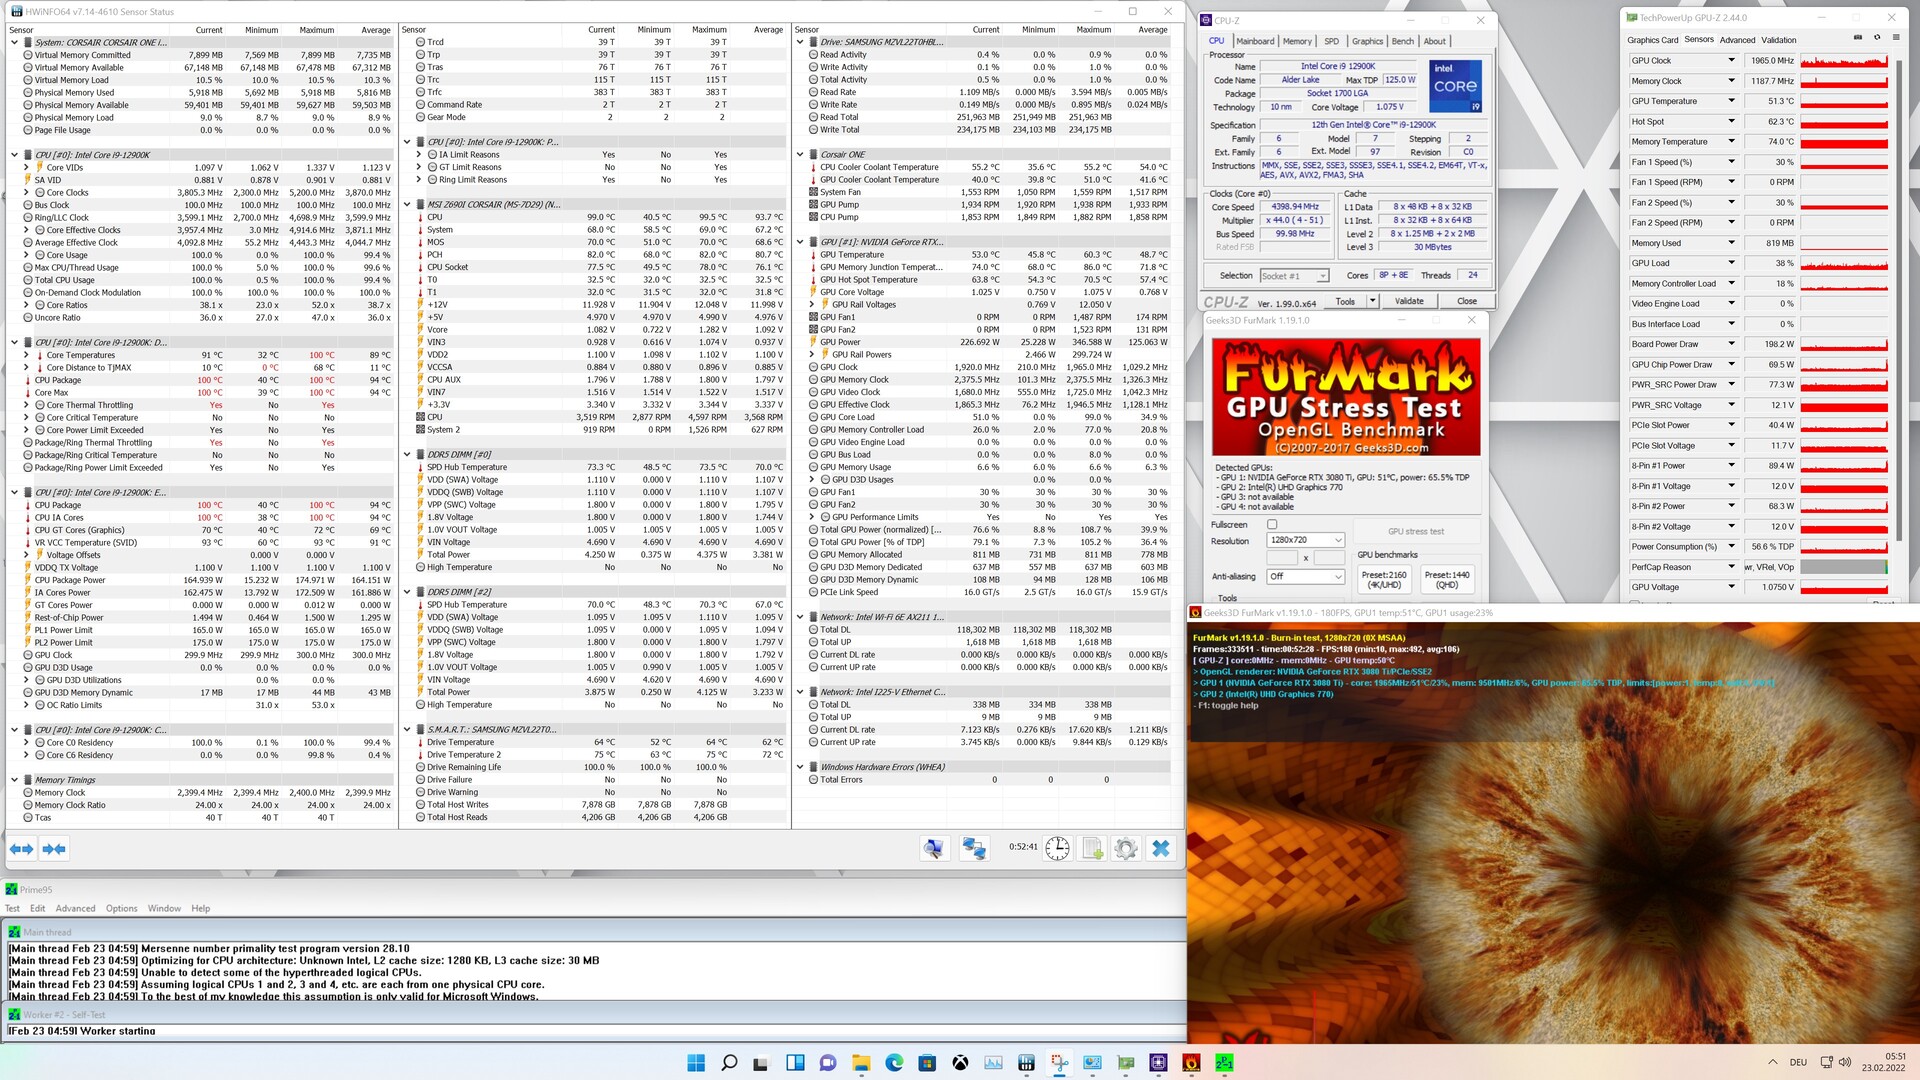
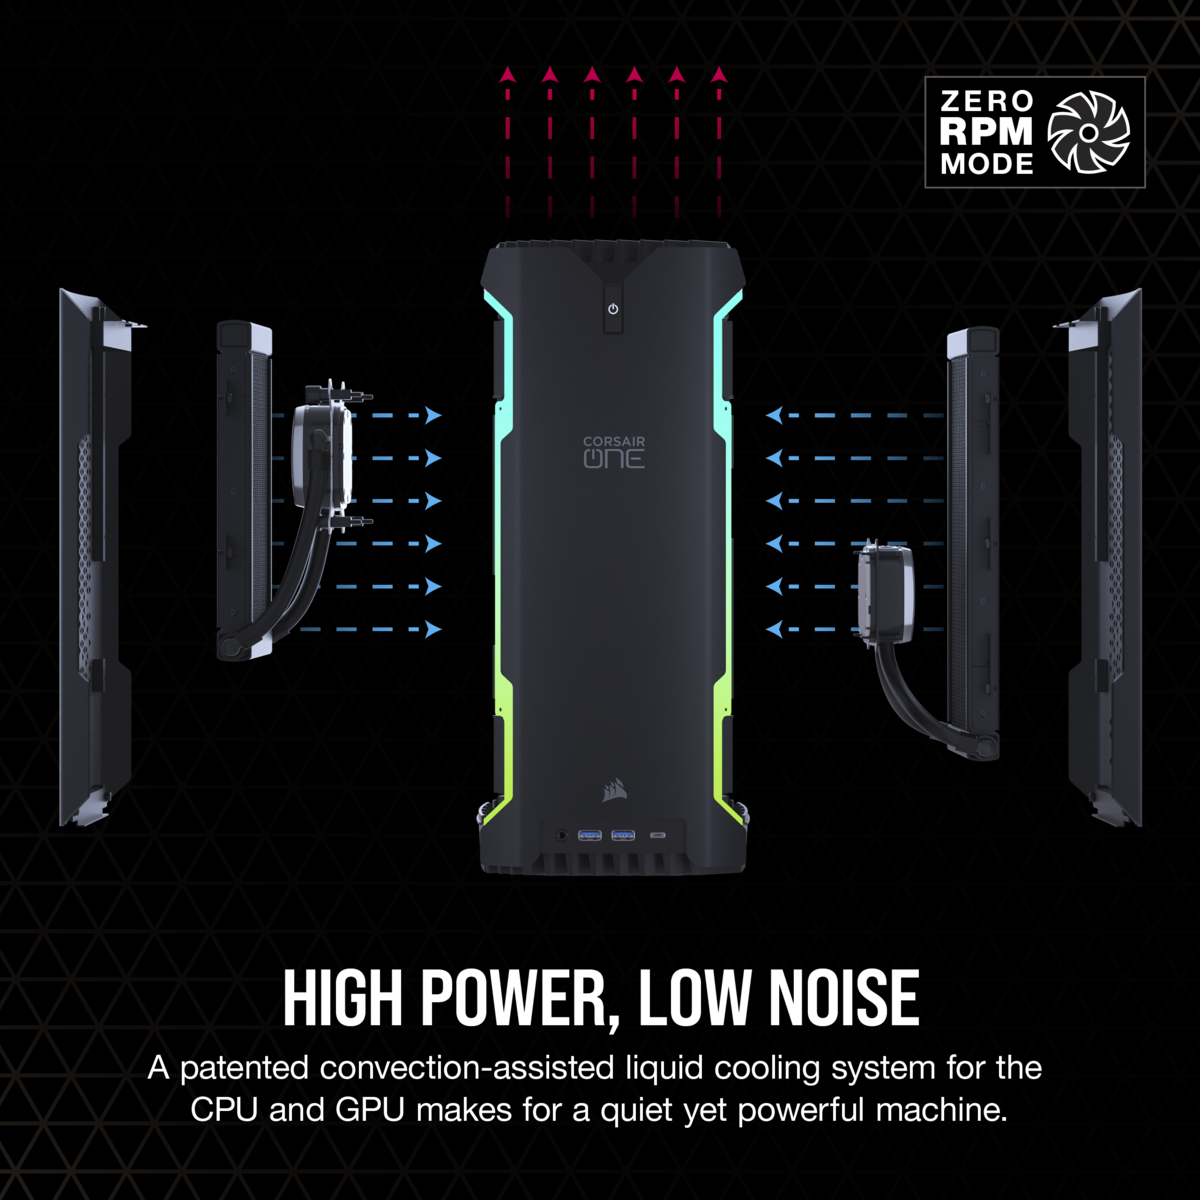
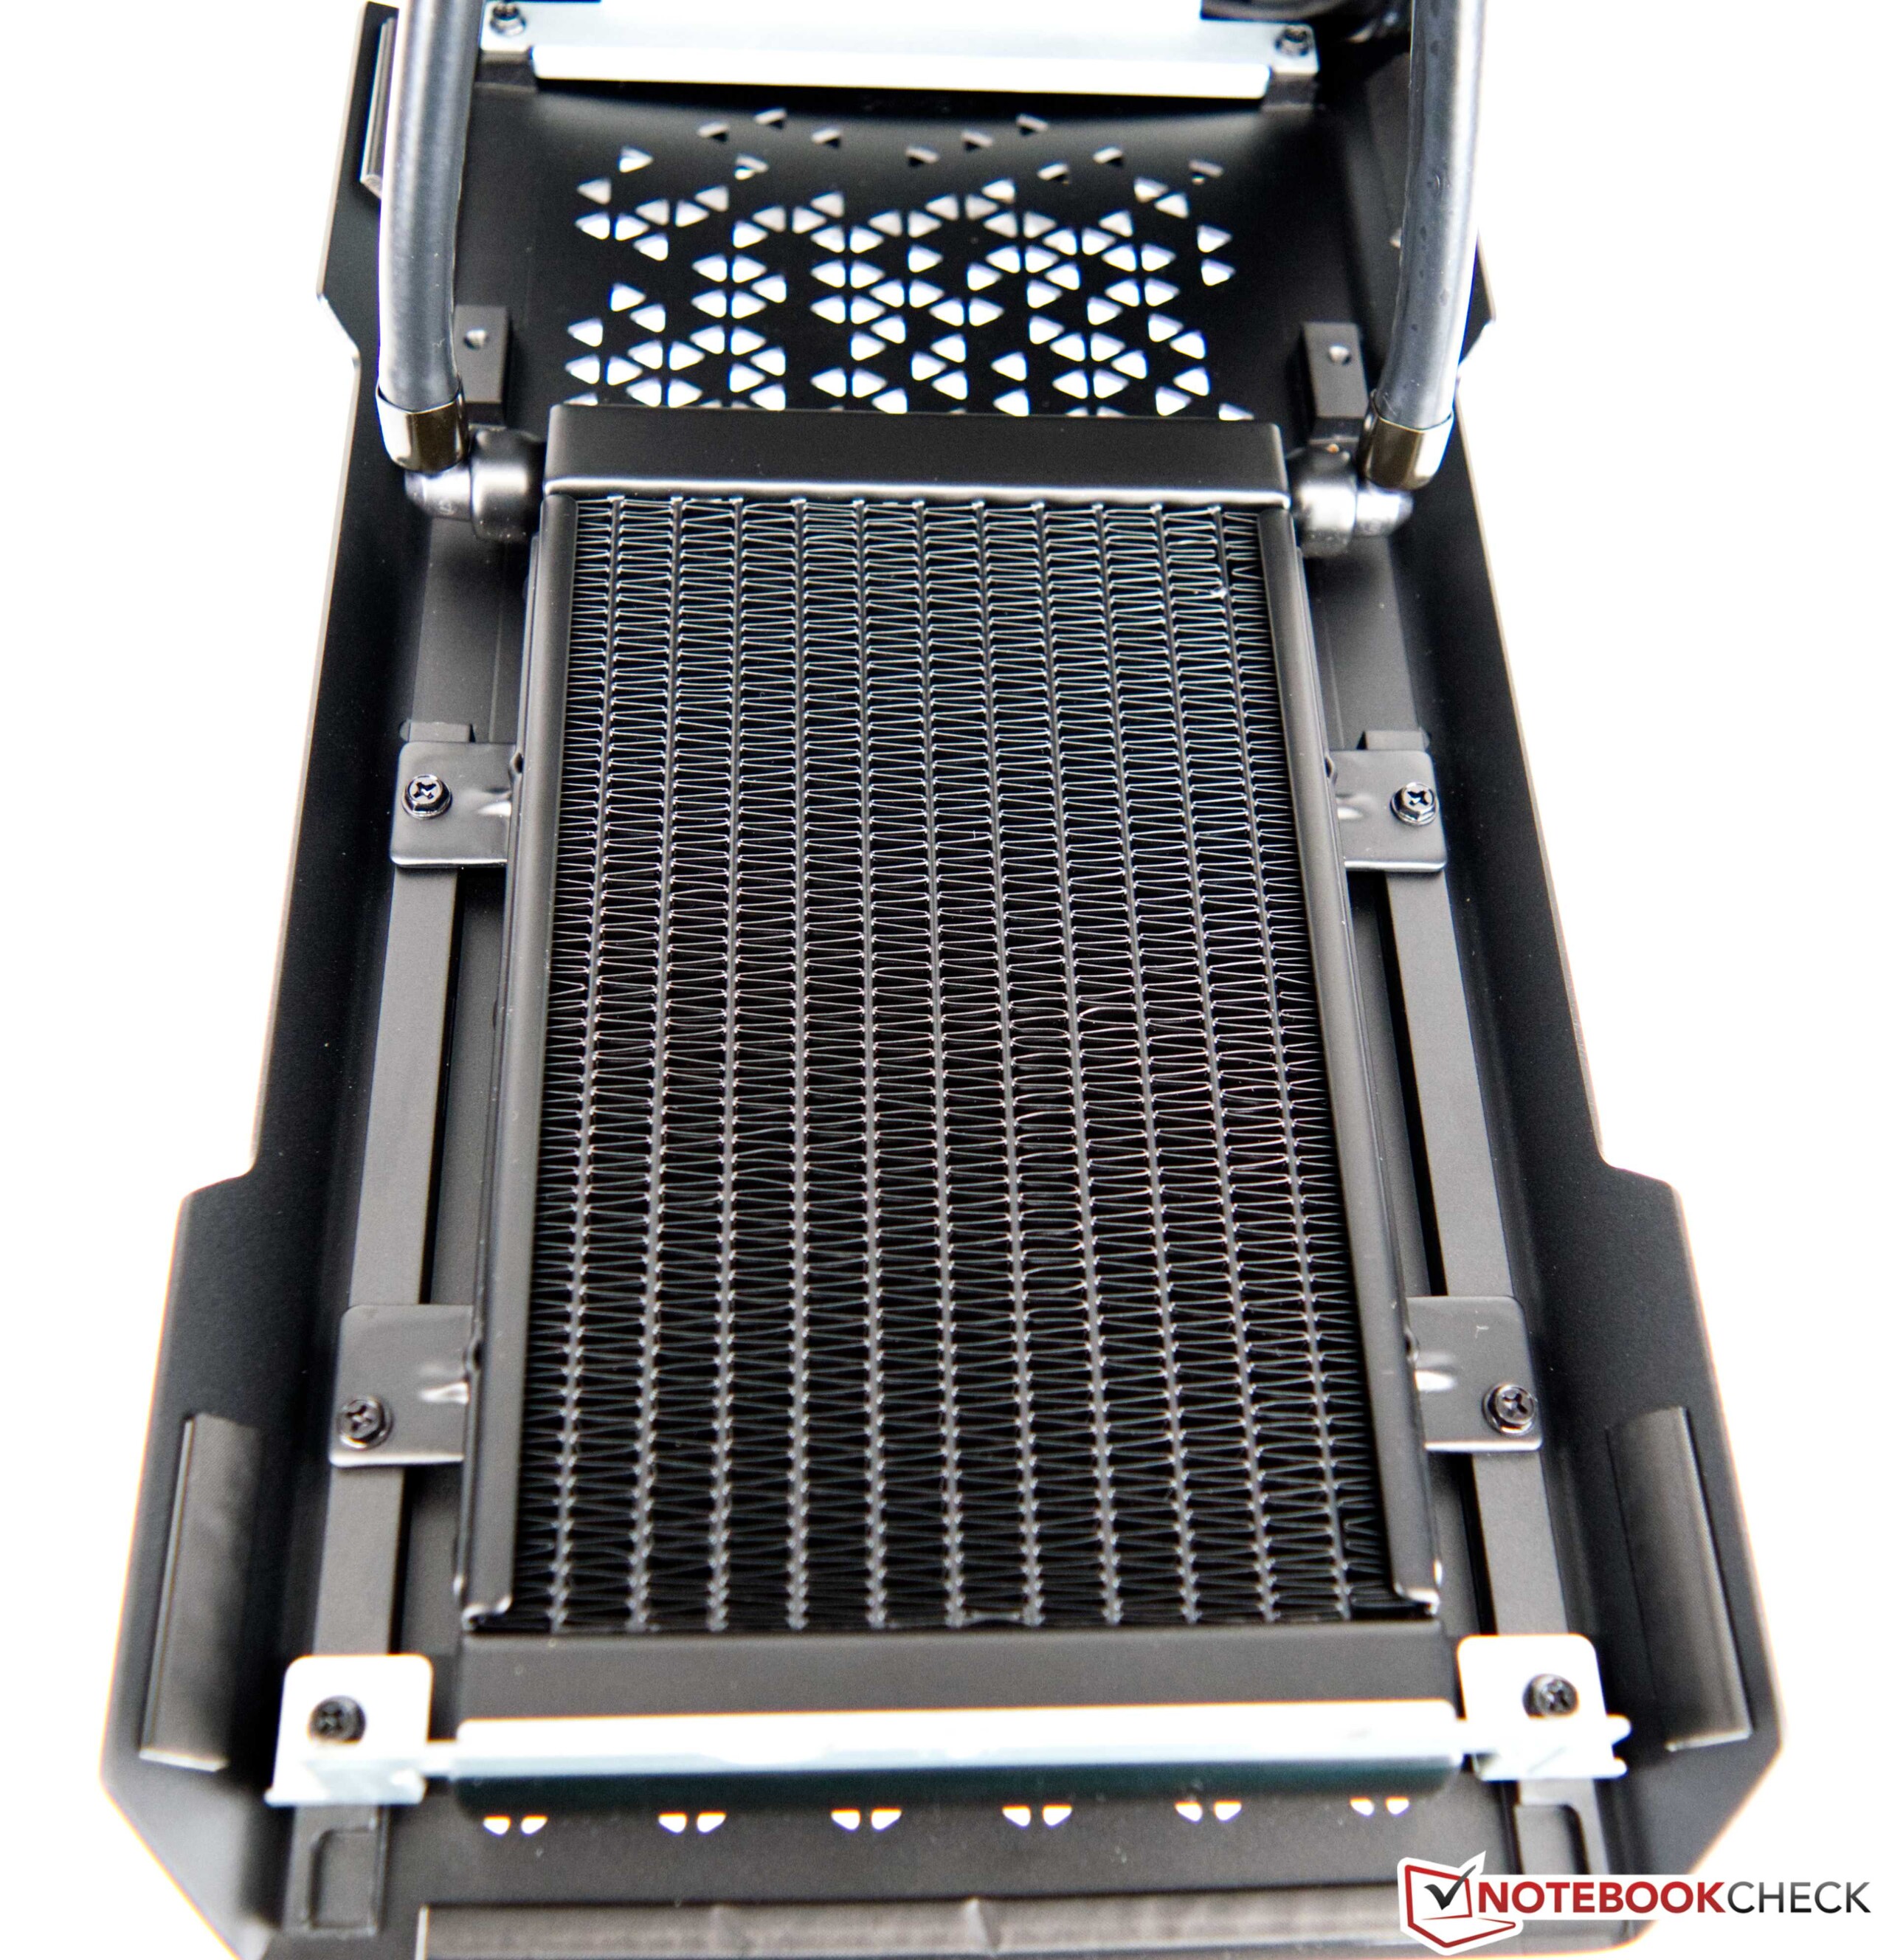
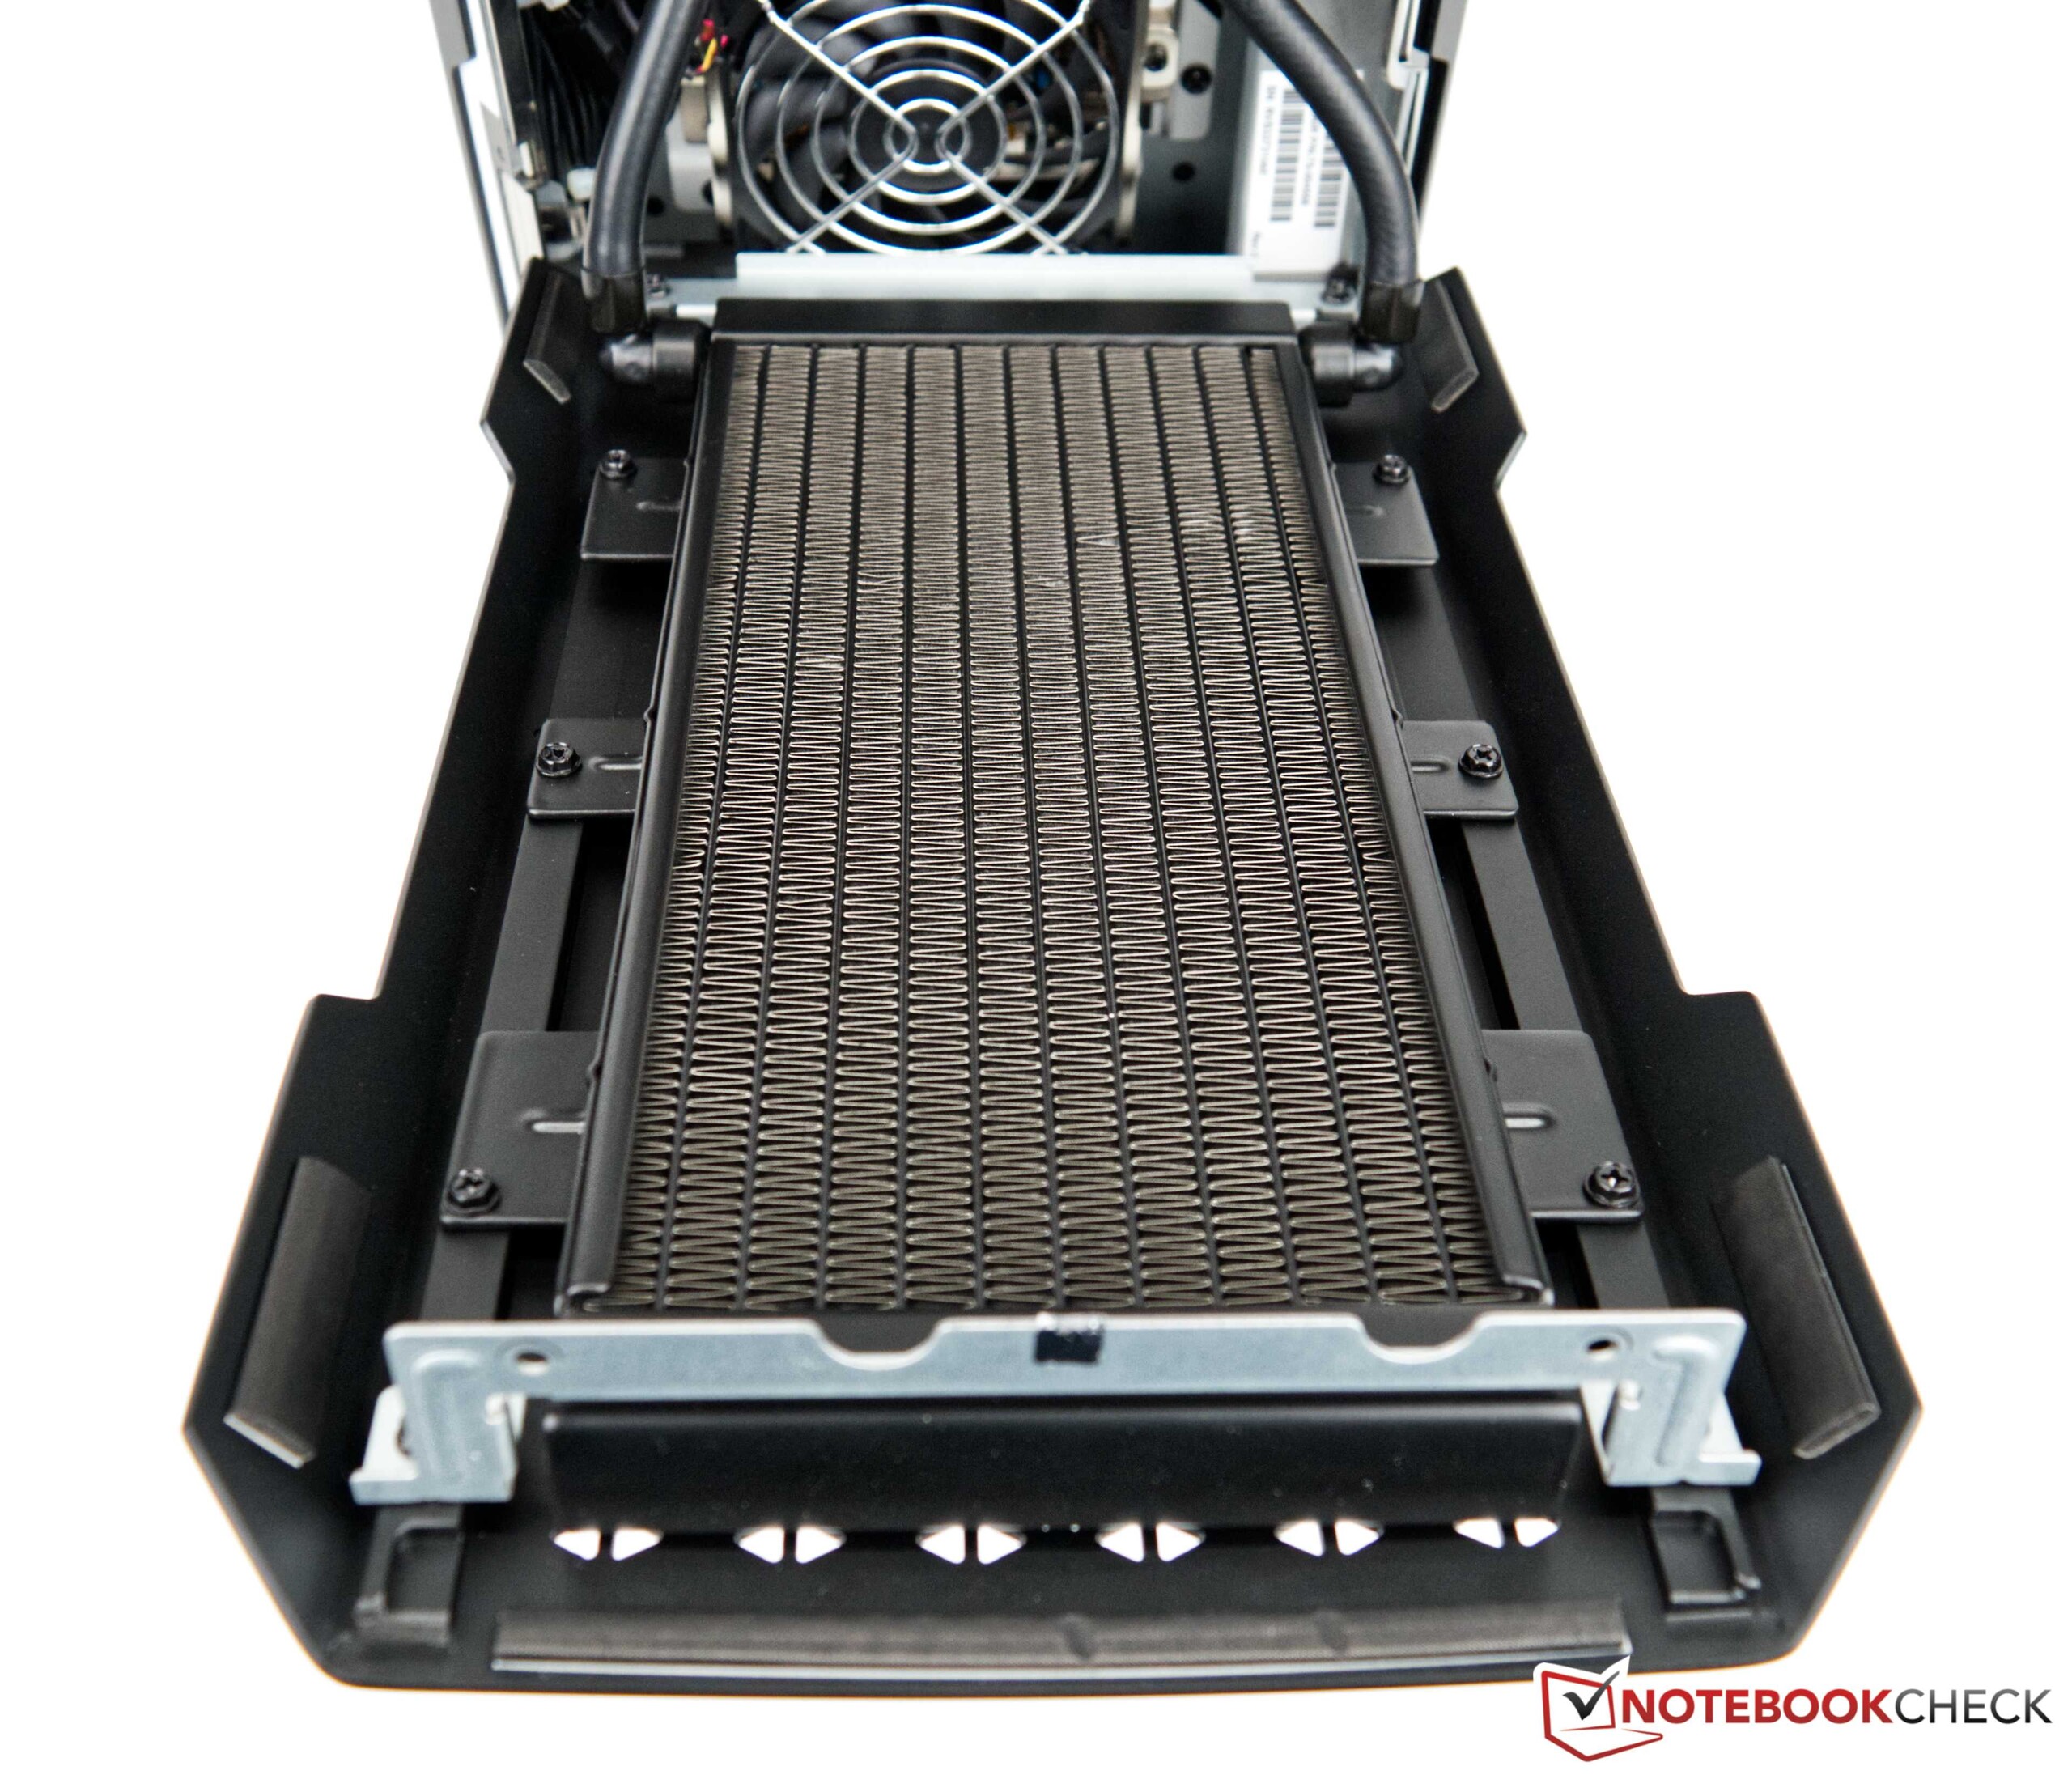
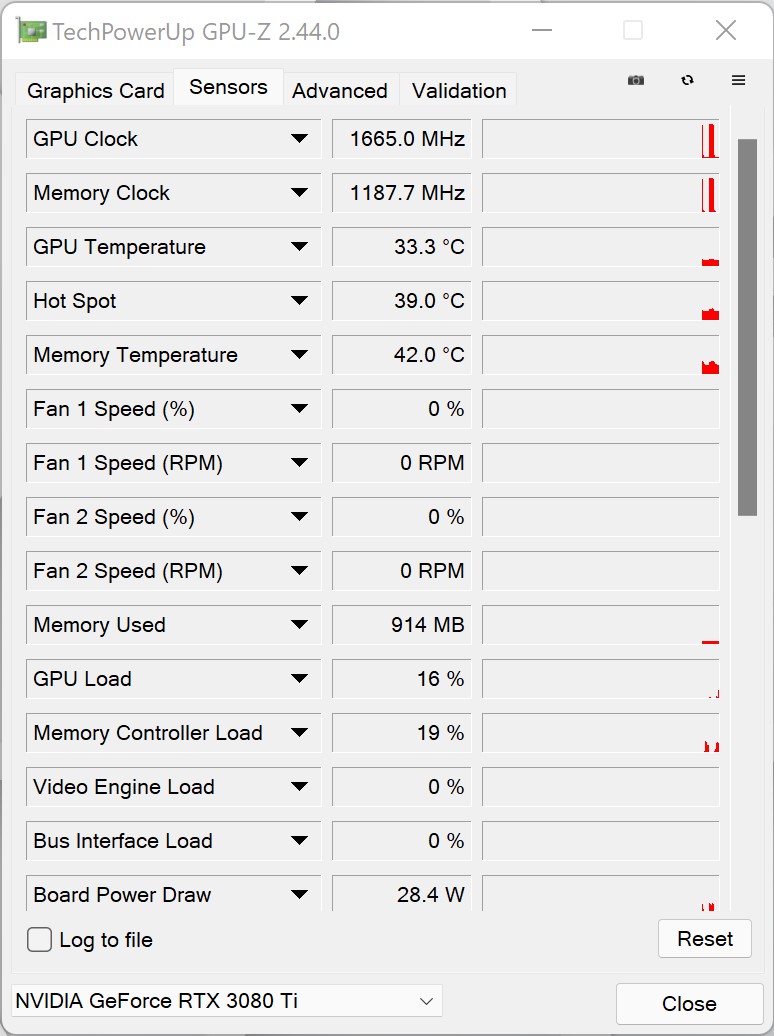
The massive case offers a very large surface area to allow for the heat transfer. Under load, this warms up noticeably, and the so-called chimney effect ensures that the cool air is pulled in from the sides and guided directly past the cooling fins of the two AiOs to then be pushed out of the case by the large 140-mm fan on top. For effective cooling of the graphics card, this is additionally equipped with two smaller fans to cool the transformer and the VRAM.
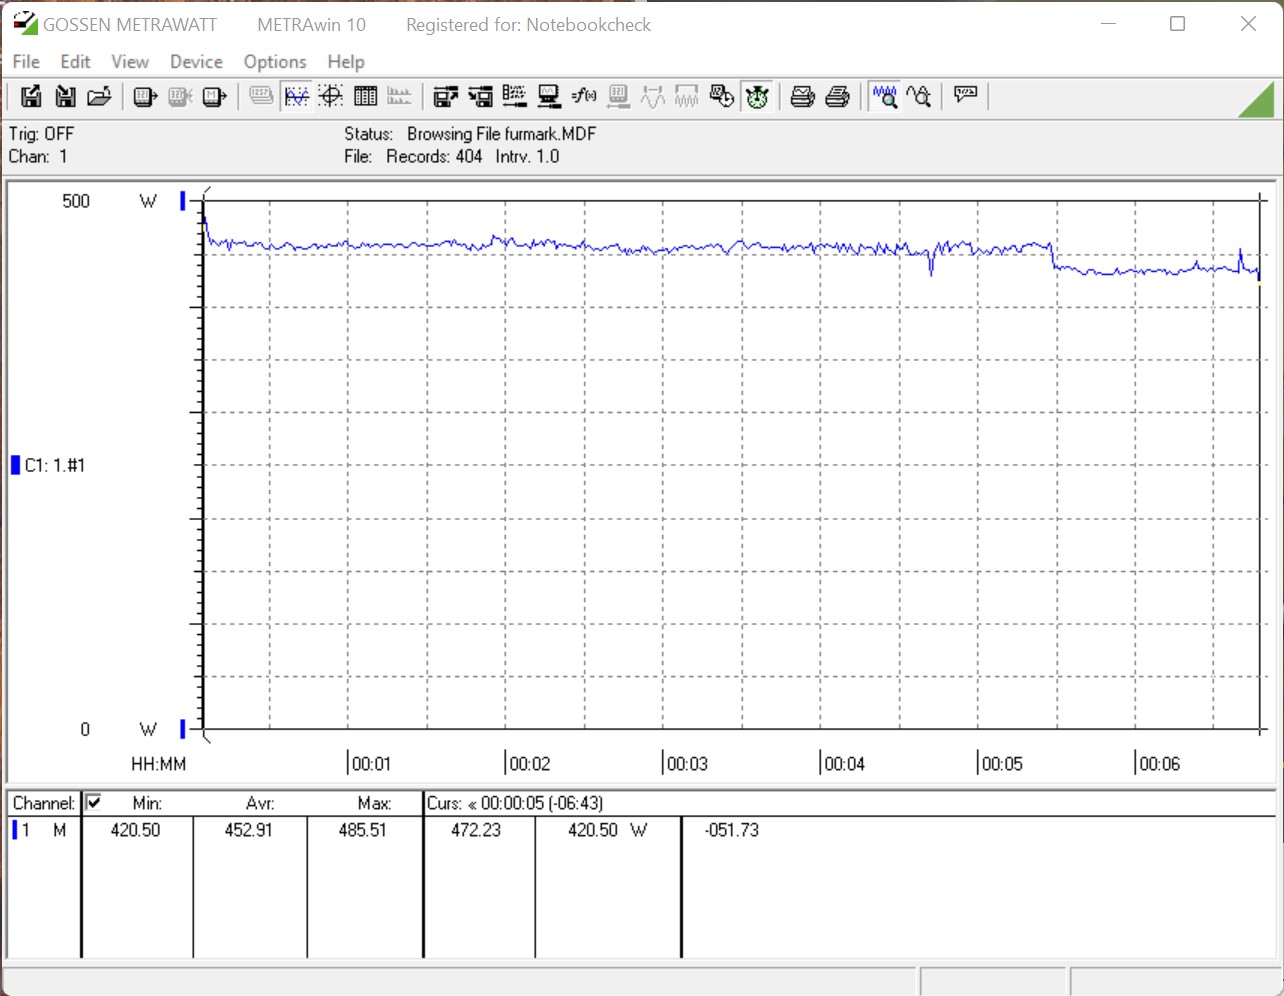
This cooling concept works well, and all the components are cooled effectively, without overheating under full load. However, the CPU still reached 100 °C (212 °F) during the stress test. This shows why Corsair throttles its performance to a maximum of 175 watts. Those for whom the 100 °C are still too hot can also reduce the performance further in the BIOS. However, the temperatures of the Intel Core i9-12900K still don't pose any problems, as we already found out during the Cinebench R15 Multi loop. The stress test with FurMark and Prime95 running at the same time represents an extreme scenario that should hardly ever happen in everyday operation.
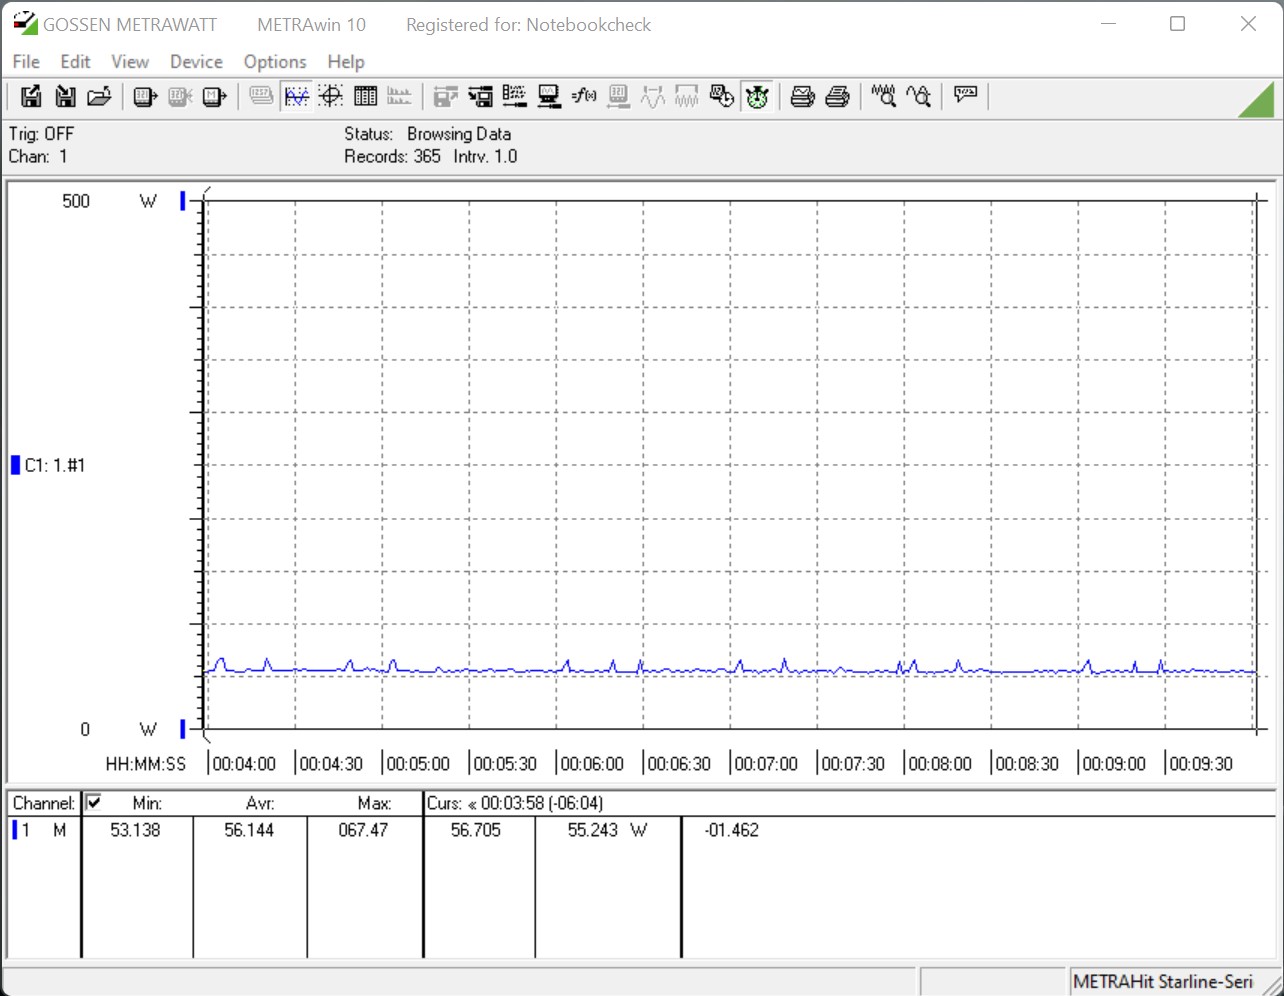
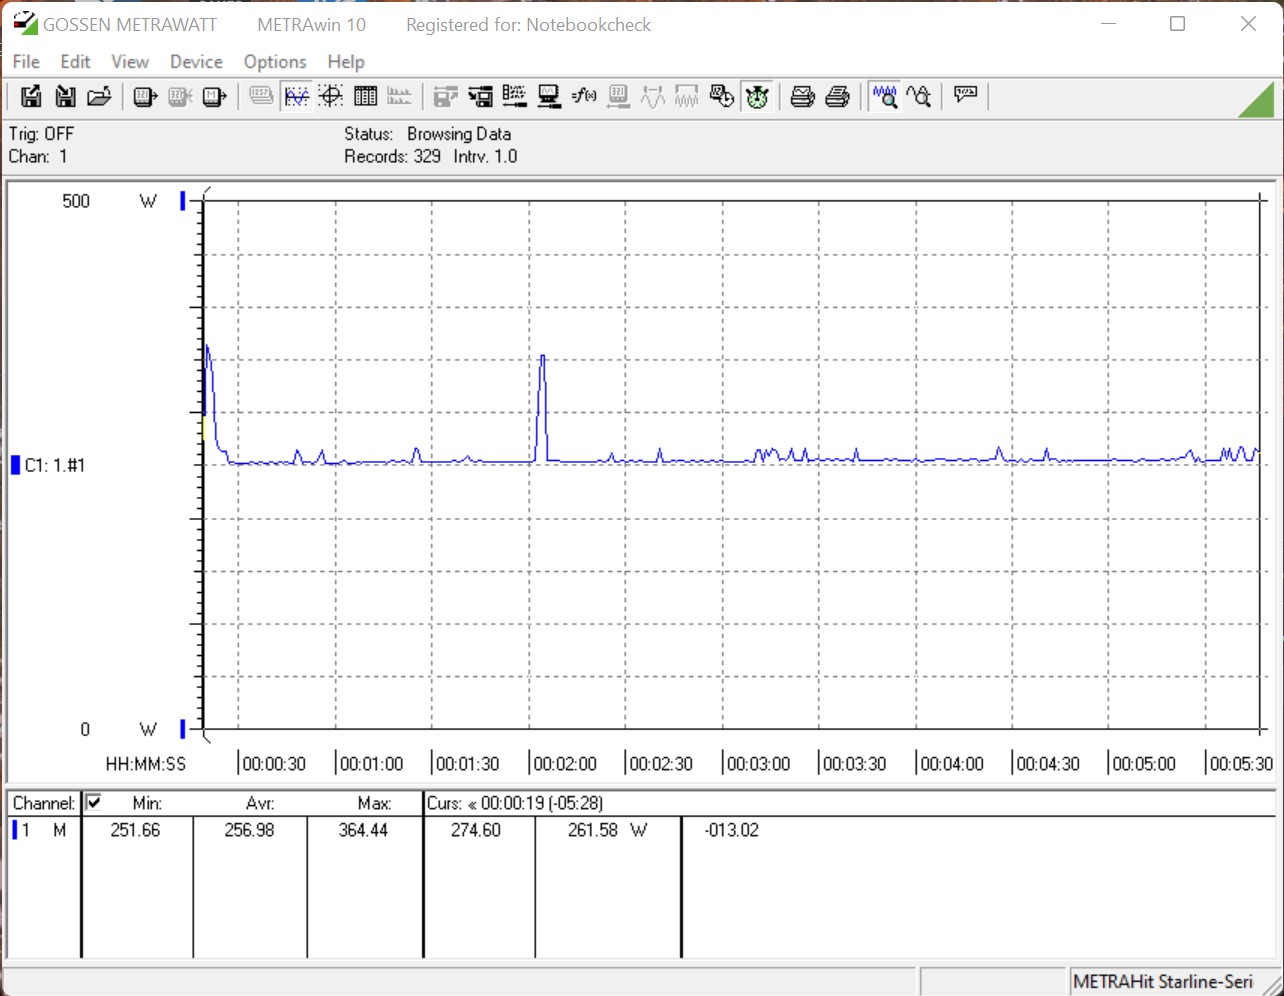
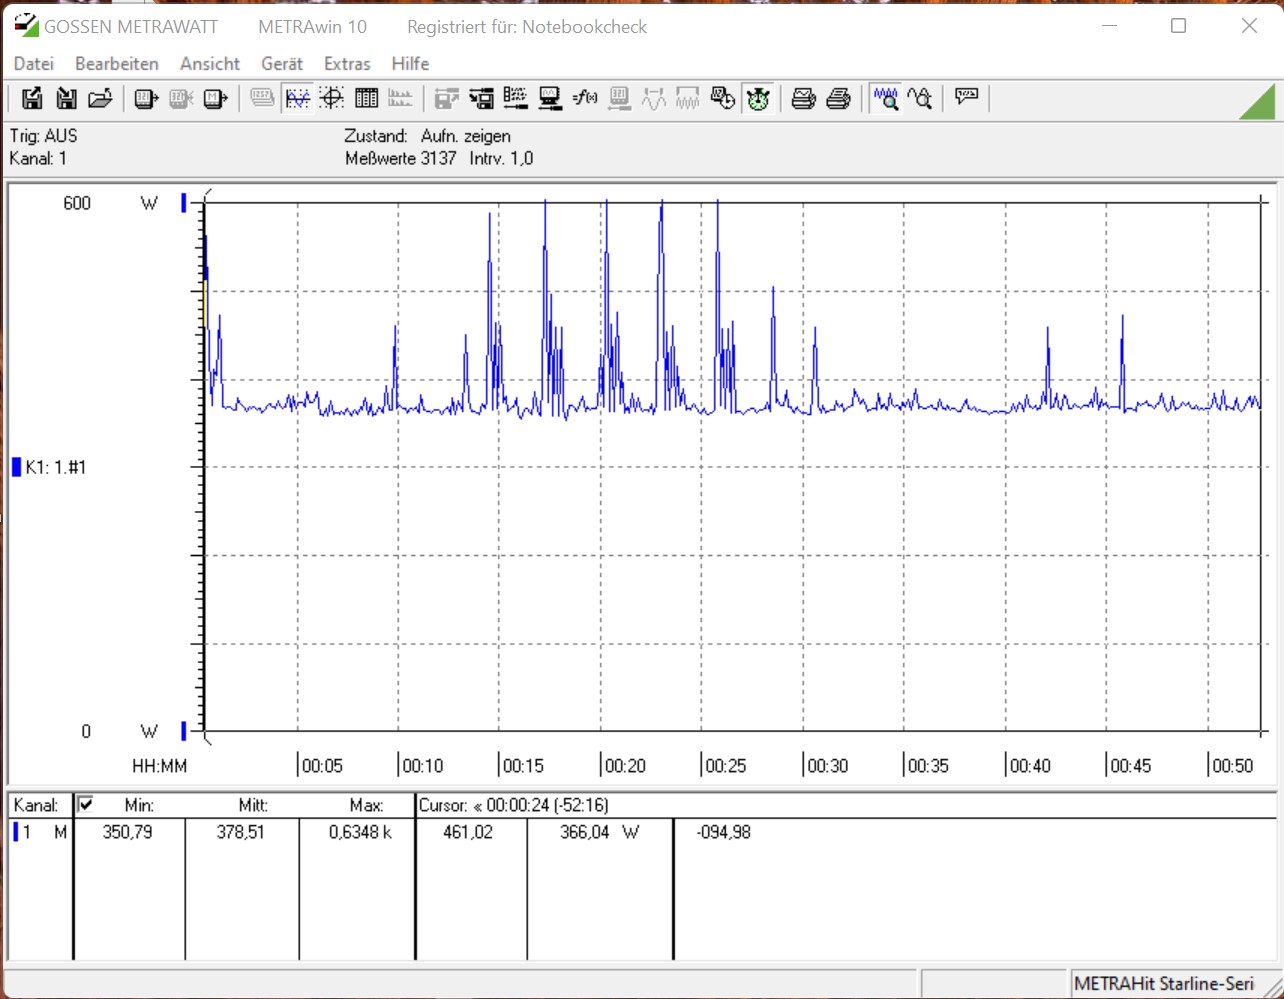
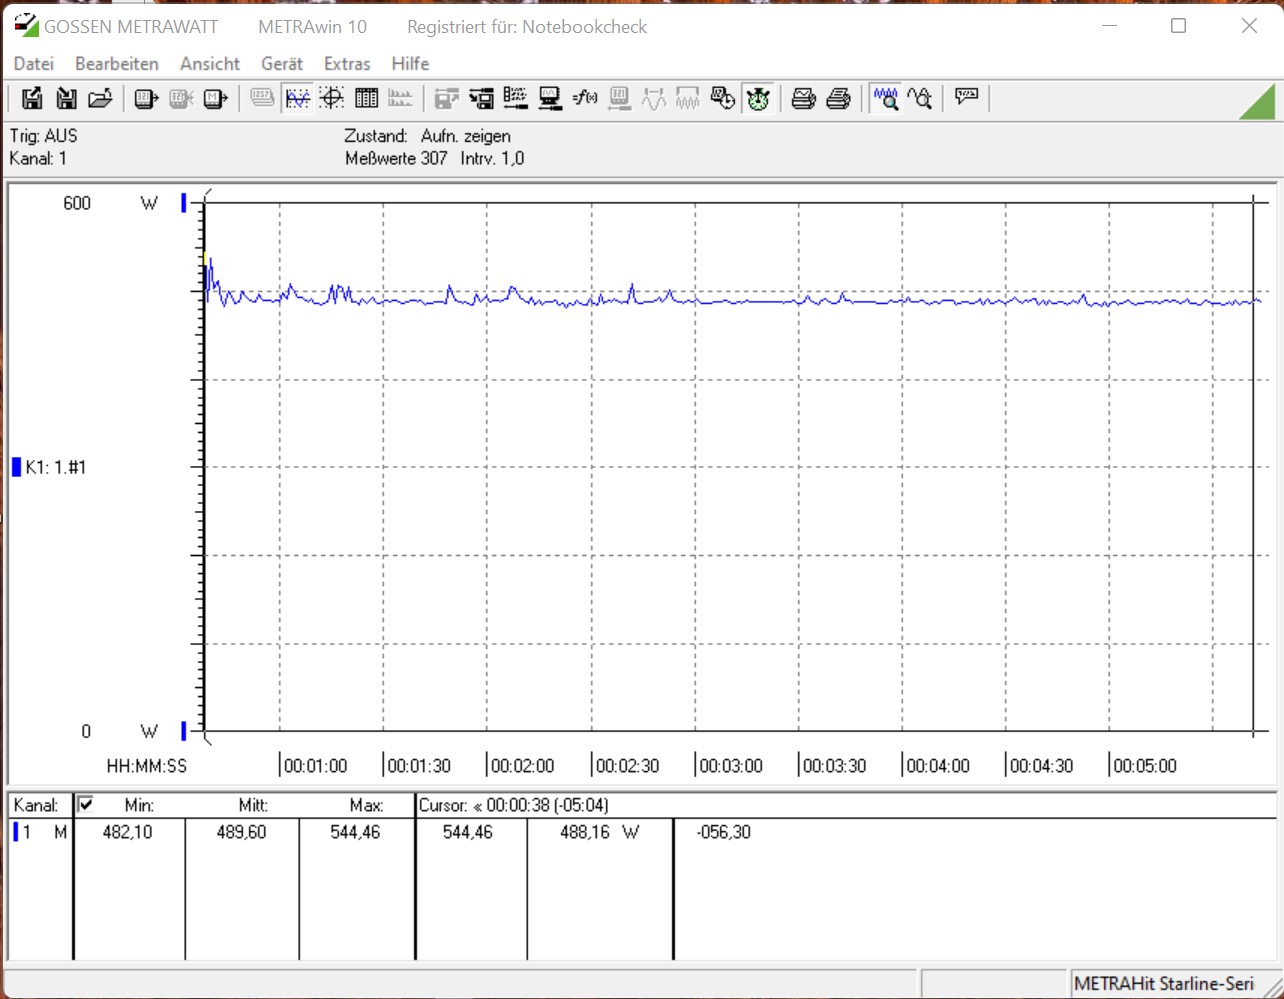
In terms of the power consumption, the system stands out with a low consumption during idle operation. Only 56 watts is a good value. While gaming, the compact 750-Watt (SFF build) power supply has to provide 489 watts on average, with the peaks reaching up to 544 watts. During the stress test, we even briefly measured 635 watts. The power supply was always able to handle this, and we did not notice any problems.
| Power Consumption - 1920x1080 The Witcher 3 ultra (external Monitor) | |
| Intel Core i9-12900K, NVIDIA GeForce RTX 3080 Ti | |
| Intel Core i9-12900K, NVIDIA Titan RTX (Idle: 70.5 W) | |
| AMD Ryzen 9 5950X, NVIDIA Titan RTX (Idle: 78 W) | |
| AMD Ryzen 9 5900X, NVIDIA Titan RTX (Idle: 78.1 W) | |
| Intel Core i5-11600K, NVIDIA Titan RTX (Idle: 69.49 W) | |
| Intel Core i5-12600K, NVIDIA Titan RTX (Idle: 70.45 W) | |
| Intel Core i9-11900K, NVIDIA Titan RTX (Idle: 57.3 W) | |
* ... smaller is better
| Power Consumption - 1280x720 FurMark 1.19 GPU Stress Test (external Monitor) | |
| AMD Ryzen 9 5900X, NVIDIA GeForce RTX 3090 (Idle: 105.9 W) | |
| AMD Ryzen 9 5900X, NVIDIA GeForce RTX 3080 (Idle: 88.3 W) | |
| Intel Core i9-12900K, NVIDIA GeForce RTX 3080 Ti | |
| AMD Ryzen 9 5950X, AMD Radeon RX 6800 XT (Idle: 99.5 W) | |
| AMD Ryzen 9 5900X, NVIDIA GeForce RTX 3070 (Idle: 95.1 W) | |
| AMD Ryzen 9 5900X, AMD Radeon RX 6800 (Idle: 81.4 W) | |
| AMD Ryzen 9 5900X, AMD Radeon RX 6700 XT (Idle: 77.1 W) | |
* ... smaller is better
Power consumption The Witcher 3 / stress test
Power consumption with external monitor
Verdict - A perfect 4K gaming PC
Pros
Cons
While the Corsair One i300 is not a complete novelty, this isn't absolutely necessary. The looks of the compact premium PC are simple and modern. In addition, the internal design allows using conventional components in terms of the mainboard and power supply. Only the cooling system is an in-house design. In our test model, it unfortunately doesn't do justice to the premium segment. Nonetheless, the two AiOs work well, cooling the system reliably. However, the two pumps made themselves noticeable acoustically. In the long run, this is unpleasant and considering the purchase price of 5099 Euros (~$5722), it is also not something you have to accept. But the cooling system design is still the highlight in addition to the most current components. With the Intel Core i9-12900K, there is the fastest gaming CPU, which combined with a current mainboard including DDR5 RAM and an Nvidia GeForce RTX 3080 Ti allows for 4K gaming without any compromises. In addition, there is also a 2-TB SSD with very good transfer rates.
Thanks to an Intel Core i9-12900K and Nvidia GeForce RTX 3080 Ti, the Corsair One i300 provides 4K gaming performance using the smallest amount of space.
A premium product naturally also has its price. At 5099 Euros (~5722) for our test unit, this is not exactly cheap, and we still shouldn't talk badly about the separate components. The case is not off-the-shelf and cannot be purchased separately. In addition, the availability of various graphics cards and other current components is still a problem, which almost makes the price justifiable overall. The system is also equipped with two AiOs that were specifically developed for the Corsair One series. This has to be taken into account when considering the price. However, in our opinion the Corsair One i300 with an Intel Core i9-12900K and Nvidia GeForce RTX 3080 would be the more reasonable system in terms of the price. But then the RAM and the SSD would only be half the size with 32 GB and 1 TB respectively. A system with those components is available for 4099 Euros ($4562). The performance deficit of the Nvidia GeForce RTX 3080 compared to the Ti model is limited and acceptable.
Price and Availability
At the time of this test, the device can be purchased directly from Corsair for $5000. Alternatively, the smaller model can also be purchased from Amazon for $4000.

