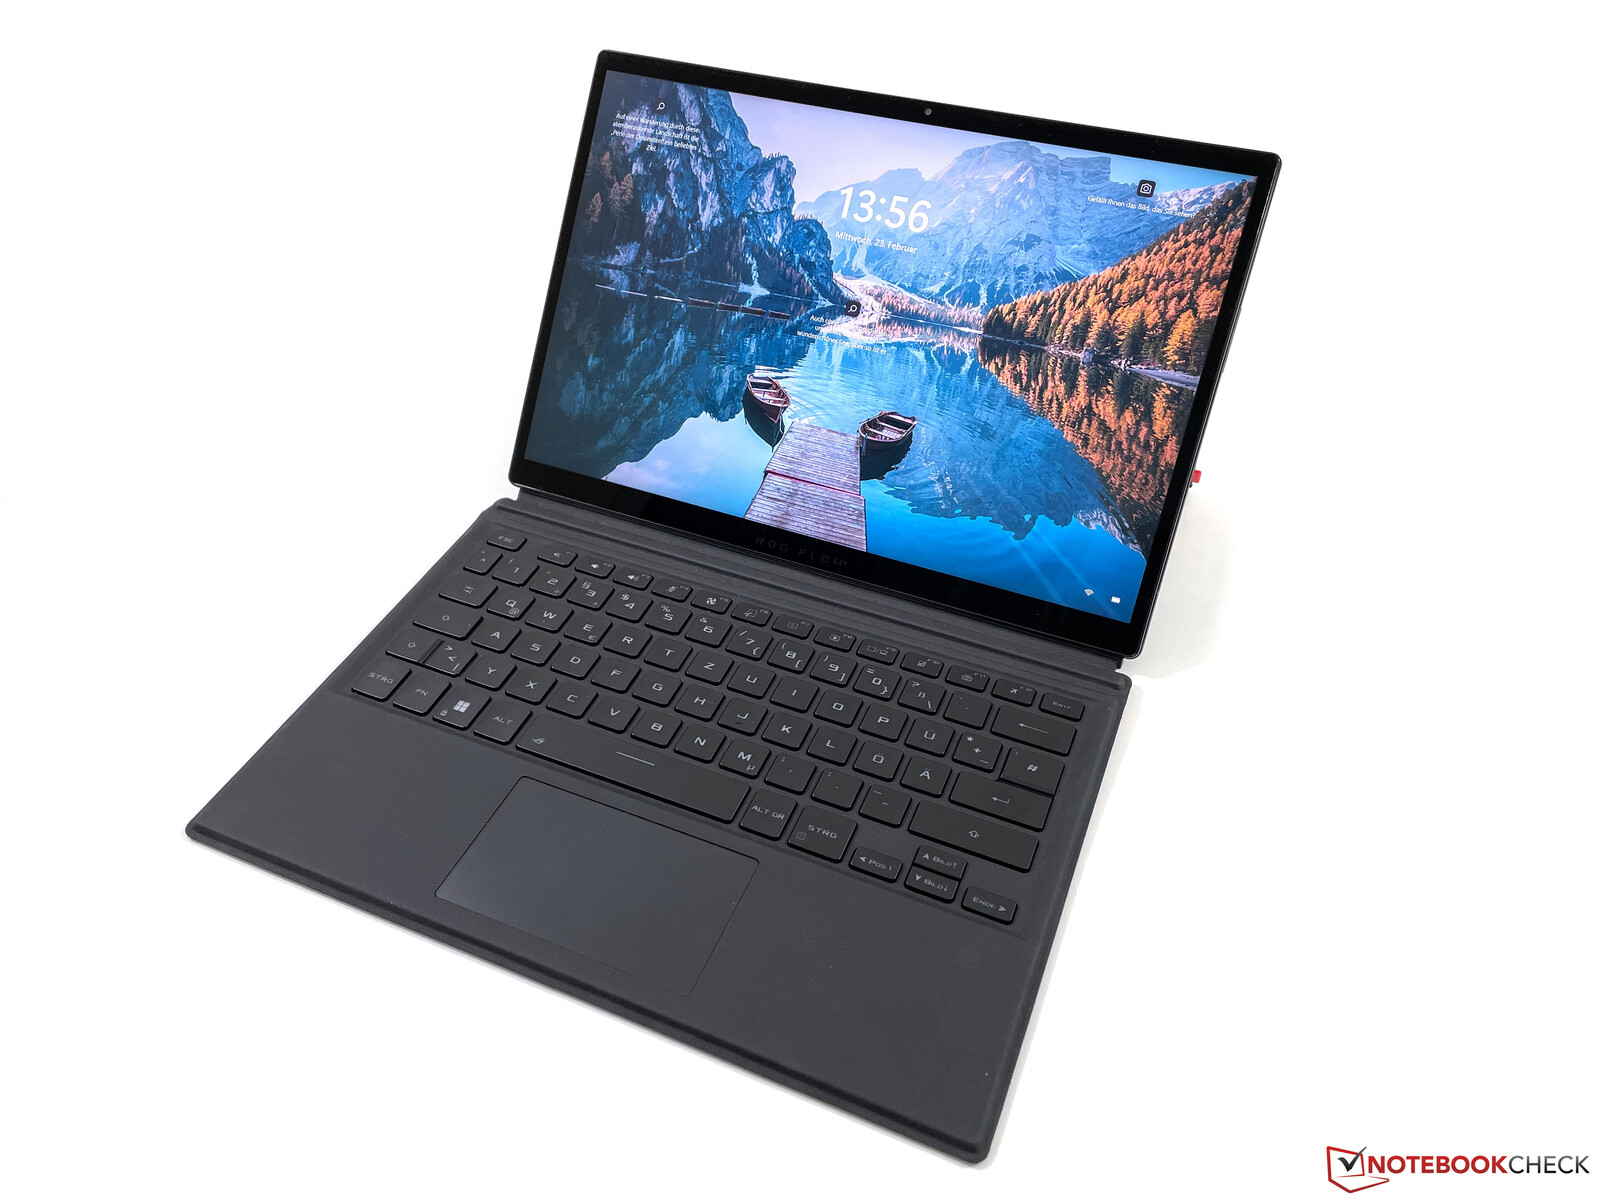
Asus ROG Flow Z13 in review: Gaming tablet with powerful Alder Lake i9 CPU
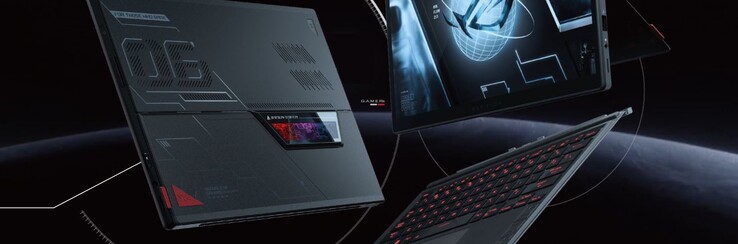
Asus refers to the new ROG Flow Z13 as the most powerful gaming tablet on the market, and a look at the spec sheet definitely supports this statement. Our review sample is equipped with a brand-new Intel Alder Lake Core i9 CPU, a dedicated Nvidia GeForce RTX 3050 Ti, and 16 GB of LPDDR5-5200 RAM. In order to be able to make reasonable use of the components' performance, the manufacturer has implemented vapor-chamber cooling as well as liquid metal on the processor for improved heat transfer. In addition, there's a 13.4-inch 16:10 display with a resolution of 1,920x1,200 pixels, a 120 Hz refresh rate, and G-Sync.
Optionally, there are other models with weaker i7 or i5 CPUs, as well as the normal RTX 3050 or even just the integrated Xe Graphics of the Alder Lake processor. This configuration with the iGPU could definitely be interesting if you don't want to game while on the go, but want to use the external XG Mobile eGPU (Nvidia GeForce RTX 3080 or AMD Radeon RX 6850M XT) at home. Our test configuration is available for around 2,100 Euros (~$2,367). There aren't many immediate rivals for the ROG Flow Z13, which is why we also resort to normal laptops with similar components as comparison devices.
Possible contenders in comparison
Rating | Date | Model | Weight | Height | Size | Resolution | Price |
|---|---|---|---|---|---|---|---|
| 86.8 % v7 (old) | 03 / 2022 | Asus ROG Flow Z13 GZ301ZE i9-12900H, GeForce RTX 3050 Ti Laptop GPU | 1.2 kg | 12 mm | 13.40" | 1920x1200 | |
| 87.7 % v7 (old) | 01 / 2022 | Schenker Vision 14 i7-11370H, GeForce RTX 3050 Ti Laptop GPU | 1.1 kg | 15.6 mm | 14.00" | 2880x1800 | |
| 82.7 % v7 (old) | 10 / 2021 | Asus Zephyrus G14 GA401QEC R9 5900HS, GeForce RTX 3050 Ti Laptop GPU | 1.7 kg | 19.9 mm | 14.00" | 2560x1440 | |
| 89.1 % v7 (old) | 11 / 2021 | Microsoft Surface Pro 8, i7-1185G7 i7-1185G7, Iris Xe G7 96EUs | 891 g | 8.5 mm | 13.00" | 2880x1920 | |
| 87.5 % v7 (old) | 06 / 2021 | Razer Blade 14 Ryzen 9 RTX 3070 R9 5900HX, GeForce RTX 3070 Laptop GPU | 1.8 kg | 16.8 mm | 14.00" | 2560x1440 | |
| 84.7 % v7 (old) | 02 / 2021 | Asus ROG Flow X13 GV301QH R9 5980HS, GeForce GTX 1650 Max-Q | 1.4 kg | 15.8 mm | 13.40" | 3840x2400 |
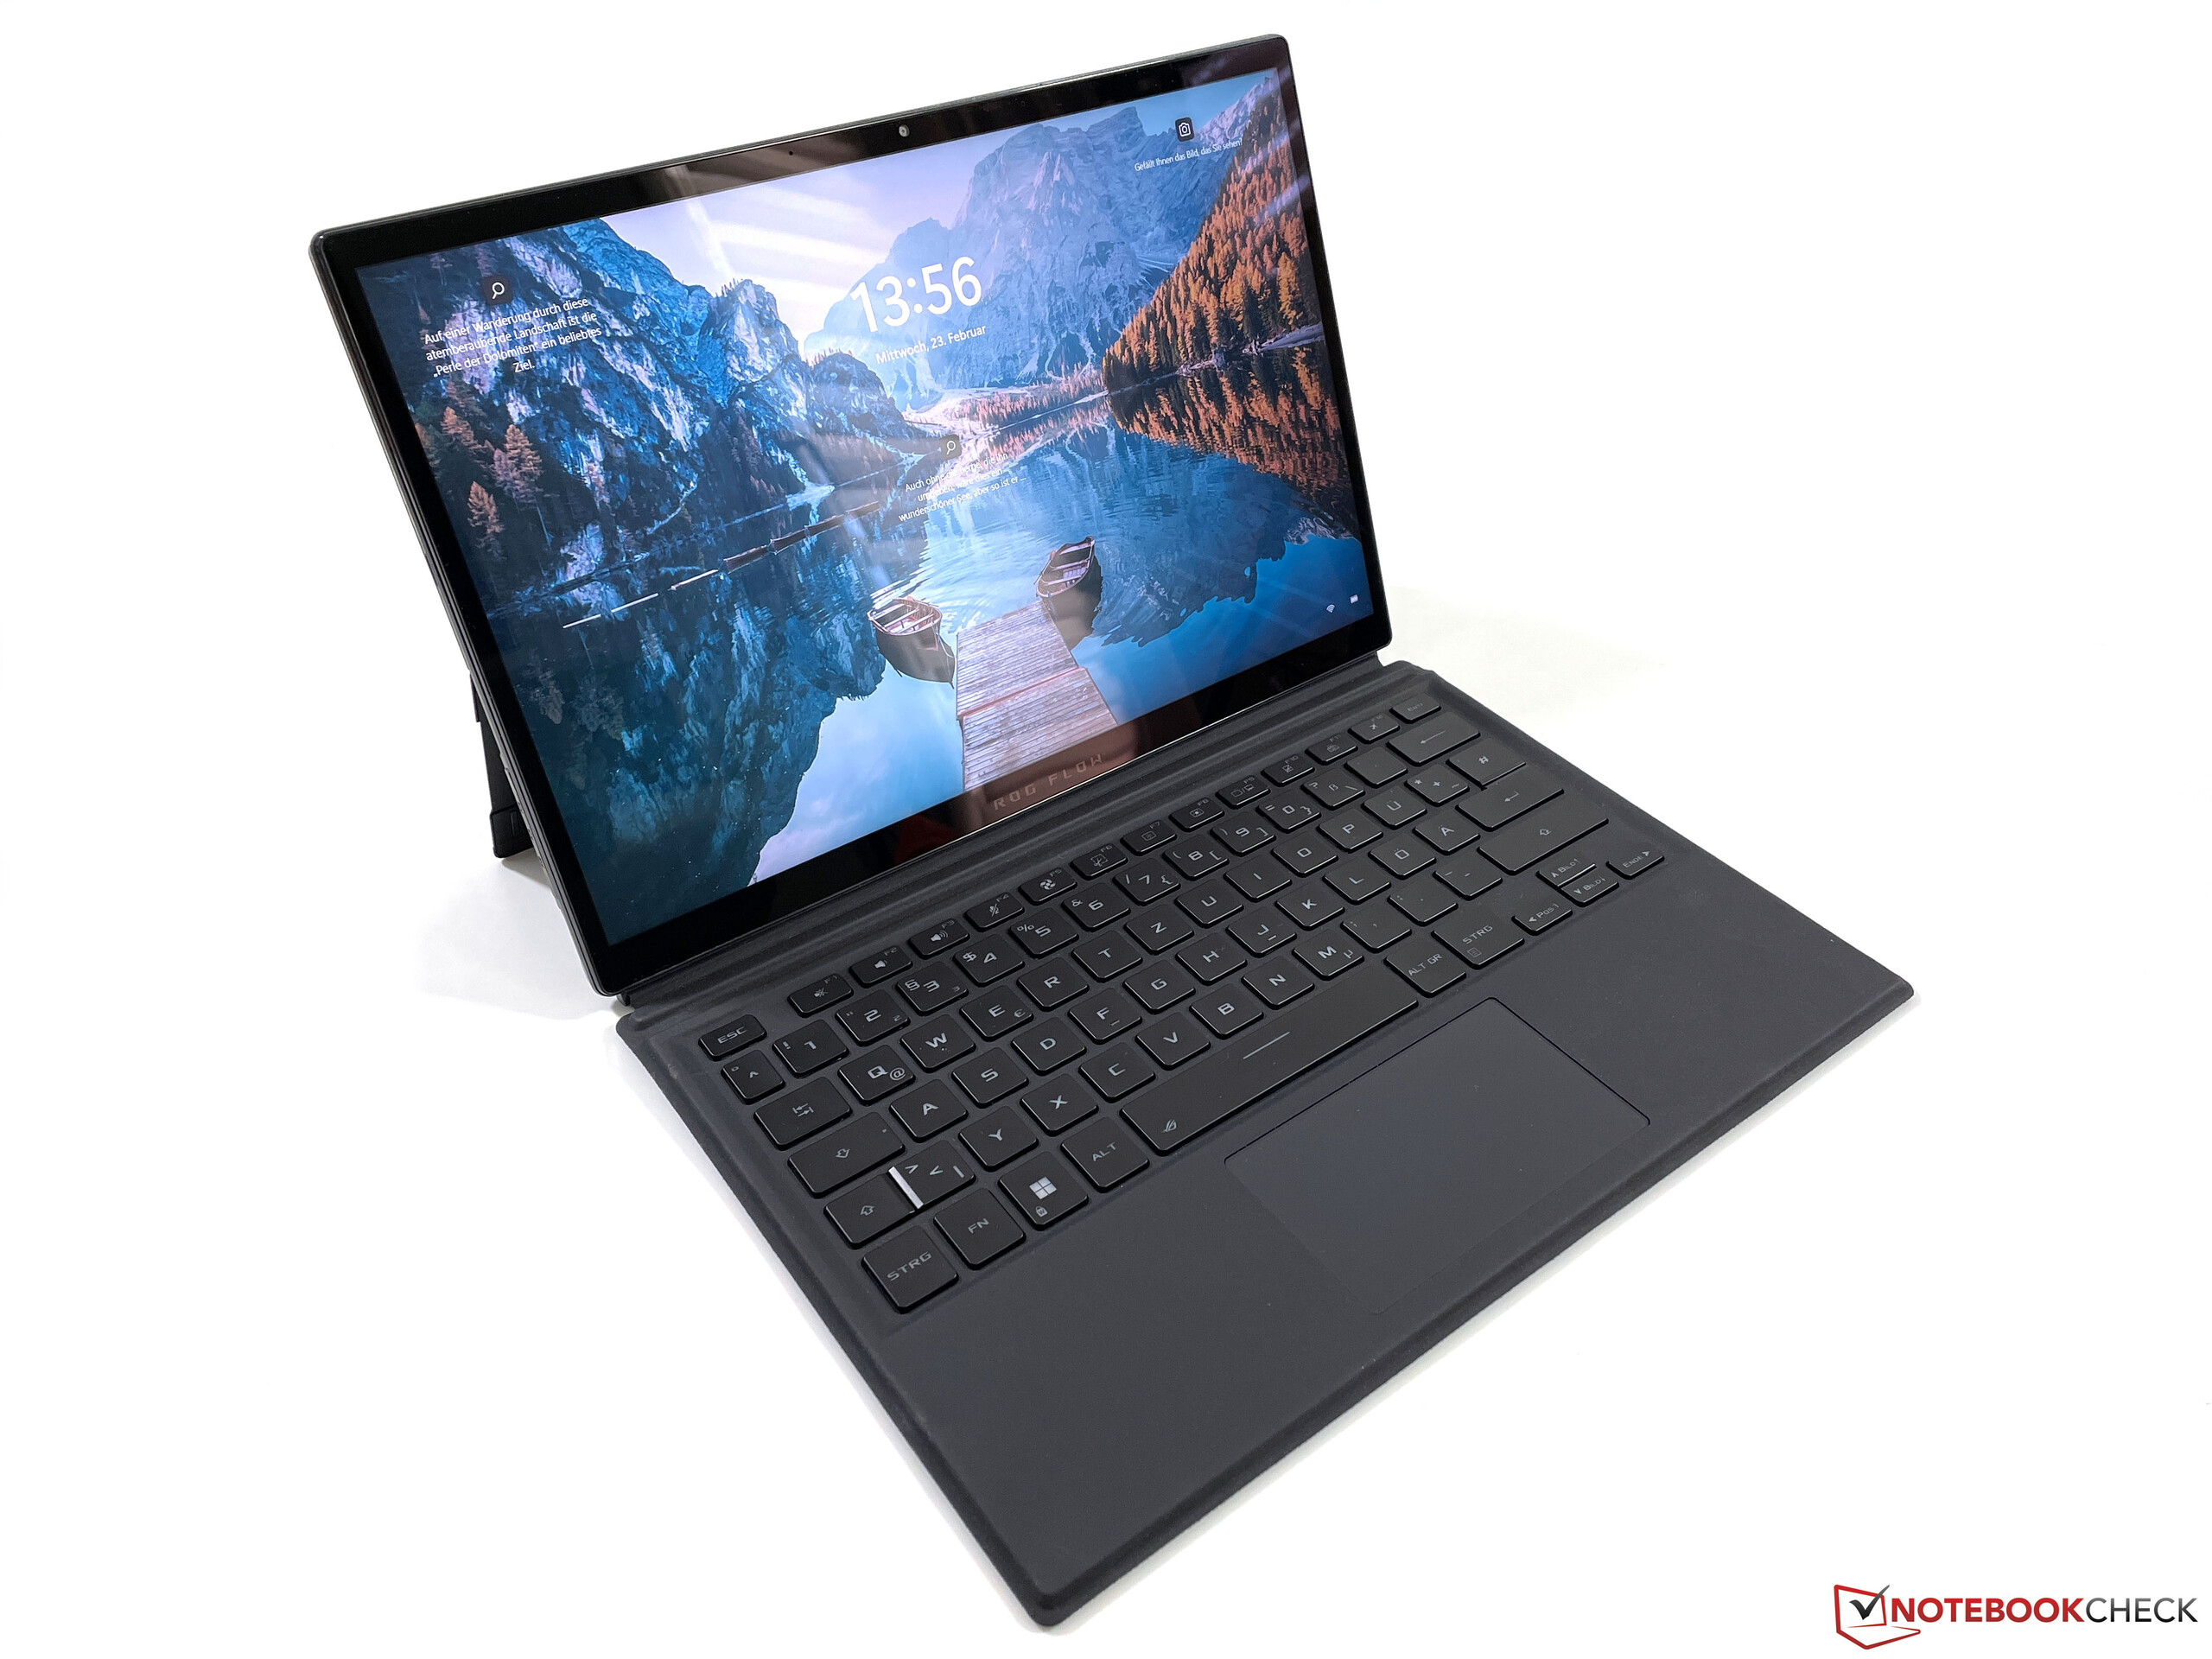
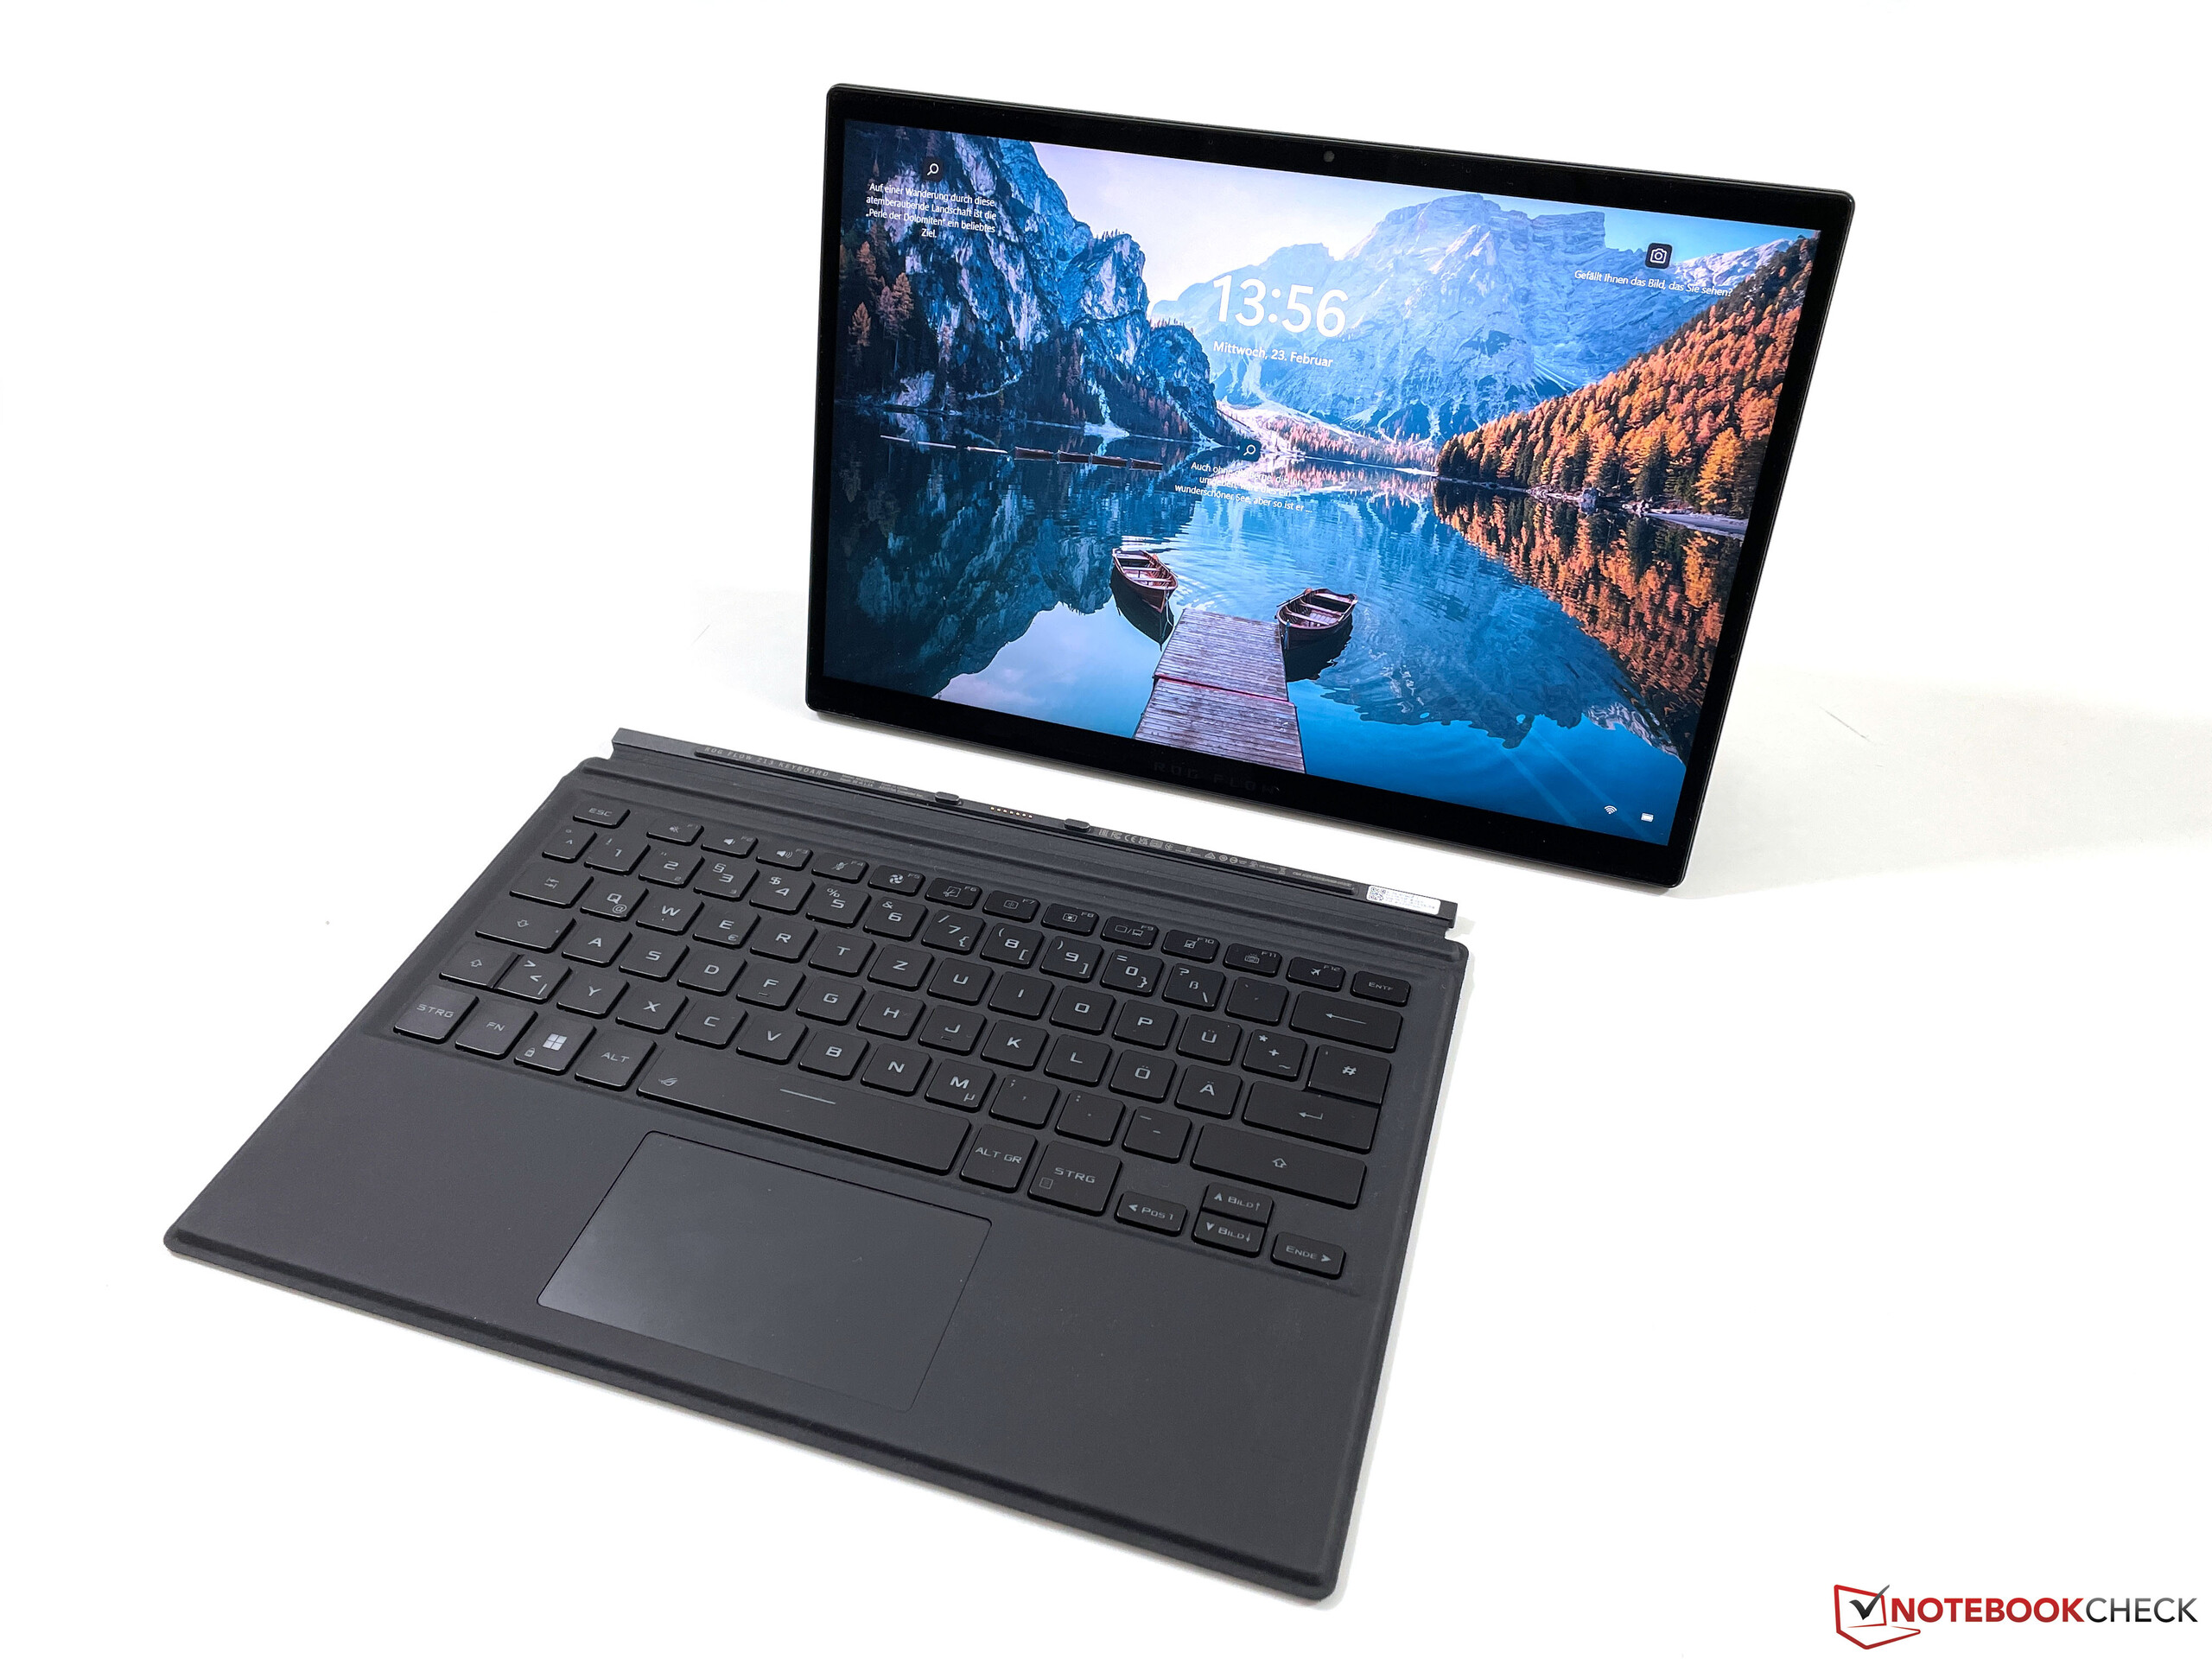
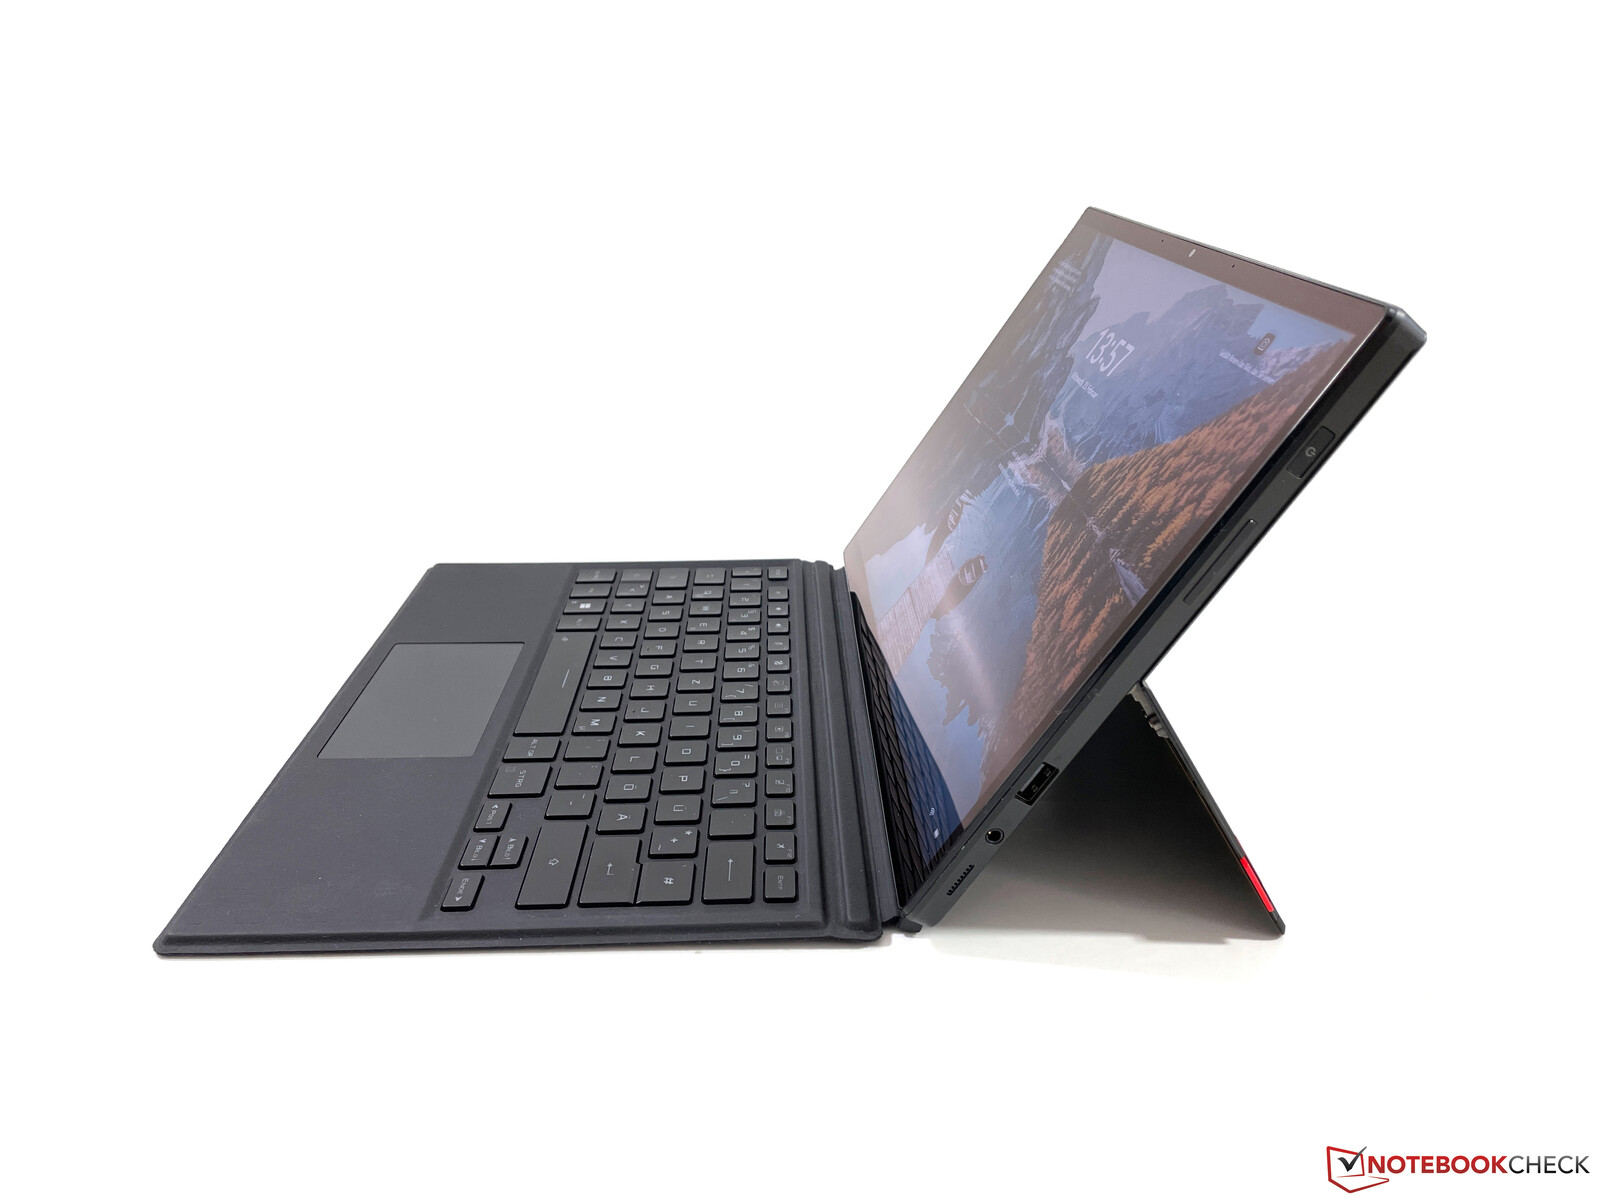
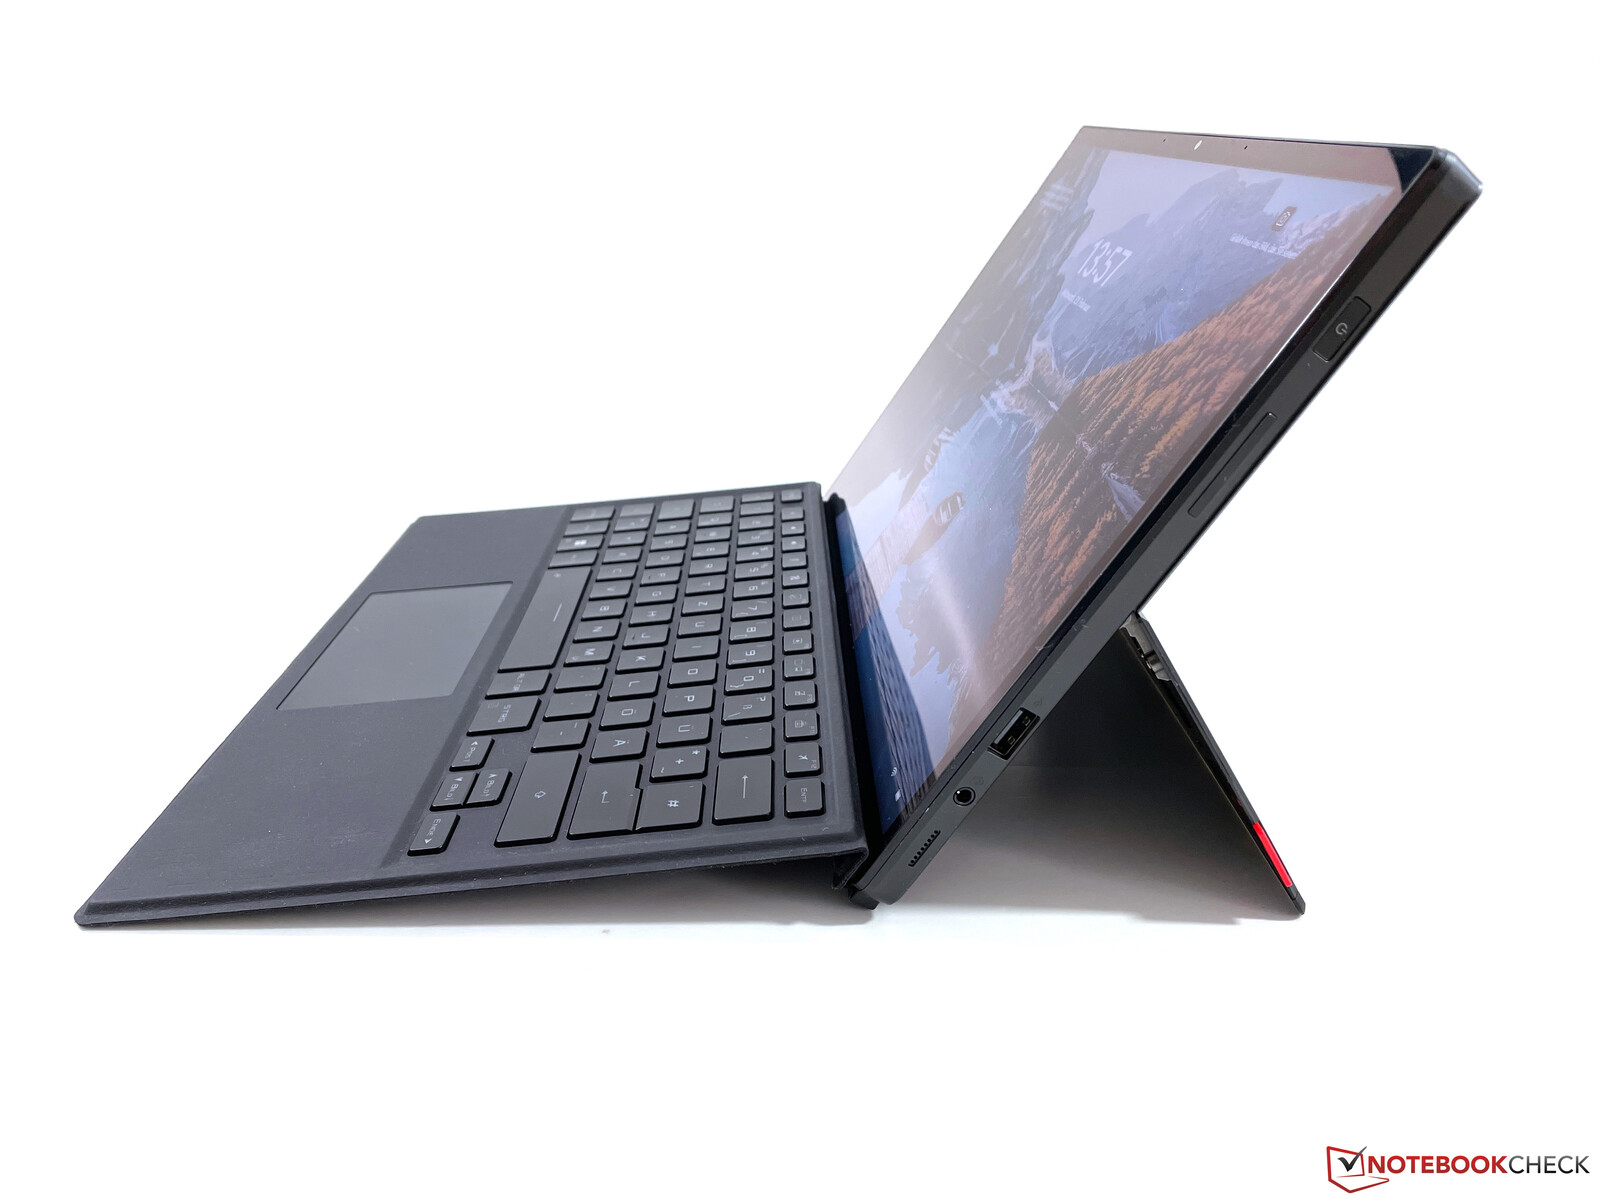
Case - A pumped-up Surface Pro
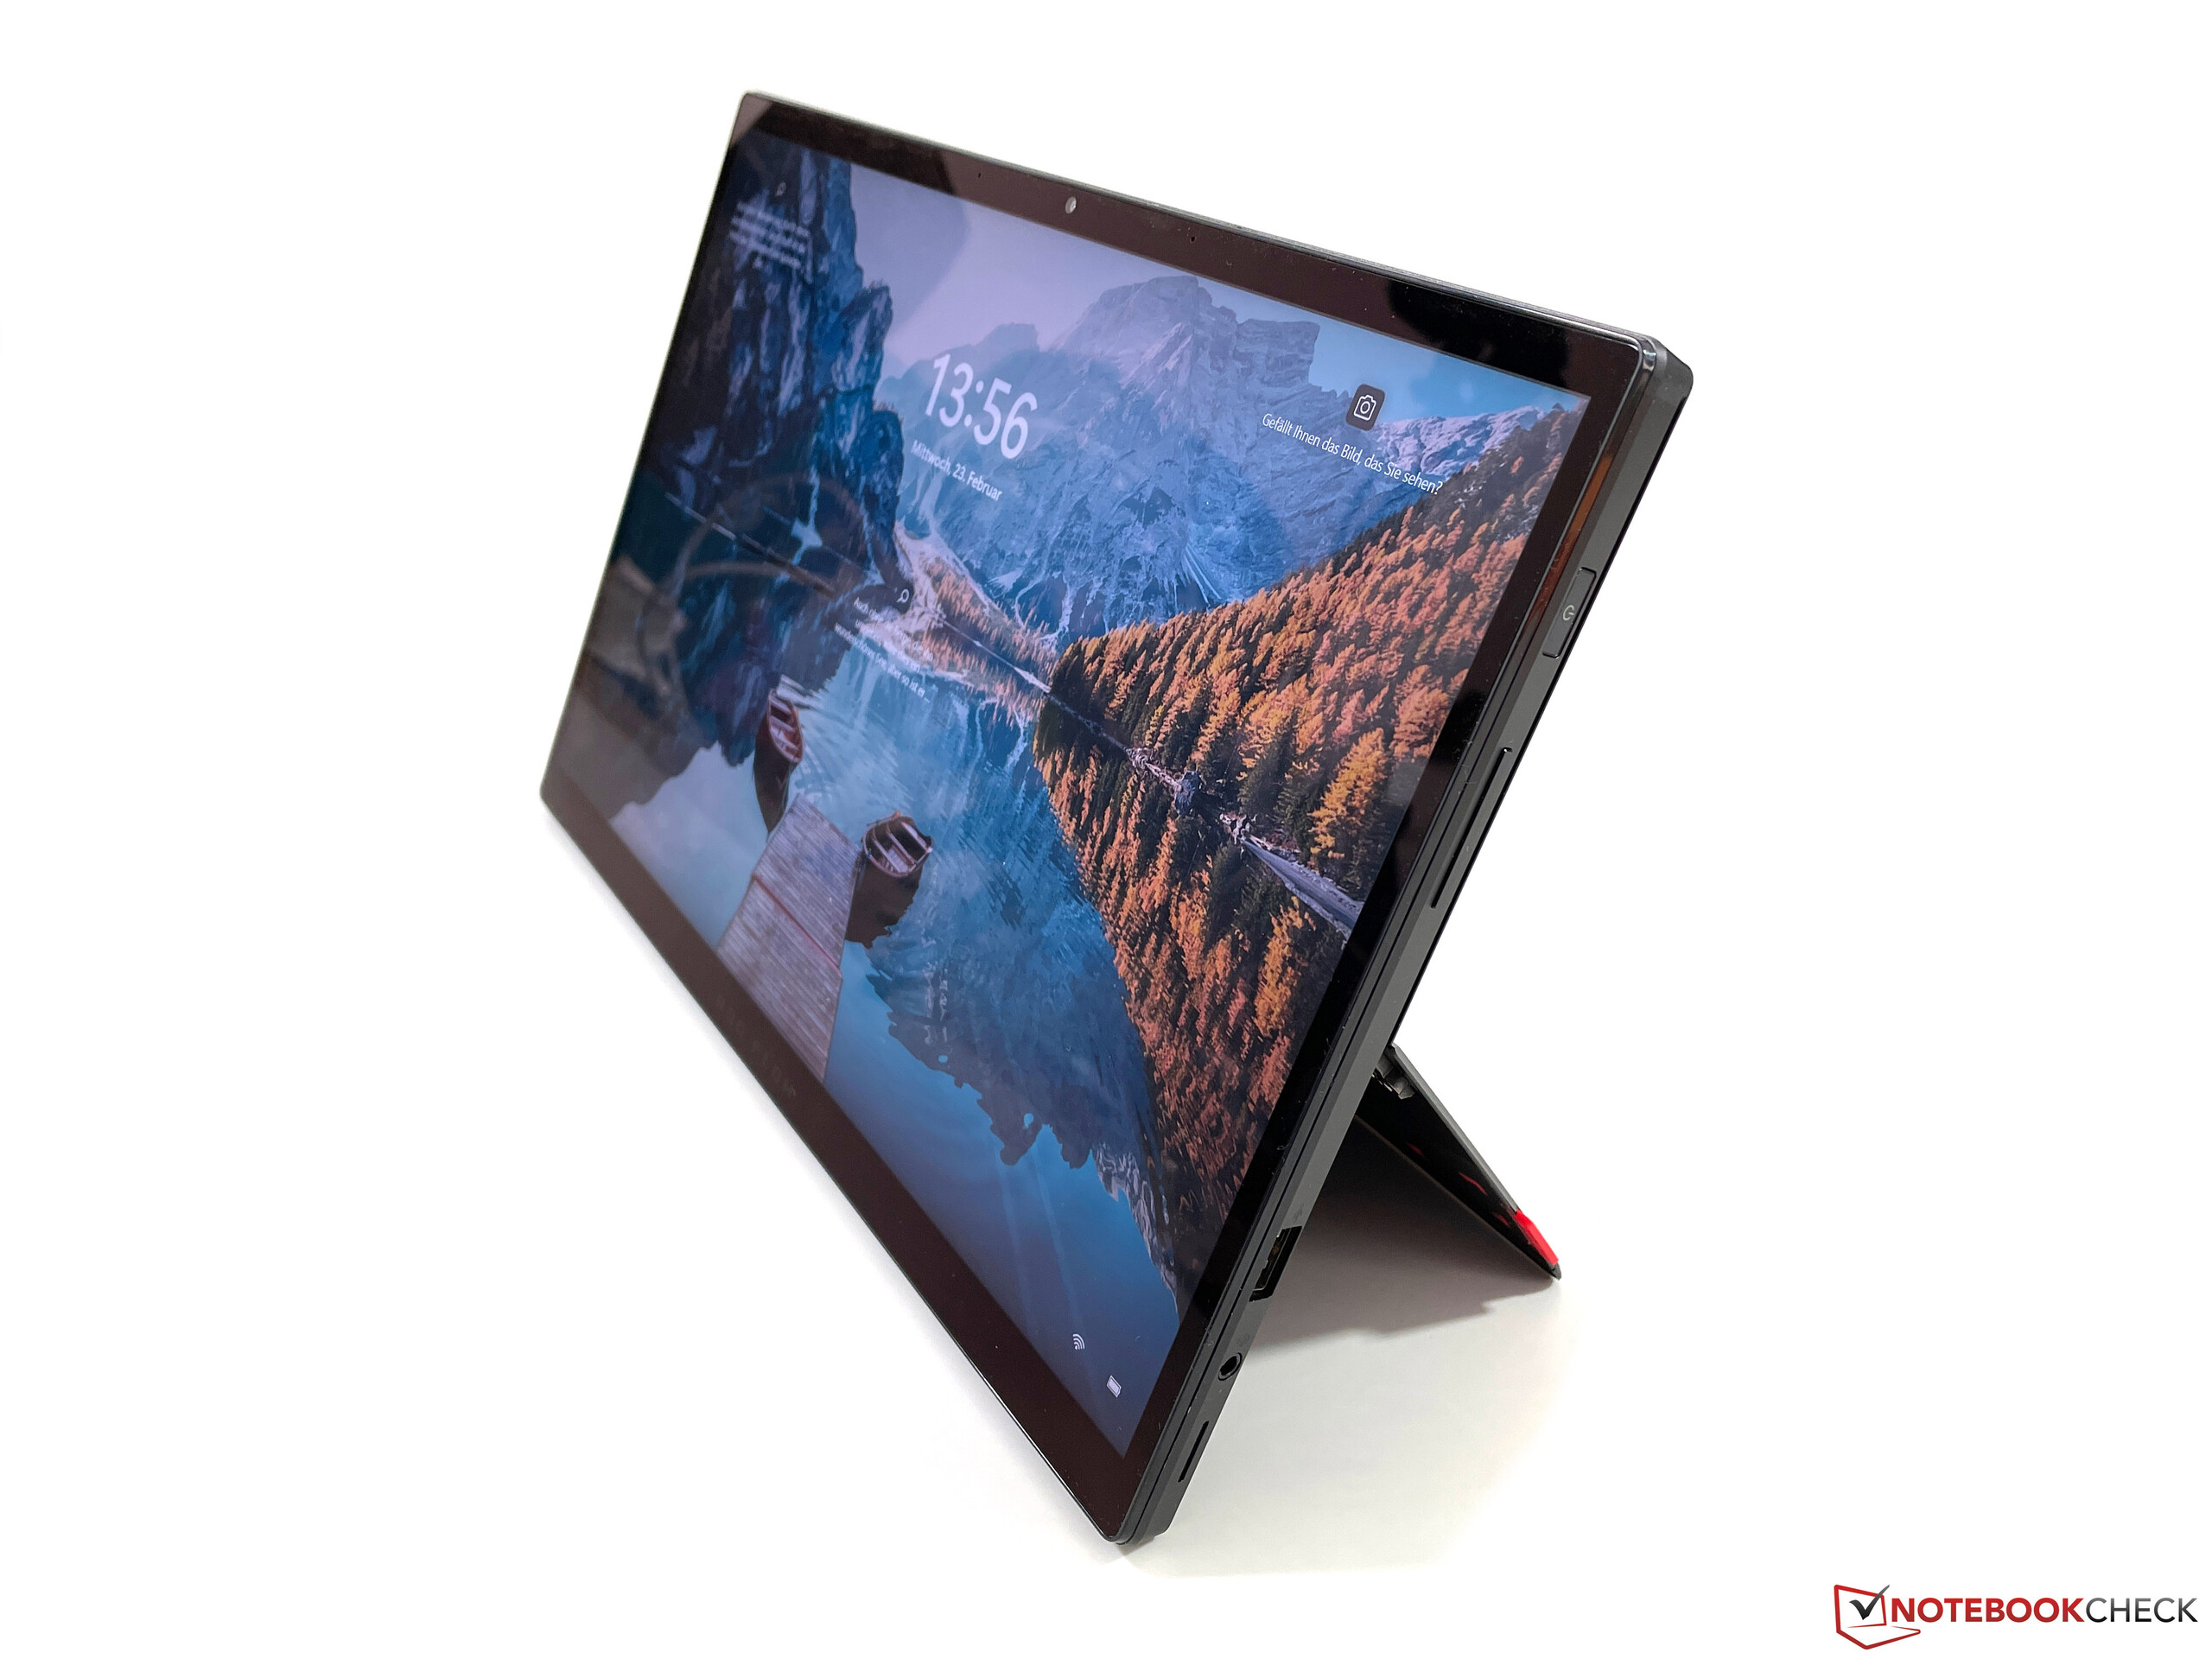
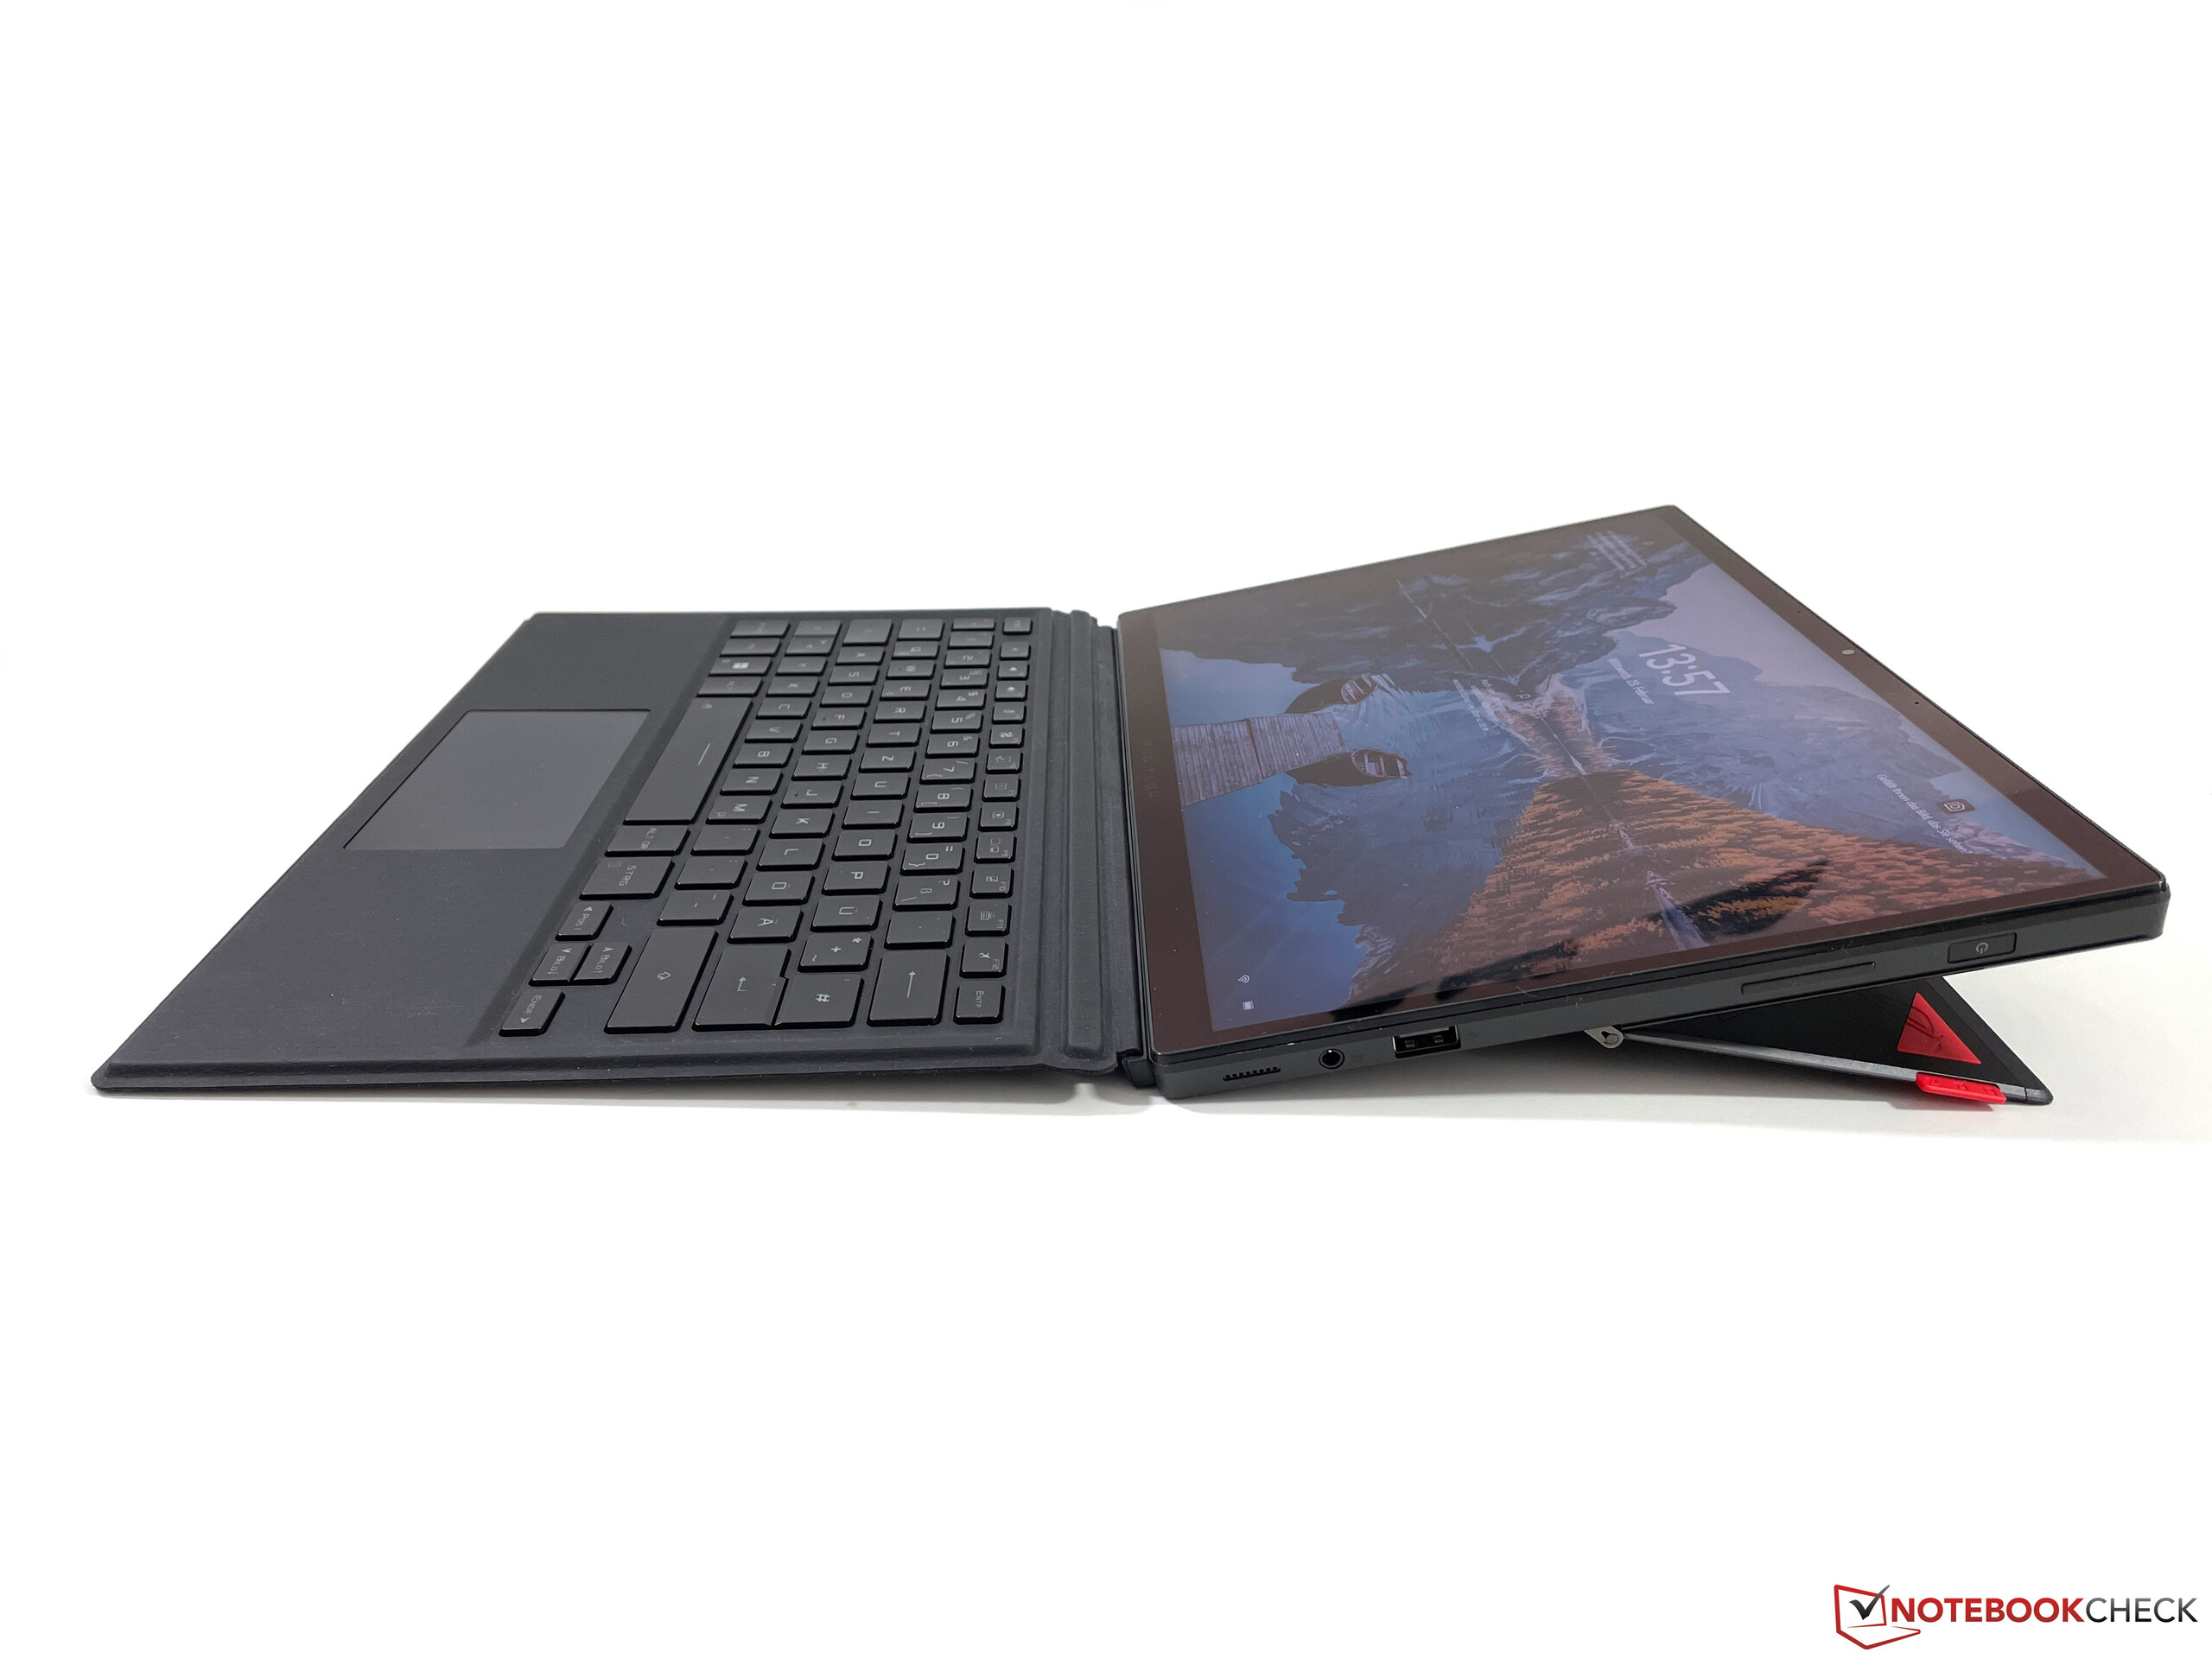
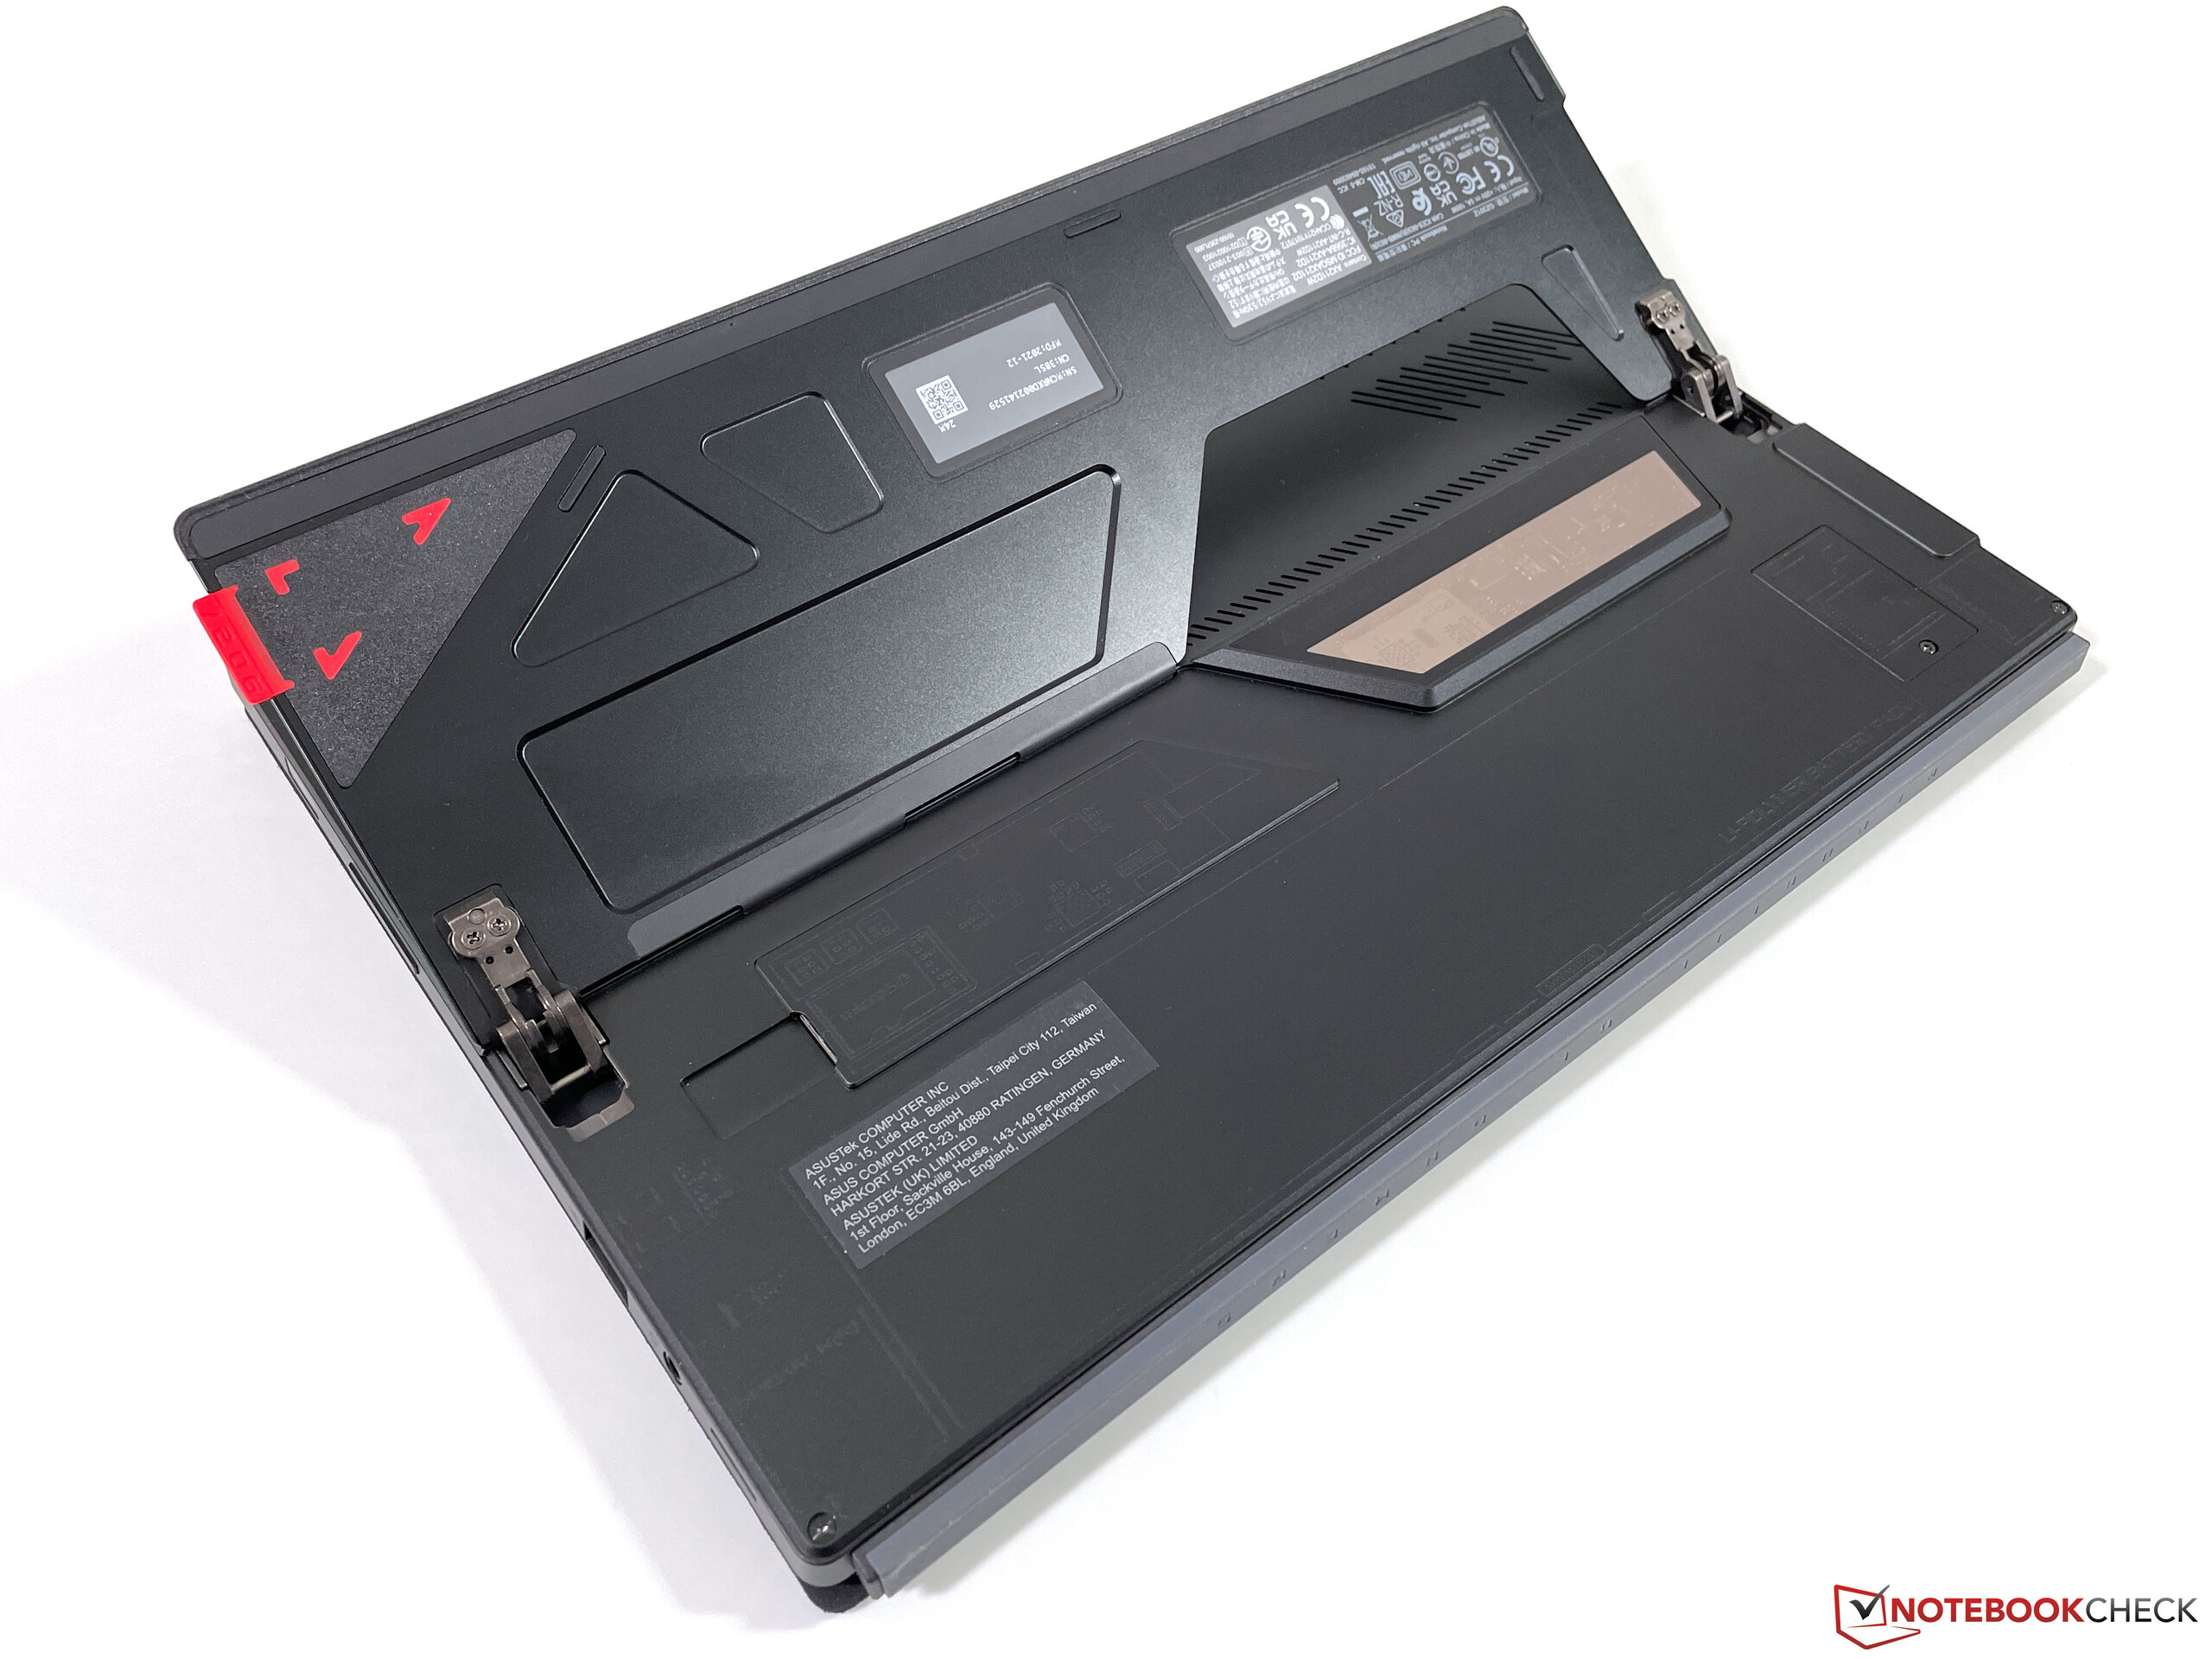
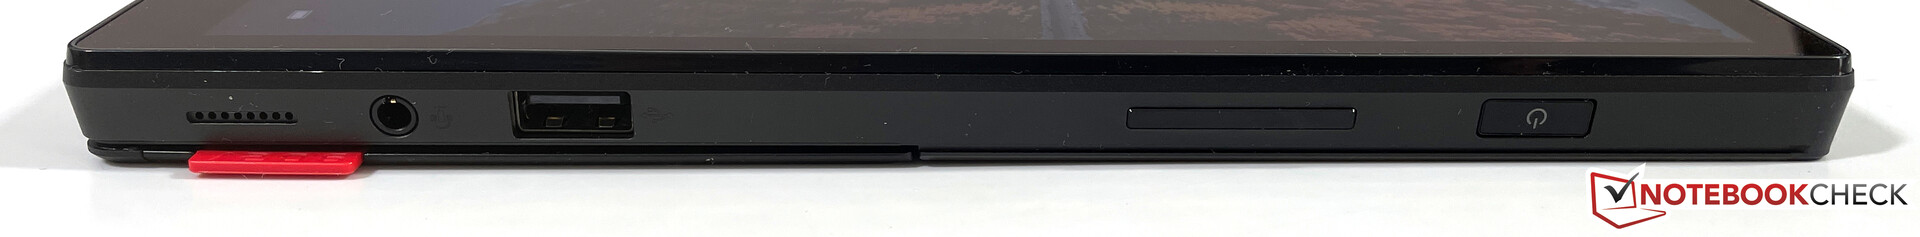
In general, the ROG Flow Z13 is a normal convertible with an integrated kickstand and an attachable keyboard, just like we've seen in the Microsoft Surface Pro for years. However, the Flow Z13 is considerably more massive and heavier. Nevertheless, due to the higher weight, the convertible also looks very premium, and this impression is supported by both the stability and workmanship of the aluminum case. The integrated kickstand, which allows a maximum opening angle of up to 170 degrees, also looks quite high quality. Although the material is very thin here, it doesn't bend when you change the angle. The two hinges are very well adjusted in principle, and there's only a minimum degree of play. Both the volume rocker and the power button (including the fingerprint scanner) are neatly integrated into the case.
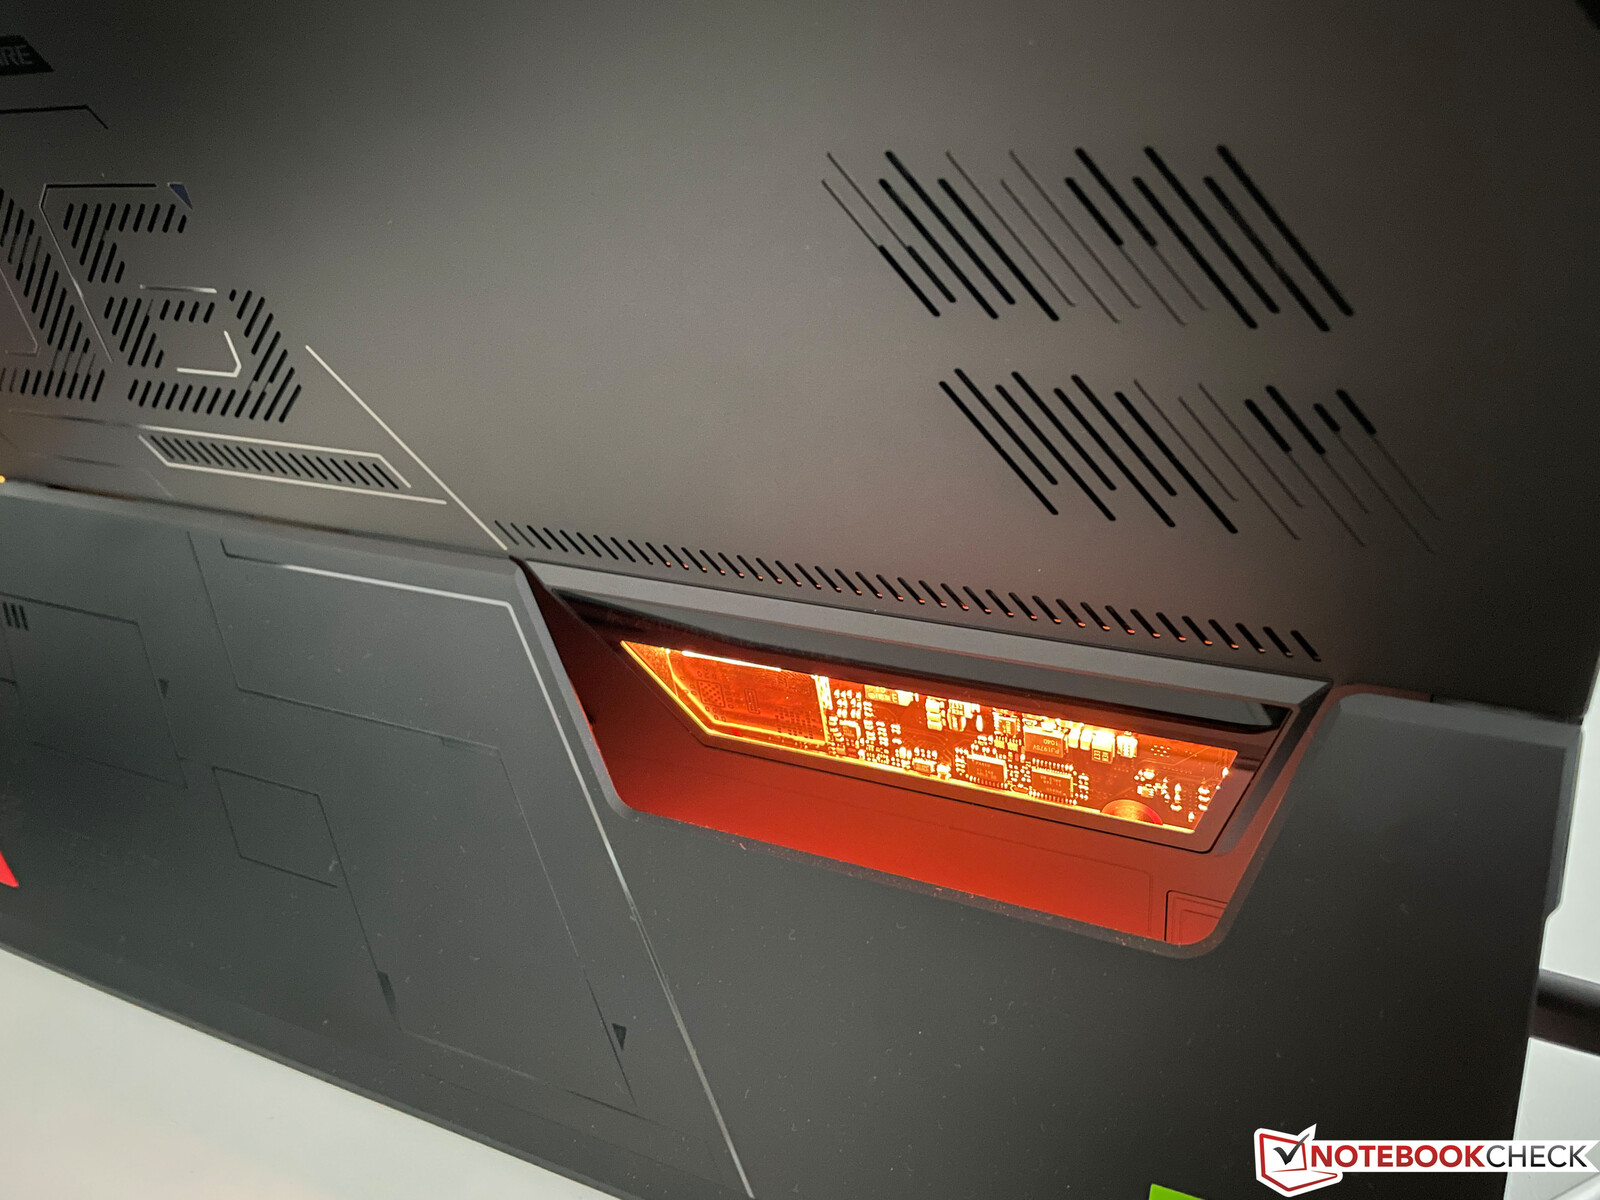
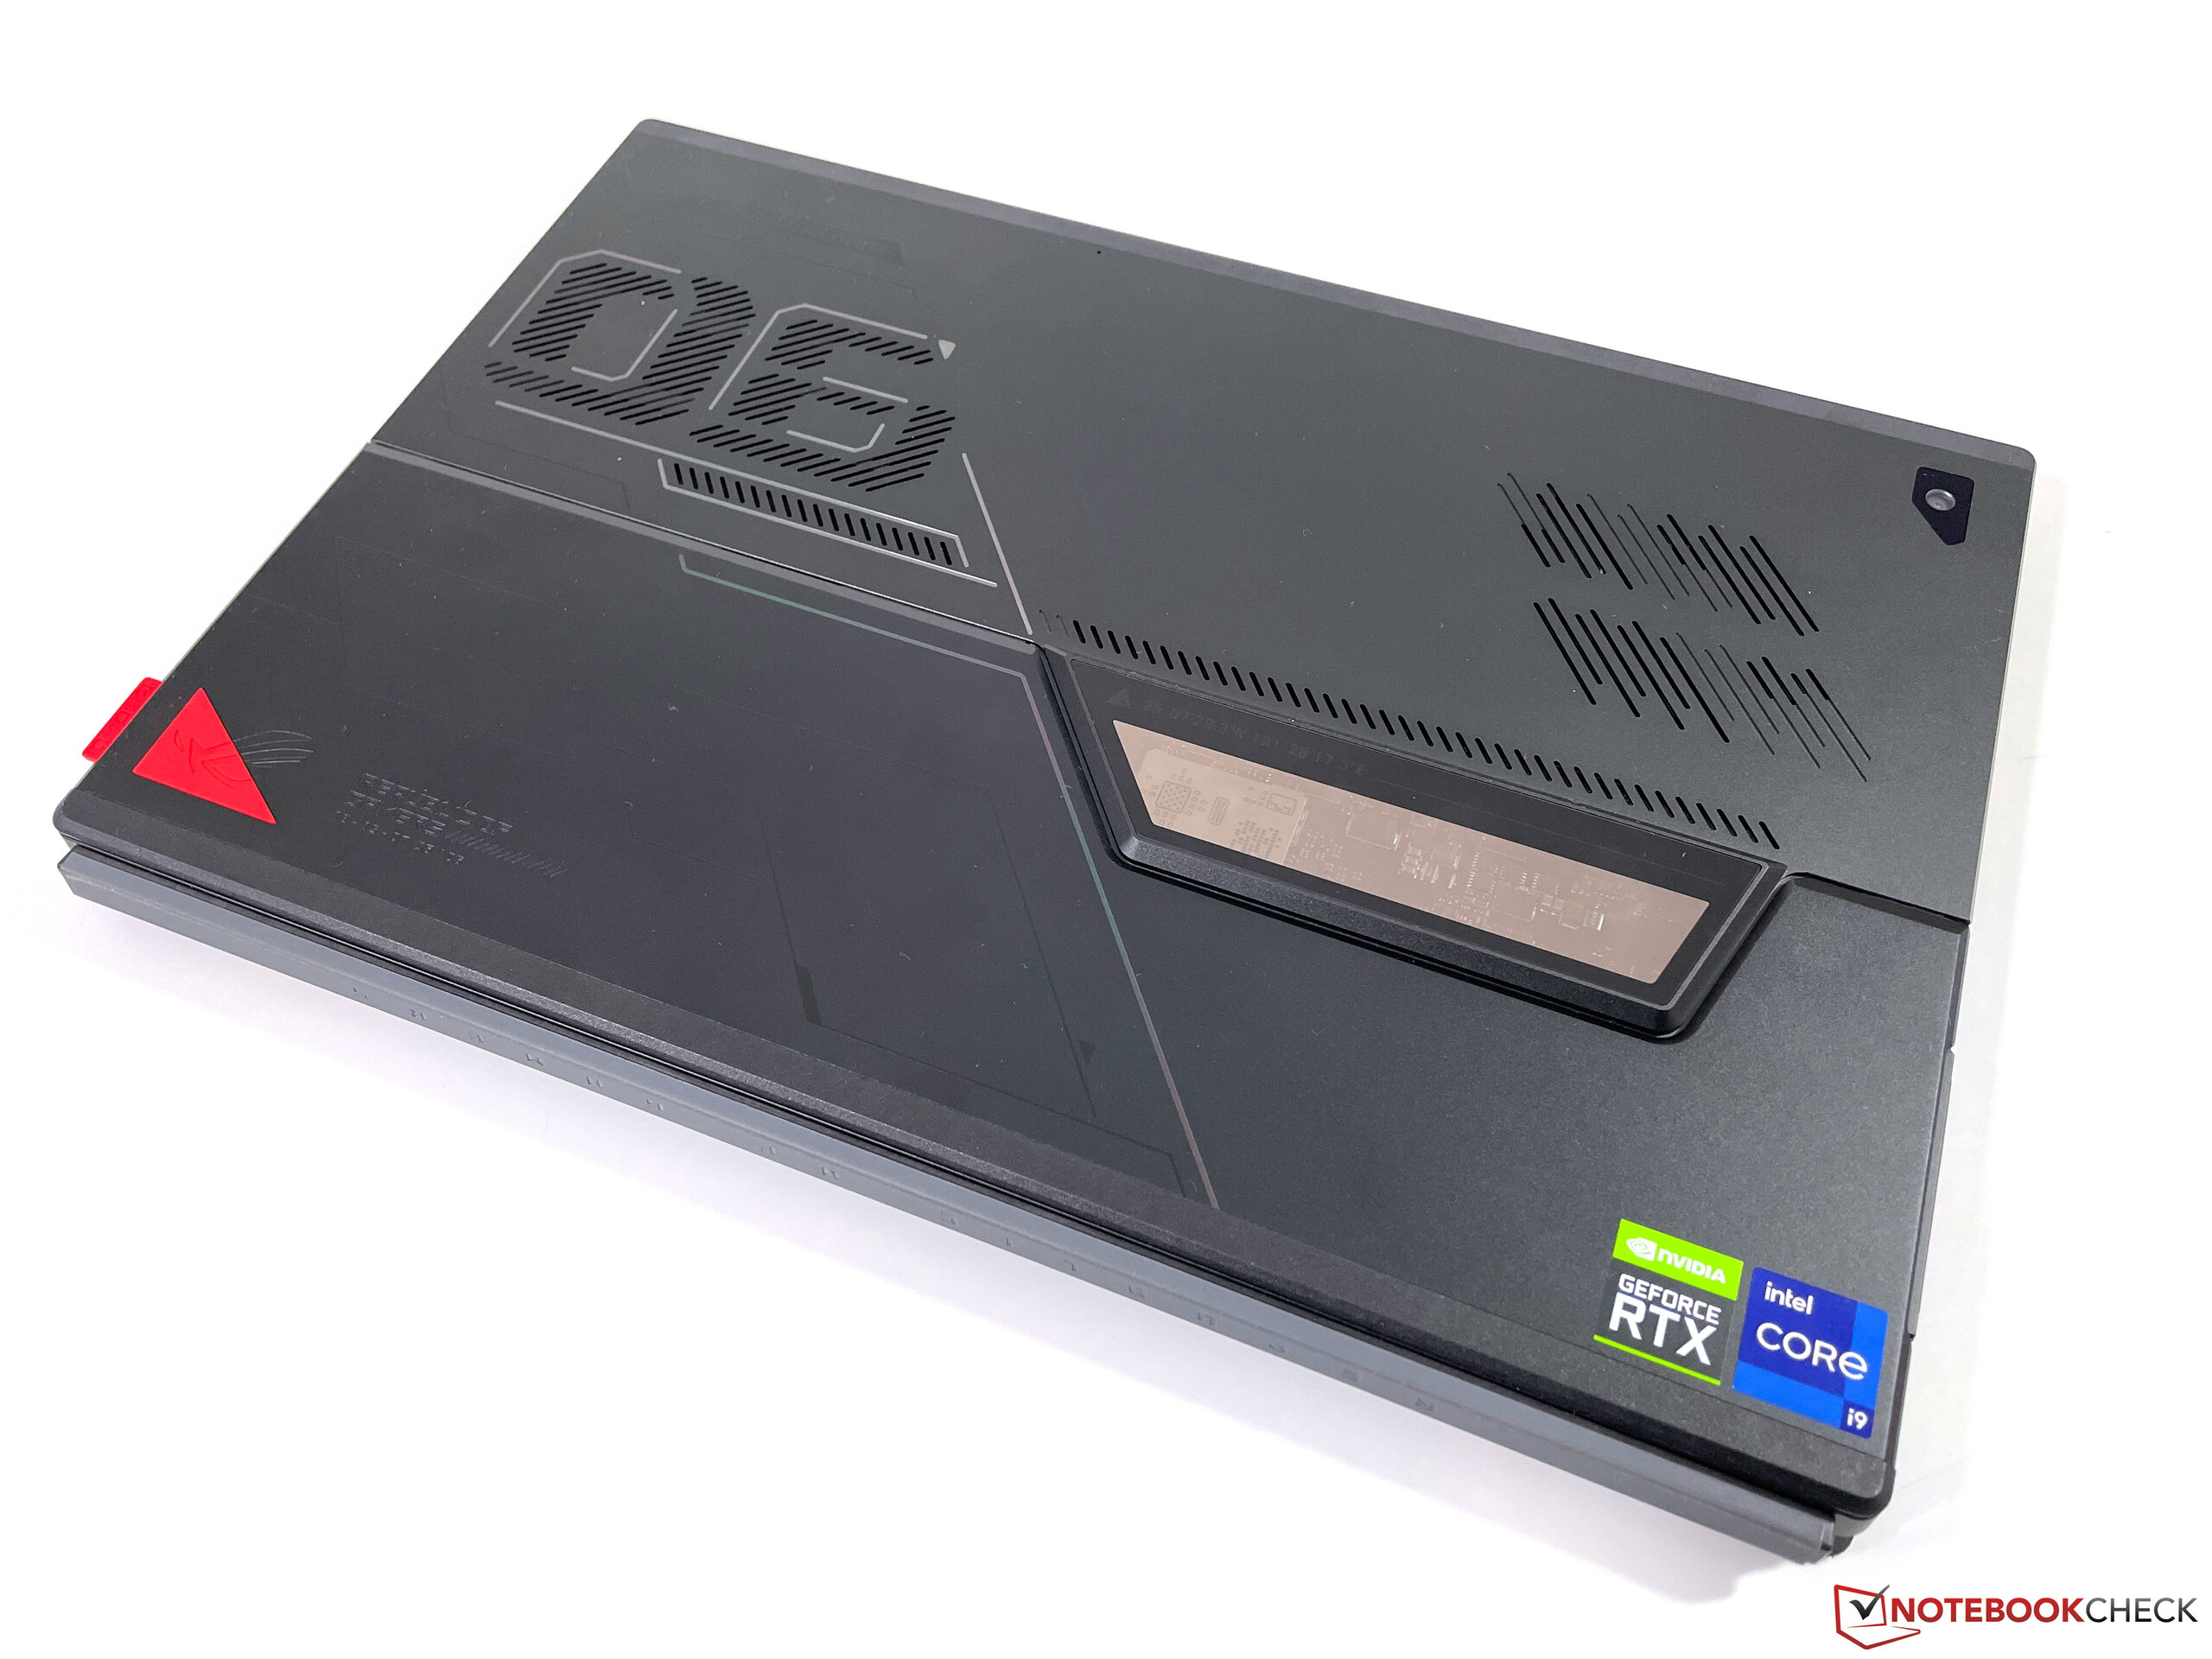
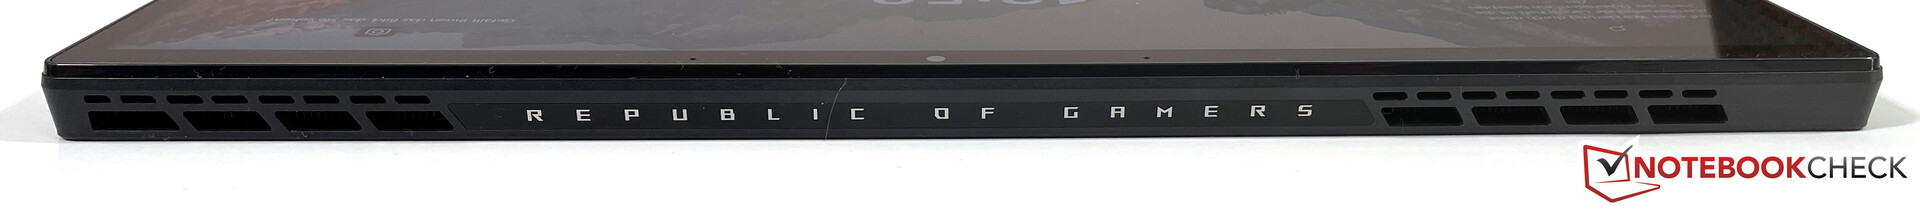
The aggressive design language is in line with the ROG laptops, and it also suits a gaming tablet. There's also a small window in the case on the back, which can be illuminated and also supports Aura Sync technology (just like the keyboard backlight). However, this also creates a small hump, which is why the tablet is unable to lay flat on its back and wobbles. The fan grilles on the back have also been implemented as design elements, so they are hardly noticeable. There's a large Republic of Gamers logo on the top, which is flanked by the two fan outlets.
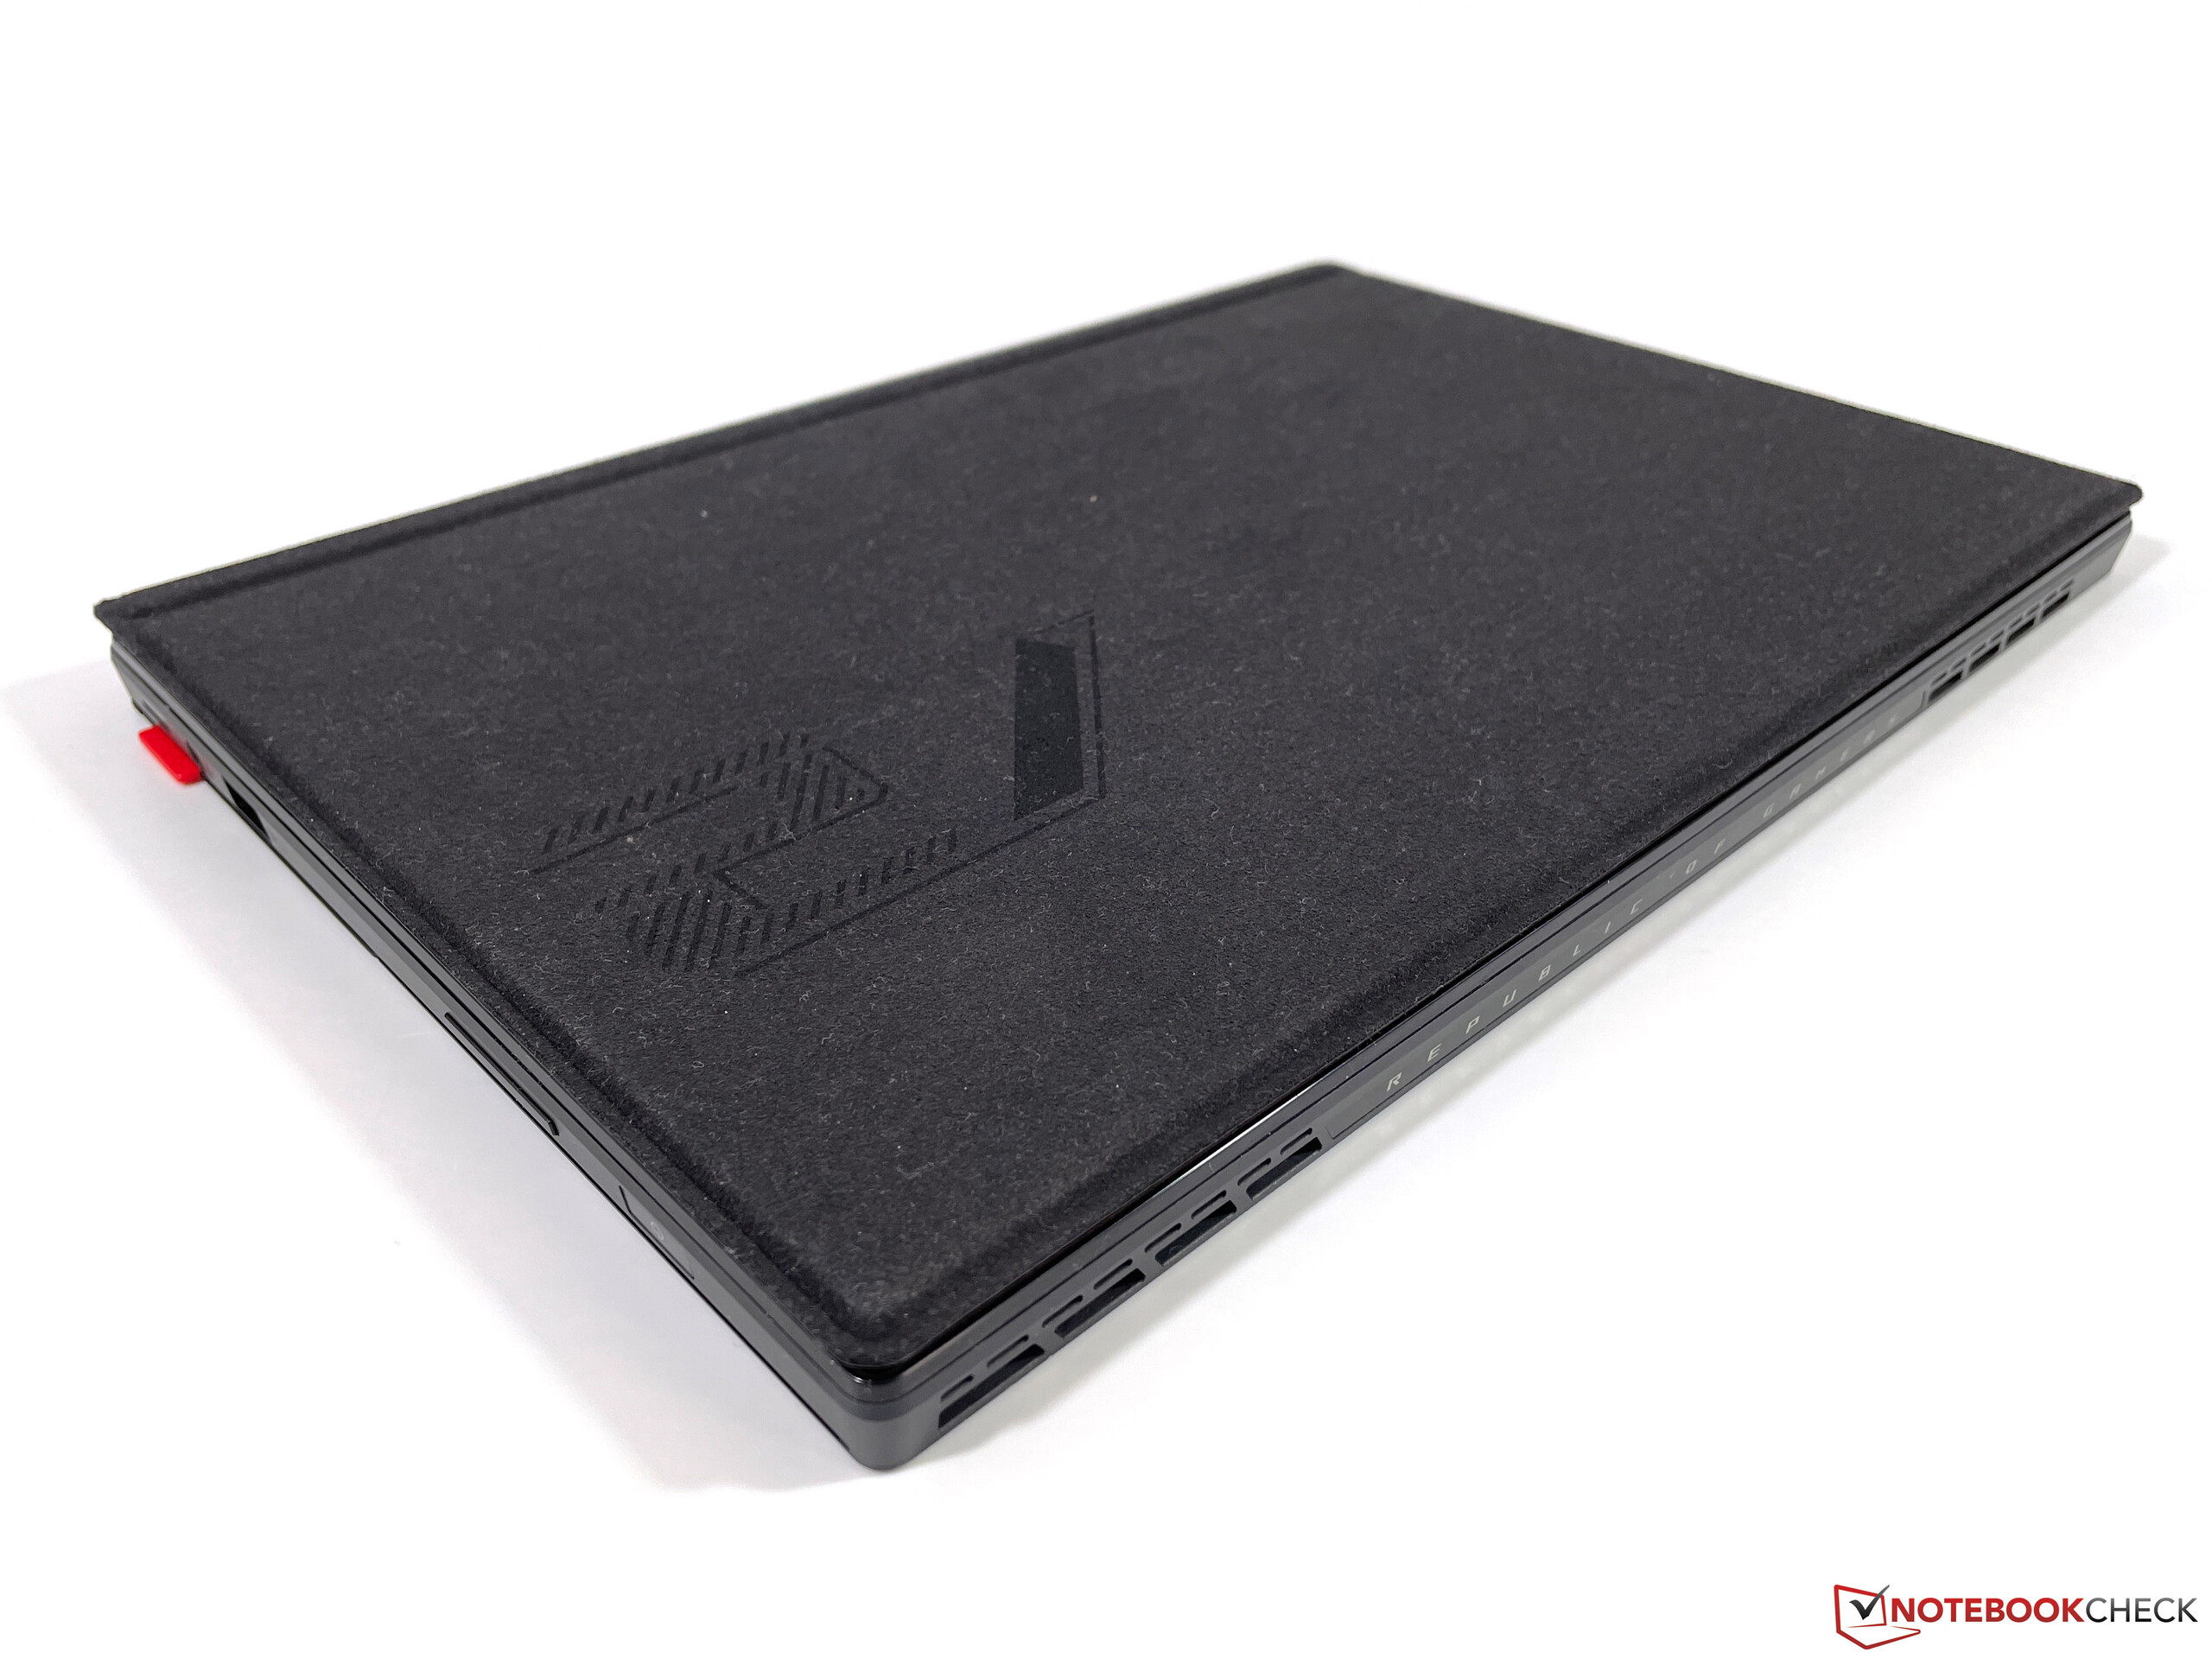
The included keyboard cover also doubles as a cover and protects the display when the device is not in use. The back of the cover has some sort of velour finish, which feels nice to the touch and provides a good grip, but also picks up dust and dirt very quickly.
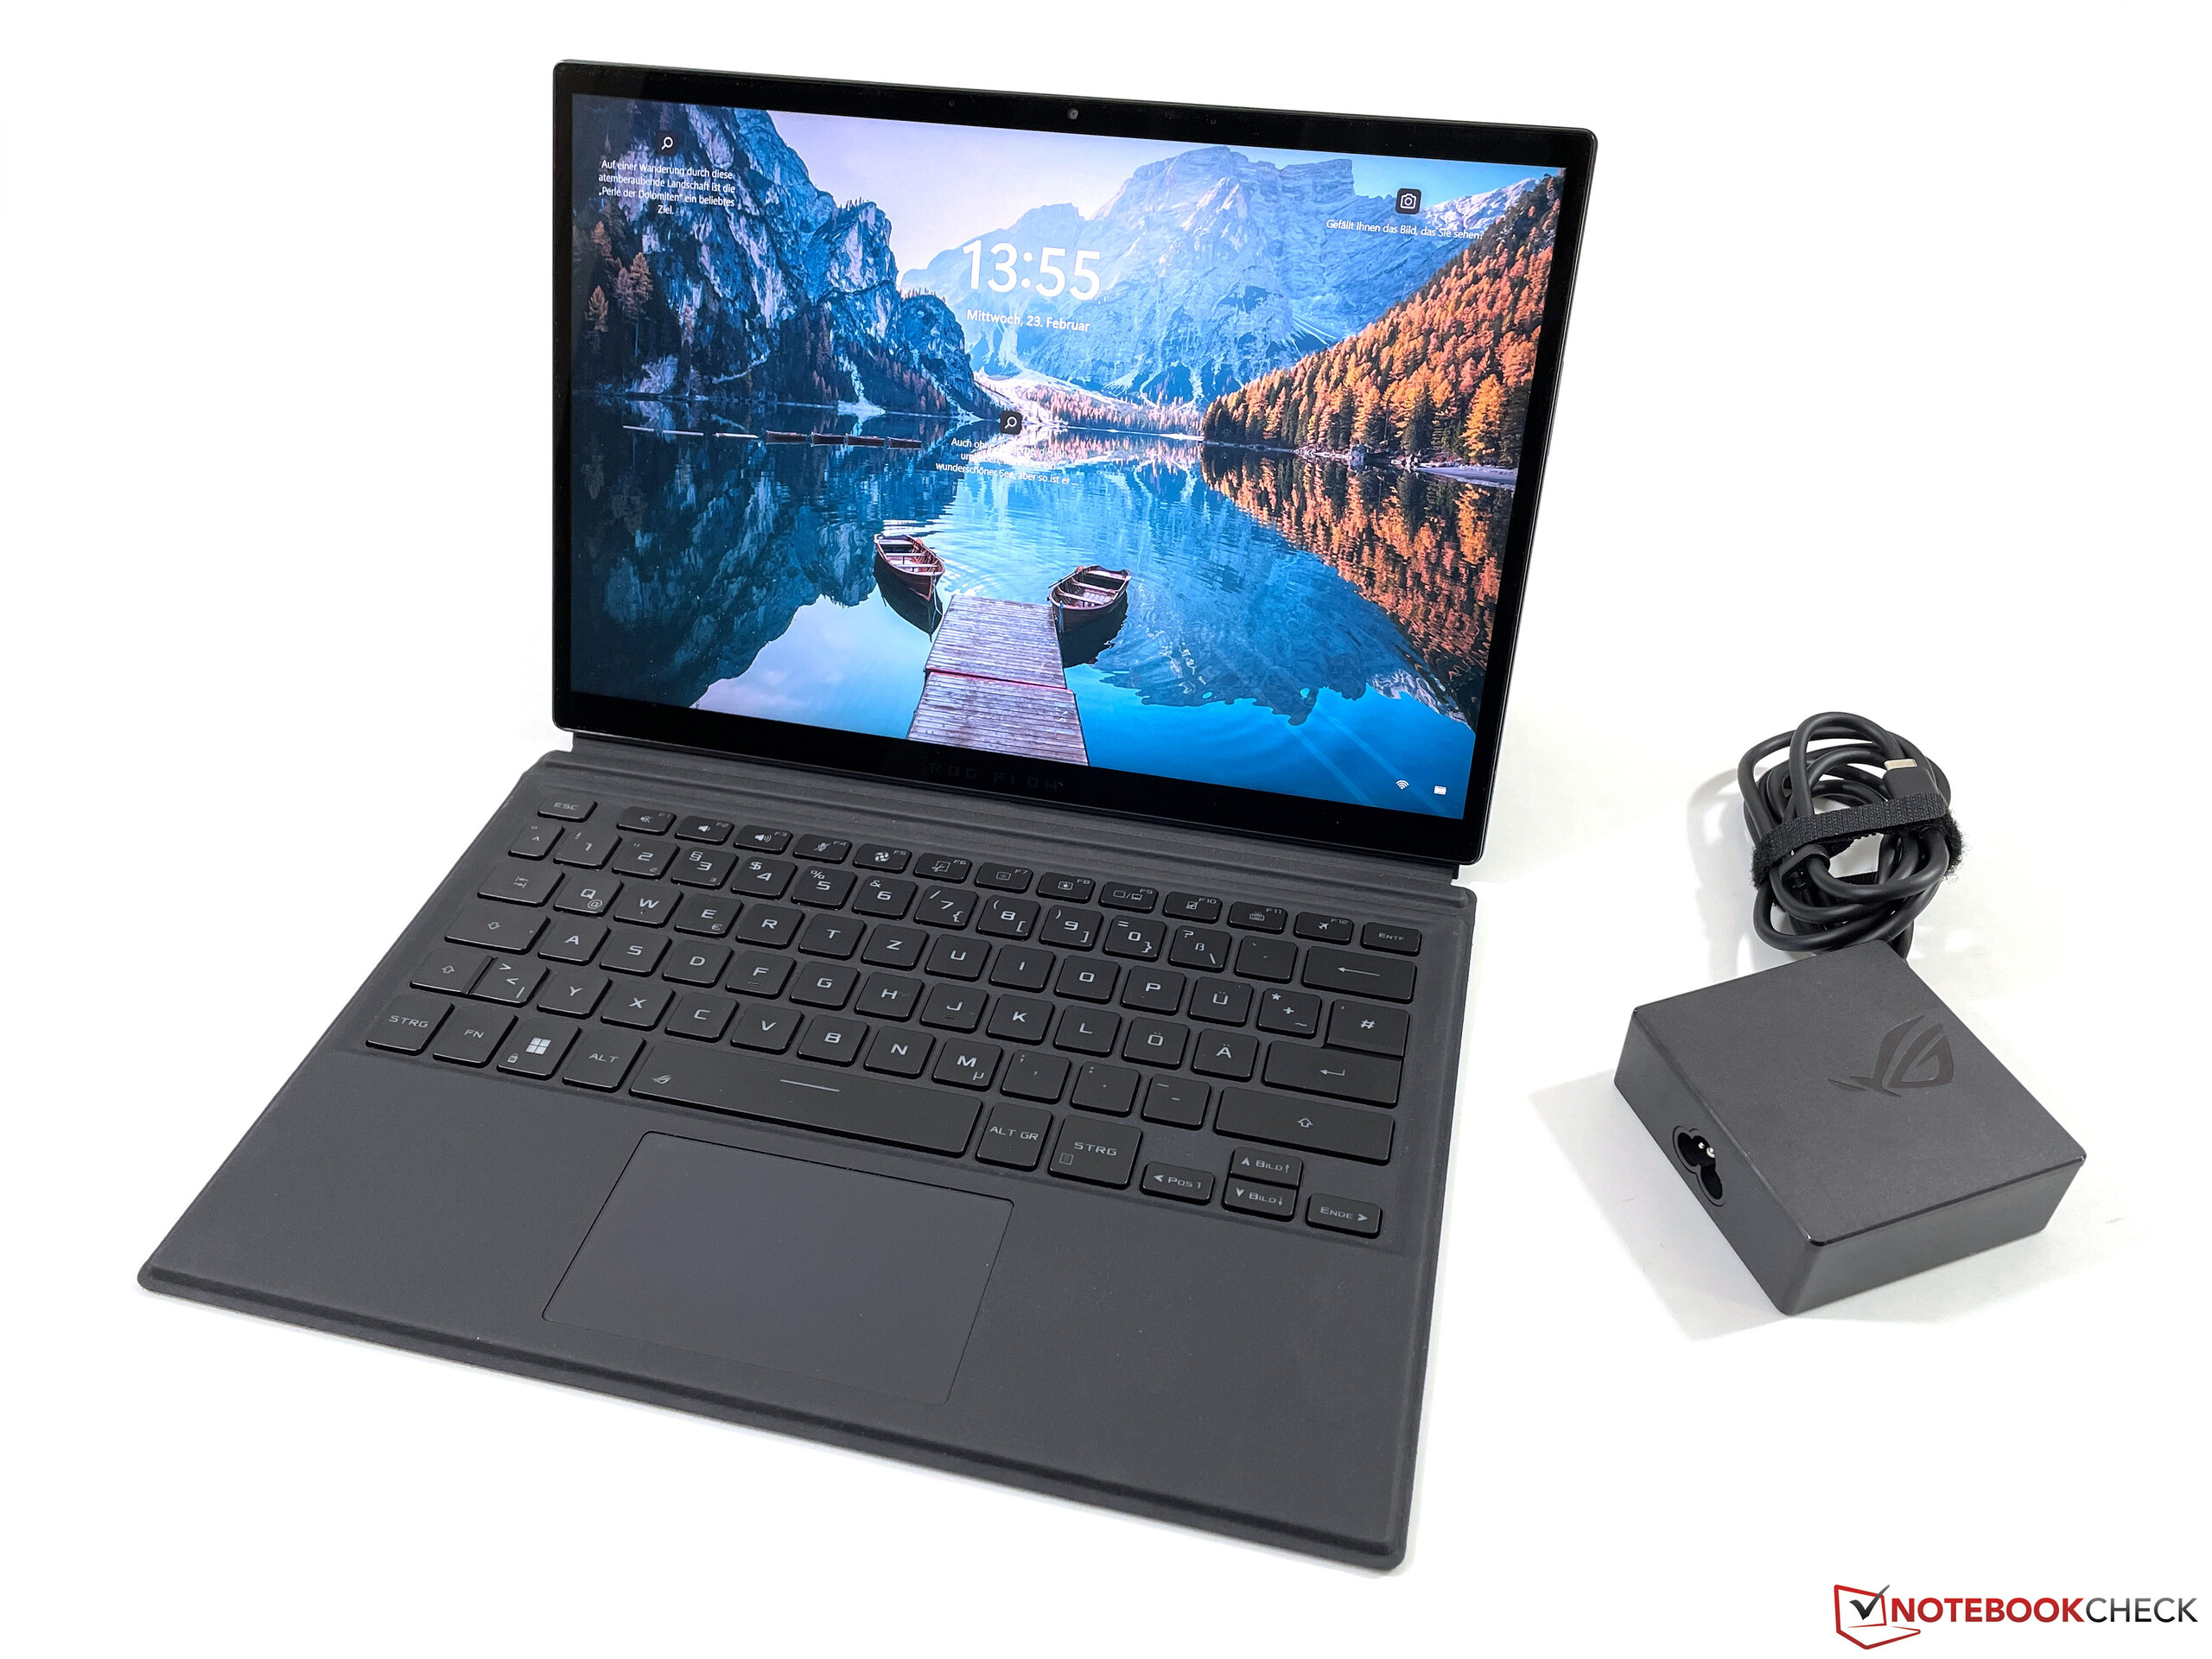
Weighing in at 1.185 kg, the ROG Flow Z13 alone already weighs more than many ultrabooks, such as the Schenker Vision 14 with the RTX 3050 Ti. With the keyboard cover, the weight climbs to a bit more than 1.5 kg, and the package is also almost 2 cm thick. Of course, this still makes it very portable, but you can clearly notice the difference to weaker convertibles like the Surface Pro 8. The 100-watt power adapter adds a bit over 400 grams to the weight.
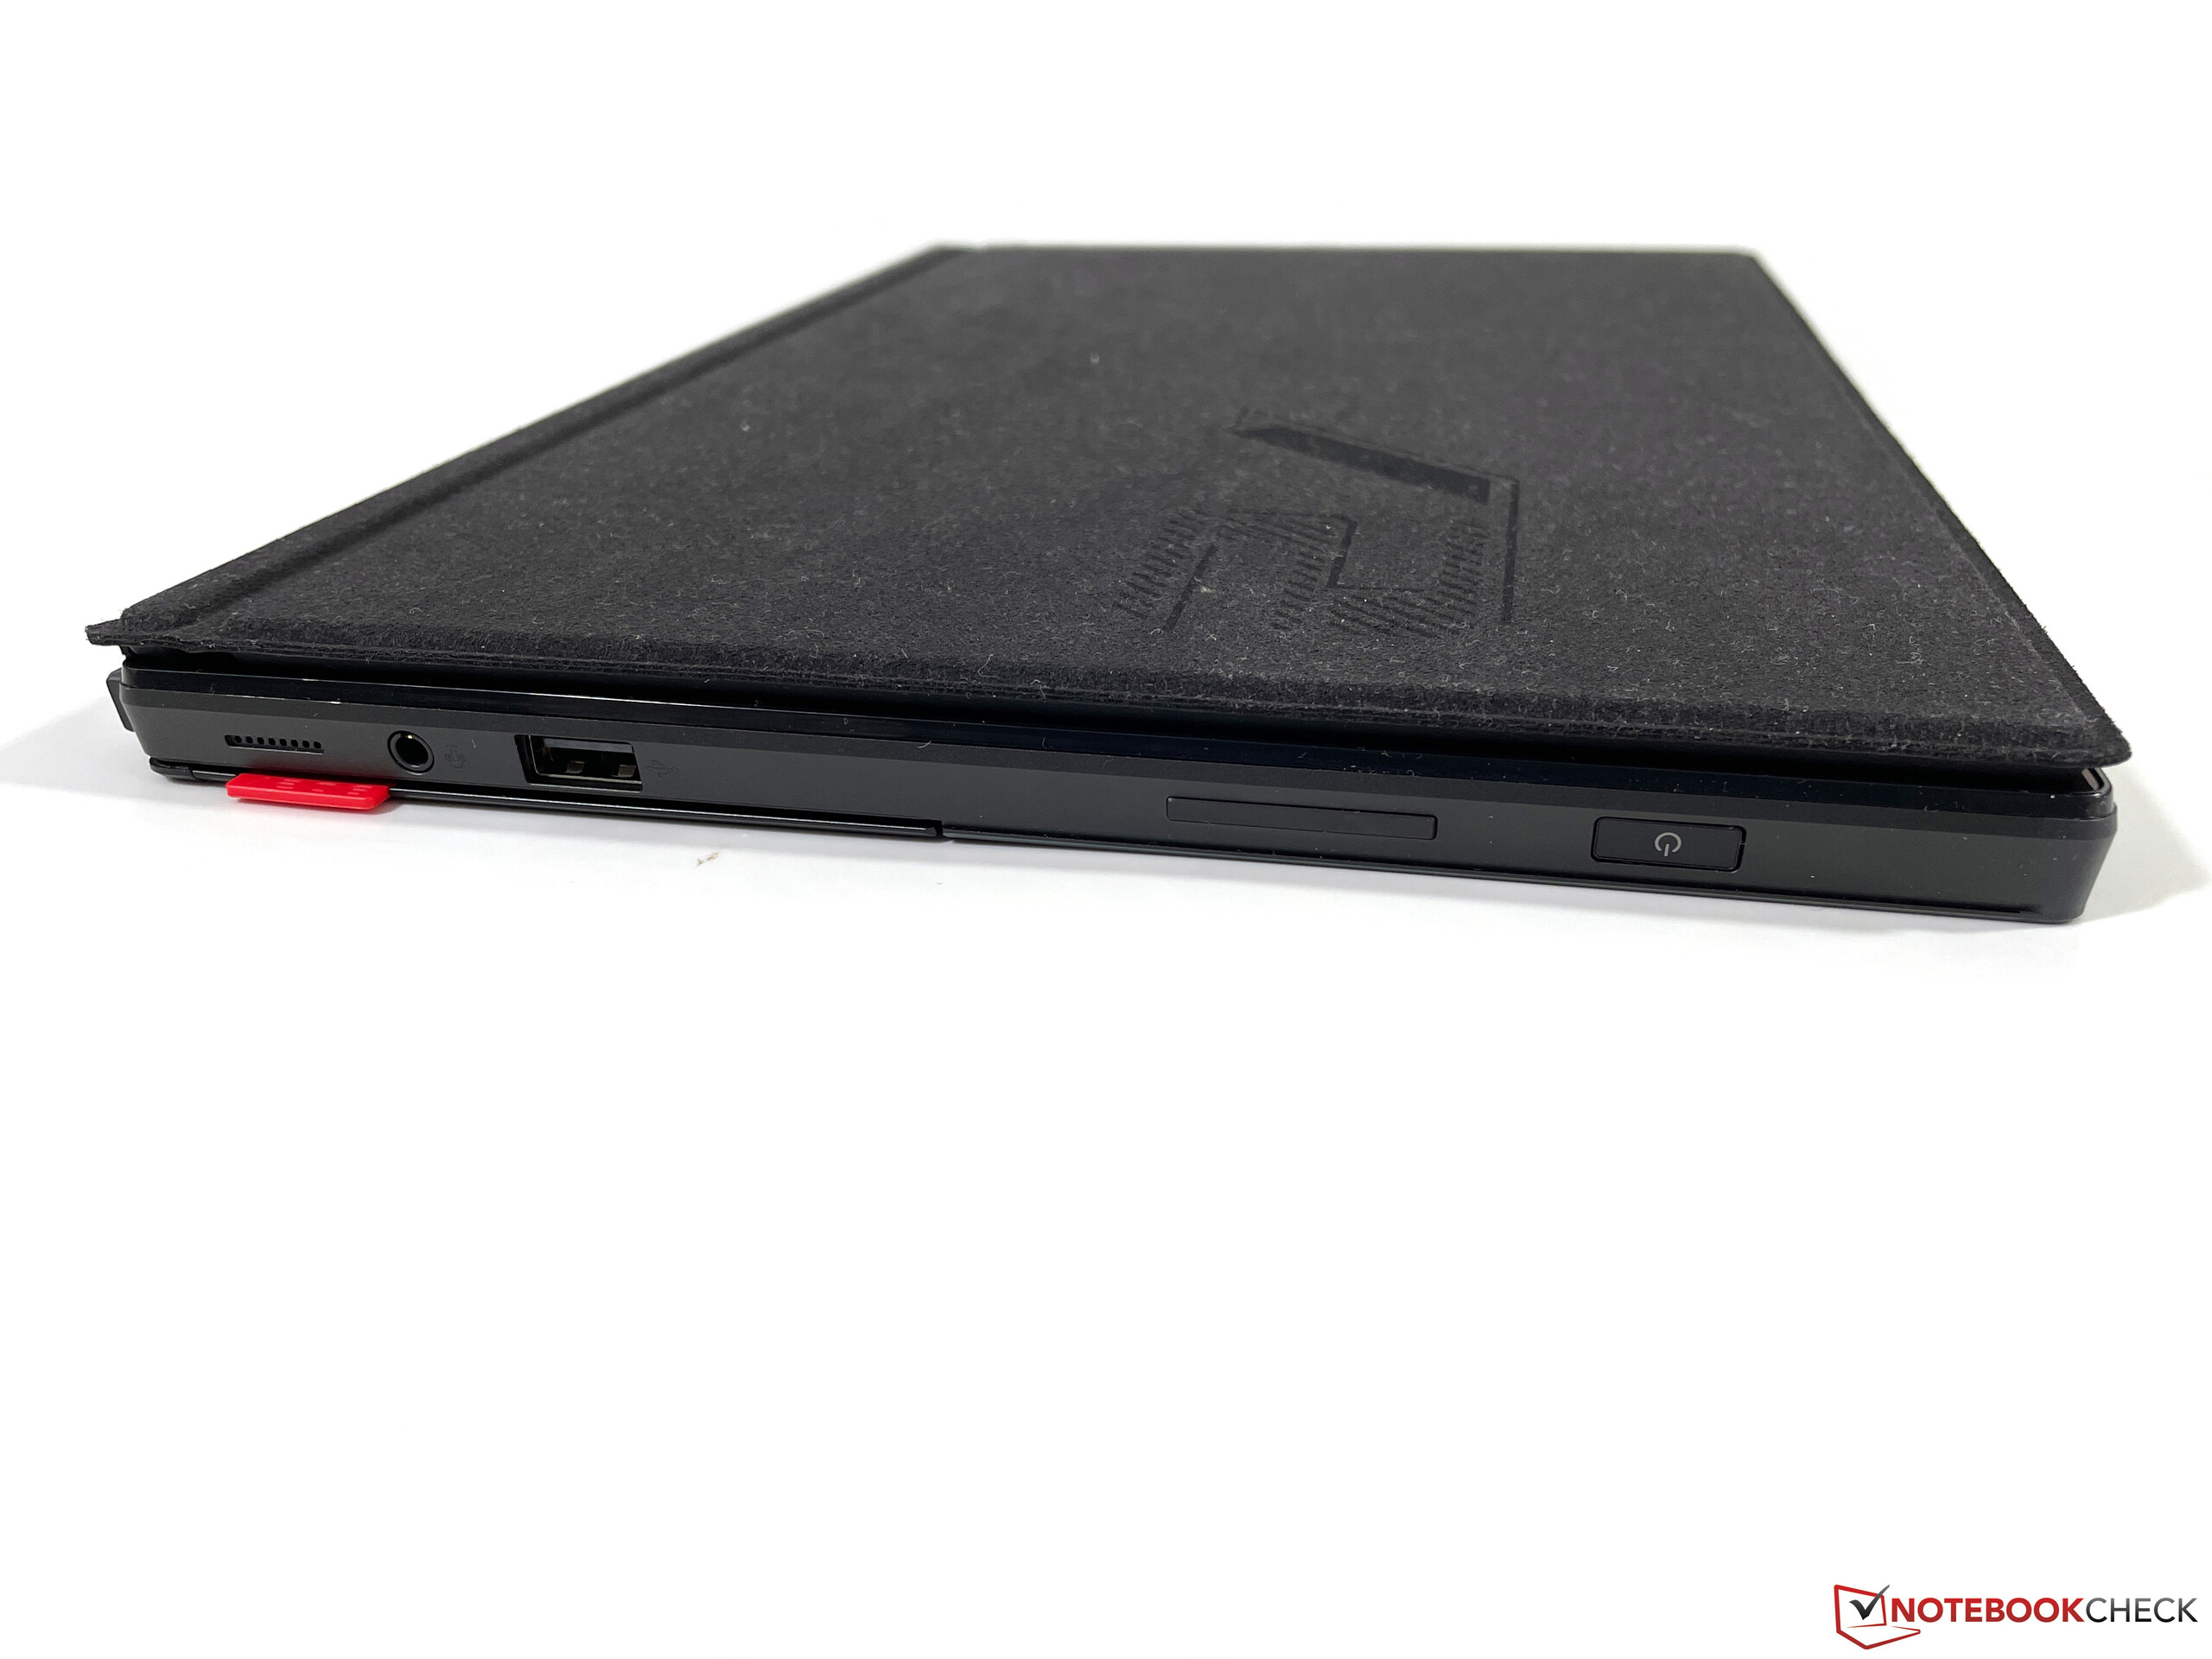
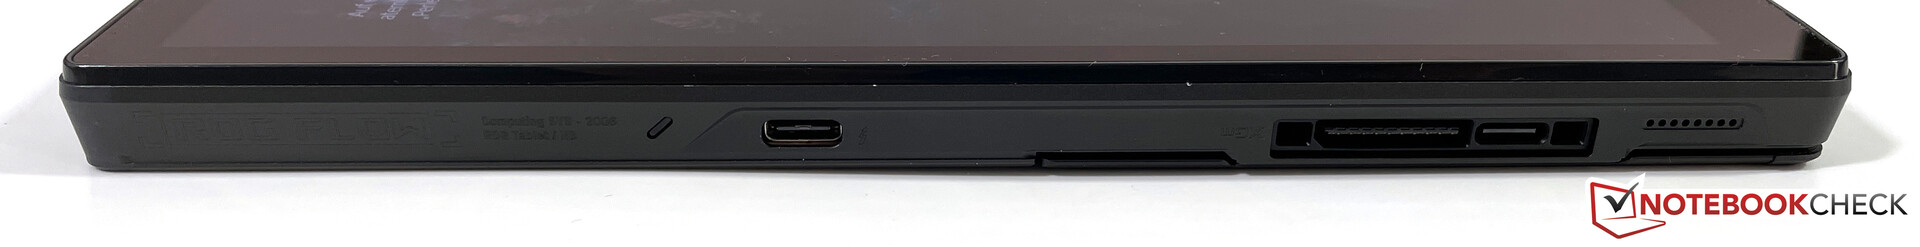
Connectivity - Thunderbolt 4 vs. USB 2.0
Considering it's a tablet, the available ports are not bad at all. On the left side, there's a USB-C port including Thunderbolt 4 support, as well as the connection for an external graphics card behind a small cover that consists of a USB-C port and a proprietary port with 8 PCIe lanes. A regular USB-A port is on the right side, but it only supports the outdated USB 2.0 standard, which is somewhat hard to understand.
We had problems with the Thunderbolt 4 port in our review sample because we were unable to charge the device via this port, regardless of whether we used the included power adapter or other USB-C power adapters. The operating system only displayed a notification saying that the device was not charging and that the included power adapter should be used. After some research, we discovered that the Thunderbolt 4 port doesn't support charging in German models. We were very surprised about that, because the charging function is actually mandatory for the Thunderbolt 4 certification. We have contacted Asus about this and will update this article accordingly as soon as we receive official feedback.
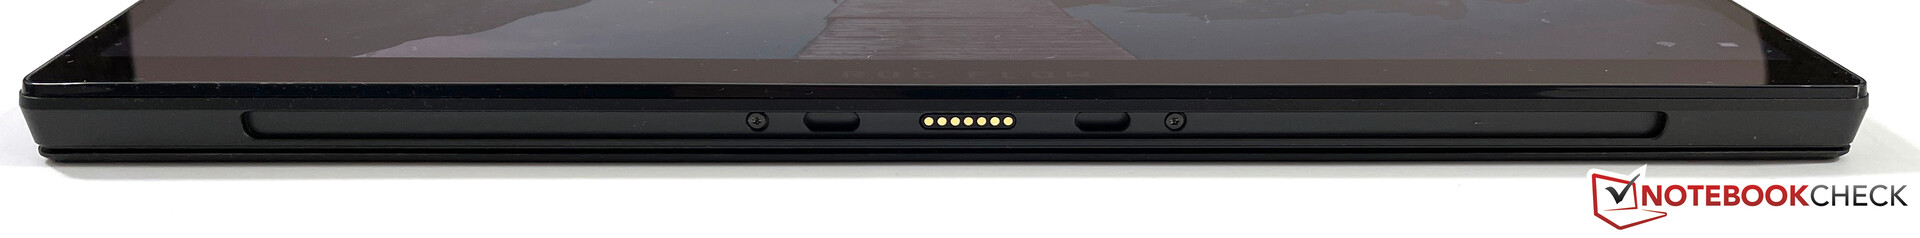
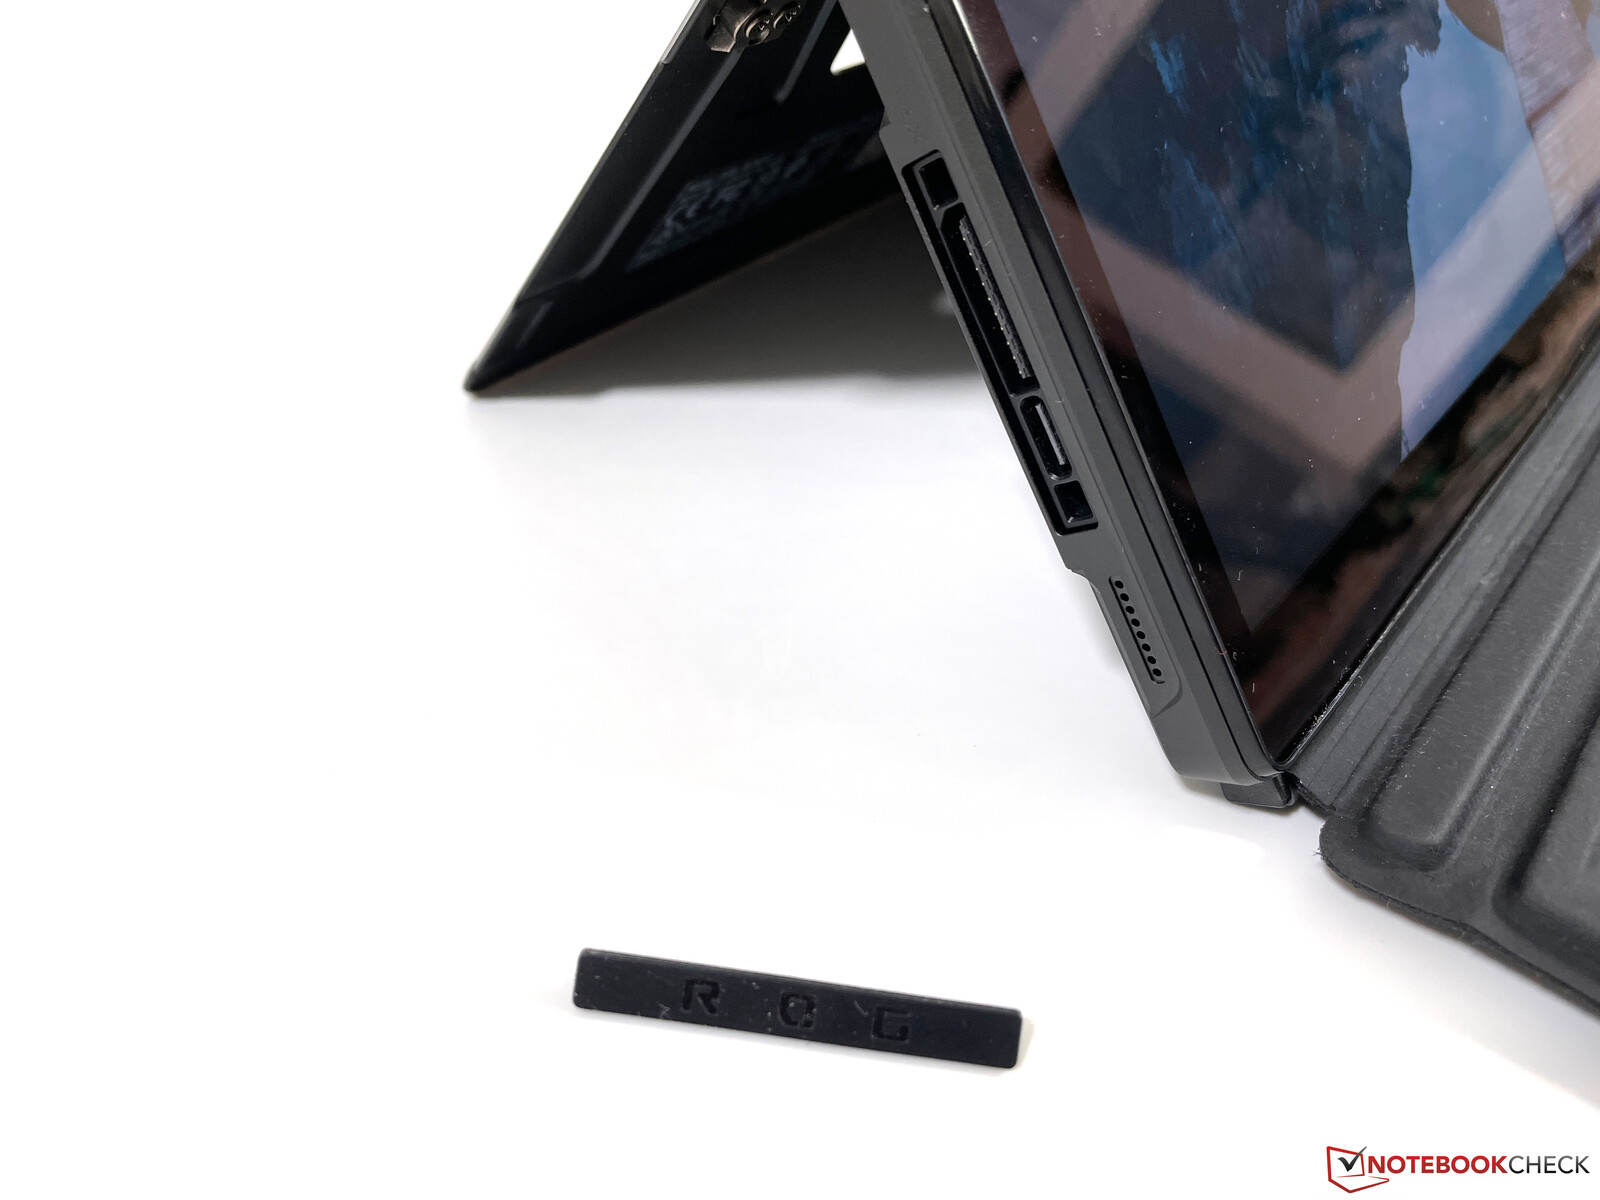
SD card reader
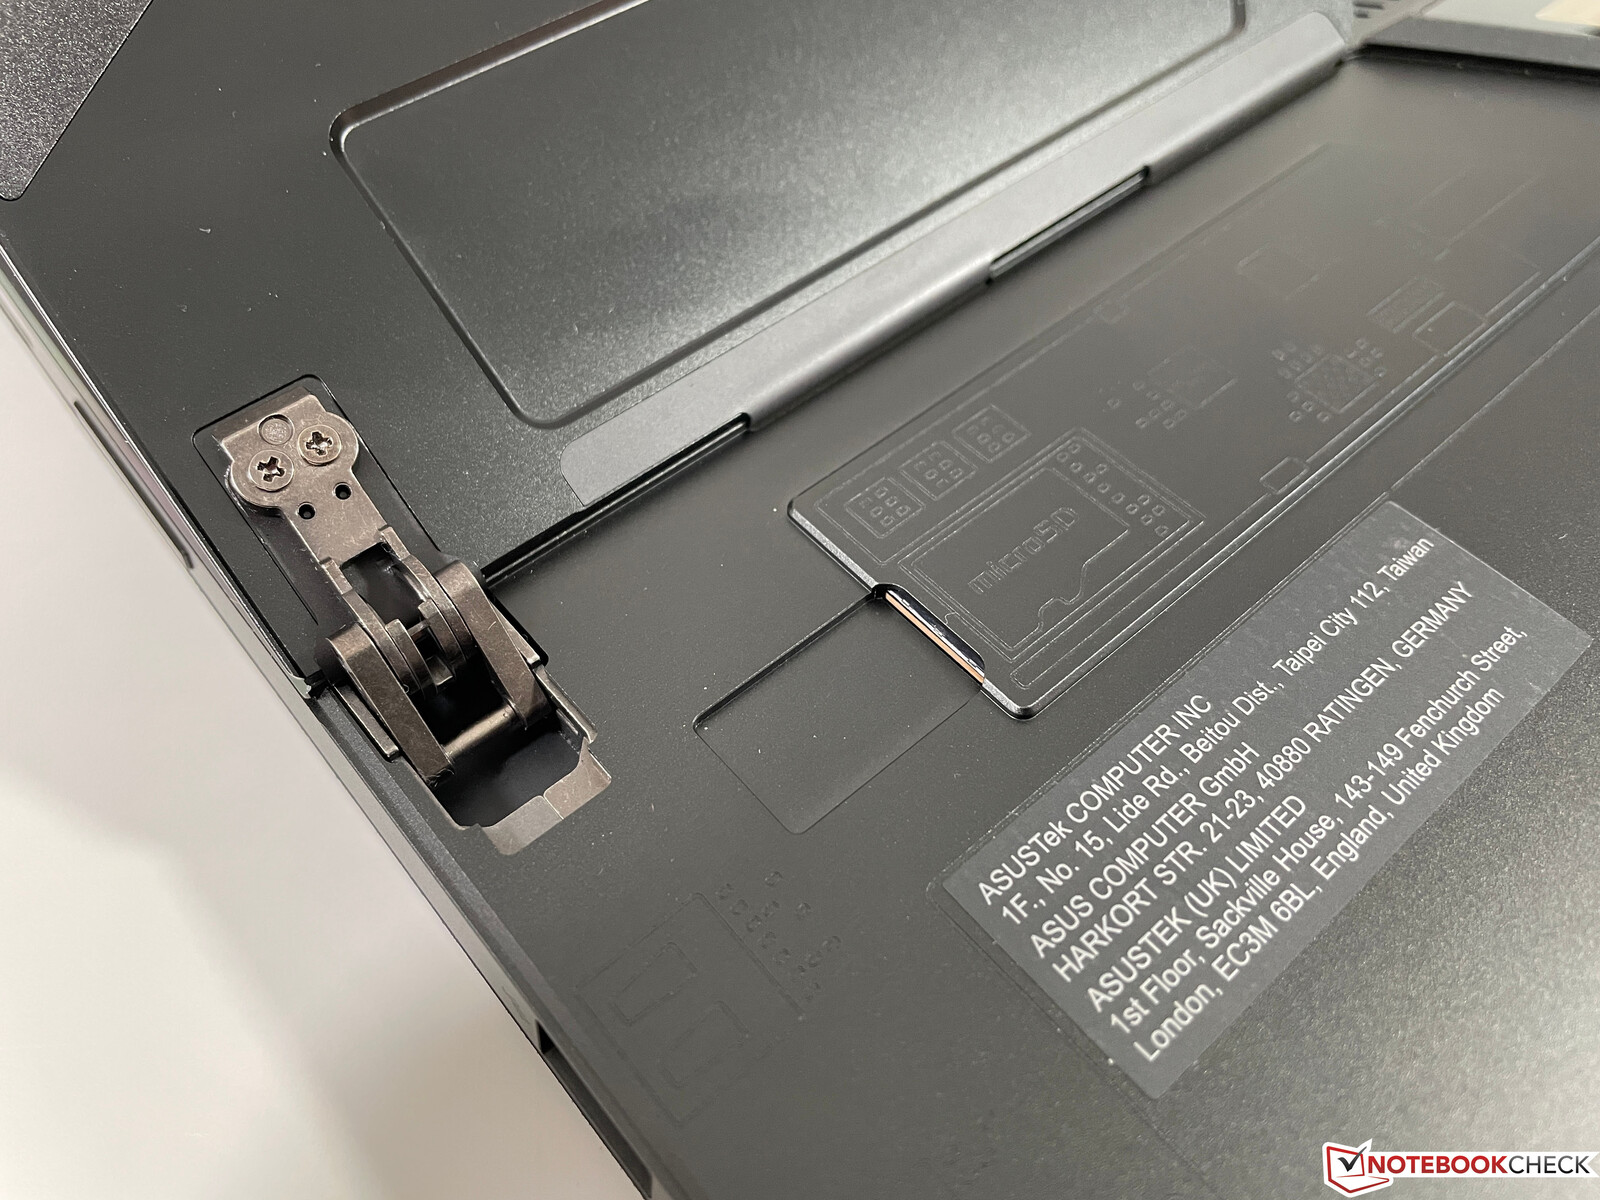
There's a small microSD card reader on the back behind the kickstand, and it's able to fully accommodate memory cards. The card reader is very fast, and we were able to determine a very high maximum transfer rate of over 260 MB/s with our reference card (Angelbird AV Pro V60). This puts the Flow Z13 firmly at the top of the comparison field. Performance was a bit lower when copying data, but the result of over 100 MB/s is still decent.
| SD Card Reader | |
| average JPG Copy Test (av. of 3 runs) | |
| Average of class Gaming (20.9 - 210, n=54, last 2 years) | |
| Asus ROG Flow Z13 GZ301ZE (Angelbird AV Pro V60) | |
| Schenker Vision 14 (Angelbird AV Pro V60) | |
| maximum AS SSD Seq Read Test (1GB) | |
| Asus ROG Flow Z13 GZ301ZE (Angelbird AV Pro V60) | |
| Average of class Gaming (25.5 - 261, n=51, last 2 years) | |
| Schenker Vision 14 (Angelbird AV Pro V60) | |
Communication
Asus integrates a cutting-edge Wi-Fi 6E module from Intel (AX210E), which supports all modern standards including Bluetooth 5.2. Wi-Fi 6E is still a bit problematic in Europe, and you can only get it to work with tricks at the moment, but at least you're optimally equipped for the next few years. The transfer rates in connection with our reference router (Netgear AX12) are very good, and we didn't notice any problems with signal quality during testing, neither with the Wi-Fi 6 router nor with a FritzBox 7490 (Wi-Fi 5). However, there's no integrated LTE or 5G modem available.
Webcam
The ROG Flow Z13 is equipped with two cameras. An 8 MP sensor is found on the back, which can be used to take very decent pictures as long as the exposure is right. Only the 720p sensor (0.9 MP) is available on the front, but the pictures are comparatively good. Of course, there's still much room for improvement here, but we've also seen much worse 720p cameras.


Accessories
Asus ships the ROG Flow Z13 with the keyboard cover by default, but there are otherwise no other accessories included in the attractive packaging. Of course, the XG Mobile eGPU is optionally available, and we already had the chance to test it in combination with the ROG Flow X13. In addition, there's the Asus Pen and various input devices as well as headsets with the ROG branding.
Maintenance
The ROG Flow Z13's case can't be opened by the user, and almost every component is soldered as well. However, there's at least a small maintenance hatch on the back with access to the M.2-2230 SSD that can be replaced. But more on that in the storage section.
Input devices - Wobbly keyboard with Aura Sync
Keyboard
The ROG Flow Z13 comes with a keyboard cover that uses Pogo pins to magnetically attach to the bottom of the tablet as well as to be powered. As with the Surface Pro, the keyboard can be used either flat or at a slight angle (see pictures). The problem here is that the keyboard's material retains the angle a bit, so that the keyboard is slightly lifted from the surface and yields when typing, for example, when you want to use it again in its flat form on a table. This affects typing stability a bit, but that is the norm for such keyboard covers.
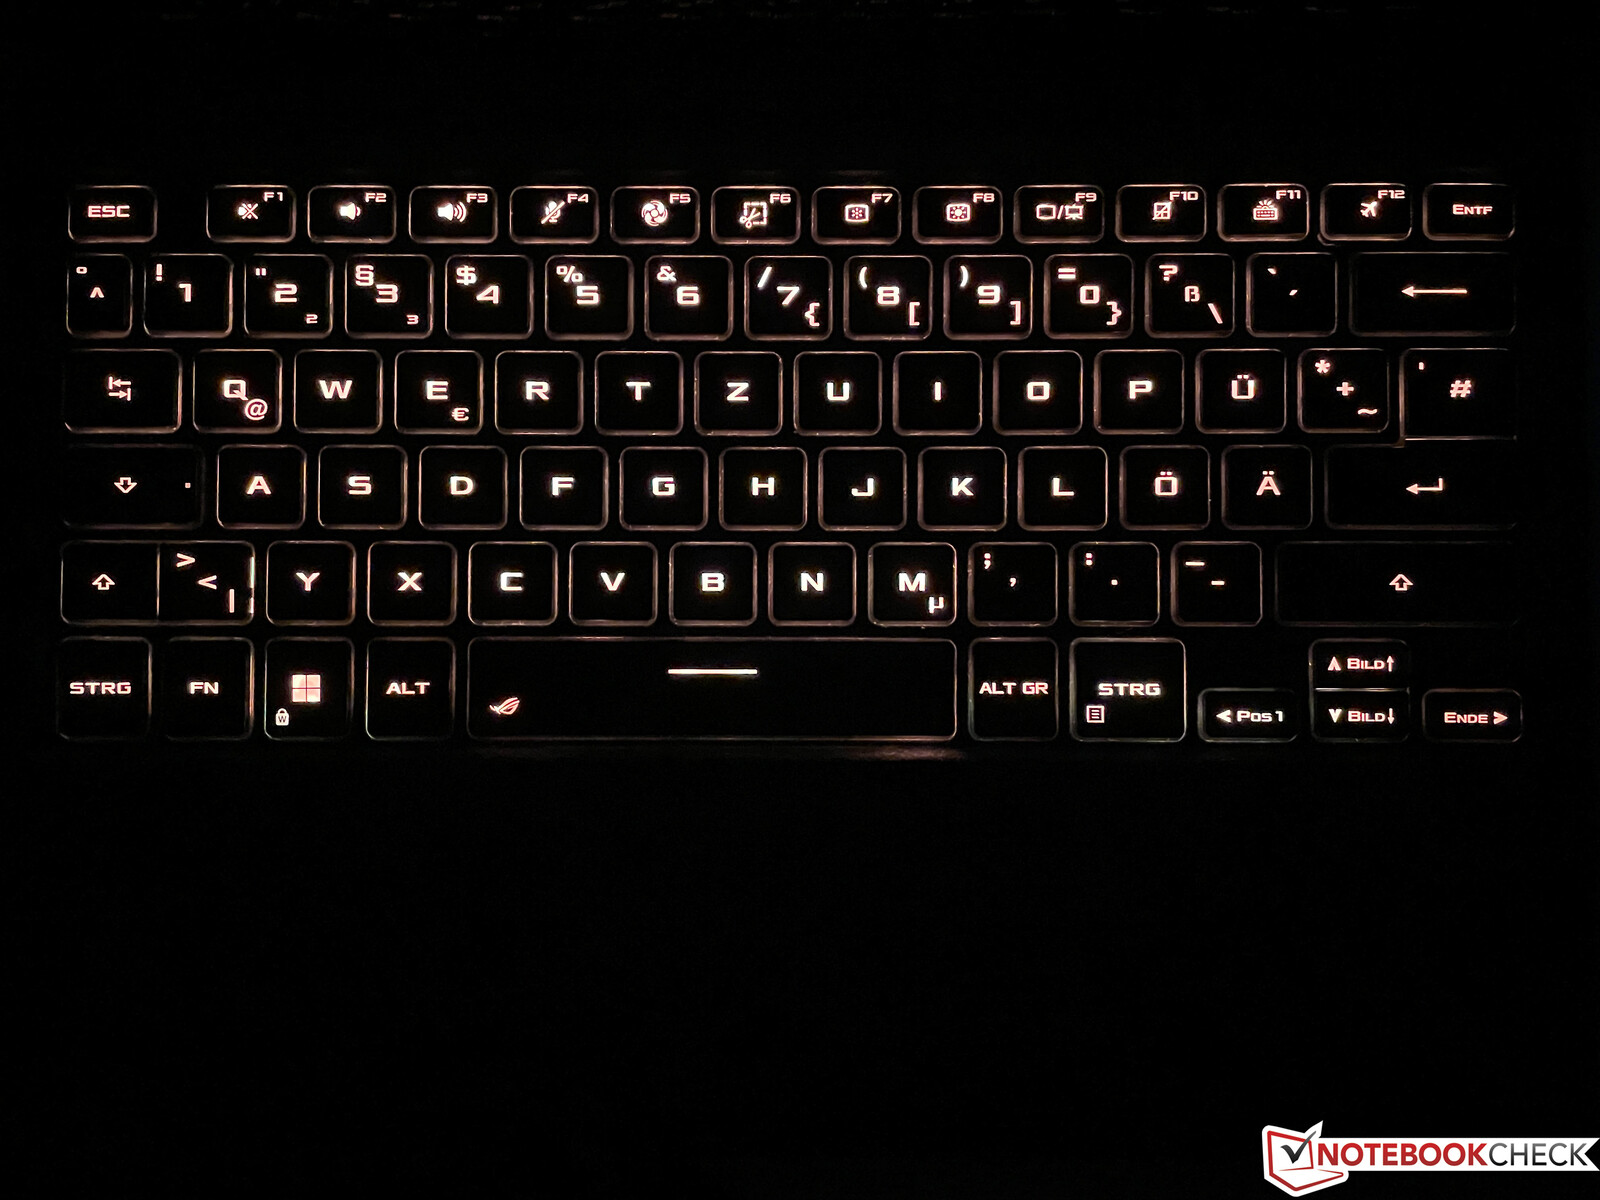
The mechanics of the keys themselves are decent, though. The key travel isn't too short (1.7 mm), and several keystrokes are registered simultaneously (N-key rollover). In practice, however, you almost always need to work with the keyboard backlight activated (RGB, one zone, supports Aura Sync), since the contrast between the dark keys and their labels is just not optimal. The keyboard offers the German QWERTZ layout, but some compromises like the single-line Enter key or the small arrow keys have been necessary to achieve this.
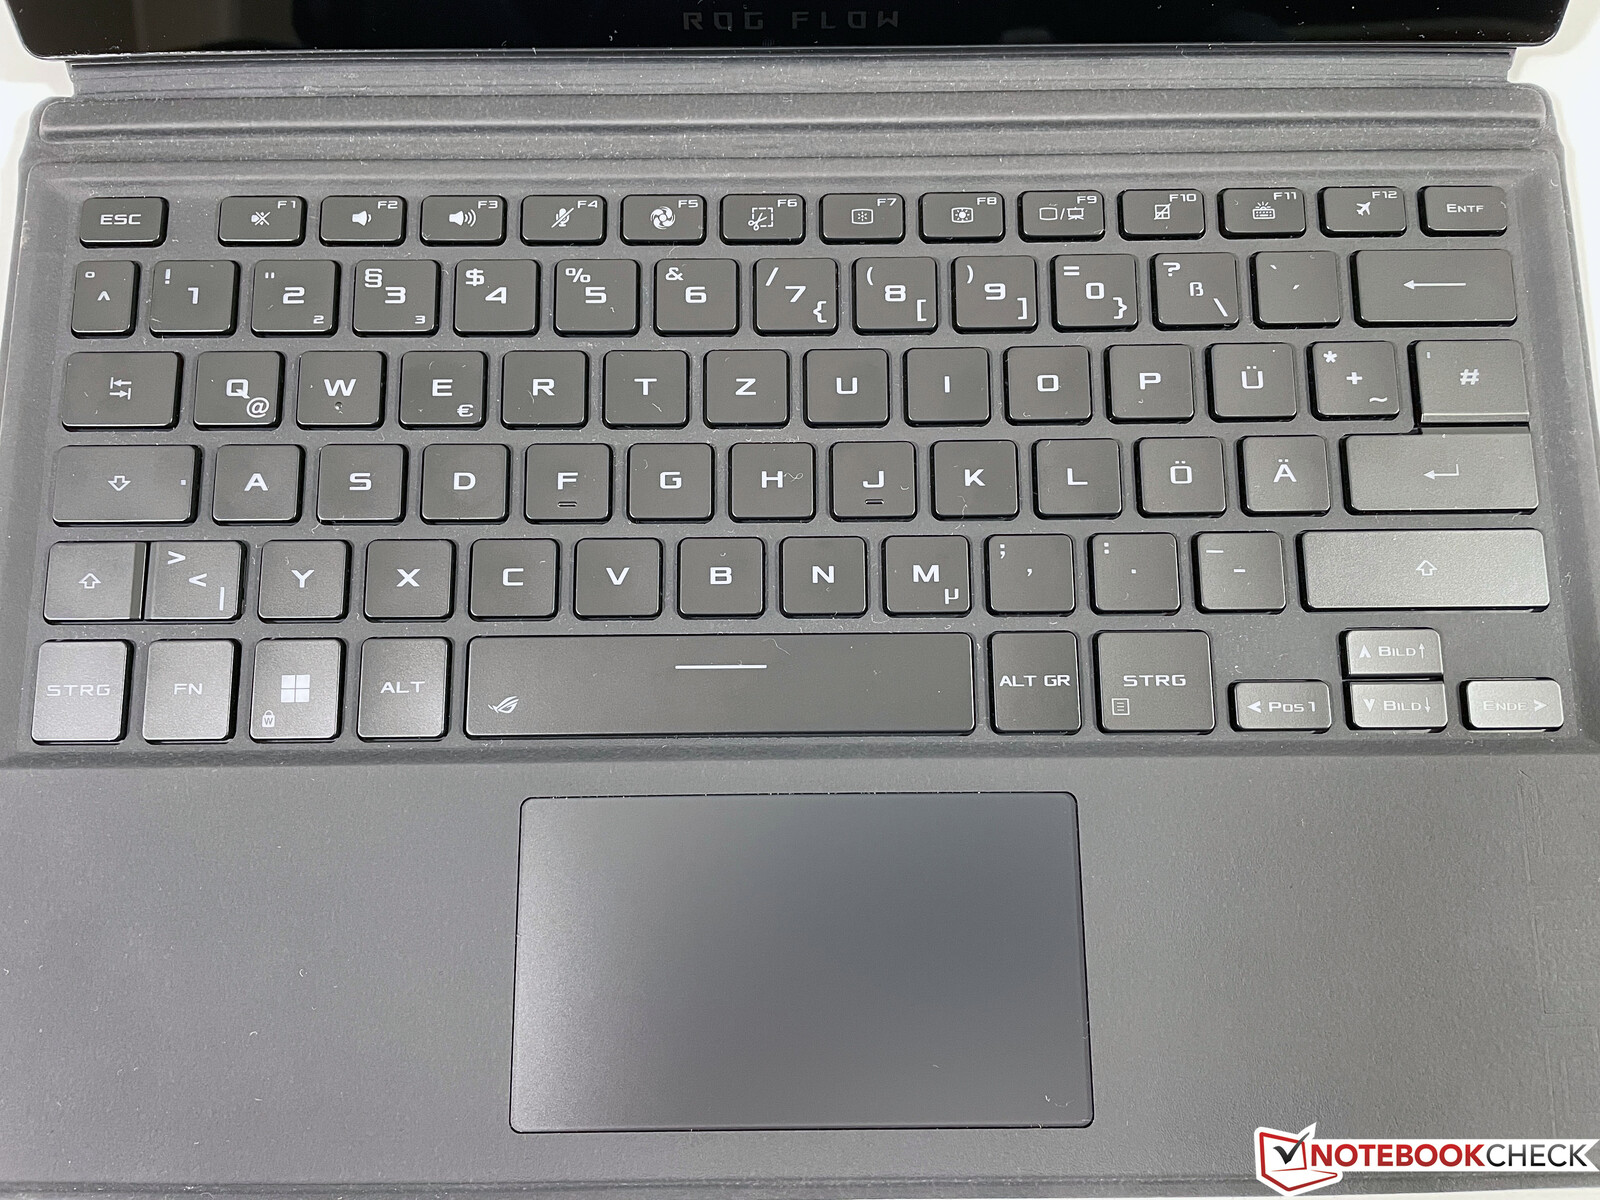
The small ClickPad (9.8 x 5.6 cm) offers good gliding properties, and mouse control is also possible without issues, but the small surface is not particularly suitable for gestures. The pad can also be pressed down in the lower area, but this is met with a very loud and cheap-sounding click noise. However, we presume that most users will use an external mouse anyway, especially when gaming. Furthermore, the capacitive touchscreen is still available for everyday use, and it works very well.
Display - Asus offers either Full HD or 4K for the gaming tablet

Asus offers two different 13.4-inch IPS touchscreens in a 16:10 aspect ratio for the ROG Flow Z13. Besides a 4K display (3,840x2,400 pixels, WQUXGA, 60 Hz, 450 nits, P3 color space), you can also choose the Full HD panel (1,920x1,200 pixels, WUXGA), which only covers the smaller sRGB color space but has a slightly higher brightness (500 nits) and a higher refresh rate of 120 Hz. The Full HD resolution also suits the RTX 3050 Ti better, so overall, we think the Full HD panel is a better fit for the gaming tablet.
The subjective image impression is very good, and everything looks very sharp, even at the lower Full HD resolution. Colors also look rich and high-contrast, something that is confirmed by our measurements as well. The maximum brightness is around 515 cd/m² at the center of the screen, but it's "only" 476 cd/m² on average. The black level is slightly elevated at 0.35 cd/m², but this still adds up to a very good contrast ratio of almost 1,500:1. Response times show no issues, and even at full brightness, screen bleeding isn't a problem.
| |||||||||||||||||||||||||
Brightness Distribution: 87 %
Center on Battery: 515 cd/m²
Contrast: 1471:1 (Black: 0.35 cd/m²)
ΔE ColorChecker Calman: 1.6 | ∀{0.5-29.43 Ø4.71}
calibrated: 1.2
ΔE Greyscale Calman: 2.5 | ∀{0.09-98 Ø4.96}
69.3% AdobeRGB 1998 (Argyll 3D)
97.1% sRGB (Argyll 3D)
67.5% Display P3 (Argyll 3D)
Gamma: 2.2
CCT: 6939 K
| Asus ROG Flow Z13 GZ301ZE LQ134N1JW54, IPS, 1920x1200, 13.4" | Schenker Vision 14 MNE007ZA1, IPS, 2880x1800, 14" | Asus Zephyrus G14 GA401QEC TL140BDXP01-0, IPS, 2560x1440, 14" | Microsoft Surface Pro 8, i7-1185G7 LP129WT212166, IPS, 2880x1920, 13" | Razer Blade 14 Ryzen 9 RTX 3070 TL140BDXP02-2, IPS, 2560x1440, 14" | Asus ROG Flow X13 GV301QH LQ134R1JW51, IPS, 3840x2400, 13.4" | |
|---|---|---|---|---|---|---|
| Display | 7% | 22% | 10% | 23% | 9% | |
| Display P3 Coverage (%) | 67.5 | 74.3 10% | 94.2 40% | 78.2 16% | 97.2 44% | 77.8 15% |
| sRGB Coverage (%) | 97.1 | 97.6 1% | 99.9 3% | 100 3% | 99.9 3% | 99.5 2% |
| AdobeRGB 1998 Coverage (%) | 69.3 | 75.7 9% | 84.5 22% | 77.6 12% | 85.4 23% | 76.8 11% |
| Response Times | 2% | 61% | -19% | 51% | -46% | |
| Response Time Grey 50% / Grey 80% * (ms) | 44 ? | 40.4 ? 8% | 20 ? 55% | 46.4 ? -5% | 16.4 ? 63% | 48 ? -9% |
| Response Time Black / White * (ms) | 17.6 ? | 18.4 ? -5% | 6 ? 66% | 23.2 ? -32% | 10.8 ? 39% | 32 ? -82% |
| PWM Frequency (Hz) | 29760 ? | |||||
| Screen | -15% | -96% | -10% | -16% | -9% | |
| Brightness middle (cd/m²) | 515 | 407 -21% | 333 -35% | 444 -14% | 331.1 -36% | 359 -30% |
| Brightness (cd/m²) | 476 | 407 -14% | 317 -33% | 451 -5% | 318 -33% | 331 -30% |
| Brightness Distribution (%) | 87 | 94 8% | 89 2% | 91 5% | 91 5% | 86 -1% |
| Black Level * (cd/m²) | 0.35 | 0.25 29% | 0.36 -3% | 0.43 -23% | 0.36 -3% | 0.23 34% |
| Contrast (:1) | 1471 | 1628 11% | 925 -37% | 1033 -30% | 920 -37% | 1561 6% |
| Colorchecker dE 2000 * | 1.6 | 2.6 -63% | 5.58 -249% | 2 -25% | 2.25 -41% | 2.46 -54% |
| Colorchecker dE 2000 max. * | 4 | 4.4 -10% | 10.62 -166% | 3.2 20% | 4.62 -16% | 3.85 4% |
| Colorchecker dE 2000 calibrated * | 1.2 | 2 -67% | 2.88 -140% | 1.7 -42% | 1.6 -33% | |
| Greyscale dE 2000 * | 2.5 | 2.7 -8% | 7.5 -200% | 1.8 28% | 1.7 32% | 1.89 24% |
| Gamma | 2.2 100% | 2.18 101% | 2.28 96% | 2.11 104% | 2.3 96% | 2.38 92% |
| CCT | 6939 94% | 6316 103% | 7220 90% | 6417 101% | 6751 96% | 6835 95% |
| Color Space (Percent of AdobeRGB 1998) (%) | 68.2 | |||||
| Color Space (Percent of sRGB) (%) | 99.4 | |||||
| Total Average (Program / Settings) | -2% /
-8% | -4% /
-48% | -6% /
-7% | 19% /
3% | -15% /
-10% |
* ... smaller is better
The default refresh rate is 120 Hz when the device is plugged in, but it automatically switches to 60 Hz on battery power. As a result, the screen goes black for about one second when the power adapter is plugged in or unplugged. This can be modified in the Armoury Crate software, where there is an option called "Energy-saving panel". As soon as you deactivate it, the frequency stays at 120 Hz even on battery power. In everyday use, the 120 Hz mode mainly leads to a smoother image impression when scrolling through documents or websites, and it can also be beneficial when gaming.
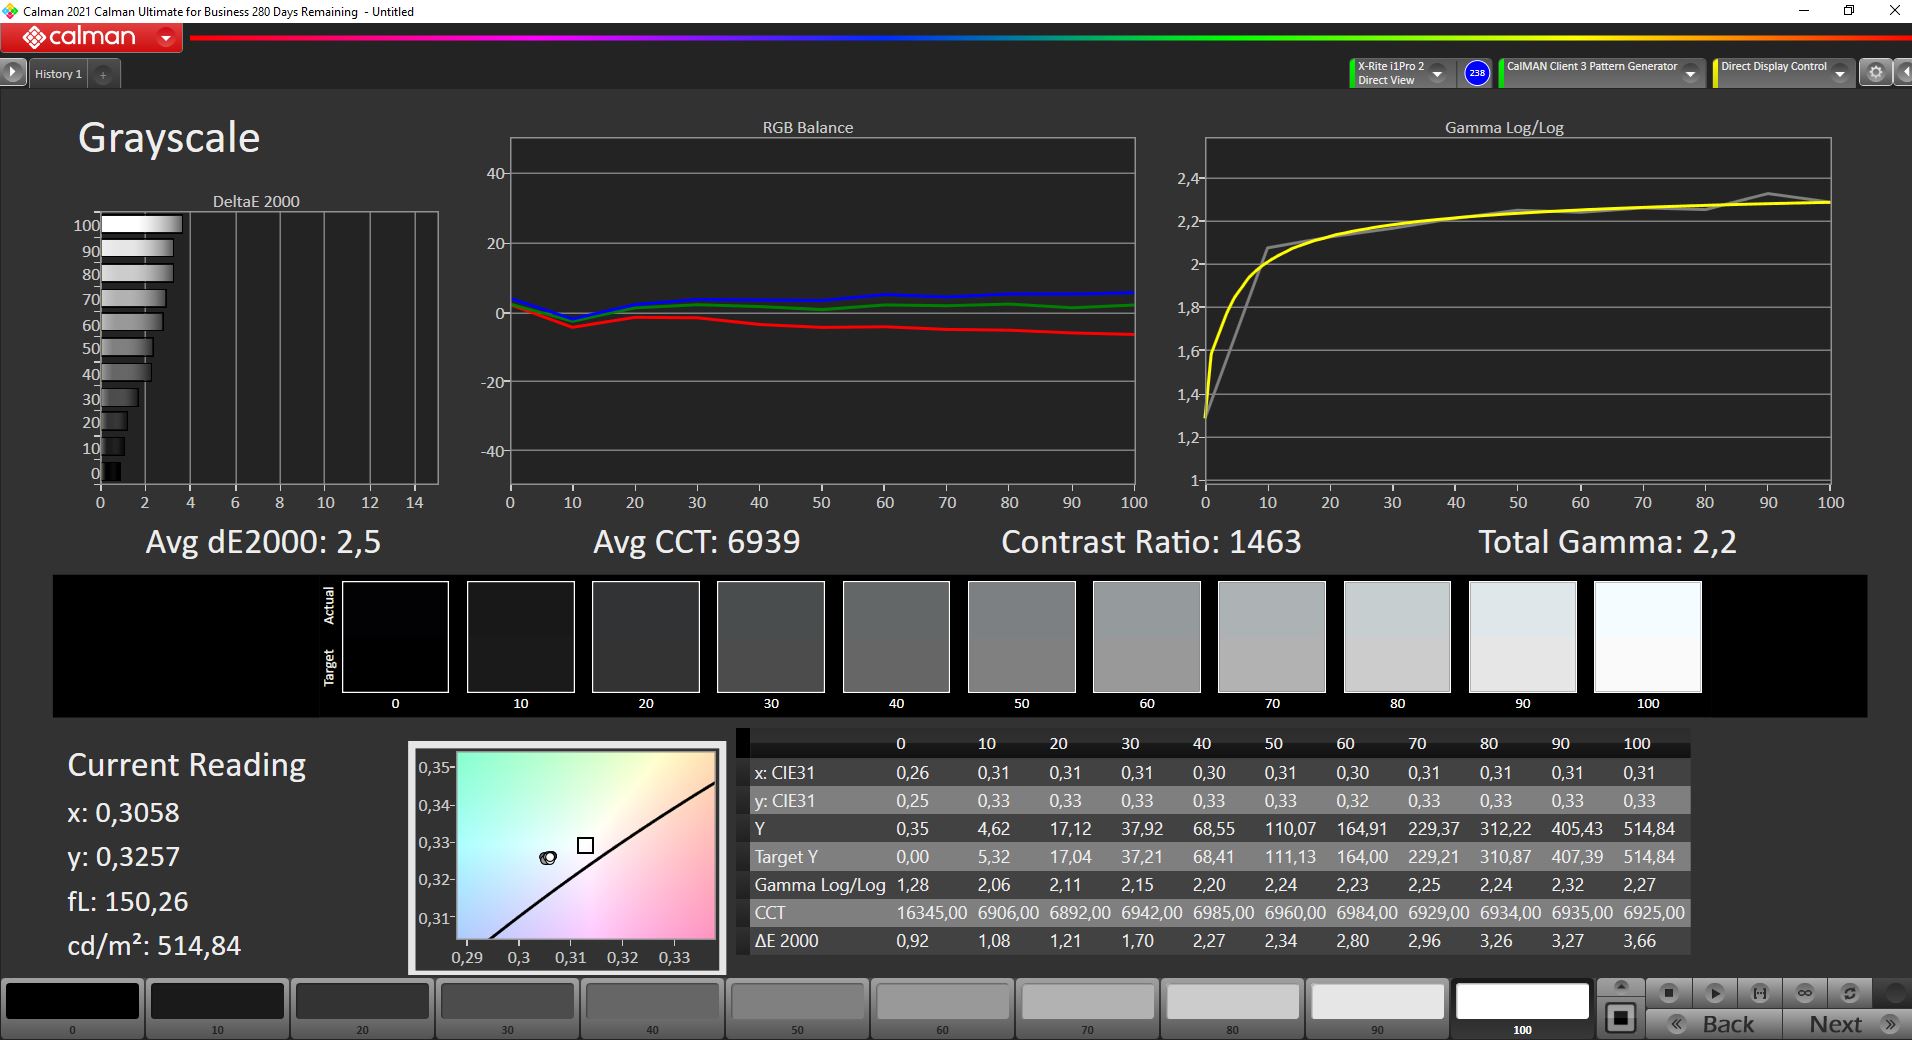
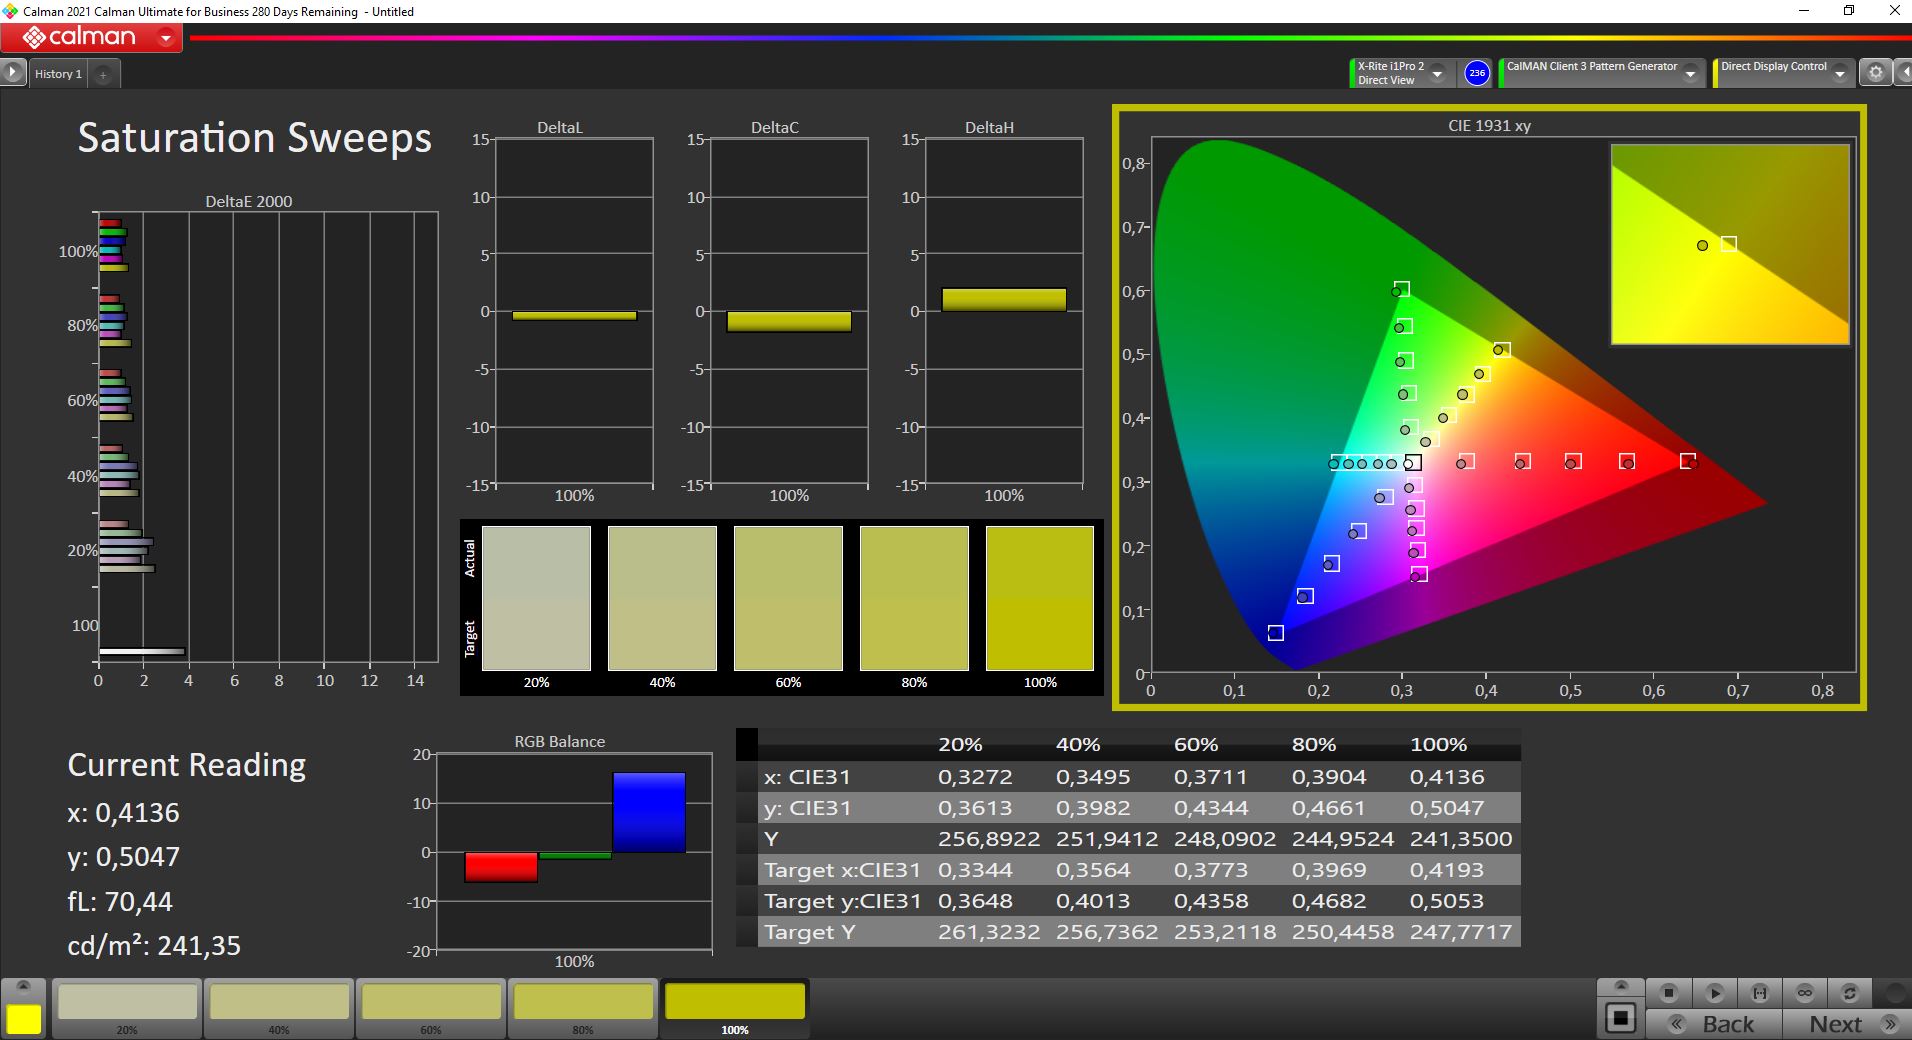
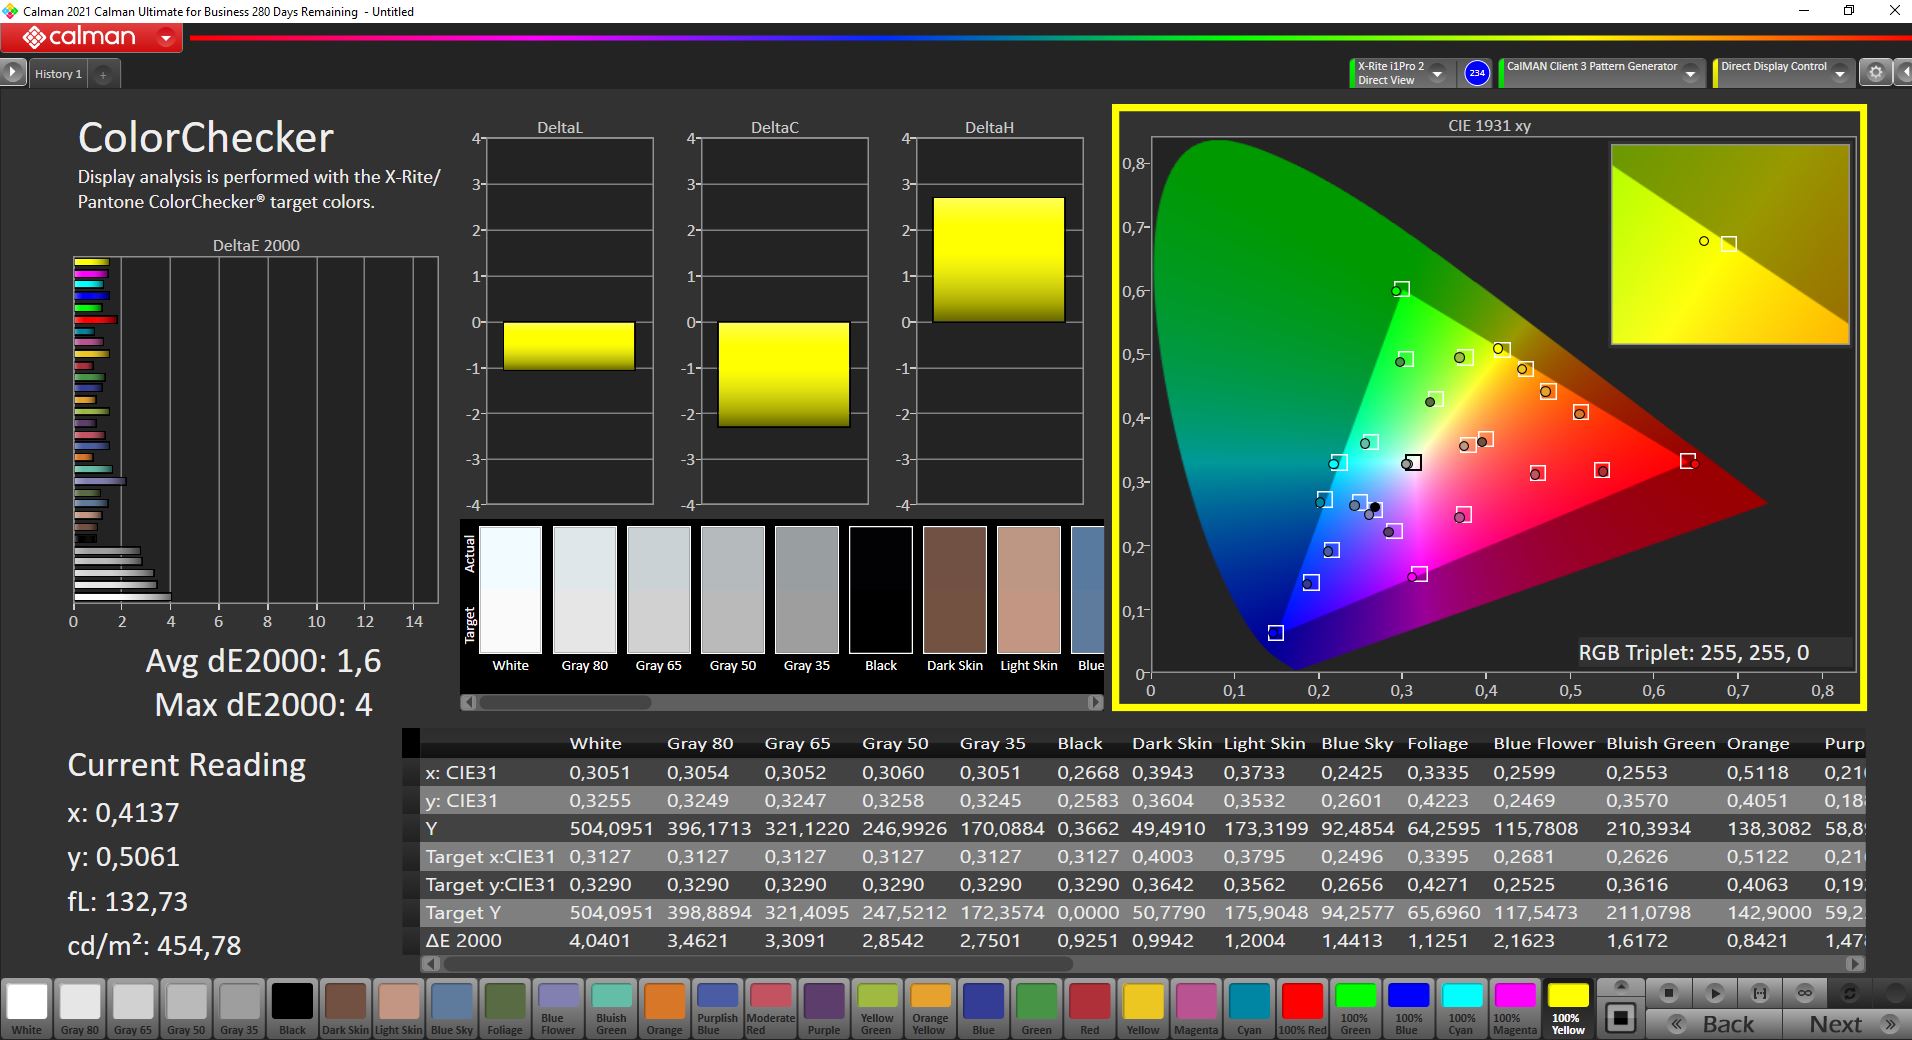
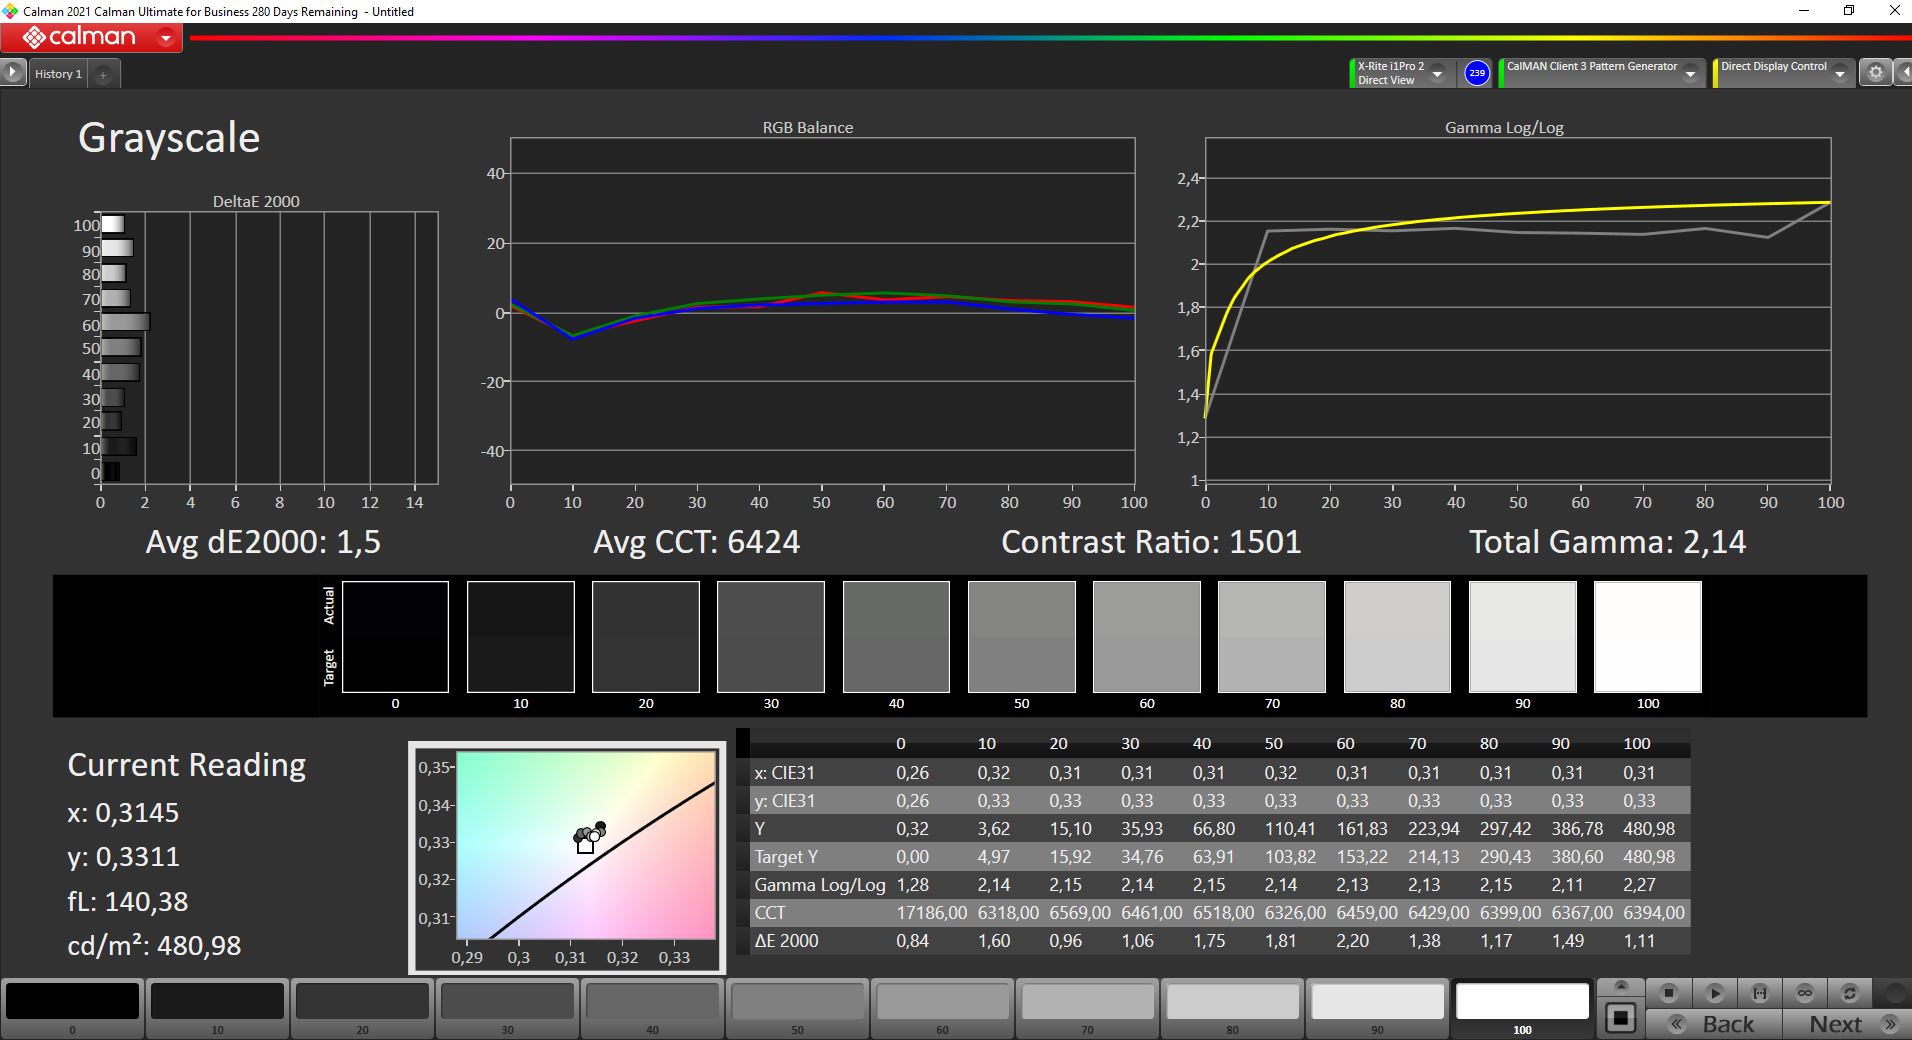
We analyzed the display with the professional CalMAN software and the X-Rite i1 Pro 2 spectrophotometer. Out of the box, we notice a slight color tint in grayscales towards green/blue in combination with a slightly too cool color temperature. This doesn't play a major role in everyday use, and you can only recognize it with the naked eye if you work with calibrated displays otherwise. Manufacturers like to use this trick to increase the maximum brightness a bit. Consequently, our calibrated profile (available for free download above) also results in a reduction of the maximum brightness from 515 to 480 cd/m². However, since both the color and grayscale deviations are already very good out of the box, calibration isn't strictly necessary. The Full HD display covers the sRGB color space almost completely, which makes it suitable for editing pictures/videos.
Display Response Times
| ↔ Response Time Black to White | ||
|---|---|---|
| 17.6 ms ... rise ↗ and fall ↘ combined | ↗ 6 ms rise | 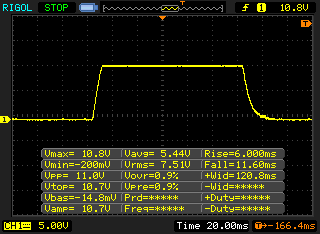 |
| ↘ 11.6 ms fall | ||
| The screen shows good response rates in our tests, but may be too slow for competitive gamers. In comparison, all tested devices range from 0.1 (minimum) to 240 (maximum) ms. » 40 % of all devices are better. This means that the measured response time is better than the average of all tested devices (19.8 ms). | ||
| ↔ Response Time 50% Grey to 80% Grey | ||
| 44 ms ... rise ↗ and fall ↘ combined | ↗ 22 ms rise | 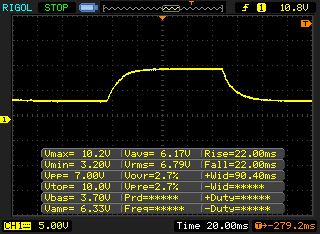 |
| ↘ 22 ms fall | ||
| The screen shows slow response rates in our tests and will be unsatisfactory for gamers. In comparison, all tested devices range from 0.165 (minimum) to 636 (maximum) ms. » 73 % of all devices are better. This means that the measured response time is worse than the average of all tested devices (31 ms). | ||
Screen Flickering / PWM (Pulse-Width Modulation)
| Screen flickering / PWM not detected | 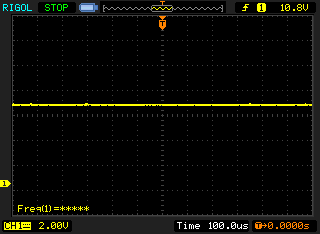 | ||
In comparison: 52 % of all tested devices do not use PWM to dim the display. If PWM was detected, an average of 7754 (minimum: 5 - maximum: 343500) Hz was measured. | |||
The brightness is very high, and it's not reduced on battery power. Nonetheless, reflections are quickly visible on the glossy touchscreen. Especially in very bright environments, content visibility becomes limited as a result. But it should be possible to use the device comfortably in the shade or on cloudy days provided that it's positioned appropriately. The IPS panel offers very stable viewing angles with no color shifts or strong contrast losses.
Performance - The ROG Flow Z13's CPU is overkill
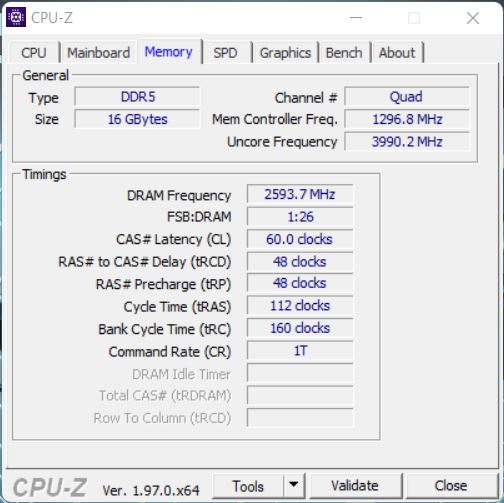
Our review configuration represents the most powerful model of the ROG Flow Z13 and is powered by the new Alder Lake Core i9-12900H in combination with the dedicated GeForce RTX 3050 Ti, which runs at a maximum of 40 watts (35 watts + 5 watts Dynamic Boost coming from the processor). The package is rounded off by 16 GB of LPDDR5-5200 RAM (dual-channel), and there are currently no models with 32 GB of RAM. We have listed the three base models below, but they can still differ in terms of storage and the built-in display:
| Model | GZ301ZE | GZ301ZC | GZ301ZA |
|---|---|---|---|
| CPU | Core i9-12900H | Core i7-12700H | Core i5-12500H |
| GPU | GeForce RTX 3050 Ti (40 watts) | GeForce RTX 3050 (40 watts) | Iris Xe Graphics |
| RAM | 16 GB LPDDR5 | 16 GB LPDDR5 | 16 GB LPDDR5 |
Installing such a powerful Core i9 CPU in a compact gaming tablet doesn't exactly seem very reasonable to us, especially in combination with the slowest variant of the RTX 3050 Ti. There's certainly a slight imbalance here, and the Core i7 CPU is unlikely to run noticeably slower in the ROG Flow Z13 (same number of cores, but lower Turbo frequency).
Test conditions
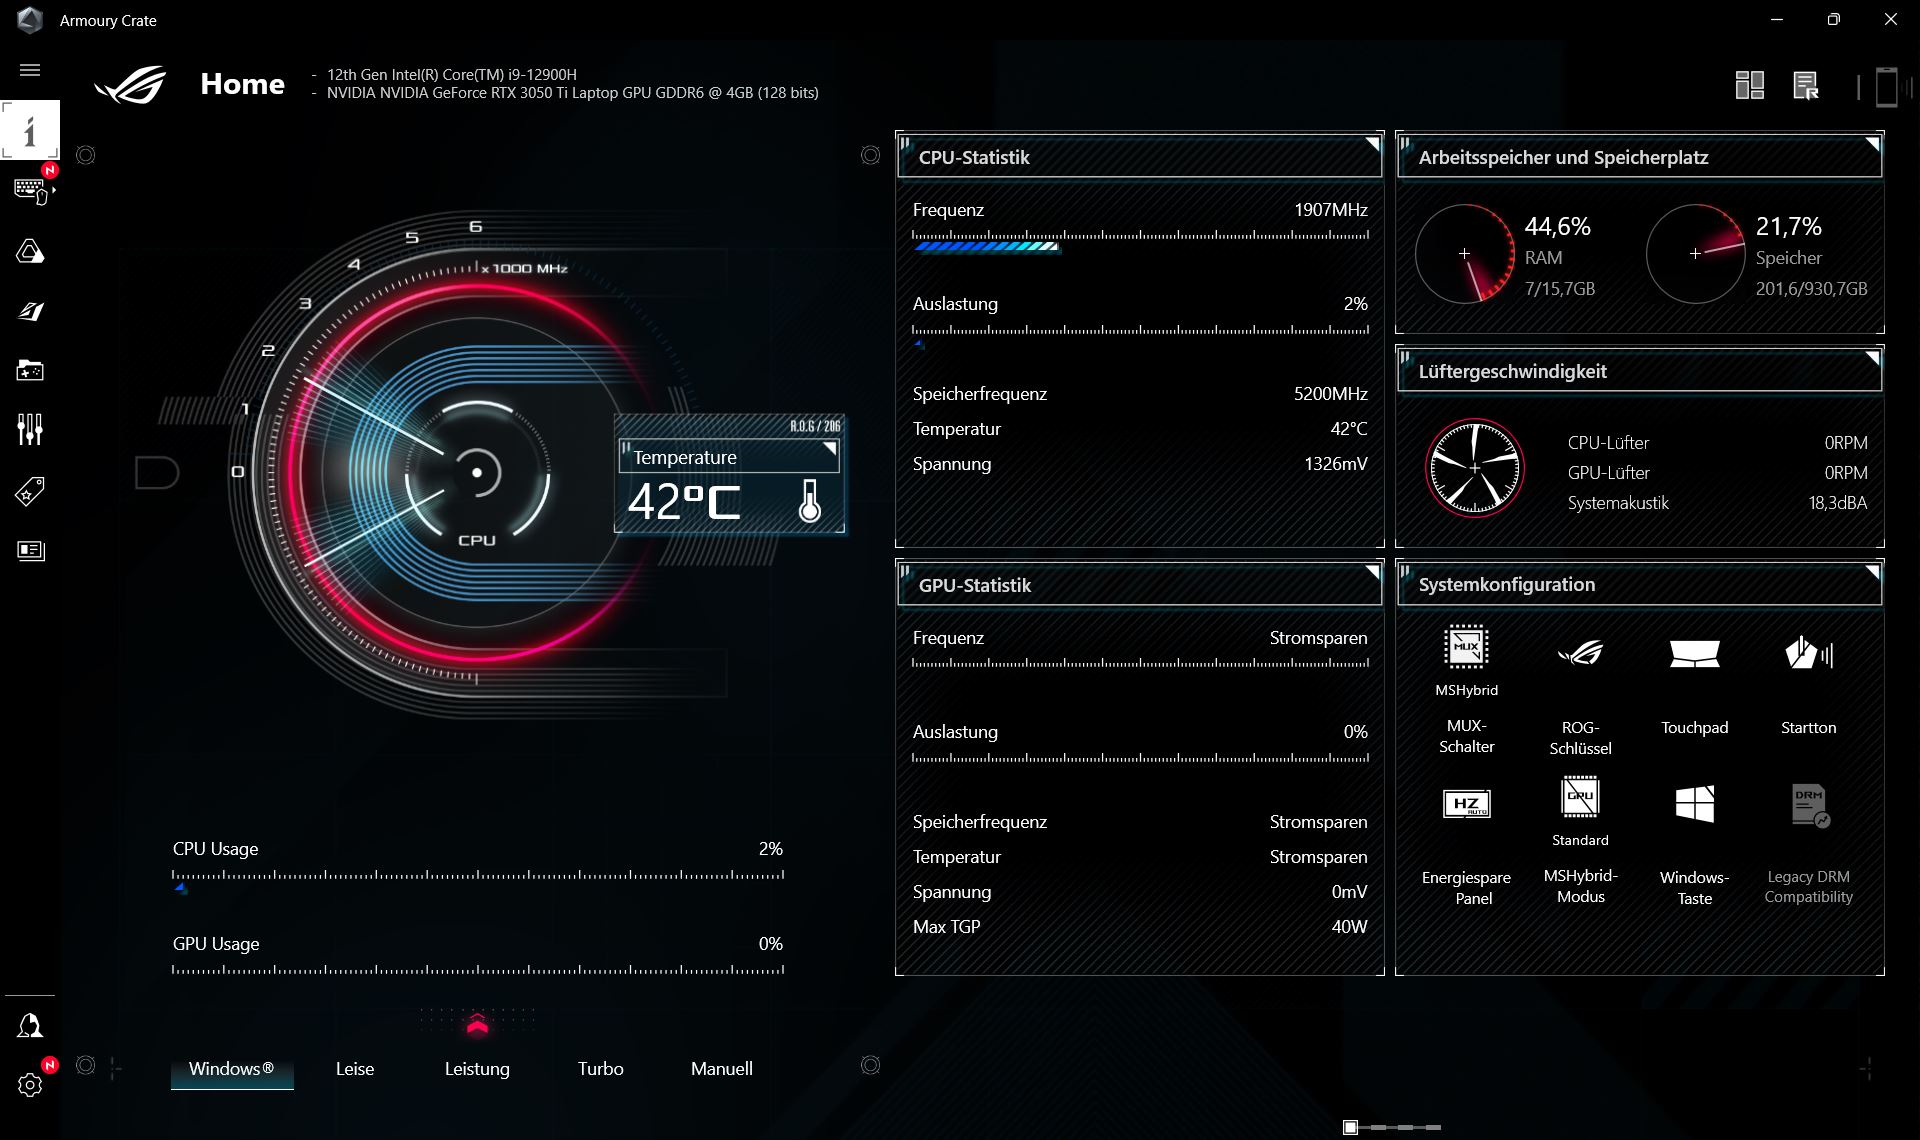
It's not so easy to find the right test settings, because besides the normal Windows settings, there is also a range of additional energy settings in the preinstalled Armoury Crate software, which also override the Windows energy-saving plan anyway. In addition, there's also the option to completely disable the integrated GPU via the MUX switch, but this requires a reboot. Furthermore, there are various settings for the hybrid graphics. For example, you can configure the dedicated GPU to only be used when the device is plugged in. All in all, there are so many options to adjust the device to your needs, but there's also the risk of getting a bit confused and possibly not using the optimal settings.
We tried all the reasonable combinations and were able to get the best results (somewhat surprisingly) with the regular Windows "Balanced" power plan along with the Windows setting in the Armoury Crate software and the Windows performance slider set to "Best Performance". There might still be updates, but we currently don't see any advantage in the additional energy profiles.
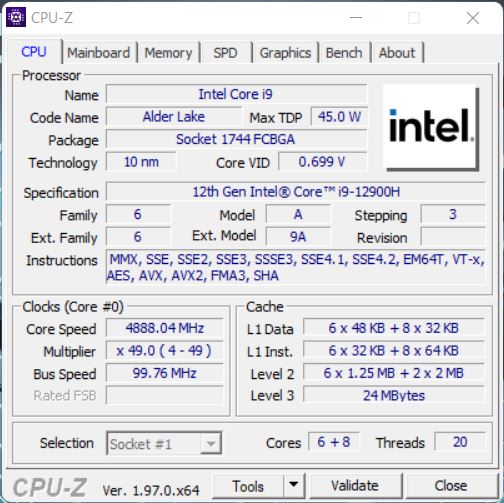
Processor - Core i9-12900H
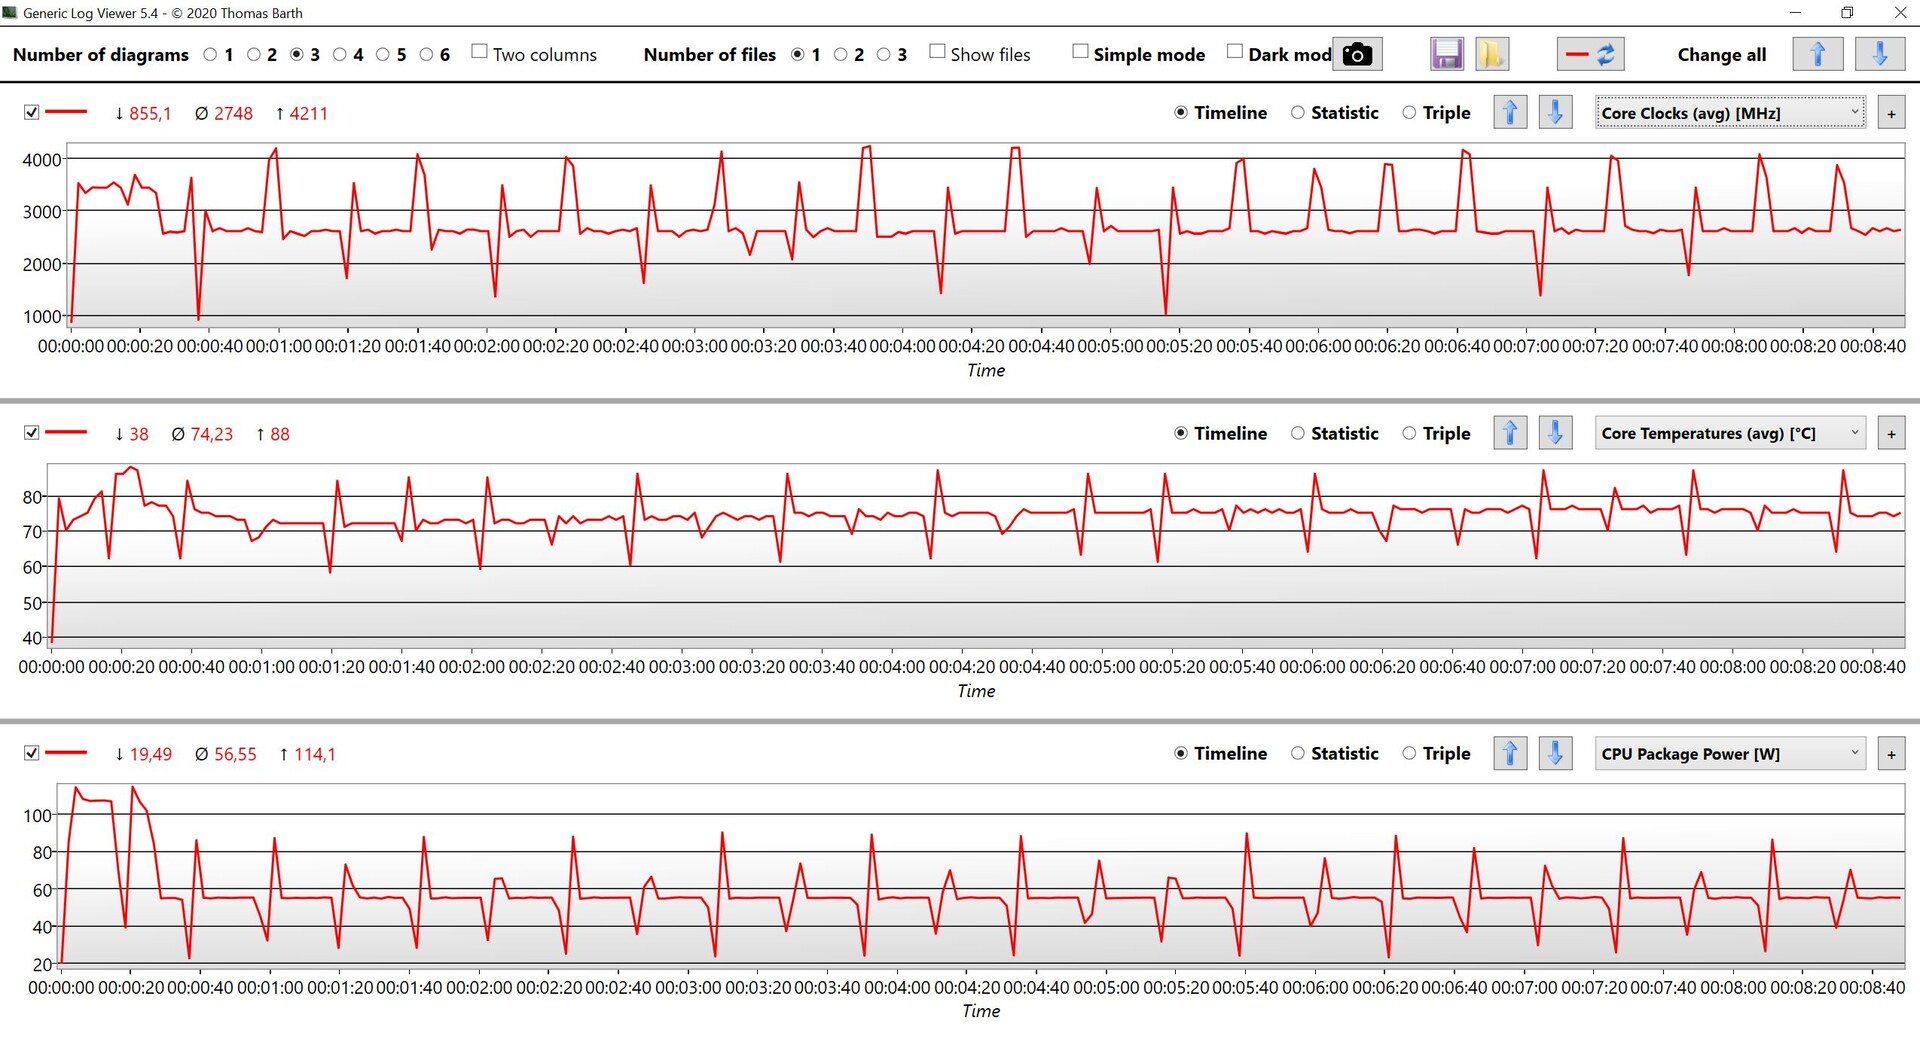
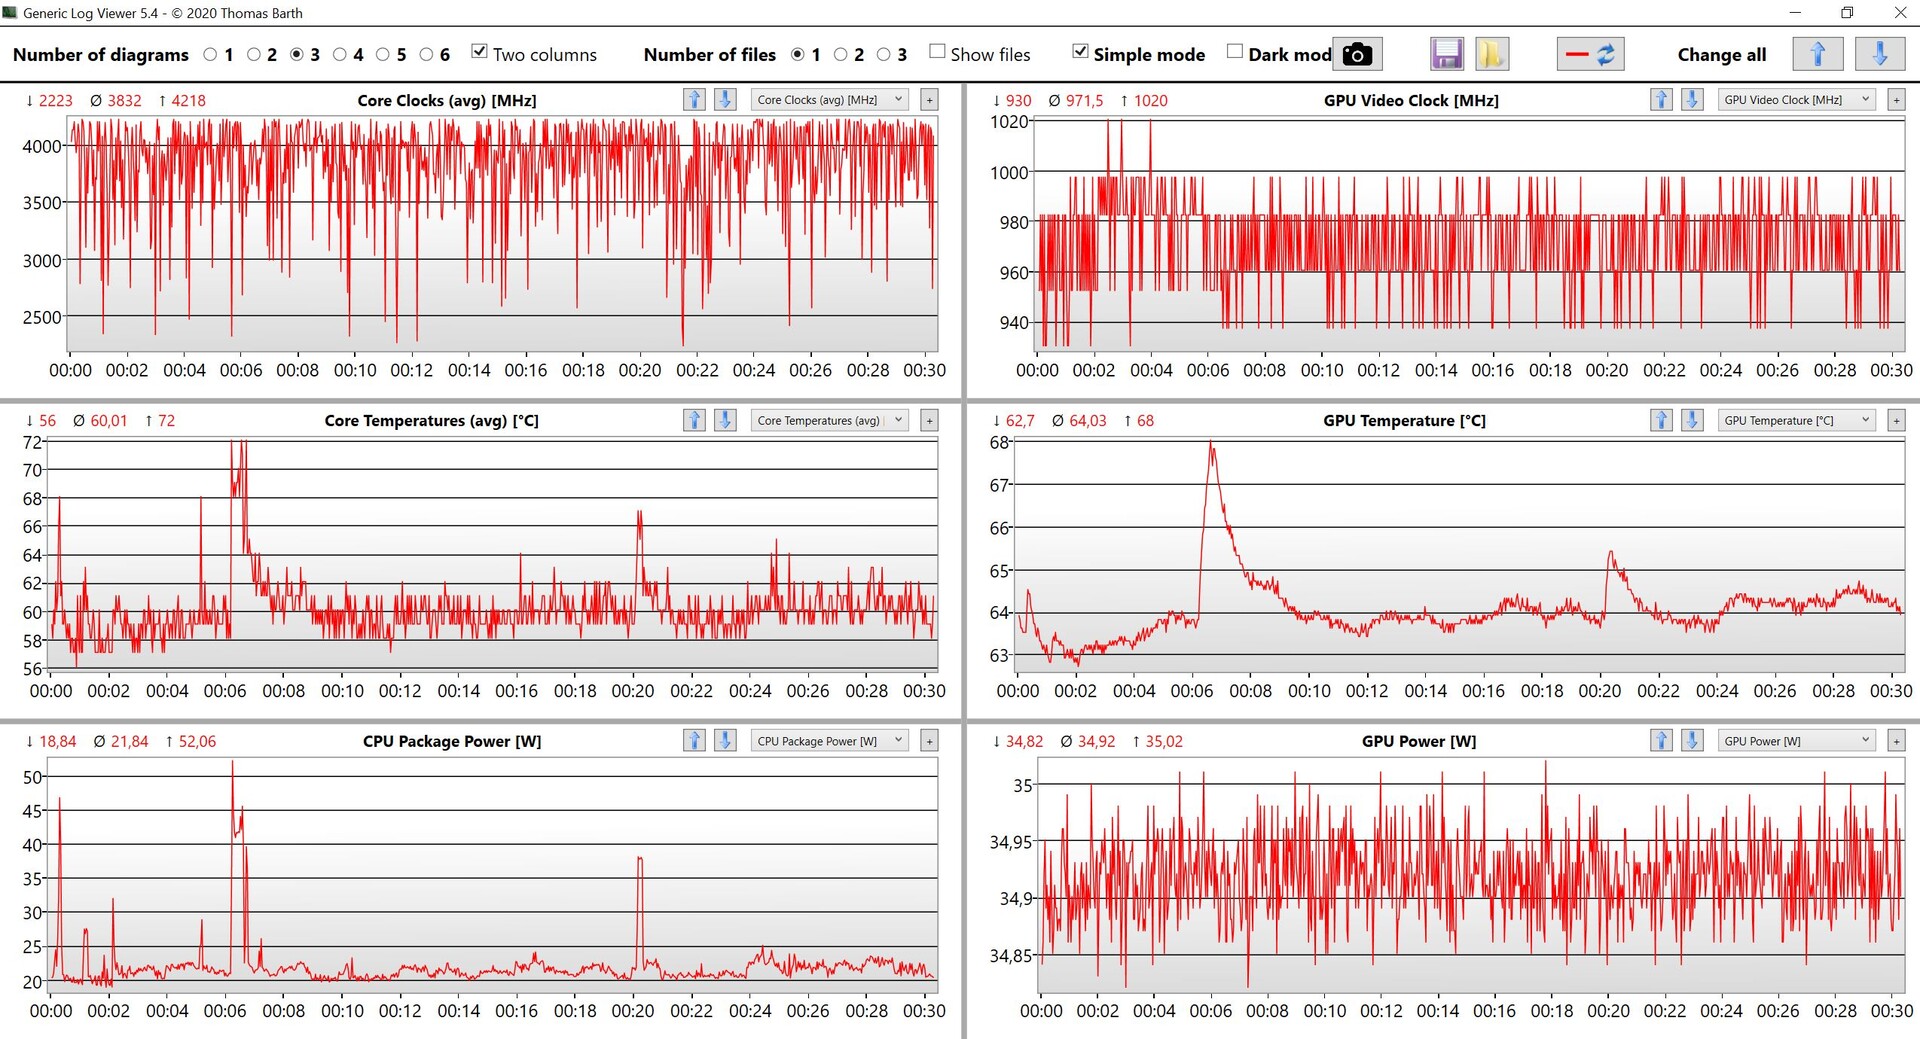
The new Core i9-12900H from Intel's Alder Lake lineup (12th generation) is one of the fastest mobile chips available on the market today, and it offers a total of 14 cores (6 performance cores with Hyper-Threading and 8 efficient cores) with 20 threads as well as a maximum clock rate of up to 5.0 GHz. You would probably expect such a CPU in high-end gaming laptops and certainly not in a compact gaming tablet. The nominal TDP is still 45 watts, but Asus hasn't limited consumption in practice, and we see consumptions of up to 114 watts (!!!) in the first 30 seconds of multi-core tests, after which consumption levels off at 55 watts. This means that during short load peaks in particular (and also in many benchmarks), the ROG Flow Z13 offers an excellent performance. However, the tablet always uses the internal battery for a brief moment because, as we will see later, the power adapter is only able to supply a maximum of 103 watts.
Cinebench R15 Multi endurance test
Consequently, the review sample is actually always at the top of the comparison field in the CPU benchmarks. In the Cinebench loop, you can clearly see that power consumption has already settled at 55 watts in the third run, so performance is more than 20% lower compared to the first run. Nevertheless, the Intel chip is still competitive with 55 watts, and it performs on par with the current Ryzen 9 5000 chips found in the Asus Zephyrus G14 or the Razer Blade 14, which are operated at 75 and 80 watts, respectively, in those devices. The current Tiger Lake H35 chips, which are still used in many compact laptops at the moment, have absolutely no chances here with their 4 cores.
The high continuous consumption of 55 watts is also good news for users of the XG Mobile eGPU, since this means that the CPU will not become a bottleneck. However, power consumption is significantly limited to 30 watts on battery power, but this still enables very good benchmark results. Nevertheless, it has to be said clearly that the Core i7-12700H (same number of cores, slightly lower clock rate) would have achieved almost the same performance in this case (especially as soon as the 55-watt limit kicks in), and that the Core i9 wouldn't provide a noticeable advantage. Additional benchmarks are available in our respective CPU Benchmarks article.
Cinebench R23: Multi Core | Single Core
Cinebench R20: CPU (Multi Core) | CPU (Single Core)
Cinebench R15: CPU Multi 64Bit | CPU Single 64Bit
Blender: v2.79 BMW27 CPU
7-Zip 18.03: 7z b 4 | 7z b 4 -mmt1
Geekbench 5.5: Multi-Core | Single-Core
HWBOT x265 Benchmark v2.2: 4k Preset
LibreOffice : 20 Documents To PDF
R Benchmark 2.5: Overall mean
| CPU Performance rating | |
| Average of class Gaming | |
| Asus ROG Flow Z13 GZ301ZE | |
| Average Intel Core i9-12900H | |
| Asus Zephyrus G14 GA401QEC | |
| Asus ROG Flow X13 GV301QH | |
| Razer Blade 14 Ryzen 9 RTX 3070 -2! | |
| Schenker Vision 14 | |
| Microsoft Surface Pro 8, i7-1185G7 | |
| Cinebench R23 / Multi Core | |
| Average of class Gaming (10488 - 42661, n=107, last 2 years) | |
| Asus ROG Flow Z13 GZ301ZE | |
| Average Intel Core i9-12900H (7359 - 19648, n=28) | |
| Asus Zephyrus G14 GA401QEC | |
| Razer Blade 14 Ryzen 9 RTX 3070 | |
| Asus ROG Flow X13 GV301QH | |
| Schenker Vision 14 | |
| Microsoft Surface Pro 8, i7-1185G7 | |
| Cinebench R23 / Single Core | |
| Average of class Gaming (1166 - 2415, n=107, last 2 years) | |
| Asus ROG Flow Z13 GZ301ZE | |
| Average Intel Core i9-12900H (1634 - 1930, n=28) | |
| Asus ROG Flow X13 GV301QH | |
| Microsoft Surface Pro 8, i7-1185G7 | |
| Asus Zephyrus G14 GA401QEC | |
| Schenker Vision 14 | |
| Razer Blade 14 Ryzen 9 RTX 3070 | |
| Cinebench R20 / CPU (Multi Core) | |
| Average of class Gaming (4029 - 16433, n=106, last 2 years) | |
| Average Intel Core i9-12900H (2681 - 7471, n=28) | |
| Asus ROG Flow Z13 GZ301ZE | |
| Asus Zephyrus G14 GA401QEC | |
| Asus ROG Flow X13 GV301QH | |
| Razer Blade 14 Ryzen 9 RTX 3070 | |
| Schenker Vision 14 | |
| Microsoft Surface Pro 8, i7-1185G7 | |
| Cinebench R20 / CPU (Single Core) | |
| Average of class Gaming (442 - 913, n=106, last 2 years) | |
| Asus ROG Flow Z13 GZ301ZE | |
| Average Intel Core i9-12900H (624 - 738, n=28) | |
| Asus ROG Flow X13 GV301QH | |
| Schenker Vision 14 | |
| Asus Zephyrus G14 GA401QEC | |
| Microsoft Surface Pro 8, i7-1185G7 | |
| Razer Blade 14 Ryzen 9 RTX 3070 | |
| Cinebench R15 / CPU Multi 64Bit | |
| Average of class Gaming (1578 - 6330, n=105, last 2 years) | |
| Asus ROG Flow Z13 GZ301ZE | |
| Average Intel Core i9-12900H (1395 - 3077, n=28) | |
| Asus Zephyrus G14 GA401QEC | |
| Asus ROG Flow X13 GV301QH | |
| Razer Blade 14 Ryzen 9 RTX 3070 | |
| Schenker Vision 14 | |
| Schenker Vision 14 | |
| Microsoft Surface Pro 8, i7-1185G7 | |
| Cinebench R15 / CPU Single 64Bit | |
| Average of class Gaming (188.8 - 350, n=106, last 2 years) | |
| Asus ROG Flow Z13 GZ301ZE | |
| Average Intel Core i9-12900H (235 - 277, n=29) | |
| Asus ROG Flow X13 GV301QH | |
| Asus Zephyrus G14 GA401QEC | |
| Schenker Vision 14 | |
| Microsoft Surface Pro 8, i7-1185G7 | |
| Razer Blade 14 Ryzen 9 RTX 3070 | |
| Blender / v2.79 BMW27 CPU | |
| Microsoft Surface Pro 8, i7-1185G7 | |
| Schenker Vision 14 | |
| Razer Blade 14 Ryzen 9 RTX 3070 | |
| Asus ROG Flow X13 GV301QH | |
| Average Intel Core i9-12900H (160 - 451, n=28) | |
| Asus Zephyrus G14 GA401QEC | |
| Asus ROG Flow Z13 GZ301ZE | |
| Average of class Gaming (79 - 330, n=104, last 2 years) | |
| 7-Zip 18.03 / 7z b 4 | |
| Average of class Gaming (33491 - 148086, n=105, last 2 years) | |
| Asus ROG Flow Z13 GZ301ZE | |
| Average Intel Core i9-12900H (34684 - 76677, n=28) | |
| Asus Zephyrus G14 GA401QEC | |
| Asus ROG Flow X13 GV301QH | |
| Razer Blade 14 Ryzen 9 RTX 3070 | |
| Schenker Vision 14 | |
| Microsoft Surface Pro 8, i7-1185G7 | |
| 7-Zip 18.03 / 7z b 4 -mmt1 | |
| Average of class Gaming (4199 - 7436, n=105, last 2 years) | |
| Asus ROG Flow Z13 GZ301ZE | |
| Average Intel Core i9-12900H (5302 - 6289, n=28) | |
| Asus Zephyrus G14 GA401QEC | |
| Asus ROG Flow X13 GV301QH | |
| Schenker Vision 14 | |
| Microsoft Surface Pro 8, i7-1185G7 | |
| Razer Blade 14 Ryzen 9 RTX 3070 | |
| Geekbench 5.5 / Multi-Core | |
| Average of class Gaming (6460 - 28263, n=105, last 2 years) | |
| Asus ROG Flow Z13 GZ301ZE | |
| Average Intel Core i9-12900H (8519 - 14376, n=31) | |
| Asus ROG Flow X13 GV301QH | |
| Asus Zephyrus G14 GA401QEC | |
| Schenker Vision 14 | |
| Microsoft Surface Pro 8, i7-1185G7 | |
| Geekbench 5.5 / Single-Core | |
| Average of class Gaming (986 - 2474, n=105, last 2 years) | |
| Asus ROG Flow Z13 GZ301ZE | |
| Average Intel Core i9-12900H (1631 - 1897, n=31) | |
| Schenker Vision 14 | |
| Microsoft Surface Pro 8, i7-1185G7 | |
| Asus Zephyrus G14 GA401QEC | |
| Asus ROG Flow X13 GV301QH | |
| HWBOT x265 Benchmark v2.2 / 4k Preset | |
| Average of class Gaming (11.5 - 44.4, n=105, last 2 years) | |
| Asus ROG Flow Z13 GZ301ZE | |
| Average Intel Core i9-12900H (8.05 - 22.5, n=28) | |
| Asus Zephyrus G14 GA401QEC | |
| Razer Blade 14 Ryzen 9 RTX 3070 | |
| Asus ROG Flow X13 GV301QH | |
| Schenker Vision 14 | |
| Microsoft Surface Pro 8, i7-1185G7 | |
| LibreOffice / 20 Documents To PDF | |
| Asus ROG Flow X13 GV301QH | |
| Razer Blade 14 Ryzen 9 RTX 3070 | |
| Asus Zephyrus G14 GA401QEC | |
| Microsoft Surface Pro 8, i7-1185G7 | |
| Average of class Gaming (33.2 - 88.8, n=105, last 2 years) | |
| Schenker Vision 14 | |
| Average Intel Core i9-12900H (36.8 - 59.8, n=28) | |
| Asus ROG Flow Z13 GZ301ZE | |
| R Benchmark 2.5 / Overall mean | |
| Razer Blade 14 Ryzen 9 RTX 3070 | |
| Microsoft Surface Pro 8, i7-1185G7 | |
| Schenker Vision 14 | |
| Asus Zephyrus G14 GA401QEC | |
| Asus ROG Flow X13 GV301QH | |
| Average Intel Core i9-12900H (0.4218 - 0.506, n=28) | |
| Average of class Gaming (0.3439 - 0.759, n=106, last 2 years) | |
| Asus ROG Flow Z13 GZ301ZE | |
* ... smaller is better
AIDA64: FP32 Ray-Trace | FPU Julia | CPU SHA3 | CPU Queen | FPU SinJulia | FPU Mandel | CPU AES | CPU ZLib | FP64 Ray-Trace | CPU PhotoWorxx
| Performance rating | |
| Average of class Gaming | |
| Asus Zephyrus G14 GA401QEC | |
| Razer Blade 14 Ryzen 9 RTX 3070 | |
| Average Intel Core i9-12900H | |
| Asus ROG Flow Z13 GZ301ZE | |
| Schenker Vision 14 | |
| Microsoft Surface Pro 8, i7-1185G7 | |
| AIDA64 / FP32 Ray-Trace | |
| Average of class Gaming (10227 - 85542, n=105, last 2 years) | |
| Asus Zephyrus G14 GA401QEC | |
| Razer Blade 14 Ryzen 9 RTX 3070 | |
| Average Intel Core i9-12900H (4074 - 18289, n=29) | |
| Schenker Vision 14 | |
| Asus ROG Flow Z13 GZ301ZE | |
| Microsoft Surface Pro 8, i7-1185G7 | |
| AIDA64 / FPU Julia | |
| Average of class Gaming (51376 - 238426, n=105, last 2 years) | |
| Asus Zephyrus G14 GA401QEC | |
| Razer Blade 14 Ryzen 9 RTX 3070 | |
| Average Intel Core i9-12900H (22307 - 93236, n=29) | |
| Asus ROG Flow Z13 GZ301ZE | |
| Schenker Vision 14 | |
| Microsoft Surface Pro 8, i7-1185G7 | |
| AIDA64 / CPU SHA3 | |
| Average of class Gaming (2180 - 10115, n=105, last 2 years) | |
| Asus Zephyrus G14 GA401QEC | |
| Razer Blade 14 Ryzen 9 RTX 3070 | |
| Average Intel Core i9-12900H (1378 - 4215, n=29) | |
| Asus ROG Flow Z13 GZ301ZE | |
| Schenker Vision 14 | |
| Microsoft Surface Pro 8, i7-1185G7 | |
| AIDA64 / CPU Queen | |
| Average of class Gaming (49785 - 173351, n=90, last 2 years) | |
| Asus ROG Flow Z13 GZ301ZE | |
| Asus Zephyrus G14 GA401QEC | |
| Average Intel Core i9-12900H (78172 - 111241, n=28) | |
| Razer Blade 14 Ryzen 9 RTX 3070 | |
| Schenker Vision 14 | |
| Microsoft Surface Pro 8, i7-1185G7 | |
| AIDA64 / FPU SinJulia | |
| Average of class Gaming (4424 - 33636, n=105, last 2 years) | |
| Asus Zephyrus G14 GA401QEC | |
| Razer Blade 14 Ryzen 9 RTX 3070 | |
| Asus ROG Flow Z13 GZ301ZE | |
| Average Intel Core i9-12900H (5709 - 10410, n=29) | |
| Schenker Vision 14 | |
| Microsoft Surface Pro 8, i7-1185G7 | |
| AIDA64 / FPU Mandel | |
| Average of class Gaming (25115 - 128721, n=105, last 2 years) | |
| Asus Zephyrus G14 GA401QEC | |
| Razer Blade 14 Ryzen 9 RTX 3070 | |
| Average Intel Core i9-12900H (11257 - 45581, n=29) | |
| Asus ROG Flow Z13 GZ301ZE | |
| Schenker Vision 14 | |
| Microsoft Surface Pro 8, i7-1185G7 | |
| AIDA64 / CPU AES | |
| Asus Zephyrus G14 GA401QEC | |
| Razer Blade 14 Ryzen 9 RTX 3070 | |
| Average of class Gaming (39258 - 247074, n=105, last 2 years) | |
| Average Intel Core i9-12900H (31935 - 151546, n=29) | |
| Asus ROG Flow Z13 GZ301ZE | |
| Schenker Vision 14 | |
| Microsoft Surface Pro 8, i7-1185G7 | |
| AIDA64 / CPU ZLib | |
| Average of class Gaming (574 - 2531, n=105, last 2 years) | |
| Average Intel Core i9-12900H (449 - 1193, n=29) | |
| Asus ROG Flow Z13 GZ301ZE | |
| Asus Zephyrus G14 GA401QEC | |
| Razer Blade 14 Ryzen 9 RTX 3070 | |
| Schenker Vision 14 | |
| Microsoft Surface Pro 8, i7-1185G7 | |
| AIDA64 / FP64 Ray-Trace | |
| Average of class Gaming (5509 - 45446, n=105, last 2 years) | |
| Razer Blade 14 Ryzen 9 RTX 3070 | |
| Asus Zephyrus G14 GA401QEC | |
| Average Intel Core i9-12900H (2235 - 10511, n=29) | |
| Schenker Vision 14 | |
| Asus ROG Flow Z13 GZ301ZE | |
| Microsoft Surface Pro 8, i7-1185G7 | |
| AIDA64 / CPU PhotoWorxx | |
| Average of class Gaming (12271 - 89891, n=105, last 2 years) | |
| Asus ROG Flow Z13 GZ301ZE | |
| Microsoft Surface Pro 8, i7-1185G7 | |
| Average Intel Core i9-12900H (20960 - 48269, n=30) | |
| Schenker Vision 14 | |
| Razer Blade 14 Ryzen 9 RTX 3070 | |
| Asus Zephyrus G14 GA401QEC | |
System performance
The ROG Flow Z13 is a very powerful system, and this is also confirmed by the good benchmark results. However, we experienced minor stutters from time to time during testing, such as when opening the Windows settings. We don't know the reason for this yet, but it doesn't seem to be a problem with the graphics-switching function. It might have something to do with the Armoury Crate software, or possibly with the new hybrid structure of the processor cores. Nevertheless, the stutters only occurred very rarely in our test and weren't really a problem because of this. Otherwise, the subjective performance impression is very good as well.
CrossMark: Overall | Productivity | Creativity | Responsiveness
| PCMark 10 / Score | |
| Average of class Gaming (5828 - 12414, n=93, last 2 years) | |
| Razer Blade 14 Ryzen 9 RTX 3070 | |
| Asus Zephyrus G14 GA401QEC | |
| Asus ROG Flow Z13 GZ301ZE | |
| Average Intel Core i9-12900H, NVIDIA GeForce RTX 3050 Ti Laptop GPU (n=1) | |
| Asus ROG Flow X13 GV301QH | |
| Schenker Vision 14 | |
| Microsoft Surface Pro 8, i7-1185G7 | |
| PCMark 10 / Essentials | |
| Asus ROG Flow Z13 GZ301ZE | |
| Average Intel Core i9-12900H, NVIDIA GeForce RTX 3050 Ti Laptop GPU (n=1) | |
| Average of class Gaming (8810 - 11935, n=97, last 2 years) | |
| Razer Blade 14 Ryzen 9 RTX 3070 | |
| Asus Zephyrus G14 GA401QEC | |
| Asus ROG Flow X13 GV301QH | |
| Microsoft Surface Pro 8, i7-1185G7 | |
| Schenker Vision 14 | |
| PCMark 10 / Productivity | |
| Average of class Gaming (6845 - 25323, n=95, last 2 years) | |
| Asus ROG Flow Z13 GZ301ZE | |
| Average Intel Core i9-12900H, NVIDIA GeForce RTX 3050 Ti Laptop GPU (n=1) | |
| Asus Zephyrus G14 GA401QEC | |
| Razer Blade 14 Ryzen 9 RTX 3070 | |
| Schenker Vision 14 | |
| Asus ROG Flow X13 GV301QH | |
| Microsoft Surface Pro 8, i7-1185G7 | |
| PCMark 10 / Digital Content Creation | |
| Average of class Gaming (7602 - 19954, n=95, last 2 years) | |
| Razer Blade 14 Ryzen 9 RTX 3070 | |
| Asus Zephyrus G14 GA401QEC | |
| Asus ROG Flow X13 GV301QH | |
| Schenker Vision 14 | |
| Asus ROG Flow Z13 GZ301ZE | |
| Average Intel Core i9-12900H, NVIDIA GeForce RTX 3050 Ti Laptop GPU (n=1) | |
| Microsoft Surface Pro 8, i7-1185G7 | |
| CrossMark / Overall | |
| Asus ROG Flow Z13 GZ301ZE | |
| Average Intel Core i9-12900H, NVIDIA GeForce RTX 3050 Ti Laptop GPU (n=1) | |
| Average of class Gaming (1366 - 2409, n=94, last 2 years) | |
| Schenker Vision 14 | |
| Microsoft Surface Pro 8, i7-1185G7 | |
| CrossMark / Productivity | |
| Asus ROG Flow Z13 GZ301ZE | |
| Average Intel Core i9-12900H, NVIDIA GeForce RTX 3050 Ti Laptop GPU (n=1) | |
| Average of class Gaming (1386 - 2254, n=94, last 2 years) | |
| Schenker Vision 14 | |
| Microsoft Surface Pro 8, i7-1185G7 | |
| CrossMark / Creativity | |
| Average of class Gaming (1343 - 2786, n=94, last 2 years) | |
| Asus ROG Flow Z13 GZ301ZE | |
| Average Intel Core i9-12900H, NVIDIA GeForce RTX 3050 Ti Laptop GPU (n=1) | |
| Microsoft Surface Pro 8, i7-1185G7 | |
| Schenker Vision 14 | |
| CrossMark / Responsiveness | |
| Asus ROG Flow Z13 GZ301ZE | |
| Average Intel Core i9-12900H, NVIDIA GeForce RTX 3050 Ti Laptop GPU (n=1) | |
| Average of class Gaming (1226 - 2334, n=94, last 2 years) | |
| Schenker Vision 14 | |
| Microsoft Surface Pro 8, i7-1185G7 | |
| PCMark 10 Score | 6335 points | |
Help | ||
| AIDA64 / Memory Copy | |
| Asus ROG Flow Z13 GZ301ZE | |
| Average of class Gaming (21750 - 129946, n=105, last 2 years) | |
| Microsoft Surface Pro 8, i7-1185G7 | |
| Average Intel Core i9-12900H (34438 - 74264, n=29) | |
| Schenker Vision 14 | |
| Asus Zephyrus G14 GA401QEC | |
| Razer Blade 14 Ryzen 9 RTX 3070 | |
| AIDA64 / Memory Read | |
| Average of class Gaming (22956 - 118858, n=105, last 2 years) | |
| Asus ROG Flow Z13 GZ301ZE | |
| Average Intel Core i9-12900H (36365 - 74642, n=29) | |
| Microsoft Surface Pro 8, i7-1185G7 | |
| Schenker Vision 14 | |
| Asus Zephyrus G14 GA401QEC | |
| Razer Blade 14 Ryzen 9 RTX 3070 | |
| AIDA64 / Memory Write | |
| Average of class Gaming (22297 - 135096, n=105, last 2 years) | |
| Asus ROG Flow Z13 GZ301ZE | |
| Microsoft Surface Pro 8, i7-1185G7 | |
| Average Intel Core i9-12900H (32276 - 67858, n=29) | |
| Schenker Vision 14 | |
| Razer Blade 14 Ryzen 9 RTX 3070 | |
| Asus Zephyrus G14 GA401QEC | |
| AIDA64 / Memory Latency | |
| Average of class Gaming (75.3 - 259, n=105, last 2 years) | |
| Asus ROG Flow Z13 GZ301ZE | |
| Microsoft Surface Pro 8, i7-1185G7 | |
| Average Intel Core i9-12900H (74.7 - 118.1, n=28) | |
| Razer Blade 14 Ryzen 9 RTX 3070 | |
| Asus Zephyrus G14 GA401QEC | |
| Schenker Vision 14 | |
* ... smaller is better
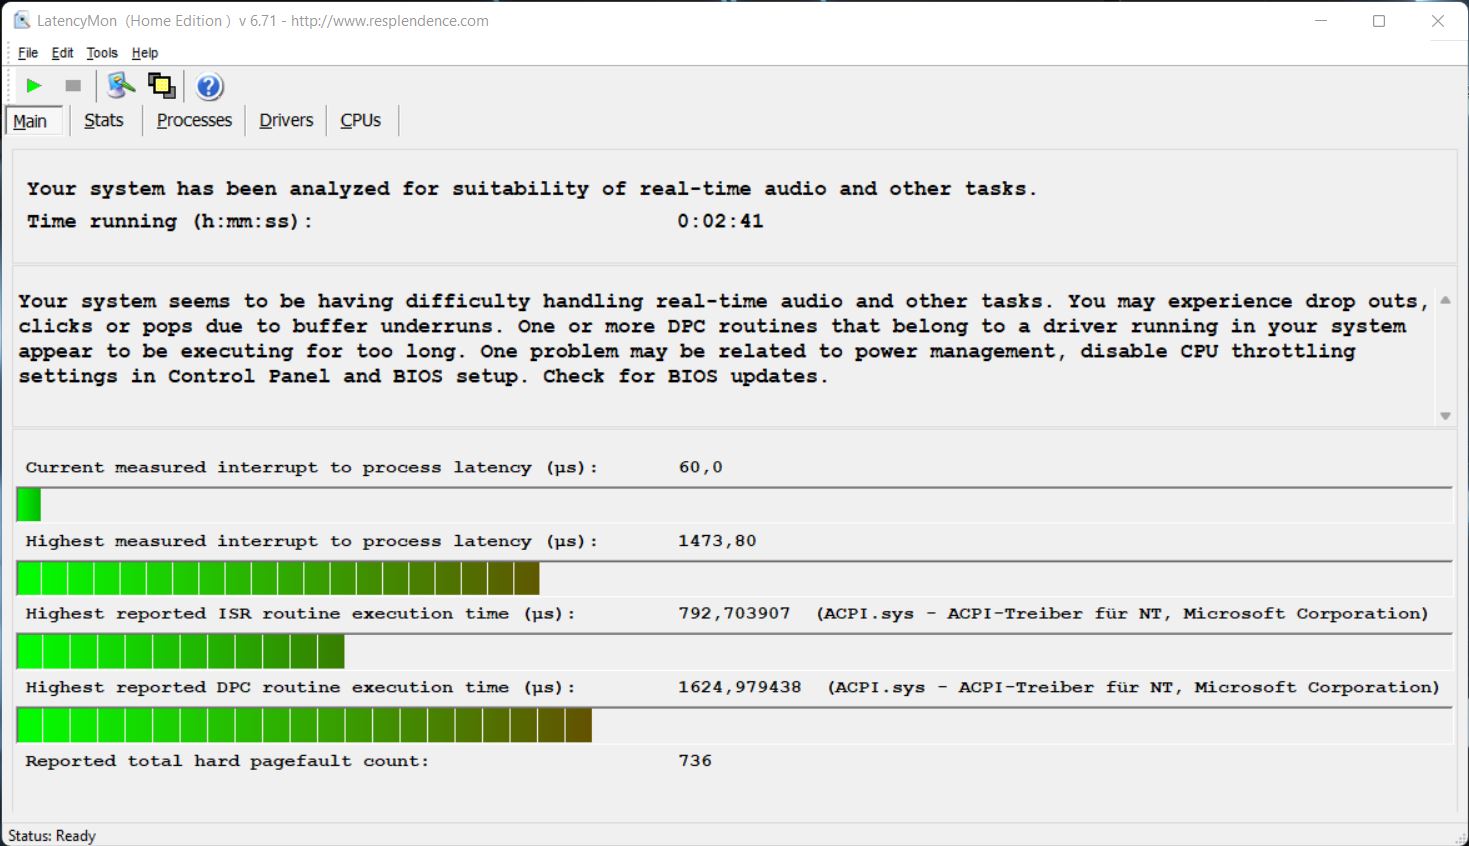
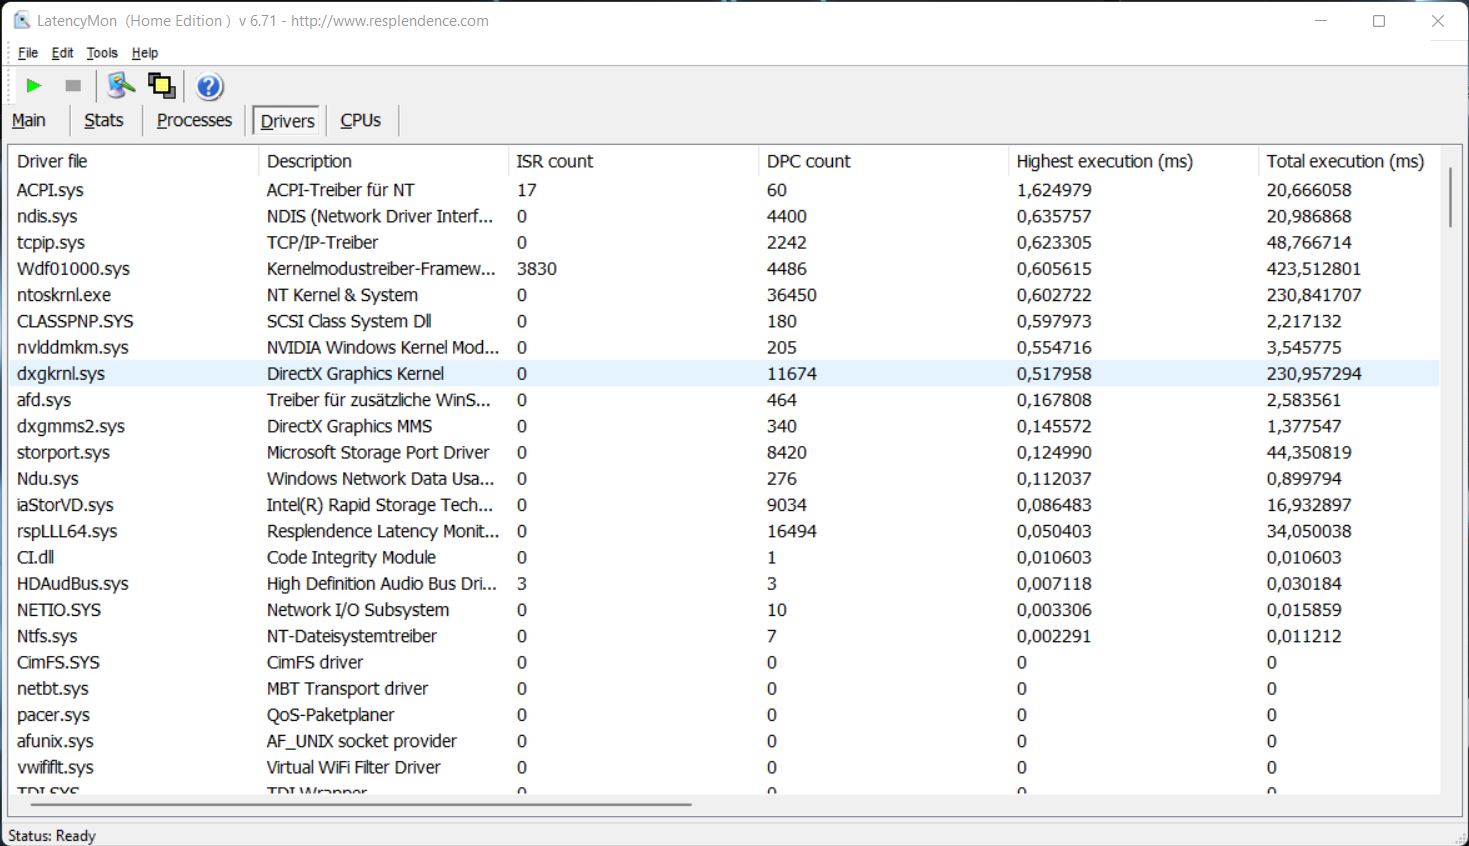
DPC latencies
In our standardized latency test (web browsing, YouTube 4K playback, CPU load), the Flow Z13 exhibits elevated latencies. Therefore, the gaming tablet is only suitable for using real-time audio software to a limited extent with the current BIOS version.
| DPC Latencies / LatencyMon - interrupt to process latency (max), Web, Youtube, Prime95 | |
| Asus ROG Flow X13 GV301QH | |
| Asus ROG Flow Z13 GZ301ZE | |
| Schenker Vision 14 | |
| Asus Zephyrus G14 GA401QEC | |
| Microsoft Surface Pro 8, i7-1185G7 | |
| Razer Blade 14 Ryzen 9 RTX 3070 | |
* ... smaller is better
Storage
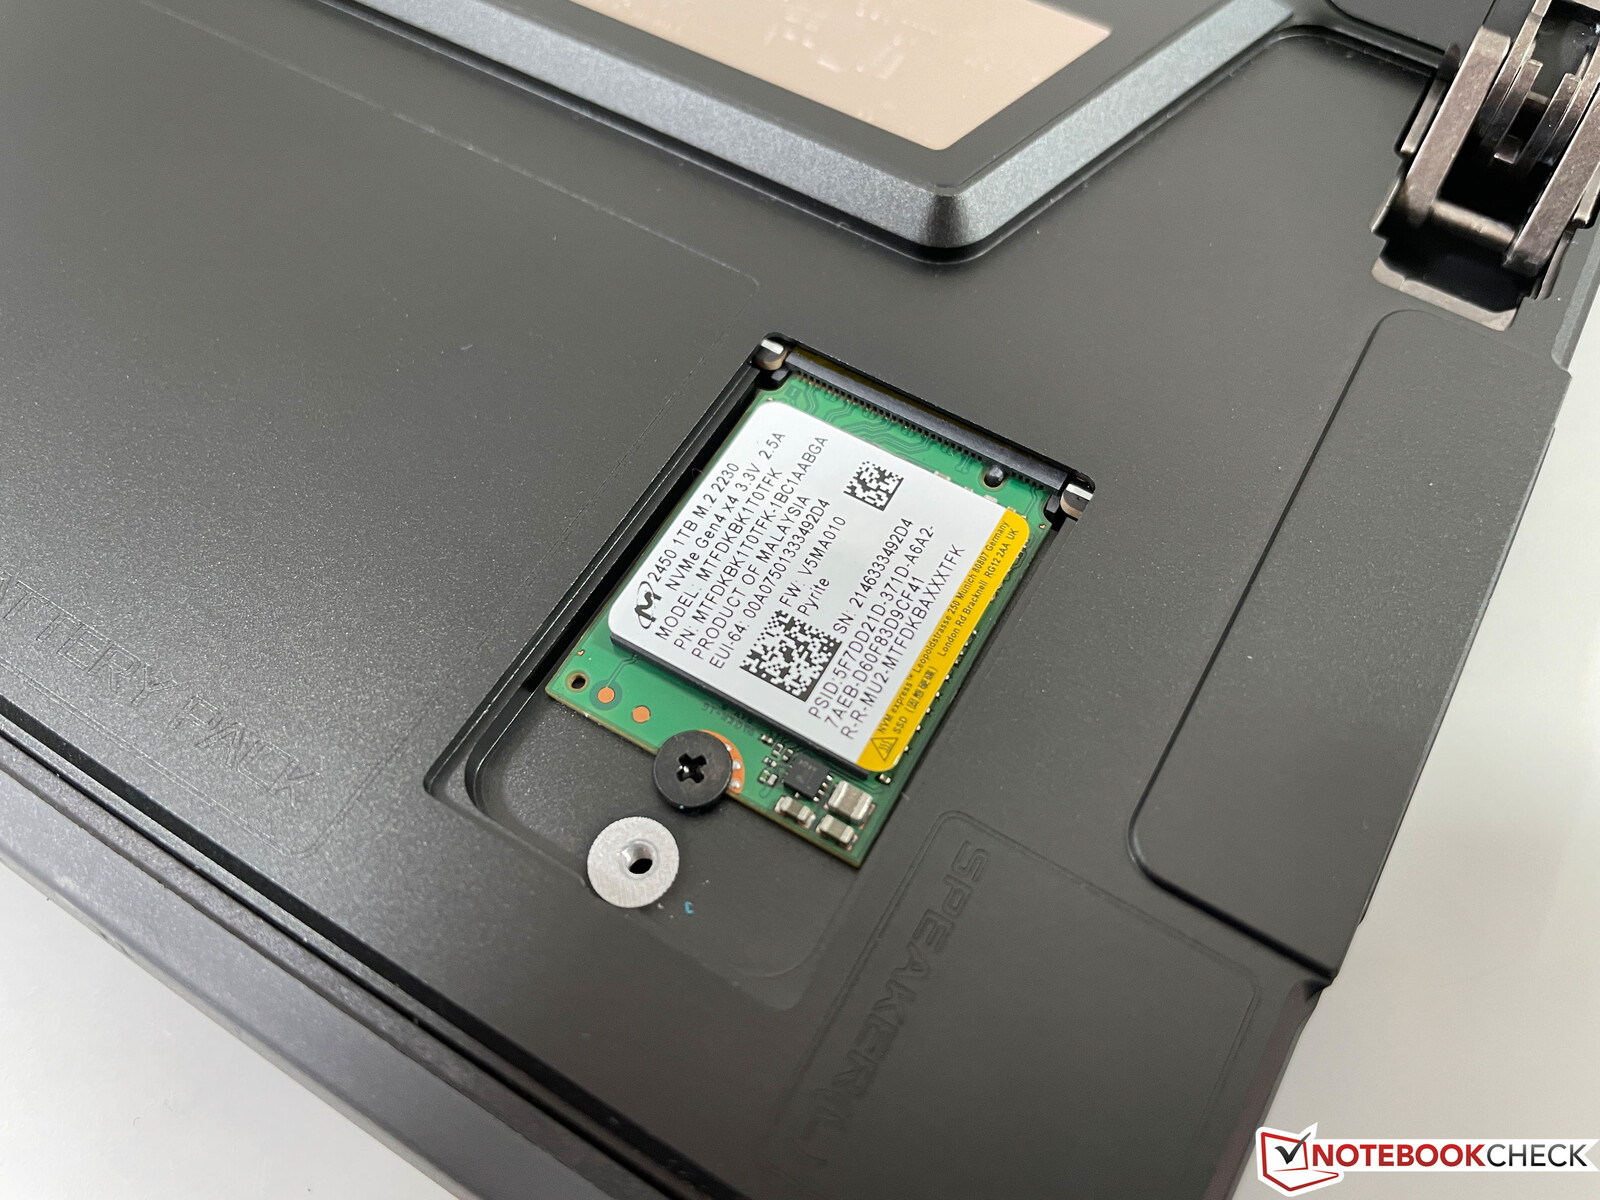
Asus has chosen to use a compact M.2-2230 SSD, which is also very easy to access through the small hatch on the back. Despite the small size, this is a PCIe 4.0 SSD, which comes from Micron in our case and offers a storage capacity of 1 TB. 875 GB of this is still available after the first boot. The benchmark results are by no means bad, and there are no issues in everyday use or gaming, but the maximum sequential transfer rates are more in line with fast PCIe 3.0 x4 drives. In exchange, the Micron SSD delivers a very good performance in the 4K tests. Further SSD benchmarks are available here.

* ... smaller is better
Continuous load read: DiskSpd Read Loop, Queue Depth 8
Graphics card - GeForce RTX 3050 Ti
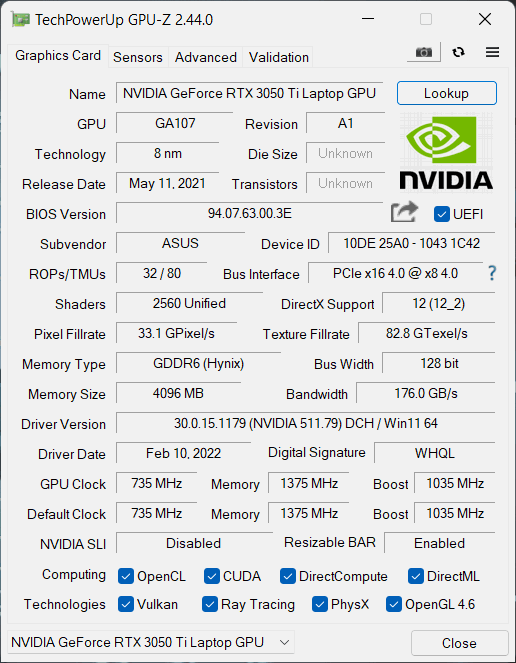
In everyday use, the processor's efficient Iris Xe Graphics G7 often takes care of graphics processing. This is the version with 96 EUs, with which we are already familiar from the Core i7 CPUs of the previous Tiger Lake U generation (e.g. Core i7-1165G7). For more demanding applications, such as games, the dedicated Nvidia GeForce RTX 3050 Ti is automatically enabled by the Optimus technology. As we mentioned before, this is the slowest version of the RTX 3050 Ti with a TGP of only 35 watts, where the processor can still provide 5 watts depending on the usage thanks to Dynamic Boost. We observed a maximum core clock rate of 1,297 MHz in the benchmarks, and there's 4 GB of GDDR6 VRAM available.
The synthetic benchmarks again show that this is one of the slowest versions of the RTX 3050 Ti, since the ROG Flow Z13 is about 20% behind the average results available in our database for the RTX 3050 Ti. However, performance remains stable under prolonged load, and the 3DMark Time Spy stress test is completed with 97%. On battery power, consumption is initially limited to 35 watts. When the battery level drops below 50%, the maximum is still 26 watts. Additional GPU benchmarks are available here.
| 3DMark 11 Performance | 14864 points | |
| 3DMark Fire Strike Score | 9794 points | |
| 3DMark Time Spy Score | 4530 points | |
Help | ||
Gaming performance
Thanks to the built-in MUX switch, the integrated graphics card can be completely disabled, which can lead to improved latency and higher gaming performance. However, we were unable to detect a performance gain in our tests, regardless of whether we ran the synthetic 3DMarks or the gaming tests. This is certainly something you can experiment with a bit, but in general, we would recommend simply leaving the hybrid graphics enabled since Nvidia's Optimus technology works very well.
The gaming performance of the RTX 3050 Ti is often only sufficient for medium details in modern games, but at least less demanding or older games are often playable at high details. We reviewed the external XG Mobile eGPU last year in combination with the ROG Flow X13, but you should then preferably play on an external display because performance will otherwise suffer. In any case, the 150-watt version of the mobile GeForce RTX 3080 offers a substantial performance boost.
| The Witcher 3 | |
| 1920x1080 High Graphics & Postprocessing (Nvidia HairWorks Off) | |
| Average of class Gaming (341 - 404, n=2, last 2 years) | |
| Razer Blade 14 Ryzen 9 RTX 3070 | |
| Asus Zephyrus G14 GA401QEC | |
| Average NVIDIA GeForce RTX 3050 Ti Laptop GPU (30 - 110, n=26) | |
| Asus ROG Flow Z13 GZ301ZE | |
| Schenker Vision 14 | |
| Asus ROG Flow X13 GV301QH | |
| Microsoft Surface Pro 8, i7-1185G7 | |
| 1920x1080 Ultra Graphics & Postprocessing (HBAO+) | |
| Average of class Gaming (104.7 - 240, n=7, last 2 years) | |
| Razer Blade 14 Ryzen 9 RTX 3070 | |
| Asus Zephyrus G14 GA401QEC | |
| Average NVIDIA GeForce RTX 3050 Ti Laptop GPU (19 - 58.5, n=29) | |
| Schenker Vision 14 | |
| Asus ROG Flow Z13 GZ301ZE | |
| Asus ROG Flow X13 GV301QH | |
| Microsoft Surface Pro 8, i7-1185G7 | |
| F1 2021 | |
| 1920x1080 High Preset AA:T AF:16x | |
| Asus Zephyrus G14 GA401QEC | |
| Average NVIDIA GeForce RTX 3050 Ti Laptop GPU (68 - 131, n=11) | |
| Schenker Vision 14 | |
| Asus ROG Flow Z13 GZ301ZE | |
| 1920x1080 Ultra High Preset + Raytracing AA:T AF:16x | |
| Asus Zephyrus G14 GA401QEC | |
| Average NVIDIA GeForce RTX 3050 Ti Laptop GPU (44.4 - 69, n=11) | |
| Asus ROG Flow Z13 GZ301ZE | |
| Schenker Vision 14 | |
| Cyberpunk 2077 1.0 | |
| 1920x1080 Medium Preset | |
| Average NVIDIA GeForce RTX 3050 Ti Laptop GPU (39 - 45.6, n=4) | |
| Asus ROG Flow Z13 GZ301ZE | |
| 1920x1080 High Preset | |
| Average NVIDIA GeForce RTX 3050 Ti Laptop GPU (32 - 36.2, n=4) | |
| Asus ROG Flow Z13 GZ301ZE | |
In principle, you can still game on battery power, but you should keep in mind that performance drops a bit when the battery is below 50% (TGP is then only 26 instead of 35 watts). In our test with The Witcher 3, the frame rate drops from 37 to 27 FPS as a result, making the game look a bit choppier and requiring you to reduce the level of detail a bit. Either way, the battery runtime during gaming is very short at 47 minutes. Further gaming benchmarks are available in our Game Benchmarks article.
The Witcher 3 FPS diagram
| low | med. | high | ultra | |
|---|---|---|---|---|
| GTA V (2015) | 181 | 174 | 114 | 54.9 |
| The Witcher 3 (2015) | 225 | 142 | 74 | 37.1 |
| Dota 2 Reborn (2015) | 187 | 172 | 151 | 137 |
| Final Fantasy XV Benchmark (2018) | 106 | 106 | ||
| X-Plane 11.11 (2018) | 134 | 114 | 92.5 | |
| Far Cry 5 (2018) | 132 | 70 | 65 | 59 |
| Strange Brigade (2018) | 232 | 100 | 79.2 | 68 |
| Cyberpunk 2077 1.0 (2020) | 75 | 39 | 32 | 26 |
| F1 2021 (2021) | 224 | 118 | 93.9 | 47.1 |
Emissions - Gaming tablet with surprisingly quiet cooling
Noise emissions
Asus uses a high-quality cooling solution for its gaming tablet, opting for liquid metal for the processor as well as vapor-chamber cooling with two fans. Considering the high performance, we're positively surprised by the noise level. In everyday use, the device is usually completely silent, and the fans don't run at all or are simply inaudible. Under load, however, the fans rev up quickly. As soon as you put the graphics card under load (e.g. when gaming), the noise level quickly reaches 41 dB(A), but it's not bothersome at all. You can hear it in the background, but you can still play without issues and actually use the speakers for the game sound. If you only stress the processor (for example when using the XG Mobile eGPU), the ROG Flow Z13 remains even quieter at 37.5 dB(A). When the load ends, the fan speed is also reduced very quickly (gradually between 31.9 and 29.6 dB(A)), and they become inaudible again quickly as well. The optional Turbo mode doesn't provide higher performance, but the noise level increases to around 44 dB(A). But as we'll see in a moment, the temperatures aren't critical at all anyway, so Turbo mode doesn't really make sense.
We noticed some slight electronic noise in the synthetic GPU benchmarks, but there were no problems in actual games and everyday tasks.
Noise level
| Idle |
| 24.5 / 24.5 / 24.5 dB(A) |
| Load |
| 41 / 41 dB(A) |
 | ||
30 dB silent 40 dB(A) audible 50 dB(A) loud |
||
min: | ||
| Asus ROG Flow Z13 GZ301ZE GeForce RTX 3050 Ti Laptop GPU, i9-12900H, Micron 2450 1TB MTFDKBK1T0TFK | Schenker Vision 14 GeForce RTX 3050 Ti Laptop GPU, i7-11370H, Samsung SSD 980 Pro 1TB MZ-V8P1T0BW | Asus Zephyrus G14 GA401QEC GeForce RTX 3050 Ti Laptop GPU, R9 5900HS, Samsung PM991 MZVLQ1T0HALB | Microsoft Surface Pro 8, i7-1185G7 Iris Xe G7 96EUs, i7-1185G7, Toshiba KBG40ZNS256G NVMe | Razer Blade 14 Ryzen 9 RTX 3070 GeForce RTX 3070 Laptop GPU, R9 5900HX, Samsung PM981a MZVLB1T0HBLR | Asus ROG Flow X13 GV301QH GeForce GTX 1650 Max-Q, R9 5980HS, WDC PC SN530 SDBPNPZ-1T00 | |
|---|---|---|---|---|---|---|
| Noise | -6% | -23% | 1% | -3% | -16% | |
| off / environment * (dB) | 24.5 | 24.3 1% | 30.5 -24% | 24.7 -1% | 25.1 -2% | 30.5 -24% |
| Idle Minimum * (dB) | 24.5 | 24.3 1% | 33.3 -36% | 24.7 -1% | 25.2 -3% | 30.5 -24% |
| Idle Average * (dB) | 24.5 | 24.3 1% | 33.3 -36% | 24.7 -1% | 25.2 -3% | 30.5 -24% |
| Idle Maximum * (dB) | 24.5 | 25.9 -6% | 33.3 -36% | 24.7 -1% | 25.2 -3% | 32.1 -31% |
| Load Average * (dB) | 41 | 43.3 -6% | 36.1 12% | 36.8 10% | 31 24% | 43 -5% |
| Witcher 3 ultra * (dB) | 41 | 44.6 -9% | 36.8 10% | 44 -7% | 42.8 -4% | |
| Load Maximum * (dB) | 41 | 49.5 -21% | 48.6 -19% | 43.8 -7% | 51.7 -26% | 41.3 -1% |
* ... smaller is better
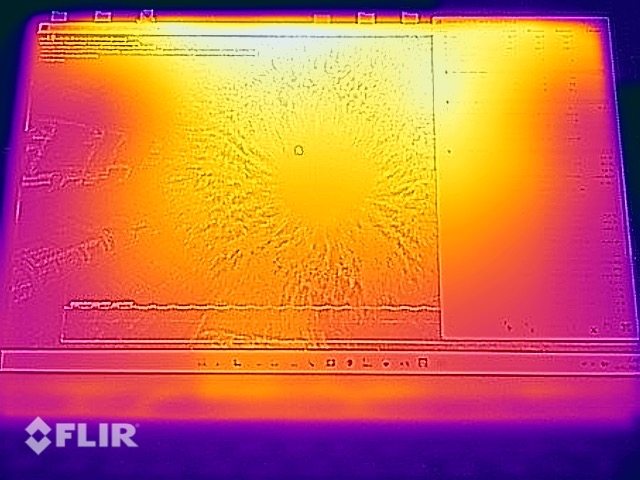
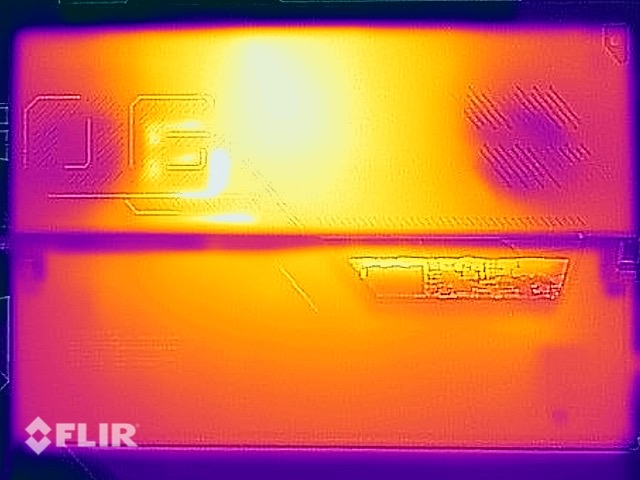
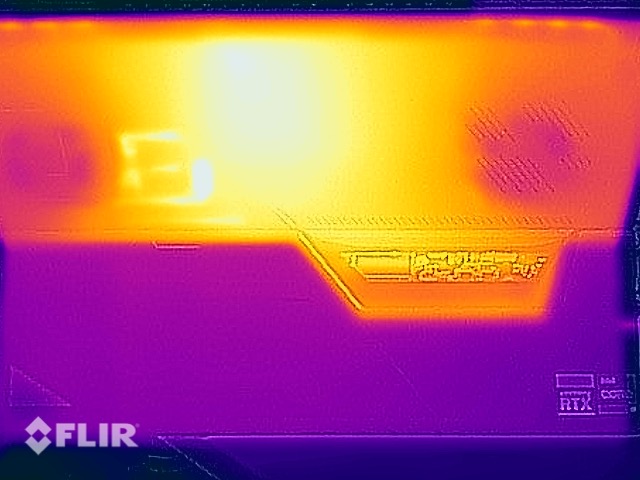
Temperature
Despite the fairly low noise level, the ROG Flow Z13 doesn't get particularly warm during gaming, as we can register a maximum of around 44 °C (~111 °F) at the back here. Even in the stress test, there's no point where the 50 °C (~122 °F) mark is exceeded. However, since you'll hardly hold the tablet in your hand when gaming (demanding games), you won't have any issues here. Moreover, the warm air is evacuated upwards, so it doesn't become a bother. The case temperatures don't even reach 30 °C (~86 °F) during everyday tasks.
The stress test reveals an interesting picture. The GPU performance is completely stable at 35 watts, but the processor always fluctuates between 23 and 55 watts after an initial peak consumption of 105 watts. The intervals with 55 watts become shorter after 20 minutes, which also explains the lower CPU temperatures beginning at this point. This CPU behavior was identical with all the performance modes of the Armoury Crate software, which means Asus should do some more work here, since we would prefer a constant CPU performance. There is no performance drop immediately after the test.
(-) The maximum temperature on the upper side is 45.3 °C / 114 F, compared to the average of 40.4 °C / 105 F, ranging from 21.2 to 68.8 °C for the class Gaming.
(-) The bottom heats up to a maximum of 48.3 °C / 119 F, compared to the average of 43.2 °C / 110 F
(+) In idle usage, the average temperature for the upper side is 27.9 °C / 82 F, compared to the device average of 33.9 °C / 93 F.
(-) Playing The Witcher 3, the average temperature for the upper side is 38.6 °C / 101 F, compared to the device average of 33.9 °C / 93 F.
(±) The palmrests and touchpad can get very hot to the touch with a maximum of 37.8 °C / 100 F.
(-) The average temperature of the palmrest area of similar devices was 28.8 °C / 83.8 F (-9 °C / -16.2 F).
| Asus ROG Flow Z13 GZ301ZE Intel Core i9-12900H, NVIDIA GeForce RTX 3050 Ti Laptop GPU | Schenker Vision 14 Intel Core i7-11370H, NVIDIA GeForce RTX 3050 Ti Laptop GPU | Asus Zephyrus G14 GA401QEC AMD Ryzen 9 5900HS, NVIDIA GeForce RTX 3050 Ti Laptop GPU | Microsoft Surface Pro 8, i7-1185G7 Intel Core i7-1185G7, Intel Iris Xe Graphics G7 96EUs | Razer Blade 14 Ryzen 9 RTX 3070 AMD Ryzen 9 5900HX, NVIDIA GeForce RTX 3070 Laptop GPU | Asus ROG Flow X13 GV301QH AMD Ryzen 9 5980HS, NVIDIA GeForce GTX 1650 Max-Q | |
|---|---|---|---|---|---|---|
| Heat | -7% | -30% | 11% | -15% | -19% | |
| Maximum Upper Side * (°C) | 45.3 | 49.7 -10% | 53.6 -18% | 45 1% | 45 1% | 51.8 -14% |
| Maximum Bottom * (°C) | 48.3 | 56 -16% | 49.9 -3% | 47.2 2% | 44.4 8% | 52.8 -9% |
| Idle Upper Side * (°C) | 29.2 | 28.8 1% | 44.8 -53% | 24.1 17% | 40.2 -38% | 37.3 -28% |
| Idle Bottom * (°C) | 30 | 30.6 -2% | 44.1 -47% | 23.4 22% | 39.2 -31% | 37.7 -26% |
* ... smaller is better
Speakers
Asus integrates two so-called Smart AMP speakers, which are located in the lower area of both sides and project sound to the sides. Despite the narrow case width, this actually creates a slight stereo effect, and the speakers offer a decent performance overall, but they simply lack force. This is also confirmed by our audio measurements. The microphones also do their job satisfactorily, but most gamers will probably use a headset anyway.
Asus ROG Flow Z13 GZ301ZE audio analysis
(±) | speaker loudness is average but good (76.6 dB)
Bass 100 - 315 Hz
(-) | nearly no bass - on average 16.4% lower than median
(±) | linearity of bass is average (10.6% delta to prev. frequency)
Mids 400 - 2000 Hz
(+) | balanced mids - only 3.3% away from median
(+) | mids are linear (5.5% delta to prev. frequency)
Highs 2 - 16 kHz
(+) | balanced highs - only 3.1% away from median
(+) | highs are linear (4.9% delta to prev. frequency)
Overall 100 - 16.000 Hz
(±) | linearity of overall sound is average (16.5% difference to median)
Compared to same class
» 42% of all tested devices in this class were better, 7% similar, 51% worse
» The best had a delta of 6%, average was 18%, worst was 132%
Compared to all devices tested
» 28% of all tested devices were better, 6% similar, 66% worse
» The best had a delta of 4%, average was 23%, worst was 134%
Microsoft Surface Pro 8, i7-1185G7 audio analysis
(±) | speaker loudness is average but good (81.9 dB)
Bass 100 - 315 Hz
(±) | reduced bass - on average 13.1% lower than median
(±) | linearity of bass is average (10.5% delta to prev. frequency)
Mids 400 - 2000 Hz
(+) | balanced mids - only 4.3% away from median
(+) | mids are linear (3.8% delta to prev. frequency)
Highs 2 - 16 kHz
(+) | balanced highs - only 4.4% away from median
(+) | highs are linear (3.6% delta to prev. frequency)
Overall 100 - 16.000 Hz
(+) | overall sound is linear (13.7% difference to median)
Compared to same class
» 18% of all tested devices in this class were better, 5% similar, 77% worse
» The best had a delta of 6%, average was 20%, worst was 57%
Compared to all devices tested
» 15% of all tested devices were better, 4% similar, 81% worse
» The best had a delta of 4%, average was 23%, worst was 134%
Energy management - Asus drains the battery
Energy consumption
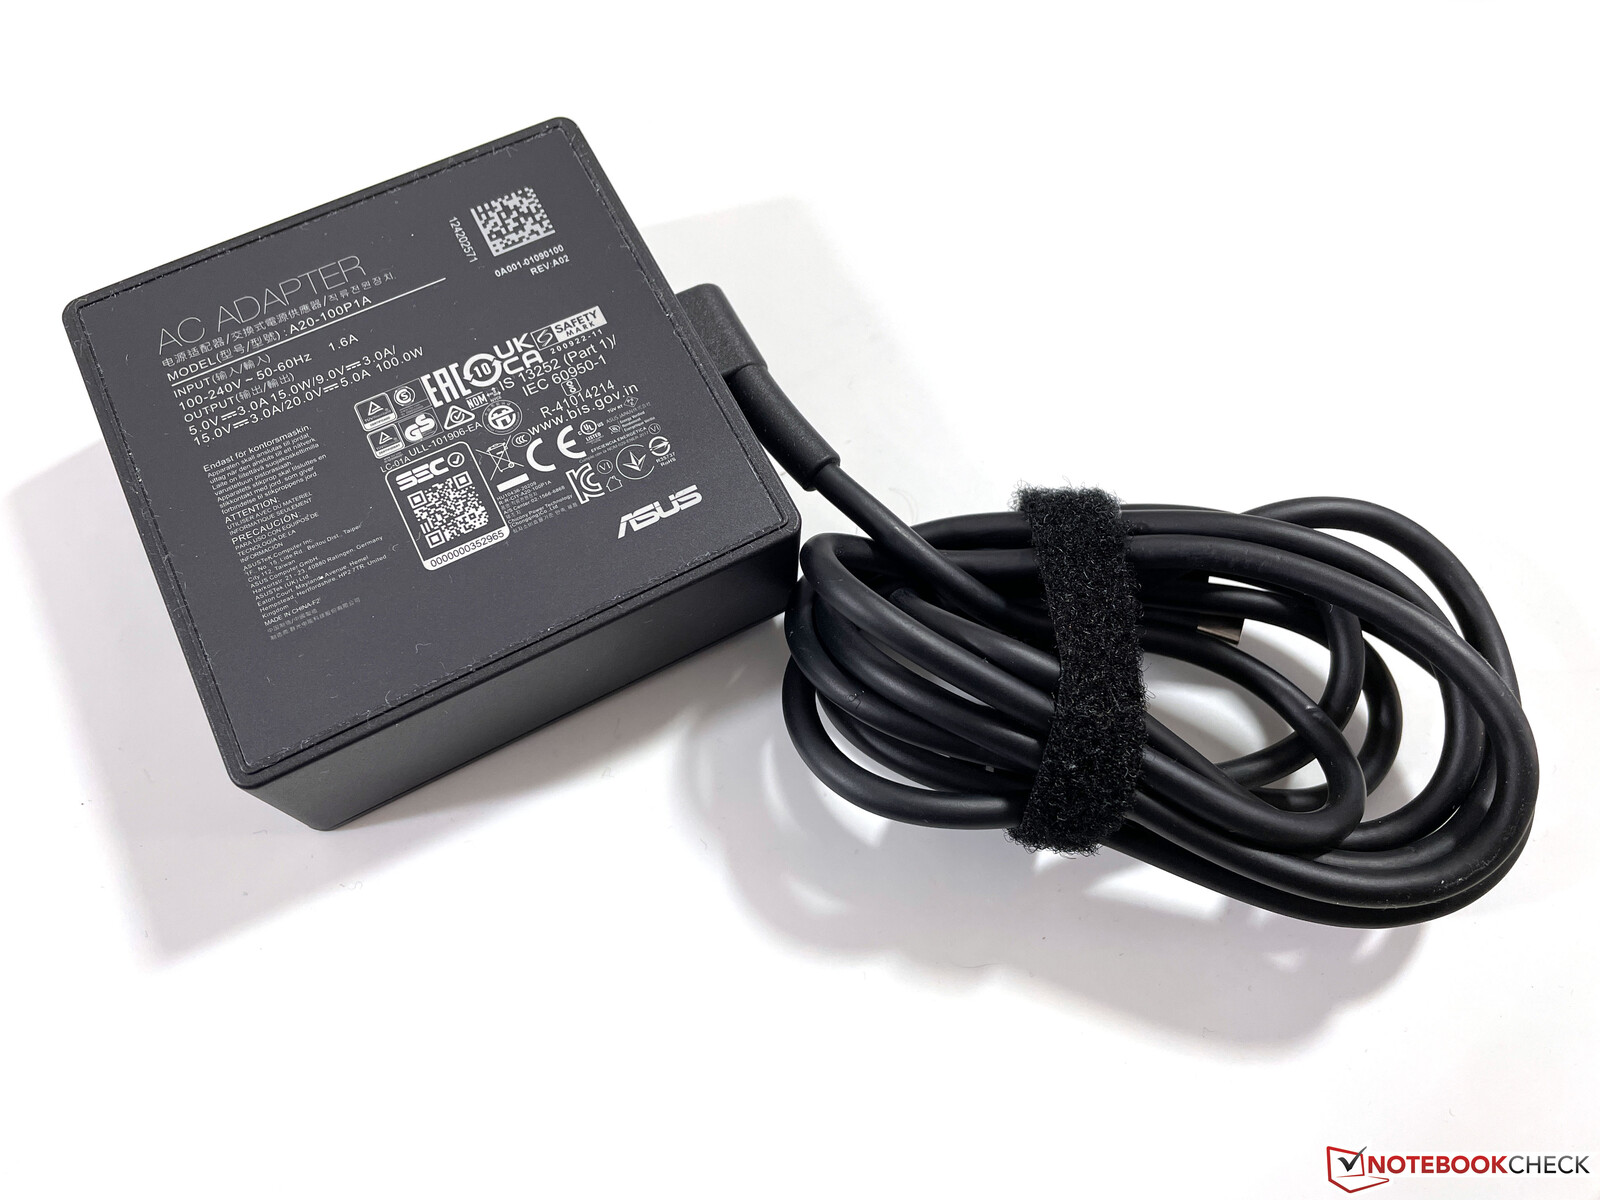
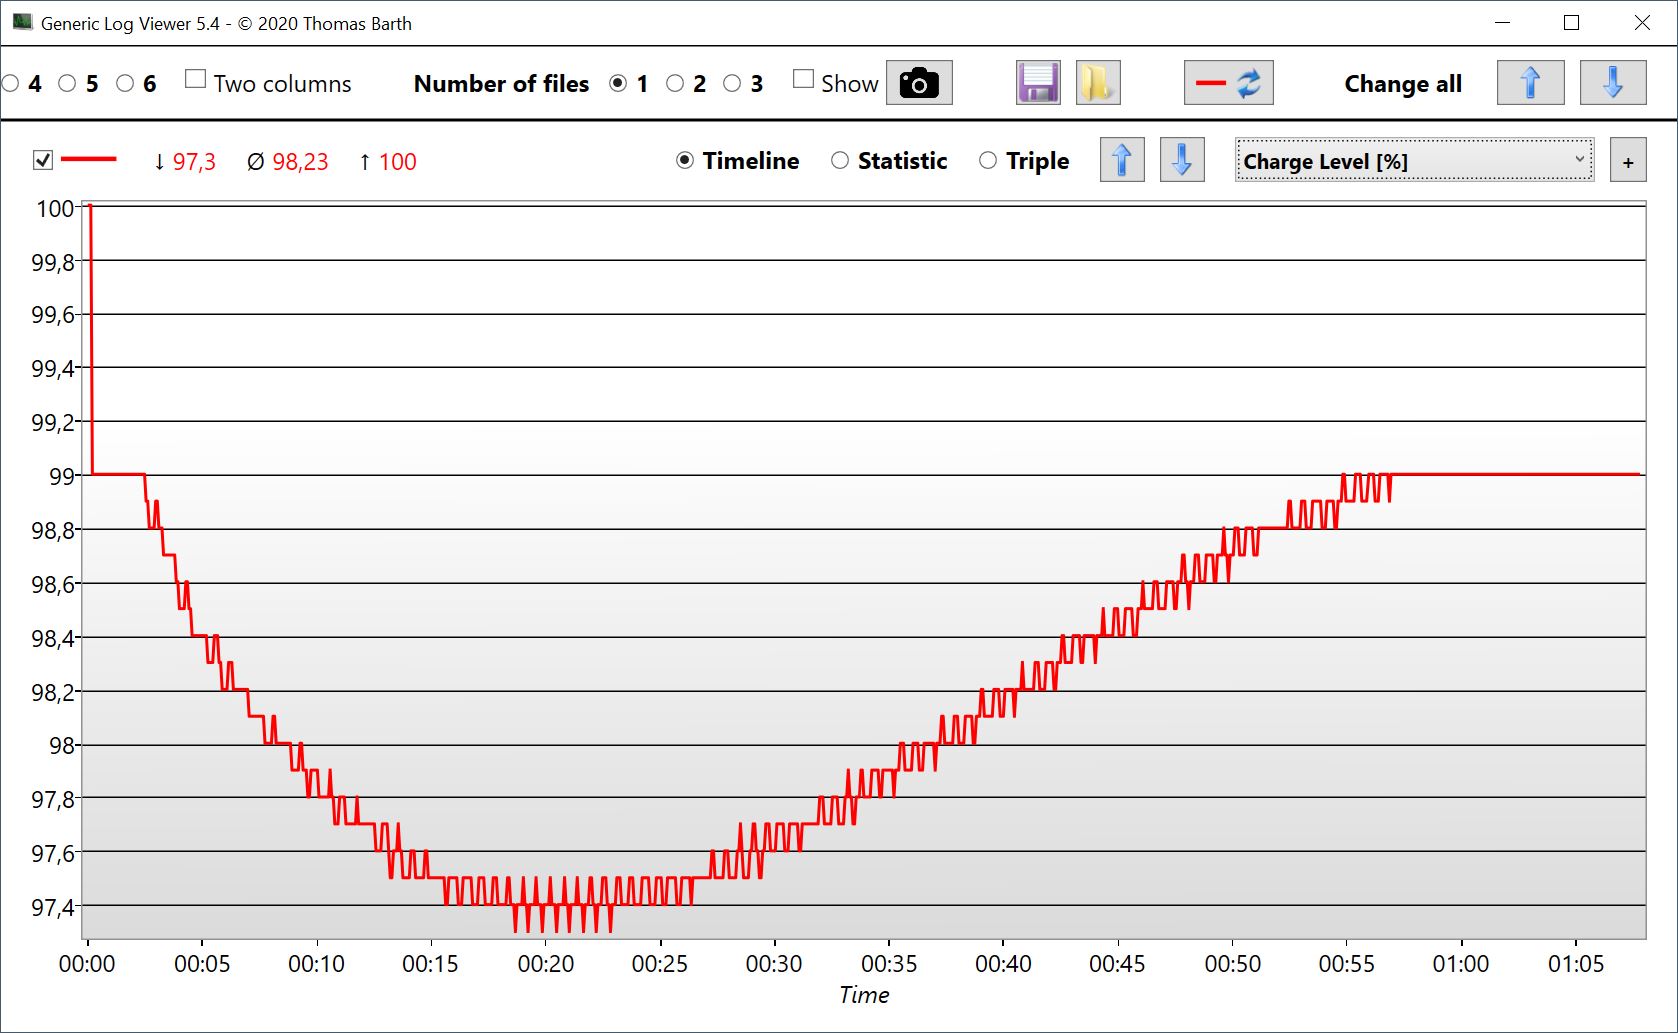
When you look at the power consumption of the processor, and then consider the dedicated GPU and the rest of the components, you will quickly notice that the included 100-watt power adapter is not enough to cover the power demand during peak loads. In the stress test, we measured a maximum consumption of 103 watts at the beginning because the power adapter simply doesn't supply more. The remaining ~40-50 watts are drawn from the battery in these situations, which can also be seen in the following graph of the battery charge in our stress test. With the processor quickly being limited to 55 watts (+35 watts dGPU and rest of system), we're still at a measured consumption of 103 watts, and the battery is still being used a bit. So the limitation is solely down to the device's power adapter; the cooling system could certainly handle more (e.g. a more powerful version of the graphics card).
As we saw in the stress test, the processor's TDP always fluctuates cyclically, and analogously, the power consumption also fluctuates between 80-103 watts in the stress test. After about 20 minutes in the stress test, the periods during which the processor runs at 55 watts become shorter, which is why the battery charge increases again. Since the battery is only "drained" during load spikes or only very briefly, this doesn't have an impact on the device's operation, but whether this is beneficial for the battery's lifespan is another story.
The idle rates are also quite high, which is due to the high screen brightness. The standby consumption of 2.5 watts is definitely too high; Asus should make improvements here.
| Off / Standby | |
| Idle | |
| Load |
|
Key:
min: | |
| Asus ROG Flow Z13 GZ301ZE i9-12900H, GeForce RTX 3050 Ti Laptop GPU, Micron 2450 1TB MTFDKBK1T0TFK, IPS, 1920x1200, 13.4" | Schenker Vision 14 i7-11370H, GeForce RTX 3050 Ti Laptop GPU, Samsung SSD 980 Pro 1TB MZ-V8P1T0BW, IPS, 2880x1800, 14" | Asus Zephyrus G14 GA401QEC R9 5900HS, GeForce RTX 3050 Ti Laptop GPU, Samsung PM991 MZVLQ1T0HALB, IPS, 2560x1440, 14" | Microsoft Surface Pro 8, i7-1185G7 i7-1185G7, Iris Xe G7 96EUs, Toshiba KBG40ZNS256G NVMe, IPS, 2880x1920, 13" | Razer Blade 14 Ryzen 9 RTX 3070 R9 5900HX, GeForce RTX 3070 Laptop GPU, Samsung PM981a MZVLB1T0HBLR, IPS, 2560x1440, 14" | Asus ROG Flow X13 GV301QH R9 5980HS, GeForce GTX 1650 Max-Q, WDC PC SN530 SDBPNPZ-1T00, IPS, 3840x2400, 13.4" | Average NVIDIA GeForce RTX 3050 Ti Laptop GPU | Average of class Gaming | |
|---|---|---|---|---|---|---|---|---|
| Power Consumption | -6% | -20% | 38% | -53% | 9% | -19% | -81% | |
| Idle Minimum * (Watt) | 8.8 | 6.7 24% | 8.1 8% | 3.9 56% | 9.4 -7% | 7.4 16% | 8.2 ? 7% | 13 ? -48% |
| Idle Average * (Watt) | 12.1 | 12.6 -4% | 12.9 -7% | 8.5 30% | 15.8 -31% | 10.3 15% | 12.6 ? -4% | 19 ? -57% |
| Idle Maximum * (Watt) | 12.7 | 15.4 -21% | 16.1 -27% | 9.8 23% | 24.1 -90% | 13.4 -6% | 17.2 ? -35% | 24.6 ? -94% |
| Load Average * (Watt) | 72.3 | 85.7 -19% | 102.4 -42% | 48 34% | 76.8 -6% | 75.9 -5% | 92 ? -27% | 110.7 ? -53% |
| Witcher 3 ultra * (Watt) | 77.3 | 83 -7% | 41.5 46% | 154 -99% | ||||
| Load Maximum * (Watt) | 103.1 | 110.9 -8% | 135.8 -32% | 63 39% | 189.7 -84% | 78 24% | 139.1 ? -35% | 259 ? -151% |
* ... smaller is better
Energy consumption during our The Witcher 3 test / stress test
Energy consumption with an external monitor
Battery life
The combination of the 56 Wh battery and the comparatively high consumption rates doesn't augur particularly long battery runtimes, and this is also confirmed by our tests. With an adjusted brightness of 150 cd/m² (corresponds to 35% of the maximum brightness in our test device), we get 5:30 to 6 hours in Wi-Fi or video mode. In contrast, our Wi-Fi test only runs for a bit over 4 hours at maximum brightness. By the way, the 120 Hz mode doesn't affect runtimes in our tests. In view of these results, we wouldn't recommend the optional 4K panel since it is likely to consume even more power.
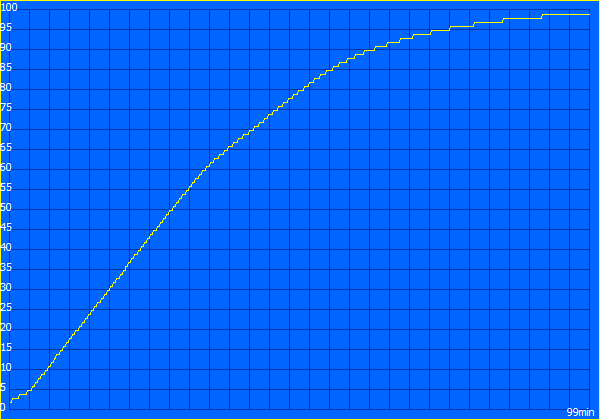
A full charge takes around 100 minutes with the device turned on, but 50% of the capacity is available again after just under 28 minutes.
| Asus ROG Flow Z13 GZ301ZE i9-12900H, GeForce RTX 3050 Ti Laptop GPU, 56 Wh | Schenker Vision 14 i7-11370H, GeForce RTX 3050 Ti Laptop GPU, 53 Wh | Asus Zephyrus G14 GA401QEC R9 5900HS, GeForce RTX 3050 Ti Laptop GPU, 76 Wh | Microsoft Surface Pro 8, i7-1185G7 i7-1185G7, Iris Xe G7 96EUs, 51.5 Wh | Razer Blade 14 Ryzen 9 RTX 3070 R9 5900HX, GeForce RTX 3070 Laptop GPU, 62 Wh | Asus ROG Flow X13 GV301QH R9 5980HS, GeForce GTX 1650 Max-Q, 62 Wh | Average of class Gaming | |
|---|---|---|---|---|---|---|---|
| Battery runtime | 9% | 99% | 35% | 19% | 23% | 30% | |
| H.264 (h) | 6 | 6.8 13% | 10.3 72% | 10.1 68% | 6.9 15% | 8.32 ? 39% | |
| WiFi v1.3 (h) | 5.6 | 5.5 -2% | 11.2 100% | 7.6 36% | 7.3 30% | 5.8 4% | 7.11 ? 27% |
| Witcher 3 ultra (h) | 0.8 | ||||||
| Load (h) | 1.2 | 1.4 17% | 2.7 125% | 1.2 0% | 1.3 8% | 1.8 50% | 1.502 ? 25% |
| Reader / Idle (h) | 19.1 | 13.8 | 10.4 | 8.27 ? |
Pros
Cons
Verdict - The ROG Flow Z13 impresses with its good cooling
The new Asus ROG Flow Z13 is a gaming tablet and a convertible that is currently quite unrivaled on the market. After our review, the impression is predominantly positive. Besides a very fast Alder Lake CPU and stable gaming performance, especially the cooling system is surprisingly effective and quiet. You can use the integrated speakers without any issues while gaming. The 1200p display in the 16:10 format also impresses with good color reproduction and high brightness. Since the battery runtimes aren't particularly long as it is, we wouldn't recommend the optional 4K panel.
However, there are also some points where there's room for improvement. For starters, the CPU/GPU combination is relatively unbalanced, as a high-end i9 CPU is combined with the slowest version of the GeForce RTX 3050 Ti. The Core i9 offers extremely high performance, especially during short load peaks and single-core benchmarks, but the Core i7-12700H would offer the same performance in everyday use, particularly once the power limit kicks in at 55 watts. Furthermore, the processor requires up to 114 watts during load peaks, and the device has to resort to the battery in addition to the 100-watt power adapter to provide enough energy. With the optional XG Mobile eGPU (either with the RTX 3080 or RX 6850M XT), the graphics performance can be increased drastically, and thanks to the good CPU performance, the tablet will not get bottlenecked here, either. In this respect, the configuration with the Core i5 and the iGPU is also interesting, but unfortunately, it's not offered in all regions.
Finally a proper gaming tablet: Asus offers a powerful gaming tablet with good cooling with the ROG Flow Z13. However, the Alder Lake Core i9 processor is a bit overkill, and we would have preferred to see a faster version of the RTX 3050 Ti.
There's also room for improvement in terms of the configuration. Besides modern interfaces like PCIe 4.0 and Thunderbolt 4, a slow USB 2.0 port somehow found its way into the Flow Z13. Furthermore, there's a problem with supplying power via the Thunderbolt 4 port in German models. We are in contact with the manufacturer here and will update the review as soon as we receive an official statement. Furthermore, the additional profiles of the Armoury Crate software don't really add any value at the moment; Asus should take another look here.
Finally, there's the price in Germany, which is not low at 2,100 Euros ($1,899 in the United States). The bundle with the XG Mobile eGPU (RTX 3080) even costs an impressive 3,500 Euros (~$3,920, not currently available in the US). For this price, powerful gaming laptops like the Razer Blade 14 are already available, and you can also buy a normal tablet for on-the-go use. Users who occasionally play games at home can also use almost any convertible, such as the Surface Pro 8, for example, with a Thunderbolt port connected to an external GPU, despite the fact that the CPU performance is certainly not as high.
Price and availability
At the time of writing, you can find the Asus ROG Flow Z13 with the Core i9 processor, the RTX 3050 Ti, 16 GB of RAM, a 1 TB SSD, and the Full HD display for $1,899 on Best Buy.
Asus ROG Flow Z13 GZ301ZE
- 02/25/2022 v7 (old)
Andreas Osthoff
Price comparison

