Asus Zephyrus G14 GA401QM Laptop Review: AMD Still Rules The 14-inch Gaming Space
Asus introduced its Zephyrus G14 laptop early last year which made headlines for its small 14-inch form factor, 8-core AMD Ryzen 9 4900HS CPU, and GeForce RTX 2060 Max-Q Turing graphics. The then-new Zen 2 CPU would allow the G14 to outperform many larger 15.6-inch and 17.3-inch gaming laptops including those with 10th gen Core i9 CPUs.
For 2021, Asus has refreshed its Zephyrus G14 model to run on the newer Zen 3 Ryzen 9 5900HS Cezanne CPU and RTX 3060 Ampere GPU instead. The display and outer lid have also gotten new options to improve the visual experience. Our specific 144 Hz FHD configuration can be found online for $1500 to 1750 USD while the 120 Hz QHD option can be found for up to $2000.
Although the original Zephyrus G14 launched with no direct competitors in its size class, this 2021 version must now face off against the formidable Razer Blade 14. This review will therefore reference the Razer laptop and other larger gaming laptops for comparison purposes.
More Asus reviews:
potential competitors in comparison
Rating | Date | Model | Weight | Height | Size | Resolution | Price |
|---|---|---|---|---|---|---|---|
| 83.5 % v7 (old) | 06 / 2021 | Asus Zephyrus G14 GA401QM R9 5900HS, GeForce RTX 3060 Laptop GPU | 1.7 kg | 19.9 mm | 14.00" | 1920x1080 | |
| 83.6 % v7 (old) | 03 / 2020 | Asus Zephyrus G14 GA401IV R9 4900HS, GeForce RTX 2060 Max-Q | 1.6 kg | 17.9 mm | 14.00" | 1920x1080 | |
| 87.5 % v7 (old) | 06 / 2021 | Razer Blade 14 Ryzen 9 RTX 3070 R9 5900HX, GeForce RTX 3070 Laptop GPU | 1.8 kg | 16.8 mm | 14.00" | 2560x1440 | |
| 86.5 % v7 (old) | 02 / 2021 | HP Envy 14-eb0010nr i5-1135G7, GeForce GTX 1650 Ti Max-Q | 1.6 kg | 17.9 mm | 14.00" | 1920x1200 | |
| 84.1 % v7 (old) | 01 / 2021 | Asus Zenbook 14 UX435EG i7-1165G7, GeForce MX450 | 1.3 kg | 16.9 mm | 14.00" | 1920x1080 | |
| 83 % v7 (old) | 08 / 2020 | HP Envy 15-ep0098nr i7-10750H, GeForce RTX 2060 Max-Q | 2 kg | 19 mm | 15.60" | 3840x2160 |
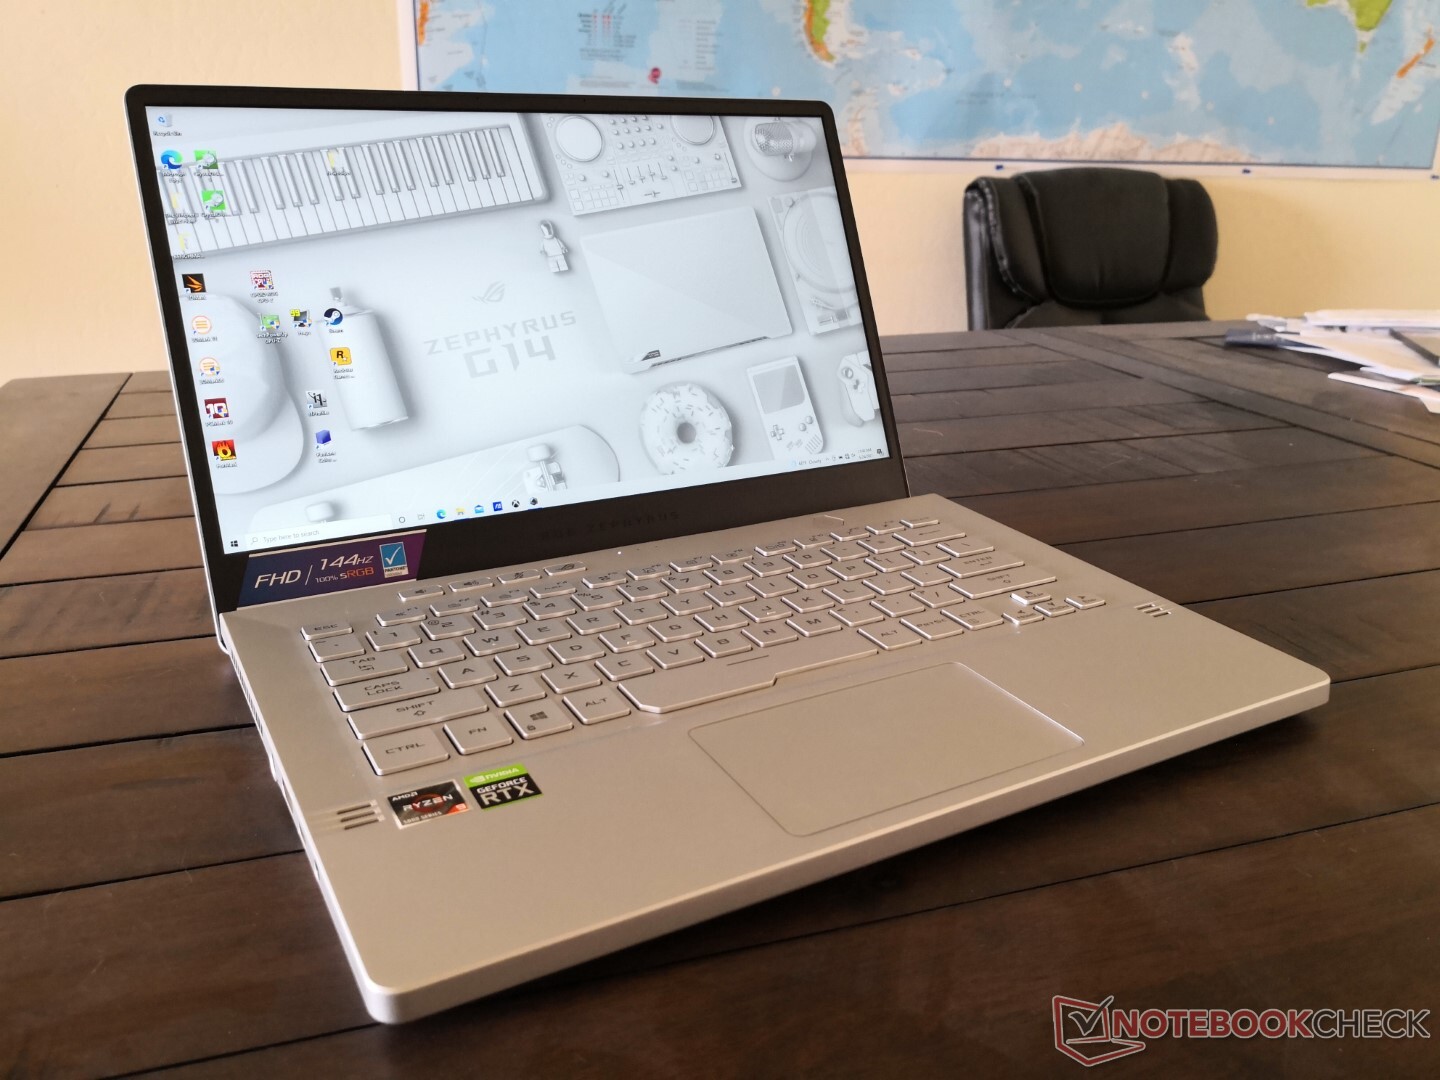
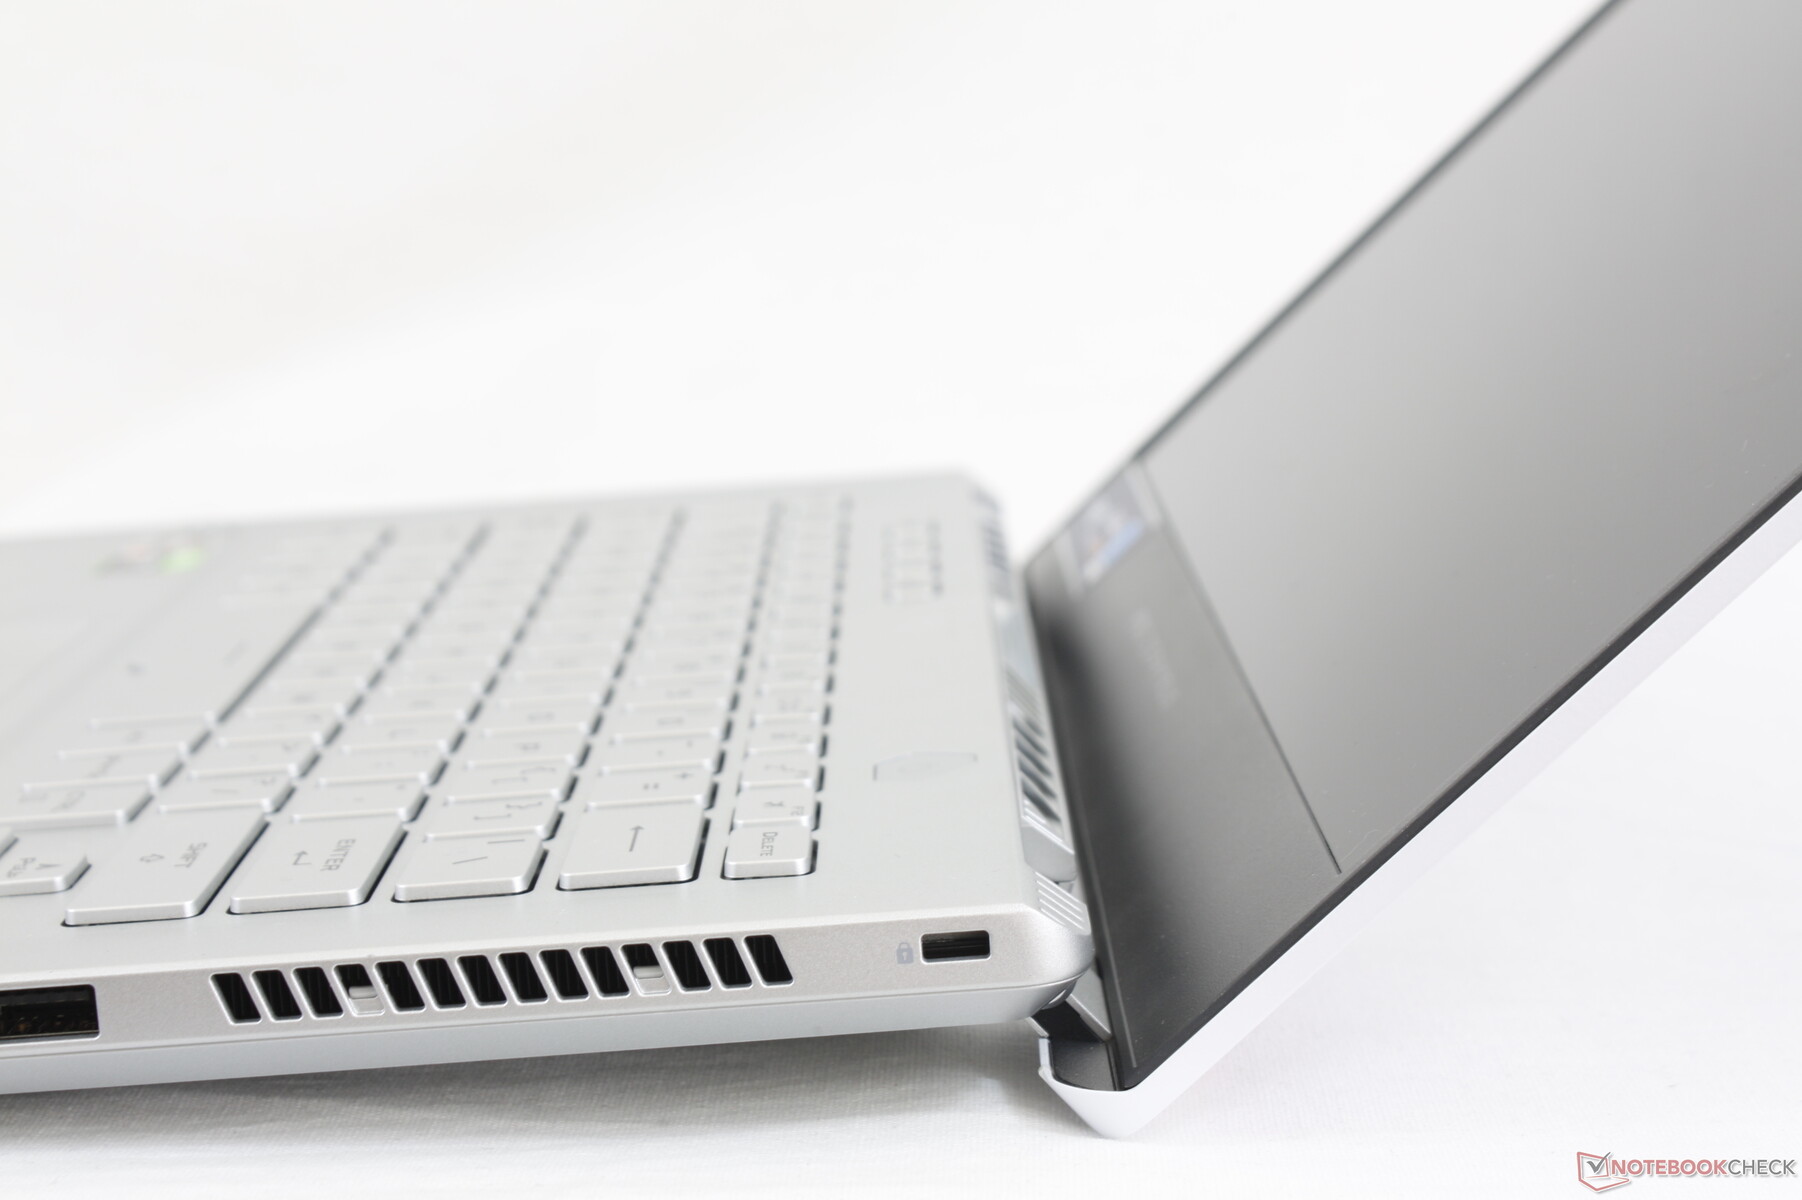
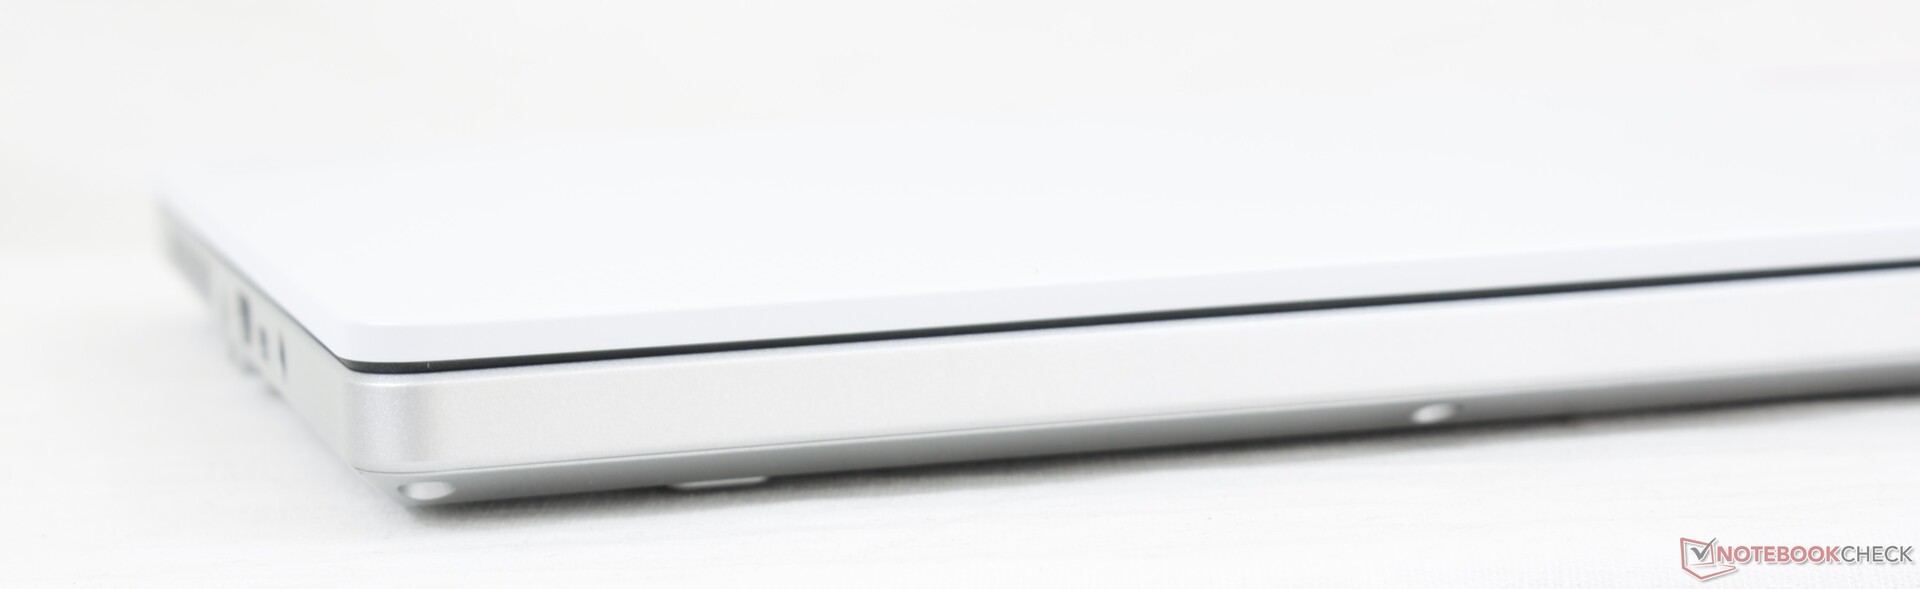
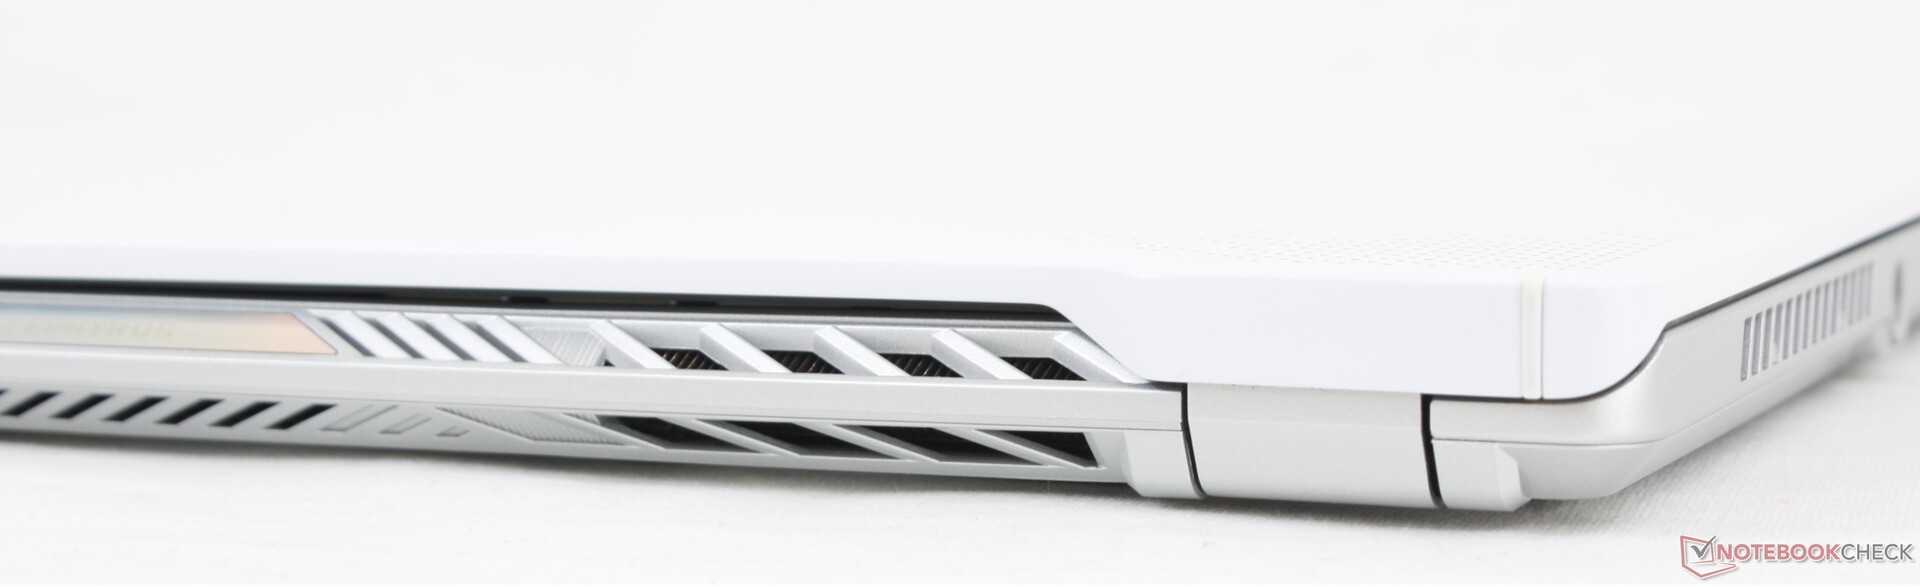
Case — Same Look With Some Shinier Trims
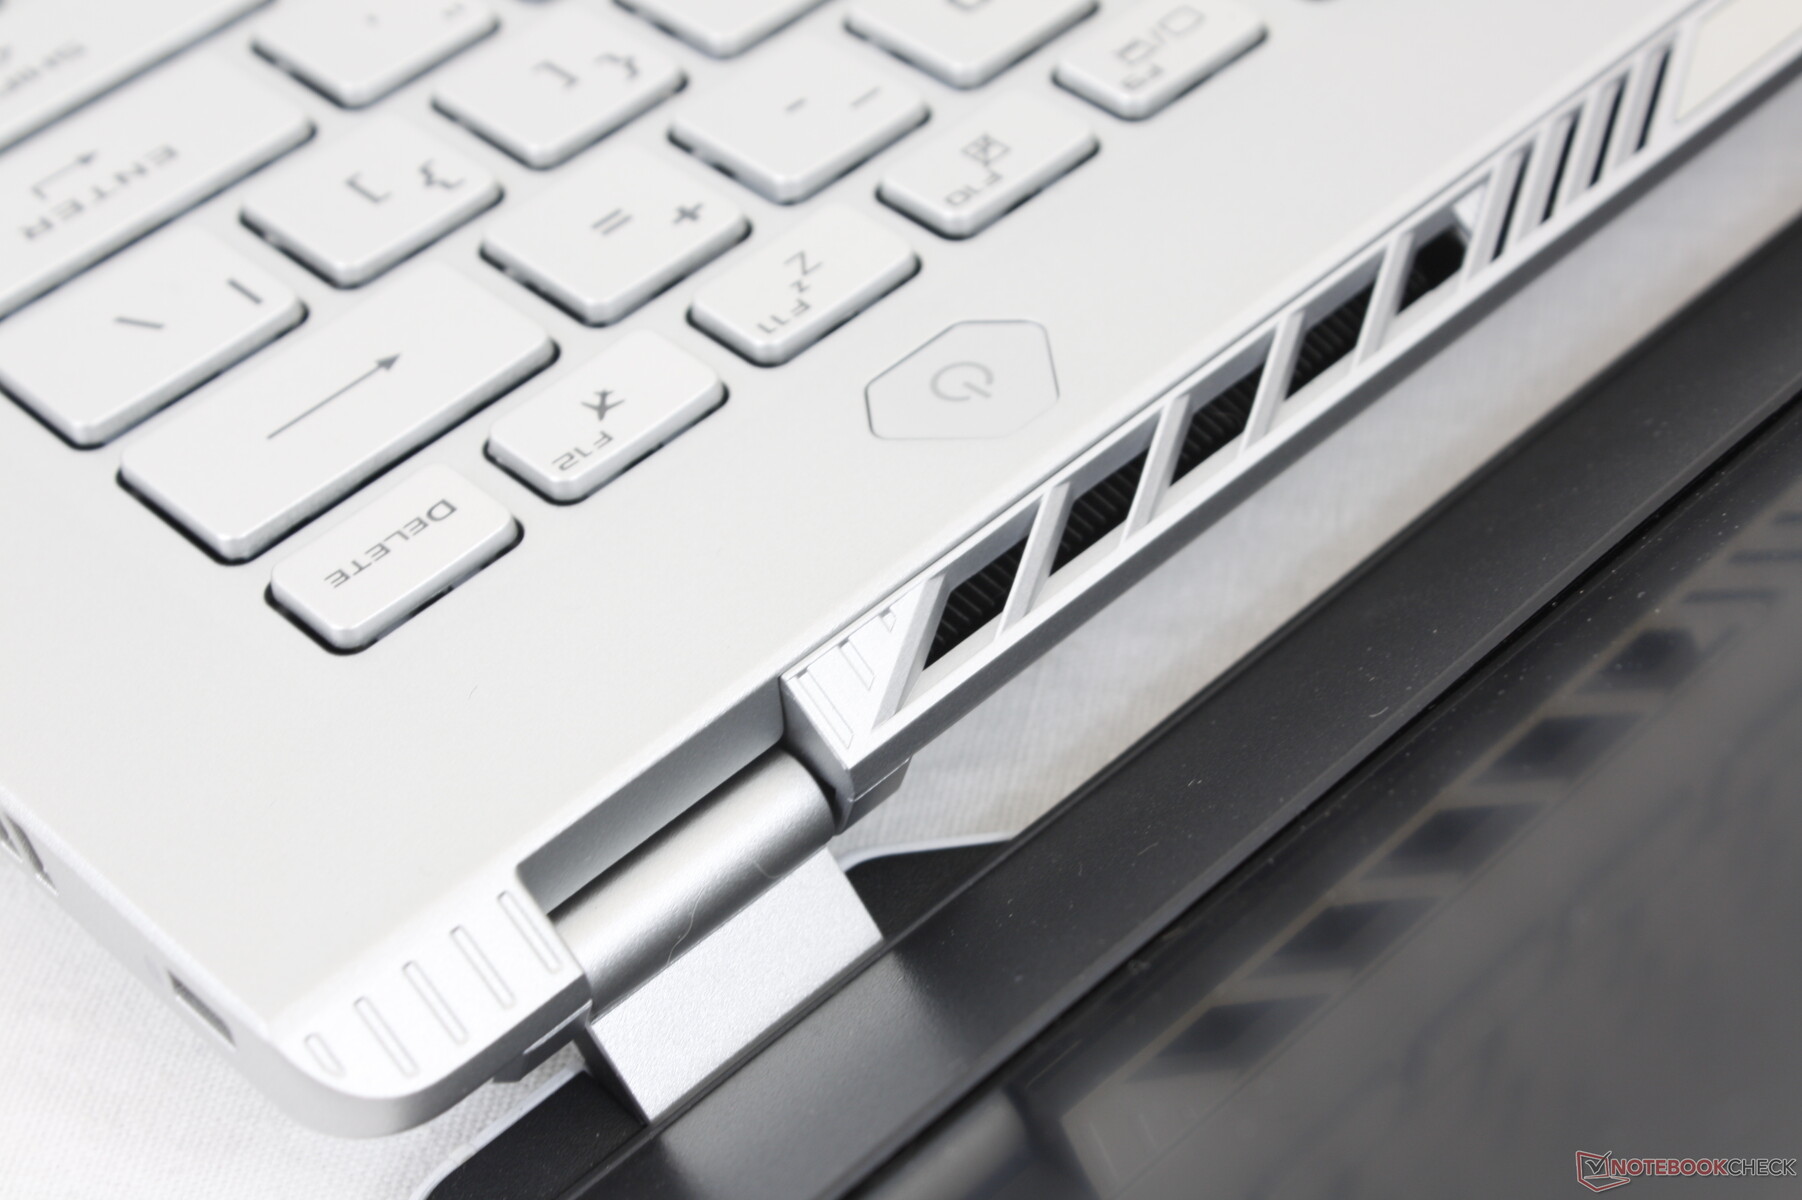
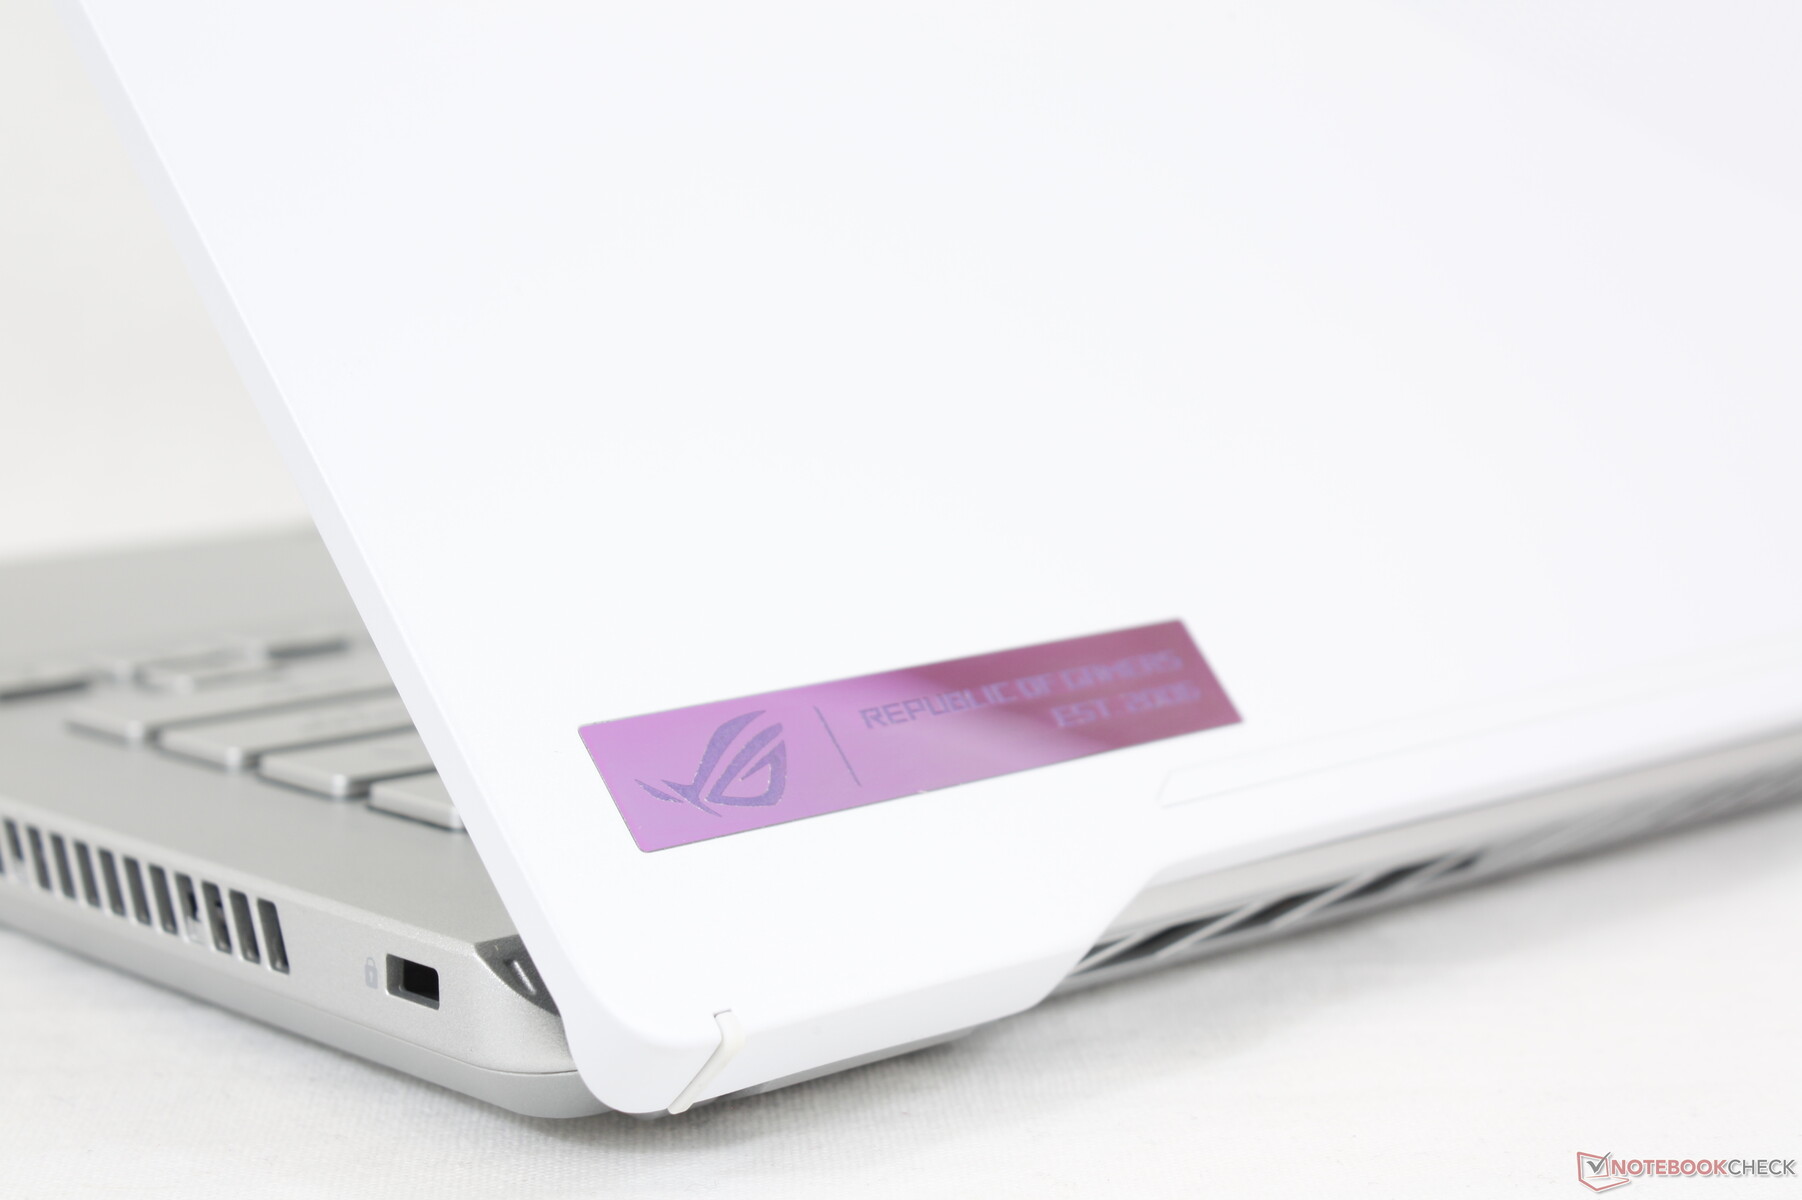
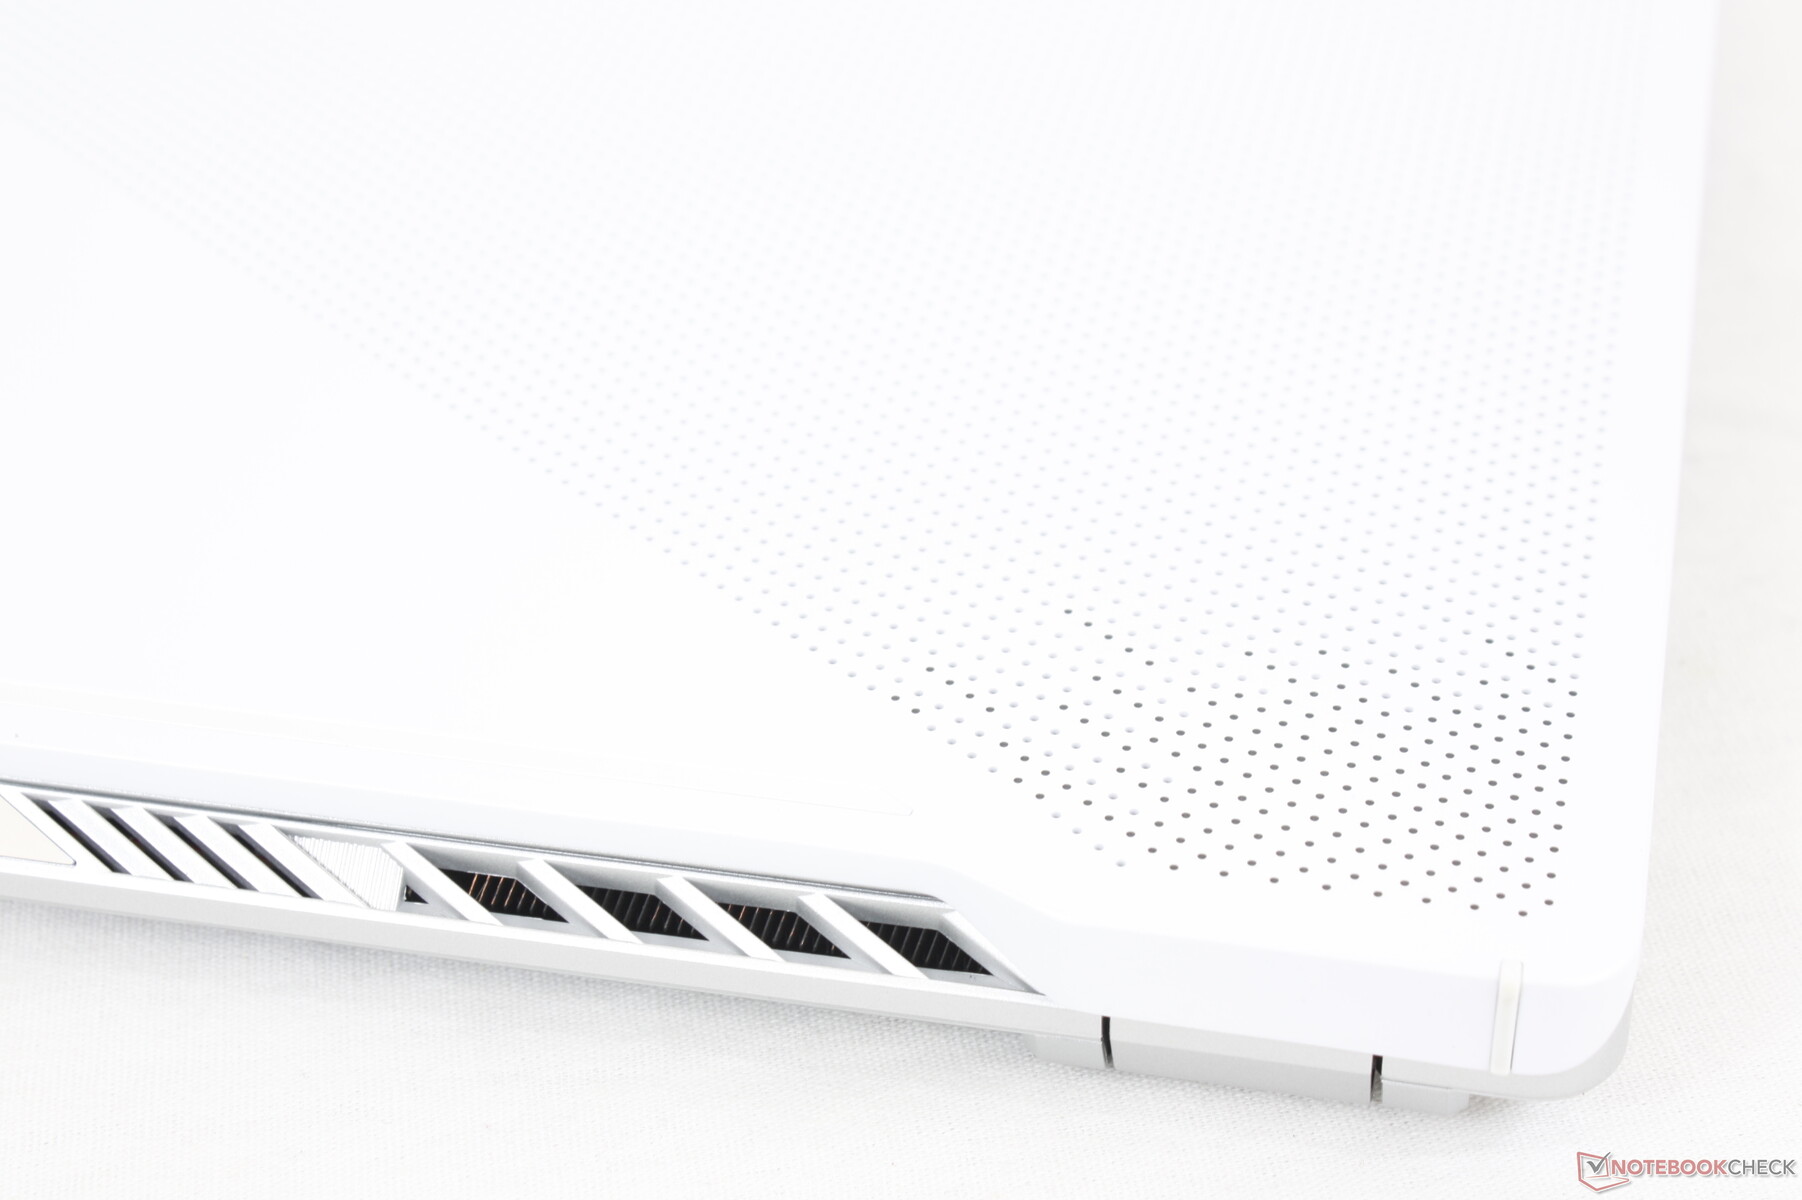
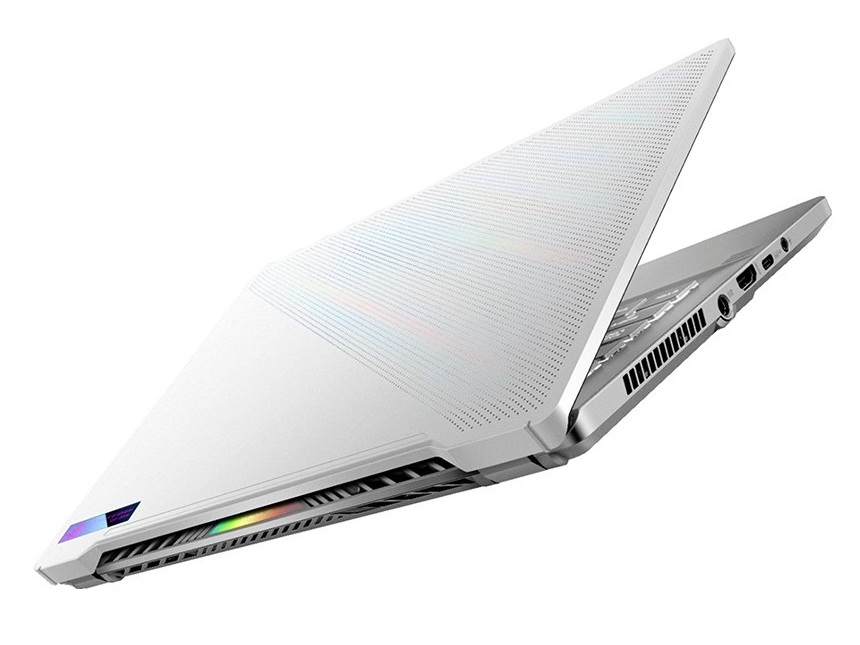
The mostly matte chassis remains the same as the 2020 model except for a couple of minor superficial changes: the Zephyrus font along the rear edge and the glossy logo near the corner of the outer lid are now more reflective and slightly purple, respectively. The small holes or perforations on the outer lid are also now reflective for a subtle rainbow effect. Dimensions and rigidity are otherwise untouched as is the optional Anime Matrix LED lighting feature.
For the enthusiasts keeping track, the Razer Blade 14 is both smaller and thinner than the Asus while weighing about 100 g more. The Zephyrus G14 is an older design, after all.
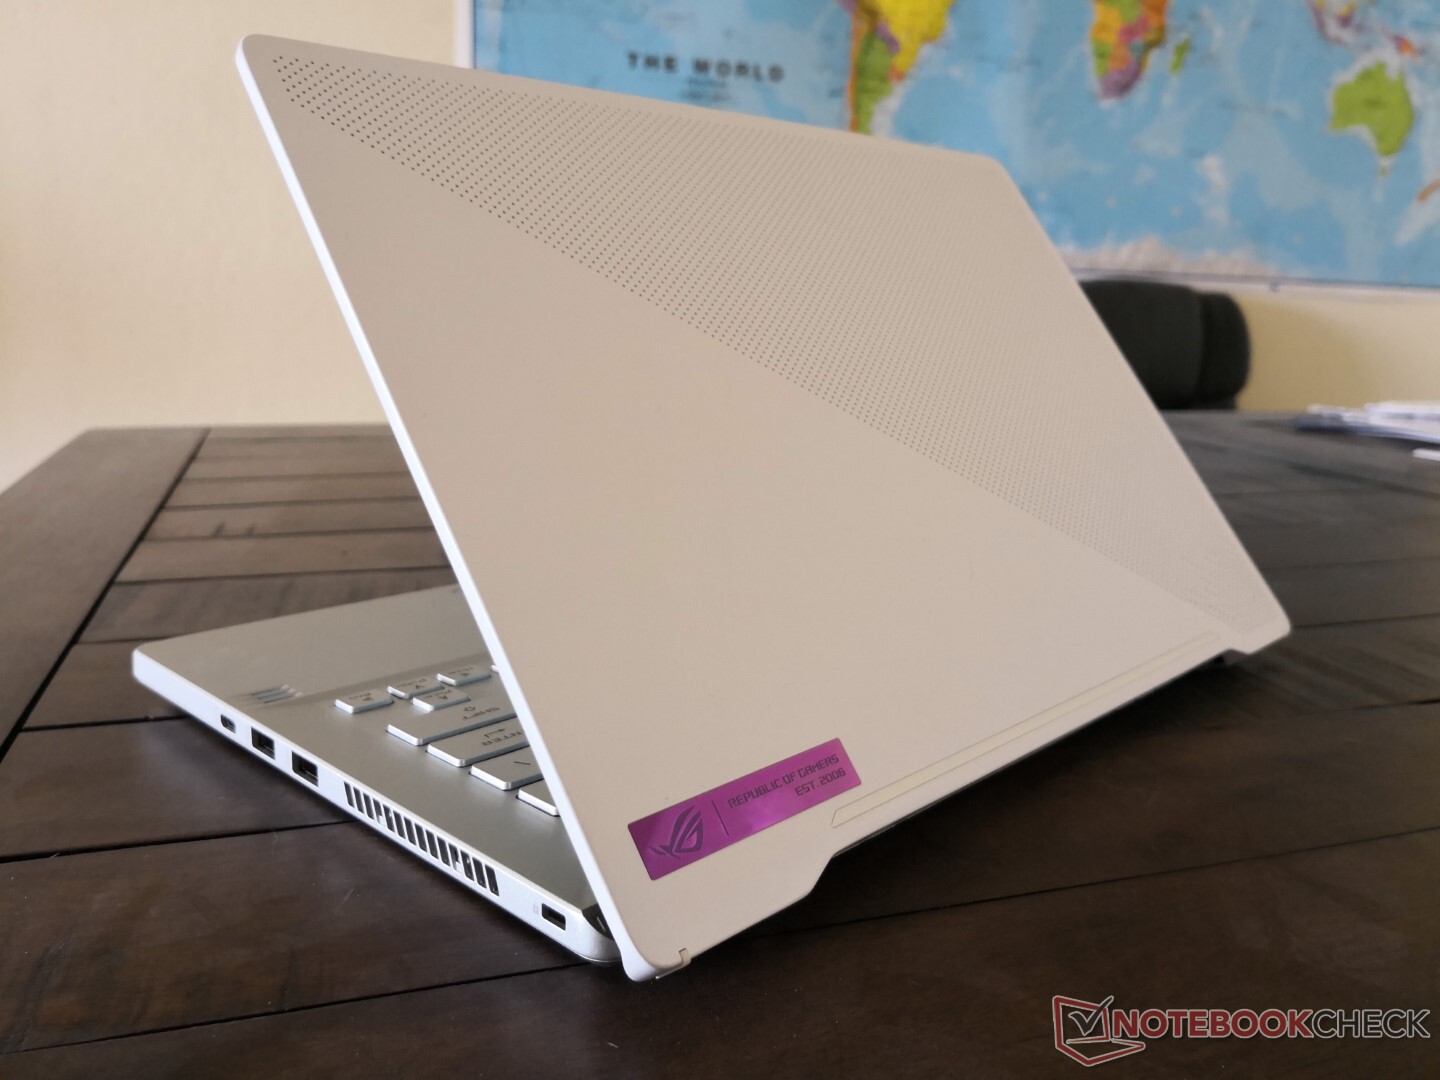
The Anime Matrix configuration is 2 mm thicker than the configuration without the feature since the outer lid must be able to hold the mini LEDs. Though unique, it's easy to forget that Anime Matrix exists since owners will almost always be looking at the screen and not its other side.
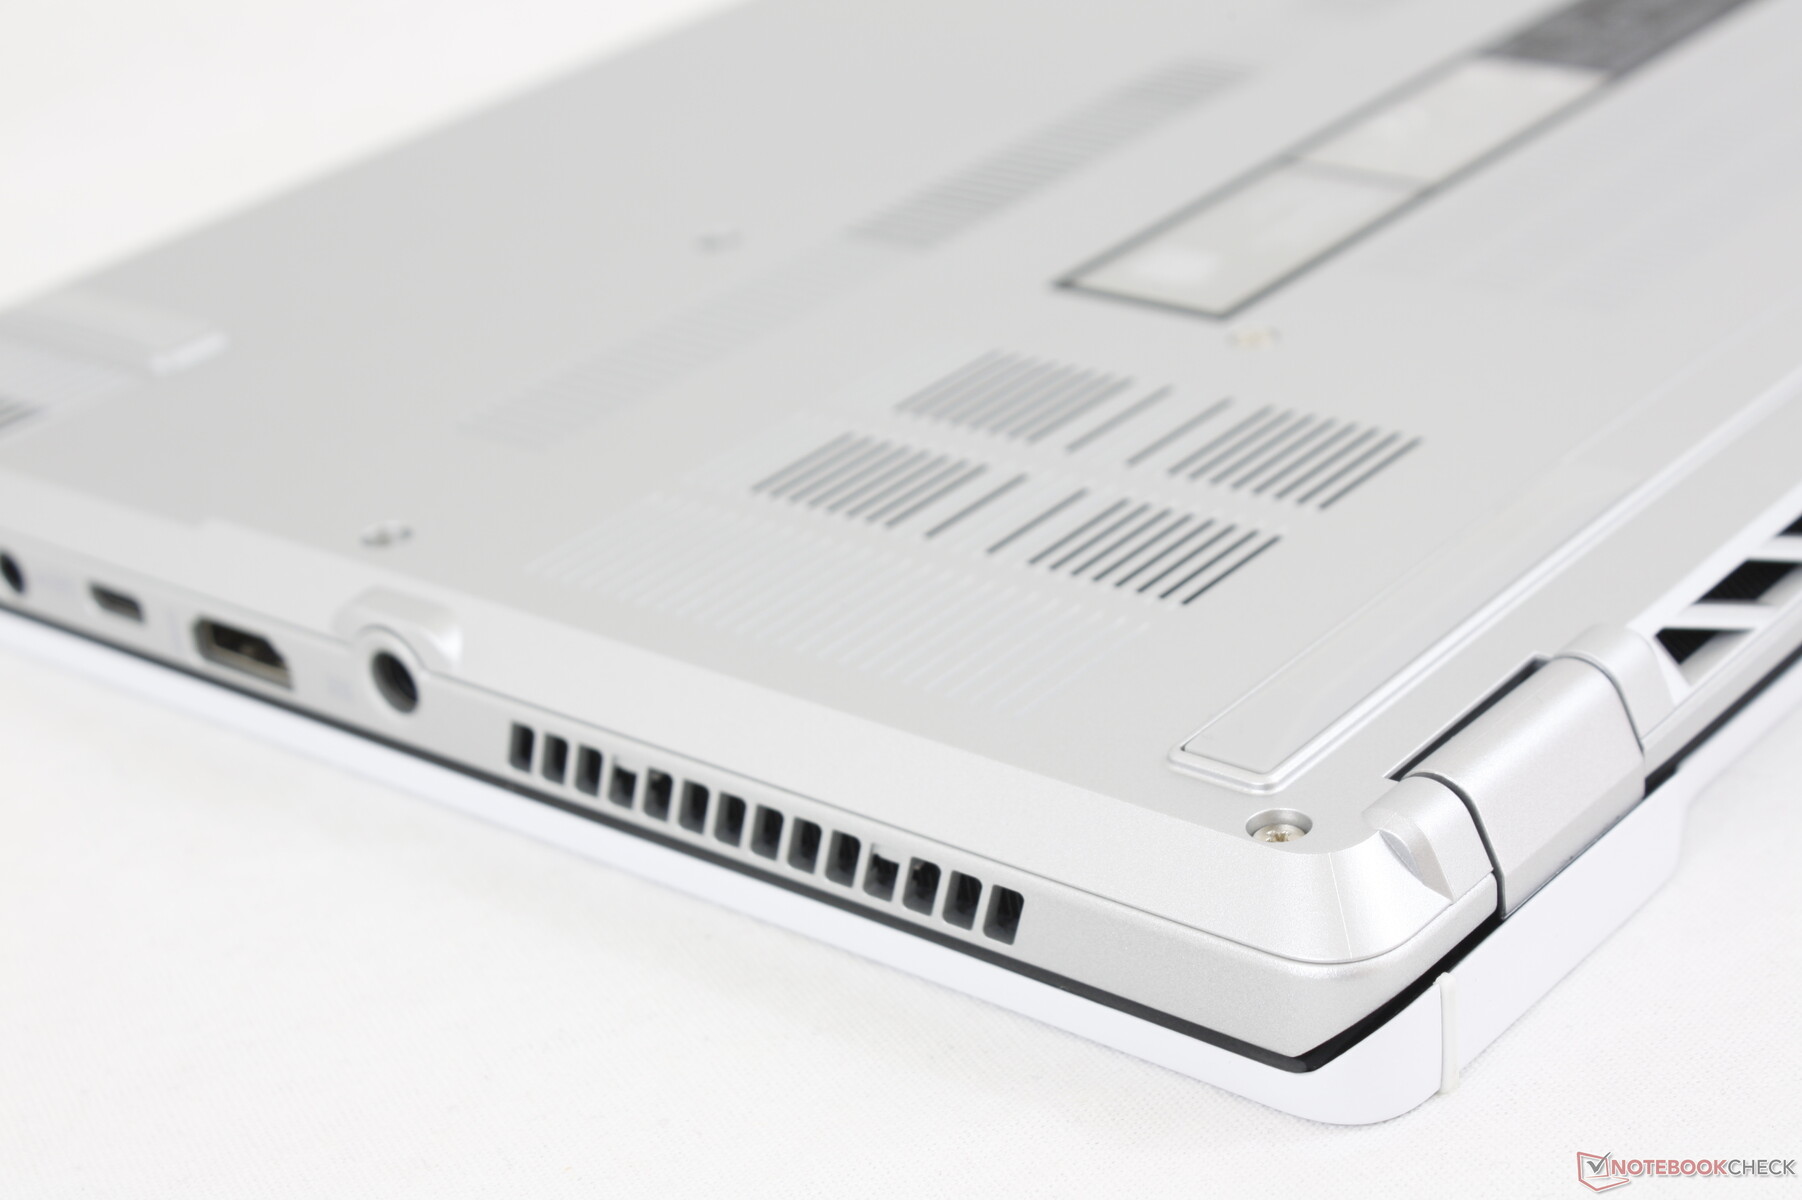
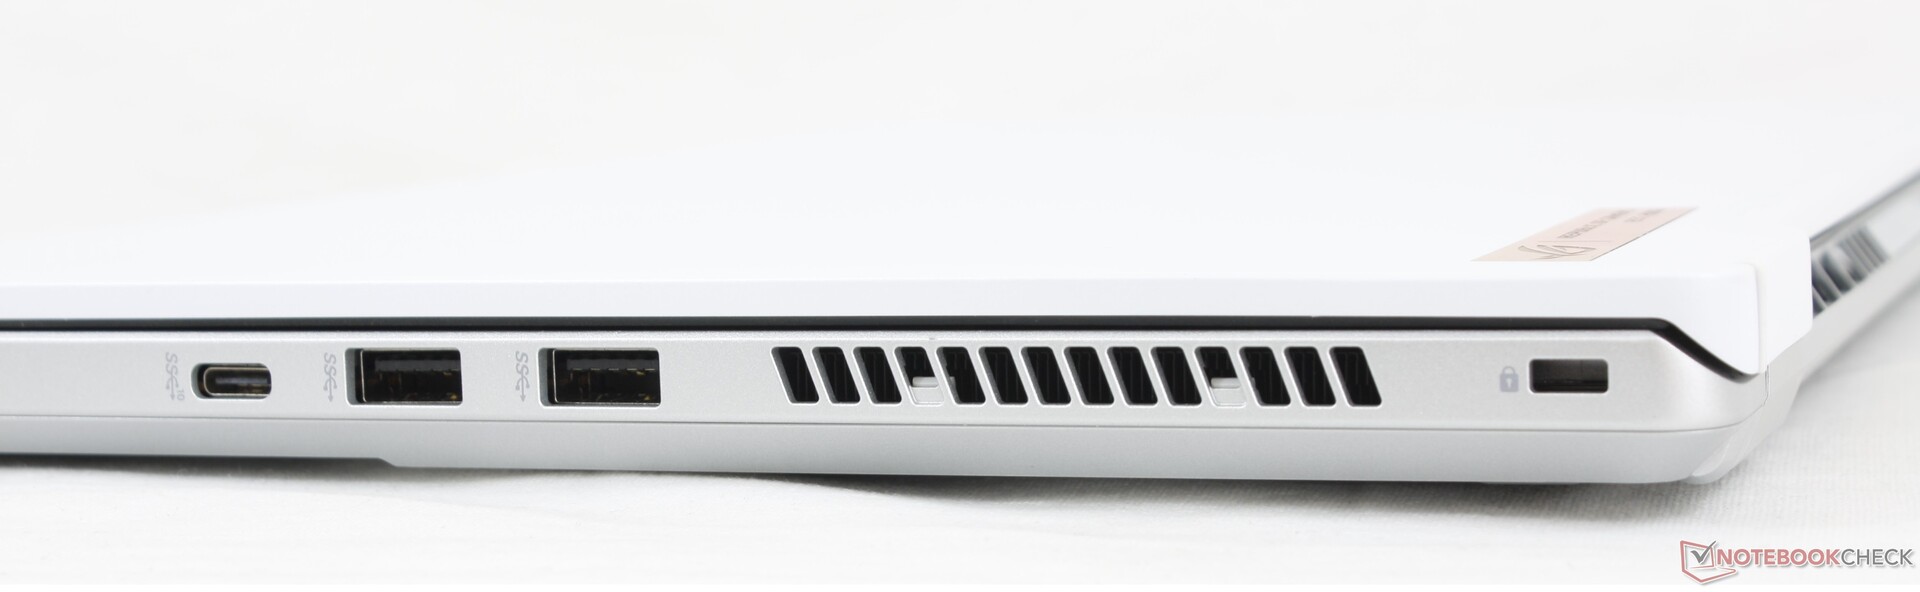
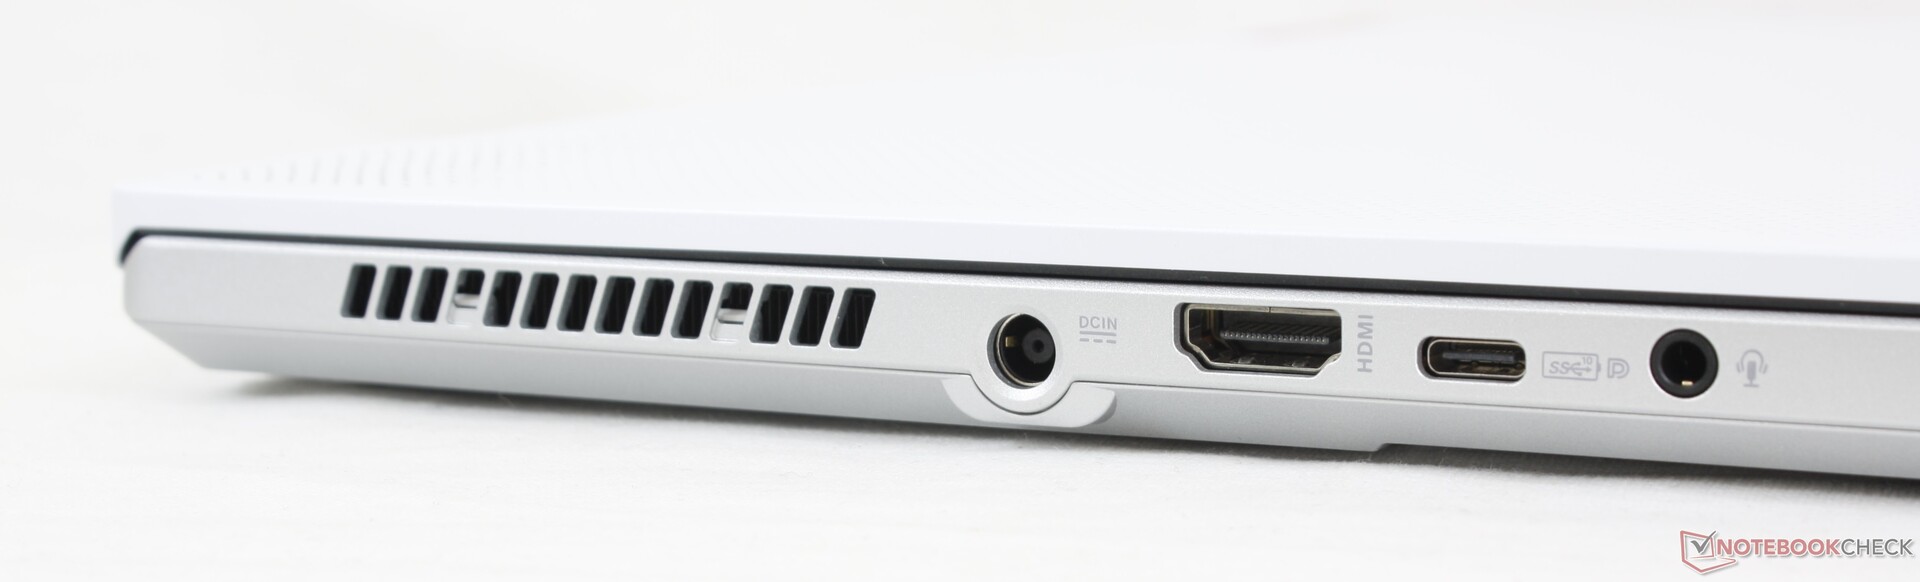
Connectivity — No Thunderbolt Compatibility
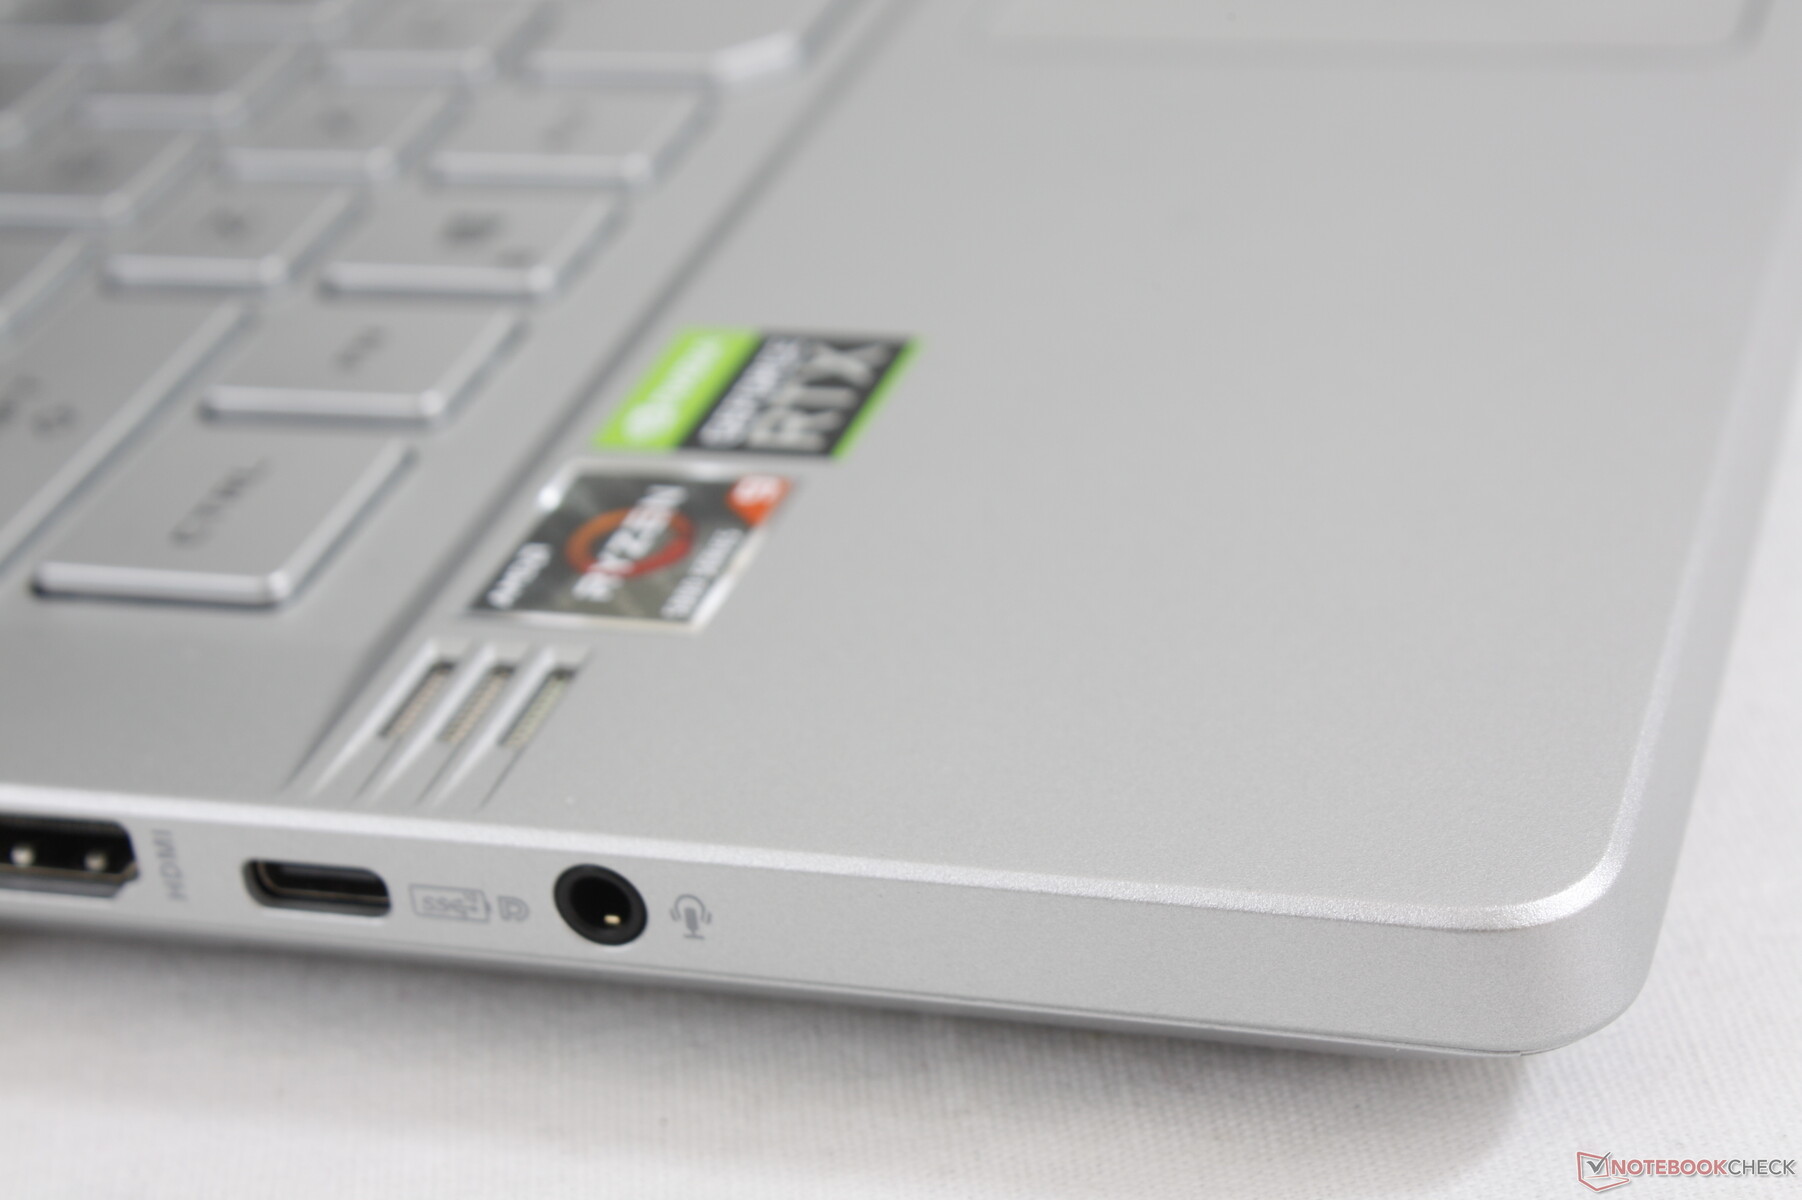
Port options and positioning haven't changed from the original G14. Thunderbolt remains elusive due to the AMD CPU, but at least the left USB-C port supports display-out, Power Delivery, and G-Sync.
Many of the ports are closer to the front edge than on most other notebooks where cables can get in the way.
Communication
An Intel AX200 comes standard for Wi-Fi 6 and Bluetooth 5.1 connectivity. Transfer rates are consistent over time for reliable performance.
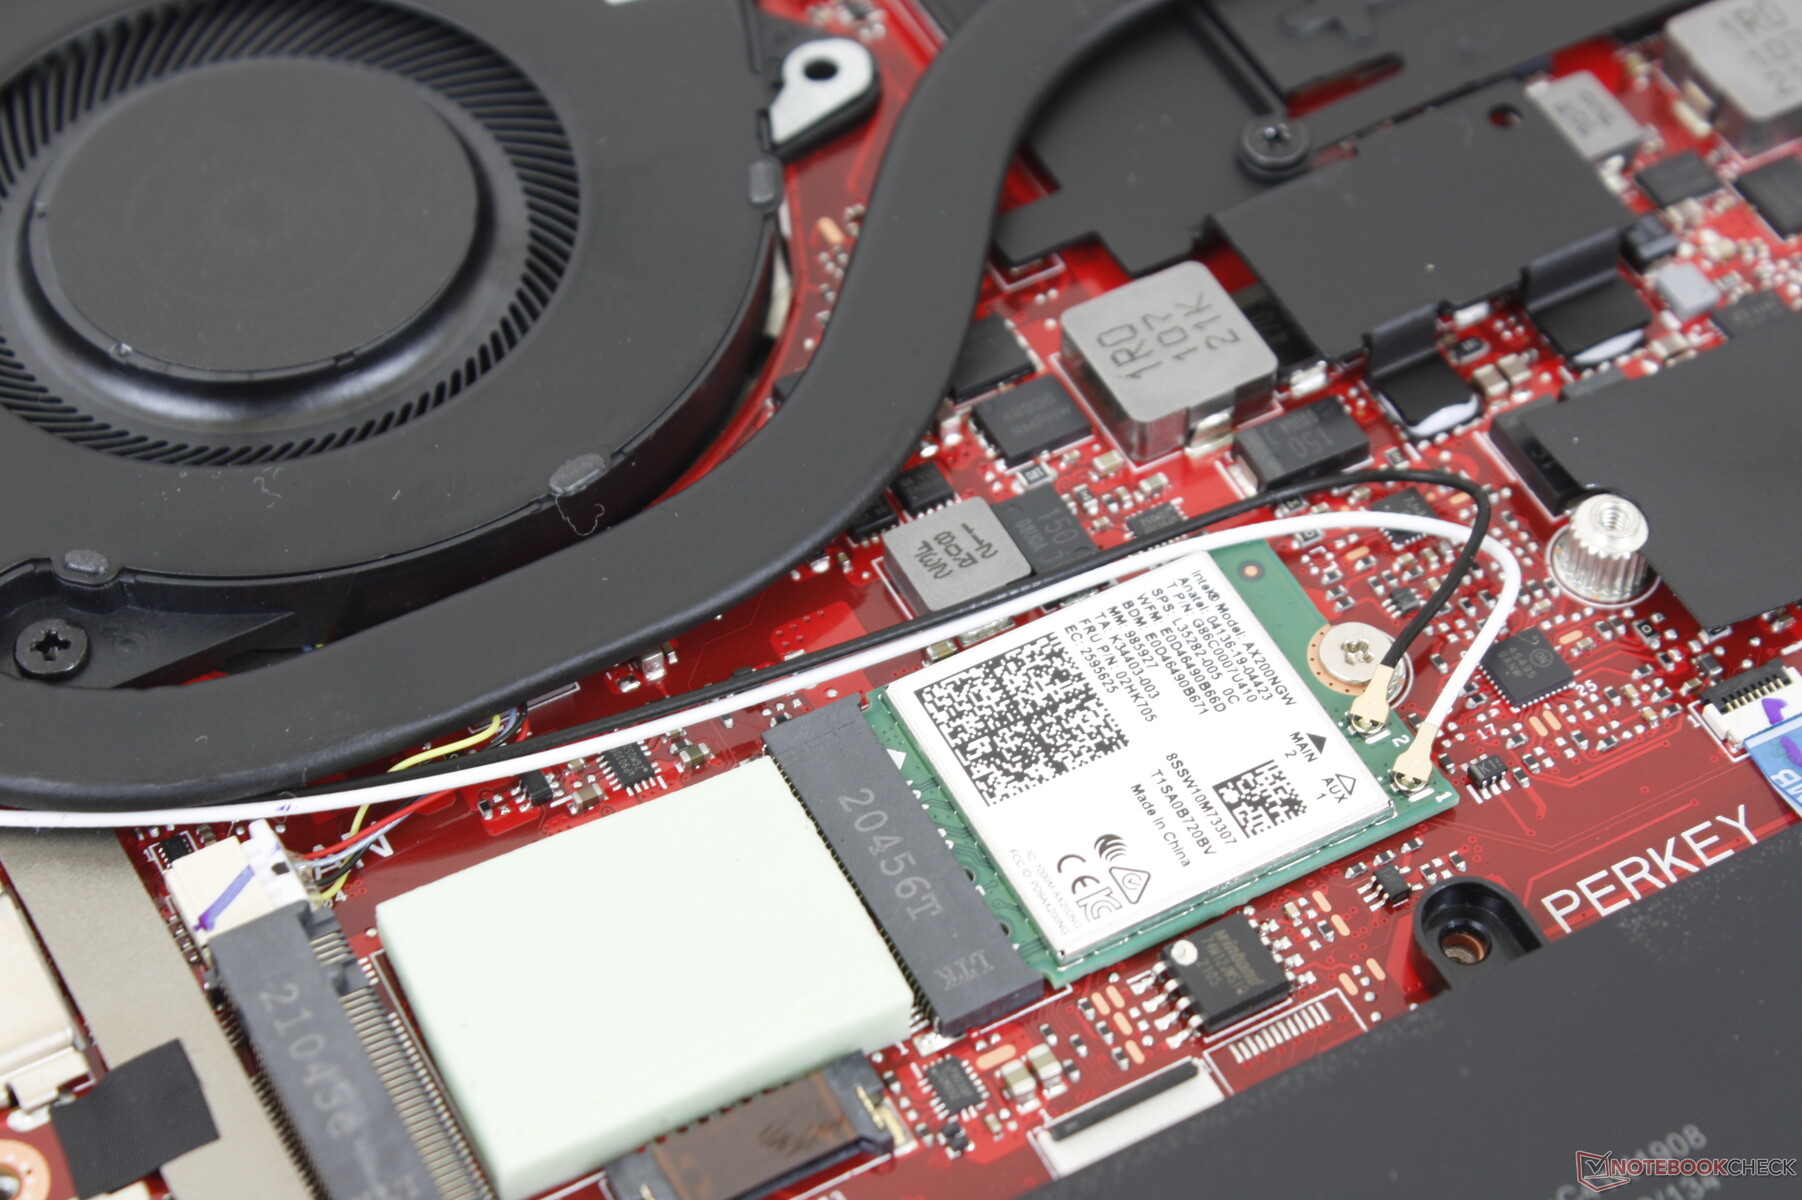
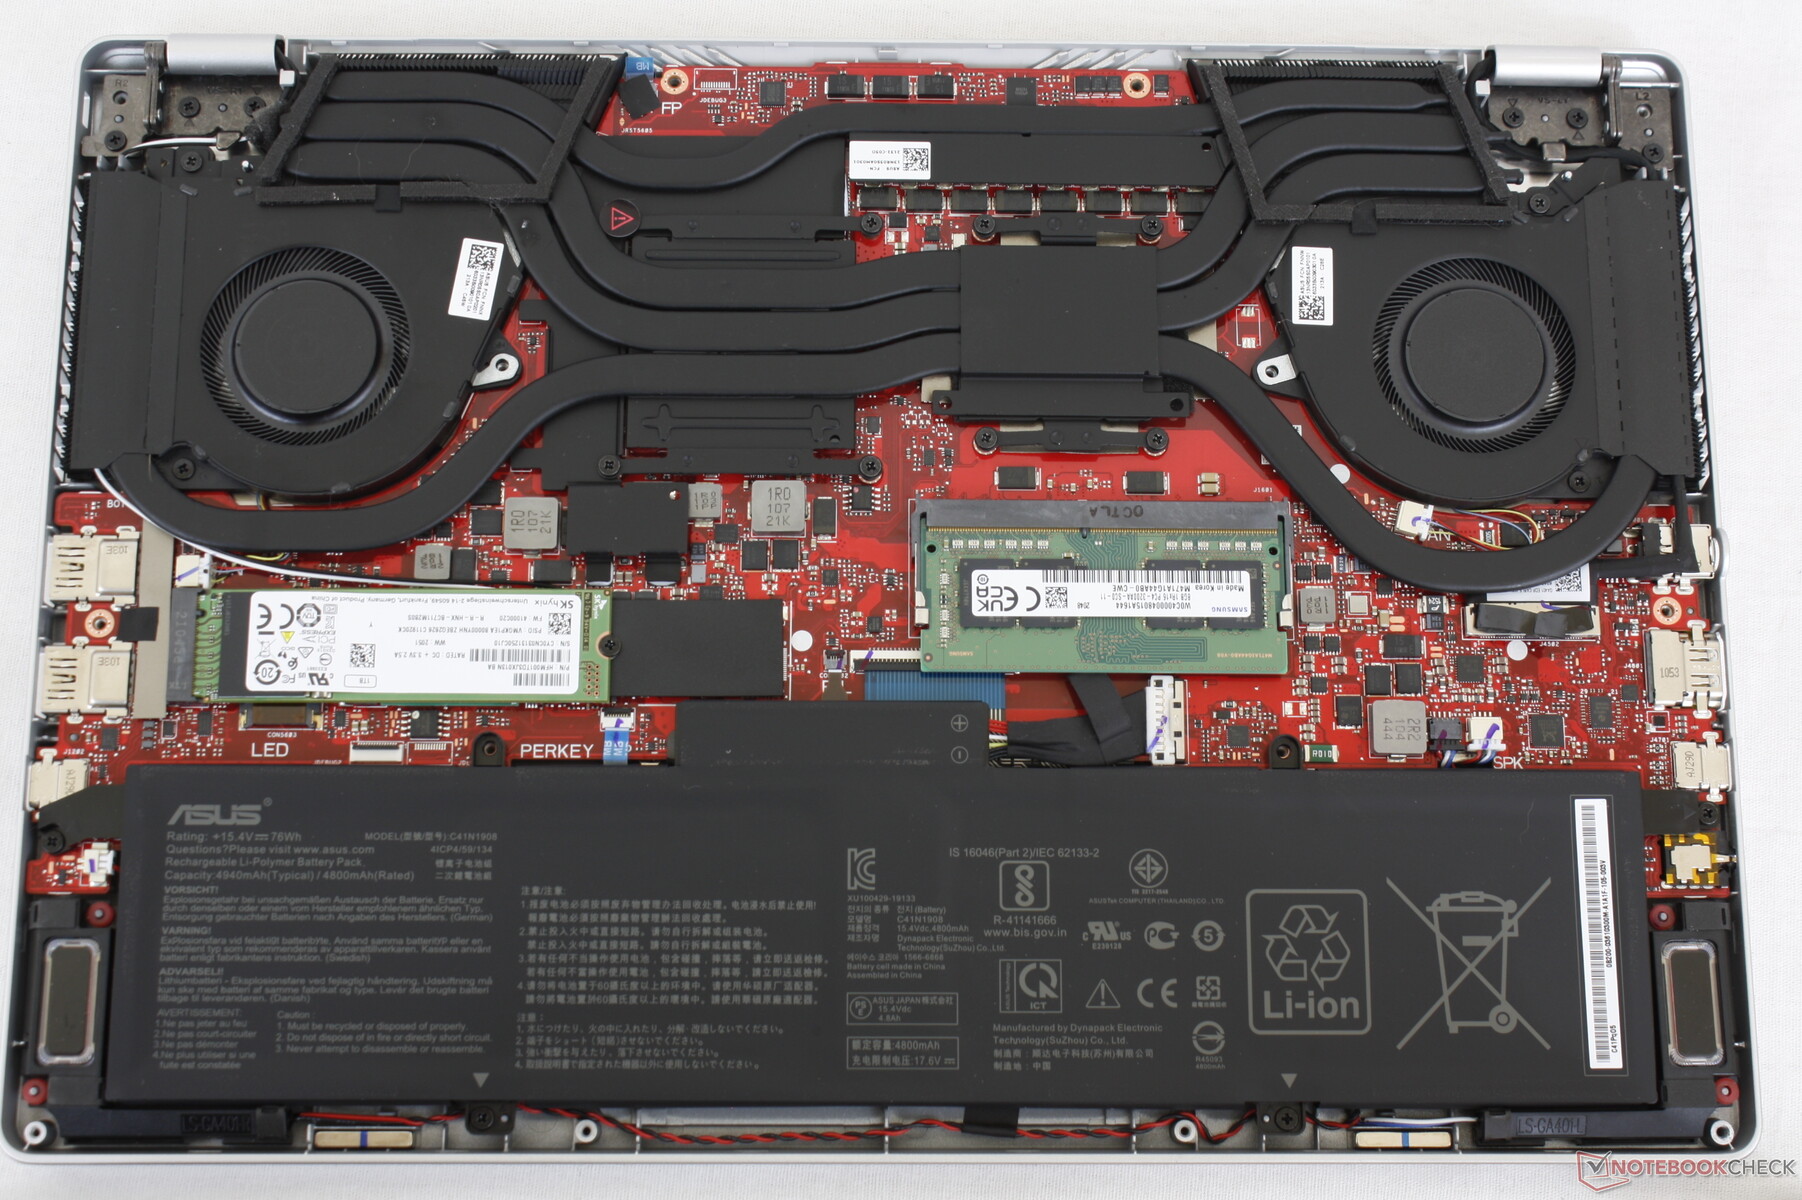
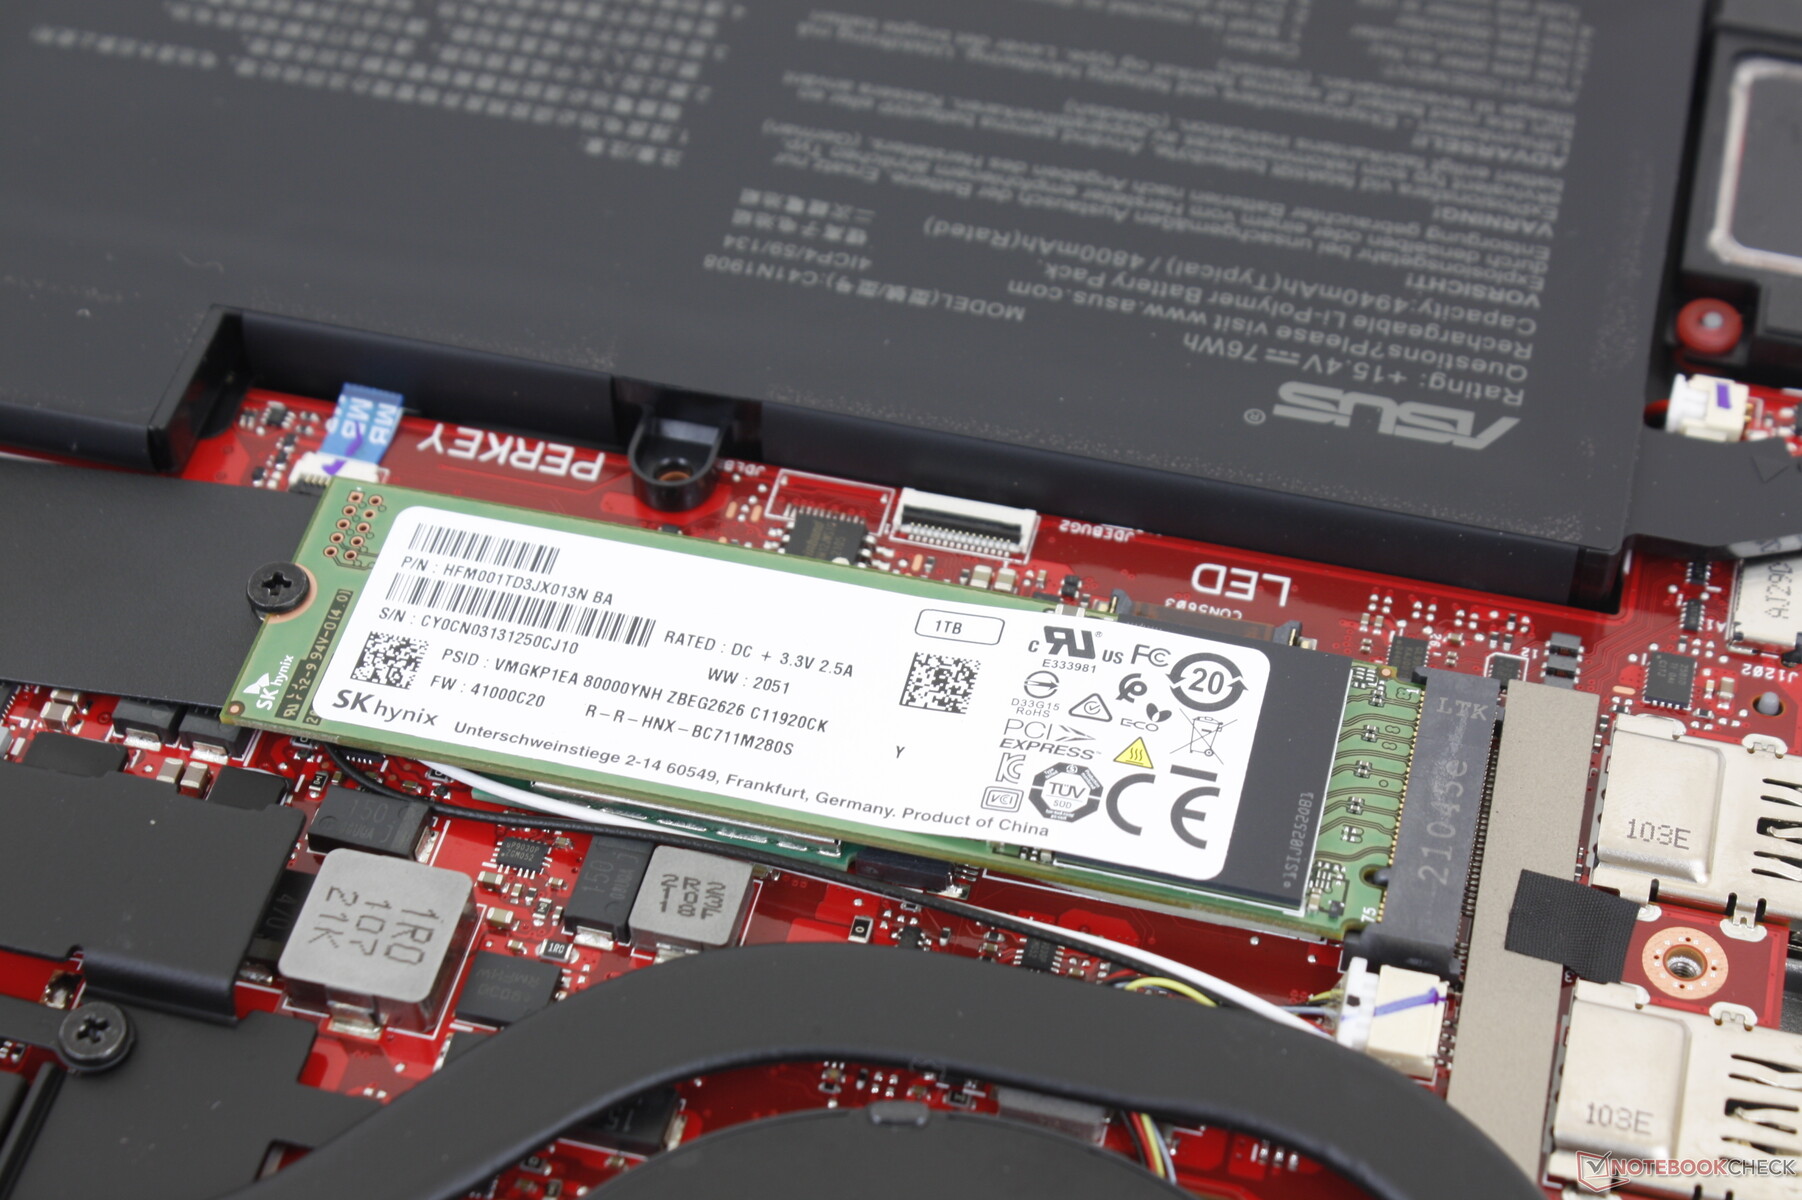
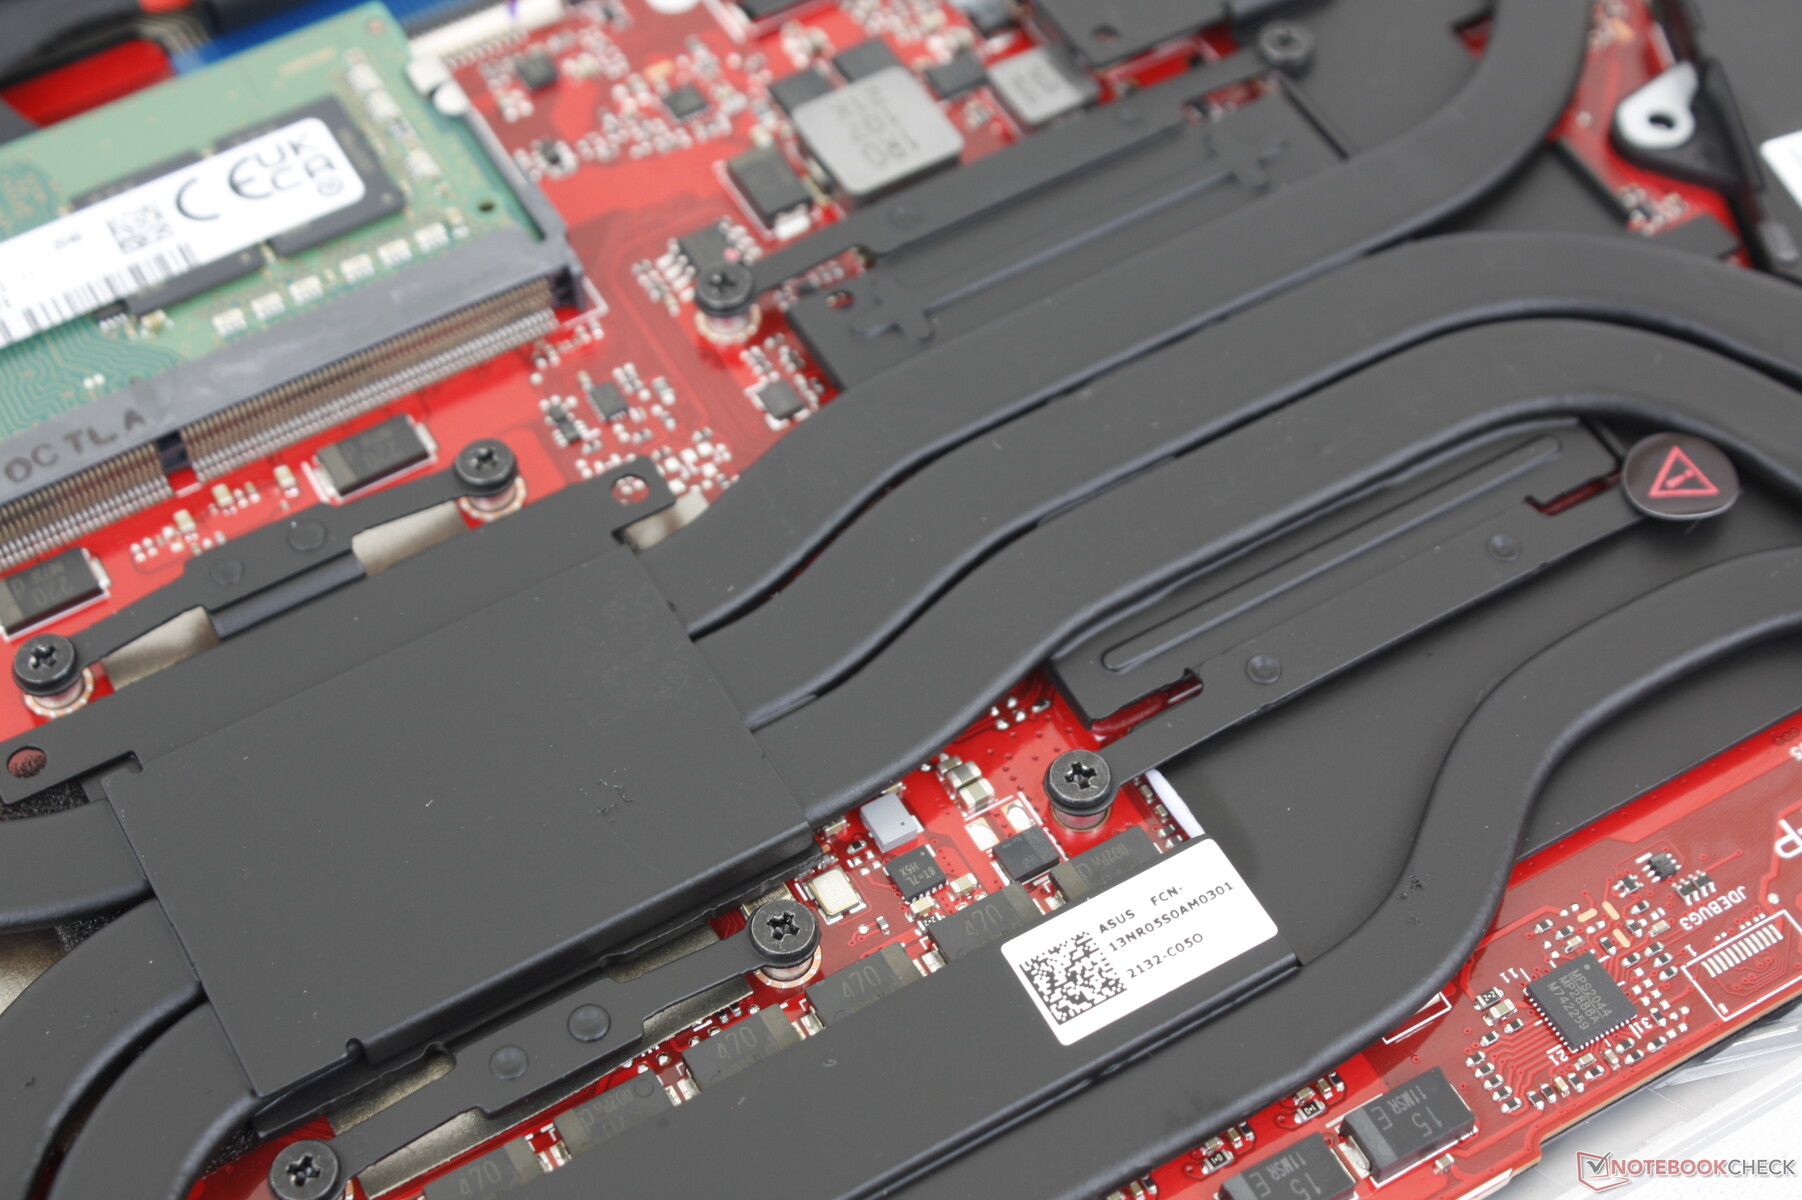
Maintenance
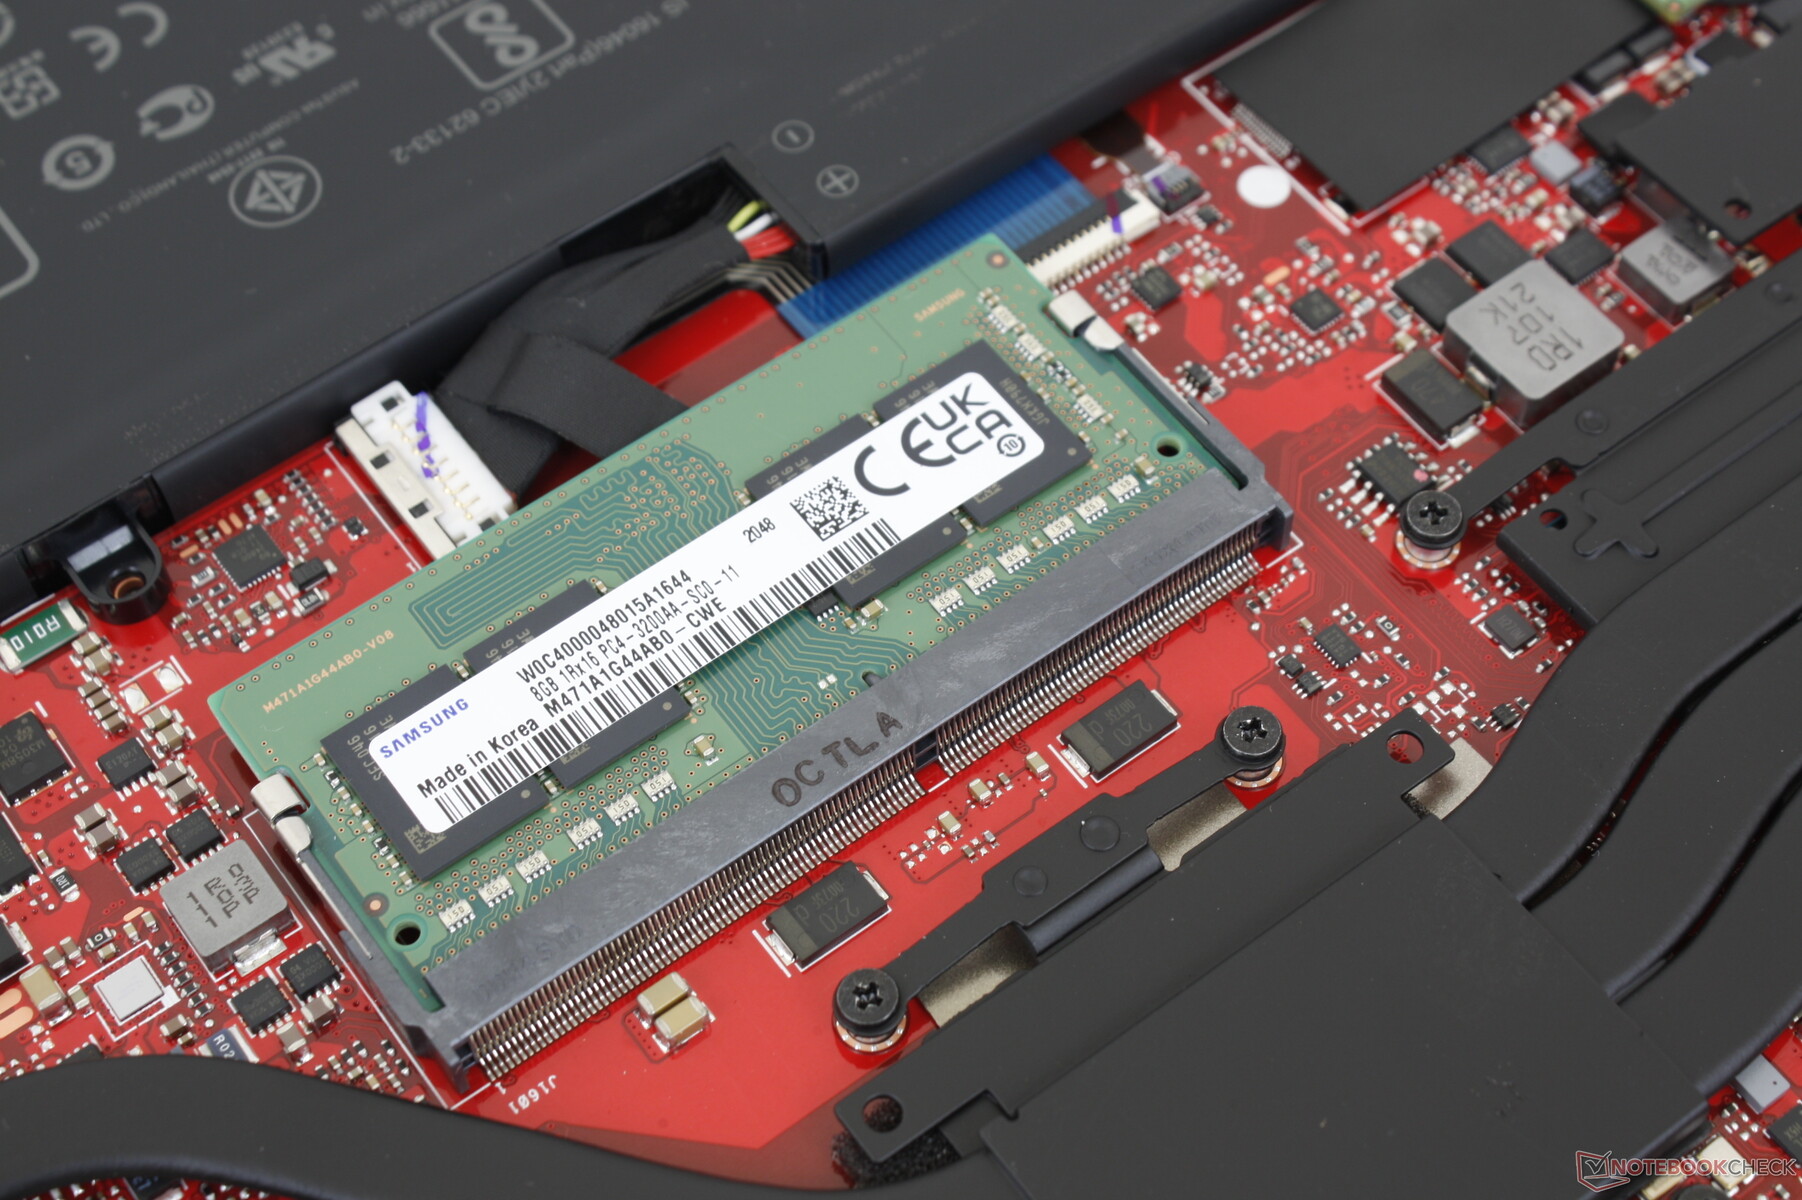
The bottom panel is easily removable with just a Philips screwdriver. Upgrade options may be limited, but at least RAM is expandable unlike on the Razer Blade 14.
Accessories and Warranty
There are no extras in the box outside of the AC adapter and paperwork. The usual one-year limited manufacturer warranty applies.
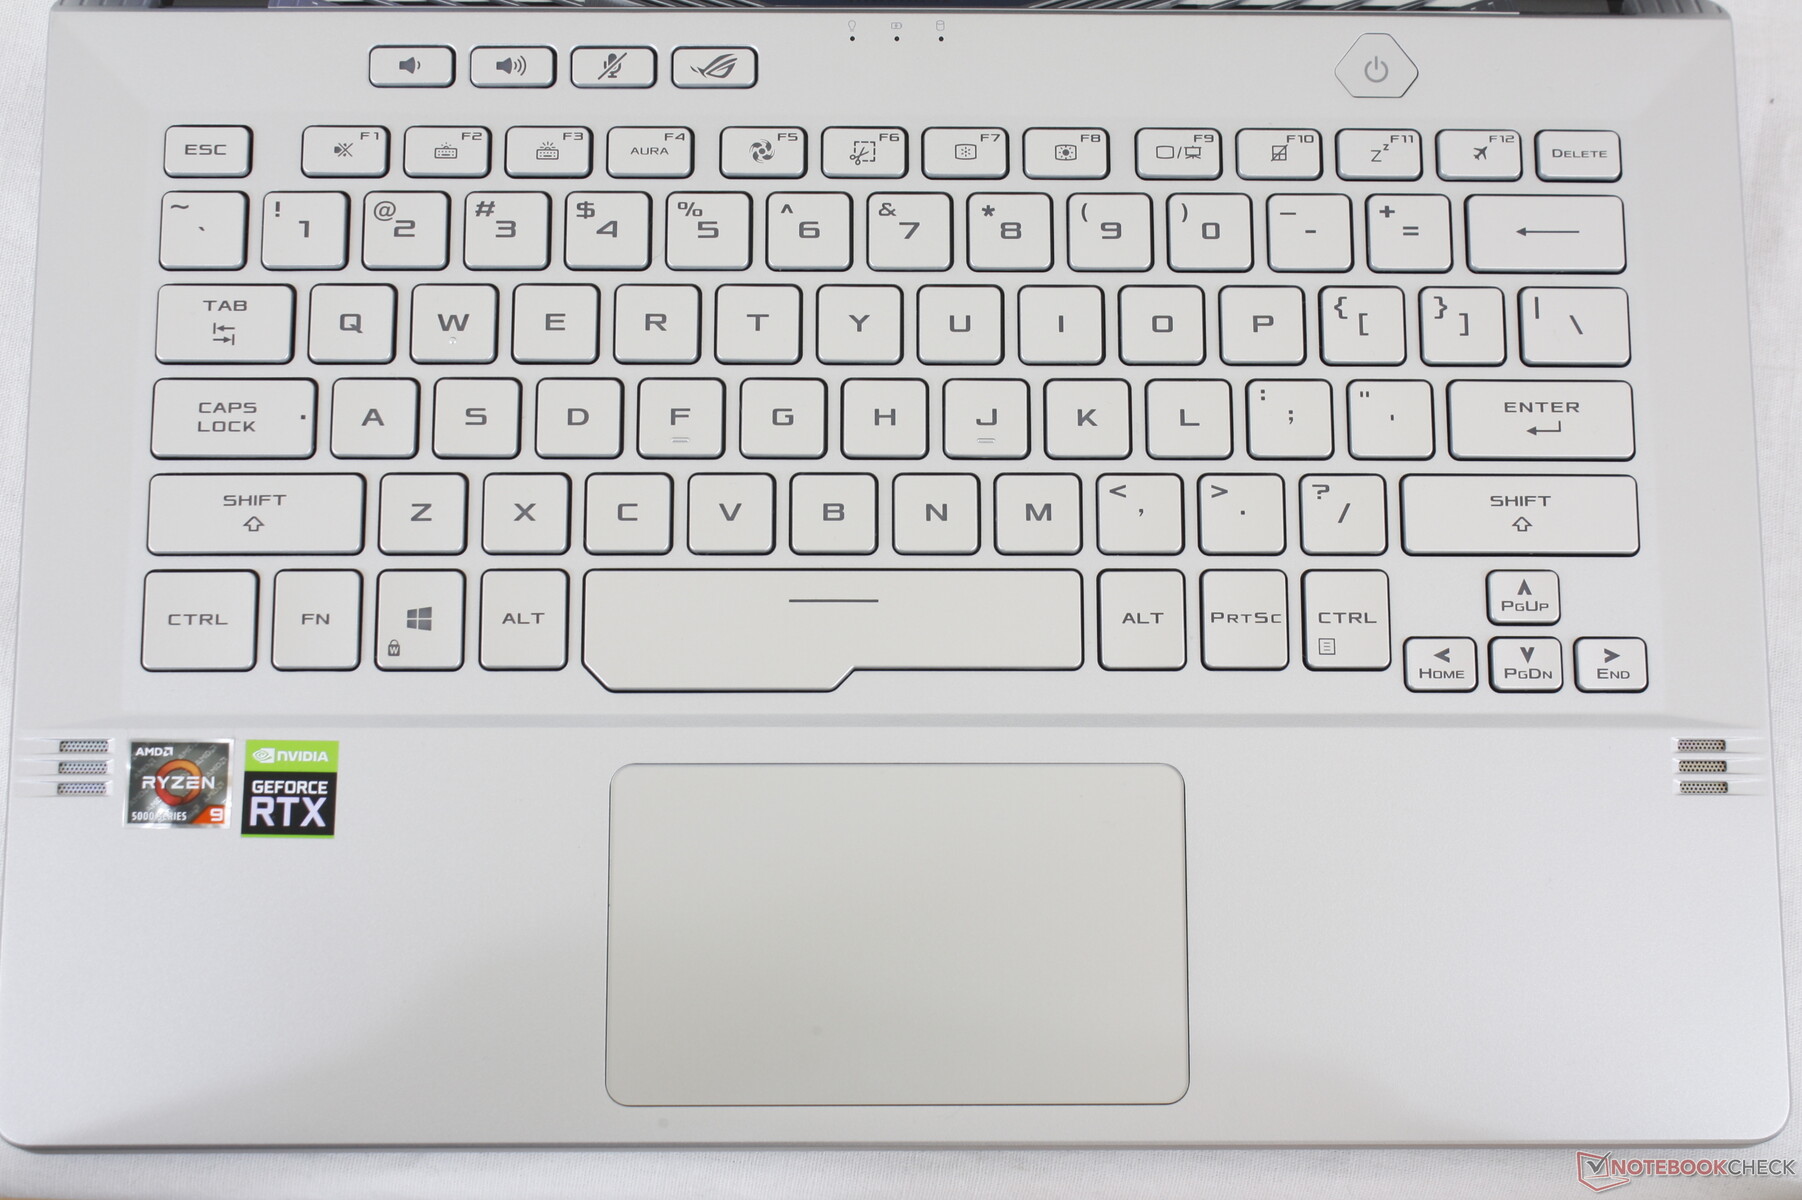
Input Devices — Excellent Key Feedback
Keyboard
Key size and feedback remain the same as on last year's model. We prefer the typing experience on the G14 over the Blade 14 as its keys have both deeper travel and stronger feedback. On the flip side, the keyboard here supports only single-zone white backlighting compared to the per-key RGB lighting of the Razer.
The layout of some secondary functions have changed year-over-year. For example, the brightness controls for the keyboard backlight have been moved to the top row while a new "Aura" key for toggling the backlight has replaced the fast forward key.
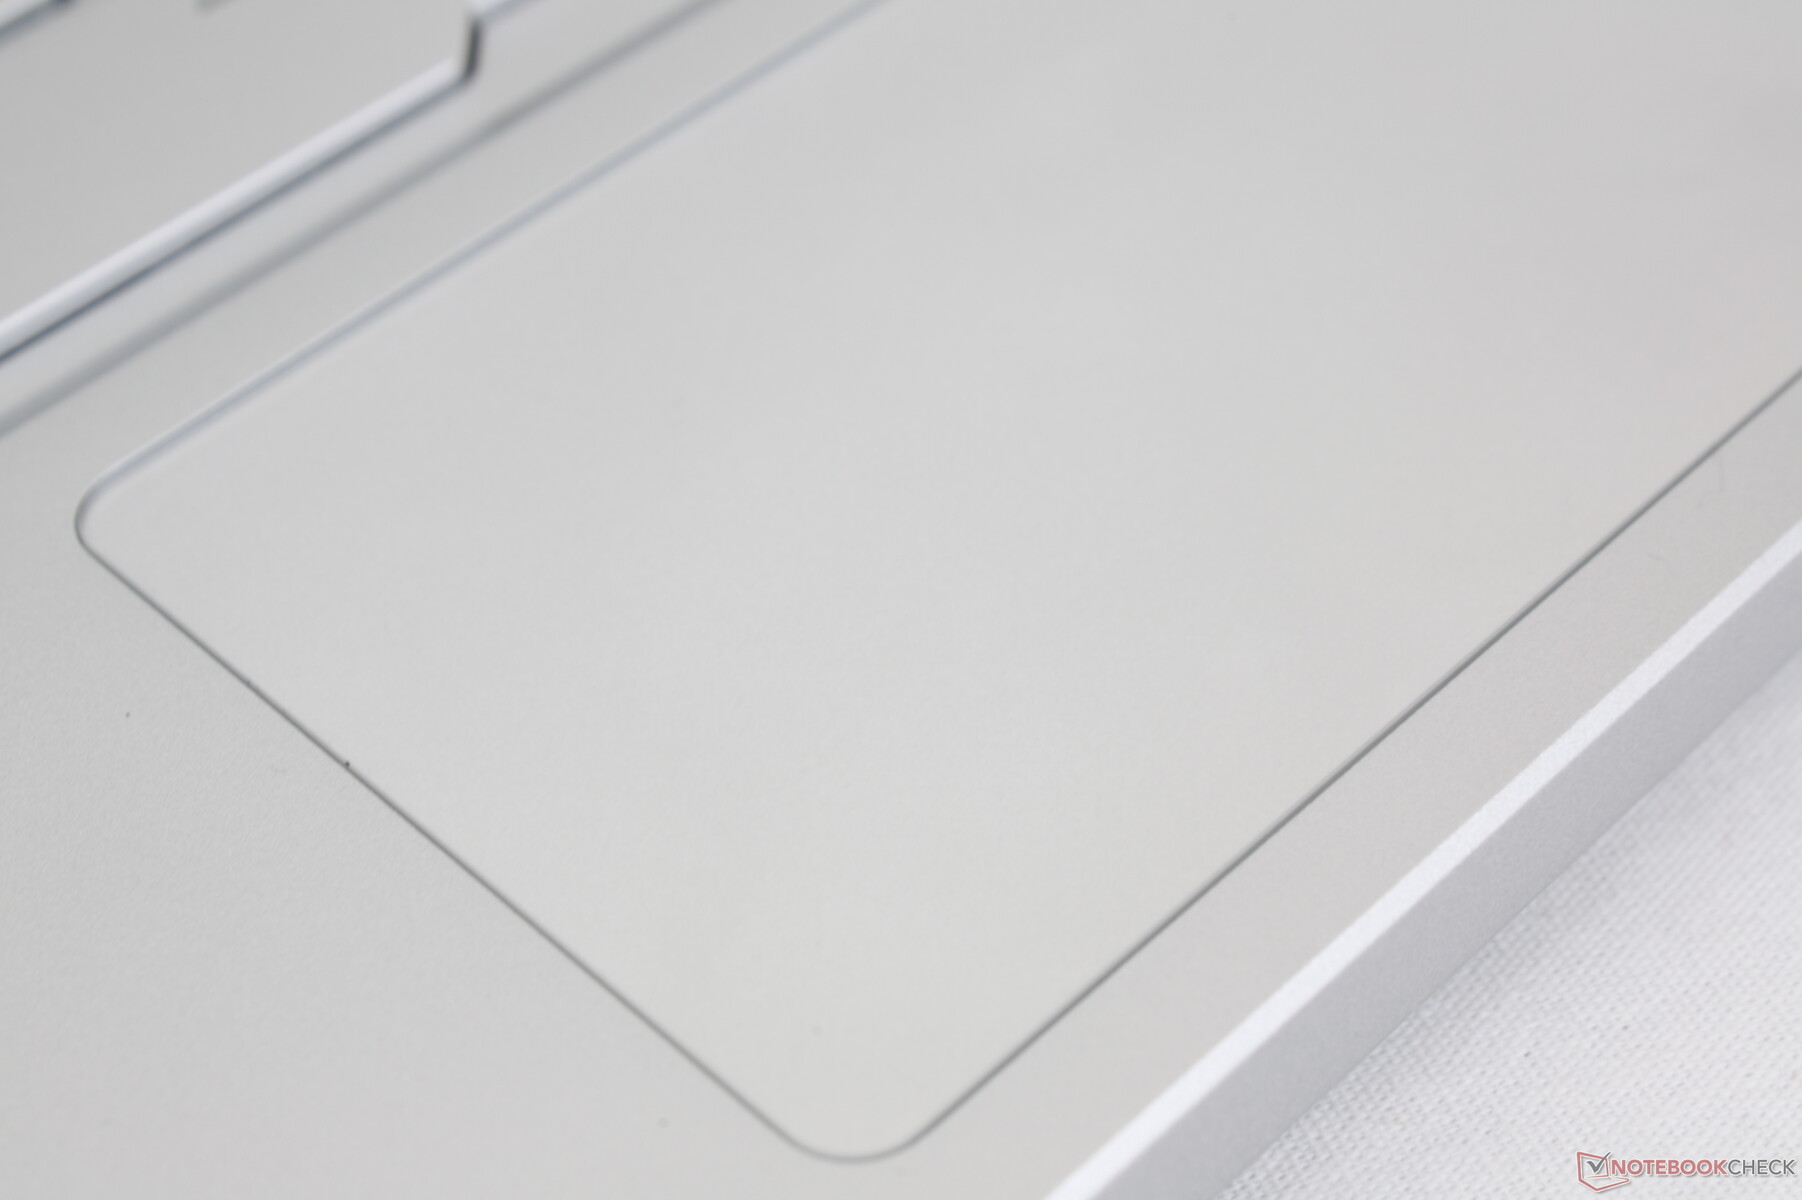
Touchpad
The Precision clickpad is smaller than the one of the Blade 14 (10.5 x 6 cm vs. 11.1 x 7.6 cm). Cursor control is still smooth and with just a bit of sticking when gliding at slow speeds while the integrated mouse keys remain shallow and with not enough feedback.


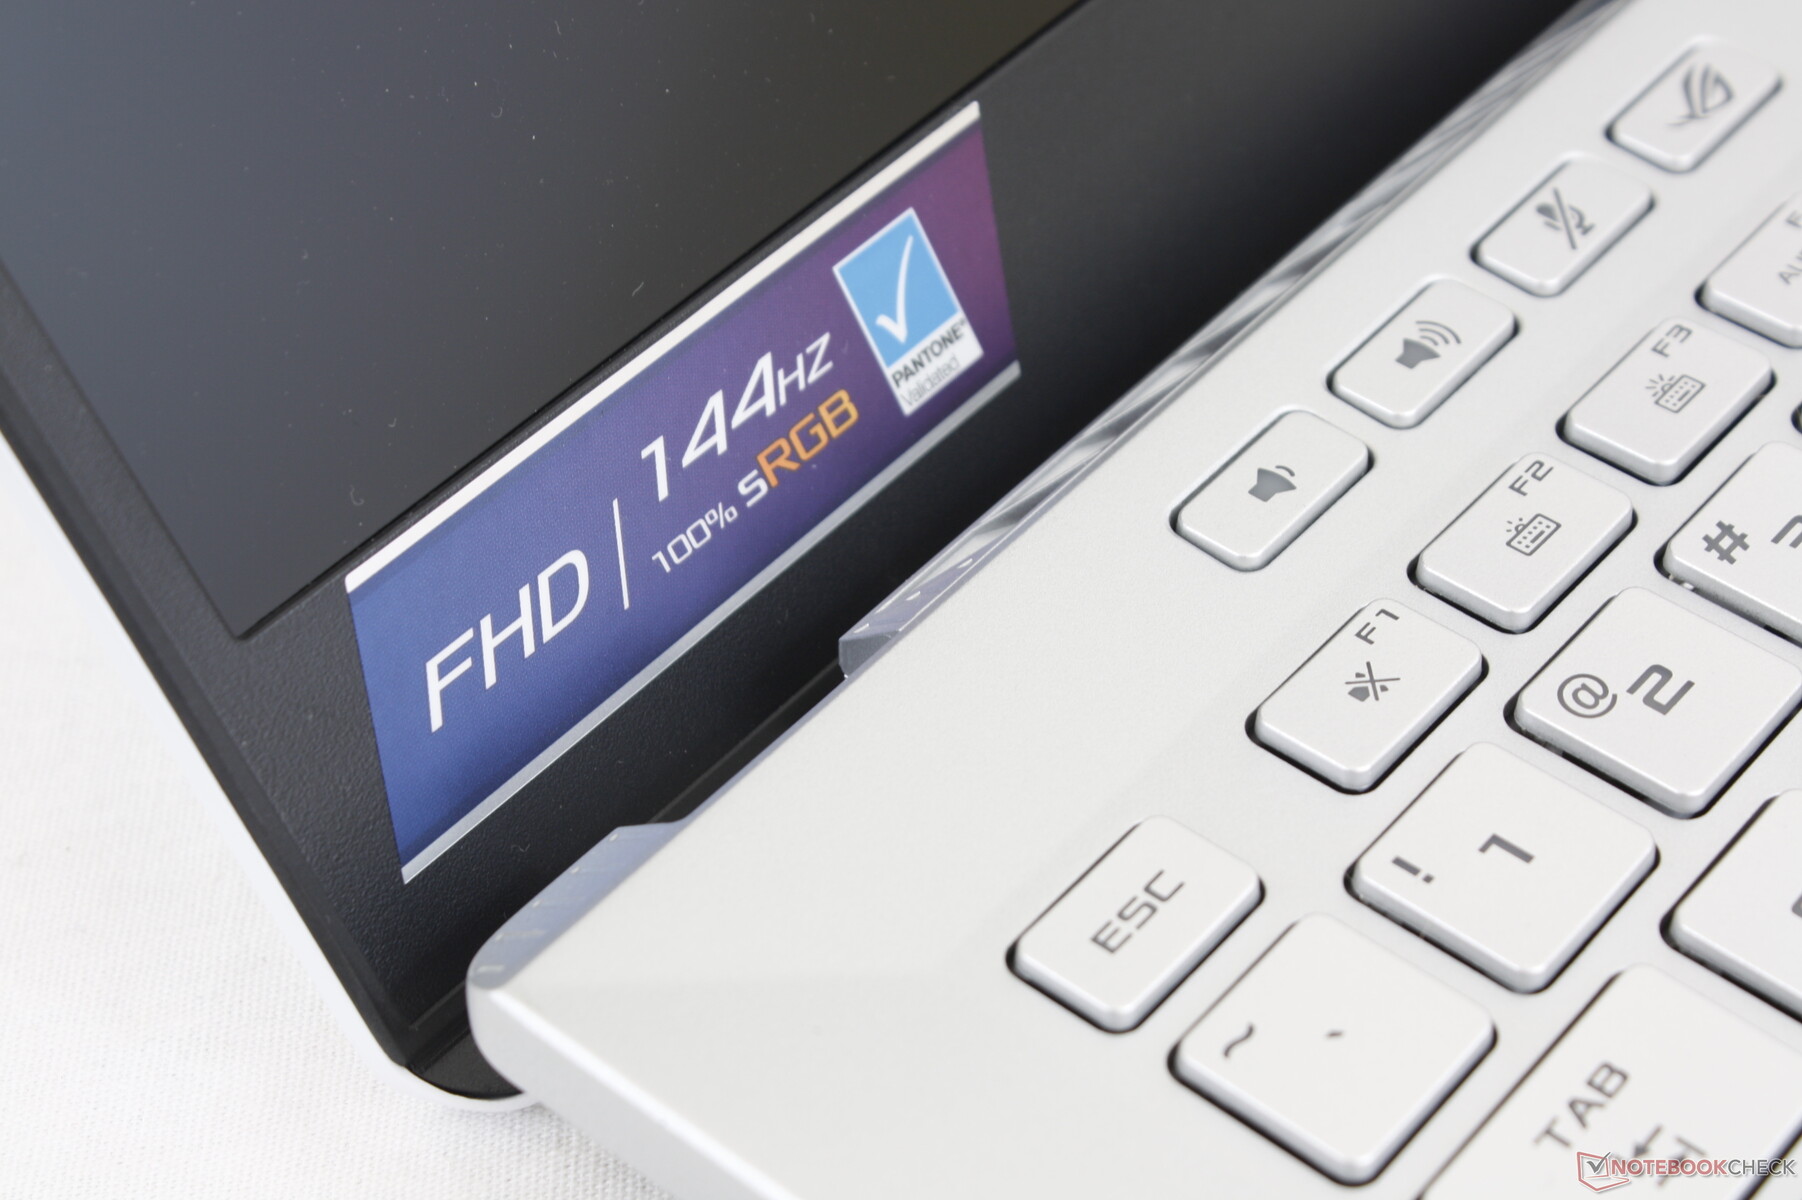
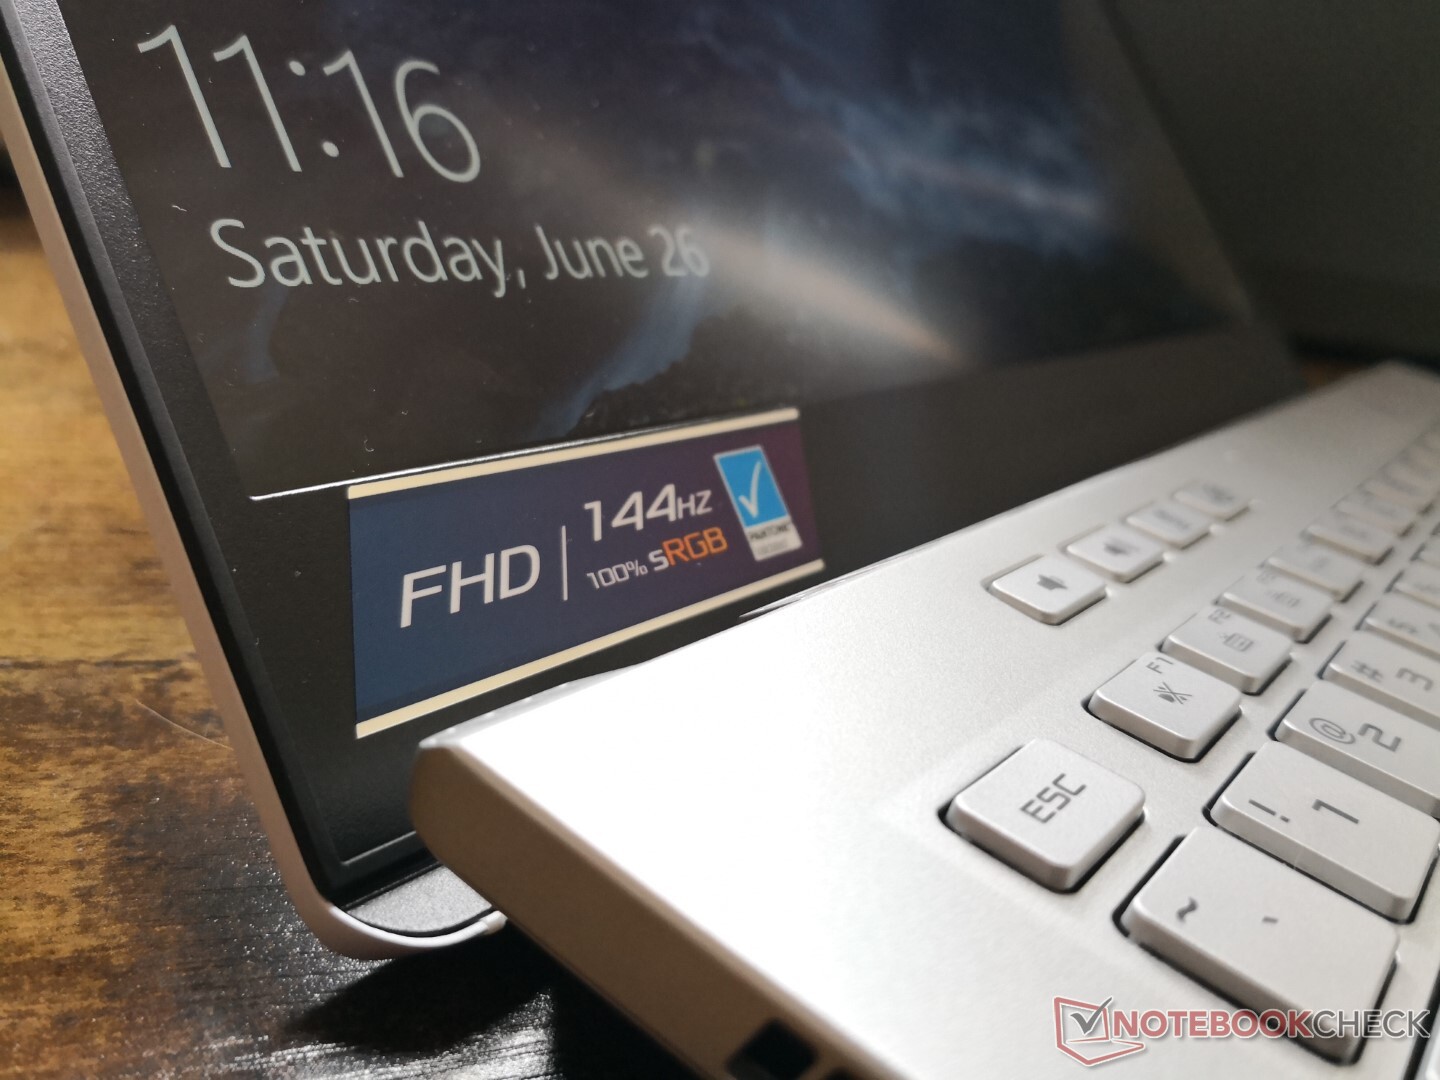
Display — Smooth 144 Hz With Good Colors
Whereas the 2020 Zephyrus G14 uses a 120 Hz CEC PA LM140LF-1F01 IPS panel, our 2021 model uses a 144 Hz CEC PA LM140LF-1F02 IPS panel. Both appear to be essentially identical in color coverage and brightness according to our tests while other characteristics like response times and contrast ratios may be slightly better and worse, respectively, on the newer panel. It's a midrange to high-end panel overall even though it can't come close to the colors or response times of many 15.6-inch or 17.3-inch gaming-ready displays.
Note that Asus offers a higher resolution 1440p display option with full DCI-P3 coverage but a lower 120 Hz native refresh rate. The Blade 14 offers a similar 1440p panel as well albeit with an even higher 165 Hz native refresh rate.
FreeSync is enabled by default on the main display while G-Sync is supported for compatible external monitors.


| |||||||||||||||||||||||||
Brightness Distribution: 90 %
Center on Battery: 329.4 cd/m²
Contrast: 845:1 (Black: 0.39 cd/m²)
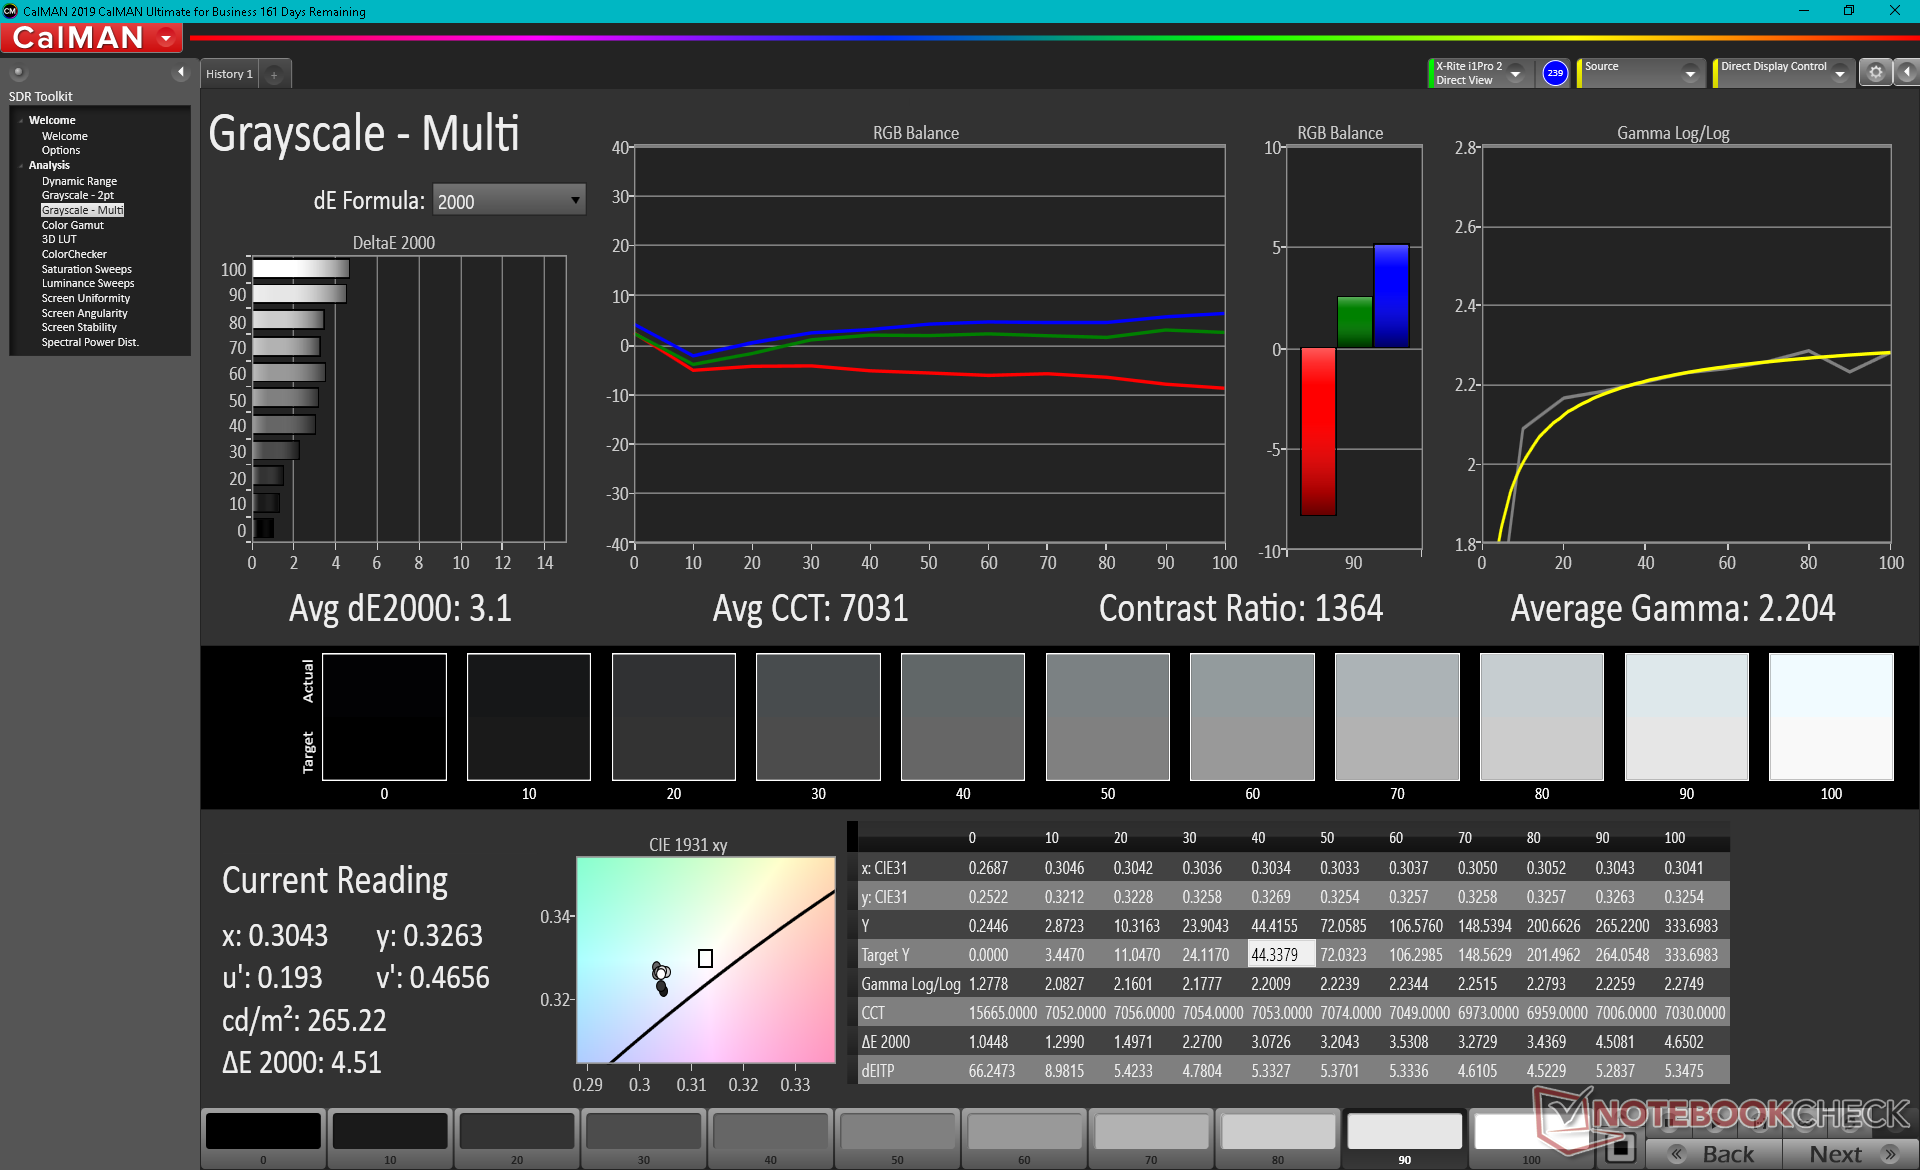
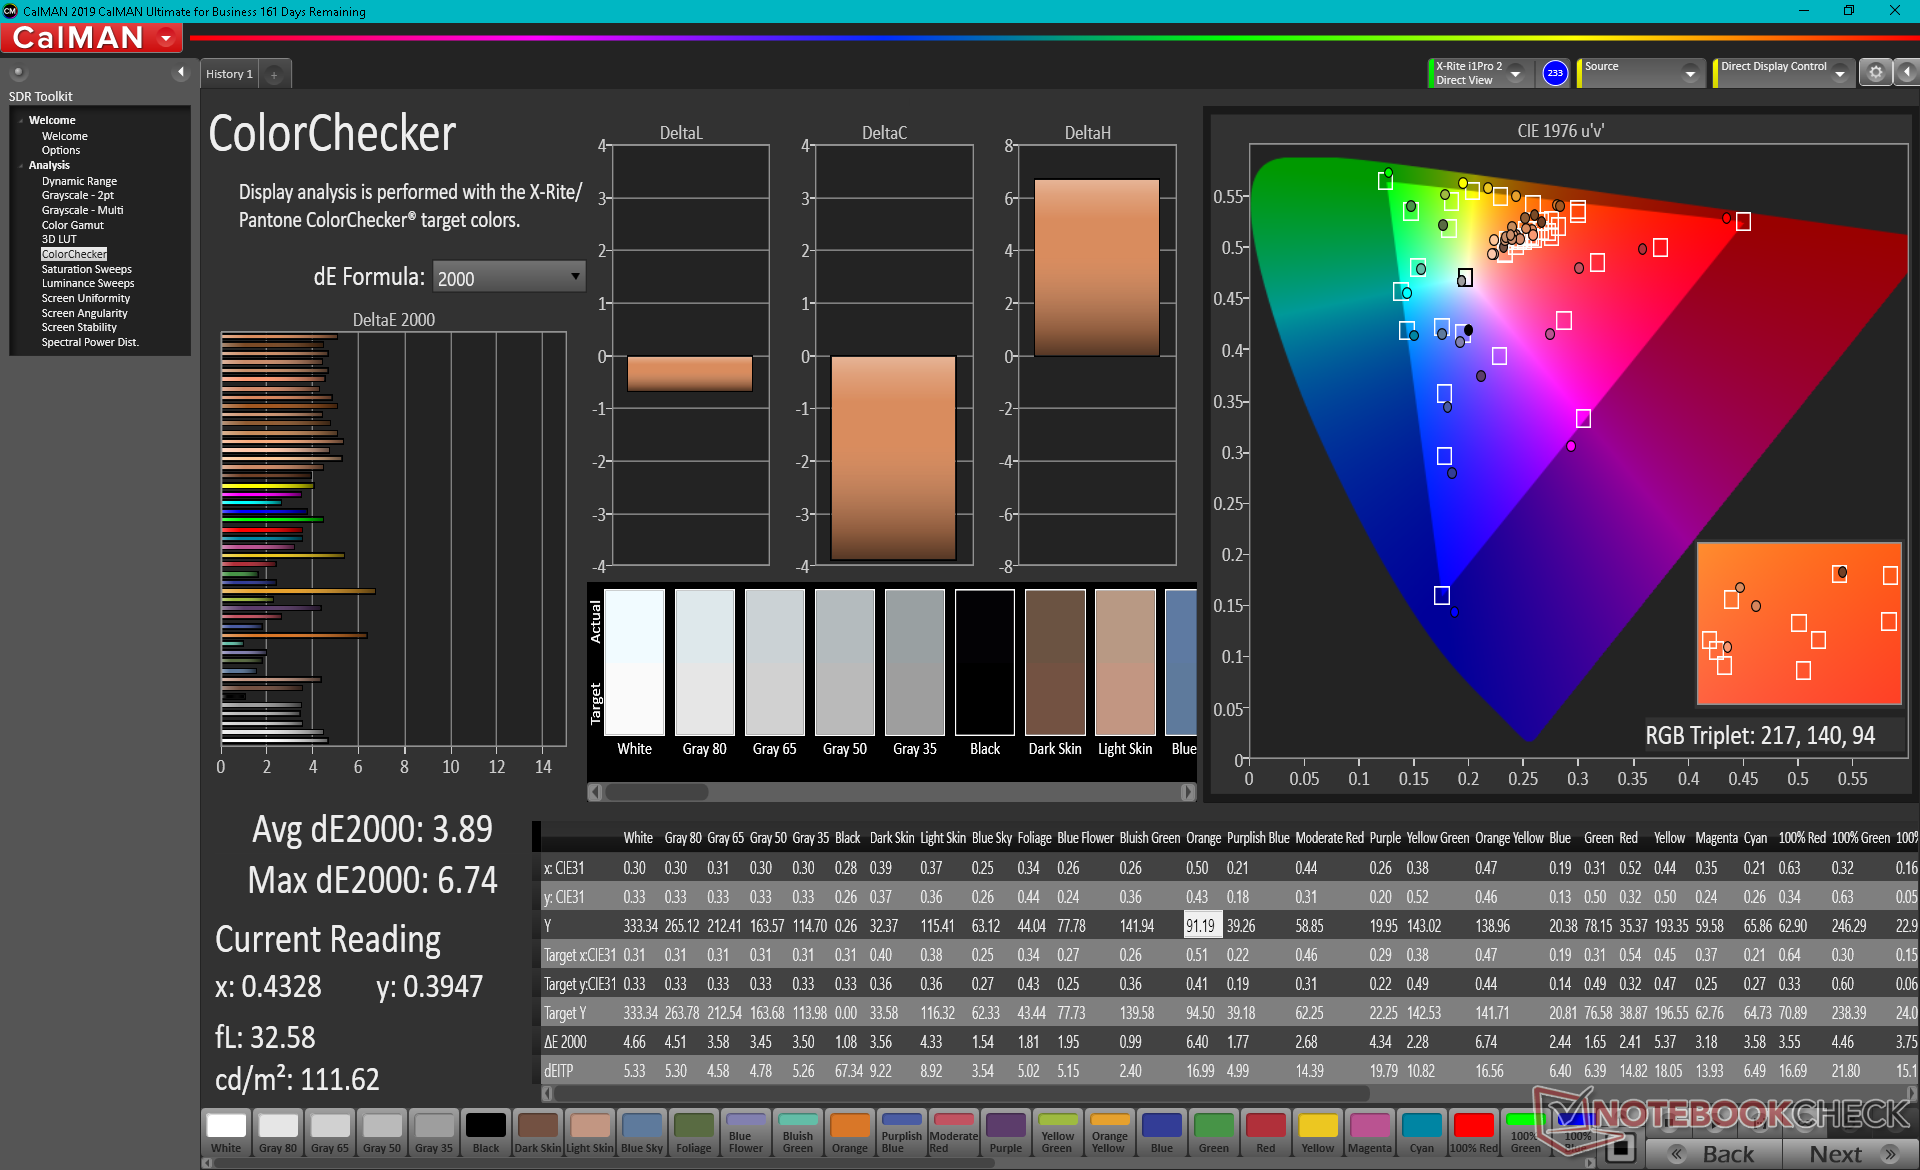
ΔE ColorChecker Calman: 4.01 | ∀{0.5-29.43 Ø4.71}
calibrated: 3.89
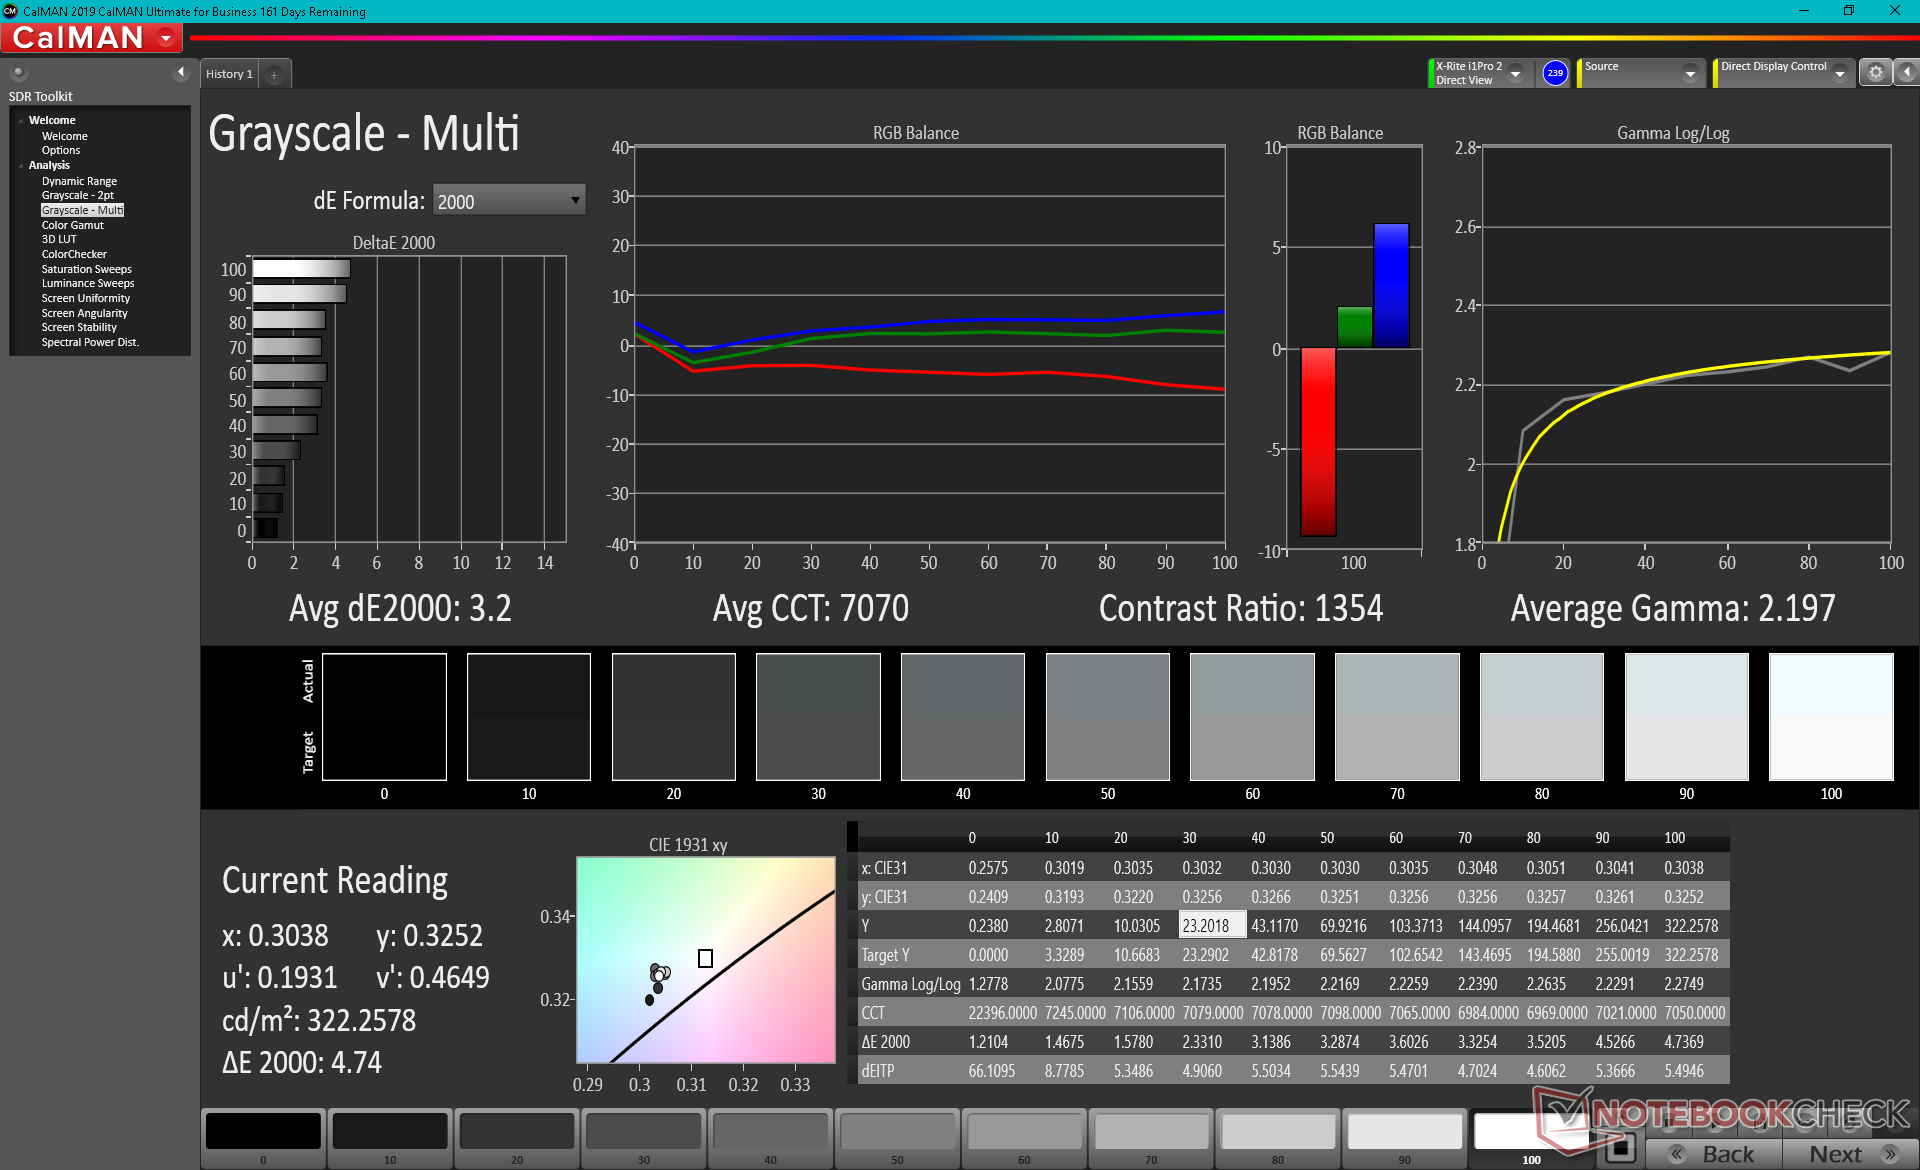
ΔE Greyscale Calman: 3.2 | ∀{0.09-98 Ø4.96}
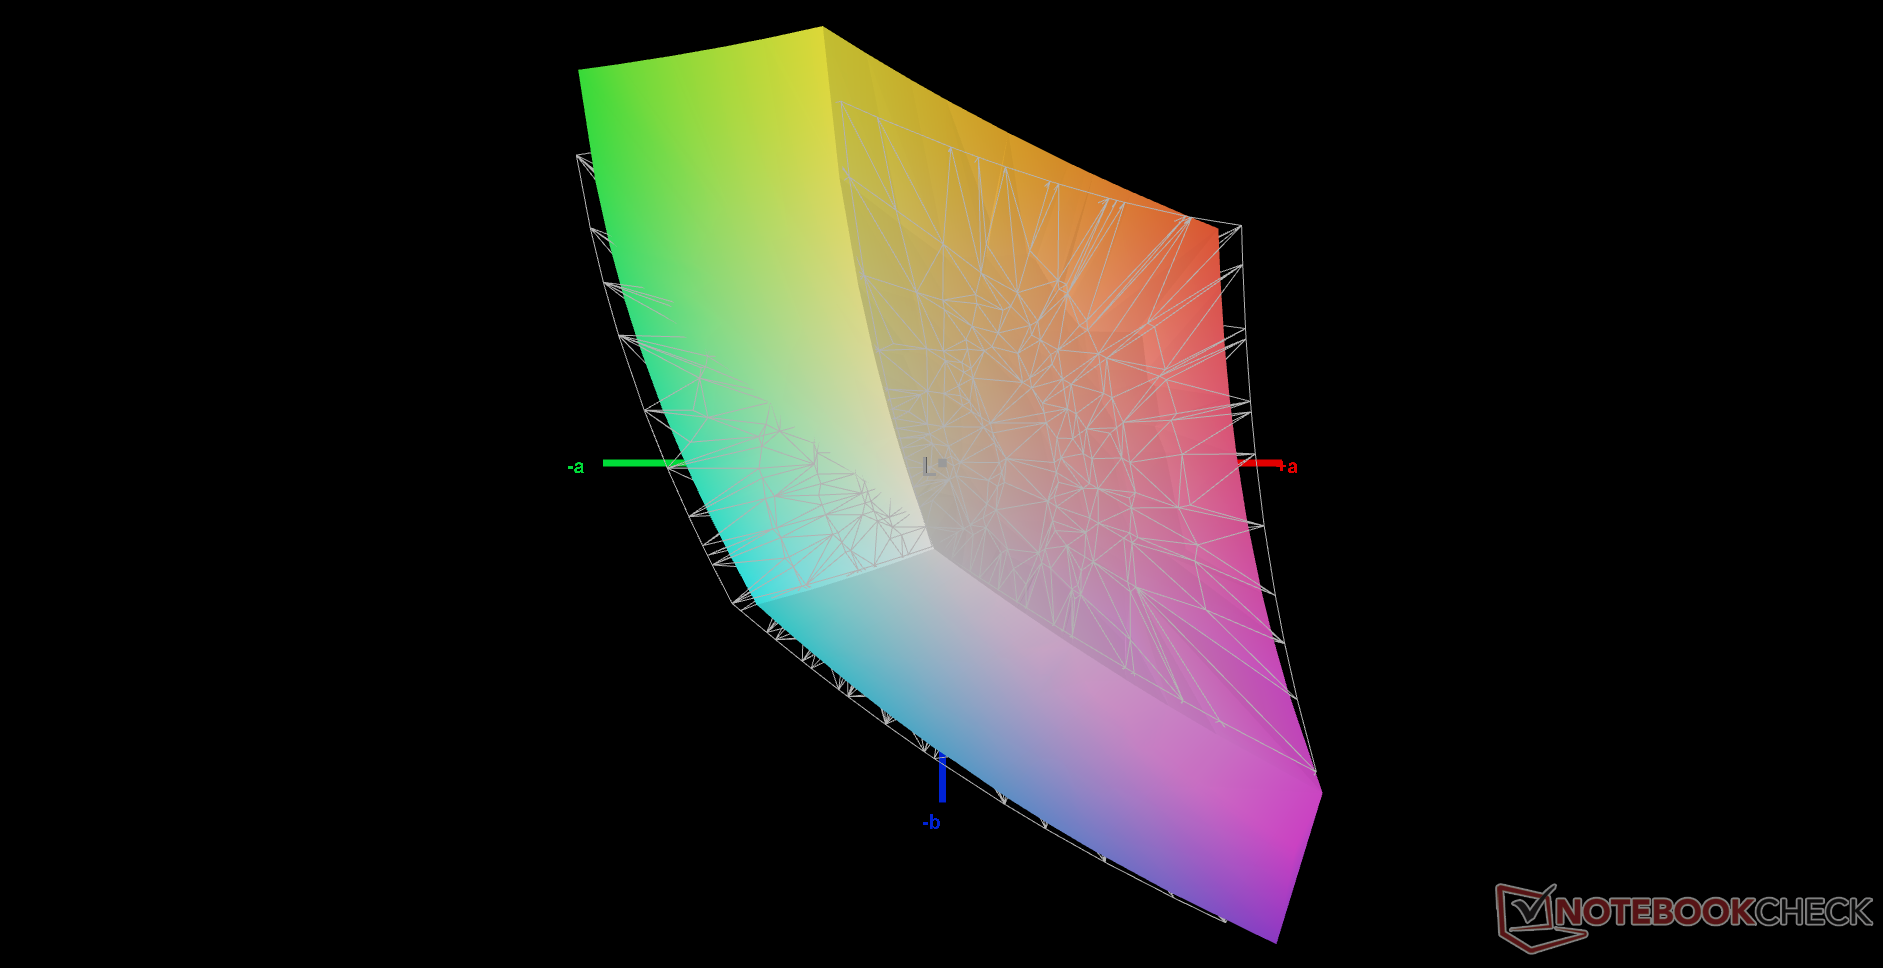
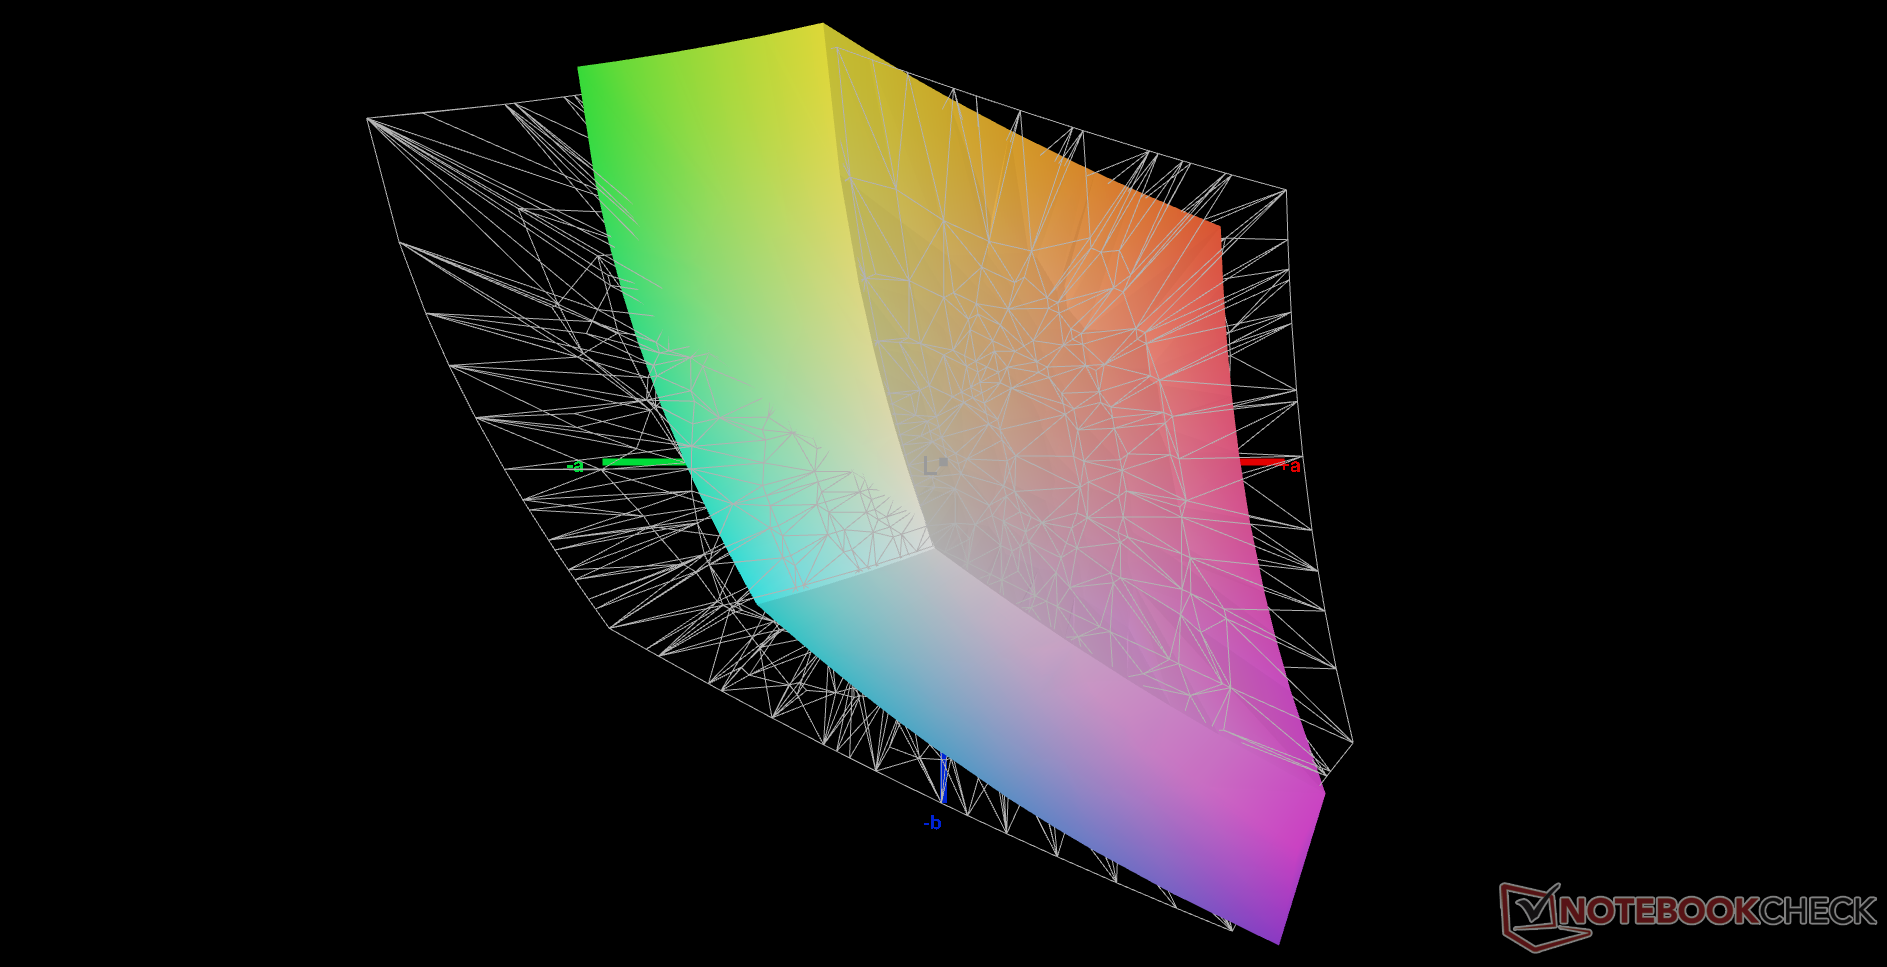
67.7% AdobeRGB 1998 (Argyll 3D)
92.4% sRGB (Argyll 3D)
68.1% Display P3 (Argyll 3D)
Gamma: 2.2
CCT: 7070 K
| Asus Zephyrus G14 GA401QM LM140LF-1F02, IPS, 14", 1920x1080 | Asus Zephyrus G14 GA401IV CEC PA LM140LF-1F01, IPS, 14", 1920x1080 | Razer Blade 14 Ryzen 9 RTX 3070 TL140BDXP02-2, IPS, 14", 2560x1440 | HP Envy 14-eb0010nr AU Optronics AUOF392, IPS, 14", 1920x1200 | Asus Zenbook 14 UX435EG Au Optronics B140HAN03.2, IPS, 14", 1920x1080 | HP Envy 15-ep0098nr Samsung SDC4145, AMOLED, 15.6", 3840x2160 | |
|---|---|---|---|---|---|---|
| Display | -1% | 26% | 11% | -7% | 29% | |
| Display P3 Coverage (%) | 68.1 | 66.5 -2% | 97.2 43% | 77.1 13% | 60.9 -11% | 88.5 30% |
| sRGB Coverage (%) | 92.4 | 92 0% | 99.9 8% | 99.8 8% | 90.4 -2% | 100 8% |
| AdobeRGB 1998 Coverage (%) | 67.7 | 67.2 -1% | 85.4 26% | 76.7 13% | 62.3 -8% | 99.9 48% |
| Response Times | -27% | 57% | -73% | -7% | 94% | |
| Response Time Grey 50% / Grey 80% * (ms) | 34.4 ? | 43.6 ? -27% | 16.4 ? 52% | 61.2 ? -78% | 39 ? -13% | 0.8 ? 98% |
| Response Time Black / White * (ms) | 27.6 ? | 34.8 ? -26% | 10.8 ? 61% | 46 ? -67% | 28 ? -1% | 2.7 ? 90% |
| PWM Frequency (Hz) | 242.7 ? | |||||
| Screen | 21% | 20% | 34% | -6% | 1% | |
| Brightness middle (cd/m²) | 329.4 | 322.2 -2% | 331.1 1% | 412 25% | 323 -2% | 374.3 14% |
| Brightness (cd/m²) | 311 | 302 -3% | 318 2% | 392 26% | 313 1% | 379 22% |
| Brightness Distribution (%) | 90 | 87 -3% | 91 1% | 81 -10% | 80 -11% | 91 1% |
| Black Level * (cd/m²) | 0.39 | 0.26 33% | 0.36 8% | 0.32 18% | 0.36 8% | |
| Contrast (:1) | 845 | 1239 47% | 920 9% | 1288 52% | 897 6% | |
| Colorchecker dE 2000 * | 4.01 | 2.43 39% | 2.25 44% | 1.88 53% | 4.86 -21% | 5.47 -36% |
| Colorchecker dE 2000 max. * | 8.21 | 5.07 38% | 4.62 44% | 3.06 63% | 7.52 8% | 8.22 -0% |
| Colorchecker dE 2000 calibrated * | 3.89 | 2.29 41% | 1.96 50% | 3.64 6% | 4.61 -19% | |
| Greyscale dE 2000 * | 3.2 | 3.3 -3% | 1.7 47% | 2.2 31% | 4.83 -51% | 2.3 28% |
| Gamma | 2.2 100% | 2.22 99% | 2.3 96% | 2.1 105% | 2.64 83% | 2.09 105% |
| CCT | 7070 92% | 6902 94% | 6751 96% | 6650 98% | 7405 88% | 6340 103% |
| Color Space (Percent of AdobeRGB 1998) (%) | 60 | 68.7 | 57.5 | 87.8 | ||
| Color Space (Percent of sRGB) (%) | 91.9 | 99.8 | 90.3 | 100 | ||
| Total Average (Program / Settings) | -2% /
9% | 34% /
27% | -9% /
14% | -7% /
-7% | 41% /
24% |
* ... smaller is better
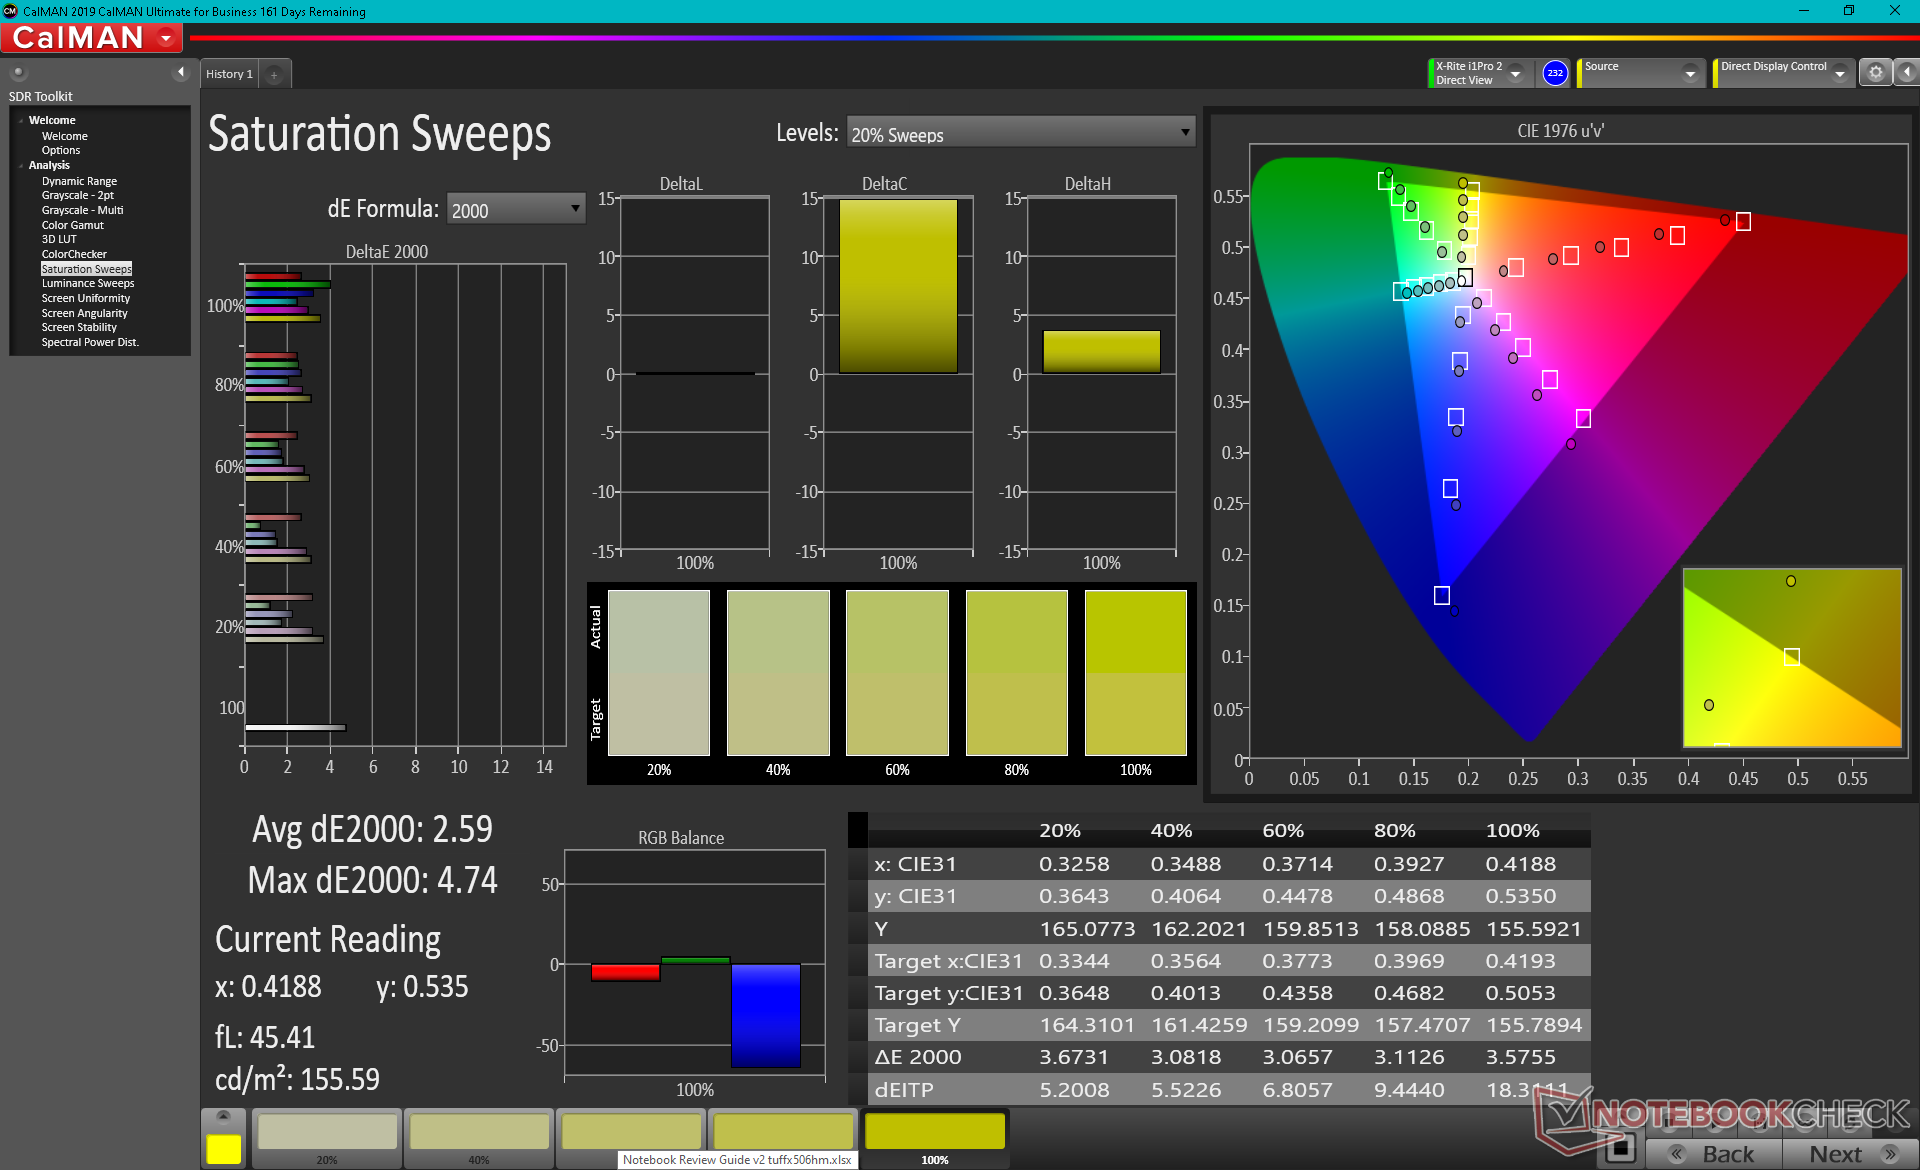
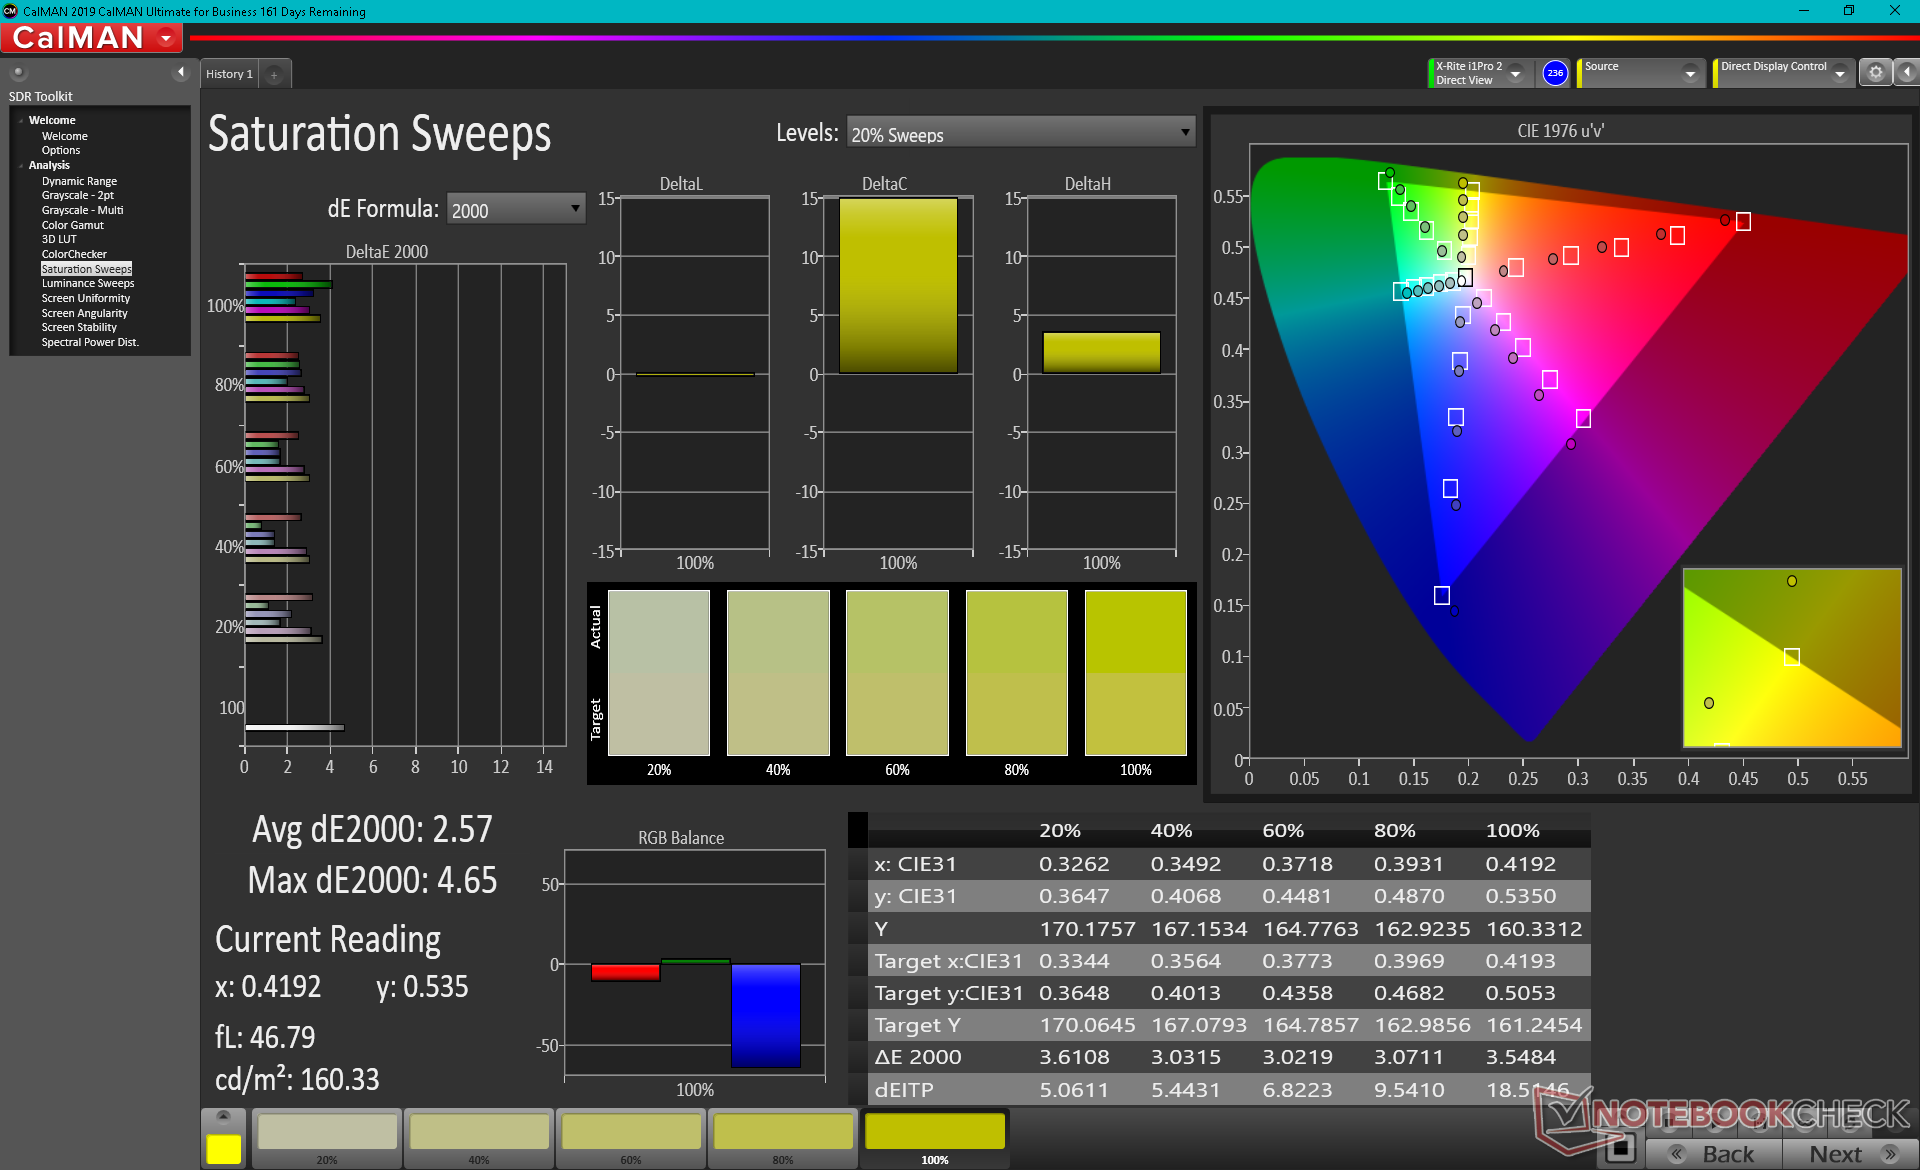
Color space covers >90 percent of sRGB to be more than enough for gaming and just barely passable for digital artists. Again, the WQHD option offers full DCI-P3 coverage for users who demand the deeper colors.
Asus claims a pre-calibrated display which our independent X-Rite colorimeter measurements can confirm. Average grayscale and color DeltaE values would barely change after attempting to calibrate the panel ourselves. Color temperature is a bit too cool, however, and so users may want to adjust it further.

Display Response Times
| ↔ Response Time Black to White | ||
|---|---|---|
| 27.6 ms ... rise ↗ and fall ↘ combined | ↗ 16.4 ms rise | 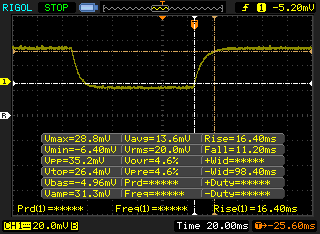 |
| ↘ 11.2 ms fall | ||
| The screen shows relatively slow response rates in our tests and may be too slow for gamers. In comparison, all tested devices range from 0.1 (minimum) to 240 (maximum) ms. » 70 % of all devices are better. This means that the measured response time is worse than the average of all tested devices (19.8 ms). | ||
| ↔ Response Time 50% Grey to 80% Grey | ||
| 34.4 ms ... rise ↗ and fall ↘ combined | ↗ 15.6 ms rise | 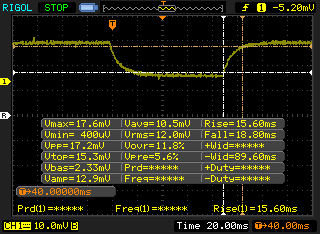 |
| ↘ 18.8 ms fall | ||
| The screen shows slow response rates in our tests and will be unsatisfactory for gamers. In comparison, all tested devices range from 0.165 (minimum) to 636 (maximum) ms. » 48 % of all devices are better. This means that the measured response time is worse than the average of all tested devices (31 ms). | ||
Screen Flickering / PWM (Pulse-Width Modulation)
| Screen flickering / PWM not detected | 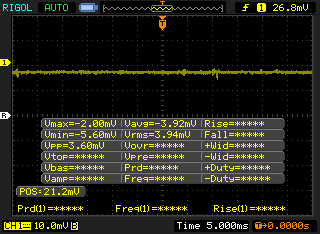 | ||
In comparison: 52 % of all tested devices do not use PWM to dim the display. If PWM was detected, an average of 7754 (minimum: 5 - maximum: 343500) Hz was measured. | |||
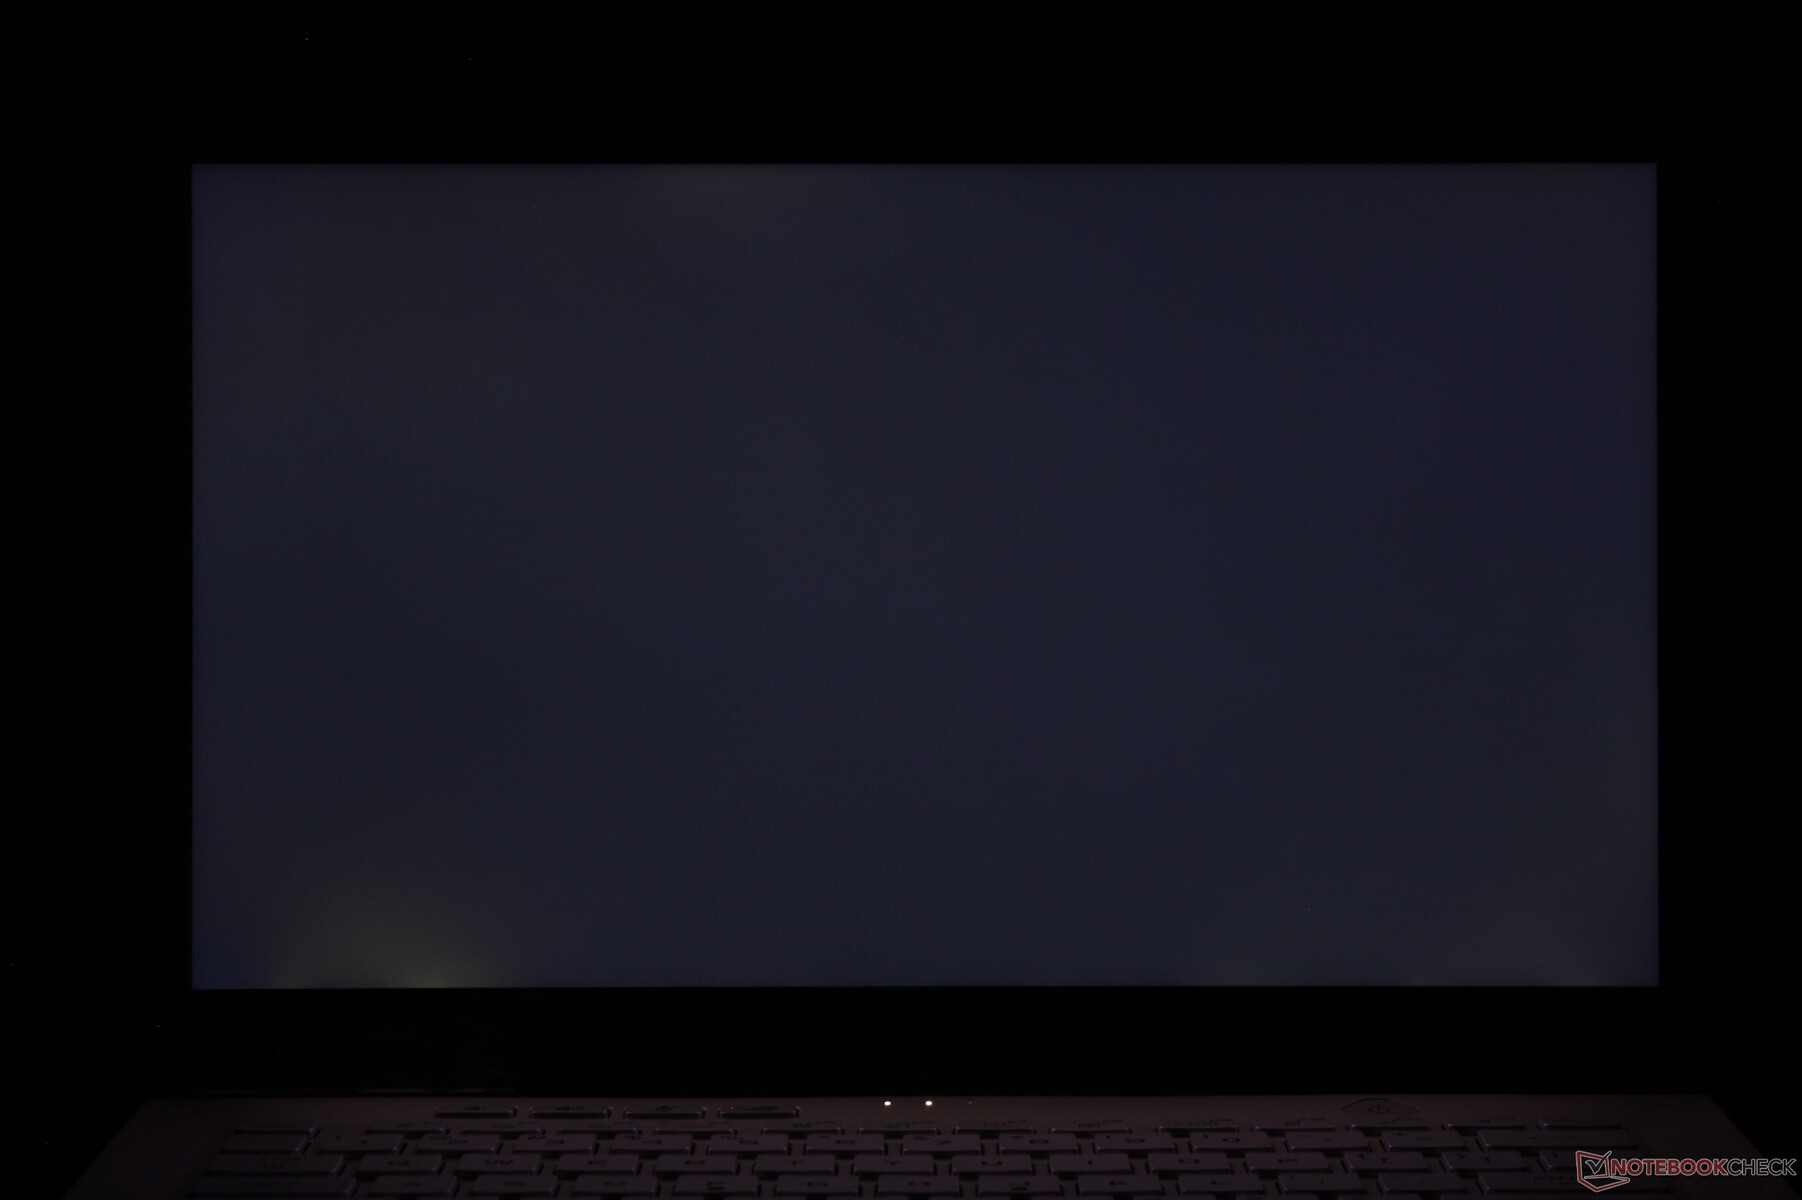
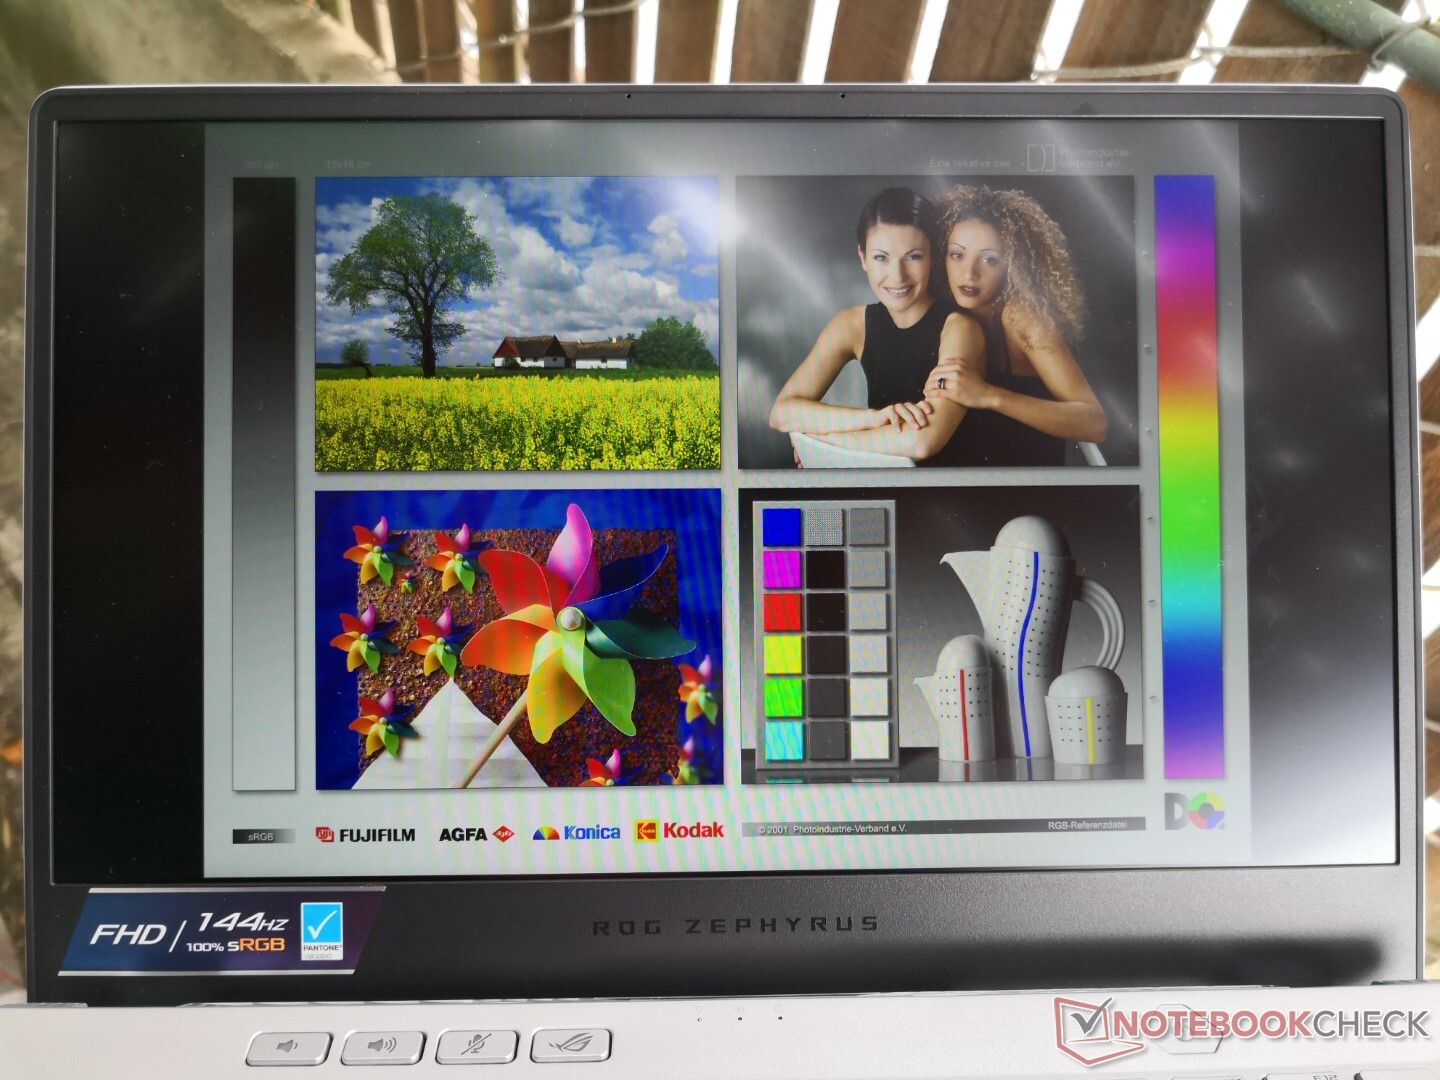
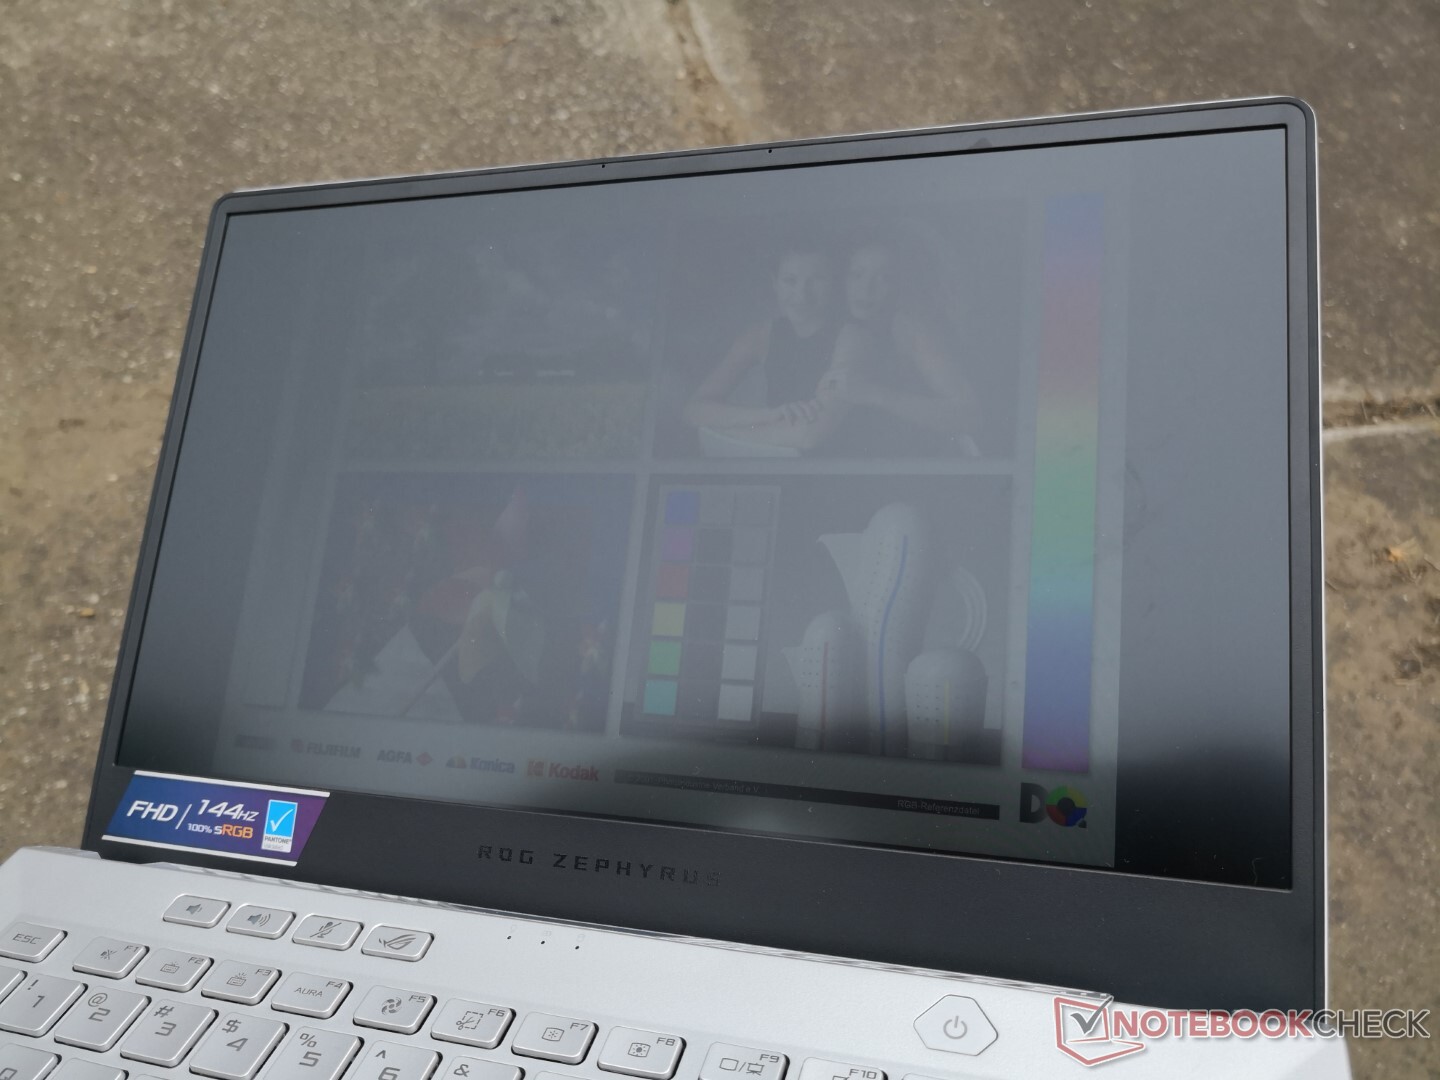
Outdoor visibility is decent when under shade but otherwise subpar on bright days as the backlight isn't as bright as most dedicated Ultrabooks like the Dell XPS or MacBook. Viewing angles are excellent which is to be expected from an IPS panel.


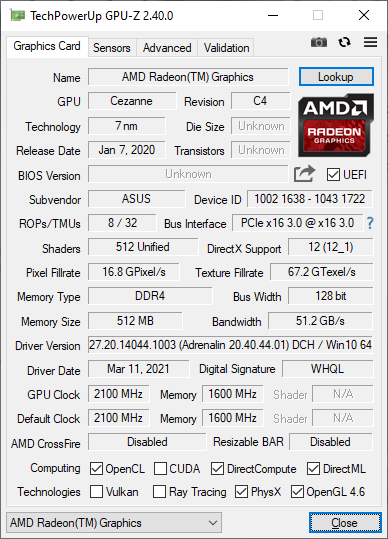
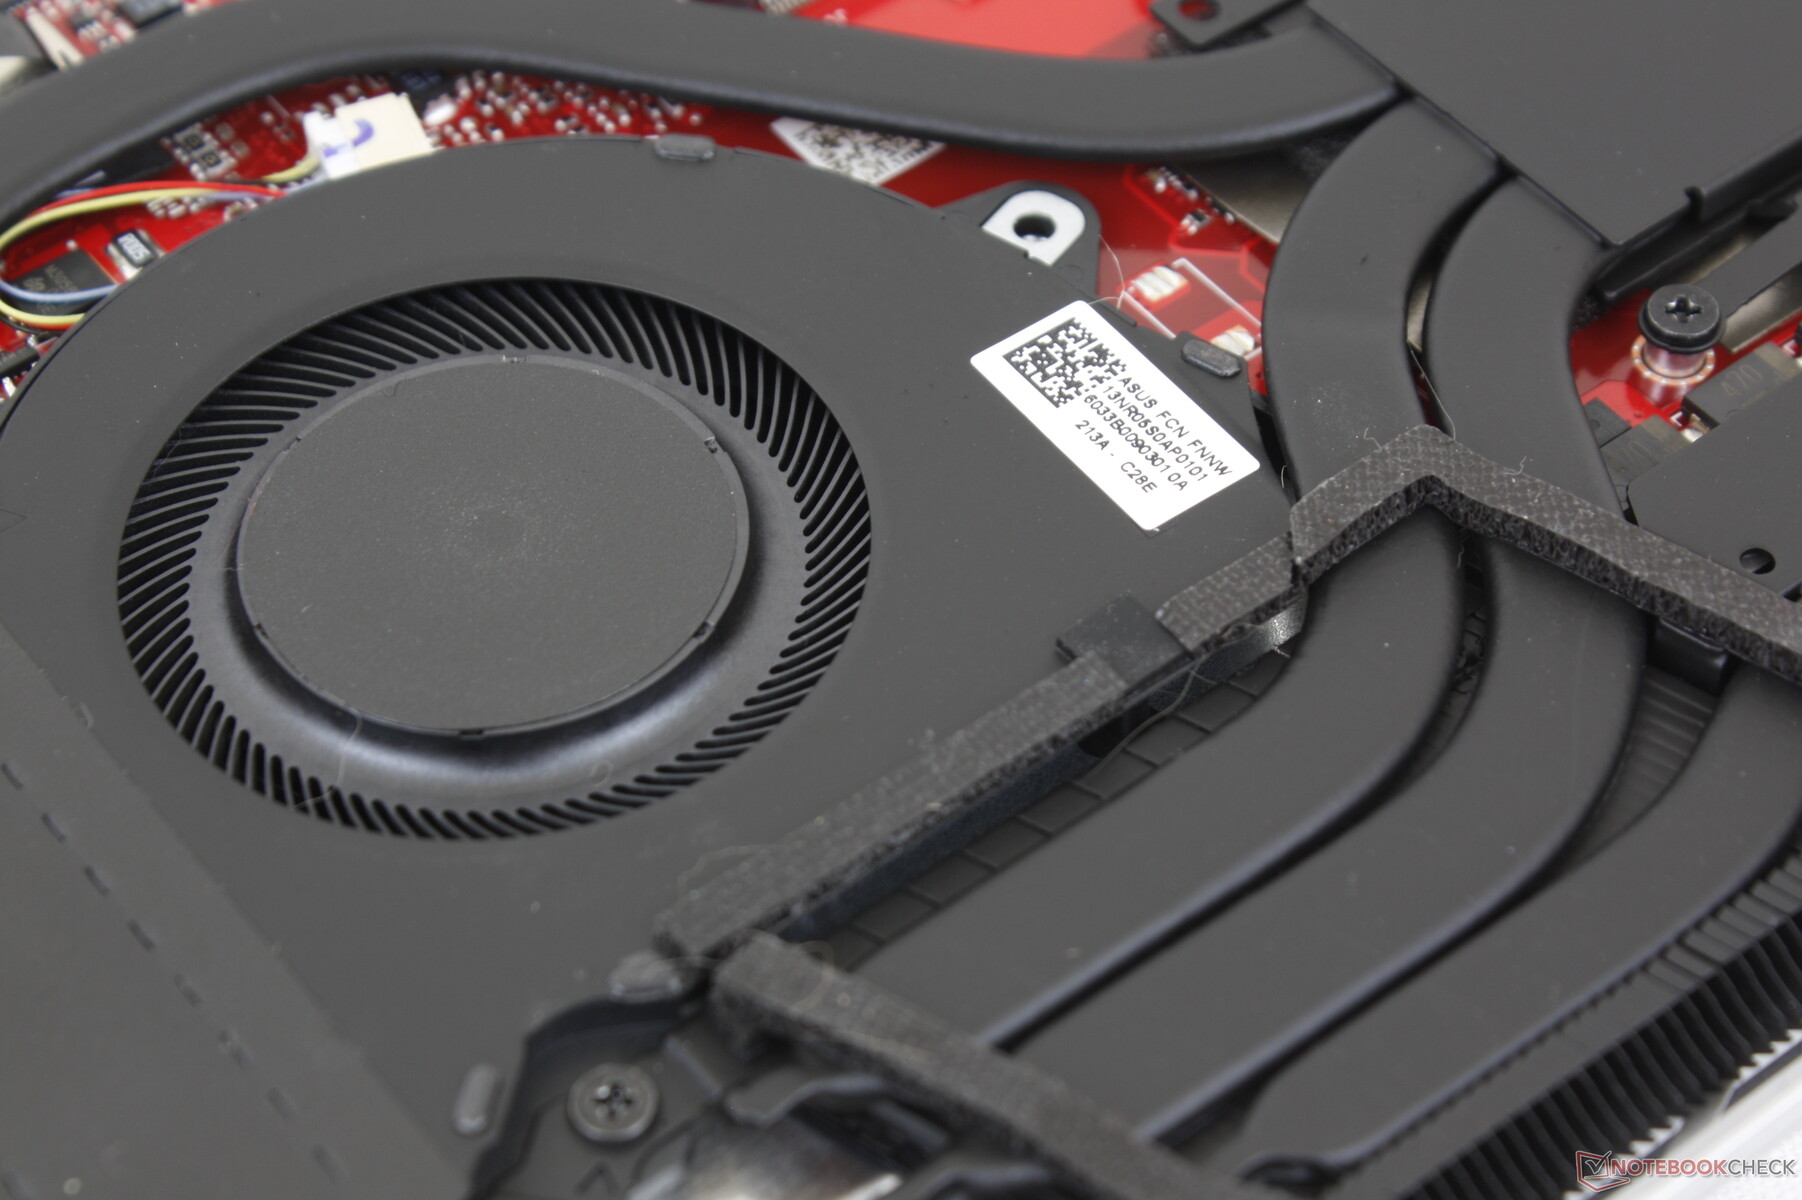
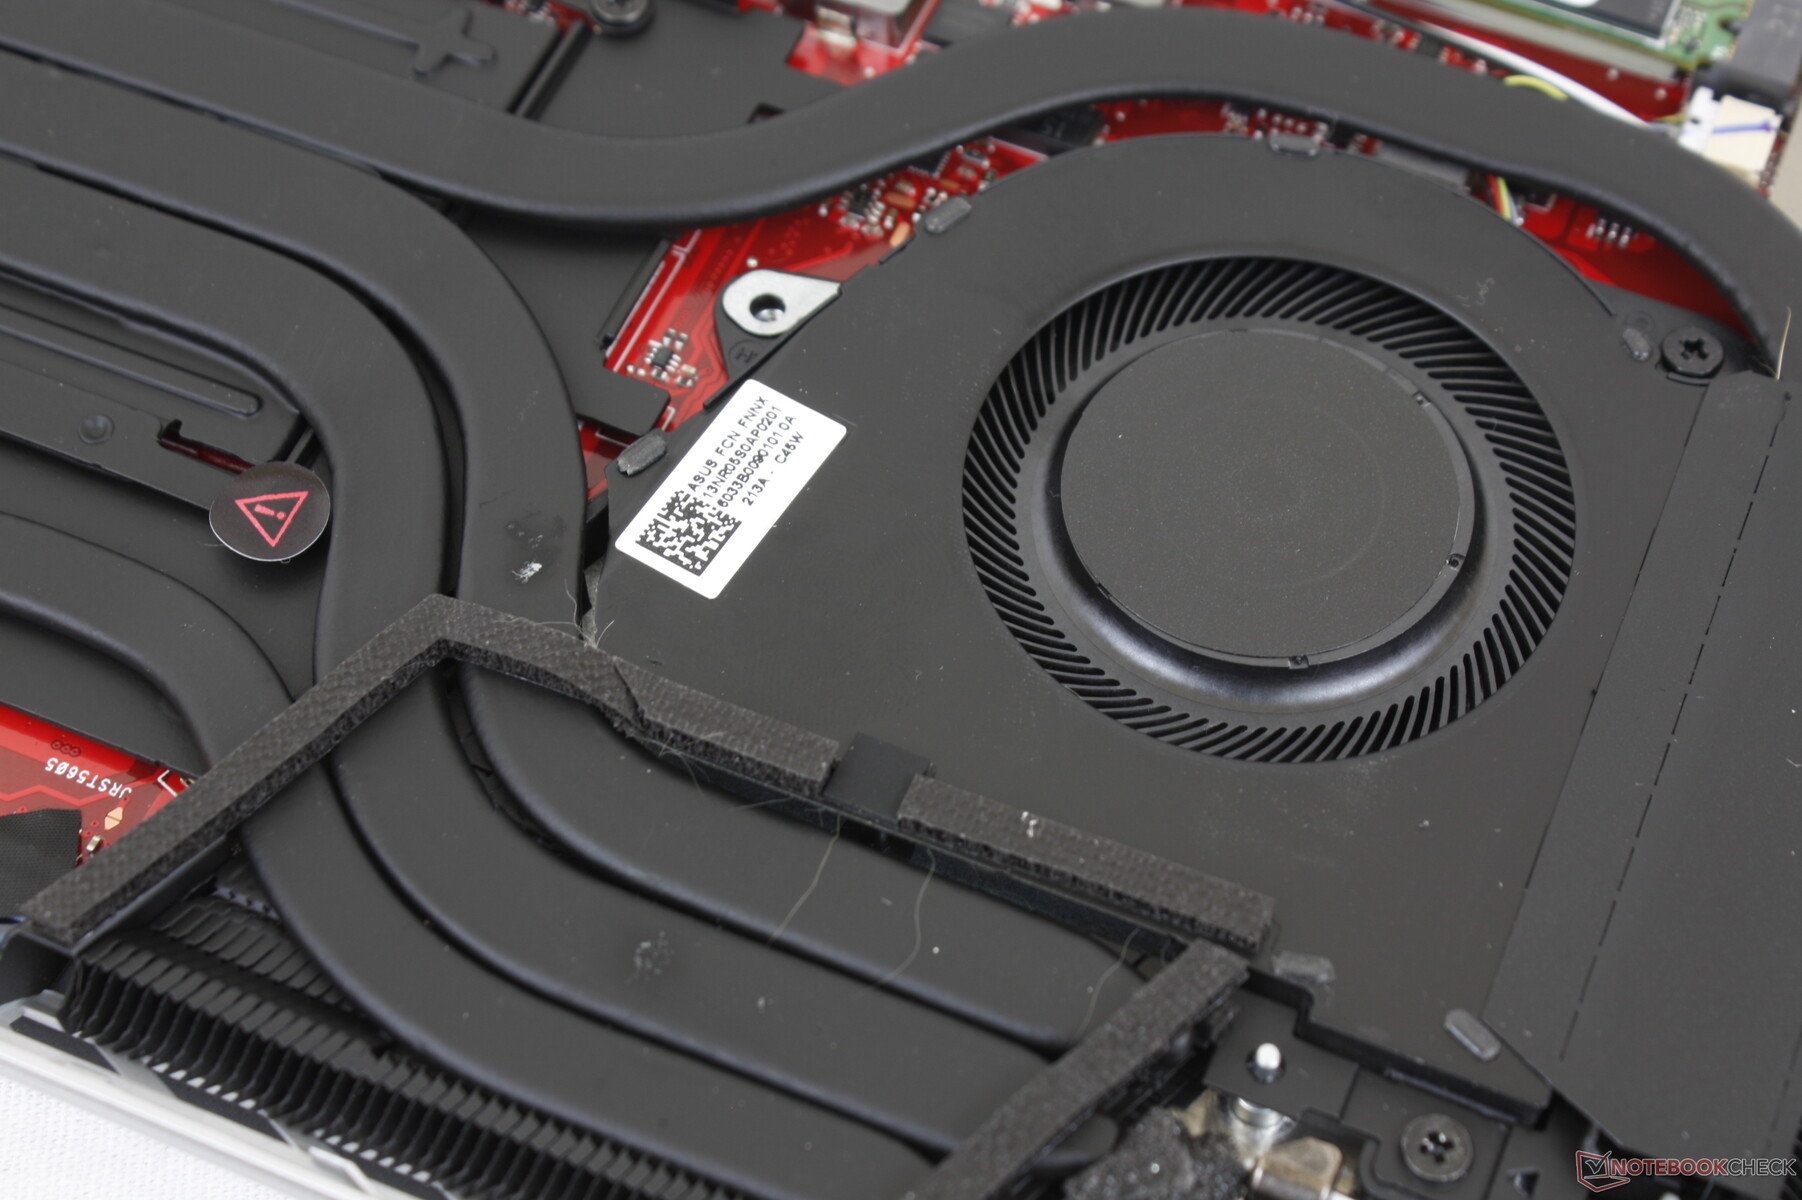
Performance — 35 W AMD Zen 3 CPU With 60 W to 80 W RTX GPU
Asus is doubling down on AMD again by going with its latest Zen 3 Ryzen 9 5900HS CPU instead of an Intel Tiger Lake-H part. This particular processor directly replaces the Ryzen 9 4900HS on last year's Zephyrus G14. The Blade 14 and even smaller ROG Flow X13 are using the slightly different unlocked Ryzen 9 5900HX and 5980HS instead, respectively.
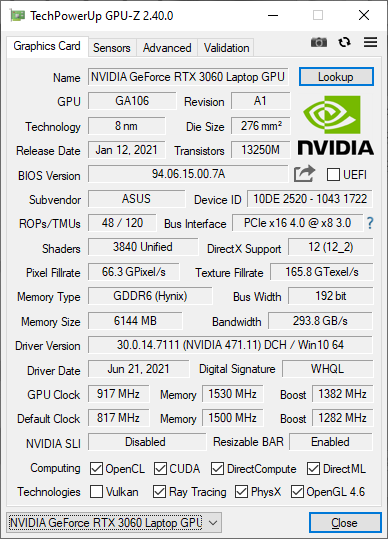
GPU options appear to be fixed at the GeForce RTX 3060 with resizable BAR and no 3070 or 3080 options. The maximum TGP (including Dynamic Boost) is only 80 W compared to 100 W or more on laptops like the Blade 14 or Aorus 17 meaning performance will be slightly slower on our Zephyrus G14. The Max-Q moniker may be gone, but its legacy remains when dealing with these small form factor gaming laptops.
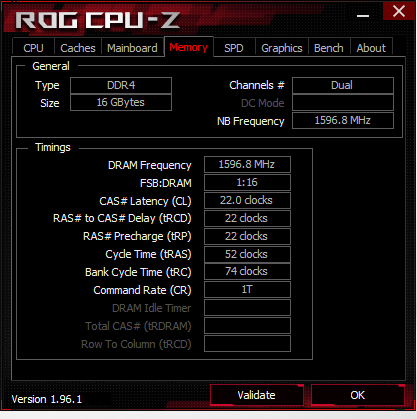
RAM is soldered at 8 GB or 16 GB of DDR4-3200 depending on the SKU with one SODIMM expansion slot.
Our unit was set to Turbo mode via Armoury Crate prior to running any performance benchmarks below for the highest possible scores. Owners should become accustomed with the Armoury Crate software as key features like fan control, lighting, and performance are all toggled here.
Asus has confirmed with us that the system utilizes liquid metal thermal paste for the CPU.
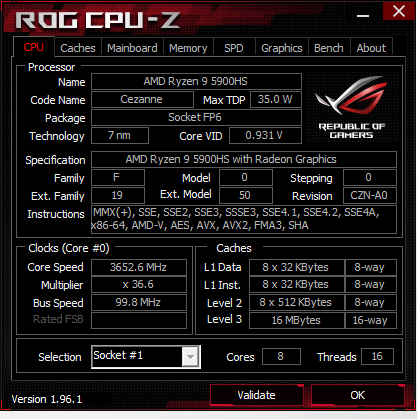

Processor
Raw processor performance is essentially on par with the new 11th gen Tiger Lake-H Core i7-11800H that only just became widely available. This includes single-core benchmarks as well which is where AMD would normally falter. Users are truly getting the processor performance of a 15.6-inch or 17.3-inch gaming laptop in a small 14-inch form factor with the Zephyrus G14.
The gen-to-gen performance gains over the Ryzen 9 4900HS are about 10 to 20 percent. The 4900HS was already top-of-the-line when it launched early last year and so we weren't expecting huge improvements with the Ryzen 9 5900HS.
Any differences between the 5900HS and 5900HX are extremely minor as they are each limited by the overarching cooling solution of the laptop.
Cinebench R23: Multi Core | Single Core
Cinebench R15: CPU Multi 64Bit | CPU Single 64Bit
Blender: v2.79 BMW27 CPU
7-Zip 18.03: 7z b 4 -mmt1 | 7z b 4
Geekbench 5.5: Single-Core | Multi-Core
HWBOT x265 Benchmark v2.2: 4k Preset
LibreOffice : 20 Documents To PDF
R Benchmark 2.5: Overall mean
| Cinebench R20 / CPU (Multi Core) | |
| Asus TUF Gaming F15 FX506HM | |
| Asus Zephyrus G14 GA401QM | |
| Razer Blade 14 Ryzen 9 RTX 3070 | |
| Average AMD Ryzen 9 5900HS (4414 - 5167, n=4) | |
| Asus TUF Gaming F17 FX706HM | |
| Asus Zephyrus G14 GA401IV | |
| HP Envy 15-ep0098nr | |
| HP Envy 14-eb0010nr | |
| Asus Zenbook 14 UX435EG | |
| Cinebench R20 / CPU (Single Core) | |
| Asus TUF Gaming F17 FX706HM | |
| Asus TUF Gaming F15 FX506HM | |
| Average AMD Ryzen 9 5900HS (560 - 584, n=4) | |
| Asus Zephyrus G14 GA401QM | |
| Asus Zenbook 14 UX435EG | |
| HP Envy 14-eb0010nr | |
| Asus Zephyrus G14 GA401IV | |
| Razer Blade 14 Ryzen 9 RTX 3070 | |
| HP Envy 15-ep0098nr | |
| Cinebench R23 / Multi Core | |
| Asus TUF Gaming F15 FX506HM | |
| Asus Zephyrus G14 GA401QM | |
| Razer Blade 14 Ryzen 9 RTX 3070 | |
| Average AMD Ryzen 9 5900HS (11426 - 13214, n=4) | |
| Asus TUF Gaming F17 FX706HM | |
| HP Envy 14-eb0010nr | |
| Asus Zenbook 14 UX435EG | |
| Cinebench R23 / Single Core | |
| Asus TUF Gaming F17 FX706HM | |
| Asus TUF Gaming F15 FX506HM | |
| Average AMD Ryzen 9 5900HS (1457 - 1488, n=4) | |
| Asus Zephyrus G14 GA401QM | |
| HP Envy 14-eb0010nr | |
| Razer Blade 14 Ryzen 9 RTX 3070 | |
| Cinebench R15 / CPU Multi 64Bit | |
| Asus Zephyrus G14 GA401QM | |
| Asus TUF Gaming F15 FX506HM | |
| Razer Blade 14 Ryzen 9 RTX 3070 | |
| Average AMD Ryzen 9 5900HS (1927 - 2180, n=5) | |
| Asus TUF Gaming F17 FX706HM | |
| Asus Zephyrus G14 GA401IV | |
| HP Envy 15-ep0098nr | |
| HP Envy 14-eb0010nr | |
| Asus Zenbook 14 UX435EG | |
| Cinebench R15 / CPU Single 64Bit | |
| Asus TUF Gaming F17 FX706HM | |
| Asus Zephyrus G14 GA401QM | |
| Average AMD Ryzen 9 5900HS (211 - 240, n=4) | |
| Asus TUF Gaming F15 FX506HM | |
| Asus Zenbook 14 UX435EG | |
| HP Envy 14-eb0010nr | |
| HP Envy 15-ep0098nr | |
| Razer Blade 14 Ryzen 9 RTX 3070 | |
| Asus Zephyrus G14 GA401IV | |
| Blender / v2.79 BMW27 CPU | |
| Asus Zenbook 14 UX435EG | |
| HP Envy 14-eb0010nr | |
| HP Envy 15-ep0098nr | |
| Asus Zephyrus G14 GA401IV | |
| Average AMD Ryzen 9 5900HS (231 - 305, n=4) | |
| Razer Blade 14 Ryzen 9 RTX 3070 | |
| Asus TUF Gaming F17 FX706HM | |
| Asus TUF Gaming F15 FX506HM | |
| Asus Zephyrus G14 GA401QM | |
| 7-Zip 18.03 / 7z b 4 -mmt1 | |
| Asus TUF Gaming F17 FX706HM | |
| Average AMD Ryzen 9 5900HS (5540 - 5804, n=4) | |
| Asus TUF Gaming F15 FX506HM | |
| Asus Zephyrus G14 GA401QM | |
| Asus Zenbook 14 UX435EG | |
| Razer Blade 14 Ryzen 9 RTX 3070 | |
| HP Envy 14-eb0010nr | |
| Asus Zephyrus G14 GA401IV | |
| HP Envy 15-ep0098nr | |
| Geekbench 5.5 / Single-Core | |
| Asus TUF Gaming F17 FX706HM | |
| Asus Zenbook 14 UX435EG | |
| Average AMD Ryzen 9 5900HS (1410 - 1547, n=3) | |
| HP Envy 14-eb0010nr | |
| HP Envy 15-ep0098nr | |
| Asus Zephyrus G14 GA401IV | |
| Geekbench 5.5 / Multi-Core | |
| Average AMD Ryzen 9 5900HS (7767 - 7910, n=3) | |
| Asus TUF Gaming F17 FX706HM | |
| Asus Zephyrus G14 GA401IV | |
| HP Envy 15-ep0098nr | |
| Asus Zenbook 14 UX435EG | |
| HP Envy 14-eb0010nr | |
| HWBOT x265 Benchmark v2.2 / 4k Preset | |
| Asus TUF Gaming F15 FX506HM | |
| Asus Zephyrus G14 GA401QM | |
| Razer Blade 14 Ryzen 9 RTX 3070 | |
| Asus TUF Gaming F17 FX706HM | |
| Average AMD Ryzen 9 5900HS (12.7 - 15.4, n=4) | |
| Asus Zephyrus G14 GA401IV | |
| HP Envy 15-ep0098nr | |
| HP Envy 14-eb0010nr | |
| Asus Zenbook 14 UX435EG | |
| LibreOffice / 20 Documents To PDF | |
| Razer Blade 14 Ryzen 9 RTX 3070 | |
| Asus Zenbook 14 UX435EG | |
| Average AMD Ryzen 9 5900HS (50.7 - 54.9, n=4) | |
| Asus Zephyrus G14 GA401QM | |
| HP Envy 14-eb0010nr | |
| HP Envy 15-ep0098nr | |
| Asus TUF Gaming F17 FX706HM | |
| Asus TUF Gaming F15 FX506HM | |
| R Benchmark 2.5 / Overall mean | |
| HP Envy 14-eb0010nr | |
| HP Envy 15-ep0098nr | |
| Razer Blade 14 Ryzen 9 RTX 3070 | |
| Asus Zenbook 14 UX435EG | |
| Asus TUF Gaming F15 FX506HM | |
| Asus TUF Gaming F17 FX706HM | |
| Average AMD Ryzen 9 5900HS (0.51 - 0.538, n=4) | |
| Asus Zephyrus G14 GA401QM | |
* ... smaller is better
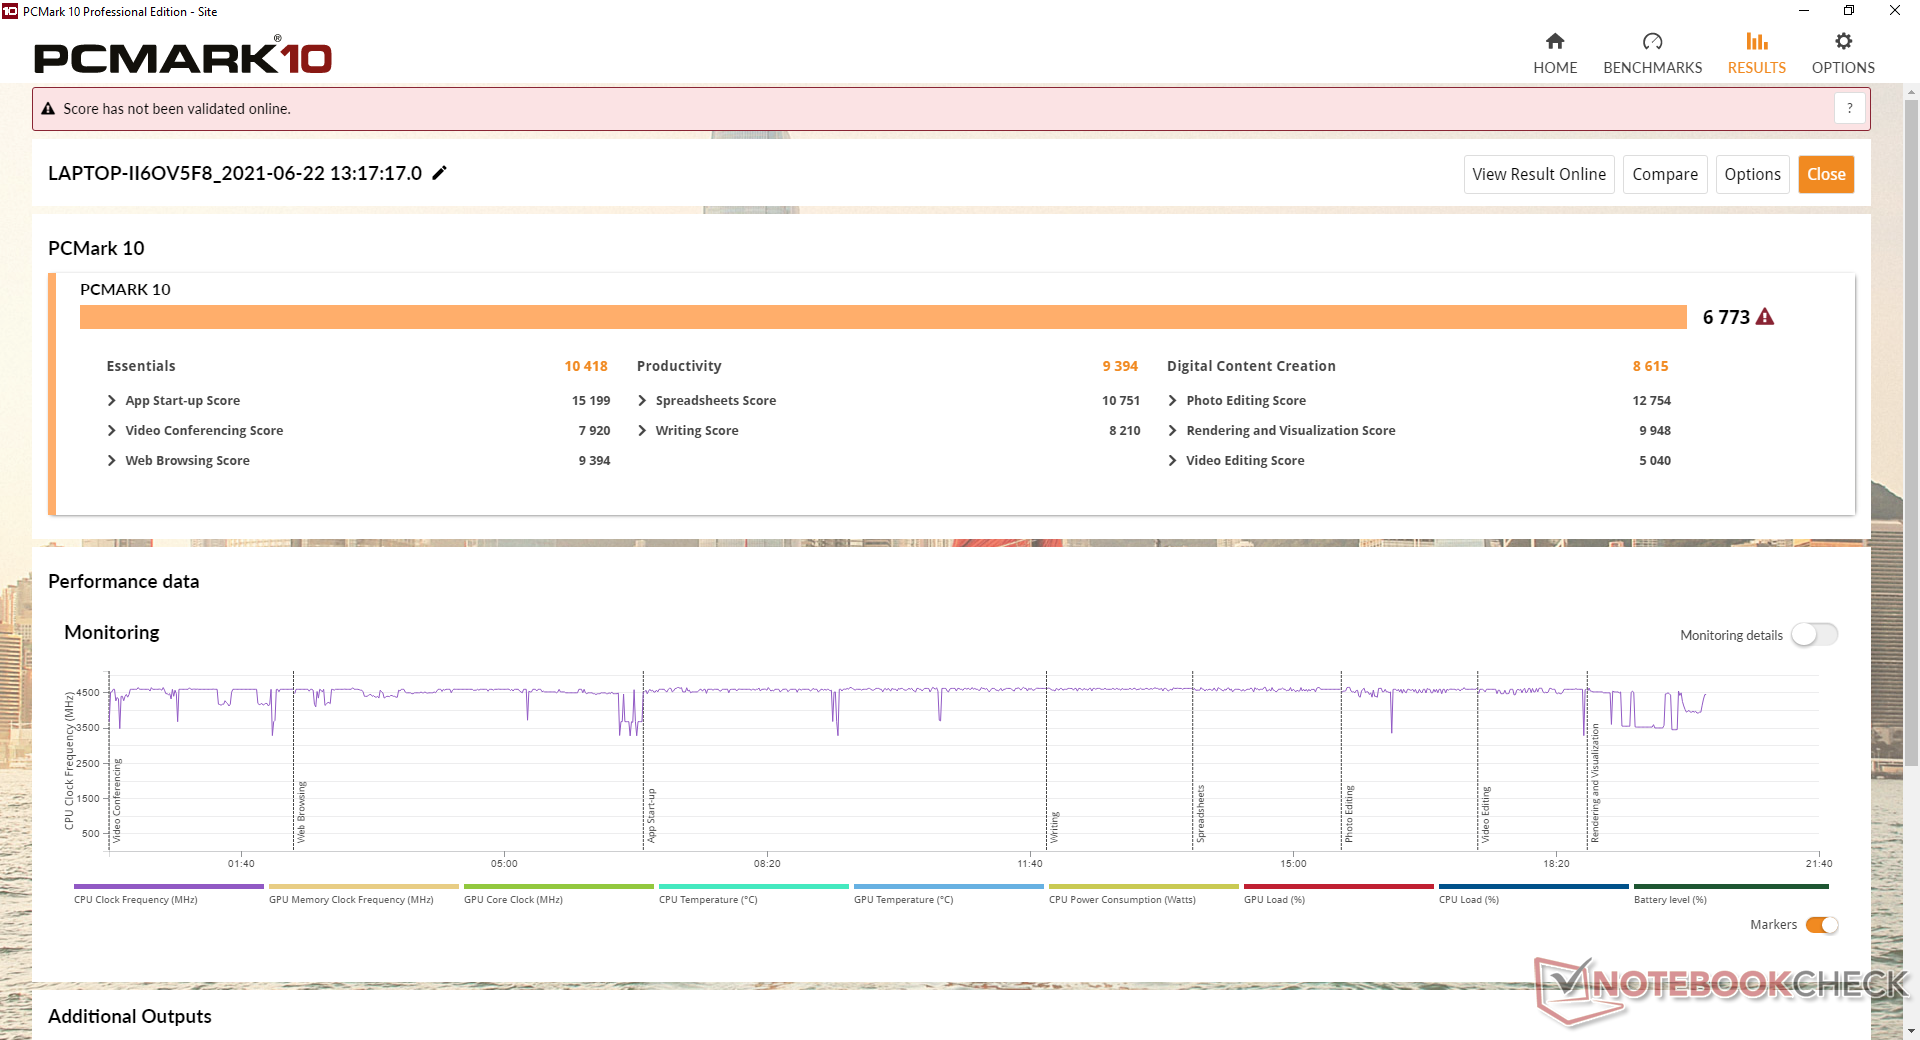
System Performance
PCMark 10 results are ever-so-slightly below that of the Blade 14 in Digital Content Creation due to the faster RTX 3070 GPU in the Razer system. Scores are otherwise very close to one another to be consistently higher than on last year's Zephyrus G14.
| PCMark 10 / Score | |
| Razer Blade 14 Ryzen 9 RTX 3070 | |
| Asus Zephyrus G14 GA401QM | |
| Average AMD Ryzen 9 5900HS, NVIDIA GeForce RTX 3060 Laptop GPU (n=1) | |
| Asus Zephyrus G14 GA401IV | |
| HP Envy 15-ep0098nr | |
| HP Envy 14-eb0010nr | |
| Asus Zenbook 14 UX435EG | |
| PCMark 10 / Essentials | |
| Asus Zephyrus G14 GA401QM | |
| Average AMD Ryzen 9 5900HS, NVIDIA GeForce RTX 3060 Laptop GPU (n=1) | |
| Razer Blade 14 Ryzen 9 RTX 3070 | |
| Asus Zephyrus G14 GA401IV | |
| HP Envy 15-ep0098nr | |
| Asus Zenbook 14 UX435EG | |
| HP Envy 14-eb0010nr | |
| PCMark 10 / Productivity | |
| Asus Zephyrus G14 GA401QM | |
| Average AMD Ryzen 9 5900HS, NVIDIA GeForce RTX 3060 Laptop GPU (n=1) | |
| Razer Blade 14 Ryzen 9 RTX 3070 | |
| Asus Zenbook 14 UX435EG | |
| HP Envy 14-eb0010nr | |
| HP Envy 15-ep0098nr | |
| Asus Zephyrus G14 GA401IV | |
| PCMark 10 / Digital Content Creation | |
| Razer Blade 14 Ryzen 9 RTX 3070 | |
| Asus Zephyrus G14 GA401QM | |
| Average AMD Ryzen 9 5900HS, NVIDIA GeForce RTX 3060 Laptop GPU (n=1) | |
| Asus Zephyrus G14 GA401IV | |
| HP Envy 15-ep0098nr | |
| HP Envy 14-eb0010nr | |
| Asus Zenbook 14 UX435EG | |
| PCMark 10 Score | 6773 points | |
Help | ||
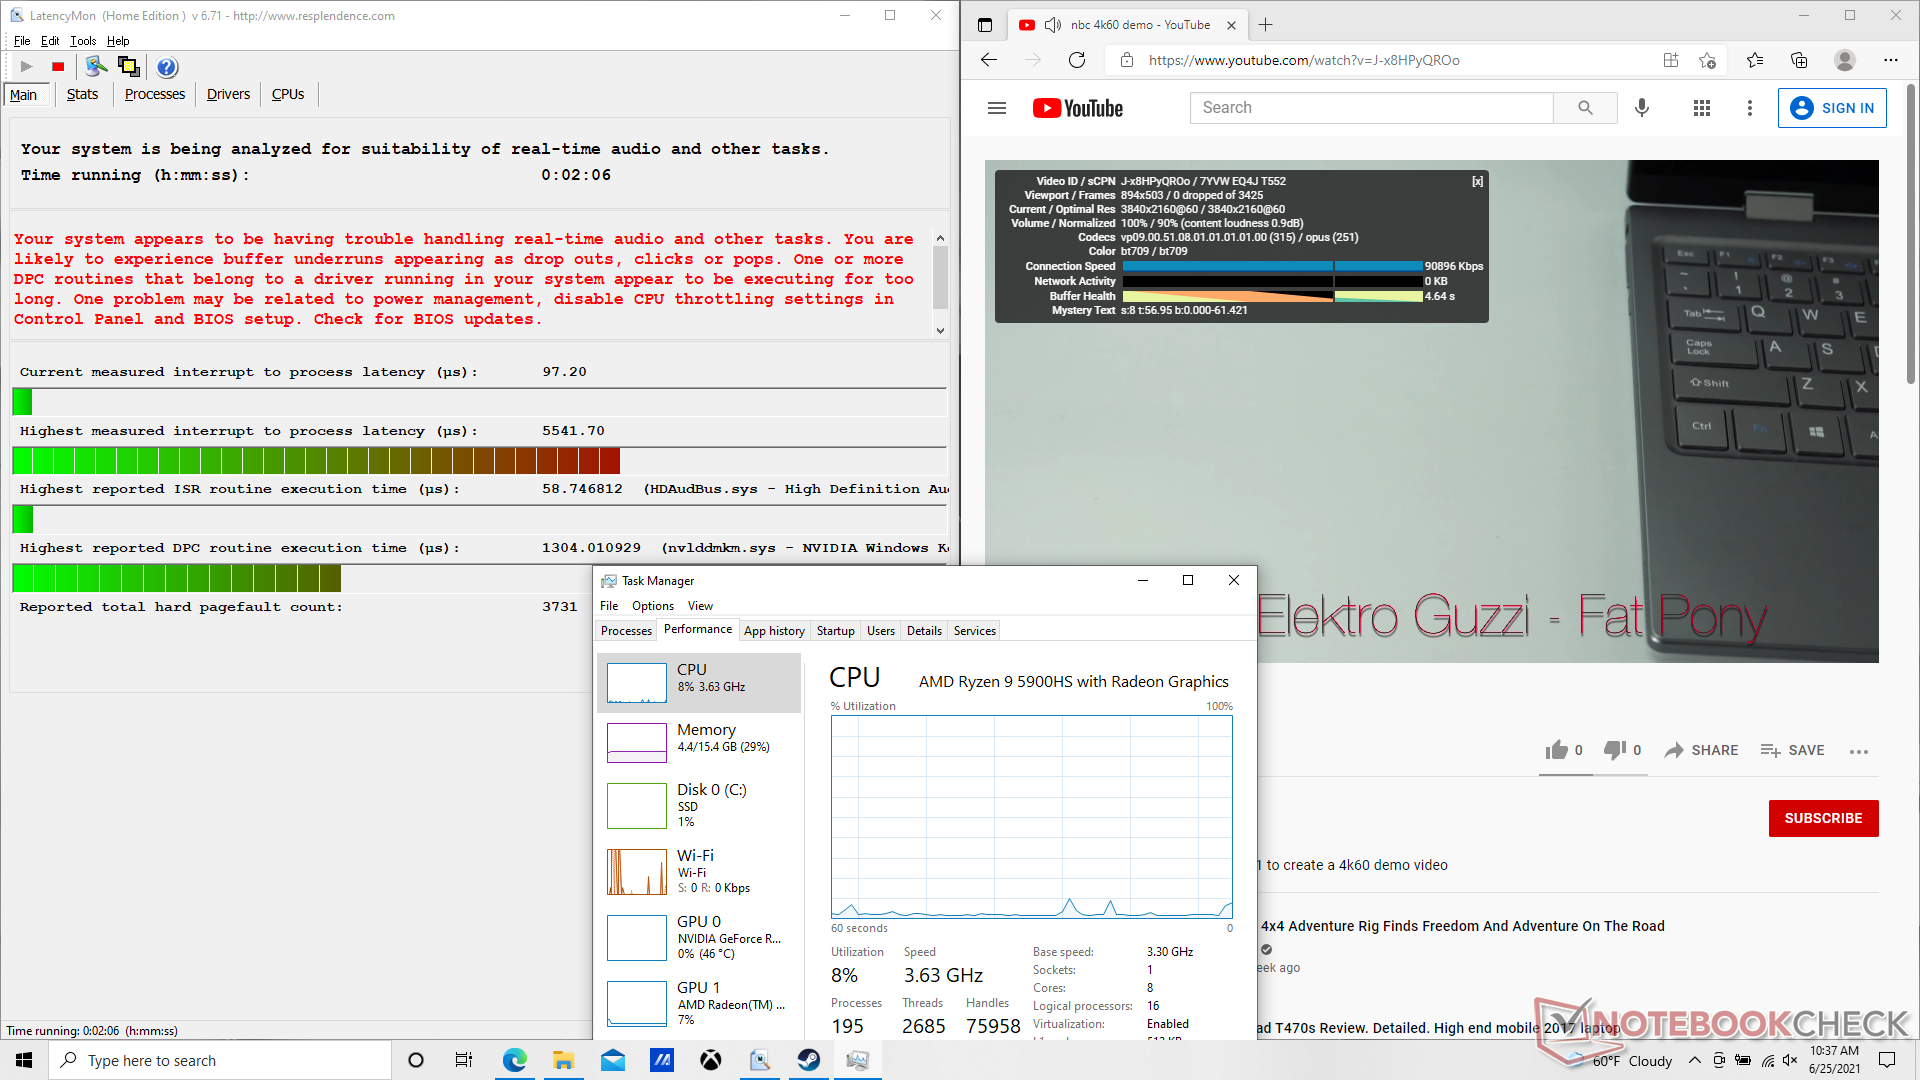
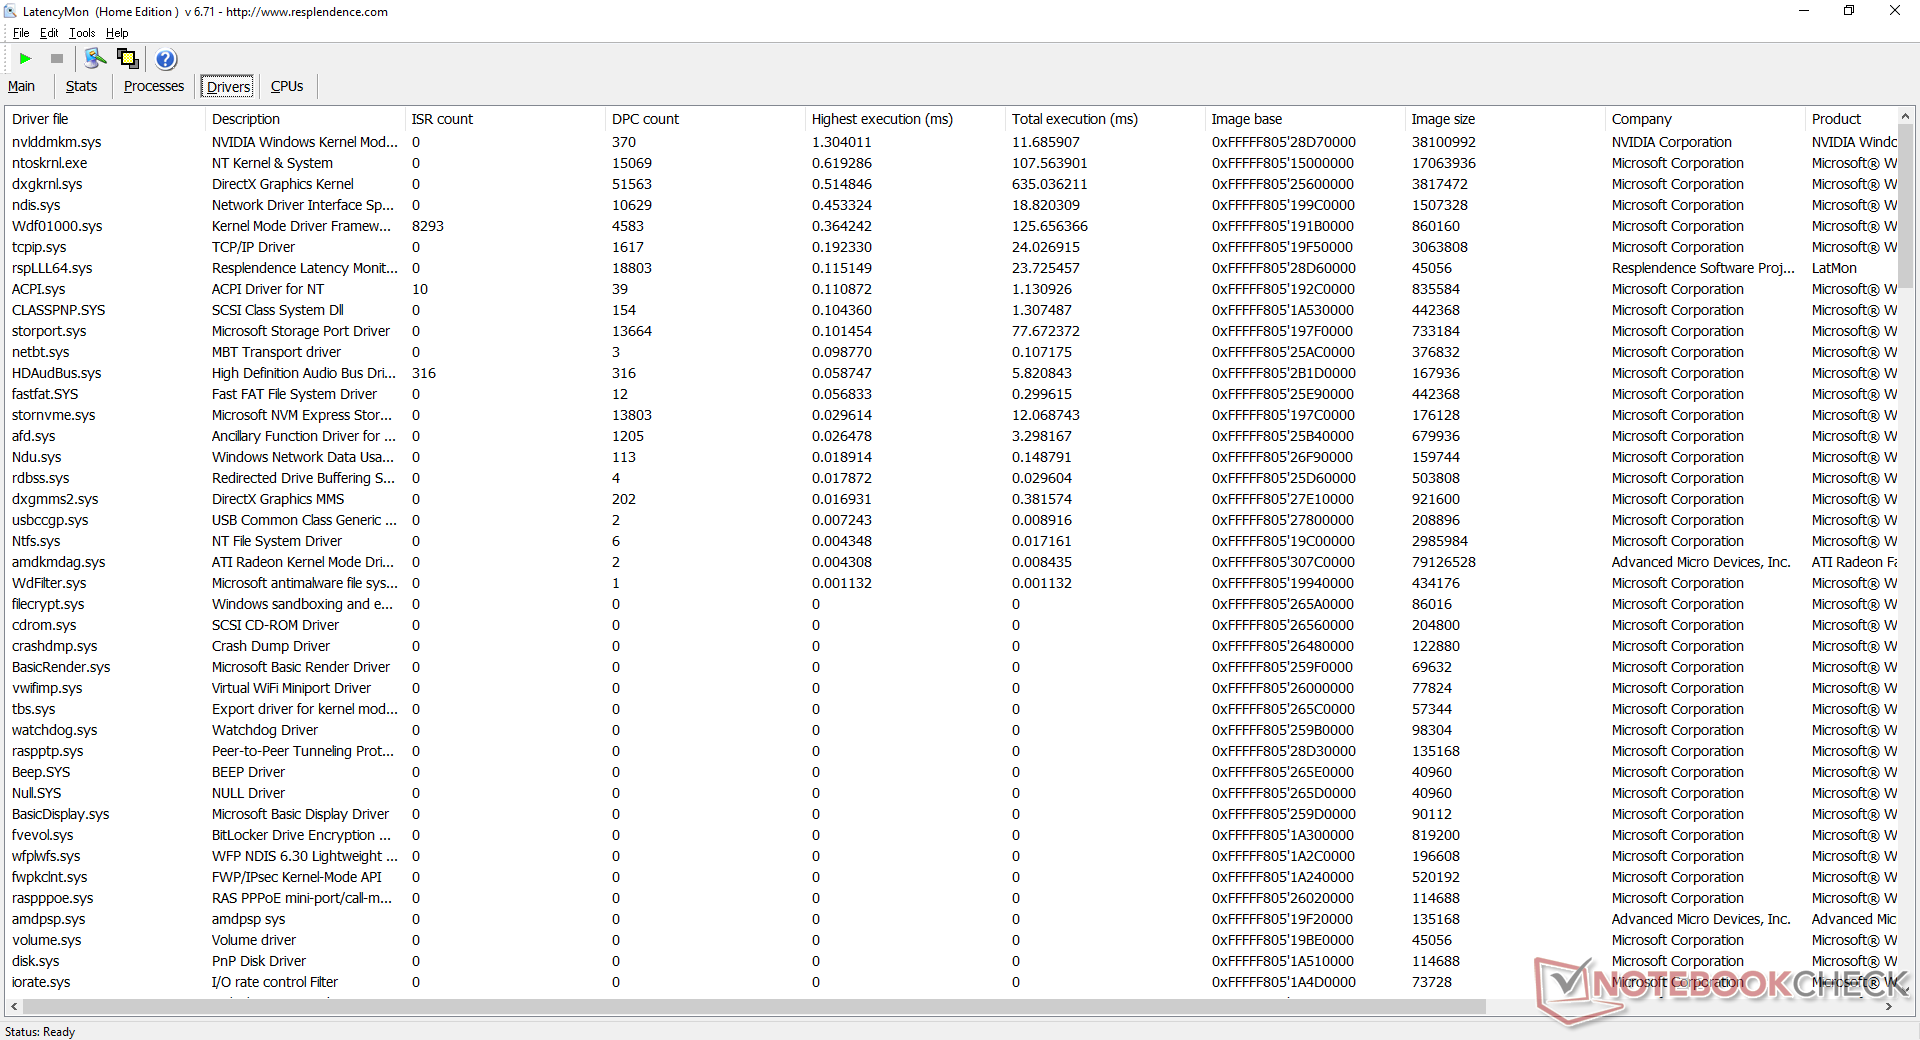
DPC Latency
LatencyMon shows heavy DPC latency issues when opening multiple browser tabs on our homepage. 4K video playback is otherwise smooth and with no dropped frames. CPU and GPU utilization would each sit in the single-digit range only.
| DPC Latencies / LatencyMon - interrupt to process latency (max), Web, Youtube, Prime95 | |
| Asus Zephyrus G14 GA401QM | |
| HP Envy 15-ep0098nr | |
| HP Envy 14-eb0010nr | |
| Asus Zephyrus G14 GA401IV | |
| Razer Blade 14 Ryzen 9 RTX 3070 | |
| Asus Zenbook 14 UX435EG | |
* ... smaller is better
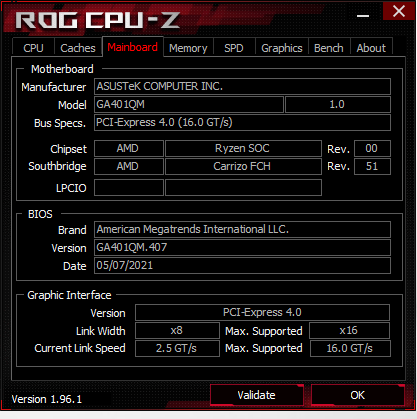
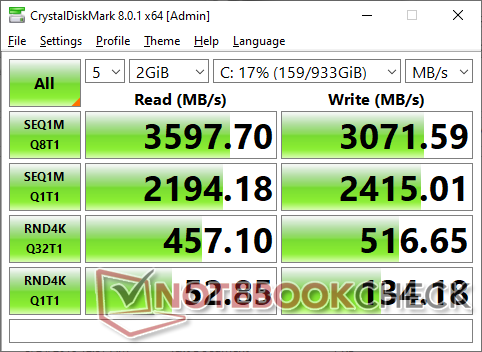
Storage Devices — Just One M.2 PCIe 3.0 x4 2280 Option
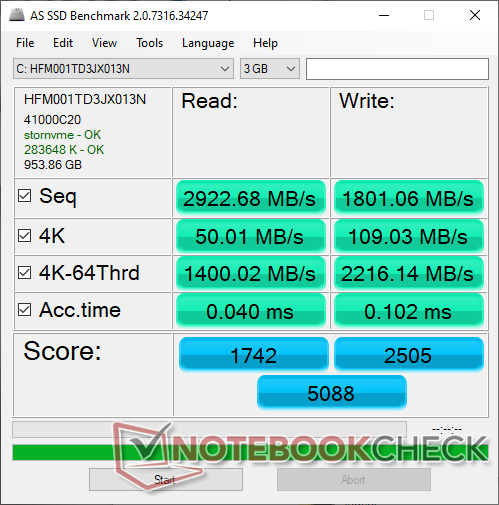
Instead of an Intel 660p like on last year's model, Asus has upgraded to the SK Hynix HFM001TD3JX013N which is able to offer significantly faster read rates approaching 3600 MB/s. Write rates are also faster even though they don't quite match the popular Samsung PM981a.
The internal M.2 slot does not fully support PCIe 4 SSDs that are becoming increasingly common on newer Intel laptops.
| Asus Zephyrus G14 GA401QM SK Hynix HFM001TD3JX013N | Asus Zephyrus G14 GA401IV Intel SSD 660p 1TB SSDPEKNW010T8 | Razer Blade 14 Ryzen 9 RTX 3070 Samsung PM981a MZVLB1T0HBLR | HP Envy 14-eb0010nr Samsung SSD PM981a MZVLB256HBHQ | Asus Zenbook 14 UX435EG Samsung PM981a MZVLB1T0HBLR | |
|---|---|---|---|---|---|
| AS SSD | -28% | 10% | -20% | 9% | |
| Seq Read (MB/s) | 2923 | 1278 -56% | 3066 5% | 2127 -27% | 2861 -2% |
| Seq Write (MB/s) | 1801 | 1624 -10% | 2805 56% | 1427 -21% | 2837 58% |
| 4K Read (MB/s) | 50 | 57.8 16% | 49.8 0% | 52.5 5% | 60.3 21% |
| 4K Write (MB/s) | 109 | 163 50% | 119.7 10% | 122.9 13% | 164.2 51% |
| 4K-64 Read (MB/s) | 1400 | 582 -58% | 2093 50% | 947 -32% | 1598 14% |
| 4K-64 Write (MB/s) | 2216 | 849 -62% | 2009 -9% | 1598 -28% | 1572 -29% |
| Access Time Read * (ms) | 0.04 | 0.036 10% | 0.046 -15% | 0.072 -80% | 0.046 -15% |
| Access Time Write * (ms) | 0.102 | 0.112 -10% | 0.086 16% | 0.09 12% | 0.021 79% |
| Score Read (Points) | 1742 | 768 -56% | 2449 41% | 1212 -30% | 1945 12% |
| Score Write (Points) | 2505 | 1174 -53% | 2410 -4% | 1864 -26% | 2020 -19% |
| Score Total (Points) | 5088 | 2372 -53% | 6095 20% | 3674 -28% | 4966 -2% |
| Copy ISO MB/s (MB/s) | 2076 | 1660 -20% | 1799 -13% | 1605 -23% | 2414 16% |
| Copy Program MB/s (MB/s) | 879 | 443.5 -50% | 750 -15% | 847 -4% | 575 -35% |
| Copy Game MB/s (MB/s) | 1855 | 1162 -37% | 1830 -1% | 1632 -12% | 1408 -24% |
* ... smaller is better

Disk Throttling: DiskSpd Read Loop, Queue Depth 8
GPU Performance
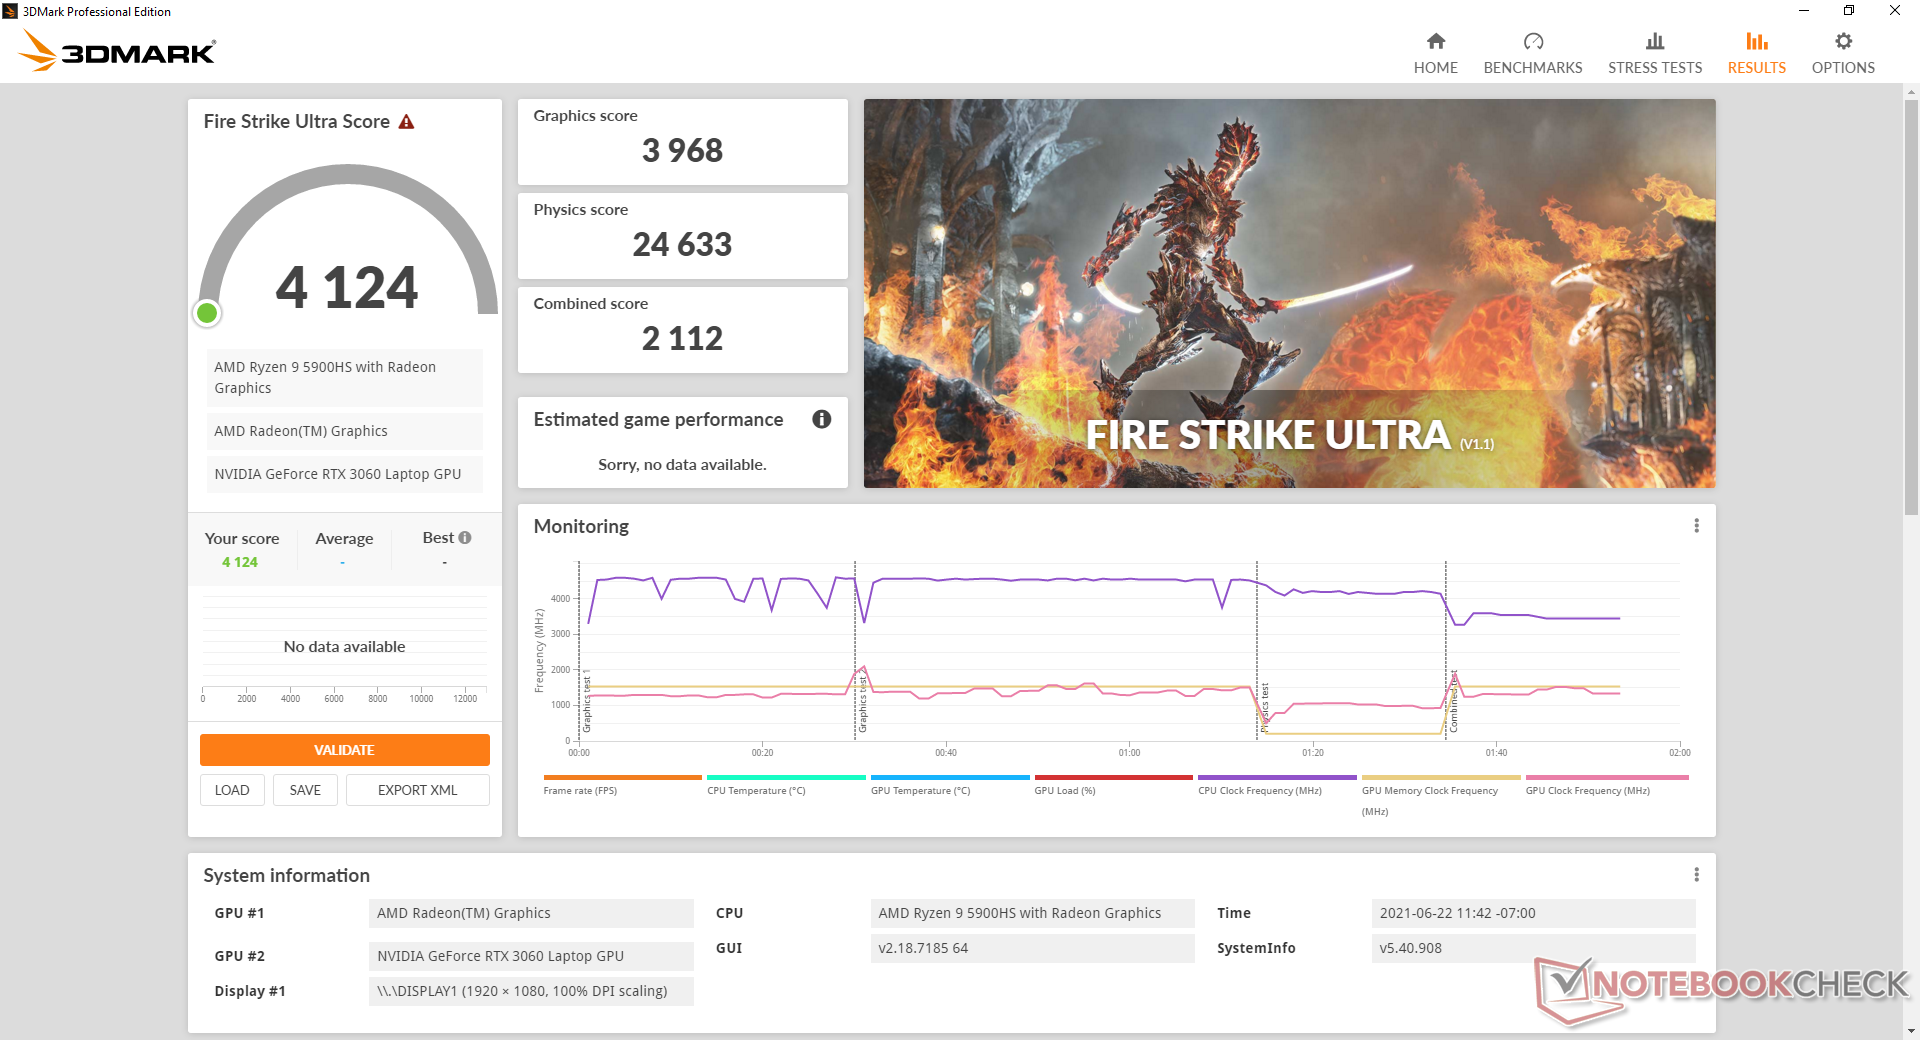
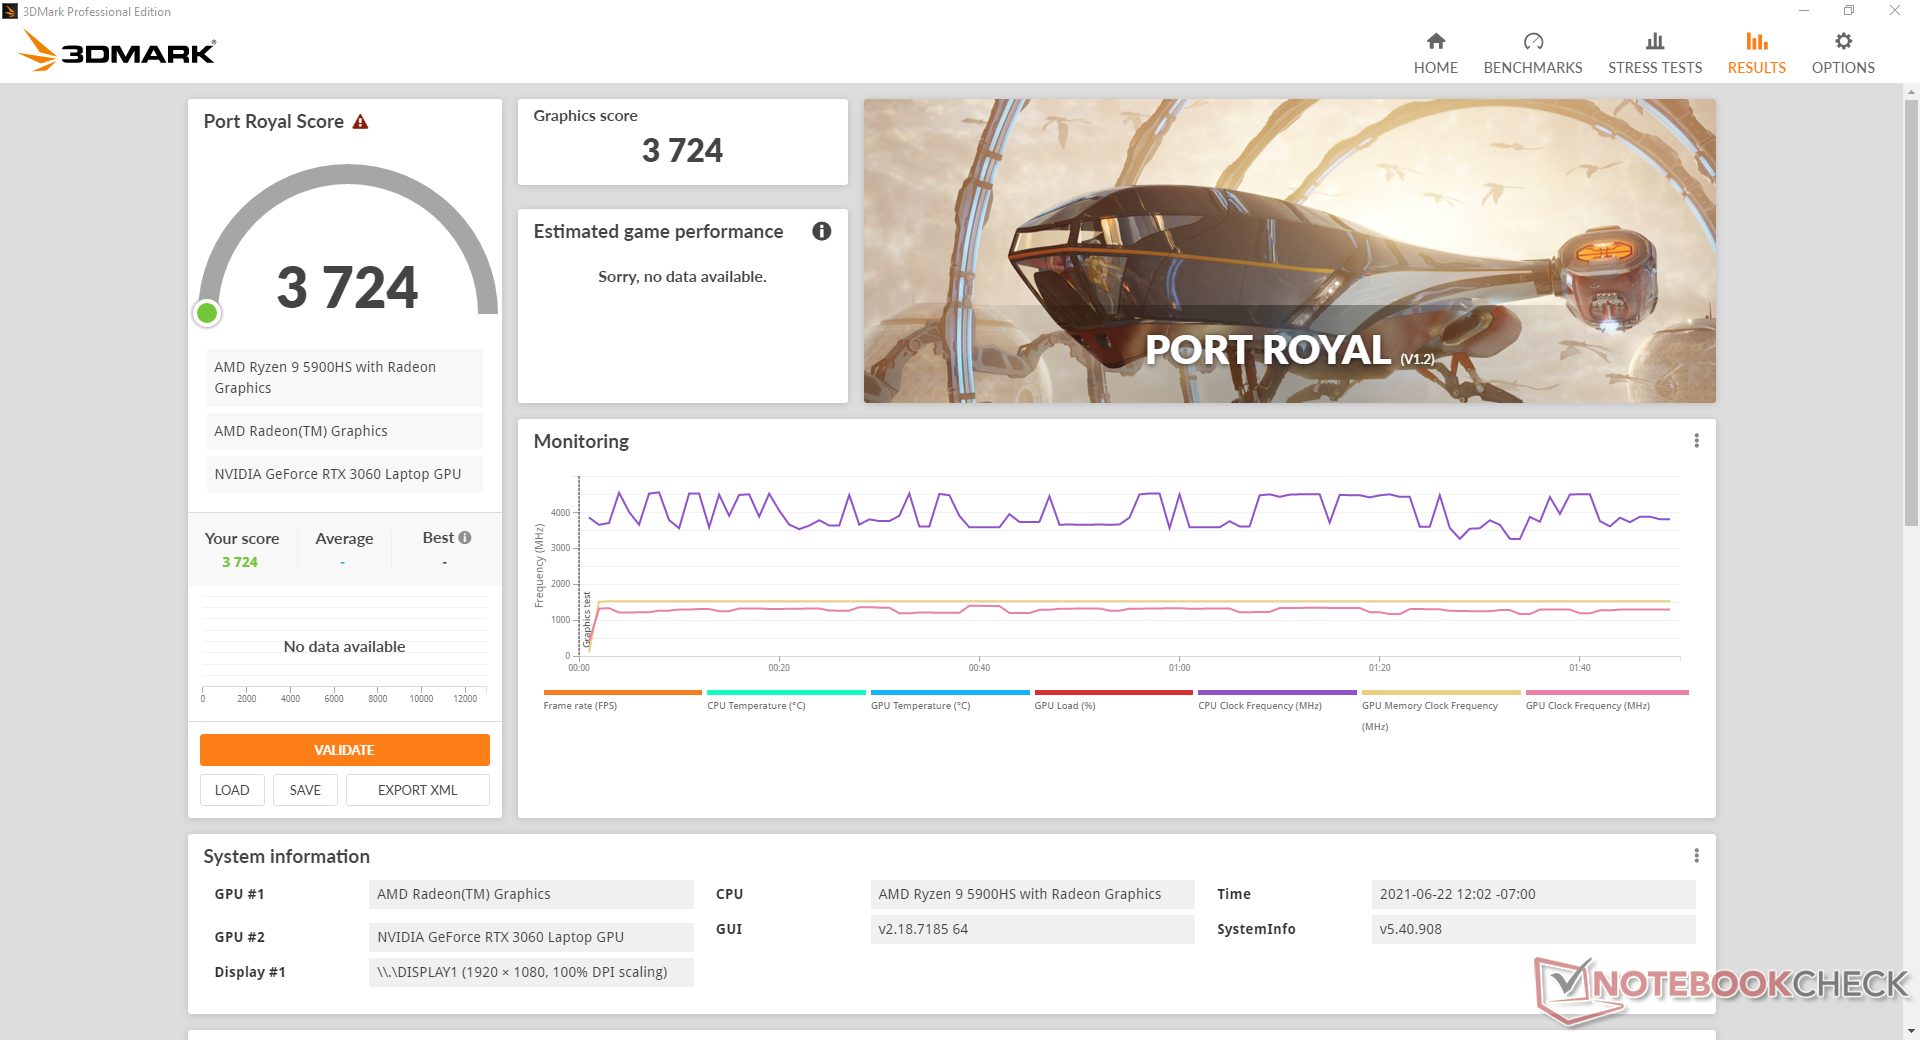
Graphics performance with our Zephyrus G14 is almost 10 percent slower than the average laptop in our database equipped with the same RTX 3060 GPU. This deficit would remain true even when running the system on Turbo or maximum fan mode. Running the laptop in Performance mode instead of Turbo mode would result in a graphics dip of about 3 to 4 percent.
The slightly lower 3DMark scores translate to slightly slower frame rates during real-world gameplay. Performance in more demanding games like GTA V, Final Fantasy XV, or Witcher 3 would be behind the average RTX 3060 laptop by a few percentage points. Frame rates are nonetheless steady and without any unusual dips or micro-stuttering over time.
Users can still expect 15 to 30 percent faster graphics performance over the RTX 2060 Max-Q despite the below-average scores from our 60+ W RTX 3060.
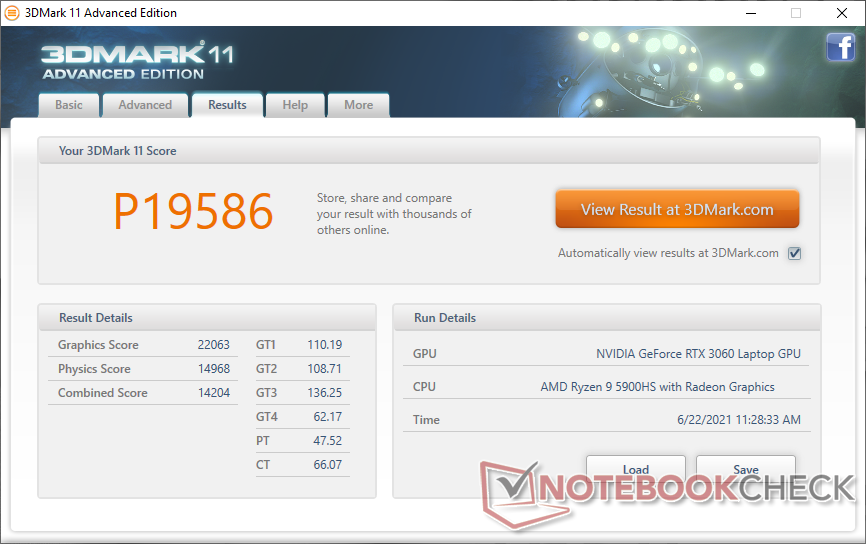

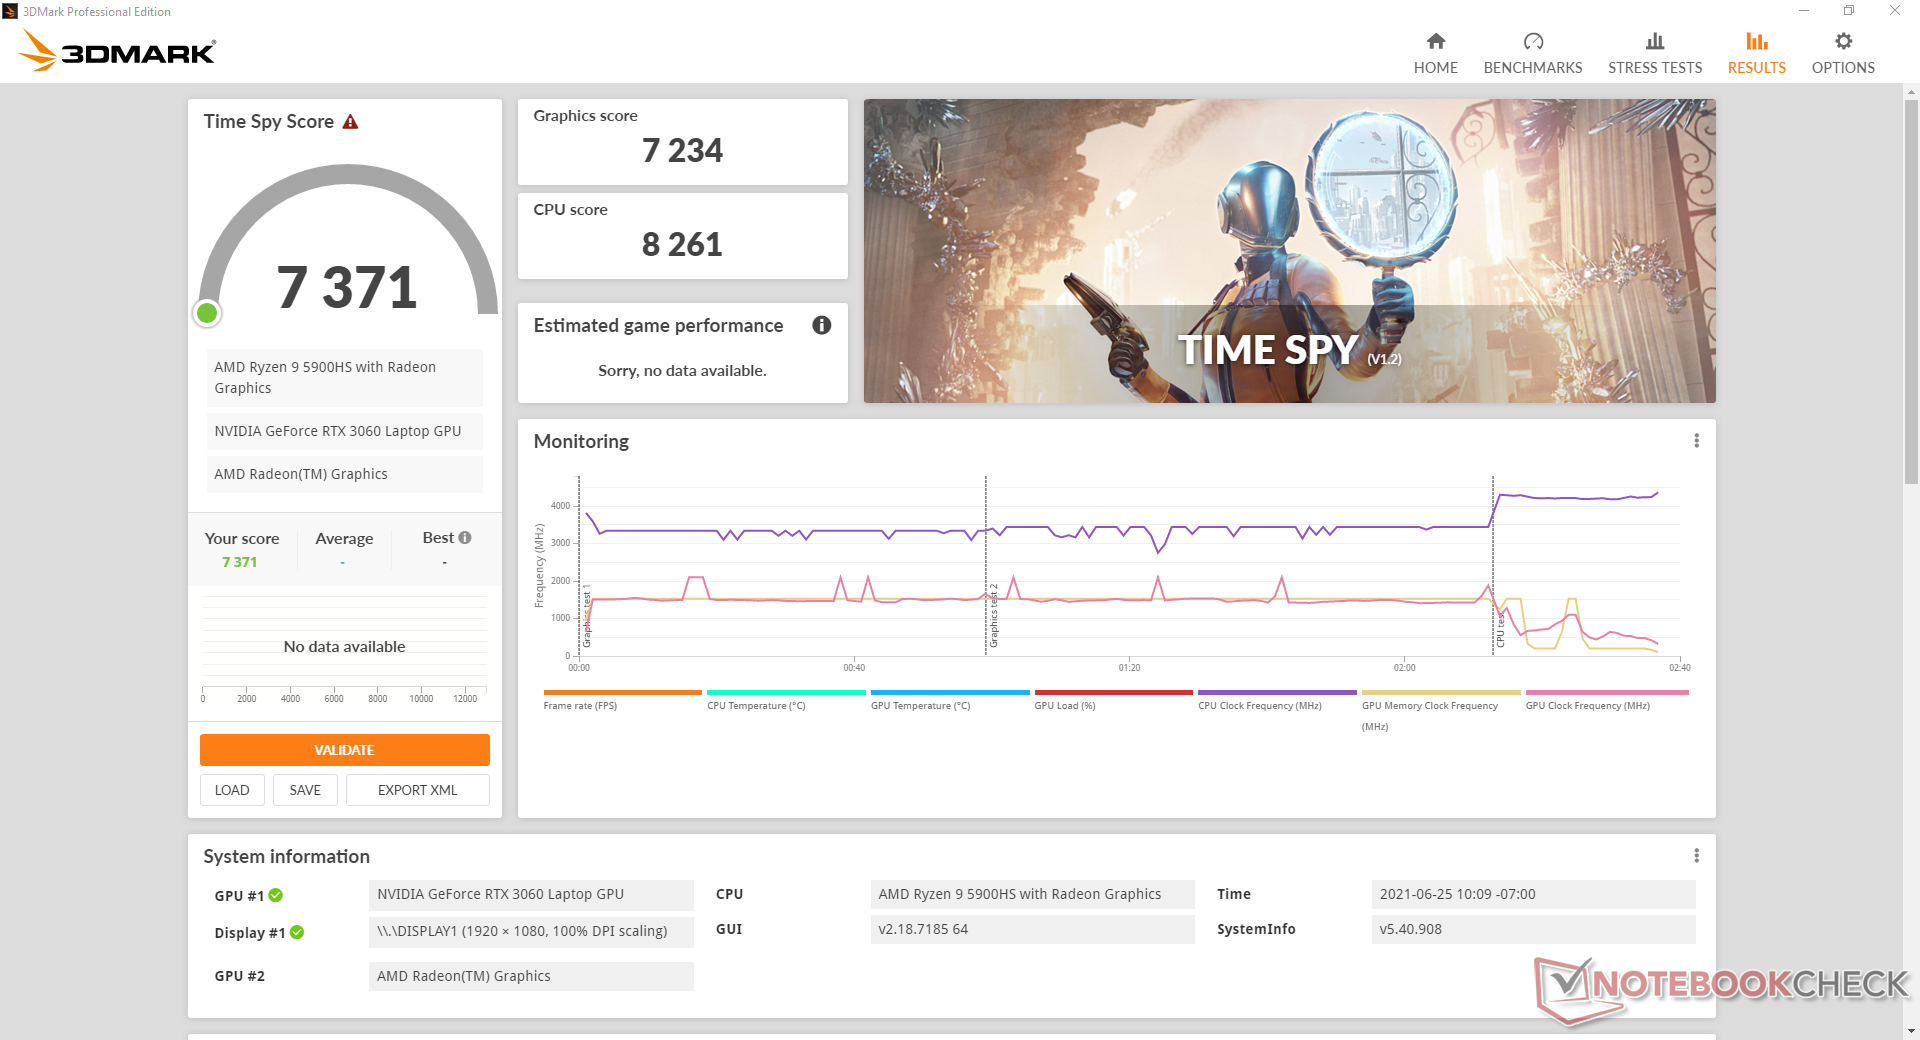
| 3DMark 11 Performance | 19586 points | |
| 3DMark Cloud Gate Standard Score | 44342 points | |
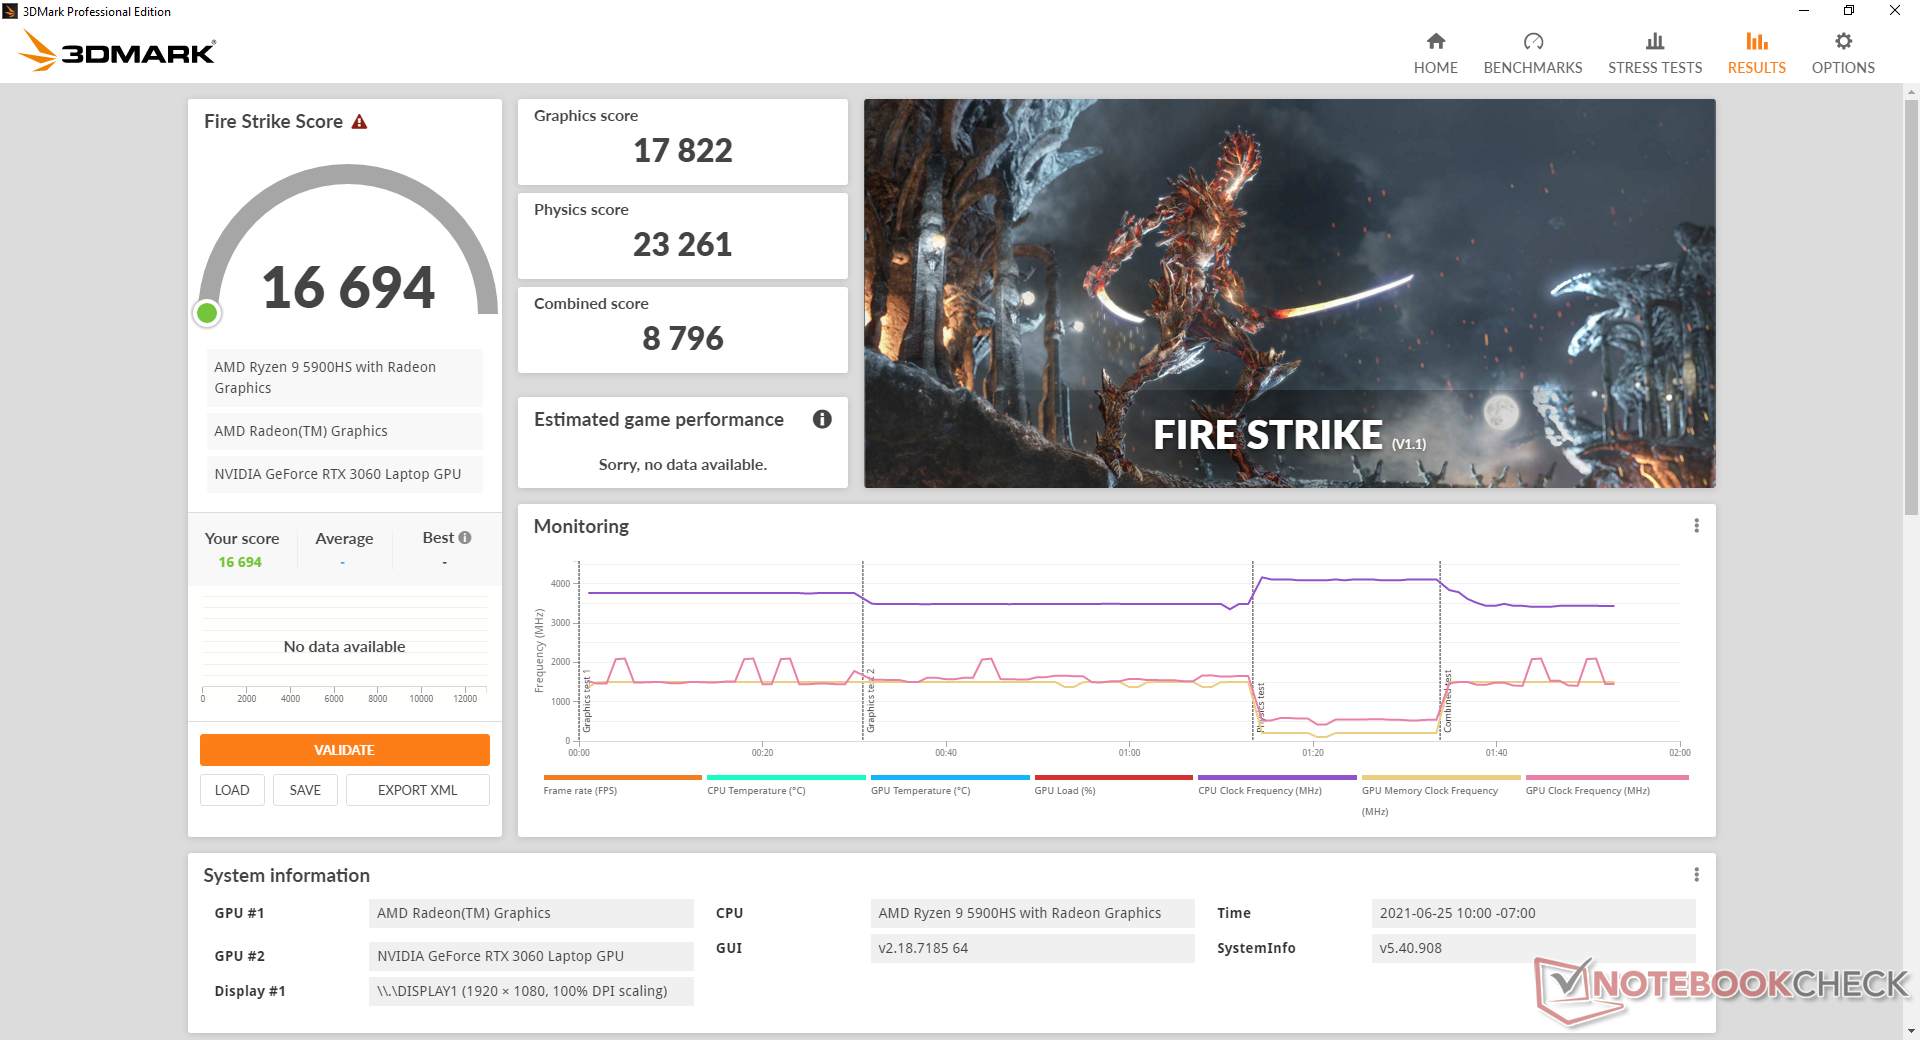
| 3DMark Fire Strike Score | 17223 points | |
| 3DMark Time Spy Score | 7371 points | |
Help | ||
Witcher 3 FPS Chart
| low | med. | high | ultra | |
|---|---|---|---|---|
| GTA V (2015) | 172 | 134 | 79.6 | |
| The Witcher 3 (2015) | 267 | 127.9 | 68.3 | |
| Dota 2 Reborn (2015) | 133 | 132 | 115 | 110 |
| Final Fantasy XV Benchmark (2018) | 139 | 88.7 | 68.9 | |
| X-Plane 11.11 (2018) | 97.1 | 82.7 | 61.9 | |
| Strange Brigade (2018) | 285 | 162 | 138 | 123 |
Emissions — Turbo Mode Required For Maximum Performance
System Noise
Fan noise is highly dependent on the Armoury Crate settings. The system does a pretty good job at remaining quiet when browsing the web or video streaming on Silent mode. At worst, fan noise would only boost up to 34.5 dB(A) temporarily against a silent background of 24.8 dB(A). Fan noise would also be reasonable when set to Windows or Performance mode at 35.4 dB(A) after running the first benchmark scene of 3DMark 06 to be a lot quieter than what we observed on the recent HP Envy 15 Creator.
Running Witcher 3 on Performance mode and Turbo would result in a steady fan noise of 48.5 dB(A) and 52.7 dB(A), respectively. Performance mode can be up to 5 percent slower than Turbo mode when gaming despite the significant fan noise difference between them.
Keep in mind that the fans will pulse frequently when set to anything other than Silent mode. Thus, it's worth running the system on Silent mode whenever the extra horsepower isn't needed.
| Asus Zephyrus G14 GA401QM GeForce RTX 3060 Laptop GPU, R9 5900HS, SK Hynix HFM001TD3JX013N | Asus Zephyrus G14 GA401IV GeForce RTX 2060 Max-Q, R9 4900HS, Intel SSD 660p 1TB SSDPEKNW010T8 | Razer Blade 14 Ryzen 9 RTX 3070 GeForce RTX 3070 Laptop GPU, R9 5900HX, Samsung PM981a MZVLB1T0HBLR | HP Envy 14-eb0010nr GeForce GTX 1650 Ti Max-Q, i5-1135G7, Samsung SSD PM981a MZVLB256HBHQ | Asus Zenbook 14 UX435EG GeForce MX450, i7-1165G7, Samsung PM981a MZVLB1T0HBLR | HP Envy 15-ep0098nr GeForce RTX 2060 Max-Q, i7-10750H, Intel Optane Memory H10 with Solid State Storage 32GB + 512GB HBRPEKNX0202A(L/H) | |
|---|---|---|---|---|---|---|
| Noise | -3% | 12% | 12% | 10% | -10% | |
| off / environment * (dB) | 24.8 | 28.1 -13% | 25.1 -1% | 25.9 -4% | 25.6 -3% | 26.4 -6% |
| Idle Minimum * (dB) | 25.4 | 30.4 -20% | 25.2 1% | 26 -2% | 25.6 -1% | 32.2 -27% |
| Idle Average * (dB) | 34.5 | 31.5 9% | 25.2 27% | 26 25% | 25.6 26% | 32.2 7% |
| Idle Maximum * (dB) | 34.5 | 33.7 2% | 25.2 27% | 26 25% | 26.3 24% | 32.2 7% |
| Load Average * (dB) | 35.4 | 34.3 3% | 31 12% | 34.9 1% | 41.6 -18% | 48.3 -36% |
| Witcher 3 ultra * (dB) | 52.7 | 53.5 -2% | 44 17% | 34.5 35% | 41.6 21% | 53.7 -2% |
| Load Maximum * (dB) | 52.3 | 53.5 -2% | 51.7 1% | 48.7 7% | 41.6 20% | 58.8 -12% |
* ... smaller is better
Noise level
| Idle |
| 25.4 / 34.5 / 34.5 dB(A) |
| Load |
| 35.4 / 52.3 dB(A) |
 | ||
30 dB silent 40 dB(A) audible 50 dB(A) loud |
||
min: | ||
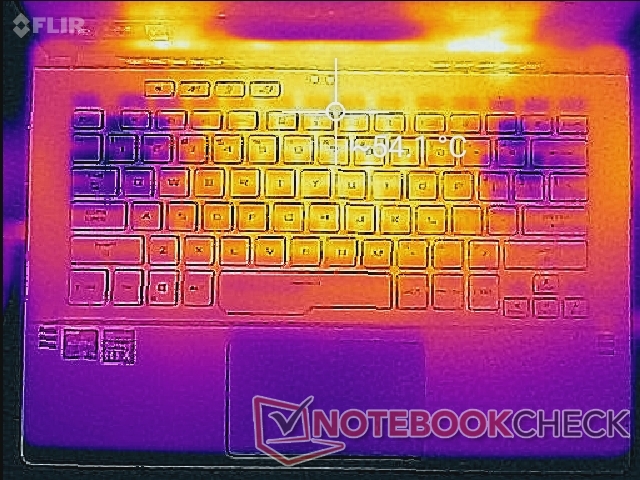
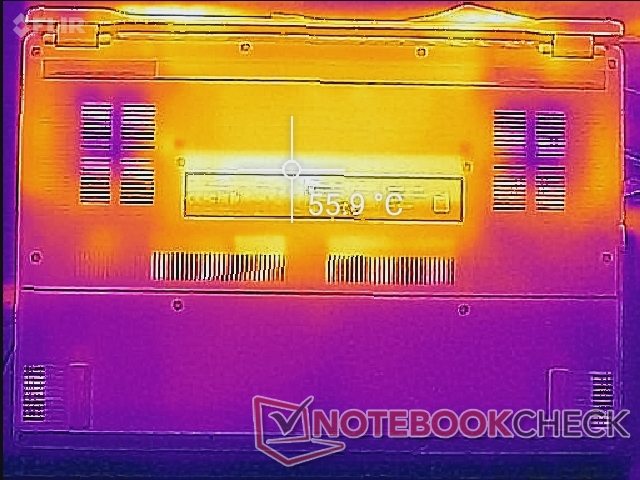
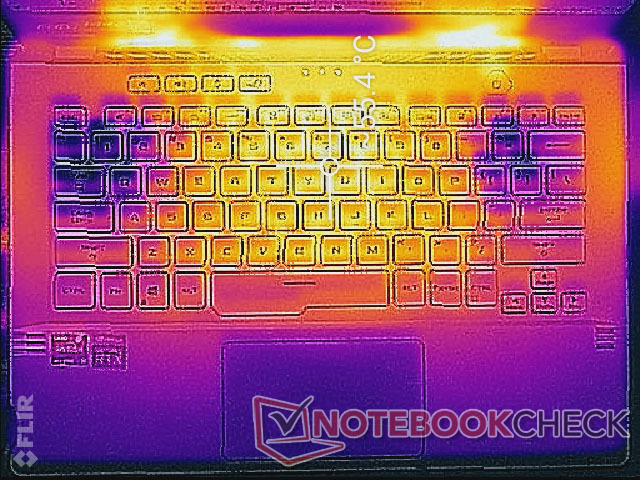
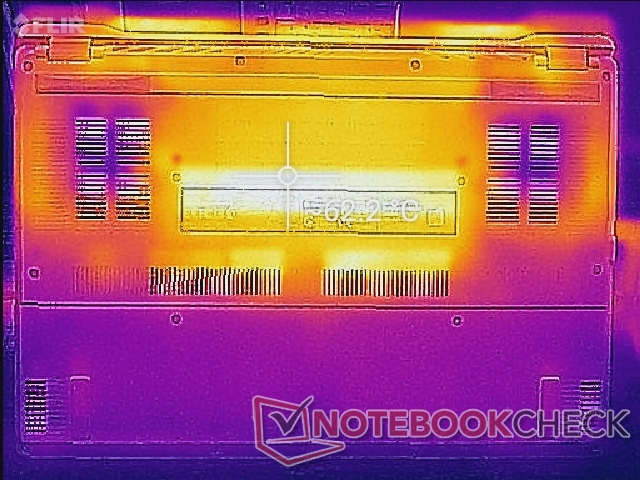
Temperature — Very Warm Keyboard Center
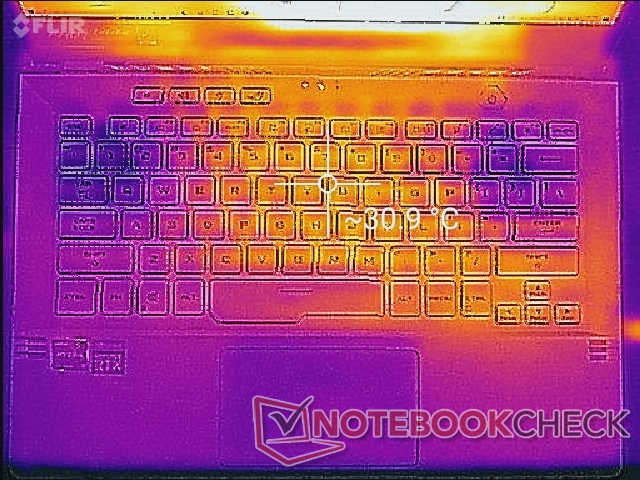
Surface temperatures are largely symmetrical and so the warmest spots on the laptop will be toward the center. When gaming, these hot spots can be as warm as 54 C to 62 C compared to 45 C to 52 C on the Blade 14. The palm rests and WASD keys will always be cooler for more comfortable hands when gaming.
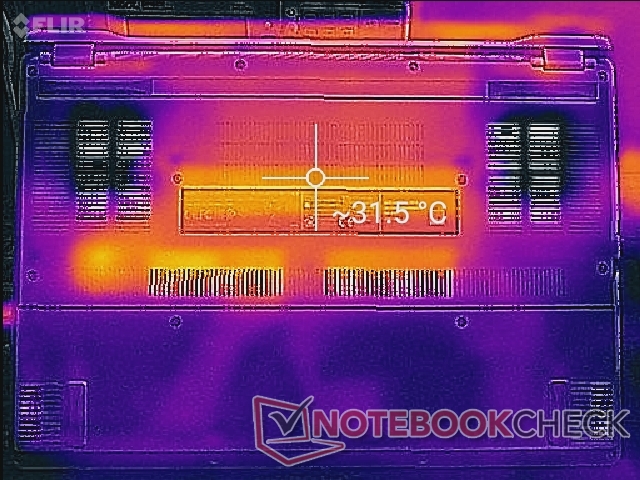
Another interesting distinction between the Zephyrus G14 and the Blade 14 is that the Asus chassis has heat exiting from the left and right edges while the Razer does not. If you're gaming with an external mouse, then it's more than likely you'll feel the warm air on your hand.
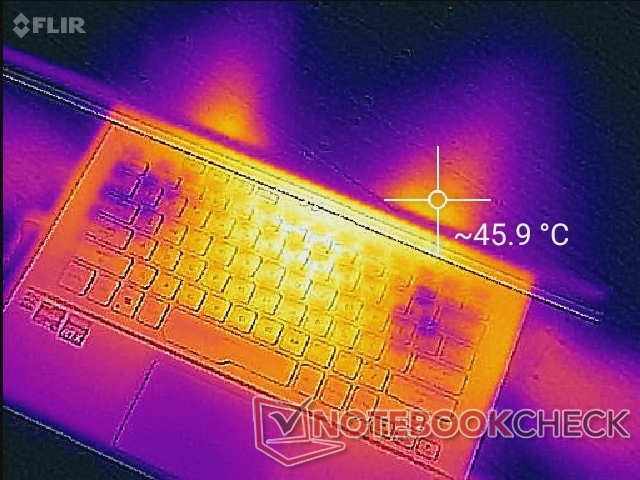

(-) The maximum temperature on the upper side is 55.4 °C / 132 F, compared to the average of 40.4 °C / 105 F, ranging from 21.2 to 68.8 °C for the class Gaming.
(-) The bottom heats up to a maximum of 62.2 °C / 144 F, compared to the average of 43.2 °C / 110 F
(+) In idle usage, the average temperature for the upper side is 29 °C / 84 F, compared to the device average of 33.9 °C / 93 F.
(-) Playing The Witcher 3, the average temperature for the upper side is 40.4 °C / 105 F, compared to the device average of 33.9 °C / 93 F.
(±) The palmrests and touchpad can get very hot to the touch with a maximum of 37.6 °C / 99.7 F.
(-) The average temperature of the palmrest area of similar devices was 28.8 °C / 83.8 F (-8.8 °C / -15.9 F).
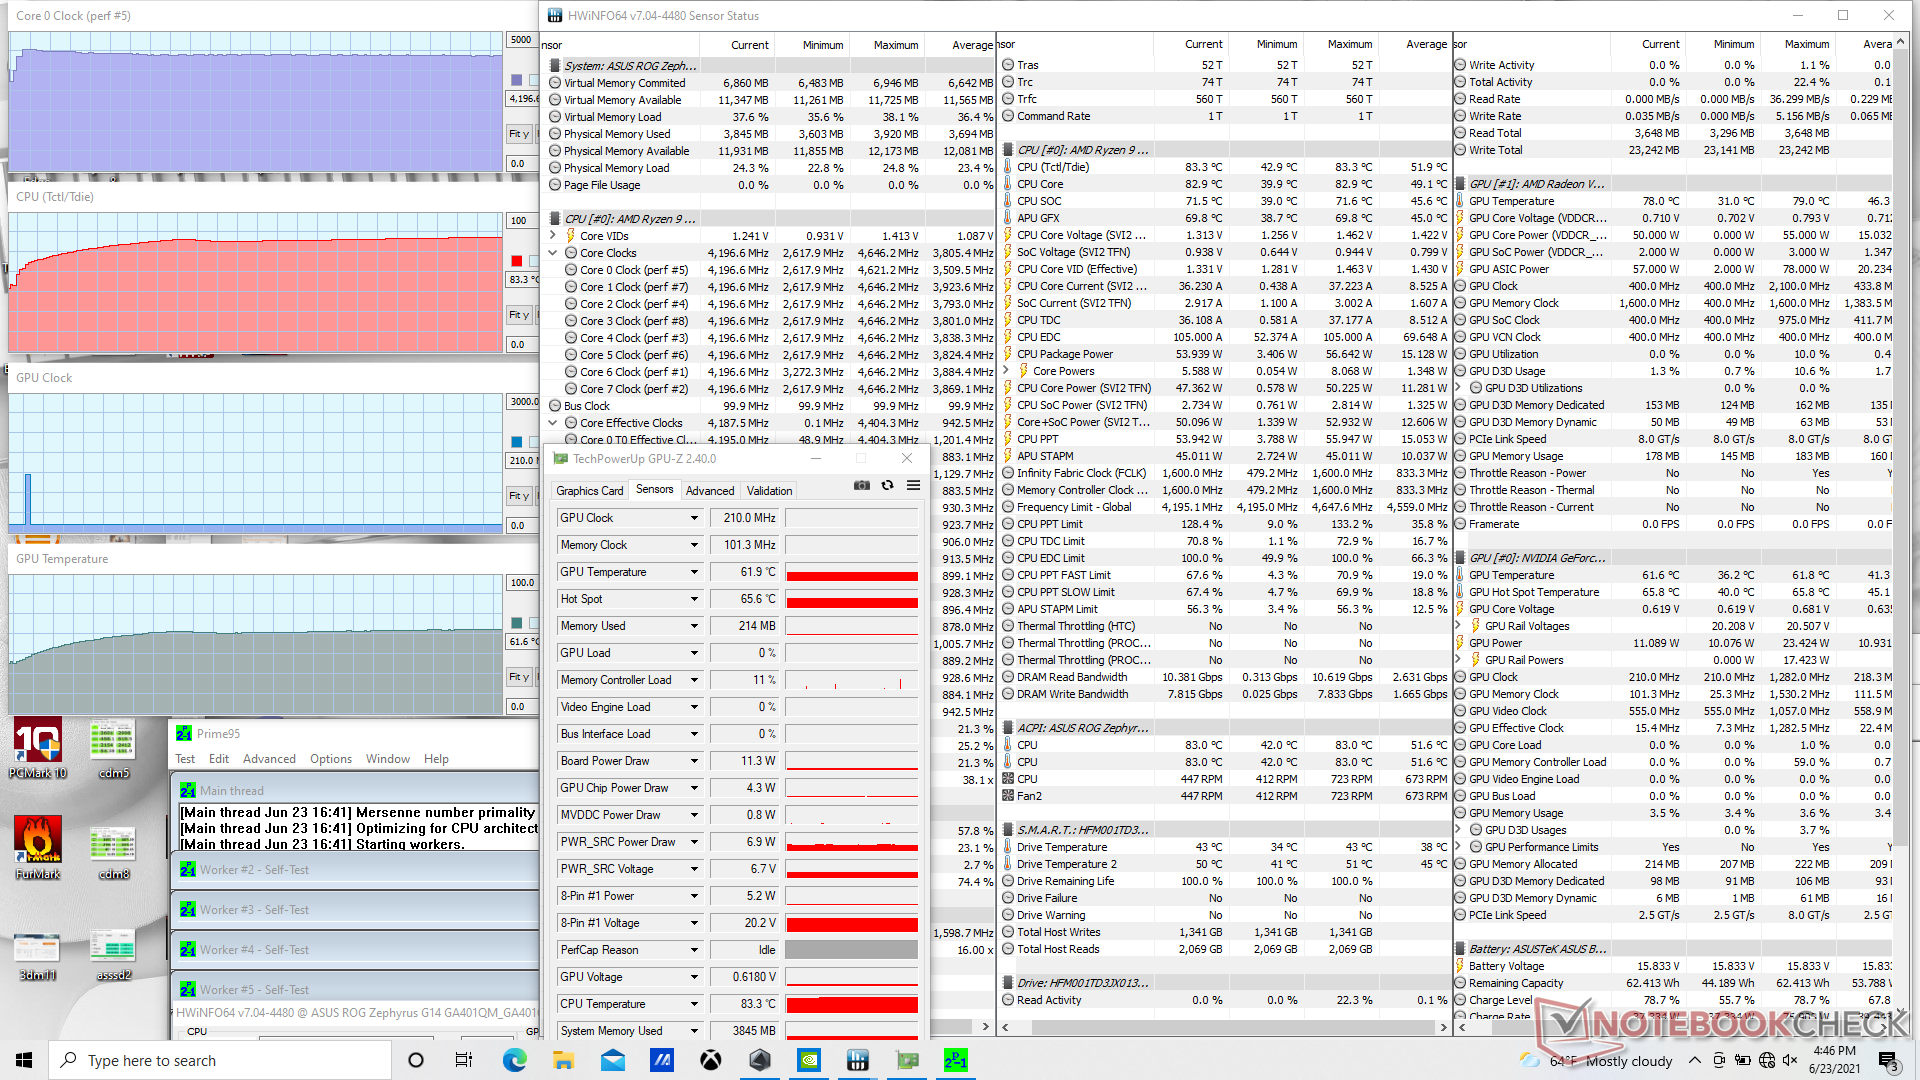
Stress Test
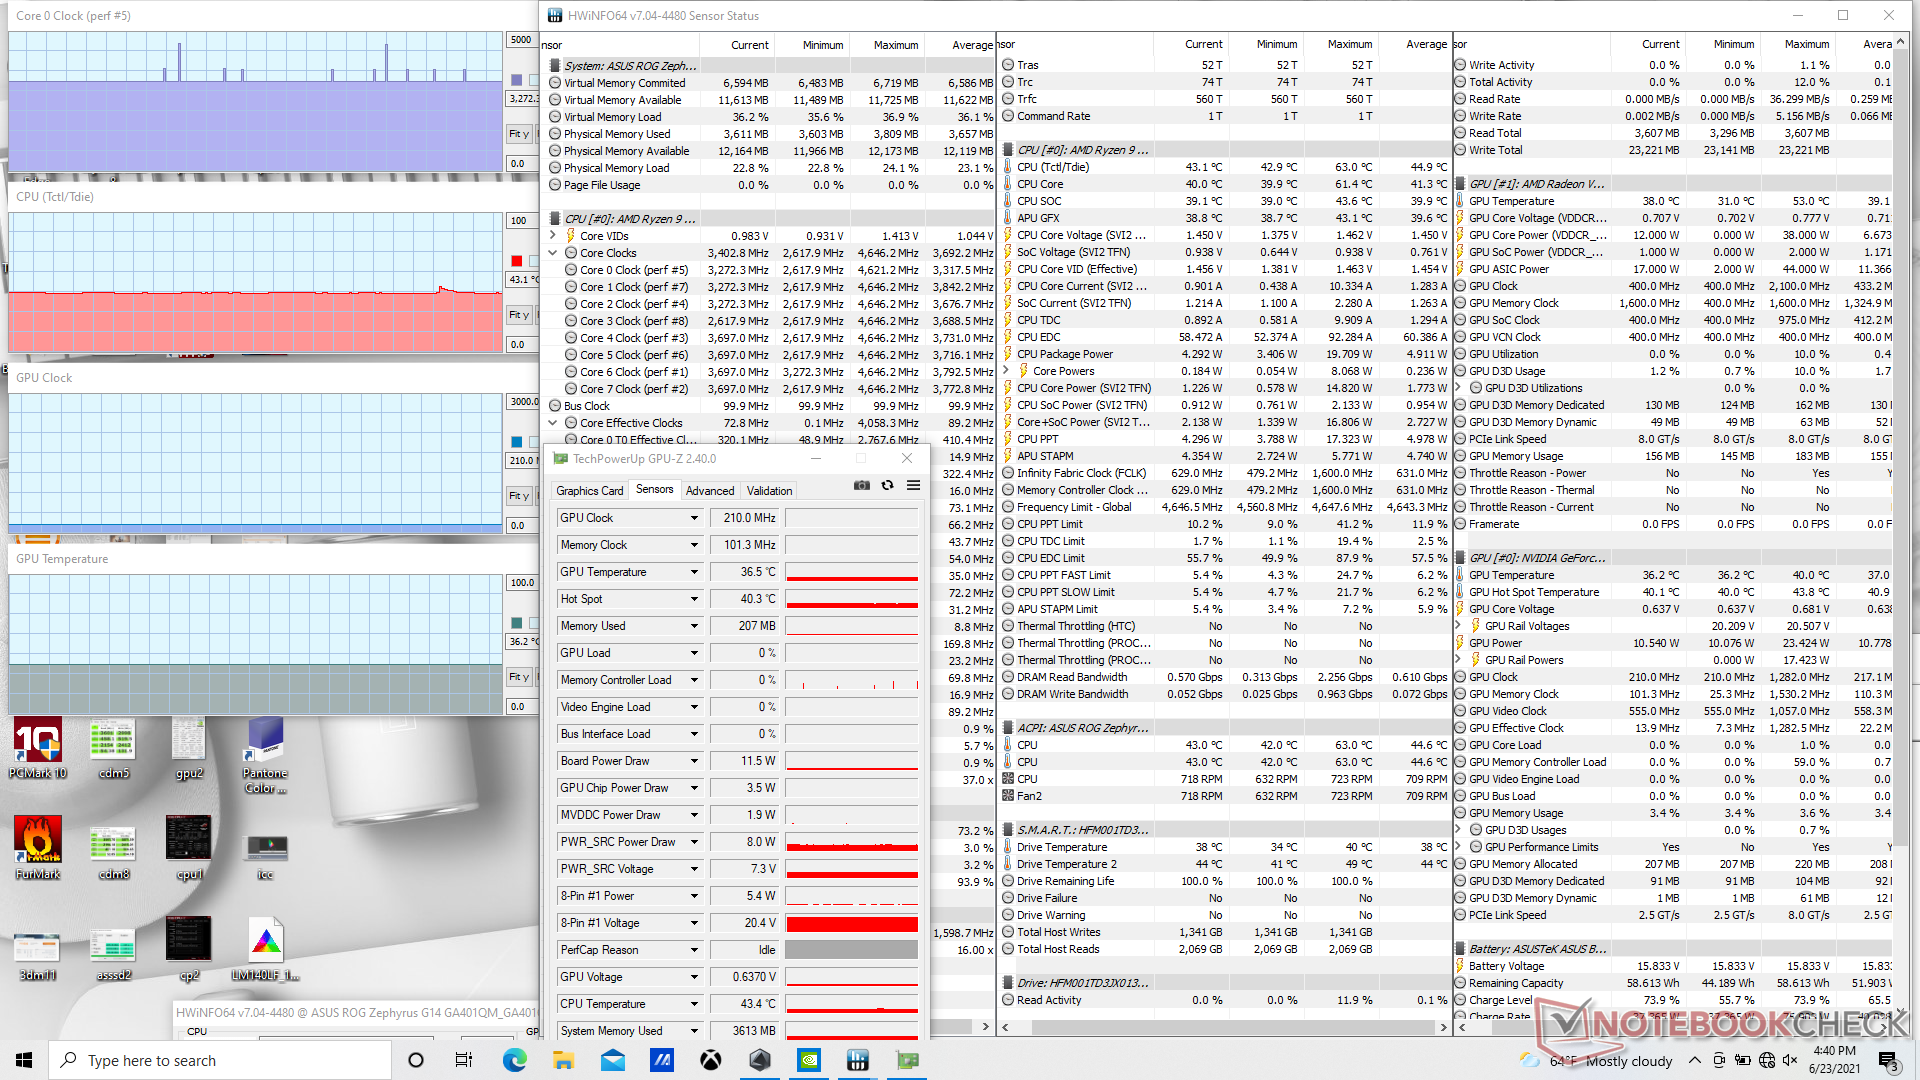
When the CPU is stressed with Prime95, clock rates would boost to 4.4 GHz for a couple of seconds before eventually settling at 4.2 GHz and 83 C. When considering that the maximum rated Turbo Boost for the CPU is 4.6 GHz, the stable 4.2 GHz isn't bad at all. Running this same test on the 2020 Zephyrus G14 would result in a stable clock rate and temperature of only 3.3 GHz and 78 C, respectively.
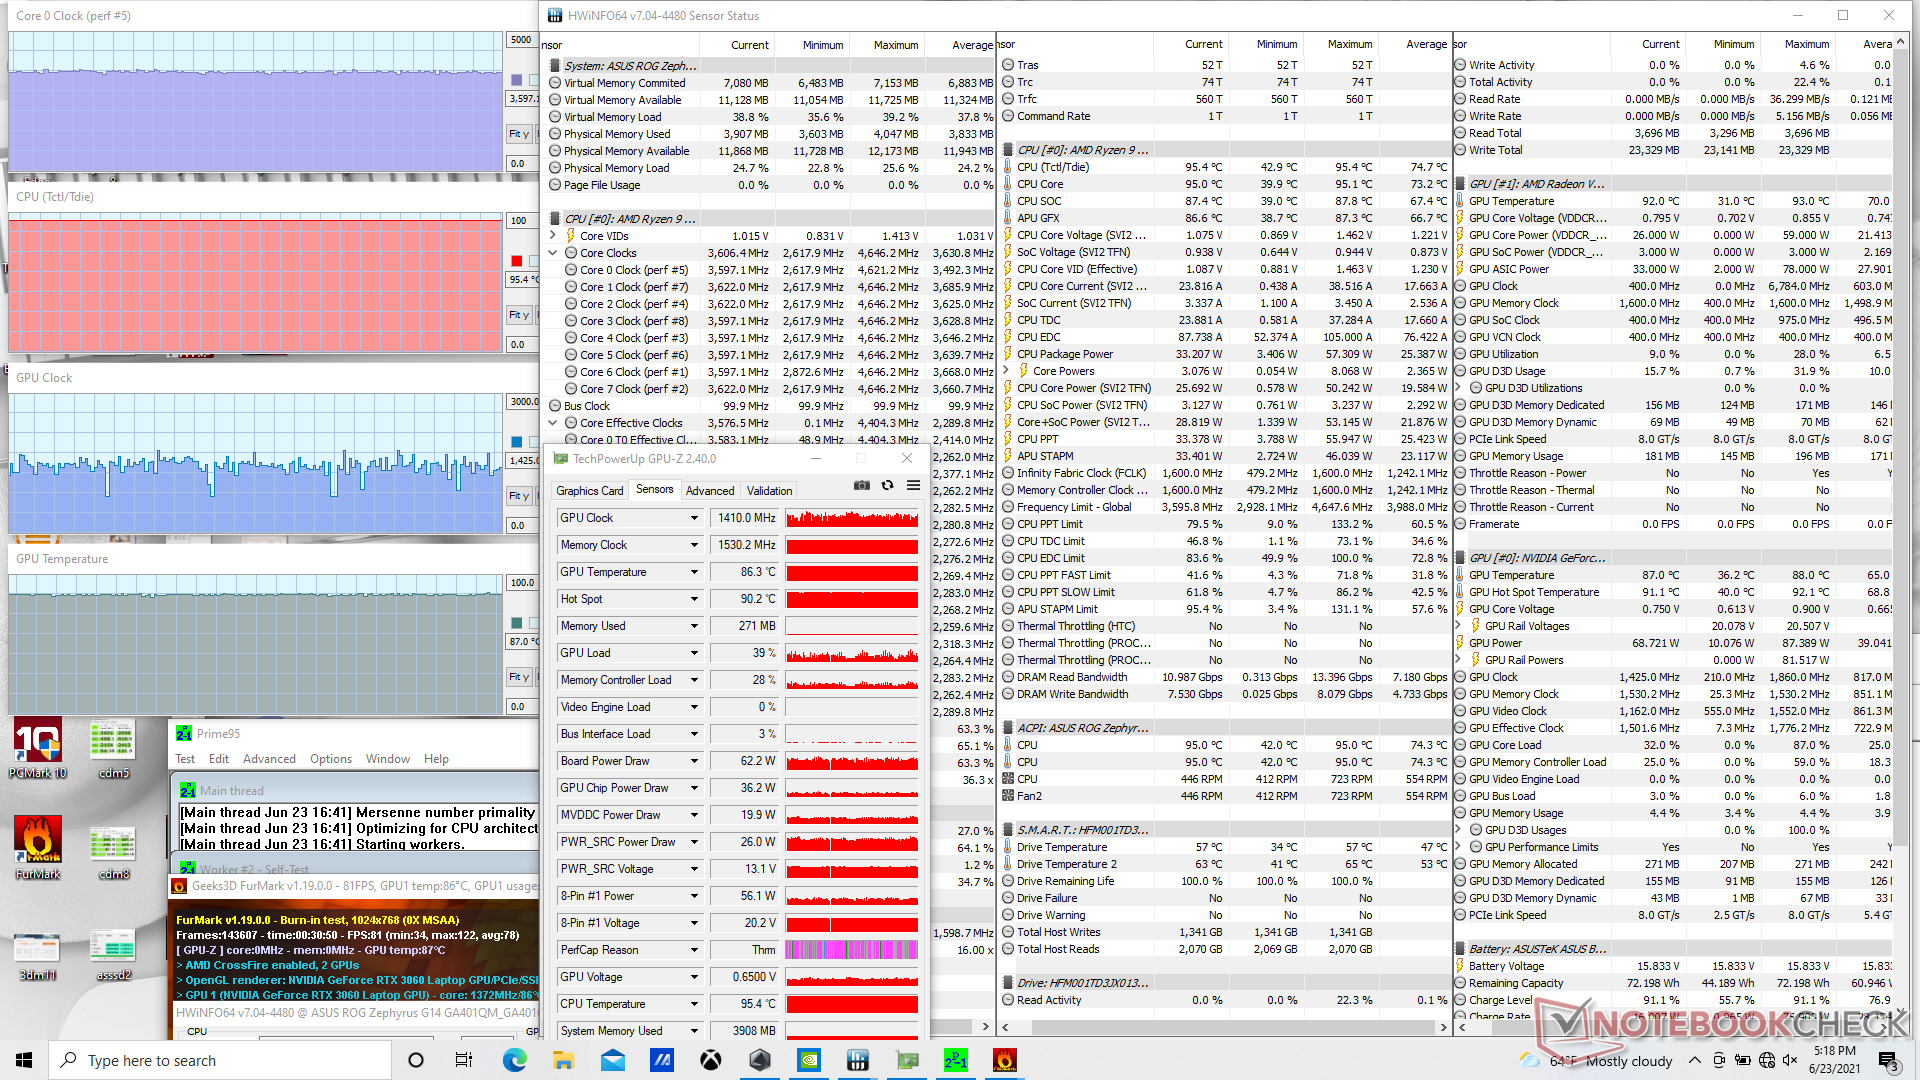
We're able to push the CPU and GPU to 95 C and 87 C, respectively, when running each at 100 percent utilization with Prime95 and FurMark.
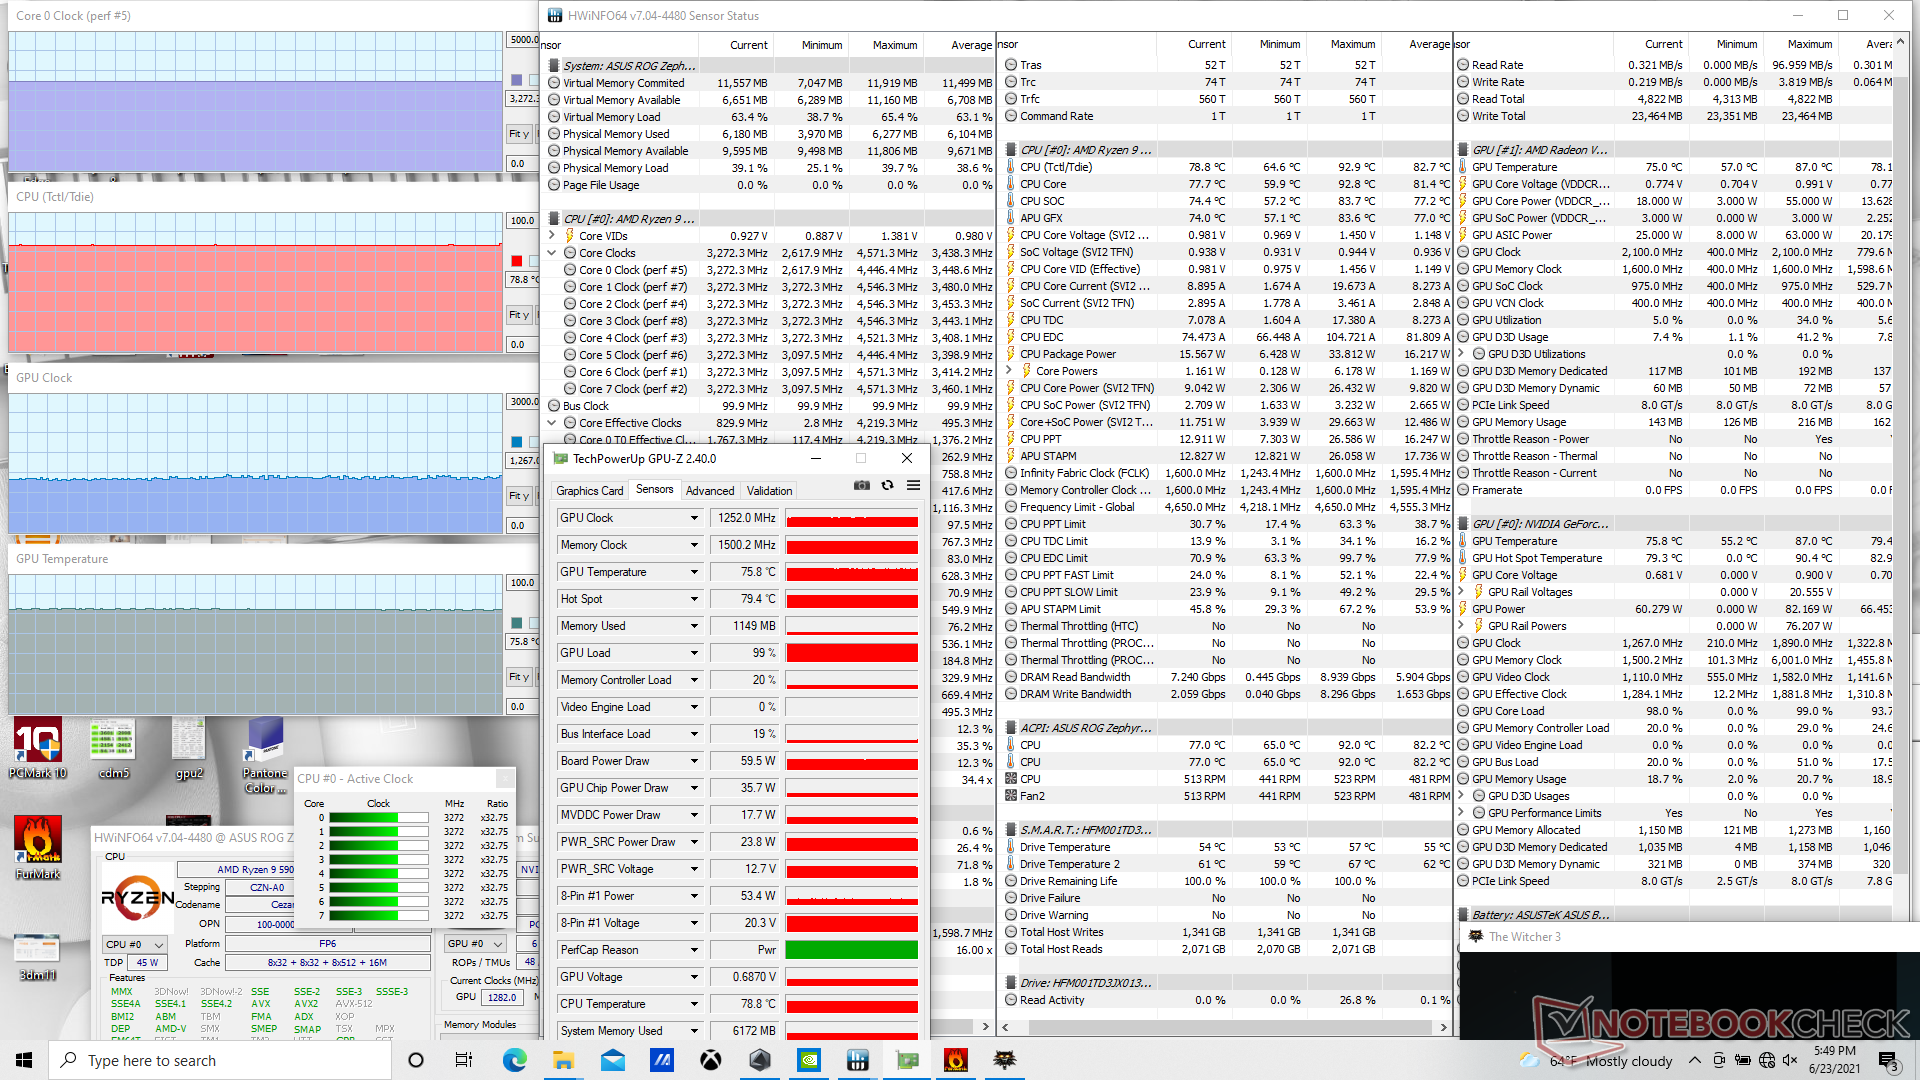
Running Witcher 3 on Turbo mode results in slightly faster GPU clock rates (1560 MHz vs. 1252 MHz), memory clock rates (1530 MHz vs. 1500 MHz), and core temperature (85 C vs. 76 C) when compared to Performance mode. Board power draw would also boost to 80 W instead of only 60 W when on Performance mode. If you want the full power of the GPU, then you'll have to game on Turbo mode and tolerate the louder fan noise.
Running on battery power will limit performance. A 3DMark 11 test on batteries would return Physics and Graphics scores of 14870 and 19946 points, respectively, compared to 14968 and 22063 points when on mains.
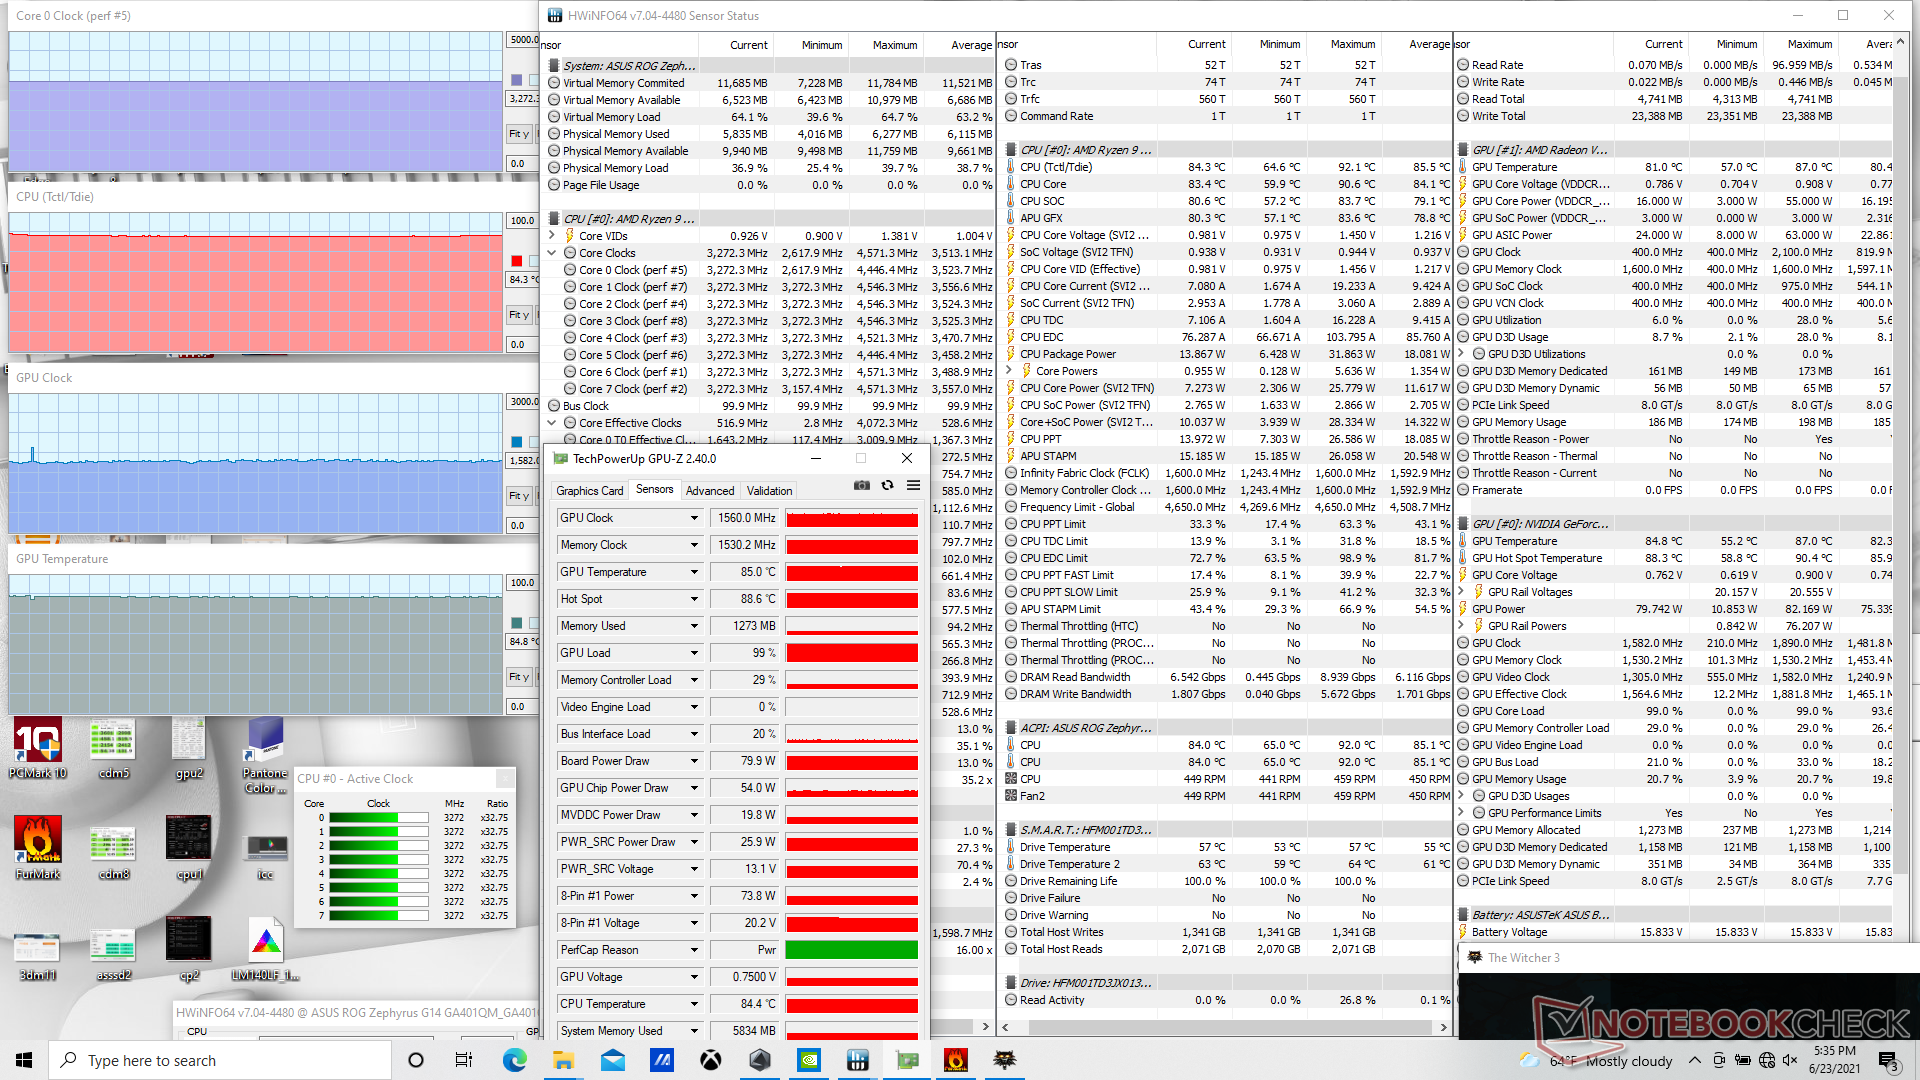
| CPU Clock (GHz) | GPU Clock (MHz) | Average CPU Temperature (°C) | Average GPU Temperature (°C) | |
| System Idle | -- | -- | 43 | 36 |
| Prime95 Stress | 4.2 | -- | 83 | 62 |
| Prime95 + FurMark Stress | 3.6 | ~1410 | 95 | 87 |
| Witcher 3 Stress (Performance mode) | 3.3 | 1252 | 79 | 76 |
| Witcher 3 Stress (Turbo mode) | 3.3 | 1560 | 84 | 85 |
Speakers
The speakers on the Zephyrus G14 are better than expected considering the 14-inch form factor. In fact, the system carries two 2.5 W regular speakers and two 0.7 W tweeters unlike most other laptops with just stereo speakers. Audio is much more balanced between lower and higher frequency ranges as a result. Maximum volume, however, could be a little louder if you're trying to fill a larger room.


Asus Zephyrus G14 GA401QM audio analysis
(±) | speaker loudness is average but good (77.2 dB)
Bass 100 - 315 Hz
(±) | reduced bass - on average 6.3% lower than median
(±) | linearity of bass is average (9% delta to prev. frequency)
Mids 400 - 2000 Hz
(+) | balanced mids - only 3.2% away from median
(+) | mids are linear (6% delta to prev. frequency)
Highs 2 - 16 kHz
(+) | balanced highs - only 2.1% away from median
(+) | highs are linear (5.2% delta to prev. frequency)
Overall 100 - 16.000 Hz
(+) | overall sound is linear (11.3% difference to median)
Compared to same class
» 8% of all tested devices in this class were better, 4% similar, 88% worse
» The best had a delta of 6%, average was 18%, worst was 132%
Compared to all devices tested
» 7% of all tested devices were better, 2% similar, 91% worse
» The best had a delta of 4%, average was 23%, worst was 134%
Apple MacBook 12 (Early 2016) 1.1 GHz audio analysis
(+) | speakers can play relatively loud (83.6 dB)
Bass 100 - 315 Hz
(±) | reduced bass - on average 11.3% lower than median
(±) | linearity of bass is average (14.2% delta to prev. frequency)
Mids 400 - 2000 Hz
(+) | balanced mids - only 2.4% away from median
(+) | mids are linear (5.5% delta to prev. frequency)
Highs 2 - 16 kHz
(+) | balanced highs - only 2% away from median
(+) | highs are linear (4.5% delta to prev. frequency)
Overall 100 - 16.000 Hz
(+) | overall sound is linear (10.2% difference to median)
Compared to same class
» 7% of all tested devices in this class were better, 2% similar, 90% worse
» The best had a delta of 5%, average was 18%, worst was 53%
Compared to all devices tested
» 5% of all tested devices were better, 1% similar, 94% worse
» The best had a delta of 4%, average was 23%, worst was 134%
Energy Management — More Performance For The Same Power
Power Consumption
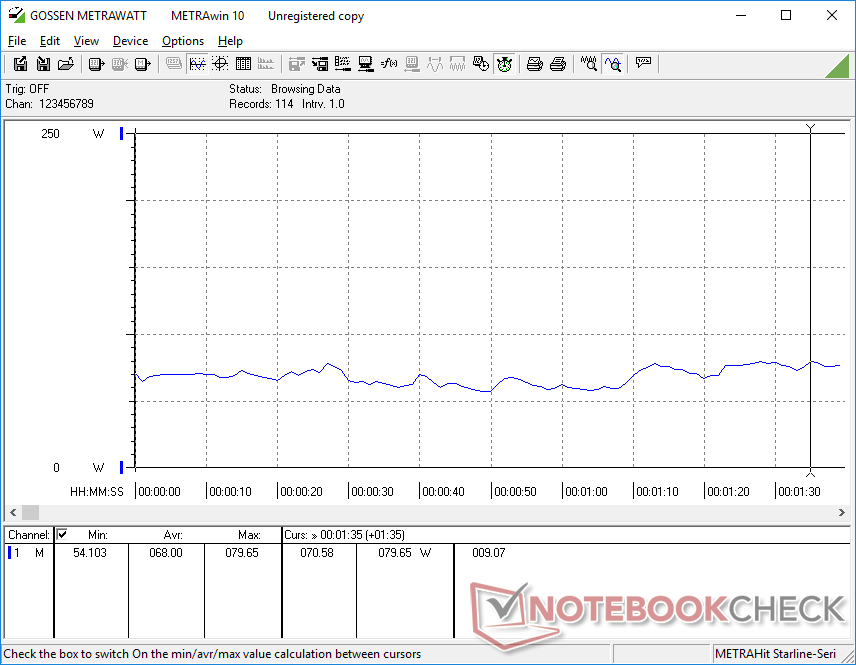
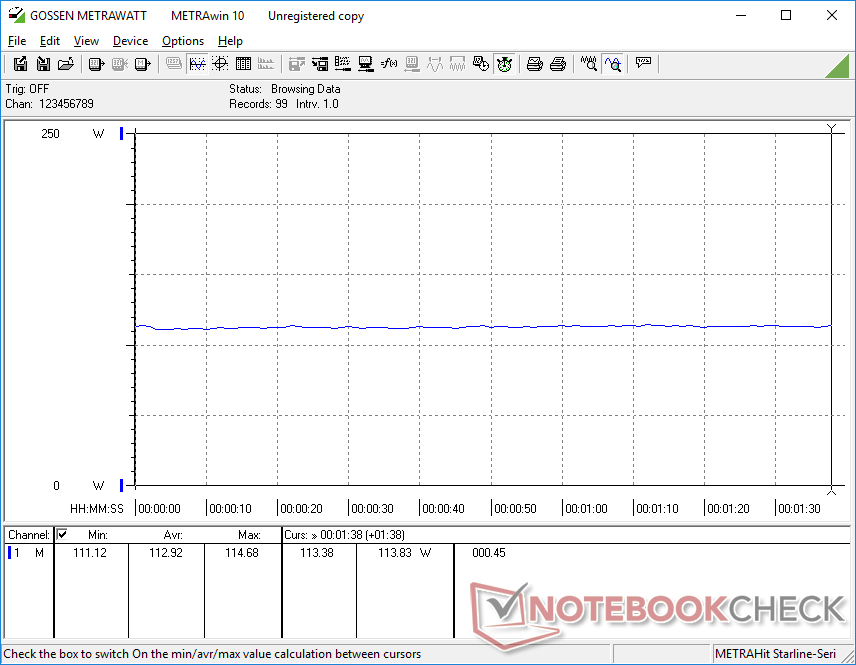
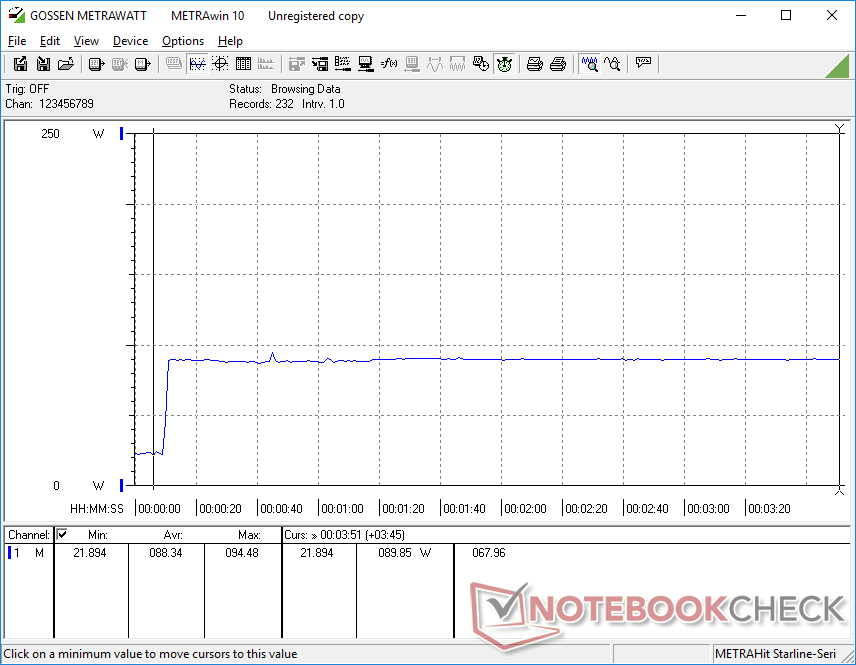
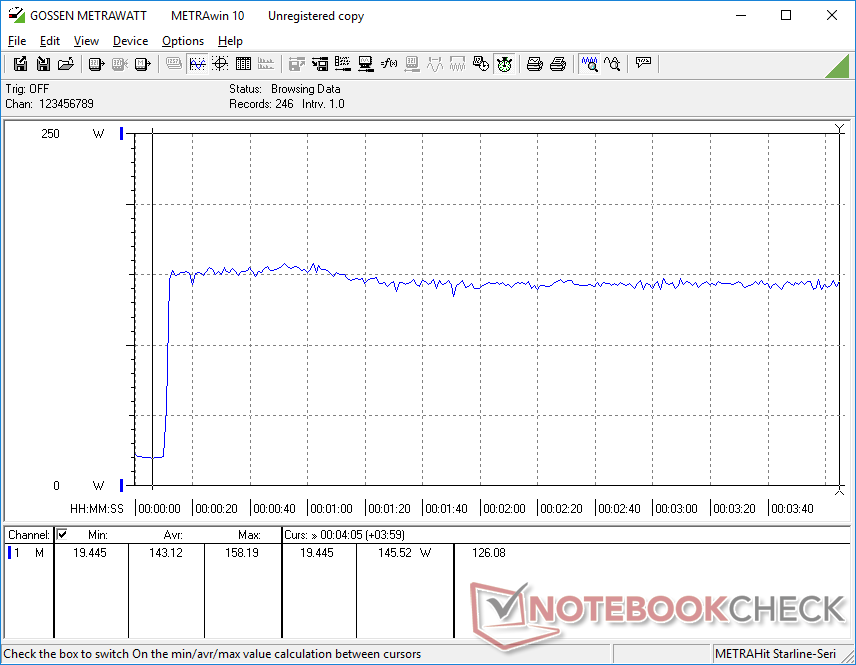
Since the 2021 model is under the same TDP and TGP limits as the 2020 model, their power consumption readings are pretty much exactly the same. Running Witcher 3 on Turbo mode would demand 113 W compared to 176 W on the larger Alienware m15 R5 with the same (albeit higher TGP) RTX 3060 GPU. Performance-per-watt is therefore noticeably higher than on last year's model.
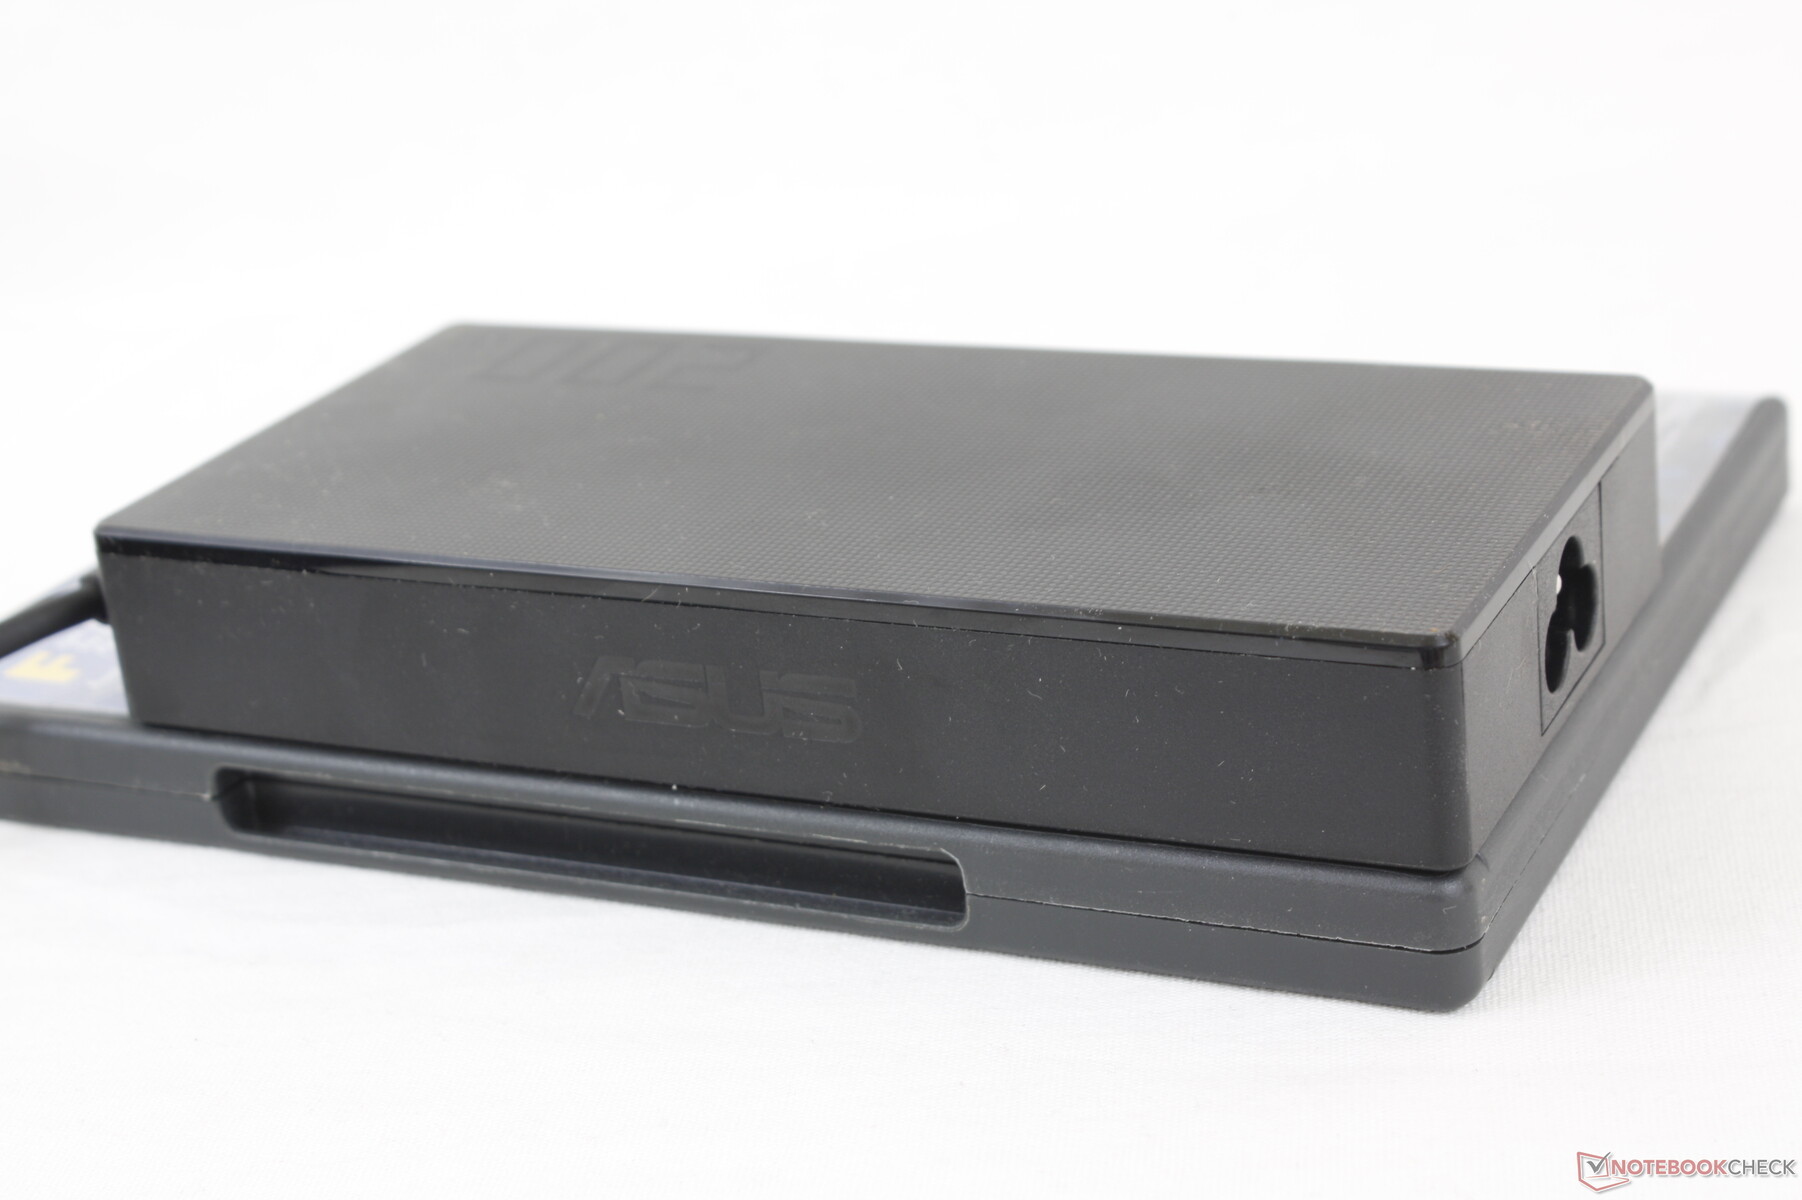
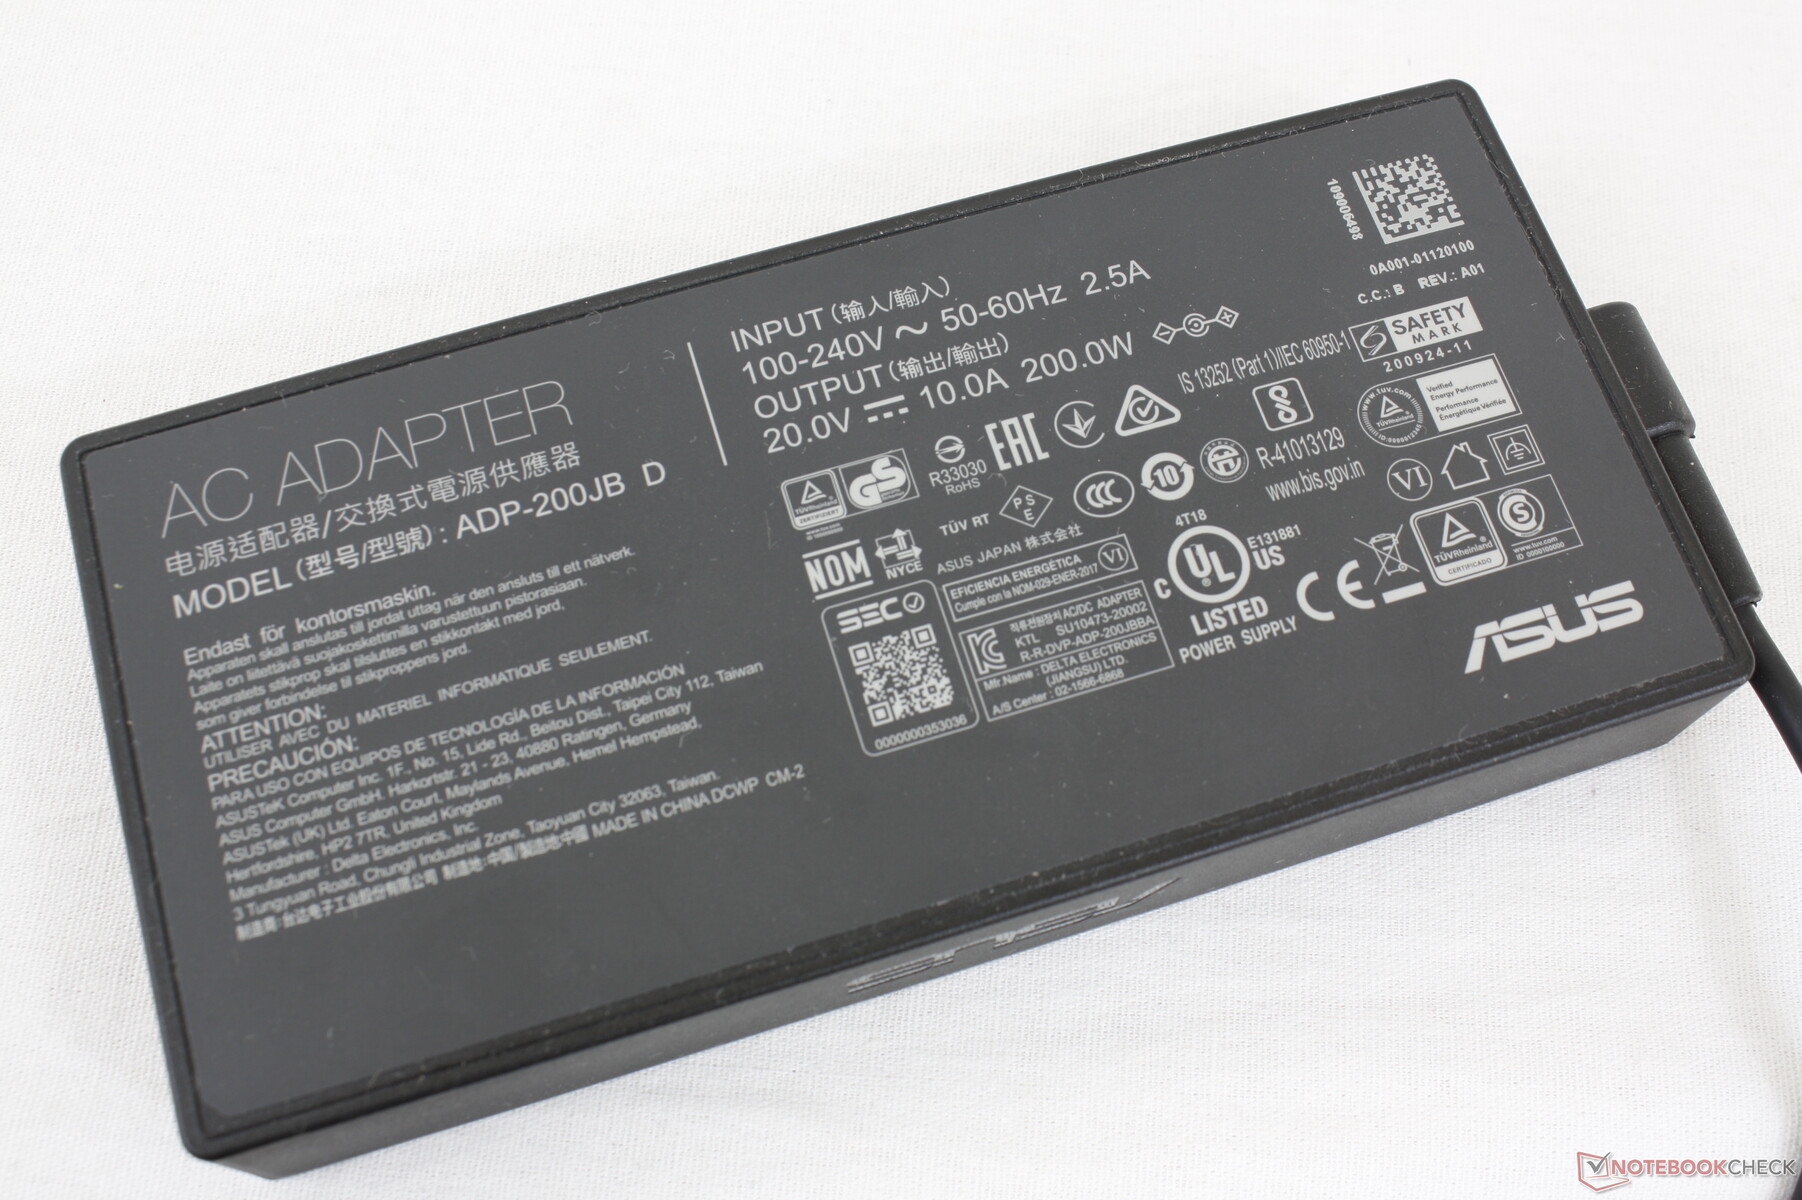
We're able to record a maximum draw of 158 W from the medium sized (~15.2 x 7.2 x 2.3 cm) 200 W AC adapter. Battery charge will slow but never drop if gaming and charging simultaneously.
| Off / Standby | |
| Idle | |
| Load |
|
Key:
min: | |
| Asus Zephyrus G14 GA401QM R9 5900HS, GeForce RTX 3060 Laptop GPU, SK Hynix HFM001TD3JX013N, IPS, 1920x1080, 14" | Asus Zephyrus G14 GA401IV R9 4900HS, GeForce RTX 2060 Max-Q, Intel SSD 660p 1TB SSDPEKNW010T8, IPS, 1920x1080, 14" | Razer Blade 14 Ryzen 9 RTX 3070 R9 5900HX, GeForce RTX 3070 Laptop GPU, Samsung PM981a MZVLB1T0HBLR, IPS, 2560x1440, 14" | HP Envy 14-eb0010nr i5-1135G7, GeForce GTX 1650 Ti Max-Q, Samsung SSD PM981a MZVLB256HBHQ, IPS, 1920x1200, 14" | Asus Zenbook 14 UX435EG i7-1165G7, GeForce MX450, Samsung PM981a MZVLB1T0HBLR, IPS, 1920x1080, 14" | HP Envy 15-ep0098nr i7-10750H, GeForce RTX 2060 Max-Q, Intel Optane Memory H10 with Solid State Storage 32GB + 512GB HBRPEKNX0202A(L/H), AMOLED, 3840x2160, 15.6" | |
|---|---|---|---|---|---|---|
| Power Consumption | -2% | -37% | 0% | 40% | -33% | |
| Idle Minimum * (Watt) | 5.6 | 5.5 2% | 9.4 -68% | 4.2 25% | 3.4 39% | 9.2 -64% |
| Idle Average * (Watt) | 10.4 | 9.3 11% | 15.8 -52% | 18.3 -76% | 7.6 27% | 14.5 -39% |
| Idle Maximum * (Watt) | 18 | 15.8 12% | 24.1 -34% | 19.2 -7% | 14.2 21% | 18 -0% |
| Load Average * (Watt) | 68 | 92.2 -36% | 76.8 -13% | 72.9 -7% | 56 18% | 110.9 -63% |
| Witcher 3 ultra * (Watt) | 113 | 112.4 1% | 154 -36% | 61.5 46% | 41 64% | 125.5 -11% |
| Load Maximum * (Watt) | 158.2 | 156.6 1% | 189.7 -20% | 127.8 19% | 50.4 68% | 194.6 -23% |
* ... smaller is better
Power Consumption Witcher 3
Battery Life
Runtimes are about two hours longer than what we recorded on last year's G14 for a total WLAN runtime of almost 12 hours. This is significantly longer than what we recorded on the Razer Blade 14 and also comparable to the newest Ultrabooks powered by much weaker U-series CPUs.
Recharging via USB-C is supported albeit at a slower rate. Keep in mind that only the USB-C port along the left can be used for this purpose.
| Asus Zephyrus G14 GA401QM R9 5900HS, GeForce RTX 3060 Laptop GPU, 76 Wh | Asus Zephyrus G14 GA401IV R9 4900HS, GeForce RTX 2060 Max-Q, 76 Wh | Razer Blade 14 Ryzen 9 RTX 3070 R9 5900HX, GeForce RTX 3070 Laptop GPU, 62 Wh | HP Envy 14-eb0010nr i5-1135G7, GeForce GTX 1650 Ti Max-Q, 63.3 Wh | Asus Zenbook 14 UX435EG i7-1165G7, GeForce MX450, 63 Wh | HP Envy 15-ep0098nr i7-10750H, GeForce RTX 2060 Max-Q, 83 Wh | |
|---|---|---|---|---|---|---|
| Battery runtime | 0% | -26% | 10% | -18% | -21% | |
| Reader / Idle (h) | 21 | 19 -10% | 13.8 -34% | 27.7 32% | 18.5 -12% | 15 -29% |
| WiFi v1.3 (h) | 11.8 | 9.6 -19% | 7.3 -38% | 10.8 -8% | 8.5 -28% | 6 -49% |
| Load (h) | 1.4 | 1.8 29% | 1.3 -7% | 1.5 7% | 1.2 -14% | 1.6 14% |
Pros
Cons
Verdict — Excellent CPU, But GPU Could Use An Upgrade
The Zephyrus G14 is a great gaming laptop on its own. Unfortunately for Asus, this second generation model now has to contend with the new kid on the block: the Razer Blade 14. Razer has proven that it's possible to engineer an even smaller 14-inch gaming laptop with faster graphics performance, per-key RGB lighting, and better display options than the Zephyrus G14 without necessarily running any louder or warmer. It even has a webcam which the Asus model completely lacks. For users who want to maximize performance and utility, these important distinctions could be deal breakers.
Processor performance and battery life are in a league of their own. Almost everything else, however, could use an update when compared to the latest competition.
The Asus system still has a few trump cards over the Razer. Battery capacity, for example, is larger for longer battery life and RAM is actually expandable unlike on the Blade 14. Secondly, audio from the integrated 4x speakers is more balanced and of higher playback quality. We also find the keyboard on the Asus to be better for typing because of its firmer feedback and deeper travel.
CPU performance remains top notch to be one of the fastest 14-inch laptops available. However, the system could use some more work in regards to GPU options and other features.
Price and availability
Asus Zephyrus G14 GA401QM
- 10/08/2021 v7 (old)
Allen Ngo
Price comparison
