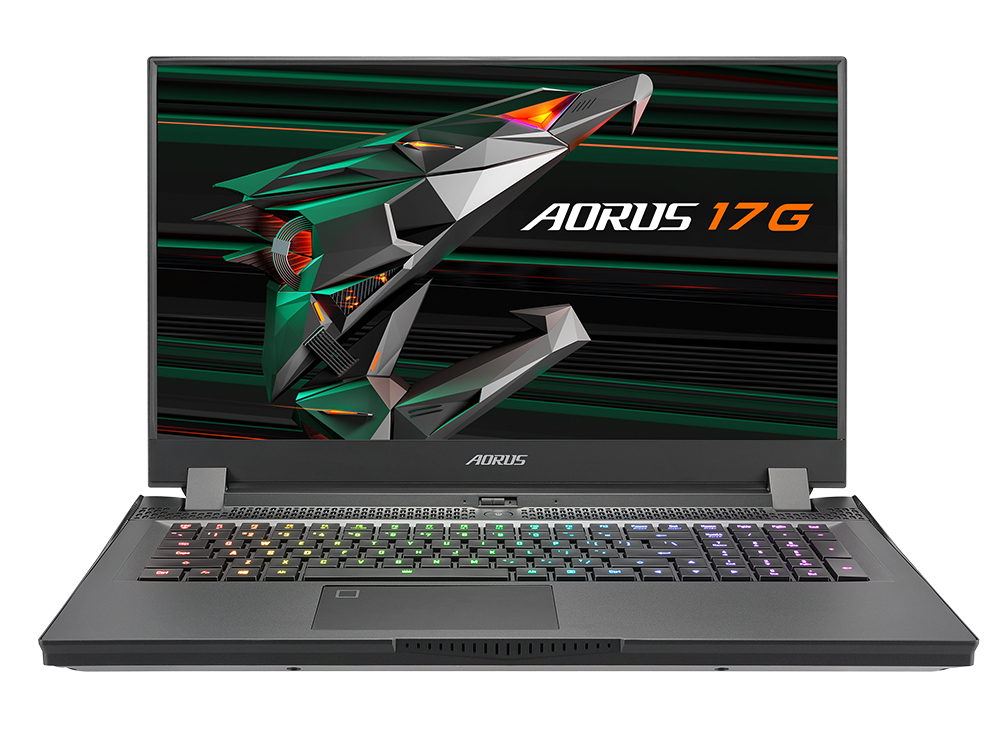
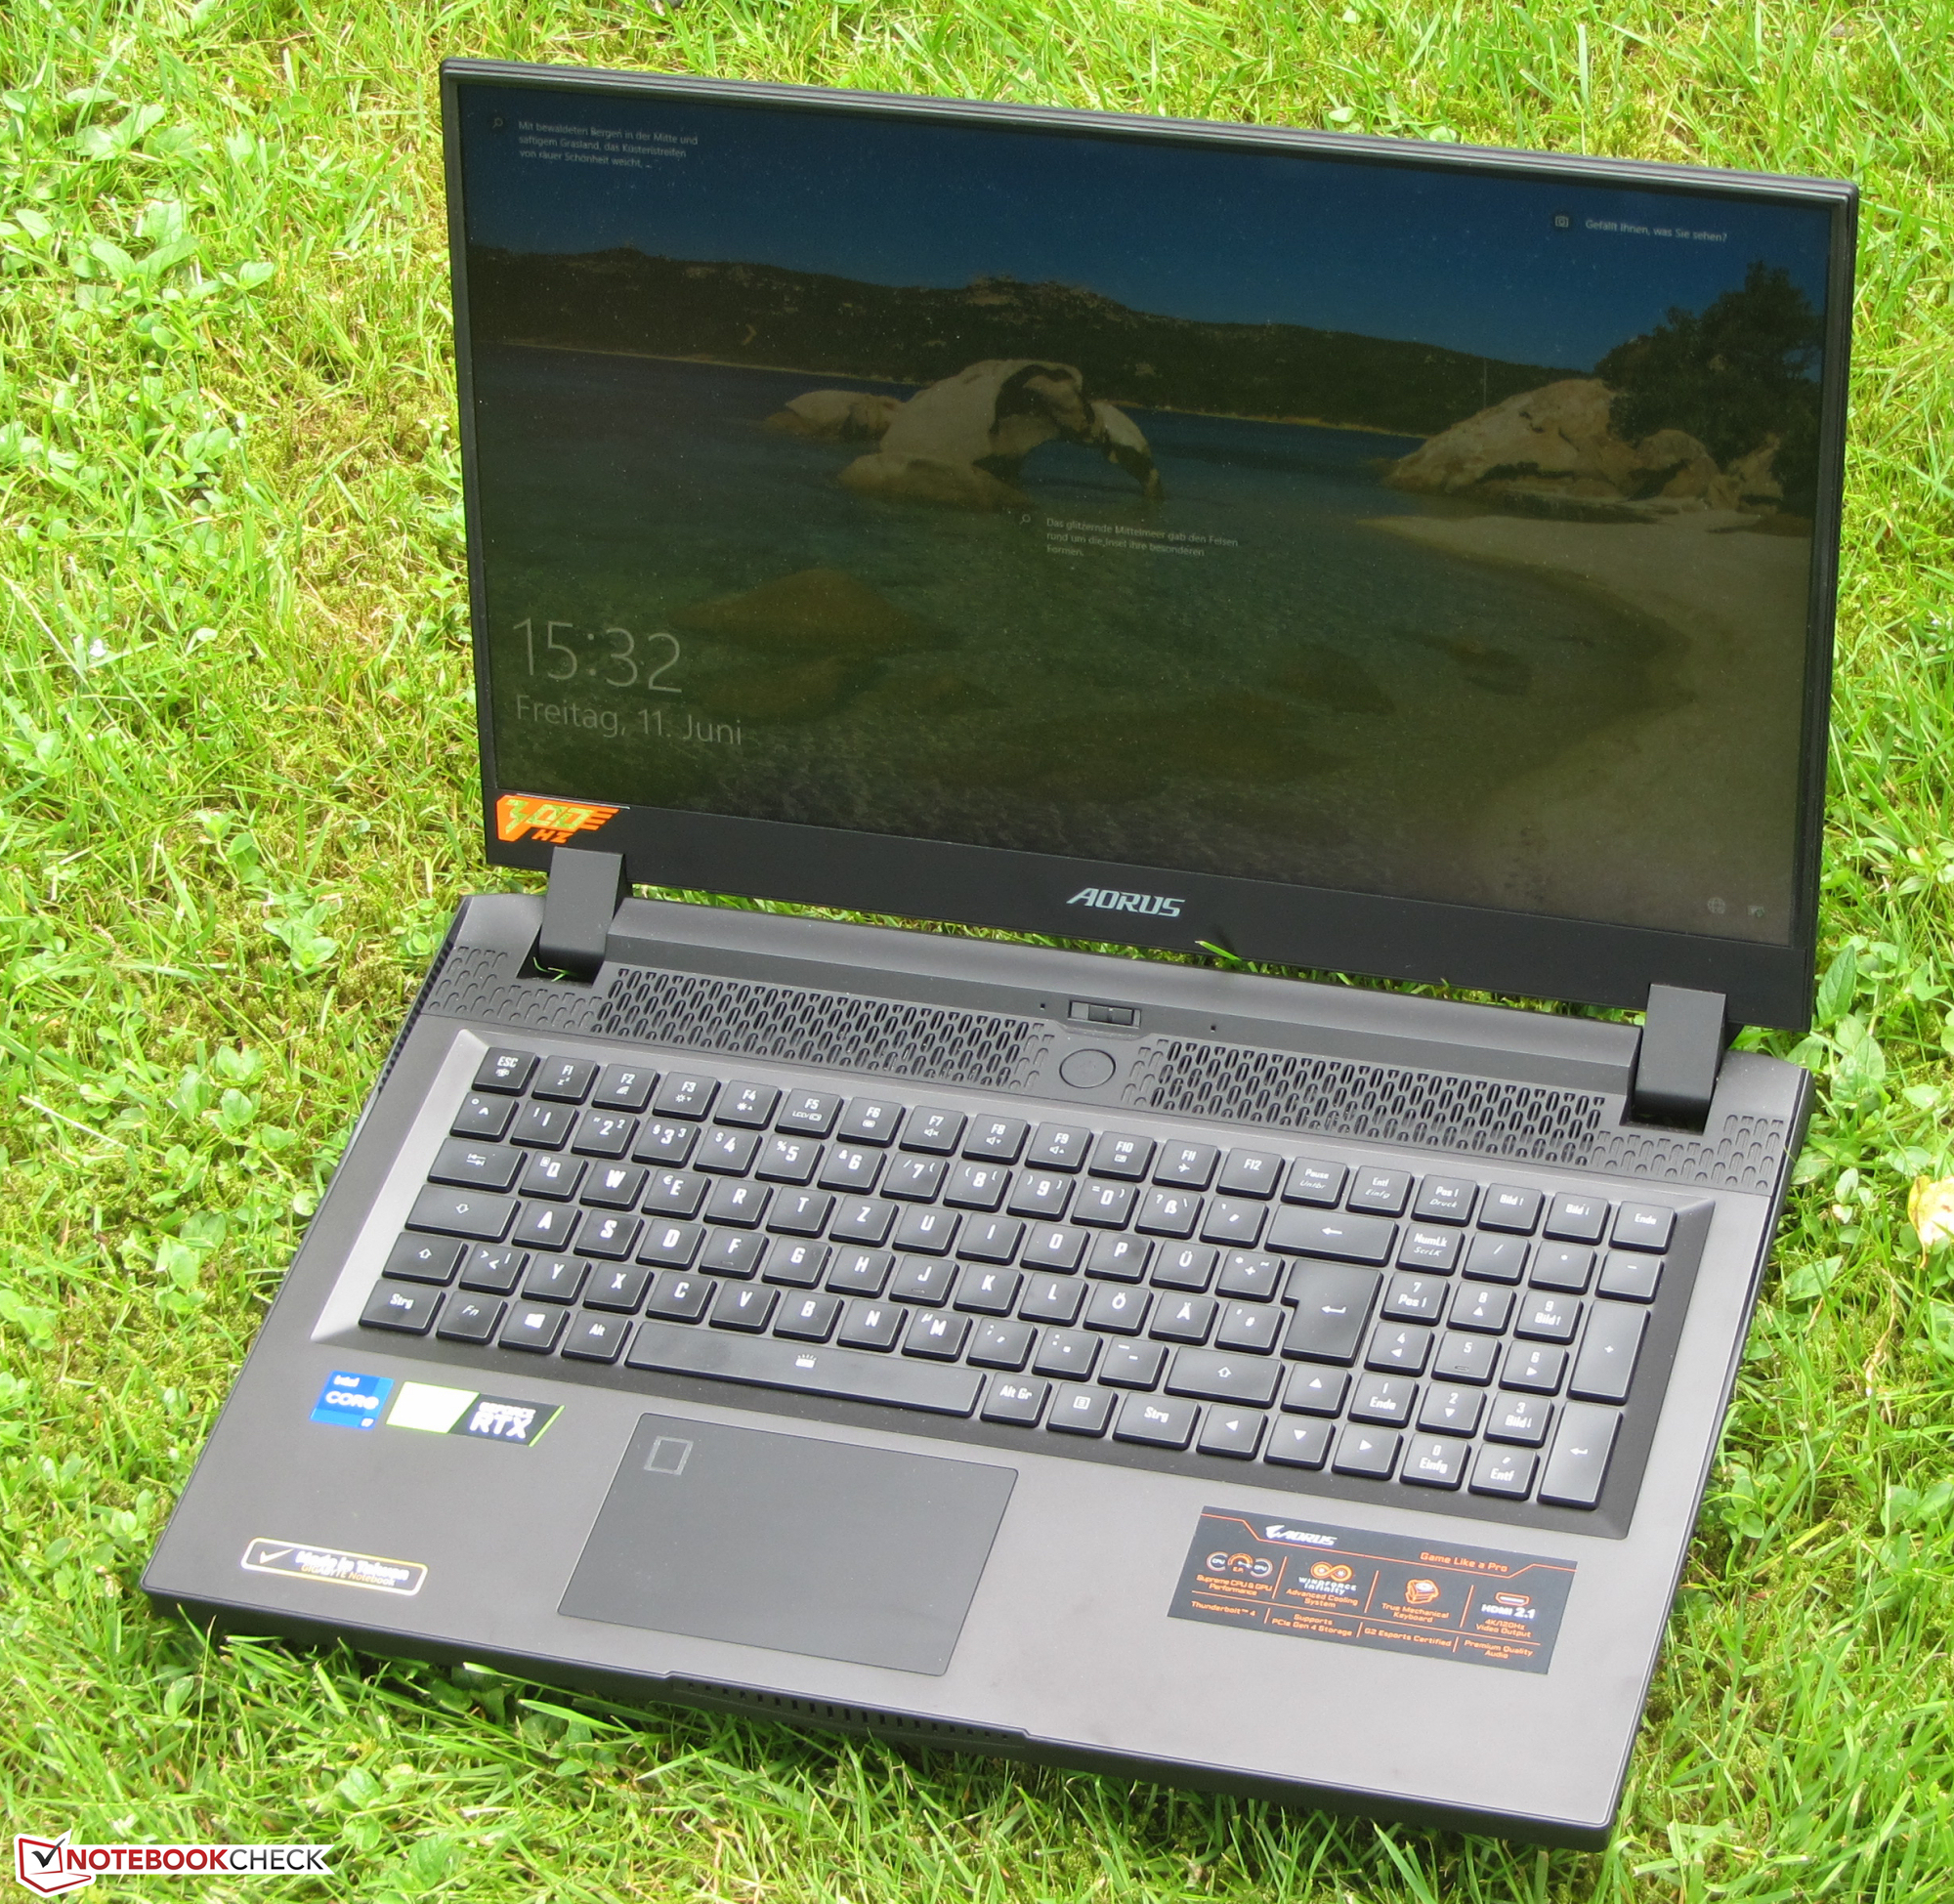
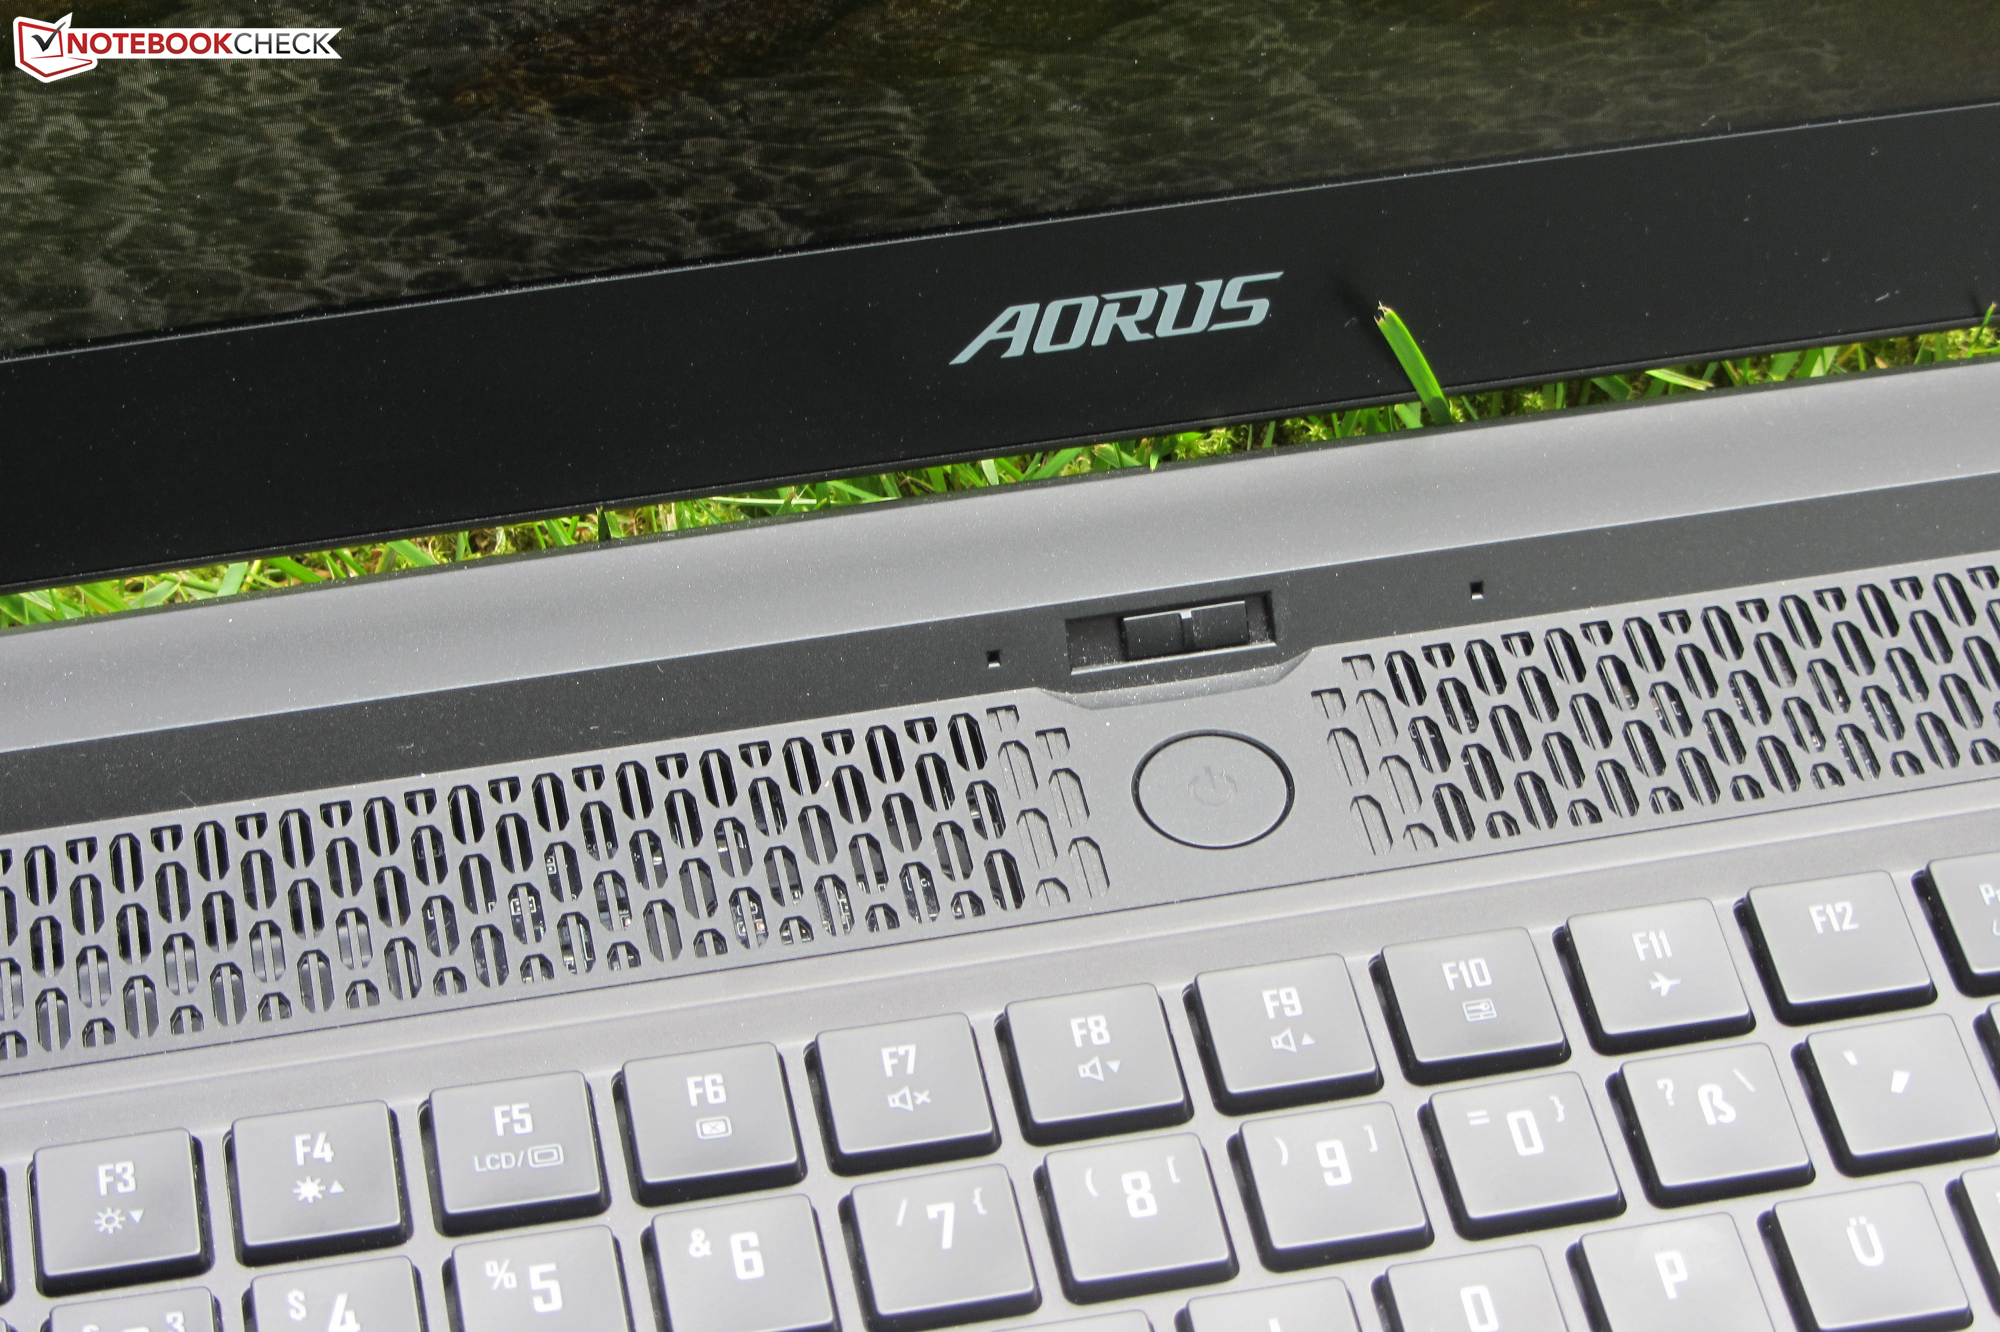
Aorus 17G YD in review: Loud gaming laptop with a good mechanical keyboard

Gigabyte presents an up-to-date gaming laptop in the 17.3-inch format with the Aorus 17G YD. This is the identical sibling model of the Aorus 17G XB that we already reviewed. The competitors include devices like the Asus Strix Scar 17 G733QSA, the Lenovo Legion 7 16ACHg6, the Schenker XMG Neo 17 (Early 2021), the Alienware m17 R4, and the MSI GE76 Raider 10UH.
Since the two Aorus 17G models are identical in construction, we won't go further into the case, the connectivity, the input devices, and the speakers. The corresponding information can be found in the review of the Aorus 17G XB.
Possible contenders in comparison
Rating | Date | Model | Weight | Height | Size | Resolution | Price |
|---|---|---|---|---|---|---|---|
| 86 % v7 (old) | 06 / 2021 | Aorus 17G YD i7-11800H, GeForce RTX 3080 Laptop GPU | 2.8 kg | 26 mm | 17.30" | 1920x1080 | |
| 86.6 % v7 (old) | 05 / 2021 | Asus Strix Scar 17 G733QSA-XS99 R9 5900HX, GeForce RTX 3080 Laptop GPU | 2.8 kg | 28.3 mm | 17.30" | 1920x1080 | |
| 88.1 % v7 (old) | 06 / 2021 | Lenovo Legion 7 16ACHg6 R9 5900HX, GeForce RTX 3080 Laptop GPU | 2.5 kg | 23.5 mm | 16.00" | 2560x1600 | |
| 85.1 % v7 (old) | 01 / 2021 | Schenker XMG Neo 17 (Early 2021, RTX 3070, 5800H) R7 5800H, GeForce RTX 3070 Laptop GPU | 2.5 kg | 27 mm | 17.30" | 2560x1440 | |
| 85.3 % v7 (old) | 04 / 2021 | Alienware m17 R4 i9-10980HK, GeForce RTX 3080 Laptop GPU | 3 kg | 22 mm | 17.30" | 1920x1080 | |
| 87.1 % v7 (old) | 03 / 2021 | MSI GE76 Raider 10UH i7-10870H, GeForce RTX 3080 Laptop GPU | 3 kg | 27.4 mm | 17.30" | 1920x1080 |
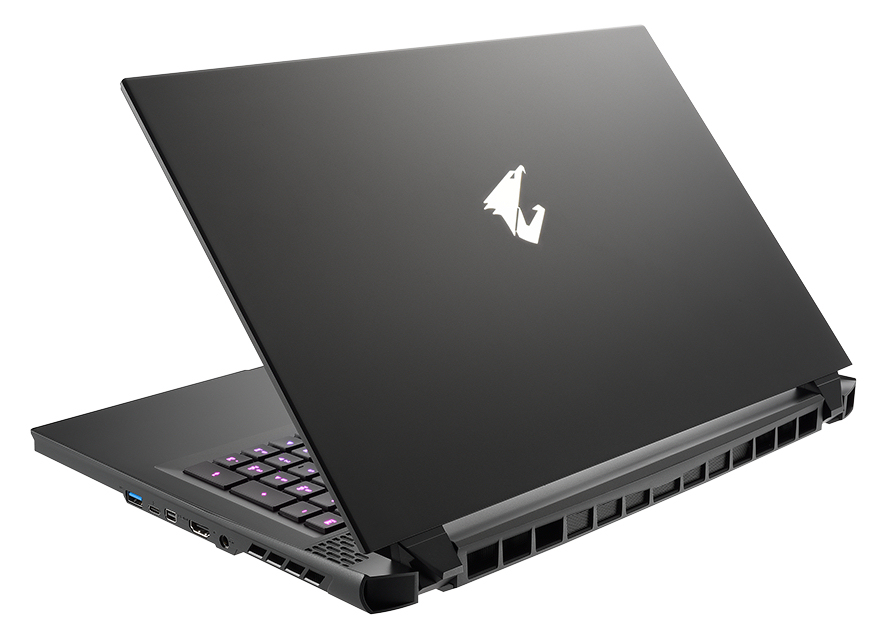
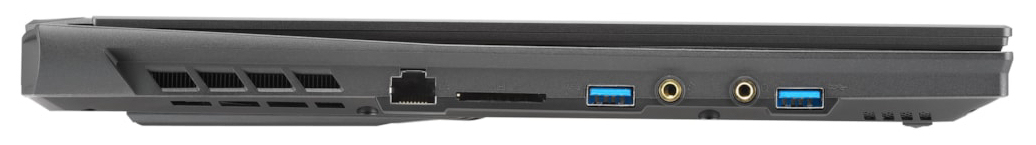
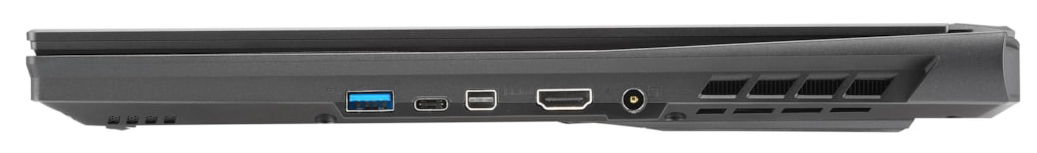
Connectivity - Now with Thunderbolt 4
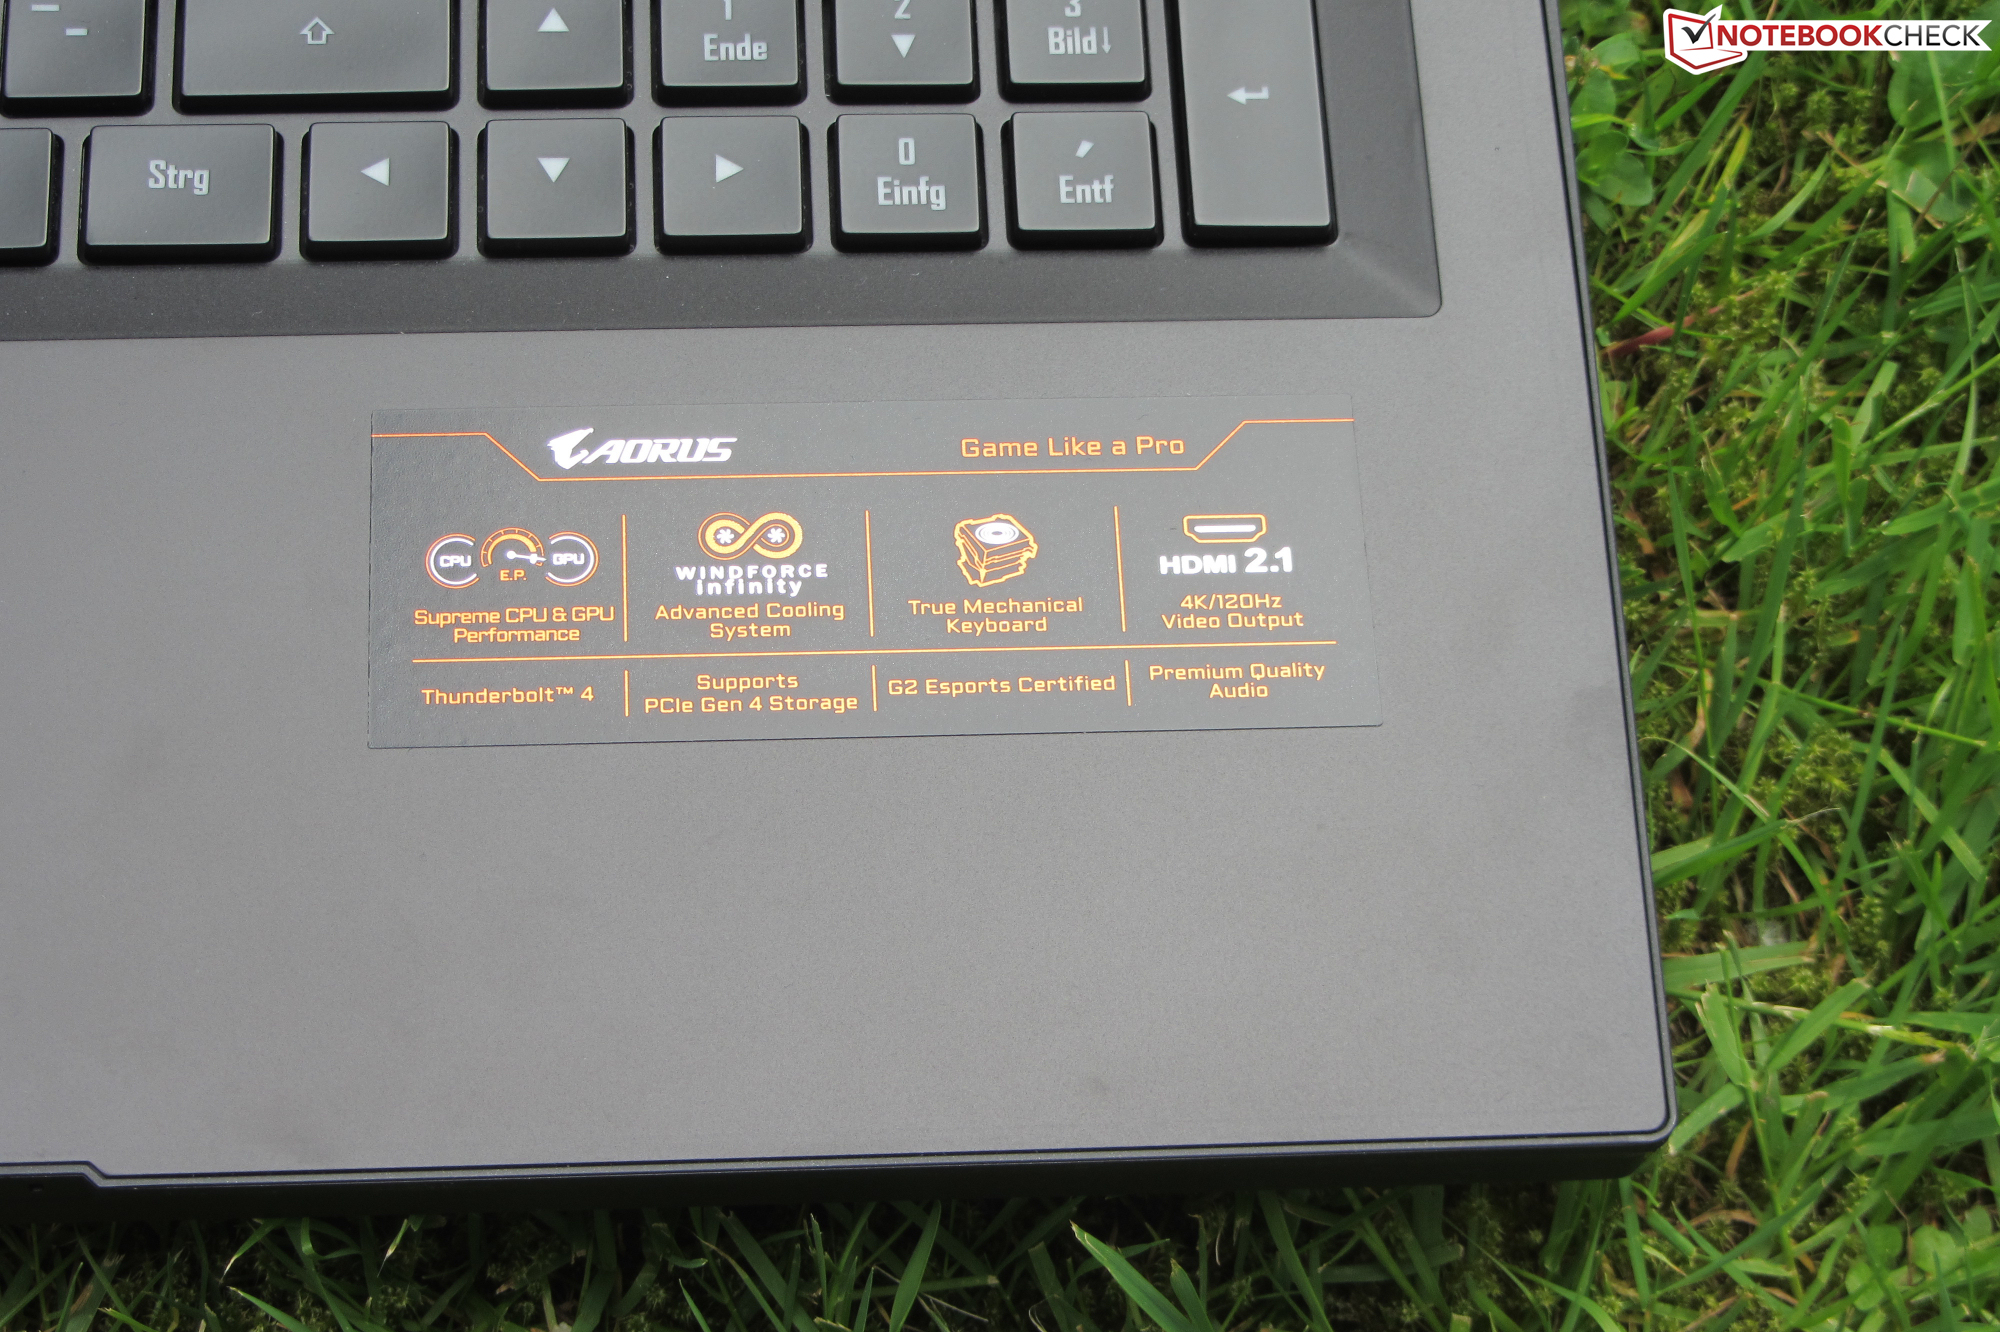
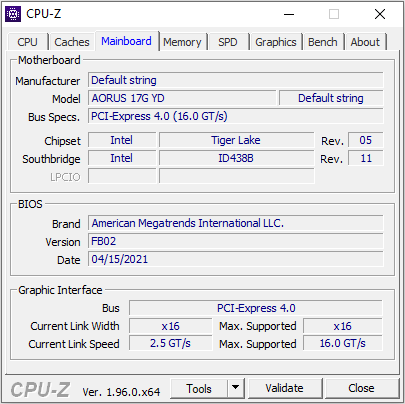
Compared to the Aorus 17G XB, the 17G YD has received some upgrades in terms of ports. The HDMI port supports the 2.1 standard (XB: 2.0), which enables higher resolutions and frame rates. The current 17G model also comes with a Thunderbolt 4 instead of a Thunderbolt 3 port. DisplayPort via USB-C and Power Delivery are supported.
| SD Card Reader | |
| average JPG Copy Test (av. of 3 runs) | |
| Aorus 17G XB (Toshiba Exceria Pro SDXC 64 GB UHS-II) | |
| MSI GE76 Raider 10UH (Toshiba Exceria Pro SDXC 64 GB UHS-II) | |
| Aorus 17G YD (AV PRO microSD 128 GB V60) | |
| Alienware m17 R4 (AV PRO microSD 128 GB V60) | |
| Average of class Gaming (20.9 - 210, n=54, last 2 years) | |
| Schenker XMG Neo 17 (Early 2021, RTX 3070, 5800H) (Toshiba Exceria Pro SDXC 64 GB UHS-II) | |
| maximum AS SSD Seq Read Test (1GB) | |
| Aorus 17G XB (Toshiba Exceria Pro SDXC 64 GB UHS-II) | |
| Alienware m17 R4 (AV PRO microSD 128 GB V60) | |
| MSI GE76 Raider 10UH (Toshiba Exceria Pro SDXC 64 GB UHS-II) | |
| Aorus 17G YD (AV PRO microSD 128 GB V60) | |
| Average of class Gaming (25.5 - 261, n=51, last 2 years) | |
| Schenker XMG Neo 17 (Early 2021, RTX 3070, 5800H) (Toshiba Exceria Pro SDXC 64 GB UHS-II) | |


 GeForce RTX 3070 Laptop GPU, R7 5800H, Samsung SSD 970 EVO Plus 500GB")
 GeForce RTX 3070 Laptop GPU, R7 5800H, Samsung SSD 970 EVO Plus 500GB")


")
")


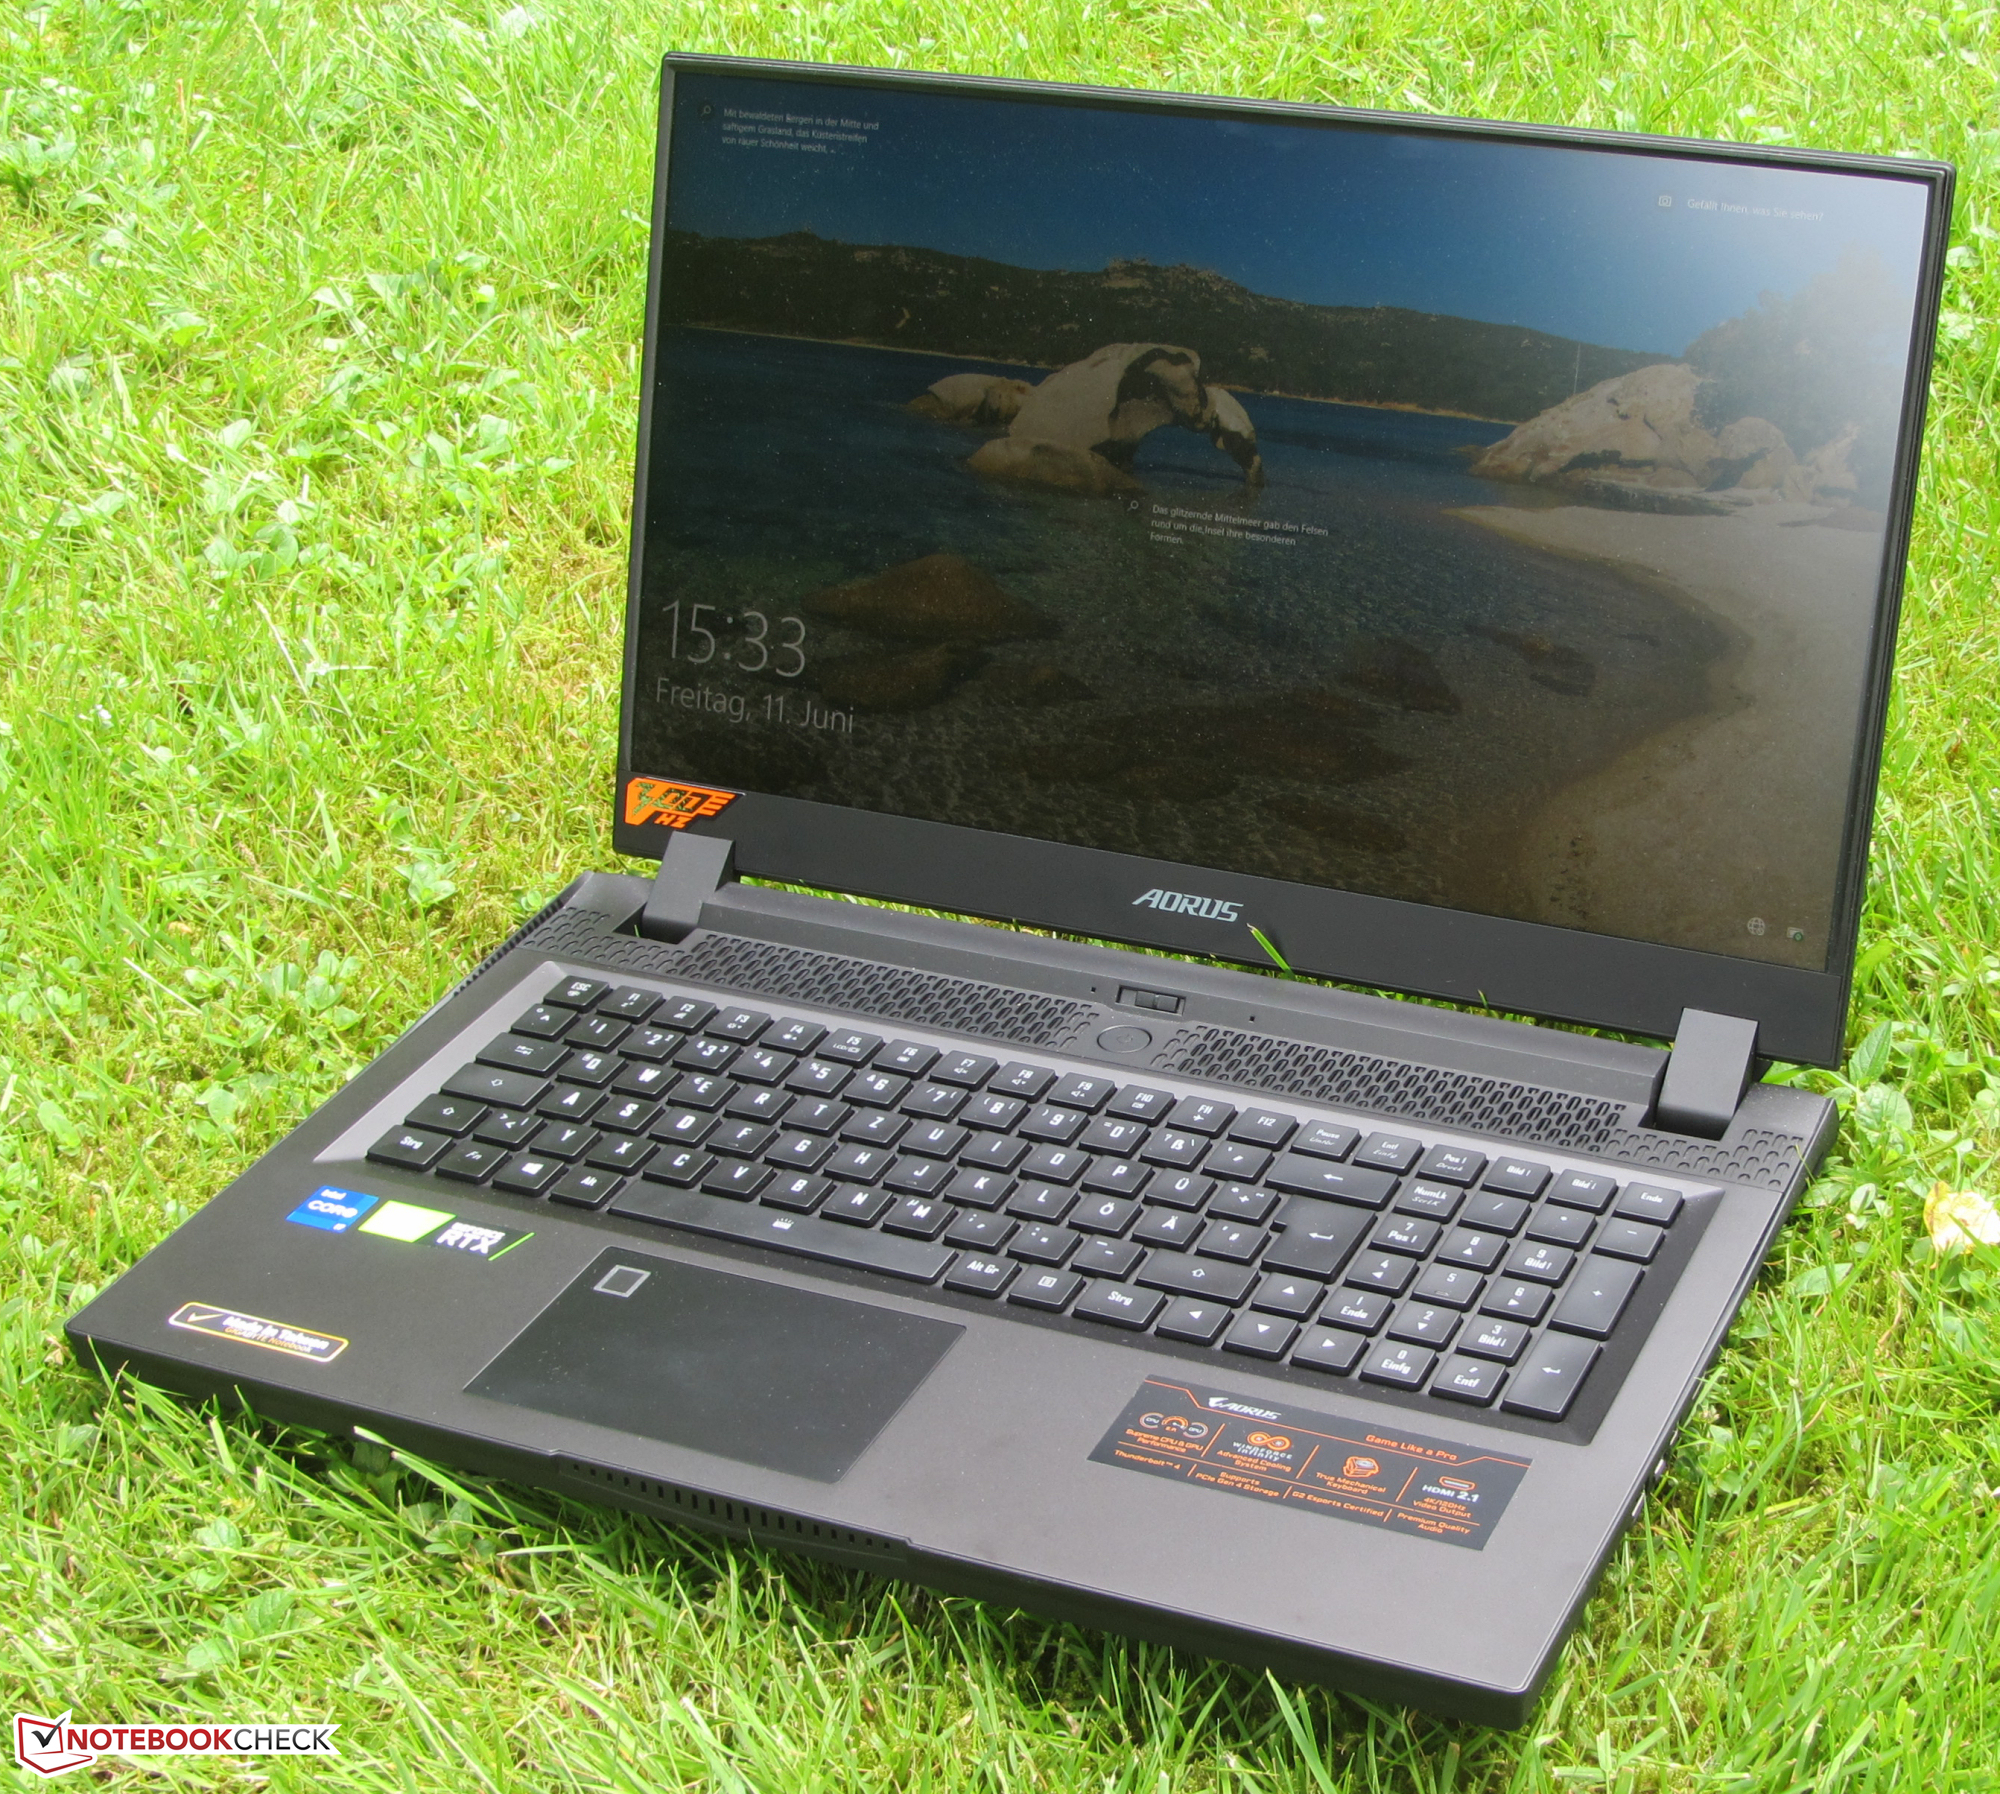
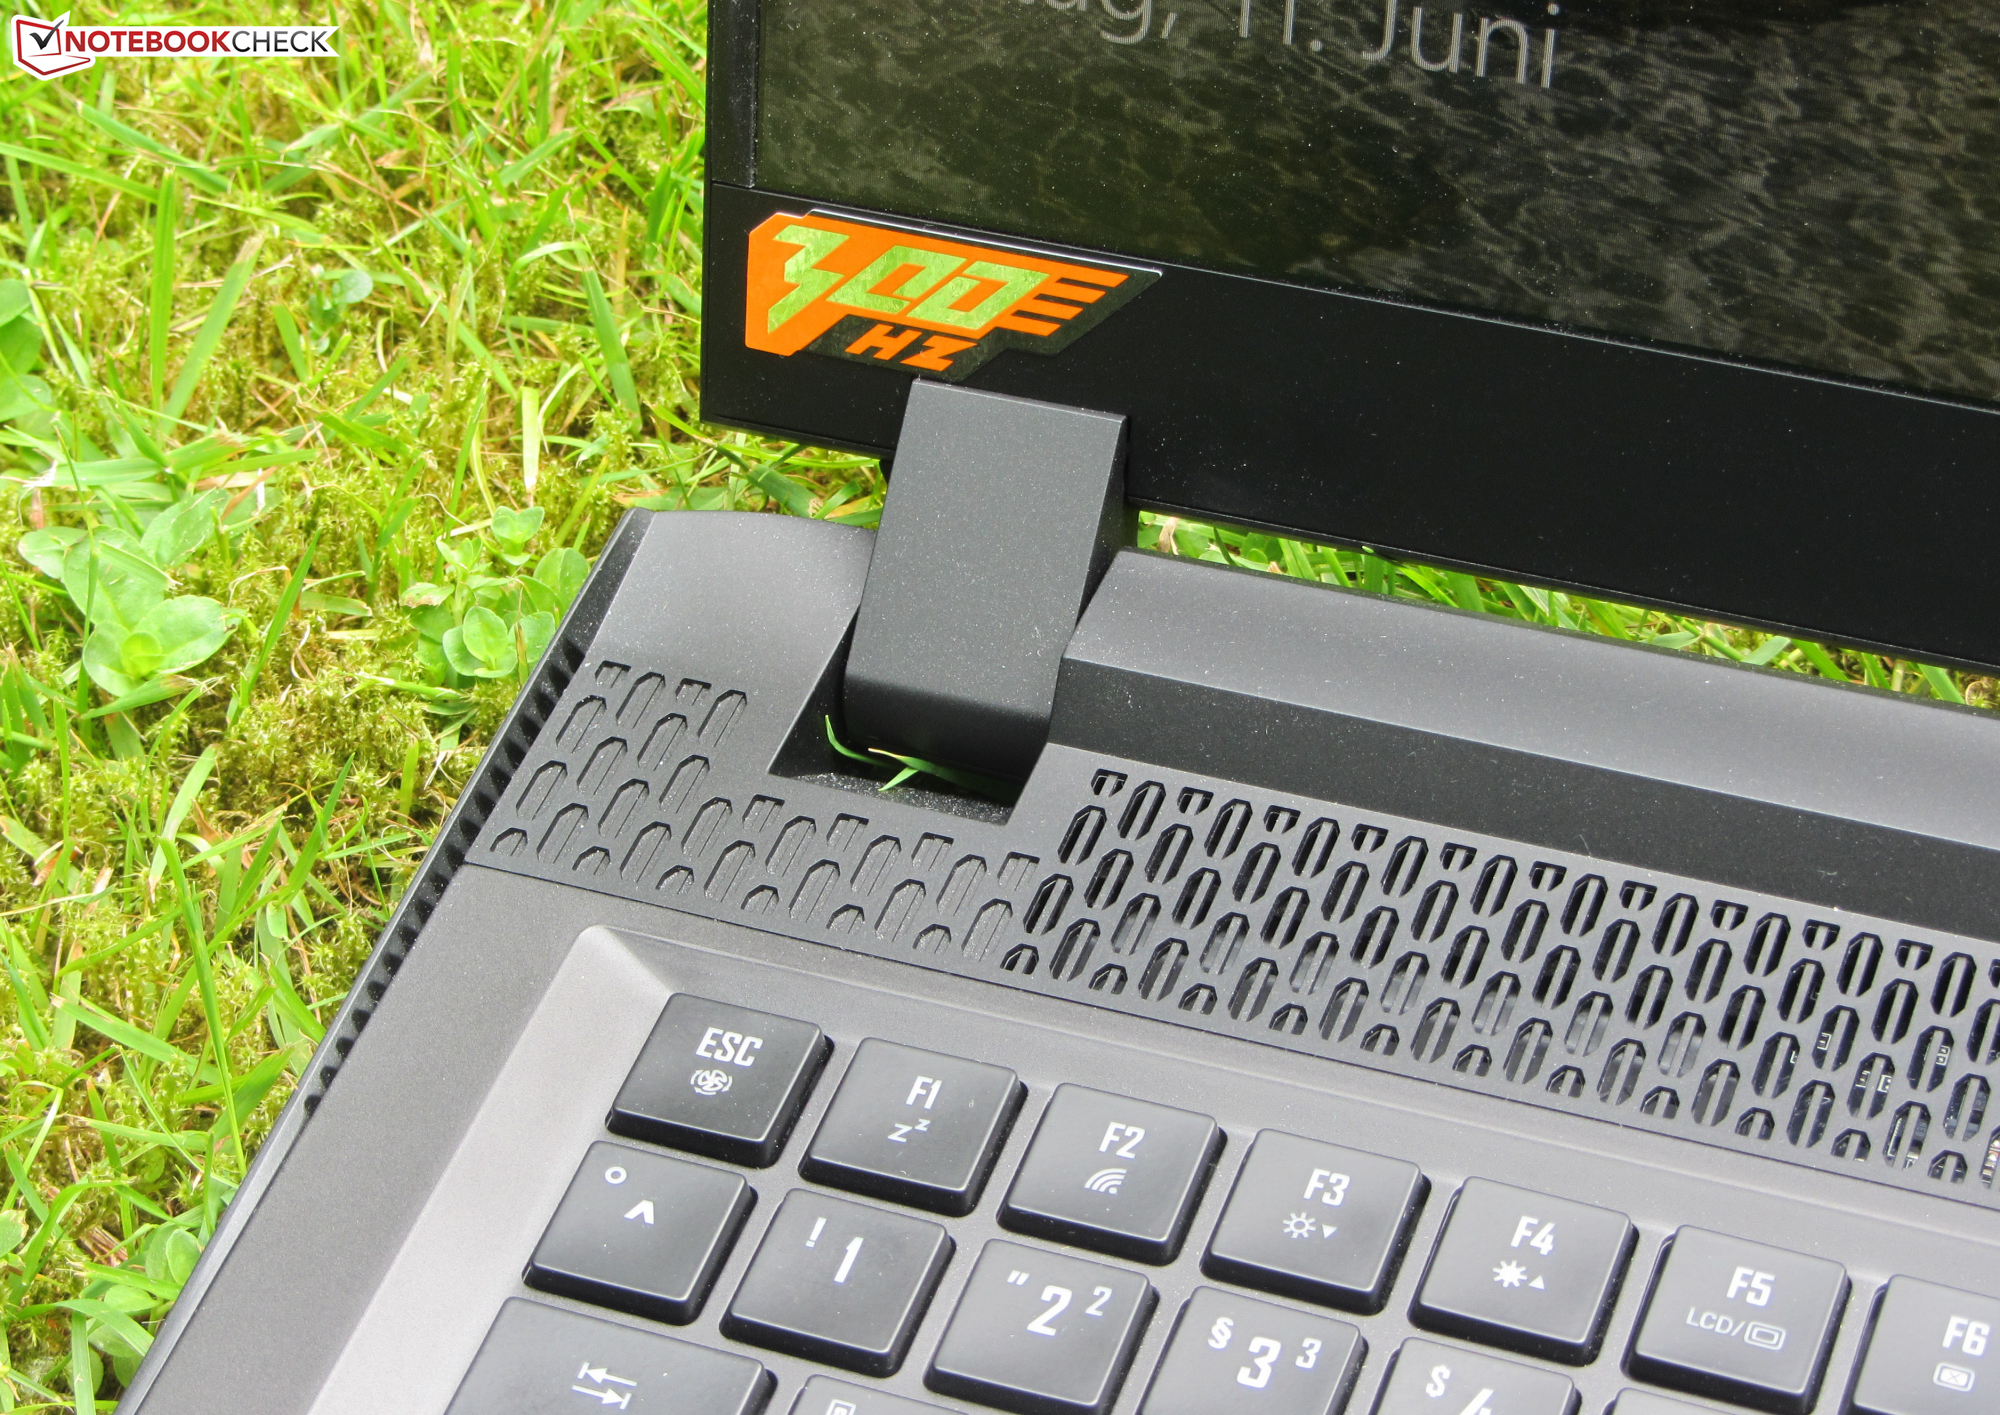
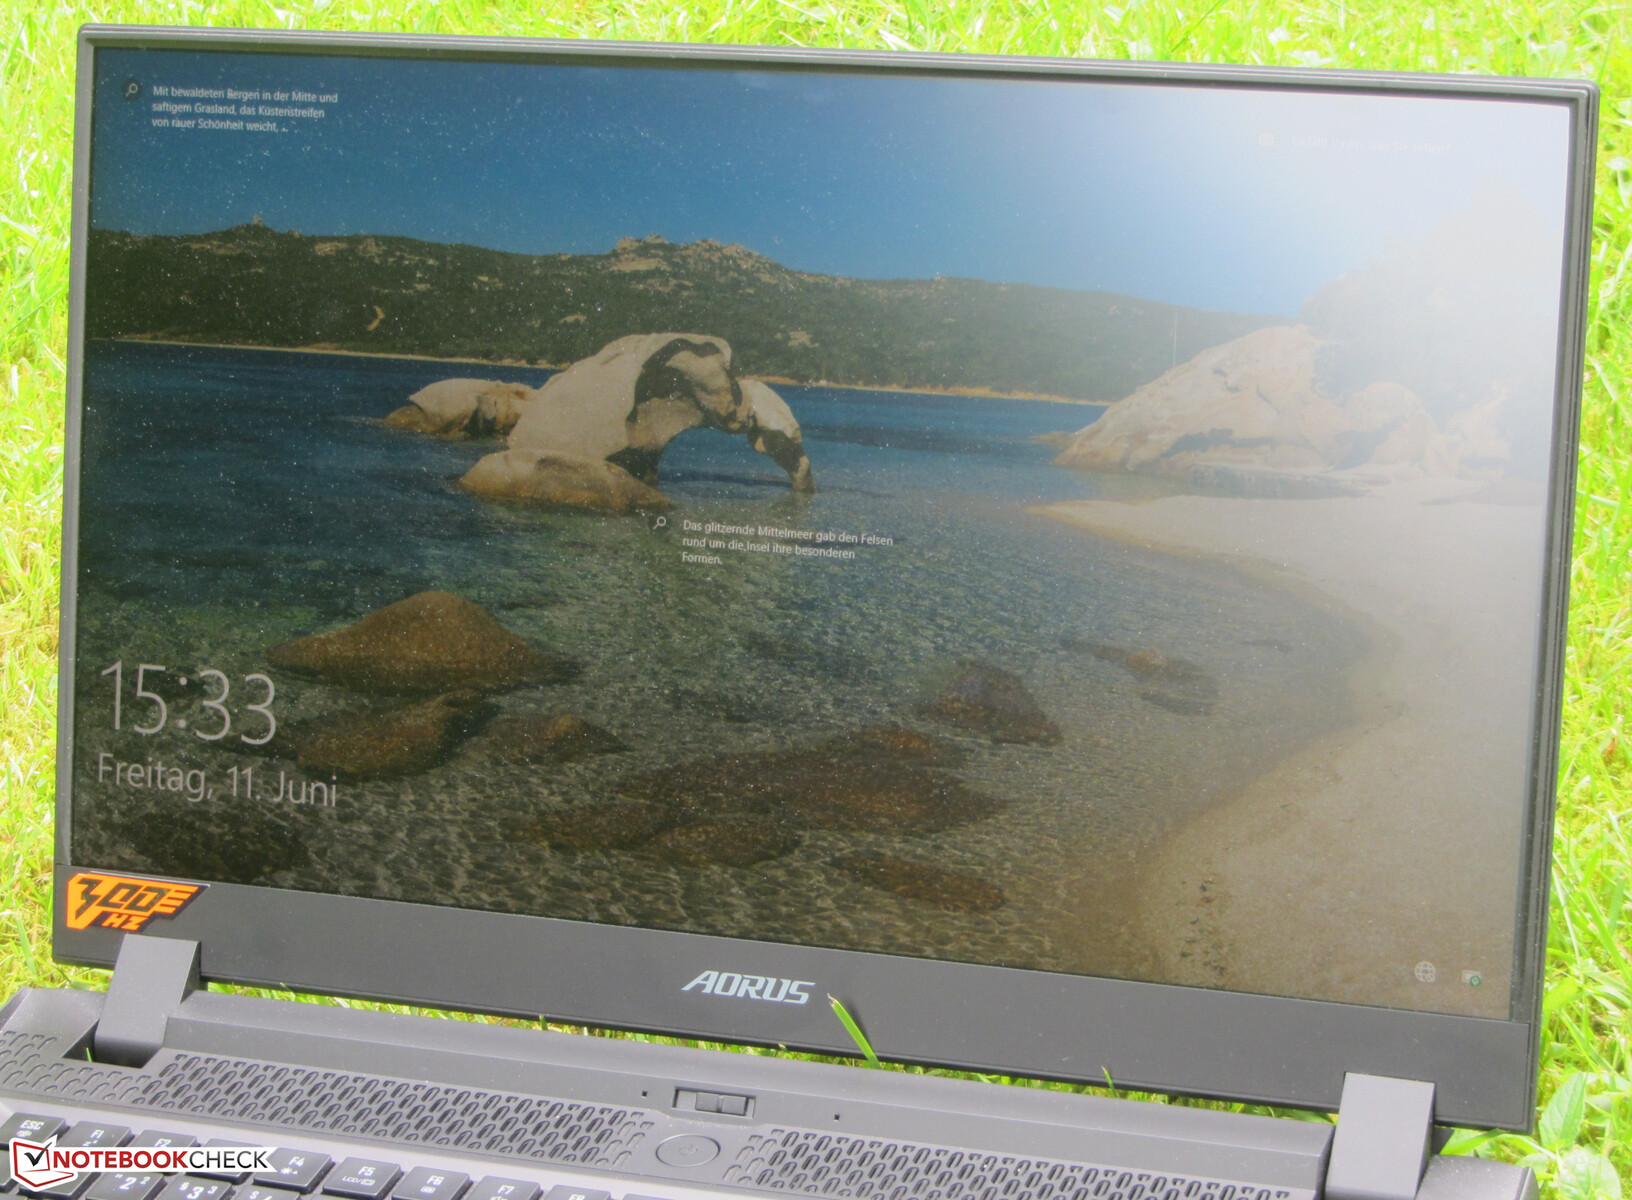
Display - 300 Hz IPS panel
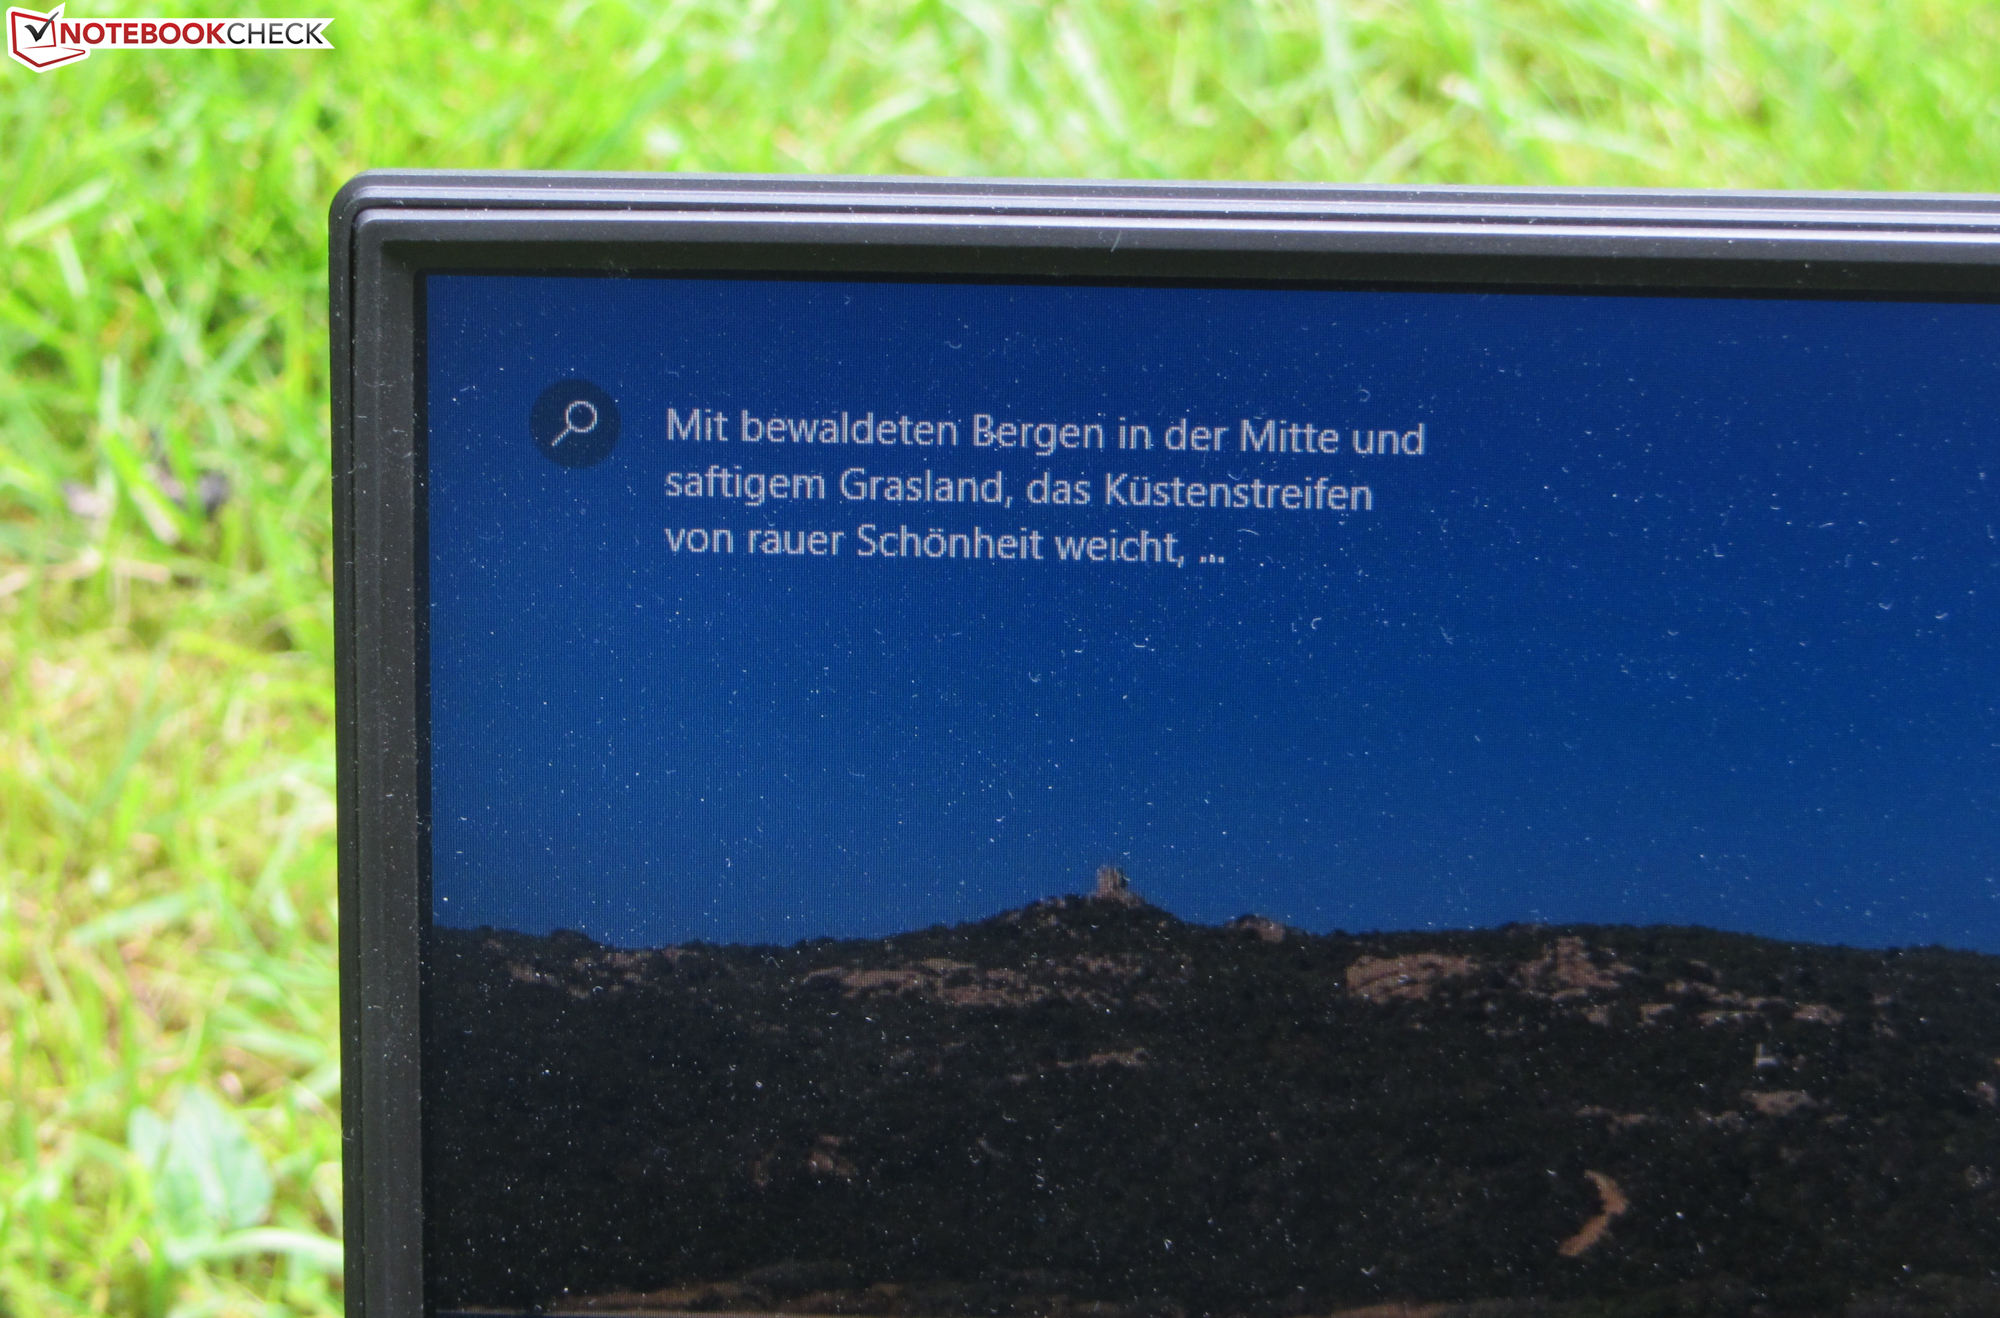
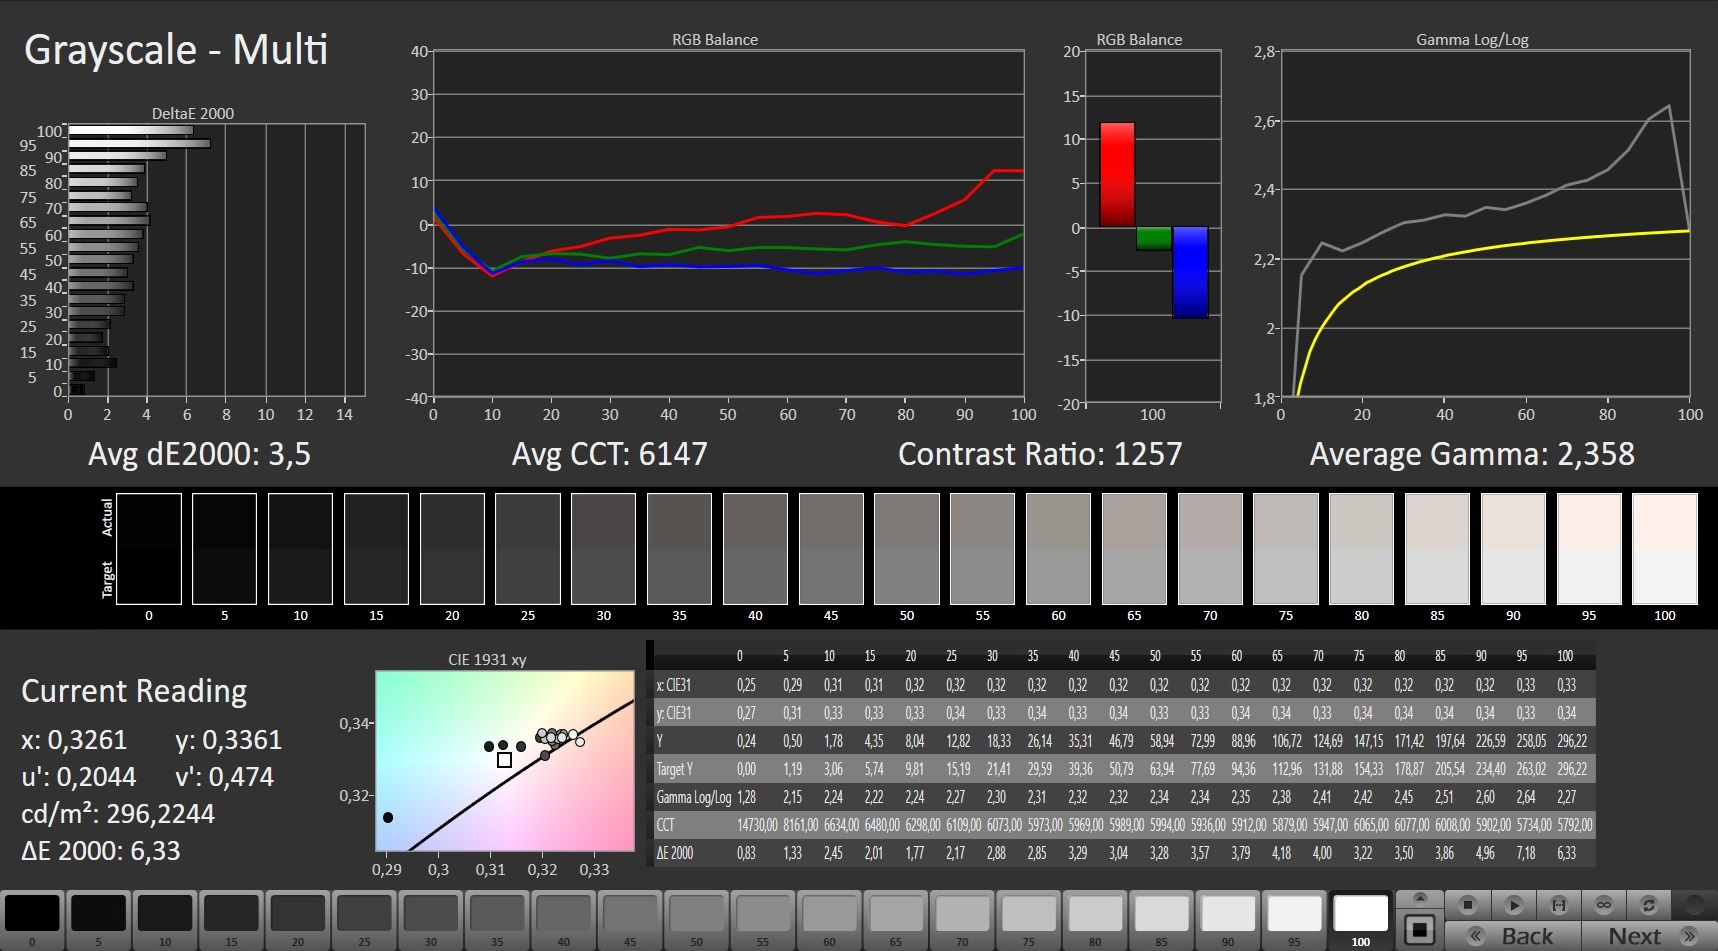
While the contrast (1,192:1) of the matte 17.3-inch display (1920x1080 pixels) meets the target (> 1,000:1), the average brightness (282.4 cd/m²) is too low. We consider values beyond 300 cd/m² to be good. The display also shows an uneven brightness distribution. However, the 300 Hz panel has fast response times and no PWM flickering.
| |||||||||||||||||||||||||
Brightness Distribution: 73 %
Center on Battery: 286 cd/m²
Contrast: 1192:1 (Black: 0.24 cd/m²)
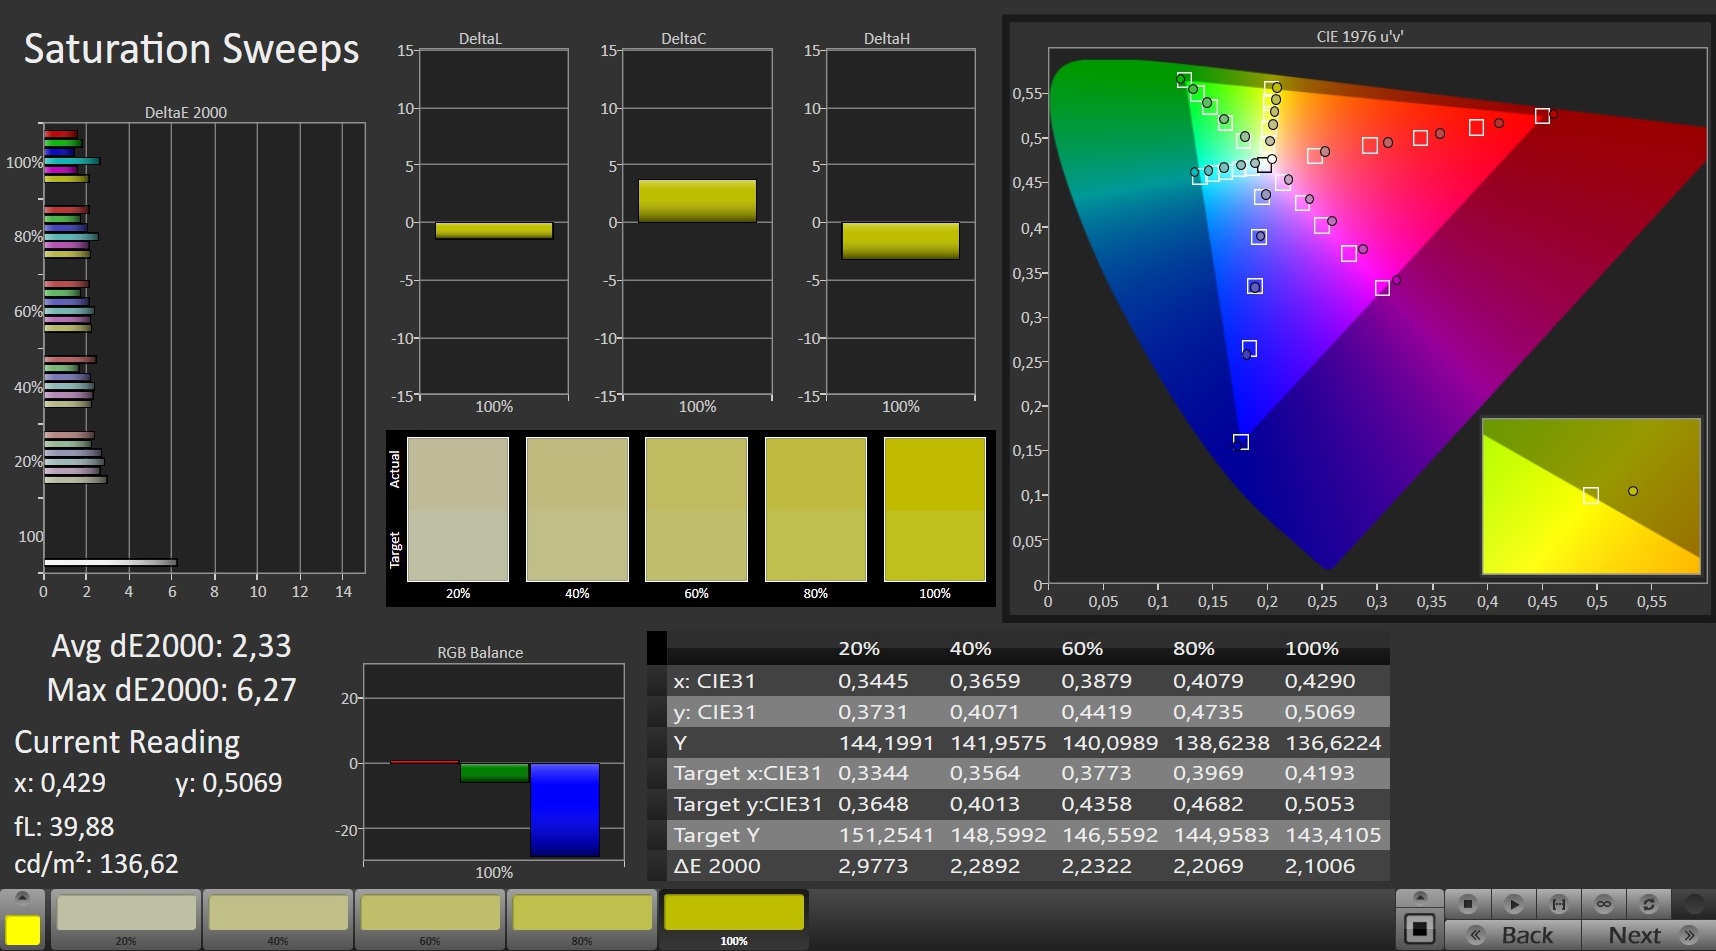
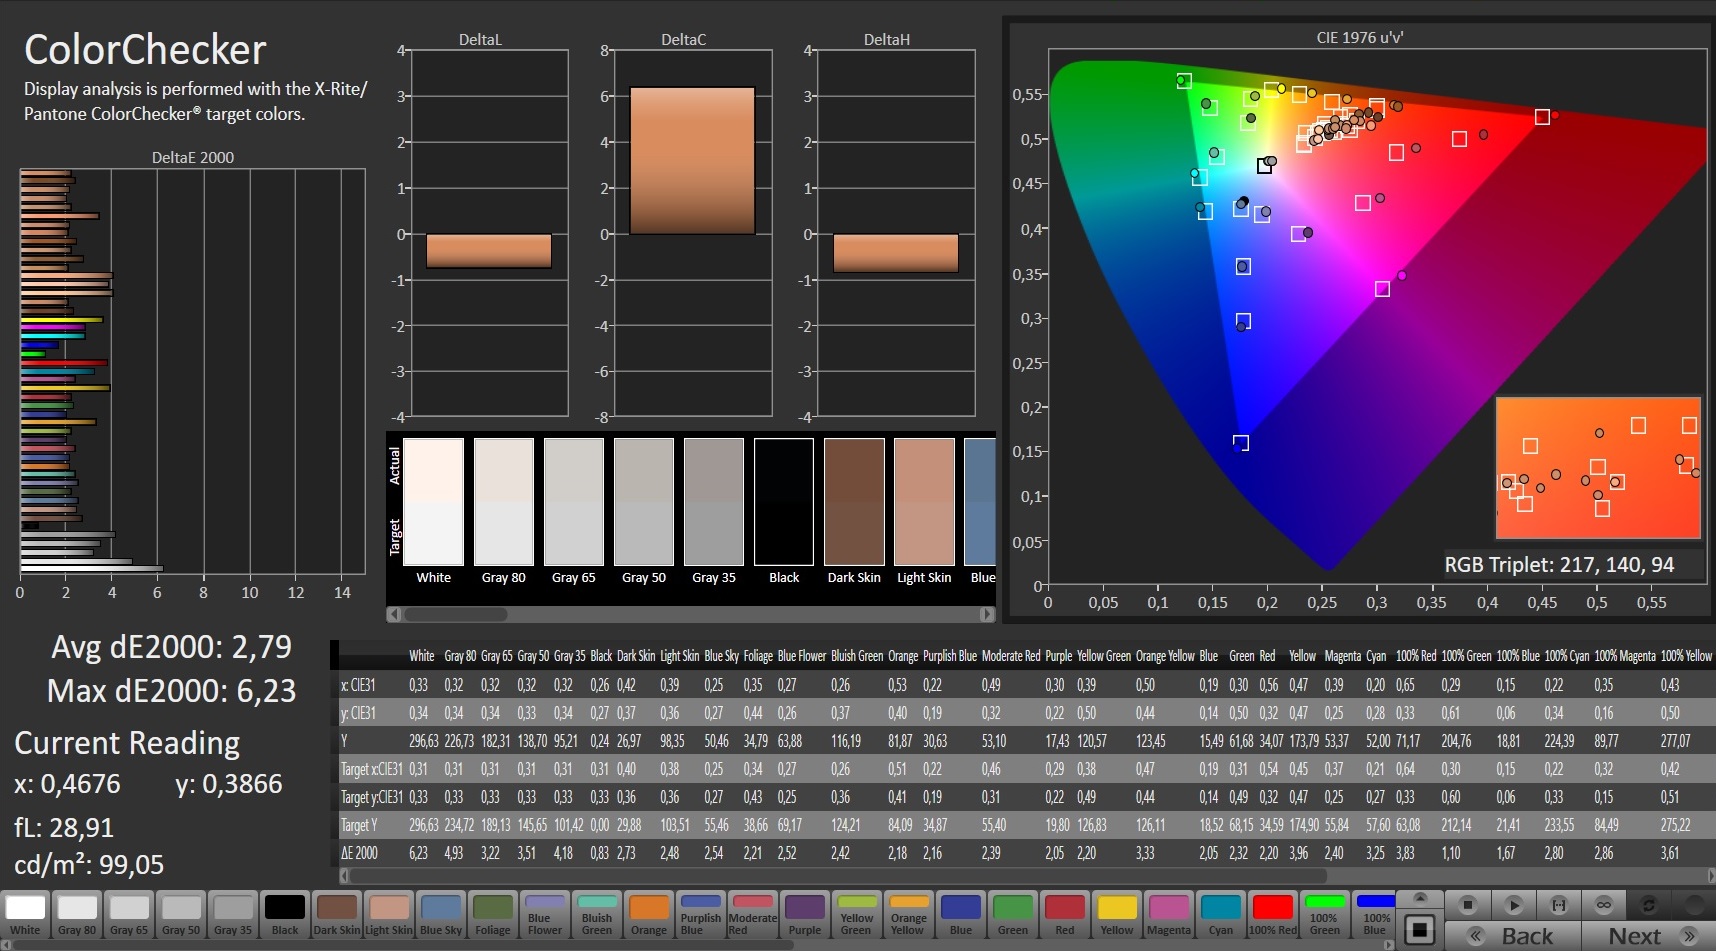
ΔE ColorChecker Calman: 2.79 | ∀{0.5-29.43 Ø4.71}
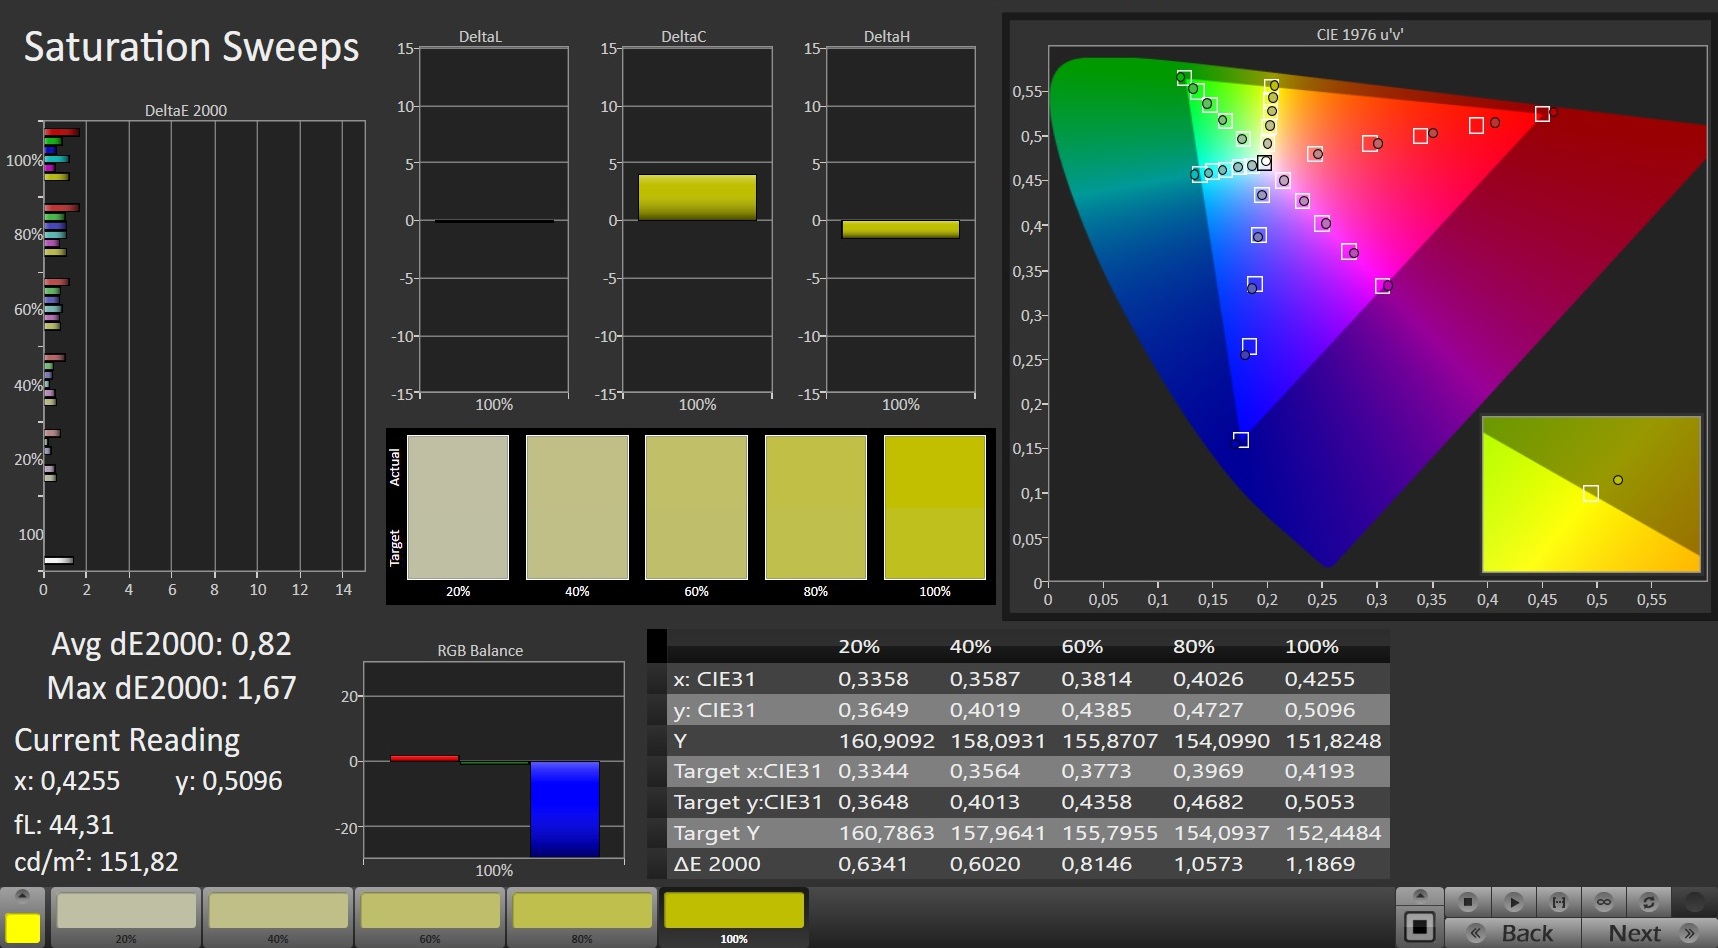
calibrated: 0.82
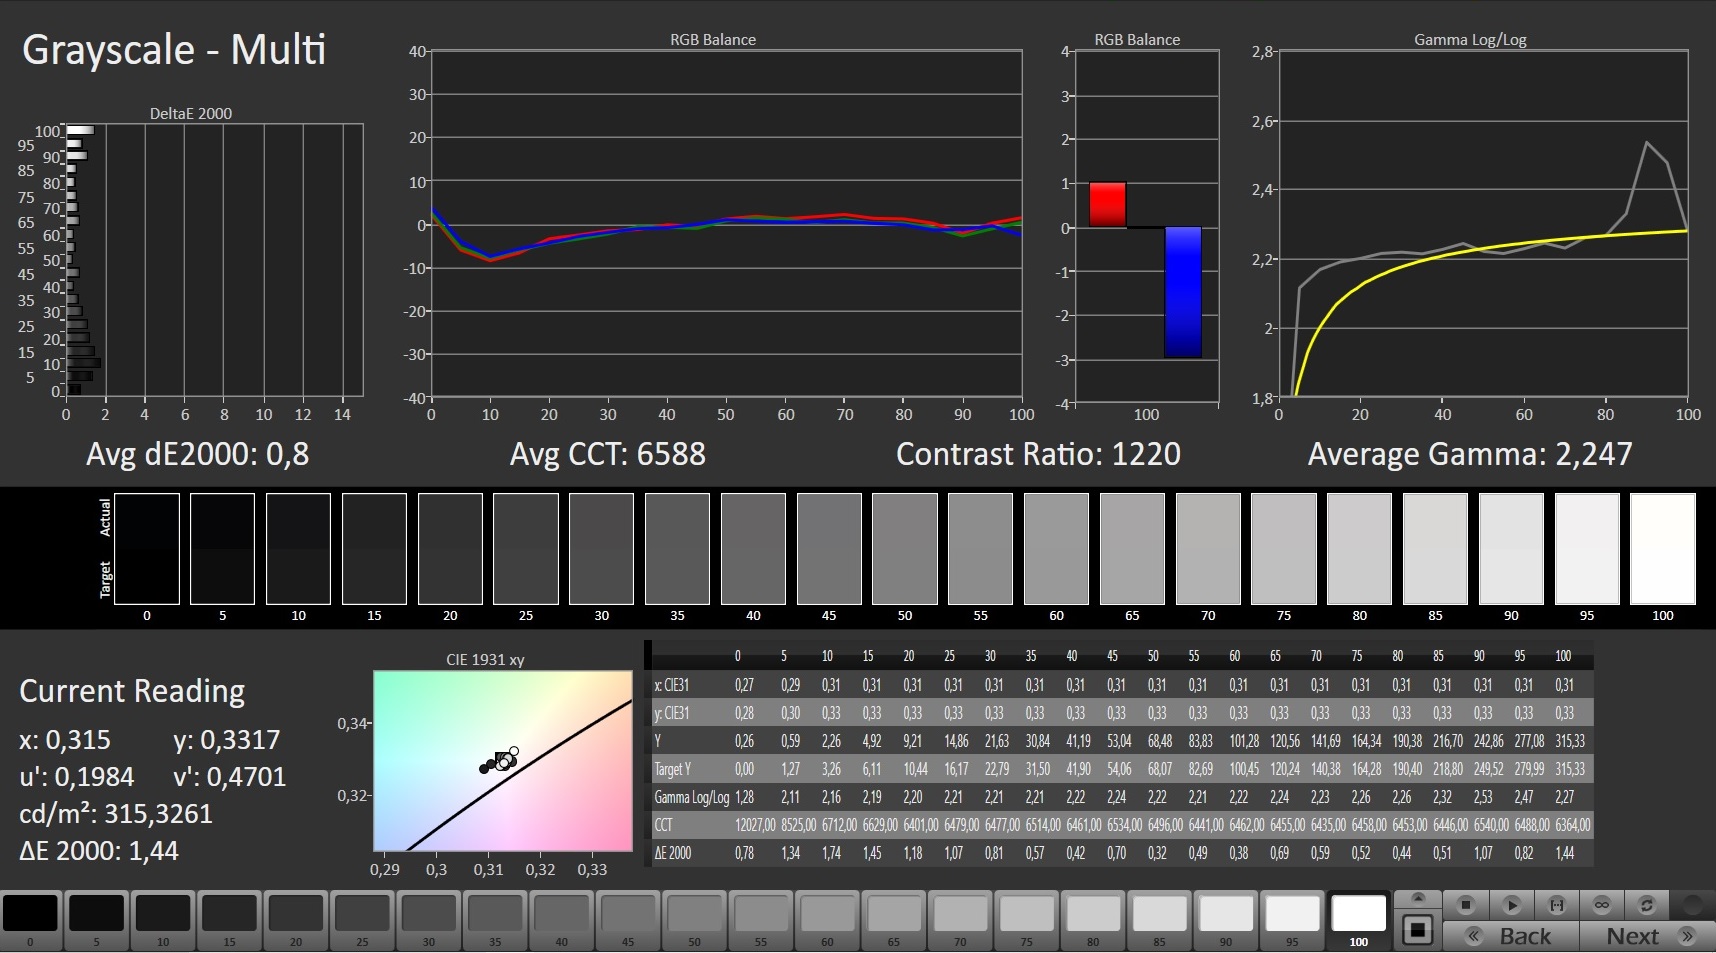
ΔE Greyscale Calman: 3.5 | ∀{0.09-98 Ø4.96}
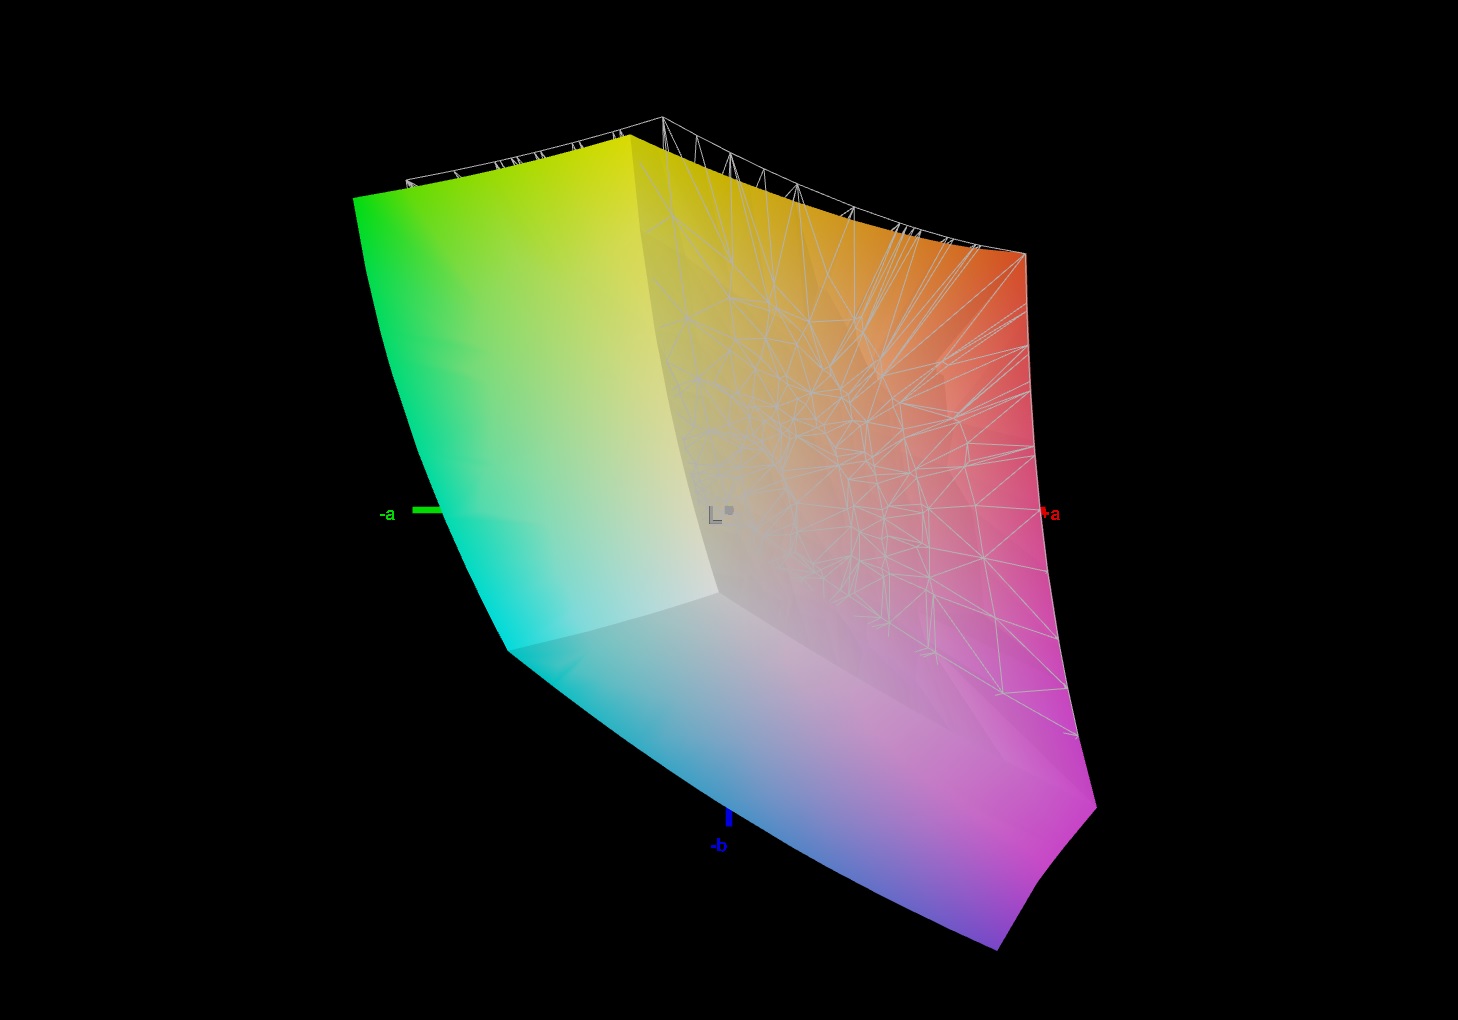
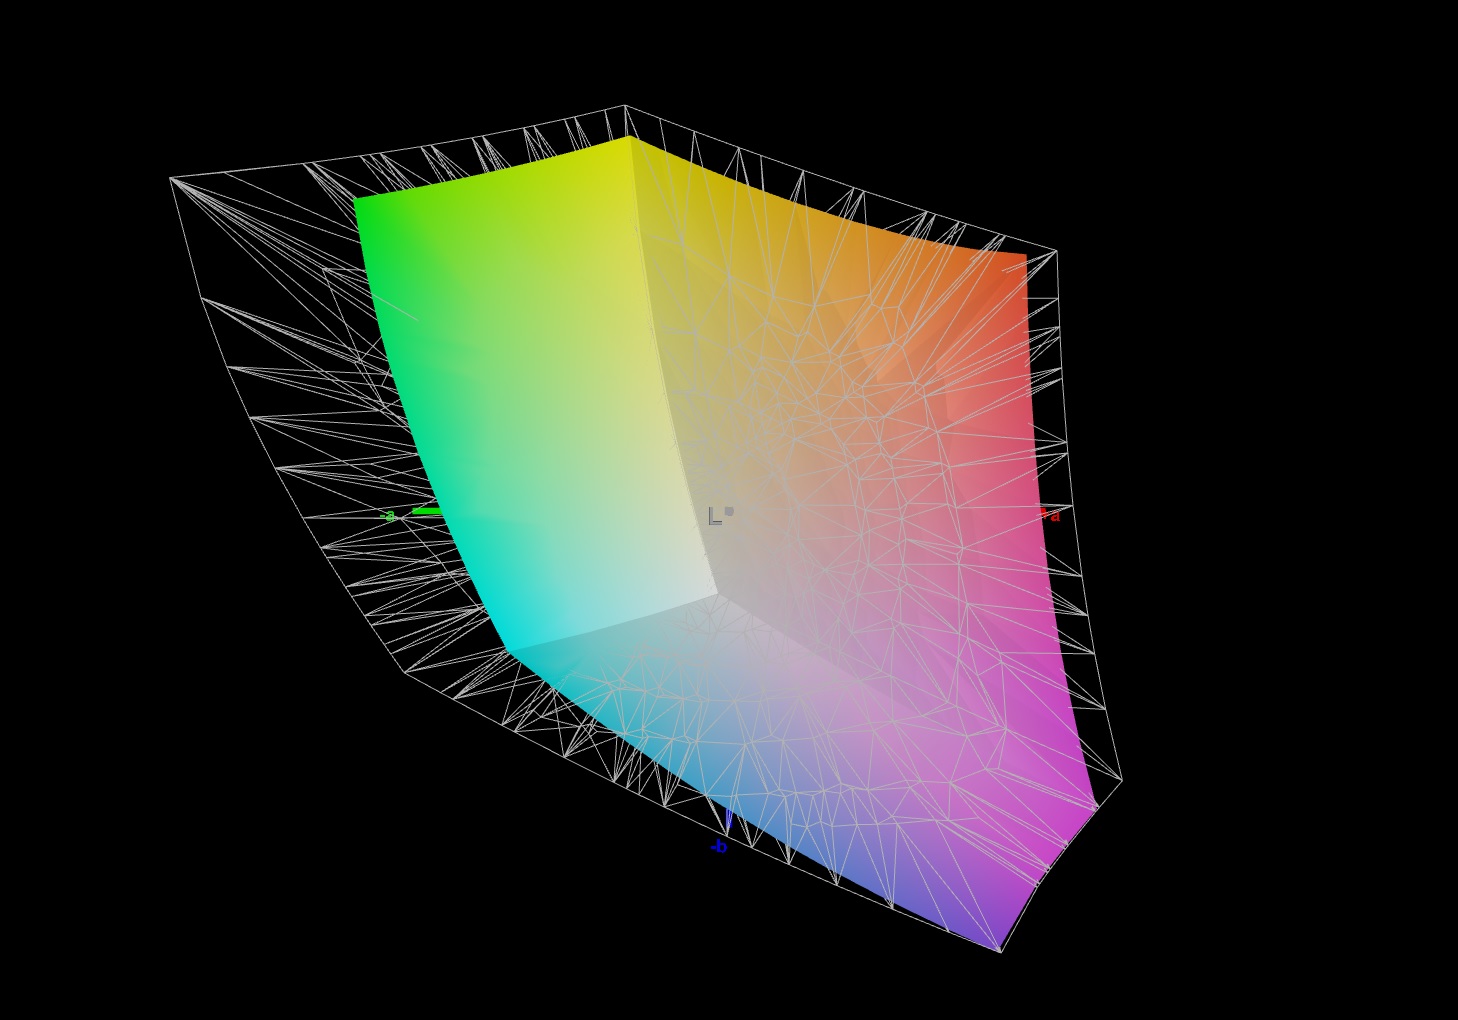
96% sRGB (Argyll 1.6.3 3D)
74% AdobeRGB 1998 (Argyll 1.6.3 3D)
73.7% AdobeRGB 1998 (Argyll 3D)
100% sRGB (Argyll 3D)
72.3% Display P3 (Argyll 3D)
Gamma: 2.358
CCT: 6147 K
| Aorus 17G YD Sharp LQ173M1JW04, IPS, 1920x1080, 17.3" | Asus Strix Scar 17 G733QSA-XS99 AU Optronics B173HAN05.4, IPS, 1920x1080, 17.3" | Lenovo Legion 7 16ACHg6 CSOT T3 MNG007DA1-1, IPS, 2560x1600, 16" | Schenker XMG Neo 17 (Early 2021, RTX 3070, 5800H) BOE NE173QHM-NY2 (BOE0977), IPS, 2560x1440, 17.3" | Aorus 17G XB AU Optronics B173HAN05.0 (AUO509D), IPS, 1920x1080, 17.3" | Alienware m17 R4 AU Optronics AUOEC91, IPS, 1920x1080, 17.3" | MSI GE76 Raider 10UH AU Optronics B173HAN05.1, IPS, 1920x1080, 17.3" | |
|---|---|---|---|---|---|---|---|
| Display | -2% | -2% | -2% | -2% | -2% | -1% | |
| Display P3 Coverage (%) | 72.3 | 71 -2% | 70.3 -3% | 70.5 -2% | 70.6 -2% | 69.8 -3% | 71.8 -1% |
| sRGB Coverage (%) | 100 | 99.4 -1% | 99.4 -1% | 99.5 0% | 97.2 -3% | 99.7 0% | 98.1 -2% |
| AdobeRGB 1998 Coverage (%) | 73.7 | 72.2 -2% | 72.7 -1% | 71.8 -3% | 72.8 -1% | 71.6 -3% | 73.9 0% |
| Response Times | 17% | 14% | -17% | -24% | 2% | -30% | |
| Response Time Grey 50% / Grey 80% * (ms) | 13.6 ? | 6.6 ? 51% | 14 ? -3% | 16.8 ? -24% | 16 ? -18% | 13.2 ? 3% | 20.4 ? -50% |
| Response Time Black / White * (ms) | 9.2 ? | 10.8 ? -17% | 6.4 ? 30% | 10 ? -9% | 12 ? -30% | 9.2 ? -0% | 10 ? -9% |
| PWM Frequency (Hz) | 151500 | ||||||
| Screen | 6% | 21% | 2% | 17% | 21% | -21% | |
| Brightness middle (cd/m²) | 286 | 303.8 6% | 489 71% | 410 43% | 293 2% | 305 7% | 324.6 13% |
| Brightness (cd/m²) | 282 | 292 4% | 469 66% | 381 35% | 285 1% | 301 7% | 312 11% |
| Brightness Distribution (%) | 73 | 85 16% | 92 26% | 88 21% | 95 30% | 93 27% | 87 19% |
| Black Level * (cd/m²) | 0.24 | 0.23 4% | 0.38 -58% | 0.37 -54% | 0.24 -0% | 0.19 21% | 0.28 -17% |
| Contrast (:1) | 1192 | 1321 11% | 1287 8% | 1108 -7% | 1221 2% | 1605 35% | 1159 -3% |
| Colorchecker dE 2000 * | 2.79 | 1.87 33% | 1.45 48% | 2.55 9% | 1.27 54% | 1.31 53% | 3.87 -39% |
| Colorchecker dE 2000 max. * | 6.23 | 3.26 48% | 2.16 65% | 4.33 30% | 2.24 64% | 2.32 63% | 9.35 -50% |
| Colorchecker dE 2000 calibrated * | 0.82 | 1.45 -77% | 1.16 -41% | 1.28 -56% | 1.06 -29% | 0.91 -11% | 1.42 -73% |
| Greyscale dE 2000 * | 3.5 | 2.7 23% | 1.6 54% | 3.4 3% | 1.34 62% | 2.3 34% | 6.5 -86% |
| Gamma | 2.358 93% | 2.26 97% | 2.197 100% | 2.275 97% | 2.38 92% | 2.281 96% | 2.23 99% |
| CCT | 6147 106% | 6436 101% | 6377 102% | 6637 98% | 6542 99% | 6449 101% | 5702 114% |
| Color Space (Percent of AdobeRGB 1998) (%) | 74 | 65.6 -11% | 73 -1% | 72 -3% | 73 -1% | 72 -3% | 66.3 -10% |
| Color Space (Percent of sRGB) (%) | 96 | 99.4 4% | 94 -2% | 95 -1% | 94 -2% | 94 -2% | 98 2% |
| Total Average (Program / Settings) | 7% /
6% | 11% /
16% | -6% /
-1% | -3% /
8% | 7% /
14% | -17% /
-18% |
* ... smaller is better
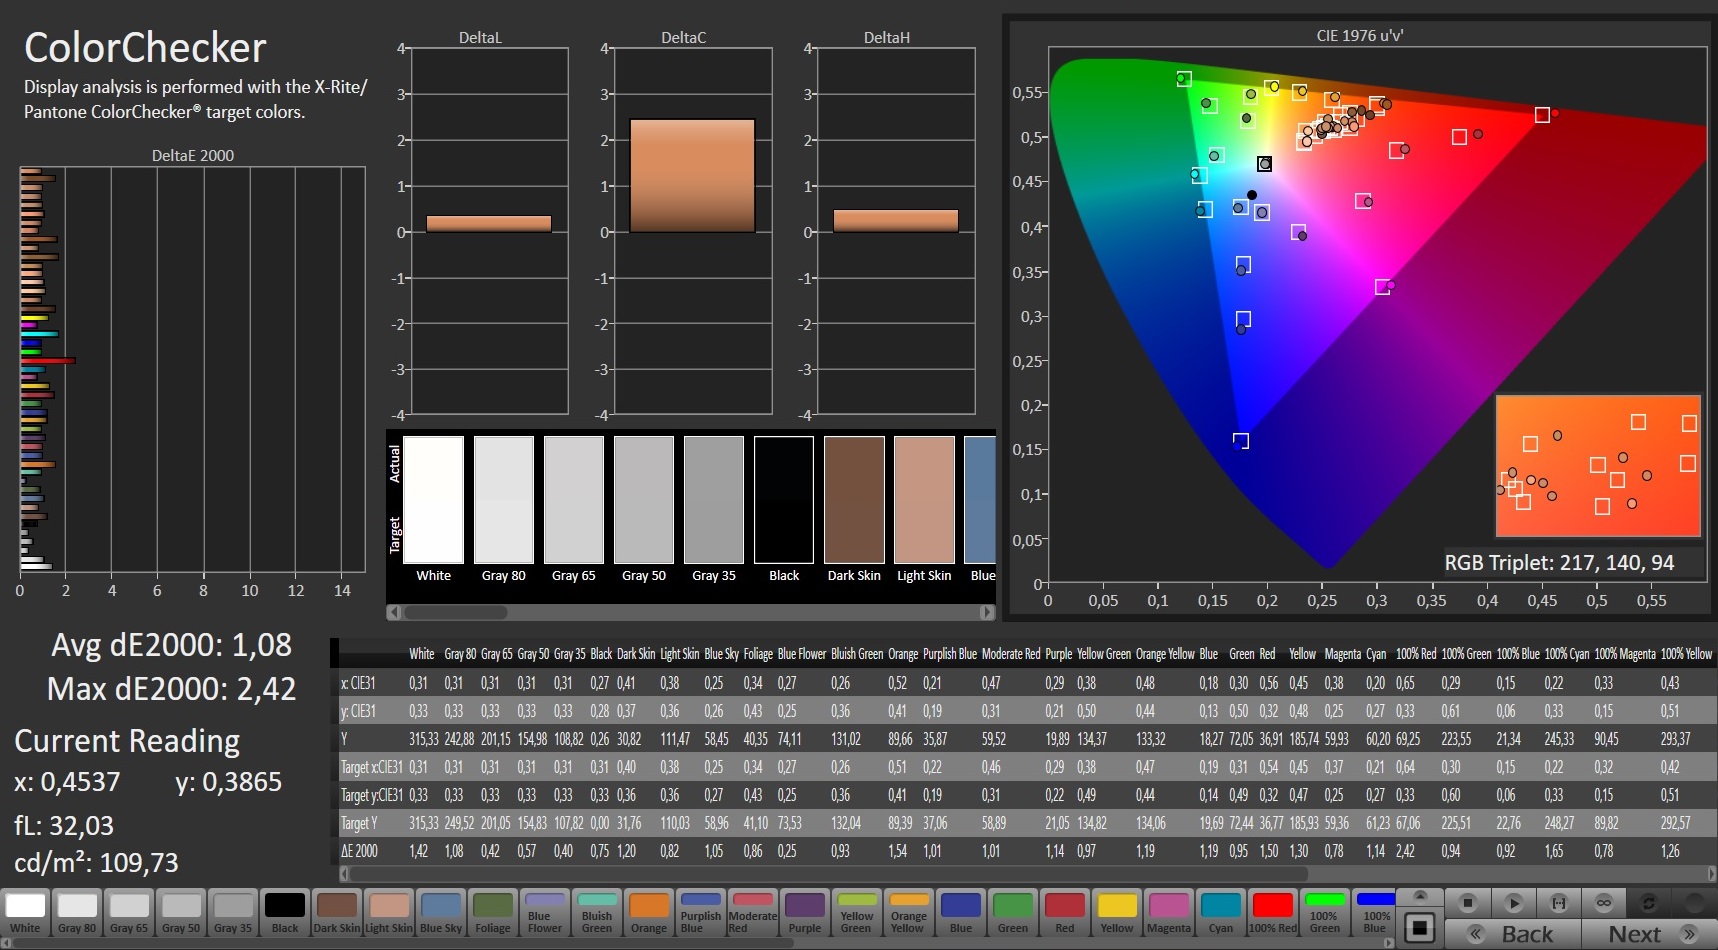
Out of the box, the display shows a good color reproduction and meets the target with a color deviation of 2.79 (DeltaE less than 3). Moreover, it doesn't suffer from a blue tint. Calibration can be used to achieve improvements. The color deviation drops to 1.08, and grayscales are represented in a more balanced way. The sRGB color space is covered by 100%, while the AdobeRGB color space is covered by 74%.
Display Response Times
| ↔ Response Time Black to White | ||
|---|---|---|
| 9.2 ms ... rise ↗ and fall ↘ combined | ↗ 5.2 ms rise | 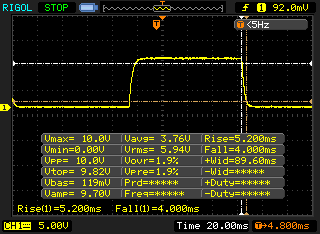 |
| ↘ 4 ms fall | ||
| The screen shows fast response rates in our tests and should be suited for gaming. In comparison, all tested devices range from 0.1 (minimum) to 240 (maximum) ms. » 26 % of all devices are better. This means that the measured response time is better than the average of all tested devices (19.8 ms). | ||
| ↔ Response Time 50% Grey to 80% Grey | ||
| 13.6 ms ... rise ↗ and fall ↘ combined | ↗ 6.8 ms rise | 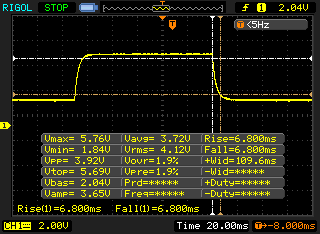 |
| ↘ 6.8 ms fall | ||
| The screen shows good response rates in our tests, but may be too slow for competitive gamers. In comparison, all tested devices range from 0.165 (minimum) to 636 (maximum) ms. » 27 % of all devices are better. This means that the measured response time is better than the average of all tested devices (31 ms). | ||
Screen Flickering / PWM (Pulse-Width Modulation)
| Screen flickering / PWM not detected | 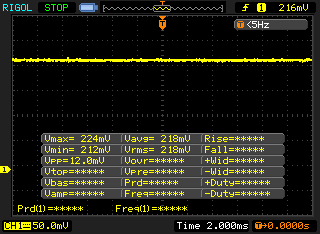 | ||
In comparison: 52 % of all tested devices do not use PWM to dim the display. If PWM was detected, an average of 7757 (minimum: 5 - maximum: 343500) Hz was measured. | |||
The viewing-angle stable IPS panel is legible from any position. Reading the display content outdoors is possible when the sun isn't too bright.

Performance - Tiger Lake meets Ampere
With the Aorus 17G YD, Gigabyte has a 17.3-inch gaming laptop in its lineup that brings every modern game smoothly onto the screen and also cuts a fine figure in all other application areas.
Test conditions
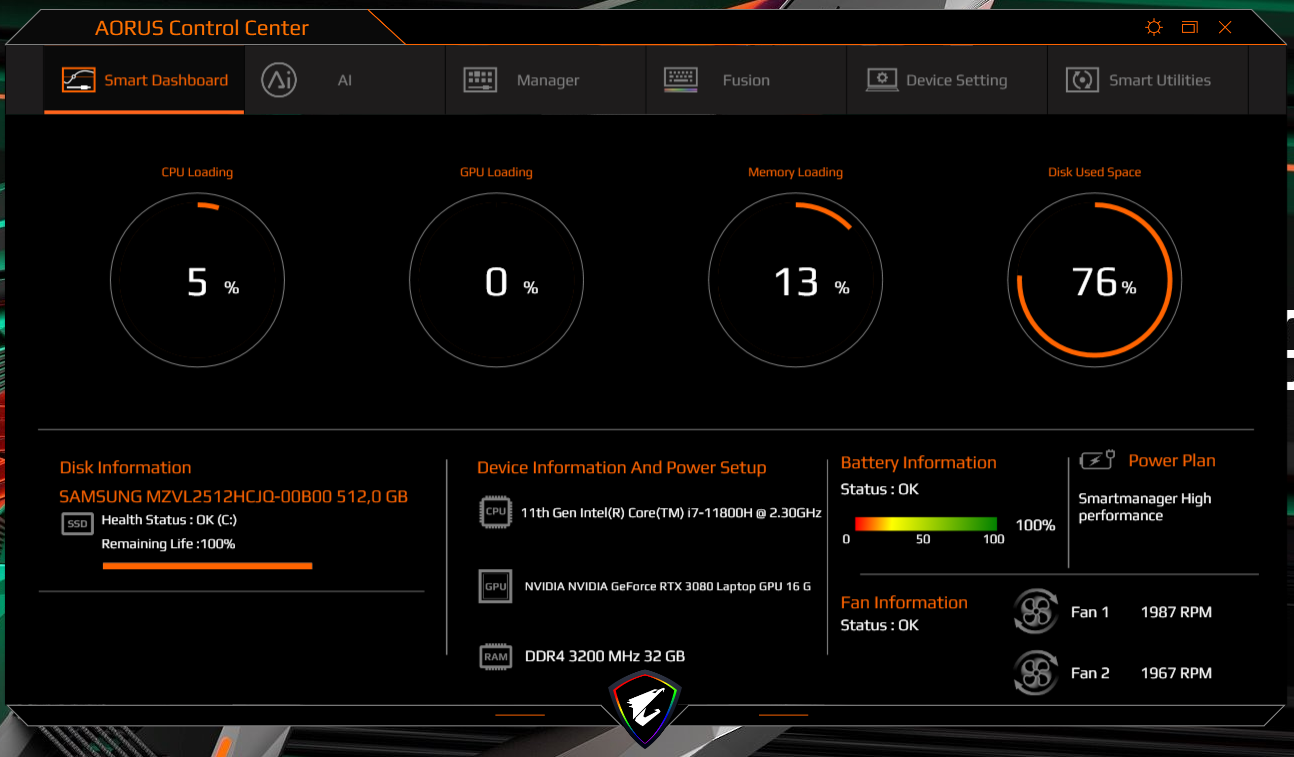
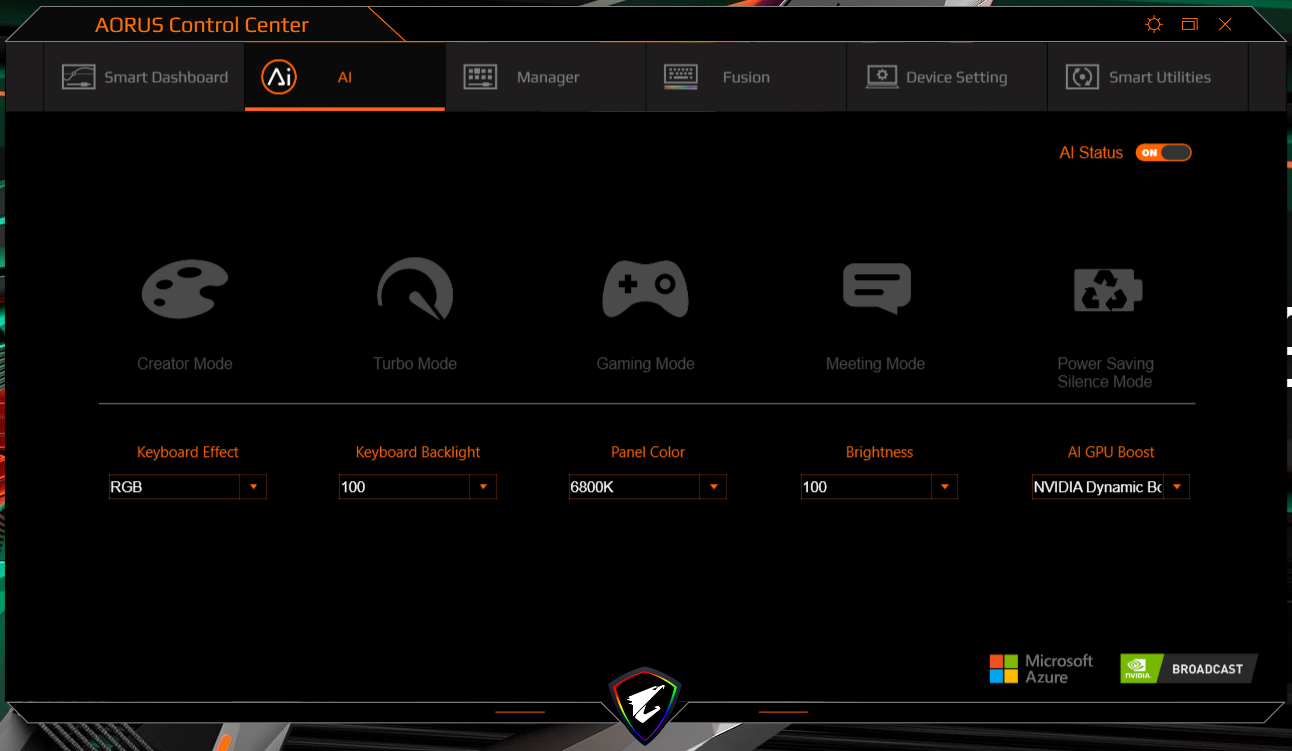
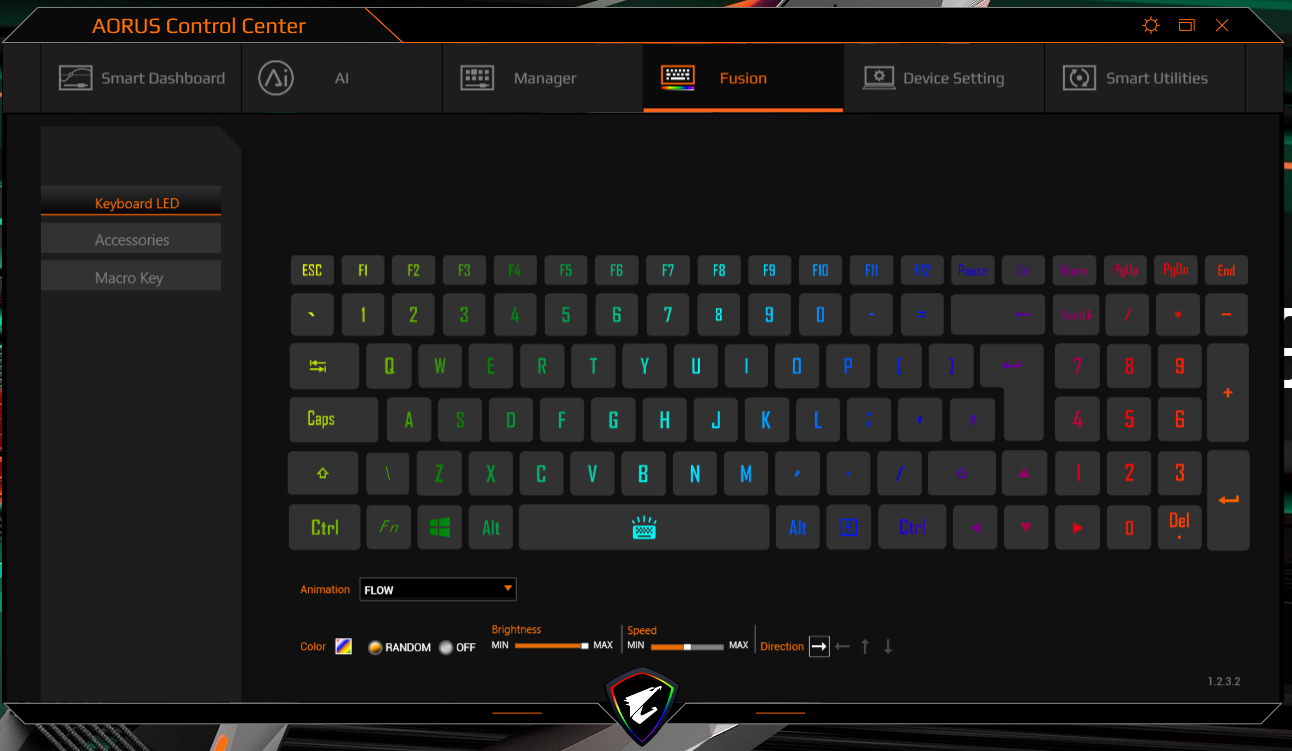
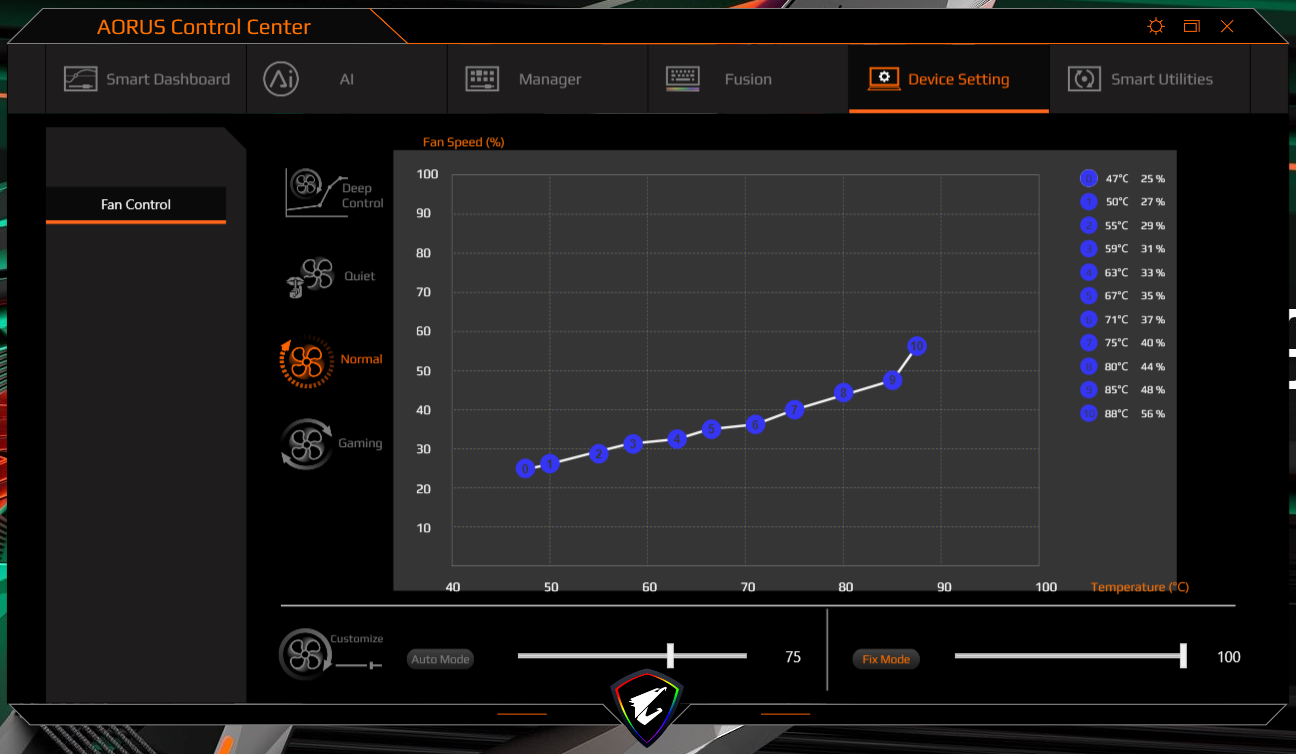
The preinstalled Aorus Control Center offers the option to specify an energy profile, among other things. We used the automatic AI function here. As a result, the Control Center chooses the appropriate settings itself. Not only does this include the CPU's and GPU's computing power and overclocking, but it also covers the display brightness, the color temperature, and the keyboard backlight.
Some benchmarks were also run with the "Turbo Mode" profile enabled. The latter allows the CPU and GPU to run permanently at maximum performance. Compared to the automatic profile selection, the differences are small. This profile isn't recommended for prolonged use because it keeps the fans running at full power.
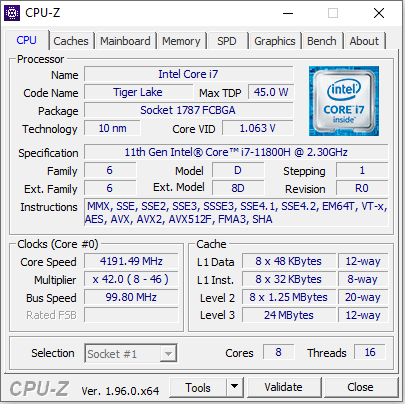
Processor
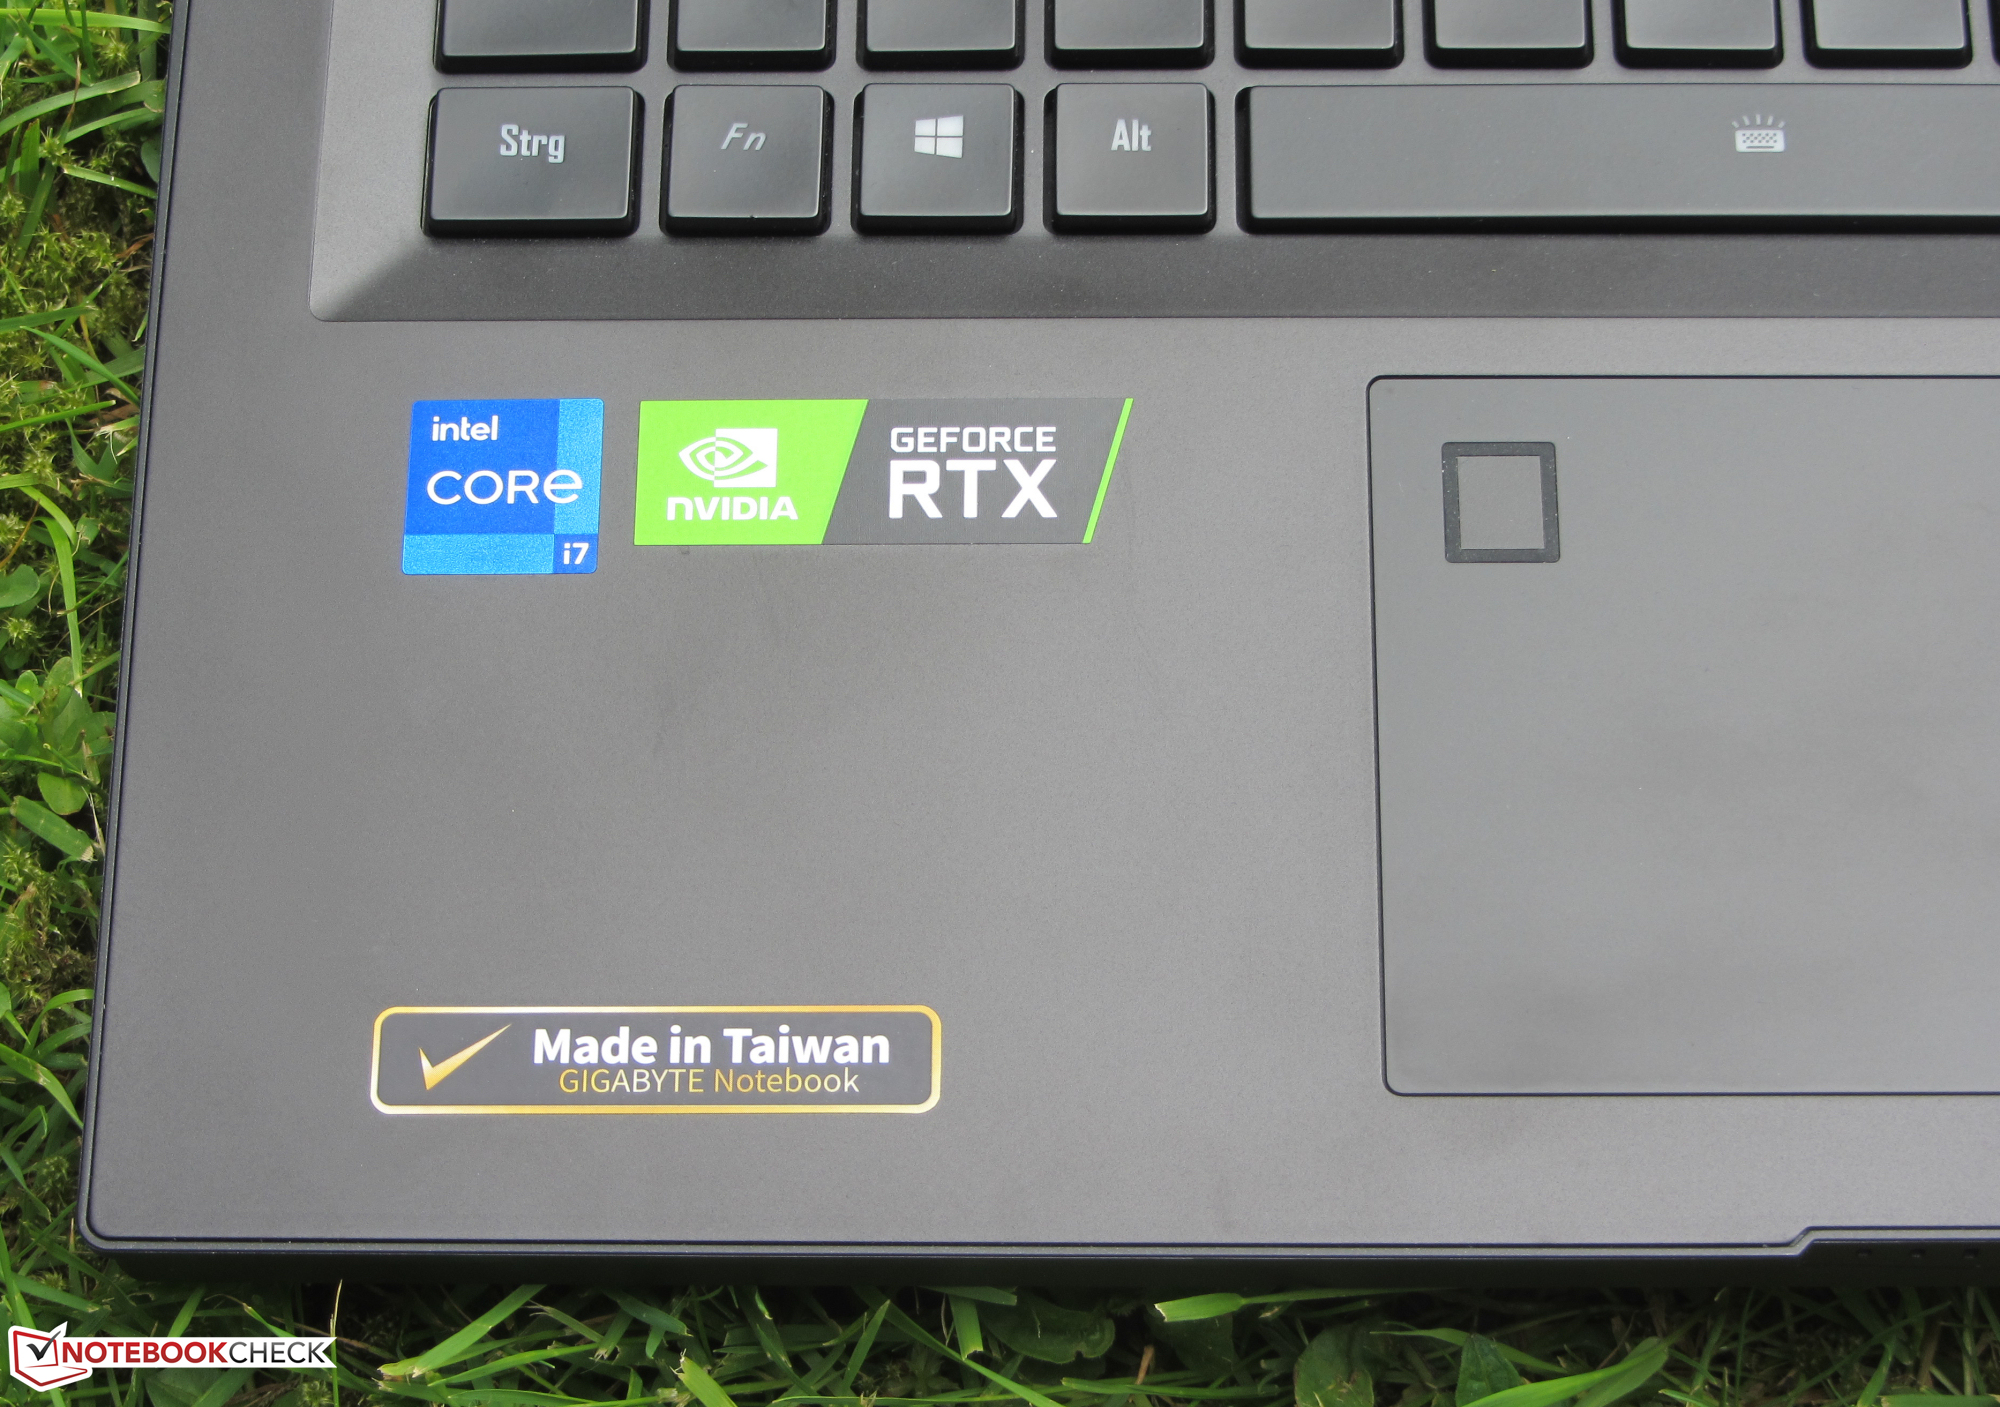
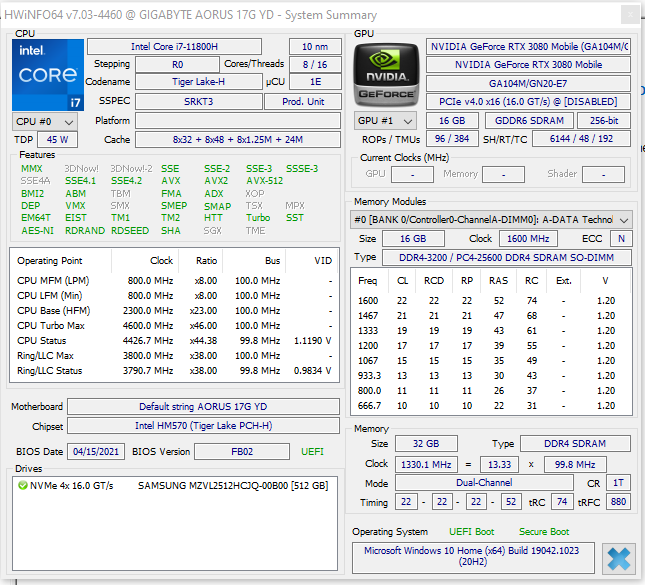
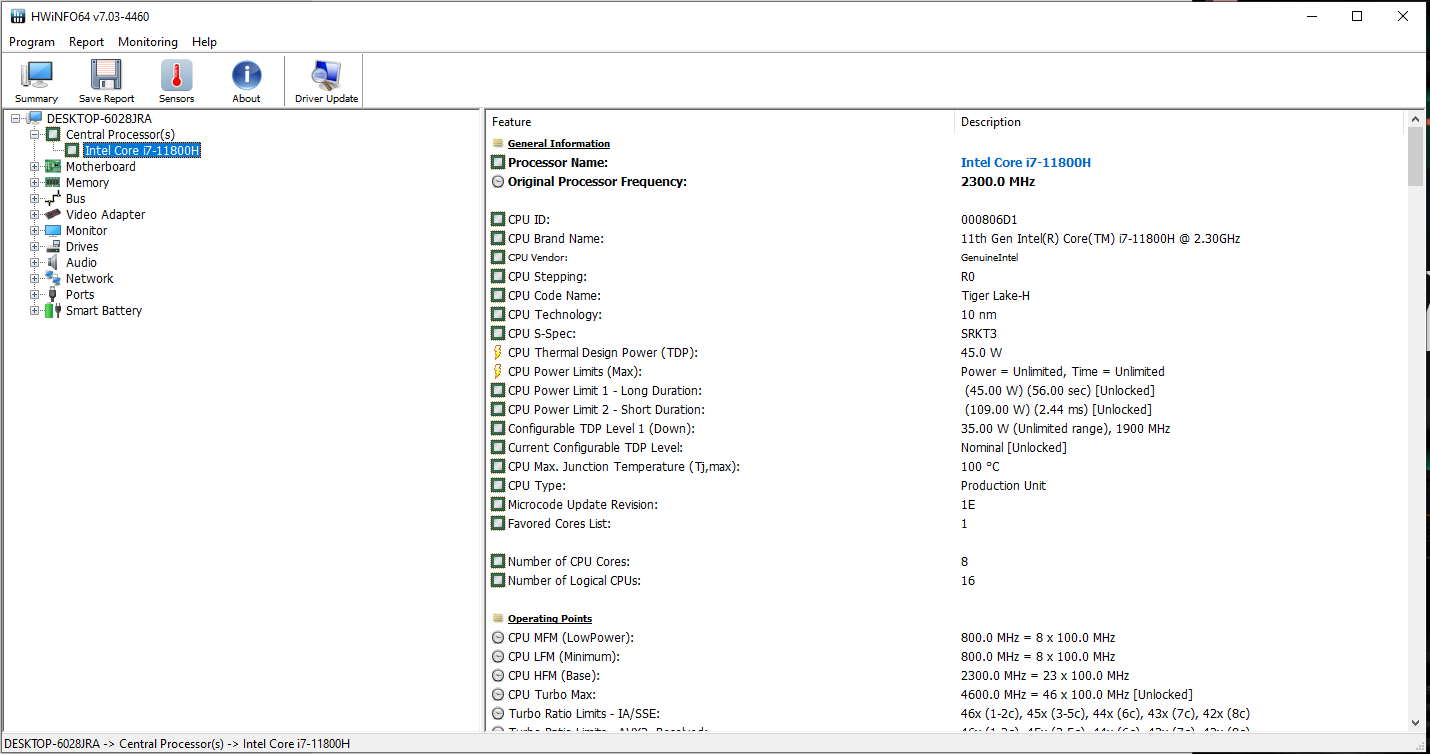
The Core-i7-11800H octa-core processor (Tiger Lake) runs at a base clock speed of 2.3 GHz. An increase to 4.2 GHz (eight cores) or 4.6 GHz (one core) is possible via Turbo. Hyper-Threading (two threads per core) is supported.
The Cinebench R15 benchmark's CPU tests are run at 4.2 GHz (multithread) and 4.2 to 4.5 GHz (single-thread), respectively. On battery power, the CPU runs at 1.6 to 4.3 GHz (multithread) and 3.2 to 4.5 GHz (single-thread).
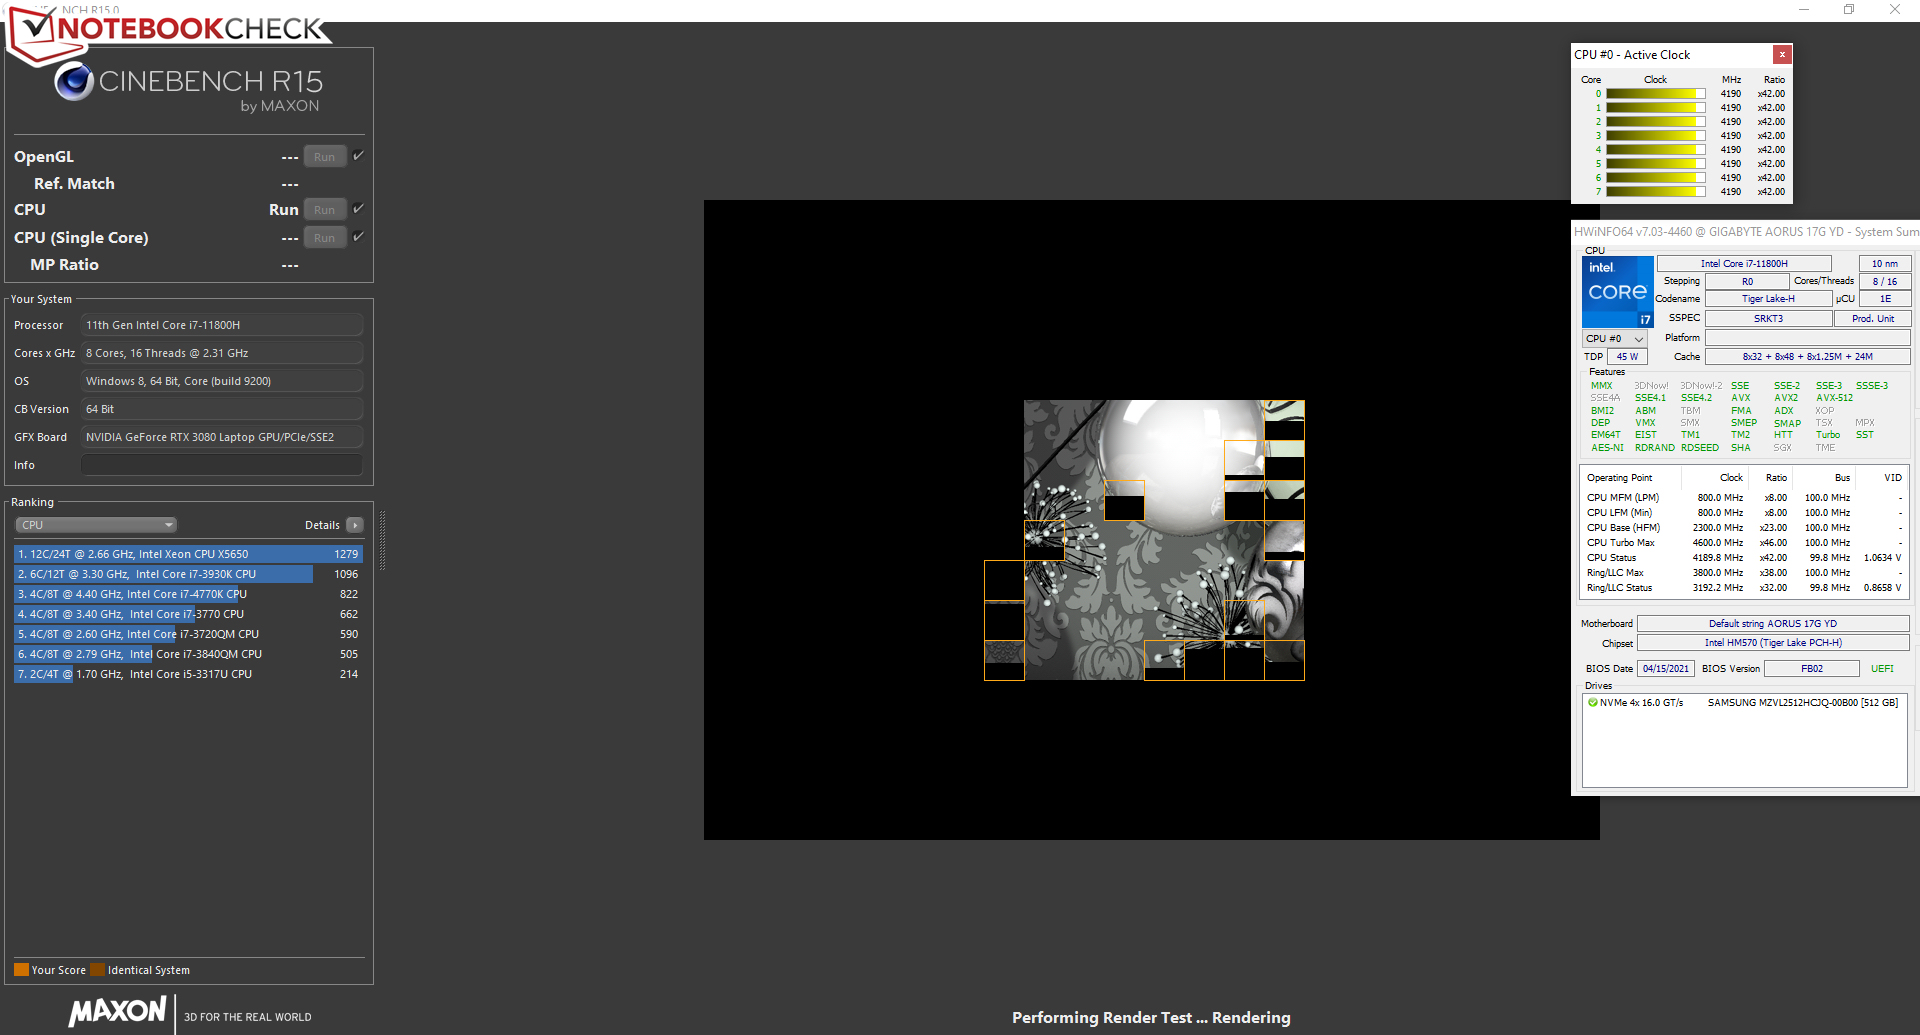
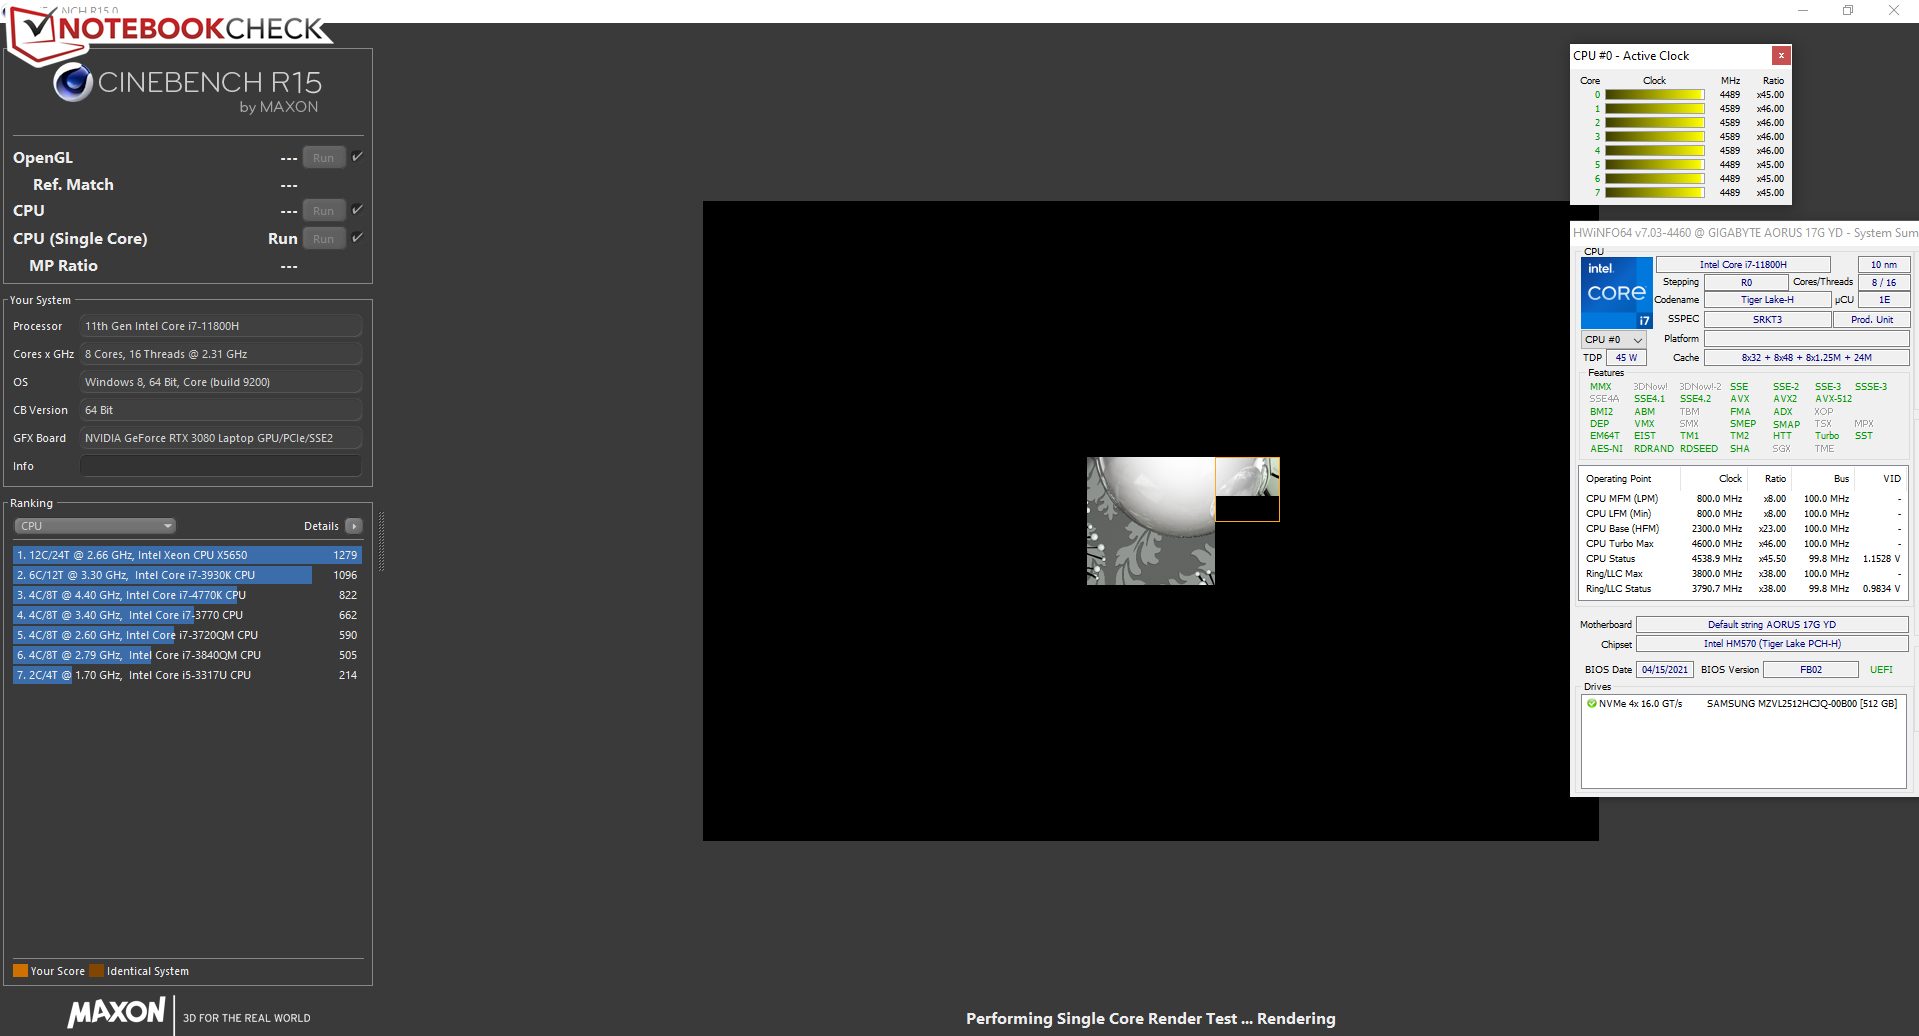
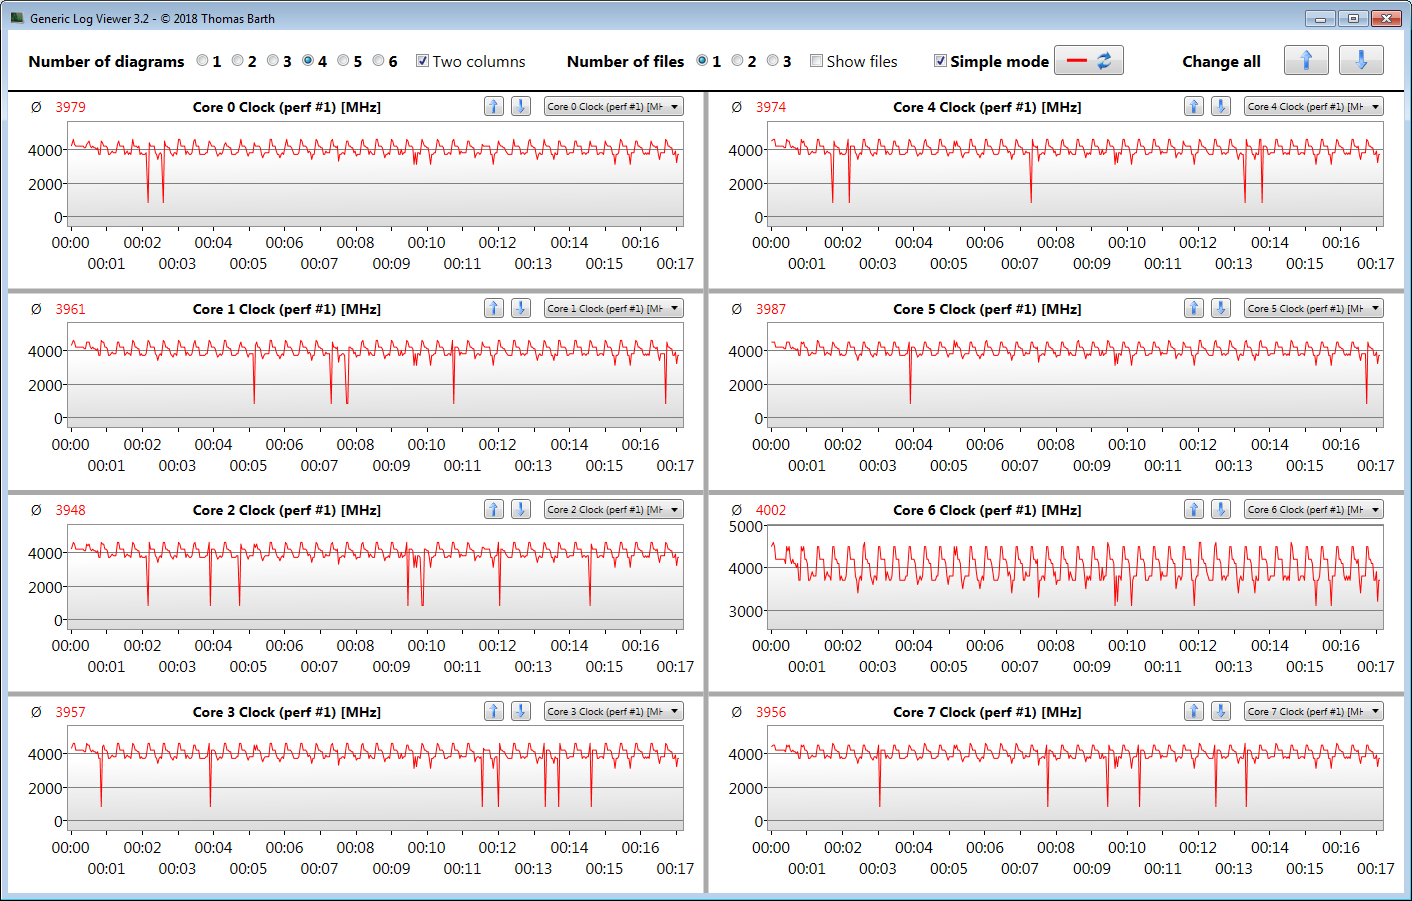
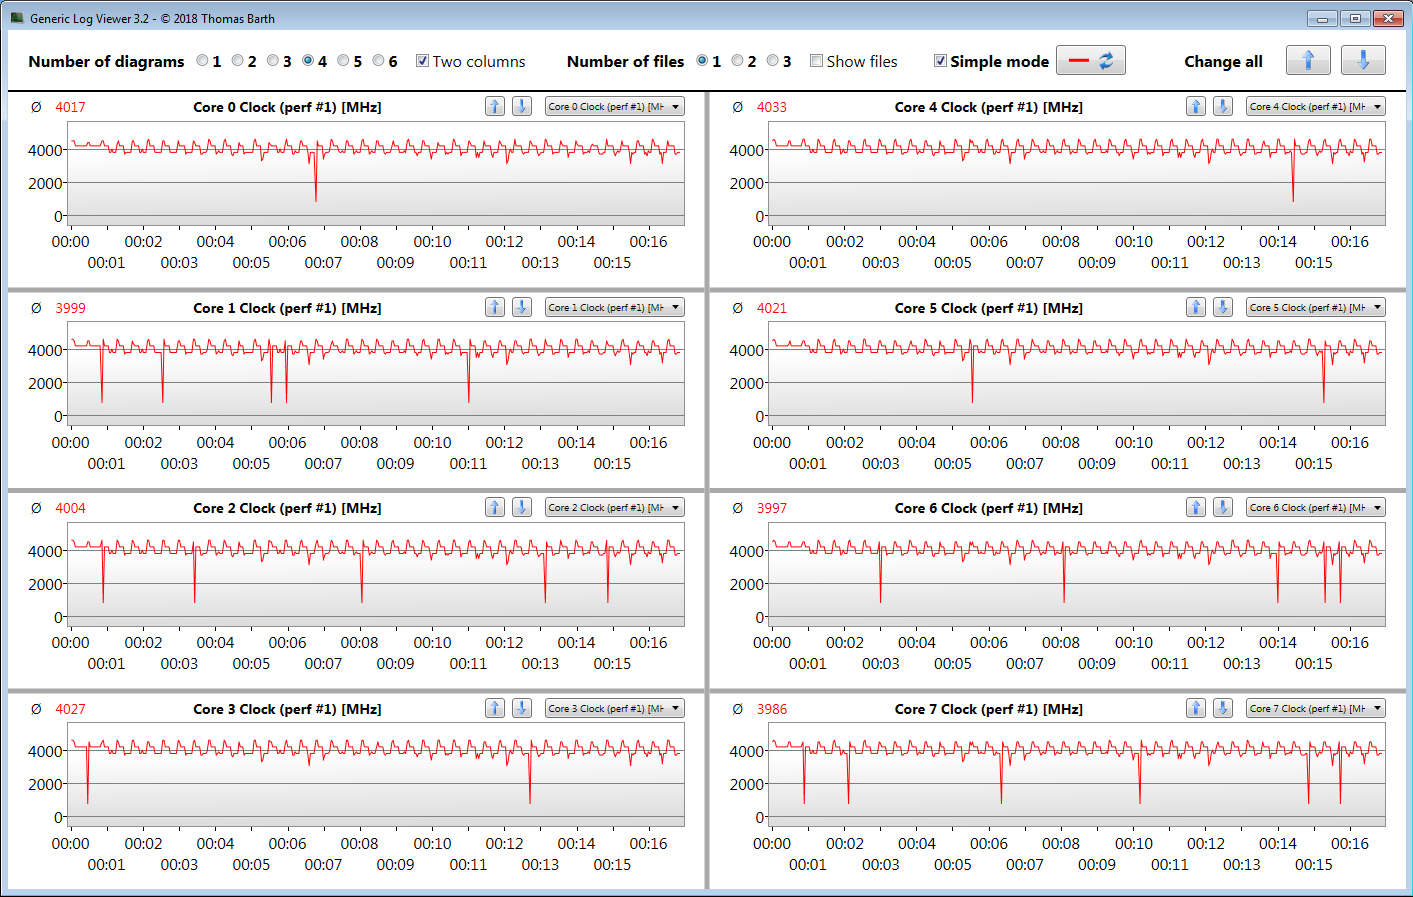
We verify if the CPU Turbo is also consistently used when plugged in by running the Cinebench R15 benchmark's multithread test in a continuous loop for at least 30 minutes. Turbo nearly operates at full power.
| HWBOT x265 Benchmark v2.2 - 4k Preset | |
| Average of class Gaming (11.5 - 44.4, n=105, last 2 years) | |
| Asus Strix Scar 17 G733QSA-XS99 | |
| Lenovo Legion 7 16ACHg6 | |
| Aorus 17G YD (Turbo Mode) | |
| Aorus 17G YD | |
| Schenker XMG Neo 17 (Early 2021, RTX 3070, 5800H) | |
| Alienware m17 R4 | |
| Average Intel Core i7-11800H (7.38 - 17.4, n=46) | |
| MSI GE76 Raider 10UH | |
| Aorus 17G XB | |
* ... smaller is better
System performance
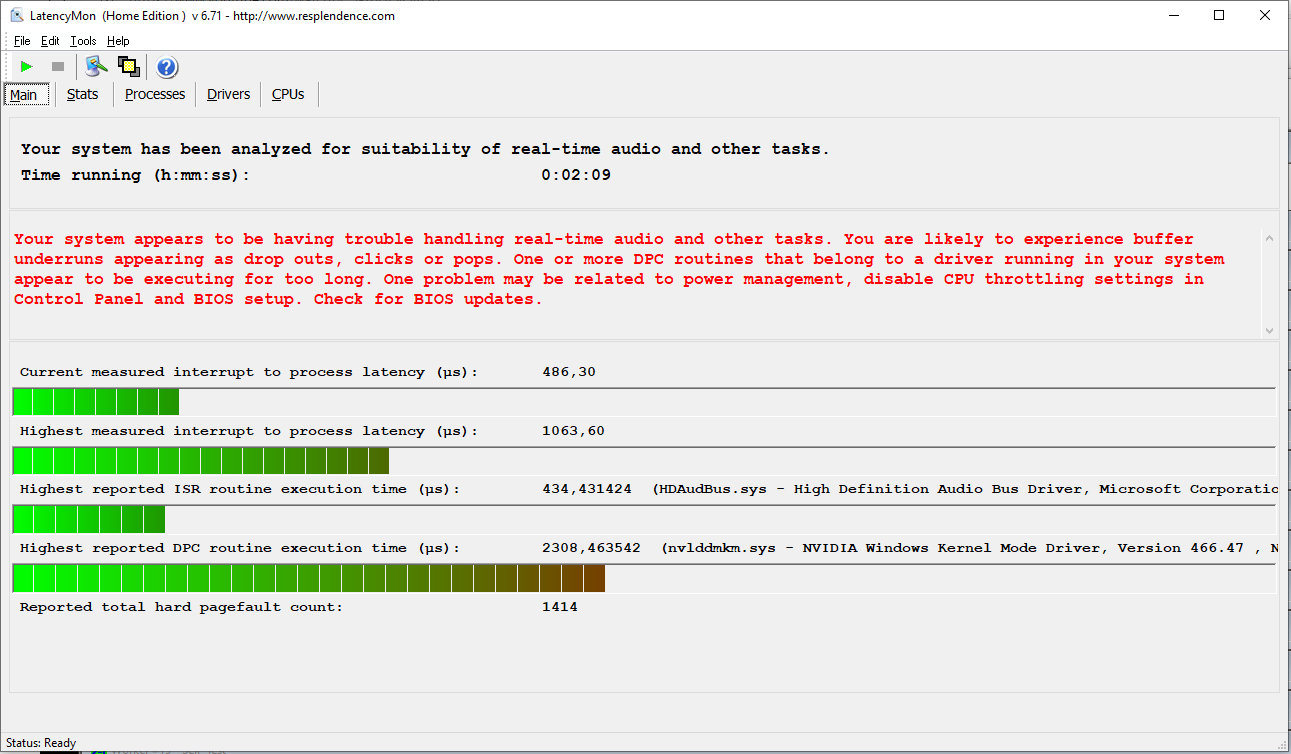
The system runs well and smoothly. We didn't experience any issues apart from the high DPC latencies. The hardware provides more than enough computing power for performance-demanding applications like gaming. This is accompanied by good PCMark results.
| PCMark 8 Home Score Accelerated v2 | 5265 points | |
| PCMark 8 Creative Score Accelerated v2 | 7359 points | |
| PCMark 8 Work Score Accelerated v2 | 7104 points | |
| PCMark 10 Score | 7073 points | |
Help | ||
| PCMark 8 | |
| Home Score Accelerated v2 | |
| Average of class Gaming (n=1last 2 years) | |
| Aorus 17G YD | |
| Average Intel Core i7-11800H, NVIDIA GeForce RTX 3080 Laptop GPU (3941 - 5640, n=3) | |
| Work Score Accelerated v2 | |
| Aorus 17G YD | |
| Average Intel Core i7-11800H, NVIDIA GeForce RTX 3080 Laptop GPU (4756 - 7104, n=3) | |
| Average of class Gaming (n=1last 2 years) | |
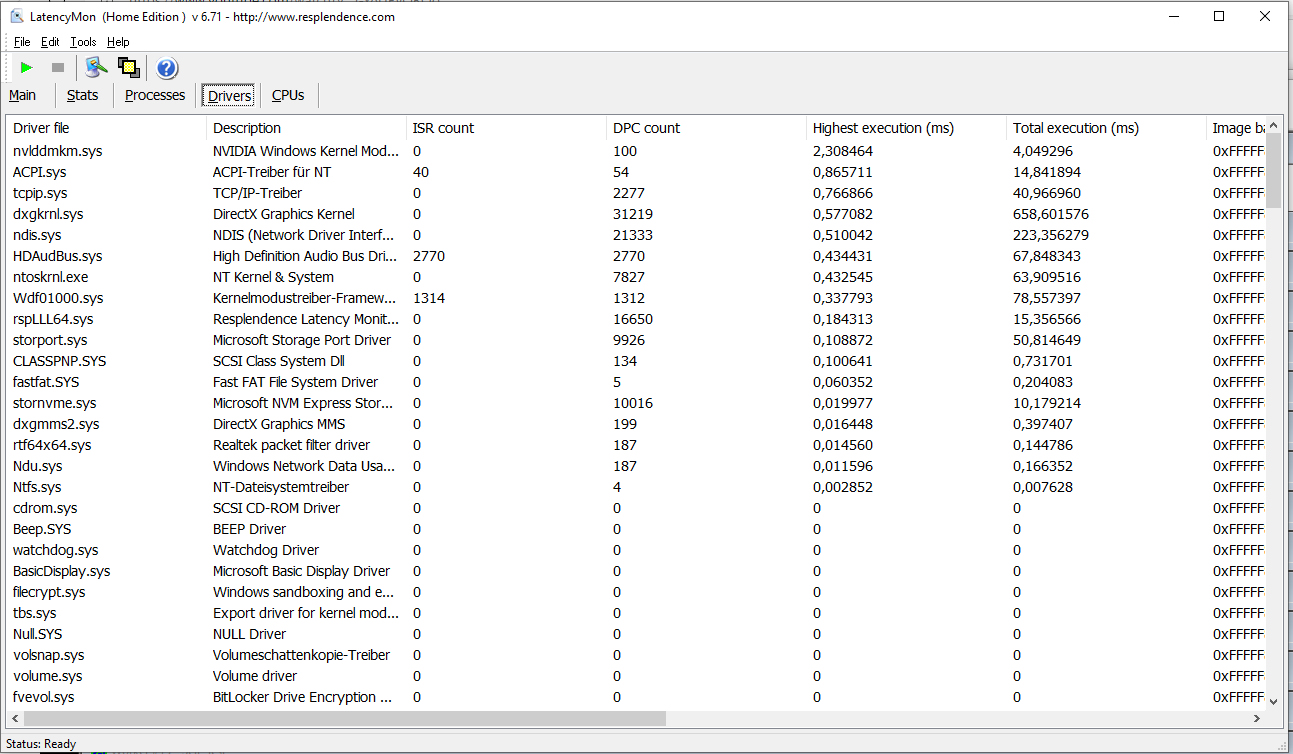
DPC latencies
Our standardized latency monitor test (web browsing, 4K video playback, high-load Prime95) revealed issues with DPC latencies. The system doesn't seem to be suitable for real-time video and audio editing.
| DPC Latencies / LatencyMon - interrupt to process latency (max), Web, Youtube, Prime95 | |
| Aorus 17G XB | |
| Schenker XMG Neo 17 (Early 2021, RTX 3070, 5800H) | |
| MSI GP76 Leopard 10UG | |
| Aorus 17G YD | |
| Asus Strix Scar 17 G733QSA-XS99 | |
| Lenovo Legion 7 16ACHg6 | |
* ... smaller is better
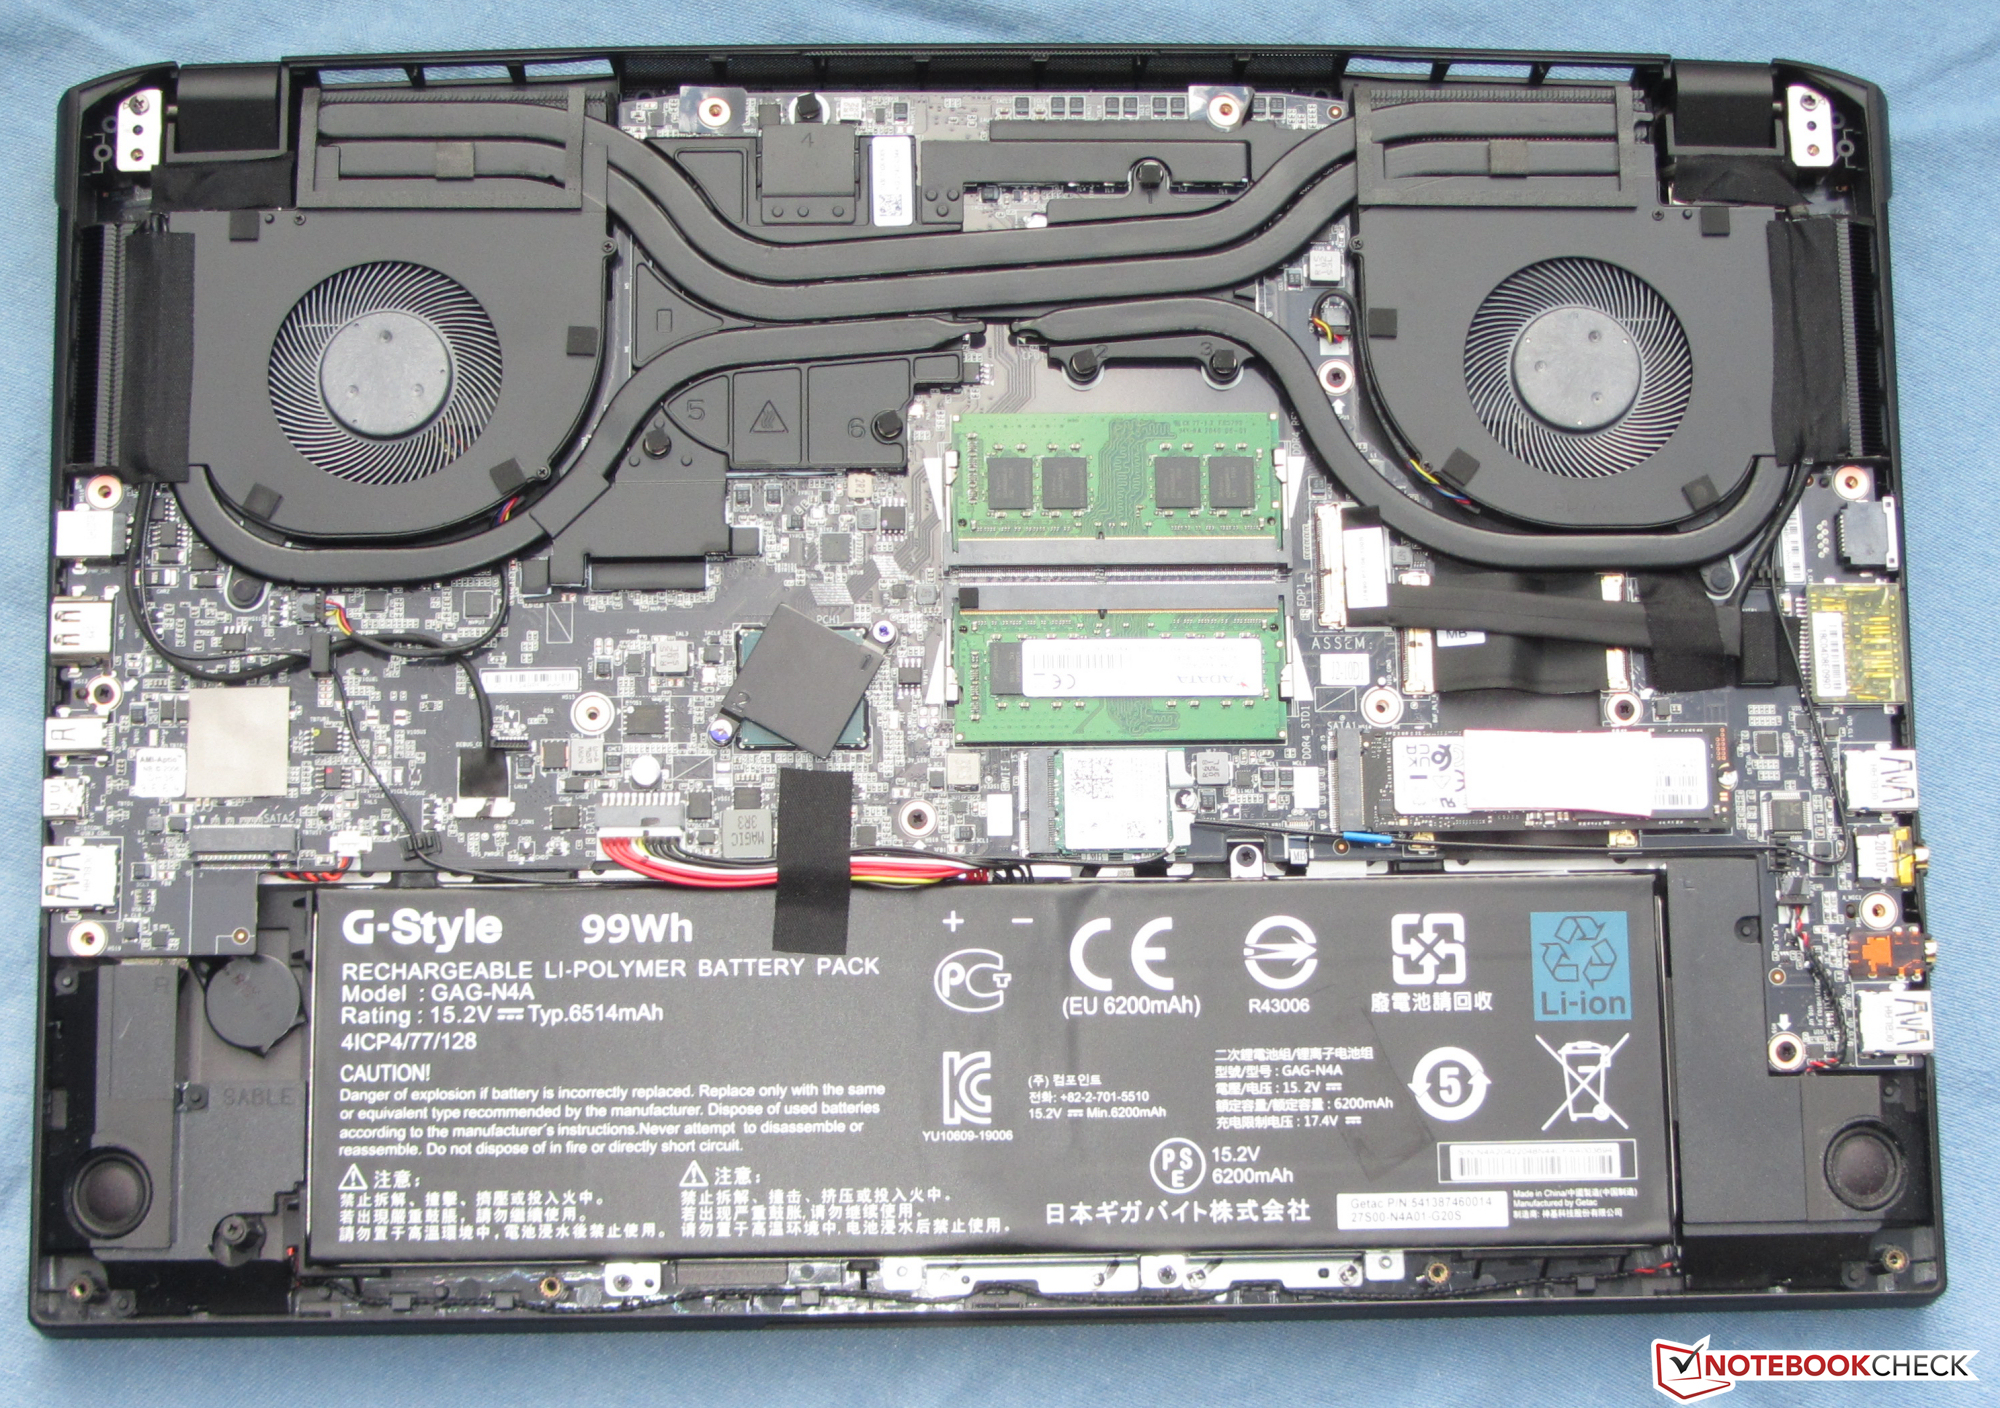
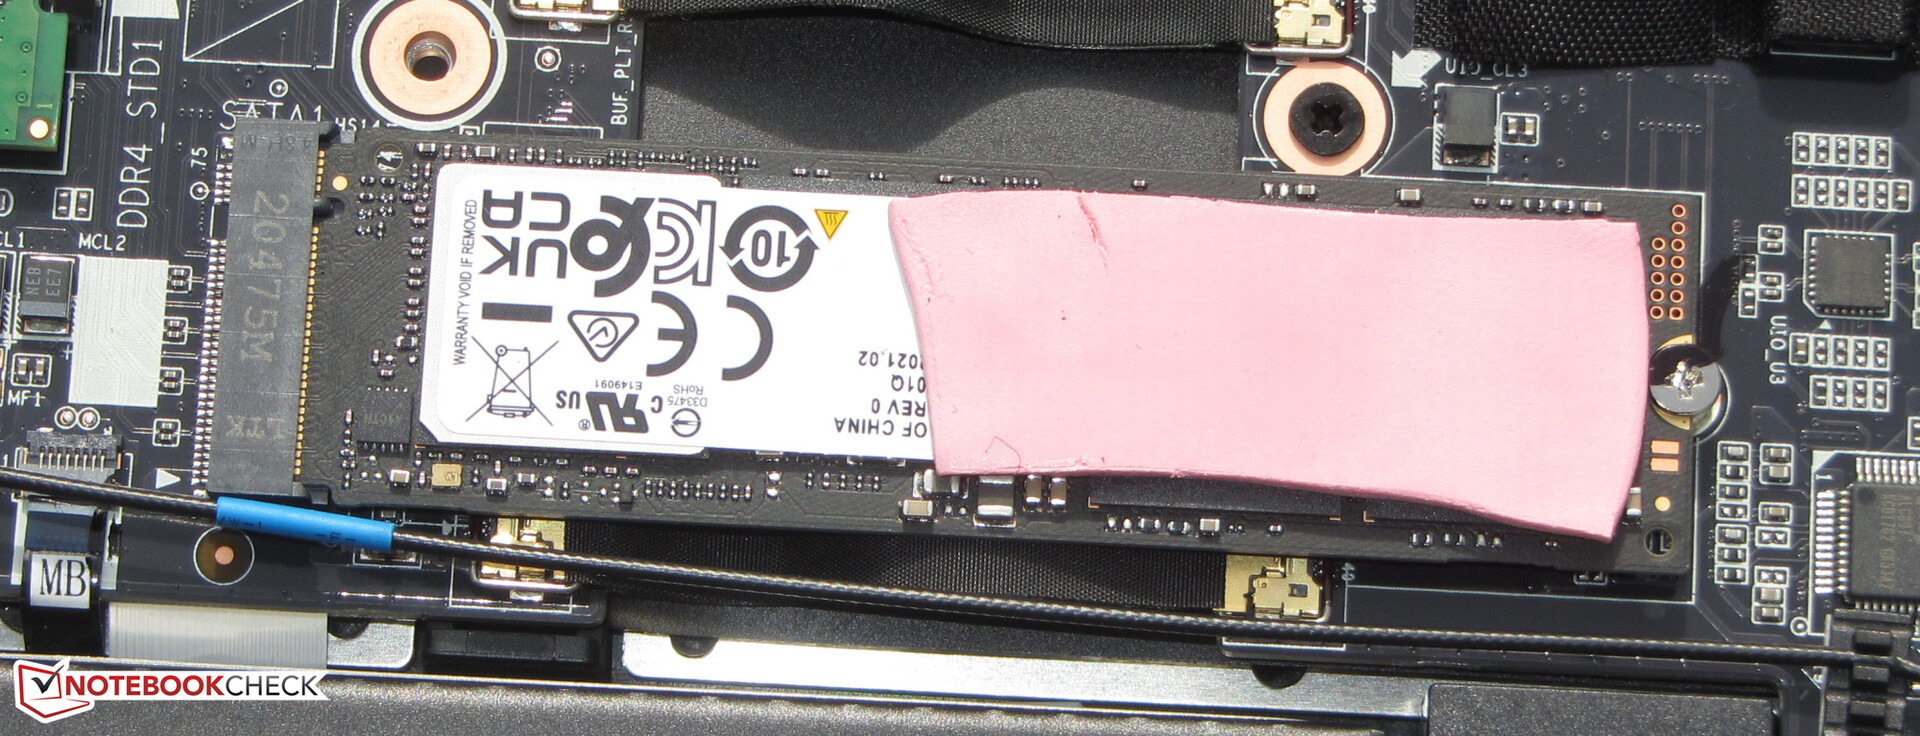
Storage
A 512 GB NVMe SSD (M.2-2280) from Samsung serves as system drive, and it delivers excellent transfer rates thanks to its PCI Express 4.0 connection. In total, the laptop has room for two M.2-2280 SSDs (1x PCIe 4.0, 1x PCIe 3.0/SATA). RAID 0/1 is not supported, though.

| Aorus 17G YD Samsung PM9A1 MZVL2512HCJQ | MSI GP76 Leopard 10UG Kingston OM8PCP3512F-AB | Asus Strix Scar 17 G733QSA-XS99 2x Samsung PM981a MZVLB1T0HBLR (RAID 0) | Lenovo Legion 7 16ACHg6 WDC PC SN730 SDBPNTY-1T00 | Schenker XMG Neo 17 (Early 2021, RTX 3070, 5800H) Samsung SSD 970 EVO Plus 500GB | Aorus 17G XB Samsung SSD PM981a MZVLB512HBJQ | Average Samsung PM9A1 MZVL2512HCJQ | |
|---|---|---|---|---|---|---|---|
| CrystalDiskMark 5.2 / 6 | -50% | 36% | -12% | -4% | -17% | 12% | |
| Write 4K (MB/s) | 227.4 | 143.7 -37% | 235.9 4% | 157.6 -31% | 206.1 -9% | 123.4 -46% | 179.1 ? -21% |
| Read 4K (MB/s) | 91.3 | 45.1 -51% | 48.02 -47% | 48.97 -46% | 53 -42% | 45.02 -51% | 75.6 ? -17% |
| Write Seq (MB/s) | 2241 | 978 -56% | 4822 115% | 2789 24% | 3018 35% | 2526 13% | 3016 ? 35% |
| Read Seq (MB/s) | 4496 | 1163 -74% | 5043 12% | 2494 -45% | 2575 -43% | 2062 -54% | 3350 ? -25% |
| Write 4K Q32T1 (MB/s) | 661 | 519 -21% | 625 -5% | 456.7 -31% | 535 -19% | 497.9 -25% | 459 ? -31% |
| Read 4K Q32T1 (MB/s) | 712 | 302.7 -57% | 392.3 -45% | 575 -19% | 608 -15% | 579 -19% | 554 ? -22% |
| Write Seq Q32T1 (MB/s) | 1540 | 981 -36% | 5350 247% | 3088 101% | 3242 111% | 2982 94% | 4346 ? 182% |
| Read Seq Q32T1 (MB/s) | 6806 | 1983 -71% | 7130 5% | 3388 -50% | 3617 -47% | 3440 -49% | 6346 ? -7% |
| AS SSD | -59% | -9% | -30% | -9% | -25% | -12% | |
| Seq Read (MB/s) | 5150 | 1659 -68% | 4981 -3% | 2944 -43% | 3020 -41% | 1791 -65% | 4656 ? -10% |
| Seq Write (MB/s) | 3920 | 921 -77% | 3050 -22% | 2657 -32% | 2631 -33% | 2193 -44% | 2742 ? -30% |
| 4K Read (MB/s) | 46.6 | 51 9% | 57 22% | 41.86 -10% | 60.3 29% | 50.7 9% | 67 ? 44% |
| 4K Write (MB/s) | 145.8 | 120.1 -18% | 261.3 79% | 111.3 -24% | 171.6 18% | 116.8 -20% | 173.8 ? 19% |
| 4K-64 Read (MB/s) | 2071 | 463.5 -78% | 1205 -42% | 1733 -16% | 1410 -32% | 1525 -26% | 1514 ? -27% |
| 4K-64 Write (MB/s) | 3267 | 909 -72% | 1290 -61% | 2119 -35% | 2324 -29% | 1958 -40% | 2355 ? -28% |
| Access Time Read * (ms) | 0.078 | 0.179 -129% | 0.032 59% | 0.157 -101% | 0.045 42% | 0.07 10% | 0.04867 ? 38% |
| Access Time Write * (ms) | 0.029 | 0.032 -10% | 0.044 -52% | 0.035 -21% | 0.024 17% | 0.032 -10% | 0.03605 ? -24% |
| Score Read (Points) | 2633 | 680 -74% | 1760 -33% | 2070 -21% | 1773 -33% | 1755 -33% | 2047 ? -22% |
| Score Write (Points) | 2805 | 1121 -60% | 1857 -34% | 2496 -11% | 2759 -2% | 2294 -18% | 2778 ? -1% |
| Score Total (Points) | 7716 | 2130 -72% | 4428 -43% | 5607 -27% | 5429 -30% | 4972 -36% | 5812 ? -25% |
| Copy ISO MB/s (MB/s) | 3190 | 3357 5% | 2310 -28% | 2192 ? -31% | |||
| Copy Program MB/s (MB/s) | 987 | 966 -2% | 748 -24% | 629 ? -36% | |||
| Copy Game MB/s (MB/s) | 2096 | 2051 -2% | 1523 -27% | 1393 ? -34% | |||
| Total Average (Program / Settings) | -55% /
-55% | 14% /
7% | -21% /
-24% | -7% /
-6% | -21% /
-22% | 0% /
-3% |
* ... smaller is better
Continuous load read: DiskSpd Read Loop, Queue Depth 8
Graphics card
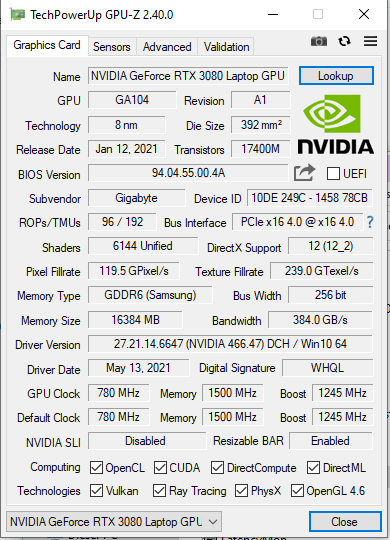
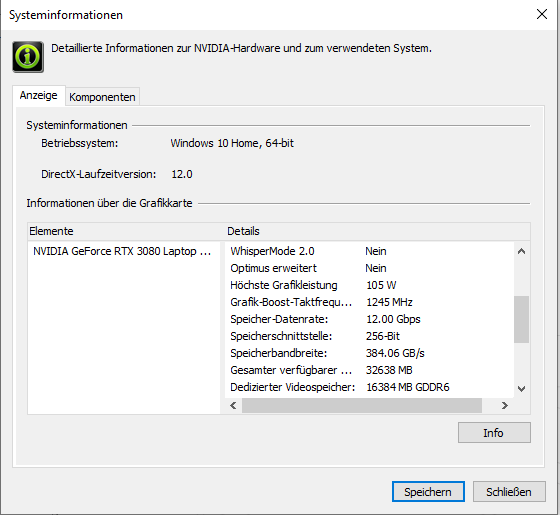
The actual performance of an RTX 3000 graphics core depends on the maximum TGP that the laptop manufacturer has chosen within the limits defined by Nvidia. With a TGP of 105 watts (90 watts + 15 watts of Dynamic Boost), Gigabyte remains has opted for the lower range of possibilities in the case of the GeForce RTX 3080 laptop GPU installed here (overview of all RTX 3080 laptops including their TGPs).
The 3DMark results are somewhere between average and below average compared to the RTX 3080 laptops we have tested so far. Due to the low TGP, the 17G has to admit defeat to the MSI GP76 Leopard 10UG that is equipped with the nominally weaker GeForce RTX 3070 laptop GPU. The RTX 3070's technical limitations compared to the RTX 3080 are more than made up for by the higher TGP (140 watts).
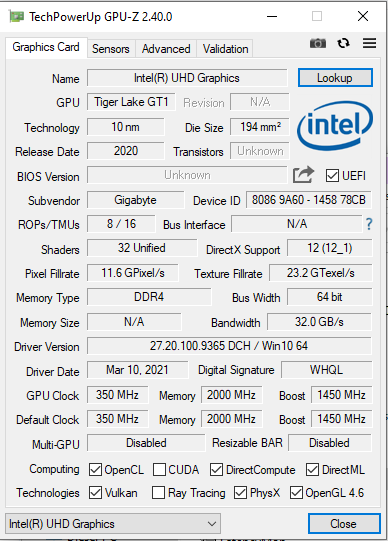
The RTX 3080 can access fast GDDR6 graphics memory (16 GB). The UHD Graphics Xe 750 GPU that's integrated into the processor is active, and the laptop works with Nvidia's Optimus graphics-switching solution.
| 3DMark 11 Performance | 28733 points | |
| 3DMark Cloud Gate Standard Score | 49494 points | |
| 3DMark Fire Strike Score | 22898 points | |
| 3DMark Time Spy Score | 10195 points | |
Help | ||
Gaming performance
The installed hardware brings all the latest games smoothly onto the screen. Full HD resolution and maximum quality level can usually be selected. The GPU can also handle resolutions beyond Full HD (an appropriate monitor would have to be connected for this) - at reduced quality settings in some cases.
Compared with the RTX 3080 laptops tested so far, the 17G performs decently and delivers average to slightly below-average frame rates.
| The Witcher 3 - 1920x1080 Ultra Graphics & Postprocessing (HBAO+) | |
| Average of class Gaming (104.7 - 240, n=7, last 2 years) | |
| Lenovo Legion 7 16ACHg6 | |
| MSI GP76 Leopard 10UG | |
| Aorus 17G YD | |
| Asus Strix Scar 17 G733QSA-XS99 | |
| Average NVIDIA GeForce RTX 3080 Laptop GPU (85.1 - 123, n=40) | |
| Schenker XMG Neo 17 (Early 2021, RTX 3070, 5800H) | |
| Aorus 17G XB | |
| Dota 2 Reborn - 1920x1080 ultra (3/3) best looking | |
| Average of class Gaming (84.8 - 248, n=107, last 2 years) | |
| Aorus 17G YD | |
| Aorus 17G XB | |
| Schenker XMG Neo 17 (Early 2021, RTX 3070, 5800H) | |
| Aorus 17G YD (Turbo Mode) | |
| Average NVIDIA GeForce RTX 3080 Laptop GPU (98 - 156, n=45) | |
| Lenovo Legion 7 16ACHg6 | |
| Asus Strix Scar 17 G733QSA-XS99 | |
| MSI GP76 Leopard 10UG | |
| X-Plane 11.11 - 1920x1080 high (fps_test=3) | |
| Average of class Gaming (55.5 - 143.5, n=109, last 2 years) | |
| Aorus 17G XB | |
| Average NVIDIA GeForce RTX 3080 Laptop GPU (65.6 - 113, n=44) | |
| Aorus 17G YD (Turbo Mode) | |
| Aorus 17G YD | |
| Lenovo Legion 7 16ACHg6 | |
| MSI GP76 Leopard 10UG | |
| Asus Strix Scar 17 G733QSA-XS99 | |
| Schenker XMG Neo 17 (Early 2021, RTX 3070, 5800H) | |
| Final Fantasy XV Benchmark - 1920x1080 High Quality | |
| Average of class Gaming (41 - 215, n=95, last 2 years) | |
| Lenovo Legion 7 16ACHg6 (1.3) | |
| Asus Strix Scar 17 G733QSA-XS99 (1.3) | |
| Average NVIDIA GeForce RTX 3080 Laptop GPU (55.5 - 115, n=34) | |
| Aorus 17G YD (1.3, Turbo Mode) | |
| Aorus 17G YD (1.3) | |
| MSI GP76 Leopard 10UG | |
| Strange Brigade - 1920x1080 ultra AA:ultra AF:16 | |
| Average of class Gaming (76.3 - 458, n=87, last 2 years) | |
| Lenovo Legion 7 16ACHg6 (1.47.22.14 D3D12) | |
| Average NVIDIA GeForce RTX 3080 Laptop GPU (117 - 219, n=34) | |
| Asus Strix Scar 17 G733QSA-XS99 (1.47.22.14 D3D12) | |
| Aorus 17G YD (1.47.22.14 D3D12) | |
| Dirt 5 - 1920x1080 Ultra High Preset | |
| Lenovo Legion 7 16ACHg6 | |
| Aorus 17G YD | |
| Average NVIDIA GeForce RTX 3080 Laptop GPU (52 - 110, n=11) | |
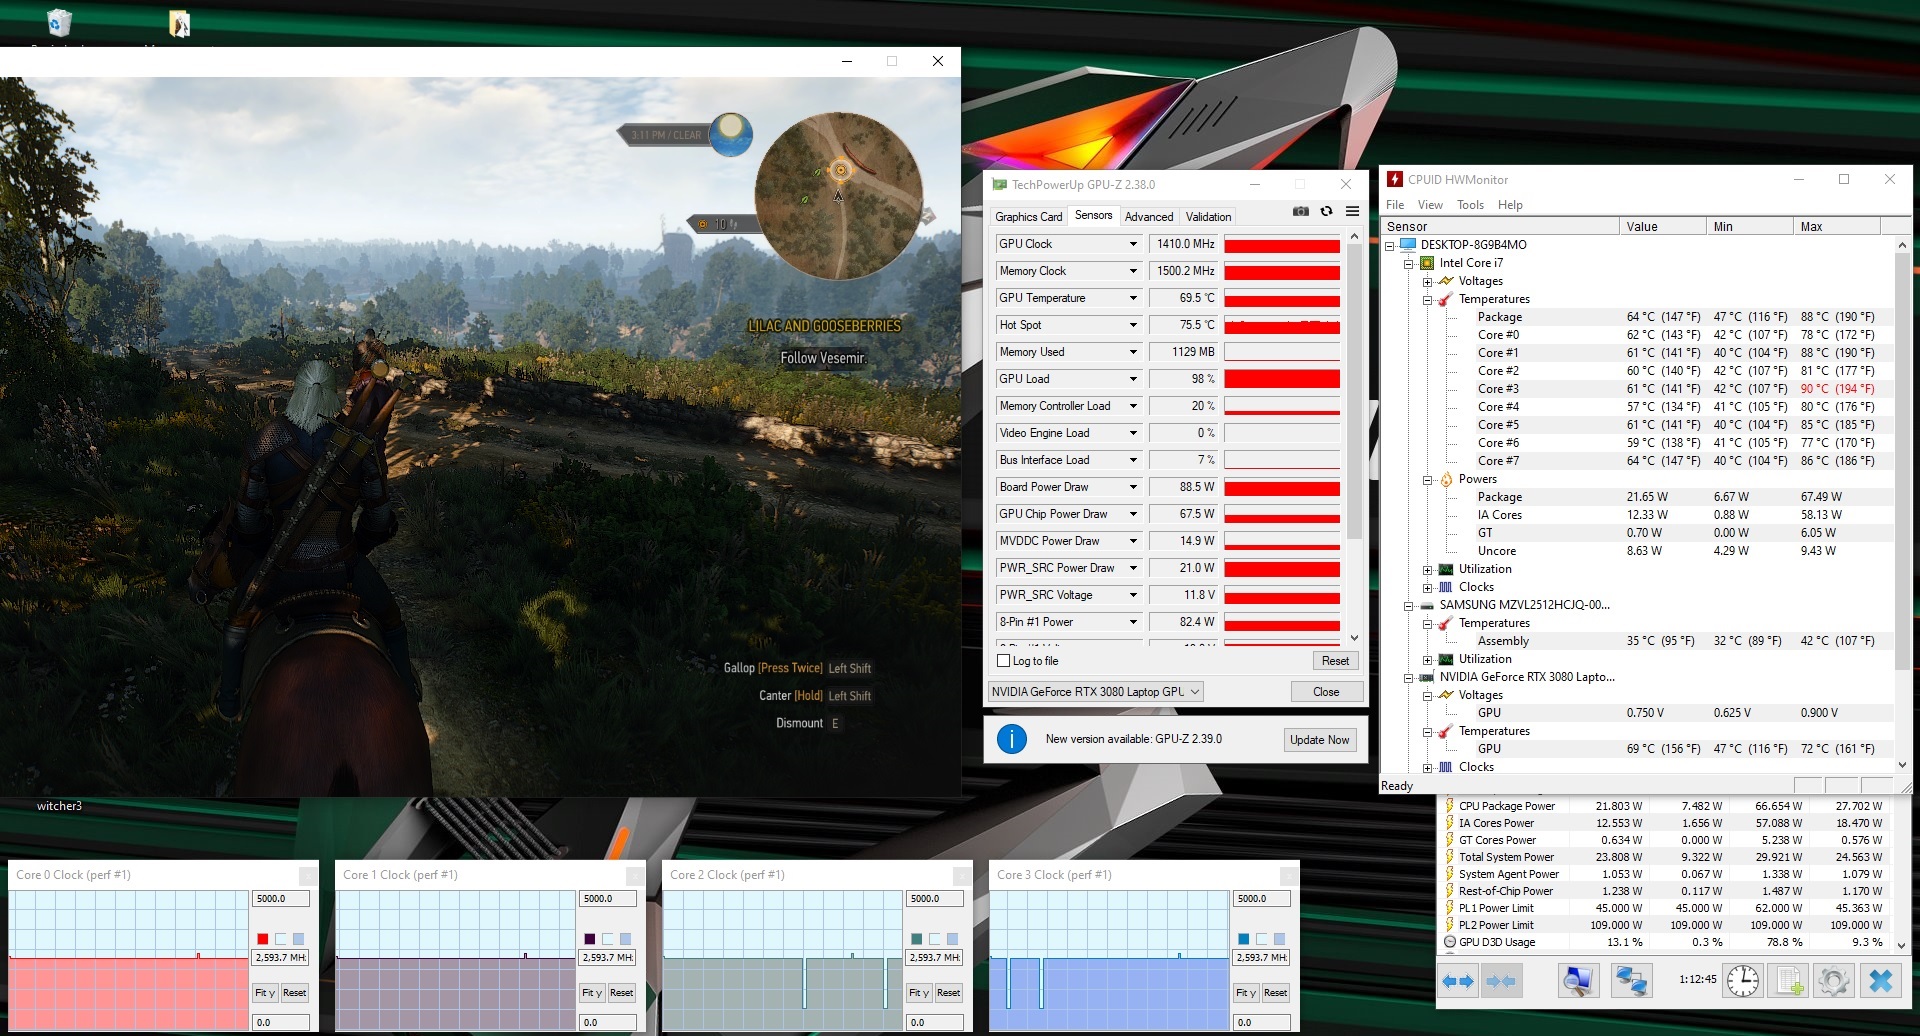
In order to verify whether the frame rates remain largely constant over a prolonged period of time, we let the game The Witcher 3 run for about 60 minutes at Full HD resolution and maximum quality settings. The character is not moved. A drop in frame rates wasn't found.
| low | med. | high | ultra | |
|---|---|---|---|---|
| GTA V (2015) | 183 | 176 | 158 | 95.7 |
| The Witcher 3 (2015) | 365 | 267 | 183 | 106 |
| Dota 2 Reborn (2015) | 164 | 146 | 139 | 130 |
| Final Fantasy XV Benchmark (2018) | 172 | 123 | 93.8 | |
| X-Plane 11.11 (2018) | 123 | 103 | 82.9 | |
| Far Cry 5 (2018) | 153 | 119 | 115 | 108 |
| Strange Brigade (2018) | 420 | 225 | 184 | 163 |
| Horizon Zero Dawn (2020) | 133 | 119 | 109 | 100 |
| Serious Sam 4 (2020) | 152 | 107 | 93.6 | 85 |
| Dirt 5 (2020) | 178 | 123 | 104 | 87.5 |
| Yakuza Like a Dragon (2020) | 141 | 121 | 117 | 108 |
| Outriders (2021) | 119 | 101 | 110 | 106 |
| Mass Effect Legendary Edition (2021) | 135 | 115 | ||
| Days Gone (2021) | 175 | 139 | 126 | 98.2 |
Emissions - The Aorus laptop gets very loud under load
Noise emissions
Even in idle usage, the fans are clearly audible at times with sound pressure levels of up to 39 dB(A). The noise is even louder under load with maximum sound pressure levels of 61 dB(A) (stress test) and 52 dB(A) (The Witcher 3 test), respectively. The use of a headset is virtually unavoidable.
Noise level
| Idle |
| 32 / 33 / 39 dB(A) |
| Load |
| 43 / 61 dB(A) |
 | ||
30 dB silent 40 dB(A) audible 50 dB(A) loud |
||
min: | ||
| Aorus 17G YD i7-11800H, GeForce RTX 3080 Laptop GPU | MSI GP76 Leopard 10UG i7-10750H, GeForce RTX 3070 Laptop GPU | Asus Strix Scar 17 G733QSA-XS99 R9 5900HX, GeForce RTX 3080 Laptop GPU | Lenovo Legion 7 16ACHg6 R9 5900HX, GeForce RTX 3080 Laptop GPU | Schenker XMG Neo 17 (Early 2021, RTX 3070, 5800H) R7 5800H, GeForce RTX 3070 Laptop GPU | Aorus 17G XB i7-10875H, GeForce RTX 2070 Super Max-Q | Average of class Gaming | |
|---|---|---|---|---|---|---|---|
| Noise | 4% | 18% | 10% | 2% | -3% | 12% | |
| off / environment * (dB) | 25 | 24 4% | 25 -0% | 26 -4% | 24 4% | 30 -20% | 24.1 ? 4% |
| Idle Minimum * (dB) | 32 | 25 22% | 25.2 21% | 26 19% | 29 9% | 35 -9% | 26 ? 19% |
| Idle Average * (dB) | 33 | 32 3% | 25.2 24% | 30 9% | 32 3% | 36 -9% | 27.4 ? 17% |
| Idle Maximum * (dB) | 39 | 34 13% | 25.2 35% | 35 10% | 38 3% | 41 -5% | 30.1 ? 23% |
| Load Average * (dB) | 43 | 54 -26% | 30.7 29% | 40 7% | 49 -14% | 47 -9% | 43.6 ? -1% |
| Witcher 3 ultra * (dB) | 52 | 51 2% | 51.3 1% | 46 12% | 53 -2% | 48 8% | |
| Load Maximum * (dB) | 61 | 54 11% | 51.3 16% | 50 18% | 55 10% | 49 20% | 54.2 ? 11% |
* ... smaller is better
Temperature
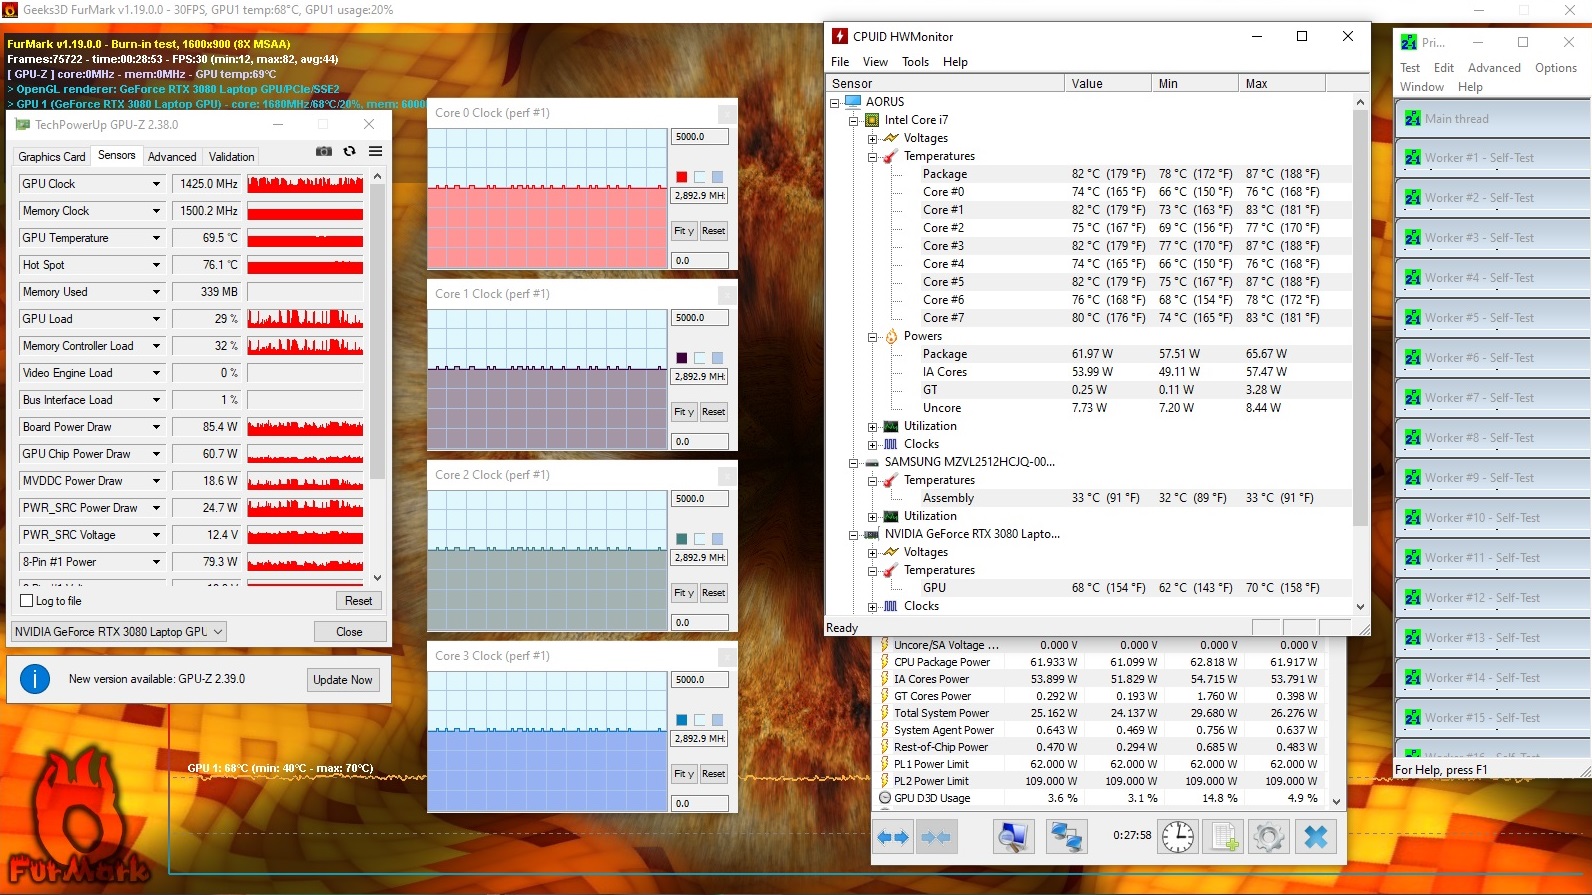
Our stress test (Prime95 and FurMark run for at least an hour) is executed by the CPU and GPU at 2.9 GHz and 1,425 MHz, respectively. The stress test represents an extreme scenario. We use this test to verify that the system remains stable under full load.
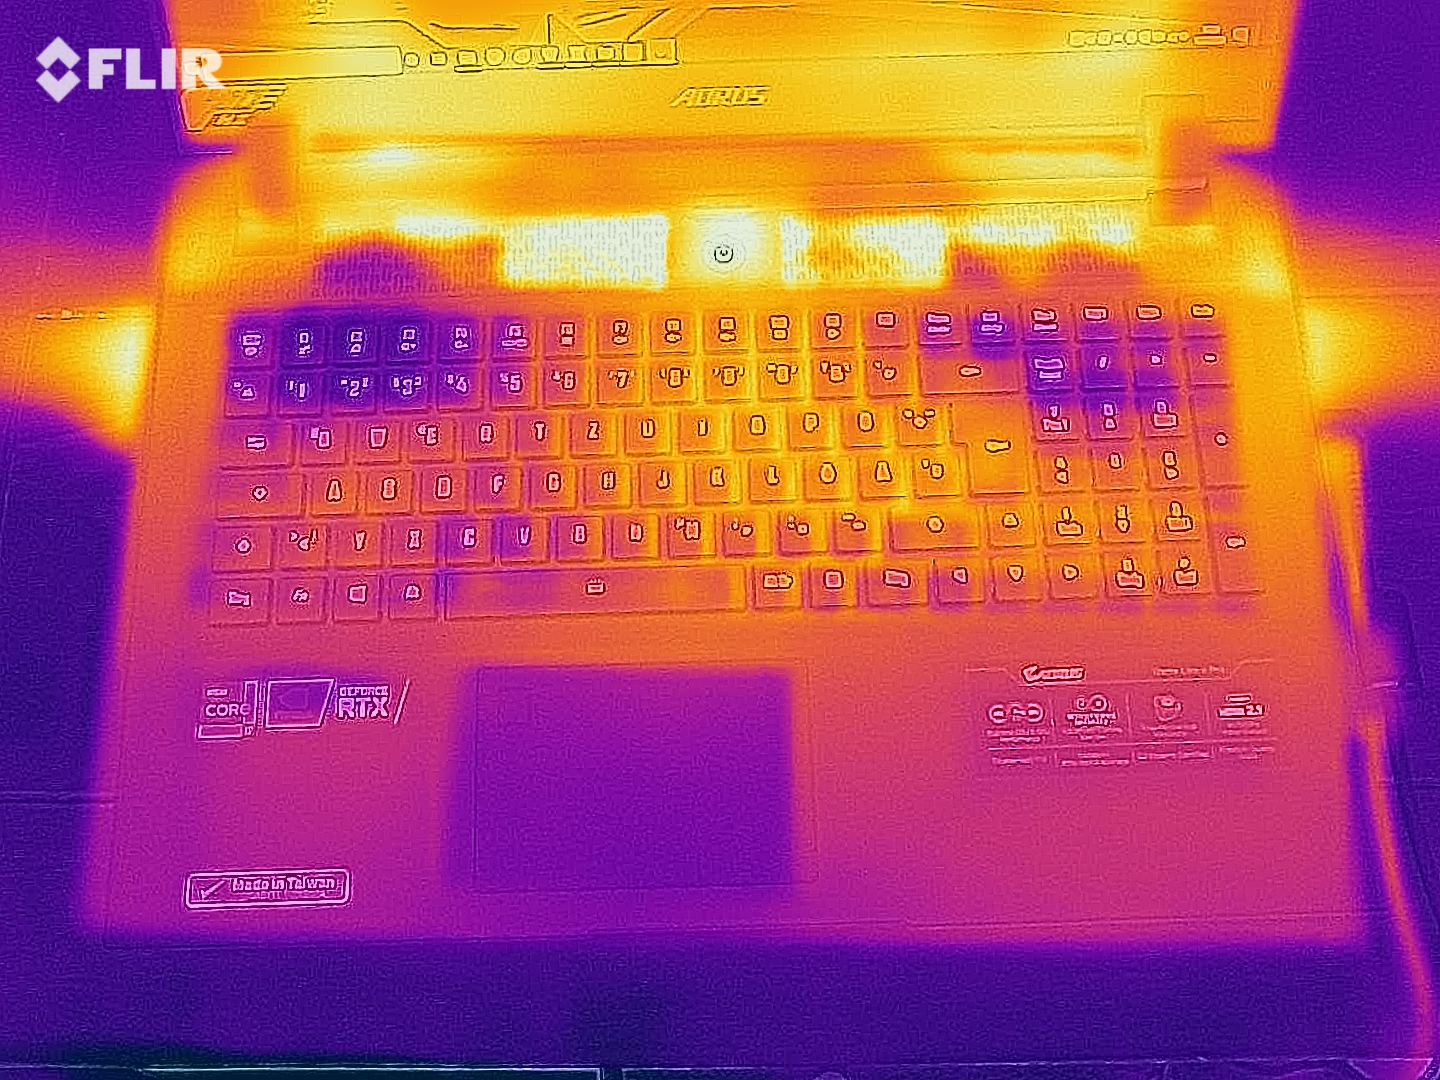
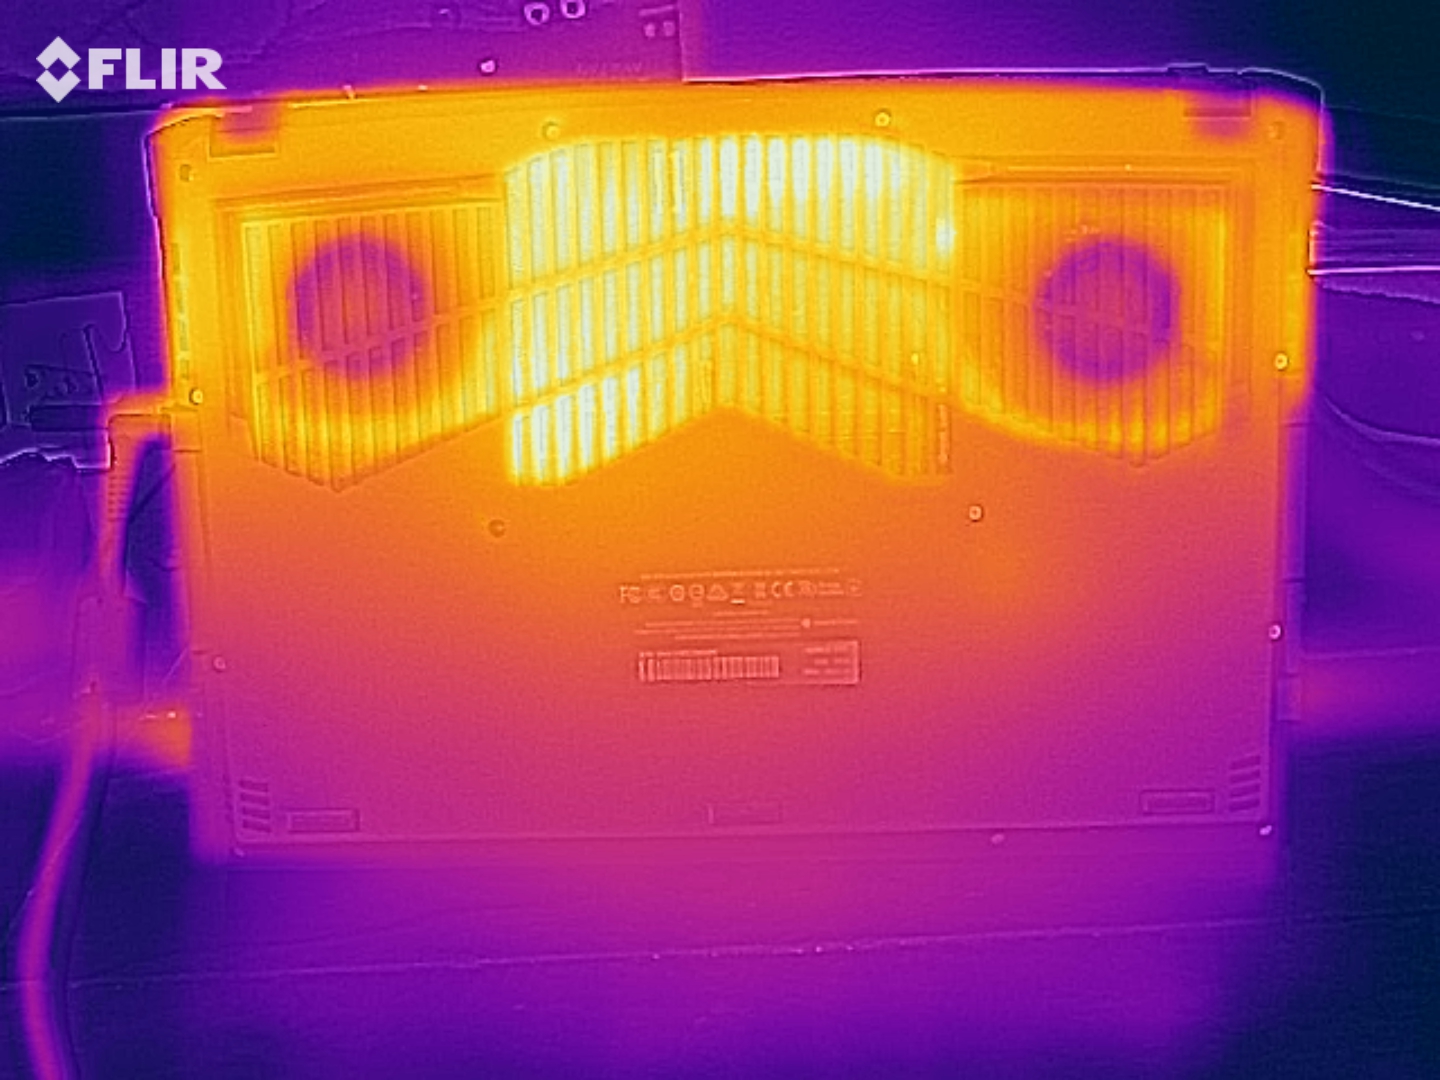
The laptop heats up noticeably. During the stress test, we register temperatures in the lower 50 °C (~122 °F) range at several measuring points on the bottom. Heat development is slightly higher when we execute our The Witcher 3 test. The device shouldn't be placed on the lap in either case.
(+) The maximum temperature on the upper side is 36 °C / 97 F, compared to the average of 40.4 °C / 105 F, ranging from 21.2 to 68.8 °C for the class Gaming.
(-) The bottom heats up to a maximum of 52 °C / 126 F, compared to the average of 43.2 °C / 110 F
(+) In idle usage, the average temperature for the upper side is 27.7 °C / 82 F, compared to the device average of 33.9 °C / 93 F.
(±) Playing The Witcher 3, the average temperature for the upper side is 33 °C / 91 F, compared to the device average of 33.9 °C / 93 F.
(+) The palmrests and touchpad are cooler than skin temperature with a maximum of 29 °C / 84.2 F and are therefore cool to the touch.
(±) The average temperature of the palmrest area of similar devices was 28.8 °C / 83.8 F (-0.2 °C / -0.4 F).
| Aorus 17G YD i7-11800H, GeForce RTX 3080 Laptop GPU | MSI GP76 Leopard 10UG i7-10750H, GeForce RTX 3070 Laptop GPU | Asus Strix Scar 17 G733QSA-XS99 R9 5900HX, GeForce RTX 3080 Laptop GPU | Lenovo Legion 7 16ACHg6 R9 5900HX, GeForce RTX 3080 Laptop GPU | Schenker XMG Neo 17 (Early 2021, RTX 3070, 5800H) R7 5800H, GeForce RTX 3070 Laptop GPU | Aorus 17G XB i7-10875H, GeForce RTX 2070 Super Max-Q | Average of class Gaming | |
|---|---|---|---|---|---|---|---|
| Heat | -3% | -6% | -21% | -13% | -6% | -8% | |
| Maximum Upper Side * (°C) | 36 | 43 -19% | 40 -11% | 51 -42% | 47 -31% | 48 -33% | 45.2 ? -26% |
| Maximum Bottom * (°C) | 52 | 47 10% | 39.8 23% | 52 -0% | 51 2% | 59 -13% | 48.1 ? 7% |
| Idle Upper Side * (°C) | 29 | 30 -3% | 34.6 -19% | 37 -28% | 32 -10% | 26 10% | 31 ? -7% |
| Idle Bottom * (°C) | 33 | 33 -0% | 38.4 -16% | 38 -15% | 37 -12% | 29 12% | 34.2 ? -4% |
* ... smaller is better
Speakers
Aorus 17G YD audio analysis
(+) | speakers can play relatively loud (83 dB)
Bass 100 - 315 Hz
(-) | nearly no bass - on average 31.4% lower than median
(±) | linearity of bass is average (14.2% delta to prev. frequency)
Mids 400 - 2000 Hz
(±) | higher mids - on average 5.4% higher than median
(±) | linearity of mids is average (7.1% delta to prev. frequency)
Highs 2 - 16 kHz
(+) | balanced highs - only 1.4% away from median
(+) | highs are linear (3% delta to prev. frequency)
Overall 100 - 16.000 Hz
(±) | linearity of overall sound is average (20.6% difference to median)
Compared to same class
» 74% of all tested devices in this class were better, 5% similar, 21% worse
» The best had a delta of 6%, average was 18%, worst was 132%
Compared to all devices tested
» 55% of all tested devices were better, 8% similar, 37% worse
» The best had a delta of 4%, average was 23%, worst was 134%
Asus Strix Scar 17 G733QSA-XS99 audio analysis
(±) | speaker loudness is average but good (73.7 dB)
Bass 100 - 315 Hz
(+) | good bass - only 2.1% away from median
(±) | linearity of bass is average (7% delta to prev. frequency)
Mids 400 - 2000 Hz
(+) | balanced mids - only 1.4% away from median
(+) | mids are linear (4.8% delta to prev. frequency)
Highs 2 - 16 kHz
(±) | higher highs - on average 5.9% higher than median
(±) | linearity of highs is average (8.7% delta to prev. frequency)
Overall 100 - 16.000 Hz
(+) | overall sound is linear (10.7% difference to median)
Compared to same class
» 7% of all tested devices in this class were better, 2% similar, 91% worse
» The best had a delta of 6%, average was 18%, worst was 132%
Compared to all devices tested
» 6% of all tested devices were better, 2% similar, 93% worse
» The best had a delta of 4%, average was 23%, worst was 134%
Energy management - The 17G offers very decent battery life
Energy consumption
We register a maximum power consumption of 38 watts in idle usage - quite a high rate considering that graphics switching is enabled. The stress test and our The Witcher 3 test allow the demand to increase up to 230 watts and an average of 164 watts, respectively. The power adapter's nominal output is 230 watts.
| Off / Standby | |
| Idle | |
| Load |
|
Key:
min: | |
| Aorus 17G YD i7-11800H, GeForce RTX 3080 Laptop GPU | MSI GP76 Leopard 10UG i7-10750H, GeForce RTX 3070 Laptop GPU | Asus Strix Scar 17 G733QSA-XS99 R9 5900HX, GeForce RTX 3080 Laptop GPU | Lenovo Legion 7 16ACHg6 R9 5900HX, GeForce RTX 3080 Laptop GPU | Schenker XMG Neo 17 (Early 2021, RTX 3070, 5800H) R7 5800H, GeForce RTX 3070 Laptop GPU | Aorus 17G XB i7-10875H, GeForce RTX 2070 Super Max-Q | Average of class Gaming | |
|---|---|---|---|---|---|---|---|
| Power Consumption | 19% | 18% | -16% | 11% | 4% | 17% | |
| Idle Minimum * (Watt) | 24 | 12 50% | 10.9 55% | 31 -29% | 13 46% | 20 17% | 13 ? 46% |
| Idle Average * (Watt) | 26 | 16 38% | 14.7 43% | 33 -27% | 16 38% | 23 12% | 19 ? 27% |
| Idle Maximum * (Watt) | 38 | 28 26% | 26.8 29% | 46 -21% | 26 32% | 38 -0% | 24.6 ? 35% |
| Load Average * (Watt) | 101 | 92 9% | 106.7 -6% | 110 -9% | 125 -24% | 105 -4% | 110.7 ? -10% |
| Witcher 3 ultra * (Watt) | 164 | 198 -21% | 192.4 -17% | 180 -10% | 187 -14% | 158 4% | |
| Load Maximum * (Watt) | 230 | 210 9% | 228.4 1% | 235 -2% | 259 -13% | 243 -6% | 259 ? -13% |
* ... smaller is better
Battery life
The 17.3-incher achieves runtimes of 6:00 hours and 6:10 hours in the Wi-Fi test (accessing websites using a script) and video test (the short film Big Buck Bunny (H.264 encoding, Full HD) running in a loop), respectively. The laptop's power-saving features are disabled during both tests, and the display brightness is set to about 150 cd/m². In addition, the wireless modules are disabled for the video test.
The battery life tests were performed without the automatic, AI-supported profile option of the Control Center. The standard power profiles were used.
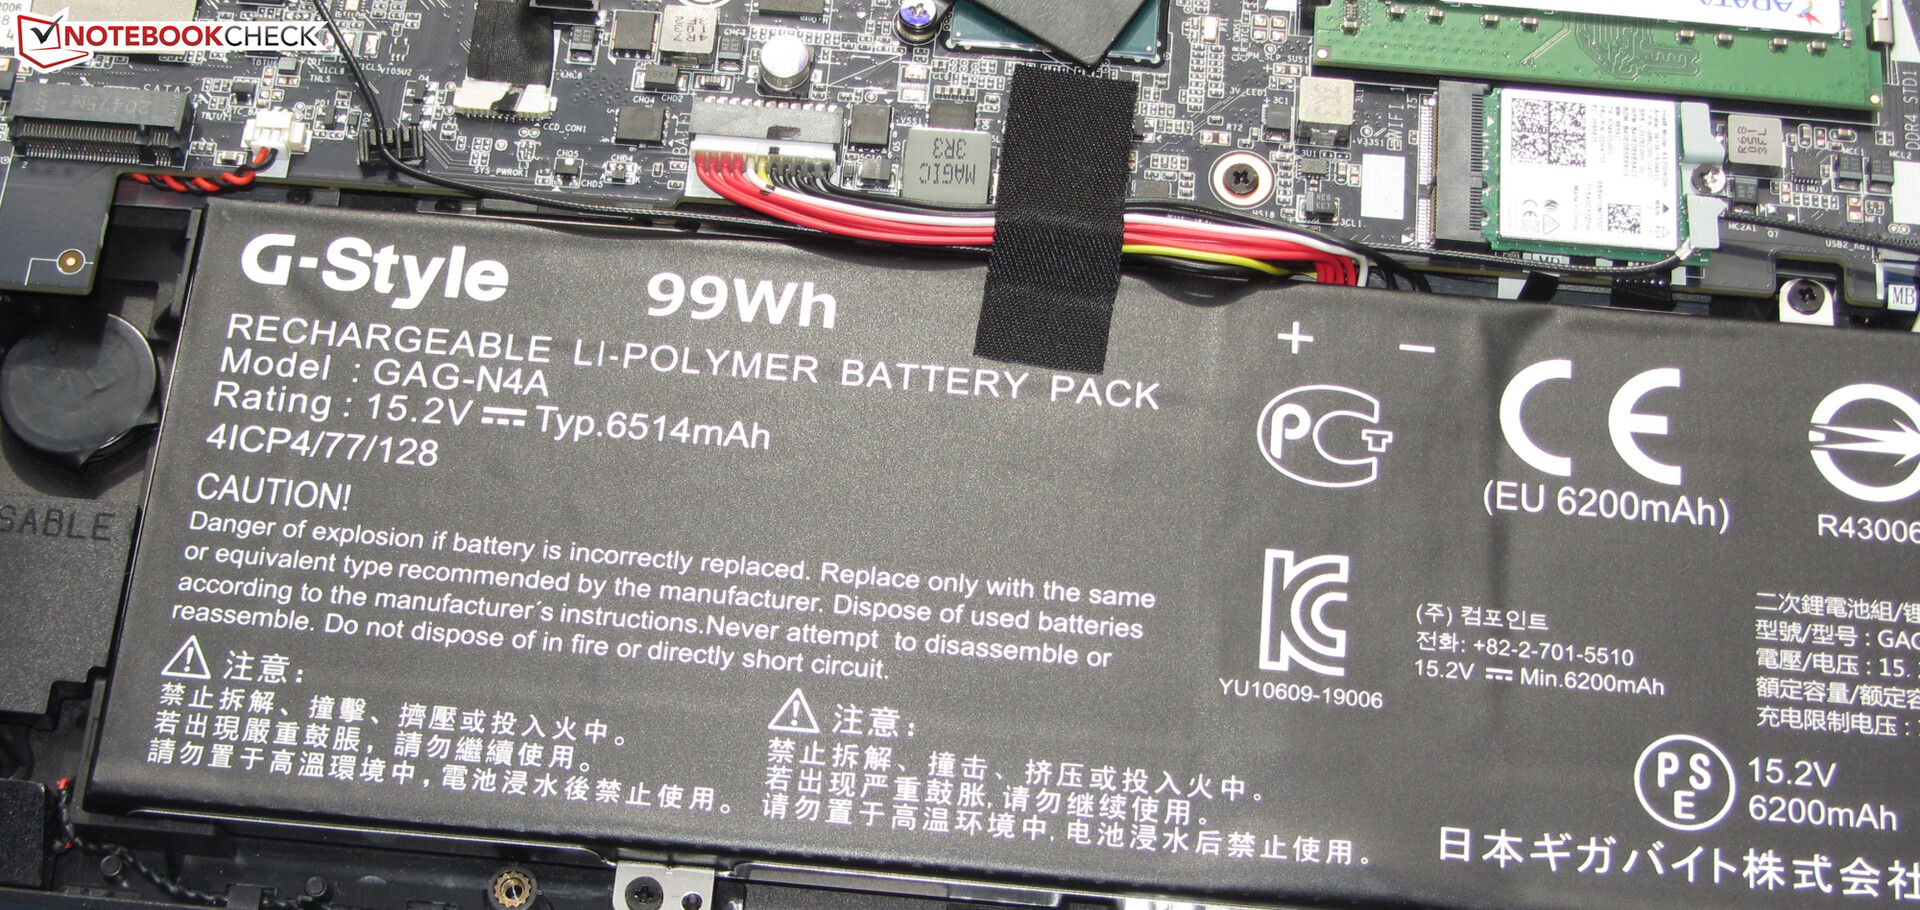
| Aorus 17G YD i7-11800H, GeForce RTX 3080 Laptop GPU, 99 Wh | MSI GP76 Leopard 10UG i7-10750H, GeForce RTX 3070 Laptop GPU, 65 Wh | Asus Strix Scar 17 G733QSA-XS99 R9 5900HX, GeForce RTX 3080 Laptop GPU, 90 Wh | Lenovo Legion 7 16ACHg6 R9 5900HX, GeForce RTX 3080 Laptop GPU, 80 Wh | Schenker XMG Neo 17 (Early 2021, RTX 3070, 5800H) R7 5800H, GeForce RTX 3070 Laptop GPU, 62 Wh | Aorus 17G XB i7-10875H, GeForce RTX 2070 Super Max-Q, 94 Wh | Average of class Gaming | |
|---|---|---|---|---|---|---|---|
| Battery runtime | -39% | 30% | 4% | -49% | 25% | 10% | |
| Reader / Idle (h) | 9 | 5.6 -38% | 13.3 48% | 8.2 -9% | 4.7 -48% | 10 11% | 8.27 ? -8% |
| H.264 (h) | 6.2 | 6.8 10% | 8.32 ? 34% | ||||
| WiFi v1.3 (h) | 6 | 4.2 -30% | 9.3 55% | 6.8 13% | 3.5 -42% | 7.5 25% | 7.11 ? 19% |
| Load (h) | 1.6 | 0.8 -50% | 1.4 -13% | 1.6 0% | 0.7 -56% | 2.2 38% | 1.502 ? -6% |
Pros
Cons
Verdict - The Aorus 17G is on the cutting edge of technology
The 17G YD isn't among the top RTX 3080 laptops due to its relatively low TGP of 105 watts. The device's gaming performance is average for an RTX 3080. For maximum performance, competitors like the Lenovo Legion 7 16ACHg6 or the Alienware m17 R4 are recommended.
With the Aorus 17G YD, Gigabyte delivers a well-rounded gaming laptop. However, the device generates a high noise level.
Throttling is not an issue. The CPU and GPU can develop their performance uniformly. Nevertheless, the device produces a lot of noise under load - more than many competitors. Gigabyte might be able to improve this with a BIOS update. The power consumption in idle usage is a bit too high as well.
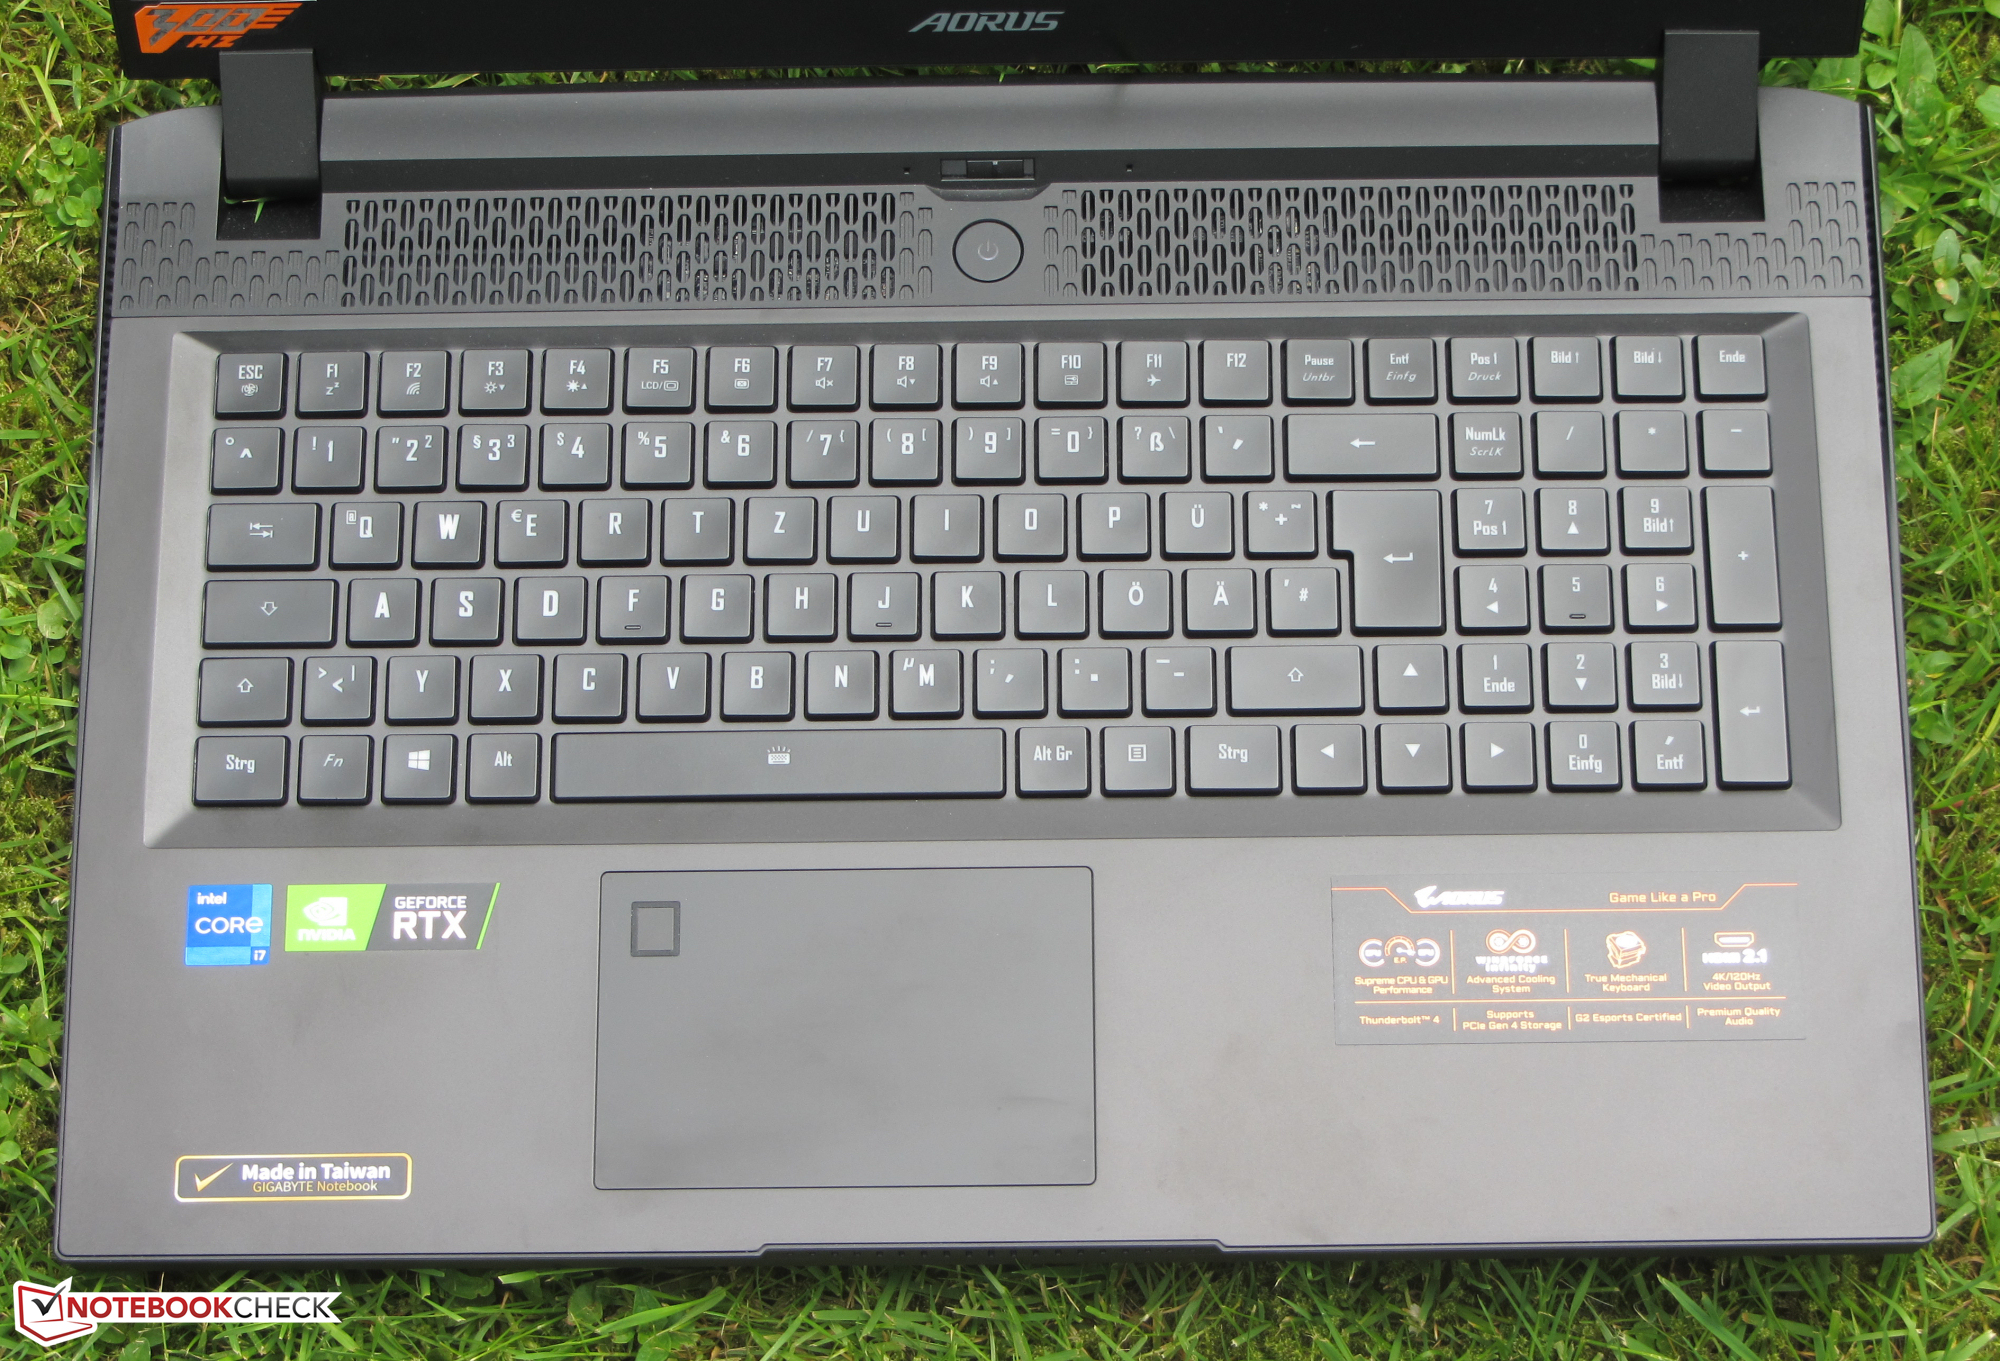
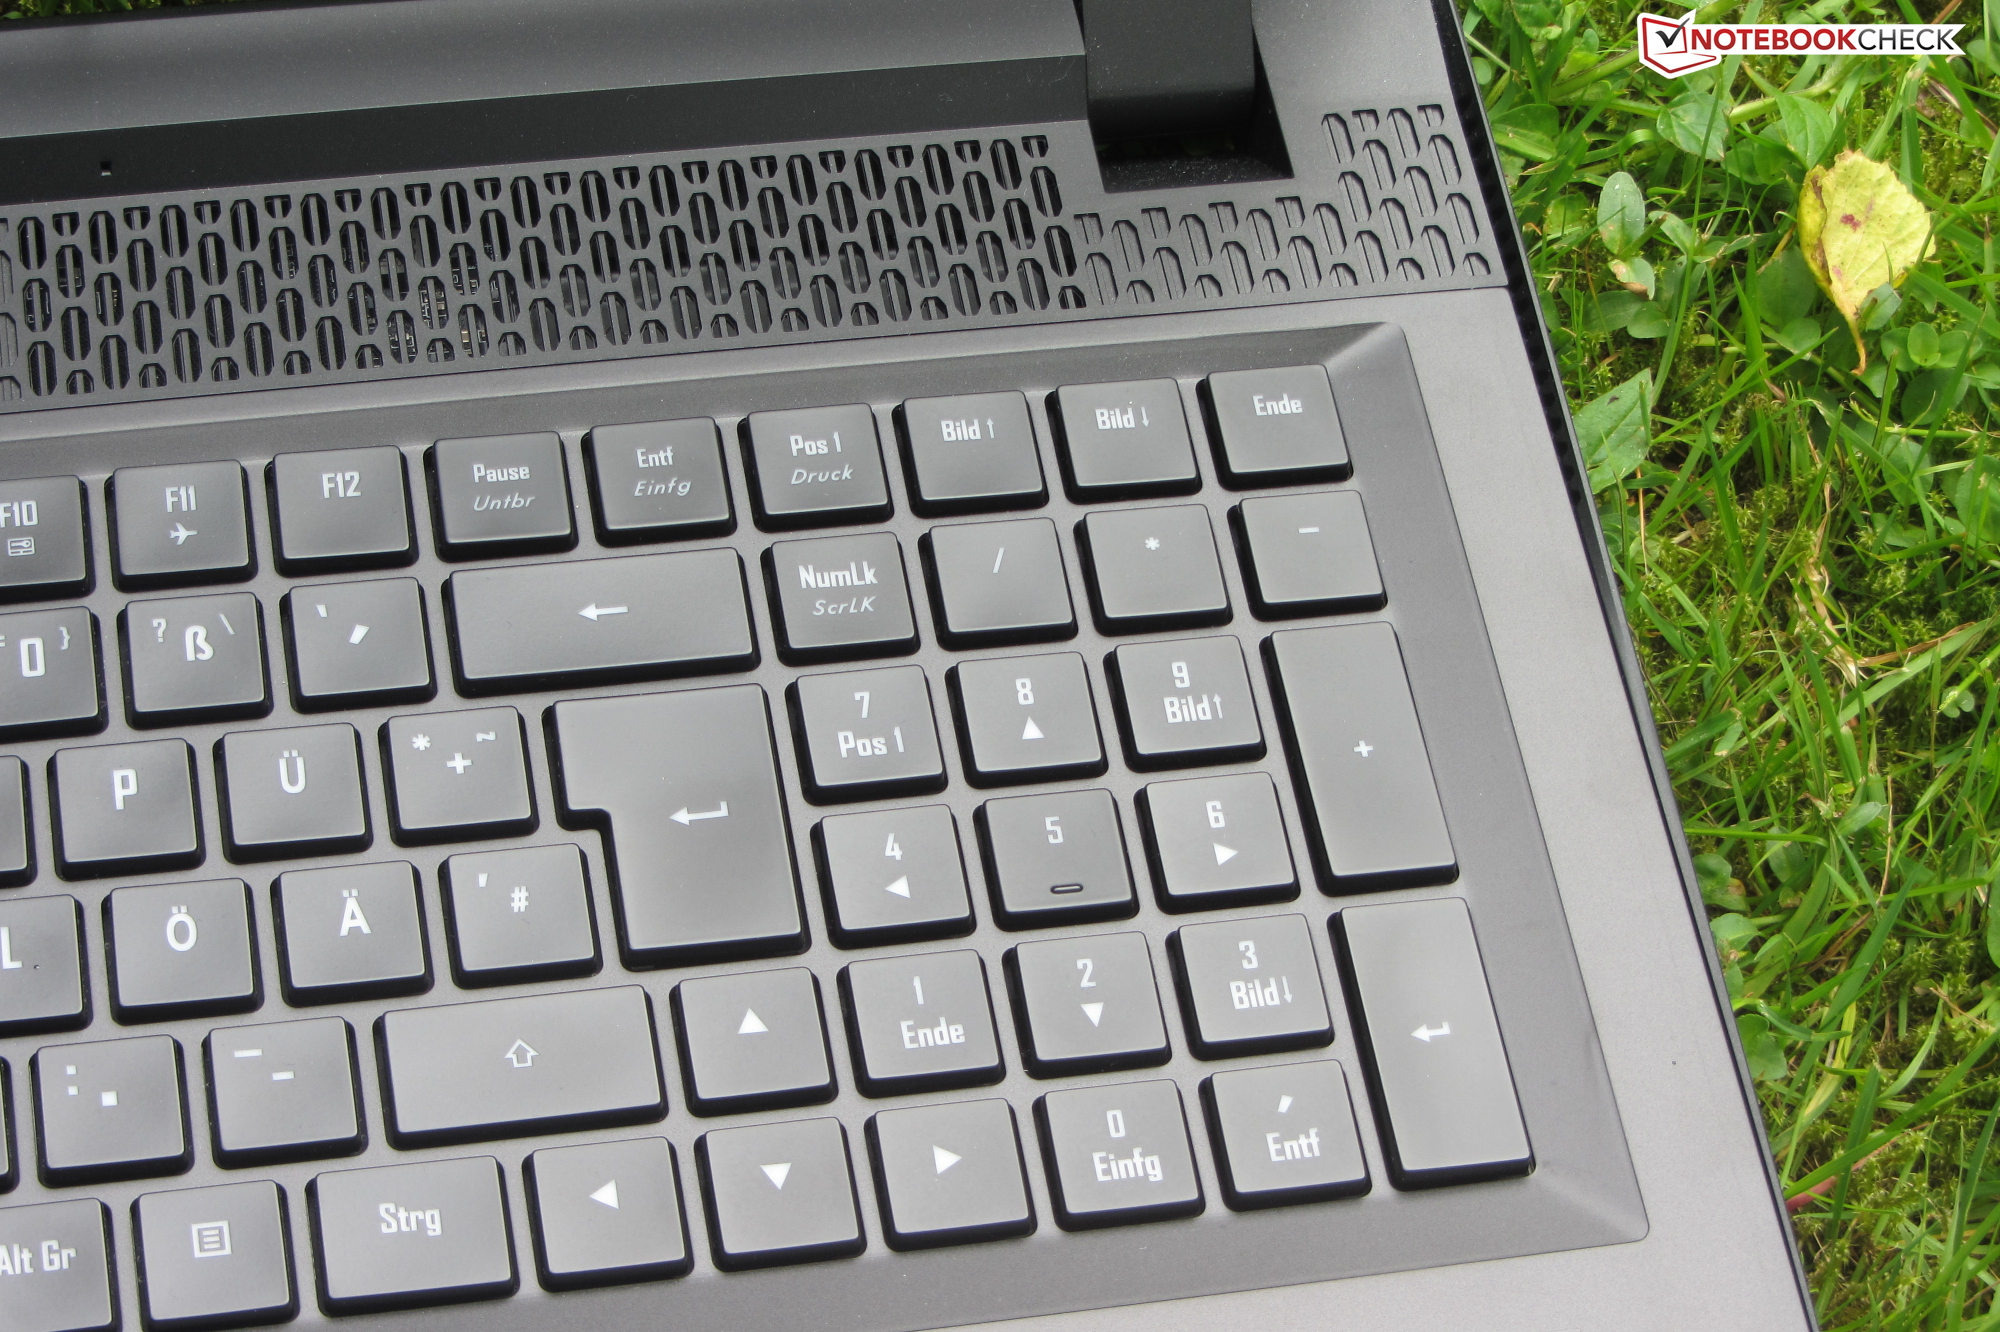
The mechanical keyboard (with RGB lighting) left a good impression and will be an important factor for many prospective buyers. Users who have never used this kind of keyboard will need to get used to the typing experience. Battery life is okay, but it lags behind that of the sibling model - despite the battery having a slightly larger capacity (94 Wh vs. 99 Wh).
The display (Full HD, IPS, 300 Hz) offers stable viewing angles, good contrast, a matte surface, quick response times, great color reproduction, and good color-space coverage (sRGB: 100%). However, the maximum brightness is too low. A laptop in this price range should offer more in this regard.
Price and availability
Aorus 17G YD
- 06/21/2021 v7 (old)
Sascha Mölck
Price comparison

