Lenovo Legion 7 16ACH in review: Gaming powerhouse with good 16:10 display

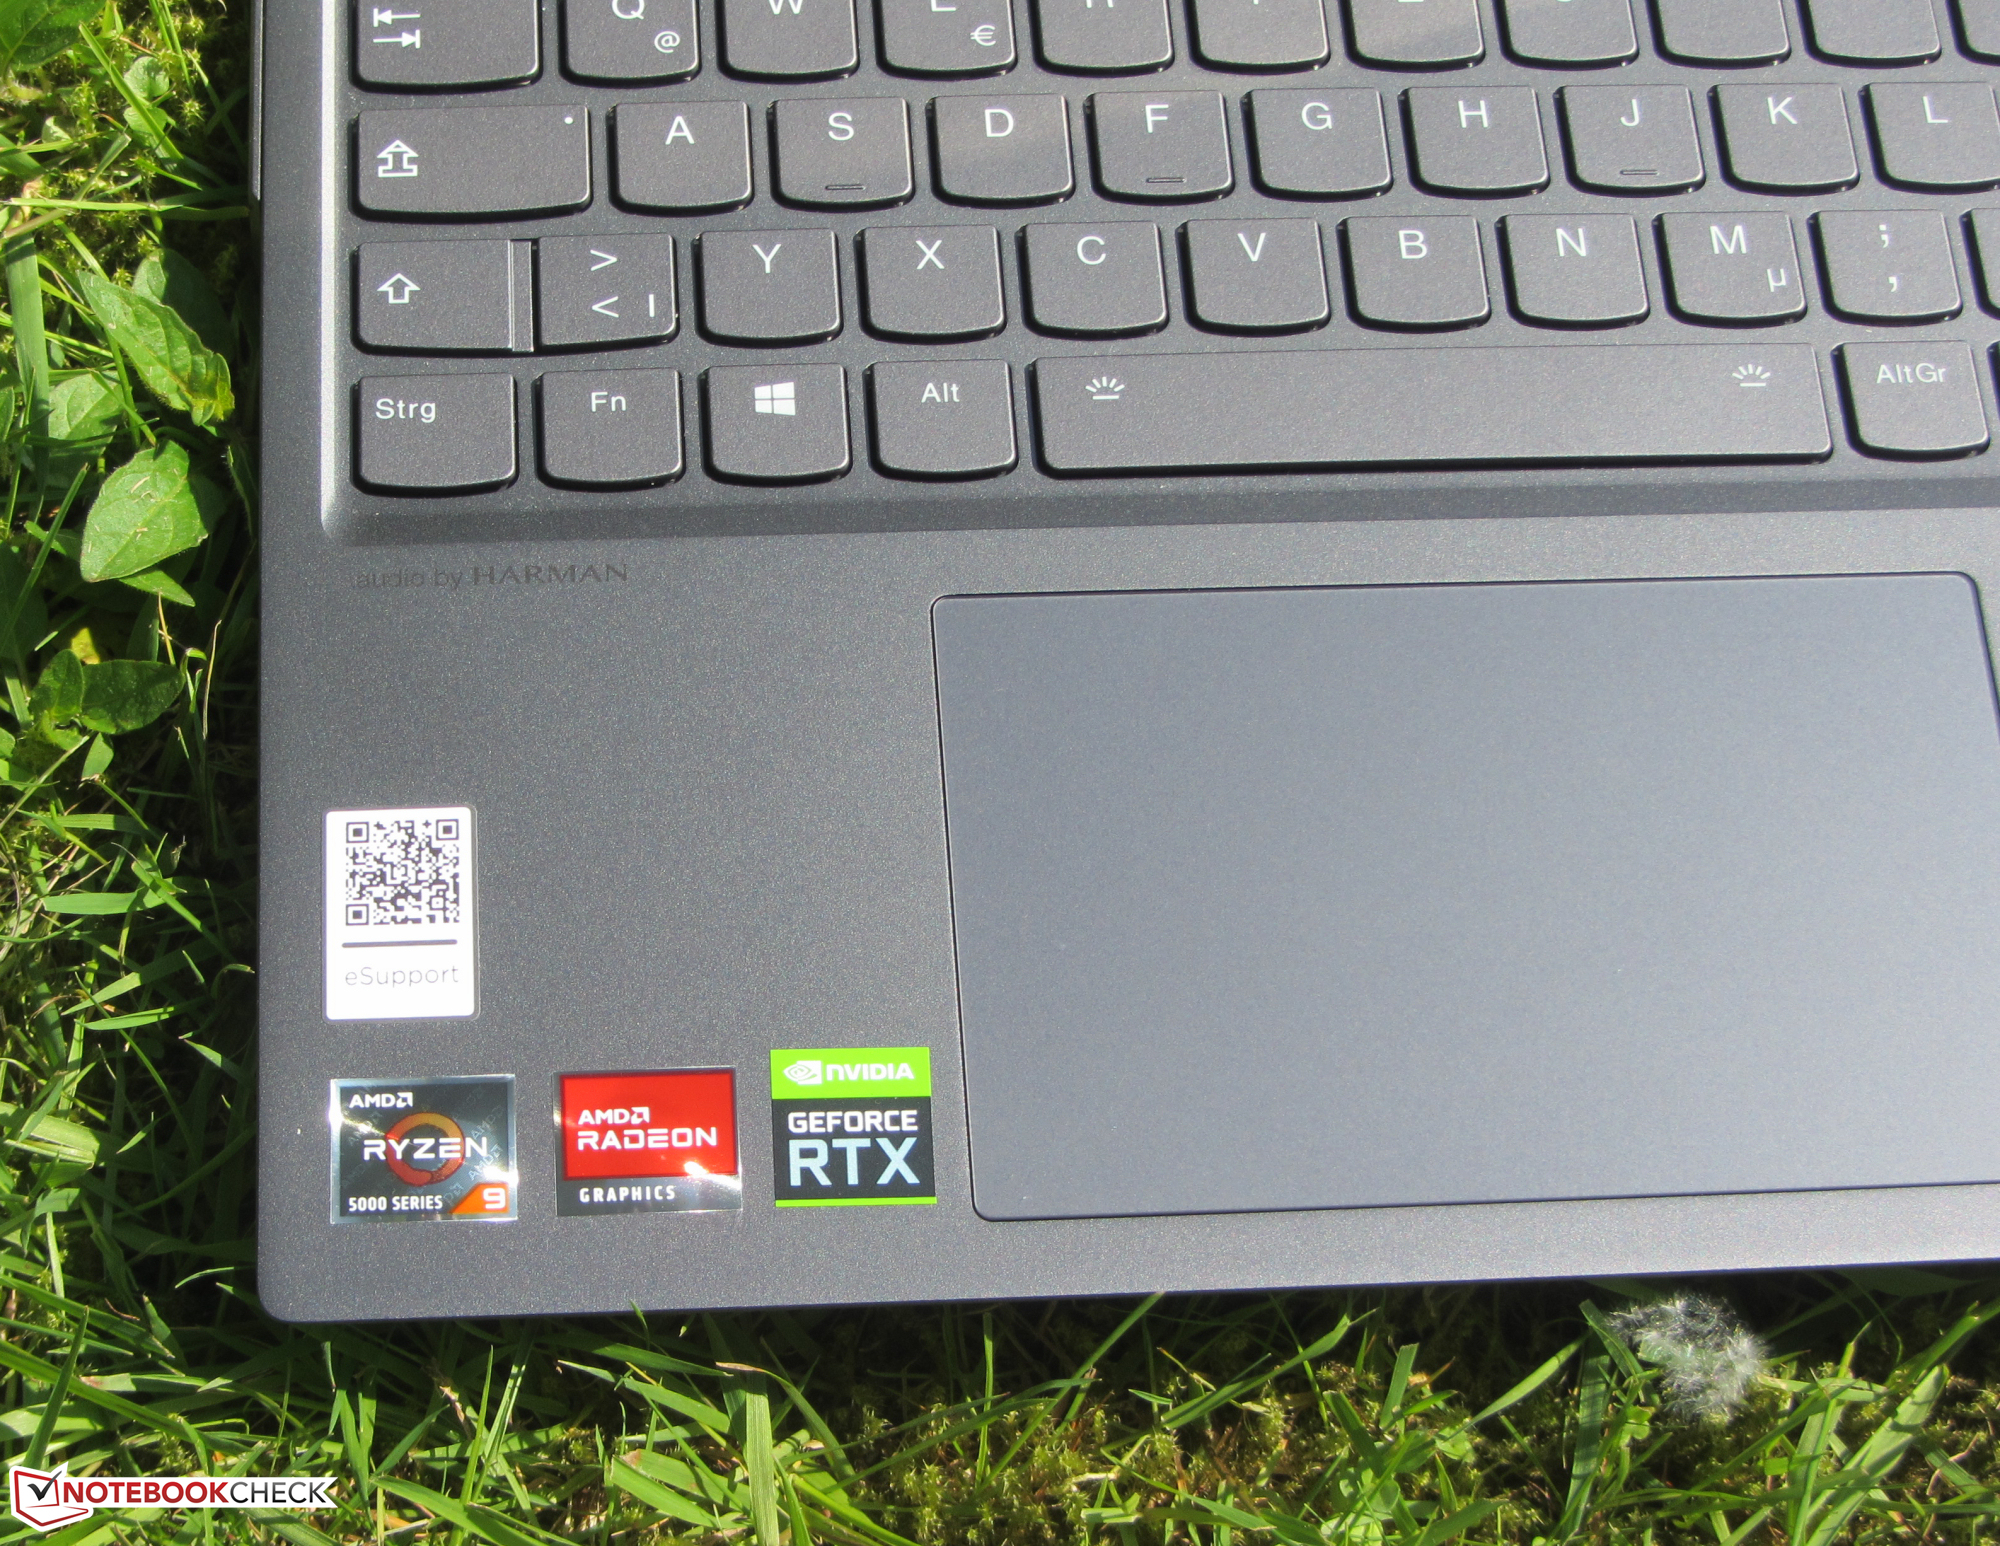
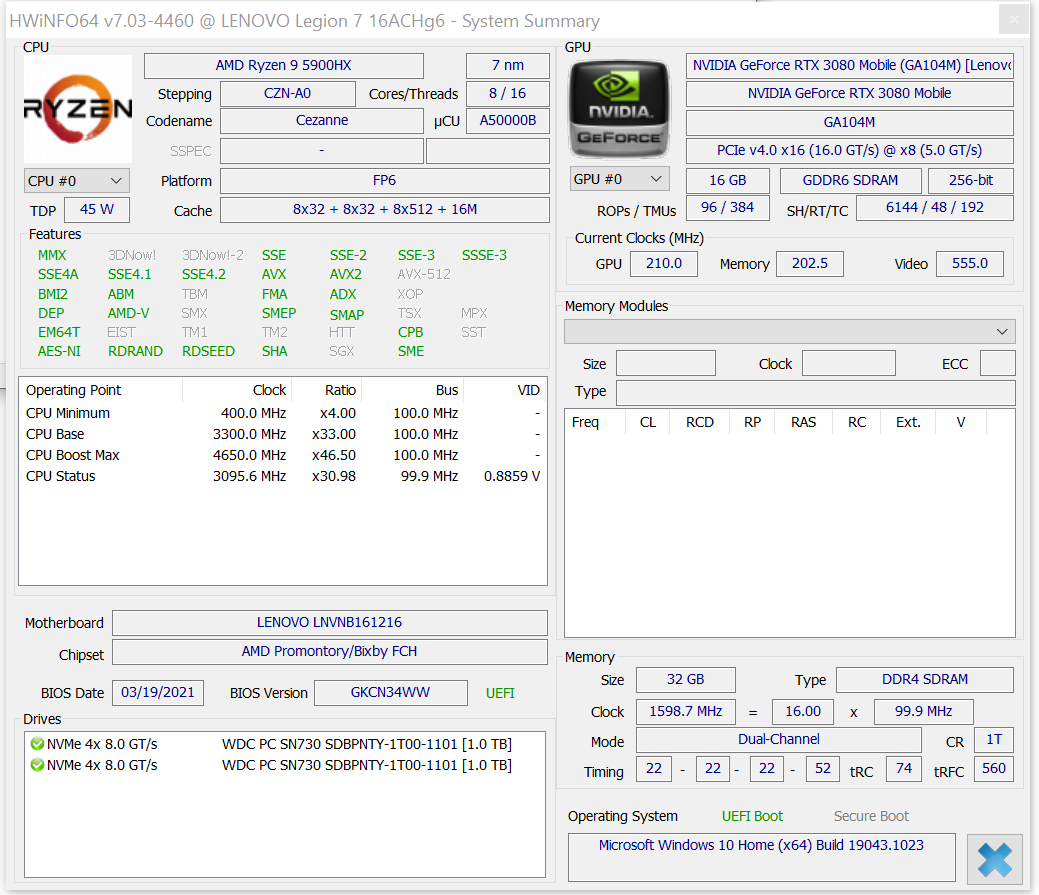
The Lenovo Legion 7 16ACHg6 is a high-end gaming laptop. The review sample that we received is one of the top models in the series and has a correspondingly very good configuration level: The Ryzen 9 5900HX APU, the GeForce RTX 3080 laptop GPU, 32 GB of RAM, and 2x 1 TB NVMe SSDs. The laptop's highlight is the bright 16-inch display in the 16:10 aspect ratio.
Competitors include devices like the Asus ROG Zephyrus G15 GA503Q, the Schenker XMG Pro 15 (early 2021), the Razer Blade 15 Advanced Model (early 2021), the Alienware m17 R4, the MSI GE76 Raider 10UH, and the Asus Strix Scar 17 G733QSA-XS99.
Possible contenders in comparison
Rating | Date | Model | Weight | Height | Size | Resolution | Price |
|---|---|---|---|---|---|---|---|
| 88.1 % v7 (old) | 06 / 2021 | Lenovo Legion 7 16ACHg6 R9 5900HX, GeForce RTX 3080 Laptop GPU | 2.5 kg | 23.5 mm | 16.00" | 2560x1600 | |
| 83.8 % v7 (old) | 02 / 2021 | Asus ROG Zephyrus G15 GA503Q R9 5900HS, GeForce RTX 3080 Laptop GPU | 2 kg | 20 mm | 15.60" | 2560x1440 | |
| 86 % v7 (old) | 03 / 2021 | Schenker XMG Pro 15 (Early 2021, RTX 3080) i7-10870H, GeForce RTX 3080 Laptop GPU | 2 kg | 19.8 mm | 15.60" | 1920x1080 | |
| 86.6 % v7 (old) | 05 / 2021 | Asus Strix Scar 17 G733QSA-XS99 R9 5900HX, GeForce RTX 3080 Laptop GPU | 2.8 kg | 28.3 mm | 17.30" | 1920x1080 | |
| 87.5 % v7 (old) | 05 / 2021 | Razer Blade 15 Advanced Model Early 2021 i7-10875H, GeForce RTX 3080 Laptop GPU | 2 kg | 16.99 mm | 15.60" | 1920x1080 | |
| 85.3 % v7 (old) | 04 / 2021 | Alienware m17 R4 i9-10980HK, GeForce RTX 3080 Laptop GPU | 3 kg | 22 mm | 17.30" | 1920x1080 | |
| 87.1 % v7 (old) | 03 / 2021 | MSI GE76 Raider 10UH i7-10870H, GeForce RTX 3080 Laptop GPU | 3 kg | 27.4 mm | 17.30" | 1920x1080 |
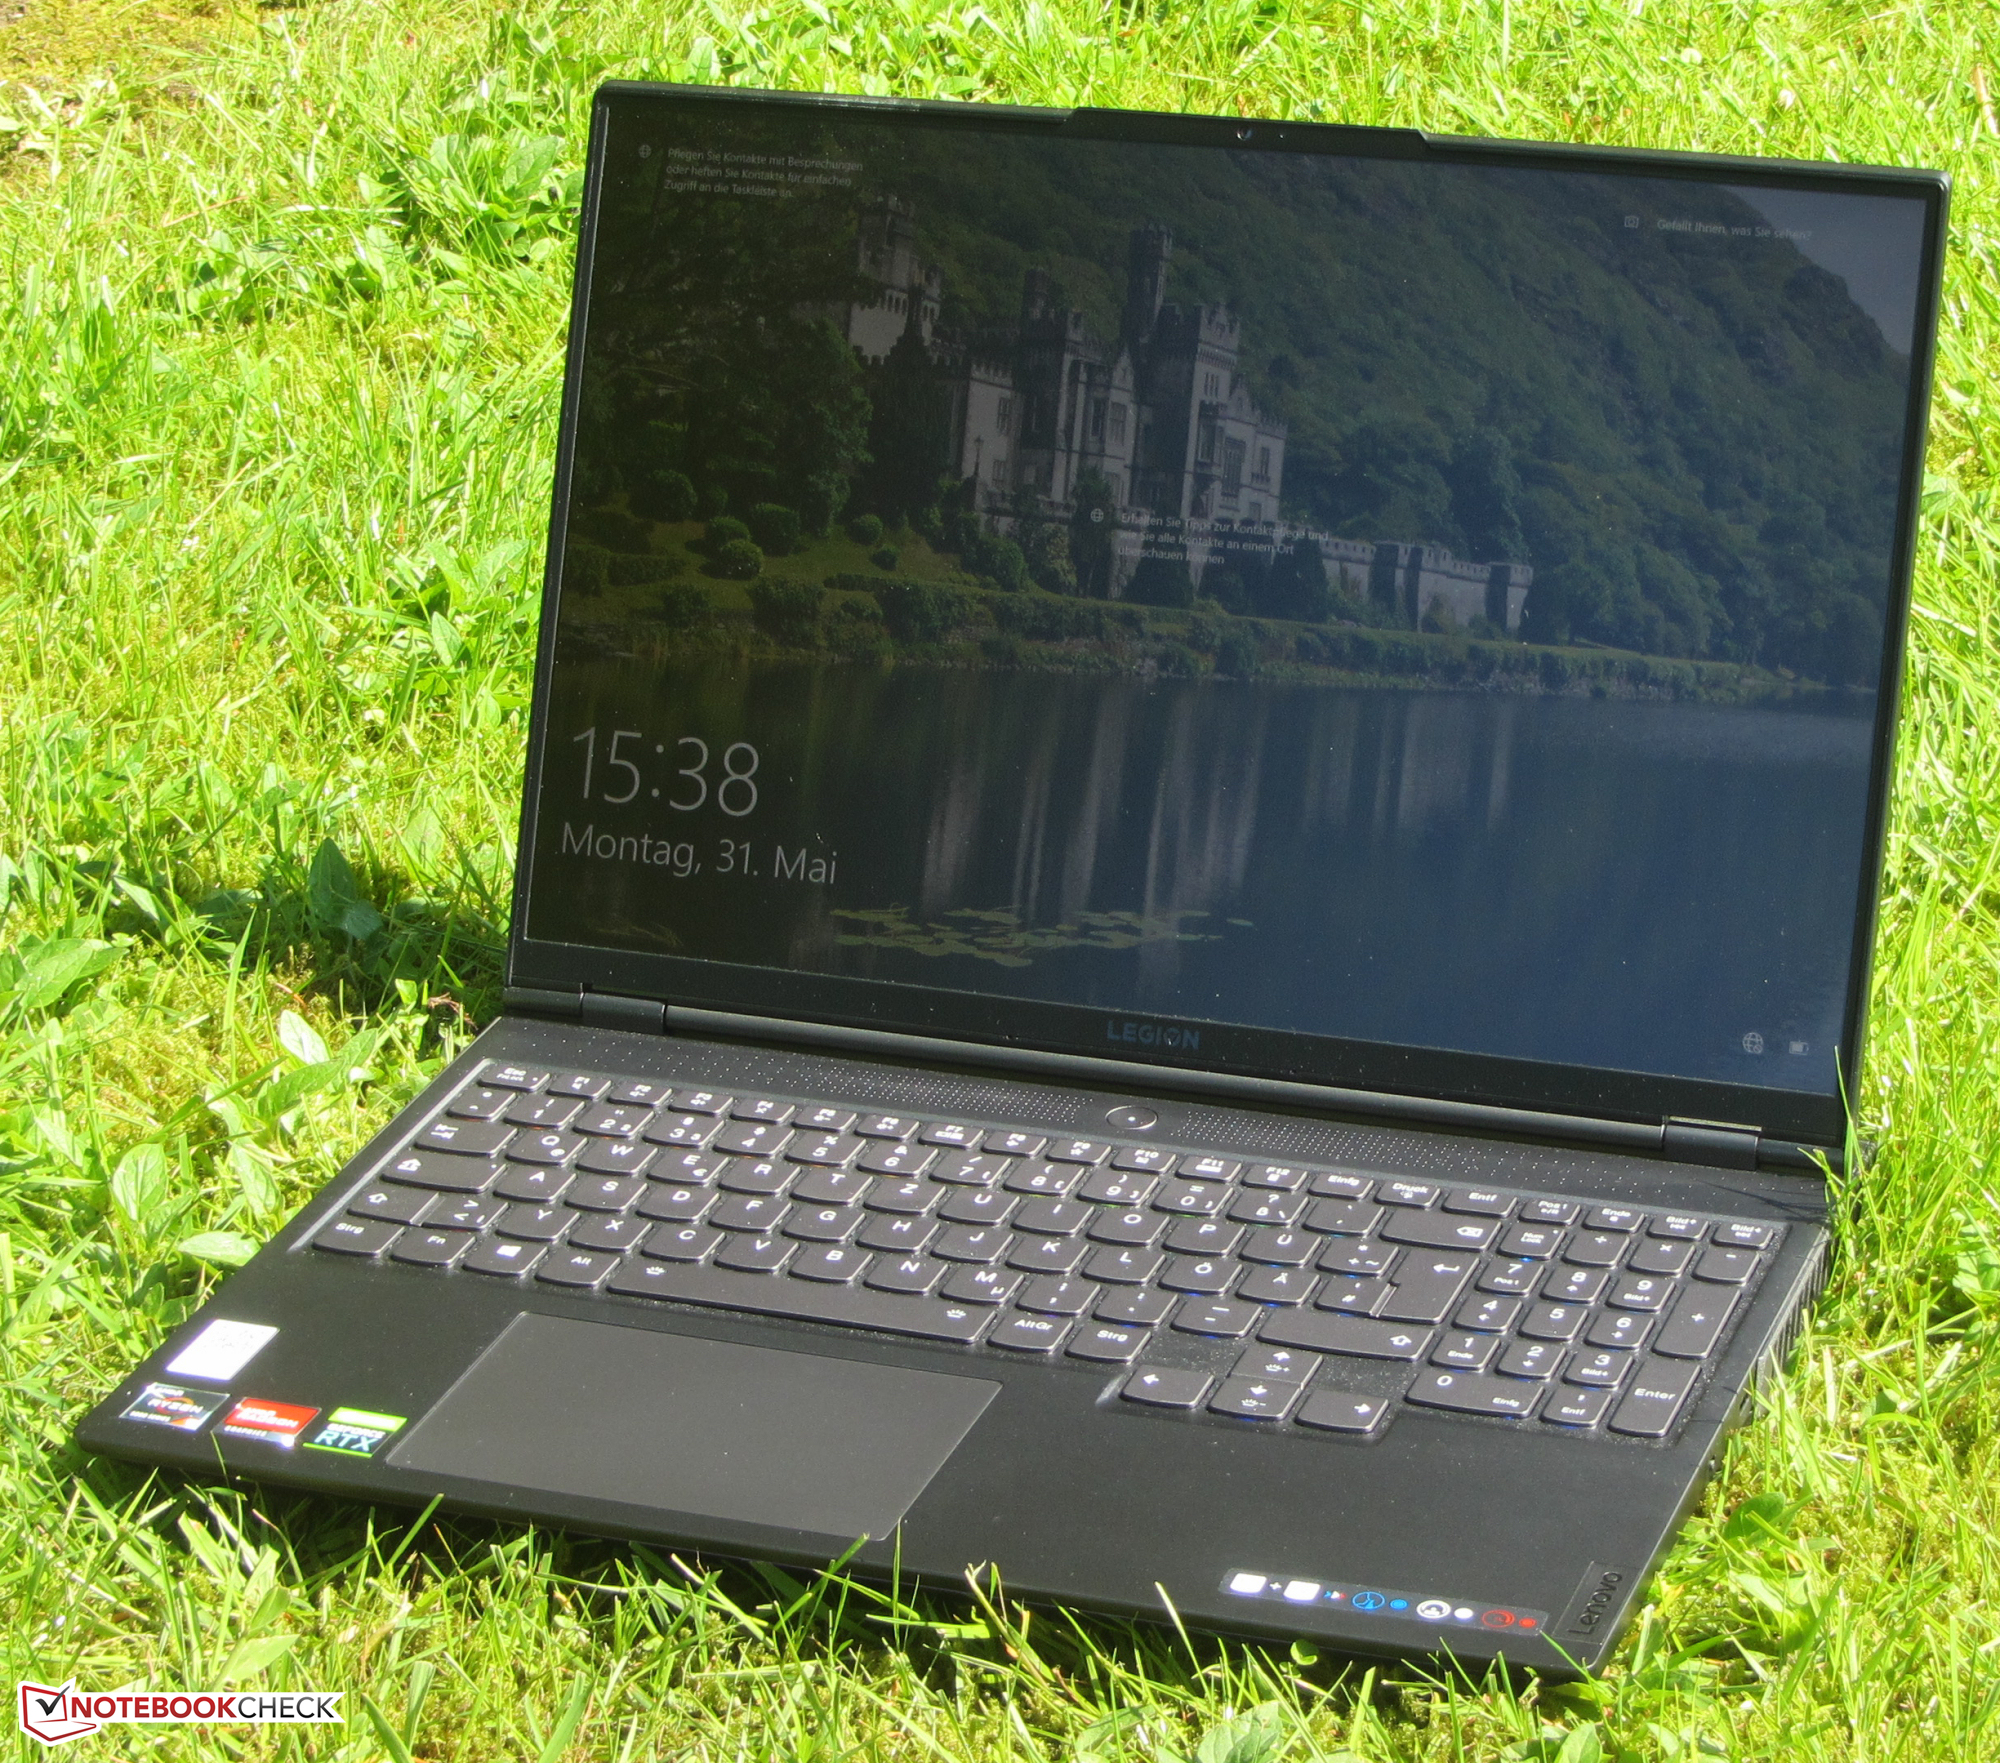
Case - Legion 7 with aluminum chassis
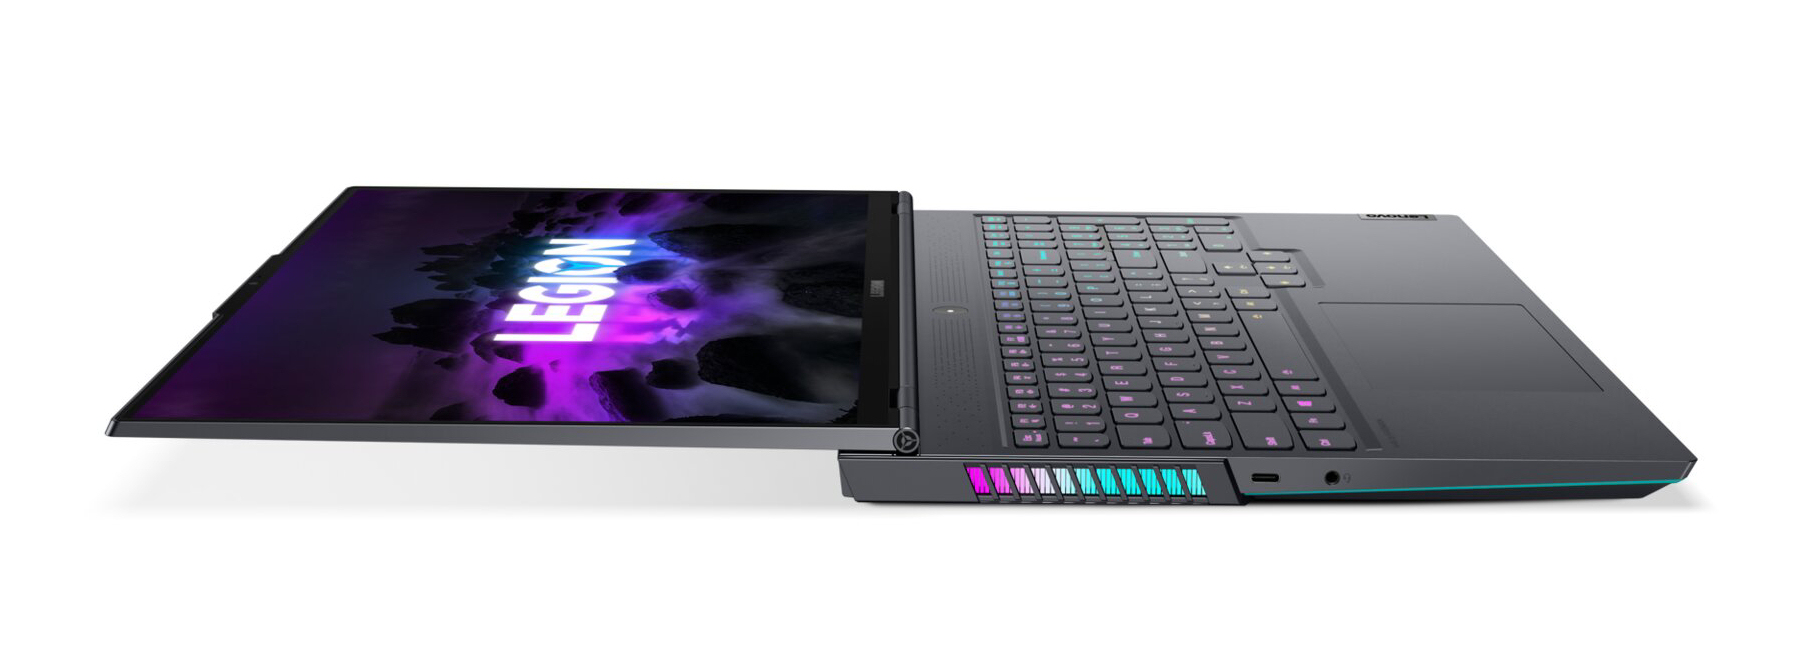
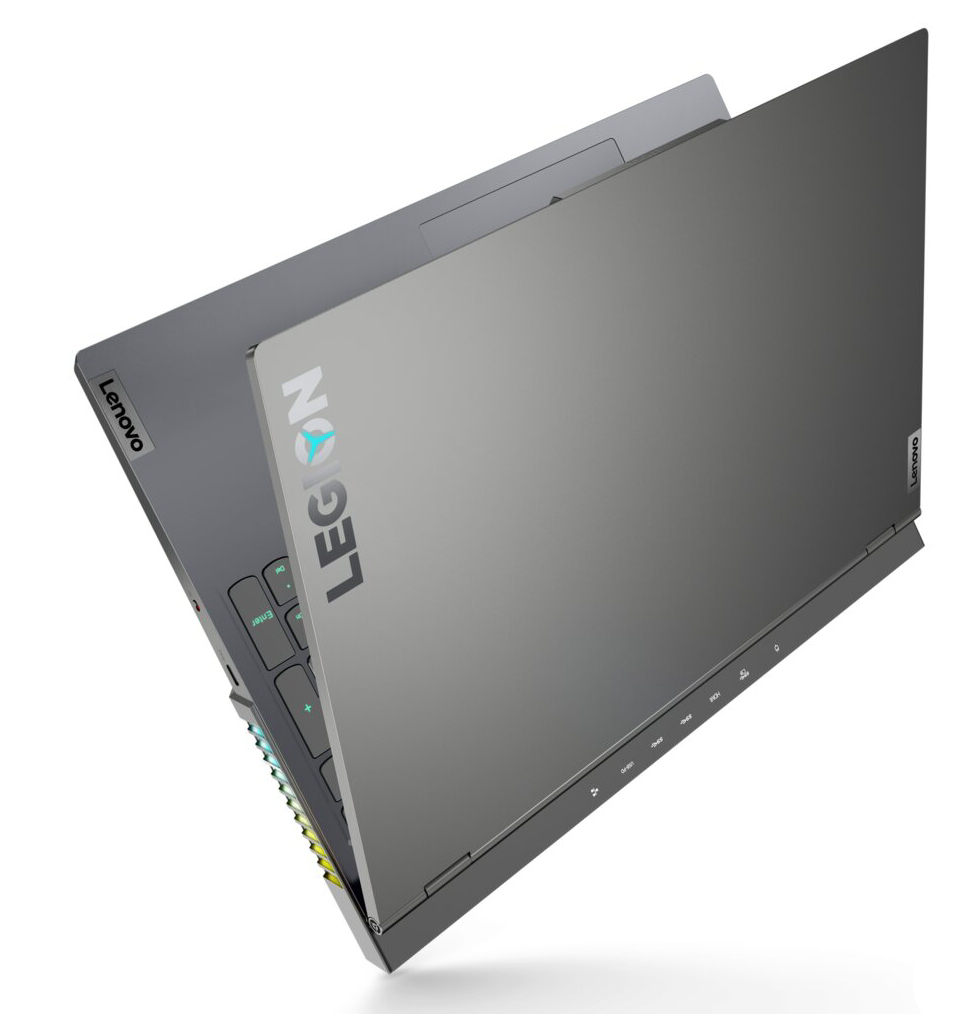
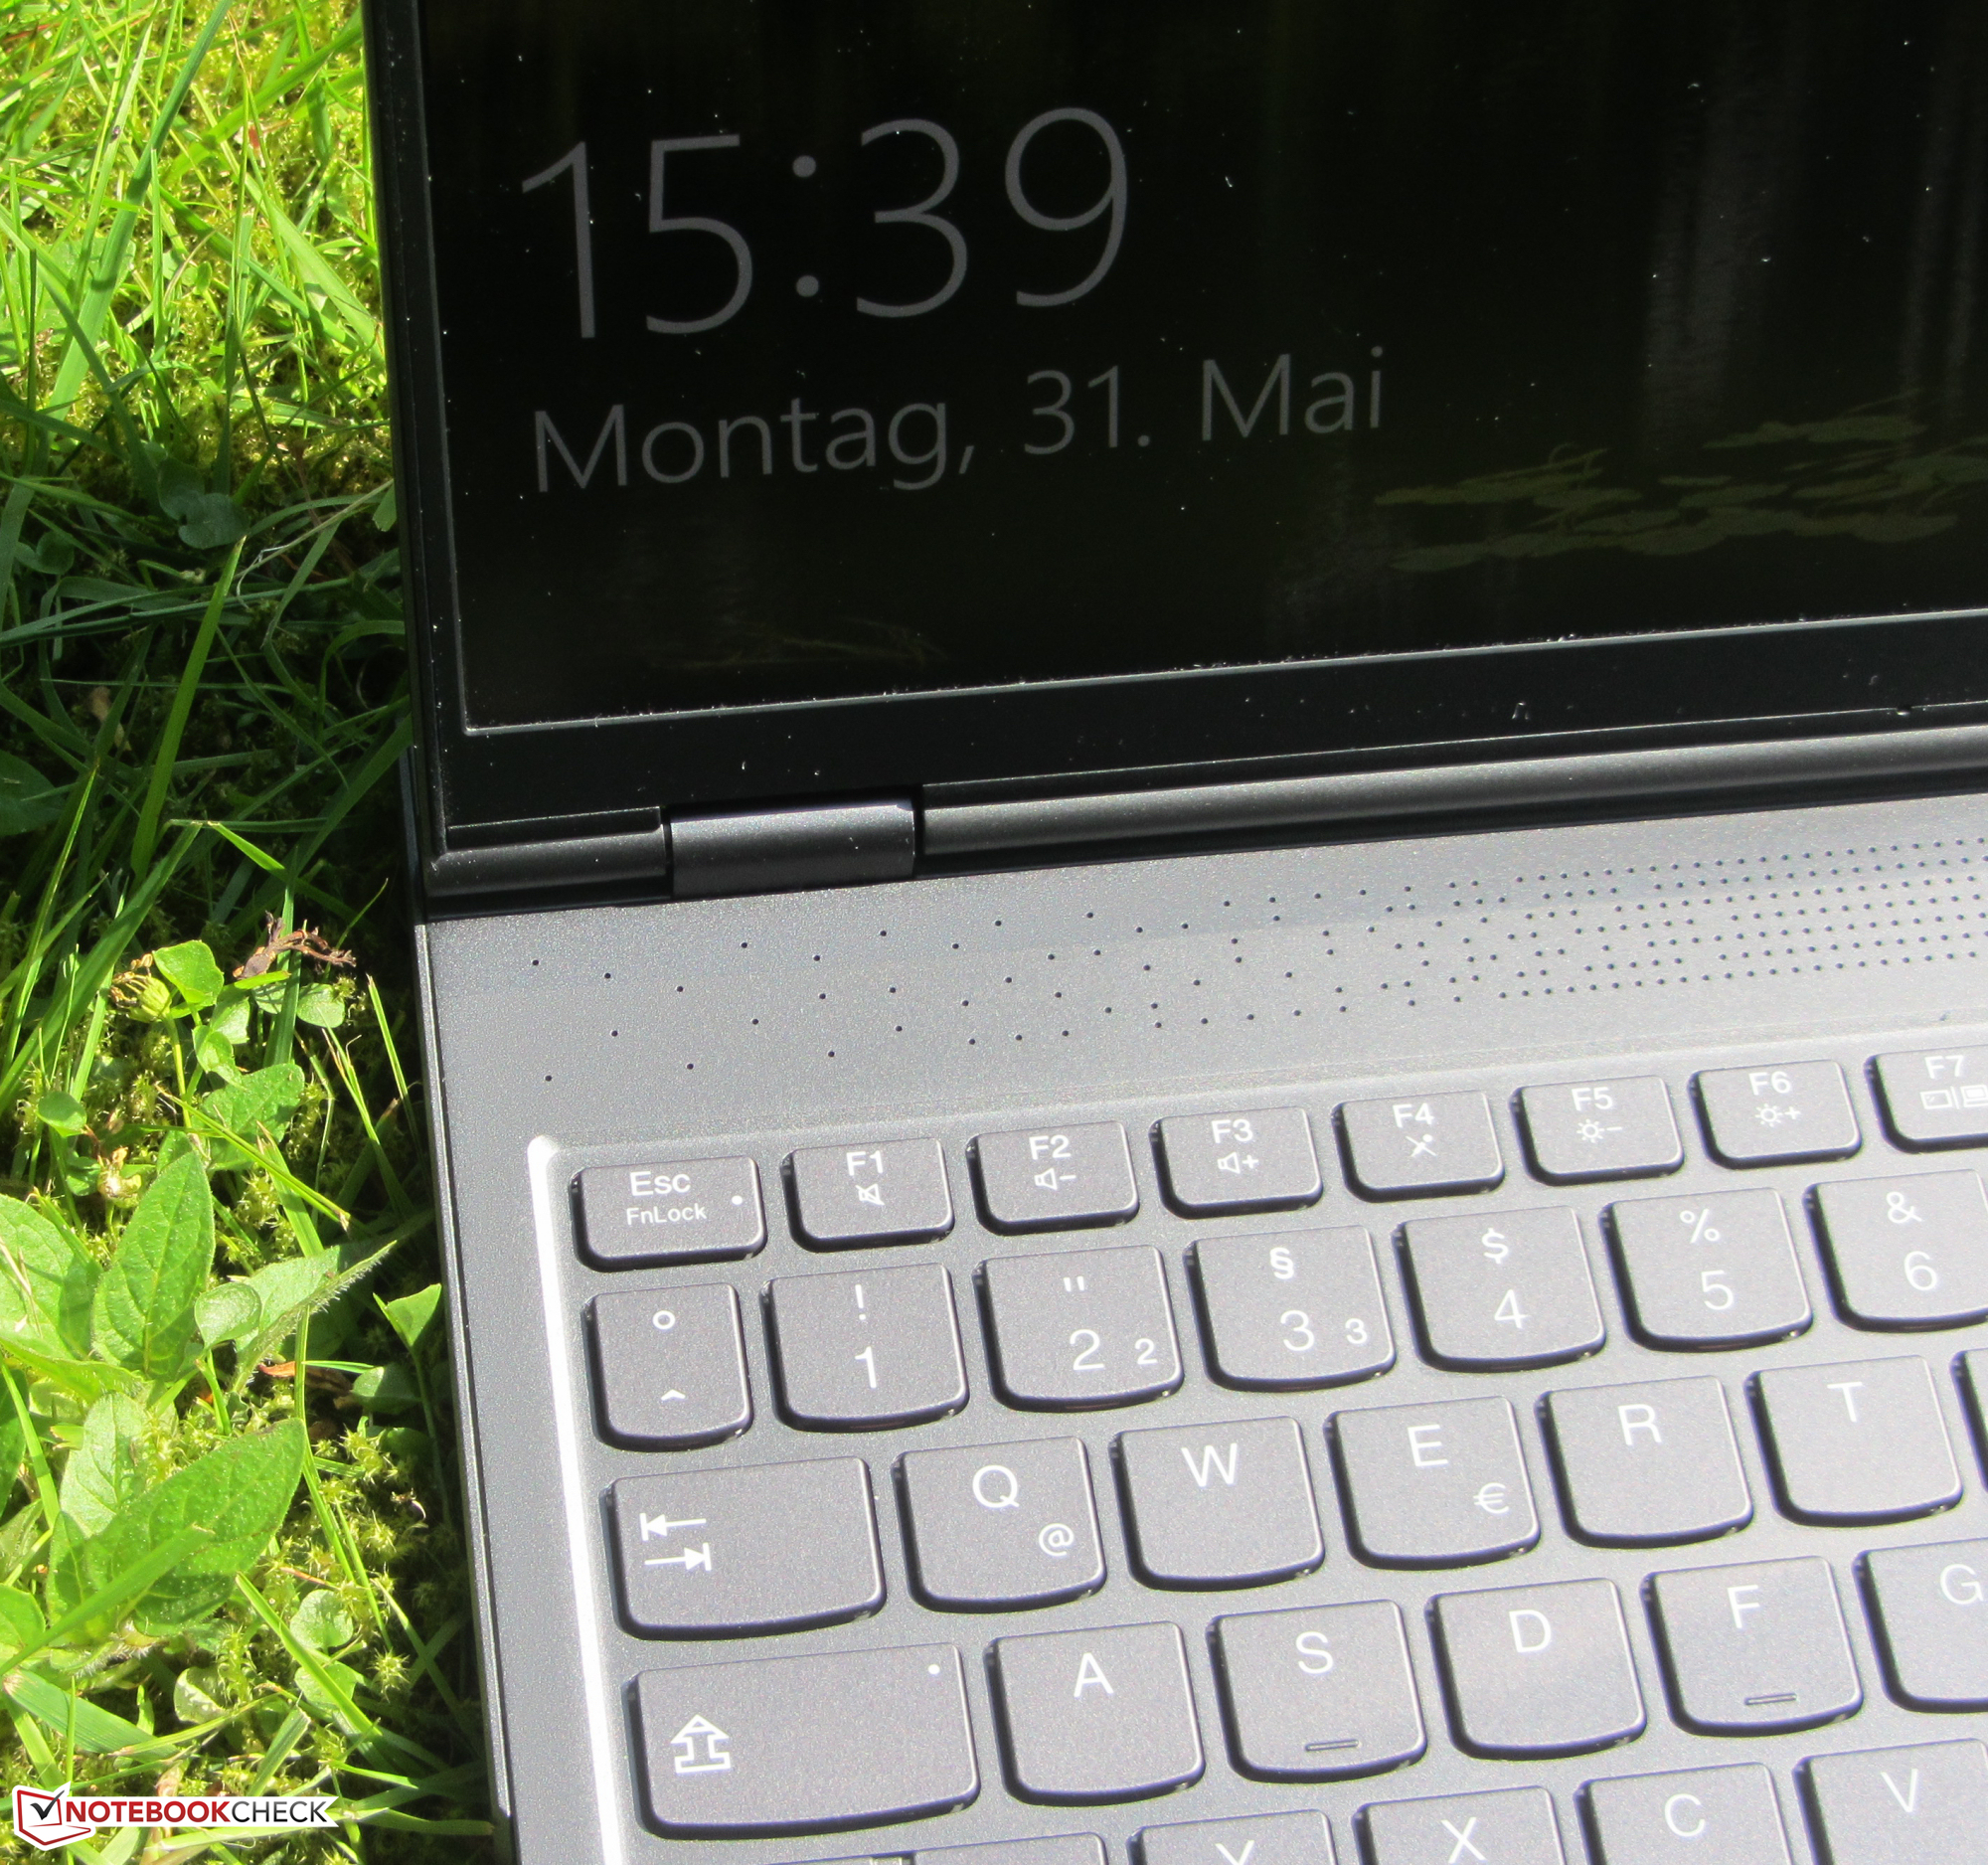
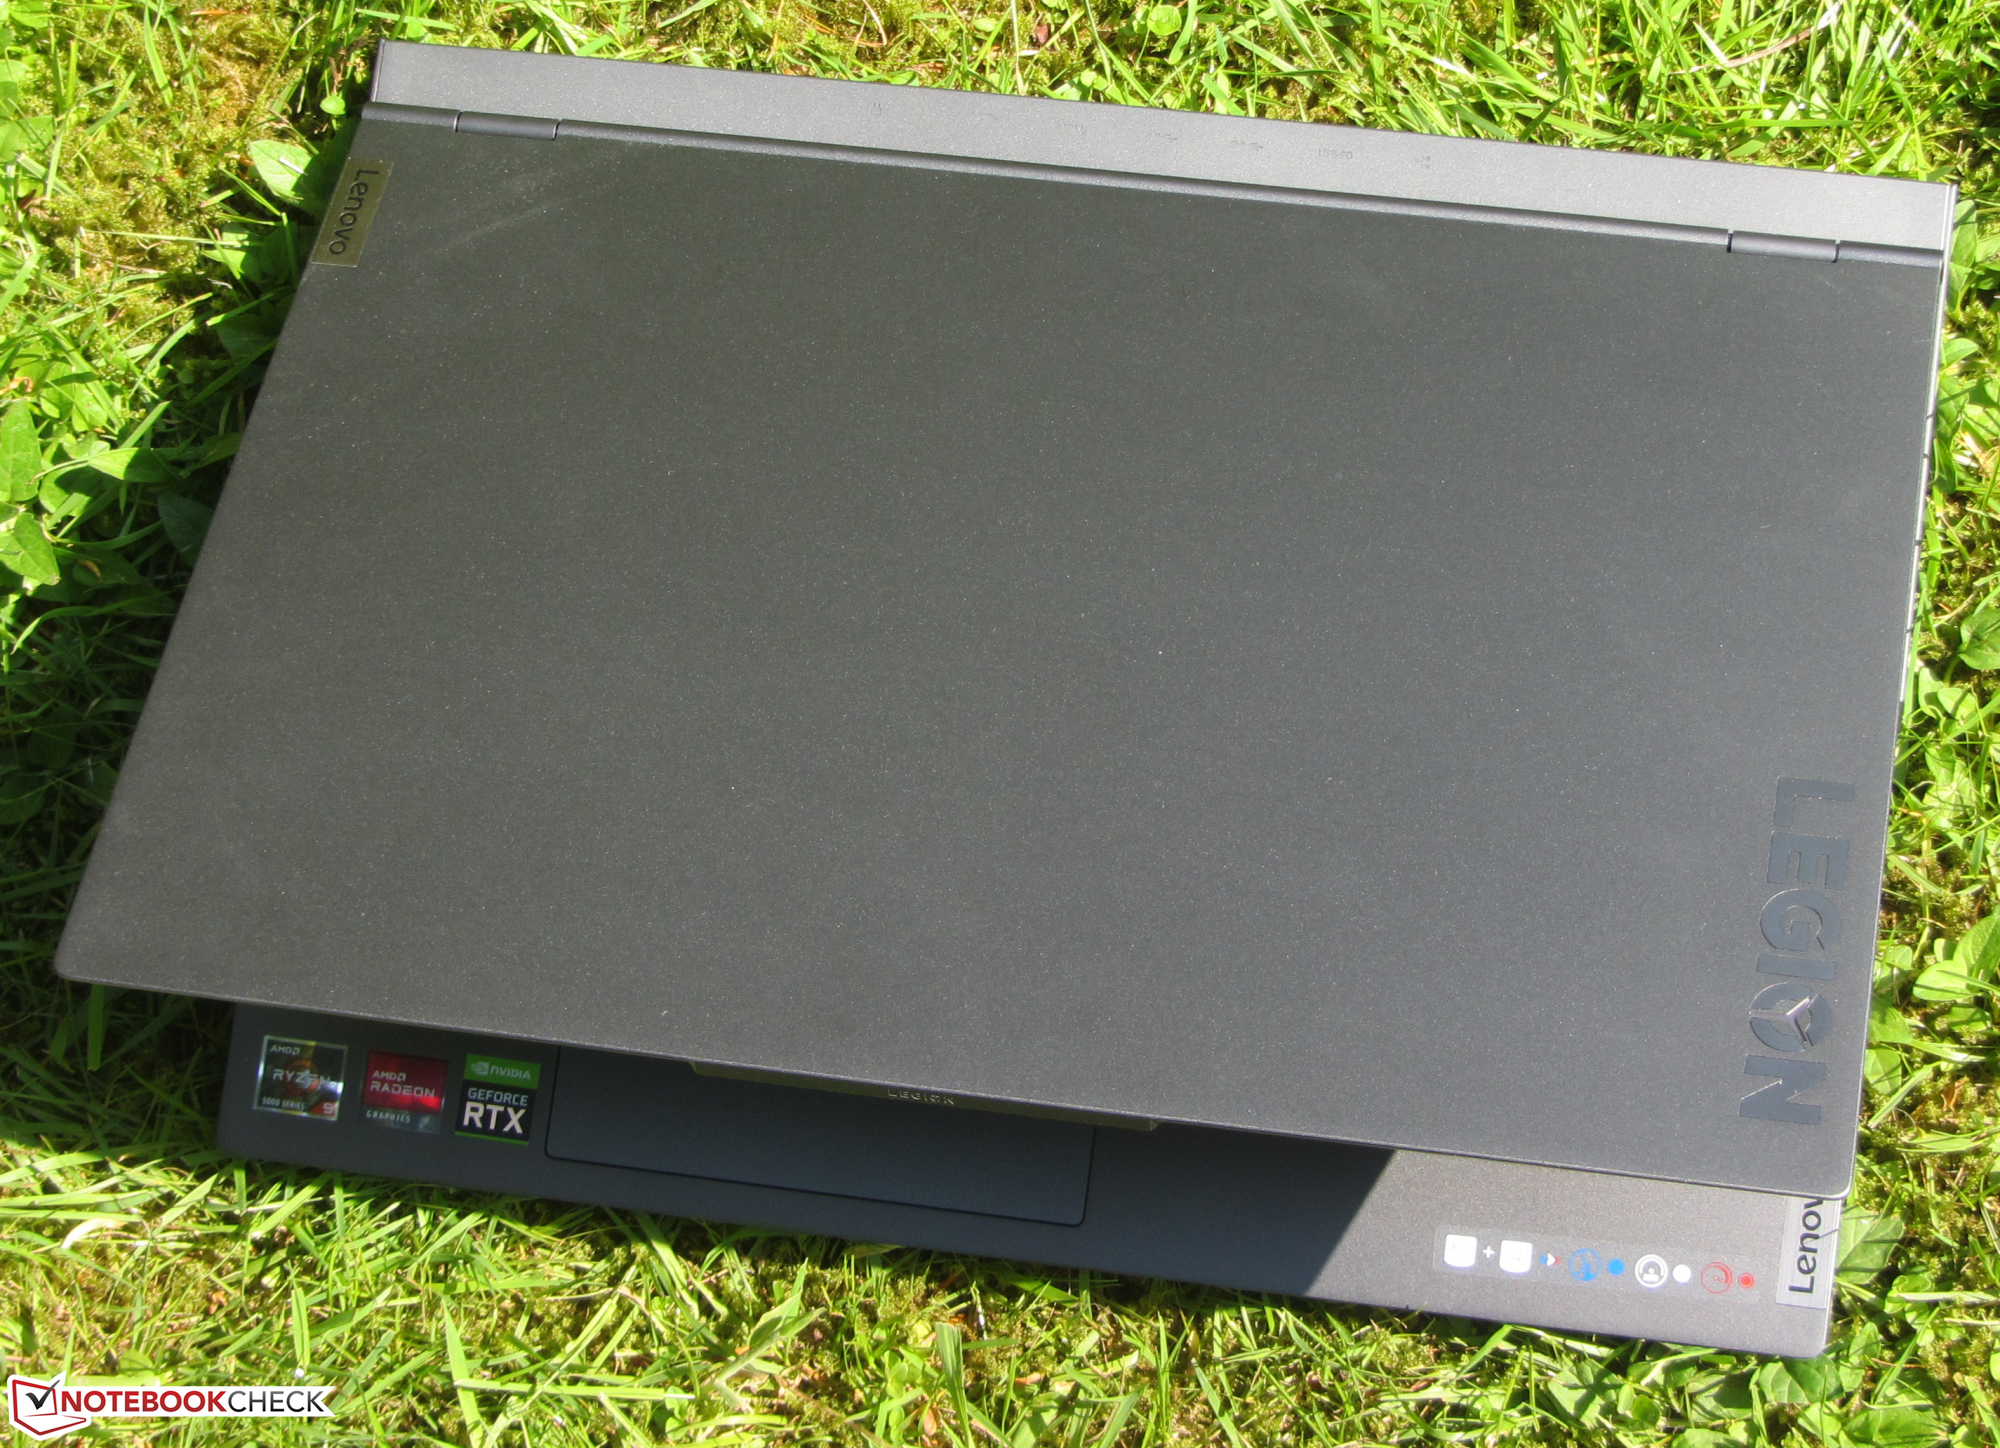
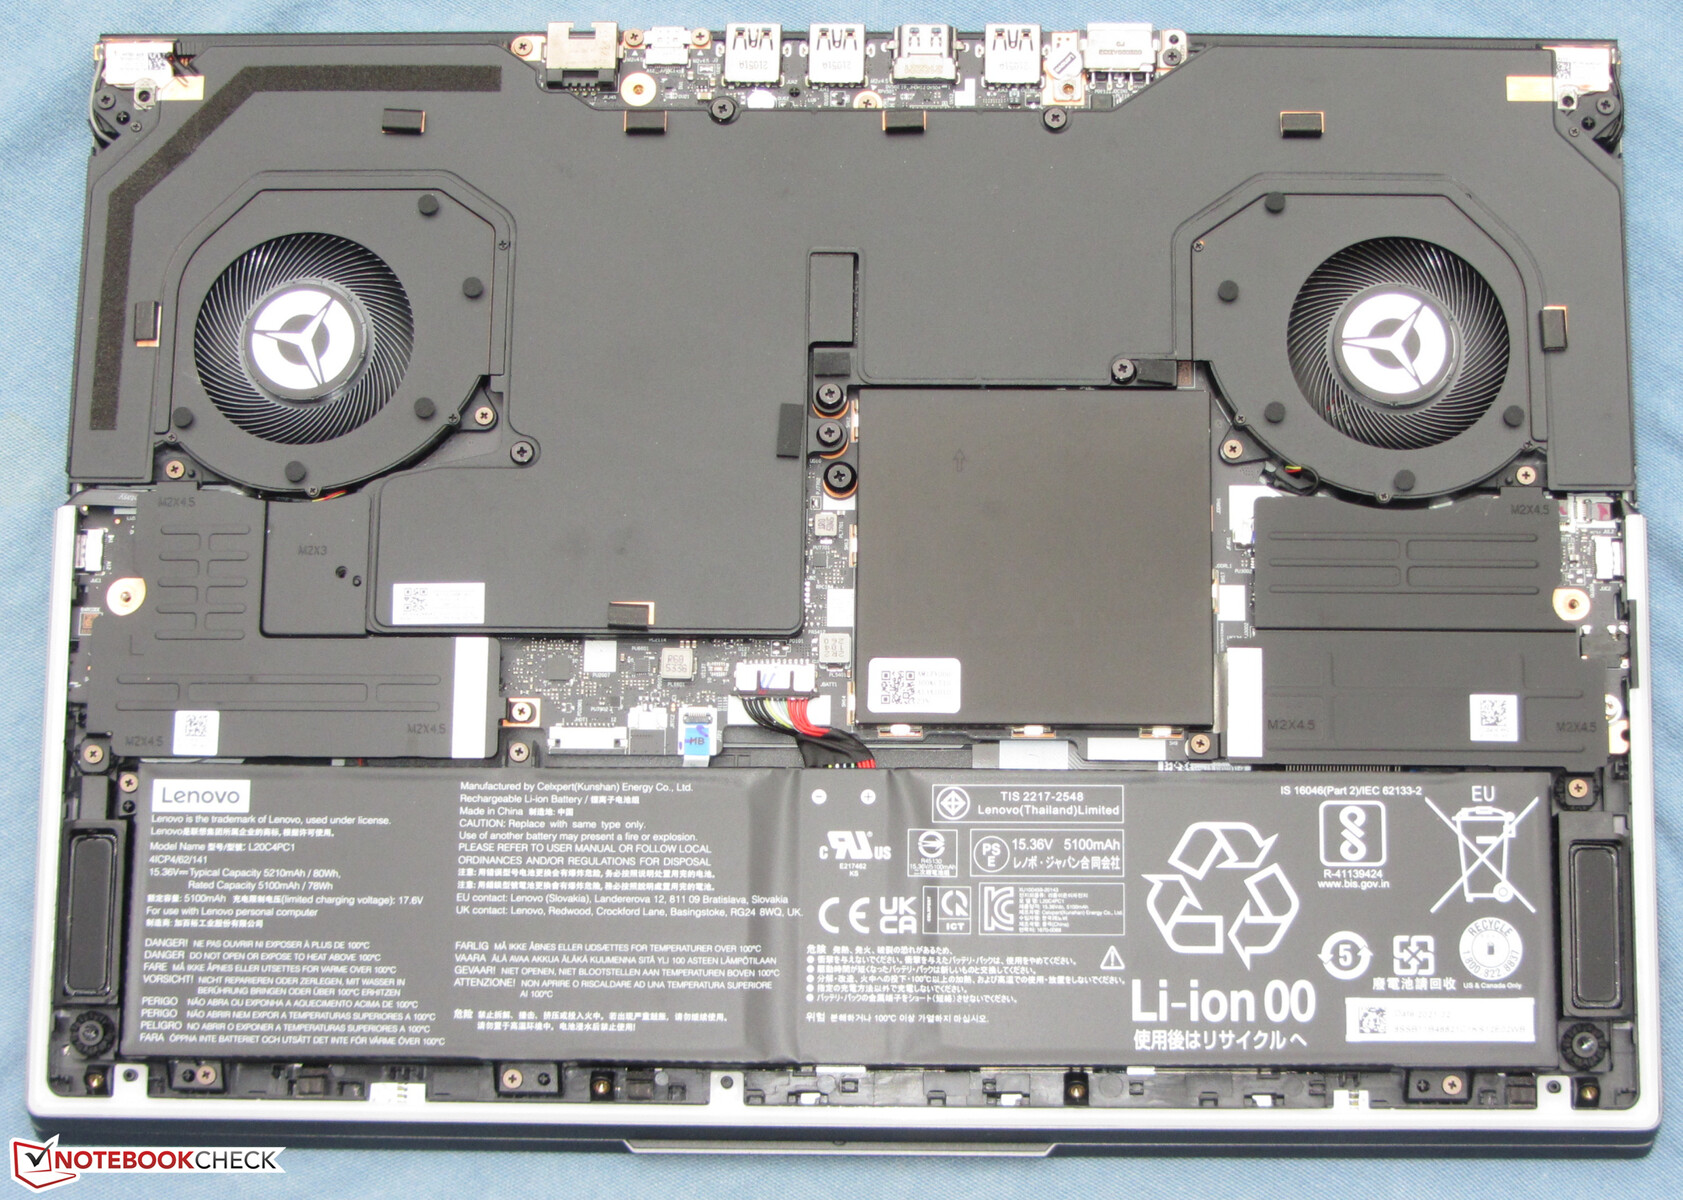
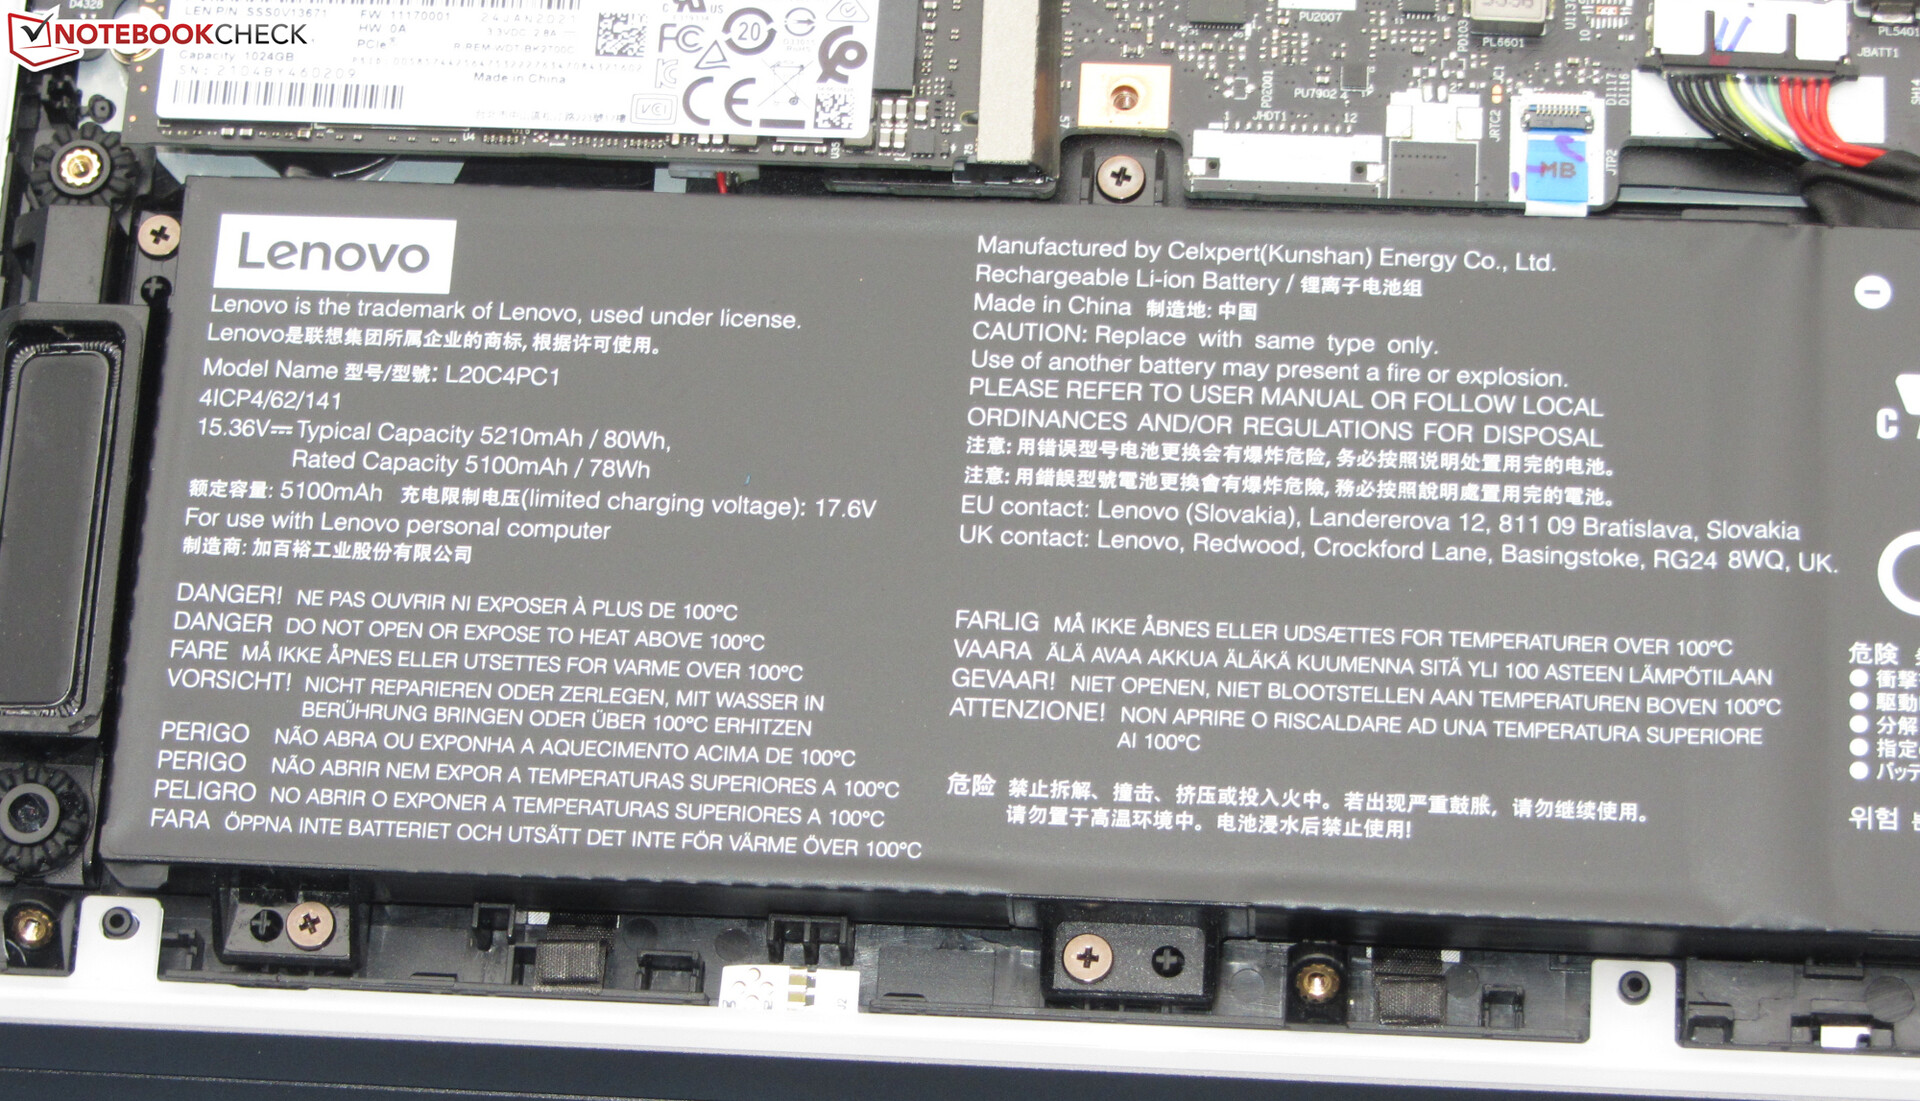
Lenovo opts for a gray (Storm Gray) aluminum case with matte, smooth surfaces for the Legion 7. The case follows Lenovo's Legion design scheme: The lid isn't flush with the back, but the latter extends a few millimeters beyond the lid's edge instead - in the case of our test device, it does so by about 18 mm. The battery is firmly built into the unit, and there is no maintenance hatch. The bottom cover has to be removed to access the internals. More on this later.
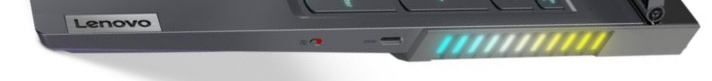
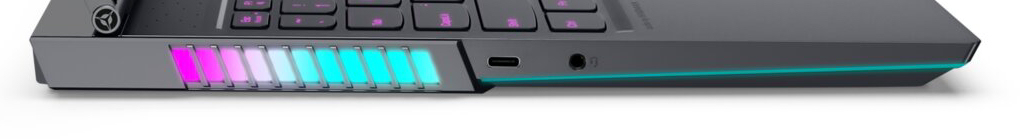
While the laptop's design is fundamentally discreet, it can still attract attention. Lenovo has installed lighting elements (LED strips on the bottom edges, illuminated air vents) that run in sync with the keyboard lighting. The light show is joined by the illuminated "Y" within the Lenovo logo on the lid's back.
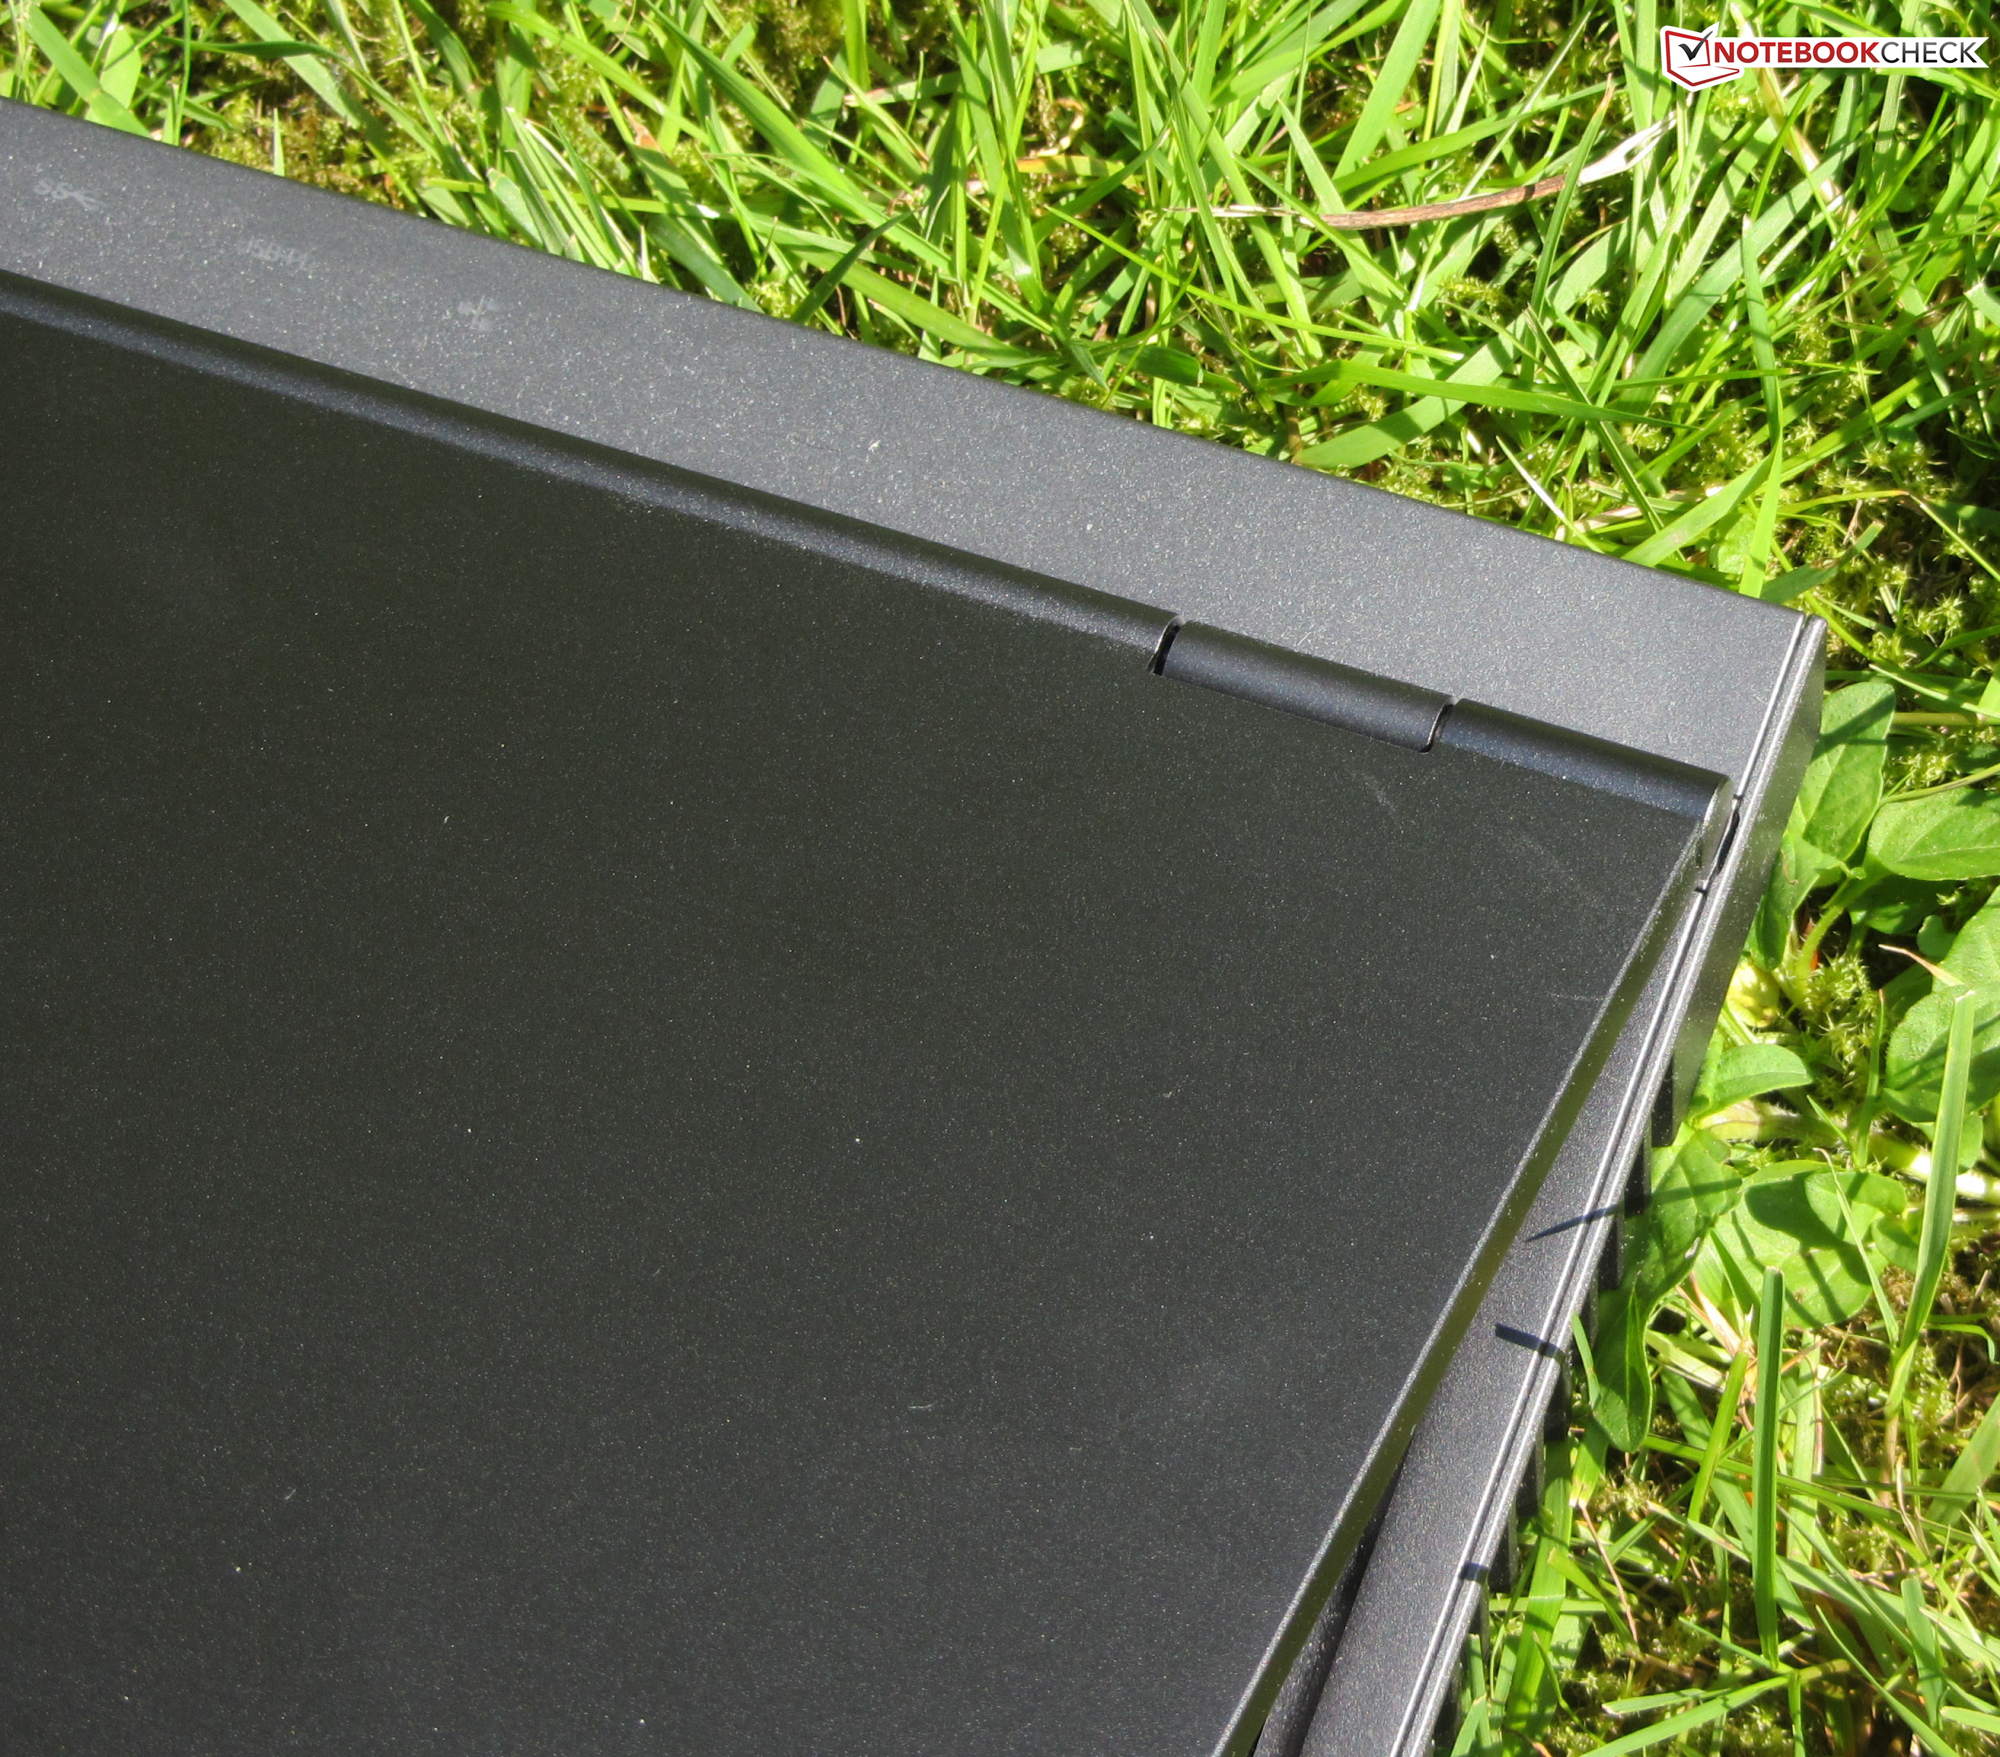
The laptop doesn't reveal any workmanship and/or stability flaws. The gap dimensions are correct, and no material protrusions can be detected. The base unit has sufficient rigidity. The lid can be twisted a bit, but the whole situation is completely within the limits. The tight hinges keep the lid firmly in position and hardly allow it to wobble. The maximum aperture angle is about 175 degrees. A one-handed opening of the lid is possible.
Within our comparison field, the Legion positions itself in the midfield in terms of dimensions and weight. It's slightly larger and heavier than the 15.6-inch competition, but it keeps the 17.3-inch competition at bay.
Connectivity - Thunderbolt isn't offered by the Lenovo laptop
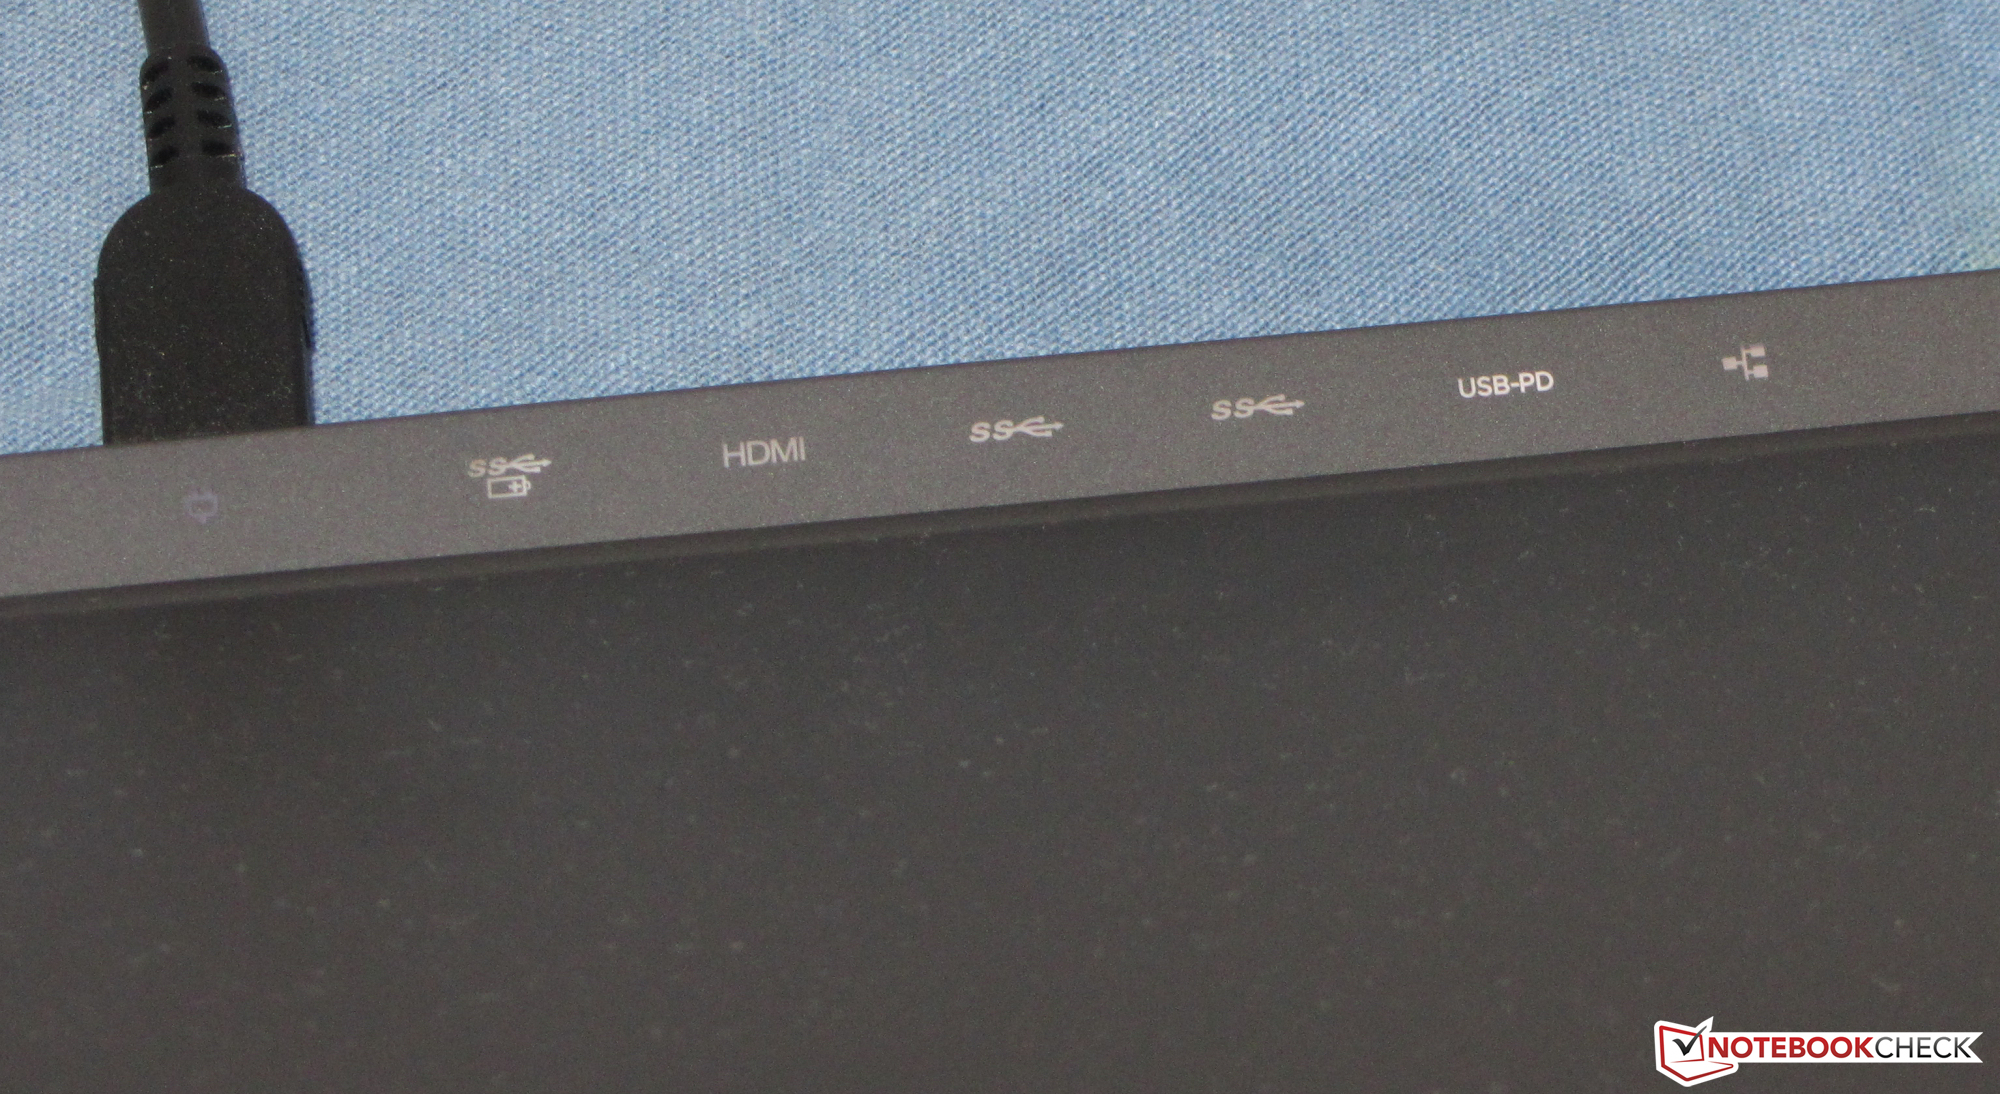
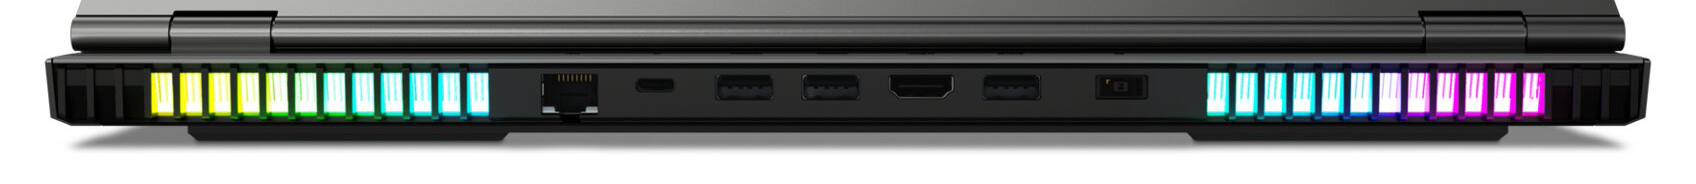
Four (3x USB-A, 1x USB-C) out of the six USB slots work according to the USB 3.2 Gen 1 standard, number five and six (USB-C; left side, rear) according to the USB 3.2 Gen 2 standard. The latter support Display Port via USB-C. This provides the laptop with a total of three video outputs (HDMI, 2x DP).
The USB-C port at the back also supports Power Delivery, which allows charging the battery using a USB-C power adapter. According to Lenovo, a 45-watt power adapter (20 V, 2.25 A) is sufficient to charge the battery in standby, hibernation mode, or when turned off. Charging the battery when the device is on requires a 65-watt power adapter (20 V, 3.25 A) at the very least. Fully supplying the laptop with power isn't possible, since a maximum of 100 watts can be transferred via USB-C.
The ports are distributed across three sides of the laptop. The majority of the ports are located at the back of the device. As a result, connected cables run to the back and don't get in the way. The illuminated labeling of the rear ports deserves praise, since it makes it much easier to plug in a connector without looking.
Communication
The Killer WLAN module carries a chip (AX200) from Intel that supports the 802.11a/b/g/n/ac/ax standards. The transfer speeds determined under optimal conditions (no other WLAN devices nearby, short distance between laptop and server PC) range from decent to good. Wired network connections are handled by a representative from Realtek's well-known RTL8168/8111 family. It performs its tasks smoothly.
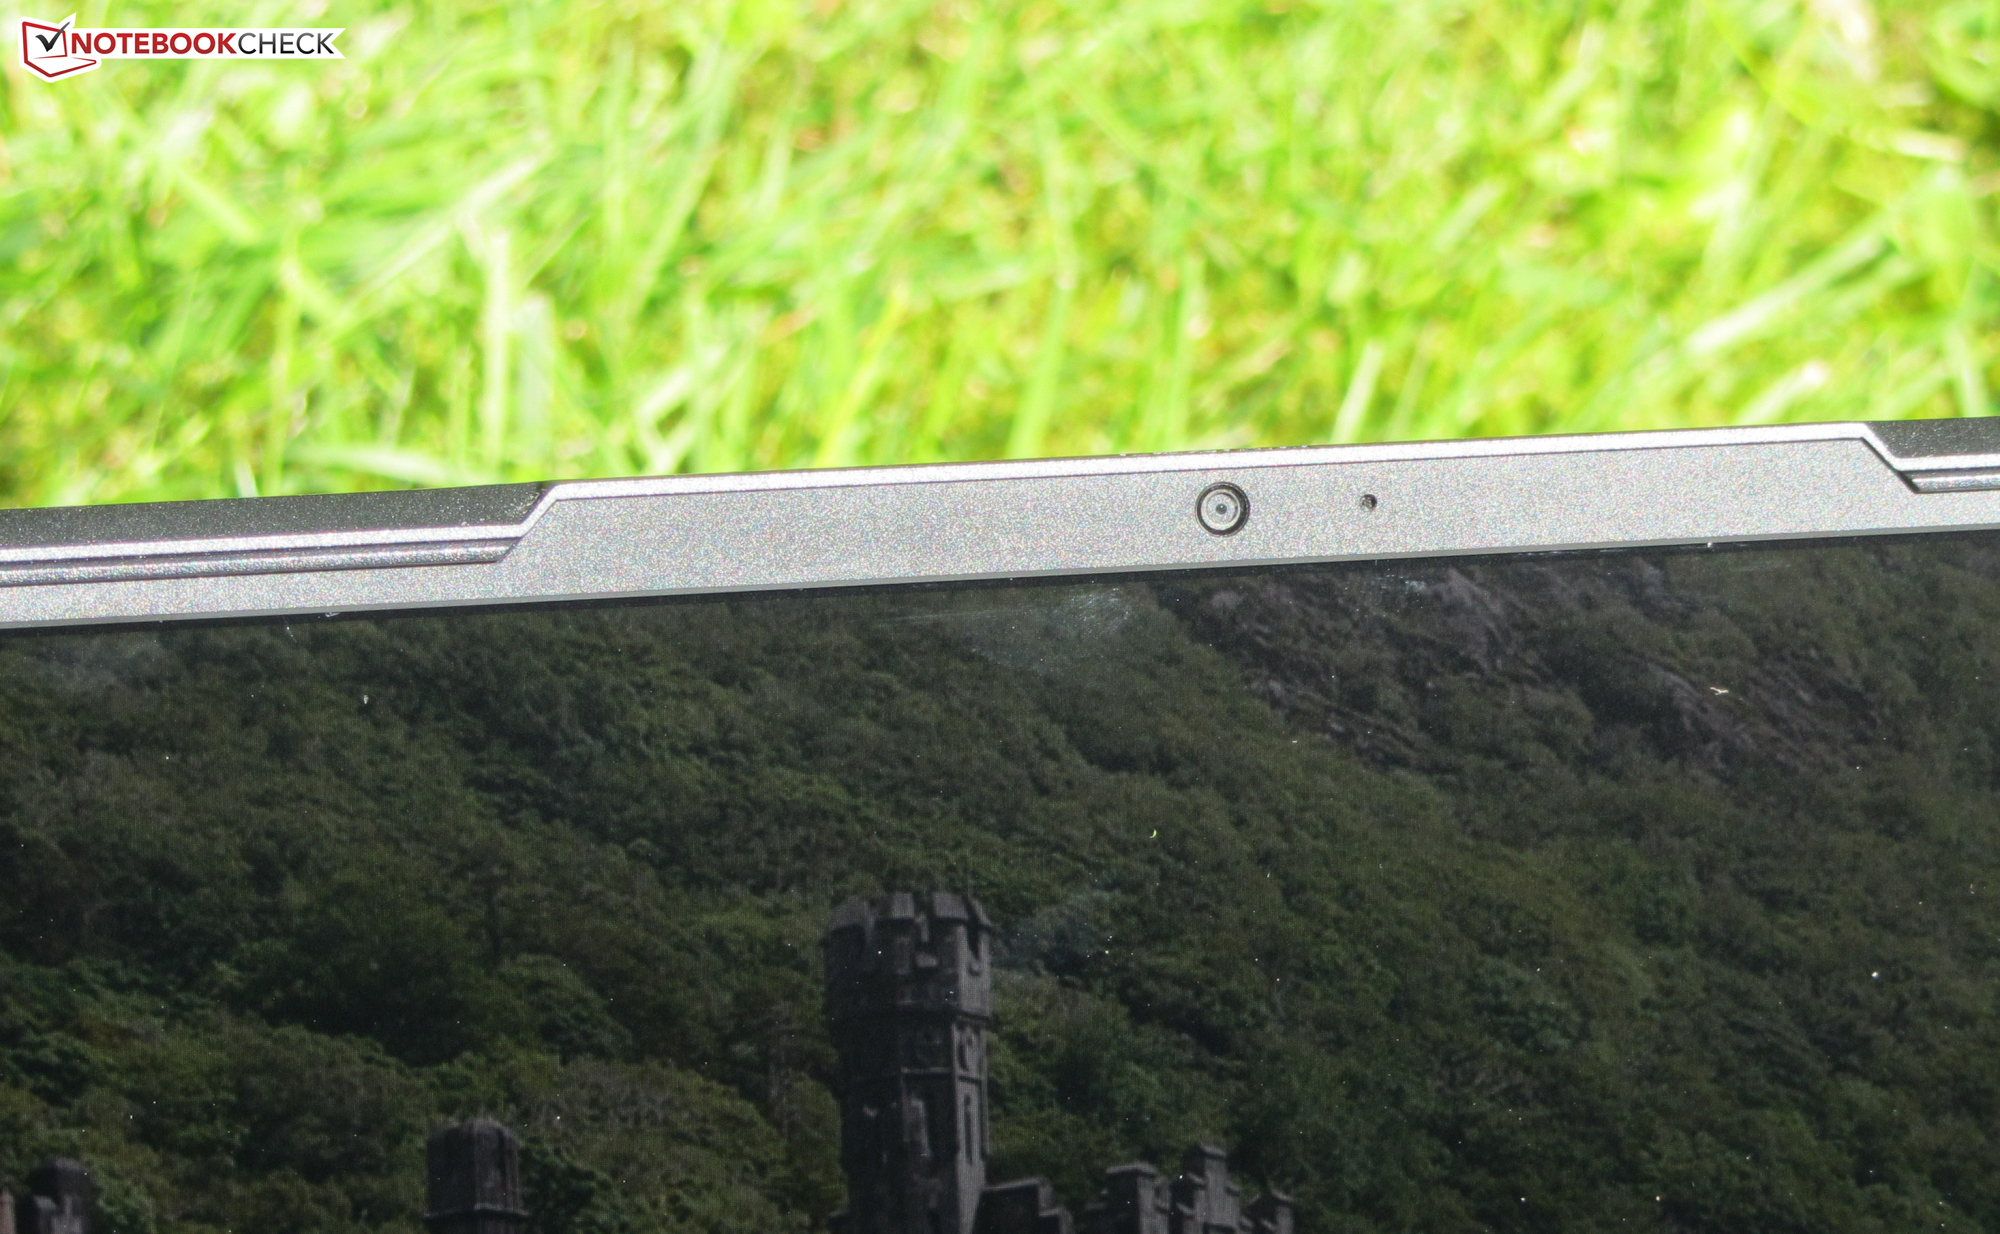
Webcam
The webcam (0.9 MP) produces images in a maximum resolution of 1280x720 pixels. Moreover, there are issues with color accuracy. With a color deviation of about 17, the target (Delta E less than 3) is very clearly missed.


 GeForce RTX 3080 Laptop GPU, i7-10870H, Samsung SSD 970 EVO Plus 1TB")
 GeForce RTX 3080 Laptop GPU, i7-10870H, Samsung SSD 970 EVO Plus 1TB")


")
")


Accessories
The laptop comes with the usual documents: A quick-start guide and warranty information.
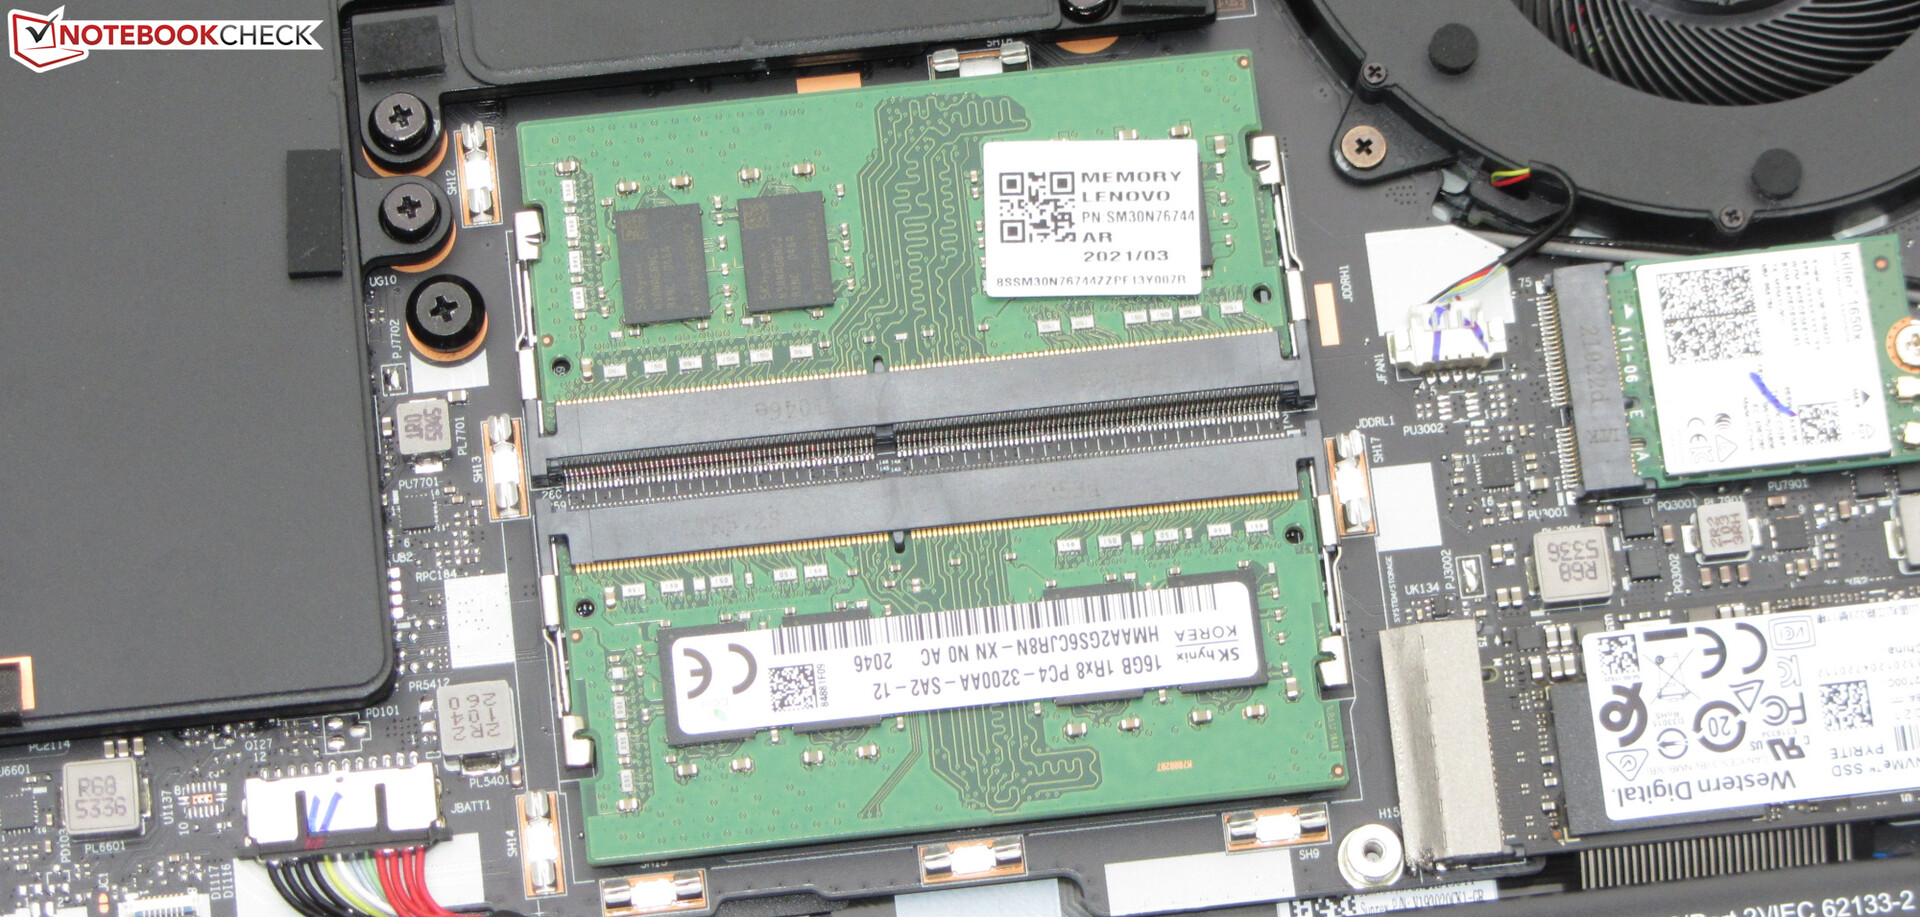
Maintenance
The bottom cover has to be removed in order to access the interior. To do so, all screws on the underside of the device are removed. Afterwards, the bottom cover can be removed with the help of a flat spatula or a grout finishing tool.
Warranty
Lenovo grants the 16-incher a three-year on-site warranty. Extending the warranty to four years would cost about 50 Euros (~$61).
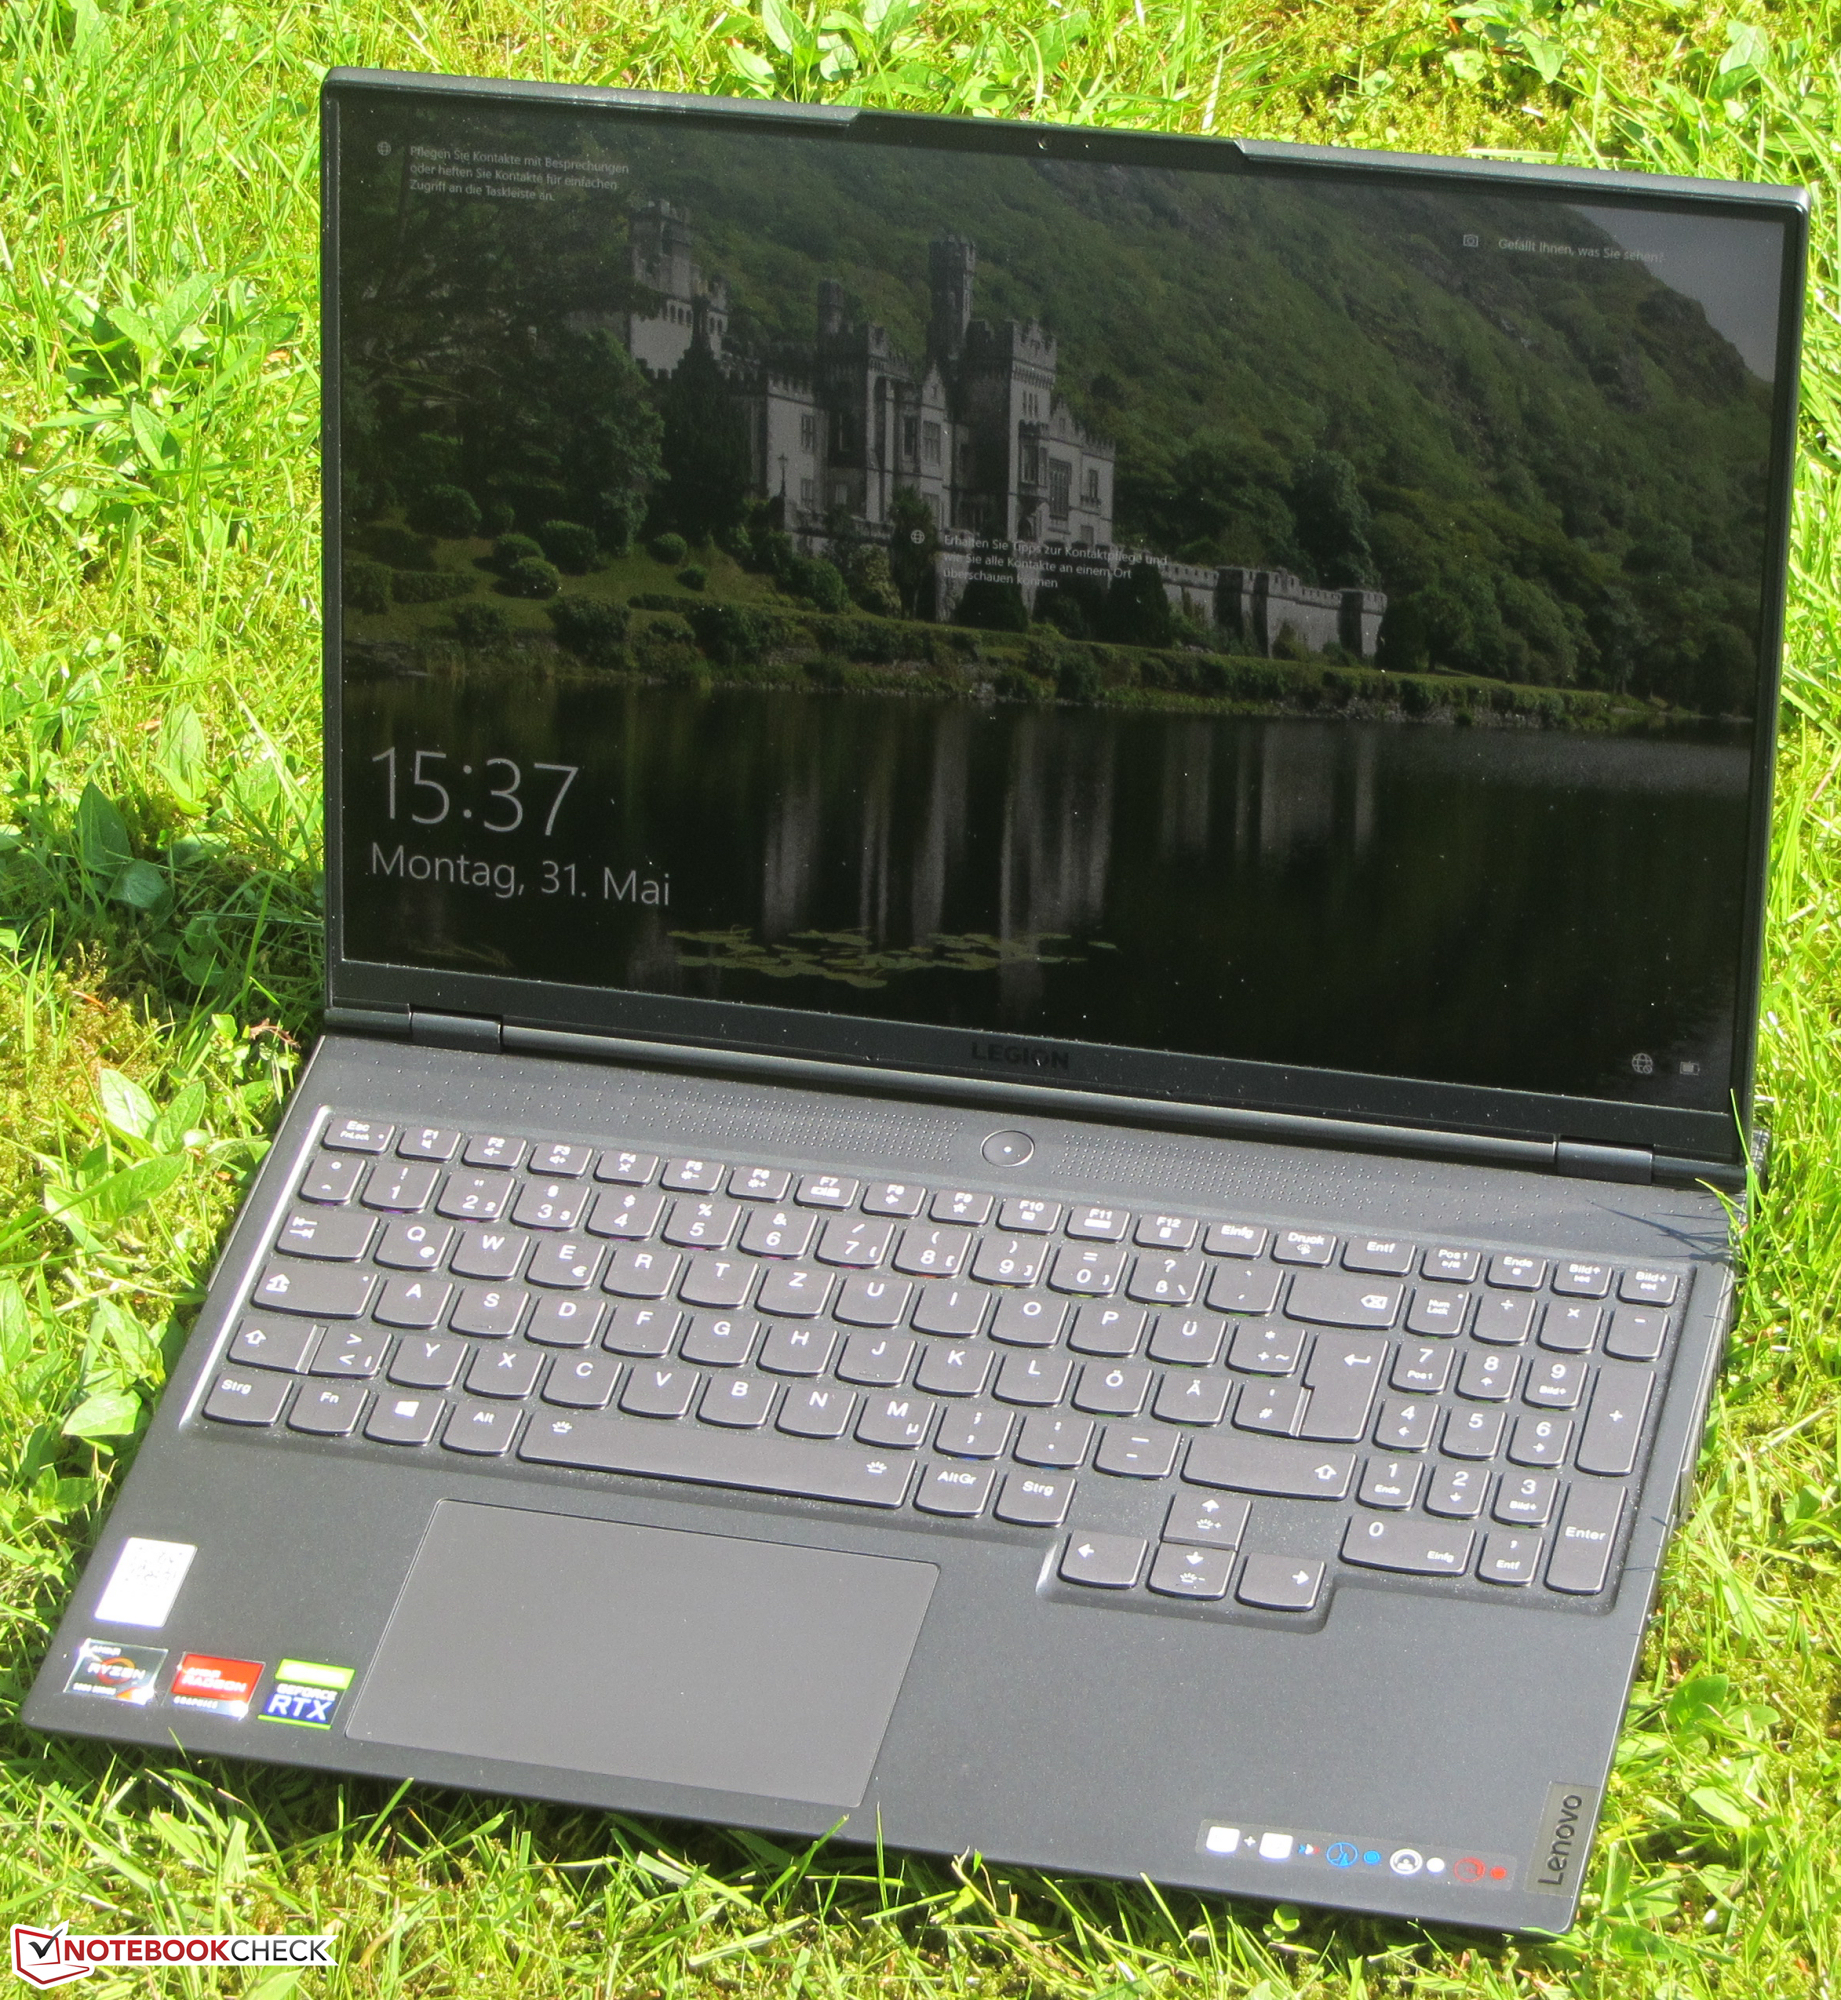
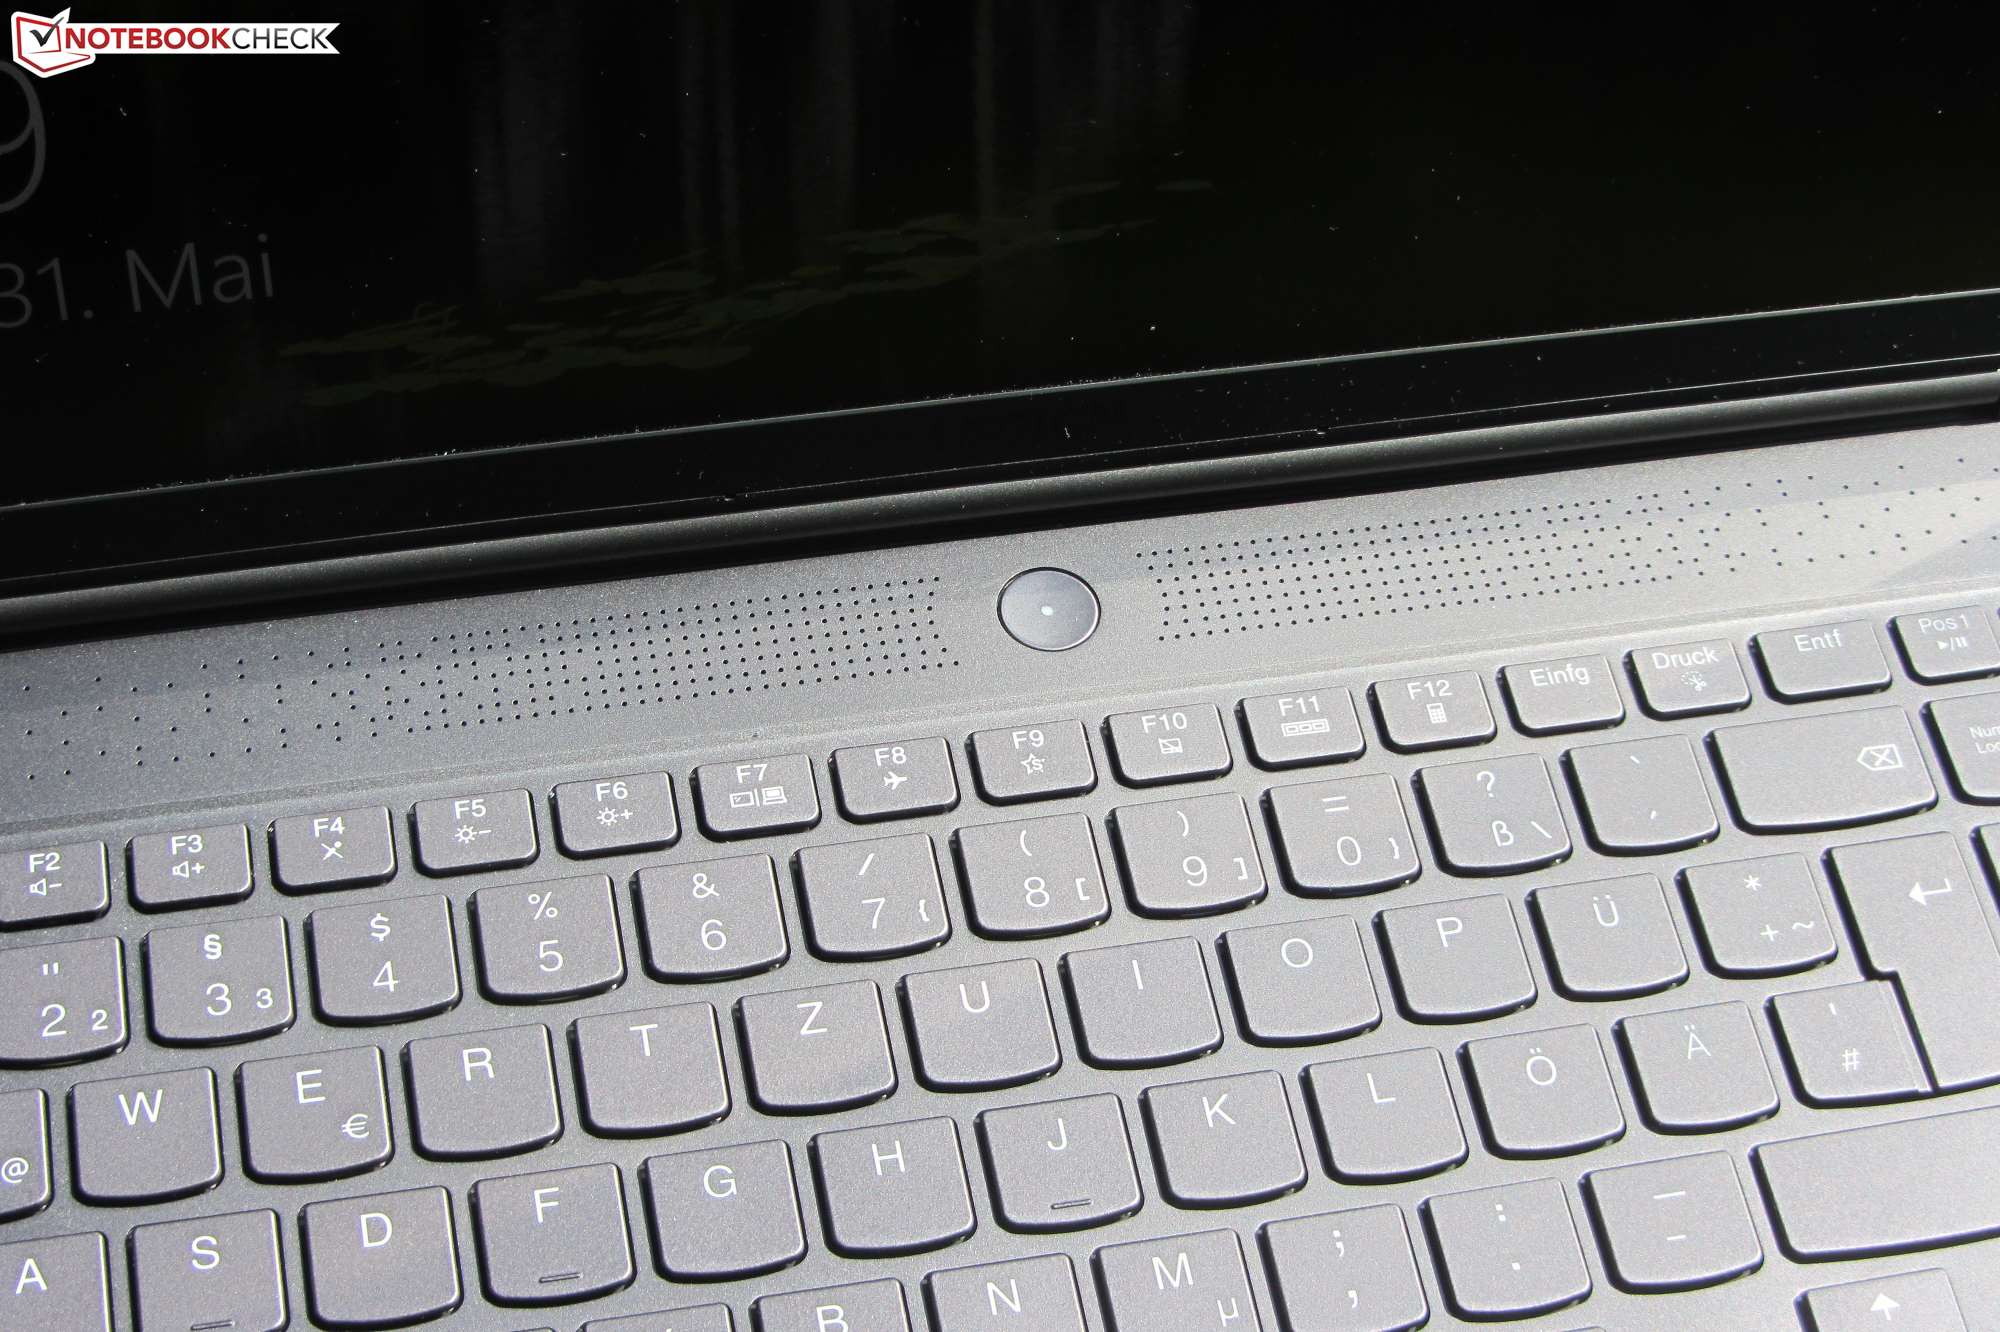
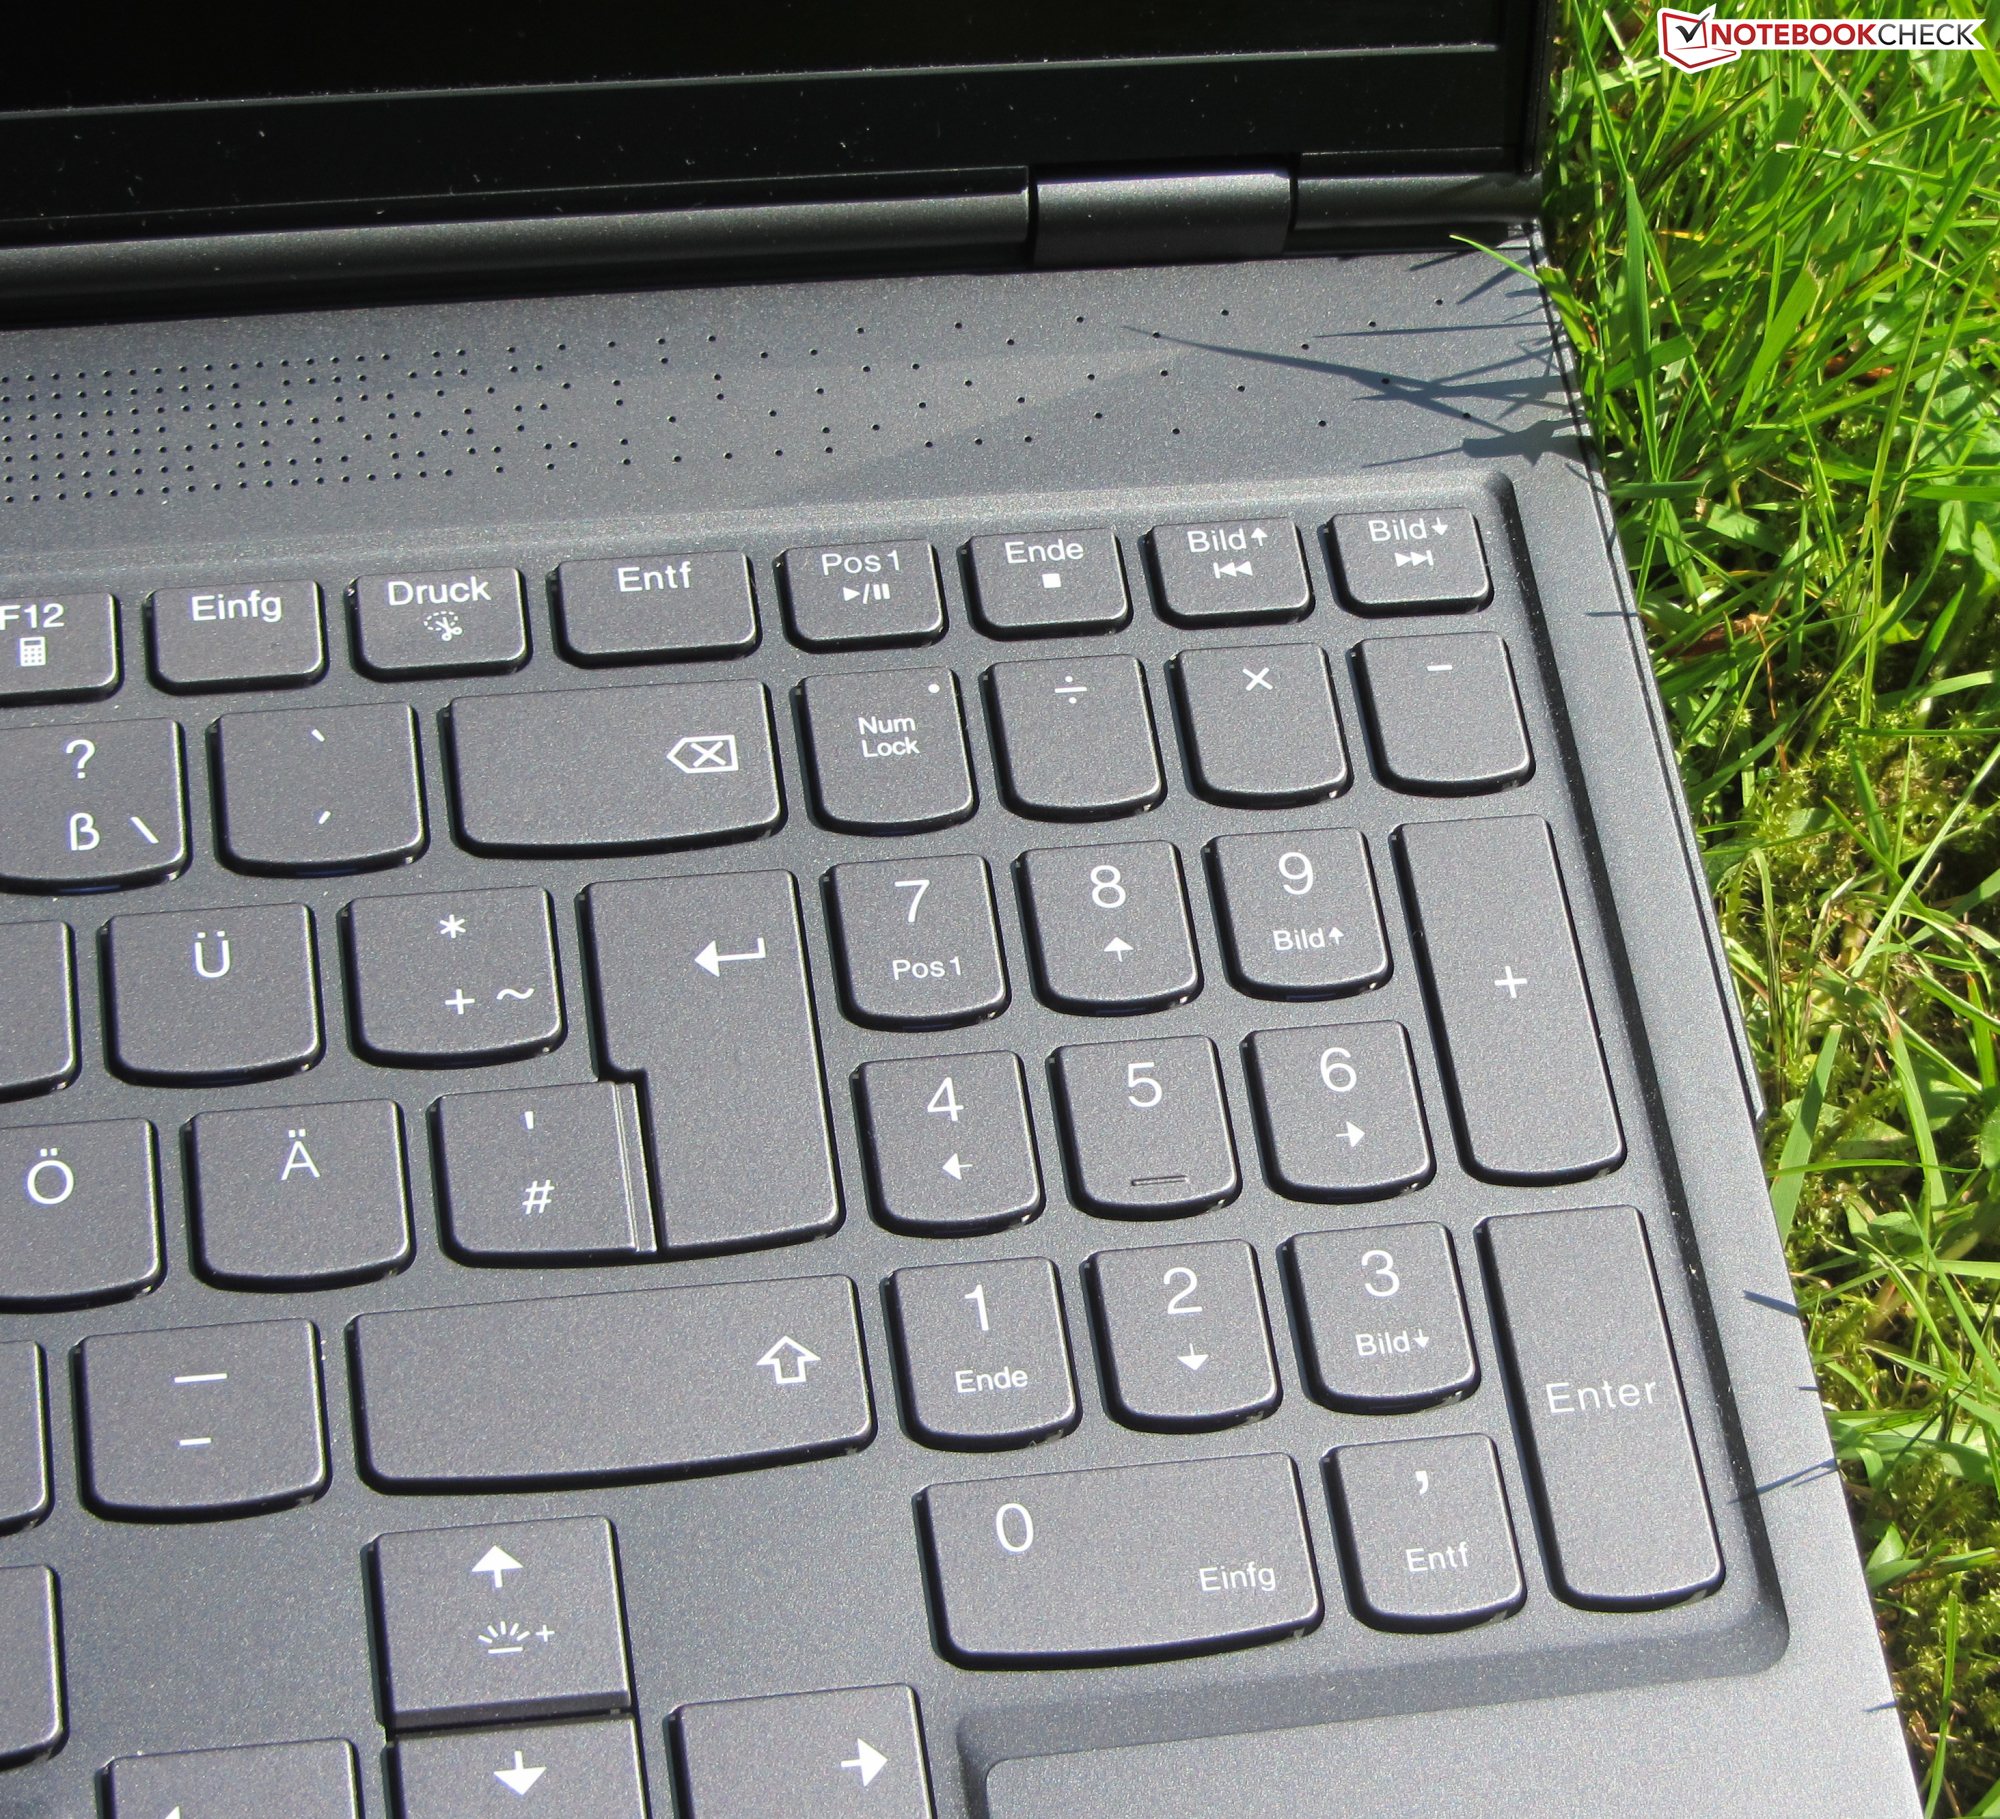
Input devices - Keyboard with RGB lighting
Keyboard
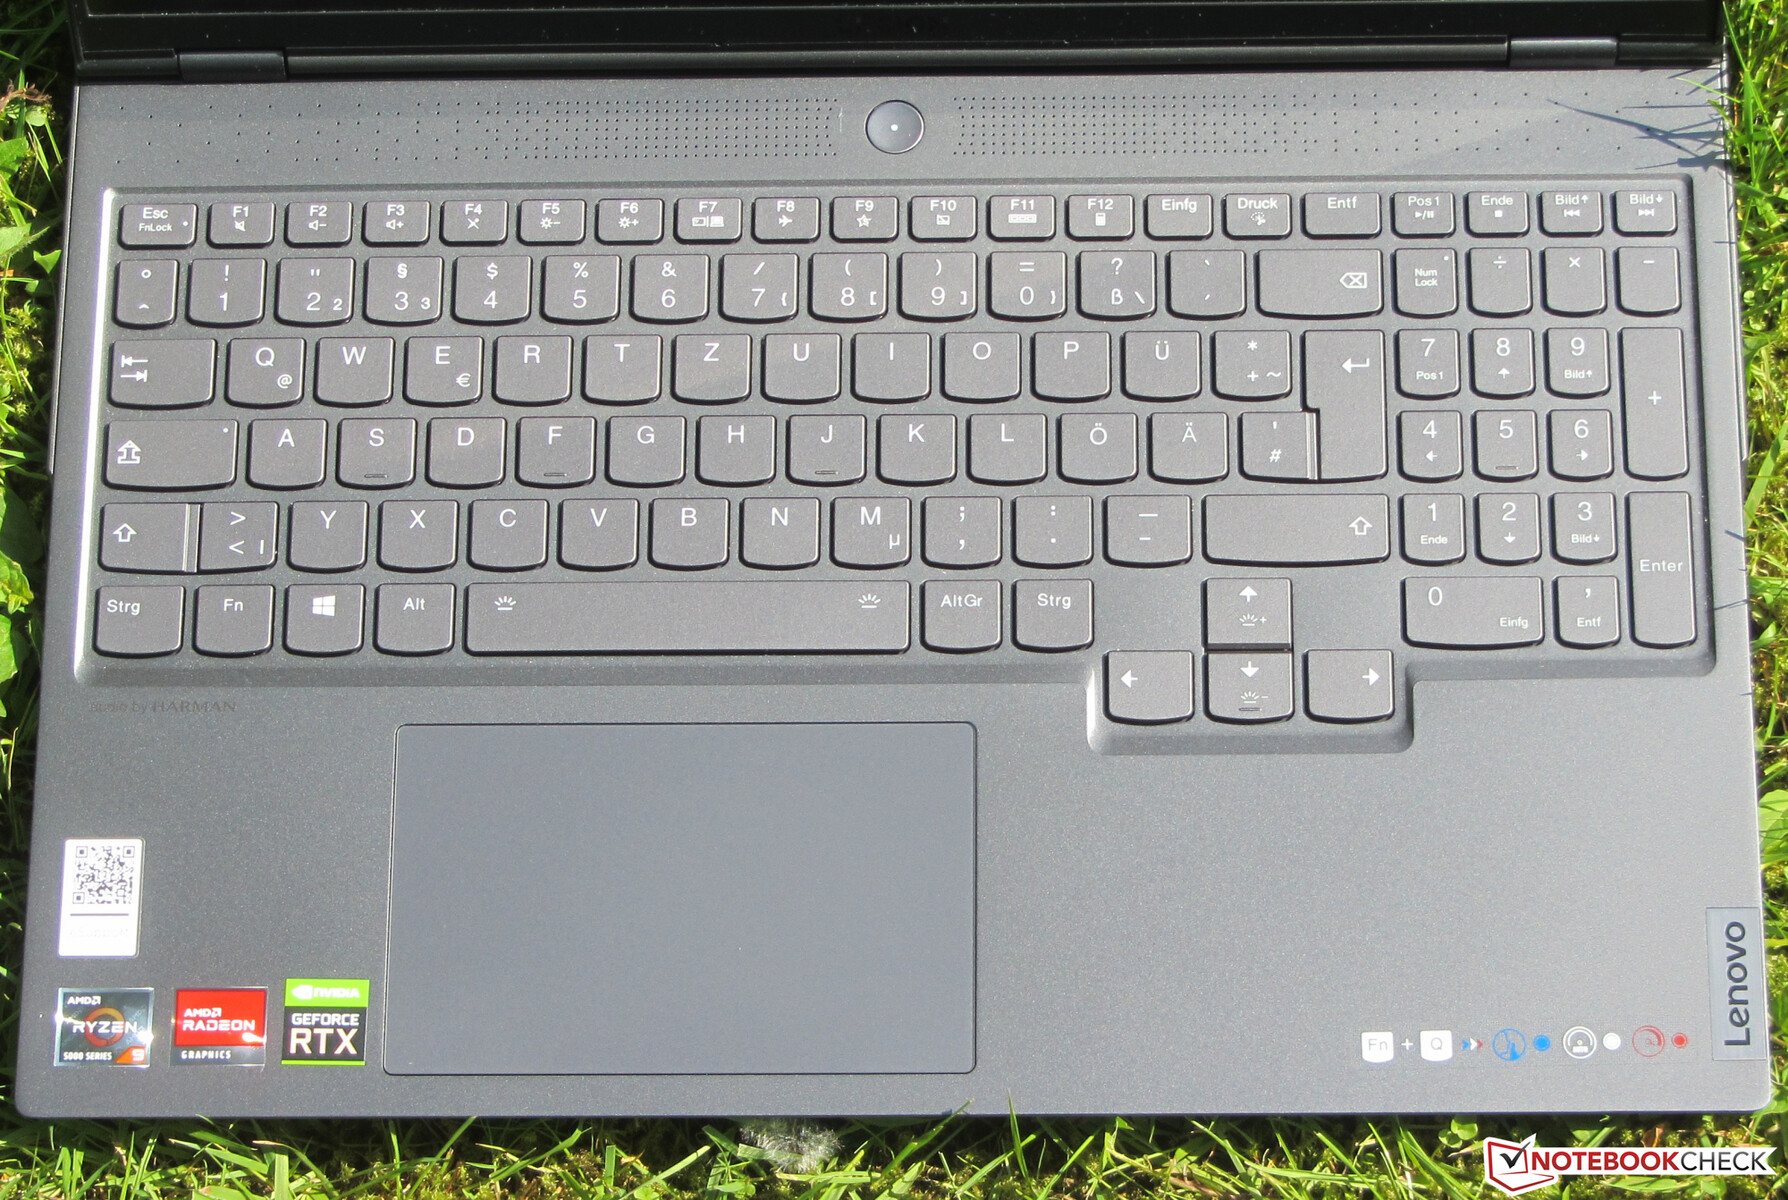
The flat, smooth keys of the backlit chiclet keyboard have a short travel and a clear pressure point. We like the key resistance, and the keyboard doesn't yield when typing. The brightness of the key illumination (three brightness levels) is controlled using secondary function keys. All in all, Lenovo delivers a keyboard that is suitable for everyday use here.
Touchpad
A multitouch-capable ClickPad (about 12 x 7.5 cm) serves as mouse replacement, and it also responds to inputs in the corners. The smooth surface doesn't restrain fingers when gliding. The pad offers a short travel and a clear pressure point.
Display - 165 Hz IPS in the 16:10 format
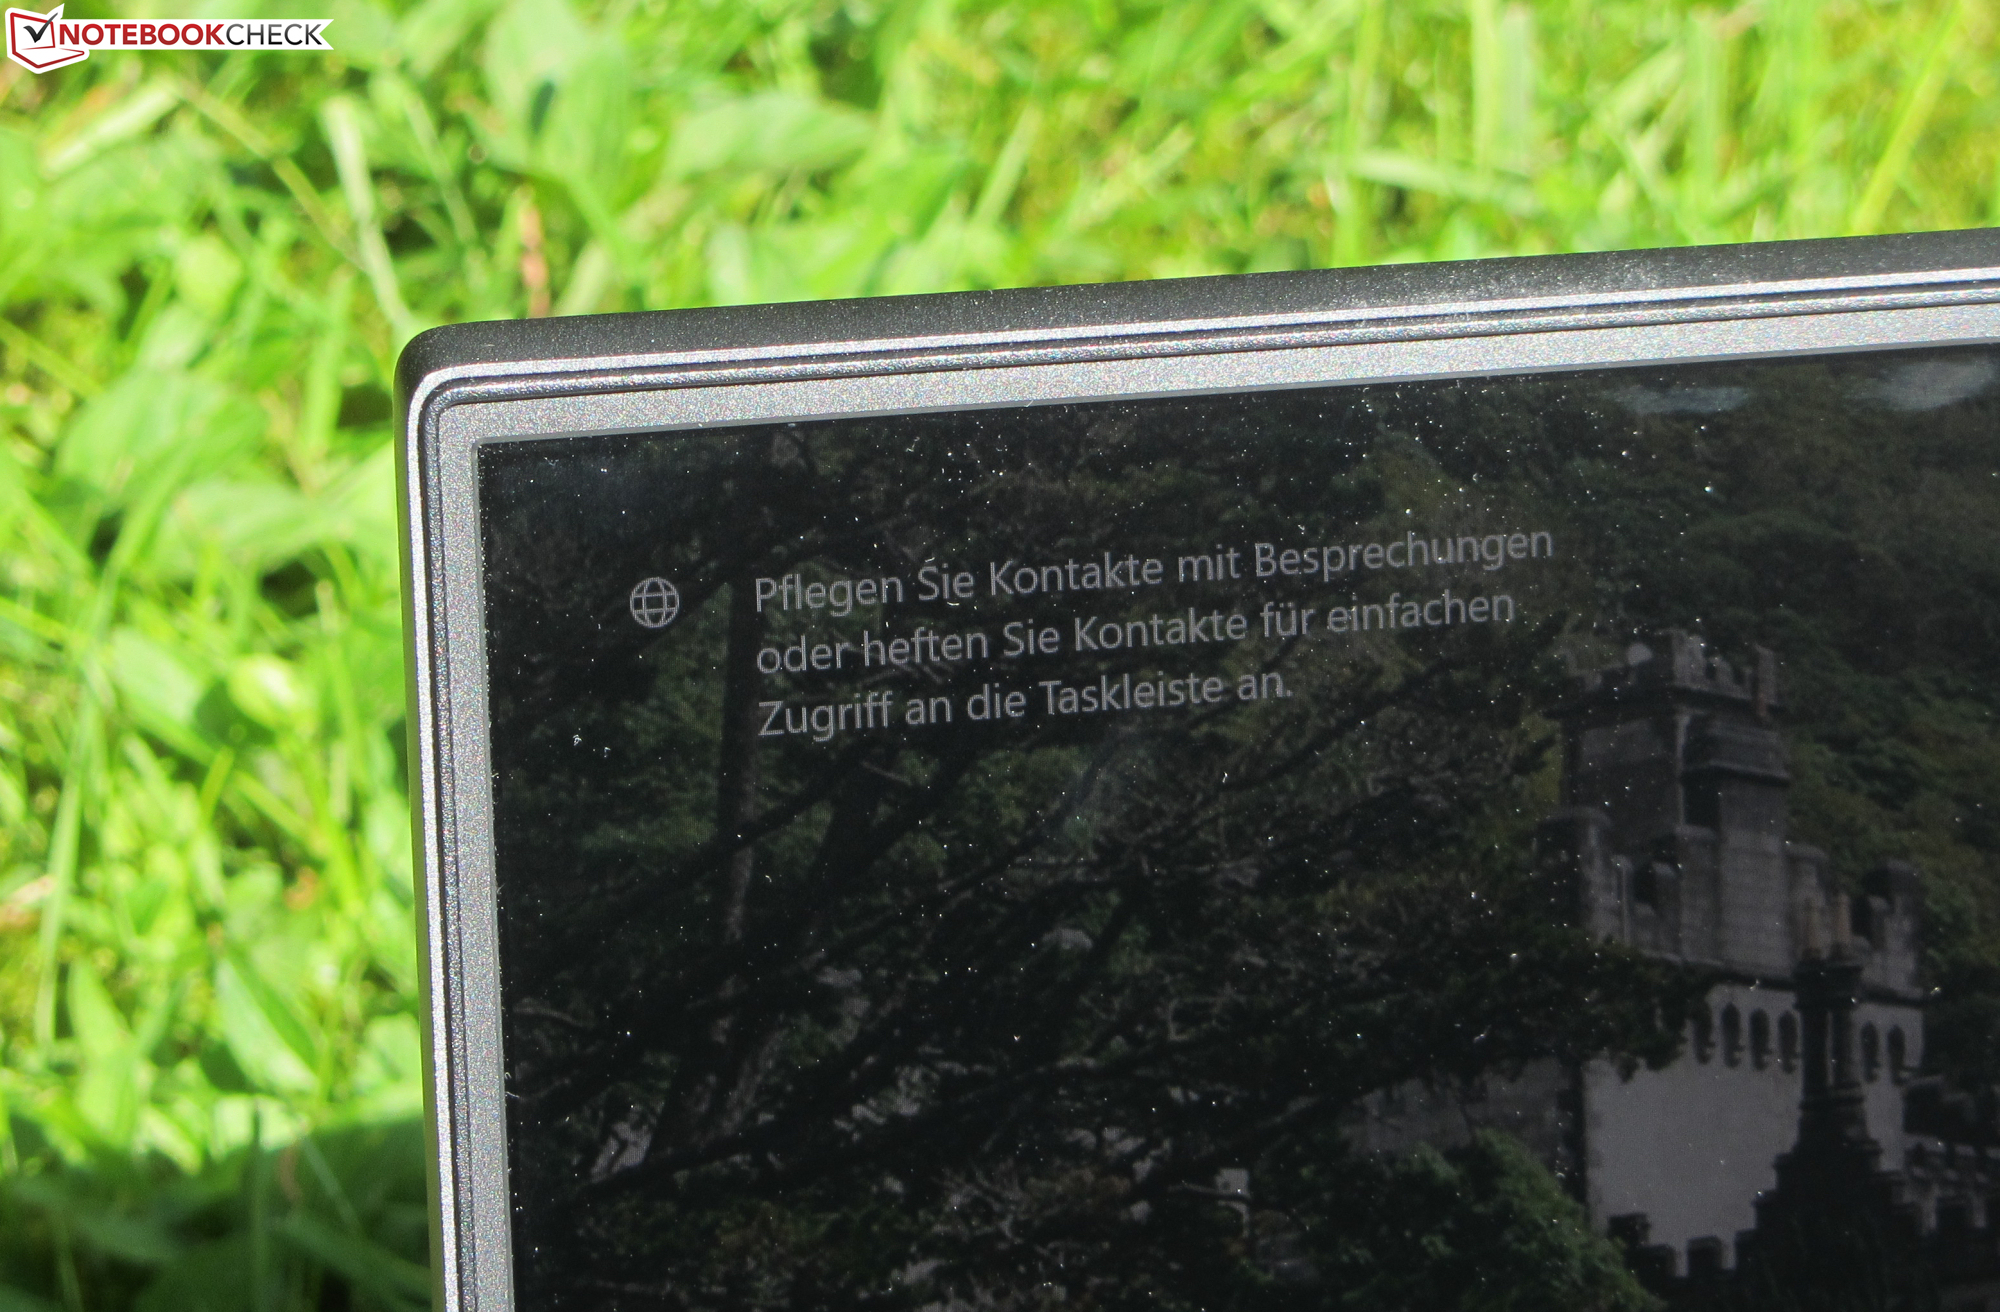
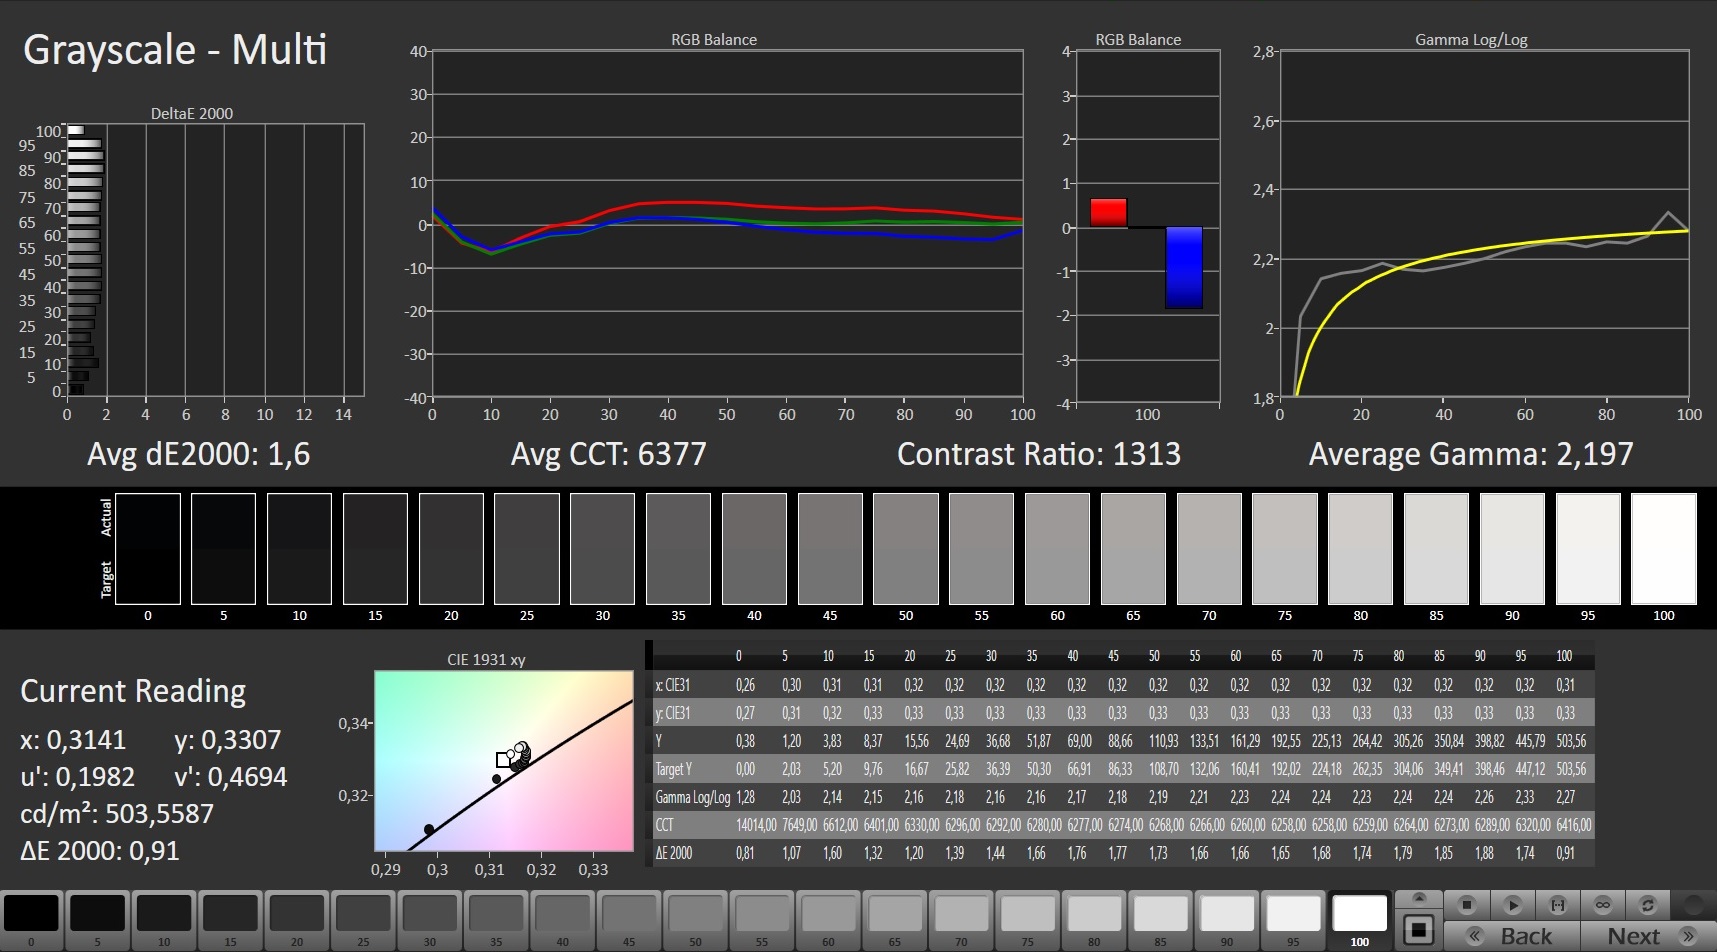
The brightness (469.4 cd/m²) and contrast (1,287:1) of the matte 16-inch display (2560x1600 pixels) are very good and good, respectively. The 165 Hz panel offers fast response times and doesn't show any PWM flickering.
The display supports G-Sync (Nvidia) and FreeSync (AMD). These technologies dynamically adjust the refresh rates of the display and GPU in relation to each other. This is intended to create the smoothest image possible - especially in computer games.
| |||||||||||||||||||||||||
Brightness Distribution: 92 %
Center on Battery: 489 cd/m²
Contrast: 1287:1 (Black: 0.38 cd/m²)
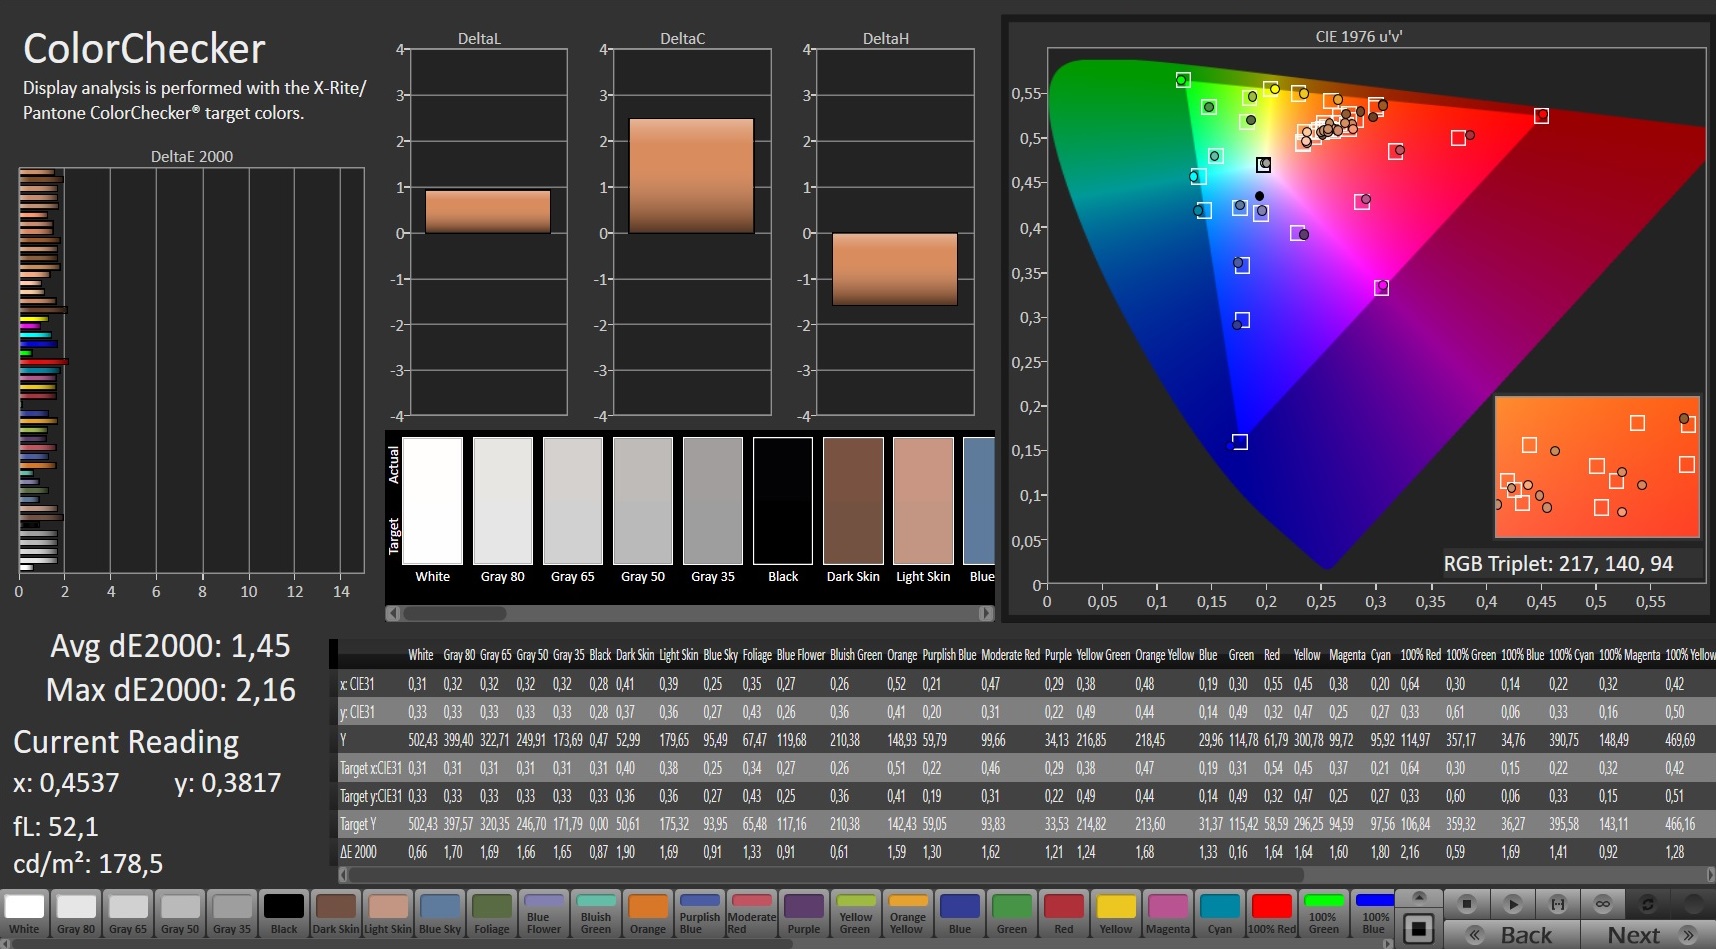
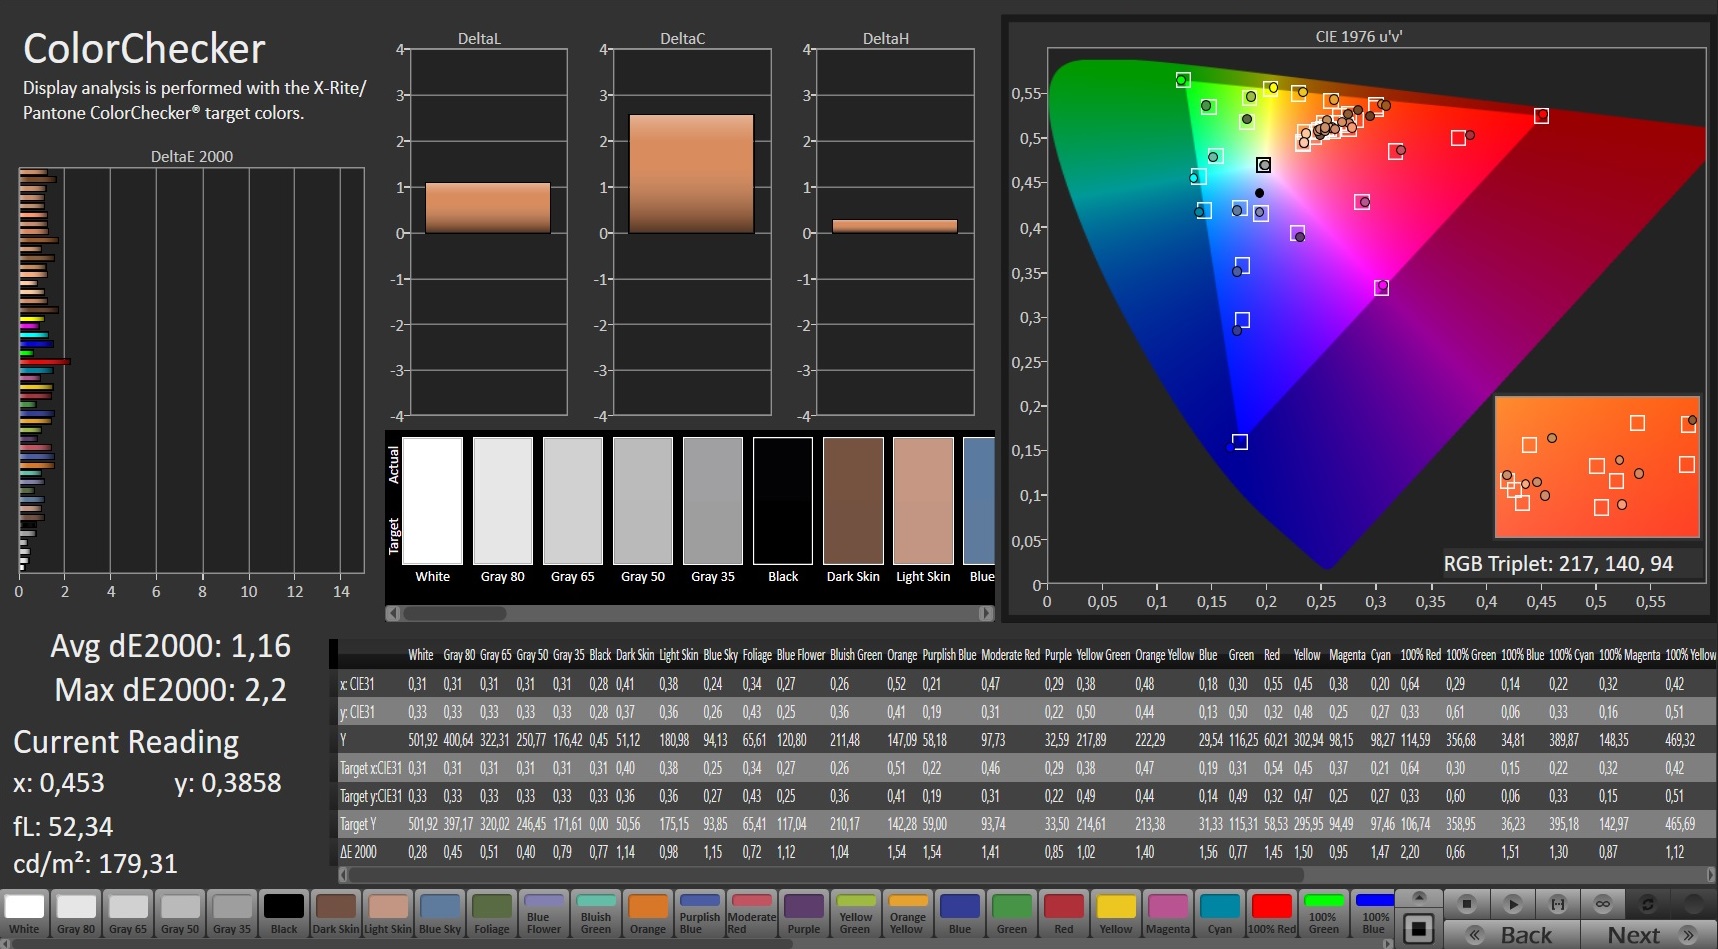
ΔE ColorChecker Calman: 1.45 | ∀{0.5-29.43 Ø4.72}
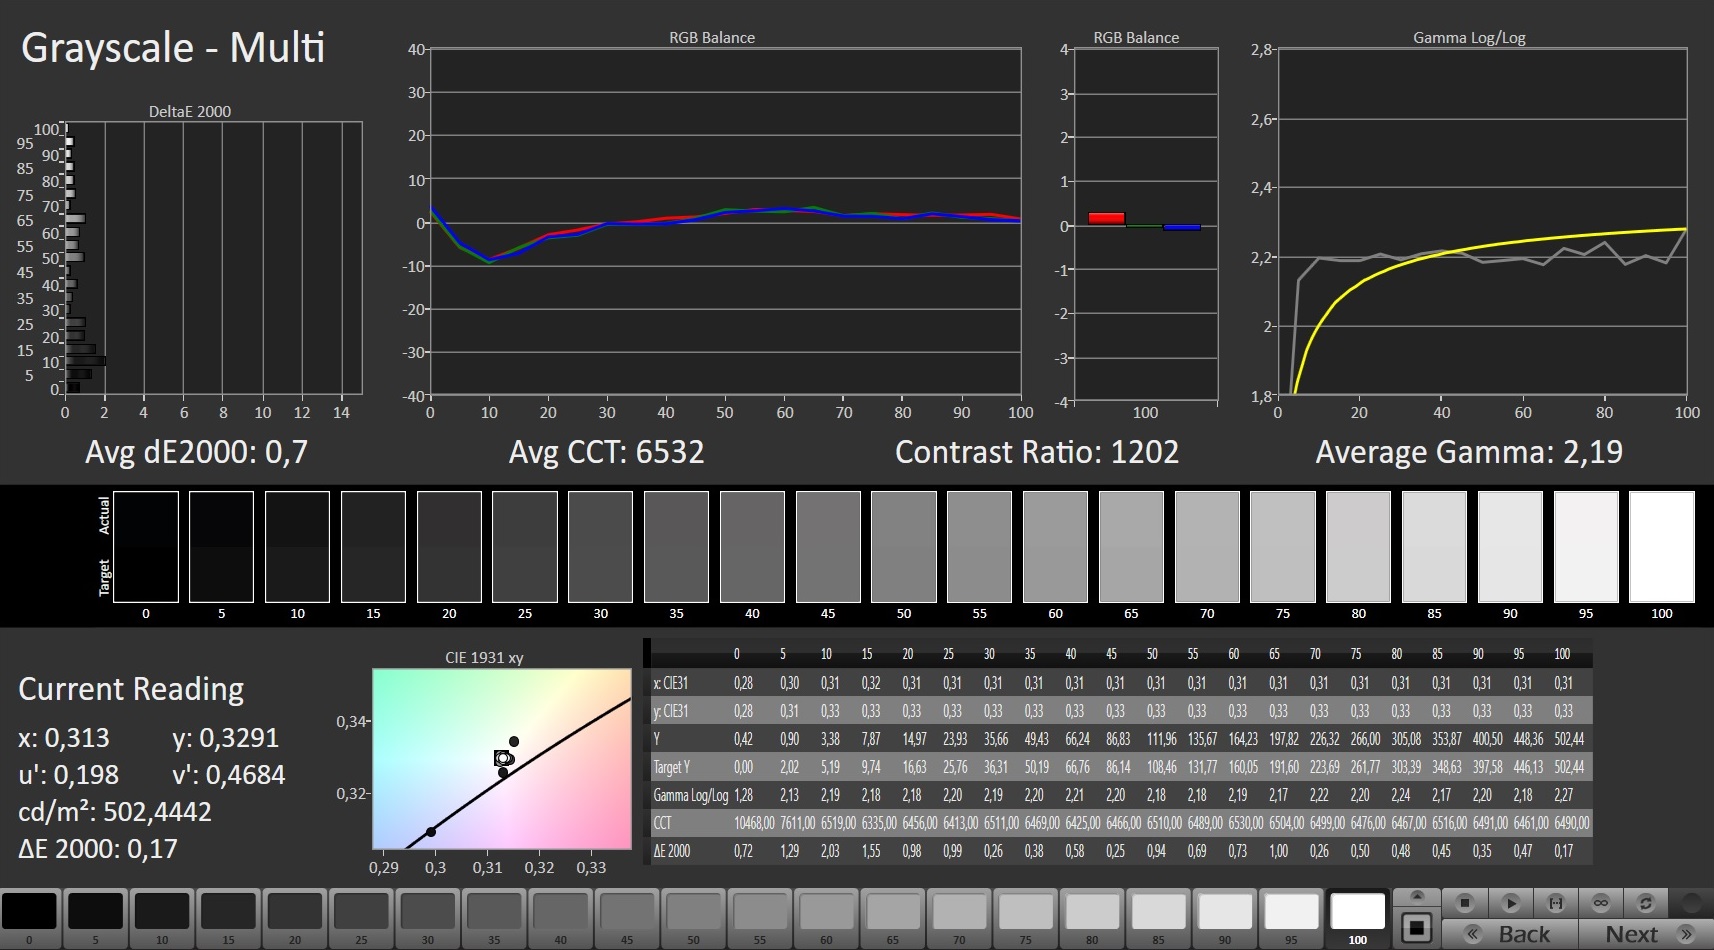
calibrated: 1.16
ΔE Greyscale Calman: 1.6 | ∀{0.09-98 Ø4.97}
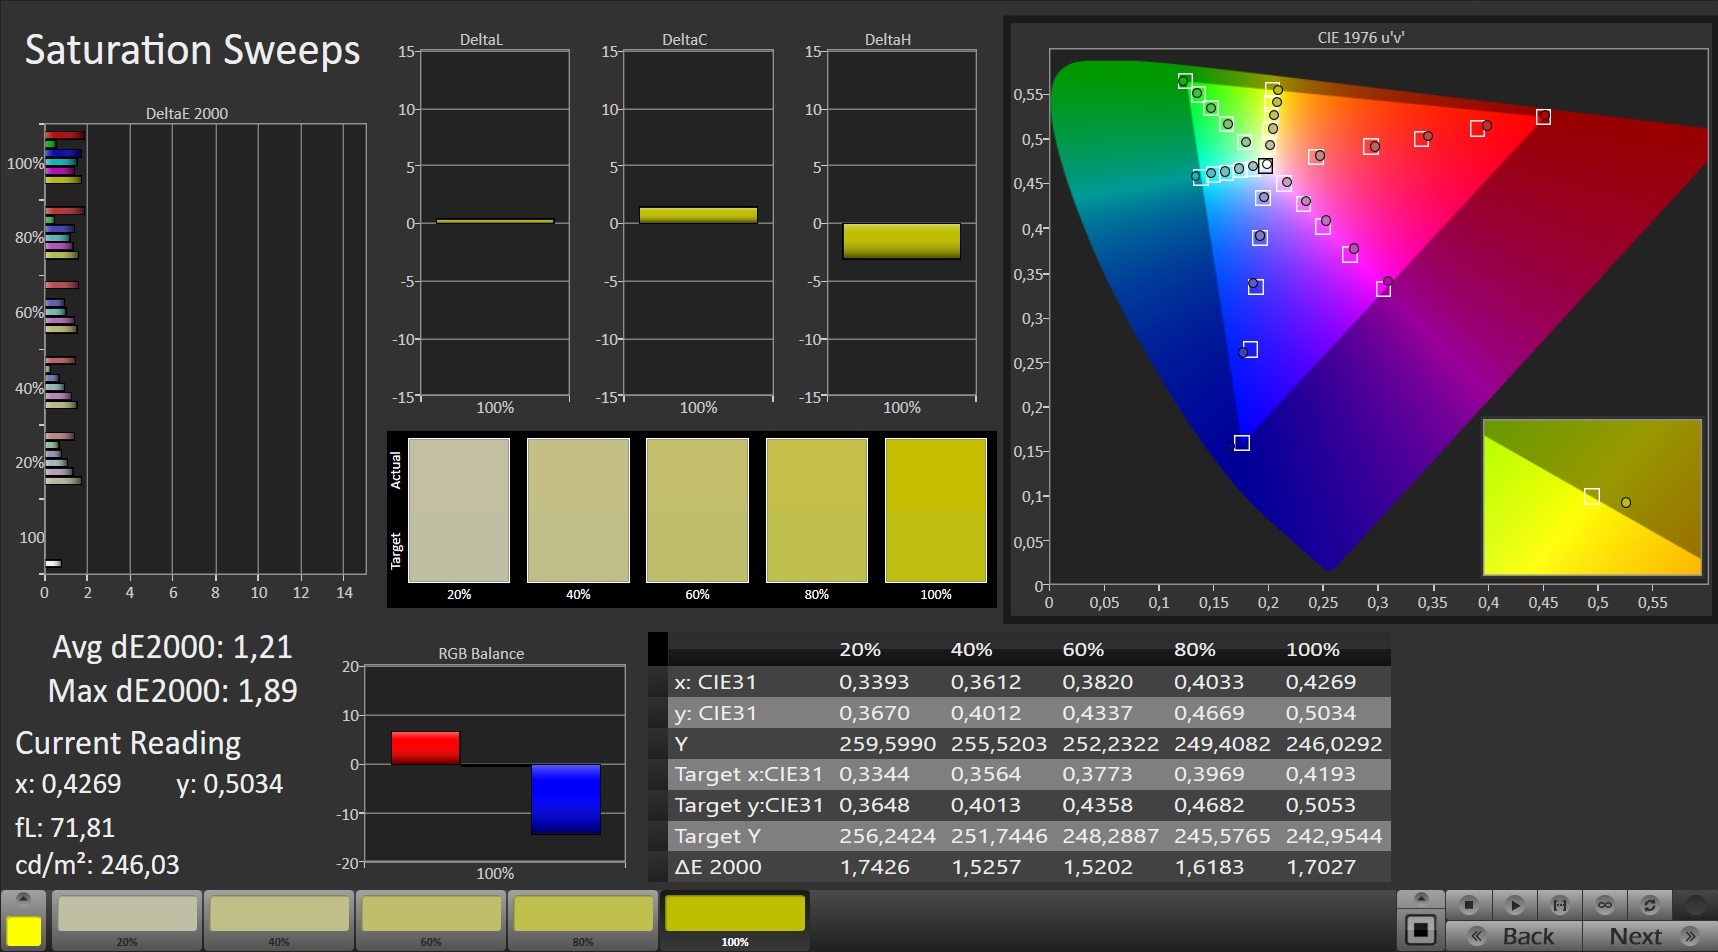
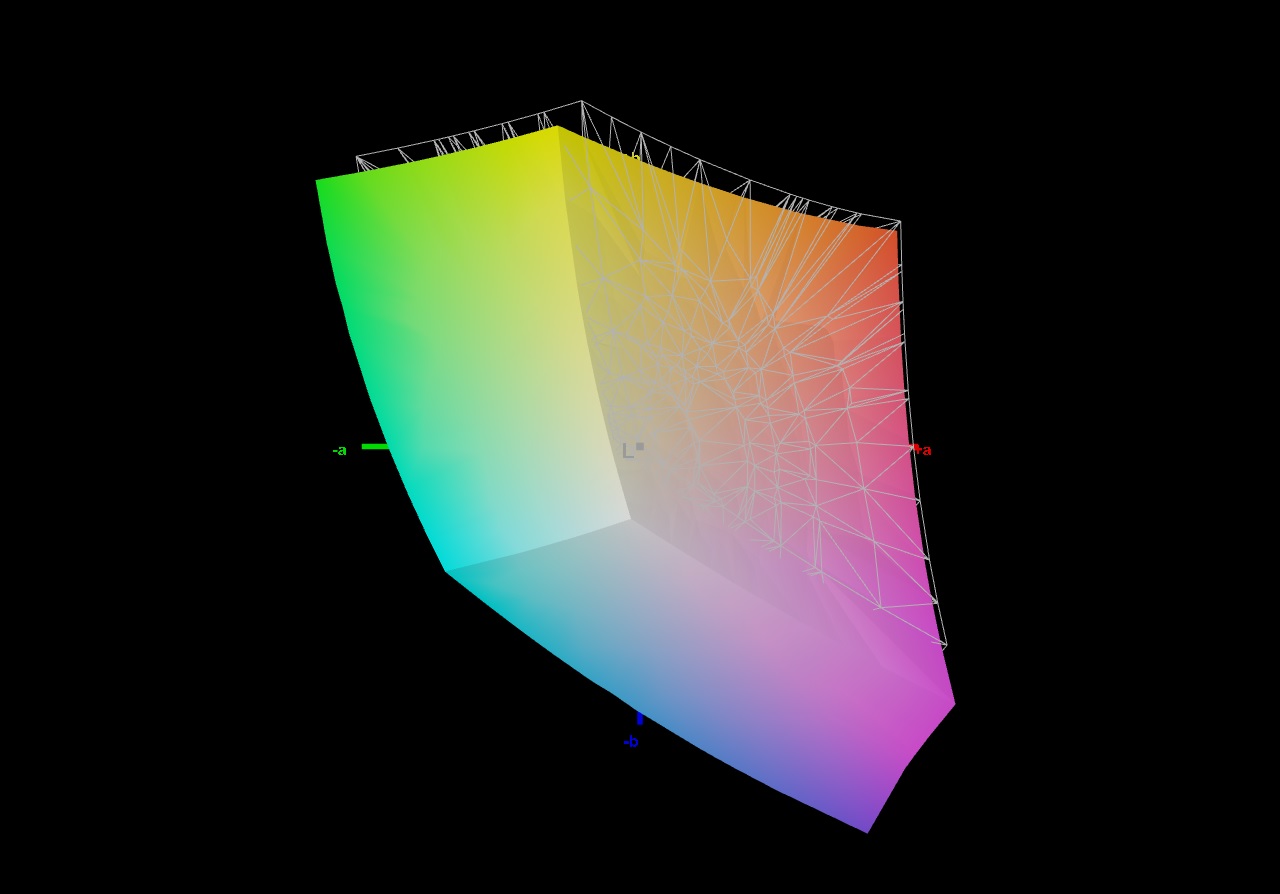
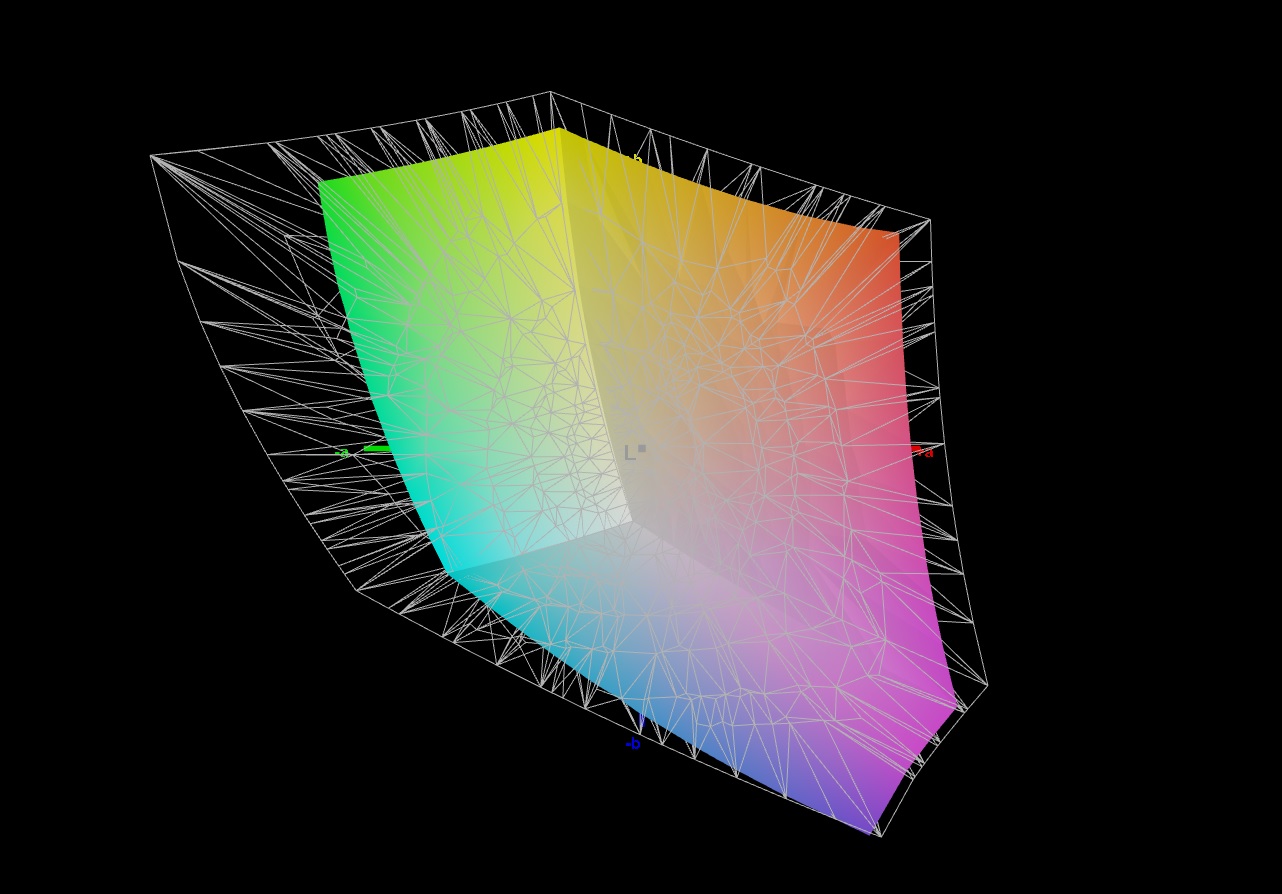
94% sRGB (Argyll 1.6.3 3D)
73% AdobeRGB 1998 (Argyll 1.6.3 3D)
72.7% AdobeRGB 1998 (Argyll 3D)
99.4% sRGB (Argyll 3D)
70.3% Display P3 (Argyll 3D)
Gamma: 2.197
CCT: 6377 K
| Lenovo Legion 7 16ACHg6 CSOT T3 MNG007DA1-1, IPS, 2560x1600, 16" | Asus ROG Zephyrus G15 GA503Q CMN N156KME-GNA (CMN152A), IPS-Level, 2560x1440, 15.6" | Schenker XMG Pro 15 (Early 2021, RTX 3080) AU Optronics AUO7A8C (B156HAN12.0), IPS, 1920x1080, 15.6" | Asus Strix Scar 17 G733QSA-XS99 AU Optronics B173HAN05.4, IPS, 1920x1080, 17.3" | Razer Blade 15 Advanced Model Early 2021 TL156VDXP02-0, IPS, 1920x1080, 15.6" | Alienware m17 R4 AU Optronics AUOEC91, IPS, 1920x1080, 17.3" | MSI GE76 Raider 10UH AU Optronics B173HAN05.1, IPS, 1920x1080, 17.3" | |
|---|---|---|---|---|---|---|---|
| Display | 19% | -2% | 0% | -5% | -1% | 1% | |
| Display P3 Coverage (%) | 70.3 | 97.3 38% | 69.2 -2% | 71 1% | 65.9 -6% | 69.8 -1% | 71.8 2% |
| sRGB Coverage (%) | 99.4 | 99.9 1% | 99.7 0% | 99.4 0% | 96.4 -3% | 99.7 0% | 98.1 -1% |
| AdobeRGB 1998 Coverage (%) | 72.7 | 86.2 19% | 70.8 -3% | 72.2 -1% | 68 -6% | 71.6 -2% | 73.9 2% |
| Response Times | -19% | 9% | -8% | -39% | -19% | -51% | |
| Response Time Grey 50% / Grey 80% * (ms) | 14 ? | 8.8 ? 37% | 3.6 ? 74% | 6.6 ? 53% | 16 ? -14% | 13.2 ? 6% | 20.4 ? -46% |
| Response Time Black / White * (ms) | 6.4 ? | 11.2 ? -75% | 10 ? -56% | 10.8 ? -69% | 10.4 ? -63% | 9.2 ? -44% | 10 ? -56% |
| PWM Frequency (Hz) | 151500 | ||||||
| Screen | -74% | -19% | -20% | -5% | -2% | -81% | |
| Brightness middle (cd/m²) | 489 | 327 -33% | 327 -33% | 303.8 -38% | 338 -31% | 305 -38% | 324.6 -34% |
| Brightness (cd/m²) | 469 | 309 -34% | 335 -29% | 292 -38% | 334 -29% | 301 -36% | 312 -33% |
| Brightness Distribution (%) | 92 | 89 -3% | 89 -3% | 85 -8% | 94 2% | 93 1% | 87 -5% |
| Black Level * (cd/m²) | 0.38 | 0.33 13% | 0.22 42% | 0.23 39% | 0.24 37% | 0.19 50% | 0.28 26% |
| Contrast (:1) | 1287 | 991 -23% | 1486 15% | 1321 3% | 1408 9% | 1605 25% | 1159 -10% |
| Colorchecker dE 2000 * | 1.45 | 4.49 -210% | 2.18 -50% | 1.87 -29% | 1.39 4% | 1.31 10% | 3.87 -167% |
| Colorchecker dE 2000 max. * | 2.16 | 8.42 -290% | 4.24 -96% | 3.26 -51% | 3.31 -53% | 2.32 -7% | 9.35 -333% |
| Colorchecker dE 2000 calibrated * | 1.16 | 2.27 -96% | 1 14% | 1.45 -25% | 0.97 16% | 0.91 22% | 1.42 -22% |
| Greyscale dE 2000 * | 1.6 | 4.2 -163% | 2.6 -63% | 2.7 -69% | 1.6 -0% | 2.3 -44% | 6.5 -306% |
| Gamma | 2.197 100% | 2.173 101% | 2.123 104% | 2.26 97% | 2.291 96% | 2.281 96% | 2.23 99% |
| CCT | 6377 102% | 7014 93% | 6815 95% | 6436 101% | 6626 98% | 6449 101% | 5702 114% |
| Color Space (Percent of AdobeRGB 1998) (%) | 73 | 86 18% | 71 -3% | 65.6 -10% | 68 -7% | 72 -1% | 66.3 -9% |
| Color Space (Percent of sRGB) (%) | 94 | 99 5% | 93 -1% | 99.4 6% | 89 -5% | 94 0% | 98 4% |
| Total Average (Program / Settings) | -25% /
-50% | -4% /
-12% | -9% /
-15% | -16% /
-9% | -7% /
-4% | -44% /
-62% |
* ... smaller is better
The display shows good color reproduction out of the box and meets the target (Delta E less than 3) with a color deviation of 1.45. In addition, it doesn't suffer from a blue tint. Calibration can be used to achieve improvements. The color deviation drops to 1.16, and grayscales are displayed in a more balanced way. The AdobeRGB (73%) and sRGB (94%) color spaces aren't completely reproduced.

Display Response Times
| ↔ Response Time Black to White | ||
|---|---|---|
| 6.4 ms ... rise ↗ and fall ↘ combined | ↗ 2 ms rise | 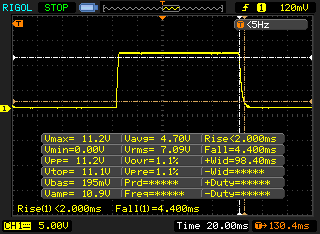 |
| ↘ 4.4 ms fall | ||
| The screen shows very fast response rates in our tests and should be very well suited for fast-paced gaming. In comparison, all tested devices range from 0.1 (minimum) to 240 (maximum) ms. » 20 % of all devices are better. This means that the measured response time is better than the average of all tested devices (19.8 ms). | ||
| ↔ Response Time 50% Grey to 80% Grey | ||
| 14 ms ... rise ↗ and fall ↘ combined | ↗ 6.8 ms rise | 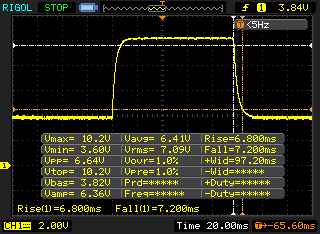 |
| ↘ 7.2 ms fall | ||
| The screen shows good response rates in our tests, but may be too slow for competitive gamers. In comparison, all tested devices range from 0.165 (minimum) to 636 (maximum) ms. » 28 % of all devices are better. This means that the measured response time is better than the average of all tested devices (31 ms). | ||
Screen Flickering / PWM (Pulse-Width Modulation)
| Screen flickering / PWM not detected | 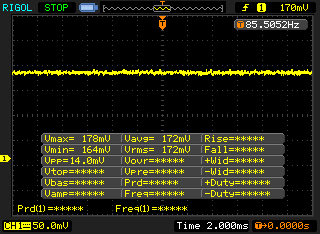 | ||
In comparison: 52 % of all tested devices do not use PWM to dim the display. If PWM was detected, an average of 7772 (minimum: 5 - maximum: 343500) Hz was measured. | |||
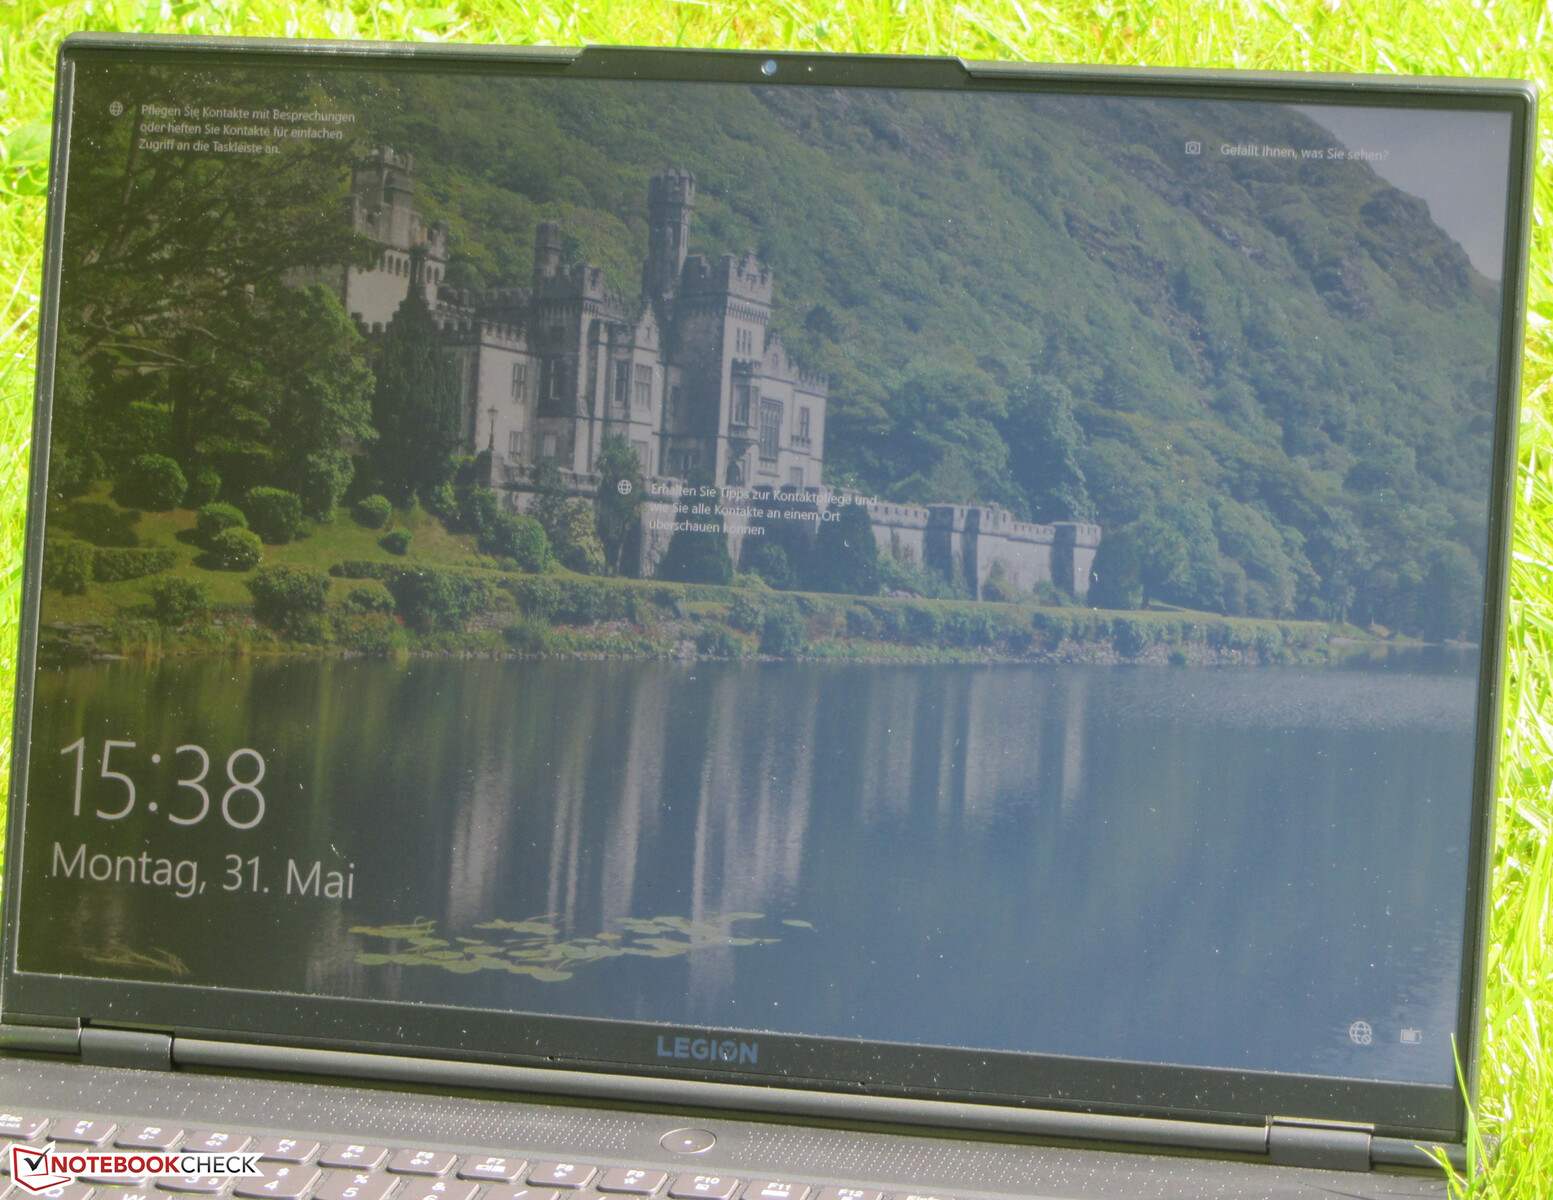
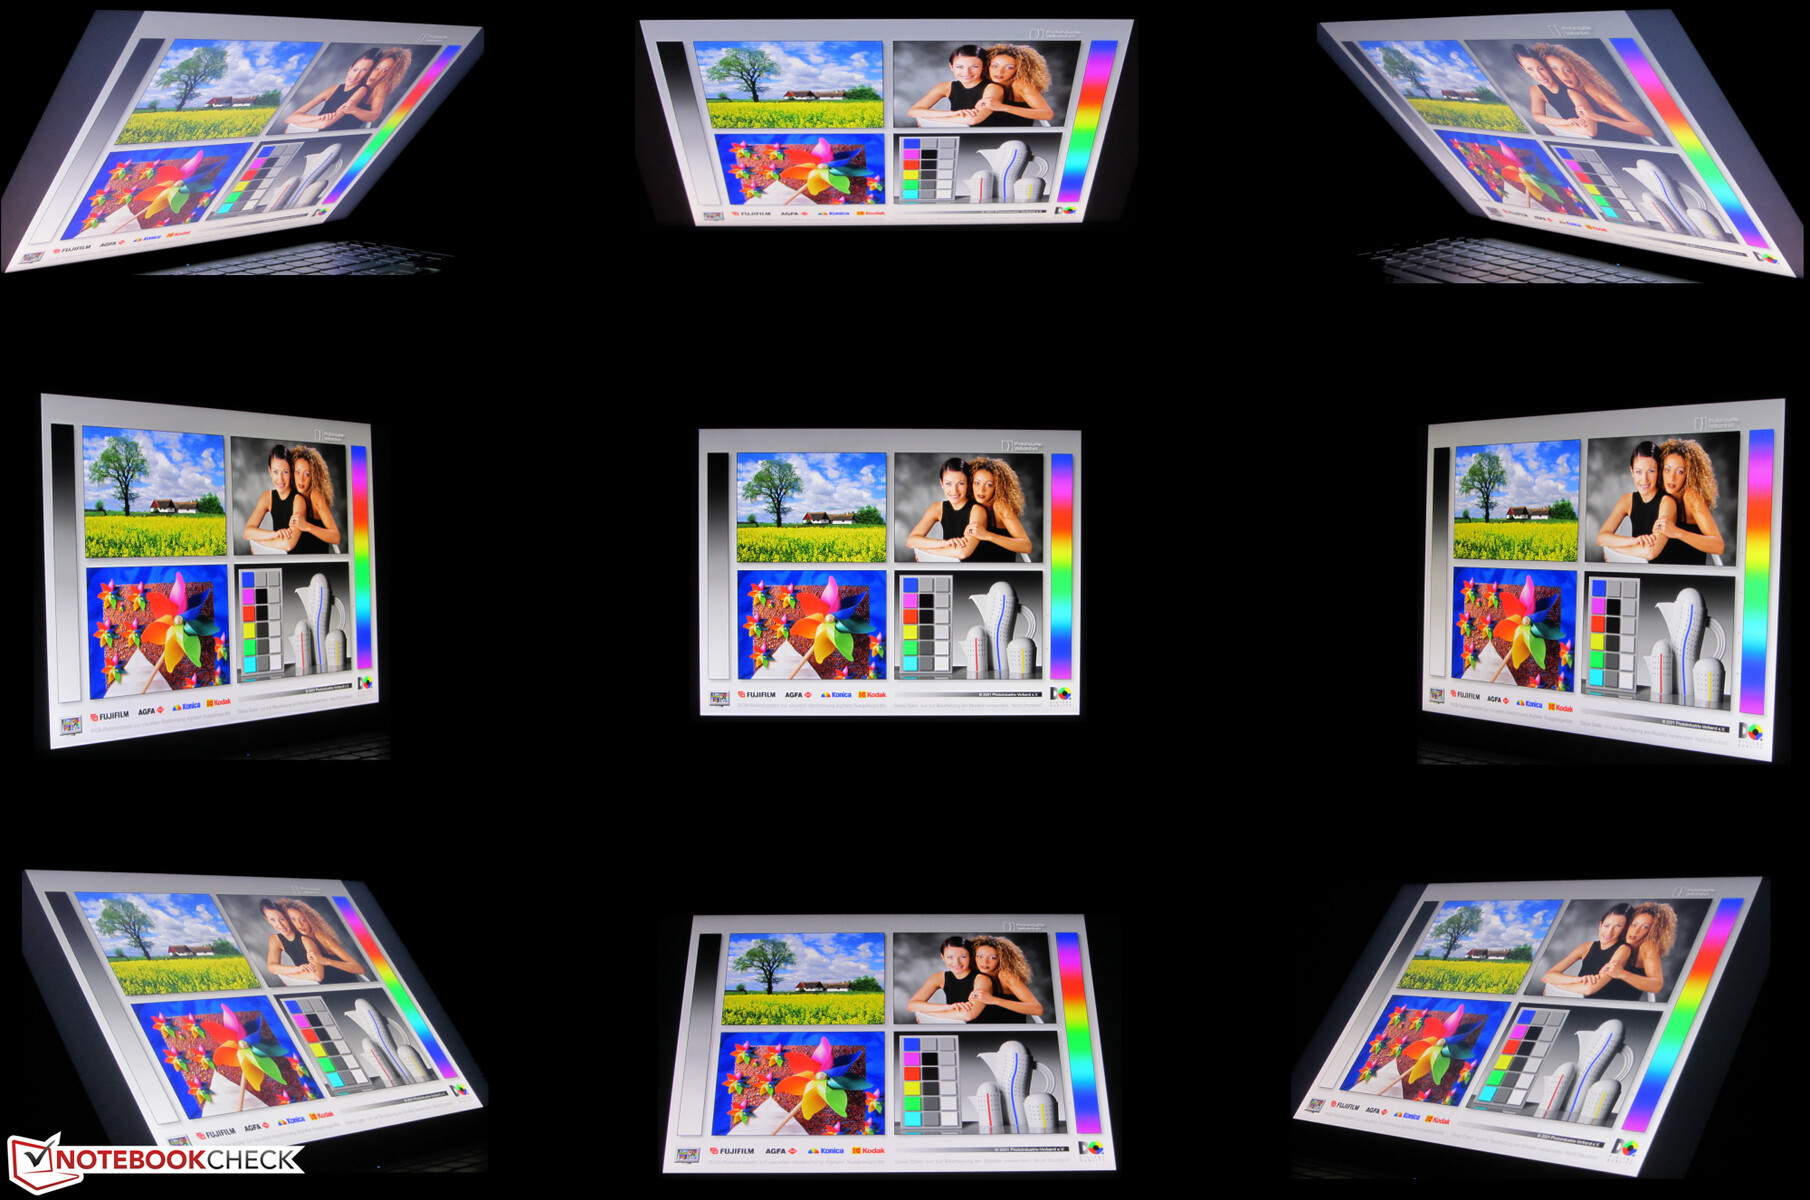
The viewing-angle stable IPS panel can be read from any position. Reading the display outdoors is possible due to the relatively high brightness.
Performance - Cezanne meets Ampere
The Lenovo Legion 7 16ACHg6 brings every modern game smoothly onto the screen and also cuts a fine figure in all other application areas.

Test conditions
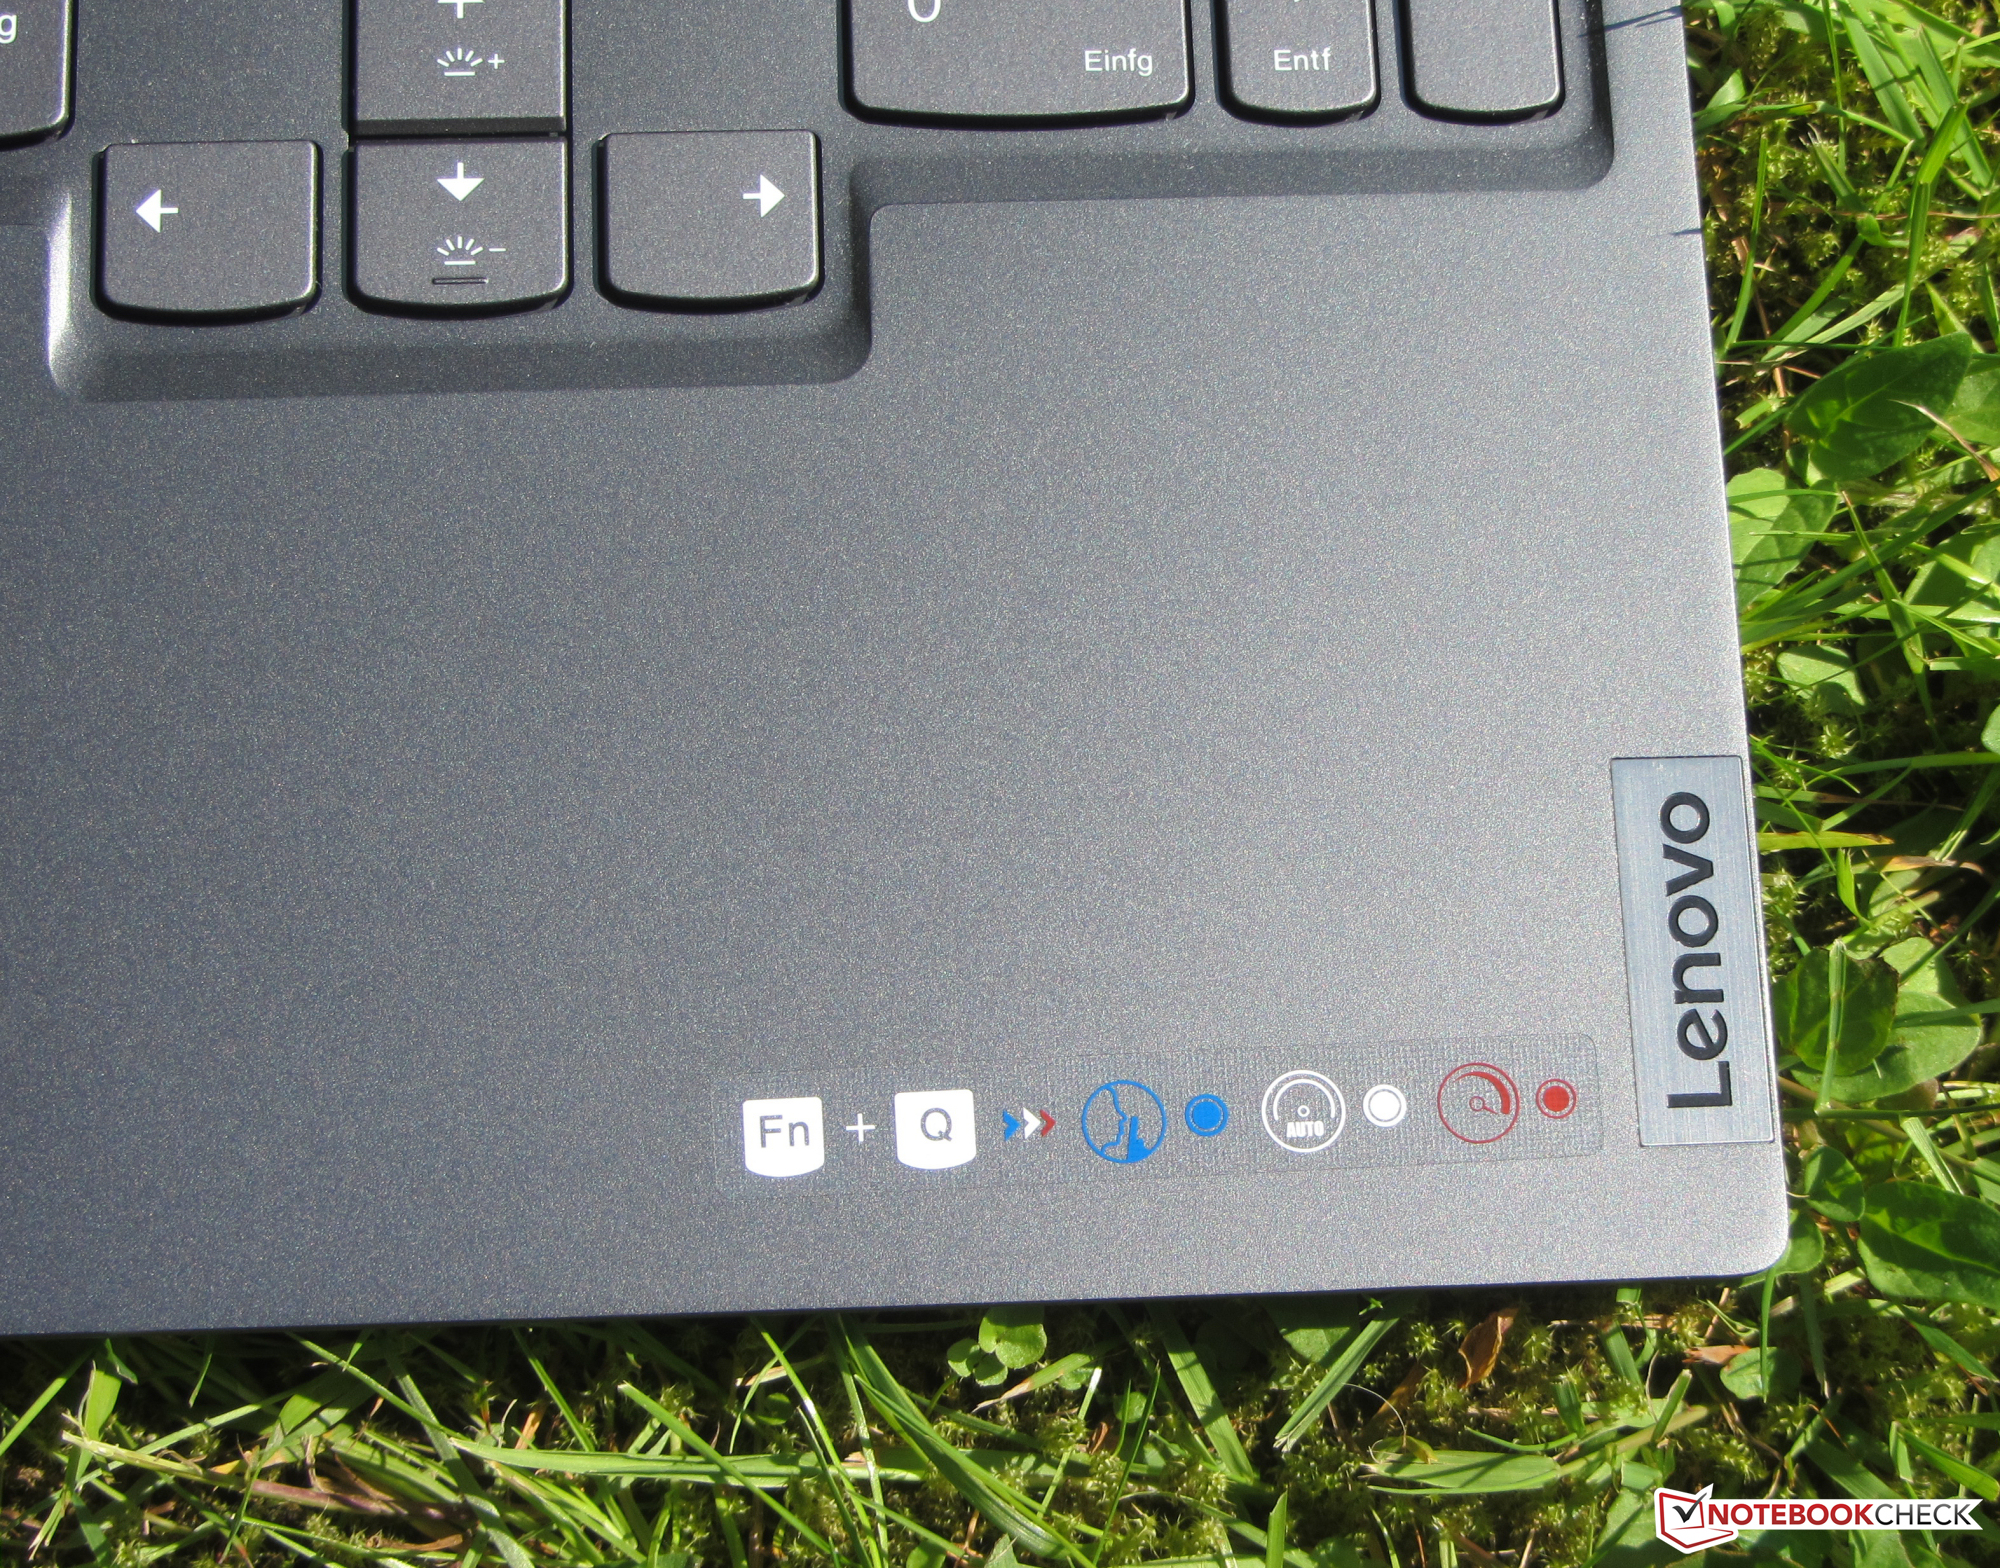
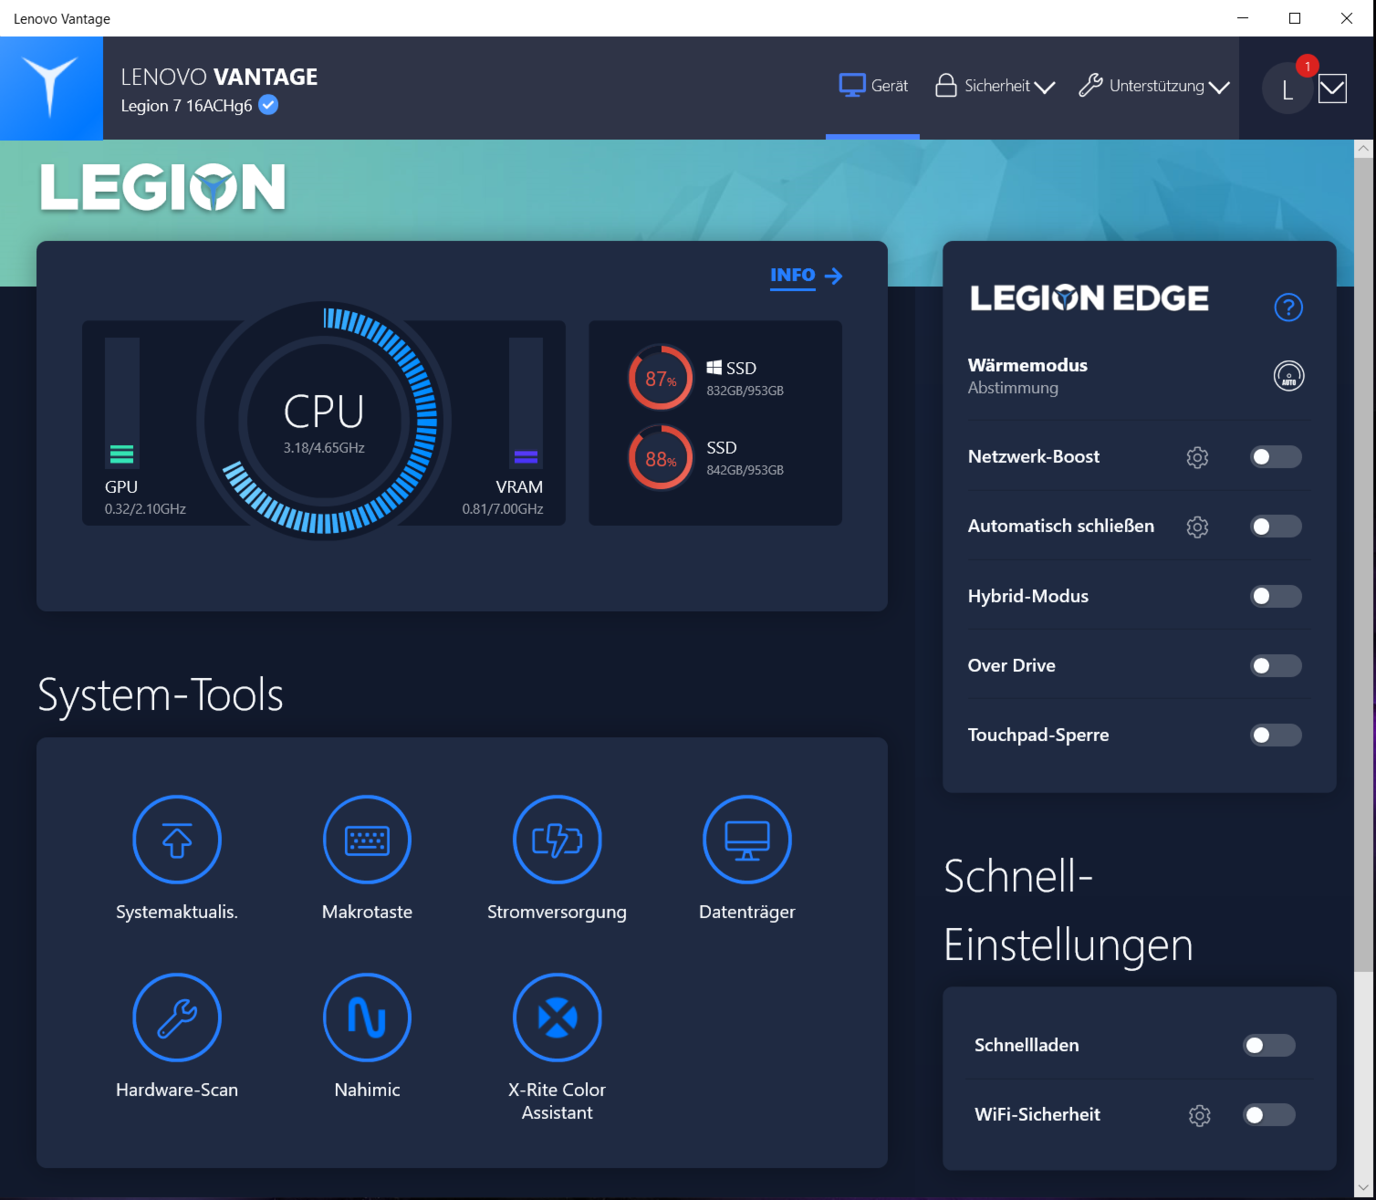
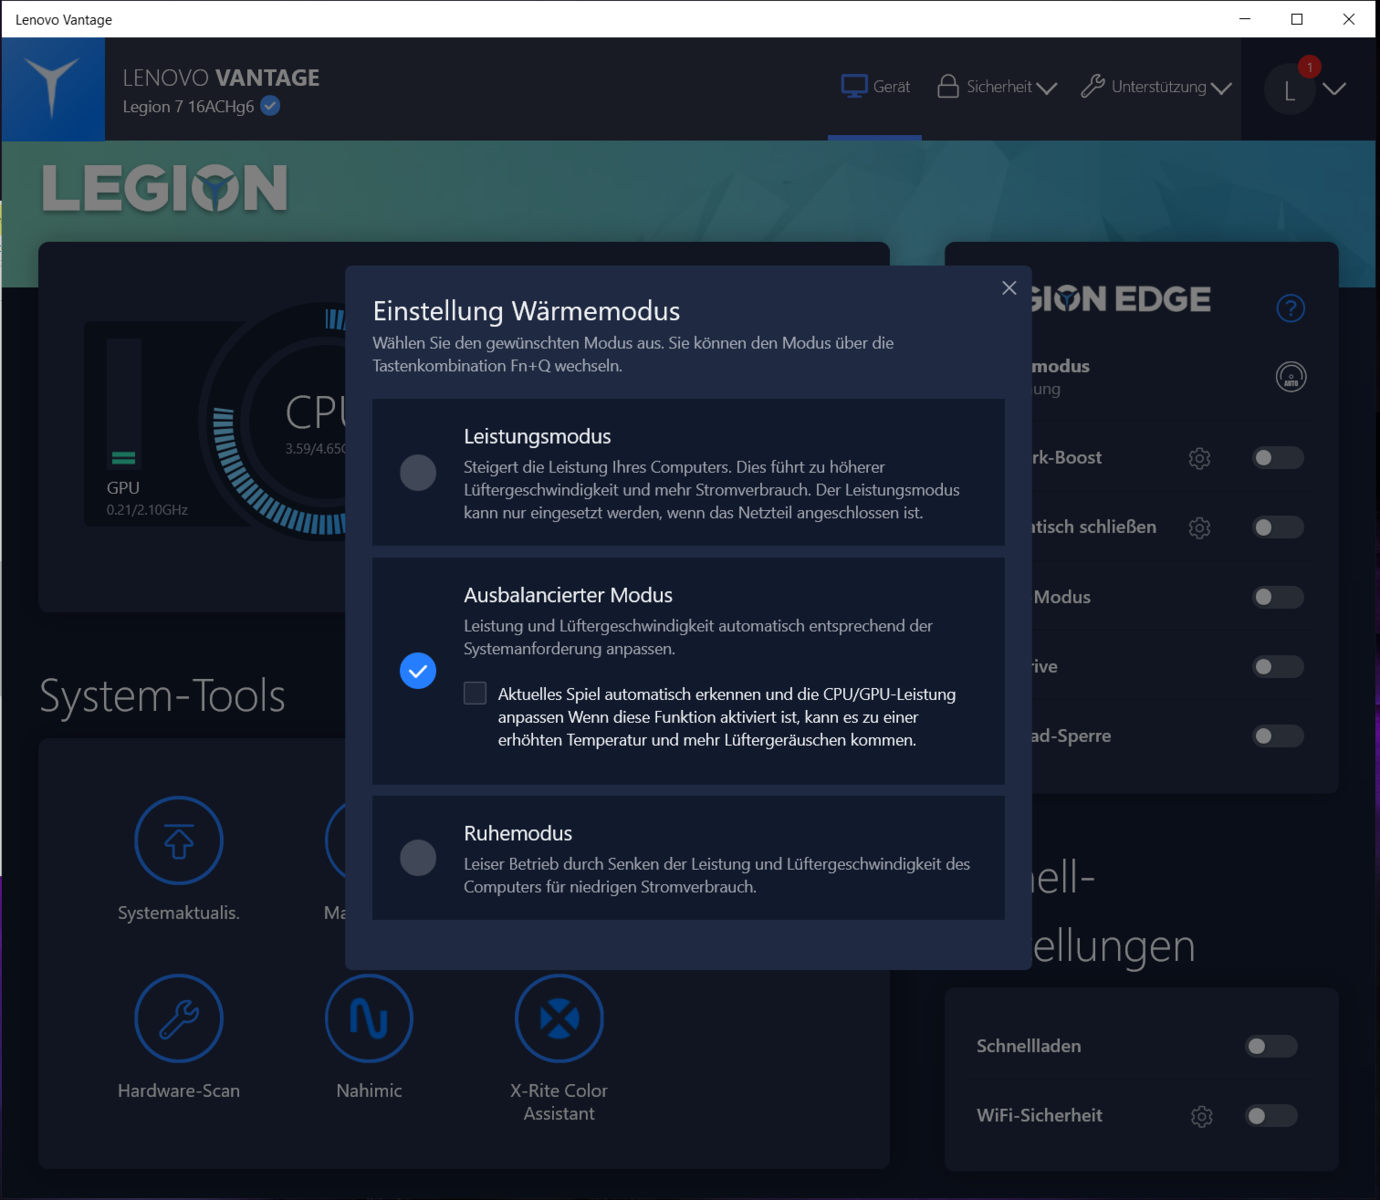
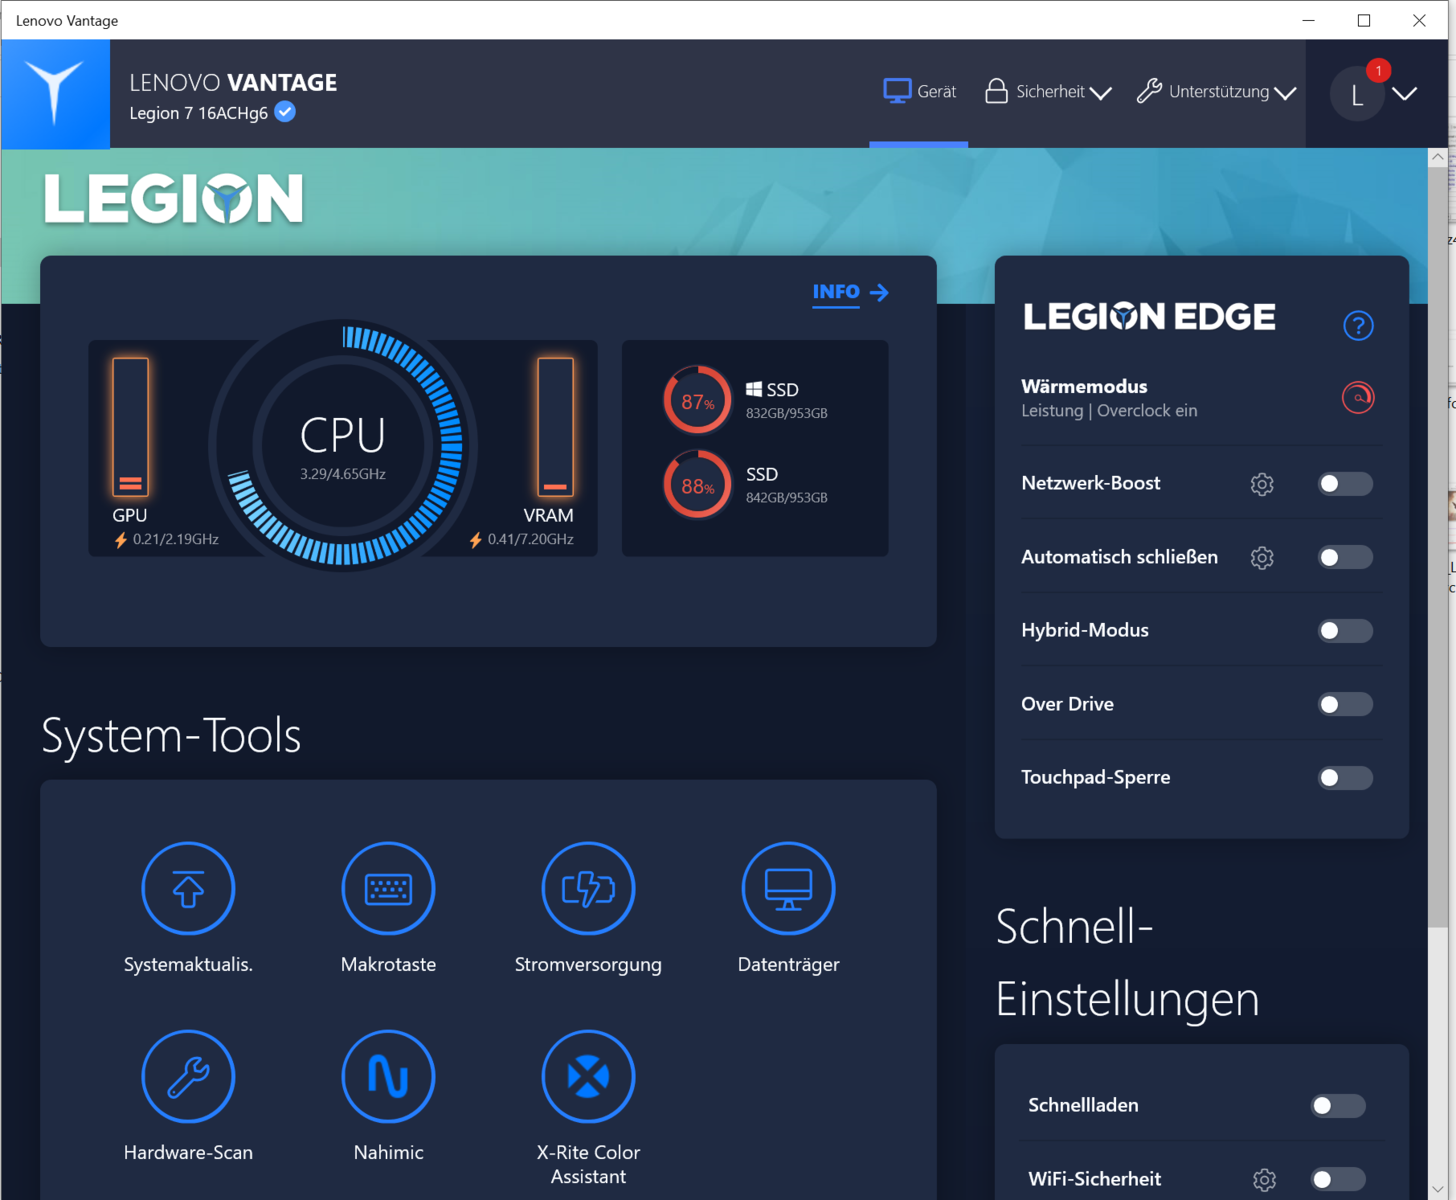
The laptop offers three performance profiles (Performance Mode, Balanced Mode, Quiet Mode) you can switch between using a key combination ("Fn" + "Q") or the preinstalled Lenovo Vantage software. We used the default "Balanced Mode" profile. In addition, we also ran some benchmarks under an active "Performance Mode" profile.
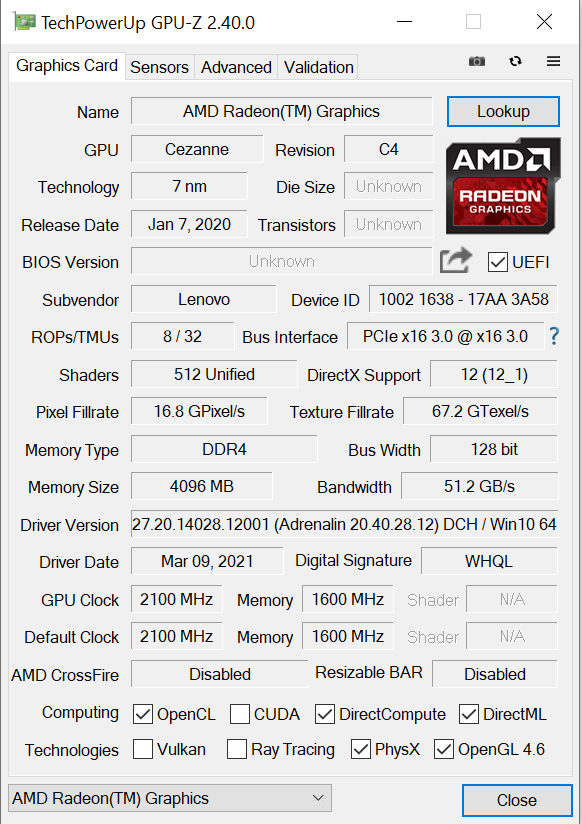
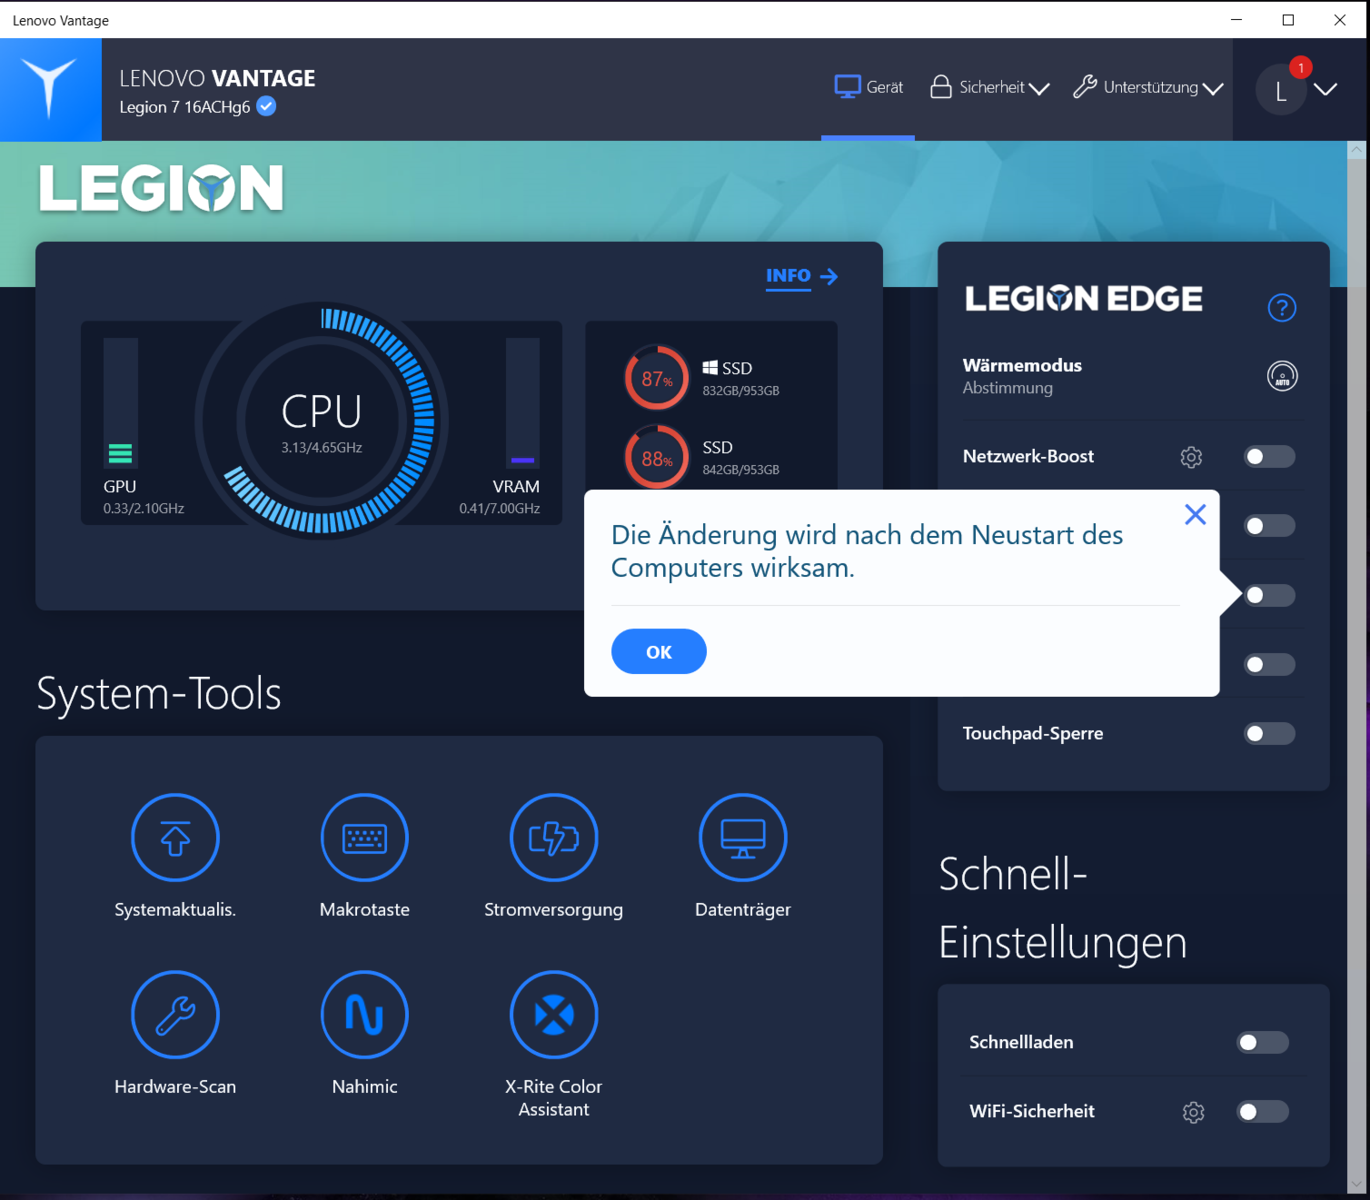
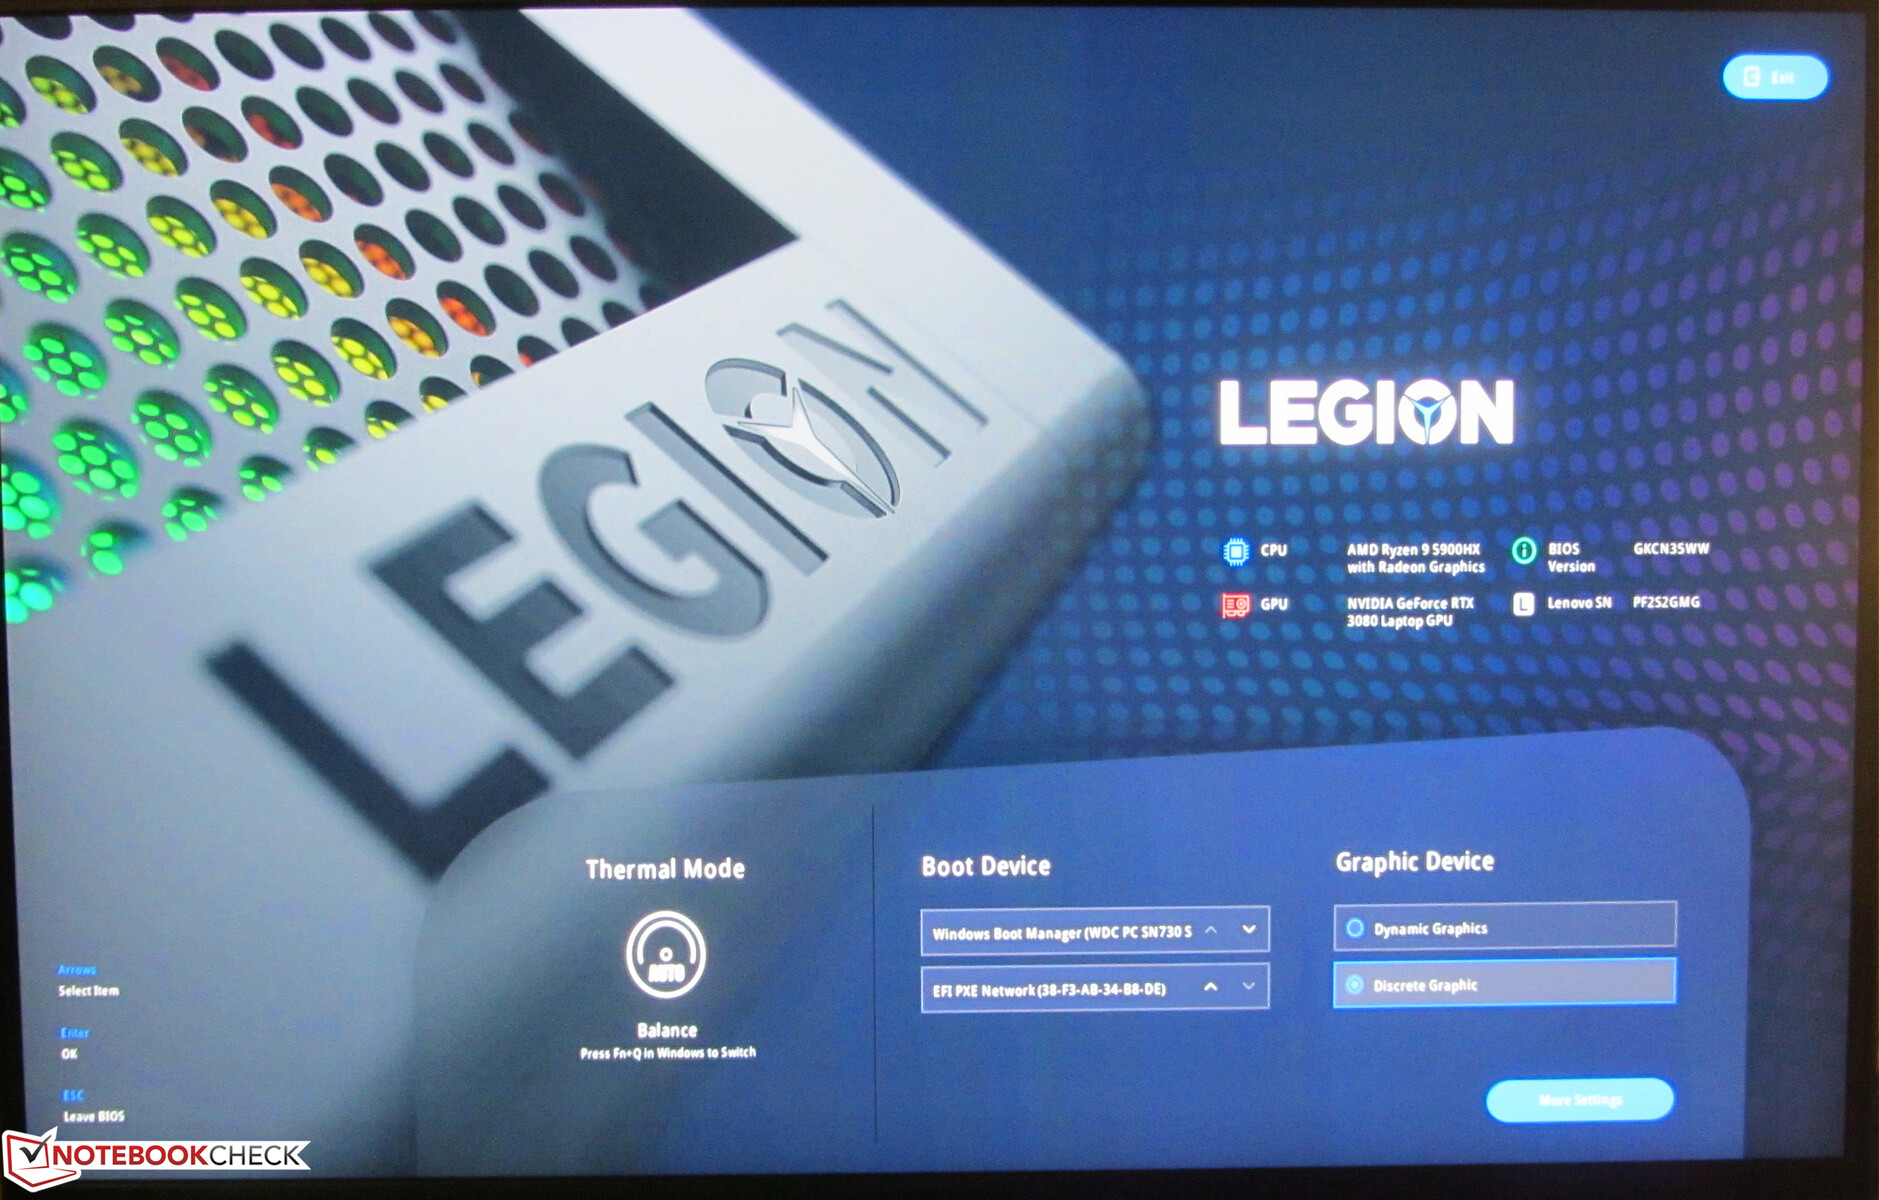
Furthermore, the Vega 8 iGPU integrated into the processor is turned off. This means that the laptop isn't working with Nvidia's Optimus graphics switching solution. The iGPU (and therefore Optimus) can be enabled through Lenovo's Vantage software ("Hybrid Mode") - this has a positive impact on battery life.
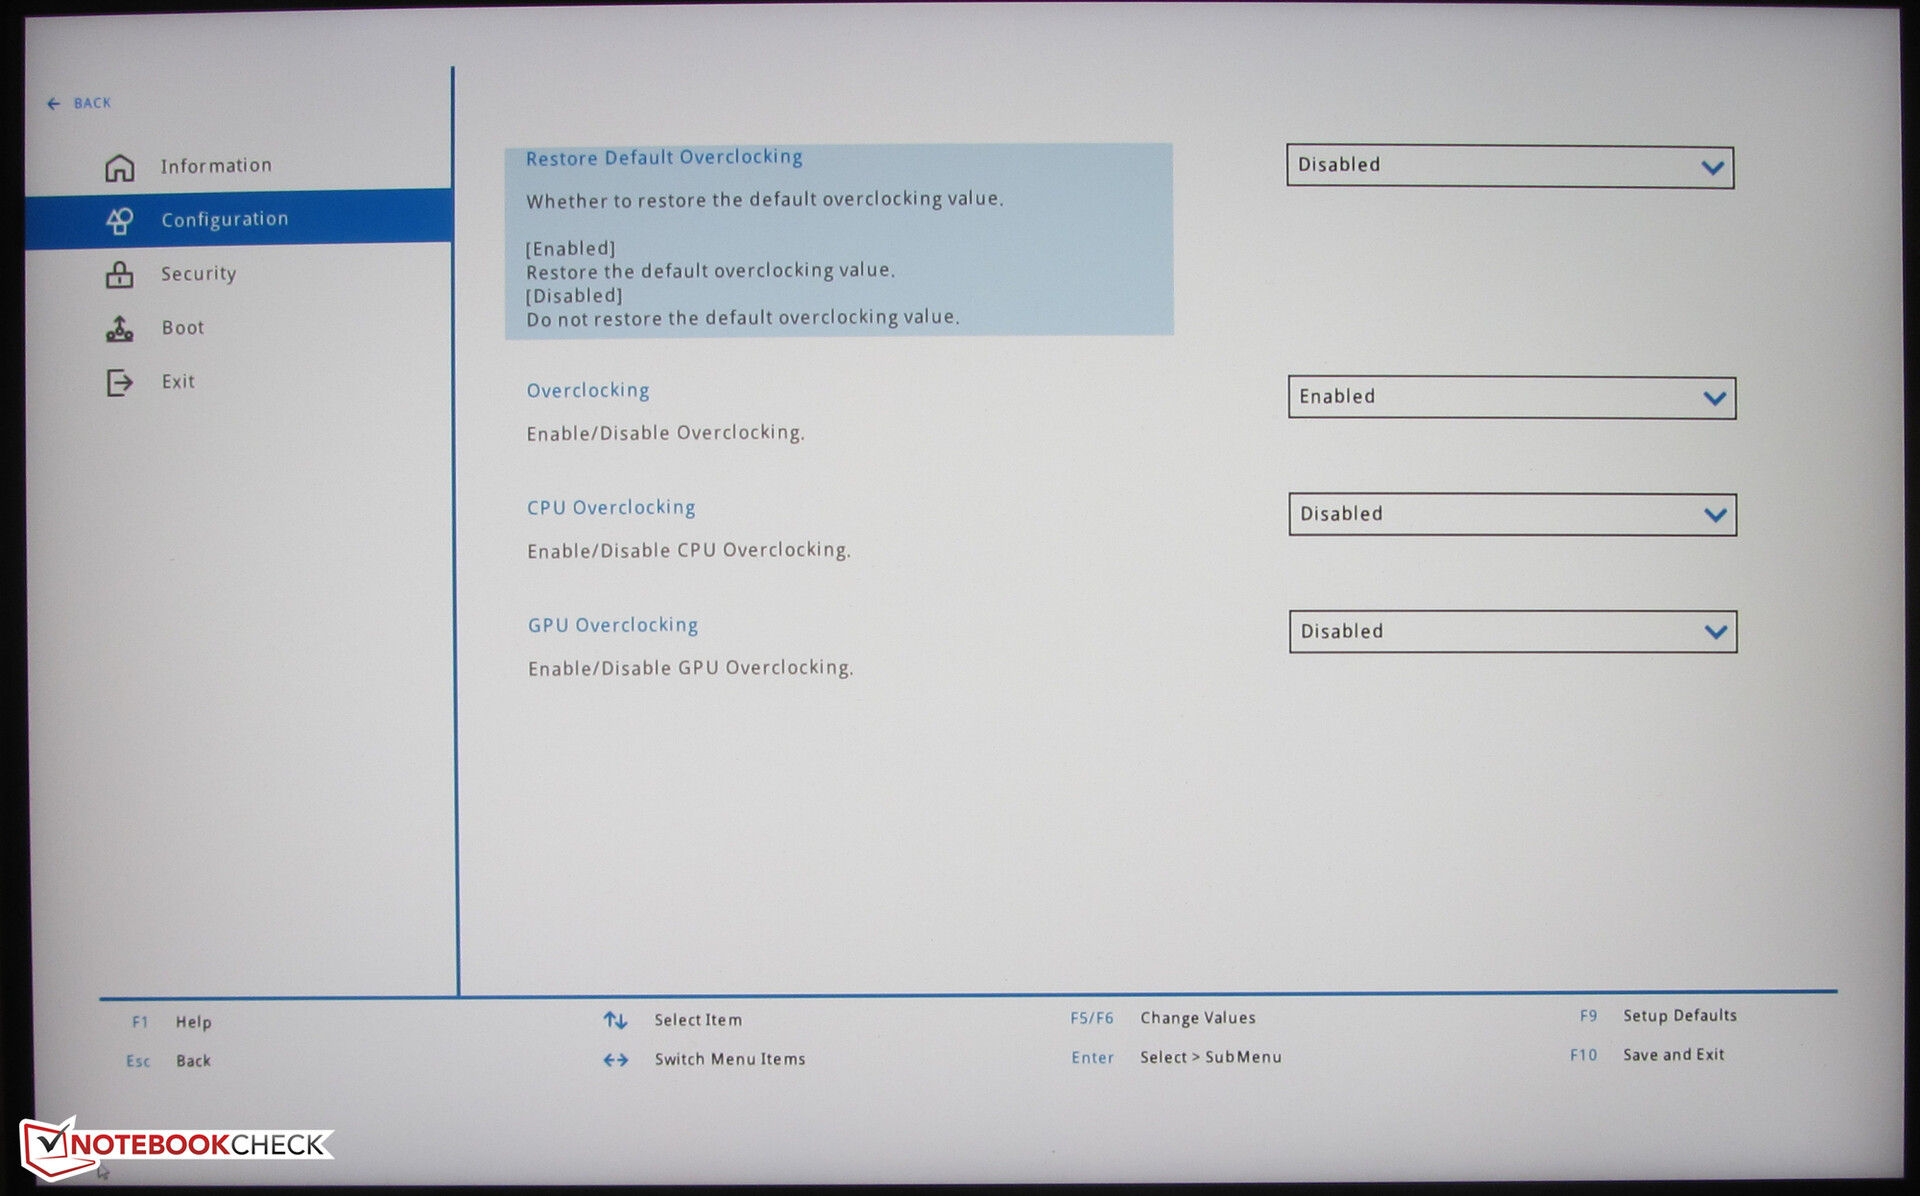
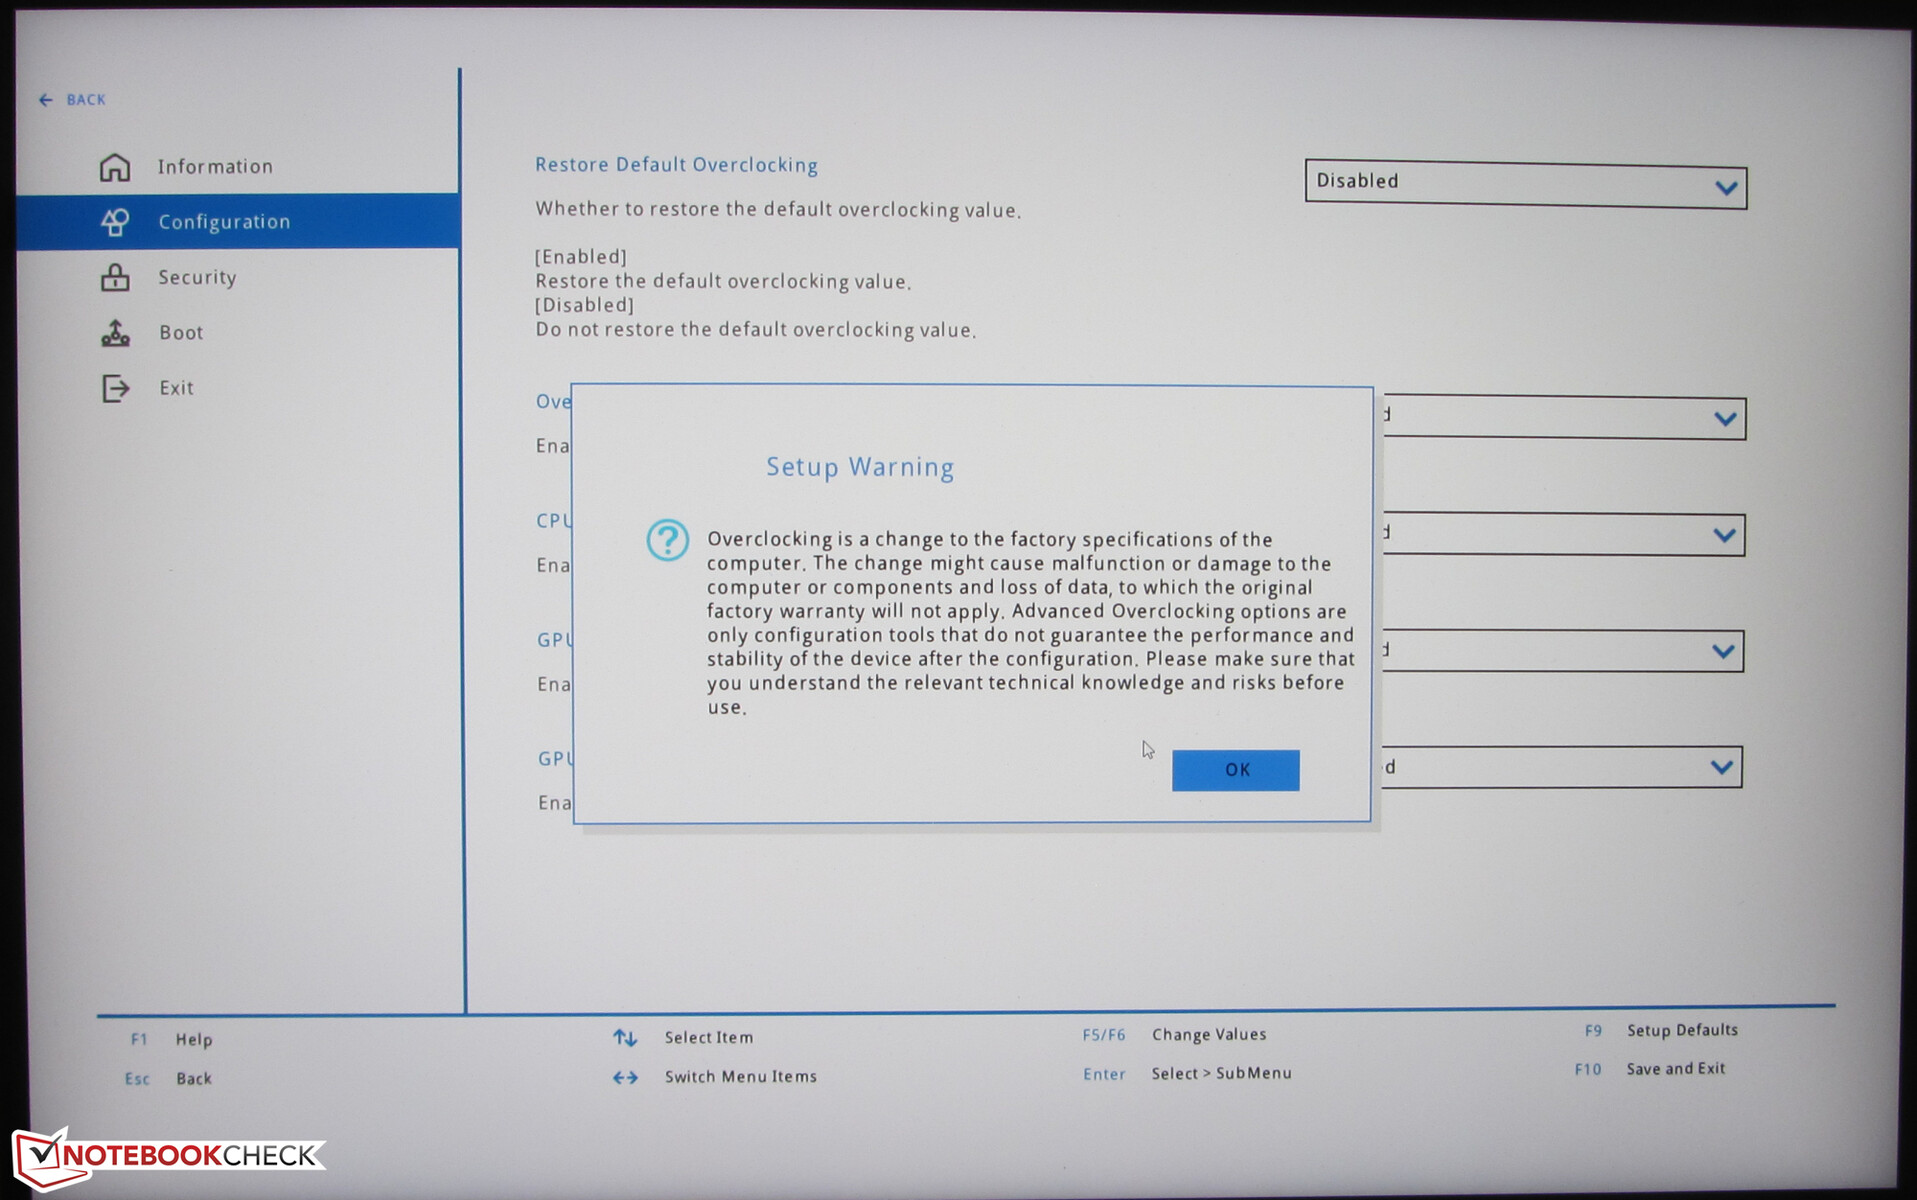
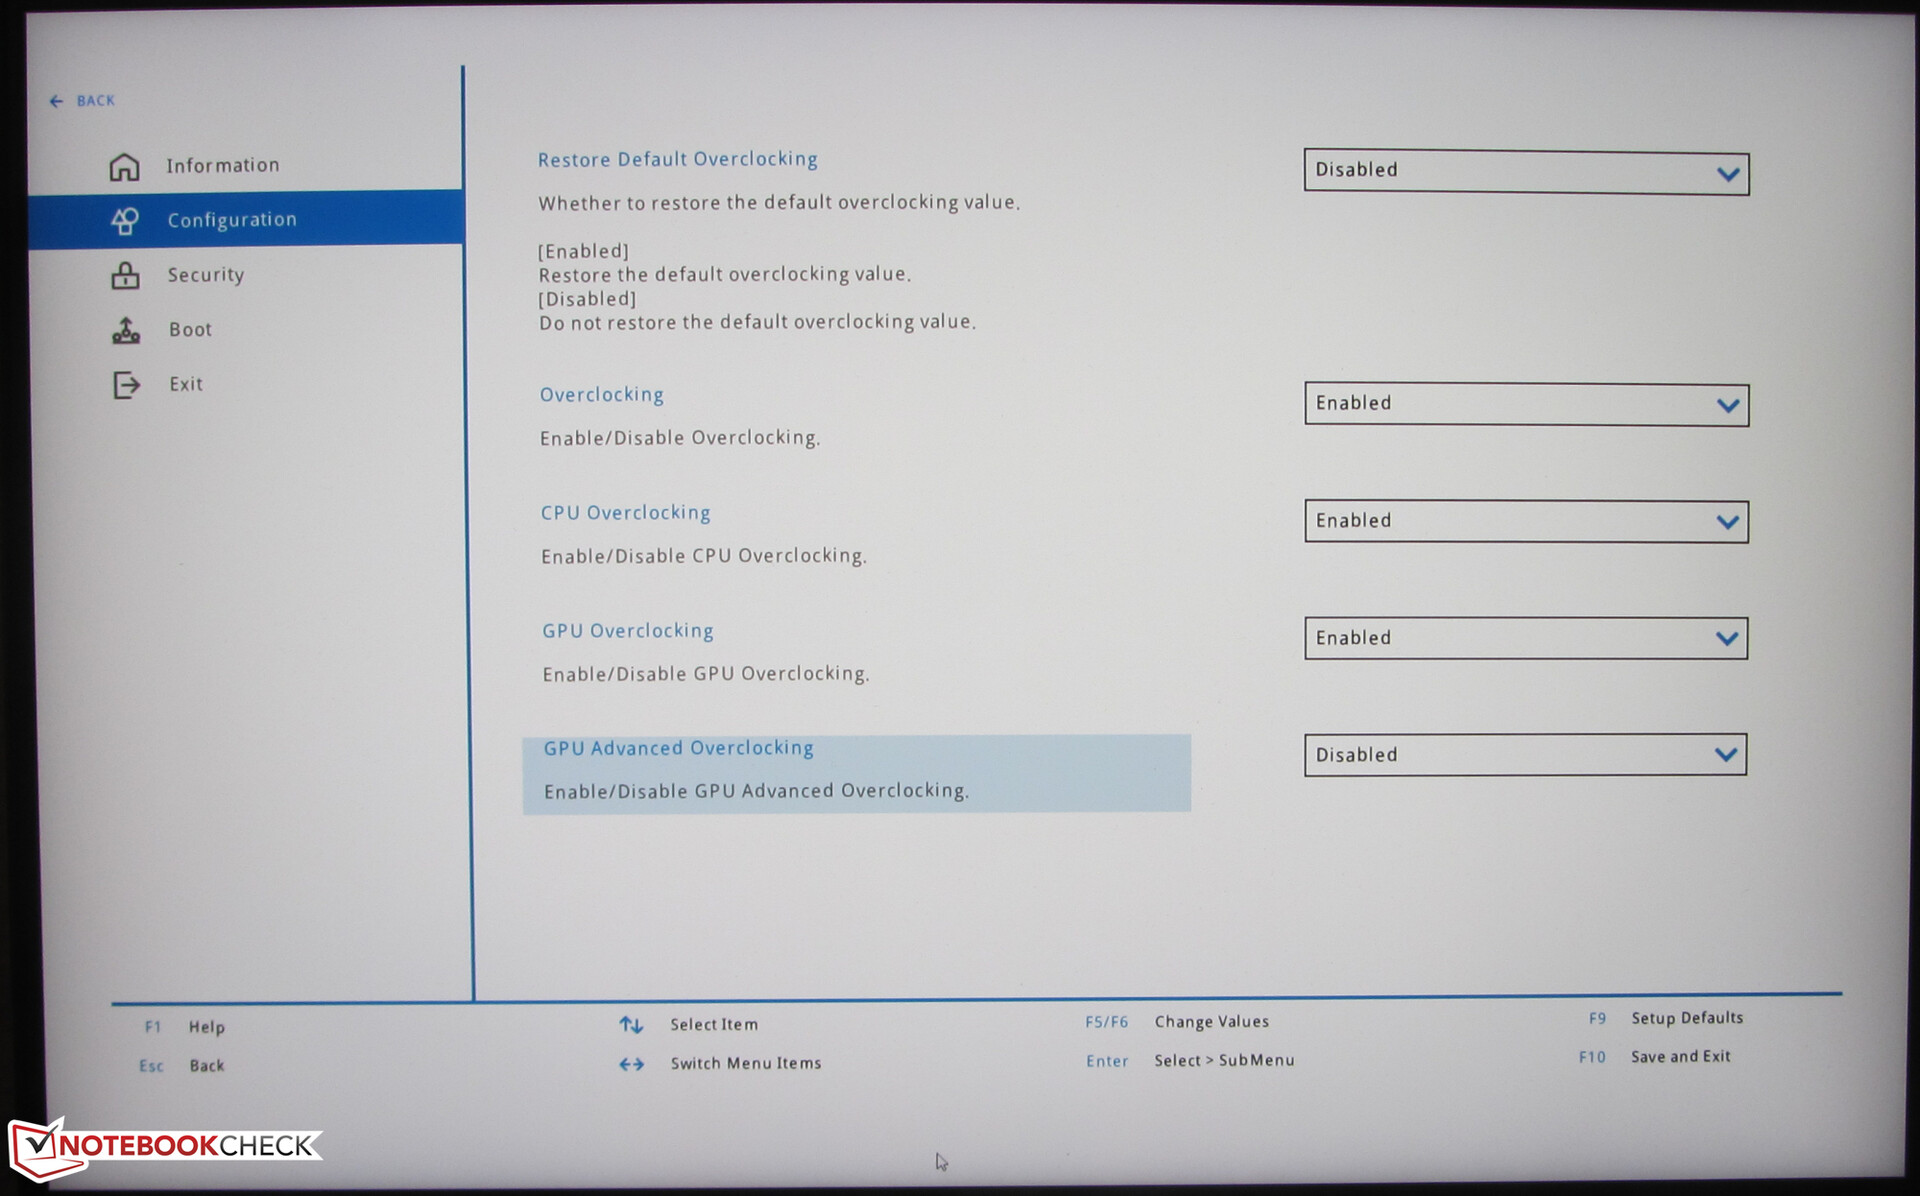
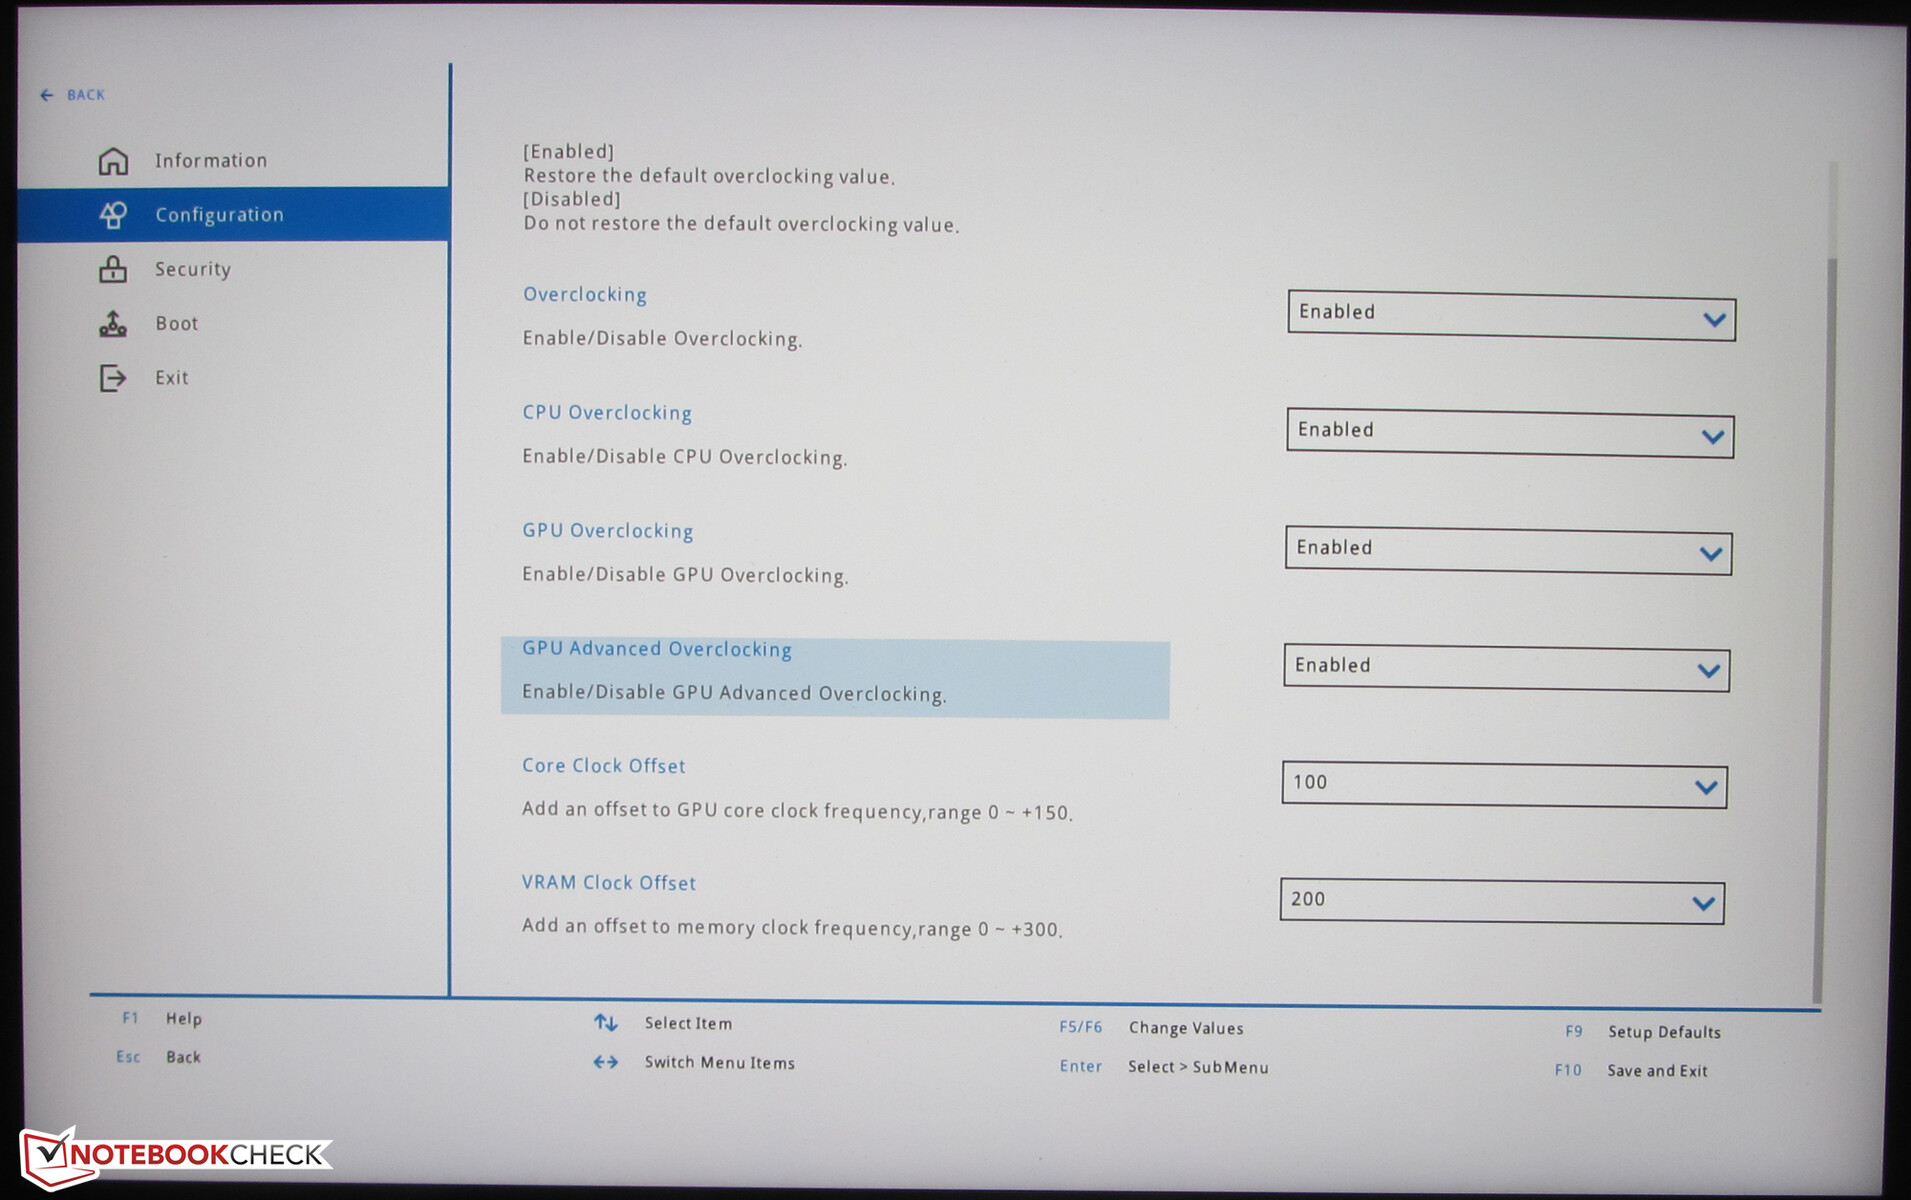
Overclocking
The laptop's BIOS hides options to automatically overclock the CPU and GPU. In addition, it's possible to manually adjust the GPU and graphics memory clock speeds. We decided against the latter and only tested the automatic overclocking of the CPU and GPU. The corresponding benchmark results can be found in the comparison tables - identified by the "Performance Overclocking" label.
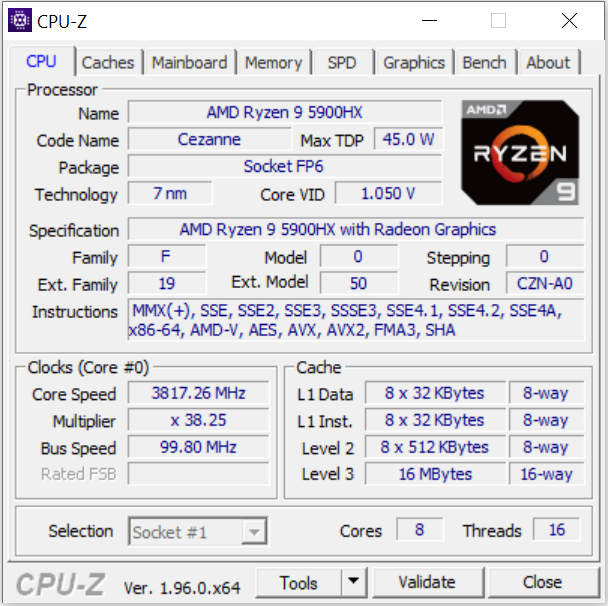
Processor
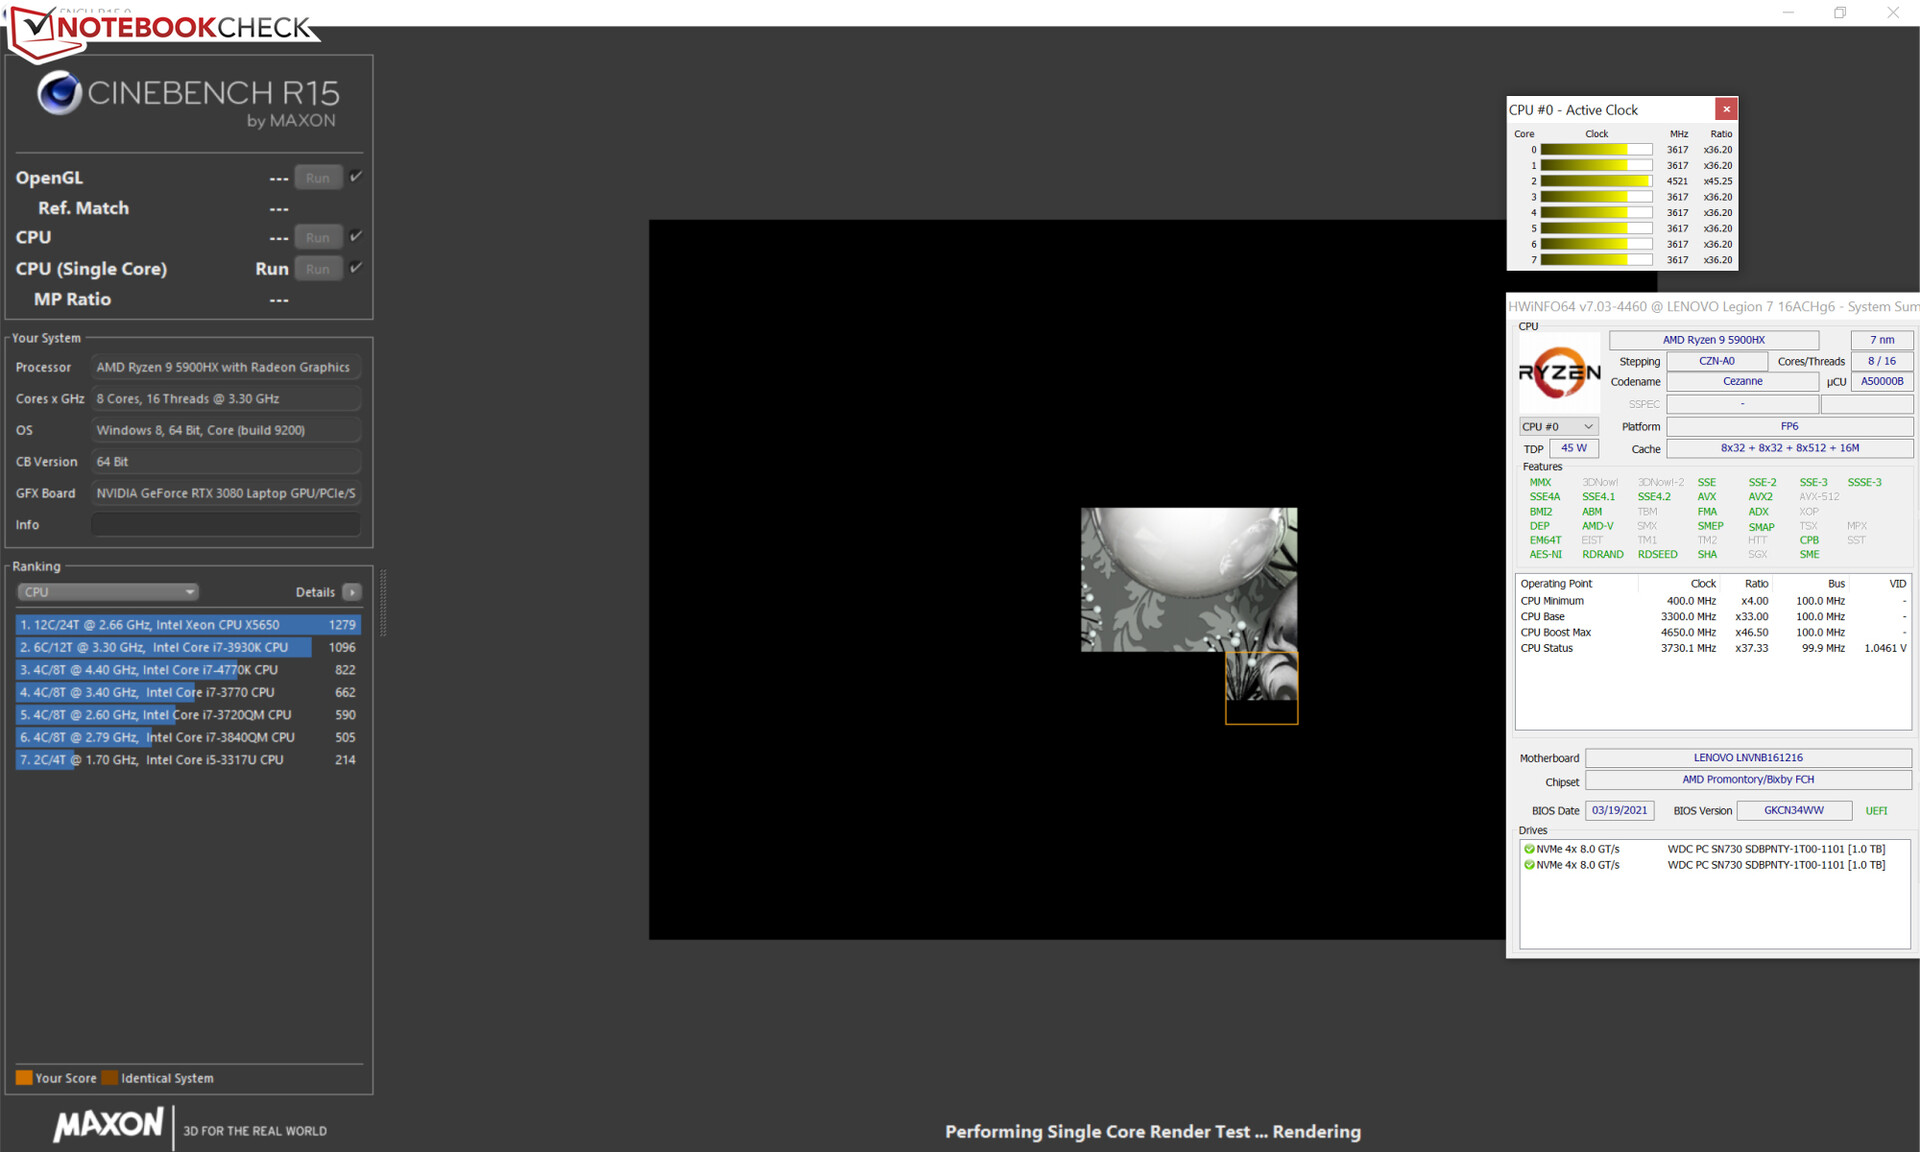
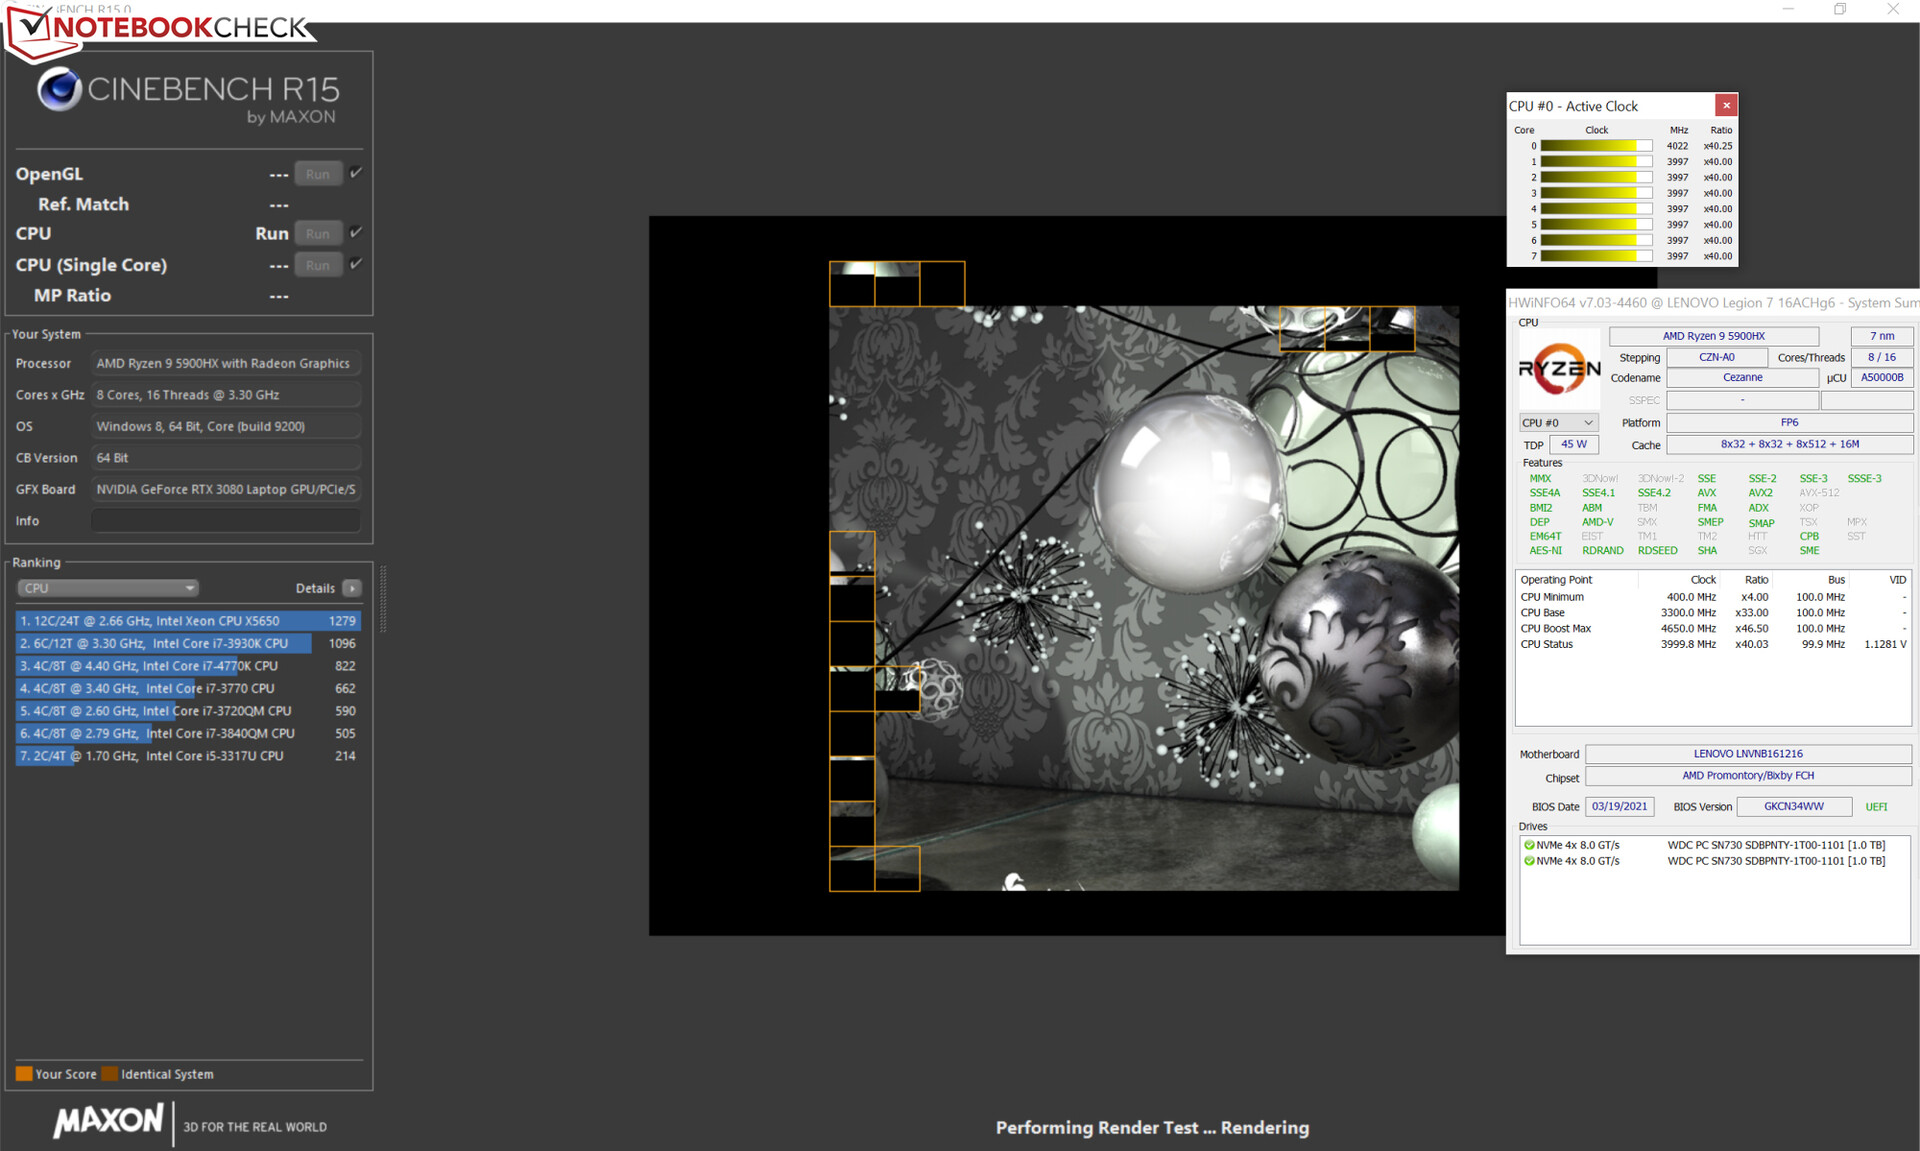
The CPU part of the Ryzen 9 5900HX APU (Cezanne) consists of an octa-core processor that operates at a base speed of 3.3 GHz. An increase up to 4.7 GHz is possible via Turbo. Simultaneous multithreading (two threads can be processed per core) is also supported.
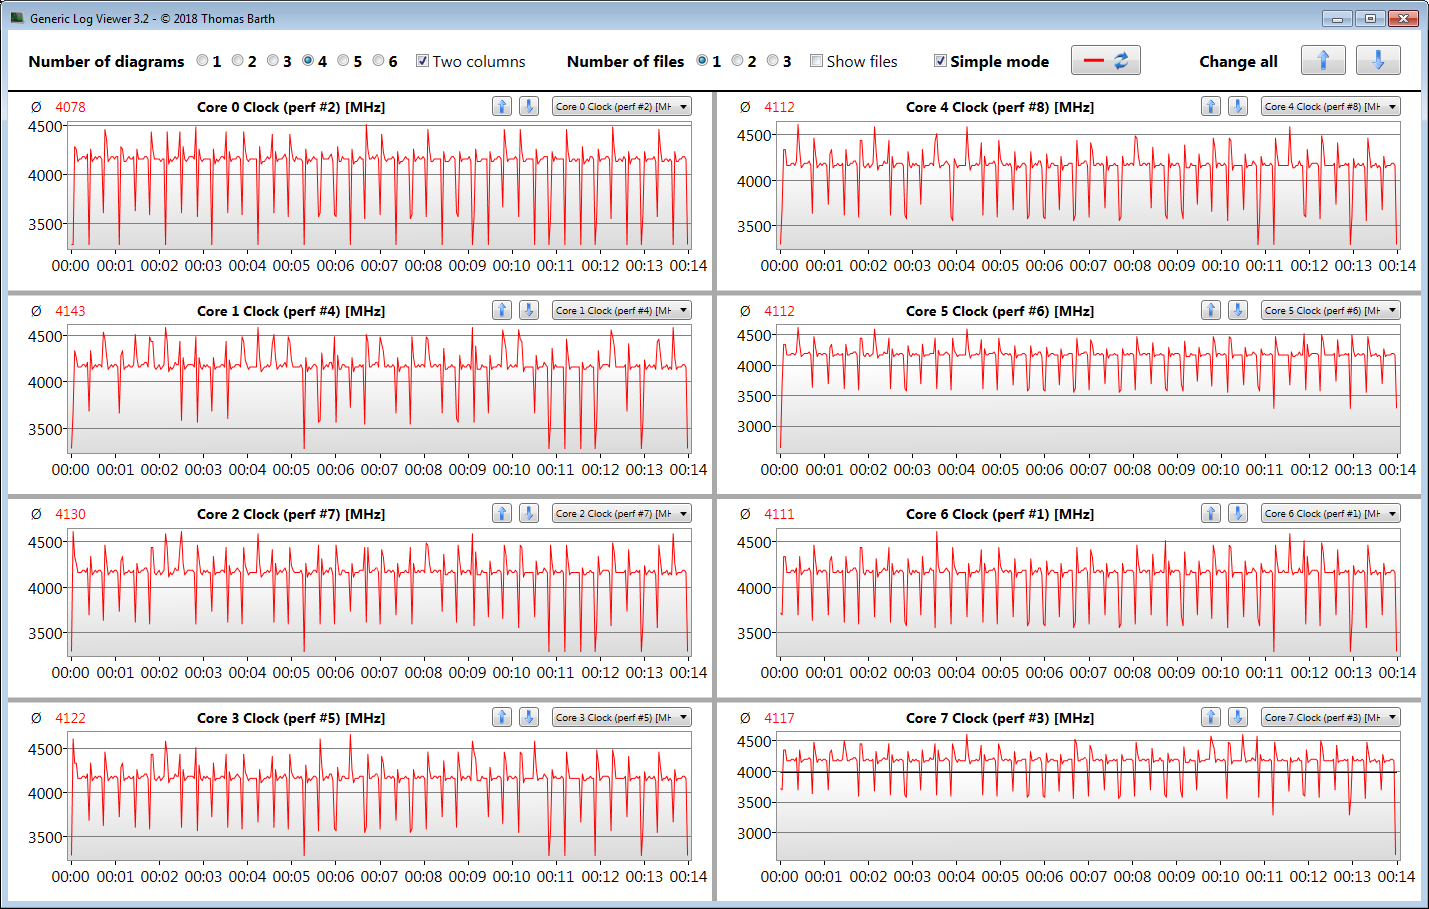
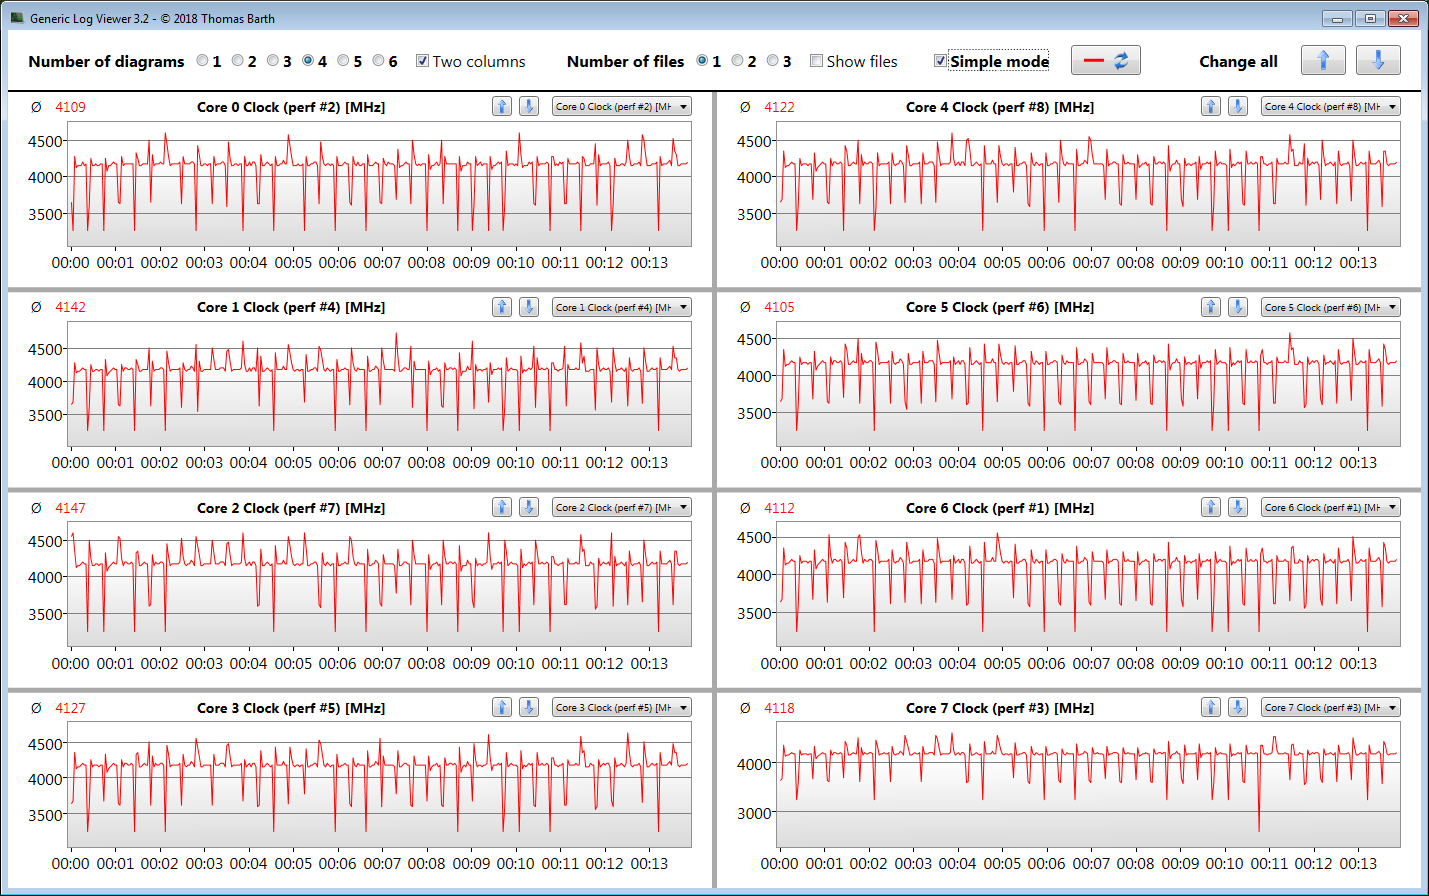
The CPU tests of the Cinebench R15 benchmark are processed at 4 to 4.2 GHz (multithread) and 3.6 to 4.7 GHz (single-thread), respectively. On battery power, the CPU runs at 2.7 to 3.5 GHz (multi-thread) and 2.2 to 3.5 GHz (single-thread), respectively.
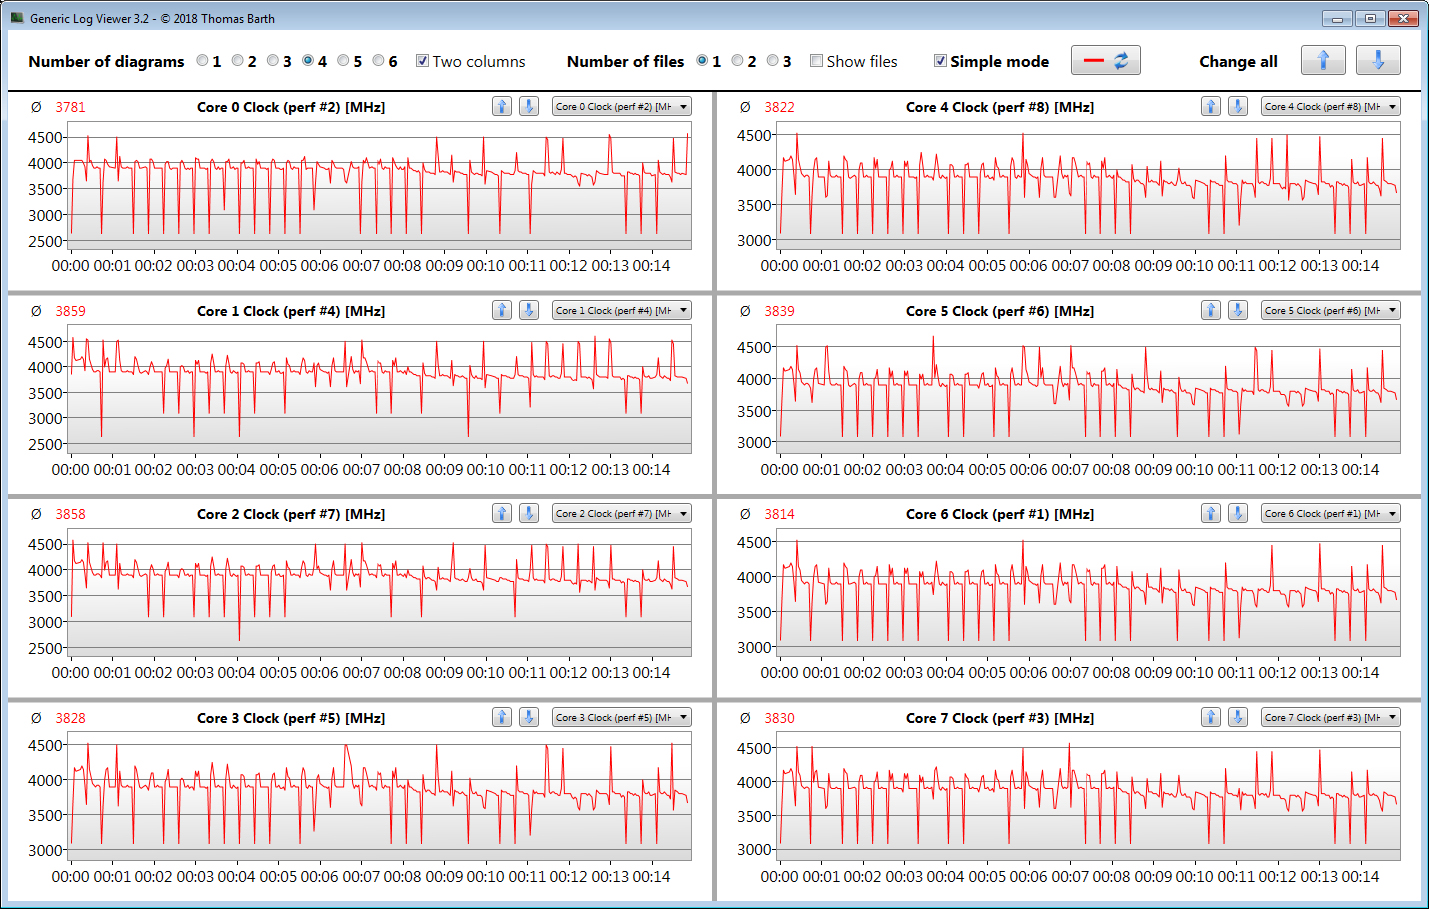
We verify if the CPU Turbo is also consistently used when plugged in by running the Cinebench R15 benchmark's multithread test in a continuous loop for at least 30 minutes. Turbo is used to a moderate extent. The "Performance Mode" profile results in an increase in clock rates, while additionally activating the automatic CPU overclocking only provides a minimal performance boost.
| Cinebench R23 | |
| Single Core | |
| Average of class Gaming (1166 - 2356, n=111, last 2 years) | |
| Lenovo Legion 7 16ACHg6 | |
| Asus Strix Scar 17 G733QSA-XS99 | |
| Lenovo Legion 7 16ACHg6 (Leistung) | |
| Asus ROG Zephyrus G15 GA503Q | |
| Lenovo Legion 7 16ACHg6 (Leistung Overclocking) | |
| Average AMD Ryzen 9 5900HX (1218 - 1499, n=29) | |
| Alienware m17 R4 | |
| MSI GE76 Raider 10UH | |
| Razer Blade 15 Advanced Model Early 2021 | |
| Schenker XMG Pro 15 (Early 2021, RTX 3080) | |
| Multi Core | |
| Average of class Gaming (10488 - 40970, n=111, last 2 years) | |
| Lenovo Legion 7 16ACHg6 (Leistung Overclocking) | |
| Asus Strix Scar 17 G733QSA-XS99 | |
| Lenovo Legion 7 16ACHg6 | |
| Lenovo Legion 7 16ACHg6 (Leistung) | |
| Average AMD Ryzen 9 5900HX (6622 - 14363, n=30) | |
| Asus ROG Zephyrus G15 GA503Q | |
| Alienware m17 R4 | |
| MSI GE76 Raider 10UH | |
| Schenker XMG Pro 15 (Early 2021, RTX 3080) | |
| Razer Blade 15 Advanced Model Early 2021 | |
| Cinebench R20 | |
| CPU (Single Core) | |
| Average of class Gaming (442 - 895, n=110, last 2 years) | |
| Lenovo Legion 7 16ACHg6 | |
| Lenovo Legion 7 16ACHg6 (Leistung Overclocking) | |
| Average AMD Ryzen 9 5900HX (471 - 584, n=29) | |
| Asus Strix Scar 17 G733QSA-XS99 | |
| Lenovo Legion 7 16ACHg6 (Leistung) | |
| Asus ROG Zephyrus G15 GA503Q | |
| Alienware m17 R4 | |
| Razer Blade 15 Advanced Model Early 2021 | |
| MSI GE76 Raider 10UH | |
| Schenker XMG Pro 15 (Early 2021, RTX 3080) | |
| CPU (Multi Core) | |
| Average of class Gaming (4029 - 16108, n=110, last 2 years) | |
| Lenovo Legion 7 16ACHg6 (Leistung) | |
| Lenovo Legion 7 16ACHg6 (Leistung Overclocking) | |
| Asus Strix Scar 17 G733QSA-XS99 | |
| Lenovo Legion 7 16ACHg6 | |
| Average AMD Ryzen 9 5900HX (2242 - 5476, n=30) | |
| Asus ROG Zephyrus G15 GA503Q | |
| Alienware m17 R4 | |
| MSI GE76 Raider 10UH | |
| Schenker XMG Pro 15 (Early 2021, RTX 3080) | |
| Razer Blade 15 Advanced Model Early 2021 | |
| Blender - v2.79 BMW27 CPU | |
| Razer Blade 15 Advanced Model Early 2021 | |
| Schenker XMG Pro 15 (Early 2021, RTX 3080) | |
| MSI GE76 Raider 10UH | |
| Average AMD Ryzen 9 5900HX (219 - 442, n=29) | |
| Asus ROG Zephyrus G15 GA503Q | |
| Alienware m17 R4 | |
| Lenovo Legion 7 16ACHg6 | |
| Asus Strix Scar 17 G733QSA-XS99 | |
| Lenovo Legion 7 16ACHg6 (Leistung) | |
| Lenovo Legion 7 16ACHg6 (Leistung Overclocking) | |
| Average of class Gaming (80 - 330, n=108, last 2 years) | |
| 7-Zip 18.03 | |
| 7z b 4 -mmt1 | |
| Average of class Gaming (4199 - 7436, n=109, last 2 years) | |
| Lenovo Legion 7 16ACHg6 | |
| Lenovo Legion 7 16ACHg6 (Leistung Overclocking) | |
| Asus Strix Scar 17 G733QSA-XS99 | |
| Lenovo Legion 7 16ACHg6 (Leistung) | |
| Average AMD Ryzen 9 5900HX (4791 - 5905, n=29) | |
| Asus ROG Zephyrus G15 GA503Q | |
| Alienware m17 R4 | |
| Razer Blade 15 Advanced Model Early 2021 | |
| Schenker XMG Pro 15 (Early 2021, RTX 3080) | |
| MSI GE76 Raider 10UH | |
| 7z b 4 | |
| Average of class Gaming (33491 - 148086, n=109, last 2 years) | |
| Lenovo Legion 7 16ACHg6 (Leistung) | |
| Lenovo Legion 7 16ACHg6 (Leistung Overclocking) | |
| Asus Strix Scar 17 G733QSA-XS99 | |
| Lenovo Legion 7 16ACHg6 | |
| Asus ROG Zephyrus G15 GA503Q | |
| Average AMD Ryzen 9 5900HX (36011 - 62503, n=29) | |
| Alienware m17 R4 | |
| MSI GE76 Raider 10UH | |
| Schenker XMG Pro 15 (Early 2021, RTX 3080) | |
| Razer Blade 15 Advanced Model Early 2021 | |
| Geekbench 5.5 | |
| Single-Core | |
| Average of class Gaming (986 - 2474, n=109, last 2 years) | |
| Asus Strix Scar 17 G733QSA-XS99 | |
| Lenovo Legion 7 16ACHg6 (Leistung) | |
| Lenovo Legion 7 16ACHg6 | |
| Average AMD Ryzen 9 5900HX (1271 - 1574, n=27) | |
| Asus ROG Zephyrus G15 GA503Q | |
| Alienware m17 R4 | |
| Razer Blade 15 Advanced Model Early 2021 | |
| Schenker XMG Pro 15 (Early 2021, RTX 3080) | |
| Lenovo Legion 7 16ACHg6 (Leistung Overclocking) | |
| MSI GE76 Raider 10UH | |
| Multi-Core | |
| Average of class Gaming (6460 - 27010, n=109, last 2 years) | |
| Asus Strix Scar 17 G733QSA-XS99 | |
| Lenovo Legion 7 16ACHg6 (Leistung) | |
| Lenovo Legion 7 16ACHg6 | |
| Average AMD Ryzen 9 5900HX (5057 - 9294, n=27) | |
| Alienware m17 R4 | |
| Lenovo Legion 7 16ACHg6 (Leistung Overclocking) | |
| Asus ROG Zephyrus G15 GA503Q | |
| Schenker XMG Pro 15 (Early 2021, RTX 3080) | |
| MSI GE76 Raider 10UH | |
| Razer Blade 15 Advanced Model Early 2021 | |
| HWBOT x265 Benchmark v2.2 - 4k Preset | |
| Average of class Gaming (11.5 - 44.3, n=109, last 2 years) | |
| Asus Strix Scar 17 G733QSA-XS99 | |
| Lenovo Legion 7 16ACHg6 (Leistung) | |
| Lenovo Legion 7 16ACHg6 | |
| Lenovo Legion 7 16ACHg6 (Leistung Overclocking) | |
| Average AMD Ryzen 9 5900HX (8.26 - 17.1, n=29) | |
| Alienware m17 R4 | |
| Asus ROG Zephyrus G15 GA503Q | |
| MSI GE76 Raider 10UH | |
| Schenker XMG Pro 15 (Early 2021, RTX 3080) | |
| Razer Blade 15 Advanced Model Early 2021 | |
| LibreOffice - 20 Documents To PDF | |
| Schenker XMG Pro 15 (Early 2021, RTX 3080) | |
| Razer Blade 15 Advanced Model Early 2021 | |
| Asus ROG Zephyrus G15 GA503Q | |
| Lenovo Legion 7 16ACHg6 (Leistung Overclocking) | |
| Average AMD Ryzen 9 5900HX (44.1 - 87.4, n=29) | |
| Alienware m17 R4 | |
| Lenovo Legion 7 16ACHg6 | |
| Average of class Gaming (19 - 88.8, n=109, last 2 years) | |
| MSI GE76 Raider 10UH | |
| Asus Strix Scar 17 G733QSA-XS99 | |
| Lenovo Legion 7 16ACHg6 (Leistung) | |
| R Benchmark 2.5 - Overall mean | |
| Schenker XMG Pro 15 (Early 2021, RTX 3080) | |
| MSI GE76 Raider 10UH | |
| Lenovo Legion 7 16ACHg6 (Leistung Overclocking) | |
| Razer Blade 15 Advanced Model Early 2021 | |
| Alienware m17 R4 | |
| Asus ROG Zephyrus G15 GA503Q | |
| Average AMD Ryzen 9 5900HX (0.48 - 0.599, n=29) | |
| Asus Strix Scar 17 G733QSA-XS99 | |
| Lenovo Legion 7 16ACHg6 | |
| Lenovo Legion 7 16ACHg6 (Leistung) | |
| Average of class Gaming (0.3439 - 0.759, n=110, last 2 years) | |
* ... smaller is better
System performance
The fast and smooth system offers enough computing power for the next few years for demanding use cases like gaming, video-editing, and image-processing. This is accompanied by very good PCMark results.
| PCMark 10 Score | 7134 points | |
Help | ||
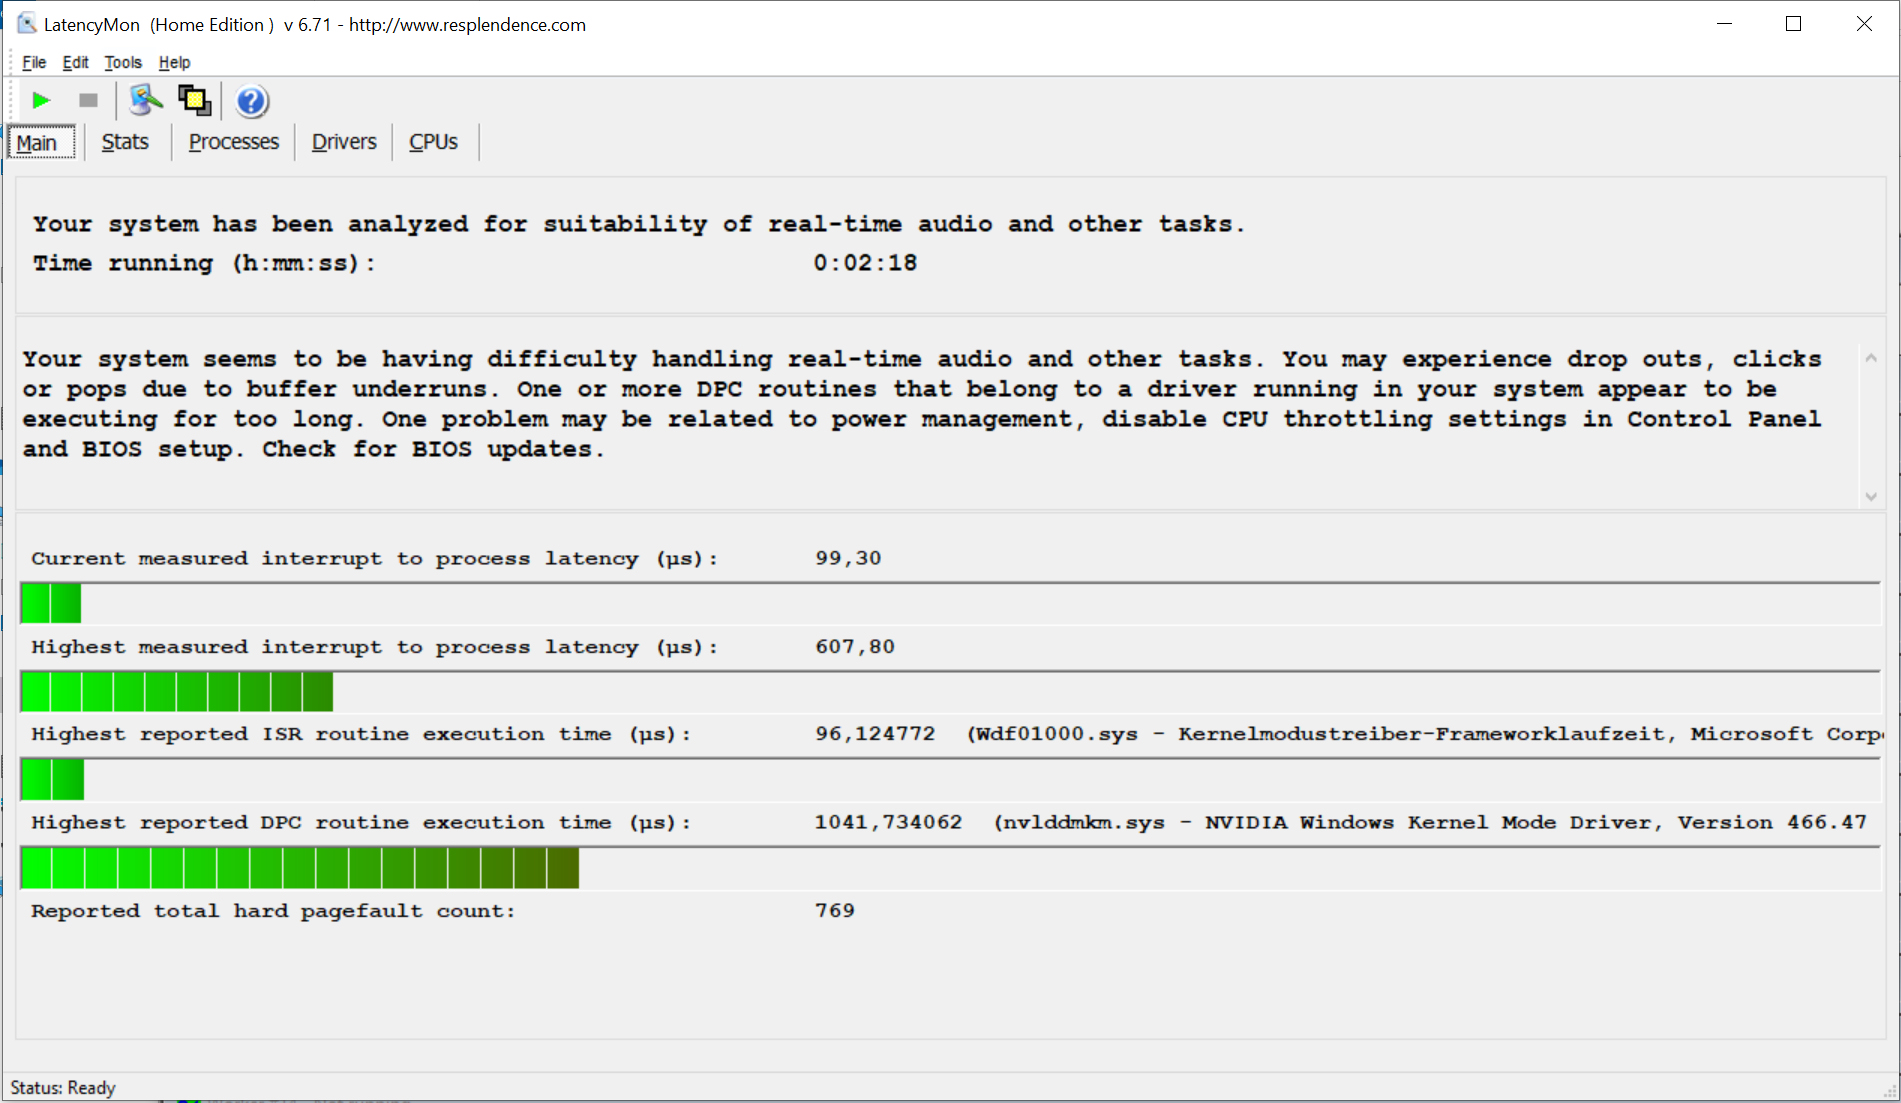
DPC latencies
Our standardized latency monitor test (web browsing, 4K video playback, high-load Prime95) revealed problems with DPC latencies. The system doesn't seem to be suitable for real-time video and audio editing.
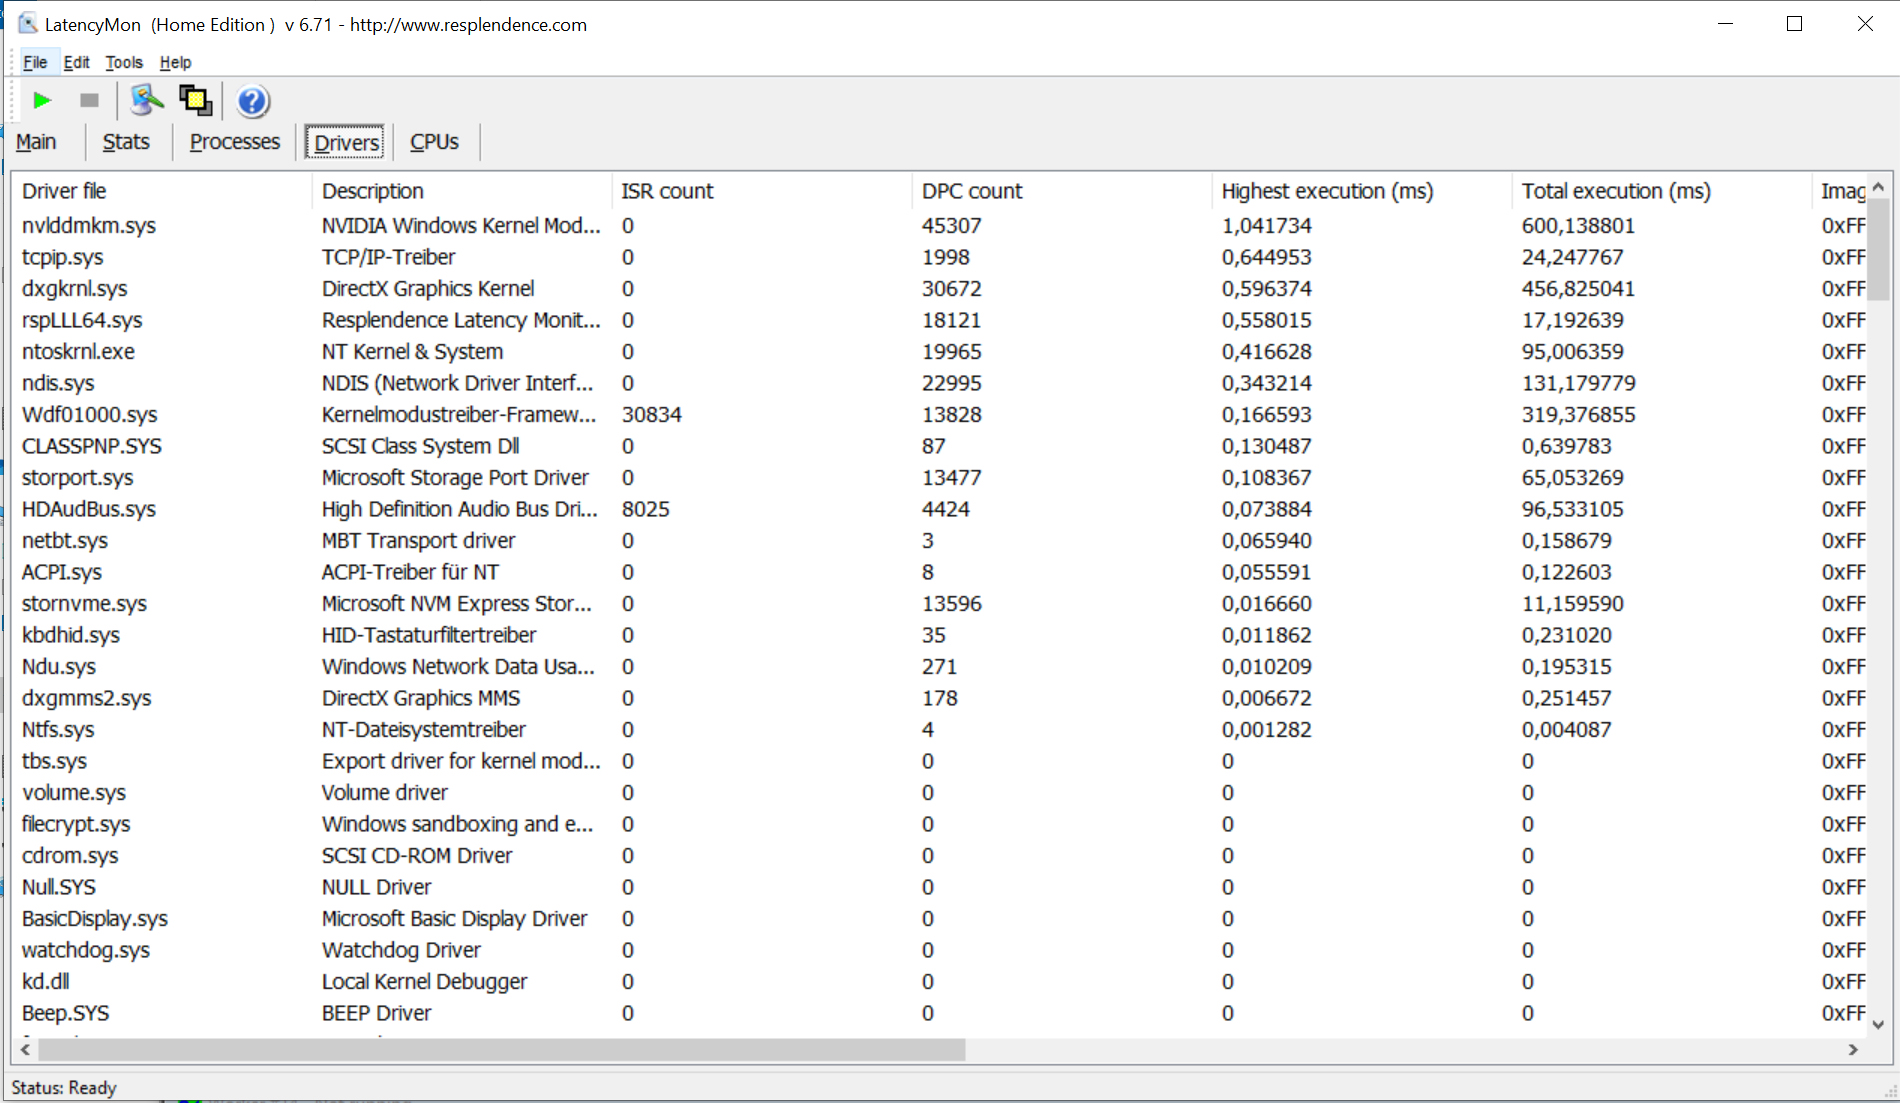
| DPC Latencies / LatencyMon - interrupt to process latency (max), Web, Youtube, Prime95 | |
| MSI GE76 Raider 10UH | |
| Asus Strix Scar 17 G733QSA-XS99 | |
| Lenovo Legion 7 16ACHg6 | |
| Schenker XMG Pro 15 (Early 2021, RTX 3080) | |
| Alienware m17 R4 | |
| Razer Blade 15 Advanced Model Early 2021 | |
| Asus ROG Zephyrus G15 GA503Q | |
* ... smaller is better
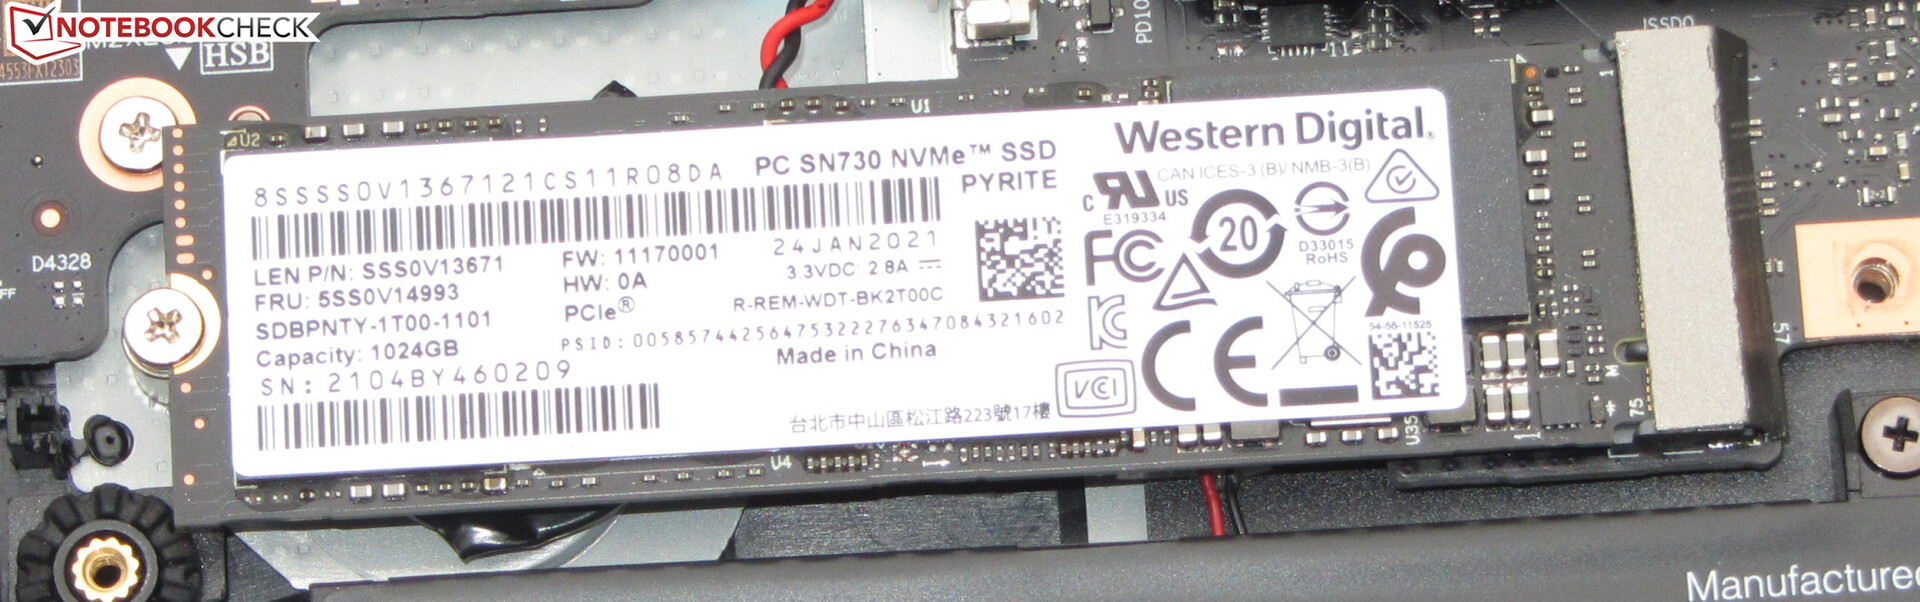
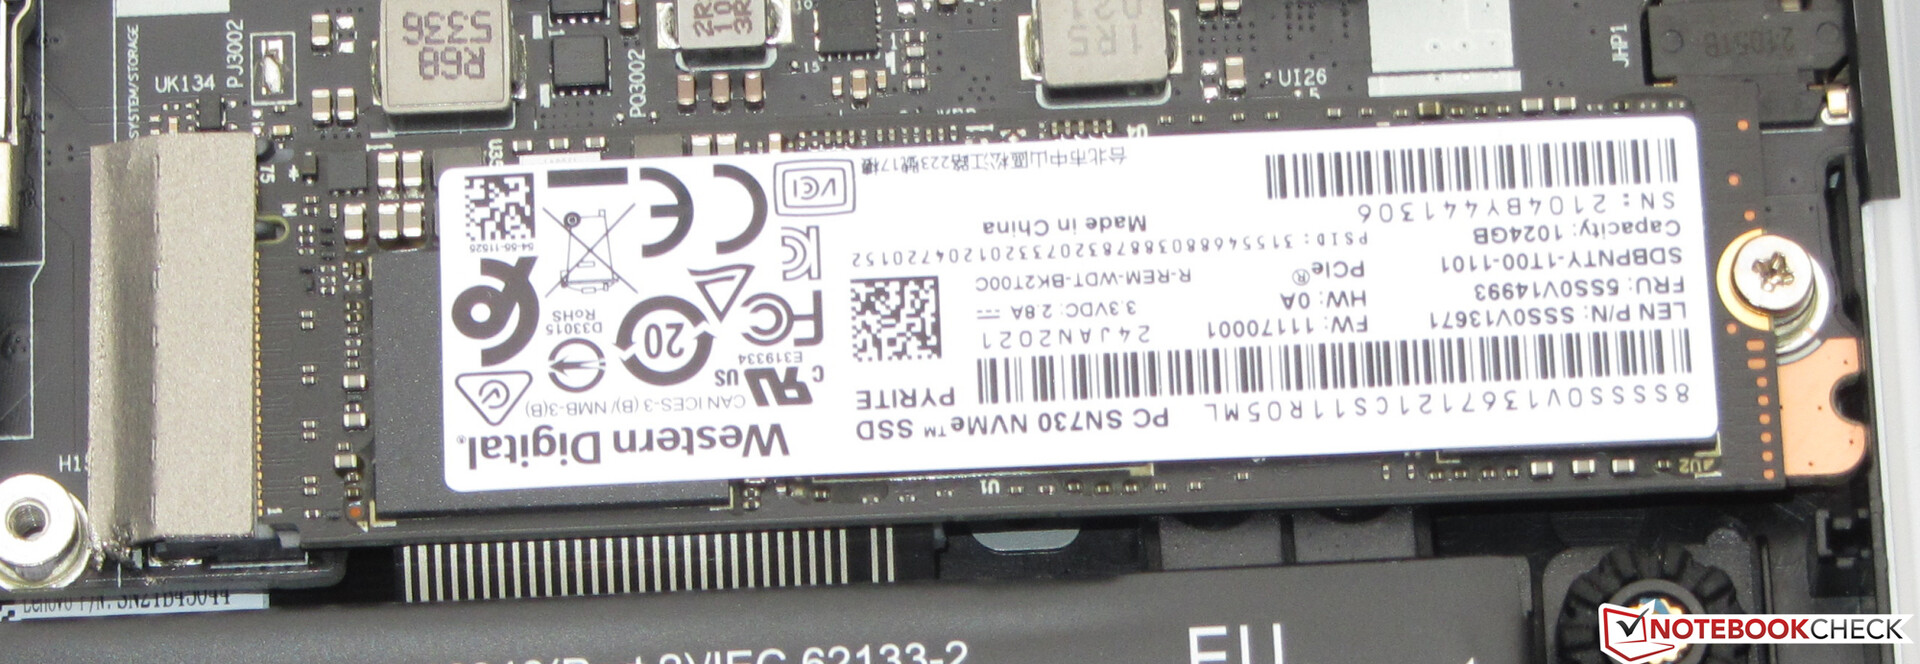
Storage
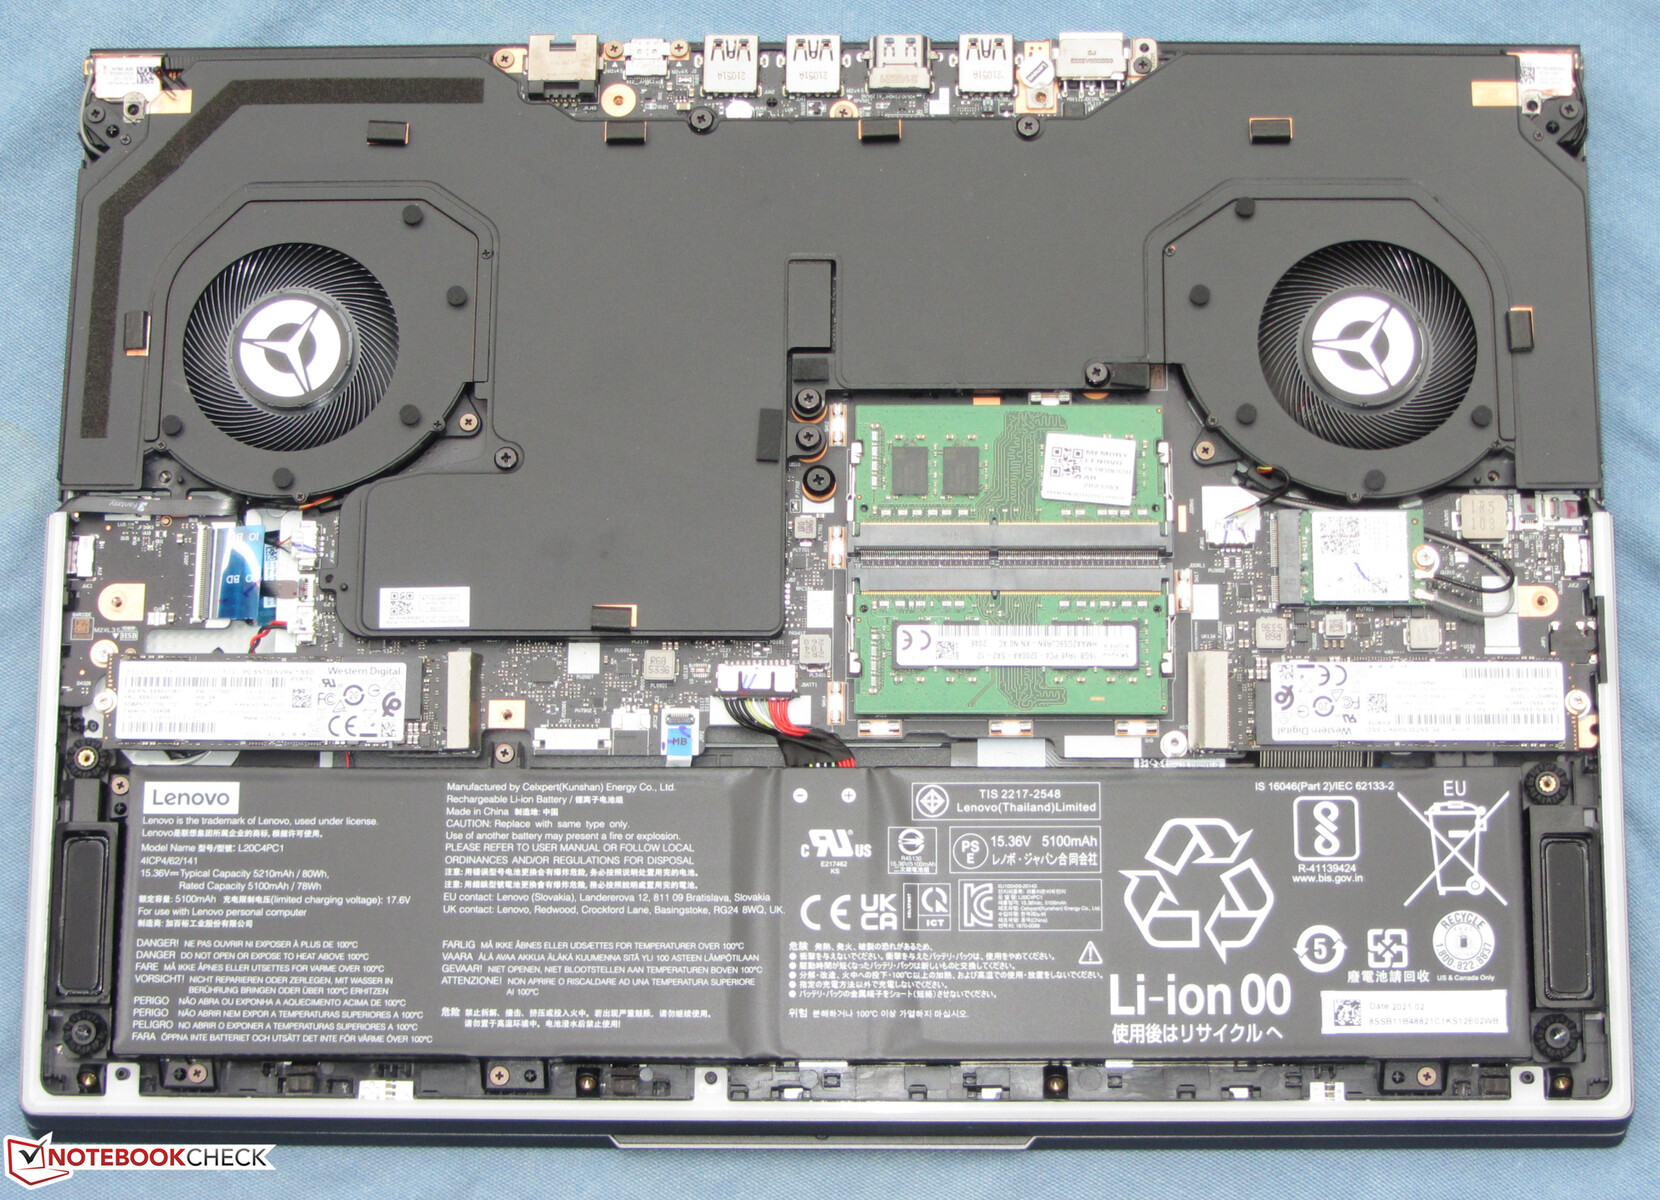
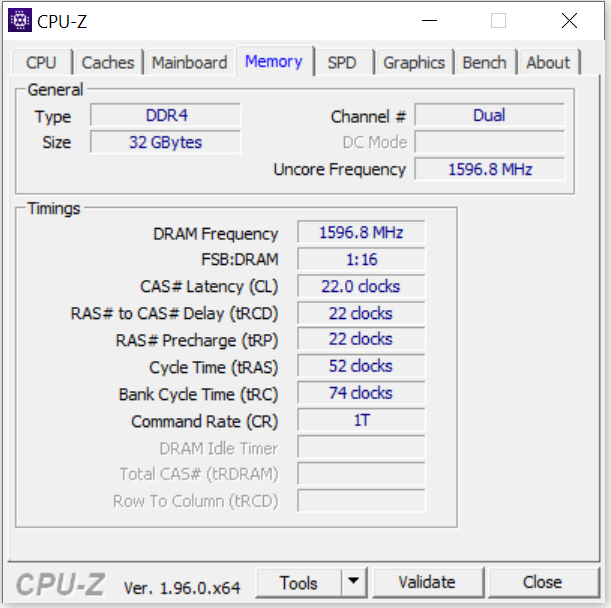
Lenovo equips the laptop with two 1 TB NVMe SSDs (M.2 2280) from Western Digital. However, the SSDs don't form a RAID array. One of the two SSDs serves as system drive, the other as data storage. Their transfer rates are very good.

| Lenovo Legion 7 16ACHg6 WDC PC SN730 SDBPNTY-1T00 | Asus ROG Zephyrus G15 GA503Q SK Hynix HFM001TD3JX013N | Schenker XMG Pro 15 (Early 2021, RTX 3080) Samsung SSD 970 EVO Plus 1TB | Asus Strix Scar 17 G733QSA-XS99 2x Samsung PM981a MZVLB1T0HBLR (RAID 0) | Razer Blade 15 Advanced Model Early 2021 Samsung PM981a MZVLB1T0HBLR | Alienware m17 R4 2x Micron 2300 512 GB (RAID 0) | MSI GE76 Raider 10UH WDC PC SN730 SDBPNTY-1T00 | |
|---|---|---|---|---|---|---|---|
| CrystalDiskMark 5.2 / 6 | 0% | 7% | 51% | -12% | -5% | -6% | |
| Write 4K (MB/s) | 157.6 | 156.4 -1% | 160.9 2% | 235.9 50% | 138 -12% | 93.1 -41% | 157.1 0% |
| Read 4K (MB/s) | 48.97 | 66.7 36% | 54 10% | 48.02 -2% | 47.41 -3% | 46.79 -4% | 46.3 -5% |
| Write Seq (MB/s) | 2789 | 2318 -17% | 2944 6% | 4822 73% | 1922 -31% | 2853 2% | 2396 -14% |
| Read Seq (MB/s) | 2494 | 2151 -14% | 2781 12% | 5043 102% | 1673 -33% | 2556 2% | 2245 -10% |
| Write 4K Q32T1 (MB/s) | 456.7 | 525 15% | 495.2 8% | 625 37% | 445.5 -2% | 475 4% | 436.1 -5% |
| Read 4K Q32T1 (MB/s) | 575 | 452.1 -21% | 593 3% | 392.3 -32% | 534 -7% | 529 -8% | 524 -9% |
| Write Seq Q32T1 (MB/s) | 3088 | 3055 -1% | 3283 6% | 5350 73% | 2976 -4% | 3331 8% | 3086 0% |
| Read Seq Q32T1 (MB/s) | 3388 | 3607 6% | 3549 5% | 7130 110% | 3232 -5% | 3319 -2% | 3363 -1% |
| AS SSD | 4% | 14% | 21% | -3% | -14% | -14% | |
| Seq Read (MB/s) | 2944 | 2950 0% | 2959 1% | 4981 69% | 2112 -28% | 2733 -7% | 2967 1% |
| Seq Write (MB/s) | 2657 | 1600 -40% | 2521 -5% | 3050 15% | 2024 -24% | 2822 6% | 2604 -2% |
| 4K Read (MB/s) | 41.86 | 53.6 28% | 50.9 22% | 57 36% | 46.53 11% | 45.04 8% | 42.97 3% |
| 4K Write (MB/s) | 111.3 | 126.8 14% | 141.1 27% | 261.3 135% | 89.7 -19% | 88.4 -21% | 107.8 -3% |
| 4K-64 Read (MB/s) | 1733 | 1429 -18% | 2110 22% | 1205 -30% | 1747 1% | 1388 -20% | 1684 -3% |
| 4K-64 Write (MB/s) | 2119 | 2177 3% | 2329 10% | 1290 -39% | 1962 -7% | 1227 -42% | 2164 2% |
| Access Time Read * (ms) | 0.157 | 0.064 59% | 0.034 78% | 0.032 80% | 0.052 67% | 0.079 50% | 0.116 26% |
| Access Time Write * (ms) | 0.035 | 0.029 17% | 0.026 26% | 0.044 -26% | 0.04 -14% | 0.095 -171% | 0.106 -203% |
| Score Read (Points) | 2070 | 1778 -14% | 2457 19% | 1760 -15% | 2004 -3% | 1706 -18% | 2023 -2% |
| Score Write (Points) | 2496 | 2464 -1% | 2722 9% | 1857 -26% | 2254 -10% | 1598 -36% | 2532 1% |
| Score Total (Points) | 5607 | 5090 -9% | 6412 14% | 4428 -21% | 5280 -6% | 4184 -25% | 5571 -1% |
| Copy ISO MB/s (MB/s) | 2310 | 2275 -2% | 3357 45% | 2128 -8% | 2414 5% | 2106 -9% | |
| Copy Program MB/s (MB/s) | 748 | 593 -21% | 966 29% | 707 -5% | 1030 38% | 687 -8% | |
| Copy Game MB/s (MB/s) | 1523 | 1408 -8% | 2051 35% | 1471 -3% | 1991 31% | 1590 4% | |
| Total Average (Program / Settings) | 2% /
2% | 11% /
11% | 36% /
32% | -8% /
-7% | -10% /
-11% | -10% /
-11% |
* ... smaller is better
Continuous load read: DiskSpd Read Loop, Queue Depth 8
Graphics card
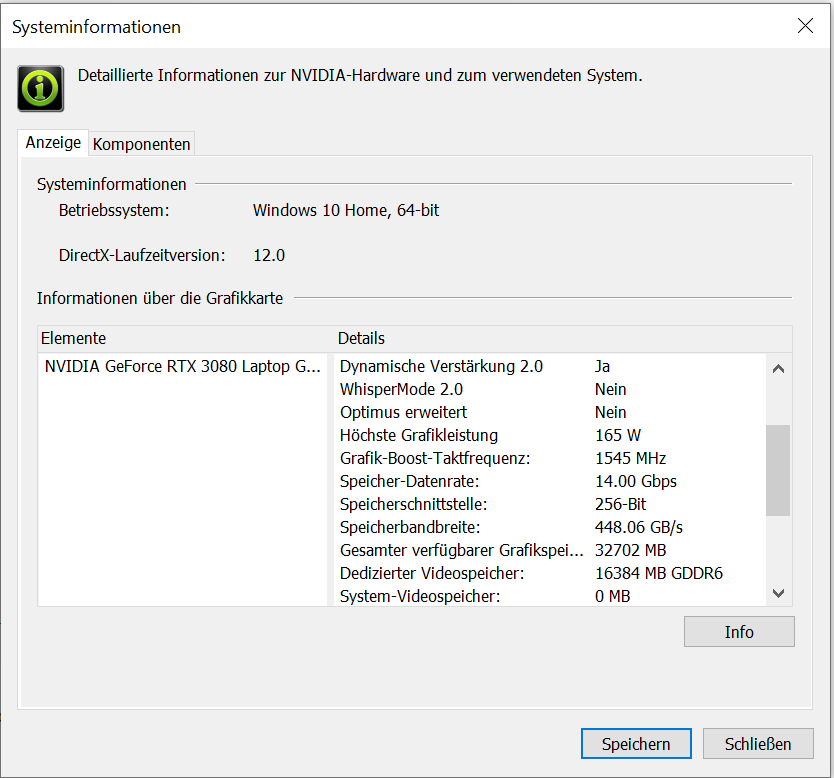
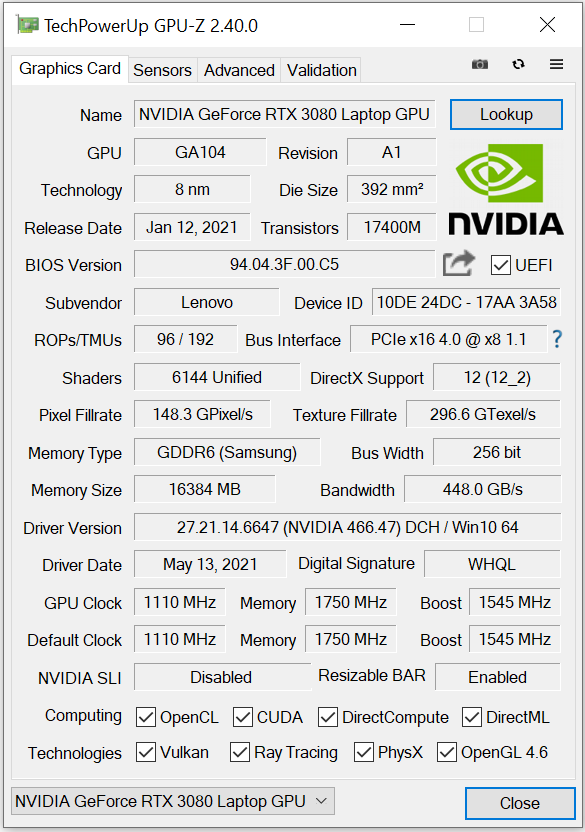
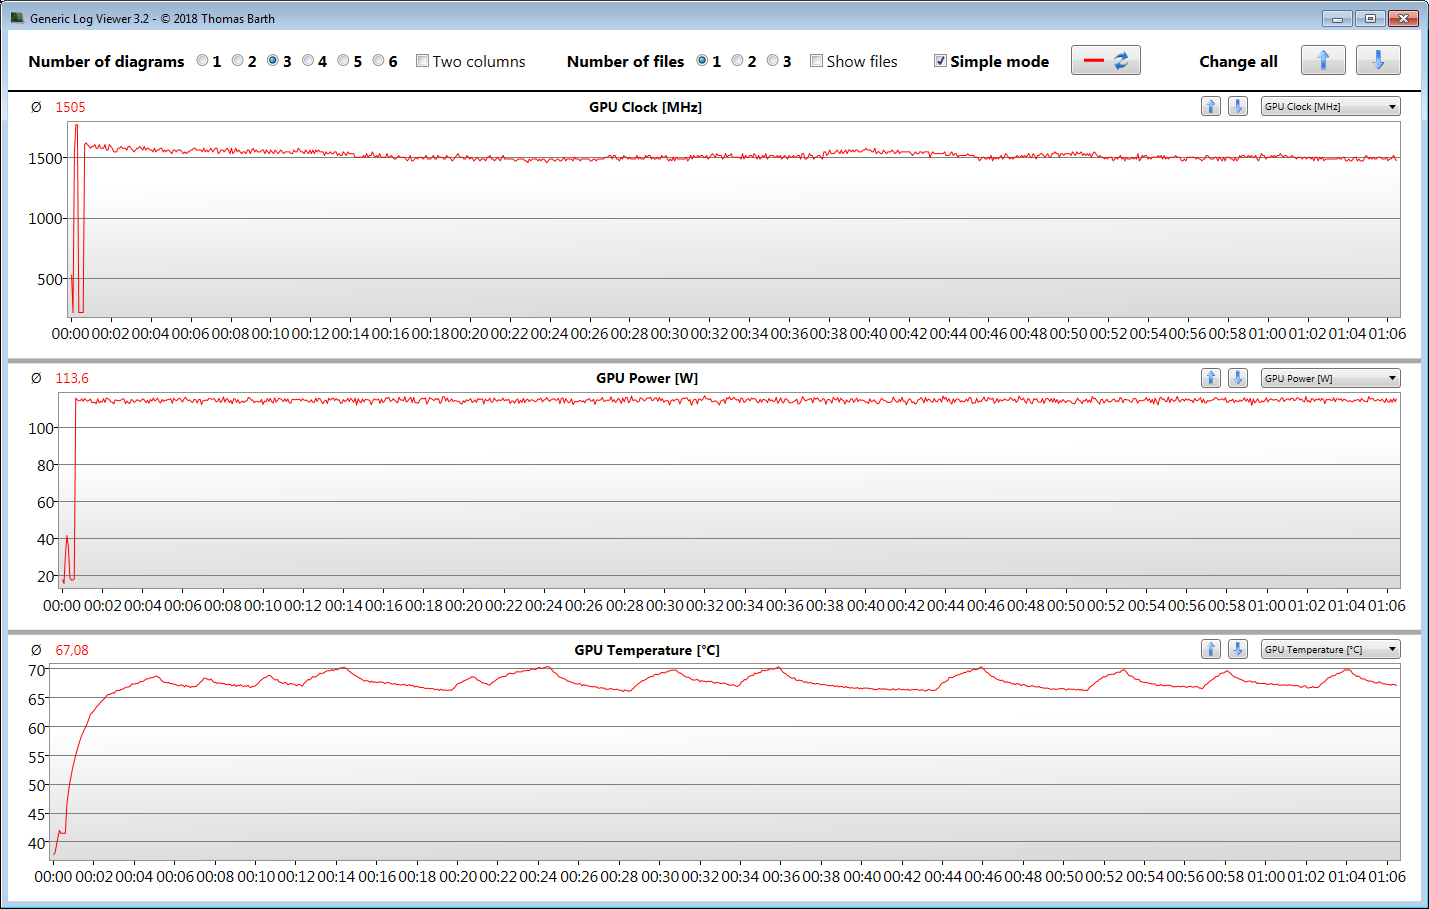
The GeForce RTX 3080 laptop graphics core is Nvidia's current top model high-end GPU. Laptop manufacturers can determine the TGP and therefore the maximum available computing power of an RTX 3000 graphics core quite freely within the limits defined by Nvidia (overview of all RTX 3080 laptops including their TGPs). Lenovo uses the maximum of 165 watts specified by Nvidia (150 watts + 15 watts Dynamic Boost).
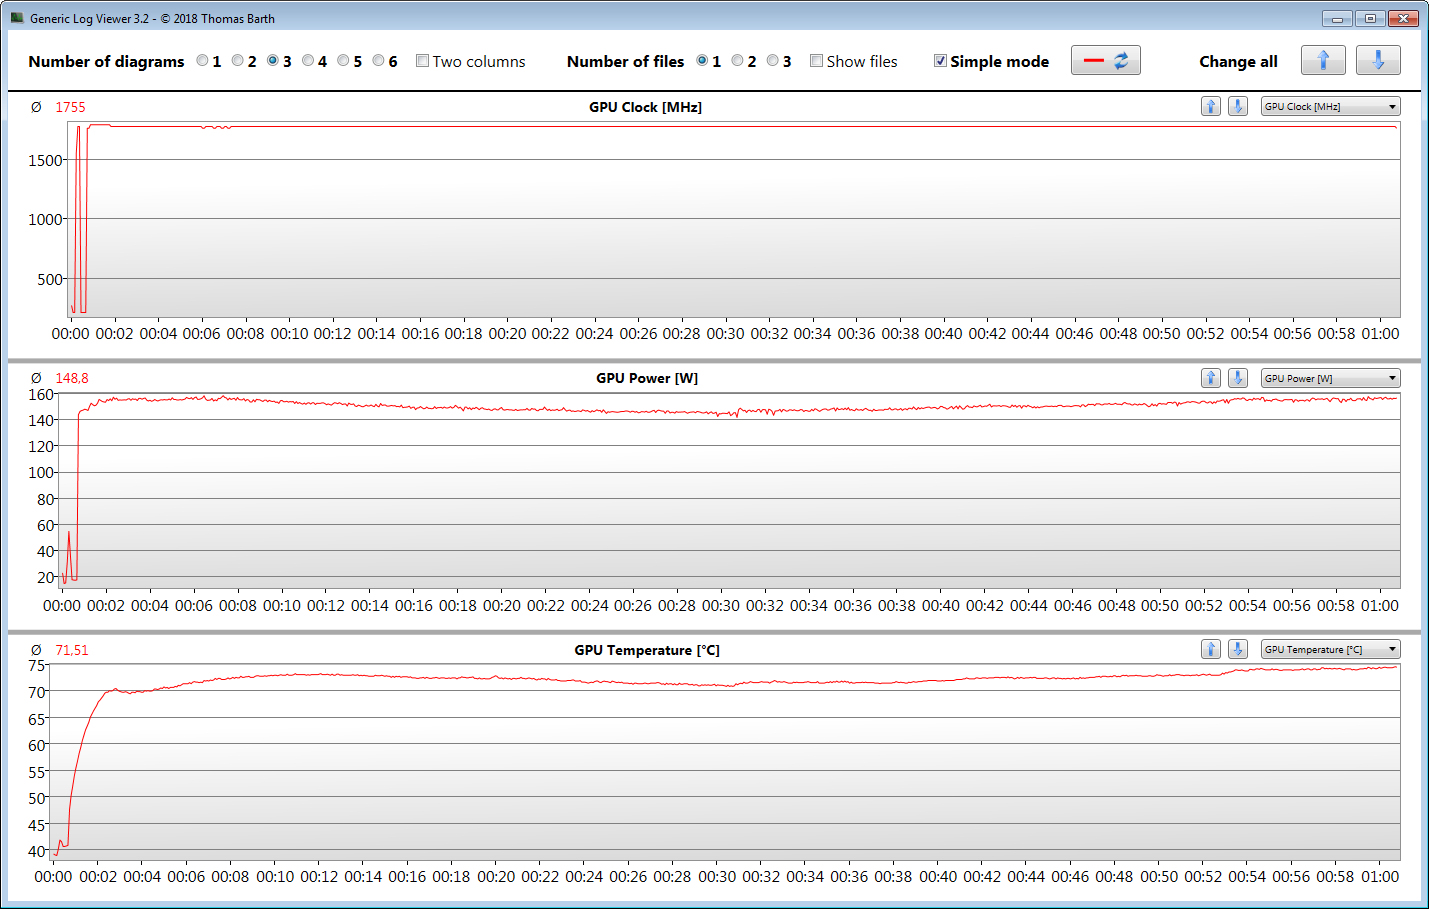
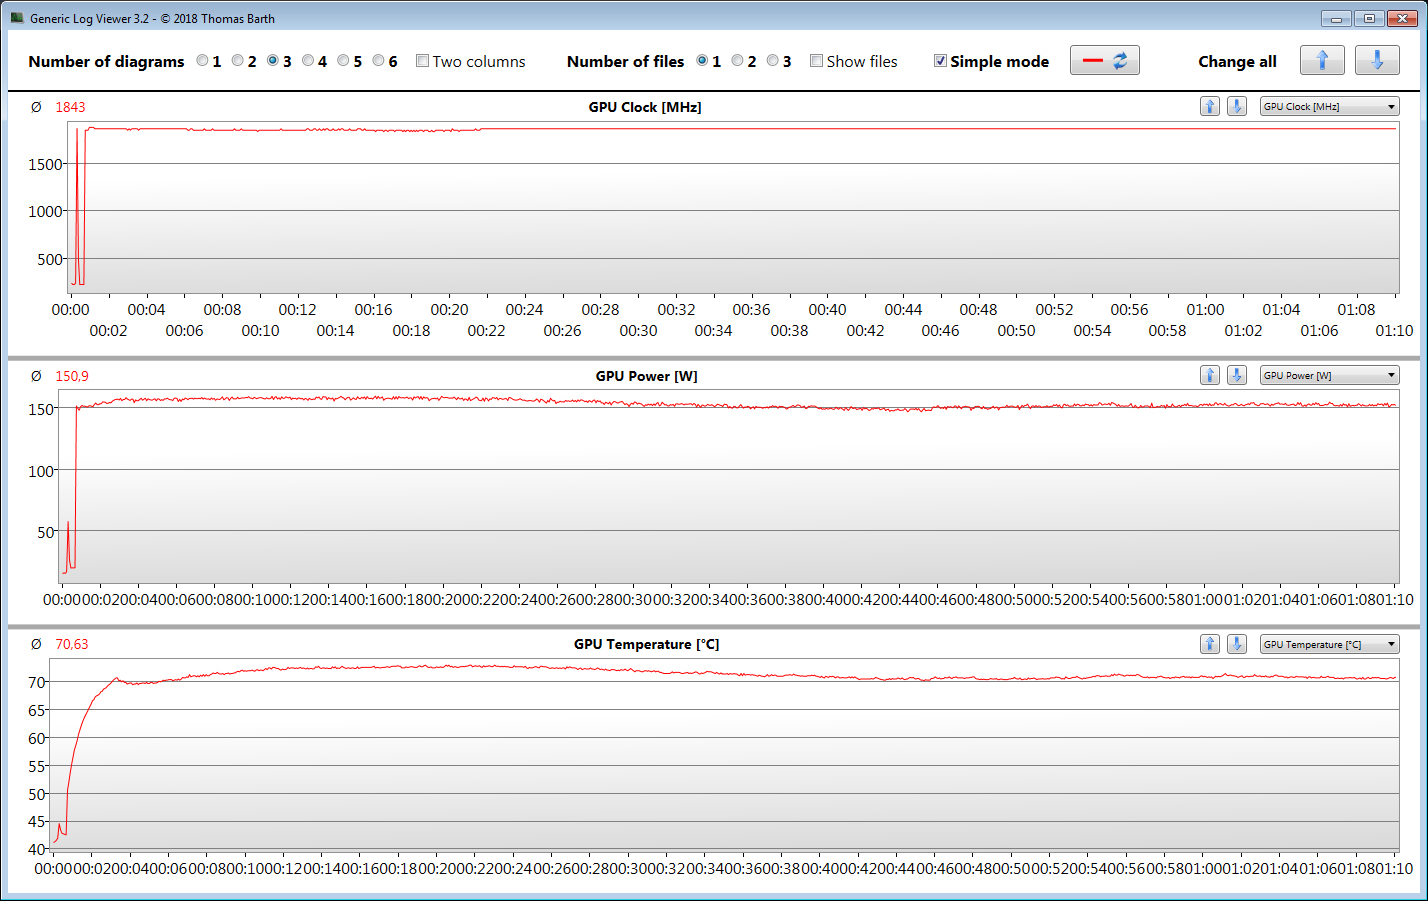
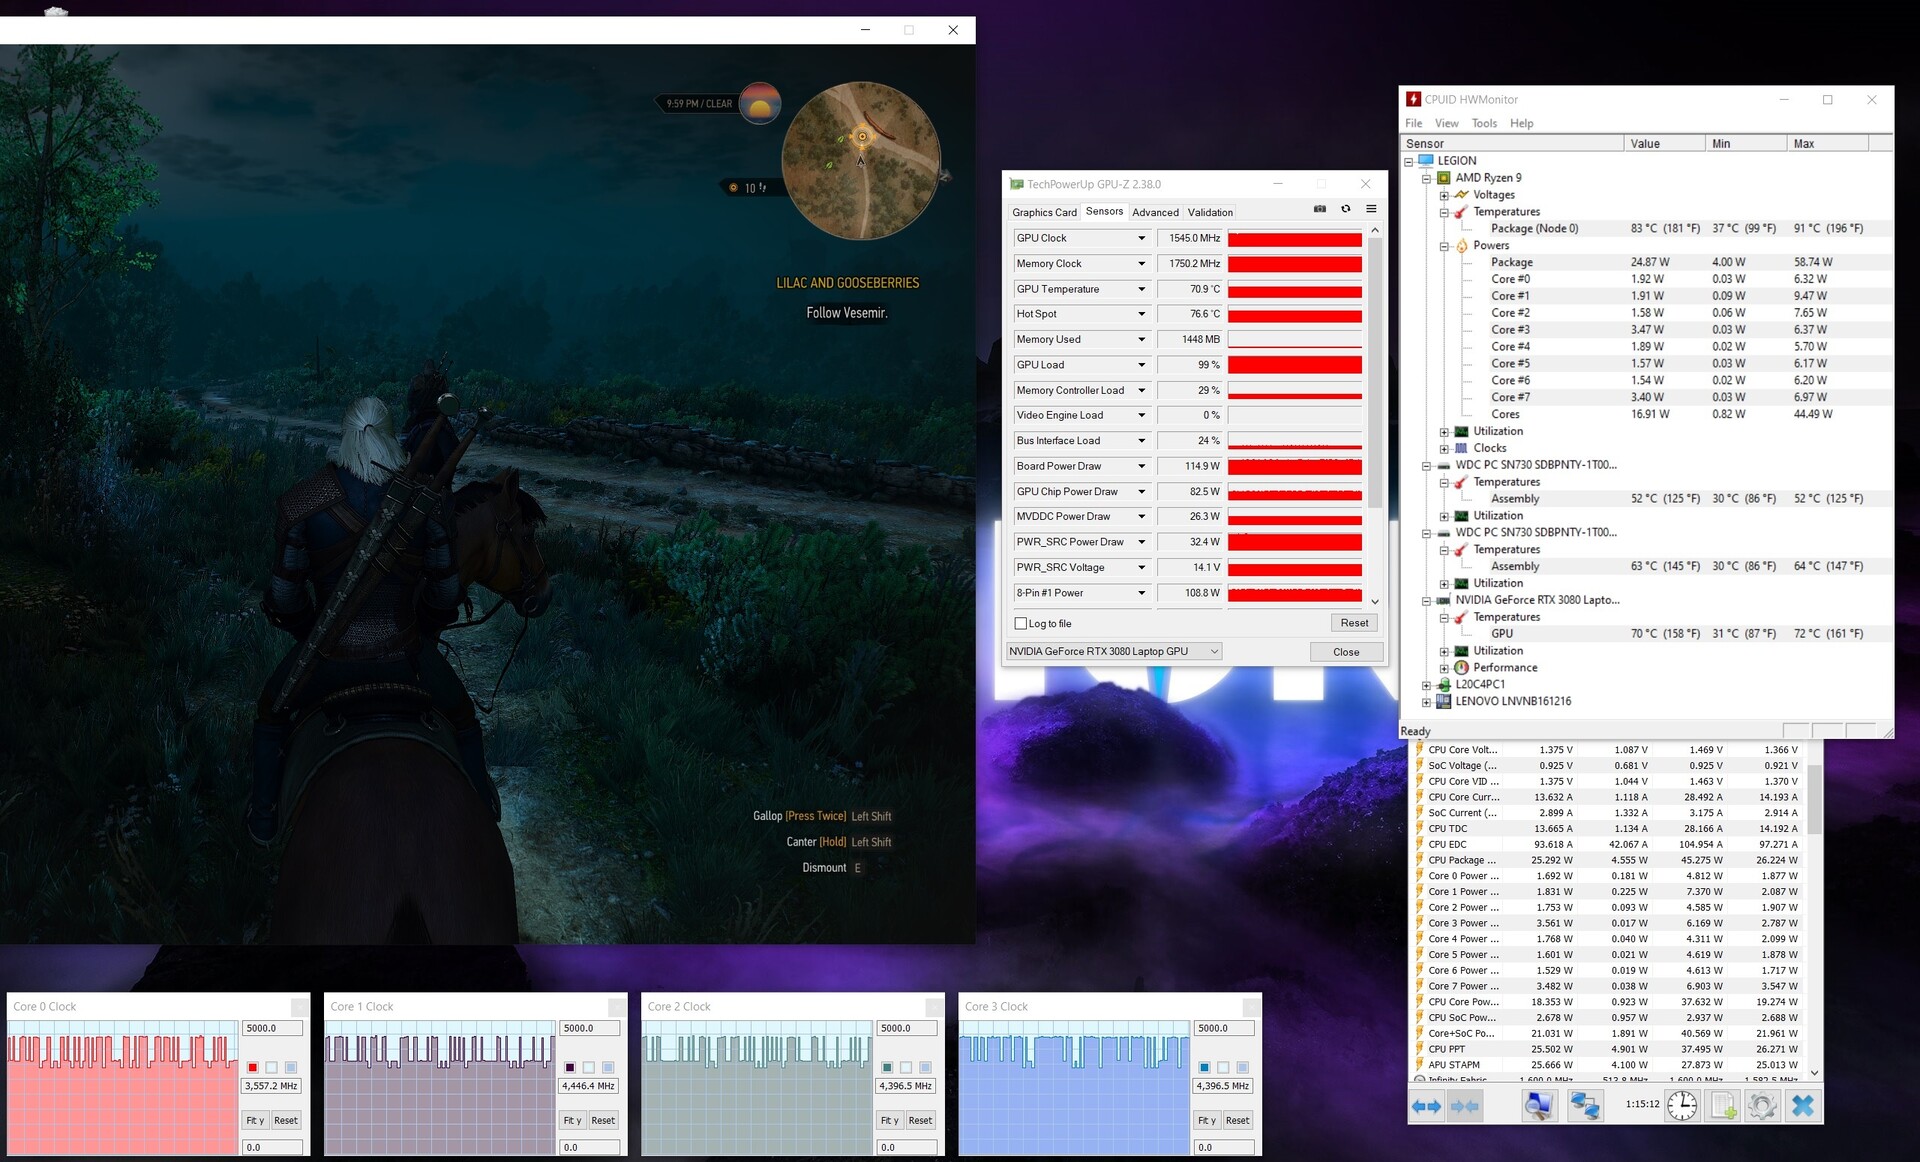
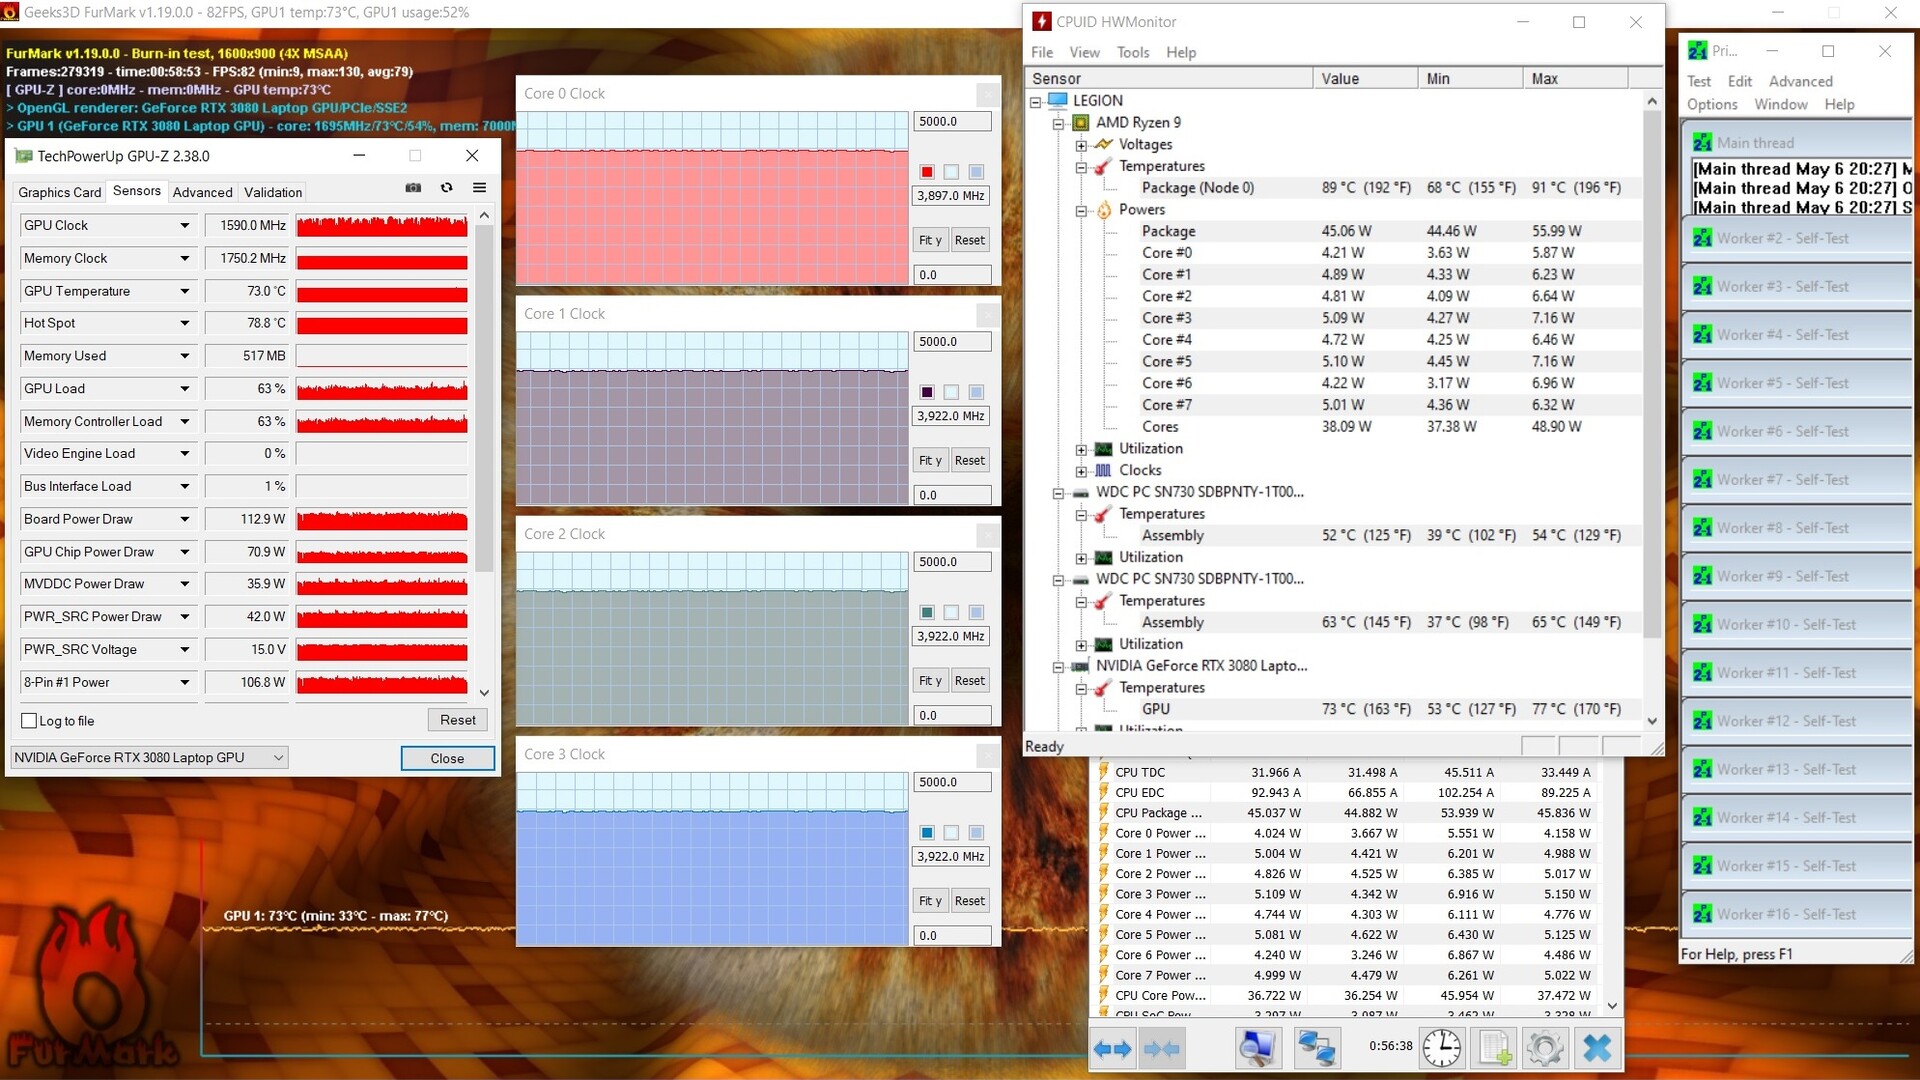
The "Balanced Mode" default profile operates with a TGP of 120 watts, and the 165-watt TGP is only implemented when the "Performance Mode" profile is active. A look at the metrics of our The Witcher 3 test reveals that Dynamic Boost is used sparingly if at all. For cross-checking, we ran the "FurMark" tool on its own and were able to measure the maximum TGP of 165 watts.
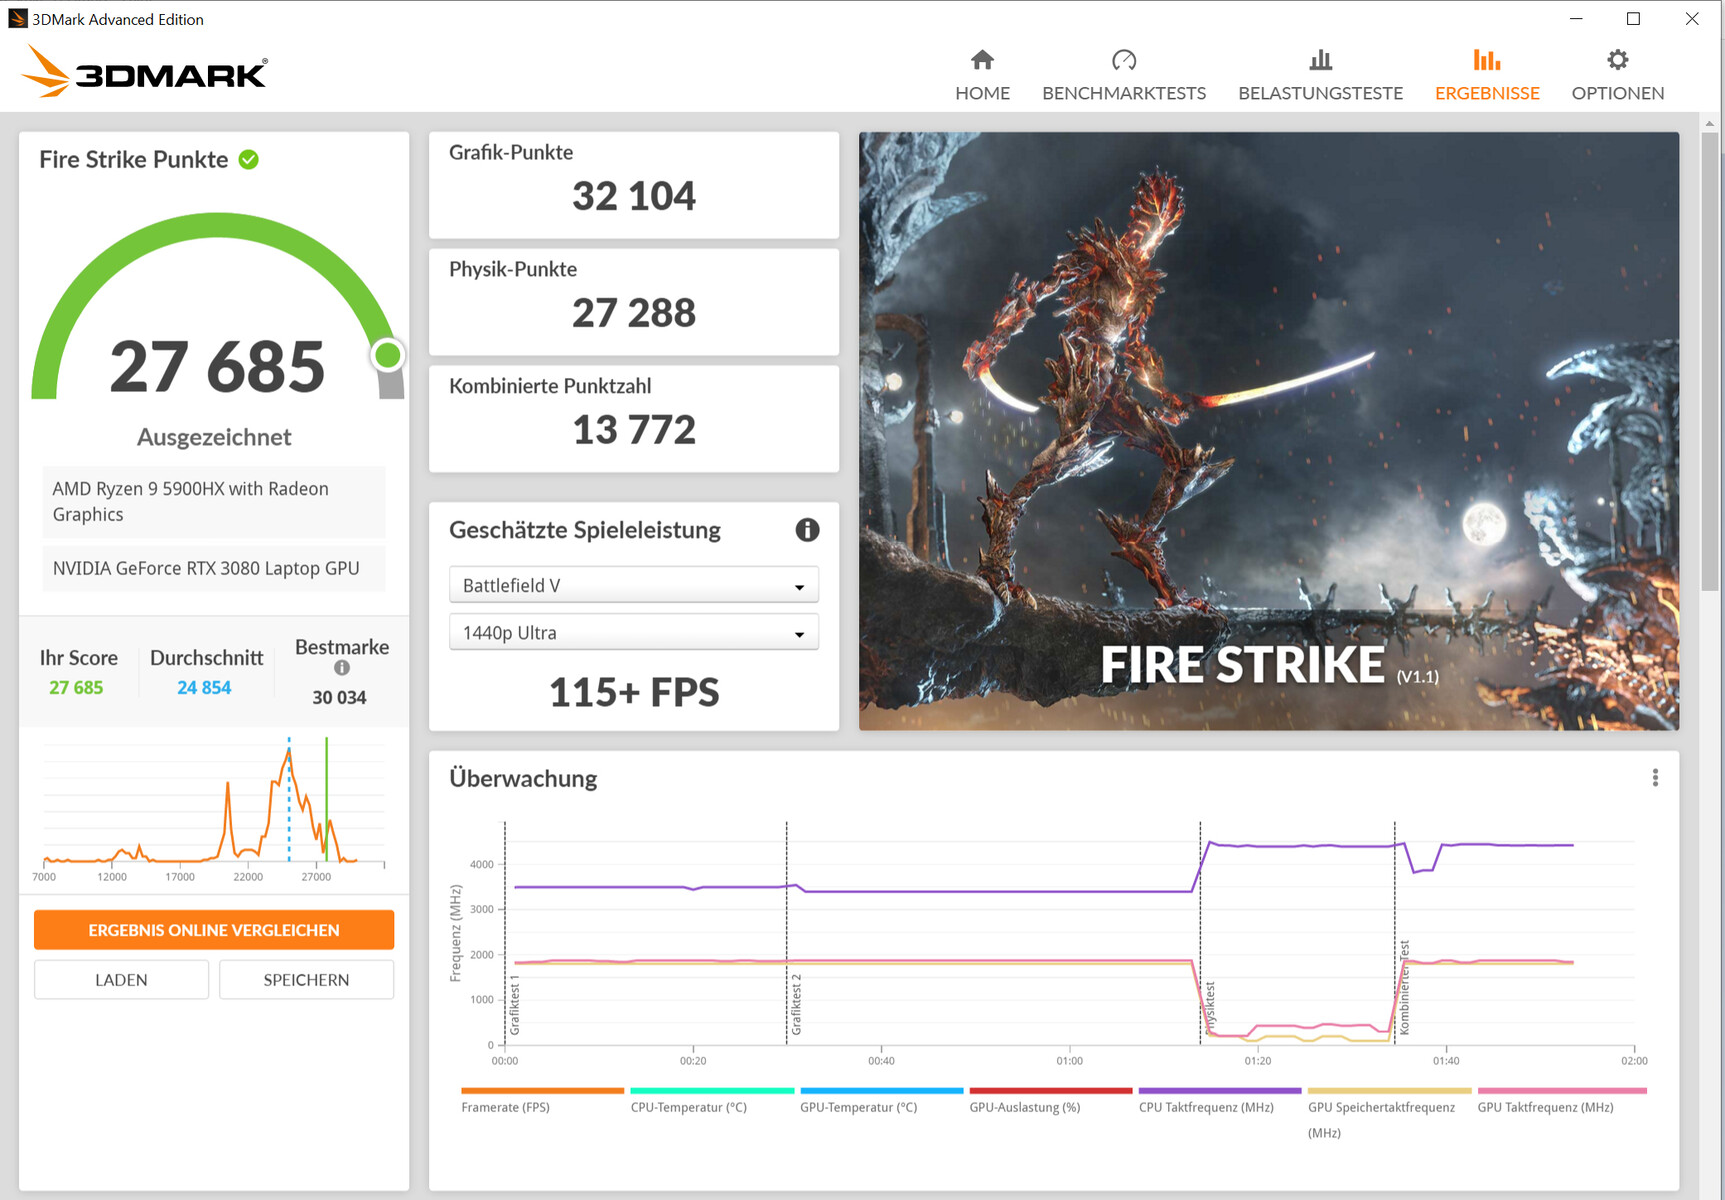
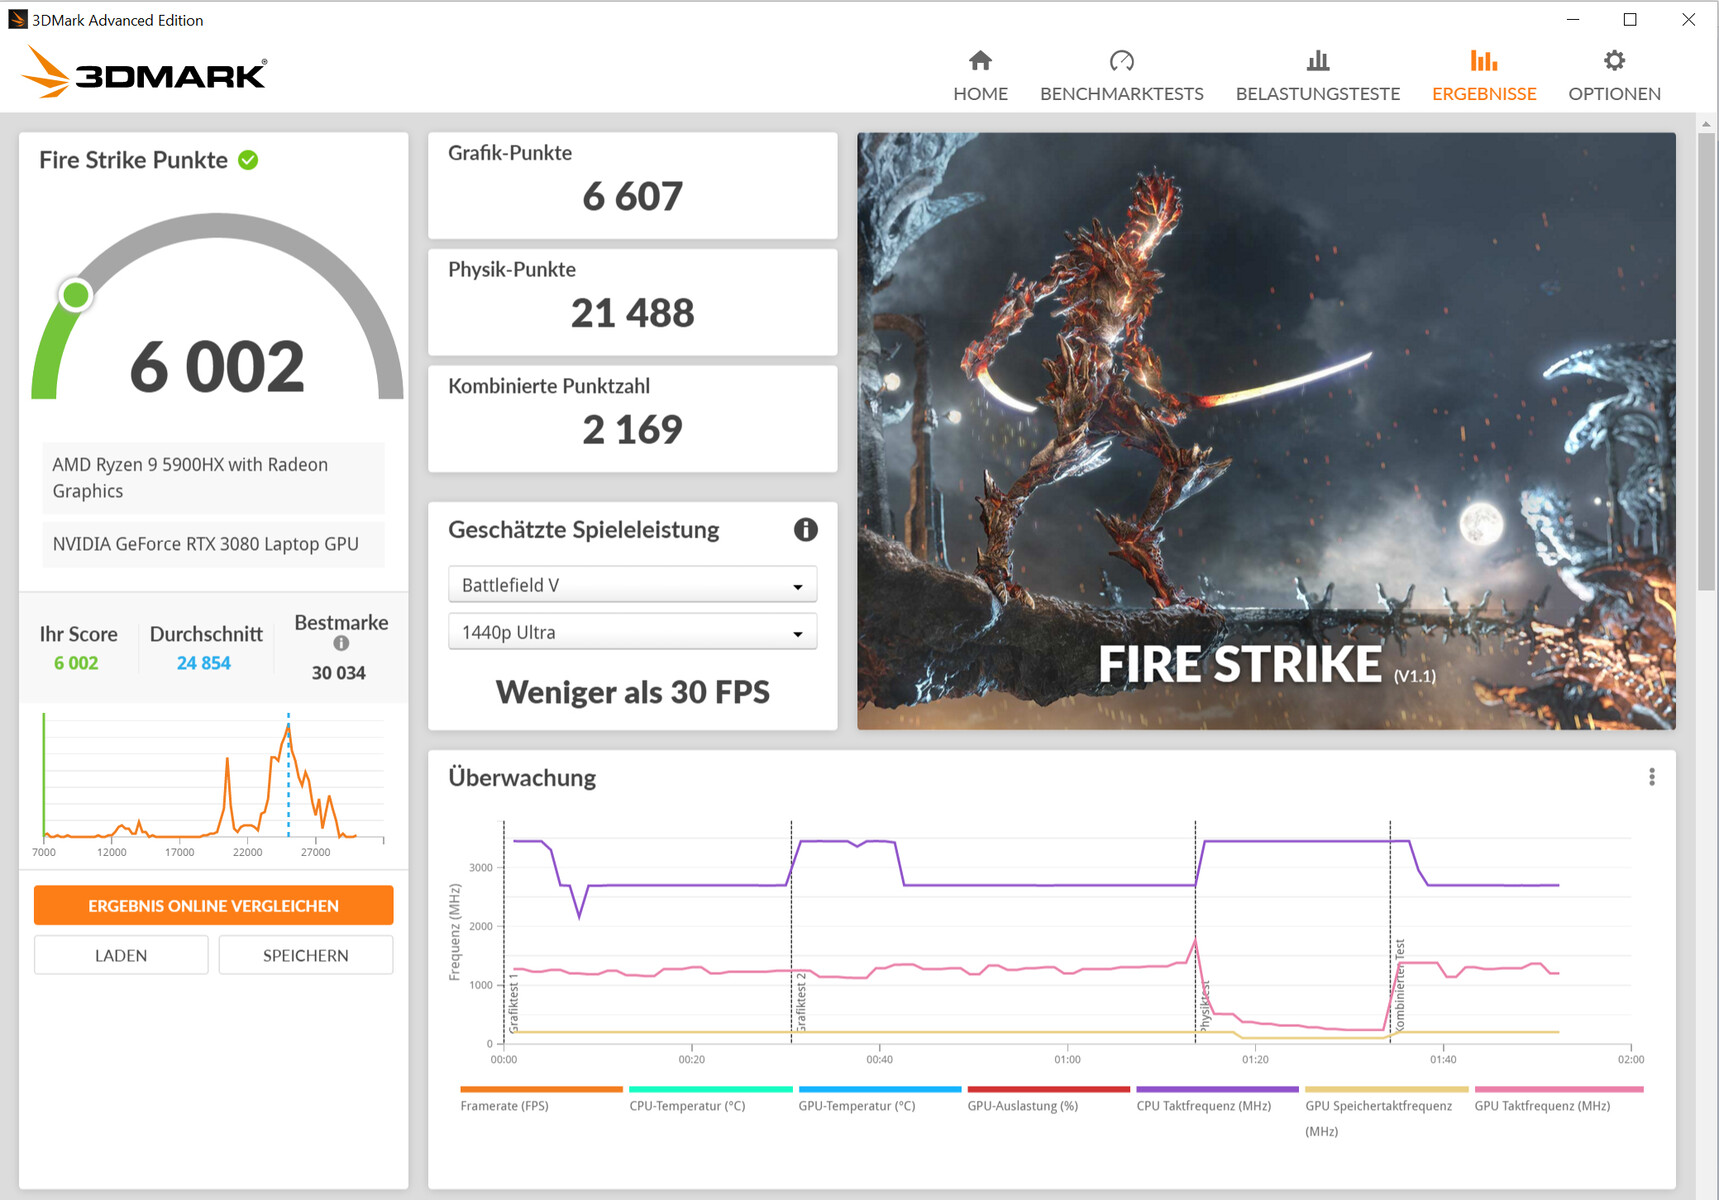
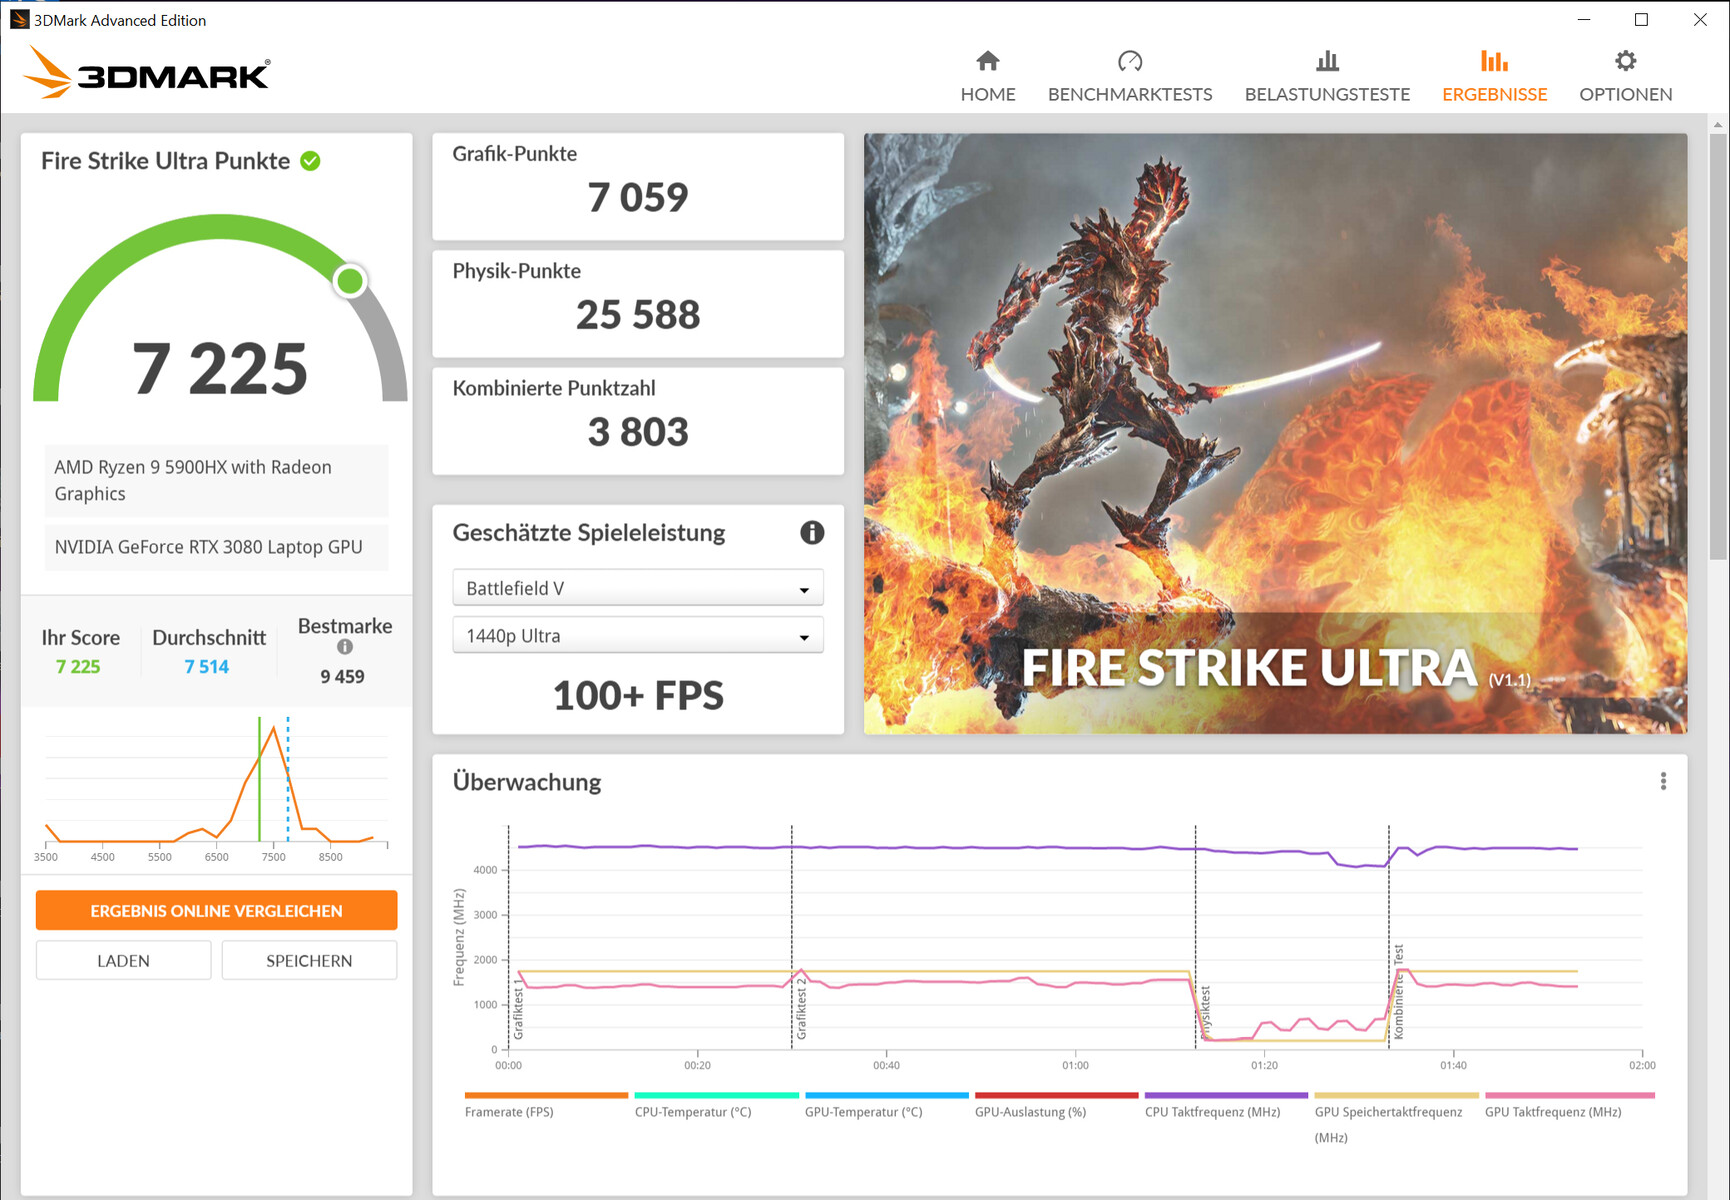
The 3DMark results are at the expected level. The "Performance Mode" profile results in an increase in graphics performance, and activating the overclocking function boosts the benchmark results a bit further.
The RTX 3080 can access fast GDDR6 graphics memory (16,384 MB). The Vega 8 graphics core integrated into the processor is disabled by default, but it's possible to turn it on.
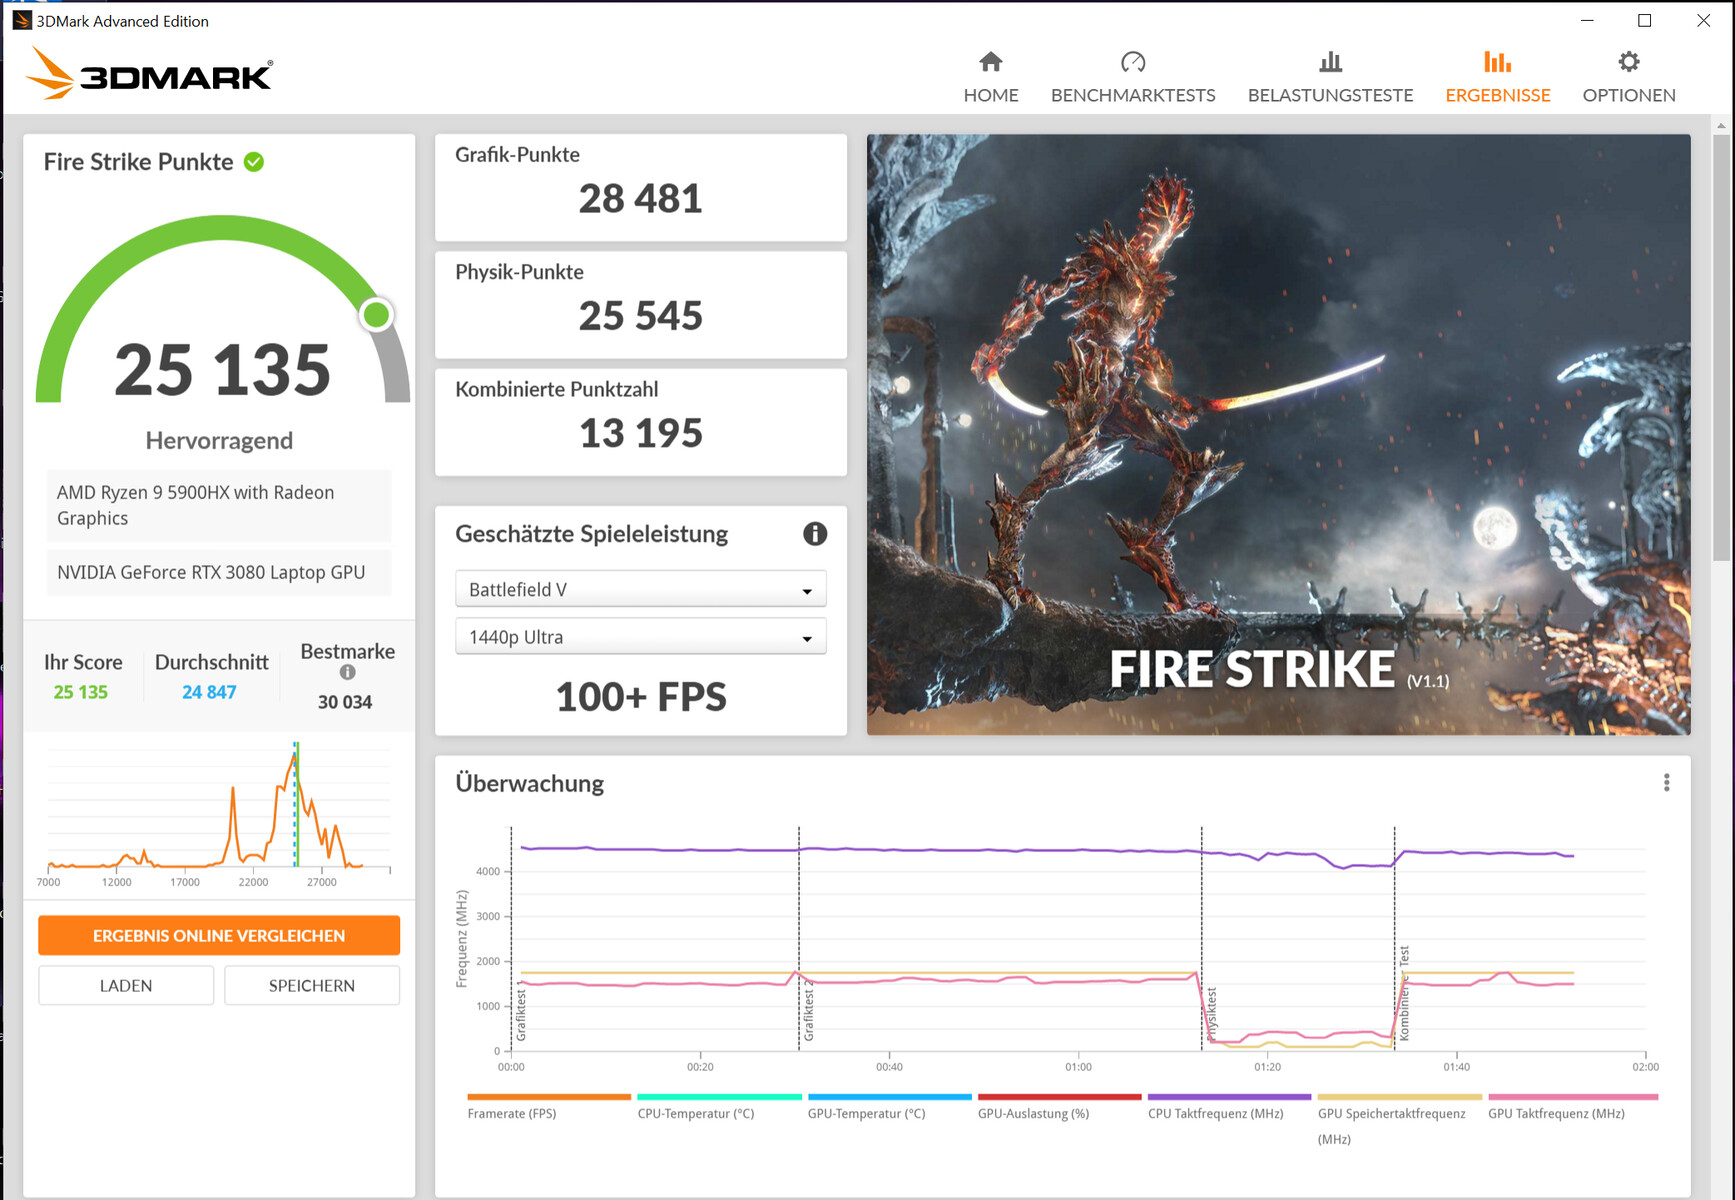
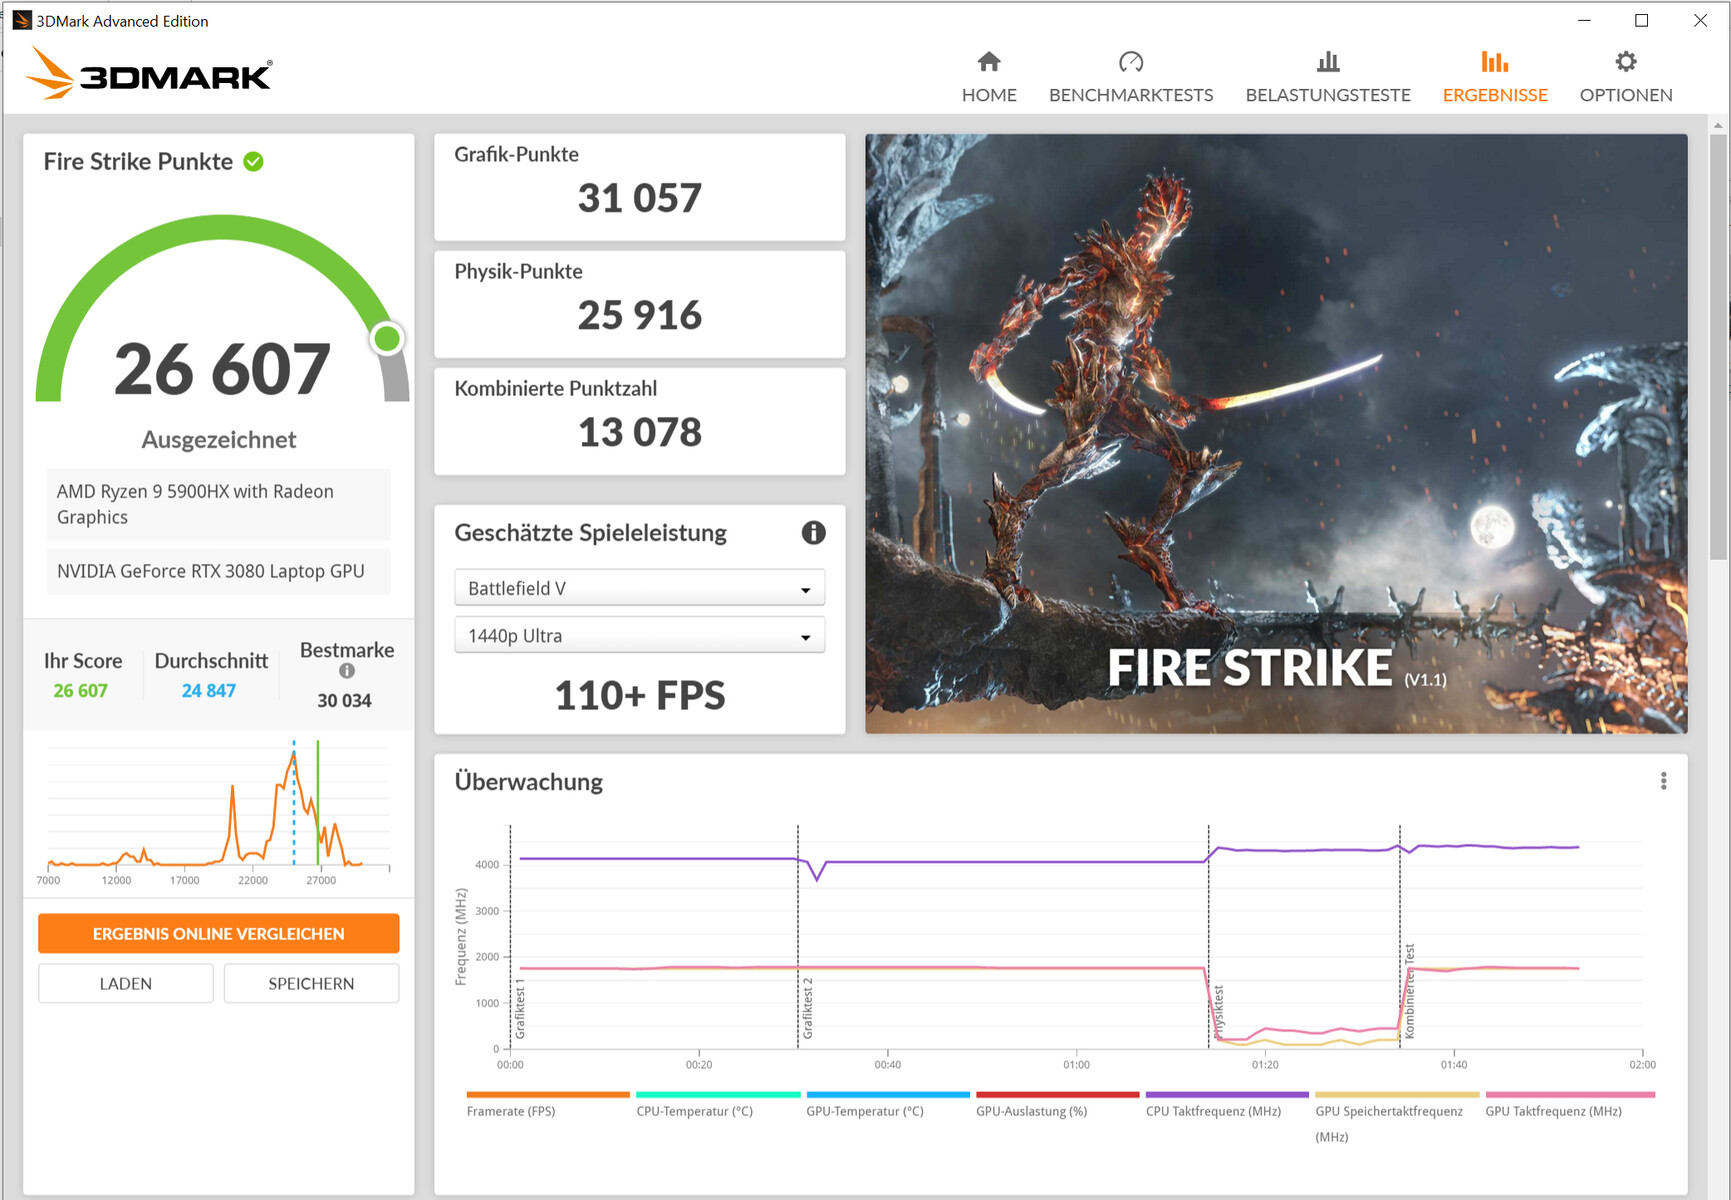


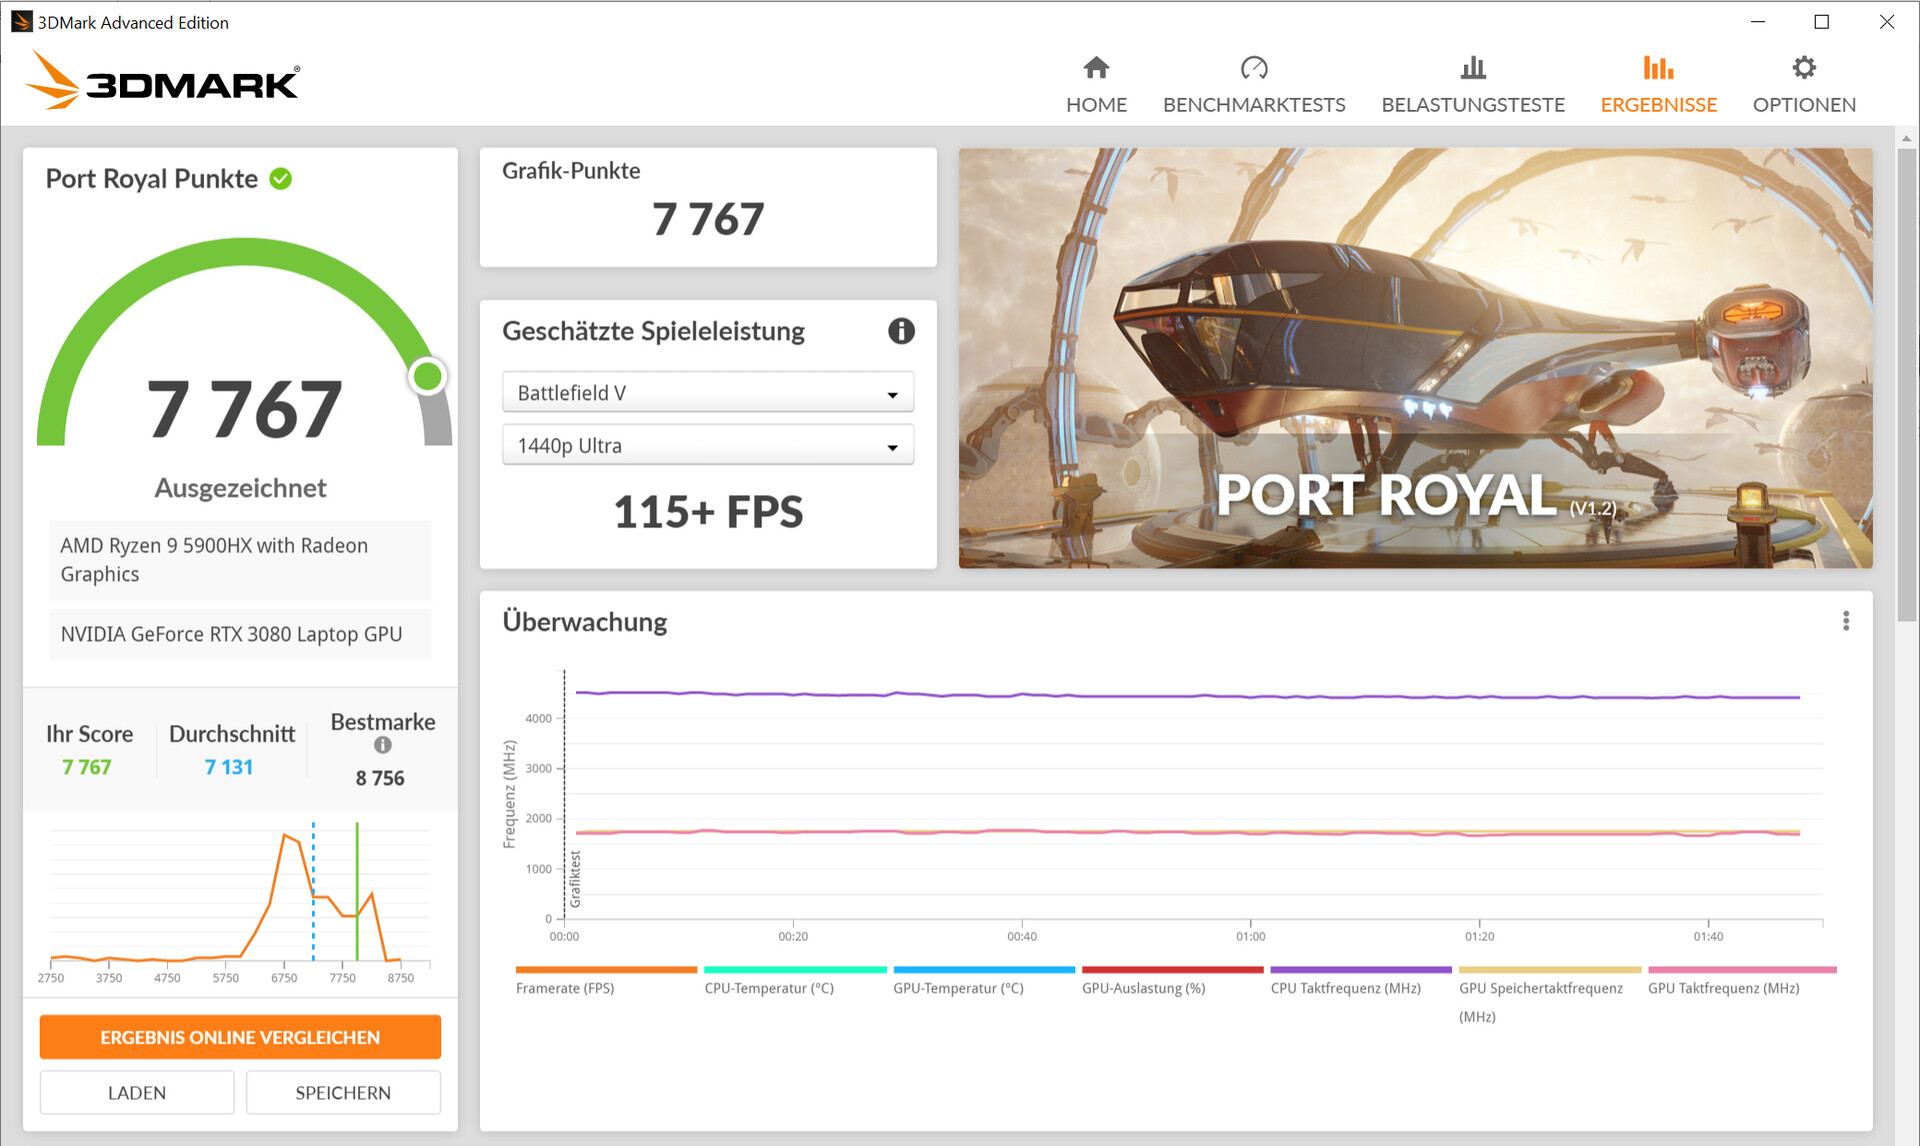
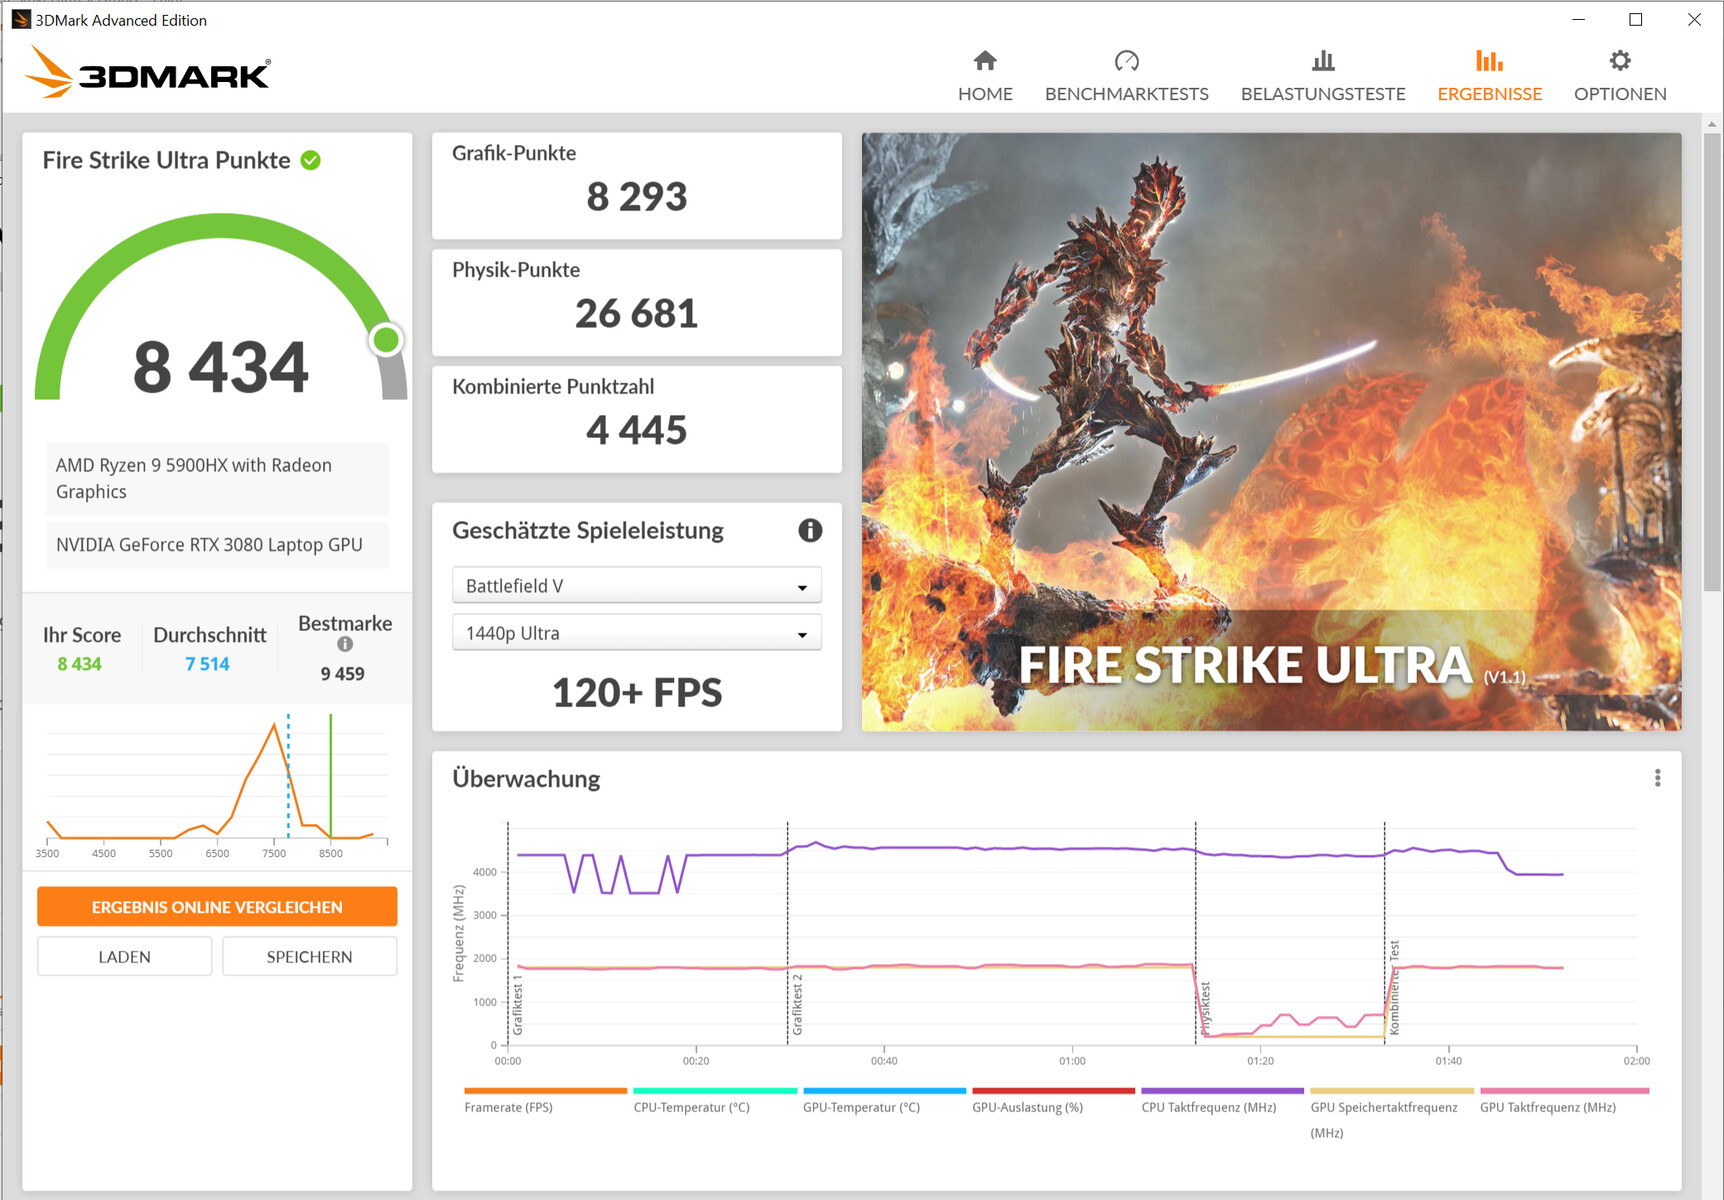
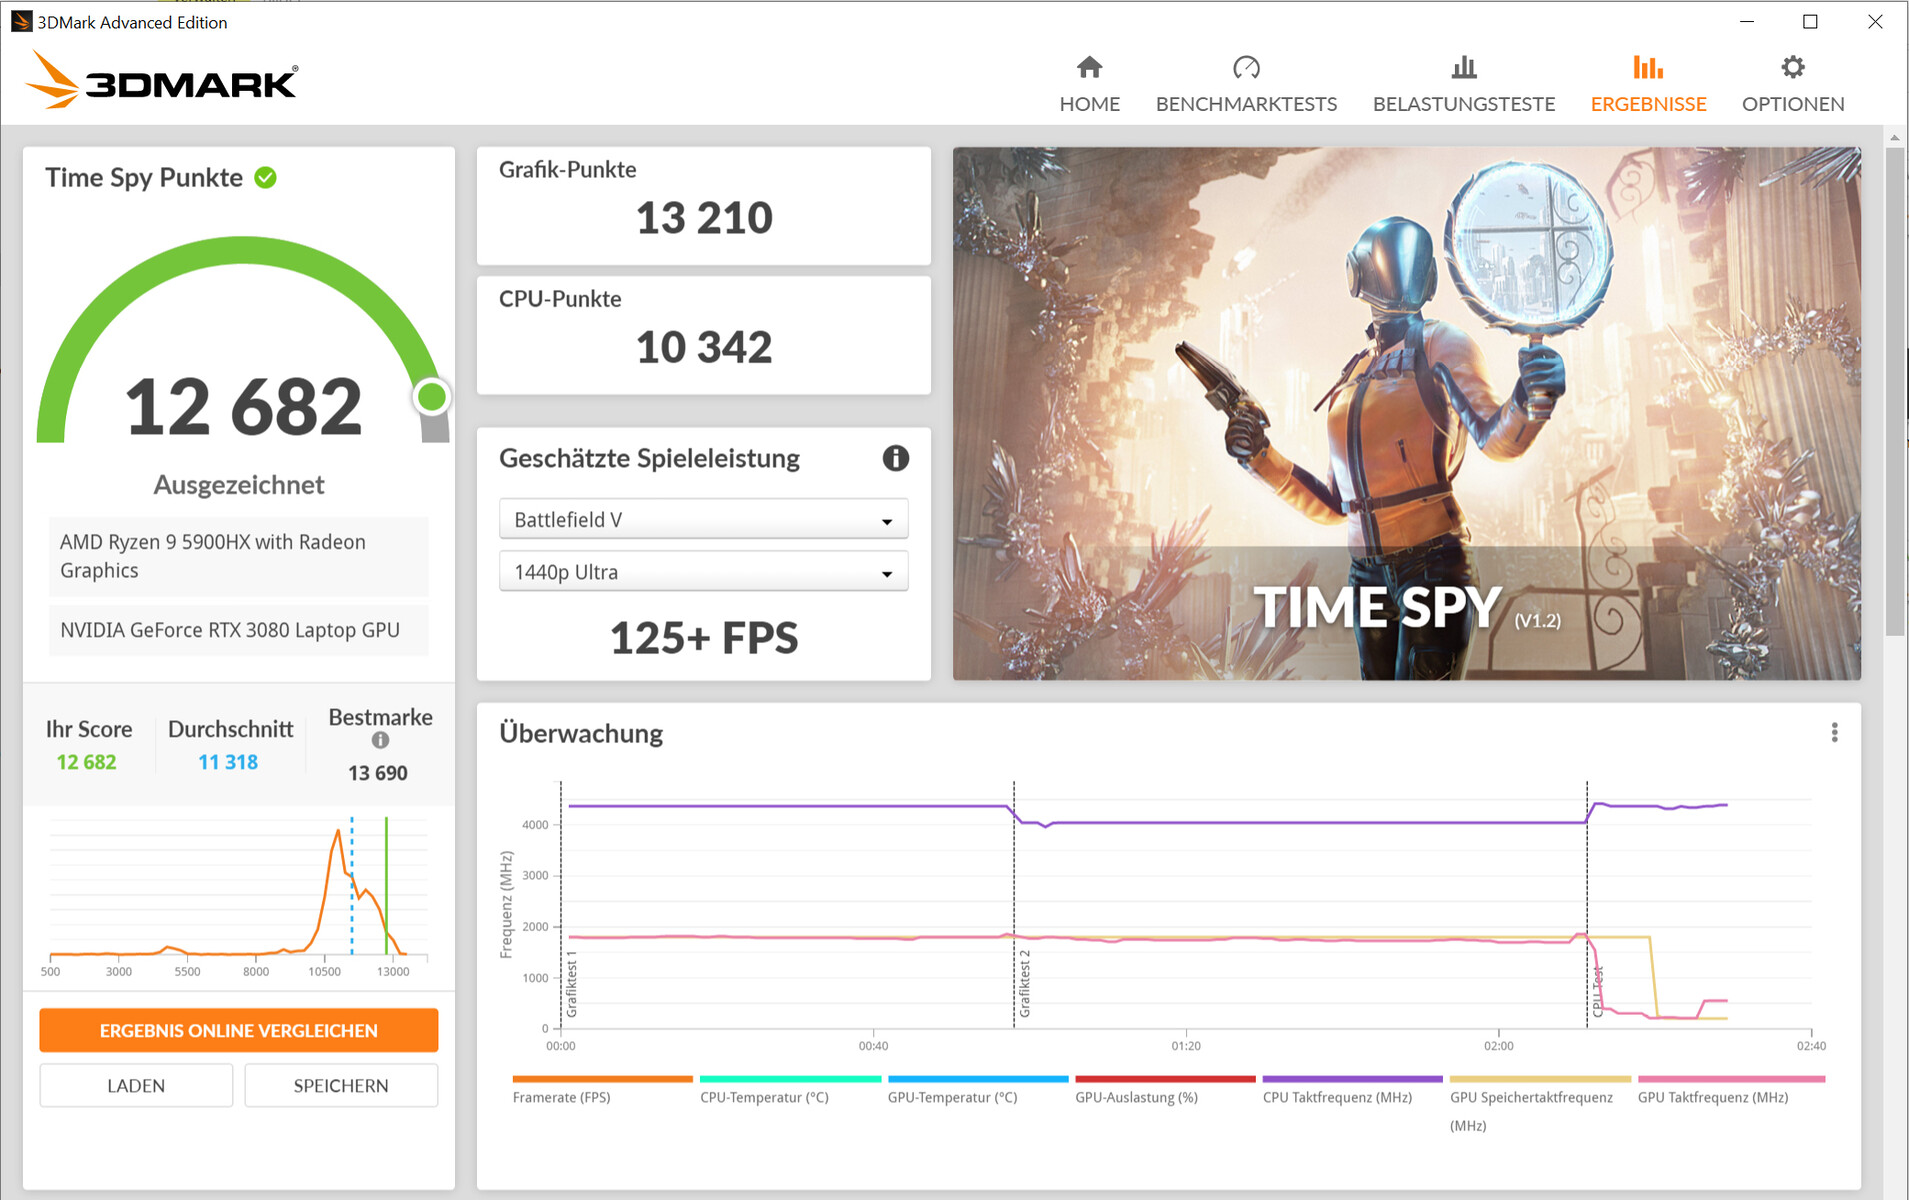

| 3DMark 11 Performance | 28426 points | |
| 3DMark Cloud Gate Standard Score | 56439 points | |
| 3DMark Fire Strike Score | 25135 points | |
| 3DMark Time Spy Score | 10867 points | |
Help | ||
| 3DMark 11 - 1280x720 Performance GPU | |
| Average of class Gaming (21841 - 80022, n=107, last 2 years) | |
| Alienware m17 R4 | |
| MSI GE76 Raider 10UH | |
| Lenovo Legion 7 16ACHg6 (Leistung Overclocking) | |
| Lenovo Legion 7 16ACHg6 (Leistung) | |
| Asus Strix Scar 17 G733QSA-XS99 | |
| Average NVIDIA GeForce RTX 3080 Laptop GPU (31288 - 43744, n=40) | |
| Lenovo Legion 7 16ACHg6 | |
| Schenker XMG Pro 15 (Early 2021, RTX 3080) | |
| Razer Blade 15 Advanced Model Early 2021 | |
Gaming performance
The laptop brings all the latest games smoothly onto the screen. Usually, the full display resolution (2560x1600 pixels) and high to maximum quality settings can be selected. Higher resolutions (an appropriate monitor would have to be connected for this) can also be handled by the GPU.
Compared with the RTX 3080 laptops tested so far, the Legion 7 does very well and delivers frame rates above the average. The "Performance Mode" profile increases the frame rates, and the automatic overclocking results in a small performance increase in some cases.
| Performance rating - Percent | |
| Average of class Gaming -2! | |
| Lenovo Legion 7 16ACHg6 -1! | |
| Lenovo Legion 7 16ACHg6 | |
| MSI GE76 Raider 10UH -6! | |
| Alienware m17 R4 -6! | |
| Lenovo Legion 7 16ACHg6 | |
| Average NVIDIA GeForce RTX 3080 Laptop GPU | |
| Asus Strix Scar 17 G733QSA-XS99 -6! | |
| Schenker XMG Pro 15 (Early 2021, RTX 3080) -10! | |
| Razer Blade 15 Advanced Model Early 2021 -8! | |
| Asus ROG Zephyrus G15 GA503Q -7! | |
| The Witcher 3 - 1920x1080 Ultra Graphics & Postprocessing (HBAO+) | |
| Average of class Gaming (95 - 240, n=8, last 2 years) | |
| Lenovo Legion 7 16ACHg6 (Leistung Overclocking) | |
| Lenovo Legion 7 16ACHg6 (Leistung) | |
| MSI GE76 Raider 10UH | |
| Alienware m17 R4 | |
| Lenovo Legion 7 16ACHg6 | |
| Asus Strix Scar 17 G733QSA-XS99 | |
| Average NVIDIA GeForce RTX 3080 Laptop GPU (85.1 - 123, n=40) | |
| Schenker XMG Pro 15 (Early 2021, RTX 3080) | |
| Razer Blade 15 Advanced Model Early 2021 | |
| Asus ROG Zephyrus G15 GA503Q | |
| Dota 2 Reborn - 1920x1080 ultra (3/3) best looking | |
| Average of class Gaming (84.8 - 248, n=111, last 2 years) | |
| Alienware m17 R4 | |
| Lenovo Legion 7 16ACHg6 (Leistung) | |
| Lenovo Legion 7 16ACHg6 (Leistung Overclocking) | |
| Average NVIDIA GeForce RTX 3080 Laptop GPU (98 - 156, n=45) | |
| MSI GE76 Raider 10UH | |
| Lenovo Legion 7 16ACHg6 | |
| Asus Strix Scar 17 G733QSA-XS99 | |
| Asus ROG Zephyrus G15 GA503Q | |
| Schenker XMG Pro 15 (Early 2021, RTX 3080) | |
| Razer Blade 15 Advanced Model Early 2021 | |
| X-Plane 11.11 - 1920x1080 high (fps_test=3) | |
| Average of class Gaming (52.1 - 143.5, n=114, last 2 years) | |
| Alienware m17 R4 | |
| Average NVIDIA GeForce RTX 3080 Laptop GPU (65.6 - 113, n=44) | |
| MSI GE76 Raider 10UH | |
| Lenovo Legion 7 16ACHg6 | |
| Lenovo Legion 7 16ACHg6 (Leistung) | |
| Schenker XMG Pro 15 (Early 2021, RTX 3080) | |
| Razer Blade 15 Advanced Model Early 2021 | |
| Asus Strix Scar 17 G733QSA-XS99 | |
| Asus ROG Zephyrus G15 GA503Q | |
| Final Fantasy XV Benchmark | |
| 1920x1080 High Quality | |
| Average of class Gaming (41 - 215, n=100, last 2 years) | |
| MSI GE76 Raider 10UH (1.3) | |
| Lenovo Legion 7 16ACHg6 (1.3, Leistung Overclocking) | |
| Lenovo Legion 7 16ACHg6 (1.3, Leistung) | |
| Lenovo Legion 7 16ACHg6 (1.3) | |
| Asus Strix Scar 17 G733QSA-XS99 (1.3) | |
| Average NVIDIA GeForce RTX 3080 Laptop GPU (55.5 - 115, n=34) | |
| Alienware m17 R4 (1.3) | |
| 2560x1440 High Quality | |
| Average of class Gaming (32.5 - 184.3, n=89, last 2 years) | |
| Lenovo Legion 7 16ACHg6 (1.3, Leistung Overclocking) | |
| Lenovo Legion 7 16ACHg6 (1.3, Leistung) | |
| Lenovo Legion 7 16ACHg6 (1.3) | |
| Average NVIDIA GeForce RTX 3080 Laptop GPU (61.6 - 90.3, n=18) | |
| Strange Brigade | |
| 1920x1080 ultra AA:ultra AF:16 | |
| Average of class Gaming (76.3 - 456, n=90, last 2 years) | |
| MSI GE76 Raider 10UH (1.47.22.14 D3D12) | |
| Lenovo Legion 7 16ACHg6 (1.47.22.14 D3D12, Leistung Overclocking) | |
| Lenovo Legion 7 16ACHg6 (1.47.22.14 D3D12, Leistung) | |
| Alienware m17 R4 (1.47.22.14 D3D12) | |
| Lenovo Legion 7 16ACHg6 (1.47.22.14 D3D12) | |
| Average NVIDIA GeForce RTX 3080 Laptop GPU (117 - 219, n=34) | |
| Asus Strix Scar 17 G733QSA-XS99 (1.47.22.14 D3D12) | |
| 2560x1440 ultra AA:ultra AF:16 | |
| Average of class Gaming (52.8 - 350, n=79, last 2 years) | |
| Lenovo Legion 7 16ACHg6 (1.47.22.14 D3D12, Leistung Overclocking) | |
| Lenovo Legion 7 16ACHg6 (1.47.22.14 D3D12, Leistung) | |
| Lenovo Legion 7 16ACHg6 (1.47.22.14 D3D12) | |
| Average NVIDIA GeForce RTX 3080 Laptop GPU (123 - 165, n=14) | |
| GTA V | |
| 1920x1080 Highest AA:4xMSAA + FX AF:16x | |
| Average of class Gaming (48.3 - 186.9, n=99, last 2 years) | |
| Lenovo Legion 7 16ACHg6 (Leistung) | |
| Lenovo Legion 7 16ACHg6 | |
| Average NVIDIA GeForce RTX 3080 Laptop GPU (68.6 - 114.6, n=34) | |
| Lenovo Legion 7 16ACHg6 (Leistung Overclocking) | |
| MSI GE76 Raider 10UH | |
| Alienware m17 R4 | |
| Asus Strix Scar 17 G733QSA-XS99 | |
| Asus ROG Zephyrus G15 GA503Q | |
| 2560x1440 Highest AA:4xMSAA + FX AF:16x | |
| Average of class Gaming (36.9 - 183.9, n=75, last 2 years) | |
| Lenovo Legion 7 16ACHg6 (Leistung) | |
| Lenovo Legion 7 16ACHg6 | |
| Lenovo Legion 7 16ACHg6 (Leistung Overclocking) | |
| Average NVIDIA GeForce RTX 3080 Laptop GPU (82.2 - 99.1, n=12) | |
| Far Cry 5 | |
| 1920x1080 Ultra Preset AA:T | |
| Alienware m17 R4 | |
| Average of class Gaming (70 - 151, n=10, last 2 years) | |
| MSI GE76 Raider 10UH | |
| Lenovo Legion 7 16ACHg6 | |
| Lenovo Legion 7 16ACHg6 (Leistung) | |
| Lenovo Legion 7 16ACHg6 (Leistung Overclocking) | |
| Average NVIDIA GeForce RTX 3080 Laptop GPU (75 - 146, n=33) | |
| Asus Strix Scar 17 G733QSA-XS99 | |
| Razer Blade 15 Advanced Model Early 2021 | |
| 2560x1440 Ultra Preset AA:T | |
| Average of class Gaming (90 - 149, n=8, last 2 years) | |
| Lenovo Legion 7 16ACHg6 (Leistung) | |
| Lenovo Legion 7 16ACHg6 (Leistung Overclocking) | |
| Lenovo Legion 7 16ACHg6 | |
| Average NVIDIA GeForce RTX 3080 Laptop GPU (86 - 112, n=17) | |
| Dirt 5 | |
| 1920x1080 Ultra High Preset | |
| Lenovo Legion 7 16ACHg6 (Leistung Overclocking) | |
| Lenovo Legion 7 16ACHg6 (Leistung) | |
| Lenovo Legion 7 16ACHg6 | |
| Average NVIDIA GeForce RTX 3080 Laptop GPU (52 - 110, n=11) | |
| Razer Blade 15 Advanced Model Early 2021 | |
| Asus ROG Zephyrus G15 GA503Q | |
| 2560x1440 Ultra High Preset | |
| Lenovo Legion 7 16ACHg6 (Leistung Overclocking) | |
| Lenovo Legion 7 16ACHg6 (Leistung) | |
| Lenovo Legion 7 16ACHg6 | |
| Average NVIDIA GeForce RTX 3080 Laptop GPU (42.7 - 96.5, n=6) | |
| Asus ROG Zephyrus G15 GA503Q | |
In order to verify whether the frame rates remain largely constant over a prolonged period of time, we let the game The Witcher 3 run for about 60 minutes at Full HD resolution and maximum quality settings. The character is not moved. A drop in frame rates wasn't found.
| low | med. | high | ultra | QHD | |
|---|---|---|---|---|---|
| GTA V (2015) | 181 | 177 | 168 | 103 | 95.6 |
| The Witcher 3 (2015) | 355 | 302 | 206 | 114 | |
| Dota 2 Reborn (2015) | 153 | 137 | 133 | 125 | |
| Final Fantasy XV Benchmark (2018) | 191 | 145 | 106 | 81 | |
| X-Plane 11.11 (2018) | 116 | 100 | 82.1 | ||
| Far Cry 5 (2018) | 149 | 129 | 121 | 116 | 106 |
| Strange Brigade (2018) | 414 | 274 | 222 | 195 | 144 |
| Dirt 5 (2020) | 193 | 141 | 117 | 97.1 | 80.2 |
| Yakuza Like a Dragon (2020) | 144 | 139 | 138 | 126 | 85.2 |
| Hitman 3 (2021) | 183.8 | 156.4 | 148.2 | 145.1 | 115.9 |
| Outriders (2021) | 125 | 123 | 122 | 124 | 91.1 |
| Resident Evil Village (2021) | 195 | 191 | 184 | 168 | 116 |
| Mass Effect Legendary Edition (2021) | 124 | 115 | 111 | ||
| Days Gone (2021) | 186 | 157 | 140 | 106 | 79.5 |
Emissions - The Lenovo laptop heats up noticeably
Noise emissions
Noise development is kept within limits in idle usage and under low load. The fans usually work at low speeds. However, they rev up under load. As a result, we register maximum sound pressure levels of 50 dB(A) (stress test) and 46 dB(A) (The Witcher 3 test). In addition, the fans emit a whistling sound at higher speeds. Gaming is no fun here without a headset.
Noise level
| Idle |
| 26 / 30 / 35 dB(A) |
| Load |
| 40 / 50 dB(A) |
 | ||
30 dB silent 40 dB(A) audible 50 dB(A) loud |
||
min: | ||
| Lenovo Legion 7 16ACHg6 R9 5900HX, GeForce RTX 3080 Laptop GPU | Asus ROG Zephyrus G15 GA503Q R9 5900HS, GeForce RTX 3080 Laptop GPU | Schenker XMG Pro 15 (Early 2021, RTX 3080) i7-10870H, GeForce RTX 3080 Laptop GPU | Asus Strix Scar 17 G733QSA-XS99 R9 5900HX, GeForce RTX 3080 Laptop GPU | Razer Blade 15 Advanced Model Early 2021 i7-10875H, GeForce RTX 3080 Laptop GPU | Alienware m17 R4 i9-10980HK, GeForce RTX 3080 Laptop GPU | MSI GE76 Raider 10UH i7-10870H, GeForce RTX 3080 Laptop GPU | Average of class Gaming | |
|---|---|---|---|---|---|---|---|---|
| Noise | -1% | -13% | 8% | 1% | 2% | 8% | 3% | |
| off / environment * (dB) | 26 | 25 4% | 25 4% | 25 4% | 24 8% | 24 8% | 25.3 3% | 24.1 ? 7% |
| Idle Minimum * (dB) | 26 | 26 -0% | 33 -27% | 25.2 3% | 26 -0% | 24 8% | 26.1 -0% | 25.9 ? -0% |
| Idle Average * (dB) | 30 | 27 10% | 34 -13% | 25.2 16% | 28 7% | 25 17% | 26.1 13% | 27.4 ? 9% |
| Idle Maximum * (dB) | 35 | 31 11% | 35 -0% | 25.2 28% | 40 -14% | 36 -3% | 26.1 25% | 29.9 ? 15% |
| Load Average * (dB) | 40 | 49 -23% | 51 -27% | 30.7 23% | 45 -13% | 45 -13% | 37.2 7% | 43 ? -8% |
| Witcher 3 ultra * (dB) | 46 | 49 -7% | 52 -13% | 51.3 -12% | 43 7% | 47 -2% | 36.8 20% | |
| Load Maximum * (dB) | 50 | 51 -2% | 57 -14% | 51.3 -3% | 45 10% | 50 -0% | 56.9 -14% | 54.1 ? -8% |
* ... smaller is better
Temperature
Our stress test (Prime95 and FurMark run for at least an hour) is executed by the CPU and GPU at 3.9 GHz and 1,590 MHz, respectively. The stress test represents an extreme scenario. We use this test to verify that the system remains stable under full load.
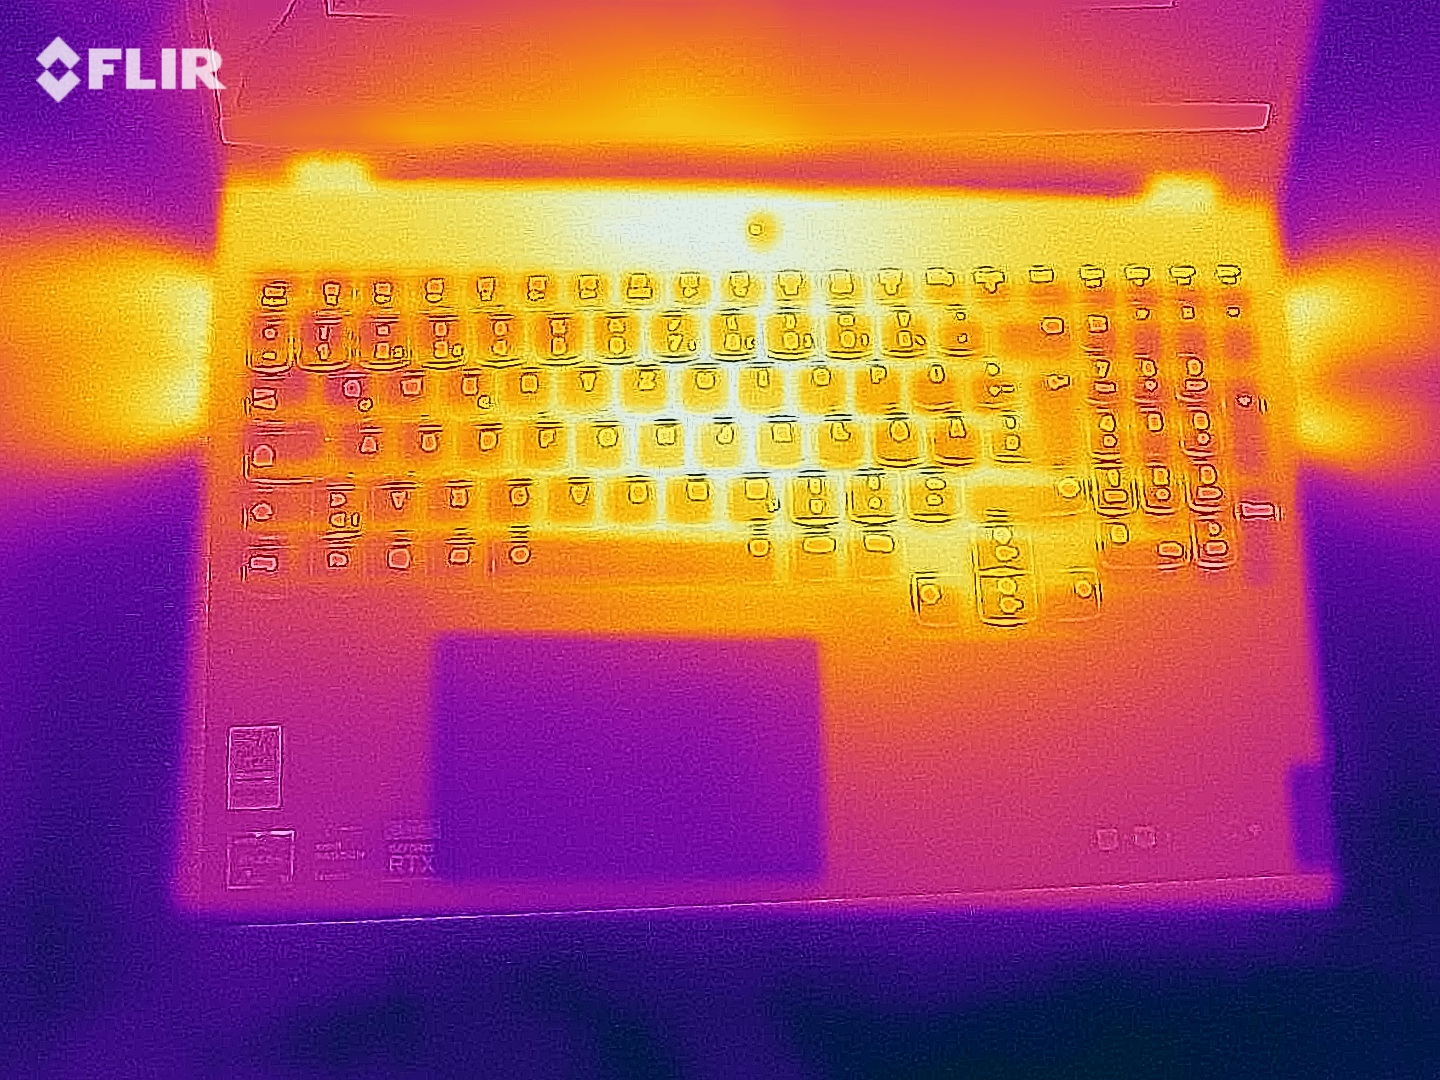
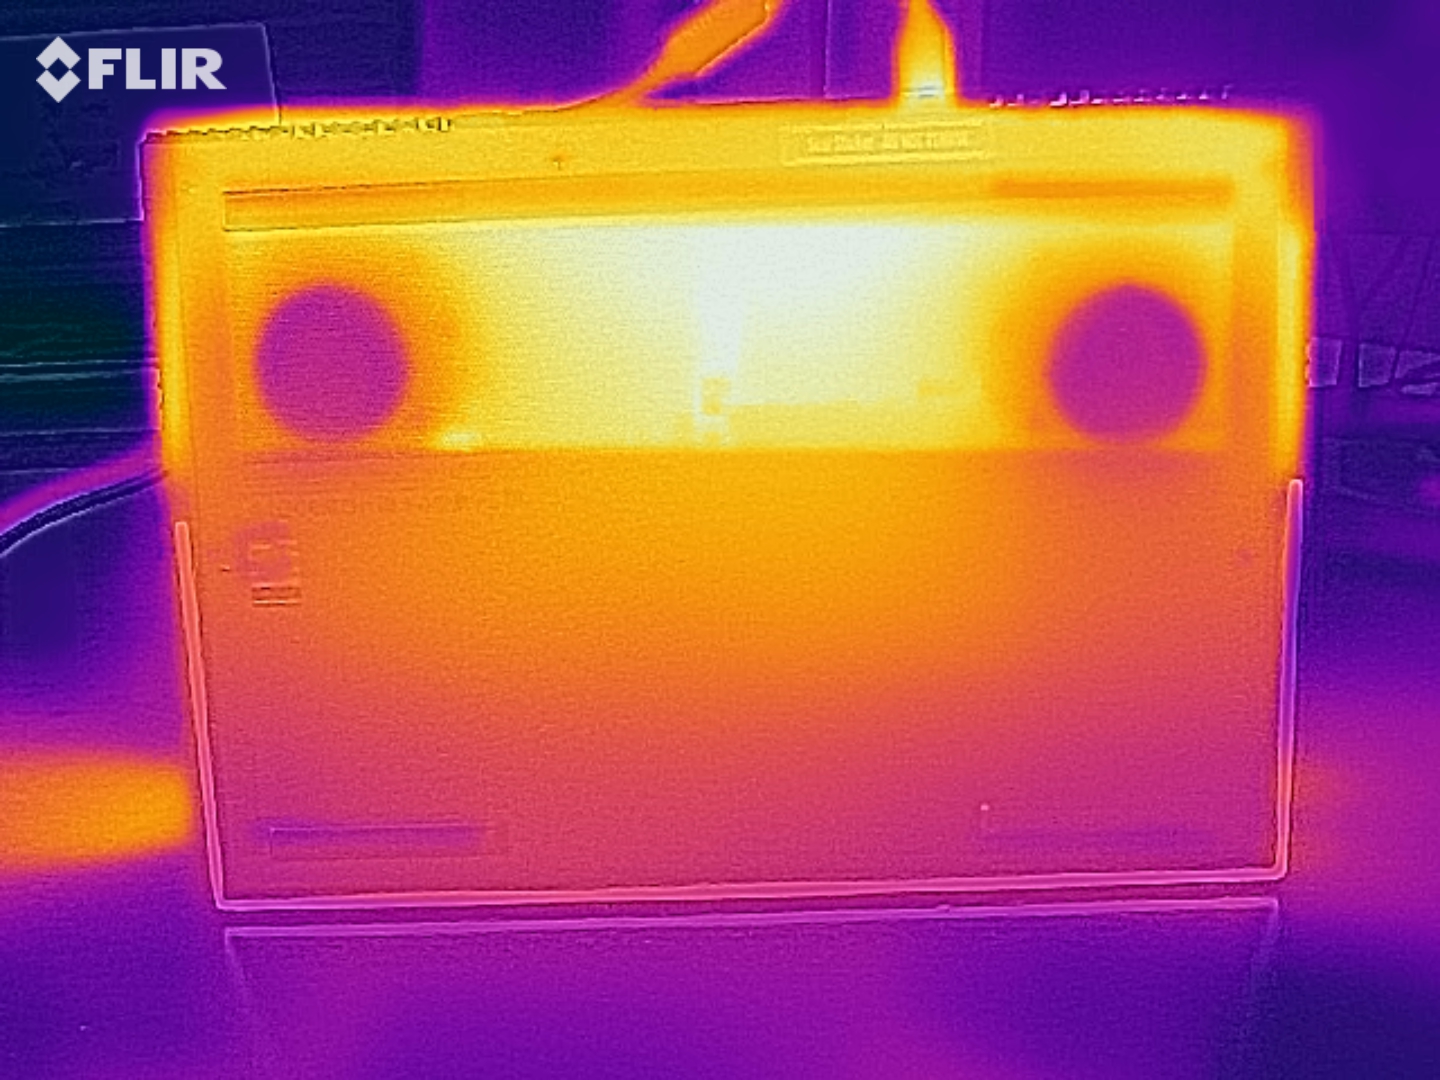
The Lenovo laptop heats up noticeably. We register temperatures around 50 °C (~122 °F) at several measuring points during the stress test. Moreover, heat development is slightly lower when running our The Witcher 3 test. The laptop shouldn't be placed on the lap in either case.
(-) The maximum temperature on the upper side is 51 °C / 124 F, compared to the average of 40.4 °C / 105 F, ranging from 21.2 to 68.8 °C for the class Gaming.
(-) The bottom heats up to a maximum of 52 °C / 126 F, compared to the average of 43.2 °C / 110 F
(±) In idle usage, the average temperature for the upper side is 33.1 °C / 92 F, compared to the device average of 33.9 °C / 93 F.
(-) Playing The Witcher 3, the average temperature for the upper side is 43.9 °C / 111 F, compared to the device average of 33.9 °C / 93 F.
(-) The palmrests and touchpad can get very hot to the touch with a maximum of 40 °C / 104 F.
(-) The average temperature of the palmrest area of similar devices was 28.8 °C / 83.8 F (-11.2 °C / -20.2 F).
| Lenovo Legion 7 16ACHg6 R9 5900HX, GeForce RTX 3080 Laptop GPU | Asus ROG Zephyrus G15 GA503Q R9 5900HS, GeForce RTX 3080 Laptop GPU | Schenker XMG Pro 15 (Early 2021, RTX 3080) i7-10870H, GeForce RTX 3080 Laptop GPU | Asus Strix Scar 17 G733QSA-XS99 R9 5900HX, GeForce RTX 3080 Laptop GPU | Razer Blade 15 Advanced Model Early 2021 i7-10875H, GeForce RTX 3080 Laptop GPU | Alienware m17 R4 i9-10980HK, GeForce RTX 3080 Laptop GPU | MSI GE76 Raider 10UH i7-10870H, GeForce RTX 3080 Laptop GPU | Average of class Gaming | |
|---|---|---|---|---|---|---|---|---|
| Heat | 6% | 1% | 13% | 9% | -11% | 11% | 11% | |
| Maximum Upper Side * (°C) | 51 | 51 -0% | 51 -0% | 40 22% | 49 4% | 58 -14% | 41 20% | 45.2 ? 11% |
| Maximum Bottom * (°C) | 52 | 56 -8% | 66 -27% | 39.8 23% | 54 -4% | 46 12% | 48.8 6% | 48.1 ? 7% |
| Idle Upper Side * (°C) | 37 | 29 22% | 32 14% | 34.6 6% | 30 19% | 45 -22% | 31.8 14% | 31.1 ? 16% |
| Idle Bottom * (°C) | 38 | 34 11% | 32 16% | 38.4 -1% | 32 16% | 46 -21% | 36 5% | 34.2 ? 10% |
* ... smaller is better
Speakers
The stereo speakers produce a very decent sound that could use a bit more bass, though. Headphones or external speakers are recommended for a better sound experience.
Lenovo Legion 7 16ACHg6 audio analysis
(+) | speakers can play relatively loud (87 dB)
Bass 100 - 315 Hz
(±) | reduced bass - on average 9% lower than median
(±) | linearity of bass is average (11.9% delta to prev. frequency)
Mids 400 - 2000 Hz
(+) | balanced mids - only 2.6% away from median
(+) | mids are linear (3% delta to prev. frequency)
Highs 2 - 16 kHz
(+) | balanced highs - only 4.2% away from median
(+) | highs are linear (5.4% delta to prev. frequency)
Overall 100 - 16.000 Hz
(+) | overall sound is linear (8.8% difference to median)
Compared to same class
» 3% of all tested devices in this class were better, 1% similar, 97% worse
» The best had a delta of 6%, average was 18%, worst was 132%
Compared to all devices tested
» 3% of all tested devices were better, 1% similar, 97% worse
» The best had a delta of 4%, average was 24%, worst was 134%
Energy management - The battery life provided by the 16ACHg6 is quite good
Energy consumption
Since the iGPU is disabled, the Legion's idle power consumption is very high with a maximum of 46 watts. When the iGPU is active (can be enabled in the BIOS or through Lenovo's Vantage software), power consumption is lower. The stress test and our The Witcher 3 test allow the demand to rise up to 235 watts and an average of 180 watts, respectively. The power adapter offers a rated output of 300 watts.
The following graph shows the fairly constant power consumption of the laptop during various tests that we performed. There was no drop in processing power.
| Off / Standby | |
| Idle | |
| Load |
|
Key:
min: | |
| Lenovo Legion 7 16ACHg6 R9 5900HX, GeForce RTX 3080 Laptop GPU | Asus ROG Zephyrus G15 GA503Q R9 5900HS, GeForce RTX 3080 Laptop GPU | Schenker XMG Pro 15 (Early 2021, RTX 3080) i7-10870H, GeForce RTX 3080 Laptop GPU | Asus Strix Scar 17 G733QSA-XS99 R9 5900HX, GeForce RTX 3080 Laptop GPU | Razer Blade 15 Advanced Model Early 2021 i7-10875H, GeForce RTX 3080 Laptop GPU | Alienware m17 R4 i9-10980HK, GeForce RTX 3080 Laptop GPU | MSI GE76 Raider 10UH i7-10870H, GeForce RTX 3080 Laptop GPU | Average of class Gaming | |
|---|---|---|---|---|---|---|---|---|
| Power Consumption | 42% | 34% | 27% | 39% | -31% | 10% | 28% | |
| Idle Minimum * (Watt) | 31 | 10 68% | 8 74% | 10.9 65% | 13 58% | 42 -35% | 15.5 50% | 13.1 ? 58% |
| Idle Average * (Watt) | 33 | 12 64% | 13 61% | 14.7 55% | 15 55% | 48 -45% | 31.3 5% | 18.8 ? 43% |
| Idle Maximum * (Watt) | 46 | 17 63% | 22 52% | 26.8 42% | 22 52% | 58 -26% | 31.7 31% | 24.4 ? 47% |
| Load Average * (Watt) | 110 | 108 2% | 97 12% | 106.7 3% | 98 11% | 124 -13% | 93.6 15% | 108.5 ? 1% |
| Witcher 3 ultra * (Watt) | 180 | 123 32% | 179 1% | 192.4 -7% | 126 30% | 219 -22% | 233 -29% | |
| Load Maximum * (Watt) | 235 | 182 23% | 225 4% | 228.4 3% | 165 30% | 337 -43% | 260.3 -11% | 254 ? -8% |
* ... smaller is better
Battery life
The 16-incher achieves runtimes of 6:50 hours and 6:46 hours, respectively, in the Wi-Fi test (accessing websites using a script) and video test (short film Big Buck Bunny (H.264 encoding, Full HD) running in a loop). The laptop's power-saving features are disabled during both tests, and the display brightness is set to about 150 cd/m². The wireless modules are also disabled for the video test.
We performed the battery life tests with the graphics switching solution active (= iGPU active). If the iGPU is disabled, the Wi-Fi runtime drops to 3:18 hours.
| Lenovo Legion 7 16ACHg6 R9 5900HX, GeForce RTX 3080 Laptop GPU, 80 Wh | Asus ROG Zephyrus G15 GA503Q R9 5900HS, GeForce RTX 3080 Laptop GPU, 90 Wh | Schenker XMG Pro 15 (Early 2021, RTX 3080) i7-10870H, GeForce RTX 3080 Laptop GPU, 73 Wh | Asus Strix Scar 17 G733QSA-XS99 R9 5900HX, GeForce RTX 3080 Laptop GPU, 90 Wh | Razer Blade 15 Advanced Model Early 2021 i7-10875H, GeForce RTX 3080 Laptop GPU, 80 Wh | Alienware m17 R4 i9-10980HK, GeForce RTX 3080 Laptop GPU, 86 Wh | MSI GE76 Raider 10UH i7-10870H, GeForce RTX 3080 Laptop GPU, 99.9 Wh | Average of class Gaming | |
|---|---|---|---|---|---|---|---|---|
| Battery runtime | 27% | -3% | 29% | 41% | -53% | -0% | 6% | |
| Reader / Idle (h) | 8.2 | 12.1 48% | 8.4 2% | 13.3 62% | 14.4 76% | 8.2 0% | 8.71 ? 6% | |
| H.264 (h) | 6.8 | 5.5 -19% | 8.9 31% | 2.2 -68% | 8.26 ? 21% | |||
| WiFi v1.3 (h) | 6.8 | 9.4 38% | 7.2 6% | 9.3 37% | 9 32% | 2.4 -65% | 6.3 -7% | 6.98 ? 3% |
| Load (h) | 1.6 | 1.5 -6% | 1.6 0% | 1.4 -13% | 2 25% | 1.2 -25% | 1.7 6% | 1.47 ? -8% |
Pros
Cons
Verdict- The Legion 7 positions itself in the top section of the rankings
The Legion 7 does what it's supposed to do: It brings all modern games smoothly onto the screen. In the process, it leaves most of the RTX 3080 laptops tested so far behind and delivers above-average frame rates. The full display resolution (2560x1600 pixels) can usually be exploited - at high to maximum quality settings.
Automatic overclocking of the CPU and GPU (has to be enabled in the BIOS) can increase frame rates a bit. However, the improvement isn't particularly high.
Lenovo introduces a well-made gaming laptop with the Legion 7 16ACHg6.
Throttling is nothing to worry about. The Ryzen 9 5900HX APU and the GeForce RTX 3080 laptop GPU (max TGP: 165 watts) can always develop their performance consistently. The 16-inch device's heat and noise development are at a normal level for the hardware installed here. In other words, the laptop heats up noticeably under load and produces a fair amount of noise. In addition, the fans emit a whistling noise at higher rotation speeds.
The 16-inch display (WQXGA, IPS, 165 Hz) in the 16:10 format left a great impression overall. It offers high brightness, good contrast, HDR, stable viewing angles, fast response times, good color reproduction, and very decent color-space coverage. Furthermore, FreeSync and G-Sync are supported.
Battery life is quite good - when the iGPU is active. If the latter is disabled, the rates are cut in half. The backlit keyboard proved to be suitable for everyday use. Finally, the three-year on-site warranty provided by Lenovo is praiseworthy.
Price and availability
At the time of writing, the Legion 7 16ACHg6 isn't being sold in the United States yet. We recommend you to follow Lenovo's official online store to know when the device becomes available. You can also keep tabs on Amazon in case it pops up here first. We estimate the MSRP for this configuration to be around $2,800.
Lenovo Legion 7 16ACHg6
- 06/12/2021 v7 (old)
Sascha Mölck
Price comparison

