Verdict - Lenovo Legion 7a 16 is lighter, but also slower than before
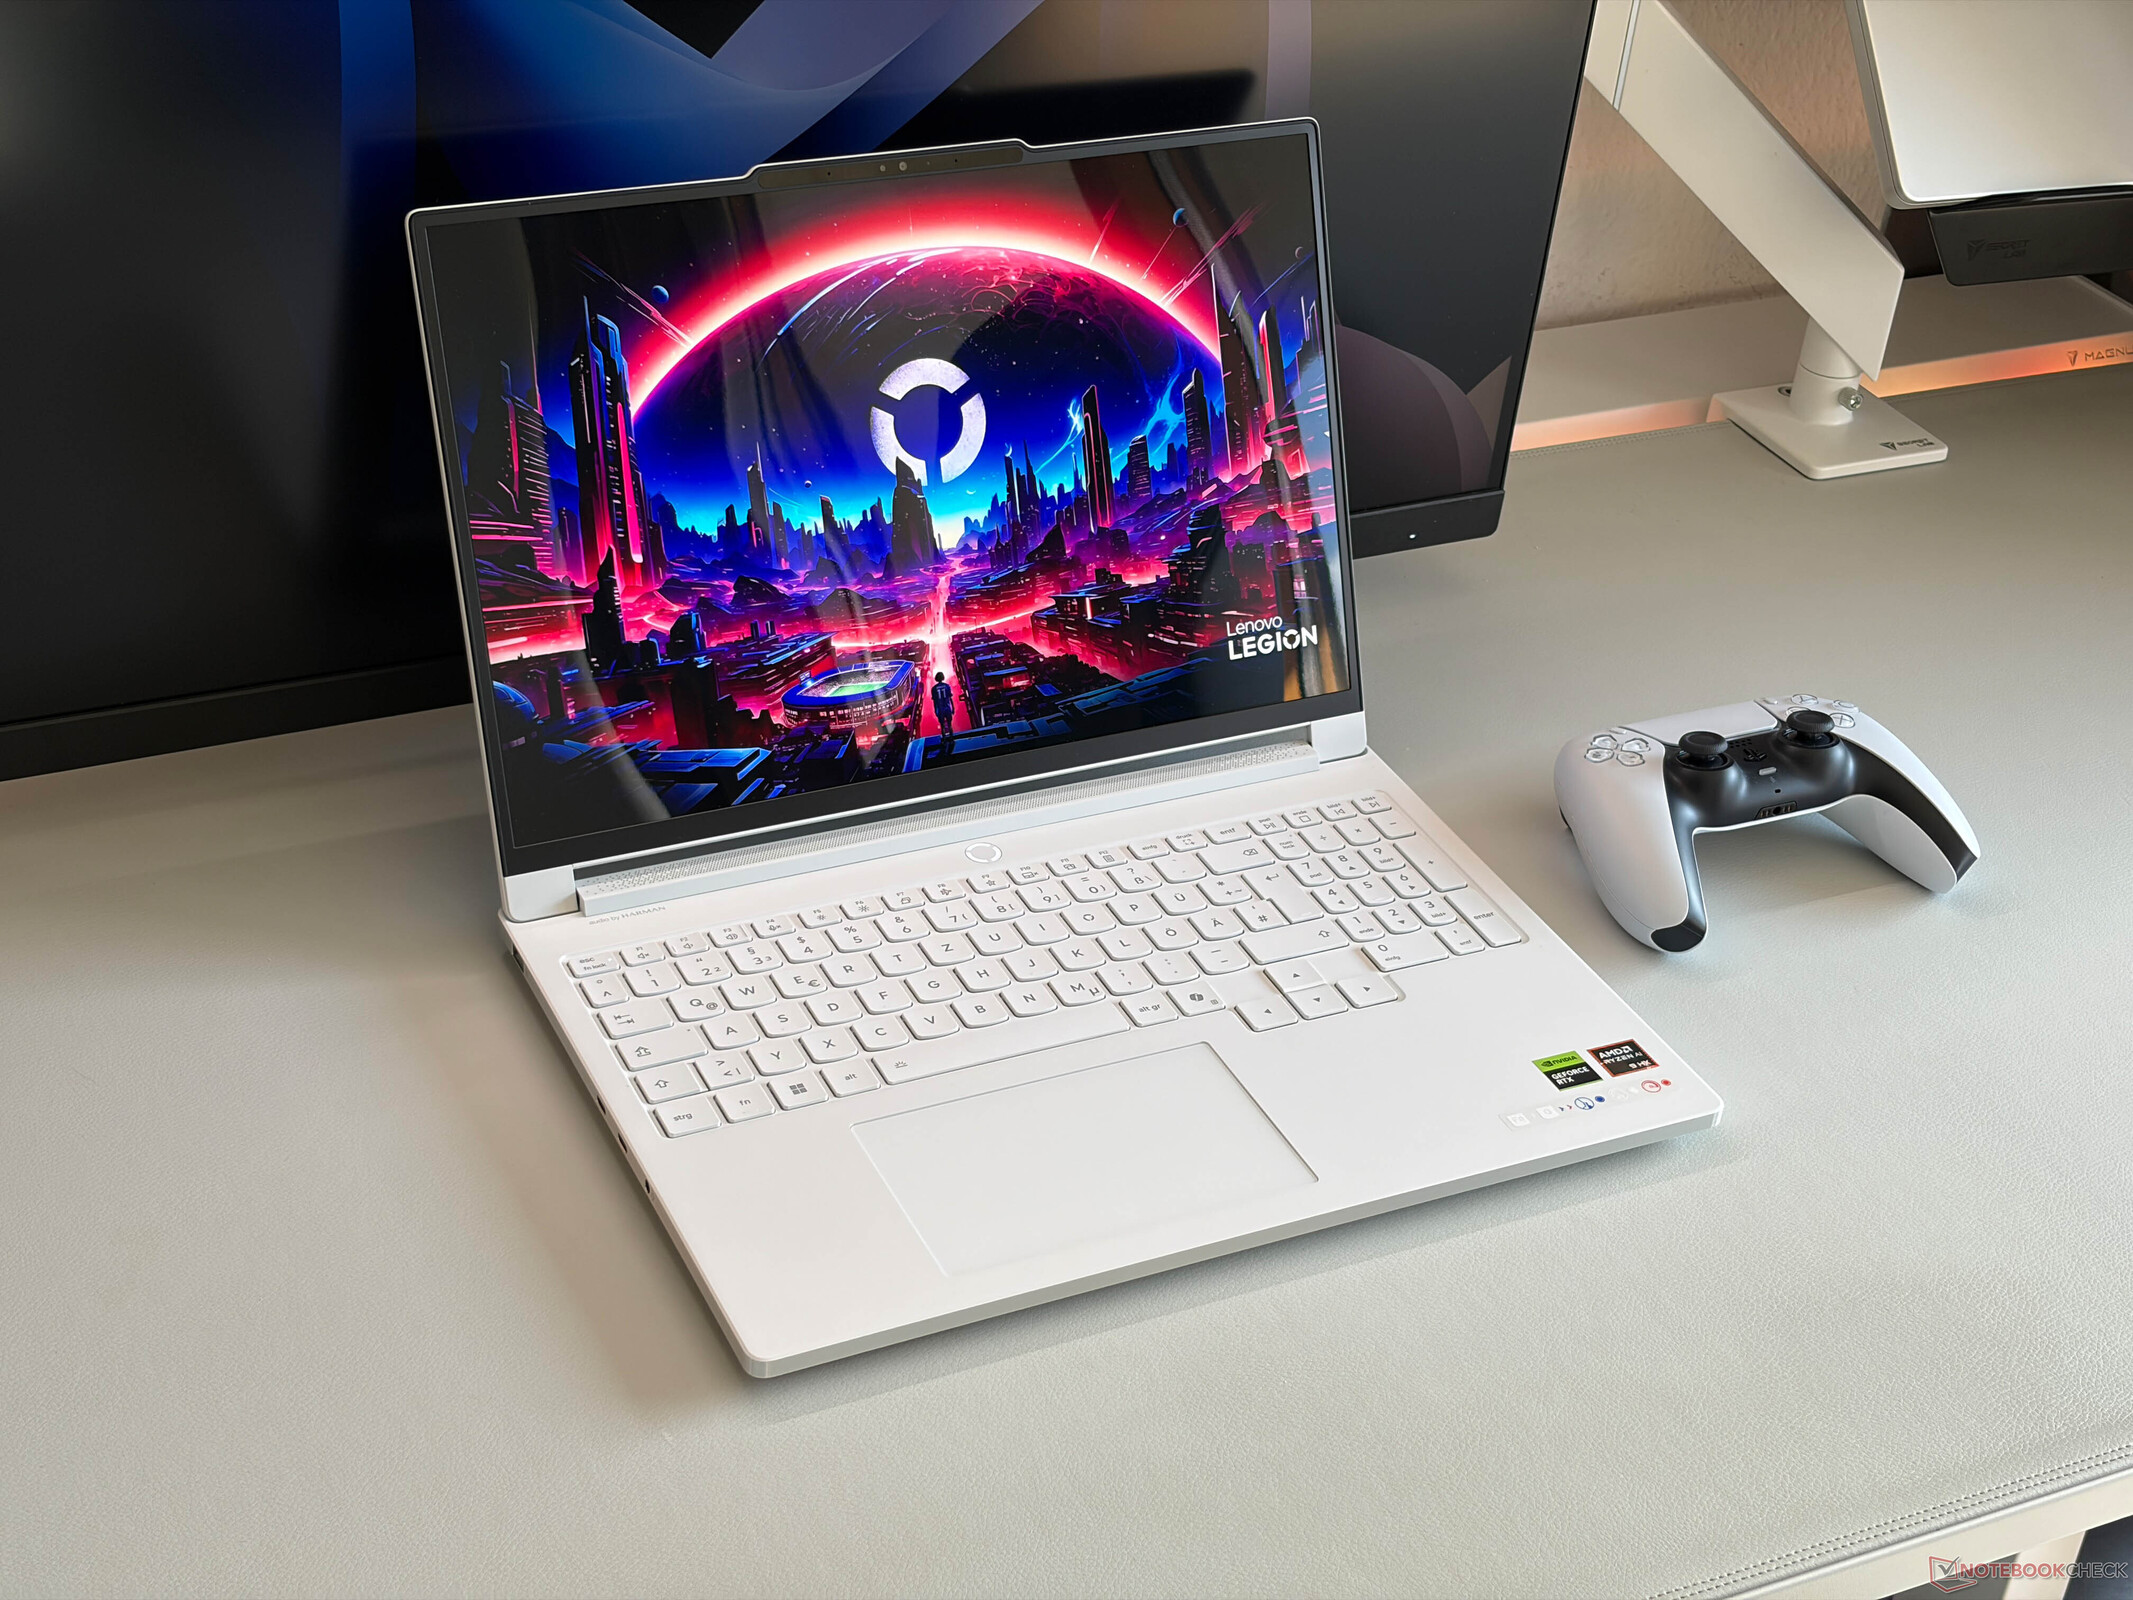
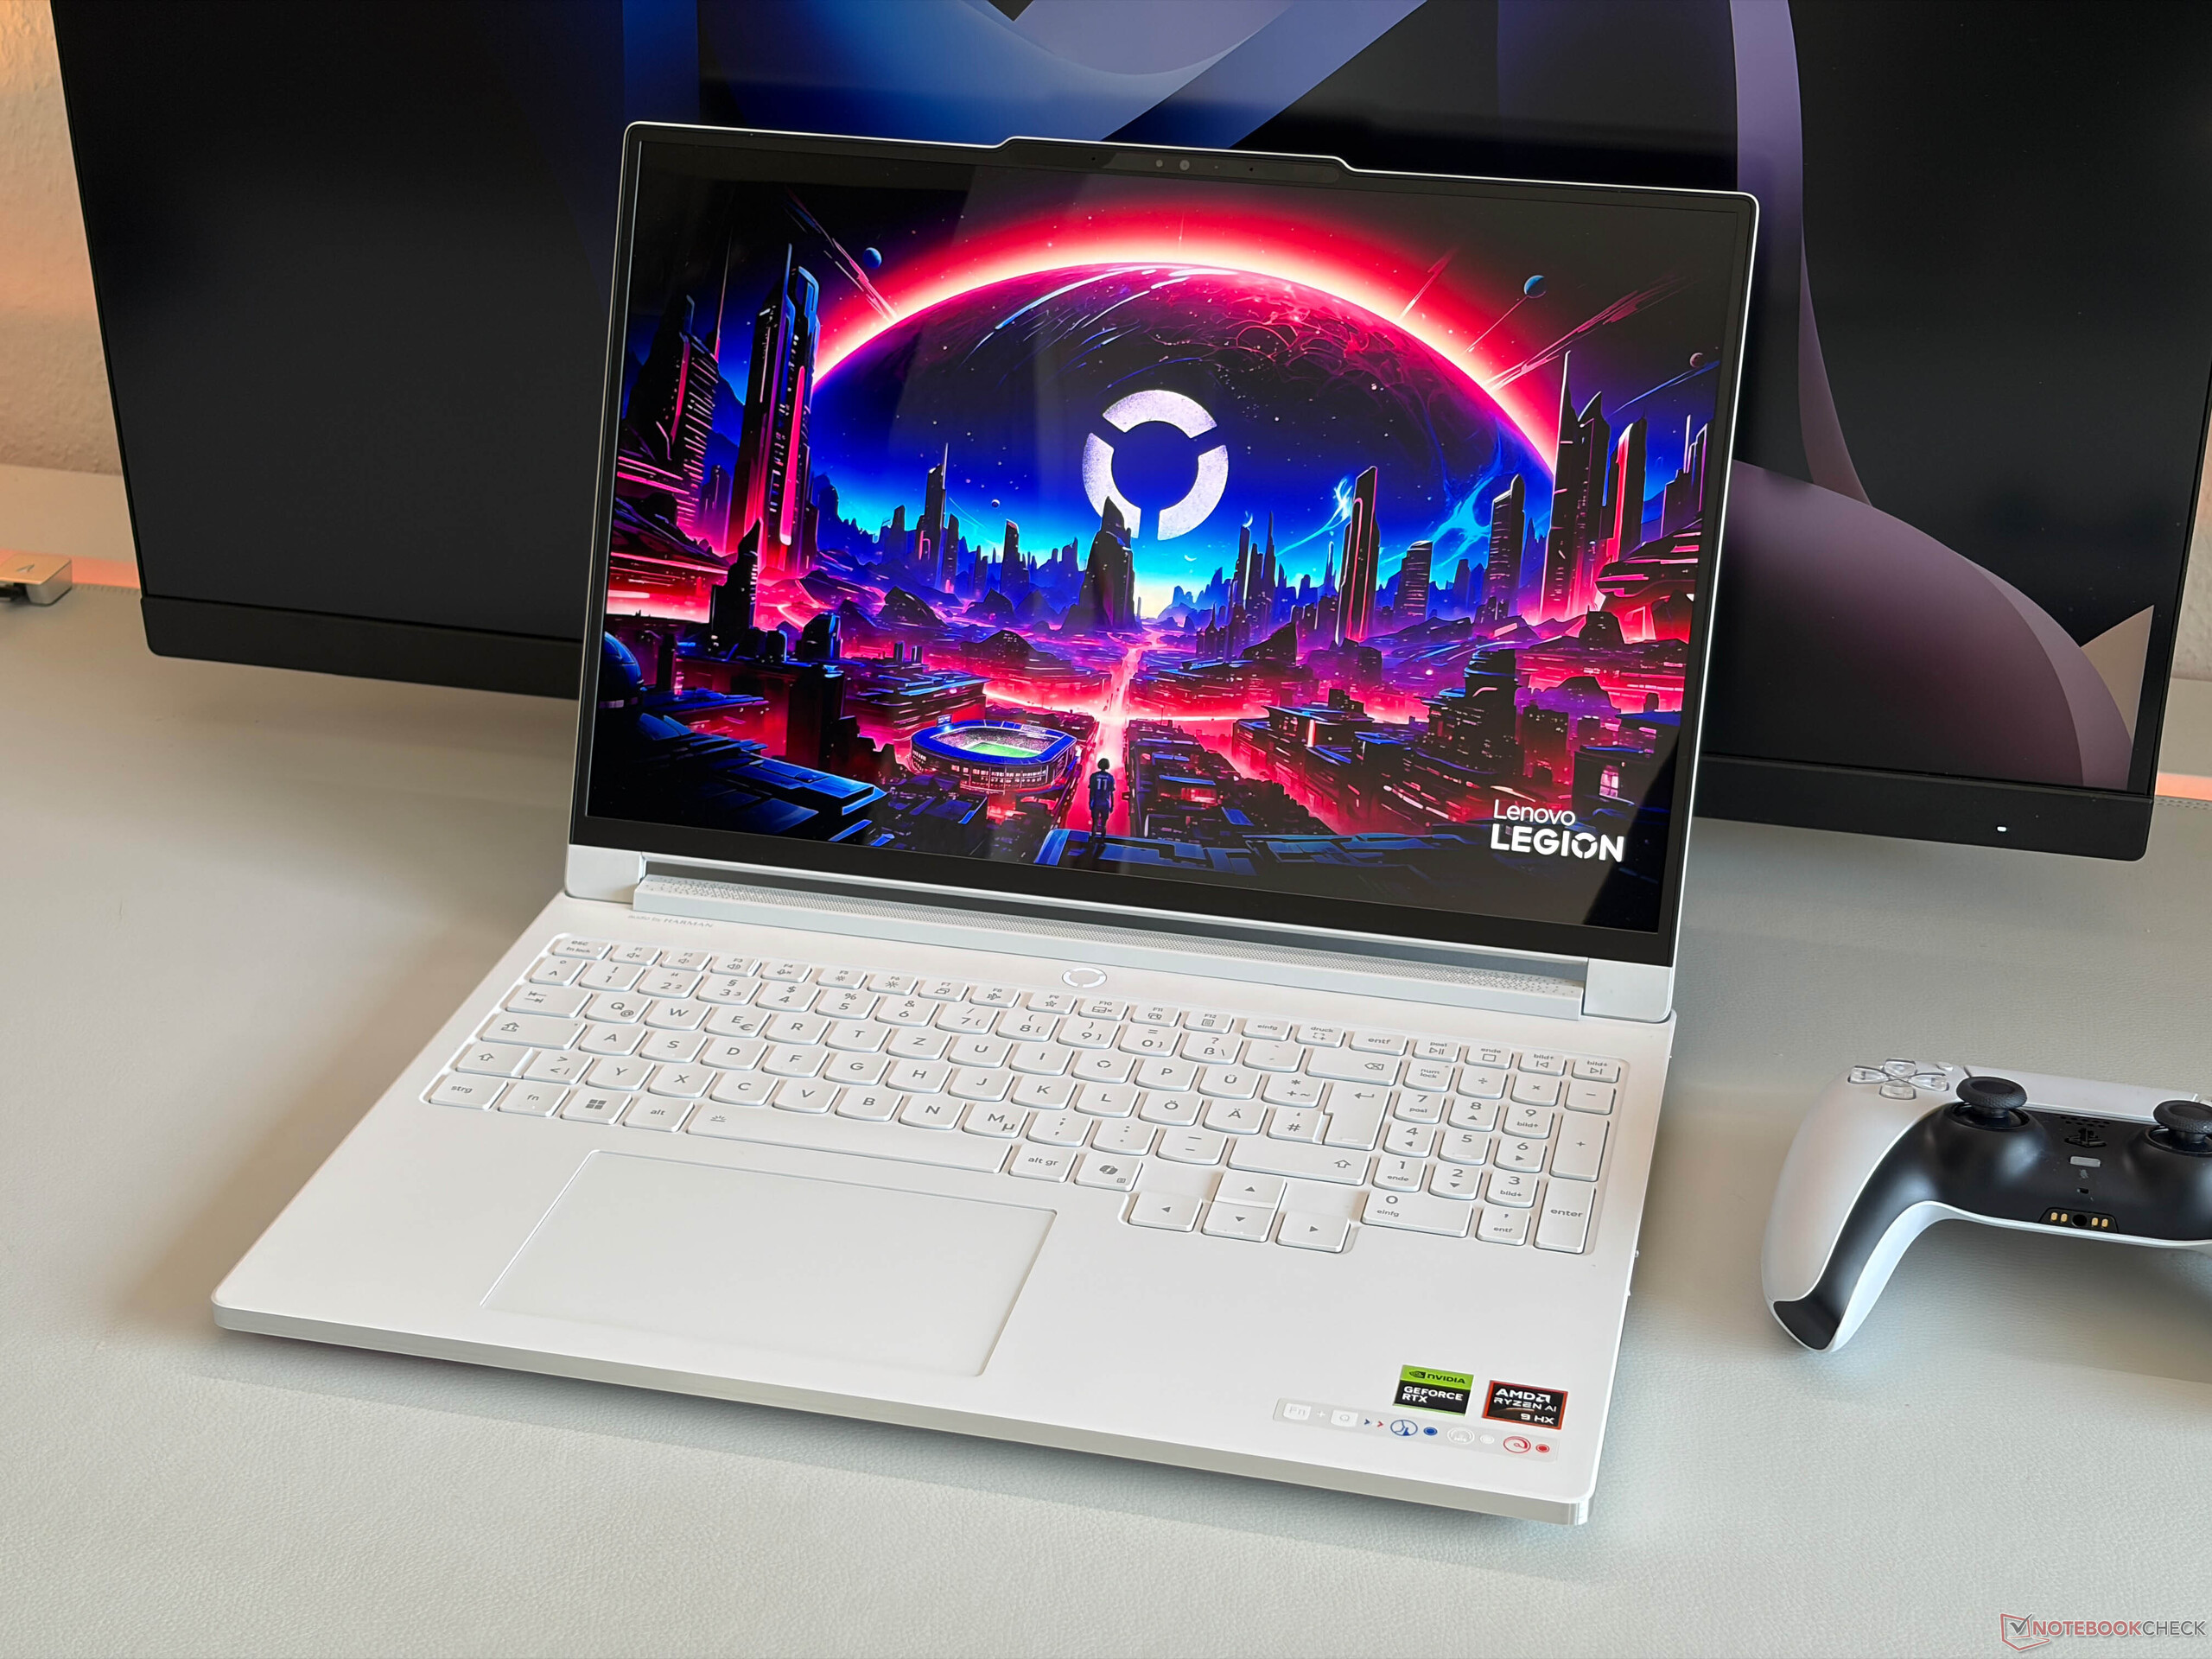
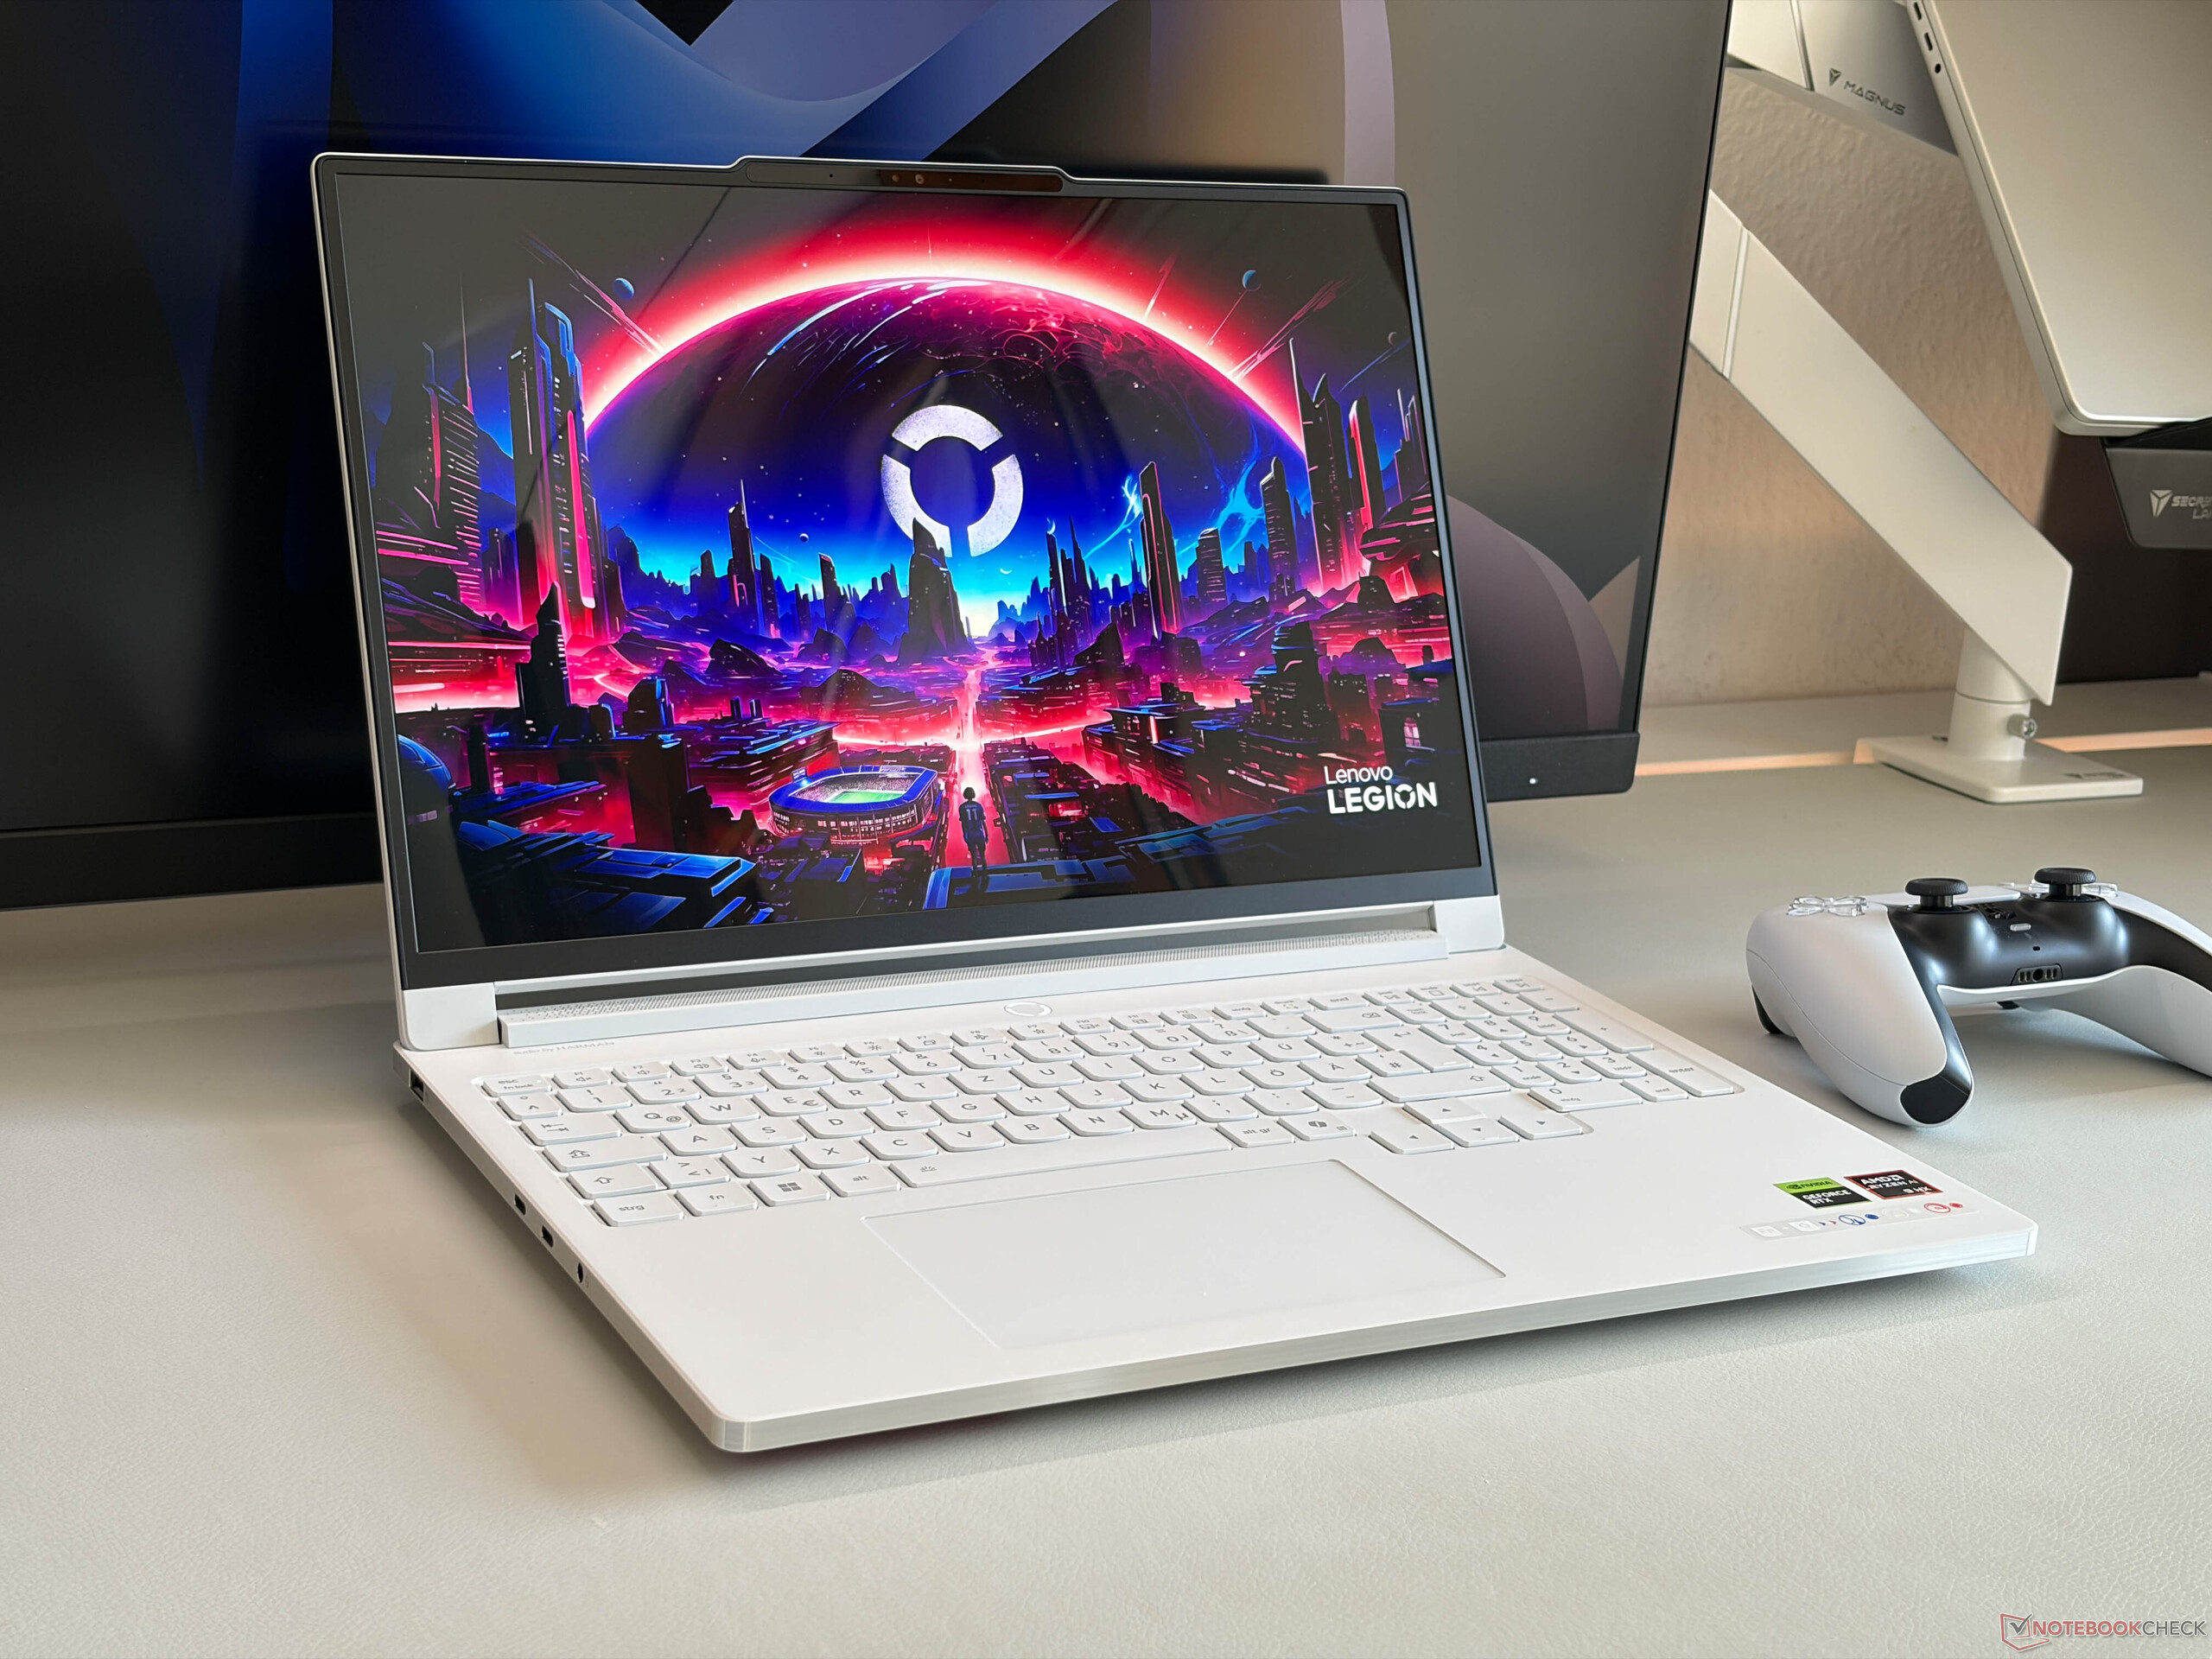
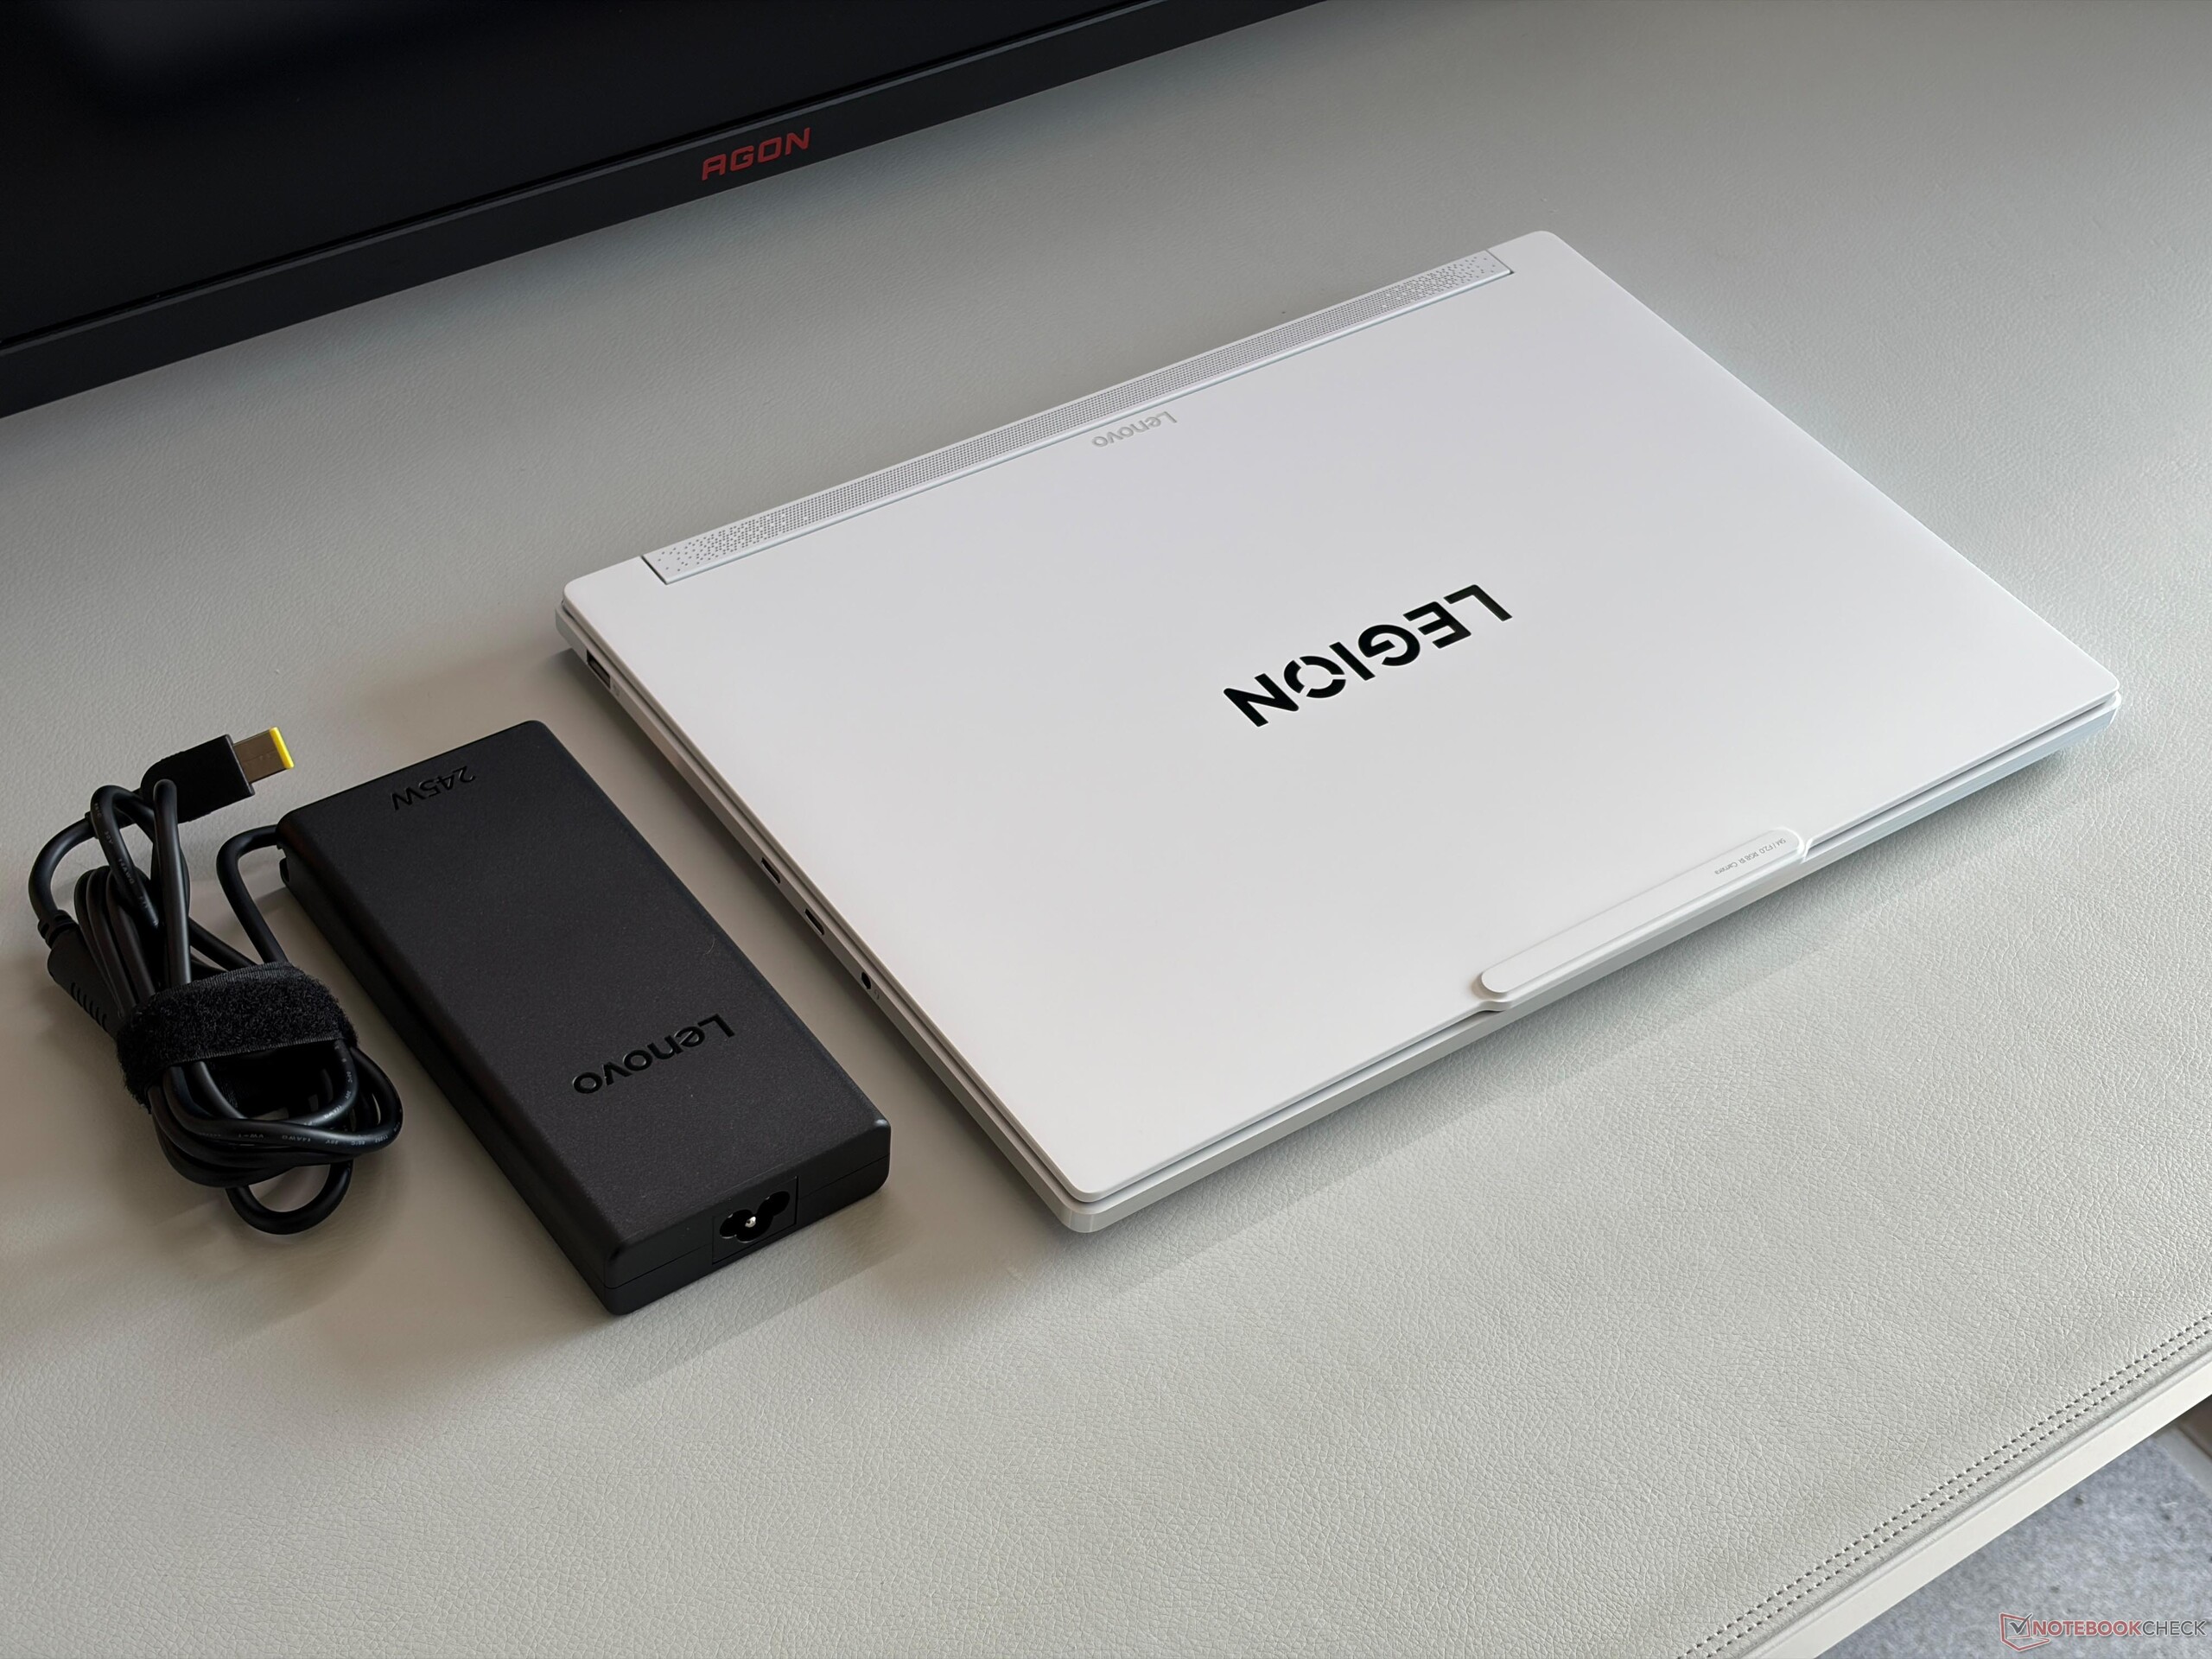
Lenovo's new Legion 7a 16 Gen 11 is a stylish and surprisingly lightweight 16-inch gaming laptop with a gorgeous OLED screen (240 Hz, VRR, G-Sync). The aluminum chassis is very sturdy and looks good and while you can install two SSDs, the RAM is unfortunately soldered. You also get a sufficent number of ports, very comfortable keyboard and decent speakers.
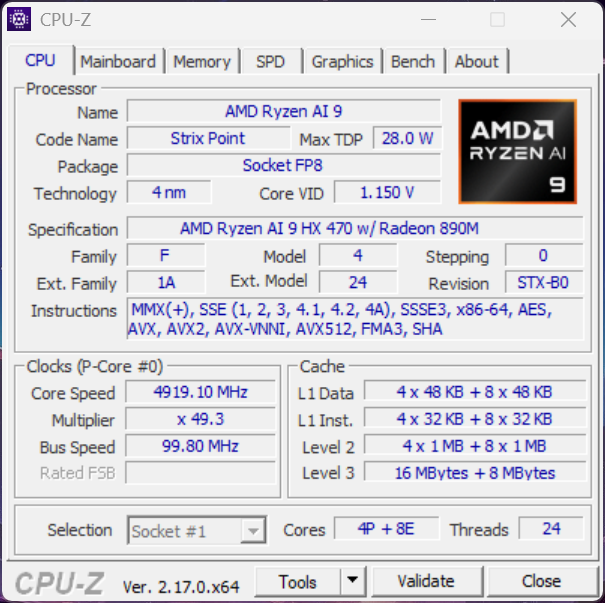
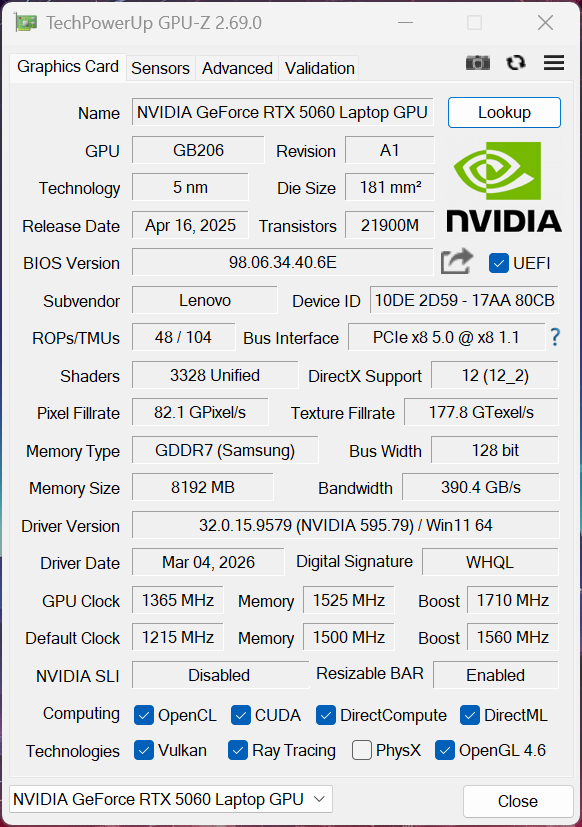
The problem is that the lower weight also affects the performance because Lenovo only uses the Ryzen AI 9 HX470, which cannot keep up with the old Intel Core Ultra 7 255HX and the mobile GeForce RTX 5060 only runs at up to 95W in Performance mode now instead of 115W. You can use the manual mode and adjust the TGP to 115 Watts, but this is impractical and the manual mode can only be selected in the app.
If you are looking for a sleek and mobile 16-inch gamer, the new Legion 7a 16 is a good option, but you have to make some compromises in terms of performance. Right now, the better option is probably the old G10 generation of the Legion 7 16, which is a bit more powerful, offers upgradeable RAM and is less expensive, but lacks Advanced Optimus.
Pros
Cons
- $1,999.99Lenovo Legion 7a Gen 11 16" Gaming Laptop with AMD Ryzen AI 9 HX 470 Processor, NVIDIA GeForce RTX 5060, OLED WQXGA 240Hz Non-Touch Display, 32GB LPDDR5X-8533MT RAM, 1TB SSD, and Windows 11 Home
- $3,499.00Lenovo Legion Pro 7i Gen 10 16" Gaming Laptop (2025 Model) Intel Core Ultra 9 275HX 24C, NVIDIA GeForce RTX 5080 16GB, 32GB RAM, 1TB Gen 5 NVMe SSD, 16.0" WQXGA OLED 500 nits 240Hz, Windows 11 Pro
- $1,479.00Lenovo Legion 5 Gen 10 Gaming Laptop: Ryzen 7 260, NVidia RTX 5060, 16GB DDR5 RAM, 512GB SSD, 15.3" WUXGA (1920x1200) 165Hz Display
Table of Contents
Lenovo launches a new version of its 16-inch gaming laptop Legion 7 and the new Legion 7a G11 model uses AMD Ryzen 400 processors. The GPU options are limited to the mobile version of the Nvidia GeForce RTX 5060, which now supports Advanced Optimus graphics switching. The starting price is $2079, while our review unit with the faster Ryzen AI 9 HX 470 CPU is $2279.
Specifications
Case
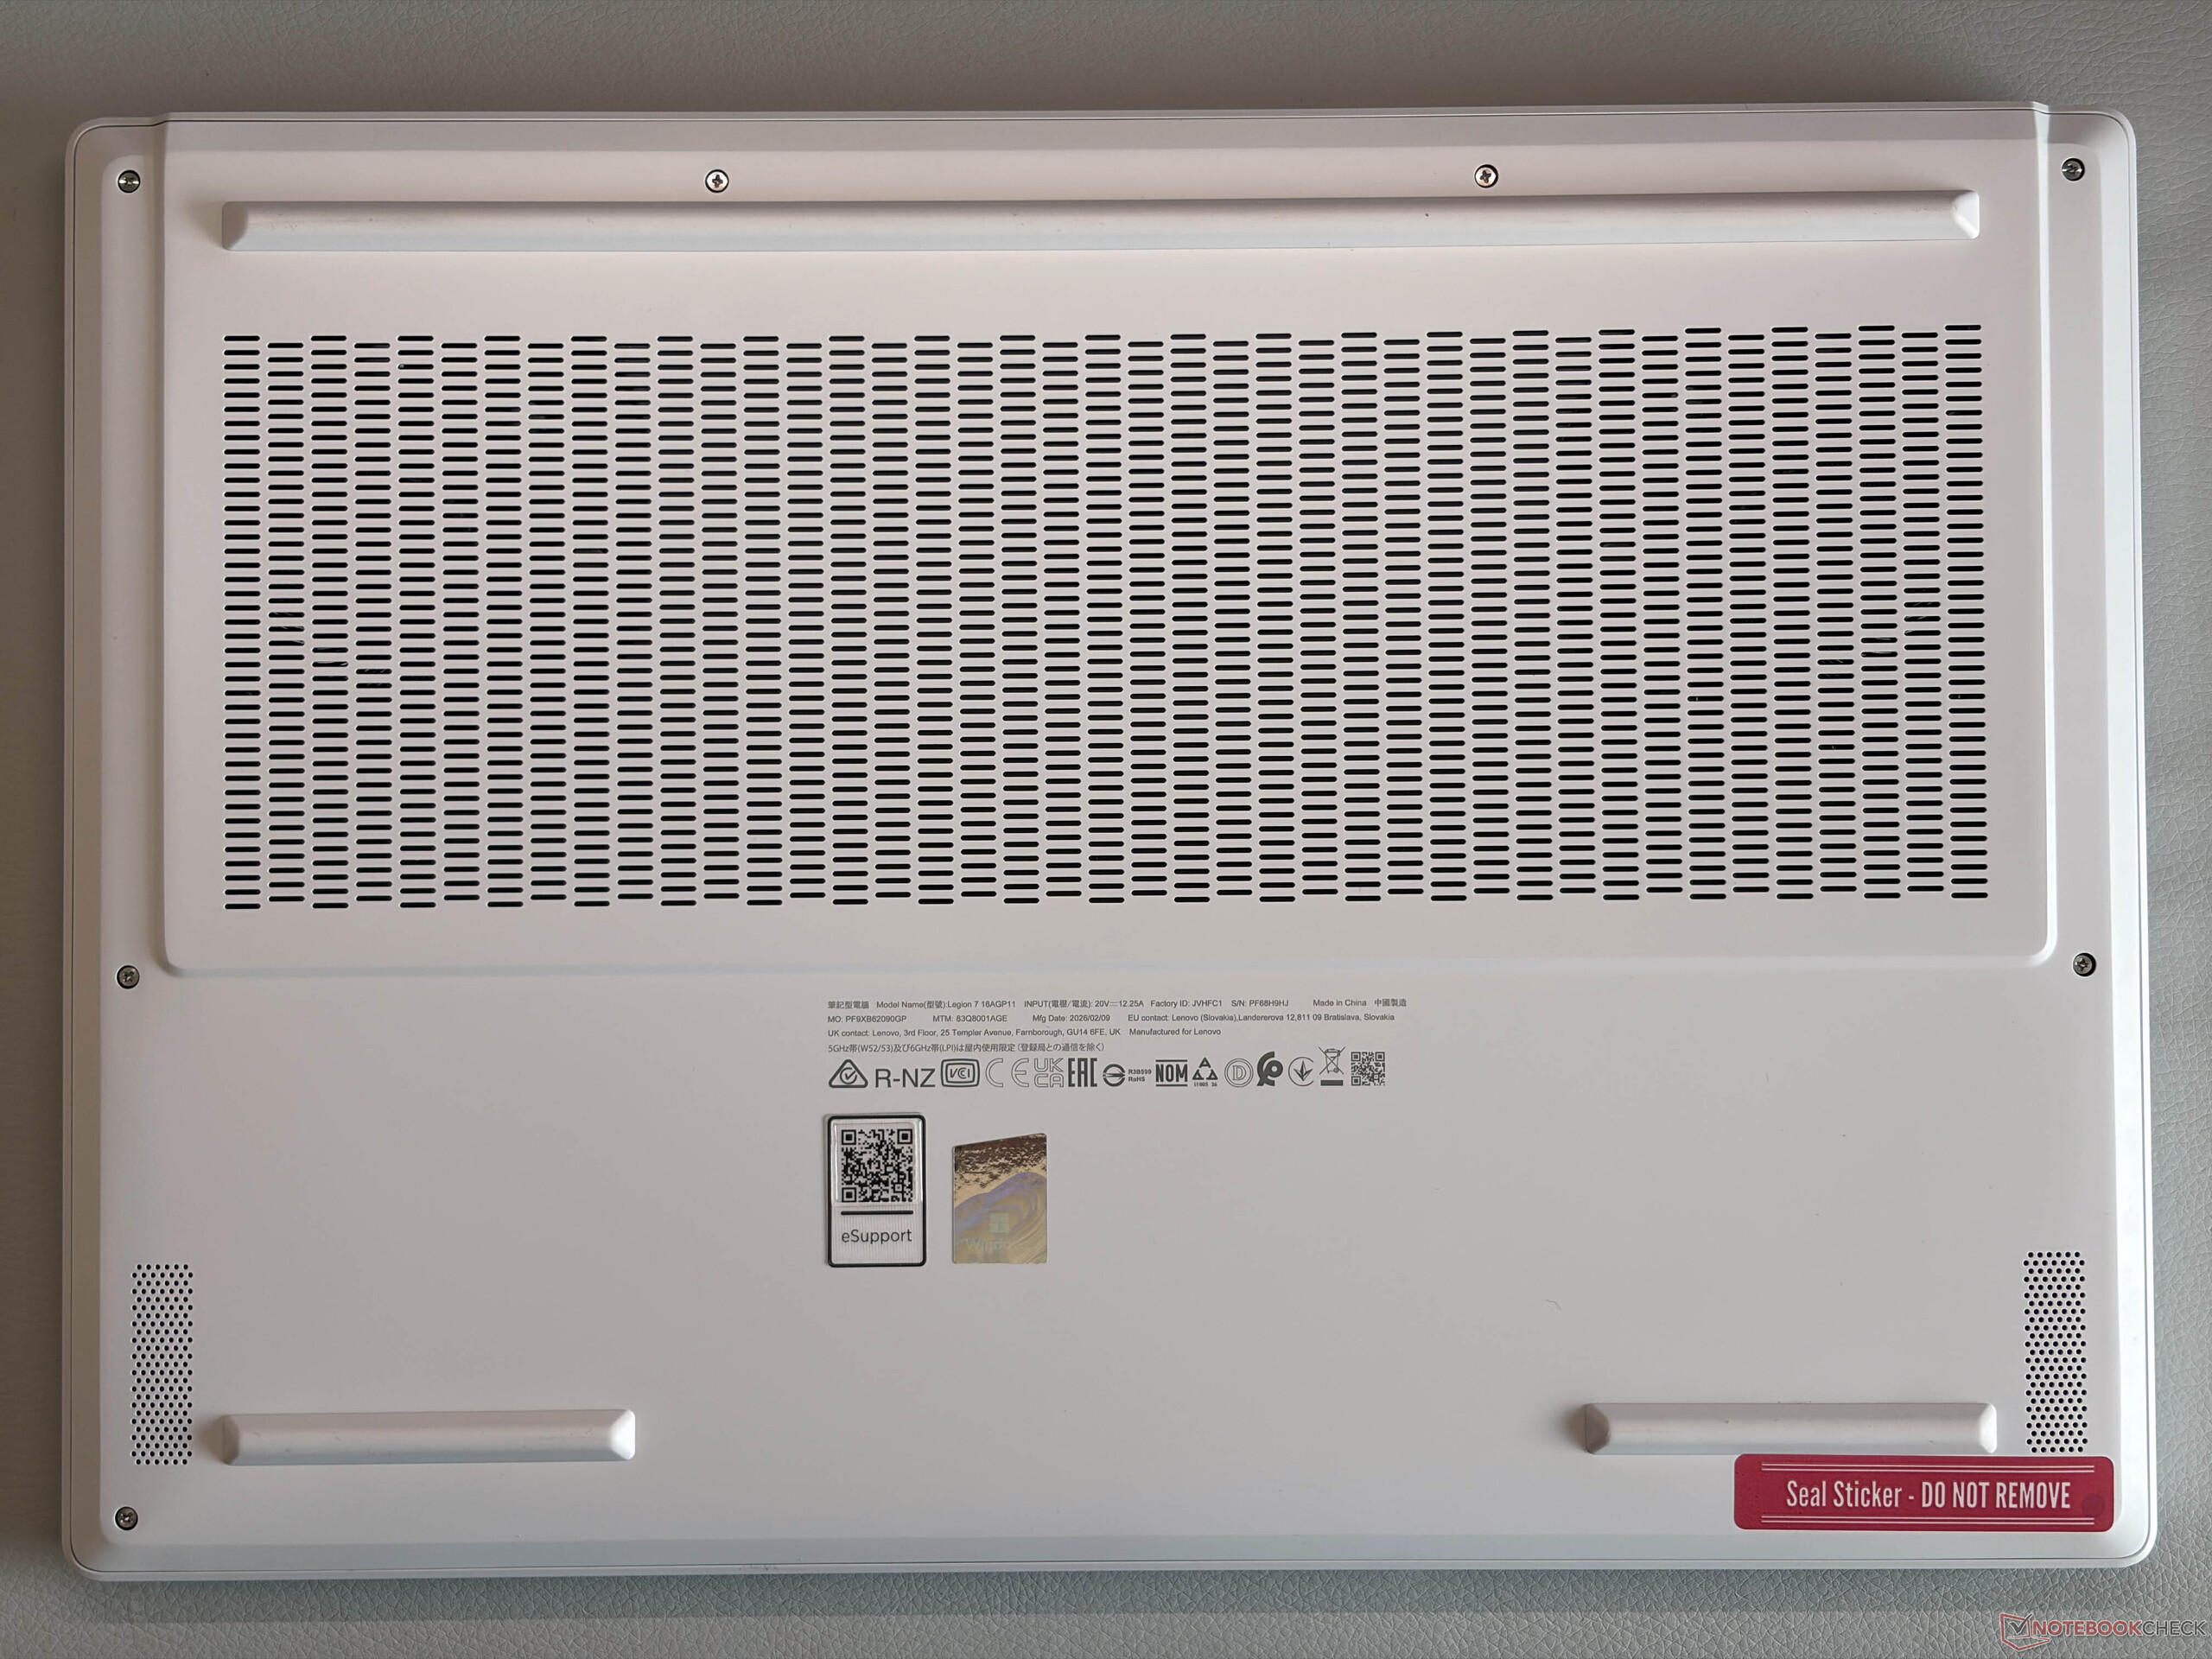
The design of the new Legion 7a 16 is pretty much identical to the previous version and you can once again choose between Glacier White or Nebula (blue). However, while the Legion 7i 16 G10 was already pretty light at 1.978 kg, the new Legion 7a 16 is even 200 grams lighter (1.78 kg) and it is therefore also clearly the lightest device within our comparison group.
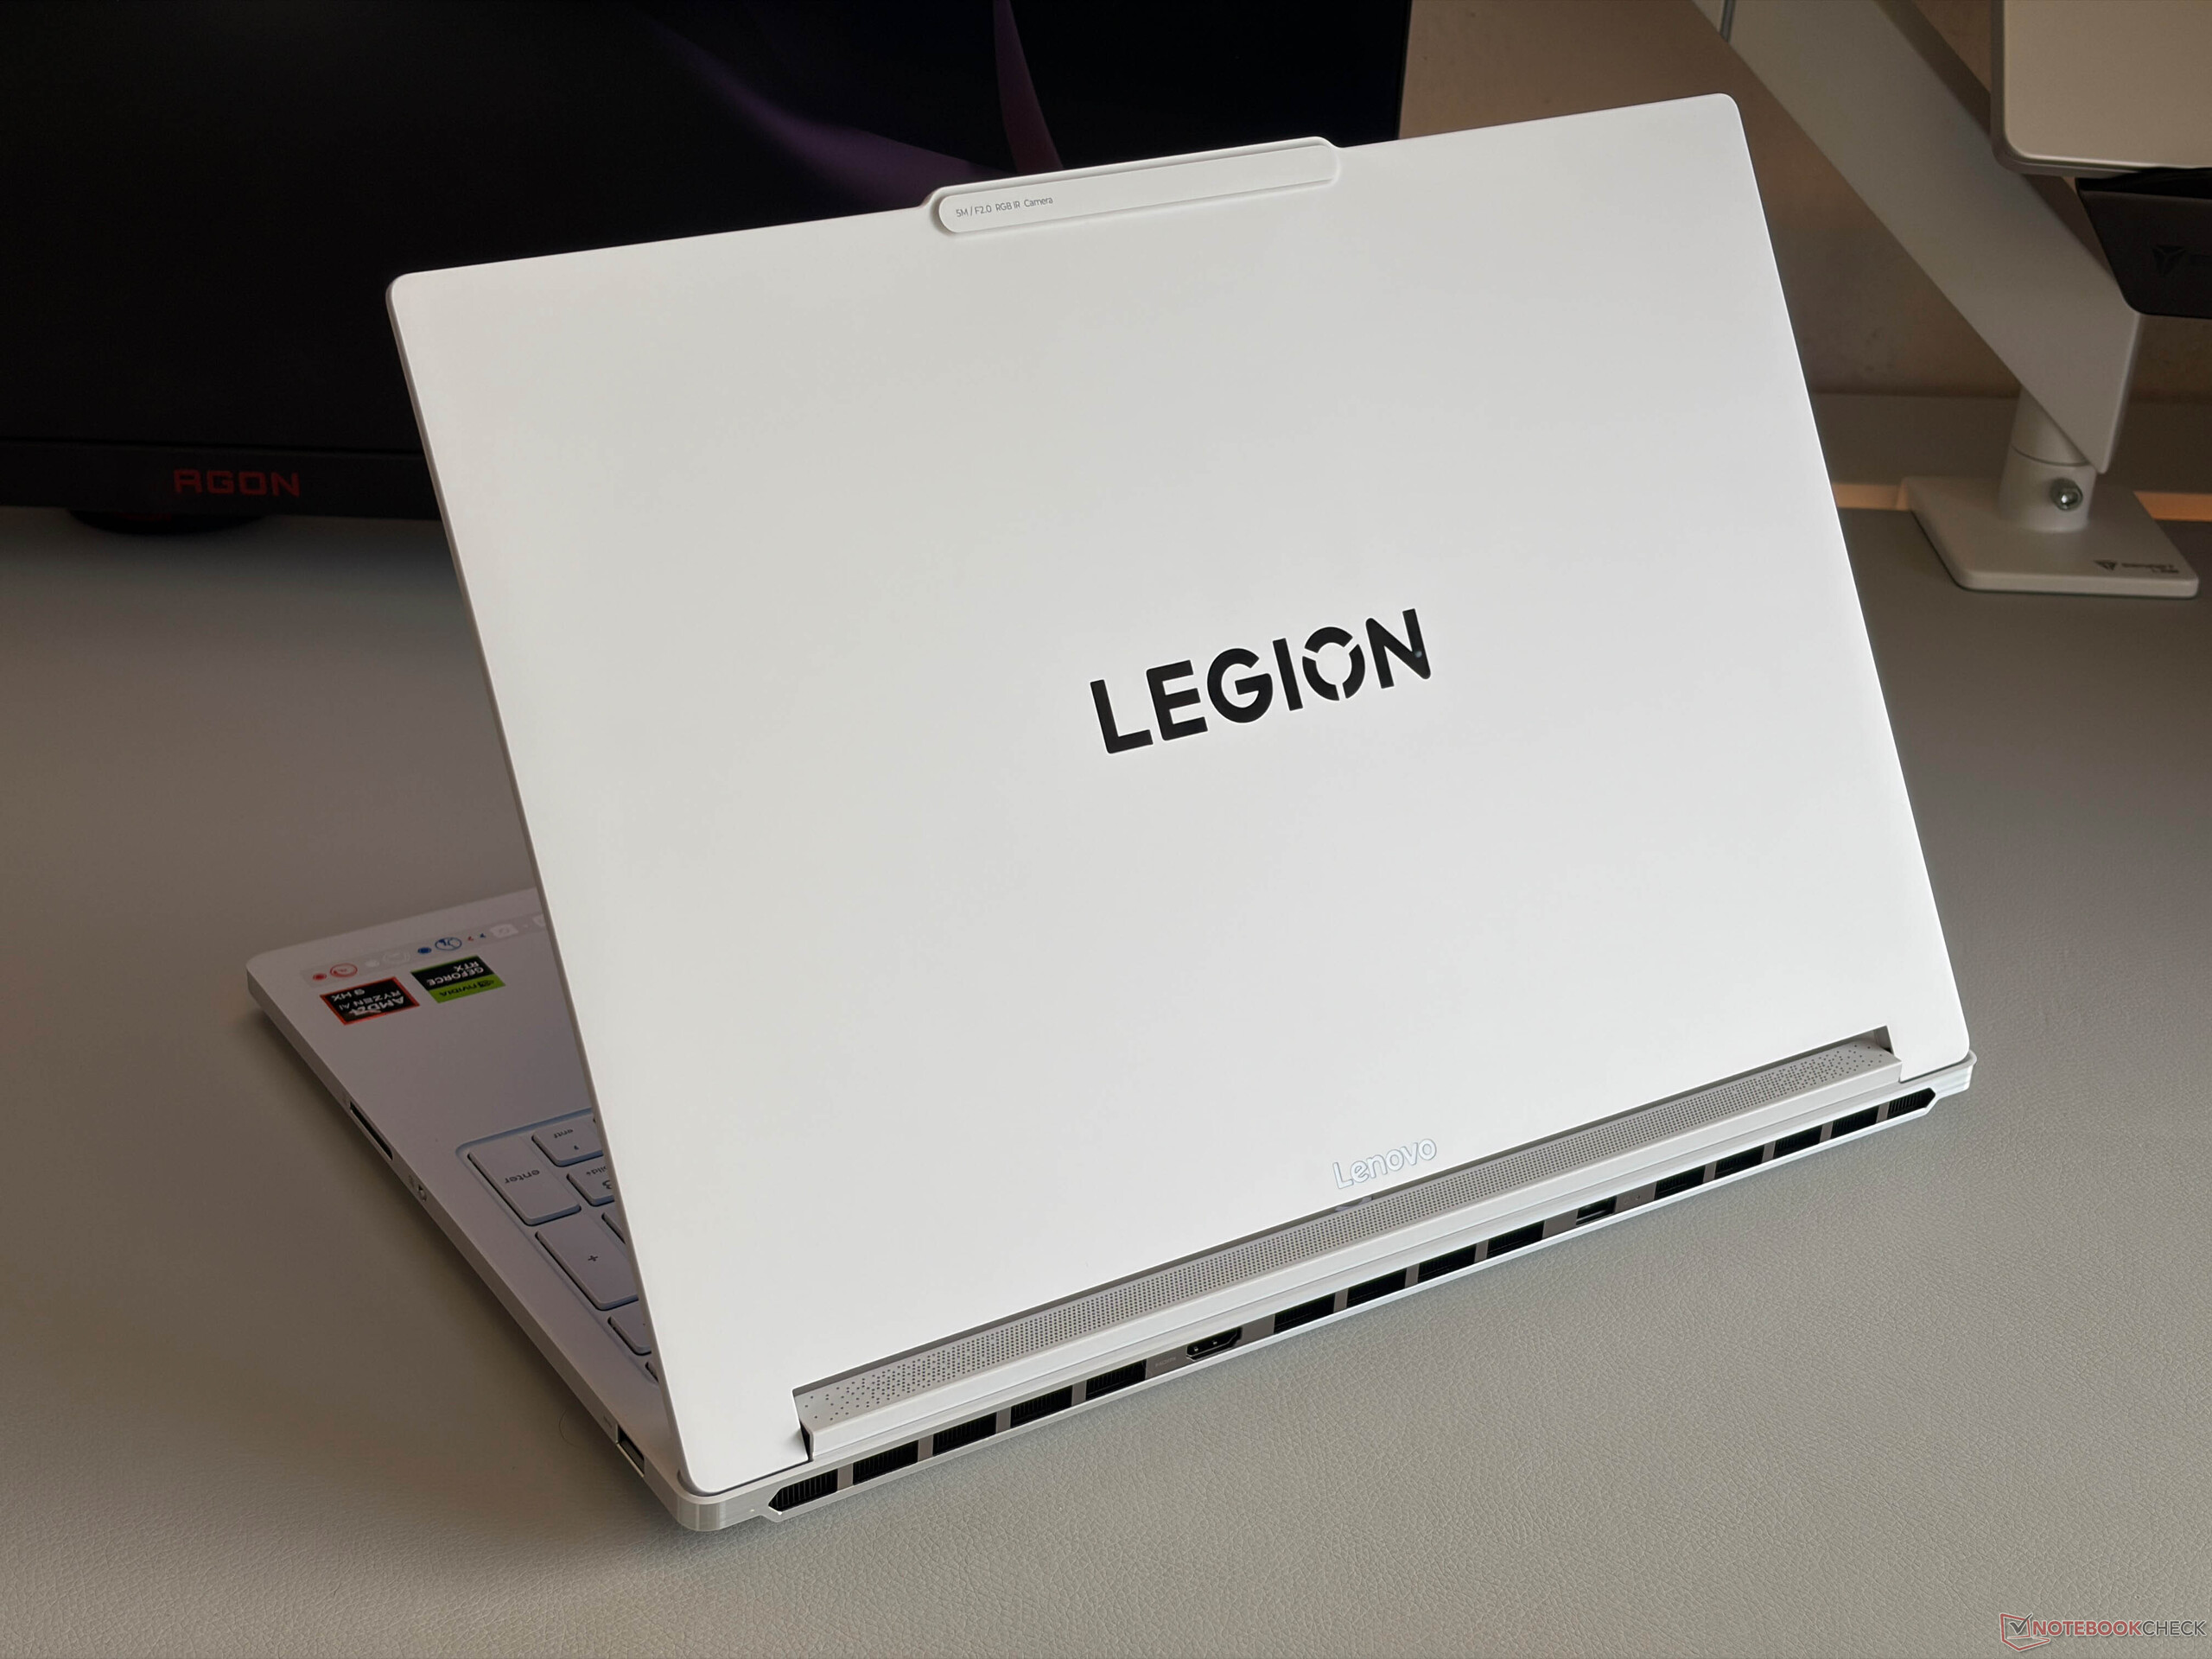
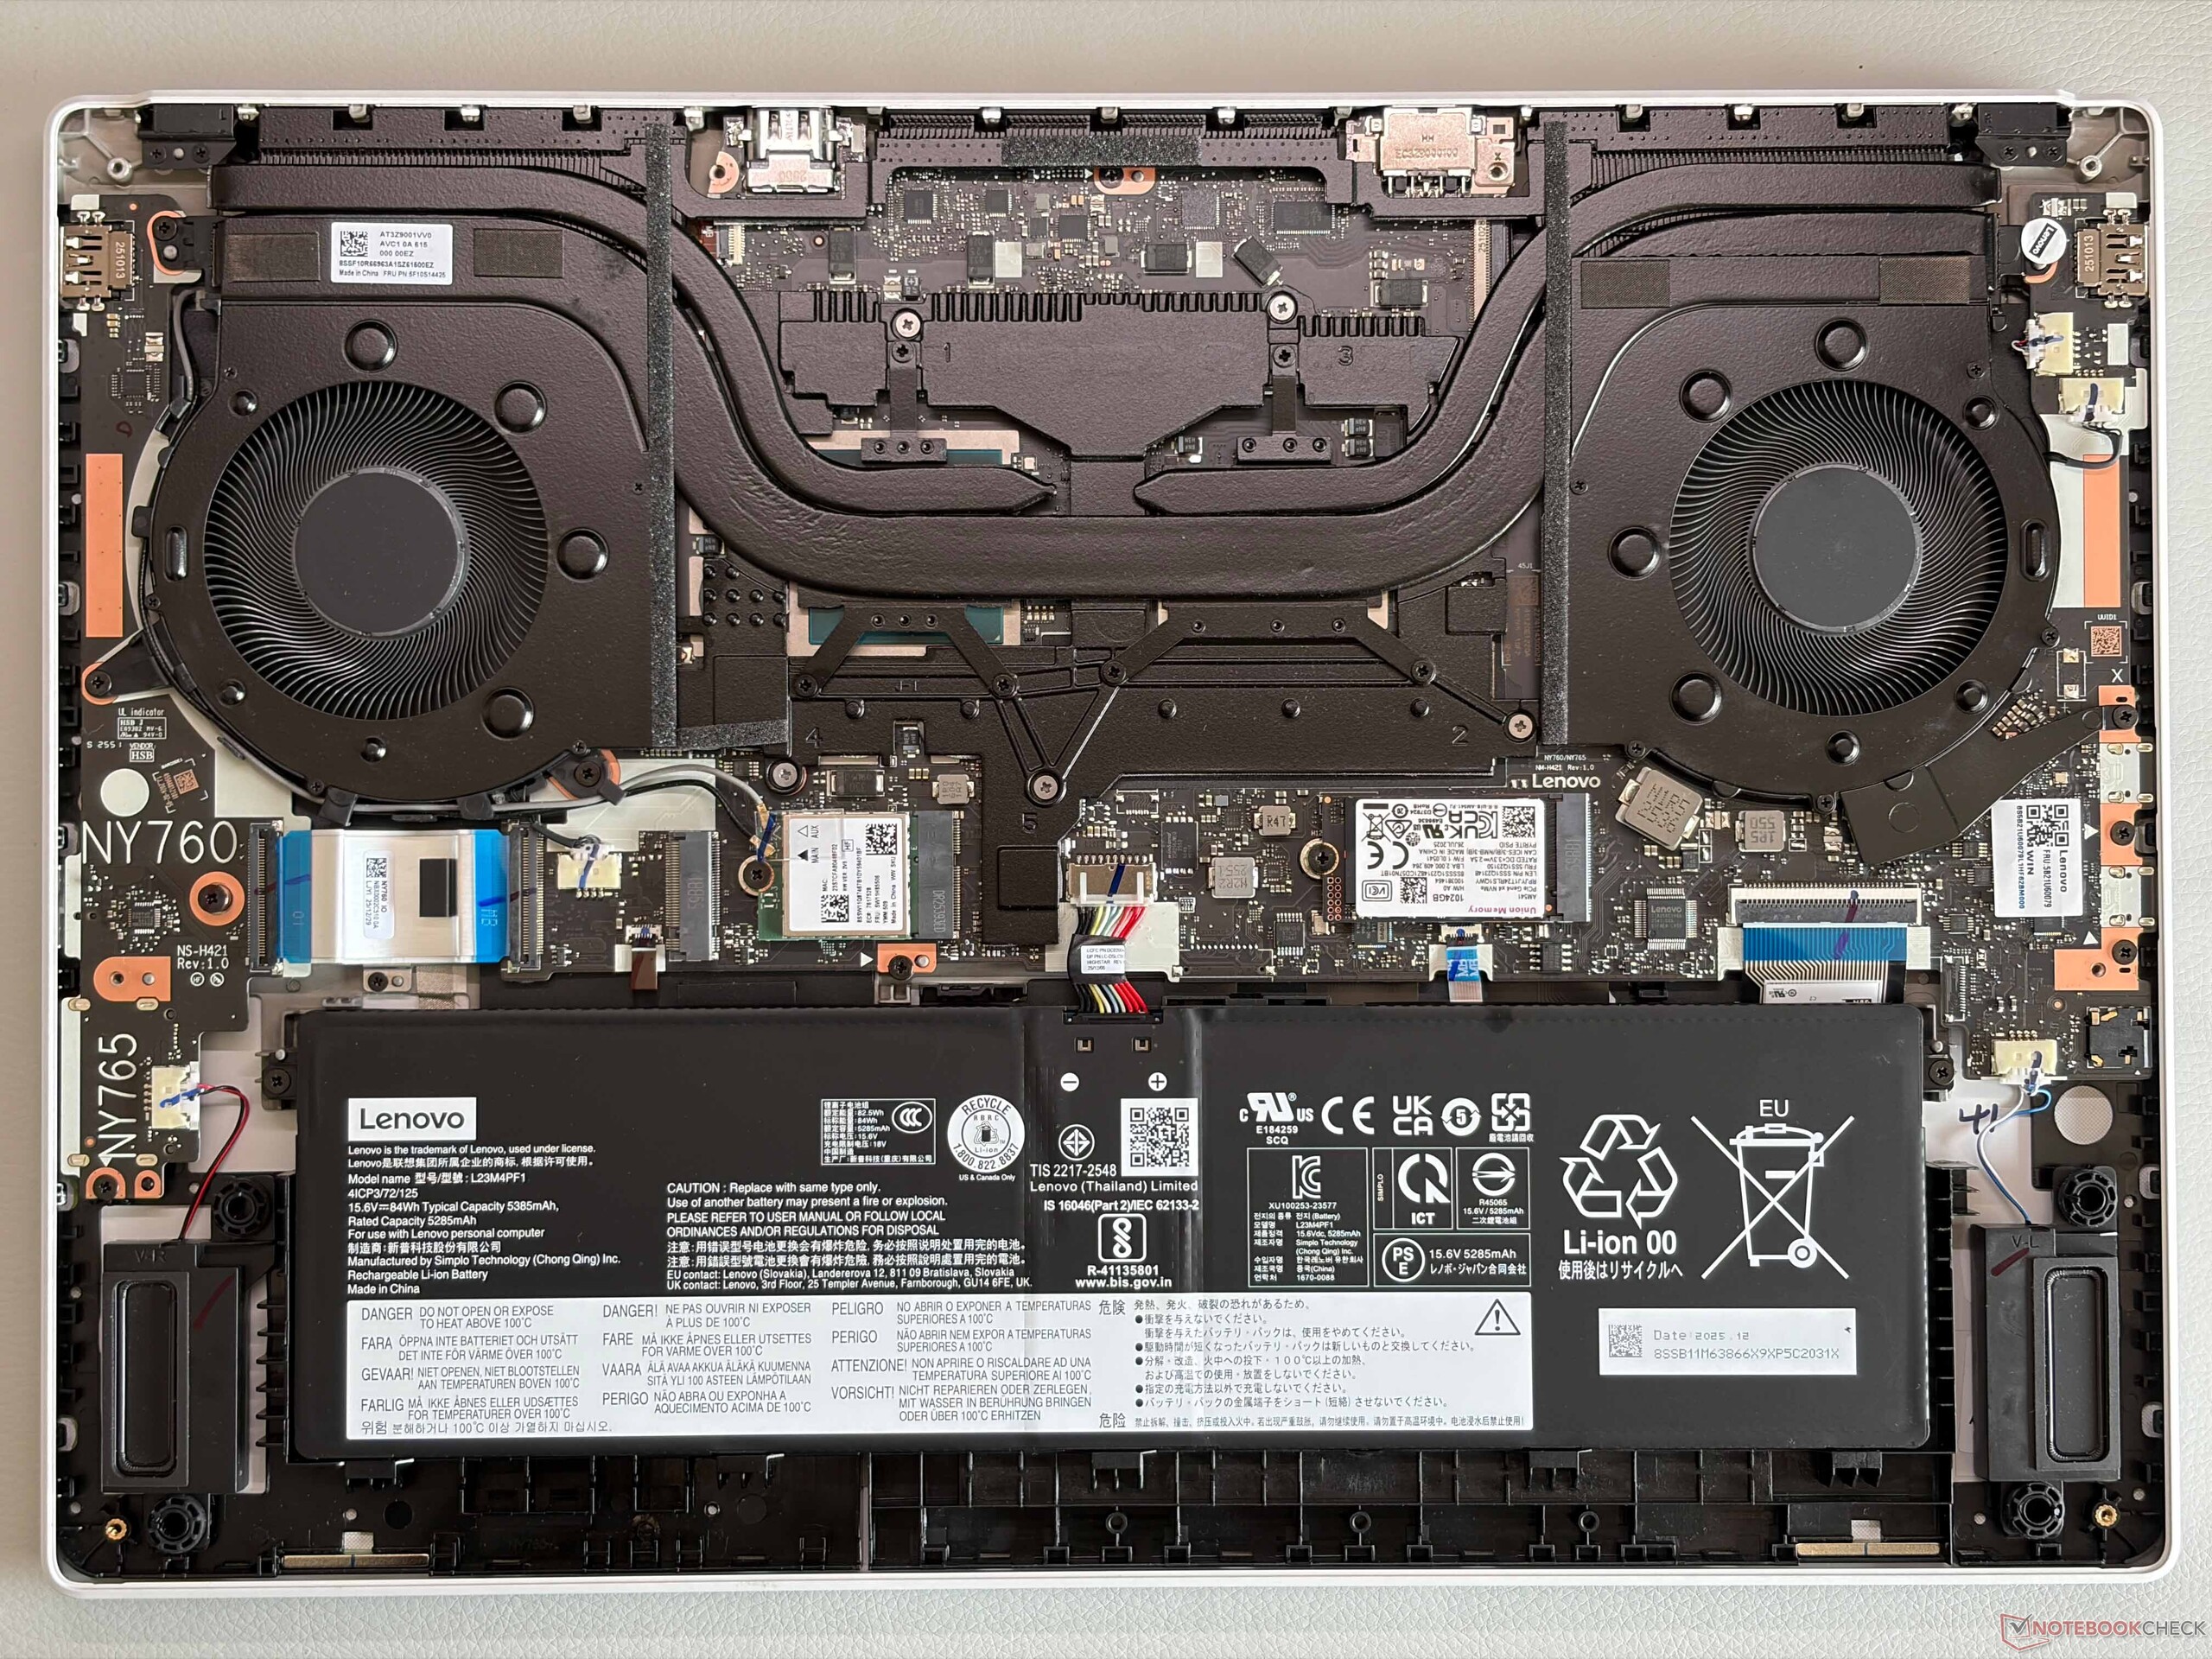
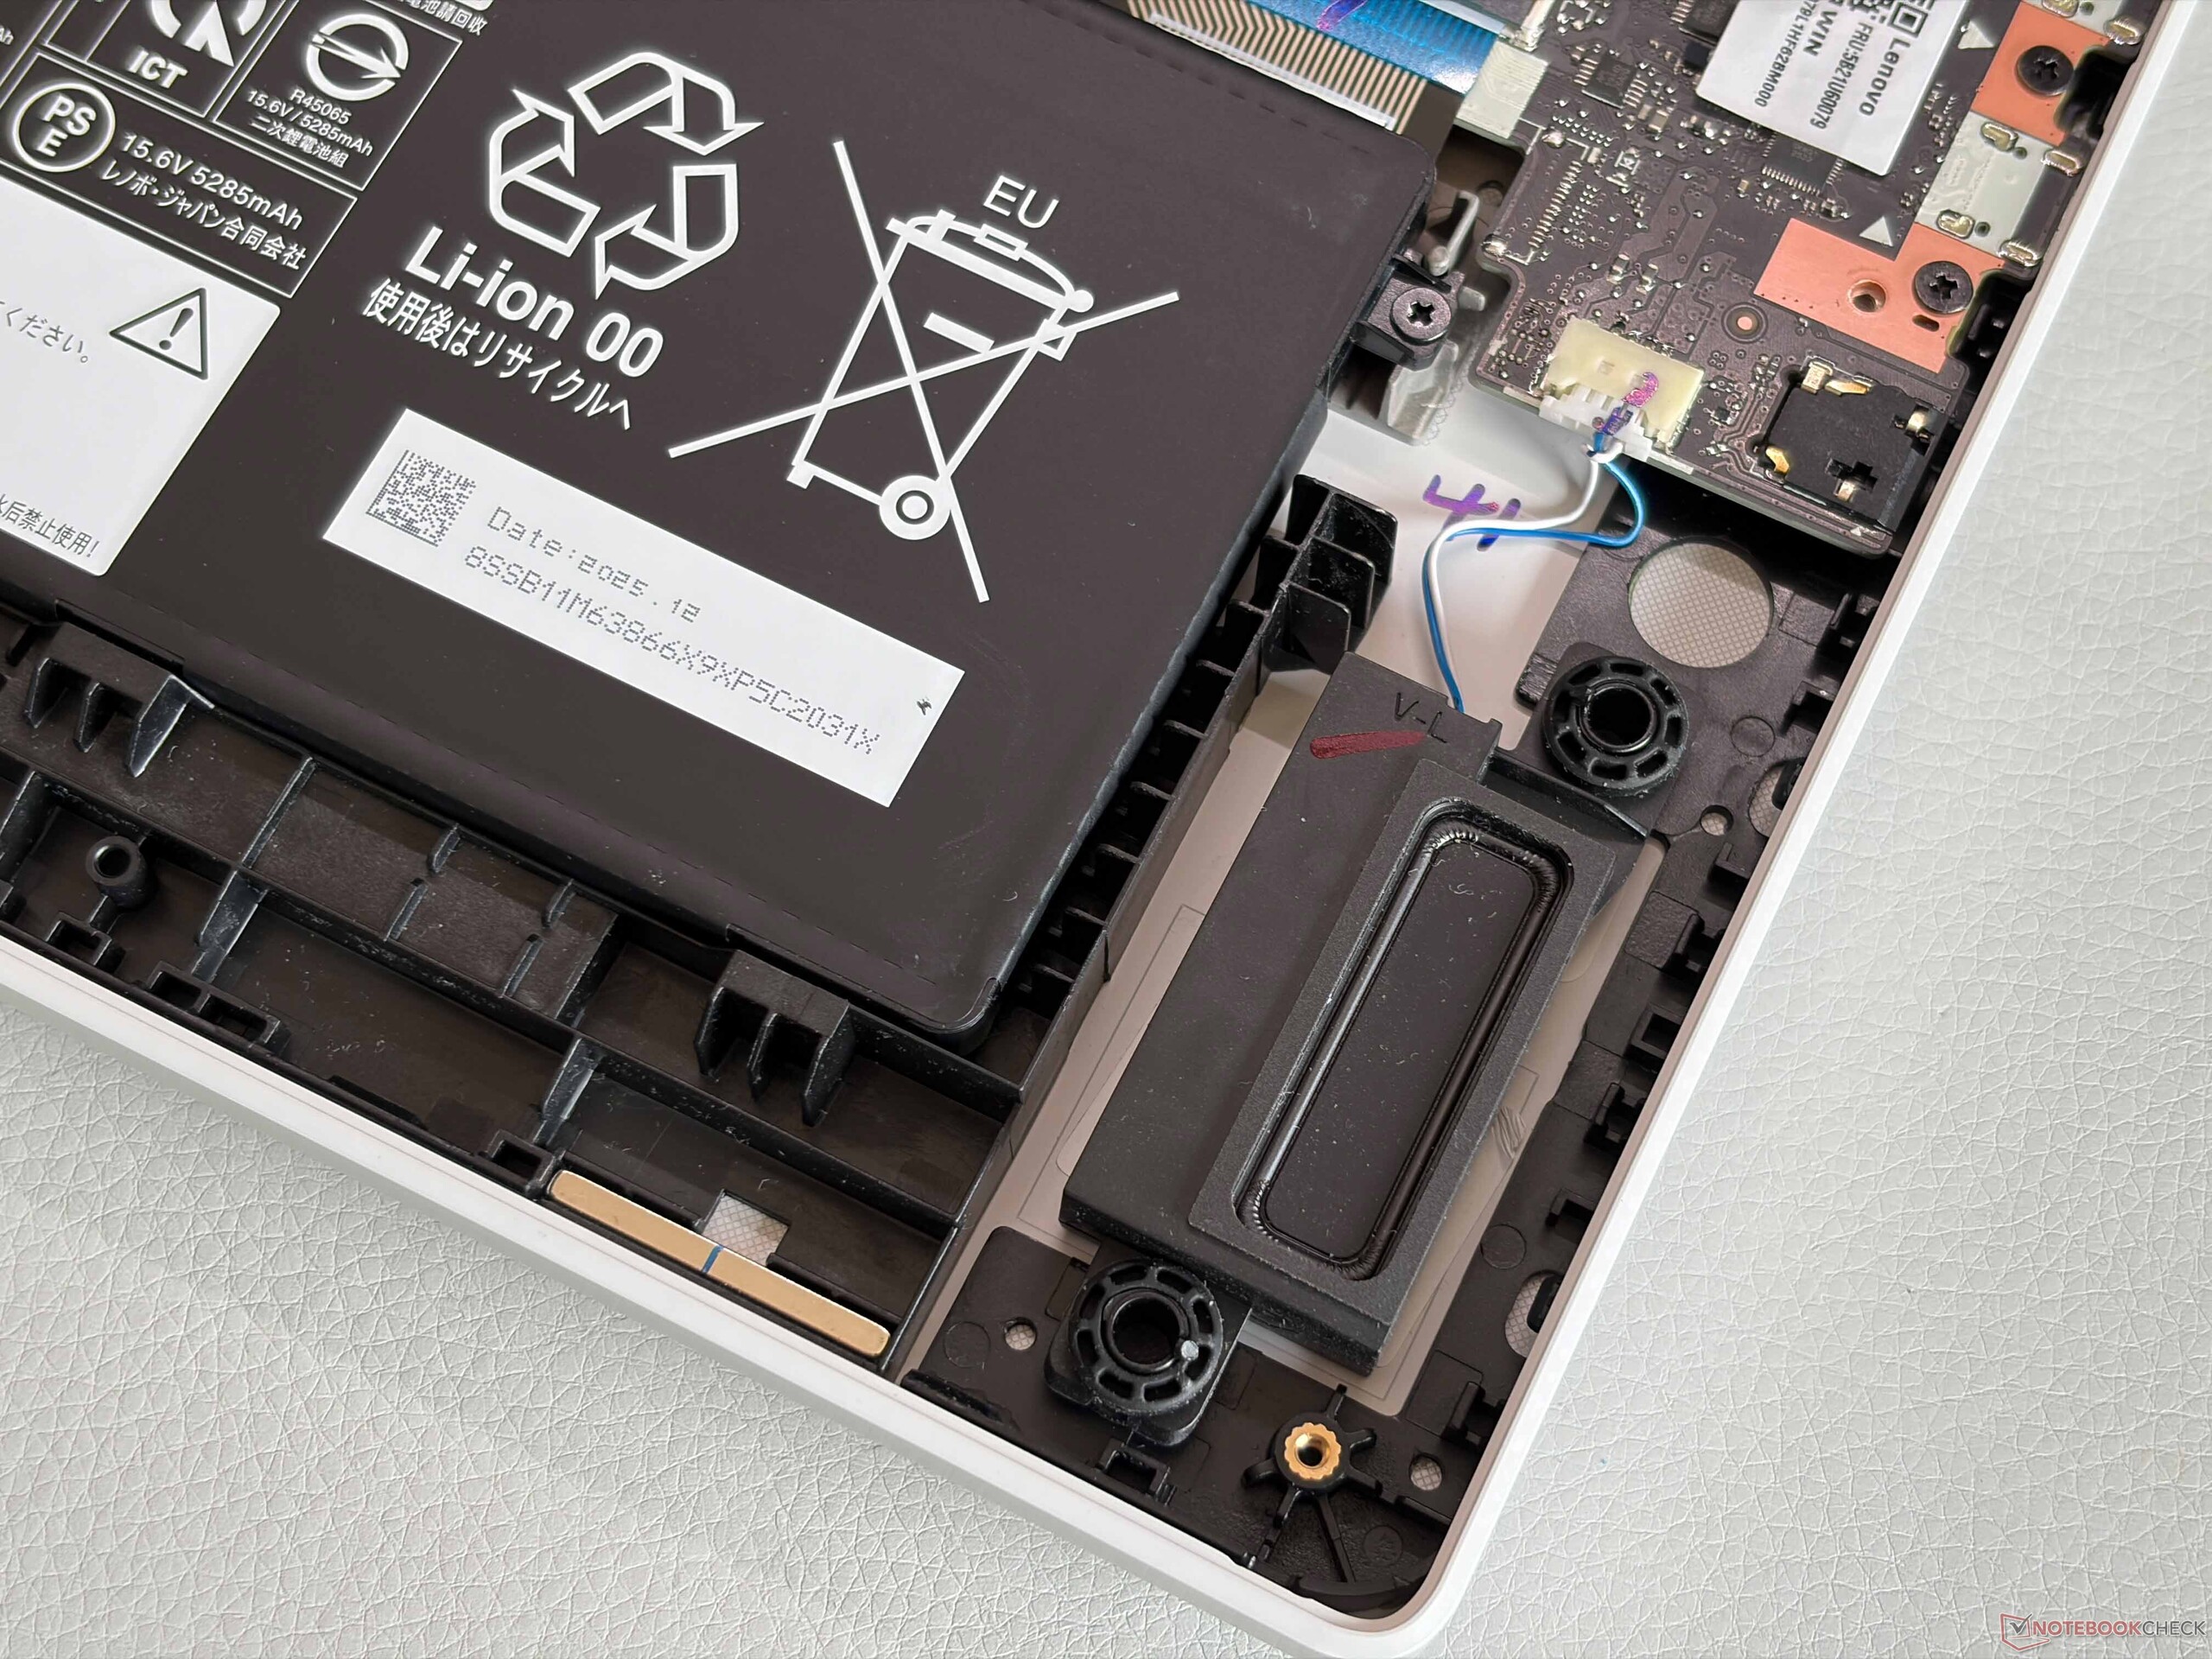
Our white review unit looks very nice and the aluminum surfaces do not really attract fingerprints or dirt, so it is very easy to keep clean. Lighting elements are kept to a minimum. The lower weight does not affect the stability and the new AMD model is just as sturdy as before. The hinges (max. opening angle 180 degrees) are also well-adjusted and keep bouncing to a minimum. Maintenance options are limited to the M.2-2242 SSD, one free M.2-2280 slot, the Wi-Fi module as well as the cleaning of the fans, while the RAM is soldered.
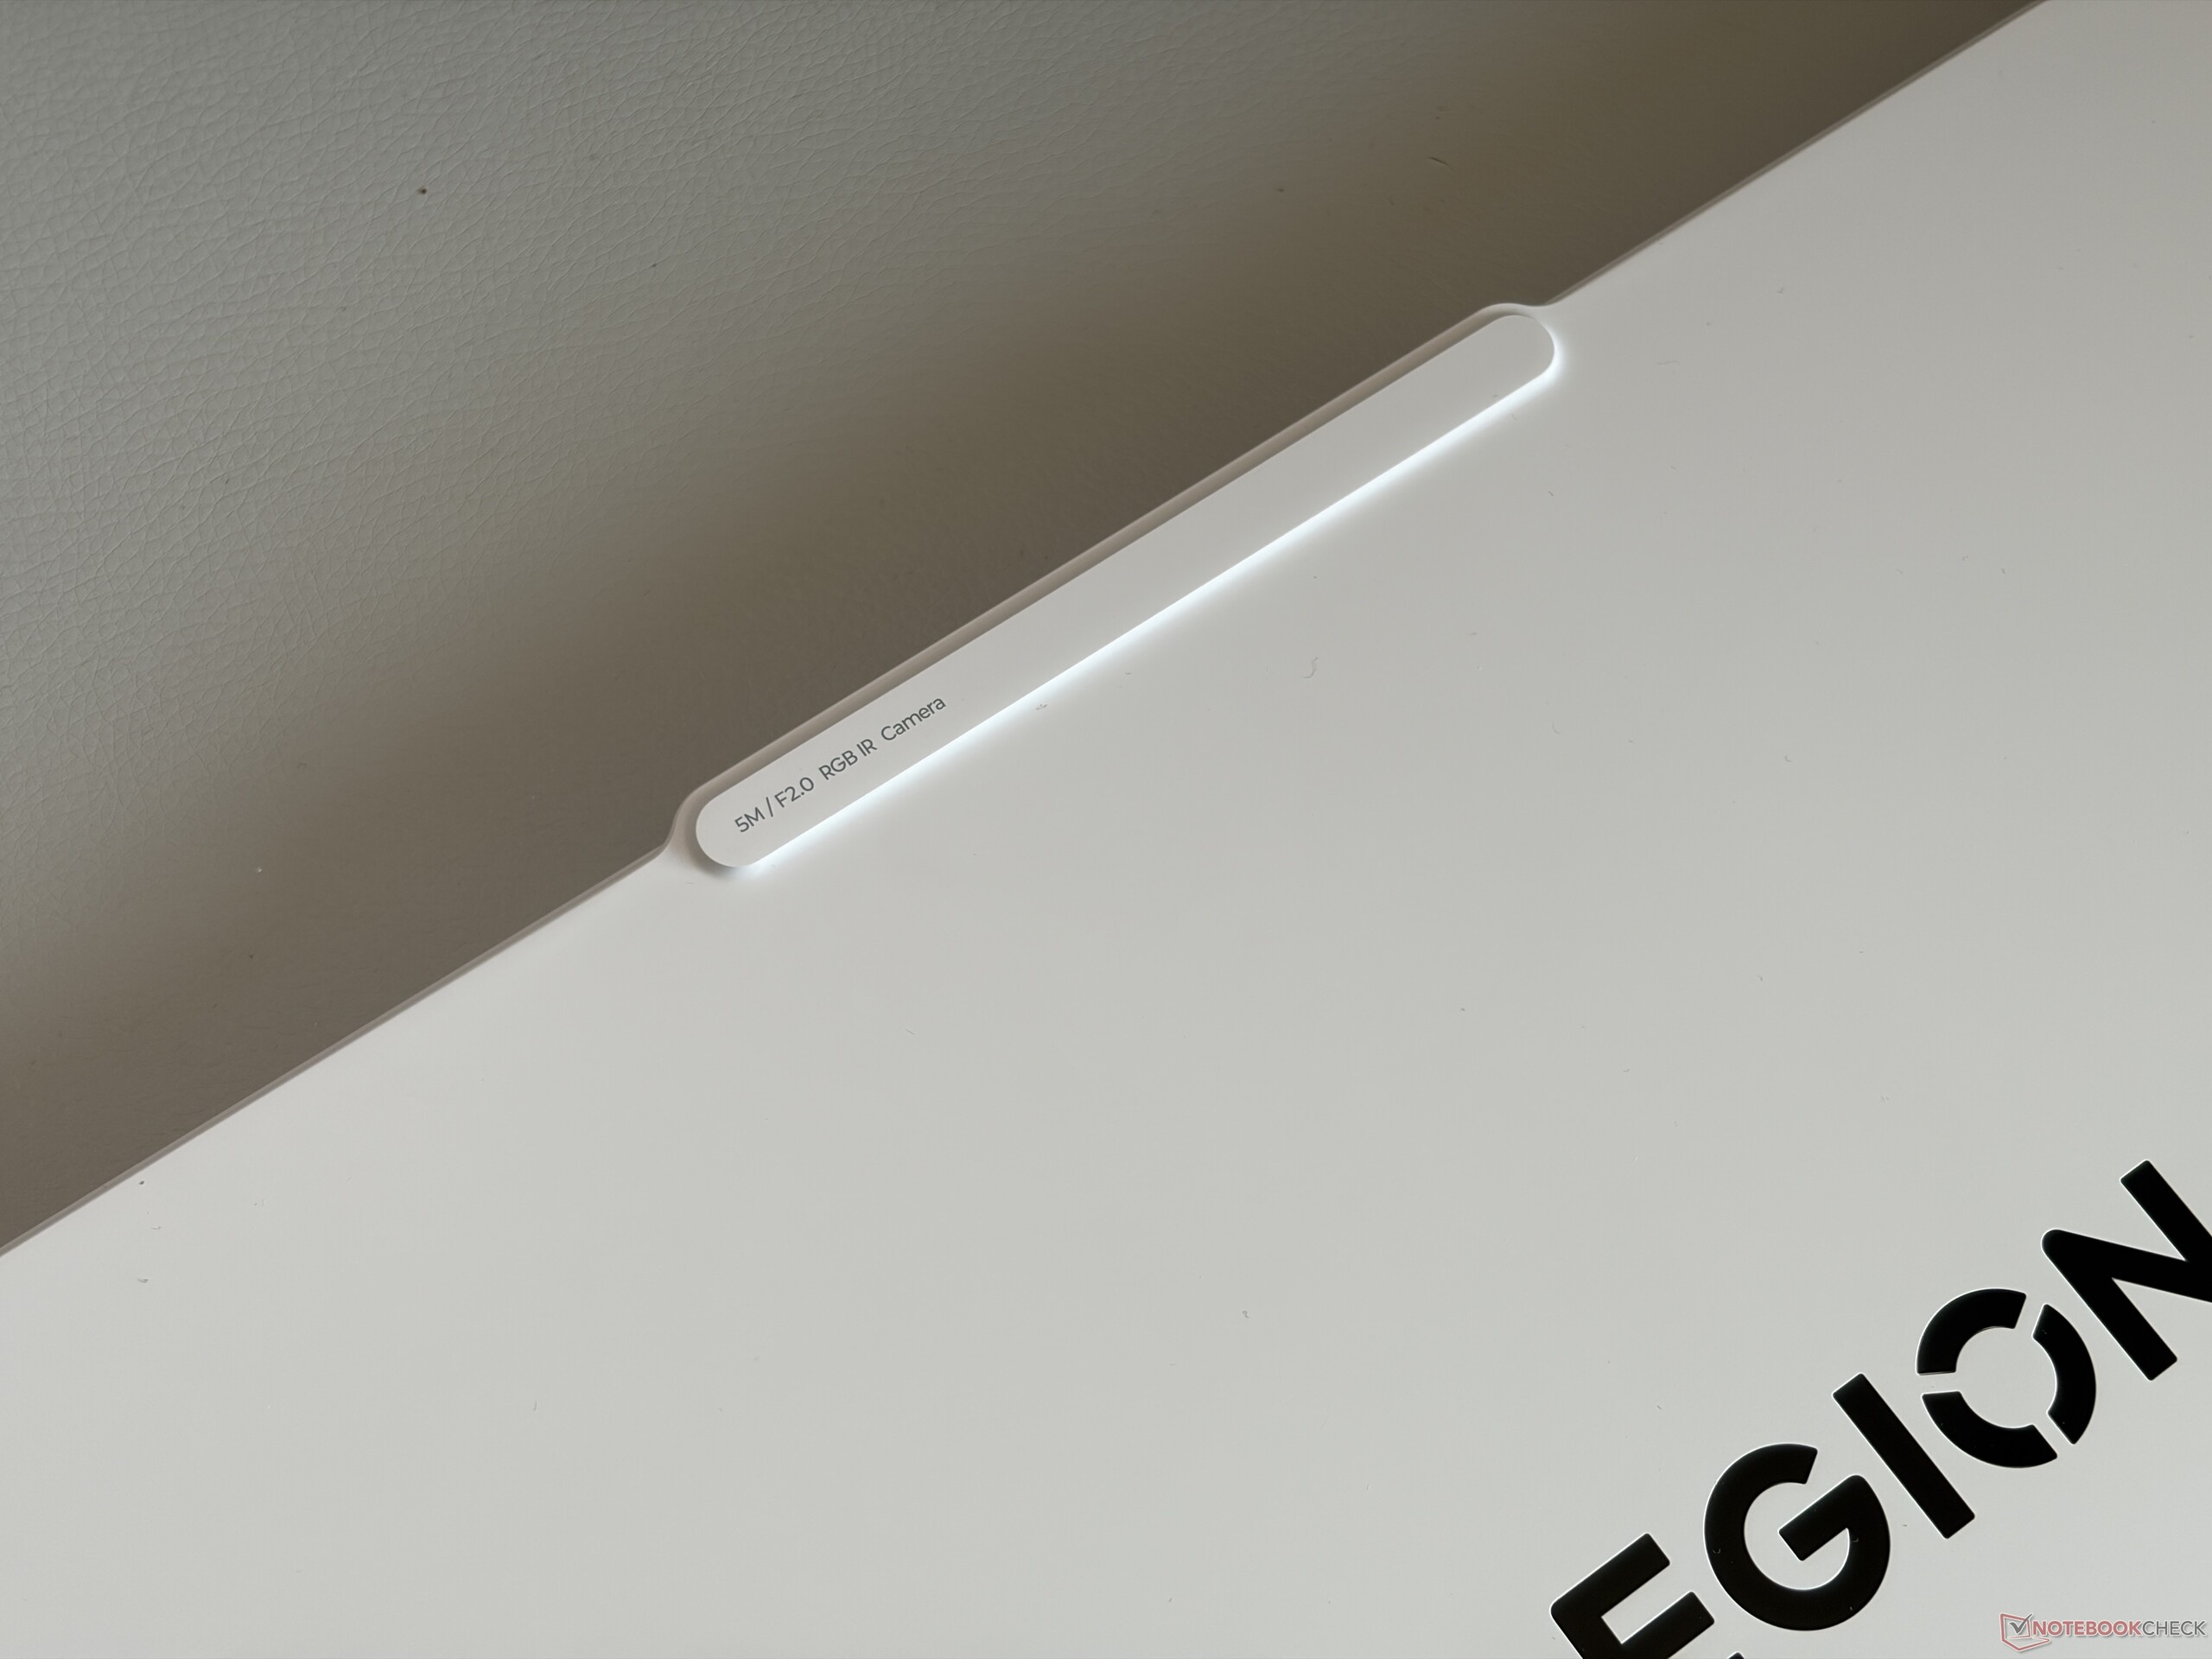
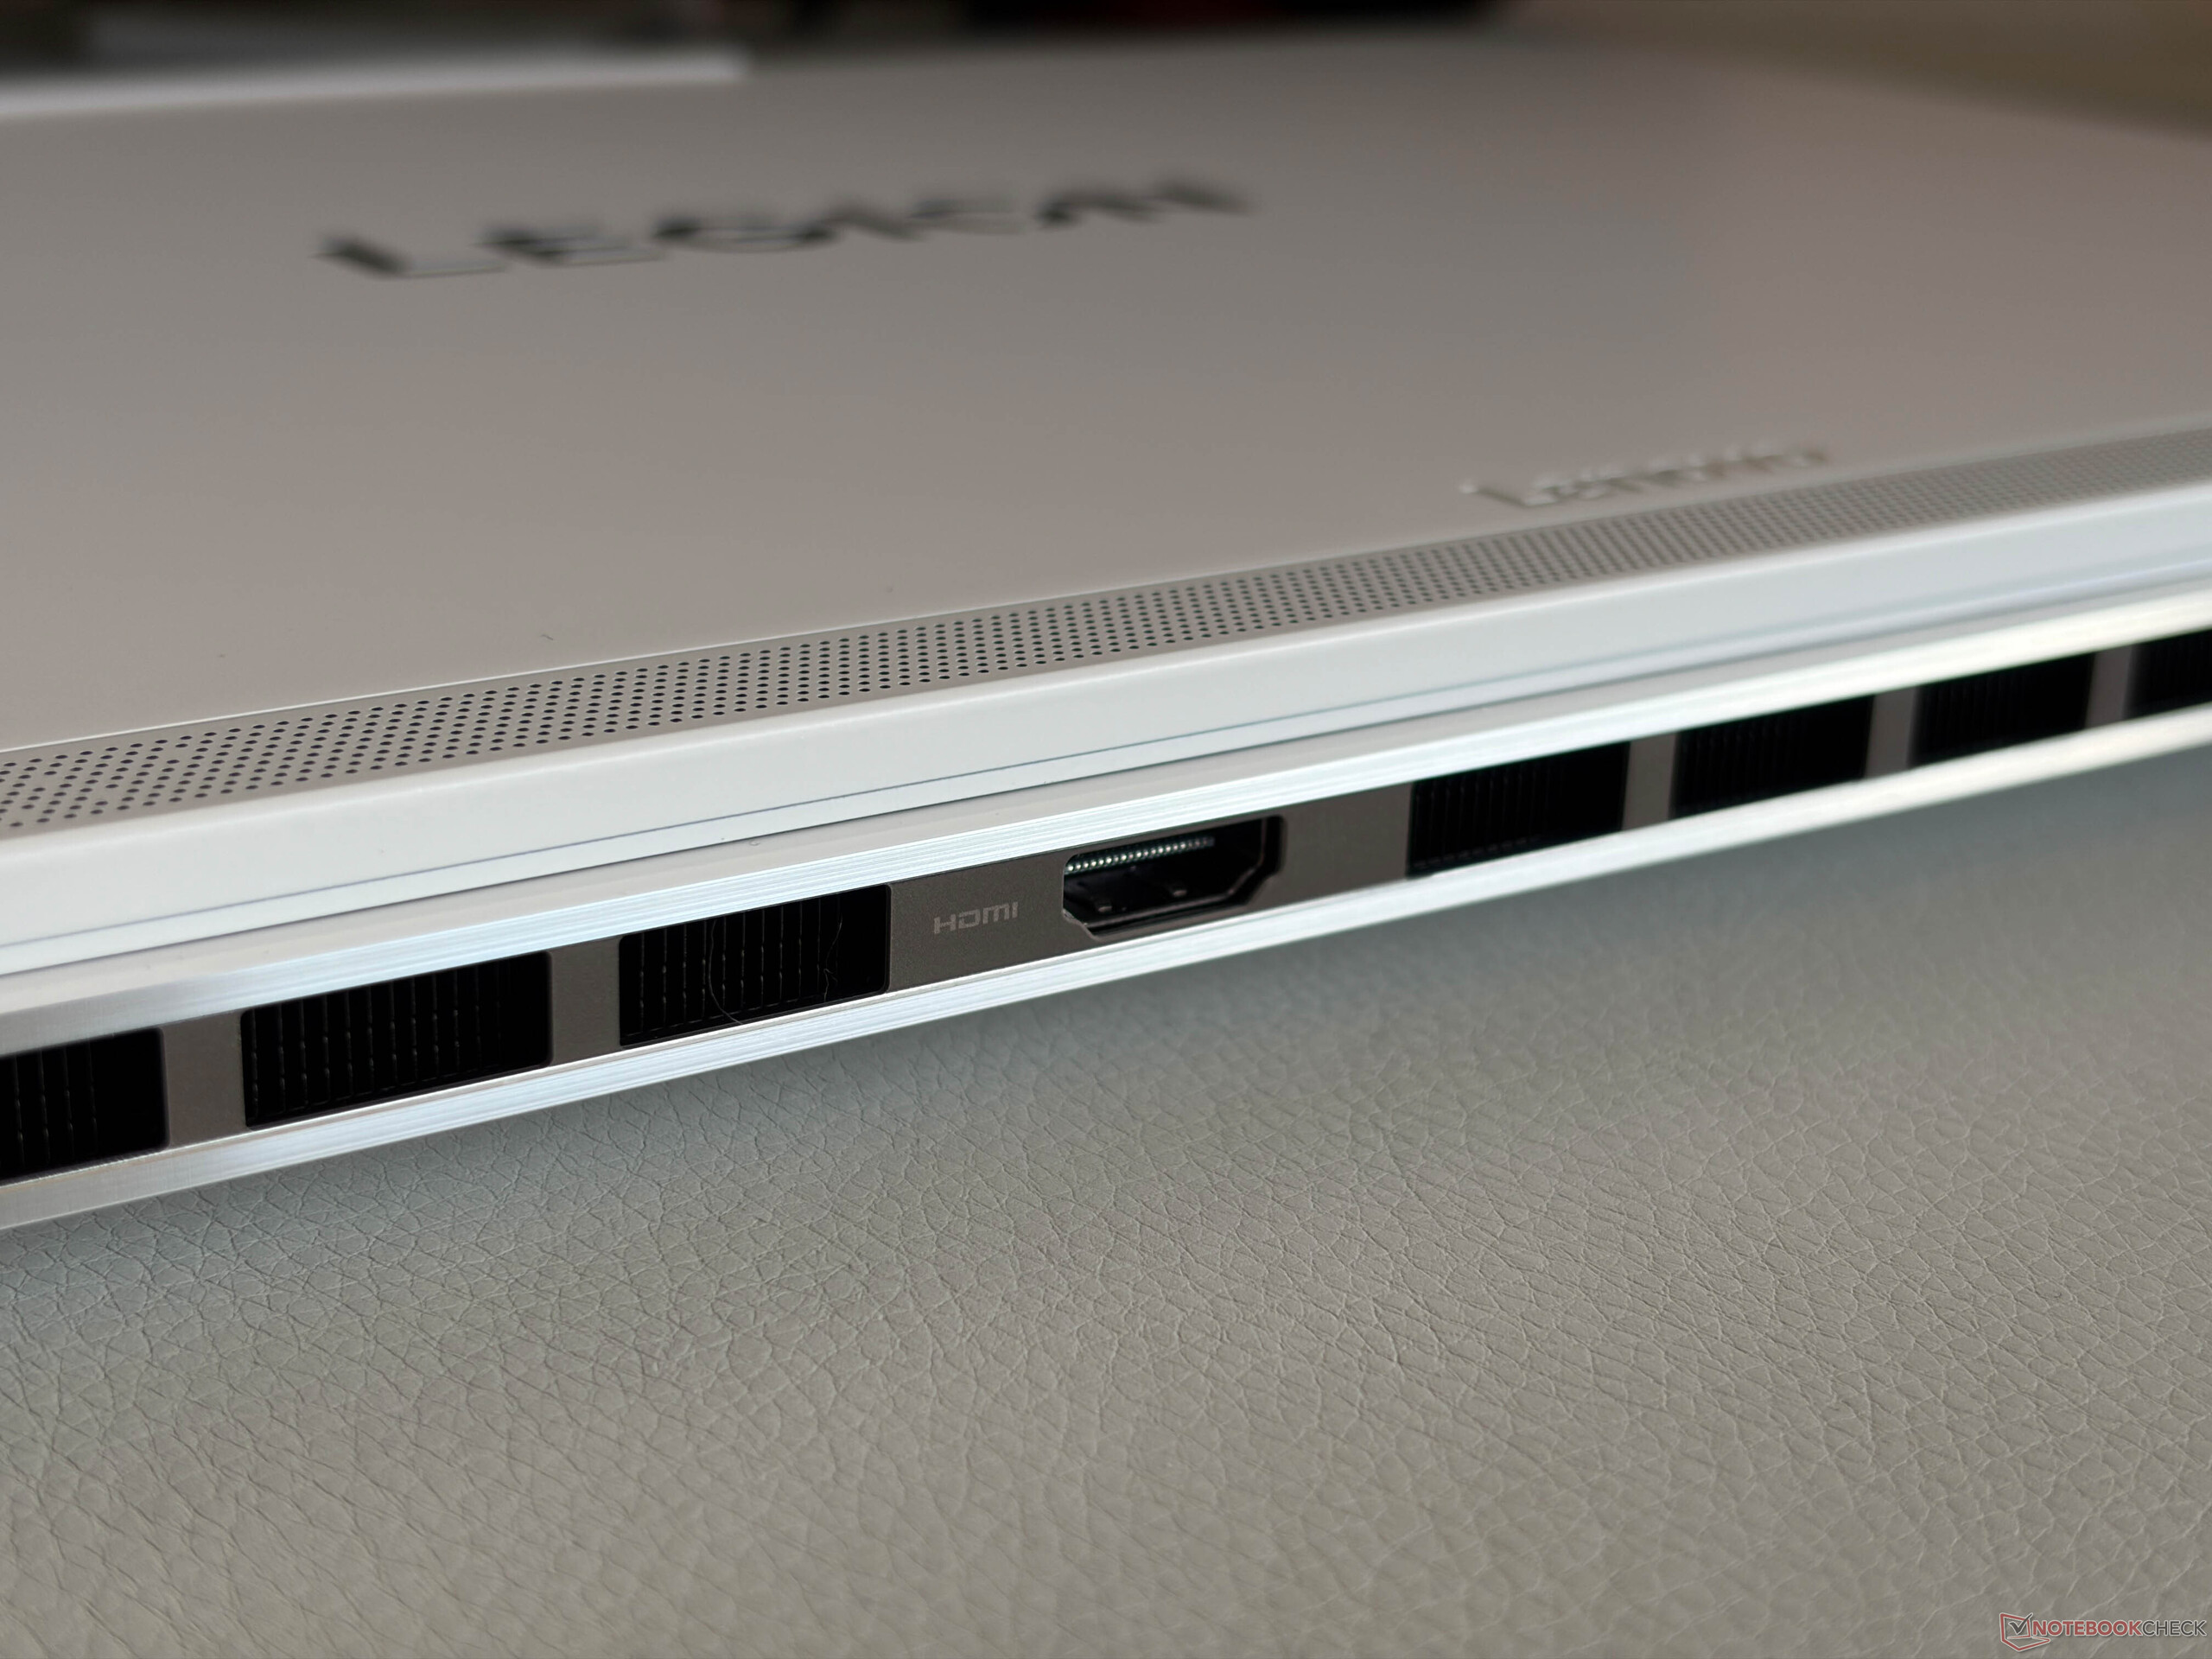
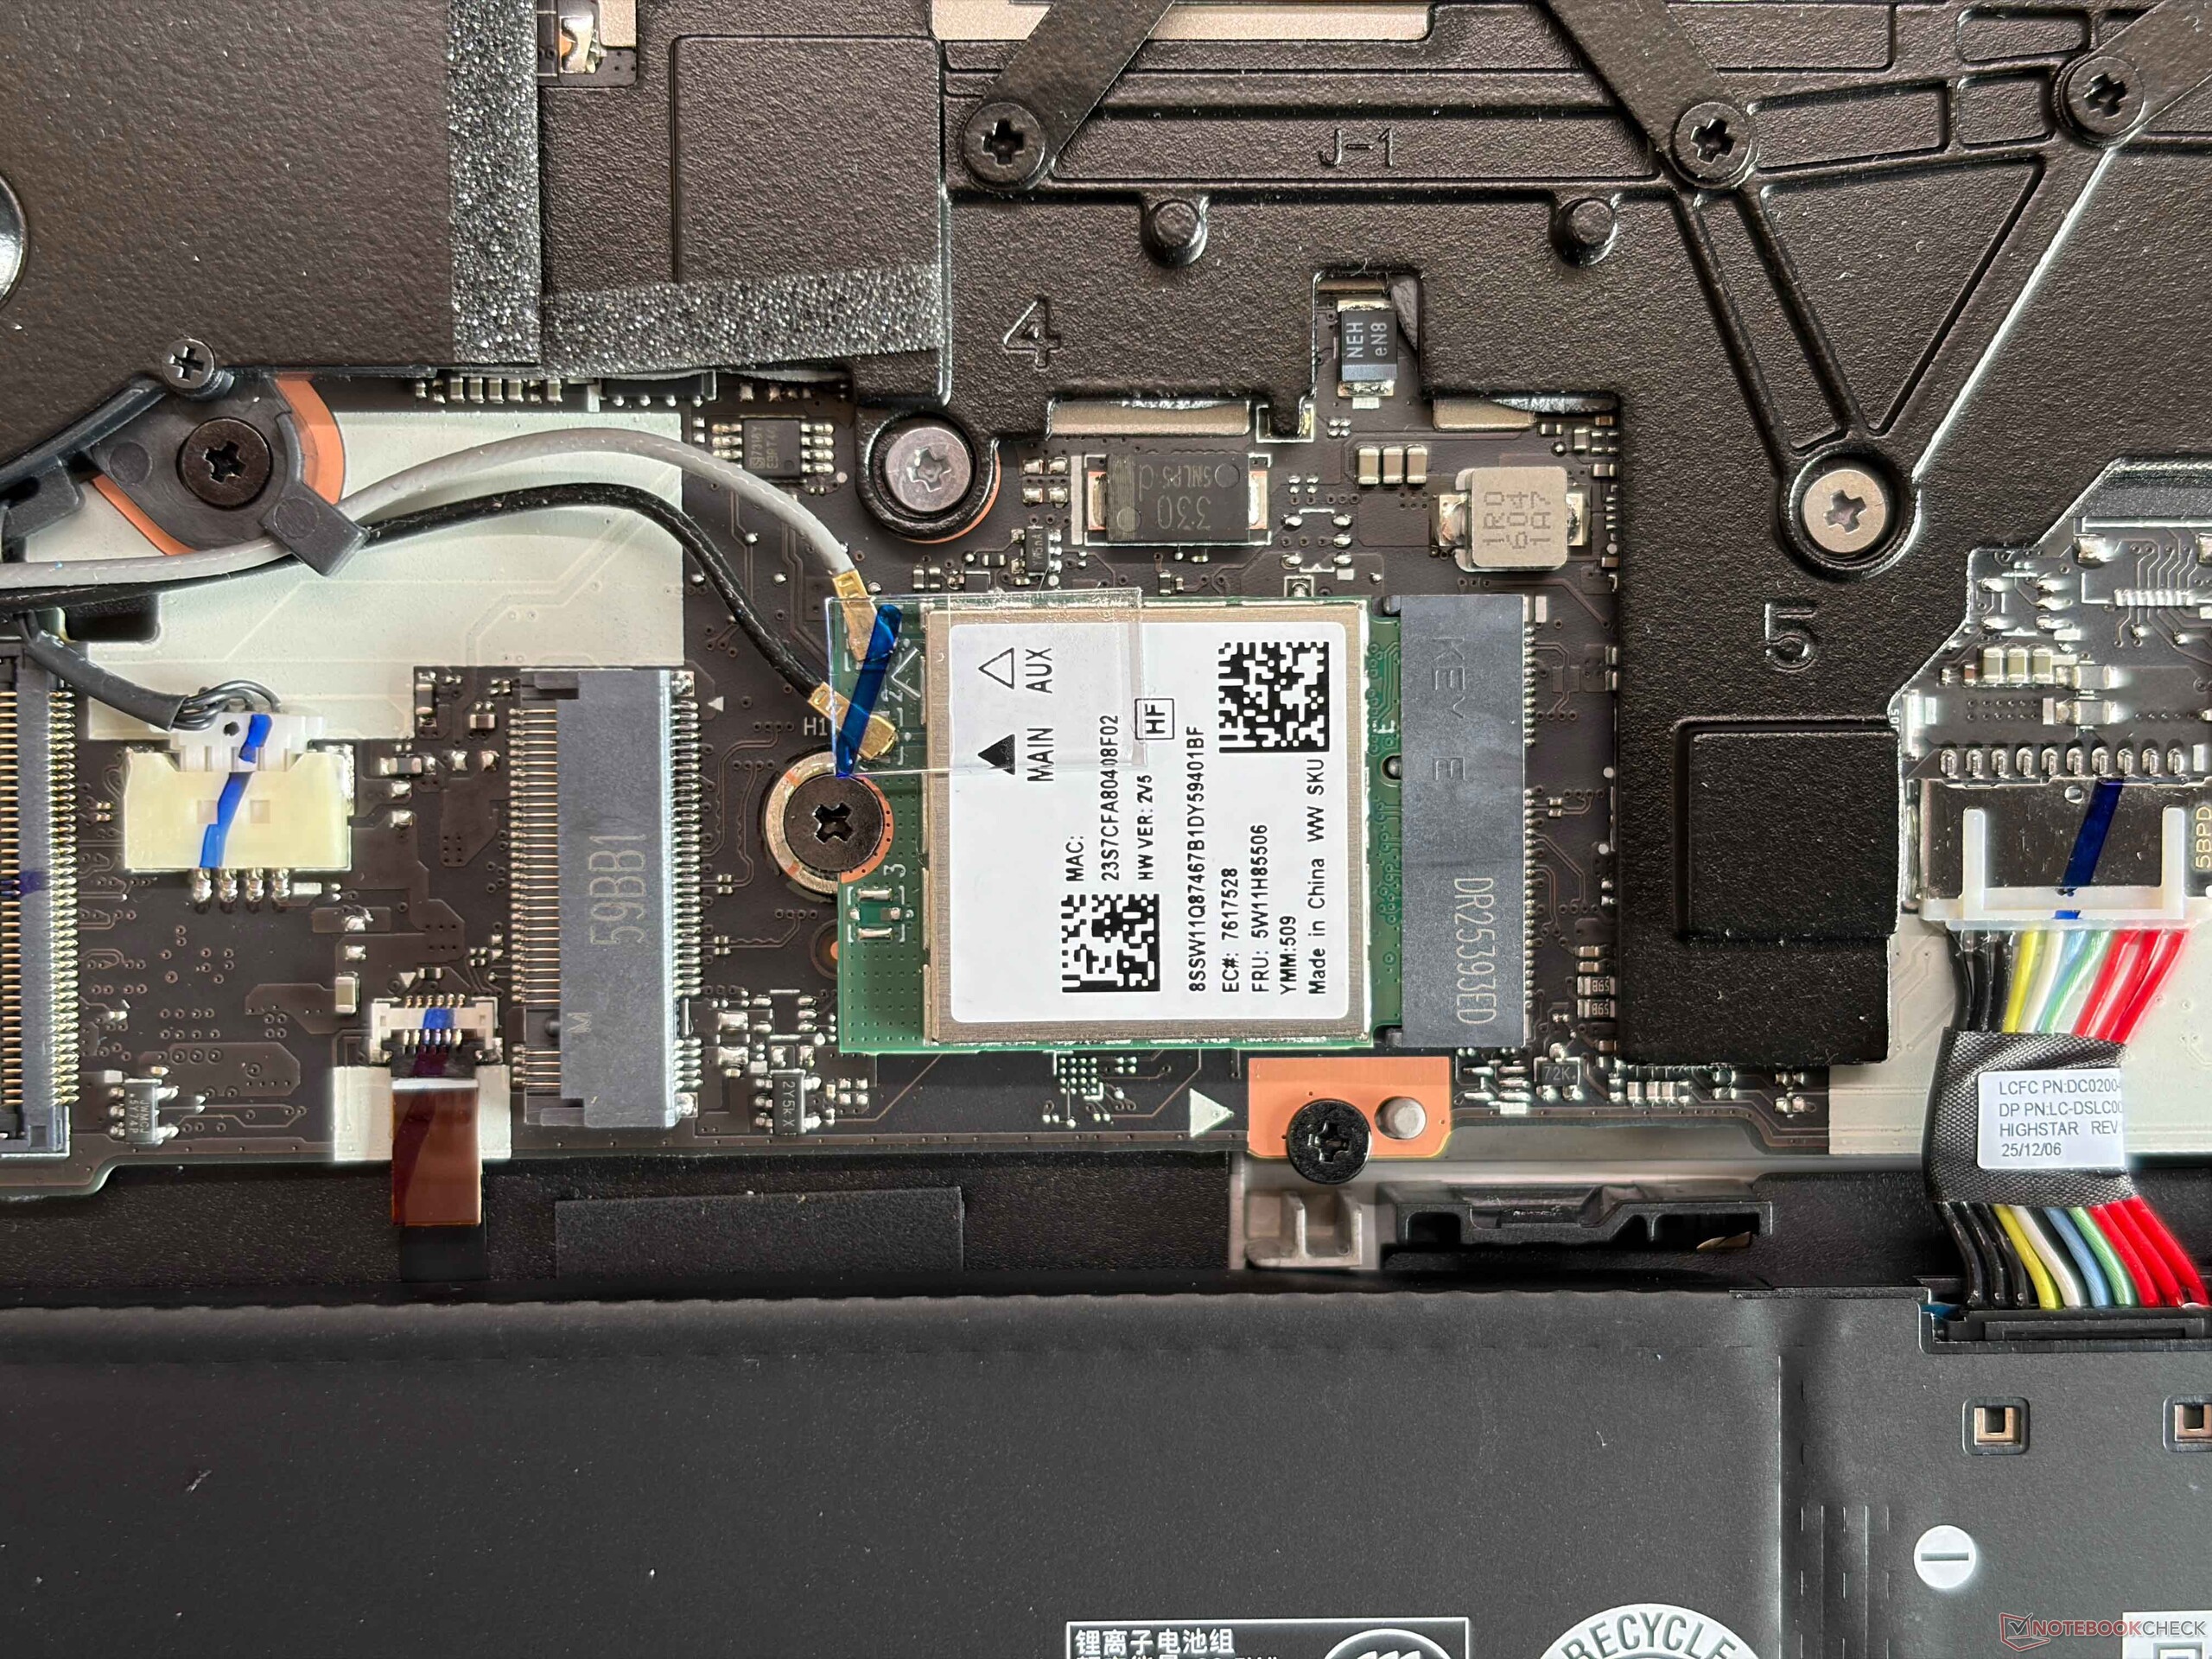
Connectivity is solid with two USB-C ports, HDMI as well as two regular USB-A ports. Yo also get a speedy SD-card reader, even though the SD Express standard is not supported. The Legion also supports the latest Wi-Fi 7 standard, but the transfer rates of the RealTek 8922AE module are just okay. Still, we did not experience any connectivity issues during our review period. An Ethernet connector is not available. The 5 MP camera (e-shutter) takes decent images.


| SD Card Reader | |
| average JPG Copy Test (av. of 3 runs) | |
| Schenker XMG Core 16 VE M25 (AV PRO microSD 128 GB V60) | |
| Lenovo Legion 7 16 AGP11 (Angelbird AV Pro V60) | |
| Average of class Gaming (20.9 - 210, n=54, last 2 years) | |
| Lenovo Legion 7 16IAX10 (Toshiba Exceria Pro SDXC 64 GB UHS-II) | |
| Schenker XMG FUSION 16 (M25) (Angelbird AV Pro V60) | |
| maximum AS SSD Seq Read Test (1GB) | |
| Lenovo Legion 7 16IAX10 (Toshiba Exceria Pro SDXC 64 GB UHS-II) | |
| Lenovo Legion 7 16 AGP11 (Angelbird AV Pro V60) | |
| Average of class Gaming (25.5 - 261, n=51, last 2 years) | |
| Schenker XMG FUSION 16 (M25) (Angelbird AV Pro V60) | |
| Networking | |
| Lenovo Legion 7 16 AGP11 | |
| iperf3 transmit RT-BE96U WiFi7 | |
| iperf3 receive RT-BE96U WiFi7 | |
| Schenker XMG Core 16 VE M25 | |
| iperf3 transmit AXE11000 | |
| iperf3 receive AXE11000 | |
| Schenker XMG FUSION 16 (M25) | |
| iperf3 transmit AXE11000 | |
| iperf3 receive AXE11000 | |
| HP Omen 16-ap0091ng | |
| iperf3 transmit AXE11000 | |
| iperf3 receive AXE11000 | |
| Asus TUF Gaming A16 FA608UP | |
| iperf3 transmit AXE11000 | |
| iperf3 receive AXE11000 | |
| Lenovo Legion 7 16IAX10 | |
| iperf3 transmit AXE11000 | |
| iperf3 receive AXE11000 | |
| iperf3 transmit AXE11000 6GHz | |
| iperf3 receive AXE11000 6GHz | |
| Lenovo Legion 5 15AHP G10 | |
| iperf3 transmit AXE11000 | |
| iperf3 receive AXE11000 | |


Input Devices - RGB keyboard with 1.6 mm travel
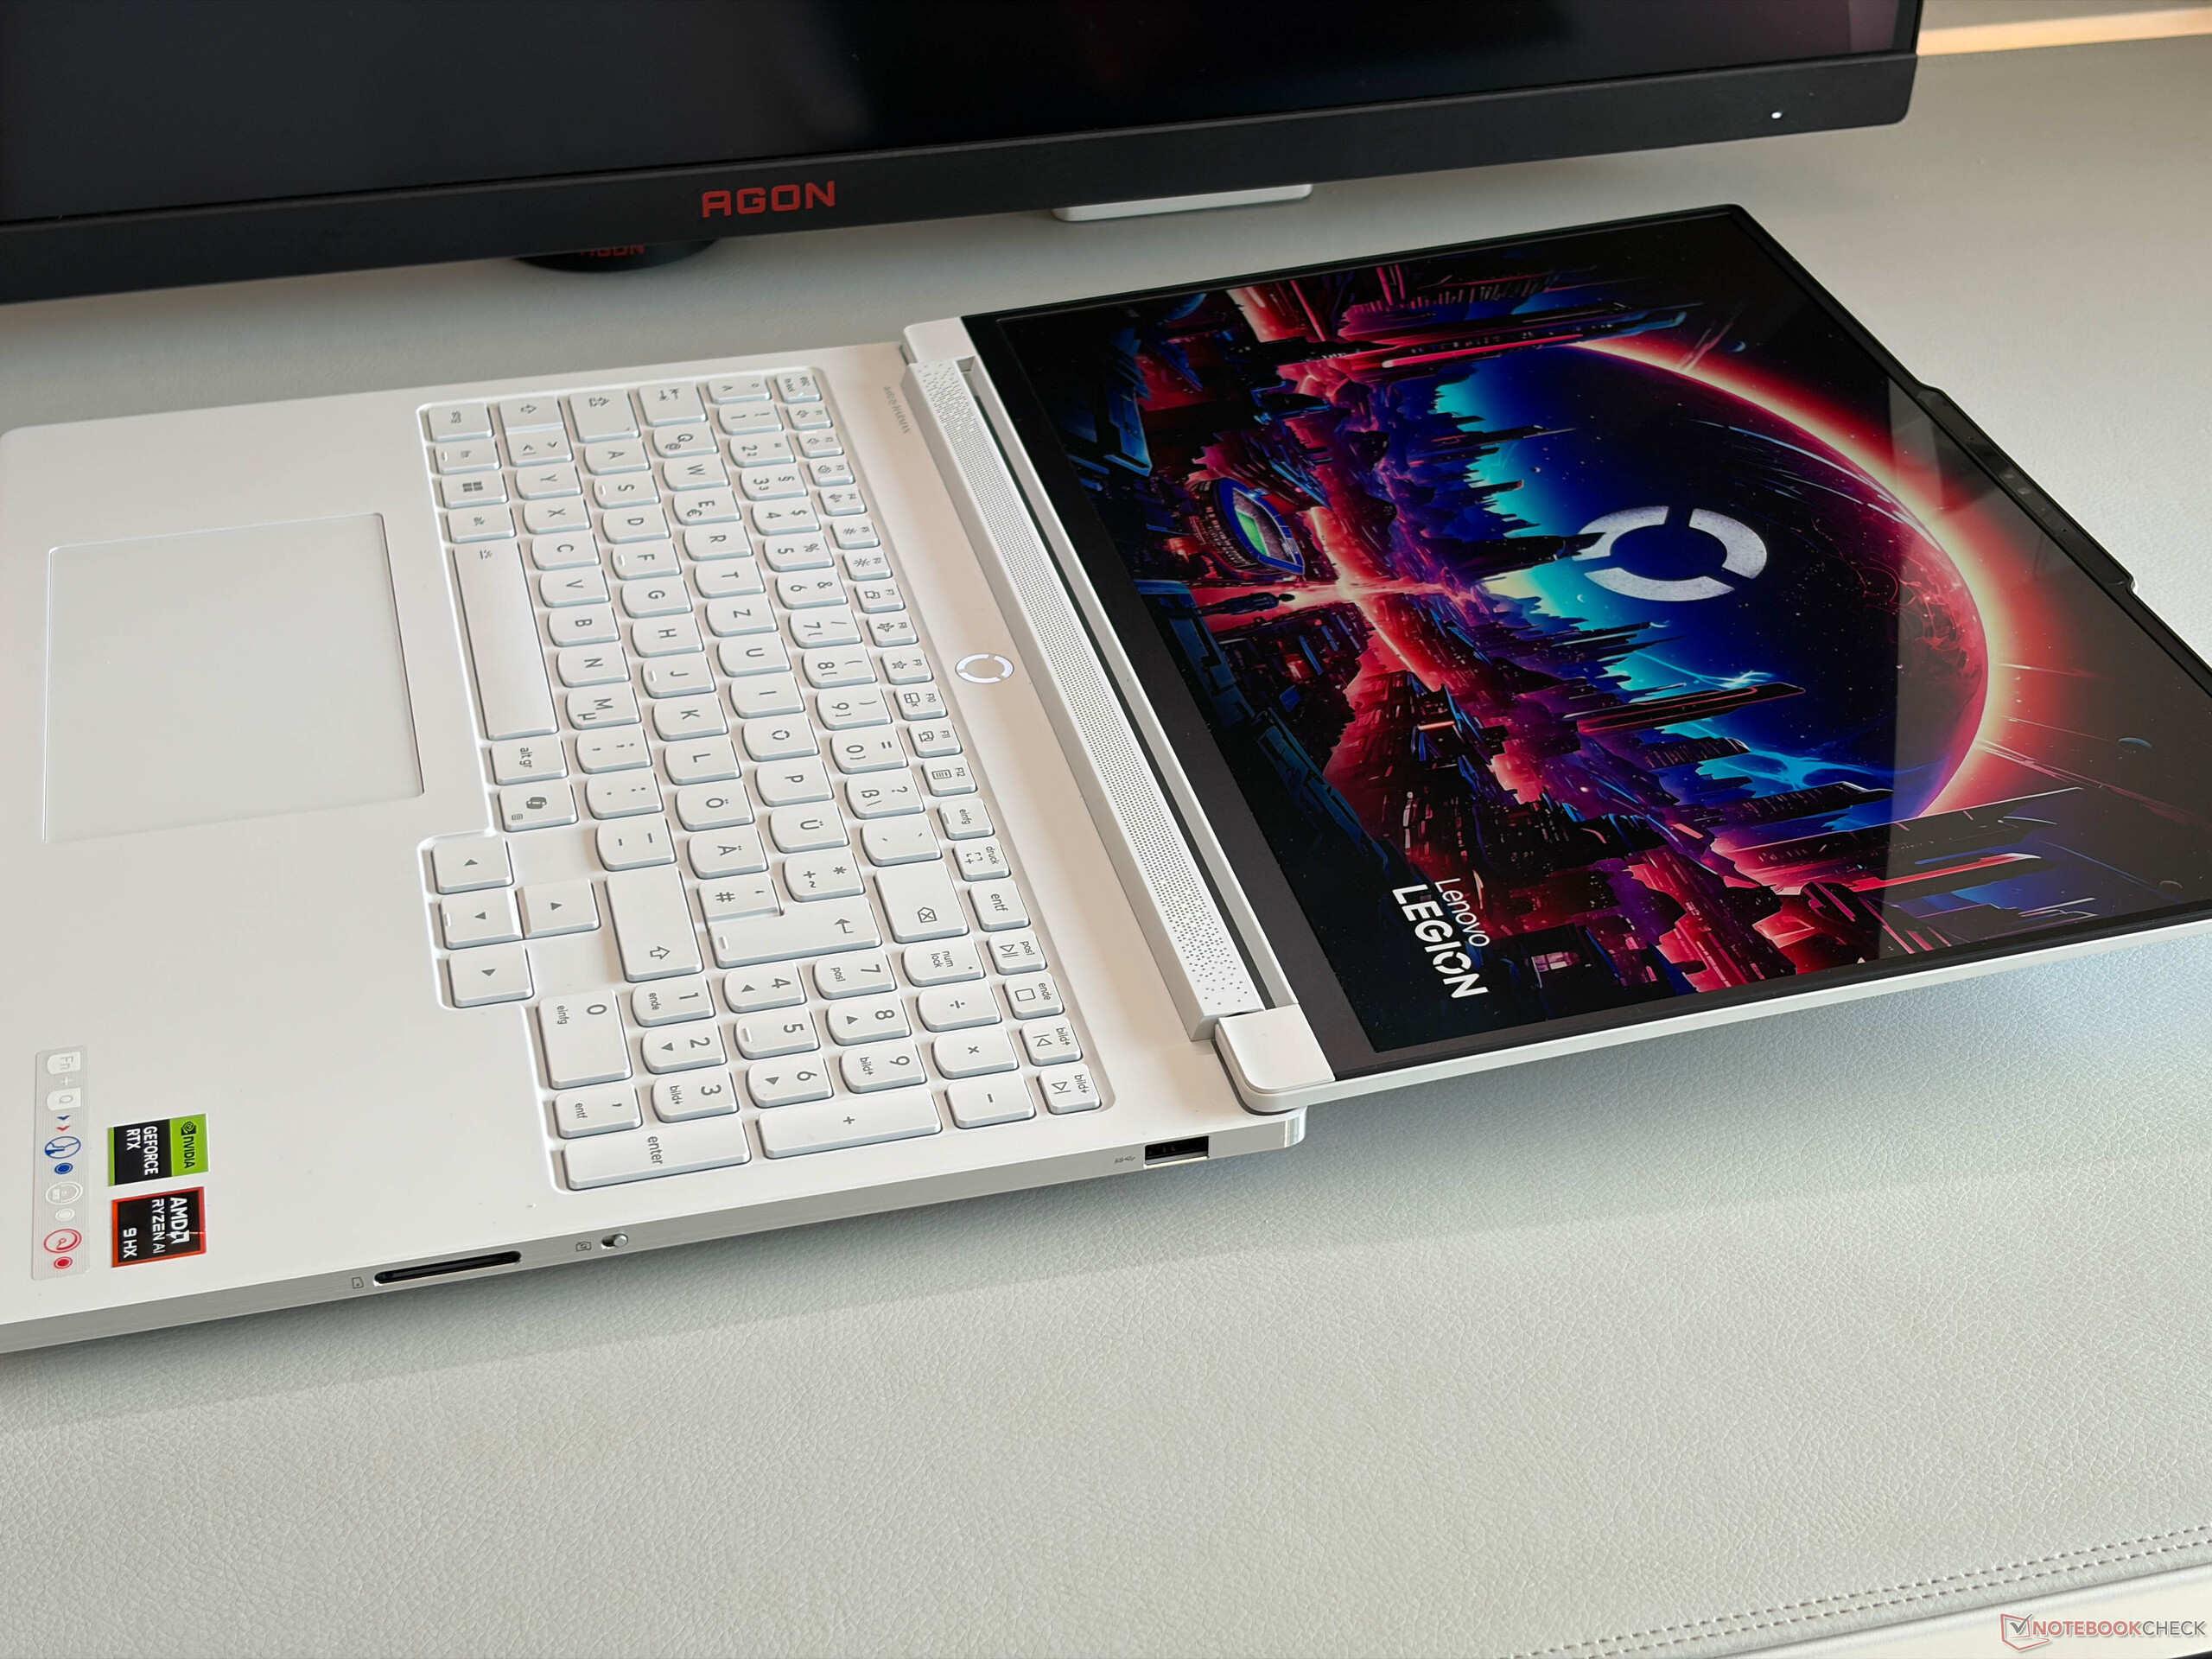
Lenovo implements a very comfortable keyboard with a key travel of 1.6 mm as well as RGB backlighting (24 zones). You also get large arrow keys as well as a dedicated numpad, even though those keys are slightly narrower. The keyboard is great for gaming as well as daily activities. The clickpad is slightly shifted towards the left side and offers good gliding capabilities. It does not rattle around, but mechanical clicks in the lower half are pretty loud.


Display - Stunning OLED with 240 Hz & VRR
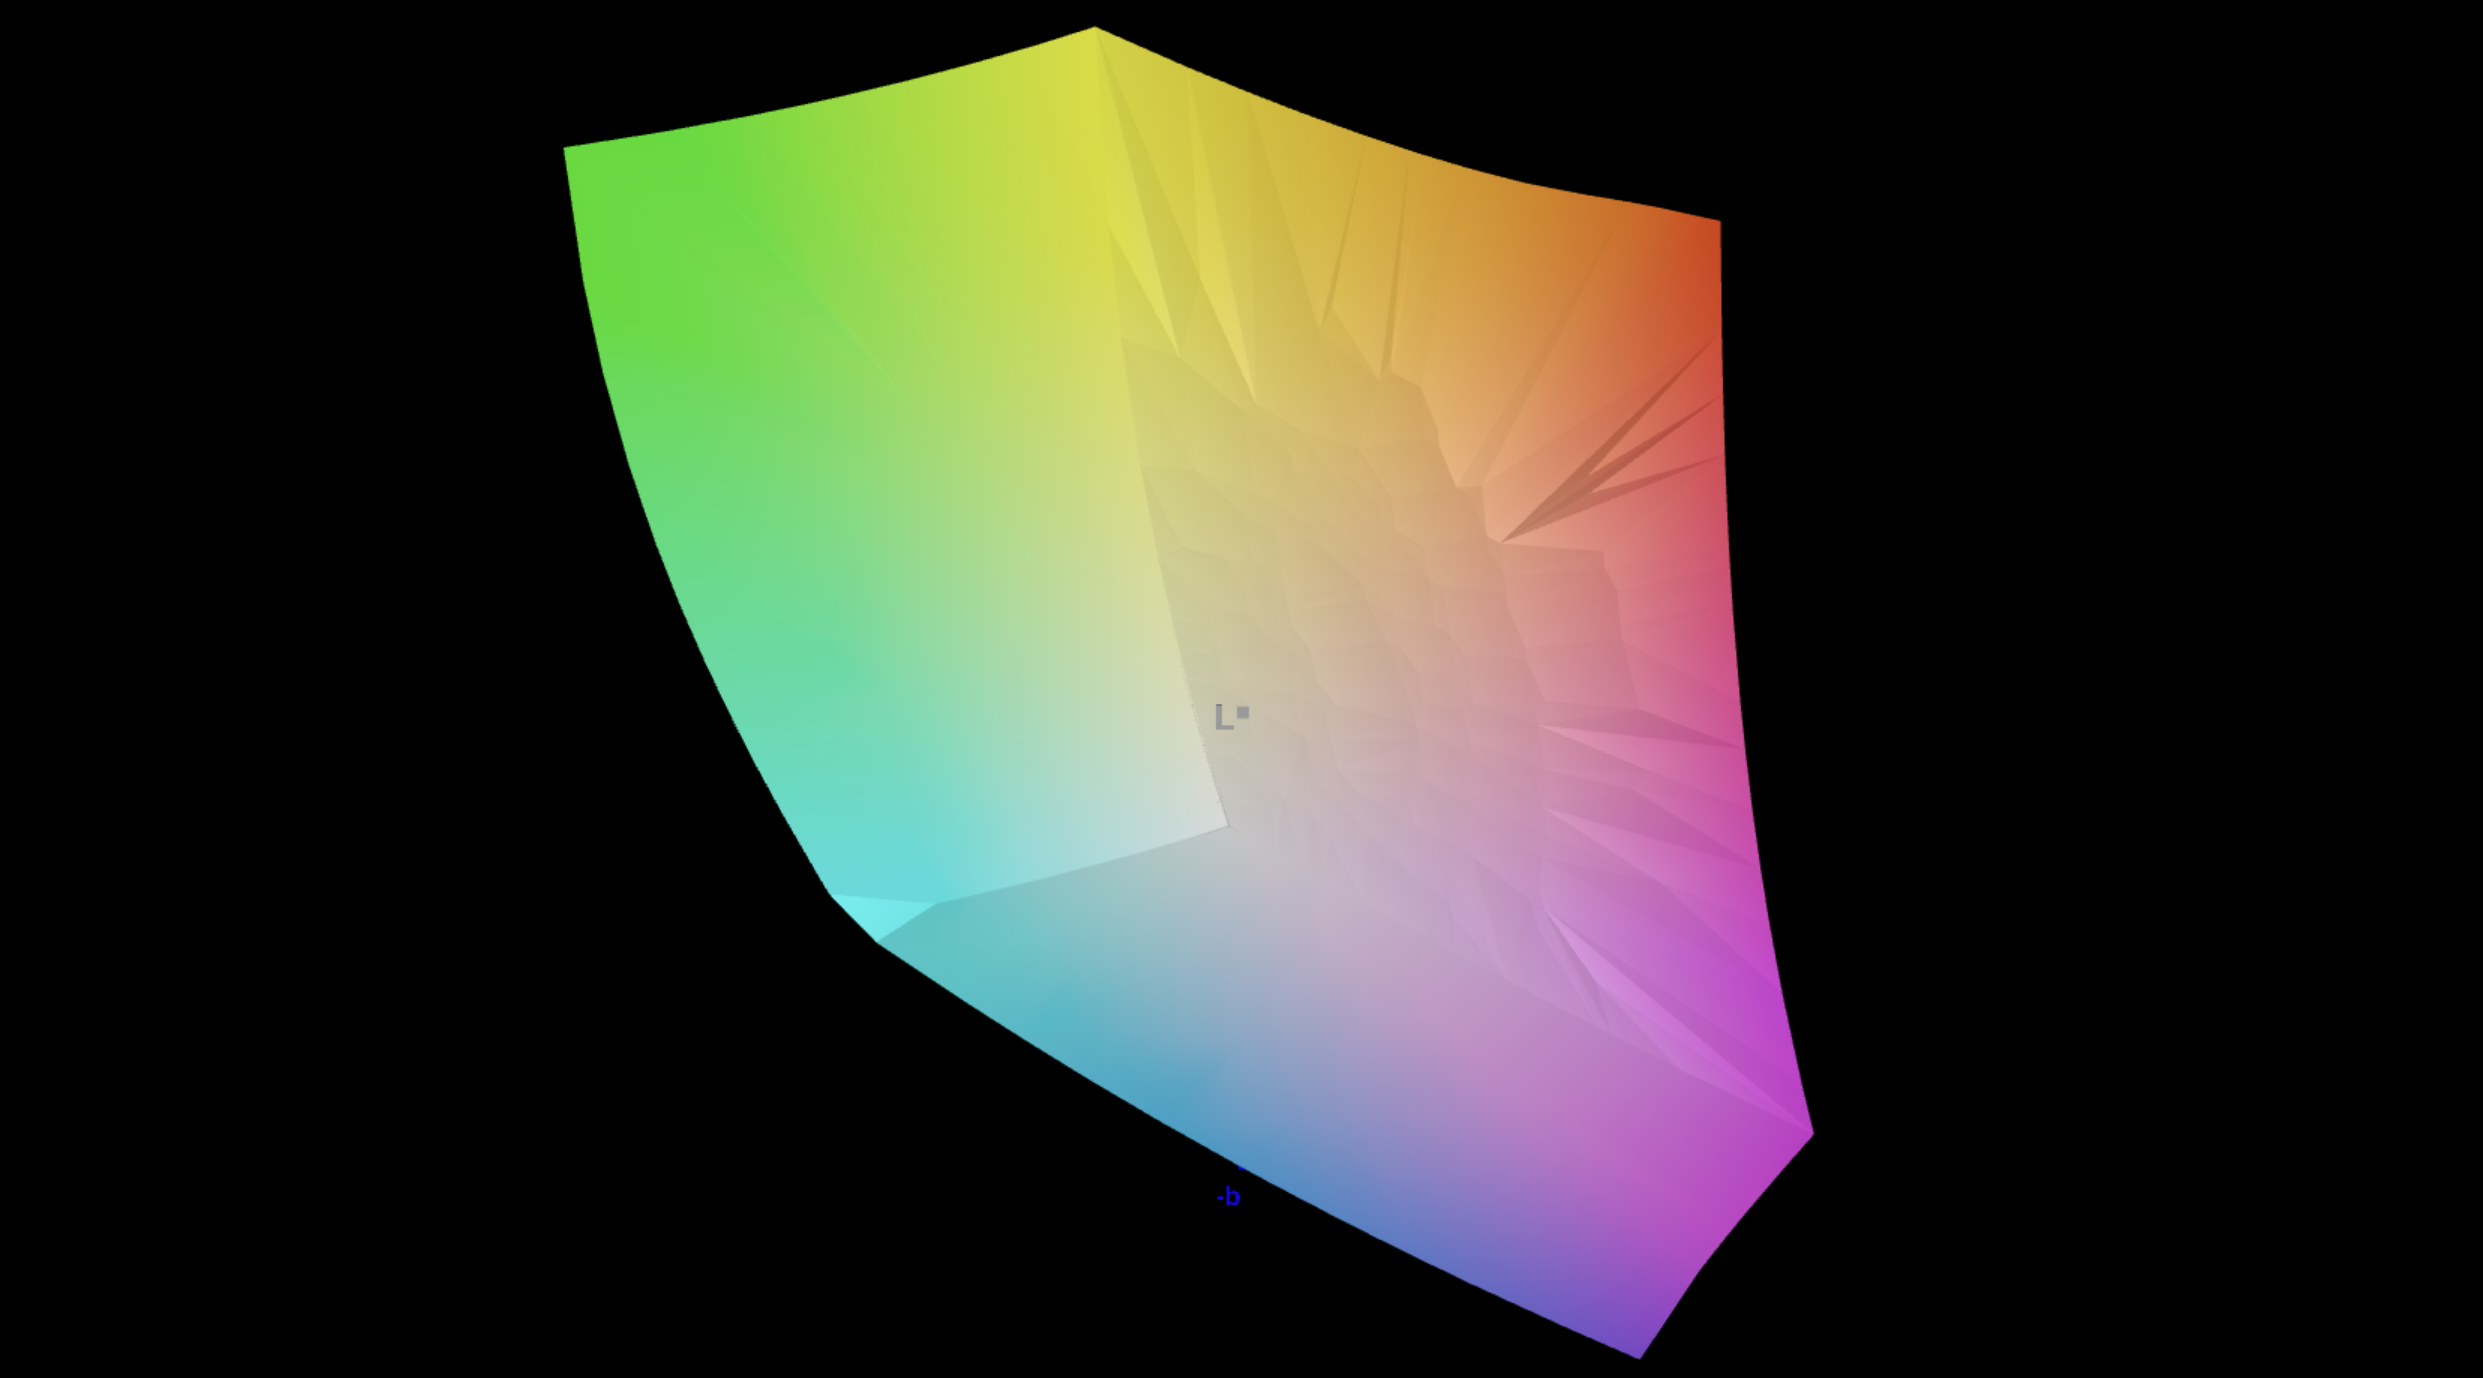
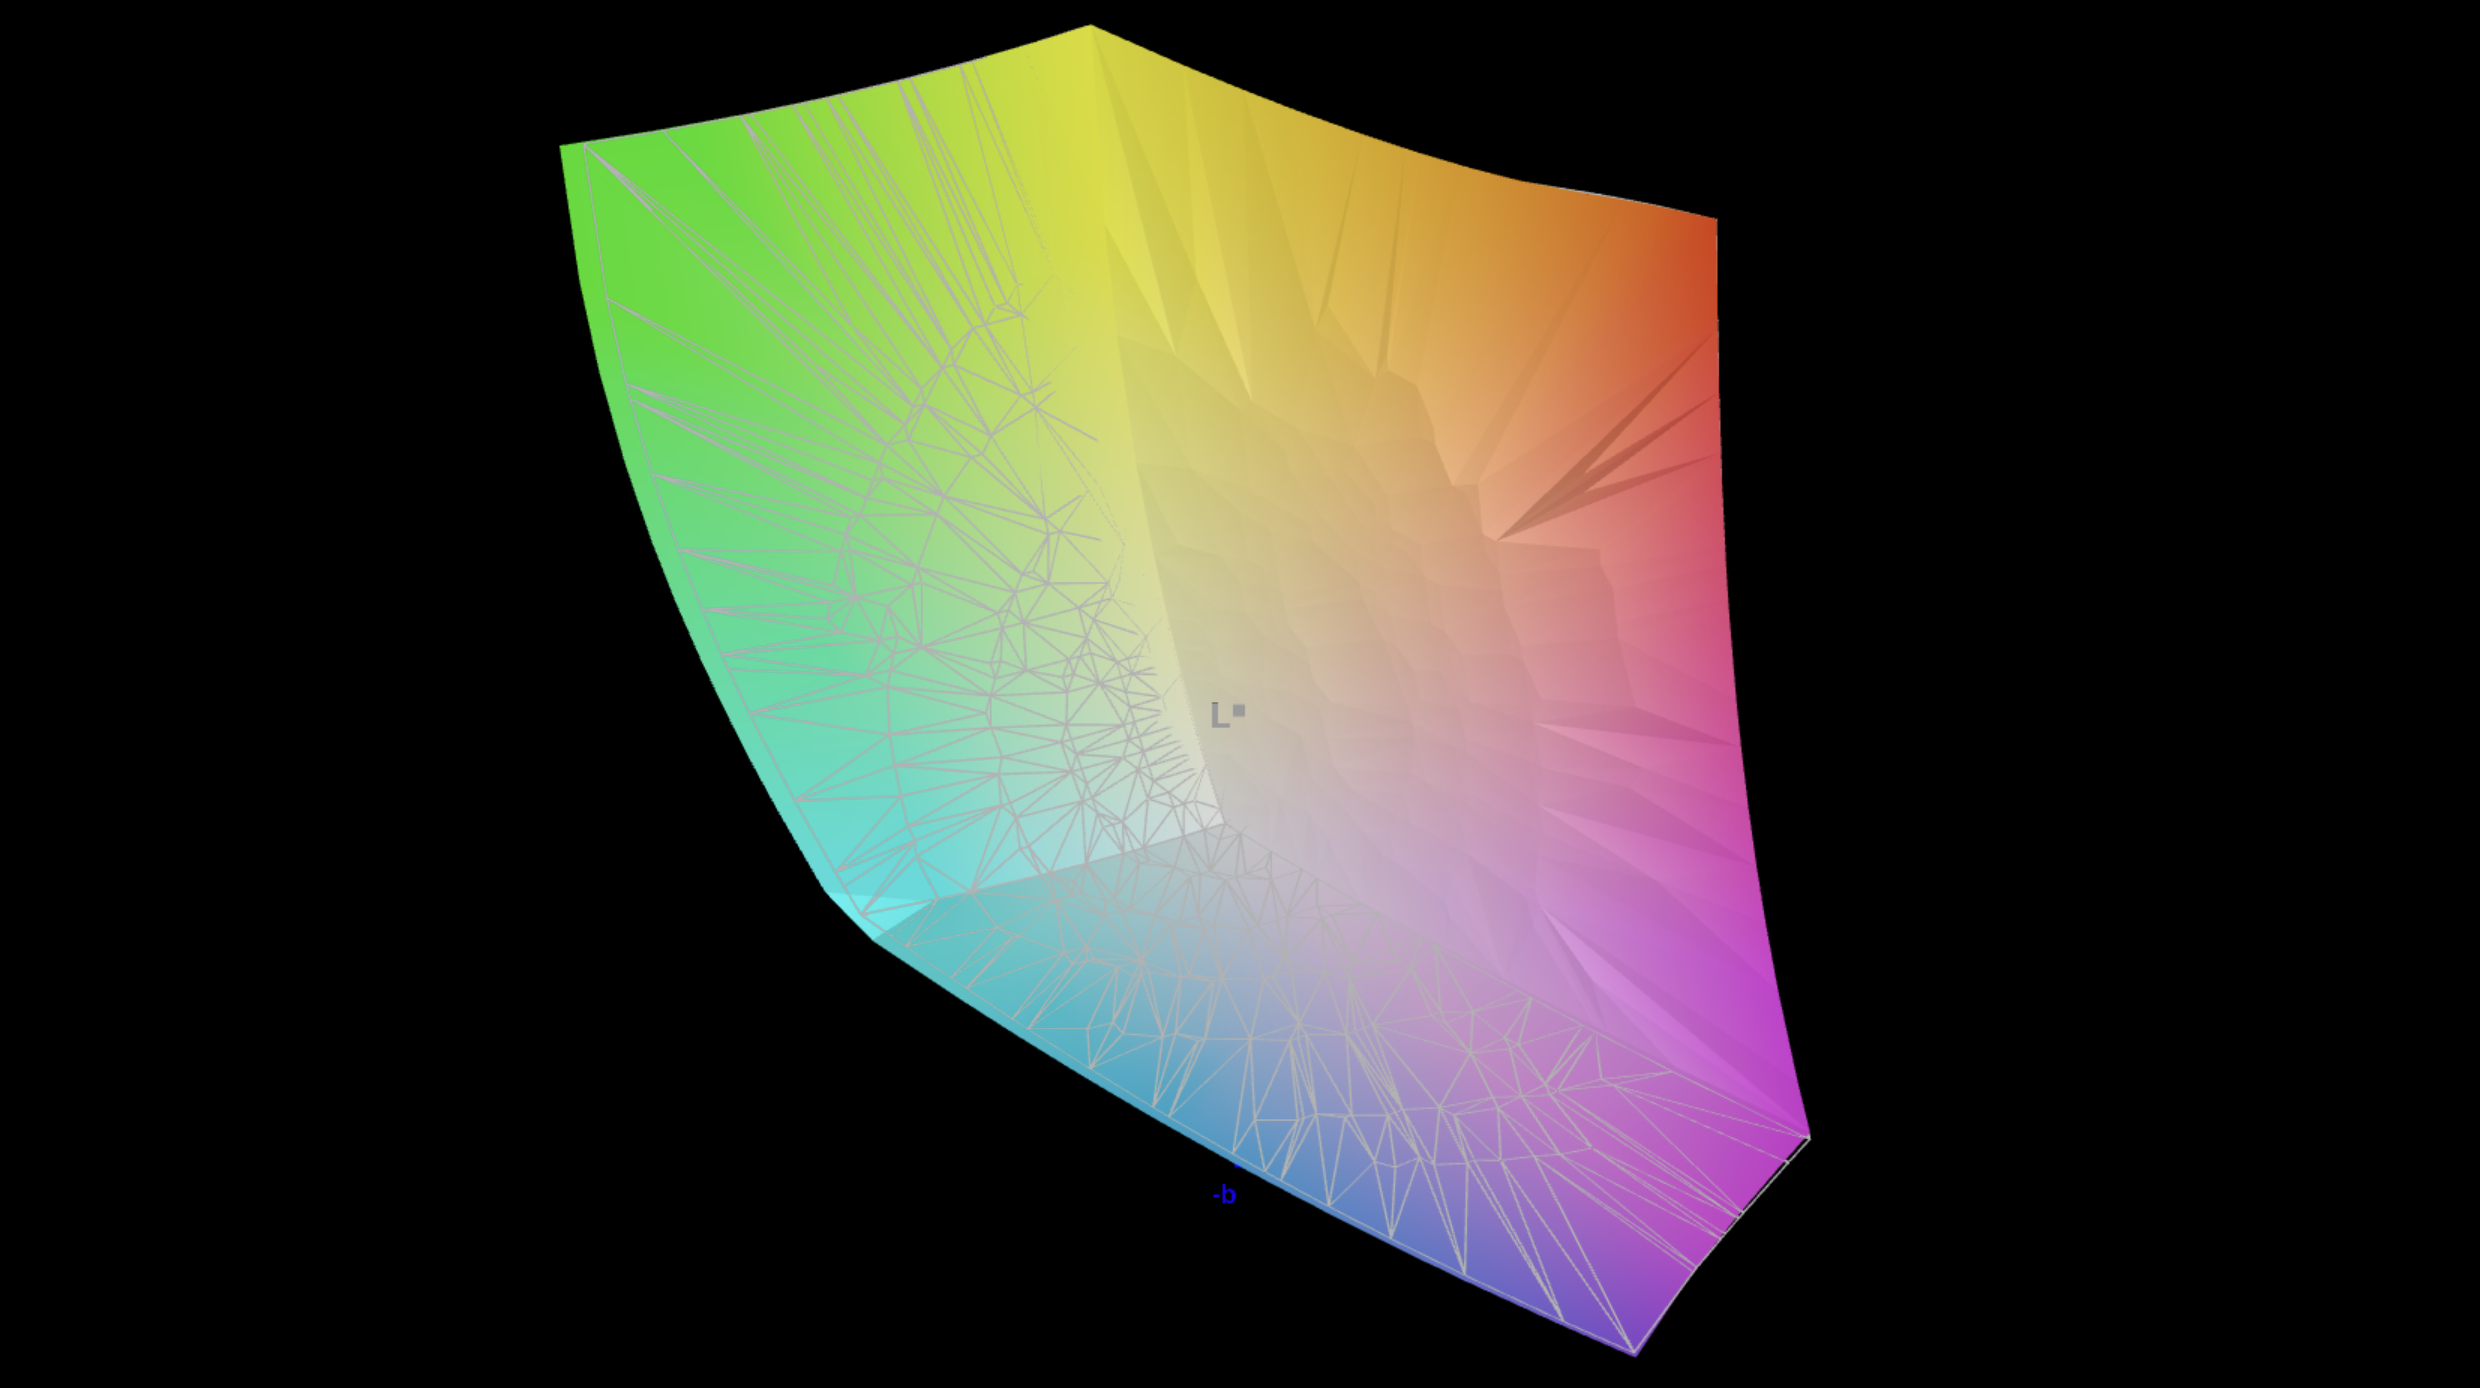
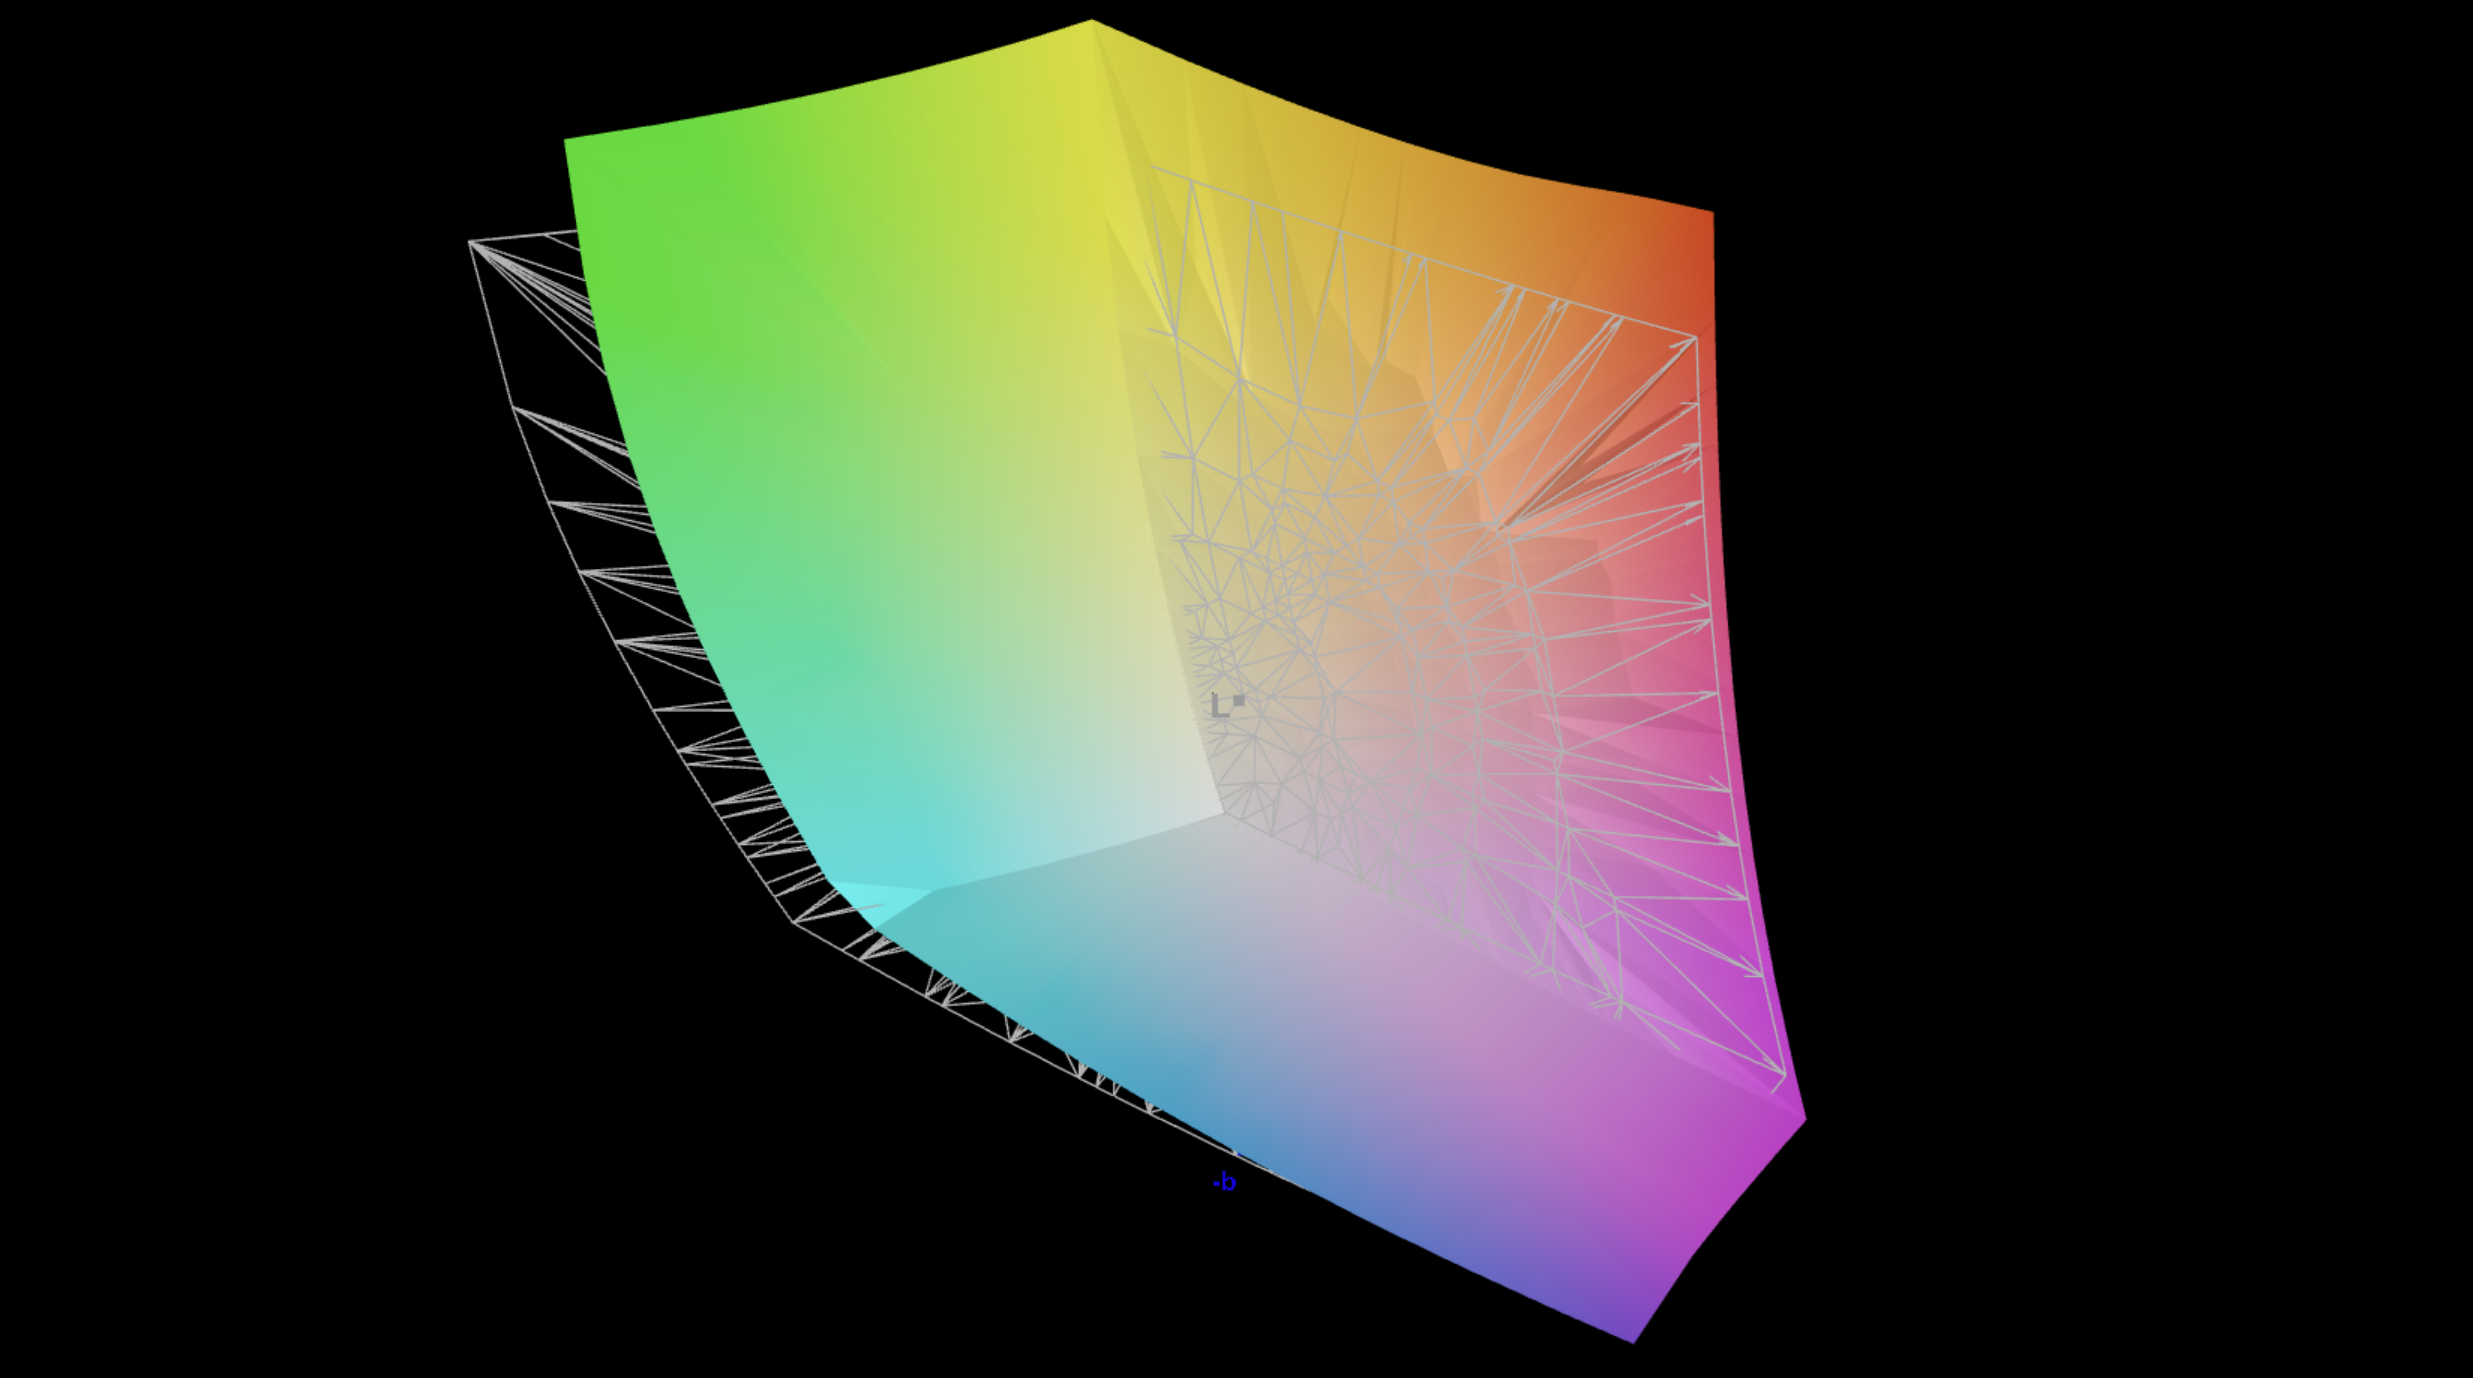
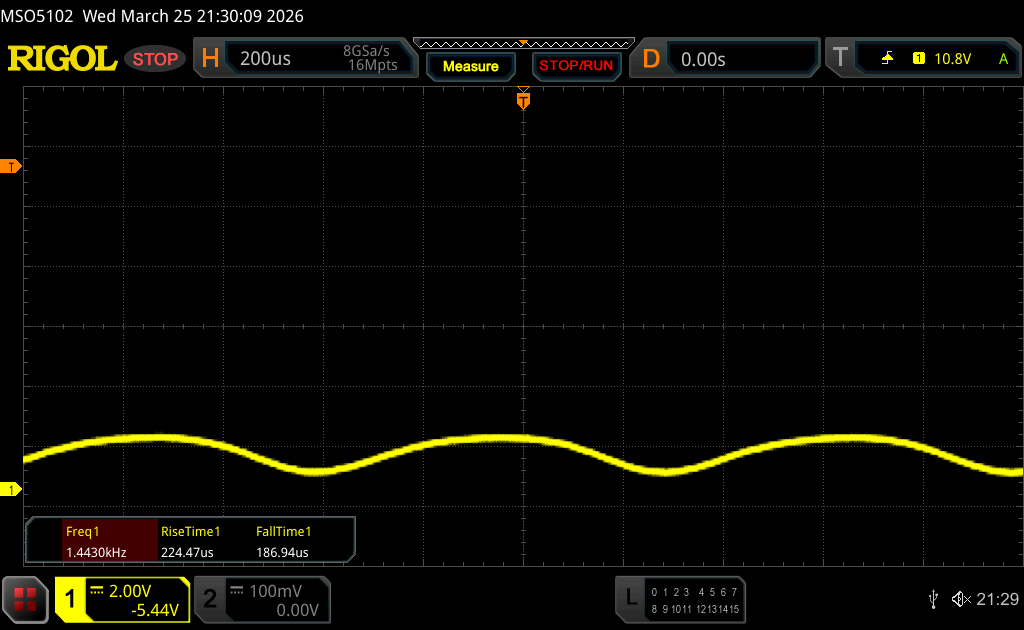
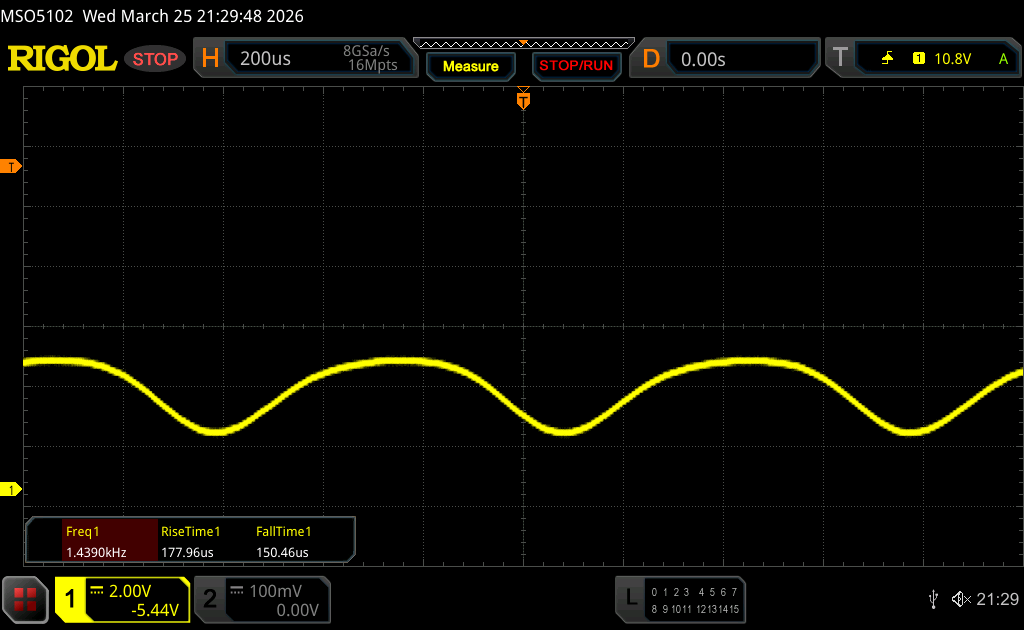
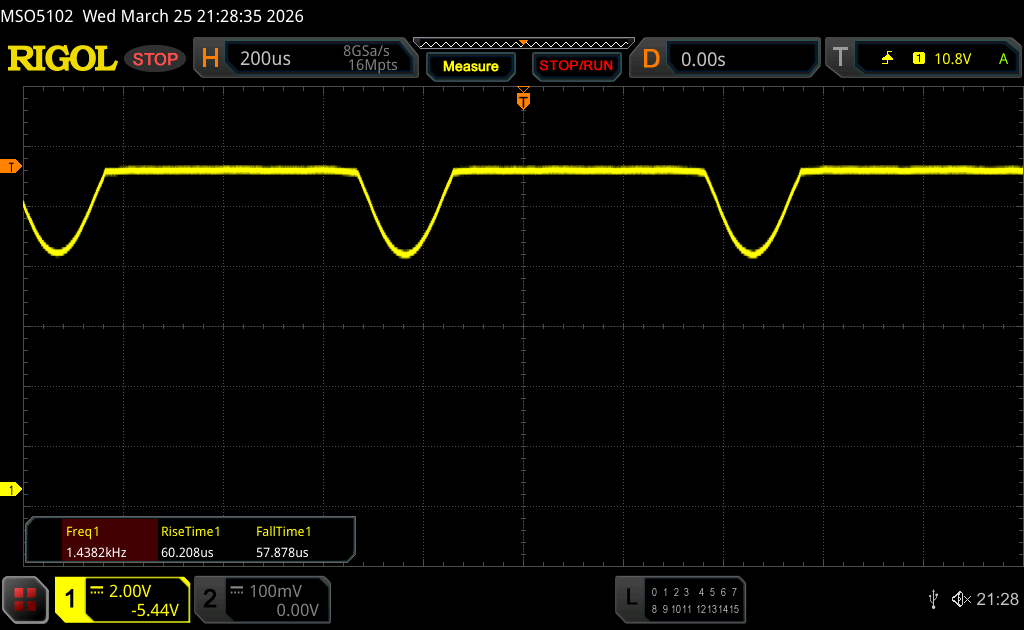
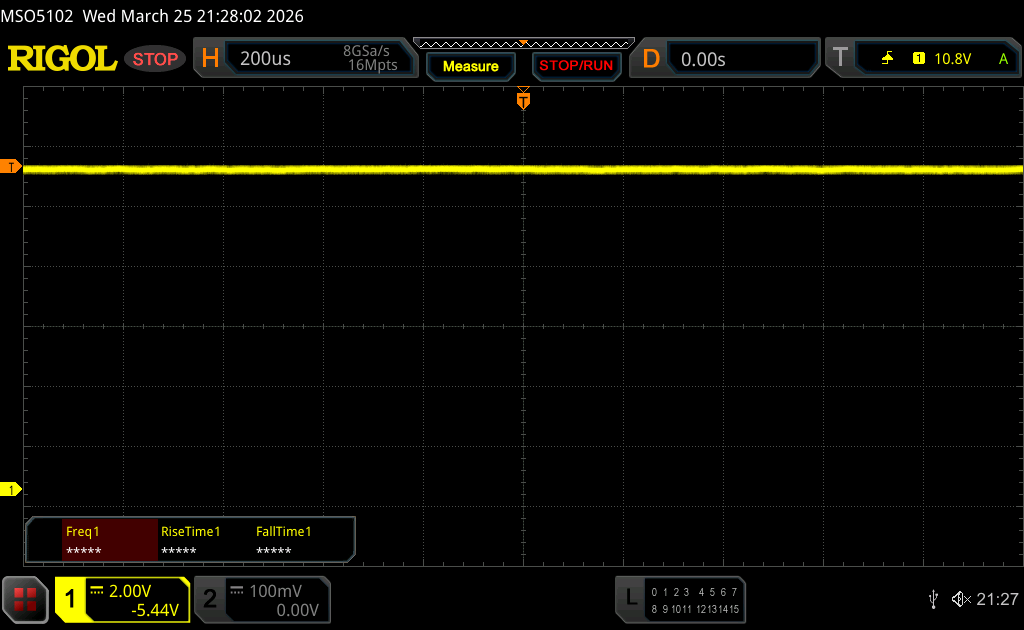
Lenovo uses a glossy OLED panel from Samsung (2560 x 1600) and the image quality is simply outstanding: impressive colors, perfect black, smooth movements with 240 Hz as well as fast response times, VRR and G-Sync. There is PWM flickering, but the frequency is high at 1.4 kHz. Games simply look stunning, both in SDR as well as HDR, where the panel also reaches up to 1100 nits. The SDR brightness is also good at 500 nits and Lenovo offers accurate color profiles out of the box, so you can also edit pictures/videos (P3 & sRGB). Our own calibration did not improve the image quality any further.
| |||||||||||||||||||||||||
Brightness Distribution: 98 %
Center on Battery: 499 cd/m²
Contrast: 24950:1 (Black: 0.02 cd/m²)
ΔE ColorChecker Calman: 2.5 | ∀{0.5-29.43 Ø4.72}
ΔE Greyscale Calman: 4.7 | ∀{0.09-98 Ø4.97}
90.2% AdobeRGB 1998 (Argyll 3D)
100% sRGB (Argyll 3D)
99.2% Display P3 (Argyll 3D)
Gamma: 2.21
CCT: 6715 K
| Lenovo Legion 7 16 AGP11 ATNA60HU02-0, OLED, 2560x1600, 16", 240 Hz | Lenovo Legion 7 16IAX10 Samsung ATNA60HS01-0, OLED, 2560x1600, 16", 165 Hz | Schenker XMG Core 16 VE M25 MNG007DA5-4, IPS, 2560x1600, 16", 180 Hz | Schenker XMG FUSION 16 (M25) ATNA60CL10_0, OLED, 2880x1800, 16", 120 Hz | HP Omen 16-ap0091ng AUODBB2, IPS, 1920x1200, 16", 144 Hz | Asus TUF Gaming A16 FA608UP MNG007DA5-3, IPS, 2560x1600, 16", 165 Hz | no name Hz | Lenovo Legion 5 15AHP G10 LEN151WQXGA, OLED, 2560x1600, 15.1", 165 Hz | |
|---|---|---|---|---|---|---|---|---|
| Display | 1% | -17% | 1% | -53% | -18% | 3% | ||
| Display P3 Coverage (%) | 99.2 | 99.6 0% | 69 -30% | 99.9 1% | 40 -60% | 69.4 -30% | 99.9 1% | |
| sRGB Coverage (%) | 100 | 100 0% | 98.7 -1% | 100 0% | 58.1 -42% | 97.2 -3% | 100 0% | |
| AdobeRGB 1998 Coverage (%) | 90.2 | 93.5 4% | 71.4 -21% | 93.3 3% | 38.7 -57% | 71.9 -20% | 98.3 9% | |
| Response Times | -38% | -1329% | -10% | -4759% | -1084% | 28% | ||
| Response Time Grey 50% / Grey 80% * (ms) | 1.41 ? | 0.6 ? 57% | 12.1 ? -758% | 0.56 ? 60% | 27.6 ? -1857% | 6.3 ? -347% | 0.42 ? 70% | |
| Response Time Black / White * (ms) | 0.25 ? | 0.8 ? -220% | 5 ? -1900% | 0.58 ? -132% | 19.4 ? -7660% | 4.8 ? -1820% | 0.4 ? -60% | |
| PWM Frequency (Hz) | 1440 ? | 1317 ? | 480 ? | 1152 ? | ||||
| PWM Amplitude * (%) | 44 | 23 48% | 26 41% | 11 75% | ||||
| Screen | 12% | -245% | 3% | -191% | -179% | -152% | 35% | |
| Brightness middle (cd/m²) | 499 | 477.6 -4% | 490 -2% | 434 -13% | 328 -34% | 480 -4% | 345.3 -31% | 492 -1% |
| Brightness (cd/m²) | 502 | 483 -4% | 488 -3% | 433 -14% | 313 -38% | 456 -9% | 324 -35% | 495 -1% |
| Brightness Distribution (%) | 98 | 95 -3% | 95 -3% | 99 1% | 91 -7% | 91 -7% | 88 -10% | 92 -6% |
| Black Level * (cd/m²) | 0.02 | 0.42 -2000% | 0.26 -1200% | 0.32 -1500% | 0.23 -1050% | |||
| Contrast (:1) | 24950 | 1167 -95% | 1262 -95% | 1500 -94% | 1501 -94% | |||
| Colorchecker dE 2000 * | 2.5 | 3.11 -24% | 1.45 42% | 3 -20% | 4.73 -89% | 1.4 44% | 3.22 -29% | 0.9 64% |
| Colorchecker dE 2000 max. * | 7.8 | 5.99 23% | 4.19 46% | 5.1 35% | 17.47 -124% | 2.5 68% | 5.68 27% | 1.8 77% |
| Greyscale dE 2000 * | 4.7 | 0.9 81% | 2 57% | 3.4 28% | 2.05 56% | 1.2 74% | 4.5 4% | 1.2 74% |
| Gamma | 2.21 100% | 2.18 101% | 2.172 101% | 2.47 89% | 2.63 84% | 2.16 102% | 2.1 105% | 2.16 102% |
| CCT | 6715 97% | 6405 101% | 6738 96% | 6452 101% | 6718 97% | 6620 98% | 7041 92% | 6291 103% |
| Colorchecker dE 2000 calibrated * | 0.79 | 0.98 | 1.4 | 4.22 | 1.3 | 0.93 | ||
| Total Average (Program / Settings) | -8% /
-4% | -530% /
-359% | -2% /
-1% | -1668% /
-862% | -427% /
-281% | -152% /
-152% | 22% /
25% |
* ... smaller is better


Display Response Times
| ↔ Response Time Black to White | ||
|---|---|---|
| 0.25 ms ... rise ↗ and fall ↘ combined | ↗ 0.13 ms rise | 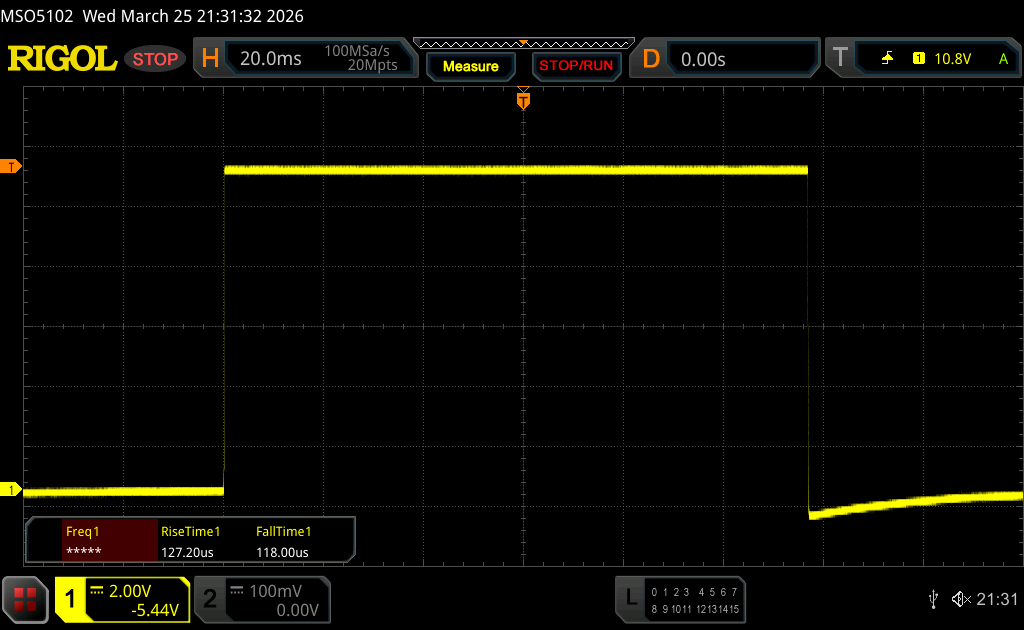 |
| ↘ 0.12 ms fall | ||
| The screen shows very fast response rates in our tests and should be very well suited for fast-paced gaming. In comparison, all tested devices range from 0.1 (minimum) to 240 (maximum) ms. » 0 % of all devices are better. This means that the measured response time is better than the average of all tested devices (19.8 ms). | ||
| ↔ Response Time 50% Grey to 80% Grey | ||
| 1.41 ms ... rise ↗ and fall ↘ combined | ↗ 0.7 ms rise | 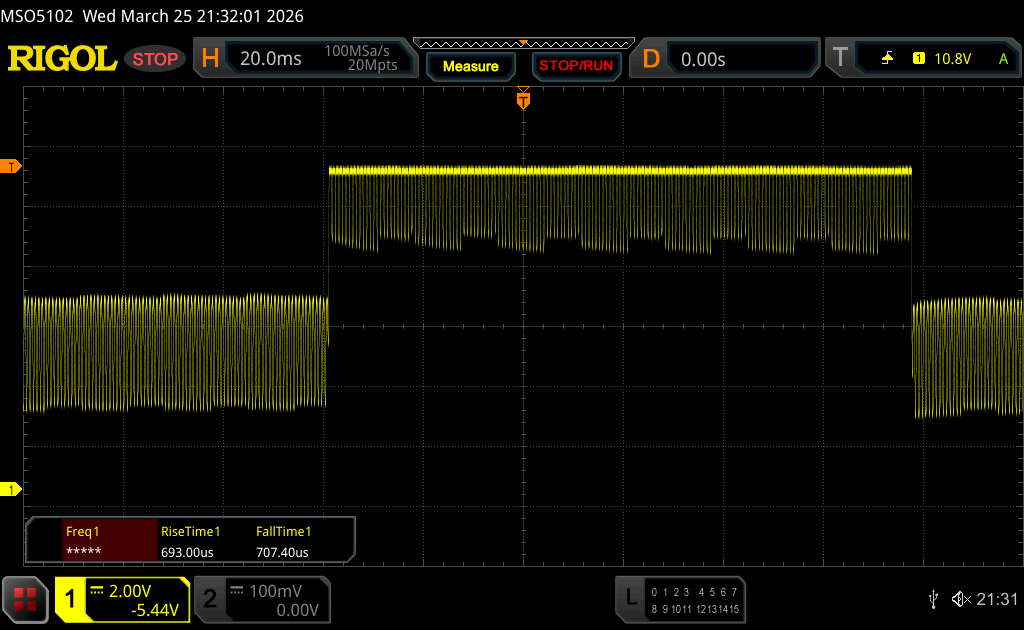 |
| ↘ 0.71 ms fall | ||
| The screen shows very fast response rates in our tests and should be very well suited for fast-paced gaming. In comparison, all tested devices range from 0.165 (minimum) to 636 (maximum) ms. » 7 % of all devices are better. This means that the measured response time is better than the average of all tested devices (31 ms). | ||
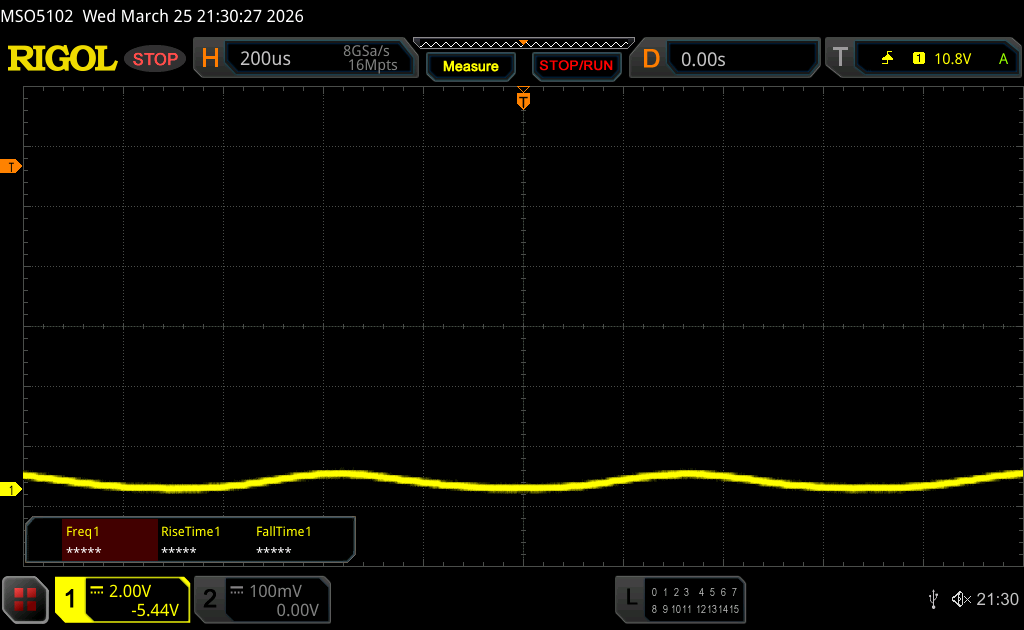
Screen Flickering / PWM (Pulse-Width Modulation)
| Screen flickering / PWM detected | 1440 Hz Amplitude: 44 % | ≤ 90 % brightness setting | 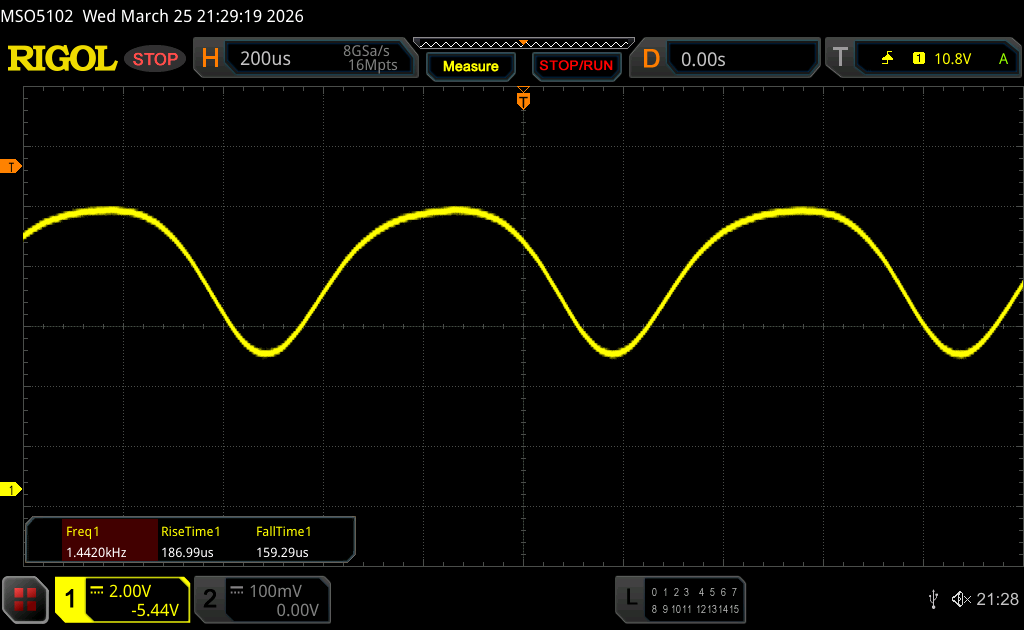 |
The display backlight flickers at 1440 Hz (worst case, e.g., utilizing PWM) Flickering detected at a brightness setting of 90 % and below. There should be no flickering or PWM above this brightness setting. The frequency of 1440 Hz is quite high, so most users sensitive to PWM should not notice any flickering. In comparison: 52 % of all tested devices do not use PWM to dim the display. If PWM was detected, an average of 7747 (minimum: 5 - maximum: 343500) Hz was measured. | |||


Performance - Ryzen 400 & Blackwell
Testing Conditions
Lenovo offers different power profiles (linked to Windows settings) and you have to use the Performance mode to get the highest GPU performance. For light workloads, however, you can easily use the Quiet mode. We performed our benchmarks in Performance mode. You can use the Manual mode to increase the GPU TGP to 115 Watts, but this has to be adjusted manually and you cannot use the shortcut (Fn+Q) to access the Manual mode, which is very impractical.
| Energy profile | CPU TDP | CB24 Multi | GPU TGP | Time Spy Graphics | Cyberpunk 2077 QHD Ultra | max. fan noise |
|---|---|---|---|---|---|---|
| Quiet | 45 W | 1127 pts | 60 W | 9688 pts | 45.9 fps | 41.3 dB(A) |
| Auto | 80 W | 1220 pts | 75 W | 10747 pts | 50.9 fps | 46.5 dB(A) |
| Performance | 90/85 W | 1241 pts | 95 W | 12071 pts | 56.2 fps | 53 dB(A) |
| Battery (Auto) | 45 W | 1088 pts | 55 W | 9071 pts | 42.1 fps | 45.9 dB(A) |
Processor
The AMD Ryzen AI 9 HX470 offers good and stable CPU performance, but it is also much slower compared to the Intel HX processor in the previous Legion 7 16 G10. Our table with the different power modes also shows that the CPU does not really benefit that much from higher power limits since the performance gains from 45 to 80-90W are very small (10 %).
Cinebench R15 Multi Loop
Cinebench 2024: CPU Multi Core | CPU Single Core
Cinebench R23: Multi Core | Single Core
Cinebench R20: CPU (Multi Core) | CPU (Single Core)
Cinebench R15: CPU Multi 64Bit | CPU Single 64Bit
Blender: v2.79 BMW27 CPU
7-Zip 18.03: 7z b 4 | 7z b 4 -mmt1
Geekbench 6.7: Multi-Core | Single-Core
Geekbench 5.5: Multi-Core | Single-Core
HWBOT x265 Benchmark v2.2: 4k Preset
LibreOffice : 20 Documents To PDF
R Benchmark 2.5: Overall mean
| CPU Performance rating | |
| Schenker XMG FUSION 16 (M25) | |
| Lenovo Legion 7 16IAX10 | |
| Average of class Gaming | |
| HP Omen 16-ap0091ng -2! | |
| Lenovo Legion 7 16 AGP11 | |
| Average AMD Ryzen AI 9 HX 470 | |
| Lenovo Legion 5 15AHP G10 | |
| Schenker XMG Core 16 VE M25 | |
| Asus TUF Gaming A16 FA608UP | |
| Cinebench 2024 / CPU Multi Core | |
| Schenker XMG FUSION 16 (M25) | |
| Lenovo Legion 7 16IAX10 | |
| Average of class Gaming (486 - 2298, n=88, last 2 years) | |
| Lenovo Legion 7 16 AGP11 | |
| Average AMD Ryzen AI 9 HX 470 (1087 - 1247, n=5) | |
| Lenovo Legion 5 15AHP G10 | |
| Asus TUF Gaming A16 FA608UP | |
| Schenker XMG Core 16 VE M25 | |
| Cinebench 2024 / CPU Single Core | |
| Schenker XMG FUSION 16 (M25) | |
| Lenovo Legion 7 16IAX10 | |
| Average of class Gaming (95 - 139.9, n=88, last 2 years) | |
| Average AMD Ryzen AI 9 HX 470 (119 - 122, n=5) | |
| Lenovo Legion 7 16 AGP11 | |
| Lenovo Legion 5 15AHP G10 | |
| Asus TUF Gaming A16 FA608UP | |
| Schenker XMG Core 16 VE M25 | |
| Cinebench R23 / Multi Core | |
| Schenker XMG FUSION 16 (M25) | |
| Lenovo Legion 7 16IAX10 | |
| HP Omen 16-ap0091ng | |
| Average of class Gaming (10488 - 40970, n=106, last 2 years) | |
| Lenovo Legion 7 16 AGP11 | |
| Average AMD Ryzen AI 9 HX 470 (22589 - 23997, n=5) | |
| Lenovo Legion 5 15AHP G10 | |
| Schenker XMG Core 16 VE M25 | |
| Asus TUF Gaming A16 FA608UP | |
| Cinebench R23 / Single Core | |
| Schenker XMG FUSION 16 (M25) | |
| Lenovo Legion 7 16IAX10 | |
| Average AMD Ryzen AI 9 HX 470 (2061 - 2091, n=5) | |
| Lenovo Legion 7 16 AGP11 | |
| Average of class Gaming (1166 - 2387, n=106, last 2 years) | |
| HP Omen 16-ap0091ng | |
| Lenovo Legion 5 15AHP G10 | |
| Asus TUF Gaming A16 FA608UP | |
| Schenker XMG Core 16 VE M25 | |
| Cinebench R20 / CPU (Multi Core) | |
| Schenker XMG FUSION 16 (M25) | |
| Lenovo Legion 7 16IAX10 | |
| HP Omen 16-ap0091ng | |
| Average of class Gaming (4029 - 16108, n=105, last 2 years) | |
| Lenovo Legion 7 16 AGP11 | |
| Average AMD Ryzen AI 9 HX 470 (8746 - 9354, n=5) | |
| Lenovo Legion 5 15AHP G10 | |
| Schenker XMG Core 16 VE M25 | |
| Asus TUF Gaming A16 FA608UP | |
| Cinebench R20 / CPU (Single Core) | |
| Schenker XMG FUSION 16 (M25) | |
| Lenovo Legion 7 16IAX10 | |
| Average AMD Ryzen AI 9 HX 470 (806 - 822, n=5) | |
| Lenovo Legion 7 16 AGP11 | |
| Average of class Gaming (442 - 904, n=105, last 2 years) | |
| HP Omen 16-ap0091ng | |
| Lenovo Legion 5 15AHP G10 | |
| Asus TUF Gaming A16 FA608UP | |
| Schenker XMG Core 16 VE M25 | |
| Cinebench R15 / CPU Multi 64Bit | |
| Schenker XMG FUSION 16 (M25) | |
| Lenovo Legion 7 16IAX10 | |
| HP Omen 16-ap0091ng | |
| Average of class Gaming (1578 - 6271, n=104, last 2 years) | |
| Lenovo Legion 7 16 AGP11 | |
| Average AMD Ryzen AI 9 HX 470 (3372 - 3607, n=5) | |
| Schenker XMG Core 16 VE M25 | |
| Lenovo Legion 5 15AHP G10 | |
| Asus TUF Gaming A16 FA608UP | |
| Cinebench R15 / CPU Single 64Bit | |
| Schenker XMG FUSION 16 (M25) | |
| Lenovo Legion 7 16IAX10 | |
| Average of class Gaming (188.8 - 344, n=105, last 2 years) | |
| Average AMD Ryzen AI 9 HX 470 (192.7 - 322, n=5) | |
| HP Omen 16-ap0091ng | |
| Lenovo Legion 5 15AHP G10 | |
| Schenker XMG Core 16 VE M25 | |
| Asus TUF Gaming A16 FA608UP | |
| Lenovo Legion 7 16 AGP11 | |
| Blender / v2.79 BMW27 CPU | |
| Schenker XMG Core 16 VE M25 | |
| Lenovo Legion 5 15AHP G10 | |
| Asus TUF Gaming A16 FA608UP | |
| Average of class Gaming (80 - 330, n=103, last 2 years) | |
| Average AMD Ryzen AI 9 HX 470 (140 - 149, n=5) | |
| Lenovo Legion 7 16 AGP11 | |
| HP Omen 16-ap0091ng | |
| Lenovo Legion 7 16IAX10 | |
| Schenker XMG FUSION 16 (M25) | |
| 7-Zip 18.03 / 7z b 4 | |
| Schenker XMG FUSION 16 (M25) | |
| HP Omen 16-ap0091ng | |
| Lenovo Legion 7 16IAX10 | |
| Average of class Gaming (33491 - 148086, n=104, last 2 years) | |
| Lenovo Legion 7 16 AGP11 | |
| Average AMD Ryzen AI 9 HX 470 (73258 - 84545, n=5) | |
| Schenker XMG Core 16 VE M25 | |
| Lenovo Legion 5 15AHP G10 | |
| Asus TUF Gaming A16 FA608UP | |
| 7-Zip 18.03 / 7z b 4 -mmt1 | |
| HP Omen 16-ap0091ng | |
| Schenker XMG FUSION 16 (M25) | |
| Schenker XMG Core 16 VE M25 | |
| Lenovo Legion 7 16IAX10 | |
| Lenovo Legion 5 15AHP G10 | |
| Average AMD Ryzen AI 9 HX 470 (6244 - 6562, n=5) | |
| Average of class Gaming (4199 - 7436, n=104, last 2 years) | |
| Lenovo Legion 7 16 AGP11 | |
| Asus TUF Gaming A16 FA608UP | |
| Geekbench 6.7 / Multi-Core | |
| Schenker XMG FUSION 16 (M25) | |
| Lenovo Legion 7 16IAX10 | |
| Lenovo Legion 7 16 AGP11 | |
| Average of class Gaming (6625 - 22104, n=105, last 2 years) | |
| Average AMD Ryzen AI 9 HX 470 (11437 - 16116, n=7) | |
| Schenker XMG Core 16 VE M25 | |
| Lenovo Legion 5 15AHP G10 | |
| Asus TUF Gaming A16 FA608UP | |
| HP Omen 16-ap0091ng | |
| Geekbench 6.7 / Single-Core | |
| Schenker XMG FUSION 16 (M25) | |
| Lenovo Legion 7 16 AGP11 | |
| Average AMD Ryzen AI 9 HX 470 (2872 - 3000, n=7) | |
| Lenovo Legion 7 16IAX10 | |
| Average of class Gaming (1490 - 3259, n=105, last 2 years) | |
| HP Omen 16-ap0091ng | |
| Lenovo Legion 5 15AHP G10 | |
| Asus TUF Gaming A16 FA608UP | |
| Schenker XMG Core 16 VE M25 | |
| Geekbench 5.5 / Multi-Core | |
| Schenker XMG FUSION 16 (M25) | |
| Lenovo Legion 7 16IAX10 | |
| Average of class Gaming (6460 - 27010, n=104, last 2 years) | |
| Lenovo Legion 7 16 AGP11 | |
| Average AMD Ryzen AI 9 HX 470 (12418 - 16002, n=5) | |
| HP Omen 16-ap0091ng | |
| Schenker XMG Core 16 VE M25 | |
| Lenovo Legion 5 15AHP G10 | |
| Asus TUF Gaming A16 FA608UP | |
| Geekbench 5.5 / Single-Core | |
| Schenker XMG FUSION 16 (M25) | |
| Lenovo Legion 7 16 AGP11 | |
| Lenovo Legion 7 16IAX10 | |
| Average AMD Ryzen AI 9 HX 470 (1950 - 2193, n=5) | |
| Average of class Gaming (986 - 2474, n=104, last 2 years) | |
| Lenovo Legion 5 15AHP G10 | |
| HP Omen 16-ap0091ng | |
| Asus TUF Gaming A16 FA608UP | |
| Schenker XMG Core 16 VE M25 | |
| HWBOT x265 Benchmark v2.2 / 4k Preset | |
| Schenker XMG FUSION 16 (M25) | |
| Lenovo Legion 7 16IAX10 | |
| Average of class Gaming (11.5 - 44.3, n=104, last 2 years) | |
| Lenovo Legion 7 16 AGP11 | |
| Average AMD Ryzen AI 9 HX 470 (24.9 - 28.5, n=5) | |
| HP Omen 16-ap0091ng | |
| Lenovo Legion 5 15AHP G10 | |
| Schenker XMG Core 16 VE M25 | |
| Asus TUF Gaming A16 FA608UP | |
| LibreOffice / 20 Documents To PDF | |
| Average AMD Ryzen AI 9 HX 470 (53.8 - 59.9, n=5) | |
| Schenker XMG Core 16 VE M25 | |
| Asus TUF Gaming A16 FA608UP | |
| Lenovo Legion 7 16 AGP11 | |
| Schenker XMG FUSION 16 (M25) | |
| Lenovo Legion 5 15AHP G10 | |
| Average of class Gaming (33.2 - 88.8, n=104, last 2 years) | |
| HP Omen 16-ap0091ng | |
| Lenovo Legion 7 16IAX10 | |
| R Benchmark 2.5 / Overall mean | |
| Schenker XMG Core 16 VE M25 | |
| Asus TUF Gaming A16 FA608UP | |
| Lenovo Legion 5 15AHP G10 | |
| Lenovo Legion 7 16IAX10 | |
| Average of class Gaming (0.3439 - 0.759, n=105, last 2 years) | |
| HP Omen 16-ap0091ng | |
| Lenovo Legion 7 16 AGP11 | |
| Schenker XMG FUSION 16 (M25) | |
| Average AMD Ryzen AI 9 HX 470 (0.3848 - 0.4157, n=5) | |
* ... smaller is better
AIDA64: FP32 Ray-Trace | FPU Julia | CPU SHA3 | CPU Queen | FPU SinJulia | FPU Mandel | CPU AES | CPU ZLib | FP64 Ray-Trace | CPU PhotoWorxx | CPU CheckMate
| Performance rating | |
| HP Omen 16-ap0091ng -1! | |
| Schenker XMG FUSION 16 (M25) -1! | |
| Lenovo Legion 7 16 AGP11 -1! | |
| Lenovo Legion 7 16IAX10 -1! | |
| Average of class Gaming | |
| Average AMD Ryzen AI 9 HX 470 | |
| Schenker XMG Core 16 VE M25 -1! | |
| Lenovo Legion 5 15AHP G10 -1! | |
| Asus TUF Gaming A16 FA608UP -1! | |
| AIDA64 / FP32 Ray-Trace | |
| HP Omen 16-ap0091ng (v6.92.6600) | |
| Lenovo Legion 7 16 AGP11 (v8.20.8100) | |
| Average AMD Ryzen AI 9 HX 470 (31969 - 38491, n=8) | |
| Schenker XMG FUSION 16 (M25) (v6.92.6600) | |
| Average of class Gaming (10227 - 85542, n=103, last 2 years) | |
| Lenovo Legion 5 15AHP G10 (v6.92.6600) | |
| Lenovo Legion 7 16IAX10 (v6.92.6600) | |
| Asus TUF Gaming A16 FA608UP (v6.92.6600) | |
| Schenker XMG Core 16 VE M25 (v6.92.6600) | |
| AIDA64 / FPU Julia | |
| Schenker XMG FUSION 16 (M25) (v6.92.6600) | |
| HP Omen 16-ap0091ng (v6.92.6600) | |
| Lenovo Legion 7 16IAX10 (v6.92.6600) | |
| Lenovo Legion 7 16 AGP11 (v8.20.8100) | |
| Average AMD Ryzen AI 9 HX 470 (117908 - 152422, n=8) | |
| Average of class Gaming (51376 - 238426, n=103, last 2 years) | |
| Lenovo Legion 5 15AHP G10 (v6.92.6600) | |
| Asus TUF Gaming A16 FA608UP (v6.92.6600) | |
| Schenker XMG Core 16 VE M25 (v6.92.6600) | |
| AIDA64 / CPU SHA3 | |
| Schenker XMG FUSION 16 (M25) (v6.92.6600) | |
| HP Omen 16-ap0091ng (v6.92.6600) | |
| Lenovo Legion 7 16IAX10 (v6.92.6600) | |
| Average of class Gaming (2180 - 9817, n=103, last 2 years) | |
| Lenovo Legion 7 16 AGP11 (v8.20.8100) | |
| Average AMD Ryzen AI 9 HX 470 (5074 - 5821, n=8) | |
| Schenker XMG Core 16 VE M25 (v6.92.6600) | |
| Asus TUF Gaming A16 FA608UP (v6.92.6600) | |
| Lenovo Legion 5 15AHP G10 (v6.92.6600) | |
| AIDA64 / CPU Queen | |
| HP Omen 16-ap0091ng (v6.92.6600) | |
| Lenovo Legion 7 16IAX10 (v6.92.6600) | |
| Schenker XMG FUSION 16 (M25) (v6.92.6600) | |
| Schenker XMG Core 16 VE M25 (v6.92.6600) | |
| Lenovo Legion 5 15AHP G10 (v6.92.6600) | |
| Asus TUF Gaming A16 FA608UP (v6.92.6600) | |
| Average of class Gaming (49785 - 173351, n=89, last 2 years) | |
| Average AMD Ryzen AI 9 HX 470 (89114 - 100242, n=3) | |
| AIDA64 / FPU SinJulia | |
| HP Omen 16-ap0091ng (v6.92.6600) | |
| Lenovo Legion 7 16 AGP11 (v8.20.8100) | |
| Average AMD Ryzen AI 9 HX 470 (17747 - 19320, n=8) | |
| Schenker XMG Core 16 VE M25 (v6.92.6600) | |
| Lenovo Legion 5 15AHP G10 (v6.92.6600) | |
| Asus TUF Gaming A16 FA608UP (v6.92.6600) | |
| Average of class Gaming (4424 - 33636, n=103, last 2 years) | |
| Schenker XMG FUSION 16 (M25) (v6.92.6600) | |
| Lenovo Legion 7 16IAX10 (v6.92.6600) | |
| AIDA64 / FPU Mandel | |
| HP Omen 16-ap0091ng (v6.92.6600) | |
| Schenker XMG FUSION 16 (M25) (v6.92.6600) | |
| Lenovo Legion 7 16IAX10 (v6.92.6600) | |
| Lenovo Legion 7 16 AGP11 (v8.20.8100) | |
| Average AMD Ryzen AI 9 HX 470 (66324 - 78045, n=8) | |
| Average of class Gaming (25115 - 128721, n=103, last 2 years) | |
| Lenovo Legion 5 15AHP G10 (v6.92.6600) | |
| Asus TUF Gaming A16 FA608UP (v6.92.6600) | |
| Schenker XMG Core 16 VE M25 (v6.92.6600) | |
| AIDA64 / CPU AES | |
| HP Omen 16-ap0091ng (v6.92.6600) | |
| Schenker XMG FUSION 16 (M25) (v6.92.6600) | |
| Lenovo Legion 7 16 AGP11 (v8.20.8100) | |
| Lenovo Legion 7 16IAX10 (v6.92.6600) | |
| Average of class Gaming (39258 - 247074, n=103, last 2 years) | |
| Schenker XMG Core 16 VE M25 (v6.92.6600) | |
| Asus TUF Gaming A16 FA608UP (v6.92.6600) | |
| Average AMD Ryzen AI 9 HX 470 (78626 - 117375, n=8) | |
| Lenovo Legion 5 15AHP G10 (v6.92.6600) | |
| AIDA64 / CPU ZLib | |
| Schenker XMG FUSION 16 (M25) (v6.92.6600) | |
| Lenovo Legion 7 16IAX10 (v6.92.6600) | |
| HP Omen 16-ap0091ng (v6.92.6600) | |
| Average of class Gaming (574 - 2531, n=103, last 2 years) | |
| Lenovo Legion 7 16 AGP11 (v8.20.8100) | |
| Average AMD Ryzen AI 9 HX 470 (1434 - 1549, n=8) | |
| Schenker XMG Core 16 VE M25 (v6.92.6600) | |
| Lenovo Legion 5 15AHP G10 (v6.92.6600) | |
| Asus TUF Gaming A16 FA608UP (v6.92.6600) | |
| AIDA64 / FP64 Ray-Trace | |
| HP Omen 16-ap0091ng (v6.92.6600) | |
| Lenovo Legion 7 16 AGP11 (v8.20.8100) | |
| Average AMD Ryzen AI 9 HX 470 (16687 - 20313, n=8) | |
| Schenker XMG FUSION 16 (M25) (v6.92.6600) | |
| Average of class Gaming (5509 - 45446, n=103, last 2 years) | |
| Lenovo Legion 7 16IAX10 (v6.92.6600) | |
| Lenovo Legion 5 15AHP G10 (v6.92.6600) | |
| Asus TUF Gaming A16 FA608UP (v6.92.6600) | |
| Schenker XMG Core 16 VE M25 (v6.92.6600) | |
| AIDA64 / CPU PhotoWorxx | |
| Lenovo Legion 7 16 AGP11 (v8.20.8100) | |
| Schenker XMG FUSION 16 (M25) (v6.92.6600) | |
| Lenovo Legion 7 16IAX10 (v6.92.6600) | |
| Schenker XMG Core 16 VE M25 (v6.92.6600) | |
| Average of class Gaming (12271 - 89891, n=103, last 2 years) | |
| Lenovo Legion 5 15AHP G10 (v6.92.6600) | |
| Asus TUF Gaming A16 FA608UP (v6.92.6600) | |
| Average AMD Ryzen AI 9 HX 470 (23851 - 54302, n=8) | |
| HP Omen 16-ap0091ng (v6.92.6600) | |
| AIDA64 / CPU CheckMate | |
| Lenovo Legion 7 16 AGP11 (v8.20.8100) | |
| Average AMD Ryzen AI 9 HX 470 (7688 - 8080, n=5) | |
| Average of class Gaming (2930 - 11788, n=13, last 2 years) | |
System Performance
The overall system performance is excellent and we did not encounter any stability issues.
PCMark 10: Score | Essentials | Productivity | Digital Content Creation
CrossMark: Overall | Productivity | Creativity | Responsiveness
WebXPRT 3: Overall
WebXPRT 4: Overall
Mozilla Kraken 1.1: Total
| Performance rating | |
| Schenker XMG FUSION 16 (M25) | |
| Lenovo Legion 7 16IAX10 | |
| Average of class Gaming | |
| Average AMD Ryzen AI 9 HX 470, NVIDIA GeForce RTX 5060 Laptop | |
| Lenovo Legion 7 16 AGP11 | |
| Schenker XMG Core 16 VE M25 | |
| HP Omen 16-ap0091ng | |
| Lenovo Legion 5 15AHP G10 | |
| Asus TUF Gaming A16 FA608UP -4! | |
| PCMark 10 / Score | |
| Schenker XMG FUSION 16 (M25) | |
| Lenovo Legion 7 16 AGP11 | |
| Average AMD Ryzen AI 9 HX 470, NVIDIA GeForce RTX 5060 Laptop (n=1) | |
| Average of class Gaming (5828 - 11730, n=92, last 2 years) | |
| Lenovo Legion 5 15AHP G10 | |
| Schenker XMG Core 16 VE M25 | |
| HP Omen 16-ap0091ng | |
| Lenovo Legion 7 16IAX10 | |
| PCMark 10 / Essentials | |
| Lenovo Legion 7 16IAX10 | |
| Lenovo Legion 5 15AHP G10 | |
| HP Omen 16-ap0091ng | |
| Average of class Gaming (8810 - 11935, n=96, last 2 years) | |
| Lenovo Legion 7 16 AGP11 | |
| Average AMD Ryzen AI 9 HX 470, NVIDIA GeForce RTX 5060 Laptop (n=1) | |
| Schenker XMG FUSION 16 (M25) | |
| Schenker XMG Core 16 VE M25 | |
| PCMark 10 / Productivity | |
| Schenker XMG FUSION 16 (M25) | |
| Lenovo Legion 7 16 AGP11 | |
| Average AMD Ryzen AI 9 HX 470, NVIDIA GeForce RTX 5060 Laptop (n=1) | |
| Schenker XMG Core 16 VE M25 | |
| Average of class Gaming (6845 - 21327, n=94, last 2 years) | |
| Lenovo Legion 7 16IAX10 | |
| Lenovo Legion 5 15AHP G10 | |
| HP Omen 16-ap0091ng | |
| PCMark 10 / Digital Content Creation | |
| Schenker XMG FUSION 16 (M25) | |
| Lenovo Legion 7 16 AGP11 | |
| Average AMD Ryzen AI 9 HX 470, NVIDIA GeForce RTX 5060 Laptop (n=1) | |
| Average of class Gaming (7602 - 19954, n=94, last 2 years) | |
| Lenovo Legion 5 15AHP G10 | |
| HP Omen 16-ap0091ng | |
| Schenker XMG Core 16 VE M25 | |
| Lenovo Legion 7 16IAX10 | |
| CrossMark / Overall | |
| Schenker XMG FUSION 16 (M25) | |
| Lenovo Legion 7 16IAX10 | |
| Average of class Gaming (1366 - 2409, n=93, last 2 years) | |
| Schenker XMG Core 16 VE M25 | |
| HP Omen 16-ap0091ng | |
| Lenovo Legion 5 15AHP G10 | |
| Asus TUF Gaming A16 FA608UP | |
| Lenovo Legion 7 16 AGP11 | |
| Average AMD Ryzen AI 9 HX 470, NVIDIA GeForce RTX 5060 Laptop (n=1) | |
| CrossMark / Productivity | |
| Lenovo Legion 7 16IAX10 | |
| Schenker XMG FUSION 16 (M25) | |
| Average of class Gaming (1386 - 2254, n=93, last 2 years) | |
| HP Omen 16-ap0091ng | |
| Schenker XMG Core 16 VE M25 | |
| Lenovo Legion 5 15AHP G10 | |
| Asus TUF Gaming A16 FA608UP | |
| Lenovo Legion 7 16 AGP11 | |
| Average AMD Ryzen AI 9 HX 470, NVIDIA GeForce RTX 5060 Laptop (n=1) | |
| CrossMark / Creativity | |
| Schenker XMG FUSION 16 (M25) | |
| Lenovo Legion 7 16IAX10 | |
| Average of class Gaming (1343 - 2729, n=93, last 2 years) | |
| HP Omen 16-ap0091ng | |
| Schenker XMG Core 16 VE M25 | |
| Lenovo Legion 5 15AHP G10 | |
| Asus TUF Gaming A16 FA608UP | |
| Lenovo Legion 7 16 AGP11 | |
| Average AMD Ryzen AI 9 HX 470, NVIDIA GeForce RTX 5060 Laptop (n=1) | |
| CrossMark / Responsiveness | |
| Lenovo Legion 7 16IAX10 | |
| Schenker XMG FUSION 16 (M25) | |
| Average of class Gaming (1226 - 2334, n=93, last 2 years) | |
| Schenker XMG Core 16 VE M25 | |
| Lenovo Legion 5 15AHP G10 | |
| HP Omen 16-ap0091ng | |
| Lenovo Legion 7 16 AGP11 | |
| Average AMD Ryzen AI 9 HX 470, NVIDIA GeForce RTX 5060 Laptop (n=1) | |
| Asus TUF Gaming A16 FA608UP | |
| WebXPRT 3 / Overall | |
| Lenovo Legion 7 16IAX10 | |
| Schenker XMG FUSION 16 (M25) | |
| Lenovo Legion 7 16 AGP11 | |
| Average AMD Ryzen AI 9 HX 470, NVIDIA GeForce RTX 5060 Laptop (n=1) | |
| HP Omen 16-ap0091ng | |
| Average of class Gaming (220 - 532, n=97, last 2 years) | |
| Lenovo Legion 5 15AHP G10 | |
| Asus TUF Gaming A16 FA608UP | |
| Schenker XMG Core 16 VE M25 | |
| WebXPRT 4 / Overall | |
| Lenovo Legion 7 16IAX10 | |
| Schenker XMG FUSION 16 (M25) | |
| Average of class Gaming (165 - 354, n=97, last 2 years) | |
| Average AMD Ryzen AI 9 HX 470, NVIDIA GeForce RTX 5060 Laptop (n=1) | |
| Lenovo Legion 7 16 AGP11 | |
| Schenker XMG Core 16 VE M25 | |
| Lenovo Legion 5 15AHP G10 | |
| HP Omen 16-ap0091ng | |
| Asus TUF Gaming A16 FA608UP | |
| Mozilla Kraken 1.1 / Total | |
| Asus TUF Gaming A16 FA608UP | |
| HP Omen 16-ap0091ng | |
| Schenker XMG Core 16 VE M25 | |
| Lenovo Legion 5 15AHP G10 | |
| Average of class Gaming (391 - 590, n=99, last 2 years) | |
| Lenovo Legion 7 16IAX10 | |
| Schenker XMG FUSION 16 (M25) | |
| Lenovo Legion 7 16 AGP11 | |
| Average AMD Ryzen AI 9 HX 470, NVIDIA GeForce RTX 5060 Laptop (n=1) | |
* ... smaller is better
| PCMark 10 Score | 9485 points | |
Help | ||
| AIDA64 / Memory Copy | |
| Lenovo Legion 7 16IAX10 | |
| Lenovo Legion 7 16 AGP11 | |
| Schenker XMG FUSION 16 (M25) | |
| Average of class Gaming (21750 - 129946, n=103, last 2 years) | |
| Lenovo Legion 5 15AHP G10 | |
| Schenker XMG Core 16 VE M25 | |
| Asus TUF Gaming A16 FA608UP | |
| Average AMD Ryzen AI 9 HX 470 (38489 - 86767, n=8) | |
| HP Omen 16-ap0091ng | |
| AIDA64 / Memory Read | |
| Lenovo Legion 7 16 AGP11 | |
| Schenker XMG FUSION 16 (M25) | |
| Lenovo Legion 7 16IAX10 | |
| Average of class Gaming (22956 - 118858, n=103, last 2 years) | |
| Average AMD Ryzen AI 9 HX 470 (39901 - 93860, n=8) | |
| Asus TUF Gaming A16 FA608UP | |
| Lenovo Legion 5 15AHP G10 | |
| Schenker XMG Core 16 VE M25 | |
| HP Omen 16-ap0091ng | |
| AIDA64 / Memory Write | |
| Lenovo Legion 7 16 AGP11 | |
| Lenovo Legion 5 15AHP G10 | |
| Asus TUF Gaming A16 FA608UP | |
| Schenker XMG Core 16 VE M25 | |
| Schenker XMG FUSION 16 (M25) | |
| Lenovo Legion 7 16IAX10 | |
| Average of class Gaming (22297 - 135096, n=103, last 2 years) | |
| Average AMD Ryzen AI 9 HX 470 (40283 - 118364, n=8) | |
| HP Omen 16-ap0091ng | |
| AIDA64 / Memory Latency | |
| Schenker XMG FUSION 16 (M25) | |
| Average of class Gaming (75.3 - 259, n=103, last 2 years) | |
| Lenovo Legion 7 16IAX10 | |
| Lenovo Legion 7 16 AGP11 | |
| Average AMD Ryzen AI 9 HX 470 (88.1 - 104.5, n=8) | |
| Asus TUF Gaming A16 FA608UP | |
| Lenovo Legion 5 15AHP G10 | |
| Schenker XMG Core 16 VE M25 | |
| HP Omen 16-ap0091ng | |
* ... smaller is better
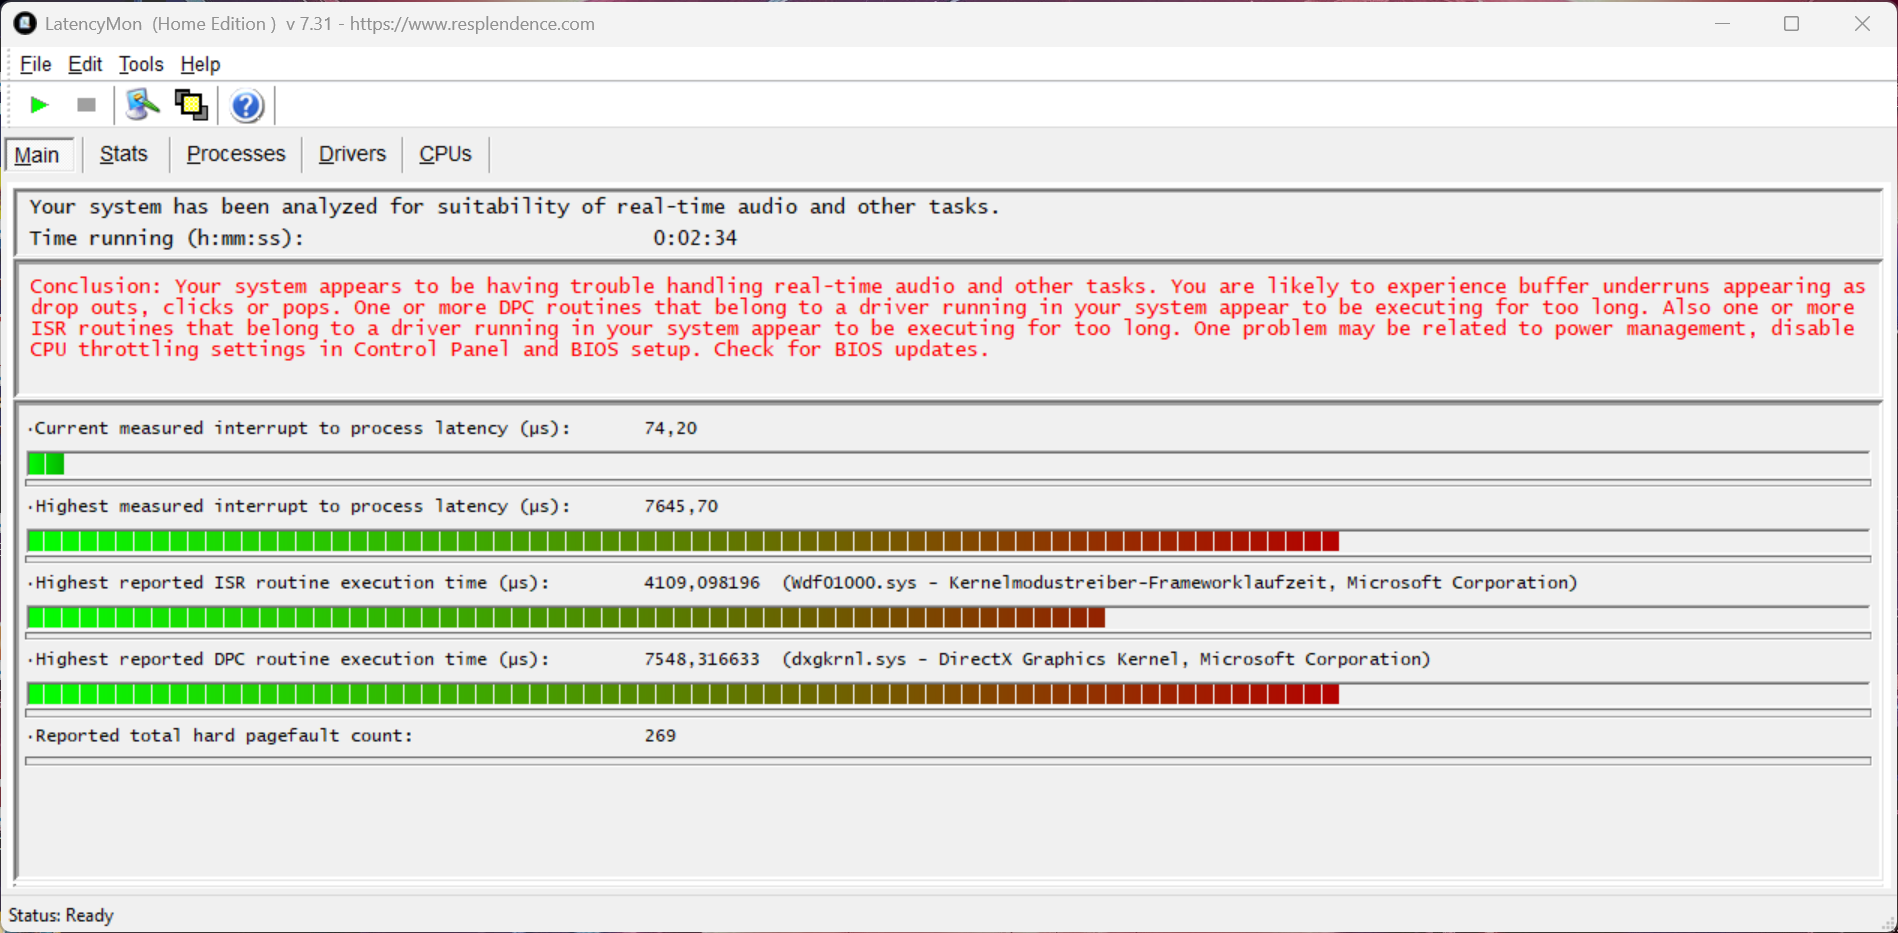
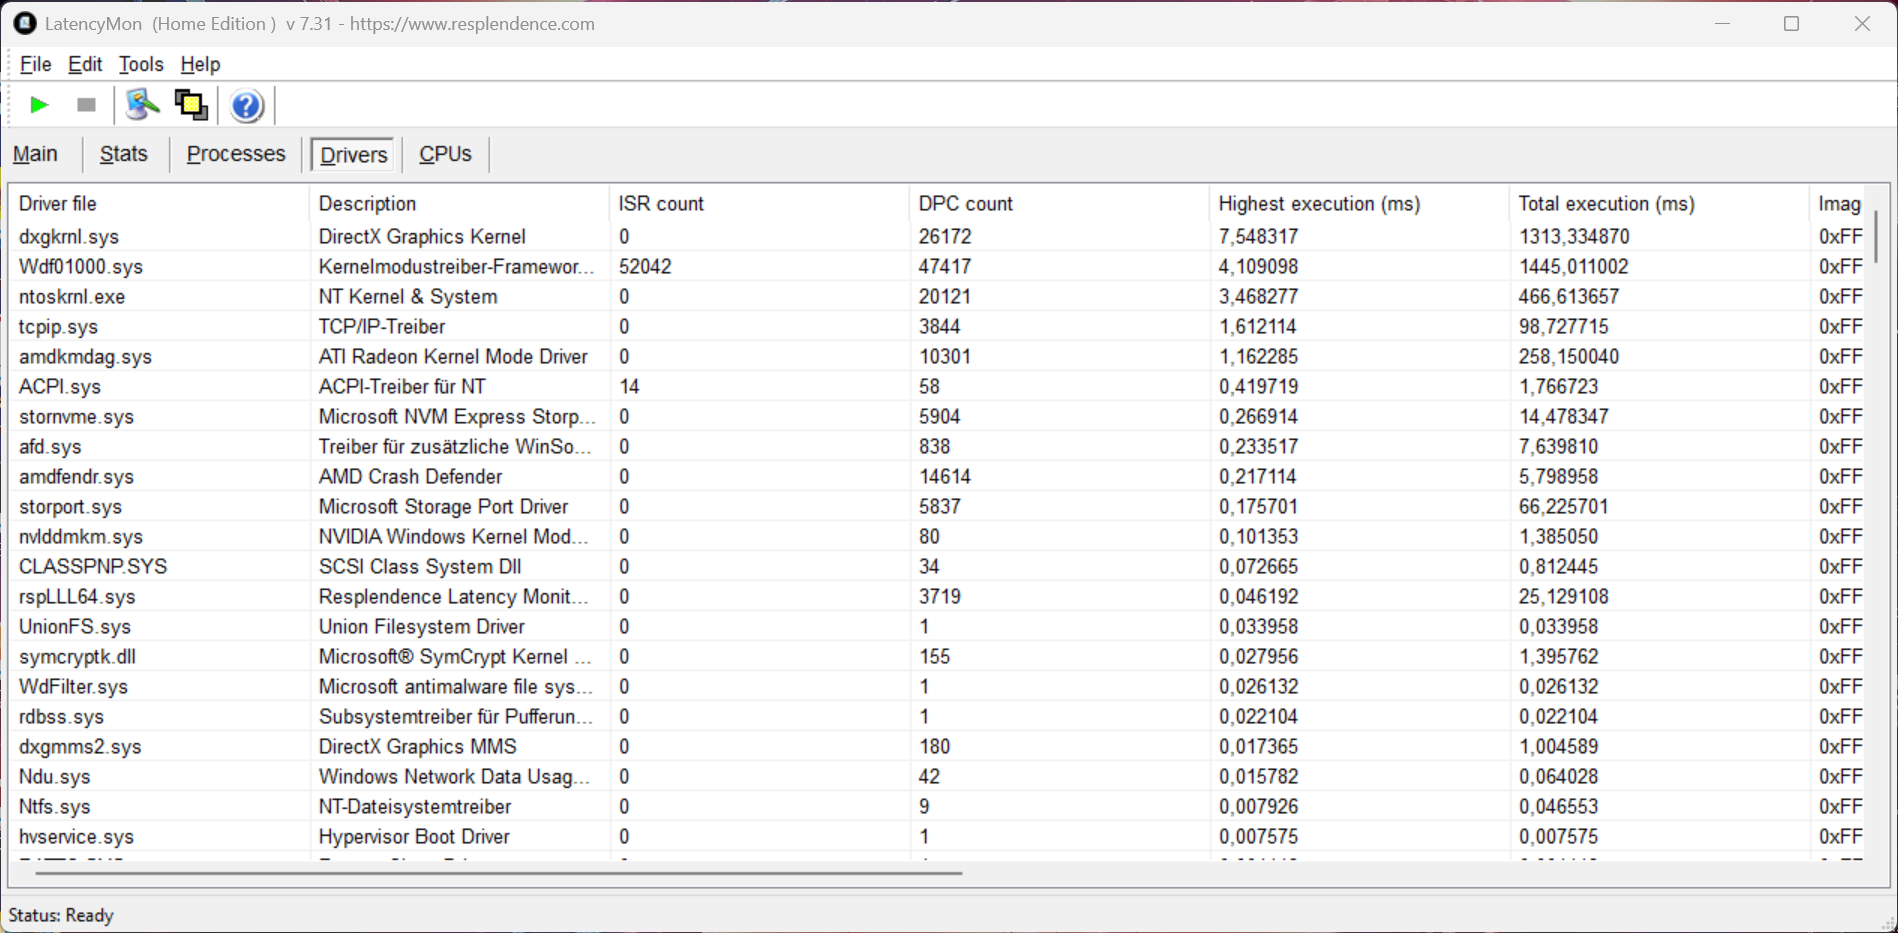
DPC Latency
Our standardized latency test shows issues for the review unit with the current BIOS version, so it is not ideal for real-time audio applications.
| DPC Latencies / LatencyMon - interrupt to process latency (max), Web, Youtube, Prime95 | |
| Lenovo Legion 7 16 AGP11 | |
| Lenovo Legion 5 15AHP G10 | |
| HP Omen 16-ap0091ng | |
| Schenker XMG Core 16 VE M25 | |
| Lenovo Legion 7 16IAX10 | |
| Schenker XMG FUSION 16 (M25) | |
| Asus TUF Gaming A16 FA608UP | |
* ... smaller is better
Storage Devices
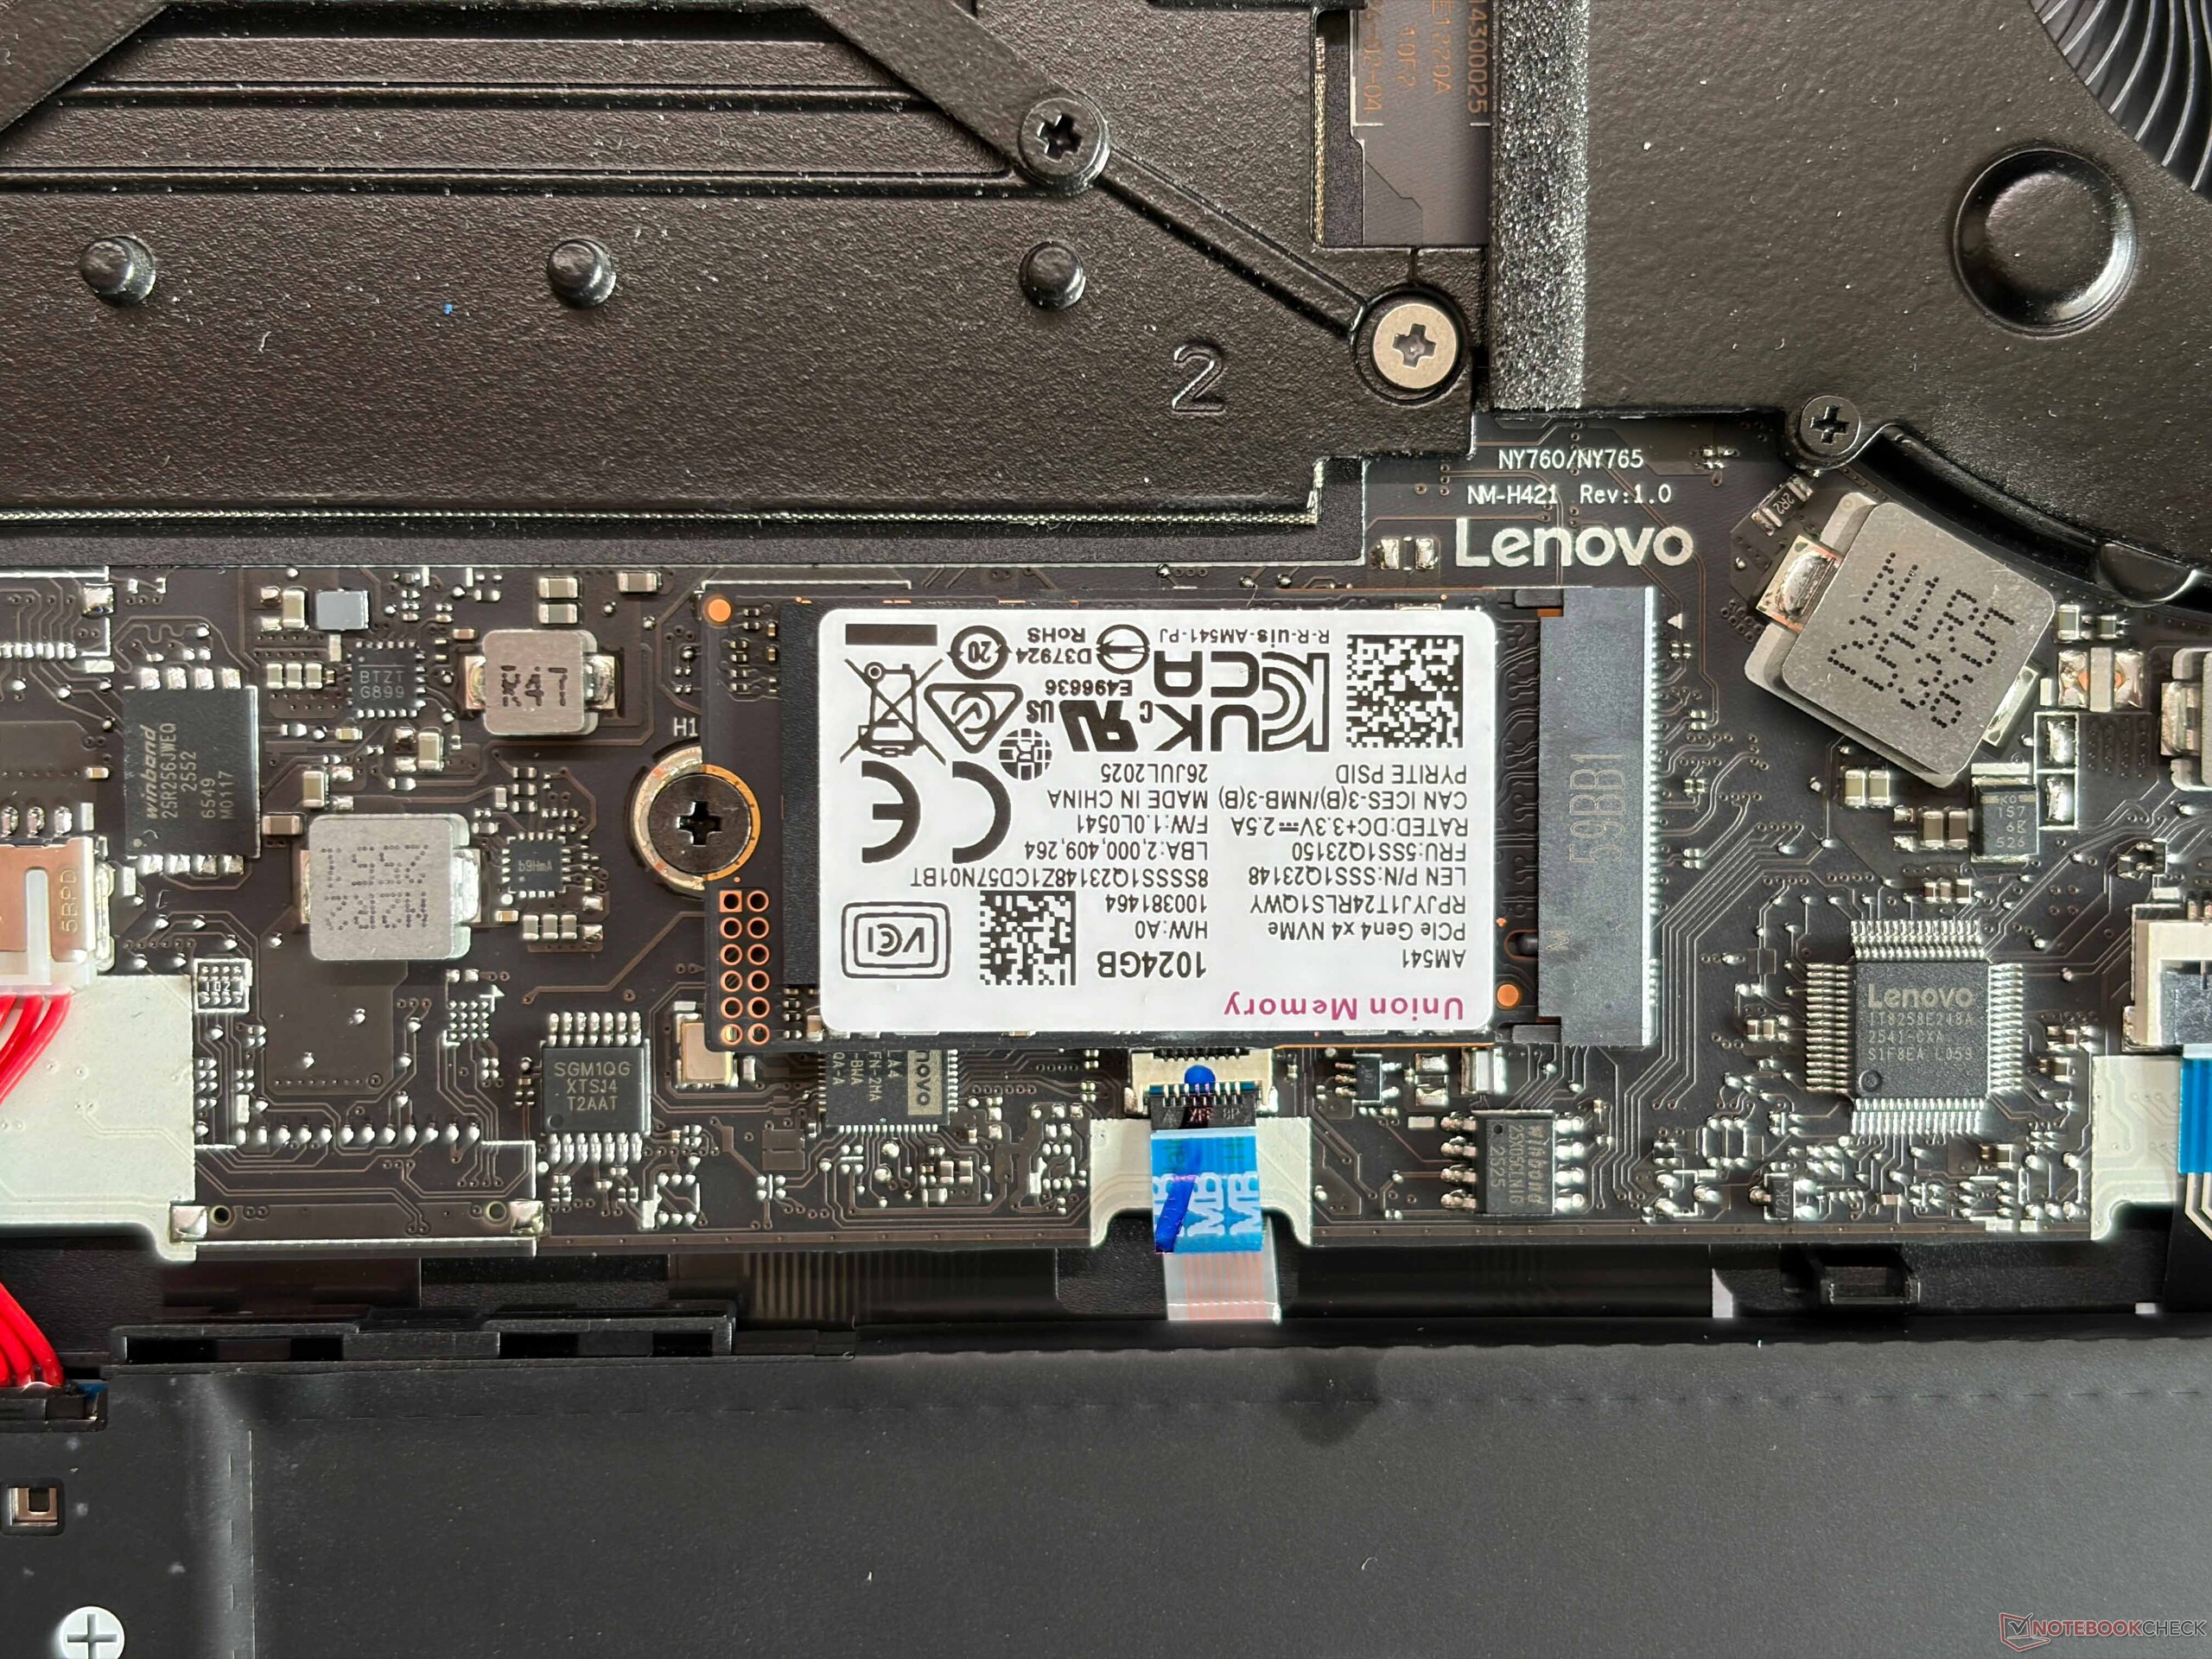
Our review unit is equipped with Lenovo's own UMIS AM541 1 TB PCIe 4.0 drive (870 GB free) and the transfer rates of the compact M.2-2242 are okay, but they are not consistent under sustained workloads. There is also a free M.2-2280 slot for another SSD, but it is limited to PCIe 4.0 x2, so transfer rates are capped at around 3.5-4 GB/s.

* ... smaller is better
Disk Throttling: DiskSpd Read Loop, Queue Depth 8
GPU Performance
Lenovo once again uses the mobile GeForce RTX 5060, but this time with Advanced Optimus support. Compared to the previous Legion 7 16 G10, however, the TGP dropped from 115 to 95 Watts, so the GPU performance is slightly lower as well. The gaming performance is affected as well, and the slower AMD CPU does not help, either. In our standardized gaming benchmarks, the new Legion 7a 16 G11 is about 10 % slower than the old model, which is simply the price you have to pay for the lighter and slimmer design.
| 3DMark 11 Performance | 34353 points | |
| 3DMark Fire Strike Score | 28519 points | |
| 3DMark Time Spy Score | 11735 points | |
| 3DMark Steel Nomad Score | 2605 points | |
| 3DMark Steel Nomad Light Score | 12141 points | |
Help | ||
| Blender / v3.3 Classroom OPTIX/RTX | |
| Average NVIDIA GeForce RTX 5060 Laptop (20 - 28, n=18) | |
| Lenovo Legion 5 15AHP G10 | |
| Lenovo Legion 7 16IAX10 | |
| HP Omen 16-ap0091ng | |
| Schenker XMG Core 16 VE M25 | |
| Lenovo Legion 7 16 AGP11 | |
| Asus TUF Gaming A16 FA608UP | |
| Schenker XMG FUSION 16 (M25) | |
| Average of class Gaming (9 - 32, n=105, last 2 years) | |
| Blender / v3.3 Classroom CUDA | |
| Average NVIDIA GeForce RTX 5060 Laptop (38 - 186, n=19) | |
| Lenovo Legion 7 16 AGP11 | |
| Schenker XMG Core 16 VE M25 | |
| Lenovo Legion 5 15AHP G10 | |
| Lenovo Legion 7 16IAX10 | |
| HP Omen 16-ap0091ng | |
| Schenker XMG FUSION 16 (M25) | |
| Asus TUF Gaming A16 FA608UP | |
| Average of class Gaming (15 - 228, n=105, last 2 years) | |
| Blender / v3.3 Classroom CPU | |
| Schenker XMG Core 16 VE M25 | |
| Asus TUF Gaming A16 FA608UP | |
| Lenovo Legion 5 15AHP G10 | |
| Average NVIDIA GeForce RTX 5060 Laptop (133 - 511, n=18) | |
| Average of class Gaming (122 - 565, n=101, last 2 years) | |
| Lenovo Legion 7 16 AGP11 | |
| HP Omen 16-ap0091ng | |
| Lenovo Legion 7 16IAX10 | |
| Schenker XMG FUSION 16 (M25) | |
* ... smaller is better
| GTA V - 1920x1080 Highest AA:4xMSAA + FX AF:16x | |
| Schenker XMG FUSION 16 (M25) | |
| Lenovo Legion 7 16IAX10 | |
| Average of class Gaming (48.3 - 186.9, n=93, last 2 years) | |
| Lenovo Legion 7 16 AGP11 | |
| HP Omen 16-ap0091ng | |
| Asus TUF Gaming A16 FA608UP | |
| Lenovo Legion 5 15AHP G10 | |
| Strange Brigade - 1920x1080 ultra AA:ultra AF:16 | |
| Average of class Gaming (76.3 - 456, n=86, last 2 years) | |
| Schenker XMG FUSION 16 (M25) | |
| Lenovo Legion 7 16IAX10 | |
| Lenovo Legion 5 15AHP G10 | |
| Lenovo Legion 7 16 AGP11 | |
| Asus TUF Gaming A16 FA608UP | |
| HP Omen 16-ap0091ng | |

Cyberpunk 2077 ultra FPS Chart
| low | med. | high | ultra | QHD DLSS | QHD | |
|---|---|---|---|---|---|---|
| GTA V (2015) | 129.7 | 108.1 | ||||
| Dota 2 Reborn (2015) | 190.6 | 164.3 | 156.5 | 147.8 | ||
| Final Fantasy XV Benchmark (2018) | 197.3 | 162.6 | 121.7 | 89.2 | ||
| X-Plane 11.11 (2018) | 105.8 | 98.8 | 78.4 | |||
| Strange Brigade (2018) | 436 | 321 | 264 | 223 | 155.2 | |
| Baldur's Gate 3 (2023) | 162 | 132 | 115 | 112.2 | 76.4 | |
| Cyberpunk 2077 (2023) | 129.8 | 116.1 | 100.3 | 90.5 | 66.7 | 56.2 |
| F1 24 (2024) | 223 | 208 | 74.3 | 74.5 | 47.2 | |
| F1 25 (2025) | 176.8 | 180.8 | 160.9 | 26.6 | 26.5 | 9.78 |
Emissions
System Noise

The Legion is a very quiet daily companion and the fan noise under load depends a lot on the power mode. In Performance mode, we can measure up to 53 dB(A) while gaming, so you will need a headset. The other modes are quieter (Auto: 46.5, Quiet: 41.3 dB(A)), but the gaming performance will be lower. We did not notice any coil whine on our unit.
Noise level
| Idle |
| 24.5 / 24.5 / 27.1 dB(A) |
| Load |
| 34.6 / 53 dB(A) |
 | ||
30 dB silent 40 dB(A) audible 50 dB(A) loud |
||
min: | ||
| Lenovo Legion 7 16 AGP11 Ryzen AI 9 HX 470, GeForce RTX 5060 Laptop | Schenker XMG Core 16 VE M25 Ryzen 7 255, GeForce RTX 5060 Laptop | Schenker XMG FUSION 16 (M25) Ultra 9 275HX, GeForce RTX 5070 Laptop | HP Omen 16-ap0091ng R9 8940HX, GeForce RTX 5060 Laptop | Asus TUF Gaming A16 FA608UP R7 260, GeForce RTX 5070 Laptop | no name | Lenovo Legion 7 16IAX10 Ultra 7 255HX, GeForce RTX 5060 Laptop | Lenovo Legion 5 15AHP G10 R7 260, GeForce RTX 5060 Laptop | |
|---|---|---|---|---|---|---|---|---|
| Noise | -4% | -3% | -3% | -15% | -3% | -3% | -0% | |
| off / environment * (dB) | 24.5 | 24 2% | 25.7 -5% | 23 6% | 25.1 -2% | 22.9 7% | 23.9 2% | 25.5 -4% |
| Idle Minimum * (dB) | 24.5 | 24 2% | 25.7 -5% | 23 6% | 32.2 -31% | 24 2% | 24 2% | 25.5 -4% |
| Idle Average * (dB) | 24.5 | 27 -10% | 25.7 -5% | 23 6% | 32.2 -31% | 25.6 -4% | 26 -6% | 25.5 -4% |
| Idle Maximum * (dB) | 27.1 | 32 -18% | 28 -3% | 27.64 -2% | 32.2 -19% | 25.6 6% | 29.4 -8% | 26.9 1% |
| Load Average * (dB) | 34.6 | 41 -18% | 38.9 -12% | 49.5 -43% | 38.1 -10% | 46.8 -35% | 35.4 -2% | 34.6 -0% |
| Cyberpunk 2077 ultra * (dB) | 53 | 49 8% | 49.7 6% | 49.5 7% | 53.9 -2% | 49.9 6% | 54.6 -3% | 50.1 5% |
| Load Maximum * (dB) | 53 | 50 6% | 49.7 6% | 52.73 1% | 57.1 -8% | 55.6 -5% | 54.7 -3% | 50.1 5% |
* ... smaller is better
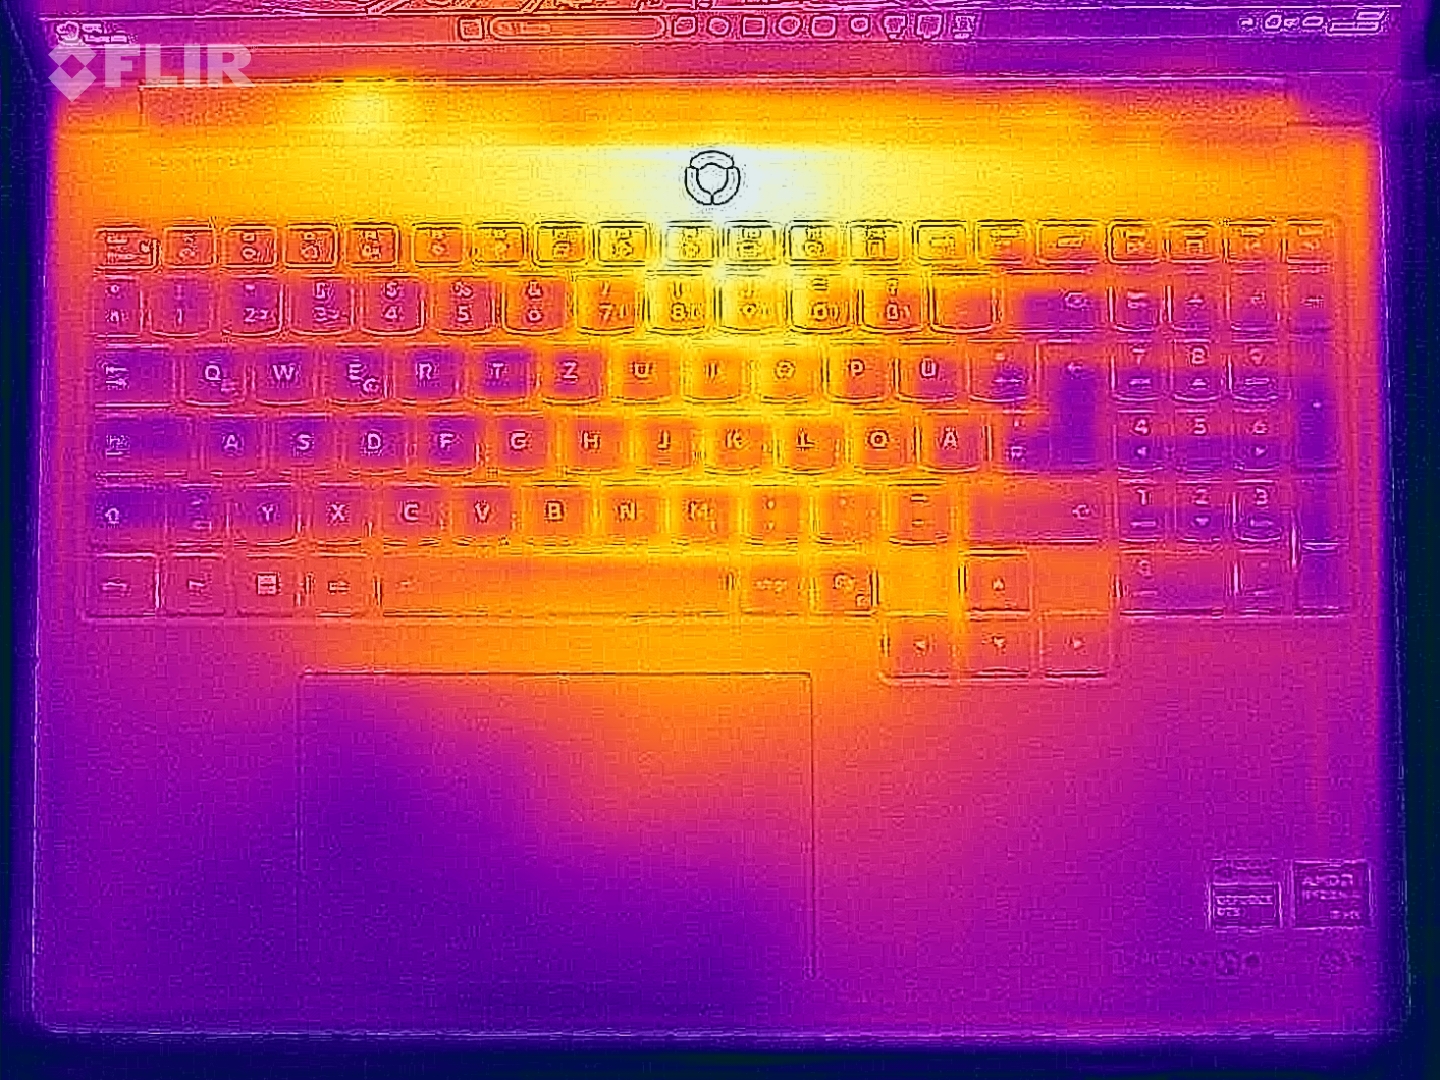
Temperature
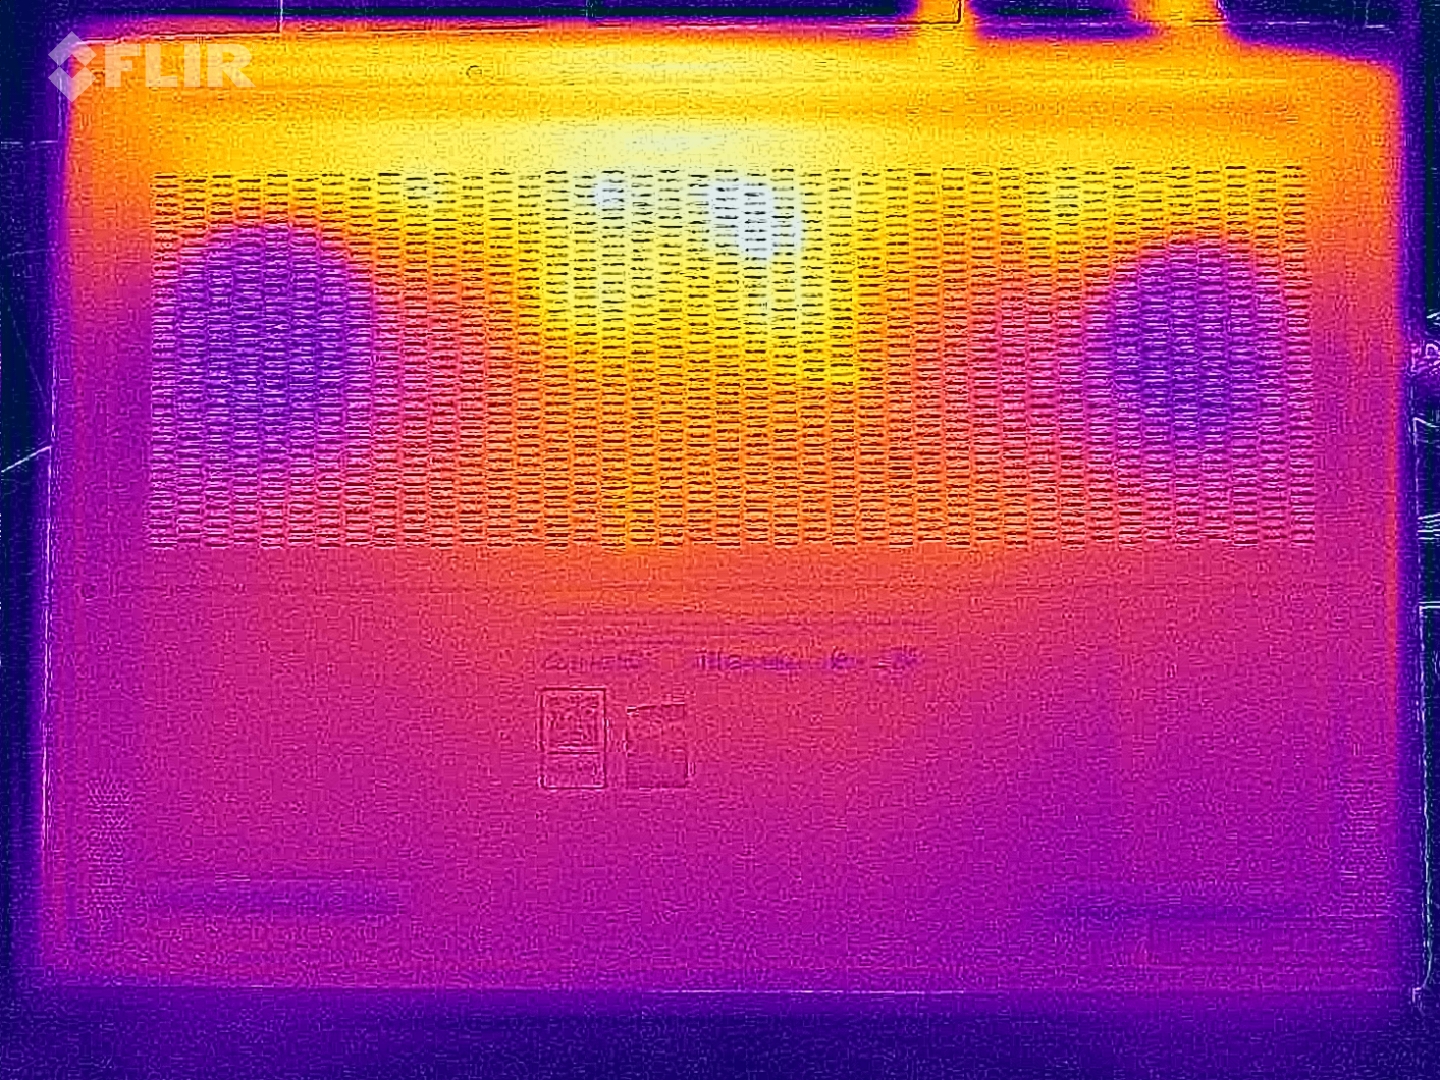
The surface temperatures are low in daily situations, but we can measure up to 50 °C at the bottom rear when you really stress the laptop, so you should not use it on your lap in this case. During the stress test, the CPU levels off at 45 Watts (76 °C) and the GPU at 80 Watts (76°C).

(±) The maximum temperature on the upper side is 44.9 °C / 113 F, compared to the average of 40.4 °C / 105 F, ranging from 21.2 to 68.8 °C for the class Gaming.
(-) The bottom heats up to a maximum of 50.5 °C / 123 F, compared to the average of 43.2 °C / 110 F
(+) In idle usage, the average temperature for the upper side is 25.8 °C / 78 F, compared to the device average of 33.9 °C / 93 F.
(±) 3: The average temperature for the upper side is 37.2 °C / 99 F, compared to the average of 33.9 °C / 93 F for the class Gaming.
(±) The palmrests and touchpad can get very hot to the touch with a maximum of 37.4 °C / 99.3 F.
(-) The average temperature of the palmrest area of similar devices was 28.8 °C / 83.8 F (-8.6 °C / -15.5 F).
| Lenovo Legion 7 16 AGP11 Ryzen AI 9 HX 470, GeForce RTX 5060 Laptop | Schenker XMG Core 16 VE M25 Ryzen 7 255, GeForce RTX 5060 Laptop | Schenker XMG FUSION 16 (M25) Ultra 9 275HX, GeForce RTX 5070 Laptop | HP Omen 16-ap0091ng R9 8940HX, GeForce RTX 5060 Laptop | Asus TUF Gaming A16 FA608UP R7 260, GeForce RTX 5070 Laptop | no name | Lenovo Legion 7 16IAX10 Ultra 7 255HX, GeForce RTX 5060 Laptop | Lenovo Legion 5 15AHP G10 R7 260, GeForce RTX 5060 Laptop | |
|---|---|---|---|---|---|---|---|---|
| Heat | -9% | 3% | 5% | 9% | -13% | -2% | ||
| Maximum Upper Side * (°C) | 44.9 | 46 -2% | 43.2 4% | 36 20% | 39.5 12% | 47 -5% | 42.2 6% | |
| Maximum Bottom * (°C) | 50.5 | 57 -13% | 48 5% | 37 27% | 45.1 11% | 44 13% | 51.7 -2% | |
| Idle Upper Side * (°C) | 27.3 | 29 -6% | 26.6 3% | 30 -10% | 25.7 6% | 35.6 -30% | 28.5 -4% | |
| Idle Bottom * (°C) | 27.5 | 31 -13% | 27.6 -0% | 32 -16% | 25.5 7% | 35.2 -28% | 29.2 -6% |
* ... smaller is better
Speakers
The sound system uses four module (2W each) and provides good audio quality.
Lenovo Legion 7 16 AGP11 audio analysis
(±) | speaker loudness is average but good (79 dB)
Bass 100 - 315 Hz
(±) | reduced bass - on average 11.4% lower than median
(±) | linearity of bass is average (8.7% delta to prev. frequency)
Mids 400 - 2000 Hz
(+) | balanced mids - only 3.1% away from median
(+) | mids are linear (2.4% delta to prev. frequency)
Highs 2 - 16 kHz
(+) | balanced highs - only 2.1% away from median
(+) | highs are linear (5% delta to prev. frequency)
Overall 100 - 16.000 Hz
(+) | overall sound is linear (11.7% difference to median)
Compared to same class
» 11% of all tested devices in this class were better, 4% similar, 85% worse
» The best had a delta of 6%, average was 18%, worst was 132%
Compared to all devices tested
» 8% of all tested devices were better, 3% similar, 89% worse
» The best had a delta of 4%, average was 23%, worst was 134%
Schenker XMG Core 16 VE M25 audio analysis
(±) | speaker loudness is average but good (76 dB)
Bass 100 - 315 Hz
(-) | nearly no bass - on average 19.1% lower than median
(±) | linearity of bass is average (10.5% delta to prev. frequency)
Mids 400 - 2000 Hz
(±) | higher mids - on average 6.3% higher than median
(±) | linearity of mids is average (7.2% delta to prev. frequency)
Highs 2 - 16 kHz
(+) | balanced highs - only 1.8% away from median
(+) | highs are linear (6% delta to prev. frequency)
Overall 100 - 16.000 Hz
(±) | linearity of overall sound is average (18.7% difference to median)
Compared to same class
» 62% of all tested devices in this class were better, 8% similar, 30% worse
» The best had a delta of 6%, average was 18%, worst was 132%
Compared to all devices tested
» 43% of all tested devices were better, 8% similar, 50% worse
» The best had a delta of 4%, average was 23%, worst was 134%
Schenker XMG FUSION 16 (M25) audio analysis
(+) | speakers can play relatively loud (85.1 dB)
Bass 100 - 315 Hz
(-) | nearly no bass - on average 17.9% lower than median
(±) | linearity of bass is average (10.5% delta to prev. frequency)
Mids 400 - 2000 Hz
(±) | higher mids - on average 5.7% higher than median
(+) | mids are linear (4.6% delta to prev. frequency)
Highs 2 - 16 kHz
(+) | balanced highs - only 3.1% away from median
(+) | highs are linear (4.8% delta to prev. frequency)
Overall 100 - 16.000 Hz
(+) | overall sound is linear (14.8% difference to median)
Compared to same class
» 30% of all tested devices in this class were better, 7% similar, 63% worse
» The best had a delta of 6%, average was 18%, worst was 132%
Compared to all devices tested
» 20% of all tested devices were better, 4% similar, 76% worse
» The best had a delta of 4%, average was 23%, worst was 134%
HP Omen 16-ap0091ng audio analysis
(±) | speaker loudness is average but good (79.91 dB)
Bass 100 - 315 Hz
(-) | nearly no bass - on average 18% lower than median
(±) | linearity of bass is average (11.1% delta to prev. frequency)
Mids 400 - 2000 Hz
(±) | higher mids - on average 6.9% higher than median
(±) | linearity of mids is average (7.5% delta to prev. frequency)
Highs 2 - 16 kHz
(+) | balanced highs - only 2.1% away from median
(±) | linearity of highs is average (7.5% delta to prev. frequency)
Overall 100 - 16.000 Hz
(±) | linearity of overall sound is average (17.8% difference to median)
Compared to same class
» 53% of all tested devices in this class were better, 10% similar, 37% worse
» The best had a delta of 6%, average was 18%, worst was 132%
Compared to all devices tested
» 36% of all tested devices were better, 8% similar, 56% worse
» The best had a delta of 4%, average was 23%, worst was 134%
Asus TUF Gaming A16 FA608UP audio analysis
(±) | speaker loudness is average but good (80.2 dB)
Bass 100 - 315 Hz
(±) | reduced bass - on average 11.8% lower than median
(±) | linearity of bass is average (8.7% delta to prev. frequency)
Mids 400 - 2000 Hz
(+) | balanced mids - only 3% away from median
(+) | mids are linear (3% delta to prev. frequency)
Highs 2 - 16 kHz
(+) | balanced highs - only 4.4% away from median
(±) | linearity of highs is average (7.4% delta to prev. frequency)
Overall 100 - 16.000 Hz
(+) | overall sound is linear (12.6% difference to median)
Compared to same class
» 16% of all tested devices in this class were better, 4% similar, 81% worse
» The best had a delta of 6%, average was 18%, worst was 132%
Compared to all devices tested
» 11% of all tested devices were better, 3% similar, 86% worse
» The best had a delta of 4%, average was 23%, worst was 134%
Lenovo Legion 7 16IAX10 audio analysis
(±) | speaker loudness is average but good (77.6 dB)
Bass 100 - 315 Hz
(±) | reduced bass - on average 9.5% lower than median
(±) | linearity of bass is average (9.8% delta to prev. frequency)
Mids 400 - 2000 Hz
(+) | balanced mids - only 1.5% away from median
(+) | mids are linear (4% delta to prev. frequency)
Highs 2 - 16 kHz
(+) | balanced highs - only 3% away from median
(+) | highs are linear (4.9% delta to prev. frequency)
Overall 100 - 16.000 Hz
(+) | overall sound is linear (11.5% difference to median)
Compared to same class
» 10% of all tested devices in this class were better, 3% similar, 87% worse
» The best had a delta of 6%, average was 18%, worst was 132%
Compared to all devices tested
» 8% of all tested devices were better, 2% similar, 90% worse
» The best had a delta of 4%, average was 23%, worst was 134%
Lenovo Legion 5 15AHP G10 audio analysis
(±) | speaker loudness is average but good (81.5 dB)
Bass 100 - 315 Hz
(-) | nearly no bass - on average 21% lower than median
(±) | linearity of bass is average (8.2% delta to prev. frequency)
Mids 400 - 2000 Hz
(+) | balanced mids - only 4.7% away from median
(+) | mids are linear (5.4% delta to prev. frequency)
Highs 2 - 16 kHz
(+) | balanced highs - only 3.1% away from median
(+) | highs are linear (6.4% delta to prev. frequency)
Overall 100 - 16.000 Hz
(±) | linearity of overall sound is average (16.7% difference to median)
Compared to same class
» 43% of all tested devices in this class were better, 10% similar, 47% worse
» The best had a delta of 6%, average was 18%, worst was 132%
Compared to all devices tested
» 29% of all tested devices were better, 7% similar, 64% worse
» The best had a delta of 4%, average was 23%, worst was 134%
Energy Management
Power Consumption

The Legion is pretty efficient while idling and the load figures are also lower compared to the previous model. During the stress test we see up to 235 Watts, but this value quickly settles at around 170 Watts, so the 245W PSU is sufficient.
| Off / Standby | |
| Idle | |
| Load |
|
Key:
min: | |
| Lenovo Legion 7 16 AGP11 Ryzen AI 9 HX 470, GeForce RTX 5060 Laptop, Lenovo UMIS AM541 1TB, OLED, 2560x1600, 16" | Schenker XMG Core 16 VE M25 Ryzen 7 255, GeForce RTX 5060 Laptop, Samsung 990 Pro 2 TB MZVL72T0HDLB, IPS, 2560x1600, 16" | Schenker XMG FUSION 16 (M25) Ultra 9 275HX, GeForce RTX 5070 Laptop, Samsung 9100 Pro 2 TB, OLED, 2880x1800, 16" | HP Omen 16-ap0091ng R9 8940HX, GeForce RTX 5060 Laptop, Samsung PM9C1b MZVL81T0HFLB-00BH1, IPS, 1920x1200, 16" | Asus TUF Gaming A16 FA608UP R7 260, GeForce RTX 5070 Laptop, Western Digital PC SN5000S SDEQNSJ-1T00, IPS, 2560x1600, 16" | no name | Lenovo Legion 7 16IAX10 Ultra 7 255HX, GeForce RTX 5060 Laptop, WD PC SN7100S SDFPMSL-1T00-1101, OLED, 2560x1600, 16" | Lenovo Legion 5 15AHP G10 R7 260, GeForce RTX 5060 Laptop, SK hynix PVC10 HFS001TEM4X182N, OLED, 2560x1600, 15.1" | Average NVIDIA GeForce RTX 5060 Laptop | Average of class Gaming | |
|---|---|---|---|---|---|---|---|---|---|---|
| Power Consumption | -46% | -56% | -32% | -6% | -16% | -64% | -7% | -40% | -89% | |
| Idle Minimum * (Watt) | 5.7 | 10.5 -84% | 15.3 -168% | 7.8 -37% | 4.6 19% | 4.4 23% | 9.4 -65% | 6.9 -21% | 8.97 ? -57% | 13 ? -128% |
| Idle Average * (Watt) | 8.7 | 13 -49% | 16.8 -93% | 8.8 -1% | 9.8 -13% | 18 -107% | 10.6 -22% | 10.7 -23% | 12.9 ? -48% | 18.7 ? -115% |
| Idle Maximum * (Watt) | 9.1 | 18.8 -107% | 17.3 -90% | 21.5 -136% | 10.2 -12% | 18.2 -100% | 36.4 -300% | 11.3 -24% | 18.3 ? -101% | 24.3 ? -167% |
| Load Average * (Watt) | 88.7 | 94.7 -7% | 119 -34% | 76.1 14% | 87.1 2% | 107.7 -21% | 69.7 21% | 92 ? -4% | 110.2 ? -24% | |
| Cyberpunk 2077 ultra external monitor * (Watt) | 156.9 | 181.1 -15% | 180.9 -15% | 164.5 -5% | 198.1 -26% | 120.6 23% | 187.5 -20% | 165 -5% | ||
| Cyberpunk 2077 ultra * (Watt) | 160.3 | 182.5 -14% | 185.3 -16% | 192 -20% | 198.9 -24% | 123 23% | 188 -17% | 162.6 -1% | ||
| Load Maximum * (Watt) | 234.9 | 246 -5% | 242.7 -3% | 208 11% | 235.2 -0% | 183 22% | 247 -5% | 233.6 1% | 213 ? 9% | 258 ? -10% |
* ... smaller is better
Power Consumption Cyberpunk / Stress Test
Power Consumption external Monitor
Battery Life
The battery life with the 83 Wh battery is just average. We record a Wi-Fi runtime of around 9 hours at 150 nits and almost 6 hours at maximum brightness.

Notebookcheck Rating
Lenovo Legion 7 16 AGP11
- 04/25/2026 v8
Andreas Osthoff
 Total Sustainability Score:
 Potential Competitors in Comparison
Image | Model / Review | Price | Weight | Height | Display |
|---|---|---|---|---|---|
1. 86.4%  | Lenovo Legion 7 16 AGP11 AMD Ryzen AI 9 HX 470 ⎘ NVIDIA GeForce RTX 5060 Laptop ⎘ 32 GB Memory, 1024 GB SSD | Amazon: List Price: 2500€ | 1.8 kg | 16.9 mm | 16.00" 2560x1600 189 PPI OLED |
2. 83.9%  | Schenker XMG Core 16 VE M25 AMD Ryzen 7 255 ⎘ NVIDIA GeForce RTX 5060 Laptop ⎘ 64 GB Memory, 2048 GB SSD | Amazon: List Price: 1935 EUR | 2.1 kg | 23 mm | 16.00" 2560x1600 189 PPI IPS |
3. 87.5%  | Schenker XMG FUSION 16 (M25) Intel Core Ultra 9 275HX ⎘ NVIDIA GeForce RTX 5070 Laptop ⎘ 64 GB Memory, 2048 GB SSD | Amazon: List Price: 2700€ | 2.1 kg | 23 mm | 16.00" 2880x1800 212 PPI OLED |
4. 82.5%  | HP Omen 16-ap0091ng AMD Ryzen 9 8940HX ⎘ NVIDIA GeForce RTX 5060 Laptop ⎘ 16 GB Memory, 1000 GB SSD | Amazon: List Price: 1500 Euro | 2.4 kg | 23.7 mm | 16.00" 1920x1200 162 PPI IPS |
5. 83.8%  | Asus TUF Gaming A16 FA608UP AMD Ryzen 7 260 ⎘ NVIDIA GeForce RTX 5070 Laptop ⎘ 32 GB Memory, 1024 GB SSD | Amazon: List Price: 2199€ | 2.2 kg | 25.7 mm | 16.00" 2560x1600 189 PPI IPS |
| no name ⎘ ⎘ | Amazon: 1. $22.03 No Name 2. No Name 3. No Name | ||||
7. 86.6%  | Lenovo Legion 7 16IAX10 Intel Core Ultra 7 255HX ⎘ NVIDIA GeForce RTX 5060 Laptop ⎘ 32 GB Memory, 1024 GB SSD | Amazon: List Price: 1650 USD | 2 kg | 17.9 mm | 16.00" 2560x1600 189 PPI OLED |
8. 87.2%  | Lenovo Legion 5 15AHP G10 AMD Ryzen 7 260 ⎘ NVIDIA GeForce RTX 5060 Laptop ⎘ 32 GB Memory, 1024 GB SSD | Amazon: List Price: 1449€ | 1.9 kg | 21.5 mm | 15.10" 2560x1600 200 PPI OLED |
Transparency
The selection of devices to be reviewed is made by our editorial team. The test sample was provided to the author as a loan by the manufacturer or retailer for the purpose of this review. The lender had no influence on this review, nor did the manufacturer receive a copy of this review before publication. There was no obligation to publish this review. As an independent media company, Notebookcheck is not subjected to the authority of manufacturers, retailers or publishers.
This is how Notebookcheck is testing
Every year, Notebookcheck independently reviews hundreds of laptops and smartphones using standardized procedures to ensure that all results are comparable. We have continuously developed our test methods for around 20 years and set industry standards in the process. In our test labs, high-quality measuring equipment is utilized by experienced technicians and editors. These tests involve a multi-stage validation process. Our complex rating system is based on hundreds of well-founded measurements and benchmarks, which maintains objectivity. Further information on our test methods can be found here.
