Intel Arc B580 Limited Edition desktop GPU review: Intel's answer to AMD Radeon RX and Nvidia GeForce RTX
Success with more VRAM?
With the Arc B580 Limited Edition, Intel continues its offensive on the GPU market and directly targets price-conscious gamers. At an attractive price of 249 US dollars, the B580 positions itself as a strong alternative to Nvidia and AMD and also offers more VRAM, which is a good move. But can Intel's mid-range GPU really convince in practice? Our review provides the answers.Sebastian Bade, 👁 Sebastian Bade, ✓ Anton Avdyushkin (translated by Ninh Duy) Published 🇩🇪 🇫🇷 ...
Verdict - Great graphics card for price-conscious buyers
The Intel Arc B580 Limited Edition is a clear recommendation for budget-conscious gamers who want to play in Full HD resolution and use modern features. Despite minor weaknesses, especially in terms of power consumption in idle mode, it offers an excellent overall package in its price class. For 1,080p gaming and occasional 1,440p, the card is a real enrichment in the GPU market and shows that Intel is a serious competitor to Nvidia and AMD in the entry-level class.
The performance of the Intel Arc B580 Limited Edition is better than that of the first-generation Intel Arc graphics cards for the most part. However, we were not completely spared from problems. If Intel keeps up with its previous efforts in terms of driver adjustments, it should be possible to eliminate most of the problems. You can get the Intel Arc B580 from AsRock for a price of 319 euros. You shouldn't spend more at the moment if price-performance is an important point of criticism. The Intel Arc B580 Limited Edition tested here costs more than 400 euros, which is no longer appropriate in terms of performance.
Pros
Cons
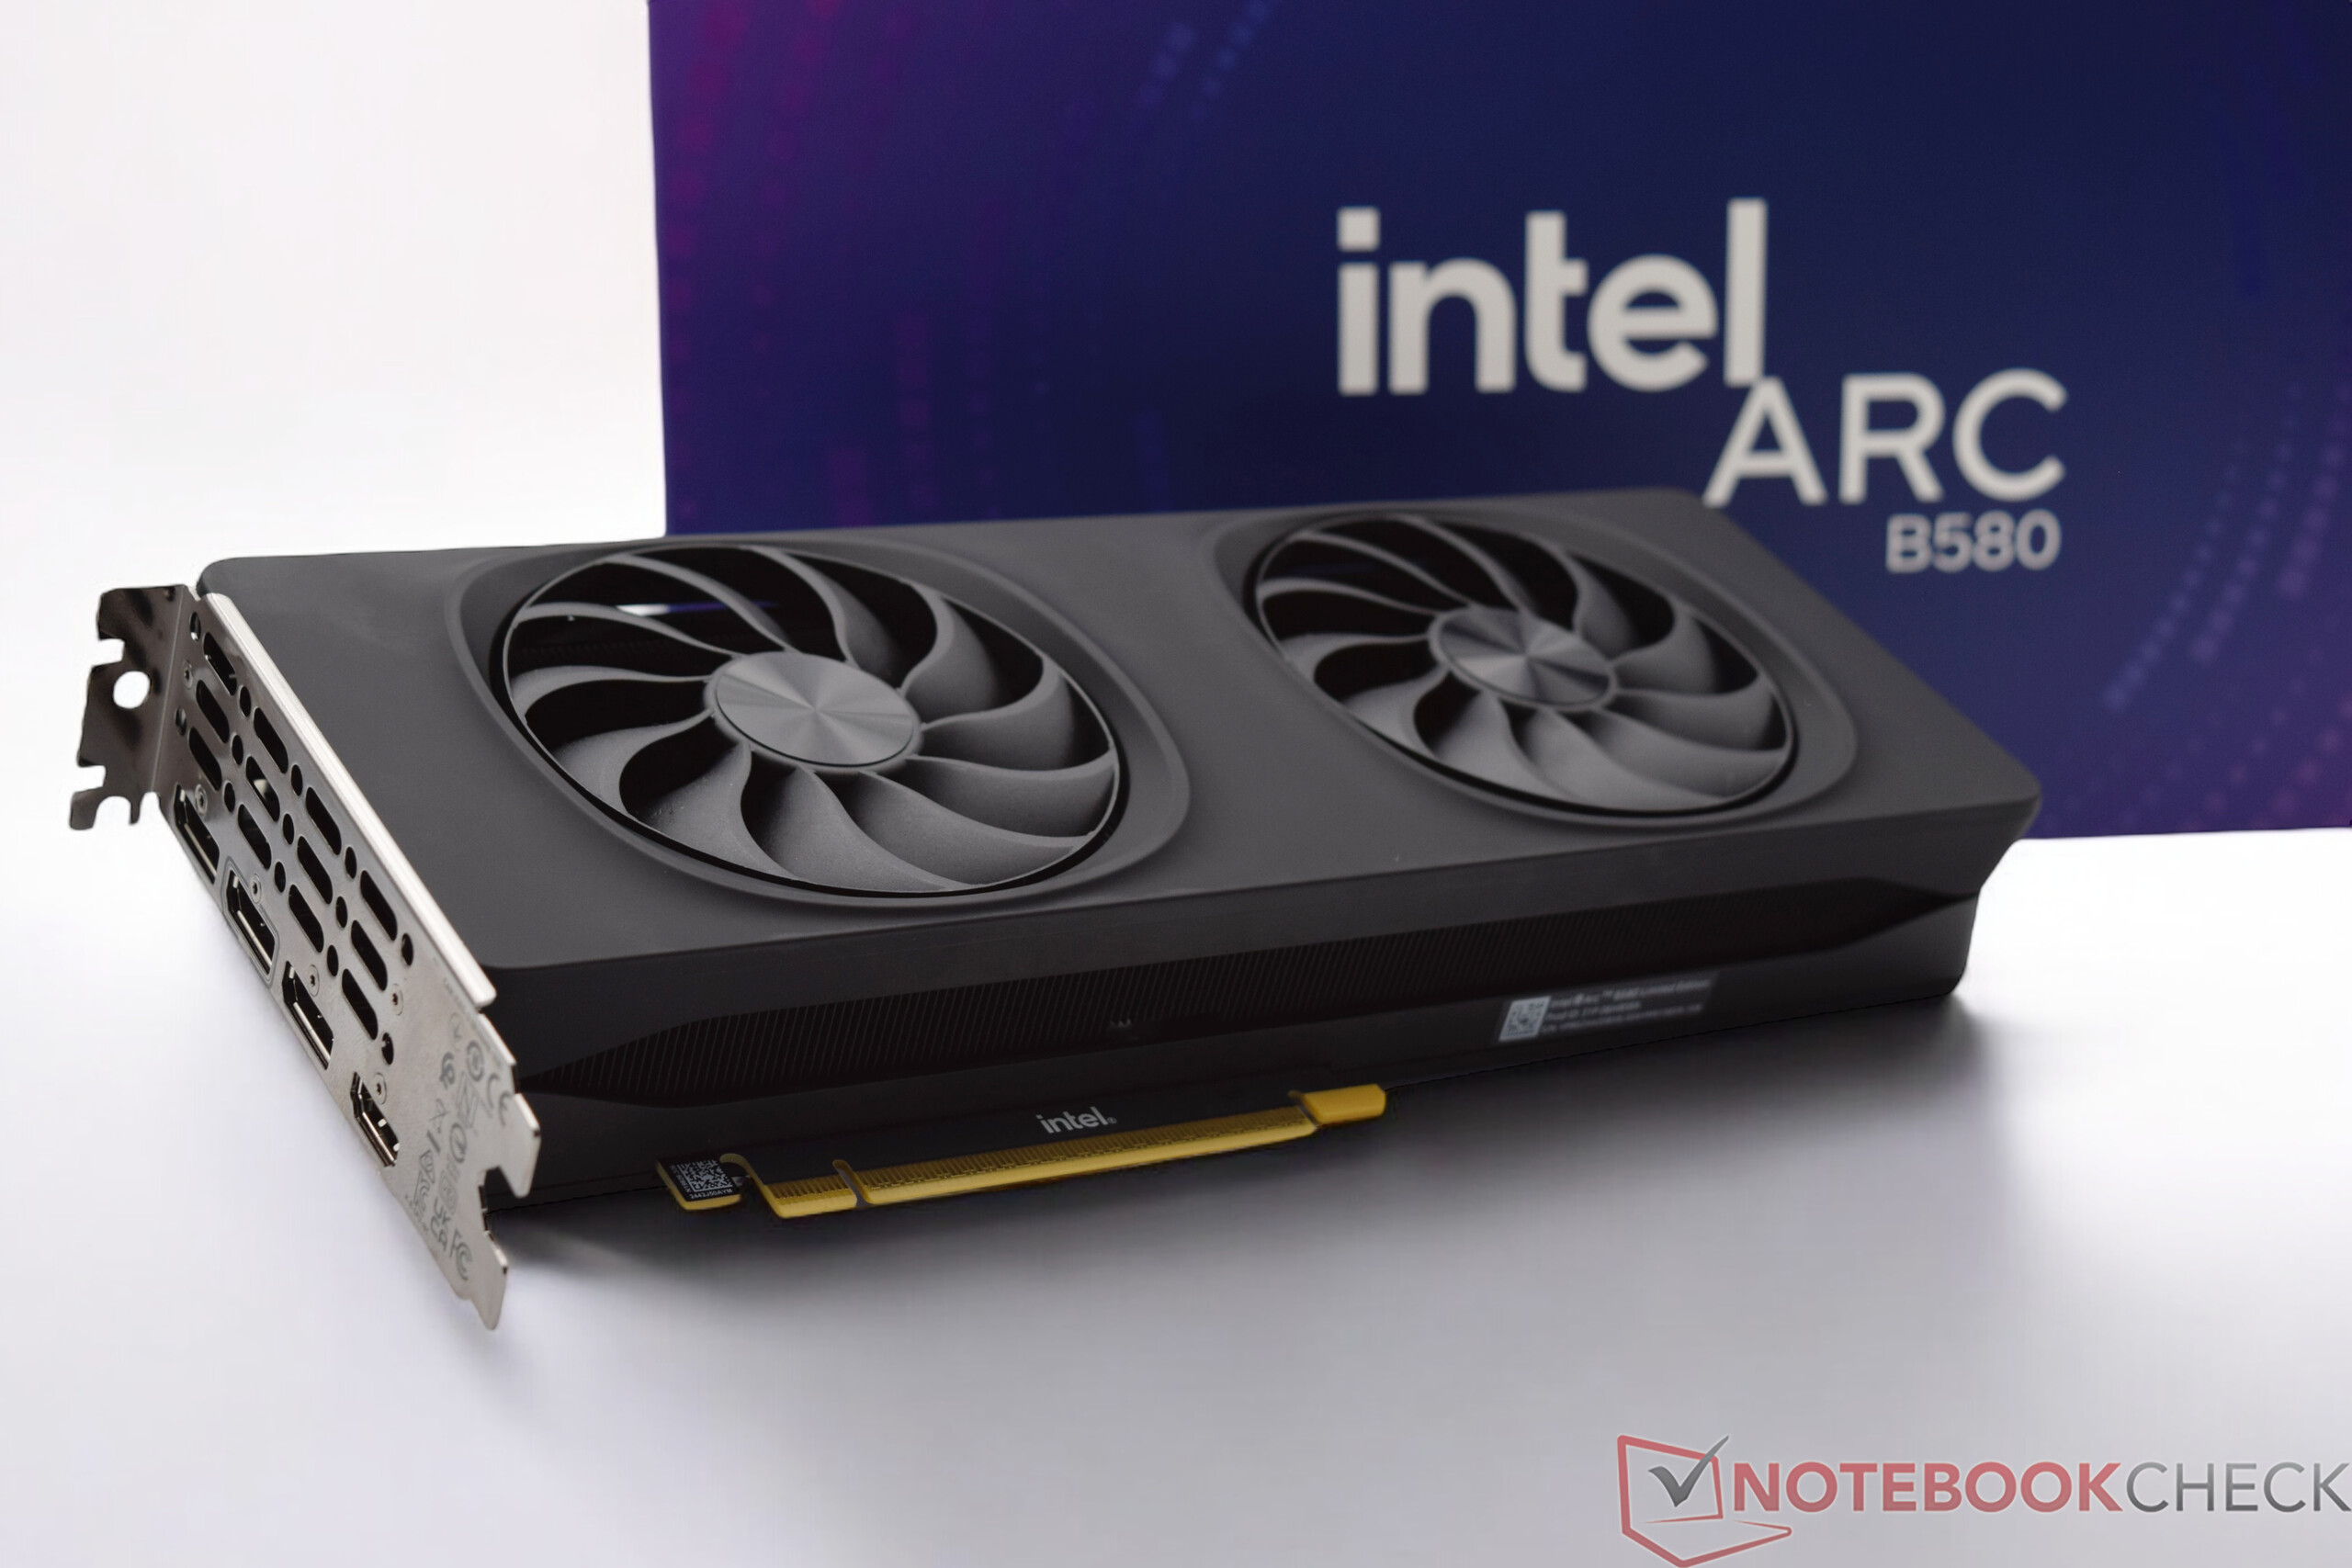
Price and availability
The price of the in-house model is significantly higher than the RRP, which is why you should also take a look at the partner models.
Table of Contents
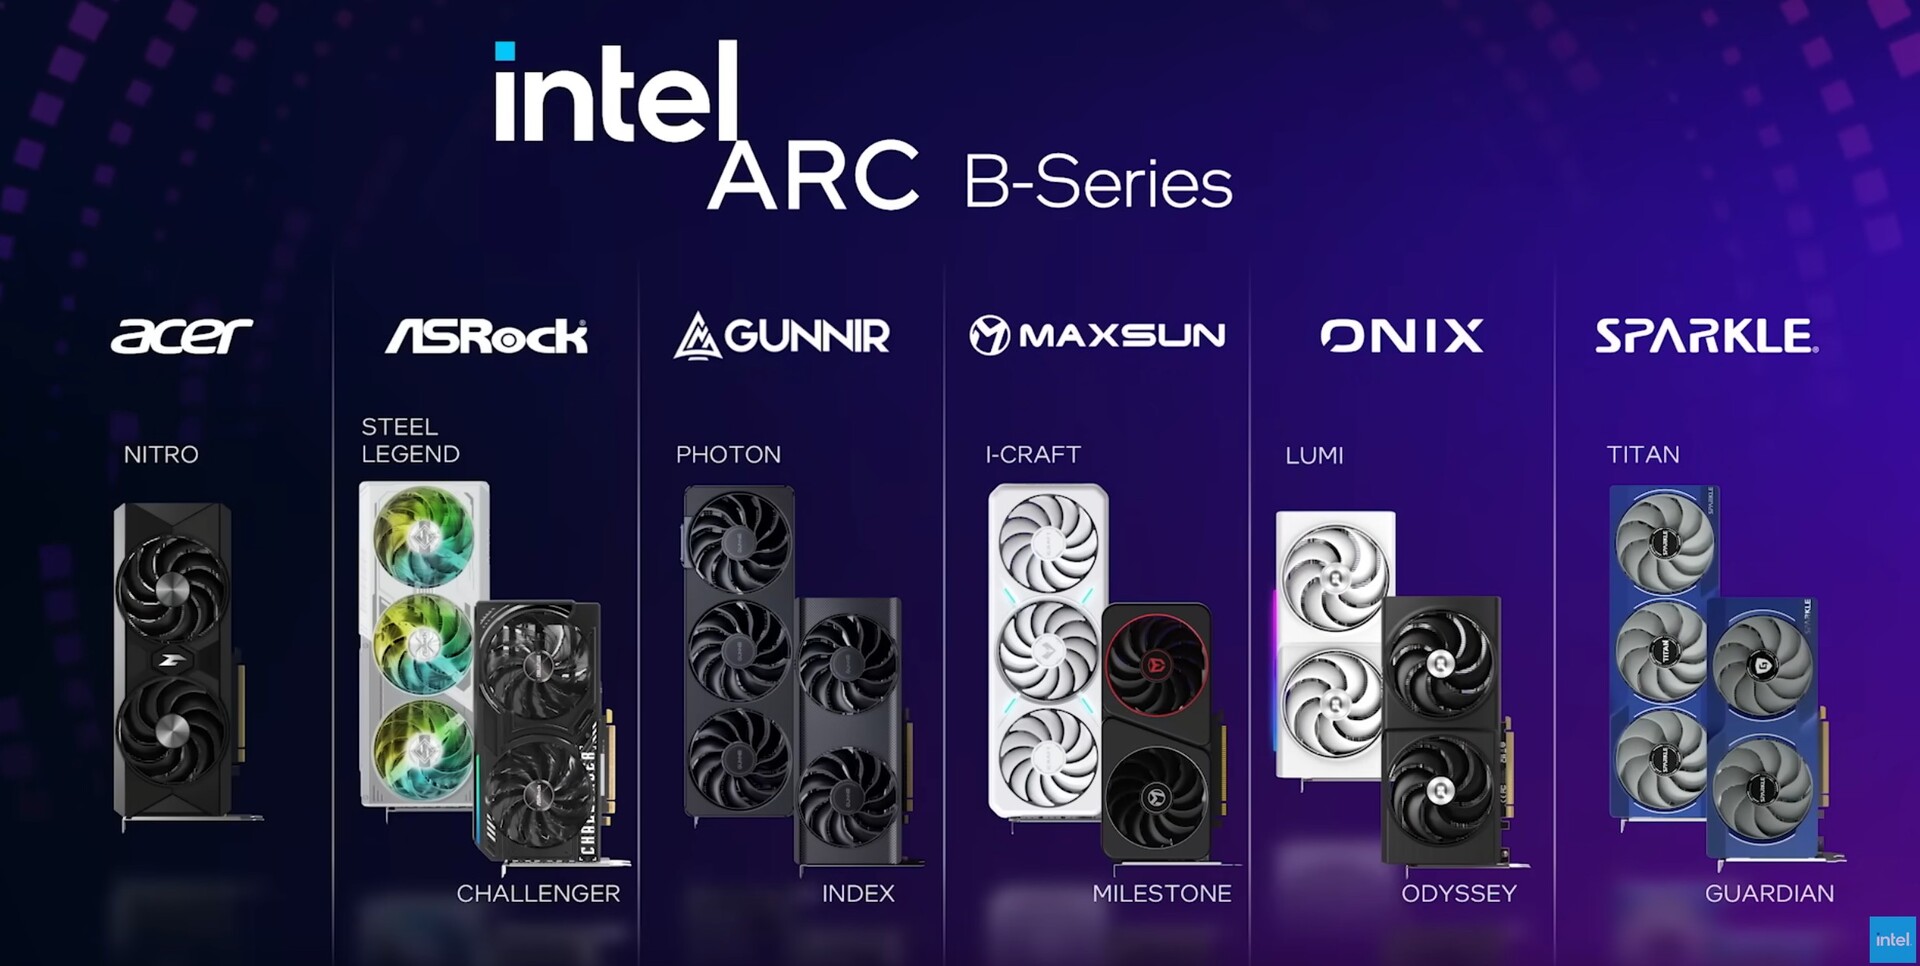
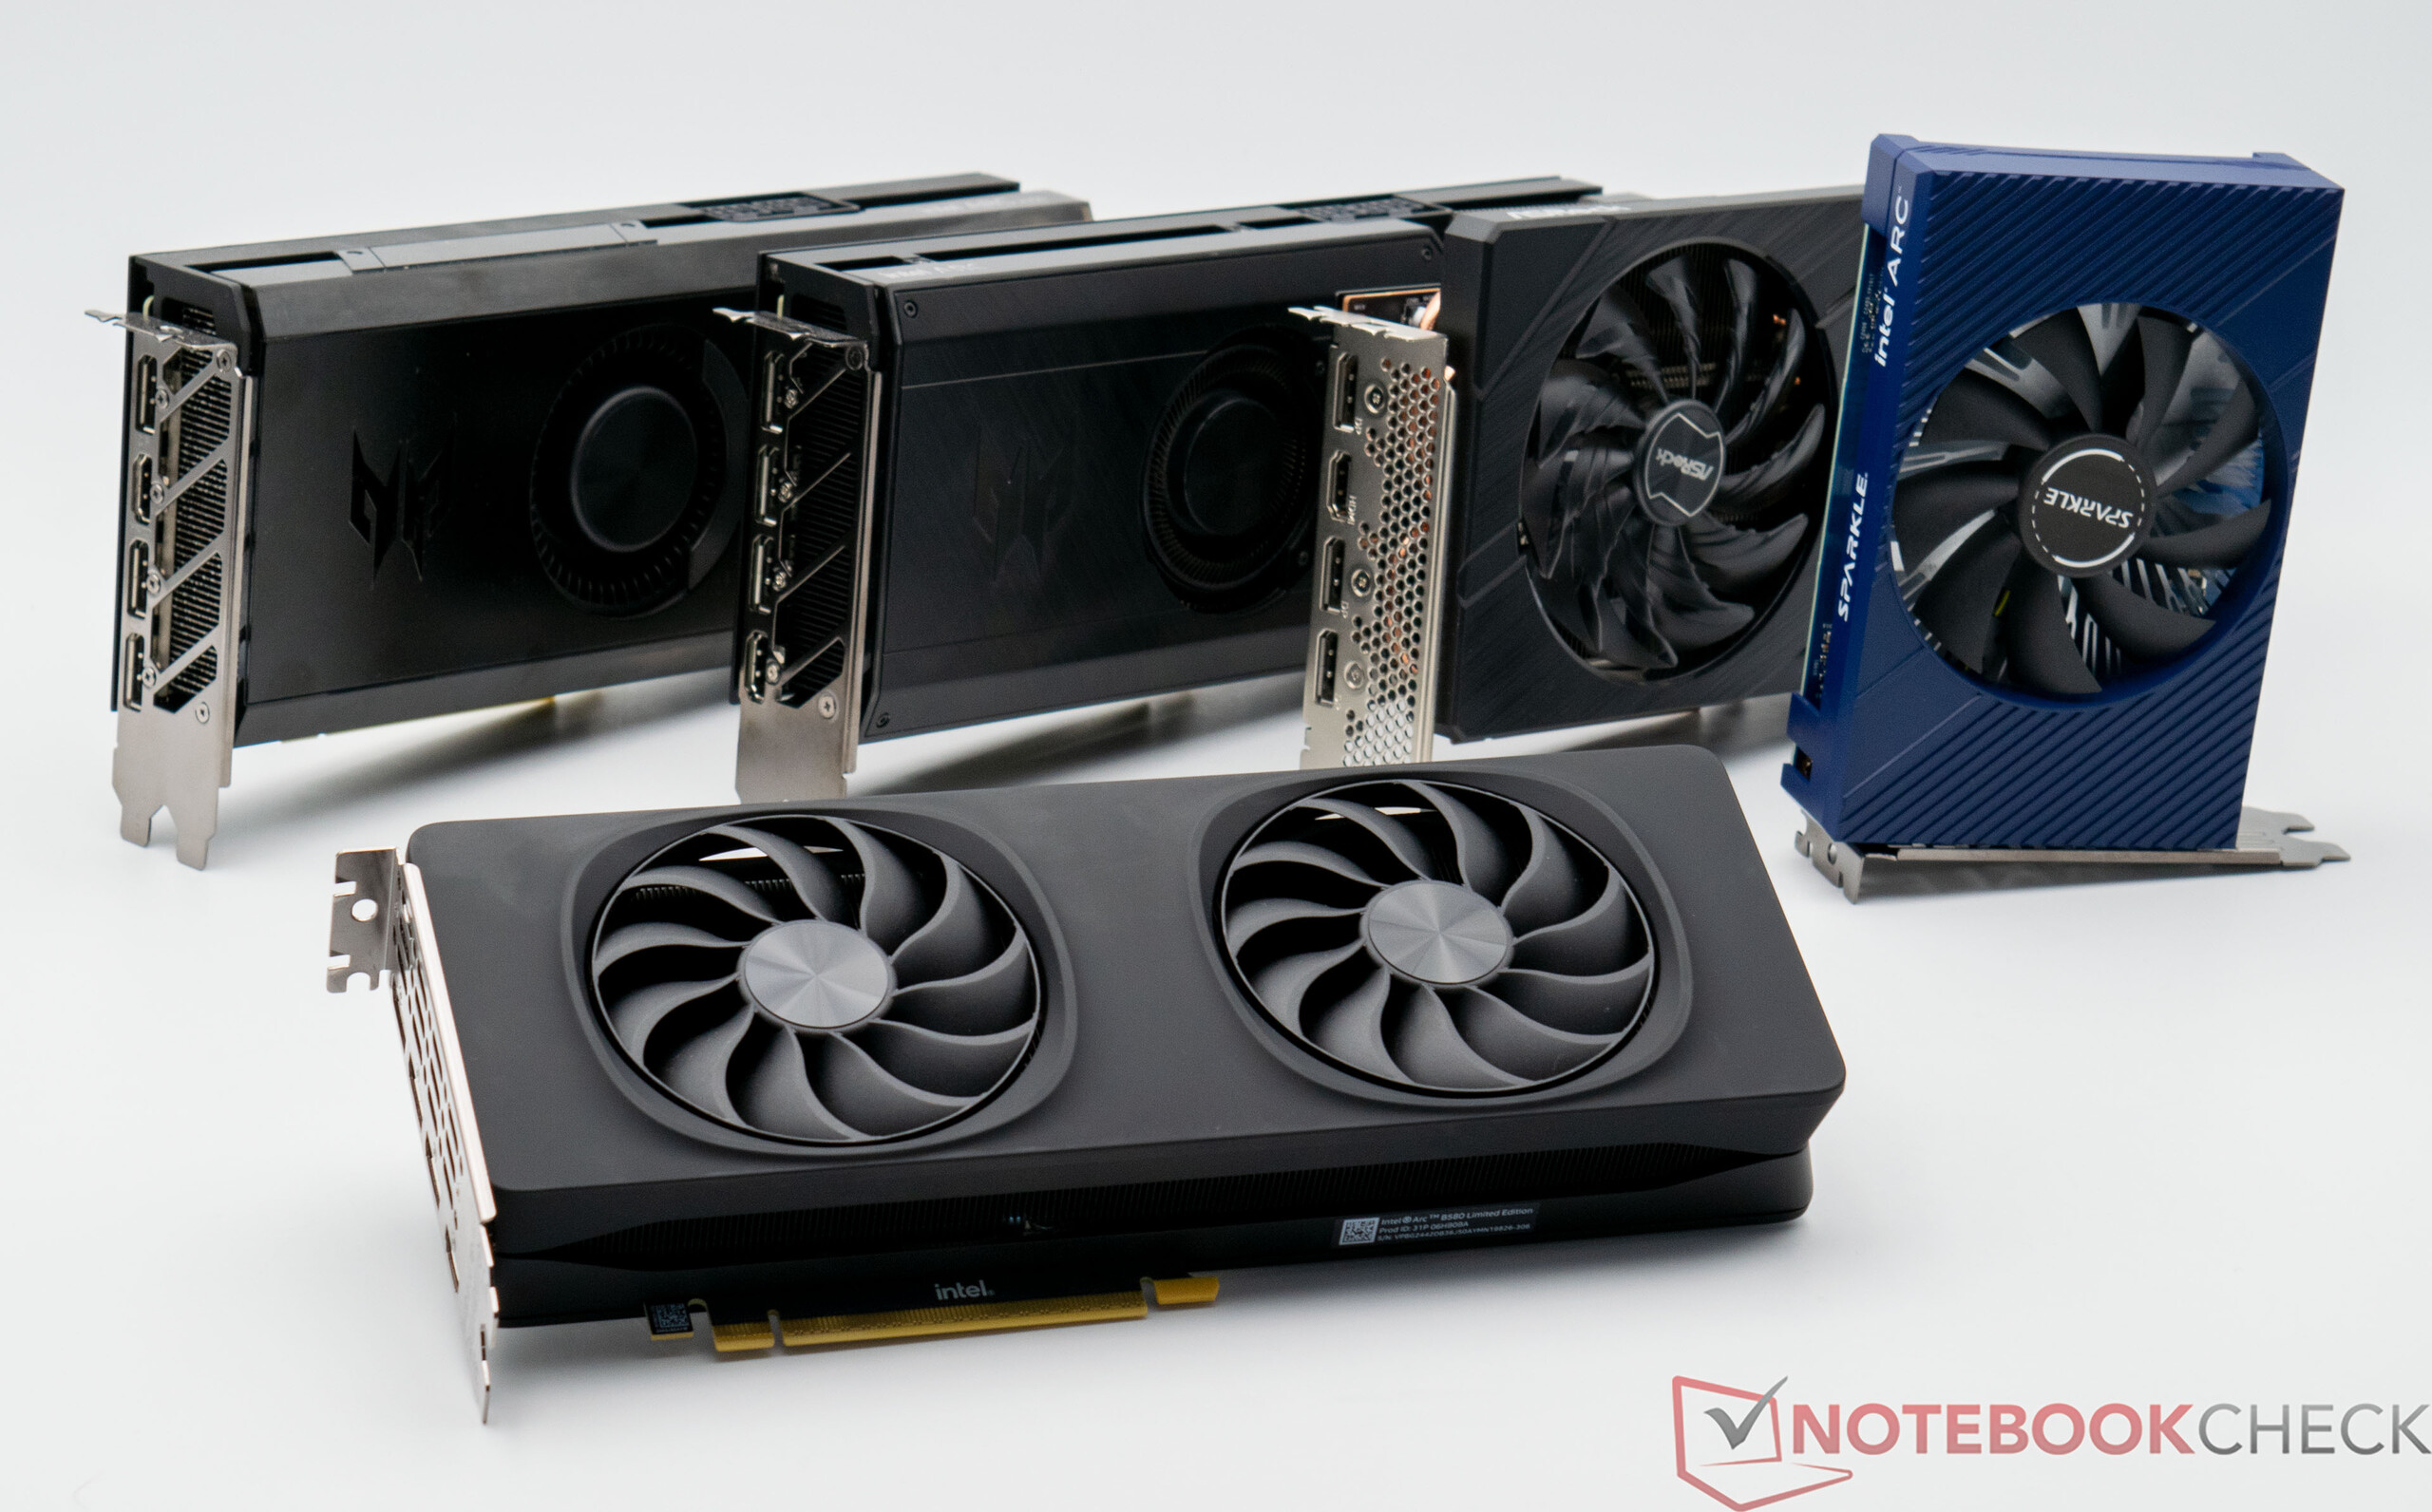
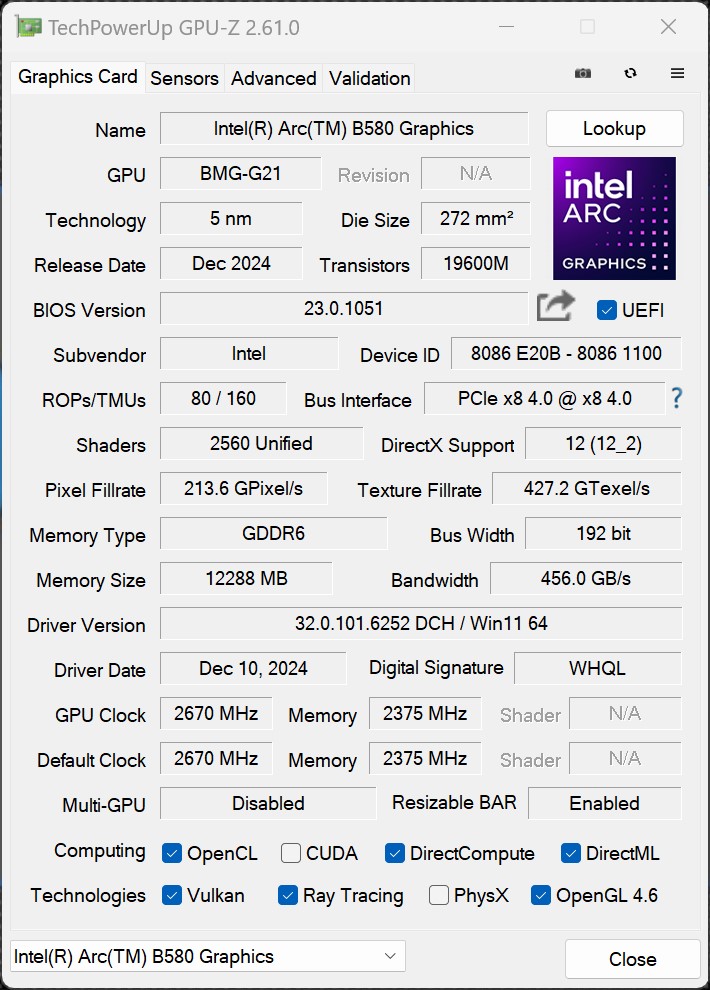
The start of the 1st generation of Arc graphics cards aka "Alchemist" was quite bumpy. However, with constant improvements, which primarily related to the adaptation of the drivers and the resulting performance improvements, the Arc graphics cards were able to cause a stir. The launch of the Battlemage graphics card should therefore be much more mature - more on whether Intel will live up to expectations later. The Intel Arc B580 is the first desktop iteration based on the new architecture, which is already used in the laptop sector in the Lunar Lake SoCs. The test sample, which bears the Limited Edition suffix, comes directly from Intel. The Intel Arc B580 Limited Edition is Intel's reference model. Nevertheless, there are other on-board partners who also have graphics cards based on the BMG-G21 graphics chip in their portfolio. The best-known brands in this country include ASRock, Acer, and Sparkle.
With the Arc B580 Limited Edition, Intel is presenting a new mid-range GPU with an attractive price-performance ratio. It is based on Intel's Battlemage architecture, which has been optimized for improved energy efficiency, higher computing performance, and advanced features. With an entry-level price of 249 US dollars, the graphics card won't tear a big hole in your wallet. It is in direct competition with Nvidia GPUs from the RTX 40 series and AMD's RX 7000 series, which are in the same price segment and lag behind in terms of VRAM. The Intel Arc B580 Limited Edition is equipped with 12 GB of VRAM, which can be a big advantage over its competitors from Nvidia and AMD in memory-hungry games.
The Arc B580 is Intel's ambitious attempt to re-establish itself in the highly competitive GPU market. With solid performance, modern technology, and an affordable price, the rough framework conditions are in place to lure the top dogs Nvidia and AMD out of the reserve.
Specifications
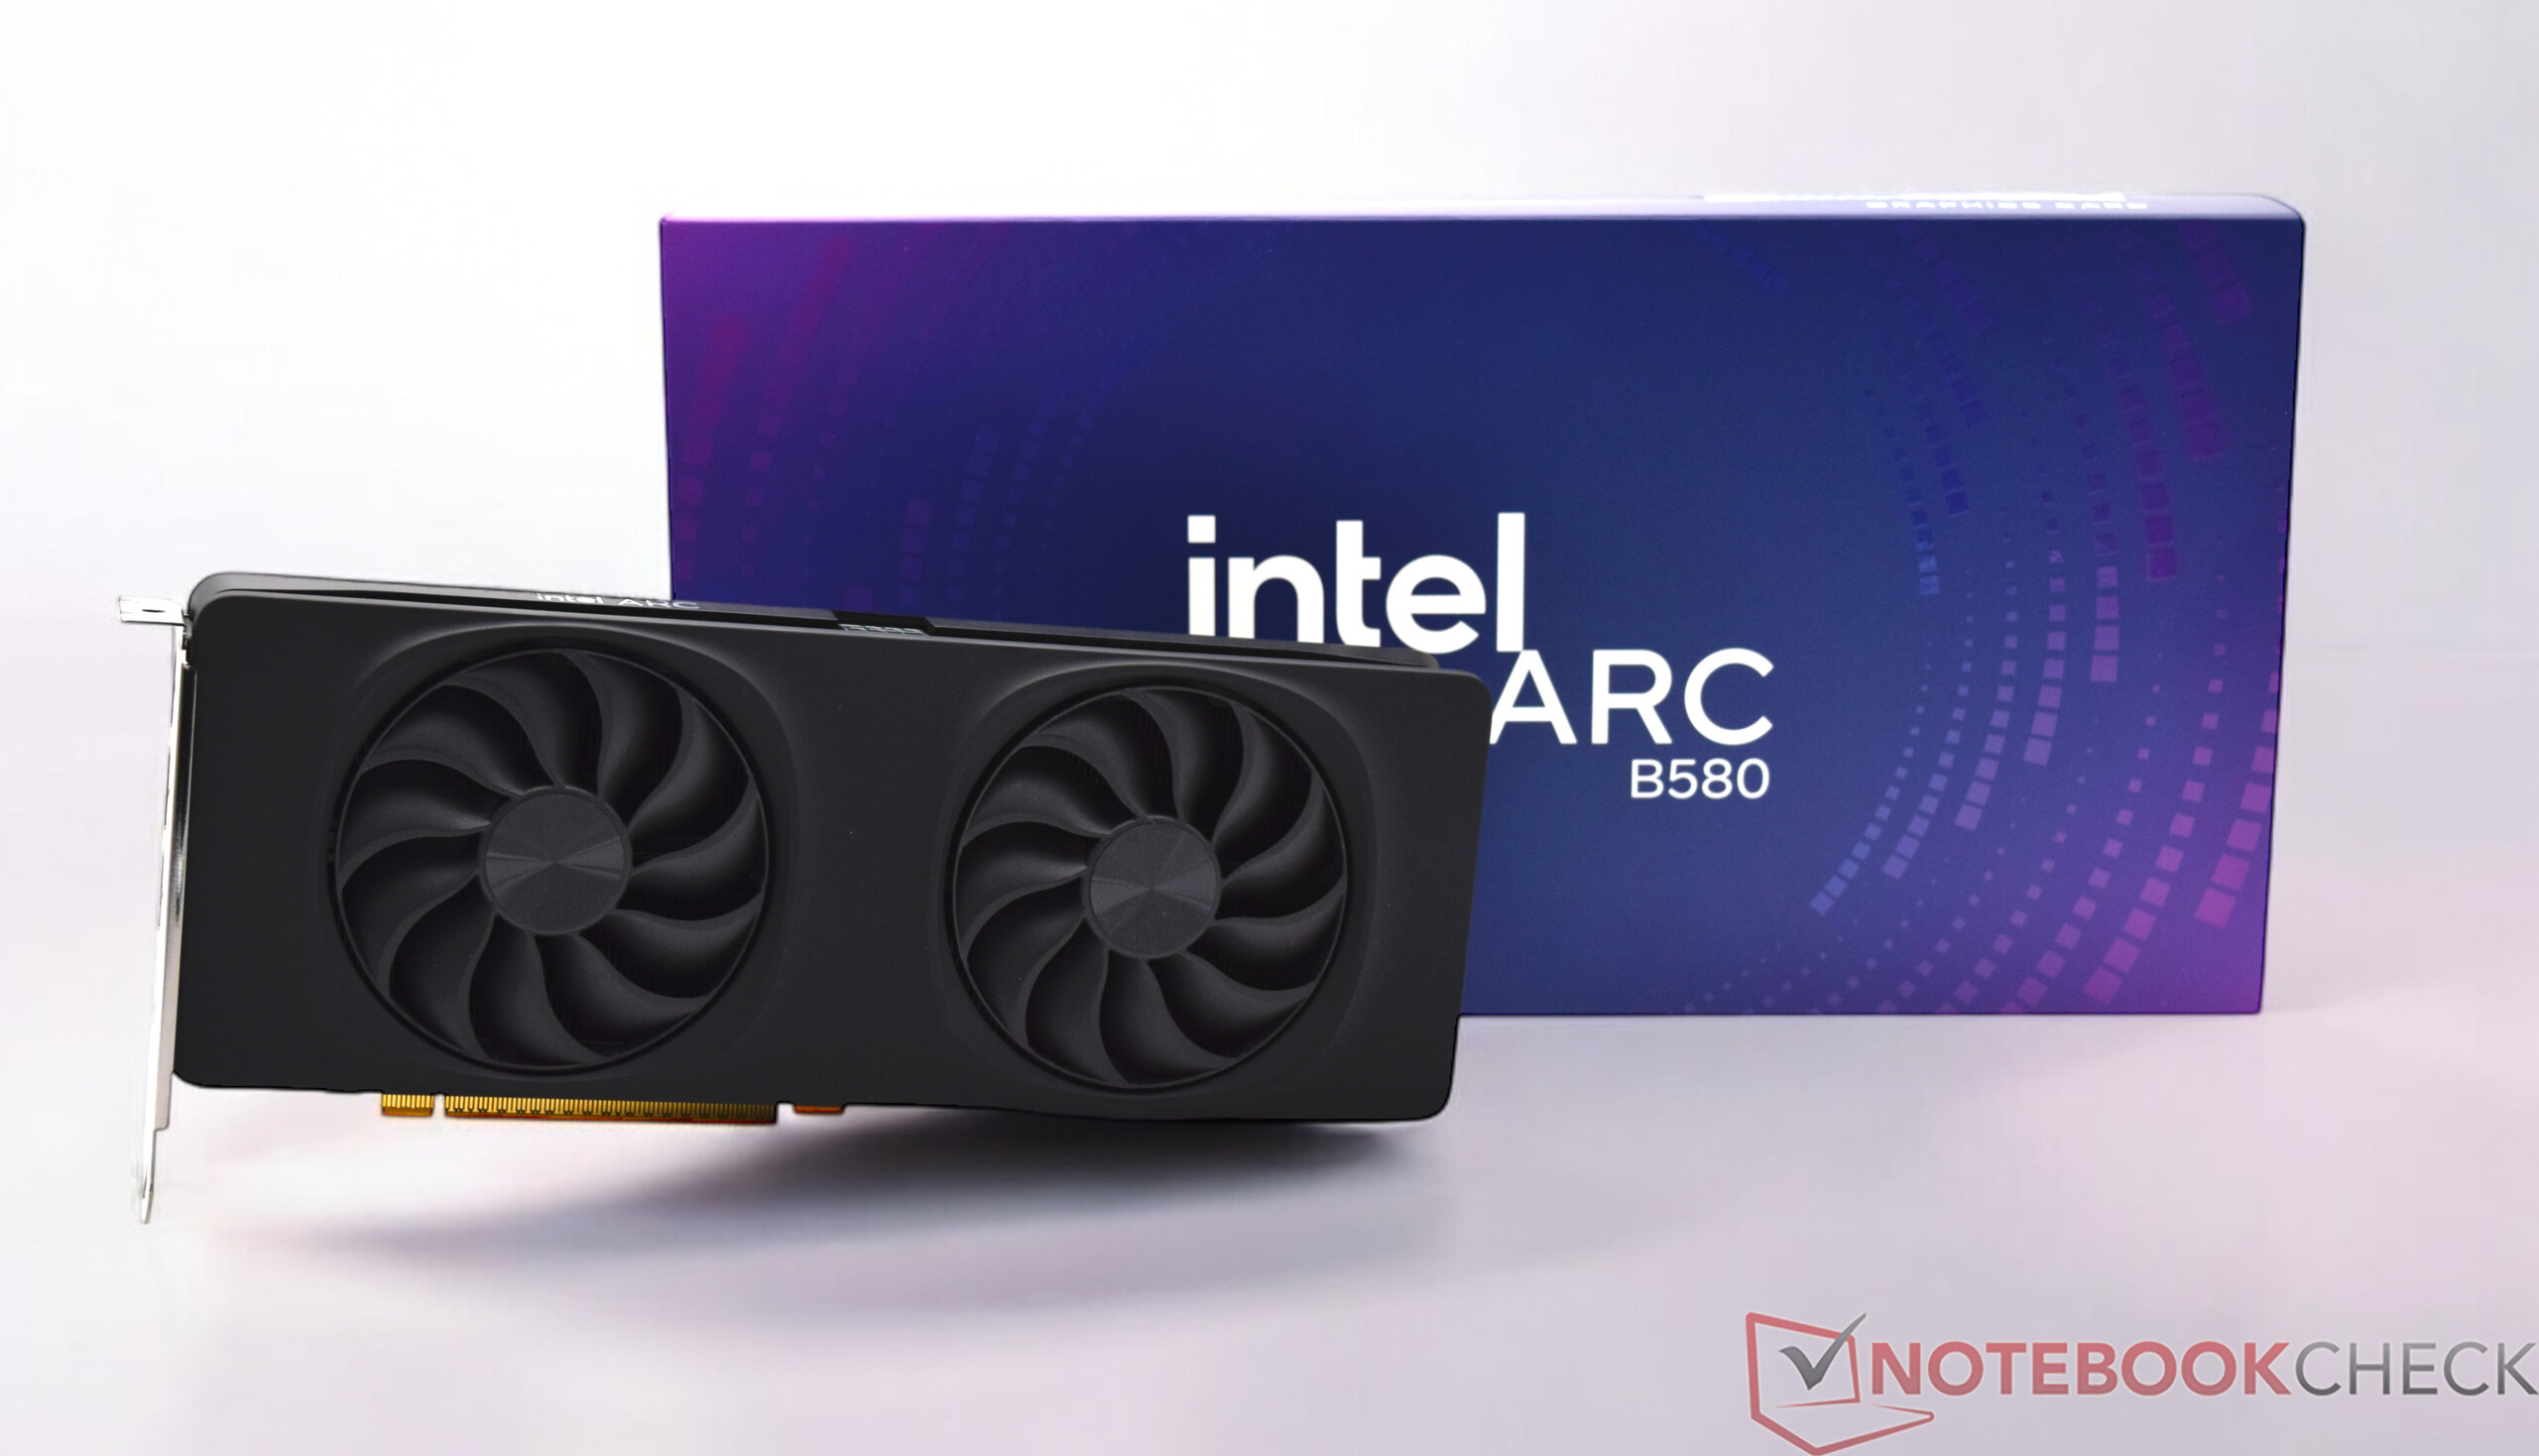
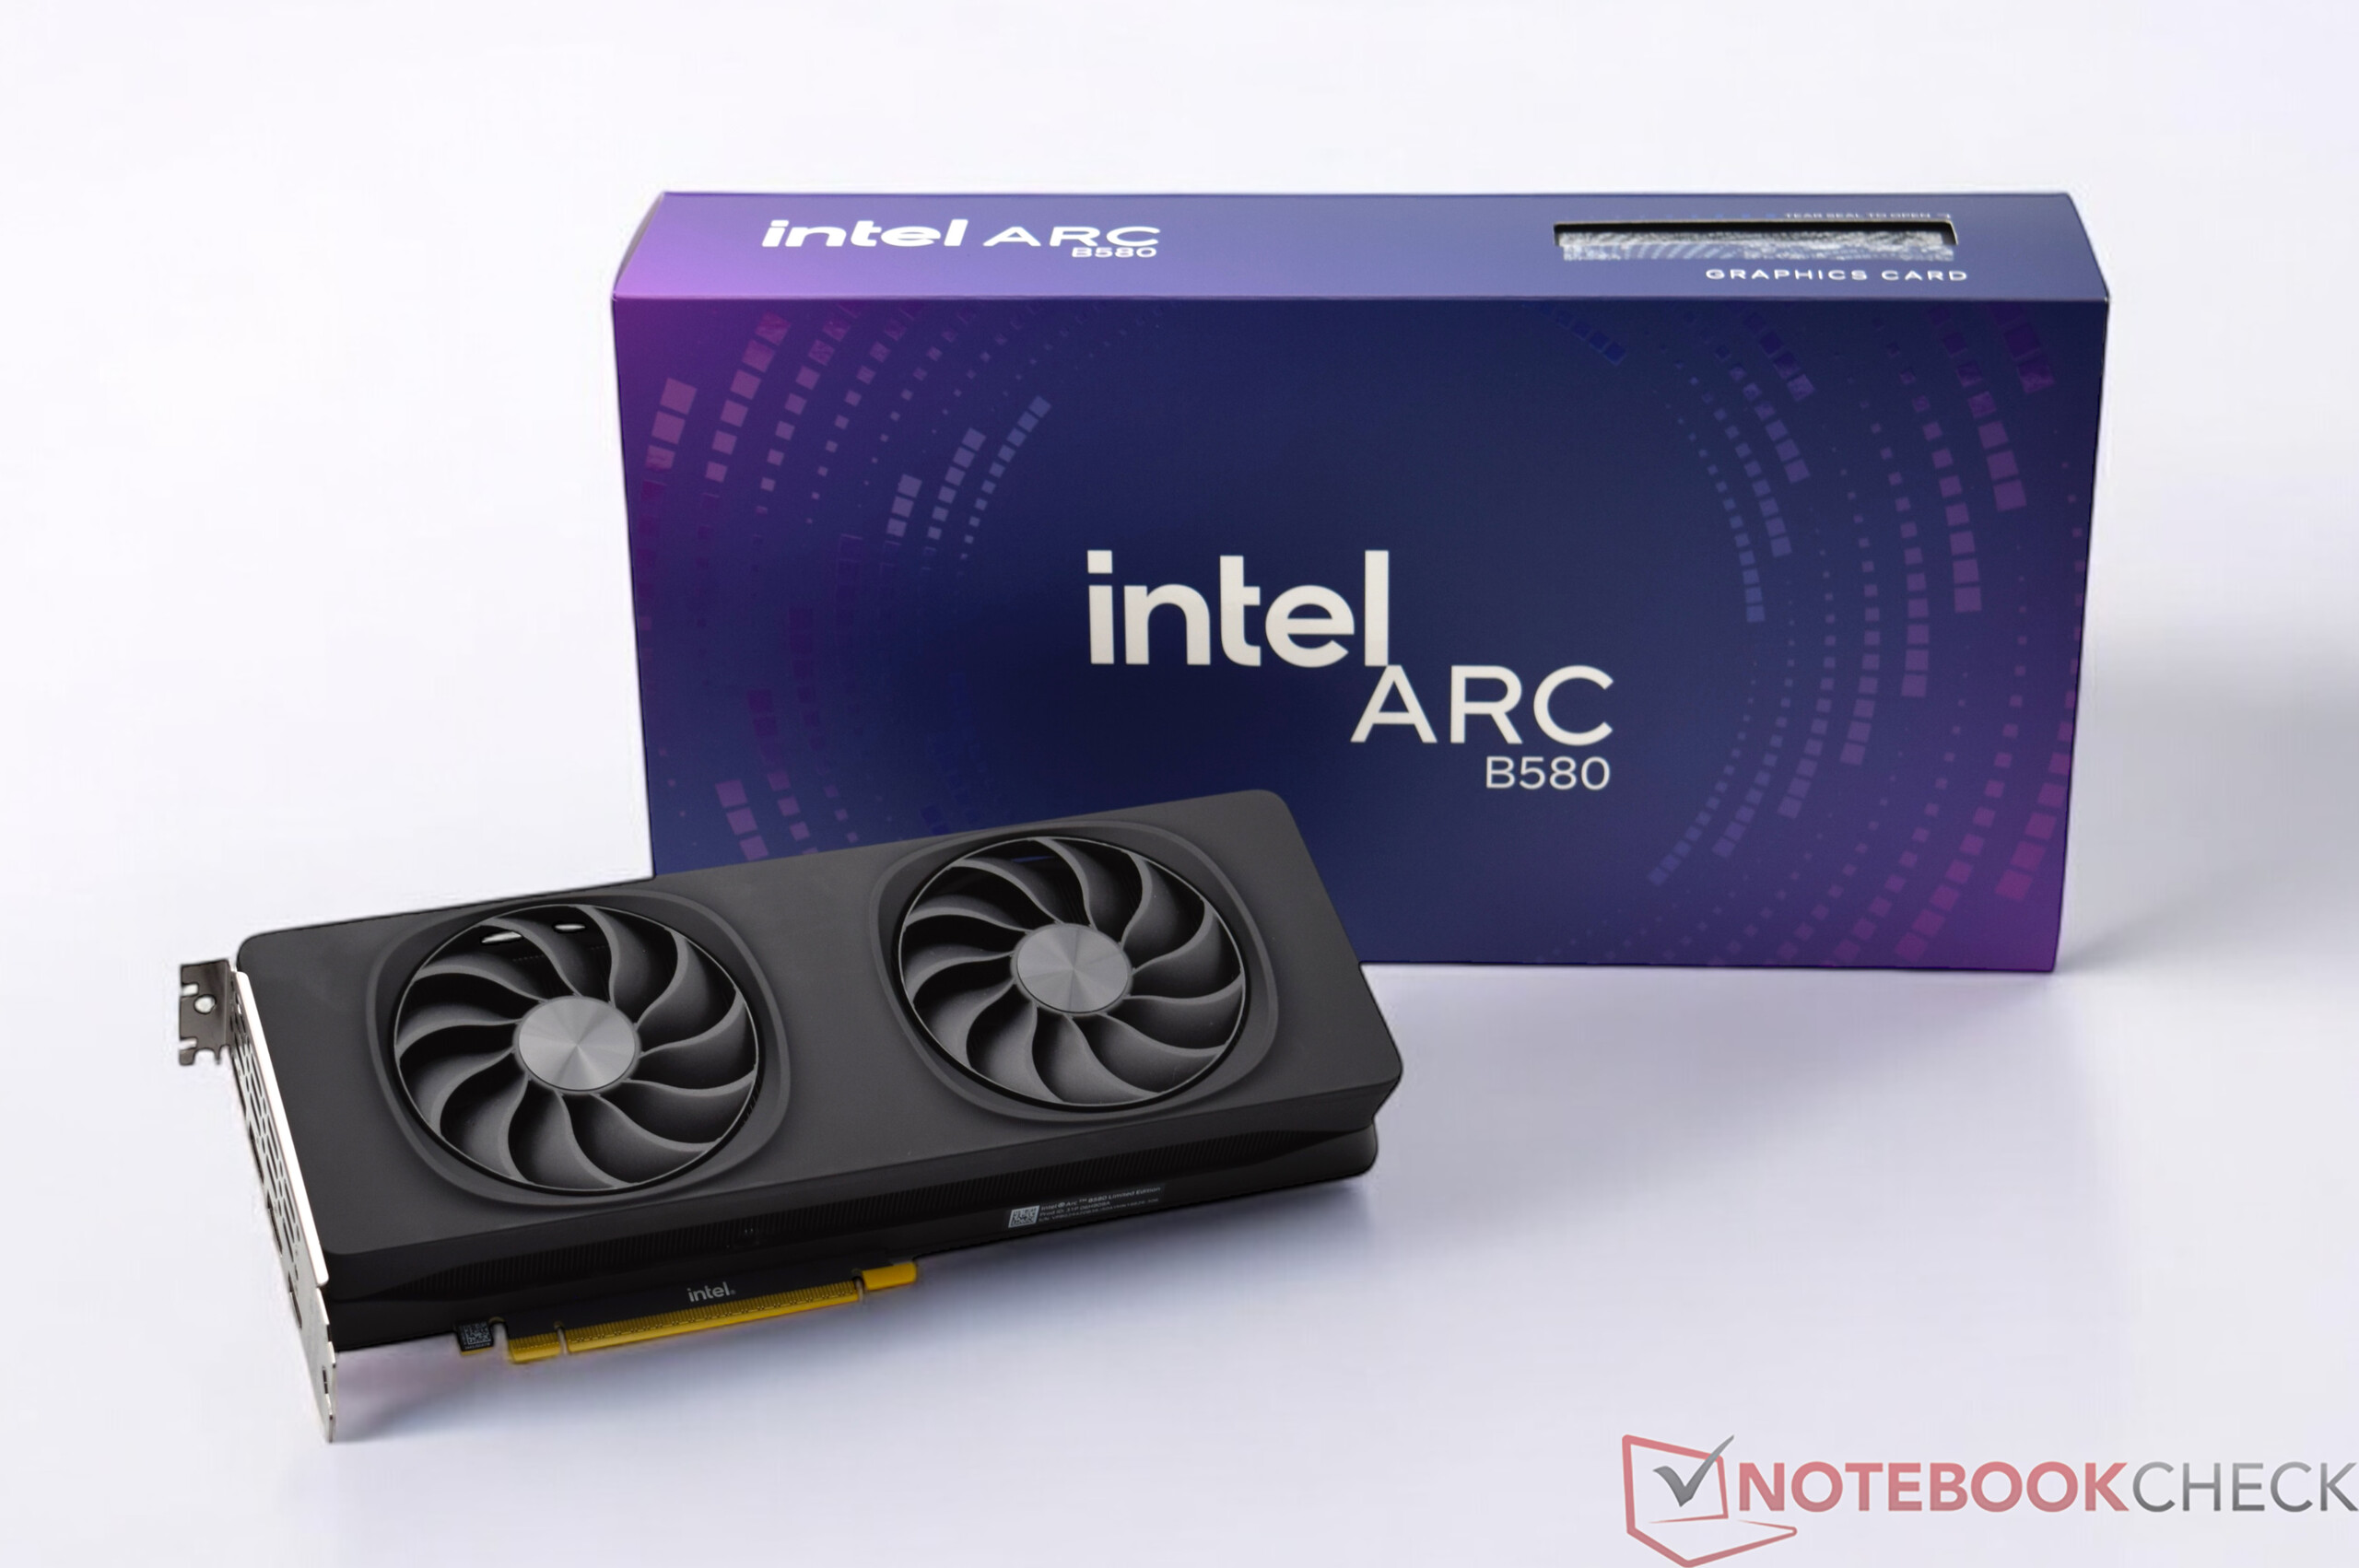
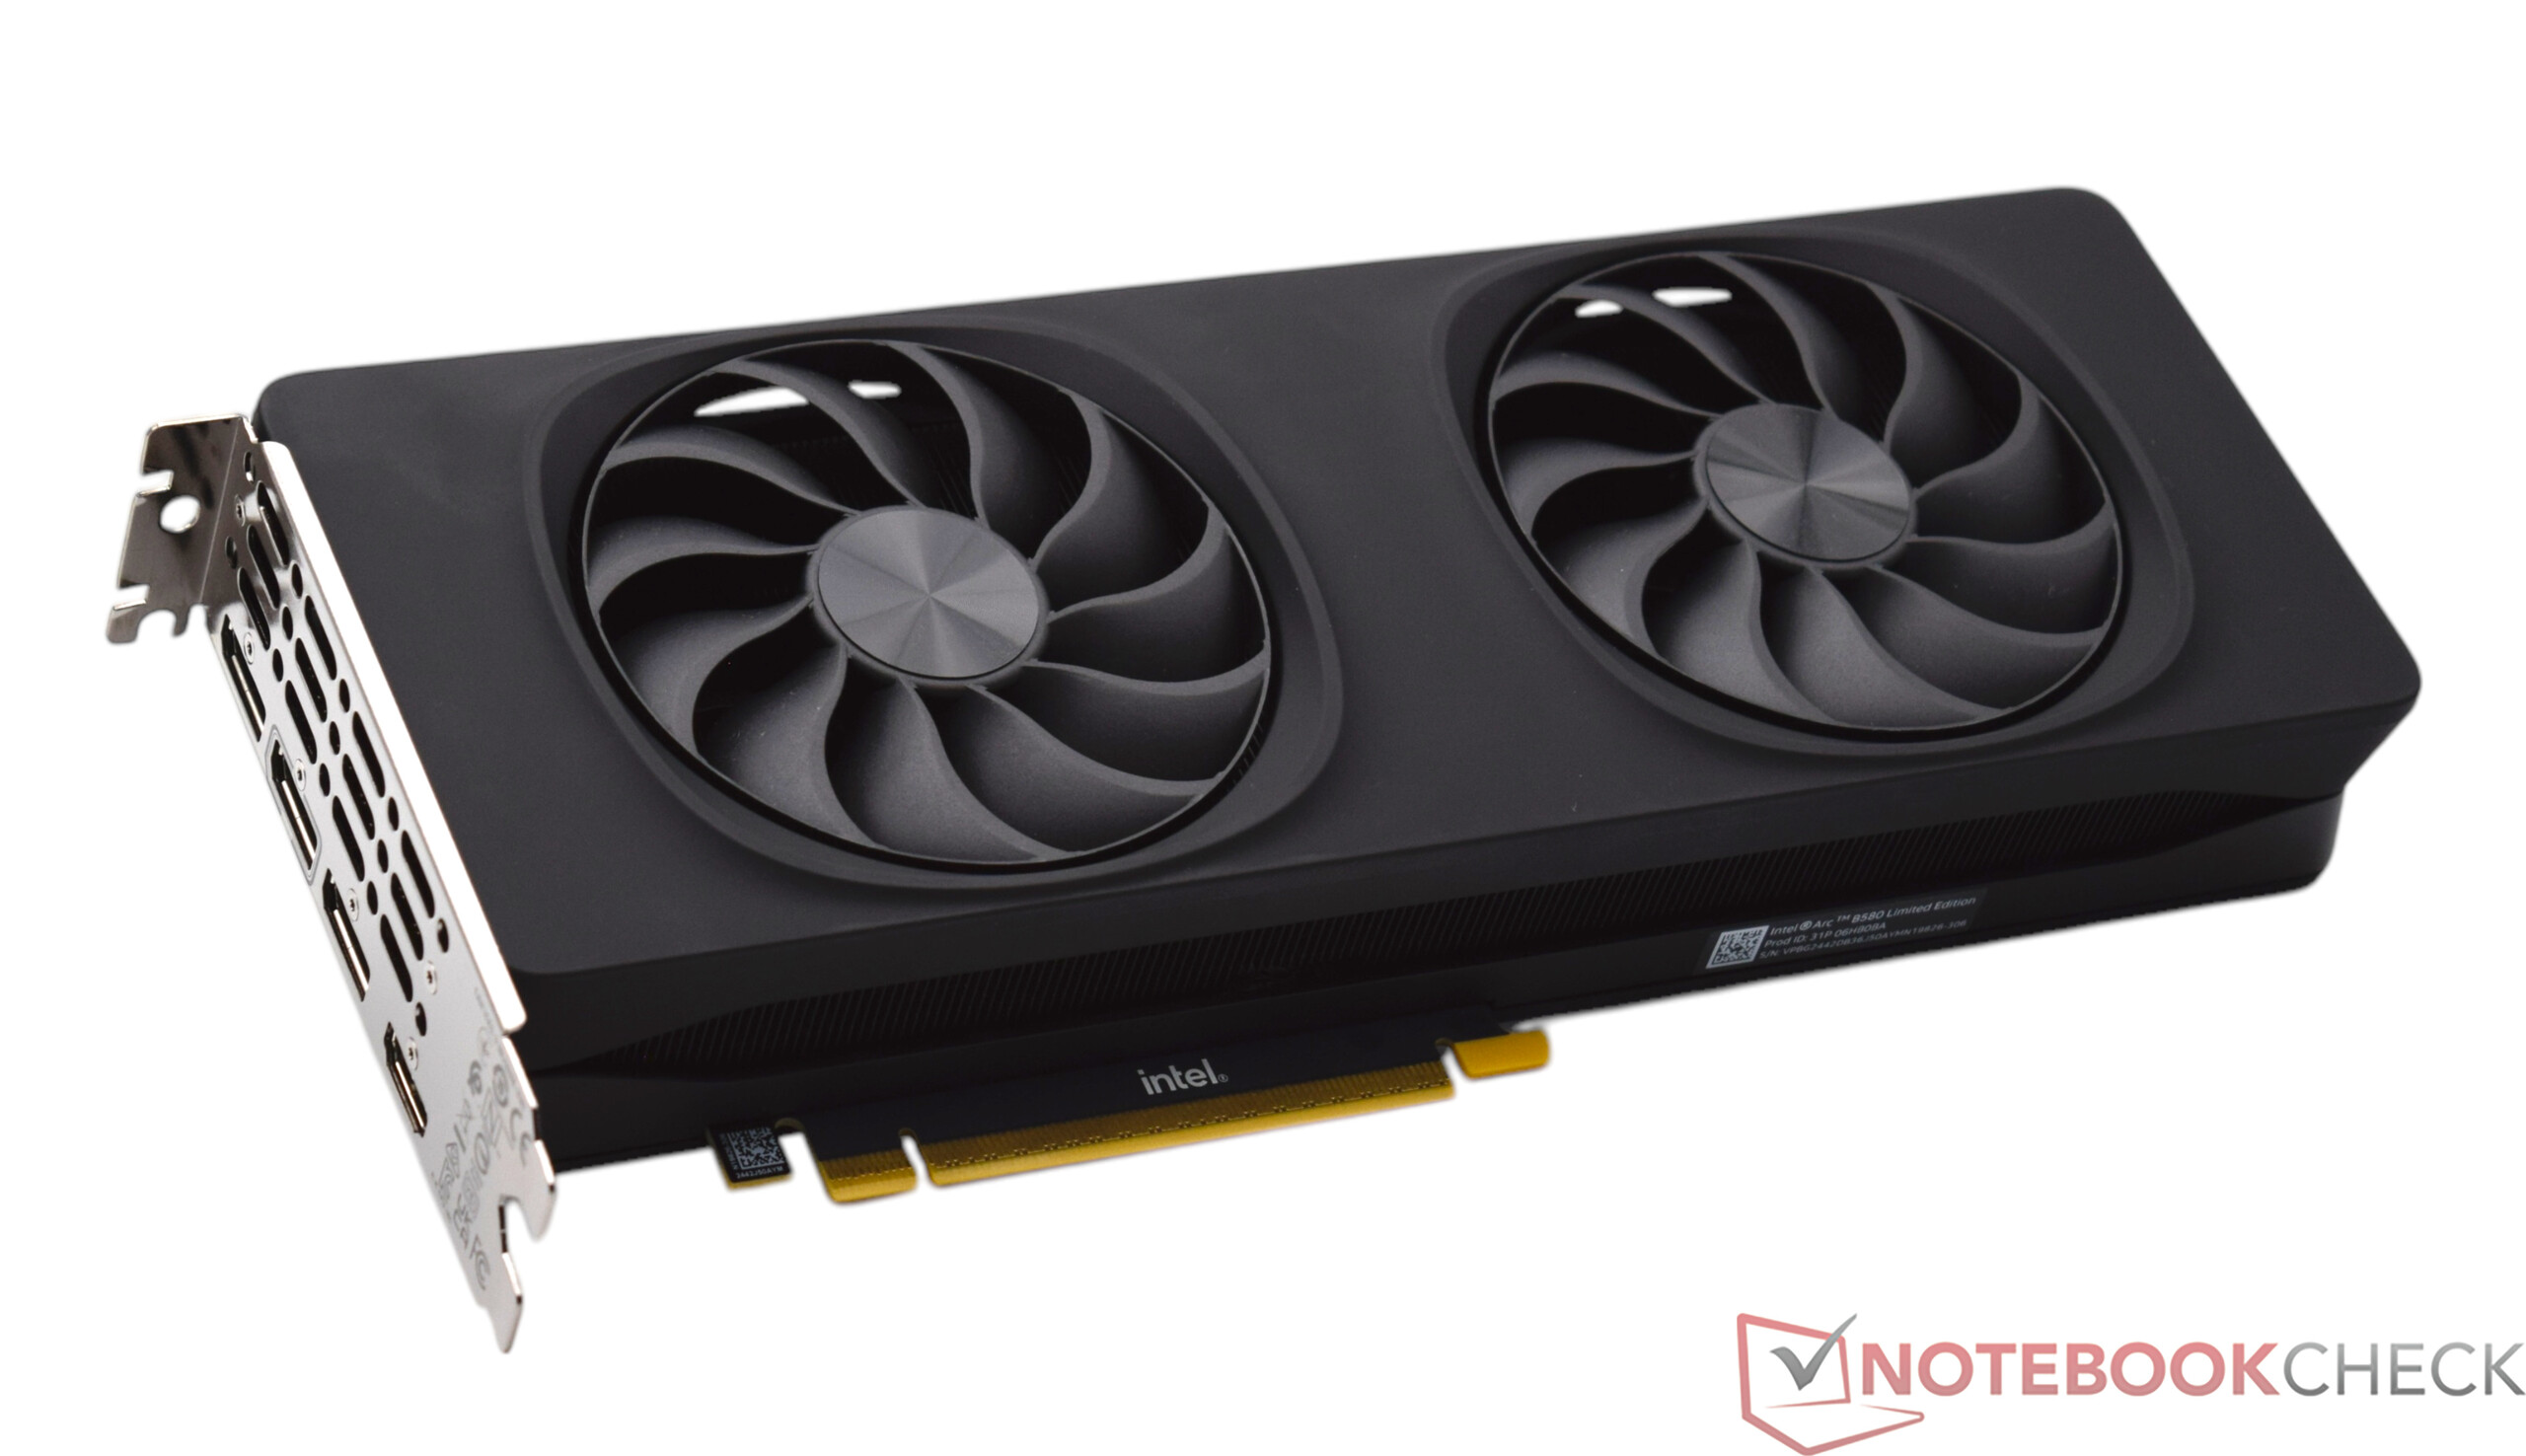
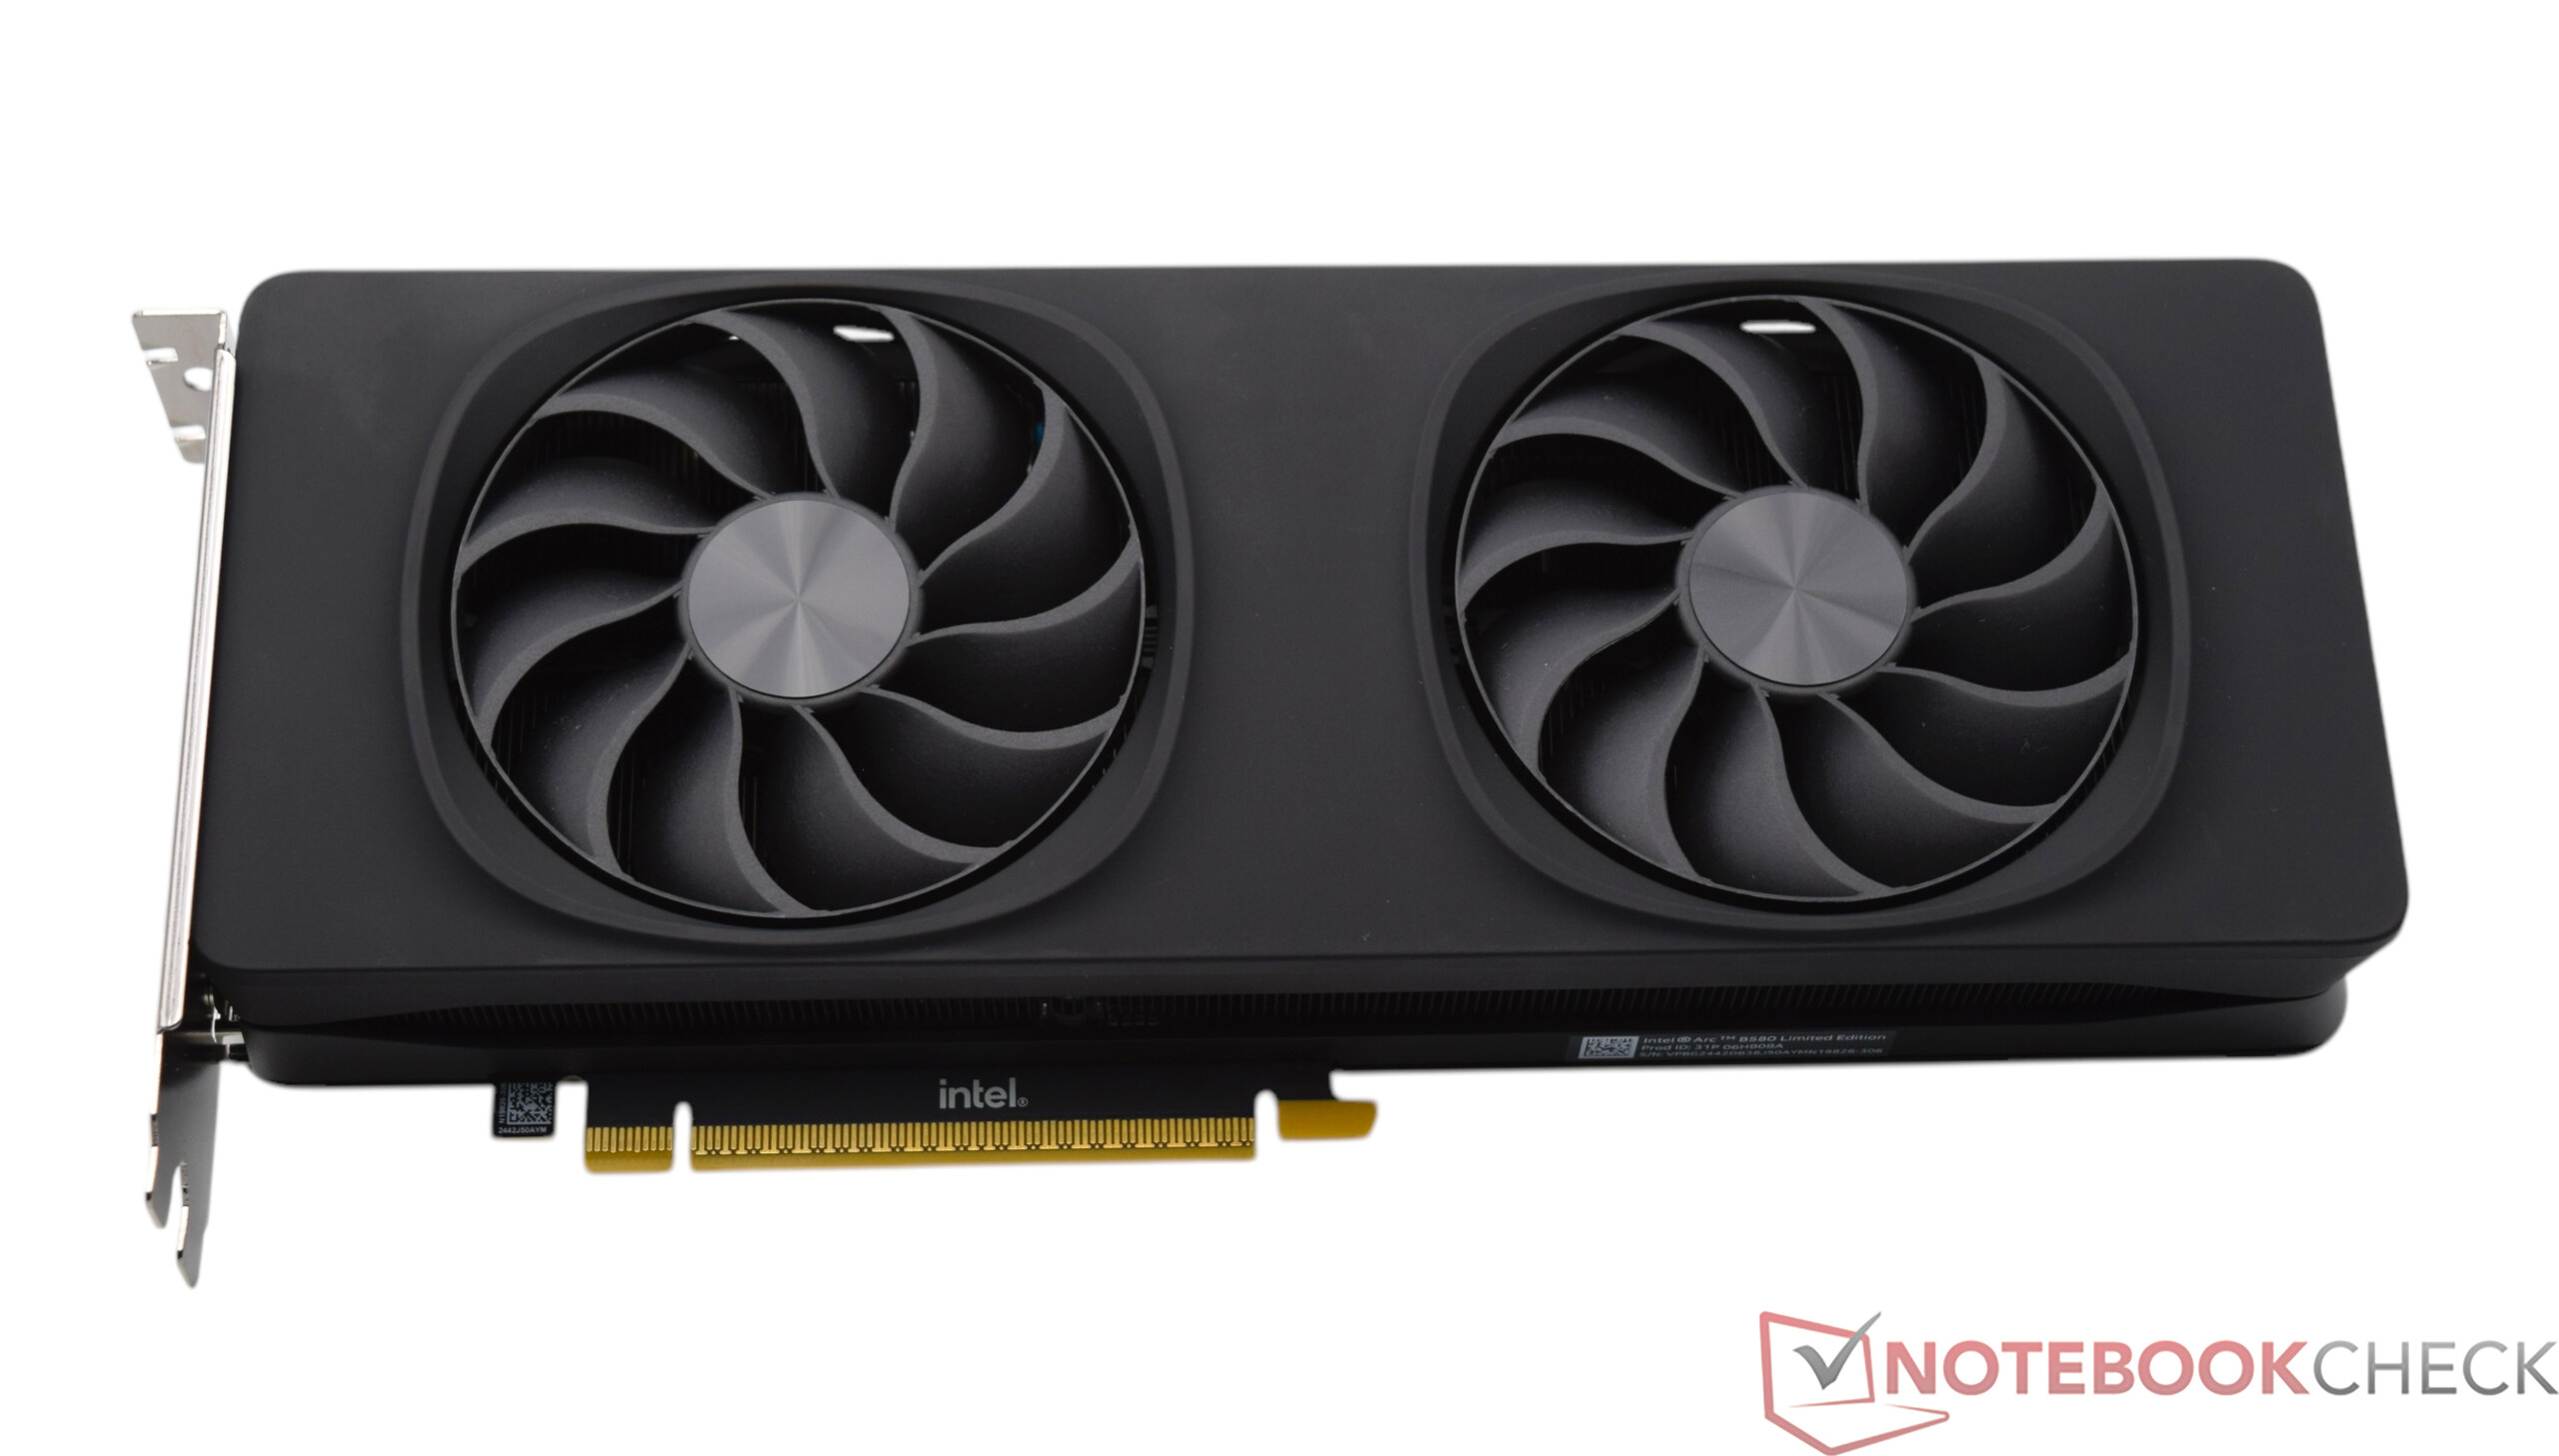
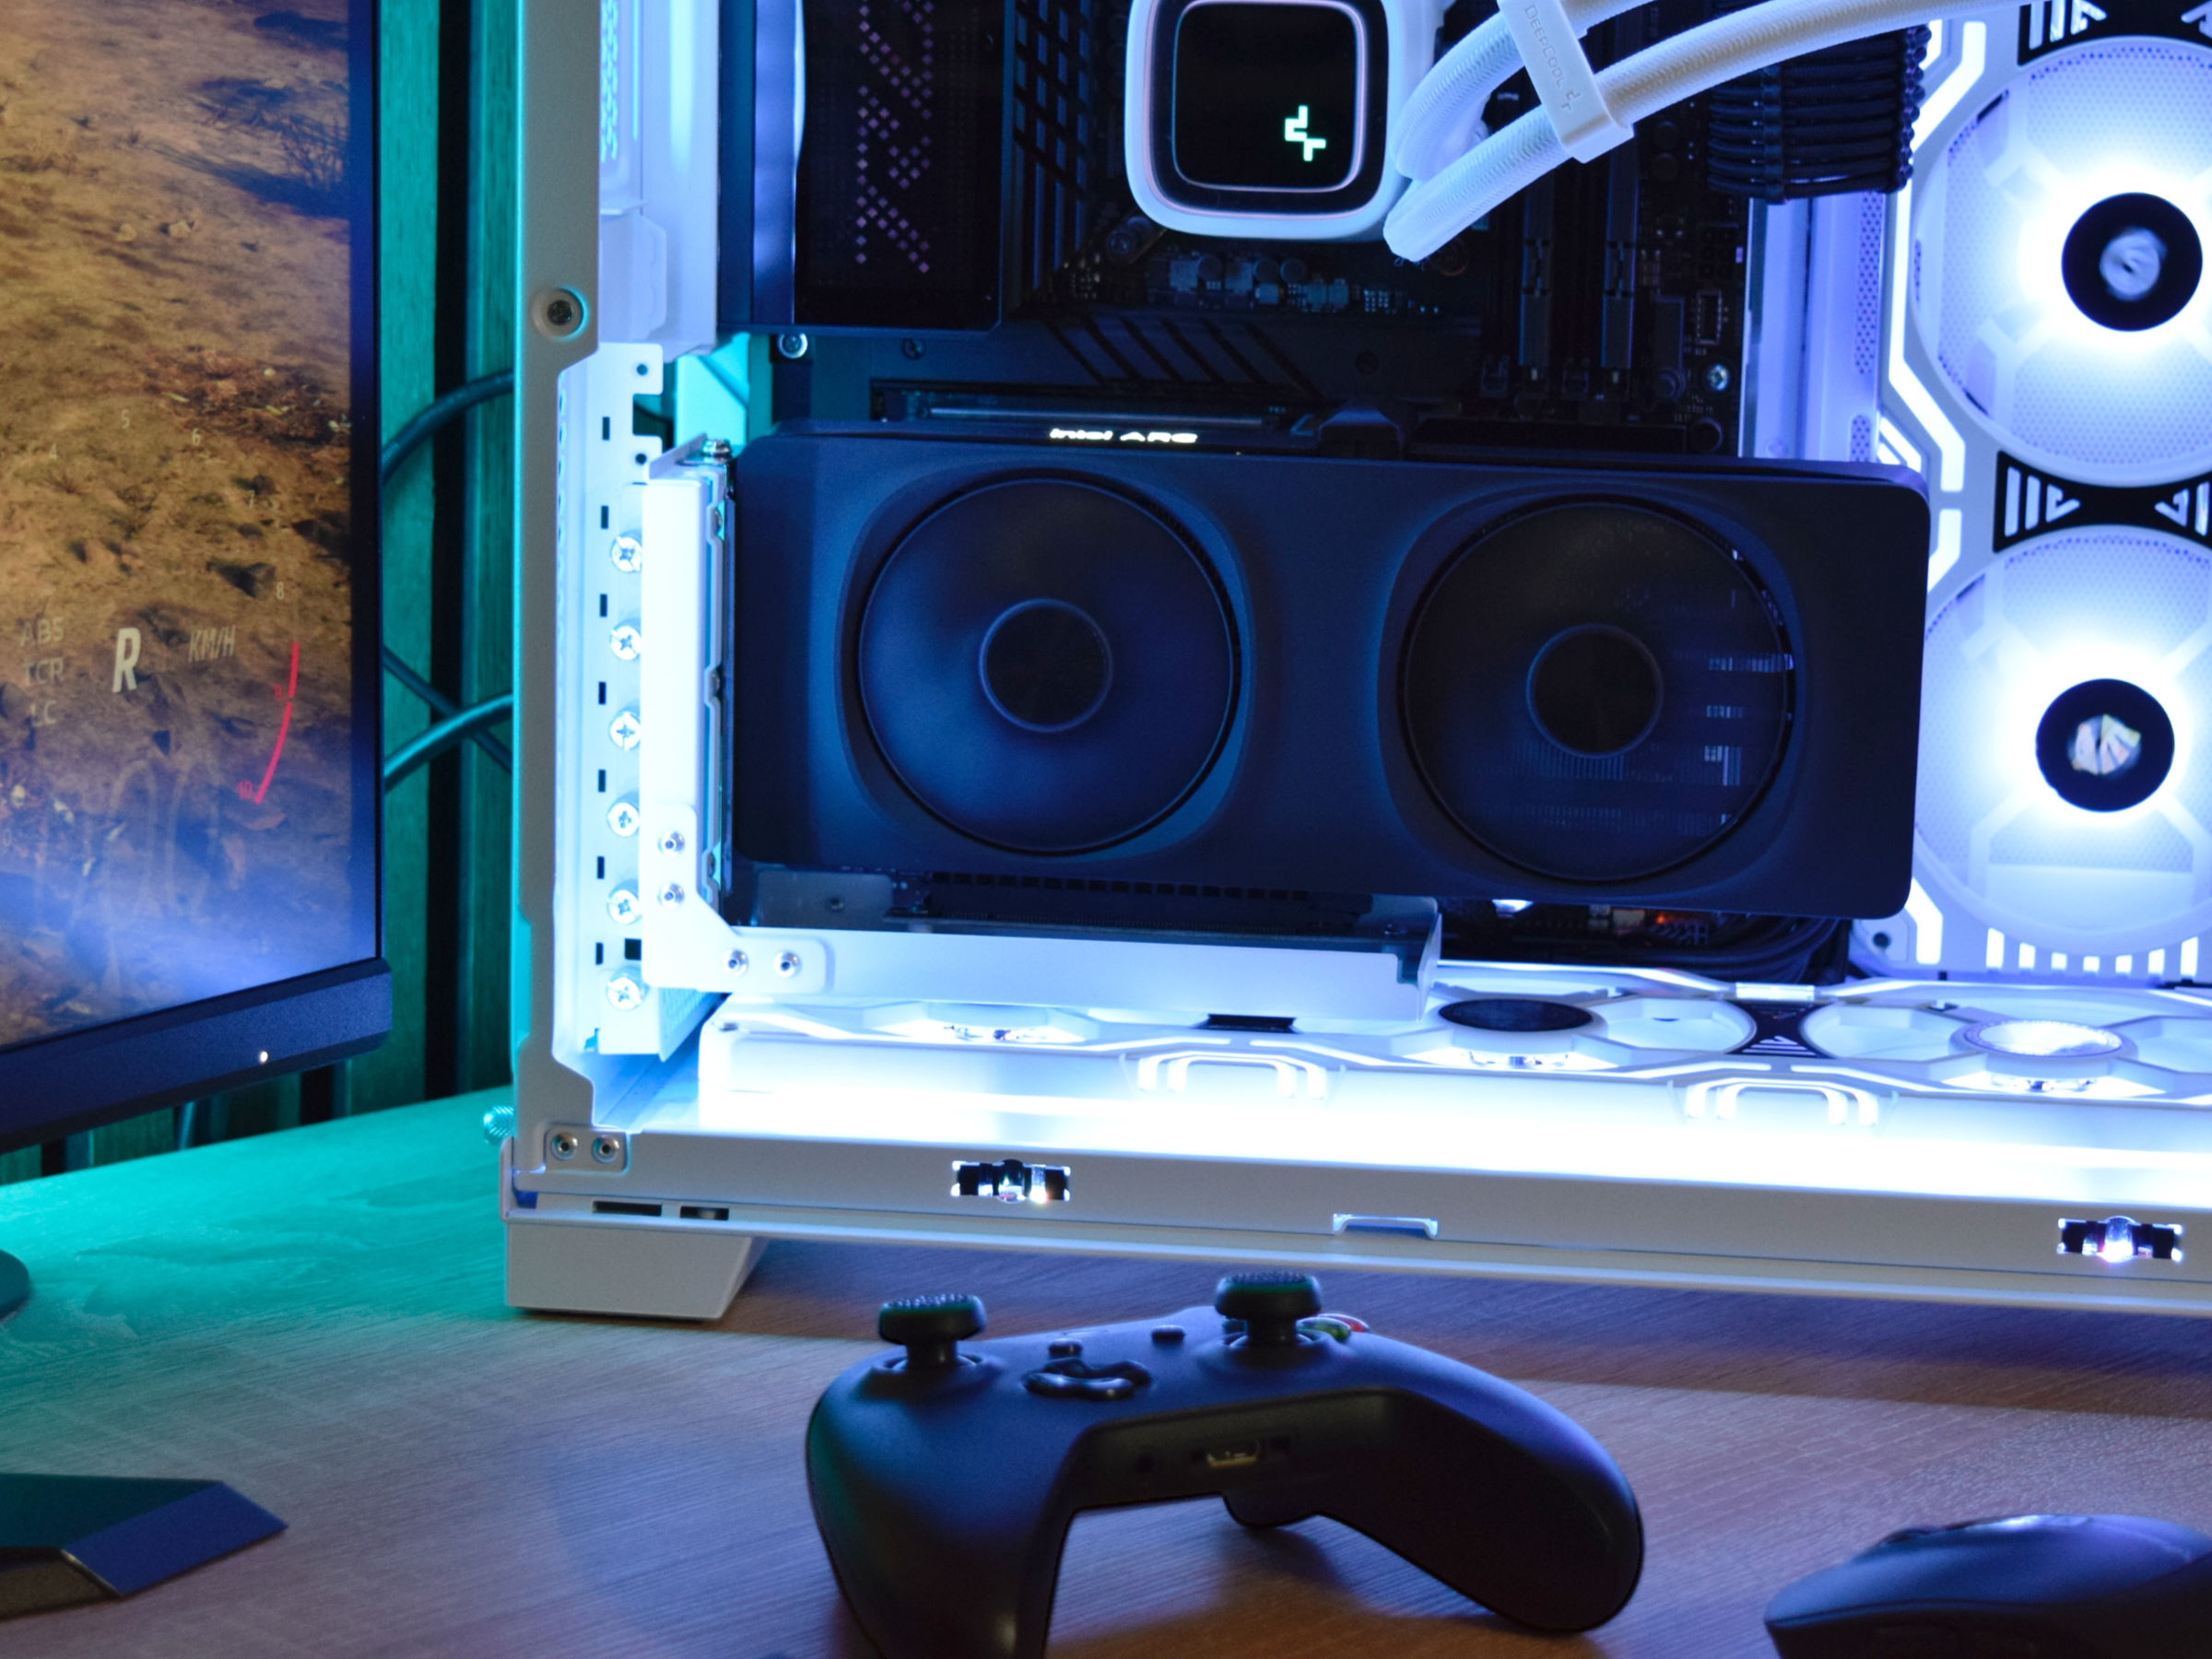
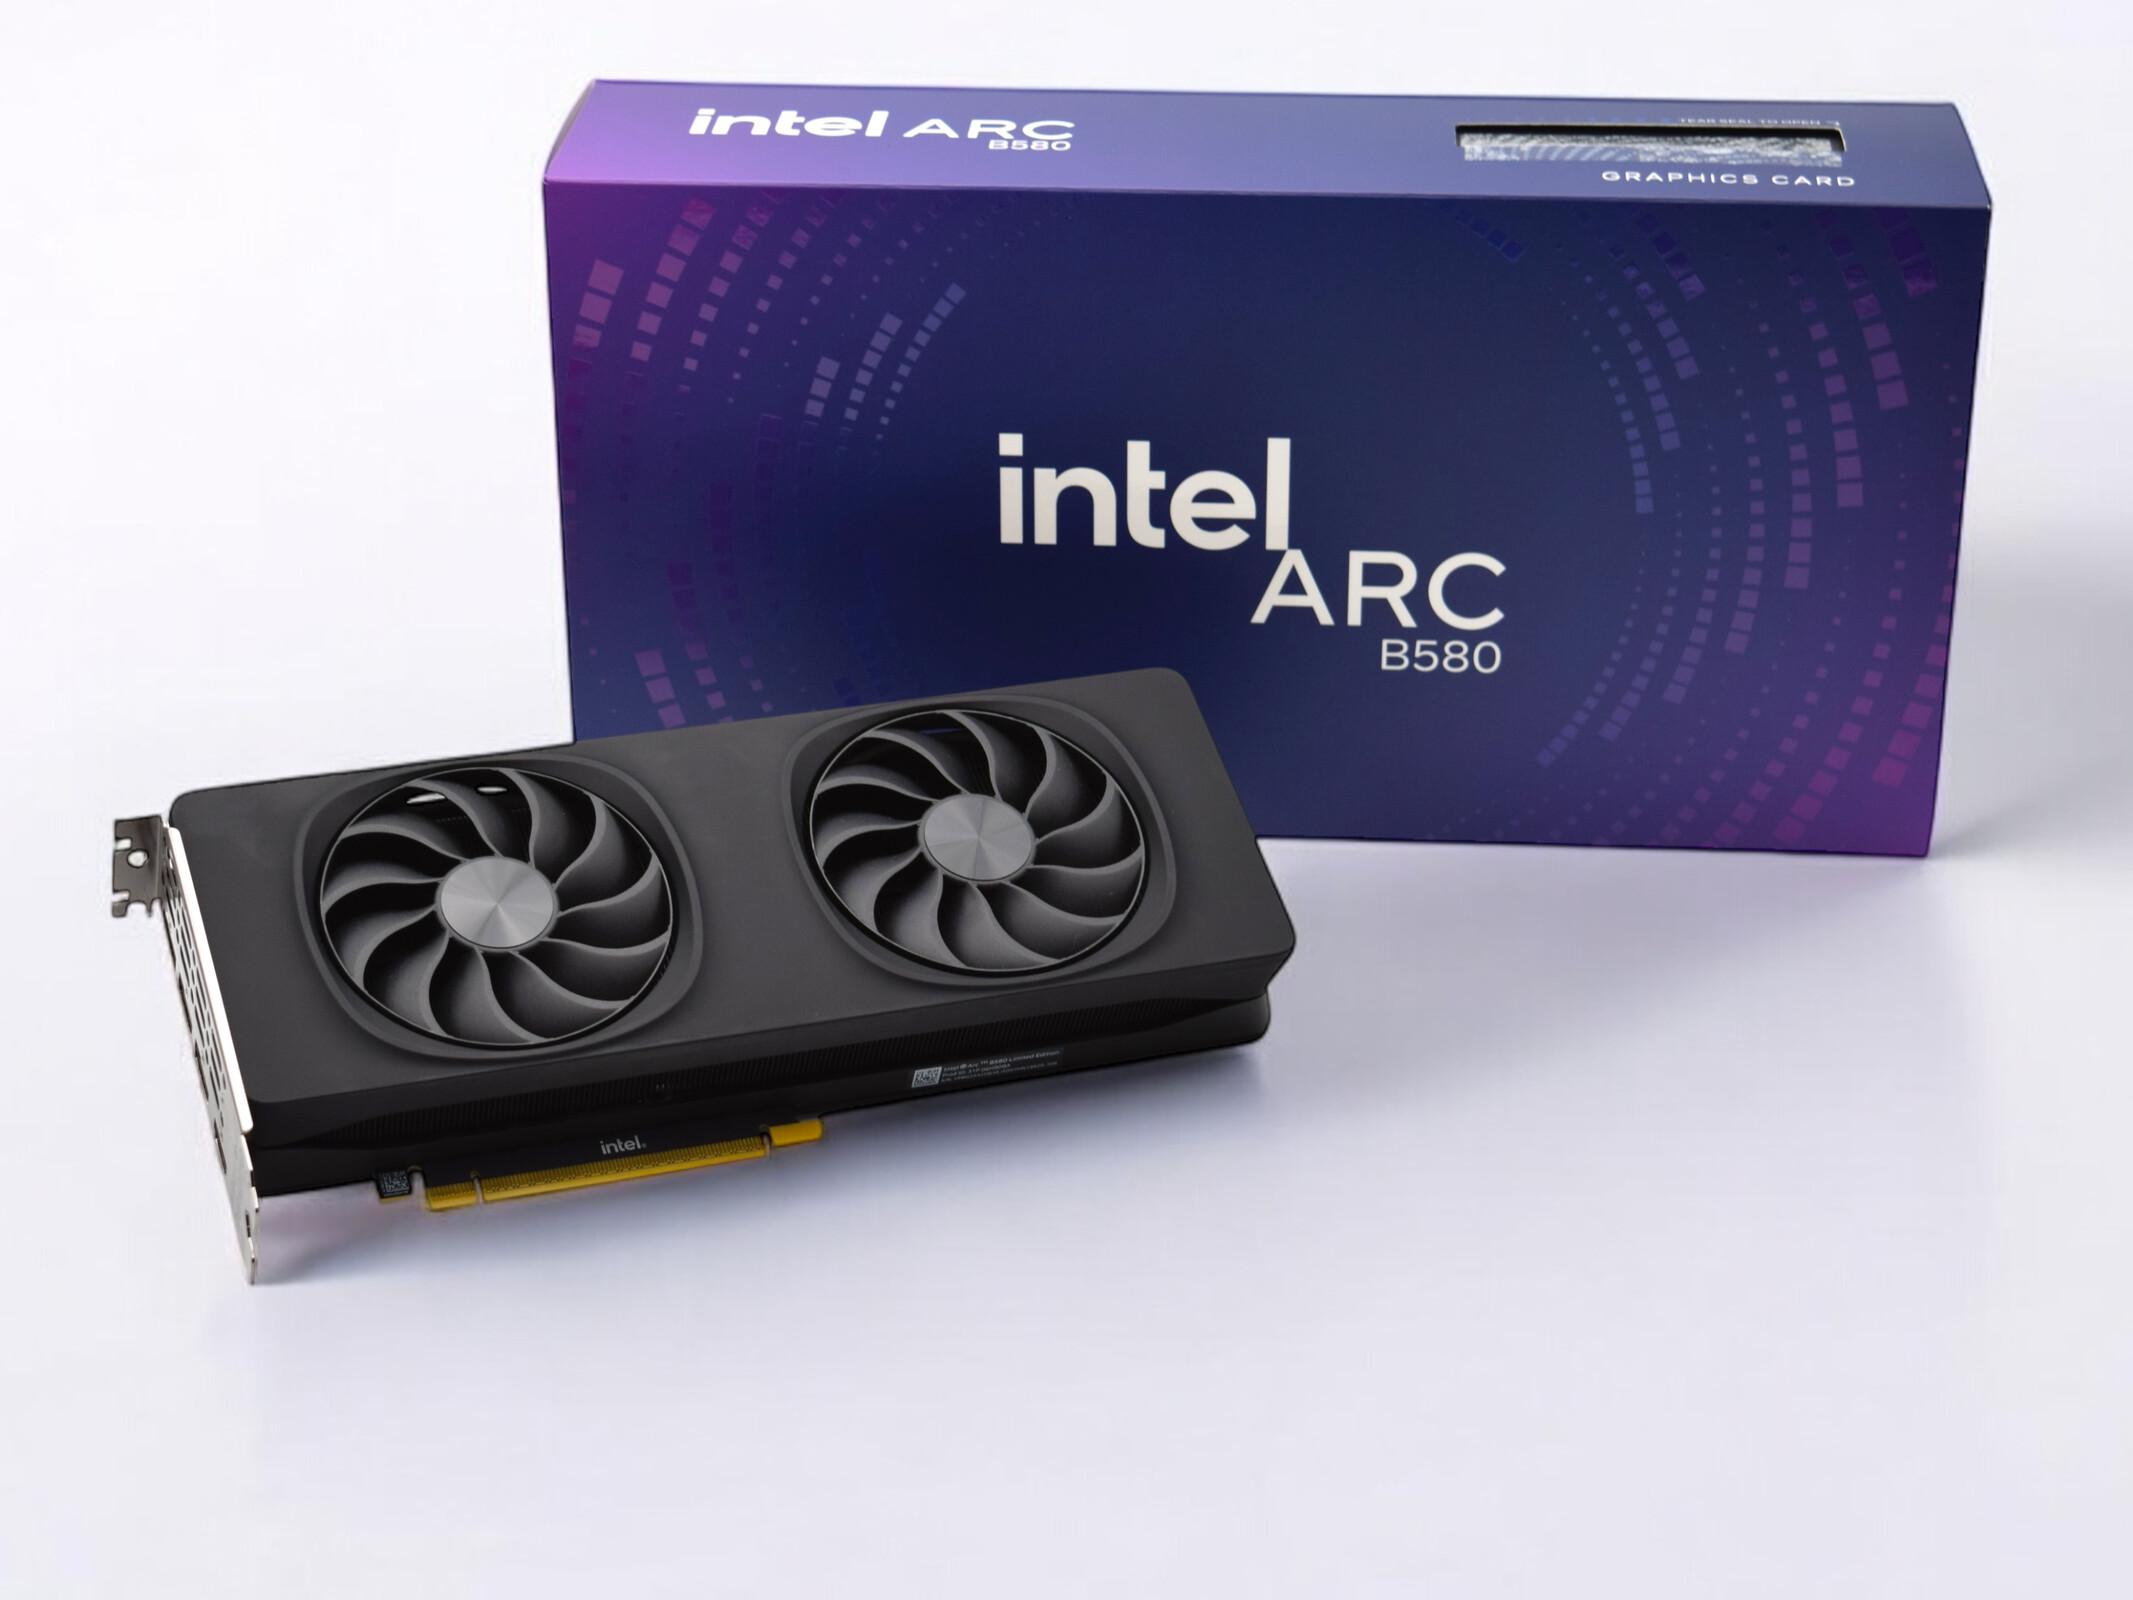
First impression and processing
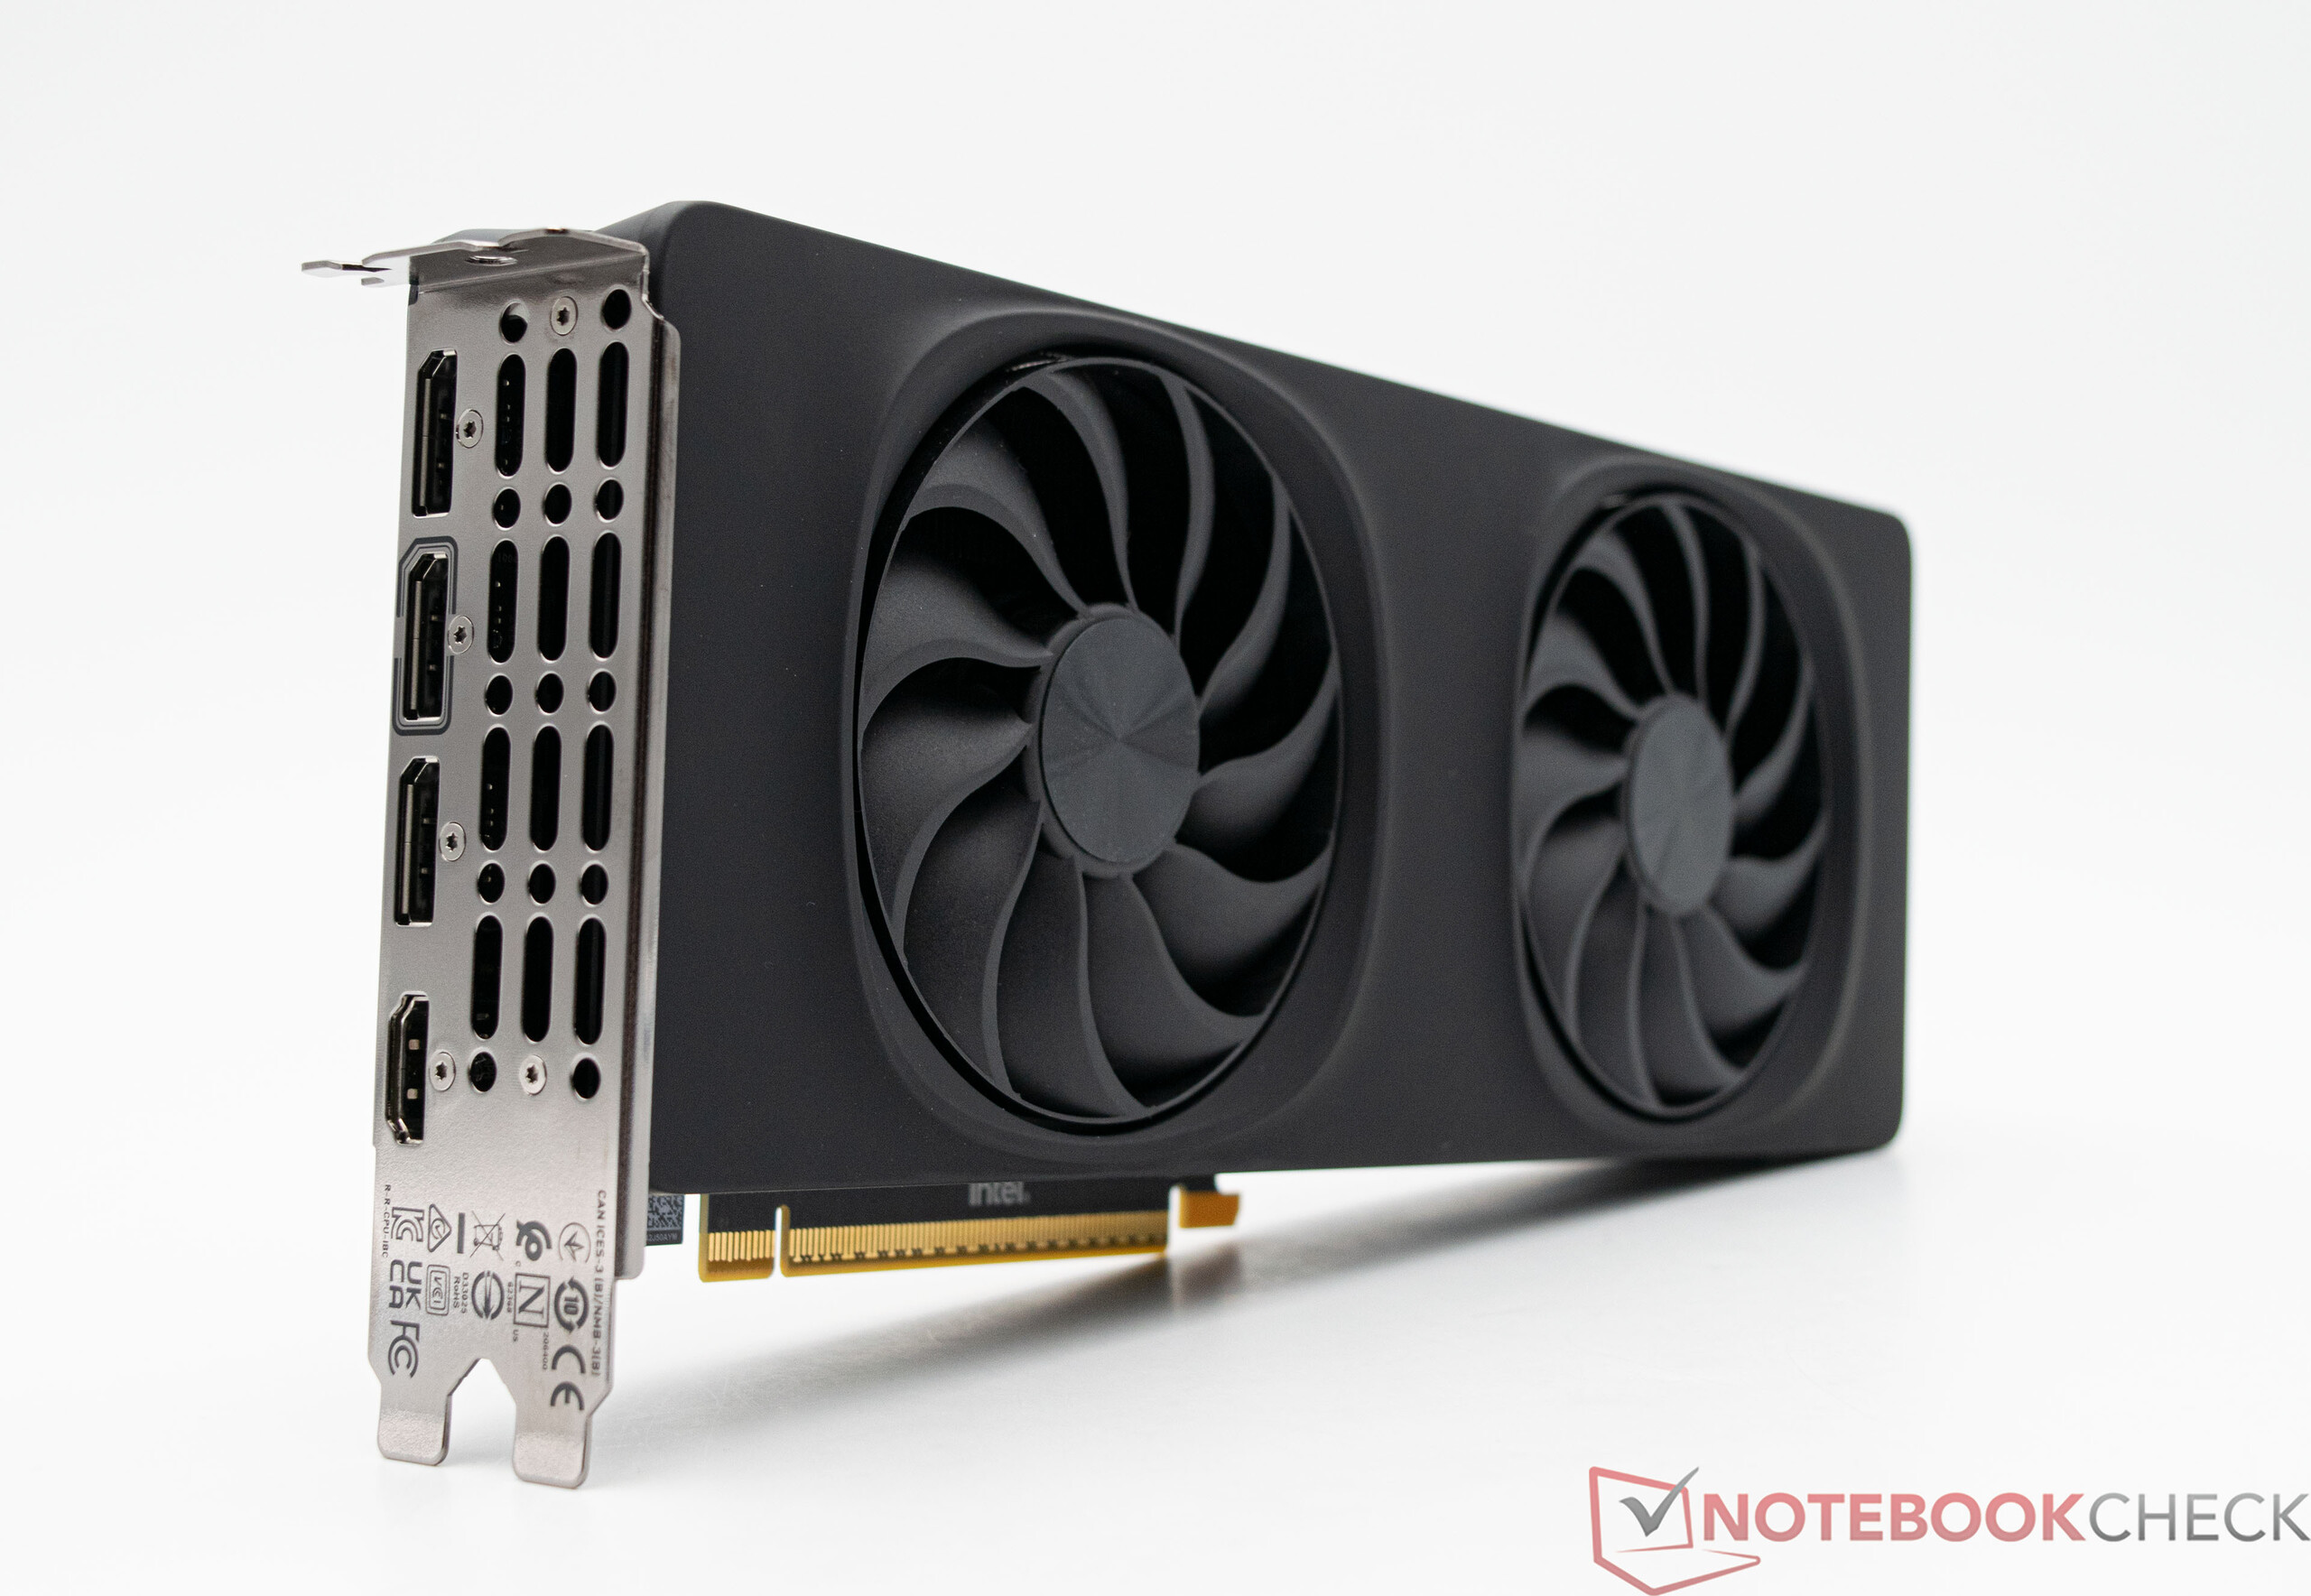
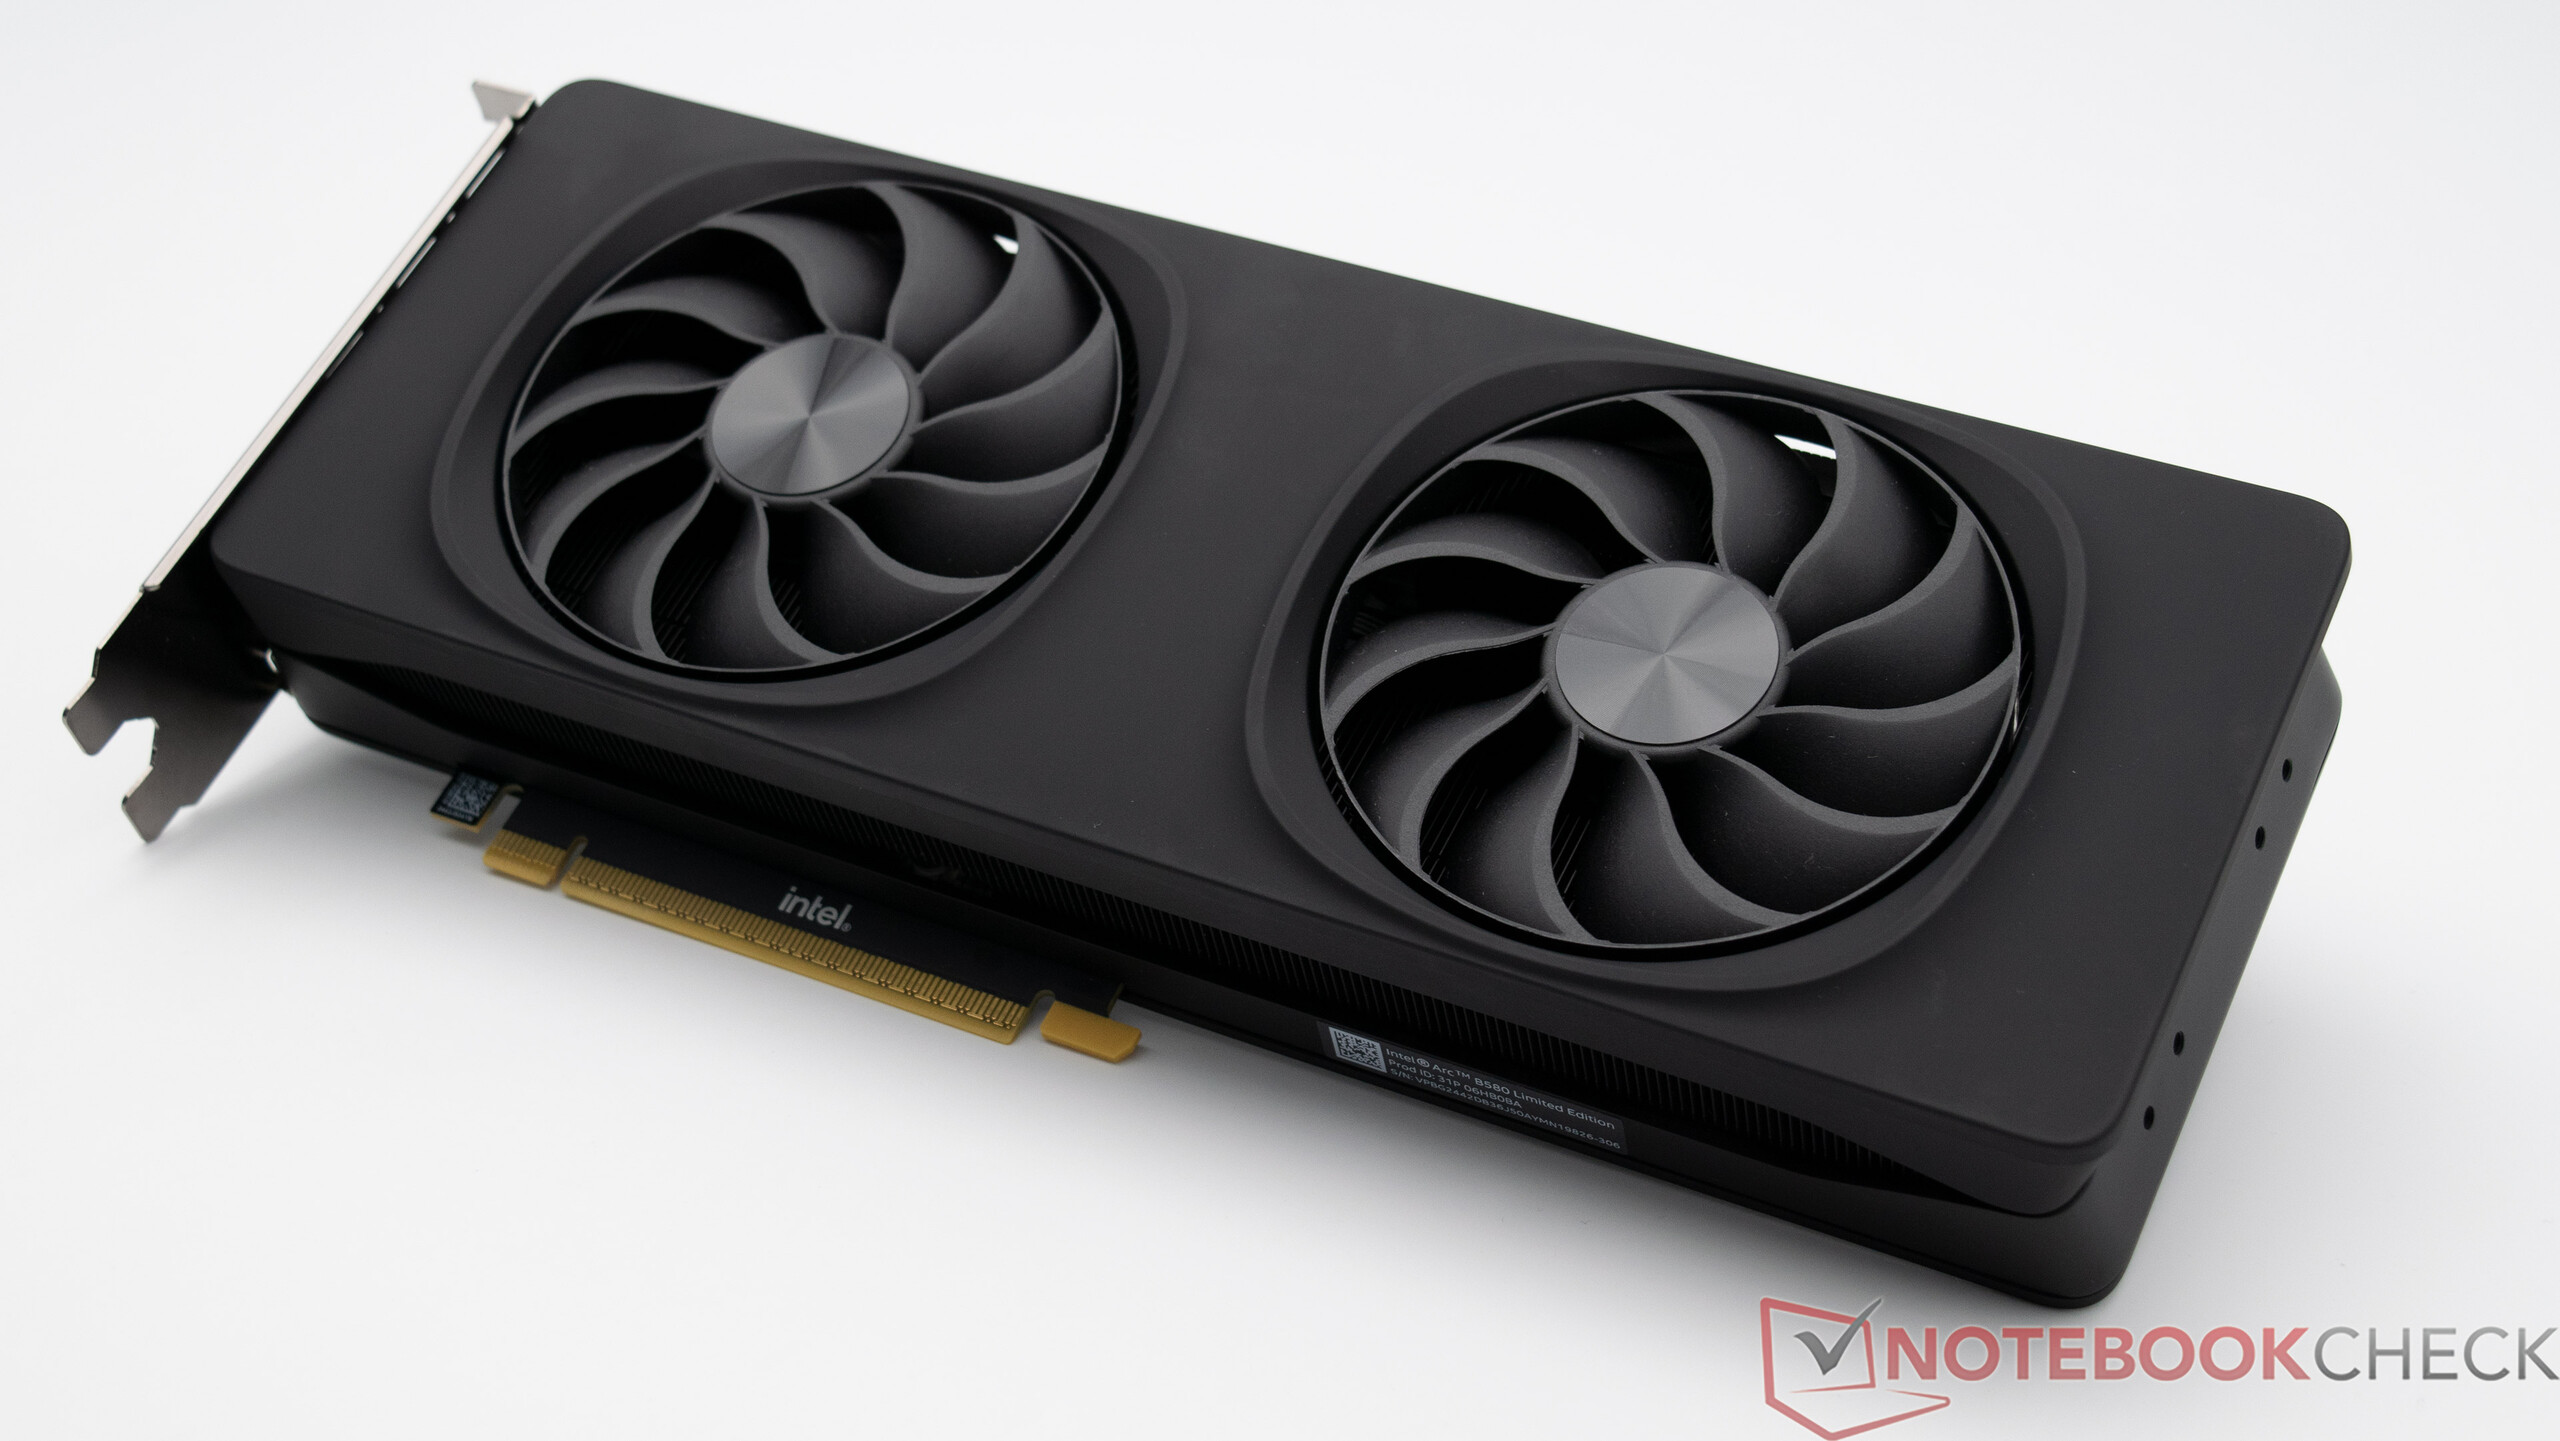
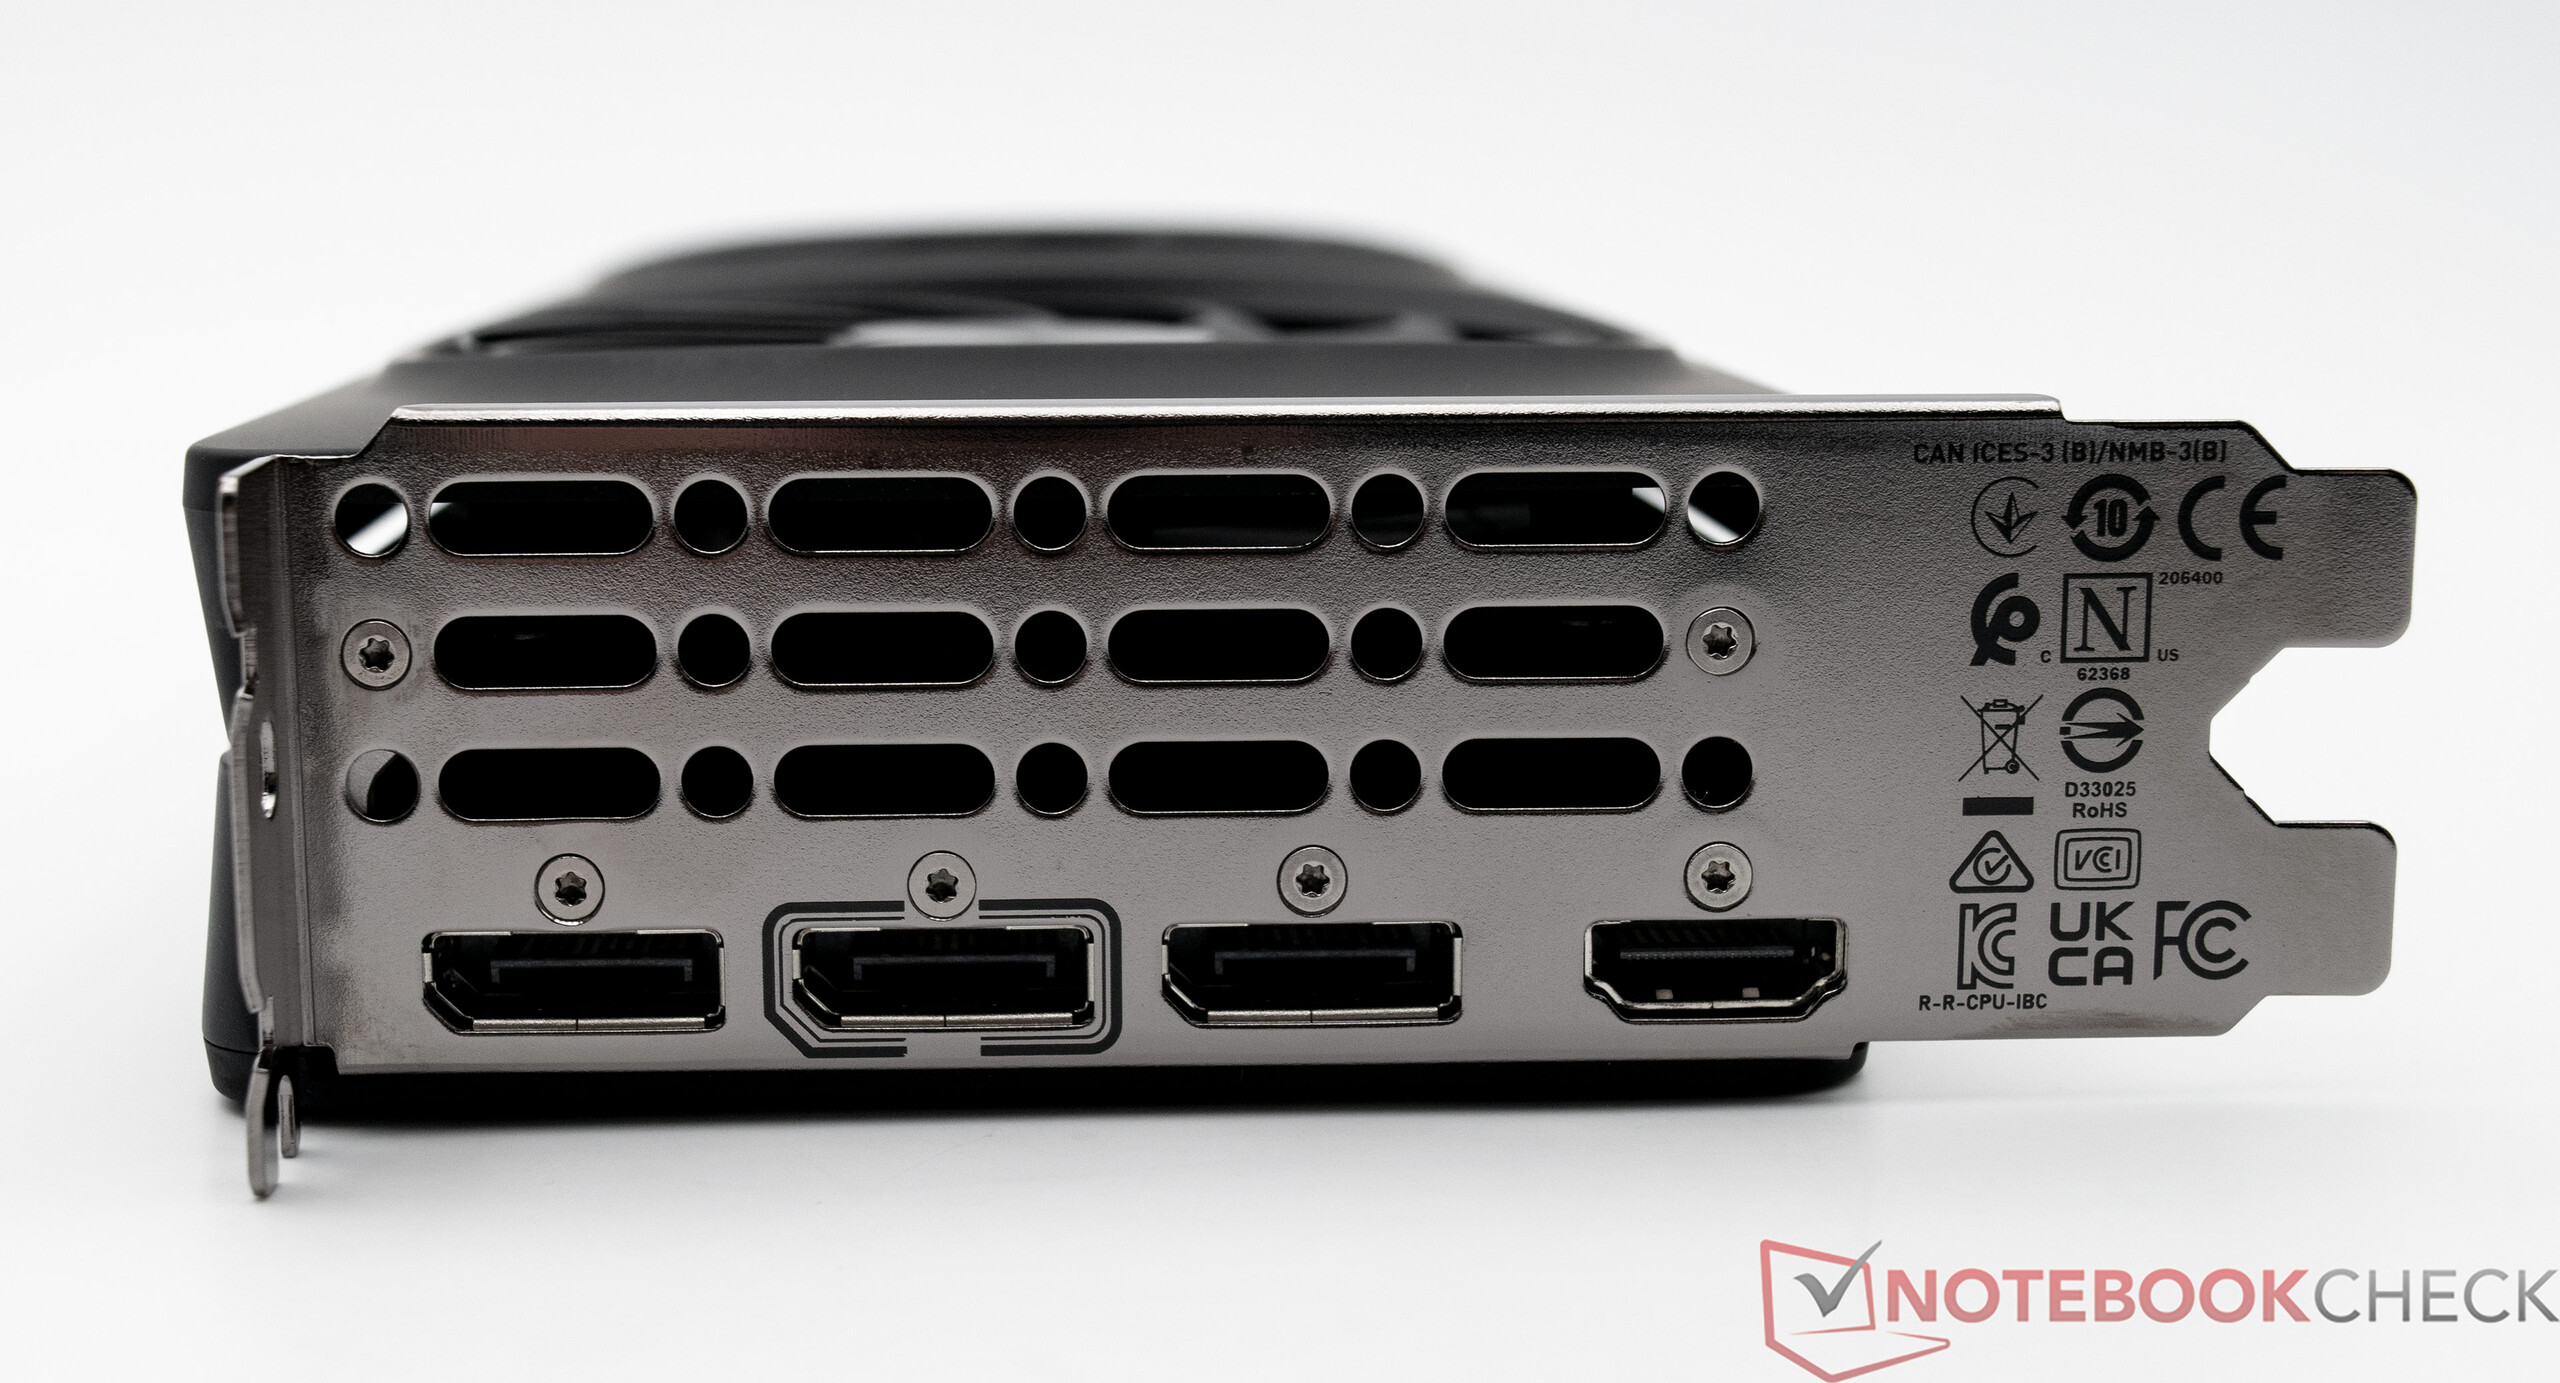
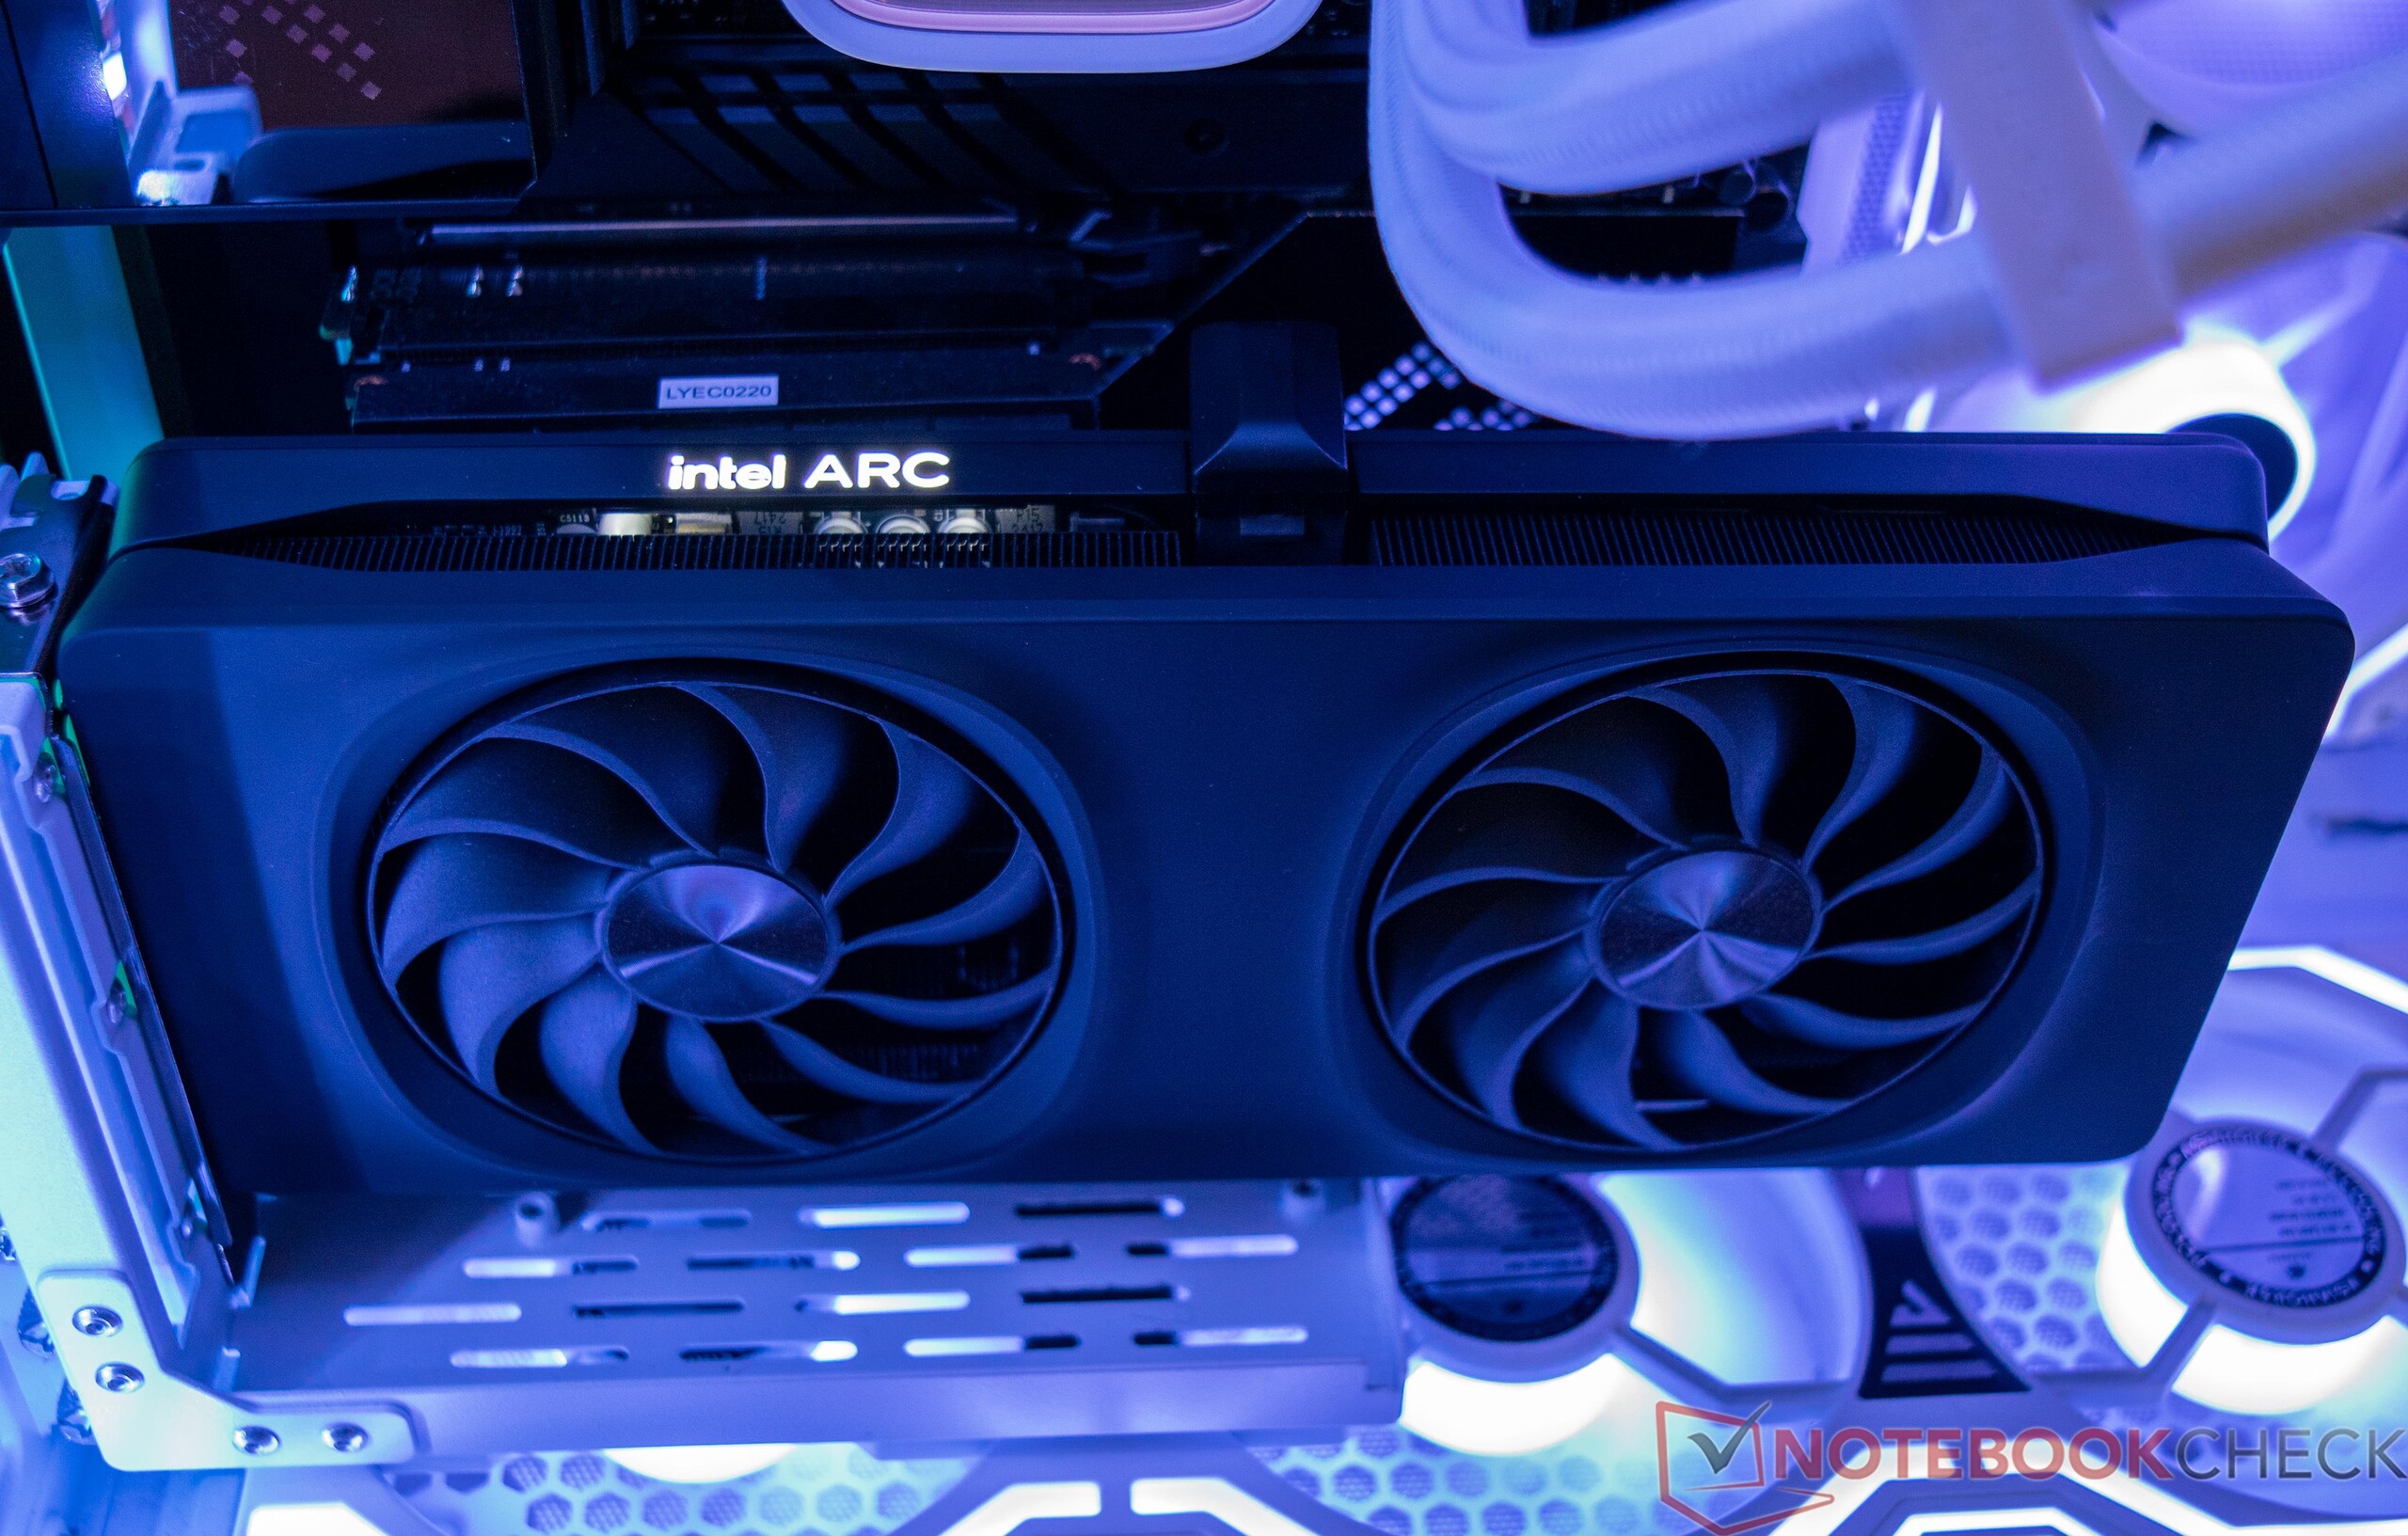
The Intel Arc B580 Limited Edition leaves a positive impression at first glance. The simple, modern design with clear lines and high-quality workmanship shows that Intel also wants to meet the high demands of the mid-range in terms of appearance. The casing is made of robust plastic with aluminum elements, which ensures a good balance between stability and weight. The card feels high-quality and durable. The soft-touch surfaces are certainly a pleasure to touch, although the durability of the material must first be proven. The Intel Arc B580 Limited Edition impresses with its timeless design, great material quality, and excellent workmanship, as well as a sophisticated cooling system. Its compact design and diverse connection options make it an attractive choice for various PC setups. From the very first impression, it is clear that Intel has not only focused on performance with this GPU but also on an appealing user experience.
Technical data in comparison
| Specifications | Intel Arc B580 | Intel Arc A770 | Intel Arc A750 | Intel Arc A580 | Intel Arc A380 | Radeon RX 7700 XT | Radeon RX 7600 | RTX 4060 Ti | RTX 4060 |
| GPU | BMG-G21 | DG2-512 | DG2-512 | DG2-512 | DG2-128 | Navi 32 XL | Navi 33 XL | AD106 | AD107 |
| Manufacturing Process | 5 nm | 6 nm | 6 nm | 6 nm | 6 nm | 5/6 nm | 6 nm | TSMC 4N | TSMC 4N |
| Shading Units | 2,560 | 4,096 | 3,584 | 3,072 | 1,024 | 3,456 | 2,048 | 4,352 | 3,072 |
| Texture Mapping Units | 160 | 256 | 224 | 192 | 64 | 216 | 128 | 136 | 96 |
| Ray Accelerators | 20 | 32 | 28 | 24 | 8 | 54 | 32 | 34 | 24 |
| Base Clock | 2,670 MHz | 2,100 MHz | 2,050 MHz | 1,700 MHz | 2,000 MHz | 1,700 MHz | 1,720 MHz | 2,310 MHz | 1,830 MHz |
| Game Clock | - | - | - | - | - | 2.171 MHz | - | - | 1.815 MHz |
| Boost Clock | 2,670 MHz | 2,400 MHz | 2,400 MHz | 2,000 MHz | 2,050 MHz | 2,544 MHz | 2,535 MHz | 2,460 MHz | 2,105 MHz |
| Cache | 18 MB | 16 MB | 16 MB | 8 MB | 4 MB | 48 MB | 32 MB | 32 MB | 24 MB |
| Memory Bus Width | 192-bit | 256-bit | 256-bit | 256-bit | 96-bit | 256-bit | 128-bit | 128-bit | 128-bit |
| Memory Bandwidth | 456 GB/s | 512 GB/s | 512 GB/s | 512 GB/s | 186 GB/s | 432 GB/s | 288 GB/s | 288 GB/s | 272 GB/s |
| Memory Size | 12 GB GDDR6 | 16 GB GDDR6 | 8 GB GDDR6 | 8 GB GDDR6 | 6 GB GDDR6 | 12 GB | 8 GB GDDR6 | 8 GB GDDR6 | 8 GB GDDR6 |
| TBP | 190 W | 225 | 225 W | 175 W | 75 W | 245 W | 165 W | 160 W | 115 W |
Performance - 12 GB VRAM is a good move
The Intel Arc B580 Limited Edition is an inexpensive graphics card. This quickly makes it clear that the Arc B580 is a Full HD graphics card. Memory-intensive games, such as "Star Wars Outlaws" or "Indiana Jones and the Great Circle", will make good use of the 12 GB VRAM. For sufficient FPS in WQHD, it is often necessary to reduce the graphics details.
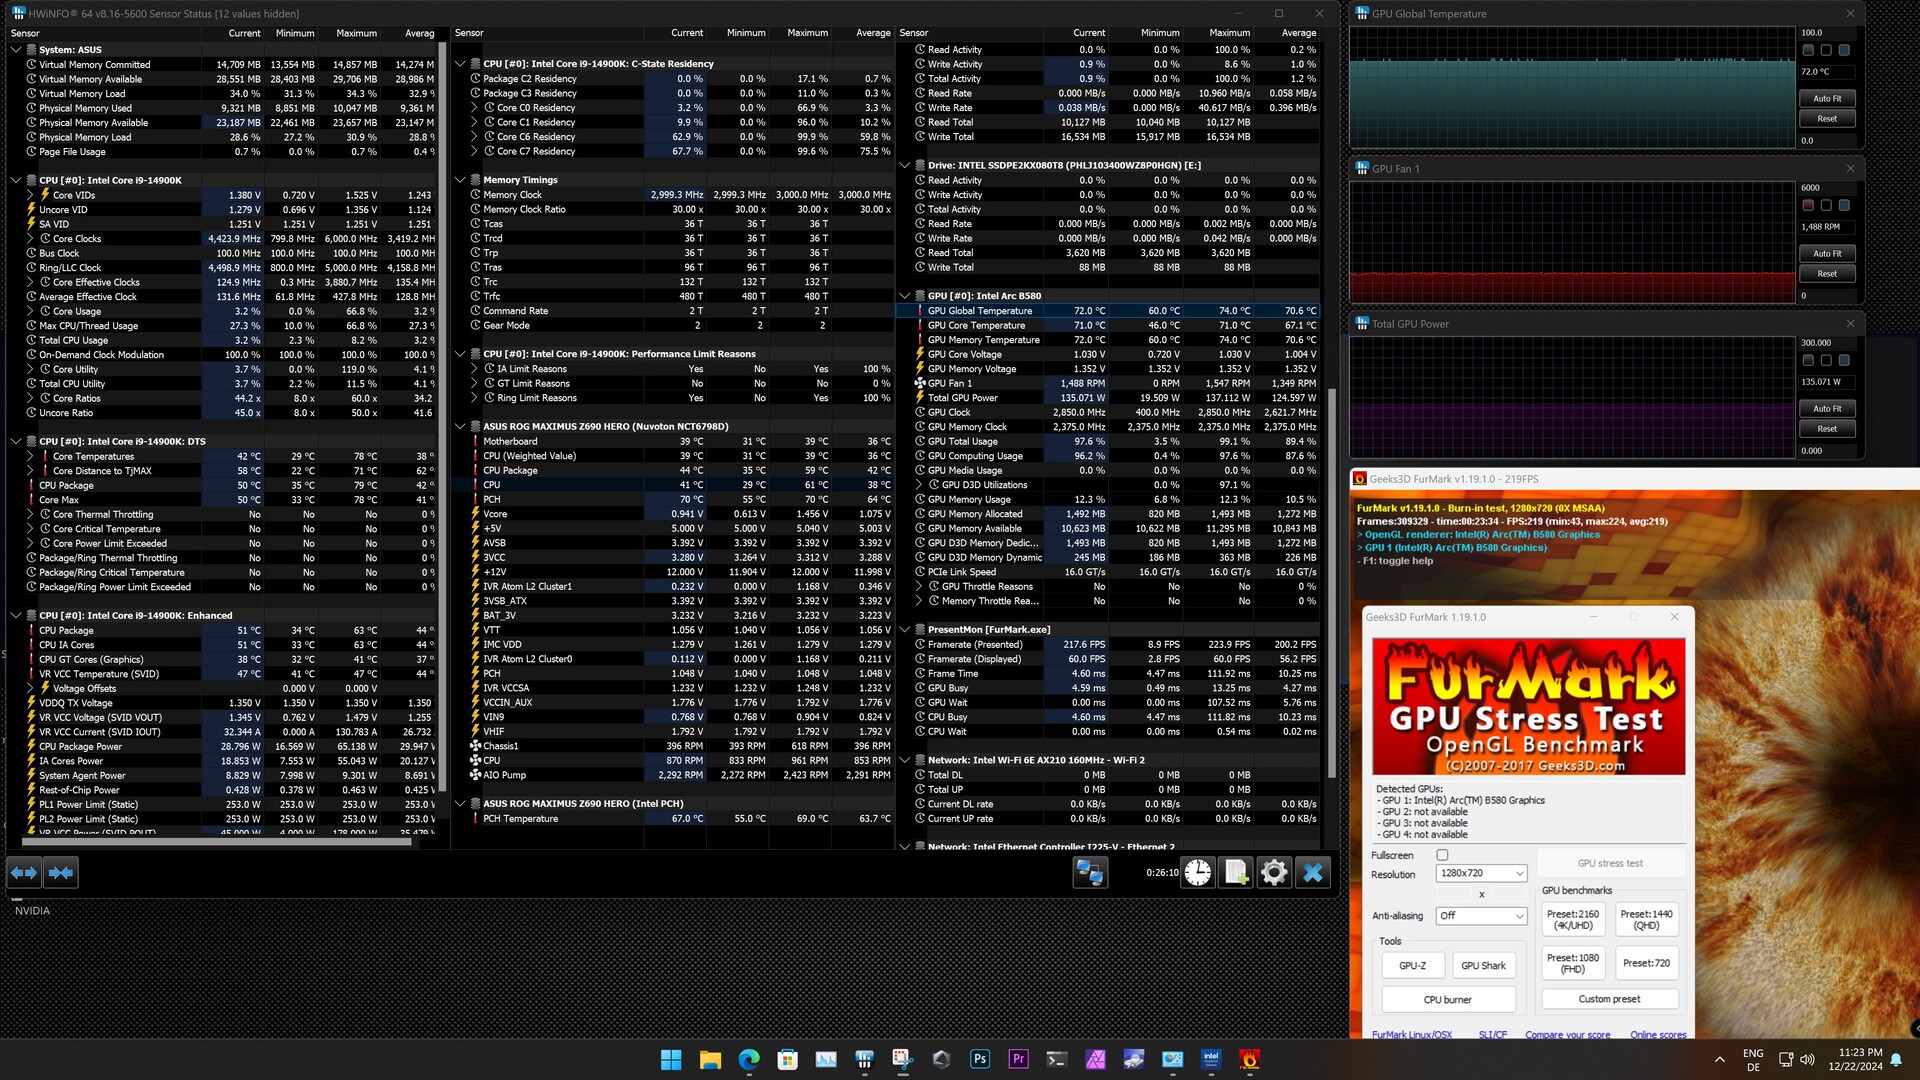
Test conditions
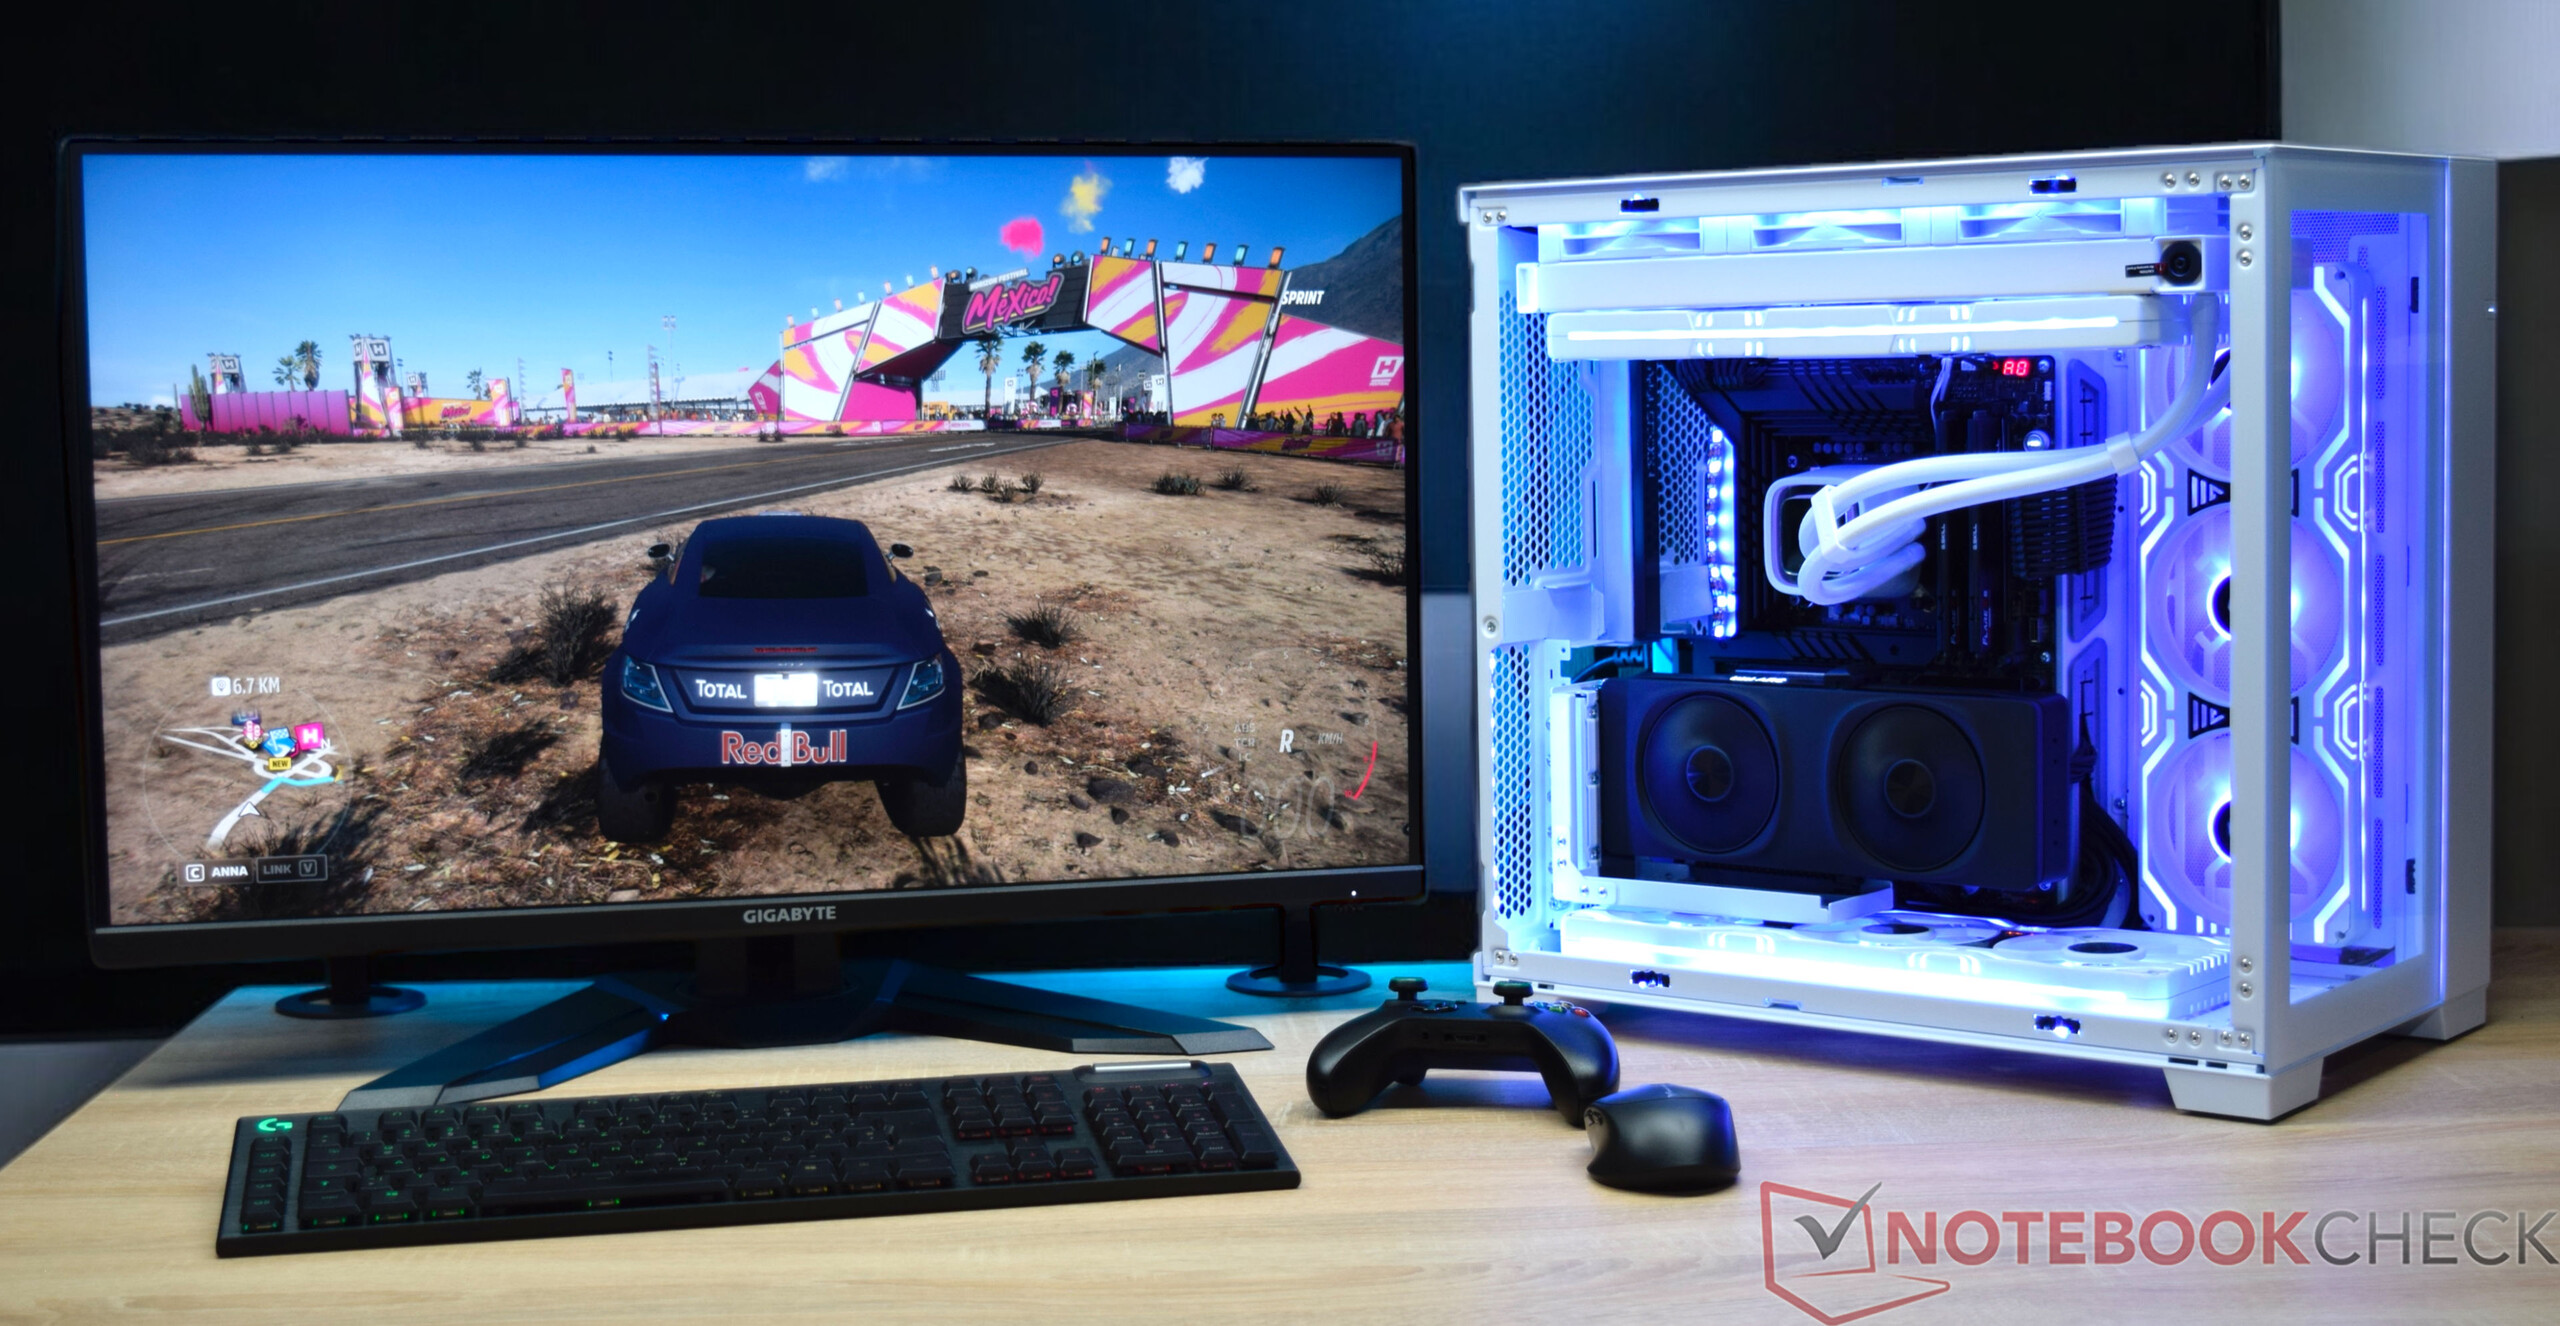
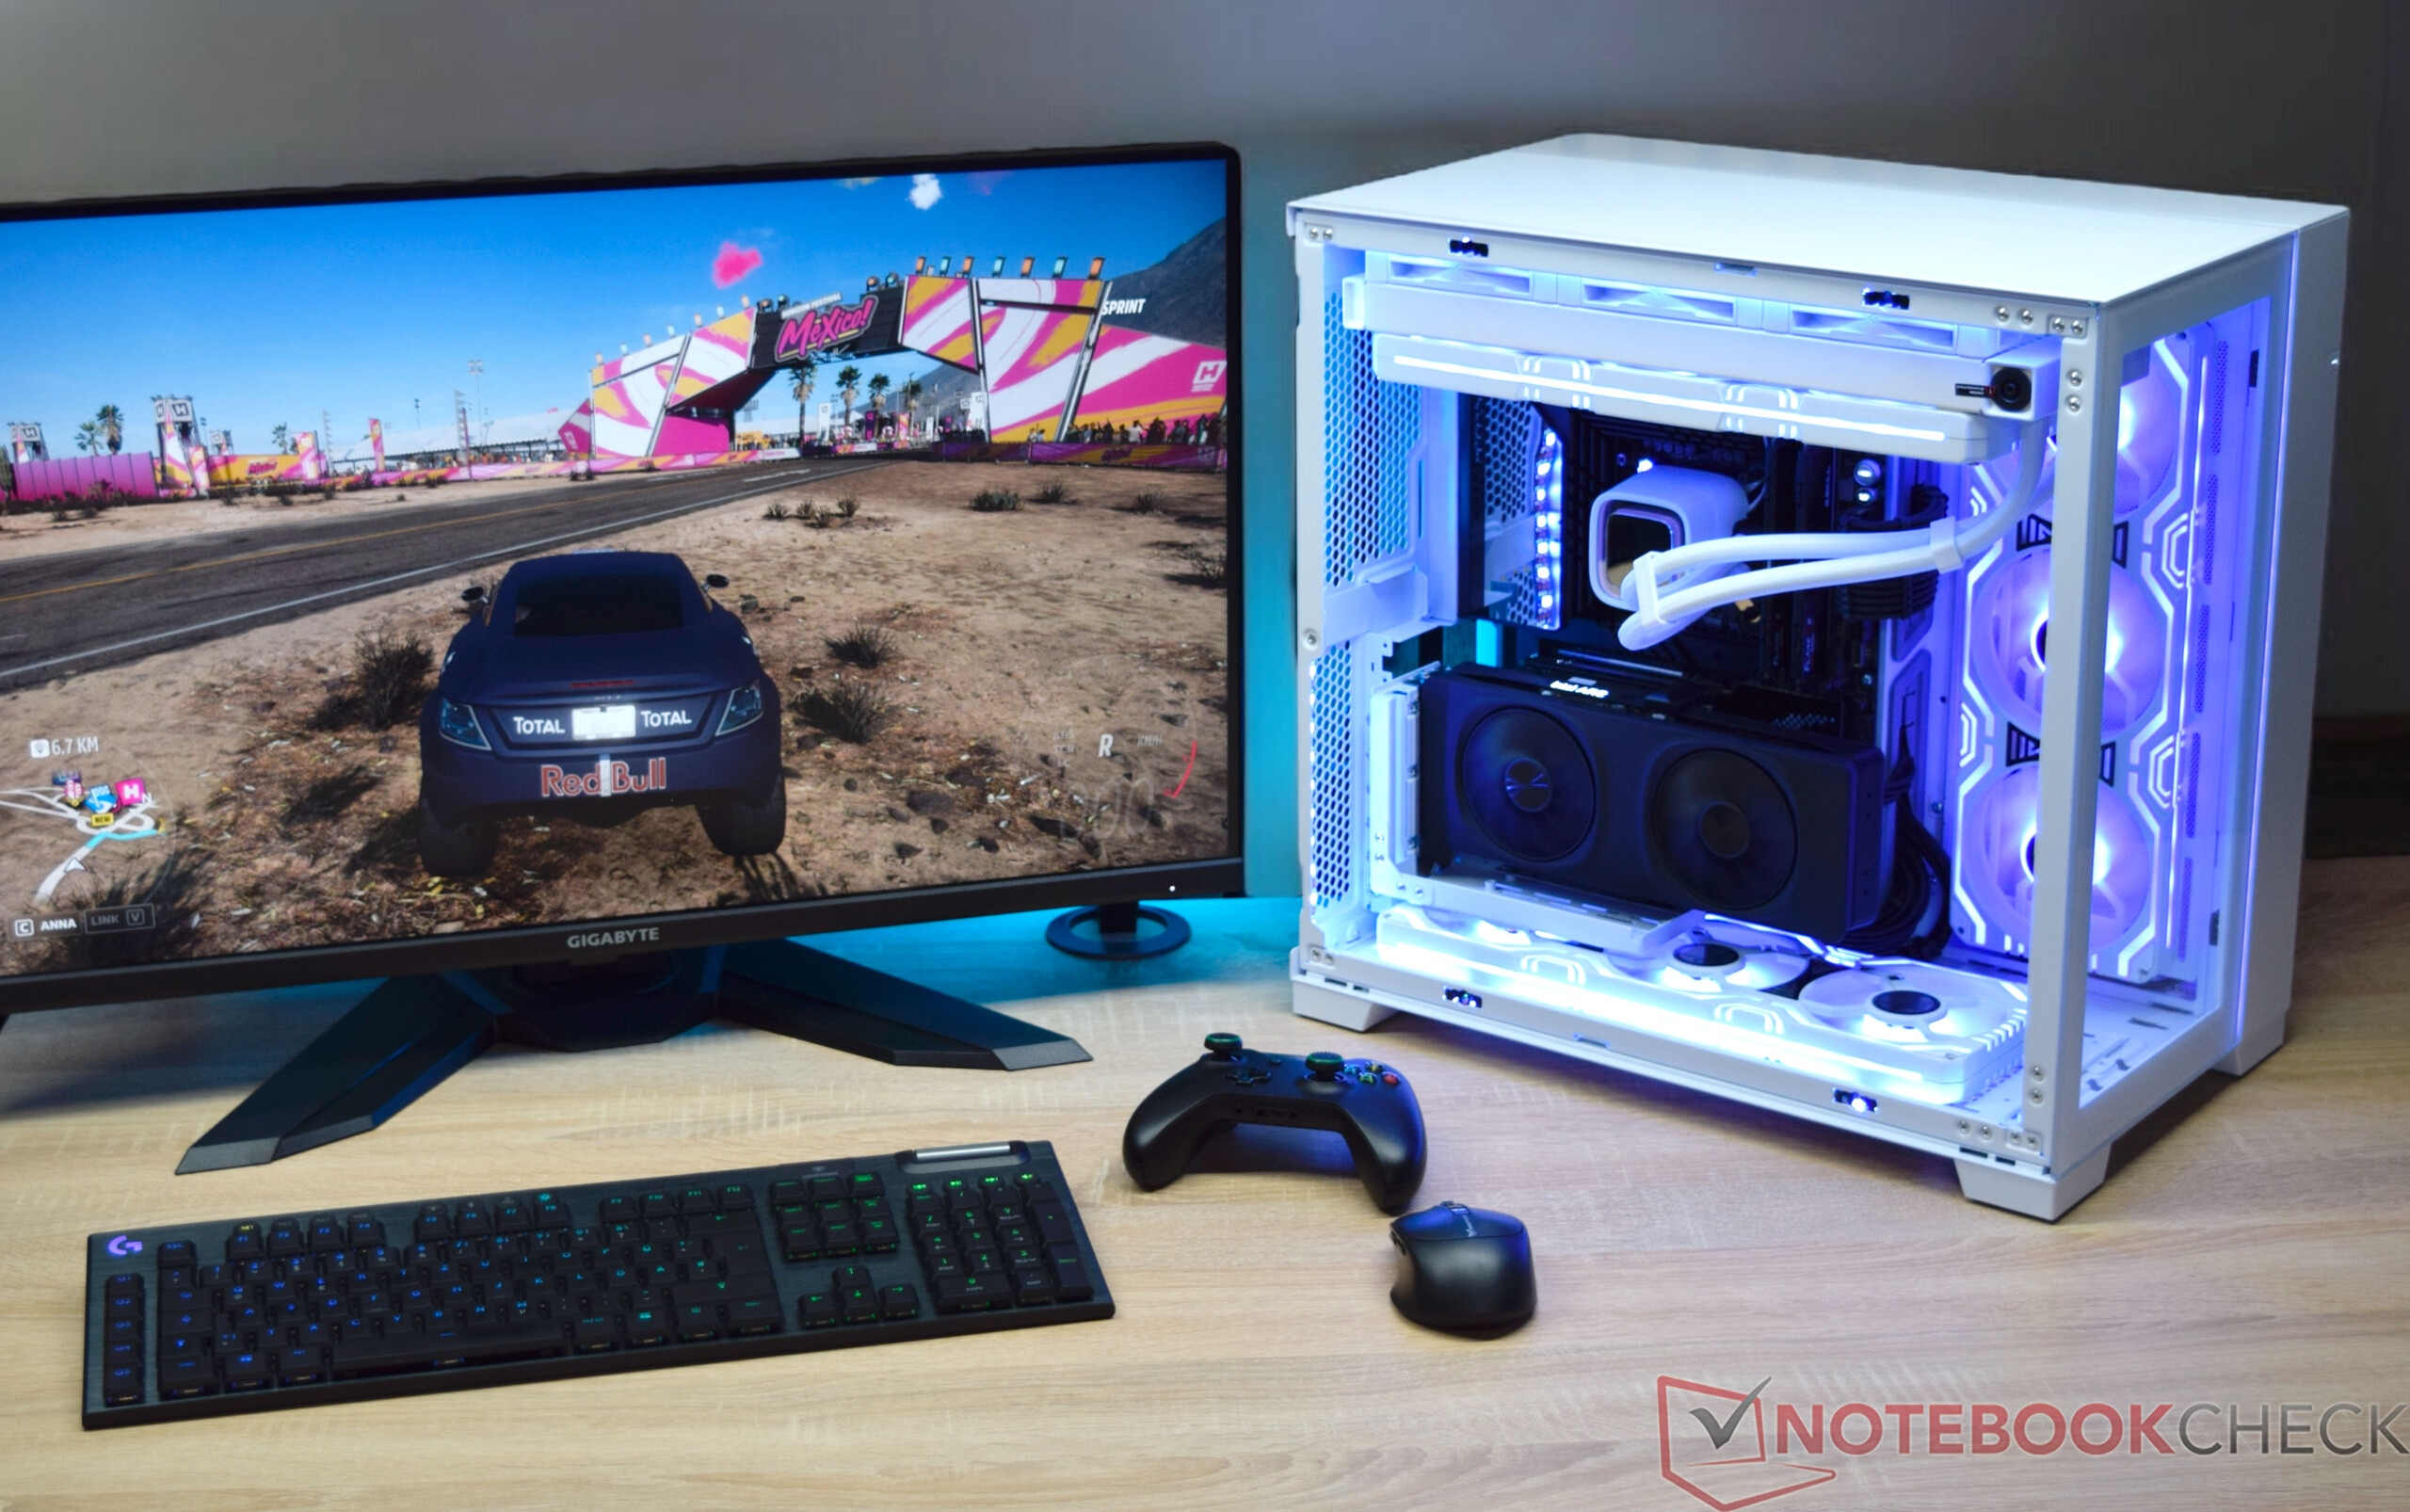
The test system consists of an Intel Core i9-14900K on an Asus ROG Maximus Z690 Hero Mainboard with 32 GB DDR5 RAM. We use the Lian Li O11 Dynamic EVO case, which is closed for all performance tests. We installed the test graphics card on our open bench table to measure the volume. The processor and power supply are in passive mode for the duration of the volume measurement, so that only the volume of the graphics card can be determined.
Synthetic benchmarks
The performance yield of the Intel Arc B580 Limited Edition is quite promising and compared to the 1st generation Arc graphics cards, the Battlemage GPU has an easy game. In a performance comparison, it can even beat the Intel Arc A770 which we have compared here as an on-board partner card from Acer. The two main competitors in terms of current pricing (Nvidia GeForce RTX 4060 and AMD Radeon RX 7600) can also outperform our test sample. However, the Intel Arc B580 bites its teeth out against the performance of an AMD Radeon RX 6700 XT. Even an Nvidia GeForce RTX 4060 Ti cannot be beaten, even though our test sample is only a single-digit percentage behind.
| Performance rating - Percent | |
| KFA2 GeForce RTX 4070 Ti EX Gamer | |
| AMD Radeon RX 7900 GRE | |
| ASUS TUF Gaming Radeon RX 7800 XT | |
| KFA2 GeForce RTX 4070 EX Gamer | |
| Sapphire Pulse Radeon RX 7700 XT | |
| Sapphire Pulse Radeon RX 6750 XT | |
| KFA2 GeForce RTX 4060 Ti EX, 16GB GDDR6 | |
| AMD Radeon RX 6700 XT | |
| Intel Arc B580 | |
| Acer Predator BiFrost Arc A770 OC, 16GB GDDR6 | |
| XFX Speedster QICK 308 Radeon RX 7600 Black Edition | |
| KFA2 GeForce RTX 4060 1-Click-OC 2X | |
| Nvidia GeForce RTX 2070 Super | |
| Acer Predator BiFrost Arc A750 OC | |
| Sapphire Nitro+ Radeon RX 6650 XT | |
| ASRock Arc A580 Challenger OC | |
| Nvidia GeForce RTX 2060 Super | |
| Sapphire Pulse Radeon RX 6600 | |
| Affinity Photo 2 - Combined (Single / Multi GPU) | |
| KFA2 GeForce RTX 4070 EX Gamer | |
| KFA2 GeForce RTX 4070 Ti EX Gamer | |
| ASUS TUF Gaming Radeon RX 7800 XT | |
| Nvidia GeForce RTX 2070 Super | |
| AMD Radeon RX 7900 GRE | |
| Nvidia GeForce RTX 2060 Super | |
| Sapphire Pulse Radeon RX 7700 XT | |
| Sapphire Pulse Radeon RX 6750 XT | |
| KFA2 GeForce RTX 4060 1-Click-OC 2X | |
| KFA2 GeForce RTX 4060 Ti EX, 16GB GDDR6 | |
| XFX Speedster QICK 308 Radeon RX 7600 Black Edition | |
| ASRock Arc A580 Challenger OC | |
| Acer Predator BiFrost Arc A770 OC, 16GB GDDR6 | |
| Acer Predator BiFrost Arc A750 OC | |
| Intel Arc B580 | |
| Sapphire Nitro+ Radeon RX 6650 XT | |
| AMD Radeon RX 6700 XT | |
| Sapphire Pulse Radeon RX 6600 | |
Professional applications
Professional applications require special graphics cards to perform the tasks in the best possible way. AMD and Nvidia have special graphics card series in their portfolio that are optimized for these tasks thanks to specially optimized drivers. Intel does not yet have such graphics cards in its portfolio. Nevertheless, conventional consumer graphics cards can also be used for rendering tasks. The results of the SPECviewperf show a clear performance gain of 22 percent compared to the Intel Arc A580. Compared to Nvidia, the Intel Arc B580 achieves the performance of a GeForce RTX 4060. AMD is known to perform excellently in this discipline. Even an AMD Radeon RX 7600 can outperform our test sample by a whopping 64 percentage points. For use in a productive environment, however, we recommend the use of a special workstation graphics card in order to achieve the best possible performance.
| Intel Arc B580 i9-14900K | Intel Arc A770 R9 7950X | Intel Arc A750 R9 7950X | Intel Arc A580 i9-14900K | NVIDIA GeForce RTX 4060 R9 7950X | AMD Radeon RX 7600 R9 7950X | NVIDIA GeForce RTX 3060 Ti R9 7950X | NVIDIA GeForce RTX 4070 R9 7950X | AMD Radeon RX 7700 XT R9 7950X | AMD Radeon RX 6700 XT R9 7950X | NVIDIA Titan RTX i9-14900K | NVIDIA RTX A6000 TR Pro 3975WX | Average of class | |
|---|---|---|---|---|---|---|---|---|---|---|---|---|---|
| SPECviewperf 2020 | -6% | -5% | -22% | 5% | 64% | 15% | 65% | 129% | 68% | 62% | 99% | 34% | |
| 3840x2160 Medical (medical-03) (fps) | 19.3 | 22.3 16% | 20 4% | 14.5 -25% | 13.7 -29% | 36.1 87% | 11.9 -38% | 22.2 15% | 56.2 191% | 30.1 56% | 17.7 -8% | 37.9 96% | 24 ? 24% |
| 3840x2160 Maya (maya-06) (fps) | 205 | 195 -5% | 180 -12% | 166 -19% | 196 -4% | 178 -13% | 235 15% | 305 49% | 261 27% | 258 26% | 279 36% | 329 60% | 220 ? 7% |
| 3840x2160 Energy (energy-03) (fps) | 26.4 | 25 -5% | 35 33% | 17.6 -33% | 33.2 26% | 67 154% | 31.2 18% | 57.6 118% | 95 260% | 52.2 98% | 57.6 118% | 63 139% | 50 ? 89% |
| 3840x2160 Creo (creo-03) (fps) | 53.1 | 52.9 0% | 51.9 -2% | 51.7 -3% | 85.9 62% | 106 100% | 91.2 72% | 112 111% | 130 145% | 123 132% | 111 109% | 78.2 ? 47% | |
| 3840x2160 CATIA (catia-06) (fps) | 46.4 | 38.9 -16% | 38.9 -16% | 36.7 -21% | 34 -27% | 68 47% | 40.5 -13% | 51.6 11% | 88.8 91% | 77.2 66% | 85.5 84% | 82.4 78% | 48.9 ? 5% |
| 3840x2160 3ds Max (3dsmax-07) (fps) | 65.6 | 47.4 -28% | 40.7 -38% | 45.2 -31% | 67.4 3% | 72.9 11% | 87 33% | 122 86% | 106 62% | 85.4 30% | 118 80% | 137 109% | 84.8 ? 29% |
Gaming performance
The Intel Arc B580 Limited Edition is primarily aimed at gamers who require smooth frame rates in Full HD (1,080p). The new Battlemage graphics card from Intel basically achieves this, although the performance of the latest games demands a lot from the graphics card. The use of the 12 GB VRAM is good and during our tests, we could always see that it was being used. More and more games require more than 8 GB of VRAM, even in 1,080p, which benefits the Intel Arc B580 Limited Edition. If the VRAM is no longer sufficient, the frame rates drop dramatically. Here, Intel has a huge advantage over the Nvidia GeForce RTX 4060 or the AMD Radeon RX 7600. Meanwhile, the competitors have more VRAM, for example with an Nvidia GeForce RTX 4060 Ti or the AMD Radeon RX 7700 XT, which are also significantly more expensive.
In the performance class that Intel is targeting here with the Arc B580 Limited Edition, the graphics card delivers impressive performance. In most cases, the performance of the Nvidia GeForce RTX 4060 Ti cannot quite be matched, but that is not a bad thing.
However, the Intel Arc B580 Limited Edition is not without its problems. We had sporadic crashes in some games, which sent us back to the desktop. Fortunately, this problem was only rarely the case and we were able to continue the benchmarks after restarting the game. Other games cannot utilize the performance of the graphics card, as can be seen in the example of Uncharted Legacy of Thieves Collection. The comparison with Intel graphics cards based on the Alchemist architecture shows that this is not a fundamental problem with Arc graphics cards. We assume that Intel will make improvements here in future driver updates.
| GRID Legends | |
| 2560x1440 Ultra Preset | |
| AMD Radeon RX 6800 (643827) | |
| KFA2 GeForce RTX 3070 Ti SG (643827) | |
| AMD Radeon RX 7800 XT (800660) | |
| KFA2 GeForce RTX 4070 EX Gamer (712825) | |
| Sapphire Pulse Radeon RX 6750 XT (712825) | |
| ASUS Dual GeForce RTX 4060 Ti OC (800660) | |
| KFA2 GeForce RTX 4060 Ti EX, 16GB GDDR6 (800660) | |
| Nvidia GeForce RTX 3060 Ti FE (591708) | |
| XFX Speedster QICK 308 Radeon RX 7600 Black Edition (800660) | |
| Sapphire Nitro+ Radeon RX 6650 XT (643827) | |
| Intel Arc B580 (800660) | |
| Nvidia GeForce RTX 2070 Super (591708) | |
| Nvidia GeForce RTX 2060 Super (623651) | |
| Sapphire Pulse Radeon RX 6600 (683088) | |
| Acer Predator BiFrost Arc A770 OC, 16GB GDDR6 (800660) | |
| Acer Predator BiFrost Arc A750 OC (800660) | |
| ASRock Arc A580 Challenger OC (800660) | |
| KFA2 GeForce GTX 1660 Super (623651) | |
| PNY GeForce GTX 1660 (623651) | |
| 1920x1080 Ultra Preset | |
| AMD Radeon RX 6800 (643827) | |
| KFA2 GeForce RTX 4070 EX Gamer (712825) | |
| Sapphire Pulse Radeon RX 6750 XT (712825) | |
| AMD Radeon RX 7800 XT (800660) | |
| KFA2 GeForce RTX 3070 Ti SG (643827) | |
| Nvidia GeForce RTX 3060 Ti FE (591708) | |
| Sapphire Nitro+ Radeon RX 6650 XT (643827) | |
| ASUS Dual GeForce RTX 4060 Ti OC (800660) | |
| KFA2 GeForce RTX 4060 Ti EX, 16GB GDDR6 (800660) | |
| XFX Speedster QICK 308 Radeon RX 7600 Black Edition (800660) | |
| Nvidia GeForce RTX 2070 Super (591708) | |
| Intel Arc B580 (800660) | |
| Sapphire Pulse Radeon RX 6600 (683088) | |
| Nvidia GeForce RTX 2060 Super (623651) | |
| KFA2 GeForce GTX 1660 Super (623651) | |
| Acer Predator BiFrost Arc A770 OC, 16GB GDDR6 (800660) | |
| Acer Predator BiFrost Arc A750 OC (800660) | |
| PNY GeForce GTX 1660 (623651) | |
| ASRock Arc A580 Challenger OC (800660) | |
| Final Fantasy XV Benchmark | |
| 1920x1080 High Quality | |
| KFA2 GeForce RTX 4070 EX Gamer (1.3) | |
| AMD Radeon RX 7800 XT (1.3) | |
| AMD Radeon RX 6800 (1.3) | |
| KFA2 GeForce RTX 3070 Ti SG (1.3) | |
| ASUS Dual GeForce RTX 4060 Ti OC (1.3) | |
| Sapphire Pulse Radeon RX 6750 XT (1.3) | |
| Nvidia GeForce RTX 3060 Ti FE (1.3) | |
| KFA2 GeForce RTX 4060 Ti EX, 16GB GDDR6 (1.3) | |
| Intel Arc B580 (1.3) | |
| Nvidia GeForce RTX 2070 Super (1.3) | |
| XFX Speedster QICK 308 Radeon RX 7600 Black Edition (1.3) | |
| Sapphire Nitro+ Radeon RX 6650 XT (1.3) | |
| Nvidia GeForce RTX 2060 Super (1.3) | |
| Sapphire Pulse Radeon RX 6600 (1.3) | |
| KFA2 GeForce GTX 1660 Super (1.3) | |
| PNY GeForce GTX 1660 (1.3) | |
| Acer Predator BiFrost Arc A770 OC, 16GB GDDR6 (1.3) | |
| Acer Predator BiFrost Arc A750 OC (1.3) | |
| 2560x1440 High Quality | |
| KFA2 GeForce RTX 4070 EX Gamer (1.3) | |
| AMD Radeon RX 7800 XT (1.3) | |
| AMD Radeon RX 6800 (1.3) | |
| KFA2 GeForce RTX 3070 Ti SG (1.3) | |
| ASUS Dual GeForce RTX 4060 Ti OC (1.3) | |
| Sapphire Pulse Radeon RX 6750 XT (1.3) | |
| Nvidia GeForce RTX 3060 Ti FE (1.3) | |
| KFA2 GeForce RTX 4060 Ti EX, 16GB GDDR6 (1.3) | |
| Intel Arc B580 (1.3) | |
| Nvidia GeForce RTX 2070 Super (1.3) | |
| XFX Speedster QICK 308 Radeon RX 7600 Black Edition (1.3) | |
| Sapphire Nitro+ Radeon RX 6650 XT (1.3) | |
| Nvidia GeForce RTX 2060 Super (1.3) | |
| Sapphire Pulse Radeon RX 6600 (1.3) | |
| KFA2 GeForce GTX 1660 Super (1.3) | |
| Acer Predator BiFrost Arc A770 OC, 16GB GDDR6 (1.3) | |
| Acer Predator BiFrost Arc A750 OC (1.3) | |
| PNY GeForce GTX 1660 (1.3) | |
| F1 23 | |
| 1920x1080 Ultra High Preset AA:T AF:16x | |
| KFA2 GeForce RTX 4070 EX Gamer | |
| AMD Radeon RX 7800 XT (1022189) | |
| KFA2 GeForce GTX 1660 Super (1016022) | |
| ASUS Dual GeForce RTX 4060 Ti OC (1012607) | |
| KFA2 GeForce RTX 4060 Ti EX, 16GB GDDR6 (1022189) | |
| PNY GeForce GTX 1660 (1016022) | |
| Intel Arc B580 (1093534) | |
| Nvidia GeForce RTX 3060 Ti FE (1021115) | |
| AMD Radeon RX 6800 (1016022) | |
| Acer Predator BiFrost Arc A770 OC, 16GB GDDR6 (1026791) | |
| Sapphire Pulse Radeon RX 6750 XT (1016022) | |
| Acer Predator BiFrost Arc A750 OC (1042581) | |
| Nvidia GeForce RTX 2070 Super (1021115) | |
| XFX Speedster QICK 308 Radeon RX 7600 Black Edition (1016022) | |
| ASRock Arc A580 Challenger OC (1082038) | |
| Nvidia GeForce RTX 2060 Super (1021115) | |
| Sapphire Nitro+ Radeon RX 6650 XT (1016022) | |
| Sapphire Pulse Radeon RX 6600 (1016022) | |
| 2560x1440 Ultra High Preset AA:T AF:16x | |
| KFA2 GeForce RTX 4070 EX Gamer | |
| KFA2 GeForce GTX 1660 Super (1016022) | |
| PNY GeForce GTX 1660 (1016022) | |
| AMD Radeon RX 7800 XT (1022189) | |
| ASUS Dual GeForce RTX 4060 Ti OC (1012607) | |
| KFA2 GeForce RTX 4060 Ti EX, 16GB GDDR6 (1022189) | |
| Intel Arc B580 (1093534) | |
| Nvidia GeForce RTX 3060 Ti FE (1021115) | |
| Acer Predator BiFrost Arc A770 OC, 16GB GDDR6 (1026791) | |
| AMD Radeon RX 6800 (1016022) | |
| Sapphire Pulse Radeon RX 6750 XT (1016022) | |
| Acer Predator BiFrost Arc A750 OC (1042581) | |
| Nvidia GeForce RTX 2070 Super (1021115) | |
| XFX Speedster QICK 308 Radeon RX 7600 Black Edition (1016022) | |
| ASRock Arc A580 Challenger OC (1082038) | |
| Nvidia GeForce RTX 2060 Super (1021115) | |
| Sapphire Nitro+ Radeon RX 6650 XT (1016022) | |
| Sapphire Pulse Radeon RX 6600 (1016022) | |
| Lords of the Fallen | |
| 1920x1080 Ultra Preset | |
| Acer Predator BiFrost Arc A770 OC, 16GB GDDR6 | |
| Intel Arc B580 | |
| AMD Radeon RX 6800 | |
| Sapphire Pulse Radeon RX 6750 XT | |
| Nvidia GeForce RTX 3060 Ti FE | |
| ASRock Arc A580 Challenger OC | |
| XFX Speedster QICK 308 Radeon RX 7600 Black Edition | |
| Nvidia GeForce RTX 2070 Super | |
| Acer Predator BiFrost Arc A750 OC | |
| Sapphire Nitro+ Radeon RX 6650 XT | |
| Nvidia GeForce RTX 2060 Super | |
| Sapphire Pulse Radeon RX 6600 | |
| KFA2 GeForce GTX 1660 Super | |
| PNY GeForce GTX 1660 | |
| 2560x1440 Ultra Preset | |
| Acer Predator BiFrost Arc A770 OC, 16GB GDDR6 | |
| Intel Arc B580 | |
| AMD Radeon RX 6800 | |
| Nvidia GeForce RTX 3060 Ti FE | |
| ASRock Arc A580 Challenger OC | |
| Sapphire Pulse Radeon RX 6750 XT | |
| Acer Predator BiFrost Arc A750 OC | |
| XFX Speedster QICK 308 Radeon RX 7600 Black Edition | |
| Nvidia GeForce RTX 2070 Super | |
| Sapphire Nitro+ Radeon RX 6650 XT | |
| Nvidia GeForce RTX 2060 Super | |
| Sapphire Pulse Radeon RX 6600 | |
| KFA2 GeForce GTX 1660 Super | |
| PNY GeForce GTX 1660 | |
| Resident Evil 4 Remake | |
| 1920x1080 Max Preset | |
| AMD Radeon RX 7800 XT | |
| KFA2 GeForce RTX 4070 EX Gamer | |
| AMD Radeon RX 6800 | |
| ASUS Dual GeForce RTX 4060 Ti OC | |
| KFA2 GeForce RTX 4060 Ti EX, 16GB GDDR6 | |
| Sapphire Pulse Radeon RX 6750 XT | |
| Intel Arc B580 | |
| Acer Predator BiFrost Arc A770 OC, 16GB GDDR6 | |
| Acer Predator BiFrost Arc A750 OC | |
| XFX Speedster QICK 308 Radeon RX 7600 Black Edition | |
| ASRock Arc A580 Challenger OC | |
| Sapphire Pulse Radeon RX 6600 | |
| KFA2 GeForce GTX 1660 Super | |
| PNY GeForce GTX 1660 | |
| 2560x1440 Max Preset | |
| AMD Radeon RX 7800 XT | |
| KFA2 GeForce RTX 4070 EX Gamer | |
| AMD Radeon RX 6800 | |
| ASUS Dual GeForce RTX 4060 Ti OC | |
| KFA2 GeForce RTX 4060 Ti EX, 16GB GDDR6 | |
| Sapphire Pulse Radeon RX 6750 XT | |
| Intel Arc B580 | |
| Acer Predator BiFrost Arc A770 OC, 16GB GDDR6 | |
| XFX Speedster QICK 308 Radeon RX 7600 Black Edition | |
| Acer Predator BiFrost Arc A750 OC | |
| ASRock Arc A580 Challenger OC | |
| Sapphire Pulse Radeon RX 6600 | |
| KFA2 GeForce GTX 1660 Super | |
| PNY GeForce GTX 1660 | |
Rough average values are all well and good, but a look at the P1 values shows more precisely whether a game runs smoothly or not. Here too, the Intel Arc B580 Limited Edition can benefit from the ample VRAM and translate this into good P1 values. However, this also requires good support from the graphics card. Without the negative outliers, our test sample can clearly distinguish itself from the two main competitors (Nvidia GeForce RTX 4060 and AMD Radeon RX 7600).
Performance rating Intel Arc B580 Limited Edition
Ray tracing performance
Intel's Arc graphics cards also support ray tracing on the hardware side. The Arc B580 is equipped with 20 ray accelerators, which deliver quite good performance in practice. Compared to an Intel Arc A770 the number of ray accelerators is significantly lower. Nevertheless, the performance with activated ray tracing is often even better than the previous top model from Intel. Compared to Nvidia and AMD, Intel can keep up well. However, too much should not be expected at this point, as ray tracing may cost a lot of performance.
| Spider-Man Miles Morales - 1920x0180 Very High Preset + Ray-Tracing AA:T | |
| KFA2 GeForce RTX 4070 EX Gamer | |
| AMD Radeon RX 7800 XT | |
| Intel Arc B580 | |
| KFA2 GeForce RTX 3070 Ti SG | |
| KFA2 GeForce RTX 4060 Ti EX, 16GB GDDR6 | |
| ASUS Dual GeForce RTX 4060 Ti OC | |
| AMD Radeon RX 6800 | |
| Nvidia GeForce RTX 3060 Ti FE | |
| Acer Predator BiFrost Arc A770 OC, 16GB GDDR6 | |
| Sapphire Pulse Radeon RX 6750 XT | |
| Nvidia GeForce RTX 2070 Super | |
| ASRock Arc A580 Challenger OC | |
| XFX Speedster QICK 308 Radeon RX 7600 Black Edition | |
| Acer Predator BiFrost Arc A750 OC | |
| Nvidia GeForce RTX 2060 Super | |
| Sapphire Nitro+ Radeon RX 6650 XT | |
| Sapphire Pulse Radeon RX 6600 | |
| Metro Exodus - 1920x1080 Ultra Quality DXR AF:16x | |
| KFA2 GeForce RTX 4070 EX Gamer | |
| AMD Radeon RX 7800 XT | |
| KFA2 GeForce RTX 3070 Ti SG | |
| ASUS Dual GeForce RTX 4060 Ti OC | |
| KFA2 GeForce RTX 4060 Ti EX, 16GB GDDR6 | |
| Nvidia GeForce RTX 3060 Ti FE | |
| Acer Predator BiFrost Arc A770 OC, 16GB GDDR6 | |
| Sapphire Pulse Radeon RX 6750 XT | |
| Acer Predator BiFrost Arc A750 OC | |
| Intel Arc B580 | |
| XFX Speedster QICK 308 Radeon RX 7600 Black Edition | |
| Nvidia GeForce RTX 2070 Super | |
| ASRock Arc A580 Challenger OC | |
| Nvidia GeForce RTX 2060 Super | |
| Sapphire Pulse Radeon RX 6600 | |
| Far Cry 6 - 1920x1080 Ultra Graphics Quality + HD Textures + DXR AA:T | |
| KFA2 GeForce RTX 4070 EX Gamer | |
| AMD Radeon RX 7800 XT | |
| AMD Radeon RX 6800 | |
| KFA2 GeForce RTX 4060 Ti EX, 16GB GDDR6 | |
| Sapphire Pulse Radeon RX 6750 XT | |
| Acer Predator BiFrost Arc A770 OC, 16GB GDDR6 | |
| Intel Arc B580 | |
| Acer Predator BiFrost Arc A750 OC | |
| ASRock Arc A580 Challenger OC | |
| XFX Speedster QICK 308 Radeon RX 7600 Black Edition | |
| KFA2 GeForce RTX 3070 Ti SG | |
| Nvidia GeForce RTX 2070 Super | |
| Nvidia GeForce RTX 2060 Super | |
| Cyberpunk 2077 1.6 - 1920x1080 Ray Tracing Ultra Preset (DLSS off) | |
| KFA2 GeForce RTX 4070 EX Gamer | |
| Intel Arc B580 (1.6) | |
| KFA2 GeForce RTX 4060 Ti EX, 16GB GDDR6 (1.6) | |
| ASUS Dual GeForce RTX 4060 Ti OC (1.6) | |
| KFA2 GeForce RTX 3070 Ti SG (1.61) | |
| AMD Radeon RX 7800 XT (1.6) | |
| Nvidia GeForce RTX 3060 Ti FE (1.5) | |
| AMD Radeon RX 6800 (1.61) | |
| Nvidia GeForce RTX 2070 Super (1.6) | |
| Acer Predator BiFrost Arc A770 OC, 16GB GDDR6 (1.6) | |
| Sapphire Pulse Radeon RX 6750 XT | |
| Acer Predator BiFrost Arc A750 OC (1.6) | |
| Nvidia GeForce RTX 2060 Super (1.6) | |
| ASRock Arc A580 Challenger OC (1.6) | |
| XFX Speedster QICK 308 Radeon RX 7600 Black Edition (1.6) | |
| Sapphire Nitro+ Radeon RX 6650 XT (1.5) | |
| The Callisto Protocol - 1920x1080 Ultra Preset (without FSR Upscaling) + Full Ray-Tracing | |
| AMD Radeon RX 7800 XT | |
| ASUS Dual GeForce RTX 4060 Ti OC | |
| KFA2 GeForce RTX 4060 Ti EX, 16GB GDDR6 | |
| Nvidia GeForce RTX 3060 Ti FE | |
| KFA2 GeForce RTX 4070 EX Gamer | |
| AMD Radeon RX 6800 | |
| XFX Speedster QICK 308 Radeon RX 7600 Black Edition | |
| KFA2 GeForce RTX 3070 Ti SG | |
| Acer Predator BiFrost Arc A770 OC, 16GB GDDR6 | |
| Intel Arc B580 | |
| Acer Predator BiFrost Arc A750 OC | |
| ASRock Arc A580 Challenger OC | |
| Sapphire Nitro+ Radeon RX 6650 XT | |
| Nvidia GeForce RTX 2070 Super | |
| Sapphire Pulse Radeon RX 6600 | |
| Nvidia GeForce RTX 2060 Super | |
| Sapphire Pulse Radeon RX 6750 XT | |
| PNY GeForce GTX 1660 | |
| KFA2 GeForce GTX 1660 Super | |
| Guardians of the Galaxy - 1920x1080 Ultra Preset + Ultra Ray-Tracing | |
| KFA2 GeForce RTX 4070 EX Gamer | |
| ASUS Dual GeForce RTX 4060 Ti OC | |
| KFA2 GeForce RTX 4060 Ti EX, 16GB GDDR6 | |
| AMD Radeon RX 7800 XT | |
| Nvidia GeForce RTX 3060 Ti FE | |
| Intel Arc B580 | |
| Nvidia GeForce RTX 2070 Super | |
| Sapphire Pulse Radeon RX 6750 XT | |
| Acer Predator BiFrost Arc A770 OC, 16GB GDDR6 | |
| Nvidia GeForce RTX 2060 Super | |
| Acer Predator BiFrost Arc A750 OC | |
| XFX Speedster QICK 308 Radeon RX 7600 Black Edition | |
| ASRock Arc A580 Challenger OC | |
| Sapphire Nitro+ Radeon RX 6650 XT | |
| Returnal - 1920x1080 Epic Preset + Epic Ray-Tracing | |
| KFA2 GeForce RTX 4070 EX Gamer | |
| AMD Radeon RX 7800 XT | |
| ASUS Dual GeForce RTX 4060 Ti OC | |
| KFA2 GeForce RTX 4060 Ti EX, 16GB GDDR6 | |
| Intel Arc B580 | |
| Nvidia GeForce RTX 3060 Ti FE | |
| AMD Radeon RX 6800 | |
| Nvidia GeForce RTX 2070 Super | |
| Sapphire Pulse Radeon RX 6750 XT | |
| Nvidia GeForce RTX 2060 Super | |
| XFX Speedster QICK 308 Radeon RX 7600 Black Edition | |
| Acer Predator BiFrost Arc A770 OC, 16GB GDDR6 | |
| Acer Predator BiFrost Arc A750 OC | |
| Sapphire Nitro+ Radeon RX 6650 XT | |
| ASRock Arc A580 Challenger OC | |
| F1 23 - 1920x1080 Ultra High Preset AA:T AF:16x | |
| KFA2 GeForce RTX 4070 EX Gamer | |
| AMD Radeon RX 7800 XT (1022189) | |
| KFA2 GeForce GTX 1660 Super (1016022) | |
| ASUS Dual GeForce RTX 4060 Ti OC (1012607) | |
| KFA2 GeForce RTX 4060 Ti EX, 16GB GDDR6 (1022189) | |
| PNY GeForce GTX 1660 (1016022) | |
| Intel Arc B580 (1093534) | |
| Nvidia GeForce RTX 3060 Ti FE (1021115) | |
| AMD Radeon RX 6800 (1016022) | |
| Acer Predator BiFrost Arc A770 OC, 16GB GDDR6 (1026791) | |
| Sapphire Pulse Radeon RX 6750 XT (1016022) | |
| Acer Predator BiFrost Arc A750 OC (1042581) | |
| Nvidia GeForce RTX 2070 Super (1021115) | |
| XFX Speedster QICK 308 Radeon RX 7600 Black Edition (1016022) | |
| ASRock Arc A580 Challenger OC (1082038) | |
| Nvidia GeForce RTX 2060 Super (1021115) | |
| Sapphire Nitro+ Radeon RX 6650 XT (1016022) | |
| Sapphire Pulse Radeon RX 6600 (1016022) | |
| Star Wars Jedi Survivor - 1920x1080 Epic Preset + Ray Tracing | |
| KFA2 GeForce RTX 4070 EX Gamer | |
| AMD Radeon RX 7800 XT | |
| KFA2 GeForce RTX 4060 Ti EX, 16GB GDDR6 | |
| AMD Radeon RX 6800 | |
| Nvidia GeForce RTX 3060 Ti FE | |
| ASUS Dual GeForce RTX 4060 Ti OC | |
| Sapphire Pulse Radeon RX 6750 XT | |
| Intel Arc B580 | |
| Nvidia GeForce RTX 2070 Super | |
| Acer Predator BiFrost Arc A770 OC, 16GB GDDR6 | |
| XFX Speedster QICK 308 Radeon RX 7600 Black Edition | |
| Sapphire Nitro+ Radeon RX 6650 XT | |
| Acer Predator BiFrost Arc A750 OC | |
| Nvidia GeForce RTX 2060 Super | |
| ASRock Arc A580 Challenger OC | |
| Sapphire Pulse Radeon RX 6600 | |
| Hogwarts Legacy - 1920x1080 Ultra Preset + Full Ray Tracing AA:High T | |
| KFA2 GeForce RTX 4070 EX Gamer | |
| KFA2 GeForce RTX 4060 Ti EX, 16GB GDDR6 | |
| ASUS Dual GeForce RTX 4060 Ti OC | |
| Nvidia GeForce RTX 3060 Ti FE | |
| AMD Radeon RX 6800 | |
| Intel Arc B580 | |
| Nvidia GeForce RTX 2070 Super | |
| Acer Predator BiFrost Arc A770 OC, 16GB GDDR6 | |
| Sapphire Pulse Radeon RX 6750 XT | |
| Nvidia GeForce RTX 2060 Super | |
| ASRock Arc A580 Challenger OC | |
| Sapphire Nitro+ Radeon RX 6650 XT | |
| Acer Predator BiFrost Arc A750 OC | |
| XFX Speedster QICK 308 Radeon RX 7600 Black Edition | |
| Ghostwire Tokyo - 1920x1080 Highest Settings + Maximum Ray Tracing | |
| KFA2 GeForce RTX 4070 EX Gamer | |
| AMD Radeon RX 7800 XT | |
| KFA2 GeForce RTX 4060 Ti EX, 16GB GDDR6 | |
| ASUS Dual GeForce RTX 4060 Ti OC | |
| Intel Arc B580 | |
| Nvidia GeForce RTX 3060 Ti FE | |
| Acer Predator BiFrost Arc A770 OC, 16GB GDDR6 | |
| Sapphire Pulse Radeon RX 6750 XT | |
| Acer Predator BiFrost Arc A750 OC | |
| Nvidia GeForce RTX 2070 Super | |
| XFX Speedster QICK 308 Radeon RX 7600 Black Edition | |
| ASRock Arc A580 Challenger OC | |
| Sapphire Nitro+ Radeon RX 6650 XT | |
| Nvidia GeForce RTX 2060 Super | |
| Sapphire Pulse Radeon RX 6600 | |
| Cyberpunk 2077 - 1920x1080 Ray Tracing Ultra Preset (DLSS off) | |
| Intel Arc B580 (2.2) | |
| AMD Radeon RX 6800 (2.02) | |
| Acer Predator BiFrost Arc A770 OC, 16GB GDDR6 (2.0) | |
| Acer Predator BiFrost Arc A750 OC (2.0) | |
| Sapphire Pulse Radeon RX 6750 XT (2.02) | |
| XFX Speedster QICK 308 Radeon RX 7600 Black Edition (2.02) | |
| ASRock Arc A580 Challenger OC (2.11) | |
| Sapphire Nitro+ Radeon RX 6650 XT (2.02) | |
| Sapphire Pulse Radeon RX 6600 (2.02) | |
Games tested with an Intel Arc B580 Limited Edition
| low | med. | high | ultra | QHD | 4K | |
|---|---|---|---|---|---|---|
| Alone in the Dark (2024) | 189.1 | 165.3 | 149.7 | 104.5 | 67.2 | 32.4 |
| F1 24 (2024) | 307 | 273 | 215 | 76.7 | 51.1 | 24.6 |
| The First Descendant (2024) | 121.6 | 99.9 | 80.6 | 68.8 | 47.9 | 28.1 |
| Black Myth: Wukong (2024) | 70 | 54 | 42 | 25 | 19 | 11 |
| Star Wars Outlaws (2024) | 57.9 | 52.9 | 44.1 | 36.5 | 26.5 | 14.5 |
| Space Marine 2 (2024) | 85.7 | 78.4 | 76.8 | 70.3 | 52.4 | 31.8 |
| Final Fantasy XVI (2024) | 59.7 | 57.1 | 48.7 | 45.9 | 37.2 | 17.8 |
| God of War Ragnarök (2024) | 123.1 | 104.3 | 88.4 | 81.5 | 62.8 | 33.8 |
| Until Dawn (2024) | 96.9 | 65.7 | 48.1 | 38.8 | 31.3 | 20.5 |
| Call of Duty Black Ops 6 (2024) | 93 | 87 | 62 | 59 | 42 | 25 |
| Stalker 2 (2024) | 67 | 58.6 | 50.7 | 43 | 33.2 | 20.4 |
| Indiana Jones and the Great Circle (2024) | 54 | 51.7 | 47.4 | 34.7 | 20.3 |
Emissions - Pleasantly quiet under load
Noise emissions
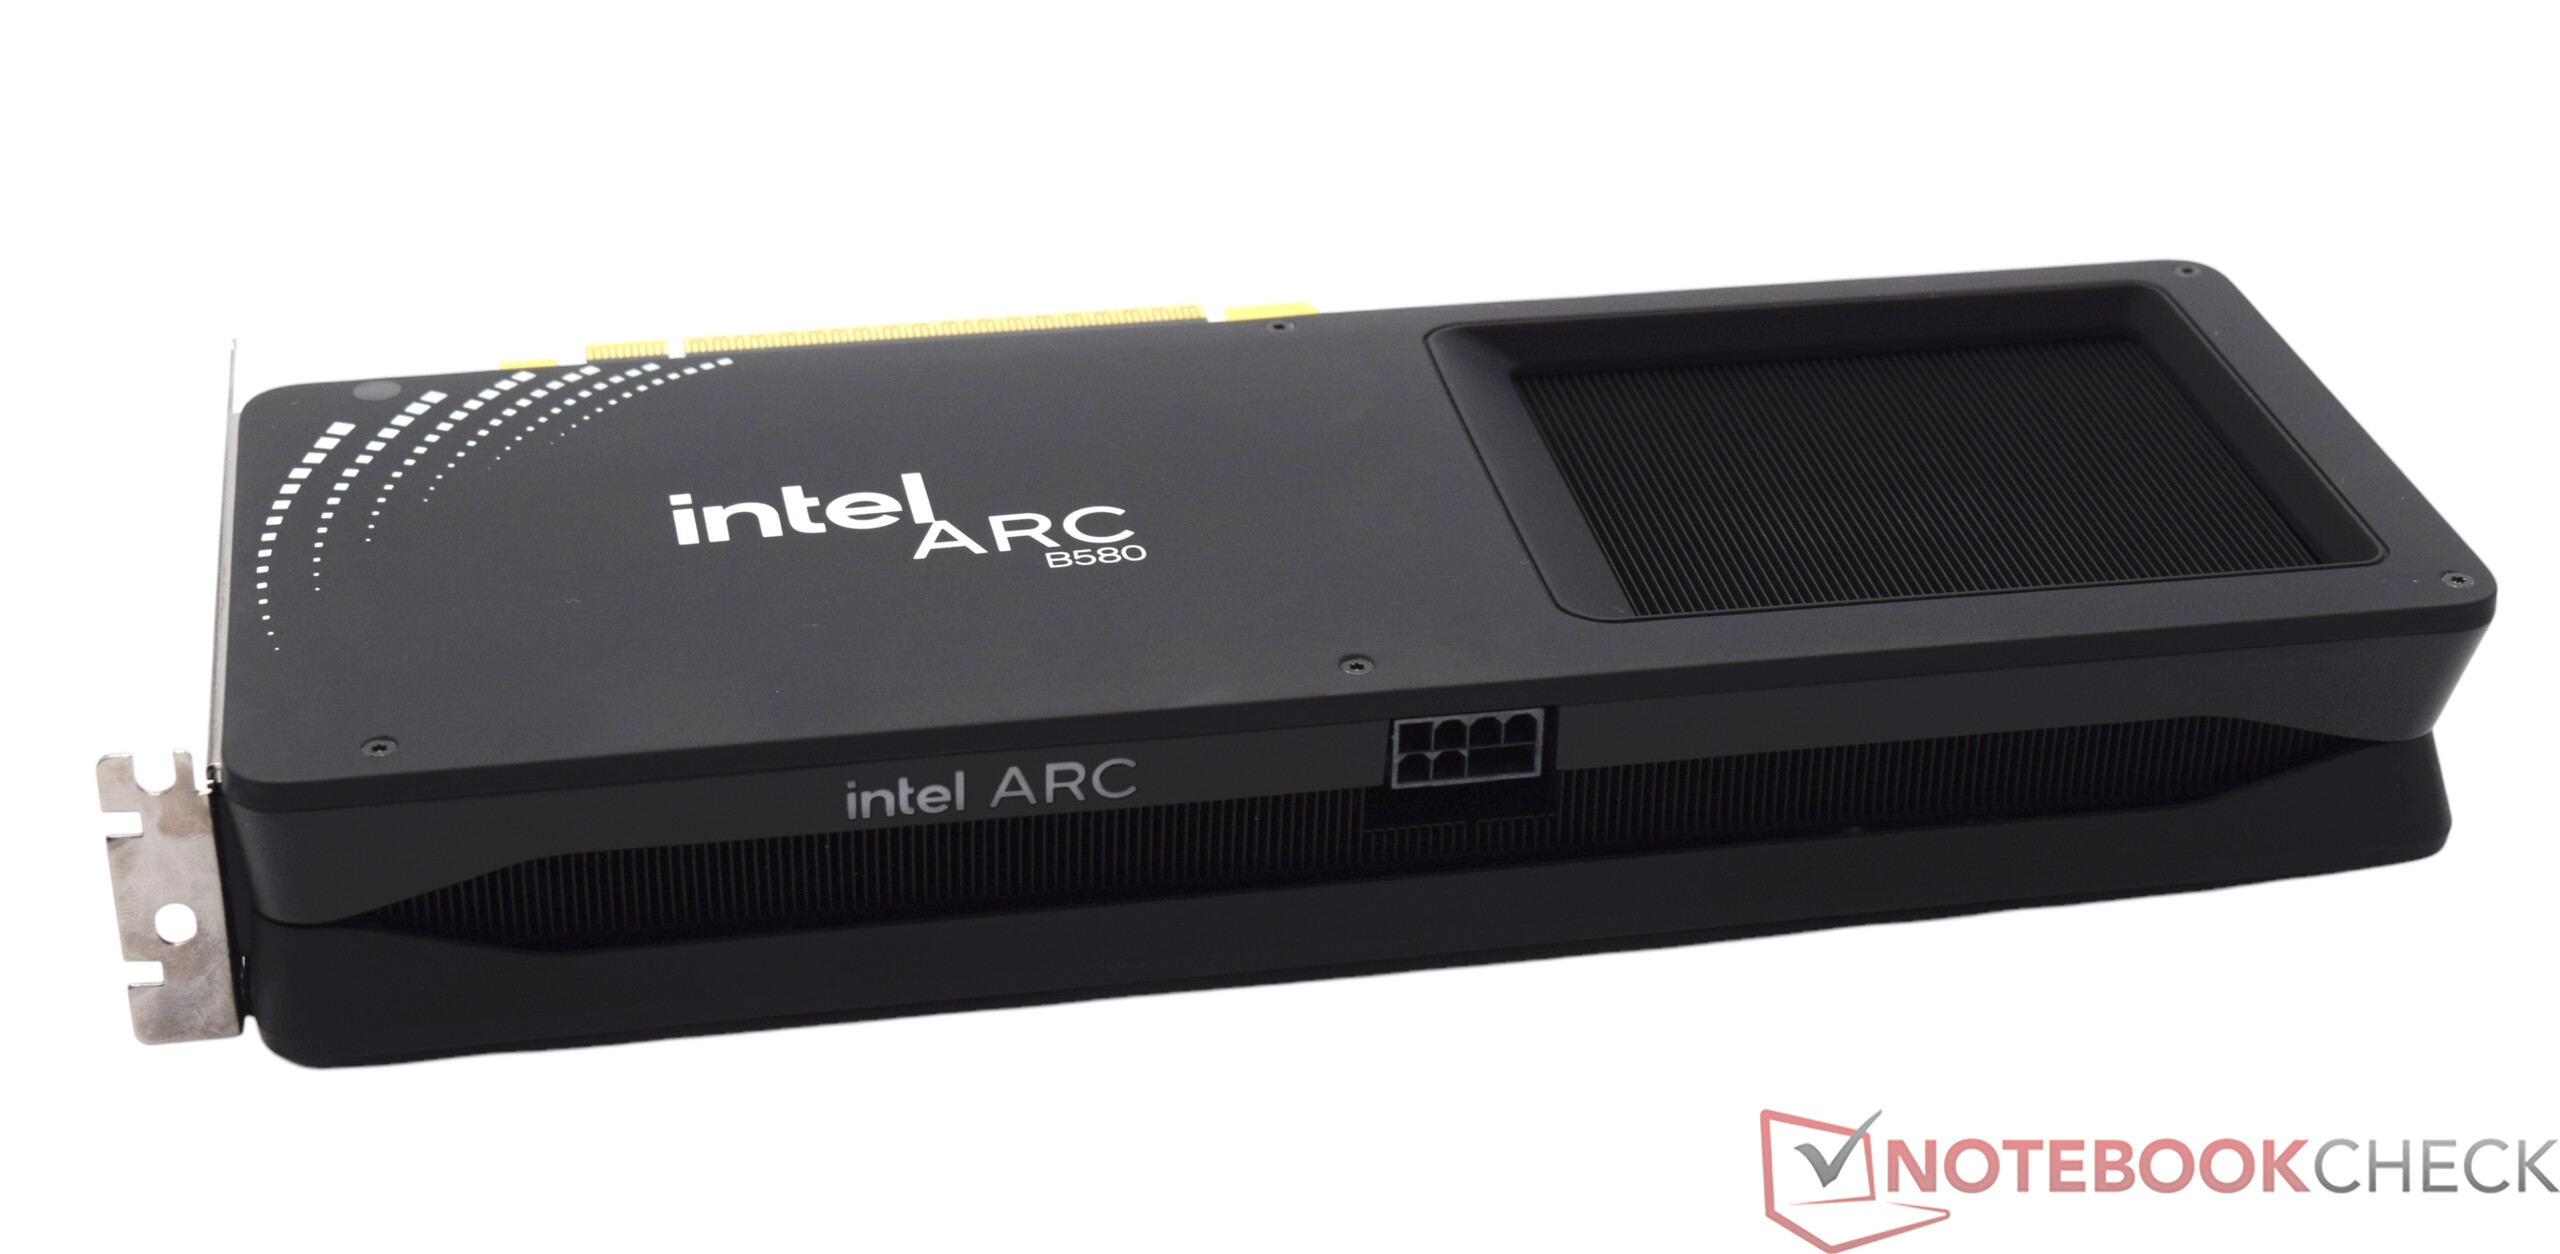
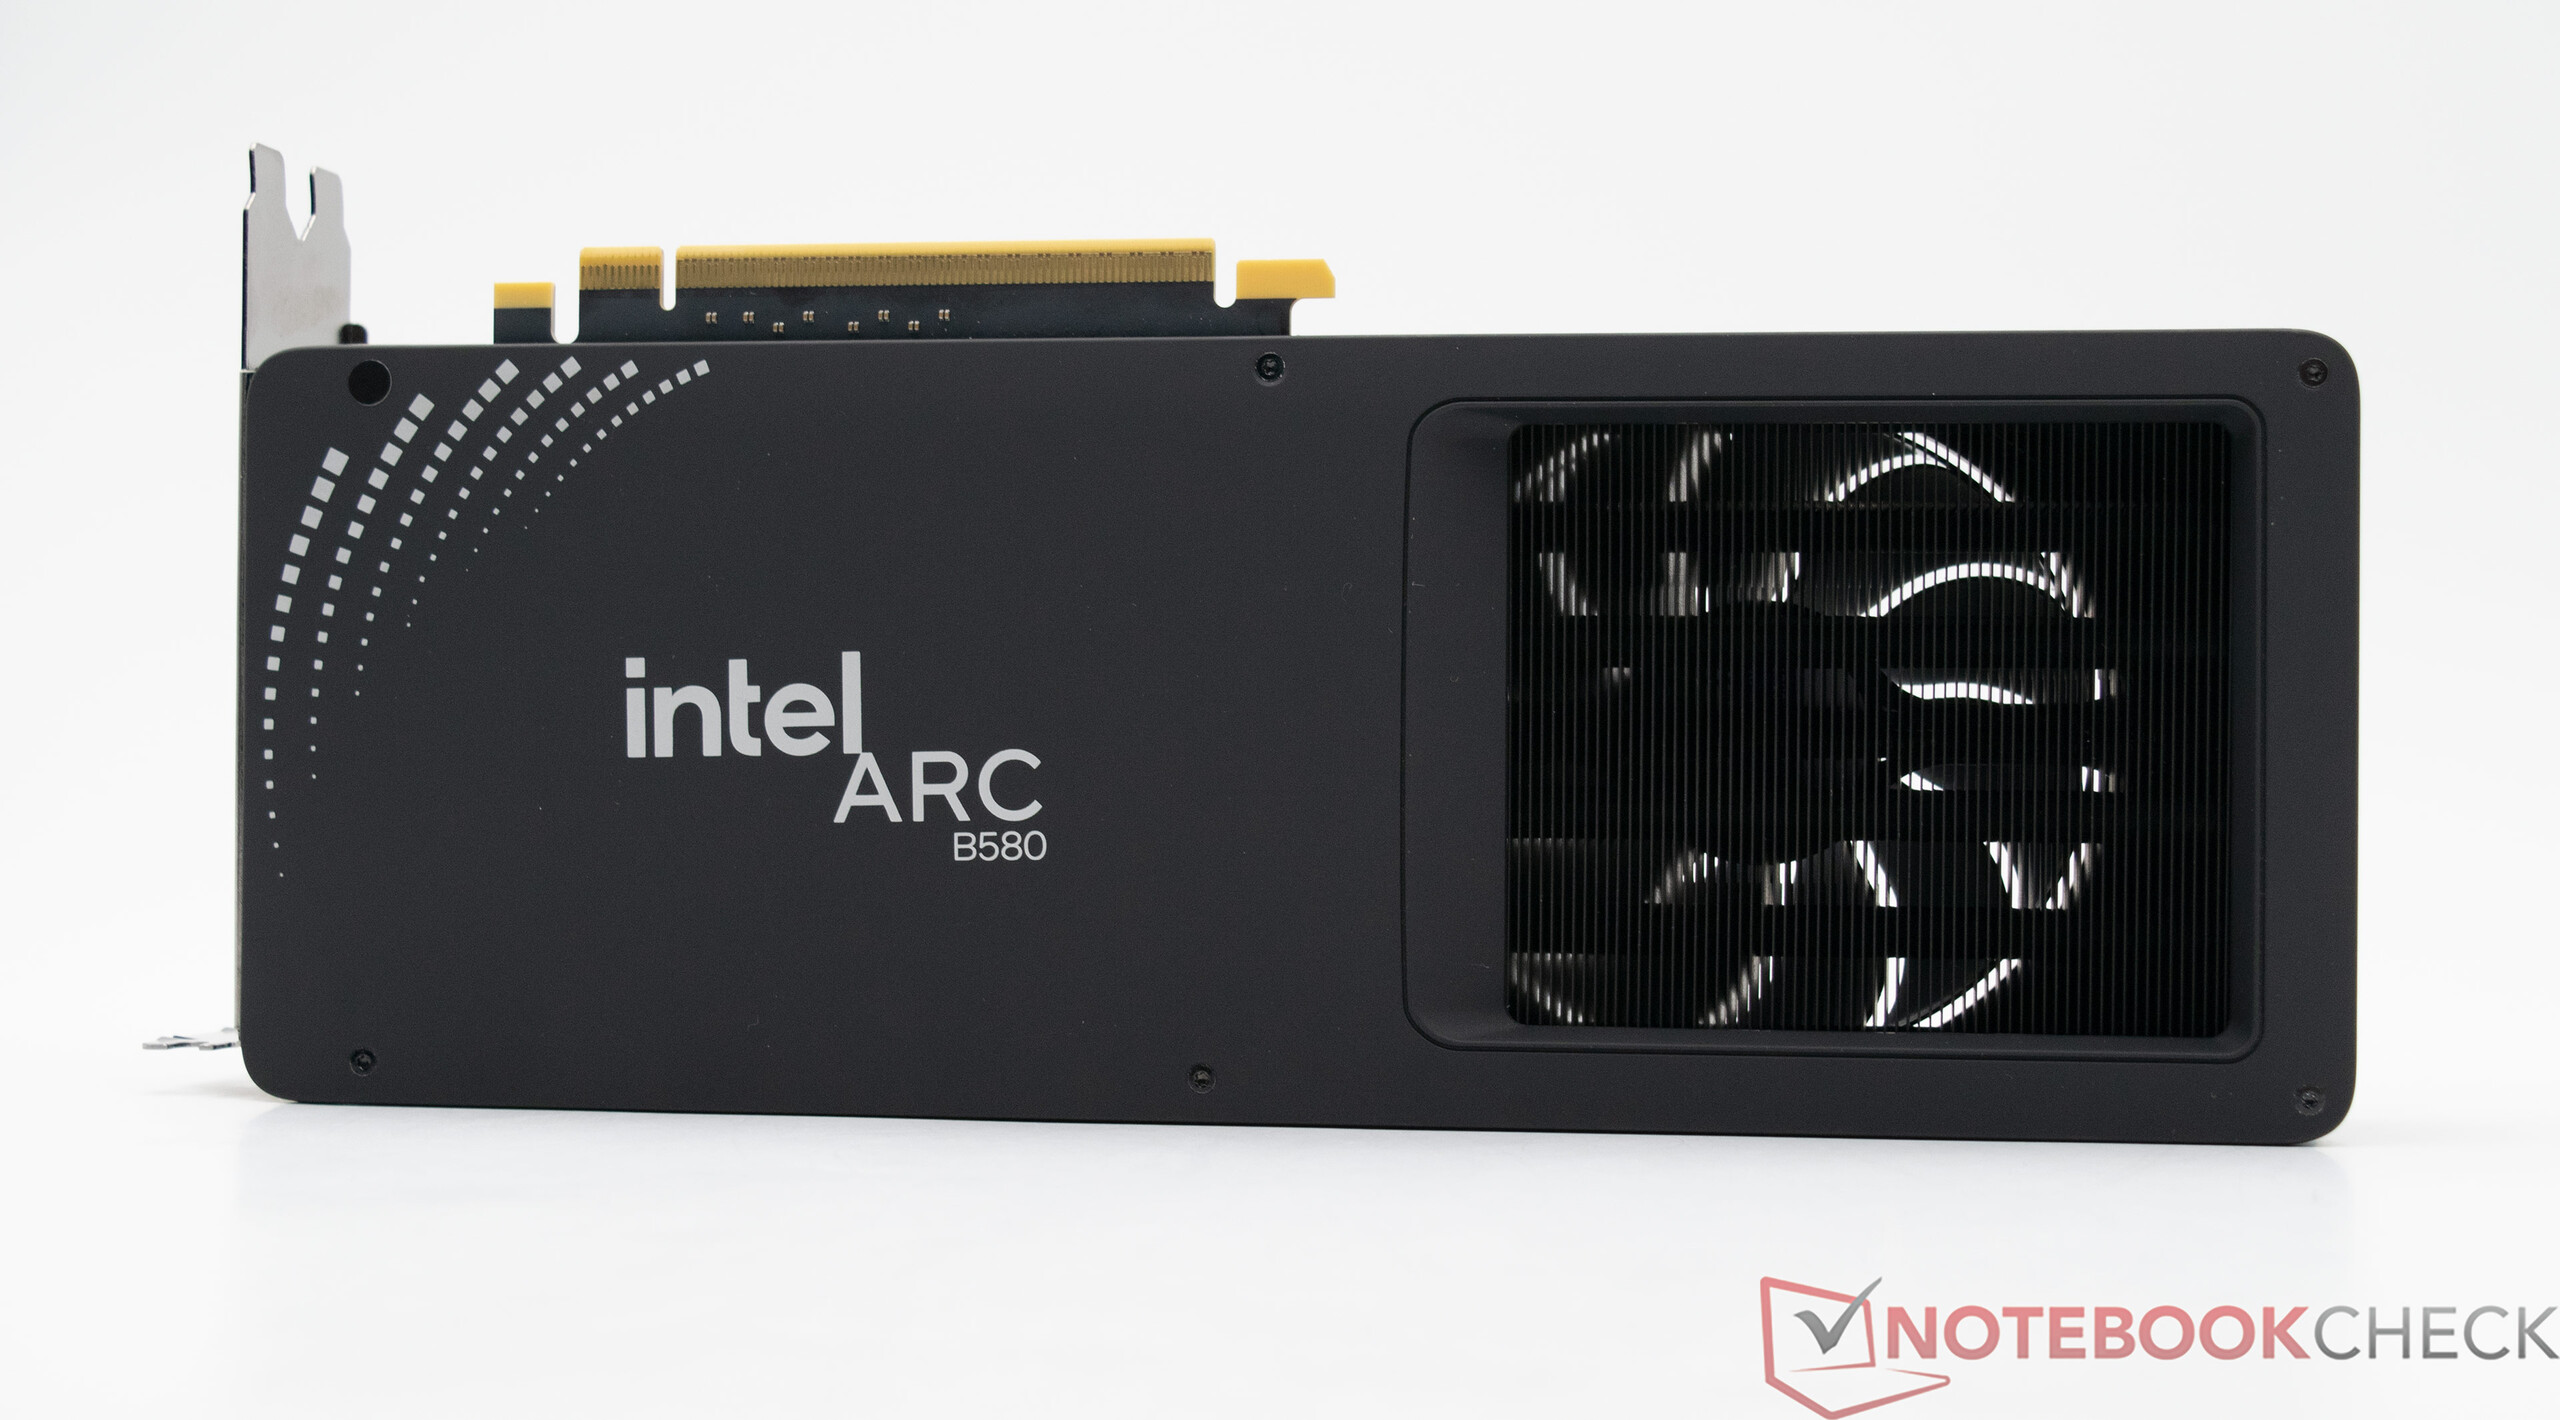
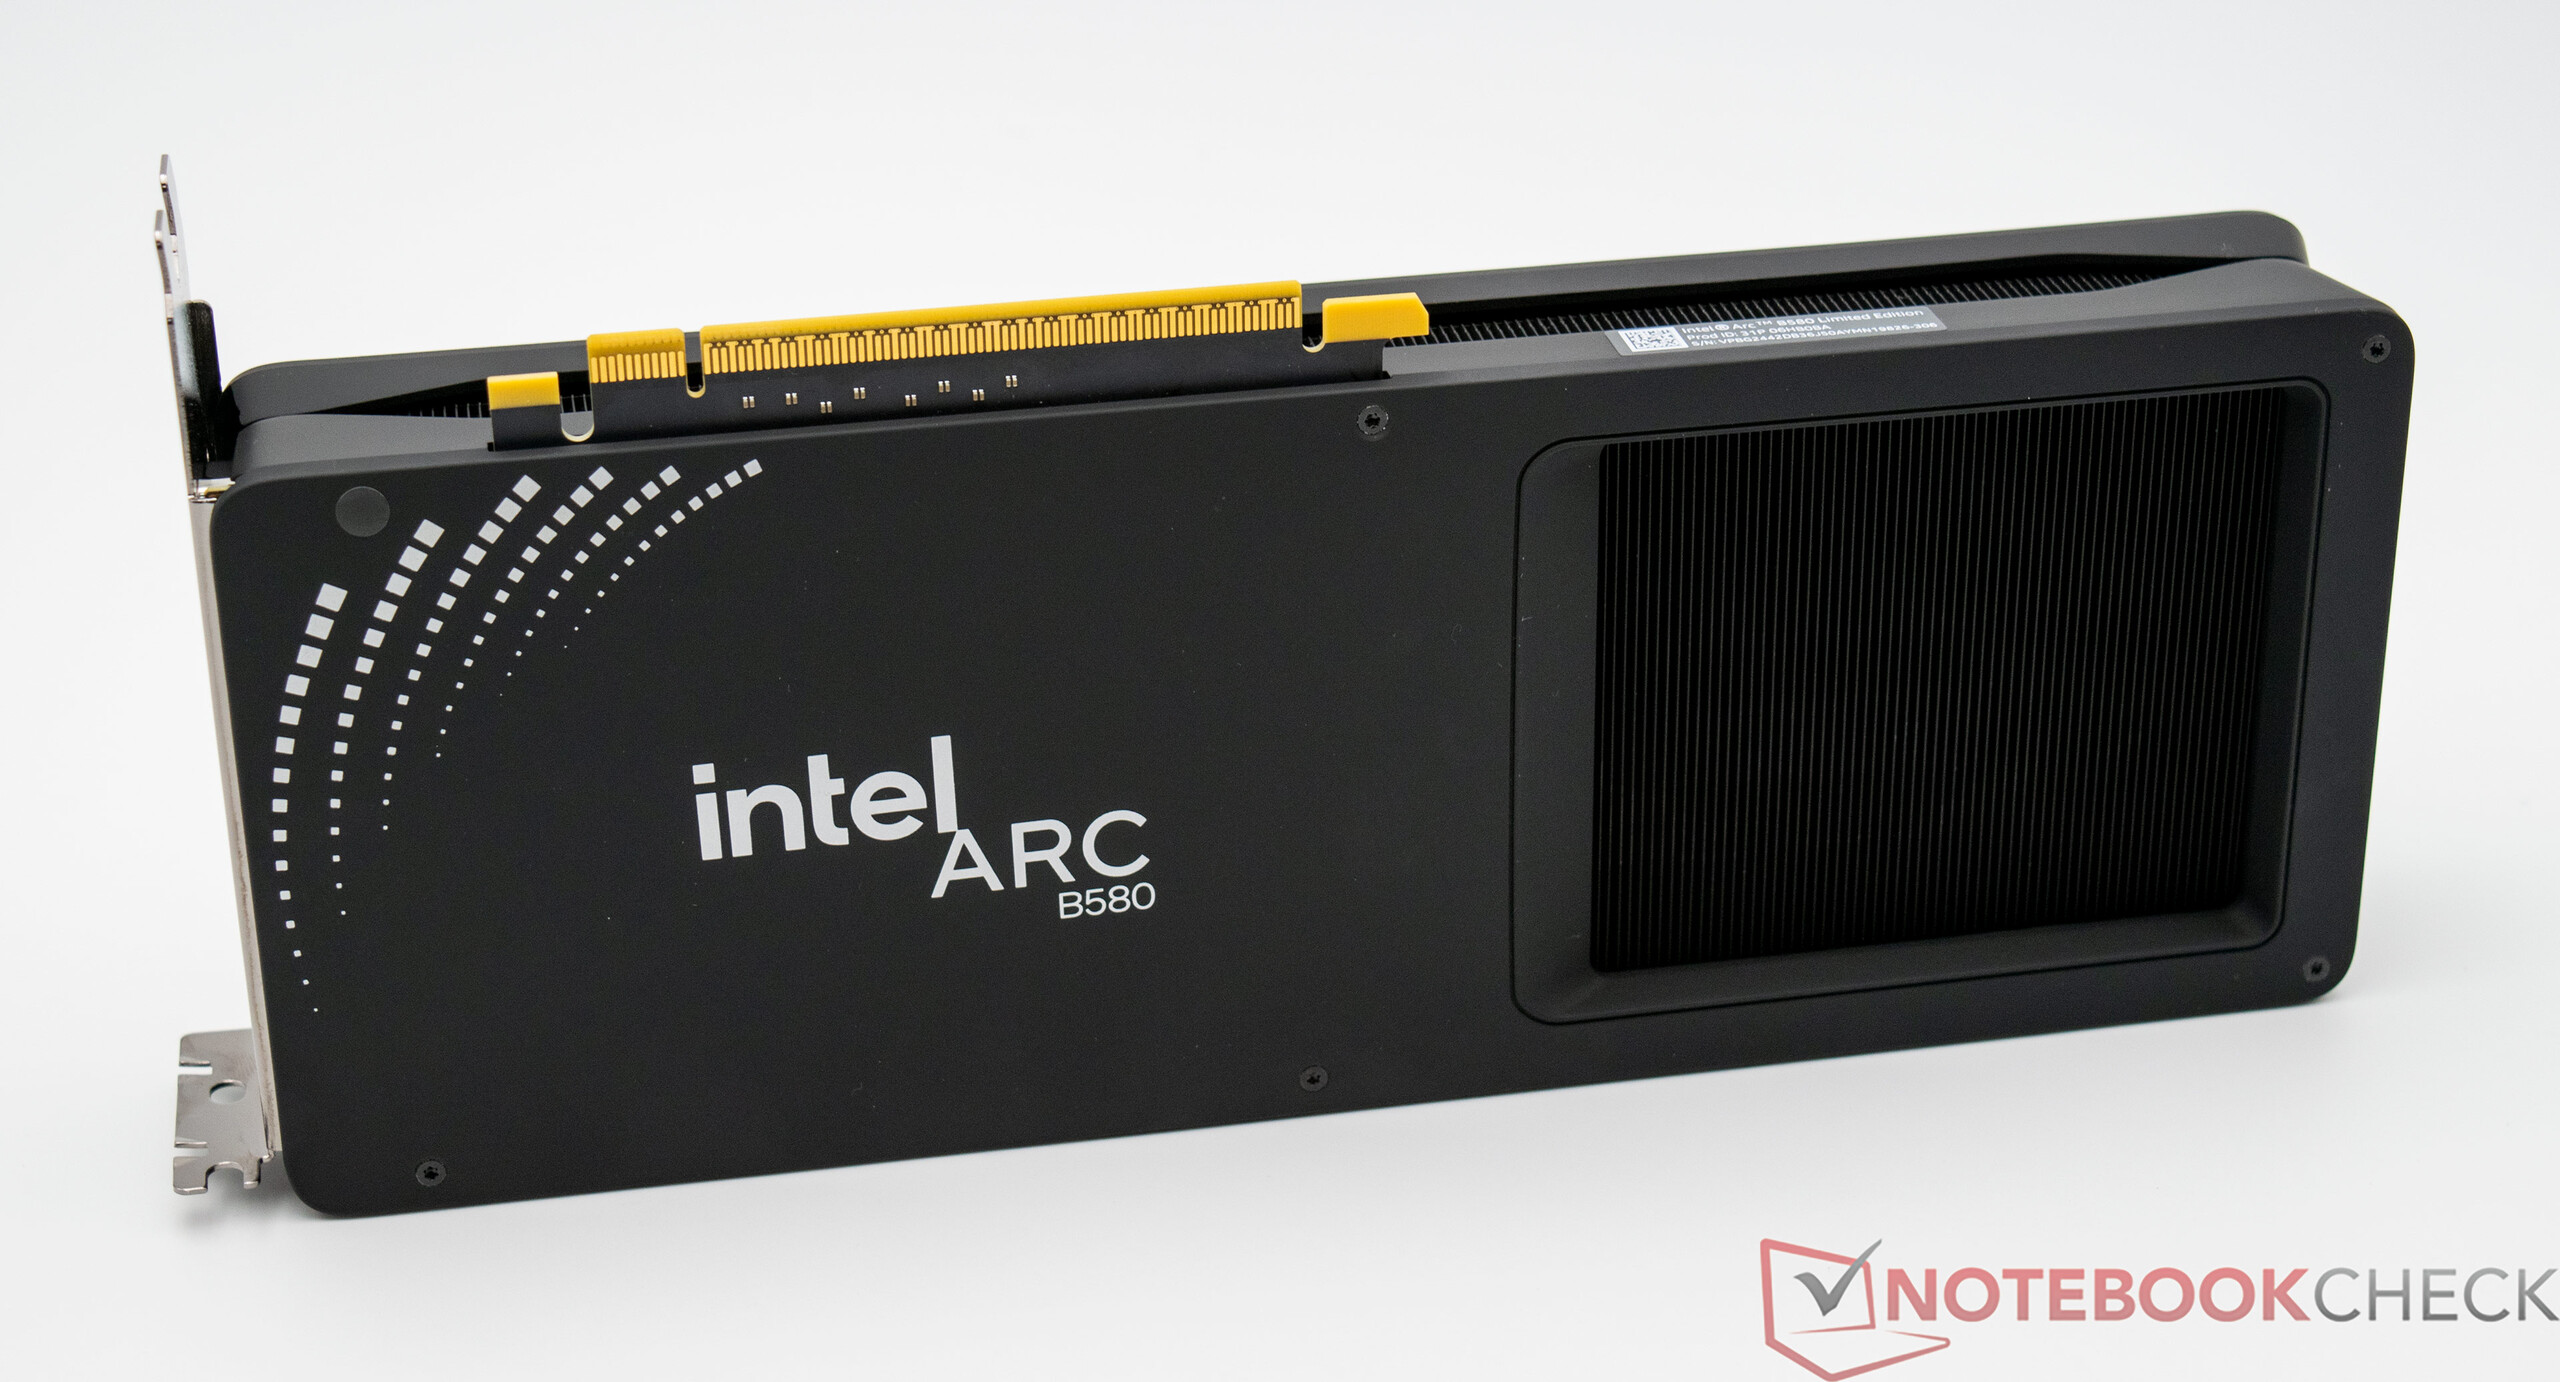
The cooling solution of the Intel Arc B580 Limited Edition is not a new invention because, as with many other graphics cards, Intel also uses the length of the graphics card for the heatpipe on the B580. Two fans provide sufficient fresh air to keep the temperatures of the graphics card in check. The maximum power consumption of 190 watts is not a major challenge for the cooling concept. The Intel Arc B580 Limited Edition has a fan stop mode, which means that the graphics card works silently in idle mode. Occasionally, however, the fans also have to work for a short period in 2D mode. Even under average load, the graphics card is only minimally louder, although 36.4 dB(A) is reached under full load. The graphics card itself is not audible from a closed housing.
Noise level
| Idle |
| 26.4 / 26.7 / 28.6 dB(A) |
| Load |
| 28.8 / 36.4 dB(A) |
 | ||
30 dB silent 40 dB(A) audible 50 dB(A) loud |
||
min: | ||
Temperature
The cooling concept of the Intel Arc B580 Limited Edition is good and was already convincing in terms of noise. In the stress test, we only reached 74 °C with the case closed, which is completely okay considering the size of the graphics card.
Energy management - Good, but not good enough
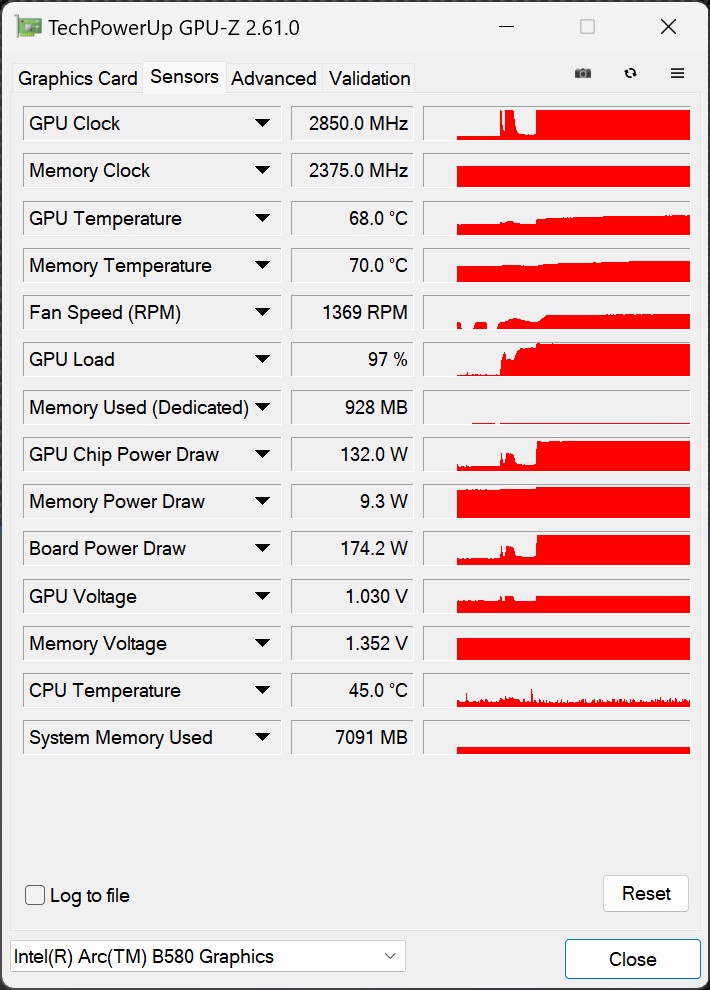
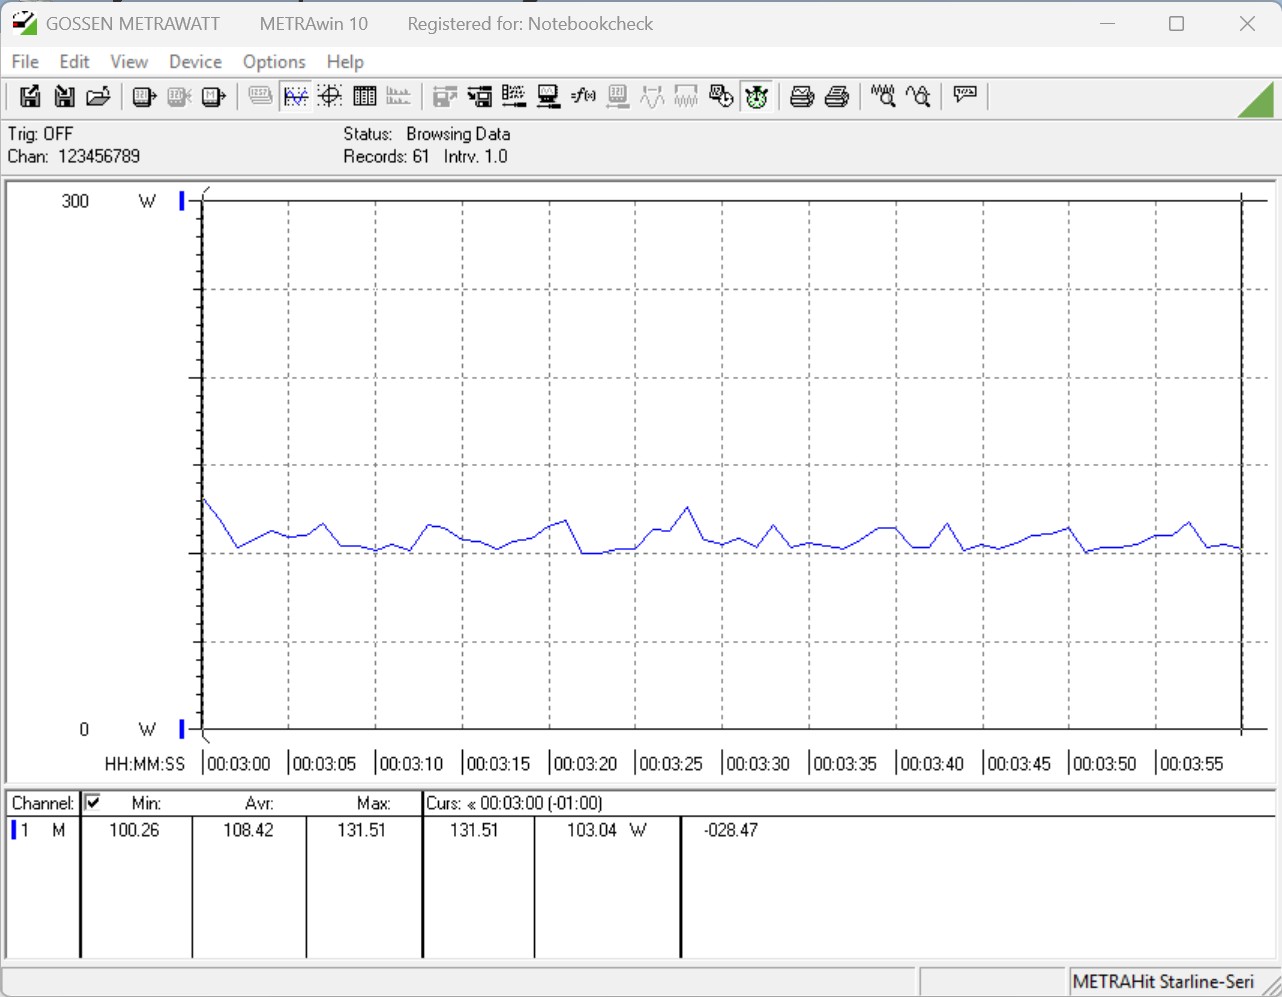
The issue of energy consumption was the biggest problem with the older Arc graphics cards. With a maximum power consumption of 190 watts, Intel has already reduced this a little compared to the Intel Arc A770 and Intel Arc A750. As we have already seen, the performance has nevertheless been increased. However, the problem of the relatively high power consumption in idle mode still exists, as can be seen from the diagrams. The same test system, in combination with the AMD Radeon RX 7600 requires significantly less power than the two Intel Arc graphics cards. Under load, things look a little better for our test sample. Our test system with the Intel Arc B580 Limited Edition is very economical in this comparison during the stress test and also when gaming. Only the combination with the Nvidia GeForce RTX 4060 is partially more economical.
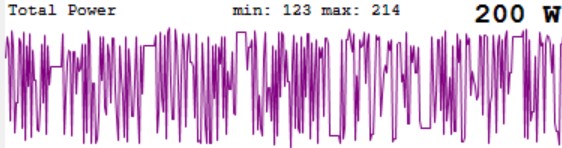
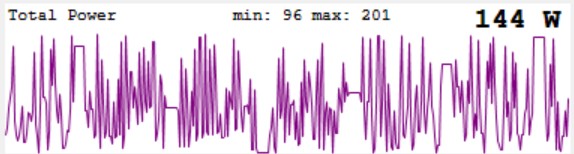
When looking at the load peaks, which we determine with the ElmorLabs PMD, we do not see any significant peaks. Under load, the Intel Arc B580 Limited Edition only slightly exceeds the specified maximum power consumption for a short time.
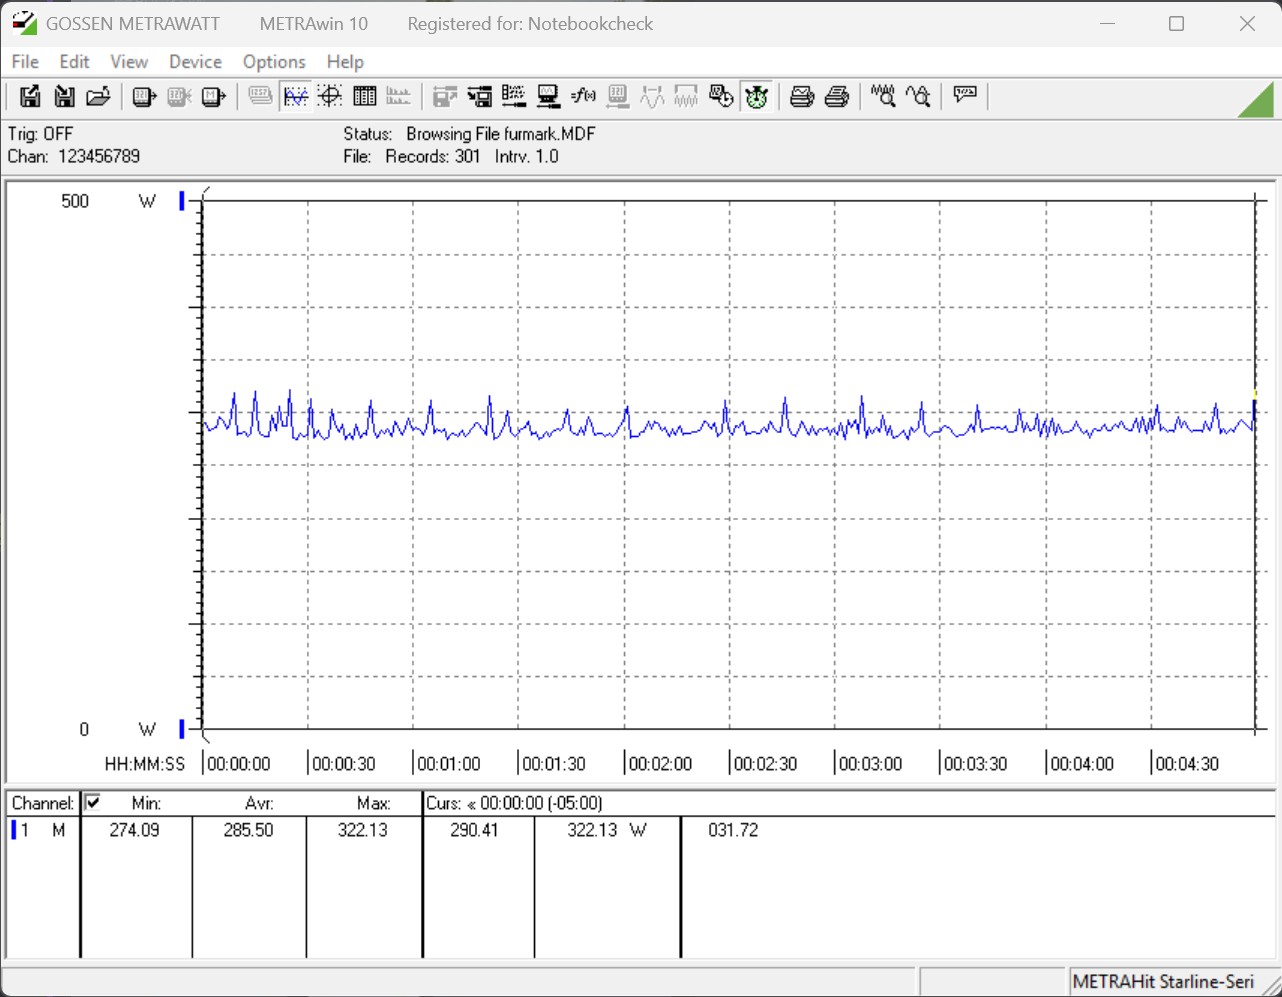

| Power Consumption / FurMark 1.19 GPU Stress Test (external Monitor) | |
| MSI GeForce RTX 3070 Ti Suprim X | |
| Nvidia Titan RTX | |
| AMD Radeon RX 7900 GRE | |
| Acer Predator BiFrost Arc A750 OC | |
| Acer Predator BiFrost Arc A770 OC | |
| Sapphire Pulse Radeon RX 6750 XT | |
| AMD Radeon RX 6800 | |
| KFA2 GeForce RTX 2070 SUPER Work The Frames Edition | |
| Nvidia GeForce RTX 3060 Ti FE | |
| ASRock Arc A580 Challenger OC | |
| XFX Speedster QICK 308 Radeon RX 7600 Black Edition | |
| ASUS Dual GeForce RTX 4060 Ti OC | |
| Intel Arc B580 | |
| KFA2 GeForce RTX 4060 1-Click-OC 2X | |
| Power Consumption / The Witcher 3 ultra (external Monitor) | |
| Nvidia Titan RTX | |
| AMD Radeon RX 7900 GRE | |
| Sapphire Pulse Radeon RX 6750 XT | |
| AMD Radeon RX 6800 | |
| Nvidia GeForce RTX 3060 Ti FE | |
| KFA2 GeForce RTX 2070 SUPER Work The Frames Edition | |
| XFX Speedster QICK 308 Radeon RX 7600 Black Edition | |
| Acer Predator BiFrost Arc A750 OC | |
| ASUS Dual GeForce RTX 4060 Ti OC | |
| ASRock Arc A580 Challenger OC | |
| Acer Predator BiFrost Arc A770 OC | |
| KFA2 GeForce RTX 4060 1-Click-OC 2X | |
| Intel Arc B580 | |
| Power Consumption / Witcher 3 ultra Efficiency (external Monitor) | |
| AMD Radeon RX 7900 GRE | |
| ASUS Dual GeForce RTX 4060 Ti OC | |
| KFA2 GeForce RTX 4060 1-Click-OC 2X | |
| Intel Arc B580 | |
| ASRock Arc A580 Challenger OC | |
* ... smaller is better
Power consumption with the external monitor
Notebookcheck overall rating
The Intel Arc B580 Limited Edition is particularly impressive in 1,080p and offers a great gaming experience. Compared to the competition from Nvidia and AMD, the Arc B580 holds its own, especially thanks to its low price and larger video memory.
Transparency
The selection of devices to be reviewed is made by our editorial team. The test sample was provided to the author as a loan by the manufacturer or retailer for the purpose of this review. The lender had no influence on this review, nor did the manufacturer receive a copy of this review before publication. There was no obligation to publish this review. As an independent media company, Notebookcheck is not subjected to the authority of manufacturers, retailers or publishers.
This is how Notebookcheck is testing
Every year, Notebookcheck independently reviews hundreds of laptops and smartphones using standardized procedures to ensure that all results are comparable. We have continuously developed our test methods for around 20 years and set industry standards in the process. In our test labs, high-quality measuring equipment is utilized by experienced technicians and editors. These tests involve a multi-stage validation process. Our complex rating system is based on hundreds of well-founded measurements and benchmarks, which maintains objectivity. Further information on our test methods can be found here.

