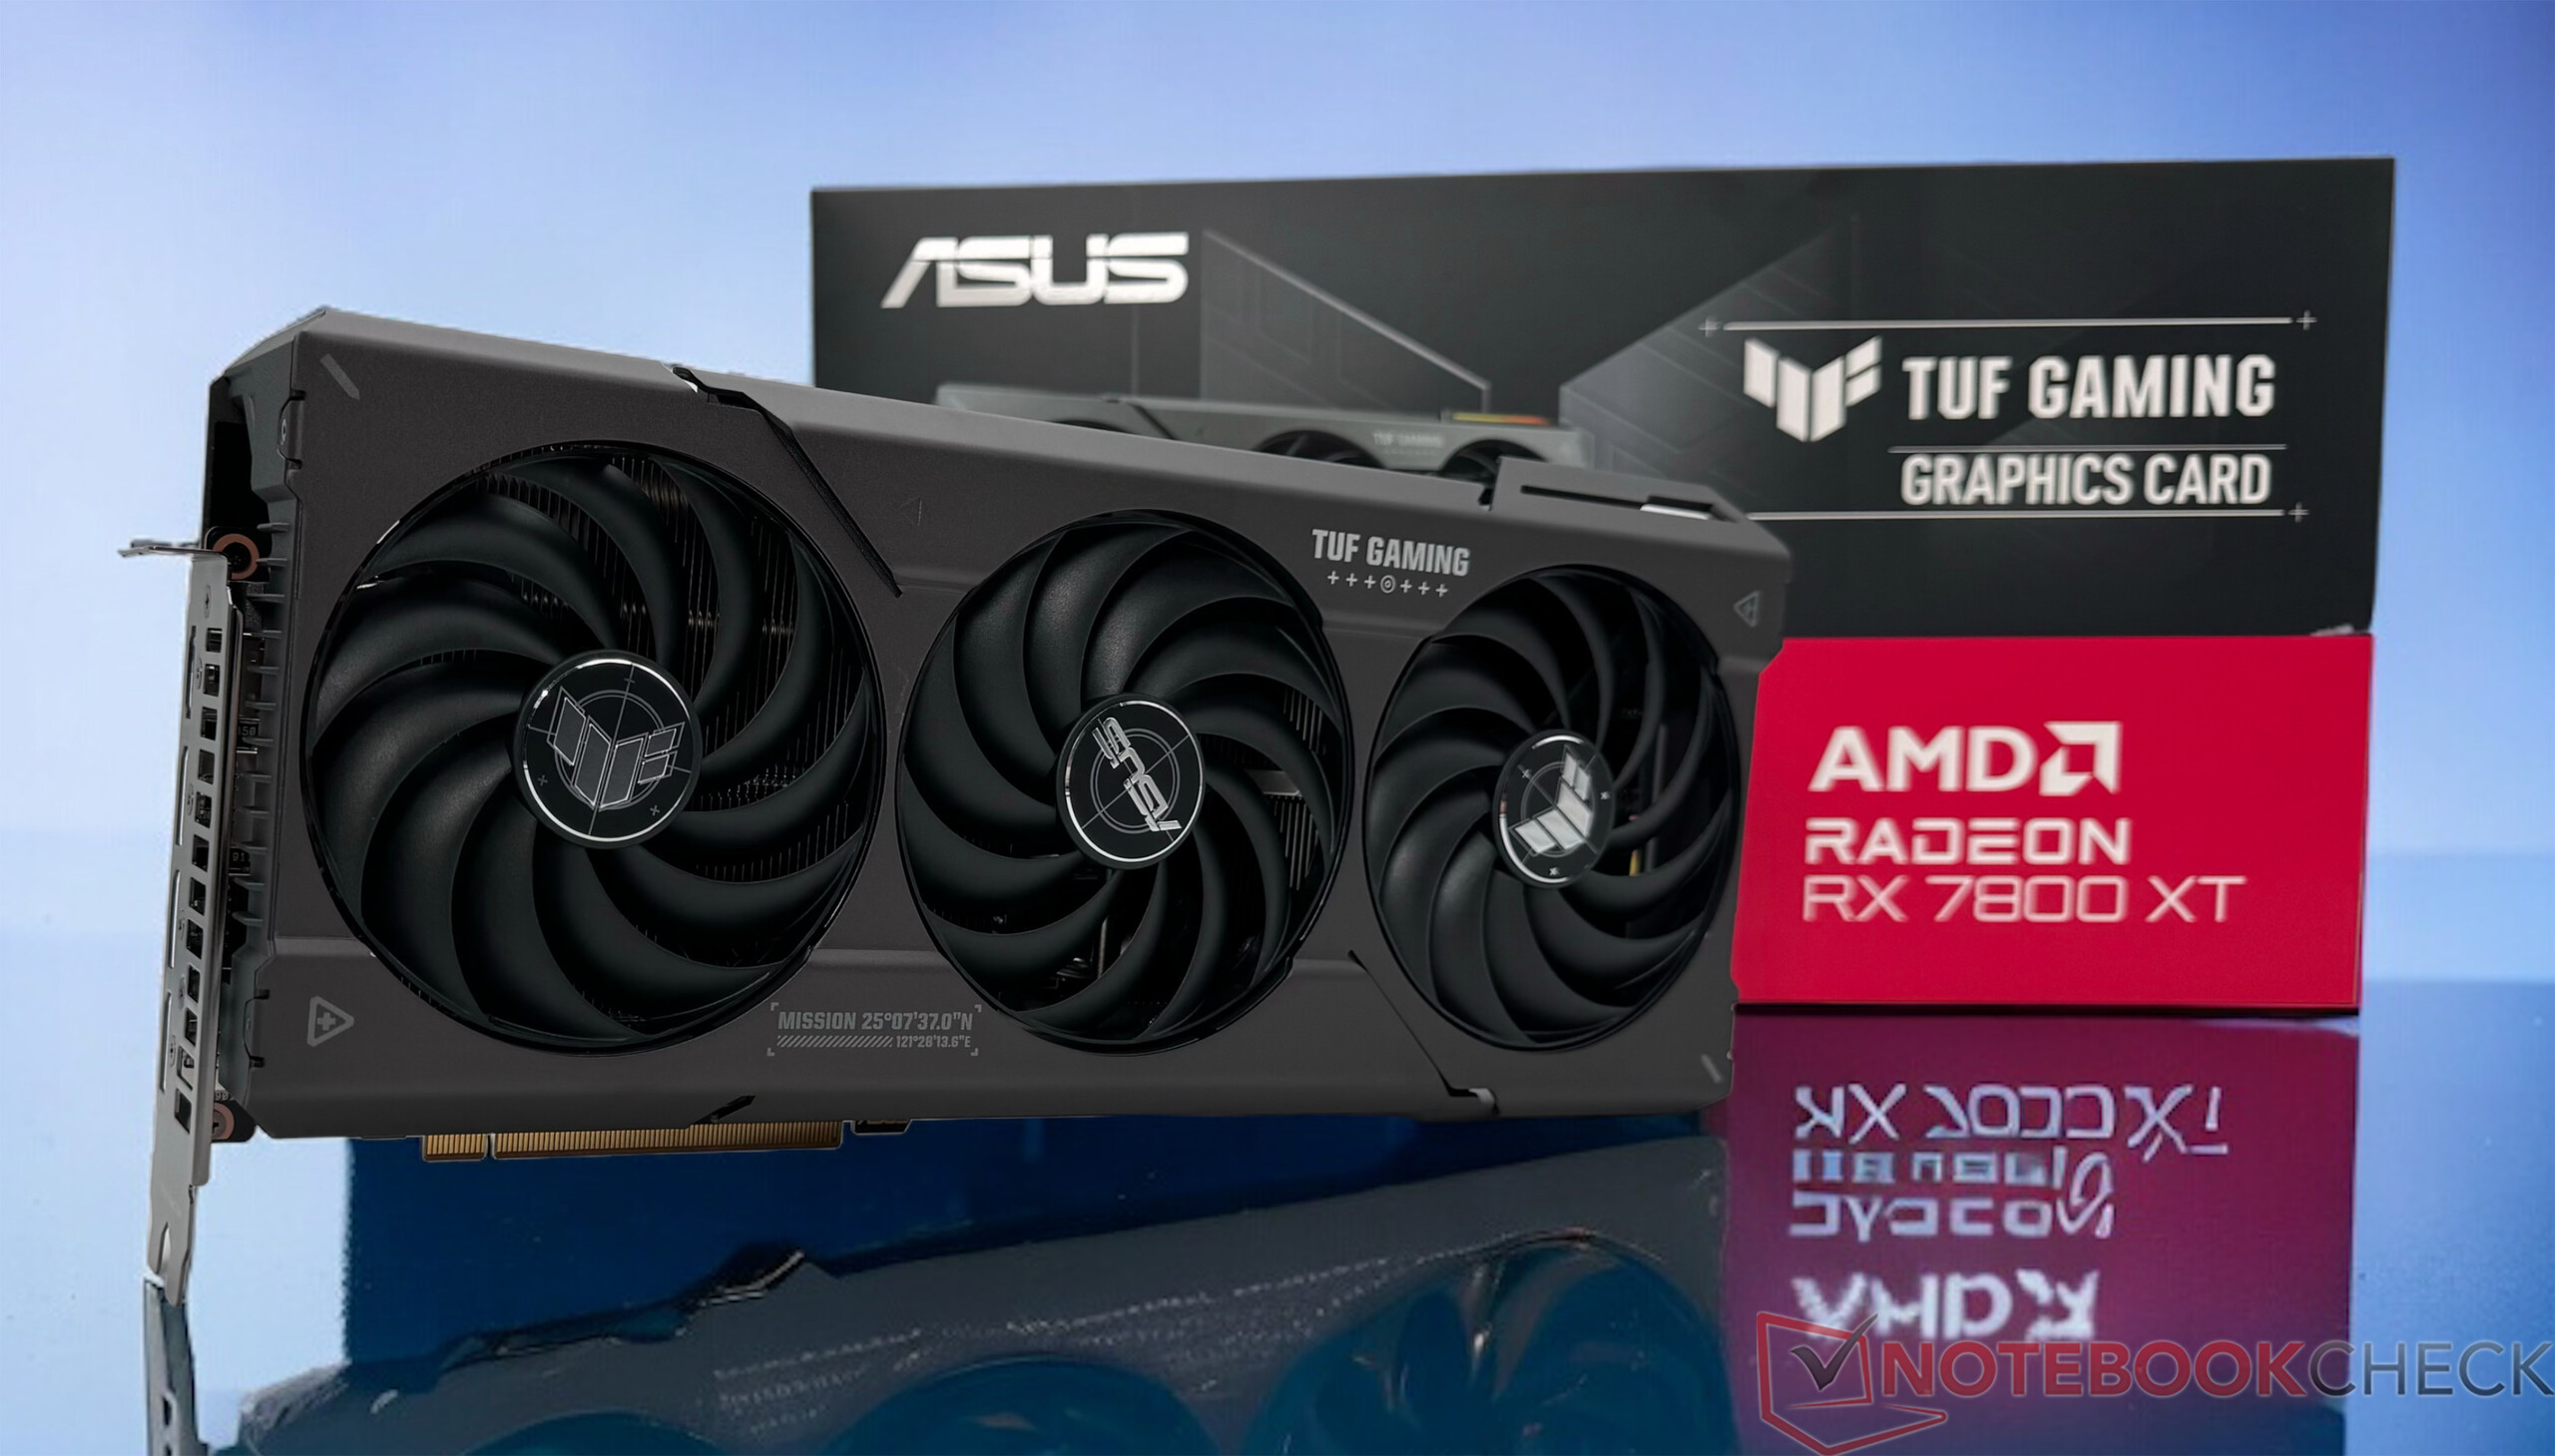
Asus TUF Gaming Radeon RX 7800 XT OC review: A serious challenger to the Nvidia GeForce RTX 4070 Super for less than 600 Euros?
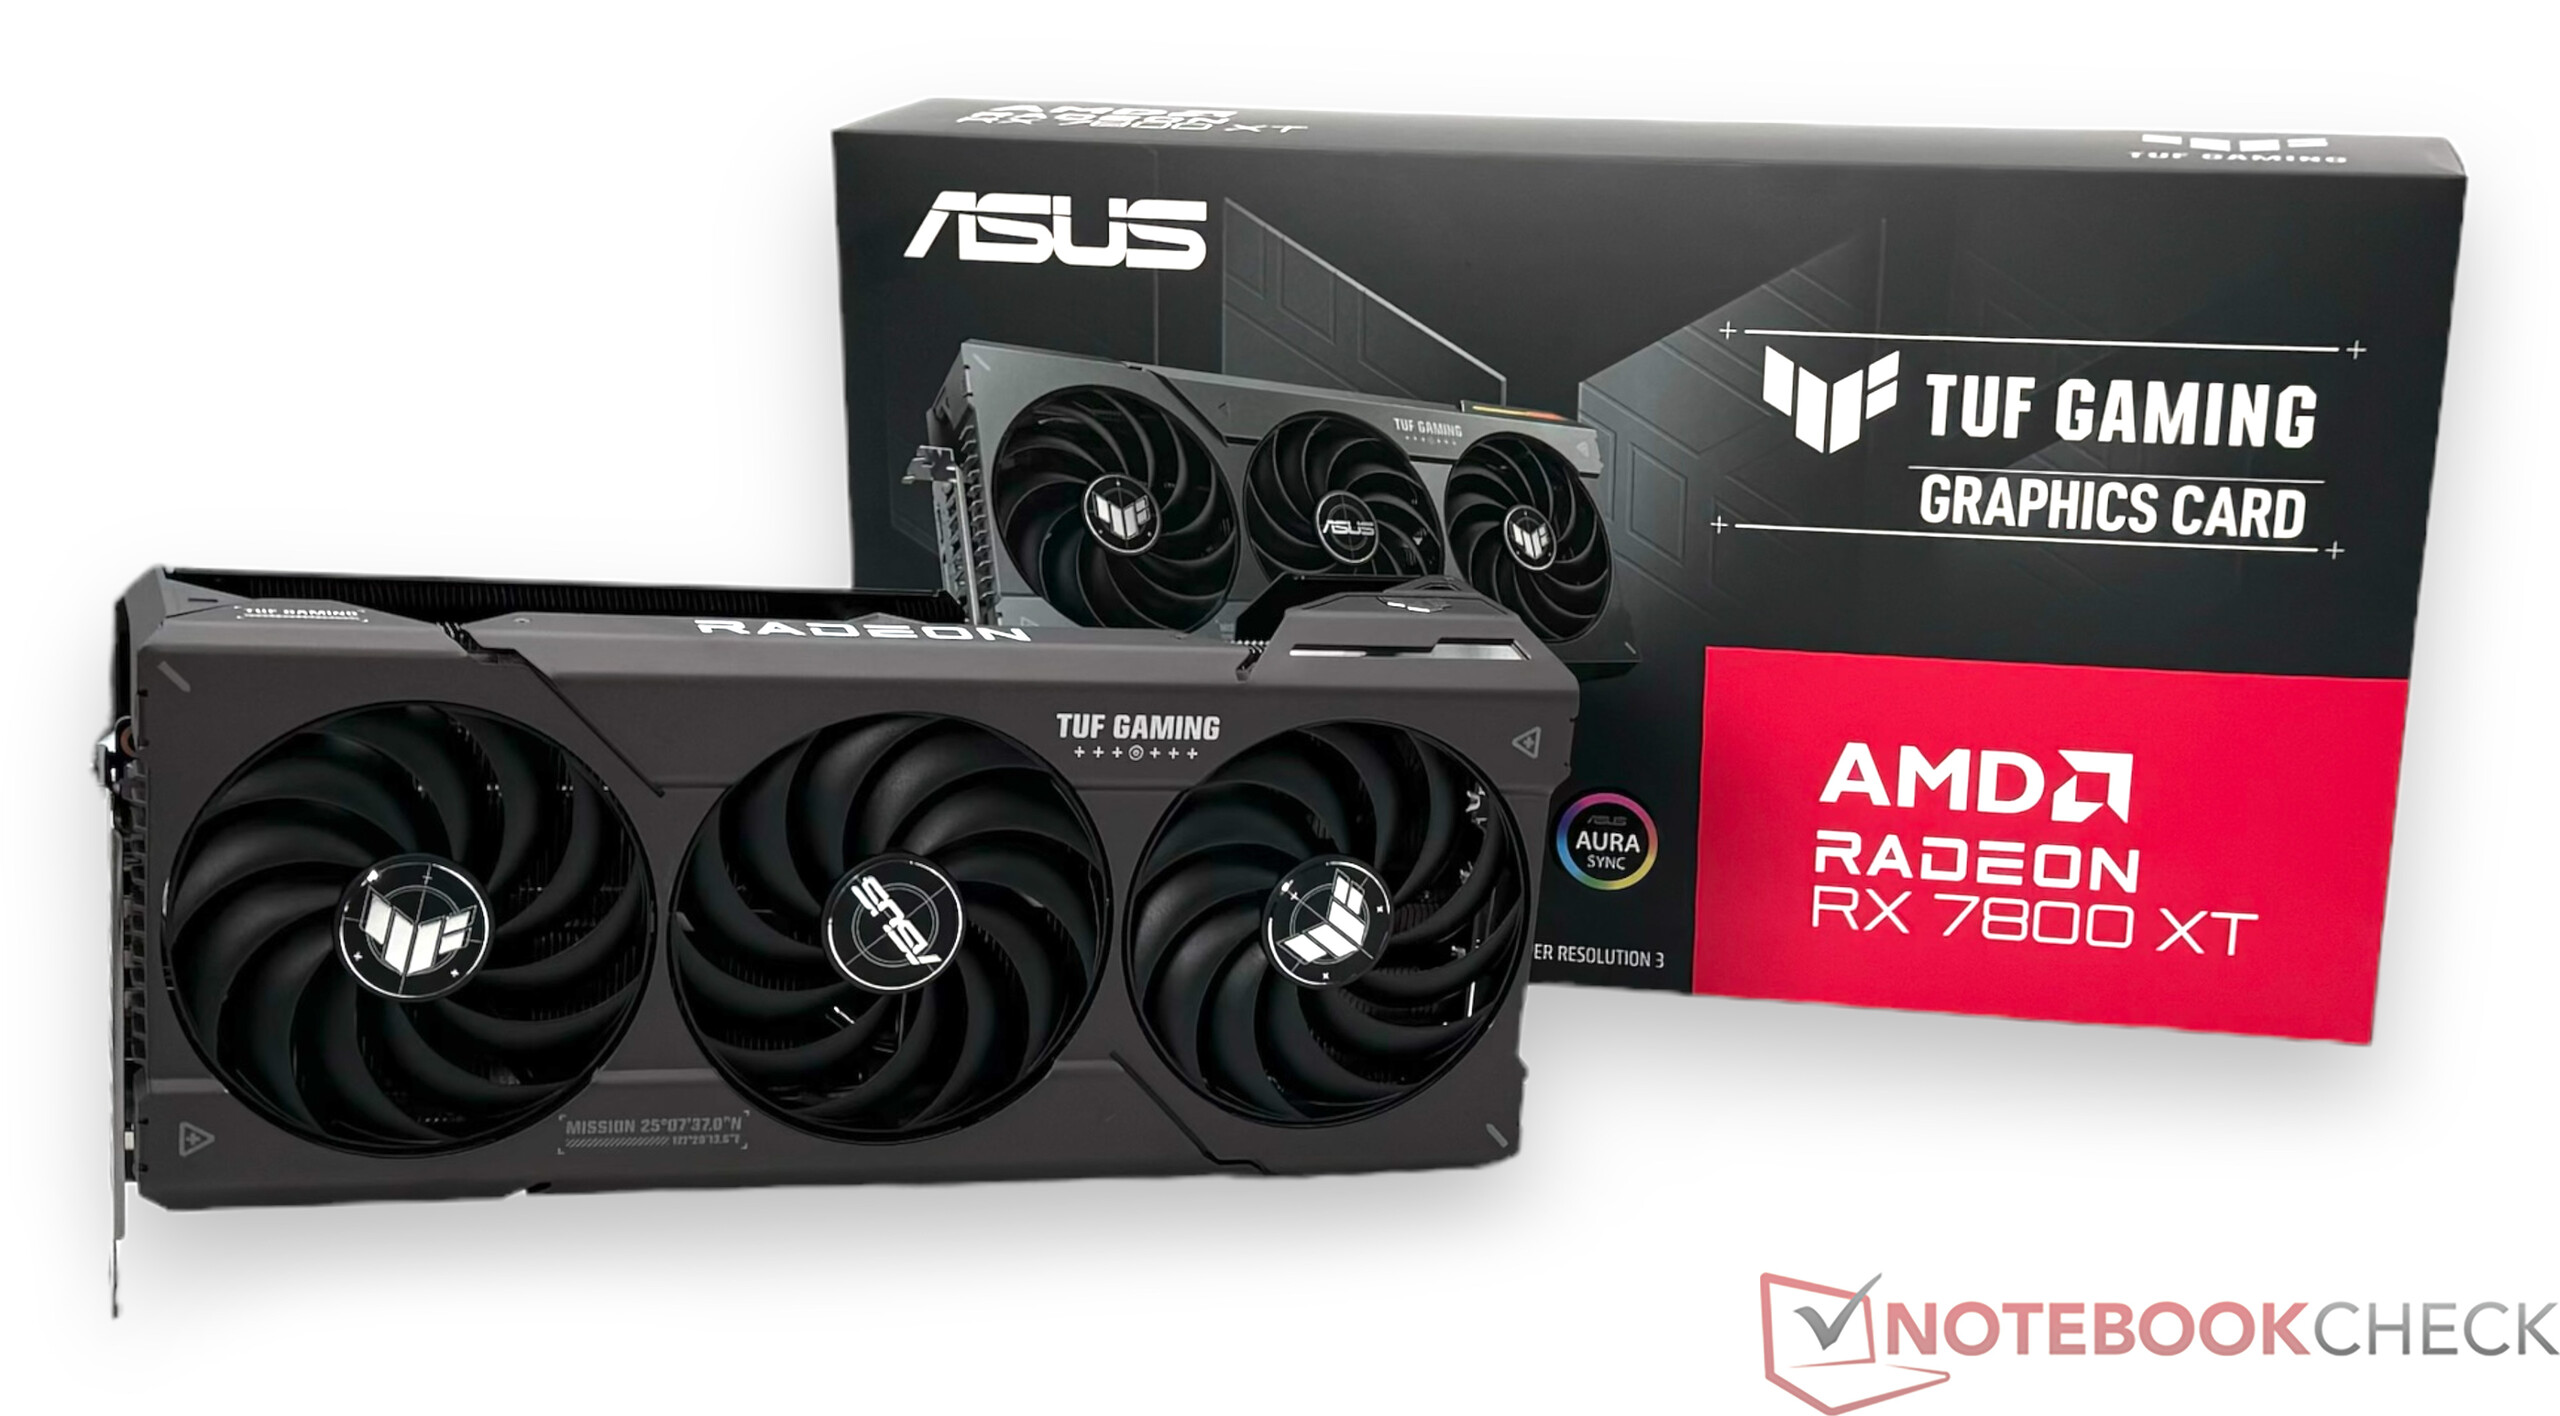
Although the AMD Radeon RX 7800 XT isn't new anymore, due to its VRAM, the graphics card enjoys a large advantage in the segment of midrange Desktop GPUs. While there are different opinions on the subject, we can basically say that more VRAM is always better. In this area, AMD has rarely been stingy, and even the AMD Radeon RX 7800 XT is equipped with 16 GB of VRAM. After we already took a look at the reference design of the RX 7800 XT shortly after its introduction last year, now the Asus TUF Gaming Radeon RX 7800 XT OC has made its way into our test lab as the board partner model.
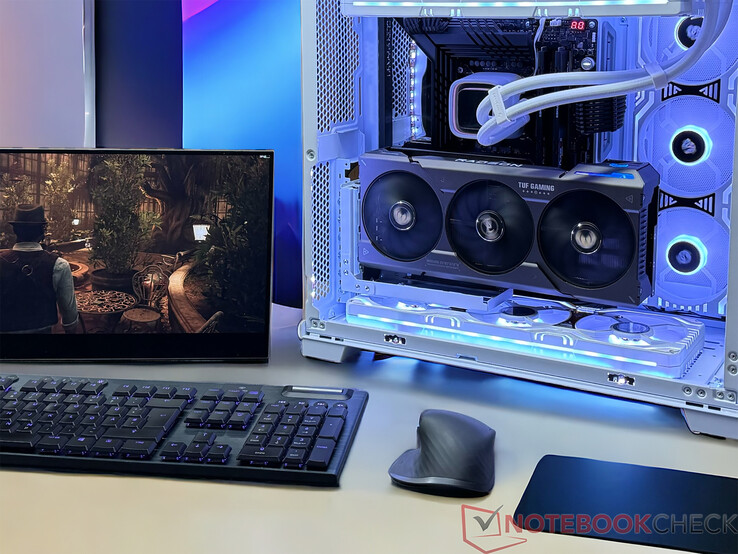
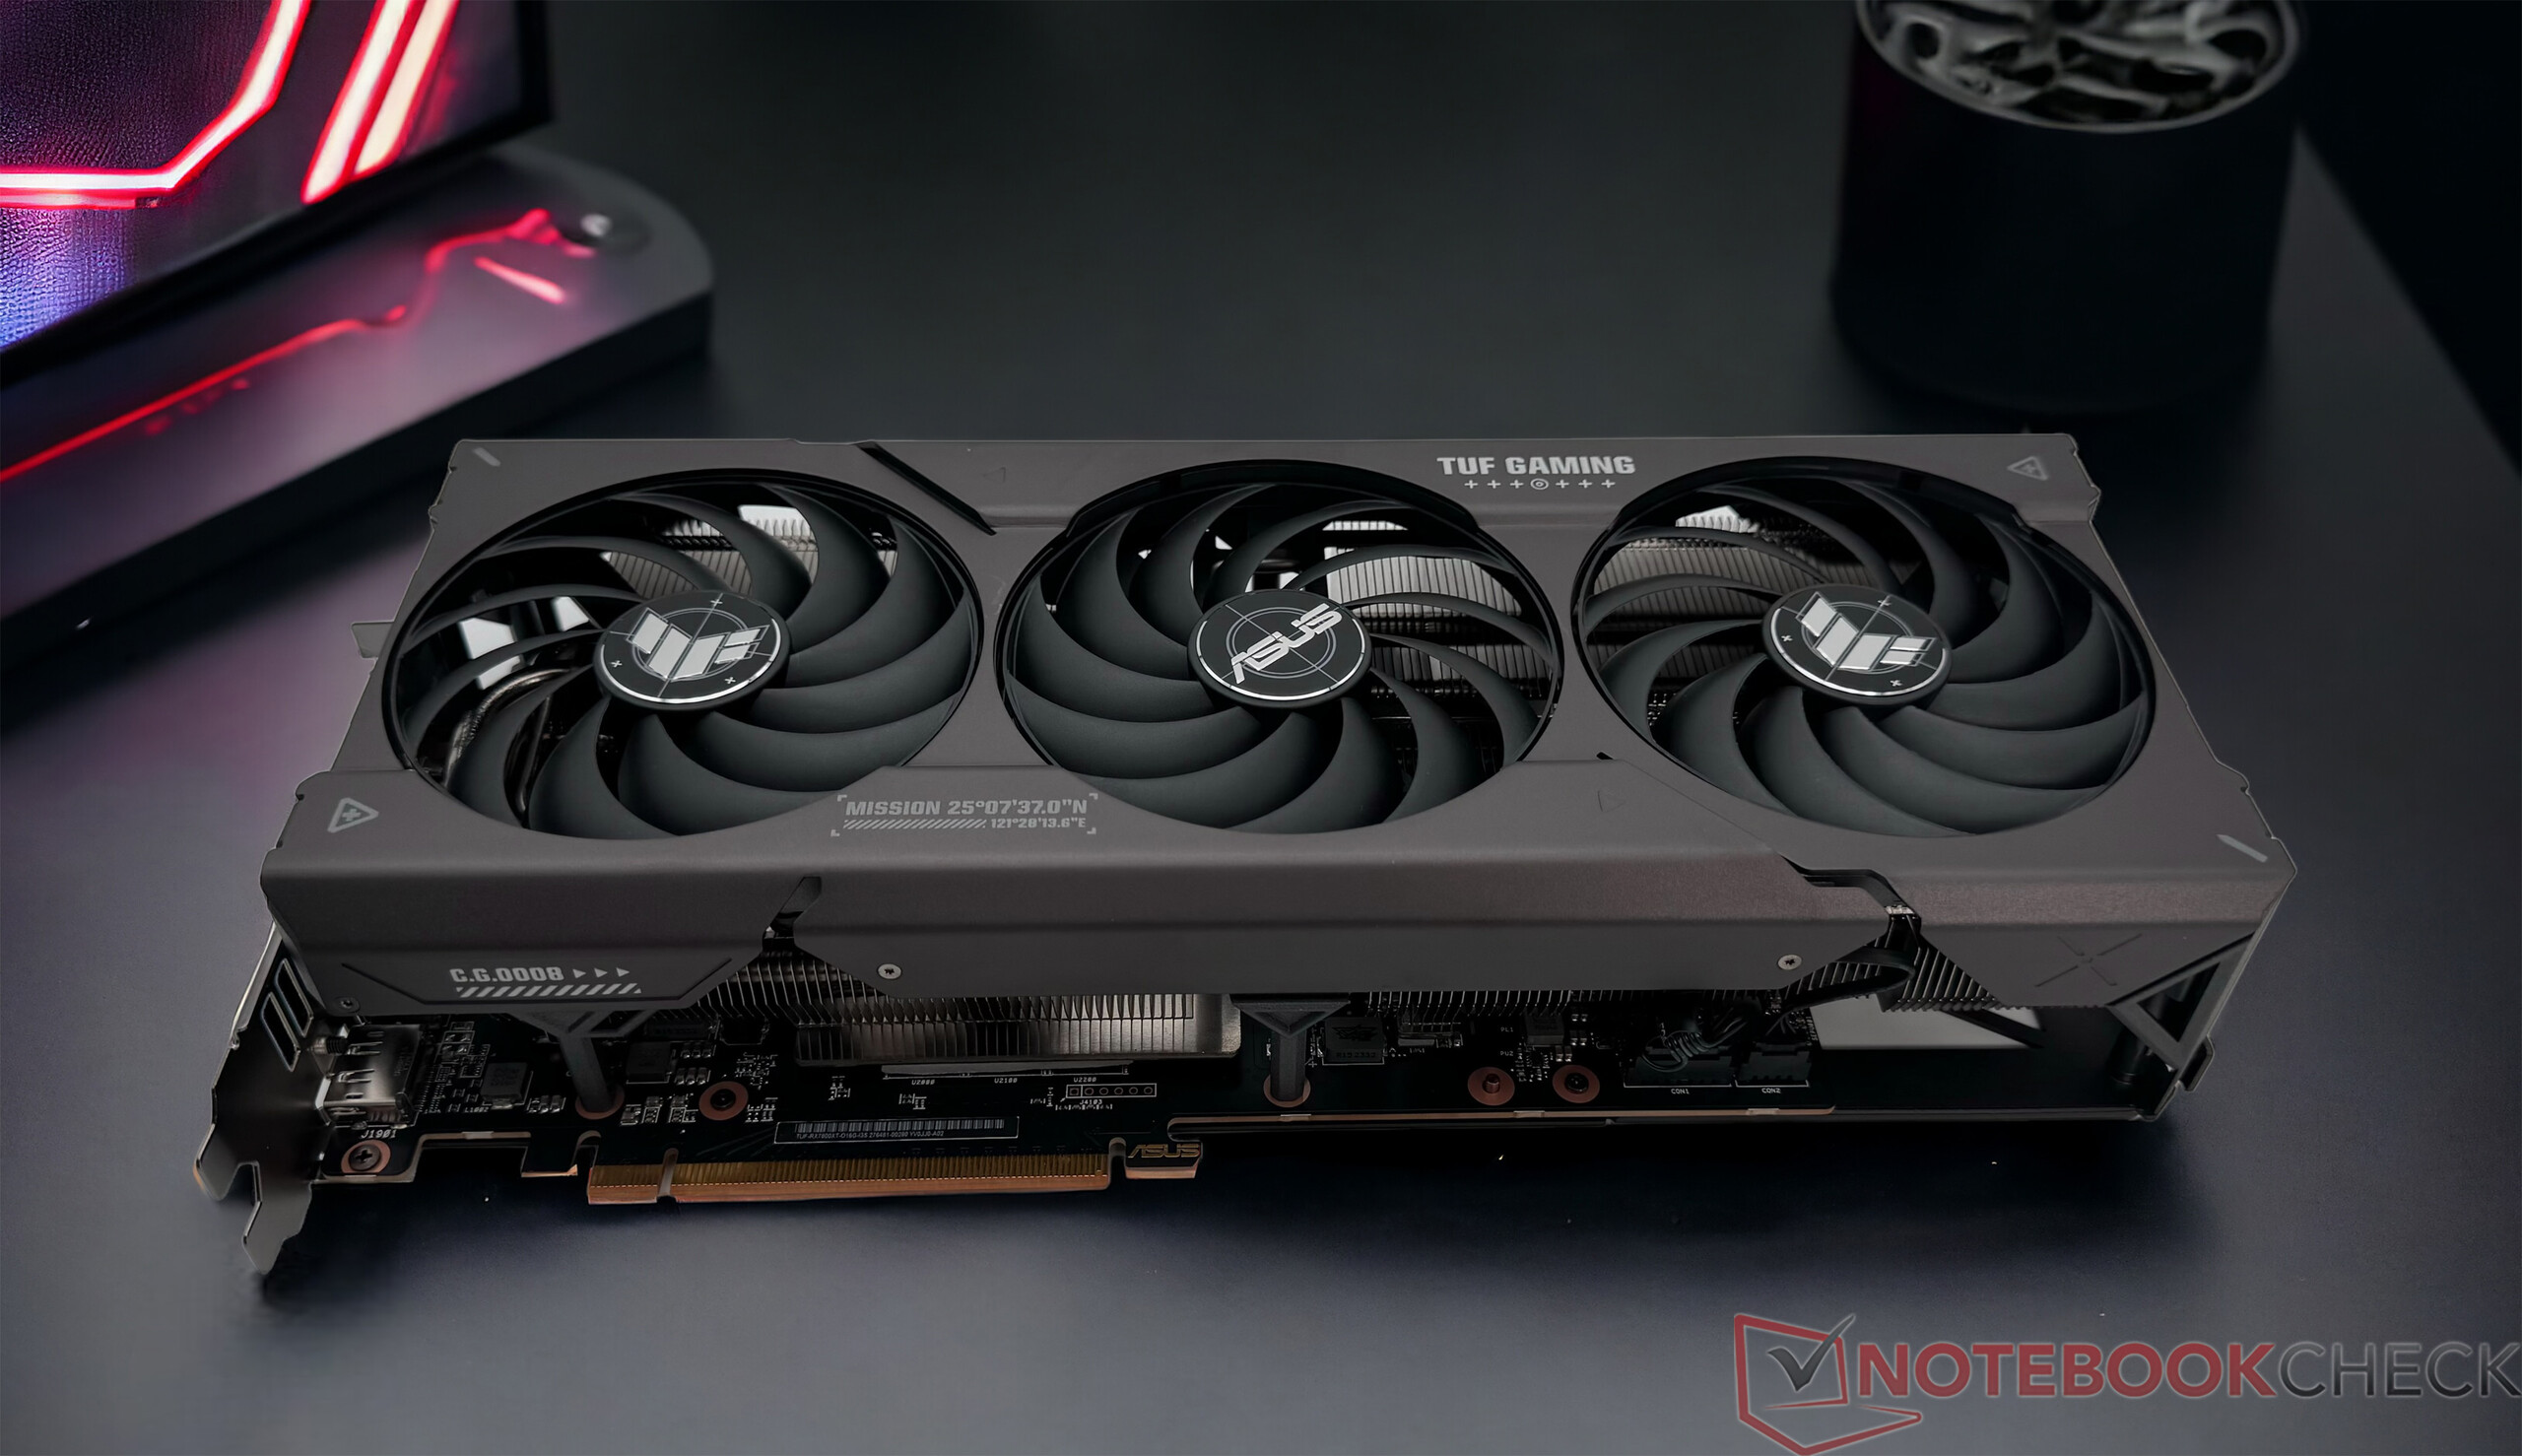
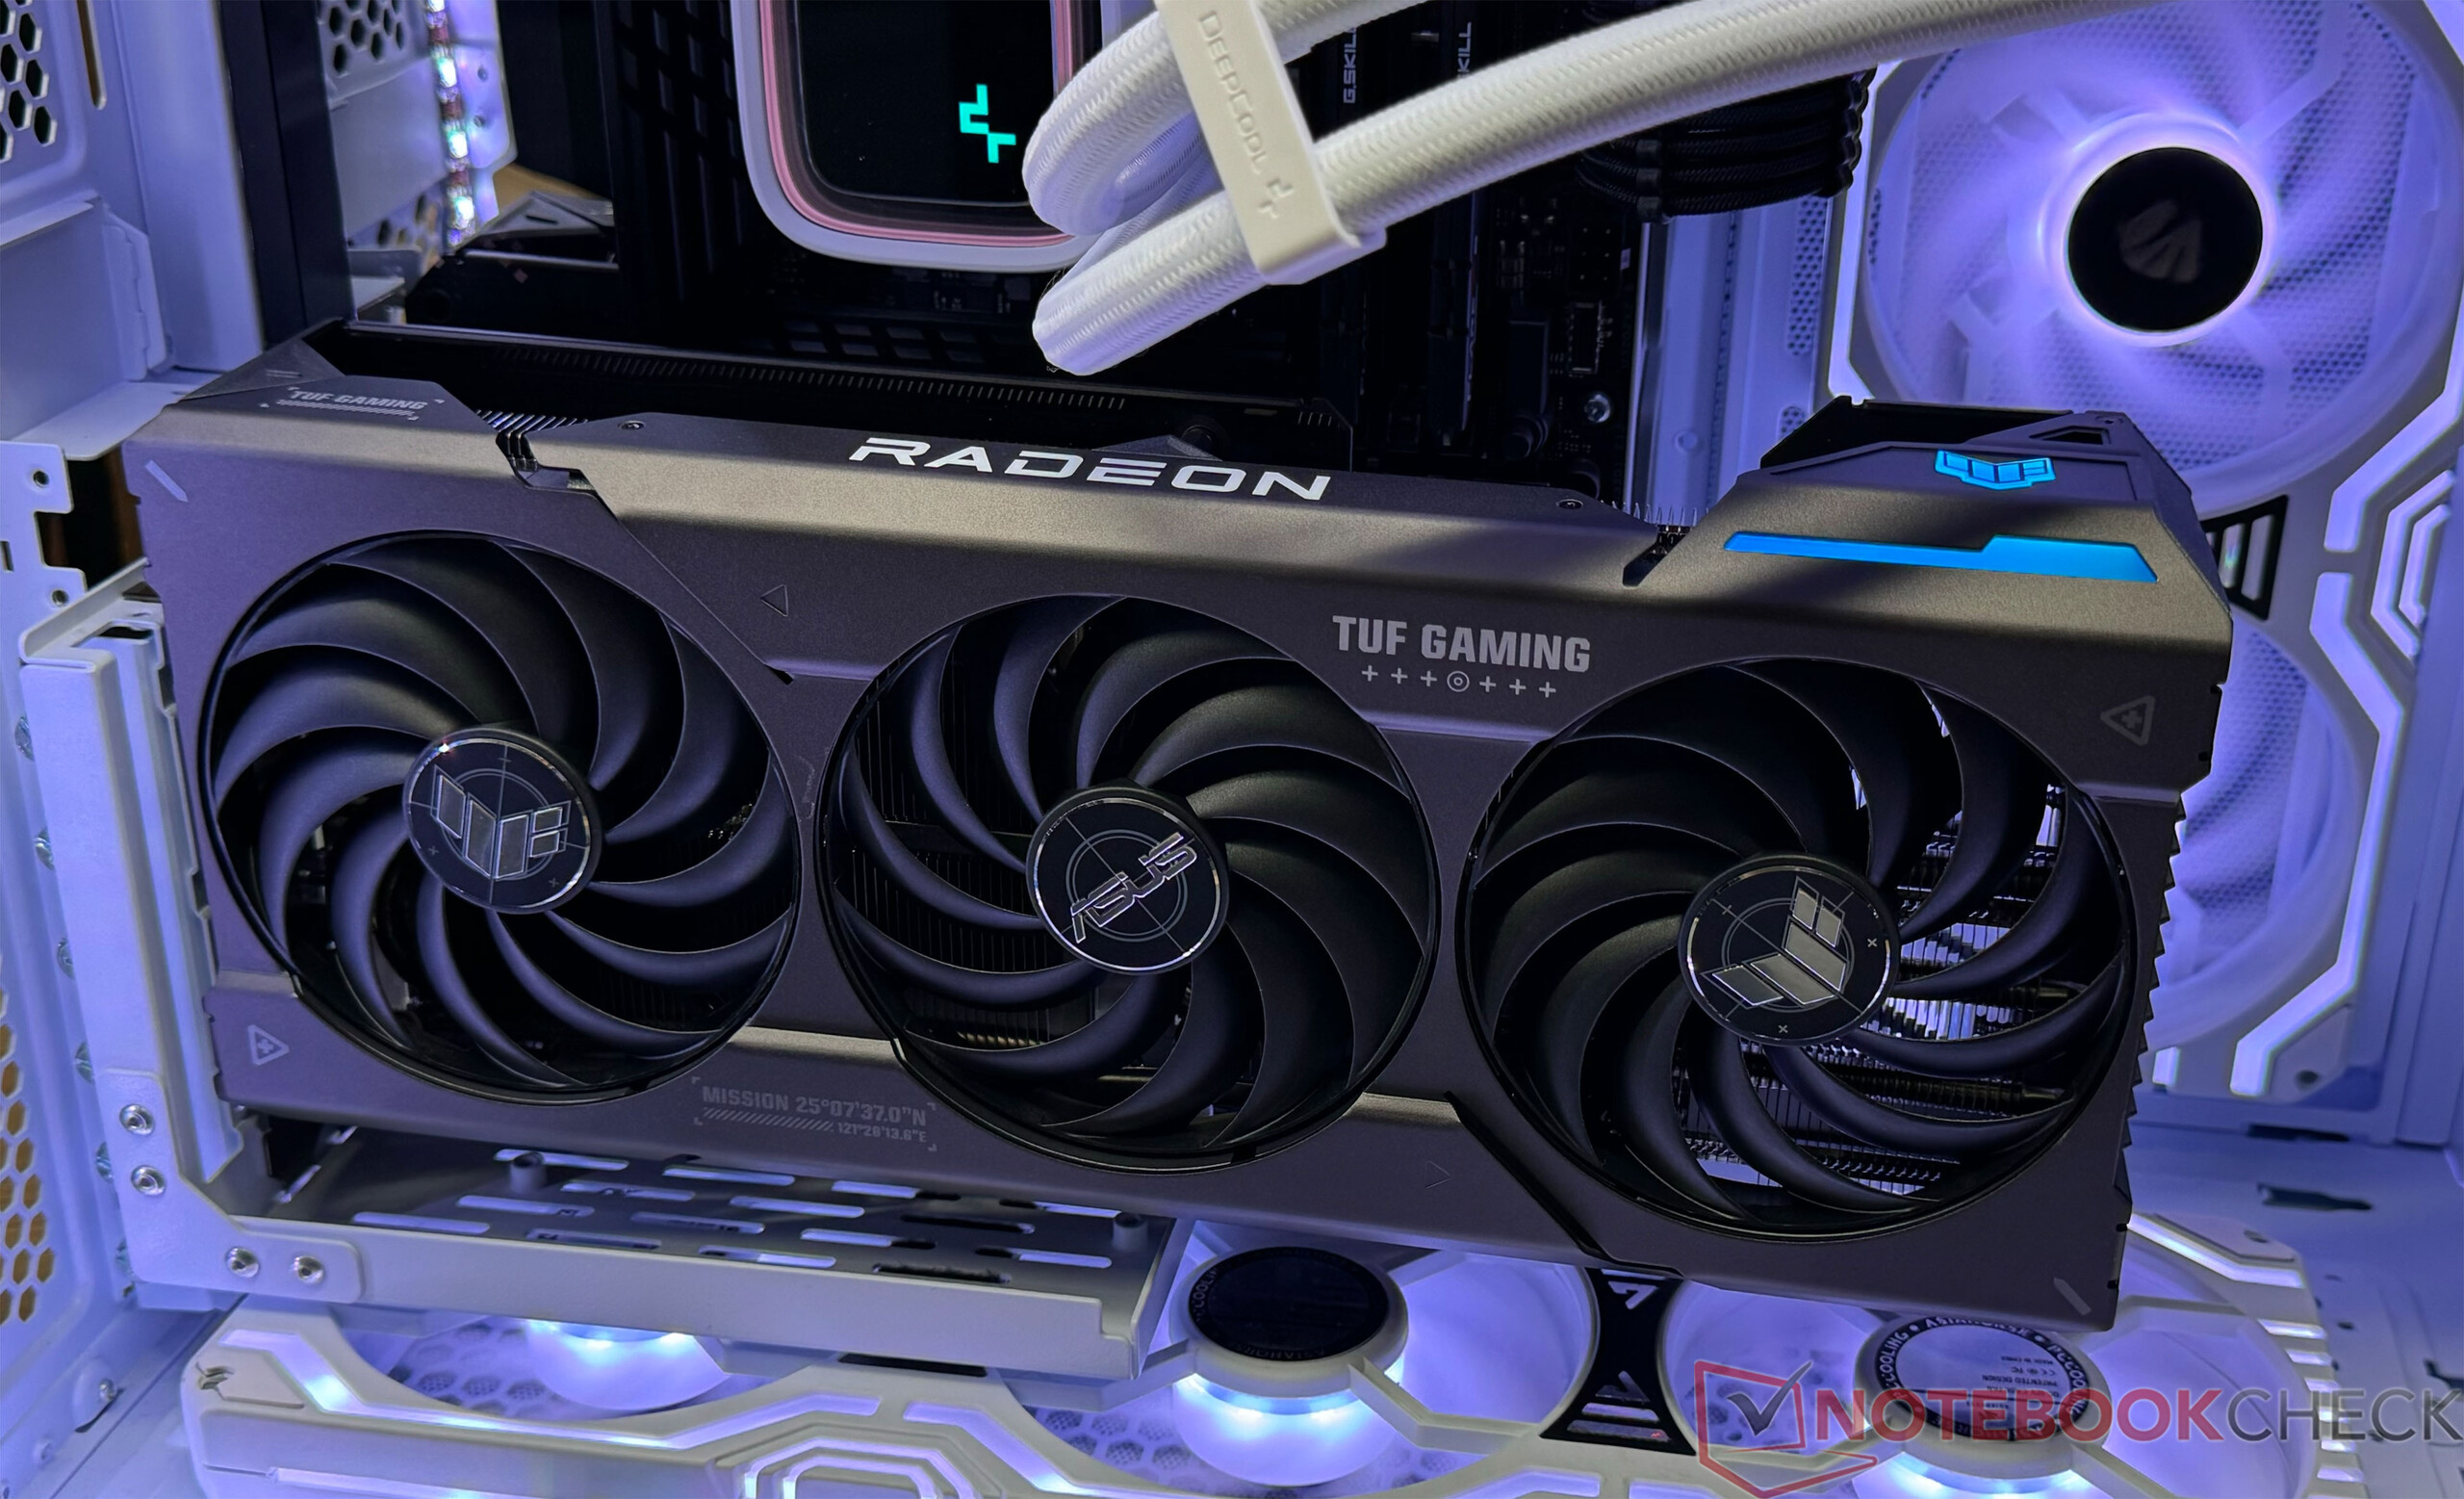
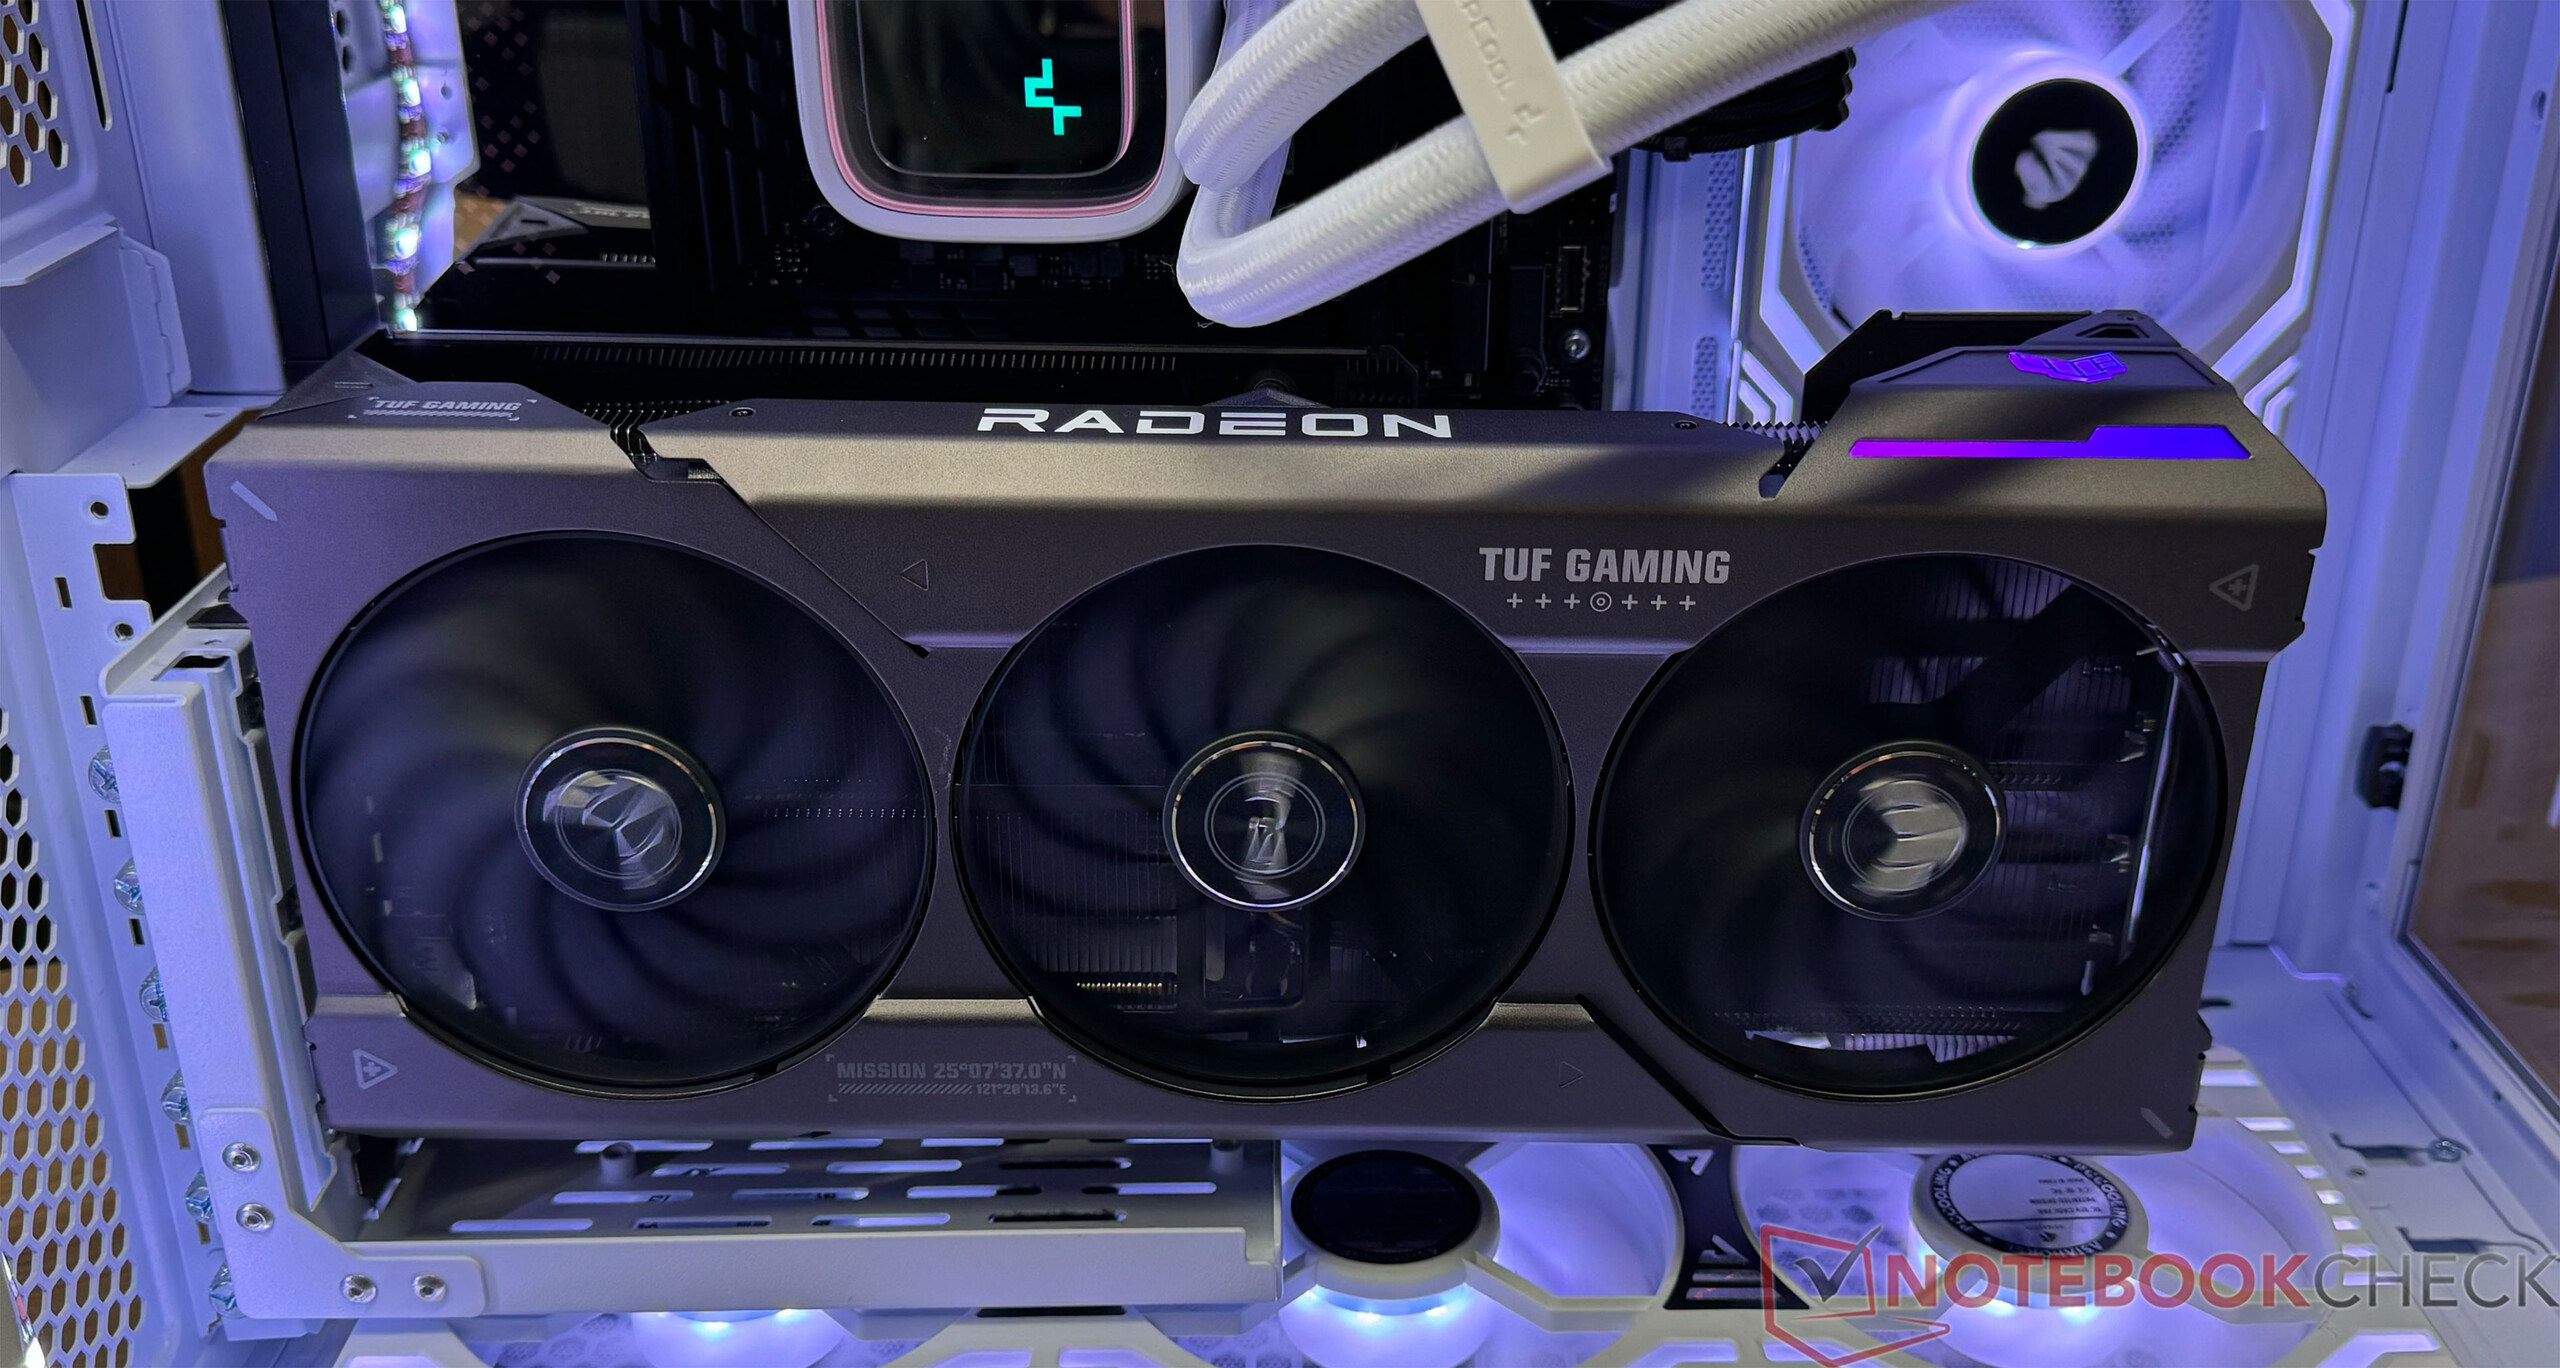
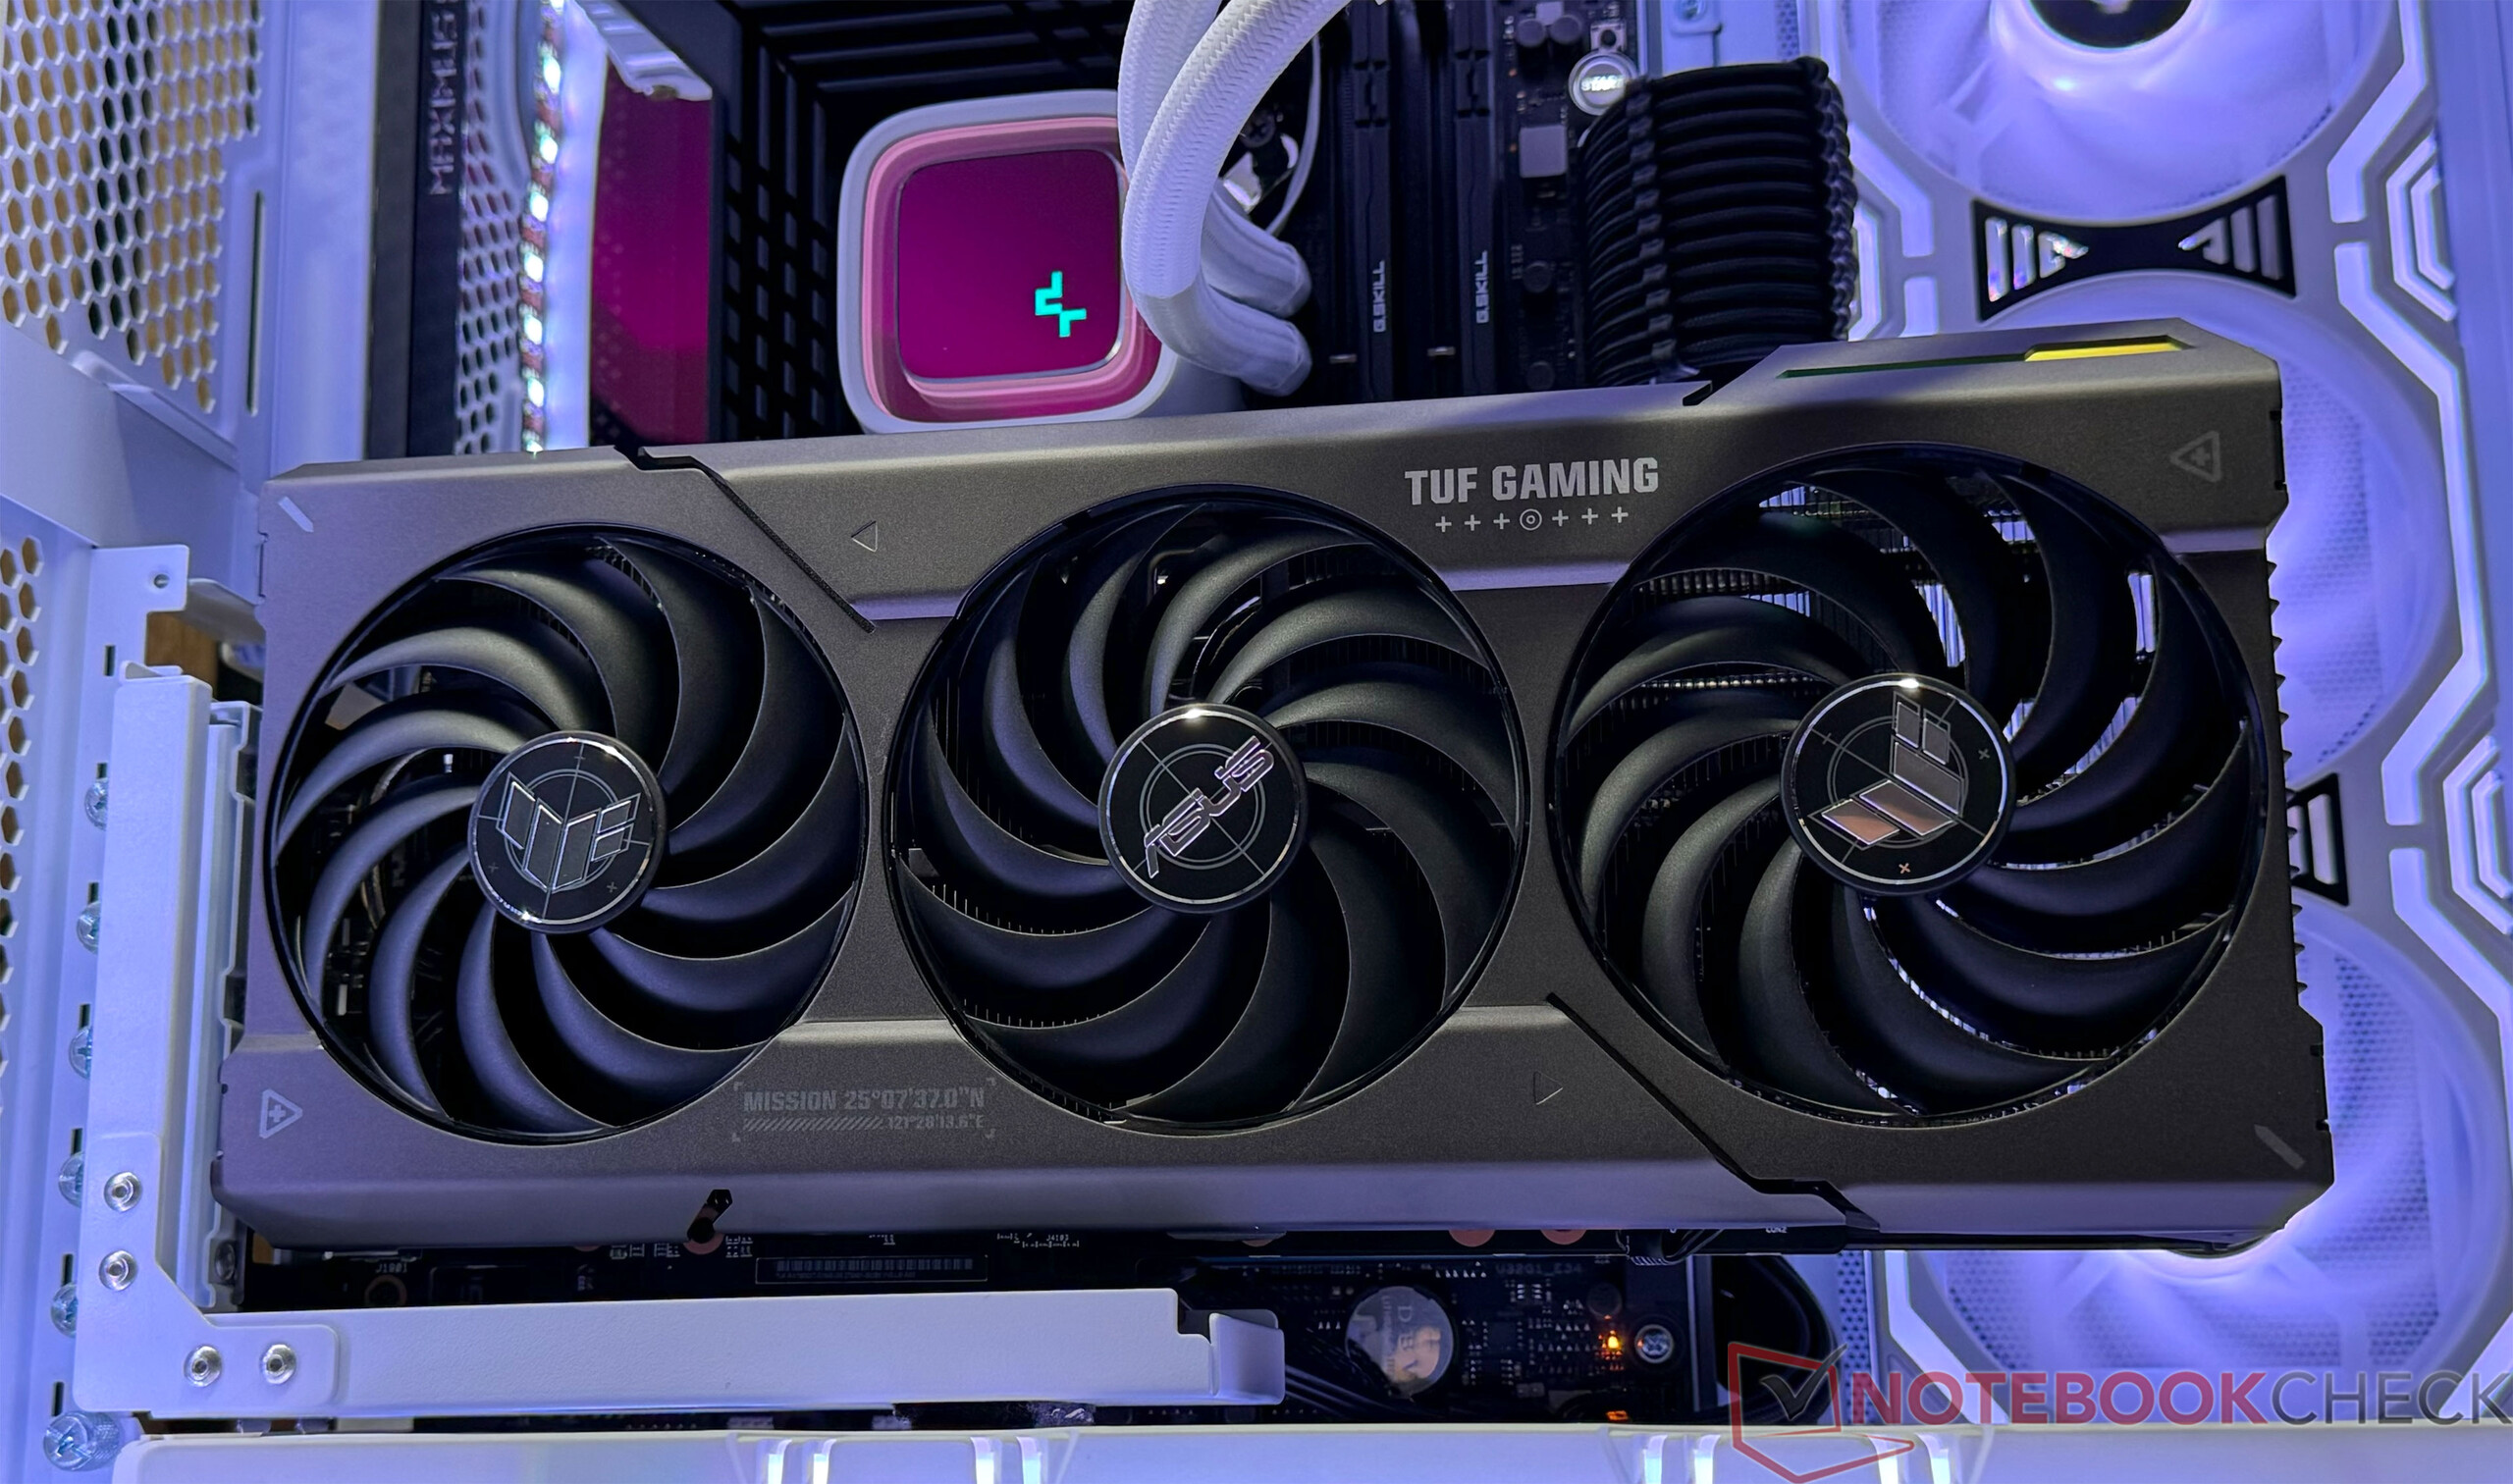
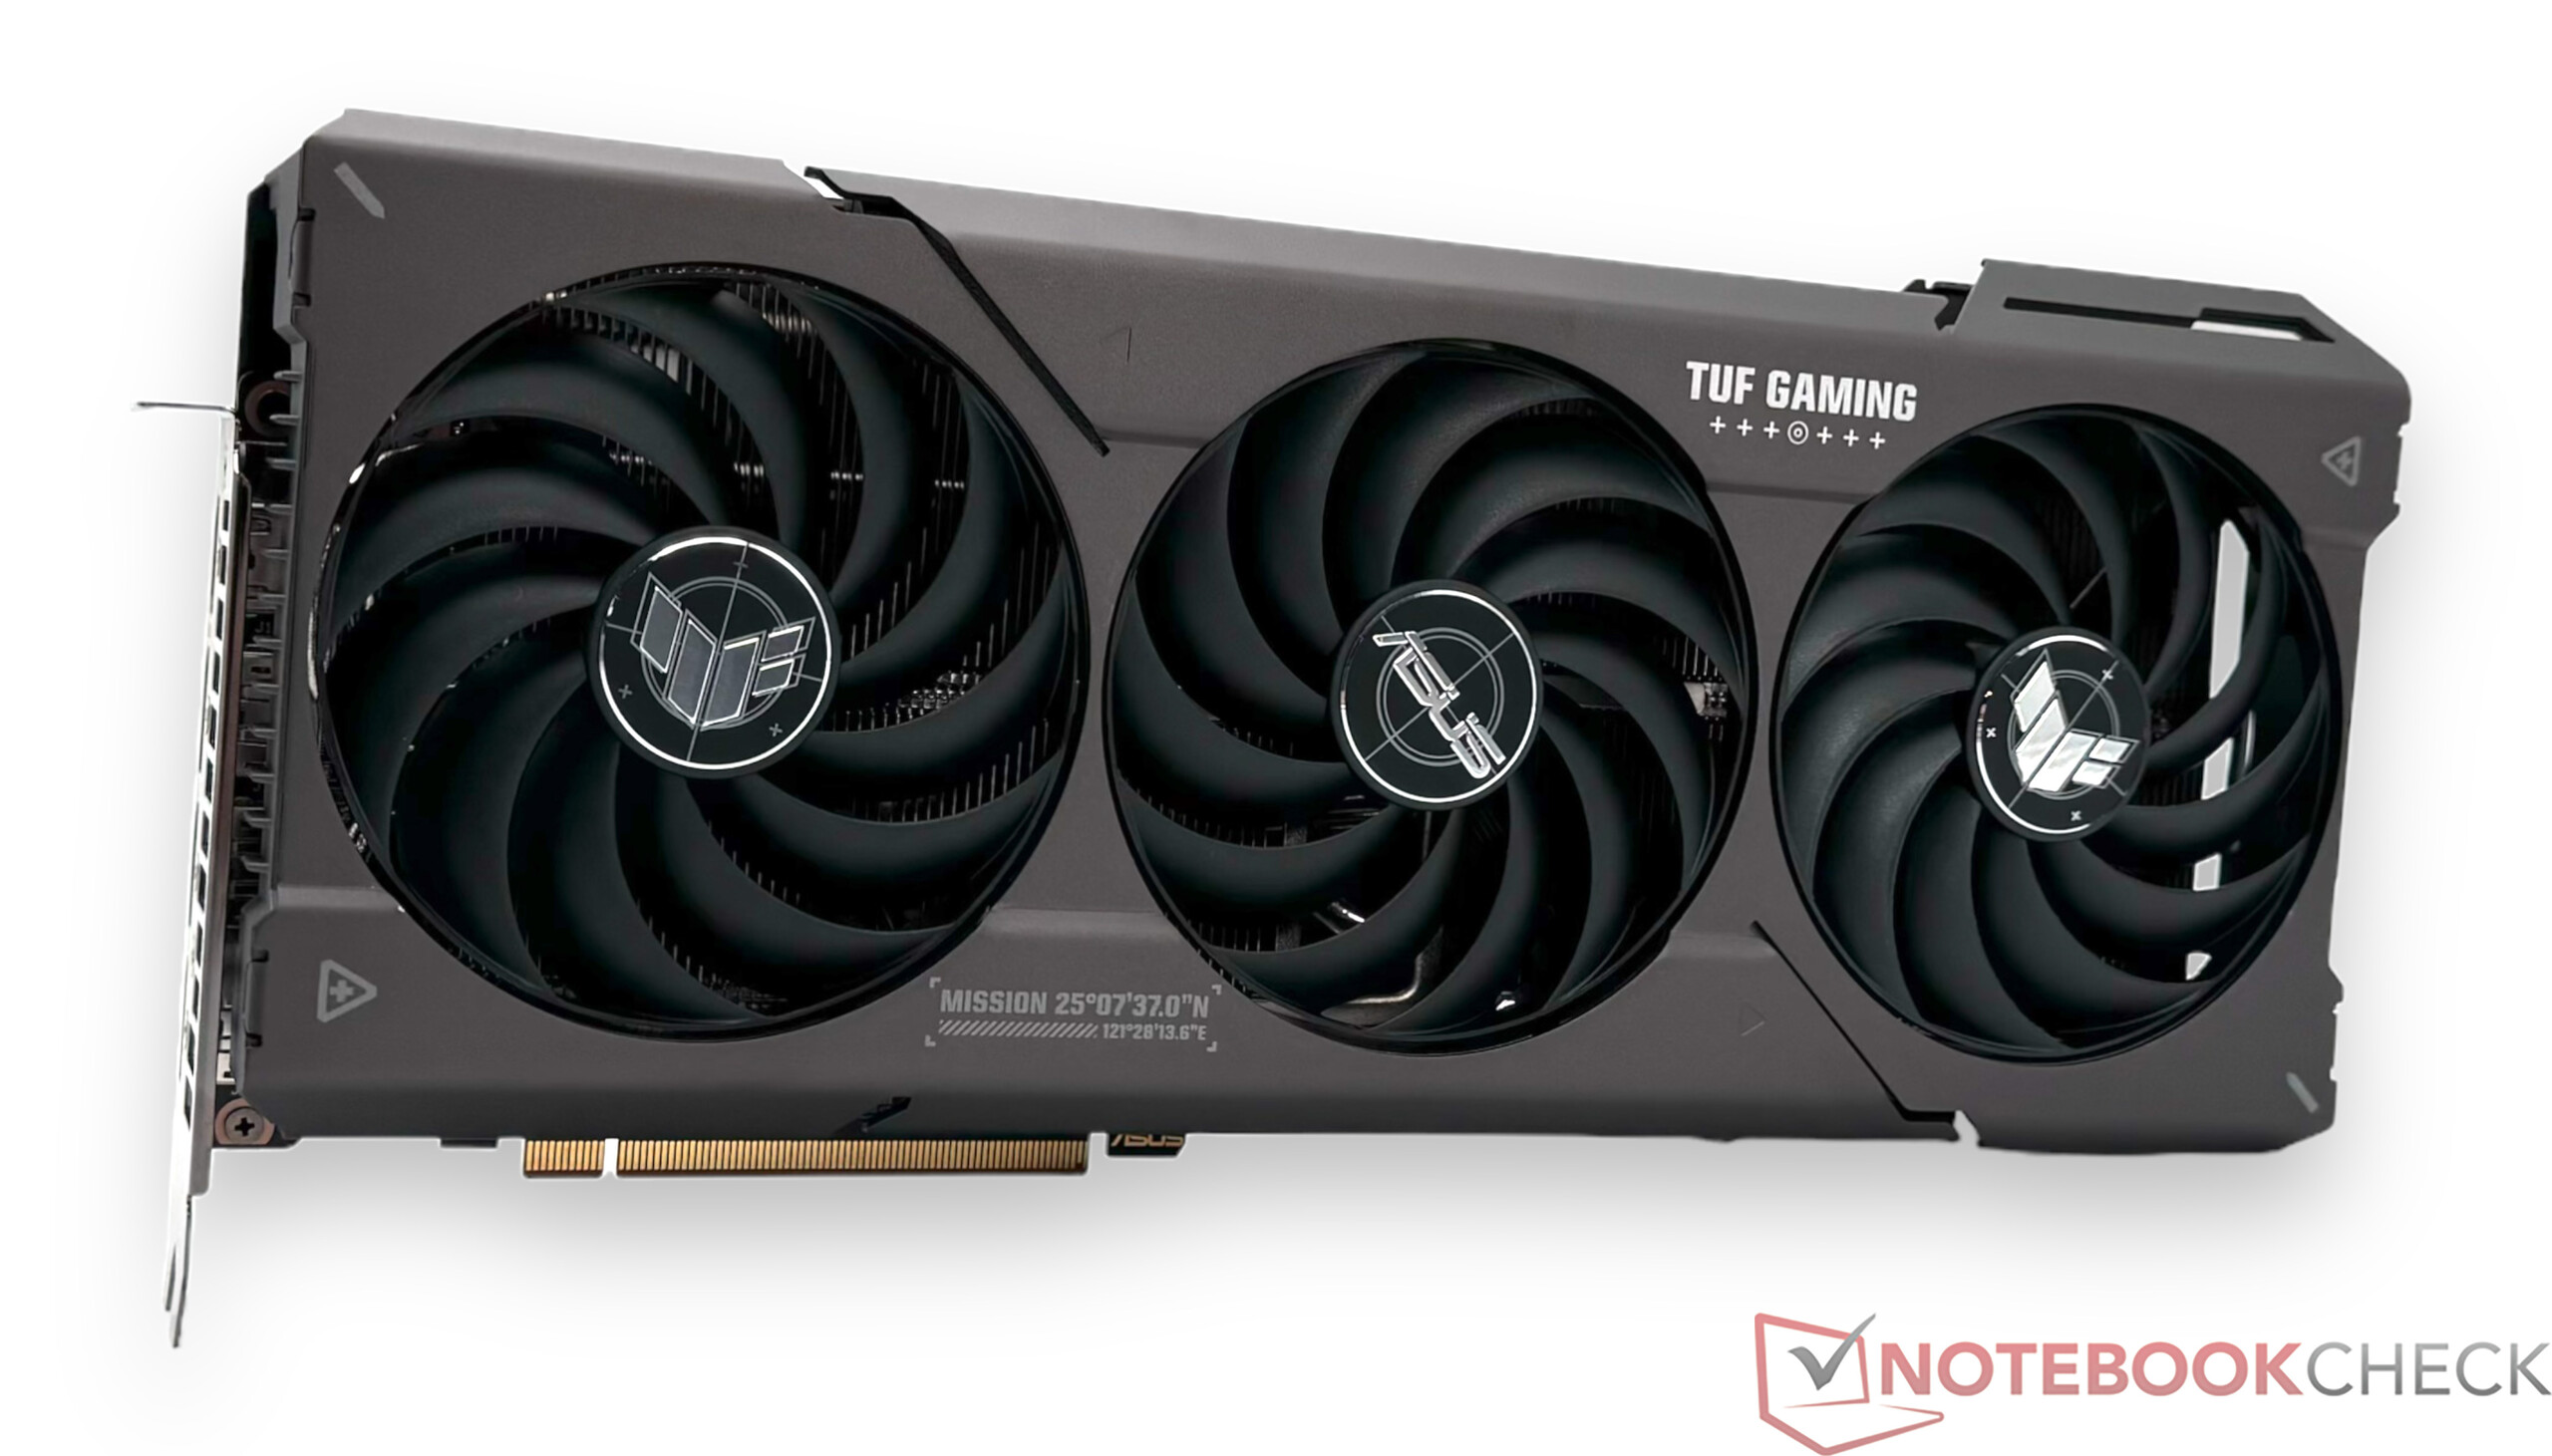
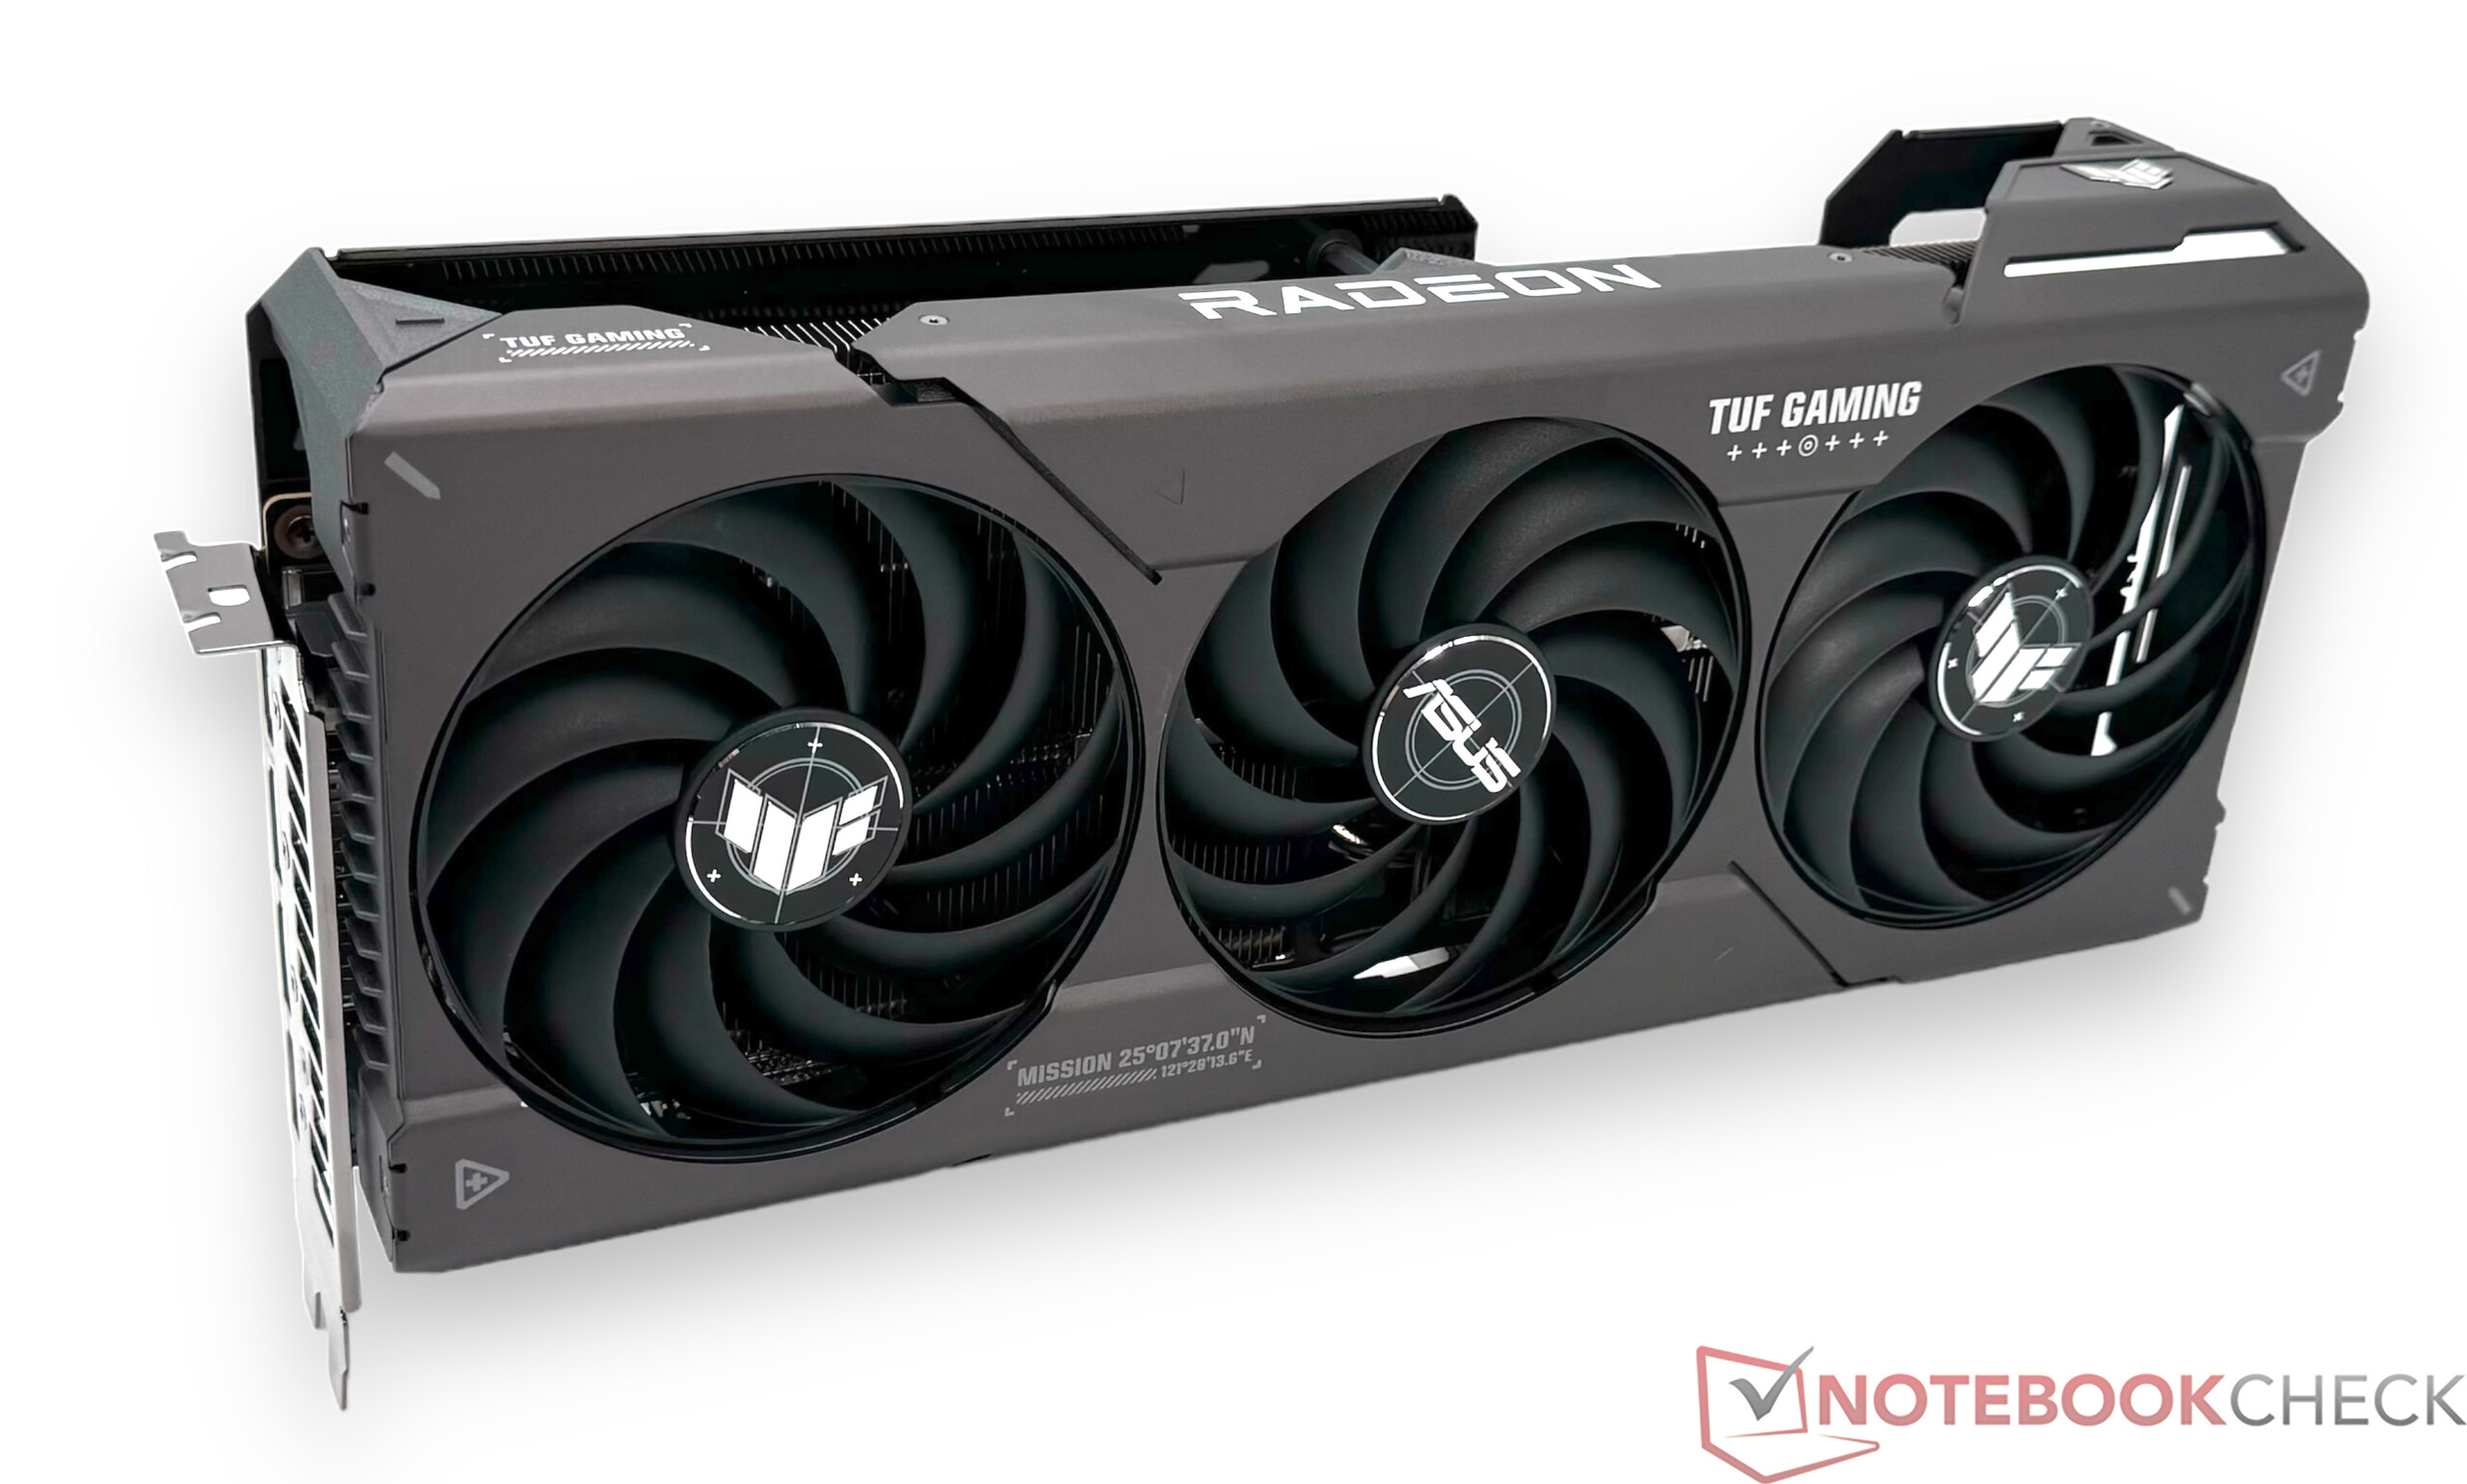
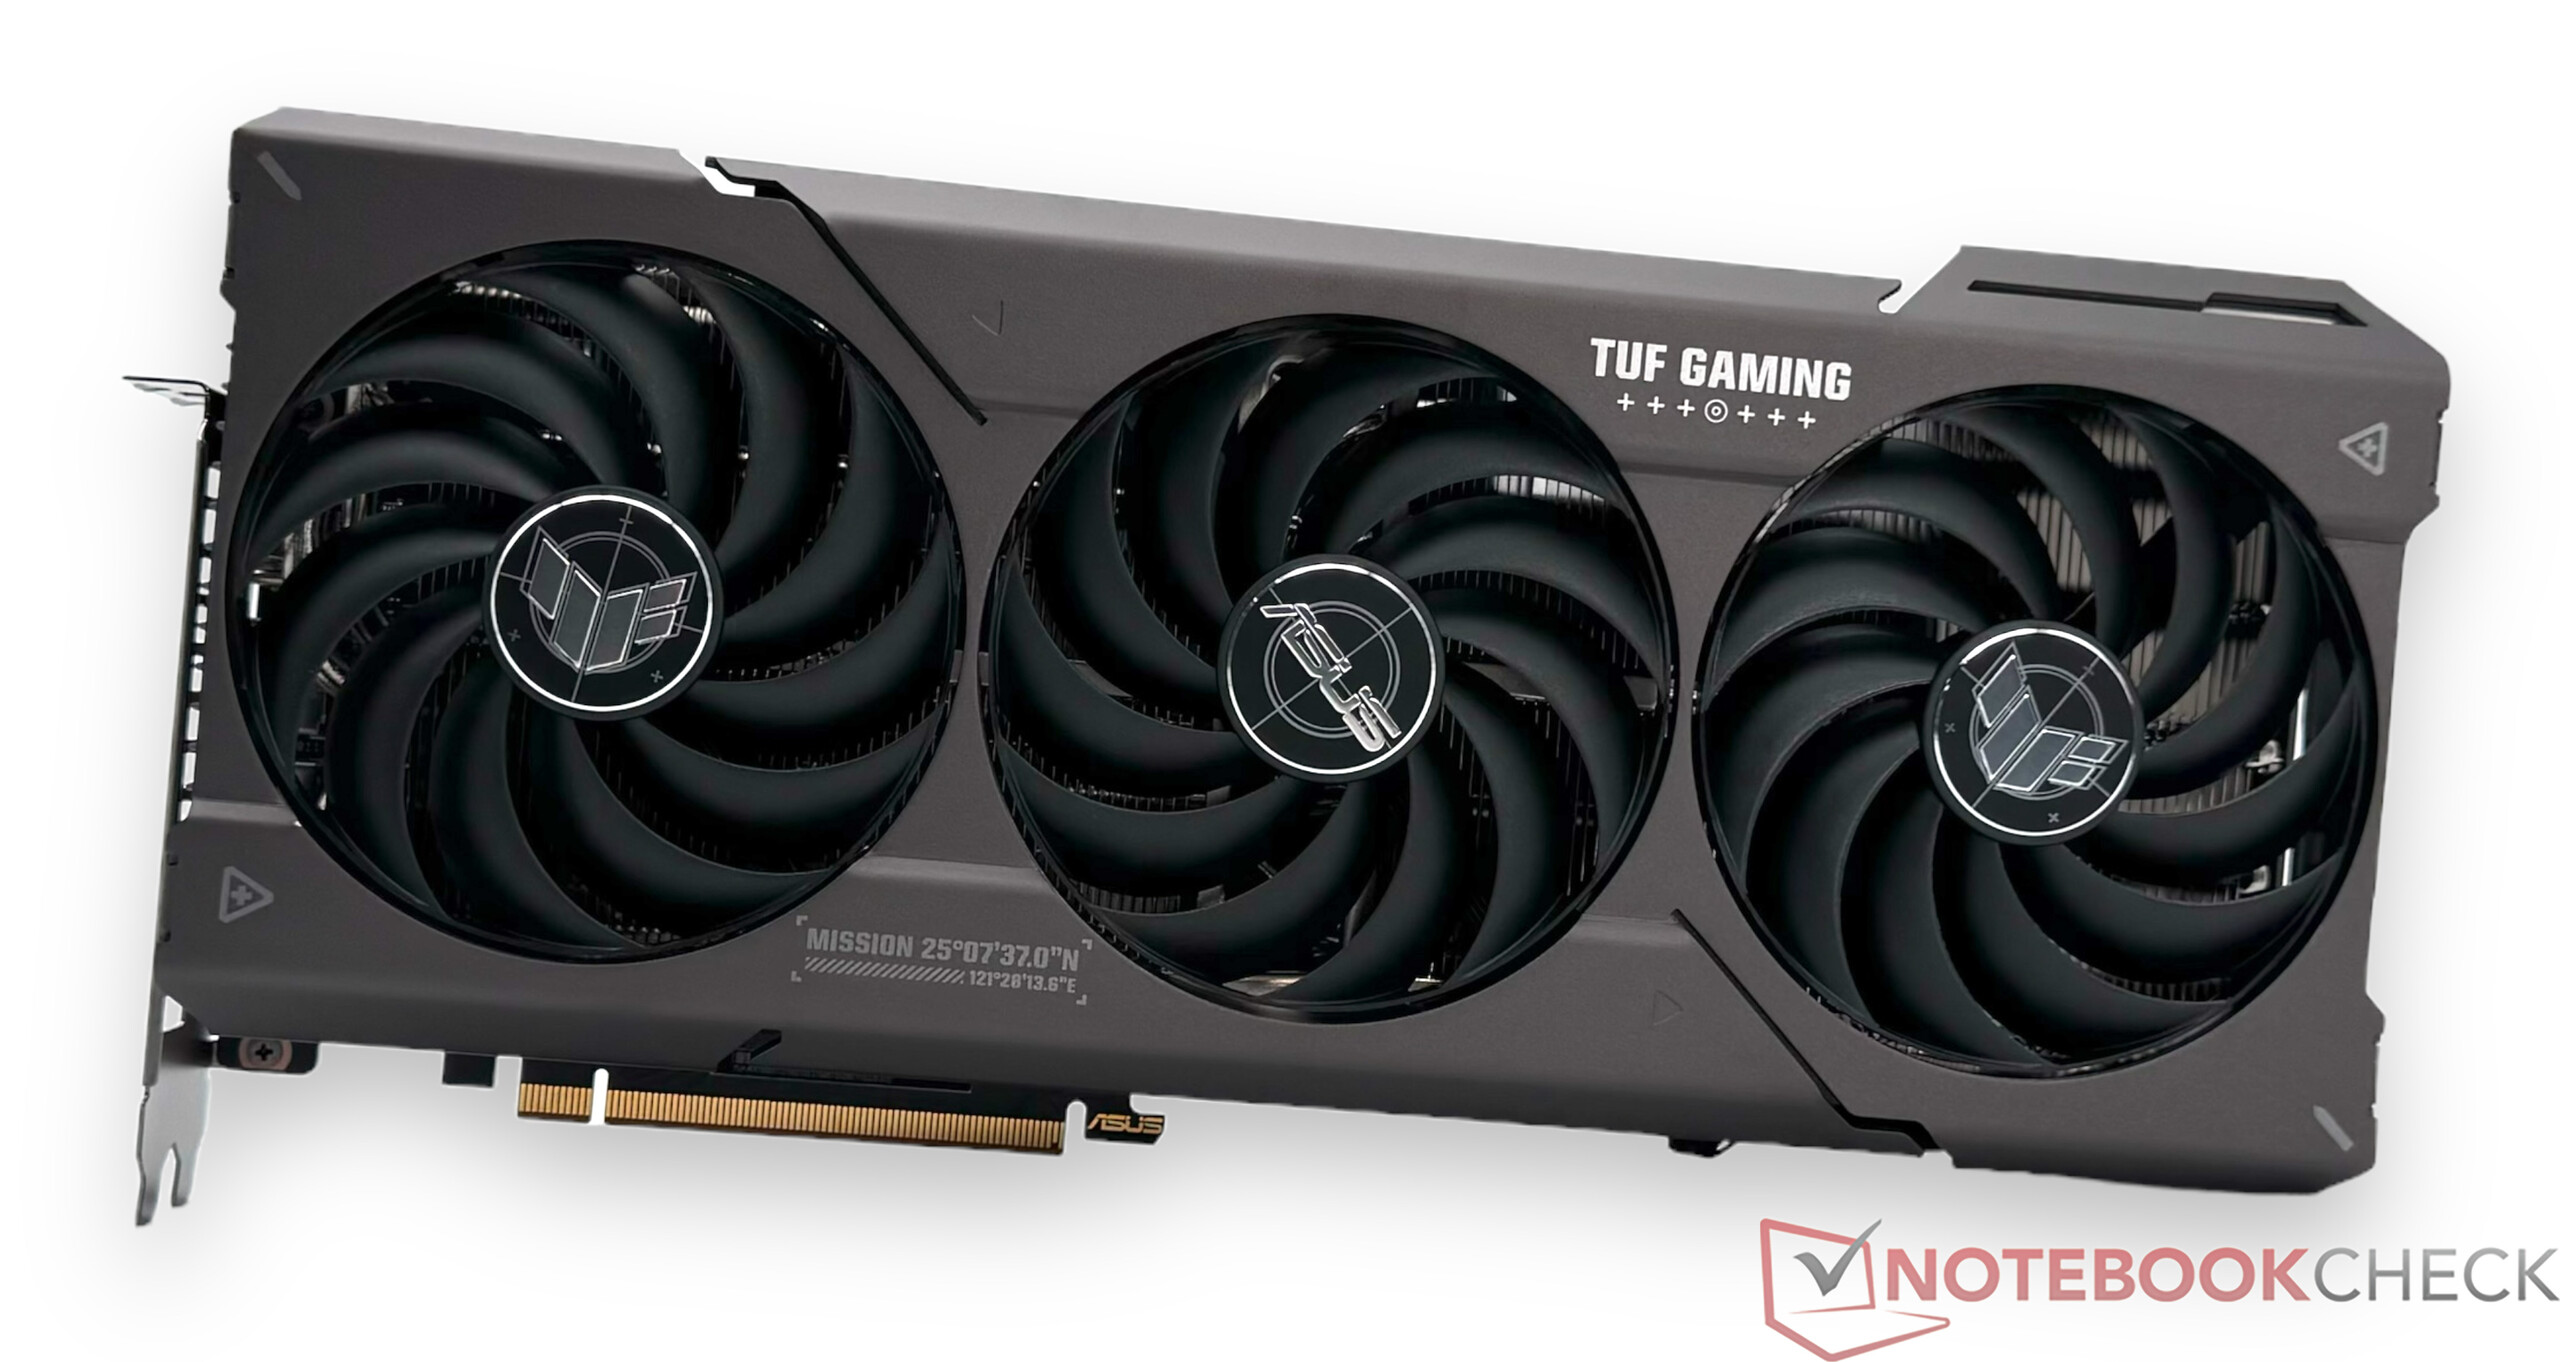
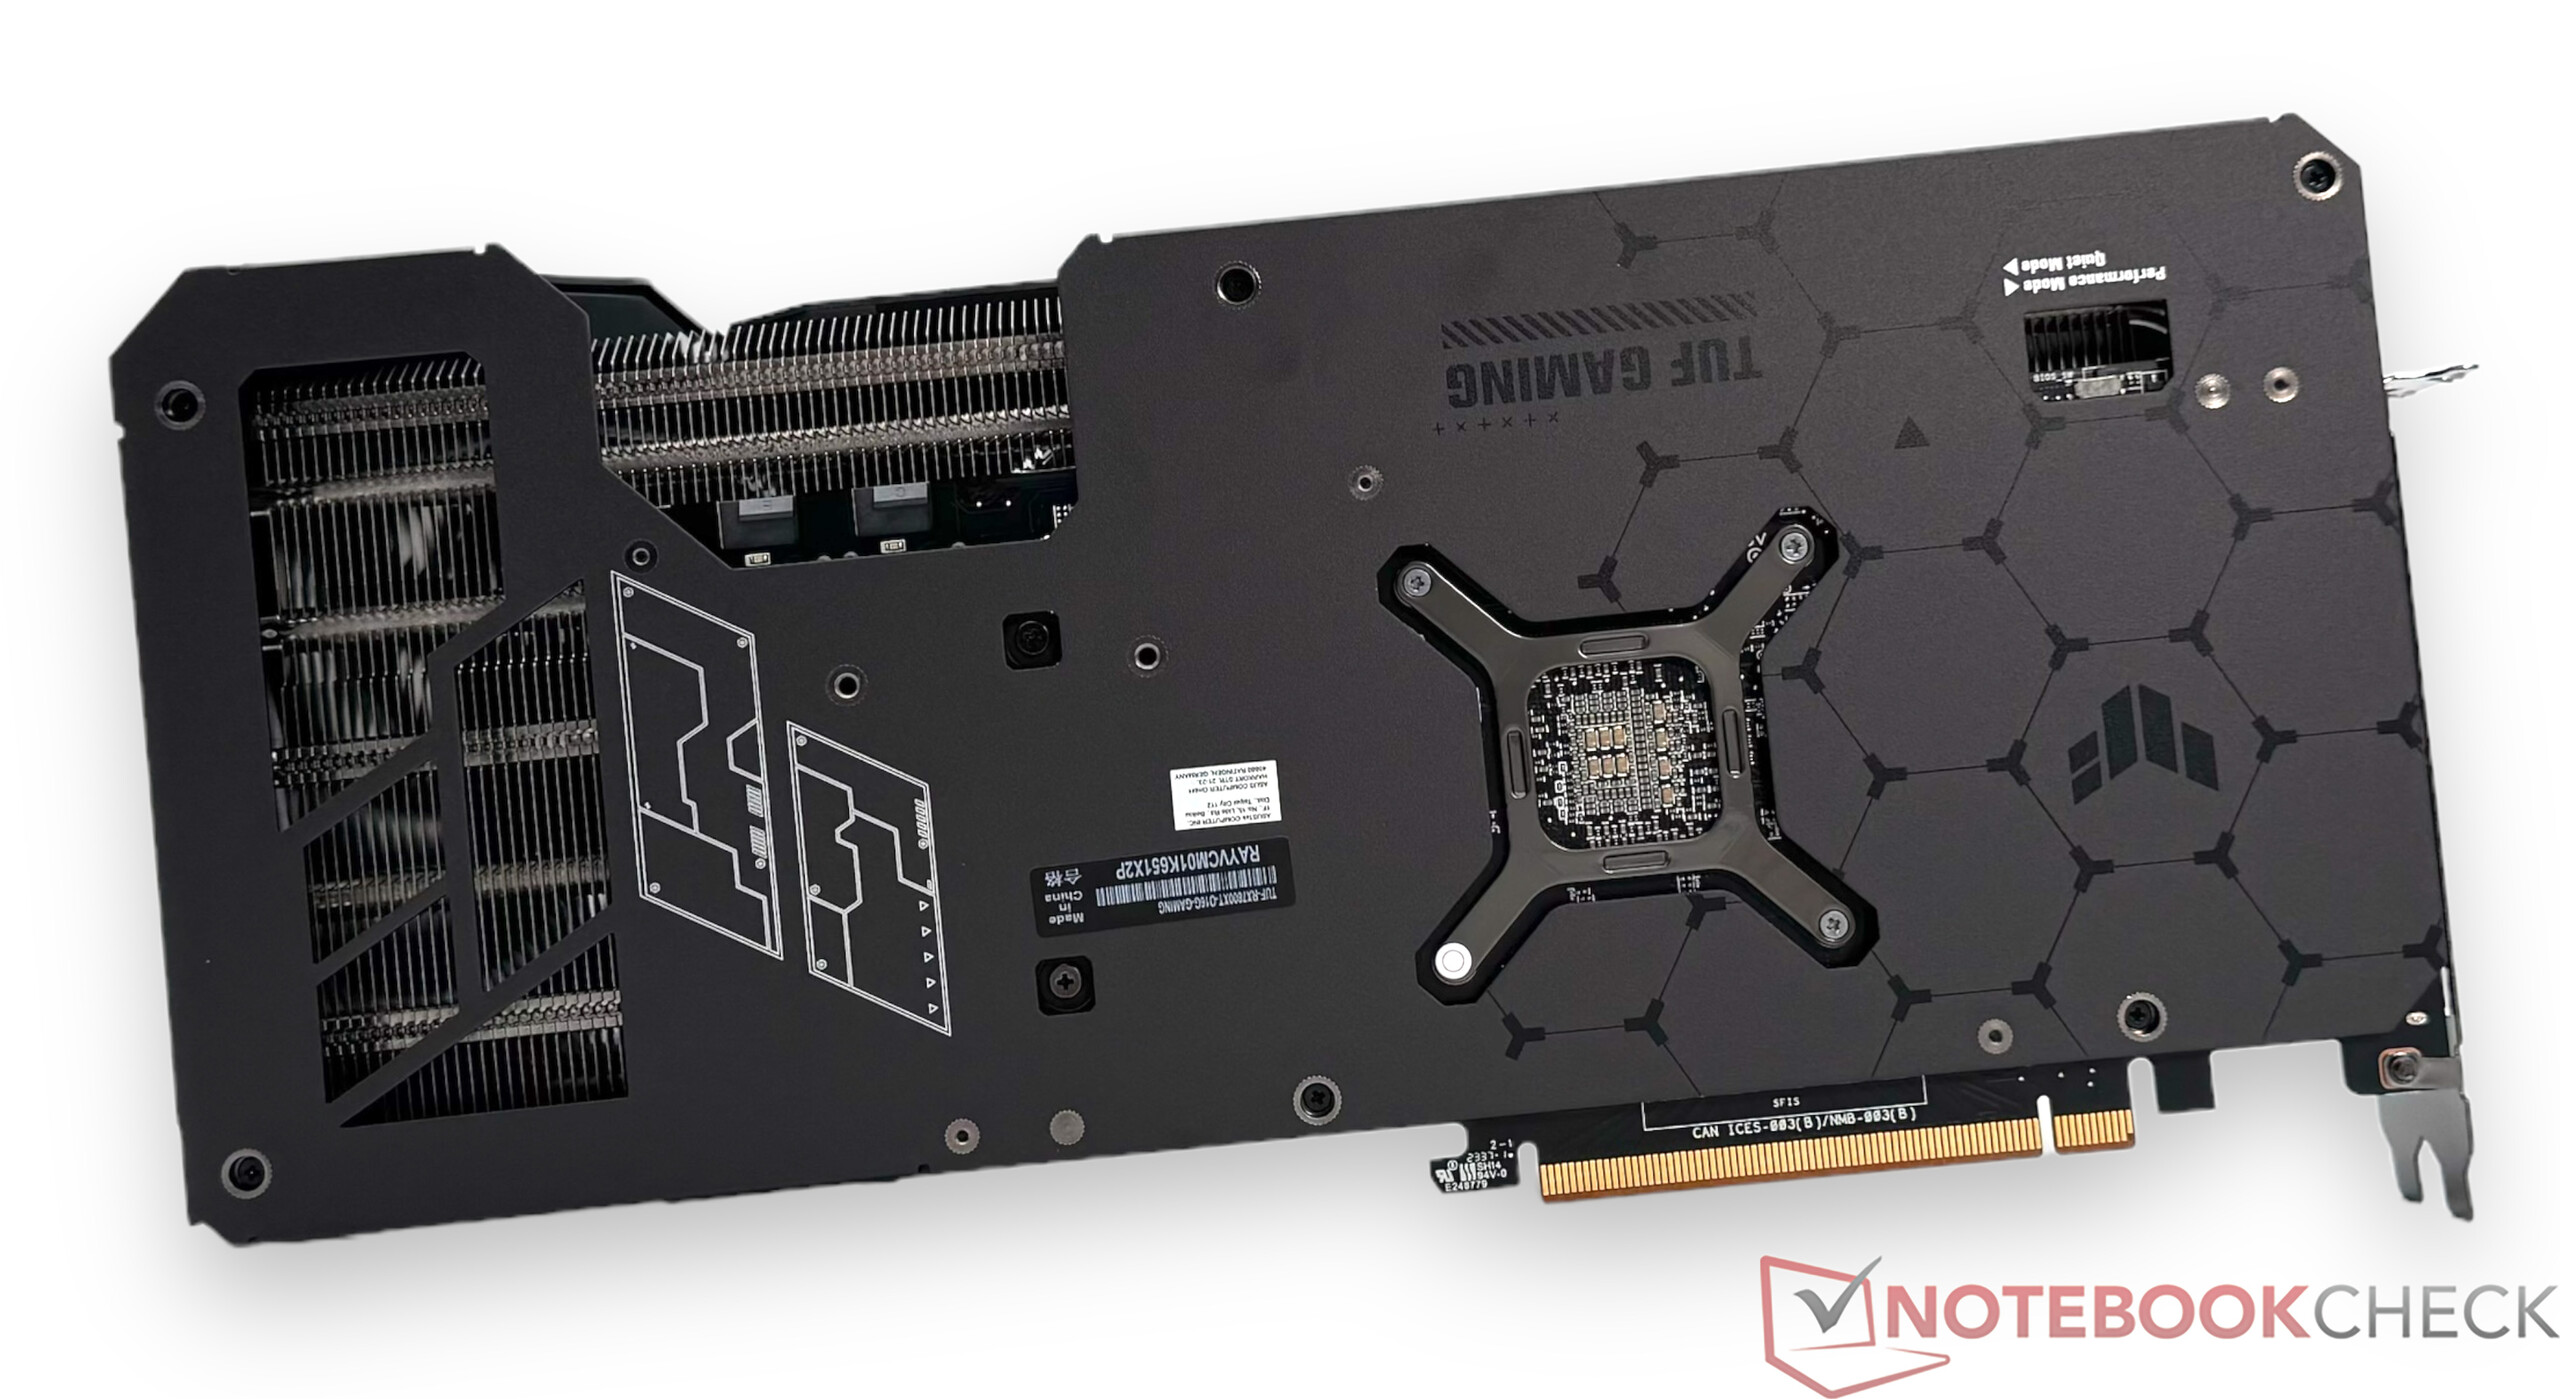
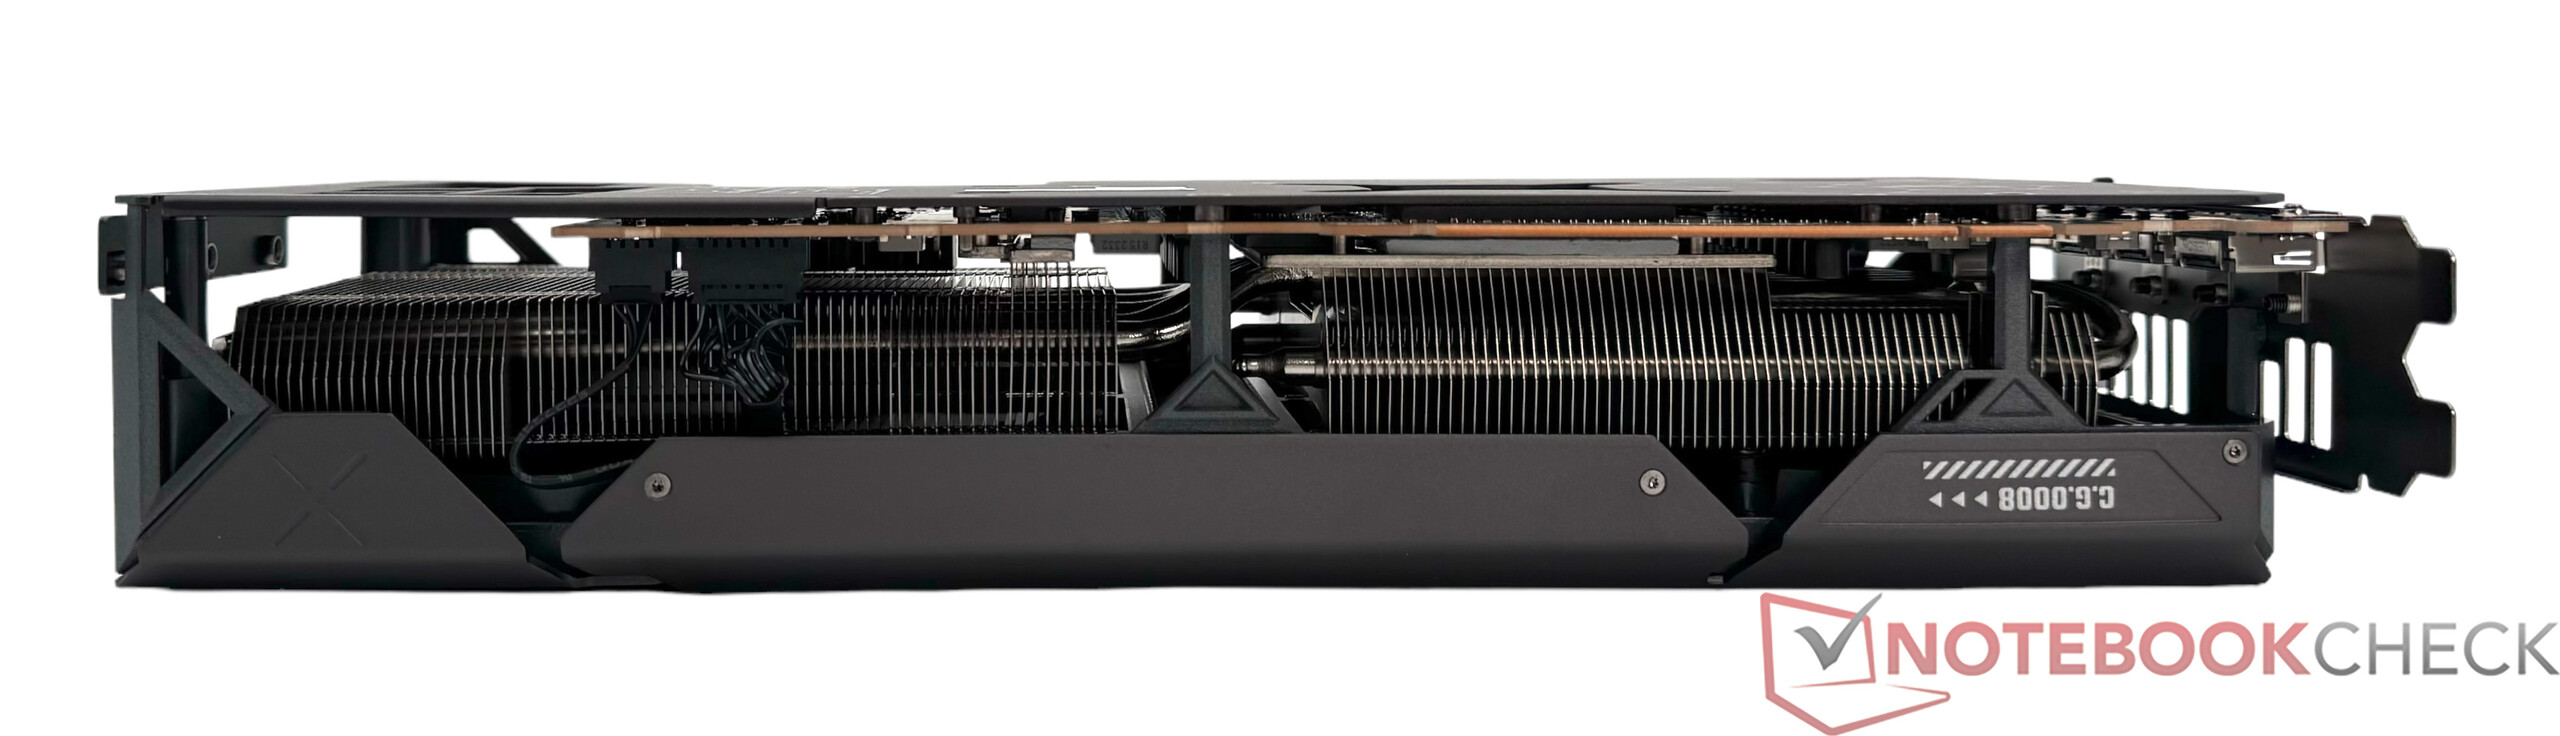
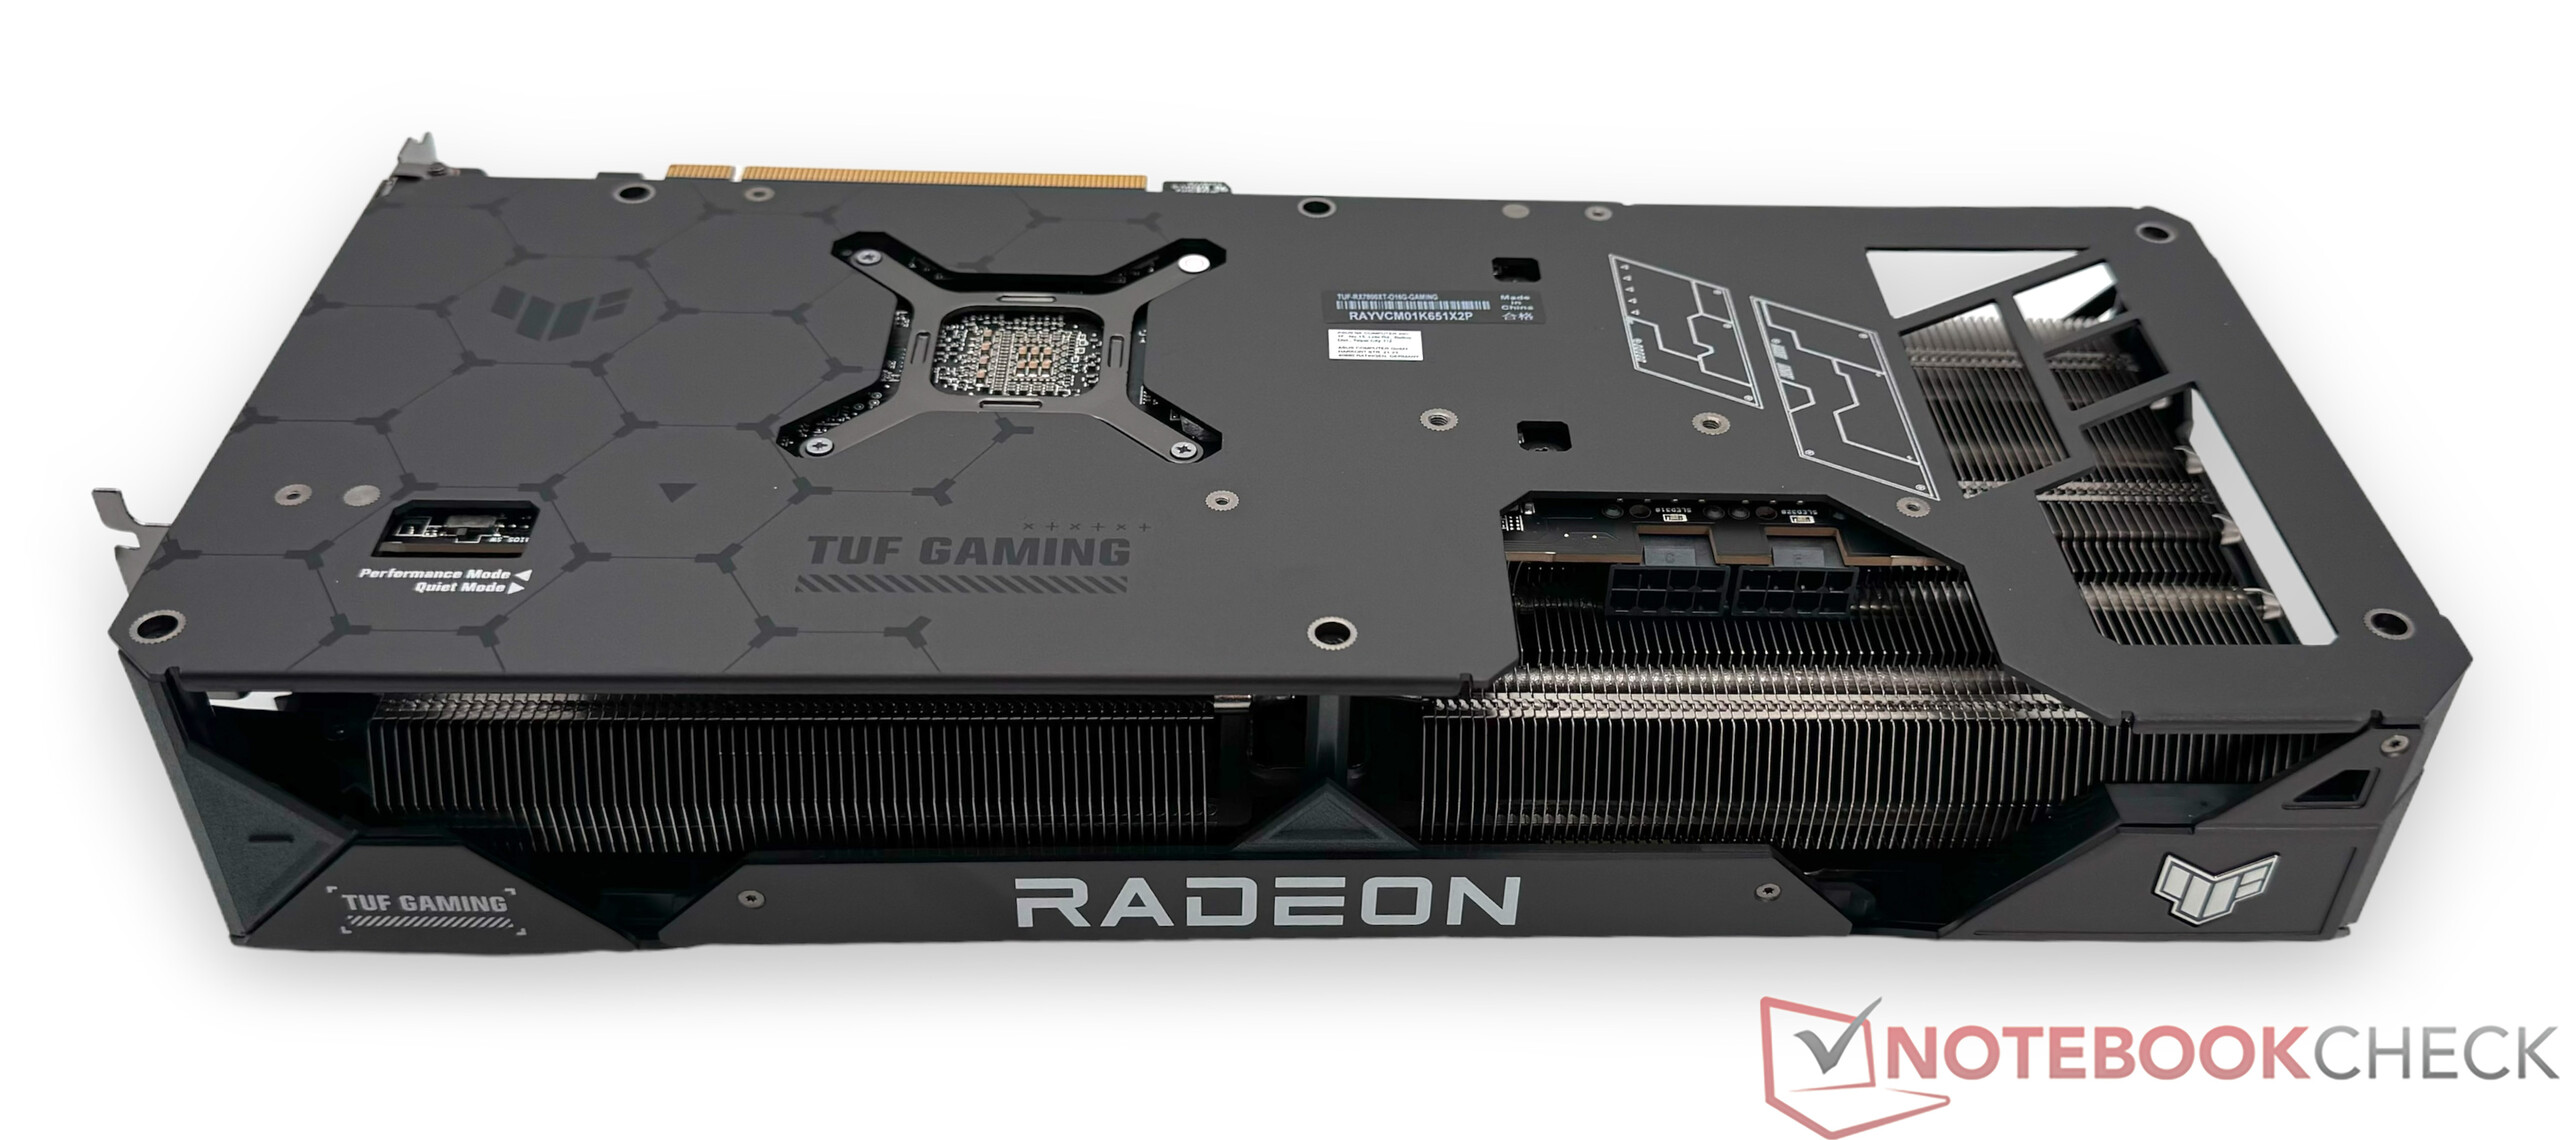
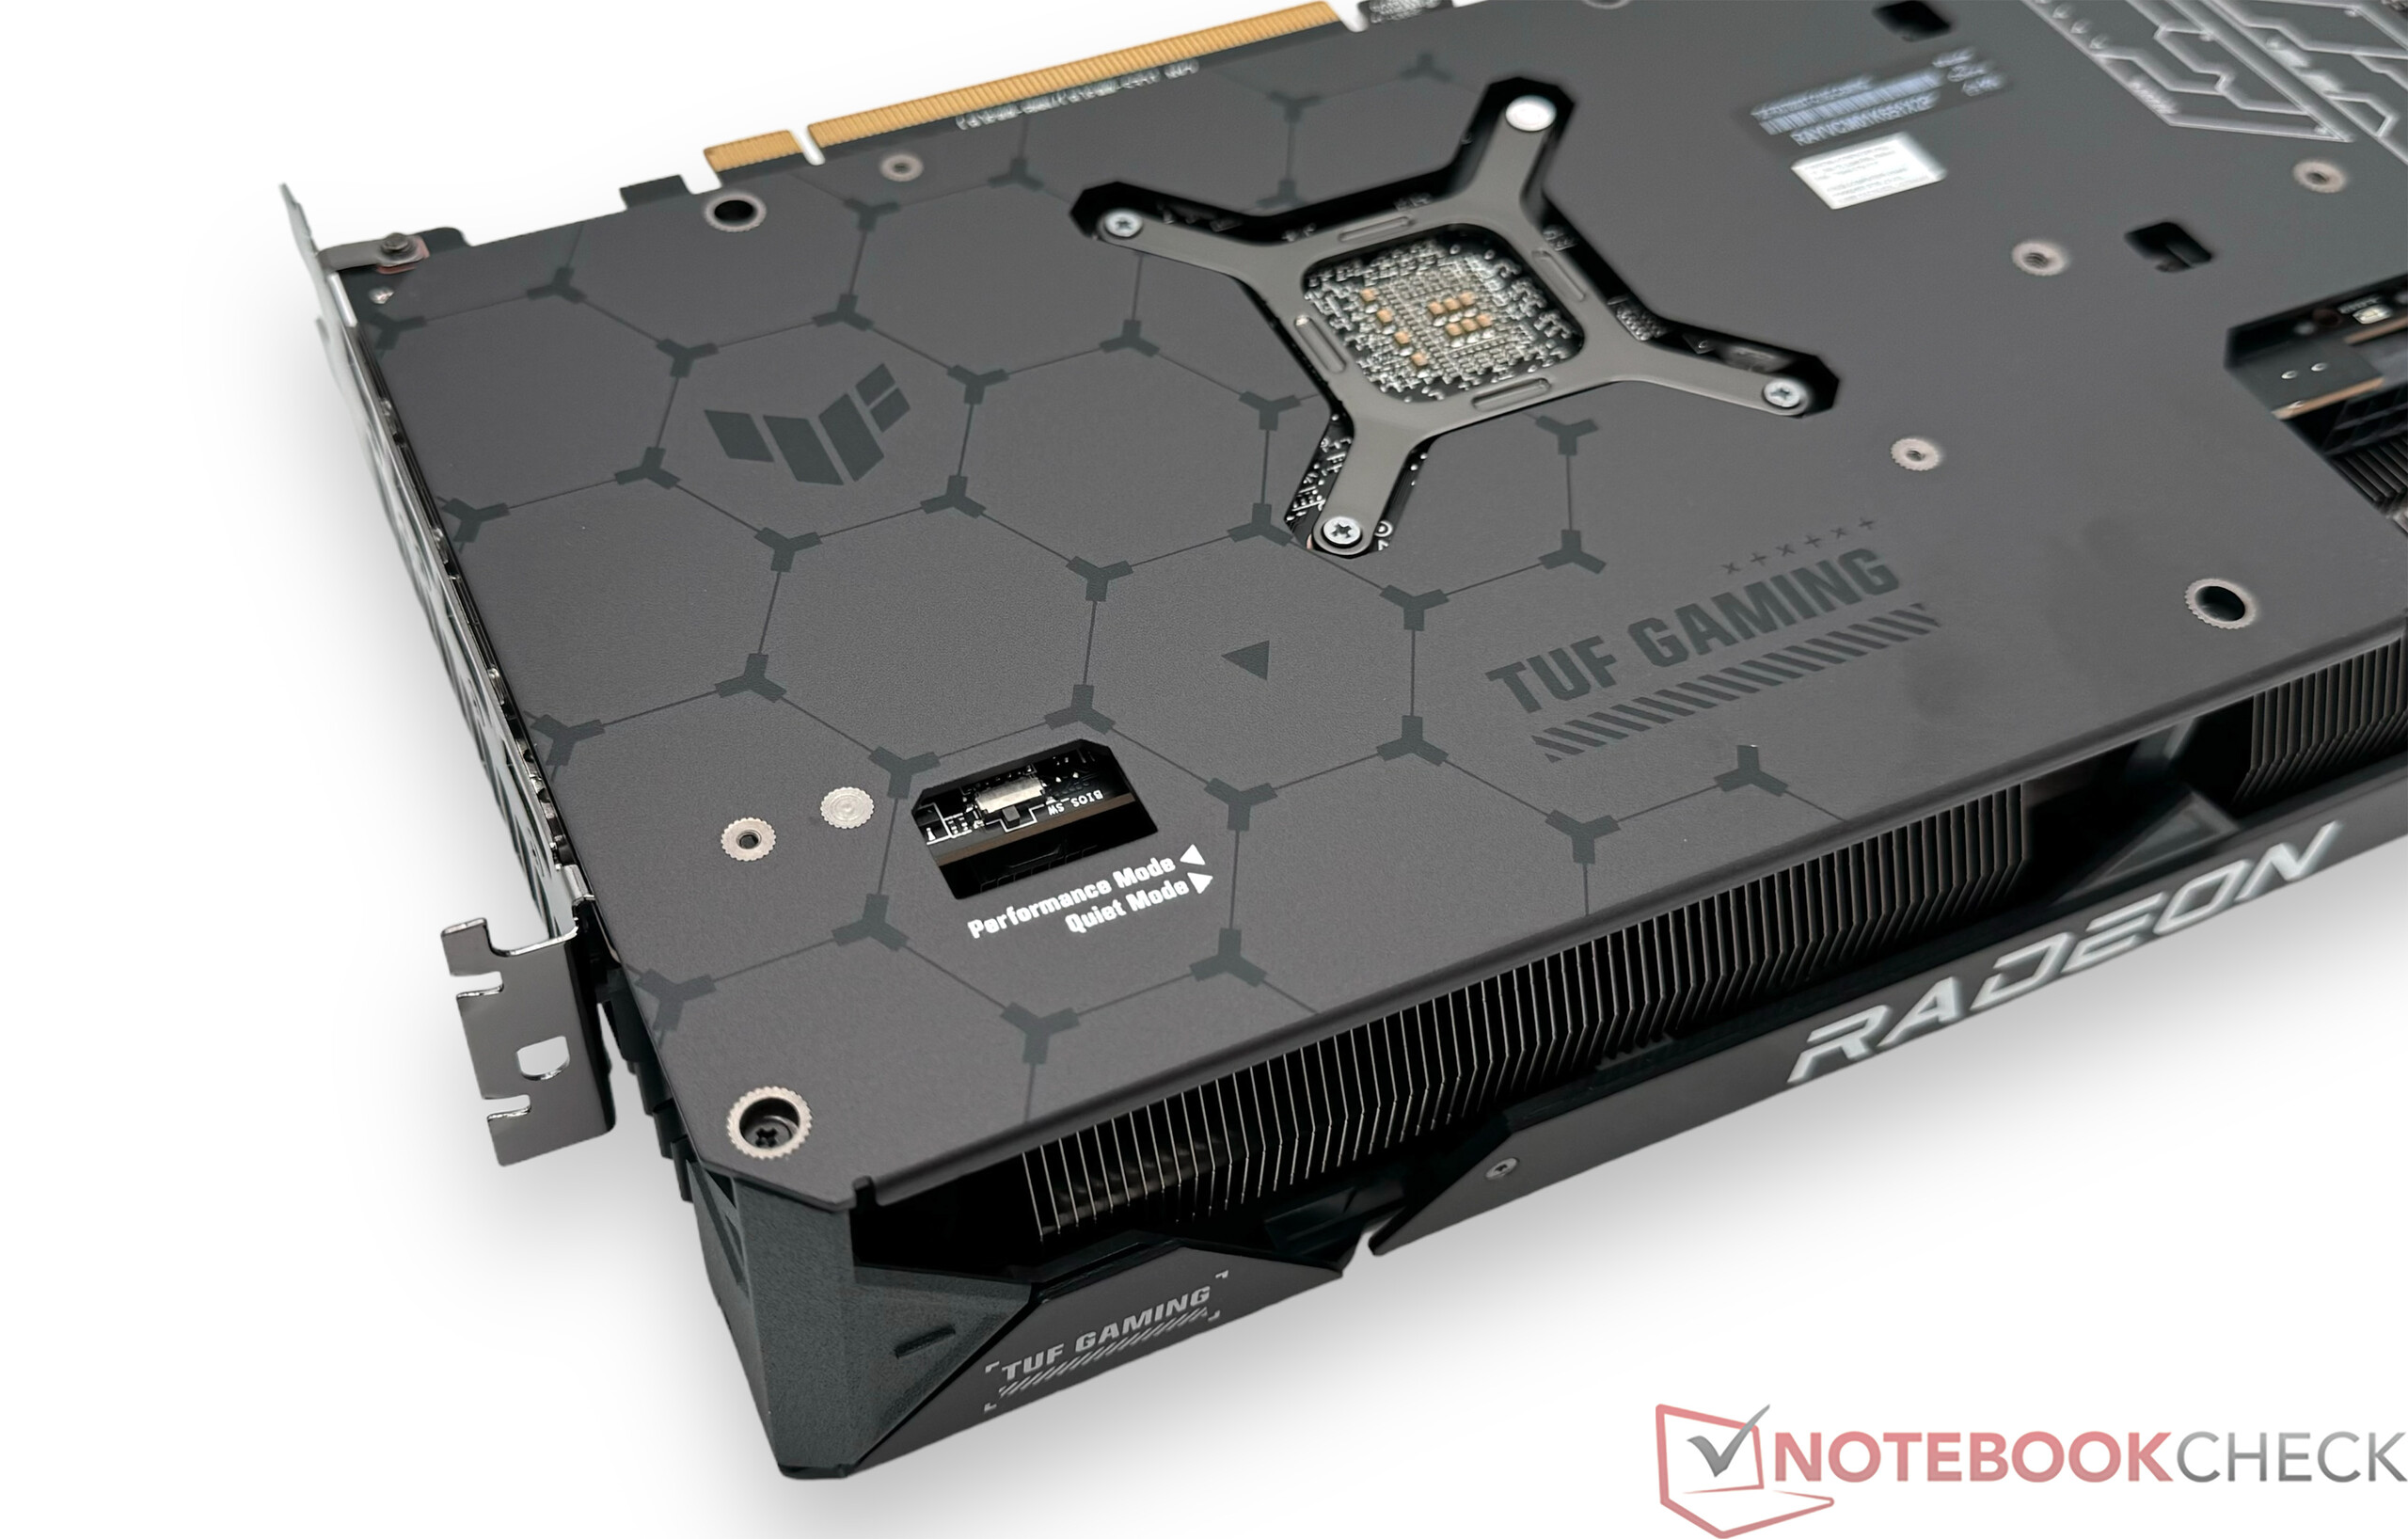
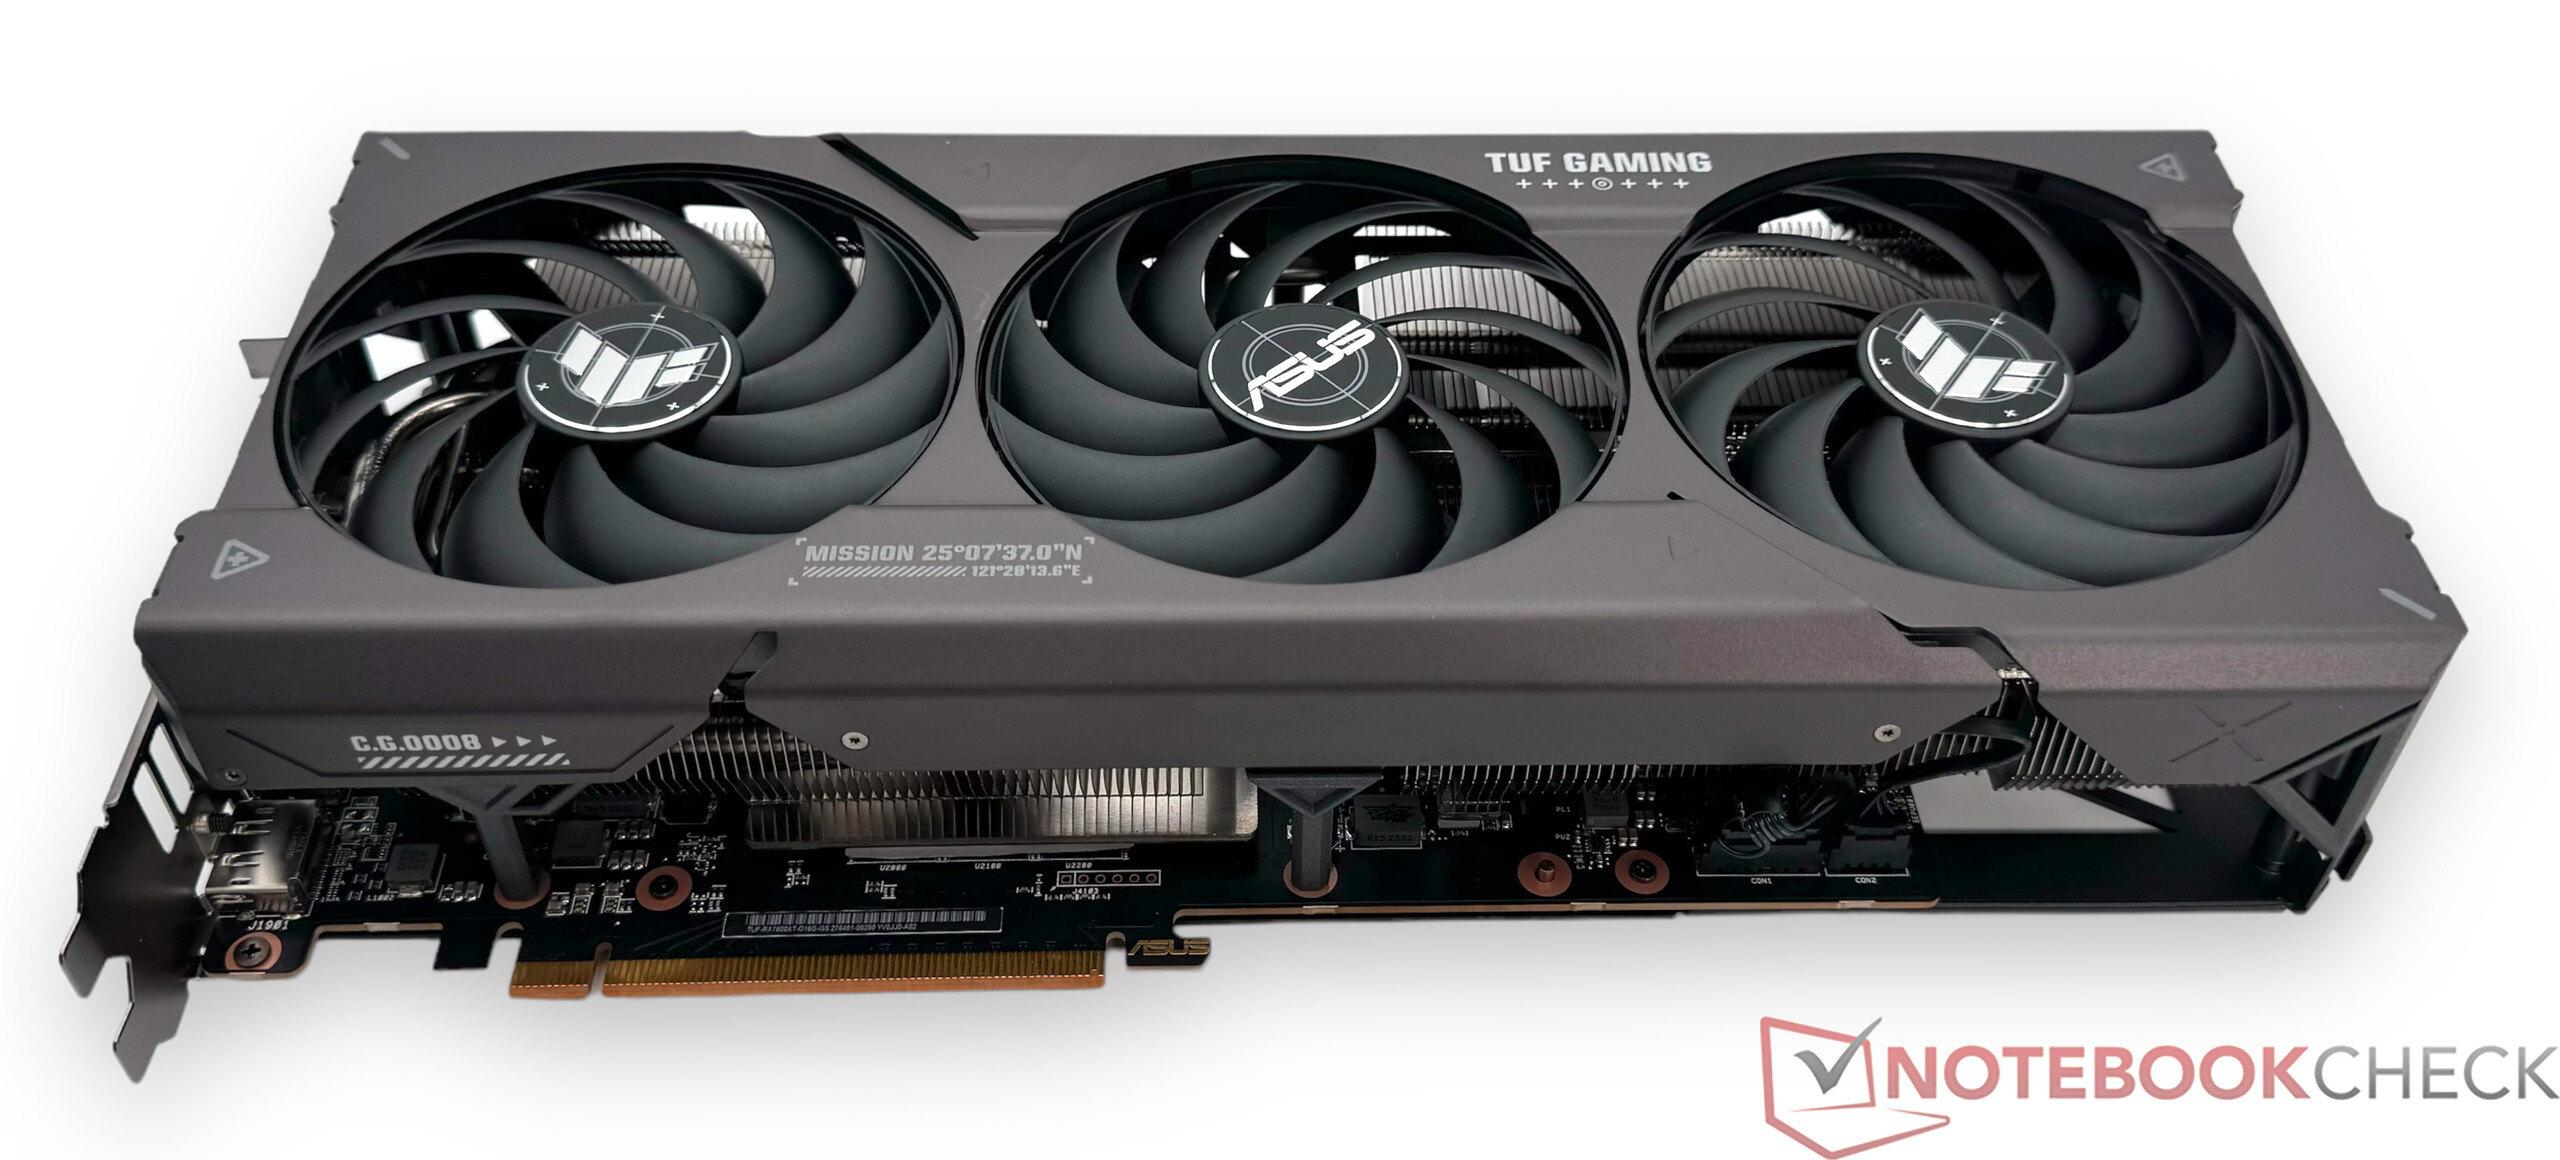
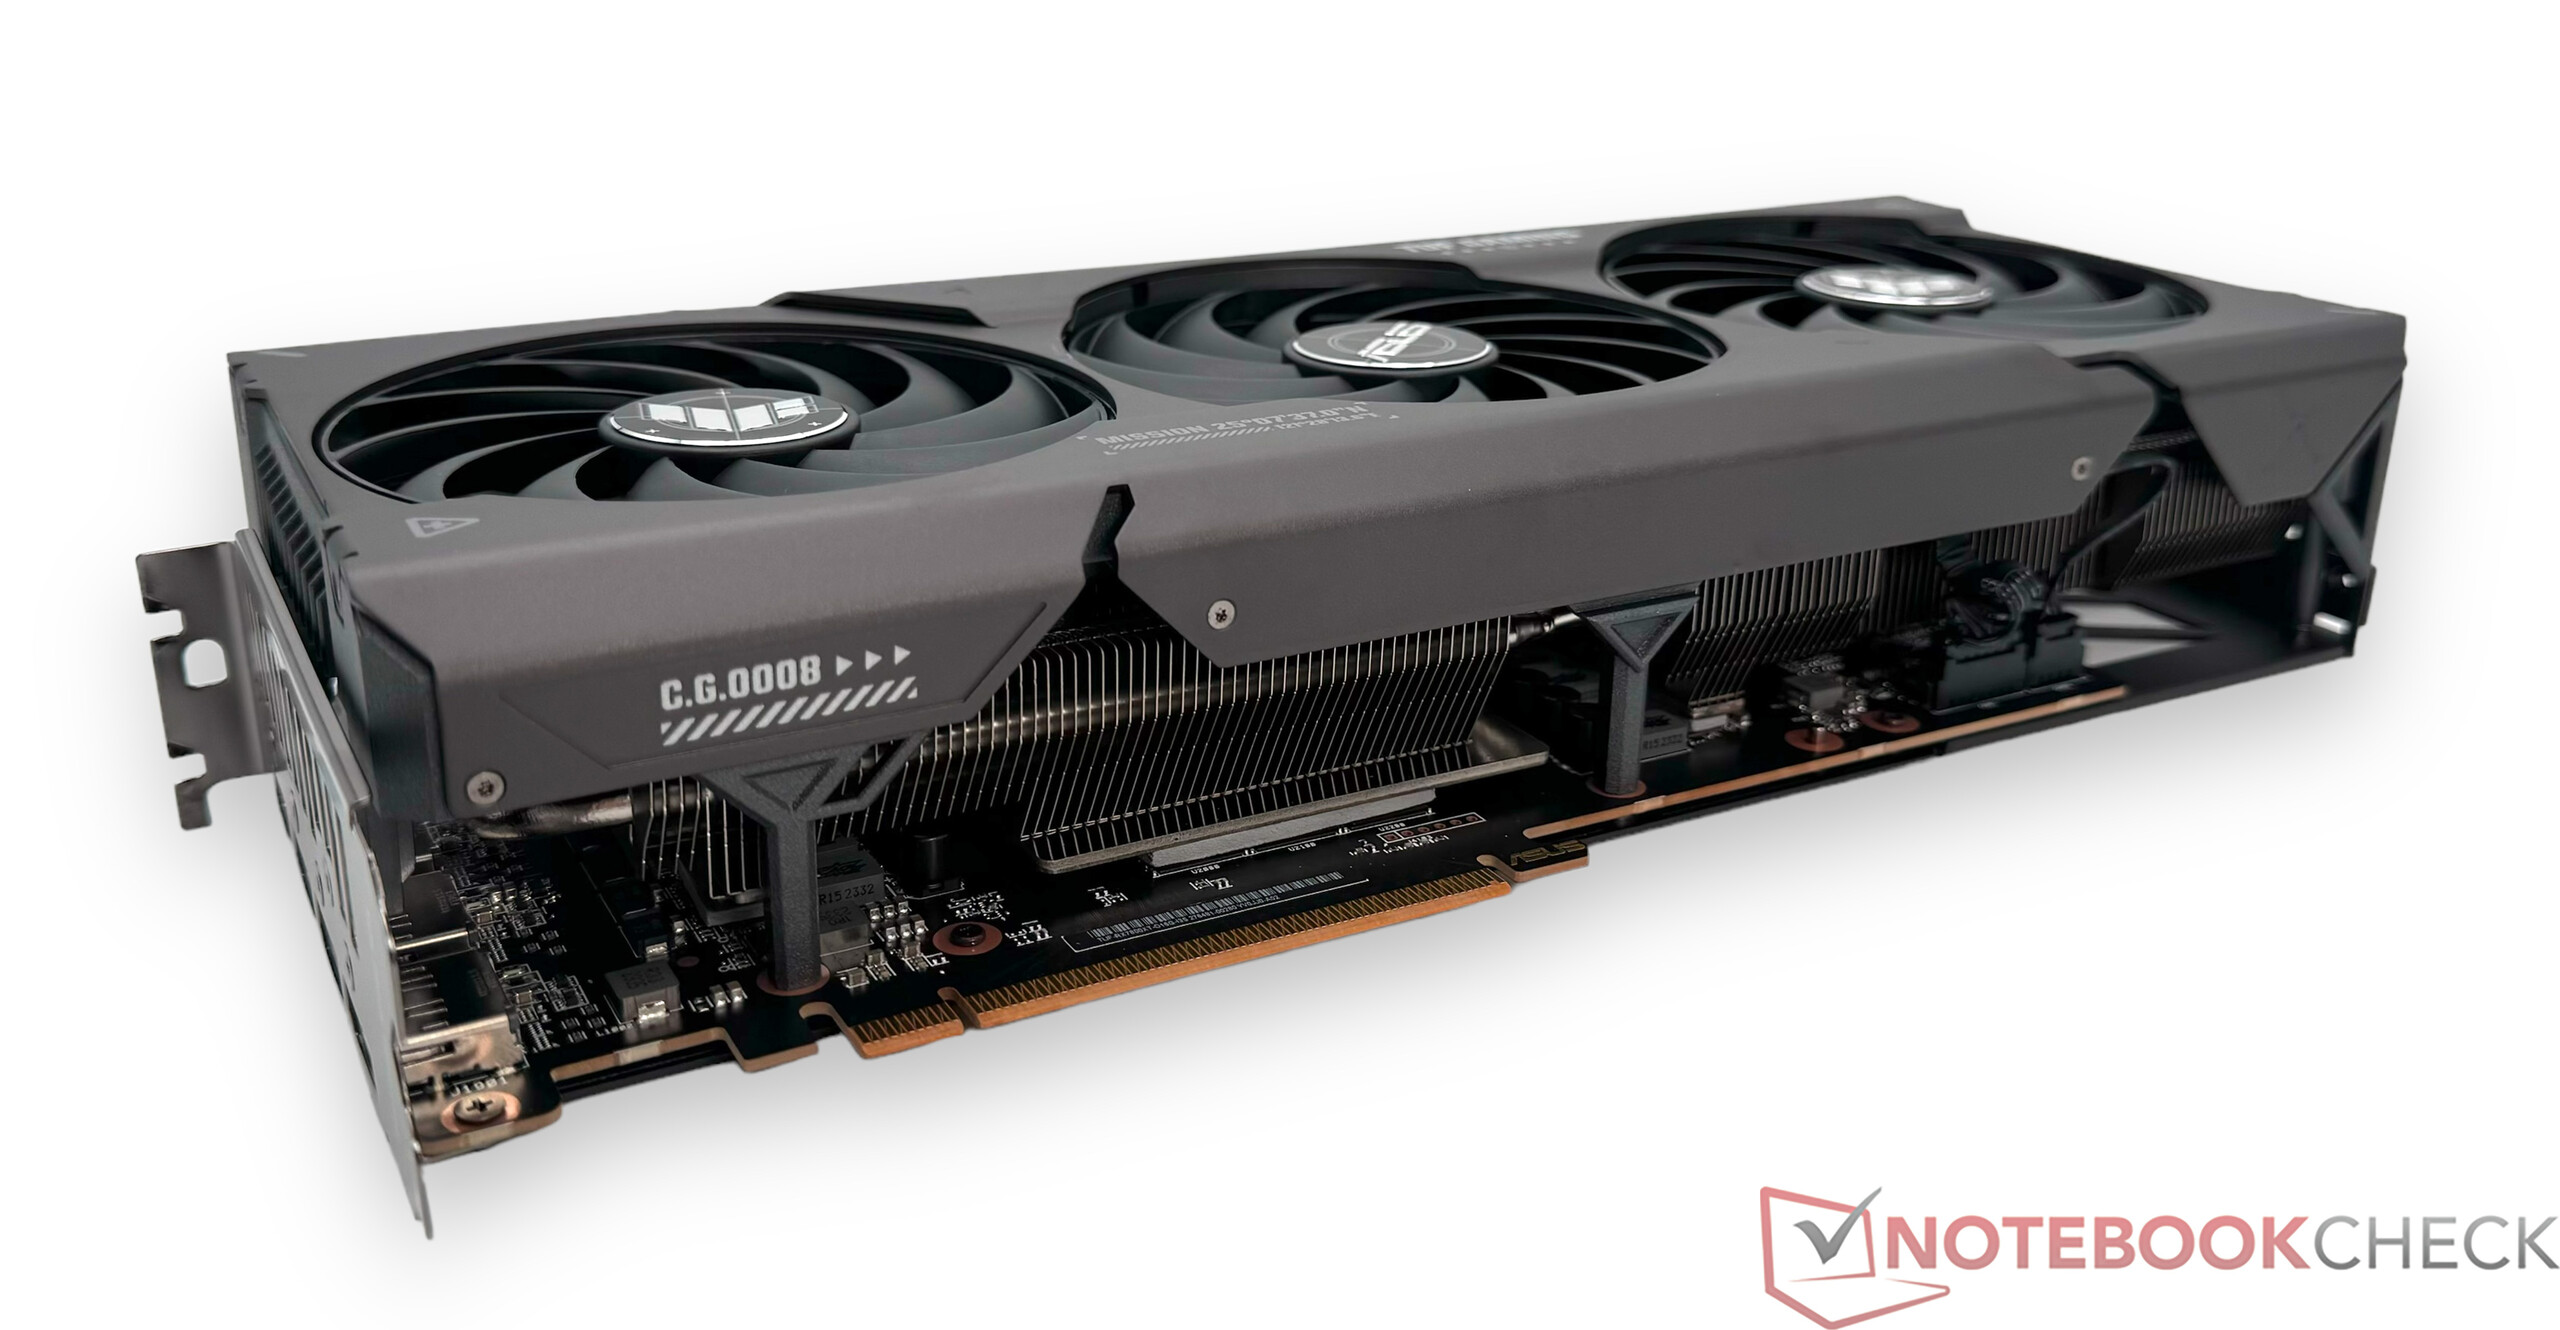
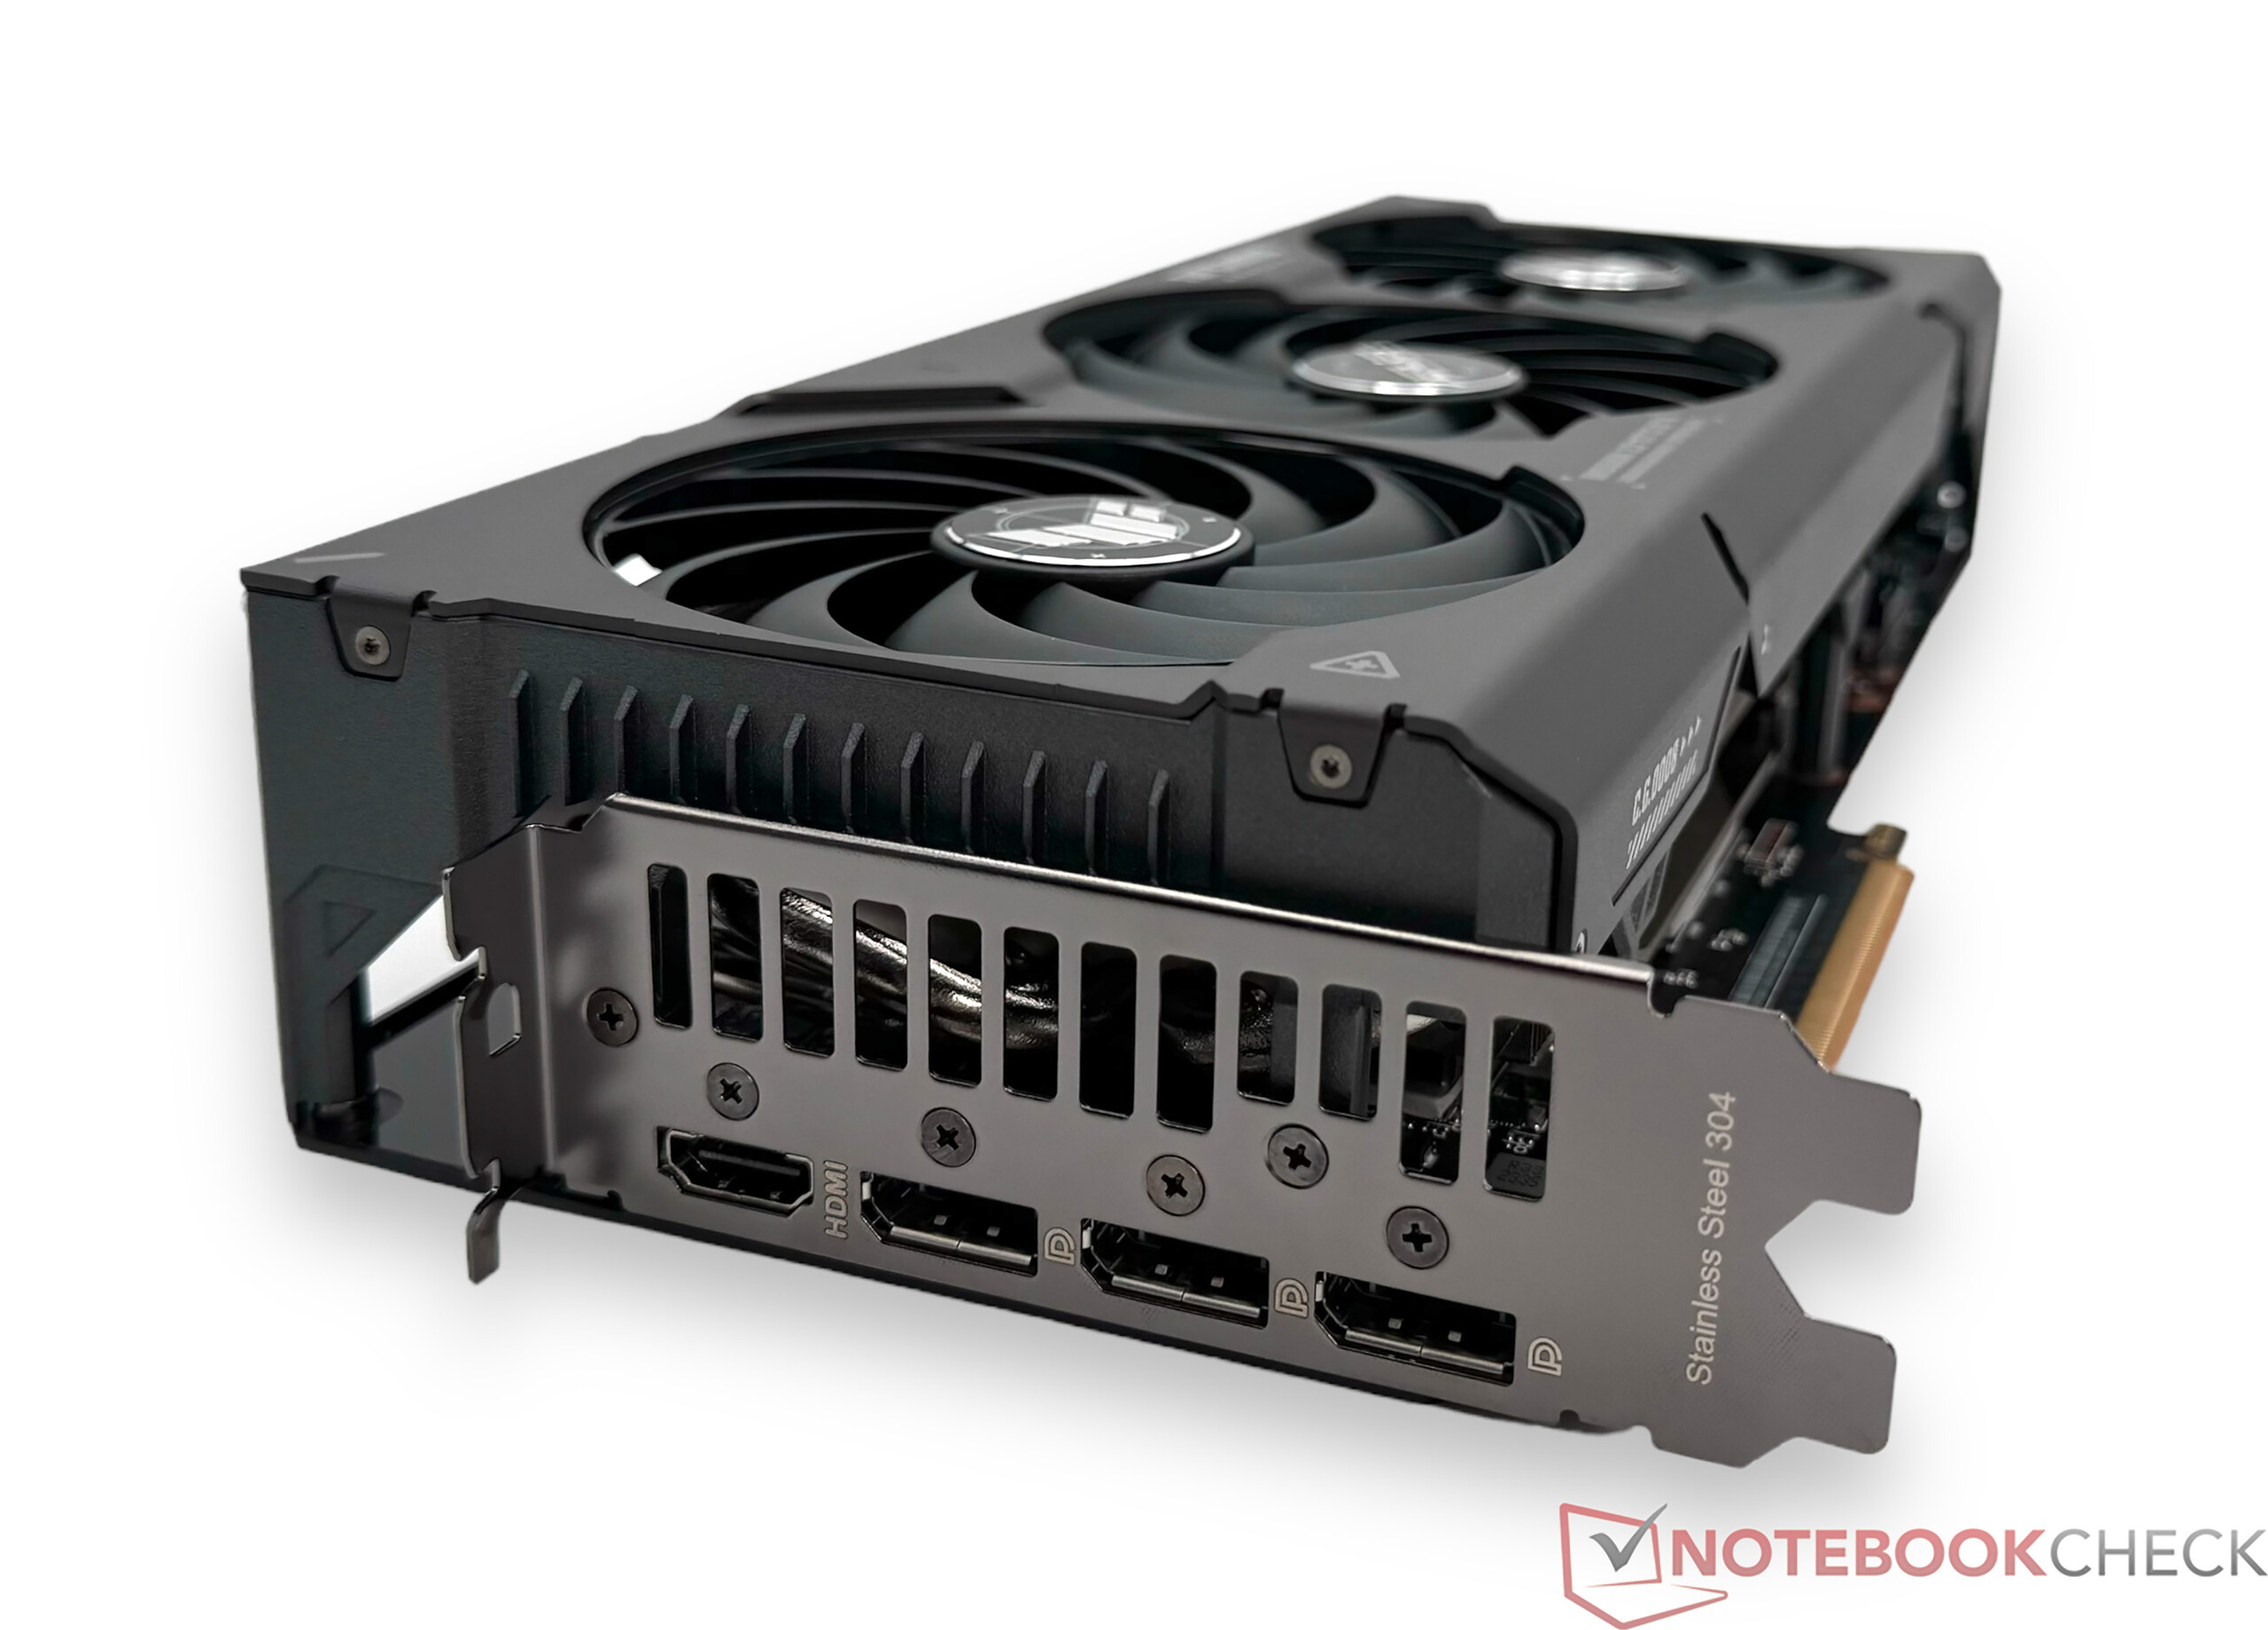
Compared to the reference model, our test unit from Asus is significantly larger, which allows it to dissipate the heat more effectively and quietly. But this also means that you have to be careful in your choice of the case, since at 32 cm (~12.6 in), the Asus TUF Gaming Radeon RX 7800 XT OC is about 5 cm (~2 in) longer than the reference model from AMD. Visually, it becomes immediately apparent that this is an Asus graphics card of the TUF series (The Ultimate Force). The distinctive design doesn't look too imposing, even if Asus uses a discrete RGB illumination. The choice of high-quality materials used on both the front and back provides the graphics card with an excellent stability and is very good. The good haptic feedback should also be mentioned and emphasizes the excellent quality Asus is delivering here.
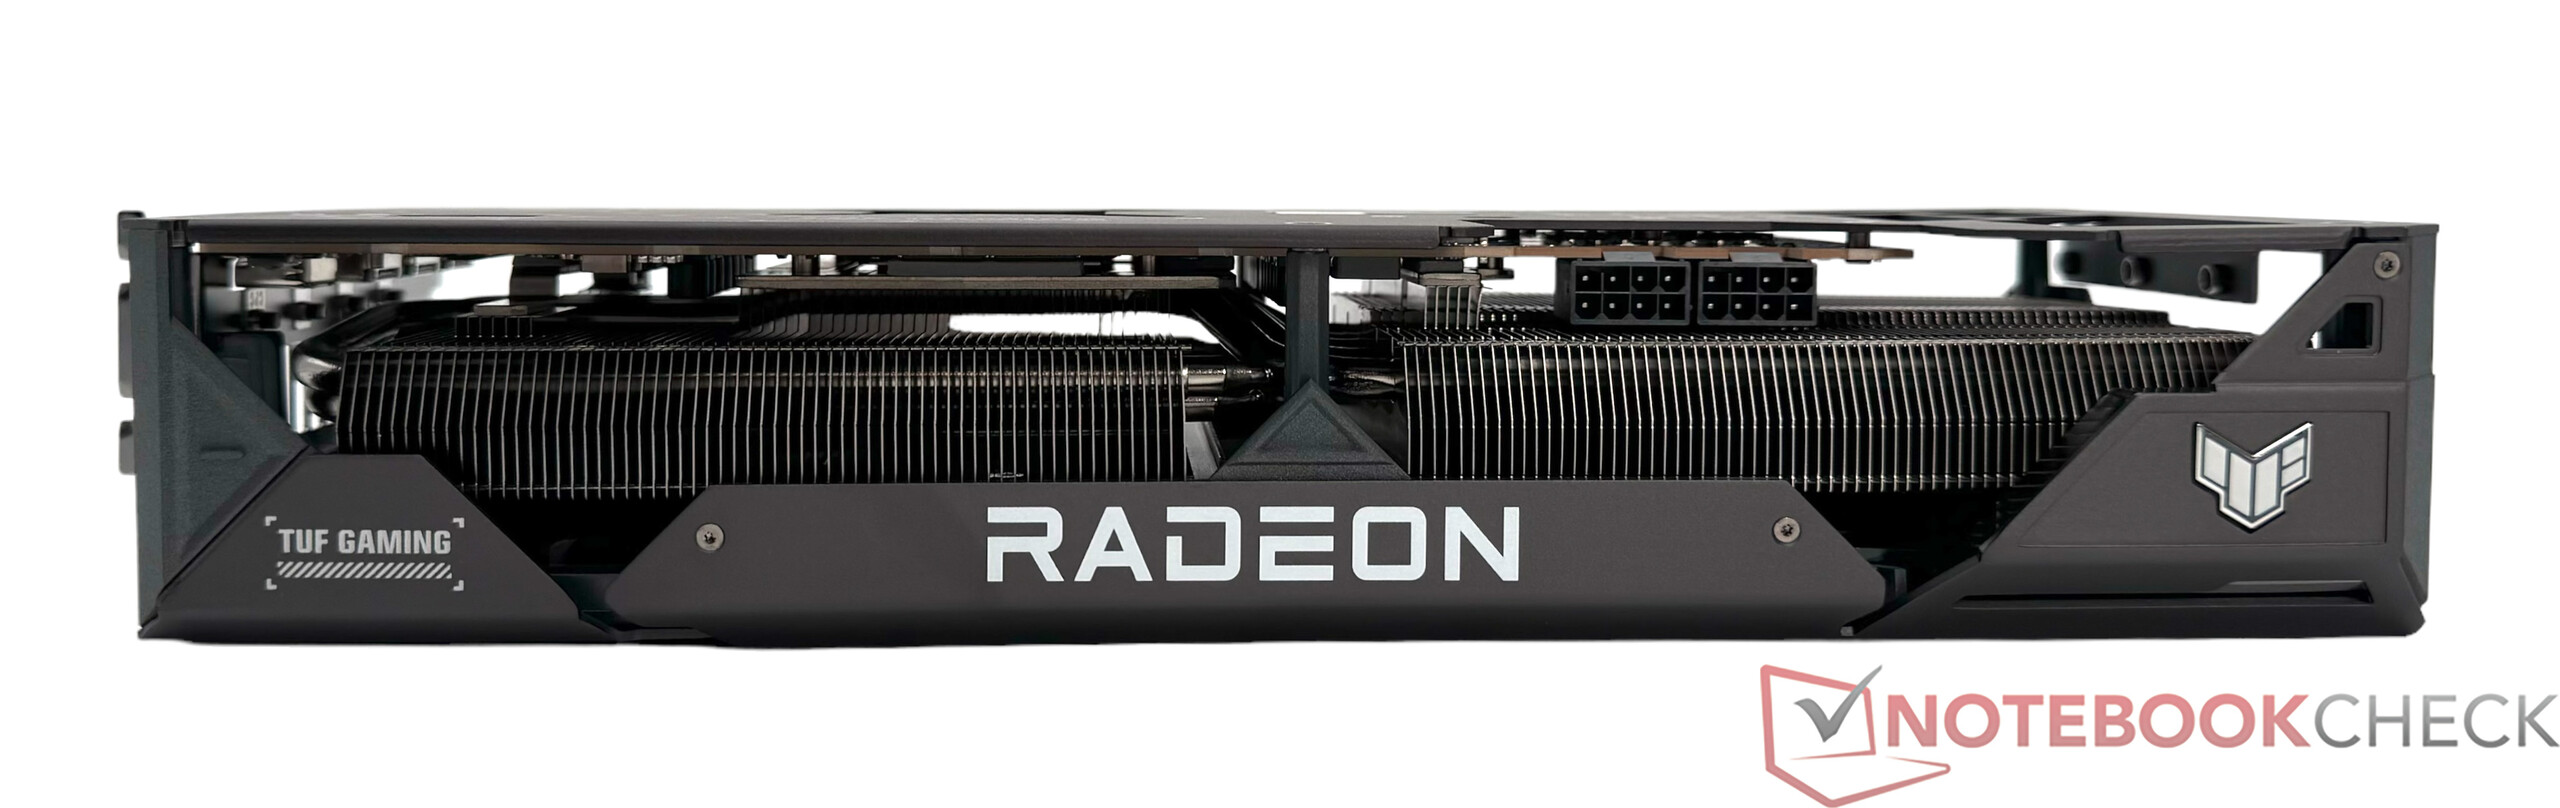
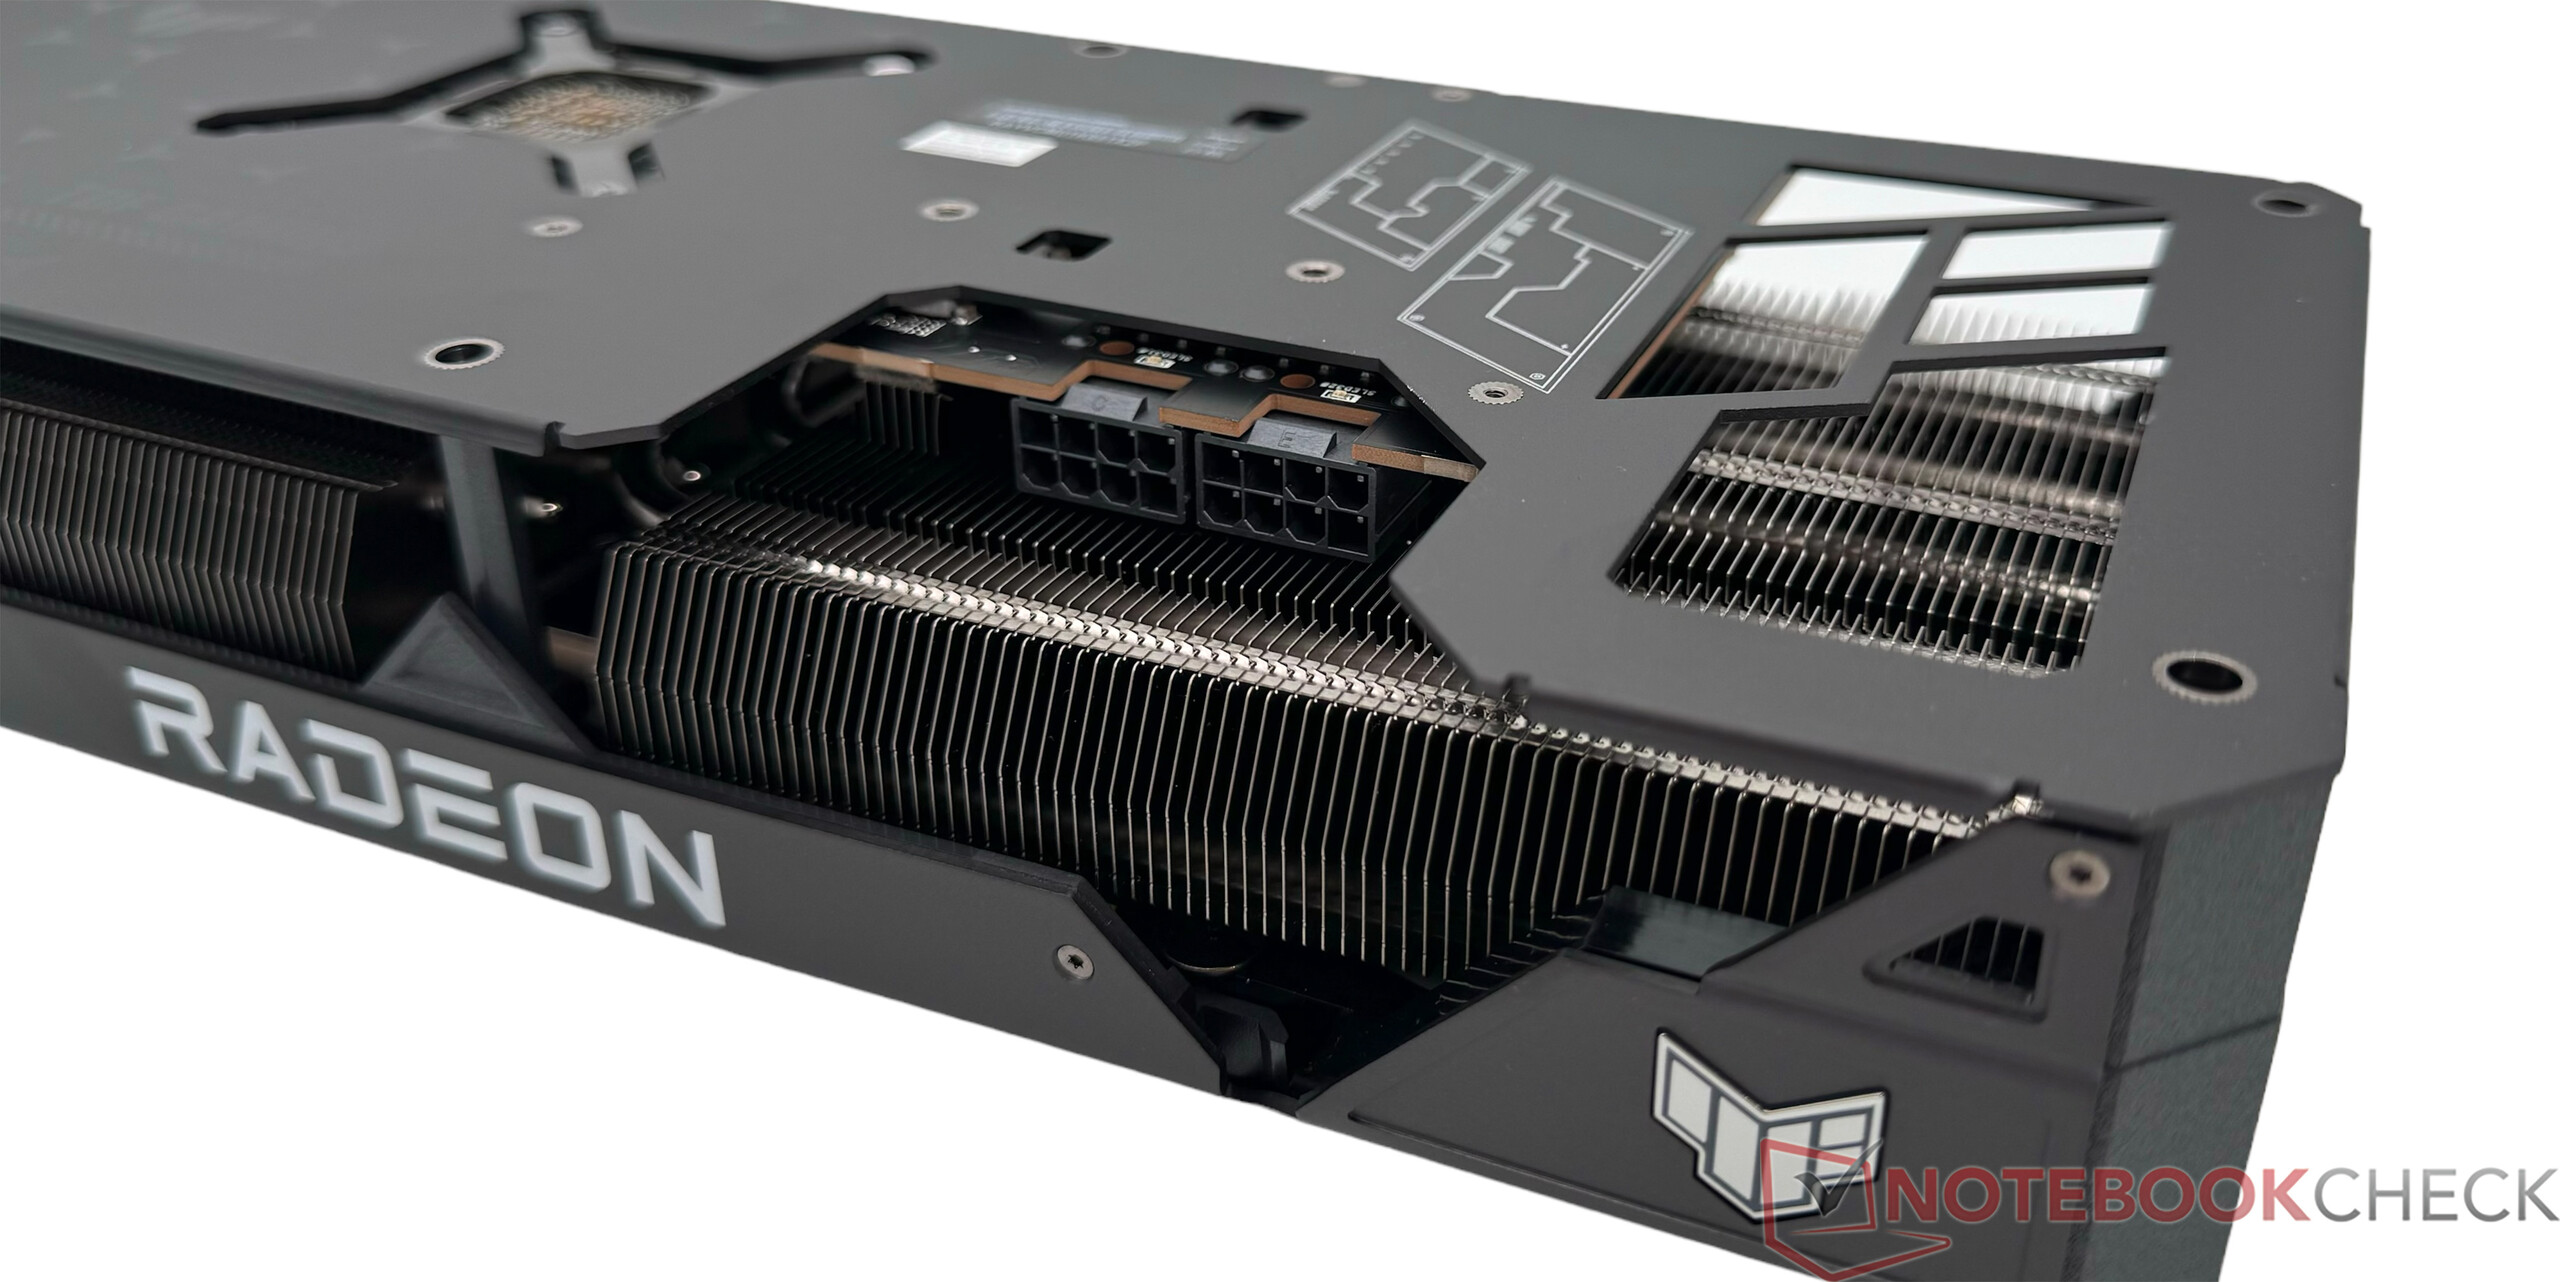
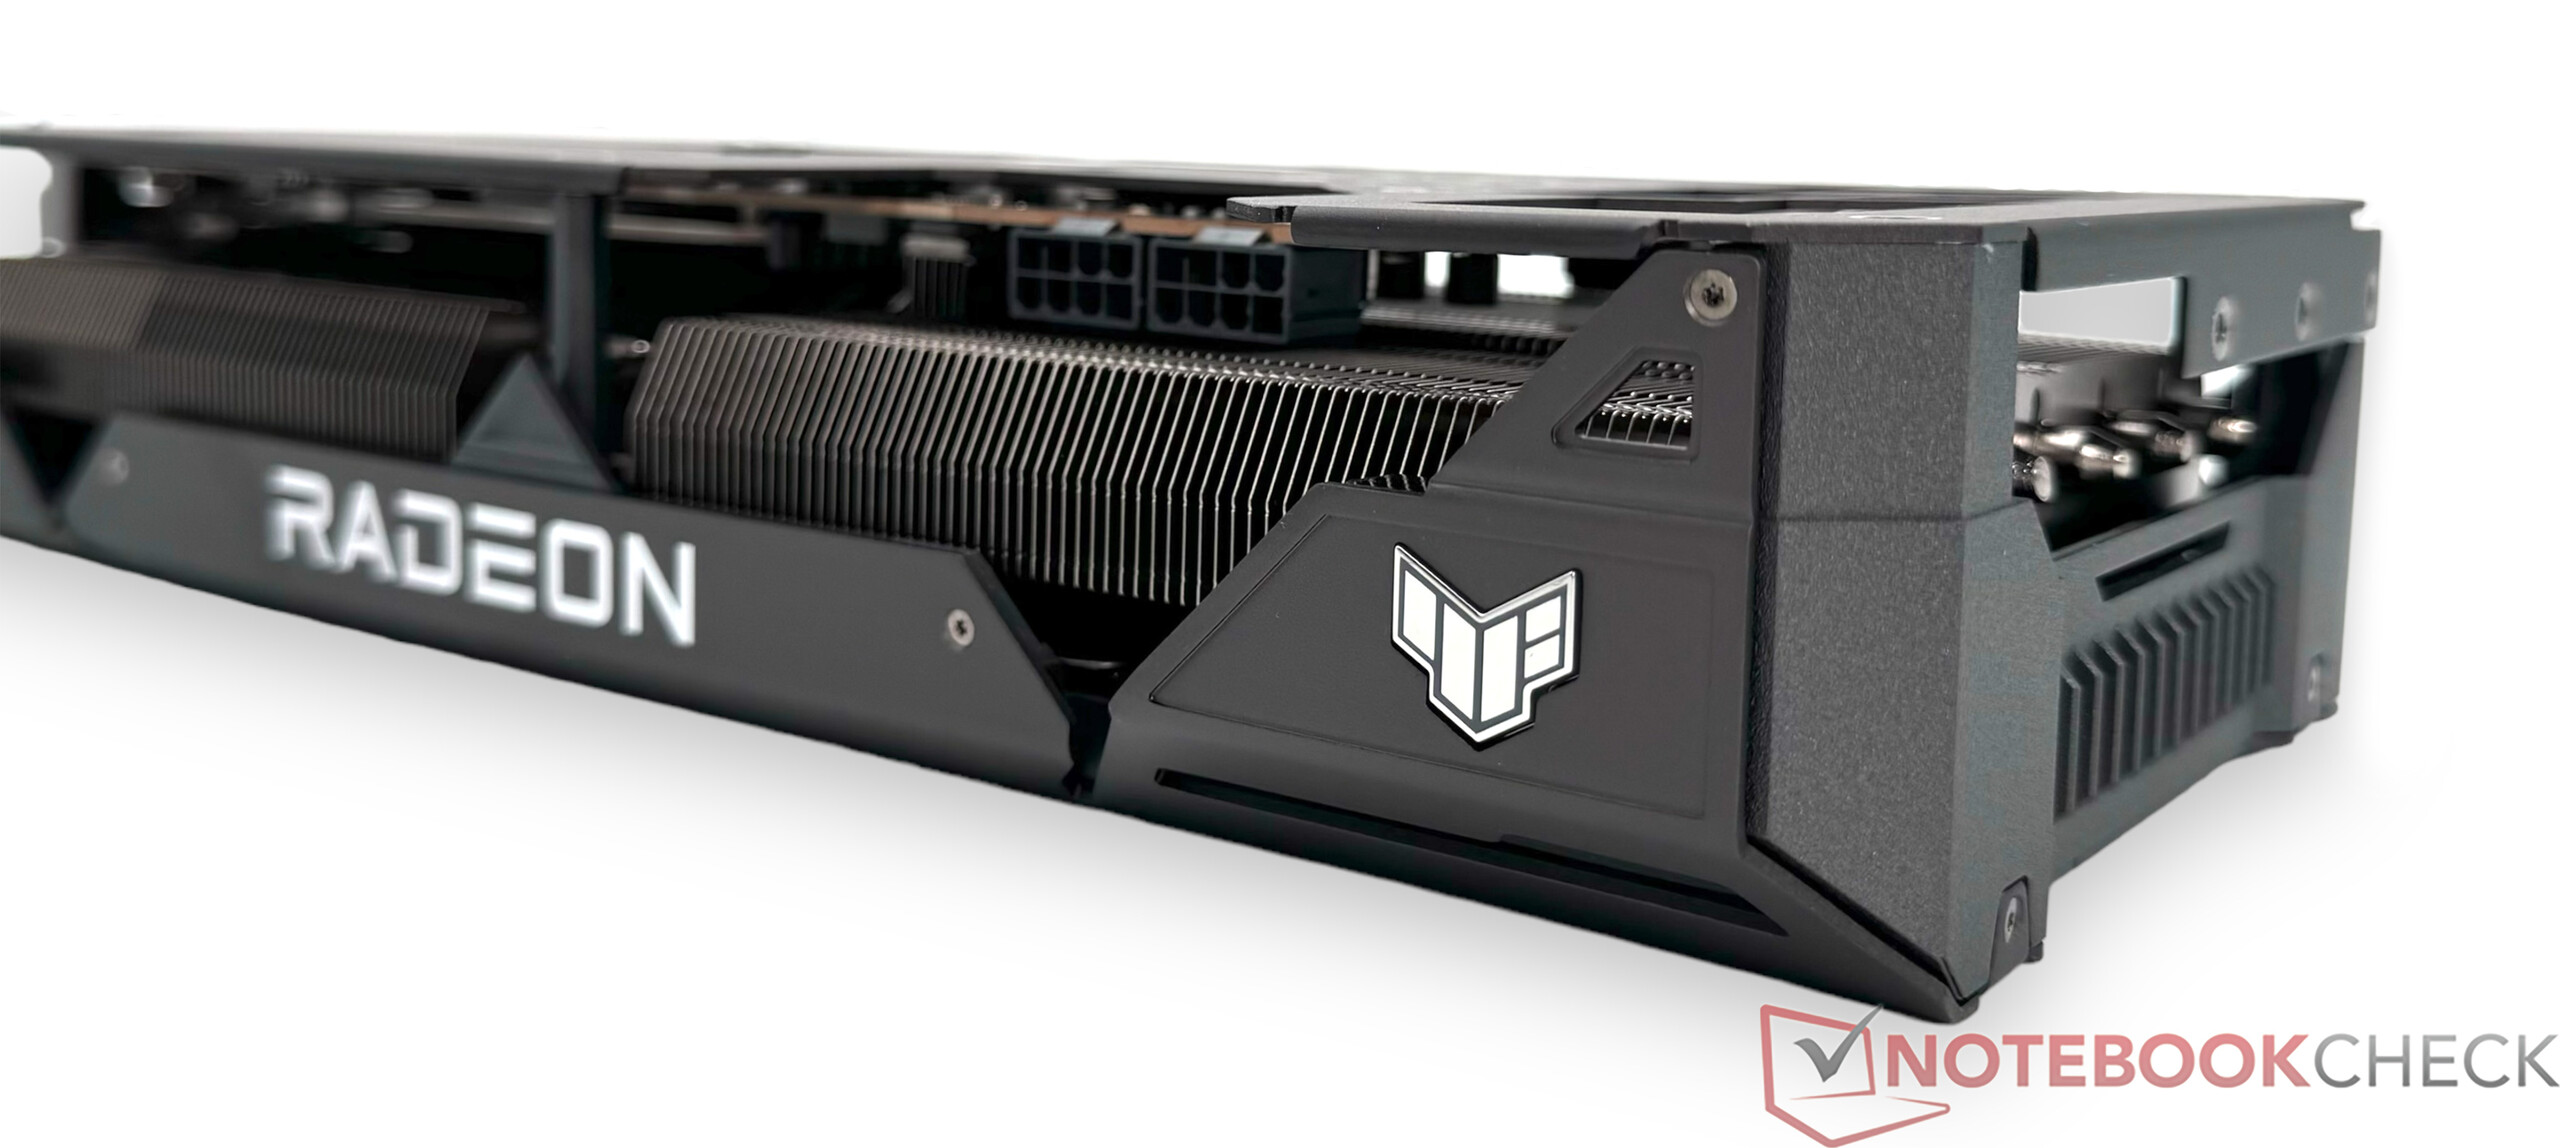
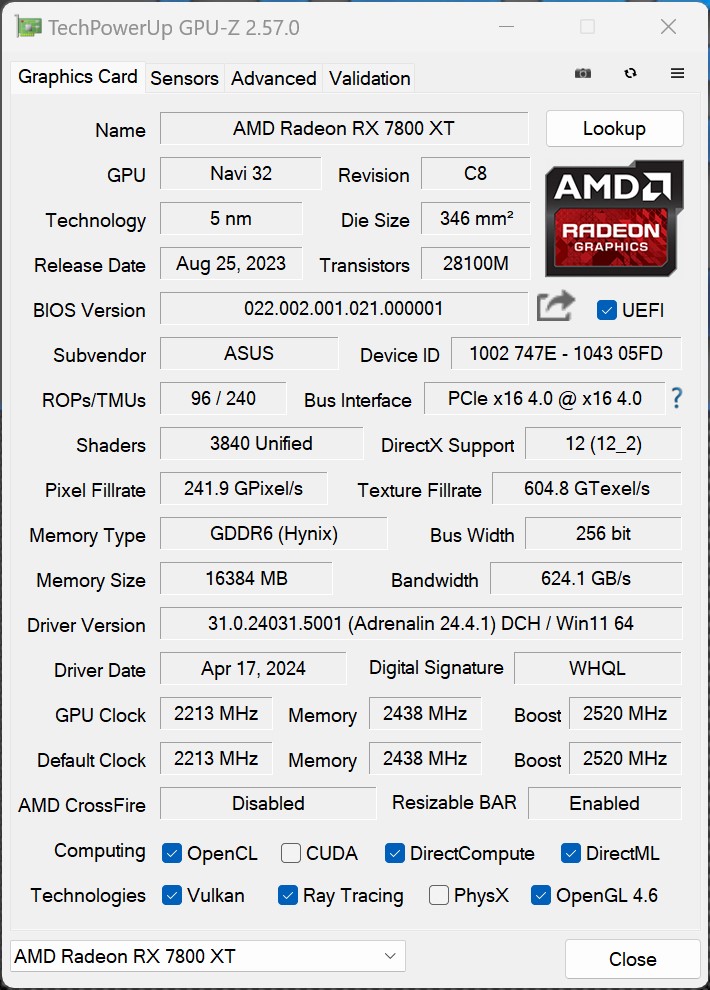
On the technical side, the graphics chip called "Navi 32 XT" with 3,840 shader units also used in the top models of the 7900 series is used here as well. To be exact, a GCD (Graphics Complex Die) with 200 mm² and four MCDs (Memory Complex Die) of 36.6 mm² each are combined in the chip design. The VRAM is connected via the MCDs, resulting in a storage connection of 256 bits. For the power, there are two 6+2 pin PCIe power connections similar to the reference model.
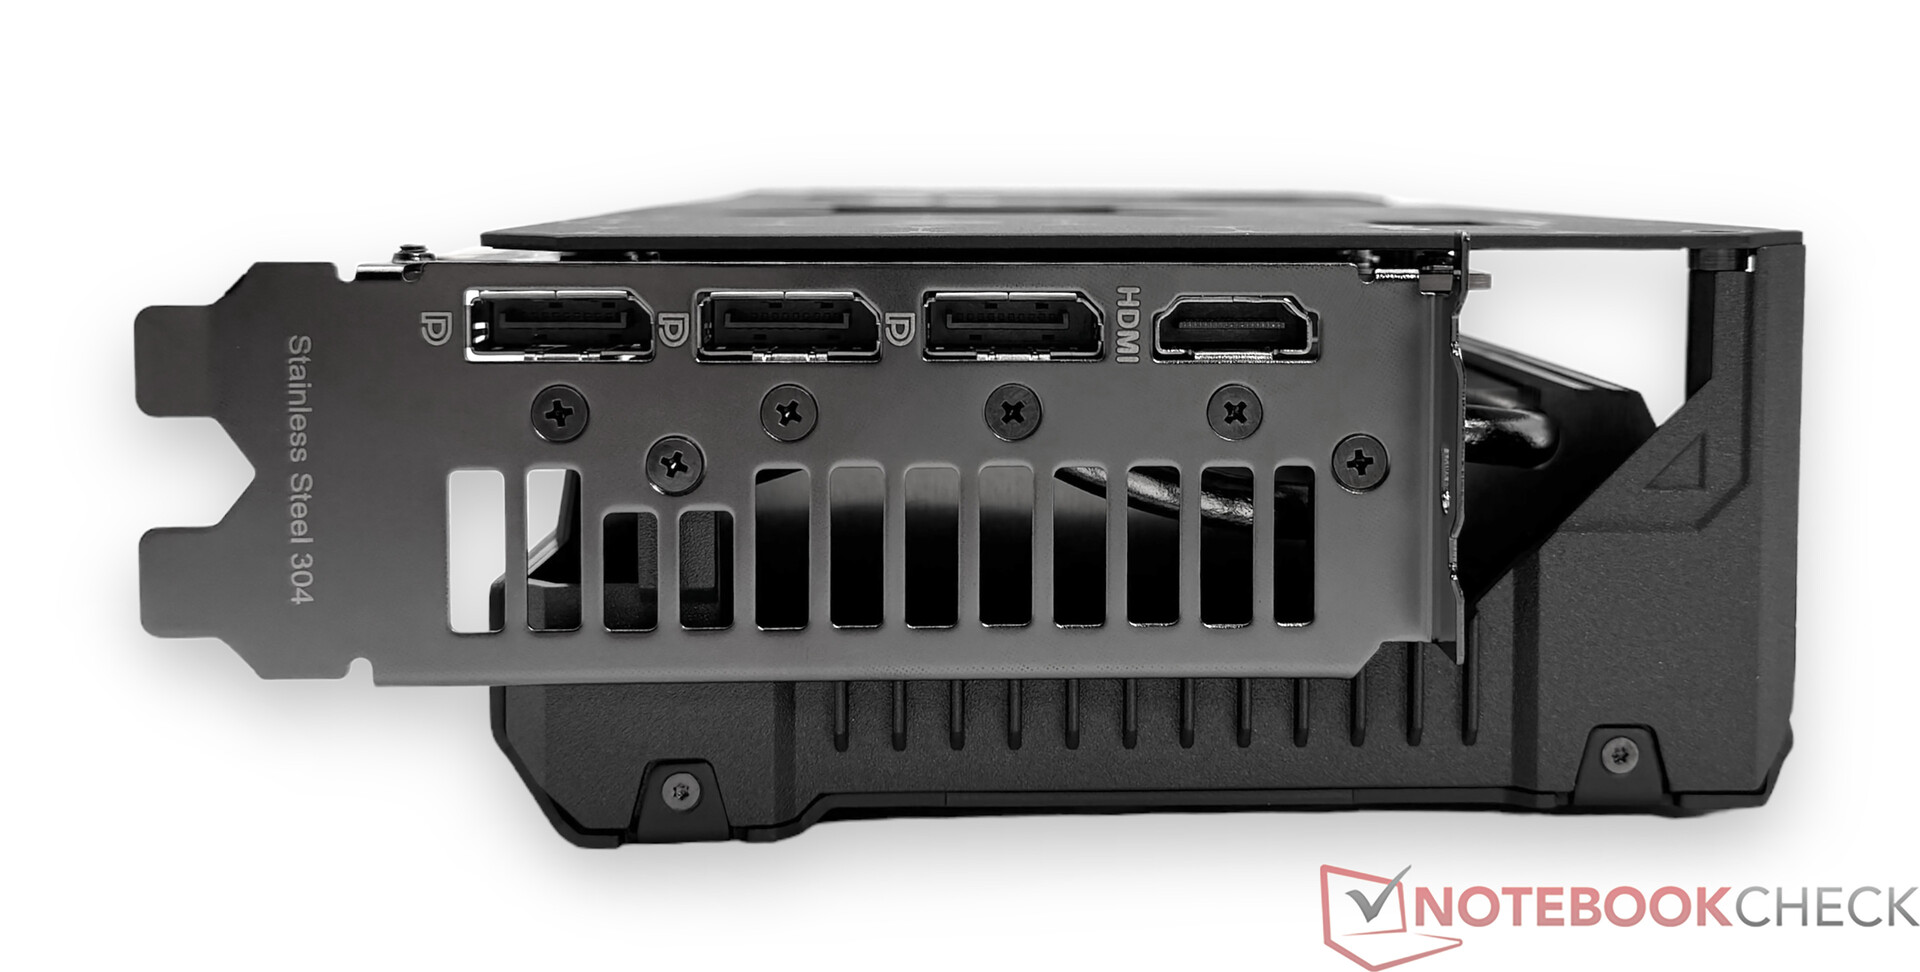
In terms of the external connections, AMD currently offers the most up-to-date equipment. Even Nvidia is unable to keep up with this, since DisplayPort 2.1 is currently only available in the AMD graphics cards of the 7000 generation. In total, the AMD Radeon RX 7800 XT offers 1x HDMI 2.1a and 3x DisplayPort 2.1, allowing you to connect four displays simultaneously.
Infos on our Test System
Asus TUF Gaming Radeon RX 7800 XT OC in Detail
Comparison of the Radeon AMD GPUs
| Specifications | Radeon RX 7900 XTX | Radeon RX 7900 XT | Radeon RX 7900 GRE | Radeon RX 7800 XT | Radeon RX 7700 XT | Radeon RX 7600 | Radeon RX 6800 XT | Radeon RX 6800 |
| GPU | Navi 31 XTX | Navi 31 XT | Navi 31 XT | Navi 32 XT | Navi 32 XL | Navi 33 XL | Navi 21 XL | Navi 21 XL |
| Manufacturing Process | 5/6 nm | 5/6 nm | 5/6 nm | 5/6 nm | 5/6 nm | 6 nm | 7 nm | 7 nm |
| Compute Units | 96 | 84 | 80 | 60 | 54 | 32 | 72 | 60 |
| Shading Units | 6,144 | 5,376 | 5,120 | 3,840 | 3,456 | 2,048 | 4,608 | 3,840 |
| Texture Mapping Units | 384 | 336 | 320 | 240 | 216 | 128 | 288 | 240 |
| Ray Accelerators | 96 | 84 | 80 | 60 | 54 | 32 | 72 | 60 |
| Base Clock | 2,270 MHz | 2,000 MHz | 1,880 MHz | 1,295 MHz | 1,700 MHz | 1,720 MHz | 1,825 MHz | 1,700 MHz |
| Game Clock | 2,300 MHz | 2,000 MHz | 1,880 MHz | 2,124 MHz | 2,171 MHz | 2,250 MHz | 2,015 MHz | 1,815 MHz |
| Boost Clock | 2,500 MHz | 2,400 MHz | 2,245 MHz | 2,430 MHz | 2,544 MHz | 2,655 MHz | 2,250 MHz | 2,105 MHz |
| Infinity Cache | 96 MB | 80 MB | 64 MB | 64 MB | 48 MB | 32 MB | 128 MB | 128 MB |
| Memory Bus Width | 384 bit | 320 bit | 256 bit | 256 bit | 256 bit | 128 bit | 256 bit | 256 bit |
| Memory Bandwidth | 960 GB/s | 800 GB/s | 576 GB/s | 624.1 GB/s | 432 GB/s | 288 GB/s | 512 GB/s | 512 GB/s |
| Memory Size | 24 GB GDDR6 | 20 GB GDDR6 | 16 GB GDDR6 | 16 GB GDDR6 | 12 GB GDDR6 | 8 GB GDDR6 | 16 GB GDDR6 | 16 GB GDDR6 |
| TBP | 355 W | 315 W | 260 W | 263 W | 245 W | 165 W | 300 W | 250 W |
The Clock Speeds of the Asus TUF Gaming Radeon RX 7800 XT OC
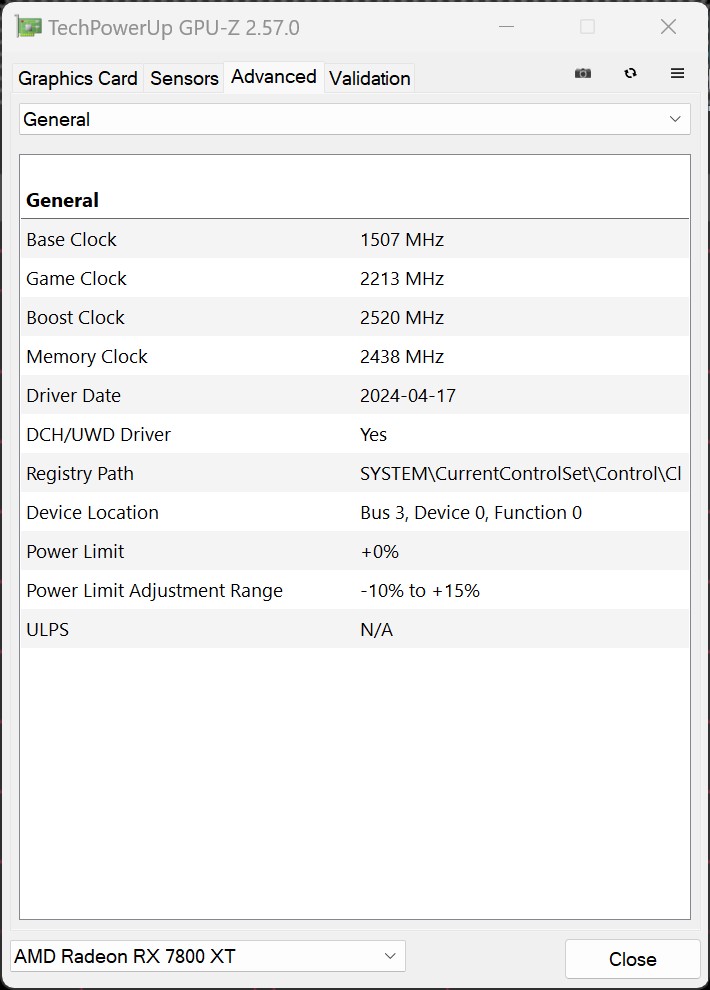
As the name of our test unit already tells us, the Asus TUF Gaming Radeon RX 7800 XT OC is a graphics card that offers slightly higher GPU clock speeds in the state of delivery than the reference model. In Default mode, we see 90 MHz more, although this shouldn't really be very noticeable in everyday operation, since the Boost speed of the current graphics cards is exceeded in most cases anyways. Asus doesn't modify the clock speeds of the VRAM here, keeping within the specifications from AMD.
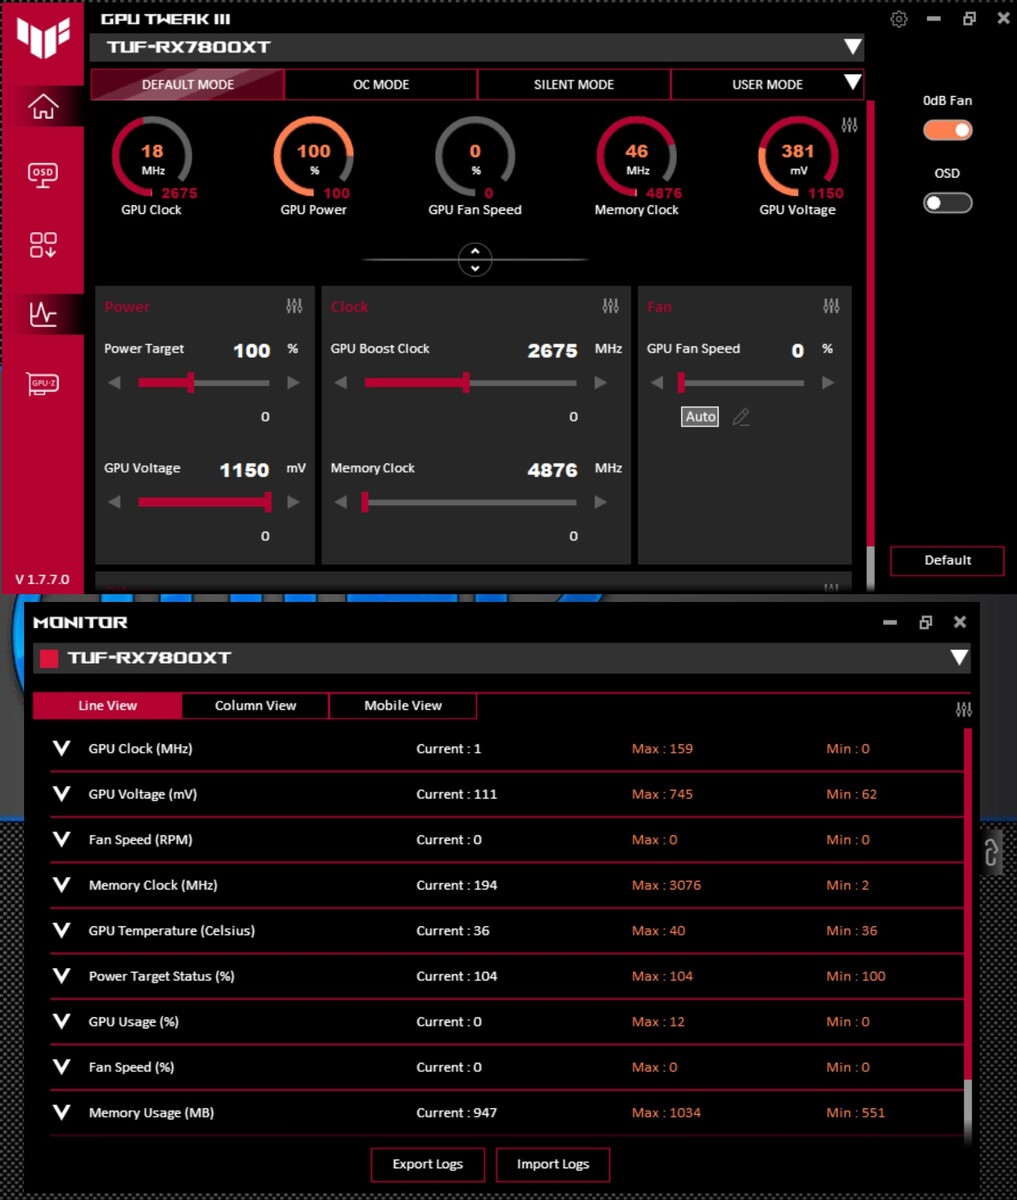
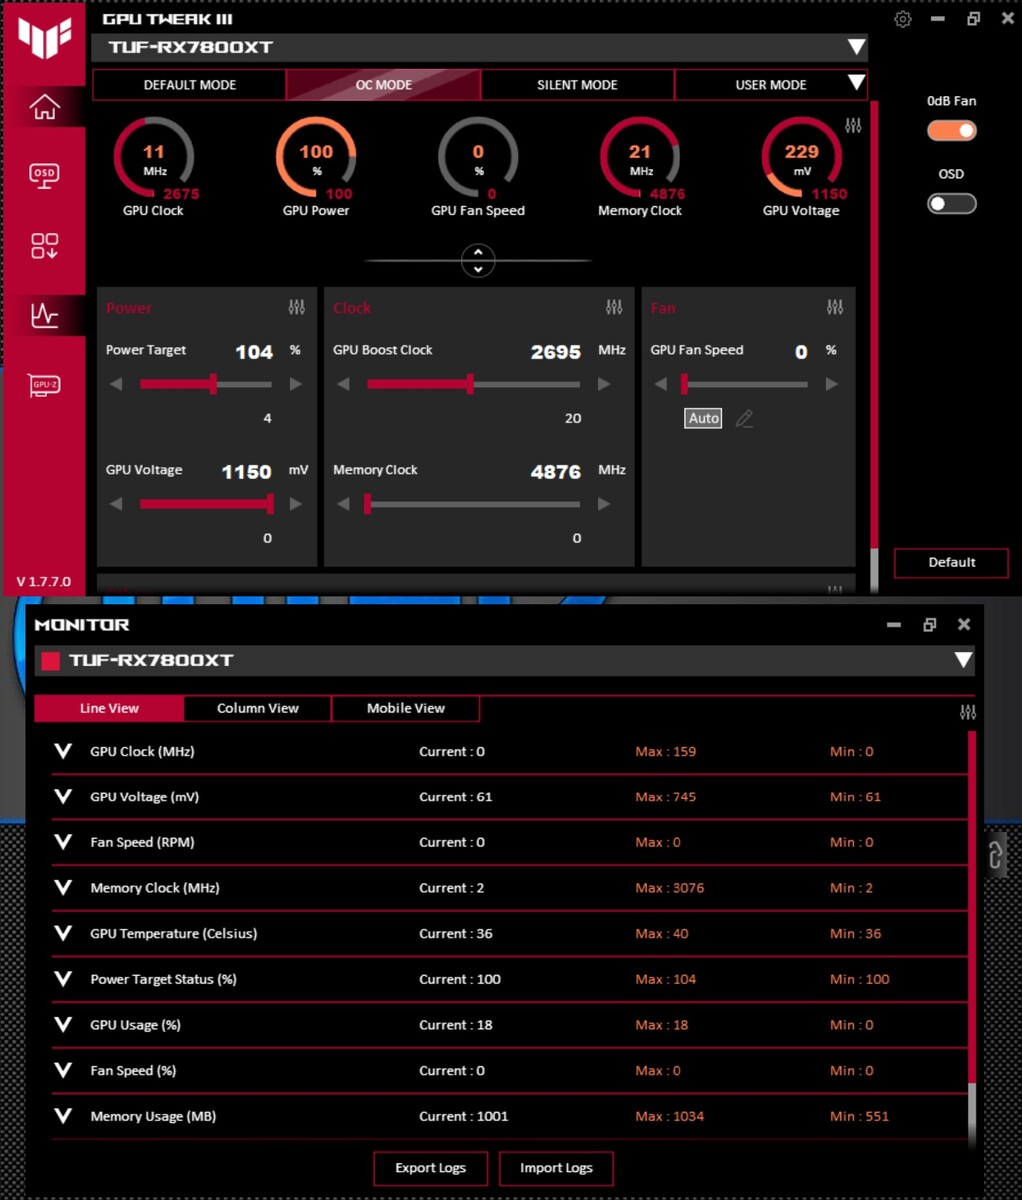
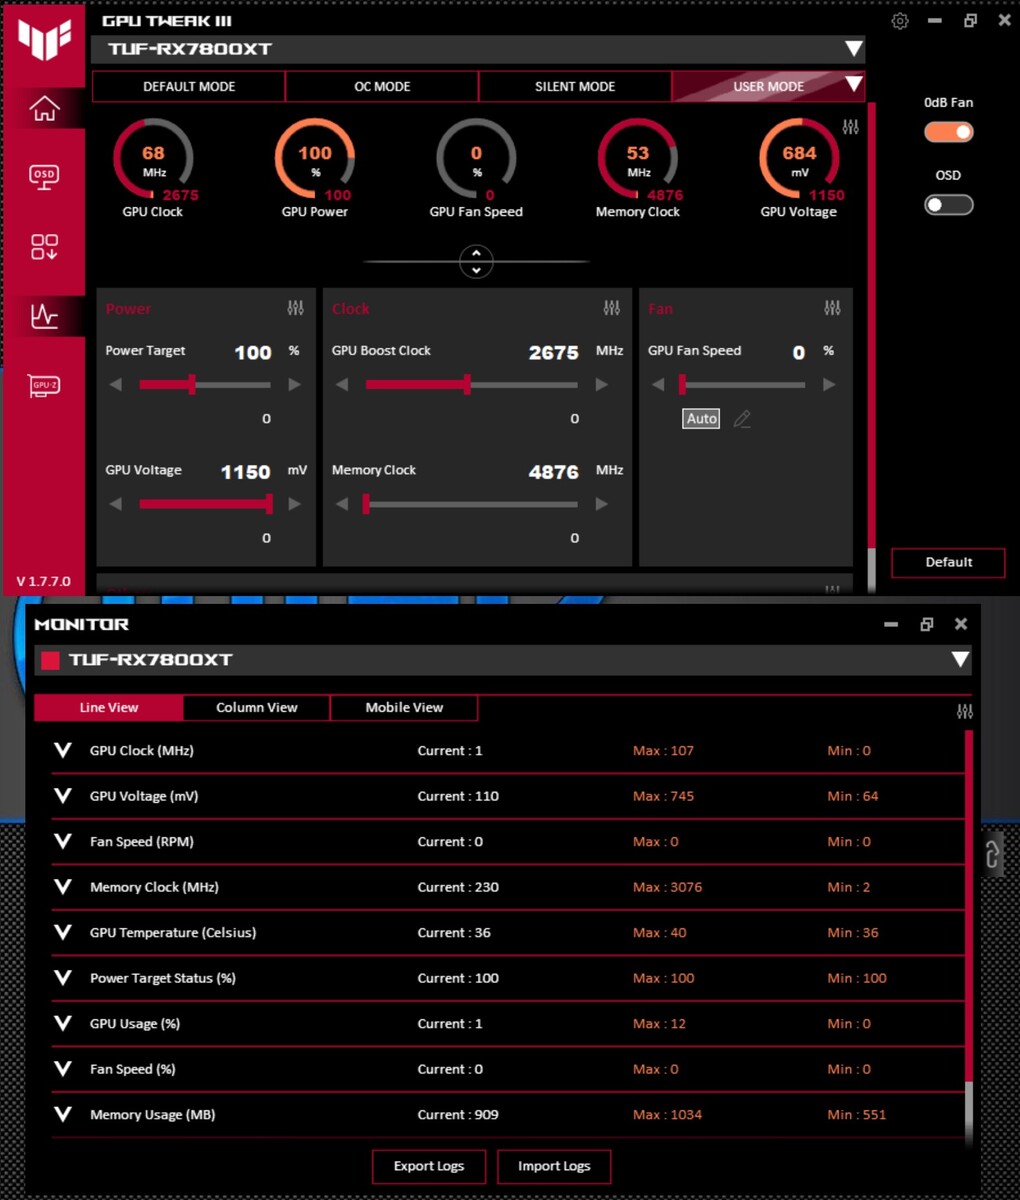
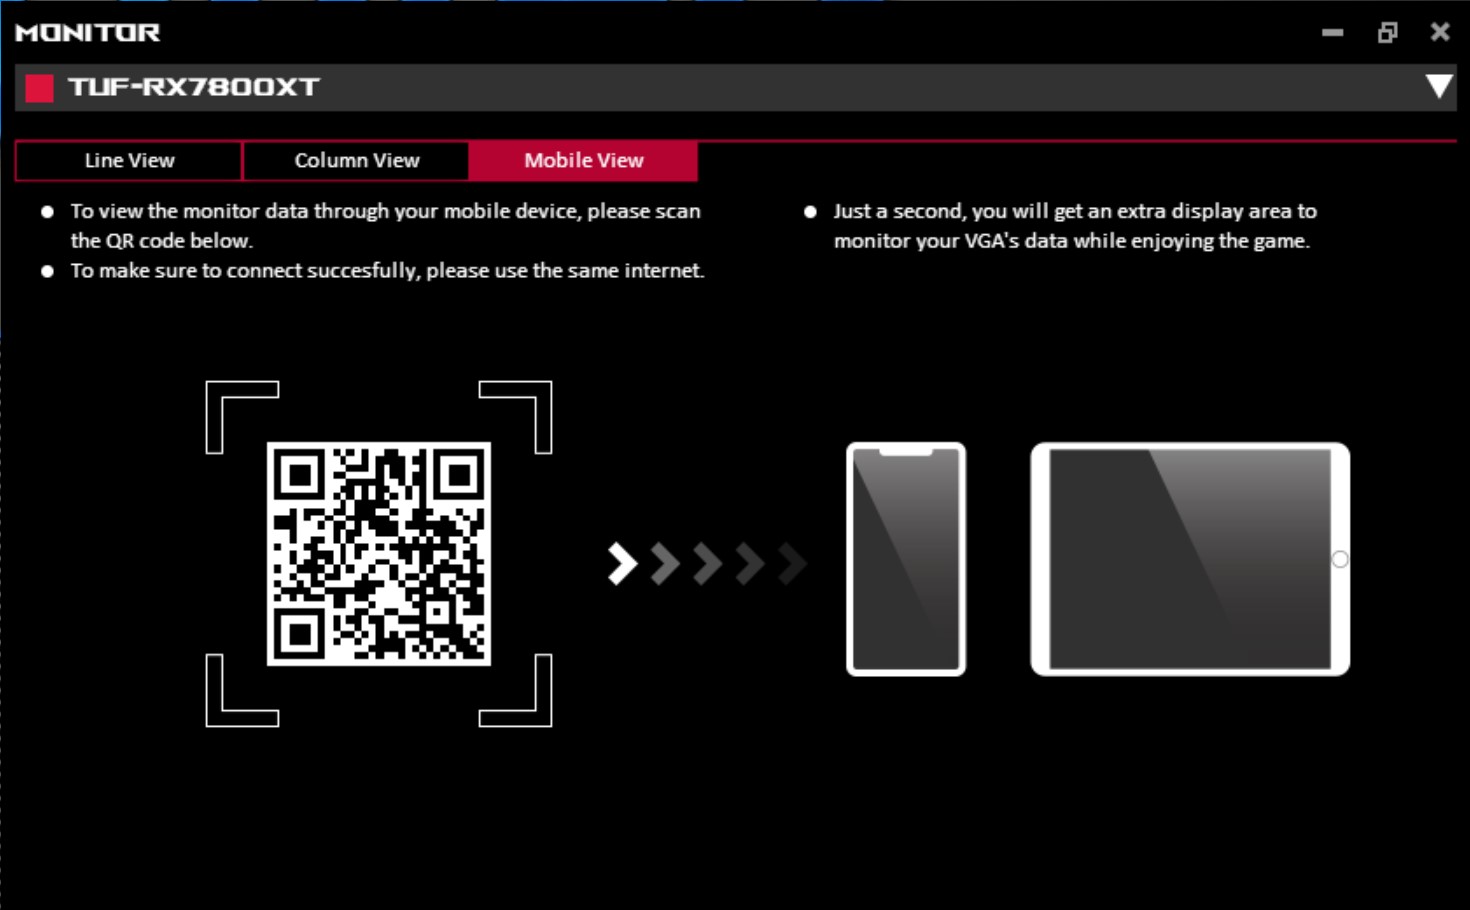
As with most other GPU manufacturers, there is an inhouse tool to make some adjustments to the graphics card. The "Asus GPU Tweak III" first allows you to see all the technical data. In addition to the Default profile, there is also an OC and a Silent profile, which minimally increase or decrease the clock speeds of the graphics chip. At the same time, the Power Target of the graphics card is also modified (+/- 4%). We used the Default profile for all of our tests. As an additional gimmick, you can also display the telemetry data of the graphics card in real time on a smartphone or tablet, without having to install any additional program, which is commendable. The only requirement is that both devices have to be connected to the same network.
Asus GPU Tweak III

Synthetic Benchmarks
For our first performance comparison, we take a look at the 3D performance of the Asus TUF Gaming Radeon RX 7800 XT OC in the synthetic tests. Our test unit is able to achieve a good place in the middle of our comparison field. It is able to distance itself from its main competitor, the Nvidia GeForce RTX 4070. Compared to the AMD Radeon RX 7900 GRE, the Asus TUF Gaming Radeon RX 7800 XT OC has to accept a small disadvantage of only 6%. But this is something that shouldn't be neglected, since at this point the AMD Radeon RX 7900 GRE has found its way onto the store shelves and isn't only available in combination with a prebuilt PC.
In the red-against-green competition, it is only with an Nvidia GeForce RTX 4070 Ti that you can expect a noticeable performance increase compared to the AMD Radeon RX 7800 XT. But that also has its price, costing a bit more. Alternatively, you can also take a look at the Nvidia GeForce RTX 4070 Super. That delivers a slightly higher performance than our test unit but offers less VRAM, which can have a negative effect in some specific scenarios.
| Performance rating - Percent | |
| XFX Radeon RX 7900 XTX Merc 310 Black Edition | |
| KFA2 GeForce RTX 4080 Super SG | |
| Asus TUF Gaming GeForce RTX 4070 Ti Super | |
| KFA2 GeForce RTX 4070 Ti EX Gamer | |
| Nvidia GeForce RTX 3090 FE | |
| AMD Radeon RX 7900 GRE | |
| Average NVIDIA GeForce RTX 4070 SUPER | |
| ASUS TUF Gaming Radeon RX 7800 XT | |
| KFA2 GeForce RTX 4070 EX Gamer | |
| AMD Radeon RX 6800 | |
| AMD Radeon RX 6700 XT | |
| ASUS Dual GeForce RTX 4060 Ti OC | |
| Nvidia GeForce RTX 3060 Ti FE | |
| XFX Speedster QICK 308 Radeon RX 7600 Black Edition | |
| Nvidia GeForce RTX 2070 Super | |
| Sapphire Nitro+ Radeon RX 6650 XT | |
| KFA2 GeForce RTX 4060 1-Click-OC 2X | |
| Nvidia GeForce RTX 2060 Super | |
| Sapphire Pulse Radeon RX 6600 | |
| LuxMark v2.0 64Bit | |
| Room GPUs-only | |
| NVIDIA GeForce RTX 4080 Super | |
| NVIDIA GeForce RTX 4070 Ti SUPER | |
| NVIDIA GeForce RTX 4070 Ti | |
| NVIDIA GeForce RTX 4070 | |
| NVIDIA GeForce RTX 3090 | |
| NVIDIA GeForce RTX 4060 Ti 8G | |
| AMD Radeon RX 7900 XTX | |
| NVIDIA GeForce RTX 4060 | |
| AMD Radeon RX 7900 GRE | |
| AMD Radeon RX 7800 XT | |
| AMD Radeon RX 6800 | |
| AMD Radeon RX 6700 XT | |
| AMD Radeon RX 7600 | |
| AMD Radeon RX 6650 XT | |
| AMD Radeon RX 6600 | |
| Sala GPUs-only | |
| NVIDIA GeForce RTX 4080 Super | |
| NVIDIA GeForce RTX 4070 Ti SUPER | |
| NVIDIA GeForce RTX 4070 Ti | |
| NVIDIA GeForce RTX 3090 | |
| NVIDIA GeForce RTX 4070 | |
| AMD Radeon RX 7900 XTX | |
| AMD Radeon RX 7900 GRE | |
| NVIDIA GeForce RTX 4060 Ti 8G | |
| AMD Radeon RX 7800 XT | |
| NVIDIA GeForce RTX 4060 | |
| AMD Radeon RX 6800 | |
| AMD Radeon RX 6700 XT | |
| AMD Radeon RX 7600 | |
| AMD Radeon RX 6650 XT | |
| AMD Radeon RX 6600 | |
| Photoshop PugetBench | |
| GPU Score | |
| AMD Radeon RX 6800 | |
| AMD Radeon RX 6700 XT | |
| AMD Radeon RX 7900 GRE | |
| AMD Radeon RX 7800 XT | |
| AMD Radeon RX 6650 XT | |
| NVIDIA GeForce RTX 3090 | |
| AMD Radeon RX 7900 XTX | |
| AMD Radeon RX 7600 | |
| NVIDIA GeForce RTX 2060 Super (Desktop) | |
| NVIDIA GeForce RTX 3060 Ti | |
| NVIDIA GeForce RTX 2070 Super (Desktop) | |
| AMD Radeon RX 6600 | |
| NVIDIA GeForce RTX 4080 Super | |
| NVIDIA GeForce RTX 4070 | |
| NVIDIA GeForce RTX 4060 Ti 8G | |
| NVIDIA GeForce RTX 4060 | |
| NVIDIA GeForce RTX 4070 Ti | |
| Overall Score | |
| AMD Radeon RX 7900 GRE | |
| NVIDIA GeForce RTX 3090 | |
| AMD Radeon RX 7900 XTX | |
| AMD Radeon RX 7800 XT | |
| AMD Radeon RX 6800 | |
| AMD Radeon RX 7600 | |
| AMD Radeon RX 6700 XT | |
| NVIDIA GeForce RTX 2060 Super (Desktop) | |
| AMD Radeon RX 6650 XT | |
| NVIDIA GeForce RTX 2070 Super (Desktop) | |
| NVIDIA GeForce RTX 4060 | |
| NVIDIA GeForce RTX 4060 Ti 8G | |
| NVIDIA GeForce RTX 3060 Ti | |
| NVIDIA GeForce RTX 4080 Super | |
| NVIDIA GeForce RTX 4070 | |
| AMD Radeon RX 6600 | |
| NVIDIA GeForce RTX 4070 Ti | |
| Premiere Pro PugetBench | |
| GPU 0.9 | |
| NVIDIA GeForce RTX 4080 Super | |
| NVIDIA GeForce RTX 3090 | |
| NVIDIA GeForce RTX 4070 Ti | |
| AMD Radeon RX 7900 XTX | |
| NVIDIA GeForce RTX 4070 | |
| AMD Radeon RX 7900 GRE | |
| AMD Radeon RX 7800 XT | |
| NVIDIA GeForce RTX 2070 Super (Desktop) | |
| AMD Radeon RX 6800 | |
| NVIDIA GeForce RTX 3060 Ti | |
| NVIDIA GeForce RTX 2060 Super (Desktop) | |
| NVIDIA GeForce RTX 4060 Ti 8G | |
| AMD Radeon RX 6700 XT | |
| NVIDIA GeForce RTX 4060 | |
| AMD Radeon RX 7600 | |
| AMD Radeon RX 6650 XT | |
| AMD Radeon RX 6600 | |
| Overall Score 0.9 | |
| NVIDIA GeForce RTX 3090 | |
| NVIDIA GeForce RTX 4080 Super | |
| AMD Radeon RX 7900 XTX | |
| NVIDIA GeForce RTX 4070 | |
| AMD Radeon RX 7800 XT | |
| NVIDIA GeForce RTX 4070 Ti | |
| AMD Radeon RX 7900 GRE | |
| NVIDIA GeForce RTX 2060 Super (Desktop) | |
| NVIDIA GeForce RTX 4060 | |
| NVIDIA GeForce RTX 3060 Ti | |
| NVIDIA GeForce RTX 2070 Super (Desktop) | |
| AMD Radeon RX 6800 | |
| NVIDIA GeForce RTX 4060 Ti 8G | |
| AMD Radeon RX 7600 | |
| AMD Radeon RX 6650 XT | |
| AMD Radeon RX 6700 XT | |
| AMD Radeon RX 6600 | |
| Affinity Photo 2 - Combined (Single / Multi GPU) | |
| NVIDIA GeForce RTX 4070 | |
| NVIDIA GeForce RTX 4080 Super | |
| NVIDIA GeForce RTX 4070 Ti | |
| AMD Radeon RX 7800 XT | |
| AMD Radeon RX 7900 XTX | |
| NVIDIA GeForce RTX 3090 | |
| NVIDIA GeForce RTX 2070 Super (Desktop) | |
| AMD Radeon RX 7900 GRE | |
| NVIDIA GeForce RTX 2060 Super (Desktop) | |
| NVIDIA GeForce RTX 3060 Ti | |
| NVIDIA GeForce RTX 4060 | |
| NVIDIA GeForce RTX 4060 Ti 8G | |
| AMD Radeon RX 7600 | |
| AMD Radeon RX 6800 | |
| AMD Radeon RX 6650 XT | |
| AMD Radeon RX 6700 XT | |
| AMD Radeon RX 6600 | |
Professional Applications
Professional applications will benefit a lot from using special graphics cards. AMD and Nvidia each offer some workstation GPUs that are significantly more expensive. However, you can often still get some good results with the regular consumer graphics cards. Compared to Nvidia, AMD performs above average in this discipline. In the current AMD portfolio, the Asus TUF Gaming Radeon RX 7800 XT OC places right behind the AMD Radeon RX 7900 GRE. The comparison with the Nvidia RTX 6000 Ada Generation that we included in our overview shows the performance you can expect from a workstation graphics card.
| AMD Radeon RX 7800 XT i9-14900K | AMD Radeon RX 6800 R9 7950X | AMD Radeon RX 6950 XT R9 7950X | AMD Radeon RX 7600 R9 7950X | AMD Radeon RX 7900 GRE R9 7950X | AMD Radeon RX 7900 XT R9 7950X | AMD Radeon RX 7900 XTX R9 7950X | NVIDIA GeForce RTX 4060 R9 7950X | NVIDIA GeForce RTX 4060 Ti 8G R9 7950X | NVIDIA GeForce RTX 4070 R9 7950X | NVIDIA GeForce RTX 4070 Ti R9 7950X | NVIDIA GeForce RTX 4080 R9 7950X | NVIDIA GeForce RTX 4090 R9 7950X | Average NVIDIA RTX 6000 Ada Generation | Average of class | |
|---|---|---|---|---|---|---|---|---|---|---|---|---|---|---|---|
| SPECviewperf 12 | -2% | -25% | -34% | 2% | 21% | 35% | -60% | -54% | -41% | -31% | -20% | -13% | 34% | -66% | |
| 1900x1060 3ds Max (3dsmax-05) (fps) | 386 | 424 10% | 418 8% | 279 -28% | 444 15% | 502 30% | 553 43% | 251 -35% | 286 -26% | 382 -1% | 436 13% | 502 30% | 571 48% | 473 ? 23% | 204 ? -47% |
| 1900x1060 Catia (catia-04) (fps) | 396 | 396 0% | 368 -7% | 273 -31% | 448 13% | 481 21% | 536 35% | 113 -71% | 128 -68% | 161 -59% | 192 -52% | 221 -44% | 257 -35% | 349 ? -12% | 111.7 ? -72% |
| 1900x1060 Creo (creo-01) (fps) | 153 | 160 5% | 163 7% | 115 -25% | 155 1% | 176 15% | 187 22% | 60.6 -60% | 74.3 -51% | 89.1 -42% | 99.4 -35% | 110 -28% | 115 -25% | 250 ? 63% | 66.2 ? -57% |
| 1900x1060 Energy (energy-01) (fps) | 57.7 | 48.4 -16% | 34.3 -41% | 25.5 -56% | 40.3 -30% | 72.4 25% | 85.2 48% | 15.9 -72% | 22.8 -60% | 31.7 -45% | 48 -17% | 58.8 2% | 54.7 -5% | 58.2 ? 1% | 16.6 ? -71% |
| 1900x1060 Maya (maya-04) (fps) | 283 | 304 7% | 195 -31% | 236 -17% | 323 14% | 347 23% | 367 30% | 233 -18% | 252 -11% | 284 0% | 287 1% | 309 9% | 317 12% | 266 ? -6% | 115.7 ? -59% |
| 1900x1060 Medical (medical-01) (fps) | 227 | 188 -17% | 95.2 -58% | 128 -44% | 226 0% | 288 27% | 347 53% | 82.4 -64% | 107 -53% | 132 -42% | 157 -31% | 171 -25% | 119 -48% | 282 ? 24% | 57.9 ? -74% |
| 1900x1060 Showcase (showcase-01) (fps) | 243 | 229 -6% | 264 9% | 127 -48% | 222 -9% | 278 14% | 322 33% | 109 -55% | 122 -50% | 190 -22% | 244 0% | 333 37% | 457 88% | 429 ? 77% | 102.1 ? -58% |
| 1900x1060 Siemens NX (snx-02) (fps) | 283 | 296 5% | 56.4 -80% | 210 -26% | 341 20% | 373 32% | 400 41% | 14.2 -95% | 14.5 -95% | 16.4 -94% | 19 -93% | 21.6 -92% | 27.1 -90% | 677 ? 139% | 60.3 ? -79% |
| 1900x1060 Solidworks (sw-03) (fps) | 332 | 315 -5% | 218 -34% | 221 -33% | 319 -4% | 342 3% | 360 8% | 91.2 -73% | 94.8 -71% | 109 -67% | 118 -64% | 113 -66% | 126 -62% | 319 ? -4% | 88.6 ? -73% |
| SPECviewperf 13 | -10% | -23% | -36% | 5% | 12% | 25% | -62% | -56% | -43% | -32% | -19% | -5% | 23% | -61% | |
| 3ds Max (3dsmax-06) (fps) | 380 | 424 12% | 416 9% | 280 -26% | 439 16% | 506 33% | 564 48% | 252 -34% | 286 -25% | 381 0% | 433 14% | 497 31% | 563 48% | 497 ? 31% | 195.3 ? -49% |
| Catia (catia-05) (fps) | 598 | 616 3% | 588 -2% | 410 -31% | 661 11% | 728 22% | 825 38% | 163 -73% | 187 -69% | 241 -60% | 290 -52% | 340 -43% | 402 -33% | 579 ? -3% | 208 ? -65% |
| Creo (creo-02) (fps) | 454 | 431 -5% | 374 -18% | 294 -35% | 470 4% | 567 25% | 613 35% | 230 -49% | 298 -34% | 375 -17% | 455 0% | 529 17% | 552 22% | 590 ? 30% | 214 ? -53% |
| Energy (energy-02) (fps) | 146 | 93.6 -36% | 60.8 -58% | 82.9 -43% | 150 3% | 147 1% | 187 28% | 34.6 -76% | 45.3 -69% | 54.2 -63% | 72.8 -50% | 92.6 -37% | 126 -14% | 230 ? 58% | 39.2 ? -73% |
| Maya (maya-05) (fps) | 581 | 544 -6% | 460 -21% | 333 -43% | 580 0% | 670 15% | 735 27% | 343 -41% | 395 -32% | 510 -12% | 591 2% | 678 17% | 715 23% | 637 ? 10% | 275 ? -53% |
| Medical (medical-02) (fps) | 348 | 166 -52% | 226 -35% | 372 7% | 237 -32% | 263 -24% | 76.5 -78% | 92 -74% | 112 -68% | 132 -62% | 150 -57% | 186 -47% | 332 ? -5% | 87 ? -75% | |
| Showcase (showcase-02) (fps) | 243 | 230 -5% | 264 9% | 127 -48% | 221 -9% | 279 15% | 323 33% | 108 -56% | 121 -50% | 191 -21% | 244 0% | 334 37% | 455 87% | 430 ? 77% | 124.8 ? -49% |
| Siemens NX (snx-03) (fps) | 512 | 537 5% | 101 -80% | 379 -26% | 617 21% | 675 32% | 725 42% | 25.6 -95% | 26.3 -95% | 29.5 -94% | 34.1 -93% | 39 -92% | 49.1 -90% | 136.1 ? -73% | |
| Solidworks (sw-04) (fps) | 321 | 304 -5% | 254 -21% | 195 -39% | 287 -11% | 307 -4% | 323 1% | 127 -60% | 135 -58% | 157 -51% | 168 -48% | 179 -44% | 186 -42% | 278 ? -13% | 123.5 ? -62% |
| SPECviewperf 2020 | -12% | -33% | -38% | 10% | 10% | 26% | -63% | -57% | -42% | -31% | -18% | 3% | 98% | -51% | |
| 3840x2160 Siemens NX (snx-04) (fps) | 336 | 330 -2% | 98.4 -71% | 240 -29% | 402 20% | 476 42% | 514 53% | 19.5 -94% | 20.1 -94% | 23.9 -93% | 27.5 -92% | 31.9 -91% | 41.3 -88% | 974 ? 190% | 89.9 ? -73% |
| 3840x2160 Medical (medical-03) (fps) | 66.7 | 36.4 -45% | 35 -48% | 36.1 -46% | 76.1 14% | 53.9 -19% | 62.3 -7% | 13.7 -79% | 17.5 -74% | 22.2 -67% | 26.9 -60% | 32.2 -52% | 45.9 -31% | 79 ? 18% | 24.1 ? -64% |
| 3840x2160 Maya (maya-06) (fps) | 335 | 331 -1% | 315 -6% | 178 -47% | 346 3% | 401 20% | 481 44% | 196 -41% | 226 -33% | 305 -9% | 372 11% | 447 33% | 498 49% | 506 ? 51% | 221 ? -34% |
| 3840x2160 Energy (energy-03) (fps) | 116 | 113 -3% | 69.3 -40% | 67 -42% | 133 15% | 99.6 -14% | 129 11% | 33.2 -71% | 44.8 -61% | 57.6 -50% | 75.7 -35% | 90.4 -22% | 141 22% | 457 ? 294% | 50.4 ? -57% |
| 3840x2160 Creo (creo-03) (fps) | 150 | 136 -9% | 92.4 -38% | 106 -29% | 159 6% | 173 15% | 187 25% | 85.9 -43% | 95.8 -36% | 112 -25% | 121 -19% | 128 -15% | 133 -11% | 191 ? 27% | 78.5 ? -48% |
| 3840x2160 CATIA (catia-06) (fps) | 103 | 92.2 -10% | 59.7 -42% | 68 -34% | 107 4% | 113 10% | 127 23% | 34 -67% | 39.1 -62% | 51.6 -50% | 61.2 -41% | 75.5 -27% | 95.3 -7% | 139 ? 35% | 49 ? -52% |
| 3840x2160 3ds Max (3dsmax-07) (fps) | 123 | 102 -17% | 140 14% | 72.9 -41% | 134 9% | 143 16% | 167 36% | 67.4 -45% | 74.5 -39% | 122 -1% | 147 20% | 179 46% | 228 85% | 207 ? 68% | 84.7 ? -31% |
| Total Average (Program / Settings) | -8% /
-8% | -27% /
-27% | -36% /
-36% | 6% /
5% | 14% /
15% | 29% /
29% | -62% /
-62% | -56% /
-56% | -42% /
-42% | -31% /
-31% | -19% /
-19% | -5% /
-6% | 52% /
49% | -59% /
-60% |
Gaming Performance
The synthetic tests give us a first impression of the performance of the graphics card in this regard. In our gaming tests, the Asus TUF Gaming Radeon RX 7800 XT OC does fairly well, even if the performance is only slightly higher in the direct comparison to the reference model. Basically, our test unit places exactly where we would have expected. However, with the wide range of games we are unable to give a general statement on the performance of the AMD Radeon RX 7800 XT compared to its competitors. The performance of the graphics cards can only be evaluated in combination with the specific game. Most of the times, it is a duel between the Asus TUF Gaming Radeon RX 7800 XT OC and the KFA2 GeForce RTX 4070 EX Gamer. Both models deliver a similar performance, and depending on the game, either the green or the red team will be ahead.
A look at the list of all the games tested with the Asus TUF Gaming Radeon RX 7800 XT OC paints a good picture. The graphics card currently offers sufficient performance to play even the most current games smoothly in 1440p. The GPU model masters many games even in 2160p, even though the graphics card covers more the QHD area. Those who have a UHD display and want to play games without any loss in detail should take a look at the 7900 models from AMD.
Raytracing Performance
The raytracing performance of the Asus TUF Gaming Radeon RX 7800 XT OC is mixed and again dependent on the specific game. Even with the RDNA 3 architecture, AMD is unable to cause any difficulties for Nvidia. However, you still don't have to let go of this feature completely. But to get adequate frame rates, it is necessary to reduce the resolution. Compared to an older AMD Radeon RX 6800, AMD was able to increase the raytracing performance of the RX 7800 XT noticeably, and you can expect a performance increase of about 30%. Compared to Nvidia's 4000 series, the AMD Radeon RX 7800 XT is only able to keep up with an Nvidia GeForce RTX 4060 Ti.
| Hogwarts Legacy - 1920x1080 Ultra Preset + Full Ray Tracing AA:High T | |
| Palit GeForce RTX 4090 GameRock OC | |
| XFX Radeon RX 7900 XTX Merc 310 Black Edition | |
| Palit GeForce RTX 4090 GameRock OC | |
| Nvidia GeForce RTX 3090 FE | |
| KFA2 GeForce RTX 4070 EX Gamer | |
| MSI Radeon RX 6950 XT Gaming X Trio | |
| AMD Radeon RX 7900 GRE | |
| Nvidia Titan RTX | |
| ASUS TUF Gaming Radeon RX 7800 XT | |
| ASUS Dual GeForce RTX 4060 Ti OC | |
| Sapphire Pulse Radeon RX 7700 XT | |
| AMD Radeon RX 6800 | |
| Nvidia GeForce RTX 2070 Super | |
| Acer Predator BiFrost Arc A770 OC, 16GB GDDR6 | |
| Sapphire Pulse Radeon RX 6750 XT | |
| Nvidia GeForce RTX 2060 Super | |
| XFX Speedster QICK 308 Radeon RX 7600 Black Edition | |
| Spider-Man Miles Morales - 1920x0180 Very High Preset + Ray-Tracing AA:T | |
| Palit GeForce RTX 4090 GameRock OC | |
| Palit GeForce RTX 4090 GameRock OC | |
| XFX Radeon RX 7900 XTX Merc 310 Black Edition | |
| KFA2 GeForce RTX 4070 Ti SG | |
| Nvidia GeForce RTX 3090 FE | |
| ASUS TUF Gaming Radeon RX 7800 XT | |
| AMD Radeon RX 7900 XT | |
| KFA2 GeForce RTX 4070 EX Gamer | |
| AMD Radeon RX 7800 XT | |
| MSI Radeon RX 6950 XT Gaming X Trio | |
| AMD Radeon RX 7900 GRE | |
| ASUS Dual GeForce RTX 4060 Ti OC | |
| Sapphire Pulse Radeon RX 7700 XT | |
| Nvidia Titan RTX | |
| AMD Radeon RX 6800 | |
| Acer Predator BiFrost Arc A770 OC, 16GB GDDR6 | |
| Sapphire Pulse Radeon RX 6750 XT | |
| Nvidia GeForce RTX 2070 Super | |
| XFX Speedster QICK 308 Radeon RX 7600 Black Edition | |
| Nvidia GeForce RTX 2060 Super | |
| Metro Exodus - 1920x1080 Ultra Quality DXR AF:16x | |
| Palit GeForce RTX 4090 GameRock OC | |
| Palit GeForce RTX 4090 GameRock OC | |
| XFX Radeon RX 7900 XTX Merc 310 Black Edition | |
| Asus TUF Gaming GeForce RTX 4070 Ti Super | |
| KFA2 GeForce RTX 4070 Ti SG | |
| AMD Radeon RX 7900 XT | |
| MSI Radeon RX 6950 XT Gaming X Trio | |
| KFA2 GeForce RTX 4070 EX Gamer | |
| ASUS TUF Gaming Radeon RX 7800 XT | |
| AMD Radeon RX 7900 GRE | |
| AMD Radeon RX 7800 XT | |
| Nvidia Titan RTX | |
| Sapphire Pulse Radeon RX 7700 XT | |
| ASUS Dual GeForce RTX 4060 Ti OC | |
| Acer Predator BiFrost Arc A770 OC, 16GB GDDR6 | |
| Sapphire Pulse Radeon RX 6750 XT | |
| XFX Speedster QICK 308 Radeon RX 7600 Black Edition | |
| Nvidia GeForce RTX 2070 Super | |
| Nvidia GeForce RTX 2060 Super | |
| Far Cry 6 - 1920x1080 Ultra Graphics Quality + HD Textures + DXR AA:T | |
| XFX Radeon RX 7900 XTX Merc 310 Black Edition | |
| Palit GeForce RTX 4090 GameRock OC | |
| Asus TUF Gaming GeForce RTX 4070 Ti Super | |
| AMD Radeon RX 7900 XT | |
| Nvidia GeForce RTX 3090 FE | |
| AMD Radeon RX 7900 GRE | |
| ASUS TUF Gaming Radeon RX 7800 XT | |
| Palit GeForce RTX 4090 GameRock OC | |
| KFA2 GeForce RTX 4070 Ti SG | |
| MSI Radeon RX 6950 XT Gaming X Trio | |
| KFA2 GeForce RTX 4070 EX Gamer | |
| AMD Radeon RX 7800 XT | |
| AMD Radeon RX 6800 | |
| Nvidia Titan RTX | |
| Sapphire Pulse Radeon RX 7700 XT | |
| Sapphire Pulse Radeon RX 6750 XT | |
| Acer Predator BiFrost Arc A770 OC, 16GB GDDR6 | |
| XFX Speedster QICK 308 Radeon RX 7600 Black Edition | |
| Nvidia GeForce RTX 2070 Super | |
| Nvidia GeForce RTX 2060 Super | |
| The Callisto Protocol - 1920x1080 Ultra Preset (without FSR Upscaling) + Full Ray-Tracing | |
| XFX Radeon RX 7900 XTX Merc 310 Black Edition | |
| ASUS TUF Gaming Radeon RX 7800 XT | |
| Nvidia GeForce RTX 3090 FE | |
| AMD Radeon RX 7800 XT | |
| AMD Radeon RX 7900 GRE | |
| Asus TUF Gaming GeForce RTX 4070 Ti Super | |
| Sapphire Pulse Radeon RX 7700 XT | |
| Palit GeForce RTX 4090 GameRock OC | |
| ASUS Dual GeForce RTX 4060 Ti OC | |
| AMD Radeon RX 7900 XT | |
| MSI Radeon RX 6950 XT Gaming X Trio | |
| KFA2 GeForce RTX 4070 Ti SG | |
| KFA2 GeForce RTX 4070 EX Gamer | |
| AMD Radeon RX 6800 | |
| XFX Speedster QICK 308 Radeon RX 7600 Black Edition | |
| Nvidia Titan RTX | |
| Acer Predator BiFrost Arc A770 OC, 16GB GDDR6 | |
| Nvidia GeForce RTX 2070 Super | |
| Nvidia GeForce RTX 2060 Super | |
| Sapphire Pulse Radeon RX 6750 XT | |
| Guardians of the Galaxy - 1920x1080 Ultra Preset + Ultra Ray-Tracing | |
| Palit GeForce RTX 4090 GameRock OC | |
| XFX Radeon RX 7900 XTX Merc 310 Black Edition | |
| Nvidia GeForce RTX 3090 FE | |
| KFA2 GeForce RTX 4070 EX Gamer | |
| AMD Radeon RX 7900 XT | |
| AMD Radeon RX 7900 GRE | |
| MSI Radeon RX 6950 XT Gaming X Trio | |
| ASUS Dual GeForce RTX 4060 Ti OC | |
| ASUS TUF Gaming Radeon RX 7800 XT | |
| AMD Radeon RX 7800 XT | |
| Nvidia Titan RTX | |
| Sapphire Pulse Radeon RX 7700 XT | |
| Nvidia GeForce RTX 2070 Super | |
| Sapphire Pulse Radeon RX 6750 XT | |
| Acer Predator BiFrost Arc A770 OC, 16GB GDDR6 | |
| Nvidia GeForce RTX 2060 Super | |
| XFX Speedster QICK 308 Radeon RX 7600 Black Edition | |
| F1 23 - 1920x1080 Ultra High Preset AA:T AF:16x | |
| Palit GeForce RTX 4090 GameRock OC (1038401) | |
| Palit GeForce RTX 4090 GameRock OC (1022189) | |
| XFX Radeon RX 7900 XTX Merc 310 Black Edition (1070925) | |
| Asus TUF Gaming GeForce RTX 4070 Ti Super (1057599) | |
| Nvidia GeForce RTX 3090 FE (1082038) | |
| KFA2 GeForce RTX 4070 EX Gamer | |
| AMD Radeon RX 7900 GRE (1016022) | |
| MSI Radeon RX 6950 XT Gaming X Trio (1016022) | |
| ASUS TUF Gaming Radeon RX 7800 XT (1093534) | |
| AMD Radeon RX 7800 XT (1022189) | |
| ASUS Dual GeForce RTX 4060 Ti OC (1012607) | |
| Nvidia Titan RTX (1021115) | |
| Sapphire Pulse Radeon RX 7700 XT (1026791) | |
| AMD Radeon RX 6800 (1016022) | |
| Acer Predator BiFrost Arc A770 OC, 16GB GDDR6 (1026791) | |
| Sapphire Pulse Radeon RX 6750 XT (1016022) | |
| Nvidia GeForce RTX 2070 Super (1021115) | |
| XFX Speedster QICK 308 Radeon RX 7600 Black Edition (1016022) | |
| Nvidia GeForce RTX 2060 Super (1021115) | |
| Star Wars Jedi Survivor - 1920x1080 Epic Preset + Ray Tracing | |
| Palit GeForce RTX 4090 GameRock OC | |
| Palit GeForce RTX 4090 GameRock OC | |
| XFX Radeon RX 7900 XTX Merc 310 Black Edition | |
| Nvidia GeForce RTX 3090 FE | |
| MSI Radeon RX 6950 XT Gaming X Trio | |
| ASUS TUF Gaming Radeon RX 7800 XT | |
| AMD Radeon RX 7900 GRE | |
| KFA2 GeForce RTX 4070 EX Gamer | |
| AMD Radeon RX 7800 XT | |
| Sapphire Pulse Radeon RX 7700 XT | |
| Nvidia Titan RTX | |
| AMD Radeon RX 6800 | |
| ASUS Dual GeForce RTX 4060 Ti OC | |
| Sapphire Pulse Radeon RX 6750 XT | |
| Nvidia GeForce RTX 2070 Super | |
| Acer Predator BiFrost Arc A770 OC, 16GB GDDR6 | |
| XFX Speedster QICK 308 Radeon RX 7600 Black Edition | |
| Nvidia GeForce RTX 2060 Super | |
| Ghostwire Tokyo - 1920x1080 Highest Settings + Maximum Ray Tracing | |
| Palit GeForce RTX 4090 GameRock OC | |
| XFX Radeon RX 7900 XTX Merc 310 Black Edition | |
| Asus TUF Gaming GeForce RTX 4070 Ti Super | |
| KFA2 GeForce RTX 4070 Ti SG | |
| Nvidia GeForce RTX 3090 FE | |
| AMD Radeon RX 7900 XT | |
| KFA2 GeForce RTX 4070 EX Gamer | |
| AMD Radeon RX 7900 GRE | |
| MSI Radeon RX 6950 XT Gaming X Trio | |
| ASUS TUF Gaming Radeon RX 7800 XT | |
| AMD Radeon RX 7800 XT | |
| ASUS Dual GeForce RTX 4060 Ti OC | |
| Sapphire Pulse Radeon RX 7700 XT | |
| Nvidia Titan RTX | |
| Acer Predator BiFrost Arc A770 OC, 16GB GDDR6 | |
| Sapphire Pulse Radeon RX 6750 XT | |
| Nvidia GeForce RTX 2070 Super | |
| XFX Speedster QICK 308 Radeon RX 7600 Black Edition | |
| Nvidia GeForce RTX 2060 Super | |
| Ratchet & Clank Rift Apart | |
| 1920x1080 Very High Preset + Very High Raytracing AA:T | |
| Palit GeForce RTX 4090 GameRock OC | |
| Palit GeForce RTX 4090 GameRock OC | |
| XFX Radeon RX 7900 XTX Merc 310 Black Edition | |
| Nvidia GeForce RTX 3090 FE | |
| AMD Radeon RX 7800 XT | |
| ASUS TUF Gaming Radeon RX 7800 XT | |
| ASUS Dual GeForce RTX 4060 Ti OC | |
| Nvidia Titan RTX | |
| AMD Radeon RX 6800 | |
| Sapphire Pulse Radeon RX 7700 XT | |
| Acer Predator BiFrost Arc A770 OC, 16GB GDDR6 | |
| Sapphire Pulse Radeon RX 6750 XT | |
| Nvidia GeForce RTX 2070 Super | |
| Nvidia GeForce RTX 2060 Super | |
| XFX Speedster QICK 308 Radeon RX 7600 Black Edition | |
| 3840x2160 Very High Preset + Very High Raytracing + DLSS Quality + FG | |
| Palit GeForce RTX 4090 GameRock OC | |
| Palit GeForce RTX 4090 GameRock OC | |
| ASUS Dual GeForce RTX 4060 Ti OC | |
| Alan Wake 2 - 1920x1080 High Preset + High Ray Tracing | |
| Palit GeForce RTX 4090 GameRock OC | |
| Asus TUF Gaming GeForce RTX 4070 Ti Super | |
| XFX Radeon RX 7900 XTX Merc 310 Black Edition | |
| Nvidia GeForce RTX 3090 FE | |
| ASUS TUF Gaming Radeon RX 7800 XT | |
| MSI Radeon RX 6950 XT Gaming X Trio | |
| Nvidia Titan RTX | |
| Sapphire Pulse Radeon RX 7700 XT | |
| AMD Radeon RX 6800 | |
| Sapphire Pulse Radeon RX 6750 XT | |
| Nvidia GeForce RTX 2070 Super | |
| Nvidia GeForce RTX 2060 Super | |
| XFX Speedster QICK 308 Radeon RX 7600 Black Edition | |
| Cyberpunk 2077 | |
| 1920x1080 Ray Tracing Ultra Preset (DLSS off) | |
| Palit GeForce RTX 4090 GameRock OC (2.0) | |
| Asus TUF Gaming GeForce RTX 4070 Ti Super (2.1) | |
| XFX Radeon RX 7900 XTX Merc 310 Black Edition (2.11) | |
| Nvidia GeForce RTX 3090 FE (2.11) | |
| MSI Radeon RX 6950 XT Gaming X Trio (2.02) | |
| ASUS TUF Gaming Radeon RX 7800 XT (2.11) | |
| Sapphire Pulse Radeon RX 7700 XT (2.02) | |
| AMD Radeon RX 6800 (2.02) | |
| Acer Predator BiFrost Arc A770 OC, 16GB GDDR6 (2.0) | |
| Sapphire Pulse Radeon RX 6750 XT (2.02) | |
| XFX Speedster QICK 308 Radeon RX 7600 Black Edition (2.02) | |
| 3840x2160 Ray Tracing Ultra Preset (DLSS off, no Path Tracing) | |
| Asus TUF Gaming GeForce RTX 4070 Ti Super (2.1) | |
| XFX Radeon RX 7900 XTX Merc 310 Black Edition (2.11) | |
| Nvidia GeForce RTX 3090 FE (2.11) | |
| Nvidia GeForce RTX 3090 FE (2.11) | |
| ASUS TUF Gaming Radeon RX 7800 XT (2.11) | |
| AMD Radeon RX 6800 (2.02) | |
| Sapphire Pulse Radeon RX 6750 XT (2.02) | |
| XFX Speedster QICK 308 Radeon RX 7600 Black Edition (2.02) | |
Overview of the Games Tested with the Asus TUF Gaming Radeon RX 7800 XT OC
| low | med. | high | ultra | QHD FSR | QHD | 4K FSR | 4K | |
|---|---|---|---|---|---|---|---|---|
| Prince of Persia The Lost Crown (2024) | 359 | 359 | 359 | 359 | 344 | |||
| Palworld (2024) | 228 | 197.1 | 140.2 | 138.9 | 118.5 | 63.4 | ||
| Enshrouded (2024) | 133 | 123.2 | 105.3 | 89.6 | 69.2 | 61 | 41 | |
| Helldivers 2 (2024) | 213 | 193.2 | 172.3 | 164.9 | 123.7 | 68.5 | ||
| Skull & Bones (2024) | 209 | 197 | 157 | 103 | 91 | 55 | 55 | |
| Last Epoch (2024) | 295 | 292 | 291 | 232 | 142.7 | 64.9 | ||
| Alone in the Dark (2024) | 310 | 298 | 280 | 166.1 | 102.5 | 98.6 | 46.5 | |
| Dragon's Dogma 2 (2024) | 113.7 | 109.2 | 90.6 | 58 | 55 | |||
| Horizon Forbidden West (2024) | 180.3 | 164.7 | 111 | 109.8 | 85.3 | 72.5 | 54.7 | |
| Ghost of Tsushima (2024) | 185.1 | 158.1 | 147.6 | 113.9 | 92 | 83.2 | 58 | |
| Senua's Saga Hellblade 2 (2024) | 114.3 | 96.3 | 70 | 73.3 | 51.7 | 47.2 | 28.4 | |
| F1 24 (2024) | 484 | 422 | 317 | 88.3 | 92.4 | 57.3 | 49.8 | 28.7 |
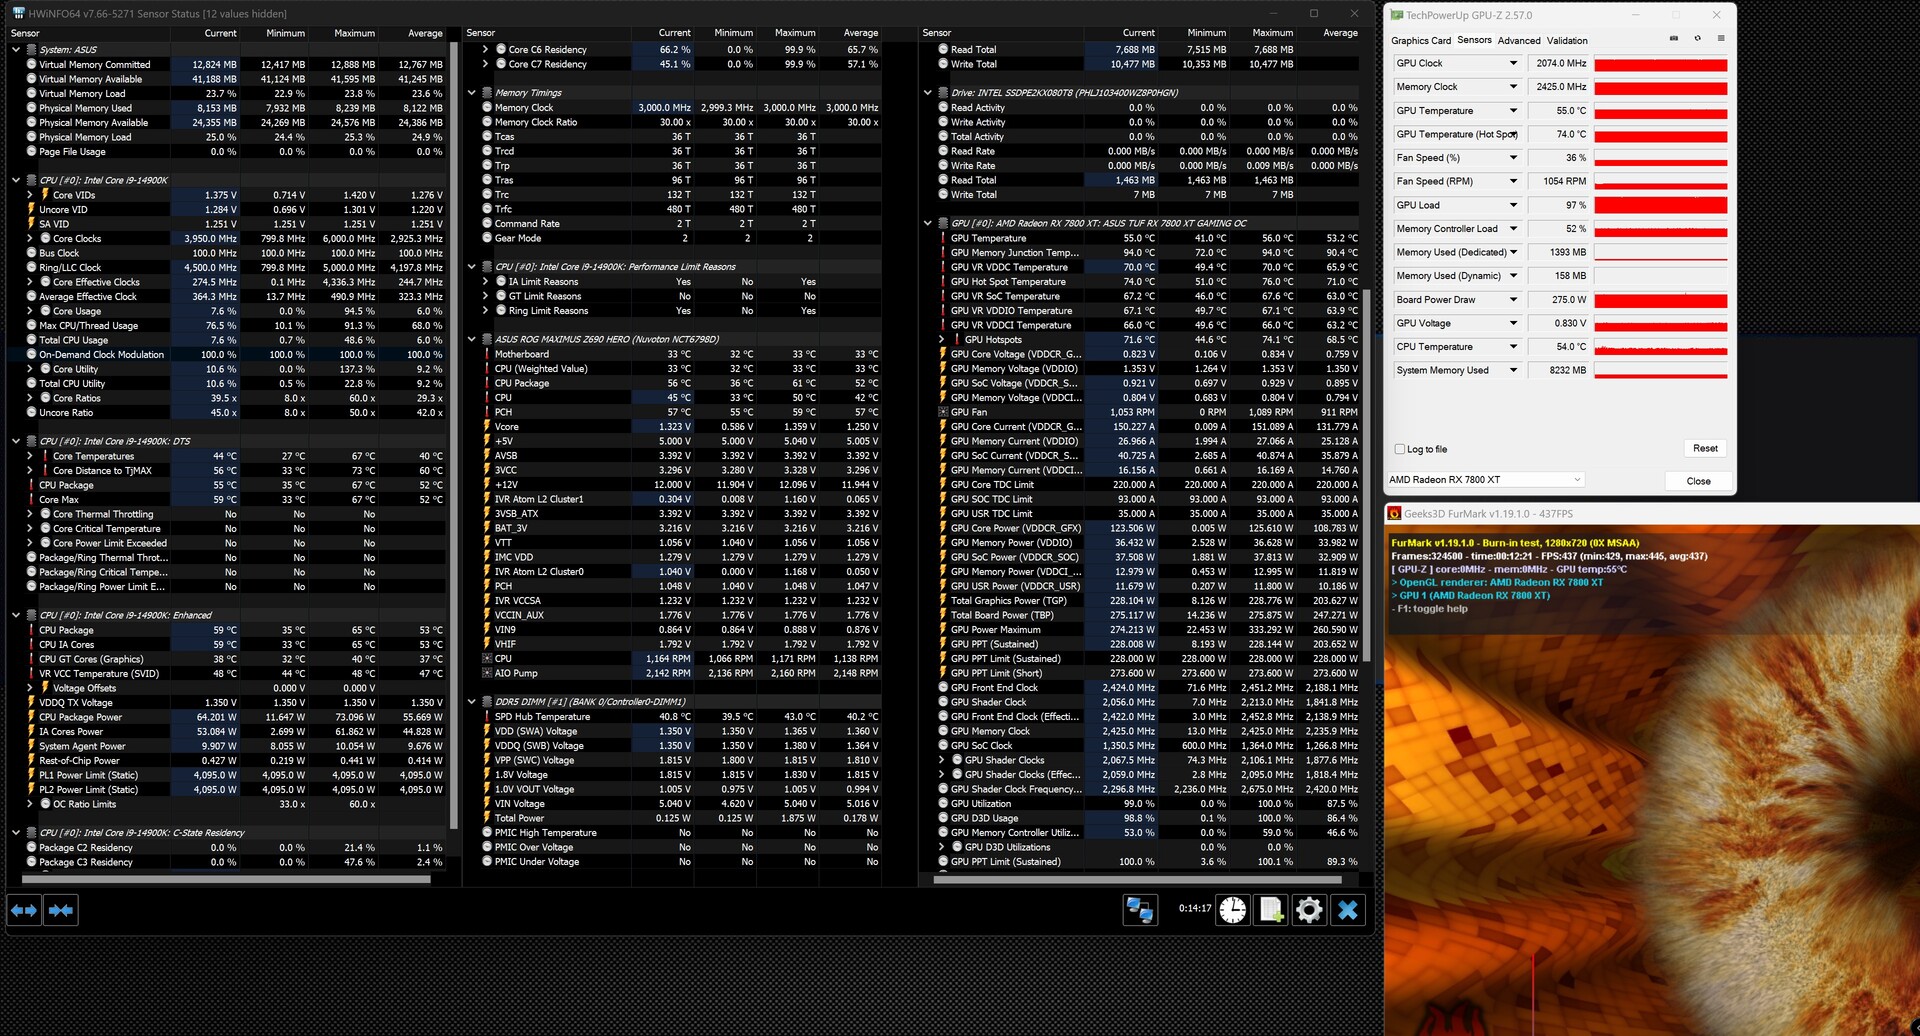
Emissions - Quiet but not very efficient
Noise Emissions
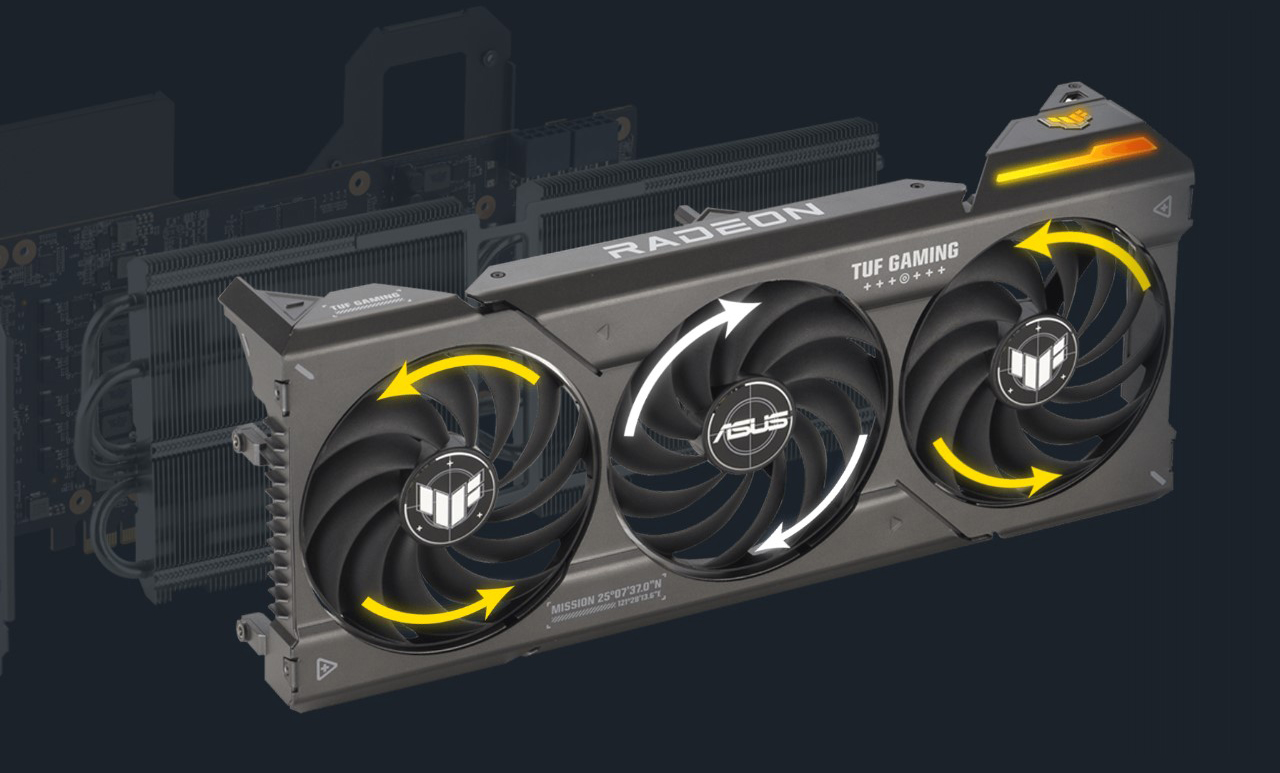
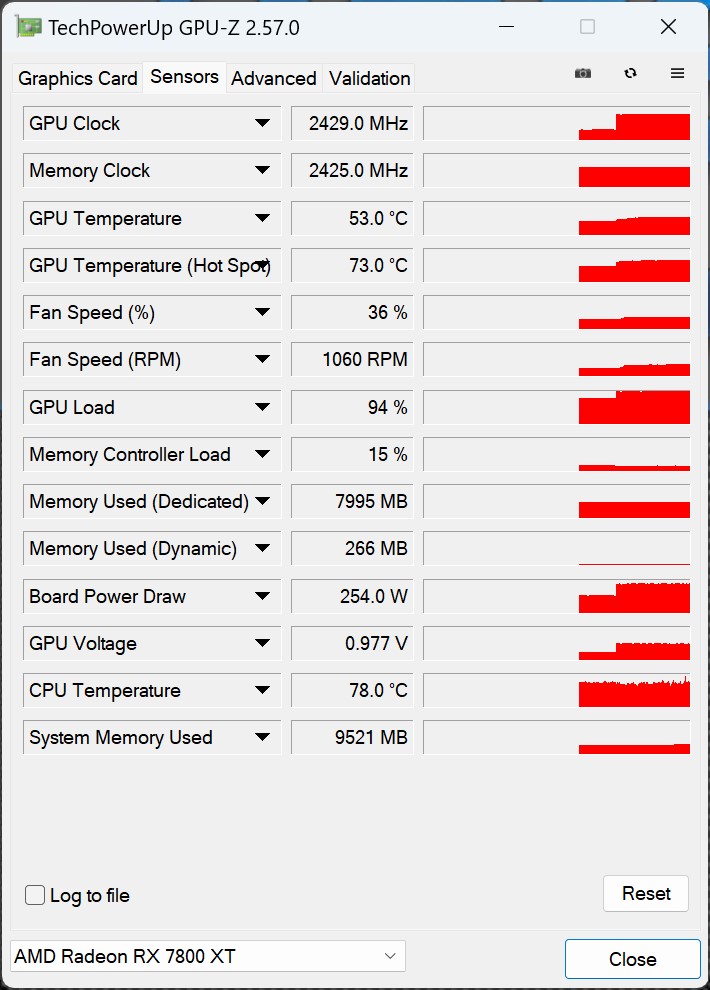
Asus has equipped the TUF Gaming Radeon RX 7800 XT OC with a fan stop mode. The three 100-mm (~3.9 in) axial fans only start running at GPU temperatures above 55 °C (131 °F), which ensures a silent operation with 2D activities and under low load. Under an average 3D load, the three fans run at a slow speed, and we only measure a low noise level of 31.1 dB(A). During the stress test, the cooling system has to work harder, which is accompanied by a maximum noise level of 37.7 dB(A). As a peculiarity, we should also mention that the two outer fans rotate counterclockwise in the opposite direction of the fan in the center. This is supposed to prevent some turbulences and ensure a better air circulation.
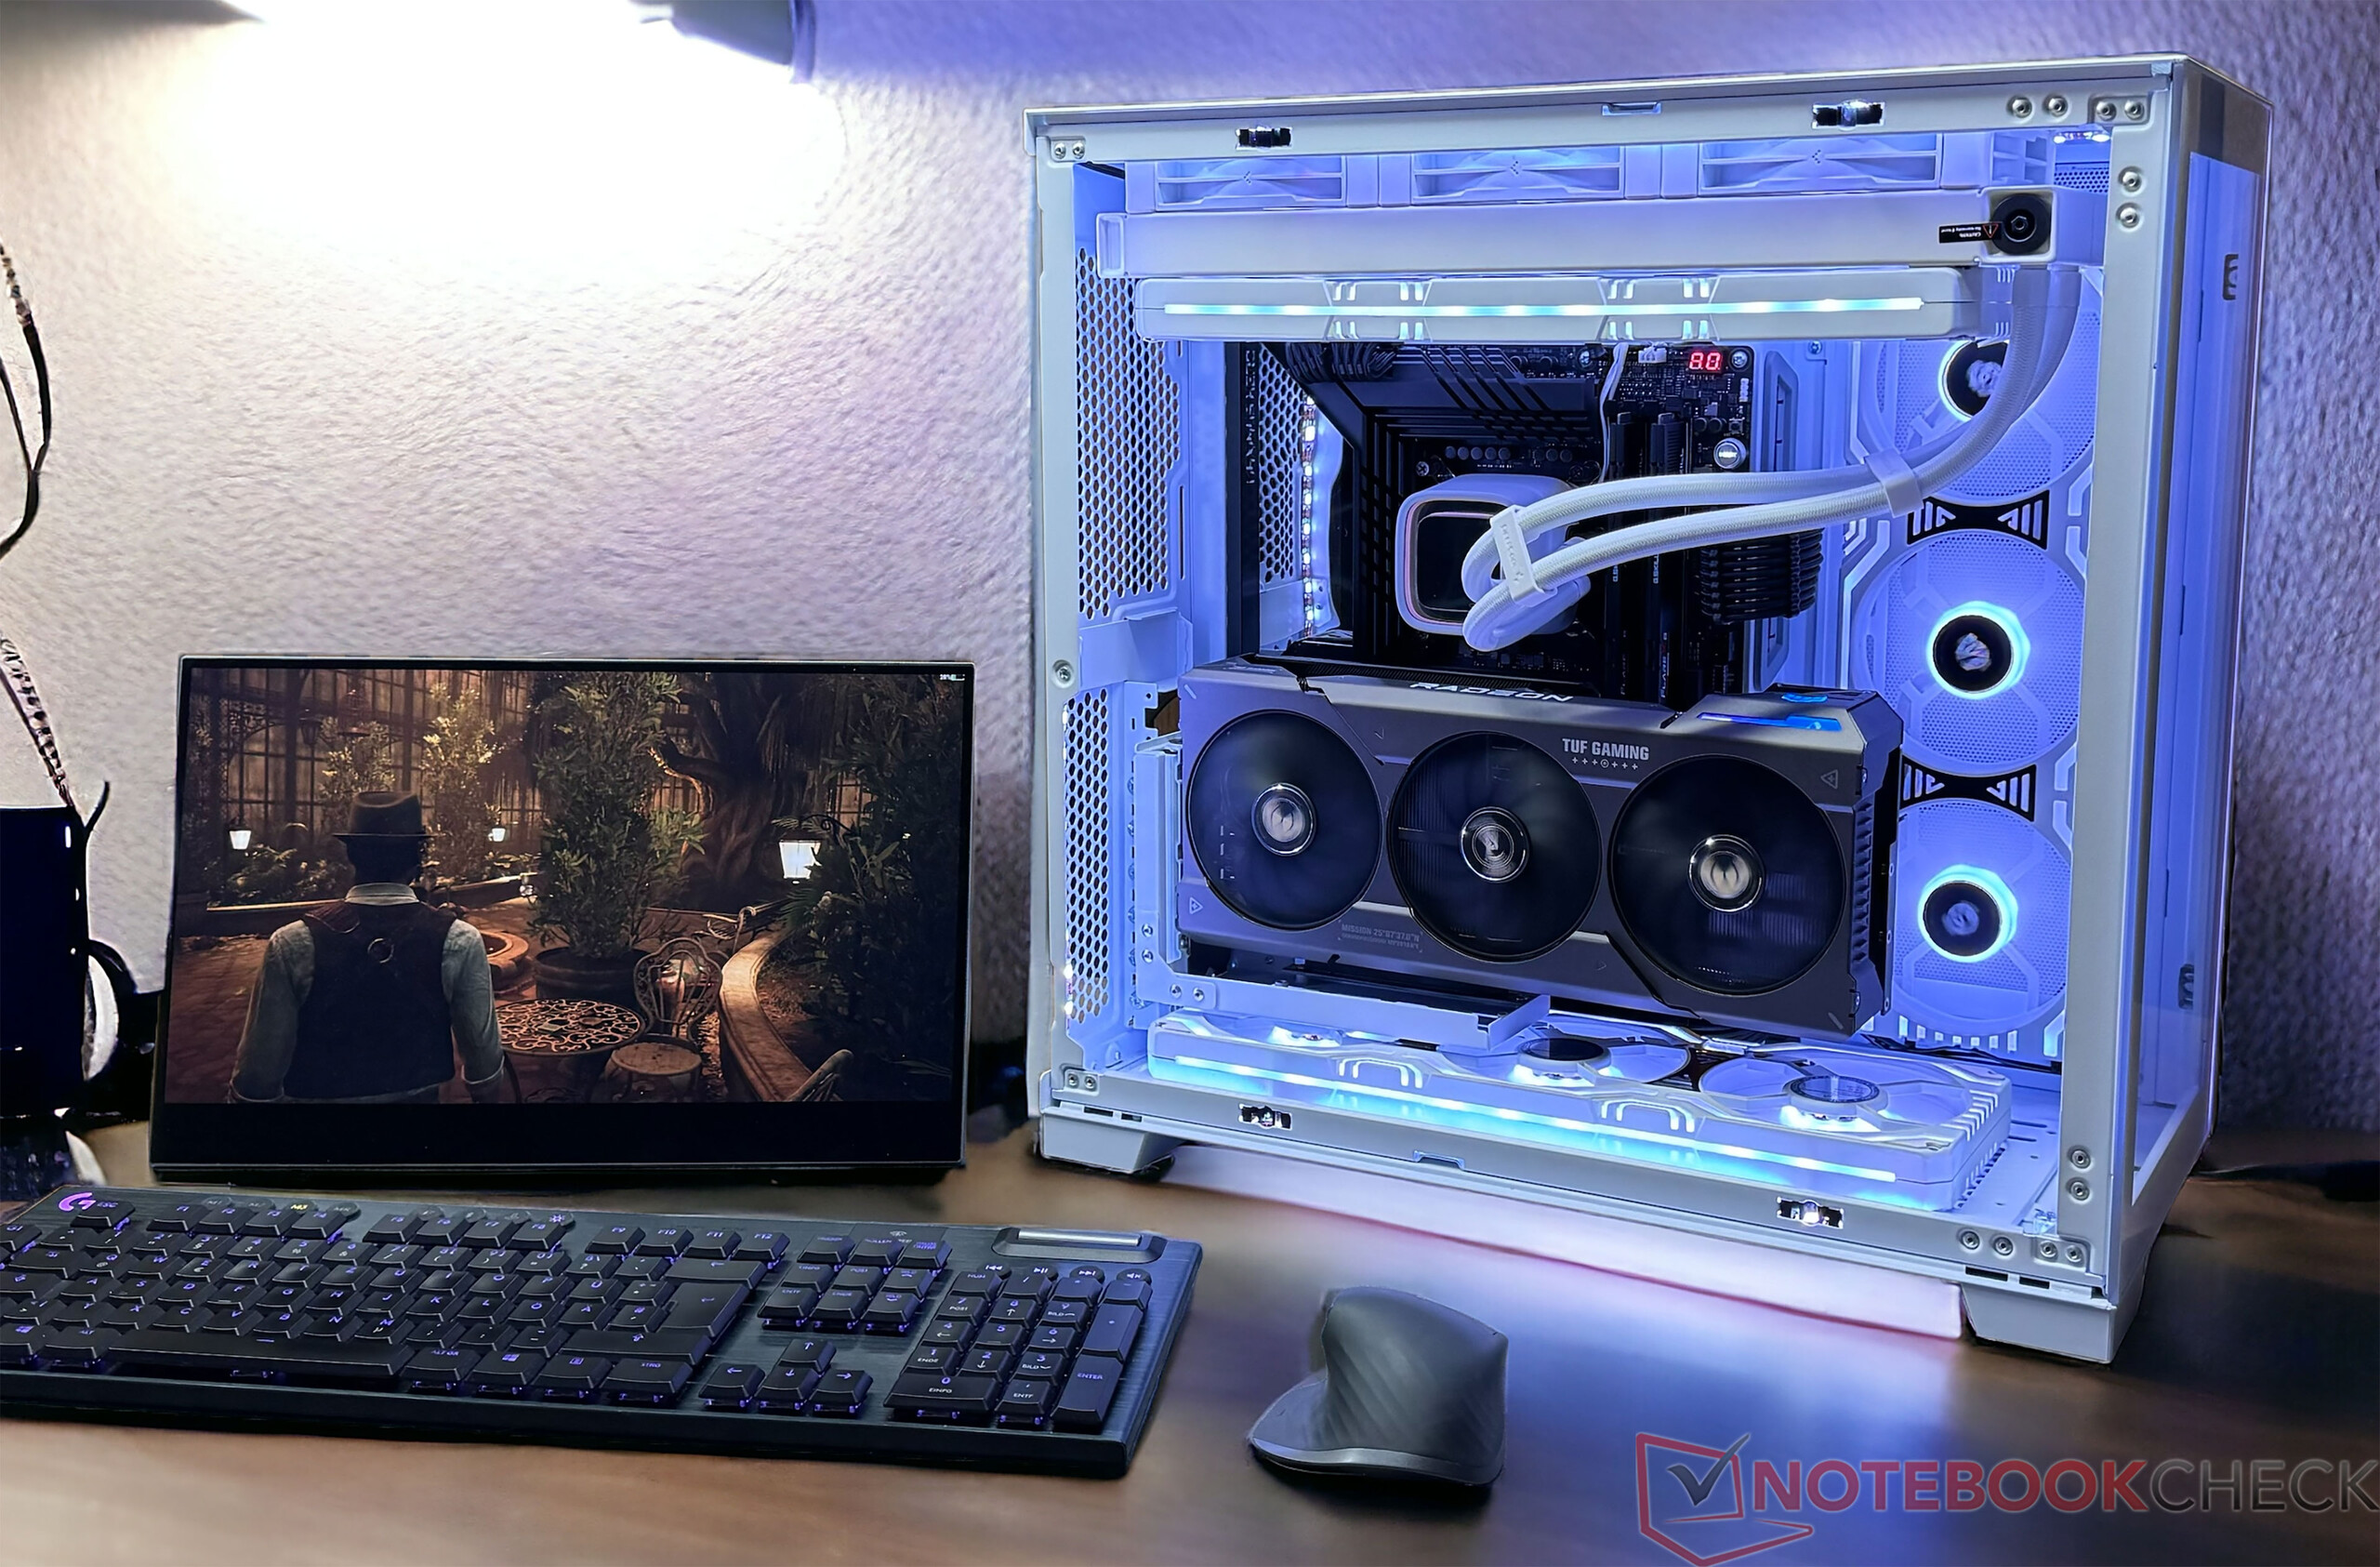
In order to document the noise level of the graphics card, we insert the Asus TUF Gaming Radeon RX 7800 XT OC into our system with an open case for measuring the noise levels. When inserted in our GPU test system, we are unable to explicitly hear the noise of our graphics card under load.